
Systems Analysis and Design with UML, 3rd Edition - Prexams ...
677
-
Upload
khangminh22 -
Category
Documents
-
view
1 -
download
0
Transcript of Systems Analysis and Design with UML, 3rd Edition - Prexams ...


Systems Analysis Design UML Version 2.0
An Object-Oriented Approach
Third Edition

This page intentionally left blank

System Analysis Design UML Version 2.0
An Object-Oriented Approach
Third Edition
Alan DennisIndiana University
Barbara Haley WixomUniversity of Virginia
David TegardenVirginia Tech
John Wiley & Sons, Inc.

Vice President & Executive Publisher Don Fowley
Executive Editor Beth Golub
Associate Editor Jen Devine
Marketing Manager Carly DeCandia
Design Director Harry Nolan
Senior Designer Kevin Murphy
Senior Production Editor Patricia McFadden
Senior Media Editor Lauren Sapira
Production Management Services
This book was set in by Laserwords and printed and bound by RRD/Von Hoffmann. The cover was printed by RRD/Von Hoffmann.
This book is printed on acid free paper. ∞
Copyright © 2009 John Wiley & Sons, Inc. All rights reserved.
No part of this publication may be reproduced, stored in a retrieval system or transmitted in any form or by anymeans, electronic, mechanical, photocopying, recording, scanning or otherwise, except as permitted under Sections 107or 108 of the 1976 United States Copyright Act, without either the prior written permission of the Publisher, or autho-rization through payment of the appropriate per-copy fee to the Copyright Clearance Center, Inc. 222 Rosewood Drive,Danvers, MA 01923, website www.copyright.com. Requests to the Publisher for permission should be addressed to the Permissions Department, John Wiley & Sons, Inc., 111 River Street, Hoboken, NJ 07030-5774, (201)748-6011,fax (201)748-6008, website http://www.wiley.com/go/permissions.
To order books or for customer service please, call 1-800-CALL WILEY (225-5945).
ISBN-13 9780470074787
Printed in the United States of America
10 9 8 7 6 5 4 3 2 1
Aptara®, Inc.
Lang
Preface xiii
Chapter 1
Introduction to Systems Analysis and Design 1
■ PART ONE PROJECT INITIATION, PROJECT MANAGEMENT,AND REQUIREMENTS DETERMINATION 39
Chapter 2
Project Initiation 41
Chapter 3
Project Management 69
Chapter 4
Requirements Determination 110
■ PART TWO ANALYSIS MODELING 155
Chapter 5
Functional Modeling 157
Chapter 6
Structural Modeling 207
Chapter 7
Behavioral Modeling 238
■ PART THREE DESIGN MODELING 269
Chapter 8
Moving on to Design 271
B R I E F C O N T E N T S
v

Chapter 9
Class and Method Design 318
Chapter 10
Data Management Layer Design 361
Chapter 11
Human–Computer Interaction Layer Design 411
Chapter 12
Physical Architecture Layer Design 463
■ PART FOUR CONSTRUCTION, INSTALLATION, AND OPERATIONS 503
Chapter 13
Construction 505
Chapter 14
Installation and Operations 533
Index 536
vi Brief Contents

Preface xiii
Chapter 1
Introduction to Systems Analysis and Design 1Introduction 2The Systems Development Life Cycle 3
Planning 4Analysis 4Design 5Implementation 6
Systems Development Methodologies 6
Structured Design 8Rapid Application Development
(RAD) 10Agile Development 14Selecting the Appropriate Development
Methodology 15Object-Oriented Systems Analysis
and Design (OOSAD) 17Use-Case Driven 18Architecture Centric 18Iterative and Incremental 18Benefits of Object-Oriented Systems
Analysis and Design 19The Unified Process 19
Phases 20Workflows 22Extensions to the Unified Process 24
The Unified Modeling Language 29Project Team Roles and Skills 30
Business Analyst 32Systems Analyst 32Infrastructure Analyst 32Change Management Analyst 32
Project Manager 32Applying the Concepts at CD
Selections 33Summary 33
■ PART ONE PROJECT INITIATION, PROJECTMANAGEMENT, AND REQUIRE-MENTS DETERMINATION 39
Chapter 2
Project Initiation 41Introduction 41Project Identification 43
System Request 44Feasibility Analysis 44
Technical Feasibility 46Economic Feasibility 48Organizational Feasibility 56
Project Selection 58Applying the Concepts at CD
Selections 61Project Identification and System
Request 61Feasibility Analysis 62Project Selection 64
Summary 66
Chapter 3
Project Management 69Introduction 69Identifying Project Size 70
Function Point Approach 72Creating and Managing
the Workplan 77
C O N T E N T S
vii
Identifying Tasks 78The Project Workplan 79Gantt Chart 79PERT Chart 81Refining Estimates 82Scope Management 83Timeboxing 85Evolutionary Work Breakdown Structures
and Iterative Workplans 86Staffing the Project 91
Staffing Plan 91Motivation 94Handling Conflict 94
Coordinating Project Activities 96CASE Tools 96Standards 97Documentation 98Managing Risk 98
Applying the Concepts at CD Selections 100
Staffing the Project 104Coordinating Project Activities 105
Summary 106
Chapter 4
Requirements Determination 110Introduction 110Requirements Determination 111
Defining a Requirement 111Requirements Definition 114Determining Requirements 115Creating a Requirements Definition 116
Requirements Analysis Strategies 117Business Process Automation 117Business Process Improvement 120Business Process Reengineering 121Selecting Appropriate Strategies 122
Requirements-Gathering Techniques 125
Interviews 125Joint application development (JAD) 132Questionnaires 136Document Analysis 138Observation 138
Other Techniques 140Selecting the Appropriate
Techniques 142The System Proposal 144Applying the Concepts at CD
Selections 145Requirements Analysis Strategies 145Requirements-Gathering Techniques 146Requirements Definition 146System Proposal 148
Summary 149
■ PART TWOANALYSIS MODELING 155
Chapter 5
Functional Modeling 157Introduction 158Business Process Modeling
with Activity Diagrams 159Elements of an Activity Diagram 160Guidelines for Creating Activity
Diagrams 165Use-Case Descriptions 166
Types of Use Cases 167Elements of a Use-Case Description 168Guidelines for Creating Use-Case
Descriptions 171Use-Case Diagrams 173
Actors 173Association 175Use Case 176System Boundary 176
Creating Use-Case Descriptions and Use-Case Diagrams 178
Identifying the Major Use Cases 179Expanding the Major Use Cases 180Confirming the Major Use Cases 181Creating a Use-Case Diagram 181
Refining Project Size and Effort Estimation Using Use-Case Points 182
Applying the Concepts at CD Selections 188
viii Contents
Business Process Modeling with ActivityDiagrams 188
Identifying the Major Use Cases 189Expanding the Major Use Cases 191Confirming the Major Use Cases 193Creating the Use-Case Diagram 198Refining Project Size and Effort
Estimation Using Use-Case Points 198Summary 201
Chapter 6
Structural Modeling 207Introduction 207Structural Models 208
Classes, Attributes, and Operations 209Relationships 209
CRC Cards 211Responsibilities and Collaborations 211Elements of a CRC Card 212
Class Diagrams 213Elements of a Class Diagram 213Simplifying Class Diagrams 221Object Diagrams 221
Creating CRC Cards and Class Diagrams 222
Object Identification 223Building CRC Cards and Class
Diagrams 225Applying the Concepts at CD
Selections 228Step 1: Create CRC Cards 228Step 2: Examine Common Object
Lists 228Step 3: Role-Play the CRC Cards 230Step 4: Create the Class Diagram 231Step 5: Review the Class Diagram 231Step 6: Incorporate Patterns 231Step 7: Review the Model 232
Summary 233
Chapter 7
Behavioral Modeling 238Introduction 238Behavioral Models 239
Interaction Diagrams 239Objects, Operations, and Messages 240Sequence Diagrams 240Communication Diagrams 246
Behavioral State Machines 250States, Events, Transitions, Actions,
and Activities 250Elements of a Behavioral State
Machine 251Building Behavioral State Machines 254
CRUD Analysis 256Applying the Concepts at CD
Selections 257Sequence Diagrams 257Communication Diagrams 260Behavioral State Machines 261CRUD Analysis 262
Summary 264
■ PART THREE DESIGN MODELING 269
Chapter 8
Moving on to Design 271Introduction 272Verifying and Validating the Analysis
Models 273Verification and Validation through
Walkthroughs 273Functional Model Verification
and Validation 275Structural Model Verification
and Validation 276Behavioral Model Verification
and Validation 278Balancing the Analysis Models 280
Evolving the Analysis Models into Design Models 287
Factoring 290Partitions and Collaborations 290Layers 292
Packages and Package Diagrams 294Identifying Packages and Creating Package
Diagrams 297
Contents ix

Verifying and Validating Package Diagrams 297
Design Strategies 299Custom Development 299Packaged Software 300Outsourcing 302Selecting a Design Strategy 304
Developing the Actual Design 306Alternative Matrix 306
Applying the Concepts at CD Selections 308
Packages and Package Diagrams 308Verifying and Validating the Analysis
Models 310Developing the Actual Design 311
Summary 312
Chapter 9
Class and Method Design 318Introduction 318Review of the Basic Characteristics
of Object Orientation 320Classes, Objects, Methods,
and Messages 320Encapsulation and Information
Hiding 321Polymorphism and Dynamic Binding 321Inheritance 322
Design Criteria 325Coupling 325Cohesion 328Connascence 331
Object Design Activities 332Adding Specifications 332Identifying Opportunities for Reuse 333Restructuring the Design 335Optimizing the Design 336Mapping Problem-Domain Classes
to Implementation Languages 339Constraints and Contracts 343
Types of Constraints 343Elements of a Contract 346
Method Specification 347General Information 348Events 349
Message Passing 349Algorithm Specification 349
Applying the Concepts at CD Selections 351
Summary 354
Chapter 10
Data Management Layer Design 361Introduction 362Object-Persistence Formats 362
Sequential and Random Access Files 363Relational Databases 366Object-Relational Databases 368Object-Oriented Databases 368Selecting an Object-Persistence
Format 369Mapping Problem-Domain Objects
to Object-Persistence Formats 372Mapping Problem-Domain Objects
to an OODBMS Format 372Mapping Problem-Domain Objects
to an ORDBMS Format 376Mapping Problem-Domain Objects
to an RDBMS Format 379Optimizing RDBMS-Based Object
Storage 382Optimizing Storage Efficiency 382Optimizing Data Access Speed 388Estimating Data Storage Size 393
Nonfunctional Requirements and DataManagement Layer Design 394
Designing Data Access and Manipulation Classes 395
Applying the Concepts at CD Selections 398
Select Object-Persistence Format 398Map Problem-Domain Objects to
Object-Persistence Format 399Optimize Object Persistence and Estimate
Its Size 400Data Access and Manipulation Class
Design 402Summary 404
x Contents

Chapter 11
Human–Computer InteractionLayer Design 411Introduction 412Principles for User Interface
Design 412Layout 413Content Awareness 415Aesthetics 417User Experience 419Consistency 419Minimizing User Effort 420
User Interface Design Process 420Use Scenario Development 421Interface Structure Design 423Interface Standards Design 424Interface Design Prototyping 426Interface Evaluation 428
Navigation Design 430Basic Principles 430Types of Navigation Controls 431Messages 432Navigation Design Documentation 435
Input Design 436Basic Principles 436Types of Inputs 439Input Validation 441
Output Design 443Basic Principles 443Types of Outputs 445Media 445
Nonfunctional Requirements and Human–Computer InteractionLayer Design 447
Applying the Concepts at CD Selections 448
Use Scenario Development 448Interface Structure Design 448Interface Standards Design 451Interface Template Design 451Interface Design Prototyping 453Interface Evaluation 454Navigation Design Documentation 455
Summary 456
Chapter 12
Physical Architecture LayerDesign 463Introduction 463Elements of the Physical Architecture
Layer 464Architectural Components 464Server-Based Architectures 465Client-Based Architectures 466Client–Server Architectures 466Client–Server Tiers 468Distributed Objects Computing 470Selecting a Physical Architecture 471
Infrastructure Design 473Deployment Diagram 473Network Model 475
Nonfunctional Requirements and Physical Architecture Layer Design 480
Operational Requirements 481Performance Requirements 482Security Requirements 484Cultural and Political
Requirements 488Synopsis 490
Hardware and Software Specification 492
Applying the Concepts at CD Selections 494
Summary 496
■ PART FOURCONSTRUCTION, INSTALLATION,AND OPERATIONS 503
Chapter 13
Construction 505Introduction 505Managing Programming 507
Assigning Programmers 507Coordinating Activities 508Managing the Schedule 509Cultural Issues 510
Contents xi
Designing Tests 512Testing and Object Orientation 513Test Planning 515Unit Tests 517Integration Tests 519System Tests 520Acceptance Tests 520
Developing Documentation 520Types of Documentation 521Designing Documentation Structure 522Writing Documentation Topics 524Identifying Navigation Terms 525
Applying the Concepts at CD Selections 526
Managing Programming 526Testing 526Developing User Documentation 528
Summary 530
Chapter 14
Installation and Operations 533Introduction 533Cultural Issues and Information
Technology 535Conversion 537
Conversion Style 538Conversion Location 539
Conversion Modules 540Selecting the Appropriate Conversion
Strategy 541Change Management 543
Understanding Resistance to Change 544Revising Management Policies 546Assessing Costs and Benefits 547Motivating Adoption 549Enabling Adoption: Training 550
Postimplementation Activities 552System Support 552System Maintenance 554Project Assessment 555
Applying the Concepts at CD Selections 557
Conversion 557Change Management 558Postimplementation Activities 558
Summary 558
Index 00
Available on line atwww.wiley.com/college/dennisAppendix 1Appendix 2Appendix 3
xii Contents
PURPOSE OF THIS BOOK
Systems Analysis and Design (SAD) is an exciting, active field in which analysts continuallylearn new techniques and approaches to develop systems more effectively and efficiently.However there is a core set of skills that all analysts need to know—no matter whatapproach or methodology is used. All information systems projects move through the fourphases of planning, analysis, design, and implementation; all projects require analysts togather requirements, model the business needs, and create blueprints for how the systemshould be built; and all projects require an understanding of organizational behavior con-cepts like change management and team building. Today, the cost of developing modernsoftware is composed primarily of the cost associated with the developers themselves andnot the computers. As such, object-oriented approaches to developing information systemshold much promise in controlling these costs.
Today, the most exciting change to systems analysis and design is the move to object-oriented techniques, which view a system as a collection of self-contained objects that haveboth data and processes. This change has been accelerated through the creation of the Uni-fied Modeling Language (UML). UML provides a common vocabulary of object-orientedterms and diagramming techniques that is rich enough to model any systems developmentproject from analysis through implementation.
This book captures the dynamic aspects of the field by keeping students focused ondoing SAD while presenting the core set of skills that we feel every systems analyst needs toknow today and in the future. This book builds on our professional experience as systemsanalysts and on our experience in teaching SAD in the classroom.
This book will be of particular interest to instructors who have students do a majorproject as part of their course. Each chapter describes one part of the process, provides clearexplanations on how to do it, gives a detailed example, and then has exercises for the stu-dents to practice. In this way, students can leave the course with experience that will forma rich foundation for further work as a systems analyst.
OUTSTANDING FEATURES
A Focus on Doing SADThe goal of this book is to enable students to do SAD—not just read about it, but under-stand the issues so they can actually analyze and design systems. The book introduces eachmajor technique, explains what it is, explains how to do it, presents an example, and pro-vides opportunities for students to practice before they do it for real in a project. After read-ing each chapter, the student will be able to perform that step in the system developmentlife cycle (SDLC) process.
P R E F A C E
xiii

Rich Examples of Success and FailureThe book includes a running case about a fictitious company called CD Selections. Eachchapter shows how the concepts are applied in situations at CD Selections. Unlike runningcases in other books, we have tried to focus these examples on planning, managing, andexecuting the activities described in the chapter, rather than on detailed dialogue betweenfictious actors. In this way, the running case serves as a template that students can apply totheir own work. Each chapter also includes numerous Concepts in Action boxes, many ofwhich were written by Dr. Bruce White from Quinnipiac University, that describe how realcompanies succeeded—and failed—in performing the activities in the chapter.
Real World FocusThe skills that students learn in a systems analysis and design course should mirror thework that they ultimately will do in real organizations.We have tried to make this book as“real” as possible by building extensively on our experience as professional systems analystsfor organizations such as Arthur Andersen, IBM, the U.S. Department of Defense, and theAustralian Army. We have also worked with a diverse industry advisory board of IS profes-sionals and consultants in developing the book and have incorporated their stories, feed-back, and advice throughout. Many students who use this book will eventually use the skillson the job in a business environment, and we believe they will have a competitive edge inunderstanding what successful practitioners feel is relevant in the real world.
Project ApproachWe have presented the topics in this book in the SDLC order in which an analyst encoun-ters them in a typical project. Although the presentation is necessarily linear (because stu-dents have to learn concepts in the way in which they build on each other), we emphasizethe iterative, complex nature of SAD as the book unfolds. The presentation of the materialshould align well with courses that encourage students to work on projects because it pre-sents topics as students need to apply them.
WHAT’S NEW IN THIS EDITION
In this edition, we have increased the coverage of and better organized the text around theenhanced Unified Process; provided a greater focus on nonfunctional requirements; provideda greater emphasis on the iterative and incremental development associated with object-oriented analysis and design; added figures and examples, along with additional explanatorytext that addresses some of the more difficult concepts to learn; better aligned the CD selec-tions case material; and did some minor reorganization. However, the biggest changes thathave been included address the issues surrounding information systems development and theso-called flat world. The global economy has brought up the need for much greater under-standing of cultural issues, regulatory issues, and the need for testing. The third edition coversthis type of material throughout the text. Details of the major changes are as follows:
1. To better align the text with a Unified Process–based methodology, all referencesto the MOOSAD methodology have been removed, the object-oriented systemsanalysis and design material and the short overview of UML 2.0 have been movedto Chapter 1, and “Basic Characteristics of Object-Oriented Systems” section isnow included in an optional appendix. This last change was driven by the desireof instructors to have the flexibility to cover this material at the most appropriatetime for the students based on the students’ backgrounds. In some cases, students
xiv Preface

may have had multiple object-oriented programming courses, whereas in othercases, students may not have had any programming courses at all. Either way, thematerial is not really necessary to understand until the functional modeling orthe class and method design material is covered. Finally, we have tied the “Evolu-tionary Work Breakdown Structures and Iterative Workplans” section of the Pro-ject Management chapter to the enhanced Unified Process. This allowed us betterto apply the iterative and incremental development characteristics of object-oriented systems development to the project management material.
2. With regards to the requirements determination, we introduced the idea that in today’s world, there are additional nonfunctional requirements, such as Sarbanes-Oxley, COBIT, ISO 9000, and CMM, being added to the set of non-functional requirements that the analyst must address. We also have introducednew requirements-gathering techniques, for example, throwaway prototyping,role-playing CRC cards, and mind/concept mapping. And, we have introducedthe system proposal idea as a separate topic instead of only having it embeddedin the CD Selections case. Furthermore, in the design chapters (data manage-ment layer design, human–computer interaction layer design, and physical architecture layer design), more emphasis has been placed on the impact ofnonfunctional requirements on the design.
3. The material included within the functional, structural, and behavioral modelingchapters has been more tightly coupled. This is especially true with regard to theidea of iterative and incremental development. The text now emphasizes that sys-tems must be incrementally built by iterating over each of the models and overthe intersection of the models. For example, the normal flow of events containedwithin a use-case description is associated with the activities on an activity dia-gram, the operations on a class diagram, the behaviors on the CRC cards, themessages on sequence and communication diagrams, and transitions on behav-ioral state machines. As such, any change to any one of these most likely willforce changes in the others. Furthermore, we have promoted the use of CRUDanalysis up to a behavioral modeling technique in and of itself instead of havingit associated only with the communications diagram.
4. A major new section has been added to the Moving On to Design chapter thataddresses the verification and validation of the analysis models. This section goesthrough great detail on how to verify and validate the analysis models developedduring functional, structural, and behavioral modeling. Furthermore, there hadbeen intentional oversights or errors placed in a couple of the earlier models.During this new section, those errors are uncovered and corrected. Furthermore,to enhance the coverage of testing material, we have added use-case testing as anintegration-testing approach in the Construction chapter.
5. We have included material that addresses global concerns throughout the text.This includes material with regard to requirements determination, outsourcing,and class and method design. With regard to the construction chapter, a new sec-tion on cultural issues has been included with the managing programmers section.Finally, with the Installation and Operations chapter a new major section has beenadded to address cultural issues and information technology. This new section isbased on the work of Geert Hofstede.
6. Additional figures and explanatory material have been added throughout thetext. However, special attention was paid to the material contained in the struc-tural modeling, behavioral modeling, and the class and method design chapters.
Preface xv

7. The CD Selections case has now been more closely aligned with each chapter. Eachchapter simply has a section of the case associated with it. For example, the intro-duction to the case is now associated with Chapter 1. The case has been slightlymodified to ensure that the case itself is more cohesive. Furthermore, in some situa-tions, the CD Selections case had introduced new content material. We have movedany new content material into the content of the corresponding chapter.
ORGANIZATION OF THIS BOOK
This book is organized by the phases of the Systems Development Life Cycle (SDLC). Eachchapter has been written to teach students specific tasks that analysts need to accomplishover the course of a project, and the deliverables that will be produced from the tasks. Asstudents complete the book, tasks will be “checked off” and deliverables will be completed.Along the way, students will be reminded of their progress using roadmaps that indicatewhere their current task fits into the larger context of SAD.
Chapter 1 introduces the SDLC, systems development methodologies, Object-orientedsystems analysis, the Unified Process, UML 2.0, and describes the roles and skills needed fora project team.
Part One contains material that in many ways goes across the phases of the traditionalSDLC. Chapter 2 presents project initiation, with a focus on project identification, systemrequest, feasibility analysis, and project selection. In Chapter 3, students learn about projectmanagement, with emphasis on the workplan, staffing plan, project charter, and risk assess-ment that are used to help manage and control the project. Chapter 4 introduces studentsto an assortment of analysis techniques to help with business automation, businessimprovement, and business process reengineering, a variety of requirements-gatheringtechniques that are used to determine the functional and nonfunctional requirements ofthe system, and to a system proposal.
Part Two focuses on creating analysis models. Chapter 5 focuses on constructing func-tional models, Chapter 6 addresses producing structural models, and Chapter 7 tackles cre-ating behavioral models.
Part Three addresses design modeling. In Chapter 8, students learn how to verify and val-idate the analysis models created during analysis modeling and to evolve the analysis modelsinto design models via the use of factoring, partitions, and layers. The students also learn tocreate an alternative matrix that can be used to compare custom, packaged, and outsourcingalternatives. Chapter 9 concentrates on designing the individual classes and their respectivemethods through the use of contracts and method specifications. Chapter 10 presents theissues involved in designing persistence for objects. These issues include the different storageformats that can be used for object persistence, how to map an object-oriented design intothe chosen storage format, and how to design a set of data access and manipulation classesthat act as a translator between the classes in the application and the object persistence. Thischapter also focuses on the nonfunctional requirements that impact the data managementlayer. Chapter 11 presents the design of the human–computer interaction layer, where stu-dents learn how to design user interfaces using use scenarios, windows navigation diagrams,storyboards, Windows layout diagrams, HTML prototypes, real use cases, interface standards,and user interface templates, to perform user interface evaluations using heuristic evaluation,walkthrough evaluation, interactive evaluation, and formal usability testing, and to addressnonfunctional requirements such as user interface layout, content awareness, aesthetics, userexperience, and consistency. Chapter 12 focuses on the physical architecture and infra-structure design, which includes deployment diagrams and hardware/software specification.This chapter, like the previous design chapters, covers the impact that nonfunctional require-ments can have on the physical architecture layer.
xvi Preface
Part Four provides material that is related to the construction, installation, and opera-tions of the system. Chapter 13 focuses on system construction, where students learn howto build, test, and document the system. Installation and operations are covered in Chapter14, where students learn about the conversion plan, change management plan, support plan,and project assessment. Additionally, these chapters address the issues related to developingsystems in a flat world, where developers and users are distributed throughout the world.
SUPPLEMENTS http://www.wiley.com/college/dennis
Instructor’s Resources Web Site
■ PowerPoint slides, which instructors can tailor to their classroom needs and thatstudents can use to guide their reading and studying activities
■ Test Bank, that includes a variety of questions ranging from multiple choice to essaystyle questions. A computerized version of the Test Bank will also be available.
Online Instructor’s ManualThe Instructor’s Manual provides resources to support the instructor both inside and outof the classroom:
■ Short experiential exercises that instructors can use to help students experienceand understand key topics in each chapter.
■ Short stories have been provided by people working in both corporate and con-sulting environments for instructors to insert into lectures to make conceptsmore colorful and real
■ Additional minicases for every chapter allow students to perform some of the keyconcepts that were learned in the chapter.
■ Solutions to end of chapter questions and exercises are provided.
Student Website
■ Relevant Web links, including career resources Web site.
■ Web quizzes help students prepare for class tests.
Cases in Systems Analysis and DesignA separate Case Book on CD-ROM provides a set of more than a dozen cases that can beused to supplement the book and provide exercises for students to practice with. The casesare primarily drawn from the United States and Canada, but also include a number ofinternational cases. We are always looking for new cases, so if you have a case that might beappropriate please contact us directly (or your local Wiley sales representative).
Software ToolsThree Software Tools can be purchased with the text in special packages:
1. Visible Systems Corporation’s Visible Analyst Student Edition.
2. Microsoft’s Visio.
3. Microsoft’s Project.A 60-day trial edition of Microsoft Project can be purchased with the textbook.Note that Microsoft has changed their policy and no longer offers the 120-daytrial previously available.
Preface xvii

Another option now available to education institutions adopting this Wileytextbook is a free 3-year membership to the MSDN Academic Alliance. The MSDNAA is designed to provide the easiest and most inexpensive way for academicdepartments to make the latest Microsoft software available in labs, classrooms, andon student and instructor PCs.
Microsoft Project 2007 software is available through this Wiley and Microsoftpublishing partnership, free of charge with the adoption of any qualified Wiley text-book. Each copy of Microsoft Project is the full version of the software, with no timelimitations, and can be used indefinitely for educational purposes. For more infor-mation about the MSDN AA program, go to http://msdn.microsoft.com/academic/.
Contact your local Wiley sales representative for details, including pricing and orderinginformation.
ACKNOWLEDGMENTS
For the third edition, we would like to thank the students of the ACIS 3515: Information Sys-tems Development I and ACIS 3516: Information Systems Development II classes at VirginiaTech for giving many suggestions that drove most of the changes from the second edition tothe third edition. Their feedback was invaluable in improving the text and examples.
We would like to thank the following reviewers for their helpful and insightful com-ments on the third edition: Evans Adams, Fort Lewis College; Murugan Anandarajan,Drexel University; Rob Anson, Boise State University; Ravi Krovi, University of Akron; LeoLegorreta, California State University Sacramento; Diane Lending, James Madison Univer-sity; Major Fernando Maymi, West Point University; J. Drew Procaccino, Rider University;Bill Watson, Indiana University–Purdue University Indianapolis; and Amy B. Woszczynski,Kennesaw State University.
We also thank the following reviewers from the first and second edition: Evans Adams,Fort Lewis College; Noushin Ashrafi, University of Massachusetts, Boston; Dirk Baldwin,University of Wisconsin-Parkside; Qing Cao, University of Missouri–Kansas City; AhmadGhafarian, North Georgia College & State University; Daniel V. Goulet, University of Wis-consin–Stevens Point; Harvey Hayashi, Loyalist College of Applied Arts and Technology;Jean-Piere Kuilboer, University of Massachusetts, Boston; Daniel Mittleman, DePaul Univer-sity; Fred Niederman, Saint Louis University; H. Robert Pajkowski, DeVry Institute of Tech-nology, Scarborough, Ontario; June S. Park, University of Iowa; Tom Pettay, DeVry Instituteof Technology, Columbus, Ohio; Neil Ramiller, Portland State University; Eliot Rich, Univer-sity at Albany, State University of New York; Carl Scott, University of Houston; Keng Siau,University of Nebraska–Lincoln; Jonathan Trower, Baylor University; Anna Wachholz, Sheri-dan College; Randy S.Weinberg, Carnegie Mellon University; Eli J.Weissman, DeVry Instituteof Technology, Long Island City, NY; Heinz Roland Weistroffer, Virginia CommonwealthUniversity; Amy Wilson, DeVry Institute of Technology, Decatur, GA; Vincent C. Yen, WrightState University; Murugan Anandarajon, Drexel University; Ron Anson, Boise State University;Noushin Ashrafi, University of Massachusetts Boston; Dirk Baldwin, University of Wisconsin;Robert Barker, University of Louisville; Terry Fox, Baylor University; Donald Golden, Cleve-land State University; Cleotilde Gonzalez, Carnegie Melon University; Scott James, SaginawValley State University; Rajiv Kishore, State University of New York–Buffalo; Ravindra Krovi,University of Akron; Fernando Maymi, United States Military Academy at West Point; FredNiederman, Saint Louis University; Graham Peace, West Virginia University; J. Drew Procac-cino, Rider University; Marcus Rothenberger,University of Wisconsin–Milwaukee; JuneVerner, Drexel University; Heinz Roland Weistroffer, Virginia Commonwealth University; andAmy Woszczynski, Kennesaw State University.
xviii Preface
1
Chapter 1 first introduces the systems development life cycle (SDLC), the fundamentalfour-phase model (planning, analysis, design, and implementation) common to all infor-mation system development projects. Second, it describes the evolution of system develop-ment methodologies. Third, the chapter overviews object-oriented systems analysis anddesign and describes the Unified Process and its extensions. Finally, the chapter closes witha discussion of the roles and skills necessary within the project team.
OBJECTIVES
■ Understand the fundamental systems development life cycle and its four phases.■ Understand the evolution of systems development methodologies.■ Be familiar with the Unified Process and its extensions.■ Be familiar with the different roles on the project team.
CHAPTER OUTLINE
C H A P T E R 1
Introduction to SystemsAnalysis and Design
IntroductionThe Systems Development Life Cycle
PlanningAnalysisDesignImplementation
Systems Development MethodologiesStructured DesignRapid Application Development (RAD)Agile DevelopmentSelecting the Appropriate Development
MethodologyObject-Oriented Systems Analysis and
Design (OOSAD)Use-Case DrivenArchitecture Centric
Iterative and IncrementalBenefits of Object-Oriented Systems
Analysis and DesignThe Unified Process
PhasesWorkflowsExtensions to the Unified Process
The Unified Modeling LanguageProject Team Roles and Skills
Business AnalystSystems AnalystInfrastructure AnalystChange Management AnalystProject Manager
Applying the Concepts at CD SelectionsSummary

INTRODUCTION
The systems development life cycle (SDLC) is the process of understanding how an infor-mation system (IS) can support business needs by designing a system, building it, anddelivering it to users. If you have taken a programming class or have programmed on yourown, this probably sounds pretty simple. Unfortunately, it is not. A 1996 survey by theStandish Group found that 42 percent of all corporate IS projects were abandoned beforecompletion. A similar study done in 1996 by the General Accounting Office found 53 per-cent of all U.S. government IS projects were abandoned. Unfortunately, many of the sys-tems that aren’t abandoned are delivered to the users significantly late, cost far more thanplanned, and have fewer features than originally planned.
Most of us would like to think that these problems only occur to “other” people or“other” organizations, but they happen in most companies. Even Microsoft has a history offailures and overdue projects (e.g., Windows 1.0, Windows 95).1
Although we would like to promote this book as a “silver bullet” that will keep you fromIS failures, we readily admit that a silver bullet that guarantees IS development success sim-ply does not exist. Instead, this book will provide you with several fundamental concepts andmany practical techniques that you can use to improve the probability of success.
The key person in the SDLC is the systems analyst, who analyzes the business situation,identifies opportunities for improvements, and designs an information system to imple-ment them. Being a systems analyst is one of the most interesting, exciting, and challeng-ing jobs around. Systems analysts work with a variety of people and learn how they conductbusiness. Specifically, they work with a team of systems analysts, programmers, and otherson a common mission. Systems analysts feel the satisfaction of seeing systems that theydesigned and developed make a significant business impact, knowing that they contributedunique skills to make that happen.
However, the primary objective of a systems analyst is not to create a wonderful sys-tem; instead, it is to create value for the organization, which for most companies meansincreasing profits (government agencies and not-for-profit organizations measure valuedifferently). Many failed systems have been abandoned because the analysts tried to builda wonderful system without clearly understanding how the system would fit with an orga-nization’s goals, current business processes, and other information systems to providevalue. An investment in an information system is like any other investment, such as a newmachine tool. The goal is not to acquire the tool, because the tool is simply a means to anend; the goal is to enable the organization to perform work better so it can earn greaterprofits or serve its constituents more effectively.
This book introduces the fundamental skills a systems analyst needs. This pragmaticbook discusses best practices in systems development; it does not present a general surveyof systems development that presents everything about the topic. By definition, systems ana-lysts do things and challenge the current way that organizations work. To get the most out ofthis book, you will need actively to apply the ideas and concepts in the examples and in the“Your Turn” exercises that are presented throughout to your own systems development pro-ject. This book guides you through all the steps for delivering a successful information sys-tem. Also, it illustrates how one organization (called CD Selections) applies the steps in oneproject (developing a Web-based CD sales system). By the time you finish the book, youwon’t be an expert analyst, but you will be ready to start building systems for real.
2 Chapter 1 Introduction to Systems Analysis and Design
1 For more information on the problem, see Capers Jones, Patterns of Software System Failure and Success (London:International Thompson Computer Press, 1996); Capers Jones, Assessment and Control of Software ProjectRisks (Englewood Cliffs, NJ: Yourdon Press, 1994); Julia King, “IS Reins in Runaway Projects,” Computerworld(February 24, 1997).

This chapter first introduces the basic SDLC that IS projects follow. This life cycle iscommon to all projects, although the focus and approach to each phase of the life cyclemay differ. The next section describes three fundamentally different types of systemsdevelopment methodologies: structured design, rapid application development, and agiledevelopment.
The next three sections introduce the fundamental characteristics of object-orientedsystems analysis and design, a specific object-oriented systems development methodology(The Unified Process), and a specific object-oriented systems development graphical nota-tion (The Unified Modeling Language). Finally, the chapter discusses one of the most chal-lenging aspects of systems development, the depth and breadth of skills required of systemsanalysts. Today, most organizations use project teams that contain members with unique,but complementary, skills. The chapter closes with a discussion of the key roles played bymembers of the systems development team.
The Systems Development Life Cycle 3
A real-estate group in the federal government cospon-sored a data warehouse with the IT department. In the for-mal proposal written by IT, costs were estimated at$800,000, the project duration was estimated to be eightmonths, and the responsibility for funding was defined asthe business unit’s. The IT department proceeded with theproject before it even knew if the project had beenaccepted.
The project actually lasted two years because require-ments gathering took nine months instead of one and ahalf, the planned user base grew from 200 to 2,500, andthe approval process to buy technology for the project
took a year. Three weeks prior to technical delivery, the ITdirector canceled the project. This failed endeavor cost theorganization and taxpayers $2.5 million.
Source: Hugh J. Watson et al., “Data Warehousing Failure: Case Studiesand Findings,” The Journal of Data Warehousing 4, (no. 1) (1999): 44–54.
Questions
1. Why did this system fail?2. Why would a company spend money and time on a
project and then cancel it?3. What could have been done to prevent this?
1–A An Expensive False StartCONCEPTS
IN ACTION
THE SYSTEMS DEVELOPMENT LIFE CYCLE
In many ways, building an information system is similar to building a house. First, thehouse (or the information system) starts with a basic idea. Second, this idea is transformedinto a simple drawing that is shown to the customer and refined (often through severaldrawings, each improving on the last) until the customer agrees that the picture depictswhat he or she wants. Third, a set of blueprints is designed that presents much moredetailed information about the house (e.g., the type of water faucets, where the telephonejacks will be placed). Finally, the house is built following the blueprints, often with somechanges directed by the customer as the house is erected.
The SDLC has a similar set of four fundamental phases: planning, analysis, design,and implementation. Different projects may emphasize different parts of the SDLC orapproach the SDLC phases in different ways, but all projects have elements of these fourphases. Each phase is itself composed of a series of steps, which rely upon techniquesthat produce deliverables (specific documents and files that provide understandingabout the project).

For example, when you apply for admission to a university, all students go through thesame phases: information gathering, applying, and accepting. Each of these phases hassteps—information gathering includes steps such as searching for schools, requestinginformation, and reading brochures. Students then use techniques (e.g., Internet search-ing) that can be applied to steps (e.g., requesting information) to create deliverables (e.g.,evaluations of different aspects of universities).
In many projects, the SDLC phases and steps proceed in a logical path from start tofinish. In other projects, the project teams move through the steps consecutively, incre-mentally, iteratively, or in other patterns. In this section, we describe the phases, actions,and some of the techniques that are used to accomplish the steps at a very high level. Notall organizations follow the SDLC in exactly the same way. As we shall shortly see, there aremany variations on the overall SDLC.
For now, there are two important points to understand about the SDLC. First, youshould get a general sense of the phases and steps through which IS projects move andsome of the techniques that produce certain deliverables. Second, it is important to under-stand that the SDLC is a process of gradual refinement. The deliverables produced in theanalysis phase provide a general idea of the shape of the new system. These deliverables areused as input to the design phase, which then refines them to produce a set of deliverablesthat describes in much more detailed terms exactly how the system will be built. Thesedeliverables, in turn, are used in the implementation phase to produce the actual system.Each phase refines and elaborates on the work done previously.
PlanningThe planning phase is the fundamental process of understanding why an information systemshould be built and determining how the project team will go about building it. It has two steps:
1. During project initiation, the system’s business value to the organization is identi-fied: how will it lower costs or increase revenues? Most ideas for new systems comefrom outside the IS area (from the marketing department, accounting department,etc.) in the form of a system request. A system request presents a brief summary ofa business need, and it explains how a system that supports the need will createbusiness value. The IS department works together with the person or departmentthat generated the request (called the project sponsor) to conduct a feasibility analysis.The feasibility analysis examines key aspects of the proposed project:
■ The idea’s technical feasibility (Can we build it?)
■ The economic feasibility (Will it provide business value?)
■ The organizational feasibility (If we build it, will it be used?)
The system request and feasibility analysis are presented to an information sys-tems approval committee (sometimes called a steering committee), which decideswhether the project should be undertaken.
2. Once the project is approved, it enters project management. During project man-agement, the project manager creates a workplan, staffs the project, and puts tech-niques in place to help the project team control and direct the project through theentire SDLC. The deliverable for project management is a project plan, whichdescribes how the project team will go about developing the system.
AnalysisThe analysis phase answers the questions of who will use the system, what the system will do,and where and when it will be used. During this phase, the project team investigates any currentsystem(s), identifies improvement opportunities, and develops a concept for the new system.
4 Chapter 1 Introduction to Systems Analysis and Design

This phase has three steps:
1. An analysis strategy is developed to guide the project team’s efforts. Such a strat-egy usually includes an analysis of the current system (called the as-is system) andits problems, and then ways to design a new system (called the to-be system).
2. The next step is requirements gathering (e.g., through interviews or question-naires). The analysis of this information—in conjunction with input from projectsponsor and many other people—leads to the development of a concept for a newsystem. The system concept is then used as a basis to develop a set of businessanalysis models, which describe how the business will operate if the new system isdeveloped. The set of models typically includes models that represent the dataand processes necessary to support the underlying business process.
3. The analyses, system concept, and models are combined into a document calledthe system proposal, which is presented to the project sponsor and other key deci-sion makers (e.g., members of the approval committee) who decide whether theproject should continue to move forward.
The system proposal is the initial deliverable that describes what business require-ments the new system should meet. Because it is really the first step in the design of the newsystem, some experts argue that it is inappropriate to use the term analysis as the name forthis phase; some argue a better name would be analysis and initial design. Most organiza-tions continue use to the name analysis for this phase, however, so we use it in this book aswell. Just keep in mind that the deliverable from the analysis phase is both an analysis anda high-level initial design for the new system.
DesignThe design phase decides how the system will operate, in terms of the hardware, software, andnetwork infrastructure; the user interface, forms and reports; and the specific programs, data-bases, and files that will be needed. Although most of the strategic decisions about the systemwere made in the development of the system concept during the analysis phase, the steps in thedesign phase determine exactly how the system will operate. The design phase has four steps:
1. The design strategy is first developed. It clarifies whether the system will be devel-oped by the company’s own programmers, whether the system will be outsourcedto another firm (usually a consulting firm), or whether the company will buy anexisting software package.
2. This leads to the development of the basic architecture design for the system,which describes the hardware, software, and network infrastructure to be used. Inmost cases, the system will add or change the infrastructure that already existsin the organization. The interface design specifies how the users will move throughthe system (e.g., navigation methods such as menus and on-screen buttons) andthe forms and reports that the system will use.
3. The database and file specifications are developed. These define exactly what datawill be stored and where they will be stored.
4. The analyst team develops the program design, which defines the programs thatneed to be written and exactly what each program will do.
This collection of deliverables (architecture design, interface design, database and filespecifications, and program design) is the system specification that is handed to the pro-gramming team for implementation. At the end of the design phase, the feasibility analysisand project plan are reexamined and revised, and another decision is made by the projectsponsor and approval committee about whether to terminate the project or continue.
The Systems Development Life Cycle 5

ImplementationThe final phase in the SDLC is the implementation phase, during which the system is actu-ally built (or purchased, in the case of a packaged software design). This is the phase thatusually gets the most attention, because for most systems it is the longest and most expensivesingle part of the development process. This phase has three steps:
1. System construction is the first step. The system is built and tested to ensure it per-forms as designed. Because the cost of bugs can be immense, testing is one of themost critical steps in implementation. Most organizations give more time andattention to testing than to writing the programs in the first place.
2. The system is installed. Installation is the process by which the old system is turnedoff and the new one is turned on. It may include a direct cutover approach (inwhich the new system immediately replaces the old system), a parallel conversionapproach (in which both the old and new systems are operated for a month or twountil it is clear that there are no bugs in the new system), or a phased conversionstrategy (in which the new system is installed in one part of the organization as aninitial trial and then gradually installed in others). One of the most importantaspects of conversion is the development of a training plan to teach users how touse the new system and help manage the changes caused by the new system.
3. The analyst team establishes a support plan for the system. This plan usuallyincludes a formal or informal post-implementation review as well as a systematicway for identifying major and minor changes needed for the system.
6 Chapter 1 Introduction to Systems Analysis and Design
Consumer electronics is a very competitive business.What might be the success story of the year one year is aforgotten item two years later. Rapid product commoditi-zation makes the consumer electronic marketplace verycompetitive. Getting the right products to market at theright time with the right components is an ongoing chal-lenge for telecommunications and consumer electronicgoods companies.
Questions
1. What external data analysis should a consumerelectronics company use to determine marketplaceneeds and its abilities to compete effectively in amarketplace?
2. Staying one step ahead of competitors requires a corporate strategy and the support of information systems. How can information systems and systemsanalysts contribute to an aggressive corporate strategy?
1–B Keeping Up with Consumer ElectronicsCONCEPTS
IN ACTION
SYSTEMS DEVELOPMENT METHODOLOGIES
A methodology is a formalized approach to implementing the SDLC (i.e., it is a list of stepsand deliverables). There are many different systems development methodologies, and eachone is unique, based on the order and focus it places on each SDLC phase. Some method-ologies are formal standards used by government agencies, whereas others have beendeveloped by consulting firms to sell to clients. Many organizations have internal method-ologies that have been honed over the years, and they explain exactly how each phase ofthe SDLC is to be performed in that company.
There are many ways to categorize methodologies. One way is by looking at whetherthey focus on business processes or the data that support the business. A process-centered

methodology emphasizes process models as the core of the system concept. In Figure 1-1,for example, process-centered methodologies would focus first on defining the processes(e.g., assemble sandwich ingredients). Data-centered methodologies emphasize data mod-els as the core of the system concept. In Figure 1-1 data-centered methodologies wouldfocus first on defining the contents of the storage areas (e.g., refrigerator) and how the con-tents were organized.2 By contrast, object-oriented methodologies attempt to balance thefocus between process and data by incorporating both into one model. In Figure 1-1, these
Systems Development Methodologies 7
2 The classic modern process-centered methodology is that by Edward Yourdon, Modern Structured Analysis(Englewood Cliffs, NJ: Yourdon Press, 1989). An example of a data-centered methodology is information engi-neering; see James Martin, Information Engineering, vols. 1–3 (Englewood Cliffs, NJ: Prentice Hall, 1989). Awidely accepted standardized non–object-oriented methodology that balances processes and data is IDEF; seeFIPS 183, Integration Definition for Function Modeling, Federal Information Processing Standards Publications,U.S. Department of Commerce, 1993.
aParent aRefrigerator aCupboard aSandwich aLunch aLunchBag
GetJelly
GetPeanutButter
GetCookies
GetBread
CreateSandwich
GetMilk
CreateLunch
GetLunchBag
PutLunchInBag
FIGURE 1-1 A Simple Behavioral Model for Making Lunch

methodologies would focus first on defining the major elements of the system (e.g., sand-wiches, lunches) and look at the processes and data involved with each element.
Another important factor in categorizing methodologies is the sequencing of theSDLC phases and the amount of time and effort devoted to each.3 In the early days of com-puting, programmers did not understand the need for formal and well-planned life cyclemethodologies. They tended to move directly from a very simple planning phase right intothe construction step of the implementation phase—in other words, from a very fuzzy,not-well-thought-out system request into writing code.
This is the same approach that you sometimes use when writing programs for a pro-gramming class. It can work for small programs that require only one programmer, but ifthe requirements are complex or unclear, you may miss important aspects of the problemand have to start all over again, throwing away part of the program (and the time and effortspent writing it). This approach also makes teamwork difficult because members have lit-tle idea about what needs to be accomplished and how to work together to produce a finalproduct.
Structured DesignThe first category of systems development methodologies is called structured design. Thesemethodologies became dominant in the 1980s, replacing the previous, ad hoc, and undis-ciplined approach. Structured design methodologies adopt a formal step-by-step approachto the SDLC that moves logically from one phase to the next. Numerous process-centeredand data-centered methodologies follow the basic approach of the two structured designcategories outlined next.
Waterfall Development The original structured design methodology (still used today)is waterfall development. With waterfall development–based methodologies, the analystsand users proceed in sequence from one phase to the next (see Figure 1-2). The key deliv-erables for each phase are typically very long (often hundreds of pages in length) and arepresented to the project sponsor for approval as the project moves from phase to phase.Once the sponsor approves the work that was conducted for a phase, the phase ends andthe next one begins. This methodology is referred to as waterfall development because itmoves forward from phase to phase in the same manner as a waterfall. Although it is pos-sible to go backward in the SDLC (e.g., from design back to analysis), it is extremely diffi-cult (imagine yourself as a salmon trying to swim upstream against a waterfall, as shownin Figure 1-2).
Structured design also introduced the use of formal modeling or diagramming tech-niques to describe the basic business processes and the data that support them. Traditionalstructured design uses one set of diagrams to represent the processes and a separate set ofdiagrams to represent data. Because two sets of diagrams are used, the systems analystmust decide which set to develop first and use as the core of the system—process-modeldiagrams or data-model diagrams. There is much debate over which should come first,the processes or the data, because both are important to the system. As a result, several dif-ferent structured design methodologies have evolved that follow the basic steps of thewaterfall model but use different modeling approaches at different times. Those thatattempt to emphasize process-model diagrams as the core of the system are process cen-tered, whereas those that emphasize data-model diagrams as the core of the system con-cept are data centered.
8 Chapter 1 Introduction to Systems Analysis and Design
3 A good reference for comparing systems development methodologies is Steve McConnell, Rapid Development(Redmond, WA: Microsoft Press, 1996).
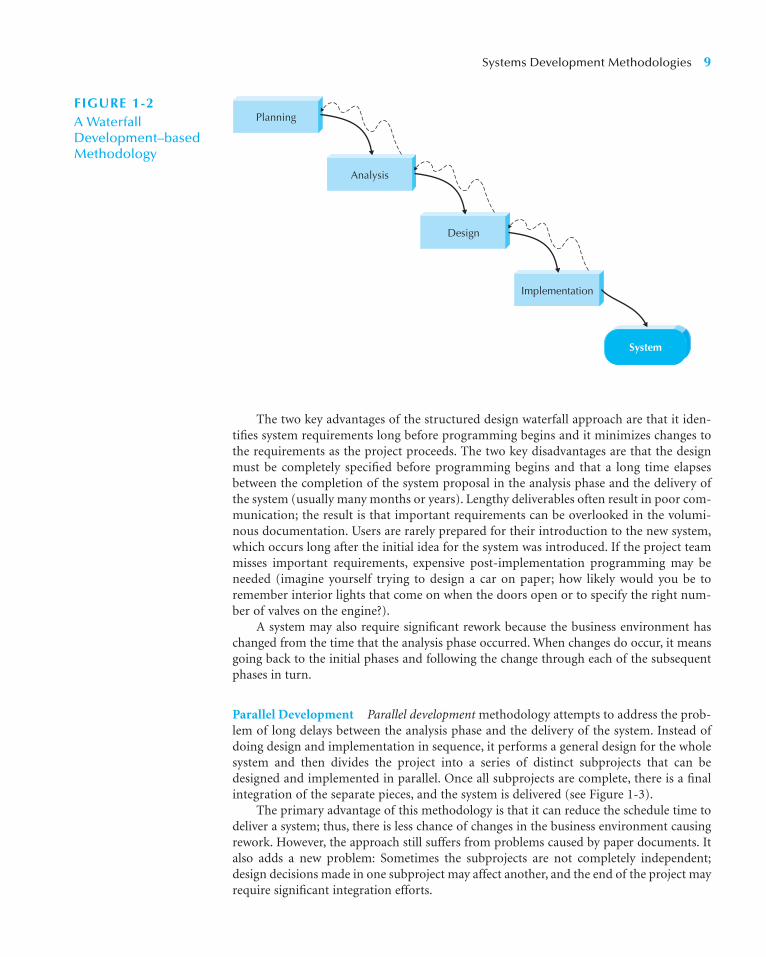
The two key advantages of the structured design waterfall approach are that it iden-tifies system requirements long before programming begins and it minimizes changes tothe requirements as the project proceeds. The two key disadvantages are that the designmust be completely specified before programming begins and that a long time elapsesbetween the completion of the system proposal in the analysis phase and the delivery ofthe system (usually many months or years). Lengthy deliverables often result in poor com-munication; the result is that important requirements can be overlooked in the volumi-nous documentation. Users are rarely prepared for their introduction to the new system,which occurs long after the initial idea for the system was introduced. If the project teammisses important requirements, expensive post-implementation programming may beneeded (imagine yourself trying to design a car on paper; how likely would you be toremember interior lights that come on when the doors open or to specify the right num-ber of valves on the engine?).
A system may also require significant rework because the business environment haschanged from the time that the analysis phase occurred. When changes do occur, it meansgoing back to the initial phases and following the change through each of the subsequentphases in turn.
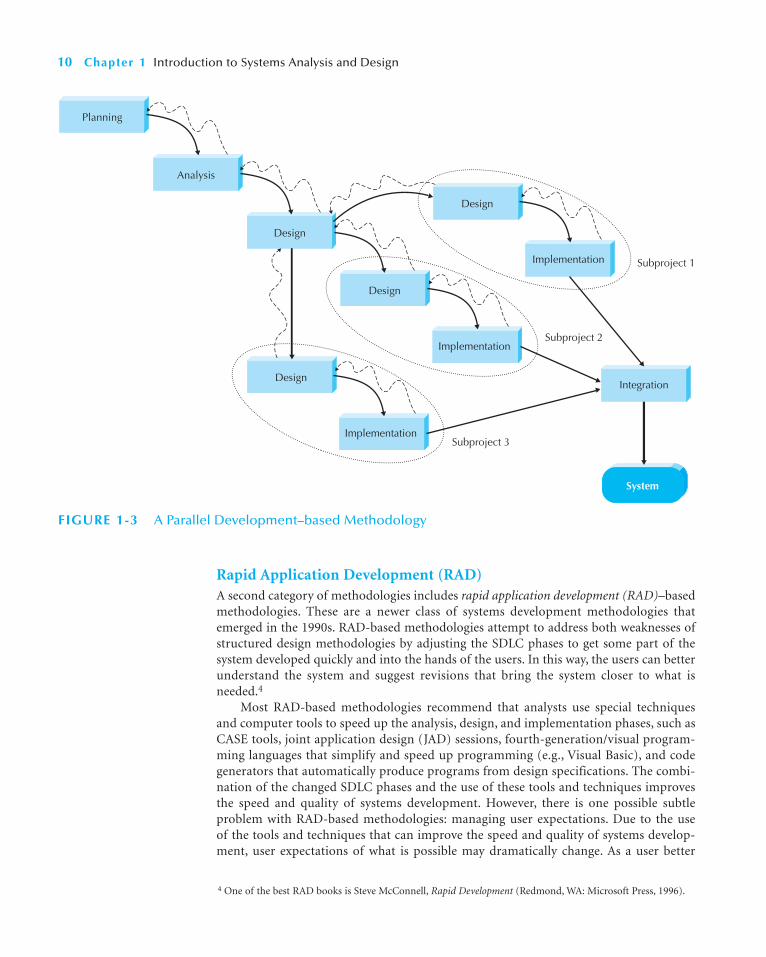
Parallel Development Parallel development methodology attempts to address the prob-lem of long delays between the analysis phase and the delivery of the system. Instead ofdoing design and implementation in sequence, it performs a general design for the wholesystem and then divides the project into a series of distinct subprojects that can bedesigned and implemented in parallel. Once all subprojects are complete, there is a finalintegration of the separate pieces, and the system is delivered (see Figure 1-3).
The primary advantage of this methodology is that it can reduce the schedule time todeliver a system; thus, there is less chance of changes in the business environment causingrework. However, the approach still suffers from problems caused by paper documents. Italso adds a new problem: Sometimes the subprojects are not completely independent;design decisions made in one subproject may affect another, and the end of the project mayrequire significant integration efforts.
Systems Development Methodologies 9
System
Planning
Analysis
Design
Implementation
FIGURE 1-2A Waterfall Development–basedMethodology
Rapid Application Development (RAD)A second category of methodologies includes rapid application development (RAD)–basedmethodologies. These are a newer class of systems development methodologies thatemerged in the 1990s. RAD-based methodologies attempt to address both weaknesses ofstructured design methodologies by adjusting the SDLC phases to get some part of thesystem developed quickly and into the hands of the users. In this way, the users can betterunderstand the system and suggest revisions that bring the system closer to what isneeded.4
Most RAD-based methodologies recommend that analysts use special techniquesand computer tools to speed up the analysis, design, and implementation phases, such asCASE tools, joint application design (JAD) sessions, fourth-generation/visual program-ming languages that simplify and speed up programming (e.g., Visual Basic), and codegenerators that automatically produce programs from design specifications. The combi-nation of the changed SDLC phases and the use of these tools and techniques improvesthe speed and quality of systems development. However, there is one possible subtleproblem with RAD-based methodologies: managing user expectations. Due to the useof the tools and techniques that can improve the speed and quality of systems develop-ment, user expectations of what is possible may dramatically change. As a user better
10 Chapter 1 Introduction to Systems Analysis and Design
System
Planning
Analysis
Design
Implementation
Design
Integration
Implementation
Design
Implementation
Design
Subproject 2
Subproject 1
Subproject 3
FIGURE 1-3 A Parallel Development–based Methodology
4 One of the best RAD books is Steve McConnell, Rapid Development (Redmond, WA: Microsoft Press, 1996).
understands the information technology, the systems requirements tend to expand. Thiswas less of a problem when using methodologies that spent a lot of time thoroughlydocumenting requirements. Process-centered, data-centered, and object-orientedmethodologies that follow the basic approaches of the three RAD categories aredescribed in the following sections.
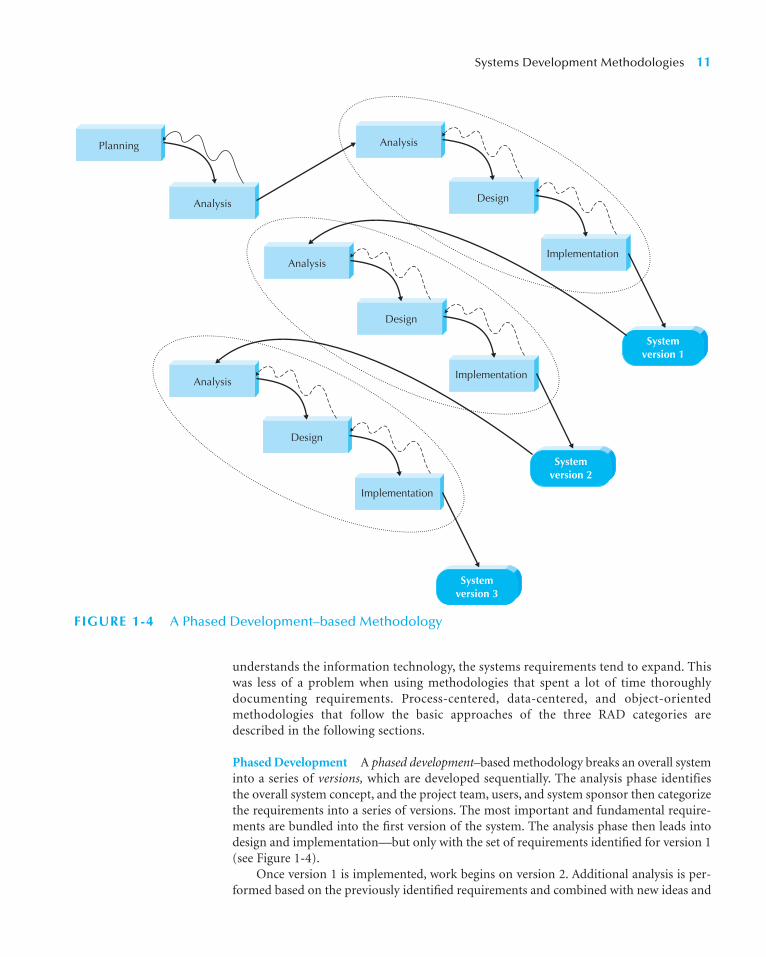
Phased Development A phased development–based methodology breaks an overall systeminto a series of versions, which are developed sequentially. The analysis phase identifiesthe overall system concept, and the project team, users, and system sponsor then categorizethe requirements into a series of versions. The most important and fundamental require-ments are bundled into the first version of the system. The analysis phase then leads intodesign and implementation—but only with the set of requirements identified for version 1(see Figure 1-4).
Once version 1 is implemented, work begins on version 2. Additional analysis is per-formed based on the previously identified requirements and combined with new ideas and
Systems Development Methodologies 11
Systemversion 1
Planning
Analysis
Analysis
Implementation
Design
Analysis
Implementation
Design
Analysis
Implementation
Design
Systemversion 2
Systemversion 3
FIGURE 1-4 A Phased Development–based Methodology

issues that arose from the users’ experience with version 1. Version 2 then is designed andimplemented, and work immediately begins on the next version. This process continuesuntil the system is complete or is no longer in use.
Phased development–based methodologies have the advantage of quickly getting auseful system into the hands of the users. Although the system does not perform all thefunctions the users need at first, it does begin to provide business value sooner than if thesystem were delivered after completion, as is the case with the waterfall and parallelmethodologies. Likewise, because users begin to work with the system sooner, they aremore likely to identify important additional requirements sooner than with structureddesign situations.
The major drawback to phased development is that users begin to work with systemsthat are intentionally incomplete. It is critical to identify the most important and usefulfeatures and include them in the first version and to manage users’ expectations alongthe way.
Prototyping A prototyping-based methodology performs the analysis, design, and imple-mentation phases concurrently, and all three phases are performed repeatedly in a cycleuntil the system is completed. With these methodologies, the basics of analysis and designare performed, and work immediately begins on a system prototype, a “quick-and-dirty”program that provides a minimal amount of features. The first prototype is usually the firstpart of the system that is used. This is shown to the users and the project sponsor, who pro-vide comments. These comments are used to reanalyze, redesign, and reimplement a sec-ond prototype, which provides a few more features. This process continues in a cycle untilthe analysts, users, and sponsor agree that the prototype provides enough functionality tobe installed and used in the organization. After the prototype (now called the system) isinstalled, refinement occurs until it is accepted as the new system (see Figure 1-5).
The key advantage of a prototyping-based methodology is that it very quickly providesa system with which the users can interact, even if it is not ready for widespread organiza-tional use at first. Prototyping reassures the users that the project team is working on thesystem (there are no long delays in which the users see little progress), and prototypinghelps to more quickly refine real requirements. Rather than attempting to understand a sys-tem specification on paper, the users can interact with the prototype to better understandwhat it can and cannot do.
The major problem with prototyping is that its fast-paced system releases challengeattempts to conduct careful, methodical analysis. Often the prototype undergoes such sig-nificant changes that many initial design decisions become poor ones. This can cause
12 Chapter 1 Introduction to Systems Analysis and Design
Systemprototype
System
Planning
Analysis
Design
Implementation
Implementation
FIGURE 1-5A Prototyping-basedMethodology

problems in the development of complex systems because fundamental issues and prob-lems are not recognized until well into the development process. Imagine building a carand discovering late in the prototyping process that you have to take the whole engine outto change the oil (because no one thought about the need to change the oil until after it hadbeen driven 10,000 miles).
Throwaway Prototyping Throwaway prototyping–based methodologies are similar toprototyping-based methodologies in that they include the development of prototypes;however, throwaway prototypes are done at a different point in the SDLC. These prototypesare used for a very different purpose than those previously discussed, and they have a verydifferent appearance (see Figure 1-6).
The throwaway prototyping–based methodologies have a relatively thorough analysisphase that is used to gather information and to develop ideas for the system concept. How-ever, users may not completely understand many of the features they suggest, and theremay be challenging technical issues to be solved. Each of these issues is examined by ana-lyzing, designing, and building a design prototype. A design prototype is not a working sys-tem; it is a product that represents a part of the system that needs additional refinement,and it contains only enough detail to enable users to understand the issues under consid-eration. For example, suppose users are not completely clear on how an order entry systemshould work. The analyst team might build a series of HTML pages viewed using a Webbrowser to help the users visualize such a system. In this case, a series of mock-up screensappear to be a system, but they really do nothing. Or, suppose that the project team needsto develop a sophisticated graphics program in Java. The team could write a portion of theprogram with pretend data to ensure that they could do a full-blown program successfully.
A system developed using this type of methodology probably relies on several designprototypes during the analysis and design phases. Each of the prototypes is used to mini-mize the risk associated with the system by confirming that important issues are under-stood before the real system is built. Once the issues are resolved, the project moves intodesign and implementation. At this point, the design prototypes are thrown away, which isan important difference between these methodologies and prototyping methodologies, inwhich the prototypes evolve into the final system.
Systems Development Methodologies 13
Designprototype
System
Analysis
Analysis
Design
Implementation
Planning
Implementation
Design
FIGURE 1-6 A Throwaway Prototyping–based Methodology

Throwaway prototyping–based methodologies balance the benefits of well-thought-out analysis and design phases with the advantages of using prototypes to refine key issuesbefore a system is built. It may take longer to deliver the final system as compared toprototyping-based methodologies (because the prototypes do not become the finalsystem), but this type of methodology usually produces more stable and reliable systems.
Agile Development5
A third category of systems development methodologies is still emerging today: agile devel-opment. These programming-centric methodologies have few rules and practices, all ofwhich are fairly easy to follow. They focus on streamlining the SDLC by eliminating muchof the modeling and documentation overhead and the time spent on those tasks. Instead,projects emphasize simple, iterative application development. Examples of agile develop-ment methodologies include extreme programming, Scrum, and the Dynamic SystemsDevelopment Method (DSDM). The agile development approach, as described next, typi-cally is used in conjunction with object-oriented methodologies.
Extreme Programming6 Extreme programming (XP) is founded on four core values:communication, simplicity, feedback, and courage. These four values provide a founda-tion that XP developers use to create any system. First, the developers must provide rapidfeedback to the end users on a continuous basis. Second, XP requires developers to followthe KISS principle.7 Third, developers must make incremental changes to grow the sys-tem, and they must not only accept change, they must embrace change. Fourth, developersmust have a quality-first mentality. XP also supports team members in developing theirown skills.
Three of the key principles that XP uses to create successful systems are continuoustesting, simple coding performed by pairs of developers, and close interactions with endusers to build systems very quickly. After a superficial planning process, projects performanalysis, design, and implementation phases iteratively (see Figure 1-7).
14 Chapter 1 Introduction to Systems Analysis and Design
5 Two good sources of information on agile development and object-oriented systems is S. W. Ambler, AgileModeling: Effective Practices for Extreme Programming and The Unified Process (New York: Wiley, 2002), andR. C. Martin, Agile Software Development: Principles, Patterns, and Practices (Upper Saddle River, NJ: PrenticeHall, 2003).6 For more information, see K. Beck, eXtreme Programming Explained: Embrace Change (Reading, MA: Addison-Wesley, 2000), M. Lippert, S. Roock, and H. Wolf, eXtreme Programming in Action: Practical Experiences from RealWorld Projects (New York: Wiley, 2002), or www.extremeprogramming.com.7 Keep It Simple, Stupid.
Implementation
Design
Analysis
System
PlanningFIGURE 1-7The Extreme Programming Methodology

Testing and efficient coding practices are core to XP. In fact, code is tested each day andis placed into an integrative testing environment. If bugs exist, the code is backed out untilit is completely free of errors. XP relies heavily on refactoring, which is a disciplined way torestructure code to keep it simple.
An XP project begins with user stories that describe what the system needs to do.Then, programmers code in small, simple modules and test to meet those needs. Users arerequired to be available to clear up questions and issues as they arise. Standards are veryimportant to minimize confusion, so XP teams use a common set of names, descriptions,and coding practices. XP projects deliver results sooner than even the RAD approaches, andthey rarely get bogged down in gathering requirements for the system.
For small projects with highly motivated, cohesive, stable, and experienced teams, XPshould work just fine. However, if the project is not small or the teams aren’t jelled,8 thenthe success of an XP development effort is doubtful. This tends to throw the whole idea ofbringing outside contractors into an existing team environment using XP into doubt.9 Thechance of outsiders “jelling” with insiders may simply be too optimistic. XP requires a greatdeal of discipline; otherwise projects will become unfocused and chaotic. Furthermore, it isrecommended only for small groups of developers—no more than ten developers, and it isnot advised for large mission-critical applications. Due to the lack of analysis and designdocumentation, there is only code documentation associated with XP, so maintaining largesystems built with XP may be impossible. And because mission-critical business informa-tion systems tend to exist for a long time, the utility of XP as a business information systemdevelopment methodology is in doubt. Finally, the methodology needs a lot of on-site userinput, something to which many business units cannot commit.10
Selecting the Appropriate Development MethodologyBecause there are many methodologies, the first challenge faced by analysts is to selectwhich methodology to use. Choosing a methodology is not simple, because no onemethodology is always best. (If it were, we’d simply use it everywhere!) Many organizationshave standards and policies to guide the choice of methodology. You will find that organi-zations range from having one “approved” methodology to having several methodologyoptions to having no formal policies at all.
Figure 1-8 summarizes some important methodology selection criteria. One impor-tant item not discussed in this figure is the degree of experience of the analyst team. Manyof the RAD-based methodologies require the use of “new” tools and techniques that havea significant learning curve. Often these tools and techniques increase the complexity of theproject and require extra time for learning. However, once they are adopted and the teambecomes experienced, the tools and techniques can significantly increase the speed inwhich the methodology can deliver a final system.
Clarity of User Requirements When the user requirements for a system are unclear, it isdifficult to understand them by talking about them and explaining them with written reports.
Systems Development Methodologies 15
8 A jelled team is one that has low turnover, a strong sense of identity, a sense of eliteness, a feeling that they jointlyown the product being developed, and enjoyment in working together. For more information regarding jelledteams, see T. DeMarco and T. Lister. Peopleware: Productive Projects and Teams (New York: Dorset/House, 1987).9 Considering the tendency for offshore outsourcing, this is a major obstacle for XP to overcome. For more infor-mation on offshore outsourcing, see P. Thibodeau, “ITAA Panel Debates Outsourcing Pros, Cons,” Computer-world Morning Update (September 25, 2003), and S. W. Ambler, “Chicken Little Was Right,” Software Development(October 2003).10 Many of the observations described on the utility of XP as a development approach were based on conversa-tions with Brian Henderson-Sellers.

Users normally need to interact with technology to really understand what a new system cando and how to best apply it to their needs. Prototyping- and throwaway prototyping–basedRAD methodologies are usually more appropriate when user requirements are unclearbecause they provide prototypes for users to interact with early in the SDLC.
Familiarity with Technology When the system will use new technology with which theanalysts and programmers are not familiar (e.g., the first Web development project withJava), early application of the new technology in the methodology will improve the chanceof success. If the system is designed without some familiarity with the base technology,risks increase because the tools might not be capable of doing what is needed. Throwawayprototyping–based methodologies are particularly appropriate if users lack familiarity withtechnology because they explicitly encourage the developers to develop design prototypesfor areas with high risks. Phased development–based methodologies are good as well,because they create opportunities to investigate the technology in some depth before thedesign is complete. Although you might think prototyping-based methodologies are alsoappropriate, they are much less so because the early prototypes that are built usually onlyscratch the surface of the new technology. It is generally only after several prototypes andseveral months that the developers discover weaknesses or problems in the new technology.
System Complexity Complex systems require careful and detailed analysis and design.Throwaway prototyping–based methodologies are particularly well suited to such detailedanalysis and design, as opposed to prototyping-based methodologies, which are not. Thetraditional structured design–based methodologies can handle complex systems, but with-out the ability to get the system or prototypes into the users’ hands early on, some keyissues may be overlooked. Although phased development–based methodologies enableusers to interact with the system early in the process, we have observed that project teamswho follow these tend to devote less attention to the analysis of the complete problemdomain than they might using other methodologies.
System Reliability System reliability is usually an important factor in system development—after all, who wants an unreliable system? However, reliability is just one factor amongseveral. For some applications reliability is truly critical (e.g., medical equipment, missilecontrol systems), whereas for other applications (e.g., games, Internet video) it is merelyimportant. Throwaway prototyping methodologies are the most appropriate when system
16 Chapter 1 Introduction to Systems Analysis and Design
With Unclear User Requirements Poor Poor Good Excellent Excellent Excellent
With Unfamiliar Technology Poor Poor Good Poor Excellent Poor
That Are Complex Good Good Good Poor Excellent Poor
That Are Reliable Good Good Good Poor Excellent Good
With a Short Time Schedule Poor Good Excellent Excellent Good Excellent
With Schedule Visibility Poor Poor Excellent Excellent Good Good
Agile Structured Methodologies RAD Methodologies Methodologies
Ability to Develop Throwaway Systems Waterfall Parallel Phased Prototyping Prototyping XP
FIGURE 1-8 Criteria for Selecting a Methodology

reliability is a high priority, because it combines detailed analysis and design phases withthe ability for the project team to test many different approaches through design proto-types before completing the design. Prototyping methodologies are generally not a goodchoice when reliability is critical because it lacks the careful analysis and design phases thatare essential for dependable systems.
Short Time Schedules Projects that have short time schedules are well suited for RAD-based methodologies. This is due to them being designed to increase the speed of develop-ment. Prototyping and phased development–based methodologies are excellent choiceswhen timelines are short because they best enable the project team to adjust the function-ality in the system based on a specific delivery date, and if the project schedule starts to slip,it can be readjusted by removing functionality from the version or prototype under devel-opment. Waterfall-based methodologies are the worst choice when time is at a premiumbecause they do not allow for easy schedule changes.
Schedule Visibility One of the greatest challenges in systems development is determin-ing whether a project is on schedule. This is particularly true of the structured designmethodologies because design and implementation occur at the end of the project. TheRAD-based methodologies move many of the critical design decisions earlier in the projectto help project managers recognize and address risk factors and keep expectations in check.
Object-Oriented Systems Analysis and Design (OOSAD) 17
Suppose you are an analyst for the Roanoke SoftwareConsulting Company (RSCC), a large consulting firmwith offices around the world. The company wants tobuild a new knowledge management system that canidentify and track the expertise of individual consultantsanywhere in the world based on their education and thevarious consulting projects on which they have worked.Assume that this is a new idea that has never beforebeen attempted in RSCC or elsewhere. RSCC has an
international network, but the offices in each countrymay use somewhat different hardware and software.RSCC management wants the system up and runningwithin a year.
Question
1. What type of methodology would you recommendRSCC use? Why?
1-1 Selecting a MethodologyYOUR
TURN
OBJECT-ORIENTED SYSTEMS ANALYSIS AND DESIGN (OOSAD)
Object-oriented approaches to developing information systems, technically speaking, canuse any of the traditional methodologies (waterfall development, parallel development,phased development, prototyping, and throwaway prototyping). However, the object-oriented approaches are most associated with a phased development RAD methodology.The primary difference between a traditional approach like structured design and an object-oriented approach is how a problem is decomposed. In traditional approaches, the problemdecomposition process is either process centric or data centric. However, processes and dataare so closely related that it is difficult to pick one or the other as the primary focus. Basedon this lack of congruence with the real world, new object-oriented methodologies haveemerged that use the RAD-based sequence of SDLC phases but attempt to balance the

emphasis between process and data by focusing the decomposition of problems on objectsthat contain both data and processes. Both approaches are valid approaches to developinginformation systems. In this book, we focus only on object-oriented approaches.11
According to the creators of the Unified Modeling Language (UML), Grady Booch, IvarJacobson, and James Rumbaugh,12 any modern object-oriented approach to developinginformation systems must be (1) use-case driven, (2) architecture-centric, and (3) iterativeand incremental.
Use-Case DrivenUse-case driven means that use cases are the primary modeling tools defining the behaviorof the system. A use case describes how the user interacts with the system to performsome activity, such as placing an order, making a reservation, or searching for information.The use cases are used to identify and to communicate the requirements for the system tothe programmers who must write the system.
Use cases are inherently simple because they focus on only one activity at a time. Incontrast, the process model diagrams used by traditional structured and RAD methodolo-gies are far more complex because they require the system analyst and user to developmodels of the entire system. With traditional methodologies, each business activity isdecomposed into a set of subprocesses, which are, in turn, decomposed into further sub-processes, and so on. This goes on until no further process decomposition makes sense, andit often requires dozens of pages of interlocking diagrams. In contrast, use cases focus ononly one activity at a time, so developing models is much simpler.13
Architecture CentricAny modern approach to systems analysis and design should be architecture centric. Archi-tecture centric means that the underlying software architecture of the evolving system spec-ification drives the specification, construction, and documentation of the system. Modernobject-oriented systems analysis and design approaches should support at least three sep-arate but interrelated architectural views of a system: functional, static, and dynamic. Thefunctional, or external, view describes the behavior of the system from the perspective of theuser. The structural, or static, view describes the system in terms of attributes, methods,classes, and relationships. The behavioral, or dynamic, view describes the behavior of thesystem in terms of messages passed among objects and state changes within an object.
Iterative and IncrementalModern object-oriented systems analysis and design approaches emphasize iterative and incre-mental development that undergoes continuous testing and refinement throughout the life ofthe project. This implies that the systems analysts develop their understanding of a user’s prob-lem by building up the three architectural views little by little. The systems analyst does this by
18 Chapter 1 Introduction to Systems Analysis and Design
11 See Alan Dennis, Barbara Haley Wixom, and Roberta M. Roth, Systems Analysis and Design: An AppliedApproach, 3rd ed. (New York: Wiley, 2006) for a description of the traditional approaches.12 Grady Booch, Ivar Jacobson, and James Rumbaugh, The Unified Modeling Language User Guide (Reading, MA:Addison-Wesley, 1999).13 For those of you that have experience with traditional structured analysis and design, this will be one of themost unusual aspects of object-oriented analysis and design using UML. Structured approaches emphasize thedecomposition of the complete business process into subprocesses and sub-subprocesses. Object-orientedapproaches stress focusing on just one use-case activity at a time and distributing that single use case over a setof communicating and collaborating objects. Therefore, use-case modeling may seem initially unsettling orcounterintuitive, but in the long run this single focus does make analysis and design simpler.

working with the user to create a functional representation of the system under study. Next,the analyst attempts to build a structural representation of the evolving system. Using thestructural representation of the system, the analyst distributes the functionality of the systemover the evolving structure to create a behavioral representation of the evolving system.
As an analyst works with the user in developing the three architectural views of theevolving system, the analyst will iterate over each of and among the views. That is, as theanalyst better understands the structural and behavioral views, the analyst will uncovermissing requirements or misrepresentations in the functional view. This, in turn, can causechanges to be cascaded back through the structural and behavioral views. All three archi-tectural views of the system are interlinked and dependent on each other (see Figure 1-9).As each increment and iteration is completed, a more complete representation of the user’sreal functional requirements are uncovered.
Benefits of Object-Oriented Systems Analysis and DesignConcepts in the object-oriented approach enable analysts to break a complex system intosmaller, more manageable modules, work on the modules individually, and easily piece themodules back together to form an information system. This modularity makes systemdevelopment easier to grasp, easier to share among members of a project team, and easierto communicate to users, who are needed to provide requirements and confirm how wellthe system meets the requirements throughout the SDLC. By modularizing system devel-opment, the project team actually is creating reusable pieces that can be plugged into othersystems efforts or used as starting points for other projects. Ultimately, this can save timebecause new projects don’t have to start completely from scratch.
Many people argue that “object-think” is a much more realistic way to think about thereal world. Users typically do not think in terms of data or process; instead, they see theirbusiness as a collection of logical units that contain both—so communicating in terms ofobjects improves the interaction between a user and an analyst or developer.
THE UNIFIED PROCESS
The Unified Process is a specific methodology that maps out when and how to use the var-ious UML techniques for object-oriented analysis and design. The primary contributorswere Grady Booch, Ivar Jacobsen, and James Rumbaugh of Rational. Whereas the UMLprovides structural support for developing the structure and behavior of an informationsystem, the Unified Process provides the behavioral support. The Unified Process, ofcourse, is use-case driven, architecture centric, and iterative and incremental.
The Unified Process 19
Functional view
Structural view
Behavioral view
Object-Oriented AnalysisFIGURE 1-9Iterative and Incremental Development
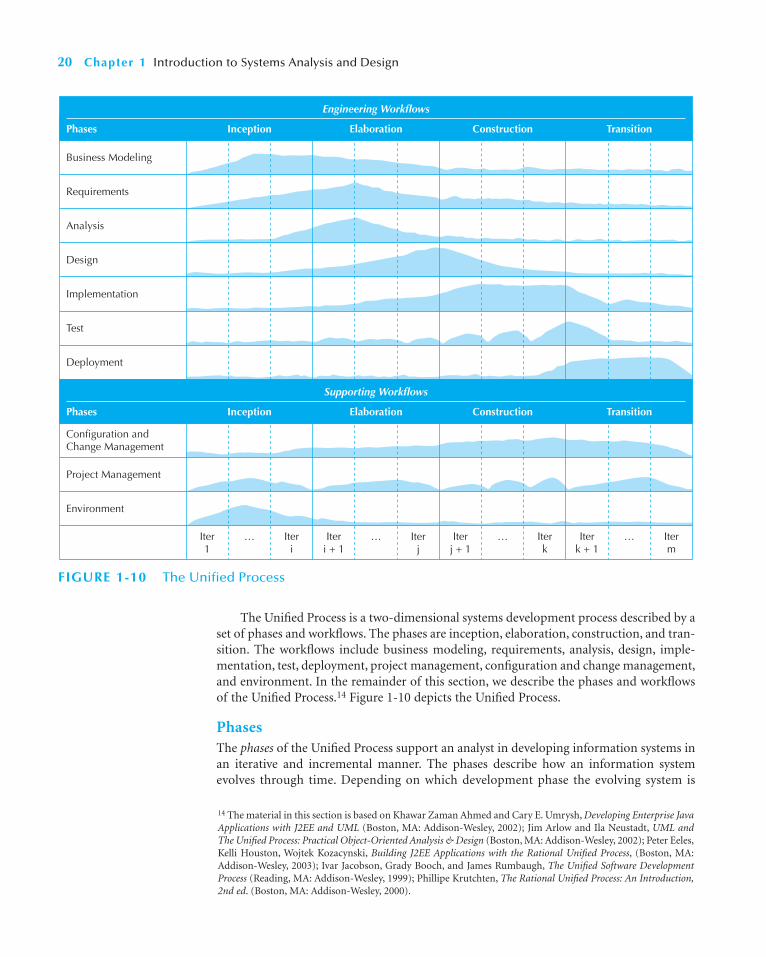
The Unified Process is a two-dimensional systems development process described by aset of phases and workflows. The phases are inception, elaboration, construction, and tran-sition. The workflows include business modeling, requirements, analysis, design, imple-mentation, test, deployment, project management, configuration and change management,and environment. In the remainder of this section, we describe the phases and workflowsof the Unified Process.14 Figure 1-10 depicts the Unified Process.
PhasesThe phases of the Unified Process support an analyst in developing information systems inan iterative and incremental manner. The phases describe how an information systemevolves through time. Depending on which development phase the evolving system is
20 Chapter 1 Introduction to Systems Analysis and Design
14 The material in this section is based on Khawar Zaman Ahmed and Cary E. Umrysh, Developing Enterprise JavaApplications with J2EE and UML (Boston, MA: Addison-Wesley, 2002); Jim Arlow and Ila Neustadt, UML andThe Unified Process: Practical Object-Oriented Analysis & Design (Boston, MA: Addison-Wesley, 2002); Peter Eeles,Kelli Houston, Wojtek Kozacynski, Building J2EE Applications with the Rational Unified Process, (Boston, MA:Addison-Wesley, 2003); Ivar Jacobson, Grady Booch, and James Rumbaugh, The Unified Software DevelopmentProcess (Reading, MA: Addison-Wesley, 1999); Phillipe Krutchten, The Rational Unified Process: An Introduction,2nd ed. (Boston, MA: Addison-Wesley, 2000).
Phases
Business Modeling
Inception
Engineering Workflows
Elaboration Construction Transition
Phases Inception
Supporting Workflows
Elaboration Construction Transition
Requirements
Analysis
Design
Implementation
Configuration and Change Management
Iter1
… Iteri
Iteri + 1
… Iterj
Iterj + 1
… Iterk
Iterk + 1
… Iterm
Project Management
Environment
Test
Deployment
FIGURE 1-10 The Unified Process

currently in, the level of activity will vary over the workflows. The curve in Figure 1-10 asso-ciated with each workflow approximates the amount of activity that takes place during thespecific phase. For example, the inception phase primarily involves the business modelingand requirements workflows, while practically ignoring the test and deployment work-flows. Each phase contains a set of iterations, and each iteration uses the various workflowsto create an incremental version of the evolving information system. As the system evolvesthrough the phases, it improves and becomes more complete. Each phase has objectives, afocus of activity over the workflows, and incremental deliverables. Each of the phases isdescribed next.
Inception In many ways, the inception phase is very similar to the planning phase of atraditional SDLC approach. In this phase, a business case is made for the proposed system.This includes feasibility analysis that should answer questions such as the following:
Do we have the technical capability to build it (technical feasibility)?
If we build it, will it provide business value (economic feasibility)?
If we build it, will it be used by the organization (organizational feasibility)?
To answer these questions, the development team performs work related primarily tothe business modeling, requirements, and analysis workflows. In some cases, depending onthe technical difficulties that could be encountered during the development of the system,a throwaway prototype is developed. This implies that the design, implementation, and testworkflows could also be involved. The project management and environment supportingworkflows are very relevant to this phase. The primary deliverables from the inceptionphase are (1) a vision document that sets the scope of the project, identifies the primaryrequirements and constraints, sets up an initial project plan, and describes the feasibility ofand risks associated with the project, and (2) the adoption of the necessary environment todevelop the system.
Elaboration When we typically think about object-oriented systems analysis and design,the activities related to the elaboration phase of the Unified Process are the most relevant.The analysis and design workflows are the primary focus during this phase. The elaborationphase continues with developing the vision document, including finalizing the businesscase, revising the risk assessment, and completing a project plan in sufficient detail to allowthe stakeholders to be able to agree with constructing the actual final system. It deals withgathering the requirements, building the UML structural and behavioral models of theproblem domain, and detailing how the problem domain models fit into the evolving sys-tem architecture. Developers are involved with all but the deployment engineering workflowin this phase. As the developers iterate over the workflows, the importance of addressingconfiguration and change management becomes apparent. Also, the development toolsacquired during the inception phase become critical to the success of the project duringthis phase.15 The primary deliverables of this phase include (1) the UML structure andbehavior diagrams and (2) an executable of a baseline version of the evolving informationsystem. The baseline version serves as the foundation for all later iterations. By providing asolid foundation at this point in time, the developers have a basis for completing the systemin the construction and transition phases.
The Unified Process 21
15 With UML comprising fourteen different, related diagramming techniques, keeping the diagrams coordinatedand the different versions of the evolving system synchronized is typically beyond the capabilities of a mere mor-tal systems developer. These tools typically include project management and CASE (Computer-Aided SoftwareEngineering) tools. We describe the use of these tools in Chapter 3.
Construction The construction phase focuses heavily on programming the evolving infor-mation system. As such, it is primarily concerned with the implementation workflow. However,the requirements workflow and the analysis and design workflows also are involved with thisphase. It is during this phase that missing requirements are uncovered, and the analysis anddesign models are finally completed. Typically, there are iterations of the workflows during thisphase, and during the last iteration, the deployment workflow kicks into high gear. The con-figuration and change management workflow, with its version control activities, becomesextremely important during the construction phase. At times, an iteration may have to berolled back. Without good version controls, rolling back to a previous version (incrementalimplementation) of the system is nearly impossible. The primary deliverable of this phase isan implementation of the system that can be released for beta and acceptance testing.
Transition Like the construction phase, the transition phase addresses aspects typicallyassociated with the implementation phase of a traditional SDLC approach. Its primary focusis on the testing and deployment workflows. Essentially, the business modeling, require-ments, and analysis workflows should have been completed in earlier iterations of the evolv-ing information system. Depending on the results from the testing workflow, it is possiblethat some redesign and programming activities on the design and implementation work-flows could be necessary, but they should be minimal at this point in time. From a manage-rial perspective, the project management, configuration and change management, andenvironment are involved. Some of the activities that take place are beta and acceptance test-ing, fine-tuning the design and implementation, user training, and the actual rolling out ofthe final product onto a production platform. Obviously, the primary deliverable is theactual executable information system. The other deliverables include user manuals, a plan tosupport the users, and a plan for upgrading the information system in the future.
WorkflowsThe workflows describe the tasks or activities that a developer performs to evolve an infor-mation system over time. The workflows of the Unified Process are grouped into two broadcategories: engineering and supporting.
Engineering Workflows Engineering workflows include business modeling, requirements,analysis, design, implementation, test, and deployment workflows. The engineering workflowsdeal with the activities that produce the technical product (i.e., the information system).
Business Modeling Workflow The business modeling workflow uncovers problems andidentifies potential projects within a user organization. This workflow aids management inunderstanding the scope of the projects that can improve the efficiency and effectiveness of auser organization. The primary purpose of business modeling is to ensure that both developerand user organizations understand where and how the to-be-developed information systemfits into the business processes of the user organization. This workflow is primarily executedduring the inception phase to ensure that we develop information systems that make businesssense. The activities that take place on this workflow are most closely associated with the plan-ning phase of the traditional SDLC; however, requirements gathering and use-case and busi-ness process modeling techniques also help to understand the business situation.
Requirements Workflow In the Unified Process, the requirements workflow includeseliciting both functional and nonfunctional requirements. Typically, requirements aregathered from project stakeholders, such as end users, managers within the end user orga-nization, and even customers. There are many different ways to capture requirements,
22 Chapter 1 Introduction to Systems Analysis and Design

including interviews, observation techniques, joint application development, documentanalysis, and questionnaires. The requirements workflow is utilized the most during theinception and elaboration phases. The identified requirements are very helpful for devel-oping the vision document and the use cases used throughout the development process.Additional requirements tend to be discovered throughout the development process. Infact, only the transition phase tends to have few, if any, additional requirements identified.
Analysis Workflow The analysis workflow primarily addresses the creation of an analysismodel of the problem domain. In the Unified Process, the analyst begins designing the archi-tecture associated with the problem domain; using the UML, the analyst creates structuraland behavioral diagrams that depict a description of the problem domain classes and theirinteractions. The primary purpose of the analysis workflow is to ensure that both the devel-oper and user organizations understand the underlying problem and its domain withoutoveranalyzing. If they are not careful, analysts can create analysis paralysis, which occurs whenthe project becomes so bogged down with analysis that the system is never actually designedor implemented. A second purpose of the analysis workflow is to identify useful reusableclasses for class libraries. By reusing predefined classes, the analyst can avoid “reinventing thewheel” when creating the structural and behavioral diagrams. The analysis workflow is pre-dominantly associated with the elaboration phase, but like the requirements workflow, it ispossible that additional analysis will be required throughout the development process.
Design Workflow The design workflow transitions the analysis model into a form thatcan be used to implement the system: the design model. Whereas the analysis workflow con-centrated on understanding the problem domain, the design workflow focuses on devel-oping a solution that will execute in a specific environment. Basically, the design workflowsimply enhances the description of the evolving information system by adding classes thataddress the environment of the information system to the evolving analysis model. As such,the design workflow uses activities such as user interface design, database design, physicalarchitecture design, detailed problem domain class design, and the optimization of theevolving information system. The design workflow is associated primarily with the elabo-ration and construction phases of the Unified Process.
Implementation Workflow The primary purpose of the implementation workflow is tocreate an executable solution based on the design model (i.e., programming). This includesnot only writing new classes but also incorporating reusable classes from executable classlibraries into the evolving solution. As with any programming activity, testing of the newclasses and their interactions with the incorporated reusable classes must occur. Finally, inthe case of multiple groups performing the implementation of the information system, theimplementers also must integrate the separate, individually tested modules to create anexecutable version of the system. The implementation workflow is associated primarilywith the elaboration and construction phases.
Testing Workflow The primary purpose of the testing workflow is to increase the qualityof the evolving system. As such, testing goes beyond the simple unit testing associated withthe implementation workflow. In this case, testing also includes testing the integration of allmodules used to implement the system, user acceptance testing, and the actual alpha testingof the software. Practically speaking, testing should go on throughout the development ofthe system; testing of the analysis and design models occurs during the elaboration andconstruction phases, whereas implementation testing is performed primarily during the con-struction and, to some degree, transition phases. Basically, at the end of each iterationduring the development of the information system, some type of test should be performed.
The Unified Process 23
Deployment Workflow The deployment workflow is most associated with the transitionphase of the Unified Process. The deployment workflow includes activities, such as soft-ware packaging, distribution, installation, and beta testing. When actually deploying thenew information system into a user organization, the developers may have to convert thecurrent data, interface the new software with the existing software, and provide end usertraining on the use of the new system.
Supporting Workflows The supporting workflows include the project management,configuration and change management, and the environment workflows. The supportingworkflows focus on the managerial aspects of information system development.
Project Management Workflow Whereas the other workflows associated with the UnifiedProcess are technically active during all four phases, the project management workflow isthe only truly cross-phase workflow. The development process supports incremental anditerative development, so information systems tend to grow or evolve over time. At the endof each iteration, a new incremental version of the system is ready for delivery. The projectmanagement workflow is quite important due to the complexity of the two-dimensionaldevelopment model of the Unified Process (workflows and phases). This workflow’s activ-ities include risk identification and management, scope management, estimating the timeto complete each iteration and the entire project, estimating the cost of the individual iter-ation and the whole project, and tracking the progress being made toward the final versionof the evolving information system.
Configuration and Change Management Workflow The primary purpose of the con-figuration and change management workflow is to keep track of the state of the evolving sys-tem. In a nutshell, the evolving information system comprises a set of artifacts, including,for example, diagrams, source code, and executables. During the development process, theseartifacts are modified. A substantial amount of work—and, hence, dollars—is involved inthe development of the artifacts. As such, the artifacts themselves should be handled as anyexpensive asset would be handled—access controls must be put into place to safeguard theartifacts from being stolen or destroyed. Furthermore, because the artifacts are modified ona regular, if not continuous, basis, good version control mechanisms should be established.Finally, a good deal of project management information needs to be captured (e.g., author,time, and location of each modification). The configuration and change management work-flow is associated mostly with the construction and transition phases.
Environment Workflow During the development of an information system, the devel-opment team needs to use different tools and processes. The environment workflowaddresses these needs. For example, a computer-aided software engineering tool that sup-ports the development of an object-oriented information system via the UML could berequired. Other tools necessary include programming environments, project managementtools, and configuration management tools. The environment workflow involves acquir-ing and installing these tools. Even though this workflow can be active during all of thephases of the Unified Process, it should be involved primarily with the inception phase.
Extensions to the Unified ProcessAs large and as complex as the Unified Process is, many authors have pointed out a setof critical weaknesses. First, the Unified Process does not address staffing, budgeting, orcontract management issues. These activities were explicitly left out of the UnifiedProcess. Second, the Unified Process does not address issues relating to maintenance,operations, or support of the product once it has been delivered. As such, it is not a
24 Chapter 1 Introduction to Systems Analysis and Design

complete software process; it is only a development process. Third, the Unified Processdoes not address cross- or interproject issues. Considering the importance of reuse inobject-oriented systems development and the fact that in many organizations employeeswork on many different projects at the same time, leaving out interproject issues is amajor omission.
To address these omissions, Ambler and Constantine suggest the addition of a pro-duction phase and two workflows: the operations and support workflow and the infra-structure management workflow (see Figure 1-11).16 In addition to these new workflows,
The Unified Process 25
Phases
Business Modeling
Inception
Engineering Workflows
Elaboration Construction Transition
Phases Inception
Supporting Workflows
Elaboration Construction Transition
Production
Production
Requirements
Analysis
Design
Implementation
Configuration and Change Management
Infrastructure Management
Project Management
Environment
Operations and Support
Iter1
… Iteri
Iteri + 1
… Iterj
Iterj + 1
… Iterk
Iterk + 1
… Iterm
Test
Deployment
FIGURE 1-11 The Enhanced Unified Process
16 S. W. Ambler and L. L. Constantine, The Unified Process Inception Phase: Best Practices in Implementing the UP(Lawrence, KS: CMP Books, 2000); S. W. Ambler and L. L. Constantine, The Unified Process Elaboration Phase:Best Practices in Implementing the UP (Lawrence, KS: CMP Books, 2000); S. W. Ambler and L. L. Constantine, TheUnified Process Construction Phase: Best Practices in Implementing the UP (Lawrence, KS: CMP Books, 2000);S. W. Ambler and L. L. Constantine, The Unified Process Transition and Production Phases: Best Practices inImplementing the UP (Lawrence, KS: CMP Books, 2002).

the test, deployment, and environment workflows are modified, and the project manage-ment and configuration and change management workflows are extended into the pro-duction phase. These extensions are based on alternative object-oriented softwareprocesses: the OPEN process and the Object-Oriented Software Process.17 The new phase,new workflows, and the modifications and extensions to the existing workflows aredescribed next.
Production Phase The production phase is concerned primarily with issues related to thesoftware product after it has been successfully deployed. This phase focuses on issuesrelated to updating, maintaining, and operating the software. Unlike the previous phases,there are no iterations or incremental deliverables. If a new release of the software is to bedeveloped, then the developers must begin a new run through the first four phases. Basedon the activities that take place during this phase, no engineering workflows are relevant.The supporting workflows that are active during this phase include the configuration andchange management workflow, the project management workflow, the new operations andsupport workflow, and the infrastructure management workflow.
Operations and Support Workflow The operations and support workflow, as you mightguess, addresses issues related to supporting the current version of the software and oper-ating the software on a daily basis. Activities include creating plans for the operation andsupport of the software product once it has been deployed, creating training and userdocumentation, putting into place necessary backup procedures, monitoring and optimizingthe performance of the software, and performing corrective maintenance on the software.This workflow becomes active during the construction phase; its level of activity increasesthroughout the transition and, finally, the production phase. The workflow finally drops offwhen the current version of the software is replaced by a new version. Many developers areunder the false impression that once the software has been delivered to the customer, theirwork is finished. In most cases, the work of supporting the software product is much morecostly and time consuming than the original development. As such, the developer’s workmay have just begun.
Infrastructure Management Workflow The infrastructure management workflow’sprimary purpose is to support the development of the infrastructure necessary todevelop object-oriented systems. Activities such as development and modification oflibraries, standards, and enterprise models are very important. When the developmentand maintenance of a problem domain architecture model goes beyond the scope of asingle project and reuse is going to occur, the infrastructure management workflow isessential. Another very important set of cross-project activities is the improvement ofthe software development process. Because the activities on this workflow tend to affectmany projects and the Unified Process focuses only on a specific project, the UnifiedProcess tends to ignore these activities (i.e., they are simply beyond the scope and pur-pose of the Unified Process).
26 Chapter 1 Introduction to Systems Analysis and Design
17 S. W. Ambler, Process Patterns—Building Large-Scale Systems Using Object Technology (Cambridge, UK:SIGS Books/Cambridge University Press, 1998); S. W. Ambler, More Process Patterns—Delivering Large-ScaleSystems Using Object Technology (Cambridge, UK: SIGS Books/Cambridge University Press, 1999); I. Graham,B. Henderson-Sellers, and H. Younessi, The OPEN Process Specification (Harlow, UK: Addison-Wesley, 1997);B. Henderson-Sellers and B. Unhelkar, OPEN Modeling with UML (Harlow, UK: Addison-Wesley, 2000).

Existing Workflow Modifications and Extensions In addition to the workflows thatwere added to address deficiencies contained in the Unified Process, existing workflows hadto be modified and/or extended into the production phase. These workflows include thetest, deployment, environment, project management, and configuration and change man-agement workflows.
Test Workflow For high-quality information systems to be developed, testing should bedone on every deliverable, including those created during the inception phase. Otherwise,less than quality systems will be delivered to the customer.
Deployment Workflow Legacy systems exist in most corporations today, and these sys-tems have databases associated with them that must be converted to interact with the newsystems. Due to the complexity of deploying new systems, the conversion requires signifi-cant planning. As such, the activities on the deployment workflow need to begin in theinception phase instead of waiting until the end of the construction phase, as suggested bythe Unified Process.
Environment Workflow The environment workflow needed to be modified to includeactivities related to setting up the operations and production environment. The actualwork performed is similar to the work related to setting up the development environmentthat was performed during the inception phase. In this case, the additional work is per-formed during the transition phase.
Project Management Workflow Even though the project management workflow doesnot include staffing the project, managing the contracts among the customers and ven-dors, and managing the project’s budget, these activities are crucial to the success of anysoftware development project. As such, we suggest extending project management toinclude these activities. Furthermore, this workflow should additionally occur in the pro-duction phase to address issues such as training, staff management, and client relation-ship management.
Configuration and Change Management Workflow The configuration and changemanagement workflow is extended into the new production phase. Activities performedduring the production phase include identifying potential improvements to the opera-tional system and assessing the potential impact of the proposed changes. Once developershave identified these changes and understood their impact, they can schedule the changesto be made and deployed with future releases.
Figure 1-12 shows the chapters in which the Enhanced Unified Process’s phases andworkflows are covered. Given the offshore outsourcing and automation of informationtechnology,18 in this textbook, we focus primarily on the elaboration phase and the busi-ness modeling, requirements, analysis, design, and project management workflows of theEnhanced Unified Process. However, as Figure 1-12 shows, the other phases and workflowsare covered. In many object-oriented systems development environments today, code gen-eration is supported. Thus, from a business perspective, we believe the activities associatedwith these workflows are the most important.
The Unified Process 27
18 See Thomas L. Friedman, The World Is Flat: A Brief History of the Twenty-First Century, Updated and ExpandedEdition (New York: Farrar, Straus, and Giroux, 2006); and Daniel H. Pink, A Whole New Mind: Why Right-BrainersWill Rule the Future (New York: Riverhead Books, 2006).
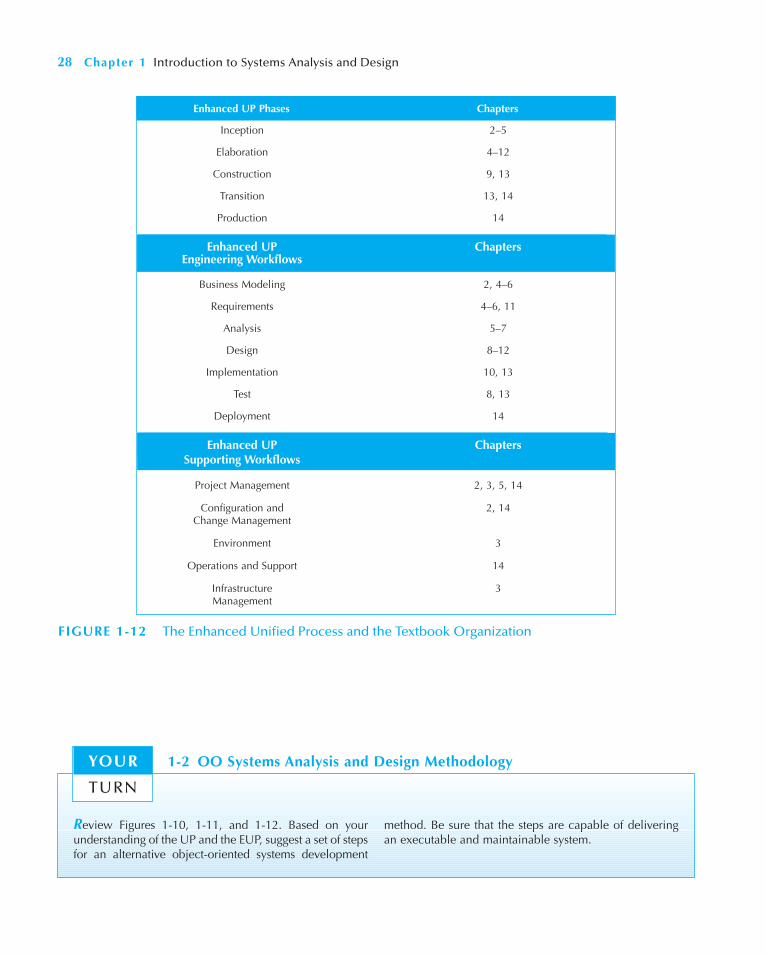
28 Chapter 1 Introduction to Systems Analysis and Design
Inception 2–5
Elaboration 4–12
Construction 9, 13
Transition 13, 14
Production 14
Business Modeling 2, 4–6
Requirements 4–6, 11
Analysis 5–7
Design 8–12
Implementation 10, 13
Test 8, 13
Deployment 14
Project Management 2, 3, 5, 14
Configuration and 2, 14Change Management
Environment 3
Operations and Support 14
Infrastructure 3Management
Enhanced UP Phases Chapters
Enhanced UP ChaptersEngineering Workflows
Enhanced UP ChaptersSupporting Workflows
FIGURE 1-12 The Enhanced Unified Process and the Textbook Organization
Review Figures 1-10, 1-11, and 1-12. Based on yourunderstanding of the UP and the EUP, suggest a set of stepsfor an alternative object-oriented systems development
method. Be sure that the steps are capable of deliveringan executable and maintainable system.
1-2 OO Systems Analysis and Design MethodologyYOUR
TURN

THE UNIFIED MODELING LANGUAGE
Until 1995, object concepts were popular but implemented in many different ways by differ-ent developers. Each developer had his or her own methodology and notation (e.g., Booch,Coad, Moses, OMT, OOSE, SOMA.)19 Then in 1995, Rational Software brought three indus-try leaders together to create a single approach to object-oriented systems development.Grady Booch, Ivar Jacobson, and James Rumbaugh worked with others to create a standardset of diagramming techniques known as the Unified Modeling Language (UML). The objec-tive of UML was to provide a common vocabulary of object-oriented terms and diagram-ming techniques rich enough to model any systems development project from analysisthrough implementation. In November 1997, the Object Management Group (OMG) for-mally accepted UML as the standard for all object developers. During the following years, theUML has gone through multiple minor revisions. The current version of UML, Version 2.0,was accepted by the members of the OMG during their spring and summer meetings of 2003.
Version 2.0 of the UML defines a set of fourteen diagramming techniques used tomodel a system. The diagrams are broken into two major groupings: one for modelingstructure of a system and one for modeling behavior. Structure diagrams provide a way torepresent the data and static relationships in an information system. The structure diagramsinclude class, object, package, deployment, component, and composite structure diagrams.Behavior diagrams provide the analyst with a way to depict the dynamic relationships amongthe instances or objects that represent the business information system. They also allow themodeling of the dynamic behavior of individual objects throughout their lifetime. Thebehavior diagrams support the analyst in modeling the functional requirements of an evolv-ing information system. The behavior modeling diagrams include activity, sequence, com-munication, interaction overview, timing, behavior state machine, protocol state machine,and use-case diagrams.20 Figure 1-13 provides an overview of these diagrams.
Depending on where in the development process the system is, different diagrams play amore important role. In some cases, the same diagramming technique is used throughout thedevelopment process. In that case, the diagrams start off very conceptual and abstract. As thesystem is developed, the diagrams evolve to include details that ultimately lead to code gen-eration and development. In other words, the diagrams move from documenting the require-ments to laying out the design. Overall, the consistent notation, integration among thediagramming techniques, and application of the diagrams across the entire developmentprocess makes the UML a powerful and flexible language for analysts and developers. Laterchapters provide more detail on using a subset of the UML in object-oriented systems analy-sis and design. In particular, these chapters describe activity, use-case, class, object, sequence,communication, and package diagrams and the behavioral state machines.
The Unified Modeling Language 29
19 See Grady Booch, Object-Oriented Analysis and Design with Applications, 2nd ed. (Redwood City, CA:Benjamin/Cummings, 1994); Peter Coad and Edward Yourdon, Object-Oriented Analysis, 2nd ed. (EnglewoodCliffs, NJ: Yourdon Press, 1991); Peter Coad and Edward Yourdon, Object-Oriented Design (Englewood Cliffs, NJ:Yourdon Press, 1991); Brian Henderson-Sellers and Julian Edwards, Book Two of Object-Oriented Knowledge: TheWorking Object (Sydney, Australia: Prentice Hall, 1994); James Rumbaugh, Michael Blaha, William Premerlani,Frederick Eddy, and William Lorensen, Object-Oriented Modeling and Design (Englewood Cliffs, NJ: Prentice Hall,1991); Ivar Jacobson, Magnus Christerson, Patrik Jonsson, and Gunnar Overgaard, Object-Oriented SoftwareEngineering: A Use Case Approach (Wokingham, England: Addison-Wesley, 1992); Ian Graham, Migrating toObject Technology (Wokingham, England: Addison-Wesley, 1994).20 The material contained in this section is based on the Unified Modeling Language: Superstructure Version 2.0,ptc/03-08-02 (www.uml.org). Additional useful references include Michael Jesse Chonoles and James A. Schardt,UML 2 for Dummies (Indianapolis, IN: Wiley, 2003); Hans-Erik Eriksson, Magnus Penker, Brian Lyons, andDavid Fado, UML 2 Toolkit (Indianapolis, IN: Wiley, 2004); and Kendall Scott, Fast Track UML 2.0 (Berkeley, CA:Apress, 2004). For a complete description of all diagrams, see www.uml.org.

30 Chapter 1 Introduction to Systems Analysis and Design
Structure Diagrams
Class Illustrate the relationships between classes modeled Analysis, Designin the system.
Object Illustrate the relationships between objects modeled Analysis, Designin the system. Used when actual instances of the classes will better communicate the model.
Package Group other UML elements together to form Analysis, Design,higher-level constructs. Implementation
Deployment Show the physical architecture of the system. Can also Physical Design, be used to show software components being deployed Implementationonto the physical architecture.
Component Illustrate the physical relationships among the software Physical Design, components. Implementation
Composite Structure Illustrate the internal structure of a class, i.e., the Analysis, Designrelationships among the parts of a class.
Behavioral Diagrams
Activity Illustrate business workflows independent of classes, the Analysis, Designflow of activities in a use case, or detailed design of a method.
Sequence Model the behavior of objects within a use case. Analysis, DesignFocuses on the time-based ordering of an activity.
Communication Model the behavior of objects within a use case. Analysis, DesignFocuses on the communication among a set of collaborating objects of an activity.
Interaction Overview Illustrate an overview of the flow of control of a process. Analysis, Design
Timing Illustrate the interaction that takes place among Analysis, Designa set of objects and the state changes in which they go through along a time axis.
Behavioral State Machine Examine the behavior of one class. Analysis, Design
Protocol State Machine Illustrates the dependencies among the different Analysis, Designinterfaces of a class.
Use-Case Capture business requirements for the system and to Analysisillustrate the interaction between the system and its environment.
FIGURE 1-13 UML 2.0 Diagram Summary
PROJECT TEAM ROLES AND SKILLS
It is clear from the various phases and steps performed during the SDLC that the projectteam needs a variety of skills. Project members are change agents who identify ways toimprove an organization, build an information system to support them, and train andmotivate others to use the system. Leading a successful organizational change effort is oneof the most difficult jobs that someone can do. Understanding what to change and how tochange it—and convincing others of the need for change—requires a wide range of skills.These skills can be broken down into six major categories: technical, business, analytical,interpersonal, management, and ethical.
Diagram Name Used to… Primary Phase

Analysts must have the technical skills to understand the organization’s existingtechnical environment, the technology that will comprise the new system, and the wayin which both can be fit into an integrated technical solution. Business skills arerequired to understand how IT can be applied to business situations and to ensure thatthe IT delivers real business value. Analysts are continuous problem solvers at boththe project and the organizational level, and they put their analytical skills to the testregularly.
Analysts often need to communicate effectively one-on-one with users and busi-ness managers (who often have little experience with technology) and with program-mers (who often have more technical expertise than the analyst). They must be able togive presentations to large and small groups and write reports. Not only do they needto have strong interpersonal abilities, but they also need to manage people with whomthey work and they need to manage the pressure and risks associated with unclearsituations.
Finally, analysts must deal fairly, honestly, and ethically with other project team mem-bers, managers, and system users. Analysts often deal with confidential information orinformation that, if shared with others, could cause harm (e.g., dissent among employees);it is important to maintain confidence and trust with all people.
In addition to these six general skill sets, analysts require many specific skills associatedwith roles performed on a project. In the early days of systems development, most organi-zations expected one person, the analyst, to have all the specific skills needed to conduct asystems development project. Some small organizations still expect one person to performmany roles, but because organizations and technology have become more complex, mostlarge organizations now build project teams containing several individuals with clearlydefined responsibilities. Different organizations divide the roles differently, but Figure 1-14presents one commonly used set of project team roles. Most IS teams include many otherindividuals, such as the programmers, who actually write the programs that make up thesystem, and technical writers, who prepare the help screens and other documentation (e.g.,users manuals and systems manuals).
Project Team Roles and Skills 31
Business analyst Analyzing the key business aspects of the systemIdentifying how the system will provide business valueDesigning the new business processes and policies
Systems analyst Identifying how technology can improve business processesDesigning the new business processesDesigning the information systemEnsuring that the system conforms to information systems standards
Infrastructure analyst Ensuring the system conforms to infrastructure standardsIdentifying infrastructure changes needed to support the system
Change management analyst Developing and executing a change management planDeveloping and executing a user training plan
Project manager Managing the team of analysts, programmers, technical writers, and other specialists
Developing and monitoring the project planAssigning resourcesServing as the primary point of contact for the project
Role Responsibilities
FIGURE 1-14Project Team Roles
Business AnalystA business analyst focuses on the business issues surrounding the system. These issues includeidentifying the business value that the system will create, developing ideas and suggestions forhow the business processes can be improved, and designing the new processes and policies inconjunction with the systems analyst. This individual will likely have business experience andsome type of professional training (e.g., the business analyst for accounting systems will likelybe a CPA [in the United States] or a CA [in Canada]). He or she represents the interests of theproject sponsor and the ultimate users of the system. A business analyst assists in the plan-ning and design phases but is most active in the analysis phase.
Systems AnalystA systems analyst focuses on the IS issues surrounding the system. This person developsideas and suggestions for how information technology can improve business processes,designs the new business processes with help from the business analyst, designs the newinformation system, and ensures that all IS standards are maintained. A systems analyst willlikely have significant training and experience in analysis and design, programming, andeven areas of the business. He or she represents the interests of the IS department and worksintensively through the project but perhaps less so during the implementation phase.
Infrastructure AnalystAn infrastructure analyst focuses on the technical issues surrounding how the system willinteract with the organization’s technical infrastructure (e.g., hardware, software, networks,and databases). An infrastructure analyst’s tasks include ensuring that the new informationsystem conforms to organizational standards and identifying infrastructure changes neededto support the system. This individual will probably have significant training and experiencein networking, database administration, and various hardware and software products. He orshe represents the interests of the organization and IS group that will ultimately have tooperate and support the new system once it has been installed. An infrastructure analystworks throughout the project but perhaps less so during planning and analysis phases.
Change Management AnalystA change management analyst focuses on the people and management issues surrounding thesystem installation. The roles of this person include ensuring that the adequate documentationand support are available to users, providing user training on the new system, and developingstrategies to overcome resistance to change. This individual should have significant trainingand experience in organizational behavior in general and change management in particular.He or she represents the interests of the project sponsor and users for whom the system isbeing designed. A change management analyst works most actively during the implementa-tion phase but begins laying the groundwork for change during the analysis and design phases.
Project ManagerA project manager is responsible for ensuring that the project is completed on time andwithin budget and that the system delivers all benefits intended by the project sponsor. Therole of the project manager includes managing the team members, developing the projectplan, assigning resources, and being the primary point of contact when people outside theteam have questions about the project. This individual will likely have significant experi-ence in project management and has probably worked for many years as a systems analystbeforehand. He or she represents the interests of the IS department and the project sponsor.The project manager works intensely during all phases of the project.
32 Chapter 1 Introduction to Systems Analysis and Design
APPLYING THE CONCEPTS AT CD SELECTIONS
Throughout this book, many new concepts about object-oriented systems analysis anddesign are introduced. As a way to make these new concepts more relevant, we applythem to a fictitious company called CD Selections. CD Selections is a chain of fifty musicstores located in California, with headquarters in Los Angeles. Annual sales last yearwere $50 million, and they have been growing at about 3 to 5 percent per year for thepast few years. However, the firm has been interested in expanding their presence beyondCalifornia. Margaret Mooney, vice president of marketing, has recently become bothexcited by and concerned with the rise of Internet sites selling CDs. She believes thatthe Internet has great potential, but she wants to use it in the right way. Rushing into e-commerce without considering things such as its effect on existing brick-and-mortarstores and the implications on existing systems at CD Selections could cause more harmthan good. Currently, CD Selections has a Web site that provides basic information aboutthe company and about each of its stores (e.g., map, operating hours, phone number,etc.). The Web site was developed by an Internet consulting firm and is hosted by aprominent local Internet service provider (ISP) in Los Angeles. The IT department at CDSelections has become experienced with Internet technology as it has worked with theISP to maintain the site; however, it still has a lot to learn when it comes to conductingbusiness over the Web. As such, Margaret is interested in investigating the possibility ofcreating an e-commerce site that will work with the current systems used by CD Selec-tions. In future chapters, we revisit CD Selections to see how the concepts introduced inthe individual chapters impact Margaret and CD Selections.
SUMMARY
The Systems Development Life CycleAll systems development projects follow essentially the same fundamental process, calledthe system development life cycle (SDLC). SDLC starts with a planning phase in which theproject team identifies the business value of the system, conducts a feasibility analysis, andplans the project. The second phase is the analysis phase, in which the team develops ananalysis strategy, gathers information, and builds a set of analysis models. In the next phase,the design phase, the team develops the physical design, architecture design, interfacedesign, database and file specifications, and program design. In the final phase, implemen-tation, the system is built, installed, and maintained.
Summary 33
Suppose you decide to become an analyst after you grad-uate. Decide what type of analyst you would most preferto be and what type of courses you should take beforeyou graduate. Then decide the type of summer job orinternship you should seek.
Question
Develop a short plan that describes how you will preparefor your career as an analyst.
1-3 Being an AnalystYOUR
TURN
The Evolution of Systems Development MethodologiesSystem development methodologies are formalized approaches to implementing an SDLC.System development methodologies have evolved over the decades. Structured designmethodologies, such as waterfall and parallel development, emphasize decomposition of aproblem by either focusing on process decomposition (process-centric methodologies) ordata decomposition (data decomposition). They produce a solid, well-thought-out systembut can overlook requirements because users must specify them early in the design processbefore seeing the actual system. RAD-based methodologies attempt to speed up develop-ment and make it easier for users to specify requirements by having parts of the systemdeveloped sooner either by producing different versions (phased development) or by usingprototypes (prototyping, throwaway prototyping) through the use of CASE tools andfourth-generation/visual programming languages. However, RAD-based methodologiesstill tend to be either process-centric or data-centric. Agile development methodologies,such as XP, focus on streamlining the SDLC by eliminating many of the tasks and timeassociated with requirements definition and documentation. Several factors influence thechoice of a methodology: clarity of the user requirements; familiarity with the base tech-nology; system complexity; need for system reliability; time pressures; and the need to seeprogress on the time schedule.
Object-Oriented Systems Analysis and DesignObject-oriented systems analysis and design (OOSAD) is most associated with a phased-development RAD-based methodology, where the time spent in each phase is very short.OOSAD uses a use-case-driven, architecture-centric, iterative, and incremental informa-tion systems development approach. It supports three different views of the evolvingsystem: functional, static, and dynamic. OOSAD allows the analyst to decompose complexproblems into smaller, more manageable components using a commonly accepted set ofnotations. Also, many people believe that users do not think in terms of data or processesbut instead think in terms of a collection of collaborating objects. As such, object-orientedsystems analysis and design allows the analyst to interact with the user with objects fromthe user’s environment instead of a set of separate processes and data.
One of the most popular approaches to object-oriented systems analysis and designis the Unified Process. The Unified Process is a two-dimensional systems developmentprocess described with a set of phases and workflows. The phases consist of the incep-tion, elaboration, construction, and transition phases. The workflows are organized intotwo subcategories: engineering and supporting. The engineering workflows include busi-ness modeling, requirements, analysis, design, implementation, test, and deploymentworkflows, and the supporting workflows comprise the project management, configura-tion and change management, and environment workflows. Depending on which devel-opment phase the evolving system is currently in, the level of activity will vary over theworkflows.
The Unified Modeling LanguageThe Unified Modeling Language, or UML, is a standard set of diagramming techniquesthat provide a graphical representation rich enough to model any systems developmentproject from analysis through implementation. Today most object-oriented systemsanalysis and design approaches use the UML to depict an evolving system. The UMLuses a set of different diagrams to portray the various views of the evolving system. Thediagrams are grouped into two broad classifications: structure and behavior. The struc-ture diagrams include class, object, package, deployment, component, and composite
34 Chapter 1 Introduction to Systems Analysis and Design

structure diagrams. The behavior diagrams include activity, sequence, communication,interaction overview, timing, behavior state machine, protocol state machine, and usecase diagrams.
Project Team Roles and SkillsThe project team needs a variety of skills. All analysts need to have general skills, such aschange management, ethics, communications, and technical. However, different kinds ofanalysts require specific skills in addition to these. Business analysts usually have businessskills that help them to understand the business issues surrounding the system, whereassystems analysts also have significant experience in analysis and design and programming.The infrastructure analyst focuses on technical issues surrounding how the system willinteract with the organization’s technical infrastructure, and the change managementanalyst focuses on people and management issues surrounding the system installation. Inaddition to analysts, project teams will include a project manager, programmers, technicalwriters, and other specialists.
KEY TERMS
Key Terms 35
Agile developmentAnalysis modelAnalysis paralysisAnalysis phaseAnalysis strategyAnalysis workflowApproval committeeArchitecture centricArchitecture designAs-is systemBehavior diagramsBehavioral viewBusiness analystBusiness modeling workflowChange agentChange management analystConfiguration and change
management workflowConstructionConstruction phaseDatabase and file specificationData-centered methodologyDeliverableDeployment workflowDesign modelDesign phaseDesign prototypeDesign strategyDesign workflowDynamic viewElaboration phase
Engineering workflowEnvironment workflowExternal viewExtreme programming (XP)Feasibility analysisFunctional viewGradual refinementImplementation phaseImplementation workflowInception phaseIncrementalInfrastructure analystInfrastructure management workflowInterface designIterativeMethodologyObject management group (OMG)Object-oriented methodologiesOperations and support workflowParallel developmentPhased developmentPhasesPlanning phaseProcess-centered methodologyProduction phaseProgram designProgrammerProject managementProject management workflowProject managerProject plan
Project sponsorPrototypingRapid application development
(RAD)Requirements gatheringRequirements workflowStatic viewStructural viewStructure diagramsStructured designSupport planSystems development life cycle
(SDLC)System proposalSystem prototypeSystem requestSystem specificationSystems analystTechnical writerTesting workflowThrowaway prototypingTraining planTransition phaseUnified Modeling Language (UML)Use caseUse-case drivenVersionWaterfall developmentWorkflowsWorkplan

QUESTIONS
36 Chapter 1 Introduction to Systems Analysis and Design
1. Compare and contrast phases, steps, techniques, anddeliverables.
2. Describe the major phases in the SDLC.3. Describe the principal steps in the planning phase.
What are the major deliverables?4. Describe the principal steps in the analysis phase.
What are the major deliverables?5. Describe the principal steps in the design phase. What
are the major deliverables?6. Describe the principal steps in the implementation
phase. What are the major deliverables?7. What are the roles of a project sponsor and the
approval committee?8. What does gradual refinement mean in the context of
SDLC?9. Compare and contrast process-centered methodolo-
gies with data-centered methodologies.10. Compare and contrast structured design-based
methodologies in general to RAD-based methodolo-gies in general.
11. Compare and contrast extreme programming andthrowaway prototyping.
12. Describe the major elements and issues with waterfalldevelopment.
13. Describe the major elements and issues with paralleldevelopment.
14. Describe the major elements and issues with phaseddevelopment.
15. Describe the major elements and issues with prototyping.
16. Describe the major elements and issues with throw-away prototyping.
17. What are the key factors in selecting a methodology?18. What is a use case?19. What is meant by use-case driven?20. What is the Unified Modeling Language?21. Who is the Object Management Group?22. What is the primary purpose of structure diagrams?
Give some examples of structure diagrams.23. For what are behavior diagrams used? Give some
examples of behavior diagrams.24. Why is it important for an OOSAD approach to be
architecture centric?25. What does it mean for an OOSAD approach to be
incremental and iterative?26. What are the phases and workflows of the Unified
Process?27. Compare the phases of the Unified Process with the
phases of the waterfall model.28. What are the major roles on a project team?29. Compare and contrast the role of a systems analyst,
business analyst, and infrastructure analyst.30. Which phase in the SDLC is most important? Why?31. Describe the major elements and issues with an
object-oriented approach to developing informationsystems.
EXERCISES
A. Suppose you are a project manager using a waterfalldevelopment–based methodology on a large andcomplex project. Your manager has just read the latestarticle in Computerworld that advocates replacing thismethodology with prototyping and comes to youroffice requesting that you switch. What would you say?
B. The basic types of methodologies discussed in thischapter can be combined and integrated to form newhybrid methodologies. Suppose you were to combinethrowaway prototyping with the use of waterfalldevelopment. What would the methodology looklike? Draw a picture (similar to those in Figures 1–2through 1–7). How would this new methodologycompare to the others?
C. Investigate IBM’s Rational Unified Process (RUP) onthe Web. RUP is a commercial version that extendsaspects of the Unified Process. Write a brief memo
describing how it is related to the Unified Process as described in this chapter. (Hint: A good Web sitewith which to begin is www.306.ibm.com/software/awdtools/rup/.)
D. Suppose you are a project manager who typicallyhas been using a waterfall development–basedmethodology on a large and complex project. Yourmanager has just read the latest article in Computer-world that advocates replacing this methodology withthe Unified Process and comes to your office request-ing you to switch. What do you say?
E. Suppose you are an analyst working for a small com-pany to develop an accounting system. Would you usethe Unified Process to develop the system, or wouldyou prefer one of the traditional approaches? Why?
F. Suppose you are an analyst developing a new infor-mation system to automate the sales transactions and

manage inventory for each retail store in a large chain.The system would be installed at each store andexchange data with a mainframe computer at thecompany’s head office. Would you use the UnifiedProcess to develop the system or would you prefer oneof the traditional approaches? Why?
G. Suppose you are an analyst working for a small com-pany to develop an accounting system. What type ofmethodology would you use? Why?
H. Suppose you are an analyst developing a new executiveinformation system intended to provide key strategicinformation from existing corporate databases tosenior executives to help in their decision making.What type of methodology would you use? Why?
I. Investigate the Unified Modeling Language on theWeb. Write a paragraph news brief describing the cur-rent state of the UML. (Hint: A good Web site withwhich to begin is www.uml.org.)
J. Investigate the Object Management Group (OMG) onthe Web. Write a report describing the purpose ofthe OMG and what it is involved with besides the
UML. (Hint: A good Web site with which to begin iswww.omg.org.)
K. Using the Web, find a set of CASE tools that supportthe UML. A couple of examples include Rational Roseand Visual Paradigm. Find at least two more. Write ashort report describing how well they support theUML, and make a recommendation as to which oneyou believe would be best for a project team to use indeveloping an object-oriented information systemusing the UML.
L. Look in the classified section of your local newspaper.What kinds of job opportunities are available forpeople who want analyst positions? Compare andcontrast the skills that the ads ask for to the skills thatwe presented in this chapter.
M. Think about your ideal analyst position. Write a news-paper ad to hire someone for that position. Whatrequirements would the job have? What skills andexperience would be required? How would an appli-cant be able to demonstrate having the appropriateskills and experience?
Minicases 37
MINICASES
1. Barbara Singleton, manager of western regional salesat the WAMAP Company, requested that the ISdepartment develop a sales force management andtracking system that would enable her to better mon-itor the performance of her sales staff. Unfortunately,due to the massive backlog of work facing the ISdepartment, her request was given a low priority. Aftersix months of inaction by the IS department, Barbaradecided to take matters into her own hands. Based onthe advice of friends, Barbara purchased a PC andsimple database software and constructed a sales forcemanagement and tracking system on her own.
Although Barbara’s system has been “com-pleted” for about six weeks, it still has many featuresthat do not work correctly, and some functions arefull of errors. Barbara’s assistant is so mistrustful ofthe system that she has secretly gone back to usingher old paper-based system, since it is much morereliable.
Over dinner one evening, Barbara complained toa systems analyst friend, “I don’t know what wentwrong with this project. It seemed pretty simple tome. Those IS guys wanted me to follow this elaborate
set of steps and tasks, but I didn’t think all that reallyapplied to a PC-based system. I just thought I couldbuild this system and tweak it around until I gotwhat I wanted without all the fuss and bother of themethodology the IS guys were pushing. I mean, doesn’tthat just apply to their big, expensive systems?”
Assuming you are Barbara’s systems analystfriend, how would you respond to her complaint?
2. Marcus Weber, IS project manager at ICAN MutualInsurance Co., is reviewing the staffing arrangementsfor his next major project, the development of anexpert system-based underwriters assistant. This newsystem will involve a whole new way for the under-writers to perform their tasks. The underwriters assis-tant system will function as sort of an underwritingsupervisor, reviewing key elements of each applica-tion, checking for consistency in the underwriter’sdecisions, and ensuring that no critical factors havebeen overlooked. The goal of the new system is toimprove the quality of the underwriters’ decisions andto improve underwriter productivity. It is expectedthat the new system will substantially change theway the underwriting staff do their jobs.

Marcus is dismayed to learn that due to budgetconstraints, he must choose between one of two avail-able staff members. Barry Filmore has had considerableexperience and training in individual and organiza-tional behavior. Barry has worked on several other pro-jects in which the end users had to make significantadjustments to the new system, and Barry seems to havea knack for anticipating problems and smoothing thetransition to a new work environment. Marcus hadhoped to have Barry’s involvement in this project.
Marcus’s other potential staff member is KimDanville. Prior to joining ICAN Mutual, Kim had con-siderable work experience with the expert system tech-nologies that ICAN has chosen for this expert systemproject. Marcus was counting on Kim to help integratethe new expert system technology into ICAN’s systemsenvironment, and also to provide on-the-job trainingand insights to the other developers on this team.
Given that Marcus’s budget will only permit himto add Barry or Kim to this project team, but not bothwhat choice do you recommend for him? Justify youranswer.
3. Joe Brown, the president of Roanoke Manufacturing,requested that Jack Jones, the MIS department man-ager, investigate the viability of selling their productsover the Web. Currently, the MIS department is stillusing an IBM mainframe as their primary deployment
environment. As a first step, Jack contacted his friends atIBM to see if they had any suggestions as to howRoanoke Manufacturing could move toward support-ing sales in an electronic commerce environment whilekeeping their mainframe as their main system. Hisfriends explained that IBM (www.ibm.com) now sup-ports Java and Linux on their mainframes. Further-more, Jack learned that IBM owns Rational(www.rational.com), the creator of the UML and theUnified Process. As such, they suggested that Jack inves-tigate using object-oriented systems as a basis for devel-oping the new system. They also suggested that usingthe Rational Unified Process (RUP), Java, and virtualLinux machines on his current mainframe as a way tosupport the movement toward a distributed electroniccommerce system would protect his current investmentin his legacy systems while allowing the new system tobe developed in a more modern manner.
Even though Jack’s IBM friends were very persua-sive, Jack is still a little wary about moving his opera-tion from a structured systems approach to this newobject-oriented approach. Assuming that you are oneof Jack’s IBM friends, how would you convince him tomove toward using an object-oriented systems devel-opment method, such as RUP, and using Java and Linuxas a basis for developing and deploying the new systemon Roanoke Manufacturing’s current mainframe.
38 Chapter 1 Introduction to Systems Analysis and Design
ProjectC
harterRisk
Assessm
entStaffing
PlanW
orkplanSystem
ProposalRequirem
entsD
efinitionFeasibility A
nalysisSystem
Request
PART ONE
Project Initiation,Project
Management, and
Requirements Determination
The Planning Phase is the fundamental process of understanding why an information system should be built, and determining how the project team will build it. The deliverables are combined into a system request which is presented to the project sponsor and approval committee. They decide whether it is advisable to proceed with the system. If the request is approved, detailed workplans, staffing plans, risk assessments, and a project charter is created. Finally, the detailed requirements are identified and a system proposal is created. The activities described in this section are continuously revisited throughout the life- time of the system.
CHAPTER 2Project Initiation
CHAPTER 3Project
Management
CHAPTER 4Requirements
Determination

This page intentionally left blank

41
This chapter describes Project Initiation, the point at which an organization creates andassesses the original goals and expectations for a new system. The first step in the processis to identify a project that will deliver value to the business and to create a system requestthat provides basic information about the proposed system. Next, the analysts perform afeasibility analysis to determine the technical, economic, and organizational feasibility ofthe system; if appropriate, the system is selected and the development project begins.
OBJECTIVES
■ Understand the importance of linking the information system to business needs.■ Be able to create a system request.■ Understand how to assess technical, economic, and organizational feasibility.■ Be able to perform a feasibility analysis.■ Understand how projects are selected in some organizations.
CHAPTER OUTLINE
C H A P T E R 2
Project Initiation
IntroductionProject Identification
System RequestFeasibility Analysis
Technical FeasibilityEconomic FeasibilityOrganizational Feasibility
Project SelectionApplying the Concepts at CD Selections
Project Identification and SystemRequest
Feasibility AnalysisProject Selection
Summary
INTRODUCTION
The first step in any new development project is for someone—a manager, staff member,sales representative, or systems analyst—to see an opportunity to improve the business.New systems start first and foremost from a business need or opportunity. Many ideas fornew systems or improvements to existing ones arise from the application of a new tech-nology, but an understanding of technology is usually secondary to a solid understandingof the business and its objectives.
This idea may sound like common sense, but, unfortunately, many projects are startedwithout a clear understanding of how the system will improve the business. The IS field isfilled with thousands of buzzwords, fads, and trends (e.g., customer relationship manage-ment (CRM), mobile computing, data mining). The promise of these innovations can appearso attractive that organizations begin projects even if they are not sure what value they offerbecause they believe that the technologies are somehow important in their own right. A1996 survey by the Standish Group found that 42 percent of all corporate IS projects were

abandoned before completion; a similar 1996 study by the General Accounting Office found53 percent of all U.S. government IS projects were abandoned. Problems can usually be tracedback to the very beginning of the SDLC, where too little attention was given to the identify-ing business value and understanding the risks associated with the project.
This does not mean that technical people should not recommend new systems projects.In fact, the ideal situation is for both IT people (i.e., the experts in systems) and the businesspeople (i.e., the experts in business) to work closely to find ways for technology to supportbusiness needs. In this way, organizations can leverage the exciting technologies that are avail-able while ensuring that projects are based upon real business objectives, such as increasingsales, improving customer service, and decreasing operating expenses. Ultimately, informa-tion systems need to affect the organization’s bottom line (in a positive way!).
In general, a project is a set of activities with a starting point and an ending pointmeant to create a system that brings value to the business. Project initiation begins whensomeone (or some group) in the organization (called the project sponsor) identifies somebusiness value that can be gained from using information technology. The proposed pro-ject is described briefly using a technique called the system request, which is submitted toan approval committee for consideration. The approval committee reviews the systemrequest and makes an initial determination, based on the information provided, of whetherto investigate the proposal or not. If so, the next step is the feasibility analysis.
A feasibility analysis plays an important role in deciding whether to proceed with aninformation systems development project. It examines the technical, economic, and orga-nizational pros and cons of developing the system, and it gives the organization a slightlymore detailed picture of the advantages of investing in the system as well as any obstaclesthat could arise. In most cases, the project sponsor works together with an analyst (or ana-lyst team) to develop the feasibility analysis for the approval committee.
Once the feasibility analysis has been completed, it is submitted to the approval com-mittee, along with a revised system request. The committee then decides whether to approvethe project, decline the project, or table it until additional information is available. Projectsare selected by weighing risks and return and by making trade-offs at the organizational level.
42 Chapter 2 Project Initiation
A CIO needs to have a global view when identifying andselecting projects for her organization. I would get lost inthe trees if I were to manage on a project-by-projectbasis. Given this, I categorize my projects according tomy three roles as a CIO, and the mix of my projectportfolio changes depending on the current businessenvironment.
My primary role is to keep the business running. Thatmeans every day when each person comes to work, he orshe can perform his or her job efficiently. I measure thisusing various service level, cost, and productivity mea-sures. Projects that keep the business running could have ahigh priority if the business were in the middle of a mergeror a low priority if things were running smoothly and itwere “business as usual.”
My second role is to push innovation that createsvalue for the business. I manage this by looking at ourlines of business and asking which lines of business createthe most value for the company. These are the areas forwhich I should be providing the most value. For example,if we had a highly innovative marketing strategy, I wouldpush for innovation there. If operations were runningsmoothly, I would push less for innovation in that area.
My third role is strategic, to look beyond today andfind new opportunities for both IT and the business ofproviding energy. This may include investigating processsystems, such as automated meter reading or looking intothe possibilities of wireless technologies.
—Lyn McDermid
2-A Interview with Lyn McDermid, CIO, Dominion Virginia PowerCONCEPTS
IN ACTION

PROJECT IDENTIFICATION
A project is identified when someone in the organization identifies a business need tobuild a system. This could occur within a business unit or IT, come from a steering com-mittee charged with identifying business opportunities, or evolve from a recommenda-tion made by external consultants. Examples of business needs include supporting a newmarketing campaign, reaching out to a new type of customer, or improving interactionswith suppliers. Sometimes, needs arise from some kind of “pain” within the organization,such as a drop in market share, poor customer service levels, or increased competition.Other times, new business initiatives and strategies are created, and a system is requiredto enable them.
Business needs also can surface when the organization identifies unique and compet-itive ways of using IT. Many organizations keep an eye on emerging technology, which istechnology that is still being developed and is not yet viable for widespread business use.For example, if companies stay abreast of technology such as the Internet, smart cards, andscent-technology in their earliest stages, they can develop business strategies that leveragethe capabilities of these technologies and introduce them into the marketplace as a firstmover. Ideally, they can take advantage of this first-mover advantage by making money andcontinuing to innovate while competitors trail behind.
The project sponsor is someone who recognizes the strong business need for a sys-tem and has an interest in seeing the system succeed. He or she will work throughout theSDLC to make sure that the project is moving in the right direction from the perspectiveof the business. The project sponsor serves as the primary point of contact for the sys-tem. Usually, the sponsor of the project is from a business function, such as marketing,accounting, or finance; however, members of the IT area also can sponsor or cosponsora project.
The size or scope of a project determines the kind of sponsor needed. A small,departmental system may require sponsorship from only a single manager; however, alarge, organizational initiative may need support from the entire senior managementteam and even the CEO. If a project is purely technical in nature (e.g., improvements tothe existing IT infrastructure or research into the viability of an emerging technology),then sponsorship from IT is appropriate. When projects have great importance to thebusiness yet are technically complex, joint sponsorship by both the business and IT maybe necessary.
The business need drives the high-level business requirements for the system. Require-ments are what the information system will do, or the functionality it will contain. Theyneed to be explained at a high level so that the approval committee and, ultimately, the pro-ject team understand what the business expects from the final product. Business require-ments are the features and capabilities the information system will have to include, such asthe ability to collect customer orders online or the ability for suppliers to receive inventoryinformation as orders are placed and sales are made.
The project sponsor also should have an idea of the business value to be gainedfrom the system, both in tangible and intangible ways. Tangible value can be quantifiedand measured easily (e.g., 2 percent reduction in operating costs). An intangible valueresults from an intuitive belief that the system provides important, but hard-to-measure,benefits to the organization (e.g., improved customer service or a better competitiveposition).
Once the project sponsor identifies a project that meets an important business needand he or she can identify the system’s business requirements and value, it is time to for-mally initiate the project. In most organizations, project initiation begins with a tech-nique called a system request.
Project Identification 43

System RequestA system request is a document that describes the business reasons for building a sys-tem and the value that the system is expected to provide. The project sponsor usuallycompletes this form as part of a formal system project selection process within the orga-nization. Most system requests include five elements: project sponsor, business need,business requirements, business value, and special issues (see Figure 2-1). The sponsordescribes the person who will serve as the primary contact for the project, and the busi-ness need presents the reasons prompting the project. The business requirements of theproject refer to the business capabilities that the system will need to have, and the busi-ness value describes the benefits that the organization should expect from the system.Special issues are included on the document as a catch-all for other information thatshould be considered in assessing the project. For example, the project may need to becompleted by a specific deadline. Project teams need to be aware of any special circum-stances that could affect the outcome of the system. Figure 2-2 shows a template for asystem request.
The completed system request is submitted to the approval committee for consideration.This approval committee could be a company steering committee that meets regularly tomake information systems decisions, a senior executive who has control of organizationalresources, or any other decision-making body that governs the use of business investments.The committee reviews the system request and makes an initial determination, based on theinformation provided, of whether to investigate the proposal or not. If so, the next step is toconduct a feasibility analysis.
Feasibility AnalysisOnce the need for the system and its business requirements have been defined, it is time tocreate a more detailed business case to better understand the opportunities and limitations
44 Chapter 2 Project Initiation
Dominion Virginia Power is one of the nation’s ten largestinvestor-owned electric utilities. The company deliverspower to more than two million homes and businesses inVirginia and North Carolina. In 1997, the company over-hauled some of its core processes and technology. Thegoal was to improve customer service and cut operationscosts by developing a new workflow and geographicinformation system. When the project was finished, ser-vice engineers who had sifted through thousands of papermaps could use computerized searches to pinpoint thelocations of electricity poles. The project helped the utilityimprove management of all its facilities, records, maps,scheduling, and human resources. That, in turn, helpedincrease employee productivity, improve customerresponse times, and reduce the costs of operating crews.
Source: Computerworld (November 11, 1997).
Questions
1. What kinds of things does Dominion VirginiaPower do that require it to know power pole locations? How often does it do these things?Who benefits if the company can locate powerpoles faster?
2. Based on your answers to question 1, describethree tangible benefits that the company canreceive from its new computer system. How canthese be quantified?
3. Based on your answers to question 1, describe threeintangible benefits that the company can receivefrom its new computer system. How can these bequantified?
2-1 Identify Tangible and Intangible ValueYOUR
TURN
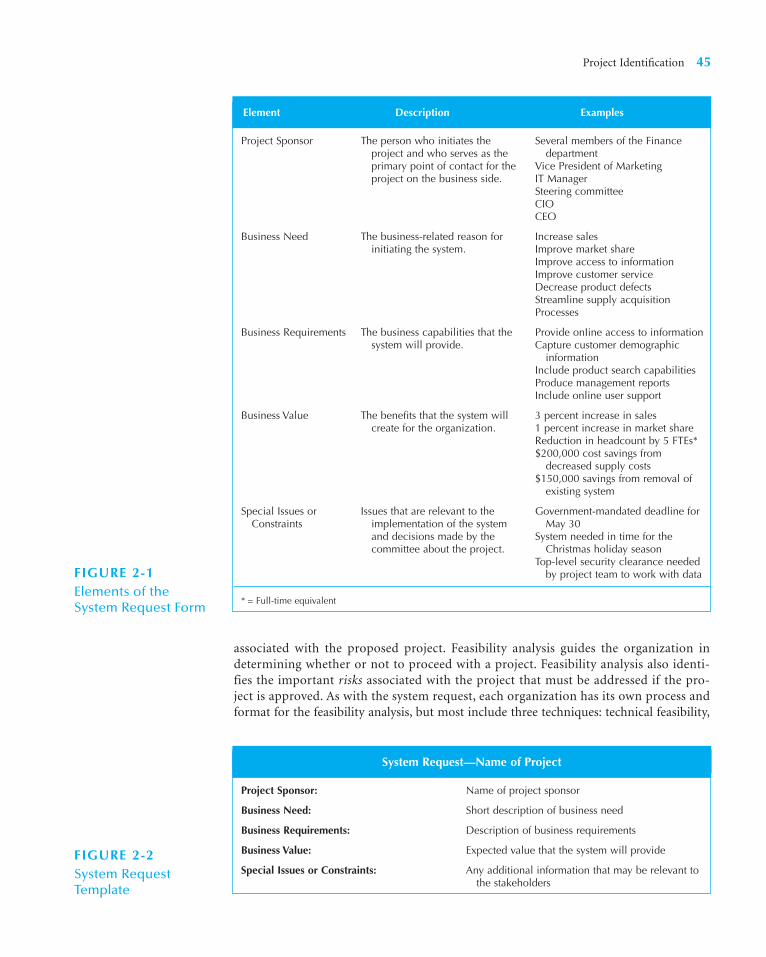
Project Identification 45
FIGURE 2-1Elements of the System Request Form
Project Sponsor The person who initiates the Several members of the Financeproject and who serves as the departmentprimary point of contact for the Vice President of Marketingproject on the business side. IT Manager
Steering committeeCIOCEO
Business Need The business-related reason for Increase salesinitiating the system. Improve market share
Improve access to informationImprove customer serviceDecrease product defectsStreamline supply acquisitionProcesses
Business Requirements The business capabilities that the Provide onIine access to information system will provide. Capture customer demographic
informationInclude product search capabilitiesProduce management reportsInclude online user support
Business Value The benefits that the system will 3 percent increase in salescreate for the organization. 1 percent increase in market share
Reduction in headcount by 5 FTEs*$200,000 cost savings from
decreased supply costs$150,000 savings from removal of
existing system
Special Issues or Issues that are relevant to the Government-mandated deadline for Constraints implementation of the system May 30
and decisions made by the System needed in time for the committee about the project. Christmas holiday season
Top-level security clearance needed by project team to work with data
* = Full-time equivalent
Element Description Examples
Project Sponsor: Name of project sponsor
Business Need: Short description of business need
Business Requirements: Description of business requirements
Business Value: Expected value that the system will provide
Special Issues or Constraints: Any additional information that may be relevant tothe stakeholders
System Request—Name of Project
FIGURE 2-2System Request Template
associated with the proposed project. Feasibility analysis guides the organization indetermining whether or not to proceed with a project. Feasibility analysis also identi-fies the important risks associated with the project that must be addressed if the pro-ject is approved. As with the system request, each organization has its own process andformat for the feasibility analysis, but most include three techniques: technical feasibility,

46 Chapter 2 Project Initiation
At Sprint, network projects originate from two vantagepoints—IT and the business units. IT projects usually addressinfrastructure and support needs. The business unit projectstypically begin after a business need is identified locally,and a business group informally collaborates with IT regard-ing how a solution can be delivered to meet customerexpectations.
Once an idea is developed, a more formal requestprocess begins, and an analysis team is assigned to inves-tigate and validate the opportunity. This team includesmembers from the user community and IT, and theyscope out at a high level what the project will do; createestimates for technology, training, and developmentcosts; and create a business case. This business case con-
tains the economic value-add and the net present value ofthe project.
Of course, not all projects undergo this rigorousprocess. The larger the project, the more time is allocatedto the analysis team. It is important to remain flexible andnot let the process consume the organization. At the begin-ning of each budgetary year, specific capital expendituresare allocated for operational improvements and mainte-nance. Moreover, this money is set aside to fund quick pro-jects that deliver immediate value without going throughthe traditional approval process.
—Don Hallacy
2-B Interview with Don Hallacy, President, Technology Services, Sprint CorporationCONCEPTS
IN ACTION
Think about your own university or college, and choosean idea that could improve student satisfaction with thecourse enrollment process. Currently can students enrollfor classes from anywhere? How long does it take? Aredirections simple to follow? Is online help available?
Next, think about how technology can help supportyour idea. Would you need completely new technology?Can the current system be changed?
Question
Create a system request that you could give to theadministration that explains the sponsor, business need,business requirements, and potential value of the pro-ject. Include any constraints or issues that should beconsidered.
2–2 Create a System RequestYOUR
TURN
economic feasibility, and organizational feasibility. The results of these techniques arecombined into a feasibility study deliverable, which is given to the approval committee atthe end of project initiation (see Figure 2-3).
Although we now discuss feasibility analysis within the context of project initiation,most project teams will revise their feasibility study throughout the SDLC and revisit itscontents at various checkpoints during the project. If at any point the project’s risks andlimitations outweigh its benefits, the project team may decide to cancel the project or makenecessary improvements.
Technical FeasibilityThe first technique in the feasibility analysis is to assess the technical feasibility of the pro-ject, the extent to which the system can be successfully designed, developed, and installedby the IT group. Technical feasibility analysis is in essence a technical risk analysis thatstrives to answer this question: Can we build it?1
1 We use build it in the broadest sense. Organizations can also choose to buy a commercial software package andinstall it, in which case, the question might be, can we select the right package and successfully install it?

Many risks can endanger the successful completion of a project. First and foremostis the users’ and analysts’ lack of familiarity with the functional area. When analysts areunfamiliar with the business functional area, they have a greater chance of misunder-standing the users or of missing opportunities for improvement. The risk increasesdramatically when the users themselves are less familiar with an application, such aswith the development of a system to support a business innovation (e.g., Microsoftstarting up a new Internet dating service). In general, the development of new systemsis riskier than extensions to an existing system because existing systems tend to be betterunderstood.
Familiarity with the technology is another important source of technical risk. When asystem uses technology that has not been used before within the organization, there is agreater chance that problems will occur and delays will be incurred because of the need tolearn how to use the technology. Risk increases dramatically when the technology itself isnew (e.g., a new Java development toolkit).
Project size is an important consideration, whether measured as the number of peopleon the development team, the length of time it will take to complete the project, or the num-ber of distinct features in the system. Larger projects present more risk, both because theyare more complicated to manage and because there is a greater chance that important sys-tem requirements will be overlooked or misunderstood. The extent to which the project ishighly integrated with other systems (which is typical of large systems) can cause problemsbecause complexity increases when many systems must work together.
Finally, project teams need to consider the compatibility of the new system with thetechnology that already exists in the organization. Systems are rarely built in a vacuum—they are built in organizations that already have numerous systems in place. New technol-ogy and applications need to be able be integrated with the existing environment for manyreasons. They may rely on data from existing systems, they may produce data that feedother applications, and they may have to use the company’s existing communications infra-structure. A new CRM system, for example, has little value if it does not use customer datafound across the organization in existing sales systems, marketing applications, and cus-tomer service systems.
Project Identification 47
Technical Feasibility: Can We Build It?
• Familiarity with Functional area: Less familiarity generates more risk
• Familiarity with Technology: Less familiarity generates more risk
• Project Size: Large projects have more risk
• Compatibility: The harder it is to integrate the system with the company’s existingtechnology, the higher the risk
Economic Feasibility: Should We Build It?
• Development costs
• Annual operating costs
• Annual benefits (cost savings and revenues)
• Intangible costs and benefits
Organizational Feasibility: If We Build It, Will They Come?
• Project champion(s)
• Senior management
• Users
• Other stakeholders
• Is the project strategically aligned with the business?
FIGURE 2-3Feasibility AnalysisAssessment Factors

The assessment of a project’s technical feasibility is not cut and dried because in manycases, some interpretation of the underlying conditions is needed (e.g., how large a pro-ject needs to grow before it becomes less feasible). One approach is to compare the pro-ject under consideration with prior projects undertaken by the organization. Anotheroption is to consult with experienced IT professionals in the organization or external ITconsultants; often they will be able to judge whether a project is feasible from a technicalperspective.
48 Chapter 2 Project Initiation
Health care is a big industry in the United States. Andwith the baby boomers born in the late 1940s and 1950s(after World War II) starting to retire, there will be hugedemands for senior health care. The desire is for bettertechnologies to allow grandpa and grandma to live inde-pendently in their own homes or apartments longer—and not to use the more expensive options of nursinghomes and assisted living centers. Some technologiesinclude vital sign monitoring and reporting; motiondetectors that sense if somebody has fallen; sensors to
turn off the stove that may have been left on; and inter-net portals so that family members can check on thehealth of their loved ones.
Questions
1. How can technology assist with keeping retireeshealthy?
2. How can technology help keep retirees out ofexpensive nursing homes and centers?
2-C Caring for Grandpa and GrandmaCONCEPTS
IN ACTION
Economic FeasibilityThe second element of a feasibility analysis is to perform an economic feasibility analysis(also called a cost–benefit analysis), which identifies the financial risk associated with theproject. It attempts to answer this question: Should we build the system? Economic feasi-bility is determined by identifying costs and benefits associated with the system, assigningvalues to them, and then calculating the cash flow and return on investment for the pro-ject. The more expensive the project, the more rigorous and detailed the analysis shouldbe. Figure 2-4 lists the steps in performing a cost benefit analysis; each step is described inthe following sections.
Identifying Costs and Benefits The first task when developing an economic feasibilityanalysis is to identify the kinds of costs and benefits the system will have and list themalong the left-hand column of a spreadsheet. Figure 2-5 lists examples of costs and bene-fits that may be included.
Costs and benefits can be broken down into four categories: (1) development costs,(2) operational costs, (3) tangible benefits, and (4) intangibles. Development costs are thosetangible expenses incurred during the construction of the system, such as salaries for theproject team, hardware and software expenses, consultant fees, training, and office spaceand equipment. Development costs are usually thought of as one-time costs. Operationalcosts are those tangible costs required to operate the system, such the salaries for operationsstaff, software licensing fees, equipment upgrades, and communications charges. Opera-tional costs are usually thought of as ongoing costs.

Project Identification 49
1. Identifing Costs and Benefits List the tangible costs and benefits for the pro-ject. Include both one-time and recurring costs.
2. Assigning Values to Costs and Benefits Work with business users and IT professionals tocreate numbers for each of the costs and bene-fits. Even intangibles should be valued if at allpossible.
3. Determining Cash Flow Project what the costs and benefits will be over a period of time, usually three to five years. Apply a growth rate to the numbers, if necessary.
4. Determining Net Present Value Calculate what the value of future costs andbenefits are if measured by today’s standards.You will need to select a rate of growth to apply the NPV formula.
5. Determining Return on Investment Calculate how much money the organizationwill receive in return for the investment it willmake using the ROI formula.
6. Determining the Break-Even Point Find the first year in which the system hasgreater benefits than costs. Apply the break-even formula using figures from that year. Thiswill help you understand how long it will takebefore the system creates real value for theorganization.
7. Graphing the Break-Even Point Plot the yearly costs and benefits on a linegraph. The point at which the lines cross is thebreak-even point.
FIGURE 2-4Steps for ConductingEconomic Feasibility
FIGURE 2-5Example Costs and Benefits for EconomicFeasibility
Development Team Salaries Software Upgrades
Consultant Fees Software Licensing Fees
Development Training Hardware Repairs
Hardware and Software Hardware Upgrades
Vendor Installation Operational Team Salaries
Office Space and Equipment Communications Charges
Data Conversion Costs User Training
Increased Sales Increased Market Share
Reductions in Staff Increased Brand Recognition
Reductions in Inventory Higher Quality Products
Reductions in IT Costs Improved Customer Service
Better Supplier Prices Better Supplier Relations
Development Costs Operational Costs
Tangible Benefits Intangible Benefits
Revenues and cost savings are the tangible benefits the system enables the organi-zation to collect or the tangible expenses the system enables the organization to avoid.Tangible benefits may include increased sales, reductions in staff, and reductions ininventory.

Of course, a project also can affect the organization’s bottom line by reaping intangiblebenefits or incurring intangible costs. Intangible costs and benefits are more difficult toincorporate into the economic feasibility because they are based on intuition and beliefrather than “hard numbers.” Nonetheless, they should be listed in the spreadsheet alongwith the tangible items.
Assigning Values to Costs and Benefits Once the types of costs and benefits have beenidentified, analysts assign specific dollar values to them. This may seem impossible; howcan someone quantify costs and benefits that haven’t happened yet? And how can thosepredictions be realistic? Although this task is very difficult, they have to do the best they canto come up with reasonable numbers for all the costs and benefits. Only then can theapproval committee make an educated decision about whether or not to move ahead withthe project.
The best strategy for estimating costs and benefits is to rely on the people who have theclearest understanding of them. For example, costs and benefits related to the technologyor the project itself can be provided by the company’s IT group or external consultants, andbusiness users can develop the numbers associated with the business (e.g., sales projections,order levels). Analysts can also consider past projects, industry reports, and vendor infor-mation, although these approaches probably will be a bit less accurate. All the estimates willprobably be revised as the project proceeds.
Sometimes, it is acceptable for analysts to list intangible benefits, such as improvedcustomer service, without assigning a dollar value; whereas other times they have tomake estimates regarding the value of an intangible benefit. If at all possible, theyshould quantify intangible costs or benefits. Otherwise, it will not be apparent whetherthey have been realized. Consider a system that is supposed to improve customer ser-vice. This is intangible, but assume that the greater customer service will decrease thenumber of customer complaints by 10 percent each year over three years and that$200,000 is spent on phone charges and phone operators who handle complaint calls.Suddenly there are some very tangible numbers with which to set goals and measure theoriginal intangible benefit.
50 Chapter 2 Project Initiation
I conducted a case study at Carlson Hospitality, a globalleader in hospitality services, encompassing more than1,300 hotel, resort, restaurant, and cruise ship operationsin seventy-nine countries. One of its brands, RadissonHotels & Resorts, researched guest stay information andguest satisfaction surveys. The company was able toquantify how much of a guest’s lifetime value can beattributed to his or her perception of the stay experience.As a result, Radisson knows how much of the collectivefuture value of the enterprise is at stake given the per-ceived quality of stay experience. Using this model,Radisson can confidently show that a 10 percent
increase in customer satisfaction among the 10 percentof highest-quality customers will capture a one-pointmarket share for the brand. Each point in market sharefor the Radisson brand is worth $20 million in additionalrevenue.
—Barbara Wixom
Question
How can a project team use this information to helpdetermine the economic feasibility of a system?
2-D Intangible Value at Carlson HospitalityCONCEPTS
IN ACTION
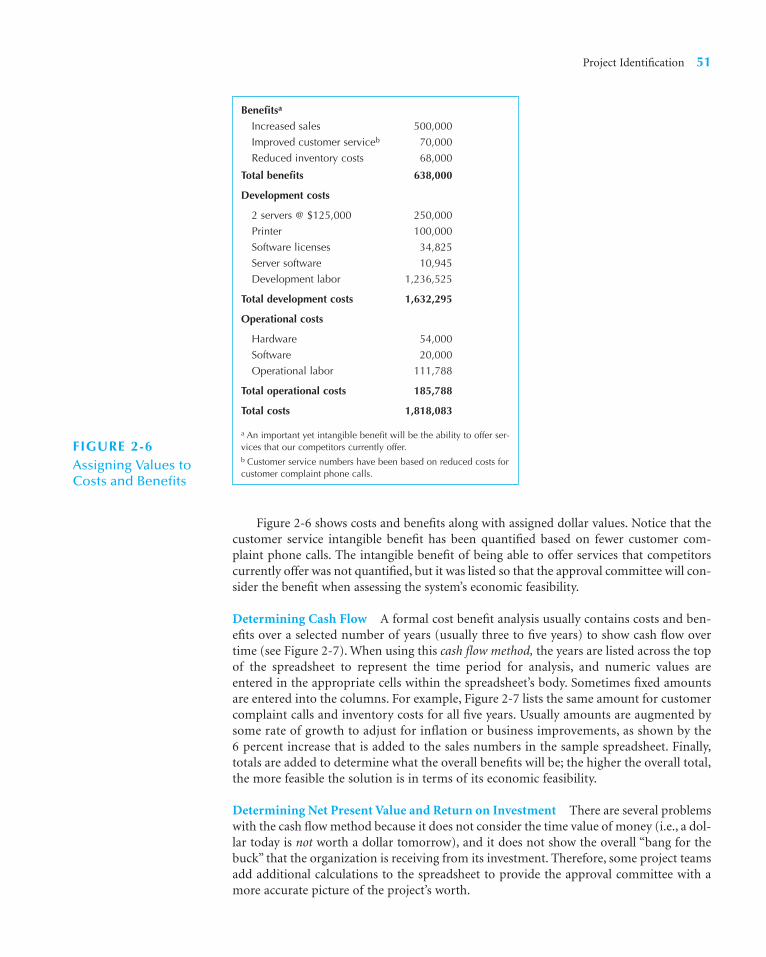
Figure 2-6 shows costs and benefits along with assigned dollar values. Notice that thecustomer service intangible benefit has been quantified based on fewer customer com-plaint phone calls. The intangible benefit of being able to offer services that competitorscurrently offer was not quantified, but it was listed so that the approval committee will con-sider the benefit when assessing the system’s economic feasibility.
Determining Cash Flow A formal cost benefit analysis usually contains costs and ben-efits over a selected number of years (usually three to five years) to show cash flow overtime (see Figure 2-7). When using this cash flow method, the years are listed across the topof the spreadsheet to represent the time period for analysis, and numeric values areentered in the appropriate cells within the spreadsheet’s body. Sometimes fixed amountsare entered into the columns. For example, Figure 2-7 lists the same amount for customercomplaint calls and inventory costs for all five years. Usually amounts are augmented bysome rate of growth to adjust for inflation or business improvements, as shown by the6 percent increase that is added to the sales numbers in the sample spreadsheet. Finally,totals are added to determine what the overall benefits will be; the higher the overall total,the more feasible the solution is in terms of its economic feasibility.
Determining Net Present Value and Return on Investment There are several problemswith the cash flow method because it does not consider the time value of money (i.e., a dol-lar today is not worth a dollar tomorrow), and it does not show the overall “bang for thebuck” that the organization is receiving from its investment. Therefore, some project teamsadd additional calculations to the spreadsheet to provide the approval committee with amore accurate picture of the project’s worth.
Project Identification 51
Benefitsa
Increased sales 500,000
Improved customer serviceb 70,000
Reduced inventory costs 68,000
Total benefits 638,000
Development costs
2 servers @ $125,000 250,000
Printer 100,000
Software licenses 34,825
Server software 10,945
Development labor 1,236,525
Total development costs 1,632,295
Operational costs
Hardware 54,000
Software 20,000
Operational labor 111,788
Total operational costs 185,788
Total costs 1,818,083
a An important yet intangible benefit will be the ability to offer ser-vices that our competitors currently offer.b Customer service numbers have been based on reduced costs forcustomer complaint phone calls.
FIGURE 2-6Assigning Values toCosts and Benefits

52 Chapter 2 Project Initiation
FIGURE 2-7 Cost–Benefit Analysis
Increased sales 500,000 530,000 561,800 595,508 631,238
Reduction in customer complaint calls 70,000 70,000 70,000 70,000 70,000
Reduced inventory costs 68,000 68,000 68,000 68,000 68,000
TOTAL BENEFITS: 638,000 668,000 699,800 733,508 769,238
PV OF BENEFITS: 619,417 629,654 640,416 651,712 663,552 3,204,752
PV OF ALL BENEFITS: 619,417 1,249,072 1,889,488 2,541,200 3,204,752
2 Servers @ $125,000 250,000 0 0 0 0
Printer 100,000 0 0 0 0
Software licenses 34,825 0 0 0 0
Server software 10,945 0 0 0 0
Development labor 1,236,525 0 0 0 0
TOTAL DEVELOPMENT COSTS: 1,632,295 0 0 0 0
Hardware 54,000 81,261 81,261 81,261 81,261
Software 20,000 20,000 20,000 20,000 20,000
Operational labor 111,788 116,260 120,910 125,746 130,776
TOTAL OPERATIONAL COSTS: 185,788 217,521 222,171 227,007 232,037
TOTAL COSTS: 1,818,083 217,521 222,171 227,007 232,037
PV OF COSTS: 1,765,129 205,034 203,318 201,693 200,157 2,575,331
PV OF ALL COSTS: 1,765,129 1,970,163 2,173,481 2,375,174 2,575,331
TOTAL PROJECT BENEFITS � COSTS: (1,180,083) 450,479 477,629 506,501 537,201
YEARLY NPV: (1,145,712) 424,620 437,098 450,019 463,395 629,421
CUMULATIVE NPV: (1,145,712) (721,091) (283,993) 166,026 629,421
RETURN ON INVESTMENT: 24.44% (629,421/2,575,331)
BREAK-EVEN POINT: 3.63 years [break-even occurs in year 4; (450,019 � 166,026)/450,019 � 0.63]
INTANGIBLE BENEFITS: This service is currently provided by competitors Improved customer satisfaction
2008 2009 2010 2011 2012 Total
Net present value (NPV) is used to compare the present value of future cash flowswith the investment outlay required to implement the project. Consider the table inFigure 2-8, which shows the future worth of a dollar investment today, given differentnumbers of years and different rates of change. If you have a friend who owes you adollar today but instead gives you a dollar three years from now, you’ve been had!Given a 10 percent increase in value, you’ll be receiving the equivalent of 75 cents intoday’s terms.
NPV can be calculated in many different ways, some of which are extremely complex.Figure 2-9 shows a basic calculation that can be used to in your cash flow analysis to getmore relevant values. In Figure 2-7, the present value of the costs and benefits are calcu-lated first (i.e., they are shown at a discounted rate). Then, net present value is calculated,and it shows the discounted rate of the combined costs and benefits.
The return on investment (ROI) is a calculation listed somewhere on the spread-sheet that measures the amount of money an organization receives in return for the

money it spends. A high ROI results when benefits far outweigh costs. ROI is deter-mined by finding the total benefits less the costs of the system and dividing that num-ber by the total costs of the system (see Figure 2-9). ROI can be determined per year orfor the entire project over a period of time. One drawback of ROI is that it considersonly the end points of the investment, not the cash flow in between, so it should not be used as the sole indicator of a project’s worth. The spreadsheet in Figure 2-7 show a ROI figure.
Determining the Break–Even Point If the project team needs to perform a rigorouscost benefit analysis, it may need to include information about the length of time beforethe project will break even, or when the returns will match the amount invested in theproject. The greater the time it takes to break even, the riskier the project. The break–evenpoint is determined by looking at the cash flow over time and identifying the year inwhich the benefits are larger than the costs (see Figure 2-7). Then, the difference betweenthe yearly and cumulative NPV for that year is divided by the yearly NPV to determinehow far into the year the break-even point will occur. See Figure 2-9 for the break-evencalculation.
Project Identification 53
1 0.943 0.909 0.870
2 0.890 0.826 0.756
3 0.840 0.751 0.572
4 0.792 0.683 0.497
This table shows how much a dollar today is worth 1–4 years from now intoday’s terms using different interest rates.
Number of years 6% 10% 15%
FIGURE 2-8The Value of a FutureDollar Today
Present Value (PV) The amount of an investment today Amountcompared to that same amount in the future, taking into account inflation and time.
(1 � interest rate)n
n � number of years in future
Net Present Value (NPV) The present value of benefit less the present PV Benefits � PV Costsvalue of costs.
Return on Investment (ROI) The amount of revenues or cost savings results Total benefits � Total costsfrom a given investment. Total costs
Break-Even Point The point in time at which the costs of the Yearly NPV* � Cumulative NPVproject equal the value it has delivered.
Yearly NPV*
*Use the Yearly NPV amount from the first year in which the project has a positive cash flow.
Add the above amount to the year in which the project has a positive cash flow.
Calculation Definition Formula
FIGURE 2-9 Financial Calculations Used For Cost–Benefit Analysis

The break-even point also can be depicted graphically, as shown in Figure 2-10. Thecumulative present value of the costs and benefits for each year are plotted on a line graph;the point at which the lines cross is the break-even point.
Alternatives to Traditional Cost–Benefit Analysis Concerns have been raised as to theappropriateness of using traditional cost–benefit analysis with NPV and ROI to determineeconomic feasibility of an IT project. One of the major problems of using traditional cost–benefit analysis to determine the economic feasibility of an IT investment is that traditionalcost–benefit analysis is based on the assumption that the investor must either invest nowor not invest at all. However, in most IT investment decisions, the decision to invest is nota now-or-never decision. In most situations, an information system is already in place. As
54 Chapter 2 Project Initiation
Break-even Point1 2 3 54
0
500,000
1,000,000
1,500,000
2,000,000
Dol
lars
2,500,000
3,500,000
Years
3,000,000CostsBenefits
FIGURE 2-10Break-even Graph
The FBI’s failure to roll out an expanded computer systemthat would help agents investigate criminals and terroristsis the latest in a series of costly technology blunders bythe government over more than a decade. Experts blamepoor planning, rapid industry advances, and the massivescope of some complex projects, whose price tags canrun into billions of dollars at U.S. agencies with tens ofthousands of employees. “There are very few success sto-ries,” said Paul Brubaker, former deputy chief informationofficer at the Pentagon. “Failures are very common, andthey’ve been common for a long time.” The FBI said ear-lier this month it might shelve its custom-built, $170 mil-lion “Virtual Case File” project because it is inadequateand outdated. The system was intended to help agents,analysts, and others around the world share informationwithout using paper or time-consuming scanning of doc-uments. Officials said commercial software might accom-plish some of what the FBI needs. The bureau’s mess—the
subject of an investigation by the Justice Department andan upcoming congressional hearing—was the latest blackeye among ambitious technology upgrades by the gov-ernment since the 1990s.
Questions
Some systems like this are very complex. They must havesecurity, and they must interface between the FBI, CIA,and other government agencies as well as state and locallaw enforcement groups. Such complexity can takeyears to build—and is almost guaranteed to fail becauseof newer technologies that have come along during thewait. How might you keep a complex project on track?What commercial software might work in this case (asmentioned in the case?)Source: www.securityfocus.com/news/10383
2-E The FBI Pulls the Plug on a ProjectCONCEPTS
IN ACTION

such, the decision to replace or upgrade the current information system can usually bedelayed. Different proposals have been made to overcome some of the weaknesses in tradi-tional cost–benefit analysis. For example, economic production models, activity-basedcosting, and balanced score cards have been suggested.2 However, in this section, wedescribe the primary alternative that has been proposed for object-oriented systems: optionpricing models (OPMs).3
At this point in time, OPMs have had limited use in economic feasibility analysis forIT investment decisions in industry. In fact, there is some controversy as to whether aninstrument created for a traded asset (stock) can be used in evaluating IT investmentopportunities. However, the preliminary research results demonstrate that their use in ITinvestment evaluations may be warranted. OPMs have shown promise in evaluating thepotential future value of an investment in IT. In many cases in which traditional cost–benefitanalysis of investments in IT has predicted that the investment would be a failure, OPMshave shown that it may indeed be feasible.
With object-oriented systems, where classes are designed not only for the currentapplication but also for use in future development efforts, an investment in developing aclass or a set of classes may pay dividends well beyond the original system developmenteffort. Furthermore, with the iterative and incremental development emphasis in object-oriented systems development approaches, an object-oriented project can be viewed as asequence of smaller projects. As such, you might treat investments in an object-orientedproject much as you would an investment in a call option in finance. A call option is essen-tially a contract that gives the right to purchase an amount of stock for a given price for aspecified period of time to the purchaser of the call option. However, a call option does notcreate an obligation to buy the stock.
Treating an IT investment as a call option allows management, at a relevant pointin the future, to determine whether additional investment into the evolving system isreasonable. This gives management the flexibility to determine the economic feasibilityof a project to decide whether to continue with the development as planned, to aban-don the project, to expand the scope of the project, to defer future development, or toshrink the current development effort. In many ways, treating IT investments as calloptions simply allows management to delay investment decisions until more informa-tion is available.
Once the decision is made to invest (i.e., the call option is exercised) the decision isconsidered irreversible. The idea of irreversible decisions is one of the fundamental
Project Identification 55
2 See, for example, Q. Hu, R. Plant, and D. Hertz, “Software Cost Estimation Using Economic ProductionModels,” Journal of MIS 15, no. 1 (Summer 1998): 143–163; G. Ooi and C. Soh, “Developing an Activity-basedApproach for System Development and Implementation,” ACM Data Base for Advances in Information Systems 34,no. 3 (Summer 2003): 54–71, and K. Milis and R. Mercken, “The Use of the Balanced Scorecard for the Evaluationof Information and Communication Technology Projects,” International Journal of Project Management 22(2004): 87–97.3 For more information regarding the use of option pricing models in evaluating economic feasibility of infor-mation systems, see M. Benaroch and R. Kauffman, “A Case for Using Real Options Pricing Analysis to EvaluateInformation Technology Project Investments,” Information Systems Research 10, no. 1 (March 1999): 70–86;M. Benaroch and R. Kauffman, “Justifying Electronic Banking Network Expansion Using Real Options Analysis,”MIS Quarterly 24, no. 2 (June 2000): 197–225; Q. Dai, R. Kauffman, and S. March, “Analyzing Investments inObject-Oriented Middleware,” Ninth Workshop on Information Technologies and Systems (December 1999):45–50; A. Kambil, J. Henderson, and H. Mohsenzadeh, Strategic Management of Information Technology Invest-ments: An Options Perspective, in R. D. Banker, R. J. Kauffman, and M. A. Mahmood (eds.), Strategic Informa-tion Technology Management: Perspectives on Organizational Growth and Competitive Advantage (Idea Group,1993); A. Taudes, “Software Growth Options,” Journal of Management Information Systems 15, no. 1 (Summer1998): 165–185; A. Taudes, M. Feurstein, and A. Mild, “Options Analysis of Software Platform Decisions: A CaseStudy,” MIS Quarterly 24, no. 2 (June 2000): pp. 227–243.

assumptions on which OPMs are based. This assumption fits quite well with modernobject-oriented systems development approaches, in which, once an iteration has begun,an increment is completed before another investment decision is made.
Researchers have studied many different OPMs in terms of their applicability to ITinvestment.4 However, all OPMs share a common thread: both the direct benefit of the pro-posed project and the indirect value (option value) must be computed to determine eco-nomic feasibility of an IT investment using an OPM. The direct benefit can be computedusing the traditional NPV, whereas the value of the option can be computed using one ofthe OPMs in the literature. Given that the minimum expected value of an option is alwayszero, the minimum estimated value for investing using an OPM will be the same as thevalue given by the traditional approach. However, when the expected value of the option(e.g., future iterations or projects) exceeds zero, an OPM will give an estimated valuegreater than the traditional approach. The actual calculation of the value of an option isquite complex and, as such, is beyond the scope of this book. However, given how well theOPMs fit the object-oriented systems development approaches, it seems reasonable thatOPMs should be considered as alternatives to evaluating IT investments in object-orientedsystems.
Organizational FeasibilityThe final technique used for feasibility analysis is to assess the organizational feasibilityof the system, how well the system ultimately will be accepted by its users and incorpo-rated into the ongoing operations of the organization. There are many organizationalfactors that can have an impact on the project, and seasoned developers know that orga-nizational feasibility can be the most difficult feasibility dimension to assess. In essence,an organizational feasibility analysis attempts to answer this question: If we build it, willthey come?
One way to assess the organizational feasibility of the project is to understand how wellthe goals of the project align with business objectives. Strategic alignment is the fit betweenthe project and business strategy—the greater the alignment, the less risky the project willbe from an organizational feasibility perspective. For example, if the marketing departmenthas decided to become more customer focused, then a CRM project that produces inte-grated customer information would have strong strategic alignment with marketing’s goal.Many IT projects fail when the IT department initiates them, because there is little or noalignment with business unit or organizational strategies.
A second way to assess organizational feasibility is to conduct a stakeholder analysis.5 Astakeholder is a person, group, or organization that can affect (or will be affected by) a newsystem. In general, the most important stakeholders in the introduction of a new system arethe project champion, system users, and organizational management (see Figure 2-11), butsystems sometimes affect other stakeholders as well. For example, the IS department can bea stakeholder of a system because IS jobs or roles may be changed significantly after itsimplementation. One key stakeholder outside of the champion, users, and management inMicrosoft’s project that embedded Internet Explorer as a standard part of Windows was theU.S. Department of Justice.
56 Chapter 2 Project Initiation
4 Two of the more important OPMs used for evaluating IT investments are the binomial OPM and the Black-Scholes OPM. For more information on these models see J. C. Hull, Options, Futures, and Other Derivative Securities(Englewood Cliffs, NJ: Prentice-Hall, 1993).5 A good book that presents a series of stakeholder analysis techniques is R. O. Mason and I. I. Mittroff, ChallengingStrategic Planning Assumptions: Theory, Cases, and Techniques (New York: Wiley, 1981).

The champion is a high-level, noninformation systems executive who is usually, butnot always, the project sponsor who created the system request. The champion supportsthe project with time, resources (e.g., money), and political support within the organiza-tion by communicating the importance of the system to other organizational decisionmakers. More than one champion is preferable because if the champion leaves the organi-zation, the support could leave as well.
Whereas champions provide day-to-day support for the system, organizational man-agement also needs to support the project. Such management support conveys to the restof the organization the belief that the system will make a valuable contribution and thatnecessary resources will be made available. Ideally, management should encourage peoplein the organization to use the system and to accept the many changes that the system willlikely create.
A third important group of stakeholders are the system users who will ultimately usethe system once it has been installed in the organization. Too often, the project team meetswith users at the beginning of a project and then disappears until after the system is cre-ated. In this situation, rarely does the final product meet the expectations and needs ofthose who are supposed to use it because needs change and users become savvier as theproject progresses. User participation should be promoted throughout the developmentprocess to make sure that the final system will be accepted and used by getting users activelyinvolved in the development of the system (e.g., performing tasks, providing feedback,making decisions).
Finally, the feasibility study helps organizations make wiser investments regarding infor-mation systems because it forces project teams to consider technical, economic, and orga-nizational factors that can impact their projects. It protects IT professionals from criticismby keeping the business units educated about decisions and positioned as the leaders in thedecision-making process. Remember, the feasibility study should be revised several timesduring the project at points where the project team makes critical decisions about the sys-tem (e.g., before the design begins). It can be used to support and explain the criticalchoices that are made throughout the SDLC.
Project Identification 57
Champion A champion: • Make a presentation about the objectives of the • Initiates the project project and the proposed benefits to those executives • Promotes the project who will benefit directly from the system• Allocates his or her time to project • Create a prototype of the system to demonstrate its • Provides resources potential value
Organizational Organizational managers: • Make a presentation to management about the Management • Know about the project objectives of the project and the proposed benefits
• Budget enough money for the project • Market the benefits of the system using memos and • Encourage users to accept and use the system organizational newsletters
• Encourage the champion to talk about the projectwith his or her peers
System Users Users: • Assign users official roles on the project team• Make decisions that influence the project • Assign users specific tasks to perform with clear • Perform hands-on activities for the project deadlines• Ultimately determine whether the project is • Ask for feedback from users regularly (e.g., at
successful by using or not using the system weekly meetings)
Role Techniques for improvement
FIGURE 2-11 Some Important Stakeholders for Organizational Feasibility
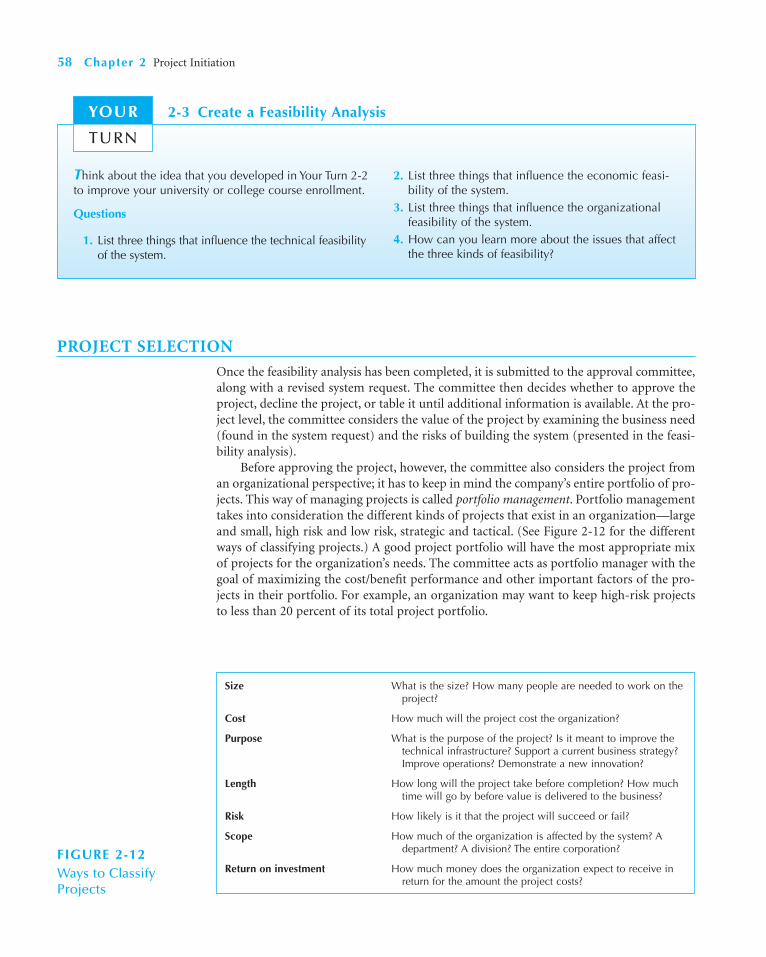
58 Chapter 2 Project Initiation
PROJECT SELECTION
Once the feasibility analysis has been completed, it is submitted to the approval committee,along with a revised system request. The committee then decides whether to approve theproject, decline the project, or table it until additional information is available. At the pro-ject level, the committee considers the value of the project by examining the business need(found in the system request) and the risks of building the system (presented in the feasi-bility analysis).
Before approving the project, however, the committee also considers the project froman organizational perspective; it has to keep in mind the company’s entire portfolio of pro-jects. This way of managing projects is called portfolio management. Portfolio managementtakes into consideration the different kinds of projects that exist in an organization—largeand small, high risk and low risk, strategic and tactical. (See Figure 2-12 for the differentways of classifying projects.) A good project portfolio will have the most appropriate mixof projects for the organization’s needs. The committee acts as portfolio manager with thegoal of maximizing the cost/benefit performance and other important factors of the pro-jects in their portfolio. For example, an organization may want to keep high-risk projectsto less than 20 percent of its total project portfolio.
Think about the idea that you developed in Your Turn 2-2to improve your university or college course enrollment.
Questions
1. List three things that influence the technical feasibilityof the system.
2. List three things that influence the economic feasi-bility of the system.
3. List three things that influence the organizationalfeasibility of the system.
4. How can you learn more about the issues that affectthe three kinds of feasibility?
2-3 Create a Feasibility AnalysisYOUR
TURN
Size What is the size? How many people are needed to work on the project?
Cost How much will the project cost the organization?
Purpose What is the purpose of the project? Is it meant to improve the technical infrastructure? Support a current business strategy?Improve operations? Demonstrate a new innovation?
Length How long will the project take before completion? How much time will go by before value is delivered to the business?
Risk How likely is it that the project will succeed or fail?
Scope How much of the organization is affected by the system? A department? A division? The entire corporation?
Return on investment How much money does the organization expect to receive in return for the amount the project costs?
FIGURE 2-12Ways to Classify Projects
Project Selection 59
The approval committee must be selective about where to allocate resources,because the organization has limited funds. This involves trade-offs, in which the orga-nization must give up something in return for something else to keep its portfolio wellbalanced. If there are three potentially high-payoff projects, yet all have very high risk,then perhaps only one of the projects will be selected. Also, there are times when a sys-tem at the project level makes good business sense, but it does not make sense at theorganization level. Thus, a project may show a very strong ROI and support importantbusiness needs for a part of the company; however, it is not selected. This could happenfor many reasons—because there is no money in the budget for another system, theorganization is about to go through some kind of change (e.g., a merger or an imple-mentation of a companywide system like an ERP), projects that meet the same businessrequirements already are underway, or the system does not align well with current orfuture corporate strategy.
It seems hard to believe that an approval committeewould not select a project that meets real business needs,has a high potential ROI, and has a positive feasibilityanalysis. Think of a company you have worked for or
know about. Describe a scenario in which a project maybe very attractive at the project level but not at the orga-nization level.
2-4 To Select or Not to SelectYOUR
TURN
At Marriott, we don’t have IT projects—we have businessinitiatives and strategies that are enabled by IT. As a result,the only time a traditional “IT project” occurs is when wehave an infrastructure upgrade that will lower costs orleverage better functioning technology. In this case, IT hasto make a business case for the upgrade and prove itsvalue to the company.
The way IT is involved in business projects in theorganization is twofold. First, senior IT positions arefilled by people with good business understanding. Sec-ond, these people are placed on key business commit-tees and forums where the real business happens, suchas finding ways to satisfy guests. Because IT has a seatat the table, we are able to spot opportunities to supportbusiness strategy. We look for ways in which IT canenable or better support business initiatives as theyarise.
Therefore, business projects are proposed, and IT isone component of them. These projects are then evalu-ated the same as any other business proposal, such as anew resort—by examining the return on investment andother financial measures.
At the organizational level, I think of projects as must-do’s, should-do’s, and nice-to-do’s. The must-do’s arerequired to achieve core business strategy, such as guest pref-erence. The should-do’s help grow the business and enhancethe functionality of the enterprise. These can be somewhatuntested, but good drivers of growth. The nice-to-do’s aremore experimental and look farther out into the future.
The organization’s project portfolio should have amix of all three kinds of projects, with a much greater pro-portion devoted to the must-do’s.
—Carl Wilson
2-F Interview with Carl Wilson, CIO, Marriott CorporationCONCEPTS
IN ACTION

60 Chapter 2 Project Initiation
Hygeia Travel Health is a Toronto-based health insurancecompany whose clients are the insurers of foreign touriststo the United States and Canada. Its project selectionprocess is relatively straightforward. The project evalua-tion committee, consisting of six senior executives, splitsinto two groups. One group includes the CIO, along withthe heads of operations and research and development,and it analyzes the costs of every project. The other groupconsists of the two chief marketing officers and the headof business development, and they analyze the expectedbenefits. The groups are permanent, and to stay objective,they don’t discuss a project until both sides have evalu-ated it. The results are then shared, both on a spreadsheetand in conversation. Projects are then approved, passedover, or tabled for future consideration.
Last year, the marketing department proposed pur-chasing a claims database filled with detailed informationon the costs of treating different conditions at different facil-ities. Hygeia was to use this information to estimate howmuch money insurance providers were likely to owe on agiven claim if a patient was treated at a certain hospital asopposed to any other. For example, a 45-year-old man suf-fering a heart attack may accrue $5,000 in treatment costsat hospital A but only $4,000 at hospital B. This information
would allow Hygeia to recommend the cheaper hospital toits customer. That would save the customer money and helpdifferentiate Hygeia from its competitors.
The benefits team used the same three-meetingprocess to discuss all the possible benefits of implementingthe claims database. Members of the team talked to cus-tomers and made a projection using Hygeia’s past experi-ence and expectations about future business trends. Theverdict: The benefits team projected a revenue increase of$210,000. Client retention would rise by 2 percent. Andoverall, profits would increase by 0.25 percent.
The costs team, meanwhile, came up with large esti-mates: $250,000 annually to purchase the database andan additional $71,000 worth of internal time to make theinformation usable. Putting it all together, it was a finan-cial loss of $111,000 in the first year.
The project still could have been good for marketing—maybe even good enough to make the loss acceptable.But some of Hygeia’s clients were also in the claims infor-mation business and therefore were potential competi-tors. This, combined with the financial loss, was enoughto make the company reject the project.Source: Ben Worthen, “Two Teams are Better than One” CIO Magazine,( July 15, 2001).
2-G A Project That Does Not Get SelectedCONCEPTS
IN ACTION
In April 1999, one of Capital Blue Cross’s health-careinsurance plans had been in the field for three years buthadn’t performed as well as expected. The ratio of premi-ums to claims payments wasn’t meeting historic norms. Inorder to revamp the product features or pricing to boostperformance, the company needed to understand why itwas underperforming. The stakeholders came to the dis-cussion already knowing they needed better extractionand analysis of usage data in order to understand productshortcomings and recommend improvements.
After listening to input from the user teams, the stake-holders proposed three options. One was to perseverewith the current manual method of pulling data from flatfiles via ad hoc reports and retyping it into spreadsheets.
The second option was to write a program to dynami-cally mine the needed data from Capital’s customer infor-mation control system (CICS). While the system was
processing claims, for instance, the program would pull outup-to-the-minute data at a given point in time for users toanalyze.
The third alternative was to develop a decision sup-port system to allow users to make relational queries froma data mart containing a replication of the relevant claimsand customer data. Each of these alternatives was evalu-ated on cost, benefits, risks and intangibles.
Questions
1. What are three costs, benefits, risks, and intangiblesassociated with each project?
2. Based on your answer to question 1, which projectwould you choose?
Source: Richard Pastore, “Capital Blue Cross,” CIO Magazine(February 15, 2000).
2-5 Project SelectionYOUR
TURN

APPLYING THE CONCEPTS AT CD SELECTIONS
So far we have introduced the concepts of identifying a project, creating a system request,performing a feasibility analysis, and selecting a project. Now we see how CD Selectionsperforms these tasks.
Project Identification and System RequestAt CD Selections, all potential IT projects are reviewed and approved by a project steeringcommittee that meets quarterly. The committee has representatives from IT as well as fromthe major areas of the business. For Margaret, the first step was to prepare a system requestfor the committee. Using the system request template (see Figure 2-2), Margaret prepareda system request (see Figure 2-13). Of course, the sponsor is Margaret, and the businessneeds are to increase sales and to better service retail customers. Notice that the need doesnot focus on the technology, such as the need “to upgrade our Web page.” The focus is onthe business aspects: sales and customer service.
Applying the Concepts at CD Selections 61
System Request—Internet Order Project
Project sponsor: Margaret Mooney, Vice President of Marketing
Business Need: This project has been initiated to reach new Internet customers and to betterserve existing customers using Internet sales support.
Business Requirements:
Using the Web, customers should be able to search for products and identify the brick-and-mor-tar stores that have them in stock. They should be able to put items on hold at a store location orplace an order for items that are not carried or are not in stock. The functionality that the systemshould have is as follows:
• Search through the CD Selections inventory of products.
• Identify the retail stores that have the product in stock.
• Put a product on hold at a retail store and schedule a time to pick up the product.
• Place an order for products not currently in stock or not carried by CD Selections.
• Receive confirmation that an order can be placed and when the item will be in stock.
Business Value:
We expect that CD Selections will increase sales by reducing lost sales due to out-of-stock ornonstocked items and by reaching out to new customers through its Internet presence. Weexpect the improved services will reduce customer complaints, primarily because 50% of allcustomer complaints stem from out-of-stocks or nonstocked items. Also, CD Selections shouldbenefit from improved customer satisfaction and increased brand recognition due to its Internetpresence.
Conservative estimates of tangible value to the company include:
• $750,000 (75% of $1,000,000) in sales from new customers
• $1,875,000 (75% of $2,500,000) in sales from existing customers
• $50,000 in sales from customers not facing “out-of-stock or nonstocked” items
Special Issues or Constraints:
• The Marketing Department views this as a strategic system. This Internet system will addvalue to our current business model, and it also will serve as a proof-of-concept forfuture Internet endeavors. For example, in the future, CD Selections may want to sellproducts directly over the Internet.
• The system should be in place for the holiday shopping season next year.
FIGURE 2-13System Request for CD Selections
For now, the business requirements are described at a very high level of detail. Inthis case, Margaret’s vision for the requirements includes the ability to help brick-and-mortar stores reach out to new customers. Specifically, customers should be able tosearch for products over the Internet, locate a retail store that contains the product, puta product on hold for later store pickup, and order products that are not currently beingstocked.
The business value describes how the requirements will affect the business. Margaretfound identifying intangible business value to be fairly straightforward in this case. TheInternet is a “hot” area, so she expects the Internet to improve customer recognition andsatisfaction. Estimating tangible value is more difficult. She expects that Internet orderingwill increase sales in the retail stores, but by how much?
Margaret decided to have her marketing group do some market research to learn howmany retail customers do not complete purchases because the store does not carry the itemthey want. They learned that stores lose approximately 5 percent of total sales from “out-of-stocks and nonstocks.” This number gave Margaret some idea of how much sales couldincrease from the existing customer base (i.e., about $50,000 per store), but it does notindicate how many new customers the system will generate.
Estimating how much revenue CD Selections should anticipate from new Internet cus-tomers was not simple. One approach was to use some of CD Selections’ standard modelsfor predicting sales of new stores. Retail stores average about $1 million in sales per year(after they have been open a year or two), depending upon location factors such as citypopulation, average incomes, proximity to universities, and so on. Margaret estimated thatadding the new Internet site would have an effect similar to adding a new store. This wouldsuggest ongoing revenues of $1 million, give or take several hundred thousand dollars, afterthe Web site had been operating for a few years.
Together, the sales from existing customers ($2.5 million) and new customers ($1 million) totaled approximately $3.5 million. Margaret created conservative and opti-mistic estimates by reducing and increasing this figure by 25 percent. This created a possi-ble range of values from $2,625,000 to $4,375,000. Margaret is conservative, so she decidedto include the lower number as her sales projection. Figure 2-13 shows the completedsystem request.
Feasibility AnalysisOnce Margaret and her marketing group completed the system request, they submittedit to the steering committee for their next meeting. When the steering committee met,they placed the Internet Order project high on its list of projects. A senior systems ana-lyst, Alec Adams, was assigned to help Margaret conduct a feasibility analysis because ofhis familiarity with CD Selections’ sales and distribution systems. He also was an aviduser of the Web and had been offering suggestions for the improvement of CD Selec-tions’ Web site.
Alec and Margaret worked closely together over the next few weeks on the feasibilityanalysis. Figure 2-14 presents the executive summary page of the feasibility analysis; thereport itself was about 10 pages long, and it provided additional detail and supportingdocumentation.
As shown in Figure 2-14, the project is somewhat risky from a technical perspective.CD Selections has minimal experience with the proposed application and the technologybecause the ISP has been managing most of the website technology to date. One solutionmay be to hire a consultant with e-commerce experience to work with the IT departmentand to offer guidance. Further, the new system would have to exchange order information
62 Chapter 2 Project Initiation
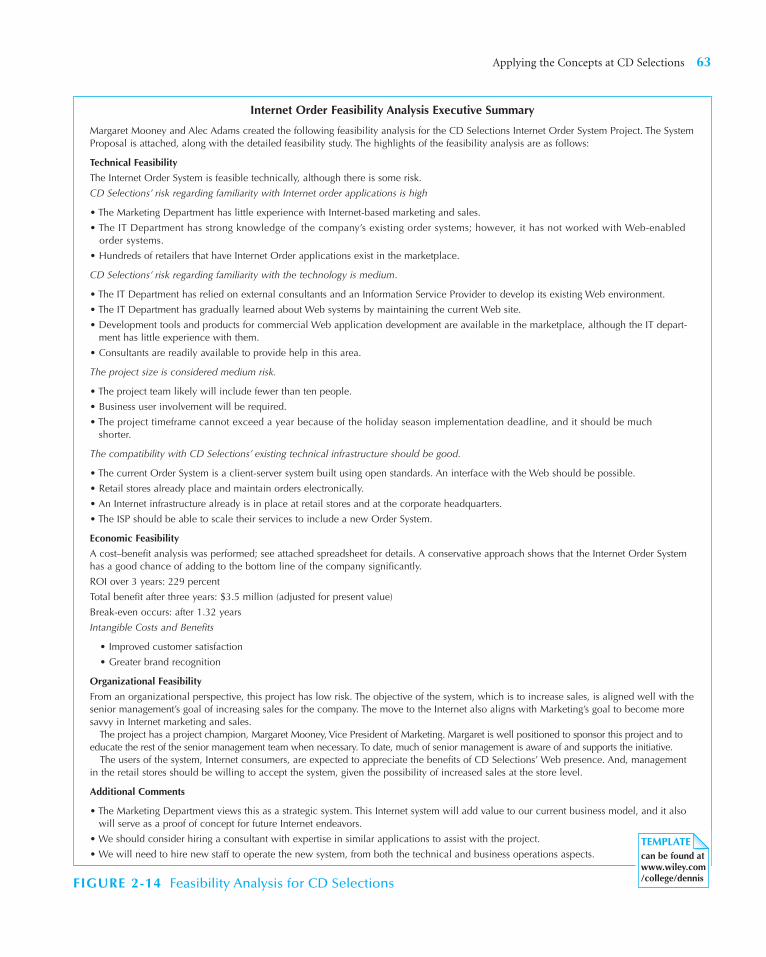
Applying the Concepts at CD Selections 63
Internet Order Feasibility Analysis Executive Summary
Margaret Mooney and Alec Adams created the following feasibility analysis for the CD Selections Internet Order System Project. The SystemProposal is attached, along with the detailed feasibility study. The highlights of the feasibility analysis are as follows:
Technical Feasibility
The Internet Order System is feasible technically, although there is some risk.
CD Selections’ risk regarding familiarity with Internet order applications is high
• The Marketing Department has little experience with Internet-based marketing and sales.
• The IT Department has strong knowledge of the company’s existing order systems; however, it has not worked with Web-enabledorder systems.
• Hundreds of retailers that have Internet Order applications exist in the marketplace.
CD Selections’ risk regarding familiarity with the technology is medium.
• The IT Department has relied on external consultants and an Information Service Provider to develop its existing Web environment.
• The IT Department has gradually learned about Web systems by maintaining the current Web site.
• Development tools and products for commercial Web application development are available in the marketplace, although the IT depart-ment has little experience with them.
• Consultants are readily available to provide help in this area.
The project size is considered medium risk.
• The project team likely will include fewer than ten people.
• Business user involvement will be required.
• The project timeframe cannot exceed a year because of the holiday season implementation deadline, and it should be much shorter.
The compatibility with CD Selections’ existing technical infrastructure should be good.
• The current Order System is a client-server system built using open standards. An interface with the Web should be possible.
• Retail stores already place and maintain orders electronically.
• An Internet infrastructure already is in place at retail stores and at the corporate headquarters.
• The ISP should be able to scale their services to include a new Order System.
Economic Feasibility
A cost–benefit analysis was performed; see attached spreadsheet for details. A conservative approach shows that the Internet Order Systemhas a good chance of adding to the bottom line of the company significantly.
ROI over 3 years: 229 percent
Total benefit after three years: $3.5 million (adjusted for present value)
Break-even occurs: after 1.32 years
Intangible Costs and Benefits
• Improved customer satisfaction
• Greater brand recognition
Organizational Feasibility
From an organizational perspective, this project has low risk. The objective of the system, which is to increase sales, is aligned well with thesenior management’s goal of increasing sales for the company. The move to the Internet also aligns with Marketing’s goal to become moresavvy in Internet marketing and sales.
The project has a project champion, Margaret Mooney, Vice President of Marketing. Margaret is well positioned to sponsor this project and toeducate the rest of the senior management team when necessary. To date, much of senior management is aware of and supports the initiative.
The users of the system, Internet consumers, are expected to appreciate the benefits of CD Selections’ Web presence. And, managementin the retail stores should be willing to accept the system, given the possibility of increased sales at the store level.
Additional Comments
• The Marketing Department views this as a strategic system. This Internet system will add value to our current business model, and it alsowill serve as a proof of concept for future Internet endeavors.
• We should consider hiring a consultant with expertise in similar applications to assist with the project.
• We will need to hire new staff to operate the new system, from both the technical and business operations aspects.
FIGURE 2-14 Feasibility Analysis for CD Selections
TEMPLATEcan be found atwww.wiley.com/college/dennis
with the company’s brick-and-mortar order system. Currently, individual retail storessubmit orders electronically, so receiving orders and exchanging information with theInternet systems should be possible.
The economic feasibility analysis includes refined assumptions that Margaret madein the system request. Figure 2-15 shows the summary spreadsheet that lead to the con-clusions on the feasibility analysis. Development costs are expected to be about$250,000. This is a very rough estimate, because Alec has had to make some assump-tions about the amount of time it will take to design and program the system. Theseestimates will be revised after a detailed workplan has been developed and as the pro-ject proceeds.6 Traditionally, operating costs include the costs of the computer opera-tions. In this case, CD Selections has had to include the costs of business staff becausethey are creating a new business unit, resulting in a total of about $450,000 each year.Margaret and Alec have decided to use a conservative estimate for revenues, althoughthey note the potential for higher returns. This shows that the project can still add sig-nificant business value, even if the underlying assumptions prove to be overly opti-mistic. The spreadsheet was projected over three years, and the ROI and break-evenpoint were included.
The organizational feasibility is presented in Figure 2-14. There is a strong champion,well placed in the organization to support the project. The project originated in the busi-ness or functional side of the company, not the IT department, and Margaret has carefullybuilt up support for the project among the senior management team.
This is an unusual system in that the ultimate end users are the consumers external toCD Selections. Margaret and Alec have not done any specific market research to see howwell potential customers will react to the CD Selections system, so this is a risk.
An additional stakeholder in the project is the management team responsible for theoperations of the traditional stores and the store managers. They should be quite supportive,given the added service that they now can offer. However, Margaret must convince themthat the Internet Sales System will not be viewed as a threat to stores’ future sales. As such,Margaret and Alec need to make sure that the management team and store managers areincluded in the development of the system so that they can incorporate the system intotheir business processes.
Project SelectionThe approval committee met and reviewed the Internet Sales System project along withtwo other projects—one calling for the implementation of a corporate Intranet andanother proposing in-store kiosks that would provide customers with information aboutthe CDs that the store carried. Unfortunately, the budget would allow for only one pro-ject to be approved, so the committee carefully examined the costs, expected benefits,risks, and strategic alignment of all three projects. Currently, a primary focus of uppermanagement is increasing sales in the retail stores and the Internet system and kiosk projectbest aligned with that goal. Given that both projects had equal risk but that the InternetOrder project expected a much greater return, the committee decided to fund the InternetSales System.
64 Chapter 2 Project Initiation
6 Some of the salary information may seem high. Most companies use a “full-cost” model for estimating salarycost, in which all benefits (e.g., health insurance, retirement, and payroll taxes) are included in salaries when esti-mating costs.
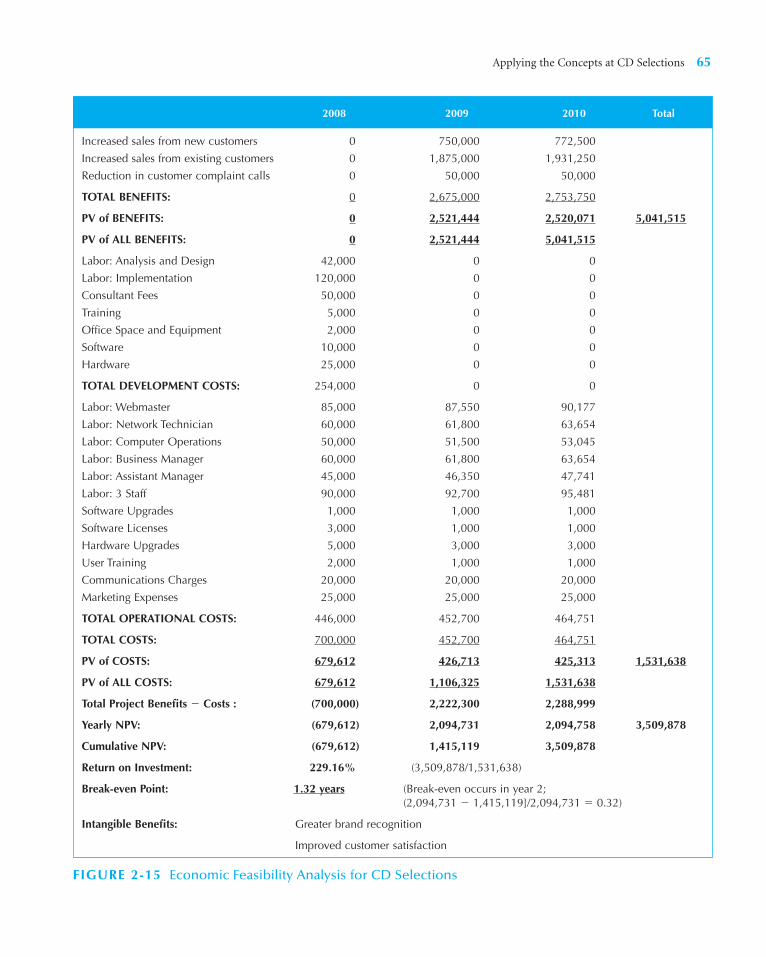
Applying the Concepts at CD Selections 65
Increased sales from new customers 0 750,000 772,500
Increased sales from existing customers 0 1,875,000 1,931,250
Reduction in customer complaint calls 0 50,000 50,000
TOTAL BENEFITS: 0 2,675,000 2,753,750
PV of BENEFITS: 0 2,521,444 2,520,071 5,041,515
PV of ALL BENEFITS: 0 2,521,444 5,041,515
Labor: Analysis and Design 42,000 0 0
Labor: Implementation 120,000 0 0
Consultant Fees 50,000 0 0
Training 5,000 0 0
Office Space and Equipment 2,000 0 0
Software 10,000 0 0
Hardware 25,000 0 0
TOTAL DEVELOPMENT COSTS: 254,000 0 0
Labor: Webmaster 85,000 87,550 90,177
Labor: Network Technician 60,000 61,800 63,654
Labor: Computer Operations 50,000 51,500 53,045
Labor: Business Manager 60,000 61,800 63,654
Labor: Assistant Manager 45,000 46,350 47,741
Labor: 3 Staff 90,000 92,700 95,481
Software Upgrades 1,000 1,000 1,000
Software Licenses 3,000 1,000 1,000
Hardware Upgrades 5,000 3,000 3,000
User Training 2,000 1,000 1,000
Communications Charges 20,000 20,000 20,000
Marketing Expenses 25,000 25,000 25,000
TOTAL OPERATIONAL COSTS: 446,000 452,700 464,751
TOTAL COSTS: 700,000 452,700 464,751
PV of COSTS: 679,612 426,713 425,313 1,531,638
PV of ALL COSTS: 679,612 1,106,325 1,531,638
Total Project Benefits � Costs : (700,000) 2,222,300 2,288,999
Yearly NPV: (679,612) 2,094,731 2,094,758 3,509,878
Cumulative NPV: (679,612) 1,415,119 3,509,878
Return on Investment: 229.16% (3,509,878/1,531,638)
Break-even Point: 1.32 years (Break-even occurs in year 2; (2,094,731 � 1,415,119]/2,094,731 � 0.32)
Intangible Benefits: Greater brand recognition
Improved customer satisfaction
2008 2009 2010 Total
FIGURE 2-15 Economic Feasibility Analysis for CD Selections

SUMMARY
Project InitiationProject initiation is the point at which an organization creates and assesses the originalgoals and expectations for a new system. The first step in the process is to identify the busi-ness value for the system by developing a system request that provides basic informationabout the proposed system. Next, the analysts perform a feasibility analysis to determinethe technical, economic, and organizational feasibility of the system; if appropriate, the sys-tem is approved, and the development project begins.
Feasibility AnalysisA feasibility analysis is then used to provide more detail about the risks associated with theproposed system, and it includes technical, economic, and organizational feasibilities. Thetechnical feasibility focuses on whether the system can be built by examining the risks asso-ciated with the users’ and analysts’ familiarity with the functional area, familiarity with thetechnology, and project size. The economic feasibility addresses whether the system shouldbe built. It includes a cost–benefit analysis of development costs, operational costs, tangi-ble benefits, and intangible costs and benefits. Finally, the organizational feasibility assesseshow well the system will be accepted by its users and incorporated into the ongoing oper-ations of the organization. The strategic alignment of the project and a stakeholder analysiscan be used to assess this feasibility dimension.
Project SelectionOnce the feasibility analysis has been completed, it is submitted to the approval committee,along with a revised system request. The committee then decides whether to approve theproject, decline the project, or table it until additional information is available. The projectselection process uses portfolio management to take into account all the projects in theorganization. The approval committee weighs many factors and makes trade-offs before aproject is selected.
KEY TERMS
66 Chapter 2 Project Initiation
Approval committeeBreak-even pointBusiness needBusiness requirementBusiness valueCall optionCash flow methodChampionCompatibilityCost–benefit analysisDevelopment costsEconomic feasibilityEmerging TechnologyFamiliarity with the functional areaFamiliarity with the technology
Feasibility analysisFeasibility studyFirst moverFunctionalityIntangible benefitsIntangible costsIntangible valueNet present value (NPV)Operational costsOption pricing models (OPMs)Organizational feasibilityOrganizational managementPortfolio managementProjectProject initiation
Project sizeProject sponsorReturn on investment (ROI)RisksSpecial issuesStakeholderStakeholder analysisStrategic alignmentSystem requestSystem usersTangible benefitsTangible valueTechnical feasibilityTechnical risk analysisTrade-offs
Minicases 67
QUESTIONS
1. Give three examples of business needs for a system.2. What is the purpose of an approval committee? Who
is usually on this committee?3. Why should the system request be created by a busi-
nessperson as opposed to an IS professional?4. What is the difference between intangible value and
tangible value? Give three examples of each.5. What are the purposes of the system request and the
feasibility analysis? How are they used in the projectselection process?
6. Describe two special issues that may be important tolist on a system request.
7. Describe the three techniques for feasibility analysis.8. What factors are use to determine project size?9. Describe a risky project in terms of technical feasibility.
Describe a project that would not be considered risky.
10. What are the steps for assessing economic feasibility?Describe each step.
11. List two intangible benefits. Describe how these bene-fits can be quantified.
12. List two tangible benefits and two operational costsfor a system. How would you determine the valuesthat should be assigned to each item?
13. Explain the net present value and return on invest-ment for a cost benefit analysis. Why would these cal-culations be used?
14. What is the break-even point for the project? How is itcalculated?
15. What is stakeholder analysis? Discuss three stakeholdersthat would be relevant for most projects.
EXERCISES
A. Locate a news article in an IT trade magazine (e.g.,Computerworld) about an organization that is imple-menting a new computer system. Describe the tangi-ble and intangible value that the organization is likelyto realize from the new system.
B. Car dealers have realized how profitable it can be tosell automobiles using the Web. Pretend you work fora local car dealership that is part of a large chain suchas CarMax. Create a system request you might use todevelop a Web-based sales system. Remember to listspecial issues that are relevant to the project.
C. Supposed that you are interested in buying a newcomputer. Create a cost-benefit analysis that illustratesthe return on investment that you would receive frommaking this purchase. Computer-related Web sites(e.g., Dell Computers, Compaq Computers) shouldhave real tangible costs that you can include in youranalysis. Project your numbers out to include a three-
year period of time and provide the net present valueof the final total.
D. Consider the Amazon.com Web site. The managementof the company decided to extend their Web-basedsystem to include products other than books (e.g.,wine and specialty gifts). How would you haveassessed the feasibility of this venture when the ideafirst came up? How risky would you have consideredthe project that implemented this idea? Why?
E. Interview someone who works in a large organizationand ask him or her to describe the approval processthat exists for approving new development projects.What do they think about the process? What are theproblems? What are the benefits?
F. Reread Your Turn 2-1. (Identify Tangible and Intan-gible Value). Create a list of the stakeholders thatshould be considered in a stakeholder analysis ofthis project.
MINICASES
1. The Amberssen Specialty Company is a chain oftwelve retail stores that sell a variety of imported giftitems, gourmet chocolates, cheeses, and wines in theToronto area. Amberssen has an IS staff of three peoplewho have created a simple but effective informationsystem of networked point-of-sale registers at the
stores and a centralized accounting system at the com-pany headquarters. Harry Hilman, the head ofAmberssens IS group, has just received the followingmemo from Bill Amberssen, Sales Director (and sonof Amberssen’s founder).

68 Chapter 2 Project Initiation
Harry—it’s time Amberssen Specialty launcheditself on the Internet. Many of our competitors arealready there, selling to customers without the expenseof a retail storefront, and we should be there too. I pro-ject that we could double or triple our annual revenuesby selling our products on the Internet. I’d like to havethis ready by Thanksgiving, in time for the prime hol-iday gift-shopping season. Bill
After pondering this memo for several days, Harryscheduled a meeting with Bill so that he could clarifyBill’s vision of this venture. Using the standard content ofa system request as your guide, prepare a list of questionsthat Harry needs to have answered about this project.
2. The Decker Company maintains a fleet of ten servicetrucks and crews that provide a variety of plumbing,heating, and cooling repair services to residential cus-tomers. Currently, it takes on average about six hoursbefore a service team responds to a service request.Each truck and crew averages twelve service calls perweek, and the average revenue earned per service callis $150. Each truck is in service fifty weeks per year.Due to the difficulty in scheduling and routing, thereis considerable slack time for each truck and crew dur-ing a typical week.
In an effort to more efficiently schedule the trucksand crews and improve their productivity, Decker man-agement is evaluating the purchase of a prewritten rout-ing and scheduling software package. The benefits ofthe system will include reduced response time to servicerequests and more productive service teams, but man-agement is having trouble quantifying these benefits.
One approach is to make an estimate of how muchservice response time will decrease with the new sys-tem, which then can be used to project the increase inthe number of service calls made each week. Forexample, if the system permits the average serviceresponse time to fall to four hours, managementbelieves that each truck will be able to make sixteenservice calls per week on average—an increase of fourcalls per week. With each truck making four addi-tional calls per week and the average revenue per callat $150, the revenue increase per truck per week is$600 (4 � $150).With ten trucks in service fifty weeksper year, the average annual revenue increase will be$300,000 ($600 � 10 � 50).
Decker Company management is unsure whetherthe new system will enable response time to fall to fourhours on average, or will be some other number.Therefore, management has developed the followingrange of outcomes that may be possible outcomes ofthe new system, along with probability estimates ofeach outcome occurring.
New Response Time # Calls/Truck/Week Likelihood
2 hours 20 20%
3 hours 18 30%
4 hours 16 50%
Given these figures, prepare a spreadsheet model thatcomputes the expected value of the annual revenues tobe produced by this new system.
69
This chapter describes the important steps of project management, which begins inplanning and continues throughout the SDLC. First, the project manager estimates thesize of the project and identifies the tasks that need to be performed. Next, he or she staffsthe project and puts several activities in place to help coordinate project activities. Thesesteps produce important project management deliverables, including the workplan,staffing plan, and standards list.
OBJECTIVES
■ Become familiar with estimation.■ Be able to create a project workplan.■ Understand why project teams use timeboxing.■ Become familiar with how to staff a project.■ Understand how computer-aided software engineering, standards, and documentation
improve the efficiency of a project.■ Understand how to reduce risk on a project.
CHAPTER OUTLINE
C H A P T E R 3
Project Management
IntroductionIdentifying Project Size
Function Point ApproachCreating and Managing the Workplan
Identifying TasksThe Project WorkplanGantt ChartPERT ChartRefining EstimatesScope ManagementTimeboxingEvolutionary Work Breakdown
Structures and Iterative Workplans
Staffing the ProjectStaffing PlanMotivationHandling Conflict
Coordinating Project ActivitiesCASE ToolsStandardsDocumentationManaging Risk
Applying the Concepts at CD SelectionsStaffing the ProjectCoordinating Project Activities
Summary
INTRODUCTION
Think about major projects that occur in people’s lives, such as throwing a big party, like awedding or graduation celebration. Months are spent in advance identifying and performingall the tasks that need to get done, such as sending out invitations and selecting a menu, and

time and money are carefully allocated among them. Along the way, decisions are recorded,problems are addressed, and changes are made. The increasing popularity of the party planner,a person whose sole job is to coordinate a party, suggests how tough this job can be. In the end,the success of any party has a lot to do with the effort that went into planning along the way.System development projects can be much more complicated than the projects we encounter inour personal lives—usually, more people are involved (e.g., the organization), the costs arehigher, and more tasks need to be completed. Therefore, it is not surprising that “party plan-ners” exist for information system projects; they are called project managers.
Project management is the process of planning and controlling the development of asystem within a specified time frame at a minimum cost with the right functionality.1 Aproject manager has the primary responsibility for managing the hundreds of tasks androles that need to be carefully coordinated. Today, project management is an actual profes-sion, and analysts spend years working on projects prior to tackling the management ofthem. In a 1999 Computerworld survey, more than half of 103 companies polled said theynow offer formal project management training for information technology (IT) projectteams. There also is a variety of project management software available, such as MicrosoftProject, PlanView, and PMOffice, which support project management activities.
Although training and software are available to help project managers, unreasonabledemands set by project sponsors and business managers can make project managementvery difficult. Too often, the approach of the holiday season, the chance at winning a pro-posal with a low bid, or a funding opportunity pressures project managers to promise sys-tems long before they are able to deliver them. These overly optimistic timetables arethought to be one of the biggest problems that projects face; instead of pushing a projectforward faster, they result in delays.
Thus, a critical success factor for project management is to start with a realistic assess-ment of the work that needs to be accomplished and then manage the project according tothat assessment. This can be achieved by carefully following the four steps presented in thischapter: identifying the project size, creating and managing the workplan, staffing the pro-ject, and coordinating project activities. The project manager ultimately creates a work-plan, staffing plan, and standards list, which are used and refined throughout the entiresystem development lifecycle.
IDENTIFYING PROJECT SIZE
The science (or art) of project management is in making trade-offs among three importantconcepts: the size of the system (in terms of what it does), the time to complete the project(when the project will be finished), and the cost of the project. Think of these three thingsas interdependent levers that the project manager controls throughout the SDLC. When-ever one lever is pulled, the other two levers are affected in some way. For example, if a pro-ject manager needs to readjust a deadline to an earlier date, then the only solutions are todecrease the size of the system (by eliminating some of its functions) or to increase costsby adding more people or having them work overtime. Often, a project manager will haveto work with the project sponsor to change the goals of the project, such as developing a
70 Chapter 3 Project Management
1 The following are good books on project management for object-oriented projects: Grady Booch, Object Solutions:Managing the Object-Oriented Project (Menlo Park, CA: Addison-Wesley, 1996); Murray R. Cantor, Object-OrientedProject Management with UML (New York, NY: Wiley, 1998); Alistair Cockburn, Surviving Object-Oriented Projects:A Manager’s Guide (Reading, MA: Addison-Wesley, 1998); and Walker Royce, Software Project Management: A Uni-fied Framework (Reading, MA: Addison-Wesley, 1998). Also, the Project Management Institute (www.pmi.org) andthe Information Systems Special Interest Group of the Project Management Institute (www.pmi-issig.org) havevaluable resources on project management in information systems.

system with less functionality or extending the deadline for the final system, so that theproject has reasonable goals that can be met.
Therefore, in the beginning of the project, the manager needs to estimate each of theselevers and then continuously assess how to roll out the project in a way that meets the orga-nization’s needs. Estimation2 is the process of assigning projected values for time and effort,and it can be performed manually or with the help of estimation software packages such asCostar and Construx—there are more than fifty available on the market. The estimatesdeveloped at the start of a project are usually based on a range of possible values (e.g., thedesign phase will take three to four months) and gradually become more specific as theproject moves forward (e.g., the design phase will be completed on March 22).
The numbers used to calculate these estimates can come from several sources. Theycan be provided with the methodology that is used, taken from projects with similar tasksand technologies, or provided by experienced developers. Generally speaking, the numbersshould be conservative. A good practice is to keep track of the actual values for time andeffort during the SDLC so that numbers can be refined along the way and the next projectcan benefit from real data. One of the greatest strengths of systems consulting firms is thepast experience they offer to a project; they have estimates and methodologies that havebeen developed and honed over time and applied to hundreds of projects.
There are a variety of ways to estimate the time required to build a system. For example,it is possible to use the function point approach, a task-decomposition approach using workbreakdown structures, and the timeboxing approach. Each of these is described later in thischapter. However, the simplest method uses the amount of time spent in the planning phaseto predict the time required for the entire project. The idea is that a simple project willrequire little planning and a complex project will require more planning, so using theamount of time spent in the planning phase is a reasonable way to estimate overall projecttime requirements.
Identifying Project Size 71
2 A good book for further reading on software estimation is that by Capers Jones, Estimating Software Costs (NewYork: McGraw-Hill, 1989).
I was once on a project to develop a system that shouldhave taken a year to build. Instead, the business needdemanded that the system be ready within five months—impossible!
On the first day of the project, the project managerdrew a triangle on a white board to illustrate some trade-offsthat he expected to occur over the course of the project. Thecorners of the triangle were labeled Functionality, Time, andMoney. The manager explained, “We have too little time.We have an unlimited budget. We will not be measured bythe bells and whistles that this system contains. So over thenext several weeks, I want you as developers to keep this tri-angle in mind and do everything it takes to meet this five-month deadline.”
At the end of the five months, the project was deliv-ered on time; however, the project was incredibly over
budget, and the final product was “thrown away” after itwas used because it was unfit for regular usage. Remark-ably, the business users felt that the project was very suc-cessful because it met the very specific business needs forwhich it was built. They believed that the trade-offs thatwere made were worthwhile.
—Barbara Wixom
Questions
1. What are the risks in stressing only one corner ofthe triangle?
2. How would you have managed this project? Canyou think of another approach that might have beenmore effective?
3-A Trade-offsCONCEPTS
IN ACTION
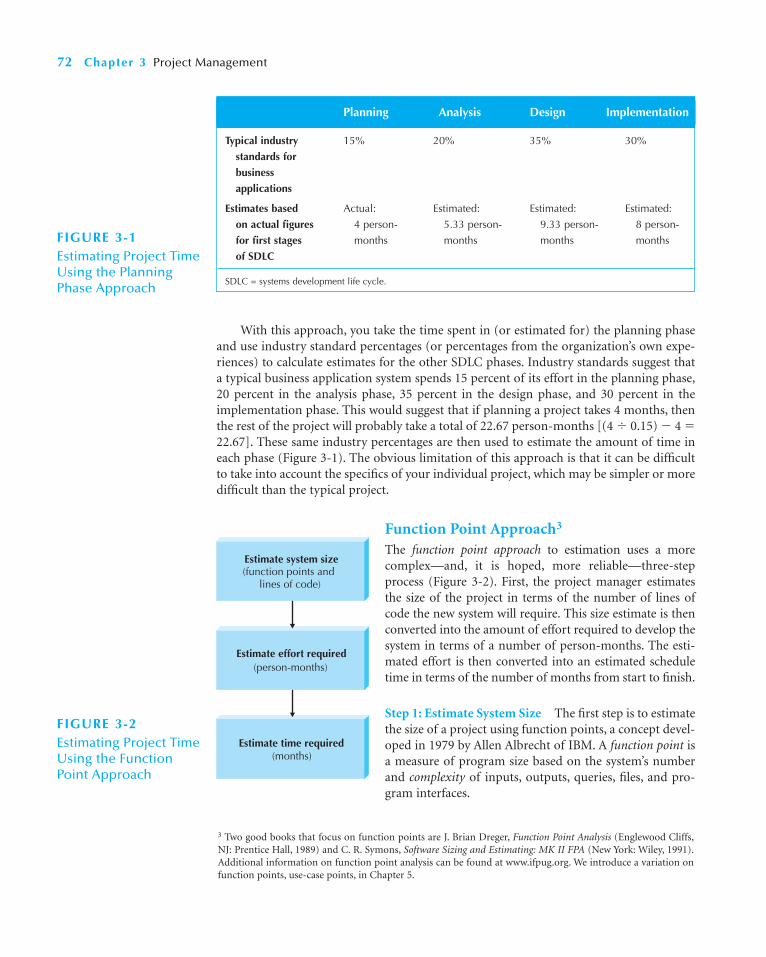
With this approach, you take the time spent in (or estimated for) the planning phaseand use industry standard percentages (or percentages from the organization’s own expe-riences) to calculate estimates for the other SDLC phases. Industry standards suggest thata typical business application system spends 15 percent of its effort in the planning phase,20 percent in the analysis phase, 35 percent in the design phase, and 30 percent in theimplementation phase. This would suggest that if planning a project takes 4 months, thenthe rest of the project will probably take a total of 22.67 person-months [(4 � 0.15) � 4 �22.67]. These same industry percentages are then used to estimate the amount of time ineach phase (Figure 3-1). The obvious limitation of this approach is that it can be difficultto take into account the specifics of your individual project, which may be simpler or moredifficult than the typical project.
Function Point Approach3
The function point approach to estimation uses a morecomplex—and, it is hoped, more reliable—three-stepprocess (Figure 3-2). First, the project manager estimatesthe size of the project in terms of the number of lines ofcode the new system will require. This size estimate is thenconverted into the amount of effort required to develop thesystem in terms of a number of person-months. The esti-mated effort is then converted into an estimated scheduletime in terms of the number of months from start to finish.
Step 1: Estimate System Size The first step is to estimatethe size of a project using function points, a concept devel-oped in 1979 by Allen Albrecht of IBM. A function point isa measure of program size based on the system’s numberand complexity of inputs, outputs, queries, files, and pro-gram interfaces.
72 Chapter 3 Project Management
3 Two good books that focus on function points are J. Brian Dreger, Function Point Analysis (Englewood Cliffs,NJ: Prentice Hall, 1989) and C. R. Symons, Software Sizing and Estimating: MK II FPA (New York: Wiley, 1991).Additional information on function point analysis can be found at www.ifpug.org. We introduce a variation onfunction points, use-case points, in Chapter 5.
Typical industry 15% 20% 35% 30%
standards for
business
applications
Estimates based Actual: Estimated: Estimated: Estimated:
on actual figures 4 person- 5.33 person- 9.33 person- 8 person-
for first stages months months months months
of SDLC
SDLC = systems development life cycle.
Planning Analysis Design Implementation
FIGURE 3-1Estimating Project TimeUsing the Planning Phase Approach
(months)
(person-months)Estimate effort required
Estimate time required
(function points andlines of code)
Estimate system size
FIGURE 3-2Estimating Project TimeUsing the FunctionPoint Approach

Identifying Project Size 73
To calculate the function points for a project, components are listed on a worksheetto represent the major elements of the system. For example, data entry screens are kindsof inputs, reports are outputs, and database queries are kinds of queries (see Figure 3-3).The project manager records the total number of each component that the system willinclude, and then he or she breaks down the number to show the number of componentsthat have low, medium, and high complexity. In Figure 3-3, there are nineteen outputsthat need to be developed for the system, four of which have low complexity, ten thathave medium complexity, and five that are very complex. After each line is filled in, a totalnumber of points is calculated per line by multiplying each number by a complexityindex. The line totals are added to determine the total unadjusted function points (TUFP)for the project.
The complexity of the overall system is greater than the sum of its parts. Things suchas the familiarity of the project team with the business area and the technology that will beused to implement the project may also influence how complex a project will be. A projectthat is very complex for a team with little experience might have little complexity for a teamwith lots of experience. To create a more realistic size for the project, a number of addi-tional system factors, such as end user efficiency, reusability, and data communications, areassessed in terms of their effect on the project’s complexity (see Figure 3-3). These assess-ments are totaled and placed into a formula to calculate an adjusted project complexity(APC) score. The TUFP value is multiplied by the APC value to determine the ultimate sizeof the project in terms of total adjusted function points (TAFP). This number should givethe project manager a reasonable idea as to how big the project will be.
Sometimes a shortcut is used to determine the complexity of the project. Instead ofcalculating the complexity for the fourteen factors listed in Figure 3-3, project managerschoose to assign an APC value that ranges from .65 for very simple systems, to 1.00 for nor-mal systems, to as much as 1.35 for complex systems; then, they multiply the value to theTUFP score. For example, a very simple system that has 200 unadjusted function points
Nielsen Media used function point analysis (FPA) for anupgrade to the Global Sample Management System (GSMS)for Nielsen Media/NetRatings, which keeps track of theInternet rating sample, a group of 40,000 homes nationwidethat volunteer to participate in ongoing ratings.
In late fall of 1998, Nielsen Media did an FP countbased on the current GSMS. (FPA is always easier and moreaccurate for an existing system.) Nielsen Media had itscounters—three quality assurance staff—do their FPA andthen input their count into KnowledgePlan, a productivitymodeling tool. In early 1999, seven programmers beganwriting code for the system, which they were expected tocomplete in ten months. As November approached, theproject was adding staff to try to meet the deadline. Whenit became evident that the deadline would not be met, anew FP count was conducted. The GSMS had grown to
900 FPs. Besides the original 500 plus 20 percent, therewere 300 FPs attributable to features and functions that hadcrept into the project.
How did that happen? The way it always does: Thedevelopers and users had added a button here and a newfeature there, and soon the project was much larger thanit was originally. But Nielsen Media had put a stake in theground at the beginning from which they could measuregrowth along the way.
The best practice is to run the FPA and productivitymodel at the project’s launch and again when there is a fulllist of functional requirements. Then do another analysisany time there is a major modification in the functionaldefinition of the project.
Source: Bill Roberts, “Ratings Game,” CIO Magazine (October 2000).
3-B Function Points at NielsenCONCEPTS
IN ACTION

74 Chapter 3 Project Management
Description
System Components:
Inputs
Outputs
Queries
Files
Program Interfaces
23
101
39
150
25
338
1 × 6
5 × 7
3 × 6
0 × 15
2 × 10
2 × 4
10 × 5
0 × 4
15 × 10
0 × 7
3 × 3
4 × 4
7 × 3
0 × 7
1 × 5
6
19
10
15
3
Total Unadjusted Function Points (TUFP):
TotalNumber Low
Complexity
Medium High Total
Overall System:
Data communications
Heavy use configuration
Transaction rate
End-user efficiency
Complex processing
Installation ease
Multiple sites
Performance
Distributed functions
Online data entry
Online update
Reusability
Operational ease
Extensibility
(0 = no effect on processing complexity; 5 = great effect on processing complexity)
Total Processing Complexity (PC):
3
0
0
0
0
0
0
0
2
2
0
0
0
0
7
Adjusted Processing Complexity (APC):
0.65 + (0.01 x 7 ) = 0.72
Total Adjusted Function Points (TAFP):
0.72 (APC) x 338 (TUFP) = 243 (TAFP)
FIGURE 3-3Function Point Estimation Worksheet
TEMPLATEcan be found atwww.wiley.com/college/dennis
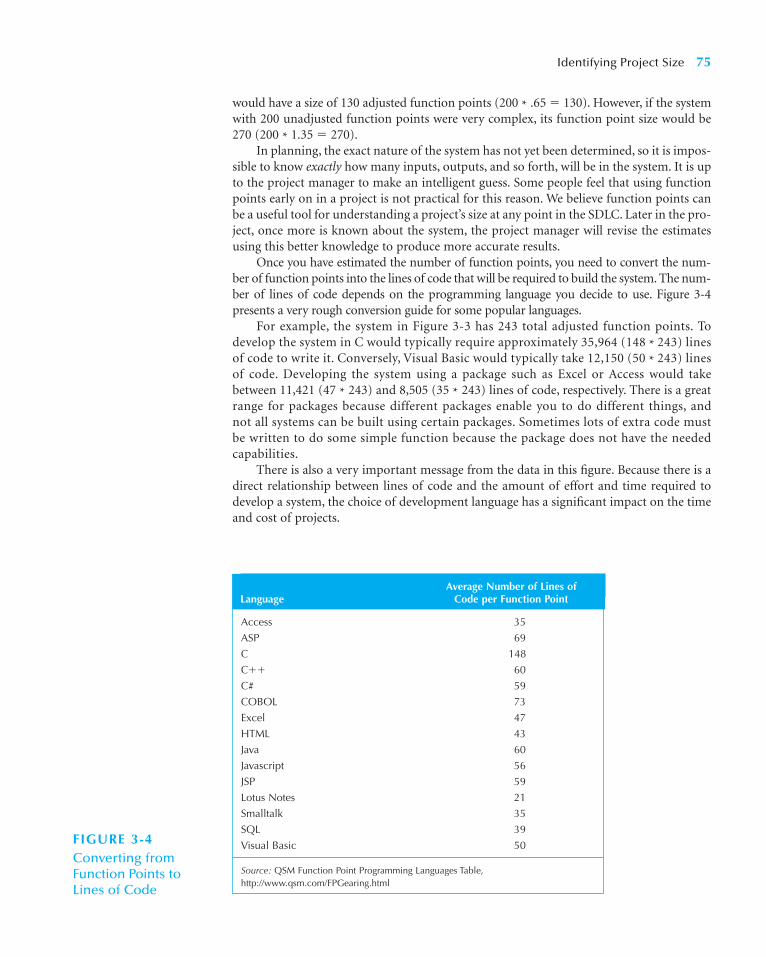
would have a size of 130 adjusted function points (200 * .65 � 130). However, if the systemwith 200 unadjusted function points were very complex, its function point size would be270 (200 * 1.35 � 270).
In planning, the exact nature of the system has not yet been determined, so it is impos-sible to know exactly how many inputs, outputs, and so forth, will be in the system. It is upto the project manager to make an intelligent guess. Some people feel that using functionpoints early on in a project is not practical for this reason. We believe function points canbe a useful tool for understanding a project’s size at any point in the SDLC. Later in the pro-ject, once more is known about the system, the project manager will revise the estimatesusing this better knowledge to produce more accurate results.
Once you have estimated the number of function points, you need to convert the num-ber of function points into the lines of code that will be required to build the system. The num-ber of lines of code depends on the programming language you decide to use. Figure 3-4presents a very rough conversion guide for some popular languages.
For example, the system in Figure 3-3 has 243 total adjusted function points. Todevelop the system in C would typically require approximately 35,964 (148 * 243) linesof code to write it. Conversely, Visual Basic would typically take 12,150 (50 * 243) linesof code. Developing the system using a package such as Excel or Access would takebetween 11,421 (47 * 243) and 8,505 (35 * 243) lines of code, respectively. There is a greatrange for packages because different packages enable you to do different things, andnot all systems can be built using certain packages. Sometimes lots of extra code mustbe written to do some simple function because the package does not have the neededcapabilities.
There is also a very important message from the data in this figure. Because there is adirect relationship between lines of code and the amount of effort and time required todevelop a system, the choice of development language has a significant impact on the timeand cost of projects.
FIGURE 3-4Converting from Function Points to Lines of Code
Access 35
ASP 69
C 148
C�� 60
C# 59
COBOL 73
Excel 47
HTML 43
Java 60
Javascript 56
JSP 59
Lotus Notes 21
Smalltalk 35
SQL 39
Visual Basic 50
Source: QSM Function Point Programming Languages Table,http://www.qsm.com/FPGearing.html
Average Number of Lines of Language Code per Function Point
Identifying Project Size 75

Step 2: Estimate Required Effort Once an understanding is reached about the size of asystem, the next step is to estimate the effort required to build it. Effort is a function of the sys-tem size combined with production rates (how much work someone can complete in a giventime). Much research has been done on software production rates. One of the most popularalgorithms, the COCOMO4 model, was designed by Barry W. Boehm to convert a lines-of-codeestimate into a person–month estimate. There are different versions of the COCOMOmodel, which vary based on the complexity of the software, the size of the system, the expe-rience of the developers, and the type of software being developed (e.g., business applica-tion software such as the registration system at a university; commercial software such asWord; or system software such as Windows). For small- to moderate-sized business softwareprojects (i.e., 100,000 lines of code and ten or fewer programmers), the model is quite simple:
effort (in person-months) � 1.4 * thousands of lines of code
For example, to develop a business software system requiring 10,000 lines of code wouldtypically take 14 person-months to complete. If the system in Figure 3-3 were developed in C(which equates to 35,964 lines of code), it would require about 50.35 person-months of effort.
Step 3: Estimate Time Required Once the effort is understood, the optimal schedule forthe project can be estimated. Historical data or estimation software can be used as aids.One rule of thumb is to determine schedule using the following equation:
schedule time (months) � 3.0 * person-months1/3
76 Chapter 3 Project Management
Imagine that job hunting has been going so well that youneed to develop a system to support your efforts. The systemshould allow you to input information about the companieswith which you interview, the interviews and office visitsthat you have scheduled, and the offers you receive. Itshould be able to produce reports, such as a company con-tact list, an interview schedule, and an office visit schedule,as well as produce thank-you letters to be brought into aword processor to customize. You also need the system toanswer queries, such as the number of interviews by cityand your average offer amount.
Questions
1. Determine the number of inputs, outputs, inter-faces, files, and queries that this system requires.For each element, determine if the complexity is
low, medium, or high. Record this information on aworksheet similar to the one in Figure 3-3.
2. Calculate the total function points for each line onyour worksheet by multiplying the number of eachelement with the appropriate complexity score.
3. Sum up the total unadjusted function points.4. Suppose the system will be built by you using
Visual Basic (VB). Given your VB skills, multiply theTUFP score by the APC score that best estimateshow complex the system will be for you to develop(.65 � simple, 1 � average, 1.35 � complex), andcalculate a TAFP value.
5. Using the table in Figure 3-4, determine the numberof lines of code that correspond to VB. Multiply thisnumber with the TAFP to find the total lines of codethat your system will require.
3-1 Calculating System SizeYOUR
TURN
4 The original COCOMO model is presented by Barry W. Boehm in Software Engineering Economics (Engle-wood Cliffs, NJ: Prentice-Hall, 1981). Since then, much additional research has been done. The latest versionof COCOMO, COCOMO II, is described in B.W. Boehm, C. Abts, A.W. Brown, S. Chulani, B.K. Clark, E. Horowitz,R. Madachy, D. Reifer, and B. Steece, Software Cost Estimation with COCOMO II (Upper Saddle River, NJ: PrenticeHall PTR, 2000). For the latest updates on COCOMO, see http://sunset.usc.edu/csse/research/ COCOMOII/cocomo_main.html.
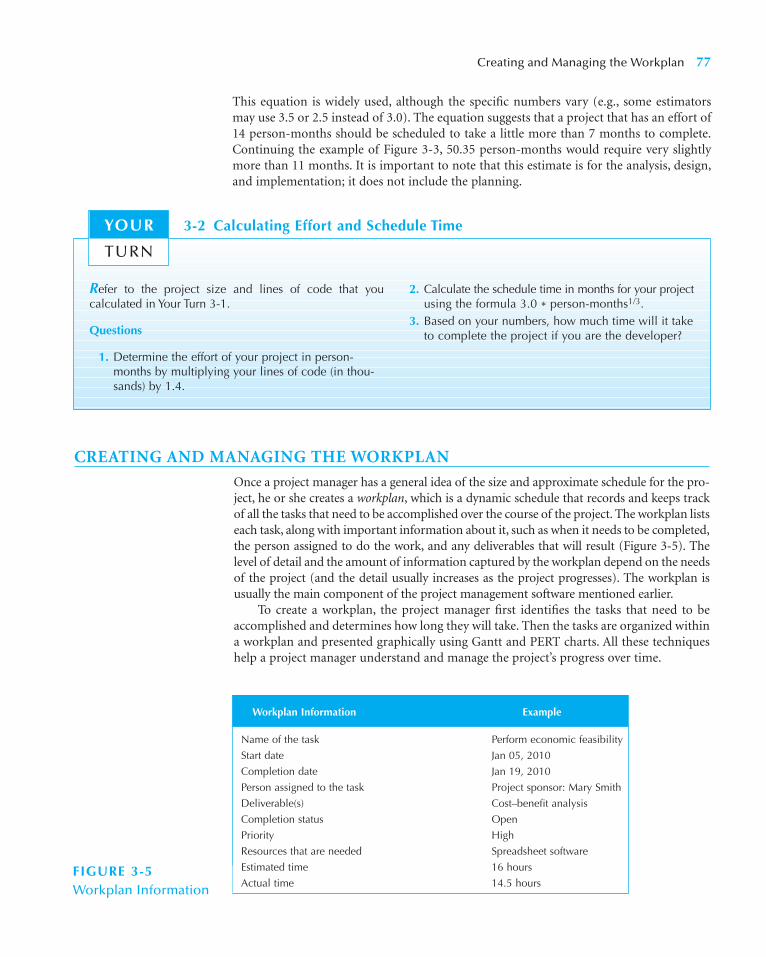
This equation is widely used, although the specific numbers vary (e.g., some estimatorsmay use 3.5 or 2.5 instead of 3.0). The equation suggests that a project that has an effort of14 person-months should be scheduled to take a little more than 7 months to complete.Continuing the example of Figure 3-3, 50.35 person-months would require very slightlymore than 11 months. It is important to note that this estimate is for the analysis, design,and implementation; it does not include the planning.
Creating and Managing the Workplan 77
Refer to the project size and lines of code that you calculated in Your Turn 3-1.
Questions
1. Determine the effort of your project in person-months by multiplying your lines of code (in thou-sands) by 1.4.
2. Calculate the schedule time in months for your projectusing the formula 3.0 * person-months1/3.
3. Based on your numbers, how much time will it taketo complete the project if you are the developer?
3-2 Calculating Effort and Schedule TimeYOUR
TURN
CREATING AND MANAGING THE WORKPLAN
Once a project manager has a general idea of the size and approximate schedule for the pro-ject, he or she creates a workplan, which is a dynamic schedule that records and keeps trackof all the tasks that need to be accomplished over the course of the project. The workplan listseach task, along with important information about it, such as when it needs to be completed,the person assigned to do the work, and any deliverables that will result (Figure 3-5). Thelevel of detail and the amount of information captured by the workplan depend on the needsof the project (and the detail usually increases as the project progresses). The workplan isusually the main component of the project management software mentioned earlier.
To create a workplan, the project manager first identifies the tasks that need to beaccomplished and determines how long they will take. Then the tasks are organized withina workplan and presented graphically using Gantt and PERT charts. All these techniqueshelp a project manager understand and manage the project’s progress over time.
Name of the task Perform economic feasibility
Start date Jan 05, 2010
Completion date Jan 19, 2010
Person assigned to the task Project sponsor: Mary Smith
Deliverable(s) Cost–benefit analysis
Completion status Open
Priority High
Resources that are needed Spreadsheet software
Estimated time 16 hours
Actual time 14.5 hours
Workplan Information Example
FIGURE 3-5Workplan Information
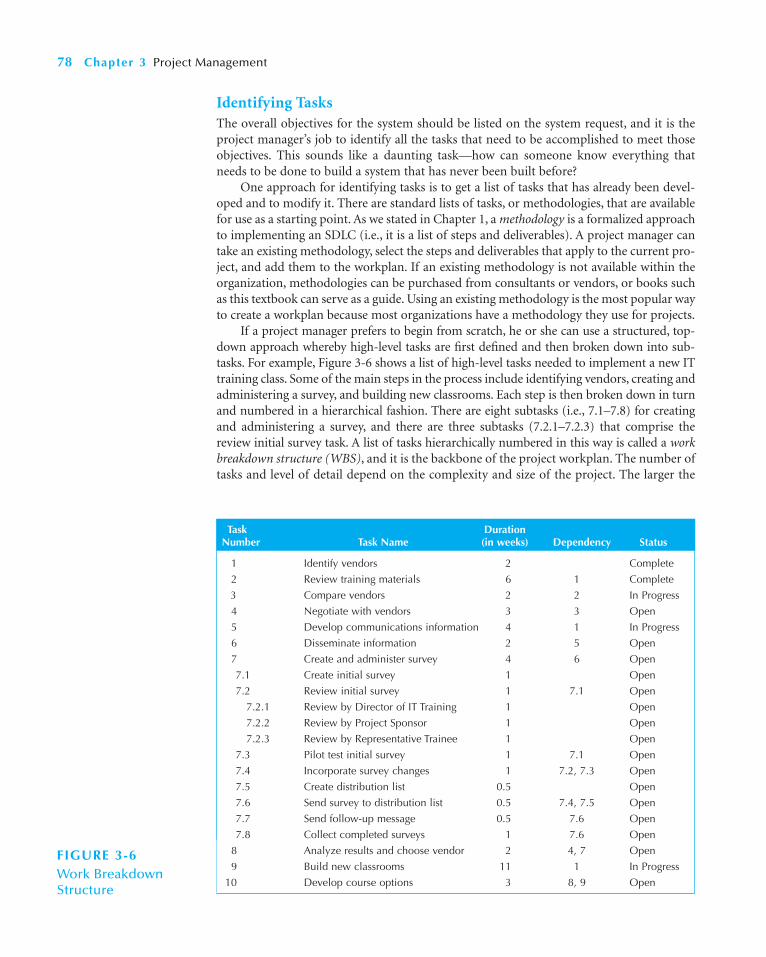
Identifying TasksThe overall objectives for the system should be listed on the system request, and it is theproject manager’s job to identify all the tasks that need to be accomplished to meet thoseobjectives. This sounds like a daunting task—how can someone know everything thatneeds to be done to build a system that has never been built before?
One approach for identifying tasks is to get a list of tasks that has already been devel-oped and to modify it. There are standard lists of tasks, or methodologies, that are availablefor use as a starting point. As we stated in Chapter 1, a methodology is a formalized approachto implementing an SDLC (i.e., it is a list of steps and deliverables). A project manager cantake an existing methodology, select the steps and deliverables that apply to the current pro-ject, and add them to the workplan. If an existing methodology is not available within theorganization, methodologies can be purchased from consultants or vendors, or books suchas this textbook can serve as a guide. Using an existing methodology is the most popular wayto create a workplan because most organizations have a methodology they use for projects.
If a project manager prefers to begin from scratch, he or she can use a structured, top-down approach whereby high-level tasks are first defined and then broken down into sub-tasks. For example, Figure 3-6 shows a list of high-level tasks needed to implement a new ITtraining class. Some of the main steps in the process include identifying vendors, creating andadministering a survey, and building new classrooms. Each step is then broken down in turnand numbered in a hierarchical fashion. There are eight subtasks (i.e., 7.1–7.8) for creatingand administering a survey, and there are three subtasks (7.2.1–7.2.3) that comprise thereview initial survey task. A list of tasks hierarchically numbered in this way is called a workbreakdown structure (WBS), and it is the backbone of the project workplan. The number oftasks and level of detail depend on the complexity and size of the project. The larger the
78 Chapter 3 Project Management
1 Identify vendors 2 Complete
2 Review training materials 6 1 Complete
3 Compare vendors 2 2 In Progress
4 Negotiate with vendors 3 3 Open
5 Develop communications information 4 1 In Progress
6 Disseminate information 2 5 Open
7 Create and administer survey 4 6 Open
7.1 Create initial survey 1 Open
7.2 Review initial survey 1 7.1 Open
7.2.1 Review by Director of IT Training 1 Open
7.2.2 Review by Project Sponsor 1 Open
7.2.3 Review by Representative Trainee 1 Open
7.3 Pilot test initial survey 1 7.1 Open
7.4 Incorporate survey changes 1 7.2, 7.3 Open
7.5 Create distribution list 0.5 Open
7.6 Send survey to distribution list 0.5 7.4, 7.5 Open
7.7 Send follow-up message 0.5 7.6 Open
7.8 Collect completed surveys 1 7.6 Open
8 Analyze results and choose vendor 2 4, 7 Open
9 Build new classrooms 11 1 In Progress
10 Develop course options 3 8, 9 Open
FIGURE 3-6Work Breakdown Structure
Task Duration Number Task Name (in weeks) Dependency Status

project, the more important it becomes to define tasks at a low level of detail so that essentialsteps are not overlooked.
There are two basic approaches to organizing a WBS: by SDLC phase or by product.For example, if a firm decided that it needed to develop a Web site, the firm could create aWBS based on the SDLC: planning, analysis, design, and implementation. In this case, atypical task that would take place during planning would be feasibility analysis. This taskwould be broken down into the different types of feasibility analysis: technical, economic,and organizational. Each of these would be further broken down into a set of subtasks.Alternatively, the firm could organize the workplan along the lines of the different productsto be developed. For example, in the case of a Web site, the products could include applets,application servers, database servers, the various sets of Web pages to be designed, a sitemap, and so on. Then these would be further decomposed into the different tasks associatedwith the phases of the SDLC. As described previously, Figure 3-6 depicts the tasks necessaryfor creating a new IT training class. Either way, once the overall structure is determined,tasks are identified and included in the WBS of the workplan. We return to the topic of WBSand their use in iterative planning later in this chapter.
The Project WorkplanThe project workplan is the mechanism that is used to manage the tasks that are listed in thework breakdown structure. It is the project manager’s primary tool for managing the project.Using it, the project manager can tell if the project is ahead or behind schedule, how well theproject was estimated, and what changes need to be made to meet the project deadline.
Basically, the workplan is a table that lists all the tasks in the WBS, along with impor-tant task information, such as the people who are assigned to perform the tasks, the actualhours that the tasks took, and the variances between estimated and actual completion times(see Figure 3-6). At a minimum, the information should include the duration of the task,the current statuses of the tasks (i.e., open, complete), and the task dependencies, whichoccur when one task cannot be performed until another task is completed. For example,Figure 3-6 shows that incorporating changes to the survey (task 7.4) takes a week to perform,but it cannot occur until after the survey is reviewed (task 7.2) and pilot tested (task 7.3). Keymilestones, or important dates, are also identified on the workplan. Presentations to theapproval committee, the start of end user training, a company retreat, and the due date ofthe system prototype are the types of milestones that may be important to track.
Gantt ChartA Gantt chart is a horizontal bar chart that shows the same task information as the projectworkplan but in a graphical way. Sometimes a picture really is worth a thousand words, andthe Gantt chart can communicate the high-level status of a project much faster and easierthan the workplan. Creating a Gantt chart is simple and can be done using a spreadsheetpackage, graphics software (e.g., Microsoft VISIO), or a project management package.
First, tasks are listed as rows in the chart, and time is listed across the top in incrementsbased on the needs of the projects (see Figure 3-7). A short project may be divided intohours or days; whereas, a medium-sized project may be represented using weeks ormonths. Horizontal bars are drawn to represent the duration of each task; the bar’s begin-ning and end mark exactly when the task will begin and end. As people work on tasks, theappropriate bars are filled in proportionately to how much of the task is finished. Too manytasks on a Gantt chart can become confusing, so it’s best to limit the number of tasks toaround twenty or thirty. If there are more tasks, break them down into subtasks and createGantt charts for each level of detail.
Creating and Managing the Workplan 79

There are many things a project manager can see by quickly looking at a Gantt chart.In addition to seeing how long tasks are and how far along they are, the project manageralso can tell which tasks are sequential, which tasks occur at the same time, and which tasksoverlap in some way. He or she can get a quick view of tasks that are ahead of schedule andbehind schedule by drawing a vertical line on today’s date. If a bar is not filled in and is tothe left of the line, that task is behind schedule.
There are a few special notations that can be placed on a Gantt chart. Project mile-stones are shown using upside-down triangles or diamonds. Arrows are drawn betweenthe task bars to show task dependencies. Sometimes, the names of people assigned toeach task are listed next to the task bars to show what human resources have been allo-cated to the tasks.
80 Chapter 3 Project Management
ID
1
2
3
4
5
Identifyvendors
ReviewtrainingmaterialsComparevendors
NegotiatewithvendorsDevelopcommunicationsinformationDisseminateinformation
Create andadministersurveyAnalyze resultsand choose
Build newclassroom
Develop courseoptionsBudgetMeeting
Software Installation
6
7
8
9
10
11
12
2 wks Wed 1/1/10
Wed 1/1/10
Wed 2/12/10
Wed 2/26/10
Wed 1/15/10
Wed 2/12/10
Wed 2/26/10
Wed 3/26/10
Wed 1/15/10
Wed 4/9/10
Wed 1/15/10
Tue4/1/10
6 wksBarbara
Barbara
Barbara
Alan
Alan
Alan
Alan
Alan
David
D
2 wks
3 wks
4 wks
2 wks
4 wks
2 wks
11 wks
3 wks
2
3
1
5
6
4, 7
1
8, 9
1 day
1 day
TaskName Duration Start
Tue1/14/10
Tue2/11/10
Tue2/25/10
Tue3/18/10
Tue2/11/10
Tue2/25/10
Tue3/25/10
Tue4/8/10
Tue4/1/10
Tue4/29/10
Wed 1/15/10
Tue4/1/10
Finish12/29 1/5 1/12
1/15
4/1
1/19 1/26 2/2 2/9 2/16 2/23 3/2 3/9 3/16 3/23 3/30 4/6 4/13 4/20 4/27Prede
January February March April M
FIGURE 3-7 Gantt Chart
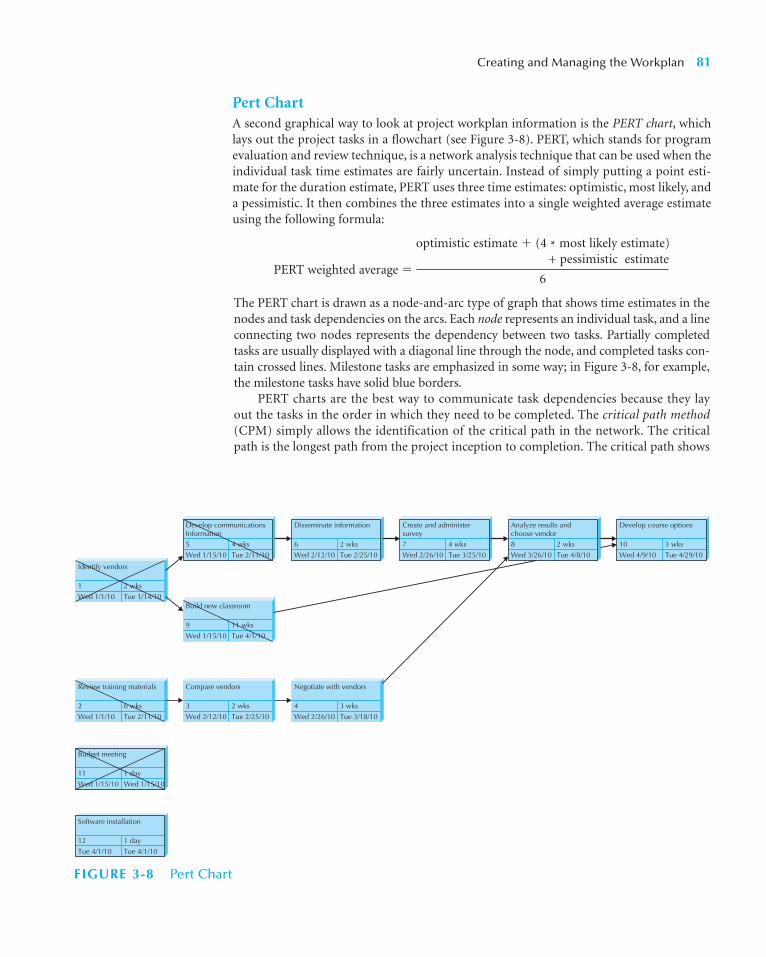
Pert ChartA second graphical way to look at project workplan information is the PERT chart, whichlays out the project tasks in a flowchart (see Figure 3-8). PERT, which stands for programevaluation and review technique, is a network analysis technique that can be used when theindividual task time estimates are fairly uncertain. Instead of simply putting a point esti-mate for the duration estimate, PERT uses three time estimates: optimistic, most likely, anda pessimistic. It then combines the three estimates into a single weighted average estimateusing the following formula:
PERT weighted average �
optimistic estimate � (4 * most likely estimate)+ pessimistic estimate
6
Creating and Managing the Workplan 81
Identify vendors
1
Wed 1/1/10
2 wks
Tue 1/14/10Build new classroom
9
Wed 1/15/10
11 wks
Tue 4/1/10
Compare vendors
3
Wed 2/12/10
2 wks
Tue 2/25/10
Negotiate with vendors
4
Wed 2/26/10
3 wks
Tue 3/18/10
Review training materials
2
Wed 1/1/10
6 wks
Tue 2/11/10
Develop communicationsInformation5
Wed 1/15/10
4 wks
Tue 2/11/10
Budget meeting
11
Wed 1/15/10
1 day
Wed 1/15/10
Software installation
12
Tue 4/1/10
1 day
Tue 4/1/10
Disseminate information
6
Wed 2/12/10
2 wks
Tue 2/25/10
Create and administersurvey7
Wed 2/26/10
4 wks
Tue 3/25/10
Analyze results andchoose vendor8
Wed 3/26/10
2 wks
Tue 4/8/10
Develop course options
10
Wed 4/9/10
3 wks
Tue 4/29/10
FIGURE 3-8 Pert Chart
The PERT chart is drawn as a node-and-arc type of graph that shows time estimates in thenodes and task dependencies on the arcs. Each node represents an individual task, and a lineconnecting two nodes represents the dependency between two tasks. Partially completedtasks are usually displayed with a diagonal line through the node, and completed tasks con-tain crossed lines. Milestone tasks are emphasized in some way; in Figure 3-8, for example,the milestone tasks have solid blue borders.
PERT charts are the best way to communicate task dependencies because they layout the tasks in the order in which they need to be completed. The critical path method(CPM) simply allows the identification of the critical path in the network. The criticalpath is the longest path from the project inception to completion. The critical path shows

all the tasks that must be completed on schedule for a project as a whole to finish onschedule. If any tasks on the critical path take longer than expected, the entire project willfall behind. Each task on the critical path is a critical task, and they are usually depictedin a unique way; in Figure 3-8 they are shown with double borders. CPM can be usedwith or without PERT.
The benefit of using project management software packages such as Microsoft Projectis that the workplan can be input once, and then the software can display the informationin many different formats. The user can toggle between the workplan, a Gantt chart, and aPERT chart, depending on project management needs.
Refining EstimatesThe estimates that are produced during planning need to be refined as the project pro-gresses. This does not mean that estimates were poorly done at the start of the project;rather, it is virtually impossible to develop an exact assessment of the project’s schedulebefore the analysis and design phases are conducted. A project manager should expect tobe satisfied with broad ranges of estimates that become more and more specific as the project’sproduct becomes better defined.
In many respects, estimating what an IS development project will cost, how long it willtake, and what the final system will actually do follows a hurricane model. When storms andhurricanes first appear in the Atlantic or Pacific, forecasters watch their behavior and, onthe basis of minimal information about them (but armed with lots of data on previousstorms), attempt to predict when and where the storms will hit and what damage they willdo when they arrive. As storms move closer to North America, forecasters refine theirtracks and develop better predictions about where and when they are most likely to hit andtheir force when they do. The predictions become more and more accurate as the stormsapproach a coast, until they finally arrive.
In planning, when a system is first requested, the project sponsor and project managerattempt to predict how long the SDLC will take, how much it will cost, and what it will ulti-mately do when it is delivered (i.e., its functionality). However, the estimates are based onvery little knowledge of the system. As the system moves into the analysis, more informa-tion is gathered, the system concept is developed, and the estimates become even moreaccurate and precise. As the system moves closer to completion, the accuracy and precisionincrease, until the final system is delivered (see Figure 3-9).
According to one of the leading experts in software development,5 a well-done projectplan (prepared at the end of planning) has a 100 percent margin of error for project costand a 25 percent margin of error for schedule time. In other words, if a carefully done pro-ject plan estimates that a project will cost $100,000 and take twenty weeks, the project willactually cost between $0 and $200,000 and take between fifteen and twenty-five weeks.Figure 3-10 presents typical margins of error for other stages in the project. It is importantto note that these margins of error apply only to well-done plans; a plan developed withoutmuch care has a much greater margin of error.
What happens if you overshoot an estimate (e.g., analysis ends up lasting two weekslonger than expected)? There are a number of ways to adjust future estimates. If the projectteam finishes a step ahead of schedule, most project managers shift the deadlines soonerby the same amount but do not adjust the promised completion date. The challenge,
82 Chapter 3 Project Management
5 Barry W. Boehm et al., “Cost Models for Future Software Life Cycle Processes: COCOMO 2.0,” in J. D. Arthurand S. M. Henry (eds.), Annals of Software Engineering: Special Volume on Software Process and Product Measurement(Amsterdam: J. C. Baltzer AG Science Publishers, 1995).

however, occurs when the project team is late in meeting a scheduled date. Three possi-ble responses to missed schedule dates are presented in Figure 3-11. If an estimate provestoo optimistic early in the project, planners should not expect to make up for lost time—very few projects end up doing this. Instead, they should change future estimates toinclude an increase similar to the one that was experienced. For example, if the firstphase was completed 10 percent over schedule, planners should increase the rest of theirestimates by 10 percent.
Scope ManagementAn analyst may assume that a project will be safe from scheduling problems because he orshe carefully estimated and planned the project up front. However, the most common rea-son for schedule and cost overruns—scope creep—occurs after the project is underway.
Scope creep happens when new requirements are added to the project after the originalproject scope was defined and “frozen.” It can happen for many reasons: users may suddenly
Creating and Managing the Workplan 83
Planning(project plan)
Size of circle indicates
estimated cost
Estimatedschedule time
Analysis(system proposal)
Design(system specification)
Implementation(system installation)
Proj
ect
sche
dule
tim
e(T
ime
need
ed t
o co
mpl
ete
proj
ect)
Stage at which estimate is made
FIGURE 3-9Hurricane Model
Planning System request 400 60
Project plan 100 25
Analysis System proposal 50 15
Design System specifications 25 10
Source: Barry W. Boehm et al., “Cost Models for Future Software Life Cycle Processes: COCOMO 2.0,”in J. D. Arthur and S. M. Henry (eds.) Annals of Software Engineering Special Volume on SoftwareProcess and Product Measurement (Amsterdam: J. C. Baltzer AG Science Publishers, 1995).
Typical Margins of Error for Well-Done Estimates
Phase Deliverable Cost (%) Schedule Time (%)
FIGURE 3-10Margins of Error in Costand Time Estimates

understand the potential of the new system and realize new functionality that would be use-ful; developers may discover interesting capabilities to which they become very attached; asenior manager may decide to let this system support a new strategy that was developed ata recent board meeting.
Unfortunately, after the project begins, it becomes increasingly difficult to addresschanging requirements. The ramifications of change become more extensive, the focus isremoved from original goals, and there is at least some impact on cost and schedule. There-fore, the project manager plays a critical role in managing this change to keep scope creepto a minimum.
The keys are to identify the requirements as well as possible in the beginning of theproject and to apply analysis techniques effectively. For example, if needs are fuzzy at theproject’s onset, a combination of intensive meetings with the users and prototyping wouldallow users to “experience” the requirements and better visualize how the system could sup-port their needs. In fact, the use of meetings and prototyping has been found to reducescope creep to less than 5 percent on a typical project.
Of course, some requirements may be missed no matter what precautions aretaken, but several practices can help control additions to the task list. First, the projectmanager should allow only absolutely necessary requirements to be added after theproject begins. Even at that point, members of the project team should carefully assessthe ramifications of the addition and present the assessment to the users. For example,it may require two more person-months of work to create a newly defined report,which would throw off the entire project deadline by several weeks. Any change that is
84 Chapter 3 Project Management
If you assume the rest of the project is Do not change schedule. High risksimpler than the part that was late and is also simpler than believed when the original schedule estimates were made, you can make up lost time.
If you assume the rest of the project is Increase the entire schedule by the Moderate risksimpler than the part that was late total amount of time that you areand is no more complex than the behind (e.g., if you missed the original estimate assumed, you can’t scheduled date by two weeks, move make up the lost time, but you will the rest of the schedule dates to two not lose time on the rest of the weeks later). If you included paddedproject. time at the end of the project in the
original schedule, you may not have to change the promised system delivery date; you’ll just use up the padded time.
If you assume that the rest of the Increase the entire schedule by the Low riskproject is as complex as the part percentage of weeks that you arethat was late (your original estimates behind (e.g., if you are two weekstoo optimistic), then all the scheduled late on part of the project that wasdates in the future underestimate the supposed to take eight weeks, youreal time required by the same need to increase all remainingpercentage as the part that was late. time estimates by 25 percent). If
this moves the new delivery date beyond what is acceptable to the project sponsor, the scope of the project must be reduced.
Assumptions Actions Level of Risk
FIGURE 3-11Possible Actions Whena Schedule Date IsMissed

implemented should be carefully tracked so that an audit trail exists to measure thechange’s impact.
Sometimes changes cannot be incorporated into the present system even though theytruly would be beneficial. In this case, these additions to scope should be recorded as futureenhancements to the system. The project manager can offer to provide functionality infuture releases of the system, thus getting around telling someone no.
TimeboxingAnother approach to scope management is a technique called timeboxing. Up until now,we have described task-oriented projects. In other words, we have described projects thathave a schedule driven by the tasks that need to be accomplished, so the greater number oftasks and requirements, the longer the project will take. Some companies have littlepatience for development projects that take a long time, and these companies take a time-oriented approach that places meeting a deadline above delivering functionality.
Think about the use of word processing software. For 80 percent of the time, only20 percent of the features, such as the spelling checker, boldfacing, and cutting and past-ing, are used. Other features, such as document merging and creation of mailing labels,may be nice to have, but they are not a part of day-to-day needs. The same goes forother software applications; most users rely on only a small subset of their capabilities.Ironically, most developers agree that typically 75 percent of a system can be providedrelatively quickly, with the remaining 25 percent of the functionality demanding mostof the time.
To resolve this incongruency, the technique of timeboxing has become quite popular,especially when using RAD methodologies. This technique sets a fixed deadline for a pro-ject and delivers the system by that deadline no matter what, even if functionality needs tobe reduced. Timeboxing ensures that project teams don’t get hung up on the final finishingtouches that can drag out indefinitely, and it satisfies the business by providing a productwithin a relatively fast time frame.
There are several steps involved in implementing timeboxing on a project (see Fig-ure 3-12). First, set the date of delivery for the proposed goals. The deadline should notbe impossible to meet, so it is best to let the project team determine a realistic due date.Next, build the core of the system to be delivered; you will find that timeboxing helpscreate a sense of urgency and helps keep the focus on the most important features.Because the schedule is absolutely fixed, functionality that cannot be completed needsto be postponed. It helps if the team prioritizes a list of features beforehand to keeptrack of what functionality the users absolutely need. Quality cannot be compromised,regardless of other constraints, so it is important that the time allocated to activities isnot shortened unless the requirements are changed (e.g., don’t reduce the time allocatedto testing without reducing features). At the end of the time period, a high-quality sys-tem is delivered, but it is likely that future iterations will be needed to make changes andenhancements. In that case, the timeboxing approach can be used once again.
Creating and Managing the Workplan 85
1. Set the date for system delivery.2. Prioritize the functionality that needs to be included in the system.3. Build the core of the system (the functionality ranked as most important).4. Postpone functionality that cannot be provided within the time frame.5. Deliver the system with core functionality.6. Repeat steps 3 through 5 to add refinements and enhancements.
FIGURE 3-12Steps for Timeboxing
Evolutionary Work Breakdown Structures and Iterative WorkplansBecause object-oriented systems approaches to systems analysis and design support incre-mental and iterative development, any project planning approach for object-oriented sys-tems development also requires an incremental and iterative process. In the description ofthe enhanced Unified Process in Chapter 1, the development process was organized arounditerations, phases, and workflows. In many ways, a workplan for an incremental and itera-tive development process is organized in a similar manner. For each iteration, there are dif-ferent tasks executed on each workflow. This section describes an incremental and iterativeprocess using evolutionary WBSs for project planning that can be used with objects-orientedsystems development.
According to Royce,6 most approaches to developing conventional WBSs tend to havethree underlying problems:
1. They tend to be focused on the design of the information system being developed.As such, the creation of the WBS forces the premature decomposition of thesystem design and the tasks associated with creating the design of the system.Where the problem domain is well understood, tying the structure of the work-plan to the product to be created makes sense. However, in cases where theproblem domain is not well understood, the analyst must commit to the archi-tecture of the system being developed before the requirements of the system arefully understood.
2. They tend to force too many levels of detail very early on in the SDLC for largeprojects or they tend to allow too few levels of detail for small projects. Becausethe primary purpose of a WBS is to allow cost estimation and scheduling totake place, in conventional approaches to planning, the WBS must be donecorrectly and completely at the beginning of the SDLC. To say the least, this is
86 Chapter 3 Project Management
Travelers Insurance Company of Hartford Connecticuthas adopted agile development methodologies. The insur-ance field can be competitive, and Travelers wanted tohave the shortest “time to implement” in the field. Travelersset up development teams of six people: two systems ana-lysts, two representatives from the user group (such asclaim services), a project manager, and a clerical supportperson. In the agile approach, the users are physicallyassigned to the development team for the project.Although at first it might seem that the users might just besitting around drinking coffee and watching the develop-ers come up with appropriate software solutions, that isnot the case. The rapport that is developed within the
team allows for instant communication. The interaction isvery deep and profound. The resulting software product isdelivered quickly—and generally with all the features andnuances that the users wanted.
Questions
1. Could this be done differently, such as by using JADsessions or having the users review the program ona weekly basis rather than taking the users awayfrom their real job to work on development?
2. What mind-set does an analyst need to work onsuch an approach?
3-C Faster Products to Market—with ITCONCEPTS
IN ACTION
6 Walker Royce, Software Project Management: A Unified Framework (Reading, MA: Addison-Wesley, 1998).
a very difficult task to accomplish with any degree of validity. In such cases, itis no wonder that cost and schedule estimation for many information systemsdevelopment projects tend to be wildly inaccurate.
3. Because they are project specific, they are very difficult to compare across projects.This leads to ineffective learning across the organization. Without some standardapproach to create WBSs, it is difficult for project managers to learn from previ-ous projects managed by others. This tends to encourage the “reinventing of thewheel” and allows managers to make the same mistakes that previous managershave made.
Evolutionary WBSs allow the analyst to address all three problems by allowing thedevelopment of an iterative workplan. First, evolutionary WBSs are organized in a stan-dard manner across all projects: by workflows, phases, and then tasks. This decouples thestructure of an evolutionary WBS from the structure of the design of the product. Thisprevents prematurely committing to a specific architecture of a new system. Second, evo-lutionary WBSs are created in an incremental and iterative manner. The first evolutionaryWBS is typically only done for the aspects of the project understood by the analyst. Lateron, as the analyst understands more about the evolving development process, more detailsare added to the WBS. This encourages a more realistic view of both cost and scheduleestimation. Third, because the structure of an evolutionary WBS is not tied to any specificproject, evolutionary WBSs enable the comparison of the current project to earlier projects.This supports learning from past successes and failures.
In the case of the enhanced Unified Process, the workflows are the major points listedin the WBS. Next, each workflow is decomposed along the phases of the enhanced UnifiedProcess. After that, each phase is decomposed along the tasks that are to be completed tocreate the deliverables associated with the phase. The tasks listed for each workflowdepend upon the level of activity on the workflow during each phase (see Figure 1-11).For example, typical activities for the inception phase of the requirements workflowwould be to interview stakeholders, develop a vision document, and develop use cases,whereas there are probably no tasks associated with the inception phase of the operationsand support workflow. The template for the first two levels of an evolutionary WBS forthe enhanced Unified Process would look like Figure 3-13. As each iteration through thedevelopment process is completed, additional tasks are added to the WBS to reflect thecurrent understanding of the remaining tasks to be completed (i.e., the WBS evolves alongwith the evolving information system). As such, the workplan is developed in an incre-mental and iterative manner. 7 A sample evolutionary WBS for the planning of the incep-tion phase of the enhanced Unified Process, based on Figures 1-11 and 3-13, is shown inFigure 3-14. Notice that the last two tasks for the project management workflow are “cre-ate workplan for first iteration of the elaboration phase” and “assess the inception phase;”that is, the last two things to do are to plan for the next iteration in the development ofthe evolving system and to assess the current iteration. As the project moves through thelater phases, each workflow has tasks added. For example, the analysis workflow will havethe creation of the functional, structural, and behavioral models created during the elab-oration phase. This approach allows the workplan to evolve through the iterations andphases of the development process.
Creating and Managing the Workplan 87
7 A set of good sources that help explain this approach are Phillippe Krutchen, “Planning an Iterative Project,”The Rational Edge (October 2002); and Eric Lopes Cordoza and D.J. de Villiers, “Project Planning Best Practices,”The Rational Edge (August 2003).

88 Chapter 3 Project Management
I. Business Modeling
a. Inception
1. Understand current business situation 0.50 days
2. Uncover business process problems 0.25 days
3. Identify potential projects 0.25 days
b. Elaboration
c. Construction
d. Transition
e. Production
II. Requirements
a. Inception
1. Identify appropriate requirements analysis technique 0.25 days
2. Identify appropriate requirements gathering techniques 0.25 days
3. Identify functional and nonfunctional requirements II.a.1, II.a.2
A. Perform JAD sessions 3 days
B. Perform document analysis 5 days II.a.3.A
Duration Dependency
I. Business Modeling
a. Inception
b. Elaboration
c. Construction
d. Transition
e. Production
II. Requirements
a. Inception
b. Elaboration
c. Construction
d. Transition
e. Production
III. Analysis
a. Inception
b. Elaboration
c. Construction
d. Transition
e. Production
IV. Design
a. Inception
b. Elaboration
c. Construction
d. Transition
e. Production
V. Implementation
a. Inception
b. Elaboration
c. Construction
d. Transition
e. Production
VI. Test
a. Inception
b. Elaboration
c. Construction
d. Transition
e. Production
VII. Deployment
a. Inception
b. Elaboration
c. Construction
d. Transition
e. Production
VIII. Configuration and Change Management
a. Inception
b. Elaboration
c. Construction
d. Transition
e. Production
IX. Project Management
a. Inception
b. Elaboration
c. Construction
d. Transition
e. Production
X. Environmenta. Inception
b. Elaboration
c. Construction
d. Transition
e. Production
XI. Operations and Support
a. Inception
b. Elaboration
c. Construction
d. Transition
e. Production
XII. Infrastructure Management
a. Inception
b. Elaboration
c. Construction
d. Transition
e. Production
FIGURE 3-13Evolutionary WBS Template for theEnhanced UnifiedProcess
FIGURE 3-14Evolutionary WBS for aSingle Iteration–basedInception Phase

Creating and Managing the Workplan 89
C. Conduct interviews II.a.3.A
1. Interview project sponsor 0.5 days
2. Interview inventory system contact 0.5 days
3. Interview special order system contact 0.5 days
4. Interview ISP contact 0.5 days
5. Interview CD Selection Web contact 0.5 days
6. Interview other personnel 1 day
D. Observe retail store processes 0.5 days II.a.3.A
4. Analyze current systems 4 days II.a.1, II.a.2
5. Create requirements definition II.a.3, II.a.4
A. Determine requirements to track 1 day
B. Compile requirements as they are elicited 5 days II.a.5.A
C. Review requirements with sponsor 2 days II.a.5.B
b. Elaboration
c. Construction
d. Transition
e. Production
III. Analysis
a. Inception
1. Identify business processes 3 days
2. Identify use cases 3 days III.a.1
b. Elaboration
c. Construction
d. Transition
e. Production
IV. Design
a. Inception
1. Identify potential classes 3 days III.a
b. Elaboration
c. Construction
d. Transition
e. Production
V. Implementation
a. Inception
b. Elaboration
c. Construction
d. Transition
e. Production
VI. Test
a. Inception
b. Elaboration
c. Construction
d. Transition
e. Production
Duration Dependency
FIGURE 3-14Continued

90 Chapter 3 Project Management
VII. Deployment
a. Inception
b. Elaboration
c. Construction
d. Transition
e. Production
VIII. Configuration and Change Management
a. Inception
1. Identify necessary access controls for developed artifacts 0.25 days
2. Identify version control mechanisms for developed artifacts 0.25 days
b. Elaboration
c. Construction
d. Transition
e. Production
IX. Project Management
a. Inception
1. Create workplan for the inception phase 1 day
2. Create system request 1 day
3. Perform feasibility analysis IX.a.2
A. Perform technical feasibility analysis 1 day
B. Perform economic feasibility analysis 2 days
C. Perform organizational feasibility analysis 2 days
4. Identify project size 0.50 days IX.a.3
5. Identify staffing requirements 0.50 days IX.a.4
6. Compute cost estimate 0.50 days IX.a.5
7. Create workplan for first iteration of the elaboration phase 1 day IX.a.1
8. Assess inception phase 1 day I.a, II.a, III.a
IV.a, V.a, VI.a
VII.a, VIII.a,
IX.a, X.a, XI.a
XII.a
b. Elaboration
c. Construction
d. Transition
e. Production
X. Environment
a. Inception
1. Acquire and install CASE tool 0.25 days
2. Acquire and install programming environment 0.25 days
3. Acquire and install configuration and change management tools 0.25 days
4. Acquire and install project management tools 0.25 days
b. Elaboration
c. Construction
Duration Dependency
FIGURE 3-14Continued
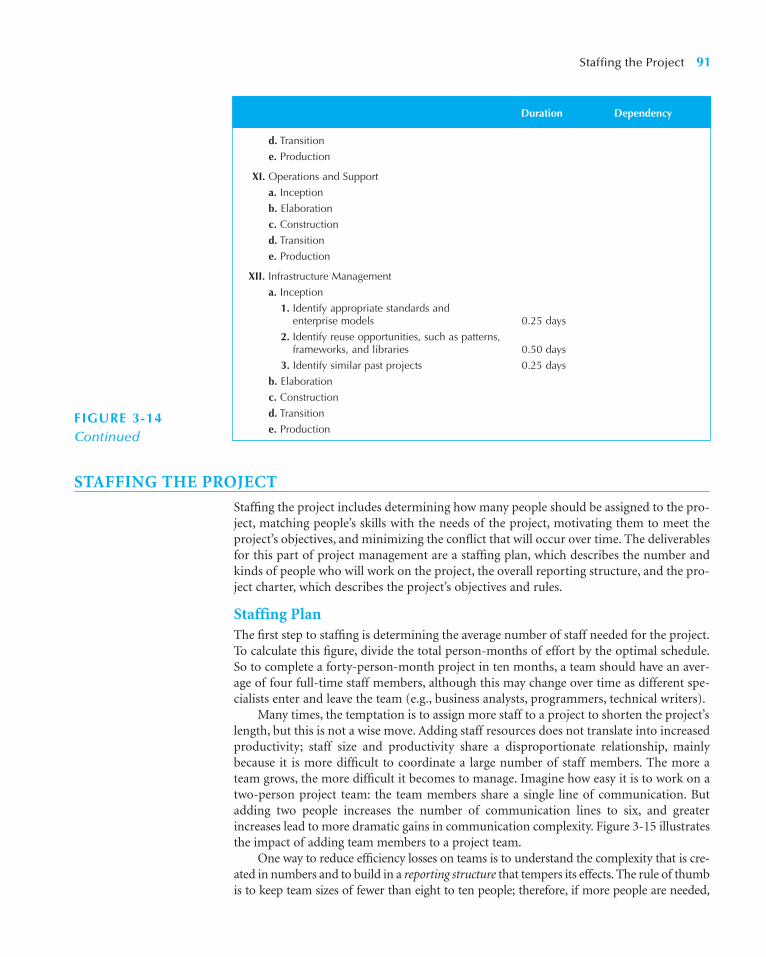
Staffing the Project 91
d. Transition
e. Production
XI. Operations and Support
a. Inception
b. Elaboration
c. Construction
d. Transition
e. Production
XII. Infrastructure Management
a. Inception
1. Identify appropriate standards and enterprise models 0.25 days
2. Identify reuse opportunities, such as patterns, frameworks, and libraries 0.50 days
3. Identify similar past projects 0.25 days
b. Elaboration
c. Construction
d. Transition
e. Production
Duration Dependency
STAFFING THE PROJECT
Staffing the project includes determining how many people should be assigned to the pro-ject, matching people’s skills with the needs of the project, motivating them to meet theproject’s objectives, and minimizing the conflict that will occur over time. The deliverablesfor this part of project management are a staffing plan, which describes the number andkinds of people who will work on the project, the overall reporting structure, and the pro-ject charter, which describes the project’s objectives and rules.
Staffing PlanThe first step to staffing is determining the average number of staff needed for the project.To calculate this figure, divide the total person-months of effort by the optimal schedule.So to complete a forty-person-month project in ten months, a team should have an aver-age of four full-time staff members, although this may change over time as different spe-cialists enter and leave the team (e.g., business analysts, programmers, technical writers).
Many times, the temptation is to assign more staff to a project to shorten the project’slength, but this is not a wise move. Adding staff resources does not translate into increasedproductivity; staff size and productivity share a disproportionate relationship, mainlybecause it is more difficult to coordinate a large number of staff members. The more ateam grows, the more difficult it becomes to manage. Imagine how easy it is to work on atwo-person project team: the team members share a single line of communication. Butadding two people increases the number of communication lines to six, and greaterincreases lead to more dramatic gains in communication complexity. Figure 3-15 illustratesthe impact of adding team members to a project team.
One way to reduce efficiency losses on teams is to understand the complexity that is cre-ated in numbers and to build in a reporting structure that tempers its effects. The rule of thumbis to keep team sizes of fewer than eight to ten people; therefore, if more people are needed,
FIGURE 3-14Continued

92 Chapter 3 Project Management
FIGURE 3-15Increasing Complexitywith Larger Teams
Two-person team Four-person team
Eight-person teamSix-person team
create subteams. In this way, the project manager can keep the communication effectivewithin small teams, which, in turn, communicate to contact at a higher level in the project.
After the project manager understands how many people are needed for the project,he or she creates a staffing plan that lists the roles that are required for the project and theproposed reporting structure for the project. Typically, a project will have one projectmanager, who oversees the overall progress of the development effort, with the core of theteam comprising the various types of analysts described in Chapter 1. A functional lead isusually assigned to manage a group of analysts, and a technical lead oversees the progressof a group of programmers and more technical staff members.
There are many structures for project teams; Figure 3-16 illustrates one possible con-figuration of a project team. After the roles are defined and the structure is in place, theproject manager needs to think about which people can fill each role. Often, one personfills more than one role on a project team.
When you make assignments, remember that people have technical skills and interper-sonal skills, and both are important on a project. Technical skills are useful when workingwith technical tasks (e.g., programming in Java) and in trying to understand the various rolesthat technology plays in the particular project (e.g., how a Web server should be configuredon the basis of a projected number of hits from customers).

Interpersonal skills, on the other hand, include interpersonal and communication abilitiesthat are used when dealing with business users, senior management executives, and othermembers of the project team. They are particularly critical when performing the requirements-gathering activities and when addressing organizational feasibility issues. Each project willrequire unique technical and interpersonal skills. For example, a Web-based project may requireInternet experience or Java programming knowledge, whereas a highly controversial projectmay need analysts who are particularly adept at managing political or volatile situations.
Ideally, project roles are filled with people who have the right skills for the job. How-ever, the people who fit the roles best may not be available; they may be working on otherprojects, or they may not exist in the company. Therefore, assigning project team membersreally is a combination of finding people with the appropriate skill sets and finding peoplewho are available. When the skills of the available project team members do not matchwhat is actually required by the project, the project manager has several options to improvethe situation. First, people can be pulled off other projects, and resources can be shuffledaround. This is the most disruptive approach from the organization’s perspective. Anotherapproach is to use outside help—such as a consultant or contractor—to train team mem-bers and start them off on the right foot. Training classes are usually available for both tech-nical and interpersonal instruction if time is available. Mentoring may also be an option; aproject team member can be sent to work on another similar project so that he or she canreturn with skills to apply to the current job.
Staffing the Project 93
Functionallead
Projectmanager
ProgrammerAnalyst Analyst Analyst Programmer
Technicallead
FIGURE 3-16Possible ReportingStructure
Now it is time to staff the project that was described inYour Turn 3-1. On the basis of the effort required for theproject (Your Turn 3-2), how many people will be neededon the project? Given this number, select classmates whowill work with you on your project.
Questions
1. What roles will be needed to develop the project?List them and write short descriptions for each of
these roles, almost as if you had to advertise the posi-tions in a newspaper.
2. Which roles will each classmate perform? Will somepeople perform multiple roles?
3. What will the reporting structure be for the project?
3-3 Staffing PlanYOUR
TURN
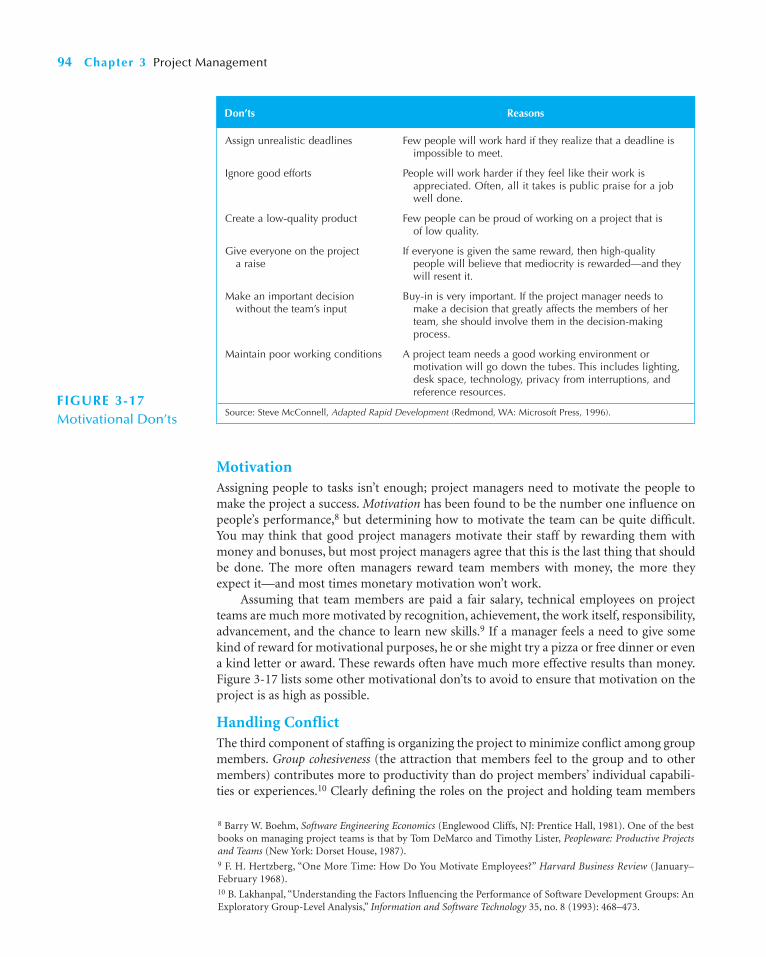
MotivationAssigning people to tasks isn’t enough; project managers need to motivate the people tomake the project a success. Motivation has been found to be the number one influence onpeople’s performance,8 but determining how to motivate the team can be quite difficult.You may think that good project managers motivate their staff by rewarding them withmoney and bonuses, but most project managers agree that this is the last thing that shouldbe done. The more often managers reward team members with money, the more theyexpect it—and most times monetary motivation won’t work.
Assuming that team members are paid a fair salary, technical employees on projectteams are much more motivated by recognition, achievement, the work itself, responsibility,advancement, and the chance to learn new skills.9 If a manager feels a need to give somekind of reward for motivational purposes, he or she might try a pizza or free dinner or evena kind letter or award. These rewards often have much more effective results than money.Figure 3-17 lists some other motivational don’ts to avoid to ensure that motivation on theproject is as high as possible.
Handling ConflictThe third component of staffing is organizing the project to minimize conflict among groupmembers. Group cohesiveness (the attraction that members feel to the group and to othermembers) contributes more to productivity than do project members’ individual capabili-ties or experiences.10 Clearly defining the roles on the project and holding team members
94 Chapter 3 Project Management
8 Barry W. Boehm, Software Engineering Economics (Englewood Cliffs, NJ: Prentice Hall, 1981). One of the bestbooks on managing project teams is that by Tom DeMarco and Timothy Lister, Peopleware: Productive Projectsand Teams (New York: Dorset House, 1987).9 F. H. Hertzberg, “One More Time: How Do You Motivate Employees?” Harvard Business Review (January–February 1968).10 B. Lakhanpal, “Understanding the Factors Influencing the Performance of Software Development Groups: AnExploratory Group-Level Analysis,” Information and Software Technology 35, no. 8 (1993): 468–473.
Assign unrealistic deadlines Few people will work hard if they realize that a deadline is impossible to meet.
Ignore good efforts People will work harder if they feel like their work is appreciated. Often, all it takes is public praise for a jobwell done.
Create a low-quality product Few people can be proud of working on a project that is of low quality.
Give everyone on the project If everyone is given the same reward, then high-quality a raise people will believe that mediocrity is rewarded—and they
will resent it.
Make an important decision Buy-in is very important. If the project manager needs to without the team’s input make a decision that greatly affects the members of her
team, she should involve them in the decision-makingprocess.
Maintain poor working conditions A project team needs a good working environment or motivation will go down the tubes. This includes lighting,desk space, technology, privacy from interruptions, andreference resources.
Source: Steve McConnell, Adapted Rapid Development (Redmond, WA: Microsoft Press, 1996).
Don’ts Reasons
FIGURE 3-17Motivational Don’ts

accountable for their tasks is a good way to begin mitigating potential conflict on a project.Some project managers develop a project charter, which lists the project’s norms and groundrules. For example, the charter may describe when the project team should be at work, whenstaff meetings will be held, how the group will communicate with each other, and the pro-cedures for updating the workplan as tasks are completed. Figure 3-18 lists additional tech-niques that can be used at the start of a project to keep conflict to a minimum.
Staffing the Project 95
Some animals are extremely valuable. For centuries,horse thieves have stolen horses, so now most horseshave tattoos in their mouths. Likewise, purebred pets,such as dog show winners, are valuable animals. What ifthere were a better way to positively identify valuableanimals?
Radio frequency identification (or RFID) has beenused for many years in airplanes and on toll roads (likeEZPass and FaneLane in the United States) as well as inlibraries so that books and materials are not taken out ofthe library without being checked out. With RFID, a low-frequency radio transmitter, when bombarded with aradio wave, replies with a unique signal. Some animalowners have inserted RFID chips into their pets’ shouldersso that they can be identified. The code is unique andcannot be changed. It would be possible to track a stolen
race horse if the horse came into range of an RFID device.Likewise, a pet shop or a veterinarian could identify avaluable pet.
Questions
1. If you were working for a state consumer-protectionagency, what requirements might you place on petshops to ensure that animals for sale have not beenstolen?
2. What technological requirements might be neededin the system proposal?
3. What ethical issues might be involved?4. If your system project team did not have the correct
technical background, what might you do?
3-D RFID—Promising Technology?CONCEPTS
IN ACTION
• Clearly define plans for the project.
• Make sure the team understands how the project is important to the organization.
• Develop detailed operating procedures and communicate these to the team members.
• Develop a project charter.
• Develop schedule commitments ahead of time.
• Forecast other priorities and their possible impact on project.
Source: H. J. Thamhain and D. L. Wilemon, “Conflict Management in Project Life Cycles,” Sloan ManagementReview (Spring 1975).
FIGURE 3-18Conflict-AvoidanceStrategies
Get together with several of your classmates and pretendthat you are all staffed on the project described in YourTurn 3-1. Discuss what would most motivate each of youto perform well on the project. List three potential sourcesof conflict that could surface as you work together.
Question
Develop a project charter that lists five rules that all teammembers will need to follow. How might these rules helpavoid potential team conflict?
3-4 Project CharterYOUR
TURN

COORDINATING PROJECT ACTIVITIES
Like all project management responsibilities, the act of coordinating project activities con-tinues throughout the entire project, until a system is delivered to the project sponsor andend users. This step includes putting efficient development practices in place and mitigatingrisk. These activities occur over the course of the entire SDLC, but it is at this point in theproject when the project manager needs to put them in place. Ultimately, these activitiesensure that the project stays on track and that the chance of failure is kept at a minimum.
Case ToolsComputer-aided software engineering (CASE) is a category of software that automates all orpart of the development process. Some CASE software packages are used primarily duringthe analysis phase to create integrated diagrams of the system and to store informationregarding the system components (often called upper CASE), whereas others are design-phase tools that create the diagrams and then generate code for database tables and systemfunctionality (often called lower CASE). Integrated CASE, or I-CASE, contains functionalityfound in both upper CASE and lower CASE tools in that it supports tasks that happenthroughout the SDLC. CASE comes in a wide assortment of flavors in terms of complexityand functionality, and there are many good programs available in the marketplace(e.g., Visible Analyst Workbench, Oracle Designer/2000, Rational Rose, Logic Works suite).
The benefits of using CASE are numerous. With CASE tools, tasks can be completed andaltered much faster, development information is centralized, and information is illustratedthrough diagrams, which are typically easier to understand. Potentially, CASE can reducemaintenance costs, improve software quality, and enforce discipline, and some projectteams even use CASE to assess the magnitude of changes to the project.
Of course, like anything else, CASE should not be considered a silver bullet for projectdevelopment. The advanced CASE tools are complex applications that require significanttraining and experience to achieve real benefits. Often, CASE serves only as a glorified dia-gramming tool. Our experience has shown that CASE is a helpful way to support the com-munication and sharing of project diagrams and technical specifications—as long as it isused by trained developers who have applied CASE on past projects.
The central component of any CASE tool is the CASE repository, otherwise known asthe information repository or data dictionary. The CASE repository stores the diagramsand other project information, such as screen and report designs, and it keeps track of howthe diagrams fit together. For example, most CASE tools will warn you if you place a fieldon a screen design that doesn’t exist in your data model. As the project evolves, project teammembers perform their tasks using CASE. As you read through the textbook, we will indi-cate when and how the CASE tool can be used so that you can see how CASE supports theproject tasks.
96 Chapter 3 Project Management
Select a CASE tool—either one that you will use for class,a program that you own, or a tool that you can examineover the Web. Create a list of the capabilities that areoffered by the CASE tool.
Question
Would you classify the CASE as upper CASE, lowerCASE, or I-CASE? Why?
3-5 Computer-Aided Software Engineering Tool AnalysisYOUR
TURN

StandardsMembers of a project team need to work together, and most project management soft-ware and CASE tools provide access privileges to everyone working on the system. Whenpeople work together, however, things can get pretty confusing. To make matters worse,people sometimes are reassigned in the middle of a project. It is important that their pro-ject knowledge does not leave with them and that their replacements can get up to speedquickly.
One way to make certain that everyone is performing tasks in the same way and fol-lowing the same procedures is to create standards that the project team must follow.Standards can range from formal rules for naming files to forms that must be completedwhen goals are reached to programming guidelines. Figure 3-19 shows some examplesof the types of standards that a project may create. When a team forms standards andthen follows them, the project can be completed faster because task coordinationbecomes less complex.
Standards work best when they are created at the beginning of each major phase of theproject and communicated clearly to the entire project team. As the team moves forward, newstandards are added when necessary. Some standards (e.g., file naming conventions, status
Coordinating Project Activities 97
FIGURE 3-19A Sampling of ProjectStandards
Documentation standards The date and project name should appear as a header on all documentation.
All margins should be set to 1 inch.
All deliverables should be added to the project binder and recorded in its table of contents.
Coding standards All modules of code should include a header that lists the programmer, last date of update, and a short descriptionof the purpose of the code.
Indentation should be used to indicate loops, if-then-elsestatements, and case statements.
On average, every program should include one line of comments for every five lines of code.
Procedural standards Record actual task progress in the work plan every Mondaymorning by 10 AM.
Report to project update meeting on Fridays at 3:30 PM.
All changes to a requirements document must be approved by the project manager.
Specification requirement standards Name of program to be created
Description of the program’s purpose
Special calculations that need to be computed
Business rules that must be incorporated into the program
Pseudocode
Due date
User interface design standards Labels will appear in boldface text, left-justified, and followed by a colon.
The tab order of the screen will move from top left to bottom right.
Accelerator keys will be provided for all updatable fields.
Types of Standards Examples

reporting) are applied to the entire SDLC, whereas others (e.g., programming guidelines) areappropriate only for certain tasks.
DocumentationA final technique that project teams put in place during the planning phase is good docu-mentation, which includes detailed information about the tasks of the SDLC. Often, thedocumentation is stored in project binder(s) that contain all the deliverables and all theinternal communication that takes place—the history of the project.
A poor project management practice is waiting until the last minute to createdocumentation; this typically leads to an undocumented system that no one under-stands. In fact, many problems that companies had updating their systems to handlethe year 2000 crisis were the result of the lack of documentation. Good project teamslearn to document a system’s history as it evolves while the details are still fresh intheir memory.
The first step to setting up documentation is to get some binders and include dividerswith which to separate content according to the major phases of the project. An additionaldivider should contain internal communication, such as the minutes from status meetings,written standards, letters to and from the business users, and a dictionary of relevant busi-ness terms. Then, as the project moves forward, the deliverables from each task can be putinto the project binder with descriptions so that someone outside of the project will be ableto understand it. Also, a table of contents should be kept up to date with the content thatis added. Documentation takes time up front, but it is a good investment that will pay offin the long run.
98 Chapter 3 Project Management
I once started on a small project (four people) in whichthe original members of the project team had not set upany standards for naming electronic files. Two weeksinto the project, I was asked to write a piece of code thatwould be referenced by other files that had already beenwritten. When I finished my piece, I had to go back tothe other files and make changes to reflect my newwork. The only problem was that the lead programmerdecided to name the files using his initials (e.g.,GG1.prg, GG2.prg, GG3.prg)—and there were morethan 200 files! I spent two days opening every one ofthose files because there was no way to tell what theircontents were.
Needless to say, from then on, the team created acode for file names that provided basic informationregarding the file’s contents, and they kept a log thatrecorded the file name, its purpose, the date of the lastupdate, and the programmer for every file on the project.
—Barbara Wixom
Question
Think about a program that you have written in the past.Would another programmer be easily able to makechanges to it? Why or why not?
3-E Poor Naming StandardsCONCEPTS
IN ACTION
Managing RiskOne final facet of project management is risk management, the process of assessing andaddressing the risks that are associated with developing a project. Many things can causerisks: weak personnel, scope creep, poor design, and overly optimistic estimates. The pro-ject team must be aware of potential risks so that problems can be avoided or controlledwell ahead of time.

Typically, project teams create a risk assessment, or a document that tracks potentialrisks along with an evaluation of the likelihood of each risk and its potential impact on theproject (Figure 3-20). A paragraph or two is also included to explain potential ways that therisk can be addressed. There are many options: the risk could be publicized, avoided, oreven eliminated by dealing with its root cause. For example, imagine that a project teamplans to use new technology but its members have identified a risk in the fact that its mem-bers do not have the right technical skills. They believe that tasks may take much longer toperform because of a high learning curve. One plan of attack could be to eliminate the rootcause of the risk—the lack of technical experience by team members—by finding the timeand resources needed to provide proper training to the team.
Most project managers keep abreast of potential risks, even prioritizing them accord-ing to their magnitude and importance. Over time, the list of risks will change as someitems are removed and others surface. The best project managers, however, work hard tokeep risks from having an impact on the schedule and costs associated with the project.
Coordinating Project Activities 99
Dawn Adams, Senior Manager with Asymetrix Consult-ing, has renamed the SDLC phases:
1. Pudding (Planning)2. Silly Putty (Analysis)3. Concrete (Design)4. Touch-this-and-you’re-dead-sucker (Implementation)
Adams also uses icons, such as a skull and crossbonesfor the implementation phase. The funny labels lend anew depth of interest to a set of abstract concepts. Buther names have had another benefit. “I had one partici-pant who adopted the names wholeheartedly,” she says,
“including my icons. He posted an icon on his officedoor for the duration of each of the phases, and he foundit much easier to deal with requests for changes from theclient, who could see the increasing difficulty of the changesright there on the door.”
Source: Learning Technology Shorttakes 1, no. 2 (Wednesday, August 26,1998).
Question
What would you do if your project sponsor demandedthat an important change be made during the “touch-this-and-you’re-dead-sucker” phase?
3-F The Real Names of the SDLC PhasesCONCEPTS
IN ACTION
Risk Assessment
RISK 1: The development of this system likely will be slowed considerably because project team members have notprogrammed in Java prior to this project.
Likelihood of risk: High probability of risk.
Potential impact on the project: This risk will probably increase the time to complete programming tasks by 50 percent.
Ways to address this risk:
It is very important that time and resources are allocated to up-front training in Java for theprogrammers who are used for this project. Adequate training will reduce the initial learningcurve for Java when programming begins. Additionally, outside Java expertise should bebrought in for at least some part of the early programming tasks. This person should be usedto provide experiential knowledge to the project team so that JAVA-related issues (of whichnovice Java programmers would be unaware) are overcome.
RISK 2: …
FIGURE 3-20Sample Risk Assessment

APPLYING THE CONCEPTS AT CD SELECTIONS
Alec Adams was very excited about managing the Internet Sales System project at CD Selec-tions, but he realized that his project team would have very little time to deliver at leastsome parts of the system because the company wanted the application developed in timefor the holiday season. Therefore, he decided that the project should follow an enhancedUnified Process–based approach (see Figure 1-11). In this way, he could be sure that someversion of the product would be in the hands of the users within several months, even ifthe completed system would be delivered at a later date.
As project manager, Alec had to estimate the project’s size, effort, and schedule—someof his least favorite jobs because of how tough they are to do at the very beginning of a pro-ject. But he knew that the users would expect at least general ranges for a product deliverydate. He began by attempting to estimate the size of the project using function points and thefunction point estimation worksheet in Figure 3-3. For the Web part of the system to be usedby customers, he could think of four main queries (searching by artist, by CD title, by songtitle, and by ad hoc criteria), three input screens (selecting a CD, entering information to put
100 Chapter 3 Project Management
As Seattle University’s David Umphress has pointed out,watching most organizations develop systems is likewatching reruns of Gilligan’s Island. At the beginning ofeach episode, someone comes up with a cockamamiescheme to get off the island that seems to work for awhile, but something goes wrong and the castaways findthemselves right back where they started—stuck on theisland. Similarly, most companies start new projects withgrand ideas that seem to work, only to make a classic mis-take and deliver the project behind schedule, over bud-get, or both. Here we summarize four classic mistakes inthe planning and project management aspects of the pro-ject and discuss how to avoid them:
1. Overly optimistic schedule: Wishful thinking canlead to an overly optimistic schedule that causesanalysis and design to be cut short (missing keyrequirements) and puts intense pressure on the programmers, who produce poor code (full of bugs).Solution: Don’t inflate time estimates; instead,explicitly schedule slack time at the end of eachphase to account for the variability in estimates,using the margins of error from Figure 3-10.
2. Failing to monitor the schedule: If the team does notregularly report progress, no one knows if the pro-ject is on schedule.
Solution: Require team members to report progress(or the lack or progress) honestly every week. There isno penalty for reporting a lack of progress, but thereare immediate sanctions for a misleading report.
3. Failing to update the schedule: When a part of theschedule falls behind (e.g., information gatheringuses all the slack in item 1 plus 2 weeks), a projectteam often thinks it can make up the time later byworking faster. It can’t. This is an early warning thatthe entire schedule is too optimistic.Solution: Immediately revise the schedule andinform the project sponsor of the new end date oruse timeboxing to reduce functionality or move itinto future versions.
4. Adding people to a late project: When a projectmisses a schedule, the temptation is to add morepeople to speed it up. This makes the project takelonger because it increases coordination problemsand requires staff to take time to explain what hasalready been done.Solution: Revise the schedule, use timeboxing,throw away bug-filled code, and add people only towork on an isolated part of the project.
Source: Adapted from Steve McConnell, Rapid Development(Redmond, WA: Microsoft Press, 1996), pp. 29–50.
Avoiding Classic Planning MistakesPRACTICAL
TIP

Complexity
DescriptionTotal
Number Low Medium High Total
Inputs 6 0 * 3 4 * 4 2 * 6 28
Outputs 7 2 * 4 4 * 5 1 * 7 35
Queries 8 3 * 3 4 * 4 1 * 6 31
Files 4 0 * 7 4 * 10 0 * 15 40
Program Interfaces 3 0 * 5 2 * 7 1 * 10 24
Total Unadjusted Function Points (TUFP): 158
a CD on hold, and a special-order screen), four output screens (the home page with generalinformation, information about CDs, information about the customer’s special order, andthe hold status), three files (CD information, inventory information, and customer orders),and two program interfaces (one to the company’s special-order system and one that com-municates hold information to the retail store systems). For the part of the system to be usedby CD Selections staff (to maintain the marketing materials), he identified three additionalinputs, three outputs, four queries, one file, and one program interface. Based on the complex-ity of each, he entered the numbers into the upper portion of the worksheet (see Figure 3-21).Based on the computation, there were 158 total unadjusted function points (TUFP).
Rather than attempt to assess the complexity of the system in detail, Alec chose to usea value of 1.20 for the adjusted processing complexity (APC). He reasoned that the systemwas of medium complexity and that the project team had little experience with Internet-based systems. This produced a total adjusted function points (TAFP) of about 190.
Converting function points into lines of code was challenging. The project would use acombination of Java (for most programs) and HTML for the Web screens. Alec decided toassume that about 75 percent of the function points would be Java and 25 percent would beHTML. Using the table in Figure 3-4, Alec estimated that there would be about 10,600 linesof code. Using the COCOMO formula, he found that this translated into about 15 person-months of effort. This in turn suggested a schedule time of about 7.5 months. Because thedevelopment team had very little experience in developing this type of system, Alec wasnot very sure of the estimate. After much deliberation, Alec decided to pad the estimate by33 percent. As such, Alec estimated that the project would take about 10 months.
Once the estimation was underway, Alec began to create an evolutionary work break-down structure and iterative workplan to identify the tasks that would be needed to com-plete the system. He started by reviewing the enhanced Unified Process phases andworkflows (see Figure 1-11) and the evolutionary work breakdown structure template (seeFigure 3-14). At that point in time, Alec did not know enough to create a complete work-plan. As such, he included as much detail as he knew to be correct (see Figure 3-22).
Applying the Concepts at CD Selections 101
FIGURE 3-21Size and Effort Estimatefor the Internet SalesSystem
System Components
Assumed project adjusted processing complexity (APC) � 1.2
Total adjusted function points (TAFP): 1.2 * 158 � 189.6
Estimated lines of code: (.75 * 190 * 60) � (.25 * 190 * 43) � 10,600 lines of code
COCOMO effort estimate: (1.4 * 10.6) � 15 person-months
Estimated schedule: 3.0 * 151/3 � 7.5 months
Final effort estimate after pad: 1.34 * 7.5 � 10 months
Final personnel estimate: 15/10 � 1.5

102 Chapter 3 Project Management
I. Business Modeling
a. Inception
1. Understand current business situation
2. Uncover business process problems
3. Identify potential projects
b. Elaboration
c. Construction
d. Transition
e. Production
II. Requirements
a. Inception
1. Identify appropriate requirements analysis technique
2. Identify appropriate requirements gathering techniques
3. Identify functional and nonfunctional requirements II.a.1, II.a.2
4. Analyze current systems II.a.1, II.a.2
5. Create requirements definition II.a.3, II.a.4
A. Determine requirements to track
B. Compile requirements as they are elicited II.a.5.A
C. Review requirements with sponsor II.a.5.B
b. Elaboration
c. Construction
d. Transition
e. Production
III. Analysis
a. Inception
1. Identify business processes
2. Identify use cases III.a.1
b. Elaboration
c. Construction
d. Transition
e. Production
IV. Design
a. Inception
1. Identify potential classes III.a
b. Elaboration
c. Construction
d. Transition
e. Production
V. Implementation
a. Inception
b. Elaboration
c. Construction
d. Transition
e. Production
VI. Test
a. Inception
b. Elaboration
Duration Dependency
FIGURE 3-22Evolutionary WorkBreakdown Structurefor the Inception Phasefor CD Selections.

Applying the Concepts at CD Selections 103
c. Construction
d. Transition
e. Production
VII. Deployment
a. Inception
b. Elaboration
c. Construction
d. Transition
e. Production
VIII. Configuration and change management
a. Inception
1. Identify necessary access controls for developed artifacts
2. Identify version control mechanisms for developed artifacts
b. Elaboration
c. Construction
d. Transition
e. Production
IX. Project management
a. Inception
1. Create workplan for the inception phase
2. Create system request
3. Perform feasibility analysis IX.a.2
A. Perform technical feasibility analysisB. Perform economic feasibility analysisC. Perform organizational feasibility analysis
4. Identify project size IX.a.3
5. Identify staffing requirements IX.a.4
6. Compute cost estimate IX.a.5
7. Create workplan for first iteration of the elaboration phase IX.a.1
8. Assess inception phase I.a, II.a, III.a
IV.a, V.a, VI.a
VII.a, VIII.a,
IX.a, X.a, XI.a
XII.a
b. Elaboration
c. Construction
d. Transition
e. Production
X. Environment
a. Inception
1. Acquire and install CASE tool
2. Acquire and install programming environment
3. Acquire and install configuration and change management tools
4. Acquire and install project management tools
b. Elaboration
Duration Dependency
(Continued)
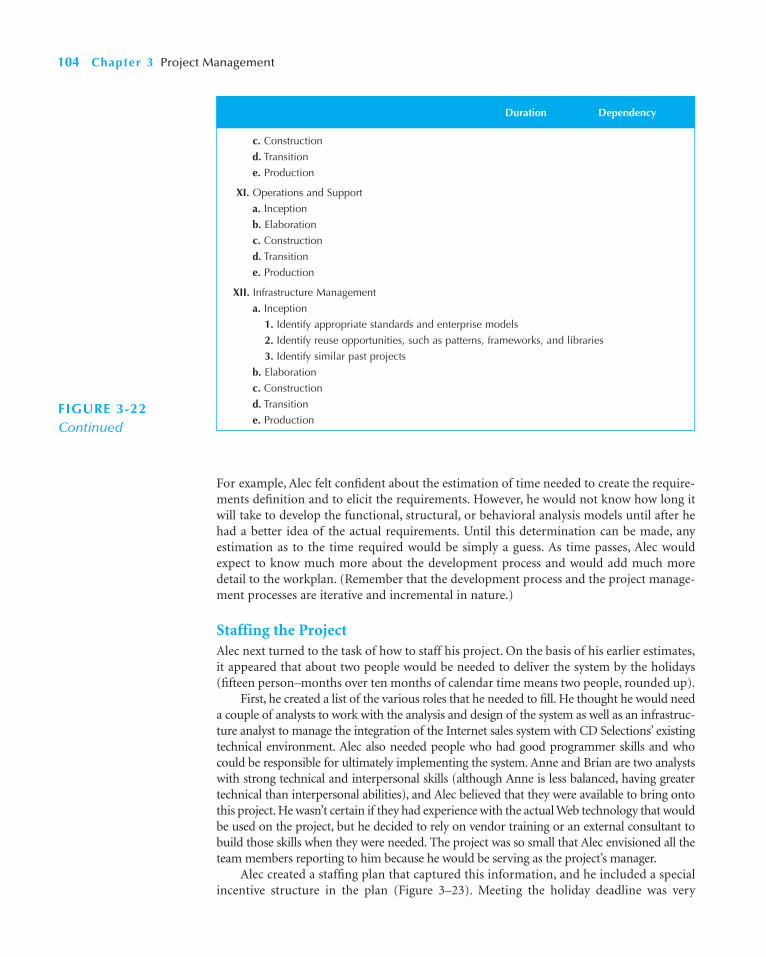
For example, Alec felt confident about the estimation of time needed to create the require-ments definition and to elicit the requirements. However, he would not know how long itwill take to develop the functional, structural, or behavioral analysis models until after hehad a better idea of the actual requirements. Until this determination can be made, anyestimation as to the time required would be simply a guess. As time passes, Alec wouldexpect to know much more about the development process and would add much moredetail to the workplan. (Remember that the development process and the project manage-ment processes are iterative and incremental in nature.)
Staffing the ProjectAlec next turned to the task of how to staff his project. On the basis of his earlier estimates,it appeared that about two people would be needed to deliver the system by the holidays(fifteen person–months over ten months of calendar time means two people, rounded up).
First, he created a list of the various roles that he needed to fill. He thought he would needa couple of analysts to work with the analysis and design of the system as well as an infrastruc-ture analyst to manage the integration of the Internet sales system with CD Selections’ existingtechnical environment. Alec also needed people who had good programmer skills and whocould be responsible for ultimately implementing the system. Anne and Brian are two analystswith strong technical and interpersonal skills (although Anne is less balanced, having greatertechnical than interpersonal abilities), and Alec believed that they were available to bring ontothis project. He wasn’t certain if they had experience with the actual Web technology that wouldbe used on the project, but he decided to rely on vendor training or an external consultant tobuild those skills when they were needed. The project was so small that Alec envisioned all theteam members reporting to him because he would be serving as the project’s manager.
Alec created a staffing plan that captured this information, and he included a specialincentive structure in the plan (Figure 3–23). Meeting the holiday deadline was very
104 Chapter 3 Project Management
c. Construction
d. Transition
e. Production
XI. Operations and Support
a. Inception
b. Elaboration
c. Construction
d. Transition
e. Production
XII. Infrastructure Management
a. Inception
1. Identify appropriate standards and enterprise models
2. Identify reuse opportunities, such as patterns, frameworks, and libraries
3. Identify similar past projects
b. Elaboration
c. Construction
d. Transition
e. Production
Duration Dependency
FIGURE 3-22Continued

important to the project’s success, so he decided to offer a day off to the team memberswho contributed to meeting that date. He hoped that this incentive would motivate theteam to work very hard. Alec also planned to budget money for pizza and sodas for timeswhen the team worked long hours.
Before he left for the day, Alec drafted a project charter, to be fine-tuned after the teamgot together for its kickoff meeting (i.e., the first time the project team gets together). Thecharter listed several norms that Alec wanted to put in place from the start to eliminate anymisunderstanding or problems that could come up otherwise (Figure 3–24).
Coordinating Project ActivitiesAlec wanted the Internet sales system project to be well coordinated, so he immediately putseveral practices in place to support his responsibilities. First, he acquired the CASE toolused at CD Selections and set up the product so that it could be used for the analysis tasks(e.g., drawing the functional, structural, and behavioral models). The team memberswould probably start creating diagrams and defining components of the system fairly earlyon. He pulled out some standards that he has used on all development projects and madea note to review them with his project team at the kickoff meeting for the system. He alsohad his assistant set up binders for the project deliverables that would start rolling in.Already, he was able to include the system request, feasibility analysis, initial workplan,staffing plan, project charter, standards list, and risk assessment.
Applying the Concepts at CD Selections 105
Project Manager Oversees the project to ensure that it meets its Alecobjectives in time and within budget.
Infrastructure Analyst Ensures the system conforms to infrastructure Annestandards at CD Selections.
Ensures that the CD Selections infrastructure can support the new system.
Systems Analyst Designs the information system—with a focus Anneon interfaces with the distribution system.
Systems Analyst Designs the information system—with a focus Brianon the data models and system performance.
Programmer Codes system. Anne
Reporting Structure: All project team members will report to Alec.Special Incentives: If the deadline for the project is met, all team members who contributed to thisgoal will receive a free day off to be taken over the holiday season.
Role Description Assigned To
FIGURE 3-23Staffing Plan for theInternet Sales System
Project objective: The Internet order system project team will create a working Web-based system to sell CDs to CD Selections’ customers in time for the holiday season.
The Internet order system team members will:
1. Attend a staff meeting each Friday at 2 PM. to report on the status of assigned tasks.2. Update the workplan with actual data each Friday by 5 PM.3. Discuss all problems with Alec as soon as they are detected.4. Agree to support each other when help is needed, especially for tasks that could hold back
the progress of the project.5. Post important changes to the project on the team bulletin board as they are made.
FIGURE 3-24Project Charter for theInternet Order System

SUMMARY
Project ManagementProject management is the second major component of planning of the SDLC, and itincludes four steps: identifying the project size, creating and managing the workplan, staffingthe project, and coordinating project activities. Project management is important in ensuringthat a system is delivered on time, within budget, and with the desired functionality.
Identifying Project SizeThe project manager estimates the amount of time and effort that will be needed to com-plete the project. First, the size is estimated by relying on past experiences or industry stan-dards or by calculating the function points, a measure of program size based on thenumber and complexity of inputs, outputs, queries, files, and program interfaces. Next, theproject manager calculates the effort for the project, which is a function of size and pro-duction rates. Algorithms such as the COCOMO model can be used to determine the effortvalue. Third, the optimal schedule for the project is estimated.
Creating And Managing the WorkplanOnce a project manager has a general idea of the size and approximate schedule for theproject, he or she creates a workplan, which is a dynamic schedule that records and keepstrack of all the tasks that need to be accomplished over the course of the project. To createa workplan, the project manager first identifies the work breakdown structure, or the tasksthat need to be accomplished, and then he or she determines how long the tasks will take.Important information about each task is entered into a workplan.
The workplan information can be presented graphically using Gantt and PERT charts.In the Gantt chart, horizontal bars are drawn to represent the duration of each task, and aspeople work on tasks, the appropriate bars are filled in proportionately to how much of thetask is finished. PERT charts are the best way to communicate task dependencies because theylay out the tasks as a flowchart in the order in which they need to be completed. The longestpath from the project inception to completion is referred to as the critical path.
Estimating what an IS development project will cost, how long it will take, and what thefinal system will actually do follows a hurricane model. The estimates become more accurateas the project progresses. One threat to the reliability of the estimates is scope creep, whichoccurs when new requirements are added to the project after the original project scope wasdefined and “frozen.” If the final schedule will not result in delivery of the system in a timelyfashion, timeboxing can be used. Timeboxing sets a fixed deadline for a project and deliversthe system by that deadline no matter what, even if functionality must be reduced.
Evolutionary work breakdown structures and iterative workplans better fit the typicalmethodologies associated with object-oriented systems development. They allow the pro-ject manager to provide more realistic estimates for each iteration, or build, of a system.Furthermore, they allow the workplan to be decoupled from the architecture of the system,thus allowing projects to be comparable. By supporting comparability among projects,evolutionary WBSs enable organizational learning to take place.
Staffing the ProjectStaffing involves determining how many people should be assigned to the project, assigningproject roles to team members, developing a reporting structure for the team, and matchingpeople’s skills with the needs of the project. Staffing also includes motivating the team tomeet the project’s objectives and minimizing conflict among team members. Both motivation
106 Chapter 3 Project Management

and cohesiveness have been found to greatly influence performance of team members inproject situations. Team members are motivated most by such nonmonetary things asrecognition, achievement, and the work itself. Conflict can be minimized by clearly definingthe roles on a project and holding team members accountable for their tasks. Some man-agers create a project charter that lists the project’s norms and ground rules.
Coordinating Project ActivitiesCoordinating project activities includes putting efficient development practices in placeand mitigating risk, and these activities occur over the course of the entire SDLC. Threetechniques are available to help coordinate activities on a project: CASE, standards, anddocumentation. CASE is a category of software that automates all or part of the develop-ment process; standards are formal rules or guidelines that project teams must follow dur-ing the project; and documentation includes detailed information about the tasks of theSDLC. Often, documentation is stored in project binders that contain all the deliverablesand all the internal communication that takes place—the history of the project. A riskassessment is used to mitigate risk because it identifies potential risks and evaluates thelikelihood of risk and its potential impact on the project.
Questions 107
KEY TERMS
Adjusted project complexity (APC)ComplexityComputer-aided software
engineering (CASE)CASE repositoryCOCOMO modelCritical path methodCritical taskDocumentationEffortEstimationEvolutionary WBSFunction pointFunction point approachFunctional leadGantt chartGroup cohesiveness
Hurricane modelIntegrated CASEIterative workplanInterpersonal skillsKickoff meetingLower CASEMethodologyMilestoneMotivationNodePERT ChartProject binderProject charterProject managementProject management softwareProject managerReporting structure
Risk assessmentRisk managementScope creepStaffing planStandardsTask dependencyTechnical leadTechnical skillsTimeboxingTotal adjusted function
points (TAFP)Total unadjusted function
points (TUFP)Trade-offsUpper CASEWork breakdown structure (WBS)Workplan
QUESTIONS
1. Why do many projects end up having unreasonabledeadlines? How should a project manager react tounreasonable demands?
2. What are the trade-offs that project managers mustmanage?
3. What are two basic ways to estimate the size of a project?4. What is a function point and how is it used?
5. Describe the three steps of the function point approach.6. What is the formula for calculating the effort for a
project?7. Name two ways to identify the tasks that need to be
accomplished over the course of a project.8. What is the difference between a methodology and a
workplan? How are the two terms related?

108 Chapter 3 Project Management
9. Compare and contrast the Gantt chart with the PERTchart.
10. Describe the hurricane model.11. What is scope creep, and how can it be managed?12. What is timeboxing, and why is it used?13. What are the problems associated with conventional
WBSs?14. What is an evolutionary WBS? How does it address
the problems associated with a conventional WBS?15. What is an iterative workplan?16. Describe the differences between a technical lead and
a functional lead. How are they similar?17. Describe three technical skills and three interpersonal
skills that would be very important to have on anyproject.
18. What are the best ways to motivate a team? What arethe worst ways?
19. List three techniques to reduce conflict.20. What is the difference between upper CASE and lower
CASE?21. Describe three types of standards and provide exam-
ples of each.22. What belongs in the project binder? How is the project
binder organized?23. Create a list of potential risks that could affect the out-
come of a project.24. Some companies hire consulting firms to develop the
initial project plans and manage the project but usetheir own analysts and programmers to develop thesystem. Why do you think some companies do this?
EXERCISES
A. Visit a project management Web site, such as the Pro-ject Management Institute (www.pmi.org). Most havelinks to project management software products, whitepapers, and research. Examine some of the links forproject management to better understand a variety ofInternet sites that contain information related to thischapter.
B. Select a specific project management topic such asCASE, project management software, or timeboxingand search for information on that topic using theWeb. The URL listed in exercise A or any search engine(e.g., Yahoo!, AltaVista, Excite, InfoSeek) can provide astarting point for your efforts.
C. Pretend that the career services office at your univer-sity wants to develop a system that collects studentrésumés and makes them available to students andrecruiters over the Web. Students should be able toinput their résumé information into a standardrésumé template. The information then is presented ina résumé format, and it also is placed in a database thatcan be queried using an online search form. You havebeen placed in charge of the project. Develop a planfor estimating the project. How long do you think itwould take for you and three other students to com-plete the project? Provide support for the schedulethat you propose.
D. Refer to the situation in exercise C. You have been toldthat recruiting season begins a month from today andthat the new system must be used. How would youapproach this situation? Describe what you can do as
the project manager to make sure that your teamdoes not burn out from unreasonable deadlines andcommitments.
E. Consider the system described in exercise C. Create aworkplan listing the tasks that will need to be com-pleted to meet the project’s objectives. Create a Ganttchart and a PERT chart in a project management tool(e.g., Microsoft Project) or using a spreadsheet pack-age to graphically show the high level tasks of theproject.
F. Suppose that you are in charge of the project that isdescribed in exercise C and the project will be staffedby members of your class. Do your classmates have allthe right skills to implement such a project? If not,how will you go about making sure that the properskills are available to get the job done?
G. Consider the application that is used at your school toregister for classes. Complete a function point work-sheet to determine the size of such an application. Youwill need to make some assumptions about the appli-cation’s interfaces and the various factors that affect itscomplexity.
H. Read Your Turn 3-1. Create a risk assessment that liststhe potential risks associated with performing the pro-ject, along with ways to address the risks.
I. Pretend that your instructor has asked you and twofriends to create a Web page to describe the course topotential students and provide current class infor-mation (e.g., syllabus, assignments, readings) to cur-rent students. You have been assigned the role of
Minicases 109
leader, so you will need to coordinate your activitiesand those of your classmates until the project iscompleted. Describe how you would apply the pro-ject management techniques that you have learnedin this chapter in this situation. Include descriptionsof how you would create a workplan, staff the pro-ject, and coordinate all activities—yours and thoseof your classmates.
J. Select two project management software packages andresearch them using the Web or trade magazines.Describe the features of the two packages. If you werea project manager, which one would you use to helpsupport your job? Why?
K. Select two estimation software packages and researchthem using the Web or trade magazines. Describe thefeatures of the two packages. If you were a project
manager, which one would you use to help supportyour job? Why?
L. In 1997, Oxford Health Plans had a computer prob-lem that caused the company to overestimate rev-enue and underestimate medical costs. Problemswere caused by the migration of its claims processingsystem from the Pick operating system to a UNIX-based system that uses Oracle database software andhardware from Pyramid Technology. As a result,Oxford’s stock price plummeted, and fixing the sys-tem became the number-one priority for the com-pany. Suppose that you have been placed in charge ofmanaging the repair of the claims processing system.Obviously, the project team will not be in good spir-its. How will you motivate team members to meetthe project’s objectives?
MINICASES
1. Emily Pemberton is an IS project manager facing a dif-ficult situation. Emily works for the First Trust Bank,which has recently acquired the City National Bank.Prior to the acquisition, First Trust and City Nationalwere bitter rivals, fiercely competing for market sharein the region. Following the acrimonious takeover,numerous staff were laid off in many banking areas,including IS. Key individuals were retained from bothbanks’ IS areas, however, and were assigned to a newconsolidated IS department. Emily has been madeproject manager for the first significant IS projectsince the takeover, and she faces the task of integratingstaffers from both banks on her team. The project theyare undertaking will be highly visible within the orga-nization, and the time frame for the project is some-what demanding. Emily believes that the team canmeet the project goals successfully, but success willrequire that the team become cohesive quickly andthat potential conflicts be avoided. What strategies doyou suggest that Emily implement in order to helpassure a successfully functioning project team?
2. Tom, Jan, and Julie are IS majors at Great State Univer-sity. These students have been assigned a class project
by one of their professors, requiring them to develop anew Web-based system to collect and update informa-tion on the IS program’s alumni. This system will beused by the IS graduates to enter job and address infor-mation as they graduate and then make changes to thatinformation as they change jobs and/or addresses.Their professor also has a number of queries that she isinterested in being able to implement. Based on theirpreliminary discussions with their professor, the stu-dents have developed this list of system elements:
Inputs: 1, low complexity; 2, medium complexity; 1,high complexity
Outputs: 4, medium complexity
Queries: 1, low complexity; 4, medium complexity; 2,high complexity
Files: 3, medium complexity
Program Interfaces: 2, medium complexity
Assume that an adjusted program complexity of 1.2 isappropriate for this project. Calculate the totaladjusted function points for this project.
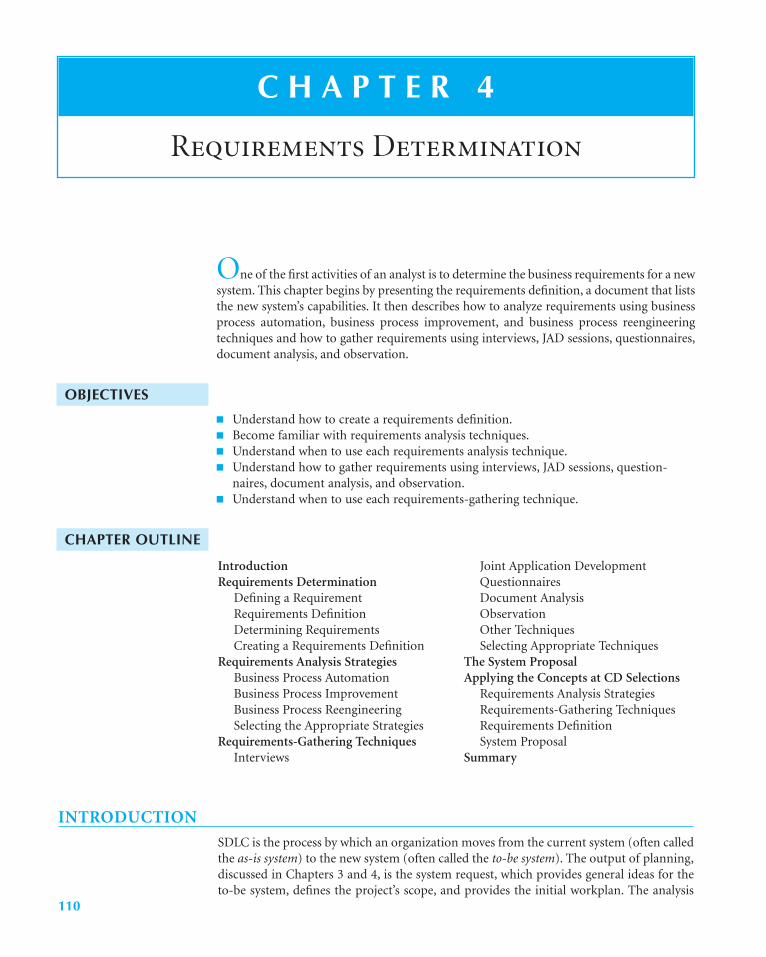
One of the first activities of an analyst is to determine the business requirements for a newsystem. This chapter begins by presenting the requirements definition, a document that liststhe new system’s capabilities. It then describes how to analyze requirements using businessprocess automation, business process improvement, and business process reengineeringtechniques and how to gather requirements using interviews, JAD sessions, questionnaires,document analysis, and observation.
OBJECTIVES
■ Understand how to create a requirements definition.■ Become familiar with requirements analysis techniques.■ Understand when to use each requirements analysis technique.■ Understand how to gather requirements using interviews, JAD sessions, question-
naires, document analysis, and observation.■ Understand when to use each requirements-gathering technique.
CHAPTER OUTLINE
C H A P T E R 4
Requirements Determination
IntroductionRequirements Determination
Defining a RequirementRequirements DefinitionDetermining RequirementsCreating a Requirements Definition
Requirements Analysis StrategiesBusiness Process AutomationBusiness Process ImprovementBusiness Process ReengineeringSelecting the Appropriate Strategies
Requirements-Gathering TechniquesInterviews
Joint Application DevelopmentQuestionnairesDocument AnalysisObservationOther TechniquesSelecting Appropriate Techniques
The System ProposalApplying the Concepts at CD Selections
Requirements Analysis StrategiesRequirements-Gathering TechniquesRequirements DefinitionSystem Proposal
Summary
INTRODUCTION
SDLC is the process by which an organization moves from the current system (often calledthe as-is system) to the new system (often called the to-be system). The output of planning,discussed in Chapters 3 and 4, is the system request, which provides general ideas for theto-be system, defines the project’s scope, and provides the initial workplan. The analysis
110
phase takes the general ideas in the system request and refines them into a detailedrequirements definition (this chapter), functional models (Chapter 5), structural models(Chapter 6), and behavioral models (Chapter 7) that together form the system proposal. Thesystem proposal also includes revised project management deliverables, such as the feasi-bility analysis (Chapter 2) and the workplan (Chapter 3).
The system proposal is presented to the approval committee, who decides if the projectis to continue. This usually happens at a system walkthrough, a meeting at which the con-cept for the new system is presented to the users, managers, and key decision makers. Thegoal of the walkthrough is to explain the system in moderate detail so that the users, man-agers, and key decision makers clearly understand it, can identify needed improvements, andare able to make a decision about whether the project should continue. If approved, the systemproposal moves into the design phase, and its elements (requirements definition, functional,structural, and behavioral models) are used as inputs to the steps in design. This furtherrefines them and defines in much more detail how the system will be built.
The line between analysis and design is very blurry. This is because the deliverablescreated during analysis are really the first step in the design of the new system. Many of themajor design decisions for the new system are found in the analysis deliverables. In fact, abetter name for analysis is really analysis and initial design, but because this is a rather longname and because most organizations simply call it analysis, we do too. Nonetheless, it isimportant to remember that the deliverables from analysis are really the first step in thedesign of the new system.
In many ways, the requirements determination step is the single most critical step ofthe entire SDLC because it is here that the major elements of the system first begin toemerge. During requirements determination, the system is easy to change because littlework has been done yet. As the system moves through the other phases in the SDLC, itbecomes harder and harder to return to requirements determination and to make majorchanges because of all of the rework that is involved. Several studies have shown that morethan half of all system failures are due to problems with the requirements.1 This is why theiterative approaches of many object-oriented methodologies are so effective—smallbatches of requirements can be identified and implemented in incremental stages, allowingthe overall system to evolve over time. In this chapter, we focus on the requirements deter-mination step of analysis. We begin by explaining what a requirement is and the overallprocess of requirements gathering and requirements analysis. We then present a set of tech-niques that can be used to analyze and gather requirements.
REQUIREMENTS DETERMINATION
The purpose of the requirements determination step is to turn the very high-level explanationof the business requirements stated in the system request into a more precise list of require-ments that can be used as inputs to the rest of analysis (creating functional, structural, andbehavioral models). This expansion of the requirements ultimately leads to the design phase.
Defining a RequirementA requirement is simply a statement of what the system must do or what characteristic itmust have. During analysis, requirements are written from the perspective of the busi-nessperson, and they focus on the “what” of the system. Because they focus on the needs ofthe business user, they are usually called business requirements (and sometimes user
Requirements Determination 111
1For example, see The Scope of Software Development Project Failures (Dennis, MA: The Standish Group, 1995).
requirements). Later in design, business requirements evolve to become more technical,and they describe how the system will be implemented. Requirements in design are writtenfrom the developer’s perspective, and they are usually called system requirements.
Before we continue, we want to stress that there is no black-and-white line dividing abusiness requirement and a system requirement—and some companies use the termsinterchangeably. The important thing to remember is that a requirement is a statement ofwhat the system must do, and requirements will change over time as the project movesfrom analysis to design to implementation. Requirements evolve from detailed statementsof the business capabilities that a system should have to detailed statements of the technicalway in which the capabilities will be implemented in the new system.
Requirements can be either functional or nonfunctional in nature. A functional require-ment relates directly to a process a system has to perform or information it needs to contain.For example, requirements that state that a system must have the ability to search for avail-able inventory or to report actual and budgeted expenses are functional requirements. Func-tional requirements flow directly into the next steps of analysis (functional, structural, andbehavioral models) because they define the functions that the system must have.
Nonfunctional requirements refer to behavioral properties that the system must have,such as performance and usability. The ability to access the system using a Web browser isconsidered a nonfunctional requirement. Nonfunctional requirements may influence the restof analysis (functional, structural, and behavioral models) but often do so only indirectly;nonfunctional requirements are used primarily in design when decisions are made about theuser interface, the hardware and software, and the system’s underlying physical architecture.
Figure 4-1 lists different kinds of nonfunctional requirements and examples of eachkind. Notice that the nonfunctional requirements describe a variety of characteristicsregarding the system: operational, performance, security, and cultural and political. Forexample, the project team needs to know if a system must be highly secure, requires sub-second response time, or has to reach a multicultural customer base.
These characteristics do not describe business processes or information, but they arevery important in understanding what the final system should be like. Nonfunctionalrequirements primarily impact decisions that will be made during the design of a system.As such, we will return to this topic later in the book when we discuss design. The goal inthis chapter is to identify any major issues.
Four topics that have recently influenced information system requirements are theSarbanes-Oxley Act, COBIT compliance, ISO 9000 compliance, and Capability MaturityModel compliance. Depending on the system being considered, these four topics couldimpact the definition of a system’s functional requirements, nonfunctional requirements,or both. The Sarbanes-Oxley Act, for example, mandates additional functional and non-functional requirements. These include additional security concerns (nonfunctional) andspecific information requirements that management must now provide (functional). As such,when developing financial information systems, information system developers should besure to include Sarbanes-Oxley expertise within the development team. In another exam-ple, a client could insist on COBIT compliance, ISO 9000 compliance, or that a specificCapability Maturity Model level had been reached for the firm to be considered as a possi-ble vendor to supply the system under consideration. Obviously, these types of require-ments add to the nonfunctional requirements. However, further discussion of these topicsis beyond the scope of this book.2
112 Chapter 4 Requirements Determination
2 A concise discussion of the Sarbanes-Oxley Act is presented in G. P. Lander, What is Sarbanes-Oxley? (New York:McGraw-Hill, 2004). A good reference for Sarbanes-Oxley Act–based security requirements is D. C. Brewer, Secu-rity Controls for Sarbanes-Oxley Section 404 IT Compliance: Authorization, Authentication, and Access(Indianapolis, IN: Wiley, 2006). For detailed information on COBIT, see www.isaca.org; for ISO 9000, seewww.iso.org; and for details on the Capability Maturity Model, see www.sei.cmu.edu/cmmi/.

Another recent topic that influences requirements for some systems is the whole area ofglobalization. The idea of having a global information supply chain brings to bear a largenumber of additional nonfunctional requirements. For example, if the necessary opera-tional environments do not exist for a mobile solution to be developed, it is important toadapt the solution to the local environment. Or, it may not be reasonable to expect to deploya high-technology-based solution in an area that does not have the necessary power andcommunications infrastructure. In some cases, we may need to consider some parts of theglobal information supply chain to be supported with manual—rather than automated—information systems. Manual systems have an entirely different set of requirements that cre-ate different performance expectations and additional security concerns. Furthermore,cultural and political concerns are potentially paramount. A simple example that impactsthe design of user interfaces is the proper use of color on forms (on a screen or paper). Dif-ferent cultures interpret different colors differently. In other words, in a global, multiculturalbusiness environment, addressing cultural concerns goes well beyond simply having a multi-lingual user interface. As such, we must be able to adapt the global solution to the localrealities. Friedman refers to these concerns as glocalization.3 Otherwise, we will simply createanother example of a failed information system development project.
Requirements Determination 113
Operational The physical and technical environments in ■ The system should be able to fit in a pocket or purse.
which the system will operate ■ The system should be able to integrate with theexisting inventory system.
■ The system should be able to work on any Webbrowser.
Performance The speed, capacity, and reliability of the system ■ Any interaction between the user and the systemshould not exceed 2 seconds.
■ The system should receive updated inventory infor-mation every 15 minutes.
■ The system should be available for use 24 hours perday, 365 days per year.
Security Who has authorized access to the system under ■ Only direct managers can see personnel records what circumstances of staff.
■ Customers can see their order history only duringbusiness hours.
Cultural and political Cultural, political factors and legal requirements ■ The system should be able to distinguish between that affect the system United States and European currency.
■ Company policy says that we buy computers onlyfrom Dell.
■ Country managers are permitted to authorize cus-tomer user interfaces within their units.
■ The system shall comply with insurance industrystandards.
Source: The Atlantic Systems Guild, http://www.systemsguild.com/GuildSite/Robs/Template.html
FIGURE 4-1 Nonfunctional Requirements
NonfunctionalRequirement Description Examples
3 T. L. Friedman, The World is Flat: A Brief History of the Twenty-First Century, Updated and Expanded Ed. (New York:Farrar, Straus, and Giroux, 2006). For a criticism of Friedman’s view, see R. Aronica and M. Ramdoo, The World isFLAT? A Critical Analysis of Thomas L. Friedman’s New York Times Bestseller (Tampa, FL: Meghan-Kiffer Press, 2006).

114 Chapter 4 Requirements Determination
One of the most common mistakes by new analysts is toconfuse functional and nonfunctional requirements. Pre-tend that you received the following list of requirementsfor a sales system.
Requirements for Proposed SystemThe system should
1. be accessible to Web users;2. include the company standard logo and color
scheme;3. restrict access to profitability information;4. include actual and budgeted cost information;5. provide management reports;6. include sales information that is updated at least
daily;
7. have two-second maximum response time for pre-defined queries and ten-minute maximum responsetime for ad hoc queries;
8. include information from all company subsidiaries;9. print subsidiary reports in the primary language of
the subsidiary;10. provide monthly rankings of salesperson performance.
Questions
1. Which requirements are functional businessrequirements? Provide two additional examples.
2. Which requirements are nonfunctional businessrequirements? What kind of nonfunctional require-ments are they? Provide two additional examples.
4-1 Identifying RequirementsYOUR
TURN
I once worked on a consulting project in which my man-ager created a requirements definition without listing non-functional requirements. The project was then estimatedbased on the requirements definition and sold to the clientfor $5,000. In my manager’s mind, the system that wewould build for the client would be a very simple stand-alone system running on current technology. It shouldn’ttake more than a week to analyze, design, and build.
Unfortunately, the clients had other ideas. Theywanted the system to be used by many people in three dif-ferent departments, and they wanted the ability for anynumber of people to work on the system concurrently. Thetechnology they had in place was antiquated; nonetheless,
they wanted the system to run effectively on the existingequipment. Because we didn’t set the project scope properlyby including our assumptions about nonfunctional require-ments in the requirements definition, we basically had todo whatever they wanted.
The capabilities they wanted took weeks to designand program. The project ended up taking four months,and the final project cost was $250,000. Our companyhad to pick up the tab for everything except the agreed-upon $5,000. This was by far the most frustrating projectsituation I ever experienced.
Barbara Wixom
4-A What Can Happen If You Ignore Nonfunctional RequirementsCONCEPTS
IN ACTION
Requirements DefinitionThe requirements definition report—usually just called the requirements definition—is astraightforward text report that simply lists the functional and nonfunctional require-ments in an outline format. Figure 4-2 shows a sample requirements definition for a wordprocessing program designed to compete against software such as Microsoft Word.
The requirements are numbered in a legal or outline format so that each requirementis clearly identified. The requirements are first grouped into functional and nonfunctionalrequirements; within each of those headings, they are further grouped by the type of non-functional requirement or by function.
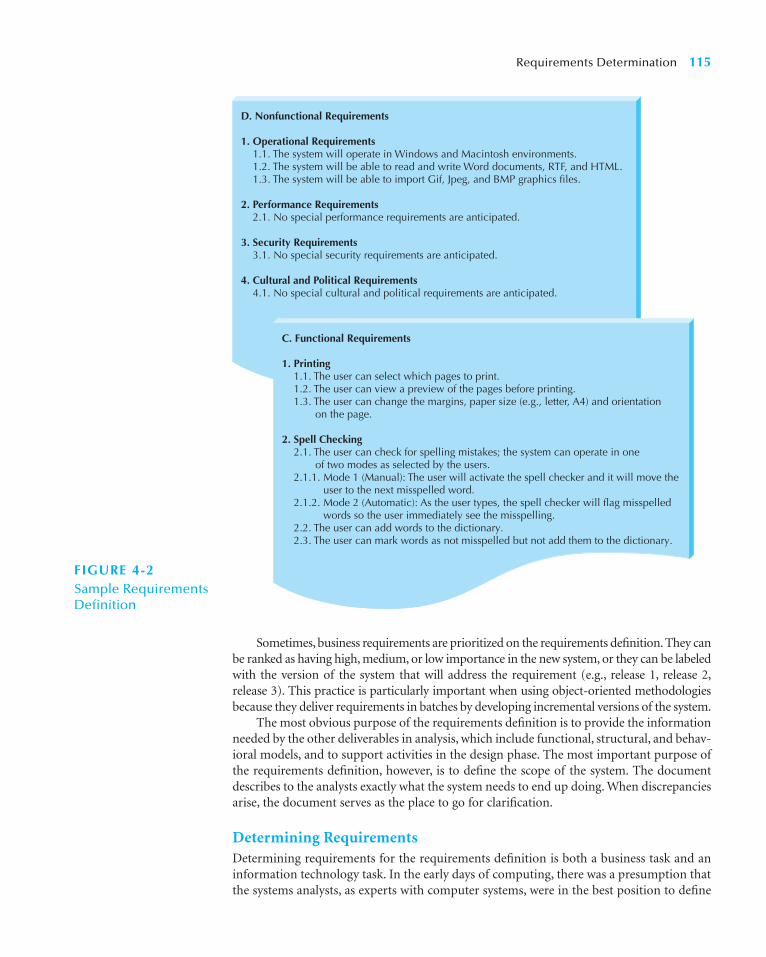
Sometimes, business requirements are prioritized on the requirements definition. They canbe ranked as having high, medium, or low importance in the new system, or they can be labeledwith the version of the system that will address the requirement (e.g., release 1, release 2,release 3). This practice is particularly important when using object-oriented methodologiesbecause they deliver requirements in batches by developing incremental versions of the system.
The most obvious purpose of the requirements definition is to provide the informationneeded by the other deliverables in analysis, which include functional, structural, and behav-ioral models, and to support activities in the design phase. The most important purpose ofthe requirements definition, however, is to define the scope of the system. The documentdescribes to the analysts exactly what the system needs to end up doing. When discrepanciesarise, the document serves as the place to go for clarification.
Determining RequirementsDetermining requirements for the requirements definition is both a business task and aninformation technology task. In the early days of computing, there was a presumption thatthe systems analysts, as experts with computer systems, were in the best position to define
Requirements Determination 115
C. Functional Requirements
1. Printing 1.1. The user can select which pages to print. 1.2. The user can view a preview of the pages before printing. 1.3. The user can change the margins, paper size (e.g., letter, A4) and orientation on the page.
2. Spell Checking 2.1. The user can check for spelling mistakes; the system can operate in one of two modes as selected by the users. 2.1.1. Mode 1 (Manual): The user will activate the spell checker and it will move the
user to the next misspelled word. 2.1.2. Mode 2 (Automatic): As the user types, the spell checker will flag misspelled words so the user immediately see the misspelling. 2.2. The user can add words to the dictionary. 2.3. The user can mark words as not misspelled but not add them to the dictionary.
D. Nonfunctional Requirements
1. Operational Requirements 1.1. The system will operate in Windows and Macintosh environments. 1.2. The system will be able to read and write Word documents, RTF, and HTML. 1.3. The system will be able to import Gif, Jpeg, and BMP graphics files.
2. Performance Requirements2.1. No special performance requirements are anticipated.
3. Security Requirements 3.1. No special security requirements are anticipated.
4. Cultural and Political Requirements 4.1. No special cultural and political requirements are anticipated.
FIGURE 4-2Sample RequirementsDefinition

how a computer system should operate. Many systems failed because they did not ade-quately address the true business needs of the users. Gradually, the presumption changedso that the users, as the business experts, were seen as being the best position to define howa computer system should operate. However, many systems failed to deliver performancebenefits because users simply automated an existing inefficient system, and they failed toincorporate new opportunities offered by technology.
A good analogy is building a house or an apartment. We have all lived in a house orapartment, and most of us have some understanding of what we would like to see in one.However, if we were asked to design one from scratch, it would be a challenge because welack appropriate design skills and technical engineering skills. Likewise, an architect actingalone would probably miss some of our unique requirements.
Therefore, the most effective approach is to have both business people and analystsworking together to determine business requirements. Sometimes, however, users don’t knowexactly what they want, and analysts need to help them discover their needs. Three kinds oftechniques have become popular to help analysts do this: business process automation (BPA),business process improvement (BPI), and business process reengineering (BPR). Analysts can usethese tools when they need to guide the users in explaining what is wanted from a system.
The three kinds of techniques work similarly. They help users critically examine thecurrent state of systems and processes (the as-is system), identify exactly what needs to change,and develop a concept for a new system (the to-be system). A different amount of changeis associated with each technique; BPA creates a small amount of change, BPI creates amoderate amount of change, and BPR creates significant change that impacts much of theorganization. All three are described in greater detail later in the chapter.
Although BPA, BPI, and BPR enable the analyst to help users create a vision for the newsystem, they are not sufficient for extracting information about the detailed business require-ments that are needed to build it. Therefore, analysts use a portfolio of requirements-gatheringtechniques to acquire information from users. The analyst has many gathering techniquesfrom which to choose: interviews, questionnaires, observation, JAD, (joint application develop-ment) and document analysis. The information gathered using these techniques is criticallyanalyzed and used to craft the requirements definition report. The final section of this chapterdescribes each of the requirements-gathering techniques in greater depth.
Creating a Requirements DefinitionCreating a requirements definition is an iterative and ongoing process whereby the analystcollects information with requirements-gathering techniques (e.g., interviews, documentanalysis), critically analyzes the information to identify appropriate business requirementsfor the system, and adds the requirements to the requirements definition report. Therequirements definition is kept up to date so that the project team and business users canrefer to it and get a clear understanding of the new system.
To create a requirements definition, the project team first determines the kinds offunctional and nonfunctional requirements that they will collect about the system (ofcourse, these may change over time). These become the main sections of the document.Next, the analysts use a variety of requirements-gathering techniques (e.g., interviews,observation) to collect information, and they list the business requirements that were iden-tified from that information. Finally, the analysts work with the entire project team and thebusiness users to verify, change, and complete the list and to help prioritize the importanceof the requirements that were identified.
This process continues throughout analysis, and the requirements definition evolves overtime as new requirements are identified and as the project moves into later phases of theSDLC. Beware: the evolution of the requirements definition must be carefully managed. The
116 Chapter 4 Requirements Determination

project team cannot keep adding to the requirements definition, or the system will keep grow-ing and growing and never get finished. Instead, the project team carefully identifies require-ments and evaluates which ones fit within the scope of the system. When a requirementreflects a real business need but is not within the scope of the current system or currentrelease, it is either added on a list of future requirements or given a low priority. The manage-ment of requirements (and system scope) is one of the hardest parts of managing a project.
REQUIREMENTS ANALYSIS STRATEGIES
Before the project team can determine what requirements are appropriate for a given sys-tem, they need to have a clear vision of the kind of system that will be created and the levelof change that it will bring to the organization. The basic process of analysis is divided intothree steps: understanding the as-is system, identifying improvements, and developingrequirements for the to-be system.
Sometimes the first step (i.e., understanding the as-is system) is skipped or done in a cur-sory manner. This happens when no current system exists, if the existing system and processesare irrelevant to the future system, or if the project team is using a RAD or agile developmentmethodology in which the as-is system is not emphasized. Users of traditional design methodssuch as waterfall and parallel development (see Chapter 1) typically spend significant timeunderstanding the as-is system and identifying improvements before moving to capturerequirements for the to-be system. However, newer RAD, agile, and object-oriented method-ologies, such as phased development, prototyping, throwaway prototyping, and extreme pro-gramming (see Chapters 1 and 2) focus almost exclusively on improvements and the to-besystem requirements, and they spend little time investigating the current as-is system.
Three requirements analysis strategies—business process automation, business processimprovement, and business process reengineering—help the analyst lead users through thethree (or two) analysis steps so that the vision of the system can be developed. Requirementsanalysis strategies and requirements-gathering techniques go hand-in-hand. Analysts needto use requirements-gathering techniques to collect information; requirements analysisstrategies drive the kind of information that is gathered and how it is ultimately analyzed.Although we now focus on the analysis strategies and then discuss requirements gatheringat the end of the chapter, they happen concurrently and are complementary activities.
The choice of analysis technique to be used is based on the amount of change the systemis meant to create in the organization. BPA is based on small change that improves processefficiency, BPI creates process improvements that lead to better effectiveness, and BPRrevamps the way things work so that the organization is transformed on some level.
To move the users “from here to there,” an analyst needs strong critical thinking skills.Critical thinking is the ability to recognize strengths and weaknesses and recast an idea inan improved form, and critical thinking skills are needed to really understand issues anddevelop new business processes. These skills are also needed to thoroughly examine theresults of requirements gathering, to identify business requirements, and to translate thoserequirements into a concept for the new system.
Business Process AutomationBPA leaves the basic way in which the organization operates unchanged and uses computertechnology to do some of the work. BPA can make the organization more efficient but hasthe least impact on the business. Planners in BPA projects spend a significant time under-standing the current as-is system before moving on to improvements and to-be systemrequirements. Problem analysis and root cause analysis are two popular BPA techniques.
Requirements Analysis Strategies 117
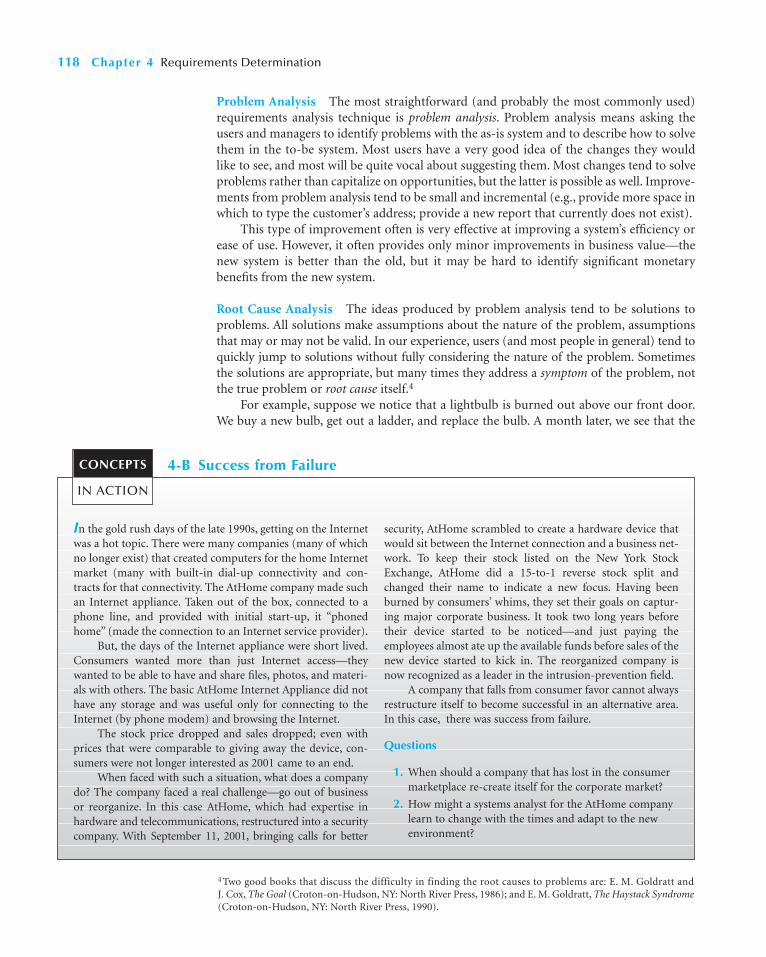
Problem Analysis The most straightforward (and probably the most commonly used)requirements analysis technique is problem analysis. Problem analysis means asking theusers and managers to identify problems with the as-is system and to describe how to solvethem in the to-be system. Most users have a very good idea of the changes they wouldlike to see, and most will be quite vocal about suggesting them. Most changes tend to solveproblems rather than capitalize on opportunities, but the latter is possible as well. Improve-ments from problem analysis tend to be small and incremental (e.g., provide more space inwhich to type the customer’s address; provide a new report that currently does not exist).
This type of improvement often is very effective at improving a system’s efficiency orease of use. However, it often provides only minor improvements in business value—thenew system is better than the old, but it may be hard to identify significant monetarybenefits from the new system.
Root Cause Analysis The ideas produced by problem analysis tend to be solutions toproblems. All solutions make assumptions about the nature of the problem, assumptionsthat may or may not be valid. In our experience, users (and most people in general) tend toquickly jump to solutions without fully considering the nature of the problem. Sometimesthe solutions are appropriate, but many times they address a symptom of the problem, notthe true problem or root cause itself.4
For example, suppose we notice that a lightbulb is burned out above our front door.We buy a new bulb, get out a ladder, and replace the bulb. A month later, we see that the
118 Chapter 4 Requirements Determination
4 Two good books that discuss the difficulty in finding the root causes to problems are: E. M. Goldratt andJ. Cox, The Goal (Croton-on-Hudson, NY: North River Press, 1986); and E. M. Goldratt, The Haystack Syndrome(Croton-on-Hudson, NY: North River Press, 1990).
In the gold rush days of the late 1990s, getting on the Internetwas a hot topic. There were many companies (many of whichno longer exist) that created computers for the home Internetmarket (many with built-in dial-up connectivity and con-tracts for that connectivity. The AtHome company made suchan Internet appliance. Taken out of the box, connected to aphone line, and provided with initial start-up, it “phonedhome” (made the connection to an Internet service provider).
But, the days of the Internet appliance were short lived.Consumers wanted more than just Internet access—theywanted to be able to have and share files, photos, and materi-als with others. The basic AtHome Internet Appliance did nothave any storage and was useful only for connecting to theInternet (by phone modem) and browsing the Internet.
The stock price dropped and sales dropped; even withprices that were comparable to giving away the device, con-sumers were not longer interested as 2001 came to an end.
When faced with such a situation, what does a companydo? The company faced a real challenge—go out of businessor reorganize. In this case AtHome, which had expertise inhardware and telecommunications, restructured into a securitycompany. With September 11, 2001, bringing calls for better
security, AtHome scrambled to create a hardware device thatwould sit between the Internet connection and a business net-work. To keep their stock listed on the New York StockExchange, AtHome did a 15-to-1 reverse stock split andchanged their name to indicate a new focus. Having beenburned by consumers’ whims, they set their goals on captur-ing major corporate business. It took two long years beforetheir device started to be noticed—and just paying theemployees almost ate up the available funds before sales of thenew device started to kick in. The reorganized company isnow recognized as a leader in the intrusion-prevention field.
A company that falls from consumer favor cannot alwaysrestructure itself to become successful in an alternative area.In this case, there was success from failure.
Questions
1. When should a company that has lost in the consumermarketplace re-create itself for the corporate market?
2. How might a systems analyst for the AtHome companylearn to change with the times and adapt to the newenvironment?
4-B Success from FailureCONCEPTS
IN ACTION

Requirements Analysis Strategies 119
Lightbulb burnsout frequently
Buy better bulbs
Fix bad fixture
Fix bad wiring
Control power surges
Left on when not needed Left on when needed
Bulb burns out atend of rated life
Bulb burnsout prematurely
Change procedure tohave bulb turned off
Develop ways toautomatically turn off bulb
Find way to simplify changing
Buy a bulb with a longer-rated life
Find other meansto deliver light
Find other ways to achieve what light does
FIGURE 4-3 Root-Cause Analysis for the Example of the Burned-out Lightbulb
same bulb is burned out, so we buy a new bulb, haul out the ladder, and replace it again.This happens several times. At this point, we have two choices. We can buy a large packageof lightbulbs and a fancy lightbulb changer on a long pole so we don’t need to haul theladder out each time (thus saving a lot of trips to the store for new bulbs and a lot of effortin working with the ladder). Or, we can fix the light fixture that is causing the light to burnout in the first place. Buying the bulb changer is treating the symptom (the burned-outbulb), whereas fixing the fixture is treating the root cause.
In the business world, the challenge lies in identifying the root cause—few problemsare as simple as the lightbulb problem. The solutions that users propose (or systems thatanalysts think of) may either address symptoms or root causes, but without a careful analysis,it is difficult to tell which one is addressed. And finding out that we just spent a milliondollars on a new lightbulb changer is a horrible feeling!
Root cause analysis, therefore, focuses on problems, not solutions. The analyst starts byhaving the users generate a list of problems with the current system and then prioritize theproblems in order of importance. Starting with the most important, the users and/or theanalysts then generate all the possible root causes for the problems. Each possible rootcause is investigated (starting with the most likely or easiest to check) until the true rootcauses are identified. If any possible root causes are identified for several problems, thoseshould be investigated first, because there is a good chance they are the real root causesinfluencing the symptom problems.
In our lightbulb example, there are several possible root causes. A decision tree some-times helps with the analysis. As Figure 4-3 shows, there are many possible root causes, sobuying a new fixture may or may not address the true root cause. In fact, buying a lightbulb

changer may actually address the root cause. The key point in root cause analysis is alwaysto challenge the obvious.
Business Process ImprovementBPI makes moderate changes to the way in which the organization operates to take advan-tage of new opportunities offered by technology or to copy what competitors are doing.BPI can improve efficiency (i.e., doing things right) and improve effectiveness (i.e., doingthe right things). Planners of BPI projects also spend time understanding the as-is system,but much less time than with BPA projects; their primary focus is on improving businessprocesses, so time is spent on the as-is only to help with the improvement analyses and theto-be system requirements. Duration analysis, activity-based costing, and informal bench-marking are three popular BPI activities.
Duration Analysis Duration analysis requires a detailed examination of the amount oftime it takes to perform each process in the current as-is system. The analysts begin bydetermining the total amount of time it takes, on average, to perform a set of businessprocesses for a typical input. They then time each of the individual steps (or sub-processes) in the business process. The time to complete the basic steps are then totaledand compared to the total for the overall process. A significant difference between thetwo—and in our experience the total time often can be 10 or even 100 times longer thanthe sum of the parts—indicates that this part of the process is badly in need of a majoroverhaul.
For example, suppose that the analysts are working on a home mortgage system anddiscover that on average, it takes thirty days for the bank to approve a mortgage. They thenlook at each of the basic steps in the process (e.g., data entry, credit check, title search,appraisal, etc.) and find that the total amount of time actually spent on each mortgage isabout eight hours. This is a strong indication that the overall process is badly broken,because it takes thirty days to perform one day’s work.
These problems probably occur because the process is badly fragmented. Many differentpeople must perform different activities before the process finishes. In the mortgageexample, the application probably sits on many people’s desks for long periods of timebefore it is processed.
Processes in which many different people work on small parts of the inputs areprime candidates for process integration or parallelization. Process integration meanschanging the fundamental process so that fewer people work on the input, which often
120 Chapter 4 Requirements Determination
A group of executives from a Fortune 500 company usedduration analysis to discuss their procurement process.Using a huge wall of Velcro and a handful of placards, afacilitator mapped out the company’s process for procuringa $50 software upgrade. Having quantified the time it tookto complete each step, she then assigned costs based onthe salaries of the employees involved. The fifteen-minute
exercise left the group stunned. Their procurement processhad gotten so convoluted that it took eighteen days, count-less hours of paperwork, and nearly $22,000 in employeetime to get the product ordered, received, and up and run-ning on the requester’s desktop.
Source: “For Good Measure” Debby Young, CIO Magazine(March 1, 1999).
4-C Duration AnalysisCONCEPTS
IN ACTION
requires changing the processes and retraining staff to perform a wider range of duties.Process parallelization means changing the process so that all the individual steps areperformed at the same time. For example, in the mortgage application case, there isprobably no reason that the credit check cannot be performed at the same time as theappraisal and title check.
Activity-Based Costing Activity-based costing is a similar analysis, which examinesthe cost of each major process or step in a business process rather than the time taken.5
The analysts identify the costs associated with each of the basic functional steps orprocesses, identify the most costly processes, and focus their improvement efforts onthem.
Assigning costs is conceptually simple. Analysts simply examine the direct cost of laborand materials for each input. Materials costs are easily assigned in a manufacturing process,whereas labor costs are usually calculated based on the amount of time spent on the inputand the hourly cost of the staff. However, as you may recall from a managerial accountingcourse, there are indirect costs such as rent, depreciation, and so on, that also can beincluded in activity costs.
Informal Benchmarking Benchmarking refers to studying how other organizations per-form a business process in order to learn how your organization can do something better.Benchmarking helps the organization by introducing ideas that employees may never haveconsidered but have the potential to add value.
Informal benchmarking is fairly common for “customer-facing” business processes(i.e., processes that interact with the customer). With informal benchmarking, the managersand analysts think about other organizations or visit them as customers to watch how thebusiness process is performed. In many cases, the business studied may be a known leaderin the industry or simply a related firm. For example, suppose the team is developing a Website for a car dealer. The project sponsor, key managers, and key team members would likelyvisit the Web sites of competitors as well as those of others in the car industry (e.g., man-ufacturers, accessories suppliers) and those in other industries that have won awards fortheir Web sites.
Business Process ReengineeringBPR means changing the fundamental way in which the organization operates, “obliter-ating” the current way of doing business and making major changes to take advantage ofnew ideas and new technology. Planners of BPR projects spend little time understandingthe as-is, because their goal is to focus on new ideas and new ways of doing business.Outcome analysis, technology analysis, and activity elimination are three popular BPRactivities.
Outcome Analysis Outcome analysis focuses on understanding the fundamental out-comes that provide value to customers. Although these outcomes sound as though theyshould be obvious, they often aren’t. For example, suppose you consider an insurance com-pany. One of its customers has just had a car accident. What is the fundamental outcome
Requirements Analysis Strategies 121
5 Many books have been written on activity-based costing. Useful ones include K. B. Burk and D. W. Webster,Activity-Based Costing (Fairfax, VA: American Management Systems, 1994); and D. T. Hicks, Activity-Based Costing:Making It Work for Small and Mid-sized Companies (New York: Wiley, 1998). The two books by Eli Goldratt men-tioned previously (The Goal and The Haystack Syndrome) also offer unique insights into costing.

from the customer’s perspective? Traditionally, insurance companies have answered thisquestion by assuming the customer wants to receive the insurance payment quickly. To thecustomer, however, the payment is only a means to the real outcome: a repaired car. Theinsurance company might benefit by extending its view of the business process past itstraditional boundaries to include not paying for repairs, but performing the repairs orcontracting with an authorized body shop to do them.
With this approach, system analysts encourage the managers and project sponsor topretend they are customers and to think carefully about what the organization’s prod-ucts and services enable the customers to do—and what they could enable the customerto do.
Technology Analysis Many major changes in business over the past decade have beenenabled by new technologies. Technology analysis starts by having the analysts and man-agers develop a list of important and interesting technologies. Then the group systemati-cally identifies how each and every technology could be applied to the business process andidentifies how the business would benefit.
For example, one useful technology is the Internet. Saturn, the car manufacturer, tookthis idea and developed an extranet application for its suppliers. Rather than ordering partsfor its cars, Saturn makes its production schedule available electronically to its suppliers,who ship the parts Saturn needs so that they arrive at the plant just in time. This savesSaturn significant costs because it eliminates the need for people to monitor the productionschedule and issue purchase orders.
Activity Elimination Activity elimination is exactly what it sounds like. The analysts andmanagers work together to identify how the organization could eliminate each and everyactivity in the business process, how the function could operate without it, and what effectsare likely to occur. Initially, managers are reluctant to conclude that processes can be elim-inated, but this is a “force-fit” exercise in that they must eliminate each activity. In somecases the results are silly; nonetheless, participants must address each and every activity inthe business process.
For example, in the home mortgage approval process discussed earlier, the man-agers and analysts would start by eliminating the first activity, entering the data into themortgage company’s computer. This leads to two obvious possibilities: (1) eliminate theuse of a computer system or (2) make someone else do the data entry (e.g., the customerover the Web). They would then eliminate the next activity, the credit check. Silly, right?After all, making sure the applicant has good credit is critical in issuing a loan. Notreally. The real answer depends upon how many times the credit check identifies badapplications. If all or almost all applicants have good credit and are seldom turneddown by a credit check, then the cost of the credit check may not be worth the cost ofthe few bad loans it prevents. Eliminating it may actually result in lower costs, even withthe cost of bad loans.
Selecting Appropriate StrategiesEach technique discussed in this chapter has its own strengths and weaknesses (see Figure 4-4).No one technique is inherently better than the others, and in practice most projects use acombination of techniques.
Potential Business Value Potential business value varies with the analysis strategy.Although BPA has the potential to improve the business, most of the benefits from BPA are
122 Chapter 4 Requirements Determination

tactical and small in nature. Because BPA does not seek to change the business processes, itcan only improve their efficiency. BPI usually offers moderate potential benefits, depend-ing upon the scope of the project, because it seeks to change the business in some way. Itcan increase both efficiency and effectiveness. BPR creates large potential benefits becauseit seeks to radically improve the nature of the business.
Requirements Analysis Strategies 123
IBM Credit was a wholly owned subsidiary of IBMresponsible for financing mainframe computers sold byIBM. Although some customers bought mainframes out-right or obtained financing from other sources, financingcomputers provided significant additional profit.
When an IBM sales representative made a sale, he orshe would immediately call IBM Credit to obtain afinancing quote. The call was received by a credit officer,who would record the information on a request form. Theform would then be sent to the credit department to checkthe customer’s credit status. This information would berecorded on the form, which was then sent to the businesspractices department, who would write a contract (some-times reflecting changes requested by the customer). Theform and the contract would then go to the pricingdepartment, which used the credit information to estab-lish an interest rate and recorded it on the form. The formand contract were then sent to the clerical group, wherean administrator would prepare a cover letter quoting theinterest rate and send the letter and contract via FederalExpress to the customer.
The problem at IBM Credit was a major one. Gettinga financing quote took anywhere for four to eight days (sixdays on average), giving the customer time to rethink theorder or find financing elsewhere. While the quote wasbeing prepared, sales representatives would often call tofind out where the quote was in the process so they couldtell the customer when to expect it. However, no one atIBM Credit could answer the question because the paperforms could be in any department, and it was impossibleto locate one without physically walking through the
departments and going through the piles of forms oneveryone’s desk.
IBM Credit examined the process and changed it sothat each credit request was logged into a computer sys-tem and each department could record an application’sstatus as they completed it and sent it to the next depart-ment. In this way, sales representatives could call thecredit office and quickly learn the status of each applica-tion. IBM used some sophisticated management sciencequeuing theory analysis to balance workloads and staffacross the different departments so none would be over-loaded. They also introduced performance standards foreach department (e.g., the pricing decision had to becompleted within one day after that department receivedan application).
However, process times got worse, even though eachdepartment was achieving almost 100 percent compli-ance on its performance goals. After some investigation,managers found that when people got busy, they conve-niently found errors that forced them to return creditrequests to the previous department for correction,thereby removing it from their time measurements.
Questions
1. What techniques can you use to identifyimprovements?
2. Choose one technique and apply it to this situation.What improvements did you identify?
Source: M. Hammer and J. Champy, Reengineering the Corporation(1993). New York, NY: Harper Business.
4-2 IBM CreditYOUR
TURN
Potential business value Low–moderate Moderate High
Project cost Low Low–moderate High
Breadth of analysis Narrow Narrow–moderate Very broad
Risk Low–moderate Low–moderate Very high
Business Process Business Process Business Process Automation Improvement Reengineering
FIGURE 4-4Characteristics ofAnalysis Strategies

Project Cost Project cost is always important. In general, BPA has the lowest cost becauseit has the narrowest focus and seeks to make the fewest number of changes. BPI can bemoderately expensive, depending upon the scope of the project. BPR is usually expensive,both because of the amount of time required of senior managers and the amount ofredesign to business processes.
Breadth of Analysis Breadth of analysis refers to the scope of analysis, or whether analysisincludes business processes within a single business function, processes that cross theorganization, or processes that interact with those in customer or supplier organizations.BPR takes a broad perspective, often spanning several major business processes, even acrossmultiple organizations. BPI has a much narrower scope that usually includes one or severalbusiness functions. BPA typically examines a single process.
Risk One final issue is risk of failure, which is the likelihood of failure due to poordesign, unmet needs, or too much change for the organization to handle. BPA and BPIhave low to moderate risk because the to-be system is fairly well defined and understood,and its potential impact on the business can be assessed before it is implemented. BPRprojects, on the other hand, are less predictable. BPR is extremely risky and is not some-thing to be undertaken unless the organization and its senior leadership are committed tomaking significant changes. Mike Hammer, the father of BPR, estimates that 70 percent ofBPR projects fail.
124 Chapter 4 Requirements Determination
Suppose you are the analyst charged with developing anew Web site for a local car dealer who wants to be very
innovative and try new things. What analysis strategieswould you recommend? Why?
4-3 Analysis StrategyYOUR
TURN
A major retail store recently spent $24 million on a largeprivate satellite communication system. The system pro-vides state-of-the-art voice, data, and video transmissionbetween stores and regional headquarters. When an itemis sold, the scanner software updates the inventory systemin real time. As a result, store transactions are passed on toregional and national headquarters instantly, which keepsinventory records up to date. One of their major competi-tors has an older system, where transactions are uploadedat the end of a business day. The first company feels suchinstant communication and feedback allows them to reactmore quickly to changes in the market and gives them acompetitive advantage. For example, if an early wintersnowstorm causes stores across the upper Midwest to start
selling high-end (and high-profit) snowblowers, the near-est warehouse can quite quickly prepare next-day ship-ments to maintain a good inventory balance, whereas thecompetitor may not move quite as quickly and thus willlose out on such quick inventory turnover.
Questions
1. Do you think a $24 million investment in a privatesatellite communication system could be justifiedby a cost–benefit analysis? Could this be done witha standard communication line (with encryption)?
2. How might the competitor in this example attemptto close the information gap?
4-D Implementing a Satellite Data NetworkCONCEPTS
IN ACTION

REQUIREMENTS-GATHERING TECHNIQUES
An analyst is very much like a detective (and business users are sometimes like elusive sus-pects). He or she knows that there is a problem to be solved and therefore must look forclues that uncover the solution. Unfortunately, the clues are not always obvious (and oftenmissed), so the analyst needs to notice details, talk with witnesses, and follow leads just asSherlock Holmes would have done. The best analysts will thoroughly gather requirementsusing a variety of techniques and make sure that the current business processes and theneeds for the new system are well understood before moving into design. Analysts don’twant to discover later that they have key requirements wrong—such surprises late in theSDLC can cause all kinds of problems.
The requirements-gathering process is used for building political support for the projectand establishing trust and rapport between the project team building the system and the userswho ultimately will choose to use or not use the system. Involving someone in the processimplies that the project teams view that person as an important resource and value his or heropinions. All the key stakeholders (the people who can affect the system or who will be affectedby the system) must be included in the requirements-gathering process. The stakeholdersmight include managers, employees, staff members, and even some customers and suppliers.If a key person is not involved, that individual may feel slighted, which can cause problemsduring implementation (e.g., How could they have developed the system without my input?).
The second challenge of requirements gathering is choosing the way(s) in which infor-mation is collected. There are many techniques for gathering requirements that vary fromasking people questions to watching them work. In this chapter, we focus on the five mostcommonly used techniques: interviews, JAD sessions (a special type of group meeting),questionnaires, document analysis, and observation. Each technique has its own strengthsand weaknesses, many of which are complementary, so most projects use a combination oftechniques, probably most often interviews, JAD sessions, and document analysis.6
InterviewsAn interview is the most commonly used requirements-gathering technique. After all, it isnatural— if you need to know something, you usually ask someone. In general, interviewsare conducted one-on-one (one interviewer and one interviewee), but sometimes, due totime constraints, several people are interviewed at the same time. There are five basic stepsto the interview process: selecting interviewees, designing interview questions, preparingfor the interview, conducting the interview, and postinterview follow-up.7
Selecting Interviewees The first step in interviewing is to create an interview schedulelisting all the people who will be interviewed, when, and for what purpose (see Figure 4-5).The schedule can be an informal list that is used to help set up meeting times or a formallist that is incorporated into the workplan. The people who appear on the interview scheduleare selected based on the analyst’s information needs. The project sponsor, key businessusers, and other members of the project team can help the analyst determine who in theorganization can best provide important information about requirements. These peopleare listed on the interview schedule in the order in which they should be interviewed.
Requirements-Gathering Techniques 125
6 Some excellent books that address the importance of gathering requirements and various techniques include Alan M.Davis, Software Requirements: Objects, Functions, & States, Revision (Englewood Cliffs, NJ: Prentice Hall, 1993); GeraldKotonya and Ian Sommerville, Requirements Engineering (Chichester, England: Wiley, 1998); and Dean Leffingwelland Don Widrig, Managing Software Requirements: A Unified Approach (Reading, MA: Addison-Wesley, 2000).7A good book on interviewing is that by Brian James, The Systems Analysis Interview (Manchester, England: NCCBlackwell, 1989).
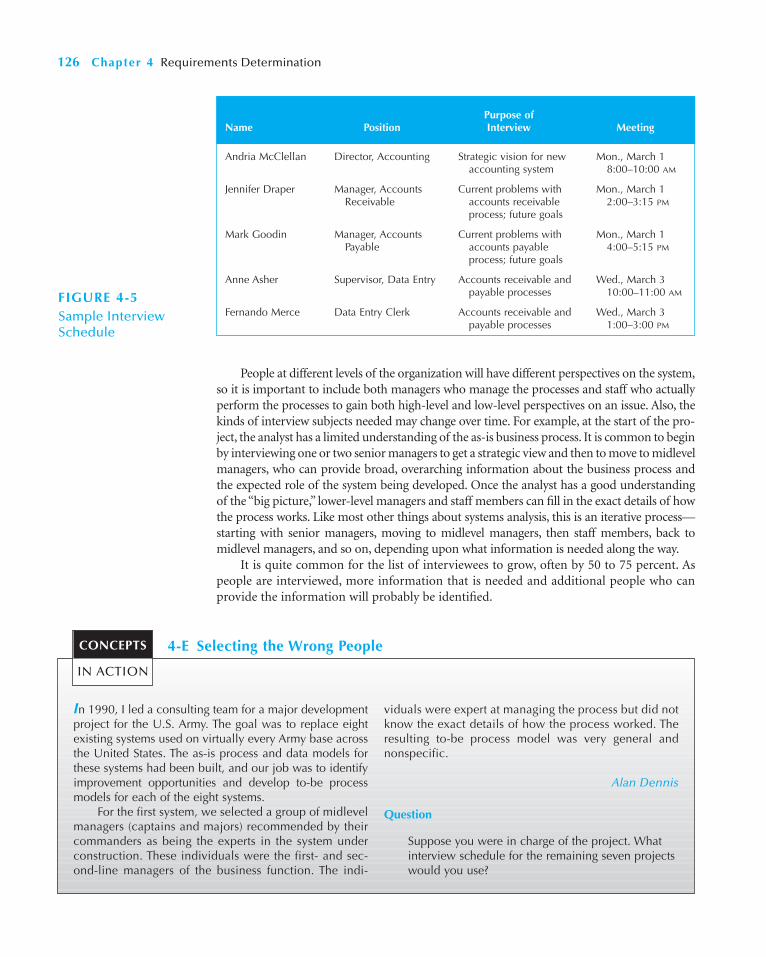
People at different levels of the organization will have different perspectives on the system,so it is important to include both managers who manage the processes and staff who actuallyperform the processes to gain both high-level and low-level perspectives on an issue. Also, thekinds of interview subjects needed may change over time. For example, at the start of the pro-ject, the analyst has a limited understanding of the as-is business process. It is common to beginby interviewing one or two senior managers to get a strategic view and then to move to midlevelmanagers, who can provide broad, overarching information about the business process andthe expected role of the system being developed. Once the analyst has a good understandingof the “big picture,” lower-level managers and staff members can fill in the exact details of howthe process works. Like most other things about systems analysis, this is an iterative process—starting with senior managers, moving to midlevel managers, then staff members, back tomidlevel managers, and so on, depending upon what information is needed along the way.
It is quite common for the list of interviewees to grow, often by 50 to 75 percent. Aspeople are interviewed, more information that is needed and additional people who canprovide the information will probably be identified.
126 Chapter 4 Requirements Determination
Andria McClellan Director, Accounting Strategic vision for new Mon., March 1 accounting system 8:00–10:00 AM
Jennifer Draper Manager, Accounts Current problems with Mon., March 1 Receivable accounts receivable 2:00–3:15 PM
process; future goals
Mark Goodin Manager, Accounts Current problems with Mon., March 1 Payable accounts payable 4:00–5:15 PM
process; future goals
Anne Asher Supervisor, Data Entry Accounts receivable and Wed., March 3 payable processes 10:00–11:00 AM
Fernando Merce Data Entry Clerk Accounts receivable and Wed., March 3 payable processes 1:00–3:00 PM
Purpose of Name Position Interview Meeting
FIGURE 4-5Sample InterviewSchedule
In 1990, I led a consulting team for a major developmentproject for the U.S. Army. The goal was to replace eightexisting systems used on virtually every Army base acrossthe United States. The as-is process and data models forthese systems had been built, and our job was to identifyimprovement opportunities and develop to-be processmodels for each of the eight systems.
For the first system, we selected a group of midlevelmanagers (captains and majors) recommended by theircommanders as being the experts in the system underconstruction. These individuals were the first- and sec-ond-line managers of the business function. The indi-
viduals were expert at managing the process but did notknow the exact details of how the process worked. Theresulting to-be process model was very general andnonspecific.
Alan Dennis
Question
Suppose you were in charge of the project. Whatinterview schedule for the remaining seven projectswould you use?
4-E Selecting the Wrong PeopleCONCEPTS
IN ACTION
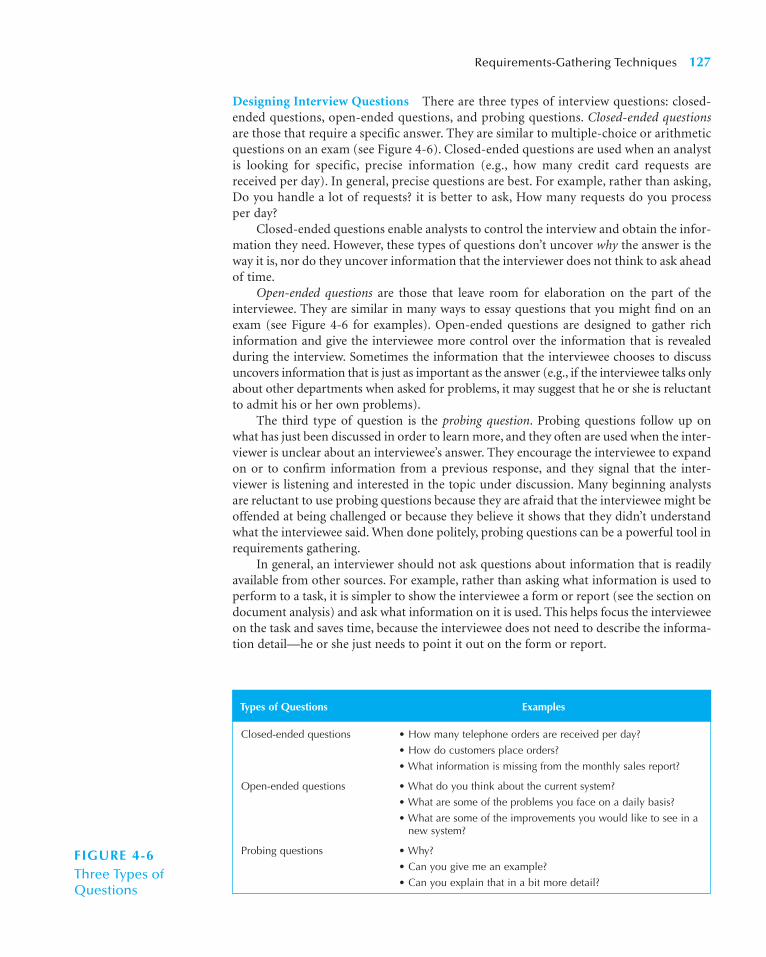
Designing Interview Questions There are three types of interview questions: closed-ended questions, open-ended questions, and probing questions. Closed-ended questionsare those that require a specific answer. They are similar to multiple-choice or arithmeticquestions on an exam (see Figure 4-6). Closed-ended questions are used when an analystis looking for specific, precise information (e.g., how many credit card requests arereceived per day). In general, precise questions are best. For example, rather than asking,Do you handle a lot of requests? it is better to ask, How many requests do you processper day?
Closed-ended questions enable analysts to control the interview and obtain the infor-mation they need. However, these types of questions don’t uncover why the answer is theway it is, nor do they uncover information that the interviewer does not think to ask aheadof time.
Open-ended questions are those that leave room for elaboration on the part of theinterviewee. They are similar in many ways to essay questions that you might find on anexam (see Figure 4-6 for examples). Open-ended questions are designed to gather richinformation and give the interviewee more control over the information that is revealedduring the interview. Sometimes the information that the interviewee chooses to discussuncovers information that is just as important as the answer (e.g., if the interviewee talks onlyabout other departments when asked for problems, it may suggest that he or she is reluctantto admit his or her own problems).
The third type of question is the probing question. Probing questions follow up onwhat has just been discussed in order to learn more, and they often are used when the inter-viewer is unclear about an interviewee’s answer. They encourage the interviewee to expandon or to confirm information from a previous response, and they signal that the inter-viewer is listening and interested in the topic under discussion. Many beginning analystsare reluctant to use probing questions because they are afraid that the interviewee might beoffended at being challenged or because they believe it shows that they didn’t understandwhat the interviewee said. When done politely, probing questions can be a powerful tool inrequirements gathering.
In general, an interviewer should not ask questions about information that is readilyavailable from other sources. For example, rather than asking what information is used toperform to a task, it is simpler to show the interviewee a form or report (see the section ondocument analysis) and ask what information on it is used. This helps focus the intervieweeon the task and saves time, because the interviewee does not need to describe the informa-tion detail—he or she just needs to point it out on the form or report.
Requirements-Gathering Techniques 127
Closed-ended questions • How many telephone orders are received per day?
• How do customers place orders?
• What information is missing from the monthly sales report?
Open-ended questions • What do you think about the current system?
• What are some of the problems you face on a daily basis?
• What are some of the improvements you would like to see in a new system?
Probing questions • Why?
• Can you give me an example?
• Can you explain that in a bit more detail?
Types of Questions Examples
FIGURE 4-6Three Types of Questions
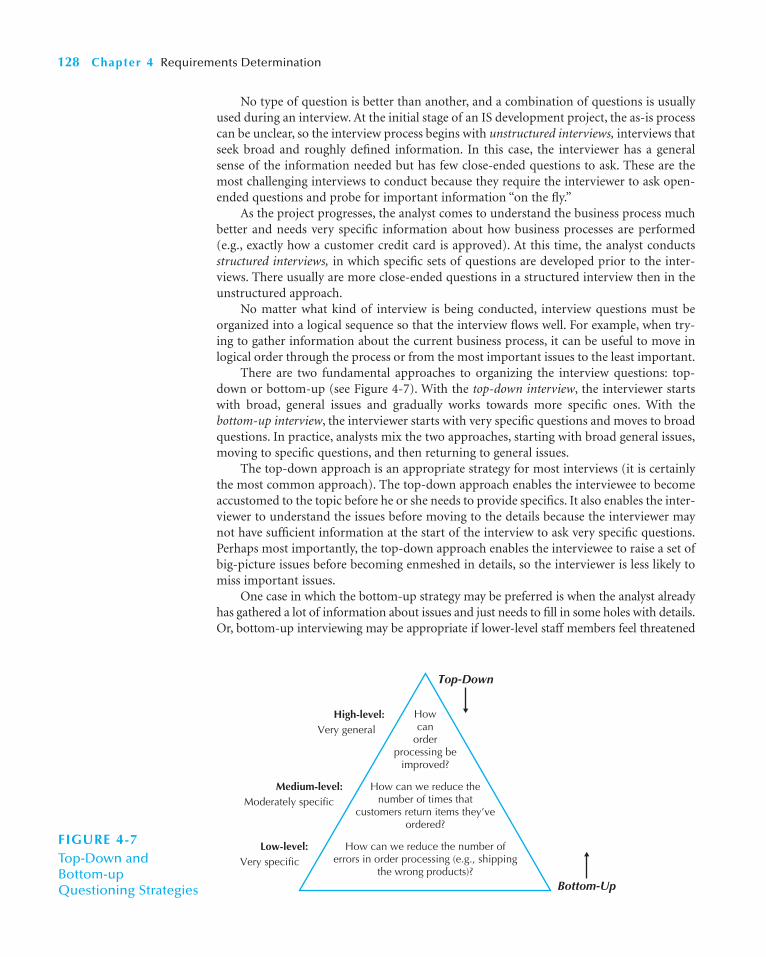
No type of question is better than another, and a combination of questions is usuallyused during an interview. At the initial stage of an IS development project, the as-is processcan be unclear, so the interview process begins with unstructured interviews, interviews thatseek broad and roughly defined information. In this case, the interviewer has a generalsense of the information needed but has few close-ended questions to ask. These are themost challenging interviews to conduct because they require the interviewer to ask open-ended questions and probe for important information “on the fly.”
As the project progresses, the analyst comes to understand the business process muchbetter and needs very specific information about how business processes are performed(e.g., exactly how a customer credit card is approved). At this time, the analyst conductsstructured interviews, in which specific sets of questions are developed prior to the inter-views. There usually are more close-ended questions in a structured interview then in theunstructured approach.
No matter what kind of interview is being conducted, interview questions must beorganized into a logical sequence so that the interview flows well. For example, when try-ing to gather information about the current business process, it can be useful to move inlogical order through the process or from the most important issues to the least important.
There are two fundamental approaches to organizing the interview questions: top-down or bottom-up (see Figure 4-7). With the top-down interview, the interviewer startswith broad, general issues and gradually works towards more specific ones. With thebottom-up interview, the interviewer starts with very specific questions and moves to broadquestions. In practice, analysts mix the two approaches, starting with broad general issues,moving to specific questions, and then returning to general issues.
The top-down approach is an appropriate strategy for most interviews (it is certainlythe most common approach). The top-down approach enables the interviewee to becomeaccustomed to the topic before he or she needs to provide specifics. It also enables the inter-viewer to understand the issues before moving to the details because the interviewer maynot have sufficient information at the start of the interview to ask very specific questions.Perhaps most importantly, the top-down approach enables the interviewee to raise a set ofbig-picture issues before becoming enmeshed in details, so the interviewer is less likely tomiss important issues.
One case in which the bottom-up strategy may be preferred is when the analyst alreadyhas gathered a lot of information about issues and just needs to fill in some holes with details.Or, bottom-up interviewing may be appropriate if lower-level staff members feel threatened
128 Chapter 4 Requirements Determination
High-level:Very general
Top-Down
Bottom-Up
Medium-level:Moderately specific
Low-level:Very specific
Howcan
orderprocessing be
improved?
How can we reduce the number of times that
customers return items they’ve ordered?
How can we reduce the number of errors in order processing (e.g., shipping
the wrong products)?
FIGURE 4-7Top-Down and Bottom-upQuestioning Strategies
or unable to answer high-level questions. For example, How can we improve customer ser-vice? may be too broad a question for a customer service clerk, whereas a specific question isreadily answerable (e.g., How can we speed up customer returns?). In any event, all interviewsshould begin with noncontroversial questions and then gradually move into more con-tentious issues after the interviewer has developed some rapport with the interviewee.
Preparing for the Interview It is important to prepare for the interview in the same waythat you would prepare to give a presentation. The interviewer should have a general interviewplan listing the questions to be asked in the appropriate order; should anticipate possibleanswers and provide follow-up with them; and should identify segues between related topics.The interviewer should confirm the areas in which the interviewee has knowledge in order notto ask questions that he or she cannot answer. Review the topic areas, the questions, and theinterview plan, and clearly decide which have the greatest priority in case time runs short.
In general, structured interviews with closed-ended questions take more time to pre-pare than unstructured interviews. So, some beginning analysts prefer unstructured inter-views, thinking that they can “wing it.” This is very dangerous and often counterproductive,because any information not gathered in the first interview will require follow-up efforts,and most users do not like to be interviewed repeatedly about the same issues.
The interviewer should be sure to prepare the interviewee as well. When the interviewis scheduled, the interviewee should be told the reason for the interview and the areas thatwill be discussed far enough in advance so that he or she has time to think about the issuesand organize his or her thoughts. This is particularly important when the interviewer is anoutsider to the organization and for lower-level employees, who often are not asked fortheir opinions and who may be uncertain about why they are being interviewed.
Conducting the Interview In starting the interview, the first goal is to build rapport withthe interviewee, so that he or she trusts the interviewer and is willing to tell the whole truth,not just give the answers that he or she thinks are wanted. The interviewer should appear tobe professional and an unbiased, independent seeker of information. The interview shouldstart with an explanation of why the interviewer is there and why he or she has chosen tointerview the person; then the interviewer should move into the planned interview questions.
It is critical to carefully record all the information that the interviewee provides. In ourexperience, the best approach is to take careful notes—write down everything the intervieweesays, even if it does not appear immediately relevant. The interviewer shouldn’t be afraid toask the person to slow down or to pause while writing, because this is a clear indication thatthe interviewee’s information is important. One potentially controversial issue is whether ornot to tape-record an interview. Recording ensures that the interviewer does not miss impor-tant points, but it can be intimidating for the interviewee. Most organizations have policiesor generally accepted practices about the recording of interviews, so they should be deter-mined before an interview. If the interviewer is worried about missing information and can-not tape the interview, then he or she can bring along a second person to take detailed notes.
As the interview progresses, it is important to understand the issues that are discussed.If the interviewer does not understand something, he or she should be sure to ask. Theinterviewer should not be afraid to ask dumb questions, because the only thing worse thanappearing dumb is to be dumb by not understanding something. If the interviewer doesn’tunderstand something during the interview, he or she certainly won’t understand itafterwards. Jargon should be recognized and defined; any jargon not understood should beclarified. One good strategy to increase understanding during an interview is to periodi-cally summarize the key points that the interviewee is communicating. This avoids misun-derstandings and also demonstrates that the interviewer is listening.
Requirements-Gathering Techniques 129

130 Chapter 4 Requirements Determination
5-1 Developing Interpersonal Skills
Finally, facts should be separated from opinion. The interviewee may say, for example,We process too many credit card requests. This is an opinion, and it is useful to followthis up with a probing question requesting support for the statement (e.g., Oh, howmany do you process in a day?). It is helpful to check the facts because any differencesbetween the facts and the interviewee’s opinions can point out key areas for improve-ment. Suppose the interviewee complains about a high or increasing number of errors,but the logs show that errors have been decreasing. This suggests that errors are viewedas a very important problem that should be addressed by the new system, even if theyare declining.
As the interview draws to a close, the interviewee should have time to ask questions orprovide information that he or she thinks is important but was not part of the interviewplan. In most cases, the interviewee will have no additional concerns or information, butin some cases this will lead to unanticipated, but important, information. Likewise, it canbe useful to ask the interviewee if there are other people who should be interviewed. Theinterview should end on time (if necessary, some topics can be omitted or another inter-view can be scheduled).
As a last step in the interview, the interviewer should briefly explain what will happennext (see the next section). The interviewer shouldn’t prematurely promise certain featuresin the new system or a specific delivery date, but he or she should reassure the intervieweethat his or her time was well spent and very helpful to the project.
Interpersonal skills are those skills that enable you todevelop rapport with others, and they are very importantfor interviewing. They help you to communicate withothers effectively. Some people develop good interper-sonal skills at an early age; they simply seem to know howto communicate and interact with others. Other people areless lucky and need to work hard to develop their skills.
Interpersonal skills, like most skills, can be learned.Here are some tips:
• Don’t worry, be happy. Happy people radiate confi-dence and project their feelings on others. Try inter-viewing someone while smiling and theninterviewing someone else while frowning and seewhat happens.
• Pay attention. Pay attention to what the other per-son is saying (which is harder than you mightthink). See how many times you catch yourself withyour mind on something other than the conversa-tion at hand.
• Summarize key points. At the end of each majortheme or idea that someone explains, repeat the
key points back to the speaker (e.g., Let me makesure I understand. The key issues are. . . .”). Thisdemonstrates that you consider the informationimportant—and also forces you to pay attention(you can’t repeat what you didn’t hear).
• Be succinct. When you speak, be succinct. The goalin interviewing (and in much of life) is to learn, notto impress. The more you speak, the less time yougive to others.
• Be honest. Answer all questions truthfully, and ifyou don’t know the answer, say so.
• Watch body language (yours and theirs). The way aperson sits or stands conveys much information. Ingeneral, a person who is interested in what you aresaying sits or leans forward, makes eye contact, andoften touches his or her face. A person leaningaway from you or with an arm over the back of achair is disinterested. Crossed arms indicate defen-siveness or uncertainty, while steepling (sitting withhands raised in front of the body with fingertipstouching) indicates a feeling of superiority.
PRACTICAL
TIP

Postinterview Follow-up After the interview is over, the analyst needs to prepare aninterview report that describes the information from the interview (Figure 4-8). The reportcontains interview notes, information that was collected over the course of the interviewand is summarized in a useful format. In general, the interview report should be writtenwithin forty-eight hours of the interview, because the longer the interviewer waits, themore likely he or she is to forget information.
Often, the interview report is sent to the interviewee with a request to read it andinform the analyst of clarifications or updates. The interviewee needs to be convinced thatthe interviewer genuinely want his or her corrections to the report. Usually there are fewchanges, but the need for any significant changes suggests that a second interview will berequired. Never distribute someone’s information without prior approval.
Requirements-Gathering Techniques 131
Interviewing is not as simple as it first appears. Select twopeople from class to go to the front of the room to demon-strate an interview. (This also can be done in groups.)Have one person be the interviewer and the other be theinterviewee. The interviewer should conduct a five-minute interview regarding the school’s course registra-tion system. Gather information about the existing systemand how the system can be improved. If there is time,repeat with another pair.
Questions
1. What was the body language of the interview pair like?
2. What kind of interview was conducted?3. What kinds of questions were asked?4. What was done well? How could the interview
be improved?
4-4 Interview PracticeYOUR
TURN
Interview Notes Approved by: Linda Estey
Person Interviewed: Linda Estey,
Director, Human Resources
Interviewer: Barbara Wixom
Purpose of Interview:
• Understand reports produced for Human Resources by the current system
• Determine information requirements for future system
Summary of Interview:
• Sample reports of all current HR reports are attached to this report. The information that is not used and missing information are noted on the reports.
• Two biggest problems with the current system are:
1. The data are too old (the HR Department needs information within two days of month end;currently information is provided to them after a three-week delay)
2. The data are of poor quality (often reports must be reconciled with departmental HR database)
• The most common data errors found in the current system include incorrect job level informationand missing salary information.
Open Items:
• Get current employee roster report from Mary Skudrna (extension 4355).
• Verify calculations used to determine vacation time with Mary Skudrna.
• Schedule interview with Jim Wack (extension 2337) regarding the reasons for data quality problems.
Detailed Notes: See attached transcript.FIGURE 4-8Interview Report

Joint Application Development (JAD)JAD is an information-gathering technique that allows the project team, users, and manage-ment to work together to identify requirements for the system. IBM developed the JAD tech-nique in the late 1970s, and it is often the most useful method for collecting information fromusers.8 Capers Jones claims that JAD can reduce scope creep by 50 percent, and it avoids therequirements for a system being too specific or too vague, both of which cause trouble dur-ing later stages of the SDLC.9 JAD is a structured process in which ten to twenty users meettogether under the direction of a facilitator skilled in JAD techniques. The facilitator is a per-son who sets the meeting agenda and guides the discussion but does not join in the discus-sion as a participant. He or she does not provide ideas or opinions on the topics underdiscussion in order to remain neutral during the session. The facilitator must be an expert inboth group process techniques and systems analysis and design techniques. One or two scribesassist the facilitator by recording notes, making copies, and so on. Often the scribes will usecomputers and CASE tools to record information as the JAD session proceeds.
The JAD group meets for several hours, several days, or several weeks until all the issueshave been discussed and the needed information is collected. Most JAD sessions take place ina specially prepared meeting room, away from the participants’ offices so that they are not inter-rupted. The meeting room is usually arranged in a U-shape so that all participants can easily seeeach other (see Figure 4-9). At the front of the room (the open part of the U), are whiteboard,flip chart and/or overhead projector for use by the facilitator leading the discussion.
One problem with JAD is that it suffers from the traditional problems associated withgroups; sometimes people are reluctant to challenge the opinions of others (particularlytheir boss), a few people often dominate the discussion, and not everyone participates. Ina fifteen-member group, for example, if everyone participates equally, then each person cantalk for only four minutes each hour and must listen for the remaining fifty-six minutes—not a very efficient way to collect information.
A new form of JAD called electronic JAD, or e-JAD, attempts to overcome these prob-lems by using groupware. In an e-JAD meeting room, each participant uses special softwareon a networked computer to send anonymous ideas and opinions to everyone else. In thisway, all participants can contribute at the same time without fear of reprisal from peoplewith differing opinions. Initial research suggests that e-JAD can reduce the time requiredto run JAD sessions by 50 to 80 percent.10
Selecting Participants Selecting JAD participants is done in the same basic way as select-ing interview participants. Participants are selected based on the information they can con-tribute, to provide a broad mix of organizational levels, and to build political support for thenew system. The need for all JAD participants to be away from their office at the same timecan be a major problem. The office may need to be closed or operate with a skeleton staffuntil the JAD sessions are complete.
Ideally, the participants who are released from regular duties to attend the JAD sessionsshould be the very best people in that business unit. However, without strong managementsupport, JAD sessions can fail because those selected to attend the JAD session are peoplewho are less likely to be missed (i.e., the least competent people).
132 Chapter 4 Requirements Determination
8 More information on JAD can be found in J. Wood and D. Silver, Joint Application Development (New York:Wiley, 1989); and Alan Cline, “Joint Application Development for Requirements Collection and Management,”http://www.carolla.com/wp-jad.htm.9 See Kevin Strehlo, “Catching up with the Jones and ‘Requirement’ Creep,” InfoWorld (July 29, 1996); and KevinStrehlo, “The Makings of a Happy Customer: Specifying Project X,” InfoWorld (November 11, 1996).10 For more information on e-JAD, see A. R. Dennis, G. S. Hayes, and R. M. Daniels, “Business Process Modelingwith Groupware,” Journal of Management Information Systems 15, no. 4 (1999): 115–142.
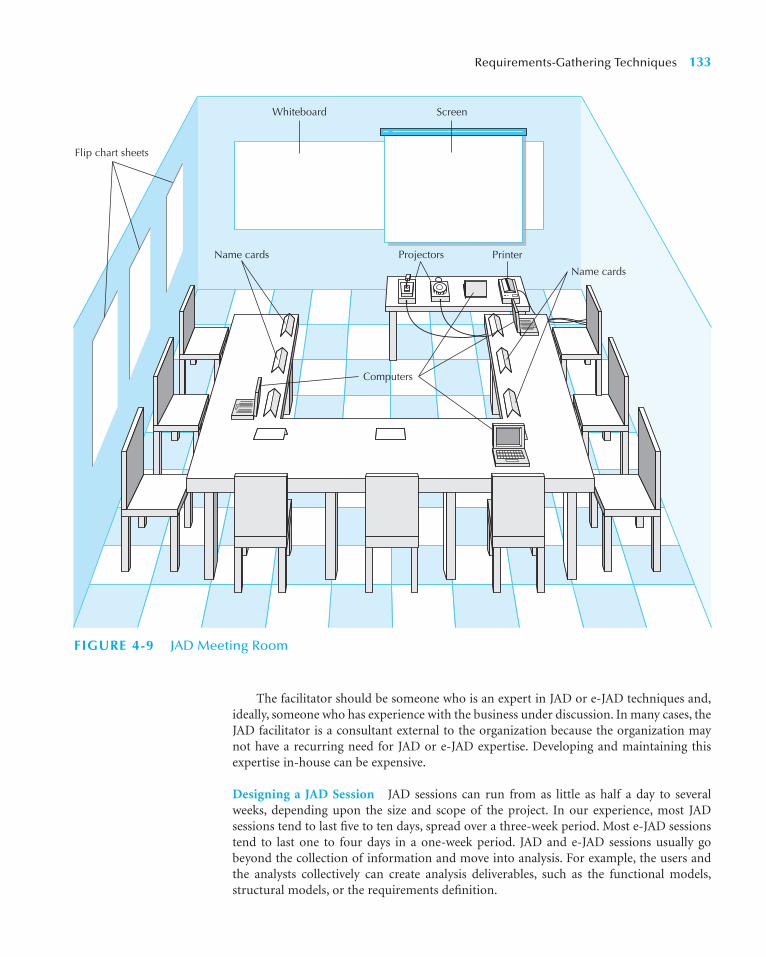
The facilitator should be someone who is an expert in JAD or e-JAD techniques and,ideally, someone who has experience with the business under discussion. In many cases, theJAD facilitator is a consultant external to the organization because the organization maynot have a recurring need for JAD or e-JAD expertise. Developing and maintaining thisexpertise in-house can be expensive.
Designing a JAD Session JAD sessions can run from as little as half a day to severalweeks, depending upon the size and scope of the project. In our experience, most JADsessions tend to last five to ten days, spread over a three-week period. Most e-JAD sessionstend to last one to four days in a one-week period. JAD and e-JAD sessions usually gobeyond the collection of information and move into analysis. For example, the users andthe analysts collectively can create analysis deliverables, such as the functional models,structural models, or the requirements definition.
Requirements-Gathering Techniques 133
Flip chart sheets
Whiteboard Screen
Computers
Projectors Printer
Name cards
Name cards
FIGURE 4-9 JAD Meeting Room

As with interviewing, success depends upon a careful plan. JAD sessions usually aredesigned and structured using the same principles as interviews. Most JAD sessions aredesigned to collect specific information from users, and this requires the development ofa set of questions prior to the meeting. One difference between JAD and interviewing isthat all JAD sessions are structured—they must be carefully planned. In general, closed-ended questions are seldom used because they do not spark the open and frank discus-sion that is typical of JAD. In our experience, it is better to proceed top-down in JADsessions when gathering information. Typically thirty minutes is allocated to each sepa-rate agenda item, and frequent breaks are scheduled throughout the day because partic-ipants tire easily.
Preparing for a JAD Session As with interviewing, it is important to prepare the ana-lysts and participants for a JAD session. Because the sessions can go beyond the depth of atypical interview and are usually conducted off-site, participants can be more concernedabout how to prepare. It is important that the participants understand what is expected ofthem. If the goal of the JAD session, for example, is to develop an understanding of thecurrent system, then participants can bring procedure manuals and documents with them.If the goal is to identify improvements for a system, then they can think about how theywould improve the system prior to the JAD session.
Conducting a JAD Session Most JAD sessions try to follow a formal agenda, and mosthave formal ground rules that define appropriate behavior. Common ground rules includefollowing the schedule, respecting others’ opinions, accepting disagreement, and ensuringthat only one person talks at once.
The role of a JAD facilitator can be challenging. Many participants come to a JAD sessionwith strong feelings about the system to be discussed. Channeling these feelings so that thesession moves forward in a positive direction and getting participants to recognize andaccept—but not necessarily agree on—opinions and situations different from their ownrequires significant expertise in systems analysis and design, JAD, and interpersonal skills. Fewsystems analysts attempt to facilitate JAD sessions without being trained in JAD techniques, andmost apprentice with a skilled JAD facilitator before they attempt to lead their first session.
The JAD facilitator performs three key functions. First, he or she ensures that thegroup sticks to the agenda. The only reason to digress from the agenda is when it becomesclear to the facilitator, project leader, and project sponsor that the JAD session has pro-duced some new information that is unexpected and requires the JAD session (and perhapsthe project) to move in a new direction. When participants attempt to divert the discussionaway from the agenda, the facilitator must be firm but polite in leading discussion back tothe agenda and getting the group back on track.
Second, the facilitator must help the group understand the technical terms and jargonthat surround the system development process, and help the participants understand the spe-cific analysis techniques used. Participants are experts in their area, or their part of the busi-ness, but they are not experts in systems analysis. The facilitator must, therefore, minimize thelearning required and teach participants how to effectively provide the right information.
Third, the facilitator records the group’s input on a public display area, which can bea whiteboard, flip chart, or computer display. He or she structures the information that thegroup provides and helps the group recognize key issues and important solutions. Underno circumstance should the facilitator insert his or her opinions into the discussion. Thefacilitator must remain neutral at all times and simply help the group through the process.The moment the facilitator offers an opinion on an issue, the group will see him or her notas a neutral party, but rather as someone who could be attempting to sway the group intosome predetermined solution.
134 Chapter 4 Requirements Determination
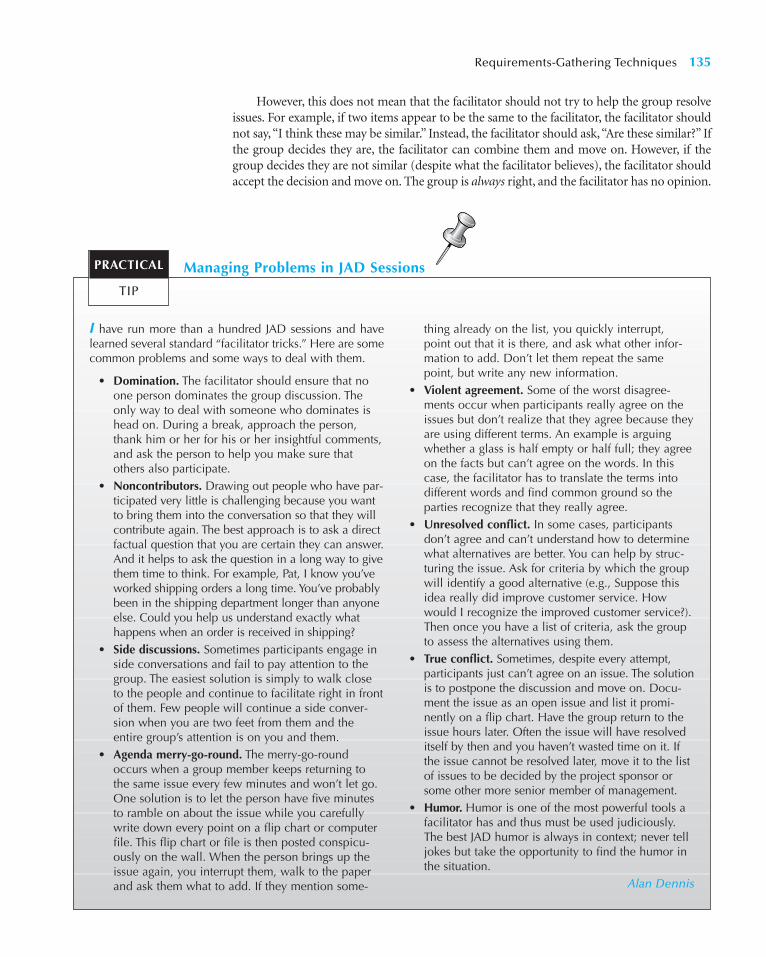
However, this does not mean that the facilitator should not try to help the group resolveissues. For example, if two items appear to be the same to the facilitator, the facilitator shouldnot say, “I think these may be similar.” Instead, the facilitator should ask, “Are these similar?” Ifthe group decides they are, the facilitator can combine them and move on. However, if thegroup decides they are not similar (despite what the facilitator believes), the facilitator shouldaccept the decision and move on. The group is always right, and the facilitator has no opinion.
Requirements-Gathering Techniques 135
Managing Problems in JAD Sessions
I have run more than a hundred JAD sessions and havelearned several standard “facilitator tricks.” Here are somecommon problems and some ways to deal with them.
• Domination. The facilitator should ensure that noone person dominates the group discussion. Theonly way to deal with someone who dominates ishead on. During a break, approach the person,thank him or her for his or her insightful comments,and ask the person to help you make sure thatothers also participate.
• Noncontributors. Drawing out people who have par-ticipated very little is challenging because you wantto bring them into the conversation so that they willcontribute again. The best approach is to ask a directfactual question that you are certain they can answer.And it helps to ask the question in a long way to givethem time to think. For example, Pat, I know you’veworked shipping orders a long time. You’ve probablybeen in the shipping department longer than anyoneelse. Could you help us understand exactly whathappens when an order is received in shipping?
• Side discussions. Sometimes participants engage inside conversations and fail to pay attention to thegroup. The easiest solution is simply to walk closeto the people and continue to facilitate right in frontof them. Few people will continue a side conver-sion when you are two feet from them and theentire group’s attention is on you and them.
• Agenda merry-go-round. The merry-go-roundoccurs when a group member keeps returning tothe same issue every few minutes and won’t let go.One solution is to let the person have five minutesto ramble on about the issue while you carefullywrite down every point on a flip chart or computerfile. This flip chart or file is then posted conspicu-ously on the wall. When the person brings up theissue again, you interrupt them, walk to the paperand ask them what to add. If they mention some-
thing already on the list, you quickly interrupt,point out that it is there, and ask what other infor-mation to add. Don’t let them repeat the samepoint, but write any new information.
• Violent agreement. Some of the worst disagree-ments occur when participants really agree on theissues but don’t realize that they agree because theyare using different terms. An example is arguingwhether a glass is half empty or half full; they agreeon the facts but can’t agree on the words. In thiscase, the facilitator has to translate the terms intodifferent words and find common ground so theparties recognize that they really agree.
• Unresolved conflict. In some cases, participantsdon’t agree and can’t understand how to determinewhat alternatives are better. You can help by struc-turing the issue. Ask for criteria by which the groupwill identify a good alternative (e.g., Suppose thisidea really did improve customer service. Howwould I recognize the improved customer service?).Then once you have a list of criteria, ask the groupto assess the alternatives using them.
• True conflict. Sometimes, despite every attempt,participants just can’t agree on an issue. The solutionis to postpone the discussion and move on. Docu-ment the issue as an open issue and list it promi-nently on a flip chart. Have the group return to theissue hours later. Often the issue will have resolveditself by then and you haven’t wasted time on it. Ifthe issue cannot be resolved later, move it to the listof issues to be decided by the project sponsor orsome other more senior member of management.
• Humor. Humor is one of the most powerful tools afacilitator has and thus must be used judiciously.The best JAD humor is always in context; never telljokes but take the opportunity to find the humor inthe situation.
Alan Dennis
PRACTICAL
TIP

Post-JAD Follow-up As with interviews, a JAD postsession report is prepared and circu-lated among session attendees. The postsession report is essentially the same as the interviewreport in Figure 4-8. Because the JAD sessions are longer and provide more information, itusually takes a week or two after the JAD session before the report is complete.
QuestionnairesA questionnaire is a set of written questions used to obtain information from individuals.Questionnaires are often used when there is a large number of people from whom informa-tion and opinions are needed. In our experience, questionnaires are a common techniquewith systems intended for use outside the organization (e.g., by customers or vendors) or forsystems with business users spread across many geographic locations. Most people automat-ically think of paper when they think of questionnaires, but today more questionnaires arebeing distributed in electronic form, either via e-mail or on the Web. Electronic distributioncan save a significant amount of money as compared to distributing paper questionnaires.
Selecting Participants As with interviews and JAD sessions, the first step is to identify theindividuals to whom the questionnaire will be sent. However, it is not usual to select everyperson who could provide useful information. The standard approach is to select a sample,or subset, of people who are representative of an entire group. Sampling guidelines are dis-cussed in most statistics books, and most business schools include courses that cover thetopic, so we do not discuss it here. The important point in selecting a sample, however, is torealize that not everyone who receives a questionnaire will actually complete it. On average,only 30 to 50 percent of paper and e-mail questionnaires are returned. Response rates forWeb-based questionnaires tend to be significantly lower (often only 5 to 30 percent).
Designing a Questionnaire Developing good questions is critical for questionnairesbecause the information on a questionnaire cannot be immediately clarified for a confusedrespondent. Questions on questionnaires must be very clearly written and leave little roomfor misunderstanding, so closed-ended questions tend to be most commonly used. Ques-tions must clearly enable the analyst to separate facts from opinions. Opinion questionsoften ask the respondent the extent to which they agree or disagree (e.g., Are network prob-lems common?), whereas factual questions seek more precise values (e.g., How often doesa network problem occur: once an hour, once a day, once a week?). See Figure 4-10 forguidelines on questionnaire design.
Perhaps the most obvious issue—but one that is sometimes overlooked—is to have aclear understanding of how the information collected from the questionnaire will be ana-lyzed and used. This issue must be addressed before the questionnaire is distributed,because it is too late afterward.
136 Chapter 4 Requirements Determination
Organize yourselves into groups of four to seven people,and pick one person in each group to be the JAD facilita-tor. Using a blackboard, whiteboard or flip chart, gatherinformation about how the group performs some process(e.g., working on a class assignment, making a sandwich,paying bills, getting to class).
Questions
1. How did the JAD session go?2. Based on your experience, what are pros and cons
of using JAD in a real organization?
4-5 JAD PracticeYOUR
TURN

Requirements-Gathering Techniques 137
Questions should be relatively consistent in style, so that the respondent does not haveto read instructions for each question before answering it. It is generally good practice togroup related questions together to make them simpler to answer. Some experts suggestthat questionnaires should start with questions important to respondents, so that the ques-tionnaire immediately grabs their interest and induces them to answer it. Perhaps the mostimportant step is to have several colleagues review the questionnaire and then pretest itwith a few people drawn from the groups to whom it will be sent. It is surprising how oftenseemingly simple questions can be misunderstood.
Administering the Questionnaire The key issue in administering the questionnaire is get-ting participants to complete the questionnaire and send it back. Dozens of marketing researchbooks have been written about ways to improve response rates. Commonly used techniquesinclude clearly explaining why the questionnaire is being conducted and why the respondenthas been selected; stating a date by which the questionnaire is to be returned; offering aninducement to complete the questionnaire (e.g., a free pen); and offering to supply a summaryof the questionnaire responses. Systems analysts have additional techniques to improveresponse rates inside the organization, such as personally handing out the questionnaire andpersonally contacting those who have not returned them after a week or two, as well as request-ing the respondents’ supervisors to administer the questionnaires in a group meeting.
Questionnaire Follow-up It is helpful to process the returned questionnaires anddevelop a questionnaire report soon after the questionnaire deadline. This ensures that theanalysis process proceeds in a timely fashion and that respondents who requested copies ofthe results receive them promptly.
• Begin with nonthreatening and interesting questions.
• Group items into logically coherent sections.
• Do not put important items at the very end of the questionnaire.
• Do not crowd a page with too many items.
• Avoid abbreviations.
• Avoid biased or suggestive items or terms.
• Number questions to avoid confusion.
• Pretest the questionnaire to identify confusing questions.
• Provide anonymity to respondents.
FIGURE 4-10Good QuestionnaireDesign
Organize yourselves into small groups. Have each persondevelop a short questionnaire to collect information abouthow often group members perform some process (e.g., work-ing on a class assignment, making a sandwich, paying bills,getting to class), how long it takes them, how they feel aboutthe process, and opportunities for improving the process.
Once everyone has completed his or her question-naire, ask each member to pass it to the right and thencomplete his or her neighbor’s questionnaire. Pass thequestionnaire back to the creator when it is completed.
Questions
1. How did the questionnaire you completed differfrom the one you created?
2. What are the strengths of each questionnaire?
3. How would you analyze the survey results if you hadreceived fifty responses?
4. What would you change about the questionnaire thatyou developed?
4-6 Questionnaire PracticeYOUR
TURN
Document AnalysisProject teams often use document analysis to understand the as-is system. Under ideal cir-cumstances, the project team that developed the existing system will have produced docu-mentation, which was then updated by all subsequent projects. In this case, the projectteam can start by reviewing the documentation and examining the system itself.
Unfortunately, most systems are not well documented because project teams fail todocument their projects along the way, and when the projects are over, there is no time togo back and document. Therefore, there may not be much technical documentation aboutthe current systems available, or it may not contain updated information about recent sys-tem changes. However, there are many helpful documents that do exist in an organization:paper reports, memorandums, policy manuals, user-training manuals, organization charts,forms, and, of course, the user interface with the existing system.
But these documents tell only part of the story. They represent the formal system thatthe organization uses. Quite often, the real, or informal, system differs from the formalone, and these differences, particularly large ones, give strong indications of what needs tobe changed. For example, forms or reports that are never used should probably be elimi-nated. Likewise, boxes or questions on forms that are never filled in (or are used for otherpurposes) should be rethought. See Figure 4-11 for an example of how a document canbe interpreted.
The most powerful indication that the system needs to be changed is when users createtheir own forms or add additional information to existing ones. Such changes clearlydemonstrate the need for improvements to existing systems. Thus, it is useful to reviewboth blank and completed forms to identify these deviations. Likewise, when users accessmultiple reports to satisfy their information needs, it is a clear sign that new informationor new information formats are needed.
ObservationObservation, the act of watching processes being performed, is a powerful tool forgathering information about the as-is system because it enables the analyst to see thereality of a situation, rather than listening to others describe it in interviews or JAD
138 Chapter 4 Requirements Determination
At my neighborhood Publix grocery store, the cashiersalways hand-write the total amount of the charge onevery credit-card charge form, even though it is printedon the form. Why? Because the “back office” staff peoplewho reconcile the cash in the cash drawers with theamount sold at the end of each shift find it hard to readthe small print on the credit-card forms. Writing in largeprint makes it easier for them to add the values up. How-ever, cashiers sometimes make mistakes and write thewrong amount on the forms, which causes problems.
Barbara Wixom
Questions
1. What does the credit-card charge form indicateabout the existing system?
2. How can you make improvements with a newsystem?
4-F Publix Credit-Card FormsCONCEPTS
IN ACTION
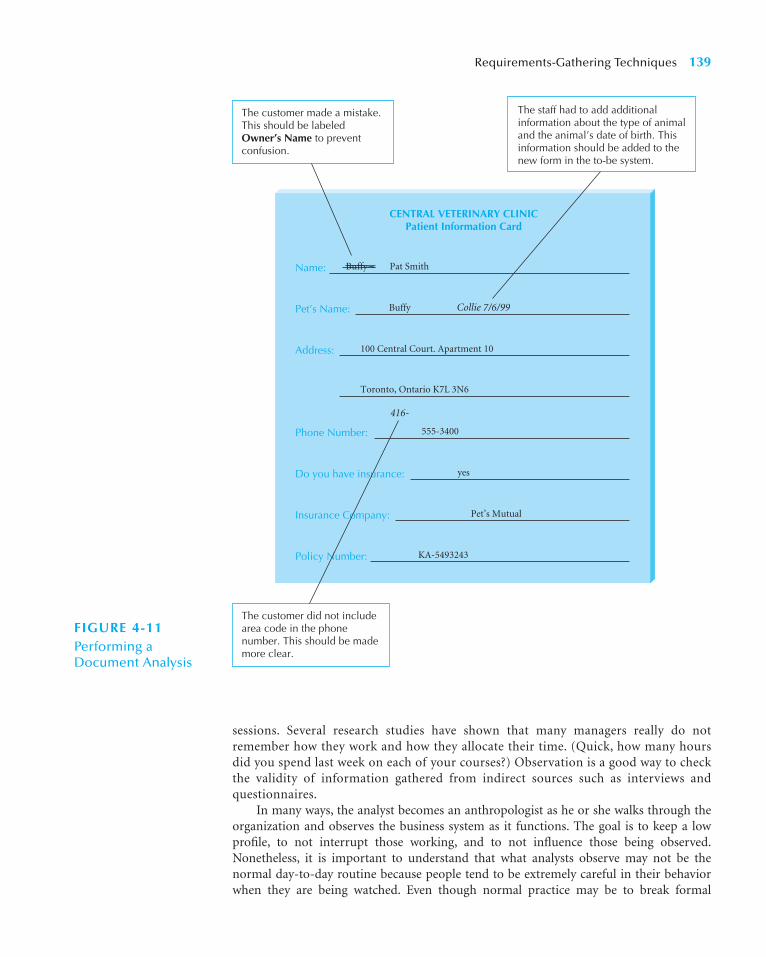
sessions. Several research studies have shown that many managers really do notremember how they work and how they allocate their time. (Quick, how many hoursdid you spend last week on each of your courses?) Observation is a good way to checkthe validity of information gathered from indirect sources such as interviews andquestionnaires.
In many ways, the analyst becomes an anthropologist as he or she walks through theorganization and observes the business system as it functions. The goal is to keep a lowprofile, to not interrupt those working, and to not influence those being observed.Nonetheless, it is important to understand that what analysts observe may not be thenormal day-to-day routine because people tend to be extremely careful in their behaviorwhen they are being watched. Even though normal practice may be to break formal
Requirements-Gathering Techniques 139
Name: Buffy Pat Smith
Pet’s Name: Buffy Collie 7/6/99
Address: 100 Central Court. Apartment 10
Toronto, Ontario K7L 3N6
Phone Number: 555-3400
416-
Do you have insurance: yes
Insurance Company: Pet’s Mutual
Policy Number: KA-5493243
CENTRAL VETERINARY CLINICPatient Information Card
The staff had to add additionalinformation about the type of animaland the animal’s date of birth. Thisinformation should be added to thenew form in the to-be system.
The customer made a mistake.This should be labeledOwner’s Name to preventconfusion.
The customer did not includearea code in the phonenumber. This should be mademore clear.
FIGURE 4-11Performing a Document Analysis

organizational rules, the observer is unlikely to see this. (Remember how you drove the lasttime a police car followed you?) Thus, what you see may not be what you get.
Observation is often used to supplement interview information. The location of a per-son’s office and its furnishings give clues as to the person’s power and influence in the orga-nization and can be used to support or refute information given in an interview. Forexample, an analyst might become skeptical of someone who claims to use the existingcomputer system extensively if the computer is never turned on while the analyst visits. Inmost cases, observation will support the information that users provide in interviews.When it does not, it is an important signal that extra care must be taken in analyzing thebusiness system.
Other TechniquesSome other very useful requirements-gathering techniques include throwaway prototyping,role-playing CRC cards with use case–based scenarios, and mind/concept mapping.Throwaway prototyping was described in Chapter 1. In essence, throwaway prototypes arecreated to better understand some aspect of the new system. In many cases, they are usedto test out some technical aspect of a nonfunctional requirement, such as connecting aclient workstation to a server. If you have never done this before, it will be a lot easier todevelop a very small example system to test out the necessary design of the connectionfrom the client workstation to the server instead of trying to do it the first time with thefull blown system. As such, throwaway prototyping is very useful when designing the physicalarchitecture of the system (see Chapter 12). Throwaway prototyping can also be very usefulin designing user interfaces (see Chapter 11).
Role-playing CRC cards with use case–based scenarios are very useful when creatingfunctional (see Chapter 5), structural (see Chapter 6), and behavioral (see Chapter 7)models. We describe this approach in Chapter 6.
Concept mapping is an educational psychology technique that has been used inschools, corporations, and health-care agencies to facilitate learning, understanding, andknowledge creation.11 Concept maps represent meaningful relationships between concepts.
140 Chapter 4 Requirements Determination
Visit the library at your college or university and observehow the book checkout process occurs. First watch severalstudents checking books out, and then check one out your-self. Prepare a brief summary report of your observations.
When you return to class, share your observationswith others.
Questions
1. Why might the reports present different information?2. How would the information be different had you
used the interview or JAD technique?
4-7 Observation PracticeYOUR
TURN
11 For more information on concept mapping, see J. D. Novak and D. B. Gowin, Learning How to Learn(Cambridge, UK: Cambridge University Press, 1984); and J. D. Novak, Learning, Creating, and Using Knowl-edge: Concept MapsTM as Facilitative Tools in Schools and Corporations (Mahwah, NL: Lawrence Erlbaum Asso-ciates, Publishers, 1998). Also, a concept mapping tool is available from the Institute of Human and MachineCognition at cmap.ihmc.us.
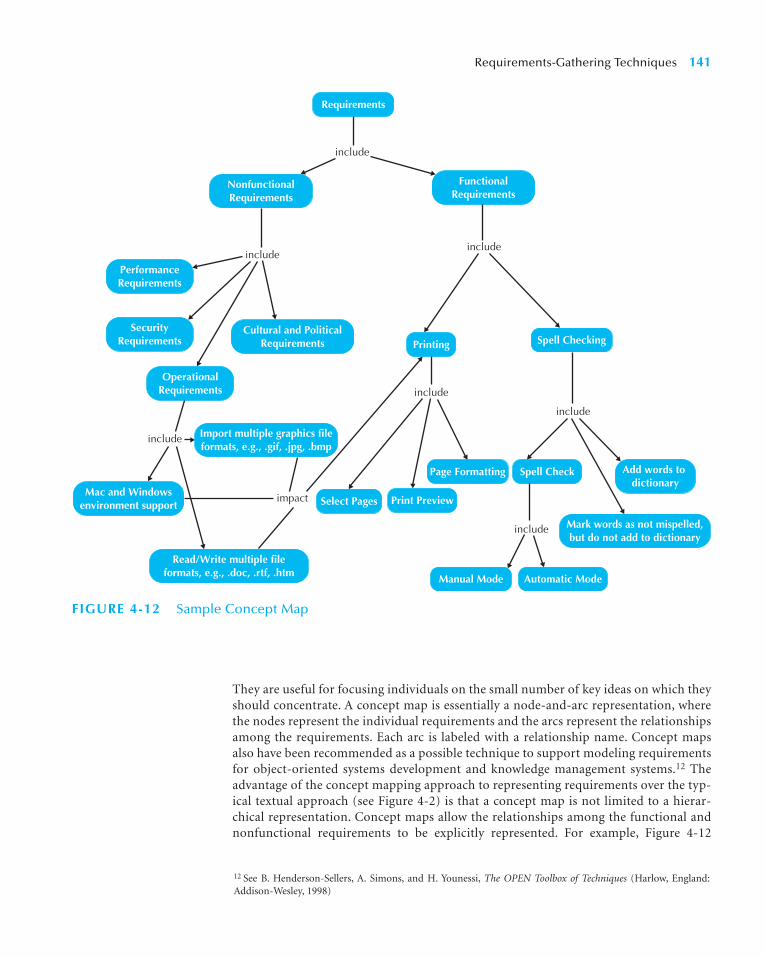
They are useful for focusing individuals on the small number of key ideas on which theyshould concentrate. A concept map is essentially a node-and-arc representation, wherethe nodes represent the individual requirements and the arcs represent the relationshipsamong the requirements. Each arc is labeled with a relationship name. Concept mapsalso have been recommended as a possible technique to support modeling requirementsfor object-oriented systems development and knowledge management systems.12 Theadvantage of the concept mapping approach to representing requirements over the typ-ical textual approach (see Figure 4-2) is that a concept map is not limited to a hierar-chical representation. Concept maps allow the relationships among the functional andnonfunctional requirements to be explicitly represented. For example, Figure 4-12
Requirements-Gathering Techniques 141
include
includeinclude
include
impact
include
include
include
Requirements
Spell Checking
Manual Mode Automatic Mode
Printing
NonfunctionalRequirements
Cultural and Political Requirements
Mark words as not mispelled, but do not add to dictionary
Read/Write multiple file formats, e.g., .doc, .rtf, .htm
PerformanceRequirements
SecurityRequirements
OperationalRequirements
FunctionalRequirements
Print Preview
Page Formatting Spell Check Add words to dictionary
Mac and Windows environment support Select Pages
Import multiple graphics fileformats, e.g., .gif, .jpg, .bmp
FIGURE 4-12 Sample Concept Map
12 See B. Henderson-Sellers, A. Simons, and H. Younessi, The OPEN Toolbox of Techniques (Harlow, England:Addison-Wesley, 1998)

shows a concept map that portrays the information contained in the requirements def-inition shown in Figure 4-1. As is demonstrated, concept maps provide a very simpleapproach for linking nonfunctional requirements to functional requirements. This isvery difficult to represent in a text-only version of the requirements definition. Bycombining both text and concept map representation, it is possible to leverage thestrength of both textual and graphical representations to more completely representthe requirements.
Selecting the Appropriate TechniquesEach of the requirements-gathering techniques discussed earlier has strengths andweaknesses. No one technique is always better than the others, and in practice mostprojects use a combination of techniques. Thus, it is important to understand thestrengths and weaknesses of each technique and when to use each (see Figure 4-13).One issue not discussed is that of the analysts’ experience. In general, document analy-sis and observation require the least amount of training, whereas JAD sessions are themost challenging.
Type of Information The first characteristic is type of information. Some techniques aremore suited for use at different stages of the analysis process, whether understanding theas-is system, identifying improvements, or developing the to-be system. Interviews andJAD are commonly used in all three stages. In contrast, document analysis and observationusually are most helpful for understanding the as-is, although occasionally they provideinformation about current problems that need to be improved. Questionnaires are oftenused to gather information about the as-is system as well as general information aboutimprovements.
Depth of Information The depth of information refers to how rich and detailed theinformation is that the technique usually produces and the extent to which the techniqueis useful for obtaining not only facts and opinions, but also an understanding of whythose facts and opinions exist. Interviews and JAD sessions are very useful for providinga good depth of rich and detailed information and helping the analyst to understand thereasons behind them. At the other extreme, document analysis and observation are use-ful for obtaining facts, but little beyond that. Questionnaires can provide a mediumdepth of information, soliciting both facts and opinions with little understanding of whythey exist.
142 Chapter 4 Requirements Determination
FIGURE 4-13 Table of Requirements-Gathering Techniques
Type of information As-is, improvements, As-is, improvements, As-is, improvements As-is As-isto-be to-be
Depth of information High High Medium Low Low
Breadth of information Low Medium High High Low
Integration of information Low High Low Low Low
User involvement Medium High Low Low Low
Cost Medium Low–Medium Low Low Low–Medium
Joint Application Document Interviews Design Questionnaires Analysis Observation

Breadth of Information Breadth of information refers to the range of information andinformation sources that can be easily collected using the chosen technique. Question-naires and document analysis are both easily capable of soliciting a wide range of informa-tion from a large number of information sources. In contrast, interviews and observationrequire the analyst to visit each information source individually and, therefore, take moretime. JAD sessions are in the middle because many information sources are broughttogether at the same time.
Integration of Information One of the most challenging aspects of requirements gath-ering is the integration of information from different sources. Simply put, different peo-ple can provide conflicting information. Combining this information and attempting toresolve differences in opinions or facts is usually very time consuming because it meanscontacting each information source in turn, explaining the discrepancy, and attemptingto refine the information. In many cases, the individual wrongly perceives that the ana-lyst is challenging his or her information, when in fact it is another user in the organiza-tion who is doing so. This can make the user defensive and make it hard to resolve thedifferences.
All techniques suffer integration problems to some degree, but JAD sessions aredesigned to improve integration because all information is integrated when it is collected,not afterwards. If two users provide conflicting information, the conflict becomes imme-diately obvious, as does the source of the conflict. The immediate integration of informa-tion is the single most important benefit of JAD that distinguishes it from other techniques,and this is why most organizations use JAD for important projects.
User Involvement User involvement refers to the amount of time and energy theintended users of the new system must devote to the analysis process. It is generallyagreed that as users become more involved in the analysis process, the chance of success
Requirements-Gathering Techniques 143
Colleges and universities need to stay current with tech-nologies. Many campuses have gone with laptop pro-grams, where students are expected to purchase or leasea particular model of laptop that will be preloaded withappropriate software and used for the students’ collegiatecareers. Likewise, the campuses need to update theirinfrastructure—such as increasing bandwidth (to handlemore video, such as YouTube)—and to provide wirelesscommunication.
The University of Northern Wisconsin is a campusthat is trying to remain current with technology. Campusbudgets are almost always tight. UNW offers programsfrom its Superior, Wisconsin, main campus as well asprograms on two satellite campuses in Ashland andRhinelander. Users on the two satellite campuses frequently
do not get the same level of service as students on themain campus. Internet access is generally slower and notall the software is the same. For example, students at themain campus have access to Blomberg systems for analy-sis of financial trading data. The campus opted to build anInternet portal for all students to get to the same softwareand systems, set up by student ID and student profiles andpermissions.
Questions
1. What technologies would be needed to make yourcampus a premier technology-oriented school?
2. How might a college campus be like a businesswith multiple locations and software needs?
4-G Campus Technology UpdatesCONCEPTS
IN ACTION
increases. However, user involvement can have a significant cost, and not all users arewilling to contribute valuable time and energy. Questionnaires, document analysis, andobservation place the least burden on users, whereas JAD sessions require the greatesteffort.
Cost Cost is always an important consideration. In general, questionnaires, documentanalysis, and observation are low-cost techniques (although observation can be quite timeconsuming). The low cost does not imply that they are more or less effective than the othertechniques. Interviews and JAD sessions generally have moderate costs. In general, JADsessions are much more expensive initially, because they require many users to be absent fromtheir offices for significant periods of time, and they often involve highly paid consultants.However, JAD sessions significantly reduce the time spent in information integration andthus cost less in the long term.
Combining Techniques In practice, requirements gathering combines a series of dif-ferent techniques. Most analysts start by using interviews with senior manager(s) to gainan understanding of the project and the big-picture issues. From these interviews, itbecomes clear whether large or small changes are anticipated. These interviews are oftenfollowed with analysis of documents and policies to gain some understanding of the as-is system. Usually interviews come next to gather the rest of the information needed forthe as-is picture.
In our experience, identifying improvements is most commonly done using JADsessions because the JAD session enables the users and key stakeholders to work togetherthrough an analysis technique and come to a shared understanding of the possibilities forthe to-be system. Occasionally, these JAD sessions are followed by questionnaires sent to amuch wider set of users or potential users to see whether the opinions of those whoparticipated in the JAD sessions are widely shared.
Developing the concept for the to-be system is often done through interviews withsenior managers, followed by JAD sessions with users of all levels to make sure the keyneeds of the new system are well understood.
THE SYSTEM PROPOSAL
A system proposal brings together into a single comprehensive document the materialcreated during planning and analysis. The system proposal typically includes an executivesummary, the system request, the workplan, the feasibility analysis, the requirements defi-nition, and the evolving models that describe the new system.13 The executive summaryprovides all critical information in a very concise form. It can be thought of as a summaryof the complete proposal. Its purpose is to allow a busy executive to quickly read throughit and determine which parts of the proposal that they need to go through more thor-oughly. Figure 4-14 provides a template for a system proposal and references to where theother sections of the proposal are described.
144 Chapter 4 Requirements Determination
13 Depending on the client, much more detailed specifications may be required; for example Department ofDefense, NASA, IEEE/ANSI, and the Naval Research Laboratory all have very specific formats that must befollowed. For more information on these more detailed specifications see A. M Davis, Software Requirements,Revision (Upper Saddle River, NJ: Prentice Hall, 1993); G. Kotonya and I. Sommerville, Requirements Engineering(Chichester, England: Wiley, 1998); and R. H. Thayer and M. Dorfman (eds.), Software Requirements Engineering,2nd ed. (Los Alamitos, CA: IEEE Computer Society Press, 1997).

APPLYING THE CONCEPTS AT CD SELECTIONS
Once the CD Selections steering committee approved the system proposal and feasibilityanalysis, the project team began performing analysis activities. These included gatheringrequirements using a variety of techniques, and analyzing the requirements that were gathered.An Internet marketing and sales consultant, Chris Campbell, was hired to advise Alec,Margaret, and the project team during the inception phase. Some highlights of the projectteam’s activities are presented next.
Requirements Analysis StrategiesMargaret suggested that the project team conduct several JAD sessions with store man-agers, marketing analysts, and Web-savvy members of the IT staff. Together, the groupscould work through some BPI strategies and brainstorm how improvements could bemade to the current order process using a new Web-based system.
Alec facilitated three JAD sessions that were conducted over the course of a week.Alec’s past facilitation experience helped the eight-person meetings run smoothly andstay on track. First, Alec used technology analysis and suggested several important Webtechnologies that could be used for the system. The JAD session generated ideas abouthow CD Selections could apply each of the technologies to the Internet order project.
Applying the Concepts at CD Selections 145
FIGURE 4-14System Proposal Template
1. Table of Contents
2. Executive Summary
A summary of all the essential information in the proposal so a busy executive can read itquickly and decide what parts of the plan to read in more depth.
3. System Request
The revised system request form (see Chapter 2).
4. Workplan
The original workplan, revised after having completed the analysis phase (see Chapter 3).
5. Feasibility Analysis
A revised feasibility analysis, using the information from the analysis phase (see Chapter 2).
6. Requirements Definition
A list of the functional and nonfunctional business requirements for the system (this chapter).
7. Functional Model
An activity diagram, a set of use case descriptions, and a use case diagram that illustrate thebasic processes or external functionality that the system needs to support (see Chapter 5).
8. Structural Models
A set of CRC cards, class diagram and object diagrams that describe the structural aspects ofthe to-be system (see Chapter 6). This may also include structural models of the current as-issystem that will be replaced.
9. Behavioral Models
A set of sequence diagrams, communication diagrams, behavioral state machines, and aCRUD matrix that describe the internal behavior of the to-be system (see Chapter 7). This mayinclude behavioral models of the as-is system that will be replaced.
Appendices
These contain additional material relevant to the proposal, often used to support the recom-mended system. This might include results of a questionnaire survey or interviews, industryreports and statistics, and so on.

146 Chapter 4 Requirements Determination
14 This JAD session was not originally planned. As such, the workplan (see Figure 3-22) should be modified.
Alec had the group categorize the ideas into three sets: definite ideas that would have agood probability of providing business value; possible ideas that might add businessvalue; and unlikely ideas.
Next, Alec applied informal benchmarking by introducing the Web sites of severalleading retailers and pointing out the features that they offered online. He selected somesites based on their success with Internet sales and others based on their similarity to thevision for CD Selections’ new system. The group discussed the features that were commonacross most retailers versus unique functionality, and they created a list of suggested busi-ness requirements for the project team.
Requirements-Gathering TechniquesAlec believed that it would be important to understand the order processes and systemsthat already existed in the organization because they would have to be closely integratedwith the Web order system. Three requirements-gathering techniques proved to be helpfulin understanding the current systems and processes—document analysis, interviews, andobservation.
First, the project team collected existing reports (e.g., order forms, screenshots of theonline order screens) and system documentation (functional, structural, and behavioralmodels) that shed light on the as-is system. They were able to gather a good amount ofinformation about the brick-and-mortar order processes and systems in this way. Whenquestions arose, they conducted short interviews with the person who provided the docu-mentation for clarification.
Next, Alec interviewed the senior analysts for the order and inventory systems to get abetter understanding of how those systems worked. He asked if they had any ideas for thenew system as well as for any integration issues that would need to be addressed. Alex alsointerviewed a contact from the ISP and the IT person who supported CD Selections’ currentWeb site; both provided information about the existing communications infrastructure atCD Selections and its Web capabilities. Finally, Alex spent a half day visiting two of the retailstores and observing exactly how the order and hold processes worked in the brick-and-mortar facilities.
Requirements DefinitionThroughout all these activities, the project team collected information and tried to identifythe business requirements for the system from the information. As the project progressed,requirements were added to the requirements definition and grouped by requirement type.When questions arose, the team worked with Margaret, Chris, and Alec to confirm thatrequirements were within the scope. The requirements that fell outside of the scope of thecurrent system were typed into a separate document that would be saved for future use.
After gathering and documenting the requirements, the requirements definition wasdistributed to Margaret, two marketing employees who would work with the system onthe business side, and several retail store managers. This group then met for a two-dayJAD session to clarify, finalize, and prioritize business requirements.14
The project team spent time creating functional, structural and behavioral models(Chapters 5, 6, and 7) that depicted the objects in the future system. Members of market-ing and IT departments reviewed the documents during interviews with the project team.Figure 4-15 shows a portion of the final requirements definition, and Figure 4-16 repre-sents the requirements in the form of a concept map.

Applying the Concepts at CD Selections 147
Nonfunctional Requirements
1. Operational Requirements1.1 The Internet sales system will draw information from the main CD information database, which contains basic information
about CDs (e.g., title, artist, ID number, price, quantity in inventory). The Internet sales system will not write information tothe main CD information database.
1.2 The Internet sales system will store orders for new CDs in the special order system and will rely on the special order systemto complete the special orders generated.
1.3 A new module for the in-store system will be written to manage the “holds” generated by the Internet sales system. Therequirements for this new module will be documented as part of the Internet sales system because they are necessary for theInternet sales system to function.
2. Performance RequirementsNo special performance requirements are anticipated.
3. Security RequirementsNo special security requirements are anticipated.
4. Cultural and Political Requirements.No special cultural and political requirements are anticipated.
Functional Requirements
1. Maintain CD Information1.1 The Internet sales system will need a database of basic information about the CDs that it can sell over the Internet, similar
to the CD database at each of the retail stores (e.g., title, artist, ID number, price, quantity in inventory).1.2 Every day, the Internet sales system will receive an update from the distribution system that will be used to update this CD
database. Some new CDs will be added, some will be deleted, and others will be revised (e.g., a new price).1.3 The electronic marketing (EM) manager (a position that will need to be created) will also have the ability to update information
(e.g., prices for sales).
2. Maintain CD Marketing Information2.1 The Internet sales system provides an additional opportunity to market CDs to current and new customers. The system will
provide a database of marketing materials about selected CDs that will help Web users learn more about them (e.g., musicreviews, links to Web sites, artist information, and sample sound clips). When information about a CD that has additionalmarketing information is displayed, a link will be provided to the additional information.
2.2 Marketing materials will be supplied primarily by vendors and record labels so that we can better promote their CDs. The EMmanager of the marketing department will determine what marketing materials will be placed in the system and will be responsible for adding, changing, and deleting the materials.
3. Place CD Orders
3.1 Customers will access the Internet sales system to look for CDs of interest. Some customers will search for specific CDs or CDsby specific artists, whereas other customers will want to browse for interesting CDs in certain categories (e.g., rock, jazz, classical).
3.2 When the customer has found all the CDs he or she wants, the customer will "check out" by providing personal information (e.g.,name, e-mail, address, credit card), and information regarding the order (e.g., the CDs to purchase, and the quantity for each item).
3.3 The system will verify the customer's credit card information with an online credit card clearance center and either accept theorder or reject it.
3.4 Customers will also be able check to see if their preferred stores have the CDs in stock. They will use zip code to find storesclose to their location. If the CD is available at a preferred store, a customer can immediately place a hold on the CD in stockand then come into the store and pick it up.
3.5 If the CD is not available in the customer’s preferred store, the customer can request that the CD be special ordered to thatstore for later pickup. The customer will be notified by e-mail when the requested CD arrives at the requested store; the CD will be placed on hold (which will again expire after 7 days). This process will work similarly to the current special order systems already available in the regular stores.
3.6 Alternatively, the customer can mail order the CD (see requirement 4).
4. Fill Mail Orders4.1 When a CD is mail-ordered, the Internet sales system will send the mail order to the mail order distribution system.4.2 The mail-order distribution system will handle the actual sending of CDs to customers; it will notify the Internet sales system
and e-mail the customer.4.3 Weekly reports can be run by the EM manager to check the order status.
FIGURE 4-15 CD Selections Requirements Definition
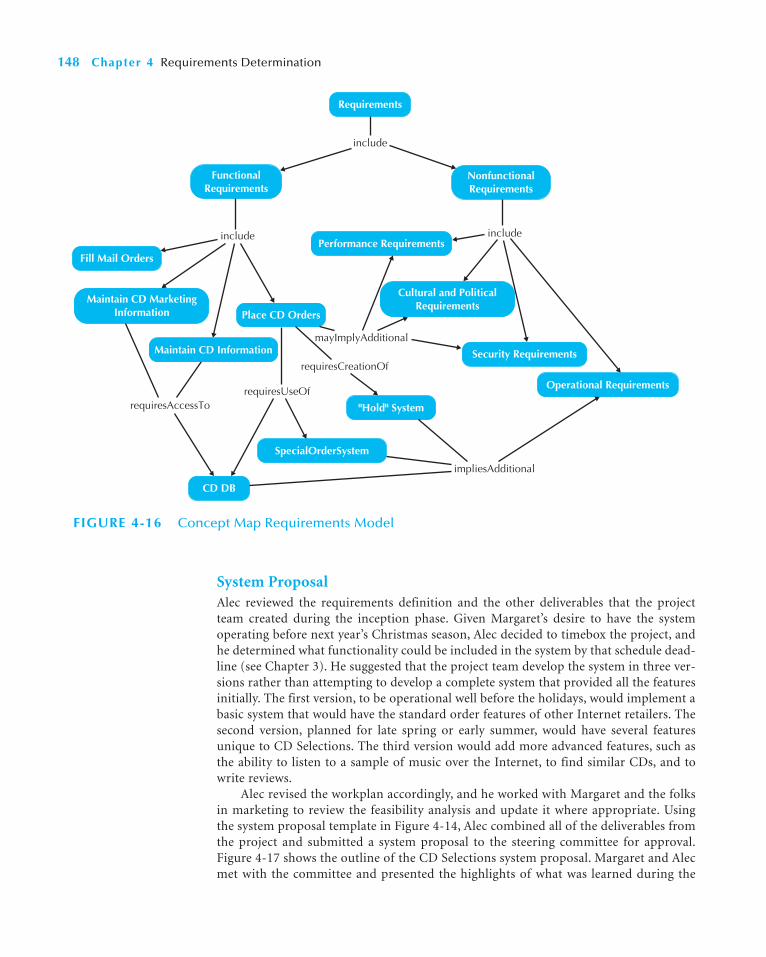
148 Chapter 4 Requirements Determination
System ProposalAlec reviewed the requirements definition and the other deliverables that the projectteam created during the inception phase. Given Margaret’s desire to have the systemoperating before next year’s Christmas season, Alec decided to timebox the project, andhe determined what functionality could be included in the system by that schedule dead-line (see Chapter 3). He suggested that the project team develop the system in three ver-sions rather than attempting to develop a complete system that provided all the featuresinitially. The first version, to be operational well before the holidays, would implement abasic system that would have the standard order features of other Internet retailers. Thesecond version, planned for late spring or early summer, would have several featuresunique to CD Selections. The third version would add more advanced features, such asthe ability to listen to a sample of music over the Internet, to find similar CDs, and towrite reviews.
Alec revised the workplan accordingly, and he worked with Margaret and the folksin marketing to review the feasibility analysis and update it where appropriate. Usingthe system proposal template in Figure 4-14, Alec combined all of the deliverables fromthe project and submitted a system proposal to the steering committee for approval.Figure 4-17 shows the outline of the CD Selections system proposal. Margaret and Alecmet with the committee and presented the highlights of what was learned during the
FIGURE 4-16 Concept Map Requirements Model
include
include
include
Maintain CD Marketing Information
requiresCreationOf
mayImplyAdditional
impliesAdditional
Cultural and Political Requirements
requiresUseOfrequiresAccessTo
Requirements
Fill Mail Orders
Place CD Orders
CD DB
"Hold" System
FunctionalRequirements
NonfunctionalRequirements
Performance Requirements
Security Requirements
Operational Requirements
SpecialOrderSystem
Maintain CD Information

Summary 149
inception phase and the final concept of the new system. Based on the proposal and pre-sentation, the steering committee decided that they would continue to fund the Inter-net sales system.
SUMMARY
Requirements DeterminationRequirements determination is the part of analysis whereby the project team turns the veryhigh-level explanation of the business requirements stated in the system request into amore precise list of requirements. A requirement is simply a statement of what the systemmust do or what characteristic it needs to have. Business requirements describe the what ofthe systems, and system requirements describe how the system will be implemented. Afunctional-requirement relates directly to a process the system has to perform or informa-tion it needs to contain. Nonfunctional requirements refer to behavioral properties that thesystem must have, such as performance and usability. All the functional and nonfunctionalbusiness requirements that fit within the scope of the system are written in the require-ments definition, which is used to create other analysis deliverables and leads to the initialdesign for the new system.
1. Table of Contents
2. Executive Summary
To be completed once everything else is done.
3. System Request
See Figure 2-13.
4. Workplan
See Figure 3-22.
5. Feasibility Analysis
See Figures 2-14 and 2-15.
6. Requirements Definition
See Figure 4-15.
7. Functional Model
To be completed in the future (see Chapter 5).
8. Structural Models
To be completed in the future (see Chapter 6).
9. Behavioral Model
To be completed in the future (see Chapter 7).
Appendices
A. Size and Effort Estimate
See Figure 3-21.
B. Staffing Plan
See Figure 3-23.
C. Project Charter
See Figure 3-24.
FIGURE 4-17Outline of the CDSelections System Proposal

150 Chapter 4 Requirements Determination
Requirements Analysis StrategiesThe basic process of analysis is divided into three steps: understanding the as-is system,identifying improvements, and developing requirements for the to-be system. Threerequirements analysis strategies—BPA, BPI, and BPR—help the analyst lead users throughthe three (or two) analysis steps so that the vision of the system can be developed. BPAmeans leaving the basic way in which the organization operates unchanged and using com-puter technology to do some of the work. Problem analysis and root-cause analysis are twopopular BPA techniques. BPI means making moderate changes to the way in which theorganization operates to take advantage of new opportunities offered by technology or tocopy what competitors are doing. Duration analysis, activity-based costing, and informa-tion benchmarking are three popular BPI activities. BPR means changing the fundamentalway in which the organization operates. Outcome analysis, technology analysis, and activityelimination are three popular BPR activities.
Requirements-Gathering TechniquesFive techniques can be used to gather the business requirements for the proposed sys-tem: interviews, joint application development, questionnaires, document analysis, andobservation. Interviews involve meeting one or more people and asking them questions.There are five basic steps in the interview process: selecting interviewees, designinginterview questions, preparing for the interview, conducting the interview, and postin-terview follow-up. JAD allows the project team, users, and management to worktogether to identify requirements for the system. Electronic JAD attempts to overcomecommon problems associated with groups by using groupware. A questionnaire is a setof written questions for obtaining information from individuals. Questionnaires areoften used when there is a large number of people from whom information and opin-ions are needed. Document analysis entails reviewing the documentation and examin-ing the system itself. It can provide insights into the formal and informal system.Observation, the act of watching processes being performed, is a powerful tool for gath-ering information about the as-is system because it enables the analyst to see the realityof a situation firsthand.
The System ProposalThe system proposal documents the results of the planning and analysis activities in asingle, comprehensive document. The actual format of the system proposal depends some-what on the client. For example, the federal government has very specific requirements thata system proposal must meet, whereas a small locally owned bike shop would be willing touse a much simpler format.
KEY TERMS
Activity eliminationActivity-based costingAnalysisAs-is systemBenchmarking
Bottom-up interviewBreadth of analysisBusiness process automation (BPA)Business process improvement (BPI)Business process reengineering (BPR)
Business requirementsClosed-ended questionCritical thinking skillsDocument analysisDuration analysis
Exercises 151
QUESTIONS
1. What are the key deliverables that are created duringthe analysis phase? What is the final deliverable fromthe analysis phase, and what does it contain?
2. What is the difference between an as-is system and ato-be system?
3. What is the purpose of the requirements definition?4. What are the three basic steps of the analysis process?
Which step is sometimes skipped or done in a cursoryfashion? Why?
5. Compare and contrast the business goals of BPA, BPI,and BPR.
6. Compare and contrast problem analysis and root-causeanalysis. Under what conditions would you use prob-lem analysis? Under what conditions would you useroot-cause analysis?
7. Compare and contrast duration analysis and activity-based costing.
8. Assuming time and money were not important con-cerns, would BPR projects benefit from additional timespent understanding the as-is system? Why or why not?
9. What are the important factors in selecting an appro-priate analysis strategy?
10. Describe the five major steps in conducting interviews.11. Explain the difference between a closed-ended ques-
tion, an open-ended question, and a probing question.When would you use each?
12. Explain the differences between unstructured inter-views and structured interviews. When would you useeach approach?
13. Explain the difference between a top-down and bottom-up interview approach. When would you use eachapproach?
14. How are participants selected for interviews and JADsessions?
15. How can you differentiate between facts and opin-ions? Why can both be useful?
16. Describe the five major steps in conducting JAD sessions.
17. How does a JAD facilitator differ from a scribe?18. What are the three primary things that a facilitator
does in conducting the JAD session?19. What is e-JAD and why might a company be inter-
ested in using it?20. How does designing questions for questionnaires dif-
fer from designing questions for interviews or JADsessions?
21. What are typical response rates for questionnaires andhow can you improve them?
22. What is document analysis?23. How does the formal system differ from the informal
system? How does document analysis help you under-stand both?
24. What are the key aspects of using observation in theinformation gathering process?
25. Explain factors that can be used to select informationgathering techniques.
Electronic JAD (e-JAD)FacilitatorFormal systemFunctional requirementsGround rulesInformal benchmarkingInformal systemInterpersonal skillsInterviewInterview notesInterview reportInterview scheduleJAD (joint application development)Nonfunctional requirements
ObservationOpen-ended questionOutcome analysisParallelizationProcess IntegrationPostsession reportPotential business valueProbing questionProblem analysisProject costQuestionnaireRequirementRequirements definitionRequirements determination
RiskRoot causeRoot-cause analysisSampleScribeStructured interviewSystem proposalSystem requirementsTechnology analysisTo-be systemTop-down interviewUnstructured interviewWalkthrough
152 Chapter 4 Requirements Determination
MINICASES
1. The State Firefighter’s Association has a membershipof 15,000. The purpose of the organization is to pro-vide some financial support to the families of deceasedmember firefighters and to organize a conference eachyear bringing together firefighters from all over thestate. Members are billed dues and calls annually. Calls
are additional funds required to take care of paymentsmade to the families of deceased members. The book-keeping work for the association is handled by theelected treasurer, Bob Smith, although it is widelyknown that his wife, Laura, does all the work. Bob runsunopposed each year at the election, because no one
EXERCISES
A. Review the Amazon.com Web site. Develop the require-ments definition for the site. Create a list of functionalbusiness requirements that the system meets. What dif-ferent kinds of non-functional business requirementsdoes the system meet? Provide examples for each kind.
B. Suppose you are going to build a new system that auto-mates or improves the interview process for the careerservices department of your school. Develop a require-ments definition for the new system. Include bothfunctional and nonfunctional system requirements.Pretend you will release the system in three differentversions. Prioritize the requirements accordingly.
C. Describe in very general terms the as-is business processfor registering for classes at your university. What BPAtechnique would you use to identify improvements?With whom would you use the BPA technique? Whatrequirements-gathering technique would help youapply the BPA technique? List some examples ofimprovements that you would expect to find.
D. Describe in very general terms the as-is business processfor registering for classes at your university. What BPItechnique would you use to identify improvements?With whom would you use the BPI technique? Whatrequirements-gathering technique would help you applythe BPI technique? List some examples of improvementsthat you would expect to find.
E. Describe in very general terms the as-is business processfor registering for classes at your university. What BPRtechnique would you use to identify improvements?With whom would you use the BPR technique? Whatrequirements gathering technique would help you applythe BPR technique? List some examples of improve-ments that you would expect to find.
F. Suppose your university is having a dramatic increasein enrollment and is having difficulty finding enoughseats in courses for students. Perform a technologyanalysis to identify new ways to help students com-plete their studies and graduate.
G. Suppose you are the analyst charged with developing anew system for the university bookstore so studentscan order books online and have them delivered totheir dorms or off-campus housing. What requirements-gathering techniques will you use? Describe in detailhow you would apply the techniques.
H. Suppose you are the analyst charged with developing anew system to help senior managers make better strategicdecisions. What requirements-gathering techniqueswill you use? Describe in detail how you would applythe techniques.
I. Find a partner and interview each other about what taskseach did in the last job you held (full-time, part-time,past, or current). If you haven’t worked before, thenassume your job is being a student. Before you do this,develop a brief interview plan. After your partnerinterviews you, identify the type of interview, inter-view approach, and types of questions used.
J. Find a group of students and run a 60-minute JAD ses-sion on improving alumni relations at your university.Develop a brief JAD plan, select two techniques thatwill help identify improvements, and then develop anagenda. Conduct the session using the agenda, andwrite your postsession report.
K. Find a questionnaire on the Web that has been createdto capture customer information. Describe the pur-pose of the survey, the way questions are worded, andhow the questions have been organized. How can it beimproved? How will the responses be analyzed?
L. Develop a questionnaire that will help gather informationregarding processes at a popular restaurant, or the collegecafeteria (e.g., ordering, customer service). Give the ques-tionnaire to ten to fifteen students, analyze the responses,and write a brief report that describes the results.
M. Contact the career services department at your univer-sity and find all the pertinent documents designed tohelp students find permanent and/or part-time jobs.Analyze the documents and write a brief report.

Minicases 153
wants to take over the tedious and time-consumingjob of tracking memberships. Bob is paid a stipend of$8,000 per year, but his wife spends well over twentyhours per week on the job. The organization, however,is not happy with their performance.
A computer system is used to track the billing andreceipt of funds. This system was developed in 1984 bya computer science student and his father. The systemis a DOS-based system written using dBase 3. The mostimmediate problem facing the treasurer and his wife isthe fact that the software package no longer exists, andthere is no one around who knows how to maintain thesystem. One query, in particular, takes seventeen hoursto run. Over the years, they have just avoided runningthis query, although the information in it would bequite useful. Questions from members concerningtheir statements cannot easily be answered. UsuallyBob or Laura just jots down the inquiry and returns acall with the answer. Sometimes it takes three to fivehours to find the information needed to answer thequestion. Often, they have to perform calculationsmanually because the system was not programmed tohandle certain types of queries. When member infor-mation is entered into the system, each field is pre-sented, one at a time, which makes it very difficult toreturn to a field and correct a value that was entered.Sometimes a new member is entered but disappearsfrom the records. The report of membership used inthe conference materials does not alphabetize membersby city. Only cities are listed in the correct order.
What requirements analysis strategy or strategieswould you recommend for this situation? Explain youranswer.
2. Brian Callahan, IS project manager, is just about readyto depart for an urgent meeting called by Joe Campbell,manager of manufacturing operations. A major BPIproject sponsored by Joe recently cleared the approvalhurdle, and Brian helped bring the project throughproject initiation. Now that the approval committeehas given the go-ahead, Brian has been working on theproject’s analysis plan.
One evening, while playing golf with a friend whoworks in the manufacturing operations department,Brian learned that Joe wants to push the project’s timeframe up from Brian’s original estimate of 13 months.Brian’s friend overheard Joe say,“I can’t see why that ISproject team needs to spend all that time analyzingthings. They’ve got two weeks scheduled just to lookat the existing system! That seems like a real waste. Iwant that team to get going on building my system.”
Because Brian has a little inside knowledge aboutJoe’s agenda for this meeting, he has been consideringhow to handle Joe. What do you suggest Brian tell Joe?
3. Barry has recently been assigned to a project team thatwill be developing a new retail store managementsystem for a chain of submarine sandwich shops.Barry has several years of experience in programming,but he has not done much analysis in his career. Hewas a little nervous about the new work he would bedoing, but was confident he could handle any assign-ment he was given.
One of Barry’s first assignments was to visit one ofthe submarine sandwich shops and prepare an obser-vation report on how the store operates. Barry plannedto arrive at the store around noon, but he chose a storein an area of town he was unfamiliar with, and due totraffic delays and difficulty in finding the store, he didnot arrive until 1:30. The store manager was notexpecting him and refused to let a stranger behind thecounter until Barry had her contact the project spon-sor (the director of store management) at companyheadquarters to verify who he was and what his pur-pose was.
After finally securing permission to observe, Barrystationed himself prominently in the work area behindthe counter so that he could see everything. The staffhad to maneuver around him as they went about theirtasks, but there were only minor occasional collisions.Barry noticed that the store staff seemed to be goingabout their work very slowly and deliberately, but hesupposed that was because the store wasn’t very busy.At first, Barry questioned each worker about what heor she was doing, but the store manager eventuallyasked him not to interrupt their work so much—hewas interfering with their service to the customers.
By 3:30, Barry was a little bored. He decided toleave, figuring he could get back to the office and pre-pare his report before 5:00 that day. He was sure histeam leader would be pleased with his quick comple-tion of his assignment. As he drove, he reflected, Therereally won’t be much to say in this report. All they dois take the order, make the sandwich, collect the pay-ment, and hand over the order. It’s really simple!Barry’s confidence in his analytical skills soared as heanticipated his team leader’s praise.
Back at the store, the store manager shook her head,commenting to her staff, “He comes here at the slowesttime of day on the slowest day of the week. He nevereven looked at all the work I was doing in the backroom while he was here—summarizing yesterday’s

154 Chapter 4 Requirements Determination
sales, checking inventory on hand, making up resup-ply orders for the weekend . . . plus he never even con-sidered our store-opening and -closing procedures. Ihate to think that the new store management system isgoing to be built by someone like that. I’d better con-tact Chuck (the director of store management) and lethim know what went on here today.” Evaluate Barry’sconduct of the observation assignment.
4. Anne has been given the task of conducting a survey ofsales clerks who will be using a new order-entry systembeing developed for a household products catalog com-pany. The goal of the survey is to identify the clerks’opinions on the strengths and weaknesses of the currentsystem. There are about 50 clerks who work in three dif-ferent cities, so a survey seemed like an ideal way of gath-ering the needed information from the clerks.
Anne developed the questionnaire carefully andpretested it on several sales supervisors who were
available at corporate headquarters. After revising itbased on their suggestions, she sent a paper version ofthe questionnaire to each clerk, asking that it bereturned within one week. After one week, she hadonly three completed questionnaires returned. Afteranother week, Anne received just two more completedquestionnaires. Feeling somewhat desperate, Annethen sent out an e-mail version of the questionnaire,again to all the clerks, asking them to respond to thequestionnaire by e-mail as soon as possible. Shereceived two e-mail questionnaires and three messagesfrom clerks who had completed the paper versionexpressing annoyance at being bothered with the samequestionnaire a second time. At this point, Anne hasjust a 14 percent response rate, which she is sure willnot please her team leader. What suggestions do youhave that could have improved Anne’s response rate tothe questionnaire?

Behavioral M
odelsStructural
Models
Functional M
odels
PART TWO
Analysis Modeling
Analysis modeling answers the questions of who will use the system, what the system will do, and where and when it will be used. During this phase, the proj-ect team will learn about the system. The team then produces the functional model (activity diagrams, use-case descriptions and diagram), structural model (CRC cards and class and object diagrams), and be-havioral models (sequence diagrams, communica-tion diagrams, behavioral state machines, and a CRUD matrix).
CHAPTER 5Functional
Modeling
CHAPTER 6Structural
Modeling
CHAPTER 7Behavioral
Modeling

This page intentionally left blank
157157
C H A P T E R 5
Functional Modeling
Functional models describe business processes and the interaction of an information systemwith its environment. In object-oriented systems development, two types of models are usedto describe the functionality of an information system: activity diagrams and use cases.Activity diagrams support the logical modeling of business processes and workflows. Use casesare used to describe the basic functions of the information system. Both activity diagrams anduse cases can be used to describe the current as-is system and the to-be system being devel-oped. This chapter describes functional modeling as a means to document and understandrequirements and to understand the function or external behavior of the system. This chapteralso introduces use case points as a basis for project size estimation.
OBJECTIVES
■ Understand the rules and style guidelines for activity diagrams.■ Understand the rules and style guidelines for use cases and use-case diagrams.■ Understand the process used to create use cases and use-case diagrams■ Be able to create functional models using activity diagrams, use cases, and use-case
diagrams.
CHAPTER OUTLINE
IntroductionBusiness Process Modeling with
Activity DiagramsElements of an Activity DiagramGuidelines for Creating Activity
DiagramsUse-Case Descriptions
Types of Use CasesElements of a Use-Case DescriptionGuidelines for Creating Use-Case
DescriptionsUse-Case Diagrams
ActorsAssociationUse CaseSystem Boundary
Creating Use-Case Descriptions and Use-Case Diagrams
Identifying the Major Use CasesExpanding the Major Use CasesConfirming the Major Use CasesCreating a Use-Case Diagram
Refining Project Size and Effort Estimation Using Use-Case Points
Applying the Concepts at CD Selections
Business Process Modeling with Activity Diagrams
Identifing the Major Use CasesExpanding the Major Use CasesConfirming the Major Use CasesCreating the Use-Case DiagramRefining Project Size and Effort
Estimation Using Use-Case PointsSummary
INTRODUCTION
The previous chapter discussed the more popular requirements-gathering techniques,such as interviewing, JAD, and observation. Using these techniques, the analyst deter-mined the requirements and created a requirements definition. The requirements defini-tion defined what the system is to do. In this chapter, we discuss how the information thatis gathered using these techniques is organized and presented in the form of activity dia-grams and use cases. Because UML has been accepted as the standard notation by theOMG, almost all object-oriented development projects today utilize activity diagrams anduse cases to document and organize the requirements that are obtained during the analysisphase.1
An activity diagram can be used for any type of process-modeling activity.2 In thischapter, we describe their use in the context of business process modeling. Process modelsdepict how a business system operates. They illustrate the processes or activities that areperformed and how objects (data) move among them. A process model can be used todocument a current system (i.e., as-is system) or a new system being developed (i.e.,to-be system), whether computerized or not. There are many different process-modelingtechniques in use today:3
A use case is a formal way of representing the way in which a business system interactswith its environment. It illustrates the activities performed by the users of the system. Assuch, use-case modeling is often thought of as an external or functional view of a businessprocess in that it shows how the users view the process, rather than the internal mecha-nisms by which the process and supporting systems operate. Like activity diagrams, usecases can document the current system (i.e., as-is system) or the new system being devel-oped (i.e., to-be system).
Activity diagrams and use cases are logical models—models that describe the busi-ness domain’s activities without suggesting how they are conducted. Logical models aresometimes referred to as problem domain models. Reading an activity diagram or usecase, in principle, should not indicate if an activity is computerized or manual; if a pieceof information is collected by paper form or via the Web; or if information is placed ina filing cabinet or a large database. These physical details are defined during design whenthe logical models are refined into physical models. These models provide informationthat is needed to ultimately build the system. By focusing on logical activities first, ana-lysts can focus on how the business should run without being distracted with imple-mentation details.
As a first step, the project team gathers requirements from the users (see Chapter 4).Next, using the gathered requirements, the project team models the overall business processusing activity diagrams. Next the team uses the identified activities to pinpoint the use casesthat occur in the business. They then prepare use-case descriptions and use-case diagrams
158 Chapter 5 Functional Modeling
1 Other similar techniques that are commonly used in non-UML projects are task modeling—see Ian Graham,Migrating to Object Technology (Reading, MA: Addison-Wesley, 1995); and Ian Graham, Brian Henderson-Sellers,and Houman Younessi, The OPEN Process Specification, (Reading, MA: Addison-Wesley, 1997)—and scenario-based design—see John M. Carroll, Scenario-Based Design: Envisioning Work and Technology in System Development(New York: Wiley, 1995).2 We actually used an activity diagram to describe a simple process in Chapter 1 (see Figure 1-1).3 Another commonly used process-modeling technique is IDEF0. IDEF0 is used extensively throughout the U.S.federal government. For more information about IDEF0, see FIPS 183: Integration Definition for FunctionModeling (IDEF0), Federal Information Processing Standards Publications (Washington, DC: U.S. Departmentof Commerce, 1993). Also, from an object-oriented perspective, a good book that utilizes the UML to addressbusiness process modeling is Hans-Erik Eriksson and Magnus Penker, Business Modeling with UML (New York:Wiley, 2000).

for each use case. Use cases are the discrete activities that the users perform, such as sellingCDs, ordering CDs, and accepting returned CDs from customers. Users work closely withthe project team to create the business process models in the form of activity diagrams anduse-case descriptions that contain all the information needed to start modeling the system.Once the activity diagrams and use-case descriptions are prepared, the systems analyststransform them into a use-case diagram, which portrays the external behavioral or func-tional view of the business process. Next, the analyst typically creates class diagrams (seeChapter 6) to create a structural model of the business problem domain.
In this chapter, we first describe business process modeling and activity diagrams. Secondwe describe use cases, their elements, and a set of guidelines for creating use cases. Third, wedescribe use-case diagrams and how to create them. Fourth, using use cases as a basis, werevisit the topic of project size estimation.
BUSINESS PROCESS MODELING WITH ACTIVITY DIAGRAMS
Business process models describe the different activities that, when combined together,support a business process. Business processes typically cut across functional depart-ments (e.g., the creation of a new product will involve many different activities that willcombine the efforts of many employees in many departments). Furthermore, from anobject-oriented perspective, they cut across multiple objects. As such, many of the earlierobject-oriented systems development approaches tended to ignore business processmodeling. Instead, they focused only on modeling processes via use cases (see later in thischapter) and behavioral models (see Chapter 7). However, today we realize that modelingbusiness processes themselves is a very constructive activity that can be used to makesense out of the gathered requirements (see Chapter 4). The one potential problem ofbuilding business process models, from an object-oriented systems development per-spective, is that they tend to reinforce a functional decomposition mindset. However, aslong as they are used properly, they are a very powerful tool for communicating theanalyst’s current understanding of the requirements with the user. In this section of thechapter, we introduce the use of UML 2.0’s activity diagrams as a means to build busi-ness process models.
Activity diagrams are used to model the behavior in a business process independent ofobjects. In many ways, activity diagrams can be viewed as sophisticated data flow diagramsthat are used in conjunction with structured analysis.4 However, unlike data flow diagrams,activity diagrams include notation that addresses the modeling of parallel, concurrent activ-ities and complex decision processes. As such, activity diagrams can be used to model every-thing from a high-level business workflow that involves many different use cases, to thedetails of an individual use case, all the way down to the specific details of an individualmethod. In a nutshell, activity diagrams can be used to model any type of process.5 In thischapter, we restrict our coverage of activity diagrams to the modeling of high-level businessprocesses.
Business Process Modeling with Activity Diagrams 159
4 For a good introduction to data flow diagrams and structured approaches to systems analysis and design, see AlanDennis, Barbara Haley Wixom, and Roberta M. Roth, Systems Analysis & Design, 3rd ed. (New York: Wiley, 2006).5 Technically speaking, activity diagrams combine process modeling ideas from many different techniques includ-ing event models, statecharts, and Petri nets. However, UML 2.0’s activity diagram has more in common withPetri nets than the other process modeling techniques. For a good description of using Petri nets to model busi-ness workflows, see Wil van der Aalst and Kees van Hee, Workflow Management: Models, Methods, and Systems(Cambridge, MA: MIT Press, 2002).

Elements of An Activity DiagramActivity diagrams portray the primary activities and the relationships among the activities ina process. Figure 5-1 shows the syntax of an activity diagram. Figure 5-2 presents a simpleactivity diagram that represents part of an appointment system for a doctor’s office.6
160 Chapter 5 Functional Modeling
An action:
■ Is a simple, nondecomposable piece of behavior.■ Is labeled by its name.
Action
An activity:
■ Is used to represent a set of actions.■ Is labeled by its name.
An object node:
■ Is used to represent an object that is connected to a set of object flows.■ Is labeled by its class name.
A decision node:
■ Is used to represent a test condition to ensure that the control flow or object flow only goes down one path.
■ Is labeled with the decision criteria to continue down the specific path.
A control flow:
■ Shows the sequence of execution.
An object flow:
■ Shows the flow of an object from one activity (or action) to another activity (or action).
A final-activity node:
■ Is used to stop all control flows and object flows in an activity (or action).
A merge node:
■ Is used to bring back together different decision paths that were created using a decision node.
An initial node:
■ Portrays the beginning of a set of actions or activities.
A final-flow node:
■ Is used to stop a specific control flow or object flow.
Activity
Class Name
[DecisionCriteria]
[DecisionCriteria]
FIGURE 5-1 Syntax for an Activity Diagram
6 Due to the actual complexity of the syntax of activity diagrams, we follow a minimalist philosophy in our coverage[see John M. Carrol, The Nurnberg Funnel: Designing Minimalist Instruction for Practical Computer Skill (Cambridge,MA: MIT Press, 1990)]. However, the material contained in this section is based on the Unified Modeling Language:Superstructure Version 2.0, ptc/03-08-02 (www.uml.org). Additional useful references include Michael Jesse Chonolesand James A. Schardt, UML 2 for Dummies (Indianapolis, IN: Wiley, 2003); Hans-Erik Eriksson, Magnus Penker,Brian Lyons, and David Fado, UML 2 Toolkit (Indianapolis, IN: Wiley, 2004); and Kendall Scott, Fast Track UML 2.0(Berkeley, CA: Apress, 2004). For a complete description of all diagrams, see www.uml.org.

Actions and Activities Actions and activities are performed for some specific businessreason. Actions and activities can represent manual or computerized behavior. They aredepicted in an activity diagram as a rounded rectangle (See Figure 5-1). Furthermore, theyshould have a name that begins with a verb and ends with a noun (e.g., Make Appoint-ment or Make Payment Arrangements). Names should be short, yet contain enough infor-mation so that the reader can easily understand exactly what they do. The only differencebetween an action and an activity is that an activity can be decomposed further into a setof activities and/or actions, whereas an action represents a simple nondecomposable pieceof the overall behavior being modeled. Typically, only activities are used for businessprocess or workflow modeling. Furthermore, in most cases, each activity is associated witha use case. The activity diagram in Figure 5-2 shows six separate but related activities fora typical appointment system used in a doctor’s office: Get Patient Information, CreateNew Patient, Make Payment Arrangements, Create Appointment, Cancel Appointment,and Change Appointment.
Object Nodes Activities and actions typically modify or transform objects. Object nodesmodel these objects in an activity diagram. Object nodes are portrayed in an activity dia-gram as rectangles (See Figure 5-1). The name of the class of the object is written inside the
Business Process Modeling with Activity Diagrams 161
Get Patient Information
ApptRequest Info
Appt
ApptRequest Info
Appt
Create New Patient
Make Payment Arrangements
[New Patient]
[Old Patient]
Cancel Appointment Change AppointmentCreate Appointment
FIGURE 5-2Activity Diagram forAppointment System
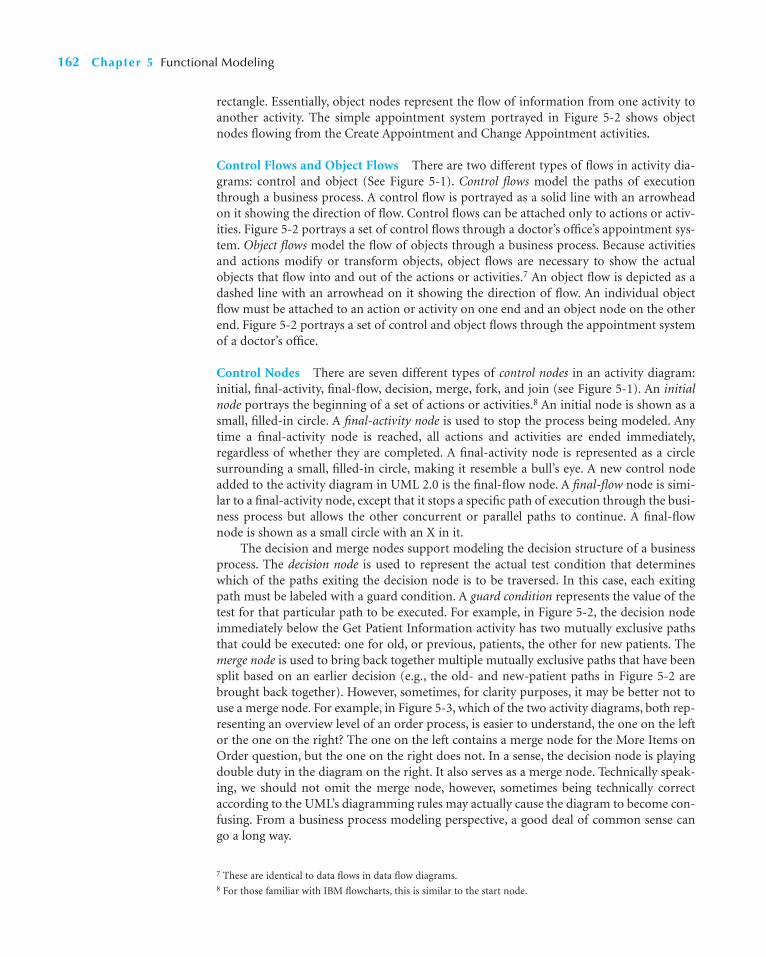
rectangle. Essentially, object nodes represent the flow of information from one activity toanother activity. The simple appointment system portrayed in Figure 5-2 shows objectnodes flowing from the Create Appointment and Change Appointment activities.
Control Flows and Object Flows There are two different types of flows in activity dia-grams: control and object (See Figure 5-1). Control flows model the paths of executionthrough a business process. A control flow is portrayed as a solid line with an arrowheadon it showing the direction of flow. Control flows can be attached only to actions or activ-ities. Figure 5-2 portrays a set of control flows through a doctor’s office’s appointment sys-tem. Object flows model the flow of objects through a business process. Because activitiesand actions modify or transform objects, object flows are necessary to show the actualobjects that flow into and out of the actions or activities.7 An object flow is depicted as adashed line with an arrowhead on it showing the direction of flow. An individual objectflow must be attached to an action or activity on one end and an object node on the otherend. Figure 5-2 portrays a set of control and object flows through the appointment systemof a doctor’s office.
Control Nodes There are seven different types of control nodes in an activity diagram:initial, final-activity, final-flow, decision, merge, fork, and join (see Figure 5-1). An initialnode portrays the beginning of a set of actions or activities.8 An initial node is shown as asmall, filled-in circle. A final-activity node is used to stop the process being modeled. Anytime a final-activity node is reached, all actions and activities are ended immediately,regardless of whether they are completed. A final-activity node is represented as a circlesurrounding a small, filled-in circle, making it resemble a bull’s eye. A new control nodeadded to the activity diagram in UML 2.0 is the final-flow node. A final-flow node is simi-lar to a final-activity node, except that it stops a specific path of execution through the busi-ness process but allows the other concurrent or parallel paths to continue. A final-flownode is shown as a small circle with an X in it.
The decision and merge nodes support modeling the decision structure of a businessprocess. The decision node is used to represent the actual test condition that determineswhich of the paths exiting the decision node is to be traversed. In this case, each exitingpath must be labeled with a guard condition. A guard condition represents the value of thetest for that particular path to be executed. For example, in Figure 5-2, the decision nodeimmediately below the Get Patient Information activity has two mutually exclusive pathsthat could be executed: one for old, or previous, patients, the other for new patients. Themerge node is used to bring back together multiple mutually exclusive paths that have beensplit based on an earlier decision (e.g., the old- and new-patient paths in Figure 5-2 arebrought back together). However, sometimes, for clarity purposes, it may be better not touse a merge node. For example, in Figure 5-3, which of the two activity diagrams, both rep-resenting an overview level of an order process, is easier to understand, the one on the leftor the one on the right? The one on the left contains a merge node for the More Items onOrder question, but the one on the right does not. In a sense, the decision node is playingdouble duty in the diagram on the right. It also serves as a merge node. Technically speak-ing, we should not omit the merge node, however, sometimes being technically correctaccording to the UML’s diagramming rules may actually cause the diagram to become con-fusing. From a business process modeling perspective, a good deal of common sense cango a long way.
162 Chapter 5 Functional Modeling
7 These are identical to data flows in data flow diagrams.8 For those familiar with IBM flowcharts, this is similar to the start node.
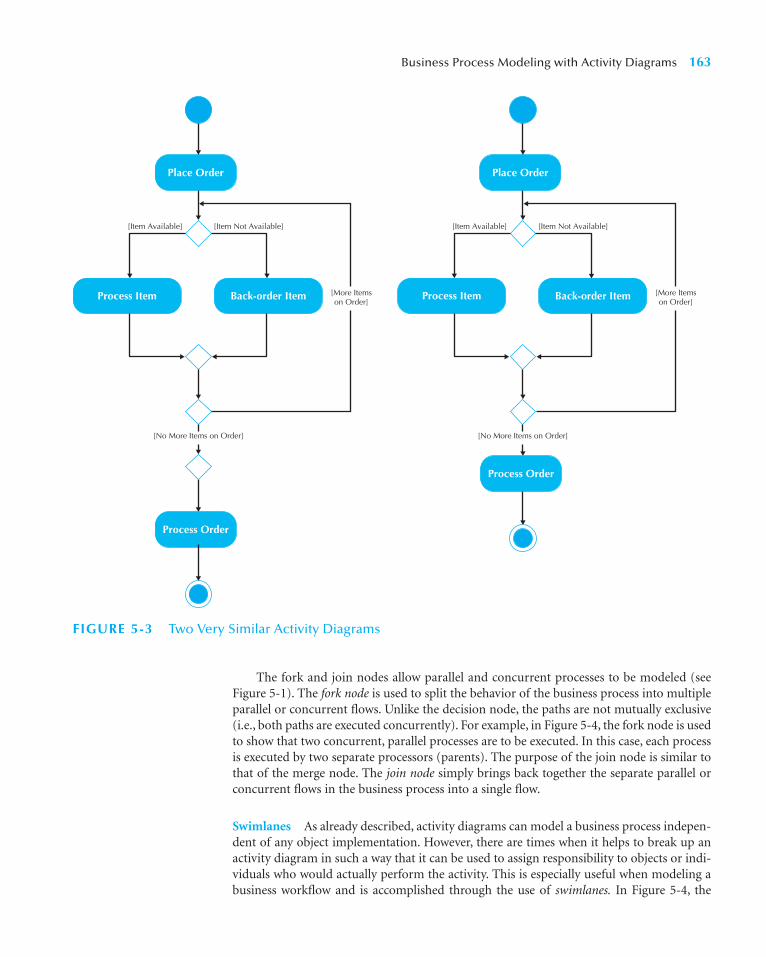
The fork and join nodes allow parallel and concurrent processes to be modeled (seeFigure 5-1). The fork node is used to split the behavior of the business process into multipleparallel or concurrent flows. Unlike the decision node, the paths are not mutually exclusive(i.e., both paths are executed concurrently). For example, in Figure 5-4, the fork node is usedto show that two concurrent, parallel processes are to be executed. In this case, each processis executed by two separate processors (parents). The purpose of the join node is similar tothat of the merge node. The join node simply brings back together the separate parallel orconcurrent flows in the business process into a single flow.
Swimlanes As already described, activity diagrams can model a business process indepen-dent of any object implementation. However, there are times when it helps to break up anactivity diagram in such a way that it can be used to assign responsibility to objects or indi-viduals who would actually perform the activity. This is especially useful when modeling abusiness workflow and is accomplished through the use of swimlanes. In Figure 5-4, the
Business Process Modeling with Activity Diagrams 163
[Item Available] [Item Not Available]
[More Itemson Order]
[No More Items on Order]
Place Order
Process Order
Back-order ItemProcess Item Process Item
[Item Available] [Item Not Available]
[More Itemson Order]
[No More Items on Order]
Place Order
Process Order
Back-order Item
FIGURE 5-3 Two Very Similar Activity Diagrams

swimlanes are used to break up among two parents the making of a school lunch compris-ing a peanut butter and jelly sandwich, a drink, and dessert. In this case, we use verticalswimlanes. We could also draw the activity diagram using more of a left-to-right orientationinstead of a top-down orientation. In that case, the swimlanes would be drawn horizontally.
In an actual business workflow, there would be activities that should be associated withroles of individuals involved in the business workflow (e.g., employees or customers) andthe activities to be accomplished by the information system being created. This association
164 Chapter 5 Functional Modeling
First Parent Second Parent
Get Jelly Get Bread
Get Drink Get Dessert
Get Peanut Butter
Create Sandwich
Create Lunch
Get Lunch Box
Put Lunch in Box
FIGURE 5-4Activity Diagram forMaking a School BoxLunch

of activities with external roles, internal roles, and the system is very useful when creatingthe use-case descriptions and diagrams described later in this chapter.
Guidelines for Creating Activity DiagramsScott Ambler suggests the following guidelines when creating activity diagrams:9
1. Because an activity diagram can be used to model any kind of process, you shouldset the context or scope of the activity being modeled. Once you have determinedthe scope, you should give the diagram an appropriate title.
2. You must identify the activities, control flows, and object flows that occurbetween the activities.
3. You should identify any decisions that are part of the process being modeled.
4. You should attempt to identify any prospects for parallelism in the process.
5. You should draw the activity diagram.
When drawing an activity diagram, the diagram should be limited to a single initial nodethat starts the process being modeled. This node should be placed at the top or top left of thediagram, depending on the complexity of the diagram. Furthermore, for most businessprocesses, there should only be a single final-activity node. This node should be placed at thebottom or bottom right of the diagram (see Figures 5-2, 5-3, and 5-4). Because most high-levelbusiness processes are sequential, not parallel, the use of a final-flow node should be limited.
When modeling high-level business processes or workflows, only the more importantdecisions should be included in the activity diagrams. In those cases, the guard conditionsassociated with the outflows of the decision nodes should be mutually exclusive. Further-more, the outflows and guard conditions should form a complete set (i.e., all potential valuesof the decision are associated with one of the flows).
As in decision modeling, forks and joins should be included only to represent the moreimportant parallel activities in the process. For example, an alternative version of Figure 5-4may not include the forks and joins associated with the Get Jelly, Get Bread, Get PeanutButter, Get Drink, and Get Dessert activities. This would greatly simplify the diagram.10
Business Process Modeling with Activity Diagrams 165
9 The guidelines presented here are based on work done by Scott Ambler. For more details, see Scott W.Ambler, The Object Primer: The Application Developer’s Guide to Object Orientation and the UML, 2nd ed.(Cambridge, UK: Cambridge University Press/SIGS Books, 2001); and Scott W. Ambler, The Elements of UMLStyle (Cambridge, UK: Cambridge University Press, 2003).10 In fact, the only reason we depicted the diagram in Figure 5-3 with the multiple fork and join nodes was todemonstrate that it could be done.
Look at the activity diagram for the appointment systemin Figure 5-2. Think of one more activity that a user mightask for when gathering requirements for this system (e.g.,maintaining patient insurance information).
Questions
1. How would you depict this on the existing diagram?
2. After adding the activity to the diagram, what isyour recommendation?
3. Would you keep the new activity within the scopeof this system? Why or why not?
5-1 Activity DiagramsYOUR
TURN

When laying out the activity diagram, line crossings should be minimized to enhancethe readability of the diagram. The activities on the diagram should also be laid out in aleft-to-right and/or top-to-bottom order, based on the order in which the activities are exe-cuted. For example, in Figure 5-4, the Create Sandwich activity takes place before the Cre-ate Lunch activity.
Swimlanes should be used only to simplify the understanding of an activity diagram.Furthermore, the swimlanes should enhance the readability of a diagram. For example,when using a horizontal orientation for swimlanes, the top swimlane should represent themost important object or individual involved with the process. The order of the remainingswimlanes should be based on minimizing the number of flows crossing the differentswimlanes. Also, when there are object flows among the activities associated with the dif-ferent individuals (swimlanes) executing the activities of the process, it is useful to show theactual object flowing from one individual to another individual by including an objectnode between the two individuals (i.e., between the two swimlanes). This, of course,impacts how the swimlanes should be placed on the diagram.
Finally, any activity that does not have any outflows or any inflows should be chal-lenged. Activities with no outflows are referred to as black-hole activities. If the activity istruly an end point in the diagram, the activity should have a control flow from it to a final-activity or final-flow node. An activity that does not have any inflow is known as a miracleactivity. In this case, the activity is either missing an inflow from the initial node of the dia-gram or from another activity.
USE-CASE DESCRIPTIONS
Use cases are simple descriptions of a system’s functions from the bird’s-eye view of the users.11
Use-case diagrams are functional diagrams in that they portray the basic functions of thesystem—that is, what the users can do and how the system should respond to the user’sactions.12 Creating use-case diagrams is a two-step process: First, the users work with the pro-ject team to write text-based use-case descriptions; second, the project team translates the use-case descriptions into formal use-case diagrams. Both the use-case descriptions and the use-casediagrams are based on the identified requirements and the activity diagram description of thebusiness process. Use-case descriptions contain all the information needed to produce use-casediagrams. Although it is possible to skip the use-case description step and move directly to cre-ating use-case diagrams and the other diagrams that follow, users often have difficulty describ-ing their business processes using only use-case diagrams. Through the creation of use-casedescriptions, users can describe the required details of each individual use case. As to whichshould come first—use-case descriptions or a use-case diagram—technically speaking, it reallydoes not matter. Both should be done to fully describe the requirements that an informationsystem must meet. In this text, we present the creation of a use-case description first.13
166 Chapter 5 Functional Modeling
11 For a more detailed description of use-case modeling, see Alistair Cockburn, Writing Effective Use Cases (Read-ing, MA: Addison-Wesley, 2001).12 Nonfunctional requirements, such as reliability requirements and performance requirements, are often documentedoutside of the use case through more traditional requirements documents. See Gerald Kotonya and Ian Sommerville,Requirements Engineering (Chichester, England: Wiley, 1998); Benjamin L. Kovitz, Practical Software Requirements: AManual of Content & Style (Greenwich, CT: Manning, 1999); Dean Leffingwell and Don Widrig, Managing SoftwareRequirements: A Unified Approach (Reading, MA: Addison-Wesley, 2000); and Richard H. Thayer, M. Dorfman, andSidney C. Bailin (eds.), Software Requirements Engineering, 2nd ed. (Los Alamitos, CA: IEEE Computer Society, 1997).13 Practically speaking, the analyst and users will iterate between the descriptions and diagram. Do not worryabout which comes first. Whichever seems to work with the user community of the current project is the way thatit should be done.

Use cases are the primary drivers for all the UML diagramming techniques. A use casecommunicates at a high level what the system needs to do, and all the UML diagrammingtechniques build on this by presenting the use-case functionality in a different way for a dif-ferent purpose. Use cases are the building blocks by which the system is designed and built.
Use cases capture the typical interaction of the system with the system’s users (endusers and other systems). These interactions represent the external, or functional, view ofthe system from the perspective of the user. Each use case describes one and only one func-tion in which users interact with the system,14 although a use case may contain severalpaths that a user can take while interacting with the system (e.g., when searching for a bookin a Web bookstore, the user might search by subject, by author, or by title). Each possibleexecution path through the use case is referred to as a scenario. Another way to look at ascenario is as if a scenario is an instantiation of a specific use case. Scenarios are used exten-sively in behavioral modeling (see Chapter 7). Finally, by identifying all scenarios and try-ing to execute them through role playing CRC cards (see Chapter 6), you will be testing theclarity and completeness of your evolving understanding of the system being developed.15
When creating use cases, the project team must work closely with the users to gatherthe requirements needed for the use cases. This is often done through interviews, JAD ses-sions, and observation. Gathering the requirements needed for a use case is a relatively sim-ple process, but it takes considerable practice. A good place to look for potential use casesis the activity diagram representation of the business process. In many cases, the activitiesidentified in the activity diagram will become the use cases in the business process beingmodeled. The key thing to remember is that each use case is associated with one and onlyone role that users have in the system. For example, a receptionist in a doctor’s office mayplay multiple roles—he or she can make appointments, answer the telephone, file medicalrecords, welcome patients, and so on. Furthermore, it is possible that multiple users willplay the same role. As such, use cases should be associated with the roles played by the usersand not with the users themselves.
Types of Use CasesThere are many different types of use cases. We suggest two separate dimensions on whichto classify a use case based on the purpose of the use case and the amount of informationthat the use case contains: (1) overview versus detail; and (2) essential versus real.
An overview use case is used to enable the analyst and user to agree on a high-leveloverview of the requirements. Typically, they are created very early in the process of under-standing the system requirements, and they document only basic information about theuse case, such as its name, ID number, primary actor, type, and a brief description.
Use-Case Descriptions 167
14 This is one key difference between traditional structured analysis and design approaches and object-orientedapproaches. If you have experience using traditional structured approaches (or have taken a course on them),then this is an important change for you. If you have no experience with structured approaches, then you canskip this footnote.
The traditional structured approach is to start with one overall view of the system and to model processes viafunctional decomposition—the gradual decomposition of the overall view of the system into the smaller andsmaller parts that make up the whole system. On the surface, this is similar to business process modeling usingactivity diagrams. However, functional decomposition is not used with object-oriented approaches. Instead, eachof the use cases documents one individual piece of the system; there is no overall use case that documents theentire system in the same way that a level 0 data flow diagram attempts to document the entire system. By remov-ing this overall view, object-oriented approaches make it easier to decouple the system’s objects so they can bedesigned, developed, and reused independently of the other parts of the system. Although this lack of an overallview may prove unsettling initially, it is very liberating over the long term.15 For presentation purposes, we defer discussion of role-playing to Chapter 6, walkthroughs to Chapter 8, andtesting to Chapter 13.
Once the user and the analyst agree upon a high-level overview of the requirements,the overview use cases can be converted to detail use cases. A detail use case typically doc-uments, as far as possible, all the information needed for the use case.
An essential use case is one that describes only the minimum essential issues necessary tounderstand the required functionality. A real use case goes further and describes a specific setof steps. For example, an essential use case in a dentist office might say that the receptionistshould attempt to match the patient’s desired appointment times with the available times,whereas a real use case might say that the receptionist should look up the available dates onthe calendar using MS Exchange to determine if the requested appointment times were avail-able. The primary difference is that essential use cases are implementation independent,whereas real use cases are detailed descriptions of how to use the system once it is imple-mented. As such, real use cases tend to be used only in detailed design, implementation, andtesting.
Elements of a Use-Case DescriptionA use-case description contains all the information needed to build the diagrams that fol-low, but it expresses the information in a less formal way that is usually simpler for usersto understand. Figure 5-5 shows a sample use-case description.16 A use-case descriptionhas three basic parts: overview information, relationships, and the flow of events.
Overview Information The overview information identifies the use case and providesbasic background information about the use case. The use-case name should be a verb–nounphrase (e.g., Make Appointment). The use-case ID number provides a unique way to find everyuse case and also enables the team to trace design decisions back to a specific requirement. Asalready stated, the use-case type is either overview or detail and essential or real. The primaryactor is usually the trigger of the use case—the person or thing that starts the execution of theuse case. The primary purpose of the use case is to meet the goal of the primary actor. Thebrief description is typically a single sentence that describes the essence of the use case.
The importance level can be used to prioritize the use cases. As described in Chapter 1,object-oriented development tends to follow a RAD-phased development approach, inwhich some parts of the system are developed first and other parts are developed only inlater versions. The importance level enables the users to explicitly prioritize which businessfunctions are most important and need to be part of the first version of the system andwhich are less important and can wait until later versions if necessary.
The importance level can use a fuzzy scale, such as high, medium, and low (e.g., inFigure 5-5 we have assigned an importance level of high to the Make Appointment usecase). It can also be done more formally using a weighted average of a set of criteria. Forexample, Larman17 suggests rating each use case over the following criteria using a scalefrom zero to five:
■ The use case represents an important business process.
■ The use case supports revenue generation or cost reduction.
■ Technology needed to support the use case is new or risky and therefore willrequire considerable research.
168 Chapter 5 Functional Modeling
16 Currently, there is no standard set of elements for a use case. The elements described in this section are basedon recommendations contained in Alistair Cockburn, Writing Effective Use Cases (Reading, MA: Addison-Wesley,2001); Craig Larman, Applying UML and Patterns: An Introduction to Object-Oriented Analysis and Design and theUnified Process, 2nd ed. (Upper Saddle River, NJ: Prentice Hall, 2002); Brian Henderson-Sellers and BhuvanUnhelkar, OPEN modeling with UML (Reading, MA: Addison-Wesley, 2000); Graham, Migrating to Object Tech-nology; and Alan Dennis and Barbara Haley Wixom, Systems Analysis and Design, 2nd ed. (New York: Wiley, 2003).17 Larman, Applying UML and Patterns: An Introduction to Object-Oriented Analysis and Design.
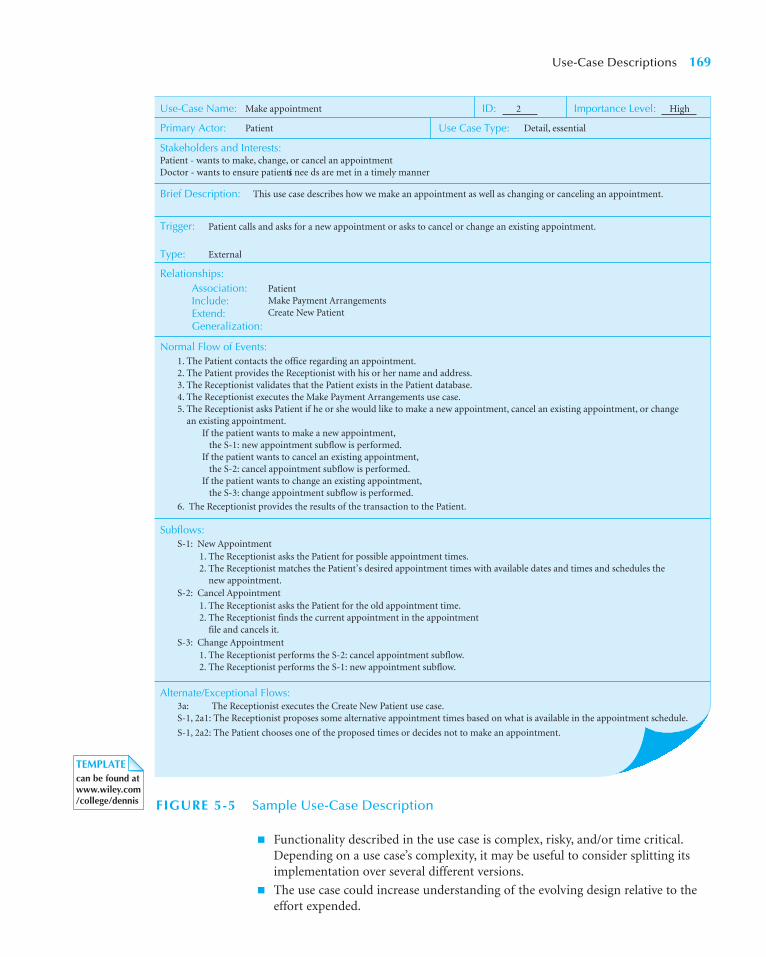
Use-Case Descriptions 169
Use-Case Name:
Primary Actor:
Stakeholders and Interests:
Brief Description:
ID: Importance Level:
Trigger:
Normal Flow of Events:
Subflows:
Alternate/Exceptional Flows:
Type: External
Make appointment 2 High
Patient
Patient - wants to make, change, or cancel an appointmentDoctor - wants to ensure patientís nee ds are met in a timely manner
Use Case Type: Detail, essential
Patient calls and asks for a new appointment or asks to cancel or change an existing appointment.
PatientMake Payment ArrangementsCreate New Patient
1. The Patient contacts the office regarding an appointment.2. The Patient provides the Receptionist with his or her name and address.3. The Receptionist validates that the Patient exists in the Patient database.4. The Receptionist executes the Make Payment Arrangements use case.5. The Receptionist asks Patient if he or she would like to make a new appointment, cancel an existing appointment, or change an existing appointment.
S-1: New Appointment1. The Receptionist asks the Patient for possible appointment times.2. The Receptionist matches the Patient’s desired appointment times with available dates and times and schedules the new appointment.
S-2: Cancel Appointment1. The Receptionist asks the Patient for the old appointment time.2. The Receptionist finds the current appointment in the appointment
file and cancels it.S-3: Change Appointment
1. The Receptionist performs the S-2: cancel appointment subflow.2. The Receptionist performs the S-1: new appointment subflow.
S-1, 2a1: The Receptionist proposes some alternative appointment times based on what is available in the appointment schedule.
S-1, 2a2: The Patient chooses one of the proposed times or decides not to make an appointment.
3a: The Receptionist executes the Create New Patient use case.
6. The Receptionist provides the results of the transaction to the Patient.
This use case describes how we make an appointment as well as changing or canceling an appointment.
Relationships:Association:Include:Extend:Generalization:
If the patient wants to make a new appointment, the S-1: new appointment subflow is performed.If the patient wants to cancel an existing appointment, the S-2: cancel appointment subflow is performed.If the patient wants to change an existing appointment, the S-3: change appointment subflow is performed.
FIGURE 5-5 Sample Use-Case Description
■ Functionality described in the use case is complex, risky, and/or time critical.Depending on a use case’s complexity, it may be useful to consider splitting itsimplementation over several different versions.
■ The use case could increase understanding of the evolving design relative to theeffort expended.
TEMPLATEcan be found atwww.wiley.com/college/dennis

A use case may have multiple stakeholders that have an interest in the use case. As such,each use case lists each of the stakeholders with each one’s interest in the use case (e.g.,Patient and Doctor). The stakeholders’ list always includes the primary actor (e.g., Patient).
Each use case typically has a trigger —the event that causes the use case to begin (e.g.,Patient calls and asks for a new appointment or asks to cancel or change an existingappointment). A trigger can be an external trigger, such as a customer placing an order orthe fire alarm ringing, or it can be a temporal trigger, such as a book being overdue at thelibrary or the need to pay the rent.
Relationships Use-case relationships explain how the use case is related to other use casesand users. There are four basic types of relationships: association, extend, include, and gener-alization. An association relationship documents the communication that takes place betweenthe use case and the actors that use the use case. An actor is the UML representation for therole that a user plays in the use case. For example, in Figure 5-5, the Make Appointment usecase is associated with the actor Patient. In this case, a patient makes an appointment. Allactors involved in the use case are documented with the association relationship.
An extend relationship represents the extension of the functionality of the use case toincorporate optional behavior. In Figure 5-5, the Make Appointment use case condition-ally uses the Create New Patient use case. This use case is executed only if the patient doesnot exist in the patient database. As such, it is not part of the normal flow of events andshould be modeled with an extend relationship and an alternate/exceptional flow.
An include relationship represents the mandatory inclusion of another use case. Theinclude relationship enables functional decomposition—the breaking up of a complex usecase into several simpler ones. For example, in Figure 5-5, the Make Payment Arrangementsuse case was considered to be complex and complete enough to be factored out as a sepa-rate use case that could be executed by the Make Appointment use case. The include rela-tionship also enables parts of use cases to be reused by creating them as separate use cases.
The generalization relationship allows use cases to support inheritance. For example,the use case in Figure 5-5 could be changed such that a new patient could be associatedwith a specialized use case called Make New Patient Appointment and an old patient couldbe associated with a Make Old Patient Appointment. The common, or generalized, behav-ior that both the Make New Patient Appointment and Make Old Patient Appointment usecases contain would be placed in the generalized Make Appointment use case—for exam-ple, the include relationship to the Make Payment Arrangements use case. In other words,the Make New Patient Appointment and Make Old Patient Appointment use cases wouldinherit the Make Payment Arrangements use case from the Make Appointment use case.The specialized behavior would be placed in the appropriate specialized use case. Forexample, the extend relationship to the Create New Patient use case would be placed withthe specialized Make New Patient Appointment use case as an included use case.
Flow of Events Finally, the individual steps within the business process are described.There are three different categories of steps, or flows of events, that can be documented:normal flow of events, subflows, and alternate, or exceptional, flows:
1. The normal flow of events includes only those steps that normally are executed in ause case. The steps are listed in the order in which they are performed. In Figure 5-5,the patient and the receptionist have a conversation regarding the patient’s name,address, and action to be performed.
2. In some cases, the normal flow of events should be decomposed into a set of sub-flows to keep the normal flow of events as simple as possible. In Figure 5-5, wehave identified three subflows: New Appointment, Cancel Appointment, and
170 Chapter 5 Functional Modeling
Change Appointment. Each of the steps of the subflows is listed. These subflowsare based on the control flow logic in the activity diagram representation of thebusiness process (see Figure 5-2). Alternatively, we could replace a subflow with aseparate use case that could be incorporated via the include relationships (see theearlier discussion). However, this should be done only if the newly created usecase makes sense by itself. For example, in Figure 5-5, does it make sense to factorout a Create New Appointment, Cancel Appointment, and/or Change Appoint-ment use case? If it does, then the specific subflow(s) should be replaced with acall to the related use case, and the use case should be added to the include rela-tionship list.
3. Alternate or exceptional flows are ones that do happen but are not considered to bethe norm. These must be documented. For example, in Figure 5-5, we have identi-fied four alternate or exceptional flows. The first one simply addresses the need tocreate a new patient before the new patient can make an appointment. Normally,the patient would already exist in the patient database. Like the subflows, the pri-mary purpose of separating out alternate or exceptional flows is to keep the nor-mal flow of events as simple as possible. Again, as with the subflows, replace thealternate or exceptional flows with separate use cases that could be integrated viathe extend relationship (see the earlier discussion).
When should events be factored out from the nomal flow of events into subflows orsubflows and/or alternate or exceptional flows be factored out into separate use cases? Or,when should things simply be left alone? The primary criteria should be based on the levelof complexity that the use case entails. The more difficult it is to understand the use case,the more likely events should be factored out into subflows, or subflows and/or alternate orexceptional flows should be factored out into separate use cases that are called by the cur-rent use case. This, of course, will create more use cases. As such, the use case diagram (seethe following discussion) will become more cluttered. Practically speaking, we must decidewhich makes more sense. This will vary greatly, depending on the problem and the client.Remember, we are trying to represent, in as complete and concise manner as possible, ourunderstanding of the business processes that we are investigating so that the client can val-idate the requirements that we are modeling. Therefore, there really is no single rightanswer. It really depends on the analyst, the client, and the problem.
Optional Characteristics There are other characteristics of use cases that can be docu-mented. These include the level of complexity of the use case, the estimated amount oftime it takes to execute the use case, the system with which the use case is associated, spe-cific data flows between the primary actor and the use case, any specific attribute, con-straint, or operation associated with the use case, any preconditions that must be satisfiedfor the use case to execute, or any guarantees that can be made based on the execution ofthe use case. As we noted at the beginning of this section, there is no standard set of char-acteristics of a use case that must be captured. In this book, we suggest that the informa-tion contained in Figure 5-5 is the minimal amount to be captured.
Guidelines for Creating Use-Case DescriptionsThe essence of a use case is the flow of events. Writing the flow of events in a manner thatis useful for later stages of development generally comes with experience. Figure 5-6 pro-vides a set of guidelines that have proven to be useful.18
Use-Case Descriptions 171
18 These guidelines are based on Cockburn, Writing Effective Use Cases, and Graham, Migrating to Object Technology.

First, write each individual step in the form subject–verb–direct object and, optionally,preposition–indirect object. This form has become known as SVDPI sentences. This formof sentence has proven to be useful in identifying classes and operations (see Chapter 6).For example, in Figure 5-5, the first step in the normal flow of events, the Patient contactsthe office regarding an appointment, suggests the possibility of three classes of objects:Patient, Office, and Appointment. This approach simplifies the process of identifying theclasses in the structural model (described in Chapter 6). SVDPI sentences cannot be usedfor all steps, but they should be used whenever possible.
Second, make clear who or what is the initiator of the action and who is the receiverof the action in each step. Normally, the initiator should be the subject of the sentence andthe receiver should be the direct object of the sentence. For example, in Figure 5-5, the sec-ond step, Patient provides the Receptionist with his or her name and address, clearly por-trays the Patient as the initiator and the Receptionist as the receiver.
Third, write the step from the perspective of an independent observer. To accomplishthis, each step may have to be written first from the perspective of both the initiator and thereceiver. Based on the two points of view, the bird’s eye view version can then be written. Forexample, in Figure 5-5, the Patient provides the Receptionist with his or her name andaddress, neither the patient’s nor the receptionist’s perspective is represented.
Fourth, write each step at the same level of abstraction. Each step should make aboutthe same amount of progress toward completing the use case as each of the other steps. Onhigh-level use cases, the amount of progress could be very substantial, whereas in a low-leveluse case, each step could represent only incremental progress. For example, in Figure 5-5,each step represents about the same amount of effort to complete.
Fifth, ensure that the use case contains a sensible set of actions. Each use case shouldrepresent a transaction. Therefore, each use case should comprise four parts:
1. The primary actor initiates the execution of the use case by sending a request(and possibly data) to the system.
2. The system ensures that the request (and data) is valid.
3. The system processes the request (and data) and possibly changes its own inter-nal state.
4. The system sends the primary actor the result of the processing.
For example, in Figure 5-5, (1) the patient requests an appointment (steps 1 and 2),(2) the receptionist determines if the patient exists in the database (step 3), (3) the recep-tionist sets up the appointment transaction (steps 4 and 5), and (4) the receptionist givesthe time and date of the appointment to the patient (step 6).
The sixth guideline is the KISS principle. If the use case becomes too complex and/ortoo long, the use case should be decomposed into a set of use cases. Furthermore, if thenormal flow of events of the use case becomes too complex, subflows should be used. For
172 Chapter 5 Functional Modeling
1. Write each set in the form of subject-verb-direct object (and sometimes preposition-indirect object).
2. Make sure it is clear who the initiator of the step is.
3. Write the steps from the perspective of the independent observer.
4. Write each step at about the same level of abstraction.
5. Ensure the use case has a sensible set of steps.
6. Apply the KISS principle liberally.
7. Write repeating instructions after the set of steps to be repeated.
FIGURE 5-6Guidelines for WritingEffective Use-CaseDescriptions

example, in Figure 5-5, the fifth step in the normal flow of events was sufficiently complexto decompose it into three separate subflows. However, as stated previously, care must betaken to avoid the possibility of decomposing too much. Most decomposition should bedone with classes (see Chapter 6).
The seventh guideline deals with repeating steps. Normally, in a programming languagesuch as Visual Basic or C, we put loop definition and controls at the beginning of the loop.However, because the steps are written in simple English, it is normally better to simply writeRepeat steps A through E until some condition is met after step E. It makes the use case morereadable to people unfamiliar with programming.
USE-CASE DIAGRAMS
In the previous section, we learned what a use case is and discussed a set of guidelinesfor writing effective use-case descriptions. In this section, we learn how the use case isthe building block for the use-case diagram, which summarizes, in one picture, all theuse cases for the part of the system being modeled. An analyst can use the use-case dia-gram to better understand the functionality of the system at a very high level. Typically,the use-case diagram is drawn early on in the SDLC when gathering and definingrequirements for the system because it provides a simple, straightforward way of com-municating to the users exactly what the system will do. In this manner, the use-casediagram can encourage the users to provide additional requirements that the writtenuse case may not uncover.
A use-case diagram illustrates in a very simple way the main functions of the systemand the different kinds of users that will interact with it. Figure 5-7 describes the basic syn-tax rules for a use-case diagram. Figure 5-8 presents a use-case diagram for a doctor’s officeappointment system. We can see from the diagram that patients, doctors, and managementpersonnel will use the appointment system to make appointments, record availability, andproduce schedule information, respectively.
ActorsThe labeled stick figures on the diagram represent actors (see Figure 5-7). An actor is not aspecific user, but instead is a role that a user can play while interacting with the system. Anactor can also represent another system in which the current system interacts. In this case,the actor optionally can be represented by a rectangle containing <<actor>> and the nameof the system. Basically, actors represent the principal elements in the environment inwhich the system operates. Actors can provide input to the system, receive output from the
Use-Case Diagrams 173
Look at the activity diagram for the appointment sys-tem in Figure 5-2 and the use case that was created inFigure 5-5. Create your own use case based on an
activity in the activity diagram or the activity that youcreated in Your Turn 5-1. Use Figure 5-6 to guide yourefforts.
5-2 Use CasesYOUR
TURN

174 Chapter 5 Functional Modeling
An actor:
■ Is a person or system that derives benefit from and is external to the subject.■ Is depicted as either a stick figure (default) or if a nonhuman actor is involved, as
a rectangle with <<actor>> in it (alternative). ■ Is labeled with its role.■ Can be associated with other actors using a specialization/superclass association,
denoted by an arrow with a hollow arrowhead.■ Is placed outside the subject boundary.
A use case:
■ Represents a major piece of system functionality.■ Can extend another use case.■ Can include another use case.■ Is placed inside the system boundary.■ Is labeled with a descriptive verb–noun phrase.
A subject boundary:
■ Includes the name of the subject inside or on top.■ Represents the scope of the subject, e.g., a system or an individual
business process.
An include relationship:
■ Represents the inclusion of the functionality of one use case within another.■ Has an arrow drawn from the base use case to the used use case.
An extend relationship:
■ Represents the extension of the use case to include optional behavior.■ Has an arrow drawn from the extension use case to the base use case.
A generalization relationship:
■ Represents a specialized use case to a more generalized one.■ Has an arrow drawn from the specialized use case to the base use case.
An association relationship:
■ Links an actor with the use case(s) with which it interacts.
<<actor>>Actor/Role
Subject
Actor/Role
Use Case
<<include>>
<<extend>>
* *
FIGURE 5-7 Syntax for Use-Case Diagram
system, or both. The diagram in Figure 5-8 shows that three actors will interact with theappointment system (a patient, a doctor, and management).
Sometimes an actor plays a specialized role of a more general type of actor. For exam-ple, there may be times when a new patient interacts with the system in a way that is some-what different than a general patient. In this case, a specialized actor (i.e., new patient) can beplaced on the model, shown using a line with a hollow triangle at the end of the more gen-eral actor (i.e., patient). The specialized actor will inherit the behavior of the more generalactor and extend it in some way (see Figure 5-9). Can you think of some ways in which a newpatient may behave differently than an existing patient?

AssociationUse cases are connected to actors through association relationships; these relationships showwith which use cases the actors interact (see Figure 5-7). A line drawn from an actor to a usecase depicts an association. The association typically represents two-way communicationbetween the use case and the actor. If the communication is only one way, then a solid arrow-head can be used to designate the direction of the flow of information. For example, in Fig-ure 5-8 the Patient actor communicates with the Make Appointment use case. Because thereare no arrowheads on the association, the communication is two-way. Finally, it is possible to
Use-Case Diagrams 175
Appointment System
Patient
Produce Schedule Information
MakeAppointment
Management
Doctor
RecordAvailability
* *
* *
* *FIGURE 5-8Use-Case Diagram for the AppointmentSystem
Appointment System
Patient
New Patient
Produce Schedule Information
MakeAppointment
Management
Doctor
RecordAvailability
* *
* *
* *FIGURE 5-9Use-Case System withSpecialized Actor

represent the multiplicity of the association. Figure 5-8 shows an asterisk (*) at either end ofthe association between the Patient and the Make Appointment use case. This simply desig-nates that an individual patient (instance of the Patient actor) executes the Make Appoint-ment use case as many times as he or she wishes and that it is possible for the appointmentpart of the Make Appointment use case to be executed by many different patients. In mostcases, this type of many-to-many relationship is appropriate. However, it is possible to restrictthe number of patients that can be associated with the Make Appointment use case. We dis-cuss the multiplicity issue in detail in the next chapter in regards to class diagrams.
Use CaseA use case, depicted by an oval in the UML, is a major process that the system will performthat benefits an actor or actors in some way (see Figure 5-7), and it is labeled using a descrip-tive verb–noun phrase. We can tell from Figure 5-8 that the system has three primary usecases: Make Appointment, Produce Schedule Information, and Record Availability.
There are times when a use case includes, extends, or generalizes the functionality ofanother use case in the diagram. These are shown using include, extend, and generalizationrelationships. To increase the ease of understanding a use-case diagram, higher-level usecases are normally drawn above the lower-level ones. It may be easier to understand theserelationships with the help of examples. Let’s assume that every time a patient makes anappointment, the patient is asked to verify payment arrangements. However, it is occa-sionally necessary to actually make new payment arrangements. Therefore, we may want tohave a use case called Make Payment Arrangements that extends the Make Appointmentuse case to include this additional functionality. In Figure 5-10, an arrow labeled withextend was drawn between the Make Payment Arrangements use case and the MakeAppointment use case to denote this special use-case relationship. Furthermore, the MakePayment Arrangements use case was drawn lower than the Make Appointment use case.
Similarly, there are times when a single use case contains common functions that areused by other use cases. For example, suppose there is a use case called Manage Schedule thatperforms some routine tasks needed to maintain the doctor’s office appointment schedule,and the two use cases Record Availability and Produce Schedule Information both performthe routine tasks. Figure 5-10 shows how we can design the system so that Manage Scheduleis a shared use case that is used by others. An arrow labeled with include is used to denote theinclude relationship and the included use case is drawn below the use cases that contain it.
Finally, there are times when it makes sense to use a generalization relationship to sim-plify the individual use cases. For example in Figure 5-10, the Make Appointment use case hasbeen specialized to include a use case for an Old Patient and a New Patient. The Make OldPatient Appt use case inherits the functionality of the Make Appointment use case (includingthe Make Payment Arrangements use-case extension) and extends its own functionality withthe Update Patient Information use case. The Make New Patient Appt use case also inheritsall the functionality of the generic Make Appointment use case and calls the Create NewPatient use case, which includes the functionality necessary to insert the new patient into thepatient database. The generalization relationship is represented as an unlabeled hollow arrowwith the more general use case being higher than the lower-use cases. Also notice that we haveadded a second specialized actor, Old Patient, and that the Patient actor is now simply a gen-eralization of the Old and New Patient actors.
Subject BoundaryThe use cases are enclosed within a subject boundary, which is a box that defines the scopeof the system and clearly delineates what parts of the diagram are external or internal to it(see Figure 5-7). One of the more difficult decisions to make is where to draw the subject
176 Chapter 5 Functional Modeling

boundary. A subject boundary can be used to separate a software system from its environ-ment, a subsystem from other subsystems within the software system, or an individualprocess in a software system. They also can be used to separate an information system,including both software and internal actors, from its environment. As such, care should betaken to decide carefully what the scope of the information system is to be.
The name of the subject can appear either inside or on top of the box. The subjectboundary is drawn based on the scope of the system. In the appointment system, the Man-agement and Doctor actors may not be drawn. Remember that actors are outside of thescope of the system. In Figure 5-8, we listed a receptionist as being part of the use case.However, in this case, we assumed that the receptionist is an internal actor who is part ofthe Make Appointment use case. As such, the receptionist is not drawn on the diagram. 19
Use-Case Diagrams 177
Appointment System
Patient
New Patient
Old Patient
Produce Schedule Information
Update Patient Information
Make Payment Arrangements
Make Old Patient Appt.
Make New Patient Appt.
Create New Patient
MakeAppointment
Management
Doctor
RecordAvailability
Manageschedule
<<exten
d>>
<<extend>>
<<in
clud
e>>
<<include>>
<<include>>
* *
*
*
**
**
FIGURE 5-10 Extend and Include Relationships
19 In other non-UML approaches to object-oriented systems development, it is possible to represent external actorsalong with internal actors. In this example, the receptionist would be considered an internal actor (see Graham,Migrating to Object Technology, and Graham, Henderson-Sellers, and Younessi, The OPEN Process Specification).

CREATING USE-CASE DESCRIPTIONS AND USE-CASE DIAGRAMS
Use cases describe the functionality of a system and are a model of the dialog between theactors and the system. As such, they tend to be used to model both the contexts of the sys-tem and the detailed requirements for the system. Even though the primary purpose of usecases is to document the functional requirements of the system, they also are used as a basisfor testing the evolving system. In this section, we describe an approach that supportsrequirements gathering and documentation with use cases.
It is important to remember that use cases are used for both the as-is and to-bebehavioral models. As-is use cases focus on the current system, whereas to-be use casesfocus on the desired new system. The two most common ways to gather information forthe use cases are through interviews and JAD sessions (observation is also sometimesused for as-is models). As discussed in Chapter 4, these techniques have advantages anddisadvantages.
Regardless of whether interviews or JAD sessions are used, recent research shows thatsome ways to gather the information for use cases are better than others. The most effec-tive process involves using thirteen steps to create use-case descriptions20 and four addi-tional steps to create use-case diagrams (see Figure 5-11). These thirteen steps are performedin order, but of course the analyst often cycles among them in an iterative fashion as he orshe moves from use case to use case.
178 Chapter 5 Functional Modeling
20 The approach in this section is based on the work of Cockburn, Writing Effective Use Cases; Graham, Migratingto Object Technology; George Marakas and Joyce Elam, “Semantic Structuring in Analyst Acquisition and Represen-tation of Facts in Requirements Analysis,” Information Systems Research 9, no. 1 (1998): 37–63; and Alan Dennis,Glenda Hayes, and Robert Daniels, “Business Process Modeling with Group Support Systems,” Journal of Manage-ment Information Systems 15, no. 4 (1999): 115–142.
Identify the Major Use Cases
1. Review the activity diagram.
2. Find the subject's boundaries.
3. Identify the primary actors and their goals.
4. Identify and write the overviews of the major use cases for the above.
5. Carefully review the current use cases. Revise as needed.
Expand the Major Use Cases
6. Choose one of the use cases to expand.
7. Start filling in the details of the chosen use case.
8. Write the normal flow of events of the use case.
9. If the normal flow of events is too complex or long, decompose into subflows.
10. List the possible alternate or exceptional flows.
11. For each alternate or exceptional flow, list how the actor and/or system should react.
Confirm the Major Use Cases
12. Carefully review the current set of use cases. Revise as needed.
13. Start at the top again.
Create the Use-Case Diagram
1. Draw the subject boundary.
2. Place the use cases on the diagram.
3. Place the actors on the diagram.
4. Draw the associations.
FIGURE 5-11Steps for Writing Effective Use-CaseDescriptions and Use-Case Diagrams

Identifying the Major Use CasesThe first step is to review the activity diagram. This helps the analyst to get a completeoverview of the underlying business process being modeled.
The second step is to identify the subject’s boundaries. This helps the analyst to iden-tify the scope of the system. However, as we work through the SDLC, the boundary of thesystem will change.
The third step is to identify the primary actors and their goals. The primary actorsinvolved with the system will come from a list of stakeholders and users. However, recallthat an actor is a role that a stakeholder or user plays, not a specific user (e.g., doctor, notDr. Jones). The goals represent the functionality that the system must provide the actor forthe system to be a success. Identifying what the tasks are that each actor must perform canfacilitate this. For example, does the actor need to create, read, update, or delete (CRUD)21
any information currently in the system, are there any external changes of which an actormust inform the system, or is there any information that the system should give the actor?Steps 2 and 3 are intertwined. As actors are identified and their goals are uncovered, theboundary of the system will change.
The fourth step is to identify and write the major use cases, with basic informationabout each, rather than jumping into one use case and describing it completely (i.e., onlyan overview use case). Recall from the previous description of the elements of a use casethat overview use cases contain only the use case name, ID number, type, primary actor,importance level, and brief description. Creating only overview use cases at this time pre-vents the users and analysts from forgetting key use cases and helps the users explain theoverall set of business processes for which they are responsible. It also helps them under-stand how to describe the use cases and reduces the chance of overlap between use cases.It is important at this point to understand and define acronyms and jargon so that the pro-ject team and others from outside the user group can clearly understand the use cases.Again, the activity diagram is a very useful beginning point for this step.
The fifth step is to carefully review the current set of use cases. It may be necessary tosplit some of them into multiple use cases or merge some of them into a single use case.Also, based on the current set, a new use case may be identified. You should remember thatidentifying use cases is an iterative process, with users often changing their minds aboutwhat a use case is and what it includes. It is very easy to get trapped in the details at thispoint, so you need to remember that the goal at this step is to identify the major use casesand that you are creating only overview use cases. For example, in the doctors’ office exam-ple in Figure 5-10, we defined one use case as Make Appointment. This use case includedthe cases for both new patients and existing patients, as well as for when a patient changesor cancels an appointment. We could have defined each of these activities (makes anappointment, changes an appointment, or cancels an appointment) as separate use cases,but this would have created a huge set of small use cases.
The trick is to select the right size so that you end up with three to nine use cases in eachsystem. If the project team discovers many more than eight use cases, this suggests that theuse cases are too small or that the system boundary is too big. If more than nine use casesexist, the use cases should be grouped together into packages (i.e., logical groups of use cases)to make the diagrams easier to read and keep the models at a reasonable level of complex-ity. It is simple at that point to sort the use cases and group together these small use casesinto larger use cases that include several small ones or to change the system boundaries.22
Creating Use-Case Descriptions and Use-Case Diagrams 179
21 We describe the use of CRUD matrices in Chapter 7.22 For those familiar with structured analysis and design, packages serve a similar purpose as the leveling and bal-ancing processes used in data flow diagramming. Packages are described in Chapter 8.

Expanding the Major Use CasesThe sixth step is to choose one of the major use cases to expand. Using the importance levelof the use case can help do this. For example, in Figure 5-5, the Make Appointment use casehas an importance level of high. As such, it should be one of the earlier use cases to beexpanded. The criteria suggested by Larman23 can also be used to set the prioritization ofthe use cases, as noted earlier.
The seventh step is to start filling in the details on the use-case template. For example,list all of the identified stakeholders and their interests in the use case, the level of impor-tance of the use case, a brief description of the use case, the trigger information for the usecase, and the relationships in which the use case participates.
The eighth step is to fill in the steps of the normal flow of events required to describeeach use case. The steps focus on what the business process does to complete the use case,as opposed to what actions the users or other external entities do. In general, the stepsshould be listed in the order in which they are performed, from first to last. Remember towrite the steps in an SVDPI form whenever possible. In writing the use case, remember theseven guidelines described earlier. The goal at this point is to describe how the chosen usecase operates. One of the best ways to begin to understand how an actor works through ause case is to visualize performing the steps in the use case—that is, role-play. The tech-niques of visualizing how to interact with the system and of thinking about how other sys-tems work (informal benchmarking) are important techniques that help analysts and usersunderstand how systems work and how to write a use case. Both techniques (visualizationand informal benchmarking) are common in practice. It is important to remember that atthis point in the development of a use case, we are interested only in the typical successfulexecution of the use case. If we try to think of all of the possible combinations of activitiesthat could go on, we will never get anything written down. At this point, we are lookingonly for the three to seven major steps. As such, focus only on performing the typicalprocess that the use case represents.
The ninth step is to ensure that the steps listed in the normal flow of events are not toocomplex or too long. Each step should be about the same size as the others. For example,if we were writing steps for preparing a meal, steps such as take fork out of drawer and putfork on table are much smaller than prepare cake using mix. If we end up with more thanseven steps or steps that vary greatly in size, we should go back and review each step care-fully and possibly rewrite the steps.
One good approach to produce the steps for a use case is to have the users visualizethemselves actually performing the use case and to have them write down the steps as ifthey were writing a recipe for a cookbook. In most cases the users will be able to quicklydefine what they do in the as-is model. Defining the steps for to-be use cases may take abit more coaching. In our experience, the descriptions of the steps change greatly as userswork through a use case. Our advice is to use a blackboard or whiteboard (or paper withpencil) that can be easily erased to develop the list of steps, and then write the list on theuse-case form. It should be written on the use-case form only after the set of steps is fairlywell defined.
The tenth step focuses on identifying the alternate or exceptional flows. Alternate orexceptional flows are those flows of success that represent optional or exceptional behav-ior. They tend to occur infrequently or as a result of a normal flow failing. They should belabeled so that there is no doubt as to which normal flow of events it is related. For exam-ple in Figure 5-5, alternate/exceptional flow 3a executes when step 3 fails (i.e., the Patientdoes not exist in the Patient database).
180 Chapter 5 Functional Modeling
23 Larman, Applying UML and Patterns: An Introduction to Object-Oriented Analysis and Design.

The eleventh step is simply to write the description of any alternate or exceptionalflows. In other words, if an alternate or exceptional flow is to be executed, describe theresponse that the actor or system should produce. Like the normal flows and subflows,alternate or exceptional flows should be written in the SVDPI form whenever possible.
Confirming the Major Use Cases24
The twelfth step is to carefully review the current set of use cases and to confirm that theuse case is correct as written, which means reviewing the use case with the users to makesure each step is correct. The review should look for opportunities to simplify a use case bydecomposing it into a set of smaller use cases, merging it with others, looking for commonaspects in both the semantics and syntax of the use cases, and identifying new use cases.This is also the time to look into adding the include, extend, or generalization relationshipsbetween use cases. The most powerful way to confirm a use case is to ask the user to role-play, or execute the process using the written steps in the use case. The analyst will hand theuser pieces of paper labeled as the major inputs to the use case and will have the user fol-low the written steps like a recipe to make sure that those steps really can produce the out-puts defined for the use case using its inputs.
The thirteenth and final step is to iterate over the entire set of steps again. Users willoften change their minds about what is a use case and what it includes. It is very easy to gettrapped in the details at this point, so remember that the goal is to just address the major usecases. Therefore, the analyst should continue to iterate over these steps until he or she andthe users believe that a sufficient number of use cases has been documented to begin iden-tifying candidate classes for the structural model (see Chapter 6). As candidate classes areidentified, it is likely that additional use cases will be uncovered. Remember, object-orientedsystems development is both iterative and incremental. As such, do not worry about identi-fying each and every possible use case at this point in the development of the system.
Creating a Use-Case DiagramBasically, drawing the use-case diagram is very straightforward once use cases have beendetailed. The actual use-case diagram encourages the use of information hiding. The onlyparts drawn on the use-case diagram are the system boundary, the use-cases themselves,the actors, and the various associations between these components. The major strength ofthe use-case diagram is that it provides the user with an overview of the detailed use cases.However, remember that anytime a use case changes, it could impact the use case diagram.
There are four major steps in drawing a use-case diagram. First, the use-case diagramstarts with the subject boundary. This forms the border of the subject, separating use cases(i.e., the subject’s functionality) from actors (i.e., the roles of the external users).
Second, the use cases are drawn on the diagram. These are taken directly from thedetailed use-case descriptions. Special use-case associations (include, extend, or generaliza-tion) are also added to the model at this point. Be careful in laying out the diagram. There isno formal order to the use cases, so they can be placed in whatever fashion needed to makethe diagram easy to read and to minimize the number of lines that cross. It often is necessaryto redraw the diagram several times with use cases in different places to make the diagrameasy to read. Also, for understandability purposes, there should be no more than three to nineuse cases on the model so the diagram is as simple as possible. These includes those use casesthat have been factored out and now are associated with another use case through theinclude, extend, or generalization relationships.
Creating Use-Case Descriptions and Use-Case Diagrams 181
24 This process is related to role-playing, which is discussed in Chapter 6, walkthroughs discussed in Chapter 8,and testing discussed in Chapter 13.

Third, the actors are placed on the diagram. The actors are taken directly from the pri-mary actor element on the detailed use-case description. Like use-case placement, to min-imize the number of lines that will cross on the diagram, the actors should be placed nearthe use cases with which they are associated.
The fourth and last step is to draw lines connecting the actors to the use cases withwhich they interact. No order is implied by the diagram, and the items added along the waydo not have to be placed in a particular order; therefore, it may help to rearrange the sym-bols a bit to minimize the number of lines that cross, making the diagram less confusing.
REFINING PROJECT SIZE AND EFFORT ESTIMATION USING USE-CASE POINTS25
In Chapter 3, we used function points and the COCOMO method to estimate the size andeffort of a systems development project, respectively. However, neither of these approacheswere developed or validated with object-oriented systems in mind. As such, even though theyare very popular approaches to estimation, their application to object-oriented systems isquestionable. Because we now know about use cases, we introduce a size and effort estimationtechnique that was developed around their use. This technique, known as use-case points, wasoriginally developed by Gustav Karner of Objectory AB.26 Use-case points are based on thesame ideas from which function points were developed. However, they have been refined totake into consideration the unique features of use cases and object orientation.
To estimate size and effort using use-case points, at least the set of essential use casesand the use-case diagram must have been created. Otherwise, the information required willnot be available. Once the use cases and use case diagram have been created, the actors anduse cases must be classified as simple, average, or complex.
Simple actors are separate systems with which the current system must communicatethrough a well-defined application program interface (API). Average actors are separatesystems that interact with the current system using standard communication protocols,such as TCP/IP, FTP, or HTTP, or an external database that can be accessed using stan-dard SQL. Complex actors are typically end users communicating with the system usingsome type of GUI. Once all the actors have been classified, the appropriate numbersshould be entered into the unadjusted actor weighting table contained in the use-casepoint–estimation worksheet (See Figure 5-12). For example, reviewing the MakeAppointment use case (see Figure 5-5) and the use-case diagram for the Appointment
182 Chapter 5 Functional Modeling
Look at the use-case diagram in Figure 5-10. Consider if ause case were added to maintain patient insurance infor-
mation. Make assumptions about the details of this use caseand add it to the existing use-case diagram in Figure 5-10.
5-3 Use–Case DiagramYOUR
TURN
25 The material in this section is based on descriptions of use-case points contained in Raul R. Reed, Jr., Develop-ing Applications with Java and UML (Reading, MA: Addison-Wesley, 2002); Geri Schneider and Jason P. Winters,Applying Use Cases: A Practical Guide (Reading, MA: Addison-Wesley, 1998); and Kirsten Ribu, “EstimatingObject-Oriented Software Projects with Use Cases” (master’s thesis, University of Oslo, 2001).26 Objectory AB was acquired by Rational in 1995. Rational has now been acquired by IBM.

Refining Project Size and Effort Estimation Using Use-Case Points 183
Unadjusted Actor Weighting Table:
Actor Type Description Weighting Factor Number Result
Simple External System with well-defined API 1Average External System using a protocol-based 2
interface, e.g., HTTP, TCT/IP, or a databaseComplex Human 3
Unadjusted Actor Weight Total (UAW)
Unadjusted Use Case Weighting Table:
Use-Case Type Description Weighting Factor Number Result
Simple 1–3 transactions 5Average 4–7 transactions 10Complex >7 transactions 15
Unadjusted Use-Case Weight Total (UUCW)
Unadjusted Use Case Points (UUCP) � UAW � UUCW
Technical Complexity Factors:
Factor Number Description Weight Assigned Value (0–5) Weighted Value Notes
T1 Distributed system 2.0T2 Response time or throughput 1.0
performance objectivesT3 End-user online efficiency 1.0T4 Complex internal processing 1.0T5 Reusability of code 1.0T6 Easy to install 0.5T7 Ease of use 0.5T8 Portability 2.0T9 Ease of change 1.0T10 Concurrency 1.0T11 Special security objectives included 1.0T12 Direct access for third parties 1.0T13 Special user training required 1.0
Technical Factor Value (TFactor)
Technical Complexity Factor (TCF) � 0.6 � (0.01 * TFactor)
Environmental Factors:
Factor Number Description Weight Assigned Value (0 – 5) Weighted Value Notes
E1 Familiarity with system 1.5development process being used
E2 Application experience 0.5E3 Object-oriented experience 1.0E4 Lead analyst capability 0.5E5 Motivation 1.0E6 Requirements stability 2.0E7 Part time staff –1.0E8 Difficulty of programming language –1.0
Environmental Factor Value (EFactor)
Environmental Factor (EF) � 1.4 � (�0.03 * EFactor)Adjusted Use Case Points (UCP) � UUCP * TCF * ECFEffort in Person Hours � UCP * PHM
FIGURE 5-12 Use-Case Point–Estimation Worksheet
TEMPLATEcan be found atwww.wiley.com/college/dennis

system (see Figure 5-10) we see that we have four human actors interacting with the sys-tem, giving an unadjusted actor weight total (UAW) of 12. This is computed by summingthe individual results that were computed by multiplying the weighting fact by the num-ber of actors of each type. In this case there were zero simple actors, zero average actors,and four complex actors.
Depending on the number of unique transactions that the use case must address, a usecase is classified as a simple use case (1–3), an average use case (4–7), or a complex use case(>7). In the original formulation of use-case point estimation, Karner suggested thatincluded and extended use cases should be ignored. However, today the recommendationis to use all use cases, regardless of their type in the estimation calculation. For example,the Make Appointment use case described in Figure 5-5 must deal with activities includingmaking a new appointment, canceling an existing appointment, changing an existingappointment, creating a new patient, and making payment arrangements. In this case,because the Make Appointment use case has to deal with five separate transactions, it isclassified as an average use case (see the unadjusted use-case weighting table in Figure 5-12).Based on the Appointment System use-case diagram (see Figure 5-10), we have three sim-ple use cases (Produce Schedule, Make Old Patient Appointment, and Record Availability),four average use cases (Make Appointment, Make New Patient Appointment, ManageSchedule, and Make Payment Arrangements), and one complex use case (Update PatientInformation). By multiplying by the appropriate weights and summing the results, we getan unadjusted use-case weight total (UUCW) value of 70.
The value of the unadjusted use-case points (UUCP) is simply the sum of the unad-justed actor weight total (12) and the unadjusted use-case weight total (70). As such, UUCPis equal to 82.
In the spirit of function point analysis, use-case point–based estimation also has aset of factors that are used to adjust the use-case point value. In this case, there are twosets of factors: technical complexity factors (TCF) and environmental factors (EF). Thereare thirteen separate technical factors and eight separate environmental factors. The pur-pose of these factors is to allow the project as a whole to be evaluated for complexity andexperience levels of the staff, respectively. Obviously, these types of factors can impactthe effort required by a team to develop a system. Each of these factors is assigned a valuebetween 0 and 5, 0 representing that the factor is irrelevant to the system under consid-eration and 5 representing that the factor is essential for the system to be successful. Theassigned values are then multiplied by their respective weights. These weighted values arethen summed up to create a technical factor value (TFactor) and an environmental factorvalue (EFactor).
The technical factors include the following:
■ Whether the system is going to be a distributed system
■ The importance of response time
■ The efficiency level of the end user using the system
■ The complexity of the internal processing of the system
■ The importance of code reuse
■ How easy the installation process has to be
■ The importance of the ease of using the system
■ How important it is for the system to be able to be ported to another platform
■ Whether system maintenance is important
■ Whether the system is going to have to handle parallel and concurrent processing
■ The level of special security required
184 Chapter 5 Functional Modeling

■ The level of system access by third parties
■ Whether special end user training is to be required (see Figure 5-12)
The environmental factors include the following:
■ The level of experience the development staff has with the development processbeing used
■ The application being developed
■ The level of object-oriented experience
■ The level of capability of the lead analyst
■ The level of motivation of the development team to deliver the system
■ The stability of the requirements
■ Whether part-time staff have to be included as part of the development team
■ The difficulty of the programming language being used to implement the system(see Figure 5-12)
Continuing the appointment example, the values for the technical factors were T1 (0),T2 (5), T3 (3), T4 (1), T5 (1), T6 (2), T7 (4), T8 (0), T9 (2), T10 (0), T11 (0), T12 (0), andT13 (0). Summing the weighted values in Figure 5-12 gives a TFactor value of 15. Pluggingthis value into the technical complexity factor (TCF) equation of the use-case point work-sheet gives a value of .75 for the TCF of the appointment system.
The values for the environmental factors were E1 (4), E2 (4), E3 (4), E4 (5), E5 (5),E6 (5), E7 (0), and E8 (4), giving an EFactor of 25.5. Like the TFactor, Efactor is simplythe sum of the weighted values. Using the environmental factor (EF) equation of the use-case point worksheet produces a value of .635 for the EF of the appointment system.Plugging the TCF and EF values, along with the UUCP value computed earlier, into theadjusted use-case points equation of the worksheet yields a value of 33.3375 adjusteduse- case points (UCP).
Now that we know the estimated size of the system by means of the value of theadjusted use-case points, we are ready to estimate the effort required to build the system. InKarner’s original work, he suggested simply multiplying the number of use-case points by20 to estimate the number of person-hours required to build the system. However, basedon additional experiences using use-case points, a decision rule to determine the value ofthe person-hours multiplier (PHM) has been created that suggests using either 20 or 28,based on the values assigned to the individual environmental factors. The decision rule is:
If the sum of (number of Efactors E1 through E6 assigned value < 3) and(number of Efactors E7 and E8 assigned value > 3)
� 2PHM � 20
Else If the sum of (number of Efactors E1 through E6 assigned value < 3) and(number of Efactors E7 and E8 assigned value > 3)
� 3 or 4PHM � 28
ElseRethink project; it has too high of a risk for failure
Based on these rules, because none of Efactors E1 through E6 have a value less than 3and only Efactors E8 has a value greater than 3, the sum of the number EFactors is 1. Thus,the appointment system should use a PHM of 20. This gives an estimated number of per-son-hours of 666.75 hours (20 * 33.3375). The filled-out worksheet is given in Figure 5-13.
Refining Project Size and Effort Estimation Using Use-Case Points 185

186 Chapter 5 Functional Modeling
Unadjusted Actor Weighting Table:
Actor Type Description Weighting Factor Number Result
Simple External system with well-defined API 1 0 0Average External system using a protocol-based 2 0 0
interface, e.g., HTTP, TCT/IP, or a databaseComplex Human 3 4 12
Unadjusted Actor Weight Total (UAW) 12
Unadjusted Use-Case Weighting Table:
Use Case Type Description Weighting Factor Number Result
Simple 1–3 transactions 5 3 15Average 4–7 transactions 10 4 40Complex >7 transactions 15 1 15
Unadjusted Use Case Weight Total (UUCW) 70
Unadjusted use-case points (UUCP) � UAW � UUCW 82 � 12 � 70
Technical Complexity Factors:
Factor Number Description Weight Assigned Value (0–5) Weighted Value Notes
T1 Distributed system 2 0 0T2 Response time or throughput 1 5 5
performance objectivesT3 End-user online efficiency 1 3 3T4 Complex internal processing 1 1 1T5 Reusability of code 1 1 1T6 Easy to install 0.5 2 1T7 Ease of use 0.5 4 2T8 Portability 2 0 0T9 Ease of change 1 2 2T10 Concurrency 1 0 0T11 Special security objectives included 1 0 0T12 Direct access for third parties 1 0 0T13 Special user training required 1 0 0
Technical Factor Value (TFactor) 15
Technical complexity factor (TCF) � 0.6 � (0.01 * TFactor) 0.75 � 0.6 � (0.01 * 15)
Environmental Factors:
Factor Number Description Weight Assigned Value (0 – 5) Weighted Value Notes
E1 Familiarity with system 1.5 4 6development process being used
E2 Application experience 0.5 4 2E3 Object-oriented experience 1 4 4E4 Lead analyst capability 0.5 5 2.5E5 Motivation 1 5 5E6 Requirements stability 2 5 10E7 Part-time staff –1 0 0E8 Difficulty of programming language –1 4 –4.0
Environmental Factor Value (EFactor) 25.5
Environmental factor (EF) � 1.4 � (�0.03 * EFactor) 0.635 � 1.4 � (�0.03 * 25.5)Adjusted use case points (UCP) � UUCP * TCF * ECF 33.3375 � 70 * 0.75 * 0.635Effort in person-hours � UCP * PHM 666.75 � 20 * 33.3375
FIGURE 5-13 Use-Case Point Estimation for the Appointment System
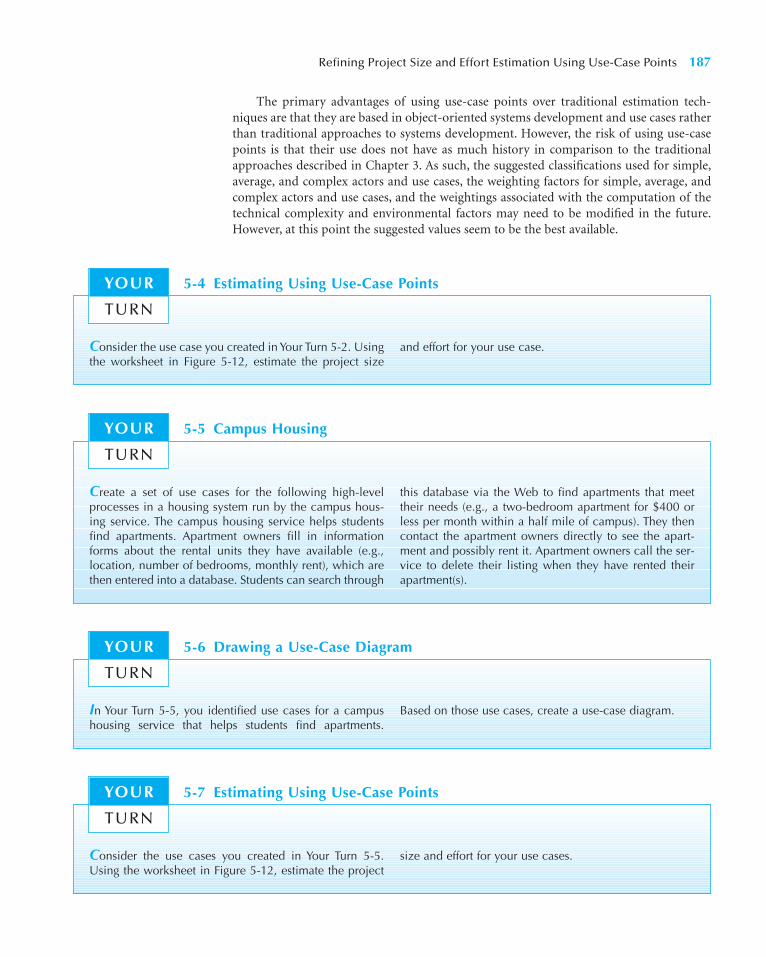
The primary advantages of using use-case points over traditional estimation tech-niques are that they are based in object-oriented systems development and use cases ratherthan traditional approaches to systems development. However, the risk of using use-casepoints is that their use does not have as much history in comparison to the traditionalapproaches described in Chapter 3. As such, the suggested classifications used for simple,average, and complex actors and use cases, the weighting factors for simple, average, andcomplex actors and use cases, and the weightings associated with the computation of thetechnical complexity and environmental factors may need to be modified in the future.However, at this point the suggested values seem to be the best available.
Refining Project Size and Effort Estimation Using Use-Case Points 187
Consider the use case you created in Your Turn 5-2. Usingthe worksheet in Figure 5-12, estimate the project size
and effort for your use case.
5-4 Estimating Using Use-Case PointsYOUR
TURN
Create a set of use cases for the following high-levelprocesses in a housing system run by the campus hous-ing service. The campus housing service helps studentsfind apartments. Apartment owners fill in informationforms about the rental units they have available (e.g.,location, number of bedrooms, monthly rent), which arethen entered into a database. Students can search through
this database via the Web to find apartments that meettheir needs (e.g., a two-bedroom apartment for $400 orless per month within a half mile of campus). They thencontact the apartment owners directly to see the apart-ment and possibly rent it. Apartment owners call the ser-vice to delete their listing when they have rented theirapartment(s).
5-5 Campus HousingYOUR
TURN
In Your Turn 5-5, you identified use cases for a campushousing service that helps students find apartments.
Based on those use cases, create a use-case diagram.
5-6 Drawing a Use-Case DiagramYOUR
TURN
Consider the use cases you created in Your Turn 5-5.Using the worksheet in Figure 5-12, estimate the project
size and effort for your use cases.
5-7 Estimating Using Use-Case PointsYOUR
TURN
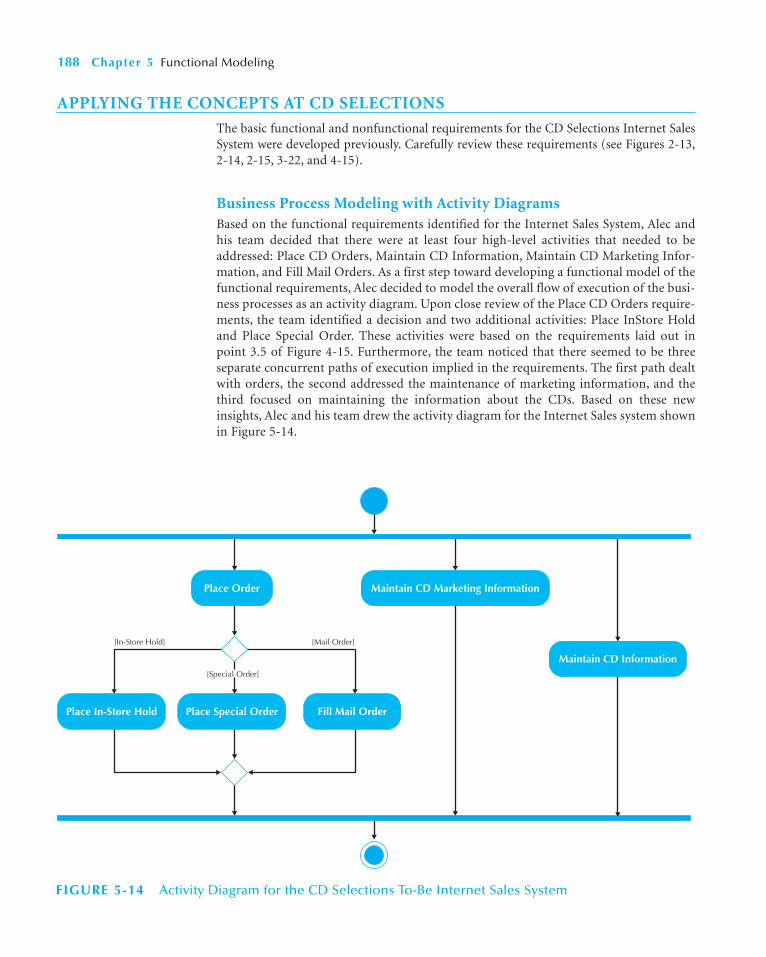
APPLYING THE CONCEPTS AT CD SELECTIONS
The basic functional and nonfunctional requirements for the CD Selections Internet SalesSystem were developed previously. Carefully review these requirements (see Figures 2-13,2-14, 2-15, 3-22, and 4-15).
Business Process Modeling with Activity DiagramsBased on the functional requirements identified for the Internet Sales System, Alec andhis team decided that there were at least four high-level activities that needed to beaddressed: Place CD Orders, Maintain CD Information, Maintain CD Marketing Infor-mation, and Fill Mail Orders. As a first step toward developing a functional model of thefunctional requirements, Alec decided to model the overall flow of execution of the busi-ness processes as an activity diagram. Upon close review of the Place CD Orders require-ments, the team identified a decision and two additional activities: Place InStore Holdand Place Special Order. These activities were based on the requirements laid out inpoint 3.5 of Figure 4-15. Furthermore, the team noticed that there seemed to be threeseparate concurrent paths of execution implied in the requirements. The first path dealtwith orders, the second addressed the maintenance of marketing information, and thethird focused on maintaining the information about the CDs. Based on these newinsights, Alec and his team drew the activity diagram for the Internet Sales system shownin Figure 5-14.
188 Chapter 5 Functional Modeling
[Mail Order][In-Store Hold]
[Special Order]
Maintain CD Marketing InformationPlace Order
Place Special Order
Maintain CD Information
Place In-Store Hold Fill Mail Order
FIGURE 5-14 Activity Diagram for the CD Selections To-Be Internet Sales System

Identify the Major Use CasesThe first four steps in writing use cases deal with reviewing the activity diagram, findingthe subject boundaries, listing the primary actors and their goals, and identifying and writ-ing overviews of the major use cases based on these results. These use cases will form thebasis of the use cases that are contained on the use-case diagram. Take a minute and goback and review the requirements identified in Figure 4-15 and the activity diagram we justcompleted (see Figure 5-14) to identify the three to nine major use cases before you con-tinue reading.
To begin with, it seems that the subject boundary should be drawn in such a mannerthat anything that is not part of CD Selections’ Internet Sales System, such as the vendorsand customers, should be identified as primary actors. Therefore, these are considered out-side of the scope of the system. The other potential actors identified could be the distribu-tion system, electronic marketing (EM) manager, and the current CD Selections stores.
Upon closer review of Figure 4-15, it seems that the distribution system and the cur-rent CD Selections stores should be outside the scope of the Internet Sales System. As such,they also should be identified as primary actors. It also seems that the EM manager shouldbe considered as part of the Internet Sales System and, therefore, should not be identifiedas a primary actor. Remember, primary actors are only those that can be viewed as beingoutside of the scope of the system. The decision on whether the EM manager, the currentCD Selections stores, or the distribution system is inside or outside of the system is some-what arbitrary. From a customer’s perspective, the distribution system, and the current CDSelections stores could be seen as being inside of the overall system, and it could be arguedthat the EM manager is a primary user of the Internet Sales System.
At this point in the process, it is important to make a decision and to move on. Dur-ing the process of writing use cases, there are ample opportunities to revisit this decisionto determine whether the set of use cases identified are necessary and sufficient to describethe requirements of the Internet Sales System for CD Selections. As you can see, based onthe preceding, finding the systems boundaries and listing the primary actors are heavilyintertwined.
Based on the functional requirements and the activity diagram, Alec and his teamidentified four overview major use cases: Maintain CD Information, Maintain CD Mar-keting Information, Place Order, and Fill Order. You might have considered adding newCDs to the database, deleting old ones, and changing information about CDs as three sep-arate use cases—which, in fact, they are. In addition to these three, we also need to have usecases for finding CD information and printing reports about CDs. However, our goal atthis point is to develop a small set of essential use cases for the Internet Sales System. Thesame pattern should be evident for the marketing materials. We have the same processesfor recording new marketing material for a CD, creating it, reading it, updating it, deletingit, and printing it. These activities are usually required any time that you have informationto be stored in a database.
The project team at CD Selections identified these same four major use cases. At thispoint in the process, the project team began writing the overview use cases for these four.Remember that an overview use case only has five pieces of information: use case name, IDnumber, primary actor, type, and a brief description. At this point in time, we have alreadyidentified the primary actors and have associated them with the four use cases. Further-more, because we are just beginning the development process, all four use cases will beoverview and essential types. Because the ID numbers are simply used for identificationpurposes (i.e., they act as a key in a database), their values can be assigned in a sequentialmanner. This leaves us with only two pieces of information for each use case to write. Theuse-case name should be an action verb–noun phrase combination (e.g., Make Appointment).
Applying the Concepts at CD Selections 189

In the CD Selections Internet Sales situation, Maintain CD Information, Maintain CDMarketing Information, Place Order, and Fill Order seem to capture the essence of each ofthe use cases. Finally, a brief description is written to describe the purpose of the use caseor the goal of the primary actor using the use case. This description can range from a sen-tence to a short essay. The idea is to capture the primary issues in the use case and makethem explicit. (See Figure 5-15).
190 Chapter 5 Functional Modeling
Use Case Name:
Primary Actor:
Stakeholders and Interests:
Brief Description:
ID: Importance Level:
Trigger:
Normal Flow of events:
Subflows:
Alternate/exceptional flows:
Maintain CD information 1
Distribution system Use Case Type: Overview, essential
This adds, deletes, and modifies the basic information about the CDs we have available for sale (e.g., album name, artist(s), price, quantityon hand, etc.).
Relationships:
Use Case Name:
Primary Actor:
Stakeholders and Interests:
Brief Description:
ID: Importance Level:
Trigger:
Normal Flow of events:
Subflows:
Alternate/exceptional flows:
Use Case Type:
Relationships:
Use Case Name:
Primary Actor:
Stakeholders and interests:
Brief Description:
ID: Importance Level:
Trigger:
Normal Flow of events:
Subflows:
Alternate/exceptional flows:
Use Case Type:
Relationships:
Maintain marketing information 2
Vendor Overview, essential
Overview, essential
This adds, delete, and modifies the additional marketing material available for some CDs (e.g., reviews).
This use case describes how customers can search the Website and place orders.
Place order 3
Customer
Use Case Name:
Primary Actor:
Stakeholders and Interests:
Brief Description:
ID: Importance Level:
Trigger:
Normal Flow of Events:
Use Case Type:
Relationships:Association:Include:Extend:Generalization:
Fill order 4
Distribution system
Type:
Overview, essential
This describes how orders move from the Internet SalesSystem into the distribution system and how statusinformation will be updated from the distribution system.
Subflows:
FIGURE 5-15 Overview of Major Use Cases for CD Selections

The fifth step is to carefully review the current set of use cases. Take a moment to reviewthe use cases and make sure you understand them. Based on the descriptions of all four usecases, there seems to be an obvious missing use case: Maintain Order. Because the projectteam did not include language in the brief description of the Place Order use case, it seemsthat the project team believes that maintaining an order is sufficiently different from plac-ing an order that it should have its own use case to describe it. Furthermore, it does not seemreasonable that a customer would see placing an order and maintaining an order as the sameuse case. This type of interactive and incremental process goes on until the project team feelsthat they have identified the major use cases for the Internet Sales System.
Expanding the Major Use CasesThe sixth step is to choose one of the major use cases to expand. To help the project teamto make this choice, they identified the trigger and the stakeholders and their interests foreach of the major use cases.
The first use case, Maintain CD Information, was triggered by the Distribution Systemdistributing new information for use in the CD database. Besides the Distribution System,another stakeholder was identified: EM Manager. The second use case, Maintain CD Market-ing Information, has a similar structure. The receipt of marketing materials from vendors trig-gers it. Again, it seemed to the project team that the EM Manager was an interested stakeholder.The third use case, Place Order, is more interesting. The trigger is the action of a Customer.Again, the EM Manager is an interested stakeholder. This use case has many more inputs. Thefourth use case, Fill Order, is based on the decision logic identified in the activity diagram.However, upon further reflection, the team decided to replace this use case with three separateuse cases, one for each approach to filling an order: Place Special Order, Place In-Store Hold,and Fill Mail Order. The first two are controlled by actions of the Customer. However, the FillMail Order use case has a temporal trigger: every hour the Internet Sales System downloadsorders into the Distribution System. The final use case, Maintain Order, is triggered by theaction of a Customer. However, on close review, it seems that it also has much in common withthe other maintenance-related use cases: Maintain CD Information and Maintain CD Mar-keting Information. And like all of the other use cases, the EM Manager has an interest.
Based on their review of the major use cases, the project team decided that the PlaceOrder use case was the most interesting. The next step, step 7, is to start filling in the detailsof the chosen use case. At this point in time, the project team had the information to fill inthe stakeholders and interests, the trigger, and the association relationship. (Note: Remem-ber that the association relationship is simply the communication link between the primaryactor and the use case.) In this use case, the association relationship is with the Customer.
The project team then needed to gather and organize the information needed to definethe Place Order use case in more detail. Specifically, they needed to begin writing the nor-mal flow of events; that is, they should perform the eighth step for writing effective usecases (see Figure 5-11). This was done based on the results of the earlier analyses describedin Chapter 4 as well as through a series of JAD meetings with the project sponsor and thekey marketing department managers and staff who would ultimately operate the system.
The goal at this point is to describe how the chosen use-case operates: Place Order.Alec and the team decided to visualize placing a CD order over the Web and to think abouthow other electronic commerce Web sites work—that is, to role-play. As they role-playedthe Place Order use case, they realized that after the customer connected to the Web site, heor she probably began searching—perhaps for a specific CD, perhaps for a category ofmusic—but in any event, they entered some information for their search. The Web site thenshould present a list of CDs matching their request along with some basic informationabout the CDs (e.g., artist, title, and price). If one of the CDs is of interest to them, they
Applying the Concepts at CD Selections 191

might seek more information about it, such as the list of songs, liner notes, reviews, etc.Once they found a CD they liked, they would add it to their order and perhaps continuelooking for more CDs. Once they were done—perhaps immediately—they would checkout by presenting their order with information on the CDs they want and giving additionalinformation such as mailing address, credit card, etc.
When the team wrote the use case’s normal flow of events, they paid close attention tothe seven guidelines described earlier. Alec realized that the first step was to present thecustomer with the home page or a form to fill in to search for an album. Even though thiswas technically correct, this type of step was very small compared to the other steps thatfollowed.27 It was analogous to making the first step, hand the user a piece of paper. Atthis point, the team was looking only for the three to seven major steps. Based on therole-playing and the application of the earlier principles (see Figure 5-6), the team suc-cessfully identified a set of steps (see Figure 5-16).
192 Chapter 5 Functional Modeling
Use Case Name:
Primary Actor:
Stakeholders and Interests:
Brief Description:
ID: importance level:
Trigger:
Type:
Normal Flow of Events:
Subflows:
Alternate/exceptional Flows:
Place Order 3 High
Customer
External
CustomerMaintain order
Use case type: Detail, Essential
This use case describes how customers can search the Website and place orders.
Customer visits Web site and places order
Customer - wants to search Web site to purchase CDEM manager - wants to maximize customer satisfaction
Relationships:Association:Include:Extend:Generalization:
1. The Customer submits a search request to the system. 2. The System provides the Customer a list of recommended CDs.3. The Customer chooses one of the CDs to find out additional information. 4. The System provides the Customer with basic information and reviews on the CD. 5. The Customer adds the CD to his or her shopping cart.6. The Customer decides how to “fill” the order.7. The Customer iterates over 3 through 5 until done shopping.8. The Customer executes the Maintain Order use case.9. The Customer logs in to check out.10. The System validates the Customer’s credit card information.11. The System sends an order confirmation to the Customer.12. The Customer leaves the Web site.
FIGURE 5-16 Places Order Use Case after Step 8
27 Because it is so small, it violates the fourth principle (see Figure 5-6).

The first major step performed by the system is to respond to the customer’s searchinquiry, which might include a search for a specific album name or albums by a specificartist. Or, it might be the customer wanting to see all the classical or alternative CDs instock. Or, it might be a request to see the list of special deals or CDs on sale. In any event,the system finds all the CDs matching the request and shows a list of CDs in response. Theuser will view this response and perhaps will decide to seek more information about oneor more CDs. He or she will click on it, and the system will provide additional informa-tion. Perhaps the user will also want to see any extra marketing material that is availableas well. The user will then select one or more CDs for purchase, decide how to take deliv-ery of each CD, and perhaps continue with a new search. These steps correspond to events1–7 in Figure 5-16.
The user may later make changes to the CDs selected, either by dropping some or chang-ing the number ordered. This seems to be similar to an already identified separate use case:Maintain Order. As such, we can simply reuse that use case to handle those types of details.At some point the user checks out by verifying the CDs he or she has selected for purchaseand providing information about himself or herself (e.g., name, mailing address, credit card).The system calculates the total payment and verifies the credit-card information with thecredit-card clearance center. At this point in the transaction, the system sends an order con-firmation to the customer, and the customer typically leaves the Web site. Figure 5-16 showsthe use case at this point. Note that the normal flow of events has been added to the form, butnothing else has changed.
The ninth step for writing uses cases (see Figure 5-11) is to try and simplify the cur-rent normal flow of events. Currently, the team has twelve events, which is a little high.Therefore, the team decided to see if there were any steps that they could merge, delete,rearrange, and or leave out. Based on this review, they decided to create a separate use casethat could handle the checkout process (events 9, 10, and 11): Checkout. They also realizedthat events 5 and 6 could be viewed as a part of the Maintain Order use case previouslyidentified. As such they deleted events 5 and 6 and moved event 8 into their place. At thispoint in time, the Place Order use case had eight events. Given the purpose of this use case,it seemed to be a reasonable number of events.
The next two steps in writing a use case deals with alternate or exceptional flows.(Note: Remember the normal flow of events captures only the typical set of events that endin a successful transaction.) With the Place Order use case, the development team definedsuccess as a new order being placed. However, the team identified two sets of events thatwere exceptions to the normal flow. First, event 3 assumed that the list of recommendedCDs was acceptable to the customer. However, as one of the team members pointed out,that is an unrealistic assumption. As such, two exceptional flows have been identified andwritten (3a-1 and 3a-2 in Figure 5-17) to handle this specific situation. Second, a customermay want to abort the entire order instead of going through the checkout process. In thiscase, exceptional flow 7a was created for this case.28
Confirming the Major Use CasesOnce all the use cases had been defined, the final step in the JAD session was to confirmthat they were accurate. The project team had the users role-play the use cases again. A fewminor problems were discovered and were easily fixed. However, one major problem was
Applying the Concepts at CD Selections 193
28 Another approach would be to force the customer through the Maintain Order or Checkout use cases. How-ever, the marketing representatives on the project team were concerned with customer frustration. As such, theproject team included it in the Place Order use case.
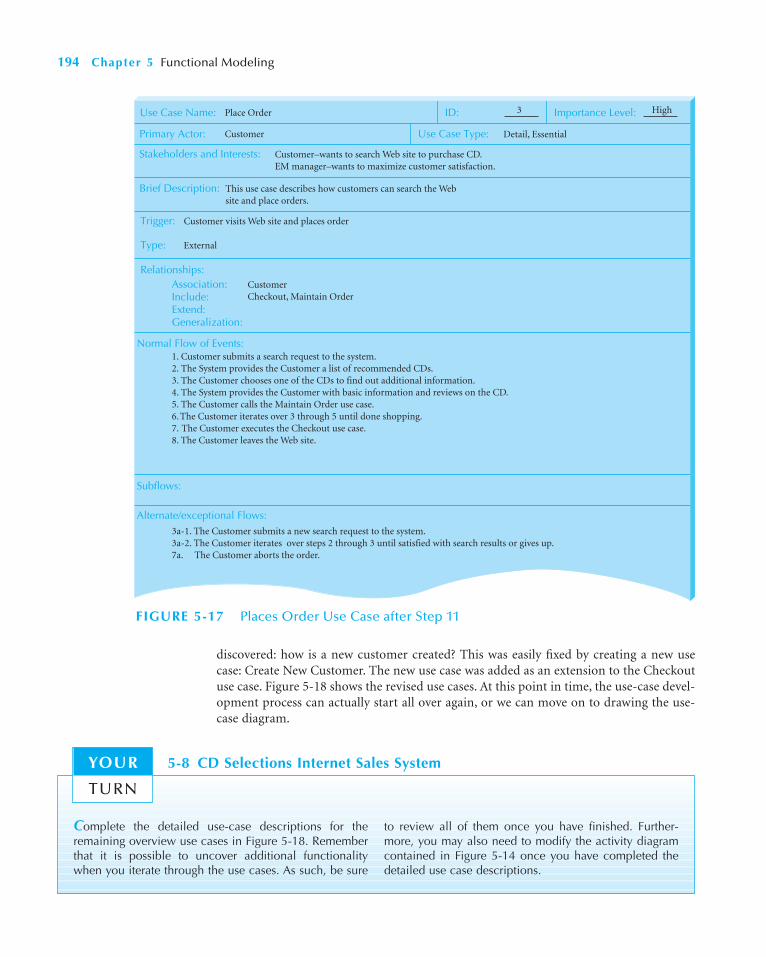
discovered: how is a new customer created? This was easily fixed by creating a new usecase: Create New Customer. The new use case was added as an extension to the Checkoutuse case. Figure 5-18 shows the revised use cases. At this point in time, the use-case devel-opment process can actually start all over again, or we can move on to drawing the use-case diagram.
194 Chapter 5 Functional Modeling
Use Case Name:
Primary Actor:
Stakeholders and Interests:
Brief Description:
ID: Importance Level:
Trigger:
Normal Flow of Events:
Subflows:
Alternate/exceptional Flows:
Place Order 3 High
Customer
CustomerCheckout, Maintain Order
Use Case Type: Detail, Essential
This use case describes how customers can search the Website and place orders.
Customer visits Web site and places order
Customer–wants to search Web site to purchase CD.EM manager–wants to maximize customer satisfaction.
Relationships:Association:Include:Extend:Generalization:
1. Customer submits a search request to the system. 2. The System provides the Customer a list of recommended CDs.3. The Customer chooses one of the CDs to find out additional information. 4. The System provides the Customer with basic information and reviews on the CD. 5. The Customer calls the Maintain Order use case.6. The Customer iterates over 3 through 5 until done shopping.7. The Customer executes the Checkout use case.8. The Customer leaves the Web site.
3a-1. The Customer submits a new search request to the system.3a-2. The Customer iterates over steps 2 through 3 until satisfied with search results or gives up.7a. The Customer aborts the order.
Type: External
FIGURE 5-17 Places Order Use Case after Step 11
Complete the detailed use-case descriptions for theremaining overview use cases in Figure 5-18. Rememberthat it is possible to uncover additional functionalitywhen you iterate through the use cases. As such, be sure
to review all of them once you have finished. Further-more, you may also need to modify the activity diagramcontained in Figure 5-14 once you have completed thedetailed use case descriptions.
5-8 CD Selections Internet Sales SystemYOUR
TURN

Applying the Concepts at CD Selections 195
Association:Include:
Materials arrive from vendors, distributors, wholesalers, record companies, and articles from trade magazines
Relationships:Association:Include:
Extend:Generalization :
Vendor
Use Case Name:
Primary Actor:
Stakeholders and Interests:
Brief Description:
ID: Importance Level:
Trigger:
Type: External
Use Case Type:
Relationships:
Use Case Name:
Primary Actor:
Stakeholders and Interests:
Brief Description:
ID: Importance Level:
Trigger:
Maintain Marketing Information 2
Vendor Use Case Type: Detail, Essential
This adds, deletes, and modifies the marketing material available for some CDs (e.g., reviews).
Vendor–wants to ensure marketing information is as current as possible.EM Manager–wants marketing information to be correct to maximize sales.
High
Maintain CD Information 1
Distribution System
Distribution System
Downloads from the Distribution System
Detail, Essential
This adds, deletes, and modifies the basic information about the CDs we have available for sale (e.g., album name, artist(s), price, quantity on hand, etc.).
Use Case Name:
Primary Actor:
Stakeholders and Interests:
Brief Description:
ID: Importance Level:
Trigger:
Use Case Type:
Relationships:Association:Include:Extend:Generalization :
This use case describes how customers can search the Web site and place orders.
Place Order 3 High
Customer
CustomerCheckout, Maintain Order
Detail, Essential
Customer visits Web site and places order.
Customer–wants to search Web site to purchase CD.EM Manager–wants to maximize Customer satisfaction.
Type: External
Type: External
FIGURE 5-18 Revised Major Use Cases for CD Selections
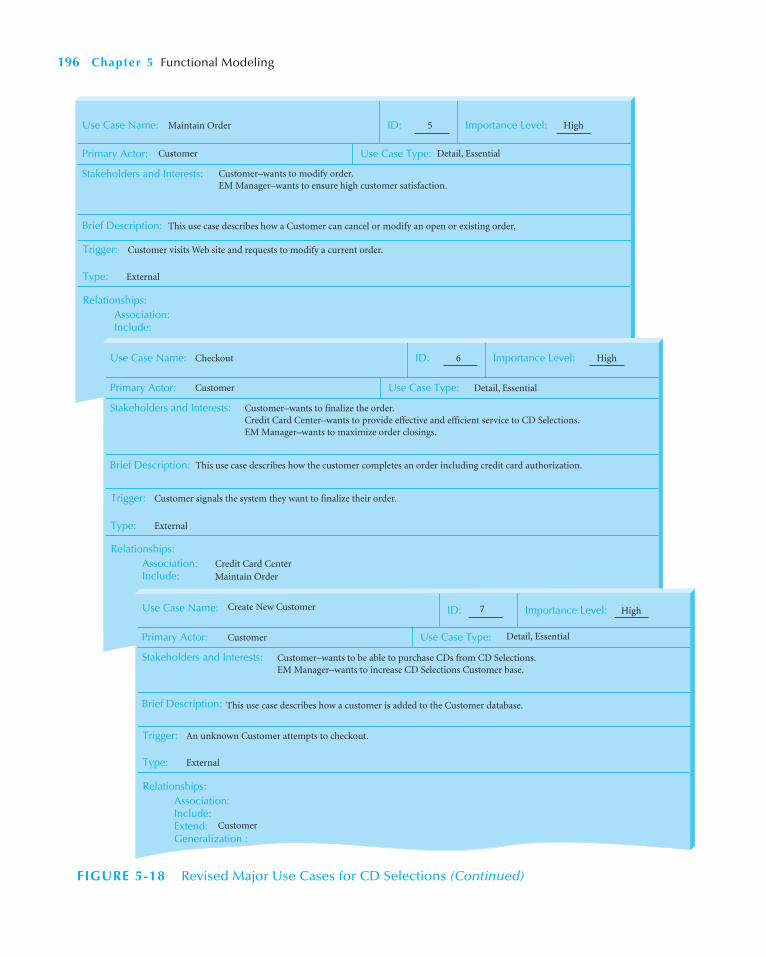
196 Chapter 5 Functional Modeling
Association:Include:
Extend:Generalization :
Customer signals the system they want to finalize their order.
Relationships:Association:Include:
Extend:Generalization :
Credit Card CenterMaintain Order
Use Case Name:
Primary Actor:
Stakeholders and Interests:
Brief Description:
ID: Importance Level:
Trigger:
Type: External
Type: External
Use Case Type:
Relationships:
Use Case Name:
Primary Actor:
Stakeholders and Interests:
Brief Description:
ID: Importance Level:
Trigger:
Checkout 6
Customer Use Case Type: Detail, Essential
This use case describes how the customer completes an order including credit card authorization.
Customer–wants to finalize the order.Credit Card Center–wants to provide effective and efficient service to CD Selections.EM Manager–wants to maximize order closings.
High
Maintain Order 5 High
Customer
Customer visits Web site and requests to modify a current order.
Detail, Essential
This use case describes how a Customer can cancel or modify an open or existing order.
Customer–wants to modify order.EM Manager–wants to ensure high customer satisfaction.
Use Case Name:
Primary Actor:
Stakeholders and Interests:
Brief Description:
ID: Importance Level:
Trigger:
Use Case Type:
Relationships:Association:Include:Extend:Generalization :
This use case describes how a customer is added to the Customer database.
Create New Customer 7 High
Customer
Customer
Detail, Essential
An unknown Customer attempts to checkout.
Customer–wants to be able to purchase CDs from CD Selections.EM Manager–wants to increase CD Selections Customer base.
Type: External
FIGURE 5-18 Revised Major Use Cases for CD Selections (Continued)

Applying the Concepts at CD Selections 197
Association:Include:
Extend:Generalization :
Customer selects CD on order for an in store hold to be picked up at bricks and mortar store.
Relationships:Association:Include:
Extend:Generalization :
Bricks and mortar store
Use Case Name:
Primary Actor:
Stakeholders and Interests:
Brief Description:
ID: Importance Level:
Trigger:
Type: External
Bricks and mortar store
Type: External
Use Case Type:
Relationships:
Use Case Name:
Primary Actor:
Stakeholders and Interests:
Brief Description:
ID: Importance Level:
Trigger:
Place InStore Hold 9
Customer Use Case Type: Detail, Essential
This use case describes how a Customer places an in store hold using the Internet Sales system.
Customer–wants to be able to place an in store hold a CD for In Store pick up.EM manager–wants to increase sales associated with the Internet Sales system.Bricks and Mortar Store Manager–wants to increase sales associated with the store.
High
Place Special Order 8 High
Customer
Customer selects CD on order for a special order at bricks and mortar store.
Detail, Essential
This use case describes how a Customer places a special order using the Internet Sales system.
Customer–wants to be able to place a special order of CDs for in store pick up.EM manager–wants to increase sales associated with the Internet Sales system.Bricks and Mortar Store Manager–wants to increase sales associated with the store.
Use Case Name:
Primary Actor:
Stakeholders and Interests:
Brief Description:
ID: Importance Level:
Trigger:
Use Case Type:
Relationships:Association:Include:Extend:Generalization :
This describes how mail orders move from the Internet Sales system into the distribution system and how status information will be updated from the distribution system.
Fill Mail Order 10 High
Customer
Distribution System
Maintain Order
Detail, Essential
Every hour the Distribution System will initiate a trading of information with the Internet Sales system.
Mail Order Distribution System–wants to complete order processing in a timely manner.Customer–wants to receive order in a timely manner.EM Manager–wants to maximize order throughput.
Type: Temporal
FIGURE 5-18 Revised Major Use Cases for CD Selections (Continued)

198 Chapter 5 Functional Modeling
Creating the Use-Case DiagramBecause use-case diagrams provide only a pictorial overview of the detailed use cases, the teamfound that creating the use-case diagram from the detailed use-case descriptions was veryeasy. (Note: Remember that a use-case diagram shows only the subject boundary, the use casesthemselves, the actors, and the various associations between these components.) The team fol-lowed the four major steps for drawing a use-case diagram given in Figure 5-11.
First, they placed a box on the use-case diagram to represent the Internet Sales Systemand placed the system’s name at the top of the box. Second, they added the use cases to thediagram. Third, they placed the actors near the use cases with which they were associated.Fourth, they drew in the association connecting the actors with their respective use cases.Figure 5-19 portrays the use case diagram that the team created.
Refining Project Size and Effort Estimation using Use-Case PointsNow that the functional modeling aspect of the system development effort has been com-pleted, Alec and his team decided that they needed to refine the estimation of the size andeffort to build the system. Based on the completed use cases (see Figure 5-18) and the use-case diagram (see Figure 5-19) and using the use-case point template (see Figure 5-13),Alec could now use the use cases as the basis for the estimation instead of using the func-tion point estimate that he had done earlier (see Figure 3-21).
First, Alec had to classify each actor and use case as being simple, average, or complex.In the case of the actors, Bricks and Mortar store and Distribution System had a well-defined API. As such they were classified as simple actors. The Credit-Card center was con-sidered to be average, whereas the vendor and customer actors were classified as beingcomplex. This gave an unadjusted actor weight total value of 10. (See Figure 5-20.)
Second, Alec classified each use case based on the number of unique transactions thateach had to handle. In this case, there were three simple use cases (Place InStore Hold,Place Special Order, and Fill Mail Order), one average use case (Create New Customer),and five complex use cases (Place Order, Checkout, Maintain Order, Maintain CD Infor-mation, and Maintain CD Marketing Information). Based on these, the unadjusted use-case weight total was computed to be 100 (see Figure 5-20).
Third, Alec computed a value of 110 for the unadjusted use-case points. Fourth, he ratedeach of the technical complexity factors, rated each of the environmental factors, and com-puted the values for TCF and EF (see Figure 5-20). Fifth, using the unadjusted use-case pointsand the TCF and EF values, Alec calculated a value of 134.992 for adjusted use-case points.Sixth, based on the decision rule to determine whether to use 20 or 28 as the value of the per-son-hours multiplier, Alec realized that he should use 28. Consequently, Alec estimated theremaining effort for the project to be 3,779.776 person-hours. Converting the person-hoursto person-months (3,779.776/160) and using the estimated schedule equation that he had
The use-case diagram for the Internet Sales Systems doesnot include any generalization relationships. See if youcan come up with one example for a use case and anotherexample for an actor that may be helpful for CD Selections
to add to the use-case diagram shown in Figure 5-19.Describe how the development effort may benefit fromincluding your examples.
5-9 Identifying Generalization Associations in Use Cases and Specialized ActorsYOUR
TURN
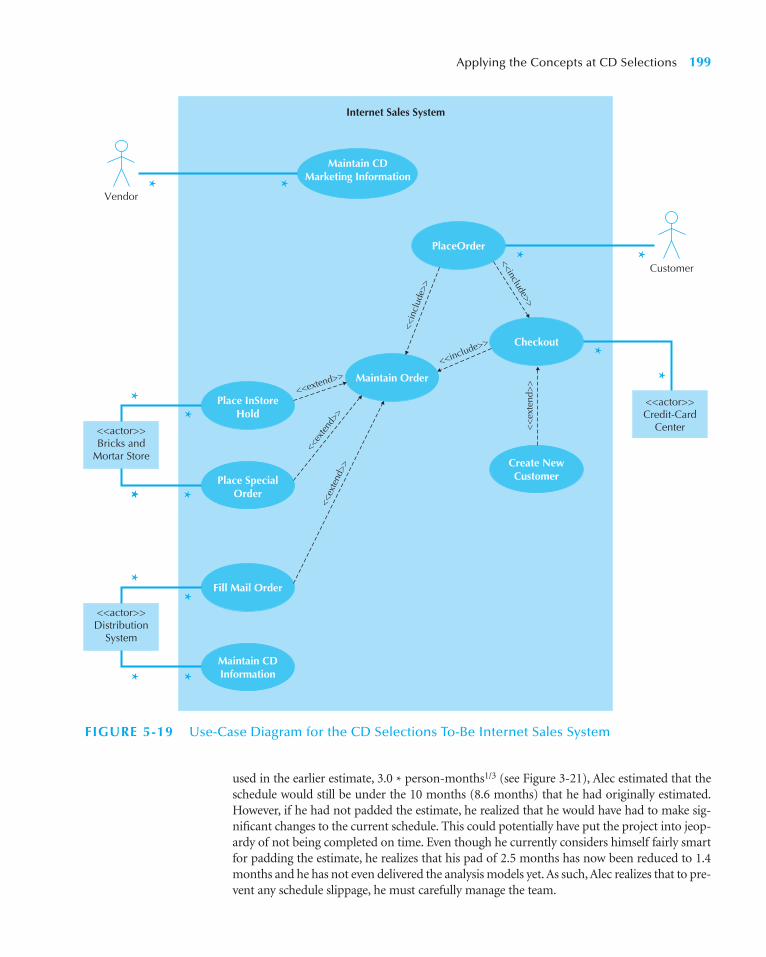
used in the earlier estimate, 3.0 * person-months1/3 (see Figure 3-21), Alec estimated that theschedule would still be under the 10 months (8.6 months) that he had originally estimated.However, if he had not padded the estimate, he realized that he would have had to make sig-nificant changes to the current schedule. This could potentially have put the project into jeop-ardy of not being completed on time. Even though he currently considers himself fairly smartfor padding the estimate, he realizes that his pad of 2.5 months has now been reduced to 1.4months and he has not even delivered the analysis models yet. As such, Alec realizes that to pre-vent any schedule slippage, he must carefully manage the team.
Applying the Concepts at CD Selections 199
Internet Sales System
Vendor
Customer
Maintain CD Marketing Information
<<actor>>Bricks and
Mortar Store
<<actor>>Credit-Card
Center
<<actor>>Distribution
System
PlaceOrder
Checkout
Maintain Order
Fill Mail Order
Create New Customer
Place InStore Hold
Place Special Order
Maintain CD Information
<<include>>
<<in
clud
e>>
<<include>>
<<extend>>
<<ex
tend
>><<
exte
nd>>
<<
exte
nd>
>
*
*
*
*
*
**
* *
* *
*
*
*
*
FIGURE 5-19 Use-Case Diagram for the CD Selections To-Be Internet Sales System
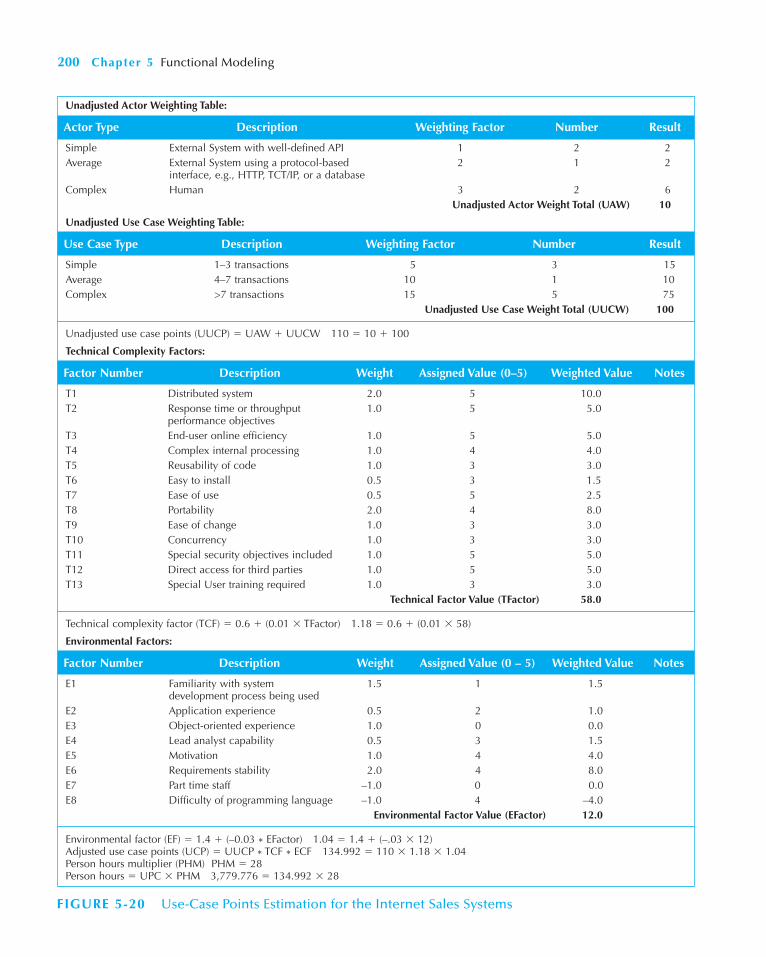
200 Chapter 5 Functional Modeling
Unadjusted Actor Weighting Table:
Actor Type Description Weighting Factor Number Result
Simple External System with well-defined API 1 2 2Average External System using a protocol-based 2 1 2
interface, e.g., HTTP, TCT/IP, or a databaseComplex Human 3 2 6
Unadjusted Actor Weight Total (UAW) 10
Unadjusted Use Case Weighting Table:
Use Case Type Description Weighting Factor Number Result
Simple 1–3 transactions 5 3 15Average 4–7 transactions 10 1 10Complex >7 transactions 15 5 75
Unadjusted Use Case Weight Total (UUCW) 100
Unadjusted use case points (UUCP) � UAW � UUCW 110 � 10 � 100
Technical Complexity Factors:
Factor Number Description Weight Assigned Value (0–5) Weighted Value Notes
T1 Distributed system 2.0 5 10.0T2 Response time or throughput 1.0 5 5.0
performance objectivesT3 End-user online efficiency 1.0 5 5.0T4 Complex internal processing 1.0 4 4.0T5 Reusability of code 1.0 3 3.0T6 Easy to install 0.5 3 1.5T7 Ease of use 0.5 5 2.5T8 Portability 2.0 4 8.0T9 Ease of change 1.0 3 3.0T10 Concurrency 1.0 3 3.0T11 Special security objectives included 1.0 5 5.0T12 Direct access for third parties 1.0 5 5.0T13 Special User training required 1.0 3 3.0
Technical Factor Value (TFactor) 58.0
Technical complexity factor (TCF) � 0.6 � (0.01 � TFactor) 1.18 � 0.6 � (0.01 � 58)
Environmental Factors:
Factor Number Description Weight Assigned Value (0 – 5) Weighted Value Notes
E1 Familiarity with system 1.5 1 1.5development process being used
E2 Application experience 0.5 2 1.0E3 Object-oriented experience 1.0 0 0.0E4 Lead analyst capability 0.5 3 1.5E5 Motivation 1.0 4 4.0E6 Requirements stability 2.0 4 8.0E7 Part time staff –1.0 0 0.0E8 Difficulty of programming language –1.0 4 –4.0
Environmental Factor Value (EFactor) 12.0
Environmental factor (EF) � 1.4 � (–0.03 * EFactor) 1.04 � 1.4 � (–.03 � 12)Adjusted use case points (UCP) � UUCP * TCF * ECF 134.992 � 110 � 1.18 � 1.04Person hours multiplier (PHM) PHM � 28Person hours � UPC � PHM 3,779.776 � 134.992 � 28
FIGURE 5-20 Use-Case Points Estimation for the Internet Sales Systems
SUMMARY
Business Process Modeling with Activity DiagramsEven from an object-oriented systems development point of view, business process model-ing has been shown to be valuable. The one major hazard of business process modeling isthat it focuses the systems development process in a functional decomposition direction.However, if used carefully, it can enhance the development of object-oriented systems.UML 2.0 supports process modeling using an activity diagram. Activity diagrams compriseactivities or actions, objects, control flows, object flows, and a set of seven different controlnodes (initial, final-activity, final-flow, decision, merge, fork, and join). Furthermore,swimlanes can be used to enhance the readability of the diagrams. An activity diagram isvery useful for helping the analyst to identify the relevant use cases for the information sys-tem being developed.
Use-Case DescriptionsUse cases are the primary method of documenting requirements for object-oriented sys-tems. They represent a functional view of the system being developed. There are overviewand detail use cases. Overview use cases comprise the use-case name, ID number, primaryactor, type, and a brief description. Detailed use cases extend the overview use case with theidentification and description of the stakeholders and their interest, the trigger and its type,the relationships in which the use case participates (association, extend, generalization, andinclude), the normal flow of events, the subflows, and any alternate or exception flows tothe normal flow of events. There are seven guidelines (see Figure 5-6) and thirteen steps(see Figure 5-11) for writing effective use cases. The thirteen steps can be summed up intothree aggregate groups of steps: identify the major use cases (steps 1–5), expand the majoruse cases (steps 6–11), and confirm the major use cases (steps 12–13).
Use-Case DiagramsUse-case diagrams are simply a graphical overview of the set of use cases contained in thesystem. They illustrate the main functionality of a system and the actors that interact withthe system. The diagram includes actors, which are people or things that derive value fromthe system, and use cases that represent the functionality of the system. The actors and usecases are separated by a system boundary and connected by lines representing associa-tions. At times, actors are specialized versions of more general actors. Similarly, use casescan extend or use other use cases. Creating use-case diagrams is a four-step process (seeFigure 5-8) whereby the analyst draws the system boundary, adds the use cases to the dia-gram, identifies the actors, and finally adds appropriate associations to connect use casesand actors together. This process is simple because the written description of the use casesis created first.
Refining Project Size and Effort Estimation with Use-Case PointsUse-case points are a relatively new size- and effort-estimation technique that is based onideas similar to function point analysis. Use-case points are founded on the two primaryconstructs associated with use-case analysis: actors and use cases. Like function points, use-case points have a set of factors used to modify their raw value: technical complexity fac-tors and environmental factors. Technical complexity factors address the complexity of theproject under consideration, whereas the environmental factors deal with the level of expe-rience of the development staff. Based on the number of use-case points, the estimatedeffort required can be computed.
Summary 201

202 Chapter 5 Functional Modeling
KEY TERMS
ActionActivityActivity diagramActorAdjusted use-case points (UCP)Alternate flowsApplication program interface (API)Association relationshipAverage actorsAverage use caseBlack-hole activitiesBrief descriptionComplex actorsComplex use caseControl flowControl nodeDecision nodeDetail use caseEffortEnvironmental factor (EF)Environmental factor value (EFactor)Essential use caseEstimationExceptional flowsExtend relationshipExternal trigger
Final-activity nodeFinal-flow nodeFlow of eventsFork nodeFunctional decompositionGeneralization relationshipGuard conditionImportance levelInclude relationshipInheritanceInitial nodeIterateJoin nodeLogical modelMerge nodeMiracle activityNormal flow of eventsObject flowObject nodeOverview use casesPackagesPerson-hours multiplier (PHM)Physical modelPrimary actorProcess modelsReal use case
RelationshipsRoleScenarioSimple actorsSimple use caseSpecialized actorStakeholdersSubflowsSubject boundarySVDPISwim lanesTechnical complexity factor (TCF)Technical factor value (TFactor)Temporal triggerTriggerUnadjusted actor weight total (UAW)Unadjusted use-case points (UUCP)Unadjusted use-case weight
total (UUCW)Use caseUse-case descriptionUse-case diagramUse-case ID numberUse-case nameUse-case pointsUse-case type
QUESTIONS
1. Why is business process modeling important?2. What is the purpose of an activity diagram?3. What is the difference between an activity and an
action?4. What is the purpose of a fork node?5. What are the different types of control nodes?6. What is the difference between a control flow and an
object flow?7. What is an object node?8. How is use case diagramming related to functional
modeling?9. Explain the following terms. Use layperson’s language,
as though you were describing them to a user: (a) actor;(b) use case; (c) system boundary; (d) relationship.
10. Every association must be connected to at least one_______ and one _________. Why?
11. What is CRUD? Why is this useful?12. How does a detail use case differ from an overview
use case?13. How does an essential use case differ from a real use
case?14. What are the major elements of an overview use case?15. What are the major elements of a detail use case?16. How do you create use cases?17. Why do we strive to have about three to nine major
use cases in a business process?18. How do you create use-case diagrams?19. What are some heuristics for creating a use case
diagram?20. Why is iteration important in creating use cases?21. What is the viewpoint of a use case, and why is it
important?
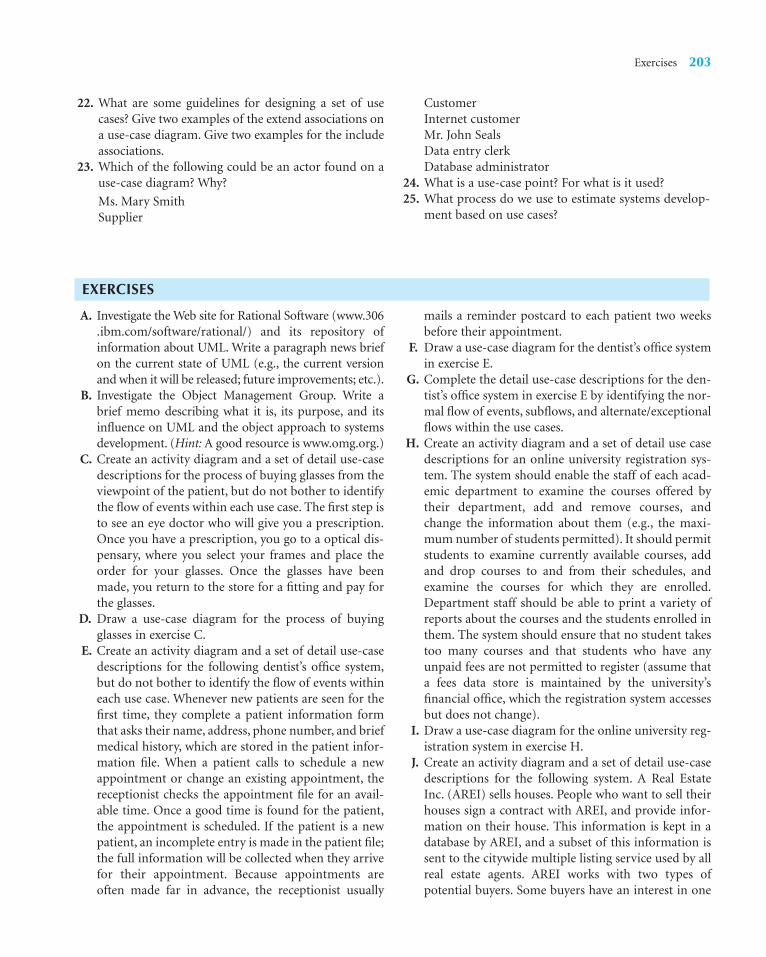
Exercises 203
22. What are some guidelines for designing a set of usecases? Give two examples of the extend associations ona use-case diagram. Give two examples for the includeassociations.
23. Which of the following could be an actor found on ause-case diagram? Why?
Ms. Mary SmithSupplier
CustomerInternet customerMr. John SealsData entry clerkDatabase administrator
24. What is a use-case point? For what is it used?25. What process do we use to estimate systems develop-
ment based on use cases?
EXERCISES
A. Investigate the Web site for Rational Software (www.306.ibm.com/software/rational/) and its repository ofinformation about UML. Write a paragraph news briefon the current state of UML (e.g., the current versionand when it will be released; future improvements; etc.).
B. Investigate the Object Management Group. Write abrief memo describing what it is, its purpose, and itsinfluence on UML and the object approach to systemsdevelopment. (Hint: A good resource is www.omg.org.)
C. Create an activity diagram and a set of detail use-casedescriptions for the process of buying glasses from theviewpoint of the patient, but do not bother to identifythe flow of events within each use case. The first step isto see an eye doctor who will give you a prescription.Once you have a prescription, you go to a optical dis-pensary, where you select your frames and place theorder for your glasses. Once the glasses have beenmade, you return to the store for a fitting and pay forthe glasses.
D. Draw a use-case diagram for the process of buyingglasses in exercise C.
E. Create an activity diagram and a set of detail use-casedescriptions for the following dentist’s office system,but do not bother to identify the flow of events withineach use case. Whenever new patients are seen for thefirst time, they complete a patient information formthat asks their name, address, phone number, and briefmedical history, which are stored in the patient infor-mation file. When a patient calls to schedule a newappointment or change an existing appointment, thereceptionist checks the appointment file for an avail-able time. Once a good time is found for the patient,the appointment is scheduled. If the patient is a newpatient, an incomplete entry is made in the patient file;the full information will be collected when they arrivefor their appointment. Because appointments areoften made far in advance, the receptionist usually
mails a reminder postcard to each patient two weeksbefore their appointment.
F. Draw a use-case diagram for the dentist’s office systemin exercise E.
G. Complete the detail use-case descriptions for the den-tist’s office system in exercise E by identifying the nor-mal flow of events, subflows, and alternate/exceptionalflows within the use cases.
H. Create an activity diagram and a set of detail use casedescriptions for an online university registration sys-tem. The system should enable the staff of each acad-emic department to examine the courses offered bytheir department, add and remove courses, andchange the information about them (e.g., the maxi-mum number of students permitted). It should permitstudents to examine currently available courses, addand drop courses to and from their schedules, andexamine the courses for which they are enrolled.Department staff should be able to print a variety ofreports about the courses and the students enrolled inthem. The system should ensure that no student takestoo many courses and that students who have anyunpaid fees are not permitted to register (assume thata fees data store is maintained by the university’sfinancial office, which the registration system accessesbut does not change).
I. Draw a use-case diagram for the online university reg-istration system in exercise H.
J. Create an activity diagram and a set of detail use-casedescriptions for the following system. A Real EstateInc. (AREI) sells houses. People who want to sell theirhouses sign a contract with AREI, and provide infor-mation on their house. This information is kept in adatabase by AREI, and a subset of this information issent to the citywide multiple listing service used by allreal estate agents. AREI works with two types ofpotential buyers. Some buyers have an interest in one

204 Chapter 5 Functional Modeling
specific house. In this case, AREI prints informationfrom its database, which the real estate agent uses tohelp show the house to the buyer (a process beyondthe scope of the system to be modeled). Other buyersseek AREI’s advice in finding a house that meets theirneeds. In this case, the buyer completes a buyer infor-mation form that is entered into a buyer data base, andAREI real estate agents use its information to searchAREI’s data base and the multiple listing service forhouses that meet their needs. The results of thesesearches are printed and used to help the real estateagent show houses to the buyer.
K. Draw a use-case diagram for the real estate system inexercise J.
L. Create an activity diagram and a set of detail use-casedescriptions for the following system. A Video Store(AVS) runs a series of fairly standard video stores.Before a video can be put on the shelf, it must be cat-aloged and entered into the video database. Every cus-tomer must have a valid AVS customer card in order torent a video. Customers rent videos for three days at atime. Every time a customer rents a video, the systemmust ensure that he or she does not have any overduevideos. If so, the overdue videos must be returned andan overdue fee paid before customer can rent morevideos. Likewise, if the customer has returned overduevideos but has not paid the overdue fee, the fee mustbe paid before new videos can be rented. Every morn-ing, the store manager prints a report that lists overduevideos. If a video is two or more days overdue, themanager calls the customer to remind him or her toreturn the video. If a video is returned in damagedcondition, the manager removes it from the videodatabase and may sometimes charge the customer.
M. Draw a use-case diagram for the video system inexercise L.
N. Create an activity diagram and a set of detail use-casedescriptions for a health club membership system.When members join the health club, they pay a fee fora certain length of time. Most memberships are forone year, but memberships as short as two months areavailable. Throughout the year, the health club offers avariety of discounts on their regular membershipprices (e.g., two memberships for the price of one forValentine’s day). It is common for members to pay dif-ferent amounts for the same length of membership.The club wants to mail out reminder letters to mem-bers asking them to renew their memberships onemonth before their memberships expire. Some mem-bers have become angry when asked to renew at a
much higher rate than their original membership con-tract, so the club wants to track the prices paid so thatthe manager can override the regular prices with spe-cial prices when members are asked to renew. The sys-tem must track these new prices so that renewals canbe processed accurately. One of the problems in thehealth club industry is the high turnover rate of mem-bers. Although some members remain active for manyyears, about half of the members do not renew theirmemberships. This is a major problem, because thehealth club spends a lot in advertising to attract eachnew member. The manager wants the system to trackeach time a member comes into the club. The systemwill then identify the heavy users and generate a reportso the manager can ask them to renew their member-ships early, perhaps offering them a reduced rate forearly renewal. Likewise, the system should identifymembers who have not visited the club in more than amonth, so the manager can call them and attempt toreinterest them in the club.
O. Draw a use-case diagram for the system in exercise N.P. Create an activity diagram and a set of detail use-case
descriptions for the following system. Picnics R Us(PRU) is a small catering firm with five employees.During a typical summer weekend, PRU caters fifteenpicnics with twenty to fifty people each. The businesshas grown rapidly over the past year and the ownerwants to install a new computer system for managingthe ordering and buying process. PUR has a set of tenstandard menus. When potential customers call, thereceptionist describes the menus to them. If the cus-tomer decides to book a picnic, the receptionist recordsthe customer information (e.g., name, address, phonenumber, etc.) and the information about the picnic(e.g., place, date, time, which one of the standardmenus, total price) on a contract. The customer is thenfaxed a copy of the contract and must sign and returnit along with a deposit (often a credit card or by check)before the picnic is officially booked. The remainingmoney is collected when the picnic is delivered. Some-times, the customer wants something special (e.g.,birthday cake). In this case, the receptionist takes theinformation and gives it to the owner, who determinesthe cost; the receptionist then calls the customer backwith the price information. Sometimes the customeraccepts the price, other times, the customer requestssome changes that have to go back to the owner for anew cost estimate. Each week, the owner looks throughthe picnics scheduled for that weekend and orders thesupplies (e.g., plates) and food (e.g., bread, chicken)
Minicases 205
needed to make them. The owner would like to use thesystem for marketing as well. It should be able to trackhow customers learned about PUR and identify repeatcustomers, so that PUR can mail special offers to them.The owner also wants to track the picnics for whichPUR sent a contract, but the customer never signed thecontract and actually booked a picnic.
Q. Draw a use-case diagram for the system in exercise P.R. Create an activity diagram and a set of detail use-case
descriptions for the following system. Of-the-MonthClub (OTMC) is an innovative young firm that sellsmemberships to people who have an interest in certainproducts. People pay membership fees for one yearand each month receive a product by mail. For exam-ple, OTMC has a coffee-of-the-month club that sendsmembers one pound of special coffee each month.OTMC currently has six memberships (coffee, wine,beer, cigars, flowers, and computer games), each ofwhich costs a different amount. Customers usuallybelong to just one, but some belong to two or more.When people join OTMC, the telephone operatorrecords the name, mailing address, phone number,e-mail address, credit-card information, start date, andmembership service(s) (e.g., coffee). Some customersrequest a double or triple membership (e.g., twopounds of coffee, three cases of beer). The computergame membership operates a bit differently from theothers. In this case, the member must also select thetype of game (action, arcade, fantasy/science fiction,educational, etc.) and age level. OTMC is planning togreatly expand the number of memberships it offers(e.g., video games, movies, toys, cheese, fruit, and veg-etables), so the system needs to accommodate thisfuture expansion. OTMC is also planning to offer three-month and six-month memberships.
S. Draw a use-case diagram for the system in exercise R.T. Create an activity diagram and a set of detail use case
descriptions for a university library borrowing system(do not worry about catalogue searching, etc.). Thesystem will record the books owned by the library andwill record who has borrowed which books. Beforesomeone can borrow a book, he or she must show avalid ID card, which is checked against the studentdatabase maintained by the registrar’s office (for stu-dent borrowers), the faculty/staff database main-tained by the personnel office (for faculty/staffborrowers), or against the library’s own guest data-base (for individuals issued a guest card by thelibrary) to ensure that it is still valid. The system mustalso check to ensure that the borrower does not haveany overdue books or unpaid fines before he or shecan borrow another book. Every Monday, the libraryprints and mails postcards to those people with over-due books. If a book is overdue by more than twoweeks, a fine will be imposed and a librarian will tele-phone the borrower to remind him or her to returnthe book(s). Sometimes books are lost or are returnedin damaged condition. The manager must thenremove them from the database and will sometimesimpose a fine on the borrower.
U. Draw a use-case diagram for the system in exercise T.V. Consider the application that is used at your school to
register for classes. Complete a use-case point work-sheet to estimate the effort to build such an applica-tion. You will need to make some assumptions aboutthe application’s interfaces and the various factors thataffect its complexity.
W. For exercises G, H, J, L, N, P, R, and T, complete a use-case point worksheet to estimate the effort to buildsuch an application.
MINICASES
1. Williams Specialty Company is a small printing andengraving organization. When Pat Williams, theowner, brought computers into the business officefive years ago, the business was very small and verysimple. Pat was able to utilize an inexpensive PC-based accounting system to handle the basic infor-mation-processing needs of the firm. As time hasgone on, however, the business has grown and thework being performed has become significantlymore complex. The simple accounting software stillin use is no longer adequate to keep track of many of
the company’s sophisticated deals and arrangementswith its customers.
Pat has a staff of four people in the business officewho are familiar with the intricacies of the company’srecord-keeping requirements. Pat recently met with herstaff to discuss her plan to hire an IS consulting firm toevaluate their information system needs and recom-mend a strategy for upgrading their computer system.The staff is excited about the prospect of a new system,because the current system causes them much aggrava-tion. No one on the staff has ever done anything like
206 Chapter 5 Functional Modeling
this before, however, and they are a little wary of theconsultants who will be conducting the project.
Assume that you are a systems analyst on the con-sulting team assigned to the Williams Specialty Co.engagement. At your first meeting with the Williamsstaff, you want to be sure that they understand thework that your team will be performing and how theywill participate in that work.a. Explain, in clear, nontechnical terms, the goals of
the analysis of the project.b. Explain, in clear, nontechnical terms, how use cases
and a use-case diagram will be used by the projectteam. Explain what these models are, what theyrepresent in the system, and how they will be usedby the team.
2. Professional and Scientific Staff Management (PSSM)is a unique type of temporary staffing agency. Manyorganizations today hire highly skilled, technicalemployees on a short-term, temporary basis to assistwith special projects or to provide a needed technicalskill. PSSM negotiates contracts with its client compa-nies in which it agrees to provide temporary staff inspecific job categories for a specified cost. For exam-ple, PSSM has a contract with an oil and gas explo-ration company in which it agrees to supply geologistswith at least a master’s degree for $5,000 per week.PSSM has contracts with a wide range of companiesand can place almost any type of professional or sci-entific staff members, from computer programmers togeologists to astrophysicists.
When a PSSM client company determines that it willneed a temporary professional or scientific employee, itissues a staffing request against the contract it had pre-viously negotiated with PSSM. When a staffing requestis received by PSSM’s contract manager, the contractnumber referenced on the staffing request is enteredinto the contract database. Using information from thedatabase, the contract manager reviews the terms andconditions of the contract and determines whether thestaffing request is valid. The staffing request is valid ifthe contract has not expired, the type of professional or
scientific employee requested is listed on the originalcontract, and the requested fee falls within the negoti-ated fee range. If the staffing request is not valid, thecontract manager sends the staffing request back to theclient with a letter stating why the staffing request can-not be filled, and a copy of the letter is filed. If thestaffing request is valid, the contract manager enters thestaffing request into the staffing request database as anoutstanding staffing request. The staffing request is thensent to the PSSM placement department.
In the placement department, the type of staffmember, experience, and qualifications requested onthe staffing request are checked against the database ofavailable professional and scientific staff. If a qualifiedindividual is found, he or she is marked “reserved” inthe staff database. If a qualified individual cannot befound in the database, or is not immediately available,the placement department creates a memo thatexplains the inability to meet the staffing request andattaches it to the staffing request. All staffing requestsare then sent to the arrangements department.
In the arrangements department the prospectivetemporary employee is contacted and asked to agree tothe placement. After the placement details have beenworked out and agreed to, the staff member is marked“placed” in the staff database. A copy of the staffingrequest and a bill for the placement fee is sent to theclient. Finally, the staffing request, the “unable-to-fill”memo (if any), and a copy of the placement fee bill issent to the contract manager. If the staffing request wasfilled, the contract manager closes the open staffingrequest in the staffing request database. If the staffingrequest could not be filled, the client is notified. Thestaffing request, placement fee bill, and unable-to-fillmemo are then filed in the contract office.a. Create an activity diagram for the business process
described here.b. Develop a use case for each major activity identi-
fied in the activity diagram.c. Create a use-case diagram for the system described
here.

207
A structural, or conceptual, model describes the structure of the data that supports thebusiness processes in an organization. During analysis, the structural model presents the log-ical organization of data without indicating how the data are stored, created, or manipulatedso that analysts can focus on the business, without being distracted by technical details. Laterduring design, the structural model is updated to reflect exactly how the data will be storedin databases and files. This chapter describes class-responsibility-collaboration (CRC) cards,class diagrams, and object diagrams, which are used to create the structural model.
OBJECTIVES
■ Understand the rules and style guidelines for creating CRC cards, class diagrams, andobject diagrams.
■ Understand the processes used to create CRC cards, class diagrams, and object diagrams.■ Be able to create CRC cards, class diagrams, and object diagrams.■ Understand the relationship between the structural and use case models.
CHAPTER OUTLINE
C H A P T E R 6
Structural Modeling
IntroductionStructural Models
Classes, Attributes, and OperationsRelationships
CRC CardsResponsibilities and CollaborationsElements of a CRC Card
Class DiagramsElements of a Class DiagramSimplifying Class DiagramsObject Diagrams
Creating CRC Cards and Class DiagramsObject Identification
Building CRC Cards and Class Diagrams
Applying the Concepts at CD Selections
Step 1: Create CRC CardsStep 2: Examine Common
Object ListsStep 3: Role-Play the CRC CardsStep 4: Create the Class DiagramStep 5: Review the Class DiagramStep 6: Incorporate PatternsStep 7: Review the Model
Summary
INTRODUCTION
During analysis, analysts create functional models to represent how the business systemwill behave. At the same time, analysts need to understand the information that is used andcreated by the business system (e.g., customer information, order information). In thischapter, we discuss how the data underlying the behavior modeled in the use cases areorganized and presented.
A structural model is a formal way of representing the objects that are used and cre-ated by a business system. It illustrates people, places, or things about which informa-tion is captured and how they are related to each other. The structural model is drawnusing an iterative process in which the model becomes more detailed and less concep-tual over time. In analysis, analysts draw a conceptual model, which shows the logicalorganization of the objects without indicating how the objects are stored, created, ormanipulated. Because this model is free from any implementation or technical details,the analysts can focus more easily on matching the model to the real business require-ments of the system.
In design, analysts evolve the conceptual structural model into a design model thatreflects how the objects will be organized in databases and files. At this point, the model ischecked for redundancy and the analysts investigate ways to make the objects easy toretrieve. The specifics of the design model are discussed in detail in the design chapters.
In this chapter, we focus on creating a conceptual structural model of the objects usingCRC cards and class diagrams. Using these techniques, it is possible to show all the objectsof a business system. We first describe structural models and their elements. Then, wedescribe CRC cards, class diagrams, and object diagrams. Finally, we describe how to createstructural models using CRC cards and class diagrams and how the structural modelrelates to the use-case descriptions and the use-case diagram that we learned about inChapter 5.
STRUCTURAL MODELS
Every time a systems analyst encounters a new problem to solve, the analyst must learn theunderlying problem domain. The goal of the analyst is to discover the key data containedin the problem domain and to build a structural model of the objects. Object-orientedmodeling allows the analyst to reduce the semantic gap between the underlying problemdomain and the evolving structural model. However, the real world and the world of soft-ware are very different. The real world tends to be messy, whereas the world of softwaremust be neat and logical. As such, an exact mapping between the structural model and theproblem domain may not be possible. In fact, it may not even be desirable.
One of the primary purposes of the structural model is to create a vocabulary thatcan be used by the analyst and the users. Structural models represent the things, ideas, orconcepts—that is, the objects—contained in the domain of the problem. They also allowthe representation of the relationships between the things, ideas, or concepts. By creating astructural model of the problem domain, the analyst creates the vocabulary necessary forthe analyst and users to communicate effectively.
One important thing to remember is that at this stage of development, the structuralmodel does not represent software components or classes in an object-oriented program-ming language, even though the structural model does contain analysis classes, attributes,operations, and relationships among the analysis classes. The refinement of these initialclasses into programming-level objects comes later. Nonetheless, the structural model atthis point should represent the responsibilities of each class and the collaborations betweenthe classes. Typically, structural models are depicted using CRC cards, class diagrams, and,in some cases, object diagrams. However, before describing CRC cards, class diagrams, andobject diagrams, we describe the basic elements of structural models: classes, attributes,operations, and relationships.1
208 Chapter 6 Structural Modeling
1 For a more complete description of the fundamental characteristics of object-oriented systems, see the appendix.

Classes, Attributes, and OperationsA class is a general template that we use to create specific instances, or objects, in the prob-lem domain. All objects of a given class are identical in structure and behavior but containdifferent data in their attributes. There are two different general kinds of classes of interestduring analysis: concrete and abstract. Normally, when an analyst describes the applicationdomain classes, they are referring to concrete classes; that is, concrete classes are used to cre-ate objects. Abstract classes do not actually exist in the real world; they are simply usefulabstractions. For example, from an employee class and a customer class, we may identify ageneralization of the two classes and name the abstract class person. We may not actuallyinstantiate the person class in the system itself, instead creating and using only employeesand customers.2 We describe generalization in more detail with the following relationships.
A second classification of classes is the type of real-world thing that a class represents.There are domain classes, user interface classes, data structure classes, file structure classes,operating environment classes, document classes, and various types of multimedia classes. Atthis point in the development of our evolving system, we are interested only in domainclasses. Later in design and implementation, the other types of classes become more relevant.
An attribute of an analysis class represents a piece of information that is relevant to thedescription of the class within the application domain of the problem being investigated. Anattribute contains information the analyst or user feels the system should store. For example,a possible relevant attribute of an employee class is employee name, whereas one that may notbe as relevant is hair color. Both describe something about an employee, but hair color isprobably not all that useful for most business applications. Only those attributes that areimportant to the task should be included in the class. Finally, only attributes that are primi-tive or atomic types (i.e., integers, strings, doubles, date, time, boolean, etc.) should be added.Most complex or compound attributes are really placeholders for relationships betweenclasses. Therefore, they should be modeled as relationships, not attributes (see the following).
The behavior of an analysis class is defined in an operation, or service. In later phases,the operations are converted to methods. However, because methods are more related toimplementation, at this point in the development we use the term operation to describe theactions to which the instances of the class are capable of responding. Like attributes, onlyproblem domain–specific operations that are relevant to the problem being investigatedshould be considered. For example, it is normally required that classes provide means ofcreating instances, deleting instances, accessing individual attribute values, setting individ-ual attribute values, accessing individual relationship values, and removing individual rela-tionship values. However, at this point in the development of the evolving system, theanalyst should avoid cluttering up the definition of the class with these basic types of oper-ations and focus only on relevant problem domain–specific operations.
RelationshipsThere are many different types of relationships that can be defined, but all can be classifiedinto three basic categories of data abstraction mechanisms: generalization relationships,aggregation relationships and association relationships. These data abstraction mechanismsallow the analyst to focus on the important dimensions while ignoring nonessential dimen-sions. Like attributes, the analyst must be careful to include only relevant relationships.
Structural Models 209
2 Because abstract classes are essentially not necessary and are not instantiated, there have been arguments made thatit would be better not to include any of them in the description of the evolving system at this stage of development(see J. Evermann and Y. Wand,“Towards Ontologically Based Semantics for UML Constructs,” in H. S. Junii, S. Jajodia,and A. Solvberg (eds.) ER 2001, Lecture Notes in Computer Science 2224 (Berlin: Springer-Verlag, 2001): 354–367. How-ever, because abstract classes have been included traditionally at this stage of development, we also include them.
Generalization Relationships The generalization abstraction enables the analyst to cre-ate classes that inherit attributes and operations of other classes. The analyst creates a super-class that contains the basic attributes and operations that will be used in several subclasses.The subclasses inherit the attributes and operations of their superclass and can also containattributes and operations that are unique just to them. For example, a customer class and anemployee class can be generalized into a person class by extracting the attributes and oper-ations they have in common and placing them into the new superclass, person. In this way,the analyst can reduce the redundancy in the class definitions so that the common elementsare defined once and then reused in the subclasses. Generalization is represented with thea-kind-of relationship, so that we say that an employee is a-kind-of person.
The analyst also can use the flip side of generalization, specialization, to uncover addi-tional classes by allowing new subclasses to be created from an existing class. For example,an employee class can be specialized into a secretary class and an engineer class. Further-more, generalization relationships between classes can be combined to form generalizationhierarchies. Based on the previous examples, a secretary class and an engineer class can besubclasses of an employee class, which in turn could be a subclass of a person class. Thiswould be read as a secretary and an engineer are a-kind-of employee and a customer andan employee are a-kind-of person.
The generalization data abstraction is a very powerful mechanism that encourages theanalyst to focus on the properties that make each class unique by allowing the similaritiesto be factored into superclasses. However, to ensure that the semantics of the subclasses aremaintained, the analyst should apply the principle of substitutability. By this we mean thatthe subclass should be capable of substituting for the superclass anywhere that uses thesuperclass (e.g., anywhere we use the employee superclass, we could also logically use itssecretary subclass). By focusing on the a-kind-of interpretation of the generalization rela-tionship, the principle of substitutability is applied.
Aggregation Relationships There have been many different types of aggregation orcomposition relationships proposed in data modeling, knowledge representation, and lin-guistics. For example, a-part-of (logically or physically), a-member-of (as in set member-ship), contained-in, related-to, and associated-with. However, generally speaking, allaggregation relationships relate parts to wholes or parts to assemblies. For our purposes, weuse the a-part-of or has-parts semantic relationship to represent the aggregation abstrac-tion. For example, a door is a-part-of a car, an employee is a-part-of a department, or adepartment is a-part-of an organization. Like the generalization relationship, aggregationrelationships can be combined into aggregation hierarchies. For example, a piston is a-part-of an engine, and an engine is a-part-of a car.
Aggregation relationships are bidirectional in nature. The flip side of aggregation isdecomposition. The analyst can use decomposition to uncover parts of a class that shouldbe modeled separately. For example, if a door and engine are a-part-of a car, then a car has-parts door and engine. The analyst can bounce around between the various parts touncover new parts. For example, the analyst can ask, What other parts are there to a car? orTo which other assemblies can a door belong?
Association Relationships There are other types of relationships that do not fit neatlyinto a generalization (a-kind-of) or aggregation (a-part-of) framework. Technically speak-ing, these relationships are usually a weaker form of the aggregation relationship. Forexample, a patient schedules an appointment. It could be argued that a patient is a-part-ofan appointment. However, there is a clear semantic difference between this type of rela-tionship and one that models the relationship between doors and cars or even workers andunions. As such, they are simply considered to be associations between instances of classes.
210 Chapter 6 Structural Modeling

CRC CARDS
CRC cards are used to document the responsibilities and collaborations of a class. We usean extended form of the CRC card to capture all relevant information associated with aclass.3 We describe the elements of our CRC cards later, after we explain responsibilities andcollaborations.
Responsibilities and CollaborationsResponsibilities of a class can be broken into two separate types: knowing and doing.Knowing responsibilities are those things that an instance of a class must be capable ofknowing. An instance of a class typically knows the values of its attributes and its rela-tionships. Doing responsibilities are those things that an instance of a class must be capa-ble of doing. In this case, an instance of a class can execute its operations or it can requesta second instance, which it knows about, to execute one of its operations on behalf of thefirst instance.
The structural model describes the objects necessary to support the business processesmodeled by the use cases. Most use cases involve a set of several classes, not just one class.These classes form a collaboration. Collaborations allow the analyst to think in terms ofclients, servers, and contracts.4 A client object is an instance of a class that sends a requestto an instance of another class for an operation to be executed. A server object is theinstance that receives the request from the client object. A contract formalizes the interac-tions between the client and server objects. For example, a patient makes an appointmentwith a doctor. This sets up an obligation for both the patient and doctor to appear at theappointed time. Otherwise, consequences, such as billing the patient for the appointmentregardless of whether he or she appears, can be dealt out. Also, the contract should spell outwhat the benefits of the contract will be, such as a treatment being prescribed for whateverails the patient and a payment to the doctor for the services provided. Chapter 9 providesa more detailed explanation of contracts and examples of their use.
An analyst can use the idea of class responsibilities and client–server–contract collab-orations to help identify the classes, along with the attributes, operations, and relation-ships, involved with a use case. One of the easiest ways in which to use CRC cards indeveloping a structural model is through anthropomorphism—pretending that the classeshave human characteristics. This is done by having analyst and/or the user role-play andpretend that they are an instance of the class being considered. They then can either askquestions of themselves or be asked questions by other members of the development team.For example:
Who or what are you?What do you know?What can you do?
The answers to the questions are then used to add detail to the evolving CRC cards.
CRC Cards 211
3 Our CRC cards are based on the work of D. Bellin and S. S. Simone, The CRC Card Book (Reading, MA:Addison-Wesley, 1997); I. Graham, Migrating to Object Technology (Wokingham, England: Addison-Wesley, 1995);and B. Henderson-Sellers and B. Unhelkar, OPEN modeling with UML (Harlow, England: Addison-Wesley, 2000).4 For more information, see K. Beck and W. Cunningham, “A Laboratory for Teaching Object-Oriented Think-ing,” Proceedings of OOPSLA, SIGPLAN Notices, 24, no. 10 (1989): 1–6; B. Henderson-Sellers and B. Unhelkar,OPEN Modeling with UML (Harlow, England: Addison-Wesley, 2000); C. Larman, Applying UML and Patterns: AnIntroduction to Object-Oriented Analysis and Design (Englewood Cliffs, NJ: Prentice Hall, 1998); B. Meyer, Object-Oriented Software Construction (Englewood Cliffs, NJ: Prentice Hall, 1994); and R. Wirfs-Brock, B. Wilkerson, andL. Wiener, Designing Object-Oriented Software (Englewood Cliffs, NJ, Prentice Hall, 1990).
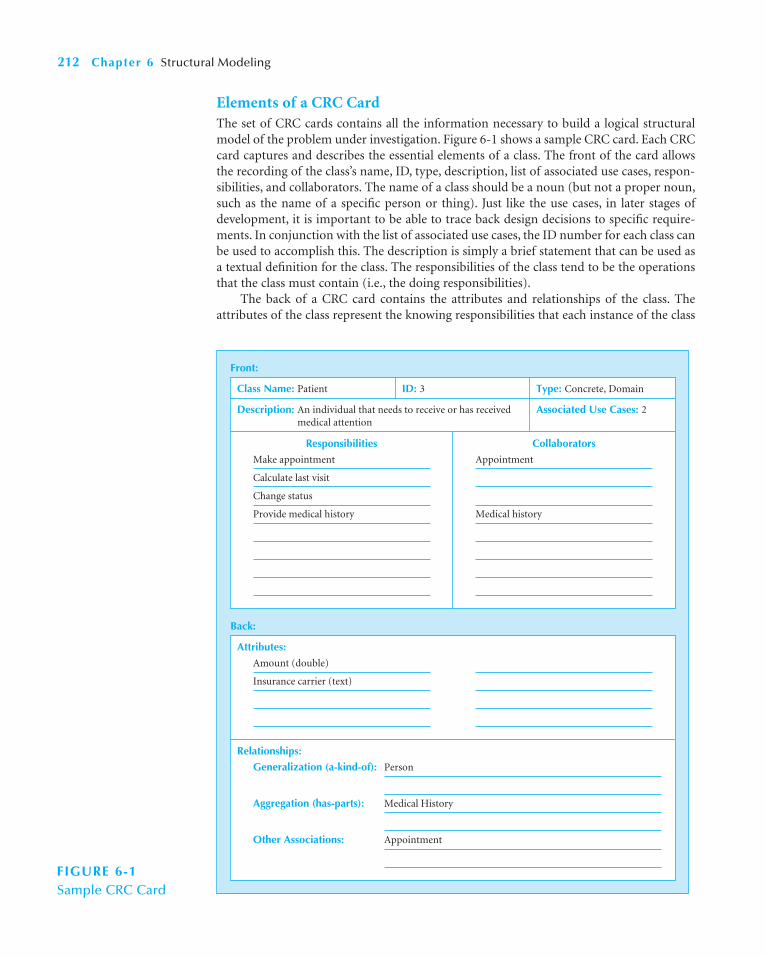
Elements of a CRC CardThe set of CRC cards contains all the information necessary to build a logical structuralmodel of the problem under investigation. Figure 6-1 shows a sample CRC card. Each CRCcard captures and describes the essential elements of a class. The front of the card allowsthe recording of the class’s name, ID, type, description, list of associated use cases, respon-sibilities, and collaborators. The name of a class should be a noun (but not a proper noun,such as the name of a specific person or thing). Just like the use cases, in later stages ofdevelopment, it is important to be able to trace back design decisions to specific require-ments. In conjunction with the list of associated use cases, the ID number for each class canbe used to accomplish this. The description is simply a brief statement that can be used asa textual definition for the class. The responsibilities of the class tend to be the operationsthat the class must contain (i.e., the doing responsibilities).
The back of a CRC card contains the attributes and relationships of the class. Theattributes of the class represent the knowing responsibilities that each instance of the class
212 Chapter 6 Structural Modeling
Front:
Class Name: Patient ID: 3
Calculate last visit
Make appointment
Change status
Provide medical history
Responsibilities
Associated Use Cases: 2Description: An individual that needs to receive or has received medical attention
Type: Concrete, Domain
Appointment
Medical history
Collaborators
Back:
Attributes:
Insurance carrier (text)
Amount (double)
Relationships:
Generalization (a-kind-of): Person
Aggregation (has-parts): Medical History
Other Associations: Appointment
FIGURE 6-1Sample CRC Card
will have to meet. Typically, the data type of each attribute is listed with the name of theattribute (e.g., the amount attribute is double and the insurance carrier is text). There arethree types of relationships typically captured at this point in time, generalization, aggre-gation, and other associations. In Figure 6-1, we see that a Patient is a-kind-of Person andthat a Patient is associated with Appointments.
Again, CRC cards are used to document the essential properties of a class. However,once the cards are filled out, the analyst can use the cards and anthropomorphism in role-playing to uncover missing properties by executing the different scenarios associated withthe use cases (see Chapter 5). This can be used as a basis to test the clarity and complete-ness of the evolving representation of the system.5
CLASS DIAGRAMS
A class diagram is a static model that shows the classes and the relationships among classesthat remain constant in the system over time. The class diagram depicts classes, whichinclude both behaviors and states, with the relationships between the classes. The follow-ing sections first present the elements of the class diagram, followed by the way in which aclass diagram is drawn.
Elements of a Class DiagramFigure 6-2 shows a class diagram that was created to reflect the classes and relationshipsneeded for the set of use cases that describe the appointment system in Chapter 5.
Class The main building block of a class diagram is the class, which stores and managesinformation in the system (see Figure 6-3). During analysis, classes refer to the people,places, events, and things about which the system will capture information. Later, duringdesign and implementation, classes can refer to implementation-specific artifacts such aswindows, forms, and other objects used to build the system. Each class is drawn using threepart rectangles, with the class’s name at top, attributes in the middle, and operations at thebottom. We can see that Person, Medical Staff, Doctor, Patient, Medical History, Appoint-ment, Bill, Diagnosis, Health Problem, and Symptom are classes in Figure 6-2. The attrib-utes of a class and their values define the state of each object created from the class, and thebehavior is represented by the operations.
Attributes are properties of the class about which we want to capture information (seeFigure 6-3). Notice that the Person class in Figure 6-2 contains the attributes lastname,firstname, address, phone, and birthdate. At times, you may want to store derived attributes,which are attributes that can be calculated or derived; these special attributes are denotedby placing a slash (/) before the attribute’s name. Notice how the person class contains aderived attribute called /age, which can be derived by subtracting the patient’s birth datefrom the current date. It is also possible to show the visibility of the attribute on the dia-gram. Visibility relates to the level of information hiding to be enforced for the attribute.The visibility of an attribute can either be public (�), protected (#), or private (�). A publicattribute is one that is not hidden from any other object. As such, other objects can modifyits value. A protected attribute is one that is hidden from all other classes except its imme-diate subclasses. A private attribute is one that is hidden from all other classes. The defaultvisibility for an attribute is normally private.
Class Diagrams 213
5 For presentation purposes, we defer discussing walkthroughs and inspections to Chapter 8 and testing toChapter 13.

Operations are actions or functions that a class can perform (see Figure 6-3). The func-tions that are available to all classes (e.g., create a new instance, return a value for a particu-lar attribute, set a value for a particular attribute, delete an instance) are not explicitly shownwithin the class rectangle. Instead, only those operations unique to the class are included,such as the cancel without notice operation in the Appointment class and the generatecancellation fee operation in the Bill class in Figure 6-2. Notice that both the operations arefollowed by parentheses, which contain the parameter(s) needed by the operation. If an
214 Chapter 6 Structural Modeling
Person
-lastname-firstname-address-phone-birthdate-/age
Patient
-amount-insurance carrier
+make appointment()+calculate last visit()+change status()+provides medical history()
provides
0..1
0..*
0..* 0..*
0..*
0..*
0..*
0..*
0..*
1..*
1..*
1..*
*
0..1
*
1
1
11
Appointment
-time-date-reason
+cancel without notice()
+primaryinsurancecarrier
Bill
-date-amount-purpose
+generate cancellation fee()
Medical History
-heart disease-high blood pressure-diabetes-allergies
Nurse
Doctor
Employee
Health Team
Administrative Staff
Symptom
-name
Illness
-description
Treatment
-medication-instructions-symptom severity
suffer
has scheduled
leads to
schedules
FIGURE 6-2 Sample Class Diagram

operation has no parameters, the parentheses are still shown but are empty. As with attrib-utes, the visibility of an operation can be designated as public, protected, or private. Thedefault visibility for an operation is normally public.
There are three kinds of operations that a class can contain: constructor, query, andupdate. A constructor operation creates a new instance of a class. For example, the patientclass may have a method called insert (), which creates a new patient instance as patientsare entered into the system. As we just mentioned, if an operation implements one of thebasic functions (e.g., create a new instance), it is not explicitly shown on the class diagram,so typically we do not see constructor methods explicitly on the class diagram.
Class Diagrams 215
A class:
• Has a name typed in bold and centered in its top compartment.
• Has a list of attributes in its middle compartment.
• Represents a kind of person, place, or thing about which the system will need to capture and store information.
• Has a list of operations in its bottom compartment.
attribute name /derived attribute name
operation name ()
• Does not explicitly show operations that are available to all classes.
An attribute:• Represents properties that describe the state of an object. • Can be derived from other attributes, shown by placing a slash before the attribute’s name.
An operation:• Represents the actions or functions that a class can perform.• Can be classified as a constructor, query, or update operation.• Includes parentheses that may contain parameters or information needed to perform the operation.
An association:• Represents a relationship between multiple classes or a class and itself.
A generalization:
• Is labeled using a verb phrase or a role name, whichever better represents the relationship.
An aggregation:• Represents a logical a-part-of relationship between multiple classes or a class and itself.• Is a special form of an association.
A composition:• Represents a physical a-part-of relationship between multiple classes or a class and itself• Is a special form of an association.
• Can exist between one or more classes.
• Represents a-kind-of relationship between multiple classes.
• Contains multiplicity symbols, which represent the minimum and maximum times a class instance can be associated with the related class instance.
Class 1
-attribute1+operation1()
AssociatedWith
0..* 1
0..* 1IsPartOf
1..* 1IsPartOf
FIGURE 6-3Class Diagram Syntax

A query operation makes information about the state of an object available to otherobjects, but it does not alter the object in any way. For instance, the calculate last visit ()operation that determines when a patient last visited the doctor’s office will result in theobject being accessed by the system, but it will not make any change to its information. Ifa query method merely asks for information from attributes in the class (e.g., a patient’sname, address, phone), then it is not shown on the diagram because we assume that allobjects have operations that produce the values of their attributes.
An update operation changes the value of some or all the object’s attributes, which mayresult in a change in the object’s state. Consider changing the status of a patient from newto current with a method called change status () or associating a patient with a particularappointment with schedule appointment (appointment).
Relationships A primary purpose of a class diagram is to show the relationships, or asso-ciations, that classes have with one another. These are depicted on the diagram by drawinglines between classes (see Figure 6-3). When multiple classes share a relationship (or a classshares a relationship with itself), a line is drawn and labeled with either the name of therelationship or the roles that the classes play in the relationship. For example, in Figure 6-2the two classes patient and appointment are associated with one another whenever apatient schedules an appointment. Thus, a line labeled schedules connects patient andappointment, representing exactly how the two classes are related to each other. Also, noticethat there is a small solid triangle beside the name of the relationship. The triangle allowsa direction to be associated with the name of the relationship. In Figure 6-2, the schedulesrelationship includes a triangle, indicating that the relationship is to be read as patientschedules appointment. Inclusion of the triangle simply increases the readability of the dia-gram. In Figure 6-4, three additional examples of associations are portrayed: an Invoice isAssociatedWith a Purchase Order (and vice versa), a Pilot Flies an Aircraft, and a Spare TireIsLocatedIn a Trunk.
Sometimes a class is related to itself, as in the case of a patient being the primary insur-ance carrier for other patients (e.g., spouse, children). In Figure 6-2, notice that a line wasdrawn between the patient class and itself and called primary insurance carrier to depictthe role that the class plays in the relationship. Notice that a plus (�) sign is placed beforethe label to communicate that it is a role as opposed to the name of the relationship. Whenlabeling an association, we use either a relationship name or a role name (not both),whichever communicates a more thorough understanding of the model.
216 Chapter 6 Structural Modeling
Purchase Order
Aircraft
TrunkSpare Tire
Pilot
Invoice
0..* 1
0..* 0..*
Flies
0..1 0..1
IsLocatedIn
Associated With
FIGURE 6-4Sample Association
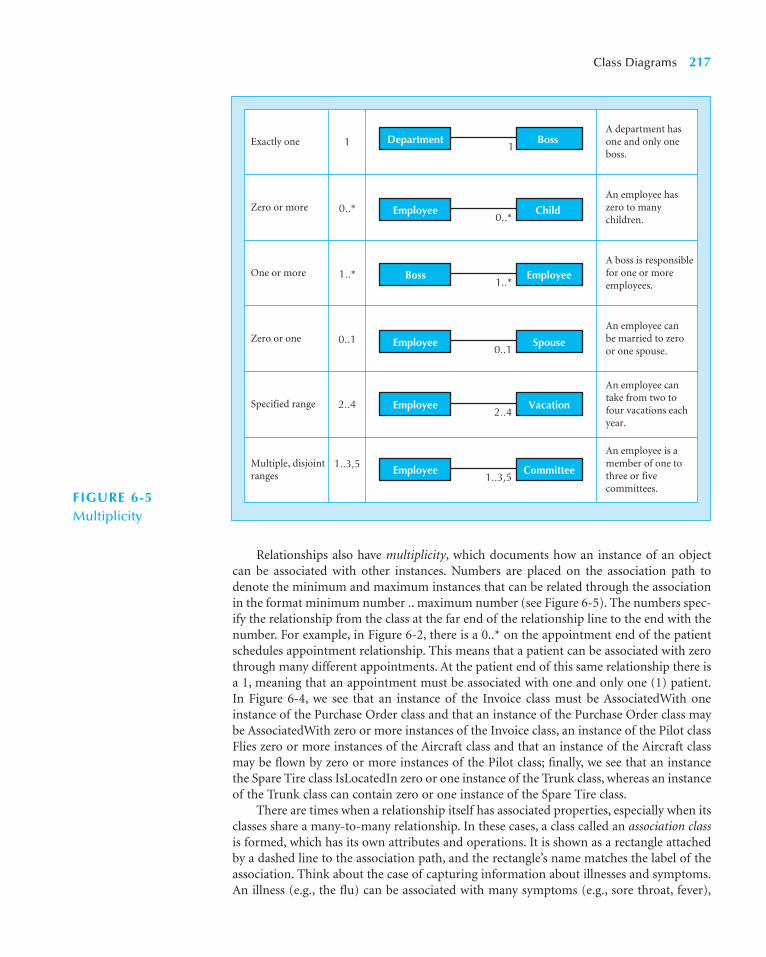
Relationships also have multiplicity, which documents how an instance of an objectcan be associated with other instances. Numbers are placed on the association path todenote the minimum and maximum instances that can be related through the associationin the format minimum number .. maximum number (see Figure 6-5). The numbers spec-ify the relationship from the class at the far end of the relationship line to the end with thenumber. For example, in Figure 6-2, there is a 0..* on the appointment end of the patientschedules appointment relationship. This means that a patient can be associated with zerothrough many different appointments. At the patient end of this same relationship there isa 1, meaning that an appointment must be associated with one and only one (1) patient.In Figure 6-4, we see that an instance of the Invoice class must be AssociatedWith oneinstance of the Purchase Order class and that an instance of the Purchase Order class maybe AssociatedWith zero or more instances of the Invoice class, an instance of the Pilot classFlies zero or more instances of the Aircraft class and that an instance of the Aircraft classmay be flown by zero or more instances of the Pilot class; finally, we see that an instancethe Spare Tire class IsLocatedIn zero or one instance of the Trunk class, whereas an instanceof the Trunk class can contain zero or one instance of the Spare Tire class.
There are times when a relationship itself has associated properties, especially when itsclasses share a many-to-many relationship. In these cases, a class called an association classis formed, which has its own attributes and operations. It is shown as a rectangle attachedby a dashed line to the association path, and the rectangle’s name matches the label of theassociation. Think about the case of capturing information about illnesses and symptoms.An illness (e.g., the flu) can be associated with many symptoms (e.g., sore throat, fever),
Class Diagrams 217
1
0..*
1..*
0..1
2..4
1..3,5
Exactly oneA department has one and only one boss.
Zero or more
One or more
Zero or one
Specified range
Multiple, disjoint ranges
An employee has zero to many children.
A boss is responsible for one or more employees.
An employee can be married to zero or one spouse.
An employee can take from two to four vacations each year.
An employee is a member of one to three or five committees.
Department Boss1
Employee Child0..*
Boss Employee1..*
Employee Spouse0..1
Employee Vacation2..4
Employee Committee1..3,5
FIGURE 6-5Multiplicity
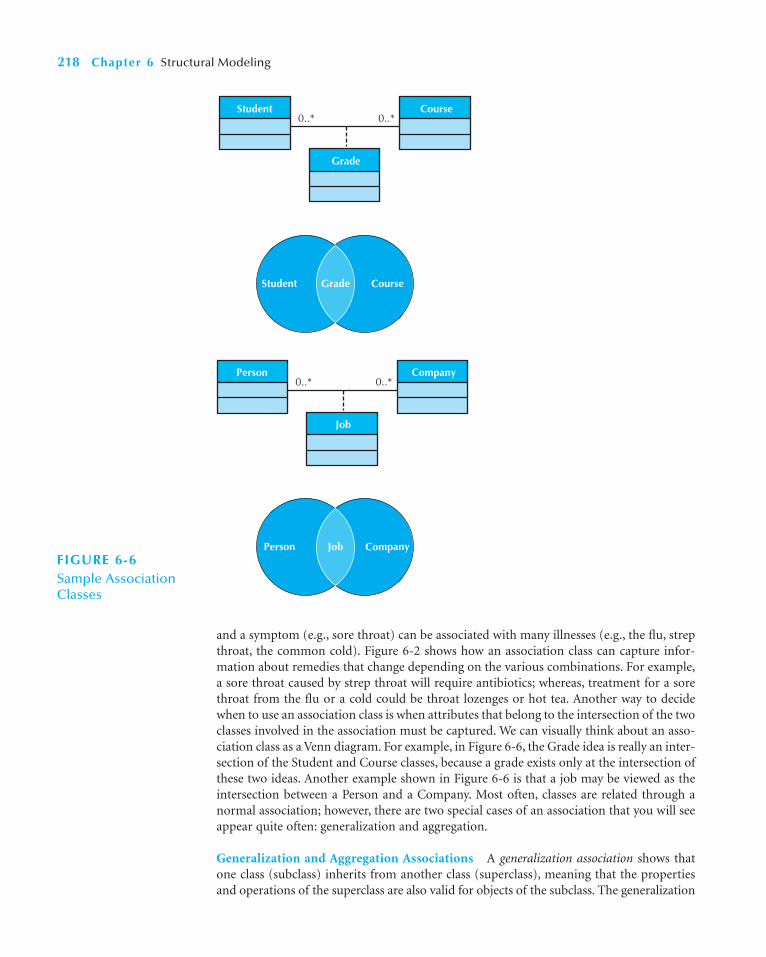
and a symptom (e.g., sore throat) can be associated with many illnesses (e.g., the flu, strepthroat, the common cold). Figure 6-2 shows how an association class can capture infor-mation about remedies that change depending on the various combinations. For example,a sore throat caused by strep throat will require antibiotics; whereas, treatment for a sorethroat from the flu or a cold could be throat lozenges or hot tea. Another way to decidewhen to use an association class is when attributes that belong to the intersection of the twoclasses involved in the association must be captured. We can visually think about an asso-ciation class as a Venn diagram. For example, in Figure 6-6, the Grade idea is really an inter-section of the Student and Course classes, because a grade exists only at the intersection ofthese two ideas. Another example shown in Figure 6-6 is that a job may be viewed as theintersection between a Person and a Company. Most often, classes are related through anormal association; however, there are two special cases of an association that you will seeappear quite often: generalization and aggregation.
Generalization and Aggregation Associations A generalization association shows thatone class (subclass) inherits from another class (superclass), meaning that the propertiesand operations of the superclass are also valid for objects of the subclass. The generalization
218 Chapter 6 Structural Modeling
CourseStudent0..* 0..*
Grade
CompanyPerson0..* 0..*
Job
Person CompanyJob
Student CourseGrade
FIGURE 6-6Sample AssociationClasses
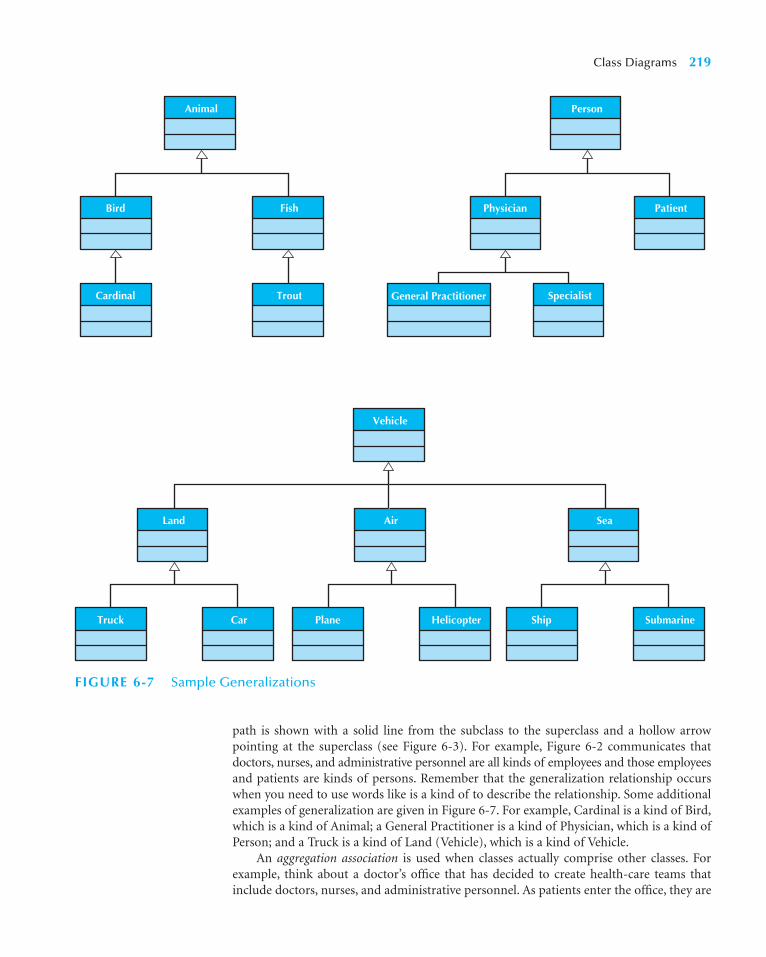
path is shown with a solid line from the subclass to the superclass and a hollow arrowpointing at the superclass (see Figure 6-3). For example, Figure 6-2 communicates thatdoctors, nurses, and administrative personnel are all kinds of employees and those employeesand patients are kinds of persons. Remember that the generalization relationship occurswhen you need to use words like is a kind of to describe the relationship. Some additionalexamples of generalization are given in Figure 6-7. For example, Cardinal is a kind of Bird,which is a kind of Animal; a General Practitioner is a kind of Physician, which is a kind ofPerson; and a Truck is a kind of Land (Vehicle), which is a kind of Vehicle.
An aggregation association is used when classes actually comprise other classes. Forexample, think about a doctor’s office that has decided to create health-care teams thatinclude doctors, nurses, and administrative personnel. As patients enter the office, they are
Class Diagrams 219
TroutCardinal
FishBird
Animal
CarTruck
Land
HelicopterPlane
Air
SubmarineShip
Sea
PatientPhysician
SpecialistGeneral Practitioner
Person
Vehicle
FIGURE 6-7 Sample Generalizations

assigned to a health-care team, which cares for their needs during their visits. Figure 6-2shows how this relationship is denoted on a class diagram. A diamond is placed nearest theclass representing the aggregation (health-care team), and lines are drawn from the arrowto connect the classes that serve as its parts (doctors, nurses, and administrative personnel).Typically, you can identify these kinds of associations when you need to use words like is apart of or is made up of to describe the relationship. However, from a UML perspective, thereare two types of aggregation associations: aggregation and composition (see Figure 6-3).Aggregation is used to portray logical a part of relationships and is depicted on a UML classdiagram by a hollow or white diamond. For example in Figure 6-8, three logical aggrega-tions are shown. Logical implies that it is possible for a part be associated with multiplewholes or that is relatively simple for the part to be removed from the whole. For example,an instance of the Employee class IsPartOf an instance of at least one instance of theDepartment class, an instance of the Wheel class IsPartOf an instance of the Vehicle class,and an instance of the Desk class IsPartOf an instance of the Office class. Obviously, it isrelatively easy to remove a wheel from a vehicle or move a desk from an office. Composi-tion is used to portray a physical part of relationships and is shown by a black diamond.Physical implies that the part can be associated with only a single whole. For example inFigure 6-9, three physical compositions are illustrated: an instance of a door can be a partof only a single instance of a car, an instance of a room can be a part of an instance only of
220 Chapter 6 Structural Modeling
Department
Vehicle
OfficeDesk
Wheel
Employee1..* 1..*
1..* 1
Is Part Of
Is Part Of
Is Part Of0..* 1
Car
Building
MouseButton
Room
Door1..* 1
1..* 1
Is Part Of
Is Part Of
Is Part Of1..* 1
FIGURE 6-8Sample AggregationAssociations
FIGURE 6-9Sample CompositionAssociations
a single building; and an instance of a button can be a part of only a single mouse. How-ever, in many cases, the distinction that you can achieve by including aggregation (whitediamonds) and composition (black diamonds) in a class diagram may not be worth theprice of adding additional graphical notation for the client to learn. As such, many UMLexperts view the inclusion of aggregation and composition notation to the UML classdiagram as simply “syntactic sugar” and, as such, not necessary because the same informationcan always be portrayed by simply using the association syntax.
Simplifying Class DiagramsWhen a class diagram is fully populated with all the classes and relationships for a real-world system, the class diagram can become very difficult to interpret (i.e., be very com-plex). When this occurs, it is sometimes necessary to simplify the diagram. One way tosimplify the class diagram is to show only concrete classes.6 However, depending on thenumber of associations that are connected to abstract classes—and thus inherited down tothe concrete classes—this particular suggestion could make the diagram more difficult tocomprehend.
A second way to simplify the class diagram is through the use of a view mechanism.Views were developed originally with relational database management systems and aresimply a subset of the information contained in the database. In this case, the view wouldbe a useful subset of the class diagram, such as a use case view that shows only the classesand relationships relevant to a particular use case. A second view could be to show only aparticular type of relationship: aggregation, association, or generalization. A third type ofview is to restrict the information shown with each class, for example, show only the nameof the class, the name and attributes, or the name and operations. These view mechanismscan be combined to further simplify the diagram.
A third approach to simplifying a class diagram is through the use of packages (i.e.,logical groups of classes). To make the diagrams easier to read and keep the models at a rea-sonable level of complexity, the classes can be grouped together into packages. Packages aregeneral constructs that can be applied to any of the elements in UML models. In Chapter 5,we introduced them to simplify use-case diagrams. In the case of class diagrams, it is simpleto sort the classes into groups based on the relationships that they share.7
Object DiagramsAlthough class diagrams are necessary to document the structure of the classes, thereare times when a second type of static structure diagram, called an object diagram, canbe useful. An object diagram is essentially an instantiation of all or part of a class dia-gram. Instantiation means to create an instance of the class with a set of appropriateattribute values.
Object diagrams can be very useful when trying to uncover details of a class. Generallyspeaking, it is easier to think in terms of concrete objects (instances) rather than abstrac-tions of objects (classes). For example in Figure 6-10, a portion of the class diagram inFigure 6-2 has been copied and instantiated. The top part of the figure simply is a copy ofa small view of the overall class diagram. The lower portion is the object diagram thatinstantiates that subset of classes. By reviewing the actual instances involved, John Doe,Appt1, and Dr. Smith, we may discover additional relevant attributes, relationships, and/or
Class Diagrams 221
6 See Footnote 2.7 For those familiar with structured analysis and design, packages serve a similar purpose as the leveling and bal-ancing processes used in data flow diagramming. Packages and package diagrams are described in more detail inChapter 8.
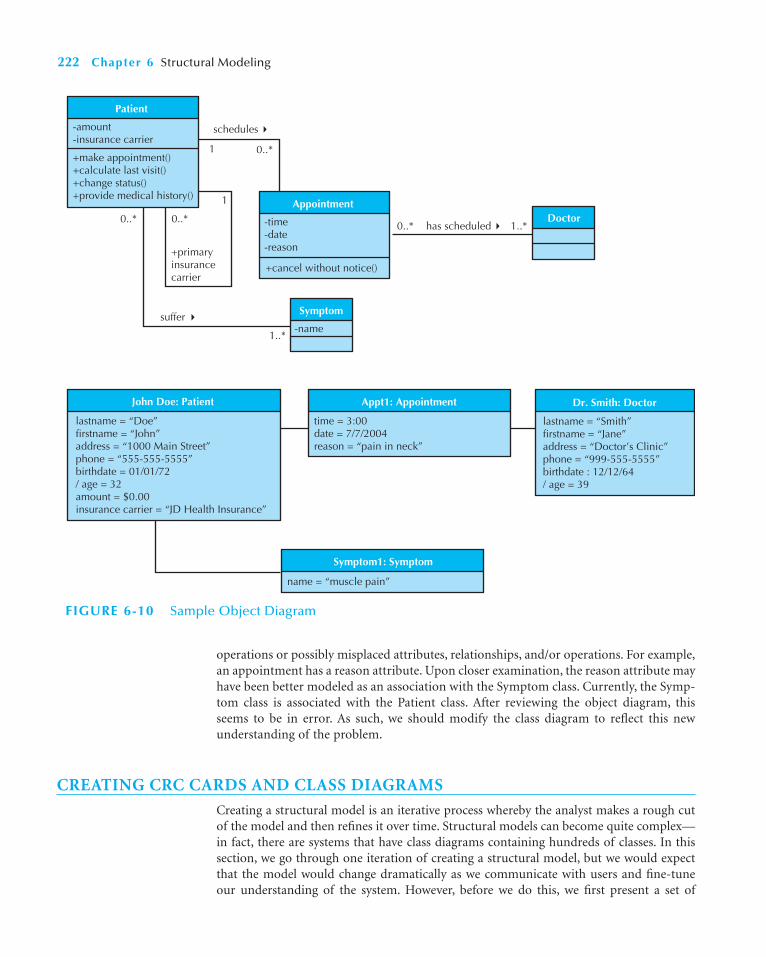
operations or possibly misplaced attributes, relationships, and/or operations. For example,an appointment has a reason attribute. Upon closer examination, the reason attribute mayhave been better modeled as an association with the Symptom class. Currently, the Symp-tom class is associated with the Patient class. After reviewing the object diagram, thisseems to be in error. As such, we should modify the class diagram to reflect this newunderstanding of the problem.
CREATING CRC CARDS AND CLASS DIAGRAMS
Creating a structural model is an iterative process whereby the analyst makes a rough cutof the model and then refines it over time. Structural models can become quite complex—in fact, there are systems that have class diagrams containing hundreds of classes. In thissection, we go through one iteration of creating a structural model, but we would expectthat the model would change dramatically as we communicate with users and fine-tuneour understanding of the system. However, before we do this, we first present a set of
222 Chapter 6 Structural Modeling
Patient
-amount-insurance carrier
+make appointment()+calculate last visit()+change status()+provide medical history()
0..*
0..*
0..*0..*
1..*
1..*
1
1
Appointment
-time-date-reason
+cancel without notice()
+primaryinsurancecarrier
Doctor
Symptom
-namesuffer
schedules
has scheduled
John Doe: Patient
lastname = “Doe”firstname = “John”address = “1000 Main Street”phone = “555-555-5555”birthdate = 01/01/72/ age = 32amount = $0.00insurance carrier = “JD Health Insurance”
Appt1: Appointment Dr. Smith: Doctor
time = 3:00date = 7/7/2004reason = “pain in neck”
Symptom1: Symptom
name = “muscle pain”
lastname = “Smith”firstname = “Jane”address = “Doctor’s Clinic”phone = “999-555-5555”birthdate : 12/12/64/ age = 39
FIGURE 6-10 Sample Object Diagram
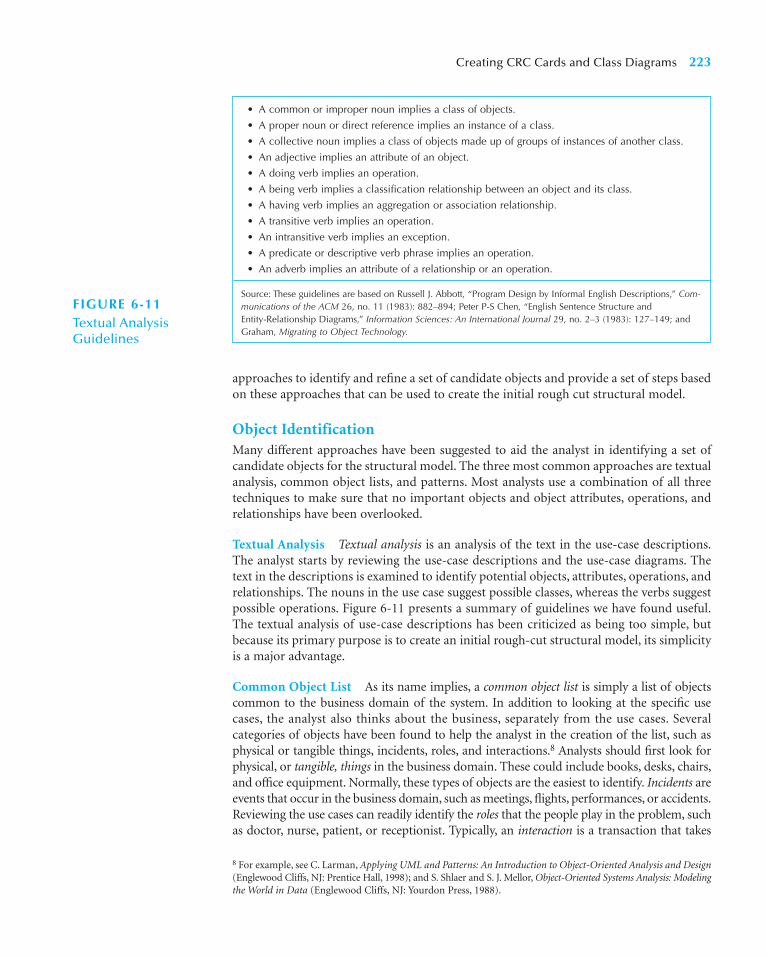
approaches to identify and refine a set of candidate objects and provide a set of steps basedon these approaches that can be used to create the initial rough cut structural model.
Object IdentificationMany different approaches have been suggested to aid the analyst in identifying a set ofcandidate objects for the structural model. The three most common approaches are textualanalysis, common object lists, and patterns. Most analysts use a combination of all threetechniques to make sure that no important objects and object attributes, operations, andrelationships have been overlooked.
Textual Analysis Textual analysis is an analysis of the text in the use-case descriptions.The analyst starts by reviewing the use-case descriptions and the use-case diagrams. Thetext in the descriptions is examined to identify potential objects, attributes, operations, andrelationships. The nouns in the use case suggest possible classes, whereas the verbs suggestpossible operations. Figure 6-11 presents a summary of guidelines we have found useful.The textual analysis of use-case descriptions has been criticized as being too simple, butbecause its primary purpose is to create an initial rough-cut structural model, its simplicityis a major advantage.
Common Object List As its name implies, a common object list is simply a list of objectscommon to the business domain of the system. In addition to looking at the specific usecases, the analyst also thinks about the business, separately from the use cases. Severalcategories of objects have been found to help the analyst in the creation of the list, such asphysical or tangible things, incidents, roles, and interactions.8 Analysts should first look forphysical, or tangible, things in the business domain. These could include books, desks, chairs,and office equipment. Normally, these types of objects are the easiest to identify. Incidents areevents that occur in the business domain, such as meetings, flights, performances, or accidents.Reviewing the use cases can readily identify the roles that the people play in the problem, suchas doctor, nurse, patient, or receptionist. Typically, an interaction is a transaction that takes
Creating CRC Cards and Class Diagrams 223
• A common or improper noun implies a class of objects.
• A proper noun or direct reference implies an instance of a class.
• A collective noun implies a class of objects made up of groups of instances of another class.
• An adjective implies an attribute of an object.
• A doing verb implies an operation.
• A being verb implies a classification relationship between an object and its class.
• A having verb implies an aggregation or association relationship.
• A transitive verb implies an operation.
• An intransitive verb implies an exception.
• A predicate or descriptive verb phrase implies an operation.
• An adverb implies an attribute of a relationship or an operation.
Source: These guidelines are based on Russell J. Abbott, “Program Design by Informal English Descriptions,” Com-munications of the ACM 26, no. 11 (1983): 882–894; Peter P-S Chen, “English Sentence Structure andEntity-Relationship Diagrams,” Information Sciences: An International Journal 29, no. 2–3 (1983): 127–149; andGraham, Migrating to Object Technology.
FIGURE 6-11Textual Analysis Guidelines
8 For example, see C. Larman, Applying UML and Patterns: An Introduction to Object-Oriented Analysis and Design(Englewood Cliffs, NJ: Prentice Hall, 1998); and S. Shlaer and S. J. Mellor, Object-Oriented Systems Analysis: Modelingthe World in Data (Englewood Cliffs, NJ: Yourdon Press, 1988).
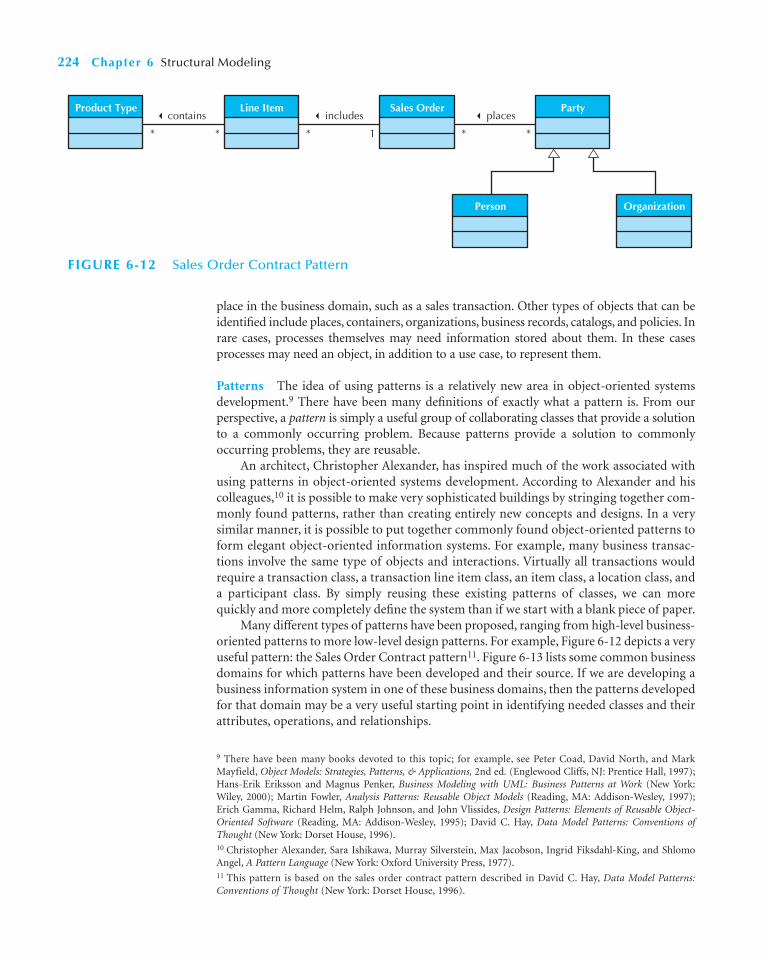
place in the business domain, such as a sales transaction. Other types of objects that can beidentified include places, containers, organizations, business records, catalogs, and policies. Inrare cases, processes themselves may need information stored about them. In these casesprocesses may need an object, in addition to a use case, to represent them.
Patterns The idea of using patterns is a relatively new area in object-oriented systemsdevelopment.9 There have been many definitions of exactly what a pattern is. From ourperspective, a pattern is simply a useful group of collaborating classes that provide a solutionto a commonly occurring problem. Because patterns provide a solution to commonlyoccurring problems, they are reusable.
An architect, Christopher Alexander, has inspired much of the work associated withusing patterns in object-oriented systems development. According to Alexander and hiscolleagues,10 it is possible to make very sophisticated buildings by stringing together com-monly found patterns, rather than creating entirely new concepts and designs. In a verysimilar manner, it is possible to put together commonly found object-oriented patterns toform elegant object-oriented information systems. For example, many business transac-tions involve the same type of objects and interactions. Virtually all transactions wouldrequire a transaction class, a transaction line item class, an item class, a location class, anda participant class. By simply reusing these existing patterns of classes, we can morequickly and more completely define the system than if we start with a blank piece of paper.
Many different types of patterns have been proposed, ranging from high-level business-oriented patterns to more low-level design patterns. For example, Figure 6-12 depicts a veryuseful pattern: the Sales Order Contract pattern11. Figure 6-13 lists some common businessdomains for which patterns have been developed and their source. If we are developing abusiness information system in one of these business domains, then the patterns developedfor that domain may be a very useful starting point in identifying needed classes and theirattributes, operations, and relationships.
224 Chapter 6 Structural Modeling
9 There have been many books devoted to this topic; for example, see Peter Coad, David North, and MarkMayfield, Object Models: Strategies, Patterns, & Applications, 2nd ed. (Englewood Cliffs, NJ: Prentice Hall, 1997);Hans-Erik Eriksson and Magnus Penker, Business Modeling with UML: Business Patterns at Work (New York:Wiley, 2000); Martin Fowler, Analysis Patterns: Reusable Object Models (Reading, MA: Addison-Wesley, 1997);Erich Gamma, Richard Helm, Ralph Johnson, and John Vlissides, Design Patterns: Elements of Reusable Object-Oriented Software (Reading, MA: Addison-Wesley, 1995); David C. Hay, Data Model Patterns: Conventions ofThought (New York: Dorset House, 1996).10 Christopher Alexander, Sara Ishikawa, Murray Silverstein, Max Jacobson, Ingrid Fiksdahl-King, and ShlomoAngel, A Pattern Language (New York: Oxford University Press, 1977).11 This pattern is based on the sales order contract pattern described in David C. Hay, Data Model Patterns:Conventions of Thought (New York: Dorset House, 1996).
OrganizationPerson
Product Type Line Item Sales Order Party
* * * 1 * *
contains includes places
FIGURE 6-12 Sales Order Contract Pattern
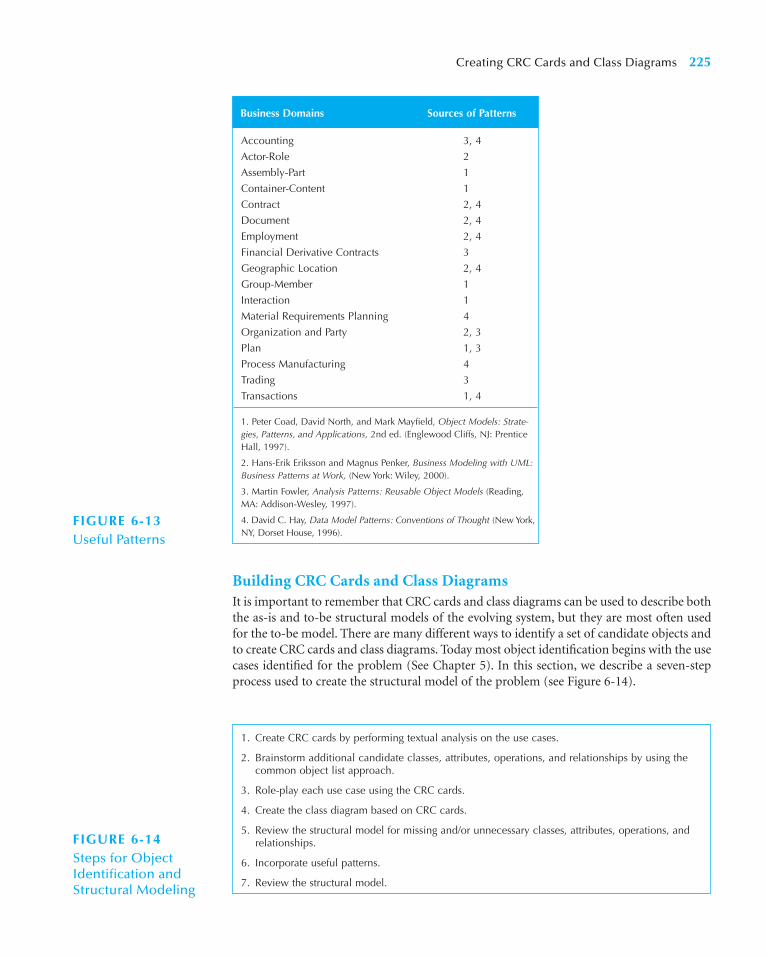
Building CRC Cards and Class DiagramsIt is important to remember that CRC cards and class diagrams can be used to describe boththe as-is and to-be structural models of the evolving system, but they are most often usedfor the to-be model. There are many different ways to identify a set of candidate objects andto create CRC cards and class diagrams. Today most object identification begins with the usecases identified for the problem (See Chapter 5). In this section, we describe a seven-stepprocess used to create the structural model of the problem (see Figure 6-14).
Creating CRC Cards and Class Diagrams 225
Accounting 3, 4
Actor-Role 2
Assembly-Part 1
Container-Content 1
Contract 2, 4
Document 2, 4
Employment 2, 4
Financial Derivative Contracts 3
Geographic Location 2, 4
Group-Member 1
Interaction 1
Material Requirements Planning 4
Organization and Party 2, 3
Plan 1, 3
Process Manufacturing 4
Trading 3
Transactions 1, 4
1. Peter Coad, David North, and Mark Mayfield, Object Models: Strate-gies, Patterns, and Applications, 2nd ed. (Englewood Cliffs, NJ: PrenticeHall, 1997).
2. Hans-Erik Eriksson and Magnus Penker, Business Modeling with UML:Business Patterns at Work, (New York: Wiley, 2000).
3. Martin Fowler, Analysis Patterns: Reusable Object Models (Reading,MA: Addison-Wesley, 1997).
4. David C. Hay, Data Model Patterns: Conventions of Thought (New York,NY, Dorset House, 1996).
Business Domains Sources of Patterns
FIGURE 6-13Useful Patterns
1. Create CRC cards by performing textual analysis on the use cases.
2. Brainstorm additional candidate classes, attributes, operations, and relationships by using thecommon object list approach.
3. Role-play each use case using the CRC cards.
4. Create the class diagram based on CRC cards.
5. Review the structural model for missing and/or unnecessary classes, attributes, operations, andrelationships.
6. Incorporate useful patterns.
7. Review the structural model.
FIGURE 6-14Steps for Object Identification andStructural Modeling
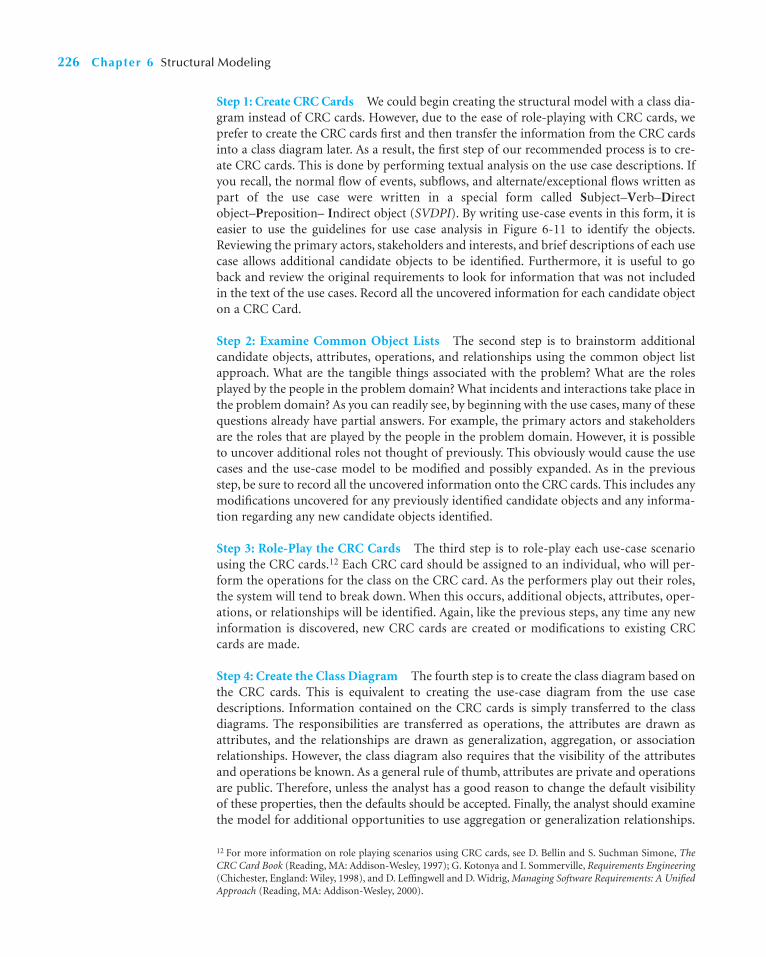
Step 1: Create CRC Cards We could begin creating the structural model with a class dia-gram instead of CRC cards. However, due to the ease of role-playing with CRC cards, weprefer to create the CRC cards first and then transfer the information from the CRC cardsinto a class diagram later. As a result, the first step of our recommended process is to cre-ate CRC cards. This is done by performing textual analysis on the use case descriptions. Ifyou recall, the normal flow of events, subflows, and alternate/exceptional flows written aspart of the use case were written in a special form called Subject–Verb–Directobject–Preposition– Indirect object (SVDPI). By writing use-case events in this form, it iseasier to use the guidelines for use case analysis in Figure 6-11 to identify the objects.Reviewing the primary actors, stakeholders and interests, and brief descriptions of each usecase allows additional candidate objects to be identified. Furthermore, it is useful to goback and review the original requirements to look for information that was not includedin the text of the use cases. Record all the uncovered information for each candidate objecton a CRC Card.
Step 2: Examine Common Object Lists The second step is to brainstorm additionalcandidate objects, attributes, operations, and relationships using the common object listapproach. What are the tangible things associated with the problem? What are the rolesplayed by the people in the problem domain? What incidents and interactions take place inthe problem domain? As you can readily see, by beginning with the use cases, many of thesequestions already have partial answers. For example, the primary actors and stakeholdersare the roles that are played by the people in the problem domain. However, it is possibleto uncover additional roles not thought of previously. This obviously would cause the usecases and the use-case model to be modified and possibly expanded. As in the previousstep, be sure to record all the uncovered information onto the CRC cards. This includes anymodifications uncovered for any previously identified candidate objects and any informa-tion regarding any new candidate objects identified.
Step 3: Role-Play the CRC Cards The third step is to role-play each use-case scenariousing the CRC cards.12 Each CRC card should be assigned to an individual, who will per-form the operations for the class on the CRC card. As the performers play out their roles,the system will tend to break down. When this occurs, additional objects, attributes, oper-ations, or relationships will be identified. Again, like the previous steps, any time any newinformation is discovered, new CRC cards are created or modifications to existing CRCcards are made.
Step 4: Create the Class Diagram The fourth step is to create the class diagram based onthe CRC cards. This is equivalent to creating the use-case diagram from the use casedescriptions. Information contained on the CRC cards is simply transferred to the classdiagrams. The responsibilities are transferred as operations, the attributes are drawn asattributes, and the relationships are drawn as generalization, aggregation, or associationrelationships. However, the class diagram also requires that the visibility of the attributesand operations be known. As a general rule of thumb, attributes are private and operationsare public. Therefore, unless the analyst has a good reason to change the default visibilityof these properties, then the defaults should be accepted. Finally, the analyst should examinethe model for additional opportunities to use aggregation or generalization relationships.
226 Chapter 6 Structural Modeling
12 For more information on role playing scenarios using CRC cards, see D. Bellin and S. Suchman Simone, TheCRC Card Book (Reading, MA: Addison-Wesley, 1997); G. Kotonya and I. Sommerville, Requirements Engineering(Chichester, England: Wiley, 1998), and D. Leffingwell and D. Widrig, Managing Software Requirements: A UnifiedApproach (Reading, MA: Addison-Wesley, 2000).
These types of relationships can simplify the individual class descriptions. As in the previoussteps any and all changes must be recorded on the CRC cards.
Step 5: Review the Class Diagram The fifth step is to review the structural model formissing and/or unnecessary classes, attributes, operations, and relationships. Up until thisstep, the focus of the process has been on adding information to the evolving model. At thispoint in time, the focus begins to switch from simply adding information to also challengingthe reasons for including the information contained in the model.
Step 6: Incorporate Patterns The sixth step is to incorporate useful patterns into theevolving structural model. A useful pattern is one that would allow the analyst to morefully describe the underlying domain of the problem being investigated. Looking at thecollection of patterns available (Figure 6-13) and comparing the classes contained in thepatterns with those in the evolving class diagram does this. After identifying the usefulpatterns, the analyst incorporates the identified patterns into the class diagram andmodifies the affected CRC cards. This includes adding and removing classes, attributes,operations, and/or relationships.
Step 7: Review the Model The seventh and final step is to validate the structuralmodel, including both the CRC cards and the class diagram. This is best accomplishedduring a formal review meeting using a walkthrough approach, in which an analyst pre-sents the model to a team of developers and users. The analyst walks through the model,explaining each part of the model and all the reasoning that went into the decision toinclude each of the classes in the structural model. This explanation includes justifica-tions for the attributes, operations, and relationships associated with the classes. Finally,each class should be linked back to at least one use case; otherwise, the purpose ofincluding the class in the structural model will not be understood. It is often best if thereview team also includes people outside the development team that produced themodel because these individuals can bring a fresh perspective to the model and uncovermissing objects.13
Creating CRC Cards and Class Diagrams 227
13 We describe walkthroughs, verification, and validation in Chapter 8 and testing in Chapter 13.
Using Figure 6-1 as a template, complete the CRC cards for the remaining identified classes in Figure 6-2.
6-1 Appointment SystemYOUR
TURN
In Your Turn 5-2, you created a set of the use cases fromthe campus housing service that helps students find apart-ments. Using the same use cases, create a structural model(CRC cards and class diagram). See if you can identify at
least one potential derived attribute, aggregation relation-ship, generalization relationship, and association relation-ship for the model.
6-2 Campus HousingYOUR
TURN
APPLYING THE CONCEPTS AT CD SELECTIONS
The previous chapter described the CD Selections Internet Sales System (see Figures 5-14through 5-20). In this section, we demonstrate the process of structural modeling usingone of the use cases identified: Place Order (see Figure 5-17). Even though we are using justone of the use cases for our structural model, you should remember that to create a completestructural model, all use cases should be used.
Step 1: Create CRC CardsThe first step Alec and the team took was to create the set of CRC cards by performing tex-tual analysis on the use cases. To begin with, Alec chose the Place Order use case (see Figure5-17). He and his team then used the textual analysis rules (see Figure 6-11) to identify thecandidate classes, attributes, operations, and relationships. Using these rules on the NormalFlow of Events, they identified Customer, Search Request, CD, List, and Review as candidateclasses. They uncovered three different types of search requests: Title Search, Artist Search,and Category Search. By applying the textual analysis rules to the Brief Description, an addi-tional candidate class was discovered: Order. By reviewing the verbs contained in this usecase, they saw that a Customer places an Order and that a Customer makes a Search Request.
To be as thorough as possible, Alec and his team also reviewed the original require-ments used to create the use case. The original requirements are contained in Figure 4-15.After reviewing this information, they identified a set of attributes for the Customer (name,address, e-mail, and credit card) and Order (CDs to purchase and quantity) classes anduncovered additional candidate classes: CD Categories and Credit-Card Clearance Center.Furthermore, they realized that the Category Search class used the CD Categories class.Finally, they also identified three subclasses of CD Categories: Rock, Jazz, and Classical.Alec’s goal, at this point in time, was to be as complete as possible. As such, he realized thatthey might have identified many candidate classes, attributes, operations, and relationshipsthat might not be included in the final structural model.
Step 2: Examine Common Object ListsThe second step for Alec and his team was to brainstorm additional candidate classes, attrib-utes, operations, and relationships. He asked the team members to take a minute and think
228 Chapter 6 Structural Modeling
A large direct health and insurance medical providerneeded an Enterprise Information Management (EIM)system to enable enterprisewide information managementand support the effective use of data for critical cross-functional decision making. In addition, the client neededto resolve issues related to data redundancy, inconsistencyand unnecessary expenditure. The client faced informationchallenges such as these: The company data resided in mul-tiple sources and was developed for department-specificuse, with limited enterprise access. In addition, departmentscreated varied data definitions and data were being man-aged by multiple departments within the company.
Source: http://www.deloitte.com/dtt/case_study/0,1005,sid%253D26562%02526cid%253D132760,00.html
Questions
1. Should the company assess their current informa-tion management?
2. How would a structural model aid the firm in under-standing their current information management?What solution would you propose?
6-A Health and Insurance Medical Provider—Implementing an EIM SystemCONCEPTS
IN ACTION

Applying the Concepts at CD Selections 229
Front:
Class Name: Customer ID: 1
Responsibilities
Associated Use Cases: 3Description: An individual that may or has purchased merchan-dise from the CD Selections Internet sales system
Type: Concrete, Domain
Collaborators
Back:
Attributes:
Last name
First name
Street address
City
State
Zip code
Country
Credit card
Relationships:
Generalization (a-kind-of):
Aggregation (has-parts):
Other Associations: Order; Search Request
Middle initial
FIGURE 6-15Customer Class CRC Card
about what information they would like to keep about CDs. The information that they thoughtof was a set of attributes—for example, title, artist, quantity on hand, price, and category.
He then asked them to take another minute and think about the information that theyshould store about orders and an order’s responsibilities. The responsibilities they identi-fied were a set of operations, including calculate tax, calculate extension price, calculateshipping, and calculate total. Currently, the attributes (CDs to purchase and quantity) ofOrder implied that a customer should be allowed to order multiple copies of the same CDand allow different CDs to be ordered on the same order. However, the current structuralmodel did not allow this. As such, they created a new class that was associated with boththe Order class and the CD class: Order Line Item. This new class only had one attribute,quantity, but it had two relationships: one with Order and the other with CD.
When they reviewed the Customer class, they decided that the name and address attrib-utes needed to be expanded; name should become last name, first name, and middle initial,and address should become street address, city, state, country, and zip code. The updated Cus-tomer class and Order class CRC cards are shown in Figures 6-15 and 6-16, respectively.

Step 3: Role-Play the CRC CardsThe third step was to role-play the classes recorded on the CRC cards. The purpose of thisstep was to validate the current state of the evolving structural model. Alec handed out theCRC cards to different members of his team. Using the CRC cards, they began executingthe different use cases (see Figure 5-18), one at a time, to see if the current structural modelcould support each use case or whether the use case caused the system to crash. Anytime
230 Chapter 6 Structural Modeling
Front:
Class Name: Order ID: 2
Calculate shipping
Calculate tax
Calculate total
Responsibilities
Associated Use Cases: 3Description: An order that has been placed by a customer whichincludes the individual items purchased by the customer
Type: Concrete, Domain
Collaborators
Back:
Attributes:
Shipping
Tax
Total
Relationships:
Generalization (a-kind-of):
Aggregation (has-parts):
Other Associations: Order Item; Customer
FIGURE 6-16Order Class CRC Card
Complete the CRC cards for the remaining identified classes.
6-3 CD Selections Internet Sales SystemYOUR
TURN
the system crashed, there was something missing: a class, an attribute, a relationship, or anoperation. They would then add the missing information to the structural model and tryexecuting the use case again.
First, Alec and the team decided that the customer had requested the system to per-form a search for all the CDs associated with a specific artist. Based on the current CRCcards, the team felt that the system would produce an accurate list of CDs. They then triedto ask the system for a set of reviews of the CDs. At this point in the exercise, the systemcrashed. The CRC cards did not have the Review class associated with the CD class. There-fore, there was no way to retrieve the requested information. This observation raisedanother question: was there other marketing information that should be made available tothe customer—for example, artist information and sample clips?
Next, the team realized that vendor information should be a separate class that wasassociated with a CD rather than an additional attribute of a CD. This was because vendorshad additional information and operations themselves. If the team had modeled the vendorinformation as an attribute of CD, then the additional information and operations wouldhave been lost. They continued role-playing each of the use cases until they were comfort-able with the structural model’s ability to support each and every one.
Step 4: Create the Class DiagramThe fourth step was to create the class diagram from the CRC cards. Figure 6-17 shows thecurrent state of the evolving structural model as depicted in a class diagram based on thePlaces Order use case.
Step 5: Review the Class DiagramThe fifth step was to review the structural model for missing and/or unnecessary classes,attributes, operations, and relationships. At this point, the team challenged all components ofthe model (class, attribute, relationship, or operation) that did not seem to be adding any-thing useful to the model. If a component could not be justified sufficiently, then theyremoved it from the structural model. By carefully reviewing the current state of the struc-tural model, they were able to challenge more than a third of the classes contained in the classdiagram (see Figure 6-17). It seemed that the CD categories and their subclasses were notreally necessary. There were no attributes or operations for these classes. As such, the idea ofCD categories was modeled as an attribute of a CD. The category attribute for the CD classwas previously uncovered during the brainstorming step. Also, upon further review of theSearch Request class and its subclasses, it was decided that the subclasses were really nothingmore than a set of operations of the Search Request class. This was an example of processdecomposition creeping into the modeling process. From an object-oriented perspective, wemust always be careful to not allow this to occur. However, during the previous steps in themodeling process, Alec wanted to include as much information as possible in the model. Hefelt that it was more beneficial to remove this type of information after it had crept into themodel than to take a chance on not capturing the information required to solve the problem.
Step 6: Incorporate PatternsThe sixth step was to incorporate any useful pattern into the structural model. One patternthat could be useful is the Contract pattern listed in Figure 6-13. By reviewing this pattern (seeFigure 6-12), Alec and his team uncovered two subclasses of the Customer class: Individualand Organizational. Furthermore, Peter Coad has identified twelve transaction patterns thatalso could be useful for Alec and his team to investigate further.14
Applying the Concepts at CD Selections 231
14 See Peter Coad, David North, and Mark Mayfield, Object Models: Strategies, Patterns, and Applications, 2nd ed.(Englewood Cliffs, NJ: Prentice Hall, 1997).
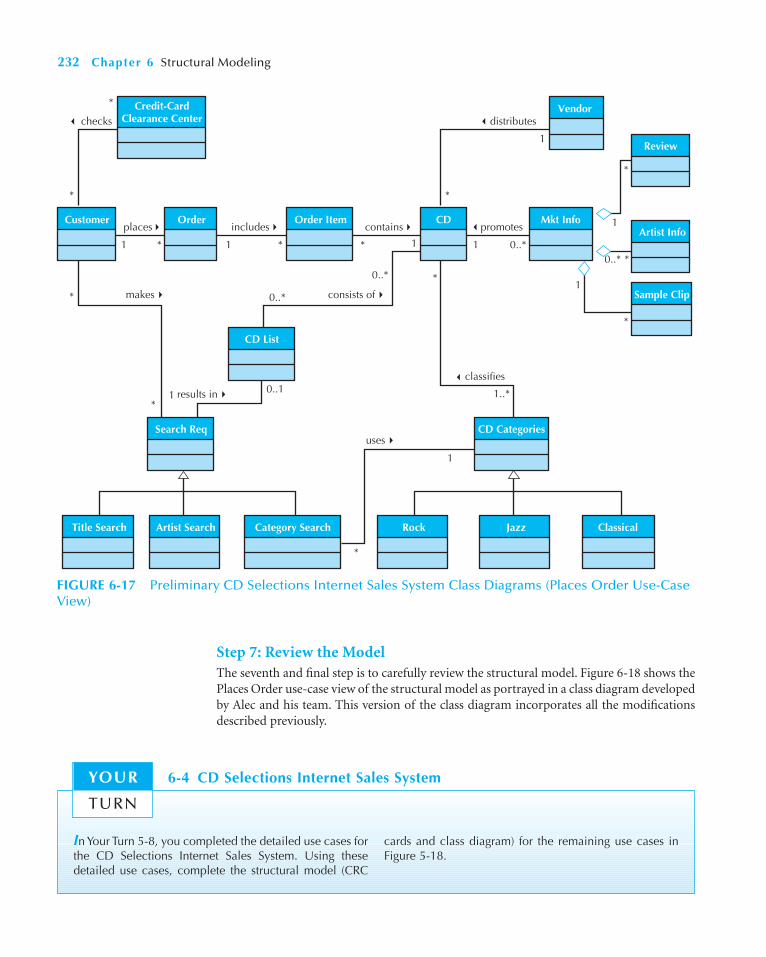
Step 7: Review the ModelThe seventh and final step is to carefully review the structural model. Figure 6-18 shows thePlaces Order use-case view of the structural model as portrayed in a class diagram developedby Alec and his team. This version of the class diagram incorporates all the modificationsdescribed previously.
232 Chapter 6 Structural Modeling
In Your Turn 5-8, you completed the detailed use cases forthe CD Selections Internet Sales System. Using thesedetailed use cases, complete the structural model (CRC
cards and class diagram) for the remaining use cases inFigure 5-18.
6-4 CD Selections Internet Sales SystemYOUR
TURN
Credit-CardClearance Center
Customer
Search Req
CD List
Order Order Item CD
Vendor
Review
Artist Info
Sample Clip
Mkt Info
*
*
*
*
checks distributes
classifies
*1
places
makes
uses
consists of
results in
*
*
*
*
*
1
*
0..*
1..*
0..*0..*
1
1 0..1
includes
1*
contains
0..*1
1
1promotes
1
*
Title Search Artist Search Category Search
CD Categories
Rock Jazz Classical
FIGURE 6-17 Preliminary CD Selections Internet Sales System Class Diagrams (Places Order Use-CaseView)

SUMMARY
Structural ModelsStructural models describe the underlying data structure of an object-oriented system.Whereas use-case models provide an external functional view of the evolving system (i.e.,what the system does), structural models provide an internal static view of the evolving sys-tem (i.e., how the objects are organized in the system). At this point in the development ofthe system, the structural model represents only a logical model of the underlying problemdomain. One of the primary purposes of the structural model is to create a vocabulary thatallows the users and developers to communicate effectively about the problem under inves-tigation. Structural models comprise classes, attributes, operations, and relationships. Thereare three basic types of relationships that normally are depicted on structural models: aggre-gation, generalization, and association. Structural models typically are represented by CRCcards, class diagrams, and, in some cases, object diagrams.
CRC CardsCRC cards model the classes, their responsibilities, and their collaborations. There are twodifferent types of responsibilities: knowing and doing. Knowing responsibilities are associ-ated mostly with attributes of instances of the class, whereas doing responsibilities are asso-ciated mostly with operations of instances of the class. Collaborations support the conceptsof clients, servers, and contracts between objects. CRC cards capture all the essentialelements of the instances of a class. The front of the card allows the recording of the class’sname, ID, type, description, list of associated use cases, responsibilities, and collaborators,whereas the back of the card contains the attributes and relationships.
Class DiagramsA class diagram is a graphical description of the information contained on the CRC cards.It shows the classes and the relationships between the classes. The class diagram portrays
Summary 233
Credit-CardClearance Center
Customer
Search Req CD List
Order Order Item CD
Vendor
Review
Artist Info
Sample Clip
Mkt Info
*
*
checks distributes
**
*
places
makes
results in
consists of
*
*
*
*
*
*
1 0..1
includes
* *
*
*
contains
* *
1
1
1
promotes
*
*
Individual Organizational
FIGURE 6-18 CD Selections Internet Sales System Class Diagram (Places Order Use-Case View)
additional information, not included on the CRC cards: the visibility of the attributes andoperations and the multiplicity of the relationships. Also, there are times that a relationshipitself contains information. In this case, an associated class is created. There are special arcsfor each of the relationships (aggregation, generalization, and association) contained in thediagram.
In real-world systems that can have over 100 classes, the class diagram can becomeoverly complicated. To allow for the simplification of the diagram, a view mechanism canbe used. A view restricts the amount of information portrayed on the diagram. Some use-ful views are: hiding all information about the class except for its name and relationships;showing only the classes that are associated with a particular use case; and limiting the rela-tionships included to only one specific type (aggregation, generalization, and association).
When attempting to uncover additional information about the details of a class, it is use-ful to portray specific instances of a class instead of the classes themselves. An object diagramis used to depict a set of objects that represent an instantiation of all or part of a class diagram.
Creating CRC Cards and Class DiagramsCreating a structural model is an iterative process. The process described is a seven-stepprocess. The steps include textual analysis of use cases, brainstorming additional objectsusing common object lists, role-playing each use case using the CRC cards, creating classdiagrams, and incorporating useful patterns.
234 Chapter 6 Structural Modeling
KEY TERMS
A-kind-ofA-part-ofAbstract classAggregation associationAssembliesAssociationAssociation classAttributeClassClass diagramClientCollaborationCommon object listConceptual modelConcrete classConstructor operationContractClass-Responsibility-
Collaboration (CRC)CRC cards
DecompositionDerived attributeDoing responsibilityGeneralization
associationHas-partsIncidentsInstanceInteractionsKnowing responsibilityMethodMultiplicityObjectObject diagramOperationPackagePartsPatternPrivateProtected
PublicQuery operationResponsibilityRolesServerStatic modelStatic structure diagramStructural modelSubclassSubstitutabilitySuperclassSVDPITangible thingsTextual analysisUMLUpdate operationViewVisibilityWholes
1. Describe to a businessperson the multiplicity of a rela-tionship between two classes.
2. Why are assumptions important to a structural model?
3. What is an association class?4. Contrast the following sets of terms:
object; class; instance
QUESTIONS

Exercises 235
property; method; attributesuperclass; subclassconcrete class; abstract class
5. Give three examples of derived attributes that may existon a class diagram. How would they be denoted on theclass diagram?
6. What are the different types of visibility? How wouldthey be denoted on a class diagram?
7. Draw the relationships that are described by the fol-lowing business rules. Include the multiplicities foreach relationship.
A patient must be assigned to only one doctor and adoctor can have one or many patients.
An employee has one phone extension, and a unique phone extension is assigned to an employee.
A movie theater shows at least one movie, and a movie can be shown at up to four other movie theaters around town.
A movie either has one star, two costars, or more than ten people starring together. A star must be in at least one movie.
8. How do you designate the reading direction of a rela-tionship on a class diagram?
9. For what is an association class used in a class dia-gram? Give an example of an association class thatmay be found in a class diagram that captures studentsand the courses that they have taken.
10. Give two examples of aggregation, generalization, andassociation relationships. How is each type of associa-tion depicted on a class diagram?
11. Identify the following operations as constructor,query, or update. Which operations would not need tobe shown in the class rectangle?
Calculate employee raise (raise percent)Calculate sick days ()Increment number of employee vacation days ()Locate employee name ()Place request for vacation (vacation day)Find employee address ()Insert employee ()Change employee address ()Insert spouse ()
EXERCISES
A. Draw class diagrams for the following classes:
Movie (title, producer, length, director, genre)Ticket (price, adult or child, showtime, movie)Patron (name, adult or child, age)
B. Create an object diagram based on the class diagramyou drew for exercise A.
C. Draw a class diagram for the following classes. Con-sider that the entities represent a system for a patientbilling system. Include only the attributes that wouldbe appropriate for this context.
Patient (age, name, hobbies, blood type, occupation,insurance carrier, address, phone)
Insurance carrier (name, number of patients on plan,address, contact name, phone)
Doctor (specialty, provider identification number, golfhandicap, age, phone, name)
D. Create an object diagram based on the class diagramyou drew for exercise C.
E. Draw the following relationships:
1. A patient must be assigned to only one doctor anda doctor can have many patients.
2. An employee has one phone extension, and a uniquephone extension is assigned to an employee.
3. A movie theater shows many different movies, andthe same movie can be shown at different movietheaters around town.
F. Draw a class diagram for each of the following situations:
1. Whenever new patients are seen for the first time,they complete a patient information form thatasks their name, address, phone number andinsurance carrier, which are stored in the patientinformation file. Patients can be signed up withonly one carrier, but they must be signed up to beseen by the doctor. Each time a patient visits thedoctor, an insurance claim is sent to the carrier forpayment. The claim must contain informationabout the visit, such as the date, purpose, and cost.It would be possible for a patient to submit twoclaims on the same day.
2. The state of Georgia is interested in designing asystem that will track its researchers. Informationof interest includes: researcher name, title, posi-tion; university name, location, enrollment; andresearch interests. Researchers are associated withone institution, and each researcher has severalresearch interests.
236 Chapter 6 Structural Modeling
3. A department store has a bridal registry. This reg-istry keeps information about the customer (usuallythe bride), the products that the store carries, andthe products each customer registers for. Customerstypically register for a large number of products andmany customers register for the same products.
4. Jim Smith’s dealership sells Fords, Hondas, andToyotas. The dealership keeps information abouteach car manufacturer with whom they deal so thatthey can get in touch with them easily. The dealershipalso keeps information about the models of cars thatthey carry from each manufacturer. They keep infor-mation such as list price, the price the dealership paidto obtain the model, and the model name and series(e.g., Honda Civic LX). They also keep informationabout all sales that they have made (for instance, theywill record the buyer’s name, the car they bought, andthe amount they paid for the car). In order to contactthe buyers in the future, contact information is alsokept (e.g., address, phone number).
G. Create object diagrams based on the class diagramsyou drew for exercise F.
H. Examine the class diagrams that you created for exer-cise F. How would the models change (if at all) basedon these new assumptions?
1. Two patients have the same first and last names.2. Researchers can be associated with more than one
institution.3. The store would like to keep track of purchase items.4. Many buyers have purchased multiple cars from
Jim over time because he is such a good dealer.
I. Visit a Web site that allows customers to order a prod-uct over the Web (e.g., Amazon.com). Create a struc-tural model (CRC cards and class diagram) that thesite must need to support its business process. Includeclasses to show what they need information about. Besure to include the attributes and operations to repre-sent the type of information they use and create. Finally,draw relationships, making assumptions about howthe classes are related.
J. Create a structural model (CRC cards and class diagram)for Exercise C in Chapter 5.
K. Create a structural model for exercise E in Chapter 5.L. Create a structural model for exercise H in Chapter 5.
M. Create a structural model for exercise J in Chapter 5.N. Create a structural model for exercise L in Chapter 5.O. Create a structural model for exercise N in Chapter 5.P. Create a structural model for exercise P in Chapter 5.Q. Create a structural model for exercise R in Chapter 5.R. Create a structural model for exercise T in Chapter 5.
MINICASES
1. West Star Marinas is a chain of twelve marinas thatoffer lakeside service to boaters, service and repair ofboats, motors, and marine equipment, and sales ofboats, motors, and other marine accessories. The sys-tems development project team at West Star Marinashas been hard at work on a project that eventuallywill link all the marina’s facilities into one unified,networked system.
The project team has developed a use-case diagram ofthe current system. This model has been carefullychecked. Last week, the team invited a number of systemusers to role-play the various use cases, and the use caseswere refined to the users’ satisfaction. Right now, theproject manager feels confident that the as-is system hasbeen adequately represented in the use-case diagram.
The director of operations for West Star is the spon-sor of this project. He sat in on the role-playing of theuse cases and was very pleased by the thorough job theteam had done in developing the model. He made itclear to you, the project manager, that he was anxiousto see your team begin work on the use cases for the
to-be system. He was a little skeptical that it was nec-essary for your team to spend any time modeling thecurrent system in the first place but grudgingly admit-ted that the team really seemed to understand thebusiness after going through that work.
The methodology you are following, however, spec-ifies that the team should now turn its attention todeveloping the structural models for the as-is system.When you stated this to the project sponsor, heseemed confused and a little irritated. “You are goingto spend even more time looking at the current sys-tem? I thought you were done with that! Why is thisnecessary? I want to see some progress on the waythings will work in the future!”
What is your response to the director of operations?Why do we perform structural modeling? Is there anybenefit to developing a structural model of the currentsystem at all? How do the use cases and use-case diagramhelp us develop the structural model?
2. Holiday Travel Vehicles sells new recreational vehiclesand travel trailers. When new vehicles arrive at Holiday

Minicases 237
Travel Vehicles, a new vehicle record is created. Includedin the new vehicle record are a vehicle serial number,name, model, year, manufacturer, and base cost.
When a customer arrives at Holiday Travel Vehicles,he or she works with a salesperson to negotiate a vehiclepurchase. When a purchase has been agreed upon, a salesinvoice is completed by the salesperson. The invoicesummarizes the purchase, including full customer infor-mation, information on the trade-in vehicle (if any), thetrade-in allowance, and information on the purchasedvehicle. If the customer requests dealer-installed options,they are listed on the invoice as well. The invoice alsosummarizes the final negotiated price, plus any applica-ble taxes and license fees. The transaction concludes witha customer signature on the sales invoice.a. Identify the classes described in the preceding sce-
nario (you should find six). Create CRC cards foreach class.
Customers are assigned a customer ID when theymake their first purchase from Holiday Travel Vehicles.Name, address, and phone number are recorded for thecustomer. The trade-in vehicle is described by a serialnumber, make, model, and year. Dealer-installed optionsare described by an option code, description, and price.b. Develop a list of attributes for each class. Place the
attributes onto the CRC cards.
Each invoice lists just one customer. A person doesnot become a customer until he or she purchases avehicle. Over time, a customer may purchase a numberof vehicles from Holiday Travel Vehicles.
Every invoice must be filled out by only one sales-person. A new salesperson may not have sold any vehi-cles, but experienced salespeople have probably soldmany vehicles.
Each invoice only lists one new vehicle. If a newvehicle in inventory has not been sold, there will be noinvoice for it. Once the vehicle sells, there will be justone invoice for it.
A customer may decide to have no options added tothe vehicle or may choose to add many options. Anoption may be listed on no invoices, or it may be listedon many invoices.
A customer may trade in no more than one vehicleon a purchase of a new vehicle. The trade-in vehiclemay be sold to another customer, who later trades it inon another Holiday Travel vehicle.c. Based on the preceding business rules in force at
Holiday Travel Vehicles and CRC cards, draw a classdiagram and document the relationships with theappropriate multiplicities. Remember to update theCRC cards.
238
Behavioral models describe the internal dynamic aspects of an information system thatsupports the business processes in an organization. During analysis, behavioral modelsdescribe what the internal logic of the processes is without specifying how the processes areto be implemented. Later, in the design and implementation phases, the detailed design ofthe operations contained in the object is fully specified. In this chapter, we describe threeUML 2.0 diagrams that are used in behavioral modeling: sequence diagrams, communicationdiagrams, and behavioral state machines.
OBJECTIVES
■ Understand the rules and style guidelines for sequence and communication diagramsand behavioral state machines.
■ Understand the processes used to create sequence and communication diagrams andbehavioral state machines.
■ Be able to create sequence and communication diagrams and behavioral state machines.■ Understand the relationship between the behavioral models and the structural and
functional models.
CHAPTER OUTLINE
C H A P T E R 7
Behavioral Modeling
IntroductionBehavioral ModelsInteraction Diagrams
Objects, Operations, and MessagesSequence DiagramsCommunication Diagrams
Behavioral State MachinesStates, Events, Transitions, Actions,
and Activities
Elements of a Behavioral State MachineBuilding Behavioral State Machines
CRUD AnalysisApplying the Concepts at CD Selections
Sequence DiagramsCommunication DiagramsBehavioral State MachinesCRUD Analysis
Summary
INTRODUCTION
The previous two chapters discussed functional models and structural models. Systemsanalysts utilize functional models to describe the external behavioral view of an informationsystem, whereas they use structural models to depict the static view of an information system.In this chapter, we discuss how analysts use behavioral models to represent the internal behav-ior or dynamic view of an information system.
There are two types of behavioral models. First, there are behavioral models used torepresent the underlying details of a business process portrayed by a use-case model. In

Interaction Diagrams 239
UML, interaction diagrams (sequence and communication) are used for this type of behav-ioral model. Second, there is a behavioral model that is used to represent the changes thatoccur in the underlying data. UML uses behavioral state machines for this.
During analysis, analysts use behavioral models to capture a basic understanding ofthe dynamic aspects of the underlying business process. Traditionally, behavioral modelshave been used primarily during design, where analysts refine the behavioral models toinclude implementation details (see Chapter 8). For now, our focus is on what the dynamicview of the evolving system is and not on how the dynamic aspect of the system will beimplemented.
In this chapter, we concentrate on creating behavioral models of the underlying busi-ness process. Using the interaction diagrams (sequence and communication diagrams) andbehavioral state machines, it is possible to give a complete view of the dynamic aspects ofthe evolving business information system. We first describe behavioral models and theircomponents. We then describe each of the diagrams, how they are created, and how theyare related to the functional and structural models described in Chapters 5 and 6.
BEHAVIORAL MODELS
When an analyst is attempting to understand the underlying application domain of a prob-lem, he or she must consider both structural and behavioral aspects of the problem. Unlikeother approaches to the development of information systems, object-oriented approachesattempt to view the underlying application domain in a holistic manner. By viewing theproblem domain as a set of use cases that are supported by a set of collaborating objects,object-oriented approaches allow an analyst to minimize the semantic gap between thereal-world set of objects and the evolving object-oriented model of the problem domain.However, as we pointed out in the previous chapter, the real world tends to be messy, whichmakes perfectly modeling the application domain practically impossible in software. Thisis because software must be neat and logical to work.
One of the primary purposes of behavioral models is to show how the underlyingobjects in a problem domain will work together to form a collaboration to support each ofthe use cases. Whereas structural models represent the objects and the relationshipsbetween them, behavioral models depict the internal view of the business process that a usecase describes. The process can be shown by the interaction that takes place between theobjects that collaborate to support a use case through the use of interaction (sequence andcommunication) diagrams. It is also possible to show the effect that the set of use cases thatmake up the system has on the objects in the system through the use of behavioral statemachines.
Creating behavioral models is an iterative process that iterates not only over the indi-vidual behavioral models [e.g., interaction (sequence and communication) diagrams andbehavioral state machines] but also over the functional (see Chapter 5) and structuralmodels (see Chapter 6). As the behavioral models are created, it is not unusual to makechanges to the functional and structural models. In the next three sections, we describeinteraction diagrams and behavioral state machines and when to use each.
INTERACTION DIAGRAMS
One of the primary differences between class diagrams and interaction diagrams, besidesthe obvious difference that one describes structure and the other behavior, is that the mod-eling focus on a class diagram is at the class level, whereas the interaction diagrams focus

on the object level. In this section we review objects, operations, and messages and we coverthe two different diagrams (sequence and communication) that can be used to model theinteractions that take place between the objects in an information system.
Objects, Operations, and MessagesAn object is an instantiation of a class, that is, an actual person, place, event, or thing aboutwhich we want to capture information. If we were building an appointment system for adoctor’s office, classes might include doctor, patient, and appointment. The specificpatients, such as Jim Maloney, Mary Wilson, and Theresa Marks, are considered objects—that is, instances of the patient class.
Each object has attributes that describe information about the object, such as a patient’sname, birth date, address, and phone number. Each object also has behaviors. At this pointin the development of the evolving system, the behaviors are described by operations. Anoperation is nothing more than an action that an object can perform. For example, anappointment object can probably schedule a new appointment, delete an appointment, andlocate the next available appointment. Later on during the development of the evolving sys-tem, the behaviors will be implemented as methods.
Each object also can send and receive messages. Messages are information sent toobjects to tell an object to execute one of its behaviors. Essentially, a message is a functionor procedure call from one object to another object. For example, if a patient is new to thedoctor’s office, the system will send an insert message to the application. The patient objectwill receive the instruction (the message) and do what it needs to do to go about insertingthe new patient into the system (the behavior).
Sequence DiagramsSequence diagrams are one of two types of interaction diagrams. They illustrate theobjects that participate in a use case and the messages that pass between them over timefor one use case. A sequence diagram is a dynamic model that shows the explicit sequenceof messages that are passed between objects in a defined interaction. Because sequencediagrams emphasize the time-based ordering of the activity that takes place among a setof objects, they are very helpful for understanding real-time specifications and complexuse cases.
The sequence diagram can be a generic sequence diagram that shows all possible sce-narios1 for a use case, but usually each analyst develops a set of instance sequence diagrams,each of which depicts a single scenario within the use case. If you are interested in under-standing the flow of control of a scenario by time, you should use a sequence diagram todepict this information. The diagrams are used throughout both the analysis and designphases. However, the design diagrams are very implementation specific, often includingdatabase objects or specific user interface components as the classes.
Elements of a Sequence Diagram Figure 7-1 shows an instance sequence diagram thatdepicts the objects and messages for the Make Appointment use case, which describes theprocess by which a patient creates a new appointment or cancels or reschedules an appoint-ment for the doctor’s office appointment system. In this specific instance, the MakeAppointment process is portrayed.
240 Chapter 7 Behavioral Modeling
1 Remember that a scenario is a single executable path through a use case.
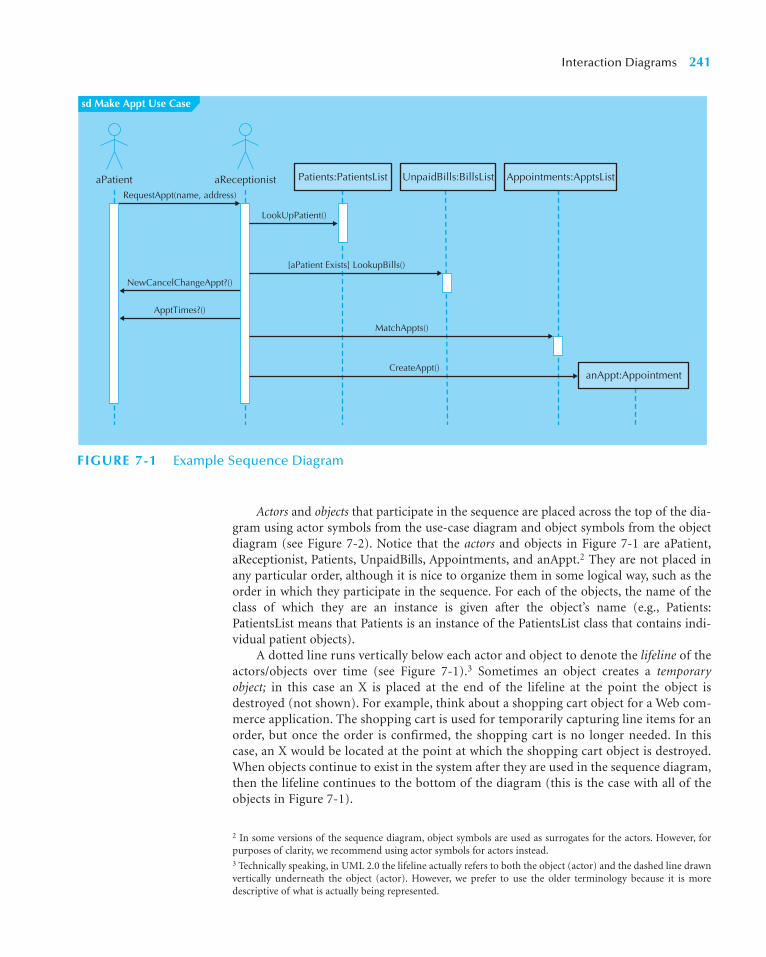
Actors and objects that participate in the sequence are placed across the top of the dia-gram using actor symbols from the use-case diagram and object symbols from the objectdiagram (see Figure 7-2). Notice that the actors and objects in Figure 7-1 are aPatient,aReceptionist, Patients, UnpaidBills, Appointments, and anAppt.2 They are not placed inany particular order, although it is nice to organize them in some logical way, such as theorder in which they participate in the sequence. For each of the objects, the name of theclass of which they are an instance is given after the object’s name (e.g., Patients:PatientsList means that Patients is an instance of the PatientsList class that contains indi-vidual patient objects).
A dotted line runs vertically below each actor and object to denote the lifeline of theactors/objects over time (see Figure 7-1).3 Sometimes an object creates a temporaryobject; in this case an X is placed at the end of the lifeline at the point the object isdestroyed (not shown). For example, think about a shopping cart object for a Web com-merce application. The shopping cart is used for temporarily capturing line items for anorder, but once the order is confirmed, the shopping cart is no longer needed. In thiscase, an X would be located at the point at which the shopping cart object is destroyed.When objects continue to exist in the system after they are used in the sequence diagram,then the lifeline continues to the bottom of the diagram (this is the case with all of theobjects in Figure 7-1).
Interaction Diagrams 241
sd Make Appt Use Case
RequestAppt(name, address)
NewCancelChangeAppt?()
ApptTimes?()
aPatient
LookUpPatient()
aReceptionist Patients:PatientsList
[aPatient Exists] LookupBills()
MatchAppts()
UnpaidBills:BillsList Appointments:ApptsList
CreateAppt()anAppt:Appointment
2 In some versions of the sequence diagram, object symbols are used as surrogates for the actors. However, forpurposes of clarity, we recommend using actor symbols for actors instead.3 Technically speaking, in UML 2.0 the lifeline actually refers to both the object (actor) and the dashed line drawnvertically underneath the object (actor). However, we prefer to use the older terminology because it is moredescriptive of what is actually being represented.
FIGURE 7-1 Example Sequence Diagram
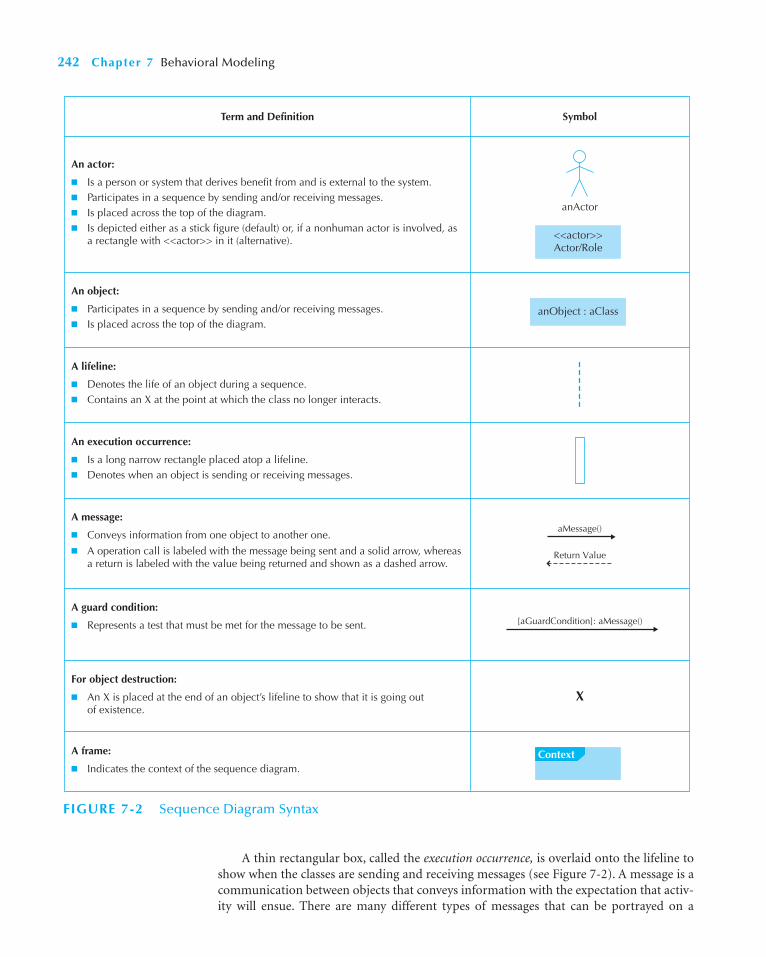
242 Chapter 7 Behavioral Modeling
An actor:
■ Is a person or system that derives benefit from and is external to the system.■ Participates in a sequence by sending and/or receiving messages.■ Is placed across the top of the diagram.■ Is depicted either as a stick figure (default) or, if a nonhuman actor is involved, as
a rectangle with <<actor>> in it (alternative).
An object:
■ Participates in a sequence by sending and/or receiving messages.■ Is placed across the top of the diagram.
A lifeline:
■ Denotes the life of an object during a sequence.■ Contains an X at the point at which the class no longer interacts.
An execution occurrence:
■ Is a long narrow rectangle placed atop a lifeline.■ Denotes when an object is sending or receiving messages.
A message:
■ Conveys information from one object to another one.■ A operation call is labeled with the message being sent and a solid arrow, whereas
a return is labeled with the value being returned and shown as a dashed arrow.
A guard condition:
■ Represents a test that must be met for the message to be sent.
anObject : aClass
<<actor>> Actor/Role
anActor
aMessage()
[aGuardCondition]: aMessage()
Return Value
For object destruction:
■ An X is placed at the end of an object’s lifeline to show that it is going out of existence.
A frame:
■ Indicates the context of the sequence diagram.
X
Context
Term and Definition Symbol
FIGURE 7-2 Sequence Diagram Syntax
A thin rectangular box, called the execution occurrence, is overlaid onto the lifeline toshow when the classes are sending and receiving messages (see Figure 7-2). A message is acommunication between objects that conveys information with the expectation that activ-ity will ensue. There are many different types of messages that can be portrayed on a

sequence diagram. However, in the case of using sequence diagrams to model use cases, twotypes of messages are typically used: operation call and return. Operation call messagespassed between classes are shown using solid lines connecting two objects with an arrowon the line showing which way the message is being passed. Argument values for the mes-sage are placed in parentheses next to the message’s name. The order of messages goes fromthe top to the bottom of the page, so messages located higher on the diagram representmessages that occur earlier on in the sequence, versus the lower messages that occur later.A return message is depicted as a dashed line with an arrow on the end of the line portrayingthe direction of the return. The information being returned is used to label the arrow. How-ever, because adding return messages tends to clutter the diagram, unless the return messagesadd a lot of information to the diagram, they can be omitted. For example, in Figure 7-1, noreturn messages are depicted.4 In Figure 7-1, ‘LookUpPatient()’ is a message sent from theactor aReceptionist to the object Patients, which is a container for the current patients todetermine whether the aPatient actor is a current patient.
At times a message is sent only if a condition is met. In those cases, the condition isplaced between a set of brackets, [ ] {e.g., [aPatient Exists] LookupBills()}. The conditionis placed in front of the message name. However, when using a sequence diagram to modela specific scenario, conditions are typically not shown on any single sequence diagram.Instead, conditions are implied only through the existence of different sequence diagrams.There are times that a message is repeated. This is designated with an asterisk (*) in frontof the message name (e.g., * Request CD). An object can send a message to itself. This isknown as self-delegation.
Sometimes, an object will create another object. This is shown by the message beingsent directly to an object instead of its lifeline. In Figure 7-1, the actor aReceptionist createsan object anAppt.
Figure 7-3 portrays two additional examples of instance-specific sequence diagrams.The first one is related to the Make Lunch use case that was described in the activity dia-gram portrayed in Figure 5-4. The second one is related to the Place Order use case associ-ated with the activity diagram in Figure 5-3. In both examples, the diagrams simplyrepresent a single scenario. Notice, in the Make Lunch sequence diagram there is a messagebeing sent from an actor to itself [CreateSandwich()]. Depending on the complexity of thescenario being modeled, this particular message could have been eliminated. Obviously,both the process of making a lunch and placing an order can be quite a bit more complex.However, from a learning point of view, you should be able to see how the sequence dia-grams and the activity diagrams relate to one another.
Building a Sequence Diagram In this section we describe a six-step process used tocreate a sequence diagram5 (see Figure 7-4). The first step in the process is to determinethe context of the sequence diagram. The context of the diagram can be a system, a usecase, or a scenario of a use case. The context of the diagram is depicted as a labeledframe around the diagram (see Figures 7-1, 7-2, and 7-3). Most commonly, it is one use-case scenario. Figure 7-1 portrays the instance-specific sequence diagram for the sce-nario from the Make Appointment use case given in Figure 5-5 for making a newappointment for an existing patient. For each possible scenario for the Make Appoint-ment use case, a separate instance-specific sequence diagram would be created. On thesurface, this seems to be a lot of potentially redundant and useless work. However, at this
Interaction Diagrams 243
4 However, some CASE tools require the return messages to be displayed. Obviously, when using these tools, youwill have to include the return messages on the diagram.5 The approach described in this section are adapted from Grady Booch, James Rumbaugh, Ivar Jacobson, TheUnified Modeling Language User Guide (Reading, MA: Addison-Wesley, 1999).
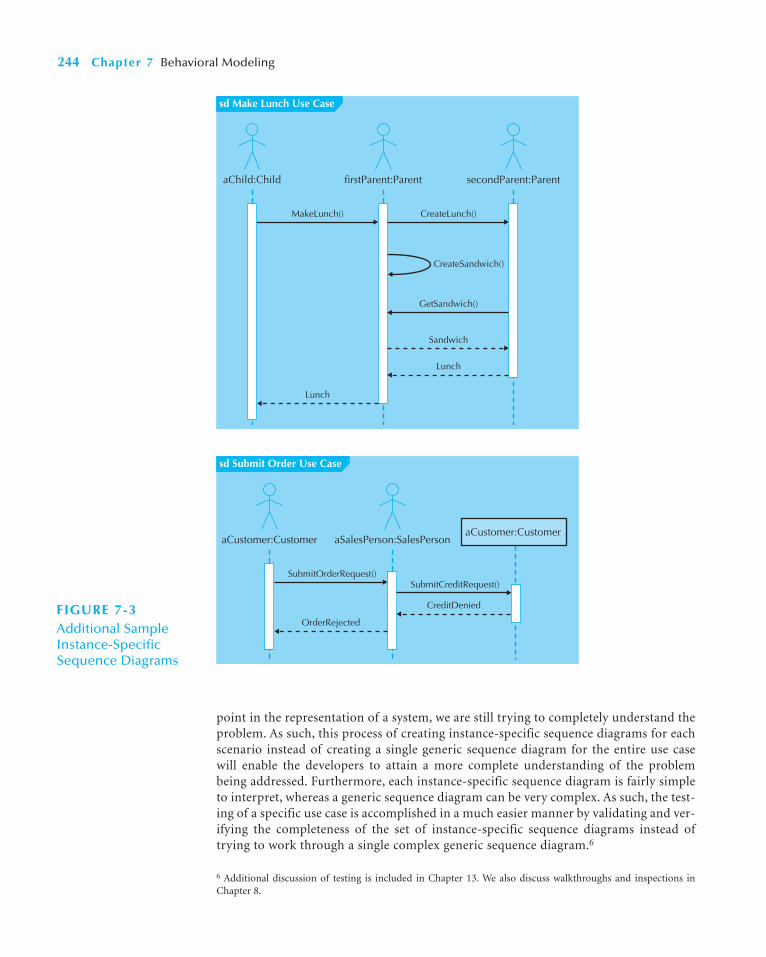
point in the representation of a system, we are still trying to completely understand theproblem. As such, this process of creating instance-specific sequence diagrams for eachscenario instead of creating a single generic sequence diagram for the entire use casewill enable the developers to attain a more complete understanding of the problembeing addressed. Furthermore, each instance-specific sequence diagram is fairly simpleto interpret, whereas a generic sequence diagram can be very complex. As such, the test-ing of a specific use case is accomplished in a much easier manner by validating and ver-ifying the completeness of the set of instance-specific sequence diagrams instead oftrying to work through a single complex generic sequence diagram.6
244 Chapter 7 Behavioral Modeling
sd Make Lunch Use Case
sd Submit Order Use Case
MakeLunch()
Lunch
aChild:Child firstParent:Parent secondParent:Parent
aCustomer:Customer
CreateLunch()
Sandwich
Lunch
GetSandwich()
CreateSandwich()
SubmitOrderRequest()
OrderRejected
aCustomer:Customer aSalesPerson:SalesPerson
SubmitCreditRequest()
CreditDeniedFIGURE 7-3Additional SampleInstance-SpecificSequence Diagrams
6 Additional discussion of testing is included in Chapter 13. We also discuss walkthroughs and inspections inChapter 8.

The second step is to identify the objects that participate in the sequence beingmodeled—that is, the objects that interact with each other during the use-case scenario.The objects are identified during the development of the structural model (see Chapter 6).These are the classes on which the objects of the sequence diagram for this scenario will bebased. One very useful approach to identifying all of the scenarios associated with a usecase is to role-play the CRC cards (see Chapter 6). This can help you identify potentiallymissing operations that are necessary to support the business process, which the use case isrepresenting, in a complete manner. Also, during role playing, it is likely that new classes,and hence new objects, will be uncovered.7 Don’t worry too much about identifying all theobjects perfectly; remember that the behavioral modeling process is iterative. Usually, thesequence diagrams are revised multiple times during the behavioral modeling processes.
The third step is to set the lifeline for each object. To do this, you need to draw a verticaldotted line below each class to represent the class’s existence during the sequence. An X shouldbe placed below the object at the point on the lifeline where the object goes out of existence.
The fourth step is to add the messages to the diagram. This is done by drawing arrowsto represent the messages being passed from object to object, with the arrow pointing inthe message’s transmission direction. The arrows should be placed in order from the firstmessage (at the top) to the last (at the bottom) to show time sequence. Any parameterspassed along with the messages should be placed in parentheses next to the message’sname. If a message is expected to be returned as a response to a message, then the returnmessage is not explicitly shown on the diagram.
The fifth step is to place the execution occurrence on each object’s lifeline by drawinga narrow rectangle box over top of the lifelines to represent when the classes are sendingand receiving messages.
The sixth and final step is to validate the sequence diagram. The purpose of this stepis to guarantee that the sequence diagram completely represents the underlying process.This is done by guaranteeing that the diagram depicts all the steps in the process.8
Interaction Diagrams 245
FIGURE 7-4Steps for BuildingSequence Diagrams
1. Set the context.
2. Identify which objects will participate.
3. Set the lifeline for each object.
4. Lay out the messages from the top to the bottom of the diagram based on the order in whichthey are sent.
5. Add the execution occurrence to each object‘s lifeline.
6. Validate the sequence diagram.
7 This obviously will cause you to go back and modify the structural model (see Chapter 6).8 We describe validation in more detail in Chapter 8.
In Your Turn 5-2, you were asked to create a set of use casesand a use-case diagram for the campus housing service thathelps students find apartments. In Your Turn 6-2, you wereasked to create a structural model (CRC cards and class
diagram) for those use-cases. Select one of the use casesfrom the use-case diagram and create a set of instance-specific sequence diagrams that represents the interactionamong classes in the different scenarios of the use case.
7-1 Drawing a Sequence DiagramYOUR
TURN
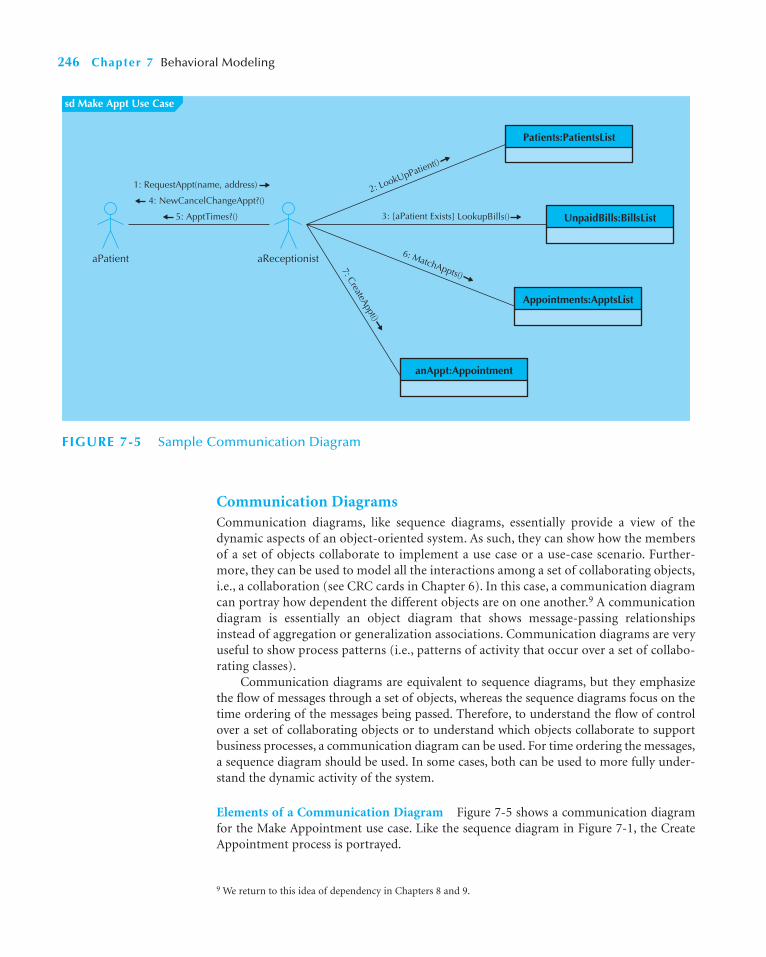
Communication DiagramsCommunication diagrams, like sequence diagrams, essentially provide a view of thedynamic aspects of an object-oriented system. As such, they can show how the membersof a set of objects collaborate to implement a use case or a use-case scenario. Further-more, they can be used to model all the interactions among a set of collaborating objects,i.e., a collaboration (see CRC cards in Chapter 6). In this case, a communication diagramcan portray how dependent the different objects are on one another.9 A communicationdiagram is essentially an object diagram that shows message-passing relationshipsinstead of aggregation or generalization associations. Communication diagrams are veryuseful to show process patterns (i.e., patterns of activity that occur over a set of collabo-rating classes).
Communication diagrams are equivalent to sequence diagrams, but they emphasizethe flow of messages through a set of objects, whereas the sequence diagrams focus on thetime ordering of the messages being passed. Therefore, to understand the flow of controlover a set of collaborating objects or to understand which objects collaborate to supportbusiness processes, a communication diagram can be used. For time ordering the messages,a sequence diagram should be used. In some cases, both can be used to more fully under-stand the dynamic activity of the system.
Elements of a Communication Diagram Figure 7-5 shows a communication diagramfor the Make Appointment use case. Like the sequence diagram in Figure 7-1, the CreateAppointment process is portrayed.
246 Chapter 7 Behavioral Modeling
9 We return to this idea of dependency in Chapters 8 and 9.
sd Make Appt Use Case
aPatient
1: RequestAppt(name, address)
4: NewCancelChangeAppt?()
5: ApptTimes?()
aReceptionist
2: LookUpPatient()
3: [aPatient Exists] LookupBills()
6: MatchAppts()
7: CreateAppt()
Appointments:ApptsList
anAppt:Appointment
UnpaidBills:BillsList
Patients:PatientsList
FIGURE 7-5 Sample Communication Diagram
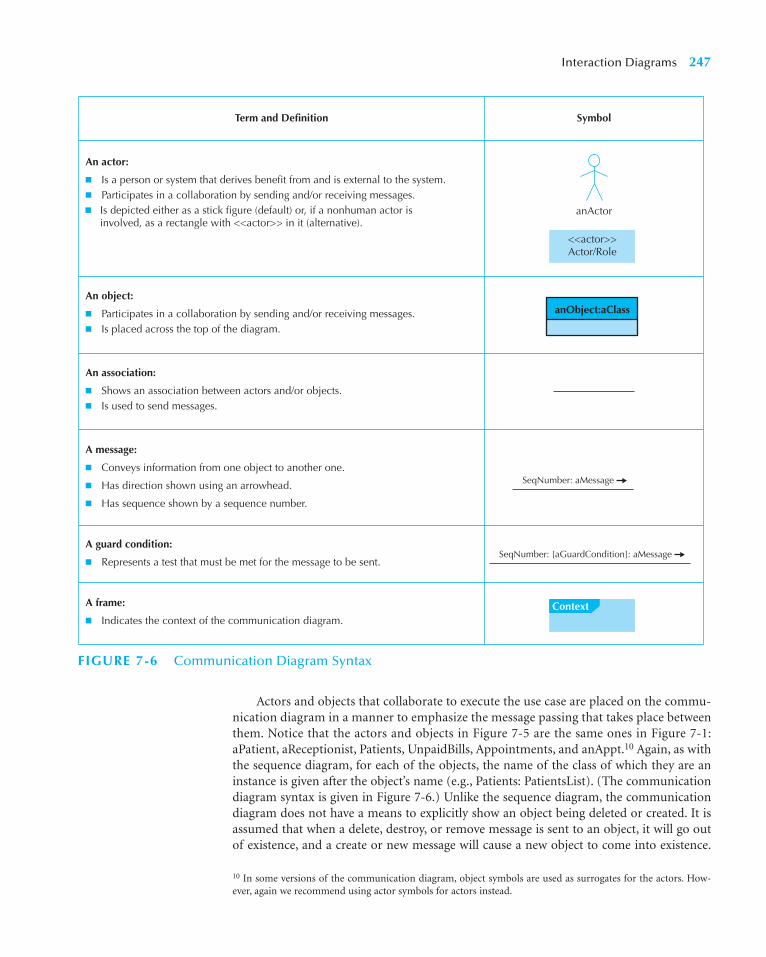
Actors and objects that collaborate to execute the use case are placed on the commu-nication diagram in a manner to emphasize the message passing that takes place betweenthem. Notice that the actors and objects in Figure 7-5 are the same ones in Figure 7-1:aPatient, aReceptionist, Patients, UnpaidBills, Appointments, and anAppt.10 Again, as withthe sequence diagram, for each of the objects, the name of the class of which they are aninstance is given after the object’s name (e.g., Patients: PatientsList). (The communicationdiagram syntax is given in Figure 7-6.) Unlike the sequence diagram, the communicationdiagram does not have a means to explicitly show an object being deleted or created. It isassumed that when a delete, destroy, or remove message is sent to an object, it will go outof existence, and a create or new message will cause a new object to come into existence.
Interaction Diagrams 247
10 In some versions of the communication diagram, object symbols are used as surrogates for the actors. How-ever, again we recommend using actor symbols for actors instead.
An actor:
■ Is a person or system that derives benefit from and is external to the system.■ Participates in a collaboration by sending and/or receiving messages.
An object:
■ Participates in a collaboration by sending and/or receiving messages.■ Is placed across the top of the diagram.
An association:
■ Shows an association between actors and/or objects.■ Is used to send messages.
A message:
■ Conveys information from one object to another one.
■ Has direction shown using an arrowhead.
■ Has sequence shown by a sequence number.
A frame:
■ Indicates the context of the communication diagram.
A guard condition:
■ Represents a test that must be met for the message to be sent.
<<actor>> Actor/Role
anActor
Context
SeqNumber: aMessage
SeqNumber: [aGuardCondition]: aMessage
Term and Definition Symbol
■ Is depicted either as a stick figure (default) or, if a nonhuman actor is involved, as a rectangle with <<actor>> in it (alternative).
anObject:aClass
FIGURE 7-6 Communication Diagram Syntax

Another difference between the two interaction diagrams is that the communication dia-gram never shows returns from message sends, whereas the sequence diagram can option-ally show them.
An association is shown between actors and objects with an undirected line. Forexample, there is an association shown between the aPatient and aReceptionist actors.Messages are shown as labels on the associations. Included with the labels are lines witharrows showing the direction of the message being sent. For example, in Figure 7-5, theaPatient actor sends the RequestAppt() message to the aReceptionist actor, and theaReceptionist actor, sends the NewCancelChangeAppt?() and the ApptTimes?() mes-sages to the aPatient actor. The sequence of the message sends is designated with asequence number. In Figure 7-5, the RequestAppt() message is the first message sent,whereas the NewCancelChangeAppt?() and the ApptTimes?() messages are the fourth andfifth message sent, respectively.
Like the sequence diagram, the communication diagram can represent conditionalmessages. For example, in Figure 7-5, the LookupBills() message is sent only if the [aPatientexists] condition is met. If a message is repeatedly sent, an asterisk is placed after thesequence number. Finally, an association that loops onto an object shows self-delegation.The message is shown as the label of the association.
When a communication diagram is fully populated with all the objects, it can becomevery complex and difficult to understand. When this occurs, it is necessary to simplify thediagram. One approach to simplifying a communication diagram, like use-case diagrams(see Chapter 5) and class diagrams (see Chapter 6), is through the use of packages (i.e., log-ical groups of classes). In the case of communication diagrams, its objects are groupedtogether based on the messages sent to and received from the other objects.11
Figure 7-7 provides two additional examples of communication diagrams. These dia-grams are equivalent to the sequence diagrams contained in Figure 7-3. However, whencomparing the communication diagrams to the sequence diagrams in these figures, you seethat there is quite a bit of information lost. For example, the CreateSandwich() message isnowhere to be found. However, the primary purpose of the communication diagram is toshow how the different actors and classes interact, and this is exactly the information thatis included.
248 Chapter 7 Behavioral Modeling
11 For those familiar with structured analysis and design, packages serve a similar purpose as the leveling andbalancing processes used in data flow diagramming. Packages and package diagrams are described in Chapter 8.
sd Make Lunch Use Case
CreateLunch()GetSandwich()MakeLunch()
aChild:Child firstParent:Parent secondParent:Parent
sd Submit Order Use Case
aCustomer:CustomerSubmitOrderRequest() SubmitCreditRequest()
aCustomer:Customer aSalesPerson:SalesPerson
FIGURE 7-7Additional SampleCommunication Diagrams

Building a Communication Diagram12 Remember that a communication diagram isbasically an object diagram that shows message-passing relationships instead of aggregation orgeneralization associations. In this section, we describe a five-step process used to build a com-munication diagram (see Figure 7-8). The first step in the process is to determine the contextof the communication diagram. Like a sequence diagram, the context of the diagram can be asystem, a use case, or a scenario of a use case. The context of the diagram is depicted as alabeled frame around the diagram (see Figures 7-5, 7-6, and 7-7).
The second step is to identify the objects (actors) and the associations that link theobjects (actors) that participate in the collaboration together. Remember, the objects that par-ticipate in the collaboration are instances of the classes identified during the development ofthe structural model (see Chapter 6). Like the sequence-diagramming process, it is likely thatadditional objects, and hence classes, will be discovered. Again, this is normal because theunderlying development process is iterative and incremental. As such, in addition to the com-munication diagram being modified, the sequence diagrams and structural model will prob-ably also have to be modified. Furthermore, additional functional requirements may also beuncovered, hence requiring the functional models to be modified as well (see Chapter 5).
The third step is to lay out the objects (actors) and their associations on the commu-nication diagram by placing them together based on the associations that they have withthe other objects in the collaboration. By focusing on the associations between the objects(actors) and minimizing the number of associations that cross over one another, we canincrease the understandability of the diagram.
The fourth step is to add the messages to the associations between the objects. We dothis by adding the name of the message(s) to the association link between the objects andan arrow showing the direction of the message being sent. Furthermore, each message hasa sequence number associated with it to portray the time-based ordering of the message.13
The fifth and final step is to validate the communication diagram. The purpose of thisstep is to guarantee that the communication diagram faithfully portrays the underlyingprocess(es). This is done by ensuring that all steps in the process are depicted on the diagram.14
Interaction Diagrams 249
12 The approach described in this section is adapted from Booch, Rumbaugh, and Jacobson, The Unified ModelingLanguage User Guide.13 However, remember the sequence diagram portrays the time-based ordering of the messages in a top-downmanner. As such, if your focus is on the time-based ordering of the messages, we recommend that you also usethe sequence diagram.14 We describe validation in Chapter 8.
1. Set the context.
2. Identify which objects (actors) and the associations between the objects participate in thecollaboration.
3. Lay out the communication diagram.
4. Add messages.
5. Validate the communication diagram.
FIGURE 7-8Steps for BuildingCommunication Diagrams
In Your Turn 7-1 you were asked to create a set of instancespecific sequence diagrams for a use case of the campus
housing service. Draw a communication diagram for thesame situation.
7-2 Drawing a Communication DiagramYOUR
TURN

BEHAVIORAL STATE MACHINES
Some of the classes in the class diagrams represent a set of objects that are quite dynamicin that they pass through a variety of states over the course of their existence. For exam-ple, a patient can change over time from being ‘new’ to ‘current,’ to ‘former,’ and so on, basedon his or her status with the doctor’s office. A behavioral state machine is a dynamicmodel that shows the different states through which a single object passes during its lifein response to events, along with its responses and actions. Typically, behavioral statemachines are not used for all objects, but just to further define complex objects to helpsimplify the design of algorithms for their methods. The behavioral state machine showsthe different states of the object and what events cause the object to change from one stateto another. In comparison to the interaction diagrams, behavioral state machines shouldbe used to help understand the dynamic aspects of a single class and how its instancesevolve over time15 and not with seeing how a particular use case or use-case scenario isexecuted over a set of classes.
In this section, we describe states, events, transitions, actions, and activities and the useof the behavioral state machine to model the state changes through which complex objectspass. As in the creation of the interaction diagrams, when we create a behavioral statemachine for an object, it is possible that we will uncover additional events that need to beincluded in your functional model (see Chapter 5), additional operations that need to beincluded in the structural model (see Chapter 6), so possibly our interaction diagrams mayhave to be modified again. Once more, because object-oriented development is iterativeand incremental, this continuous modification of the evolving models (functional, struc-tural, and behavioral) of the system is to be expected.
States, Events, Transitions, Actions, and ActivitiesThe state of an object is defined by the value of its attributes and its relationships with otherobjects at a particular point in time. For example, a patient might have a state of new, cur-rent, or former. The attributes or properties of an object affect the state that it is in; how-ever, not all attributes or attribute changes will make a difference. For example, think abouta patient’s address. Those attributes make very little difference as to changes in a patient’sstate. However, if states were based on a patient’s geographic location (e.g., in-townpatients were treated differently than out-of-town patients), changes to the patient’saddress would influence state changes.
An event is something that takes place at a certain point in time and changes a valueor values that describe an object, which, in turn, changes the object’s state. It can be a des-ignated condition becoming true, the receipt of the call for a method by an object, or thepassage of a designated period of time. The state of the object determines exactly what theresponse will be.
A transition is a relationship that represents the movement of an object from one stateto another state. Some transitions have a guard condition. A guard condition is a Booleanexpression that includes attribute values, which allows a transition to occur only if the con-dition is true. An object typically moves from one state to another based on the outcomeof an action triggered by an event. An action is an atomic, nondecomposable process thatcannot be interrupted. From a practical perspective, actions take zero time, and they areassociated with a transition. In contrast, an activity is a nonatomic, decomposable processthat can be interrupted. Activities take a long period of time to complete, they can bestarted and stopped by an action, and they are associated with states.
250 Chapter 7 Behavioral Modeling
15 Some authors refer to this as modeling an object’s life cycle.
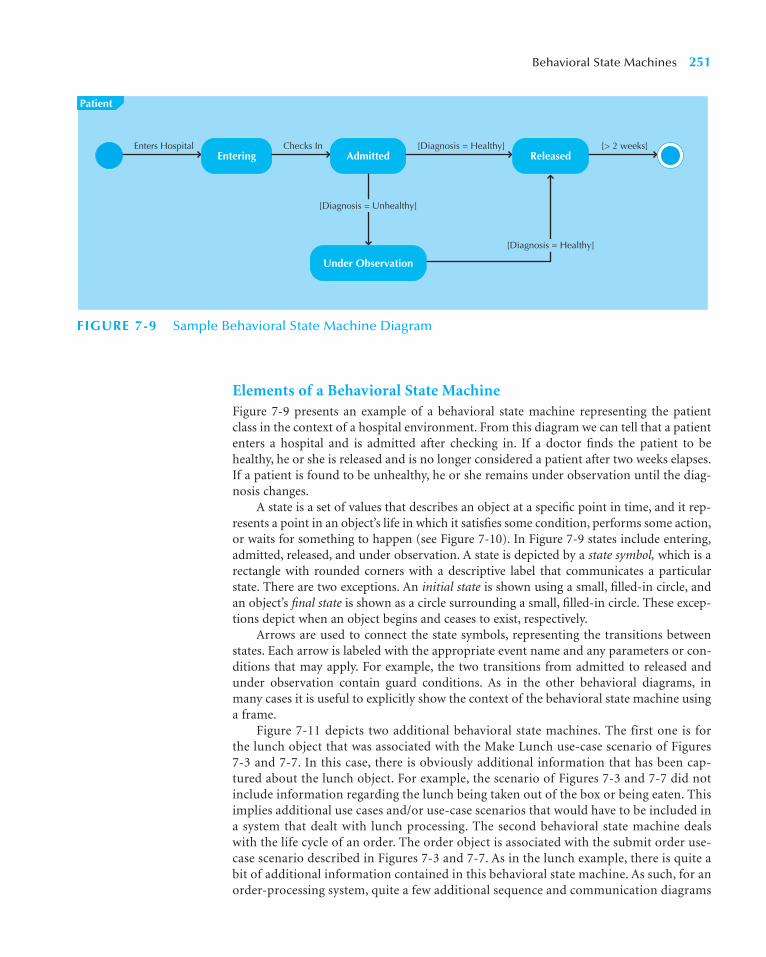
Elements of a Behavioral State MachineFigure 7-9 presents an example of a behavioral state machine representing the patientclass in the context of a hospital environment. From this diagram we can tell that a patiententers a hospital and is admitted after checking in. If a doctor finds the patient to behealthy, he or she is released and is no longer considered a patient after two weeks elapses.If a patient is found to be unhealthy, he or she remains under observation until the diag-nosis changes.
A state is a set of values that describes an object at a specific point in time, and it rep-resents a point in an object’s life in which it satisfies some condition, performs some action,or waits for something to happen (see Figure 7-10). In Figure 7-9 states include entering,admitted, released, and under observation. A state is depicted by a state symbol, which is arectangle with rounded corners with a descriptive label that communicates a particularstate. There are two exceptions. An initial state is shown using a small, filled-in circle, andan object’s final state is shown as a circle surrounding a small, filled-in circle. These excep-tions depict when an object begins and ceases to exist, respectively.
Arrows are used to connect the state symbols, representing the transitions betweenstates. Each arrow is labeled with the appropriate event name and any parameters or con-ditions that may apply. For example, the two transitions from admitted to released andunder observation contain guard conditions. As in the other behavioral diagrams, inmany cases it is useful to explicitly show the context of the behavioral state machine usinga frame.
Figure 7-11 depicts two additional behavioral state machines. The first one is forthe lunch object that was associated with the Make Lunch use-case scenario of Figures7-3 and 7-7. In this case, there is obviously additional information that has been cap-tured about the lunch object. For example, the scenario of Figures 7-3 and 7-7 did notinclude information regarding the lunch being taken out of the box or being eaten. Thisimplies additional use cases and/or use-case scenarios that would have to be included ina system that dealt with lunch processing. The second behavioral state machine dealswith the life cycle of an order. The order object is associated with the submit order use-case scenario described in Figures 7-3 and 7-7. As in the lunch example, there is quite abit of additional information contained in this behavioral state machine. As such, for anorder-processing system, quite a few additional sequence and communication diagrams
Behavioral State Machines 251
Patient
Enters Hospital Checks In [Diagnosis = Healthy] [> 2 weeks]Entering Admitted Released
Under Observation
[Diagnosis = Unhealthy]
[Diagnosis = Healthy]
FIGURE 7-9 Sample Behavioral State Machine Diagram
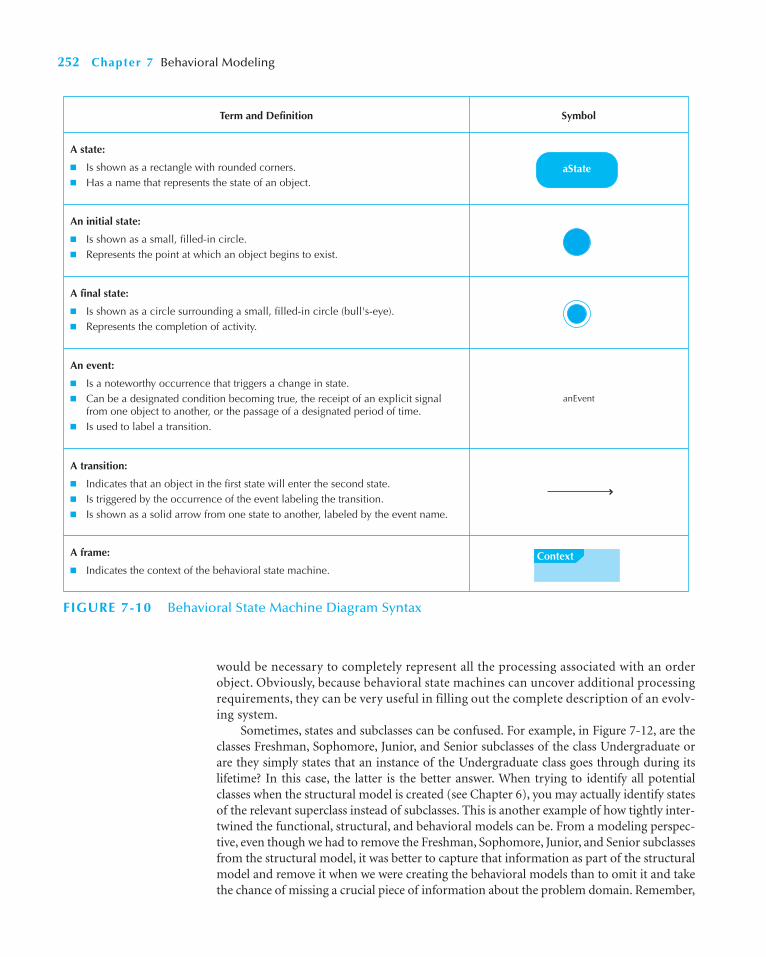
would be necessary to completely represent all the processing associated with an orderobject. Obviously, because behavioral state machines can uncover additional processingrequirements, they can be very useful in filling out the complete description of an evolv-ing system.
Sometimes, states and subclasses can be confused. For example, in Figure 7-12, are theclasses Freshman, Sophomore, Junior, and Senior subclasses of the class Undergraduate orare they simply states that an instance of the Undergraduate class goes through during itslifetime? In this case, the latter is the better answer. When trying to identify all potentialclasses when the structural model is created (see Chapter 6), you may actually identify statesof the relevant superclass instead of subclasses. This is another example of how tightly inter-twined the functional, structural, and behavioral models can be. From a modeling perspec-tive, even though we had to remove the Freshman, Sophomore, Junior, and Senior subclassesfrom the structural model, it was better to capture that information as part of the structuralmodel and remove it when we were creating the behavioral models than to omit it and takethe chance of missing a crucial piece of information about the problem domain. Remember,
252 Chapter 7 Behavioral Modeling
A state:
■ Is shown as a rectangle with rounded corners.■ Has a name that represents the state of an object.
An initial state:
■ Is shown as a small, filled-in circle.■ Represents the point at which an object begins to exist.
A final state:
■ Is shown as a circle surrounding a small, filled-in circle (bull's-eye).■ Represents the completion of activity.
An event:
■ Is a noteworthy occurrence that triggers a change in state.■ Can be a designated condition becoming true, the receipt of an explicit signal
from one object to another, or the passage of a designated period of time.■ Is used to label a transition.
A transition:
■ Indicates that an object in the first state will enter the second state.■ Is triggered by the occurrence of the event labeling the transition.■ Is shown as a solid arrow from one state to another, labeled by the event name.
A frame:
■ Indicates the context of the behavioral state machine.Context
anEvent
aState
Term and Definition Symbol
FIGURE 7-10 Behavioral State Machine Diagram Syntax
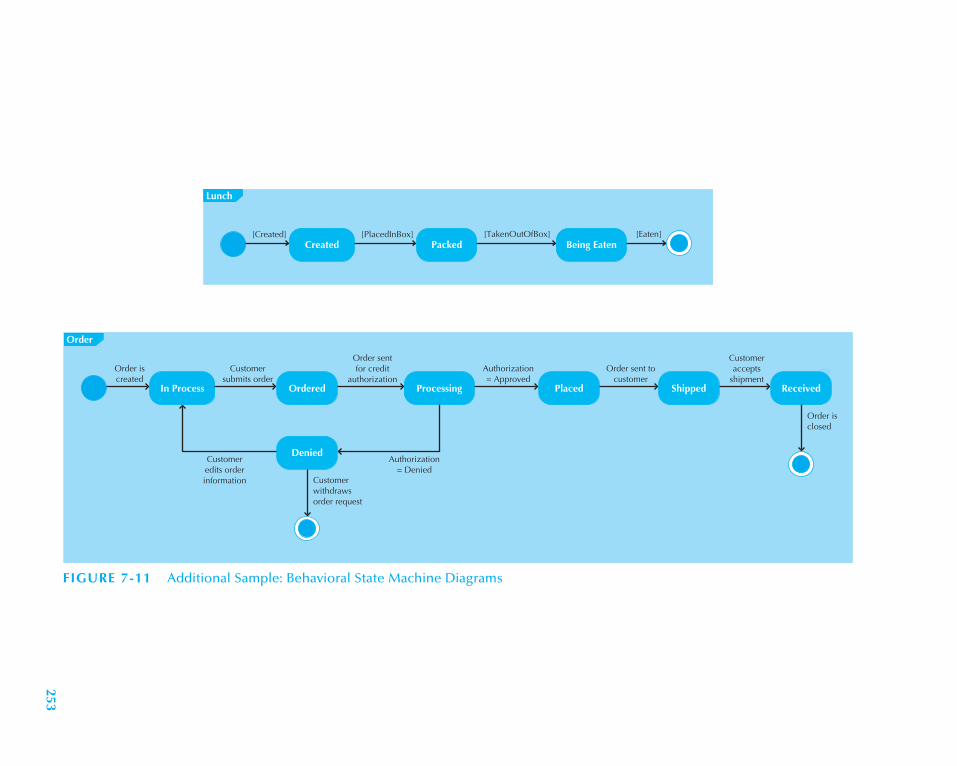
Order
Denied
Order is created
Customer submits order
Customer edits order information
Authorization = Denied
Order sent for credit
authorization
Customer withdraws order request
Order sent to customer
Customer accepts
shipmentReceived
Authorization = Approved
Order is closed
Lunch
[Created] [PlacedInBox] [TakenOutOfBox] [Eaten]Created Packed Being Eaten
In Process Ordered Processing Placed Shipped
FIGURE 7-11 Additional Sample: Behavioral State Machine Diagrams
253
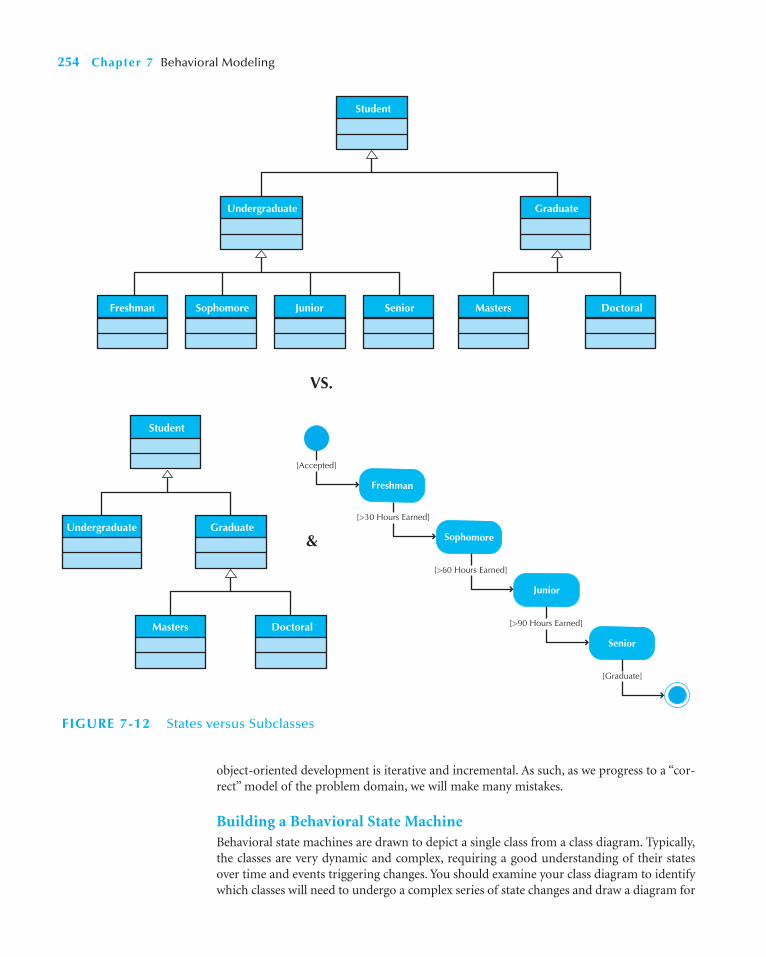
object-oriented development is iterative and incremental. As such, as we progress to a “cor-rect” model of the problem domain, we will make many mistakes.
Building a Behavioral State MachineBehavioral state machines are drawn to depict a single class from a class diagram. Typically,the classes are very dynamic and complex, requiring a good understanding of their statesover time and events triggering changes. You should examine your class diagram to identifywhich classes will need to undergo a complex series of state changes and draw a diagram for
254 Chapter 7 Behavioral Modeling
Graduate
Student
DoctoralMasters
Freshman
VS.
&
[Accepted]
SophomoreFreshman
Undergraduate
Undergraduate
SeniorJunior DoctoralMasters
Graduate
Student
Sophomore
[>30 Hours Earned]
Junior
[>60 Hours Earned]
Senior
[>90 Hours Earned]
[Graduate]
FIGURE 7-12 States versus Subclasses

each of them. In this section, we describe a five-step process used to build a behavioral statemachine (see Figure 7-13).16 Like the other behavioral models, the first step in the processis to determine the context of the behavioral state machine, which is shown in the label ofthe frame of the diagram. The context of a behavioral state machine is usually a class. How-ever, it also could be a set of classes, a subsystem, or an entire system.
The second step is to identify the various states that an object will have over its life-time. This includes establishing the boundaries of the existence of an object by identifyingthe initial and final states of an object. We also must identify the stable states of an object.The information necessary to perform this is gleaned from reading the use-case descrip-tions, talking with users, and relying on the requirements-gathering techniques that youlearned about in Chapter 4. An easy way to identify the states of an object is to write thesteps of what happens to an object over time, from start to finish, similar to how the nor-mal flow of events section of a use-case description would be created.
The third step is to determine the sequence of the states that an object will passthrough during its lifetime. Using this sequence, the states are placed onto the behavioralstate machine in a left-to-right order.
The fourth step is to identify the events, actions, and guard conditions associated withthe transitions between the states of the object. The events are the triggers that cause anobject to move from one state to the next state. In other words, an event causes an actionto execute that changes the value(s) of an object’s attribute(s) in a significant manner. Theactions are typically operations contained within the object. Also, guard conditions canmodel a set of test conditions that must be met for the transition to occur. At this point inthe process, the transitions are drawn between the relevant states and labeled with theevent, action, or guard condition.
The fifth step is to validate the behavioral state machine by making sure that each state isreachable and that it is possible to leave all states except for final states. Obviously, if an iden-tified state is not reachable, either a transition is missing or the state was identified in error.Furthermore, only final states can be a dead end from the perspective of an object-life cycle.17
Behavioral State Machines 255
16 The approach described in this section is adapted from Booch, Rumbaugh, and Jacobson, The Unified Model-ing Language User Guide.17 We describe validation in Chapter 8.
1. Set the context.
2. Identify the initial, final, and stable states of the object.
3. Determine the order in which the object will pass through the stable states.
4. Identify the events, actions, and guard conditions associated with the transitions.
5. Validate the behavioral state machine.
FIGURE 7-13Steps for Building a Behavioral StateMachine
You have been working with the system for the campushousing service that helps students find apartments. Oneof the dynamic classes in this system is probably theapartment class. Draw a behavioral state machine to
show the various states that an apartment class transitionsthroughout its lifetime. Can you think of other classes thatwould make good candidates for a behavioral statemachine?
7-3 Drawing a Behavioral State MachineYOUR
TURN
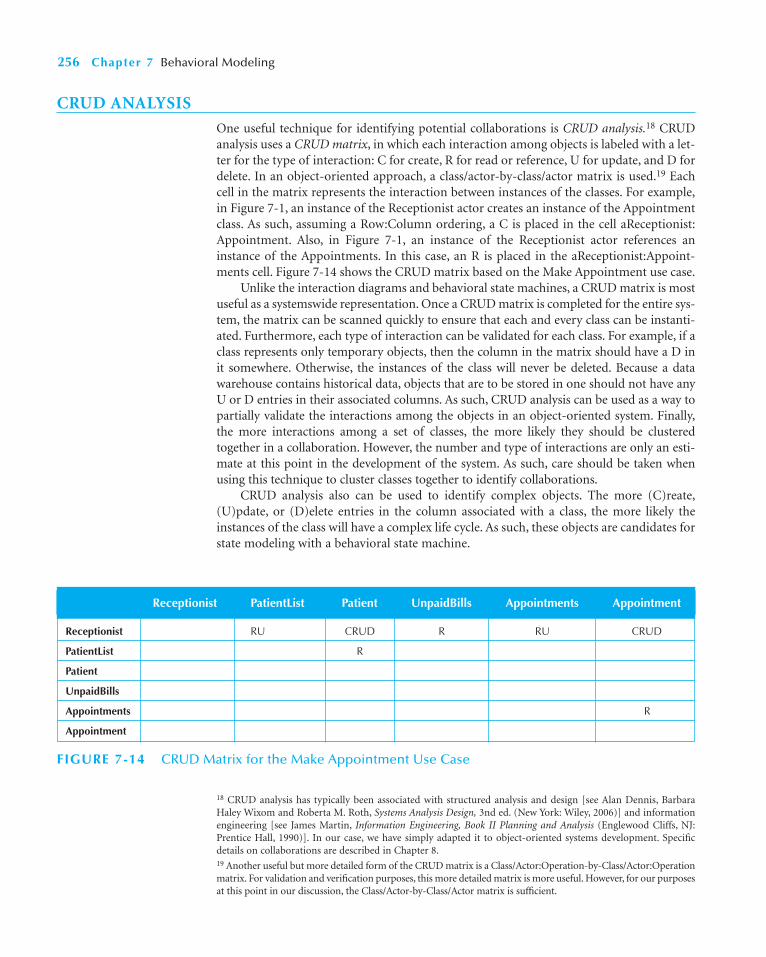
CRUD ANALYSIS
One useful technique for identifying potential collaborations is CRUD analysis.18 CRUDanalysis uses a CRUD matrix, in which each interaction among objects is labeled with a let-ter for the type of interaction: C for create, R for read or reference, U for update, and D fordelete. In an object-oriented approach, a class/actor-by-class/actor matrix is used.19 Eachcell in the matrix represents the interaction between instances of the classes. For example,in Figure 7-1, an instance of the Receptionist actor creates an instance of the Appointmentclass. As such, assuming a Row:Column ordering, a C is placed in the cell aReceptionist:Appointment. Also, in Figure 7-1, an instance of the Receptionist actor references aninstance of the Appointments. In this case, an R is placed in the aReceptionist:Appoint-ments cell. Figure 7-14 shows the CRUD matrix based on the Make Appointment use case.
Unlike the interaction diagrams and behavioral state machines, a CRUD matrix is mostuseful as a systemswide representation. Once a CRUD matrix is completed for the entire sys-tem, the matrix can be scanned quickly to ensure that each and every class can be instanti-ated. Furthermore, each type of interaction can be validated for each class. For example, if aclass represents only temporary objects, then the column in the matrix should have a D init somewhere. Otherwise, the instances of the class will never be deleted. Because a datawarehouse contains historical data, objects that are to be stored in one should not have anyU or D entries in their associated columns. As such, CRUD analysis can be used as a way topartially validate the interactions among the objects in an object-oriented system. Finally,the more interactions among a set of classes, the more likely they should be clusteredtogether in a collaboration. However, the number and type of interactions are only an esti-mate at this point in the development of the system. As such, care should be taken whenusing this technique to cluster classes together to identify collaborations.
CRUD analysis also can be used to identify complex objects. The more (C)reate,(U)pdate, or (D)elete entries in the column associated with a class, the more likely theinstances of the class will have a complex life cycle. As such, these objects are candidates forstate modeling with a behavioral state machine.
256 Chapter 7 Behavioral Modeling
Receptionist RU CRUD R RU CRUD
PatientList R
Patient
UnpaidBills
Appointments R
Appointment
Receptionist PatientList Patient UnpaidBills Appointments Appointment
FIGURE 7-14 CRUD Matrix for the Make Appointment Use Case
18 CRUD analysis has typically been associated with structured analysis and design [see Alan Dennis, BarbaraHaley Wixom and Roberta M. Roth, Systems Analysis Design, 3nd ed. (New York: Wiley, 2006)] and informationengineering [see James Martin, Information Engineering, Book II Planning and Analysis (Englewood Cliffs, NJ:Prentice Hall, 1990)]. In our case, we have simply adapted it to object-oriented systems development. Specificdetails on collaborations are described in Chapter 8.19 Another useful but more detailed form of the CRUD matrix is a Class/Actor:Operation-by-Class/Actor:Operationmatrix. For validation and verification purposes, this more detailed matrix is more useful. However, for our purposesat this point in our discussion, the Class/Actor-by-Class/Actor matrix is sufficient.

APPLYING THE CONCEPTS AT CD SELECTIONS
Because Alec and the team has now completed the functional and structural models for theInternet Sales System, he has decided that it was time to move on and begin to create thebehavioral models. Alec understood that in some ways the behavioral models will allowthem to complete their understanding of the problem that they are solving. As such,Alec and his team created sequence diagrams, communication diagrams, behavioral statemachines, and a CRUD matrix. As in Chapter 6, the team created behavioral models for allthe use cases and classes in the evolving system description. However, in the sections thatfollow, we see only the models associated with the Place Order use case and the Order class.The sections are organized in the same manner as the chapter: sequence diagrams, com-munication diagrams, behavioral state machine, and CRUD matrix.
Sequence DiagramsTo begin with Alec decided to follow the steps for building a sequence diagram listed inFigure 7-4. As such, Alec first needed to determine the context of the sequence diagram.He decided to use a scenario20 from the Place Order use case that was created in Chap-ter 5 and illustrated in Figure 5-17. (Refer to the original use case for the details.) Figure7-15 lists the normal flow of events, which contains the scenario that this sequence dia-gram describes.
The second step was to identify the objects that participated in the scenario beingmodeled. The classes associated with the Place Order use case are shown in Figure 6-18. Forexample, the classes used for the Place Order use case include Customer, CD, MarketingInformation, Credit Card Clearance Center, Order, Order Item, Vendor, Search Request,CD List, Review, Artist Information, Sample Clip, Individual, and Organizational.
Applying the Concepts at CD Selections 257
You have been working with the system for the campushousing service that helps students find apartments.Based on the work completed so far, perform a CRUD
analysis to identify which classes collaborate the most andto perform some validation of the evolving representationof the system.
7-4 CRUD AnalysisYOUR
TURN
20 Remember, as stated previously, a scenario is a single executable path through a use case.
Normal Flow of Events:
1. Customer submits a search request to the system.
2. The System provides the Customer a list of recommended CDs.
3. The Customer chooses one of the CDs to find out additional information.
4. The System provides the Customer with basic information and reviews on the CD.
5. The Customer calls the Maintain Order use case.
6. The Customer iterates over 3 through 5 until done shopping.
7. The Customer executes the Checkout use case.
8. The Customer leaves the Web site.
FIGURE 7-15Normal Flow of Eventsof the Places OrderUse Case

During the role playing of the CRC cards, Anne, one of the analysts assigned to the CDSelections Internet System development team, asked whether a Shopping Cart class shouldbe included. She stated that every Internet sales site she had been to had a shopping cartthat was used to build an order. However, the instance of the Shopping Cart class existedonly until either an order was placed or the shopping cart was emptied. Based on this obvi-ous oversight, both the Place Order use case and the class diagram will have to be modi-fied. Brian, another analyst, pointed out that the CDs themselves were going to have to beassociated with some type of searchable storage. Otherwise, it would be impossible to findthe CD in which the customer was interested. However, Alec decided that the CD List classwould suffice for both the searchable storage and a temporary instance that would be cre-ated as a result of a search request. Alec pointed out to the team that this process was fairlytypical in object-oriented development. The more the development team learned about therequirements, the more the models (functional, structural, and behavioral) would evolve.Alec reminded them that the important thing to remember was that an object-orienteddevelopment process was incremental and it iterated over all of the models. As such, as theyunderstood the problem better, the team would most likely have to make changes to thefunctional and structural models already completed.
Based on the team’s current understanding of the Place Order use case, they decidedthat instances of the Search Request, CD List, CD, Marketing Material, Customer, Review,Artist Information, Sample Clip, and Shopping Cart classes would be required to describethis scenario. Furthermore, they realized that the Customer actor interacted with the sce-nario. To complete this step, the team laid out the objects on the sequence diagram bydrawing them, from left to right, across the diagram.
The third step was to set the lifeline for each object. To do this, they drew a vertical dot-ted line below each of the objects (aSR, aCDL, CDs, aCD, MI, aR, AI, SC, aSC and anOrder)and the actor (aCustomer). They placed an X at the bottom of the lifelines for aCDL andaSC because they go away at the end of this process.
The fourth step was to add the messages to the diagram. By examining the steps in Fig-ure 7-15, the team was able to determine the way in which the messages should be addedto the diagram. Figure 7-16 shows the diagram they created. Notice how they did notinclude messages back to Customer in response to create SR and add CD. In these cases, theteam assumed that aCustomer would receive response messages about the requested CDand inserted CD, respectively.
The fifth step was to add the execution occurrence to each object’s and actor’s lifeline.This was done by drawing a narrow rectangle box over top of the lifelines to represent whenthe objects (actors) are sending and receiving messages [e.g., in Figure 7-16 aCustomer isactive during the entire process, whereas aSR is active only at the beginning of the process(the top of the diagram)].
Finally, the CD Selections team validated the diagram by ensuring that the diagram accu-rately and completely represented the scenario of the Place Order use case being modeled.Figure 7-16 portrays their completed sequence diagram.
258 Chapter 7 Behavioral Modeling
In Your Turn 5-8, you completed the detailed use cases forthe CD Selections Internet Sales System. In Your Turn 6-4,you completed the structural model. Based on the com-
pleted functional and structural models, create thesequence diagrams for the remaining scenarios of all ofthe use cases in Figure 5-18.
7-5 CD Selections Internet Sales SystemYOUR
TURN

sd Place Order Use Case
CreateSR()
aCustomer
Find CDs()
Create CDL()
Get Mkt Info()Get Review()
Get Sample Clip()
aSR:SearchReq
aCDL:CDList
CDs:CDList aCD:CD MI:Mkt Info aR:Review
anOrder:Order
AI:Artist Info SC:Sample Clip aSC:ShoppingCart
Get Basic Info()
add CD(()
Create Order()
Get Artist Info()
X X
FIGURE 7-16 Sequence Diagram for the Places Order Use Case
259
Communication DiagramsBrian, one of the analysts, pointed out to the team that sequence diagrams and communi-cation diagrams essentially modeled the same things. As such, he felt that it was not worththe time for the team to do both. And because they had already completed the sequencediagrams, he really did not want to do the communication diagrams also. However, eventhough the diagrams are very similar in what they portray, Alec decided that it would beworth the team’s time to build both. He felt that it could be possible that the different for-mats of the diagrams might uncover additional requirements. As such, the team also cre-ated communication diagrams.
Alec chose to create the communication diagrams by following the steps in Figure 7-8that describe how to build a communication diagram. Like creating sequence diagrams, thefirst step in the process was to determine the context of the communication diagram. Alecchose to start with the same scenario of the Place Order use case that he and the team hadused previously when they created the sequence diagrams (see Figure 7-16).
By executing the second step, the CD Selections team again identified the objects andthe associations that link the objects together. Because they are using the same scenario asthey did in the previously described sequence diagram, instances of the Search Request, CDList, CD, Marketing Material, Customer, Review, Artist Information, Sample Clip, and Shop-ping Cart classes should be the ones included. Also, because the Customer actor interactswith the scenario, it should also be included. Furthermore, the team identified the associa-tions between the objects (e.g., the instances of CD are associated with instances of MktInfo, which, in turn, are associated with instances of Review, Artist Info, and Sample Clip).
During the third step, the team placed the objects on the diagram based on the asso-ciations that they have with the other objects in the collaboration. This was done toincrease in readability and, hence, the understandability of the diagram (see Figure 7-17).
During the fourth step, the CD Selections team added the messages to the associationsbetween the objects. For example, in Figure 7-17, the Create SR() message is the first mes-sage sent, and the FindCDs() message is the second message sent. The aCustomer actorsends the Create SR() message to the aSR object, and the aSR object sends the FindCDs()message to the CDs object.
Finally, the CD Selections team executed the fifth and final step: validating the dia-gram. They accomplished this by ensuring that the scenario of the Place Order use case wasaccurately and completely represented by the diagram. See Figure 7-17 for the completedcommunication diagram for this particular scenario of the Place Order use case. Further-more, they compared the previously created sequence diagram (see Figure 7-16) with thecommunication diagram (see Figure 7-17) to ensure that that both diagrams were equiva-lent. The only difference between the two diagrams was the ease in portraying the timeordering of the messages in the sequence diagram to represent how the objects interactedwith each other in the communication diagram.
260 Chapter 7 Behavioral Modeling
In Your Turn 5-8, you completed the detailed use cases forthe CD Selections Internet Sales System. In Your Turn 6-4,you completed the structural model. Based on the com-pleted functional and structural models, create the com-
munication diagrams for the remaining scenarios of all theuse cases in Figure 5-18. Be sure to compare these dia-grams to the sequence diagrams created in Your Turn 7-5.
7-6 CD Selections Internet Sales SystemYOUR
TURN

Behavioral State MachinesAs in the previous example diagrams, we focus our attention only on the Place Order use case.Alec decided to follow the steps building a behavioral state machine (see Figure 7-13). As withthe earlier diagrams, the first step was to determine the context for the behavioral statemachine to be drawn. Upon reviewing the objects involved in the scenario described by thesequence diagram (see Figure 7-16) and the communication diagram (see Figure 7-17), Alecdecided that the team should focus on the Order class.
The second step was to identify the various states that an order will go through duringits lifetime. To enable the discovery of the initial, final, and stable states of an order, Alecand the development team interviewed a customer representative who dealt with process-ing customer orders on a regular basis. Based on this interview, the team uncovered the lifeof an order (see Figure 7-18) from start to finish, from an order’s perspective.
Applying the Concepts at CD Selections 261
sd Place Order Use Case
10. Create O
rder()
7: Get Artist Info()8: Get Sam
ple Clip()
3: Create CDL()
2: Find CDs()
5: Get Mkt Info()6: G
et Revi
ew()
9: add CD()
4: Get Basic Info()
1: C
reat
e SR
()
aSR:Search Request
aSC:Shopping Cart
aCD:CD
anOrder:Order
MI:Mkt Info
SC:Sample Clip
aCDL:CDList
CDs:CDList
aR:Review
AI:Artist InfoaCustomer
FIGURE 7-17 Communication Diagram for the Places Order Use Case
1. The customer creates an order on the Web.
2. The customer submits the order once he or she is finished.
3. The credit authorization needs to be approved for the order to be accepted.
4. If denied, the order is returned to the customer for changes or deletion.
5. If accepted, the order is placed.
6. The order is shipped to the customer.
7. The customer receives the order.
8. The order is closed.FIGURE 7-18The Life of an Order
The third step was to determine the sequence of the states that an order object will passthrough during its lifetime. Based on the order’s lifecycle portrayed in Figure 7-18, the teamidentified and laid out the states of the order on the behavioral state machine.
Next, the team identified the events, actions, and guard conditions associated with thetransitions between the states of the order. For example, the event Order is created moves theorder from the Initial state to the In process state (see Figure 7-19). During the Processingstate, a credit authorization is requested. The guard condition Authorization � Approved pre-vents the order from moving from the Processing state to the Placed state unless the creditauthorization has been approved. Also, the guard condition Authorization � Denied preventsthe order from moving from the Processing state to the Denied state unless the credit autho-rization has been denied. As such, between the two guard conditions, the order is stuck in theprocessing state until the credit authorization has been either approved or denied.
The team finally validated the Order’s behavioral state machine by ensuring that eachstate was reachable and that it was possible to leave all states except for the final states. Fur-thermore, the team made sure that all states and transitions for the order had been mod-eled. At this point in time, one of the analysts on the team, Brian, suggested that possiblythere were multiple types of orders being described in the behavioral state machine.Specifically, he thought that there were denied and accepted orders. Based on this discov-ery, he suggested that two new classes, for each subtype of order, be created. However,upon further review by the entire team, it was decided that adding these classes to the classdiagram and modifying all the other diagrams to reflect this change would not add any-thing to the understanding of the problem. Therefore, it was decided not to add theclasses. However, in many cases, modeling the states that an object will go through duringits lifetime may, in fact, uncover additional useful subclasses. Figure 7-19 illustrates thebehavioral state machine that the CD Selections team created for an order object.21
CRUD MatrixAs an attempt to tie the functional, structural, and behavioral models together, Alec decidedto create a CRUD matrix. To accomplish this, Alec assigned Anne the task of creating thematrix. As in the previous examples, we have limited this example to the Place Order use case.
To begin with, Anne created a class-by-class matrix. She then placed a (C)reate, (R)ead,(U)pdate, or a (D)elete in each cell of the matrix that represented an interaction betweeninstances of the classes. For example, in Figures 7-16 and 7-17, an instance of SearchReqcreated an instance of CDList. Also, in Figures 7-16 and 7-17, an instance of CD referencesan instance of MktInfo. In this case, an R was placed in the CD:MktInfo cell. Figure 7-20shows the CRUD matrix that Anne created based on the Place Order use case.
262 Chapter 7 Behavioral Modeling
In Your Turn 7-5 and 7-6, you completed the sequenceand communication diagrams for all the use-case scenar-ios for the CD Selections Internet Sales System. Based onthese scenario-based diagrams and the structural model
you created in Your Turn 6-4, create a set of behavioralstate machines for each concrete class contained in theclass diagram.
7-7 CD Selections Internet Sales SystemYOUR
TURN
21 If the development team had been carefully reading our textbook, they would have seen that they could havereused the Order behavioral state machine in Figure 7-11.

Order
In Process Ordered
Denied
Order is created
Customer submits order
Customer edits order information
Authorization = Denied
Processing
Order sent for credit
authorization
Customer withdraws order request
Placed
Order sent to customer
Customer accepts
shipmentShipped Received
Authorization = Approved
Order is closed
FIGURE 7-19 Behavioral State Machine for the Order Class
263
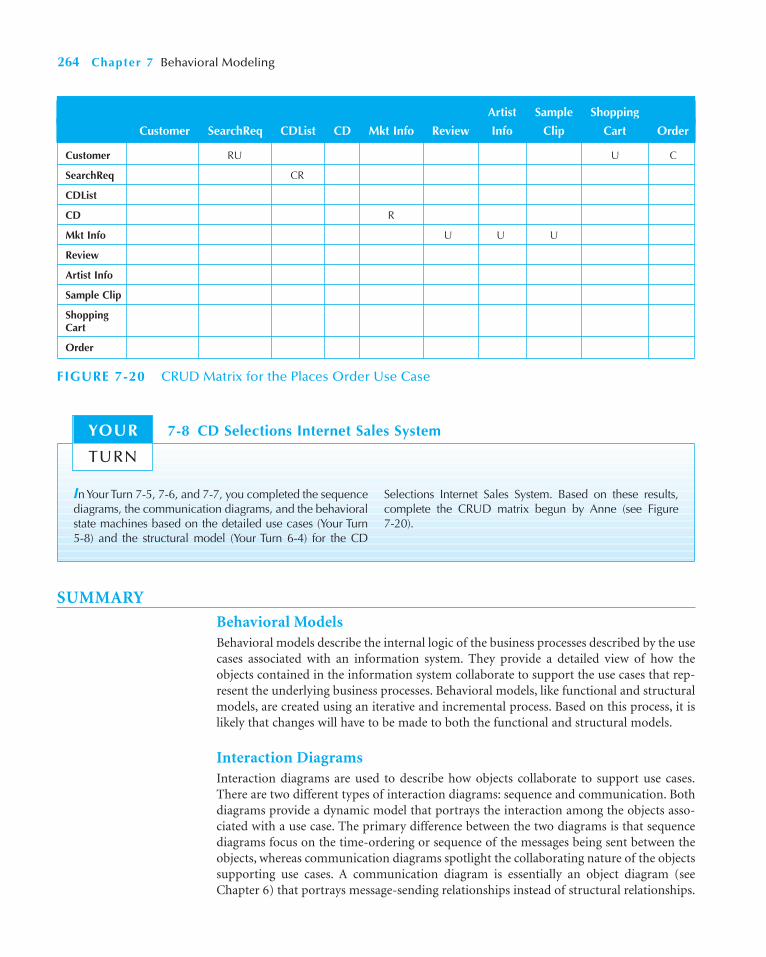
SUMMARY
Behavioral ModelsBehavioral models describe the internal logic of the business processes described by the usecases associated with an information system. They provide a detailed view of how theobjects contained in the information system collaborate to support the use cases that rep-resent the underlying business processes. Behavioral models, like functional and structuralmodels, are created using an iterative and incremental process. Based on this process, it islikely that changes will have to be made to both the functional and structural models.
Interaction DiagramsInteraction diagrams are used to describe how objects collaborate to support use cases.There are two different types of interaction diagrams: sequence and communication. Bothdiagrams provide a dynamic model that portrays the interaction among the objects asso-ciated with a use case. The primary difference between the two diagrams is that sequencediagrams focus on the time-ordering or sequence of the messages being sent between theobjects, whereas communication diagrams spotlight the collaborating nature of the objectssupporting use cases. A communication diagram is essentially an object diagram (seeChapter 6) that portrays message-sending relationships instead of structural relationships.
264 Chapter 7 Behavioral Modeling
Customer RU U C
SearchReq CR
CDList
CD R
Mkt Info U U U
Review
Artist Info
Sample Clip
ShoppingCart
Order
Artist Sample Shopping
Customer SearchReq CDList CD Mkt Info Review Info Clip Cart Order
FIGURE 7-20 CRUD Matrix for the Places Order Use Case
In Your Turn 7-5, 7-6, and 7-7, you completed the sequencediagrams, the communication diagrams, and the behavioralstate machines based on the detailed use cases (Your Turn5-8) and the structural model (Your Turn 6-4) for the CD
Selections Internet Sales System. Based on these results,complete the CRUD matrix begun by Anne (see Figure 7-20).
7-8 CD Selections Internet Sales SystemYOUR
TURN

Behavioral State MachineThe behavioral state machine shows the different states through which a single class passesduring its life in response to events, along with responses and actions. A state is a set of val-ues that describes an object at a specific point in time, and it represents a point in anobject’s life in which it satisfies some condition, performs some action, or waits for some-thing to happen. An event is something that takes place at a certain point in time andchanges a value(s) that describes an object, which, in turn, changes the object’s state. Asobjects move from state to state, they undergo transitions.
When drawing a behavioral state machine, like the other behavioral diagrams, the firstthing is to set the context of the diagram: system, subsystem, set of classes, or an individ-ual class. Then, rectangles with rounded corners are placed on the model to represent thevarious states on which the context will take. Next, arrows are drawn between the rectan-gles to denote the transitions, and event labels are written above the arrows to describe theevent that causes the transition to occur. Typically, behavioral state machines are used toportray the dynamic aspect of a complex class.
CRUD AnalysisCRUD analysis is a very useful approach to identifying potential collaborations amongclasses and to verifying and validating a system. It allows the analyst to see what type ofinteractions (create, read/reference, update, or delete) that the different types of objects havein the system in a very concise format (CRUD Matrix). CRUD analysis also supports theidentification of the more complex objects that could benefit from state modeling using abehavioral state machine.
Questions 265
KEY TERMS
ActionActivityActorAssociationAttributesBehaviorBehavior modelsBehavioral state machinesClassClass diagramCollaborationCommunication diagramConditionCRC cardsCRUD analysis
CRUD matrixDynamic modelEventExecution occurrenceFinal stateFrameGeneric sequence diagramGuard conditionInitial stateInstanceInstance sequence diagramLifelineMessageMethodObject
OperationOperation call messagePackagesReturn messageScenarioSelf-delegationSequence diagramStateState symbolTemporary objectTransitionTriggerUse case
QUESTIONS
1. How is behavioral modeling related to structuralmodeling?
2. How does a use case relate to a sequence diagram? Acommunication diagram?
3. Contrast the following sets of terms:state; behaviorclass; objectaction; activity
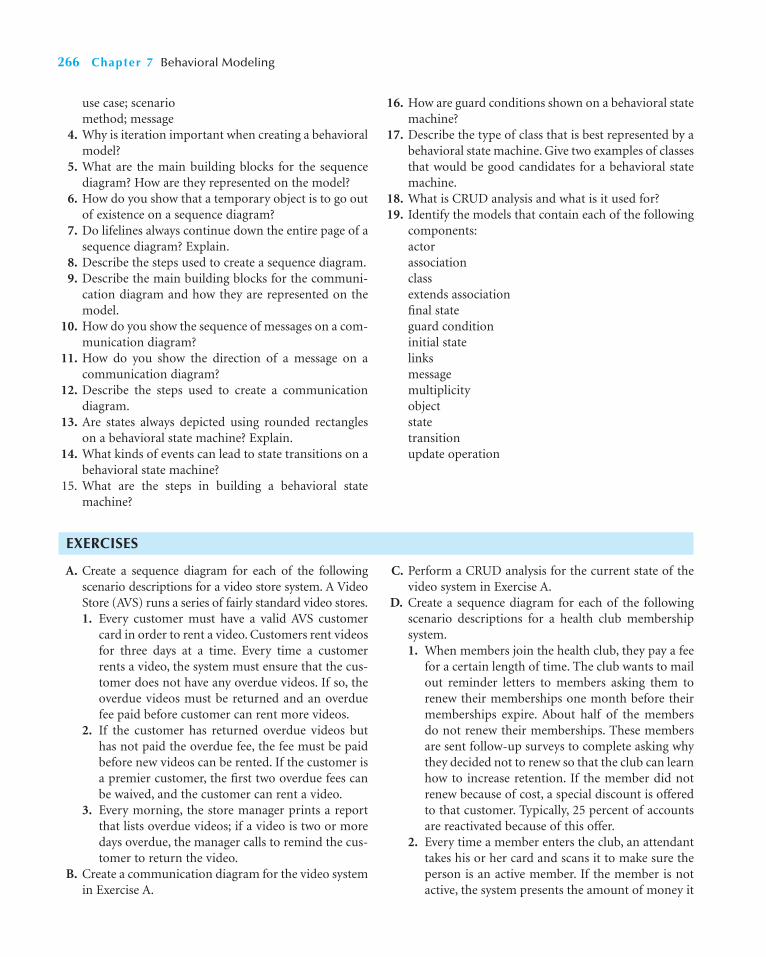
266 Chapter 7 Behavioral Modeling
use case; scenariomethod; message
4. Why is iteration important when creating a behavioralmodel?
5. What are the main building blocks for the sequencediagram? How are they represented on the model?
6. How do you show that a temporary object is to go outof existence on a sequence diagram?
7. Do lifelines always continue down the entire page of asequence diagram? Explain.
8. Describe the steps used to create a sequence diagram.9. Describe the main building blocks for the communi-
cation diagram and how they are represented on themodel.
10. How do you show the sequence of messages on a com-munication diagram?
11. How do you show the direction of a message on acommunication diagram?
12. Describe the steps used to create a communicationdiagram.
13. Are states always depicted using rounded rectangleson a behavioral state machine? Explain.
14. What kinds of events can lead to state transitions on abehavioral state machine?
15. What are the steps in building a behavioral statemachine?
16. How are guard conditions shown on a behavioral statemachine?
17. Describe the type of class that is best represented by abehavioral state machine. Give two examples of classesthat would be good candidates for a behavioral statemachine.
18. What is CRUD analysis and what is it used for?19. Identify the models that contain each of the following
components:actorassociationclassextends associationfinal stateguard conditioninitial statelinksmessagemultiplicityobjectstatetransitionupdate operation
EXERCISES
A. Create a sequence diagram for each of the followingscenario descriptions for a video store system. A VideoStore (AVS) runs a series of fairly standard video stores.1. Every customer must have a valid AVS customer
card in order to rent a video. Customers rent videosfor three days at a time. Every time a customerrents a video, the system must ensure that the cus-tomer does not have any overdue videos. If so, theoverdue videos must be returned and an overduefee paid before customer can rent more videos.
2. If the customer has returned overdue videos buthas not paid the overdue fee, the fee must be paidbefore new videos can be rented. If the customer isa premier customer, the first two overdue fees canbe waived, and the customer can rent a video.
3. Every morning, the store manager prints a reportthat lists overdue videos; if a video is two or moredays overdue, the manager calls to remind the cus-tomer to return the video.
B. Create a communication diagram for the video systemin Exercise A.
C. Perform a CRUD analysis for the current state of thevideo system in Exercise A.
D. Create a sequence diagram for each of the followingscenario descriptions for a health club membershipsystem.1. When members join the health club, they pay a fee
for a certain length of time. The club wants to mailout reminder letters to members asking them torenew their memberships one month before theirmemberships expire. About half of the membersdo not renew their memberships. These membersare sent follow-up surveys to complete asking whythey decided not to renew so that the club can learnhow to increase retention. If the member did notrenew because of cost, a special discount is offeredto that customer. Typically, 25 percent of accountsare reactivated because of this offer.
2. Every time a member enters the club, an attendanttakes his or her card and scans it to make sure theperson is an active member. If the member is notactive, the system presents the amount of money it

Exercises 267
costs to renew the membership. The customer isgiven the chance to pay the fee and use the club,and the system makes note of the reactivation ofthe account so that special attention can be given tothis customer when the next round of renewalnotices are dispensed.
E. Create a communication diagram for each of the healthclub membership scenarios described in Exercise D.
F. Perform a CRUD analysis for the current state of thehealth club membership system in Exercise D.
G. Think about sending a first-class letter to an interna-tional pen pal. Describe the process that the letter goesthrough to get from your initial creation of the letterto being read by your friend, from the letter’s perspec-tive. Draw a behavioral state machine that depicts thestates that the letter moves through.
H. Consider the video store that is described in QuestionA. Draw a behavioral state machine that describes thevarious states that a video goes through from the timeit is placed on the shelf through the rental and returnprocess.
I. Draw a behavioral state machine that describes thevarious states that a travel authorization can havethrough its approval process. A travel authorizationform is used in most companies to approve travelexpenses for employees. Typically, an employee fills outa blank form and sends it to his or her boss for a sig-nature. If the amount is fairly small (< $300), then theboss signs the form and routes it to accounts payable tobe input into the accounting system. The system cuts acheck that is sent to the employee for the right amount,and after the check is cashed, the form is filed awaywith the canceled check. If the check is not cashedwithin 90 days, the travel form expires. When theamount of the travel voucher is a large amount (> $300),then the boss signs the form and sends it to the CFO,along with a paragraph explaining the purpose of thetravel; the CFO signs the form and passes it along toaccounts payable. Of course, both the boss and theCFO can reject the travel authorization form if they donot feel that the expenses are reasonable. In this case,the employee can change the form to include moreexplanation or decide to pay the expenses.
J. Picnics R Us (PRU) is a small catering firm with fiveemployees. During a typical summer weekend, PRUcaters fifteen picnics with twenty to fifty people each.The business has grown rapidly over the past year, andthe owner wants to install a new computer system formanaging the ordering and buying processes. PRU hasa set of ten standard menus. When potential cus-
tomers call, the receptionist describes the menus tothem. If the customer decides to book a picnic, thereceptionist records the customer information (e.g.,name, address, phone number, etc.) and the informa-tion about the picnic (e.g., place, date, time, which oneof the standard menus, total price) on a contract. Thecustomer is then faxed a copy of the contract andmust sign and return it along with a deposit (a credit-card number or check) before the picnic is officiallybooked. The remaining money is collected when thepicnic is delivered. Sometimes, the customer wantssomething special (e.g., birthday cake). In this case,the receptionist takes the information and gives it tothe owner, who determines the cost; the receptionistthen calls the customer back with the price informa-tion. Sometimes the customer accepts the price; othertimes, the customer requests some changes that haveto go back to the owner for a new cost estimate. Eachweek, the owner looks through the picnics scheduledfor that weekend and orders the supplies (e.g., plates)and food (e.g., bread, chicken) needed to make them.The owner would like to use the system for marketingas well. It should be able to track how customerslearned about PRU and identify repeat customers, sothat PRU can mail special offers to them. The owneralso wants to track the picnics on which PRU sent acontract but the customer did not sign the contractand actually book a picnic.1. Create an activity diagram for the PRU system.2. Identify the use cases for the PRU system.3. Create the use-case diagram for the PRU system.4. Create a class diagram for the PRU System.5. Choose one use case and create sequence diagrams.6. Create a communication diagram for the use case
chosen in Question 5.7. Create a behavioral state machine to depict one of
the classes on the class diagram in Question 2.8. Perform a CRUD analysis for the current state of
the system’s representation.K. Of-the-Month Club (OTMC) is an innovative young
firm that sells memberships to people who have aninterest in certain products. People pay membershipfees for one year and each month receive a product bymail. For example, OTMC has a coffee-of-the-monthclub, which sends members one pound of special cof-fee each month. OTMC currently has six member-ships (coffee, wine, beer, cigars, flowers, and computergames), each of which costs a different amount. Cus-tomers usually belong to just one, but some belong totwo or more. When people join OTMC, the telephone
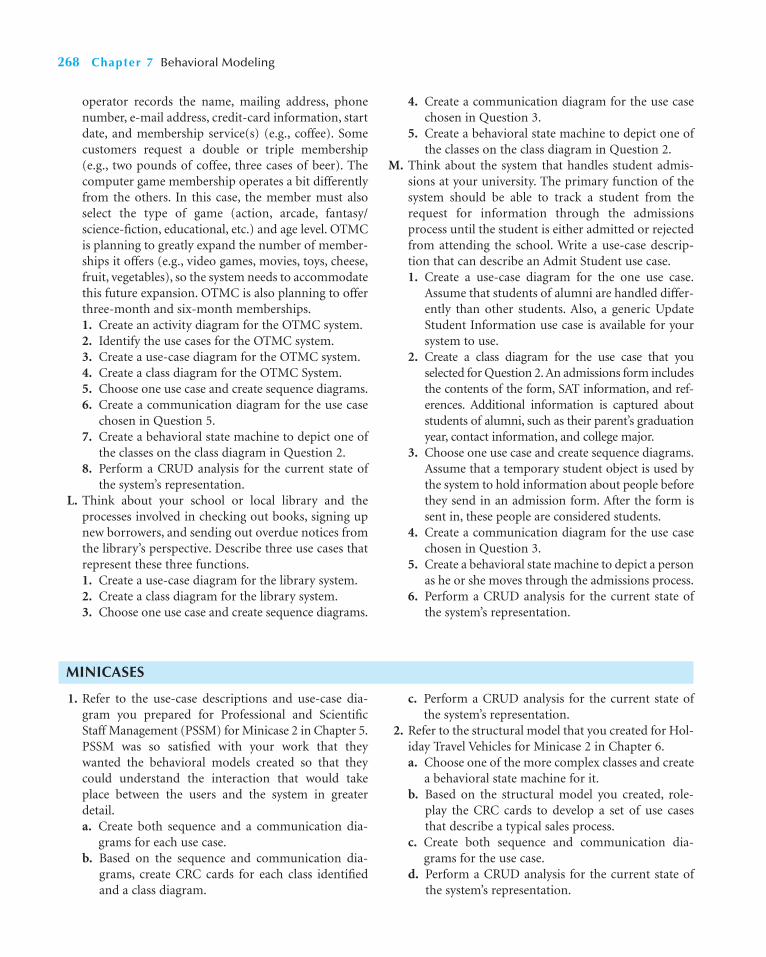
268 Chapter 7 Behavioral Modeling
operator records the name, mailing address, phonenumber, e-mail address, credit-card information, startdate, and membership service(s) (e.g., coffee). Somecustomers request a double or triple membership(e.g., two pounds of coffee, three cases of beer). Thecomputer game membership operates a bit differentlyfrom the others. In this case, the member must alsoselect the type of game (action, arcade, fantasy/science-fiction, educational, etc.) and age level. OTMCis planning to greatly expand the number of member-ships it offers (e.g., video games, movies, toys, cheese,fruit, vegetables), so the system needs to accommodatethis future expansion. OTMC is also planning to offerthree-month and six-month memberships.1. Create an activity diagram for the OTMC system.2. Identify the use cases for the OTMC system.3. Create a use-case diagram for the OTMC system.4. Create a class diagram for the OTMC System.5. Choose one use case and create sequence diagrams.6. Create a communication diagram for the use case
chosen in Question 5.7. Create a behavioral state machine to depict one of
the classes on the class diagram in Question 2.8. Perform a CRUD analysis for the current state of
the system’s representation.L. Think about your school or local library and the
processes involved in checking out books, signing upnew borrowers, and sending out overdue notices fromthe library’s perspective. Describe three use cases thatrepresent these three functions.1. Create a use-case diagram for the library system.2. Create a class diagram for the library system.3. Choose one use case and create sequence diagrams.
4. Create a communication diagram for the use casechosen in Question 3.
5. Create a behavioral state machine to depict one ofthe classes on the class diagram in Question 2.
M. Think about the system that handles student admis-sions at your university. The primary function of thesystem should be able to track a student from therequest for information through the admissionsprocess until the student is either admitted or rejectedfrom attending the school. Write a use-case descrip-tion that can describe an Admit Student use case.1. Create a use-case diagram for the one use case.
Assume that students of alumni are handled differ-ently than other students. Also, a generic UpdateStudent Information use case is available for yoursystem to use.
2. Create a class diagram for the use case that youselected for Question 2. An admissions form includesthe contents of the form, SAT information, and ref-erences. Additional information is captured aboutstudents of alumni, such as their parent’s graduationyear, contact information, and college major.
3. Choose one use case and create sequence diagrams.Assume that a temporary student object is used bythe system to hold information about people beforethey send in an admission form. After the form issent in, these people are considered students.
4. Create a communication diagram for the use casechosen in Question 3.
5. Create a behavioral state machine to depict a personas he or she moves through the admissions process.
6. Perform a CRUD analysis for the current state ofthe system’s representation.
1. Refer to the use-case descriptions and use-case dia-gram you prepared for Professional and ScientificStaff Management (PSSM) for Minicase 2 in Chapter 5.PSSM was so satisfied with your work that theywanted the behavioral models created so that theycould understand the interaction that would takeplace between the users and the system in greaterdetail.a. Create both sequence and a communication dia-
grams for each use case.b. Based on the sequence and communication dia-
grams, create CRC cards for each class identifiedand a class diagram.
c. Perform a CRUD analysis for the current state ofthe system’s representation.
2. Refer to the structural model that you created for Hol-iday Travel Vehicles for Minicase 2 in Chapter 6.a. Choose one of the more complex classes and create
a behavioral state machine for it.b. Based on the structural model you created, role-
play the CRC cards to develop a set of use casesthat describe a typical sales process.
c. Create both sequence and communication dia-grams for the use case.
d. Perform a CRUD analysis for the current state ofthe system’s representation.
MINICASES

Contracts
Hardware/Software Specifications
Deploym
ent D
iagrams
User Interface
Design
Data Access & Manipula-tion Class Design
Object
Persistence Design
Method
SpecificationsC
lass Specifications
Package D
iagramsA
lternativeM
atrix
Factored/Partitioned Structural M
odel
Factored/Partitioned Functional M
odelFactored/Partitioned
Behavioral Model
PART THREE
Design Modeling
Whereas analysis modeling concentrated on the functional requirements of the evolving system, de-sign modeling incorporates the nonfunctional re-quirements. That is, design modeling focuses on how the system will operate. First, the project team veri-fies and validates the analysis models (functional, structural, and behavioral). Next, a set of factored and partitioned analysis models are created. The class and method designs are illustrated using the class specifications (using CRC cards and class diagrams), contracts, and method specifications. Next, the data management layer is addressed by designing the ac-tual database or file structure to be used for object persistence, and a set of classes that will map the class specifications into the object persistence format chosen. Concurrently, the team produces the user in-terface layer design using use scenarios, windows navigation diagrams, real use cases, interface stand-ards, and user interface templates. The physical archi-tecture layer design is created using deployment diagrams and hardware software specification. This collection of deliverables represents the system speci-fication that is handed to the programming team for implementation.
CHAPTER 8Moving on to Design
CHAPTER 9Class and
Method Design
CHAPTER 10Data
Management Layer Design
CHAPTER 11Human Computer
Interaction Layer Design
CHAPTER 12Physical
Architecture Layer Design

This page intentionally left blank
Object-oriented system development uses the requirements that were gathered duringanalysis to create a blueprint for the future system. A successful object-oriented designbuilds upon what was learned in earlier phases and leads to a smooth implementation bycreating a clear, accurate plan of what needs to be done. This chapter describes the initialtransition from analysis to design and presents three ways to approach the design for thenew system.
OBJECTIVES
■ Understand the verification and validation of the analysis models.■ Understand the transition from analysis to design.■ Understand the use of factoring, partitions, and layers.■ Be able to create package diagrams.■ Be familiar with the custom, packaged, and outsource design alternatives.■ Be able to create an alternative matrix.
CHAPTER OUTLINE
C H A P T E R 8
Moving on to Design
271
IntroductionVerifying and Validating the
Analysis ModelsVerification and Validation
through WalkthroughsFunctional Model Verification
and ValidationStructural Model Verification
and ValidationBehavioral Model Verification
and ValidationBalancing the Analysis Models
Evolving the Analysis Models into Design Models
FactoringPartitions and CollaborationsLayers
Packages and Package Diagrams
Identifying Packages and CreatingPackage Diagrams
Verifying and Validating Package Diagrams
Design StrategiesCustom DevelopmentPackaged SoftwareOutsourcingSelecting a Design Strategy
Developing the Actual DesignAlternative Matrix
Applying the Concepts at CD Selections
Packages and Package DiagramsVerifying and Validating the
Analysis ModelsDeveloping the Actual Design
Summary

INTRODUCTION
The purpose of analysis is to figure out what the business needs are. The purpose of designis to decide how to build the system. The major activity that takes place during design isevolving the set of analysis representations into design representations.
Throughout design, the project team carefully considers the new system in respectto the current environment and systems that exist within the organization as a whole.Major considerations of the how of a system are environmental factors such as inte-grating with existing systems, converting data from legacy systems, and leveraging skillsthat exist in-house. Although the planning and analysis are undertaken to develop apossible system, the goal of design is to create a blueprint for a system that makes senseto implement.
An important initial part of design is to examine several design strategies and decidewhich will be used to build the system. Systems can be built from scratch, purchased andcustomized, or outsourced to others, and the project team needs to investigate the viabil-ity of each alternative. This decision influences the tasks that are to be accomplished dur-ing design.
At the same time, detailed design of the individual classes and methods that areused to map out the nuts and bolts of the system and how they are to be stored muststill be completed. Techniques such as CRC cards, class diagrams, contract specification,method specification, and database design provide the final design details in prepara-tion for the implementation phase, and they ensure that programmers have sufficientinformation to build the right system efficiently. These topics are covered in Chapters 9and 10.
Design also includes activities such as designing the user interface, system inputs, andsystem outputs, which involve the ways that the user interacts with the system. Chapter 11describes these three activities in detail, along with techniques such as storyboarding andprototyping, which help the project team design a system that meets the needs of its usersand is satisfying to use.
Finally, physical architecture decisions are made regarding the hardware and softwarethat will be purchased to support the new system and the way that the processing of thesystem will be organized. For example, the system can be organized so that its processing iscentralized at one location, distributed, or both centralized and distributed, and each solu-tion offers unique benefits and challenges to the project team. Because global issues andsecurity will influence the implementation plans that are made, they need to be consideredalong with the system’s technical architecture. Physical architecture, security, and globalissues are described in Chapter 12.
The many steps of design are highly interrelated and, as with the steps in analysis, theanalysts often go back and forth among them. For example, prototyping in the interfacedesign step often uncovers additional information that is needed in the system. Alterna-tively, a system that is being designed for an organization that has centralized systems mayrequire substantial hardware and software investments if the project team decides tochange to a system in which all the processing is distributed.
In this chapter, we overview the processes that are used to evolve the analysis modelsinto design models. But, before we move on into design, we really need to be sure that thecurrent analysis models are consistent. As such, we next discuss an approach to verify andvalidate the analysis models. Afterward, we describe different higher-level constructs thatcan be used to evolve the analysis models into design models. Then, we introduce the useof packages and package diagrams as a means of representing the higher-level constructsused to evolve the models. Finally, we examine the three fundamental approaches to devel-oping new systems: make, buy, or outsource.
272 Chapter 8 Moving on to Design
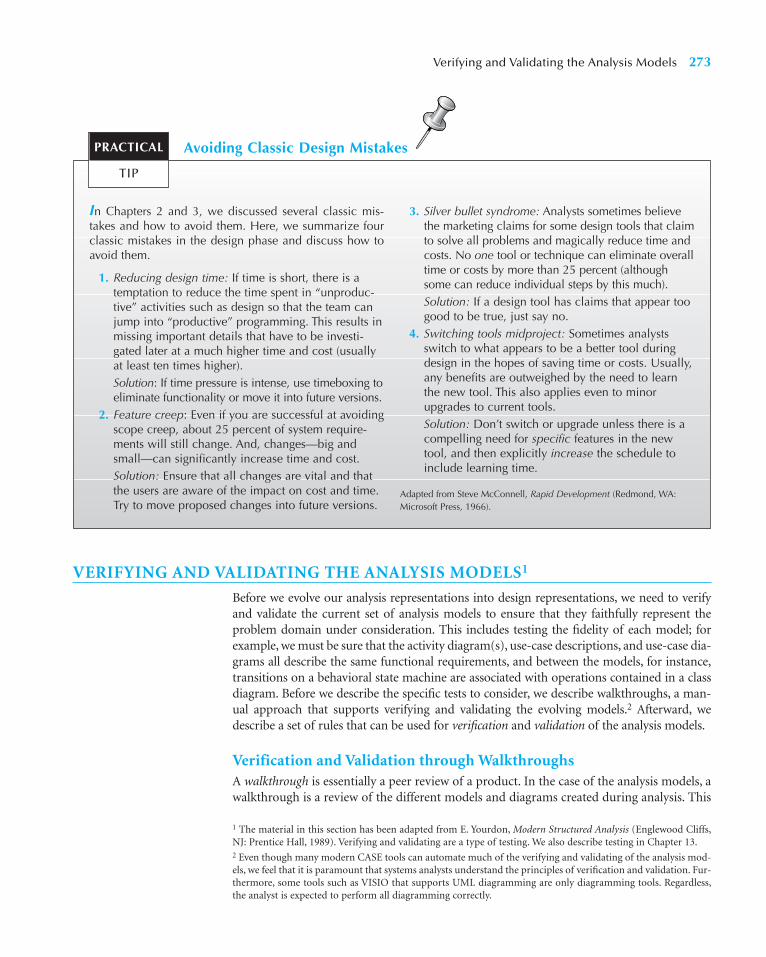
VERIFYING AND VALIDATING THE ANALYSIS MODELS1
Before we evolve our analysis representations into design representations, we need to verifyand validate the current set of analysis models to ensure that they faithfully represent theproblem domain under consideration. This includes testing the fidelity of each model; forexample, we must be sure that the activity diagram(s), use-case descriptions, and use-case dia-grams all describe the same functional requirements, and between the models, for instance,transitions on a behavioral state machine are associated with operations contained in a classdiagram. Before we describe the specific tests to consider, we describe walkthroughs, a man-ual approach that supports verifying and validating the evolving models.2 Afterward, wedescribe a set of rules that can be used for verification and validation of the analysis models.
Verification and Validation through WalkthroughsA walkthrough is essentially a peer review of a product. In the case of the analysis models, awalkthrough is a review of the different models and diagrams created during analysis. This
Verifying and Validating the Analysis Models 273
In Chapters 2 and 3, we discussed several classic mis-takes and how to avoid them. Here, we summarize fourclassic mistakes in the design phase and discuss how toavoid them.
1. Reducing design time: If time is short, there is atemptation to reduce the time spent in “unproduc-tive” activities such as design so that the team canjump into “productive” programming. This results inmissing important details that have to be investi-gated later at a much higher time and cost (usuallyat least ten times higher).Solution: If time pressure is intense, use timeboxing toeliminate functionality or move it into future versions.
2. Feature creep: Even if you are successful at avoidingscope creep, about 25 percent of system require-ments will still change. And, changes—big andsmall—can significantly increase time and cost.Solution: Ensure that all changes are vital and thatthe users are aware of the impact on cost and time.Try to move proposed changes into future versions.
3. Silver bullet syndrome: Analysts sometimes believethe marketing claims for some design tools that claimto solve all problems and magically reduce time andcosts. No one tool or technique can eliminate overalltime or costs by more than 25 percent (althoughsome can reduce individual steps by this much).Solution: If a design tool has claims that appear toogood to be true, just say no.
4. Switching tools midproject: Sometimes analystsswitch to what appears to be a better tool duringdesign in the hopes of saving time or costs. Usually,any benefits are outweighed by the need to learnthe new tool. This also applies even to minorupgrades to current tools.Solution: Don’t switch or upgrade unless there is acompelling need for specific features in the newtool, and then explicitly increase the schedule toinclude learning time.
Adapted from Steve McConnell, Rapid Development (Redmond, WA:Microsoft Press, 1966).
Avoiding Classic Design MistakesPRACTICAL
TIP
1 The material in this section has been adapted from E. Yourdon, Modern Structured Analysis (Englewood Cliffs,NJ: Prentice Hall, 1989). Verifying and validating are a type of testing. We also describe testing in Chapter 13.2 Even though many modern CASE tools can automate much of the verifying and validating of the analysis mod-els, we feel that it is paramount that systems analysts understand the principles of verification and validation. Fur-thermore, some tools such as VISIO that supports UML diagramming are only diagramming tools. Regardless,the analyst is expected to perform all diagramming correctly.
review typically is completed by a team of individuals that comes from the analysis team, thedesign team, and the client. The purpose of an analysis walkthrough is to thoroughly test thefidelity of the analysis models to the functional requirements and to ensure that the modelsare consistent. That is, an analysis walkthrough uncovers errors or faults in the evolving spec-ification. However, a walkthrough does not correct errors—it simply identifies them. Errorcorrection is to be accomplished by the analysis team after the walkthrough is completed.
Walkthroughs are very interactive. As the presenter “walks” through the representa-tion, members of the walkthrough team should ask questions regarding the representation.For example, if the presenter is walking through a class diagram, another member of theteam could ask why certain attributes, operations, or associations were not included. Theactual process of simply presenting the representation to a new set of eyes can uncoverobvious misunderstandings and omissions. In many cases, the representation creator canget lost in the proverbial trees and not see the forest.3 In fact, many times the act of walkingthrough the representation causes a presenter to see the error himself or herself. For psy-chological reasons, hearing the representation helps the analyst to see the representationmore completely.4 As such, the representation creators should regularly do a walkthroughof the analysis models themselves by reading the representations out loud to themselves,regardless of how they think it may make them look.
There are specified roles that different members of the walkthrough team can play. Thefirst is the presenter role. This should be played by the individual who is primarily responsi-ble for the specific representation being reviewed. This individual presents the representationto the walkthrough team. The second role is recorder, or scribe. The recorder should be amember of the analysis team. This individual carefully takes the minutes of the meeting byrecording all significant events that occur during the walkthrough. In particular, all errorsthat are uncovered must be documented so that the analysis team can address them. Anotherimportant role is to have someone who raises issues regarding maintenance of the represen-tation. Yourdon refers to this individual as a maintenance oracle.5 Due to the emphasis onreusability in object-oriented development, this role becomes particularly crucial. Finally,someone must be responsible for calling, setting up, and running the walkthrough meetings.
For a walkthrough to be successful, the members of the walkthrough team must befully prepared. As such, all materials to be reviewed must be distributed with sufficient timefor the team members to review them before the actual meeting. Furthermore, all teammembers should be expected to mark up the representations so that during the walk-through meeting, all relevant issues can be discussed. Otherwise, the walkthrough will beboth inefficient and ineffective. During the actual meeting, as the presenter is walkingthrough the representation, the team members should point out any potential errors ormisunderstandings. In many cases, the errors and misunderstandings are caused by invalidassumptions that would not be uncovered without the walkthrough.
One potential danger of walkthroughs is when management decides the results ofuncovering errors in the representation are a reflection of an analyst’s capability. This mustbe avoided at all costs. Otherwise, the underlying purpose of the walkthrough—to improvethe fidelity of the representation—will be thwarted. Depending on the organization, it maybe necessary to omit management from the walkthrough process. If not, the walkthroughprocess may break down into a slugfest to make some team members to look good bydestroying the presenter. To say the least, this is obviously counterproductive.
274 Chapter 8 Moving on to Design
3 In fact, all joking aside, in many cases the developer is down at the knothole level and can’t even see the tree, letalone the forest.4 This has to do with using different senses. Because our haptic senses are the most sensitive, “touching” the rep-resentation would be best. However, it is not clear how one can touch a use case or a class.5 See Appendix D of Yourdon, Modern Structured Analysis.

Functional Model Verification and ValidationIn this book, we have suggested three different representations for the functional model:activity diagrams, use-case descriptions, and use-case diagrams (see Chapter 5). In this sec-tion, we describe a set of rules to ensure that these three representations are consistentamong themselves.
First, when comparing an activity diagram to a use-case description, there should beat least one event recorded in the normal flow of events, subflows, or alternate/exceptionalflows of the use-case description for each activity or action that is included on an activitydiagram, and each event should be associated with an activity or action. For example, inFigure 5-2, there is an activity labeled Get Patient Information that seems to be associatedwith the first two events contained in the normal flow of events of the use-case descriptionshown in Figure 5-5.
Second, all objects portrayed as an object node in an activity diagram must be mentionedin an event in the normal flow of events, subflows, or alternate/exceptional flows of the use-case description. For example, the activity diagram in Figure 5-2 portrays an Appt object, andthe use-case description refers to a new appointment and changing an existing appointment.
Third, sequential order of the events in a use-case description should occur in the samesequential order of the activities contained in an activity diagram. For example in Figures 5-2and 5-5, the events associated with the Get Patient Information activity (events 1 and 2) shouldoccur before the events associated with the Make Payment Arrangements activity (event 4).
Fourth, when comparing a use-case description to a use-case diagram, there mustbe one and only one use-case description for each use case, and vice versa. For example,Figure 5-5 portrays the use-case description of the Make Appointment use case. However,the use-case diagrams shown in Figures 5-8, 5-9, and 5-10 are not totally consistent withthe use-case description given in Figure 5-5. As such, either the use-case description needsto be modified by breaking it down into multiple use-case descriptions or the use-casediagram needs to be modified. Upon reviewing the two representations, it was decidedto create a new use-case diagram (see Figure 8-1) that was consistent with the use-case
Verifying and Validating the Analysis Models 275
Appointment System
Make Payment Arrangements
Create New Patient
Produce Schedule Information
Patient
Make Appointment * *
Management
Doctor
Record Availability
Manage Schedule
* *
* *
<<
include>>
<<include>>
<<include>><<
exte
nd>>
FIGURE 8-1 Modified Use-Case Diagram for the Appointment System

description given in Figure 5-5. However, there are still inconsistencies between the tworepresentations: the use-case diagram has use cases portrayed on it, but there were no use-case descriptions associated with them. For presentation purposes, we have omitted thoseadditional descriptions. As such, we can safely assume that they would go through the sametesting procedure that the Make Appointment use case does.
Fifth, all actors listed in a use case description must be portrayed on the use-case dia-gram. Furthermore, each one must have an association link that connects it to the use caseand must be listed with the association relationships in the use-case description. Forexample, the Patient actor is listed in the use-case description of the Make Appointmentuse case (see Figure 5-5), it is listed with the association relationships in the MakeAppointment use-case description, and it is connected to the use case in the use-case dia-gram (see Figure 8-1).
Sixth, in some organizations, we should also include the stakeholders listed in the use-case description as actors in the use-case diagram. For example, there could have been anassociation between the Doctor actor and the Make Appointment use case (see Figures 5-5and 8-1). However, in this case it was decided not to include this association because theDoctor never participates in the Make Appointment use case.6
Seventh, all other relationships listed in a use-case description (include, extend, andgeneralization) must be portrayed on a use-case diagram. For example, in Figure 5-5, thereis an include relationship listed with the Make Payment Arrangements use case and inFigure 8-1, we see that it appears on the diagram between the two use cases.
Finally, there are many diagram-specific requirements that must be enforced. Forexample, in an activity diagram a decision node can be connected to activity or actionnodes only with a control flow, and for every decision node there should be a matchingmerge node (see Chapter 5). Every type of node and flow has different restrictions.However, the complete restrictions for all the UML diagrams are beyond the scope ofthis text.7 The concept map in Figure 8-2 portrays the associations among the func-tional models.
Structural Model Verification and ValidationIn Chapter 6, we suggested three representations that could be used for structural model-ing: CRC cards, class diagrams, and object diagrams. Because an object diagram is simplyan instantiation of some part of a class diagram, we limit our discussion to CRC cards andclass diagrams. As in the previous section regarding functional models, this section pro-vides a set of rules that will test the consistency within the structural models. For examplepurposes, we use the appointment problem described in Chapters 5, 6, and 7. An exampleCRC card for the patient class is shown in Figure 6-1, and the associated class diagram isportrayed in Figure 6-2.
First, every CRC card should be associated with a class on the class diagram, and viceversa. For example, the Patient CRC card is associated with the Patient class on the classdiagram (see Figures 6-1 and 6-2). However, in Chapter 6 we portrayed a CRC card onlyfor the Patient class. Obviously, there needs to be a CRC card associated with each andevery class on the class diagram for the structural model to be consistent.
276 Chapter 8 Moving on to Design
6 Another possibility could have been to include a Receptionist actor. However, we had previously decided that theReceptionist was in fact part of the Appointment System and not simply a user of the system. If UML supportedthe idea of internal actors, or actor-to-actor associations, this implicit association could easily be made explicit byhaving the Patient actor communicate with the Receptionist actor directly, regardless of whether the Receptionistactor was part of the system or not. See Footnote 19 in Chapter 5.7 A good reference for these types of restrictions is S.W. Ambler, The Elements of UML 2.0 Style (Cambridge, UK:Cambridge University Press, 2005).
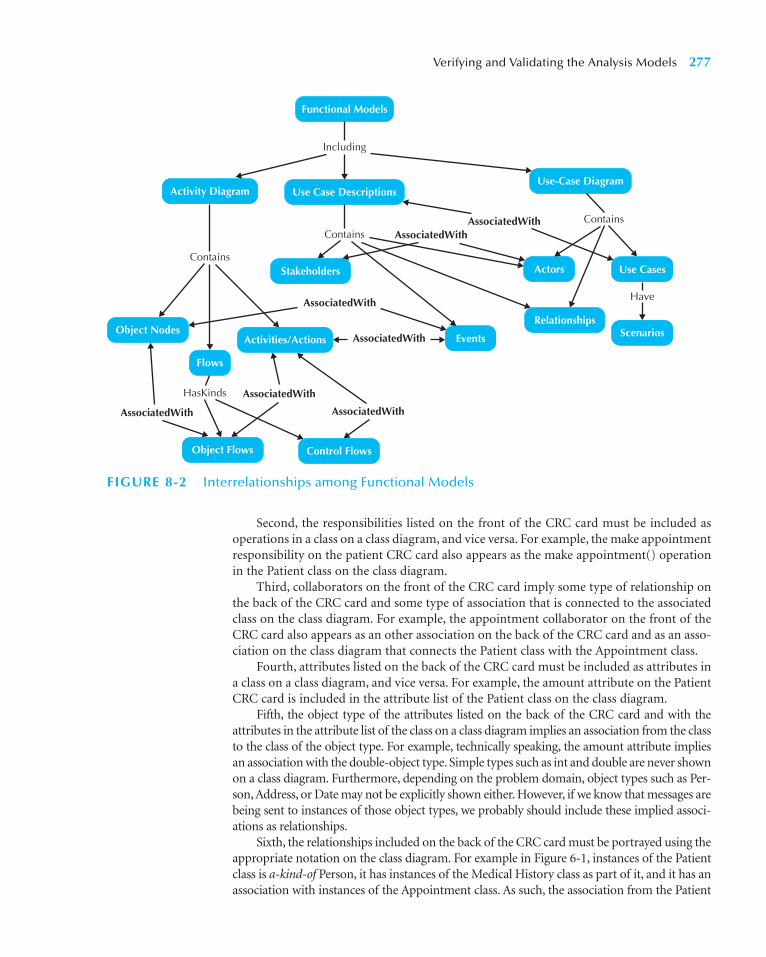
Second, the responsibilities listed on the front of the CRC card must be included asoperations in a class on a class diagram, and vice versa. For example, the make appointmentresponsibility on the patient CRC card also appears as the make appointment() operationin the Patient class on the class diagram.
Third, collaborators on the front of the CRC card imply some type of relationship onthe back of the CRC card and some type of association that is connected to the associatedclass on the class diagram. For example, the appointment collaborator on the front of theCRC card also appears as an other association on the back of the CRC card and as an asso-ciation on the class diagram that connects the Patient class with the Appointment class.
Fourth, attributes listed on the back of the CRC card must be included as attributes ina class on a class diagram, and vice versa. For example, the amount attribute on the PatientCRC card is included in the attribute list of the Patient class on the class diagram.
Fifth, the object type of the attributes listed on the back of the CRC card and with theattributes in the attribute list of the class on a class diagram implies an association from the classto the class of the object type. For example, technically speaking, the amount attribute impliesan association with the double-object type. Simple types such as int and double are never shownon a class diagram. Furthermore, depending on the problem domain, object types such as Per-son, Address, or Date may not be explicitly shown either. However, if we know that messages arebeing sent to instances of those object types, we probably should include these implied associ-ations as relationships.
Sixth, the relationships included on the back of the CRC card must be portrayed using theappropriate notation on the class diagram. For example in Figure 6-1, instances of the Patientclass is a-kind-of Person, it has instances of the Medical History class as part of it, and it has anassociation with instances of the Appointment class. As such, the association from the Patient
Verifying and Validating the Analysis Models 277
Including
Contains
ContainsContains
HasKinds
AssociatedWith
AssociatedWith
AssociatedWith
AssociatedWith
AssociatedWith
AssociatedWith
Have
AssociatedWith
Activity Diagram
Activities/Actions
Functional Models
Use-Case Diagram
Object Nodes
Flows
Use Cases
ScenariosRelationships
Stakeholders Actors
Events
Use Case Descriptions
Object Flows Control Flows
FIGURE 8-2 Interrelationships among Functional Models

class to the Person class should represent that the Person class is a generalization of its sub-classes, including the Patient class; the association from the Patient class to the Medical His-tory class is in the form of aggregation (a white diamond); and the association betweeninstances of the Patient class and instances of the Appointment class is a simple association.
Seventh, an association class, such as the Treatment class in Figure 6-2, should be cre-ated only if there is indeed some unique characteristic (attribute, operation, or relation-ship) about the intersection of the connecting classes. If no unique characteristic exists,then the association class should be removed and only an association between the two con-necting classes should be displayed.
Eighth, there are times that subclasses contained in a class diagram are really nothingmore than different states through which an instance of the superclass will go during theinstance’s lifetime. For example, as we discussed in Chapter 7, the subclasses of Freshman,Sophomore, Junior, and Senior really were states that an instance of the Undergraduateclass would traverse (see Figure 7-12). In this case, removing subclasses from the class dia-gram can improve the fidelity of the diagram.
Finally, as in the functional models, there are specific representation rules that must beenforced. For example, a class cannot be a subclass of itself. As such, the Patient CRC cardcannot list Patient with the generalization relationships on the back of the CRC card, norcan a generalization relationship be drawn from the Patient class to itself. Again, all thedetailed restrictions for each representation is beyond the scope of this book.8 Figure 8-3portrays the associations among the structural models.
Behavioral Model Verification and ValidationIn Chapter 7, we described three different diagrams that could be used to represent thebehavioral model: the sequence diagram, the communication diagram, and the behavioralstate machine. The sequence and communication diagrams modeled the interactionamong instances of classes that worked together to support the business processes includedin a system, whereas the behavioral state machine described the state changes throughwhich an object traverses during its lifetime. We again use the appointment systemdescribed in Chapters 5, 6, and 7 and focus on Figures 7-1, 7-5, 7-9, and 7-14 to describe aset of rules that can be used to ensure that the behavioral model is internally consistent.
First, every actor and object included on a sequence diagram must be included as anactor and an object on a communication diagram, and vice versa. For example, in Figures7-1 and 7-5, the aReceptionist actor and the Patients object appear on both diagrams.
Second, if there is a message on the sequence diagram, there must be an association onthe communications diagram, and vice versa. For example, Figure 7-1 portrays a messagebeing sent from the aReceptionist actor to the Patients object. As such, a matching associ-ation appears in the corresponding communication diagram (see Figure 7-5).
Third, every message that is included on a sequence diagram must appear as a messageon an association in the corresponding communication diagram, and vice versa. For exam-ple, the LookUpPatient() message sent by the aReceptionist actor to the Patients object onthe sequence diagram (see Figure 7-1) appears as a message on the association between theaReceptionist actor and the Patients object on the communication diagram (see Figure 7-5).
Fourth, if a guard condition appears on a message in the sequence diagram, there mustbe an equivalent guard condition on the corresponding communication diagram, and viceversa. For example, the message sent from the aReceptionist actor to the UnpaidBills objecthas a guard condition of [aPatient Exists] (see Figure 7-1). Figure 7-5 shows the matchingguard condition included on the communication diagram.
278 Chapter 8 Moving on to Design
8 See Footnote 7.
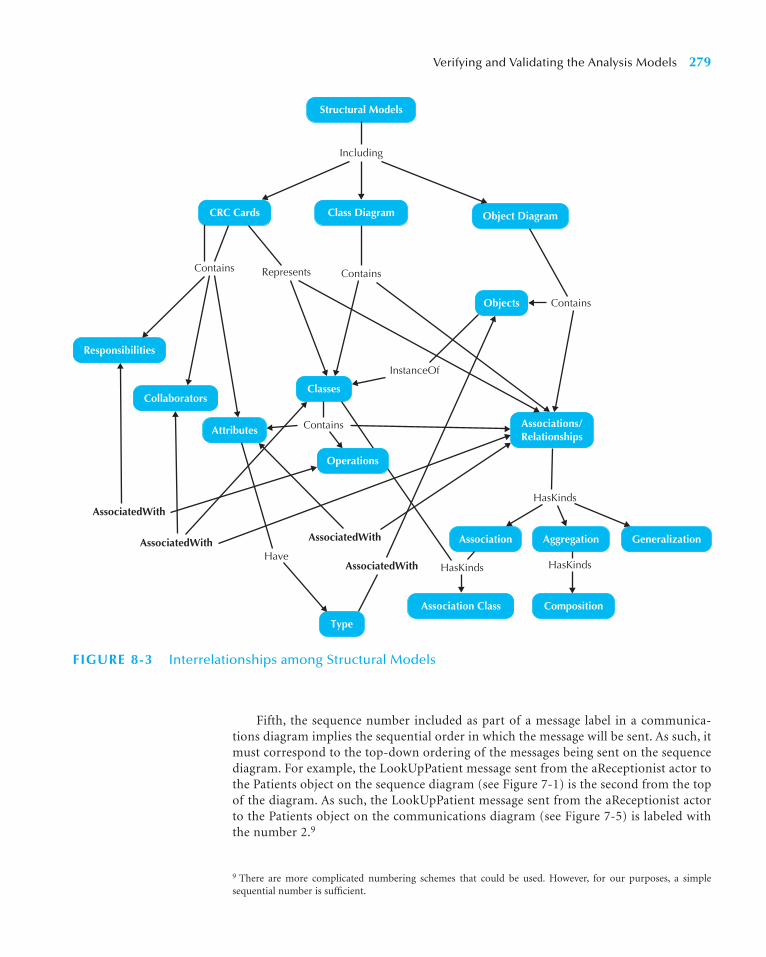
Fifth, the sequence number included as part of a message label in a communica-tions diagram implies the sequential order in which the message will be sent. As such, itmust correspond to the top-down ordering of the messages being sent on the sequencediagram. For example, the LookUpPatient message sent from the aReceptionist actor tothe Patients object on the sequence diagram (see Figure 7-1) is the second from the topof the diagram. As such, the LookUpPatient message sent from the aReceptionist actorto the Patients object on the communications diagram (see Figure 7-5) is labeled withthe number 2.9
Verifying and Validating the Analysis Models 279
9 There are more complicated numbering schemes that could be used. However, for our purposes, a simplesequential number is sufficient.
Structural Models
Including
Contains Contains
Contains
Class Diagram
Responsibilities
Collaborators
Association Aggregation
Composition
Attributes
Classes
Type
CRC Cards
Objects
Object Diagram
Contains
Represents
Associations/ Relationships
Have
HasKinds
Generalization
Association Class
HasKindsHasKinds
InstanceOf
AssociatedWith
AssociatedWith
AssociatedWith
AssociatedWith
Operations
FIGURE 8-3 Interrelationships among Structural Models

Sixth, all transitions contained in a behavior state machine must be associated with amessage being sent on a sequence and communication diagram, and it must be classifiedas a (C)reate, (U)pdate, or (D)elete message in a CRUD matrix. For example, in Figure 7-9the Checks In transition must be associated with a message in the corresponding sequenceand communication diagrams. Furthermore, it should be associated with an (U)pdateentry in the CRUD matrix associated with the hospital patient system.
Seventh, all entries in a CRUD matrix imply a message being sent from an actor orobject to another actor or object. If the entry is a (C)reate, (U)pdate, or (D)elete, then theremust be an associated transition in a behavioral state machine that represents the instancesof the receiving class. For example in Figure 7-14 the R and U entries in the Receptionistrow and Appointments column imply that instances of the Receptionist actor will read andupdate instances of the Appointments class. As such, there should be read and update mes-sages on the sequence and communication diagrams corresponding with the appointmentsprocesses. Reviewing Figures 7-1 and 7-5, we see that there is a message, MatchAppts(),from the aReceptionist actor to the Appointments object. However, based on this review, itis unclear as to whether the MatchAppts() message represents a read, update, or both. Assuch, additional analysis is required.10 Furthermore, because there is an (U)pdate messageinvolved, there must be a transition on a behavioral state machine that portrays the lifecycle of an Appointments object.
Finally, there are many representation specific rules that have been proposed. However,as in the other models, these rules are beyond the scope of this section on verification andvalidation.11 Figure 8-4 portrays the associations among the behavioral models.
Balancing the Analysis ModelsIn the previous sections, we have focused on verifying and validating the individualmodels: function, structural, and behavioral. However, as we have stated repeatedly,object-oriented systems development is incremental and iterative. Figure 8-5 portraysthe fact that the object-oriented analysis models are highly interrelated. Next, we centerour attention on ensuring that the different models are consistent. For example, do thefunctional and structural models agree? What about the functional and behavioral mod-els? And finally, are the structural and behavioral models trustworthy? In this section, wedescribe a set of rules that are useful to verify and validate the intersections of the analy-sis models. Depending on the specific constructs of each actual model, different interre-lationships are relevant. The process of ensuring the consistency among them is knownas balancing the models.
Balancing Functional and Structural Models To balance the functional and structuralmodels, we must ensure that the two sets of models are consistent with each other. That is,the activity diagrams, use-case descriptions, and use-case diagrams must agree with theCRC cards and class diagrams that represent the evolving model of the problem domain.Figure 8-6 shows the interrelationships between the functional and structural models. Byreviewing this figure, we uncover four sets of associations between the models. This givesus a place to begin balancing the functional and structural models.12
280 Chapter 8 Moving on to Design
10 We have delayed the description of designing operations/methods until Chapter 9. As such, the detailed infor-mation required to understand a specific message has not been created yet. However, in many cases, enough infor-mation will already have been created to validate many of the transitions in behavioral state machines and CRUDmatrices.11 See Footnote 7.12 Role-playing the CRC cards (see Chapter 6) also can be very useful in verifying and validating the interrela-tionships among the functional and structural models.

Verifying and Validating the Analysis Models 281
Including
HasKinds
Contains
HasKinds
DescribeContains Contains
Contains
AssociatedWithAssociatedWith
Behavioral State Machine
Interaction Diagram
Behavioral Models
Sequence DiagramCommunication Diagram
Objects Actors
Delete
Update
States
Create
MessagesCell Entries Transitions
CRUD Matrix
Associations
Read
FIGURE 8-4 Interrelationships among Behavioral Models
Functional Models
Structural Models
Behavioral Models
FIGURE 8-5Object-OrientedAnalysis Models
First, each and every class on a class diagram and each and every CRC card must beassociated with at least one use case, and vice versa. For example, the CRC card, portrayedin Figure 6-1, and its related class contained in the class diagram (see Figure 6-2) is associ-ated with the Make Appointment use case described in Figure 5-5.
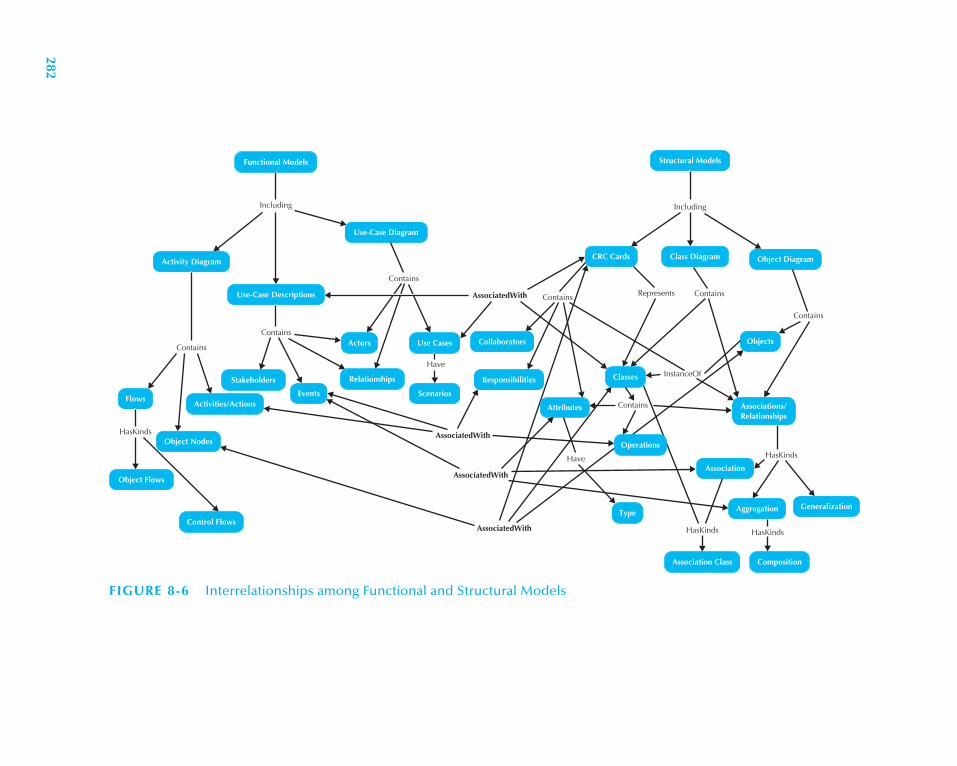
Including
Contains
AssociatedWith
AssociatedWith
AssociatedWith
AssociatedWith
InstanceOf
Represents
Have
HasKindsHasKinds
HasKinds
Contains
Including
Contains
HasKinds
Contains
Contains
Have
Contains
Contains
Structural Models
CRC Cards Object DiagramClass Diagram
Collaborators
Responsibilities
Type
Objects
Classes
Aggregation
Association
Generalization
Associations/ Relationships
CompositionAssociation Class
Functional Models
Use-Case Diagram
Activity Diagram
Activities/Actions
Use-Case Descriptions
FlowsEvents
Actors
Object Nodes
Stakeholders Relationships
Object Flows
Control Flows
Use Cases
Scenarios
Attributes
Operations
FIGURE 8-6 Interrelationships among Functional and Structural Models
282
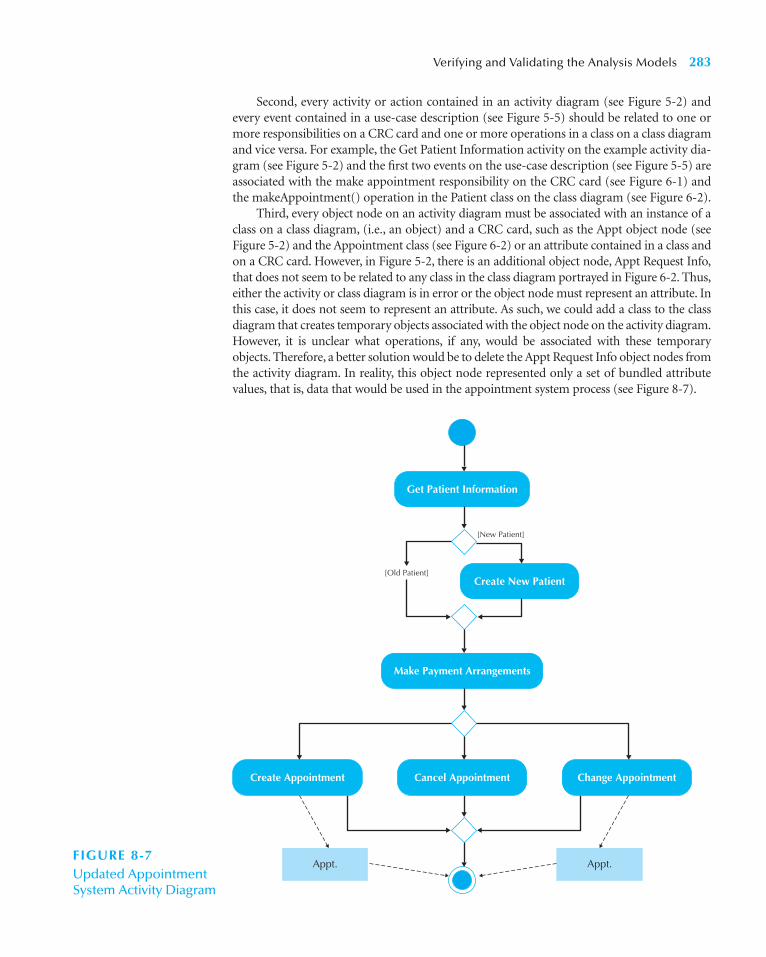
Second, every activity or action contained in an activity diagram (see Figure 5-2) andevery event contained in a use-case description (see Figure 5-5) should be related to one ormore responsibilities on a CRC card and one or more operations in a class on a class diagramand vice versa. For example, the Get Patient Information activity on the example activity dia-gram (see Figure 5-2) and the first two events on the use-case description (see Figure 5-5) areassociated with the make appointment responsibility on the CRC card (see Figure 6-1) andthe makeAppointment() operation in the Patient class on the class diagram (see Figure 6-2).
Third, every object node on an activity diagram must be associated with an instance of aclass on a class diagram, (i.e., an object) and a CRC card, such as the Appt object node (seeFigure 5-2) and the Appointment class (see Figure 6-2) or an attribute contained in a class andon a CRC card. However, in Figure 5-2, there is an additional object node, Appt Request Info,that does not seem to be related to any class in the class diagram portrayed in Figure 6-2. Thus,either the activity or class diagram is in error or the object node must represent an attribute. Inthis case, it does not seem to represent an attribute. As such, we could add a class to the classdiagram that creates temporary objects associated with the object node on the activity diagram.However, it is unclear what operations, if any, would be associated with these temporaryobjects. Therefore, a better solution would be to delete the Appt Request Info object nodes fromthe activity diagram. In reality, this object node represented only a set of bundled attributevalues, that is, data that would be used in the appointment system process (see Figure 8-7).
Verifying and Validating the Analysis Models 283
Get Patient Information
Appt. Appt.
Create New Patient
Make Payment Arrangements
[New Patient]
[Old Patient]
Cancel Appointment Change AppointmentCreate Appointment
FIGURE 8-7Updated AppointmentSystem Activity Diagram

Fourth, every attribute and association/aggregation relationships contained on a CRCcard (and connected to a class on a class diagram) should be related to the subject or objectof an event in a use-case description. For example, in Figure 5-5, the second event states:The Patient provides the Receptionist with their name and address. By reviewing the CRCcard in Figure 6-1 and the class diagram in Figure 6-2, we see that the Patient class is a sub-class of the Person class and, hence, inherits all the attributes, associations, and operationsdefined with the Person class, where name and address attributes are defined.
Balancing Functional and Behavioral Models As in balancing the functional and struc-tural models, we must ensure the consistency of the two sets of models. In this case, theactivity diagrams, use-case descriptions, and use-case diagrams must agree with thesequence diagrams, communication diagrams, behavioral state machines, and CRUDmatrix. Figure 8-8 portrays the interrelationships between the functional and behavioralmodels. Based on these interrelationships, we see that there are four areas with which wemust be concerned.13
First, the sequence and communication diagrams must be associated with a use caseon the use-case diagram and a use-case description. For example, the sequence diagram inFigure 7-1 and the communication diagram in Figure 7-5 are related to scenarios of theMake Appointment use case that appears in the use-case description in Figure 5-5 and theuse-case diagram in Figure 8-1.
Second, actors on sequence diagrams, communication diagrams, and/or CRUD matricesmust be associated with actors on the use-case diagram or referenced in the use-case description,and vice versa. For example, the aPatient actor in the sequence diagram in Figure 7-1, the com-munication diagram in Figure 7-5, and the CRUD matrix in Figure 7-14 appears in the use-casediagram in Figure 8-1 and the use-case description of Figure 5-5. However, the aReceptionistdoes not appear in the use-case diagram but is referenced in the events associated with the MakeAppointment use-case description. In this case, the aReceptionist actor is obviously an internalactor, which cannot be portrayed on UML’s use-case diagram.
Third, messages on sequence and communication diagrams, transitions on behavioralstate machines, and entries in a CRUD matrix must be related to activities and actions onan activity diagram and events listed in a use-case description, and vice versa. For example,the CreateAppt() message on the sequence and communication diagrams (see Figures 7-1and 7-5) is related to the CreateAppointment activity (see Figure 8-7) and the S-1: NewAppointment subflow on the use-case description (see Figure 5-5). Furthermore, the Centry into the Receptionist Appointment cell of the CRUD matrix is also associated withthese messages, activity, and subflow.
Fourth, all complex objects represented by an object node in an activity diagram musthave a behavioral state machine that represents the object’s lifecycle, and vice versa. Asstated in Chapter 7, complex objects tend to be very dynamic and pass through a variety ofstates during their lifetimes. However, the Appointment object node (see Figure 8-7) seemsto represent a fairly simple object. It seems only to be created, changed, and canceled. Assuch, in this case no behavioral state machine would be necessary.
Balancing Structural and Behavioral Models To discover the interrelationships amongthe structural and behavioral models, we use the concept map in Figure 8-9. In this case,there are five areas in which we must ensure the consistency among the models.14
284 Chapter 8 Moving on to Design
13 Performing CRUD analysis (see Chapter 7) could also be useful in reviewing the intersections among thefunctional and behavioral models.14 Both role-playing (see Chapter 6) and CRUD analysis (see Chapter 7) also can be very useful in this undertaking.
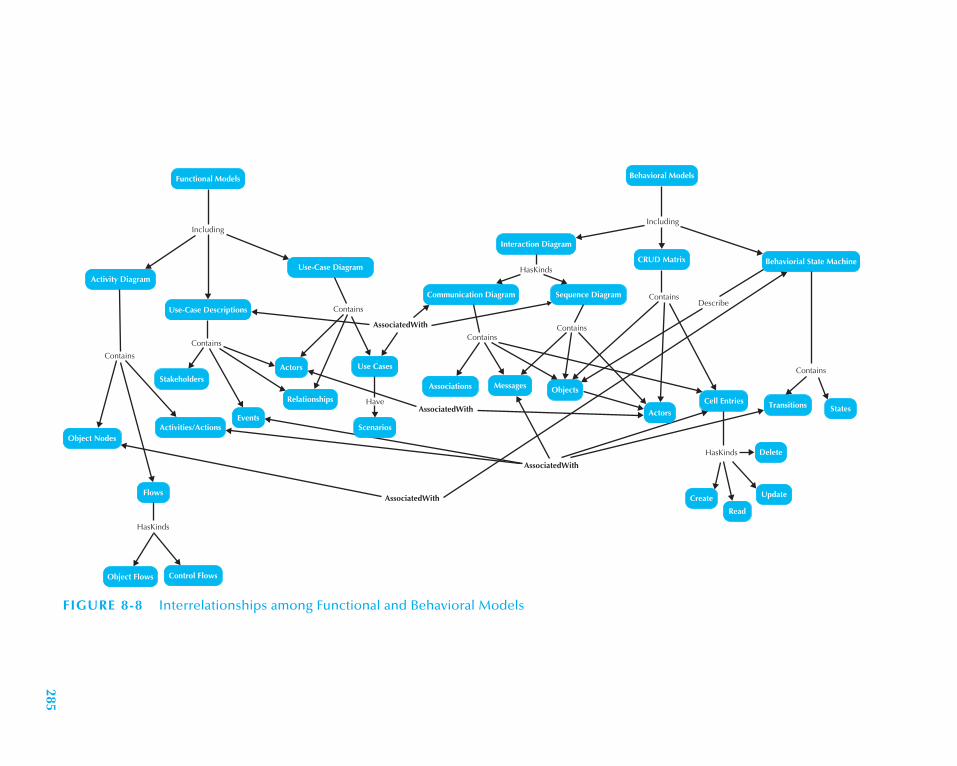
Including
AssociatedWith
AssociatedWith
AssociatedWith
AssociatedWith
Contains
Describe
Including
Contains
Contains
Contains
HasKinds
HasKinds
ContainsContains
Have
HasKinds
Contains
Behavioral Models
CRUD Matrix
Communication Diagram
Associations Messages
Sequence Diagram
Cell Entries Transitions States
Activity Diagram
Use-Case Diagram
Use-Case Descriptions
Object NodesActivities/Actions
Stakeholders
Relationships
UpdateCreate
Objects
Use Cases
Control FlowsObject Flows
Flows
Events
Actors
Functional Models
Behaviorial State Machine
Interaction Diagram
Read
Delete
Scenarios
Actors
FIGURE 8-8 Interrelationships among Functional and Behavioral Models
285

IncludingIncluding
Contains Contains
AssociatedWith
AssociatedWith
AssociatedWith
AssociatedWith
Structural Models
CRC Cards
Object DiagramClass Diagram
Contains
Contains Contains
InstanceOf
Responsibilities
ObjectsRepresents
ClassesAssociations/ Relationships
Attributes
Type
Have
HasKinds
HasKinds
HasKinds
HasKinds
Association Aggregation Generalization
CompositionAssociation Class
Operations
Contains
Behavioral Models
Interaction Diagram
Behaviorial State MachineCRUD Matrix
Communication Diagram
Associations
Actors
Messages
Sequence Diagram
Cell Entries
Transitions
Contains
Contains
Describe
States
Delete
UpdateReadCreate
HasKinds
Objects
Collaborators
FIGURE 8-9 Interrelationships among Structural and Behavioral Models
286

First, objects that appear in a CRUD matrix must be associated with classes that arerepresented by CRC cards and appear on the class diagram, and vice versa. For example,the Patient class in the CRUD matrix in Figure 7-14 is associated with the CRC card inFigure 6-1 and the Patient class in the class diagram in Figure 6-2.
Second, because behavioral state machines represent the life cycle of complex objects,they must be associated with instances (objects) of classes on a class diagram and with aCRC card that represent the class of the instance. For example, the behavior state machinethat describes an instance of an Order class in Figure 7-11 implies that an Order class existson a related class diagram and that a CRC card exists for the related class.
Third, communication and sequence diagrams contain objects that must be an instanti-ation of a class that is represented by a CRC card and is located on a class diagram. For exam-ple, Figure 7-1 and Figure 7-5 have an anAppt object that is an instantiation of anAppointment class. As such, the Appointment class must exist in the class diagram (see Figure6-2) and a CRC card should exist that describes it. However, there are several objects on thecommunication and sequence diagrams associated with classes that do not exist on the classdiagram. These include a PatientsList class, a BillsList class, and ApptsList class. At this point intime, the analyst must decide to either modify the class diagram by adding these classes orrethink the communication and sequence diagrams. In this specific case, because we are mov-ing on into design, it is better to add the classes to the class diagram (see Figure 8-10).
Fourth, messages contained on the sequence and communication diagrams, transi-tions on behavioral state machines, and cell entries on a CRUD matrix must be associatedwith responsibilities and associations on CRC cards and operations in classes and associa-tions connected to the classes on class diagrams. For example, the CreateAppt() message onthe sequence and communication diagrams (see Figures 7-1 and 7-5) relate to the makeAp-pointment operation of the Patient class and the schedules association between the Patientand Appointment classes on the class diagram (see Figure 6-2).
Fifth, the states in a behavioral state machine must be associated with different valuesof an attribute or set of attributes that describe an object. For example, in Figure 7-12 aninstance of the Undergraduate class has different states based on the value of an attribute:HoursEarned.
Summary Figure 8-11 portrays a concept map that is a complete picture of the interre-lationships among the diagrams covered in Chapters 5, 6, and 7. It is obvious from thecomplexity of this figure that balancing all the functional, structural, and behavioral mod-els is a very time-consuming, tedious, and difficult task. However, without paying this levelof attention to the evolving models that represent the system, the models will not providea sound foundation on which to design and build the system.
EVOLVING THE ANALYSIS MODELS INTO DESIGN MODELS
Now that we have successfully verified and validated our analysis models, we need to beginevolving them into appropriate design models. The purpose of the analysis models was torepresent the underlying business problem domain as a set of collaborating objects. Inother words, the analysis activities defined the functional requirements. To achieve this, theanalysis activities ignored nonfunctional requirements such as performance and the systemenvironment issues (e.g., distributed or centralized processing, user interface issues, anddatabase issues). In contrast, the primary purpose of the design models is to increase thelikelihood of successfully delivering a system that implements the functional requirementsin a manner that is affordable and easily maintainable. Therefore, in system design, weaddress both the functional and nonfunctional requirements.
Evolving the Analysis Models into Design Models 287

288 Chapter 8 Moving on to Design
Person
-lastname-firstname-address-phone-birthdate-/ age
Patient
-amount-insurance carrier
+make appointment()+calculate last visit()+change status()+provides medical history()
provides
0..1
0..1
0..1
0..1
0..*
0..* 0..*
0..*
0..*
0..*
0..*
0..*
1..*
1..*
1..*
*
0..1
1
1
1
1
1 1
1
Appointment
-time-date-reason
+cancel without notice()
+primaryinsurancecarrier
Bill
-date-amount-purpose
+generate cancellation fee()
Medical History
-heart disease-high blood pressure-diabetes-alergies
Nurse
Doctor
Employee
PatientsList BillsList
Health Team
Administrative Staff
Symptom
-name
Illness
-description
Treatment
medicationinstructionssymptom severity
containedIn containedIn
containedIn
suffer
has scheduled
leads to
schedules
ApptsList
FIGURE 8-10 Updated Appointment System Class Diagram
From an object-oriented perspective, system design models simply refine the systemanalysis models by adding system environment (or solution domain) details to them and refin-ing the problem domain information already contained in the analysis models. When evolvingthe analysis model into the design model, you should first carefully review the use cases andthe current set of classes (their operations and attributes, and the relationships between them).

Including
ContainsContains
ContainsRepresents
Instanceof
Contains
HasKinds
HasKinds
HasKinds
HaveHasKinds
Including
AssociatedWith
AssociatedWith
AssociatedWith
AssociatedWithAssociatedWith
AssociatedWith
AssociatedWith
Associated With
AssociatedWith
AssociatedWith
AssociatedWith
AssociatedWith
AssociatedWith
AssociatedWith AssociatedWithAssociatedWith
Includes
HasKinds
Including
ContainsContains
Contains
Contains
Contains Contains
Contains
HasKinds
Structural Models
CRC Cards Object DiagramClass Diagram
Collaborators
Attributes
Operations
Type
Classes
Associations/ Relationships
Aggregation Generalization
CompositionAssociation Class
Behavioral Models
Object-Oriented Analysis Models
Interaction Diagram
Behaviorial State Machine
CRUD Matrix
Communication Diagram
Messages
Sequence Diagram
Cell Entries
Activity DiagramUse-Case Diagram
Use-Case Descriptions
Object Flows Control Flows
Object NodesActivities/ Actions
Flows
Stakeholders
Relationships
Events
Delete
Read
Update
Create
Scenarios
Functional Models
Actors
Objects
AssociatedWith
Transitions
States
Association
Have
Use CasesResponsibilities
FIGURE 8-11 Interrelationships among Object-Oriented Analysis Models
289
Are all the classes necessary? Are there any missing classes? Are the classes fully defined? Aretheir any missing attributes or methods? Do the classes have any unnecessary attributes andmethods? Is the current representation of the evolving system optimal? Obviously, if we havealready verified and validated the analysis models, quite a bit of this has already taken place.Yet,object-oriented systems development is both incremental and iterative. Therefore, we mustreview the analysis models again. However this time, we begin looking at the models of theproblem domain through a design lens. As such, we will make modifications to the problemdomain models that will enhance the efficiency and effectiveness of the evolving system.
In the following sections, we introduce factoring, partitions and collaborations, and lay-ers as a way to evolve problem domain-oriented analysis models into optimal solutiondomain-oriented design models. From an enhanced Unified Process perspective (see Figure1-11), we are moving from the analysis workflow to the design workflow. Furthermore, weare moving further into the Elaboration phase and partially into the Construction phase.
FactoringFactoring is the process of separating out a module into a stand-alone module in and of itself.The new module can be a new class or a new method. For example, when reviewing a set ofclasses, it may be discovered that they have a similar set of attributes and methods. As such, itmay make sense to factor out the similarities into a separate class. Depending on whether thenew class should be in a superclass relationship to the existing classes or not, the new class canbe related to the existing classes through generalization (a-kind-of ) or possibly through aggre-gation (has-parts) relationship. For example, using the appointment system example in theprevious chapters (see Figure 6-2), if the Employee class had not been identified, we could pos-sibly identify it at this stage by factoring out the similar methods and attributes from the Nurse,Administrative Staff, and Doctor classes. In this case, we would relate the new class (Employee)to the existing classes using the generalization (a-kind-of) relationship. Obviously, by exten-sion we also could have created the Person class if it had not been previously identified.
Abstraction and refinement are two processes closely related to factoring. Abstraction dealswith the creation of a higher-level idea from a set of ideas. Identifying the Employee class is anexample of abstracting from a set of lower classes to a higher one. In some cases, the abstrac-tion process will identify abstract classes, whereas in other situations, it will identify additionalconcrete classes.15 The refinement process is the opposite of the abstraction process. In theappointment system example in the previous chapters (see Figure 6-2), we could identify addi-tional subclasses of the Administrative Staff class, such as Receptionist, Secretary, and Book-keeper. Of course we would add the new classes only if there were sufficient differencesbetween them. Otherwise, the more general class, Administrative Staff, would suffice.
Partitions and CollaborationsBased on all the factoring, refining, and abstracting that can take place to the evolving system,the sheer size of the system representation can overload both the user and the developer. Atthis point in the evolution of the system, it may make sense to split the representation into aset of partitions. A partition is the object-oriented equivalent of a subsystem,16 where a sub-system is a decomposition of a larger system into its component systems (e.g., an accounting
290 Chapter 8 Moving on to Design
15 See Chapter 6 for the differences between abstract and concrete classes.16 Some authors refer to partitions as subsystems [e.g., see R. Wirfs-Brock, B. Wilkerson, and L. Weiner, DesigningObject-Oriented Software (Englewood Cliffs, NJ: Prentice Hall, 1990)], whereas others refer to them as layers [e.g.,see I. Graham, Migrating to Object Technology (Reading, MA: Addison-Wesley, 1994)]. However, we have chosento use the term partition [C. Larman, Applying UML and Patterns: An Introduction to Object-Oriented Analysis andDesign (Englewood Cliffs, NJ: Prentice Hall, 1998)] to minimize confusion between subsystems in a traditionalsystem development approach and layers associated with Rational’s Unified Approach.
information system could be functionally decomposed into an accounts payable system, anaccount receivable system, a payroll system, etc.). From an object-oriented perspective, parti-tions are based on the pattern of activity (messages sent) among the objects in an object-oriented system. We describe an easy approach to model partitions and collaborations laterin this chapter: packages and package diagrams.
A good place to look for potential partitions is the collaborations modeled in UML’s com-munication diagrams (see Chapter 7). If you recall, one useful way to identify collaborationsis to create a communication diagram for each use case. However, because an individual classmay support multiple use cases, an individual class can participate in multiple use-case-basedcollaborations. In those cases where classes are supporting multiple use cases, the collabora-tions should be merged together. Furthermore, the class diagram should be reviewed to seehow the different classes are related to one another. For example, if attributes of a class havecomplex object types, such as Person, Address, Department, etc., and these object types werenot modeled as associations in the class diagram, we need to recognize these implied associ-ations. As such, creating a diagram that combines the class diagram with the communicationdiagrams can be very useful to show to what degree the classes are coupled.17 The greater thecoupling between classes, the more likely the classes should be grouped together in a collab-oration or partition. Finally, by looking at a CRUD matrix, we can use CRUD analysis (seeChapter 7) to identify potential classes on which to merge collaborations.
Depending on the complexity of the merged collaboration, it may be useful in decom-posing the collaboration into multiple partitions. In this case, in addition to having collabo-rations between objects, it is possible to have collaborations among partitions. The generalrule of thumb is the more messages sent between objects, the more likely the objects belongin the same partition. The fewer messages sent, the less likely the two objects belong together.
Another useful approach to identifying potential partitions is to model each collabo-ration between objects in terms of clients, servers, and contracts. A client is an instance ofa class that sends a message to an instance of another class for a method to be executed; aserver is the instance of a class that receives the message; and a contract is the specificationthat formalizes the interactions between the client and server objects (see Chapters 6 and9). This approach allows the developer to build up potential partitions by looking at thecontracts that have been specified between objects. In this case, the more contracts thereare between objects, the more likely that the objects belong in the same partition. The fewercontracts, the less chance there is that the two classes do belong in the same partition.
Remember, the primary purpose of identifying collaborations and partitions is todetermine which classes should be grouped together in design.
Evolving the Analysis Models into Design Models 291
17 We describe the concept of coupling in Chapter 9.
You have been working with the system for the campushousing service over the previous three chapters. In Chap-ter 5, you were asked to create a set of use cases (Your Turn5-5) and to create a use-case diagram (Your Turn 5-6). InChapter 6, you created a structural model (CRC cards andclass diagram) for the same situation (Your Turn 6-2). InChapter 7, you created a sequence diagram (Your Turn 7-1)and a communication diagram (Your Turn 7-2) for one of the
use cases you had identified in Chapter 5. Finally, you alsocreated a behavioral state machine for the apartment classin Chapter 7 (Your Turn 7-3).
Based on the current set of functional, structural, andbehavioral models portrayed in these diagrams, apply theabstraction and refinement processes to identify addi-tional abstract and concrete classes that would be usefulto include in the evolving system.
8-1 Campus HousingYOUR
TURN

LayersUntil this point in the development of our system, we have focused only on the problemdomain; we have totally ignored the system environment (data management, user inter-face, and physical architecture). To successfully evolve the analysis model of the system intoa design model of the system, we must add the system environment information. One use-ful way to do this, without overloading the developer, is to use layers. A layer represents anelement of the software architecture of the evolving system. We have focused only on onelayer in the evolving software architecture: the problem domain layer. There should be alayer for each of the different elements of the system environment (e.g., data management,user interface, physical architecture). Like partitions and collaborations, layers also can beportrayed using packages and package diagrams (see the following text).
The idea of separating the different elements of the architecture into separate layerscan be traced back to the MVC architecture of Smalltalk.18 When Smalltalk was first cre-ated,19 the authors decided to separate the application logic from the logic of the user inter-face. In this manner, it was possible to easily develop different user interfaces that workedwith the same application. To accomplish this, they created the Model-View-Controller(MVC) architecture, where Models implemented the application logic (problem domain)and Views and Controllers implemented the logic for the user interface. Views handled theoutput and Controllers handled the input. Because graphical user interfaces were firstdeveloped in the Smalltalk language, the MVC architecture served as the foundation forvirtually all graphical user interfaces that have been developed today (including the Macinterfaces, the Windows family, and the various Unix-based GUI environments).
Based on Smalltalk’s innovative MVC architecture, many different software layers havebeen proposed.20 Based on these proposals, we suggest the following layers on which to basesoftware architecture: foundation, problem domain, data management, human–computerinteraction, and physical architecture (see Figure 8-12). Each layer limits the types of classesthat can exist on it (e.g., only user interface classes may exist on the human–computer inter-action layer). The following provides a short description of each layer.
292 Chapter 8 Moving on to Design
18 See S. Lewis, The Art and Science of Smalltalk: An Introduction to Object-Oriented Programming Using Visual-Works (Englewood Cliffs, NJ: Prentice Hall, 1995).19 Smalltalk was first invented in the early 1970s by a software-development research team at Xerox PARC. It intro-duced many new ideas into the area of programming languages (e.g., object orientation, windows-based userinterfaces, reusable class library, and the idea of a development environment). In many ways, Smalltalk is thefather (or mother) of all object-based and object-oriented languages, such as Visual Basic, C++, and Java.20 For example, Problem Domain, Human Interaction, Task Management, and Data Management (P. Coad and E.Yourdon, Object-Oriented Design [Englewood Cliffs, NJ: Yourdon Press, 1991)]; Domain, Application, and Interface(I. Graham, Migrating to Object Technology [Reading, MA: Addison-Wesley, 1994)]; Domain, Service, and Presentation[C. Larman, Applying UML and Patterns: An Introduction to Object-Oriented Analysis and Design (Englewood Cliffs,NJ: Prentice Hall, 1998)]; Business,View, and Access [A. Bahrami, Object-Oriented Systems Development using the Uni-fied Modeling Language (New York: McGraw-Hill, 1999)]; Application-Specific, Application-General, Middleware,System-Software [I. Jacobson, G. Booch, and J. Rumbaugh, The Unified Software Development Process (Reading, MA:Addison-Wesley, 1999)]; and Foundation, Architecture, Business, and Application [M. Page-Jones, Fundamentals ofObject-Oriented Design in UML (Reading, MA: Addison-Wesley, 2000)].
Layers Examples Relevant Chapters
Foundation Date, Enumeration 8, 9
Problem Domain Employee, Customer 5, 6, 7, 8, 9
Data Access DataInputStream, 9, 10and Management FileInputStream
Human–Computer Interaction Button, Panel 9, 11
Physical Architecture ServerSocket, URLConnection 9, 12
FIGURE 8-12Layers and Sample Classes

Foundation The foundation layer is, in many ways, a very uninteresting layer. It containsclasses that are necessary for any object-oriented application to exist. They include classes thatrepresent fundamental data types (e.g., integers, real numbers, characters, strings), classesthat represent fundamental data structures, sometimes referred to as container classes (e.g.,lists, trees, graphs, sets, stacks, queues), and classes that represent useful abstractions, some-times referred to as utility classes (e.g., date, time, money). Today, the classes found on thislayer are typically included with the object-oriented development environments.
Problem Domain The problem-domain layer is what we have focused our attention onup until now. At this stage of the development of our system, we will need to further detailthe classes so that it will be possible to implement them in an effective and efficient man-ner. Many issues need to be addressed when designing classes, no matter on which layerthey appear. For example, there are issues related to factoring, cohesion and coupling, con-nascence, encapsulation, proper use of inheritance and polymorphism, constraints, con-tract specification, and detailed method design. These issues are discussed in Chapter 9.
Data Management The data management layer addresses the issues involving the persis-tence of the objects contained in the system. The types of classes that appear in this layerdeal with how objects can be stored and retrieved. The classes contained in this layer allowthe problem domain classes to be independent of the storage utilized and, hence, increasethe portability of the evolving system. Some of the issues related to this layer include choiceof the storage format (such as relational, object/relational, and object databases) and stor-age optimization (such as clustering and indexing). A complete description of all the issuesrelated to the data management layer is beyond the scope of this book.21 However, we dopresent the fundamentals in Chapter 10.
Human–Computer Interaction The human–computer interaction layer contains classesassociated with the View and Controller idea from Smalltalk. The primary purpose of thislayer is to keep the specific user interface implementation separate from the problemdomain classes. This increases the portability of the evolving system. Typical classes foundon this layer include classes that can be used to represent buttons, windows, text fields,scroll bars, check boxes, drop-down lists, and many other classes that represent user inter-face elements.
When it comes to designing the user interface for an application, there are many issuesthat must be addressed. For example, how important is consistency across different userinterfaces, what about differing levels of user experience, how is the user expected to be ableto navigate through the system, what about help systems and online manuals, what typesof input elements should be included (e.g., text box, radio buttons, check boxes, sliders,drop-down list boxes, etc.), and what types of output elements should be included (e.g.,text, tables, graphs, etc.)? Like the data management layer, a complete description of all theissues related to human–computer interaction is beyond the scope of this book.22 Howeverfrom the user’s perspective, the user interface is the system. As such, we present the basicissues in user interface design in Chapter 11.
Evolving the Analysis Models into Design Models 293
21 There are many good database design books that are relevant to this layer; see, for example, F. R. McFadden,J. A. Hoffer, Mary B. Prescott, Modern Database Management, 4th ed. (Reading, MA: Addison-Wesley, 1998);M. Blaha and W. Premerlani, Object-Oriented Modeling and Design for Database Applications (Englewood Cliffs,NJ: Prentice Hall, 1998); and R. J. Muller, Database Design for Smarties: Using UML for Data Modeling (SanFrancisco: Morgan Kaufmann, 1999).22 One of the best books on user interface design is B. Schheiderman, Designing the User Interface: Strategies forEffective Human Computer Interaction, 3rd ed. (Reading, MA: Addison-Wesley, 1998).

Physical Architecture The physical architecture layer addresses how the software willexecute on specific computers and networks. As such, this layer includes classes that dealwith communication between the software and the computer’s operating system and thenetwork. For example, classes that address how to interact with the various ports on a spe-cific computer are included in this layer. This layer also includes classes that interact withso-called middleware applications, such as the OMG’s CORBA and Microsoft’s DCOM and.NET architectures that handle distributed objects.
Unlike the foundation layer, there are many design issues that must be addressedbefore choosing the appropriate set of classes for this layer. These design issues include thechoice of a computing or network architecture (such as the various client-server architec-tures), the actual design of a network, hardware and server software specification,global/international issues (such as multilingual requirements), and security issues. Likethe data management and human–computer interaction layers, a complete description ofall the issues related to the physical architecture is beyond the scope of this book. However,we do present the basic issues in Chapter 12.
PACKAGES AND PACKAGE DIAGRAMS
In UML, collaborations, partitions, and layers can be represented by a higher-level con-struct: a package.23 A package is a general construct that can be applied to any of the ele-ments in UML models. In Chapter 5, we introduced the idea of packages as a way to groupuse cases together to make the use-case diagrams easier to read and to keep the models ata reasonable level of complexity. In Chapters 6 and 7, we did the same thing for class andcommunication diagrams, respectively. In this section we describe a package diagram: a dia-gram composed only of packages. A package diagram is effectively a class diagram that onlyshows packages.
The symbol for a package is similar to a tabbed folder (see Figure 8-13). Depending onwhere a package is used, packages can participate in different types of relationships. Forexample, in a class diagram, packages represent groupings of classes. Therefore, aggregationand association relationships are possible.
In a package diagram, it is useful to depict a new relationship, the dependency relationship.A dependency relationship is portrayed by a dashed arrow (see Figure 8-13). A dependency
294 Chapter 8 Moving on to Design
A package:
■ Is a logical grouping of UML elements■ Is used to simplify UML diagrams by grouping related elements into a single
higher-level element
A dependency relationship:
■ Represents a dependency between packages, i.e., if a package is changed, the dependent package also could have to be modified.
■ Has an arrow drawn from the dependent package toward the package on which it is dependent.
Package
FIGURE 8-13 Syntax for Package Diagram
23 This discussion is based on material in Chapter 7 of M. Fowler with K. Scott, UML Distilled: A Brief Guide tothe Standard Object Modeling Language, 3rd ed. (Reading, MA: Addison-Wesley, 2004).

relationship represents the fact that a modification dependency exists between two packages.That is, it is possible that a change in one package potentially could cause a change to berequired in another package. Figure 8-14 portrays the dependencies among the different lay-ers (foundation, problem domain, data management, human–computer interaction, andphysical architecture). For example, if a change occurs in the problem domain layer, it mostlikely will cause changes to occur in the human–computer interaction, physical architecture,and data management layers. Notice that these layers “point to” the problem domain layer; assuch, they are dependent on it. However, the reverse is not true.24
At the class level, there could be many causes for dependencies among classes. Forexample, if the protocol for a method is changed, then this causes the interface for allobjects of this class to change. Therefore, all classes that have objects that send messages tothe instances of the modified class may have to be modified. Capturing dependency rela-tionships among the classes and packages helps the organization in maintaining object-oriented information systems.
As already stated, collaborations, partitions, and layers are modeled as packages inUML. Furthermore, collaborations are normally factored into a set of partitions, which aretypically placed on a layer. In addition, partitions can be composed of other partitions.Also, it is possible to have classes in partitions, which are contained in another partition,which is placed on a layer. All these groupings are represented using packages in UML.Remember that a package is simply a generic, grouping construct used to simplify UMLmodels through the use of composition.25
A simple package diagram, based on the appointment system example from the previ-ous chapters, is shown in Figure 8-15. This diagram portrays only a very small portion ofthe entire system. In this case, we see that the Patient UI, Patient-DAM, and Patient Table
Packages and Package Diagrams 295
FIGURE 8-14Package Diagram ofDependency Relation-ships among Layers
Human–Computer Interaction
Problem Domain
Physical Architecture Data Management
Foundation
24 A useful side effect of the dependencies among the layers is that the project manager can divide the project teamup into separate subteams: one for each design layer. This is possible because each of the design layers is depen-dent on the problem domain layer, which has been the focus of analysis. In design, the team can gain some pro-ductivity-based efficiency by working on the different layer designs in parallel.25 For those familiar with traditional approaches, such as structured analysis and design, packages serve a similarpurpose as the leveling and balancing processes used in data flow diagramming.
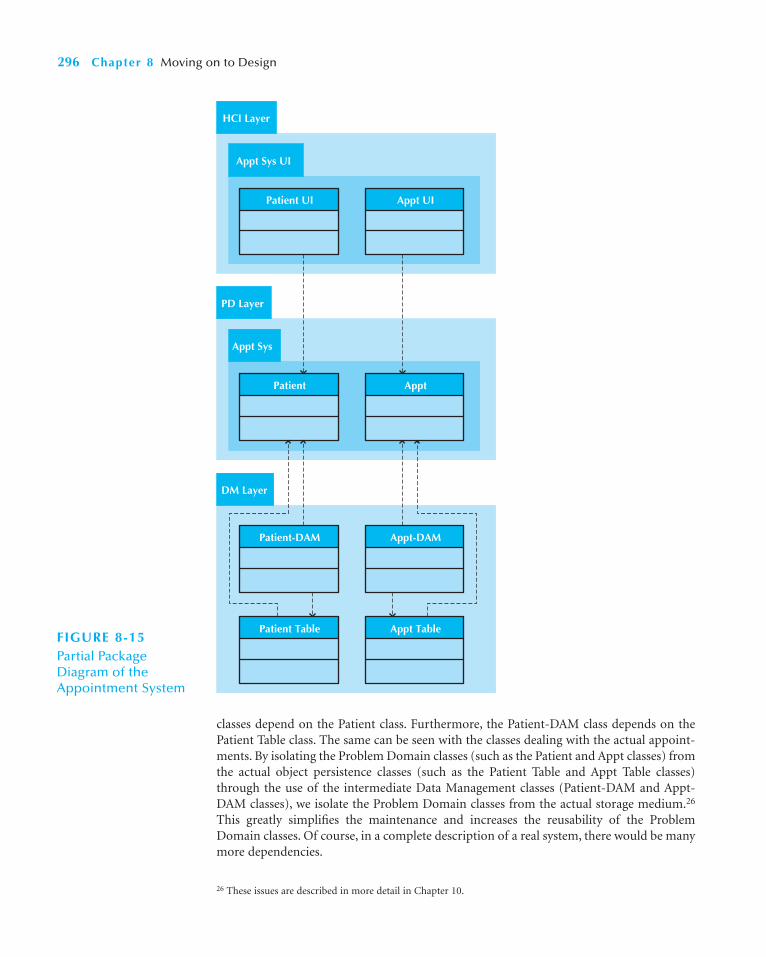
classes depend on the Patient class. Furthermore, the Patient-DAM class depends on thePatient Table class. The same can be seen with the classes dealing with the actual appoint-ments. By isolating the Problem Domain classes (such as the Patient and Appt classes) fromthe actual object persistence classes (such as the Patient Table and Appt Table classes)through the use of the intermediate Data Management classes (Patient-DAM and Appt-DAM classes), we isolate the Problem Domain classes from the actual storage medium.26
This greatly simplifies the maintenance and increases the reusability of the ProblemDomain classes. Of course, in a complete description of a real system, there would be manymore dependencies.
296 Chapter 8 Moving on to Design
HCI Layer
Appt Sys UI
Patient UI Appt UI
PD Layer
Appt Sys
Patient Appt
DM Layer
Patient-DAM Appt-DAM
Patient Table Appt TableFIGURE 8-15Partial Package Diagram of theAppointment System
26 These issues are described in more detail in Chapter 10.
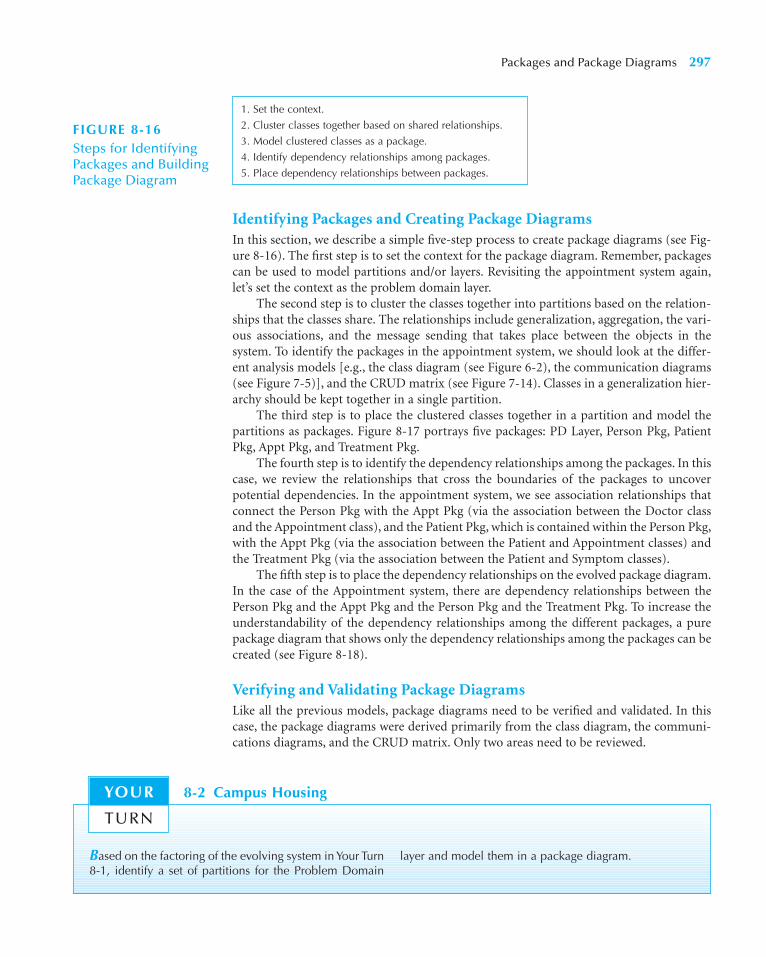
Identifying Packages and Creating Package DiagramsIn this section, we describe a simple five-step process to create package diagrams (see Fig-ure 8-16). The first step is to set the context for the package diagram. Remember, packagescan be used to model partitions and/or layers. Revisiting the appointment system again,let’s set the context as the problem domain layer.
The second step is to cluster the classes together into partitions based on the relation-ships that the classes share. The relationships include generalization, aggregation, the vari-ous associations, and the message sending that takes place between the objects in thesystem. To identify the packages in the appointment system, we should look at the differ-ent analysis models [e.g., the class diagram (see Figure 6-2), the communication diagrams(see Figure 7-5)], and the CRUD matrix (see Figure 7-14). Classes in a generalization hier-archy should be kept together in a single partition.
The third step is to place the clustered classes together in a partition and model thepartitions as packages. Figure 8-17 portrays five packages: PD Layer, Person Pkg, PatientPkg, Appt Pkg, and Treatment Pkg.
The fourth step is to identify the dependency relationships among the packages. In thiscase, we review the relationships that cross the boundaries of the packages to uncoverpotential dependencies. In the appointment system, we see association relationships thatconnect the Person Pkg with the Appt Pkg (via the association between the Doctor classand the Appointment class), and the Patient Pkg, which is contained within the Person Pkg,with the Appt Pkg (via the association between the Patient and Appointment classes) andthe Treatment Pkg (via the association between the Patient and Symptom classes).
The fifth step is to place the dependency relationships on the evolved package diagram.In the case of the Appointment system, there are dependency relationships between thePerson Pkg and the Appt Pkg and the Person Pkg and the Treatment Pkg. To increase theunderstandability of the dependency relationships among the different packages, a purepackage diagram that shows only the dependency relationships among the packages can becreated (see Figure 8-18).
Verifying and Validating Package DiagramsLike all the previous models, package diagrams need to be verified and validated. In thiscase, the package diagrams were derived primarily from the class diagram, the communi-cations diagrams, and the CRUD matrix. Only two areas need to be reviewed.
Packages and Package Diagrams 297
1. Set the context.
2. Cluster classes together based on shared relationships.
3. Model clustered classes as a package.
4. Identify dependency relationships among packages.
5. Place dependency relationships between packages.
FIGURE 8-16Steps for IdentifyingPackages and BuildingPackage Diagram
Based on the factoring of the evolving system in Your Turn8-1, identify a set of partitions for the Problem Domain
layer and model them in a package diagram.
8-2 Campus HousingYOUR
TURN

PD Layer
Person Pkg
Appt Package
Treatment Pkg
Patient PkgPerson
-lastname-firstname-address-phone-birthdate-/ age
Administrative Staff
Employee
Nurse
Health Team
Doctor
Symptom Illness
0..*
0..*
0..*
1..*
0..*
0..*
1..*
1..*
1
1
1
0..1
0..*
1
0..1
Patient
-amount-insurance carrier
+make appointment()+calculate last visit()+change status()+provides medical history()
Medical History
-heart disease-high blood pressure-diabetes-alergies
Appointment
-time-date-reason
-name -description
+cancel without notice()
Bill
-date-amount-purpose
+generate cancellation fee()
0..*0..*
**
+primaryinsurancecarrier
Treatment
medicationinstructionssymptom severity
provides
has scheduled
schedules leads to
suffer
FIGURE 8-17 Package Diagram of the PD Layer for the Appointment System
298

First, the identified packages must make sense from a problem domain point of view.For example, in the context of an appointment system, the packages in Figure 8-18 (Per-son, Patient, Appt, and Treatment) seem to be reasonable.
Second, all dependency relationships must be based on message-sending relationshipson the communications diagram, associations on the class diagram, and cell entries in theCRUD matrix. In the case of the appointment system, the identified dependency relation-ships are reasonable (see Figures 6-2, 7-5, 7-14, and 8-18).
DESIGN STRATEGIES
Until now, we have assumed that the system will be built and implemented by the pro-ject team; however, there are actually three ways to approach the creation of a newsystem: developing a custom application in-house, buying a packaged system and cus-tomizing it, and relying on an external vendor, developer, or service provider to buildthe system. Each of these choices has its strengths and weaknesses, and each is moreappropriate in different scenarios. The following sections describe each design choice inturn, and then we present criteria that you can use to select one of the three approachesfor your project.
Custom DevelopmentMany project teams assume that custom development, or building a new system fromscratch, is the best way to create a system. For one thing, teams have complete control overthe way the system looks and functions. Furthermore, custom development also allowsdevelopers to be flexible and creative in the way they solve business problems. Additionally,a custom application would be easier to change to include components that take advantageof current technologies that can support such strategic efforts.
Building a system in-house also builds technical skills and functional knowledgewithin the company. As developers work with business users, their understanding of the
Design Strategies 299
PD Layer
Person Pkg Appt Pkg
Treatment Pkg
Patient Pkg
FIGURE 8-18Overview Package Diagram of the PDLayer for the Appointment System
business grows and they become better able to align IS with strategies and needs. Thesesame developers climb the technology learning curve so that future projects applying sim-ilar technology require much less effort.
Custom application development, however, also includes a dedicated effort thatinvolves long hours and hard work. Many companies have a development staff that alreadyis overcommitted to filling huge backlogs of systems requests, and they just do not havetime for another project. Also, a variety of skills—technical, interpersonal, functional, pro-ject management, and modeling—all have to be in place for the project to move aheadsmoothly. IS professionals, especially highly skilled individuals, are quite difficult to hireand retain.
The risks associated with building a system from the ground up can be quite high, andthere is no guarantee that the project will succeed. Developers could be pulled away to workon other projects, technical obstacles could cause unexpected delays, and the business userscould become impatient with a growing timeline.
Packaged SoftwareMany business needs are not unique, and because it makes little sense to reinvent the wheel,many organizations buy packaged software that has already been written rather than devel-oping their own custom solution. In fact, there are thousands of commercially availablesoftware programs that have already been written to serve a multitude of purposes. Thinkabout your own need for a word processor—did you ever consider writing your own wordprocessing software? That would be very silly considering the number of good softwarepackages available that are relatively inexpensive.
Similarly, most companies have needs that can be met quite well by packaged software,such as payroll or accounts receivable. It can be much more efficient to buy programs that
300 Chapter 8 Moving on to Design
I worked with a large financial institution in the southeastthat suffered serious financial losses several years ago. Anew CEO was brought in to change the strategy of theorganization to being more “customer focused.” The newdirection was quite innovative, and it was determined thatcustom systems, including a data warehouse, would haveto be built to support the new strategic efforts. The prob-lem was that the company did not have the in-house skillsfor these kinds of custom projects.
The company now has one of the most successfuldata-warehouse implementations because of its willing-ness to use outside skills and its focus on project manage-ment. To supplement skills within the company, eight setsof external consultants, including hardware vendors, sys-tem integrators, and business strategists, were hired to takepart and transfer critical skills to internal employees. An in-house project manager coordinated the data-warehouseimplementation full-time, and her primary goals were toset clearly expectations, define responsibilities, and com-
municate the interdependencies that existed among theteam members.
This company shows that successful custom devel-opment can be achieved, even when the company maynot start off with the right skills in-house. But, this kind ofproject is not easy to pull off—it takes a talented projectmanager to keep the project moving along and to transi-tion the skills to the right people over time.
—Barbara Wixom
Questions
1. What are the risks in building a custom systemwithout the right technical expertise?
2. Why did the company select a project managerfrom within the organization?
3. Would it have been better to hire an external pro-fessional project manager to coordinate the project?
8-A Building a Custom System—with Some HelpCONCEPTS
IN ACTION
have already been created, tested, and proven, and a packaged system can be bought andinstalled in a relatively short period of time, when compared with a custom system. Plus,packaged systems incorporate the expertise and experience of the vendor who created thesoftware.
Packaged software can range from reusable components (such as ActiveX andJavabeans) to small, single-function tools (such as the shopping cart program) to huge,all-encompassing systems such as enterprise resource planning (ERP) applications that areinstalled to automate an entire business. Implementing ERP systems is a process in whichlarge organizations spend millions of dollars installing packages by companies such asSAP, PeopleSoft, Oracle, and Baan and then change their businesses accordingly. InstallingERP software is much more difficult than installing small application packages becausebenefits can be harder to realize and problems are much more serious.
One problem is that companies buying packaged systems must accept the func-tionality that is provided by the system, and rarely is there a perfect fit. If the packagedsystem is large in scope, its implementation could mean a substantial change in the waythe company does business. Letting technology drive the business can be a dangerousway to go.
Most packaged applications allow for customization, or the manipulation of systemparameters to change the way certain features work. For example, the package might havea way to accept information about your company or the company logo that would thenappear on input screens. Or, an accounting software package could offer a choice of vari-ous ways to handle cash flow or inventory control so that it can support the accountingpractices in different organizations. If the amount of customization is not enough and thesoftware package has a few features that don’t quite work the way the company needs it towork, the project team can create workarounds.
A workaround is a custom-built add-on program that interfaces with the packagedapplication to handle special needs. It can be a nice way to create needed functionality thatdoes not exist in the software package. But, workarounds should be a last resort for severalreasons. First, workarounds are not supported by the vendor who supplied the packagedsoftware, so upgrades to the main system may make the workaround ineffective. Also, ifproblems arise, vendors have a tendency to blame the workaround as the culprit and refuseto provide support.
Although choosing a packaged software system is simpler than custom development,it too can benefit from following a formal methodology, just as if a custom application werebeing built.
Systems integration refers to the process of building new systems by combiningpackaged software, existing legacy systems, and new software written to integrate thesetogether. Many consulting firms specialize in systems integration, so it is not uncom-mon for companies to select the packaged software option and then outsource the inte-gration of a variety of packages to a consulting firm. (Outsourcing is discussed in thenext section).
The key challenge in systems integration is finding ways to integrate the data producedby the different packages and legacy systems. Integration often hinges on taking data pro-duced by one package or system and reformatting it for use in another package or system.The project team starts by examining the data produced by and needed by the differentpackages or systems and identifying the transformations that must occur to move the datafrom one to the other. In many cases, this involves “fooling” the different packages or sys-tems into thinking that the data were produced by an existing program module that thepackage or system expects to produce the data rather than the new package/system that isbeing integrated.
Design Strategies 301
A third approach is through the use of an object wrapper.27 An object wrapper is essen-tially an object that “wraps around” a legacy system, enabling an object-oriented system tosend messages to the legacy system. Effectively, object wrappers create an application pro-gram interface (API) to the legacy system. The creation of an object wrapper allows theprotection of the corporation’s investment in the legacy system.
OutsourcingThe design choice that requires the least amount of in-house resources is outsourcing—hiringan external vendor, developer, or service provider to create the system. Outsourcing hasbecome quite popular in recent years. Some estimate that as many as 50 percent of companieswith IT budgets of more than $5 million are currently outsourcing or evaluating the approach.
According to Wikipedia,“outsourcing involves transferring or sharing management con-trol and/or decision-making of a business function to an outside supplier, which involves adegree of two-way information exchange, coordination and trust between the outsourcer andits client.” From an IT perspective, IT outsourcing can include things such as (1) hiring con-sultants to solve a specific problem, (2) hiring contract programmers to implement a solu-tion, (3) hiring a firm to manage the IT function and assets of a company, or (4) actuallyoutsourcing the entire IT function to a separate firm. Today, through the use of ApplicationService Providers (ASPs) and Web Services technology, it is possible to use a pay-as-you-goapproach for a software package.28 Essentially, IT outsourcing involves hiring a third party toperform some IT function that traditionally would be performed in-house.
There can be great benefit to having someone else develop a company’s system. Theymay be more experienced in the technology or have more resources, such as experiencedprogrammers. Many companies embark upon outsourcing deals to reduce costs, whereasothers see it as an opportunity to add value to the business.
302 Chapter 8 Moving on to Design
Pharmaceutical companies are generally heavily regu-lated companies. It may take years for a new drug to makeit to the marketplace because of time for the developmentphase, highly monitored testing, and final approval by theFood and Drug Administration (FDA). Once in the market-place, other companies can try to produce generic drugsthat seem to be compatible with the name-brand drug.
Occasionally an approved drug, some years into itslife span, gets scrutiny for higher-than-expected side effects.For example, a drug that is effective in lowering cholesterolmay also cause the side effect of an increased chance forcataract growth that was not discovered during the initialtesting and approval cycle. Data are collected on allaspects of clinical trials and from the marketplace, butsome relationships are just harder to find.
Questions
1. Is there a particular system approach to being ableto collect and analyze data from a mountain ofdata?
2. If you were building a strategic planning system fortracking a drug from proposal through developmentand testing and into the marketplace, how wouldyou approach it?
3. What requirements might be necessary to build sucha system?
8-B Collecting Data for the Long TermCONCEPTS
IN ACTION
27 Ian Graham, Object-Oriented Methods: Principles & Practice, 3rd ed. (Reading, MA: Addison-Wesley, 2001).28 For an economic explanation of how this could work, see H. Baetjer, Software as Capital: An Economic Perspectiveon Software Engineering (Los Alamitos, CA: IEEE Computer Society Press, 1997).

For whatever reason, outsourcing can be a good alternative for a new system. However, itdoes not come without costs. If you decide to leave the creation of a new system in the handsof someone else, you could compromise confidential information or lose control over futuredevelopment. In-house professionals are not benefiting from the skills that could be learnedfrom the project; instead the expertise is transferred to the outside organization. Ultimately,important skills can walk right out the door at the end of the contract. Furthermore, when off-shore outsourcing is being considered, we must also be cognizant of language issues, time-zonedifferences, and cultural differences (for example, acceptable business practices as understoodin one country that may be unacceptable in another). All these concerns, if not dealt with prop-erly, can prevail over any advantage that outsourcing or offshore outsourcing could realize.
However, most risks can be addressed if a company decides to outsource, but two areparticularly important. First, the company must thoroughly assess the requirements for theproject—a company should never outsource what is not understood. If rigorous planningand analysis has occurred, then the company should be well aware of its needs. Second, thecompany should carefully choose a vendor, developer, or service with a proven track recordwith the type of system and technology that its system needs.
Three primary types of contracts can be drawn to control the outsourcing deal. Atime-and-arrangements contract is very flexible because a company agrees to pay for what-ever time and expenses are needed to get the job done. Of course, this agreement couldresult in a large bill that exceeds initial estimates. This works best when the company andthe outsourcer are unclear about what it is going to take to finish the job.
A company will pay no more than expected with a fixed-price contract because if theoutsourcer exceeds the agreed-upon price, it will have to absorb the costs. Outsourcers aremuch more careful about defining requirements clearly up front, and there is little flexibil-ity for change.
The type of contract gaining in popularity is the value-added contract, whereby theoutsourcer reaps some percentage of the completed system’s benefits. The company hasvery little risk in this case, but it must expect to share the wealth once the system is in place.
Creating fair contracts is an art because flexibility must be carefully balanced withclearly defined terms. Often needs change over time. As such, the contract should not be sospecific and rigid that alterations can’t be made. Think about how quickly technology likethe World Wide Web changes. It is difficult to foresee how a project may evolve over a longperiod of time. Short-term contracts help leave room for reassessment if needs change orif relationships are not working out the way both parties expected. In all cases, the rela-tionship with the outsourcer should be viewed as a partnership where both parties benefitand communicate openly.
Managing the outsourcing relationship is a full-time job. Thus, someone needs to beassigned full-time to manage the outsourcer, and the level of that person should be appro-priate for the size of the job (a multimillion dollar outsourcing engagement should be han-dled by a high-level executive). Throughout the relationship, progress should be trackedand measured against predetermined goals. If a company does embark upon an outsourc-ing design strategy, it should be sure to get adequate information. Many books have beenwritten that provide much more detailed information on the topic.29 Figure 8-19 summa-rizes some guidelines for outsourcing.
Design Strategies 303
29 For more information on outsourcing, we recommend M. Lacity and R. Hirschheim, Information Systems Out-sourcing: Myths, Metaphors, and Realities (New York, NY: Wiley, 1993); L. Willcocks and G. Fitzgerald, A BusinessGuide to Outsourcing Information Technology (London: Business Intelligence, 1994); E. Carmel, Offshoring Infor-mation Technology: Sourcing and Outsourcing to a Global Workforce (Cambridge, UK: Cambridge University Press,2005); J. K Halvey and B. M. Melby, Information Technology Outsourcing Transactions: Process, Strategies, and Con-tracts, 2nd Ed. (Hoboken, NJ: Wiley, 2005); and T. L. Friedman, The World is Flat: A Brief History of the Twenty-First Century, Updated and Expanded Edition (New York: Farrar, Straus, and Giroux, 2006).
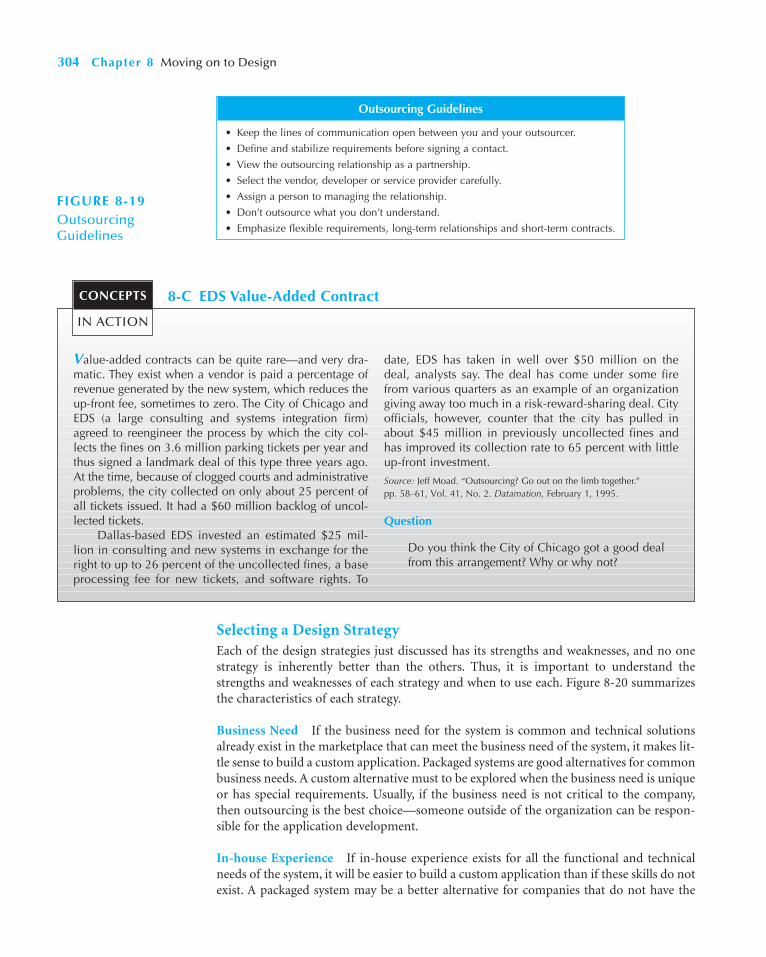
304 Chapter 8 Moving on to Design
Outsourcing Guidelines
• Keep the lines of communication open between you and your outsourcer.
• Define and stabilize requirements before signing a contact.
• View the outsourcing relationship as a partnership.
• Select the vendor, developer or service provider carefully.
• Assign a person to managing the relationship.
• Don’t outsource what you don’t understand.
• Emphasize flexible requirements, long-term relationships and short-term contracts.
FIGURE 8-19Outsourcing Guidelines
Value-added contracts can be quite rare—and very dra-matic. They exist when a vendor is paid a percentage ofrevenue generated by the new system, which reduces theup-front fee, sometimes to zero. The City of Chicago andEDS (a large consulting and systems integration firm)agreed to reengineer the process by which the city col-lects the fines on 3.6 million parking tickets per year andthus signed a landmark deal of this type three years ago.At the time, because of clogged courts and administrativeproblems, the city collected on only about 25 percent ofall tickets issued. It had a $60 million backlog of uncol-lected tickets.
Dallas-based EDS invested an estimated $25 mil-lion in consulting and new systems in exchange for theright to up to 26 percent of the uncollected fines, a baseprocessing fee for new tickets, and software rights. To
date, EDS has taken in well over $50 million on thedeal, analysts say. The deal has come under some firefrom various quarters as an example of an organizationgiving away too much in a risk-reward-sharing deal. Cityofficials, however, counter that the city has pulled inabout $45 million in previously uncollected fines andhas improved its collection rate to 65 percent with littleup-front investment.
Source: Jeff Moad. “Outsourcing? Go out on the limb together.” pp. 58–61, Vol. 41, No. 2. Datamation, February 1, 1995.
Question
Do you think the City of Chicago got a good dealfrom this arrangement? Why or why not?
8-C EDS Value-Added ContractCONCEPTS
IN ACTION
Selecting a Design StrategyEach of the design strategies just discussed has its strengths and weaknesses, and no onestrategy is inherently better than the others. Thus, it is important to understand thestrengths and weaknesses of each strategy and when to use each. Figure 8-20 summarizesthe characteristics of each strategy.
Business Need If the business need for the system is common and technical solutionsalready exist in the marketplace that can meet the business need of the system, it makes lit-tle sense to build a custom application. Packaged systems are good alternatives for commonbusiness needs. A custom alternative must to be explored when the business need is uniqueor has special requirements. Usually, if the business need is not critical to the company,then outsourcing is the best choice—someone outside of the organization can be respon-sible for the application development.
In-house Experience If in-house experience exists for all the functional and technicalneeds of the system, it will be easier to build a custom application than if these skills do notexist. A packaged system may be a better alternative for companies that do not have the

technical skills to build the desired system. For example, a project team that does not haveWeb commerce technology skills may want to acquire a Web commerce package that canbe installed without many changes. Outsourcing is a good way to bring in outside experi-ence that is missing in-house so that skilled people are in charge of building a system.
Project Skills The skills that are applied during projects are either technical (e.g., Java,SQL) or functional (e.g., electronic commerce), and different design alternatives are moreviable, depending on how important the skills are to the company’s strategy. For example,if certain functional and technical expertise that relate to Internet sales applications andWeb commerce application development are important to an organization because itexpects the Internet to play an important role in its sales over time, then it makes sense forthe company to develop Web commerce applications in-house, using company employees,so that the skills can be developed and improved. On the other hand, some skills, such asnetwork security, may be either beyond the technical expertise of employees or not ofinterest to the company’s strategists—it is just an operational issue that needs to beaddressed. In this case, packaged systems or outsourcing should be considered so internalemployees can focus on other business-critical applications and skills.
Project Management Custom applications require excellent project management and aproven methodology. There are so many things, such as funding obstacles, staffing holdups,and overly demanding business users, that can push a project offtrack. Therefore, the pro-ject team should choose to develop a custom application only if it is certain that the under-lying coordination and control mechanisms will be in place. Packaged and outsourcingalternatives also need to be managed; however, they are more shielded from internal obsta-cles because the external parties have their own objectives and priorities (e.g., it may be eas-ier for an outside contractor to say no to a user than it is for a person within the company).The latter alternatives typically have their own methodologies, which can benefit compa-nies that do not have an appropriate methodology to use.
Time Frame When time is a factor, the project team should probably start looking for asystem that is already built and tested. In this way, the company will have a good idea ofhow long the package will take to put in place and what the final result will contain. Thetime frame for custom applications is hard to pin down, especially when you consider how
Design Strategies 305
Use Custom Use a Packaged Use OutsourcingDevelopment When… System When… When…
Business Need The business need is unique. The business need is common. The business need is not core to the business.
In-house Experience In-house functional and In-house functional In-house functional or technical technical experience exists. experience exists. experience does not exist.
Project Skills There is a desire to The skills are not strategic. The decision to outsource is a build in-house skills. strategic decision.
Project Management The project has a highly The project has a project The project has a highly skilledskilled project manager manager who can coordinate project manager at the leveland a proven methodology. vendor’s efforts. of the organization that matches
the scope of the outsourcing deal.
Time frame The time frame is flexible. The time frame is short. The time frame is short or flexible.
FIGURE 8-20 Selecting a Design Strategy

many projects end up missing important deadlines. If a company must choose the customdevelopment alternative and the time frame is very short, it should consider using tech-niques such as timeboxing to manage this problem. The time to produce a system usingoutsourcing really depends on the system and the outsourcer’s resources. If a serviceprovider has services in place that can be used to support the company’s needs, then a busi-ness need could be implemented quickly. Otherwise, an outsourcing solution could take aslong as a custom development initiative.
DEVELOPING THE ACTUAL DESIGN
Once the project team has a good understanding of how well each design strategy fits withthe project’s needs, it must begin to understand exactly how to implement these strategies.For example, what tools and technology would be used if a custom alternative wereselected? What vendors make packaged systems that address the project needs? What ser-vice providers would be able to build this system if the application were outsourced? Thisinformation can be obtained from people working in the IS department and from recom-mendations by business users. Or, the project team can contact other companies with sim-ilar needs and investigate the types of systems that they have put in place. Vendors andconsultants usually are willing to provide information about various tools and solutions inthe form of brochures, product demonstrations, and information seminars. However, acompany should be sure to validate the information it receives from vendors and consul-tants. After all, they are trying to make a sale. Therefore, they may stretch the capabilitiesof their tool by focusing on only the positive aspects of the tool while omitting the tool’sdrawbacks.
It is likely that the project team will identify several ways that a system could be con-structed after weighing the specific design options. For example, the project team may havefound three vendors that make packaged systems that potentially could meet the project’sneeds. Or, the team may be debating over whether to develop a system using Java as a devel-opment tool and the database management system from Oracle or to outsource the devel-opment effort to a consulting firm such as Accenture or American Management Systems.Each alternative will have pros and cons associated with it that need to be considered, andonly one solution can be selected in the end.
Alternative MatrixAn alternative matrix can be used to organize the pros and cons of the design alternativesso that the best solution will be chosen in the end. This matrix is created using the samesteps as the feasibility analysis, which was presented in Chapter 2. The only difference isthat the alternative matrix combines several feasibility analyses into one matrix so that thealternatives can easily be compared. An alternative matrix is a grid that contains the technical,
306 Chapter 8 Moving on to Design
Suppose that your university is interested in creating anew course registration system that can support Web-based registration. What should the university consider
when determining whether to invest in a custom, pack-aged, or outsourced system solution?
8-3 Choose a Design StrategyYOUR
TURN

budget, and organizational feasibilities for each system candidate, pros and cons associatedwith adopting each solution, and other information that is helpful when making compar-isons. Sometimes weights are provided for different parts of the matrix to show when somecriteria are more important to the final decision.
To create the alternative matrix, draw a grid with the alternatives across the top anddifferent criteria (e.g., feasibilities, pros, cons, and other miscellaneous criteria) along theside. Next, fill in the grid with detailed descriptions about each alternative. This becomes auseful document for discussion because it clearly presents the alternatives being reviewedand comparable characteristics for each one.
Suppose that a company is thinking about implementing a packaged financial systemsuch as Oracle E-Business Financials or Microsoft’s Dynamics GP, but there is not enoughexpertise in-house to be able to create a thorough alternative matrix. This situation is quitecommon—often the alternatives for a project are unfamiliar to the project team, so outsideexpertise is needed to provide information about the alternatives’ criteria.
One helpful tool is the request for proposals (RFP). An RFP is a document that solicitsproposals to provide the alternative solutions from a vendor, developer, or service provider.Basically, an RFP explains the system that a company is trying to build and the criteria thatit will use to select a system. Vendors then respond by describing what it would mean forthem to be a part of the solution. They communicate the time, the cost, and exactly howtheir product or services will address the needs of the project.
There is no formal way to write an RFP, but it should include basic information suchas the description of the desired system, any special technical needs or circumstances, eval-uation criteria, instructions for how to respond, and the desired schedule. An RFP can bea very large document (i.e., hundreds of pages) because companies try to include as muchdetail as possible about their needs so that the respondent can be just as detailed in thesolution that would be provided. Thus, RFPs typically are used for large projects ratherthan small ones because they take a lot of time to create; even more time and effort areneeded for vendors, developers, and service providers to develop high-quality responses—only a project with a fairly large price tag would be worth the time and cost to develop aresponse for an RFP.
A less-effort-intensive tool is a request for information (RFI) that includes the same for-mat as the RFP. The RFI is shorter and contains less-detailed information about a com-pany’s needs, and it requires general information from respondents that communicates thebasic services that they can provide.
The final step, of course, is to decide which solution to design and implement. Thedecision should be made by a combination of business users and technical profession-als after the issues involved with the different alternatives are well understood. Once thedecision is finalized, design can continue as needed, based on the selected alternative.
Developing the Actual Design 307
Suppose you have been assigned the task of selecting aCASE tool for your class to use for a semester project.Using the Web or other reference resources, select threeCASE tools (e.g., ArgoUML, IBM’s Rational Rose, or Visual
Paradigm). Create an alternative matrix that can be usedto compare the three software products so that a selectiondecision can be made.
8-4 Alternative MatrixYOUR
TURN

APPLYING THE CONCEPTS AT CD SELECTIONS
In the previous installments of the CD Selections Case, the CD Selections Internet SalesSystem has been described:
■ In Chapter 4, the functional and nonfunctional requirements for the system weregiven (see Figure 4-15).
■ In Chapter 5, the functional model was given (see Figures 5-14 through 5-19).
■ In Chapter 6, the structural model was given (see Figures 6-15 through 6-18).
■ In Chapter 7 the behavioral models were developed for the Places Order use caseand the Order class (Figures 7-15 through 7-19).
In this section of the case, we see how Alec and his team prepared to move from an analy-sis, or problem-domain, orientation to a design, or solution-domain, orientation. Follow-ing, we will see that to get ready for this transition, Alec and his team first create a packagediagram to partition the problem-domain layer. Next, they go through a verification andvalidation of all of the analysis models; finally, they choose a design strategy to develop theactual design. As in the previous installments of the case, we deal only with the Places Orderuse case. However, object-oriented systems development is holistic. Therefore, to be com-plete, Alec and company had to finish all the previous Your Turns associated with the case.
Packages and Package DiagramsAt this point in the development of the Internet Sales System for CD Selections, Alecwanted to explicitly partition the evolving system. To do this, Alec decided to use packagesto represent both the layers and partitions in each layer. Once he made this decision, hechose to follow the steps for identifying packages and building package diagrams in Figure8-9. Because, at this point in the development, the team has been focusing only on analy-sis models, Alec decided that the team should concentrate on identifying only potentialpartitions on the Problem Domain Layer.
The second step, cluster classes together, was accomplished by reviewing the relation-ships among the different classes (see Figures 6-18, 7-17, and 7-20). Through this reviewprocess, the team saw that there were generalization, aggregation, various associations, andmessage-sending relationships. They also saw the entries in the CRUD matrix. Because theyunderstood that classes in a generalization hierarchy should be kept together, they clusteredthe Customer, Individual, and Organization classes together to form a partition. Brianpointed out that it is also preferred to keep classes together that participate in aggregationrelationships. Based on aggregation relationships, they clustered the Mkt Info, Review,Artist Info, and Sample Clip classes together in a partition. Based on the association rela-tionship and the message-sending pattern of activity between the CD and Mkt Info classes,Anne suggested that they should be in the same partition. Furthermore, because the Ven-dor class was related only to the CD class, Alec suggested that they be placed in the samepartition. Finally, the development team decided to place the Order and Order Item classestogether and the Search Req and CD List classes together in their own partitions.
The third step was to model each of these partitions as packages. Figure 8-21 shows theclasses being contained in their respective packages. Observe that the Credit-Card Clear-ance Center is not currently contained in any package.
Next, Alec quickly identified four associations among the different packages: the Cus-tomer Package and the Order Package, the Customer Package and the Search Package, theOrder Package and the CD Package, and the Search Package and the CD Package. He alsoidentified an association between the Credit-Card Clearance Center class and the CustomerPackage. Based on these associations, five dependency relationships were identified.
308 Chapter 8 Moving on to Design

PD Layer
Order PackageCD Package
Search Package
Customer Package
includes
Results in
makes
consists of
contains
distributes
checks
places
promotes
Organizational
Customer
Individual
Credit Card Clearance Center
Order Item
Review
Artist Info
Sample Clip
CD
Vendor
Mkt Info
Order
CD ListSearch Req
1 0..1
*
*
*
*
*
11
1
*
*
*
*
*
*
*
*
*
*
*
* *
*
FIGURE 8-21 Package Diagram of the PD of CD Selections Internet Sales System
309
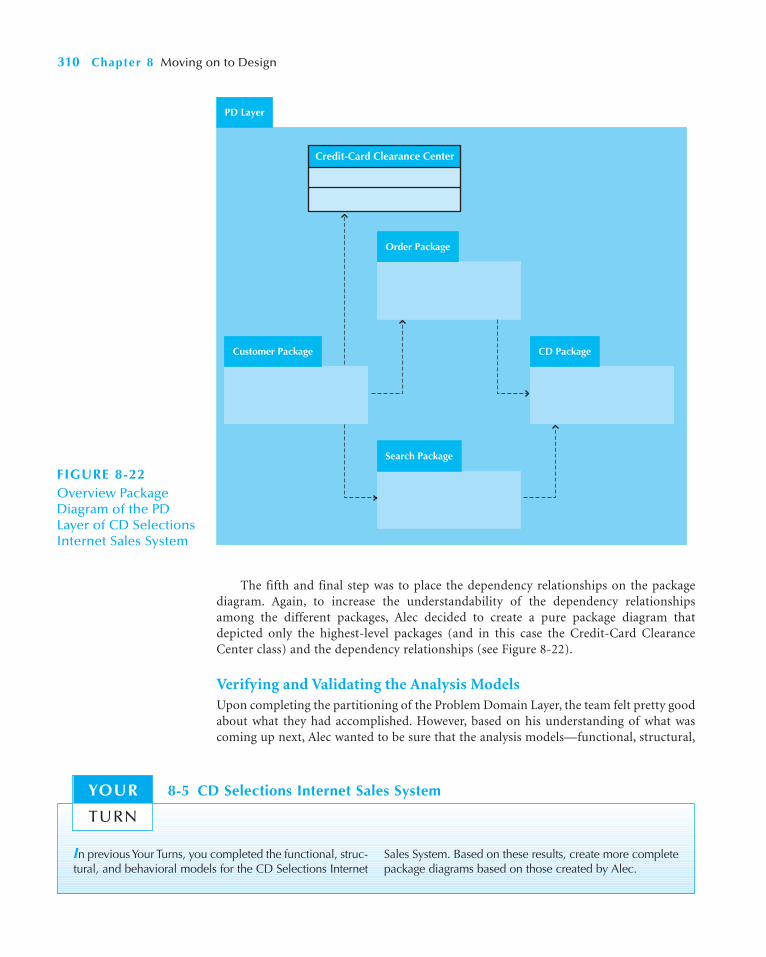
The fifth and final step was to place the dependency relationships on the packagediagram. Again, to increase the understandability of the dependency relationshipsamong the different packages, Alec decided to create a pure package diagram thatdepicted only the highest-level packages (and in this case the Credit-Card ClearanceCenter class) and the dependency relationships (see Figure 8-22).
Verifying and Validating the Analysis ModelsUpon completing the partitioning of the Problem Domain Layer, the team felt pretty goodabout what they had accomplished. However, based on his understanding of what wascoming up next, Alec wanted to be sure that the analysis models—functional, structural,
310 Chapter 8 Moving on to Design
PD Layer
Customer Package
Order Package
Search Package
CD Package
Credit-Card Clearance Center
FIGURE 8-22Overview Package Diagram of the PDLayer of CD SelectionsInternet Sales System
In previous Your Turns, you completed the functional, struc-tural, and behavioral models for the CD Selections Internet
Sales System. Based on these results, create more completepackage diagrams based on those created by Alec.
8-5 CD Selections Internet Sales SystemYOUR
TURN

behavioral—and the partitions made sense, so he decided that all the work to date neededto go through a verification and validation step. To say the least, the team was not all thatexcited about this. In fact, Brian pointed out that the team had been verifying and vali-dating everything as they went along. As such, he argued that this would simply be a wasteof time. But, Alec prevailed. He explained that in past projects, when they had not assuredthe quality of the Problem Domain Layer, teams had run into significant problems. Theseproblems included the system not solving the right problem, significant cost overruns,and the system not being delivered on time. Because this team was relatively inexperi-enced with the technology that they were about to use, Alec told the team that there wasnot enough slack in the workplan to run into problems related to the analysis models. Hesuggested that the team perform a walkthrough with the model and that they ensure allthe relationships among the diagrams were fully tested (see Figures 8-2, 8-3, 8-4, 8-6, 8-8,8-9, and 8-10).
The good news was that the team had actually been very careful in developing theanalysis models and they did not uncover any errors within the diagrams. Brian broughtup his earlier point in an “I told you so” manner. However, Alec let him blow off a littlesteam and simply reminded the team that it was better to have done the verification andvalidation step now and not have to be sorry later. He pointed out that the other layers aremostly dependent on the Problem Domain Layer (see Figure 8-14) and any mistake notcaught now could be very costly to catch later.
Developing the Actual DesignOnce the team had verified and validated the analysis models, Alec had to decide on adesign strategy. As he saw it, he had three different approaches that he could take with thenew system: He could develop the entire system using development resources from CDSelections, he could buy a commercial Internet sales packaged software program (or a setof different packages and integrate them), or he could hire a consulting firm or serviceprovider to create the system. Immediately, Alec ruled out the third option. Building Inter-net applications, especially sales systems, was important to the CD Selections’ businessstrategy. By outsourcing the Internet Sales System, CD Selections would not develop Inter-net application development skills and business skills within the organization.
Instead, Alec decided that a custom development project using the company’s stan-dard Web development tools would be the best choice for CD Selections. In this way, thecompany would be developing critical technical and business skills in-house, and the pro-ject team would be able to have a high level of flexibility and control over the final prod-uct. Also, Alec wanted the new Internet Sales System to directly interface with the existingdistribution system, and there was a chance that a packaged solution would not be able tointegrate as well into the CD Selections environment.
There was one part of the project that potentially could be handled using packagedsoftware: the shopping cart portion of the application. Alec realized that a multitude of
Applying the Concepts at CD Selections 311
At this point in time, you should go back through all ofthe analysis models created and verifiy and validate them
using a walkthrough process.
8-6 CD Selections Internet Sales SystemYOUR
TURN
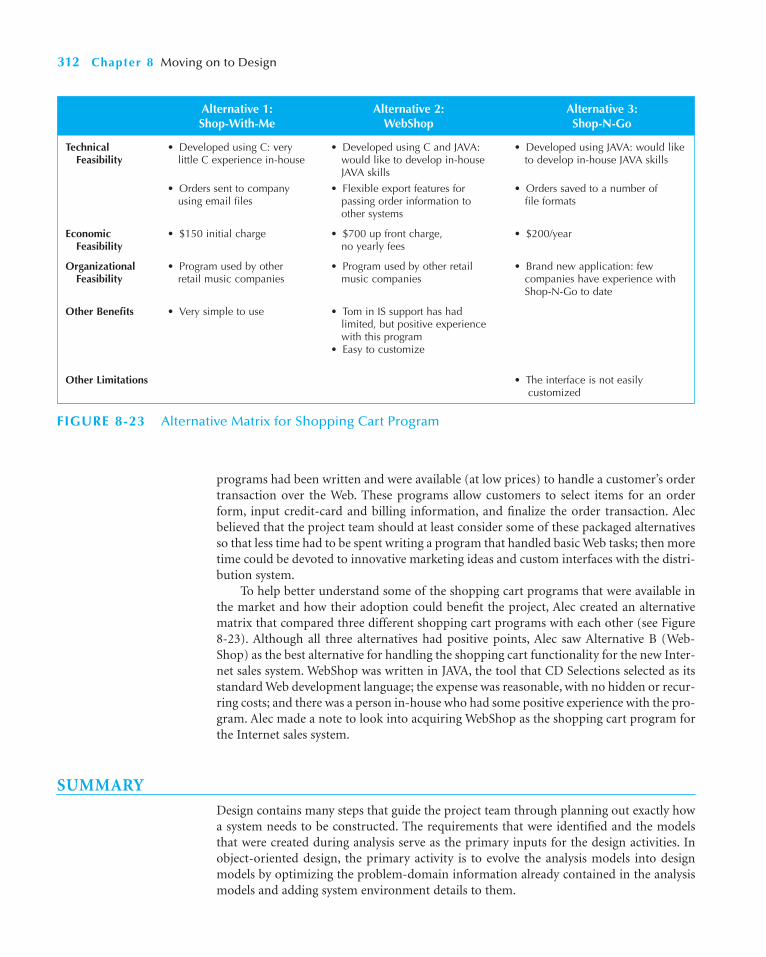
programs had been written and were available (at low prices) to handle a customer’s ordertransaction over the Web. These programs allow customers to select items for an orderform, input credit-card and billing information, and finalize the order transaction. Alecbelieved that the project team should at least consider some of these packaged alternativesso that less time had to be spent writing a program that handled basic Web tasks; then moretime could be devoted to innovative marketing ideas and custom interfaces with the distri-bution system.
To help better understand some of the shopping cart programs that were available inthe market and how their adoption could benefit the project, Alec created an alternativematrix that compared three different shopping cart programs with each other (see Figure8-23). Although all three alternatives had positive points, Alec saw Alternative B (Web-Shop) as the best alternative for handling the shopping cart functionality for the new Inter-net sales system. WebShop was written in JAVA, the tool that CD Selections selected as itsstandard Web development language; the expense was reasonable, with no hidden or recur-ring costs; and there was a person in-house who had some positive experience with the pro-gram. Alec made a note to look into acquiring WebShop as the shopping cart program forthe Internet sales system.
SUMMARY
Design contains many steps that guide the project team through planning out exactly howa system needs to be constructed. The requirements that were identified and the modelsthat were created during analysis serve as the primary inputs for the design activities. Inobject-oriented design, the primary activity is to evolve the analysis models into designmodels by optimizing the problem-domain information already contained in the analysismodels and adding system environment details to them.
312 Chapter 8 Moving on to Design
Alternative 1: Alternative 2: Alternative 3:Shop-With-Me WebShop Shop-N-Go
Technical • Developed using C: very • Developed using C and JAVA: • Developed using JAVA: would likeFeasibility little C experience in-house would like to develop in-house to develop in-house JAVA skills
JAVA skills
• Orders sent to company • Flexible export features for • Orders saved to a number ofusing email files passing order information to file formats
other systems
Economic • $150 initial charge • $700 up front charge, • $200/yearFeasibility no yearly fees
Organizational • Program used by other • Program used by other retail • Brand new application: fewFeasibility retail music companies music companies companies have experience with
Shop-N-Go to date
Other Benefits • Very simple to use • Tom in IS support has hadlimited, but positive experiencewith this program
• Easy to customize
Other Limitations • The interface is not easilycustomized
FIGURE 8-23 Alternative Matrix for Shopping Cart Program

Verifying and Validating the Analysis ModelsBefore actually adding system environment details to the analysis models, the various rep-resentations need to be verified and validated. One very useful approach to test the fidelityof the representations is to perform a walkthrough in which developers walk through therepresentations by presenting the different models to members of the analysis team, mem-bers of the design team, and representatives of the client. The walkthrough must validateeach model to be sure that the different representations within the model all agree with eachother; for example, for the functional model, activity diagrams, use-case descriptions, anduse-case diagrams must be consistent with each other. Furthermore, the different models(functional, structural, and behavioral) must be consistent. Finally, care must be taken dur-ing the walkthroughs to ensure that the presenter is not simply degraded and destroyed.
Evolving the Analysis Models into Design ModelsWhen evolving the analysis models into design models, the analysis models: activity dia-grams, use-case descriptions, use-case diagrams, CRC cards, class and object diagrams,sequence diagrams, communication diagrams, and behavioral state machines should first becarefully reviewed. During this review, factoring, refinement, and abstraction processes canbe used to polish the current models. During this polishing, it is possible that the analysismodels may become overly complex. If this occurs, then the models should be partitionedbased on the interactivity (message sending) and relationships (generalization, aggregation,and association) shared among the classes. The more a class has in common with anotherclass (i.e., the more relationships shared), the more likely they belong in the same partition.
The second thing to do to evolve the analysis mode is to add the system environment(physical architecture, user interface, and data access and management) information to theproblem domain information already contained in the model. To accomplish this and tocontrol the complexity of the models, layers are used. A layer represents an element of thesoftware architecture of the system. We recommend five different layers to be used: foun-dation, physical architecture, human–computer interaction, data access and management,and problem domain. Each layer supports only certain types of classes (e.g., databasemanipulation classes would be allowed only on the data access and management layer).
Packages and Package DiagramsA package is a general UML construct used to represent collaborations, partitions, and layers.Its primary purpose is to support the logical grouping of other UML constructs together (e.g.,use cases and classes by the developer and user to simplify and increase the understandabilityof a UML diagram). There are instances in which a diagram that contains only packages isuseful. A package diagram contains packages and dependency relationships. A dependencyrelationship represents the possibility of a modification dependency existing between twopackages (i.e., changes in one package could cause changes in the dependent package).
Identifying packages and creating a package diagram is accomplished using a five-stepprocess. The five steps can be summed up as setting the context, clustering similar classes,placing the clustered classes into a package, identifying dependency relationships amongthe packages, and placing the dependency relationship on the package diagram.
Design StrategiesDuring the design phase, the project team also needs to consider three approaches to cre-ating the new system, including developing a custom application in-house, buying a pack-aged system and customizing it, and relying on an external vendor, developer, or systemprovider to build and/or support the system.
Summary 313
Custom development allows developers to be flexible and creative in the way they solvebusiness problems, and it builds technical and functional knowledge within the organiza-tion. But, many companies have a development staff that is already overcommitted to fill-ing huge backlogs of systems requests, and they just don’t have time to devote to a projectwhere a system is built from scratch. It can be much more efficient to buy programs thathave been created, tested, and proven, and a packaged system can be bought and installedin a relatively short period of time as compared with a custom solution. Workarounds canbe used to meet the needs that are not addressed by the packaged application.
The third design strategy is to outsource the project and pay an external vendor, devel-oper, or service provider to create the system. It can be a good alternative to approachingthe new system; however, it does not come without costs. However, if a company decides toleave the creation of a new system in the hands of someone else, the organization couldcompromise confidential information or lose control over future development.
Each of the design strategies discussed here has its strengths and weaknesses, and noone strategy is inherently better than the others. Thus, it is important to consider suchissues as the uniqueness of business need for the system, the amount of in-house experi-ence that is available to build the system, and the importance of the project skills to thecompany. Also, the existence of good project management and the amount of time avail-able to develop the application play a role in the selection process.
Developing the Actual DesignUltimately, the decision must be made regarding the specific type of system that needs tobe designed. An alternative matrix can help make this decision by presenting feasibilityinformation for several candidate solutions in a way in which they can be compared easily.Both the Request for Proposal and Request for Information are two ways to gather accu-rate information regarding the alternatives.
314 Chapter 8 Moving on to Design
KEY TERMS
A-kind-ofAbstract classesAbstractionAggregationAlternative matrixBalancing the modelsClassClientCollaborationConcrete classesContractControllerCORBACustom developmentCustomizationData management layerDependency relationshipDesign phaseEnterprise resource systems (ERP)Errors
FactoringFaultsFixed-price contractFoundation layerGeneralizationHas-partsHuman–computer interaction layerLayerMaintenance oracleMessageMethodModelModel-View-Controller (MVC)ModuleObject wrapperOutsourcingPackagePackage diagramPackaged softwarePartition
Physical architecture layerPresenterProblem domain layerRecorderRefinementRequest for information (RFI)Request for proposals (RFP)ScribeServerSmalltalkSystems integrationTestTime-and-arrangements
contractValidationValue-added contractVerificationViewWalkthroughWorkaround
Exercises 315
QUESTIONS
1. What is the primary difference between an analysismodel and a design model?
2. What is a walkthrough? How does it relate to verifica-tion and validation?
3. What are the different roles played during a walk-through? What are their purposes?
4. What are the relationships within the functional mod-els, structural models, and the behavioral models thatneed to be tested?
5. What is meant by balancing the models?6. What are the interrelationships between the func-
tional, structural, and the behavioral models that needto be tested?
7. What does factoring mean? How is it related toabstraction and refinement?
8. What is a partition? How does a partition relate to acollaboration?
9. What is a layer? Name the different layers.10. What is a package? How are packages related to parti-
tions and layers?11. What is a dependency relationship? How do you iden-
tify them?
12. What are the five steps for identifying packages andcreating package diagrams?
13. What needs to be verified and validated in packagediagrams?
14. What situations are most appropriate for a customdevelopment design strategy?
15. What are some problems with using a packaged soft-ware approach to building a new system? How canthese problems be addressed?
16. Why do companies invest in ERP systems?17. What are the pros and cons of using a workaround?18. When is outsourcing considered a good design strat-
egy? When is it not appropriate?19. What are the differences between the time-and-
arrangements, fixed-price, and value-added contractsfor outsourcing?
20. How are the alternative matrix and feasibility analysisrelated?
21. What is an RFP? How is this different from an RFI?
EXERCISES
A. Perform a verification and validation walkthrough ofthe functional and structural models of the dentistoffice problem-domain layer described in exercises E,F, and G in Chapter 5 and exercise K in Chapter 6.
B. Based on the functional models you created for exer-cises E, F, and G in Chapter 5 and the structuralmodel you created in exercise K in Chapter 6, draw apackage diagram for the problem-domain layer forthe dentist office system. Be sure to verify and vali-date the diagram.
C. Perform a verification and validation walkthrough ofthe functional and structural models of the real estatesystem problem-domain layer described in exercises Jand K in Chapter 5 and Exercise M in Chapter 6.
D. Based on the functional models you created for exer-cises J and K in Chapter 5 and the structural model youcreated in exercise M in Chapter 6, draw a package dia-gram for the problem-domain layer for the real estatesystem. Be sure to verify and validate the diagram.
E. Perform a verification and validation walkthrough ofthe functional, structural, and behavioral models ofthe video store system problem-domain layer described
in exercises L and M in Chapter 5, exercise N inChapter 6, and exercises A, B, and C in Chapter 7.
F. Based on the functional models you created for exer-cises L and M in Chapter 5, the structural model youcreated in exercise N in Chapter 6, and the behavioralmodels you created in exercises A, B, and C in Chapter7, draw a package diagram for the problem-domainlayer for the video store system. Be sure to verify andvalidate the diagram.
G. Perform a verification and validation walkthrough ofthe functional, structural, and behavioral models ofthe health club membership system problem-domainlayer described in exercises N and O in Chapter 5,exercise O in Chapter 6, and exercises D, E, and F inChapter 7.
H. Based on the functional models you created for exer-cises N and O in Chapter 5, the structural model youcreated in exercise O in Chapter 6, and the behav-ioral models you created in exercises D, E, and F inChapter 7, draw a package diagram for the problemdomain layer for the health club membership system.Be sure to verify and validate the diagram.

316 Chapter 8 Moving on to Design
I. Perform a verification and validation walkthrough ofthe functional, structural, and behavioral models ofthe catering system problem-domain layer describedin exercises P and Q in Chapter 5, exercise P in Chap-ter 6, and exercise J in Chapter 7.
J. Based on the functional models you created for exer-cises P and Q in Chapter 5, the structural model youcreated in exercise P in Chapter 6, and the behavioralmodels you created in exercise J in Chapter 7, draw apackage diagram for the problem-domain layer forthe catering system. Be sure to verify and validate thediagram.
K. Perform a verification and validation walkthrough ofthe functional, structural, and behavioral models ofthe Of-the-Month Club system problem-domain layerdescribed in exercises R and S in Chapter 5, exercise Qin Chapter 6, and exercise K in Chapter 7.
L. Based on the functional models you created for exer-cises R and S in Chapter 5, the structural model youcreated in Exercise Q in Chapter 6, and the behavioralmodels you created in exercise K in Chapter 7, draw apackage diagram for the problem-domain layer for thesystem for the Of-the-Month Club. Be sure to verifyand validate the diagram.
M. Perform a verification and validation walkthrough ofthe functional, structural, and behavioral models ofthe university library system problem-domain layerdescribed in exercises T and U in Chapter 5, exercise Rin Chapter 6, and exercise L in Chapter 7.
N. Based on the functional models you created for exer-cises T and U in Chapter 5, the structural model youcreated in Exercise R in Chapter 6, and the behavioralmodels you created in exercises L in Chapter 7, draw apackage diagram for the problem domain layer for theuniversity library system. Be sure to verify and validatethe diagram.
O. Which design strategy would you recommend for theconstruction of the system in each exercise? Why?a. exercises A & Bb. exercises C & Dc. exercises E & Fd. exercises G & He. exercises I & Jf. exercises K & Lg. exercises M & N
P. Suppose you are leading a project that will implement anew course-enrollment system for your university. Youare thinking about either using a packaged course-enrollment application or outsourcing the job to anexternal consultant. Create an outline for an RFP towhich interested vendors and consultants could respond.
Q. Suppose you and your friends are starting a smallbusiness painting houses in the summertime. Youneed to buy a software package that handles the finan-cial transactions of the business. Create an alternativematrix that compares three packaged systems (e.g.,Quicken, MS Money, Quickbooks). Which alternativeappears to be the best choice?
MINICASES
1. Susan, president of MOTO, Inc., a human resourcesmanagement firm, is reflecting on the client manage-ment software system her organization purchased fouryears ago. At that time, the firm had just gone througha major growth spurt, and the mixture of automatedand manual procedures that had been used to manageclient accounts became unwieldy. Susan and Nancy, herIS department head, researched and selected the pack-age that is currently used. Susan had heard about thesoftware at a professional conference she attended, andat least initially, it worked fairly well for the firm. Someof their procedures had to change to fit the package,but they expected that and were prepared for it.
Since that time, MOTO, Inc. has continued to grow,not only through an expansion of the client base, butalso through the acquisition of several smaller employ-ment-related businesses. MOTO, Inc. is a much different
business than it was four years ago. Along with expand-ing to offer more diversified human resource manage-ment services, the firm’s support staff has also expanded.Susan and Nancy are particularly proud of the IS depart-ment they have built up over the years. Using strong tieswith a local university, an attractive compensation pack-age, and a good working environment, the IS depart-ment is well-staffed with competent, innovative people,plus a steady stream of college interns that keeps thedepartment fresh and lively. One of the IS teams pio-neered the use of the Internet to offer MOTO’s servicesto a whole new market segment, an experiment that hasproven very successful.
It seems clear that a major change is needed in theclient management software, and Susan has alreadybegun to plan financially to undertake such a project.This software is a central part of MOTO’s operations,

Minicases 317
and Susan wants to be sure that a quality system isobtained this time. She knows that the vendor of theircurrent system has made some revisions and additionsto its product line. There are also a number of othersoftware vendors who offer products that may be suit-able. Some of these vendors did not exist when thepurchase was made four years ago. Susan is also con-sidering Nancy’s suggestion that the IS departmentdevelop a custom software application.a. Outline the issues that Susan should consider that
would support the development of a custom soft-ware application in-house.
b. Outline the issues that Susan should considerwhich would support the purchase of a softwarepackage.
c. Within the context of a systems development pro-ject, when should the decision of “make-versus-buy”be made? How should Susan proceed? Explain youranswer.
2. Refer to minicase 1 in Chapter 6. After completing allthe analysis models (both the as-is and to-be models)for West Star Marinas, the director of operationsfinally understood why it was important to under-stand the as-is system before delving into the develop-ment of the to-be system. However, you now tell him
that the to-be models are only the problem-domainportion of the design. To say the least, he is now veryconfused. After explaining to him the advantages ofusing a layered approach to developing the system, hesays, “I don’t care about reusability or maintenance. Ionly want the system to be implemented as soon aspossible. You IS types are always trying to pull a fastone on the users. Just get the system completed.”
What is your response to the Director of Opera-tions? Do you jump into implementation as he seemsto want? What do you do next?
3. Refer to the analysis models that you created for profes-sional and scientific staff management (PSSM) for mini-case 2 in Chapter 5 and for minicase 1 in Chapter 7.a. Add packages to your use-case diagram to simplify it.b. Use the communication diagram to identify logical
partitions in your class diagram. Add packages tothe diagram to represent the partitions.
4. Refer to the analysis models that you created for HolidayTravel Vehicles for minicase 2 in Chapter 6 and for mini-case 2 in Chapter 7.a. Add packages to your use-case diagram to simplify it.b. Use the communication diagram to identify logical
partitions in your class diagram. Add packages tothe diagram to represent the partitions.
318
The most important step of the design phase is designing the individual classes andmethods. Object-oriented systems can be quite complex, so analysts need to create instruc-tions and guidelines for programmers that clearly describe what the system must do. Thischapter presents a set of criteria, activities, and techniques used to design classes and meth-ods. Together they are used to ensure the object-oriented design communicates how thesystem needs to be coded.
OBJECTIVES
■ Become familiar with coupling, cohesion, and connascence.■ Be able to specify, restructure, and optimize object designs.■ Be able to identify the reuse of predefined classes, libraries, frameworks, and components.■ Be able to specify constraints and contracts.■ Be able to create a method specification.
CHAPTER OUTLINE
C H A P T E R 9
Class and Method Design
IntroductionReview of the Basic Characteristics
of Object OrientationClasses, Objects, Methods, and MessagesEncapsulation and Information HidingPolymorphism and Dynamic BindingInheritance
Design CriteriaCouplingCohesionConnascence
Object Design ActivitiesAdding SpecificationsIdentifying Opportunities for Reuse
Restructuring the DesignOptimizing the DesignMapping Problem-Domain Classes
to Implementation LanguagesConstraints and Contracts
Elements of a ContractTypes of Constraints
Method SpecificationGeneral InformationEventsMessage PassingAlgorithm Specification
Applying the Concepts at CD SelectionsSummary
INTRODUCTION
WARNING: This material may be hazardous to your mental stability. Not really, but now thatwe have your attention, you must realize that this material is fairly technical in nature andthat it is extremely important in today’s “flat” world. Today, much of the actual implementa-tion will be done in a different geographic location than where the analysis and design are

Introduction 319
performed. As such, we must ensure that the design is specified in a “correct” manner. Wemust make certain that there is no, or at least minimal, ambiguity in the design specification.
In today’s flat world, the common language spoken among developers is very likely to beUML and some object-oriented language, such as Java, and not English. English has alwaysbeen and always will be ambiguous. Furthermore, to what version of English do we refer? Asboth Oscar Wilde and George Bernard Shaw independently pointed out, the United States andEngland are divided by a common language. A simple, but relevant, example is the number ofzeros in one billion. In American English, there are nine, but in British English there are twelve.Obviously, this could lead to problems when one is building financial information systems.
Practically speaking, Class and Method design is where all the work actually gets doneduring design. No matter which layer you are focusing on, the classes, which will be used tocreate the system objects, must be designed. Some people believe that with reusable classlibraries and off-the-shelf components, this type of low-level, or detailed, design is a waste oftime and that we should jump immediately into the “real” work: coding the system. However,if the past shows us anything, it shows that low-level, or detailed, design is critical despite theuse of libraries and components. Detailed design is still very important for three reasons. First,with today’s modern CASE tools, quite a bit of the actual code can be generated by the toolfrom the detailed design. Second, even preexisting classes and components needs to be under-stood, organized, and pieced together. Third, it is still common for the project team to have towrite some code and produce original classes that support the application logic of the system.
Jumping right into coding will guarantee results that can be disastrous. For example,even though the use of layers can simplify the individual classes, they can increase the com-plexity of the interactions between them. As such, if the classes are not designed carefully,the resulting system can be very inefficient. Or worse, the instances of the classes (i.e., theobjects) will not be capable of communicating with each other, which, of course, will resultin the system not working properly.
Furthermore, in an object-oriented system, changes can take place at different levels ofabstraction. These levels include variable, method, class/object, package,1 library, and/orapplication/system levels (see Figure 9-1). The changes that take place at one level canimpact other levels (e.g., changes to a class can affect the package level, which can affectboth the system level and the library level, which in turn can cause changes back down atthe class level). Finally, changes can occur at different levels at the same time.
The good news is that the detailed design of the individual classes and methods is fairlystraightforward, and the interactions among the objects on the problem-domain layer havebeen designed, in some detail, during analysis (see Chapters 5–7). The other layers (data man-agement, human–computer interaction, and system architecture), are highly dependent on theproblem-domain layer (see Figure 8-7). Therefore, if the problem-domain classes are designedcorrectly, the design of the classes on the other layers will fall into place, relatively speaking.
That being said, it has been our experience that many project teams are much tooquick at jumping into writing code for the classes without first designing them. Some ofthis has been caused by the fact that object-oriented systems analysis and design hasevolved from object-oriented programming. Until recently there has been a general lack ofaccepted guidelines on how to design and develop effective object-oriented systems. How-ever, with the acceptance of UML as a standard object notation, standardized approachesbased on work of many object methodologists have begun to emerge.2
1 A package is a group of collaborating objects. Other names for a package include cluster, partition, pattern, sub-ject, and subsystem.2 For example, OPEN [I. Graham, B. Henderson-Seller, and H. Yanoussi, The Open Process Specification (Reading,MA: Addison-Wesley, 1997)], RUP [P. Kruchten, The Rational Unified Process: An Introduction, 2nd ed. (Reading,MA: Addison-Wesley, 2000)], and the Enhanced Unified Process (see Chapter 1).

In this chapter, we begin by reviewing the basic characteristics of object orientation.Next, we present a set of useful design criteria and activities that are applicable across anylayer for class and method design. Finally, we present a set of techniques that are useful fordesign methods: contracts and method specifications.
Review of the Basic Characteristics of Object Orientation3
Object-oriented systems can be traced back to the Simula and the Smalltalk programminglanguages. However, until the increase in processor power and the decrease in processorcost that occurred in the 1980s, object-oriented approaches were not practical. Many of thespecific details concerning the basic characteristics of object-orientation are languagedependent; that is, each object-oriented programming language tends to implement someof the object-oriented basics in different ways. As such, we need to know which program-ming language is going to be used to implement the different aspects of the solution. Oth-erwise, the system may behave in a manner different than the analyst, designer, and clientexpect. Today, the C��, Java, and Visual Basic.Net programming languages tend to be themore predominant ones used. In this section, we review the basic characteristics of objectorientation and point out where the language specific issues emerge.
Classes, Objects, Methods, and MessagesThe basic building block of the system is the object. Objects are instances of classes that weuse as templates to define objects. A class defines both the data and processes that eachobject contains. Each object has attributes that describe data about the object. Objects havestate, which is defined by the value of its attributes and its relationships with other objectsat a particular point in time. And, each object has methods, which specify what processesthe object can perform. From our perspective, methods are used to implement the opera-tions that specified the behavior of the objects (see Chapter 6). In order to get an object toperform a method (e.g., to delete itself), a message is sent to the object. A message is essen-tially a function or procedure call from one object to another object.
320 Chapter 9 Class and Method Design
Application/System
Package Library
Class/Object
Variable MethodFIGURE 9-1Levels of Abstractionin Object-OrientedSystems
Source: Adapted from David P. Tegarden, Steven D. Sheetz, and David E. Monarchi, “A Software ComplexityModel of Object-Oriented Systems,” Decision Support Systems 13 (March 1995): 241–262.
3 For an introduction to the basic characteristics, see Appendix 1.

Encapsulation and Information HidingEncapsulation is the mechanism that combines the processes and data into a single object.Information hiding suggests only the information required to use an object be available out-side the object; that is, information hiding is related to the visibility of the methods andattributes (see Chapter 6). Exactly how the object stores data or performs methods is notrelevant, as long as the object functions correctly. All that is required to use an object arethe set of methods and the messages needed to be sent to trigger them. The only commu-nication between objects should be through an object’s methods. The fact that we can usean object by sending a message that calls methods is the key to reusability because it shieldsthe internal workings of the object from changes in the outside system, and it keeps the sys-tem from being affected when changes are made to an object.
Polymorphism and Dynamic BindingPolymorphism means having the ability to take several forms. By supporting polymor-phism, object-oriented systems can send the same message to a set of objects, which can beinterpreted differently by different classes of objects. And, based on encapsulation andinformation hiding, an object does not have to be concerned with how something is donewhen using other objects. It simply sends a message to an object and that object determineshow to interpret the message. This is accomplished through the use of dynamic binding.
Dynamic binding refers to the ability of object-oriented systems to defer the data typ-ing of objects to run time. For example, imagine that you have an array of type employeethat contains instances of hourly employees and salaried employees (see Figure 9-2). Boththese types of employees implement a compute pay method. An object can send the mes-sage to each instance contained in the array to compute the pay for that individual instance.Depending on whether the instance is an hourly employee or a salaried employee, a differ-ent method will be executed. The specific method is chosen at run time. With this ability,individual classes are easier to understand. However, the specific level of support for poly-morphism and dynamic binding is language specific. Most object-oriented programminglanguages support dynamic binding of methods, and some support dynamic binding ofattributes. As such, it is important to know what object-oriented programming language isgoing to be used.
But polymorphism can be a double-edged sword. Through the use of dynamic bind-ing, there is no way to know before run time which specific object will be asked to executeits method. In effect, there is a decision made by the system that is not coded anywhere.4
Introduction 321
Array Employee
* *
contains
+computePay()
Hourly Employee
+computePay()
Salaried Employee
+computePay()
FIGURE 9-2Polymorphism Example
4 From a practical perspective, there is an implied case statement. The system chooses the method based on thetype of object being asked to execute it and the parameters passed as arguments to the method.

Furthermore, because all these decisions are made at run time, it is possible to send a mes-sage to an object that it does not understand (i.e., the object does not have a correspond-ing method). This can cause a run-time error that, if not programmed to handle correctly,can cause the system to abort.5
Finally, if the methods are not semantically consistent, the developer cannotassume that all methods with the same name will perform the same generic operation.For example, imagine that you have an array of type person that contains instances ofemployees and customers (see Figure 9-3). These both implement a compute paymethod. An object can send the message to each instance contained in the array to exe-cute the compute pay method for that individual instance. In the case of an instance ofemployee, the compute pay method computes the amount that the employee is owed bythe firm, whereas the compute pay method associated with an instance of a customercomputes the amount owed the firm by the customer. Depending on whether theinstance is an employee or a customer, a different meaning is associated with themethod. As such, the semantics of each method must be determined individually. Thissubstantially increases the difficulty of understanding individual objects. The key tocontrolling the difficulty of understanding object-oriented systems when using poly-morphism is to ensure that all methods with the same name implement that samegeneric operation (i.e., they are semantically consistent).
InheritanceInheritance allows developers to define classes incrementally by reusing classes defined pre-viously as the basis for new classes. Although we could define each class separately, it mightbe simpler to define one general superclass that contains the data and methods needed bythe subclasses and then have these classes inherit the properties of the superclass. Sub-classes inherit the appropriate attributes and methods from the superclasses above them.Inheritance makes it simpler to define classes.
322 Chapter 9 Class and Method Design
Array Person
* *
contains
+computePay()
Employee
+computePay()
Customer
+computePay()
Hourly Employee
+computePay()
Salaried Employee
+computePay()
FIGURE 9-3Polymorphism Misuse Example
5 In Java, these errors are referred to as exceptions that the system “throws” and must “catch.” In other words, theprogrammer must correctly program the throw and catch or the Java virtual machine will abort. Again, each pro-gramming language can handle these situations in a unique manner.
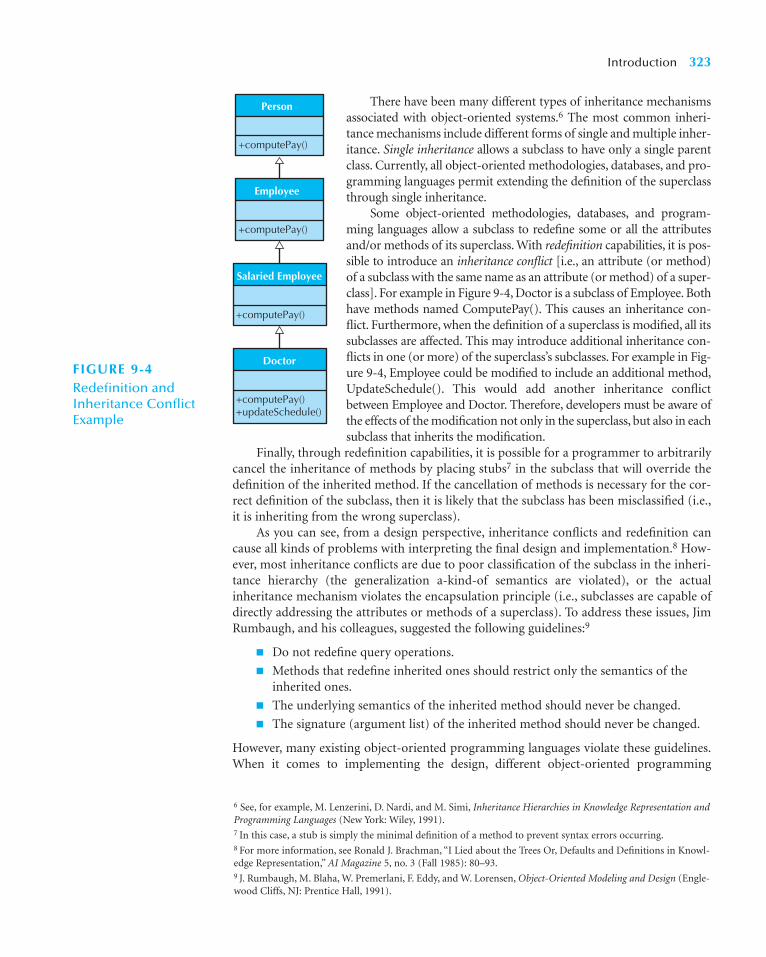
There have been many different types of inheritance mechanismsassociated with object-oriented systems.6 The most common inheri-tance mechanisms include different forms of single and multiple inher-itance. Single inheritance allows a subclass to have only a single parentclass. Currently, all object-oriented methodologies, databases, and pro-gramming languages permit extending the definition of the superclassthrough single inheritance.
Some object-oriented methodologies, databases, and program-ming languages allow a subclass to redefine some or all the attributesand/or methods of its superclass. With redefinition capabilities, it is pos-sible to introduce an inheritance conflict [i.e., an attribute (or method)of a subclass with the same name as an attribute (or method) of a super-class]. For example in Figure 9-4, Doctor is a subclass of Employee. Bothhave methods named ComputePay(). This causes an inheritance con-flict. Furthermore, when the definition of a superclass is modified, all itssubclasses are affected. This may introduce additional inheritance con-flicts in one (or more) of the superclass’s subclasses. For example in Fig-ure 9-4, Employee could be modified to include an additional method,UpdateSchedule(). This would add another inheritance conflictbetween Employee and Doctor. Therefore, developers must be aware ofthe effects of the modification not only in the superclass, but also in eachsubclass that inherits the modification.
Finally, through redefinition capabilities, it is possible for a programmer to arbitrarilycancel the inheritance of methods by placing stubs7 in the subclass that will override thedefinition of the inherited method. If the cancellation of methods is necessary for the cor-rect definition of the subclass, then it is likely that the subclass has been misclassified (i.e.,it is inheriting from the wrong superclass).
As you can see, from a design perspective, inheritance conflicts and redefinition cancause all kinds of problems with interpreting the final design and implementation.8 How-ever, most inheritance conflicts are due to poor classification of the subclass in the inheri-tance hierarchy (the generalization a-kind-of semantics are violated), or the actualinheritance mechanism violates the encapsulation principle (i.e., subclasses are capable ofdirectly addressing the attributes or methods of a superclass). To address these issues, JimRumbaugh, and his colleagues, suggested the following guidelines:9
■ Do not redefine query operations.
■ Methods that redefine inherited ones should restrict only the semantics of theinherited ones.
■ The underlying semantics of the inherited method should never be changed.
■ The signature (argument list) of the inherited method should never be changed.
However, many existing object-oriented programming languages violate these guidelines.When it comes to implementing the design, different object-oriented programming
Introduction 323
6 See, for example, M. Lenzerini, D. Nardi, and M. Simi, Inheritance Hierarchies in Knowledge Representation andProgramming Languages (New York: Wiley, 1991).7 In this case, a stub is simply the minimal definition of a method to prevent syntax errors occurring.8 For more information, see Ronald J. Brachman, “I Lied about the Trees Or, Defaults and Definitions in Knowl-edge Representation,” AI Magazine 5, no. 3 (Fall 1985): 80–93.9 J. Rumbaugh, M. Blaha, W. Premerlani, F. Eddy, and W. Lorensen, Object-Oriented Modeling and Design (Engle-wood Cliffs, NJ: Prentice Hall, 1991).
Person
+computePay()
Employee
+computePay()
Salaried Employee
+computePay()
Doctor
+computePay() +updateSchedule()
FIGURE 9-4Redefinition andInheritance ConflictExample

languages address inheritance conflicts differently. Therefore, it is important at this pointin the development of the system to know what the chosen programming language sup-ports. And, we must be sure that the design can be implemented as intended. Otherwise,the design needs to be modified before it is turned over to remotely located programmers.
When considering the interaction of inheritance with polymorphism and dynamic bind-ing, object-oriented systems provide the developer with a very powerful, but dangerous, set oftools. Depending on the object-oriented programming language used, this interaction canallow the same object to be associated with different classes at different times. For example, aninstance of Doctor can be treated as an instance of Employee or any of its direct and indirectsuperclasses, such as SalariedEmployee and Person, respectively (see Figure 9-4). Therefore,depending on whether static or dynamic binding is supported, the same object may executedifferent implementations of the same method at different times. Or, if the method is definedonly with the SalariedEmployee class and it is currently treated as an instance of the Employeeclass, the instance may cause a run-time error to occur.10 As stated previously, it is importantto know what object-oriented programming language is going to be used so that these kindsof issues can be solved with the design, instead of the implementation, of the class.
With multiple inheritance, a subclass may inherit from more than one superclass. Inthis situation, the types of inheritance conflicts are multiplied. In addition to the possibil-ity of having an inheritance conflict between the subclass and one (or more) of its super-classes, it is now possible to have conflicts between two (or more) superclasses. In this lattercase, there are three different types of additional inheritance conflicts that can occur:
■ Two inherited attributes (or methods) have the same name (spelling) and semantics.
■ Two inherited attributes (or methods) have different names but identical semantics(i.e., they are synonyms).
■ Two inherited attributes (or methods) have the same name but different seman-tics (i.e., they are heteronyms, homographs, or homonyms). This also violates theproper use of polymorphism.
For example, in Figure 9-5, Robot-Employee is a subclass of both Employee andRobot. In this case, Employee and Robot conflict with the attribute name. Which oneshould Robot-Employee inherit? Because they are the same, semantically speaking, does
324 Chapter 9 Class and Method Design
Employee
-name -classification-runningTime
Robot
-name -type-runningTime
Robot-EmployeeFIGURE 9-5Additional InheritanceConflicts with MultipleInheritance
10 This happens with novices quite regularly when using C��.

it really matter? It is also possible that Employee and Robot could have a semantic con-flict on the classification and type attributes if they have the same semantics. Practicallyspeaking, the only way to prevent this situation is for the developer to catch it during thedesign of the subclass. Finally, what if the runningTime attributes have different seman-tics? In the case Employee objects, the runningTime attribute stores the employee’s timerunning a mile, whereas the runningTime attribute for Robot objects stores the averagetime between checkups. Should Robot-Employee inherit both of them? It really dependson whether the robot employees can run the mile or not. With the potential for theseadditional types of conflicts, there is a risk of decreasing the understandability in anobject-oriented system instead of increasing it through the use of multiple inheritance.As such, great care should be taken when using multiple inheritance.
DESIGN CRITERIA
When considering the design of an object-oriented system, a set of criteria exists that can beused to determine whether the design is a good one or a bad one. According to Coad andYourdon,11 “A good design is one that balances trade-offs to minimize the total cost of thesystem over its entire lifetime.” These criteria include coupling, cohesion, and connascence.
CouplingCoupling refers to how interdependent or interrelated the modules (classes, objects, andmethods) are in a system. The higher the interdependency, the more likely changes inpart of a design can cause changes to be required in other parts of the design. For object-oriented systems, Coad and Yourdon12 identified two types of coupling to consider:interaction and inheritance.
Interaction coupling deals with the coupling among methods and objects through mes-sage passing. Lieberherr and Holland put forth the law of Demeter as a guideline to
Design Criteria 325
Meilir Page-Jones, through his consulting company, identi-fied a set of abuses of inheritance. In some cases, theseabuses led to lengthy and bloody disputes, gruesome imple-mentations, and in one case, it led to the destruction of thedevelopment team. In all cases, the error was in not enforc-ing a generalization (a-kind-of) semantics. In one case, theinheritance hierarchy was inverted: BoardMember was asuperclass of Manager, which was a superclass of Employee.However, in this case, an Employee is NOT a-kind-of Man-ager, which is NOT a-kind-of BoardMember. In fact, theopposite was true. However, if you think of an OrganizationChart, a BoardMember is super to a Manager, which is superto an Employee. In another example, the client’s firm
attempted to use inheritance to model a membership idea(e.g., Student is a member of a club). However, the clubshould have had an attribute that contained the studentmembers. In the other examples, inheritance was used toimplement an association relationship and an aggregationrelationship.
Source: Meilir Page-Jones, Fundamentals of Object-Oriented Design inUML (Reading, MA: Addison-Wesley, 2000).
Question
As an analyst, how can you attempt to avoid these typesof inheritance abuses?
9-A Inheritance AbusesCONCEPTS
IN ACTION
11 Peter Coad and Edward Yourdon, Object-Oriented Design (Englewood Cliffs, NJ: Yourdon Press, 1991), p. 128.12 Ibid.

326 Chapter 9 Class and Method Design
minimize this type of coupling.13 Essentially, the law minimizes the number of objects thatcan receive messages from a given object. The law states that an object should send mes-sages only to one of the following:
■ Itself (For example, in Figure 9-6a, Object1 can send Message1 to itself. In otherwords, a method associated with Object1 can use other methods associated withObject1.14)
■ An object that is contained in an attribute of the object or one of its superclasses(For example in Figure 9-6b, PO1 should be able to send messages using both itsCustomer and Date attributes.)
■ An object that is passed as a parameter to the method (For example in Figure 9-6c,the aPatient instance sends the message RequestAppt(name, address) to the aReceptionist instance, which is allowed to send messages to the instances containedin the name and address parameters.)
■ An object that is created by the method (For example in Figure 9-6c, the methodRequestAppt associated with the aReceptionist instance creates an instance of theAppointment class. As such, the RequestAppt method is allowed to send messagesto anAppt.)
■ An object that is stored in a global variable15
In each case, interaction coupling is increased. For example, the coupling increases betweenthe objects if the calling method passes attributes to the called method or if the callingmethod depends on the value being returned by the called method.
There are six types of interaction coupling, each falling on different parts of a good-to-bad continuum. They range from no direct coupling to content coupling. Figure 9-7presents the different types of interaction coupling. In general, interaction coupling shouldbe minimized. The one possible exception is that non-problem-domain classes must becoupled to their corresponding problem-domain classes. For example, a report object (onthe human–computer interaction layer) that displays the contents of an employee object(on the problem-domain layer) will be dependent on the employee object. In this case, foroptimization purposes, the report class may be even content or pathologically coupled tothe employee class. However, problem-domain classes should never be coupled to non-problem-domain classes.
Inheritance coupling, as its name implies, deals with how tightly coupled the classes arein an inheritance hierarchy. Most authors tend to say simply that this type of coupling isdesirable. However, depending on the issues raised previously with inheritance—inheri-tance conflicts, redefinition capabilities, and dynamic binding—a high level of inheritancecoupling may not be a good thing. For example, in Figure 9-8, should Method2() definedin Subclass be allowed to call Method1() defined in Superclass? Or, should Method2()defined in Subclass refer to Atribute1 defined in Superclass? Or, even more confusing,assuming that Superclass is an abstract class, can a Method1() call Method2() or useAttribute2 defined in Subclass? Obviously, the first two examples have some intuitive sense.Using the properties of a superclass is the primary purpose of inheriting from it in the firstplace. On the other hand, the third example is somewhat counterintuitive. However, due to
13 Karl J. Lieberherr and Ian M. Holland, “Assuring Good Style for Object-Oriented Programs,” IEEE Software, 6,no. 5 (September, 1989): 38–48; and Karl J. Lieberherr, Adaptive Object-Oriented Software: The Demeter Methodwith Propagation Patterns (Boston, MA: PWS Publishing, 1996).14 Obviously, this is stating what is expected.15 From a design perspective, global variables should be avoided. Most pure object-oriented programming lan-guages do not explicitly support global variables. As such, we do not address them any further.

the way that different object-oriented programming languages support dynamic binding,polymorphism and inheritance, all these examples could be possible.
As Snyder has pointed out, most problems with inheritance involve the abilitywithin the object-oriented programming languages to violate the encapsulation and
Design Criteria 327
Purchase Order
-PO Number[1..1] : unsigned long-Sub Total[0..1] : Currency-Tax[0..1] : Currency -Shipping[0..1] : Currency -Total[0..1] : Currency-Customer[1..1] : Customer-State[1..1] : State
PO1: Purchase Order
Date : Date PO Number : unsigned longSub Total : CurrencyTax : Currency Shipping : Currency Total : CurrencyCustomer : CustomerState : State
Message 1
Invoice
Object 1 Accts Pay Forms
-Date : date
RequestAppt(name, address)
NewCancelChangeAppt?()
ApptTimes?()
aPatient
LookUpPatient()
aReceptionist Patients:PatientsList
[aPatient Exists]: LookupBills()
MatchAppts()
UnpaidBills:BillsList Appointments:ApptsList
CreateAppt()anAppt:Appointment
(a) (b)
(c)
FIGURE 9-6 Interaction Coupling Examples
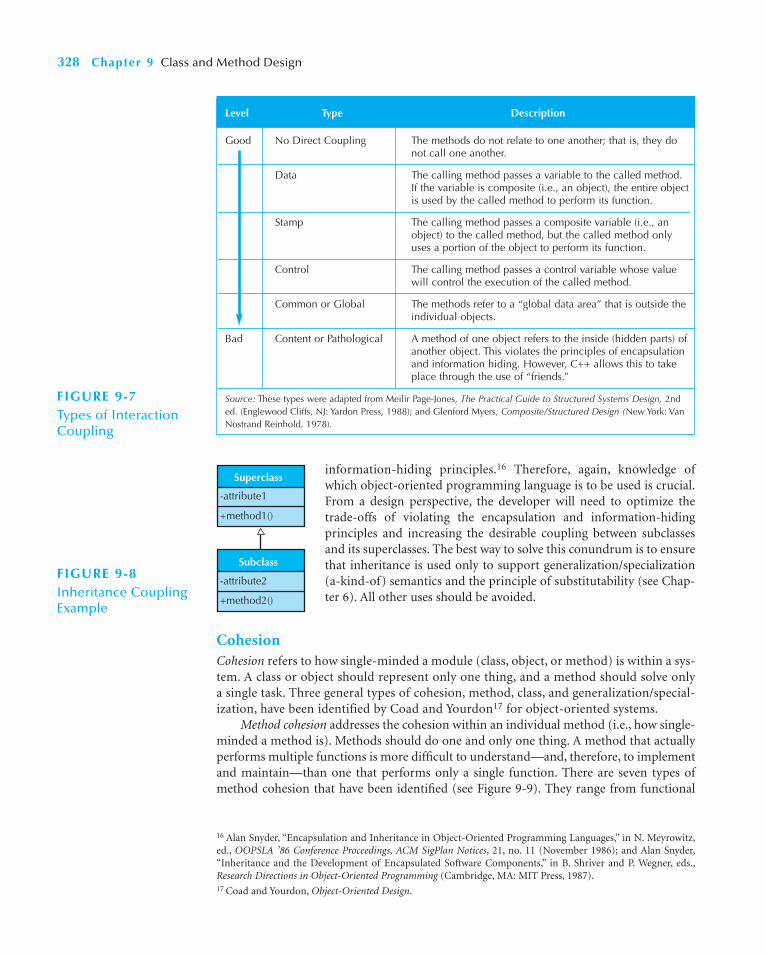
information-hiding principles.16 Therefore, again, knowledge ofwhich object-oriented programming language is to be used is crucial.From a design perspective, the developer will need to optimize thetrade-offs of violating the encapsulation and information-hidingprinciples and increasing the desirable coupling between subclassesand its superclasses. The best way to solve this conundrum is to ensurethat inheritance is used only to support generalization/specialization(a-kind-of) semantics and the principle of substitutability (see Chap-ter 6). All other uses should be avoided.
CohesionCohesion refers to how single-minded a module (class, object, or method) is within a sys-tem. A class or object should represent only one thing, and a method should solve onlya single task. Three general types of cohesion, method, class, and generalization/special-ization, have been identified by Coad and Yourdon17 for object-oriented systems.
Method cohesion addresses the cohesion within an individual method (i.e., how single-minded a method is). Methods should do one and only one thing. A method that actuallyperforms multiple functions is more difficult to understand—and, therefore, to implementand maintain—than one that performs only a single function. There are seven types ofmethod cohesion that have been identified (see Figure 9-9). They range from functional
328 Chapter 9 Class and Method Design
Good No Direct Coupling The methods do not relate to one another; that is, they donot call one another.
Data The calling method passes a variable to the called method.If the variable is composite (i.e., an object), the entire objectis used by the called method to perform its function.
Stamp The calling method passes a composite variable (i.e., anobject) to the called method, but the called method onlyuses a portion of the object to perform its function.
Control The calling method passes a control variable whose valuewill control the execution of the called method.
Common or Global The methods refer to a “global data area” that is outside theindividual objects.
Bad Content or Pathological A method of one object refers to the inside (hidden parts) ofanother object. This violates the principles of encapsulationand information hiding. However, C++ allows this to takeplace through the use of “friends.”
Source: These types were adapted from Meilir Page-Jones, The Practical Guide to Structured Systems Design, 2nded. (Englewood Cliffs, NJ: Yardon Press, 1988); and Glenford Myers, Composite/Structured Design (New York: VanNostrand Reinhold, 1978).
Level Type Description
FIGURE 9-7Types of InteractionCoupling
Superclass
+method1()
-attribute1
Subclass
+method2()
-attribute2FIGURE 9-8Inheritance CouplingExample
16 Alan Snyder, “Encapsulation and Inheritance in Object-Oriented Programming Languages,” in N. Meyrowitz,ed., OOPSLA ’86 Conference Proceedings, ACM SigPlan Notices, 21, no. 11 (November 1986); and Alan Snyder,“Inheritance and the Development of Encapsulated Software Components,” in B. Shriver and P. Wegner, eds.,Research Directions in Object-Oriented Programming (Cambridge, MA: MIT Press, 1987).17 Coad and Yourdon, Object-Oriented Design.

cohesion (good) down to coincidental cohesion (bad). In general, method cohesion shouldbe maximized.
Class cohesion is the level of cohesion among the attributes and methods of a class (i.e.,how single-minded a class is). A class should represent only one thing, such as an employee,a department, or an order. All attributes and methods contained in a class should berequired for the class to represent the thing. For example, an employee class should haveattributes that deal with a social security number, last name, first name, middle initial,addresses, and benefits, but it should not have attributes such as door, engine, or hood. Fur-thermore, there should be no attributes or methods that are never used. In other words, aclass should have only the attributes and methods necessary to fully define instances for theproblem at hand. In this case, we have ideal class cohesion. Glenford Meyers suggested thata cohesive class18 should have these attributes:
■ It should contain multiple methods that are visible outside the class (i.e., a single-method class rarely makes sense).
■ Each visible method performs only a single function (i.e., it has functional cohesion).
Design Criteria 329
FIGURE 9-9Types of MethodCohesion
18 We have adapted his informational-strength module criteria from structured design to object-oriented design.[see Glenford J. Myers, Composite/Structured Design (New York, NY: Van Nostrand Reinhold, 1978)].
Good Functional A method performs a single problem-related task (e.g.,calculate current GPA).
Sequential The method combines two functions in which the outputfrom the first one is used as the input to the second one(e.g., format and validate current GPA).
Communicational The method combines two functions that use the sameattributes to execute (e.g., calculate current and cumulative GPA).
Procedural The method supports multiple weakly related functions. Forexample, the method could calculate student GPA, printstudent record, calculate cumulative GPA, and printcumulative GPA.
Temporal or Classical The method supports multiple related functions in time (e.g., initialize all attributes).
Logical The method supports multiple related functions, but thechoice of the specific function is chosen based on a controlvariable that is passed into the method. For example, thecalled method could open a checking account, open a sav-ings account, or calculate a loan, depending on the messagethat is send by its calling method.
Bad Coincidental The purpose of the method cannot be defined or it performsmultiple functions that are unrelated to one another. Forexample, the method could update customer records, calcu-late loan payments, print exception reports, and analyzecompetitor pricing structure.
Source: These types were adapted from Page-Jones, The Practical Guide to Structured Systems, and Myers,Composite/Structured Design.
Level Type Description

■ All methods reference only attributes or other methods defined within theclass or one of its superclasses (i.e., if a method is going to send a message toanother object, the remote object must be the value of one of the local object’sattributes).19
■ It should not have any control-flow couplings between its visible methods.
Page-Jones20 has identified three less-than-desirable types of class cohesion: mixed-instance, mixed-domain, and mixed-role (see Figure 9-10). An individual class can have amixture of any of the three types.
Generalization/specialization cohesion addresses the sensibility of the inheritance hier-archy. How are the classes in the inheritance hierarchy related? Are the classes relatedthrough a generalization/specialization (a-kind-of) semantics? Or, are they related viasome association, aggregation, or membership type of relationship that was created forsimple reuse purposes? Recall all the issues raised previously on the use of inheritance. Forexample, in Figure 9-11, the subclasses ClassRooms and Staff inherit from the superclassDepartment. Obviously, instances of the ClassRooms and Staff classes are not a-kind-ofDepartment. However, in the early days of object-oriented programming, this use of inher-itance was quite common. When a programmer saw that there were some common prop-erties that a set of classes shared, the programmer would create an artificial abstraction thatdefined the commonalities. This was potentially useful in a reuse sense, but it turned outto cause many maintenance nightmares. In this case, instances of the ClassRooms and Staffclasses are associated with or a-part-of an instance of Department. Today we know thathighly cohesive inheritance hierarchies should support only the semantics of generalizationand specialization (a-kind-of) and the principle of substitutability.
330 Chapter 9 Class and Method Design
19 This restricts message passing to only the first, second, and fourth conditions supported by the law of Demeter.For example, in Figure 9-6c, aReceptionist must have attributes associated with it that contains objects forPatients, Unpaid Bills, and Appointments. Furthermore, once anAppt is created, a Receptionist must have anattribute with anAppt as it’s value to send any additional messages.20 See Meilir Page-Jones, Fundamentals of Object-Oriented Design in UML (Reading, MA: Addison-Wesley, 2000).
Good Ideal The class has none of the mixed cohesions.
Mixed-Role The class has one or more attributes that relate objects ofthe class to other objects on the same layer (e.g., theproblem domain layer), but the attribute(s) have nothing todo with the underlying semantics of the class.
Mixed-Domain The class has one or more attributes that relate objects of theclass to other objects on a different layer. As such, they havenothing to do with the underlying semantics of the thing thatthe class represents. In these cases, the offending attribute(s)belongs in another class located on one of the other layers.For example, a port attribute located in a problem domainclass should be in a system architecture class that is relatedto the problem domain class.
Worse Mixed-Instance The class represents two different types of objects. The classshould be decomposed into two separate classes. Typically,different instances only use a portion of the full definition ofthe class.
Source: Page-Jones, Fundamentals of Object-Oriented Design in UML.
Level Type Description
FIGURE 9-10Types of Class Cohesion

ConnascenceConnascence21 generalizes the ideas of cohesion and coupling, and it combines them withthe arguments for encapsulation. To accomplish this, three levels of encapsulation havebeen identified. Level-0 encapsulation refers to the amount of encapsulation realized in anindividual line of code, level-1 encapsulation is the level of encapsulation attained by com-bining lines of code into a method, and level-2 encapsulation is achieved by creating classesthat contain both methods and attributes. Method cohesion and interaction couplingaddress primarily level-1 encapsulation. Class cohesion, generalization/specialization cohe-sion, and inheritance coupling address only level-2 encapsulation. Connascence, as a gen-eralization of cohesion and coupling, addresses both level-1 and level-2 encapsulation.
But what exactly is connascence? Connascence literally means to be born together.From an object-oriented design perspective, it really means that two modules (classes ormethods) are so intertwined that if you make a change in one, it is likely that a change inthe other will be required. On the surface, this is very similar to coupling and, as such,should be minimized. However, when you combine it with the encapsulation levels, it is notquite as simple as that. In this case, we want to (1) minimize overall connascence by elim-inating any unnecessary connascence throughout the system, (2) minimize connascenceacross any encapsulation boundaries, such as method boundaries and class boundaries,and (3) maximize connascence within any encapsulation boundary.
Based on these guidelines, a subclass should never directly access any hidden attributeor method of a superclass [i.e., a subclass should not have special rights to the propertiesof its superclass(es)]. If direct access to the nonvisible attributes and methods of a super-class by its subclass is allowed—and is permitted in most object-oriented programminglanguages—and a modification to the superclass is made, then due to the connascencebetween the subclass and its superclass, it is likely that a modification to the subclass alsowill be required.22 In other words, the subclass has access to something across an encapsu-lation boundary (the class boundary between the subclass and the superclass). Practicallyspeaking, you should maximize the cohesion (connascence) within an encapsulationboundary and minimize the coupling (connascence) between the encapsulation bound-aries. There are many possible types of connascence. Figure 9-12 describes five of the types.
Design Criteria 331
Department
ClassRooms StaffFIGURE 9-11Generalization/Specialization vs.Inheritance Abuse
21 See Meilir Page-Jones, “Comparing Techniques by Means of Encapsulation and Connascence,” Communicationsof the ACM 35, no. 9 (September 1992): 147–151.22 Based on these guidelines, the use of the protected visibility, as supported in Java and C��, should be mini-mized if not avoided. Furthermore, so-called friends as defined in C�� also should be minimized or avoided.Due to the level of dependencies these language features create, any convenience afforded to a programmer ismore than offset in potential design, understandability, and maintenance problems. As such, these features mustbe used with great caution and must be fully documented.
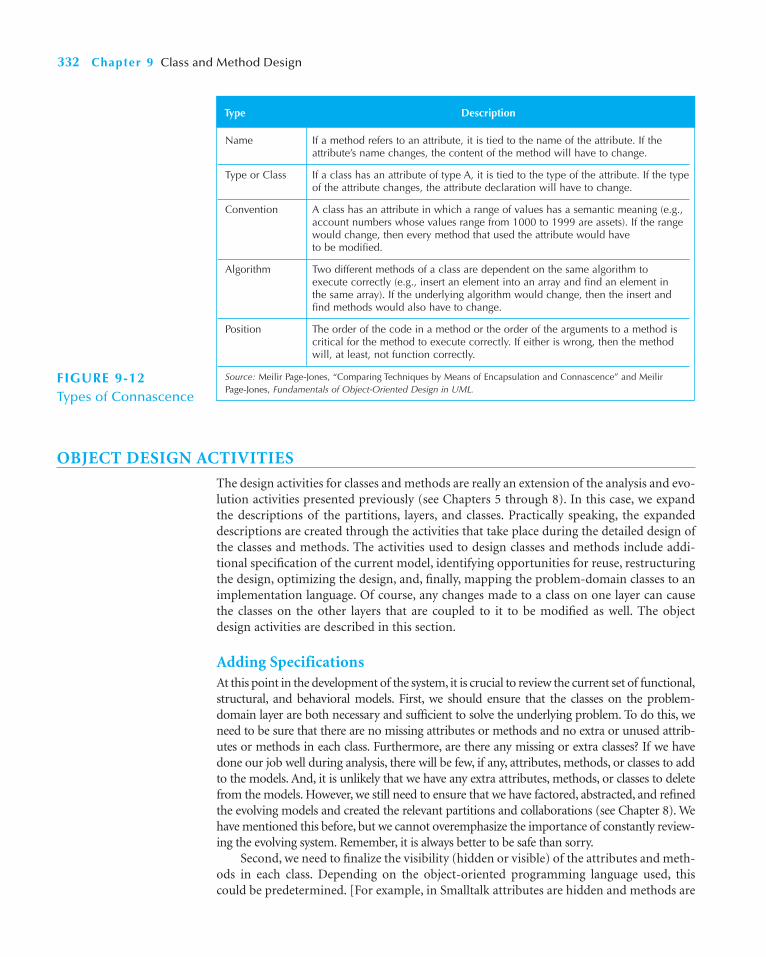
OBJECT DESIGN ACTIVITIES
The design activities for classes and methods are really an extension of the analysis and evo-lution activities presented previously (see Chapters 5 through 8). In this case, we expandthe descriptions of the partitions, layers, and classes. Practically speaking, the expandeddescriptions are created through the activities that take place during the detailed design ofthe classes and methods. The activities used to design classes and methods include addi-tional specification of the current model, identifying opportunities for reuse, restructuringthe design, optimizing the design, and, finally, mapping the problem-domain classes to animplementation language. Of course, any changes made to a class on one layer can causethe classes on the other layers that are coupled to it to be modified as well. The objectdesign activities are described in this section.
Adding SpecificationsAt this point in the development of the system, it is crucial to review the current set of functional,structural, and behavioral models. First, we should ensure that the classes on the problem-domain layer are both necessary and sufficient to solve the underlying problem. To do this, weneed to be sure that there are no missing attributes or methods and no extra or unused attrib-utes or methods in each class. Furthermore, are there any missing or extra classes? If we havedone our job well during analysis, there will be few, if any, attributes, methods, or classes to addto the models. And, it is unlikely that we have any extra attributes, methods, or classes to deletefrom the models. However, we still need to ensure that we have factored, abstracted, and refinedthe evolving models and created the relevant partitions and collaborations (see Chapter 8). Wehave mentioned this before, but we cannot overemphasize the importance of constantly review-ing the evolving system. Remember, it is always better to be safe than sorry.
Second, we need to finalize the visibility (hidden or visible) of the attributes and meth-ods in each class. Depending on the object-oriented programming language used, thiscould be predetermined. [For example, in Smalltalk attributes are hidden and methods are
332 Chapter 9 Class and Method Design
Name If a method refers to an attribute, it is tied to the name of the attribute. If theattribute’s name changes, the content of the method will have to change.
Type or Class If a class has an attribute of type A, it is tied to the type of the attribute. If the typeof the attribute changes, the attribute declaration will have to change.
Convention A class has an attribute in which a range of values has a semantic meaning (e.g.,account numbers whose values range from 1000 to 1999 are assets). If the rangewould change, then every method that used the attribute would have to be modified.
Algorithm Two different methods of a class are dependent on the same algorithm to execute correctly (e.g., insert an element into an array and find an element in the same array). If the underlying algorithm would change, then the insert andfind methods would also have to change.
Position The order of the code in a method or the order of the arguments to a method iscritical for the method to execute correctly. If either is wrong, then the methodwill, at least, not function correctly.
Source: Meilir Page-Jones, “Comparing Techniques by Means of Encapsulation and Connascence” and MeilirPage-Jones, Fundamentals of Object-Oriented Design in UML.
Type Description
FIGURE 9-12Types of Connascence
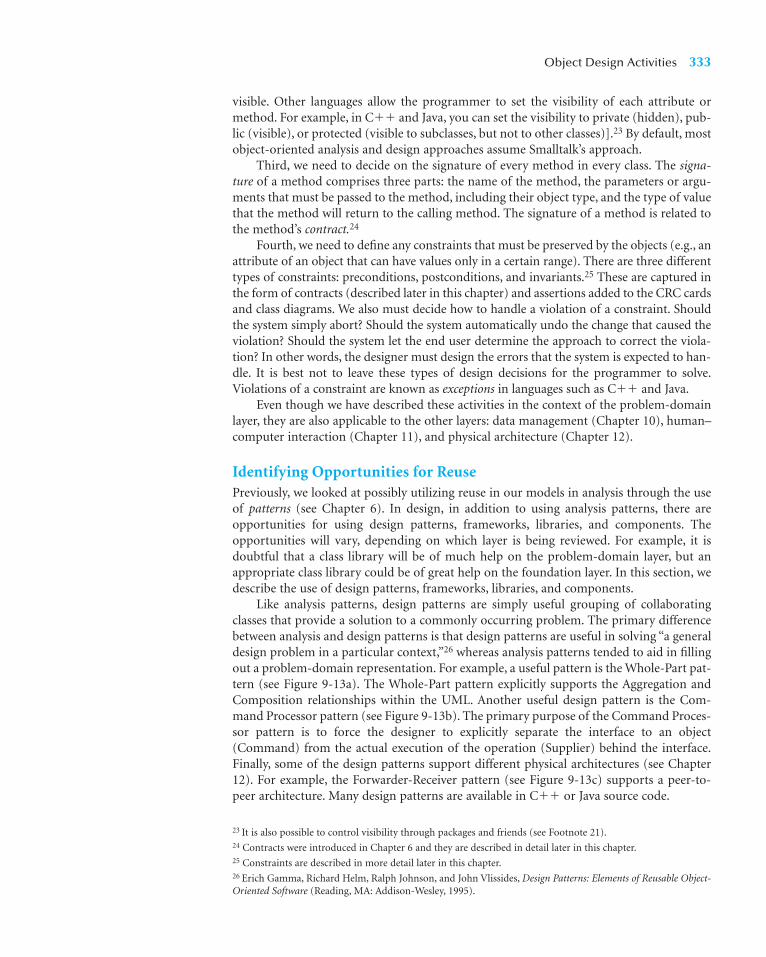
visible. Other languages allow the programmer to set the visibility of each attribute ormethod. For example, in C�� and Java, you can set the visibility to private (hidden), pub-lic (visible), or protected (visible to subclasses, but not to other classes)].23 By default, mostobject-oriented analysis and design approaches assume Smalltalk’s approach.
Third, we need to decide on the signature of every method in every class. The signa-ture of a method comprises three parts: the name of the method, the parameters or argu-ments that must be passed to the method, including their object type, and the type of valuethat the method will return to the calling method. The signature of a method is related tothe method’s contract.24
Fourth, we need to define any constraints that must be preserved by the objects (e.g., anattribute of an object that can have values only in a certain range). There are three differenttypes of constraints: preconditions, postconditions, and invariants.25 These are captured inthe form of contracts (described later in this chapter) and assertions added to the CRC cardsand class diagrams. We also must decide how to handle a violation of a constraint. Shouldthe system simply abort? Should the system automatically undo the change that caused theviolation? Should the system let the end user determine the approach to correct the viola-tion? In other words, the designer must design the errors that the system is expected to han-dle. It is best not to leave these types of design decisions for the programmer to solve.Violations of a constraint are known as exceptions in languages such as C�� and Java.
Even though we have described these activities in the context of the problem-domainlayer, they are also applicable to the other layers: data management (Chapter 10), human–computer interaction (Chapter 11), and physical architecture (Chapter 12).
Identifying Opportunities for ReusePreviously, we looked at possibly utilizing reuse in our models in analysis through the useof patterns (see Chapter 6). In design, in addition to using analysis patterns, there areopportunities for using design patterns, frameworks, libraries, and components. Theopportunities will vary, depending on which layer is being reviewed. For example, it isdoubtful that a class library will be of much help on the problem-domain layer, but anappropriate class library could be of great help on the foundation layer. In this section, wedescribe the use of design patterns, frameworks, libraries, and components.
Like analysis patterns, design patterns are simply useful grouping of collaboratingclasses that provide a solution to a commonly occurring problem. The primary differencebetween analysis and design patterns is that design patterns are useful in solving “a generaldesign problem in a particular context,”26 whereas analysis patterns tended to aid in fillingout a problem-domain representation. For example, a useful pattern is the Whole-Part pat-tern (see Figure 9-13a). The Whole-Part pattern explicitly supports the Aggregation andComposition relationships within the UML. Another useful design pattern is the Com-mand Processor pattern (see Figure 9-13b). The primary purpose of the Command Proces-sor pattern is to force the designer to explicitly separate the interface to an object(Command) from the actual execution of the operation (Supplier) behind the interface.Finally, some of the design patterns support different physical architectures (see Chapter12). For example, the Forwarder-Receiver pattern (see Figure 9-13c) supports a peer-to-peer architecture. Many design patterns are available in C�� or Java source code.
Object Design Activities 333
23 It is also possible to control visibility through packages and friends (see Footnote 21).24 Contracts were introduced in Chapter 6 and they are described in detail later in this chapter.25 Constraints are described in more detail later in this chapter.26 Erich Gamma, Richard Helm, Ralph Johnson, and John Vlissides, Design Patterns: Elements of Reusable Object-Oriented Software (Reading, MA: Addison-Wesley, 1995).

334 Chapter 9 Class and Method Design
Client
+doTask()
Whole
+service1() +service2()
Part1
+serviceA1() +serviceA2()
PartN
+serviceN1() +serviceN2()
Supplier
+appFunctions() +getState()+restoreState()
Receiver
+receive() +unmarshal()+receiveMsg()
Forwarder
+marshal() +deliver()+sendMsg()
Forwarder
+marshal() +deliver()+sendMsg()
Receiver
+receive() +unmarshal()+receiveMsg()
Abstract Command
+do() +undo()
Command Processor
+dolt(in cmd) +undolt()
-commandStack
Command
+do() +undo()
-stateForUndo
Controller
+eventLoop()
Peer2
+service()
Peer1
+service()
(a)
(b)
(c)
calls service
usescreates
InterProcessCommunication
InterProcessCommunication
performs/stores
combines
1
transfer/command
1
sendMsg
receiveMsg
1
1
1
receiveMsg
sendMsg
FIGURE 9-13 Sample Design PatternsSource: These design patterns, along with many more, can be found in Frank Buschmann, Regine Meunier, Hans Rohnert, Peter Sommerlad, and MichaelStal, Pattern-Oriented Software Architecture: A System of Patterns (Chichester, UK: Wiley, 1996).

A framework is composed of a set of implemented classes that can be can be used as abasis for implementing an application. For example, there are frameworks available forCORBA and DCOM on which the implementation of part of the system architecture layercould be based. Most frameworks allow us to create subclasses to inherit from classes in theframework. There are object-persistence frameworks that can be purchased and used to addpersistence to the problem-domain classes, which would be helpful on the data managementlayer. Of course, when inheriting from classes in a framework, we are creating a dependency(i.e., increasing the inheritance coupling from the subclass to the superclass). Therefore, ifwe use a framework and the vendor makes changes to the framework, we will have to at leastrecompile the system when we upgrade to the new version of the framework.
A class library is similar to a framework in that it typically has a set of implementedclasses that were designed for reuse. However, frameworks tend to be more domain speci-fic. In fact, frameworks may be built using a class library. A typical class library could bepurchased to support numerical or statistical processing, file management (data manage-ment layer), or user interface development (human–computer interaction layer). In somecases, instances of classes contained in the class library can be created, and in other casesclasses in the class library can be extended by creating subclasses based on them. As withframeworks, if we use inheritance to reuse the classes in the class library, we will run intoall the issues dealing with inheritance coupling and connascence. If we directly instantiateclasses in the class library, we will create a dependency between our object and the libraryobject based on the signatures of the methods in the library object. This increases the inter-action coupling between the class library object and our object.
A component is a self-contained, encapsulated piece of software that can be pluggedinto a system to provide a specific set of required functionalities. Today, there are manycomponents available for purchase that have been implemented using ActiveX or JavaBeantechnologies. A component has a well-defined API (application program interface). An APIis essentially a set of method interfaces to the objects contained in the component. Theinternal workings of the component are hidden behind the API. Components can beimplemented using class libraries and frameworks. However, components also can be usedto implement frameworks. Unless the API changes between versions of the component,upgrading to a new version normally will require only linking the component back into theapplication. As such, recompilation typically is not required.
Which of these approaches should we use? It depends on what we are trying to build. Ingeneral, frameworks are used mostly to aid in developing objects on the system architecture,human–computer interaction, or data management layers; components are used primarily tosimplify the development of objects on the problem-domain and human–computer interac-tion layers; and class libraries are used to develop frameworks and components and to sup-port the foundation layer. Whichever of these reuse approaches you use, you must rememberthat reuse brings many potential benefits and possible problems. For example, the softwarehas previously been verified and validated, which should reduce the amount of testingrequired for our system. However as stated before, if the software on which we are basing oursystem changes, then most likely, we will also have to change our system. Furthermore, if thesoftware is from a third-party firm, we are creating a dependency from our firm (or ourclient’s firm) to the third-party vendor. As such, we need to have some confidence that thevendor will be in business for a while.
Restructuring the DesignOnce the individual classes and methods have been specified and the class libraries, frame-works, and components have been incorporated into the evolving design, we should usefactoring to restructure the design. Factoring (Chapter 8) is the process of separating out
Object Design Activities 335

aspects of a method or class into a new method or class to simplify the overall design. Forexample, when reviewing a set of classes on a particular layer, we might discover that asubset of them shares a similar definition. In that case, it may be useful to factor out thesimilarities and create a new class. Based on the issues related to cohesion, coupling, andconnascence, the new class may be related to the old classes via inheritance (generaliza-tion) or through an aggregation or association relationship.
Another process that is useful for restructuring the evolving design is normalization.Normalization is described in Chapter 10 in relation to relational databases. However, nor-malization can be useful at times to identify potential classes that are missing from thedesign. Also related to normalization is the requirement to implement the actual associa-tion and aggregation relationships as attributes. Virtually no object-oriented programminglanguage differentiates between attributes and association and aggregation relationships.Therefore, all association and aggregation relationships must be converted to attributes inthe classes. For example in Figure 9-14a, the Customer and State classes are associated withthe Order class. Therefore, we need to add attributes to the Order class to reference the Cus-tomer and State classes. Furthermore, the Product-Order association class must be con-verted to a class (see Figure 9-14b).
Finally, all inheritance relationships should be challenged to ensure that they supportonly a generalization/specialization (a-kind-of) semantics. Otherwise, all the problemsmentioned previously with inheritance coupling, class cohesion, and generalization/spe-cialization cohesion will come to pass.
Optimizing the Design27
Up until now, we have focused our energy on developing an understandable design. Withall the classes, patterns, collaborations, partitions, and layers designed and with all the classlibraries, frameworks, and components included in the design, understandability has been,as it should have been, our primary focus. However, increasing the understandability of adesign typically creates an inefficient design. Conversely, focusing on efficiency issues willdeliver a design that is more difficult to understand. A good practical design will managethe inevitable trade-offs that must occur to create an acceptable system. In this section, wedescribe a set of simple optimizations that can be used to create a more efficient design.28
336 Chapter 9 Class and Method Design
In the previous chapters, you have been working on asystem for the campus housing service. Based on the cur-rent set of functional, structural, and behavioral modelsthat you have developed, are there potential opportunities
of reuse in developing the system? Search the Web forpotential patterns, class libraries, and components thatcould be useful in developing this system.
9-1 Campus HousingYOUR
TURN
27 The material contained in this section is based on James Rumbaugh, Michael Blaha, William Premerlani,Frederick Eddy, and William Lorensen, Object-Oriented Modeling and Design (Englewood Cliffs, NJ: PrenticeHall, 1991); and Bernd Brugge and Allen H. Dutoit, Object-Oriented Software Engineering: Conquering Complexand Changing Systems (Englewood Cliffs, NJ: Prentice Hall, 2000).28 The optimizations described here are only suggestions. In all cases, the decision to implement one or more ofthese optimizations really depends on the problem domain of the system and the environment on which the sys-tem will reside, that is, the data access and management layer (see Chapter 10), the human–computer interactionlayer (see Chapter 11), and the physical architecture layer (see Chapter 12).

Object Design Activities 337
Order
-Order Number[1..1] : unsigned long-Date[1..1] : Date-Sub Total[0..1] : double-Tax[0..1] : double-Shipping[0..1] : double-Total[0..1] : double
Product
-Product Number -Product Desc -Price
Customer
-Cust ID -Last Name -First Name 1..1
1..1
0..*
1..*0..*
0..*
State
-State -TaxRate
Product Order
-Order -Product -Qty-Extension
Product Order
-Order : order -Product : product -Qty : integer -Extension : decimal
Customer
-Cust ID -Last Name -First Name 1..1 0..* 1..*1..1 1..10..*
Product
-Product Number -Product Desc -Price
1..1
0..*
State
-State -TaxRate
Order
-Order Number[1..1] : unsigned long-Date[1..1] : Date-Sub Total[0..1] : double-Tax[0..1] : double-Shipping[0..1] : double-Total[0..1] : double-Customer[1..1] : Customer-State[1..1] : State
(a)
(b)
FIGURE 9-14 Converting Associations to Attributes

The first optimization to consider is to review the access paths between objects. Insome cases, a message from one object to another may have a long path to traverse (i.e., itgoes through many objects). If the path is long and the message is sent frequently, a redun-dant path should be considered. Adding an attribute to the calling object that will store adirect connection to the object at the end of the path can accomplish this.
A second optimization is to review each attribute of each class. Which methods use theattributes and which objects use the methods should be determined. If the only methodsthat use an attribute are read and update methods and only instances of a single class sendmessages to read and update the attribute, then the attribute may belong with the callingclass instead of the called class. Moving the attribute to the calling class will substantiallyspeed up the system.
A third optimization is to review the direct and indirect fan-out of each method. Fan-out refers to the number of messages sent by a method. The direct fan-out is the numberof messages sent by the method itself, whereas the indirect fan-out also includes the num-ber of messages sent by the methods called by the other methods in a message tree. If thefan-out of a method is high relative to the other methods in the system, the method shouldbe optimized. One way to do this is to consider adding an index to the attributes used tosend the messages to the objects in the message tree.
A fourth optimization is to look at the execution order of the statements in often-usedmethods. In some cases, it may be possible to rearrange some of the statements to be moreefficient. For example, if it is known, based on the objects in the system, that a search rou-tine can be narrowed by searching on one attribute before another one, then the searchalgorithm should be optimized by forcing it to always search in a predefined order.
A fifth optimization is to avoid recomputation by creating a derived attribute (oractive value) (e.g., a total that will store the value of the computation). This is alsoknown as caching computational results. It can be accomplished by adding a trigger tothe attributes contained in the computation (i.e., those attributes on which the derivedattribute is dependent). This would require a recomputation to take place only whenone of the attributes that go into the computation is changed. Another approach is tosimply mark the derived attribute for recomputation and delay the recomputation untilthe next time the derived attribute is accessed. This last approach delays the recompu-tation as long as possible. In this manner, a computation does not occur unless it mustoccur. Otherwise, every time a derived attribute needs to be accessed, a computationwill be required.
A sixth optimization that should be considered deals with objects that participate in aone-to-one association, that is, they both must exist for either to exist. In this case, it maymake sense, for efficiency purposes, to collapse the two defining classes into a single class.
338 Chapter 9 Class and Method Design
Assume that you are the project leader for the campushousing system that you have been developing over theprevious chapters and that you just modified in Your Turn9-1. However, as you review the current set of models,you realize that even though the models provide a rathercomplete description of the problem-domain layer, theevolving models have begun to become unmanageable.
And, as project leader, you also need to guarantee that thedesign will be efficient. Create a set of discussion pointsthat you will use to explain to your development team theimportance of optimizing the design before jumping intocoding. Be sure to include an example of each optimiza-tion technique that can be used in the current set of mod-els for the campus housing system.
9-2 Campus HousingYOUR
TURN
However, this optimization may need to be reconsidered when storing the “fatter” object ina database. Depending on the type of object persistence used (see Chapter 10), it may actu-ally be more efficient to keep the two classes separate. Or, it could make more sense for thetwo classes to be combined on the problem-domain layer but kept separate on the dataaccess and management layer.
Mapping Problem-Domain Classes to Implementation Languages29
Up until this point in the development of the system, it has been assumed that the classes andmethods in the models would be implemented directly in an object-oriented programminglanguage. However, now it is important to map the current design to the capabilities of theprogramming language used. For example, if we have used multiple inheritance in your designbut we are implementing in a language that supports only single inheritance, then the multi-ple inheritance must be factored out of the design. Or, if the implementation is to be done inan object-based language, one that does not support inheritance,30 or a non-object-based lan-guage, such as C or Pascal, we must map the problem-domain objects to programming con-structs that can be implemented using the chosen implementation environment. In thissection, we describe a set of rules that can be used to do the necessary mapping.
Implementing Problem Domain Classes in a Single-Inheritance Language The onlyissue associated with implementing problem-domain objects is the factoring out of anymultiple inheritance—that is, the use of more than one superclass—used in the evolvingdesign. For example, if you were to implement the solution in Java, Smalltalk, or VisualBasic.net, you must factor out any multiple inheritance. The easiest way to do this is to usethe following rule:
RULE 1a: Convert the additional inheritance relationships to association relation-ships. The multiplicity of the new association from the subclass to thesuperclass should be 1..1. If the additional superclasses are concrete, thatis, they can be instantiated themselves, then the multiplicity from thesuperclass to the subclass is 0..1. Otherwise, it is 1..1. Furthermore, anexclusive-or (XOR) constraint must be added between the associations.Finally, you must add appropriate methods to ensure that all informationis still available to the original class.
OR
RULE 1b: Flatten the inheritance hierarchy by copying the attributes and methods ofthe additional superclass(es) down to all of the subclasses and remove theadditional superclass from the design.31
Figure 9-15 demonstrates the application of these rules. Figure 9-15a portrays a simple exam-ple of multiple inheritance where Class 1 inherits from both SuperClass1 and SuperClass2,and Class 2 inherits from both SuperClass2 and SuperClass3. Assuming that SuperClass2 is
Object Design Activities 339
29 The mapping rules presented in this section are based on material in Coad and Yourdon, Object-OrientedDesign.30 In this case, we are talking about implementation inheritance, not the so-called interface inheritance. Interfaceinheritance supported by Visual Basic and Java supports only inheriting the requirements to implement certainmethods, not any implementation. Java and Visual Basic.net also support single inheritance as described in thistext, whereas Visual Basic 6 supports only interface inheritance.31 It is also a good idea to document this modification in the design so that in the future, modifications to thedesign can be maintained easily.

340 Chapter 9 Class and Method Design
Class1
-attribute5 -attribute6
SuperClass1
-attribute1 -attribute2
SuperClass2
-attribute3 -attribute4
SuperClass2
-attribute3 -attribute4
Class1
-attribute5 -attribute6
-attribute1 -attribute2
Class2
-attribute5 -attribute6
Class2
-attribute5 -attribute6
SuperClass3
-attribute7 -attribute8
SuperClass1
-attribute1 -attribute2
SuperClass3
-attribute7 -attribute8
(a)
(b)
Class1
-attribute3 -attribute4-attribute5 -attribute6
Class2
-attribute3 -attribute4-attribute5 -attribute6
SuperClass1
-attribute1 -attribute2
SuperClass3
-attribute7 -attribute8
(c)
{XOR}
0..*
0..*
1..1
1..1
FIGURE 9-15 Factoring Out Multiple-Inheritance Effect for a Single-InheritanceLanguage
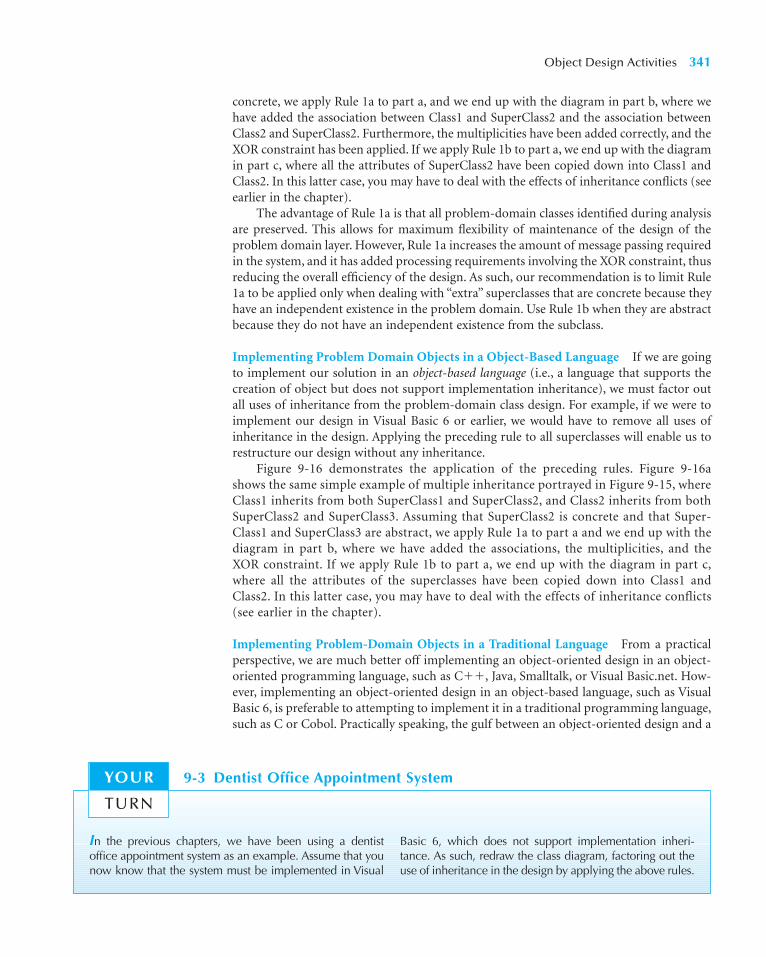
concrete, we apply Rule 1a to part a, and we end up with the diagram in part b, where wehave added the association between Class1 and SuperClass2 and the association betweenClass2 and SuperClass2. Furthermore, the multiplicities have been added correctly, and theXOR constraint has been applied. If we apply Rule 1b to part a, we end up with the diagramin part c, where all the attributes of SuperClass2 have been copied down into Class1 andClass2. In this latter case, you may have to deal with the effects of inheritance conflicts (seeearlier in the chapter).
The advantage of Rule 1a is that all problem-domain classes identified during analysisare preserved. This allows for maximum flexibility of maintenance of the design of theproblem domain layer. However, Rule 1a increases the amount of message passing requiredin the system, and it has added processing requirements involving the XOR constraint, thusreducing the overall efficiency of the design. As such, our recommendation is to limit Rule1a to be applied only when dealing with “extra” superclasses that are concrete because theyhave an independent existence in the problem domain. Use Rule 1b when they are abstractbecause they do not have an independent existence from the subclass.
Implementing Problem Domain Objects in a Object-Based Language If we are goingto implement our solution in an object-based language (i.e., a language that supports thecreation of object but does not support implementation inheritance), we must factor outall uses of inheritance from the problem-domain class design. For example, if we were toimplement our design in Visual Basic 6 or earlier, we would have to remove all uses ofinheritance in the design. Applying the preceding rule to all superclasses will enable us torestructure our design without any inheritance.
Figure 9-16 demonstrates the application of the preceding rules. Figure 9-16ashows the same simple example of multiple inheritance portrayed in Figure 9-15, whereClass1 inherits from both SuperClass1 and SuperClass2, and Class2 inherits from bothSuperClass2 and SuperClass3. Assuming that SuperClass2 is concrete and that Super-Class1 and SuperClass3 are abstract, we apply Rule 1a to part a and we end up with thediagram in part b, where we have added the associations, the multiplicities, and theXOR constraint. If we apply Rule 1b to part a, we end up with the diagram in part c,where all the attributes of the superclasses have been copied down into Class1 andClass2. In this latter case, you may have to deal with the effects of inheritance conflicts(see earlier in the chapter).
Implementing Problem-Domain Objects in a Traditional Language From a practicalperspective, we are much better off implementing an object-oriented design in an object-oriented programming language, such as C��, Java, Smalltalk, or Visual Basic.net. How-ever, implementing an object-oriented design in an object-based language, such as VisualBasic 6, is preferable to attempting to implement it in a traditional programming language,such as C or Cobol. Practically speaking, the gulf between an object-oriented design and a
Object Design Activities 341
In the previous chapters, we have been using a dentistoffice appointment system as an example. Assume that younow know that the system must be implemented in Visual
Basic 6, which does not support implementation inheri-tance. As such, redraw the class diagram, factoring out theuse of inheritance in the design by applying the above rules.
9-3 Dentist Office Appointment SystemYOUR
TURN

traditional programming language is simply too great for mere mortals to be able to cross.The best advice that we can give about implementing an object-oriented design in a tradi-tional programming language is to run away as fast and as far as possible from the project.However, if we are brave (foolish?) enough to attempt this, we must realize that, in addi-tion to factoring out inheritance from the design, we will have to factor out all uses of poly-morphism, dynamic binding, encapsulation, and information hiding. To say the least, this
342 Chapter 9 Class and Method Design
Class1
-attribute5 -attribute6
SuperClass1
-attribute1 -attribute2
SuperClass2
-attribute3 -attribute4
SuperClass2
-attribute3 -attribute4
Class1
-attribute5 -attribute6
-attribute1 -attribute2
Class2
-attribute5 -attribute6
Class2
-attribute5 -attribute6
SuperClass3
-attribute7 -attribute8
SuperClass1
-attribute1 -attribute2
SuperClass3
-attribute7 -attribute8
(a)
(b)
Class1
-attribute1 -attribute2-attribute3 -attribute4-attribute5 -attribute6
Class2
-attribute3 -attribute4-attribute5 -attribute6-attribute7 -attribute8
(c)
{XOR}
0..* 1..1
0..*
1..1 1..1
1..1
1..1
1..1
FIGURE 9-16 Factoring Out Multiple Inheritance Effect for an Object-Based Language

is quite a bit of additional work to be accomplished. Furthermore, the manner in which wefactor these object-oriented features out of the detailed design of the system tends to belanguage dependent. As such, this is beyond the scope of this text.
CONSTRAINTS AND CONTRACTS
Contracts were introduced in Chapter 6 in association with collaborations. A contract for-malizes the interactions between the client and server objects, where a client (consumer)object is an instance of a class that sends a message to a server (supplier) object that executesone of its methods in response to the request. Contracts are modeled on the legal notionof a contract, where both parties, client and server objects, have obligations and rights.Practically speaking, a contract is a set of constraints and guarantees. If the constraints aremet, then the server object will guarantee certain behavior.32 Constraints can be written ineither a natural language (e.g., English, Structured English, pseudocode) or a formal lan-guage (e.g., UML’s Object Constraint Language33).
Types of ConstraintsThere are three different types of constraints typically captured in object-oriented design:preconditions, postconditions, and invariants.
Contracts are used primarily to establish the preconditions and postconditions for amethod to be able to execute properly. A precondition is a constraint that must be met fora method to execute. For example, the parameters passed to a method must be valid for themethod to execute. Otherwise, an exception should be raised. A postcondition is a con-straint that must be met after the method executes, or the effect of the method executionmust be undone. For example, the method can not make any of the attributes of the objecttake on an invalid value. In this case, an exception should be raised, and the effect of themethod’s execution should be undone.
Whereas preconditions and postconditions model the constraints on an individualmethod, invariants model constraints that must always be true for all instances of a class.Examples of invariants include domains or types of attributes, multiplicity of attributes,and the valid values of attributes. This includes the attributes that model association andaggregation relationships. For example, if an association relationship is required, an invari-ant should be created that will enforce it to have a valid value for the instance to exist.Invariants are normally attached to the class. As such, we can attach invariants to the CRCcards or class diagram by adding a set of assertions to them.
In Figure 9-17, the back of the CRC card constrains the attributes of an Order tospecific types. For example, Order Number must be an unsigned long, and Customermust be an instance of the Customer class. Furthermore, additional invariants wereadded to four of the attributes. For example, Cust ID must not only be an unsignedlong, but it also must have one and only one value [i.e., a multiplicity of (1..1)], and itmust have the same value as the result of the GetCustID() message sent to the instanceof Customer stored in the Customer attribute. Also shown is the constraint for aninstance to exist, an instance of the Customer class, an instance of the State class, and atleast one instance of the Product class must be associated with the Order object (see the
Constraints and Contracts 343
32 The idea of using contracts in design evolved from the “Design by Contract” technique developed by BertrandMeyer. See Bertrand Meyer, Object-Oriented Software Construction (Englewood Cliffs, NJ: Prentice Hall, 1988).33 See Jos Warmer and Anneke Kleppe, The Object Constraint Language: Precise Modeling with UML (Reading, MA:Addison-Wesley, 1999).
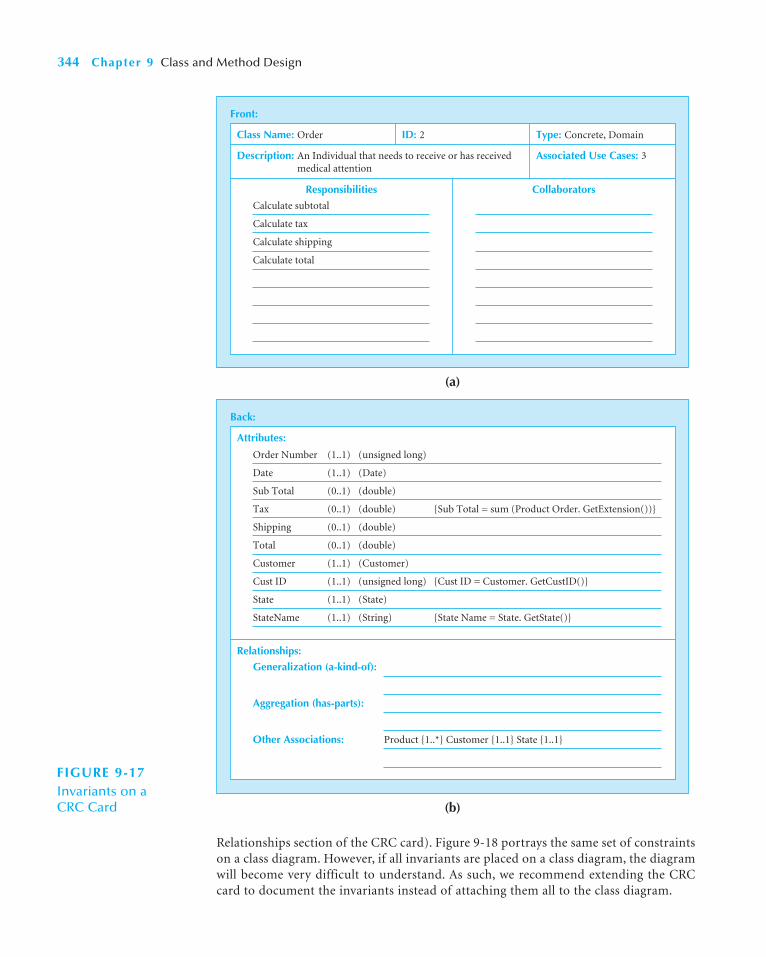
344 Chapter 9 Class and Method Design
Front:
Class Name: Order ID: 2
Calculate tax
Calculate subtotal
Calculate shipping
Calculate total
Responsibilities
Associated Use Cases: 3Description: An Individual that needs to receive or has received medical attention
Type: Concrete, Domain
Collaborators
(a)
Back:
Attributes:
Relationships:
Generalization (a-kind-of):
Aggregation (has-parts):
Other Associations: Product {1..*} Customer {1..1} State {1..1}
Order Number (1..1) (unsigned long)
Date (1..1) (Date)
Sub Total (0..1) (double)
Tax (0..1) (double) {Sub Total = sum (Product Order. GetExtension())}
Shipping (0..1) (double)
Total (0..1) (double)
Customer (1..1) (Customer)
Cust ID (1..1) (unsigned long) {Cust ID = Customer. GetCustID()}
State (1..1) (State)
StateName (1..1) (String) {State Name = State. GetState()}
(b)
FIGURE 9-17Invariants on a CRC Card
Relationships section of the CRC card). Figure 9-18 portrays the same set of constraintson a class diagram. However, if all invariants are placed on a class diagram, the diagramwill become very difficult to understand. As such, we recommend extending the CRCcard to document the invariants instead of attaching them all to the class diagram.

Constraints and Contracts 345
Using the CRC card in Figure 9-17 and the class diagramin Figure 9-18 as guides, add invariants for the Customerclass, the State class, the Product class, and the Product-Order Association to their respective CRC cards and theclass diagram.
Questions
1. How easy is it to interpret the class diagram onceall of the invariants were added?
2. Look at the class diagram in Figure 6-2 and thepackage diagram in Figure 8-21. What would theylook like if the invariants were all attached to thediagrams? What would you recommend doing toavoid this situation?
9-4 InvariantsYOUR
TURN
Order
-Order Number[1..1] : unsigned long-Date[1..1] : Date-Sub Total[0..1] : double-Tax[0..1] : double-Shipping[0..1] : double-Total[0..1] : double-Customer[1..1] : Customer-Cust ID[1..1] : unsigned long-State[1..1] : State-State Name[1..1] : String
Product
-Product Number -Product Desc -Price
Customer
-Cust ID -Last Name -First Name 1..1
1..1
0..*
1..*0..*
0..*
State
-State -TaxRate
<<invariant>>{Cust ID = Customer.GetCustID()}
<<invariant>>{State Name = State.GetState()}
<<invariant>>{Tax =State.GetTaxRate()*SubTotal}
<<invariant>>{Sub Total =Sum(Product Order.GetExtension())}
Product Order
Order Product QtyExtension
FIGURE 9-18 Invariants on a Class Diagram
Elements of a ContractContracts document the message passing that takes place between objects. Technicallyspeaking, a contract should be created for each message sent and received by each object;one for each interaction. However, there would be quite a bit of duplication if this weredone. In practice, a contract is created for each method that can receive messages fromother objects (i.e., one for each visible method).
A contract should contain the information necessary for a programmer to understandwhat a method is to do (i.e., they are declarative in nature). This information includes themethod name, class name, ID number, client objects, associated use cases, description,arguments received, type of data returned, and the pre- and postconditions.34 Contracts donot have a detailed algorithmic description of how the method is to work (i.e., they are notprocedural in nature). Detailed algorithmic descriptions typically are documented in amethod specification (as described later in this chapter). In other words, a contract is com-posed of the information required for the developer of a client object to know what mes-sages can be sent to the server objects and what the client can expect in return. Figure 9-19shows a sample format for a contract.
Because each contract is associated with a specific method and a specific class, the con-tract must document them. The ID number of the contract is used to provide a uniqueidentifier for every contract. The Clients (Consumers) element of a contract is a list ofclasses and methods that send a message to this specific method. This list is determined byreviewing the sequence diagrams associated with the server class. The Associated Use Caseselement is a list of use cases in which this method is used to realize the implementation ofthe use case. The use cases listed here can be found by reviewing the server class’s CRC cardand the associated sequence diagrams.
The Description of Responsibilities provides an informal description of what themethod is to perform, not how it is to do it. The arguments received are the data types ofthe parameters passed to the method and the value returned is the data type of the valuethat the method will return to its clients. Together with the method name, they form thesignature of the method.
The precondition and postcondition elements are where the pre- and postconditionsfor the method are recorded. Recall that pre- and postconditions can be written in naturallanguage, Structured English, pseudocode, or a formal language. It really does not matterwhich one you use. However, the more precisely they are written, the less likely it is that theprogrammer will misunderstand them. As such, we recommend that you use eitherpseudocode or a formal language such as UML’s Object Constraint Language.35
346 Chapter 9 Class and Method Design
34 Currently, there is no standard format for a contract. The contract in Figure 9-19 is based on material containedin Ian Graham, Migrating to Object Technology (Reading, MA: Addison-Wesley, 1995); Craig Larman, ApplyingUML and Patterns: An Introduction to Object-Oriented Analysis and Design (Englewood Cliffs, NJ: Prentice Hall,1998); Meyer, Object-Oriented Software Construction; and R. Wirfs-Brock, B. Wilkerson, and L. Wiener, DesigningObject-Oriented Software (Englewood Cliffs, NJ: Prentice Hall, 1990).35 See Warmer and Kleppe, The Object Constraint Language: Precise Modeling with UML.
In Your Turn 6-2, you created a set of CRC cards and aclass diagram. Add invariants to the class diagram and to
the set of CRC cards.
9-5 Campus HousingYOUR
TURN
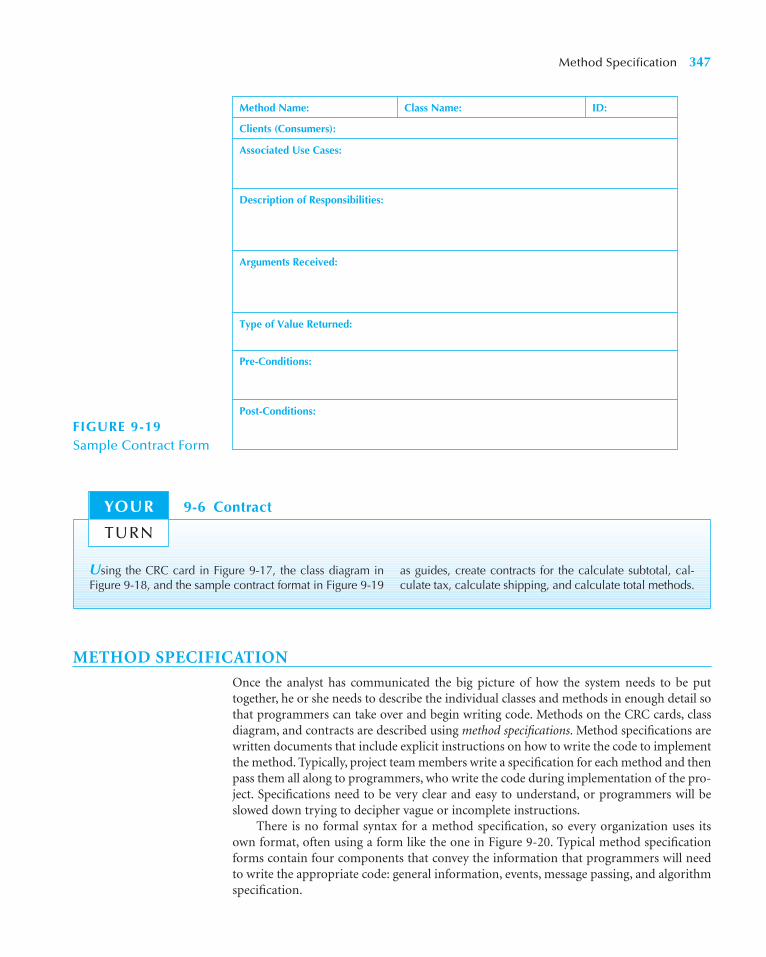
METHOD SPECIFICATION
Once the analyst has communicated the big picture of how the system needs to be puttogether, he or she needs to describe the individual classes and methods in enough detail sothat programmers can take over and begin writing code. Methods on the CRC cards, classdiagram, and contracts are described using method specifications. Method specifications arewritten documents that include explicit instructions on how to write the code to implementthe method. Typically, project team members write a specification for each method and thenpass them all along to programmers, who write the code during implementation of the pro-ject. Specifications need to be very clear and easy to understand, or programmers will beslowed down trying to decipher vague or incomplete instructions.
There is no formal syntax for a method specification, so every organization uses itsown format, often using a form like the one in Figure 9-20. Typical method specificationforms contain four components that convey the information that programmers will needto write the appropriate code: general information, events, message passing, and algorithmspecification.
Method Specification 347
Method Name: Class Name:
Clients (Consumers):
ID:
Associated Use Cases:
Type of Value Returned:
Description of Responsibilities:
Arguments Received:
Pre-Conditions:
Post-Conditions:
FIGURE 9-19Sample Contract Form
Using the CRC card in Figure 9-17, the class diagram inFigure 9-18, and the sample contract format in Figure 9-19
as guides, create contracts for the calculate subtotal, cal-culate tax, calculate shipping, and calculate total methods.
9-6 ContractYOUR
TURN

General InformationThe top of the form in Figure 9-20 contains general information, such as the name of themethod, name of the class in which this implementation of the method will reside, IDnumber, Contract ID (which identifies the contract associated with this method imple-mentation), programmer assigned, the date due, and the target programming language.This information is used to help manage the programming effort.
348 Chapter 9 Class and Method Design
Method Name:
Contract ID:
Class Name:
❏ Visual Basic ❏ Smalltalk ❏ C++ ❏ Java
ID:
Programmer: Date Due:
Programming Language:
Triggers/Events:
Algorithm Specification:
Misc. Notes:
Data Type: Notes:Arguments Received:
Data Type: Notes:Arguments Returned:
ClassName.MethodName: Data Type: Notes:Messages Sent & Arguments Passed:
FIGURE 9-20Method SpecificationForm
EventsThe second section of the form is used to list the events that trigger the method. An eventis a thing that happens or takes place. Clicking the mouse generates a mouse event, press-ing a key generates a keystroke event—in fact, almost everything the user does generates anevent to occur.
In the past, programmers used procedural programming languages (e.g., COBOL, C)that contained instructions that were implemented in a predefined order, as determined bythe computer system, and users were not allowed to deviate from the order. Many pro-grams today are event driven (e.g., programs written in languages such as Visual Basic,Smalltalk, C��, or Java), and event-driven programs include methods that are executedin response to an event initiated by the user, system, or another method. After initializa-tion, the system waits for an event to occur. When it does, a method is fired that carries outthe appropriate task, and then the system waits once again.
We have found that many programmers still use method specifications when program-ming in event-driven languages, and they include the event section on the form to capturewhen the method will be invoked. Other programmers have switched to other design toolsthat capture event-driven programming instructions, such as the behavioral state machinedescribed in Chapter 7.
Message PassingThe next sections of the method specification describe the message passing to and from themethod, which are identified on the sequence and collaboration diagrams. Programmerswill need to understand what arguments are being passed into, from, and returned by themethod because the arguments ultimately will translate into attributes and data structureswithin the actual method.
Algorithm SpecificationAlgorithm specifications can be written in Structured English, some form of pseudocode,or some type of formal language.36 Structured English is simply a formal way of writinginstructions that describe the steps of a process. Because it is the first step toward the imple-mentation of the method, it looks much like a simple programming language. StructuredEnglish uses short sentences that clearly describe exactly what work is performed on whatdata. There are many versions of Structured English because there are no formal standards;each organization has its own type of Structured English.
Figure 9-21 shows some examples of commonly used Structured English statements.Action statements are simple statements that perform some action. An If statement controlsactions that are performed under different conditions, and a For statement (or a While state-ment) performs some actions until some condition is reached. Finally, a Case statement isan advanced form of an If statement that has several mutually exclusive branches.
Pseudocode is a language that contains logical structures, including sequential state-ments, conditional statements, and iteration. It differs from Structured English in thatpseudocode contains details that are programming specific, such as initialization instruc-tions or linking, and it also is more extensive so that a programmer can write the moduleby mirroring the pseudocode instructions. In general, pseudocode is much more like realcode, and its audience is the programmer, as opposed to the analyst. Its format is not as
Method Specification 349
36 For our purposes, Structured English or pseudocode will suffice. However, there has been some work with theCatalysis, Fusion, and Syntropy methodologies to include formal languages, such as VDM and Z, into specifyingobject-oriented systems.

important as the information it conveys. Figure 9-22 shows a short example of pseudocodefor a module that is responsible for getting CD information.
Writing good pseudocode can be difficult—imagine creating instructions that some-one else can follow without having to ask for clarification or making a wrong assumption.For example, have you ever given a friend directions to your house, and they ended up get-ting lost? To you, the directions may have been very clear, but that is because of your per-sonal assumptions. To you, the instruction take the first left turn may really mean take a leftturn at the first stoplight. Someone else may have made the interpretation take a left turnat the first road, with or without a light. Therefore, when writing pseudocode, pay specialattention to detail and readability.
If the algorithm of a method is complex, a tool that can be useful for algorithm spec-ification is UML’s activity diagram (see Chapter 5). Recall that activity diagrams can beused to specify any type of process. Obviously, an algorithm specification represents aprocess. However, due to the nature of object orientation, processes tend to be highly dis-tributed over many little methods over many objects. As such, needing to use an activitydiagram to specify the algorithm of a method may, in fact, hint at a problem in the design.For example, the method should be further decomposed or there could be missing classes.
The last section of the method specificationprovides space for other information that needs tobe communicated to the programmer, such as cal-culations, special business rules, calls to subrou-tines or libraries, and other relevant issues. Thisalso can point out changes or improvements thatwill be made to any of the other design documen-tation based on problems that the analyst detectedduring the specification process.37
350 Chapter 9 Class and Method Design
Profits = Revenues – Expenses
Action Statement Generate Inventory-Report
IF Customer Not in the Customer Object Store
THEN Add Customer record to Customer Object Store
If Statement ELSE Add Current-Sale to Customer’s Total-Sales
Update Customer record in Customer Object Store
FOR all Customers in Customer Object Store DO
For Statement Generate a new line in the Customer-Report
Add Customer’s Total-Sales to Report-Total
CASE
IF Income < 10,000: Marginal-tax-rate = 10 percent
IF Income < 20,000: Marginal-tax-rate = 20 percent
Case Statement IF Income < 30,000: Marginal-tax-rate = 31 percent
IF Income < 40,000: Marginal-tax-rate = 35 percent
ELSE Marginal-Tax-Rate = 38 percent
ENDCASE
Common Statements Example
FIGURE 9-21Structured English
37 Remember that the development process is very incremental and iterative in nature. Therefore, changes couldbe cascaded back to any point in the development process (e.g., to use-case descriptions, use-case diagrams, CRCcards, class diagrams, object diagrams, sequence diagrams, communication diagrams, behavioral state machines,and package diagrams).
(Get_CD_Info module)Accept (CD.Title) {Required}Accept (CD.Artist) {Required}Accept (CD.Category) {Required}Accept (CD.Length)
ReturnFIGURE 9-22Pseudocode

APPLYING THE CONCEPTS AT CD SELECTIONS
Alec and his team began the detailed object design process by reviewing the class and pack-age diagram for the problem-domain layer (see Figures 6-18, 8-14, and 8-15). Alec made itclear that the team should be aware of the cohesion, coupling, and connascence design cri-teria and to review the models with those in mind. Furthermore, he insisted that they lookto see if there were any additional specifications necessary, any opportunities for reuse thatcould be exploited, and any further restructuring of the design. Alec assigned Anne toreview all results and to look for any possible optimizations that could be implemented.Finally, since the implementation would be in Java, he asked Anne to also ensure that thedesign could be implemented in a single-inheritance-based language.
Upon their review, it was discovered that there were quite a few many-to-many (*..*)association relationships on the class diagram. Alec questioned whether this was a correctrepresentation of the actual situation. Brian admitted that when they put together the classdiagram, they had decided to model most of the associations as a many-to-many multi-plicity, figuring that this could be easily fixed at a later point in time when they had moreprecise information. Alec also questioned why this issue was not addressed during the ver-ification and validation step. However, he did not assign any blame at this point in time.Instead, because Brian was the team member most familiar with structural modeling andwas the analyst in charge of the data management layer (see Chapter 10), Alec assigned himto evaluate the multiplicity of each association in the model and to restructure and opti-mize the evolving problem domain model.
Figure 9-23 shows the updated version of the class diagram. As you can see, Brianincluded both the lower and upper values of the multiplicity of the associations. He did thisto remove any ambiguity about the associations. Because there is a one-to-one relationshipbetween the CD class and the Mkt Info class, Brian considered merging them into a singleclass. However, he decided that they were sufficiently different to keep them separate. Hereasoned this by assuming that not all customers would want to see all the Mkt Info asso-ciated with every CD.
Because Brian had already spent quite a bit of time on the classes in the CD package,upon reviewing the new, revised class diagram, Alec assigned it to Brian. The classes in theCD package were CD, Vendor, Mkt Info, Review, Artist Info, and Sample Clip. BecauseAnne was going to have to review all classes and packages from a more technical perspec-tive, Alec decided to take on the Customer and Order packages himself (see Figures 8-14and 8-15). However, because the Search package could become rather technical, heassigned it to Anne.
Next, Brian added invariants, preconditions, and postconditions to the classes andtheir methods. For example, Figure 9-24 portrays the back of the CRC card for the CDclass. He decided to add only the invariant information to the CRC cards and not the classdiagram in order to keep the class diagram as simple and as easy to understand as possible.
Applying the Concepts at CD Selections 351
Using the CRC card in Figure 9-17, the class diagram inFigure 9-18, and the contract created in Your Turn 9-6 asguides, create method specifications for the calculate
subtotal, calculate tax, calculate shipping, and calculatetotal methods.
9-7 Method SpecificationYOUR
TURN
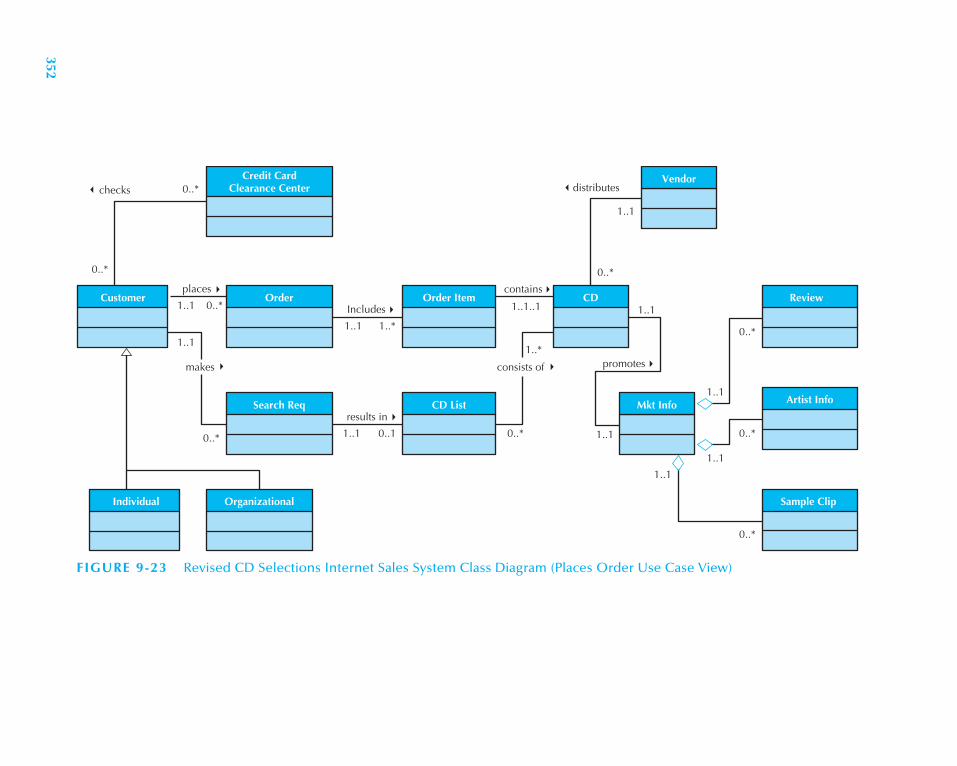
Credit CardClearance Center0..*
0..*
checks
places
makes consists of
Individual Organizational
Search Req CD List
Customer Order1..1 0..*
0..*
0..*1..1 0..1
Order Item Review
Artist Info
Sample Clip
CD
Vendor
Mkt Info
1..*
1..*
1..1..1
1..1
1..1
1..1
1..1
1..1
1..1
1..1
0..*
0..*
0..*
0..*
1..1
results in
Includes
contains
distributes
promotes
FIGURE 9-23 Revised CD Selections Internet Sales System Class Diagram (Places Order Use Case View)
352
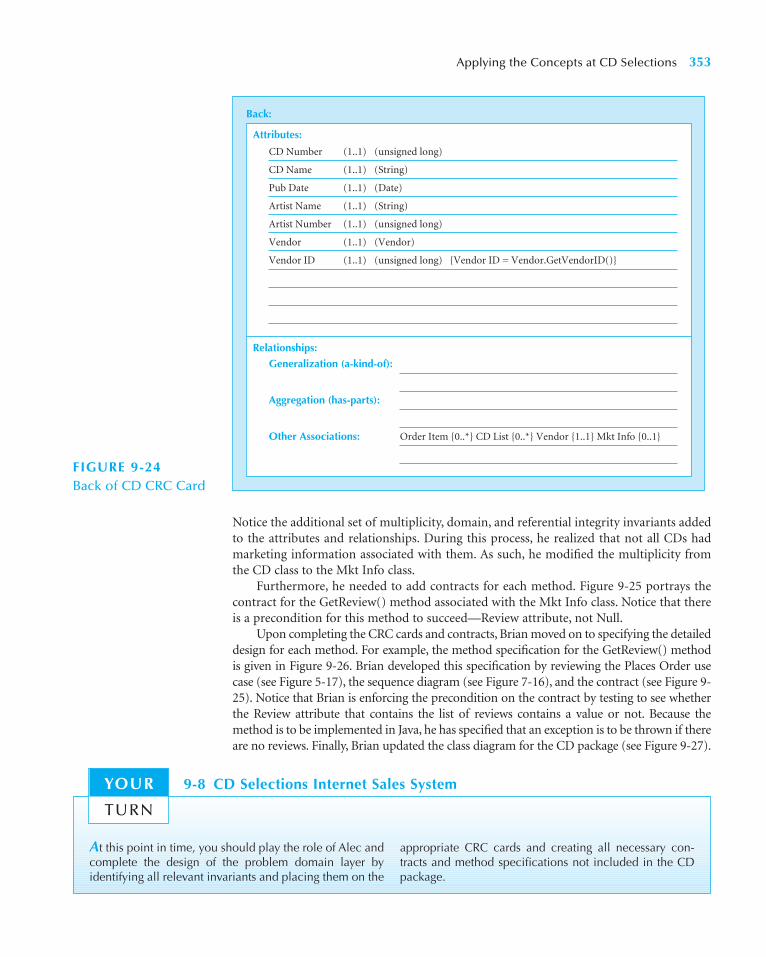
Notice the additional set of multiplicity, domain, and referential integrity invariants addedto the attributes and relationships. During this process, he realized that not all CDs hadmarketing information associated with them. As such, he modified the multiplicity fromthe CD class to the Mkt Info class.
Furthermore, he needed to add contracts for each method. Figure 9-25 portrays thecontract for the GetReview() method associated with the Mkt Info class. Notice that thereis a precondition for this method to succeed—Review attribute, not Null.
Upon completing the CRC cards and contracts, Brian moved on to specifying the detaileddesign for each method. For example, the method specification for the GetReview() methodis given in Figure 9-26. Brian developed this specification by reviewing the Places Order usecase (see Figure 5-17), the sequence diagram (see Figure 7-16), and the contract (see Figure 9-25). Notice that Brian is enforcing the precondition on the contract by testing to see whetherthe Review attribute that contains the list of reviews contains a value or not. Because themethod is to be implemented in Java, he has specified that an exception is to be thrown if thereare no reviews. Finally, Brian updated the class diagram for the CD package (see Figure 9-27).
Applying the Concepts at CD Selections 353
Back:
Attributes:
Relationships:
Generalization (a-kind-of):
Aggregation (has-parts):
Other Associations: Order Item {0..*} CD List {0..*} Vendor {1..1} Mkt Info {0..1}
CD Number (1..1) (unsigned long)
CD Name (1..1) (String)
Pub Date (1..1) (Date)
Artist Name (1..1) (String)
Artist Number (1..1) (unsigned long)
Vendor (1..1) (Vendor)
Vendor ID (1..1) (unsigned long) {Vendor ID = Vendor.GetVendorID()}
FIGURE 9-24Back of CD CRC Card
At this point in time, you should play the role of Alec andcomplete the design of the problem domain layer byidentifying all relevant invariants and placing them on the
appropriate CRC cards and creating all necessary con-tracts and method specifications not included in the CDpackage.
9-8 CD Selections Internet Sales SystemYOUR
TURN

SUMMARY
Review of the Basic Characteristics of Object-Oriented SystemsA class is a template on which objects can be instantiated. An object is a person, place, orthing about which we want to capture information. Each object has attributes and meth-ods. The methods are executed by objects sending messages that trigger them. Encapsu-lation and information hiding allows an object to conceal its inner processes and datafrom the other objects. Polymorphism and dynamic binding allow a message to be inter-preted differently by different kinds of objects. However, if polymorphism is not used ina semantically consistent manner, it can make an object design incomprehensible.Classes can be arranged in a hierarchical fashion in which subclasses inherit attributesand methods from superclasses to reduce the redundancy in development. However,through redefinition capabilities or multiple inheritance, inheritance conflicts can beintroduced into the design.
Design CriteriaCoupling, cohesion, and connascence have been put forth as a set of criteria by which adesign of an object-oriented system can be evaluated. Two types of coupling, interac-tion and inheritance, and three types of cohesion, method, class, and generalization/specialization, were described. Interaction coupling deals with the communication thattakes place among the objects, and inheritance coupling deals with the innate depen-dencies in the use of inheritance in object-oriented systems. Method cohesion addresseshow single-minded a method is. The fewer things a method does, the more cohesive itis. Class cohesion does the same for classes. A class should be a representation of oneand only one thing. Generalization/specialization cohesion deals with the quality of an
354 Chapter 9 Class and Method Design
Method Name: GetReview() Class Name:
Clients (Consumers): CD Detailed Report
ID:
Associated Use Cases:
Places Order
Type of Value Returned:
List of Review objects
Review attribute not Null
Description of Responsibilities:
Return review objects for the Detailed Report Screen to display
Arguments Received:
Preconditions:
Postconditions: FIGURE 9-25Get Review Method Contract

Summary 355
Method Name: GetReview()
Contract ID: 89
Class Name: Mkt Info
❏ Visual Basic ❏ Smalltalk ❏ C++ ❏ Java
ID: 453
Programmer: John Smith Date Due: 7/7/06
Programming Language:
Triggers/Events:
Detail Button on Basic Report is pressed
Algorithm Specification:
IF Review Not Null Return Review Else Throw Null Exception
Misc. Notes:
Data Type: Notes:Arguments Received:
List List of Review objects
Data Type: Notes:
Argument Returned:
ClassName.MethodName: Data Type: Notes:Messages Sent & Arguments Passed:
✓
FIGURE 9-26Create Review Method Specification
inheritance hierarchy. Good inheritance hierarchies support only generalization andspecialization (a-kind-of) semantics. Connascence generalizes coupling and cohesionand then combines them with the different levels of encapsulation. The general rule ofthumb is to maximize the cohesion (connascence) within an encapsulation boundaryand minimize the coupling (connascence) between the encapsulation boundaries.

Object Design ActivitiesThere are five basic object design activities. First, additional specification is possible bycarefully reviewing the models, deciding on the proper visibility of the attributes and meth-ods, setting the signature for each method, and identifying any constraints associated withthe classes or the classes’ methods. Second, look for opportunities for reuse by reviewingthe model and looking at possible patterns, class libraries, frameworks, and componentsthat could be used to enhance the system. Third, restructure the model through the use offactoring and normalization. Be sure to take the programming language into considera-tion. It may be necessary to map the current design into the restricted capabilities of thelanguage (e.g., the language supports only single inheritance). Also, be certain that theinheritance in your model supports only generalization/specialization (a-kind-of) seman-tics. Fourth, optimize the design. However, be careful in the process of optimizing thedesign. Optimizations typically decrease the understandability of the model. Fifth, map theproblem domain classes to an implementation language.
Constraints and ContractsThere are three types of constraints associated with object-oriented design: invariants, pre-conditions, and postconditions. Invariants capture constraints that must always be true forall instances of a class (e.g., domains and values of attributes or multiplicity of relation-ships). Typically, invariants are attached to class diagrams and CRC cards. However, forclarity purposes, we suggest placing them only on the CRC cards.
Contracts formalize the interaction between objects (i.e., the message passing). Assuch, they include the pre- and postconditions that must be enforced for a method to exe-cute properly. Contracts provide an approach to modeling the rights and obligations whenclient and server objects interact. From a practical perspective, all interactions that can takeplace between all possible client and server objects are not modeled on separate contracts.Instead, a single contract is drawn up for using each visible method of a server object.
356 Chapter 9 Class and Method Design
CD Package
0..*
Review
Artist Info
Sample Clip
Vendor
Mkt InfoCD
1..1
0..11..1
1..1
1..1
1..1
0..*
0..*
0..*
distributes
promotes
FIGURE 9-27Revised Package Diagram for the CDPackage on the PDLayer of the CD Selections InternetSales System
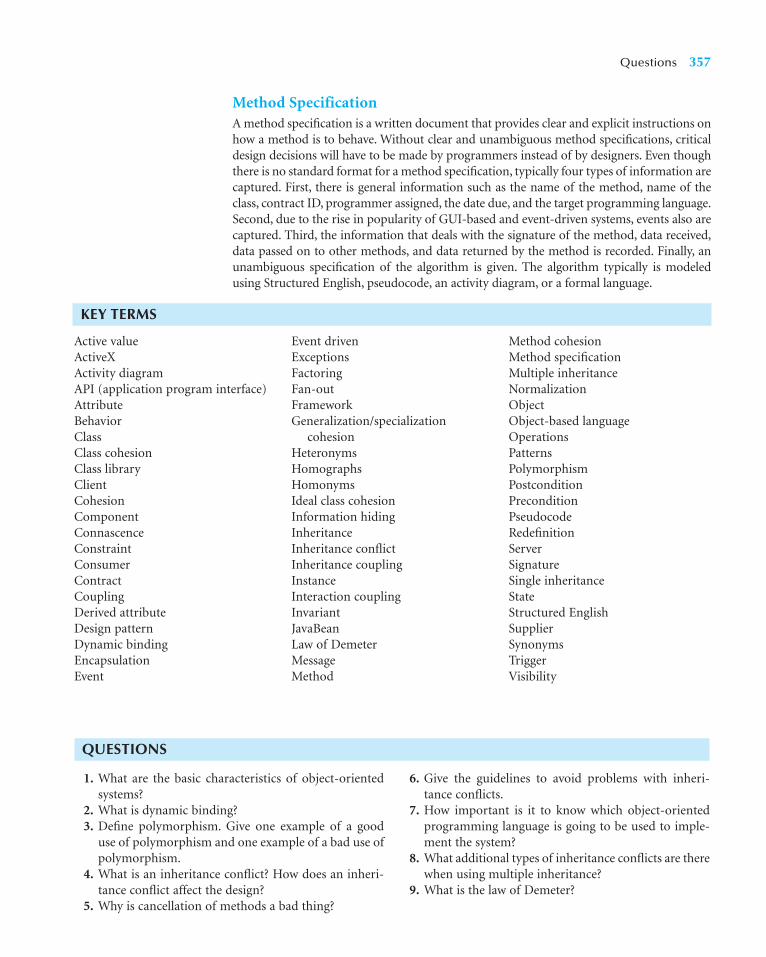
Method SpecificationA method specification is a written document that provides clear and explicit instructions onhow a method is to behave. Without clear and unambiguous method specifications, criticaldesign decisions will have to be made by programmers instead of by designers. Even thoughthere is no standard format for a method specification, typically four types of information arecaptured. First, there is general information such as the name of the method, name of theclass, contract ID, programmer assigned, the date due, and the target programming language.Second, due to the rise in popularity of GUI-based and event-driven systems, events also arecaptured. Third, the information that deals with the signature of the method, data received,data passed on to other methods, and data returned by the method is recorded. Finally, anunambiguous specification of the algorithm is given. The algorithm typically is modeledusing Structured English, pseudocode, an activity diagram, or a formal language.
Questions 357
KEY TERMS
Active valueActiveXActivity diagramAPI (application program interface)AttributeBehaviorClassClass cohesionClass libraryClientCohesionComponentConnascenceConstraintConsumerContractCouplingDerived attributeDesign patternDynamic bindingEncapsulationEvent
Event drivenExceptionsFactoringFan-outFrameworkGeneralization/specialization
cohesionHeteronymsHomographsHomonymsIdeal class cohesionInformation hidingInheritanceInheritance conflictInheritance couplingInstanceInteraction couplingInvariantJavaBeanLaw of DemeterMessageMethod
Method cohesionMethod specificationMultiple inheritanceNormalizationObjectObject-based languageOperationsPatternsPolymorphismPostconditionPreconditionPseudocodeRedefinitionServerSignatureSingle inheritanceStateStructured EnglishSupplierSynonymsTriggerVisibility
QUESTIONS
1. What are the basic characteristics of object-orientedsystems?
2. What is dynamic binding?3. Define polymorphism. Give one example of a good
use of polymorphism and one example of a bad use ofpolymorphism.
4. What is an inheritance conflict? How does an inheri-tance conflict affect the design?
5. Why is cancellation of methods a bad thing?
6. Give the guidelines to avoid problems with inheri-tance conflicts.
7. How important is it to know which object-orientedprogramming language is going to be used to imple-ment the system?
8. What additional types of inheritance conflicts are therewhen using multiple inheritance?
9. What is the law of Demeter?

358 Chapter 9 Class and Method Design
EXERCISES
A. For the health club exercises in Chapter 5 (N, O),Chapter 6 (O), Chapter 7 (E, F), and Chapter 8 (G, H),choose one of the classes and create a set of invariantsfor attributes and relationships and add them to theCRC card for the class.
B. Choose one of the methods in the class that you chosefor exercise A and create a contract and a methodspecification for it. Use Structured English for thealgorithm specification.
C. For the Picnics R Us exercises in Chapter 5 (P, Q),Chapter 6 (P), Chapter 7 (J), and Chapter 8 (I, J),choose one of the classes and create a set of invariantsfor attributes and relationships and add them to theCRC card for the class.
D. Choose one of the methods in the class that you chosefor exercise C and create a contract and a methodspecification for it. Use Structured English for thealgorithm specification.
E. For the Of-the-Month Club exercises in Chapter 5 (R,S), Chapter 6 (Q), Chapter 7 (K), and Chapter 8 (K, L),choose one of the classes and create a set of invariantsfor attributes and relationships and add them to theCRC card for the class.
F. Choose one of the methods in the class that you chosefor exercise E and create a contract and a method spec-
ification for it. Use Structured English for the algo-rithm specification.
G. For the library exercises in Chapter 5 (T, U), Chapter 6(R), Chapter 7 (L), and Chapter 8 (M, N), choose oneof the classes and create a set of invariants for attrib-utes and relationships and add them to the CRC cardfor the class.
H. Choose one of the methods in the class that you chosefor exercise G and create a contract and a methodspecification for it. Use Structured English for thealgorithm specification.
I. Describe the difference in meaning between the fol-lowing two class diagrams. Which is a better model?Why?
J. From a cohesion, coupling, and connascence perspec-tive, is the following class diagram a good model? Whyor why not?
Name-Address
Employee
PersonPerson
Employee
Name-Address
1..10..*
10. What are the six types of interaction coupling? Giveone example of good interaction coupling and oneexample of bad interaction coupling.
11. What are the seven types of method cohesion? Give oneexample of good method cohesion and one example ofbad method cohesion.
12. What are the four types of class cohesion? Give oneexample of each type.
13. What the five types of connascence described in yourtext? Give one example of each type.
14. When designing a specific class, what types of addi-tional specification for a class could be necessary?
15. What are constraints? What are the three differenttypes of constraints?
16. What are exceptions?17. What are patterns, frameworks, class libraries, and
components? How are they used to enhance the evolv-ing design of the system?
18. How are factoring and normalization used in design-ing an object system?
19. What are the different ways to optimize an objectsystem?
20. What is the typical downside of system optimization?21. What is the purpose of a contract? How are contracts
used?22. What is an invariant? How are invariants modeled in
a design of a class? Give an example of an invariant fora hourly employee class.
23. Create a contract for a compute pay method associ-ated with an hourly employee class.
24. How do you specify a method’s algorithm? Give anexample of an algorithm specification for a computepay method associated with an hourly employee class.
25. How are methods specified? Give an example of amethod specification for a compute pay method asso-ciated with an hourly employee class.

Minicases 359
K. From a cohesion, coupling, and connascence perspec-tive, are the following class diagrams good models?Why or why not?
Customer
Credit Customer Cash Customer Check Customer
Person
L. Create a set of inheritance conflicts for the two inher-itance structures in the class diagrams of exercise K.
Car
Car–Person
Person Robot
Robot–Employee
Employee
1. Your boss has been in the software development fieldfor thirty years. He has always prided himself on hisability to adapt his skills from one approach to devel-oping software to the next approach. For example, hehad no problem learning structured analysis anddesign in the early 1980s and information engineeringin the early 1990s. He even understands the advantageof rapid application development. But the other day,when you and he were talking about the advantages ofobject-oriented approaches, he became totally con-fused. He thought that characteristics such as poly-morphism and inheritance were an advantage forobject-oriented systems. However, when you explainedthe problems with inheritance conflicts, redefinitioncapabilities, and the need for semantic consistencyacross different implementations of methods, he wasready to simply give up. To make matters worse, youthen went on to explain the importance of contracts incontrolling the development of the system. At thispoint in the conservation, he basically threw in thetowel. As he walked off, you heard him say somethinglike “I guess it’s true, it’s too hard to teach an old dognew tricks.”
Being a loyal employee and friend, you decided towrite a short tutorial to give your boss on object-oriented systems development. As a first step, create adetailed outline for the tutorial. As a subtle example,use good design criteria, such as coupling and cohe-sion, in the design of your tutorial outline.
2. You have been working with the Holiday Travel Vehi-cle problem for quite a while. You should go back andrefresh your memory about the problem beforeattempting to solve this situation. Refer back to yoursolutions for Minicase 2 in Chapter 6 and Minicase 2in Chapter 7.
In the new system for Holiday Travel Vehicles, thesystem users follow a two-stage process to recordcomplete information on all of the vehicles sold.When an RV or trailer first arrives at the companyfrom the manufacturer, a clerk from the inventorydepartment creates a new vehicle record for it in thecomputer system. The data entered at this timeinclude basic descriptive information on the vehiclesuch as manufacturer, name, model, year, base cost,and freight charges. When the vehicle is sold, the newvehicle record is updated to reflect the final salesterms and the dealer-installed options added to thevehicle. This information is entered into the systemat the time of sale when the salesperson completesthe sales invoice.
When it is time for the clerk to finalize the newvehicle record, the clerk will select a menu optionfrom the system, which is called Finalize New VehicleRecord. The tasks involved in this process are describedbelow.
When the user selects the “Finalize New VehicleRecord” from the system menu, the user is immediatelyprompted for the serial number of the new vehicle. This
MINICASES

360 Chapter 9 Class and Method Design
serial number is used to retrieve the new vehicle record forthe vehicle from system storage. If a record cannot befound, the serial number is probably invalid. The vehicleserial number is then used to retrieve the option recordsthat describe the dealer-installed options that were addedto the vehicle at the customer’s request. There may be zeroor more options. The cost of the option specified on theoption record(s) is totaled. Then, the dealer cost is calcu-lated using the vehicle’s base cost, freight charge, and totaloption cost. The completed new vehicle record is passedback to the calling module.
a. Update the structural model (CRC cards and classdiagram) with this additional information.
b. For each class in the structural model create a set ofinvariants for attributes and relationships and addthem to the CRC cards for the classes.
c. Choose one of the classes in the structural model.Create a contract for each method in that class. Beas complete as possible.
d. Create a method specification for each method inthe class you chose for question c. Use StructuredEnglish for the algorithm specification.

361
A project team designs the data management layer of a system using a four-step process:selecting the format of the storage, mapping the problem domain classes to the selected format,optimizing the storage to perform efficiently, and then designing the necessary data access andmanipulation classes. This chapter first describes the different ways in which objects can bestored and several important characteristics that should be considered when choosing amongobject-persistence formats. Second, the chapter describes a problem-domain class to object-persistence format mapping process for the most important object-persistence formats. Third,because the most popular storage format today is the relational database, the chapter focuses onthe optimization of relational databases from both storage and access perspectives. Fourth, thechapter describes the affect that nonfunctional requirements have on the data managementlayer. Last, the chapter describes how to design data access and manipulation classes.
OBJECTIVES
■ Become familiar with several object-persistence formats.■ Be able to map problem domain objects to different object-persistence formats.■ Be able to apply the steps of normalization to a relational database.■ Be able to optimize a relational database for object storage and access.■ Become familiar with indexes for relational databases.■ Be able to estimate the size of a relational database.■ Understand the affect of nonfunctional requirements on the data management layer.■ Be able to design the data access and manipulation classes.
CHAPTER OUTLINE
C H A P T E R 1 0
Data Management Layer Design
IntroductionObject-Persistence Formats
Sequential and Random Access FilesRelational DatabasesObject-Relational DatabasesObject-Oriented DatabasesSelecting an Object-Persistence Format
Mapping Problem-Domain Objects toObject-Persistence Formats
Mapping Problem-Domain Objects to an OODBMS Format
Mapping Problem-Domain Objects to an ORDBMS Format
Mapping Problem-Domain Objects to an RDBMS Format
Optimizing RDBMS-Based Object Storage
Optimizing Storage EfficiencyOptimizing Data Access SpeedEstimating Data Storage Size
Nonfunctional Requirements and Data Management Layer Design
Designing Data Access and Manipulation Classes
Applying the Concepts at CD SelectionsSelect Object-Persistence FormatMap Problem-Domain Objects to
Object-Persistence FormatOptimize Object Persistence and
Estimate Its SizeData Access and Manipulation
Class DesignSummary

INTRODUCTION
As explained in Chapter 8, the work done by any application can be divided into a setof layers. This chapter focuses on the data management layer, which includes both dataaccess and manipulation logic, along with the actual design of the storage. The datastorage component of the data management layer manages how data are stored andhandled by the programs that run the system. This chapter describes how a project teamdesigns the storage for objects (object persistence) using a four-step approach: selectingthe format of the storage, mapping the problem-domain objects to the object-persistenceformat, optimizing the object-persistence format, and designing the data access andmanipulation classes necessary to handle the communication between the system andthe database.
Applications are of little use without the data that they support. How useful is a mul-timedia application that can’t support images or sound? Why would someone log into asystem to find information if it took him or her less time to locate the information manu-ally? Design includes four steps to object-persistence design that decrease the chances ofending up with inefficient systems, long system-response times, and users who cannot getto the information that they need in the way that they need it—all of which can affect thesuccess of the project.
The first part of this chapter describes a variety of storage formats and explains howto select the appropriate one for your application. From a practical perspective, there arefour basic types of formats that can be used to store objects for application systems: files(sequential and random), object-oriented databases, object-relational databases, or rela-tional databases.1 Each type has certain characteristics that make it more appropriate forsome types of systems over others.
Once the object-persistence format is selected to support the system, the problem-domain objects need to drive the design of the actual object storage. Then the object stor-age needs to be designed to optimize its processing efficiency, which is the focus of thenext part of the chapter. One of the leading complaints by end users is that the final sys-tem is too slow, so to avoid such complaints project team members must allow time dur-ing design to carefully make sure that the file or database performs as fast as possible. Atthe same time, the team must keep hardware costs down by minimizing the storage spacethat the application will require. The goals of maximizing access to the objects and mini-mizing the amount of space taken to store objects can conflict, and designing object per-sistence efficiency usually requires trade-offs.
Finally, it is necessary to design a set of data access and manipulation classes to ensurethe independence of the problem-domain classes from the storage format. The data accessand manipulation classes handle all communication with the database. In this manner, theproblem domain is decoupled from the object storage allowing the object storage to bechanged without impacting the problem domain classes.
OBJECT-PERSISTENCE FORMATS
There are four main types of object-persistence formats: files (sequential and randomaccess), object-oriented databases, object-relational databases, and relational databases. Filesare electronic lists of data that have been optimized to perform a particular transaction. For
362 Chapter 10 Data Management Layer Design
1 There are other types of files, such as relative, indexed sequential, and multi-indexed sequential, and databases,such as hierarchical, network, and multidimensional. However, these formats typically are not used for objectpersistence.

example, Figure 10-1 shows a customer order file with information about customers’ orders,in the form in which it is used, so that the information can be accessed and processedquickly by the system.
A database is a collection of groupings of information, each of which is related to eachother in some way (e.g., through common fields). Logical groupings of information couldinclude such categories as customer data, information about an order, product informa-tion, and so on. A database management system (DBMS) is software that creates and manip-ulates these databases (see Figure 10-2 for a relational database example). Such end userDBMSs as Microsoft Access support small-scale databases that are used to enhance per-sonal productivity, whereas enterprise DBMSs, such as DB2, Jasmine, and Oracle, can man-age huge volumes of data and support applications that run an entire company. An enduser DBMS is significantly less expensive and easier for novice users to use than its enter-prise counterpart, but it does not have the features or capabilities that are necessary to sup-port mission-critical or large-scale systems.
In the next sections we describe sequential and random access files, relational data-bases, object-relational databases, and object-oriented databases that can be used to han-dle a system’s object persistence requirements. Finally, we describe a set of characteristicson which the different formats can be compared.
Sequential and Random Access FilesFrom a practical perspective, most object-oriented programming languages supportsequential and random access files as part of the language.2 In this section, we describe
Object-Persistence Formats 363
234 11/23/00 2242 DeBerry Ann $ 90.00 $5.85 $ 95.85 Y MC
235 11/23/00 9500 Chin April $ 12.00 $0.60 $ 12.60 Y VISA
236 11/23/00 1556 Fracken Chris $ 50.00 $2.50 $ 52.50 N VISA
237 11/23/00 2242 DeBerry Ann $ 75.00 $4.88 $ 79.88 Y AMEX
238 11/23/00 2242 DeBerry Ann $ 60.00 $3.90 $ 63.90 Y MC
239 11/23/00 1035 Black John $ 90.00 $4.50 $ 94.50 Y AMEX
240 11/23/00 9501 Kaplan Bruce $ 50.00 $2.50 $ 52.50 N VISA
241 11/23/00 1123 Williams Mary $120.00 $9.60 $129.60 N MC
242 11/24/00 9500 Chin April $ 60.00 $3.00 $ 63.00 Y VISA
243 11/24/00 4254 Bailey Ryan $ 90.00 $4.50 $ 94.50 Y VISA
244 11/24/00 9500 Chin April $ 24.00 $1.20 $ 25.20 Y VISA
245 11/24/00 2242 DeBerry Ann $ 12.00 $0.78 $ 12.78 Y AMEX
246 11/24/00 4254 Bailey Ryan $ 20.00 $1.00 $ 21.00 Y MC
247 11/24/00 2241 Jones Chris $ 50.00 $2.50 $ 52.50 N VISA
248 11/24/00 4254 Bailey Ryan $ 12.00 $0.60 $ 12.60 Y AMEX
249 11/24/00 5927 Lee Diane $ 50.00 $2.50 $ 52.50 N AMEX
250 11/24/00 2242 DeBerry Ann $ 12.00 $0.78 $ 12.78 Y MC
251 11/24/00 9500 Chin April $ 15.00 $0.75 $ 15.75 Y MC
252 11/24/00 2242 DeBerry Ann $132.00 $8.58 $140.58 Y MC
253 11/24/00 2242 DeBerry Ann $ 72.00 $4.68 $ 76.68 Y AMEX
Order Cust Last First Prior PaymentNumber Date ID Name Name Amount Tax Total Customer Type
FIGURE 10-1 Customer Order File
2 For example, see the FileInputStream, FileOutputStream, and RandomAccessFile classes in the java.io package.

what sequential access and random access files are.3 We also describe how sequential accessand random access files are used to support an application. For example, they can be usedto support master files, look-up files, transaction files, audit files, and history files.
Sequential access files allow only sequential file operations to be performed (e.g., read,write, and search). Sequential access files are very efficient for sequential operations, suchas report writing. However, for random operations, such as finding or updating a specific
364 Chapter 10 Data Management Layer Design
Cust Last First Prior ID Name Name Customer
2242 DeBerry Ann Y 9500 Chin April Y 1556 Fracken Chris N 1035 Black John Y 9501 Kaplan Bruce N 1123 Williams Mary N 4254 Bailey Ryan Y 2241 Jones Chris N 5927 Lee Diane N
Customer
Payment Payment Type Description
MC Mastercard VISA Visa AMEX American Express
Payment Type
Order Cust Payment Number Date ID Amount Tax Total Type
234 11/23/00 2242 $ 90.00 $5.85 $ 95.85 MC 235 11/23/00 9500 $ 12.00 $0.60 $ 12.60 VISA 236 11/23/00 1556 $ 50.00 $2.50 $ 52.50 VISA 237 11/23/00 2242 $ 75.00 $4.88 $ 79.88 AMEX 238 11/23/00 2242 $ 60.00 $3.90 $ 63.90 MC 239 11/23/00 1035 $ 90.00 $4.50 $ 94.50 AMEX 240 11/23/00 9501 $ 50.00 $2.50 $ 52.50 VISA 241 11/23/00 1123 $ 120.00 $9.60 $ 129.60 MC 242 11/24/00 9500 $ 60.00 $3.00 $ 63.00 VISA 243 11/24/00 4254 $ 90.00 $4.50 $ 94.50 VISA 244 11/24/00 9500 $ 24.00 $1.20 $ 25.20 VISA 245 11/24/00 2242 $ 12.00 $0.78 $ 12.78 AMEX 246 11/24/00 4254 $ 20.00 $1.00 $ 21.00 MC 247 11/24/00 2241 $ 50.00 $2.50 $ 52.50 VISA 248 11/24/00 4254 $ 12.00 $0.60 $ 12.60 AMEX 249 11/24/00 5927 $ 50.00 $2.50 $ 52.50 AMEX 250 11/24/00 2242 $ 12.00 $0.78 $ 12.78 MC 251 11/24/00 9500 $ 15.00 $0.75 $ 15.75 MC 252 11/24/00 2242 $ 132.00 $8.58 $ 140.58 MC 253 11/24/00 2242 $ 72.00 $4.68 $ 76.68 AMEX
Order
Tables related through Cust ID
Tables related through Payment Type
3 For a more complete coverage of issues related to the design of files, see Owen Hanson, Design of Computer DataFiles (Rockville, MD: Computer Science Press, 1982).
FIGURE 10-2 Customer Order Database

object, they are very inefficient. On the average, 50 percent of the contents of a sequentialaccess file will have to be searched through before finding the specific object of interest inthe file. They come in two flavors: ordered and unordered.
An unordered sequential access file is basically an electronic list of information storedon disk. Unordered files are organized serially (i.e., the order of the file is the order in whichthe objects are written to the file). Typically, new objects simply are added to the file’s end.
Ordered sequential access files are placed into a specific sorted order (e.g., in ascendingorder by customer number). However, there is overhead associated with keeping files in aparticular sorted order. The file designer can keep the file in sorted order by always creat-ing a new file each time a delete or addition occurs, or he or she can keep track of the sortedorder via the use of a pointer, which is information about the location of the related record.A pointer is placed at the end of each record, and it “points” to the next record in a seriesor set. The underlying data/file structure in this case is a linked list.4
Random access files allow only random or direct file operations to be performed. Thistype of file is optimized for random operations, such as finding and updating a specificobject. Random access files typically give a faster response time to find and update opera-tions than any other type of file. However, because they do not support sequential pro-cessing, applications such as report writing are very inefficient. The various methods toimplement random access files are beyond the scope of this book.5
There are times when it is necessary to be able to process files in both a sequential andrandom manner. One simple way to do this is to use a sequential file that contains a list ofthe keys (the field in which the file is to be kept in sorted order) and a random access filefor the actual objects. This will minimize the cost of additions and deletions to a sequen-tial file while allowing the random file to be processed sequentially by simply passing thekey to the random file to retrieve each object in sequential order. It also allows for fast ran-dom processing to occur by using only the random access file, thus optimizing the overallcost of file processing. However, if a file of objects needs to be processed in both a randomand sequential manner, the developer should look toward using a database (relational,object relational, or object oriented) instead.
There are many different application types of files—for example, master files, lookupfiles, transaction files, audit files, and history files. Master files store core information thatis important to the business and, more specifically, to the application, such as order infor-mation or customer mailing information. They usually are kept for long periods of time,and new records are appended to the end of the file as new orders or new customers arecaptured by the system. If changes need to be made to existing records, programs must bewritten to update the old information.
Lookup files contain static values, such as a list of valid zip codes or the names of theU.S. states. Typically, the list is used for validation. For example, if a customer’s mailingaddress is entered into a master file, the state name is validated against a lookup file thatcontains U.S. states to make sure that the operator entered the value correctly.
A transaction file holds information that can be used to update a master file. The trans-action file can be destroyed after changes are added, or the file may be saved in case thetransactions need to be accessed again in the future. Customer address changes, for one,would be stored in a transaction file until a program is run that updates the customeraddress master file with the new information.
Object-Persistence Formats 365
4 For more information on various data structures see Ellis Horowitz and Sartaj Sahni, Fundamentals of DataStructures (Rockville, MD: Computer Science Press, 1982) and Michael T. Goodrich and Roberto Tamassia, DataStructures and Algorithms in Java (New York: Wiley, 1998).5 For a more detailed look at the underlying data and file structures of the different types of files, see Mary E. S.Loomis, Data Management and File Structures, 2nd ed. (Englewood Cliffs, NJ: Prentice Hall, 1989); and MichaelJ. Folk and Bill Zoeellick, File Structures: A Conceptual Toolkit (Reading, MA: Addison-Wesley, 1987).

For control purposes, a company might need to store information about how datachange over time. For example, as human resource clerks change employee salaries in ahuman resource system, the system should record the person who made the changes to thesalary amount, the date, and the actual change that was made. An audit file records beforeand after images of data as they are altered so that an audit can be performed if the integrityof the data is questioned.
Sometimes files become so large that they are unwieldy, and much of the informationin the file is no longer used. The history file (or archive file) stores past transactions (e.g.,old customers, past orders) that are no longer needed by system users. Typically the file isstored off-line; yet it can be accessed on an as-needed basis. Other files, such as master files,can then be streamlined to include only active or very recent information.
Relational DatabasesA relational database is the most popular kind of database for application developmenttoday. A relational database is based on collections of tables with each table having a pri-mary key—a field or fields whose values are unique for every row of the table. The tablesare related to each other by placing the primary key from one table into the related table asa foreign key (see Figure 10-3). Most relational database management systems (RDBMS)support referential integrity, or the idea of ensuring that values linking the tables togetherthrough the primary and foreign keys are valid and correctly synchronized. For example, ifan order-entry clerk using the tables in Figure 10-3 attempted to add order 254 for cus-tomer number 1111, he or she would have made a mistake because no customer exists inthe Customer table with that number. If the RDBMS supported referential integrity, itwould check the customer numbers in the Customer table; discover that the number 1111is invalid; and return an error to the entry clerk. The clerk would then go back to the orig-inal order form and recheck the customer information. Can you imagine the problems thatwould occur if the RDBMS let the entry clerk add the order with the wrong information?There would be no way to track down the name of the customer for order 254.
Tables have a set number of columns and a variable number of rows that containoccurrences of data. Structured query language (SQL) is the standard language for access-ing the data in the tables, and it operates on complete tables, as opposed to the individualrows in the tables. Thus, a query written in SQL is applied to all the rows in a table all atonce, which is different than a lot of programming languages, which manipulate data rowby row. When queries must include information from more than one table, the tables firstare joined together based on their primary key and foreign key relationships and treated asif they were one large table. Examples of RDBMS software are Microsoft Access, Oracle,DB2, and Microsoft SQL Server.
366 Chapter 10 Data Management Layer Design
Suppose you are building a Web-based system for the admissions office at your university that will be usedto accept electronic applications from students. All the data for the system will be stored in a variety of files.
Question
Give an example using this system for each of thefollowing file types: master, lookup, transaction, audit,and history. What kind of information would each filecontain, and how would the file be used?
10-1 Student Admissions SystemYOUR
TURN

Object-Persistence Formats 367
Cust Last First Prior ID Name Name Customer
2242 DeBerry Ann Y 9500 Chin April Y 1556 Fracken Chris N 1035 Black John Y 9501 Kaplan Bruce N 1123 Williams Mary N 4254 Bailey Ryan Y 2241 Jones Chris N 5927 Lee Diane N
Customer
Payment Payment Type Description
MC Mastercard VISA Visa AMEX American Express
Payment Type
Referential Integrity:
■ All payment type values inOrder must exist first inthe Payment Type table
■ All Cust ID values in order must exist first in the Customer table
Order Cust Payment Number Date ID Amount Tax Total Type
234 11/23/00 2242 $ 90.00 $5.85 $ 95.85 MC 235 11/23/00 9500 $ 12.00 $0.60 $ 12.60 VISA 236 11/23/00 1556 $ 50.00 $2.50 $ 52.50 VISA 237 11/23/00 2242 $ 75.00 $4.88 $ 79.88 AMEX 238 11/23/00 2242 $ 60.00 $3.90 $ 63.90 MC 239 11/23/00 1035 $ 90.00 $4.50 $ 94.50 AMEX 240 11/23/00 9501 $ 50.00 $2.50 $ 52.50 VISA 241 11/23/00 1123 $ 120.00 $9.60 $ 129.60 MC 242 11/24/00 9500 $ 60.00 $3.00 $ 63.00 VISA 243 11/24/00 4254 $ 90.00 $4.50 $ 94.50 VISA 244 11/24/00 9500 $ 24.00 $1.20 $ 25.20 VISA 245 11/24/00 2242 $ 12.00 $0.78 $ 12.78 AMEX 246 11/24/00 4254 $ 20.00 $1.00 $ 21.00 MC 247 11/24/00 2241 $ 50.00 $2.50 $ 52.50 VISA 248 11/24/00 4254 $ 12.00 $0.60 $ 12.60 AMEX 249 11/24/00 5927 $ 50.00 $2.50 $ 52.50 AMEX 250 11/24/00 2242 $ 12.00 $0.78 $ 12.78 MC 251 11/24/00 9500 $ 15.00 $0.75 $ 15.75 MC 252 11/24/00 2242 $ 132.00 $8.58 $ 140.58 MC 253 11/24/00 2242 $ 72.00 $4.68 $ 76.68 AMEX
Order
Cust ID is a foreign key in Order
Payment Type is a foreign key in Order
Cust ID is the primary key of Customer table
Order Number is theprimary key of theOrder table
Payment Type is the primary key of the Payment Type table
FIGURE 10-3 Relational Database

To use a RDBMS to store objects, objects must be converted so that they can be storedin a table. From a design perspective, this entails mapping a UML class diagram to a rela-tional database schema. We describe the mapping necessary later in this chapter.
Object-Relational DatabasesObject-relational database management systems (ORDBMS) are relational database man-agement systems with extensions to handle the storage of objects in the relational tablestructure. This is typically done through the use of user-defined types. For example, anattribute in a table could have a data type of map, which would support storing a map. Thisis an example of a complex data type. In pure RDBMSs, attributes are limited to simple oratomic data types, such as integers, floats, or chars.
ORDBMSs, because they are simply extensions to their RDBMS counterparts, alsohave very good support for the typical data management operations that business has cometo expect from RDBMSs, including an easy-to-use query language (SQL), authorization,concurrency-control, and recovery facilities. However, because SQL was designed to han-dle only simple data types, it too has been extended to handle complex object data. Cur-rently, vendors deal with this issue in different manners. For example, DB2, Informix, andOracle all have extensions that provide some level of support for objects.
Many of the ORDBMSs on the market still do not support many of the object-orientedfeatures that can appear in an object-oriented design (e.g., inheritance). One of the problemsin supporting inheritance is that inheritance support is language dependent. For example, themanner in which Smalltalk supports inheritance is different than C++’s approach, which isdifferent than Java’s approach. As such, vendors currently must support many different ver-sions of inheritance, one for each object-oriented language, or decide on a specific version andforce developers to map their object-oriented design (and implementation) to their approach.As such, like RDBMSs, a mapping from a UML class diagram to an object-relational databaseschema is required. We describe the mapping necessary later in this chapter.
Object-Oriented DatabasesThe final type of database management system that we describe is the object-oriented data-base management systems (OODBMS). There have been two primary approaches to sup-porting object persistence within the OODBMS community: adding persistence extensionsto an object-oriented programming language and the creation of an entirely separate data-base management system. In the case of OODBMS, the Object Data Management Group(ODMG) has completed the standardization process for defining (Object Definition Lan-guage, ODL), manipulating (Object Manipulating Language, OML), and querying (ObjectQuery Language, OQL) objects in an OODBMS.6
With an OODBMS, collections of objects are associated with an extent. An extent issimply the set of instances associated with a particular class (i.e., it is the equivalent of atable in a RDBMS). Technically speaking, each instance of a class has a unique identifierassigned to it by the OODBMS: the Object ID. However, from a practical point of view, itis still a good idea to have a semantically meaningful primary key (even though from anOODBMS perspective this is unnecessary). Referential integrity is still very important. Inan OODBMS, from the user’s perspective, it looks as if the object is contained within theother object. However, the OODBMS actually keeps track of these relationships throughthe use of the Object ID; as such, foreign keys are not necessary.7
368 Chapter 10 Data Management Layer Design
6 See www.odmg.org for more information.7 Depending on the storage and updating requirements, it usually is a good idea to use a foreign key in addition to theObject ID. The Object ID has no semantic meaning. As such, in the case of needing to rebuild relationships betweenobjects, Object IDs are difficult to validate. Foreign keys, by contrast, should have some meaning outside of the DBMS.
OODBMSs provide support for some form of inheritance. However, as already dis-cussed, inheritance tends to be language dependent. Currently, most OODBMSs are tiedclosely to either a particular object-oriented programming language (OOPL) or a set ofOOPLs. Most OODBMSs originally supported either Smalltalk or C++. Today, many of thecommercially available OODBMSs provide support for C++, Java, and Smalltalk.
OODBMSs also support the idea of repeating groups (fields) or multivalued attributes.These are supported through the use of attribute sets and relationships sets. RDBMSs do notexplicitly allow for multivalued attributes or repeating groups. This is considered to be aviolation of the first normal form (discussed later in this chapter) for relational databases.Some ORDBMSs do support repeating groups and multivalued attributes.
Up until recently, OODBMSs have mainly been used to support multimedia applica-tions or systems that involve complex data (e.g., graphics, video, sound). Application areas,such as computer-aided design and manufacturing (CAD/CAM), financial services, geo-graphic information systems, health care, telecommunications, and transportation, havebeen the most receptive to OODBMSs. They are also becoming popular technologies forsupporting electronic commerce, online catalogs, and large Web multimedia applications.Examples of pure OODBMSs include Gemstone, Jasmine, O2, Objectivity, ObjectStore,POET, and Versant.
Although pure OODBMS exist, most organizations currently invest in ORDBMS tech-nology. The market for OODBMS is expected to grow, but its ORDBMS and RDBMScounterparts dwarf it. One reason for this situation is that there are many more experi-enced developers and tools in the RDBMS arena. Furthermore, relational users find thatusing an OODBMS comes with a fairly steep learning curve.
SELECTING AN OBJECT-PERSISTENCE FORMAT
Each of the file and database storage formats that have been presented has its strengths andweaknesses, and no one format is inherently better than the others are. In fact, sometimesa project team will choose multiple formats (e.g., a relational database for one, a file foranother, and an object-oriented database for a third). Thus, it is important to understandthe strengths and weaknesses of each format and when to use each one. Figure 10-4 pre-sents a summary of the characteristics of each and the characteristics that can help identifywhen each type of format is more appropriate.
Major Strengths and Weaknesses The major strengths of files include that some sup-port for sequential and random access files is normally part of an OOPL, files can bedesigned to be very efficient, and they are a good alternative for temporary or short-termstorage. However, all file manipulation must be done through the OOPL. Files do not haveany form of access control beyond that of the underlying operating system. Finally, in mostcases, if files are used for permanent storage, redundant data most likely will result. Thiscan cause many update anomalies.
RDBMSs bring with them proven commercial technology. They are the leaders in theDBMS market. Furthermore, they can handle very diverse data needs. However, they can-not handle complex data types, such as images. Therefore, all objects must be convertedto a form that can be stored in tables composed of atomic or simple data. They provideno support for object orientation. This lack of support causes an impedance mismatchbetween the objects contained in the OOPL and the data stored in the tables. An imped-ance mismatch refers to the amount of work done by both the developer and DBMS andthe potential information loss that can occur when converting objects to a form that canbe stored in tables.
Selecting an Object-Persistence Format 369

Because ORDBMSs are typically object-oriented extensions to RDBMSs, they inheritthe strengths of RDBMSs. They are based on established technologies, such as SQL, andunlike their predecessors, they can handle complex data types. However, they provide onlylimited support for object orientation. The level of support varies among the vendors;therefore, ORDBMSs also suffer from the impedance mismatch problem.
OODBMSs support complex data types and have the advantage of directly supportingobject orientation. Therefore, they do not suffer from the impedance mismatch that theprevious DBMSs do. Even though the ODMG has released version 3.0 of its set of stan-dards, the OODBMS community is still maturing. As such, this technology may still be toorisky for some firms. The other major problems with OODBMS are the lack of skilled laborand the perceived steep learning curve of the RDBMS community.
Data Types Supported The first issue is the type of data that will need to be stored in thesystem. Most applications need to store simple data types, such as text, dates, and numbers,and all files and DBMSs are equipped to handle this kind of data. The best choice for sim-ple data storage, however, is usually the RDBMS because the technology has matured overtime and has continuously improved to handle simple data very effectively.
Increasingly, applications are incorporating complex data, such as video, images, oraudio. ORDBMSs or OODBMSs are best able to handle data of this type. Complex datastored as objects can be manipulated much faster than with other storage formats.
370 Chapter 10 Data Management Layer Design
Sequential and Object Relational Object-Oriented Random Access Files Relational DBMS DBMS DBMS
MajorStrengths
MajorWeaknesses
Data Types Supported
Types of ApplicationSystemsSupported
ExistingStorage Formats
Future Needs
Usually part of an object-oriented programming lan-guageFiles can be designed forfast performanceGood for short-term datastorage
Redundant dataData must be updated usingprograms, i.e., no manipula-tion or query languageNo access control
Simple and Complex
Transaction processing
Organizationdependent
Poor future prospects
Leader in the database marketCan handle diverse dataneeds
Cannot handle complexdataNo support for objectorientationImpedance mismatchbetween tables and objects
Simple
Transaction processing anddecision making
Organizationdependent
Good future prospects
Based on established,proven technology, e.g.,SQLAble to handle complexdata
Limited support for objectorientationImpedance mismatchbetween tables and objects
Simple and Complex
Transaction processing anddecision making
Organizationdependent
Good future prospects
Able to handle complexdataDirect support for objectorientation
Technology is still maturingSkills are hard to find
Simple and Complex
Transaction processing anddecision making
Organizationdependent
Good future prospects
FIGURE 10-4 Comparison of Object-Persistence Formats

Type of Application System There are many different kinds of application systems thatcan be developed. Transaction-processing systems are designed to accept and process manysimultaneous requests (e.g., order entry, distribution, payroll). In transaction-processingsystems, the data are continuously updated by a large number of users, and the queries thatare asked of the systems typically are predefined or targeted at a small subset of records(e.g., List the orders that were backordered today or What products did customer #1234order on May 12, 2001?).
Another set of application systems is the set designed to support decision making, suchas decision support systems (DSS), management information systems (MIS), executive infor-mation systems (EIS), and expert systems (ES). These decision-making support systems arebuilt to support users who need to examine large amounts of read-only historical data. Thequestions that they ask are often ad hoc, and they include hundreds or thousands ofrecords at a time (e.g., List all customers in the West region who purchased a product cost-ing more than $500 at least three times. or What products had increased sales in the sum-mer months that have not been classified as summer merchandise?).
Transaction-processing systems and DSSs thus have very different data storage needs.Transaction-processing systems need data storage formats that are tuned for a lot of dataupdates and fast retrieval of predefined, specific questions. Files, relational databases,object-relational databases, and object-oriented databases can all support these kinds ofrequirements. By contrast, systems to support decision making are usually only readingdata (not updating it), often in ad hoc ways. The best choices for these systems usually areRDBMSs because these formats can be configured specially for needs that may be unclearand less apt to change the data.
Existing Storage Formats The storage format should be selected primarily on the basisof the kind of data and application system being developed. However, project teams shouldconsider the existing storage formats in the organization when making design decisions. Inthis way, they can better understand the technical skills that already exist and how steep thelearning curve will be when the storage format is adopted. For example, a company that isfamiliar with RDBMS will have little problem adopting a relational database for the pro-ject, whereas an OODBMS may require substantial developer training. In the latter situa-tion, the project team may have to plan for more time to integrate the object-orienteddatabase with the company’s relational systems or possibly consider moving toward anORDBMS solution.
Future Needs Not only should a project team consider the storage technology within thecompany, but it should also be aware of current trends and technologies that are being usedby other organizations. A large number of installations of a specific type of storage formatsuggest that skills and products are available to support the format. Therefore, the selectionof that format is safe. For example, it would probably be easier and less expensive to findRDBMS expertise when implementing a system than to find help with an OODBMS.
Other Miscellaneous Criteria Other criteria that should be considered include cost,licensing issues, concurrency control, ease of use, security and access controls, versionmanagement, storage management, lock management, query management, language bind-ings, and APIs. We also should consider performance issues, such as cache management,insertion, deletion, retrieval, and updating of complex objects. Finally, the level of supportfor object orientation (such as objects, single inheritance, multiple inheritance, polymor-phism, encapsulation and information hiding, methods, multivalued attributes, repeatinggroups) is critical.
Selecting an Object-Persistence Format 371

MAPPING PROBLEM-DOMAIN OBJECTS TO OBJECT-PERSISTENCE FORMATS8
As described in the previous section, there are many different formats from which tochoose to support object persistence. Each of the different formats can have some conver-sion requirements. Regardless of the object-persistence format chosen, we suggest sup-porting primary keys and foreign keys by adding them to the problem domain classes atthis point in time. However, this does imply some additional processing required. Thedeveloper has to set the value for the foreign key when adding the relationship to an object.In some cases, this overhead may be too costly. In those cases, this suggestion should beignored. In the remainder of this section, we describe how to map the problem-domainclasses to the different object-persistence formats. From a practical perspective, file formatsare used mostly for temporary storage. As such, we do not consider them further.
We also recommend that the data management functionality specifics, such as retrievaland updating of data from the object storage, be included only in classes contained in the DataManagement layer. This will ensure that the Data Management classes are dependent on theProblem-Domain classes and not the other way around. Furthermore, this allows the design ofproblem-domain classes to be independent of any specific object-persistence environment,thus increasing their portability and their potential for reuse. Like our previous recommenda-tion, this one also implies additional processing. However, the increased portability and poten-tial for reuse realized should more than compensate for the additional processing required.
Mapping Problem-Domain Objects to an OODBMS FormatIf we support object persistence with an OODBMS, the mappings between the problem-domain objects and the OODBMS tend to be fairly straightforward. As a starting point,we suggest that each concrete problem-domain class should have a corresponding object-persistence class in the OODBMS. Furthermore, there will be a data access and manage-ment (DAM) class that contains the functionality required to manage the interactionbetween the object-persistence class and the problem-domain layer. For example, using
372 Chapter 10 Data Management Layer Design
A major public university graduates approximately10,000 students per year, and the development office hasdecided to build a Web-based system that solicits andtracks donations from the university’s large alumni body.Ultimately, the development officers hope to use theinformation in the system to better understand the alumnigiving patterns so that they can improve giving rates.
Question
1. What kind of system is this? Does it have character-istics of more than one?
2. What different kinds of data will this system use?3. On the basis of your answers, what kind of data
storage format(s) do you recommend for this system?
10-2 Donation-Tracking SystemYOUR
TURN
8 The rules presented in this section are based on material in Ali Bahrami, Object-Oriented Systems Developmentusing the Unified Modeling Language (New York: McGraw-Hill, 1999); Michael Blaha and William Premerlani,Object-Oriented Modeling and Design for Database Applications (Upper Saddle River, NJ: Prentice Hall, 1998);Akmal B. Chaudri and Roberto Zicari, Succeeding with Object Databases: A Practical Look at Today’s Implementa-tions with Java and XML (New York: Wiley, 2001); Peter Coad and Edward Yourdon, Object-Oriented Design(Upper Saddle River, NJ: Yourdon Press, 1991); and Paul R. Read, Jr., Developing Applications with Java and UML(Boston: Addison-Wesley, 2002).
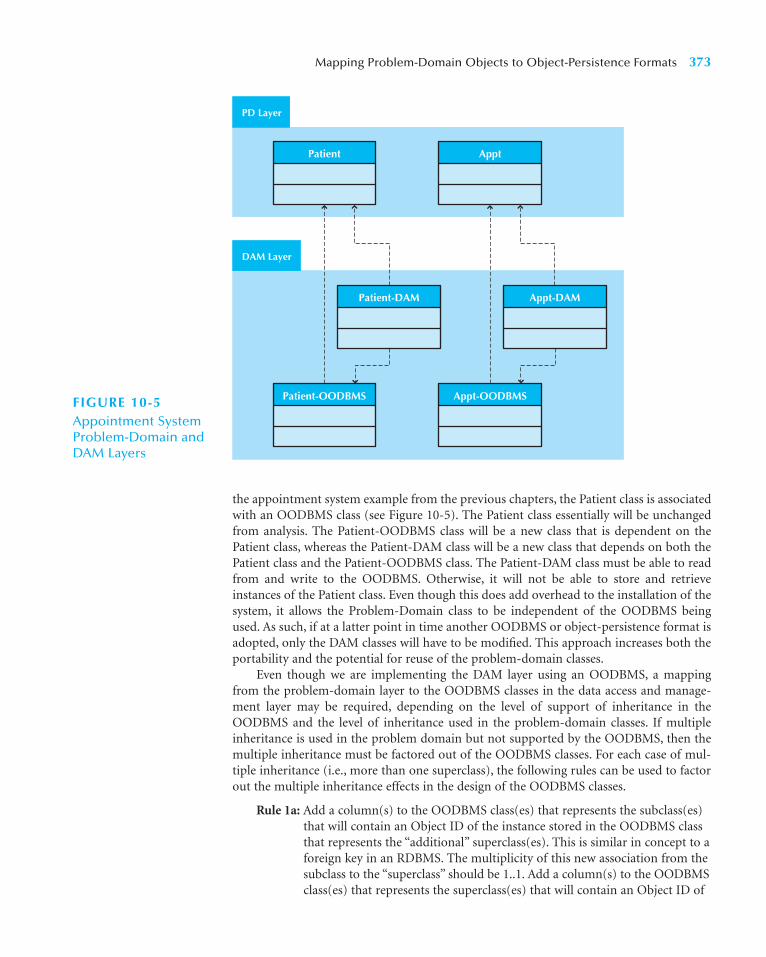
the appointment system example from the previous chapters, the Patient class is associatedwith an OODBMS class (see Figure 10-5). The Patient class essentially will be unchangedfrom analysis. The Patient-OODBMS class will be a new class that is dependent on thePatient class, whereas the Patient-DAM class will be a new class that depends on both thePatient class and the Patient-OODBMS class. The Patient-DAM class must be able to readfrom and write to the OODBMS. Otherwise, it will not be able to store and retrieveinstances of the Patient class. Even though this does add overhead to the installation of thesystem, it allows the Problem-Domain class to be independent of the OODBMS beingused. As such, if at a latter point in time another OODBMS or object-persistence format isadopted, only the DAM classes will have to be modified. This approach increases both theportability and the potential for reuse of the problem-domain classes.
Even though we are implementing the DAM layer using an OODBMS, a mappingfrom the problem-domain layer to the OODBMS classes in the data access and manage-ment layer may be required, depending on the level of support of inheritance in theOODBMS and the level of inheritance used in the problem-domain classes. If multipleinheritance is used in the problem domain but not supported by the OODBMS, then themultiple inheritance must be factored out of the OODBMS classes. For each case of mul-tiple inheritance (i.e., more than one superclass), the following rules can be used to factorout the multiple inheritance effects in the design of the OODBMS classes.
Rule 1a: Add a column(s) to the OODBMS class(es) that represents the subclass(es)that will contain an Object ID of the instance stored in the OODBMS classthat represents the “additional” superclass(es). This is similar in concept to aforeign key in an RDBMS. The multiplicity of this new association from thesubclass to the “superclass” should be 1..1. Add a column(s) to the OODBMSclass(es) that represents the superclass(es) that will contain an Object ID of
Mapping Problem-Domain Objects to Object-Persistence Formats 373
PD Layer
DAM Layer
ApptPatient
Appt-OODBMSPatient-OODBMS
Appt-DAMPatient-DAM
FIGURE 10-5Appointment SystemProblem-Domain andDAM Layers

the instance stored in the OODBMS class that represents the subclass(es).If the superclasses are concrete, that is, they can be instantiated themselves,then the multiplicity from the superclass to the subclass is 0..*, otherwise,it is 1..1. Furthermore, an exclusive-or (XOR) constraint must be addedbetween the associations. Do this for each “additional” superclass.
OR
Rule 1b: Flatten the inheritance hierarchy of the OODBMS classes by copying the attrib-utes and methods of the additional OODBMS superclass(es) down to all of theOODBMS subclasses and remove the additional superclass from the design.9
These multiple-inheritance rules are very similar to those described in Chapter 9. Fig-ure 10-6 demonstrates the application of these rules. The right side of the figure portrays aset of problem-domain classes that are involved in a set of multiple-inheritance relation-ships, where Class 1 inherits from both SuperClass1 and SuperClass2, and Class 2 inheritsfrom both SuperClass2 and SuperClass3. Figure 10-6a portrays the mapping of multipleinheritance relationships into a single inheritance-based OODBMS using Rule 1a. Assum-ing that SuperClass2 is concrete, we apply Rule 1a to the problem-domain classes, and weend up with the OODBMS classes on the left side of Part a, where we have:
■ Added a column (attribute) to Class1-OODBMS that represents an associationwith SuperClass2-OODBMS;
■ Added a column (attribute) to Class2-OODBMS that represents an associationwith SuperClass2-OODBMS;
■ Added a pair of columns (attributes) to SuperClass2-OODBMS that represents anassociation with Class1-OODBMS and Class2-OODBMS and for completeness sake;
■ Added associations between Class2-OODBMS and SuperClass2-OODBMS andClass2-OODBMS and SuperClass2-OODBMS that have the correct multiplicitiesand the XOR constraint explicitly shown.
We also display the dependency relationships from the OODBMS classes to the problem-domain classes. Furthermore, we illustrate the fact that the association between Class1-OODBMS and SuperClass2-OODBMS and the association between Class2-OODBMS andSuperClass2-OODBMS are based on the original factored-out inheritance relationships inthe problem-domain classes by showing dependency relationships from the associations tothe inheritance relationships.
On the other hand, if we apply Rule 1b to map the problem-domain classes to a single-inheritance-based OODBMS, we end up with the mapping in Figure 10-6b, where all theattributes of SuperClass2 have been copied into the Class1-OODBMS and Class2-OODBMSclasses. In this latter case, you may have to deal with the effects of inheritance conflicts (seeChapter 9).
The advantage of Rule 1a is that all problem-domain classes identified during analysisare preserved in the database. This allows for maximum flexibility of maintenance of thedesign of the data management layer. However, Rule 1a increases the amount of messagepassing required in the system, and it has added processing requirements involving the XORconstraint, thus reducing the overall efficiency of the design. As such, our recommendationis to limit Rule 1a to be applied only when dealing with “extra” superclasses that are concretebecause they have an independent existence in the problem domain. Use Rule 1b when theyare abstract because they do not have an independent existence from the subclass.
374 Chapter 10 Data Management Layer Design
9 It is also a good idea to document this modification in the design so that in the future, modifications to thedesign can be easily maintained.
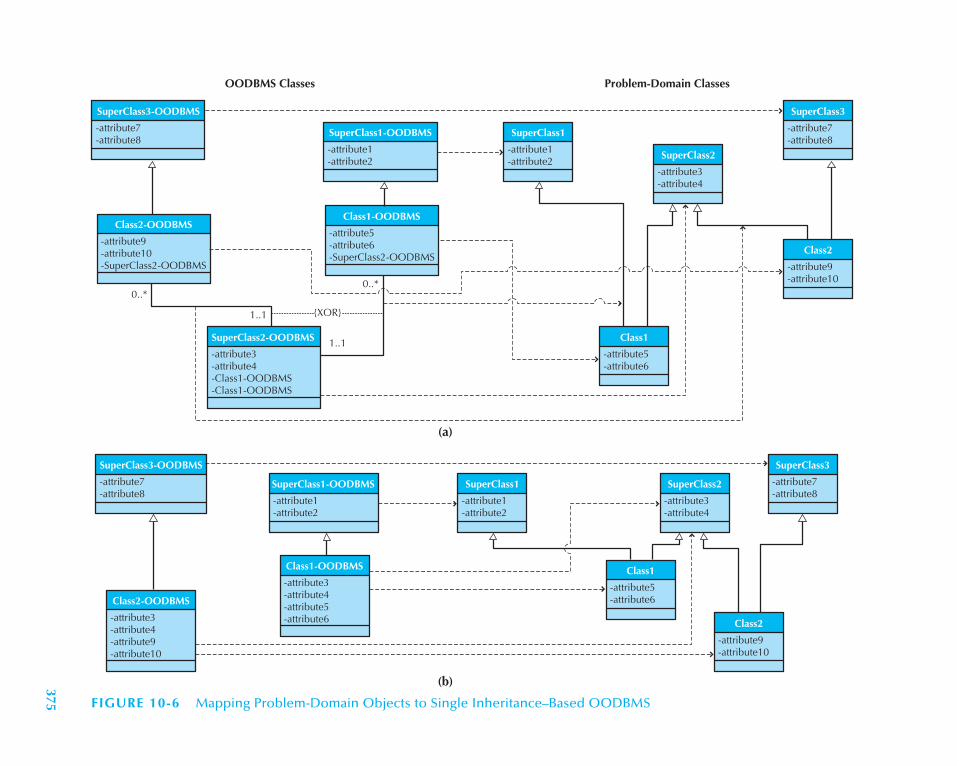
SuperClass3-OODBMS
-attribute7-attribute8
OODBMS Classes Problem-Domain Classes
Class2-OODBMS
-attribute9-attribute10-SuperClass2-OODBMS
SuperClass3-OODBMS
-attribute7-attribute8
Class1-OODBMS
-attribute5-attribute6-SuperClass2-OODBMS
SuperClass2-OODBMS
-attribute3-attribute4-Class1-OODBMS-Class1-OODBMS
Class2-OODBMS
-attribute3-attribute4-attribute9-attribute10
SuperClass1-OODBMS
-attribute1-attribute2
Class1-OODBMS
-attribute3-attribute4-attribute5-attribute6
0..*
1..1
1..1
0..*
(a)
(b)
SuperClass1-OODBMS
-attribute1-attribute2
SuperClass1
-attribute1-attribute2
{XOR}
Class1
-attribute5-attribute6
SuperClass1
-attribute1-attribute2
Class1
-attribute5-attribute6
Class2
-attribute9-attribute10
SuperClass3
-attribute7-attribute8
SuperClass2
-attribute3-attribute4
Class2
-attribute9-attribute10
SuperClass2
-attribute3-attribute4
SuperClass3
-attribute7-attribute8
FIGURE 10-6 Mapping Problem-Domain Objects to Single Inheritance–Based OODBMS
375
In either case, additional processing will be required. In the first case, cascading ofdeletes will work, not only from the individual object to all its elements, but also from thesuperclass instances to all the subclass instances. Most OODBMSs do not support this typeof deletion. However, to enforce the referential integrity of the system, it must be done. Inthe second case, there will be a lot of copying and pasting of the structure of the superclassto the subclasses. In the case that a modification of the structure of the superclass isrequired; then the modification must be cascaded to all of the subclasses. Again, mostOODBMSs do not support this type of modification cascading. Therefore, the developermust address it. However, multiple inheritance is rare in most business problems. As such,in most situations the preceding rules will never be necessary.
When instantiating problem-domain objects from OODBMS objects, additional pro-cessing will also be required. The additional processing will be in the retrieval of theOODBMS objects and taking their elements to create a problem-domain object. Also,when storing the problem-domain object, the conversion to a set of OODBMS objects isrequired. Basically speaking, anytime that an interaction takes place between the OODBMSand the system, if multiple inheritance is involved and the OODBMS supports only singleinheritance, a conversion between the two formats will be required. This conversion is thepurpose of the data access and management classes.
Mapping Problem Domain Objects to an ORDBMS FormatIf we support object persistence with an ORDBMS, then the mapping from the problemdomain objects to the data management objects is much more involved. Depending on thelevel of support for object orientation, different mapping rules are necessary. For our pur-poses, we assume that the ORDBMS supports Object IDs, multivalued attributes, andstored procedures. However, we assume that the ORDBMS does not provide any supportfor inheritance. Based on these assumptions, Figure 10-7 lists a set of rules that can be usedto design the mapping from the problem-domain objects to the tables of the ORDBMS-based data access and management layer.
First, all concrete problem-domain classes must be mapped to the tables in theORDBMS. For example in Figure 10-8, the Patient class has been mapped to PatientORDBMS table. Notice that the Person class has also been mapped to an ORDBMS table.Even though the Person class is abstract, this mapping was done because in the completeclass diagram (see Figure 7-2), the Person class had multiple direct subclasses (Employeeand Patient).
Second, single-valued attributes should be mapped to columns in the ORDBMStables. Again, referring to Figure 10-8, we see that the amount attribute of the Patient classhas been included in the Patient Table class.
Third, depending on the level of support of stored procedures, the methods andderived attributes should be mapped either to stored procedures or program modules.
376 Chapter 10 Data Management Layer Design
In the previous chapters, we have been using a dentistoffice appointment system as an example. Assume thatyou now know that the OODBMS that will be used to
support the system will support only single inheritance.Using a class diagram, draw the design for the database.
10-3 Dentist Office Appointment SystemYOUR
TURN
-

Fourth, single-valued (one-to-one) aggregation and association relationships shouldbe mapped to a column that can store an Object ID. This should be done for both sides ofthe relationship.
Fifth, multivalued attributes should be mapped to columns that can contain a set ofvalues. For example in Figure 10-8, the insurance carrier attribute in the Patient class maycontain multiple values because a patient may have more than one insurance carrier. Assuch, in the Patient table, a multiplicity has been added to the insurance carrier attributeto portray this fact.
The sixth mapping rule addresses repeating groups of attributes in a problem-domainobject. In this case, the repeating group of attributes should be used to create a new tablein the ORDBMS. Furthermore, it may imply a missing class in the problem-domain layer.Normally, when a set of attributes repeat together as a group, it implies a new class. Finally,we must create a one-to-many association from the original table to the new one.
The seventh rule supports mapping multivalued (many-to-many) aggregation andassociation relationships to columns that can store a set of Object IDs. Basically, this is acombination of the fourth and fifth rules. Like the fourth rule, this should be done for bothsides of the relationships. For example in Figure 10-8, the Symptom table has a multival-ued attribute (Patients) that can contain multiple Object IDs to Patient Table objects, andPatient table has a multivalued attribute (Symptoms) that can contain multiple Object IDsto Symptom Table objects.
The eighth rule combines the intentions of Rules 4 and 7. In this case, the rule mapsone-to-many and many-to-one relationships. On the single-valued side (1..1 or 0..1) of the
Mapping Problem-Domain Objects to Object-Persistence Formats 377
Rule 1: Map all concrete problem-domain classes to the ORDBMS tables. Also, if an abstract problem domain class has multipledirect subclasses, map the abstract class to an ORDBMS table.
Rule 2: Map single-valued attributes to columns of the ORDBMS tables.
Rule 3: Map methods and derived attributes to stored procedures or to program modules.
Rule 4: Map single-valued aggregation and association relationships to a column that can store an Object ID. Do this for both sidesof the relationship.
Rule 5: Map multivalued attributes to a column that can contain a set of values.
Rule 6: Map repeating groups of attributes to a new table and create a one-to-many association from the original table to the newone.
Rule 7: Map multivalued aggregation and association relationships to a column that can store a set of Object IDs. Do this for bothsides of the relationship.
Rule 8: For aggregation and association relationships of mixed type (one-to-many or many-to-one), on the single-valued side (1..1or 0..1) of the relationship, add a column that can store a set of Object IDs. The values contained in this new column will be theObject IDs from the instances of the class on the multivalued side. On the multivalued side (1..* or 0..*), add a column that canstore a single Object ID that will contain the value of the instance of the class on the single-valued side.
For generalization/inheritance relationships:
Rule 9a: Add a column(s) to the table(s) that represents the subclass(es) that will contain an Object ID of the instance stored in thetable that represents the superclass. This is similar in concept to a foreign key in an RDBMS. The multiplicity of this new associa-tion from the subclass to the “superclass” should be 1..1. Add a column(s) to the table(s) that represents the superclass(es) that willcontain an Object ID of the instance stored in the table that represents the subclass(es). If the superclasses are concrete, that is,they can be instantiated themselves, then the multiplicity from the superclass to the subclass is 0..*, otherwise, it is 1..1. Further-more, an exclusive-or (XOR) constraint must be added between the associations. Do this for each superclass.
OR
Rule 9b: Flatten the inheritance hierarchy by copying the superclass attributes down to all of the subclasses and remove the super-class from the design.10
10 Again, it is also a good idea to document this modification in the design so that in the future, modifications to the design can be maintained easily.
FIGURE 10-7 Mapping Problem-Domain Objects to ORDBMS Schema

relationship, a column that can store a set of Object IDs from the table on the multival-ued side (1..* or 0..*) of the relationship should be added. On the multivalued side, a col-umn should be added to the table that can store an Object ID from an instance stored inthe table on the single-valued side of the relationship. For example, in Figure 10-8, thePatient table has a multivalued attribute (Appts) that can contain multiple Object IDs toAppt Table objects, whereas the Appt table has a single-valued attribute (Patient) that cancontain an Object ID to a Patient Table object.
378 Chapter 10 Data Management Layer Design
ORDBMS Tables Problem-Domain Classes
Person Table
-lastname[1..1]-firstname[1..1]-address[1..1]-phone[1..1]-birthdate[1..1]-SubClassObjects[1..1]
Patient Table
-amount[1..1]-Person[1..1]-Appts[0..*]-Symptoms[1..*]-Insurance carrier[0..*]-Primary Insurance Carrier[0..*]
Symptom Table
-name[1..1]-Patients[0..*]
Appt Table
-Patient[1..1]-time[1..1]-date[1..1]-reason[1..1]
1..1
1..1
0..*
0..*0..* 0..*
0..*
1
1
1..* 1..*
+ primary insurancecarrier
0..*
1
1
suffers
schedules
Appt
-time-date-reason
+cancel without notice()Patient
-amount-insurance carrier
+make appointment()+calculate last visit()+change status()+provides medical history()
Person
-lastname-firstname-address-phone-birthdate-/ age
Symptom
-name
FIGURE 10-8 Mapping Problem-Domain Objects to ORDBMS Schema Example

The ninth, and final, rule deals with the lack of support for generalization and inheritance.In this case, there are two different approaches. These approaches are virtually identical to therules described with the preceding OODBMS object-persistence formats. For example in Fig-ure 10-8, the Patient table contains an attribute (Person) that can contain an Object ID for aPerson Table object, and the Person table contains an attribute (SubClassObjects) that containan Object ID for an object, in this case, stored in the Patient table. In the other case, the inher-itance hierarchy is flattened.
Of course, there will be additional processing required anytime that an interaction takesplace between the database and the system. Every time an object must be created, retrieved fromthe database, updated, or deleted, the ORDBMS object(s) must be converted to the problem-domain object, or vice versa. Again, this is the purpose of the data access and manipulationclasses. The only other choice is to modify the problem-domain objects. However, such a mod-ification can cause problems between the problem-domain layer and the physical architectureand human–computer interface layers. Generally speaking, the cost of conversion between theORDBMS and the problem-domain layer will be more than offset by the savings in develop-ment time associated with (1) the interaction between the problem-domain and physicalarchitecture and human–computer interaction layers, and (2) the ease of maintenance of asemantically clean problem-domain layer. In the long run, due to the conversions necessary,the development and production cost of using an OODBMS may be less than the developmentand production cost implementing the object persistence in an ORDBMS.
Mapping Problem Domain Objects to an RDBMS FormatIf we support object persistence with an RDBMS, then the mapping from the problem-domain objects to the RDBMS tables is similar to the mapping to an ORDBMS. However,the assumptions made for an ORDBMS are no longer valid. Figure 10-9 lists a set of rulesthat can be used to design the mapping from the problem-domain objects to the RDBMS-based data access and management layer tables.
The first four rules are basically the same set of rules used to map problem-domainobjects to ORDBMS-based data management objects. First, all concrete problem-domainclasses must be mapped to tables in the RDBMS. Second, single-valued attributes shouldbe mapped to columns in the RDBMS table. Third, methods should be mapped to eitherstored procedures or program modules, depending on the complexity of the method.Fourth, single-valued (one-to-one) aggregation and association relationships are mappedto columns that can store the foreign keys of the related tables. This should be done forboth sides of the relationship. For example in Figure 10-10, we needed to include tables inthe RDBMS for the Person, Patient, Symptom, and Appt classes.
The fifth rule addresses multivalued attributes and repeating groups of attributes in aproblem-domain object. In these cases, the attributes should be used to create new tables inthe RDBMS. Furthermore, as in the ORDBMS mappings, repeating groups of attributes may
Mapping Problem-Domain Objects to Object-Persistence Formats 379
In Your Turn 10-3, you created a design for the databaseassuming that the database would be implemented usingan OODBMS that supported only single inheritance. Inthis case, assume that you now know that an ORDBMS
will be used and that it does not support any inheritance.However, it does support Object IDs, multivalued attrib-utes, and stored procedures. Using a class diagram, drawthe design for the database.
10-4 Dentist Office Appointment SystemYOUR
TURN
-

imply missing classes in the problem-domain layer. As such, a new problem-domain class maybe required. Finally, we should create a one-to-many or zero-to-many association from theoriginal table to the new one. For example, in Figure 10-10, we needed to create a new table forinsurance carrier because it was possible for a patient to have more than one insurance carrier.
The sixth rule supports mapping multivalued (many-to-many) aggregation and asso-ciation relationships to a new table that relates the two original tables. In this case, the newtable should contain foreign keys back to the original tables. For example, in Figure 10-10,we needed to create a new table that represents the suffer association between the Patientand Symptom problem-domain classes.
The seventh rule addresses one-to-many and many-to-one relationships. With thesetypes of relationships, the multivalued side (0..* or 1..*) should be mapped to a column inits table that can store a foreign key back to the single-valued side (0..1 or 1..1). It is possi-ble that we have already taken care of this situation because we earlier recommended inclu-sion of both primary and foreign key attributes in the problem-domain classes. In the caseof Figure 10-10, we had already added the primary key from the Patient class to the Apptclass as a foreign key (see personNumber). However, in the case of the reflexive relation-ship, primary insurance carrier, associated with the Patient class, we need to add a newattribute (primaryInsuranceCarrier) to be able to store the relationship.
The eighth, and final, rule deals with the lack of support for generalization and inher-itance. As in the case of an ORDBMS, there are two different approaches. These approachesare virtually identical to the rules described with OODBMS and ORDBMS object-persistenceformats given earlier. The first approach is to add a column to each table that represents asubclass for each of the concrete superclasses of the subclass. Essentially, this ensures thatthe primary key of the subclass is the same as the primary key for the superclass. If we hadpreviously added the primary and foreign keys to the problem-domain objects, as we rec-ommended, then we do not have to do anything else. The primary keys of the tables will beused to rejoin the instances stored in the tables that represent each of the pieces of the
380 Chapter 10 Data Management Layer Design
Rule 1: Map all concrete-problem domain classes to the RDBMS tables. Also, if an abstract problem-domain class has multipledirect subclasses, map the abstract class to a RDBMS table.Rule 2: Map single-valued attributes to columns of the tables.Rule 3: Map methods to stored procedures or to program modules.Rule 4: Map single-valued aggregation and association relationships to a column that can store the key of the related table, i.e.,add a foreign key to the table. Do this for both sides of the relationship.Rule 5: Map multivalued attributes and repeating groups to new tables and create a one-to-many association from the originaltable to the new ones.Rule 6: Map multivalued aggregation and association relationships to a new associative table that relates the two original tablestogether. Copy the primary key from both original tables to the new associative table, i.e., add foreign keys to the table.Rule 7: For aggregation and association relationships of mixed type, copy the primary key from the single-valued side (1..1 or 0..1)of the relationship to a new column in the table on the multivalued side (1..* or 0..*) of the relationship that can store the key ofthe related table, i.e., add a foreign key to the table on the multivalued side of the relationship.For generalization/inheritance relationships:Rule 8a: Ensure that the primary key of the subclass instance is the same as the primary key of the superclass. The multiplicity of thisnew association from the subclass to the “superclass” should be 1..1. If the superclasses are concrete, that is, they can be instanti-ated themselves, then the multiplicity from the superclass to the subclass is 0..*, otherwise, it is 1..1. Furthermore, an exclusive-or(XOR) constraint must be added between the associations. Do this for each superclass.ORRule 8b: Flatten the inheritance hierarchy by copying the superclass attributes down to all of the subclasses and remove the super-class from the design.11
11 Again, it is also a good idea to document this modification in the design so that in the future, modifications to the design can be maintained easily.
FIGURE 10-9 Mapping Problem-Domain Objects to RDBMS Schema
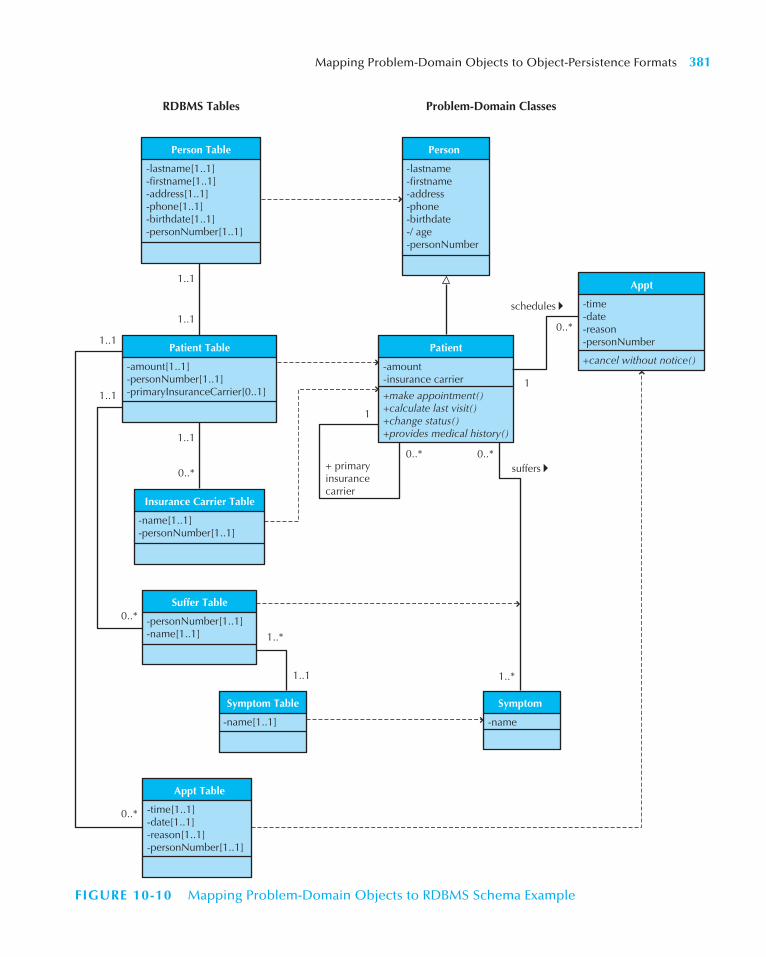
Mapping Problem-Domain Objects to Object-Persistence Formats 381
RDBMS Tables Problem-Domain Classes
Person Table
-lastname[1..1]-firstname[1..1]-address[1..1]-phone[1..1]-birthdate[1..1]-personNumber[1..1]
Patient Table
-amount[1..1]-personNumber[1..1]-primaryInsuranceCarrier[0..1]
Symptom Table
-name[1..1]
Suffer Table
-personNumber[1..1]-name[1..1]
Insurance Carrier Table
-name[1..1]-personNumber[1..1]
Appt Table
-time[1..1]-date[1..1]-reason[1..1]-personNumber[1..1]
1..1
1..1
1..1
1..1
1..1
1..1
0..*
0..* 0..*
0..*
0..*
0..*
1
1
1..*
1..*
+ primary insurancecarrier
suffers
schedules
Appt
-time-date-reason-personNumber
+cancel without notice()Patient
-amount-insurance carrier
+make appointment()+calculate last visit()+change status()+provides medical history()
Person
-lastname-firstname-address-phone-birthdate-/ age-personNumber
Symptom
-name
FIGURE 10-10 Mapping Problem-Domain Objects to RDBMS Schema Example

problem-domain object. Conversely, the inheritance hierarchy can be flattened and therules (Rules 1–7) reapplied.
As in the case of the ORDBMS approach, additional processing will be required any-time that an interaction takes place between the database and the system. Every time anobject must be created, retrieved from the database, updated, or deleted, the mappingbetween the problem domain and the RDBMS must be used to convert between the twodifferent formats. In this case, a great deal of additional processing will be required. How-ever, from a practical point of view, it is more likely that you will use a RDBMS for storageof objects than the other approaches because RDBMSs are by far the most popular formatin the marketplace. As such, we will focus on how to optimize the RDBMS format forobject persistence in the next section of this chapter.
OPTIMIZING RDBMS-BASED OBJECT STORAGE
Once the object-persistence format is selected, the second step is to optimize the object per-sistence for processing efficiency. The methods of optimization will vary based on the for-mat that you select; however, the basic concepts will remain the same. Once youunderstand how to optimize a particular type of object persistence, you will have some ideaas to how to approach the optimization of other formats. This section focuses on the opti-mization of the most popular storage format: relational databases.
There are two primary dimensions in which to optimize a relational database: for stor-age efficiency and for speed of access. Unfortunately, these two goals often conflict becausethe best design for access speed may take up a great deal of storage space as compared toother, less-speedy designs. This section describes how to optimize the object persistence forstorage efficiency using a process called normalization. The next section presents designtechniques, such as denormalization and indexing, that can speed up the performance ofthe system. Ultimately, the project team will go through a series of trade-offs until the idealbalance of the two optimization dimensions is reached. Finally, the project team must esti-mate the size of the data storage needed to ensure there is enough capacity on the server(s).
Optimizing Storage EfficiencyThe most efficient tables in a relational database in terms of storage space have no redun-dant data and very few null values because the presence of these suggest that space is beingwasted (and more data to store means higher data storage hardware costs). For example,the table in Figure 10-11 repeats customer information, such as name and state, each timea customer places an order, and it contains many null values in the product-relatedcolumns. These nulls occur whenever a customer places an order for less than three items(the maximum number on an order).
382 Chapter 10 Data Management Layer Design
In Your Turn 10-3, you created a design for the databaseassuming that the database would be implemented usingan OODBMS that supported only single inheritance. And,in Your Turn 10-4, you created a design for the databaseassuming that the database would be implemented using
an ORDBMS that did not support any inheritance but didsupport Object IDs, multivalued attributes, and storedprocedures. In this case, you should assume that the systemwill be supported by an RDBMS. Using a class diagram,draw the design for the database.
10-5 Dentist Office Appointment SystemYOUR
TURN
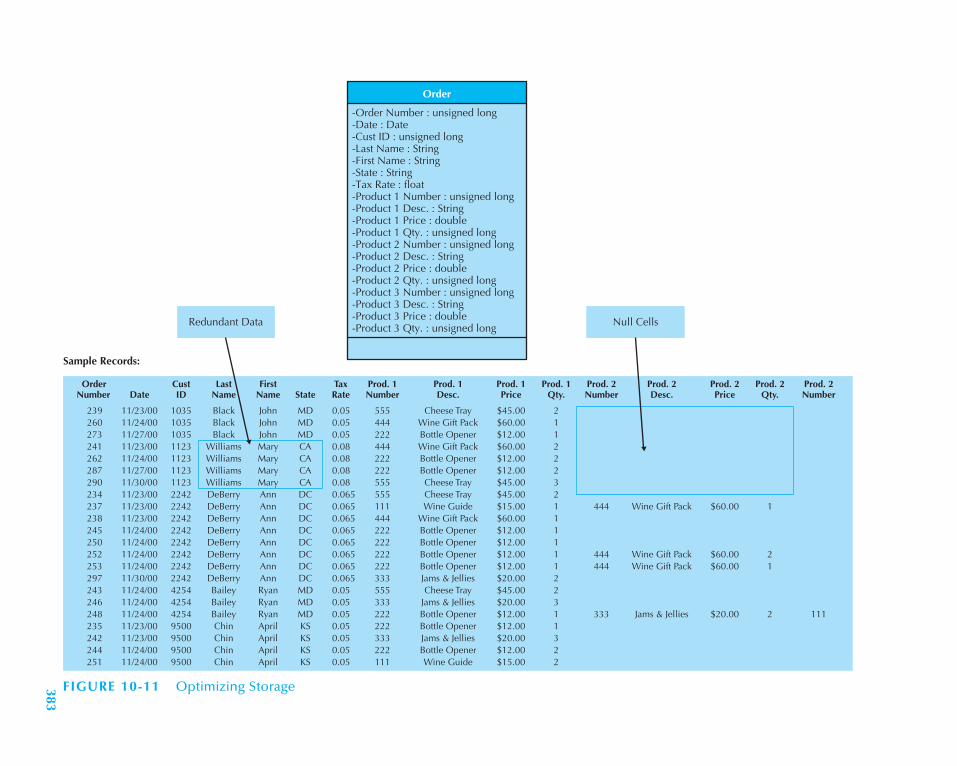
Redundant Data Null Cells
Sample Records:
Order
-Order Number : unsigned long-Date : Date-Cust ID : unsigned long-Last Name : String-First Name : String-State : String-Tax Rate : float-Product 1 Number : unsigned long-Product 1 Desc. : String-Product 1 Price : double-Product 1 Qty. : unsigned long-Product 2 Number : unsigned long-Product 2 Desc. : String-Product 2 Price : double-Product 2 Qty. : unsigned long-Product 3 Number : unsigned long-Product 3 Desc. : String-Product 3 Price : double-Product 3 Qty. : unsigned long
Order Cust Last First Tax Prod. 1 Prod. 1 Prod. 1 Prod. 1 Prod. 2 Prod. 2 Prod. 2 Prod. 2 Prod. 2 Number Date ID Name Name State Rate Number Desc. Price Qty. Number Desc. Price Qty. Number
239 11/23/00 1035 Black John MD 0.05 555 Cheese Tray $45.00 2 260 11/24/00 1035 Black John MD 0.05 444 Wine Gift Pack $60.00 1 273 11/27/00 1035 Black John MD 0.05 222 Bottle Opener $12.00 1 241 11/23/00 1123 Williams Mary CA 0.08 444 Wine Gift Pack $60.00 2 262 11/24/00 1123 Williams Mary CA 0.08 222 Bottle Opener $12.00 2 287 11/27/00 1123 Williams Mary CA 0.08 222 Bottle Opener $12.00 2 290 11/30/00 1123 Williams Mary CA 0.08 555 Cheese Tray $45.00 3 234 11/23/00 2242 DeBerry Ann DC 0.065 555 Cheese Tray $45.00 2 237 11/23/00 2242 DeBerry Ann DC 0.065 111 Wine Guide $15.00 1 444 Wine Gift Pack $60.00 1 238 11/23/00 2242 DeBerry Ann DC 0.065 444 Wine Gift Pack $60.00 1 245 11/24/00 2242 DeBerry Ann DC 0.065 222 Bottle Opener $12.00 1 250 11/24/00 2242 DeBerry Ann DC 0.065 222 Bottle Opener $12.00 1 252 11/24/00 2242 DeBerry Ann DC 0.065 222 Bottle Opener $12.00 1 444 Wine Gift Pack $60.00 2 253 11/24/00 2242 DeBerry Ann DC 0.065 222 Bottle Opener $12.00 1 444 Wine Gift Pack $60.00 1 297 11/30/00 2242 DeBerry Ann DC 0.065 333 Jams & Jellies $20.00 2 243 11/24/00 4254 Bailey Ryan MD 0.05 555 Cheese Tray $45.00 2 246 11/24/00 4254 Bailey Ryan MD 0.05 333 Jams & Jellies $20.00 3 248 11/24/00 4254 Bailey Ryan MD 0.05 222 Bottle Opener $12.00 1 333 Jams & Jellies $20.00 2 111 235 11/23/00 9500 Chin April KS 0.05 222 Bottle Opener $12.00 1 242 11/23/00 9500 Chin April KS 0.05 333 Jams & Jellies $20.00 3 244 11/24/00 9500 Chin April KS 0.05 222 Bottle Opener $12.00 2 251 11/24/00 9500 Chin April KS 0.05 111 Wine Guide $15.00 2
FIGURE 10-11 Optimizing Storage383

384 Chapter 10 Data Management Layer Design
In addition to wasting space, redundancy and null values also allow more room forerror and increase the likelihood that problems will arise with the integrity of the data.What if customer 1035 moved from Maryland to Georgia? In the case of Figure 10-11, aprogram must be written to ensure that all instances of that customer are updated to showGA as the new state of residence. If some of the instances are overlooked, then the table willcontain an update anomaly, whereby some of the records contain the correctly updatedvalue for state and other records contain the old information.
Nulls threaten data integrity because they are difficult to interpret. A blank value inthe Order table’s product fields could mean (1) the customer did not want more than oneor two products on his or her order, (2) the operator forgot to enter in all three productson the order, or (3) the customer canceled part of the order and the products weredeleted by the operator. It is impossible to be sure of the actual meaning of the nulls.
For both these reasons—wasted storage space and data integrity threats—projectteams should remove redundancy and nulls from the table. During design, the class dia-gram is used to examine the design of the RDBMS tables (e.g., see Figure 10-10) and opti-mize it for storage efficiency. If you follow the modeling instructions and guidelines thatwere presented in Chapter 6, you will have little trouble creating a design that is highly opti-mized in this way because a well-formed logical data model does not contain redundancyor many null values.
Sometimes, however, a project team needs to start with a model that was poorly con-structed or with one that was created for files or a nonrelational type of format. In thesecases, the project team should follow a series of steps that serve to check the model for stor-age efficiency. These steps make up a process called normalization.12
Normalization is a process whereby a series of rules are applied to the RDBMStables to determine how well formed they are (see Figure 10-12). These rules help ana-lysts identify tables that are not represented correctly. Here, we describe three normal-ization rules that are applied regularly in practice. Figure 10-11 shows a model in 0Normal Form, which is an unnormalized model before the normalization rules havebeen applied.
A model is in first normal form (1NF) if it does not lead to multivalued fields, fieldsthat allow a set of values to be stored, or repeating fields, which are fields that repeatwithin a table to capture multiple values. The rule for 1NF says that all tables must con-tain the same number of columns (i.e., fields) and that all the columns must contain asingle value. Notice that the model in Figure 10-11 violates 1NF because it causes prod-uct number, description, price, and quantity to repeat three times for each order in thetable. The resulting table has many records that contain nulls in the product-relatedcolumns, and orders are limited to three products because there is no room to storeinformation for more.
A much more efficient design (and one that conforms to 1NF) leads to a separate tableto hold the repeating information; to do this, we create a separate table on the model tocapture product order information. A zero-to-many relationship would then exist betweenthe two tables. As shown in Figure 10-13, the new design eliminates nulls from the Ordertable and supports an unlimited number of products that can be associated with an order.
Second normal form (2NF) requires first that the data model is in 1NF and second thatthe data model leads to tables containing fields that depend on a whole primary key. Thismeans that the primary key value for each record can determine the value for all the other
12 Normalization also can be performed on the problem-domain layer. However, the normalization processshould be used on the problem-domain layer only to uncover missing classes. Otherwise, optimizations that havenothing to do with the semantics of the problem domain can creep into the problem-domain layer.
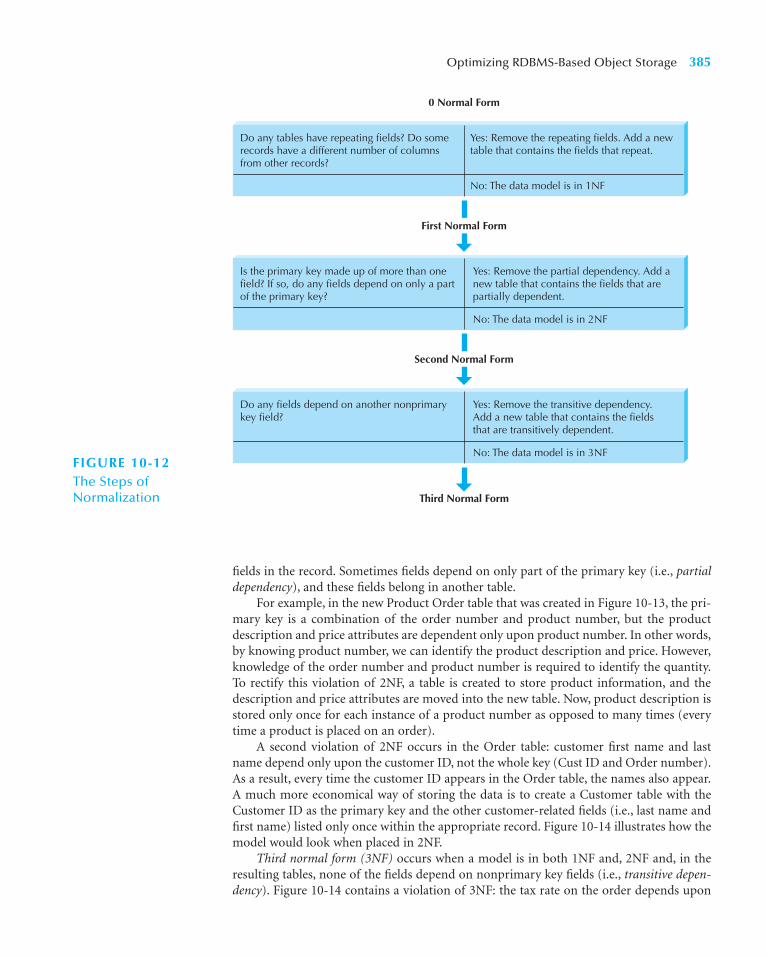
fields in the record. Sometimes fields depend on only part of the primary key (i.e., partialdependency), and these fields belong in another table.
For example, in the new Product Order table that was created in Figure 10-13, the pri-mary key is a combination of the order number and product number, but the productdescription and price attributes are dependent only upon product number. In other words,by knowing product number, we can identify the product description and price. However,knowledge of the order number and product number is required to identify the quantity.To rectify this violation of 2NF, a table is created to store product information, and thedescription and price attributes are moved into the new table. Now, product description isstored only once for each instance of a product number as opposed to many times (everytime a product is placed on an order).
A second violation of 2NF occurs in the Order table: customer first name and lastname depend only upon the customer ID, not the whole key (Cust ID and Order number).As a result, every time the customer ID appears in the Order table, the names also appear.A much more economical way of storing the data is to create a Customer table with theCustomer ID as the primary key and the other customer-related fields (i.e., last name andfirst name) listed only once within the appropriate record. Figure 10-14 illustrates how themodel would look when placed in 2NF.
Third normal form (3NF) occurs when a model is in both 1NF and, 2NF and, in theresulting tables, none of the fields depend on nonprimary key fields (i.e., transitive depen-dency). Figure 10-14 contains a violation of 3NF: the tax rate on the order depends upon
Optimizing RDBMS-Based Object Storage 385
Do any tables have repeating fields? Do somerecords have a different number of columnsfrom other records?
Yes: Remove the repeating fields. Add a newtable that contains the fields that repeat.
No: The data model is in 1NF
0 Normal Form
Is the primary key made up of more than onefield? If so, do any fields depend on only a partof the primary key?
Yes: Remove the partial dependency. Add a new table that contains the fields that arepartially dependent.
No: The data model is in 2NF
Do any fields depend on another nonprimarykey field?
Yes: Remove the transitive dependency. Add a new table that contains the fieldsthat are transitively dependent.
No: The data model is in 3NF
Third Normal Form
Second Normal Form
First Normal Form
FIGURE 10-12The Steps of Normalization
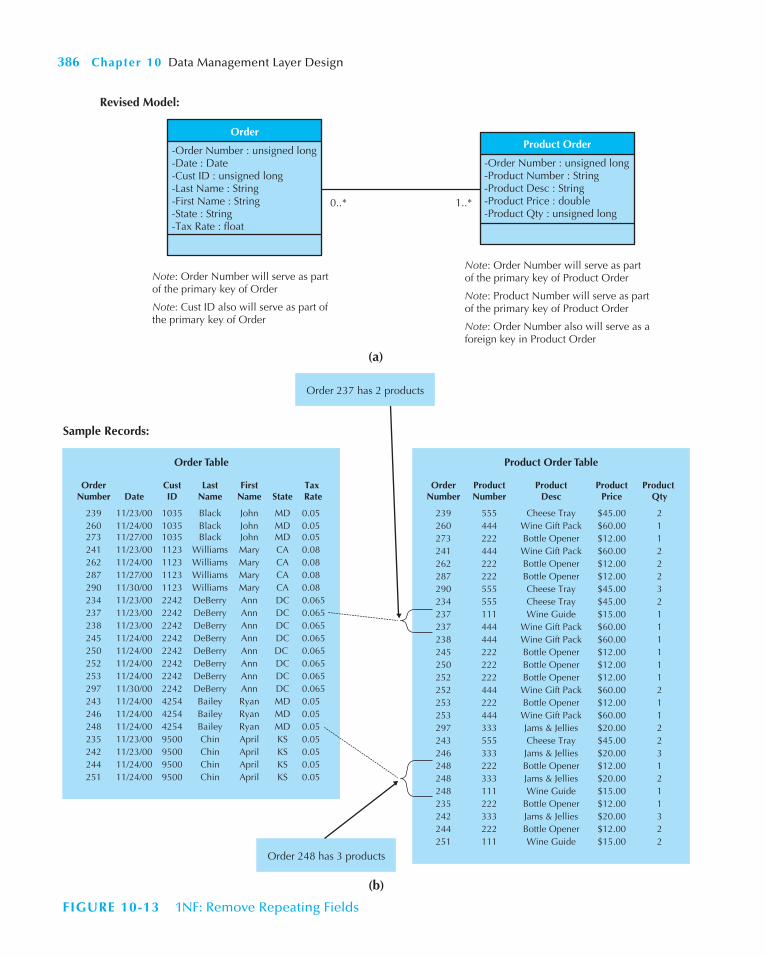
386 Chapter 10 Data Management Layer Design
Order
-Order Number : unsigned long-Date : Date-Cust ID : unsigned long-Last Name : String-First Name : String-State : String-Tax Rate : float
Product Order
-Order Number : unsigned long-Product Number : String-Product Desc : String-Product Price : double-Product Qty : unsigned long
Revised Model:
0..* 1..*
Note: Order Number will serve as part of the primary key of Product Order
Note: Product Number will serve as part of the primary key of Product Order
Note: Order Number also will serve as a foreign key in Product Order
Note: Order Number will serve as part of the primary key of Order
Note: Cust ID also will serve as part of the primary key of Order
(a)
Sample Records:
Order Table
Order 248 has 3 products
Order 237 has 2 products
Order Cust Last First Tax Number Date ID Name Name State Rate
239 11/23/00 1035 Black John MD 0.05 260 11/24/00 1035 Black John MD 0.05 273 11/27/00 1035 Black John MD 0.05 241 11/23/00 1123 Williams Mary CA 0.08 262 11/24/00 1123 Williams Mary CA 0.08 287 11/27/00 1123 Williams Mary CA 0.08 290 11/30/00 1123 Williams Mary CA 0.08 234 11/23/00 2242 DeBerry Ann DC 0.065 237 11/23/00 2242 DeBerry Ann DC 0.065 238 11/23/00 2242 DeBerry Ann DC 0.065 245 11/24/00 2242 DeBerry Ann DC 0.065 250 11/24/00 2242 DeBerry Ann DC 0.065 252 11/24/00 2242 DeBerry Ann DC 0.065 253 11/24/00 2242 DeBerry Ann DC 0.065 297 11/30/00 2242 DeBerry Ann DC 0.065 243 11/24/00 4254 Bailey Ryan MD 0.05 246 11/24/00 4254 Bailey Ryan MD 0.05 248 11/24/00 4254 Bailey Ryan MD 0.05 235 11/23/00 9500 Chin April KS 0.05 242 11/23/00 9500 Chin April KS 0.05 244 11/24/00 9500 Chin April KS 0.05 251 11/24/00 9500 Chin April KS 0.05
Product Order Table
Order Product Product Product Product Number Number Desc Price Qty
239 555 Cheese Tray $45.00 2 260 444 Wine Gift Pack $60.00 1 273 222 Bottle Opener $12.00 1 241 444 Wine Gift Pack $60.00 2 262 222 Bottle Opener $12.00 2 287 222 Bottle Opener $12.00 2 290 555 Cheese Tray $45.00 3 234 555 Cheese Tray $45.00 2 237 111 Wine Guide $15.00 1 237 444 Wine Gift Pack $60.00 1 238 444 Wine Gift Pack $60.00 1 245 222 Bottle Opener $12.00 1 250 222 Bottle Opener $12.00 1 252 222 Bottle Opener $12.00 1 252 444 Wine Gift Pack $60.00 2 253 222 Bottle Opener $12.00 1 253 444 Wine Gift Pack $60.00 1 297 333 Jams & Jellies $20.00 2 243 555 Cheese Tray $45.00 2 246 333 Jams & Jellies $20.00 3 248 222 Bottle Opener $12.00 1 248 333 Jams & Jellies $20.00 2 248 111 Wine Guide $15.00 1 235 222 Bottle Opener $12.00 1 242 333 Jams & Jellies $20.00 3 244 222 Bottle Opener $12.00 2 251 111 Wine Guide $15.00 2
(b)
FIGURE 10-13 1NF: Remove Repeating Fields

Optimizing RDBMS-Based Object Storage 387
Customer
-Cust ID : unsigned long-Last Name : String-First Name : String
Order
-Order Number : unsigned long-Date : Date-Cust ID : unsigned long-State : String-Tax Rate : float
Product Order
-Order Number : unsigned long-Product Number : unsigned long-Qty : unsigned long
Product
-Product Number : unsigned long-Product Desc : String-Price : double1..1 0..*
1..*0..*
Sample Records:
Customer Table
Cust Last First ID Name Name
1035 Black John 1123 Williams Mary 2242 DeBerry Ann 4254 Bailey Ryan 9500 Chin April
Product Table
Product Product Product Number Desc Price
111 Wine Guide $15.00 222 Bottle Opener $12.00 333 Jams & Jellies $20.00 444 Wine Gift Pack $60.00 555 Cheese Tray $45.00
Product Order Table
Order Product Product Number Number Qty
239 555 2 260 444 1 273 222 1 241 444 2 262 222 2 287 222 2 290 555 3 234 555 2 237 111 1 237 444 1 238 444 1 245 222 1 250 222 1 252 222 1 252 444 2 253 222 1 253 444 1 297 333 2 243 555 2 246 333 3 248 222 1 248 333 2 248 111 1 235 222 1 242 333 3 244 222 2 251 111 2
Order Table
Order Cust Number Date ID State
239 11/23/00 1035 MD 260 11/24/00 1035 MD 273 11/27/00 1035 MD 241 11/23/00 1123 CA 262 11/24/00 1123 CA 287 11/27/00 1123 CA 290 11/30/00 1123 CA 234 11/23/00 2242 DC 237 11/23/00 2242 DC 238 11/23/00 2242 DC 245 11/24/00 2242 DC 250 11/24/00 2242 DC 252 11/24/00 2242 DC 253 11/24/00 2242 DC 297 11/30/00 2242 DC 243 11/24/00 4254 MD 246 11/24/00 4254 MD 248 11/24/00 4254 MD 235 11/23/00 9500 KS 242 11/23/00 9500 KS 244 11/24/00 9500 KS 251 11/24/00 9500 KS
Note: Order Number will serve as part of the primary key of ProductOrder.
Note: Order Number also will serve as a foreign key in Product Order.
Note: Product Numberwill serve as part of the primary key in ProductOrder.
Note: Product Numberalso will serve as a foreignkey in Product Order.
Note: Product Number will serve as part of the primary key of Product Order.
Note: Order Number will serve as the primary key of Order.
Note: Cust ID will serve as a foreign key in Order.
Note: Cust ID will serve as the primary key of Customer.
Product Desc and Price was moved to the Producttable to eliminateredundancy
Last Name and First Name was moved to the Customertable to eliminateredundancy
FIGURE 10-14 2NF Partial Dependencies Removed

388 Chapter 10 Data Management Layer Design
Suppose that you have been asked to build a system thattracks student involvement in activities around campus.You have been given a file with information that needs tobe imported into the system, and the file contains the fol-lowing fields:
student social security number activity 1 start datestudent last name activity 2 code
student first name activity 2 descriptionstudent advisor name activity 2 start datestudent advisor phone activity 3 codeactivity 1 code activity 3 descriptionactivity 1 description activity 3 start date
Normalize the file. Show how the logical data modelwould change at each step.
10-6 Normalizing a Student Activity FileYOUR
TURN
Customer
-Cust ID : unsigned long-Last Name : String-First Name : String
State
-State : String-Tax Rate : float
Order
-Order Number : unsigned long-Date : Date-Cust ID : unsigned long-State : String
Product Order
-Order Number : unsigned long-Product Number : unsigned long-Qty : unsigned long
Product
-Product Number : unsigned long (idl)-Product Desc : String-Price : double1..1
0..*
1..1
0..*
1..*0..*
FIGURE 10-15 3NF Normalized Field
the state to which the order is being sent. The solution involves creating another table thatcontains state abbreviations serving as the primary key and the tax rate as a regular field.Figure 10-15 presents the end results of applying the steps of normalization to the originalmodel from Figure 10-11.
Optimizing Data Access SpeedAfter you have optimized the design of the object storage for efficiency, the end result isthat data are spread out across a number of tables. When data from multiple tables need
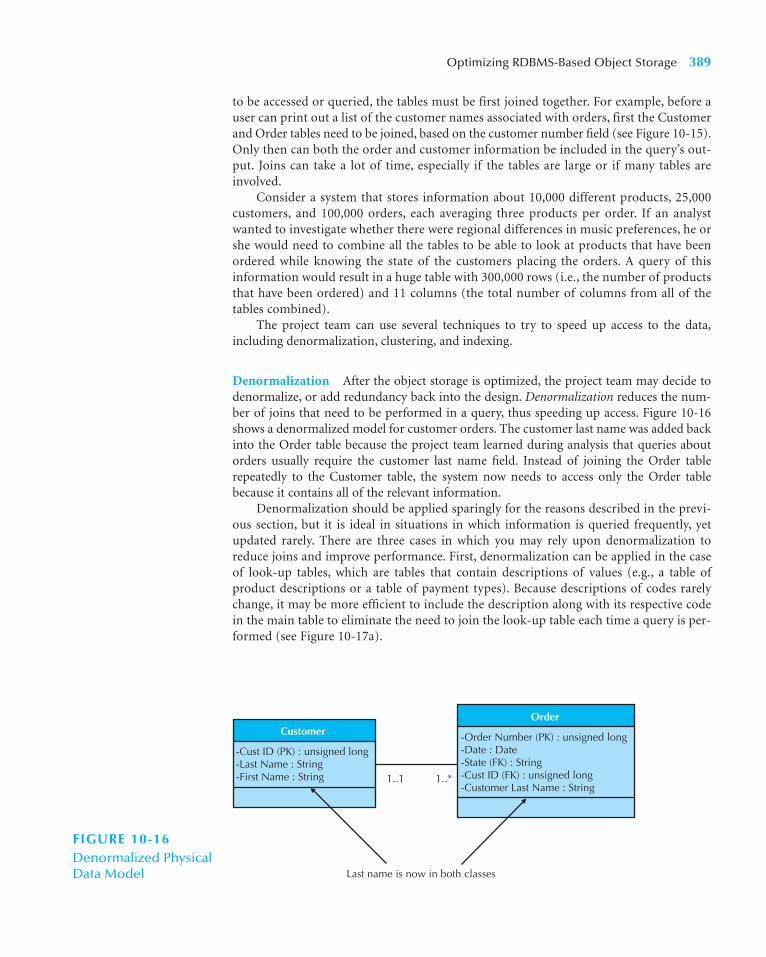
to be accessed or queried, the tables must be first joined together. For example, before auser can print out a list of the customer names associated with orders, first the Customerand Order tables need to be joined, based on the customer number field (see Figure 10-15).Only then can both the order and customer information be included in the query’s out-put. Joins can take a lot of time, especially if the tables are large or if many tables areinvolved.
Consider a system that stores information about 10,000 different products, 25,000customers, and 100,000 orders, each averaging three products per order. If an analystwanted to investigate whether there were regional differences in music preferences, he orshe would need to combine all the tables to be able to look at products that have beenordered while knowing the state of the customers placing the orders. A query of thisinformation would result in a huge table with 300,000 rows (i.e., the number of productsthat have been ordered) and 11 columns (the total number of columns from all of thetables combined).
The project team can use several techniques to try to speed up access to the data,including denormalization, clustering, and indexing.
Denormalization After the object storage is optimized, the project team may decide todenormalize, or add redundancy back into the design. Denormalization reduces the num-ber of joins that need to be performed in a query, thus speeding up access. Figure 10-16shows a denormalized model for customer orders. The customer last name was added backinto the Order table because the project team learned during analysis that queries aboutorders usually require the customer last name field. Instead of joining the Order tablerepeatedly to the Customer table, the system now needs to access only the Order tablebecause it contains all of the relevant information.
Denormalization should be applied sparingly for the reasons described in the previ-ous section, but it is ideal in situations in which information is queried frequently, yetupdated rarely. There are three cases in which you may rely upon denormalization toreduce joins and improve performance. First, denormalization can be applied in the caseof look-up tables, which are tables that contain descriptions of values (e.g., a table ofproduct descriptions or a table of payment types). Because descriptions of codes rarelychange, it may be more efficient to include the description along with its respective codein the main table to eliminate the need to join the look-up table each time a query is per-formed (see Figure 10-17a).
Optimizing RDBMS-Based Object Storage 389
Customer
-Cust ID (PK) : unsigned long-Last Name : String-First Name : String
Order
-Order Number (PK) : unsigned long-Date : Date-State (FK) : String-Cust ID (FK) : unsigned long-Customer Last Name : String
1..1 1..*
Last name is now in both classes
FIGURE 10-16Denormalized PhysicalData Model

Second, one-to-one relationships are good candidates for denormalization.Although logically two tables should be separated, from a practical standpoint the infor-mation from both tables may regularly be accessed together. Think about an order andits shipping information. Logically, it may make sense to separate the attributes relatedto shipping into a separate table, but as a result the queries regarding shipping will prob-ably always need a join to the Order table. If the project team finds that certain shippinginformation, such as state and shipping method, are needed when orders are accessed,they may decide to combine the tables or include some shipping attributes in the Ordertable (see Figure 10-17b).
Third, at times it will be more efficient to include a parent entity’s attributes in its childentity on the physical data model. For example, consider the Customer and Order tables inFigure 10-16, which share a one-to-many relationship, with Customer as the parent andOrder as the child. If queries regarding orders continuously require customer information,the most popular customer fields can be placed in Order to reduce the required joins to theCustomer table, as was done with Customer Last Name.
Clustering Speed of access also is influenced by the way that the data are retrieved.Think about going shopping in a grocery store. If you have a list of items to buy but you
390 Chapter 10 Data Management Layer Design
Shipment
-Shipment ID (PK) : unsigned long-Shipment Street Address : String-Shipment City : String-Shipment State : String-Shipment Zip Code : String-Shipment Method : String
Order
-Order: Number (PK) : unsigned long-Date : Date-State (FK) : String-Cust ID (FK) : unsigned long-Customer Last Name : String-Payment Type (FK) : unsigned long-Payment Description : String-Shipment ID (FK) : unsigned long-Shipment State : String-Shipment Method : String
Order
-Order : Number (PK) : unsigned long-Date : Date-State (FK) : String-Cust ID (FK) : unsigned long-Customer Last Name : String-Payment Type (FK) : unsigned long-Payment Description : String
1..1 1..1
1..1 0..*
Notice that the payment description fieldappears in both Payment Type and Order.
(a) Look-up Table
Notice that the shipment state and shipment methodare included in both Shipment and Order.
(b) One-to-one Relationship
Payment Type
-Payment Type (PK) : String-Payment Description : String
FIGURE 10-17DenormalizationSituations (FK � foreignkey; PK � primary key)
are unfamiliar with the store’s layout, then you need to walk down every aisle to make surethat you don’t miss anything from your list. Likewise, if records are arranged on a harddisk in no particular order (or in an order that is irrelevant to your data needs), then anyquery of the records results in a table scan in which the DBMS has to access every row inthe table before retrieving the result set. Table scans are the most inefficient of dataretrieval methods.
One way to improve access speed is to reduce the number of times that the storagemedium needs to be accessed during a transaction. One method is to cluster recordstogether physically so that similar records are stored close together. With intrafile clus-tering, like records in the table are stored together in some way, such as in order by pri-mary key or, in the case of a grocery store, by item type. Thus, whenever a query looksfor records, it can go directly to the right spot on the hard disk (or other storagemedium) because it knows in what order the records are stored, just as we can walkdirectly to the bread aisle to pick up a loaf of bread. Interfile clustering combines recordsfrom more than one table that typically are retrieved together. For example, if customerinformation is usually accessed with the related order information, then the records fromthe two tables may be physically stored in a way that preserves the customer-order rela-tionship. Returning to the grocery store scenario, an interfile cluster would be similar tostoring peanut butter, jelly, and bread next to each other in the same aisle because theyare usually purchased together, not because they are similar types of items. Of course,each table can have only one clustering strategy because the records can be arrangedphysically in only one way.
Indexing A familiar time saver is an index located in the back of a textbook, which pointsdirectly to the page or pages that contain a topic of interest. Think of how long it would take tofind all the times that relational database appears in this textbook without the index to rely on!An index in data storage is like an index in the back of a textbook; it is a minitable that containsvalues from one or more columns in a table and the location of the values within the table.Instead of paging through the entire textbook, we can move directly to the right pages and getthe information we need. Indexes are one of the most important ways to improve database per-formance. Whenever there are performance problems, the first place to look is an index.
A query can use an index to find the locations of only those records that are included inthe query answer, and a table can have an unlimited number of indexes. Figure 10-18 showsan index that orders records by payment type. A query that searches for all the customers whoused American Express can use this index to find the locations of the records that containAmerican Express as the payment type without having to scan the entire Order table.
Project teams can make indexes perform even faster by placing them into the mainmemory of the data storage hardware. Retrieving information from memory is much fasterthan from another storage medium, such as a hard disk—think about how much faster it is
Optimizing RDBMS-Based Object Storage 391
Consider the logical data model that you created for YourTurn 10-3. Examine the model and describe possibleopportunities for denormalization. How would you
change the physical data model for this file, and what arethe benefits of your changes?
10-7 Denormalizing a Student Activity FileYOUR
TURN

392 Chapter 10 Data Management Layer Design
Order
Order Cust Payment Number Date ID Amount Tax Total Type
234 11/23/00 2242 $ 90.00 $5.85 $ 95.85 MC 235 11/23/00 9500 $ 12.00 $0.60 $ 12.60 VISA 236 11/23/00 1556 $ 50.00 $2.50 $ 52.50 VISA 237 11/23/00 2242 $ 75.00 $4.88 $ 79.88 AMEX 238 11/23/00 2242 $ 60.00 $3.90 $ 63.90 MC 239 11/23/00 1035 $ 90.00 $4.50 $ 94.50 AMEX 240 11/23/00 9501 $ 50.00 $2.50 $ 52.50 VISA 241 11/23/00 1123 $ 120.00 $9.60 $ 129.60 MC 242 11/24/00 9500 $ 60.00 $3.00 $ 63.00 VISA 243 11/24/00 4254 $ 90.00 $4.50 $ 94.50 VISA 244 11/24/00 9500 $ 24.00 $1.20 $ 25.20 VISA 245 11/24/00 2242 $ 12.00 $0.78 $ 12.78 AMEX 246 11/24/00 4254 $ 20.00 $1.00 $ 21.00 MC 247 11/24/00 2241 $ 50.00 $2.50 $ 52.50 VISA 248 11/24/00 4254 $ 12.00 $0.60 $ 12.60 AMEX 249 11/24/00 5927 $ 50.00 $2.50 $ 52.50 AMEX 250 11/24/00 2242 $ 12.00 $0.78 $ 12.78 MC 251 11/24/00 9500 $ 15.00 $0.75 $ 15.75 MC 252 11/24/00 2242 $ 132.00 $8.58 $ 140.58 MC 253 11/24/00 2242 $ 72.00 $4.68 $ 76.68 AMEX
Payment Type Index
Payment Type Pointer
AMEX * AMEX * AMEX * AMEX * AMEX * AMEX * MC * MC * MC * MC * MC * MC * MC * VISA * VISA * VISA * VISA * VISA * VISA * VISA * VISA *
FIGURE 10-18 Payment Type Index
A Virginia-based mail-order company sends out approx-imately 25 million catalogs each year using a Customertable with 10 million names. Although the primary keyof the Customer table is customer identification number,the table also contains an index of Customer Last Name.Most people who call to place orders remember theirlast name, not their customer identification number, sothis index is used frequently.
An employee of the company explained that indexesare critical to reasonable response times. A fairly compli-cated query was written to locate customers by the state
in which they lived, and it took more than three weeks toreturn an answer. A customer state index was created, andthat same query provided a response in twenty minutes:that’s 1,512 times faster!
Question
As an analyst, how can you make sure that the properindexes have been put in place so that users are notwaiting for weeks to receive the answers to theirquestions?
10-A Mail-Order IndexCONCEPTS
IN ACTION
to retrieve a memorized phone number versus one that must be looked up in a phone book.Similarly, when a database has an index in memory, it can locate records very, very quickly.
Of course, indexes require overhead in that they take up space on the storage medium.Also, they need to be updated as records in tables are inserted, deleted, or changed. Thus,although queries lead to faster access to the data, they slow down the update process. Ingeneral, we should create indexes sparingly for transaction systems or systems that require

a lot of updates, but we should apply indexes generously when designing systems for deci-sion support (see Figure 10-19).
Estimating Data Storage SizeEven if we have denormalized our physical data model, clustered records, and createdindexes appropriately, the system will perform poorly if the database server cannot handleits volume of data. Therefore, one last way to plan for good performance is to apply volu-metrics, which means estimating the amount of data that the hardware will need to sup-port. You can incorporate your estimates into the database server hardware specification tomake sure that the database hardware is sufficient for the project’s needs. The size of thedatabase is based on the amount of raw data in the tables and the overhead requirementsof the DBMS. To estimate size you will need to have a good understanding of the initial sizeof your database as well as its expected growth rate over time.
Raw data refers to all the data that are stored within the tables of the database, and it iscalculated based on a bottom-up approach. First, write down the estimated average width foreach column (field) in the table and sum the values for a total record size (see Figure 10-20).For example, if a variable-width LAST NAME column is assigned a width of 20 characters,you can enter 13 as the average character width of the column. In Figure 10-20, the estimatedrecord size is 49.
Next, calculate the overhead for the table as a percentage of each record. Overheadincludes the room needed by the DBMS to support such functions as administrative actionsand indexes, and it should be assigned based on past experience, recommendations fromtechnology vendors, or parameters that are built into software that was written to calculatevolumetrics. For example, your DBMS vendor may recommend that you allocate 30 percentof the records’ raw data size for overhead storage space, creating a total record size of 63.7 inthe Figure 10-20 example.
Finally, record the number of initial recordsthat will be loaded into the table, as well as theexpected growth per month. This informationshould have been collected during analysis.According to Figure 10-20, the initial spacerequired by the first table is 3,185,000, andfuture sizes can be project based on the growthfigure. These steps are repeated for each table toget a total size for the entire database.
Many CASE tools will provide you withdatabase-size information based on how you setup the object persistence, and they will calculatevolumetrics estimates automatically. Ultimately,the size of the database needs to be shared with thedesign team so that the proper technology can beput in place to support the system’s data andpotential performance problems can be addressedlong before they affect the success of the system.
Optimizing RDBMS-Based Object Storage 393
Field Average Size
Order Number 8
Date 7
Cust ID 4
Last Name 13
First Name 9
State 2
Amount 4
Tax Rate 2
Record Size 49
Overhead 30%
Total Record Size 63.7
Initial Table Size 50,000
Initial Table Volume 3,185,000
Growth Rate/Month 1,000
Table Volume @ 3 years 5,478,200
FIGURE 10-20CalculatingVolumetrics
Use indexes sparingly for transaction systems.
Use many indexes to increase response times in decision support systems.
For each table, create a unique index that is based on the primary key.
For each table, create an index that is based on the foreign key to improve the performance of joins.
Create an index for fields that are used frequently for grouping, sorting, or criteria.
FIGURE 10-19Guidelines for Creating Indexes

NONFUNCTIONAL REQUIREMENTS AND DATA MANAGEMENT LAYER DESIGN11
Recall that nonfunctional requirements refer to behavioral properties that the system musthave. These properties include issues related to performance, security, ease of use, opera-tional environment, and reliability. In this text, we have grouped nonfunctional require-ments into four categories: operational, performance, security, and cultural and politicalrequirements. We describe each of these in relation to the DAM layer.
The operational requirements for the DAM layer include issues that deal with the tech-nology being used to support object persistence. However, the choice of the hardware andoperating system may limit the choice of the technology and format of the object persis-tence available. For example, if the system is to be deployed on a Macintosh-based networkthat is running the Mac OS, the choices of object persistence is fairly limited, for example,FileMaker. This, in turn, will determine which set of the mapping rules described earlierwill have to be used. Another operational requirement could be the ability to import andexport data using XML. Again, this could limit the object stores under consideration.
The primary performance requirements that affect the data access and managementlayer are speed and capacity. As described before, depending on the anticipated—and,afterwards, actual—usage patterns of the objects being stored, different indexing andcaching approaches may be necessary. When considering distributing objects over a net-work, there are speed considerations that may cause objects to be replicated on differentnodes in the network. As such, multiple copies of the same object may be stored in differ-ent locations on the network. This raises the issue of update anomalies described before inconjunction with normalization. Also, depending on the estimated size and growth of thesystem, different DBMSs may need to be considered. An additional requirement that mayimpact the design of the DAM layer deals with the availability of the objects being stored.It may make sense to limit the availability to different objects based on the time of day. Forexample, one class of users may be allowed to access a set of objects only from 8 to 12 inthe morning and a second set of users may be able to access them only from 1 to 5 in theafternoon. Through the DBMS, these types of restrictions could be set.
394 Chapter 10 Data Management Layer Design
Many companies are undergoing server virtualization.This is the concept of putting multiple virtual servers ontoone physical device. The payoffs can be significant: fewerservers, less electricity, less generated heat, less air condi-tioning, less infrastructure and administration costs;increased flexibility; less physical presence (i.e., smallerserver rooms), faster maintenance of servers, and more.There are (of course) costs—such as licensing the virtual-ization software, labor costs in establishing the virtualservers onto a physical device, and labor costs in updat-ing tables and access. But, determining the Return onInvestment can be a challenge. Some companies have
lost money on server virtualization, but most would saythey have gained a positive return on investment with vir-tualization but have not really quantified the results.
Questions
1. How might a company really determine the returnon investment for server virtualization?
2. Would server virtualization impact the amount ofdata storage required? Why or why not?
3. Is this a project that a systems analyst might beinvolved in? Why or why not?
10-B Return on Investment from Virtualization—A Hard Factor to DetermineCONCEPTS
IN ACTION
11 Because the vast majority of nonfunctional requirements impact the physical architecture layer, we provideadditional details in Chapter 12.

The security requirements deal primarily with access controls, encryption, and backup.Through a modern DBMS, different types of access can be set (e.g., Read, Update, orDelete) granting access only to those users (or class of users) who have been authorized.Furthermore, access control can be set to guarantee that only users with “administrator”privileges are allowed to modify the object storage schema or access controls. Encryptionrequirements on this layer deal with whether the object should be stored in an encryptedformat or not. Even though encrypted objects are more secure than unencrypted objects,the process of encrypting and decrypting the objects will slow down the system. Depend-ing on the physical architecture being used, the cost of encryption may be negligible. Forexample, if we plan on encrypting the objects before transmitting them over a network,there may be no additional cost of storing them in the encrypted format. Backup require-ments deal with ensuring that the objects are routinely copied and stored in case the objectstore becomes corrupted or unusable. Having a backup copy made on a periodic basis andstoring the updates that have occurred since the last backup copy was made ensures thatthe updates are not lost and the object store can be reconstituted by running the copies ofthe updates against the backup copy to create a new current copy.
The only political and cultural requirements that can impact the DAM layer deals withhow the detailed format of the data is to be stored. For example, in what format should a datebe stored? Or, how many characters should be allocated for a last name field that is part of anEmployee object? There could be a corporate IT bias toward different hardware and softwareplatforms. If so, as mentioned before, this could limit the type of object store available.
DESIGNING DATA ACCESS AND MANIPULATION CLASSES
The final step in developing the data management layer is to design the data access andmanipulation classes that act as a translator between the object-persistence and the problem-domain objects. As such, they should always be capable of at least reading and writing boththe object-persistence and problem-domain objects. As described earlier and in Chapter 8,the object-persistence classes are derived from the concrete problem-domain classes,whereas the data access and manipulation classes depend on both the object-persistence andproblem-domain classes.
Depending on the application, a simple rule to follow is that there should be one dataaccess and manipulation class for each concrete problem domain class. In some cases, itmight make sense to create data access and manipulation classes associated with thehuman–computer interaction classes (see Chapter 11). However, this creates a dependencyfrom the data management layer to the human–computer interaction layer. Adding thisadditional complexity to the design of the system normally is not recommended.
Returning to the ORDBMS solution for the Appointment system example (see Fig-ure 10-8), we see that we have four problem-domain classes and four ORDBMS tables. Fol-lowing the previous rule, the DAM classes are rather simple. They have to support only aone-to-one translation between the concrete problem-domain classes and the ORDBMStables (see Figure 10-21). Because the Person problem-domain class is an abstract class, onlythree data access and manipulation classes are required: Patient-DAM, Symptom-DAM, andAppt-DAM. However, the process to create an instance of the Patient problem-domain classcan be fairly complicated. The Patient-DAM class may have to be able to retrieve informa-tion from all four ORDBMS tables. To accomplish this, the Patient-DAM class retrieves theinformation from the Patient table. Using the Object-IDs stored in the attribute values asso-ciated with the Person, Appts, and Symptoms attributes, the remaining informationrequired to create an instance of Patient is easily retrieved by the Patient-DAM class.
Designing Data Access and Manipulation Classes 395
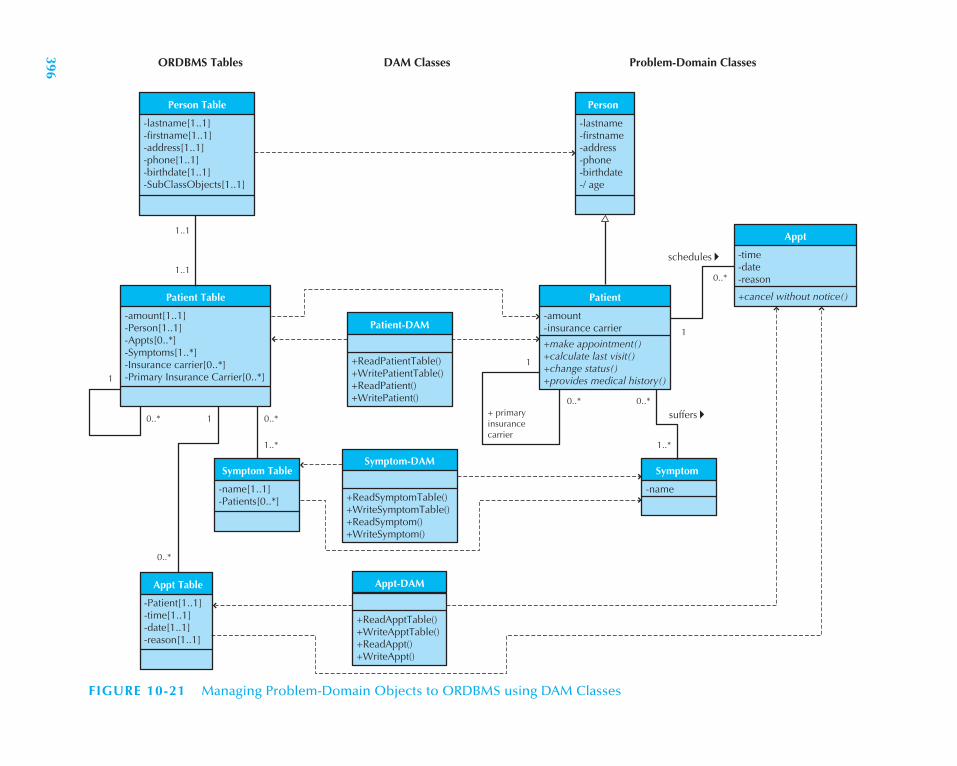
ORDBMS Tables Problem-Domain ClassesDAM Classes
Person Table
-lastname[1..1]-firstname[1..1]-address[1..1]-phone[1..1]-birthdate[1..1]-SubClassObjects[1..1]
Patient-DAM
+ReadPatientTable()+WritePatientTable()+ReadPatient()+WritePatient()
Symptom-DAM
+ReadSymptomTable()+WriteSymptomTable()+ReadSymptom()+WriteSymptom()
Appt-DAM
+ReadApptTable()+WriteApptTable()+ReadAppt()+WriteAppt()
Patient Table
-amount[1..1]-Person[1..1]-Appts[0..*]-Symptoms[1..*]-Insurance carrier[0..*]-Primary Insurance Carrier[0..*]
Symptom Table
-name[1..1]-Patients[0..*]
Appt Table
-Patient[1..1]-time[1..1]-date[1..1]-reason[1..1]
1..1
1..1
0..* 0..*
0..* 0..*
0..*
1
1
1..* 1..*
+ primary insurancecarrier
0..*
1
1
suffers
schedules
Appt
-time-date-reason
+cancel without notice()Patient
-amount-insurance carrier
+make appointment()+calculate last visit()+change status()+provides medical history()
Person
-lastname-firstname-address-phone-birthdate-/ age
Symptom
-name
FIGURE 10-21 Managing Problem-Domain Objects to ORDBMS using DAM Classes
396
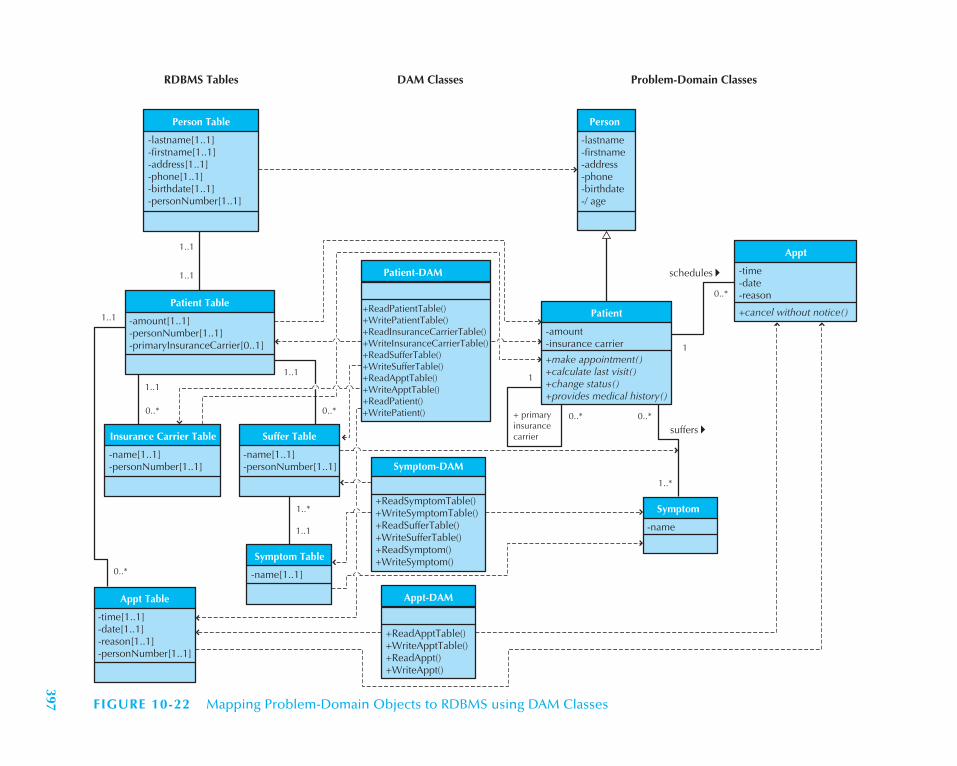
397
RDBMS Tables Problem-Domain ClassesDAM Classes
Person Table
-lastname[1..1]-firstname[1..1]-address[1..1]-phone[1..1]-birthdate[1..1]-personNumber[1..1]
Patient-DAM
+ReadPatientTable()+WritePatientTable()+ReadInsuranceCarrierTable()+WriteInsuranceCarrierTable()+ReadSufferTable()+WriteSufferTable()+ReadApptTable()+WriteApptTable()+ReadPatient()+WritePatient()
Symptom-DAM
+ReadSymptomTable()+WriteSymptomTable()+ReadSufferTable()+WriteSufferTable()+ReadSymptom()+WriteSymptom()
Appt-DAM
+ReadApptTable()+WriteApptTable()+ReadAppt()+WriteAppt()
Patient Table
-amount[1..1]-personNumber[1..1]-primaryInsuranceCarrier[0..1]
Symptom Table
-name[1..1]
Appt Table
-time[1..1]-date[1..1]-reason[1..1]-personNumber[1..1]
1..1
1..1
1..1
0..* 0..*
0..*
1
1
1..1
1..*
Suffer Table
-name[1..1]-personNumber[1..1]
Insurance Carrier Table
-name[1..1]-personNumber[1..1]
0..*
1..*
+ primary insurancecarrier
0..*
1..1
suffers
schedules
1..1
0..*
Symptom
-name
Appt
-time-date-reason
+cancel without notice()Patient
-amount-insurance carrier
+make appointment()+calculate last visit()+change status()+provides medical history()
Person
-lastname-firstname-address-phone-birthdate-/ age
FIGURE 10-22 Mapping Problem-Domain Objects to RDBMS using DAM Classes

398 Chapter 10 Data Management Layer Design
In the case of using an RDBMS to provide persistence, the data access and manipula-tion classes tend to become more complex. For example, in the Appointment system, thereare still four problem-domain classes, but, due to the limitations of RDBMSs, we have tosupport six RDBMS tables (see Figure 10-10). The data access and manipulation class forthe Appt problem-domain class and the Appt RDBMS table is no different than those sup-ported for the ORDBMS solution (see Figures 10-21 and 10-22). However, due to the mul-tivalued attributes and relationships associated with the Patient and Symptomproblem-domain classes, the mappings to the RDBMS tables were more complicated. Assuch, the number of dependencies from the data access and manipulation classes (Patient-DAM and Symptom-DAM) to the RDBMS tables (Patient table, Insurance Carrier table,Suffer table, and the Symptom table) has increased. Furthermore, because the Patient problem-domain class is associated with the other three problem-domain classes, the actual retrievalof all information necessary to create an instance of the Patient class could involve joiningtogether information from all six RDBMS tables. To accomplish this, the Patient-DAM classmust first retrieve information from the Patient table, Insurance Carrier table, Suffer table,and the Appt table. Because the primary key of the Patient table and the Person table areidentical, the Patient-DAM class can either directly retrieve the information from the Persontable, or the information can be joined using the personNumber attributes of the two tables,which act as both primary and foreign keys. Finally, using the information contained in theSuffer table, the information in the Symptom table can also be retrieved. Obviously, the fur-ther we get from the object-oriented problem-domain class representation, the more workmust be performed. However, as in the case of the ORDBMS example, notice that absolutelyno modifications were made to the problem-domain classes. Therefore, the data access andmanipulation classes again have prevented data management functionality from creepinginto the problem-domain classes.
APPLYING THE CONCEPTS AT CD SELECTIONS
Alec met with Margaret to keep up to date as to the progress being made. She wanted Alecto realize that the CD Selections Internet Sales System needed both to present CD infor-mation effectively to users and to capture order data. Alec recognized that these goalsdepended upon a good design of the data management layer for the new application. Heapproached the design of the data management layer by first asking Brian to take charge ofthis task. Second, Alec made sure that Brian followed the following four steps:
■ Select the object-persistence format.
■ Map the problem-domain classes to the selected format.
■ Optimize the selected format for processing efficiency.
■ Design the data access and manipulation classes.
Brian assured Alec that he would do so and keep him abreast of the data management layerdesign as it progressed. Based on a quick review of the requirements, Brian requested toadd two database experts to help with the design of the data management layer: John andSusan. After a little deliberation, Alec decided it would be worth the additional expense toadd them to the team.
Select Object-Persistence FormatThe first thing that Brian did was to call a meeting of the team to discuss two issues thatwould drive the object-persistence format selection: What kind of objects would be in
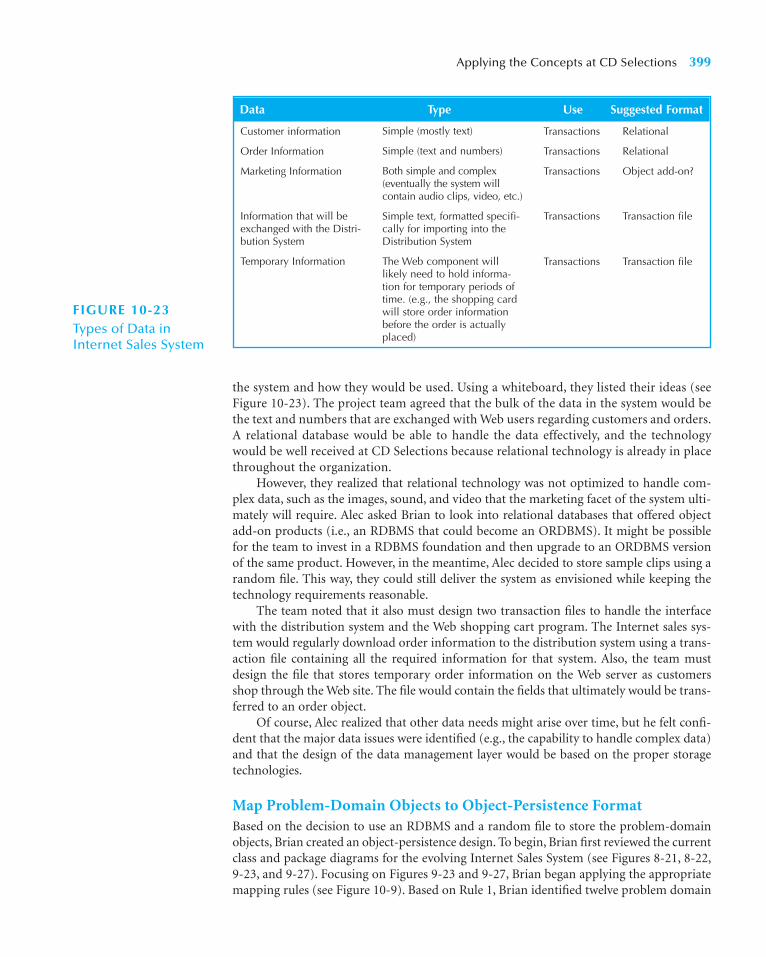
the system and how they would be used. Using a whiteboard, they listed their ideas (seeFigure 10-23). The project team agreed that the bulk of the data in the system would bethe text and numbers that are exchanged with Web users regarding customers and orders.A relational database would be able to handle the data effectively, and the technologywould be well received at CD Selections because relational technology is already in placethroughout the organization.
However, they realized that relational technology was not optimized to handle com-plex data, such as the images, sound, and video that the marketing facet of the system ulti-mately will require. Alec asked Brian to look into relational databases that offered objectadd-on products (i.e., an RDBMS that could become an ORDBMS). It might be possiblefor the team to invest in a RDBMS foundation and then upgrade to an ORDBMS versionof the same product. However, in the meantime, Alec decided to store sample clips using arandom file. This way, they could still deliver the system as envisioned while keeping thetechnology requirements reasonable.
The team noted that it also must design two transaction files to handle the interfacewith the distribution system and the Web shopping cart program. The Internet sales sys-tem would regularly download order information to the distribution system using a trans-action file containing all the required information for that system. Also, the team mustdesign the file that stores temporary order information on the Web server as customersshop through the Web site. The file would contain the fields that ultimately would be trans-ferred to an order object.
Of course, Alec realized that other data needs might arise over time, but he felt confi-dent that the major data issues were identified (e.g., the capability to handle complex data)and that the design of the data management layer would be based on the proper storagetechnologies.
Map Problem-Domain Objects to Object-Persistence FormatBased on the decision to use an RDBMS and a random file to store the problem-domainobjects, Brian created an object-persistence design. To begin, Brian first reviewed the currentclass and package diagrams for the evolving Internet Sales System (see Figures 8-21, 8-22,9-23, and 9-27). Focusing on Figures 9-23 and 9-27, Brian began applying the appropriatemapping rules (see Figure 10-9). Based on Rule 1, Brian identified twelve problem domain
Applying the Concepts at CD Selections 399
FIGURE 10-23Types of Data in Internet Sales System
Data Type Use Suggested Format
Customer information
Order Information
Marketing Information
Information that will beexchanged with the Distri-bution System
Temporary Information
Simple (mostly text)
Simple (text and numbers)
Both simple and complex(eventually the system willcontain audio clips, video, etc.)
Simple text, formatted specifi-cally for importing into theDistribution System
The Web component willlikely need to hold informa-tion for temporary periods oftime. (e.g., the shopping cardwill store order informationbefore the order is actuallyplaced)
Transactions
Transactions
Transactions
Transactions
Transactions
Relational
Relational
Object add-on?
Transaction file
Transaction file

classes that needed to have their objects stored; as such, Brian created eleven RDBMS tablesand one file to represent these objects. These included Credit-Card Clearance Center table,Customer table, Individual table, Organizational table, Order table, Order Item table, CDtable, Vendor table, Mkt Info table, Review table, Artist Info table, and Sample Clip File. Healso created a set of tentative primary keys for each of the tables and the file. Based on thefact that the objects in the Search Package (see Figures 8-21, 8-22, and 9-23), Search Req,and CD List were only temporary, Brian decided that there was no real need to addressthem at this point in the design.
Using Rule 4, Brian identified the need for the CD table and the Mkt Info table to bothhave each other’s primary key stored as a foreign key to the other table. Upon further reflec-tion, Brian reasoned that because an actual instance of marketing information was going to beassociated with only a single instance of CD, and vice versa, he could have merged the twotables. However, the team had earlier decided to keep them separate, so he decided to simplyuse the primary key of the CD table as the primary key of the Mkt Info table.
While reviewing the current set of attributes for each of the tables, John suggestedthat the development had left out the idea of a CD containing a set of tracks. As such, theyadded a multivalued attribute, tracks, to the CD problem-domain class. However, Brianthen pointed out that when they applied Rule 5 to the CD class, they really needed to fac-tor the tracks attribute out as a separate table. Furthermore, as Brian, John, and Susandiscussed the track attribute further, it was decided to include it as a problem-domainclass as well.
Next, the data management layer team applied Rule 6 to the evolving object-persistencedesign. In doing this, Susan pointed out that the checks relationship between the Customerand Credit-Card Clearance Center problem-domain classes was a multivalued association.Therefore, it needed its own table in the relational database. Not to be upstaged by Susan,John immediately pointed out that Rule 7 was applicable to eight associations: Customerplaces Order, Order includes Order Item, Order Item contains CD, Vendor distributes CD,Mkt Info promotes CD, CD contains Tracks, and the three aggregation associations with theMkt Info class (Review, Artist Info, and Sample Clip). As such, quite a few primary keys hadto be copied into the relevant tables as foreign keys (e.g., the primary key of the Customertable had to be copied to the Order table). Can you identify the others?
Finally, Susan suggested the solution to the inheritance problem because RDBMSs donot support inheritance. She pointed out that when applying Rule 8a to the Customersuperclass and the Individual and Organizational subclasses, the primary key of the Cus-tomer table also had to be copied to the tables representing the subclasses. Furthermore,she pointed out that an XOR condition existed between the two subclasses.
Based on all the suggestions and hard work accomplished by the data managementlayer team, Brian was able to create a design of the object persistence for the Internet SalesSystem (see Figure 10-24).
Optimize Object Persistence and Estimate Its SizeUpon completing the object-persistence design, Brian requested a meeting with the devel-opment team to walk through the design.12 After the walkthrough, Alec asked Brian to staybehind to discuss the data management layer model. Now that the team had a good idea ofthe type of object-persistence formats that would be used, they were ready for the thirdstep: optimizing the design for performance efficiency. Because Brian was the analyst in
400 Chapter 10 Data Management Layer Design
12 It seems that Brian finally got the importance of verifying and validating everything.
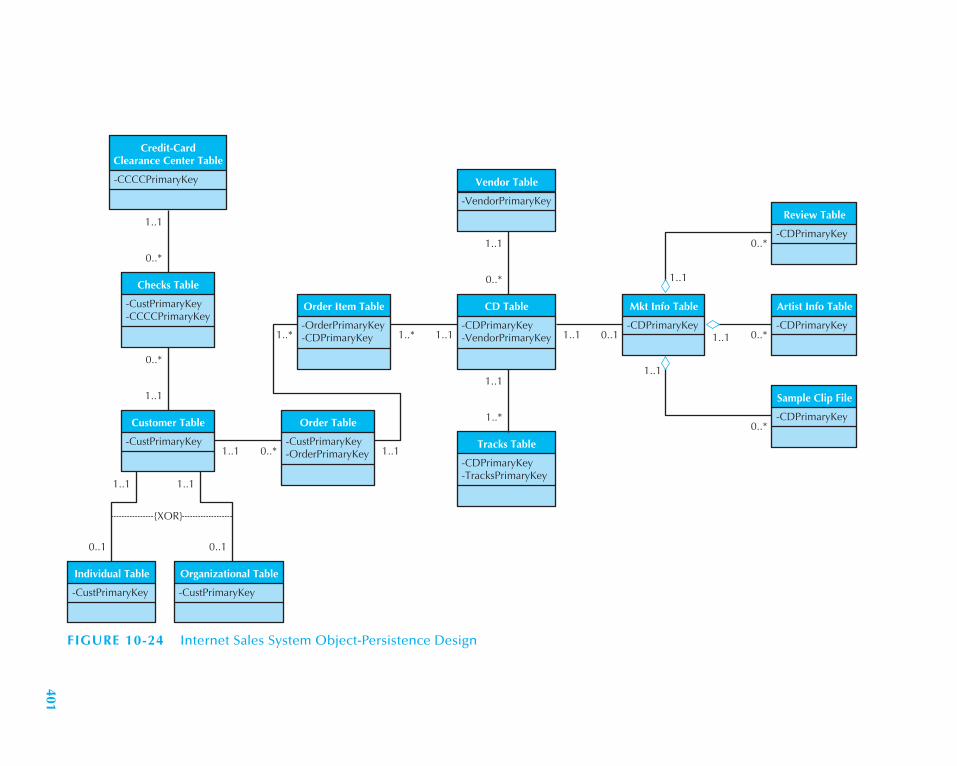
Checks Table
-CustPrimaryKey-CCCCPrimaryKey
Order Table
-CustPrimaryKey-OrderPrimaryKey
0..*
1..1
Customer Table
-CustPrimaryKey
1..1
1..1
0..*
0..*
Individual Table
-CustPrimaryKey
0..1
1..1
Organizational Table
-CustPrimaryKey
0..1
1..1
Credit-CardClearance Center Table
-CCCCPrimaryKey
{XOR}
Order Item Table
-OrderPrimaryKey-CDPrimaryKey
1..1
1..*
CD Table
-CDPrimaryKey-VendorPrimaryKey
Vendor Table
-VendorPrimaryKey
1..* 1..1
Mkt Info Table
-CDPrimaryKey
Review Table
-CDPrimaryKey
Artist Info Table
-CDPrimaryKey
Sample Clip File
-CDPrimaryKey
1..1 0..1 1..1 0..*
0..*
0..*
1..1
Tracks Table
-CDPrimaryKey-TracksPrimaryKey
1..*
1..1
1..1
0..*
1..1
FIGURE 10-24 Internet Sales System Object-Persistence Design
401
charge of the data management layer, Alec wanted to discuss with him whether the modelwas optimized for storage efficiency. He also needed this done before the team discussedaccess speed issues.
Brian assured Alec that the current object-persistence model was in 3NF. He was con-fident of this because the project team followed the modeling guidelines that lead to a well-formed model.
Brian then asked about the file formats for the two transaction files identified in theearlier meeting. Alec suggested that he normalize the files to better understand the varioustables that would be involved in the import procedure. Figure 10-25 shows the initial filelayout for the Distribution System import file as well as the steps that were taken as Brianapplied each normalization rule.
The next step for the design of the data management layer was to optimize the designfor access speed. Alec met with the data management layer design team and talked aboutthe techniques that were available to speed up access. Together they listed all the data thatwill be supported by the Internet Sales System and discussed how all the data would beused. Based on these discussions, they developed the strategy to identify the specific tech-niques to put in place (see Figure 10-26).
Ultimately, clustering strategies, indexes, and denormalization decisions were applied tothe physical data model, and a volumetrics report was run from the CASE tool to estimatethe initial and projected size of the database. The report suggested that an initial storagecapacity of about 450 megabytes would be needed for the expected one-year life of the firstversion of the system. Additional storage capacity would be needed for the second version,which would include sound files for samples of the songs, but for the moment not muchstorage would be needed.
Because Anne was in charge of managing the server hardware acquisition, Alec gavethe estimates to her so that the she could make sure that the technology could handle theexpected volume of data for the Internet Sales System. She then would send the estimatesto the DBMS vendor during the implementation of the software so that the DBMS couldbe configured properly.
Data Access and Manipulation Class DesignThe final step in designing the data management layer was to develop the design of the dataaccess and manipulation classes that would act as translators between the object persistenceand the problem domain classes. Because the CD package (see Figures 8-21, 8-22, and 9-27)was the most important package, Alec asked Brian to complete the design of the data man-agement layer for the CD package and report back when he was finished. Upon reviewingthe concrete problem-domain classes in the CD package, Brian realized that he needed tohave seven data access and manipulation classes, one for each concrete problem-domainclass. These classes would be fully dependent on their related problem-domain classes.Next, Brian mapped the data access and manipulation classes down to the RDBMS tablesand the random file associated with storing the objects. In this case, there were six RDBMS
402 Chapter 10 Data Management Layer Design
At this point in time, you should play the role of Brian andhis data management layer design team and complete thedesign of the data management layer. As a starting point
you should use Figures 10-24 and 10-27. (Hint: For someadditional help, you should look at Figure 10-22.)
10-8 CD Selections Internet Sales SystemYOUR
TURN
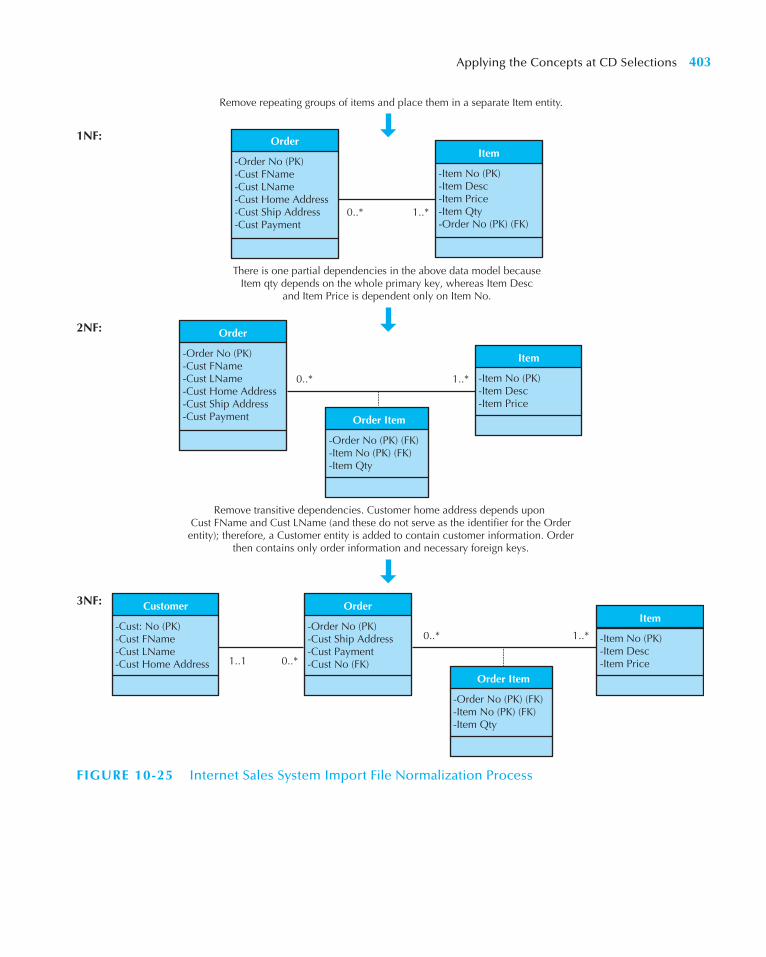
Applying the Concepts at CD Selections 403
Order
-Order No (PK) -Cust FName-Cust LName-Cust Home Address-Cust Ship Address -Cust Payment
Item
-Item No (PK) -Item Desc-Item Price-Item Qty-Order No (PK) (FK)
1..*0..*
1NF:
2NF:
3NF:
Order
-Order No (PK) -Cust FName-Cust LName-Cust Home Address-Cust Ship Address -Cust Payment
Item
-Item No (PK) -Item Desc-Item Price
Item
-Item No (PK) -Item Desc-Item Price
Order Item
-Order No (PK) (FK) -Item No (PK) (FK) -Item Qty
1..*0..*
0..*1..1
1..*0..*
Customer
-Cust: No (PK) -Cust FName-Cust LName-Cust Home Address
Order
-Order No (PK) -Cust Ship Address-Cust Payment-Cust No (FK)
Order Item
-Order No (PK) (FK) -Item No (PK) (FK) -Item Qty
Remove transitive dependencies. Customer home address depends uponCust FName and Cust LName (and these do not serve as the identifier for the Order
entity); therefore, a Customer entity is added to contain customer information. Order then contains only order information and necessary foreign keys.
There is one partial dependencies in the above data model becauseItem qty depends on the whole primary key, whereas Item Desc
and Item Price is dependent only on Item No.
Remove repeating groups of items and place them in a separate Item entity.
FIGURE 10-25 Internet Sales System Import File Normalization Process
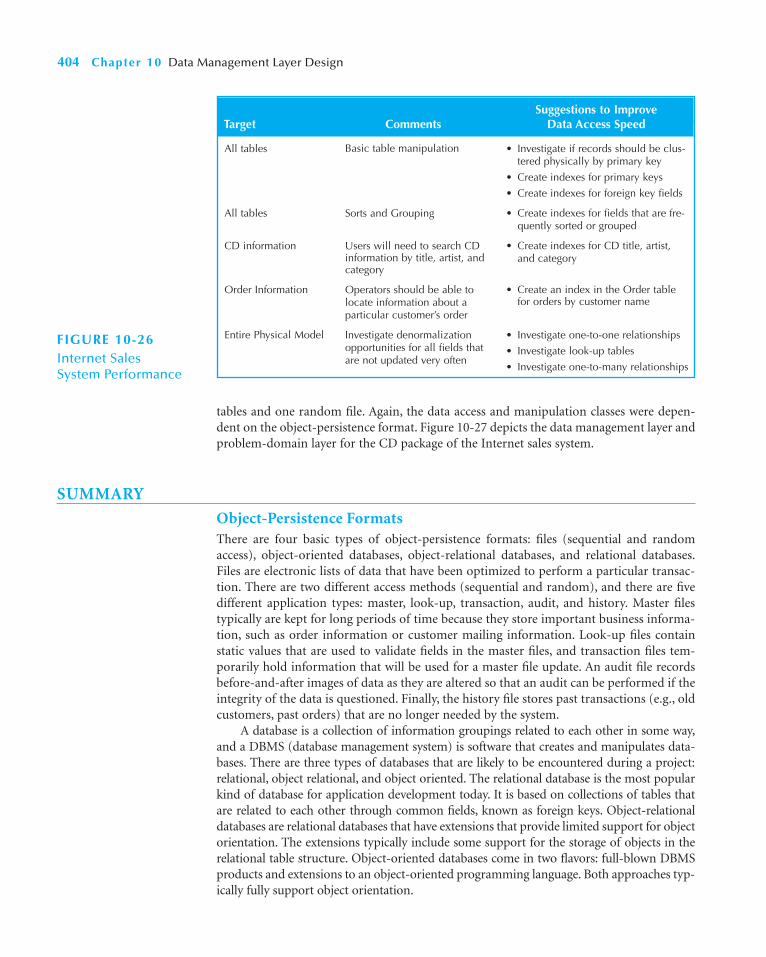
tables and one random file. Again, the data access and manipulation classes were depen-dent on the object-persistence format. Figure 10-27 depicts the data management layer andproblem-domain layer for the CD package of the Internet sales system.
SUMMARY
Object-Persistence FormatsThere are four basic types of object-persistence formats: files (sequential and randomaccess), object-oriented databases, object-relational databases, and relational databases.Files are electronic lists of data that have been optimized to perform a particular transac-tion. There are two different access methods (sequential and random), and there are fivedifferent application types: master, look-up, transaction, audit, and history. Master filestypically are kept for long periods of time because they store important business informa-tion, such as order information or customer mailing information. Look-up files containstatic values that are used to validate fields in the master files, and transaction files tem-porarily hold information that will be used for a master file update. An audit file recordsbefore-and-after images of data as they are altered so that an audit can be performed if theintegrity of the data is questioned. Finally, the history file stores past transactions (e.g., oldcustomers, past orders) that are no longer needed by the system.
A database is a collection of information groupings related to each other in some way,and a DBMS (database management system) is software that creates and manipulates data-bases. There are three types of databases that are likely to be encountered during a project:relational, object relational, and object oriented. The relational database is the most popularkind of database for application development today. It is based on collections of tables thatare related to each other through common fields, known as foreign keys. Object-relationaldatabases are relational databases that have extensions that provide limited support for objectorientation. The extensions typically include some support for the storage of objects in therelational table structure. Object-oriented databases come in two flavors: full-blown DBMSproducts and extensions to an object-oriented programming language. Both approaches typ-ically fully support object orientation.
404 Chapter 10 Data Management Layer Design
Suggestions to Improve Target Comments Data Access Speed
All tables
All tables
CD information
Order Information
Entire Physical Model
Basic table manipulation
Sorts and Grouping
Users will need to search CDinformation by title, artist, andcategory
Operators should be able tolocate information about aparticular customer’s order
Investigate denormalizationopportunities for all fields thatare not updated very often
• Investigate if records should be clus-tered physically by primary key
• Create indexes for primary keys
• Create indexes for foreign key fields
• Create indexes for fields that are fre-quently sorted or grouped
• Create indexes for CD title, artist, and category
• Create an index in the Order table for orders by customer name
• Investigate one-to-one relationships
• Investigate look-up tables
• Investigate one-to-many relationships
FIGURE 10-26Internet Sales System Performance

Vendor-DAM
CD-DAM
Mkt Info-DAM
Review-DAM
Tracks-DAM
Artist Info-DAM
Sample Clip-DAM
Vendor Table
Mkt Info Table
Review Table
Artist Info Table
Sample Clip File
CD TableTracks Table
Vendor
Mkt Info
Review
Artist Info
Sample Clip
CD Tracks
1..1
1..1
1..1
1..1 1..1
1..10..1
1..*
0..*
0..*
0..*
0..*
1..1
1..1
1..1
1..11..1
1..10..1
1..*
0..*
0..*
0..*
0..*
Object Persistence DAM Classes Problem-Domain Classes
promotes
contains
distributes
FIGURE 10-27 Data Management and Problem-Domain Layer Design for the CD Package of the Internet Sales System405

The application’s data should drive the storage format decision. Relational databasessupport simple data types very effectively, whereas object databases are best for complexdata. The type of system also should be considered when choosing among data storage for-mats (e.g., relational databases have matured to support transactional systems). Althoughless critical to the format selection decision, the project team needs to consider what tech-nology exists within the organization and the kind of technology likely to be used in thefuture.
Mapping Problem-Domain Objects to Object-Persistence FormatsThere are many different approaches to support object persistence. Each of the differentformats for object persistence has some conversion requirements. The complexity of theconversion requirements increases the further the format is from an object-oriented for-mat. An OODBMS has the fewest conversion requirements, whereas an RDBMS tends tohave the most. No matter what format is chosen, all data access and management func-tionality should be kept out of the problem-domain classes to minimize the maintenancerequirements of the system and to maximize the portability and reusability of the problemdomain classes.
Optimizing RDBMS-Based Object StorageThere are two primary dimensions by which to optimize a relational database: storageefficiency and speed of access. The most efficient relational database tables in terms ofdata storage are those that have no redundant data and very few null values. Normaliza-tion is the process whereby a series of rules are applied to the data management layer todetermine how well formed it is. A model is in first normal form (1NF) if it does not leadto repeating fields, which are fields that repeat within a table to capture multiple values.Second normal form (2NF) requires that all tables be in 1NF and lead to fields whose valuesare dependent on the whole primary key. Third normal form (3NF) occurs when a modelis in both 1NF and 2NF and none of the resulting fields in the tables depend on nonpri-mary key fields (i.e., transitive dependency). With each violation, additional tablesshould be created to remove the repeating fields or improper dependencies from theexisting tables.
Once we have optimized the design of the object persistence for storage efficiency,the data may be spread out across a number of tables. To improve speed, the projectteam may decide to denormalize—add redundancy back into—the design. Denormal-ization reduces the number of joins that need to be performed in a query, thus speed-ing up data access. Denormalization is best in situations where data are accessedfrequently and updated rarely. There are three modeling situations that are good candi-dates for denormalization: lookup tables, entities that share one-to-one relationships,and entities that share one-to-many relationships. In all three cases, attributes from oneentity are moved or repeated in another entity to reduce the joins that must occur whileaccessing the database.
Clustering occurs when similar records are stored close together on the storage mediumto speed up retrieval. In intrafile clustering, similar records in the table are stored togetherin some way, such as in sequence. Interfile clustering combines records from more than onetable that typically are retrieved together. Indexes also can be created to improve the accessspeed of a system. An index is a minitable that contains values from one or more columnsin a table and tells where the values can be found. Instead of performing a table scan, whichis the most inefficient way to retrieve data from a table, an index points directly to therecords that match the requirements of a query.
406 Chapter 10 Data Management Layer Design

Finally, the speed of the system can be improved if the right hardware is purchased tosupport it. Analysts can use volumetrics to estimate the current and future size of the data-base and then share these numbers with the people who are responsible for buying andconfiguring the database hardware.
Nonfunctional Requirements and Data Management Layer DesignNonfunctional requirements can impact the design of the data access and managementlayer. Operational requirements can potentially limit the viability of different object-persistence formats. Performance requirements can cause various indexing and cachingapproaches to be considered. Furthermore, performance requirements can create situa-tions where denormalization must be considered. The security requirements can causethe design to include varying types of access to be controlled and the possibility of usingdifferent encryption algorithms to make the data more difficult to utilize by unautho-rized users. Finally, political and cultural concerns can influence the design of certainattributes and objects.
Designing Data Access and Manipulation ClassesOnce the object persistence has been designed, a translation layer between the problem-domain classes and the object persistence should be created. The translation layer is imple-mented through data access and manipulation classes. In this manner, any changes to theobject-persistence format chosen will require changes only to the data access and manipu-lation classes. The problem-domain classes will be completely isolated from the changes.
Key Terms 407
KEY TERMS
Access controlAttribute setsAudit fileClusterData access and manipulation classesData management layerDatabaseDatabase management
system (DBMS)Decision support systems (DSS)DenormalizationEnd user DBMSEnterprise DBMSExecutive information systems (EIS)Expert system (ES)ExtentFileFirst normal form (1NF)Foreign keyHardware and operating systemHistory fileImpedance mismatchIndex
Interfile clusteringIntrafile clusteringJoinLinked listLookup fileManagement information
system (MIS)Master fileMultivalued attributes (fields)NormalizationObject IDObject-oriented database
management system (OODBMS)Object-oriented programming
language (OOPL)Object persistenceObject-relational database
management system (ORDBMS)Operational requirementsOrdered sequential access fileOverheadPartial dependencyPerformance requirements
PointerPolitical and cultural requirementsPrimary keyProblem-domain classesRandom access filesRaw dataReferential integrityRelational database management
system (RDBMS)Relationship setsRepeating groups (fields)Second normal form (2NF)Security requirementsSequential access filesStructured query language (SQL)Table scanThird normal form (3NF)Transaction fileTransaction-processing systemTransitive dependencyUnordered sequential access fileUpdate anomalyVolumetrics

408 Chapter 10 Data Management Layer Design
QUESTIONS
1. Describe the four steps in object-persistence design.2. How are a file and a database different from each
other?3. What is the difference between an end-user database
and an enterprise database? Provide an example ofeach one.
4. What are the differences between sequential and ran-dom access files?
5. Name five types of files and describe the primary pur-pose of each type.
6. What is the most popular kind of database today? Pro-vide three examples of products that are based on thisdatabase technology.
7. What is referential integrity and how is it imple-mented in an RDBMS?
8. List some of the differences between an ORDBMS andan RDBMS.
9. What are the advantages of using an ORDBMS overan RDBMS?
10. List some of the differences between an ORDBMS andan OODBMS.
11. What are the advantages of using an ORDBMS overan OODBMS?
12. What are the advantages of using an OODBMS overan RDBMS?
13. What are the advantages of using an OODBMS overan ORDBMS?
14. What are the factors in determining the type ofobject-persistence format that should be adopted for asystem? Why are these factors so important?
15. Why should you consider the storage formats thatalready exist in an organization when deciding upon astorage format for a new system?
16. When implementing the object persistence in anORDBMS, what types of issues must you address?
17. When implementing the object persistence in anRDBMS, what types of issues must you address?
18. Name three ways in which null values can be inter-preted in a relational database. Why is this problematic?
19. What are the two dimensions in which to optimize arelational database?
20. What is the purpose of normalization?21. How does a model meet the requirements of third
normal form?22. Describe three situations that can be good candidates
for denormalization.23. Describe several techniques that can improve perfor-
mance of a database.24. What is the difference between interfile and intrafile
clustering? Why are they used?25. What is an index and how can it improve the perfor-
mance of a system?26. Describe what should be considered when estimating
the size of a database.27. Why is it important to understand the initial and pro-
jected size of a database during design?28. What are some of the nonfunctional requirements
that can influence the design of the data managementlayer?
29. What are the key issues in deciding between using per-fectly normalized databases and denormalized data-bases?
30. What is the primary purpose of the data access andmanipulation classes?
31. Why should the data access and manipulation classesbe dependent on the associated problem-domainclasses instead of the other way around?
32. Why should the object persistence be dependent onthe associated problem-domain classes instead of theother way around?
EXERCISES
A. Using the Web or other resources, identify a productthat can be classified as an end-user database and aproduct that can be classified as an enterprise data-base. How are the products described and marketed?What kinds of applications and users do they support?
In what kinds of situations would an organizationchoose to implement an end-user database over anenterprise database?
B. Visit a commercial Web site (e.g., Amazon.com). Iffiles were being used to store the data supporting the
Exercises 409
application, what types of files would be needed? Whataccess type would be required? What data would theycontain?
C. Using the Web, review one of the following products.What are the main features and functions of the soft-ware? In what companies has the DBMS been imple-mented, and for what purposes? According to theinformation that you found, what are three strengthsand weaknesses of the product?1. Relational DBMS2. Object-relational DBMS3. Object-oriented DBMS
D. You have been given a file that contains the followingfields relating to CD information. Using the steps ofnormalization, create a model that represents this filein third normal form. The fields include:
Musical group name CD title 2Musicians in group CD title 3Date group was formed CD 1 lengthGroup’s agent CD 2 lengthCD title 1 CD 3 length
Assumptions:• Musicians in group contains a list of the members of
the people in the musical group.• Musical groups can have more than one CD, so both
group name and CD title are needed to uniquelyidentify a particular CD.
E. Jim Smith’s dealership sells Fords, Hondas, and Toy-otas. The dealership keeps information about each carmanufacturer with whom they deal so that they canget in touch with them easily. The dealership alsokeeps information about the models of cars that theycarry from each manufacturer. They keep informa-tion like list price, the price the dealership paid toobtain the model, and the model name and series(e.g., Honda Civic LX). They also keep informationabout all sales that they have made (for instance, theywill record a buyer’s name, the car bought, and theamount paid for the car). In order to contact the buy-ers in the future, contact information is also kept(e.g., address, phone number). Create a class diagramfor this situation. Apply the rules of normalization tothe class diagram to check the diagram for processingefficiency.
F. Describe how you would denormalize the model thatyou created in exercise E. Draw the new class diagrambased on your suggested changes. How would perfor-mance be affected by your suggestions?
G. Examine the model that you created in exercise F.Develop a clustering and indexing strategy for thismodel. Describe how your strategy will improve theperformance of the database.
H. Calculate the size of the database that you created inexercise F. Provide size estimates for the initial size ofthe database as well as for the database in one year’stime. Assume that the dealership sells ten models ofcars from each manufacturer to approximately 20,000customers a year. The system will be set up initiallywith one year’s worth of data.
I. For the health club exercises in Chapter 5 (N, O),Chapter 6 (O), Chapter 7 (E, F), Chapter 8 (G, H), andChapter 9 (A):1. Apply the rules of normalization to the class
diagram to check the diagram for processing efficiency.
2. Develop a clustering and indexing strategy for thismodel. Describe how your strategy will improvethe performance of the database.
J. For the Picnics R Us exercises in Chapter 5 (P, Q),Chapter 6 (P), Chapter 7 (J), Chapter 8 (I, J), andChapter 9 (C):1. Apply the rules of normalization to the class
diagram to check the diagram for processingefficiency.
2. Develop a clustering and indexing strategy for thismodel. Describe how your strategy will improvethe performance of the database.
K. For the Of-the-Month Club exercises in Chapter 5 (R, S), Chapter 6 (Q), Chapter 7 (K), Chapter 8 (K, L),and Chapter 9 (E):1. Apply the rules of normalization to the class
diagram to check the diagram for processingefficiency.
2. Develop a clustering and indexing strategy for thismodel. Describe how your strategy will improvethe performance of the database.
L. For the library exercises in Chapter 5 (T, U), Chapter 6(R), Chapter 7 (L), Chapter 8 (M, N), and Chapter 9(G):1. Apply the rules of normalization to the class
diagram to check the diagram for processingefficiency.
2. Develop a clustering and indexing strategy for thismodel. Describe how your strategy will improvethe performance of the database.

410 Chapter 10 Data Management Layer Design
MINICASES
1. The system development team at the Wilcon Com-pany is working on developing a new customer orderentry system. In the process of designing the new sys-tem, the team has identified the following class and itsattributes:
Inventory OrderOrder Number (PK)Order DateCustomer NameStreet AddressCityStateZipCustomer TypeInitialsDistrict NumberRegion Number1 to 22 occurrences of:
Item NameQuantity OrderedItem UnitQuantity ShippedItem OutQuantity Received
a. State the rule that is applied to place a class in firstnormal form. Revise the above class diagram sothat it is in 1NF.
b. State the rule that is applied to place a class intosecond normal form. Create a class diagram for theWilcon Company using the class and attributesdescribed (if necessary) to place it in 2NF.
c. State the rule that is applied to place a class intothird normal form. Revise the class diagram toplace it in 3NF.
d. When planning for the physical design of this data-base, can you identify any likely situations where
the project team may chose to denormalize theclass diagram? After going through the work ofnormalizing, why would this be considered?
2. In the new system under development for HolidayTravel Vehicles, seven tables will be implemented inthe new relational database. These tables are: NewVehicle, Trade-in Vehicle, Sales Invoice, Customer,Salesperson, Installed Option, and Option. Theexpected average record size for these tables and theinitial record count per table are given here.
Average Initial Table Table Name Record Size Size (records)
New Vehicle 65 characters 10,000Trade-in Vehicle 48 characters 7,500Sales Invoice 76 characters 16,000Customer 61 characters 13,000Salesperson 34 characters 100Installed Option 16 characters 25,000Option 28 characters 500
Perform a volumetrics analysis for the HolidayTravel Vehicle system. Assume that the DBMS that willbe used to implement the system requires 35 percentoverhead to be factored into the estimates. Also,assume a growth rate for the company of 10 percentper year. The systems development team wants toensure that adequate hardware is obtained for the nextthree years.
3. Refer to the Professional and Scientific Staff Manage-ment (PSSM) minicase in Chapters 5, 7, and 8.a. Apply the rules of normalization to the class
diagram to check the diagram for processingefficiency.
b. Develop a clustering and indexing strategy for thismodel. Describe how your strategy will improvethe performance of the database.
C H A P T E R 1 1
Human–Computer InteractionLayer Design
411411
A user interface is the part of the system with which the users interact. It includes thescreen displays that provide navigation through the system, the screens and forms that cap-ture data, and the reports that the system produces (whether on paper, on the screen, or viasome other media). This chapter introduces the basic principles and processes of interfacedesign and discusses how to design the interface structure and standards, navigationdesign, input design, and output design. The chapter also describes the affect of the non-functional requirements on designing the human-computer interaction layer.
OBJECTIVES
■ Understand several fundamental user interface design principles.■ Understand the process of user interface design.■ Understand how to design the user interface structure.■ Understand how to design the user interface standards.■ Understand commonly used principles and techniques for navigation design.■ Understand commonly used principles and techniques for input design.■ Understand commonly used principles and techniques for output design.■ Be able to design a user interface.■ Understand the affect of nonfunctional requirements on the human-computer inter-
action layer.
CHAPTER OUTLINE
IntroductionPrinciples for User Interface Design
LayoutContent AwarenessAestheticsUser ExperienceConsistencyMinimizing User Effort
User Interface Design ProcessUse Scenario DevelopmentInterface Structure DesignInterface Standards DesignInterface Design PrototypingInterface Evaluation
Navigation DesignBasic PrinciplesTypes of Navigation ControlsMessagesNavigation Design
DocumentationInput Design
Basic PrinciplesTypes of InputsInput Validation
Output DesignBasic PrinciplesTypes of OutputsMedia
INTRODUCTION
Interface design is the process of defining how a system will interact with external entities(e.g., customers, suppliers, other systems). In this chapter we focus on the design of userinterfaces, but it is also important to remember that there are sometimes system interfaces,which exchange information with other systems. System interfaces are typically designed aspart of a systems integration effort. They are defined in general terms as part of the physicalarchitecture and data management layers.
The human–computer interface layer defines the way in which the users will interactwith the system and the nature of the inputs and outputs that the system accepts and pro-duces. The user interface includes three fundamental parts. The first is the navigation mech-anism, the way in which the user gives instructions to the system and tells it what to do (e.g.,buttons, menus). The second is the input mechanism, the way in which the system capturesinformation (e.g., forms for adding new customers). The third is the output mechanism, theway in which the system provides information to the user or to other systems (e.g., reports,Web pages). Each of these is conceptually different, but they are closely intertwined. All com-puter displays contain navigation mechanisms, and most contain input and output mecha-nisms. Therefore, navigation design, input design, and output design are tightly coupled.
First, this chapter introduces several fundamental user interface design principles. Sec-ond, it provides an overview of the design process for the human–computer interactionlayer. Third, the chapter provides an overview of the navigation, input, and output com-ponents that are used in interface design. This chapter focuses on the design of Web-basedinterfaces and graphical user interfaces (GUI) that use windows, menus, icons and a mouse(e.g., Windows, Macintosh).1 Although text-based interfaces are still commonly used onmainframes and Unix systems, GUI interfaces are probably the most common type ofinterfaces that we will use, with the possible exception of printed reports.2
PRINCIPLES FOR USER INTERFACE DESIGN
In many ways, user interface design is an art. The goal is to make the interface pleasing tothe eye and simple to use while minimizing the effort the users need to accomplish theirwork. The system is never an end in itself; it is merely a means to accomplish the businessof the organization.
412 Chapter 11 Human–Computer Interaction Layer Design
Nonfunctional Requirements and Human–Computer Interaction Layer Design
Applying the Concepts at CD Selections
Use Scenario DevelopmentInterface Structure Design
Interface Standards DesignInterface Template DesignInterface Design PrototypingInterface EvaluationNavigation Design
DocumentationSummary
1 Many people attribute the origin of GUI interfaces to Apple or Microsoft. Some people know that Microsoftcopied from Apple, which, in turn, “borrowed” the whole idea from a system developed at the Xerox Palo AltoResearch Center (PARC) in the 1970s. Very few know that the Xerox system was based on a system developed byDoug Englebart of Stanford that was first demonstrated at the Western Computer Conference in 1968. Aroundthe same time, Doug also invented the mouse, desktop video conferencing, groupware, and host of other thingswe now take for granted. Doug is a legend in the computer science community and has won too many awards tocount but is relatively unknown by the general public.2 A good book on GUI design is Susan Fowler, GUI Design Handbook (New York: McGraw-Hill, 1998).

We have found that the greatest problem facing experienced designers is using spaceeffectively. Simply put, there often is too much information that needs to be presented ona screen or report or form than will fit comfortably. Analysts must balance the need forsimplicity and pleasant appearance against the need to present the information across mul-tiple pages or screens, which decreases simplicity. In this section, we discuss some funda-mental interface design principles, which are common for navigation design, input design,and output design3 (see Figure 11-1).
LayoutThe first element of design is the basic layout of the screen, form, or report. Most soft-ware designed for personal computers follows the standard Windows or Macintoshapproach for screen design. The screen is divided into three boxes. The top box is thenavigation area, through which the user issues commands to navigate through the sys-tem. The bottom box is the status area, which displays information about what the useris doing. The middle—and largest—box is used to display reports and present forms fordata entry.
In many cases (particularly on the Web), multiple layout areas are used. Figure 11-2shows a screen with five navigation areas, each of which is organized to provide differentfunctions and navigation within different parts of the system. The top area provides thestandard Internet Explorer navigation and command controls that change the contents ofthe entire system. The navigation area on the left edge navigates between sections andchanges all content to its right. The other two navigation areas at the top and bottom of thepage provide other ways to navigate between sections. The content in the middle of thepage displays the results (i.e., a report on a book) and also provides additional navigationwithin the page about this book.
Principles for User Interface Design 413
3 A good book on the design of interfaces is Susan Weinschenk, Pamela Jamar, and Sarah Yeo, GUI Design Essen-tials (New York: Wiley, 1997).
Layout The interface should be a series of areas on the screen that are used consistently for different purposes—for example, a top area for commandsand navigation, a middle area for information to be input or output, and abottom area for status information.
Content Awareness Users should always be aware of where they are in the system and what information is being displayed.
Aesthetics Interfaces should be functional and inviting to users through careful use of white space, colors, and fonts. There is often a trade-off between includingenough white space to make the interface look pleasing without losing somuch space that important information does not fit on the screen.
User Experience Although ease of use and ease of learning often lead to similar design decisions, there is sometimes a trade-off between the two. Novice users orinfrequent users of software will prefer ease of learning, whereas frequentusers will prefer ease of use.
Consistency Consistency in interface design enables users to predict what will happen before they perform a function. It is one of the most important elements inease of learning, ease of use, and aesthetics.
Minimal User Effort The interface should be simple to use. Most designers plan on having no more than three mouse clicks from the starting menu until users perform work.
Principle Description
FIGURE 11-1Principles of UserInterface Design

414 Chapter 11 Human–Computer Interaction Layer Design
Status Bar
SectionNavigation
SystemNavigation
Page Navigation
FIGURE 11-2 Layout with Multiple Navigation Areas

This use of multiple layout areas for navigation also applies to inputs and outputs.Data areas on reports and forms are often subdivided into subareas, each of which is usedfor a different type of information. These areas are almost always rectangular in shape,although sometimes space constraints will require odd shapes. Nonetheless, the margins onthe edges of the screen should be consistent. Each of the areas within the report or form isdesigned to hold different information. For example, on an order form (or order report),one part may be used for customer information (e.g., name, address), one part, for infor-mation about the order in general (e.g., date, payment information), and one part, for theorder details (e.g., how many units of which items at what price each). Each area is self-contained so that information in one area does not run into another.
The areas and information within areas should have a natural intuitive flow to mini-mize the users’ movement from one area to the next. People in westernized nations (e.g.,United States, Canada, Mexico) tend to read top-to-bottom, left-to-right, so related infor-mation should be placed so it is used in this order (e.g., address lines, followed by city,state/province, and then zip code/postal code). Sometimes the sequence is in chronologi-cal order, or from the general to the specific, or from most frequently to least frequentlyused. In any event, before the areas are placed on a form or report, the analyst should havea clear understanding of what arrangement makes the most sense for how the form orreport will be used. The flow between sections should also be consistent, whether horizon-tal or vertical (see Figure 11-3). Ideally, the areas will remain consistent in size, shape, andplacement for the forms used to enter information (whether paper or on-screen) and thereports used to present it.
Content AwarenessContent awareness refers to the ability of an interface to make the user aware of the infor-mation it contains with the least amount of effort on the user’s part. All parts of the inter-face, whether navigation, input, or output, should provide as much content awareness aspossible, but it is particularly important for forms or reports that are used quickly or irreg-ularly (e.g., a Web site).
Content awareness applies to the interface in general. All interfaces should have titles(on the screen frame, for example). Menus should show where we are and, if possible,where we came from to get there. For example, in Figure 11-2, the line below the top sec-tion navigation area shows that the user has browsed from the Wiley home page to thecomputer science section, to the networking section, to the general networking section, andthen to this specific book.
Content awareness also applies to the areas within forms and reports. All areas shouldbe clear and well defined (with titles if space permits) so that it is difficult for the user tobecome confused about the information in any area. Then users can quickly locate the partof the form or report that is likely to contain the information they need. Sometimes theareas are marked using lines, colors, or headings (e.g., the section area in Figure 11-2),whereas in other cases the areas are only implied (e.g., the page controls at the bottom ofFigure 11-2).
Content awareness also applies to the fields within each area. Fields are the individ-ual elements of data that are input or output. The field labels that identify the fields onthe interface should be short and specific—objectives that often conflict. There shouldbe no uncertainty about the format of information within fields, whether for entry ordisplay. For example a date of 10/5/07 is different depending on whether you are in theUnited States (October 5, 2007) or in Canada (May 10, 2007). Any fields for which thereis the possibility of uncertainty or multiple interpretations should provide explicitexplanations.
Principles for User Interface Design 415
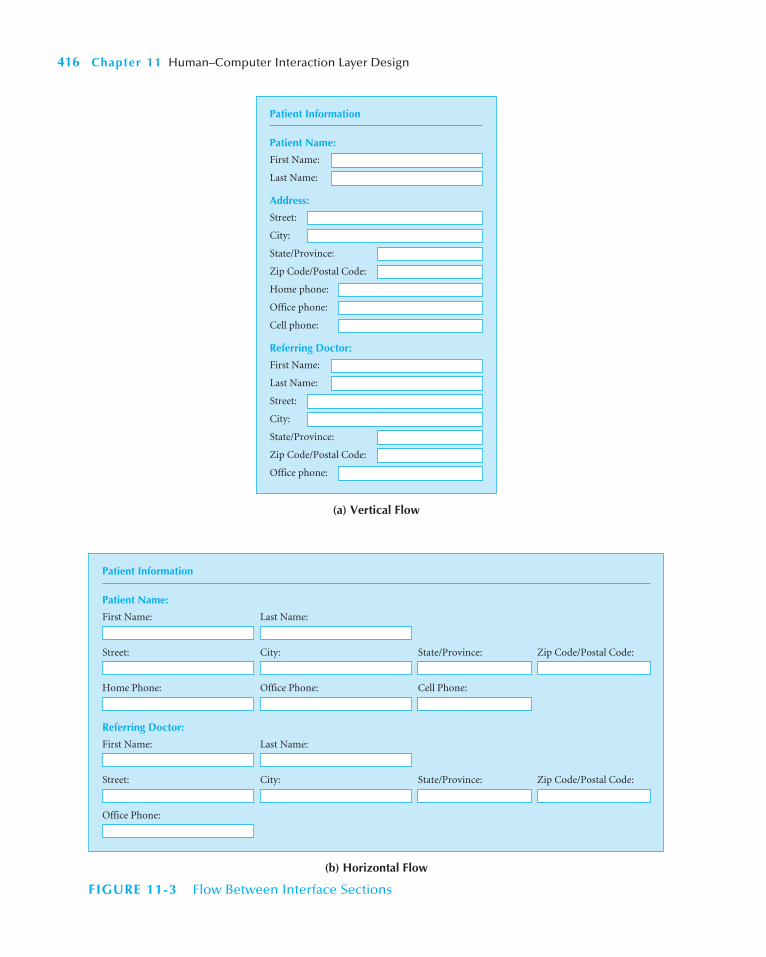
416 Chapter 11 Human–Computer Interaction Layer Design
Patient Information
Patient Name:
First Name:
Last Name:
Address:
Street:
City:
State/Province:
Zip Code/Postal Code:
Home phone:
Office phone:
Cell phone:
Referring Doctor:
First Name:
Last Name:
Street:
City:
State/Province:
Zip Code/Postal Code:
Office phone:
(a) Vertical Flow
Patient Information
Patient Name:
First Name: Last Name:
Street: City: State/Province: Zip Code/Postal Code:
Home Phone: Office Phone: Cell Phone:
Referring Doctor:
First Name: Last Name:
Street: City: State/Province: Zip Code/Postal Code:
Office Phone:
(b) Horizontal Flow
FIGURE 11-3 Flow Between Interface Sections

Content awareness also applies to the information that a form or report contains. Ingeneral, all forms and reports should contain a preparation date (i.e., the date printed orthe data completed) so that the age of information is obvious. Likewise, all printed formsand software should provide version numbers so that users, analysts, and programmers canidentify outdated materials.
Figure 11-4 shows a form from the University of Georgia. This form illustrates the log-ical grouping of fields into areas with an explicit box (top left), as well as an implied areawith no box (lower left). The address fields within the address area follow a clear, naturalorder. Field labels are short where possible (see the top left) but long where more informa-tion is needed to prevent misinterpretation (see the bottom left).
AestheticsAesthetics refers to designing interfaces that are pleasing to the eye. Interfaces do not haveto be works of art, but they do need to be functional and inviting to use. In most cases, lessis more, meaning that a simple, minimalist design is the best.
Space is usually at a premium on forms and reports, and often there is the temptationto squeeze as much information as possible onto a page or a screen. Unfortunately, this canmake a form or report so unpleasant that users do not want to use it. In general, all formsand reports need a minimum amount of white space that is intentionally left blank.
What was your first reaction when you looked at Figure 11-4? This is the most unpleas-ant form at the University of Georgia, according to staff members. Its density is too high; ithas too much information packed into a too-small space with too little white space. Althoughit may be efficient to save paper by using one page, not two, it is not effective for many users.
In general, novice or infrequent users of an interface, whether on a screen or on paper,prefer interfaces with low density, often one with a density of less than 50 percent (i.e., lessthan 50 percent of the interface occupied by information). More experienced users preferhigher densities, sometimes approaching 90 percent occupied because they know whereinformation is located and high densities reduce the amount of physical movementthrough the interface. We suspect the form in Figure 11-4 was designed for the experiencedstaff in the personnel office, who use it daily, rather than for the clerical staff in academicdepartments with less personnel experience, who use the form only a few times a year.
The design of text is equally important. As a general rule, all text should be in the samefont and about the same size. Fonts should be no less than 8 points in size, but 10 points isoften preferred, particularly if the interface will be used by older people. Changes in fontand size are used to indicate changes in the type of information that is presented (e.g.,headings, status indicators). In general, italics and underlining should be avoided becausethey make text harder to read.
Serif fonts (i.e., those having letters with serifs, or tails, such as Times Roman, or the fontyou are reading right now) are the most readable for printed reports, particularly for smallletters. Sans serif fonts (i.e., those without serifs, such as Helvetica or Arial, like those used forthe chapter titles in this book) are the most readable for computer screens and are often usedfor headings in printed reports. Never use all capital letters, except possibly for titles.
Color and patterns should be used carefully and sparingly and only when they serve apurpose. (About 10 percent of men are color blind, so the improper use of color can impairtheir ability to read information.) A quick trip around the Web will demonstrate the prob-lems caused by indiscriminate use of colors and patterns. Remember, the goal is pleasantreadability, not art; color and patterns should be use to strengthen the message, not over-whelm it. Color is best used to separate and categorize items, such as showing the differ-ence between headings and regular text, or to highlight important information. Therefore,colors with high contrast should be used (e.g., black and white). In general, black text on a
Principles for User Interface Design 417
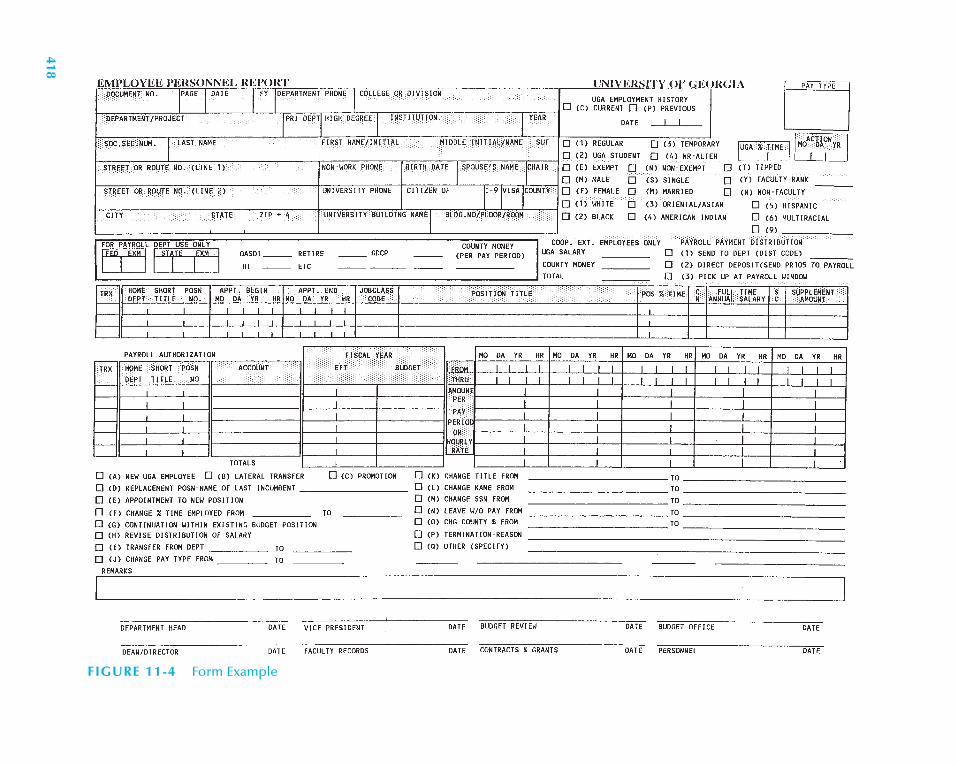
FIGURE 11-4 Form Example
418

white background is the most readable, with blue on red the least readable. (Most expertsagree that background patterns on Web pages should be avoided). Color has been shownto affect emotion, with red provoking intense emotion (e.g., anger) and blue provokinglowered emotions (e.g., drowsiness).
User ExperienceUser experience can essentially be broken down into two levels: those with experience and thosewithout. Interfaces should be designed for both types of users. Novice users usually are mostconcerned with ease of learning—how quickly they can learn new systems. Expert users areusually most concerned with ease of use—how quickly they can use the system once they havelearned how to use it. Often these two are complementary and lead to similar design decisions,but sometimes there are trade-offs. Novices, for example, often prefer menus, which show allavailable system functions, because these promote ease of learning. Experts, on the other hand,sometimes prefer fewer menus organized around the most commonly used functions.
Systems that will end up being used by many people on a daily basis are more likely tohave a majority of expert users (e.g., order entry systems). Although interfaces should tryto balance ease of use and ease of learning, these types of systems should put more empha-sis on ease of use rather than ease of learning. Users should be able to access the commonlyused functions quickly, with few keystrokes or a small number of menu selections.
In many other systems (e.g., decision support systems), most people will remain occa-sional users for the lifetime of the system. In this case, greater emphasis may be placed onease of learning rather than ease of use.
Ease of use and ease of learning often go hand-in-hand—but sometimes they don’t.Research shows that expert and novice users have different requirements and behavior pat-terns in some cases. For example, novices virtually never look at the bottom area of a screenthat presents status information, whereas experts refer to the status bar when they needinformation. Most systems should be designed to support frequent users, except for sys-tems designed to be used infrequently or when many new users or occasional users areexpected (e.g., the Web). Likewise, systems that contain functionality that is used onlyoccasionally must contain a highly intuitive interface or an interface that contains clearexplicit guidance regarding its use.
The balance of quick access to commonly used and well-known functions and guidancethrough new and less-well-known functions is challenging to the interface designer, and thisbalance often requires elegant solutions. Microsoft Office, for example, addresses this issuethrough the use of the “show-me” functions, which demonstrate the menus and buttons forspecific functions. These features remain in the background until they are needed by noviceusers (or even experienced users when they use an unfamiliar part of the system).
ConsistencyConsistency in design is probably the single most important factor in making a system sim-ple to use because it enables users to predict what will happen. When interfaces are consis-tent, users can interact with one part of the system and then know how to interact with therest, aside, of course, from elements unique to those parts. Consistency usually refers to theinterface within one computer system, so that all parts of the same system work in the sameway. Ideally, the system should also be consistent with other computer systems in the orga-nization and with commercial software that is used (e.g., Windows). For example, manyusers are familiar with the Web, so the use of Web-like interfaces can reduce the amount oflearning required by the user. In this way, the user can reuse Web knowledge, thus significantlyreducing the learning curve for a new system. Many software development tools support
Principles for User Interface Design 419
consistent system interfaces by providing standard interface objects (e.g., list boxes, pull-down menus, and radio buttons).
Consistency occurs at many different levels. Consistency in the navigation controls con-veys how actions in the system should be performed. For example, using the same icon orcommand to change an item clearly communicates how changes are made throughout thesystem. Consistency in terminology is also important. This refers to using the same wordsfor elements on forms and reports (e.g., not customer in one place and client in another).We also believe that consistency in report and form design is important, although a recentstudy suggests that being too consistent can cause problems.4 When reports and forms arevery similar except for very minor changes in titles, users sometimes mistakenly use thewrong form and either enter incorrect data or misinterpret its information. The implica-tion for design is to make the reports and forms similar but give them some distinctive ele-ments (e.g., color, size of titles) that enable users to immediately detect differences.
Minimizing User EffortFinally, interfaces should be designed to minimize the amount of effort needed to accom-plish tasks. This means using the fewest possible mouse clicks or keystrokes to move fromone part of the system to another. Most interface designers follow the three-clicks rule: usersshould be able to go from the start or main menu of a system to the information or actionthey want in no more than three mouse clicks or three keystrokes.
USER INTERFACE DESIGN PROCESS
User interface design is a five-step process that is iterative—analysts often move back and forthbetween steps, rather than proceeding sequentially from step 1 to step 5 (see Figure 11-5).First, the analysts examine the use cases (see Chapter 5) and sequence diagrams (see Chapter 7)developed in analysis and interview users to develop use scenarios that describe commonlyemployed patterns of actions the users will perform so the interface enables users to quicklyand smoothly perform these scenarios. Second, the analysts develop the windows navigationdiagram (WND) that defines the basic structure of the interface. These diagrams show all theinterfaces (e.g., screens, forms, and reports) in the system and how they are connected. Third,the analysts design interface standards, which are the basic design elements on which interfacesin the system are based. Fourth, the analysts create an interface design prototype for each of theindividual interfaces in the system, such as navigation controls (including the conversion ofthe essential use cases to real use cases), input screens, output screens, forms (includingpreprinted paper forms), and reports. Finally, the individual interfaces are subjected to inter-face evaluation to determine if they are satisfactory and how they can be improved.
420 Chapter 11 Human–Computer Interaction Layer Design
4 John Satzinger and Lorne Olfman, “User Interface Consistency Across End-User Application: The Effects ofMental Models,” Journal of Management Information Systems (Spring 1998): 167–193.
Visit the Web home page for your university and navigatethrough several of its Web pages. Evaluate the extent to
which they meet the six design principles.
11-1 Web Page CritiqueYOUR
TURN
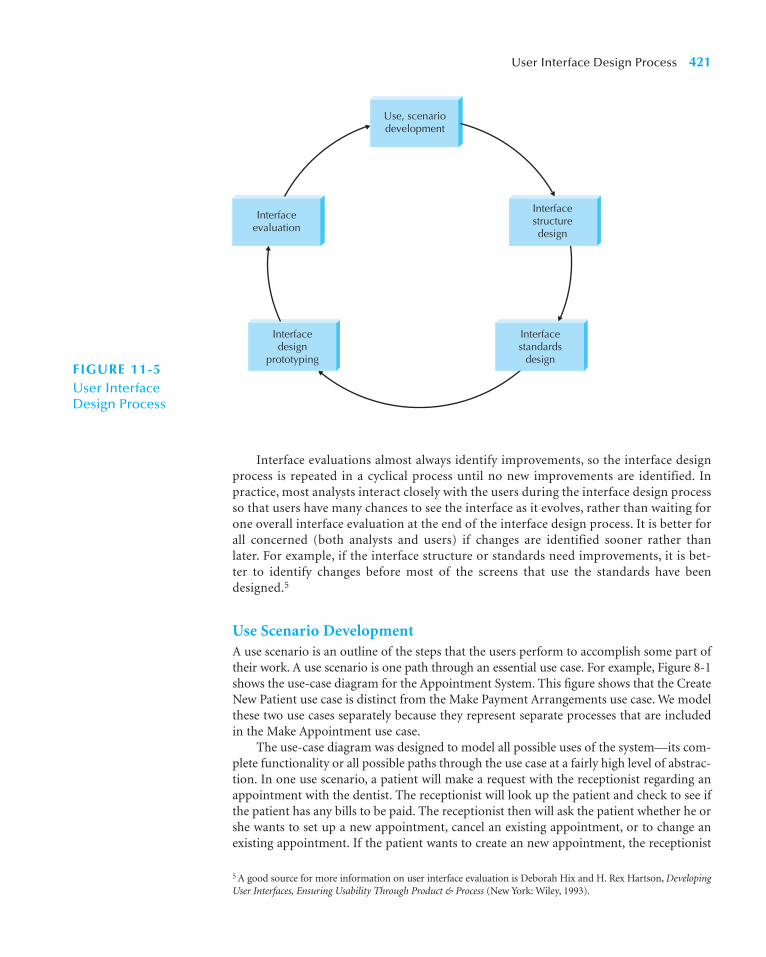
Interface evaluations almost always identify improvements, so the interface designprocess is repeated in a cyclical process until no new improvements are identified. Inpractice, most analysts interact closely with the users during the interface design processso that users have many chances to see the interface as it evolves, rather than waiting forone overall interface evaluation at the end of the interface design process. It is better forall concerned (both analysts and users) if changes are identified sooner rather thanlater. For example, if the interface structure or standards need improvements, it is bet-ter to identify changes before most of the screens that use the standards have beendesigned.5
Use Scenario DevelopmentA use scenario is an outline of the steps that the users perform to accomplish some part oftheir work. A use scenario is one path through an essential use case. For example, Figure 8-1shows the use-case diagram for the Appointment System. This figure shows that the CreateNew Patient use case is distinct from the Make Payment Arrangements use case. We modelthese two use cases separately because they represent separate processes that are includedin the Make Appointment use case.
The use-case diagram was designed to model all possible uses of the system—its com-plete functionality or all possible paths through the use case at a fairly high level of abstrac-tion. In one use scenario, a patient will make a request with the receptionist regarding anappointment with the dentist. The receptionist will look up the patient and check to see ifthe patient has any bills to be paid. The receptionist then will ask the patient whether he orshe wants to set up a new appointment, cancel an existing appointment, or to change anexisting appointment. If the patient wants to create an new appointment, the receptionist
User Interface Design Process 421
Interfacestandards
design
Interfacedesign
prototyping
Interfaceevaluation
Interfacestructuredesign
Use, scenariodevelopment
FIGURE 11-5User Interface Design Process
5 A good source for more information on user interface evaluation is Deborah Hix and H. Rex Hartson, DevelopingUser Interfaces, Ensuring Usability Through Product & Process (New York: Wiley, 1993).

asks the patient for some suggested appointment times, which the receptionist matchesagainst potential times available. The receptionist finally creates a new appointment (seeFigures 7-1 and 7-5).
In another use scenario, a patient simply wants to cancel an appointment. In this case,the receptionist looks up the patient and checks to see if the patient has any bills to be paid.The receptionist then asks the patient for the time of the appointment to be canceled.Finally, the receptionist deletes the appointment.
Use scenarios are presented in a simple narrative description that is tied to the essen-tial use cases developed during analysis (see Chapter 5). Figure 11-6 shows the two use sce-narios just described. The key point with using use cases for interface design is not todocument all possible use scenarios within a use case. The goal is to document two or threeof the most common use scenarios so the interface can be designed to enable the mostcommon uses to be performed simply and easily.
422 Chapter 11 Human–Computer Interaction Layer Design
Use scenario: Existing Patient Cancels Appointment
1. Patient requests appointment (1) and gives the receptionist their name and address (2). 2. The receptionist looks up the patient (3) and determines whether the patient has any unpaid bills (4).3. The receptionist then asks the patient whether he or she is going to set up a new appointment, change an appointment, or delete an appointment (5).4. The receptionist asks the patient for the appointment time to be canceled (S-2, 1).5. The receptionist finds and deletes the appointment (S-2, 2). 6. The receptionist informs the patient that their appointment time was canceled (6).
Use scenario: Existing Patient Makes New Appointment
1. Patient requests appointment (1) and gives the receptionist their name and address (2).
The numbers in parentheses refer to specific events in the essential use case.
2. The receptionist looks up the patient (3) and determines whether the patient has any unpaid bills (4). 3. The receptionist then asks the patient whether he or she is going to set up a new appointment, change an appointment, or delete an appointment (5).4. The receptionist asks the patient for a list of potential appointment times (S-1, 1).5. The receptionist matches the potential appointment times with the available times and schedules the appointment (S-1, 2). 6. The receptionist informs the patient of their appointment time (6).
FIGURE 11-6 Use Scenarios
Visit the Web home page for your university and navi-gate through several of its Web pages. Develop two use
scenarios for it.
11-2 Use Scenario Development for the WebYOUR
TURN
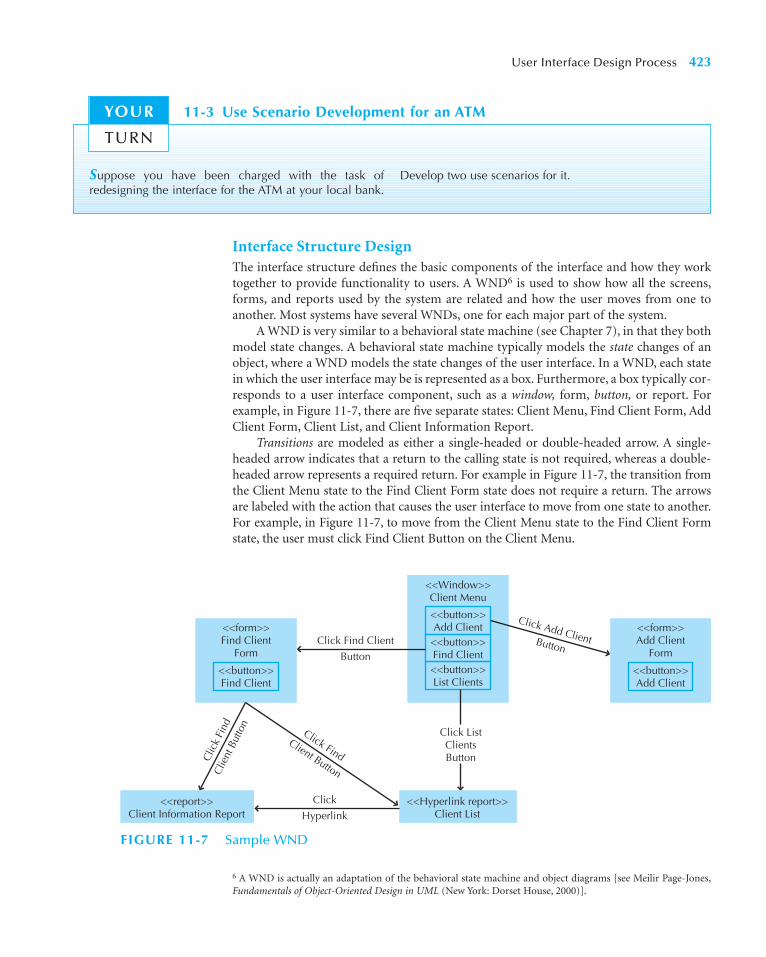
Interface Structure DesignThe interface structure defines the basic components of the interface and how they worktogether to provide functionality to users. A WND6 is used to show how all the screens,forms, and reports used by the system are related and how the user moves from one toanother. Most systems have several WNDs, one for each major part of the system.
A WND is very similar to a behavioral state machine (see Chapter 7), in that they bothmodel state changes. A behavioral state machine typically models the state changes of anobject, where a WND models the state changes of the user interface. In a WND, each statein which the user interface may be is represented as a box. Furthermore, a box typically cor-responds to a user interface component, such as a window, form, button, or report. Forexample, in Figure 11-7, there are five separate states: Client Menu, Find Client Form, AddClient Form, Client List, and Client Information Report.
Transitions are modeled as either a single-headed or double-headed arrow. A single-headed arrow indicates that a return to the calling state is not required, whereas a double-headed arrow represents a required return. For example in Figure 11-7, the transition fromthe Client Menu state to the Find Client Form state does not require a return. The arrowsare labeled with the action that causes the user interface to move from one state to another.For example, in Figure 11-7, to move from the Client Menu state to the Find Client Formstate, the user must click Find Client Button on the Client Menu.
User Interface Design Process 423
Suppose you have been charged with the task ofredesigning the interface for the ATM at your local bank.
Develop two use scenarios for it.
11-3 Use Scenario Development for an ATMYOUR
TURN
6 A WND is actually an adaptation of the behavioral state machine and object diagrams [see Meilir Page-Jones,Fundamentals of Object-Oriented Design in UML (New York: Dorset House, 2000)].
Click Find Client
Button
Click FindClient Button
Clic
k Fi
ndCl
ient
But
ton
Click List ClientsButton
<<report>>Client Information Report
<<Hyperlink report>>Client List
Click Add ClientButton
<<form>>Add Client
Form
<<button>>Add Client
<<form>>Find Client
Form
<<button>>Find Client
<<Window>>Client Menu
<<button>>Add Client
<<button>>Find Client<<button>>List Clients
Click
Hyperlink
FIGURE 11-7 Sample WND

The last item to be described in a WND is the stereotype. A stereotype is modeled as atext item enclosed within guillemets (<< >>) or angle brackets (<< >>). The stereotyperepresents the type of user interface component of a box on the diagram. For example, theClient Menu is a window, whereas Find Client Form is a form.
The basic structure of an interface follows the basic structure of the business processitself, as defined in the use cases and behavioral model. The analyst starts with the essentialuse cases and develops the fundamental flow of control of the system as it moves fromobject to object. The analyst then examines the use scenarios to see how well the WND sup-ports them. Quite often, the use scenarios identify paths through the WND that are morecomplicated then they should be. The analyst then reworks the WND to simplify the abil-ity of the interface to support the use scenarios, sometimes by making major changes to themenu structure, sometimes by adding shortcuts.
Interface Standards DesignInterface standards are the basic design elements that are common across the individualscreens, forms, and reports within the system. Depending on the application, there may beseveral sets of interface standards for different parts of the system (e.g., one for Webscreens, one for paper reports, one for input forms). For example, the part of the systemused by data entry operators may mirror other data entry applications in the company,whereas a Web interface for displaying information from the same system may adhere tosome standardized Web format. Likewise, each individual interface may not contain all ofthe elements in the standards (e.g., a report screen might not have an edit capability), andthey may contain additional characteristics beyond the standard ones, but the standardsserve as the touchstone that ensures the interfaces are consistent across the system. The fol-lowing sections discuss some of the main areas in which interface standards should be con-sidered: metaphors, objects, actions, icons, and templates.
Interface Metaphor First of all, the analysts must develop the fundamental interfacemetaphor(s) that defines how the interface will work. An interface metaphor is a conceptfrom the real world that is used as a model for the computer system. The metaphor helps theuser understand the system and enables the user to predict what features the interface mightprovide, even without actually using the system. Sometimes systems have one metaphor,whereas in other cases there are several metaphors in different parts of the system.
Often, the metaphor is explicit. Quicken, for example, uses a checkbook metaphor forits interface, even to the point of having the users type information into an on-screen formthat looks like a real check. In other cases, the metaphor is implicit or unstated, but it isthere, nonetheless. Many Windows systems use the paper form or table as a metaphor.
In some cases, the metaphor is so obvious that it requires no thought. For example,most online stores use a shopping cart metaphor to temporarily store the items that thecustomer is considering purchasing. In other cases, a metaphor is hard to identify. In general,it is better not to force a metaphor that really doesn’t fit a system, because an ill-fittingmetaphor will confuse users by promoting incorrect assumptions.
424 Chapter 11 Human–Computer Interaction Layer Design
Suppose you have been charged with the task of redesign-ing the interface for the ATM at your local bank. Design an
interface structure design using a WND that shows how auser would navigate among the screens.
11-4 Interface Structure DesignYOUR
TURN

Interface Objects The template specifies the names that the interface will use for the majorinterface objects, the fundamental building blocks of the system, such as the classes. In manycases, the object names are straightforward, such as calling the shopping cart the “shoppingcart.” In other cases, it is not so simple. For example, Amazon.com sells much more thanbooks. In some cases the user may not know whether he or she is looking for a book, CD, DVD,or VHS tape. In those cases, the user can use a catchall search item: Amazon.com. In the casethat the user knows the type of item that he or she wants to buy, the user can limit the searchby specifying more specific types of search items, such as book, CD, DVD, or VHS. Obviously,the object names should be easily understood and help promote the interface metaphor.
In general, in cases of disagreements between the users and the analysts over names,whether for objects or actions (discussed later), the users should win. A more understand-able name always beats a more precise or more accurate one.
Interface Actions The template also specifies the navigation and command languagestyle (e.g., menus) and grammar (e.g., object-action order; see the navigation design sec-tion later in this chapter). It gives names to the most commonly used interface actions inthe navigation design (e.g., buy versus purchase or modify versus change).
Interface Icons The interface objects and actions and also their status (e.g., deleted or over-drawn) may be represented by interface icons. Icons are pictures that will appear on commandbuttons as well as in reports and forms to highlight important information. Icon design is verychallenging because it means developing a simple picture less than half the size of a postagestamp that needs to convey an often-complex meaning. The simplest and best approach is tosimply adopt icons developed by others (e.g., a blank page to indicate create a new file, adiskette to indicate save). This has the advantage of quick icon development, and the iconsmay already be well understood by users because they have seen them in other software.
Commands are actions that are especially difficult to represent with icons because theyare in motion, not static. Many icons have become well known from widespread use, but iconsare not as well understood as first believed. Use of icons can sometimes cause more confusionthan insight. [For example, did you know that a picture of a sweeping broom (paintbrush?)in Microsoft Word means format painter?] Icon meanings become clearer with use, butsometimes a picture is not worth even one word; when in doubt, use a word, not a picture.
Interface Templates An interface template defines the general appearance of all screensin the information system and the paper-based forms and reports that are used. The tem-plate design, for example, specifies the basic layout of the screens [e.g., where the naviga-tion area(s), status area, and form/report area(s) will be placed] and the color scheme(s)that will be applied. It defines whether windows will replace one another on the screen orwill cascade over the top of each other. The template defines a standard placement andorder for common interface actions (e.g., File Edit View rather than File View Edit). Inshort, the template draws together the other major interface design elements: metaphors,objects, actions, and icons.
User Interface Design Process 425
Suppose you have been charged with the task of redesign-ing the interface for the ATM at your local bank. Develop an
interface standard that includes metaphors, objects, actions,icons, and a template.
11-5 Interface Standards DevelopmentYOUR
TURN
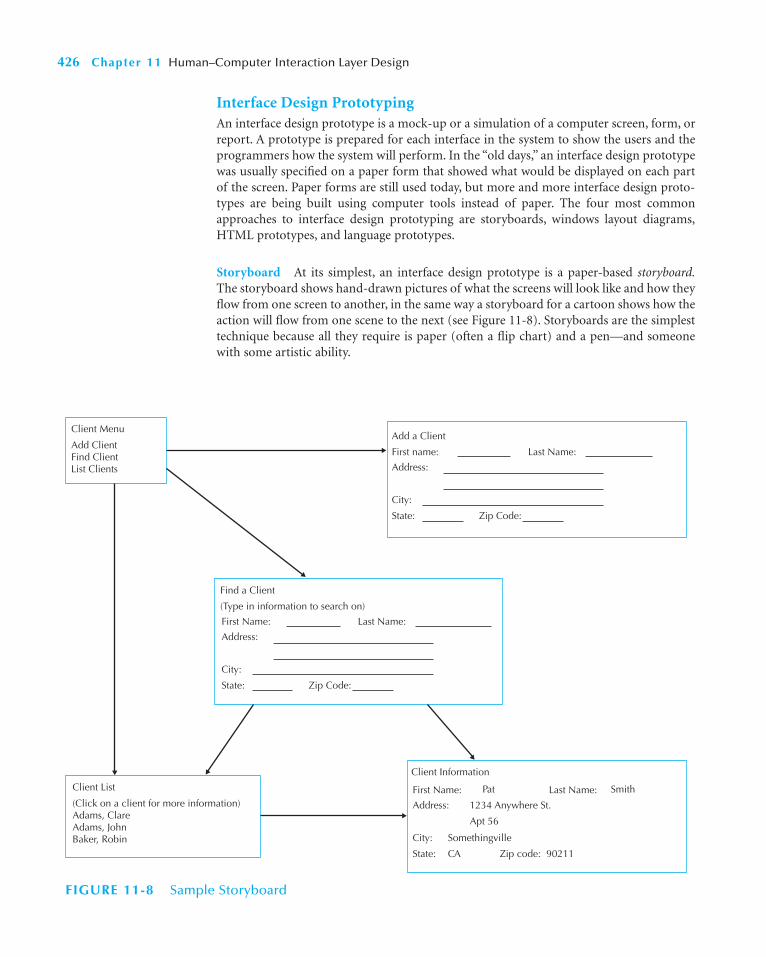
Interface Design PrototypingAn interface design prototype is a mock-up or a simulation of a computer screen, form, orreport. A prototype is prepared for each interface in the system to show the users and theprogrammers how the system will perform. In the “old days,” an interface design prototypewas usually specified on a paper form that showed what would be displayed on each partof the screen. Paper forms are still used today, but more and more interface design proto-types are being built using computer tools instead of paper. The four most commonapproaches to interface design prototyping are storyboards, windows layout diagrams,HTML prototypes, and language prototypes.
Storyboard At its simplest, an interface design prototype is a paper-based storyboard.The storyboard shows hand-drawn pictures of what the screens will look like and how theyflow from one screen to another, in the same way a storyboard for a cartoon shows how theaction will flow from one scene to the next (see Figure 11-8). Storyboards are the simplesttechnique because all they require is paper (often a flip chart) and a pen—and someonewith some artistic ability.
426 Chapter 11 Human–Computer Interaction Layer Design
(Click on a client for more information)Adams, ClareAdams, JohnBaker, Robin
Client List
Add ClientFind ClientList Clients
Add a Client
First name: Last Name:
Address:
City:
State: Zip Code:
Client Menu
First Name: Last Name:
Address:
City:
State: Zip Code:
Find a Client
(Type in information to search on)
First Name: Pat SmithLast Name:
Address: 1234 Anywhere St.
Apt 56
City: Somethingville
State: CA 90211Zip code:
Client Information
FIGURE 11-8 Sample Storyboard

Windows Layout Diagram A slight step up from a storyboard is a windows layout dia-gram. From our perspective, a windows layout diagram is a storyboard that more closelyresembles the actual user interface that the user will gradually receive. Typically, it is cre-ated using a tool such as Visio’s Windows User Interface Template. Using this type of tool,the designer can quickly drag and drop the user interface components onto the canvas to layout the design of the user interface. For example, in Figure 11-9, an equivalent diagram forthe Add a Client window for the storyboard is portrayed. Furthermore, by combining thewindows layout diagrams with the windows navigation diagram, the designer can workeffectively with a set of users to design both the look and feel of the evolving system withouthaving to actually implement anything.
HTML Prototype One of the most common types of interface design prototypes usedtoday is the HTML prototype. As the name suggests, an HTML prototype is built usingWeb pages created in HTML (hypertext markup language). The designer uses HTML tocreate a series of Web pages, which show the fundamental parts of the system. The userscan interact with the pages by clicking on buttons and entering pretend data into forms(but because there is no system behind the pages, the data are never processed). The pagesare linked together so that as the user clicks on buttons, the requested part of the systemappears. HTML prototypes are superior to storyboards in that they enable users to inter-act with the system and gain a better sense of how to navigate among the different screens.However, HTML has limitations—the screens shown in HTML will never appear exactlylike the real screens in the system (unless, of course, the real system will be a Web systemin HTML).
Language Prototype A language prototype is an interface design prototype built usingthe actual language or tool that will be used to build the system. Language prototypes aredesigned in the same ways as HTML prototypes (they enable the user to move from screento screen but perform no real processing). For example, in Visual Basic, it is possible to cre-ate and view screens without actually attaching program code to the screens. Language pro-totypes take longer to develop than storyboards or HTML prototypes but have the distinctadvantage of showing exactly what the screens will look like. The user does not have toguess about the shape or position of the elements on the screen.
User Interface Design Process 427
FIGURE 11-9Sample Windows Layout Diagram
Selecting the Appropriate Techniques Projects often use a combination of differentinterface design prototyping techniques for different parts of the system. Storyboarding isthe fastest and least expensive but provides the least amount of detail. Windows layout dia-grams provide more of a feel that the user will experience, while remaining fairly inexpen-sive to develop. HTML prototyping is useful for testing the basic design and navigation (seethe following) of the user interface. Language prototyping is the slowest, most expensive,and most detailed approach. Therefore, storyboarding is used for parts of the system inwhich the interface is well understood and when more expensive prototypes are thought tobe unnecessary. However, in most cases it is probably worth the additional cost of devel-oping windows layout diagrams in addition to storyboards. HTML prototypes and lan-guage prototypes are used for parts of the system that are critical, yet not well understood.
Interface Evaluation7
The objective of interface evaluation is to understand how to improve the interface designbefore the system is complete. Most interface designers intentionally or unintentionallydesign an interface that meets their personal preferences, which might or might not matchthe preferences of the users. The key message, therefore, is to have as many people as pos-sible evaluate the interface, and the more users the better. Most experts recommend involv-ing at least ten potential users in the evaluation process.
Many organizations save interface evaluation for the very last step in the systems devel-opment before the system is installed. Ideally, however, interface evaluation should be per-formed while the system is being designed—before it is built—so that any major designproblems can be identified and corrected before the time and cost of programming hasbeen spent on a weak design. It is not uncommon for the system to undergo one or twomajor changes after the users see the first interface design prototype because they identifyproblems that are overlooked by the project team.
428 Chapter 11 Human–Computer Interaction Layer Design
I was involved in the development of several DSSs whileworking as a consultant. On one project, a future user wasfrustrated because he could not imagine what a DSSlooked like and how one would be used. He was a keyuser, but the project team had a difficult time involvinghim in the project because of his frustration. The teamused SQLWindows (one of the most popular developmenttools at the time) to create a language prototype thatdemonstrated the future system’s appearance, proposedmenu system, and screens (with fields, but no processing).
The team was amazed at the user’s response to theprototype. He appreciated being given a context withwhich to visualize the DSS, and he soon began to recom-mend improvements to the design and flow of the system
and to identify some important information that was over-looked during analysis. Ultimately, the user became oneof the strongest supporters of the system, and the projectteam felt sure that the prototype would lead to a muchbetter product in the end.
—Barbara Wixom
Questions
1. Why do you think the team chose to use a lan-guage prototype rather than a storyboard or HTMLprototype?
2. What trade-offs were involved in the decision?
11-A Interface Design Prototypes for a DSS ApplicationCONCEPTS
IN ACTION
7 Verifying and validation approaches, in general, were described in Chapter 8. Also, further approaches to testingthe evolving system are described in Chapter 13. In this section, we describe approaches that have been cus-tomized to the human–computer interaction layer.

As with interface design prototyping, interface evaluation can take many differentforms, each with different costs and different amounts of detail. Four common approachesare heuristic evaluation, walkthrough evaluation, interactive evaluation, and formal usabil-ity testing. As with interface design prototyping, the different parts of a system can be eval-uated using different techniques.
Heuristic Evaluation A heuristic evaluation examines the interface by comparing it to aset of heuristics or principles for interface design. The project team develops a checklist ofinterface design principles—from the list at the start of this chapter, for example, as well asthe list of principles in the navigation, input, and output design sections later in this chap-ter. At least three members of the project team then individually work through the interfacedesign prototype examining each and every interface to ensure it satisfies each design prin-ciple on a formal checklist. After each has gone through the prototype separately, they meetas a team to discuss their evaluations and identify specific improvements that are required.
Walkthrough Evaluation An interface design walkthrough evaluation is a meeting con-ducted with the users who will ultimately have to operate the system. The project team pre-sents the prototype to the users and walks them through the various parts of the interface.The project team shows the storyboard and windows layout diagrams or actually demon-strates the HTML or language prototype and explains how the interface will be used. Theusers identify improvements to each of the interfaces that are presented.
Interactive Evaluation With an interactive evaluation, the users themselves actually workwith the HTML or language prototype in a one-person session with member(s) of the pro-ject team (an interactive evaluation cannot be used with a storyboard or windows layout dia-grams). As the user works with the prototype (often by going through the use scenarios, usingthe real use cases described later in this chapter, or just navigating at will through the system),he or she tells the project team member(s) what he or she likes and doesn’t like and whatadditional information or functionality is needed. As the user interacts with the prototype,team member(s) record the cases when he or she appears to be unsure of what to do, makesmistakes, or misinterprets the meaning of an interface component. If the pattern of uncer-tainty, mistakes, or misinterpretations reoccurs across several of the users participating in theevaluation, it is a clear indication that those parts of the interface need improvement.
Formal Usability Testing Formal usability testing is commonly done with commercial soft-ware products and products developed by large organizations that will be widely used throughthe organization. As the name suggests, it a very formal—almost scientific—process that canbe used only with language prototypes (and systems that have been completely built awaitinginstallation or shipping).8 As with interactive evaluation, usability testing is done in one-person sessions in which a user works directly with the software. However, it is typically donein a special lab equipped with video cameras and special software that records each and everykeystroke and mouse operation so they can be replayed to understand exactly what the user did.
The user is given a specific set of tasks to accomplish (usually the use scenarios) andafter some initial instructions, the project team’s members are not permitted to interactwith the user to provide assistance. The user must work with the software without help,which can be hard on the users if they become confused with the system. It is critical thatusers understand that the goal is to test the interface, not their abilities, and if they areunable to complete the task, the interface—not the user—has failed the test.
User Interface Design Process 429
8 A good source for usability testing is Jakob Nielsen, and Robert Mack (eds.), Usability Inspection Methods (NewYork: Wiley, 1994). See also www.useit.com/papers.
Formal usability testing is very expensive, because each one-user session can take oneto two days to analyze due to the volume of detail collected in the computer logs and video-tapes. Sessions typically last one to two hours. Most usability testing involves five to tenusers, because if there are fewer than five users, the results depend too much on the specificindividual users who participated, and more than ten users are often too expensive to justify(unless a large commercial software developer is involved).
NAVIGATION DESIGN
The navigation component of the interface enables the user to enter commands to navigatethrough the system and perform actions to enter and review information it contains. Thenavigation component also presents messages to the user about the success or failure of hisor her actions. The goal of the navigation system is to make the system as simple as possi-ble to use. A good navigation component is one the user never really notices. It simplyfunctions the way the user expects, and thus the user gives it little thought.
Basic PrinciplesOne of the hardest things about using a computer system is learning how to manipulate thenavigation controls to make the system do what you want. Analysts usually need to assumethat users have not read the manual, have not attended training, and do not have externalhelp readily at hand. All controls should be clear and understandable and placed in an intu-itive location on the screen. Ideally, the controls should anticipate what the user will do andsimplify his or her efforts. For example, many setup programs are designed so that for atypical installation, the user can simply keep pressing the Next button.
Prevent Mistakes The first principle of designing navigation controls is to prevent theuser from making mistakes. A mistake costs time and creates frustration. Worse still, aseries of mistakes can cause the user to discard the system. Mistakes can be reduced bylabeling commands and actions appropriately and by limiting choices. Too many choicescan confuse the user, particularly when they are similar and hard to describe in the shortspace available on the screen. When there are many similar choices on a menu, considercreating a second menu level or a series of options for basic commands.
Never display a command that cannot be used. For example, many Windows applica-tions gray out commands that cannot be used; they are displayed on pull-down menus ina very light-colored font, but they cannot be selected. This shows that they are available butcannot be used in the current context. It also keeps all menu items in the same place.
When the user is about to perform a critical function that is difficult or impossible toundo (e.g., deleting a file), it is important to confirm the action with the user (and makesure the selection was not made by mistake). This is usually done by having the userrespond to a confirmation message, which explains what the user has requested and asksthe user to confirm that this action is correct.
430 Chapter 11 Human–Computer Interaction Layer Design
Suppose you have been charged with the task of redesign-ing the interface for the ATM at your local bank. What type
of prototyping and interface evaluation approach wouldyou recommend? Why?
11-6 Prototyping and EvaluationYOUR
TURN

Simplify Recovery from Mistakes No matter what the system designer does, users willmake mistakes. The system should make it as easy as possible to correct these errors. Ideally,the system will have an Undo button that makes mistakes easy to override; however, writingthe software for such buttons can be very complicated.
Use Consistent Grammar Order One of the most fundamental decisions is the grammarorder. Most commands require the user to specify an object (e.g., file, record, word), and theaction to be performed on that object (e.g., copy, delete). The interface can require the userto first choose the object and then the action (an object-action order) or first choose the actionand then the object (an action-object order). Most Windows applications use an object-actiongrammar order (e.g., think about copying a block of text in your word processor).
The grammar order should be consistent throughout the system, both at the data ele-ment level as well as at the overall menu level. Experts debate about the advantages of oneapproach over the other, but because most users are familiar with the object-action order,most systems today are designed using that approach.
Types of Navigation ControlsThere are two traditional hardware devices that can be used to control the user interface:the keyboard and a pointing device such as a mouse, trackball, or touch screen. In recentyears, voice recognition systems have made an appearance, but they are not yet common.There are three basic software approaches for defining user commands: languages, menus,and direct manipulation.
Languages With a command language, the user enters commands using a special lan-guage developed for the computer system (e.g., DOS and SQL both use command lan-guages). Command languages sometimes provide greater flexibility than other approachesbecause the user can combine language elements in ways not predetermined by developers.However, they put a greater burden on users because users must learn syntax and typecommands rather than select from a well-defined, limited number of choices. Systemstoday use command languages sparingly, except in cases where there is an extremely largenumber of command combinations that make it impractical to try to build all combina-tions into a menu (e.g., SQL queries for databases).
Natural language interfaces are designed to understand the user’s own language (e.g.,English, French, Spanish). These interfaces attempt to interpret what the user means, andoften they present back to the user a list of interpretations from which to choose. An exam-ple of the use of natural language is Microsoft’s Office Assistant, which enables users to askfree-form questions for help.
Menus The most common type of navigation system today is the menu. A menu presentsa user with a list of choices, each of which can be selected. Menus are easier to learn thanlanguages because a limited number of available commands are presented to the user in anorganized fashion. Clicking on an item with a pointing device or pressing a key thatmatches the menu choice (e.g., a function key) takes very little effort. Therefore, menus areusually preferred to languages.
Menu design needs to be done with care because the submenus behind a main menu arehidden from users until they click on the menu item. It is better to make menus broad andshallow (i.e., each menu containing many items with only one or two layers of menus) ratherthan narrow and deep (i.e., each menu containing only a few items, but each leading to threeor more layers of menus). A broad and shallow menu presents the user with the most infor-mation initially so that he or she can see many options and requires only a few mouse clicks
Navigation Design 431

or keystrokes to perform an action. A narrow and deep menu makes users hunt for items hid-den behind menu items and requires many more clicks or keystrokes to perform an action.
Research suggests that in an ideal world, any one menu should contain no more thaneight items, and it should take no more than two mouse clicks or keystrokes from any menuto perform an action (or three from the main menu that starts a system).9 However, ana-lysts sometimes must break this guideline in the design of complex systems. In this case,menu items are often grouped together and separated by a horizontal line (see Figure 11-10).Often menu items have hot keys that enable experienced users to quickly invoke a commandwith keystrokes in lieu of a menu choice (e.g., Ctrl-F in Word invokes the Find command orAlt-F opens the file menu).
Menus should put together like items so that the user can intuitively guess what eachmenu contains. Most designers recommend grouping menu items by interface objects (e.g.,customers, purchase orders, inventory) rather than by interface actions (e.g., new, update,format), so that all actions pertaining to one object are in one menu, all actions for anotherobject are in a different menu, and so. However, this is highly dependent on the specificinterface. As Figure 11-10 shows, Microsoft Word groups menu items by interface objects(e.g., File, Table, Window) and by interface actions (e.g., Edit, Insert, Format) on the samemenu. Some of the more common types of menus include menu bars, drop-down menus,pop-up menus, tab menus, toolbars, and image maps (see Figure 11-11).
Direct Manipulation With direct manipulation, the user enters commands by workingdirectly with interface objects. For example, users can change the size of objects inMicrosoft PowerPoint by clicking on them and moving their sides, or they can move filesin Windows Explorer by dragging the filenames from one folder to another. Direct manip-ulation can be simple, but it suffers from two problems. First, users familiar with language-or menu-based interfaces don’t always expect it. Second, not all commands are intuitive.[How do you copy (not move) files in Windows explorer? On the Macintosh, why doesmoving a folder to the trash delete the file if it is on the hard disk, but eject the diskette ifthe file is on a diskette?]
MessagesMessages are the way in which the system responds to a user and informs him or her of thestatus of the interaction. There are many different types of messages, such as error messages,confirmation messages, acknowledgment messages, delay messages, and help messages (seeFigure 11-12). In general, messages should be clear, concise, and complete, which are some-times conflicting objectives. All messages should be grammatically correct and free of jar-gon and abbreviations (unless they are the users’ jargon and abbreviations). Avoidnegatives because they can be confusing (e.g., replace Are you sure you do not want to con-tinue? with Do you want to quit?). Likewise, avoid humor, because it wears off quickly afterthe same message appears dozens of times.
432 Chapter 11 Human–Computer Interaction Layer Design
9 Kent L. Norman, The Psychology of Menu Selection (Norwood NJ.: Ablex Publishing Corp., 1991).
Design a navigation system for a system into which usersmust enter information about customers, products, and
orders. For all three, users will want to change, delete,find one specific record, and list all records.
11-7 Design a Navigation SystemYOUR
TURN

Navigation Design 433
Line DividingMenu Group
Grayed OutCommands
A pop-up menuthat is also atab menu
Menu Bar
Drop-Down Menu Tool Bar with Buttons
FIGURE 11-10 Common Types of Menus
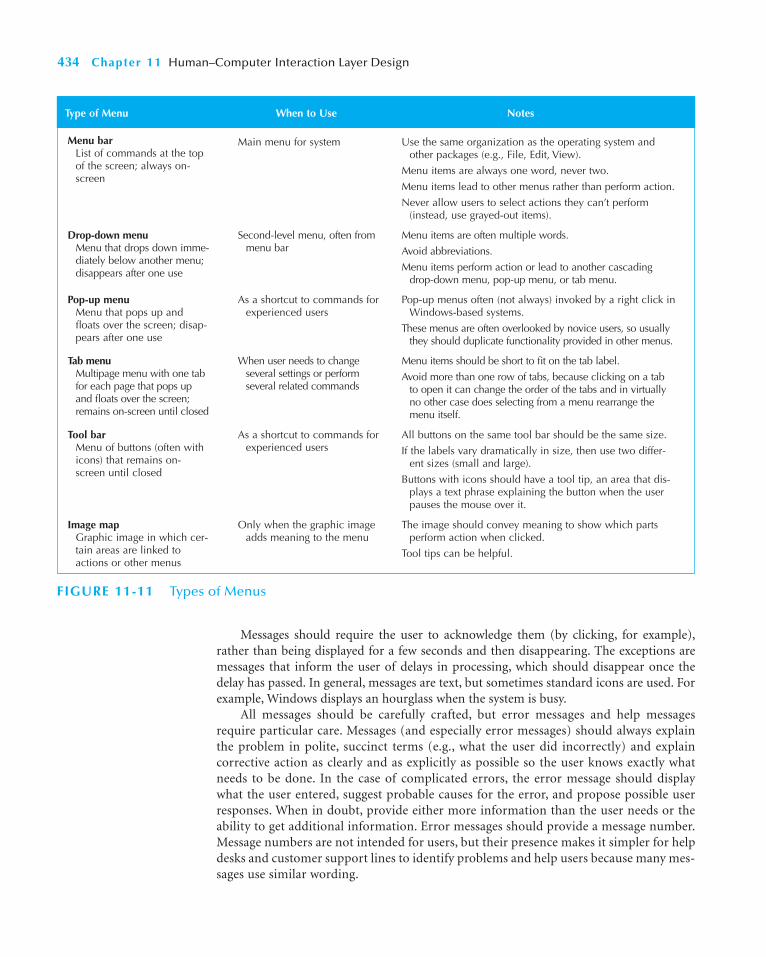
Messages should require the user to acknowledge them (by clicking, for example),rather than being displayed for a few seconds and then disappearing. The exceptions aremessages that inform the user of delays in processing, which should disappear once thedelay has passed. In general, messages are text, but sometimes standard icons are used. Forexample, Windows displays an hourglass when the system is busy.
All messages should be carefully crafted, but error messages and help messagesrequire particular care. Messages (and especially error messages) should always explainthe problem in polite, succinct terms (e.g., what the user did incorrectly) and explaincorrective action as clearly and as explicitly as possible so the user knows exactly whatneeds to be done. In the case of complicated errors, the error message should displaywhat the user entered, suggest probable causes for the error, and propose possible userresponses. When in doubt, provide either more information than the user needs or theability to get additional information. Error messages should provide a message number.Message numbers are not intended for users, but their presence makes it simpler for helpdesks and customer support lines to identify problems and help users because many mes-sages use similar wording.
434 Chapter 11 Human–Computer Interaction Layer Design
Type of Menu When to Use Notes
Menu barList of commands at the topof the screen; always on-screen
Main menu for system Use the same organization as the operating system andother packages (e.g., File, Edit, View).
Menu items are always one word, never two.
Menu items lead to other menus rather than perform action.
Never allow users to select actions they can’t perform(instead, use grayed-out items).
Drop-down menuMenu that drops down imme-diately below another menu;disappears after one use
Second-level menu, often frommenu bar
Menu items are often multiple words.
Avoid abbreviations.
Menu items perform action or lead to another cascadingdrop-down menu, pop-up menu, or tab menu.
Pop-up menuMenu that pops up andfloats over the screen; disap-pears after one use
As a shortcut to commands forexperienced users
Pop-up menus often (not always) invoked by a right click inWindows-based systems.
These menus are often overlooked by novice users, so usuallythey should duplicate functionality provided in other menus.
Tab menuMultipage menu with one tabfor each page that pops upand floats over the screen;remains on-screen until closed
When user needs to changeseveral settings or performseveral related commands
Menu items should be short to fit on the tab label.
Avoid more than one row of tabs, because clicking on a tabto open it can change the order of the tabs and in virtuallyno other case does selecting from a menu rearrange themenu itself.
Tool barMenu of buttons (often withicons) that remains on-screen until closed
As a shortcut to commands forexperienced users
All buttons on the same tool bar should be the same size.
If the labels vary dramatically in size, then use two differ-ent sizes (small and large).
Buttons with icons should have a tool tip, an area that dis-plays a text phrase explaining the button when the userpauses the mouse over it.
Image mapGraphic image in which cer-tain areas are linked toactions or other menus
Only when the graphic imageadds meaning to the menu
The image should convey meaning to show which partsperform action when clicked.
Tool tips can be helpful.
FIGURE 11-11 Types of Menus
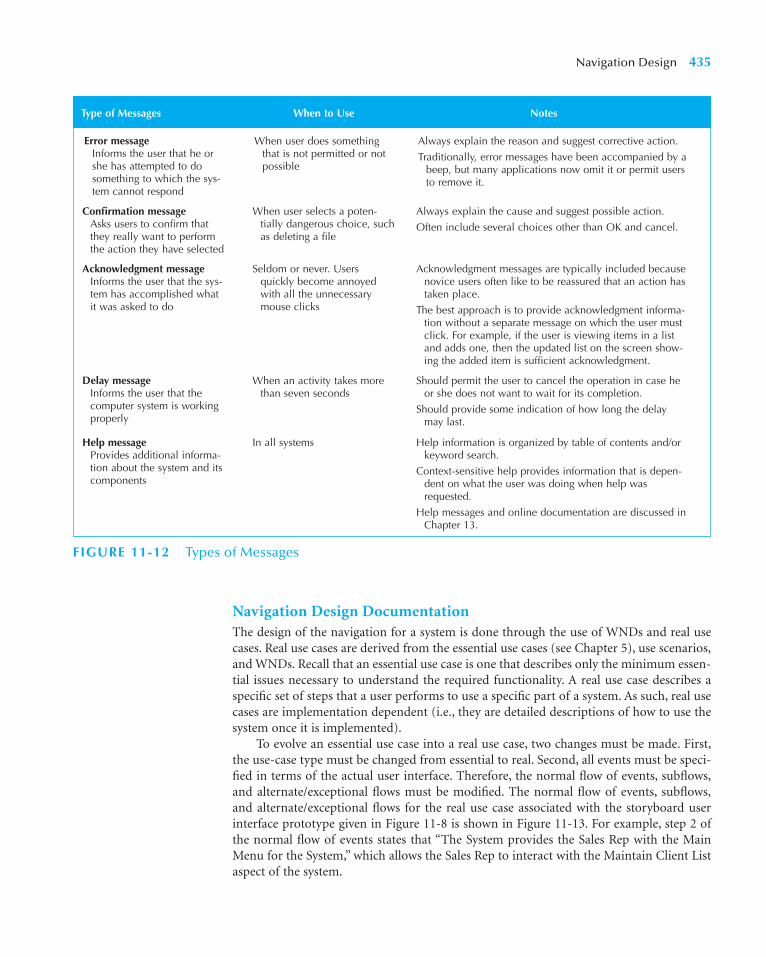
Navigation Design DocumentationThe design of the navigation for a system is done through the use of WNDs and real usecases. Real use cases are derived from the essential use cases (see Chapter 5), use scenarios,and WNDs. Recall that an essential use case is one that describes only the minimum essen-tial issues necessary to understand the required functionality. A real use case describes aspecific set of steps that a user performs to use a specific part of a system. As such, real usecases are implementation dependent (i.e., they are detailed descriptions of how to use thesystem once it is implemented).
To evolve an essential use case into a real use case, two changes must be made. First,the use-case type must be changed from essential to real. Second, all events must be speci-fied in terms of the actual user interface. Therefore, the normal flow of events, subflows,and alternate/exceptional flows must be modified. The normal flow of events, subflows,and alternate/exceptional flows for the real use case associated with the storyboard userinterface prototype given in Figure 11-8 is shown in Figure 11-13. For example, step 2 ofthe normal flow of events states that “The System provides the Sales Rep with the MainMenu for the System,” which allows the Sales Rep to interact with the Maintain Client Listaspect of the system.
Navigation Design 435
Type of Messages When to Use Notes
Error messageInforms the user that he orshe has attempted to dosomething to which the sys-tem cannot respond
When user does somethingthat is not permitted or notpossible
Always explain the reason and suggest corrective action.
Traditionally, error messages have been accompanied by abeep, but many applications now omit it or permit usersto remove it.
Confirmation messageAsks users to confirm thatthey really want to performthe action they have selected
When user selects a poten-tially dangerous choice, suchas deleting a file
Always explain the cause and suggest possible action.
Often include several choices other than OK and cancel.
Acknowledgment messageInforms the user that the sys-tem has accomplished whatit was asked to do
Seldom or never. Usersquickly become annoyedwith all the unnecessarymouse clicks
Acknowledgment messages are typically included becausenovice users often like to be reassured that an action hastaken place.
The best approach is to provide acknowledgment informa-tion without a separate message on which the user mustclick. For example, if the user is viewing items in a listand adds one, then the updated list on the screen show-ing the added item is sufficient acknowledgment.
Delay messageInforms the user that thecomputer system is workingproperly
When an activity takes morethan seven seconds
Should permit the user to cancel the operation in case heor she does not want to wait for its completion.
Should provide some indication of how long the delay may last.
Help messageProvides additional informa-tion about the system and itscomponents
In all systems Help information is organized by table of contents and/orkeyword search.
Context-sensitive help provides information that is depen-dent on what the user was doing when help wasrequested.
Help messages and online documentation are discussed inChapter 13.
FIGURE 11-12 Types of Messages

INPUT DESIGN
Inputs facilitate the entry of data into the computer system, whether highly structureddata, such as order information (e.g., item numbers, quantities, costs) or unstructuredinformation (e.g., comments). Input design means designing the screens used to enter theinformation as well as any forms on which users write or type information (e.g., timecards,expense claims).
Basic PrinciplesThe goal of the input mechanism is to simply and easily capture accurate information forthe system. The fundamental principles for input design reflect the nature of the inputs(whether batch or online) and ways to simplify their collection.
Online versus Batch Processing There are two general formats for entering inputs intoa computer system: online processing and batch processing. With online processing (some-times called transaction processing), each input item (e.g., a customer order, a purchaseorder) is entered into the system individually, usually at the same time as the event or trans-action prompting the input. For example, when you take a book out from the library, buyan item at the store, or make an airline reservation, the computer system that supports thatprocess uses online processing to immediately record the transaction in the appropriatedatabase(s). Online processing is most commonly used when it is important to have real-time information about the business process. For example, when you reserve an airline seat,the seat is no longer available for someone else to use.
With batch processing, all the inputs collected over some time period are gatheredtogether and entered into the system at one time in a batch. Some business processes nat-urally generate information in batches. For example, most hourly payrolls are done usingbatch processing because time cards are gathered together in batches and processed atonce. Batch processing is also used for transaction processing systems that do not requirereal-time information. For example, most stores send sales information to district officesso that new replacement inventory can be ordered. This information can be sent in real-time as it is captured in the store so that the district offices are aware within a second ortwo that a product is sold. If stores do not need this up-to-the-second real-time data,
436 Chapter 11 Human–Computer Interaction Layer Design
Systems integration across platforms and companiesgrows more complex with time. In a case study fromFlorida in 2008, an electrical company’s real-time sys-tem detected a minor problem in the power grid andshut down the entire system—plunging more than 2million people into the dark. The system experts placethe blame on a substation software system that detectedthe minor fluctuation but had the ability to immediatelyshut down the entire system. Although there may betimes where such a rapid response is vital (such asnuclear disasters in Chernobyl, Ukraine, and on Three
Mile Island), this was a case where such response wasnot warranted.
Questions
1. Because software controls substation operations,how might a systems analyst approach this as a sys-tems project?
2. Are there special considerations that a systems ana-lyst needs to think about when dealing with real-time systems?
11-B Complex Electrical SystemsCONCEPTS
IN ACTION
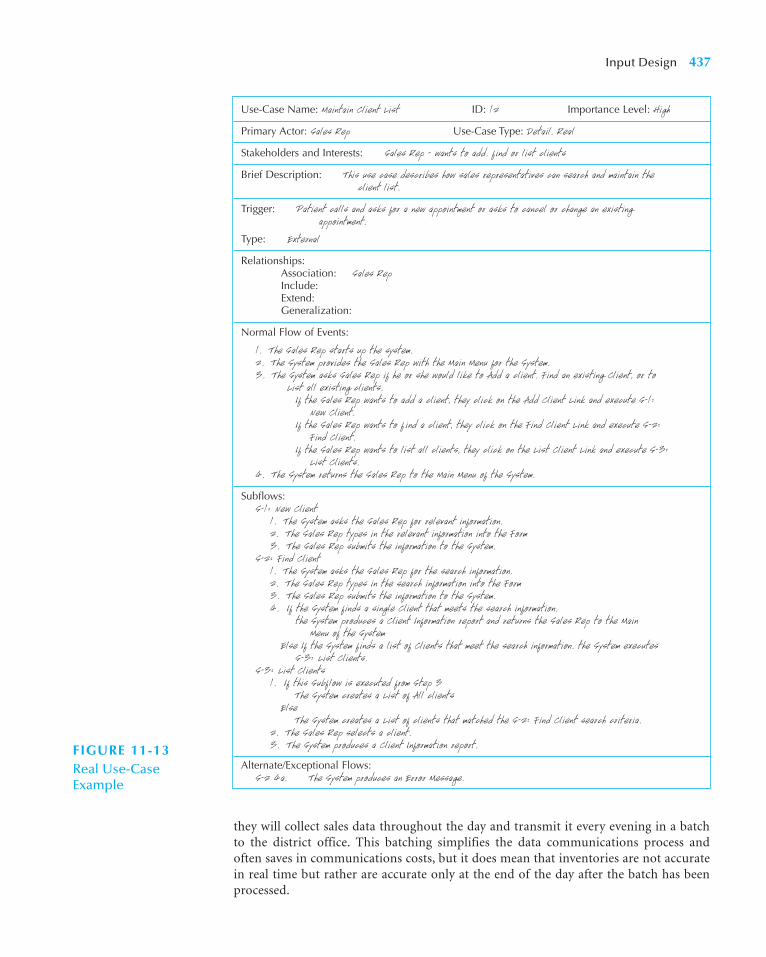
Input Design 437
Use-Case Name: Maintain Client List ID: 12 Importance Level: High
Primary Actor: Sales Rep Use-Case Type: Detail. Real
Stakeholders and Interests: Sales Rep - wants to add. find or list clients
Brief Description: This use case describes how sales representatives can search and maintain the client list.
Trigger: Patient calls and asks for a new appointment or asks to cancel or change an existing appointment.
Type: External
Relationships:Association: Sales RepInclude:Extend:Generalization:
Normal Flow of Events:
1. The Sales Rep starts up the system.2. The System provides the Sales Rep with the Main Menu for the System.3. The System asks Sales Rep if he or she would like to Add a client. Find an existing Client, or to
List all existing clients.If the Sales Rep wants to add a client, they click on the Add Client Link and execute S-1:
New Client.If the Sales Rep wants to f ind a client, they click on the Find Client Link and execute S-2:
Find Client.If the Sales Rep wants to list all clients, they click on the List Client Link and execute S-3:
List Clients.4. The System returns the Sales Rep to the Main Menu of the System.
Subflows:S-1: New Client
1. The System asks the Sales Rep for relevant information.2. The Sales Rep types in the relevant information into the Form3. The Sales Rep submits the information to the System.
S-2: Find Client1. The System asks the Sales Rep for the search information.2. The Sales Rep types in the search information into the Form3. The Sales Rep submits the information to the System.4. If the System finds a single Client that meets the search information.
the System produces a Client Information report and returns the Sales Rep to the Main Menu of the System
Else If the System finds a list of Clients that meet the search information. the System executes S-3: List Clients.
S-3: List Clients1. If this Subflow is executed from Step 3
The System creates a List of All clientsElse
The System creates a List of clients that matched the S-2: Find Client search criteria.2. The Sales Rep selects a client.3. The System produces a Client Information report.
Alternate/Exceptional Flows:S-2 4a. The System produces an Error Message.
FIGURE 11-13Real Use-Case Example
they will collect sales data throughout the day and transmit it every evening in a batchto the district office. This batching simplifies the data communications process andoften saves in communications costs, but it does mean that inventories are not accuratein real time but rather are accurate only at the end of the day after the batch has beenprocessed.

Capture Data at the Source Perhaps the most important principle of input design is tocapture the data in an electronic format at its original source or as close to the originalsource as possible. In the early days of computing, computer systems replaced traditionalmanual systems that operated on paper forms. As these business processes were automated,many of the original paper forms remained, either because no one thought to replace themor because it was too expensive to do so. Instead, the business process continued to containmanual forms that were taken to the computer center in batches to be typed into the com-puter system by a data entry operator.
Many business processes still operate this way today. For example, most organizationshave expense claim forms that are completed by hand and submitted to an accountingdepartment, which approves them and enters them into the system in batches. There arethree problems with this approach. First, it is expensive because it duplicates work (the formis filled out twice, once by hand, once by keyboard.)10 Second, it increases processing timebecause the paper forms must be physically moved through the process. Third, it increasesthe cost and probability of error, because it separates the entry from the processing of infor-mation; someone may misread the handwriting on the input form, data may be enteredincorrectly, or the original input may contain an error that invalidates the information.
Most transaction-processing systems today are designed to capture data at its source.Source data automation refers to using special hardware devices to automatically capturedata without requiring anyone to type it. Stores commonly use bar-code readers that auto-matically scan products and enter data directly into the computer system. No intermedi-ate formats such as paper forms are used. Similar technologies include optical characterrecognition, which can read printed numbers and text (e.g., on checks), magnetic stripereaders, which can read information encoded on a stripe of magnetic material similar toa diskette (e.g., credit cards), and smart cards, which contain microprocessors, memorychips, and batteries (much like credit-card-sized calculators). As well as reducing the timeand cost of data entry, these systems reduce errors because they are far less likely to cap-ture data incorrectly. Today, portable computers and scanners allow data to be captured atthe source even when in mobile settings (e.g., air courier deliveries, use of rental cars).
These automatic systems are not capable of collecting a lot of information, so the next-best option is to capture data immediately from the source using a trained entry operator.Many airline and hotel reservations, loan applications, and catalog orders are recordeddirectly into a computer system while the customer provides the operator with answers toquestions. Some systems eliminate the operator altogether and allow users to enter theirown data. For example, several universities [e.g., the Massachusetts Institute of Technology(MIT)] no longer accept paper-based applications for admissions; all applications aretyped by students into electronic forms.
The forms for capturing information (on a screen, on paper, etc.) should support thedata source. That is, the order of the information on the form should match the naturalflow of information from the data source, and data-entry forms should match paper formsused to initially capture the data.
Minimize Keystrokes Another important principle is to minimize keystrokes. Key-strokes cost time and money, whether they are performed by a customer, user, or traineddata-entry operator. The system should never ask for information that can be obtainedin another way (e.g., by retrieving it from a database or by performing a calculation).Likewise, a system should not require a user to type information that can be selected froma list; selecting reduces errors and speeds entry.
438 Chapter 11 Human–Computer Interaction Layer Design
10 Or in the case of the University of Georgia, three times: first by hand on an expense form, a second time whenit is typed onto a new form for the “official” submission because the accounting department refuses handwrittenforms, and, finally, when it is typed into the accounting computer system.

In many cases, some fields have values that often recur. These frequent values shouldbe used as the default value for the field so that the user can simply accept the value and nothave to retype it time and time again. Examples of default values are the current date, thearea code held by the majority of a company’s customers, and a billing address, which isbased on the customer’s residence. Most systems permit changes to default values to han-dle data-entry exceptions as they occur.
Types of InputsEach data item that has to be input is linked to a field on the form into which its value istyped. Each field also has a field label, which is the text beside, above, or below the field thattells the user what type of information belongs in the field. Often the field label is similarto the name of the data element, but they do not have to have identical words. In somecases, a field will display a template over the entry box to show the user exactly how datashould be typed. There are many different types of inputs, in the same way that there aremany different types of fields (see Figure 11-14).
Text As the name suggests, a text box is used to enter text. Text boxes can be defined tohave a fixed length or can be scrollable and can accept a virtually unlimited amount of text.In either case, boxes can contain single or multiple lines of textual information. We neveruse a text box if we can use a selection box.
Text boxes should have field labels placed to the left of the entry area, their size clearlydelimited by a box (or a set of underlines in a non-GUI interface). If there are multiple textboxes, their field labels and the left edges of their entry boxes should be aligned. Text boxesshould permit standard GUI functions, such as cut, copy, and paste.
Numbers A number box is used to enter numbers. Some software can automatically for-mat numbers as they are entered, so that 3452478 becomes $34,524.78. Dates are a specialform of numbers that sometimes have their own type of number box. Never use a numberbox if you can use a selection box.
Selection Box A selection box enables the user to select a value from a predefined list. Theitems in the list should be arranged in some meaningful order, such as alphabetical for longlists or in order of most frequently used. The default selection value should be chosen withcare. A selection box can be initialized as unselected. However, it is better to start with themost commonly used item already selected.
There are six commonly used types of selection boxes: check boxes, radio buttons, on-screenlist boxes, drop-down list boxes, combo boxes, and sliders (see Figure 11-15). The choice amongthe types of text selection boxes generally comes down to one of screen space and the numberof choices the user can select. If screen space is limited and only one item can be selected, then
Input Design 439
Suppose you are designing the new interface for a careerservices system at your university that accepts studentrésumés and presents them in a standard format torecruiters. Describe how you could incorporate the basic
principles of input design into your interface design.Remember to include the use of online versus batch datainput, the capture of information, and plans to minimizekeystrokes.
11-8 Career ServicesYOUR
TURN
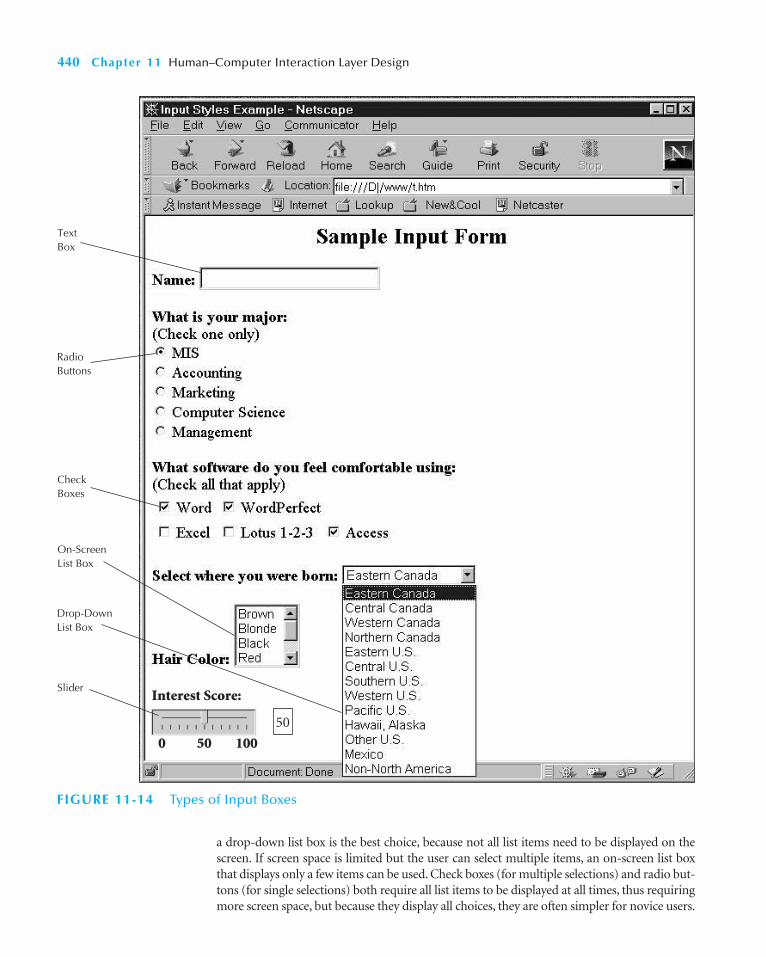
a drop-down list box is the best choice, because not all list items need to be displayed on thescreen. If screen space is limited but the user can select multiple items, an on-screen list boxthat displays only a few items can be used. Check boxes (for multiple selections) and radio but-tons (for single selections) both require all list items to be displayed at all times, thus requiringmore screen space, but because they display all choices, they are often simpler for novice users.
440 Chapter 11 Human–Computer Interaction Layer Design
50
0 50 100
Interest Score:
On-ScreenList Box
TextBox
Slider
Drop-DownList Box
RadioButtons
CheckBoxes
FIGURE 11-14 Types of Input Boxes

Input ValidationAll data entered into the system need to be validated to ensure their accuracy. Input valida-tion (also called edit checks) can take many forms. Ideally, computer systems should not acceptdata that fail any important validation check to prevent invalid information from entering thesystem. However, this can be very difficult, and invalid data often slip by data-entry operatorsand the users providing the information. It is up to the system to identify invalid data andeither make changes or notify someone who can resolve the information problem.
There are six different types of validation checks: completeness check, format check,range check, check digit check, consistency check, and database check (see Figure 11-16). Everysystem should use at least one validation check on all entered data and, ideally, will performall appropriate checks where possible.
Input Design 441
Type of Box When to Use Notes
Check boxPresents a complete list ofchoices, each with a squarebox in front
When several items can beselected from a list of items
Check boxes are not mutually exclusive.
Do not use negatives for box labels.
Check box labels should be placed in some logical order,such as that defined by the business process, or failingthat, alphabetically or most commonly used first.
Use no more than ten check boxes for any particular setof options. If you need more boxes, group them intosubcategories.
Radio buttonPresents a complete list ofmutually exclusive choices,each with a circle in front
When only one item can beselected from a set of mutu-ally exclusive items
Use no more than six radio buttons in any one list; if youneed more, use a drop-down list box.
If there are only two options, one check box is usually pre-ferred to two radio buttons, unless the options are not clear.
Avoid placing radio buttons close to check boxes to pre-vent confusion between different selection lists.
On-screen list boxPresents a list of choices in abox
Seldom or never—only if thereis insufficient room for checkboxes or radio buttons
This type of box can permit only one item to be selected(in which case it is an ugly version of radio buttons).
This type of box can also permit many items to be selected(in which case it is an ugly version of check boxes), butusers often fail to realize they can choose multiple items.
This type of box permits the list of items to be scrolled,thus reducing the amount of screen space needed.
Drop-down list boxDisplays selected item inone-line box that opens toreveal list of choices
When there is insufficientroom to display all choices
This type of box acts like radio buttons but is more compact.
This type of box hides choices from users until it is opened,which can decrease ease of use; conversely, because itshelters novice users from seldom-used choices, it canimprove ease of use.
This type of box simplifies design if the number of choicesis unclear, because it takes only one line when closed.
Combo boxA special type of drop-downlist box that permits user totype as well as scroll the list
Shortcut for experienced users This type of box acts like drop-down list but is faster forexperienced users when the list of items is long.
SliderGraphic scale with a slidingpointer to select a number
Entering an approximatenumeric value from a largecontinuous scale
The slider makes it difficult for the user to select a precisenumber.
Some sliders also include a number box to enable the userto enter a specific number.
FIGURE 11-15 Types of Selection Boxes

442 Chapter 11 Human–Computer Interaction Layer Design
Type of Validation When to Use Notes
Completeness checkEnsures all required datahave been entered
When several fields must beentered before the form canbe processed
If required information is missing, the form is returned tothe user unprocessed.
Format checkEnsures data are of the righttype (e.g., numeric) and inthe right format (e.g., month,day, year)
When fields are numeric orcontain coded data
Ideally, numeric fields should not permit users to type textdata, but if this is not possible, the entered data must bechecked to ensure it is numeric.
Some fields use special codes or formats (e.g., license plateswith three letters and three numbers) that must be checked.
Range checkEnsures numeric data arewithin correct minimum andmaximum values
With all numeric data, if pos-sible
A range check permits only numbers between correct values.
Such a system can also be used to screen data for “reason-ableness”—e.g., rejecting birthdates prior to 1880because people do not live to be a great deal over 100years old (most likely, 1980 was intended).
Check digit checkCheck digits are added tonumeric codes
When numeric codes are used Check digits are numbers added to a code as a way ofenabling the system to quickly validate correctness. Forexample, U.S. Social Security numbers and Canadian SocialInsurance numbers assign only eight of the nine digits in thenumber. The ninth number—the check digit—is calculatedusing a mathematical formula from the first eight numbers.
When the identification number is typed into a computer sys-tem, the system uses the formula and compares the resultwith the check digit. If the numbers don’t match, then anerror has occurred.
Consistency checksEnsure combinations of dataare valid
When data are related Data fields are often related. For example, someone’s birth yearshould precede the year in which he or she was married.
Although it is impossible for the system to know whichdata are incorrect, it can report the error to the user forcorrection.
Database checksCompare data against adatabase (or file) to ensurethey are correct
When data are available to bechecked
Data are compared against information in a database (orfile) to ensure they are correct. For example, before anidentification number is accepted, the database isqueried to ensure that the number is valid.
Because database checks are more expensive than theother types of checks (they require the system to do morework), most systems perform the other checks first andperform database checks only after the data have passedthe previous checks.
FIGURE 11-16 Types of Input Validation
Consider a Web form that a student would use to inputstudent information and résumé information into a careerservices application at your university. First, sketch outhow this form would look and identify the fields that the
form would include. What types of validity checks wouldyou use to make sure that the correct information isentered into the system?
11-9 Career ServicesYOUR
TURN

OUTPUT DESIGN
Outputs are the reports that the system produces, whether on the screen, on paper, or in othermedia, such as the Web. Outputs are perhaps the most visible part of any system because aprimary reason for using an information system is to access the information that it produces.
Basic PrinciplesThe goal of the output mechanism is to present information to users so they can accuratelyunderstand it with the least effort. The fundamental principles for output design reflecthow the outputs are used and ways to make it simpler for users to understand them.
Understand Report Usage The first principle in designing reports is to understand howthey are used. Reports can be used for many different purposes. In some cases—but notvery often—reports are read cover to cover because all information is needed. In mostcases, reports are used to identify specific items or used as references to find information,so the order in which items are sorted on the report or grouped within categories is criti-cal. This is particularly important for the design of electronic or Web-based reports. Webreports that are intended to be read from start to finish should be presented in one longscrollable page, whereas reports that are used primarily to find specific information shouldbe broken into multiple pages, each with a separate link. Page numbers and the date onwhich the report was prepared are also important for reference reports.
The frequency of the report may also play an important role in its design and distrib-ution. Real-time reports provide data that are accurate to the second or minute at whichthey were produced (e.g., stock market quotes). Batch reports are those that report histori-cal information that may be months, days, or hours old, and they often provide additionalinformation beyond the reported information (e.g., totals, summaries, historical averages).
There are no inherent advantages to real-time reports over batch reports. The onlyadvantages lie in the time value of the information. If the information in a report is timecritical (e.g., stock prices, air-traffic control information), then real time reports have value.This is particularly important because real-time reports are often expensive to produce;unless they offer some clear business value, they may not be worth the extra cost.
Manage Information Load Most managers get too much information, not too little (i.e.,the information load that the manager must deal with is too great). The goal of a well-designed report is to provide all the information needed to support the task for which it wasdesigned. This does not mean that the report needs to provide all the information availableon the subject—just what the users decide they need in order to perform their jobs. In somecases, this may result in the production of several different reports on the same topics for thesame users because they are used in different ways. This is not a bad design.
For users in westernized countries, the most important information should always bepresented first in the top-left corner of the screen or paper report. Information should beprovided in a format that is usable without modification. The user should not need to re-sort the report’s information, highlight critical information to find it more easily amid amass of data, or perform additional mathematical calculations.
Minimize Bias No analyst sets out to design a biased report. The problem with bias isthat it can be very subtle; analysts can introduce it unintentionally. Bias can be introducedby the way in which lists of data are sorted because entries that appear first in a list mayreceive more attention than those later in the list. Data are often sorted in alphabeticalorder, making those entries starting with the letter A more prominent. Data can be sortedin chronological order (or reverse chronological order), placing more emphasis on older
Output Design 443

(or most recent) entries. Data may be sorted by numeric value, placing more emphasis onhigher or lower values. For example, consider a monthly sales report by state. Should thereport be listed in alphabetical order by state name, in descending order by the amountsold, or in some other order (e.g., geographic region)? There are no easy answers to this,except to say that the order of presentation should match the way in which the informa-tion is used.
Graphical displays and reports can present particularly challenging design issues.11
The scale on the axes in graphs is particularly subject to bias. For most types of graphs, thescale should always begin at zero; otherwise, comparisons among values can be misleading.For example, in Figure 11-17, have sales increased by very much since 1993? The numbersin both charts are the same, but the visual images the two present are quite different. Aglance at Figure 11-17a would suggest only minor changes, whereas a glance at Figure 11-17bmight suggest that there have been some significant increases. In fact, sales have increasedby a total of 15 percent over five years, or 3 percent per year. Figure 11-17a presents the
444 Chapter 11 Human–Computer Interaction Layer Design
11 Some of the best books on the design of charts and graphical displays are by Edward R. Tufte, published by Graph-ics Press in Cheshire, Connecticut: The Visual Display of Quantitative Information, Envisioning Information, and VisualExplanations. Another good book is by William Cleveland, Visualizing Data, (Summit, NJ: Hobart Press, 1993).
140
120
100
80
60
40
20
0
Unbiased graph with scale starting at 0
(a)
(b)
Biased graph with scale starting at 90
120
115
110
105
100
95
901993 1994 19961995 1997 1998
1993 1994 19961995 1997 1998
FIGURE 11-17Bias in Graphs

most accurate picture; Figure 11-17b is biased because the scale starts very close to the low-est value in the graph and misleads the eye into inferring that there have been majorchanges (i.e., more than doubling from two lines in 1993 to five lines in 1998). Figure 11-17b is the default graph produced by Microsoft Excel.
Types of OutputsThere are many different types of reports, such as detail reports, summary reports, exceptionreports, turnaround documents, and graphs (see Figure 11-18). Classifying reports is chal-lenging because many reports have characteristics of several different types. For example,some detail reports also produce summary totals, making them summary reports.
MediaThere are many different types of media used to produce reports. The two dominant mediain use today are paper and electronic. Paper is the more traditional medium. For almost aslong as there have been human organizations, there have been reports on paper or similarmedia (e.g., papyrus, stone). Paper is permanent, easy to use, and accessible in most situa-tions. It also is highly portable, at least for short reports.
Output Design 445
Read through recent copies of a newspaper or popular press magazine, such as Time, Newsweek, or BusinessWeek,
and find four graphs. Are any of these biased? if so, why?
11-10 Finding BiasYOUR
TURN
I helped a university department develop a small DSS toanalyze and rank students who applied to a specializedprogram. Some of the information was numeric and couldeasily be processed directly by the system (e.g., grade-point average, standardized test scores). Other informa-tion required the faculty to make subjective judgmentsamong the students (e.g., extracurricular activities, workexperience). The users entered their evaluations of thesubjective information via several data analysis screens inwhich the students were listed in alphabetical order.
To make the system easier to use, it was designed sothat the reports listing the results of the analysis were alsopresented in alphabetical order by student name rather thanin order from the highest-ranked student to the lowest-ranked student. In a series of tests prior to installation, theusers selected the wrong students to admit in 20 percent of
the cases. They assumed, wrongly, that the students listedfirst were the highest-ranked students and simply selectedthe first students on the list for admission. Neither the titleon the report nor the fact that all the students’ names werein alphabetical order made users realize that they had readthe report incorrectly.
—Alan Dennis
Question
This system was biased because users assumed that thelist of students implied ranking. Suppose that you are ananalyst charged with minimizing bias in this application.Where else may you find bias in the application? Howwould you eliminate it?
11-C Selecting the Wrong StudentsCONCEPTS
IN ACTION
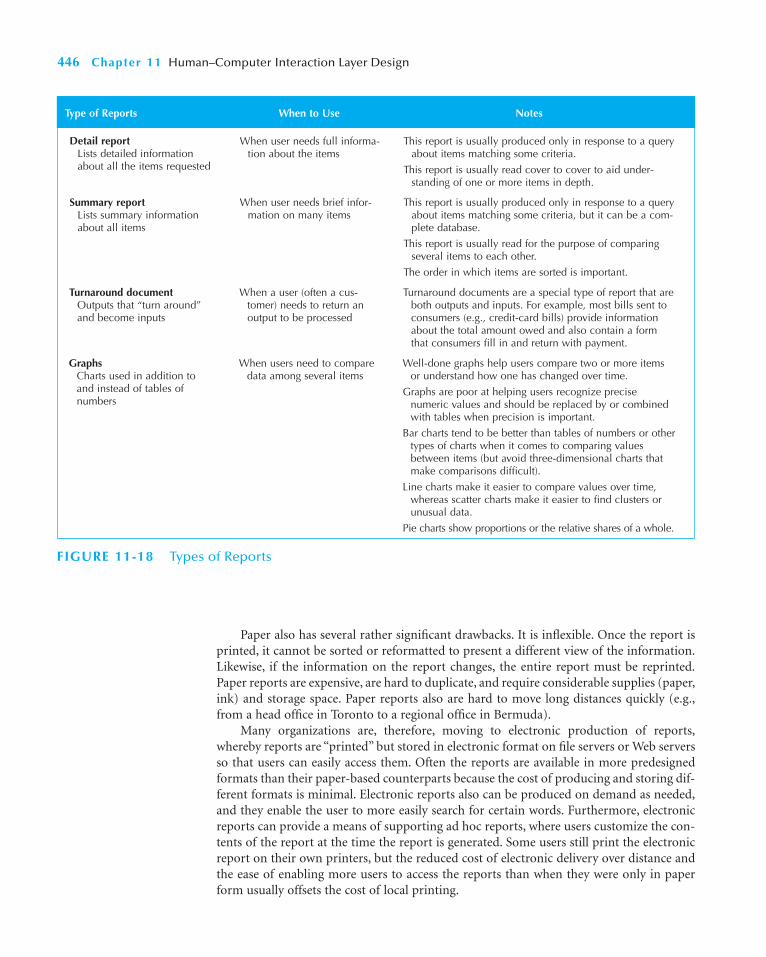
Paper also has several rather significant drawbacks. It is inflexible. Once the report isprinted, it cannot be sorted or reformatted to present a different view of the information.Likewise, if the information on the report changes, the entire report must be reprinted.Paper reports are expensive, are hard to duplicate, and require considerable supplies (paper,ink) and storage space. Paper reports also are hard to move long distances quickly (e.g.,from a head office in Toronto to a regional office in Bermuda).
Many organizations are, therefore, moving to electronic production of reports,whereby reports are “printed” but stored in electronic format on file servers or Web serversso that users can easily access them. Often the reports are available in more predesignedformats than their paper-based counterparts because the cost of producing and storing dif-ferent formats is minimal. Electronic reports also can be produced on demand as needed,and they enable the user to more easily search for certain words. Furthermore, electronicreports can provide a means of supporting ad hoc reports, where users customize the con-tents of the report at the time the report is generated. Some users still print the electronicreport on their own printers, but the reduced cost of electronic delivery over distance andthe ease of enabling more users to access the reports than when they were only in paperform usually offsets the cost of local printing.
446 Chapter 11 Human–Computer Interaction Layer Design
Type of Reports When to Use Notes
Detail reportLists detailed informationabout all the items requested
When user needs full informa-tion about the items
This report is usually produced only in response to a queryabout items matching some criteria.
This report is usually read cover to cover to aid under-standing of one or more items in depth.
Summary reportLists summary informationabout all items
When user needs brief infor-mation on many items
This report is usually produced only in response to a queryabout items matching some criteria, but it can be a com-plete database.
This report is usually read for the purpose of comparingseveral items to each other.
The order in which items are sorted is important.
Turnaround documentOutputs that “turn around”and become inputs
When a user (often a cus-tomer) needs to return anoutput to be processed
Turnaround documents are a special type of report that areboth outputs and inputs. For example, most bills sent toconsumers (e.g., credit-card bills) provide informationabout the total amount owed and also contain a formthat consumers fill in and return with payment.
GraphsCharts used in addition toand instead of tables ofnumbers
When users need to comparedata among several items
Well-done graphs help users compare two or more itemsor understand how one has changed over time.
Graphs are poor at helping users recognize precisenumeric values and should be replaced by or combinedwith tables when precision is important.
Bar charts tend to be better than tables of numbers or othertypes of charts when it comes to comparing valuesbetween items (but avoid three-dimensional charts thatmake comparisons difficult).
Line charts make it easier to compare values over time,whereas scatter charts make it easier to find clusters orunusual data.
Pie charts show proportions or the relative shares of a whole.
FIGURE 11-18 Types of Reports

NONFUNCTIONAL REQUIREMENTS AND HUMAN–COMPUTERINTERACTION LAYER DESIGN12
The human–computer interaction layer is heavily influenced by nonfunctional require-ments. Earlier in this chapter, we dealt with issues such as user interface layout, contentawareness, aesthetics, user experience, and consistency. None of these have anything to dowith the functional requirements of the system. However, if they are ignored, the systemcan prove to be unusable. Like the data management layer, there are four primary types ofnonfunctional requirements that can be important in designing the human–computerinteraction layer: operational, performance, security, and cultural/political requirements.
Operational requirements, such as choice of hardware and software platforms, influ-ence the design of the human–computer interaction layer. For example, something as sim-ple as the number of buttons on a mouse (one, two, three, or more) changes the interactionthat the user will experience. Other operational nonfunctional requirements that can influ-ence the design of the human–computer interaction layer include system integration andportability. In these cases, a Web-based solution may be required, which can affect thedesign; not all features of a user interface can be implemented efficiently and/or effectivelyon the Web. This can cause additional user interface design to occur.
Performance requirements, over time, have become less of an issue for this layer. How-ever, speed requirements are still paramount. Most users do not care for hitting return orclicking the mouse and having to take a coffee break while they are waiting for the system torespond. As such, efficiency issues must be still addressed. Depending on the user interfacetoolkit used, different user interface components may be required. Furthermore, the inter-action of the human–computer interaction layer with the other layers must be considered.For example, if the system response is slow, incorporating more-efficient data structureswith the problem domain layer, including indexes in the tables with the data managementlayer, and/or replicating objects across the physical architecture layer could be required.
Security requirements impacting the human–computer interaction layer deal primarilywith the access controls implemented to protect the objects from unauthorized access. Mostof these controls will be enforced through the DBMS on the data management layer and the
Nonfunctional Requirements and Human–Computer Interaction Layer Design 447
One of the Fortune 500 firms with which I have worked hadan eighteen-story office building for its world headquarters.It devoted two full floors of this building to nothing morethan storing “current” paper reports (a separate warehousewas maintained outside the city for archived reports such astax documents). Imagine the annual cost of office space inthe headquarters building tied up in these paper reports.Now imagine how a staff member would gain access to thereports, and you can quickly understand the driving forcebehind electronic reports, even if most users end up print-ing them. Within one year of switching to electronic reports
(for as many reports as practical), the paper report storagearea was reduced to one small storage room.
—Alan Dennis
Questions
1. What types of reports are most suited to electronicformat?
2. What types of reports are less suited to electronicreports?
11-D Cutting Paper to Save MoneyCONCEPTS
IN ACTION
12 Because the vast majority of nonfunctional requirements impact the physical architecture layer, we provideadditional details in Chapter 12.
operating system on the physical architecture layer. However, the human–computer interac-tion layer design must include appropriate log-on controls and the possibility of encryption.
Cultural and political requirements that can impact the design of the human–computerinteraction layer include multilingual requirements and unstated norms. The multilingualrequirements include simple concerns such as the number of characters to allocate for dif-ferent fields. For example, Spanish can take between 20 and 30 percent more characters todisplay the equivalent message when compared to English. Furthermore, there are manydifferent alphabets. Also, translating a message from one language to another is still nota very automatable process.13 Unstated norm requirements include things such as havingthe date displayed in the appropriate format (MM/DD/YYYY versus DD/MM/YYYY).Another concern is the layout of the user interface. Because English is read left to right andtop to bottom, we tend to design the layout of the user interface in a similar manner. Butnot all languages are read in this order. Finally, the use of color can be problematic. Differ-ent cultures attach different meaning to different colors. For example the implification ofthe colors black and white depends on the culture that is viewing the user interface. Inmany western cultures, black implies bad and white implies good. However, in certain east-ern cultures, the opposite is true. For a system to be truly useful in a global environment,the user interface must be customizable to address local cultural requirements.
APPLYING THE CONCEPTS AT CD SELECTIONS
In the CD Selections Internet Sales System case, there are three different high-level use cases(see Figure 5-19): Maintain CD Information, Place Order, and Maintain CD MarketingInformation. There are also six additional use cases, Maintain Order, Checkout, Create NewCustomer, Place InStore Hold, Place Special Order, and Fill Mail Order, associated with thePlace Order use case. To keep the complexity of the current example under control, in thissection we focus only on the Place Order, Maintain Order, and Checkout use cases.
Use Scenario DevelopmentThe first step in the interface design process was to develop the key use scenarios for the Inter-net Sales System. Because Alec assigned the human–computer interaction layer design tohimself, he began by examining the essential use cases (see Figure 5-18) and thinking aboutthe types of users and how they would interact with the system. To begin with, Alec identi-fied two use scenarios: the browsing shopper and the hurry-up shopper (see Figure 11-6).14
Alec also thought of several other use scenarios for the Web site in general, but he omittedthem because they were not relevant to the Internet sales portion. Likewise, he thought of sev-eral use scenarios that did not lead to sales (e.g., fans looking for information about theirfavorite artists and albums) and omitted them as well.
Interface Structure DesignNext, Alec created a WND for the Web system. He began with the Place Order, MaintainOrder, and Checkout essential use cases to ensure that all functionality defined for thesystem was included in the WND. Figure 11-19 shows the WND for the Web portion of the
448 Chapter 11 Human–Computer Interaction Layer Design
13 For example, type the text “I would like my steak cooked rare into babel fish” (http://babelfish.yahoo.com/) andtranslate it to Russian and back to English. You will get back “I wanted would be my rare welded [steykom] done”not exactly the most useful translation.14 Of course, it may be necessary to modify the original essential use cases in light of these new subtypes of cus-tomer. Furthermore, the structural and behavioral models may have to be modified. Remember that object-oriented systems analysis and design is incremental and iterative; as such, additional requirements can be uncoveredat any time.

Internet Sales System. The system started with a home page that contained the main menufor the sales system. Based on the essential use cases, Alec identified four basic operationsthat he felt made sense to support on the main menu: search the CD catalog, search bymusic category, review the contents of the shopping cart, and actually place the order. Eachof these was modeled as a hyperlink on the home page.
Alec then decided to model the full search option as a pop-up search menu that allowedthe customer to choose to search the CD catalog based on artist, title, or composer. He furtherdecided that a textbox would be required to allow the customer to type in the name of theartist, title, or composer, depending on the type of search requested. Finally, he chose to use abutton to submit the request to the system. After the Submit button was pressed, the systemproduced a report composed of hyperlinks to the individual information on each CD. A CDreport containing the basic information was generated by clicking on the hyperlink associatedwith the CD. On the basic report, Alec added buttons for choosing to find out additional infor-mation on the CD and to add the CD to the shopping cart. If the Detail button was pressed, adetailed report containing the marketing information on the CD was produced. Finally, Alecdecided to include a button on this report to add the CD to the shopping cart.
The second basic operation supported on the home page was to allow the user to searchthe CD catalog by category of music. As with the previous operation, Alec chose to model thecategory search with a pop-up search menu. In this case, once the customer chose the cate-gory, the system would produce the report with the hyperlinks to the individual informationon each CD. From that point on, the navigation would be identical to the previous searches.
The third operation supported was to review the contents of the shopping cart. In thiscase, Alec decided to model the shopping cart as a report that contained three types ofhyperlinks: one for removing an individual CD from the shopping cart, one for removingall CDs from the shopping cart, and one for placing the order. The removal hyperlinkswould remove the individual CD (or all the CDs) from the shopping cart if the user wouldconfirm the operation. The place order link would send the customer to an order form.Once the customer filled out the order form, the customer would press the order button.The system would then respond with an order confirmation message box.
The fourth operation supported on the home page was to allow the customer to placean order directly. Upon review, Alec decided that the place order and review cart operationswere essentially identical. As such, he decided to force the user to have the place order andreview shopping cart operations go through the same process.
Alec also envisioned that by using frames, the user would be able to return to the homepage from any screen. Documenting these would give the WND too many lines, so Alecsimply put a note describing it with the WND.
The Revised WND Alec then examined the use scenarios to see how well the initial WNDenabled different types of users to work through the system. He started with the BrowsingShopping use scenario and followed it through the WND, imagining what would appear oneach screen and pretending to navigate through the system. He found the WND to workwell, but he noticed a couple of minor issues related to the shopping cart. First, he decidedthat it would make sense to allow the customer to retrieve the information related to theCDs contained in the shopping cart. As such, he changed the stereotype of the user inter-face component from Report to HyperLink Rep and added a hyperlink from the ShoppingCart to the Basic Report created by the different search requests. Second, he noticed thatthe Shopping Cart was using hyperlinks to link to the Removal and Place Order processes.However, in all the other elements of the WND, he was using buttons to model the equivalentideas. As such, he decided to change the Shopping Cart component to model these con-nections as buttons. Of course, this forced him to modify the transitions as well.
Applying the Concepts at CD Selections 449
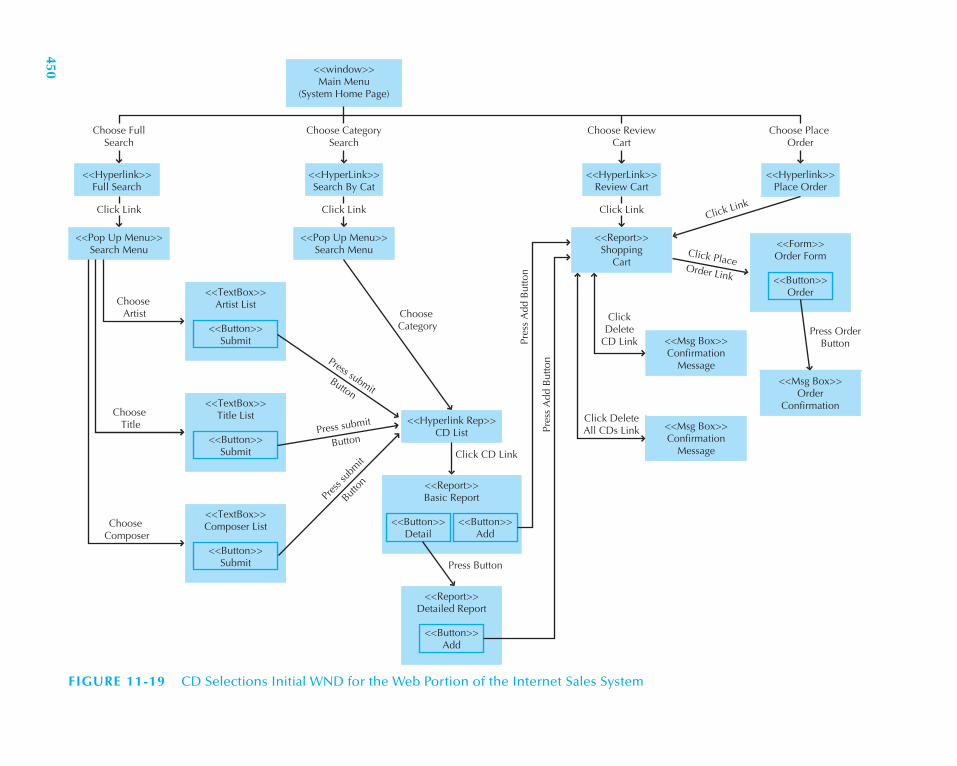
Choose CategorySearch
Choose ReviewCart
Choose Place Order
<<window>>Main Menu
(System Home Page)
Choose FullSearch
<<Hyperlink>>Full Search
Click Link Click Link Click Link Click Link
Click PlaceOrder Link
ChooseArtist Choose
Category
Click CD Link
Pres
s A
dd B
utto
n
Pres
s A
dd B
utto
n
Press Button
<<Pop Up Menu>>Search Menu
<<TextBox>>Artist List
<<Button>>Submit
<<Pop Up Menu>>Search Menu
<<Report>>Shopping
Cart
<<Msg Box>>Confirmation
Message
<<Msg Box>>Order
Confirmation
<<Msg Box>>Confirmation
Message
<<Hyperlink Rep>>CD List
<<HyperLink>>Search By Cat
<<HyperLink>>Review Cart
<<Hyperlink>>Place Order
<<Form>>Order Form
<<Button>>Order
Press OrderButton
ClickDelete
CD Link
Click DeleteAll CDs Link
<<TextBox>>Title List
<<Button>>Submit
<<TextBox>>Composer List
<<Button>>Submit
<<Report>>Basic Report
<<Button>>Detail
<<Button>>Add
<<Report>>Detailed Report
<<Button>>Add
ChooseComposer
ChooseTitle
Press submitButton
Press submit
Button
Pres
s sub
mit
Button
FIGURE 11-19 CD Selections Initial WND for the Web Portion of the Internet Sales System
450
Alec next explored the Hurry-up Shopper use scenario. In this case, the WND did notwork as well. Moving from the home page, to the search page, to the list of matching CDs,to the CD page with price and other information took three mouse clicks. This falls withinthe three clicks rule, but for someone in a hurry, this may be too many. Alec decided to adda quick-search option to the home page that would enable the user to enter one search cri-teria (e.g., just artist name or title, rather than a more detailed search as would be possibleon the search page) thus, with one click, taking the user to the one CD that matched thecriteria or to a list of CDs if there were more than one. This would enable an impatient userto get to the CD of interest in one or two clicks.
Once the CD was displayed on the screen, the Hurry-up Shopper use scenario wouldsuggest that the user would immediately purchase the CD, do a new search, or abandon theWeb site and surf elsewhere. This suggested two important changes. First, there had to be aneasy way to go to the Place Order screen. As the WND stood (see Figure 11-19), the user hadto add the item to the shopping cart and then click on the link on the HTML frame to getto the Place Order screen. Although the ability of users to notice the place order link in theframe would await the interface evaluation stage, Alec suspected, based on past experience,that a significant number of users would not see it. Therefore, he decided to add a buttonto the Basic Report screen and the Detailed Report screen called Buy (see Figure 11-20).
Second, because the hurry-up shopper might want to search for another CD insteadof buying the CD, Alec decided to include the quick-search item from the home page onthe frame. This would make all searches immediately available from anywhere in the sys-tem. This would mean that all functionality on the home page would now be carried on theframe. Alec updated the note on the bottom attached to the WND to reflect the change.
Finally, upon review of the WND, Alec decided to remodel the Artist List, Title List,and Composer Lists as window stereotypes instead of textbox stereotypes. He then addeda Search Item textbox to each of these elements. Figure 11-20 shows the revised WND forthe Web portion of the Place Order use case. All changes are highlighted.
Interface Standards DesignOnce the WND was complete, Alec moved on to develop the interface standards for the sys-tem. The interface metaphor was straightforward: a CD Selections music store. The keyinterface objects and actions were equally straightforward, as was the use of the CD Selec-tions logo icon (see Figure 11-21).
Interface Template DesignFor the interface template, Alec decided on a simple, clean design that had a modern back-ground pattern with the CD Selections logo in the upper-left corner. The template hadtwo navigation areas: one menu across the top for navigation within the entire Web site(e.g., overall Web site home page, store locations) and one menu down the left edge fornavigation within the Internet sales system. The left-edge menu contained the links to thetop-level operations (see WND in Figure 11-19), as well as the “quick search” option. Thecenter area of the screen is used for displaying forms and reports when the appropriateoperation is chosen (see Figure 11-22).
At this point, Alec decided to seek some quick feedback on the interface structure andstandards before investing time in prototyping the interface designs. Therefore, he met withMargaret Mooney, the project sponsor, and Chris Campbell, the consultant, to discuss theemerging design. Making changes at this point would be much simpler than after doingthe prototype. Margaret and Chris had a few suggestions, so after the meeting Alec madethe changes and moved into the design-prototyping step.
Applying the Concepts at CD Selections 451
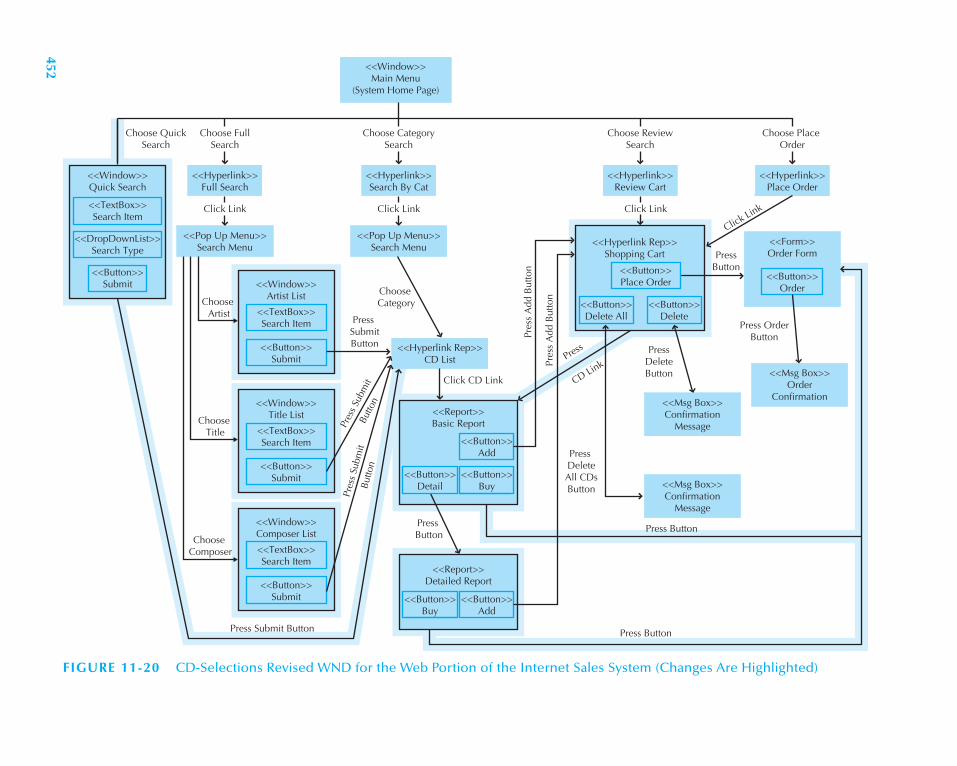
Choose FullSearch
Choose ReviewSearch
Choose Place Order
<<Window>>Main Menu
(System Home Page)
Click Link Click Link
Click Link
ChooseCategory
Click CD Link
Pres
s A
dd B
utto
nPress
Button
<<TextBox>>Search Item
<<Pop Up Menu>>Search Menu
<<Msg Box>>Confirmation
Message
<<Msg Box>>Order
Confirmation<<Msg Box>>Confirmation
Message
<<Hyperlink Rep>>CD List
<<Hyperlink>>Full Search
<<Window>>Quick Search
<<Hyperlink>>Review Cart
<<Hyperlink>>Place Order
<<DropDownList>>Search Type
<<Button>>Submit
<<Form>>Order Form
<<Button>>Order
Press OrderButton
PressDeleteButton
PressDeleteAll CDsButton
<<TextBox>>Search Item
<<Button>>Submit
<<TextBox>>Search Item
<<Button>>Submit
<<TextBox>>Search Item
<<Button>>Submit
<<Button>>Detail
<<Button>>Delete All
<<Button>>Delete
<<Button>>Buy
<<Button>>Add
Choose CategorySearch
Click Link
<<Pop Up Menu>>Search Menu
<<Hyperlink>>Search By Cat
ChooseTitle
<<Button>>Buy
<<Button>>Add
Press Submit Button
<<Hyperlink Rep>>Shopping Cart
<<Button>>Place Order
PressButton
PressSubmitButton
Choose QuickSearch
<<Window>>Artist List
<<Window>>Title List
<<Window>>Composer List
Press Button
<<Report>>Basic Report
<<Report>>Detailed Report
Pres
s Sub
mit
Butto
n
Pres
s Su
bmit
Butto
nPress
CD LinkPres
s A
dd B
utto
n
Press Button
ChooseArtist
ChooseComposer
FIGURE 11-20 CD-Selections Revised WND for the Web Portion of the Internet Sales System (Changes Are Highlighted)
452

Interface Design PrototypingAlec decided to develop a hypertext markup language (HTML) prototype of the system.The Internet sales system was new territory for CD Selections and a strategic investment ina new business model, so it was important to make sure that no key issues were overlooked.The HTML prototype would provide the most detailed information and enable interactiveevaluation of the interface.
In designing the prototype, Alec started with the home screen and gradually worked hisway through all the screens. The process was very iterative, and he made many changes to thescreens as he worked. Once he had an initial prototype designed, he posted it on CD Selectionsintranet and solicited comments from several friends with lots of Web experience. He revisedit based on the comments he received. Figure 11-23 presents some screens from the prototype.
Applying the Concepts at CD Selections 453
Interface Metaphor: A CD Selections Music Store
Interface Objects
• CD: All items, whether CD, tape, or DVD, unless it is important to distinguish among them
• Artist: Person or group who records the CD
• Title: Title or name of CD
• Composer: Person or group who wrote the music for the CD (primarily used for classical music)
• Music Category: Type of music. Current categories include: Rock, Jazz, Classical, Country, Alter-native, Soundtracks, Rap, Folk, Gospel.
• CD List: List of CD(s) that match the specified criteria
• Shopping Cart: Place to store CDs until they are requested
Interface Actions
• Search for: Display a CD list that matches specified criteria
• Browse: Display a CD list sorted in order by some criteria
• Order: Authorize special order or place hold
Interface Icons
• CD Selections Logo: Will be used on all screens
FIGURE 11-21CD Selections Interface Standards
FIGURE 11-22CD Selections Inter-face Template for theWeb Portion of theInternet Sales System
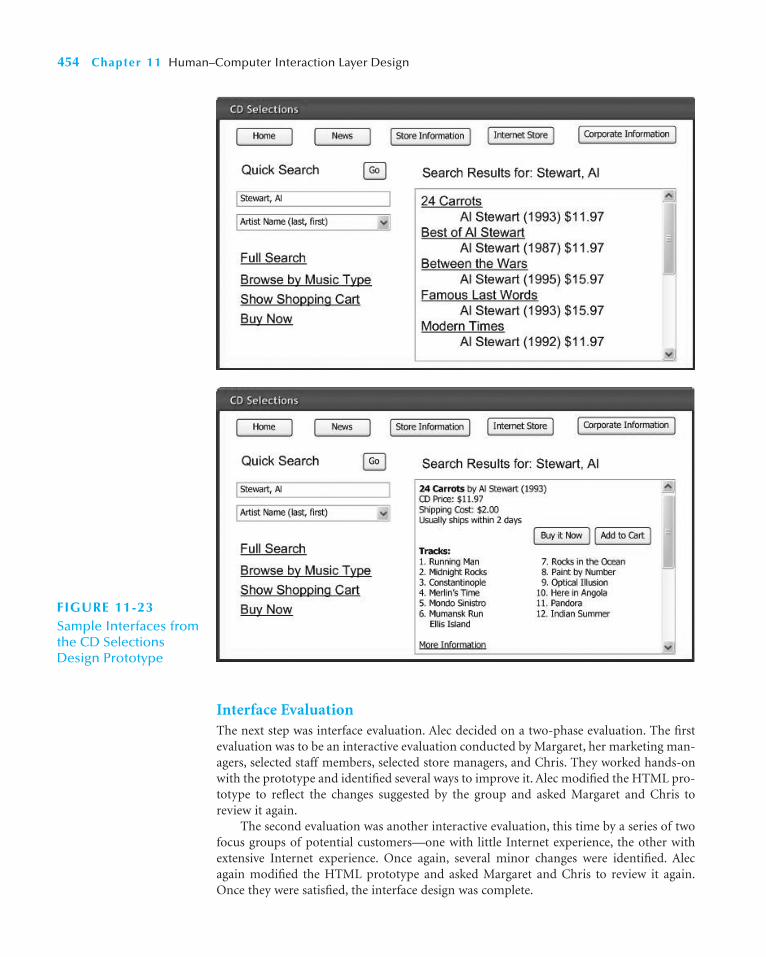
Interface EvaluationThe next step was interface evaluation. Alec decided on a two-phase evaluation. The firstevaluation was to be an interactive evaluation conducted by Margaret, her marketing man-agers, selected staff members, selected store managers, and Chris. They worked hands-onwith the prototype and identified several ways to improve it. Alec modified the HTML pro-totype to reflect the changes suggested by the group and asked Margaret and Chris toreview it again.
The second evaluation was another interactive evaluation, this time by a series of twofocus groups of potential customers—one with little Internet experience, the other withextensive Internet experience. Once again, several minor changes were identified. Alecagain modified the HTML prototype and asked Margaret and Chris to review it again.Once they were satisfied, the interface design was complete.
454 Chapter 11 Human–Computer Interaction Layer Design
FIGURE 11-23Sample Interfaces fromthe CD SelectionsDesign Prototype

Applying the Concepts at CD Selections 455
Use-Case Name: Place Order ID: 15 Importance Level: High
Primary Actor: The Browsing Customer Use-Case Type: Detail, Real
Stakeholders and Interests: Customer Wants to search web site to purchase CDEM Manager Wants to maximize Customer satisfaction.
Brief Description: This use case describes how customers can search the web site and place orders.
Trigger: Customer visits web site
Type: External
Relationships:Association: CustomerInclude: Checkout, Maintain OrderExtend:Generalization:
Normal Flow of Events:1. The Customer visits the Web site.2. The System displays the Home Page
If the Customer wants to do a Full Search, execute S-1:Full SearchIf the Customer wants to Browse by Music Type, execute S-2: Browse by Music TypeIf the Customer wants to see any Special Deals, execute S-3: Special DealsIf the Customer wants to see the contents of the Shopping Cart, execute S-4: Shopping CartIf the Customer wants to Buy Now, execute S-5: Buy Now
3. The Customer leaves the site.
Subflows:S-1: Full Search
1. The Customer clicks the Full Search hyperlink2. The System displays the search type pop-up menu
If the Customer chooses an Artist search, execute S-1a: Artist ListIf the Customer chooses an Title search, execute S-1a: Title ListIf the Customer chooses an Composer search, execute S-1a:composer List
S-1a: Artist List1. The System displays the Artist List window in the Center Area of the Home Page.2. The Customer enters the Artist Name into the Search Item text box.3. The Customer presses the Submit button.4. The System executes S-2a:CD List.
S-2a:CD List1. The System displays the CD List hyperlink report.2. The Customer chooses a CD to review by clicking the CD link.3. The System executes s-2b: Display Basic Report4. Iterate over steps 2 and 3.
Alternate/Exceptional Flows:
FIGURE 11-24The Browsing Customer Real UseCase (Partial ListingOnly)
Navigation Design DocumentationThe last step that Alec completed was to document the navigation design through theuse of real use cases. To accomplish this, Alec gathered together the essential use case(see Figure 5-18), the use scenarios (see Figure 11-6), the window navigation diagram(see Figure 11-20), and the user interface prototype (see Figures 11-22 and 11-23).First, he copied the contents of the essential use case to the real use case. He changedthe type from detail, essential to detail, real; the primary actor was specialized tobrowsing customer instead of simply customer. Second, he wrote the specific set ofsteps and responses that described the interaction between the browsing customerand system. Figure 11-24 shows a partial listing of the steps in the normal flow ofevents and subflows sections of the real use case. Last, he repeated the steps for thehurry-up shopper.

SUMMARY
Principles for User Interface DesignThe first element of the user interface design is the layout of the screen, form or report,which is usually depicted using rectangular shapes with a top area for navigation, a centralarea for inputs and outputs, and a status line at the bottom. The design should help the userbe aware of content and context, both between different parts of the system as they navi-gate through it and within any one form or report. All interfaces should be aestheticallypleasing (not works of art) and need to include significant white space, use colors carefully,and be consistent with fonts. Most interfaces should be designed to support bothnovice/first time users, as well as experienced users. Consistency in design (both within thesystem and across other systems used by the users) is important for the navigation controls,terminology, and the layout of forms and reports. Finally, all interfaces should attempt tominimize user effort—for example, by requiring no more than three clicks from the mainmenu to perform an action.
User Interface Design ProcessFirst, analysts develop use scenarios that describe commonly used patterns of actions thatthe users will perform. Second, they design the interface structure via a WND based on theessential use cases. The WND is then tested with the use scenarios to ensure that it enablesusers to quickly and smoothly perform these scenarios. Third, analysts define the interfacestandards in terms of interface metaphor(s), objects, actions, and icons. These elements aredrawn together by the design of a basic interface template for each major section of the sys-tem. Fourth, the designs of the individual interfaces are prototyped, either through a simplestoryboard, an HTML prototype, or a prototype using the development language of thesystem itself (e.g., Visual Basic). Finally, interface evaluation is conducted using heuristicevaluation, walkthrough evaluation, interactive evaluation, or formal usability testing. Thisevaluation almost always identifies improvements, so the interfaces are redesigned and eval-uated further.
Navigation DesignThe fundamental goal of the navigation design is to make the system as simple to use as pos-sible, by preventing the user from making mistakes, simplifying the recovery from mistakes,and using a consistent grammar order (usually object-action order). Command languages,natural languages, and direct manipulation are used in navigation, but the most commonapproach is menus (menu bar, drop-down menu, pop-up menu, tab menu, button and toolbars, and image maps). Error messages, confirmation messages, acknowledgment messages,delay messages, and help messages are common types of messages. Once the navigationdesign is agreed upon, it is documented in the form of WNDs and real use cases.
456 Chapter 11 Human–Computer Interaction Layer Design
At this point in time, you should play the role of Alec andcomplete the design of the human–computer interactionlayer. This includes adding use scenarios, updating the
WND, updating the user interface template design,updating the user interface prototypes, and adding anyadditional real use cases required.
11-11 CD Selections Internet Sales SystemYOUR
TURN

Input DesignThe goal of the input mechanism is to simply and easily capture accurate information forthe system, typically by using online or batch processing, capturing data at the source, andminimizing keystrokes. Input design includes both the design of input screens and allpreprinted forms that are used to collect data before they are entered into the informationsystem. There are many types of inputs, such as text fields, number fields, check boxes,radio buttons, on-screen list boxes, drop-down list boxes, and sliders. Most inputs are val-idated by using some combination of completeness checks, format checks, range checks,check digits, consistency checks, and database checks.
Output DesignThe goal of the output mechanism is to present information to users so they can accuratelyunderstand it with the least effort, usually by understanding how reports will be used anddesigning them to minimize information overload and bias. Output design means design-ing both screens and reports in other media, such as paper and the Web. There are manytypes of reports, such as detail reports, summary reports, exception reports, turnarounddocuments, and graphs.
Nonfunctional Requirements and the Human–Computer Interaction LayerNonfunctional requirements can affect the usefulness of the human–computer interactionlayer. Because the user/client sees the system as the human–computer interaction layer, notpaying sufficient attention to the nonfunctional requirements in the design of this layer cancause the entire system development effort to fail. These requirements include operational,performance, security, and cultural and political issues, and they are intertwined with thedesign of the data management and physical architecture layers. However, special attentionmust be paid to cultural and political requirements, such as user interface layout and multi-lingual capabilities, that address the design of this layer for the system to be effective.
Key Terms 457
KEY TERMS
Acknowledgment messageAction-object orderAestheticsBar-code readerBatch processingBatch reportBiasButtonCheck boxCheck digit checkCombo boxCommand languageCompleteness checkConfirmation messageConsistencyConsistency checkContent awarenessDatabase check
Data-entry operatorDefault valueDelay messageDensityDetail reportDirect manipulationDrop-down list boxDrop-down menuEase of learningEase of useEdit checkError messageEssential use caseException reportFieldField labelFormFormat check
Grammar orderGraphGraphical user interface (GUI)Help messageHeuristic evaluationHot keyHTML prototypeImage mapInformation loadInput mechanismInteractive evaluationInterface actionInterface design prototypeInterface evaluationInterface iconInterface metaphorInterface objectInterface standards

458 Chapter 11 Human–Computer Interaction Layer Design
Interface templateLanguage prototypeLayoutMagnetic stripe readersMenuMenu barNatural languageNavigation controlsNavigation mechanismNumber boxObject-action orderOnline processingOn-screen list boxOptical character recognitionOutput mechanismPop-up menuRadio button
Range checkReal-time informationReal-time reportReal use caseReportScreenSelection boxSequence diagramsSliderSmart cardSource data automationStateStereotypeStoryboardSummary reportSystem interfaceTab menu
Text boxThree-clicks ruleToolbarTransaction processingTransitionTurnaround documentUsability testingUse caseUse scenarioUser experienceUser interfaceValidationWalkthrough evaluationWhite spaceWindowWindows layout diagramWindow navigation diagram (WND)
QUESTIONS
1. Explain three important user interface design principles.2. What are three fundamental parts of most user
interfaces?3. Why is content awareness important?4. What is white space, and why is it important?5. Under what circumstances should densities be low?
High?6. How can a system be designed to be used by experi-
enced and first-time users?7. Why is consistency in design important? Why can too
much consistency cause problems?8. How can different parts of the interface be consistent?9. Describe the basic process of user interface design.
10. What are use cases, and why are they important?11. What is a WND, and why is it used?12. Why are interface standards important?13. Explain the purpose and contents of interface
metaphors, interface objects, interface actions, interfaceicons, and interface templates.
14. Why do we prototype the user interface design?15. Compare and contrast the three types of interface
design prototypes.16. Why is it important to perform an interface evalua-
tion before the system is built?17. Compare and contrast the four types of interface
evaluation.18. Under what conditions is heuristic evaluation justified?19. What type of interface evaluation did you perform in
the Your Turn 11-1?20. Describe three basic principles of navigation design.21. How can you prevent mistakes?22. Explain the differences between object-action order
and action-object order.23. Describe four types of navigation controls.24. Why are menus the most commonly used navigation
control?25. Compare and contrast four types of menus.26. Under what circumstances would you use a drop-
down menu versus a tab menu?27. Under what circumstances would you use an image
map versus a simple list menu?28. Describe five types of messages.29. What are the key factors in designing an error
message?30. What is context-sensitive help? Does your word proces-
sor have context-sensitive help?31. How do an essential use case and a real use case differ?32. What is the relationship between essential use cases
and use scenarios?33. What is the relationship between real use cases and
use scenarios?34. Explain three principles in the design of inputs.35. Compare and contrast batch processing and online
processing. Describe one application that would usebatch processing and one that would use onlineprocessing.

Exercises 459
36. Why is capturing data at the source important?37. Describe four devices that can be used for source data
automation.38. Describe five types of inputs.39. Compare and contrast check boxes and radio buttons.
When would you use one versus the other?40. Compare and contrast on-screen list boxes and drop-
down list boxes. When would you use one versus theother?
41. Why is input validation important?42. Describe five types of input validation methods.43. Explain three principles in the design of outputs.44. Describe five types of outputs.
45. When would you use electronic reports rather thanpaper reports, and vice versa?
46. What do you think are three common mistakes thatnovice analysts make in navigation design?
47. What do you think are three common mistakes thatnovice analysts make in input design?
48. What do you think are three common mistakes thatnovice analysts make in output design?
49. How would you improve the form in Figure 11-4?50. What are some of the nonfunctional requirements
that can influence the design of the human computerinteraction layer?
EXERCISES
A. Develop two use scenarios for a Web site that sellssome retail products (e.g., books, music, clothes).
B. Draw a WND for a Web site that sells some retailproducts (e.g., books, music, clothes).
C. Describe the primary components of the interfacestandards for a Web site that sells some retail prod-ucts (metaphors, objects, actions, icons and tem-plate).
D. Based on the use-case diagram for the health clubproblem in exercise O in Chapter 5:1. Develop two use scenarios.2. Develop the interface standards (omitting the inter-
face template).3. Draw a WND.4. Design a storyboard.
E. Based on your solution to exercise D:1. Design an interface template.2. Create Windows Layout Diagrams for the interface
design.3. Develop an HTML prototype.4. Develop a real use case.
F. Based on the use-case diagram for Picnics R Us inexercise Q in Chapter 5:1. Develop two use scenarios.2. Develop the interface standards (omitting the inter-
face template).3. Draw a WND.4. Design a storyboard.
G. Based on your solution to exercise F:1. Design an interface template.2. Create Windows Layout Diagrams for the interface
design.
3. Develop an HTML prototype.4. Develop a real use case.
H. Based on the use-case diagram for the Of-the-Month-Club in exercise S in Chapter 5:1. Develop two use scenarios.2. Develop the interface standards (omitting the inter-
face template).3. Draw a WND.4. Design a storyboard.
I. Based on your solution to exercise H:1. Design an interface template.2. Create Windows Layout Diagrams for the interface
design.3. Develop an HTML prototype.4. Develop a real use case.
J. Based on the use-case diagram for the universitylibrary borrowing system in exercise U in Chapter 5:1. Develop two use scenarios.2. Develop the interface standards (omitting the inter-
face template).3. Draw a WND.4. Design a storyboard.
K. Based on your solution to exercise J:1. Design an interface template.2. Create Windows Layout Diagrams for the interface
design.3. Develop an HTML prototype.4. Develop a real use case.
L. Ask Jeeves (http://www.ask.com) is an Internetsearch engine that uses natural language. Experimentwith it and compare it to search engines that use keywords.

460 Chapter 11 Human–Computer Interaction Layer Design
MINICASES
1. Tots to Teens is a catalog retailer specializing in chil-dren’s clothing. A project has been under way todevelop a new order entry system for the company’scatalog clerks. The old system had a character-baseduser interface that corresponded to the system’sCOBOL underpinnings. The new system will feature agraphical user interface more in keeping with up-to-date PC products in use today. The company hopesthat this new user interface will help reduce theturnover they have experienced with their order entryclerks. Many newly hired order entry staff found theold system very difficult to learn and were over-whelmed by the numerous mysterious codes that hadto be used to communicate with the system.
A user interface walkthrough evaluation was sched-uled for today to give the user a first look at the newsystem’s interface. The project team was careful toinvite several key users from the order entry depart-ment. In particular, Norma was included because ofher years of experience with the order entry system.Norma was known to be an informal leader in thedepartment; her opinion influenced many of her asso-ciates. Norma had let it be known that she was less thanthrilled with the ideas she had heard for the new sys-tem. Due to her experience and good memory, Normaworked very effectively with the character-based sys-tem and was able to breeze through even the most con-voluted transactions with ease. Norma had troublesuppressing a sneer when she heard talk of such thingsas “icons” and “buttons” in the new user interface.
Cindy was also invited to the walkthrough becauseof her influence in the order entry department. Cindyhas been with the department for just one year, butshe quickly became known because of her successfulorganization of a sick child day-care service for thechildren of the department workers. Sick children arethe number-one cause of absenteeism in the depart-ment, and many of the workers could not afford tomiss workdays. Never one to keep quiet when a situa-tion needed improvement, Cindy has been a vocalsupporter of the new system.a. Drawing upon the design principles presented in
the text, describe the features of the user interface
that will be most important to experienced userslike Norma.
b. Drawing upon the design principles presented inthe text, describe the features of the user interfacethat will be most important to novice users likeCindy.
2. The members of a systems development project teamhave gone out for lunch together, and as often hap-pens, the conversation turns to work. The team hasbeen working on the development of the user inter-face design, and so far, work has been progressingsmoothly. The team should be completing work onthe interface prototypes early next week. A combina-tion of storyboards and language prototypes has beenused in this project. The storyboards depict the over-all structure and flow of the system, but the teamdeveloped language prototypes of the actual screensbecause they felt that seeing the actual screens wouldbe valuable for the users.
Chris (the youngest member of the project team):I read an article last night about a really cool way toevaluate a user interface design. It’s called usabilitytesting, and it’s done by all the major software vendors.I think we should use it to evaluate our interfacedesign.
Heather (system analyst): I’ve heard of that, too,but isn’t it really expensive?
Mark (project manager): I’m afraid it is expensive,and I’m not sure we can justify the expense for thisproject.
Chris: But we really need to know that the interfaceworks. I thought this usability testing technique wouldhelp us prove we have a good design.
Amy (systems analyst): It would, Chris, but thereare other ways too. I assumed we’d do a thoroughwalkthrough with our users and present the interfaceto them at a meeting. We can project each interfacescreen so that the users can see it and give us theirreaction. This is probably the most efficient way to getthe users’ response to our work.
Heather: That’s true, but I’d sure like to see theusers sit down and work with the system. I’ve alwayslearned a lot by watching what they do, seeing where
M. Draw a WND for Your Turn 11-7 using the oppositegrammar order from your original design (if youdidn’t do it, draw two WNDs, one in each grammarorder). Which is best? Why?
N. In Your Turn 11-7, you probably used menus. Designthe navigation system again using a command lan-guage.

Minicases 461
they get confused, and hearing their comments andfeedback.
Ryan (systems analyst): It seems to me that we’veput so much work into this interface design that all wereally need to do is review it ourselves. Let’s just makea list of the design principles we’re most concernedabout and check it ourselves to make sure we’ve fol-lowed them consistently. If we have, we should befine. We want to get moving on the implementation,you know.
Mark: These are all good ideas. It seems like we’veall got a different view of how to evaluate the interfacedesign. Let’s try and sort out the technique that is bestfor our project.
Develop a set of guidelines that can help a projectteam like the one above select the most appropriateinterface evaluation technique for their project.
3. The menu structure for Holiday Travel Vehicle’sexisting character-based system is shown here.Develop and prototype a new interface design for thesystem’s functions using a graphical user interface.Also, develop a set of real use cases for your newinterface. Assume the new system will need toinclude the same functions as those shown in themenus provided. Include any messages that will beproduced as a user interacts with your interface(error, confirmation, status, etc.). Also, prepare awritten summary that describes how your interfaceimplements the principles of good interface design aspresented in the textbook.
4. One aspect of the new system under development atHoliday Travel Vehicles will be the direct entry of thesales invoice into the computer system by the salesper-son as the purchase transaction is being completed. Inthe current system, the salesperson fills out a paperform (shown on p. 462):
Design and prototype an input screen that will permitthe salesperson to enter all the necessary information forthe sales invoice. The following information may behelpful in your design process. Assume that HolidayTravel Vehicles sells recreational vehicles and trailers fromfour different manufacturers. Each manufacturer has afixed number of names and models of RVs and trailers.For the purposes of your prototype, use this format:
Mfg-A Name-1 Model-XMfg-A Name-1 Model-YMfg-A Name-1 Model-ZMfg-B Name-1 Model-XMfg-B Name-1 Model-YMfg-B Name-2 Model-X
Holiday Travel Vehicles
Sales Staff Maintenance Menu
1 Add Salesperson Record2 Change Salesperson Record3 Delete Salesperson Record
Type number of menu selection here:____
Holiday Travel Vehicles
Reports Menu
1 Commission Report2 RV Sales by Make Report3 Trailer Sales by Make Report4 Dealer Options Report
Type number of menu selection here:____
Holiday Travel Vehicles
Vehicle Inventory Menu
1 Create Vehicle Inventory Record2 Change Vehicle Inventory Record3 Delete Vehicle Inventory Record
Type number of menu selection here:____
Holiday Travel Vehicles
Sales Invoice Menu
1 Create Sales Invoice2 Change Sales Invoice3 Cancel Sales Invoice
Type number of menu selection here:____
Holiday Travel Vehicles
Main Menu
1 Sales Invoice2 Vehicle Inventory3 Reports4 Sales Staff
Type number of menu selection here:____
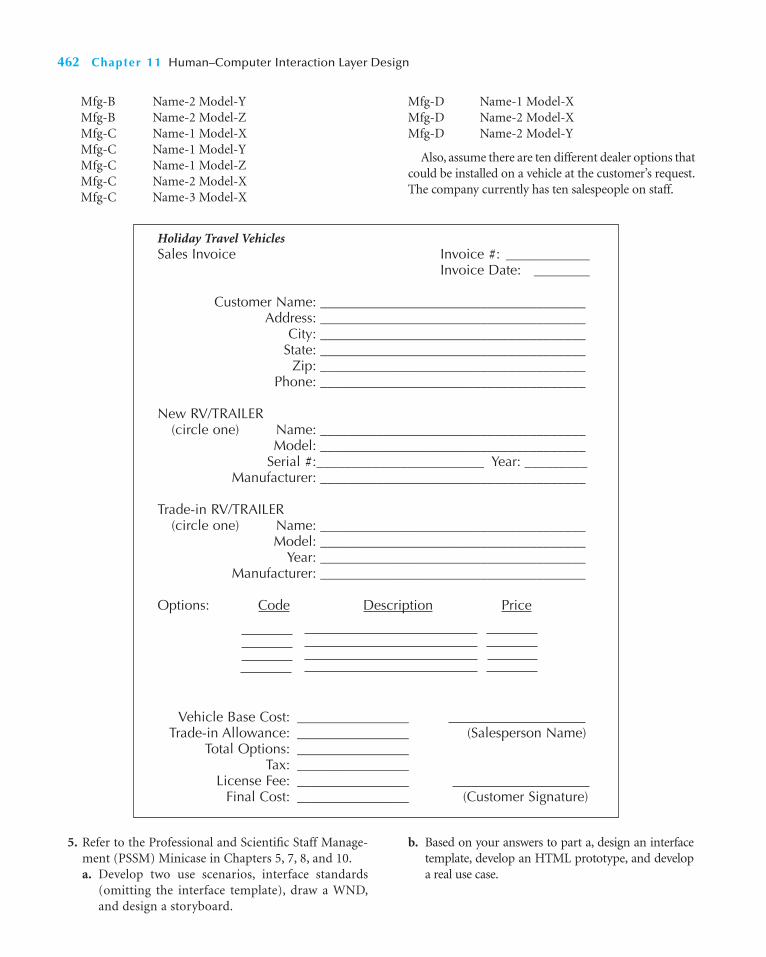
462 Chapter 11 Human–Computer Interaction Layer Design
Holiday Travel VehiclesSales Invoice Invoice #: ____________
Invoice Date: ________
Customer Name: ______________________________________Address: ______________________________________
City: ______________________________________State: ______________________________________
Zip: ______________________________________Phone: ______________________________________
New RV/TRAILER(circle one) Name: ______________________________________
Model: ______________________________________Serial #:________________________ Year: _________
Manufacturer: ______________________________________
Trade-in RV/TRAILER(circle one) Name: ______________________________________
Model: ______________________________________Year: ______________________________________
Manufacturer: ______________________________________
Options: Code Description Price
Vehicle Base Cost: ________________Trade-in Allowance: ________________ (Salesperson Name)
Total Options: ________________Tax: ________________
License Fee: ________________Final Cost: ________________ (Customer Signature)
Mfg-B Name-2 Model-YMfg-B Name-2 Model-ZMfg-C Name-1 Model-XMfg-C Name-1 Model-YMfg-C Name-1 Model-ZMfg-C Name-2 Model-XMfg-C Name-3 Model-X
Mfg-D Name-1 Model-XMfg-D Name-2 Model-XMfg-D Name-2 Model-Y
Also, assume there are ten different dealer options thatcould be installed on a vehicle at the customer’s request.The company currently has ten salespeople on staff.
5. Refer to the Professional and Scientific Staff Manage-ment (PSSM) Minicase in Chapters 5, 7, 8, and 10.a. Develop two use scenarios, interface standards
(omitting the interface template), draw a WND,and design a storyboard.
b. Based on your answers to part a, design an interfacetemplate, develop an HTML prototype, and developa real use case.

C H A P T E R 1 2
Physical Architecture Layer Design
463463
An important component of the design of an information system is the design of thephysical architecture layer, which describes the system’s hardware, software, and networkenvironment. The physical architecture layer design flows primarily from the nonfunctionalrequirements, such as operational, performance, security, cultural, and political require-ments. The deliverable from the physical architecture layer design includes the architectureand the hardware and software specification.
OBJECTIVES
■ Understand the different physical architecture components.■ Understand server-based, client-based, and client–server physical architectures.■ Be familiar with distributed objects computing.■ Be able to create a network model using a deployment diagram.■ Understand how operational, performance, security, cultural, and political require-
ments affect the design of the physical architecture layer.■ Be familiar with how to create a hardware and software specification.
CHAPTER OUTLINE
IntroductionElements of the Physical Architecture Layer
Architectural ComponentsServer-Based ArchitecturesClient-Based ArchitecturesClient–Server ArchitecturesClient–Server TiersDistributed Objects ComputingSelecting a Physical Architecture
Infrastructure DesignDeployment DiagramNetwork Model
Nonfunctional Requirements and PhysicalArchitecture Layer Design
Operational RequirementsPerformance RequirementsSecurity RequirementsCultural and Political RequirementsSynopsis
Hardware and Software SpecificationApplying the Concepts at
CD SelectionsSummary
INTRODUCTION
In today’s environment, most information systems are spread across two or more comput-ers. A Web-based system, for example, will run in the browser on a desktop computer butwill interact with the Web server (and possibly other computers) over the Internet. A sys-tem that operates completely inside a company’s network may have a Visual Basic programinstalled on one computer but interact with a database server elsewhere on the network.
Therefore, an important step of design is the creation of the physical architecture layerdesign, the plan for how the system will be distributed across the computers and whathardware and software will be used for each computer (e.g., Windows, Linux).
Most systems are built to use the existing hardware and software in the organization,so often the current architecture and hardware and software infrastructure restricts thechoice. Other factors, such as corporate standards, existing site-licensing agreements, andproduct–vendor relationships also can mandate what architecture, hardware, and softwarethe project team must design. However, many organizations now have a variety of infra-structures available or are openly looking for pilot projects to test new architectures, hard-ware, and software, which enables a project team to select an architecture on the basis ofother important factors.
Designing a physical architecture layer can be quite difficult; therefore, many organiza-tions hire expert consultants or assign very experienced analysts to the task.1 In this chapter,we examine the key factors in physical architecture layer design, but it is important toremember that it takes lots of experience to do it well. The nonfunctional requirementsdeveloped during analysis (see Chapter 5) play a key role in physical architecture layerdesign. These requirements are reexamined and refined into more detailed requirementsthat influence the system’s architecture. In this chapter, we first explain how the designersthink about application architectures, and we describe the three primary architectures:server-based, client-based, and client–server. Next, we look at using UML’s deploymentdiagram as a way to model the physical architecture layer. Then we examine how the verygeneral nonfunctional requirements from analysis are refined into more specific require-ments and the implications that they have for physical architecture layer design. Finally, weconsider how the requirements and architecture can be used to develop the hardware andsoftware specifications that define exactly what hardware and other software (e.g., databasesystems) are needed to support the information system being developed.
ELEMENTS OF THE PHYSICAL ARCHITECTURE LAYER
The objective of designing the physical architecture layer is to determine what parts of theapplication software will be assigned to what hardware. In this section we first discuss themajor architectural elements to understand how the software can be divided into differentparts. Then we briefly discuss the major types of hardware onto which the software can beplaced. Although there are numerous ways in which the software components can beplaced on the hardware components, there are three principal application architectures inuse today: server-based architectures, client-based architectures and client–server architec-tures. The most common architecture is the client–server architecture, so we focus on it.
Architectural ComponentsThe major architectural components of any system are the software and the hardware. Themajor software components of the system being developed have to be identified and thenallocated to the various hardware components on which the system will operate. Each ofthese components can be combined in a variety of different ways.
All software systems can be divided into four basic functions. The first is data storage (asso-ciated with the object persistence located on the data management layer—see Chapter 10).
464 Chapter 12 Physical Architecture Layer Design
1 For more information on physical architecture layer design, see Stephen D. Burd, Systems Architecture, 4th ed.(Boston: Course Technology, 2003); Irv Englander, The Architecture of Computer Hardware and Systems Software:An Information Technology Approach, 3rd ed. (New York: Wiley, 2003); and William Stallings, Computer Organi-zation & Architecture: Designing for Performance (Upper Saddle River, NJ: Prentice Hall, 2003).

Most application programs require data to be stored and retrieved, whether the informationis a small file such as a memo produced by a word processor or a large database that stores anorganization’s accounting records. These are the data documented in the structural model(CRC cards and class diagrams). The second function is data access logic (associated with thedata access and manipulation classes located on the data management layer—see Chapter10), the processing required to access data, which often means database queries in SQL (struc-tured query language). The third function is the application logic (located on the problemdomain layer—see Chapters 5–9), which can be simple or complex, depending on the appli-cation. This is the logic documented in the functional (activity diagrams and use cases) andbehavioral models (sequence, communication, and behavioral state machines). The fourthfunction is the presentation logic (located on the human–computer interaction layer—seeChapter 11), the presentation of information to the user, and the acceptance of the user’scommands (the user interface). These four functions (data storage, data access logic, applica-tion logic, and presentation logic) are the basic building blocks of any application.
The three primary hardware components of a system are client computers, servers, andthe network that connects them. Client computers are the input/output devices employedby the user and are usually desktop or laptop computers, but they can also be handhelddevices, cell phones, special-purpose terminals, and so on. Servers are typically larger com-puters that are used to store software and hardware that can be accessed by anyone who haspermission. Servers can come in several types: mainframes (very large, powerful computersusually costing millions of dollars), minicomputers (large computers costing hundreds ofthousands of dollars) and microcomputers (small desktop computers like the ones we all useto those costing $50,000 or more). The network that connects the computers can vary inspeed from a slow cell phone or modem connection that must be dialed, to medium-speedalways-on frame relay networks, to fast always-on broadband connections such as cablemodem, DSL, or T1 circuits, to high-speed always-on Ethernet, T3, or ATM circuits.2
Server-Based ArchitecturesThe very first computing architectures were server-based architectures, with the server(usually a central mainframe computer) performing all four application functions. Theclients (usually terminals) enabled users to send and receive messages to and from theserver computer. The clients merely captured keystrokes and sent them to the server forprocessing and accepted instructions from the server on what to display (see Figure 12-1).
Elements of the Physical Architecture Layer 465
2 For more information on networks, see Alan Dennis, Networking in the Internet Age (New York: Wiley, 2002).
Server Host(mainframe computer)
Client /(terminal)
Presentation logicApplication logicData access logicData storage
FIGURE 12-1Server-Based Architecture

This very simple architecture often works very well. Application software is developedand stored on one computer, and all data are on the same computer. There is one point ofcontrol, because all messages flow through the one central server. The fundamental prob-lem with server-based networks is that the server must process all messages. As thedemands for more and more applications grow, many server computers become over-loaded and unable to quickly process all the users’ demands. Response time becomesslower, and network managers are required to spend increasingly more money to upgradethe server computer. Unfortunately, upgrades come in large increments and are expensive;it is difficult to upgrade “a little.”
Client-Based ArchitecturesWith client-based architectures, the clients are personal computers on a local area network(LAN), and the server computer is a server on the same network. The application softwareon the client computers is responsible for the presentation logic, the application logic, andthe data access logic; the server simply stores the data (see Figure 12-2).
This simple architecture also often works well. However, as the demands for more andmore network applications grow, the network circuits can become overloaded. The funda-mental problem in client-based networks is that all data on the server must travel to theclient for processing. For example, suppose the user wishes to display a list of all employ-ees with company life insurance. All the data in the database must travel from the serverwhere the database is stored over the network to the client, which then examines eachrecord to see if it matches the data requested by the user. This can overload both the net-work and the power of the client computers.
Client–Server ArchitecturesMost organizations today are moving to client–server architectures, which attempt tobalance the processing between the client and the server by having both do some of theapplication functions. In these architectures, the client is responsible for the presentationlogic, whereas the server is responsible for the data access logic and data storage. Theapplication logic may reside on either the client or the server or be split between both(see Figure 12-3). The client shown in Figure 12-3 can be referred to as a thick, or fat,client if it contains the bulk of application logic. A current practice is to createclient–server architectures using thin clients because there is less overhead and mainte-nance in supporting thin-client applications. For example, many Web-based systems aredesigned with the Web browser performing presentation, with only minimal applicationlogic using programming languages like Java and the Web server having the applicationlogic, data access logic, and data storage.
466 Chapter 12 Physical Architecture Layer Design
Client(microcomputer)
Presentation logicApplication logicData access logic
Server(microcomputer)
Data storageFIGURE 12-2Client-BasedArchitectures

Client–server architectures have four important benefits. First and foremost, they arescalable. That means it is easy to increase or decrease the storage and processing capabili-ties of the servers. If one server becomes overloaded, you simply add another server so thatmany servers are used to perform the application logic, data access logic, or data storage.The cost to upgrade is much more gradual, and you can upgrade in smaller steps ratherthan spending hundreds of thousands to upgrade a mainframe server.
Second, client–server architectures can support many different types of clients andservers. It is possible to connect computers that use different operating systems so thatusers can choose which type of computer they prefer (e.g., combining both Windows com-puters and Apple Macintoshes on the same network). We are not locked into one vendor,as is often the case with server-based networks. Middleware is a type of system softwaredesigned to translate between different vendors’ software. Middleware is installed on boththe client computer and the server computer. The client software communicates with themiddleware, which can reformat the message into a standard language that can be under-stood by the middleware assisting the server software. We describe two approaches to mid-dleware in the distributed objects computing section.
Third, for thin-client server architectures that use Internet standards, it is simple toclearly separate the presentation logic, the application logic, and the data access logic anddesign so each is somewhat independent. For example, the presentation logic can bedesigned in HTML or XML to specify how the page will appear on the screen (e.g., the col-ors, fonts, order of items, specific words used, command buttons, the type of selection lists,etc.; see Chapter 11). Simple program statements are used to link parts of the interface tospecific application logic modules that perform various functions. These HTML or XMLfiles defining the interface can be changed without affecting the application logic. Likewise,it is possible to change the application logic without changing the presentation logic or thedata, which are stored in databases and accessed using SQL commands.
Finally, because no single server computer supports all the applications, the network isgenerally more reliable. There is no central point of failure that will halt the entire networkif it fails, as there is in server-based computing. If any one server fails in a client–serverenvironment, the network can continue to function using all the other servers (but, ofcourse, any applications that require the failed server will not work).
Client–server architectures also have some critical limitations, the most important ofwhich is its complexity. All applications in client–server computing have two parts, the soft-ware on the client and the software on the server. Writing this software is more complicatedthan writing the traditional all-in-one software used in server-based architectures. Updat-ing the network with a new version of the software is more complicated, too. In server-based architectures, there is one place in which application software is stored; to update the
Elements of the Physical Architecture Layer 467
Client(microcomputer)
Presentation logicApplication logic
Server(microcomputer,minicomputer,or mainframe)
Data access logicData storage
FIGURE 12-3Client–Server Architecture
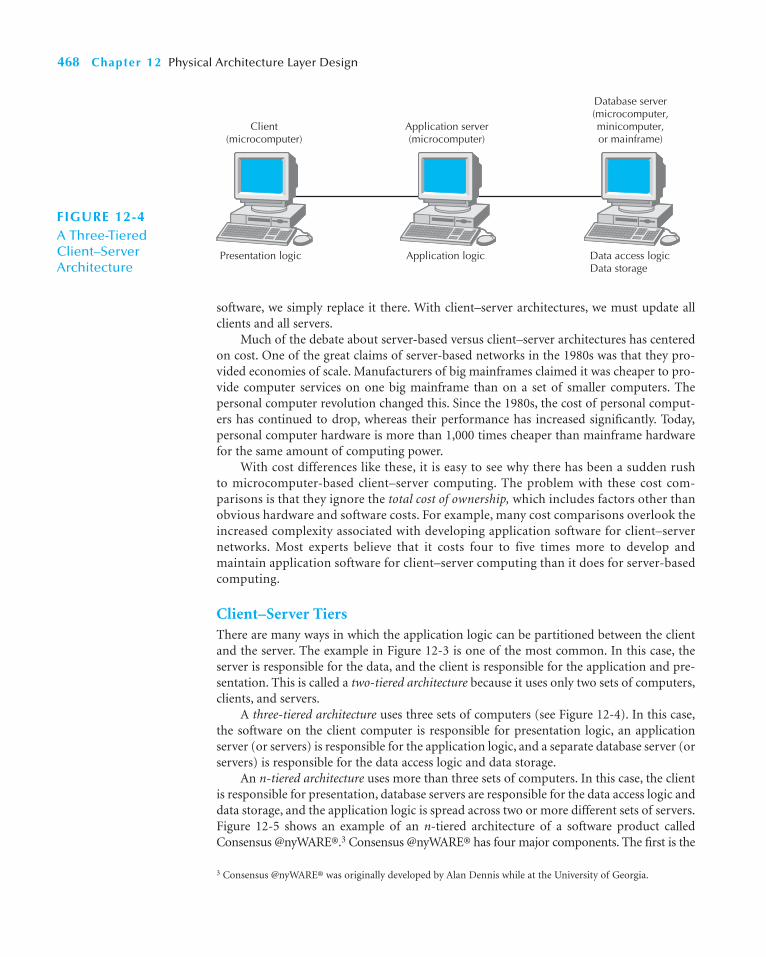
software, we simply replace it there. With client–server architectures, we must update allclients and all servers.
Much of the debate about server-based versus client–server architectures has centeredon cost. One of the great claims of server-based networks in the 1980s was that they pro-vided economies of scale. Manufacturers of big mainframes claimed it was cheaper to pro-vide computer services on one big mainframe than on a set of smaller computers. Thepersonal computer revolution changed this. Since the 1980s, the cost of personal comput-ers has continued to drop, whereas their performance has increased significantly. Today,personal computer hardware is more than 1,000 times cheaper than mainframe hardwarefor the same amount of computing power.
With cost differences like these, it is easy to see why there has been a sudden rushto microcomputer-based client–server computing. The problem with these cost com-parisons is that they ignore the total cost of ownership, which includes factors other thanobvious hardware and software costs. For example, many cost comparisons overlook theincreased complexity associated with developing application software for client–servernetworks. Most experts believe that it costs four to five times more to develop andmaintain application software for client–server computing than it does for server-basedcomputing.
Client–Server TiersThere are many ways in which the application logic can be partitioned between the clientand the server. The example in Figure 12-3 is one of the most common. In this case, theserver is responsible for the data, and the client is responsible for the application and pre-sentation. This is called a two-tiered architecture because it uses only two sets of computers,clients, and servers.
A three-tiered architecture uses three sets of computers (see Figure 12-4). In this case,the software on the client computer is responsible for presentation logic, an applicationserver (or servers) is responsible for the application logic, and a separate database server (orservers) is responsible for the data access logic and data storage.
An n-tiered architecture uses more than three sets of computers. In this case, the clientis responsible for presentation, database servers are responsible for the data access logic anddata storage, and the application logic is spread across two or more different sets of servers.Figure 12-5 shows an example of an n-tiered architecture of a software product calledConsensus @nyWARE®.3 Consensus @nyWARE® has four major components. The first is the
468 Chapter 12 Physical Architecture Layer Design
Client(microcomputer)
Presentation logic
Application server(microcomputer)
Application logic
Database server(microcomputer,minicomputer,or mainframe)
Data access logicData storage
FIGURE 12-4A Three-TieredClient–Server Architecture
3 Consensus @nyWARE® was originally developed by Alan Dennis while at the University of Georgia.
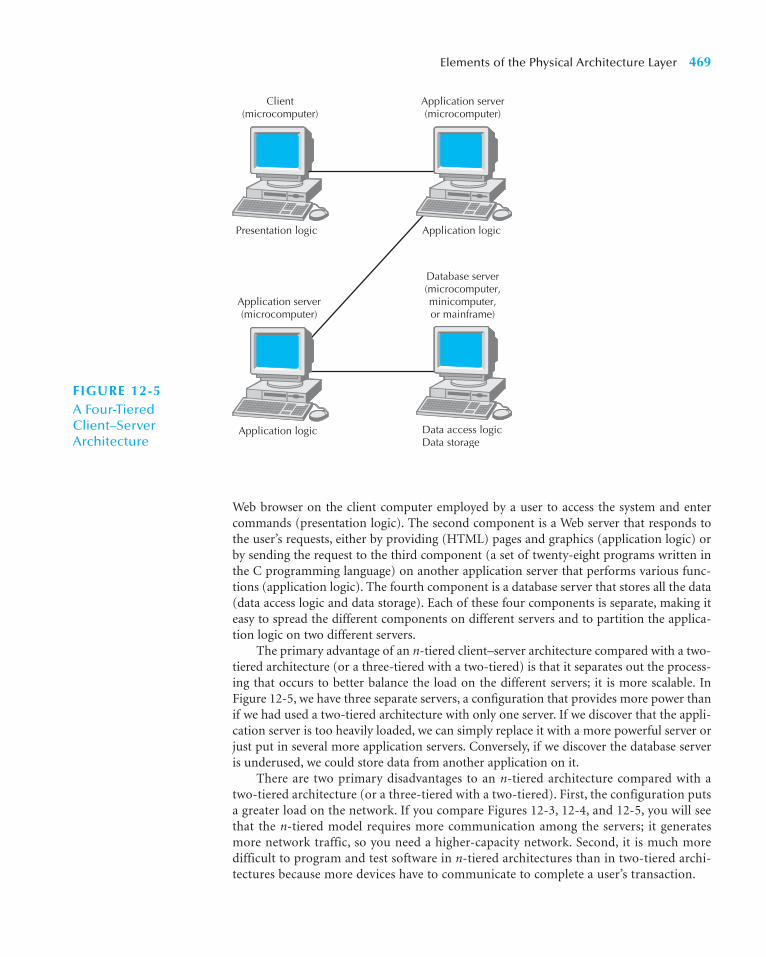
Web browser on the client computer employed by a user to access the system and entercommands (presentation logic). The second component is a Web server that responds tothe user’s requests, either by providing (HTML) pages and graphics (application logic) orby sending the request to the third component (a set of twenty-eight programs written inthe C programming language) on another application server that performs various func-tions (application logic). The fourth component is a database server that stores all the data(data access logic and data storage). Each of these four components is separate, making iteasy to spread the different components on different servers and to partition the applica-tion logic on two different servers.
The primary advantage of an n-tiered client–server architecture compared with a two-tiered architecture (or a three-tiered with a two-tiered) is that it separates out the process-ing that occurs to better balance the load on the different servers; it is more scalable. InFigure 12-5, we have three separate servers, a configuration that provides more power thanif we had used a two-tiered architecture with only one server. If we discover that the appli-cation server is too heavily loaded, we can simply replace it with a more powerful server orjust put in several more application servers. Conversely, if we discover the database serveris underused, we could store data from another application on it.
There are two primary disadvantages to an n-tiered architecture compared with atwo-tiered architecture (or a three-tiered with a two-tiered). First, the configuration putsa greater load on the network. If you compare Figures 12-3, 12-4, and 12-5, you will seethat the n-tiered model requires more communication among the servers; it generatesmore network traffic, so you need a higher-capacity network. Second, it is much moredifficult to program and test software in n-tiered architectures than in two-tiered archi-tectures because more devices have to communicate to complete a user’s transaction.
Elements of the Physical Architecture Layer 469
Client(microcomputer)
Presentation logic
Application server(microcomputer)
Application logic
Database server(microcomputer,minicomputer,or mainframe)
Data access logicData storage
Application server(microcomputer)
Application logic
FIGURE 12-5A Four-TieredClient–Server Architecture
Distributed Objects ComputingFrom an object-oriented perspective, distributed objects computing (DOC) is the next ver-sion of client–server computing. DOC represents a software layer that goes between theclients and servers; hence, it is known as middleware. Middleware supports the interactionbetween objects in a distributed computing environment. Furthermore, middleware treatsthe actual physical network architecture in a transparent manner. This allows the developerto focus on the development of the application and ignore the peculiarities of a specific dis-tributed environment.
From a practical perspective, DOC allows the developer to simply concentrate on theusers, objects, and methods of an application instead of worrying about which server con-tains which set of objects. The client object simply requests the “network” to locate and exe-cute the server object’s method. This basically allows the physical location of the serverobject to become irrelevant from the client object’s perspective. Therefore, because serversare no longer being addressed directly on the client, servers can be added and subtractedfrom the network without having to update the client code. Only the middleware must bemade aware of the new addresses of the server objects. This can greatly reduce the mainte-nance in a client–server environment. However, because middleware adds an additionallayer between the clients and servers, it can reduce the efficiency of the application.
Currently, there are three competing approaches to support DOC: Object Manage-ment Group’s, Sun’s, and Microsoft’s. The Object Management Group supports DOC viaits Common Object Request Broker Architecture (CORBA) standard. Sun supports DOC viaits Enterprise JavaBeans (EJB) and its Java 2 Enterprise Edition (J2EE). At this point in time,the approaches supported by OMG and Sun seem to be evolving toward one another. Eventhough Microsoft is involved in OMG, Microsoft has its own competing approach to sup-port DOC: .net. At this point in time, all three are competitors to support DOC; it is notclear which approach will win in the marketplace.
470 Chapter 12 Physical Architecture Layer Design
Every spring, Monster.com, one of the largest job sites inthe United States with an average of more than 3 millionvisitors per month, experiences a large increase in traffic.Aaron Braham, vice president of operations, attributes thespike to college students who increase their job-searchactivities as they approach graduation.
Monster.com uses a three-tier client–server architec-ture that has 150 Web servers and 30 database servers inits main site in Indianapolis. It plans to move that to 400over the next year by gradually growing the main site andadding a new site with servers in Maynard, Massachusetts,just in time for the spring rush. The main Web site has a setof load-balancing devices that forward Web requests tothe different servers, depending on how busy they are.
Braham says the major challenge is that 90 percentof the traffic is not simple requests for Web pages but,rather, search requests (e.g., the network jobs are avail-able in New Mexico), which require more processing and
access to the database servers. Monster.com has morethan 350,000 job postings and more than 3 million resumeson file, spread across its database servers. Several copiesof each posting and résumé are kept on several databaseservers to improve access speed and provide redundancyin case a server crashes, so just keeping the databaseservers in sync so that they contain correct data is achallenge.
Questions
1. What are the two or three primary nonfunctionalrequirements that have influenced Monster.com’sapplication architecture?
2. What alternatives do you think Monster.com considered?
Source: “Resume Influx Tests Mettle of Job Sites’ Scalability,” InternetWeek (May 29, 2000).
12-A A Monster Client–Server ArchitectureCONCEPTS
IN ACTION

Selecting a Physical ArchitectureMost systems are built to use the existing infrastructure in the organization, so often thecurrent infrastructure restricts the choice of architecture. For example, if the new systemwill be built for a mainframe-centric organization, a server-based architecture may be thebest option. Other factors such as corporate standards, existing licensing agreements, andproduct/vendor relationships can also mandate what architecture the project team needs todesign. However, many organizations now have a variety of infrastructures available or areopenly looking for pilot projects to test new architectures and infrastructures, enabling aproject team to select an architecture based on other important factors.
Each of the computing architectures just discussed has its strengths and weaknesses, andno architecture is inherently better than the others. Thus, it is important to understand thestrengths and weaknesses of each computing architecture and when to use each. Figure 12-6presents a summary of the important characteristics of each architecture.
Cost of Infrastructure One of the strongest driving forces to client–server architecturesis cost of infrastructure (the hardware, software, and networks that will support the appli-cation system). Simply put, personal computers are more than 1,000 times cheaper thanmainframes for the same amount of computing power. The personal computers on ourdesks today have more processing power, memory, and hard disk space than the typicalmainframe of the past, and the cost of the personal computers is a fraction of the cost ofthe mainframe.
Therefore, the cost of client–server architectures is low compared to server-basedarchitectures that rely on mainframes. Client–server architectures also tend to be cheaperthan client-based architectures because they place less of a load on networks and thusrequire less network capacity.
Cost of Development The cost of developing systems is an important factor when con-sidering the financial benefits of client–server architectures. Developing application soft-ware for client–server computing is extremely complex, and most experts believe that itcosts four to five times more to develop and maintain application software for client–servercomputing than it does for server-based computing. Developing application software forclient-based architectures is usually cheaper still, because there are many GUI developmenttools for simple stand-alone computers that communicate with database servers (e.g.,Visual Basic, Access).
The cost differential may change as more companies gain experience with client–serverapplications; new client–server products are developed and refined; and client–server stan-dards mature. However, given the inherent complexity of client–server software and theneed to coordinate the interactions of software on different computers, there is likely toremain a cost difference.
Elements of the Physical Architecture Layer 471
Cost of infrastructure Very high Medium Low
Cost of development Medium Low High
Ease of development Low High Low–medium
Interface capabilities Low High High
Control and security High Low Medium
Scalability Low Medium High
Server-Based Client-Based Client–Server
FIGURE 12-6Characteristicsof Computing Architectures
Ease of Development In most organizations today, there is a huge backlog of mainframeapplications, systems that have been approved but that lack the staff to implement them.This backlog signals the difficulty in developing server-based systems. The tools formainframe-based systems often are not user friendly and require highly specialized skills(e.g., COBOL/CICS)—skills that new graduates often don’t have and aren’t interested inacquiring. In contrast, client-based and client–server architectures can rely on graphicaluser interface (GUI) development tools that can be intuitive and easy to use. The develop-ment of applications for these architectures can be fast and painless. Unfortunately, theapplications for client–server can be very complex because they must be built for severallayers of hardware (e.g., database servers, Web servers, client workstations) that need tocommunicate effectively with each other. Project teams often underestimate the effortinvolved in creating secure, efficient client–server applications.
Interface Capabilities Typically, server-based applications contain plain, character-basedinterfaces. For example, think about airline reservation systems such as SABRE, which canbe quite difficult to use unless the operator is well trained on the commands and hundredsof codes that are used to navigate through the system. Today, most users of systems expecta GUI or a Web-based interface that they can operate using a mouse and graphical objects(e.g., pushbuttons, drop-down lists, icons, and so on). GUI and Web development toolstypically are created to support client-based or client–server applications; rarely can server-based environments support these types of applications.
Control and Security The server-based architecture was originally developed to controland secure data, and it is much easier to administer because all the data are stored in a sin-gle location. In contrast, client–server computing requires a high degree of coordinationamong many components, and the chance for security holes or control problems is muchmore likely. Also, the hardware and software used in client–server architecture are stillmaturing in terms of security. When an organization has a system that absolutely must besecure (e.g., an application used by the Department of Defense), then the project team maybe more comfortable with the server-based alternative on highly secure and control-oriented mainframe computers.
Scalability Scalability refers to the ability to increase or decrease the capacity of the com-puting infrastructure in response to changing capacity needs. The most scalable architec-ture is client–server computing because servers can be added to (or removed from) thearchitecture when processing needs change. Also, the types of hardware that are used inclient–server situations (e.g., minicomputers) typically can be upgraded at a pace that mostclosely matches the growth of the application. In contrast, server-based architectures relyprimarily on mainframe hardware that needs to be scaled up in large, expensive incre-ments, and client-based architectures have ceilings above which the application cannotgrow because increases in use and data can result in increased network traffic to the extentthat performance is unacceptable.
472 Chapter 12 Physical Architecture Layer Design
Think about the course registration system in your univer-sity. What physical architecture does it use? If you had tocreate a new system today, would you use the current
architecture or change to a different one? Describe the cri-teria that you would consider when making your decision.
12-1 Course Registration SystemYOUR
TURN
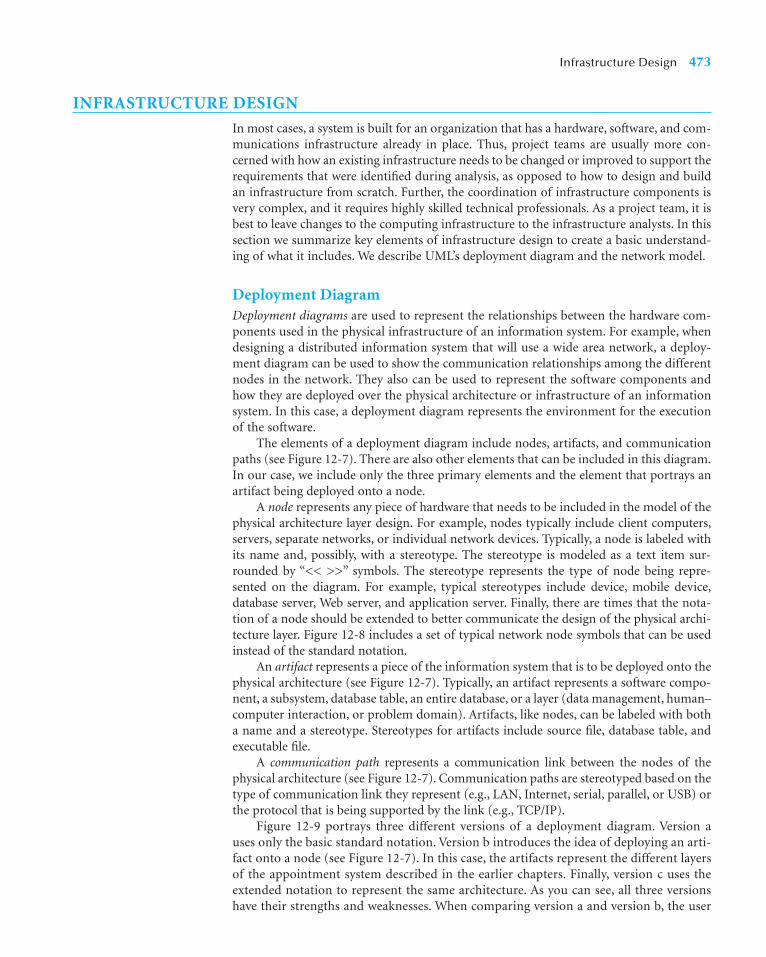
INFRASTRUCTURE DESIGN
In most cases, a system is built for an organization that has a hardware, software, and com-munications infrastructure already in place. Thus, project teams are usually more con-cerned with how an existing infrastructure needs to be changed or improved to support therequirements that were identified during analysis, as opposed to how to design and buildan infrastructure from scratch. Further, the coordination of infrastructure components isvery complex, and it requires highly skilled technical professionals. As a project team, it isbest to leave changes to the computing infrastructure to the infrastructure analysts. In thissection we summarize key elements of infrastructure design to create a basic understand-ing of what it includes. We describe UML’s deployment diagram and the network model.
Deployment DiagramDeployment diagrams are used to represent the relationships between the hardware com-ponents used in the physical infrastructure of an information system. For example, whendesigning a distributed information system that will use a wide area network, a deploy-ment diagram can be used to show the communication relationships among the differentnodes in the network. They also can be used to represent the software components andhow they are deployed over the physical architecture or infrastructure of an informationsystem. In this case, a deployment diagram represents the environment for the executionof the software.
The elements of a deployment diagram include nodes, artifacts, and communicationpaths (see Figure 12-7). There are also other elements that can be included in this diagram.In our case, we include only the three primary elements and the element that portrays anartifact being deployed onto a node.
A node represents any piece of hardware that needs to be included in the model of thephysical architecture layer design. For example, nodes typically include client computers,servers, separate networks, or individual network devices. Typically, a node is labeled withits name and, possibly, with a stereotype. The stereotype is modeled as a text item sur-rounded by “<< >>” symbols. The stereotype represents the type of node being repre-sented on the diagram. For example, typical stereotypes include device, mobile device,database server, Web server, and application server. Finally, there are times that the nota-tion of a node should be extended to better communicate the design of the physical archi-tecture layer. Figure 12-8 includes a set of typical network node symbols that can be usedinstead of the standard notation.
An artifact represents a piece of the information system that is to be deployed onto thephysical architecture (see Figure 12-7). Typically, an artifact represents a software compo-nent, a subsystem, database table, an entire database, or a layer (data management, human–computer interaction, or problem domain). Artifacts, like nodes, can be labeled with botha name and a stereotype. Stereotypes for artifacts include source file, database table, andexecutable file.
A communication path represents a communication link between the nodes of thephysical architecture (see Figure 12-7). Communication paths are stereotyped based on thetype of communication link they represent (e.g., LAN, Internet, serial, parallel, or USB) orthe protocol that is being supported by the link (e.g., TCP/IP).
Figure 12-9 portrays three different versions of a deployment diagram. Version auses only the basic standard notation. Version b introduces the idea of deploying an arti-fact onto a node (see Figure 12-7). In this case, the artifacts represent the different layersof the appointment system described in the earlier chapters. Finally, version c uses theextended notation to represent the same architecture. As you can see, all three versionshave their strengths and weaknesses. When comparing version a and version b, the user
Infrastructure Design 473
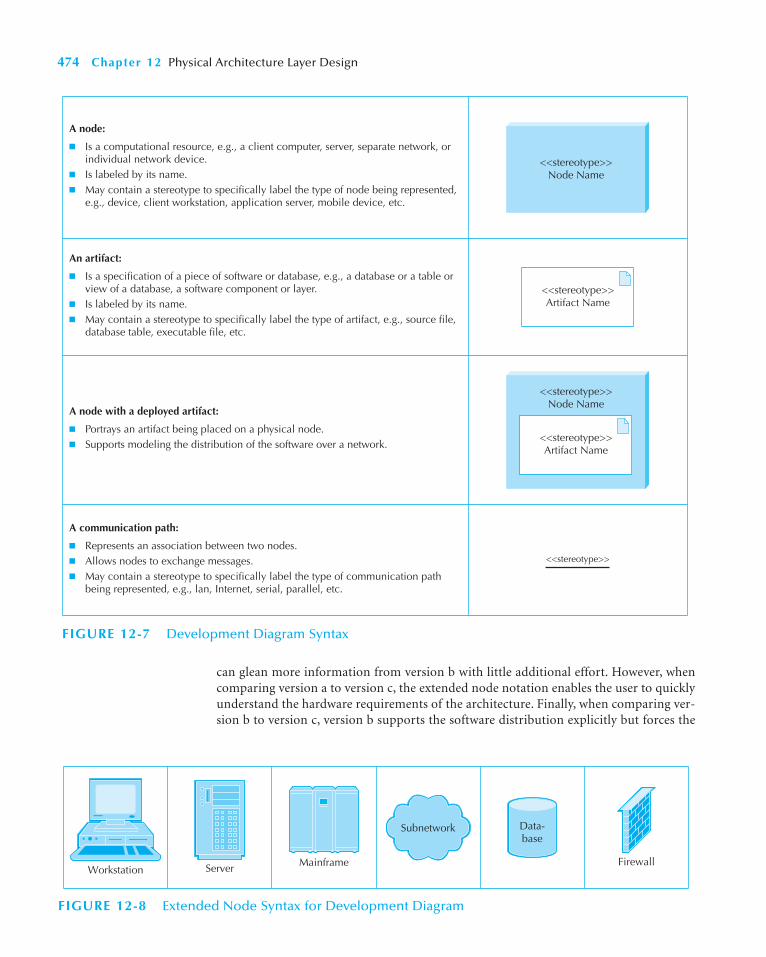
can glean more information from version b with little additional effort. However, whencomparing version a to version c, the extended node notation enables the user to quicklyunderstand the hardware requirements of the architecture. Finally, when comparing ver-sion b to version c, version b supports the software distribution explicitly but forces the
474 Chapter 12 Physical Architecture Layer Design
A node:
n Is a computational resource, e.g., a client computer, server, separate network, or individual network device.
n Is labeled by its name. n May contain a stereotype to specifically label the type of node being represented,
e.g., device, client workstation, application server, mobile device, etc.
An artifact:
n Is a specification of a piece of software or database, e.g., a database or a table or view of a database, a software component or layer.
n Is labeled by its name.n May contain a stereotype to specifically label the type of artifact, e.g., source file,
database table, executable file, etc.
A communication path:
n Represents an association between two nodes.n Allows nodes to exchange messages.n May contain a stereotype to specifically label the type of communication path
being represented, e.g., lan, Internet, serial, parallel, etc.
A node with a deployed artifact:
n Portrays an artifact being placed on a physical node.n Supports modeling the distribution of the software over a network.
<<stereotype>>Node Name
<<stereotype>>
<<stereotype>>Artifact Name
<<stereotype>>Node Name
<<stereotype>>Artifact Name
FIGURE 12-7 Development Diagram Syntax
Workstation Server Mainframe
Subnetwork Data-base
Firewall
FIGURE 12-8 Extended Node Syntax for Development Diagram
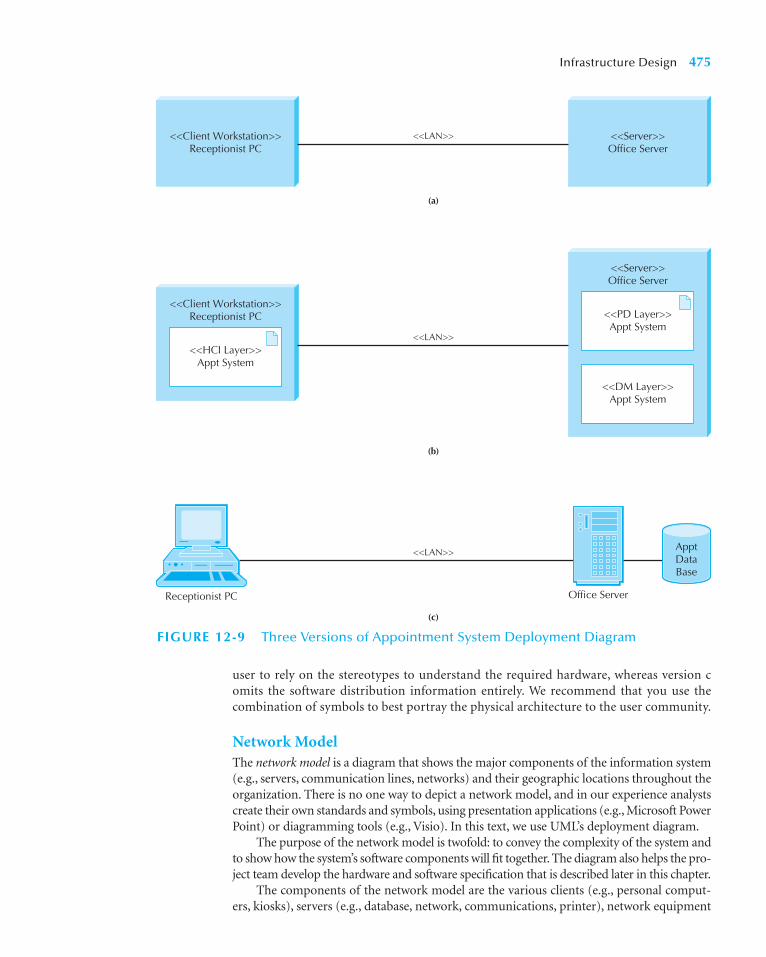
user to rely on the stereotypes to understand the required hardware, whereas version comits the software distribution information entirely. We recommend that you use thecombination of symbols to best portray the physical architecture to the user community.
Network ModelThe network model is a diagram that shows the major components of the information system(e.g., servers, communication lines, networks) and their geographic locations throughout theorganization. There is no one way to depict a network model, and in our experience analystscreate their own standards and symbols, using presentation applications (e.g., Microsoft PowerPoint) or diagramming tools (e.g., Visio). In this text, we use UML’s deployment diagram.
The purpose of the network model is twofold: to convey the complexity of the system andto show how the system’s software components will fit together. The diagram also helps the pro-ject team develop the hardware and software specification that is described later in this chapter.
The components of the network model are the various clients (e.g., personal comput-ers, kiosks), servers (e.g., database, network, communications, printer), network equipment
Infrastructure Design 475
<<LAN>>
<<Client Workstation>> Receptionist PC
<<Server>>Office Server
<<Client Workstation>> Receptionist PC
<<HCI Layer>> Appt System
<<Server>>Office Server
<<PD Layer>> Appt System
<<DM Layer>> Appt System
Receptionist PC Office Server
ApptDataBase
<<LAN>>
<<LAN>>
(a)
(b)
(c)
FIGURE 12-9 Three Versions of Appointment System Deployment Diagram
(e.g., wires, dial-up connections, satellite links), and external systems or networks (e.g.,Internet service providers) that support the application. Locations are the geographic sitesrelated to these components. For example, if a company created an application for users atfour of its plants in Canada and eight plants in the United States and it used one externalsystem to provide Internet service, the network model to depict this would contain twelvelocations (4 � 8 � 12).
Creating the network model is a top-down exercise whereby we first graphically depictall the locations where the application will reside. This is accomplished by placing symbolsthat represent the locations for the components on a diagram and then connecting themwith lines that are labeled with the approximate amount of data or types of network cir-cuits between the separated components.
Companies seldom build networks to connect distant locations by buying land andlaying cable (or sending up their own satellites). Instead, they usually lease services pro-vided by large telecommunications firms such as AT&T, Sprint, and WorldCom/MCI. Fig-ure 12-10 shows a typical network. The “clouds” in the diagram represent the networks atdifferent locations (e.g., Toronto, Atlanta). The lines represent network connectionsbetween specific points (e.g., Toronto to Brampton). In other cases, a company may leaseconnections from many points to many others, and rather than trying to show all the con-nections, a separate cloud may be drawn to represent this many-to-many type of connec-tion (e.g., the cloud in the center of this Figure 12-10 represents a network ofmany-to-many connections provided by a telecom firm like Verizon).
This high-level diagram has several purposes. First, it shows the locations of the com-ponents needed to support the application; therefore, the project team can get a goodunderstanding of the geographic scope of the new system and how complex and costly thecommunications infrastructure will be to support. (For example, an application that sup-ports one site will probably have less communications costs as compared to a more-complex application that will be shared all over the world.) The diagram also indicates theexternal components of the system (e.g., customer systems, supplier systems), which mayimpact security or global needs (discussed later in this chapter).
The second step to the network model is to create low-level network diagrams for eachof the locations shown on the top-level diagram. First, hardware is drawn on the model ina way that depicts how the hardware for the new system will be placed throughout thelocation. It usually helps to use symbols that resemble the hardware that will be used.
476 Chapter 12 Physical Architecture Layer Design
Nortel, the giant Canadian manufacturer of networkswitches, recently implemented a network using its ownequipment. Prior to implementing it, Nortel had used a setof more than 100 circuits that was proving to be more andmore expensive and unwieldy to manage. Nortel startedby identifying the 20 percent of its sites that accounted for80 percent of the network traffic. These were the first tomove to the new network. By the time the switchover iscomplete, more than 100 sites will be connected.
There are two primary parts to the new network (seeFigure 12-7). The largest part uses a public network
provided by WorldCom/MCI. Nortel also operates a pri-vate network in Ontario. Both parts of the network use 44Mbps circuits. Nortel is planning to move to 155 Mbpscircuits when costs drop.
Question
What are the advantages and disadvantages of Nortel’sphased implementation of the new network?
Source: “A Case for ATM,” Network World ( June 2, 1997). Tim Greene,Vol. 14, No. 22, pp. 1-2.
12-B Nortel’s NetworkCONCEPTS
IN ACTION

The amount of detail to include on the network model depends on the needs of the pro-ject. Some low-level network models contain text descriptions below each of the hardwarecomponents that describe in detail the proposed hardware configurations and processingneeds; others include only the number of users that are associated with the different partsof the diagram.
Next, lines are drawn connecting the components that will be physically attached toeach other. In terms of software, some network models list the required software for eachnetwork model component right on the diagram, whereas other times, the software isdescribed in a memo attached to the network model and stored in the project binder.
Infrastructure Design 477
<<privatenetwork>><<private
network>>
<<priva
te
netw
ork>
>
<<private network>>
<<private network>>
<<pr
ivat
e ne
twor
k>>
<<private network>><<private network>>
<<
priv
ate
netw
ork>
>
<<pr
ivat
e ne
twor
k>><<private network>>
<<private network>>
<<private network>>
Verizon Network
Ottawa,ONT
Tyson’s Corner, VA
ResearchTriangle Park,
NC
Ossining,NY
Sunrise,FL
Atlanta,GA
Nashville,TN
Richardson,TX
Santa Clara, CA
Toronto,ONT
Brampton,ONT
Mariline,ONT
FIGURE 12-10 Deployment Diagram Representation of a Top-Level Network Model
478 Chapter 12 Physical Architecture Layer Design
Each year, the U.S. Department of Education (DOE)processes more than 10 million student loans, such asPell grants, guaranteed student loans, and college work-study programs. The DOE has more than 5,000 employ-ees that need access to more than 400 gigabytes ofstudent data.
The financial aid network, located in one Washing-ton, D.C., building, has two major parts (i.e., backbones)that each use high-speed 155 Mbps circuits to connectfour LANs and three high-performance database servers(see Figure 12-11). These two backbones are connectedinto another network backbone that connects the finan-cial aid building using 100 Mbps circuits to five other
DOE buildings in Washington with similar networks. Thetwo backbones are also connected to the ten regionalDOE offices across the United States and to other U.S.government agencies via a set of lower-speed 1.5 Mbpsconnections.
Source: Network Computing (May 15, 1996). Maureen Zaprylok,Financial Aid: Department of Education’s EdNet, p. 84.
Question
Why does each part of the network have different datarates?
12-C The Department of Education’s Financial Aid NetworkCONCEPTS
IN ACTION
Suppose that you have just moved into a fraternity orsorority house with twenty other people. The house has alaser printer and a low-cost scanner that its inhabitantsare free to use. You have decided to network the house sothat everyone can share the printer and scanner and have
dial-up access to the university network. Create a high-level network model that describes the locations that willbe involved in your work. Next, create a low-level dia-gram for the house itself.
12-2 Create a Network ModelYOUR
TURN
Figure 12-11 shows a deployment diagram that portrays two levels of detail of a low-levelnetwork model. Notice, we use both the standard and extended node notation in this fig-ure. Furthermore, in this case, we have included a package (see Chapter 8) to represent aset of connections to the router in the MFA building. By including a package, we showonly the detail necessary. The extended notation in many cases aids the user in under-standing the topology of the physical architecture layer much better than the standardnotation. As such, we recommend using the symbols that get the message across best.
Our experiences have shown that most project teams create a memo for the projectfiles that provides additional detail about the network model. This information is helpfulto the people who are responsible for creating the hardware and software specification(described later in this chapter) and who will work more extensively with the infrastruc-ture development. This memo can include special issues that impact communications,requirements for hardware and software that may not be obvious from the networkmodel, or specific hardware or software vendors or products that should be acquired.
Again, the primary purpose of the network model diagram is to present the proposedinfrastructure for the new system. The project team can use the diagrams to understand thescope of the system, the complexity of its structure, any important communication issuesthat may affect development and implementation, and the actual components that willneed to be acquired or integrated into the environment.

Infrastructure Design 479
<<location>>Main Financial Aid Building
<<private>>
<<private>>
DOEWashington, DC
Offices
DOE Regional Offices
(a)
(b)
Main Financial Aid Building
<<ATM>>
<<ATM>>
ServerServer
EthernetLAN
EthernetLAN
<<AT
M>><<ATM>>
<<ATM>>
<<ATM>>
ServerServer
EthernetLAN
EthernetLAN
<<switch>>
EthernetLAN
<<ATM
>>
<<ATM>>
<<ATM>>
<<switch>>
EthernetLAN
<<ATM>>
<<A
TM>>
<<router>>MFA Building
<<ATM
>>
<<private>>
<<private>>DOE
Washington, DC Offices
DOE Regional Offices
FIGURE 12-11 Deployment Diagram Representation of a Low-Level Network Model
NONFUNCTIONAL REQUIREMENTS AND PHYSICALARCHITECTURE LAYER DESIGN4
The design of the physical architecture layer specifies the overall architecture and the place-ment of software and hardware that will be used. Each of the architectures discussed beforehas its strengths and weaknesses. Most organizations are trying to move to client–serverarchitectures for cost reasons, so in the event that there is no compelling reason to chooseone architecture over another, cost usually suggests client–server.
Creating a physical architecture layer design begins with the nonfunctional requirements.The first step is to refine the nonfunctional requirements into more detailed requirementsthat are then used to help select the architecture to be used (sever-based, client-based,or client–server) and what software components will be placed on each device. In aclient–server architecture, one also has to decide whether to use a two-tier, three-tier, or n-tierarchitecture. Then the nonfunctional requirements and the architecture design are used todevelop the hardware and software specification.
There are four primary types of nonfunctional requirements that can be important indesigning the architecture: operational requirements, performance requirements, securityrequirements, and cultural/political requirements. We describe each in turn and thenexplain how they may affect the physical architecture layer design.
480 Chapter 12 Physical Architecture Layer Design
4 Nonfunctional requirements were also discussed in Chapters 4, 10, and 11.
Shamrock Foods is a major food distributor centered inTralee, Ireland. Originally a dairy cooperative, theybranched into various food components [dried milk,cheese solids, flavorings (or flavourings, as they wouldspell it)]. They have had substantial growth in the past tenyears, most coming by way of acquisition of existing com-panies or facilities. For example, Iowa Soybean in theUnited States in now a subsidiary of Shamrock Foods, asis a large dairy cooperative in Wisconsin.
They have processing facilities in more than twelvecountries and distribution sales in more than thirty coun-tries. With the rapid growth by acquisition, they have gen-erally adopted a hands-off policy, keeping the systemsseparated and not integrated into unified ERP system.Thus, each acquired company is still largely autonomous,although it reports to Shamrock Foods and is managed byShamrock Foods.
This separation concept has been a problem for theCFO of Shamrock Foods, Conor Lynch. The board of direc-tors would like some aggregated data for direction andanalysis of acquired businesses. Conor has the reports from
the various subsidiaries but has to have his staff convertthem to a consistent basic currency (generally either toeuros or American dollars).
Questions
1. When should a multinational or multisite businessconsolidate data systems?
2. There are costs associated with consolidating datasystems—the various acquired companies had theirown functioning accounting systems—with a varietyof hardware and software systems. What justifica-tion should Conor use to push for a consolidated,unified ERP system?
3. Conor at times has to deal with incomplete andincompatible data. Inventory systems might be firstin, first out (FIFO) for some of the subsidiaries andlast in, first out (LIFO) or another accountingmethod for other subsidiaries. How might a multi-national CFO deal with incomplete and incompati-ble data?
12-D Managing Global ProjectsCONCEPTS
IN ACTION

Operational RequirementsOperational requirements specify the operating environment(s) in which the system mustperform and how those may change over time. This usually refers to operating systems,system software, and information systems with which the system must interact, but it willon occasion also include the physical environment if the environment is important to theapplication (e.g., it’s located on a noisy factory floor, so no audible alerts can be heard).Figure 12-12 summarizes four key operational requirement areas and provides someexamples of each.
Technical Environment Requirements Technical environment requirements specify thetype of hardware and software system on which the system will work. These requirementsusually focus on the operating system software (e.g., Windows, Linux), database systemsoftware (e.g., Oracle), and other system software (e.g., Internet Explorer). Occasionally,specific hardware requirements will impose important limitations on the system, such asthe need to operate on a PDA or cell phone with a very small display.
System Integration Requirements System integration requirements are those that requirethe system to operate with other information systems, either inside or outside the company.These typically specify interfaces through which data will be exchanged with other systems.
Portability Requirements Information systems never remain constant. Business needschange and operating technologies change, so the information systems that supportthem and run on them must change, too. Portability requirements define how the technicaloperating environments may change over time and how the system must respond (e.g., the
Nonfunctional Requirements and Physical Architecture Layer Design 481
Technical Environment Special hardware, software, and network • The system will work over the Web Requirements requirements imposed by business requirements environment with Internet Explorer.
• All office locations will have an always-on net-work connection to enable real-time databaseupdates.
• A version of the system will be provided for cus-tomers connecting over the Internet via a smallscreen PDA.
System Integration The extent to which the system will • The system must be able to import and exportRequirements operate with other systems Excel spreadsheets.
• The system will read and write to the main inven-tory database in the inventory system.
Portability Requirements The extent to which the system will need • The system must be able to work with differentto operate in other environments operating systems (e.g., Linux and Windows Vista).
• The system may need to operate with handhelddevices such as a Palm.
Maintainability Expected business changes to which the • The system will be able to support more thanRequirements system should be able to adapt one manufacturing plant with six months
advance notice.
• New versions of the system will be released everysix months.
Type of Requirement Definition Examples
FIGURE 12-12 Operational Requirements
system may run currently on Windows XP, whereas in the future it may be required todeploy the system on Linux). Portability requirements also refer to potential changes inbusiness requirements that will drive technical environment changes. For example, in thefuture users may want to access a Web site from their cell phones.
Maintainability Requirements Maintainability requirements specify the businessrequirement changes that can be anticipated. Not all changes are predictable, but some are.For example, suppose a small company has only one manufacturing plant but is anticipat-ing the construction of a second plant in the next five years. All information systems mustbe written to make it easy to track each plant separately, whether for personnel, budgeting,or inventory systems. The maintainability requirements attempt to anticipate futurerequirements so that the systems designed today will be easy to maintain if and when thosefuture requirements appear. Maintainability requirements may also define the update cyclefor the system, such as the frequency with which new versions will be released.
Performance RequirementsPerformance requirements focus on performance issues, such as response time, capacity, andreliability. Figure 12-13 summarizes three key performance requirement areas and providessome examples.
Speed Requirements Speed requirements are exactly what they say: how fast should thesystem operate. First and foremost is the response time of the system: how long it takes thesystem to respond to a user request. Although everyone would prefer low response times,with the system responding immediately to each user request, this is not practical. We coulddesign such a system, but it would be expensive. Most users understand that certain partsof a system will respond quickly, whereas others are slower. Those actions that are per-formed locally on the user’s computer must be almost immediate (e.g., typing, draggingand dropping), whereas others that require communicating across a network can havehigher response times (e.g., a Web request). In general, response times less than seven sec-onds are considered acceptable when they require communication over a network.
482 Chapter 12 Physical Architecture Layer Design
Seattle officials might finally be ready to start crunchingnumbers and nailing down specifics of a long-mulled, butslow-moving, proposal to build a citywide broadbandnetwork. But they might yet need to build a case beforethe city council to justify such a network. The idea hasbeen studied by the city council, a task force, and themayor’s information technology office since 2004. Hav-ing estimated last year that it would cost $500 million tobuild and connect all Seattle to a fiber broadband net-work, the city is now looking to invite private companiesto do that work—perhaps with taxpayer help.
The mayor is asking the city council to free up$185,000 he says his information technology office will
use to invite companies to bid on the sweeping and still-undefined job.
Questions
1. How much money (if any) will taxpayers contributein subsidies or access to public facilities?
2. Should the city start with a small-scale pilot project,as it did with Wi-Fi, before deciding about a citywidewireless network?
3. Is such a network even a feasible, cost-effective idea?
12-E Citywide BroadbandCONCEPTS
IN ACTION

The second aspect of speed requirements is how long it takes transactions in one partof the system to be reflected in other parts. For example, how soon after an order is placedwill the items it contained be shown as no longer available for sale to someone else? If theinventory is not updated immediately, then someone else could place an order for the sameitem, only to find out later it is out of stock. Or, how soon after an order is placed is it sentto the warehouse to be picked from inventory and shipped? In this case, some time delaymight have little impact.
Capacity Requirements Capacity requirements attempt to predict how many users thesystem will have to support, both in total and simultaneously. Capacity requirements areimportant in understanding the size of the databases, the processing power needed, and soon. The most important requirement is usually the peak number of simultaneous usersbecause this has a direct impact on the processing power of the computer(s) needed to sup-port the system.
It is often easier to predict the number of users for internal systems designed to sup-port an organization’s own employees than it is to predict the number of users forcustomer-facing systems, especially those on the Web. How does weather.com estimate thepeak number of users who will simultaneously seek weather information? This is as muchan art as a science, so often the team provides a range of estimates, with wider ranges usedto signal a less-accurate estimate.
Availability and Reliability Requirements Availability and reliability requirements focuson the extent to which users can assume that the system will be available for them to use.Although some systems are intended to be used only during the forty-hour workweek,some systems are designed to be used by people around the world. For such systems, pro-ject team members need to consider how the application can be operated, supported, andmaintained 24/7 (i.e., 24 hours a day, 7 days a week). This 24/7 requirement means thatusers may need help or have questions at any time, and a support desk that is available eighthours a day will not be sufficient support. It is also important to consider what reliability
Nonfunctional Requirements and Physical Architecture Layer Design 483
Type of Requirement Definition Examples
Speed Requirements
Capacity Requirements
Availability and ReliabilityRequirements
The time within which the system mustperform its functions
The total and peak number of usersand the volume of data expected
The extent to which the system will beavailable to the users and thepermissible failure rate due to errors
• Response time must be less than 7 seconds for anytransaction over the network.
• The inventory database must be updated in real time.
• Orders will be transmitted to the factory floor every 30 minutes.
• There will be a maximum of 100–200 simultaneoususers at peak use times.
• A typical transaction will require the transmission of 10K of data.
• The system will store data on approximately 5,000 customers for a total of about 2 meg of data.
• The system should be available 24/7, with the exception of scheduled maintenance.
• Scheduled maintenance shall not exceed one 6-hourperiod each month.
• The system shall have 99% uptime performance.
FIGURE 12-13 Performance Requirements

is needed in the system. A system that requires high reliability (e.g., a medical device or tele-phone switch) needs far greater planning and testing than one that does not have suchhigh-reliability needs (e.g., personnel system, Web catalog).
It is more difficult to predict the peaks and valleys in usage of the system when the sys-tem has a global audience. Typically, applications are backed up on weekends or lateevenings when users are no longer accessing the system. Such maintenance activities needto be rethought with global initiatives. The development of Web interfaces, in particular,has escalated the need for 24/7 support; by default the Web can be accessed by anyone atany time. For example, the developers of a Web application for U.S. outdoor gear and cloth-ing retailer Orvis were surprised when the first order after going live came from Japan.
Security Requirements5
Security is the ability to protect the information system from disruption and data loss,whether caused by an intentional act (e.g., a hacker, a terrorist attack) or a random event(e.g., disk failure, tornado). Security is primarily the responsibility of the operationsgroup—the staff responsible for installing and operating security controls, such as fire-walls, intrusion-detection systems, and routine backup and recovery operations. Nonethe-less, developers of new systems must ensure that the system’s security requirements producereasonable precautions to prevent problems; system developers are responsible for ensuringsecurity within the information systems themselves.
Security is an ever-increasing problem in today’s Internet-enabled world. Historically,the greatest security threat has come from inside the organization itself. Ever since the early1980s when the FBI first began keeping computer crime statistics and security firms beganconducting surveys of computer crime, organizational employees have perpetrated the vastmajority of computer crimes. For years, 80 percent of unauthorized break-ins, thefts, andsabotage have been committed by insiders, leaving only 20 percent to hackers external tothe organizations.
In 2001, that changed. Depending on what survey you read, the percent of incidentsattributed to external hackers in 2001 increased to 50 to 70 percent of all incidents, meaningthat the greatest risk facing organizations is now from the outside. Although some of this shiftmay be due to better internal security and better communications with employees to preventsecurity problems, much of it is simply due to an increase in activity by external hackers.
Developing security requirements usually starts with some assessment of the value ofthe system and its data. This helps pinpoint extremely important systems so that the oper-ations staff are aware of the risks. Security within systems usually focuses on specifyingwho can access what data, identifying the need for encryption and authentication, andensuring the application prevents the spread of viruses (see Figure 12-14).
System Value The most important computer asset in any organization is not the equip-ment; it is the organization’s data. For example, suppose someone destroyed a mainframecomputer worth $10 million. The mainframe could be replaced, simply by buying a new one.It would be expensive, but the problem would be solved in a few weeks. Now suppose some-one destroyed all the student records at your university so that no one knew what courses any-one had taken or their grades. The cost would far exceed the cost of replacing a $10 millioncomputer. The lawsuits alone would easily exceed $10 million, and the cost of staff to find andreenter paper records would be enormous and certainly would take more than a few weeks.
484 Chapter 12 Physical Architecture Layer Design
5 For more information, see Brett C. Tjaden, Fundamentals of Secure Computer Systems (Wilsonville, OR: Franklin,Beedle, and Associates, 2004); for security controls associated with the Sarbanes-Oxley act, see Dennis C. Brewer,Security Controls for Sarbanes-Oxley Section 404 IT Compliance: Authorization, Authentication, and Access(Indianapolis, IN: Wiley, 2006).

In some cases, the information system itself has value that far exceeds the cost of theequipment as well. For example, for an Internet bank that has no brick and mortar branches,the Web site is a mission critical system. If the Web site crashes, the bank cannot conductbusiness with its customers. A mission critical application is an information system that isliterally critical to the survival of the organization. It is an application that cannot be per-mitted to fail, and if it does fail, the network staff drops everything else to fix it. Mission crit-ical applications are usually clearly identified so their importance is not overlooked.
Even temporary disruptions in service can have significant costs. The cost of disruptionsto a company’s primary Web site or the LANs and backbones that support telephone salesoperations are often measured in the millions. Amazon.com, for example, has revenues ofmore than $10 million per hour, so if their Web site were unavailable for an hour or even partof an hour, it would cost them millions of dollars in lost revenue. Companies that do lesse-business or telephone sales have lower costs, but recent surveys suggest losses of $100,000to $200,000 per hour are not uncommon for major customer-facing information systems.
Nonfunctional Requirements and Physical Architecture Layer Design 485
System Value Estimates Estimated business value of the system and • The system is not mission critical but a system outageits data is estimated to cost $50,000 per hour in lost revenue.
• A complete loss of all system data is estimated to cost$20 million.
Access Control Limitations on who can access what data • Only department managers will be able to changeRequirements inventory items within their own department.
• Telephone operators will be able to read and createitems in the customer file, but cannot change ordelete items.
Encryption and Defines what data will be encrypted • Data will be encrypted from the user’s computer to the Authentication where and whether authentication will Web site to provide secure ordering.Requirements be needed for user access • Users logging in from outside the office will be
required to authenticate.
Virus Control Requirements to control the spread • All uploaded files will be checked for viruses before Requirements of viruses being saved in the system.
Type of Requirement Definition Examples
FIGURE 12-14 Security Requirements
Lithonia Lighting, located just outside of Atlanta, is theworld’s largest manufacturer of light fixtures, with morethan $1 billion in annual sales. One afternoon, the powertransformer at its corporate headquarters exploded, leav-ing the entire office complex, including the corporatedata center, without power. The data center’s backuppower system immediately took over and kept criticalparts of the data center operational. However, it wasinsufficient to power all systems, so the system supportingsales for all of Lithonia Lighting’s North American agents,dealers, and distributors had to be turned off.
The transformer was quickly replaced and power wasrestored. However, the three hour shutdown of the salessystem cost $1 million in potential sales lost. Unfortu-nately, it is not uncommon for the cost of a disruption tobe hundreds or thousands of times the cost of the failedcomponents.
Question
What would you recommend to avoid similar losses inthe future?
12-F Power Outage Costs a Million DollarsCONCEPTS
IN ACTION

Access Control Requirements Some of the data stored in the system need to be keptconfidential; some data need special controls on who is allowed to change or delete it. Per-sonnel records, for example, should be able to be read only by the personnel departmentand the employee’s supervisor; changes should be permitted to be made only by the per-sonnel department. Access control requirements state who can access what data and whattype of access is permitted: whether the individual can create, read, update and/or deletethe data. The requirements reduce the chance that an authorized user of the system canperform unauthorized actions.
Encryption and Authentication Requirements One of the best ways to prevent unau-thorized access to data is encryption, which is a means of disguising information by the useof mathematical algorithms (or formulas). Encryption can be used to protect data storedin databases or data that are in transit over a network from a database to a computer. Thereare two fundamentally different types of encryption: symmetric and asymmetric. A sym-metric encryption algorithm [such as Data Encryption Standard (DES) or AdvancedEncryption Standard (AES)] is one in which the key used to encrypt a message is the sameas the one used to decrypt it, which means that it is essential to protect the key and that aseparate key must be used for each person or organization with whom the system sharesinformation (or else everyone can read all the data).
An asymmetric encryption algorithm (such as public key encryption) is one in which thekey used to encrypt data (called the public key) is different from the one used to decrypt it(called the private key). Even if everyone knows the public key, once the data are encrypted,they cannot be decrypted without the private key. Public key encryption greatly reduces thekey-management problem. Each user has its public key that is used to encrypt messagessent to it. These public keys are widely publicized (e.g., listed in a telephone book–styledirectory)—that’s why they’re called public keys. The private key, in contrast, is kept secret(which is why it’s called private).
Public key encryption also permits authentication (or digital signatures). When oneuser sends a message to another, it is difficult to legally prove who actually sent the message.Legal proof is important in many communications, such as bank transfers and buy/sellorders in currency and stock trading, which normally require legal signatures. Public keyencryption algorithms are invertible, meaning that text encrypted with either key can bedecrypted by the other. Normally, we encrypt with the public key and decrypt with the pri-vate key. However, it is possible to do the reverse: encrypt with the private key and decryptwith the public key. Because the private key is secret, only the real user can use it to encrypta message. Thus, a digital signature or authentication sequence is used as a legal signatureon many financial transactions. This signature is usually the name of the signing party plusother unique information from the message (e.g., date, time, or dollar amount). This signa-ture and the other information are encrypted by the sender using the private key. Thereceiver uses the sender’s public key to decrypt the signature block and compares the resultto the name and other key contents in the rest of the message to ensure a match.
The only problem with this approach lies in ensuring that the person or organizationthat sent the document with the correct private key is the actual person or organization.Anyone can post a public key on the Internet, so there is no way of knowing for sure whoactually used it. For example, it would be possible for someone other than Organization Ain this example to claim to be Organization A when, in fact, he or she is an imposter.
This is where the Internet’s public key infrastructure (PKI) becomes important.6 ThePKI is a set of hardware, software, organizations, and polices designed to make public key
486 Chapter 12 Physical Architecture Layer Design
6 For more on the PKI, see www.ietf.org/html.charters/pkix-charter.html.
encryption work on the Internet. PKI begins with a certificate authority (CA), which is atrusted organization that can vouch for the authenticity of the person or organizationusing authentication (e.g., VeriSign). A person wanting to use a CA registers with the CAand must provide some proof of identify. There are several levels of certification, rangingfrom a simple confirmation from a valid e-mail address to a complete police-style back-ground check with an in-person interview. The CA issues a digital certificate that is therequestor’s public key, encrypted using the CA’s private key as proof of identify. This cer-tificate is then attached to the user’s e-mail or Web transactions in addition to the authen-tication information. The receiver then verifies the certificate by decrypting it with the CA’spublic key—and must also contact the CA to ensure that the user’s certificate has not beenrevoked by the CA.
The encryption and authentication requirements state what encryption and authenti-cation requirements are needed for what data. For example, will sensitive data such as cus-tomer credit-card numbers be stored in the database in encrypted form, or will encryptionbe used to take orders over the Internet from the company’s Web site? Will users berequired to use a digital certificate in addition to a standard password?
Virus Control Requirements Virus control requirements address the single most com-mon security problem: viruses. Recent studies have shown that almost 90 percent of orga-nizations suffer a virus infection each year. Viruses cause unwanted events—some harmless(such as nuisance messages), some serious (such as the destruction of data). Any time a sys-tem permits data to be imported or uploaded from a user’s computer, there is the poten-tial for a virus infection. Many systems require that all information systems that permitthe import or upload of user files to check those files for viruses before they are stored inthe system.
Nonfunctional Requirements and Physical Architecture Layer Design 487
Quinnipiac University is a four-year university in Hamden,Connecticut, with about 7,400 students. As a universitywith residence halls, the IT staff has to support academicfunctions—but also have to be an Internet Service Provider(ISP) for students. The IT staff can shape much of the acad-emic usage of the Internet, but students living in residencehalls can cause havoc. Students (and faculty) inadvertentlyopen the campus to all kind of attacks, such as viruses,malware, worms, spybots and other intrusions throughaccessing various Web sites. A particularly trying time isafter the semester break in late January, when studentsreturn to campus and plug in laptops that have been cor-rupted with other viruses from home networks. Theseviruses try to infect the entire campus. Quinnipiac Univer-sity installed an Intrusion Prevention System (IPS) by Tip-ping Point Technology in August 2006. On a daily basis,this IPS detects and drops thousands of destructive mes-sages and packets. But, the real proof was in late January
2007 when students returned to campus from semesterbreak. In the previous year, the viruses and spyware virtu-ally took the campus network down for three days. But inJanuary 2007, there were no outages, and the networkremained strong and functioning at full speed. Brian Kelly,information security officer at Quinnipiac University said,“Without the IPS solution, this campus would have strug-gled under this barrage of malicious packets and may haveshut down. With the IPS system, we were able to functionat full speed without any problems.”
Questions
1. What might be some of the tangible and intangiblecosts of having the internet down for three days ona busy college campus?
2. What benefits would an IPS mean to a campus, toend users (e.g., faculty, staff and students)?
12-G Securing the EnvironmentCONCEPTS
IN ACTION

488 Chapter 12 Physical Architecture Layer Design
Cultural and Political RequirementsCultural and political requirements are those specific to the countries in which the systemwill be used. In today’s global business environment, organizations are expanding their sys-tems to reach users around the world. Although this can make great business sense, itsimpact on application development should not be underestimated. Yet another importantpart of the design of the system’s architecture is understanding the global cultural andpolitical requirements for the system (see Figure 12-15).
Multilingual Requirements The first and most obvious difference between applicationsused in one region and those designed for global use is language. Global applications oftenhave multilingual requirements, which means that they have to support users who speak dif-ferent languages and write using non-English letters (e.g., those with accents, Cyrillic,Japanese). One of the most challenging aspects in designing global systems is getting a goodtranslation of the original language messages into a new language. Words often have simi-lar meanings but can convey subtly different meanings when they are translated, so it isimportant to use translators skilled in translating technical words.
The other challenge is often screen space. In general, English-language messages usu-ally take 20 percent to 30 percent fewer letters than their French or Spanish counterparts.Designing global systems requires allocating more screen space to messages than might beused in the English-language version.
Some systems are designed to handle multiple languages on the fly so that users in dif-ferent countries can use different languages concurrently; that is, the same system supportsseveral different languages simultaneously (a concurrent multilingual system). Other sys-tems contain separate parts that are written in each language and must be reinstalled beforea specific language can be used; that is, each language is provided by a different version ofthe system so that any one installation will use only one language (i.e., a discrete multilin-gual system). Either approach can be effective, but this functionality must be designed intothe system well in advance of implementation.
488 Chapter 12 Physical Architecture Layer Design
Multilingual Requirements The language in which the system will need • The system will operate in English, French, andto operate Spanish.
Customization Specification of what aspects of the system • Country managers will be able to define newRequirements can be changed by local users fields in the product database to capture country-
specific information.
• Country managers will be able to change the for-mat of the telephone number field in the cus-tomer database.
Making Unstated Norms Explicitly stating assumptions that differ from • All date fields will be explicitly identified as usingExplicit country to country the month-day-year format.
• All weight fields will be explicitly identified asbeing stated in kilograms.
Legal Requirements The laws and regulations that impose • Personal information about customers cannot be requirements on the system transferred out of European Union countries into
the United States.
• It is against U.S. federal law to divulge informa-tion on who rented what videotape, so access toa customer’s rental history is permitted only toregional managers.
Type of Requirement Definition Examples
FIGURE 12-15 Cultural and Political Requirements

Customization Requirements For global applications, the project team will need to givesome thought to customization requirements: How much of the application will be con-trolled by a central group, and how much of the application will be managed locally? Forexample, some companies allow subsidiaries in some countries to customize the applica-tion by omitting or adding certain features. This decision has trade-offs between flexibilityand control because customization often makes it more difficult for the project team to cre-ate and maintain the application. It also means that training can differ between differentparts of the organization, and customization can create problems when staff move fromone location to another.
Unstated Norms Many countries have unstated norms that are not shared internation-ally. It is important for the application designer to make these assumptions explicit becausethey can lead to confusion otherwise. In the United States, the unstated norm for enteringa date is the date format MM/DD/YYYY; however, in Canada and most European coun-tries, the unstated norm is DD/MM/YYYY. Another example is the order of a person’sname; does the family name come first or last? The answer depends on the locality. Whenyou are designing global systems, it is critical to recognize these unstated norms and makethem explicit so that users in different countries do not become confused. Currency is theother item sometimes overlooked in system design; global application systems must spec-ify the currency in which information is being entered and reported.
Legal Requirements Legal requirements are those requirements imposed by laws andgovernment regulations. System developers sometimes forget to think about legal regula-tions; unfortunately, forgetting comes at some risk because ignorance of the law is nodefense. For example, in 1997 a French court convicted the Georgia Institute of Technol-ogy of violating French language law. Georgia Tech operated a small campus in France thatoffered summer programs for American students. The information on the campus Webserver was primarily in English because classes are conducted in English, which violated the
Nonfunctional Requirements and Physical Architecture Layer Design 489
I’ve had the opportunity to develop two multilingual sys-tems. The first was a special-purpose decision support sys-tem to help schedule orders in paper mills calledBCW-Trim. The system was installed by several dozenpaper mills in Canada and the United States, and it wasdesigned to work in either English or French. All messageswere stored in separate files (one set English, one setFrench), with the program written to use variables initial-ized either to the English or French text. The appropriatelanguage files were included when the system was com-piled to produce either the French or English version.
The second program was a groupware system calledGroupSystems, for which I designed several modules. Thesystem has been translated into dozens of different lan-guages, including French, Spanish, Portuguese, German,Finnish, and Croatian. This system enables the user toswitch between languages at will by storing messages in
simple text files. This design is far more flexible becauseeach individual installation can revise the messages atwill. Without this approach, it is unlikely that there wouldhave been sufficient demand to warrant the developmentof versions to support less commonly used languages(e.g., Croatian).
—Alan Dennis
Questions
1. How would you decide how much to support userswho speak languages other than English?
2. Would you create multilingual capabilities for anyapplication that would be available to non-English-speaking people? Think about Web sites that existtoday.
12-H Developing Multilingual SystemsCONCEPTS
IN ACTION

law requiring French to be the predominant language on all Internet servers in France. Byformally considering legal regulations, they are less likely to be overlooked.
SynopsisIn many cases, the technical environment requirements as driven by the business require-ments may simply define the physical architecture layer. In this case, the choice is simple:business requirements dominate other considerations. For example, the business require-ments may specify that the system needs to work over the Web using the customer’s Webbrowser. In this case, the architecture probably should be a thin client–server. Such busi-ness requirements are most likely in systems designed to support external customers. Inter-nal systems may also impose business requirements, but usually they are not as restrictive.
In the event that the technical environment requirements do not require the choice ofa specific architecture, then the other nonfunctional requirements become important. Evenin cases when the business requirements drive the architecture, it is still important to workthrough and refine the remaining nonfunctional requirements because they are importantin later stages of design and implementation. Figure 12-16 summarizes the relationshipbetween requirements and recommended architectures.
490 Chapter 12 Physical Architecture Layer Design
Requirements
Operational Requirements
System Integration Requirements
Portability Requirements
Maintainability Requirements
Speed Requirements
Capacity Requirements
Availability/Reliability Requirements
High System Value
Access Control Requirements
Encryption/Authentication Requirements
Virus Control Requirements
Multilingual Requirements
Customization Requirements
Making Unstated Norms Explicit
Legal Requirements
Performance Requirements
Security Requirements
Cultural/Political Requirements
Server-Based
Client-Based
ThinClient–Server
ThickClient–Server
FIGURE 12-16NonfunctionalRequirements andTheir Implications forArchitecture Design

Operational Requirements System integration requirements may lead to one archi-tecture being chosen over another, depending on the architecture and design of the sys-tem(s) with which the system needs to integrate. For example, if the system mustintegrate with a desktop system (e.g., Excel), this may suggest a thin or thick client–serverarchitecture, whereas if it must integrate with a server-based system, a server-basedarchitecture may be indicated. Systems that have extensive portability requirements tendto be best suited for a thin client–server architecture because it is simpler to write forWeb-based standards (e.g., HTML, XML) that extend the reach of the system to otherplatforms, rather than trying to write and rewrite extensive presentation logic for dif-ferent platforms in the server-based, client-based, or thick client–server architectures.Systems with extensive maintainability requirements may not be well suited to client-based or thick client–server architectures because of the need to reinstall software onthe desktops.
Performance Requirements Generally speaking, information systems that have highperformance requirements are best suited to client–server architectures. Client–serverarchitectures are more scalable, which mean they respond better to changing capacityneeds and thus enable the organization to better tune the hardware to the speed require-ments of the system. Client–server architectures that have multiple servers in each tiershould be more reliable and have greater availability, because if any one server crashes,requests are simply passed to other servers, and users might not even notice (althoughresponse time could be worse). In practice, however, reliability and availability dependgreatly on the hardware and operating system, and Windows-based computers tend to havelower reliability and availability than Linux or mainframe computers.
Security Requirements Generally speaking, server-based architectures tend to be moresecure because all software is in one location and because mainframe operating systemsare more secure than microcomputer operating systems. For this reason, high-value sys-tems are more likely to be found on mainframe computers, even if the mainframe is usedas a server in client–server architectures. In today’s Internet-dominated world, authenti-cation and encryption tools for Internet-based client–server architectures are moreadvanced than those for mainframe-based server-based architectures. Viruses are poten-tial problems in all architectures because they easily spread on desktop computers. If aserver-based system can reduce the functions needed on desktop systems, then they maybe more secure.
Cultural and Political Requirements As cultural and political requirements becomemore important, the ability to separate the presentation logic from the application logicand the data becomes important. Such separation makes it easier to develop the presen-tation logic in different languages while keeping the application logic and data the same.It also makes it easier to customize the presentation logic for different users and tochange it to better meet cultural norms. To the extent that the presentation logic providesaccess to the application and data, it also makes it easier to implement different versionsthat enable or disable different features required by laws and regulations in differentcountries. This separation is the easiest in thin client–server architectures, so systemswith many cultural and political requirements often use thin client–server architectures.As with system integration requirements, the impact of legal requirements depends onthe specific nature of the requirements, but in general, client-based systems tend to beless flexible.
Nonfunctional Requirements and Physical Architecture Layer Design 491

492 Chapter 12 Physical Architecture Layer Design
HARDWARE AND SOFTWARE SPECIFICATION
The time to begin acquiring the hardware and software that will be needed for a future sys-tem is during the design of the system. In many cases, the new system will simply run onthe existing equipment in the organization. Other times, however, new hardware and soft-ware (usually for servers) must be purchased. The hardware and software specification is adocument that describes what hardware and software are needed to support an applica-tion. The actual acquisition of hardware and software should be left to the purchasingdepartment or the area in the organization that handles capital procurement. However, theproject team can use the hardware and software specification to communicate the projectneeds to the appropriate people. There are several steps involved in creating the document.Figure 12-17 shows a sample hardware and software specification.
Think about the course registration system in your univer-sity. First, develop a set of nonfunctional requirements if thesystem were to be developed today. Consider the opera-
tional requirements, performance requirements, securityrequirements, and cultural and political requirements. Thencreate an architecture design to satisfy these requirements.
12-3 University Course Registration SystemYOUR
TURN
Many multinational organizations provide global Web-based e-learning courses for their employees. First, developa set of nonfunctional requirements for such a system. Con-sider the operational requirements, performance require-
ments, security requirements, and cultural and politicalrequirements. Then create an architecture design to satisfythese requirements.
12-4 Global e-Learning SystemYOUR
TURN
Standard Standard Standard StandardClient Web Server Application Server Database Server
Operating System • Windows • Linux • Linux • Linux
• Internet Explorer
Special Software • Adobe Acrobat Reader • Apache • Java • Oracle
• Real Audio
Hardware • 40 gig disk drive • 80 gig disk drive • 80 gig disk drive • 200 gig disk drive
• Pentium • Pentium • Pentium • RAID
• 17 inch Monitor • Quad Pentium
Network • Always-on • Dual 100 Mbps • Dual 100 Mbps • Dual 100 Mbps
Broadband preferred Ethernet Ethernet Ethernet
• Dial-up at 56 Kbps possible with some performance loss
FIGURE 12-17 Sample Hardware and Software Specification

First, we will need to define the software that will run on each component. This usu-ally starts with the operating system (e.g., Windows, Linux) and includes any special-purpose software on the client and servers (e.g., Oracle database). This document shouldconsider any additional costs, such as technical training, maintenance, extended war-ranties, and licensing agreements (e.g., a site license for a software package). Again, thelisted needs are influenced by decisions that are made in the other design activities.
Second, we must create a list of the hardware that is needed to support the future sys-tem. The low-level network model provides a good starting point for recording the pro-ject’s hardware needs because each component on the diagram corresponds to an item onthis list. In general, the list can include things like database servers, network servers, periph-eral devices (e.g., printers, scanners), backup devices, storage components, and any otherhardware component that is needed to support an application. At this time, you also shouldnote the quantity of each item that will be needed.
Third, we must describe, in as much detail as possible, the minimum requirements foreach piece of hardware. Typically, the project team must convey requirements like theamount of processing capacity, the amount of storage space, and any special features thatshould be included. Many organizations have standard lists of approved hardware and soft-ware that must be used, so in many cases, this step simply involves selecting items from thelists. Other times, however, the team is operating in new territory and is not constrained bythe need to select from an approved list. In these cases, the project team must convey suchrequirements as the amount of processing capacity, the amount of storage space, and anyspecial features that should be included.
This step becomes easier with experience; however, there are some hints that can helpyou describe hardware needs (see Figure 12-18). For example, consider the hardware stan-dards within the organization or those recommended by vendors. Talk with experienced
Hardware and Software Specification 493
Develop a hardware and software specification for the university course registration system described in Your Turn 12-3.
12-5 University Course Registration SystemYOUR
TURN
1. Functions and Features What specific functions and features are needed (e.g., size of monitor,software features)
2. Performance How fast the hardware and software operates (e.g., processor, number of databasewrites per second)
3. Legacy Databases and Systems How well the hardware and software interacts with legacy sys-tems (e.g., can it write to this database)
4. Hardware and OS Strategy What are the future migration plans (e.g., the goal is to have all ofone vendor’s equipment)
5. Cost of Ownership What are the costs beyond purchase (e.g., incremental license costs, annualmaintenance, training costs, salary costs)
6. Political Preferences People are creatures of habit and are resistant to change, so changesshould be minimized
7. Vendor Performance Some vendors have reputations or future prospects that are different fromthose of a specific hardware or software system they currently sell
FIGURE 12-18Factors in Hardwareand Software Selection
system developers or other companies with similar systems. Finally, think about the fac-tors that affect hardware performance, such as the response-time expectations of theusers, data volumes, software memory requirements, the number of users accessing thesystem, the number of external connections, and growth projections.
APPLYING THE CONCEPTS AT CD SELECTIONS
Alec realized that the hardware, software, and networks that would support the new appli-cation would need to be integrated into the current infrastructure at CD Selections. Assuch, he had asked Anne to begin by reviewing the high-level nonfunctional requirementsdeveloped in the analysis phase (see Figure 4-15) and by conducting a JAD session and aseries of interviews with managers in the marketing department and three store managersto refine the nonfunctional requirements into more detail. Figure 12-19 shows some of theresults. The clear business need for a Web-based architecture required a thin client–serverarchitecture for the Internet sales portion of the system.
CD Selections had a formal architecture group responsible for managing CD Selec-tions architecture and its hardware and software infrastructure. Therefore, Anne set up ameeting with the development team and the architecture group. During the meeting, sheconfirmed that CD Selections was still moving toward a target client–server architecture,although the central mainframe still existed as the primary server for many server-basedapplications.
They discussed the Internet system and decided that it should be built using a three-tier thin client–server architecture. Everyone believed that it was hard to know at this pointexactly how much traffic this Web site would get and how much power the system wouldrequire, but a client–server architecture would allow CD Selections to easily scale up thesystem as needed.
By the end of the meeting, it was agreed that a three-tiered client–server architecturewas the best configuration for the Internet portion of the Internet sales system (i.e., thePlace Order process in Figures 5-17 and 5-19). Customers would use their personal com-puters running a Web browser as the client. A database server would store the Internet sys-tem’s databases, whereas an application server would have Web-server software and theapplication software to run the system.
494 Chapter 12 Physical Architecture Layer Design
Develop a hardware and software specification for the global e-learning system described in Your Turn 12-4.
12-6 Global e-Learning SystemYOUR
TURN
You have decided to purchase a computer, printer, andlow-cost scanner to support your academic work. Create
a hardware and software specification for these compo-nents that describes your hardware and software needs.
12-7 Create a Hardware and Software SpecificationYOUR
TURN
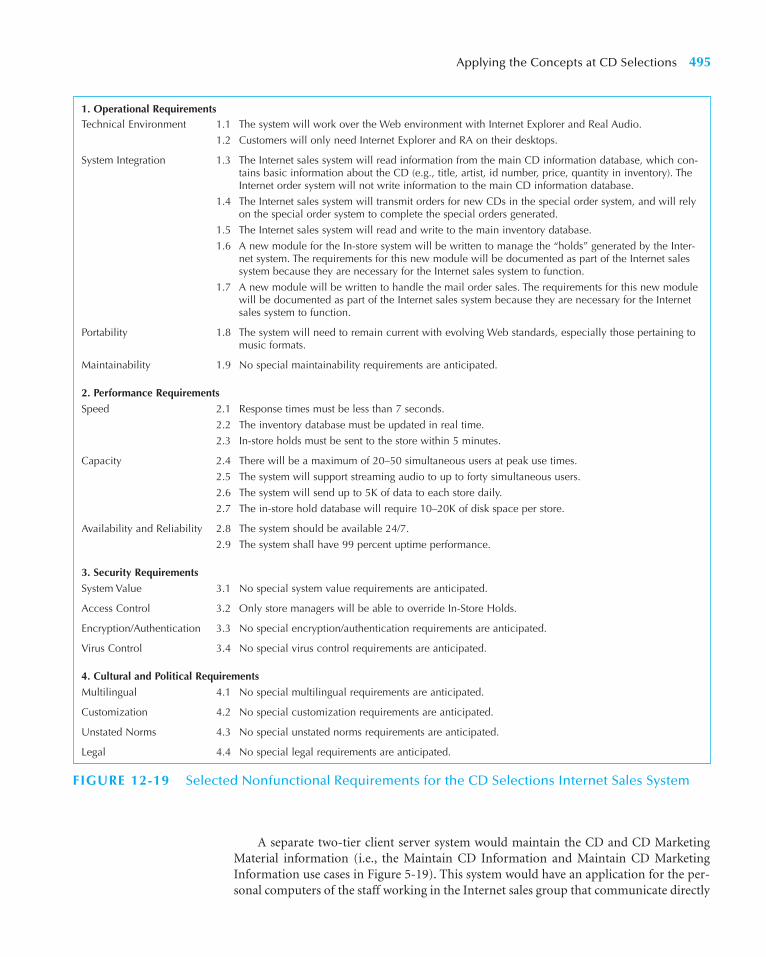
Applying the Concepts at CD Selections 495
1. Operational RequirementsTechnical Environment 1.1 The system will work over the Web environment with Internet Explorer and Real Audio.
1.2 Customers will only need Internet Explorer and RA on their desktops.
System Integration 1.3 The Internet sales system will read information from the main CD information database, which con-tains basic information about the CD (e.g., title, artist, id number, price, quantity in inventory). TheInternet order system will not write information to the main CD information database.
1.4 The Internet sales system will transmit orders for new CDs in the special order system, and will relyon the special order system to complete the special orders generated.
1.5 The Internet sales system will read and write to the main inventory database.
1.6 A new module for the In-store system will be written to manage the “holds” generated by the Inter-net system. The requirements for this new module will be documented as part of the Internet salessystem because they are necessary for the Internet sales system to function.
1.7 A new module will be written to handle the mail order sales. The requirements for this new modulewill be documented as part of the Internet sales system because they are necessary for the Internetsales system to function.
Portability 1.8 The system will need to remain current with evolving Web standards, especially those pertaining tomusic formats.
Maintainability 1.9 No special maintainability requirements are anticipated.
2. Performance Requirements
Speed 2.1 Response times must be less than 7 seconds.
2.2 The inventory database must be updated in real time.
2.3 In-store holds must be sent to the store within 5 minutes.
Capacity 2.4 There will be a maximum of 20–50 simultaneous users at peak use times.
2.5 The system will support streaming audio to up to forty simultaneous users.
2.6 The system will send up to 5K of data to each store daily.
2.7 The in-store hold database will require 10–20K of disk space per store.
Availability and Reliability 2.8 The system should be available 24/7.
2.9 The system shall have 99 percent uptime performance.
3. Security Requirements
System Value 3.1 No special system value requirements are anticipated.
Access Control 3.2 Only store managers will be able to override In-Store Holds.
Encryption/Authentication 3.3 No special encryption/authentication requirements are anticipated.
Virus Control 3.4 No special virus control requirements are anticipated.
4. Cultural and Political Requirements
Multilingual 4.1 No special multilingual requirements are anticipated.
Customization 4.2 No special customization requirements are anticipated.
Unstated Norms 4.3 No special unstated norms requirements are anticipated.
Legal 4.4 No special legal requirements are anticipated.
FIGURE 12-19 Selected Nonfunctional Requirements for the CD Selections Internet Sales System
A separate two-tier client server system would maintain the CD and CD MarketingMaterial information (i.e., the Maintain CD Information and Maintain CD MarketingInformation use cases in Figure 5-19). This system would have an application for the per-sonal computers of the staff working in the Internet sales group that communicate directly

with the database server and enable staff to update the information. The database serverwould have a separate program to enable it to exchange data with CD Selections’ distribu-tion system on the company mainframe. Furthermore, the in-store system was currentlybuilt using a two-tier client–server architecture, so the portion of the system responsible forthe in-store holds would conform to that architecture.
Next, Anne created a network model to show the major components of the Internetsales system (see Figure 12-20). The Internet sales system was on a separate network seg-ment separated from the CD Selections’ main network by a firewall that separated the net-work from the Internet while granting access to the Web and database servers. The Internetsales system had two parts. A firewall was used to connect the Web/Application server tothe Internet, and another firewall further protected the Internet sales group’s client com-puters and database server from the Internet. In order to improve response time, a directconnection was made from the Web/Application server to the database server because thesewould exchange a lot of data. Based on these decisions, she also created a deployment dia-gram that shows how the problem domain, human–computer interaction, and data man-agement layers would be deployed over the physical architecture layer (see Figure 12-21).
Given that the Web interface could reach a geographically dispersed group, the devel-opment team realized that it needed to plan for 24/7 system support. As such, Anne sched-uled a meeting to talk with the CD Selections systems operations group and discussed howthey might be able to support the Internet system outside of standard working hours.
After examining the network model, the architecture group and the development teamdecided that the only components that needed to be acquired for the project were a data-base server, a Web server, and five new client computers for the marketing group, whowould maintain the CD marketing materials. They developed a hardware and softwarespecification for these components and handed them off to the purchasing department tostart the acquisition process.
SUMMARY
An important component of design is the design of the physical architecture layer, whichincludes the hardware, software, and communications infrastructure for the new systemand the way in which the information system will be distributed over the architecture. Thephysical architecture layer design is described in a deliverable that contains the networkmodel and the hardware and software specification.
Elements of the Physical Architecture LayerAll software systems can be divided into four basic functions: data storage, data access logic,application logic, and presentation logic. There are three fundamental computing architec-tures that place these functions on different computers. In server-based architectures, theserver performs all the functions. In client-based architectures, the client computers are
496 Chapter 12 Physical Architecture Layer Design
At this point in time, you should play the role of Anneand complete the design of the physical architecturelayer. This would include any additional hardware and
software that would be required to support the MaintainCD Information and Maintain CD Marketing Informationuse cases.
12-8 CD Selections Internet Sales SystemYOUR
TURN
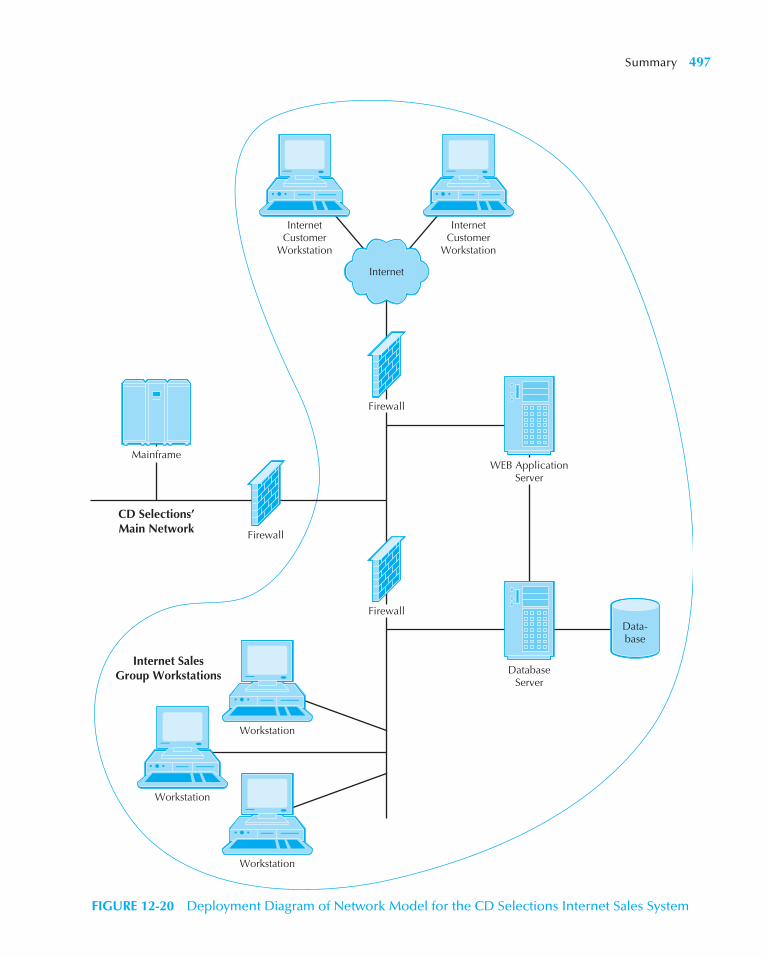
Summary 497
DatabaseServer
InternetCustomer
Workstation
Workstation
Workstation
Workstation
Firewall
WEB Application Server
Firewall
Firewall
Data-base
Mainframe
Internet
InternetCustomer
Workstation
Internet Sales Group Workstations
CD Selections’ Main Network
FIGURE 12-20 Deployment Diagram of Network Model for the CD Selections Internet Sales System
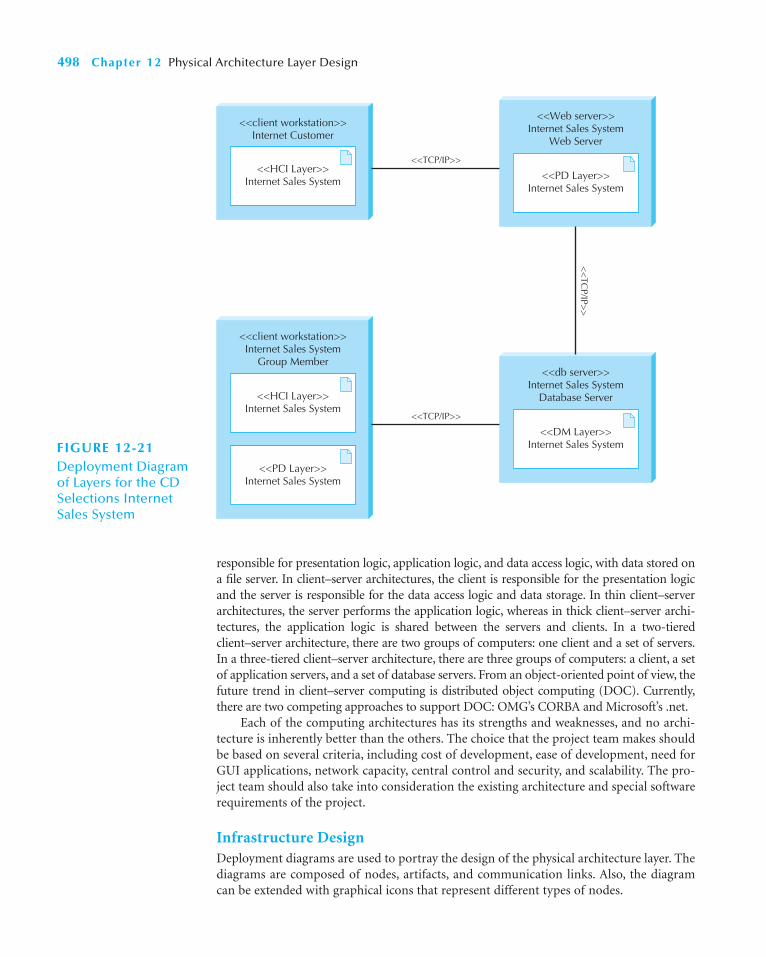
responsible for presentation logic, application logic, and data access logic, with data stored ona file server. In client–server architectures, the client is responsible for the presentation logicand the server is responsible for the data access logic and data storage. In thin client–serverarchitectures, the server performs the application logic, whereas in thick client–server archi-tectures, the application logic is shared between the servers and clients. In a two-tieredclient–server architecture, there are two groups of computers: one client and a set of servers.In a three-tiered client–server architecture, there are three groups of computers: a client, a setof application servers, and a set of database servers. From an object-oriented point of view, thefuture trend in client–server computing is distributed object computing (DOC). Currently,there are two competing approaches to support DOC: OMG’s CORBA and Microsoft’s .net.
Each of the computing architectures has its strengths and weaknesses, and no archi-tecture is inherently better than the others. The choice that the project team makes shouldbe based on several criteria, including cost of development, ease of development, need forGUI applications, network capacity, central control and security, and scalability. The pro-ject team should also take into consideration the existing architecture and special softwarerequirements of the project.
Infrastructure DesignDeployment diagrams are used to portray the design of the physical architecture layer. Thediagrams are composed of nodes, artifacts, and communication links. Also, the diagramcan be extended with graphical icons that represent different types of nodes.
498 Chapter 12 Physical Architecture Layer Design
<<client workstation>> Internet Customer
<<HCI Layer>> Internet Sales System
<<Web server>> Internet Sales System
Web Server
<<PD Layer>> Internet Sales System
<<db server>> Internet Sales System
Database Server
<<DM Layer>> Internet Sales System
<<client workstation>> Internet Sales System
Group Member
<<HCI Layer>> Internet Sales System
<<PD Layer>> Internet Sales System
<<TCP/IP>>
<<TCP/IP>>
<<
TCP/IP>
>
FIGURE 12-21Deployment Diagramof Layers for the CDSelections InternetSales System
The network model is a diagram that shows the technical components of the infor-mation system (e.g., servers, personal computers, networks) and their geographic locationsthroughout the organization. The components of the network model are the various clients(e.g., personal computers, kiosks), servers (e.g., database, network, communications,printer), network equipment (e.g., wire, dial-up connections, satellite links), and externalsystems or networks (e.g., Internet service provider) that support the application. Creatinga network model is a top-down process whereby a high-level diagram is first created toshow the geographic sites, or locations, that house the various components of the futuresystem. Next, a low-level diagram is created to describe each location in detail, and it showsthe system’s hardware components and how they are attached to one another.
Nonfunctional Requirements and Physical Architecture Layer DesignCreating an architecture design begins with the nonfunctional requirements. Operationalrequirements specify the operating environment(s) in which the system must perform andhow those may change over time (i.e., technical environment, system integration, portabil-ity, and maintainability). Performance requirements focus on performance issues such assystem speed, capacity, and availability and reliability. Security requirements attempt toprotect the information system from disruption and data loss (e.g., system value, accesscontrol, encryption and authentication, and virus control). Cultural and political require-ments are those that are specific to the specific countries in which the system will be used(e.g., language, customization, unstated norms, and legal).
Hardware and Software SpecificationThe hardware and software specification is a document that describes what hardware andsoftware are needed to support the application. To create a specification document, thehardware that is needed to support the future system is listed and then described in asmuch detail as possible. Next, the software to run on each hardware component is writtendown, along with any additional associated costs, such as technical training, maintenance,extended warrantees, and licensing agreements. Although the project team may suggestspecific products or vendors, ultimately the hardware and software specification is turnedover to the people who are in charge of procurement
Key Terms 499
KEY TERMS
.net24/7Access control requirementsApplication logicArchitectural componentArtifactAsymmetric encryption algorithmAuthenticationAvailability and reliability
requirementsCapacity requirementsCertificate of authority (CA)Client-based architectureClient computer
Client–server architectureCommon Object Request Broker
Architecture (CORBA)Communication pathCultural and political requirementsCustomization requirementsData access logicData storageDeployment diagramsDistributed objects computing
(DOC)EncryptionEnterprise JavaBeans (EJB)Fat client
Graphical user interface (GUI)Hardware and software specificationInvertibleJava 2 Enterprise Edition (J2EE)Legal requirementsLocationsMainframeMaintainability requirementsMicrocomputerMiddlewareMinicomputerMission critical systemMultilingual requirementsNetwork
500 Chapter 12 Physical Architecture Layer Design
Network modelNodeN-tiered architectureOperational requirementsPerformance requirementsPhysical architecture layer designPortability requirementsPresentation logicPrivate keyPublic key
Public key encryptionResponse timeScalableSecurity requirementsServerServer-based architectureSpeed requirementsSQL (Structured query language)Symmetric encryption algorithmSystem integration requirements
Technical environment requirements
Thick clientThin clientThree-tiered architectureTotal cost of ownershipTwo-tiered architectureUnstated normsVirusVirus control requirements
QUESTIONS
1. What are the four basic functions of any informationsystem?
2. What are the three primary hardware components ofany physical architecture?
3. Name two examples of a server.4. Compare and contrast server-based architectures,
client-based architectures, and client–server-basedarchitectures.
5. What is the biggest problem with server-based com-puting?
6. What is the biggest problem with client-based com-puting?
7. Describe the major benefits and limitations of thinclient–server architectures.
8. Describe the major benefits and limitations of thickclient–server architectures.
9. Describe the differences among two-tiered, three-tiered, and n-tiered architectures.
10. What is distributed object computing?11. What are the three competing approaches for sup-
porting distributed object computing?12. Define scalable. Why is this term important to system
developers?13. What six criteria are helpful to use when comparing
the appropriateness of computing alternatives?
14. Why should the project team consider the existingphysical architecture in the organization when design-ing the physical architecture layer of the new system?
15. Describe the major nonfunctional requirements andhow they influence physical architecture layer design.
16. Why is it useful to define the nonfunctional require-ments in more detail even if the technical environ-ment requirements dictate a specific architecture?
17. What does the network model communicate to theproject team?
18. What are the differences between the top-level net-work model and the low-level network model?
19. What additional hardware- and software-associatedcosts may need to be included on the hardware andsoftware specification?
20. Who is ultimately in charge of acquiring hardwareand software for a project?
21. What do you think are three common mistakes thatnovice analysts make in architecture design and hard-ware and software specification?
22. Are some nonfunctional requirements more impor-tant than others in influencing the architecture designand hardware and software specification?
23. What do you think are the most important securityissues for a system?
EXERCISES
A. Using the Web (or past issues of computer industrymagazines such as Computerworld), locate a systemthat runs in a server-based environment. Based onyour reading, why do you think the company chosethat computing environment?
B. Using the Web (or past issues of computer industrymagazines such as Computerworld), locate a system
that runs in a client–server environment. Based onyour reading, why do you think the company chosethat computing environment?
C. Using the Web, locate examples of a mainframe com-ponent, a minicomputer component, and a micro-computer component. Compare the components interms of price, speed, available memory, and disk
Minicases 501
storage. Did you find large differences in prices whenthe performances of the components are considered?
D. You have been selected to find the best client–servercomputing architecture for a Web-based order entrysystem that is being developed for L.L. Bean. Write ashort memo that describes to the project manageryour reason for selecting an n-tiered architecture overa two-tiered architecture. In the memo, give some ideaas to what different components of the architectureyou would include.
E. You have been selected to determine whether yourfirm should invest in CORBA- or .net-based technolo-gies to support distributed objects computing. Write ashort memo that describes to the steering committeethe advantages and disadvantages of both approaches.(Note: You probably should check out the Web sitesassociated with both.)
F. Think about the system that your university currentlyuses for career services, and suppose that you are incharge of replacing the system with a new one.Describe how you would decide on the computingarchitecture for the new system using the criteria pre-sented in this chapter. What information will you needto find out before you can make an educated compar-ison of the alternatives?
G. Locate a consumer products company on the Web andread its company description (so that you get a goodunderstanding of the geographic locations of the com-pany). Pretend that the company is about to create anew application to support retail sales over the Web.Create a high-level network model that depicts thelocations that would include components that supportthis application.
H. An energy company with headquarters in Dallas,Texas, is thinking about developing a system to trackthe efficiency of its oil refineries in North America.Each week, the ten refineries—as far as Valdez, Alaska,and as close as San Antonio, Texas—will upload per-formance data via satellite to the corporate mainframein Dallas. Production managers at each site will use apersonal computer to dial into an Internet service
provider and access reports via the Web. Create a high-level network model that depicts the locations thathave components supporting this system.
I. Create a low-level network diagram for the buildingthat houses the computer labs at your university.Choose an application (e.g., course registration, stu-dent admissions) and include only the componentsthat are relevant to that application.
J. Suppose that your mother is a real estate agent, andshe has decided to automate her daily tasks using alaptop computer. Consider her potential hardware andsoftware needs, and create a hardware and softwarespecification that describes them. The specificationshould be developed to help your mother buy herhardware and software on her own.
K. Suppose that the admissions office in your universityhas a Web-based application so that students can applyfor admission online. Recently, there has been a push toadmit more international students into the university.What do you recommend that the application includesto ensure that it supports this global requirement?
L. Based on the health club exercises in Chapter 5 (N, O),Chapter 6 (O), Chapter 7 (E, F), Chapter 8 (G, H),Chapter 9 (A), Chapter 10 (I), and Chapter 11 (D, E),suggest a physical architecture design and portray itwith a deployment diagram.
M. Based on the Picnics R Us exercises in Chapter 5 (P,Q), Chapter 6 (P), Chapter 7 (J), Chapter 8 (I, J), andChapter 9 (C), Chapter 10 (J), and Chapter 11 (F, G),suggest a physical architecture design and portray itwith a deployment diagram.
N. Based on the Of-the-Month Club exercises in Chapter5 (R, S), Chapter 6 (Q), Chapter 7 (K), Chapter 8 (K,L), Chapter 9 (E), Chapter 10 (K), and Chapter 11 (H,I), suggest a physical architecture design and portray itwith a deployment diagram.
O. Based on the library exercises in Chapter 5 (T, U),Chapter 6 (R), Chapter 7 (L), Chapter 8 (M, N), Chap-ter 9 (G), Chapter 10 (L), and Chapter 11 (J, K), sug-gest a physical architecture design and portray it witha deployment diagram.
MINICASES
1. The system development project team at Birdie Mastersgolf schools has been working on defining the physicalarchitecture design for the system. The major focus ofthe project is a networked school location operationssystem, allowing each school location to easily record
and retrieve all school location transaction data. Anothersystem element is the use of the Internet to enable cur-rent and prospective students to view class offerings atany of the Birdie Masters’ locations, schedule lessonsand enroll in classes at any Birdie Masters location, and

502 Chapter 12 Physical Architecture Layer Design
maintain a student progress profile—a confidentialanalysis of the student’s golf skill development.
The project team has been considering the global-ization issues that should be factored into the archi-tecture design. The school’s plan for expansion intothe golf-crazed Japanese market is moving ahead. Thefirst Japanese school location is tentatively planning toopen about six months after the target completiondata for the system project. Therefore, it is importantthat issues related to the international location beaddressed now during design.
Assume that you have been given the responsibilityof preparing a summary memo on the globalizationissues that should be factored into the design. Preparethis memo discussing the globalization issues that arerelevant to Birdie Masters’ new system.
2. Jerry is a relatively new member of a project team thatis developing a retail store management system for achain of sporting goods stores. Company headquartersis in Las Vegas, and the chain has twenty-seven loca-tions throughout Nevada, Utah, and Arizona. Severalcities have multiple stores.
The new system will be a networked, client–serverarchitecture. Stores will be linked to one of three
regional servers, and the regional servers will be linkedto corporate headquarters in Las Vegas. The regionalservers also link to each other. Each retail store will beoutfitted with similar configurations of two PC-basedpoint-of-sale terminals networked to a local file server.Jerry has been given the task of developing a networkmodel that will document the geographic structure ofthis system. He has not faced a system of this scopebefore and is a little unsure how to begin.a. Prepare a set of instructions for Jerry to follow in
developing this network model.b. Using a deployment diagram, draw a network
model for this organization.c. Prepare a set of instructions for Jerry to follow in
developing a hardware and software specification.3. Refer to the Professional and Scientific Staff Manage-
ment (PSSM) minicase in Chapters 5, 7, 8, 10, and 11.Based on the solutions developed for those problems,suggest a physical architecture design and portray itwith a deployment diagram.
4. Refer to the Holiday Travel Vehicles minicase in Chap-ters 6, 7, 8, 9, 10, and 11. Based on the solutions devel-oped for those problems, suggest a physical architecturedesign and portray it with a deployment diagram.
Project A
ssessment
Support Plan
Change
Managem
ent PlanC
onversion Plan
Docum
entationTest Plan
Programs
During construction, the actual system is built. Building a successful information system requires a set of activities: programming, testing, and docu-menting the system. In today's global economy, cul-tural issues also play an important role in managing these activities. Installing an information system re-quires switching from the current system to the new system. This conversion process can be quite in-volved; for example, cultural differences among the users, the development team, and the two groups can be quite challenging. Furthermore, not only does conversion involve shutting the old system down and turning the new one on, it also can involve a signifi-cant training effort. Finally, operating the system may uncover additional requirements that may have to be addressed by the development team.
CHAPTER 13Construction
CHAPTER 14Installation
and Operations
PART FOUR
Construction, Installation, and
Operations

This page intentionally left blank
C H A P T E R 1 3
Construction
505505
This chapter discusses the activities needed to successfully build an information system:programming, testing and documenting the system. Programming is time consuming andcostly, but except in unusual circumstances, it is the simplest for the systems analystbecause it is well understood. For this reason, the system analyst focuses on testing (prov-ing that the system works as designed) and developing documentation.
OBJECTIVES:
■ Be familiar with the system construction process.■ Understand different types of tests and when to use them.■ Understand how to develop documentation.
CHAPTER OUTLINE
IntroductionManaging Programming
Assigning ProgrammersCoordinating ActivitiesManaging the ScheduleCultural Issues
Designing TestsTesting and Object OrientationTest PlanningUnit TestsIntegration TestsSystem TestsAcceptance Tests
Developing DocumentationTypes of DocumentationDesigning Documentation
StructureWriting Documentation TopicsIdentifying Navigation Terms
Applying the Concepts at CD Selections
Managing ProgrammingTestingDeveloping User Documentation
Summary
INTRODUCTION
When people first learn about developing information systems, they usually think imme-diately about writing programs. Programming can be the largest single component of anysystems development project in terms of both time and cost. However, it also can be thebest understood component and therefore—except in rare circumstances—offers the leastproblems of all aspects of system development. When projects fail, it is usually not becausethe programmers were unable to write the programs, but because the analysis, design,installation, and/or project management were done poorly. In this chapter, we focus on theconstruction and testing of the software and the documentation.

Construction is the development of all parts of the system, including the software itself,documentation, and new operating procedures. Looking back at Figure 1-11, we see thatthe Construction phase of the Enhance Unified Process deals predominantly with theImplementation and Testing and Configuration and Change Management workflows.Implementation obviously deals with programming. Programming is often seen as thefocal point of system development. After all, system development is writing programs. It isthe reason why we do all the analysis and design. And it’s fun. Many beginning program-mers see testing and documentation as bothersome afterthoughts. Testing and documen-tation aren’t fun, so they often receive less attention than the creative activity of writingprograms.
However, programming and testing are very similar to writing and editing. No pro-fessional writer (or student writing an important term paper) would stop after writingthe first draft. Rereading, editing, and revising the initial draft into a good paper are thehallmarks of good writing. Likewise, thorough testing is the hallmark of professionalsoftware developers. Most professional organizations devote more time and money totesting (and the subsequent revision and retesting) than to writing the programs in thefirst place.
The reasons are simple economics: downtime and failures caused by software bugs1 areextremely expensive. Many large organizations estimate the costs of downtime of criticalapplications at $50,000 to $200,000 per hour.2 One serious bug that causes an hour ofdowntime can cost more than one year’s salary of a programmer—and how often are bugsfound and fixed in one hour? Testing is, therefore, a form of insurance. Organizations arewilling to spend a lot of time and money to prevent the possibility of major failures afterthe system is installed.
Therefore, a program is usually not considered finished until the test for that pro-gram is passed. For this reason, programming and testing are tightly coupled, andbecause programming is the primary job of the programmer (not the analyst), testing(not programming) often becomes the focus of the construction stage for the systemsanalysis team.
The Configuration and Change Management workflow keeps track of the state of theevolving system. The evolving information system comprises a set of artifacts thatincludes, for example, diagrams, source code, and executables. During the developmentprocess, these artifacts are modified. The amount of work, and hence dollars, that goesinto the development of the artifacts is substantial. As such, the artifacts themselvesshould be handled as any expensive asset would be handled—access controls must be putinto place to safeguard the artifacts from being stolen or destroyed. Furthermore, becausethe artifacts are modified on a regular, if not continuous, basis, good version controlmechanisms should be established. The traceability of the artifacts back through the var-ious artifacts developed, such as data management layer designs, class diagrams, packagediagrams, and use-case diagrams, to the specific requirements is also very important.Without this traceability, we will not know which aspects of a system to modify when, notif, the requirements change.
506 Chapter 13 Construction
1 When I (Alan Dennis) was an undergraduate, I had the opportunity to hear Admiral Grace Hopper tell how theterm bug was introduced. She was working on one of the early Navy computers when suddenly it failed. The com-puter would not restart properly so she began to search for failed vacuum tubes. She found a moth inside one tubeand recorded in the log book that a bug had caused the computer to crash. From then on, every computer crashwas jokingly blamed on a bug (as opposed to programmer error), and eventually the term bug entered the gen-eral language of computing.2 See Billie Shea, “Quality Patrol: Eye on the Enterprise,” Application Development Trends (November 5, 1998):31–38.
Managing Programming 507
My first programming job in 1977 was to convert a set ofapplication systems from one version of COBOL toanother version of COBOL for the Government of PrinceEdward Island. The testing approach was to first run a setof test data through the old system and then run it throughthe new system to ensure that the results from the twomatched. If they matched, then the last three months ofproduction data were run through both to ensure they,too, matched.
Things went well until I began to convert the gas taxsystem that kept records on everyone authorized to pur-chase gasoline without paying tax. The test data ran fine,but the results using the production data were peculiar.The old and new systems matched, but rather than list-ing several thousand records, the report listed only fifty.I checked the production data file and found it listedonly fifty records, not the thousands that were supposedto be there.
The system worked by copying the existing gas taxrecords file into a new file and making changes in thenew file. The old file was then copied to tape backup.There was a bug in the program such that if there were nochanges to the file, a new file was created, but no recordswere copied into it.
I checked the tape backups and found one with thefull set of data that were scheduled to be overwrittenthree days after I discovered the problem. The govern-ment was only three days away from losing all gas taxrecords.
— Alan Dennis
Question
What would have been the cost of this bug if it hadn’tbeen caught?
13-A The Cost of a BugCONCEPTS
IN ACTION
3 A good reference for information on configuration and change management is Jessica Keyes, Software ConfigurationManagement (Boca Raton, FL: Auerbach, 2004).4 One of the best books on managing programming (even though it was first written over 30 years ago) is that byFrederick P. Brooks, Jr. The Mythical Man-Month, 20th Anniversary Edition (Reading, MA: Addison-Wesley, 1995).
In this chapter, we discuss three aspects of construction: managing programming,testing, and writing the documentation. Because programming is primarily the job ofprogrammers, not systems analysts, and because this is not a programming book, wedevote less time to programming than to testing and documentation. Furthermore, we donot delve into the details of configuration and change management in this chapter (seeChapter 14).3
MANAGING PROGRAMMING
In general, systems analysts do not write programs; programmers write programs.Therefore, the primary task of the systems analysts during programming is . . . waiting.However, the project manager is usually very busy managing the programming effort byassigning the programmers, coordinating the activities, and managing the programmingschedule.4
Assigning ProgrammersThe first step in programming is assigning modules to the programmers. As discussed inChapter 9, each module (class, object, or method) should be as separate and distinct aspossible from the other modules (i.e., cohesion should be maximized and coupling should
be minimized). The project manager first groups together classes that are related so thateach programmer is working on related classes. These groups of classes are then assignedto programmers. A good place to start is to look at the package diagrams.
One of the rules of system development is that the more programmers who areinvolved in a project, the longer the system will take to build. This is because as the size ofthe programming team increases, the need for coordination increases exponentially, andthe more coordination required, the less time programmers can spend actually writing sys-tems. The best size is the smallest possible programming team. When projects are so com-plex that they require a large team, the best strategy is to try to break the project into aseries of smaller parts that can function as independently as possible.
Coordinating ActivitiesCoordination can be done through both high-tech and low-tech means. The simplestapproach is to have a weekly project meeting to discuss any changes to the system that havearisen during the past week—or just any issues that have come up. Regular meetings, evenif they are brief, encourage the widespread communication and discussion of issues beforethey become problems.
Another important way to improve coordination is to create and follow standardsthat can range from formal rules for naming files, to forms that must be completed whengoals are reached, to programming guidelines (see Chapter 3). When a team forms stan-dards and then follows them, the project can be completed faster because task coordina-tion is less complex.
The analysts also must put mechanisms in place to keep the programming effort wellorganized. Many project teams set up three areas in which programmers can work: adevelopment area, a testing area, and a production area. These areas can be different
508 Chapter 13 Construction
Quantitative analysis provides the data for making deci-sions. Some major league baseball teams have used Saber-metrics (and similar data analysis measures) to quantify thevalue of a player to his salary. For example, is a .250 hitterwith a strong base-stealing background getting paid $5 mil-lion per year worth more in terms of salary dollars as com-pared to a .330 hitter with slower speed who is getting paid$15 million per year? Is Alex Rodriguez of the Yankeesworth more than Joe Maurer of the Minnesota Twins? IsRandy Johnson of the Arizona Diamondbacks more valu-able than Ryan Dempster of the Chicago Cubs? Statisticsare gathered and analyzed on all aspects of the game: hit-ting, fielding, injuries, leadership, coachability, age (andexpected lifetime contributions), and much more.
Now take that concept to the business marketplace.Can quantitative measures be placed on IT workers? Is asystems analyst that manages six major projects in a yearworth more than an analyst who manages twelve muchsmaller projects? Is a project leader who is known for
effectively managing teams worth more than one who fre-quently has disagreements with his or her team? Is adeveloper who can write 1,000 lines of Java code in aweek worth more or less than a developer who writes 500lines of Visual Basic code? When we discussed tangibleand intangible benefits, the authors suggested putting adollar amount on to intangible benefits if possible.
Questions
1. How could you put quantitative measures on thequalitative efforts of a systems analyst?
2. What might be some of the costs in implementing astatistical analysis of employees?
3. What data might be needed to do such a statisticalanalysis on employees?
4. Could this system replace the conventional humanresource department roles for recruiting and evalu-ating corporate talent?
13-B Identifying the Best TalentCONCEPTS
IN ACTION

directories on a server hard disk, different servers, or different physical locations, but thepoint is that files, data, and programs are separated based on their status of completion.At first, programmers access and build files within the development area and then copythem to the testing area when the programmers are finished. If a program does not passa test, it is sent back to development. Once all programs, etc., are tested and ready to sup-port the new system, they are copied into the production area—the location where thefinal system will reside.
Keeping files and programs in different places based on completion status helps man-age change control, the action of coordinating a system as it changes through construction.Another change control technique is keeping track of which programmer changes whichclasses and packages by using a program log. The log is merely a form on which program-mers sign out classes and packages to write and sign in when they are completed. Both theprogramming areas and program log help the analysts understand exactly who has workedon what and the system’s current status. Without these techniques, files can be put into pro-duction without the proper testing (e.g., two programmers can start working on the sameclass or package at the same time).
If a CASE tool is used during the construction step, it can be very helpful for changecontrol because many CASE tools are set up to track the status of programs and help man-age programmers as they work. In most cases, maintaining coordination is not conceptu-ally complex. It just requires a lot of attention and discipline to tracking small details.
Managing the ScheduleThe time estimates that were produced during project initiation and refined during analy-sis and design will almost always need to be refined as the project progresses during con-struction because it is virtually impossible to develop an exact assessment of the project’sschedule. As we discussed in Chapter 3, a well-done set of time estimates will usually havea 10 percent margin of error by the time we reach the construction step. It is critical thatthe time estimates be revised as construction proceeds. If a program module takes longerto develop than expected, then the prudent response is to move the expected completiondate later by the same amount.
Managing Programming 509
As a great analyst, you’ve planned, analyzed and designeda good solution. Now you need to implement. As part ofimplementation do you think that training is just a wastedexpense?
Stress is common in a help-desk call center. Users ofcomputing services call to get access to locked accountsor get help when technology isn’t working as planned,and they frequently are very upset. Employees of the help-desk call center can get stressed out, and this can result inmore sick days, less productivity, and higher turnover.Max Productivity Incorporated is a training company thatworks with people in high-stress jobs. Their training pro-gram helps employees in how to relax, how to shake off
tough users—and how to create “win-win” scenarios. Theyclaim to be able to reduce employee turnover by 50 per-cent, increase productivity by 20 percent, and reducestress, anger, and depression by 75 percent.
Questions
1. How would you challenge Max Productivity to ver-ify its claims for reducing turnover, increasing pro-ductivity, and decreasing stress and anger?
2. How would you conduct a cost–benefit analysis onhiring Max Productivity Incorporated to do ongoingtraining for your help-desk call-center employees?
13-C Finishing the ProcessCONCEPTS
IN ACTION
510 Chapter 13 Construction
In previous chapters, we discussed classic mistakes andhow to avoid them. Here, we summarize four classic mis-takes in implementation:5
1. Research-oriented development: Using state-of-the-arttechnology requires research-oriented developmentthat explores the new technology because “bleedingedge” tools and techniques are not well understood,are not well documented, and do not function exactlyas promised.Solution: If you use state-of-the-art technology, youneed to significantly increase the project’s time andcost estimates even if (some experts would say espe-cially if) such technologies claim to reduce time andeffort.
2. Using low-cost personnel: You get what you pay for. Thelowest-cost consultant or staff member is significantlyless productive than the best staff. Several studies haveshown that the best programmers produce software sixto eight times faster than the least productive (yet costonly 50 to 100% more).
Solution: If cost is a critical issue, assign the best, mostexpensive personnel; never assign entry-level person-nel in an attempt to save costs.
3. Lack of code control: On large projects, programmersneed to coordinate changes to the program sourcecode (so that two programmers don’t try to change thesame program at the same time and overwrite theother’s changes). Although manual procedures appearto work (e.g., sending e-mail notes to others when youwork on a program to tell them not to), mistakes areinevitable.Solution: Use a source code library that requires pro-grammers to “check out” programs and prohibits oth-ers from working on them at the same time.
4. Inadequate testing: The number one reason for projectfailure during implementation is ad hoc testing—whereprogrammers and analysts test the system withoutformal test plans.Solution: Always allocate sufficient time in the projectplan for formal testing.
13-1 Avoiding Classic Implementation MistakesPRACTICAL
TIP
One of the most common causes for schedule problems is scope creep. Scope creepoccurs when new requirements are added to the project after the system design was final-ized. Scope creep can be very expensive because changes made late in system developmentcan require much of the completed system design (and even programs already written) to beredone. Any proposed change during construction must require the approval of the pro-ject manager and should only be done after a quick cost–benefit analysis has been done.
Another common cause is the unnoticed day-by-day slippages in the schedule. One pack-age is a day late here; another one is a day late there. Pretty soon these minor delays add upand the project is noticeably behind schedule. Once again, the key to managing the program-ming effort is to watch these minor slippages carefully and update the schedule accordingly.
Typically, a project manager will create a risk assessment that tracks potential risksalong with an evaluation of their likelihood and potential impact. As the construction stepmoves to a close, the list of risks will change as some items are removed and others surface.The best project managers, however, work hard to keep risks from having an impact on theschedule and costs associated with the project.
Cultural IssuesOne of the major issues facing information systems development organizations is the off-shoring of the implementation aspects of information systems development. Conflictscaused by different national and organizational cultures are now becoming a real area of
5 Adapted from Steve McConnell, Rapid Development, (Redmond, WA: Microsoft Press, 1996).

concern. A simple example that can demonstrate cultural differences with regard to studentlearning is the idea of plagiarism. What exactly does plagiarism really imply? Different cul-tures have very different views. In some cultures, one of the highest forms of respect is sim-ply to quote an expert. However, in these same cultures, there is no need to reference theexpert. The act of quoting the expert itself is the act of respect. In some cases, actually ref-erencing the expert through the use of quotation marks and a footnote may be viewed asan insult to the expert and the reader because it is obvious to the reader that the writer didnot expect the reader to recognize the expert’s quote. This expectation was either caused bythe reader’s own ignorance or the expert’s lack of reputation. Either way, the writer wouldbe insulting someone through the use of quotation marks and footnotes. However, in theUnited States, the opposite is true. If a writer does not use quotation marks and footnotesto appropriately give credit to the source of the quote (or paraphrase), then the writer isguilty of theft.6 Obviously, in today’s global world, plagiarism is not a simple issue.
Another simple example of cultural differences, with regard to student learning, is theidea of students working together to complete homework assignments. Even though we allknow that research has shown that students learn better in groups, in the United States, weview students that turn in the same assignment as cheaters.7 In other cultures, individualperformance is not as important as the performance of the group. As such, helping a fellow
Managing Programming 511
Systems Projects are notorious for being late and over bud-get. When should management stop a project that is late orcosting more than the intended budget? Consider this case.
Valley Enterprises opted to implement Voiceover Inter-net Protocol (VoIP) service in its Phoenix, Arizona, servicearea. The company has fifteen locations in the Phoenixarea—all with LANs and all with secure Wi-Fi connections.Their current phone system was designed and implementedin the 1950s, when they operated in three locations. As theyexpanded to additional locations, they generally imple-mented standard telecommunications’ solutions with littlethought for compatibility. Over the years, they added phoneservices as they added new buildings and facilities. TheCEO, Doug Wilson, heard of VoIP at a trade show and con-tacted TMR Telecommunications Consultants for a bid. TMRspent a week with the CIO of Valley Enterprises gatheringdata and submitted a bid for $50,000 in late 2007. The pro-ject was to be started by March 2008 and completed byJanuary 2009. The bid was accepted.
TMR started the project in March 2008. In late July2008, TMR was bought out by Advanced Communications
of Scottsdale, Arizona. This merger delayed the project ini-tially by over a month. In early September 2008, some ofthe same personnel from TMR, as well as a new projectmanager from Advanced Communications, went back tothe project.
By March 2009, the project had already cost $150,000and only eight of the locations had VoIP implemented.Advanced Communications insisted that the LANs were outof date and were unable to carry the expanded load with-out major upgrades to the bandwidth, the routers, and othertelecommunications equipment.
Questions
1. Is it time to end this project? Why or why not?2. What negotiations should have occurred between
TMR and Valley Enterprises prior to December2008?
3. What should a project manager or project coordi-nator from Valley Enterprises do when the projectfirst starts to slip?
13-D Managing a Late Project: When to Say When?CONCEPTS
IN ACTION
6 A wonderful little book on plagiarism is Richard A. Posner, The Little Book of Plagiarism (New York: PantheonBooks, 2007).7 In this case, the recent work of Roger Schank is very enlightening. For example, see Roger C. Schank, MakingMinds Less Well Educated Than Our Own (Mahwah, NJ: Lawrence Erlbaum Associates, 2004).

student to understand the assignment and to perform better in the class would be theexpectation. Obviously, this is another example of a substantive cultural difference.
From a project management perspective, information systems development teams canbe geographically dispersed and multicultural in their membership. To say the least, thisadds a new wrinkle in the management of developing a successful information system. Foryears, project managers in the United States have had to bring together individuals fromvery different backgrounds. But, there was always a common spoken and written language,English, and the so-called ‘melting pot’ idea that guaranteed some level of commonalityamong the team members.8 However, in today’s “flat world,” there is no longer any com-mon culture or common spoken and written language. The common language today tendsto be UML, Java, SQL, and Visual Basic, not English. And, as the Internet becomes moreprevalent, the only common culture could be the Web.
DESIGNING TESTS9
In object-oriented systems, the temptation is to minimize testing. After all, through the useof patterns, frameworks, class libraries, and components, much of the system has beentested previously. Therefore, we should not have to test as much. Right? Wrong! Testing ismore critical to object-oriented systems than systems developed in the past. Based onencapsulation (and information hiding), polymorphism (and dynamic binding), inheri-tance, and reuse, thorough testing is much more difficult and critical. Furthermore, giventhe global nature of information systems development, testing becomes even more crucial.As such, testing must be done systematically and the results documented so that the pro-ject team knows what has and has not been tested.
The purpose of testing is not to demonstrate that the system is free of errors. It is notpossible to prove that a system is error free, which is especially true with object-orientedsystems. This is similar to theory testing. You cannot prove a theory. If a test fails to findproblems with a theory, your confidence in the theory is increased. However, if a test suc-ceeds in finding a problem, then the theory has been falsified. Software testing is similar inthat it can only show the existence of errors. As such, the purpose of testing is to uncoveras many errors as feasible.10
There are four general stages of tests: unit tests, integration tests, system tests, andacceptance tests. Although each application system is different, most errors are found dur-ing integration and system testing (see Figure 13-1).
In each of the following sections, we describe the four stages. However, before doingthis, we describe the effect that the object-oriented characteristics have on testing and thenecessary planning and management activities that must take place to have a successfultesting program.
512 Chapter 13 Construction
8 Even though individuals who grew up in different areas of the United States (e.g., New York City, Nashville, Min-neapolis, Denver, and Los Angeloes) are, in a very real sense, culturally different, the prevalence of the Internet andcable TV has created much more of a shared culture in the United States than in many other parts of the world.9 This section is based on material contained in Imran Bashir and Amrit L. Goel, Testing Object-Oriented Software:Life Cycle Solutions (New York: Springer Verlag, 1999); Bernd Bruegge and Allen H. Dutoit, Object-Oriented Soft-ware Engineering: Conquering Complex and Changing Systems (Upper Saddle River, NJ: Prentice Hall, 2000);Philippe Kruchten, The Rational Unified Process: An Introduction, 2nd ed. (Boston, MA: Addison-Wesley, 2000);and John D. McGregor and David A. Sykes, A Practical Guide to Testing Object-Oriented Software (Boston, MA:Addison-Wesley, 2001). For more information on testing object-oriented software, see Robert V. Binder, TestingObject-Oriented Systems: Models, Patterns, and Tools (Reading, MA: Addison-Wesley, 1999); and Shel Sieget,Object-Oriented Software Testing: A Hierarchical Approach (New York: Wiley, 1996).10 It is not cost-effective to try to get each and every error out of the software. Except in simple examples, it is, infact, impossible. There are simply too many combinations to check.
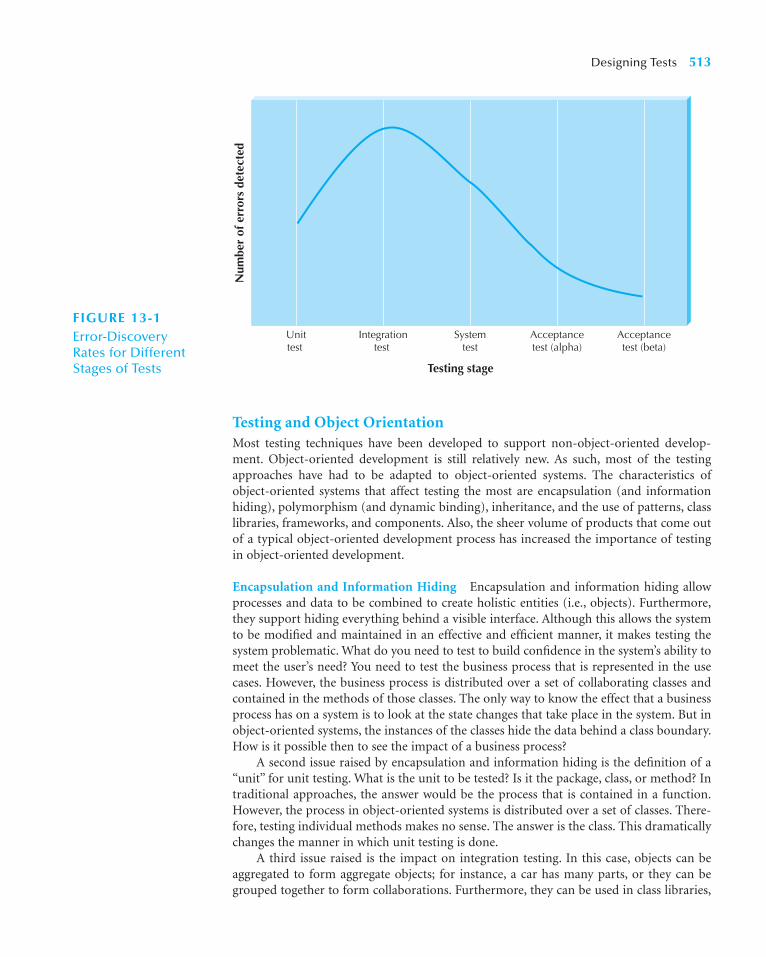
Testing and Object OrientationMost testing techniques have been developed to support non-object-oriented develop-ment. Object-oriented development is still relatively new. As such, most of the testingapproaches have had to be adapted to object-oriented systems. The characteristics ofobject-oriented systems that affect testing the most are encapsulation (and informationhiding), polymorphism (and dynamic binding), inheritance, and the use of patterns, classlibraries, frameworks, and components. Also, the sheer volume of products that come outof a typical object-oriented development process has increased the importance of testingin object-oriented development.
Encapsulation and Information Hiding Encapsulation and information hiding allowprocesses and data to be combined to create holistic entities (i.e., objects). Furthermore,they support hiding everything behind a visible interface. Although this allows the systemto be modified and maintained in an effective and efficient manner, it makes testing thesystem problematic. What do you need to test to build confidence in the system’s ability tomeet the user’s need? You need to test the business process that is represented in the usecases. However, the business process is distributed over a set of collaborating classes andcontained in the methods of those classes. The only way to know the effect that a businessprocess has on a system is to look at the state changes that take place in the system. But inobject-oriented systems, the instances of the classes hide the data behind a class boundary.How is it possible then to see the impact of a business process?
A second issue raised by encapsulation and information hiding is the definition of a“unit” for unit testing. What is the unit to be tested? Is it the package, class, or method? Intraditional approaches, the answer would be the process that is contained in a function.However, the process in object-oriented systems is distributed over a set of classes. There-fore, testing individual methods makes no sense. The answer is the class. This dramaticallychanges the manner in which unit testing is done.
A third issue raised is the impact on integration testing. In this case, objects can beaggregated to form aggregate objects; for instance, a car has many parts, or they can begrouped together to form collaborations. Furthermore, they can be used in class libraries,
Designing Tests 513
Acceptancetest (beta)
Acceptancetest (alpha)
Systemtest
Integrationtest
Unittest
Num
ber
of e
rror
s de
tect
ed
Testing stage
FIGURE 13-1Error-Discovery Rates for DifferentStages of Tests
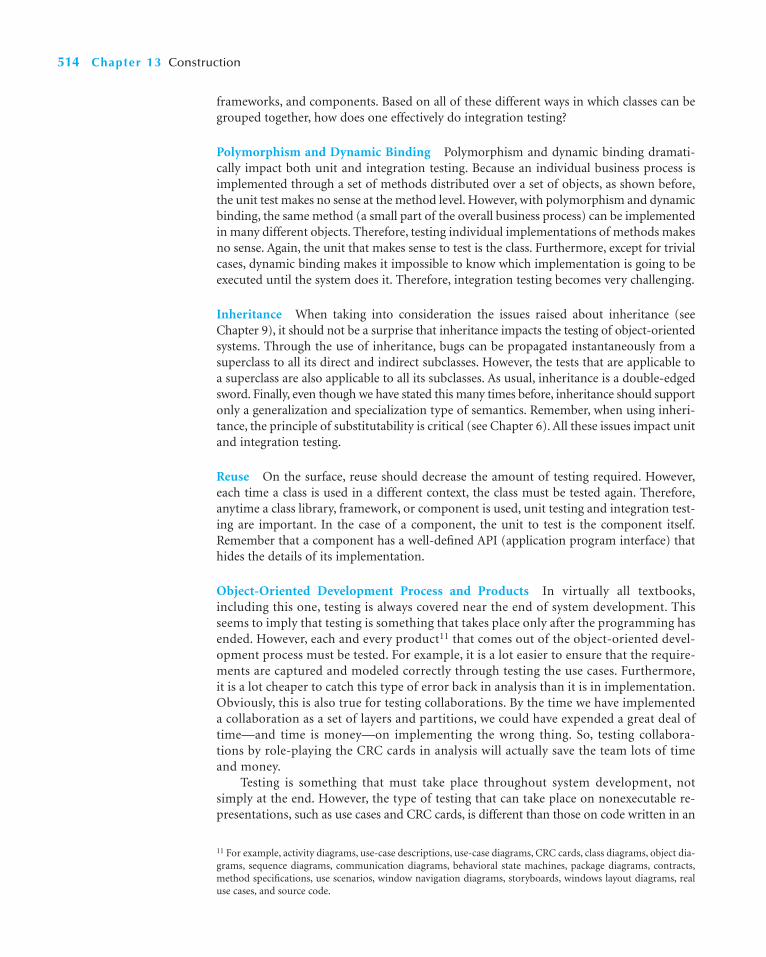
frameworks, and components. Based on all of these different ways in which classes can begrouped together, how does one effectively do integration testing?
Polymorphism and Dynamic Binding Polymorphism and dynamic binding dramati-cally impact both unit and integration testing. Because an individual business process isimplemented through a set of methods distributed over a set of objects, as shown before,the unit test makes no sense at the method level. However, with polymorphism and dynamicbinding, the same method (a small part of the overall business process) can be implementedin many different objects. Therefore, testing individual implementations of methods makesno sense. Again, the unit that makes sense to test is the class. Furthermore, except for trivialcases, dynamic binding makes it impossible to know which implementation is going to beexecuted until the system does it. Therefore, integration testing becomes very challenging.
Inheritance When taking into consideration the issues raised about inheritance (seeChapter 9), it should not be a surprise that inheritance impacts the testing of object-orientedsystems. Through the use of inheritance, bugs can be propagated instantaneously from asuperclass to all its direct and indirect subclasses. However, the tests that are applicable toa superclass are also applicable to all its subclasses. As usual, inheritance is a double-edgedsword. Finally, even though we have stated this many times before, inheritance should supportonly a generalization and specialization type of semantics. Remember, when using inheri-tance, the principle of substitutability is critical (see Chapter 6). All these issues impact unitand integration testing.
Reuse On the surface, reuse should decrease the amount of testing required. However,each time a class is used in a different context, the class must be tested again. Therefore,anytime a class library, framework, or component is used, unit testing and integration test-ing are important. In the case of a component, the unit to test is the component itself.Remember that a component has a well-defined API (application program interface) thathides the details of its implementation.
Object-Oriented Development Process and Products In virtually all textbooks,including this one, testing is always covered near the end of system development. Thisseems to imply that testing is something that takes place only after the programming hasended. However, each and every product11 that comes out of the object-oriented devel-opment process must be tested. For example, it is a lot easier to ensure that the require-ments are captured and modeled correctly through testing the use cases. Furthermore,it is a lot cheaper to catch this type of error back in analysis than it is in implementation.Obviously, this is also true for testing collaborations. By the time we have implementeda collaboration as a set of layers and partitions, we could have expended a great deal oftime—and time is money—on implementing the wrong thing. So, testing collabora-tions by role-playing the CRC cards in analysis will actually save the team lots of timeand money.
Testing is something that must take place throughout system development, notsimply at the end. However, the type of testing that can take place on nonexecutable re-presentations, such as use cases and CRC cards, is different than those on code written in an
514 Chapter 13 Construction
11 For example, activity diagrams, use-case descriptions, use-case diagrams, CRC cards, class diagrams, object dia-grams, sequence diagrams, communication diagrams, behavioral state machines, package diagrams, contracts,method specifications, use scenarios, window navigation diagrams, storyboards, windows layout diagrams, realuse cases, and source code.
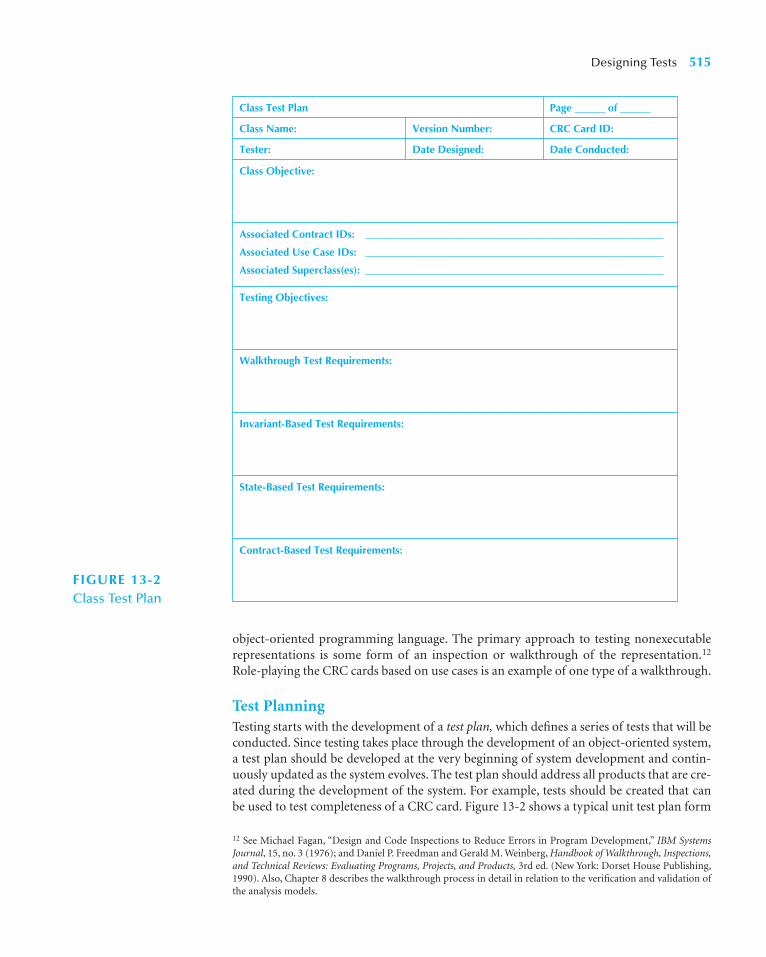
object-oriented programming language. The primary approach to testing nonexecutablerepresentations is some form of an inspection or walkthrough of the representation.12
Role-playing the CRC cards based on use cases is an example of one type of a walkthrough.
Test PlanningTesting starts with the development of a test plan, which defines a series of tests that will beconducted. Since testing takes place through the development of an object-oriented system,a test plan should be developed at the very beginning of system development and contin-uously updated as the system evolves. The test plan should address all products that are cre-ated during the development of the system. For example, tests should be created that canbe used to test completeness of a CRC card. Figure 13-2 shows a typical unit test plan form
Designing Tests 515
Class Test Plan
Class Name:
Page ______ of ______
Version Number:
Tester: Date Designed:
CRC Card ID:
Date Conducted:
Class Objective:
Testing Objectives:
Associated Contract IDs: ___________________________________________________________
Associated Use Case IDs: ___________________________________________________________
Associated Superclass(es): ___________________________________________________________
Walkthrough Test Requirements:
Invariant-Based Test Requirements:
State-Based Test Requirements:
Contract-Based Test Requirements:
FIGURE 13-2Class Test Plan
12 See Michael Fagan, “Design and Code Inspections to Reduce Errors in Program Development,” IBM SystemsJournal, 15, no. 3 (1976); and Daniel P. Freedman and Gerald M. Weinberg, Handbook of Walkthrough, Inspections,and Technical Reviews: Evaluating Programs, Projects, and Products, 3rd ed. (New York: Dorset House Publishing,1990). Also, Chapter 8 describes the walkthrough process in detail in relation to the verification and validation ofthe analysis models.
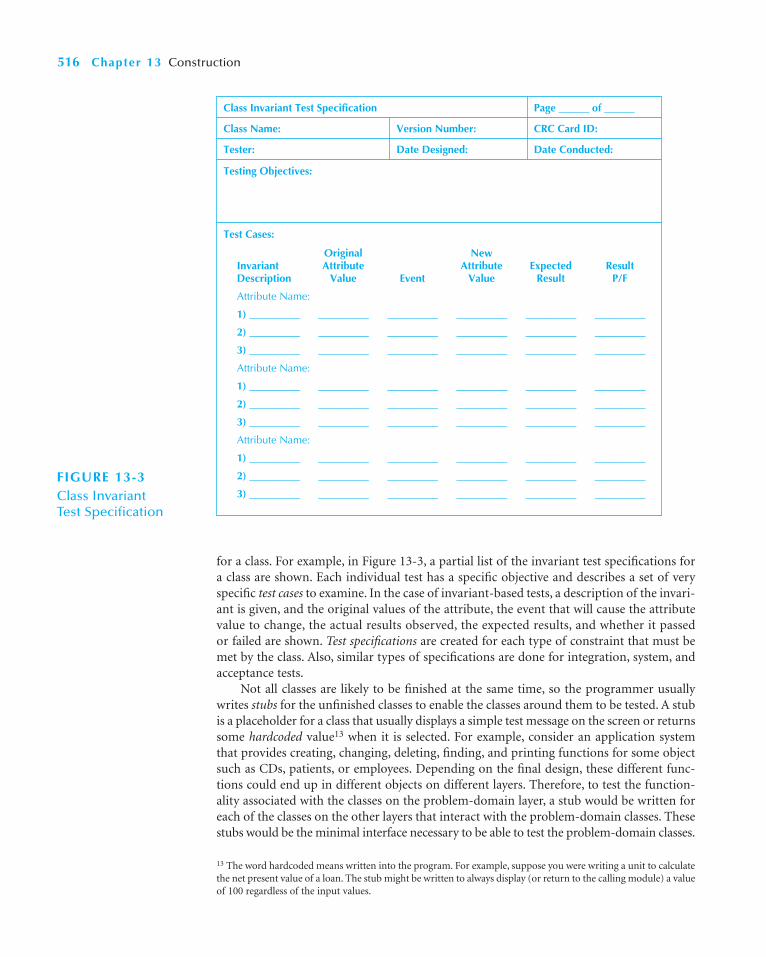
for a class. For example, in Figure 13-3, a partial list of the invariant test specifications fora class are shown. Each individual test has a specific objective and describes a set of veryspecific test cases to examine. In the case of invariant-based tests, a description of the invari-ant is given, and the original values of the attribute, the event that will cause the attributevalue to change, the actual results observed, the expected results, and whether it passedor failed are shown. Test specifications are created for each type of constraint that must bemet by the class. Also, similar types of specifications are done for integration, system, andacceptance tests.
Not all classes are likely to be finished at the same time, so the programmer usuallywrites stubs for the unfinished classes to enable the classes around them to be tested. A stubis a placeholder for a class that usually displays a simple test message on the screen or returnssome hardcoded value13 when it is selected. For example, consider an application systemthat provides creating, changing, deleting, finding, and printing functions for some objectsuch as CDs, patients, or employees. Depending on the final design, these different func-tions could end up in different objects on different layers. Therefore, to test the function-ality associated with the classes on the problem-domain layer, a stub would be written foreach of the classes on the other layers that interact with the problem-domain classes. Thesestubs would be the minimal interface necessary to be able to test the problem-domain classes.
516 Chapter 13 Construction
Class Invariant Test Specification
Class Name:
Page ______ of ______
Version Number:
Tester: Date Designed:
CRC Card ID:
Date Conducted:
Testing Objectives:
Test Cases:
Original New Invariant Attribute Attribute Expected Result Description Value Event Value Result P/F
Attribute Name:
1) __________ __________ __________ __________ __________ __________
2) __________ __________ __________ __________ __________ __________
3) __________ __________ __________ __________ __________ __________
Attribute Name:
1) __________ __________ __________ __________ __________ __________
2) __________ __________ __________ __________ __________ __________
3) __________ __________ __________ __________ __________ __________
Attribute Name:
1) __________ __________ __________ __________ __________ __________
2) __________ __________ __________ __________ __________ __________
3) __________ __________ __________ __________ __________ __________
FIGURE 13-3Class Invariant Test Specification
13 The word hardcoded means written into the program. For example, suppose you were writing a unit to calculatethe net present value of a loan. The stub might be written to always display (or return to the calling module) a valueof 100 regardless of the input values.

For example, they would have methods that could receive the messages being sent by theproblem-domain layer objects and methods that could send messages to the problem-domain layer objects. Typically, the methods would display a message on the screen notify-ing the tester that the method was successfully reached (e.g., Delete item from Databasemethod reached). In this way, the problem-domain classes could pass class testing beforethe classes on the other layers were completed.
Unit TestsUnit tests focus on a single unit—the class. There are two approaches to unit testing:black-box testing and white-box testing (see Figure 13-4). Black-box testing is the mostcommonly used because each class represents an encapsulated object. Black-box testingis driven by the CRC cards, state chart diagrams, and contracts associated with a class,not by the programmers’ interpretation. In this case, the test plan is developed directlyfrom the specification of the class: each item in the specification becomes a test, and sev-eral test cases are developed for it. White-box testing is based on the method specifica-tions associated with each class. However, white-box testing has had limited impact inobject-oriented development. This is due to the rather small size of the individual meth-ods in a class. As such, most approaches to testing classes use black-box testing to assuretheir correctness.
Class tests should be based on the invariants on the CRC cards, the behavioral statemachines associated with each class, and the pre- and postconditions contained on eachmethod’s contract. Assuming all the constraints have been captured on the CRC cards andcontracts, individual test cases can be developed fairly easily. For example, suppose theCRC card for an order class gave an invariant that the order quantity must be between 10and 100 cases. The tester would develop a series of test cases to ensure that the quantity isvalidated before the system accepts it. It is impossible to test every possible combination ofinput and situation; there are simply too many possible combinations. In this example, thetest requires a minimum of three test cases: one with a valid value (e.g., 15), one with a lowinvalid value (e.g., 7), and one with a high invalid value (e.g., 110). Most tests would alsoinclude a test case with a nonnumeric value to ensure the data types were checked (e.g.,ABCD). A really good test would include a test case with nonsensical but potentially validdata (e.g. 21.4).
Using a behavioral state machine is a useful way to identify tests for a class. Anyclass that has a behavioral state machine associated with it will have a potentially complexlife cycle. As such, it is possible to create a series of tests to guarantee that each state canbe reached.
Tests also can be developed for each contract associated with the class. In the case of acontract, a set of tests for each pre- and postcondition is required. Furthermore, if the classis a subclass of another class, then all the tests associated with the superclass must be exe-cuted again. Also, the interactions among the constraints, invariants, and the pre- and post-conditions in the subclass and the superclass(es) must be addressed.
Finally, owing to good object-oriented design, to fully test a class, special testing meth-ods may have to be added to the class being tested. For example, how can invariants betested? The only way to really test them is to have methods that are visible to the outside ofthe class that can be used to manipulate the values of the class’s attributes. However, addingthese types of methods to a class does two things. First, they add to the testing requirementsbecause they themselves will have to be tested. Second, if they are not removed from thedeployed version of the system, the system will be less efficient, and the advantage of infor-mation hiding effectively will be lost. As is readily apparent, testing classes is complex.Therefore, great care must be taken when designing tests for classes.
Designing Tests 517
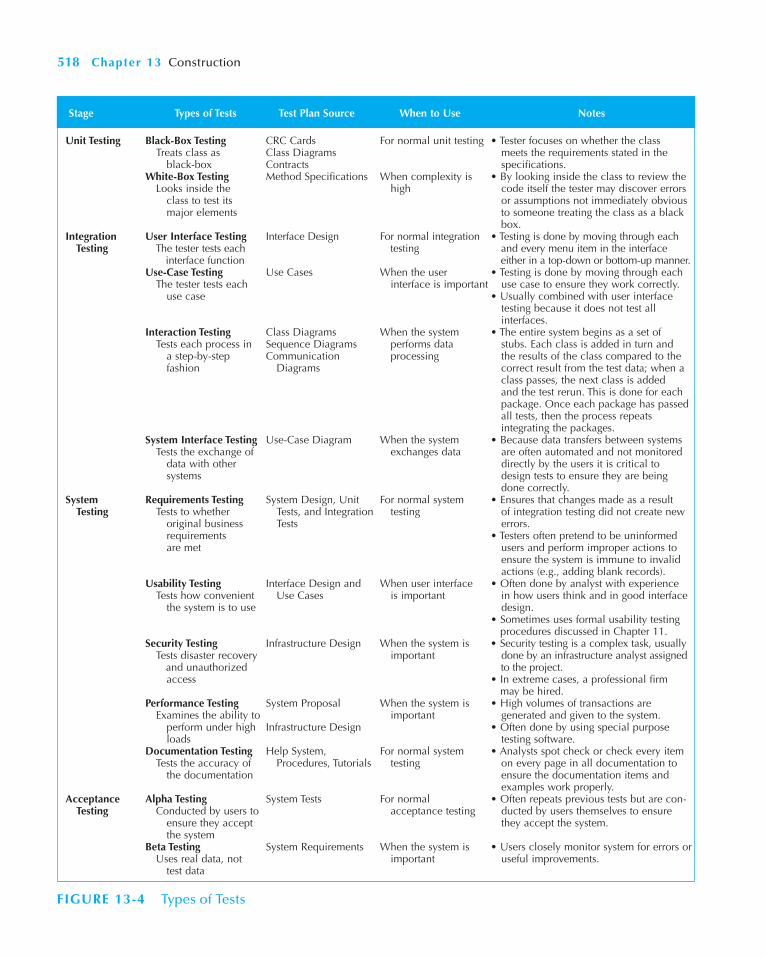
518 Chapter 13 Construction
Unit Testing Black-Box Testing CRC Cards For normal unit testing • Tester focuses on whether the class Treats class as Class Diagrams meets the requirements stated in the
black-box Contracts specifications.White-Box Testing Method Specifications When complexity is • By looking inside the class to review the
Looks inside the high code itself the tester may discover errors class to test its or assumptions not immediately obvious major elements to someone treating the class as a black
box.Integration User Interface Testing Interface Design For normal integration • Testing is done by moving through each
Testing The tester tests each testing and every menu item in the interface interface function either in a top-down or bottom-up manner.
Use-Case Testing Use Cases When the user • Testing is done by moving through each The tester tests each interface is important use case to ensure they work correctly.
use case • Usually combined with user interface testing because it does not test all interfaces.
Interaction Testing Class Diagrams When the system • The entire system begins as a set of Tests each process in Sequence Diagrams performs data stubs. Each class is added in turn and
a step-by-step Communication processing the results of the class compared to the fashion Diagrams correct result from the test data; when a
class passes, the next class is added and the test rerun. This is done for eachpackage. Once each package has passedall tests, then the process repeats integrating the packages.
System Interface Testing Use-Case Diagram When the system • Because data transfers between systems Tests the exchange of exchanges data are often automated and not monitored
data with other directly by the users it is critical to systems design tests to ensure they are being
done correctly.System Requirements Testing System Design, Unit For normal system • Ensures that changes made as a result
Testing Tests to whether Tests, and Integration testing of integration testing did not create new original business Tests errors.requirements • Testers often pretend to be uninformed are met users and perform improper actions to
ensure the system is immune to invalid actions (e.g., adding blank records).
Usability Testing Interface Design and When user interface • Often done by analyst with experience Tests how convenient Use Cases is important in how users think and in good interface
the system is to use design.• Sometimes uses formal usability testing
procedures discussed in Chapter 11.Security Testing Infrastructure Design When the system is • Security testing is a complex task, usually
Tests disaster recovery important done by an infrastructure analyst assigned and unauthorized to the project.access • In extreme cases, a professional firm
may be hired.Performance Testing System Proposal When the system is • High volumes of transactions are
Examines the ability to important generated and given to the system.perform under high Infrastructure Design • Often done by using special purpose loads testing software.
Documentation Testing Help System, For normal system • Analysts spot check or check every item Tests the accuracy of Procedures, Tutorials testing on every page in all documentation to
the documentation ensure the documentation items and examples work properly.
Acceptance Alpha Testing System Tests For normal • Often repeats previous tests but are con-Testing Conducted by users to acceptance testing ducted by users themselves to ensure
ensure they accept they accept the system.the system
Beta Testing System Requirements When the system is • Users closely monitor system for errors or Uses real data, not important useful improvements.
test data
Stage Types of Tests Test Plan Source When to Use Notes
FIGURE 13-4 Types of Tests

Integration TestsIntegration tests assess whether a set of classes that must work together do so without error.They ensure that the interfaces and linkages between different parts of the system workproperly. At this point, the classes have passed their individual unit tests, so the focus nowis on the flow of control among the classes and on the data exchanged among them. Inte-gration testing follows the same general procedures as unit testing: the tester develops a testplan that has a series of tests, which, in turn, have a test. Integration testing is often doneby a set of programmers and/or systems analysts.
From an object-oriented systems perspective, integration testing can be difficult. A sin-gle class can be in many different aggregations, due to the way in which objects can be com-bined to form new objects, class libraries, frameworks, components, and packages. Whereis the best place to start the integration? Typically, the answer is to begin with the set ofclasses, a collaboration, that are used to support the highest-priority use case (see Chapter 5).Also, dynamic binding makes it crucial to design the integration tests carefully to ensurethe combinations of methods are tested.
There are four approaches to integration testing: user interface testing,14 use-case testing,interaction testing, and system interface testing (see Figure 13-4). Most projects use all fourapproaches. However, like unit testing, integration testing must be carefully planned. Forexample, Figure 13-5 shows a typical form that can be used to plan a use-case test. Becauseeach use case will be supported by a set of classes, the class test plans, and invariant testspecifications (see Figures 13-2 and 13-3) can be reused for documenting the details for eachtest performed for the use case. In the case of use-case testing, only the aspects of the classand class invariants related to the specific use case are included in these use-case context-dependent class test plans and invariant test specifications. In many ways, use-case testingcan be viewed as a more rigorous role-playing exercise (see Chapter 5). At this point in thesystem’s development, we have completed the system’s specification, and we have completedunit testing. Furthermore, we have the contracts and the methods fully specified for all layers.Therefore, we can more rigorously test whether the use case is fully supported or not.
Designing Tests 519
14 We describe some of the different types of user interface testing in Chapter 11.
Class Case Test Plan
Use Case Name:
Page ______ of ______
Version Number:
Tester: Date Designed:
Use Case ID:
Date Conducted:
Use Case Objective:
Testing Objectives:
Scenario-Based Test Requirements:
Associated Class IDs: ______________________________________________________________
Associated Use Case IDs: ___________________________________________________________
_
FIGURE 13-5Use-Case Test Plan
One of the major problems with integration testing and object-oriented systems is thedifficulty caused by the interaction of inheritance and dynamic binding. This specific prob-lem has become known as the yo-yo problem. The yo-yo problem occurs when the analyst ordesigner must bounce up and down through the inheritance graph to understand the controlflow through the methods being executed. In most cases, this is caused by a rather deep inher-itance graph; that is, the subclass has many superclasses above it in the inheritance graph. Theyo-yo problem becomes even more of a nightmare in testing object-oriented systems wheninheritance conflicts exist and when multiple inheritance is used (See Chapter 9).
System TestsSystem tests are usually conducted by the systems analysts to ensure that all classes worktogether without error. System testing is similar to integration testing but is much broaderin scope. Whereas integration testing focuses on whether the classes work together withouterror, system tests examine how well the system meets business requirements and its usabil-ity, security, and performance under heavy load (see Figure 13-4). It also tests the system’sdocumentation.
Acceptance TestsAcceptance testing is done primarily by the users with support from the project team. The goalis to confirm that system is complete, meets the business needs that prompted the system tobe developed, and is acceptable to the users. Acceptance testing is done in two stages: alpha test-ing, in which users test the system using made-up data, and beta testing, in which users beginto use the system with real data but are carefully monitored for errors (see Figure 13-4).
DEVELOPING DOCUMENTATION
Like testing, developing documentation of the system must be done throughout systemdevelopment. There are two fundamentally different types of documentation: system docu-mentation and user documentation. System documentation is intended to help programmersand systems analysts understand the application software and enable them to build it ormaintain it after the system is installed. System documentation is largely a by-product of thesystems analysis and design process and is created as the project unfolds. Each step and phaseproduces documents that are essential in understanding how the system is or is to be built,and these documents are stored in the project binder(s). In many object-oriented develop-ment environments, it is possible to somewhat automate the creation of detailed documen-tation for classes and methods. For example, in Java, if the programmers use javadoc-stylecomments, it is possible to create HTML pages that document a class and its methods auto-matically by using the javadoc utility.15 Because most programmers look on documentationwith much distaste, anything that can make documentation easier to create is useful.
520 Chapter 13 Construction
Suppose you are a project manager for a bank develop-ing software for ATMs. Develop a unit test plan for the
user interface component of the ATM.
13-1 Test Planning for an ATMYOUR
TURN
15 For those that have used Java, javadoc is how the JDK documentation from Sun is created.

User documentation (such as user’s manuals, training manuals, and online help systems)is designed to help the user operate the system. Although most project teams expect users tohave received training and to have read the user’s manuals before operating the system, unfor-tunately, this is not always the case. It is more common today—especially in the case of com-mercial software packages for microcomputers—for users to begin using the software withouttraining or reading the user’s manuals. In this section, we focus on user documentation.16
User documentation is often left until the end of the project, which is a dangerousstrategy. Developing good documentation takes longer than many people expect because itrequires much more than simply writing a few pages. Producing documentation requiresdesigning the documents (whether on paper or online), writing the text, editing the docu-ments, and testing them. For good-quality documentation, this process usually takes aboutthree hours per page (single-spaced) for paper-based documentation or two hours perscreen for online documentation. Thus a “simple” documentation, such as a ten-page user’smanual and a set of twenty help screens takes seventy hours. Of course, lower-quality doc-umentation can be produced faster.
The time required to develop and test user documentation should be built into theproject plan. Most organizations plan for documentation development to start once theinterface design and program specifications are complete. The initial draft of documenta-tion is usually scheduled for completion immediately after the unit tests are complete. Thisreduces (but doesn’t eliminate) the chance that the documentation will need to be changeddue to software changes and still leaves enough time for the documentation to be testedand revised before the acceptance tests are started.
Although paper-based manuals are still important, online documentation is becomingmore important. Paper-based documentation is simpler to use because it is more familiarto users, especially novices who have less computer experience; online documentationrequires the users to learn one more set of commands. Paper-based documentation is alsoeasier to flip through and gain a general understanding of its organization and topics andcan be used far away from the computer itself.
There are four key strengths of online documentation that all but guarantee it will be thedominant form for the next century. First, searching for information is often simpler (providedthe help search index is well designed) because the user can type in a variety of keywords toview information almost instantaneously, rather than having to search through the index ortable of contents in a paper document. Second, the same information can be presented severaltimes in many different formats, so that the user can find and read the information in the mostinformative way (such redundancy is possible in paper documentation, but the cost and intim-idating size of the resulting manual make it impractical). Third, online documentation enablesmany new ways for the user to interact with the documentation that is not possible in staticpaper documentation. For example, it is possible to use links, or “tool tips” (i.e., pop-up text;see Chapter 11) to explain unfamiliar terms, and one can write “show-me” routines thatdemonstrate on the screen exactly what buttons to click and text to type. Finally, online docu-mentation is significantly less expensive to distribute than paper documentation.
Types of DocumentationThere are three fundamentally different types of user documentation: reference documents,procedures manuals, and tutorials. Reference documents (also called the help system) aredesigned to be used when the user needs to learn how to perform a specific function (e.g.,updating a field, adding a new record). Often people read reference information when they
Developing Documentation 521
16 For more information on developing documentation, see Thomas T. Barker, Writing Software Documentation(Boston: Allyn and Bacon, 1998).

have tried and failed to perform the function; writing reference documents requires specialcare because the user is often impatient or frustrated when he or she begins to read them.
Procedures manuals describe how to perform business tasks (e.g., printing a monthlyreport, taking a customer order). Each item in the procedures manual typically guides theuser through a task that requires several functions or steps in the system. Therefore, eachentry is typically much longer than an entry in a reference document.
Tutorials—obviously—teach people how to use major components of a system (e.g.,an introduction to the basic operations of the system). Each entry in the tutorial is typi-cally longer still than the entries in procedures manuals, and the entries are usuallydesigned to be read in sequence (whereas entries in reference documents and proceduresmanuals are designed to be read individually).
Regardless of the type of user documentation, the overall process for developing it issimilar to the process of developing interfaces (see Chapter 11). The developer firstdesigns the general structure for the documentation and then develops the individualcomponents within it.
Designing Documentation StructureIn this section, we focus on the development of online documentation, because we believeit will become the most common form of user documentation. The general structure usedin most online documentation, whether reference documents, procedures manuals, or tuto-rials, is to develop a set of documentation navigation controls that lead the user to documen-tation topics. The documentation topics are the material that user wants to read, whereas thenavigation controls are the way in which the user locates and accesses a specific topic.
Designing the structure of the documentation begins by identifying the different typesof topics and navigation controls that need to be included. Figure 13-6 shows a commonlyused structure for online reference documents (i.e., the help system). The documentationtopics generally come from three sources. The first and most obvious source of topics is theset of commands and menus in the user interface. This set of topics is very useful if the userwants to understand how a particular command or menu is used.
However, the users often don’t know what commands to look for or where they are inthe system’s menu structure. Instead, users have tasks they want to perform, and ratherthan thinking in terms of commands, they think in terms of their business tasks. Therefore,the second and often more useful set of topics focuses on how to perform certain tasks,usually those in the use scenarios, WND, and the real use cases from the user interfacedesign (see Chapter 11). These topics walk the user through the set of steps (often involv-ing several keystrokes or mouse clicks) needed to perform some task.
The third topics are definitions of important terms. These terms are usually the usecases and classes in the system, but sometimes they also include commands.
There are five general types of navigation controls for topics, but not all systems use allfive types (see Figure 13-6). The first is the table of contents that organizes the informationin a logical form, as though the users were to read the reference documentation from startto finish. The index provides access into the topics based on important keywords, in thesame way that the index at the back of a book helps us find topics. Text search provides theability to search through the topics either for any text the user types or for words thatmatch a developer-specified set of words that is much larger than the set of words in theindex. Unlike the index, text search typically provides no organization to the words (otherthan alphabetical). Some systems provide the ability to use an intelligent agent to help inthe search (e.g., the Microsoft Office Assistant—also know as the paper-clip guy). The fifthand final navigation controls to topics are the Weblike links between topics that enable theuser to click and move among topics.
522 Chapter 13 Construction

Procedures manuals and tutorials are similar but often simpler in structure. Topics forprocedures manuals usually come from the use scenarios, WNDs, and the real use casesdeveloped during interface design and from other basic tasks the users must perform. Top-ics for tutorials are usually organized around major sections of the system and the level ofexperience of the user. Most tutorials start with basic, most commonly used commandsand them move into more complex and less frequently used commands.
Developing Documentation 523
Topics
Tasks
Commands
Definitions
Links
Navigation Controls
ContentsIntroductionBasic Features Finding Albums
IndexFinding Finding Albums Finding Artists Finding Songs
Text Searchalbumsannouncementsarticlesartists
Agent SearchEnter a question
FullSearch
---------
MusicCategory
---------
CreditCard
---------
Move…
---------
Copy…
---------
Delete…
---------
How to…
---------
How to…
---------
How to…
---------
FIGURE 13-6Organizing Online Reference Documents

Writing Documentation TopicsThe general format for topics is fairly similar across application systems and operating sys-tems (see Figure 13-7). Topics typically start with very clear titles, followed by some intro-ductory text that defines the topic and then by detailed, step-by-step instructions on howto perform what is being described (where appropriate). Many topics include screenimages to help the user find items on the screen; some also have show-me examples, inwhich the series of keystrokes and/or mouse movements and clicks needed to performthe function are demonstrated to the user. Most also include navigation controls toenable the movement among topics, usually at the top of the window, plus links to othertopics. Some also include links to related topics that include options or other commandsand tasks the user may want to perform in concert with the topic being read.
Writing the topic content can be challenging. It requires a good understanding of theuser (or more accurately the range of users) and a knowledge of what skills the user(s) cur-rently have and can be expected to import from other systems and tools they are using orhave used (including the system the new system is replacing). Topics should always be writ-ten from the viewpoint of the user and describe what the user wants to accomplish, notwhat the system can do. Figure 13-8 provides some general guidelines to improve thequality of documentation text.17
524 Chapter 13 Construction
Links toother pages
NavigationButtons
Show mebutton
Title
FIGURE 13-7A Help Topic inMicrosoft Word
17 One of the best books to explain the art of writing is William Strunk and E. B. White, Elements of Style, 4th ed.(Needham Heights, MA: Allyn & Bacon, 2000).

Developing Documentation 525
Guideline Before the Guideline After the Guideline
Use the active voice: The active voice cre-ates more active and readable text byputting the subject at the start of the sen-tence, the verb in the middle, and theobject at the end.
Finding albums is done using the albumtitle, the artist’s name, or a song title.
You can find an album by using the albumtitle, the artist’s name, or a song title.
Use e-prime style: E-prime style createsmore active writing by omitting all formsof the verb to be.
The text you want to copy must beselected before you click on the copybutton.
Select the text you want to copy beforeyou click on the copy button.
Use consistent terms: Always use the sameterm to refer to the same items, ratherthan switching among synonyms (e.g.,change, modify, update).
Select the text you want to copy. Pressingthe copy button will copy the markedtext to the new location.
Select the text you want to copy. Pressingthe copy button will copy the selectedtext to the new location.
Use simple language: Always use the sim-plest language possible to accuratelyconvey the meaning. This does not meanyou should “dumb down” the text butthat you should avoid artificially inflatingits complexity. Avoid separating subjectsand verbs and try to use the fewest wordspossible. (When you encounter a com-plex piece of text, try eliminating words;you may be surprised at how few wordsare really needed to convey meaning.)
The Georgia Statewide Academic andMedical System (GSAMS) is a coopera-tive and collaborative distance learningnetwork in the state of Georgia. Theorganization in Atlanta that administersand manages the technical and overalloperations of the currently more than300 interactive audio and video telecon-ferencing classrooms throughout Georgiasystem is the Department of Administra-tive Service (DOAS). (56 words)
The Department of Administrative Service(DOAS) in Atlanta manages the GeorgiaStatewide Academic and Medical System(GSAMS), a distance learning networkwith more than 300 teleconferencingclassrooms throughout Georgia. (29words)
Use friendly language: Too often, docu-mentation is cold and sterile because itis written in a very formal manner.Remember, you are writing for a person,not a computer.
Blank disks have been provided to you byOperations. It is suggested that youensure your data are not lost by makingbackup copies of all essential data.
You should make a backup copy of alldata that are important to you. If youneed more diskettes, contact Operations.
Use parallel grammatical structures: Paral-lel grammatical structures indicate thesimilarity among items in list and helpthe reader understand content.
Opening filesSaving a documentHow to delete files
Opening a fileSaving a fileDeleting a file
Use steps correctly: Novices often inter-sperse action and the results of actionwhen describing a step-by-step process.Steps are always actions.
1. Press the customer button.2. The customer dialogue box will appear.3. Type the customer ID and press the
submit button and the customer recordwill appear.
1. Press the customer button.2. Type the customer ID in the customer
dialogue box when it appears.3. Press the submit button to view the cus-
tomer record for this customer.
Use short paragraphs: Readers of docu-mentation usually quickly scan text tofind the information they need, so thetext in the middle of long paragraphs isoften overlooked. Use separate para-graphs to help readers find informationmore quickly.
Source: Adapted from T. T. Barker, Writing Software Documentation (Boston: Allyn & Bacon, 1998).
FIGURE 13-8 Guidelines for Crafting Documentation Topics
Identifying Navigation TermsAs we write the documentation topics, we also begin to identify the terms that will be usedto help users find topics. The table of contents is usually the most straightforward, becauseit is developed from the logical structure of the documentation topics, whether reference
topics, procedure topics, or tutorial topics. The items for the index and search enginerequire more care because they are developed from the major parts of the system and theusers’ business functions. Every time we write a topic, we must also list the terms that willbe used to find the topic. Terms for the index and search engine can come from four dis-tinct sources.
The first source for index terms is set of the commands in the user interface, such asopen file, modify customer, and print open orders. All commands contain two parts (actionand object). It is important to develop the index for both parts because users could searchfor information using either part. A user looking for more information about saving files,for example, might search by using the term save or the term files.
The second source is the set of major concepts in the system, which are often use casesand classes. In the case of Appointment system, for example, this might include appoint-ment, symptoms, or patient.
A third source is the set of business tasks the user performs, such as ordering replace-ment units or making an appointment. Often these will be contained in the command set,but sometimes these require several commands and use terms that do not always appear inthe system. Good sources for these terms are the use scenarios and real use cases developedduring interface design (see Chapter 11).
A fourth, often controversial, source is the set of synonyms for the three sets of pre-ceding items. Users sometimes don’t think in terms of the nicely defined terms used bythe system. They may try to find information on how to stop or quit rather than exit orerase rather than delete. Including synonyms in the index increases the complexity andsize of the documentation system but can greatly improve the usefulness of the system tothe users.
APPLYING THE CONCEPTS AT CD SELECTIONS
Managing ProgrammingTo keep the project on schedule, Anne requested that she be allowed to assign three pro-grammers from the CD Selections programming staff to develop the three major parts ofthe Internet Sales System. The first was the Web interface, both the client side (browser)and the server side. The second was the client–server-based management system (manag-ing the CD information and marketing materials data bases). The third was the interfacesbetween the Internet Sales System and CD Selections’ existing distribution system and thecredit-card clearance center. Programming went smoothly and, despite a few minor prob-lems, according to plan.
TestingWhile Anne and the programmers were working, Alec began developing the test plans.The test plans for the three components were similar but slightly more intensive for the
526 Chapter 13 Construction
Suppose you are a project manager for a bank developing software for ATMs. Develop an online help system.
13-2 Documentation for an ATMYOUR
TURN

Web interface component (see Figure 13-9). Unit testing would use black-box testingbased on the CRC cards, class diagrams, and contracts for all components. Figure 13-10shows part of the class invariant test specification for the order class in the Web inter-face component.
Integration testing for the Web interface and system management component wouldbe subjected to all user interface and use-case tests to ensure the interface worked properly.The system interface component would undergo system interface tests to ensure that thesystem performed calculations properly and was capable of exchanging data with the CDSelections’ other systems and the credit-card clearance center.
Applying the Concepts at CD Selections 527
Unit tests Black-box tests Black-box tests Black-box tests
Integration tests User interface tests; User interface tests; System interface testsuse-case tests use-case tests
System tests Requirements tests; Requirements tests; Requirements tests; security tests; security tests security tests; performance tests; performance testsusability tests
Acceptance tests Alpha test; beta test Alpha test; beta test Alpha test; beta test
Test Stage Web Interface System Management System Interfaces
FIGURE 13-9Test Plan for CD Selections
Class Invariant Test Specification
Class Name: Order
Page ______ of ______5 15
Version Number: 3
Tester: Susan Doe Date Designed: 9/9
CRC Card ID: 15
Date Conducted:
Testing Objectives: Ensure that the information entered by the customer on the place order form is valid.
Test Cases:
Original New Invariant Attribute Attribute Expected Result Description Value Event Value Result P/F
Attribute Name: CD Number
1) __________ __________ __________ __________ __________ __________
2) __________ __________ __________ __________ __________ __________
3) __________ __________ __________ __________ __________ __________
Attribute Name: CD Name
1) __________ __________ __________ __________ __________ __________
2) __________ __________ __________ __________ __________ __________
3) __________ __________ __________ __________ __________ __________
Attribute Name: Artist Name
1) __________ __________ __________ __________ __________ __________
2) __________ __________ __________ __________ __________ __________
3) __________ __________ __________ __________ __________ __________
(1..1) Null CreateOrder Null F
(unsigned long) Null CreateOrder ABC F
(unsigned long) Null CreateOrder 123 P
(1..1) Null CreateOrder Null F
(String) Null CreateOrder ABC P
(String) Null CreateOrder 123 P
(1..1) Null CreateOrder Null F
(String) Null CreateOrder ABC P
(String) Null CreateOrder 123 P
FIGURE 13-10Partial Class InvariantTest Specification forthe Order Class
Systems tests are by definition tests of the entire system—all components together.However, not all parts of the system would receive the same level of testing. Requirementstests would be conducted on all parts of the system to ensure that all requirements weremet. Security was a critical issue, so the security of all aspects of the system would be tested.Security tests would be developed by CD Selections’ infrastructure team, and once the sys-tem passed those tests, an external security consulting firm would be hired to attempt tobreak into the system.
Performance was an important issue for the parts of the system used by the cus-tomer (the Web interface and the system interfaces to the credit-card clearance andinventory systems), but it was not as important for the management component thatwould be used by staff, not customers. The customer-facing components would undergorigorous performance testing to see how many transactions (whether searching or pur-chasing) they could handle before they were unable to provide a response time of twoseconds or less. Alec also developed an upgrade plan so that as demand on the systemincreased, there was a clear plan for when and how to increase the processing capabilityof the system.
Finally, formal usability tests would be conducted on the Web interface portion of thesystem with six potential users (both novice and expert Internet users).
Acceptance tests would be conducted in two stages, alpha and beta. Alpha testswould be done during the training of CD Selections’ staff. The Internet Sales managerwould work together with Alec to develop a series of tests and training exercises to trainthe Internet Sales group staff on how to use the system. They would then load the realCD data into the system and begin adding marketing materials. These same staff andother CD Selections staff members would also pretend to be customers and test the Webinterface.
Beta testing would be done by “going live” with the Web site but only announcing itsexistence to CD Selections employees. As an incentive to try the Web site (rather than buy-ing from the store in which they worked), employees would be offered triple their normalemployee discount for all products ordered from the Web site. The site would also have aprominent button on every screen that would enable employees to e-mail comments to theproject team, and the announcement would encourage employees to report problems, sug-gestions, and compliments to the project team. After one month, assuming all went well,the beta test would be completed, and the Internet Sales site would be linked to the mainWeb site and advertised to the general public.
Developing User DocumentationWhile Anne and Alec were busy with the programming and test plans, Brian began theprocess of developing all necessary documentation. There were three types of documenta-tion (reference documents, procedures manuals, and tutorials) that needed to be producedfor the Web interface and the management component. Because the number of CD Selec-tions staff using the system management component would be small, Brian suggested thatthey produce only the reference documentation (an online help system). After talking withAlec and Anne, the team felt that an intensive training program and a one month beta-testperiod would be sufficient without tutorials and formal procedures manuals. Likewise, theyfelt that the process of ordering CDs and the Web interface itself was simple enough to notrequire a tutorial on the Web—a help system would be sufficient (and a procedures man-ual didn’t make sense).
Brian decided that the reference documents for both the Web interface and systemmanagement components would contain help topics for user tasks, commands, and defin-itions. He also decided that the documentation component would contain four types of
528 Chapter 13 Construction

navigation controls: a table of contents, an index, a find, and links to definitions. He didnot feel that the system was complex enough to benefit from a search agent.
After these decisions were discussed with the development team, Brian delegated thedevelopment of the reference documents to a technical writer assigned to the project team.Figure 13-11 shows examples of a few of topics that the writer developed. The tasks andcommands were taken directly from the interface design. The list of definitions was devel-oped once the tasks and commands were developed, based on the writer’s experience inunderstanding what terms might be confusing to a user.
Once the topic list was developed, the technical writer then began writing the top-ics themselves and the navigation controls to access. Figure 13-12 shows an example ofone topic taken from the task list: how to place an order. This topic presented a briefdescription of what it was and then led the user through the step-by-step processneeded to complete the task. The topic also listed the navigation controls that would beused to find the topic, in terms of the table of contents entries, the index entries, andsearch entries. It also listed the words in the topic itself that would have links to othertopics (e.g., shopping cart).
Applying the Concepts at CD Selections 529
Find an album Find Album
Add an album to my shopping cart Browse Artist
Placing an order Quick search Music type
How to buy Full search Special deals
What’s in my shopping cart? Cart
Shopping cart
Tasks Commands Terms
FIGURE 13-11Sample Help Topics for CD Selections
Help Topic Navigation Controls
How to Place an Order
When you are ready to pay for the merchandise youhave selected (the items in your shopping cart) youcan place your order. There are four steps.
1. Move to the Place order Page
Click on the button to move to theplace order page.
2. Make sure you are ordering what you want
The place order screen displays all the items in yourshopping cart. Read through the list to make surethese are what you want because once you submityour credit card information you cannot change theorder.
You can delete an item by
Table of Contents list: How to Place an Order
Index list: Credit Card Order Pay Place order
Search find by: Credit Card Delete Items Order Pay Place order Shopping Cart Verify Order
Links: Shopping Cart
Place order
FIGURE 13-12Sample Documenta-tion Topic for CDSelections

SUMMARY
Managing ProgrammingProgramming is done by programmers, so systems analysts have few responsibilities dur-ing this stage. The project manager, however, is usually very busy. The first task is to assignthe programmers to complete the project, ideally the fewest possible because coordinationproblems increase as the size of the programming team increases. Coordination can beimproved by having regular meetings, ensuring that standards are followed, implementingchange control, and using CASE tools effectively. One of the key functions of the projectmanager is to manage the schedule and adjust it for delays. Two common causes of delaysare scope creep and minor slippages that go unnoticed. Given today’s global developmentof information systems, different cultural issues need to be taken into consideration.
Designing TestsTests must be carefully planned because the cost of fixing one major bug after the system isinstalled can easily exceed the annual salary of a programmer. A test plan contains severaltests that examine different aspects of the system. A test, in turn, specifies several test casesthat will be examined by the testers. A unit test examines a class within the system; test casescome from the class specifications or the class code itself. An integration test examines howwell several classes work together; test cases come from the interface design, use cases, andthe use-case, sequence, and collaboration diagrams. A system test examines the system as awhole and is broader than the unit and integration tests; test cases come from the systemdesign, the infrastructure design, the unit, and integration tests. Acceptance testing is doneby the users to determine whether the system is acceptable to them; it draws on the systemtest plans (alpha testing) and the real work the users perform (beta testing).
Developing DocumentationDocumentation, both user documentation and system documentation, is moving awayfrom paper-based documents to online documentation. There are three types of user doc-umentation: Reference documents are designed to be used when the user needs to learnhow to perform a specific function (e.g., an online help system), procedures manualsdescribe how to perform business tasks, and tutorials teach people how to use the system.Documentation navigation controls (e.g., a table of contents, index, find, intelligent agents,or links between pages) enable users to find documentation topics (e.g., how to perform afunction, how to use an interface command, an explanation of a term).
530 Chapter 13 Construction
KEY TERMS
Acceptance testAlpha testBeta testBlack-box testingChange controlChange managementConstructionDocumentation navigation controlDocumentation topicHardcodedIntegration test
Interaction testingProcedures manualProgram logReference documentRequirements testingSecurity testingStubSystem documentationSystem interface testingSystem testTest case
Test planTest specificationTraceabilityTutorialUnit testUsability testingUse-case testingUser documentationUser interface testingWhite-box testingYo-yo problem

Exercises 531
QUESTIONS
1. Why is testing important?2. How can different national or organizational cultures
affect the management of an information systems devel-opment project?
3. What is the primary role of systems analysts duringthe programming stage?
4. In The Mythical Man-Month, Frederick Brooks arguesthat adding more programmers to a late project makesit later. Why?
5. What are the common language or languages usedtoday in information systems development?
6. What is the purpose of testing?7. Describe how object orientation impacts testing.8. Compare and contrast the terms test, test plan, and
test case.9. What is a stub and why is it used in testing?
10. What is the primary goal of unit testing?11. Compare and contrast black-box testing and white-
box testing.12. How are the test cases developed for unit tests?13. What are the different types of class tests?14. What is the primary goal of integration testing?15. How are the test cases developed for integration tests?
16. Describe the yo-yo problem. Why does it make integra-tion testing difficult?
17. What is the primary goal of system testing?18. How are the test cases developed for system tests?19. What is the primary goal of acceptance testing?20. How are the test cases developed for acceptance tests?21. Compare and contrast alpha testing and beta testing.22. Compare and contrast user documentation and system
documentation.23. Why is online documentation becoming more
important?24. What are the primary disadvantages of online docu-
mentation?25. Compare and contrast reference documents, proce-
dures manuals, and tutorials.26. What are five types of documentation navigation
controls?27. What are the commonly used sources of documenta-
tion topics? Which is the most important? Why?28. What are the commonly used sources of documenta-
tion navigation controls? Which is the most important?Why?
EXERCISES
A. Different views of plagiarism and collaborative learn-ing were described as examples of differences amongdifferent cultures today. Using the Web, identify otherdifferences that may impact the success of an informa-tion systems development team.
B. Create an invariant test specification for the classyou chose for the health club in exercise A in Chapter 9.
C. Create a use-case test plan, including the specific classplans and invariant tests for a use case from the healthclub exercises in previous chapters.
D. Create an invariant test specification for the class youchose for Picnics R Us in exercise C in Chapter 9.
E. Create a use-case test plan, including the specific classplans and invariant tests, for a use case from the Pic-nics R Us exercises in the previous chapters.
F. Create an invariant test specification for the class youchose for the Of-the-Month Club (OTMC) in exerciseE in Chapter 9.
G. Create a use-case test plan, including the specific classplans and invariant tests, for a use case from the Of-the-Month Club (OTMC) exercises in the previouschapters.
H. Create an invariant test specification for the class youchose for the library in exercise G in Chapter 9.
I. Create a use-case test plan, including the specific classplans and invariant tests, for a use case from thelibrary exercises in the previous chapters.
J. If the registration system at your university does nothave a good online help system, develop one for onescreen of the user interface.
K. Examine and prepare a report on the online help systemfor the calculator program in Windows (or a similar oneon the Mac or Unix). (You will probably be surprised atthe amount of help for such a simple program.)
L. Compare and contrast the online help at two differentWeb sites that enable you to perform some function(e.g., make travel reservations, order books).

532 Chapter 13 Construction
MINICASES
1. Pete is a project manager on a new systems develop-ment project. This project is Pete’s first experience as aproject manager, and he has led his team successfullyto the programming phase of the project. The projecthas not always gone smoothly, and Pete has made a fewmistakes, but he is generally pleased with the progressof his team and the quality of the system being devel-oped. Now that programming has begun, Pete hasbeen hoping for a little break in the hectic pace of hisworkday.
Prior to beginning programming, Pete recognizedthat the time estimates made earlier in the project weretoo optimistic. However, he was firmly committed tomeeting the project deadline because of his desire forhis first project as project manager to be a success. Inanticipation of this time pressure problem, Petearranged with the Human Resources department tobring in two new college graduates and two collegeinterns to beef up the programming staff. Pete wouldhave liked to find some staff with more experience, butthe budget was too tight, and he was committed tokeeping the project budget under control.
Pete made his programming assignments, and workon the programs began about two weeks ago. Now,Pete has started to hear some rumbles from the pro-gramming team leaders that may signal trouble. Itseems that the programmers have reported severalinstances where they wrote programs, only to beunable to find them when they went to test them. Also,
several programmers have opened programs that theyhad written, only to find that someone had changedportions of their programs without their knowledge.a. Is the programming phase of a project a time for
the project manager to relax? Why or why not?b. What problems can you identify in this situation?
What advice do you have for the project manager?How likely does it seem that Pete will achieve hisdesired goals of being on time and within budget ifnothing is done?
2. The systems analysts are developing the test plan forthe user interface for the Holiday Travel Vehicles sys-tem. As the salespeople are entering a sales invoice intothe system, they will be able to either enter an optioncode into a text box, or select an option code from adrop-down list. A combo box was used to implementthis, since it was felt that the salespeople would quicklybecome familiar with the most common option codesand would prefer entering them directly to speed upthe entry process.
It is now time to develop the test for validating theoption code field during data entry. If the customerdid not request any dealer-installed options for thevehicle, the salesperson should enter “none”; the fieldshould not be blank. The valid option codes are four-character alphabetic codes and should be matchedagainst a list of valid codes.
Prepare a test plan for the test of the option codefield during data entry.

C H A P T E R 1 4
Installation and Operations
533
This chapter examines the activities needed to install an information system and success-fully convert an organization to using it. It also discusses postimplementation activities, suchas system support, system maintenance, and project assessment. Installing the system andmaking it available for use from a technical perspective is relatively straightforward. However,the training and organizational issues surrounding the installation are more complex andchallenging because they focus on people, not computers.
OBJECTIVES
■ Be familiar with the system installation process.■ Understand different types of conversion strategies and when to use them.■ Understand several techniques for managing change.■ Be familiar with postinstallation processes.
CHAPTER OUTLINE
IntroductionCultural Issues and Information
TechnologyConversion
Conversion StyleConversion LocationConversion ModulesSelecting the Appropriate Conversion
StrategyChange Management
Understanding Resistance to ChangeRevising Management Policies
Assessing Costs and BenefitsMotivating AdoptionEnabling Adoption: Training
Postimplementation ActivitiesSystem SupportSystem MaintenanceProject Assessment
Applying the Concepts at CD SelectionsConversionChange ManagementPostimplementation Activities
Summary
INTRODUCTION
It must be remembered that there is nothing more difficult to plan, more doubtful of success,nor more dangerous to manage than the creation of a new system. For the initiator has the ani-mosity of all who would profit by the preservation of the old institution and merely lukewarmdefenders in those who would gain by the new.
—Machiavelli, The Prince, 1513
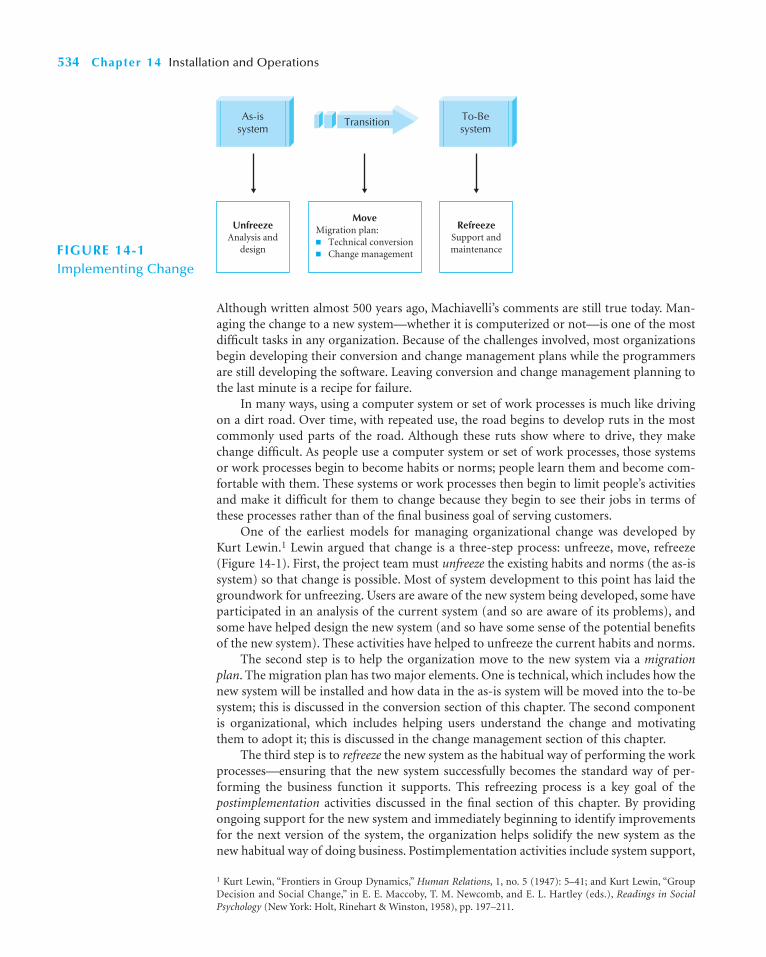
Although written almost 500 years ago, Machiavelli’s comments are still true today. Man-aging the change to a new system—whether it is computerized or not—is one of the mostdifficult tasks in any organization. Because of the challenges involved, most organizationsbegin developing their conversion and change management plans while the programmersare still developing the software. Leaving conversion and change management planning tothe last minute is a recipe for failure.
In many ways, using a computer system or set of work processes is much like drivingon a dirt road. Over time, with repeated use, the road begins to develop ruts in the mostcommonly used parts of the road. Although these ruts show where to drive, they makechange difficult. As people use a computer system or set of work processes, those systemsor work processes begin to become habits or norms; people learn them and become com-fortable with them. These systems or work processes then begin to limit people’s activitiesand make it difficult for them to change because they begin to see their jobs in terms ofthese processes rather than of the final business goal of serving customers.
One of the earliest models for managing organizational change was developed byKurt Lewin.1 Lewin argued that change is a three-step process: unfreeze, move, refreeze(Figure 14-1). First, the project team must unfreeze the existing habits and norms (the as-issystem) so that change is possible. Most of system development to this point has laid thegroundwork for unfreezing. Users are aware of the new system being developed, some haveparticipated in an analysis of the current system (and so are aware of its problems), andsome have helped design the new system (and so have some sense of the potential benefitsof the new system). These activities have helped to unfreeze the current habits and norms.
The second step is to help the organization move to the new system via a migrationplan. The migration plan has two major elements. One is technical, which includes how thenew system will be installed and how data in the as-is system will be moved into the to-besystem; this is discussed in the conversion section of this chapter. The second componentis organizational, which includes helping users understand the change and motivatingthem to adopt it; this is discussed in the change management section of this chapter.
The third step is to refreeze the new system as the habitual way of performing the workprocesses—ensuring that the new system successfully becomes the standard way of per-forming the business function it supports. This refreezing process is a key goal of thepostimplementation activities discussed in the final section of this chapter. By providingongoing support for the new system and immediately beginning to identify improvementsfor the next version of the system, the organization helps solidify the new system as thenew habitual way of doing business. Postimplementation activities include system support,
534 Chapter 14 Installation and Operations
1 Kurt Lewin, “Frontiers in Group Dynamics,” Human Relations, 1, no. 5 (1947): 5–41; and Kurt Lewin, “GroupDecision and Social Change,” in E. E. Maccoby, T. M. Newcomb, and E. L. Hartley (eds.), Readings in SocialPsychology (New York: Holt, Rinehart & Winston, 1958), pp. 197–211.
As-issystem
To-Besystem
UnfreezeAnalysis and
design
RefreezeSupport andmaintenance
Transition
MoveMigration plan:■ Technical conversion■ Change managementFIGURE 14-1
Implementing Change
which means providing help desk and telephone support for users with problems; systemmaintenance, which means fixing bugs and improving the system after it has been installed;and project assessment, which means the process of evaluating the project to identify whatwent well and what could be improved for the next system development project.
Change management is the most challenging of the three components because itfocuses on people, not technology, and because it is the one aspect of the project that is theleast controllable by the project team. Change management means winning the hearts andminds of potential users and convincing them that the new system actually provides value.
Maintenance is the most costly aspect of the installation process, because the cost ofmaintaining systems usually greatly exceeds the initial development costs. It is not unusualfor organizations to spend 60 to 80 percent of their total IS development budget on main-tenance. Although this may sound surprising initially, think about the software you use.How many software packages do you use that are the very first version? Most commercialsoftware packages become truly useful and enter widespread use only in their second orthird version. Maintenance and continual improvement of software is ongoing, whether itis a commercially available package or software developed in-house. Would you buy soft-ware if you knew that no new versions were going to be produced? Of course, commercialsoftware is somewhat different from custom in-house software used by only one company,but the fundamental issues remain.
Project assessment is probably the least commonly performed part of system devel-opment but is perhaps the one that has the most long-term value to the IS department.Project assessment enables project team members to step back and consider what they didright and what they could have done better. It is an important component in the indi-vidual growth and development of each member of the team, because it encourages teammembers to learn from their successes and failures. It also enables new ideas or newapproaches to system development to be recognized, examined, and shared with otherproject teams to improve their performance.
In this chapter, we describe deploying the new system through the process of transi-tioning from the old to the new system (i.e., conversion). Next, we describe issues relatedto managing the changes necessary to adapt to the new business processes. Finally, wedescribe issues related to placing the system into production (i.e., postimplementationactivities). However, before we address these issues, we describe how the cultural issuesimpact the deployment of a new system.
CULTURAL ISSUES AND INFORMATION TECHNOLOGY2
Cultural issues are one of the things that are typically identified as at least partially to blamewhen there is a failure in an organization. Cultural issues have been studied at both orga-nizational and national levels. In previous chapters we discussed the effect that culturalissues can have on designing the human–computer interaction and physical architecturelayers (see Chapters 11 and 12) and the management of programmers. In this chapter, wedescribe how these issues can impact the successful deployment of an information systemthat supports a global information supply chain. Cultural issues include things such aspower distance, uncertainty avoidance, individualism versus collectivism, masculinity ver-sus femininity, and long- versus short-term orientation.3
Cultural Issues and Information Technology 535
2 A good summary of cultural issues and information systems is Dorothy E. Leidner and Timothy Kayworth, “AReview of Culture in Information Systems Research: Toward a Theory of Information Technology Culture Con-flict,” MIS Quarterly 30, no. 2 (2006): 357–399.3 See Geert Hofstede, Culture’s Consequences: Comparing Values, Behaviors, Institutions and Organizations AcrossNations, 2nd ed. (Thousand Oaks, CA: Sage, 2001).

The first dimension, power distance, addresses how power issues are dealt with in theculture. For example, if a superior in an organization has an incorrect belief about animportant issue, can a subordinate point out this error? In some cultures, the answer is aresounding no. As such, this dimension could have major ramifications for the successfuldevelopment and deployment of an information system. For example, it could haveaffected the determination of the actual requirements used to create the system. If the supe-rior really does not understand the actual problem being solved, then the only way togather the correct requirements would be to ensure that the subordinates are not negativelyimpacted when they cooperate. Otherwise, it will be virtually impossible to create a systemthat will solve the client’s problem.
The second dimension, uncertainty avoidance, is based on the degree to which theculture depends on rules for direction, how well individuals in the culture handle stress,and the importance of employment stability. Depending on the culture, this dimensioncan be associated with the power distance dimension. For example, if the culturedemands that an employee be subordinate to his or her supervisor, it can influence thepower distance dimension, which can influence the manner in which the employee viewsthe stability of his or her employment. As another example, through the use of detailedprocedures manuals, a good deal of uncertainty in decision making can be avoided. Froman IT perspective, this can influence the importance of the informal structure of an orga-nization. In fact, if the culture really tries to remove any and all uncertainty from deci-sion making, there may be little, if any, informal organizational structures to uncover.However, the opposite could also be true where the informal organization is simplyburied very deep.
The third dimension, individualism versus collectivism, is based on the level of empha-sis the culture places on the individual or the collective, or group. The relationship betweenthe individual and the group is important for the success of an information system. In theWest, individualism is rewarded. However, in the East, it is believed by focusing on opti-mizing the group, the individual will be most successful. In other words, it is the group thatis the most important. Depending on the culture’s orientation, the success of an informa-tion system being transitioned into production can depend on whether the focus of theinformation system will benefit the individual or the group.
The fourth dimension, masculinity versus femininity, from an information sys-tem’s perspective, raises the issues of how gender differences are addressed. Some of thedifferences that could impact the utility of an information system include males’ workmotivation being based on advancement, earnings, and training, whereas females’ workmotivations are based on friendly atmosphere, physical conditions, and cooperation.4
Depending on how the culture views this dimension, different motivations may needto be used to increase the likelihood of the information system being successfullydeployed.
The fifth dimension, long- versus short-term orientation, deals with how the cultureviews the past and the future. In the East, long-term thinking is highly respected,whereas in the West, short-term profits and the current stock price seem to be the onlythings that matter. Based on this dimension, all the political concerns raised previouslyin this text become very important. For example, if the local culture views success onlyin a short-term manner, then any new information system that is deployed to supportone department of an organization may give that department a competitive advantageover other departments in the short run. If only short-run measures are used to judgethe success of a department, then it would be in the interest of the other departments
536 Chapter 14 Installation and Operations
4 See footnote 3.

to fight the successful deployment of the information system. However, if a longer-runperspective is the norm, then the other departments could be convinced to support thenew information system because they could have new supportive information systemsin the future.
Obviously, when reviewing these dimensions, they do interact with each other. Themost important thing to remember from an IT perspective is that we must be careful notto view the local user community through our eyes; in a global economy, we must take intoconsideration the local cultural concerns for the information system to be deployed in asuccessful manner.
CONVERSION5
Conversion is the technical process by which a new system replaces an old system. Users aremoved from using the as-is business processes and computer programs to the to-be busi-ness processes and programs. The migration plan specifies what activities will be per-formed when and by whom and includes both technical aspects (such as installinghardware and software and converting data from the as-is system to the to-be system) andorganizational aspects (such as training and motivating the users to embrace the new sys-tem). Conversion refers to the technical aspects of the migration plan.
There are three major steps to the conversion plan before commencement of opera-tions: install hardware, install software, and convert data (Figure 14-2). Although it may bepossible to do some of these steps in parallel, usually they must be done sequentially at anyone location.
The first step in the conversion plan is to buy and install any needed hardware. Inmany cases, no new hardware is needed, but sometimes the project requires such new hard-ware as servers, client computers, printers, and networking equipment. It is critical to workclosely with vendors who are supplying needed hardware and software to ensure that thedeliveries are coordinated with the conversion schedule so that the equipment is availablewhen it is needed. Nothing can stop a conversion plan in its tracks as easily as the failure ofa vendor to deliver needed equipment.
Conversion 537
5 The material in this section is related to the Enhanced Unified Process’s Transition phase and the Deploymentworkflow (see Figure 1-11).
Commenceoperations
Conversion Plan(Technical Issues)
Install hardware
Install software
Convert data
Change Management Plan(Organizational Issues)
Revise management policies
Conduct training
Assess costs and benefits
Motivate adoption
FIGURE 14-2Elements of a Migration Plan

Once the hardware is installed, tested, and certified as being operational, the secondstep is to install the software. This includes the to-be system under development and, some-times, additional software that must be installed to make the system operational. At thispoint, the system is usually tested again to ensure that it operates as planned.
The third step is to convert the data from the as-is system to the to-be system. Dataconversion is usually the most technically complicated step in the migration plan. Often,separate programs must be written to convert the data from the as-is system to the newformats required in the to-be system and store it in the to-be system files and databases.This process is often complicated by the fact that the files and databases in the to-be sys-tem do not exactly match the files and databases in the as-is system (e.g., the to-be systemmay use several tables in a database to store customer data that were contained in one filein the as-is system). Formal test plans are always required for data conversion efforts (seeChapter 13).
Conversion can be thought of along three dimensions: the style in which the con-version is done (conversion style), what location or work groups are converted at whattime (conversion location), and what modules of the system are converted at what time(conversion modules). Figure 14-3 shows the potential relationships among these threedimensions.
Conversion StyleThe conversion style is the way in which users are switched between the old and new sys-tems. There are two fundamentally different approaches to the style of conversion: directconversion and parallel conversion.
Direct Conversion With direct conversion (sometimes called cold turkey, big bang, orabrupt cutover), the new system instantly replaces the old system. The new system is turnedon and the old system is immediately turned off. This is the approach that we are likely touse when we upgrade commercial software (e.g., Microsoft Word) from one version toanother; we simply begin using the new version and stop using the old version.
Direct conversion is the simplest and most straightforward. However, it is the mostrisky because any problems with the new system that have escaped detection during test-ing may seriously disrupt the organization.
538 Chapter 14 Installation and Operations
PhasedPilot
Modular
Whole system
Direct
Parallel
Simultaneous
Location
Modules
Style
FIGURE 14-3Conversion Strategies
Parallel Conversion With parallel conversion, the new system is operated side by sidewith the old system; both systems are used simultaneously. For example, if a new account-ing system is installed, the organization enters data into both the old system and the newsystem and then carefully compares the output from both systems to ensure that thenew system is performing correctly. After some time period (often one to two months)of parallel operation and intense comparison between the two systems, the old system isturned off and the organization continues using the new system.
This approach is more likely to catch any major bugs in the new system and preventthe organization from suffering major problems. If problems are discovered in the new sys-tem, the system is simply turned off and fixed and then the conversion process starts again.The problem with this approach is the added expense of operating two systems that per-form the same function.
Conversion LocationConversion location refers to those parts of the organization that are converted at whatpoints in time the conversion occurs. Often, parts of the organization are physically locatedin different offices (e.g., Toronto, Atlanta, Los Angeles). In other cases, location refers to dif-ferent organizational units located in different parts of the same office complex (e.g., orderentry, shipping, purchasing). There are at least three fundamentally different approaches toselecting the way in which different organizational locations are converted: pilot conver-sion, phased conversion, and simultaneous conversion.
Pilot Conversion With a pilot conversion, one or more locations or units or work groupswithin a location are selected to be converted first as part of a pilot test. The locations par-ticipating in the pilot test are converted (using either direct or parallel conversion). If thesystem passes the pilot test, then the system is installed at the remaining locations (againusing either direct or parallel conversion).
Pilot conversion has the advantage of providing an additional level of testing beforethe system is widely deployed throughout the organization, so that any problems with thesystem affect only the pilot locations. However, this type of conversion obviously requiresmore time before the system is installed at all organizational locations. Also, it means thatdifferent organizational units are using different versions of the system and businessprocesses, which may make it difficult for them to exchange data.
Phased Conversion With phased conversion, the system is installed sequentially at differ-ent locations. A first set of locations is converted, then a second set, then a third set, and soon, until all locations are converted. Sometimes there is a deliberate delay between the dif-ferent sets (at least between the first and the second), so that any problems with the systemare detected before too much of the organization is affected. In other cases, the sets are con-verted back to back so that as soon as those converting one location have finished, the pro-ject team moves to the next and continues the conversion.
Phased conversion has the same advantages and disadvantages of pilot conversion. Inaddition, it means that fewer people are required to perform the actual conversion (and anyassociated user training) than if all locations were converted at once.
Simultaneous Conversion Simultaneous conversion, as the name suggests, means that alllocations are converted at the same time. The new system is installed and made ready at alllocations; at a preset time, all users begin using the new system. Simultaneous conversionis often used with direct conversion, but it can also be used with parallel conversion.
Conversion 539
Simultaneous conversion eliminates problems with having different organizationalunits using different systems and processes. However, it also means that the organizationmust have sufficient staff to perform the conversion and train the users at all locationssimultaneously.
Conversion ModulesAlthough it is natural to assume that systems are usually installed in their entirety, this isnot always the case.
Whole-System Conversion A whole-system conversion, in which the entire system isinstalled at one time, is the most common. It is simple and the easiest to understand. How-ever, if the system is large and/or extremely complex (e.g., an enterprise resource-planningsystem such as SAP or PeopleSoft), the whole system may prove too difficult for users tolearn in one conversion step.
Modular Conversion When the modules6 within a system are separate and distinct,organizations sometimes choose to convert to the new system one module at a time—thatis, using modular conversion. Modular conversion requires special care in developing thesystem (and usually adds extra cost). Each module either must be written to work withboth the old and new systems or object wrappers (see Chapter 8) must be used toencapsulate the old system from the new. When modules are tightly integrated, this is
540 Chapter 14 Installation and Operations
The South Dakota Department of Worker’s Compensationwas sinking under a load of paper files. As a state agencythat oversees that employees are treated fairly when theyare injured on the job, the agency had a plethora of paperfiles and filing cabinets. If a person (or company) called tosee the status of an injury claim, the clerk who received thecall would have to take a message, get the paper file,review the status, and call the person back. Files werestored in huge filing cabinets and were entered by year andcase number (e.g., the 415th person injured in 2008 wouldbe in a file numbered 08-415). But, most people did notremember their file number and would give a name,address, and date of injury. The clerk would look in a spi-ral notebook for the last name around the date that wasgiven and then find the file number to retrieve the folder.Some folders were small—possibly a minor cut or minorinjury that was taken care of quickly and the employee wasback to work. Other folders could be very large, with med-ical reports from several doctors verifying the extent of theinjury (such as an arm amputation). A digital solution
was suggested; reports could be submitted online using asecure Web site. Medical reports could be submitted elec-tronically, either as a .pdf file or as a faxed digital file. Thissolution would also mean that the clerk taking the phonecall could query the database by the person’s name andaccess the information in a matter of seconds.
Questions
1. The digital solution was going to change the workprocess of filing injury claims, interacting with peo-ple who filed the claims (or companies) wanting tosee the status of the claim, and with the process ofclaims. What might this mean from a work-flowanalysis?
2. In many ways, this was a business process reengi-neering solution. The proposal was to throw out theold process for a completely electronic version.What might a systems analyst do in the data-gathering stage?
14-A Too Much Paper (Part 1)CONCEPTS
IN ACTION
6 In this case, a module is typically a component or a package, that is, a set of collaborating classes.

very challenging and, therefore, seldom done. However, when there is only a loose associ-ation between modules, module conversion becomes easier. For example, consider a con-version from an old version of Microsoft Office to a new version. It is relatively simple toconvert from the old version of Word to the new version without simultaneously having tochange from the old to the new version of Microsoft Excel.
Modular conversion reduces the amount of training required to begin using thenew system. Users need training only in the new module being implemented. However,modular conversion does take longer and has more steps than does the whole-systemprocess.
Selecting the Appropriate Conversion StrategyEach of the three dimensions in Figure 14-3 is independent, so that a conversion strategycan be developed to fit in any one of the boxes in this figure. Different boxes can also bemixed and matched into one conversion strategy. For example, one commonly usedapproach is to begin with a pilot conversion of the whole system using parallel conversionin a handful of test locations. Once the system has passed the pilot test at these locations,it is then installed in the remaining locations using phased conversion with direct cutover.There are three important factors to consider in selecting a conversion strategy: risk, cost,and the time required (Figure 14-4).
Risk After the system has passed a rigorous battery of unit, system, integration, and accep-tance testing, it should be bug free … maybe. Because humans make mistakes, nothing builtby people is ever perfect. Even after all these tests, there may still be a few undiscovered bugs.The conversion process provides one last step in which to catch these bugs before the systemgoes live and the bugs have the chance to cause problems.
Parallel conversion is less risky than is direct conversion because it has a greater chanceof detecting bugs that have gone undiscovered in testing. Likewise, pilot conversion is lessrisky than is phased conversion or simultaneous conversion because if bugs do occur, theyoccur in pilot test locations whose staff are aware that they may encounter bugs. Becausepotential bugs affect fewer users, there is less risk. Likewise, converting a few modules at atime lowers the probability of a bug because there is more likely to be a bug in the wholesystem than in any given module.
How important the risk is depends on the system being implemented—the combina-tion of the probability that bugs remain undetected in the system and the potential cost ofthose undetected bugs. If the system has indeed been subjected to extensive methodicaltesting, including alpha and beta testing, then the probability of undetected bugs is lowerthan if the testing was less rigorous. However, there still might have been mistakes made in
Conversion 541
Risk High Low Low Medium High High Medium
Cost Low High Medium Medium High Medium High
Time Short Long Medium Long Short Short Long
Conversion Style Conversion Location Conversion Modules
Direct Parallel Pilot Phased Simultaneous Whole-System ModularCharacteristic Conversion Conversion Conversion Conversion Conversion Conversion Conversion
FIGURE 14-4 Characteristics of Conversion Strategies

the analysis process, so that although there might be no software bugs, the software mightfail to properly address the business needs.
Assessing the cost of a bug is challenging, but most analysts and senior managers canmake a reasonable guess at the relative cost of a bug. For example, the cost of a bug in anautomated stock market trading program or a heart-lung machine keeping someone aliveis likely to be much greater than a bug in a computer game or word processing program.Therefore, risk is likely to be a very important factor in the conversion process if the sys-tem has not been as thoroughly tested as it might have been and/or if the cost of bugs ishigh. If the system has been thoroughly tested and/or the cost of bugs is not that high, thenrisk becomes less important to the conversion decision.
Cost As might be expected, different conversion strategies have different costs. Thesecosts can include things such as salaries for people who work with the system (e.g., users,trainers, system administrators, external consultants), travel expenses, operation expenses,communication costs, and hardware leases. Parallel conversion is more expensive thandirect cutover because it requires that two systems (the old and the new) be operated at thesame time. Employees must then perform twice the usual work because they have to enterthe same data into both the old and the new systems. Parallel conversion also requires theresults of the two systems to be completely cross-checked to make sure there are no differ-ences between the two, which entails additional time and cost.
Pilot conversion and phased conversion have somewhat similar costs. Simultaneousconversion has higher costs because more staff are required to support all the locations asthey simultaneously switch from the old to the new system. Modular conversion is moreexpensive than whole-system conversion because it requires more programming. The oldsystem must be updated to work with selected modules in the new system, and modules inthe new system must be programmed to work with selected modules in both the old andnew systems.
Time The final factor is the amount of time required to convert between the old andthe new system. Direct conversion is the fastest because it is immediate. Parallel conver-sion takes longer because the full advantages of the new system do not become availableuntil the old system is turned off. Simultaneous conversion is fastest because all locationsare converted at the same time. Phased conversion usually takes longer than pilot con-version because once the pilot test is complete, all remaining locations are usually (but notalways) converted simultaneously. Phased conversion proceeds in waves, often requiringseveral months before all locations are converted. Likewise, modular conversion takeslonger than whole-system conversion because the models are introduced one afteranother.
542 Chapter 14 Installation and Operations
Suppose you are leading the conversion from one wordprocessor to another at your university. Develop a con-version plan (i.e., technical issues only). You have alsobeen asked to develop a conversion plan for the uni-
versity’s new Web-based course registration system.How would the second conversion plan be similar toand different from the one you developed for the wordprocessor?
14-1 Developing a Conversion PlanYOUR
TURN

CHANGE MANAGEMENT7
In the context of a systems development project, change management is the process ofhelping people to adopt and adapt to the to-be system and its accompanying workprocesses without undue stress. There are three key roles in any major organizationalchange. The first is the sponsor of the change—the person who wants the change. This per-son is the business sponsor who first initiated the request for the new system (see Chapter 2).Usually, the sponsor is a senior manager of the part of the organization that must adoptand use the new system. It is critical that the sponsor be active in the change managementprocess because a change that is clearly being driven by the sponsor, not by the project teamor the IS organization, has greater legitimacy. The sponsor has direct management author-ity over those who adopt the system.
The second role is that of the change agent—the person(s) leading the change effort.The change agent, charged with actually planning and implementing the change, is usuallysomeone outside of the business unit adopting the system and therefore has no direct man-agement authority over the potential adopters. Because the change agent is an outsiderfrom a different organizational culture, he or she has less credibility than do the sponsorand other members of the business unit. After all, once the system has been installed, thechange agent usually leaves and thus has no ongoing impact.
Change Management 543
Throughout the 1960s, 1970s, and 1980s, the U.S. Armyautomated its installations (army bases, in civilian terms).Automation was usually a local effort at each of the morethan 100 bases. Although some bases had developed soft-ware together (or borrowed software developed at otherbases), each base often had software that performed dif-ferent functions or performed the same function in differ-ent ways. In 1989, the army decided to standardize thesoftware so that the same software would be used every-where. This would greatly reduce software maintenanceand also reduce training when soldiers were transferredbetween bases.
The software took four years to develop. The systemwas quite complex, and the project manager was con-cerned that there was a high risk that not all requirementsof all installations had been properly captured. Cost andtime were less important because the project had alreadyrun four years and cost $100 million.
Therefore, the project manager chose a modular pilotconversion using parallel conversion. The manager selectedseven installations, each representing a different type ofarmy installation (e.g., training base, arsenal, depot) andbegan the conversion. All went well, but several new fea-tures were identified that had been overlooked during theanalysis, design, and construction. These were added andthe pilot testing resumed. Finally, the system was installedin the rest of the army installations using a phased directconversion of the whole system.
—Alan Dennis
Questions
1. Do you think the conversion strategy was appropriate?2. Regardless of whether you agree, what other con-
version strategy could have been used?
14-B U.S. Army Installation SupportCONCEPTS
IN ACTION
7 The material in this section is related to the Enhanced Unified Process’s Transition and Production phases andthe Configuration and Change Management workflow (see Figure 1-11). Many books have been written onchange management. Some of our favorites are the following: Patrick Connor and Linda Lake, Managing Organi-zational Change, 2nd ed. (Westport, CT: Praeger, 1994); Douglas Smith, Taking Charge of Change (Reading, MA:Addison-Wesley, 1996); Daryl Conner, Managing at the Speed of Change (New York: Villard Books, 1992); andMary Lynn Manns and Linda Rising, Fearless Change: Patterns for Introducing New Ideas (Boston, MA: Addison-Wesley, 2005).

The third role is that of potential adopters, or targets of the change—the people whoactually must change. These are the people for whom the new system is designed and whowill ultimately choose to use or not use the system.
In the early days of computing, many project teams simply assumed that their jobended when the old system was converted to the new system at a technical level. The phi-losophy was “build it and they will come.” Unfortunately, that happens only in the movies.Resistance to change is common in most organizations. Therefore, the change managementplan is an important part of the overall installation plan that glues together the key steps inthe change management process. Successful change requires that people want to adopt thechange and are able to adopt the change. The change management plan has four basic steps:revising management policies, assessing the cost and benefit models of potential adopters,motivating adoption, and enabling people to adopt through training (see Figure 14-2).However, before we can discuss the change management plan, we must first understand whypeople resist change.
Understanding Resistance to Change8 People resist change—even change for the better—for very rational reasons. What is good for the organization is not necessarily good for thepeople who work there. For example, consider an order-processing clerk who used toreceive orders to be shipped on paper shipping documents but now uses a computer toreceive the same information. Rather than typing shipping labels with a typewriter, theclerk now clicks on the print button on the computer and the label is produced automati-cally. The clerk can now ship many more orders each day, which is a clear benefit to theorganization. The clerk, however, probably doesn’t really care how many packages are shipped.His or her pay doesn’t change; it’s just a question of which the clerk prefers to use, a com-puter or typewriter. Learning to use the new system and work processes—even if the changeis minor—requires more effort than continuing to use the existing, well-understood systemand work processes.
So why do people accept change? Simply put, every change has a set of costs and ben-efits associated with it. If the benefits of accepting the change outweigh the costs of thechange, then people change. And sometimes the benefit of change is avoidance of the painthat might be experienced if the change were not adopted (e.g., if you don’t change, you arefired, so one of the benefits of adopting the change is that you still have a job).
In general, when people are presented with an opportunity for change, they perform acost–benefit analysis (sometime consciously, sometimes subconsciously) and decide theextent to which they will embrace and adopt the change. They identify the costs of and ben-efits from the system and decide whether the change is worthwhile. However, it is not thatsimple, because most costs and benefits are not certain. There is some uncertainty as towhether a certain benefit or cost will actually occur; so both the costs of and benefits fromthe new system will need to be weighted by the degree of certainty associated with them(Figure 14-5). Unfortunately, most humans tend to overestimate the probability of costsand underestimate the probability of benefits.
There are also costs and, sometimes, benefits associated with the actual transitionprocess itself. For example, suppose we found a nicer house or apartment than our currentone. Even if we liked it better, we might decide not to move simply because the cost of mov-ing outweighed the benefits from the new house or apartment itself. Likewise, adopting anew computer system might require us to learn new skills, which could be seen as a cost tosome people or as a benefit to others, if they perceived that those skills would somehow
544 Chapter 14 Installation and Operations
8 This section benefited from conversations with Dr. Robert Briggs, research scientist at the Center for theManagement of Information at the University of Arizona.
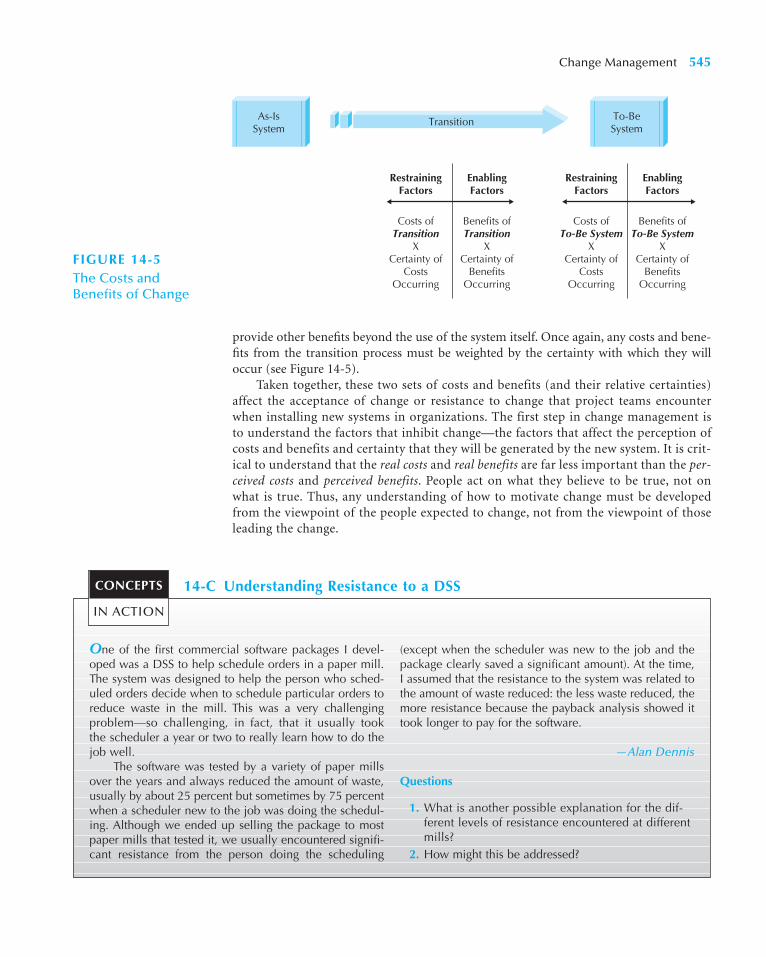
provide other benefits beyond the use of the system itself. Once again, any costs and bene-fits from the transition process must be weighted by the certainty with which they willoccur (see Figure 14-5).
Taken together, these two sets of costs and benefits (and their relative certainties)affect the acceptance of change or resistance to change that project teams encounterwhen installing new systems in organizations. The first step in change management isto understand the factors that inhibit change—the factors that affect the perception ofcosts and benefits and certainty that they will be generated by the new system. It is crit-ical to understand that the real costs and real benefits are far less important than the per-ceived costs and perceived benefits. People act on what they believe to be true, not onwhat is true. Thus, any understanding of how to motivate change must be developedfrom the viewpoint of the people expected to change, not from the viewpoint of thoseleading the change.
Change Management 545
As-IsSystem
RestrainingFactors
EnablingFactors
Costs ofTransition
XCertainty of
CostsOccurring
Benefits ofTransition
XCertainty of
BenefitsOccurring
To-BeSystem
Transition
RestrainingFactors
EnablingFactors
Costs ofTo-Be System
XCertainty of
CostsOccurring
Benefits ofTo-Be System
XCertainty of
BenefitsOccurring
FIGURE 14-5The Costs and Benefits of Change
One of the first commercial software packages I devel-oped was a DSS to help schedule orders in a paper mill.The system was designed to help the person who sched-uled orders decide when to schedule particular orders toreduce waste in the mill. This was a very challengingproblem—so challenging, in fact, that it usually tookthe scheduler a year or two to really learn how to do thejob well.
The software was tested by a variety of paper millsover the years and always reduced the amount of waste,usually by about 25 percent but sometimes by 75 percentwhen a scheduler new to the job was doing the schedul-ing. Although we ended up selling the package to mostpaper mills that tested it, we usually encountered signifi-cant resistance from the person doing the scheduling
(except when the scheduler was new to the job and thepackage clearly saved a significant amount). At the time,I assumed that the resistance to the system was related tothe amount of waste reduced: the less waste reduced, themore resistance because the payback analysis showed ittook longer to pay for the software.
—Alan Dennis
Questions
1. What is another possible explanation for the dif-ferent levels of resistance encountered at differentmills?
2. How might this be addressed?
14-C Understanding Resistance to a DSSCONCEPTS
IN ACTION
Revising Management PoliciesThe first major step in the change management plan is to change the management policiesthat were designed for the as-is system to new management policies designed to supportthe to-be system. Management policies provide goals, define how work processes should beperformed, and determine how organizational members are rewarded. No computer sys-tem will be successfully adopted unless management policies support its adoption. Manynew computer systems bring changes to business processes; they enable new ways of work-ing. Unless the policies that provide the rules and rewards for those processes are revisedto reflect the new opportunities that the system permits, potential adopters cannot easilyuse it.
Management has three basic tools for structuring work processes in organizations.9
The first are the standard operating procedures (SOPs) that become the habitual routines forhow work is performed. The SOPs are both formal and informal. Formal SOPs defineproper behavior. Informal SOPs are the norms that have developed over time for howprocesses are actually performed. Management must ensure that the formal SOPs arerevised to match the to-be system. The informal SOPs will then evolve to refine and fill indetails absent in the formal SOPs.
The second aspect of management policy is defining how people assign meaning toevents. What does it mean to “be successful” or “do good work”? Policies help peopleunderstand meaning by defining measurements and rewards. Measurements explicitlydefine meaning because they provide clear and concrete evidence about what is importantto the organization. Rewards reinforce measurements because “what gets measured getsdone” (an overused but accurate saying). Measurements must be carefully designed tomotivate desired behavior. The IBM credit example (Your Turn 4-2) illustrates the prob-lem when flawed measurements drive improper behavior (when the credit analysts becametoo busy to handle credit requests, they would find nonexistent errors so they could returnthem unprocessed).
A third aspect of management policy is resource allocation. Managers can have clearand immediate impacts on behavior by allocating resources. They can redirect funds andstaff from one project to another, create an infrastructure that supports the new system,and invest in training programs. Each of these activities has both a direct and symboliceffect. The direct effect comes from the actual reallocation of resources. The symbolic effectshows that management is serious about its intentions. There is less uncertainty aboutmanagement’s long-term commitment to a new system when potential adopters seeresources being committed to support it.
546 Chapter 14 Installation and Operations
9 This section builds on the work of Anthony Giddons, The Constitution of Society: Outline of the Theory ofStructure (Berkeley: University of California Press, 1984). A good summary of Giddons’s theory that has beenrevised and adapted for use in understanding information systems is an article by Wanda Orlikowski and DanRobey: “Information Technology and the Structuring of Organizations,” Information Systems Research 2, no. 2(1991): 143–169.
Identify and explain three standard operating proceduresfor the course in which you are using this book. Discuss
whether they are formal or informal.
14-2 Standard Operating ProceduresYOUR
TURN

Assessing Costs and BenefitsThe next step in developing a change management plan is to develop two clear and conciselists of costs and benefits provided by the new system (and the transition to it) comparedwith the as-is system. The first list is developed from the perspective of the organization,which should flow easily from the business case developed during the feasibility study andrefined over the life of the project (see Chapter 2). This set of organizational costs and ben-efits should be distributed widely so that everyone expected to adopt the new systemshould clearly understand why the new system is valuable to the organization.
The second list of costs and benefits is developed from the viewpoints of the differentpotential adopters expected to change, or stakeholders in the change. For example, one setof potential adopters may be the frontline employees, another may be the first-line super-visors, and yet another might be middle management. Each of these potential adopters, orstakeholders, may have a different set of costs and benefits associated with the change—costs and benefits that can differ widely from those of the organization. In some situations,unions may be key stakeholders that can make or break successful change.
Many systems analysts naturally assume that frontline employees are the ones whoseset of costs and benefits are the most likely to diverge from those of the organization andthus are the ones who most resist change. However, they usually bear the brunt of prob-lems with the current system. When problems occur, they often experience them firsthand.Middle managers and first-line supervisors are the most likely to have a divergent set ofcosts and benefits and, therefore, resist change because new computer systems often changehow much power they have. For example, a new computer system may improve the organi-zation’s control over a work process (a benefit to the organization) but reduce the decision-making power of middle management (a clear cost to middle managers).
An analysis of the costs and benefits for each set of potential adopters, or stakeholders,will help pinpoint those who will likely support the change and those who may resist thechange. The challenge at this point is to try to change the balance of the costs and benefits forthose expected to resist the change so that they support it (or at least do not actively resist it).This analysis may uncover some serious problems that have the potential to block the suc-cessful adoption of the system. It may be necessary to reexamine the management policiesand make significant changes to ensure that the balance of costs and benefits is such thatimportant potential adopters are motivated to adopt the system.
Figure 14-6 summarizes some of the factors that are important to successful change.The first and most important reason is a compelling personal reason to change. All changeis made by individuals, not organizations. If there are compelling reasons for the keygroups of individual stakeholders to want the change, then the change is more likely to besuccessful. Factors such as increased salary, reduced unpleasantness, and—depending onthe individuals—opportunities for promotion and personal development can be impor-tant motivators. However, if the change makes current skills less valuable, individuals mayresist the change because they have invested a lot of time and energy in acquiring thoseskills, and anything that diminishes those skills may be perceived as diminishing the indi-vidual (because important skills bring respect and power).
There must also be a compelling reason for the organization to need the change; oth-erwise, individuals become skeptical that the change is important and are less certain itwill, in fact, occur. Probably the hardest organization to change is an organization that hasbeen successful because individuals come to believe that what worked in the past will con-tinue to work. By contrast, in an organization that is on the brink of bankruptcy, it is eas-ier to convince individuals that change is needed. Commitment and support from crediblebusiness sponsors and top management are also important in increasing the certainty thatthe change will occur.
Change Management 547
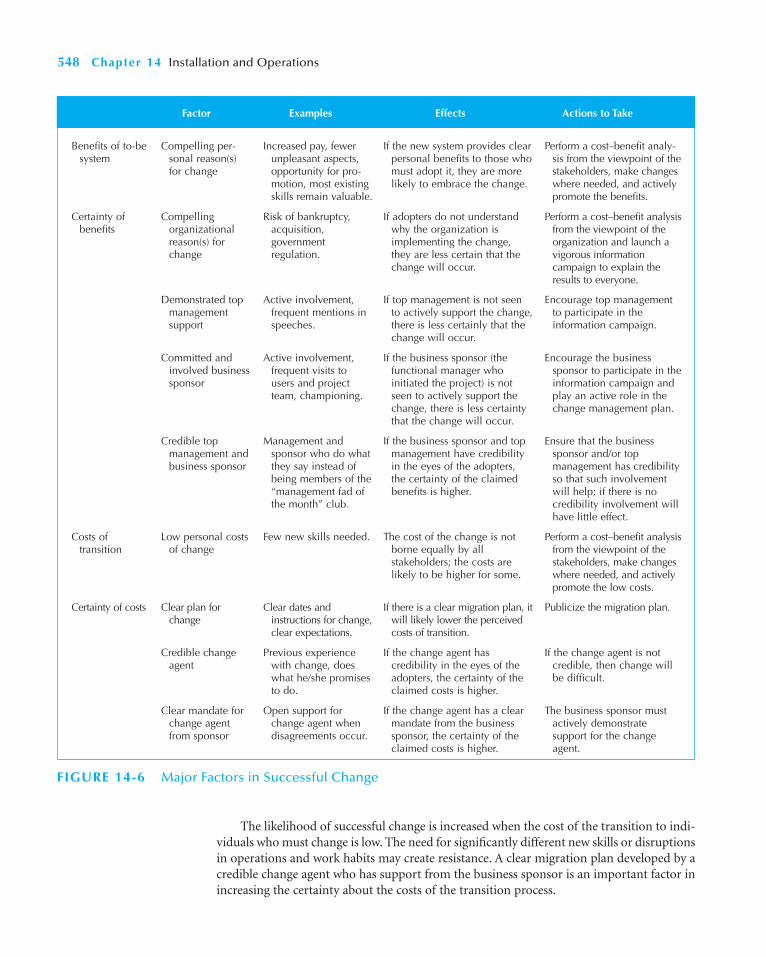
548 Chapter 14 Installation and Operations
Factor Examples Effects Actions to Take
Benefits of to-besystem
Compelling per-sonal reason(s)for change
Increased pay, fewerunpleasant aspects,opportunity for pro-motion, most existingskills remain valuable.
If the new system provides clearpersonal benefits to those whomust adopt it, they are morelikely to embrace the change.
Perform a cost–benefit analy-sis from the viewpoint of thestakeholders, make changeswhere needed, and activelypromote the benefits.
Certainty ofbenefits
Compellingorganizationalreason(s) forchange
Risk of bankruptcy,acquisition,governmentregulation.
If adopters do not understandwhy the organization isimplementing the change,they are less certain that thechange will occur.
Perform a cost–benefit analysisfrom the viewpoint of theorganization and launch avigorous informationcampaign to explain theresults to everyone.
Demonstrated topmanagementsupport
Active involvement,frequent mentions inspeeches.
If top management is not seento actively support the change,there is less certainly that thechange will occur.
Encourage top managementto participate in theinformation campaign.
Committed andinvolved businesssponsor
Active involvement,frequent visits tousers and projectteam, championing.
If the business sponsor (thefunctional manager whoinitiated the project) is notseen to actively support thechange, there is less certaintythat the change will occur.
Encourage the businesssponsor to participate in theinformation campaign andplay an active role in thechange management plan.
Credible topmanagement andbusiness sponsor
Management andsponsor who do whatthey say instead ofbeing members of the“management fad ofthe month” club.
If the business sponsor and topmanagement have credibilityin the eyes of the adopters,the certainty of the claimedbenefits is higher.
Ensure that the businesssponsor and/or topmanagement has credibilityso that such involvementwill help; if there is nocredibility involvement willhave little effect.
Costs oftransition
Low personal costsof change
Few new skills needed. The cost of the change is notborne equally by allstakeholders; the costs arelikely to be higher for some.
Perform a cost–benefit analysisfrom the viewpoint of thestakeholders, make changeswhere needed, and activelypromote the low costs.
Certainty of costs Clear plan forchange
Clear dates andinstructions for change,clear expectations.
If there is a clear migration plan, itwill likely lower the perceivedcosts of transition.
Publicize the migration plan.
Credible changeagent
Previous experiencewith change, doeswhat he/she promisesto do.
If the change agent hascredibility in the eyes of theadopters, the certainty of theclaimed costs is higher.
If the change agent is notcredible, then change willbe difficult.
Clear mandate forchange agentfrom sponsor
Open support forchange agent whendisagreements occur.
If the change agent has a clearmandate from the businesssponsor, the certainty of theclaimed costs is higher.
The business sponsor mustactively demonstratesupport for the changeagent.
FIGURE 14-6 Major Factors in Successful Change
The likelihood of successful change is increased when the cost of the transition to indi-viduals who must change is low. The need for significantly different new skills or disruptionsin operations and work habits may create resistance. A clear migration plan developed by acredible change agent who has support from the business sponsor is an important factor inincreasing the certainty about the costs of the transition process.

Motivating AdoptionThe single most important factor in motivating a change is providing clear and convincingevidence of the need for change. Simply put, everyone who is expected to adopt the changemust be convinced that the benefits from the to-be system outweigh the costs of changing.
There are two basic strategies to motivating adoption: informational and political.Both strategies are often used simultaneously. With an informational strategy, the goal is toconvince potential adopters that the change is for the better. This strategy works when thecost–benefit set of the target adopters has more benefits than costs. In other words, therereally are clear reasons for the potential adopters to welcome the change.
Using this approach, the project team provides clear and convincing evidence of thecosts and benefits of moving to the to-be system. The project team writes memos anddevelops presentations that outline the costs and benefits of adopting the system from theperspective of the organization and from the perspective of the target group of potentialadopters. This information is disseminated widely throughout the target group, much likean advertising or public relations campaign. It must emphasize the benefits as well asincrease the certainty in the minds of potential adopters that these benefits will actually beachieved. In our experience, it is always easier to sell painkillers than vitamins; that is, it iseasier to convince potential adopters that a new system will remove a major problem (orother source of pain) than that it will provide new benefits (e.g., increase sales). Therefore,informational campaigns are more likely to be successful if they stress the reduction orelimination of problems rather than focusing on the provision of new opportunities.
The other strategy for motivating change is a political strategy. With a political strat-egy, organizational power, not information, is used to motivate change. This approach isoften used when the cost–benefit set of the target adopters has more costs than benefits. Inother words, although the change may benefit the organization, there are no reasons for thepotential adopters to welcome the change.
The political strategy is usually beyond the control of the project team. It requiressomeone in the organization who holds legitimate power over the target group to influencethe group to adopt the change. This may be done in a coercive manner (e.g., adopt the sys-tem or you’re fired) or in a negotiated manner, in which the target group gains benefits inother ways that are linked to the adoption of the system (e.g., linking system adoption toincreased training opportunities). Management policies can play a key role in a politicalstrategy by linking salary to certain behaviors desired with the new system.
In general, for any change that has true organizational benefits, about 20 percent to30 percent of potential adopters will be ready adopters. They recognize the benefits, quicklyadopt the system, and become proponents of the system. Another 20 percent to 30 percentare resistant adopters. They simply refuse to accept the change and they fight against it, eitherbecause the new system has more costs than benefits for them personally or because theyplace such a high cost on the transition process itself that no amount of benefits from thenew system can outweigh the change costs. The remaining 40 percent to 60 percent are reluc-tant adopters. They tend to be apathetic and will go with the flow to either support or resistthe system, depending on how the project evolves and how their coworkers react to the sys-tem. Figure 14-7 illustrates the actors who are involved in the change management process.
The goal of change management is to actively support and encourage the readyadopters and help them win over the reluctant adopters. There is usually little that can bedone about the resistant adopters because their set of costs and benefits may be divergentfrom those of the organization. Unless there are simple steps that can be taken to rebalancetheir costs and benefits or the organization chooses to adopt a strongly political strategy, itis often best to ignore this small minority of resistant adopters and focus on the largermajority of ready and reluctant adopters.
Change Management 549

Enabling Adoption: TrainingPotential adopters may want to adopt the change, but unless they are capable of adoptingit, they won’t. Adoption is enabled by providing the skills needed to adopt the changethrough careful training. Training is probably the most self-evident part of any changemanagement initiative. How can an organization expect its staff members to adopt a newsystem if they are not trained? However, we have found that training is one of the mostcommonly overlooked parts of the process. Many organizations and project managers sim-ply expect potential adopters to find the system easy to learn. Because the system is pre-sumed to be so simple, it is taken for granted that potential adopters should be able to learnwith little effort. Unfortunately, this is usually an overly optimistic assumption.
Every new system requires new skills, either because the basic work processes havechanged (sometimes radically in the case of BPR; see Chapter 4) or because the computer sys-tem used to support the processes is different. The more radical the changes to the businessprocesses, the more important it is to ensure the organization has the new skills required tooperate the new business processes and supporting information systems. In general, there arethree ways to get these new skills. One is to hire new employees who have the needed skillsthat the existing staff does not. Another is to outsource the processes to an organization thathas the skills that the existing staff does not. Both these approaches are controversial and areusually considered only in the case of BPR when the new skills needed are likely to be themost different from the set of skills of the current staff. In most cases, organizations choosethe third alternative: training existing staff in the new business processes and the to-be sys-tem. Every training plan must consider what to train and how to deliver the training.
What to Train What training should you provide to the system users? It’s obvious: howto use the system. The training should cover all the capabilities of the new system so usersunderstand what each module does, right?
Wrong. Training for business systems should focus on helping the users to accomplishtheir jobs, not on how to use the system. The system is simply a means to an end, not theend in itself. This focus on performing the job (i.e., the business processes), not using the
550 Chapter 14 Installation and Operations
The sponsor wants The change agent leads Potential adopters are the peoplethe change to occur. the change effort. who must change.
20–30 percent are ready adopters.
20–30 percent are resistant adopters.
40–60 percent are reluctant adopters.
Sponsor Change Agent Potential Adopters
FIGURE 14-7Actors in the ChangeManagement Process
Some clerks at the South Dakota Department of Worker’sCompensation (see Concepts in Action 14-A) were afraidthat the digital solution might not work. What if theycould not find an electronic file on the computer? What ifa hard drive crashed or files were accidentally deleted?What if they could not retrieve the electronic file?
Question
In terms of organizational feasibility and adoption, whatmight an analyst do to convince these clerks to adoptthe new technology?
14-D Too Much Paper (Part 2)CONCEPTS
IN ACTION
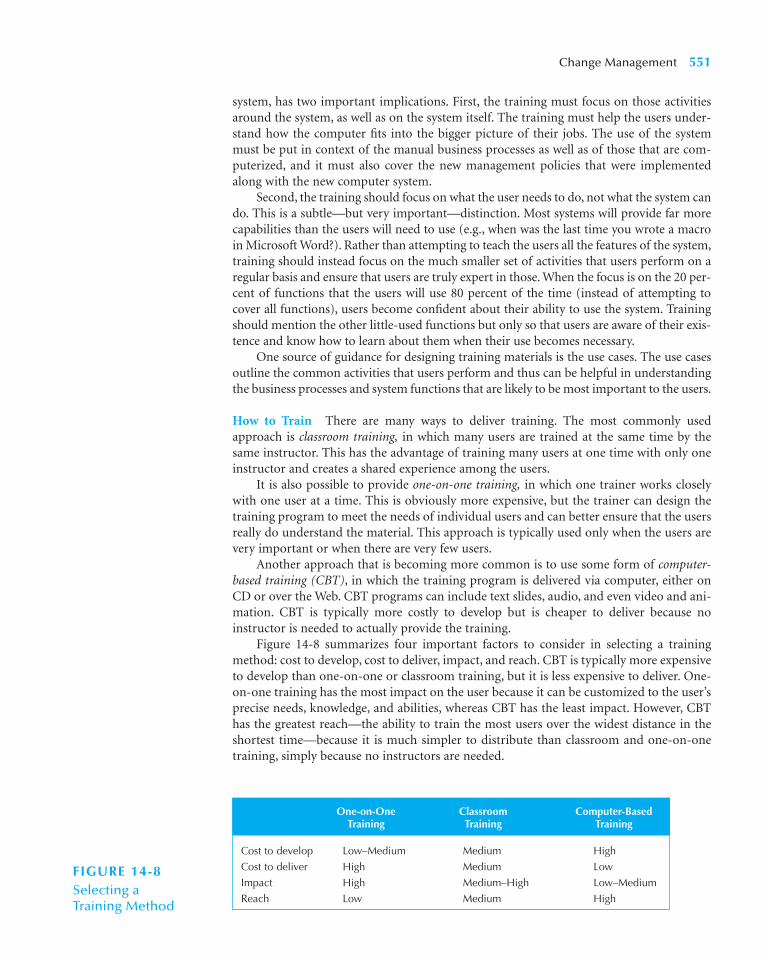
system, has two important implications. First, the training must focus on those activitiesaround the system, as well as on the system itself. The training must help the users under-stand how the computer fits into the bigger picture of their jobs. The use of the systemmust be put in context of the manual business processes as well as of those that are com-puterized, and it must also cover the new management policies that were implementedalong with the new computer system.
Second, the training should focus on what the user needs to do, not what the system cando. This is a subtle—but very important—distinction. Most systems will provide far morecapabilities than the users will need to use (e.g., when was the last time you wrote a macroin Microsoft Word?). Rather than attempting to teach the users all the features of the system,training should instead focus on the much smaller set of activities that users perform on aregular basis and ensure that users are truly expert in those. When the focus is on the 20 per-cent of functions that the users will use 80 percent of the time (instead of attempting tocover all functions), users become confident about their ability to use the system. Trainingshould mention the other little-used functions but only so that users are aware of their exis-tence and know how to learn about them when their use becomes necessary.
One source of guidance for designing training materials is the use cases. The use casesoutline the common activities that users perform and thus can be helpful in understandingthe business processes and system functions that are likely to be most important to the users.
How to Train There are many ways to deliver training. The most commonly usedapproach is classroom training, in which many users are trained at the same time by thesame instructor. This has the advantage of training many users at one time with only oneinstructor and creates a shared experience among the users.
It is also possible to provide one-on-one training, in which one trainer works closelywith one user at a time. This is obviously more expensive, but the trainer can design thetraining program to meet the needs of individual users and can better ensure that the usersreally do understand the material. This approach is typically used only when the users arevery important or when there are very few users.
Another approach that is becoming more common is to use some form of computer-based training (CBT), in which the training program is delivered via computer, either onCD or over the Web. CBT programs can include text slides, audio, and even video and ani-mation. CBT is typically more costly to develop but is cheaper to deliver because noinstructor is needed to actually provide the training.
Figure 14-8 summarizes four important factors to consider in selecting a trainingmethod: cost to develop, cost to deliver, impact, and reach. CBT is typically more expensiveto develop than one-on-one or classroom training, but it is less expensive to deliver. One-on-one training has the most impact on the user because it can be customized to the user’sprecise needs, knowledge, and abilities, whereas CBT has the least impact. However, CBThas the greatest reach—the ability to train the most users over the widest distance in theshortest time—because it is much simpler to distribute than classroom and one-on-onetraining, simply because no instructors are needed.
Change Management 551
Cost to develop Low–Medium Medium High
Cost to deliver High Medium Low
Impact High Medium–High Low–Medium
Reach Low Medium High
One-on-One Classroom Computer-Based Training Training Training
FIGURE 14-8Selecting a Training Method

552 Chapter 14 Installation and Operations
Figure 14-8 suggests a clear pattern for most organizations. If there are only a few usersto train, one-on-one training is the most effective. If there are many users to train, manyorganizations turn to CBT. We believe that the use of CBT will increase in the future. Quiteoften, large organizations use a combination of all three methods. Regardless of whichapproach is used, it is important to leave the users with a set of easily accessible materialsthat can be referred to long after the training has ended (usually a quick reference guideand a set of manuals, whether on paper or in electronic form).
POSTIMPLEMENTATION ACTIVITIES10
The goal of postimplementation activities is the institutionalization of the use of the newsystem—that is to make it the normal, accepted, routine way of performing the businessprocesses. Postimplementation activities attempt to refreeze the organization after the suc-cessful transition to the new system. Although the work of the project team naturally windsdown after implementation, the business sponsor and sometimes the project manager areactively involved in refreezing. These two—and, ideally, many other stakeholders—activelypromote the new system and monitor its adoption and usage. They usually provide a steadyflow of information about the system and encourage users to contact them to discuss issues.
In this section, we examine three key postimplementation activities: system support(providing assistance in the use of the system), system maintenance (continuing to refineand improve the system), and project assessment (analyzing the project to understand whatactivities were done well—and should be repeated—and what activities need improvementin future projects).
System SupportOnce the project team has installed the system and performed the change management activ-ities, the system is officially turned over to the operations group. This group is responsible forthe operation of the system, whereas the project team was responsible for development of thesystem. Members of the operations group are usually closely involved in the installation activ-ities because they are the ones who must ensure that the system actually works. After the sys-tem is installed, the project team leaves but the operations group remains.
Providing system support means helping the users to use the system. Usually, thismeans providing answers to questions and helping users understand how to perform a cer-tain function; this type of support can be thought of as on-demand training.
Online support is the most common form of on-demand training. This includes thedocumentation and help screens built into the system, as well as separate Web sites thatprovide answers to frequently asked questions (FAQs), which enable users to find answers
Suppose you are leading the conversion from one wordprocessor to another in your organization. Develop an
outline of topics that would be included in the training.Develop a plan for training delivery.
14-3 Developing a Training PlanYOUR
TURN
10 The material in this section is related to the Enhanced Unified Process’s Production Phase and the Operationsand Support workflow (see Figure 1-11).
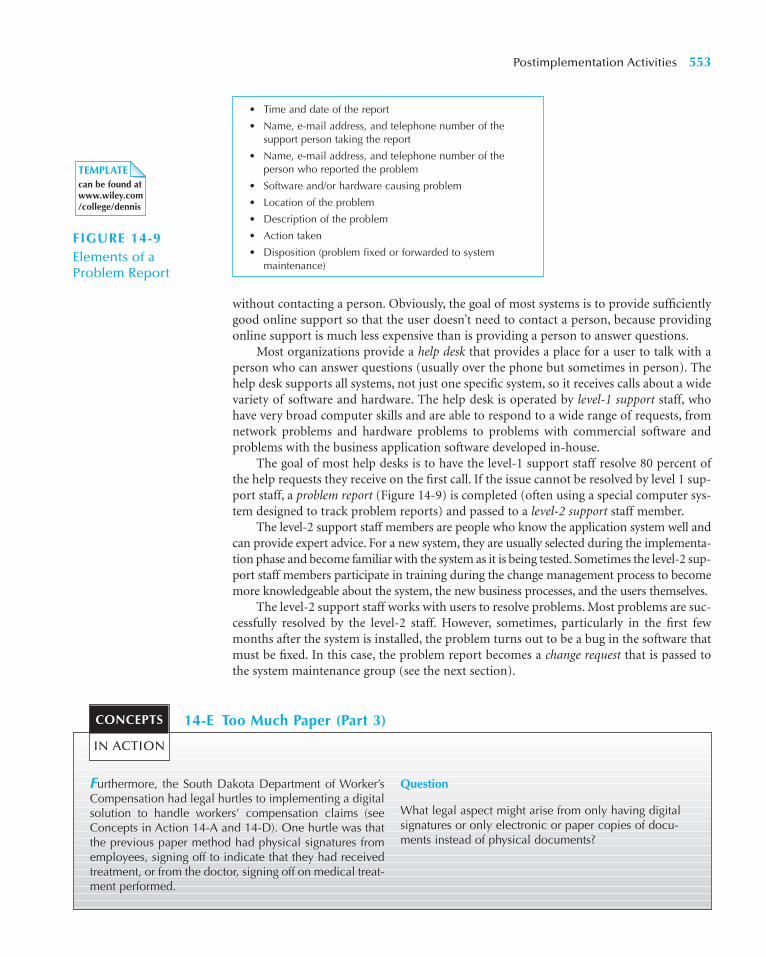
Postimplementation Activities 553
without contacting a person. Obviously, the goal of most systems is to provide sufficientlygood online support so that the user doesn’t need to contact a person, because providingonline support is much less expensive than is providing a person to answer questions.
Most organizations provide a help desk that provides a place for a user to talk with aperson who can answer questions (usually over the phone but sometimes in person). Thehelp desk supports all systems, not just one specific system, so it receives calls about a widevariety of software and hardware. The help desk is operated by level-1 support staff, whohave very broad computer skills and are able to respond to a wide range of requests, fromnetwork problems and hardware problems to problems with commercial software andproblems with the business application software developed in-house.
The goal of most help desks is to have the level-1 support staff resolve 80 percent ofthe help requests they receive on the first call. If the issue cannot be resolved by level 1 sup-port staff, a problem report (Figure 14-9) is completed (often using a special computer sys-tem designed to track problem reports) and passed to a level-2 support staff member.
The level-2 support staff members are people who know the application system well andcan provide expert advice. For a new system, they are usually selected during the implementa-tion phase and become familiar with the system as it is being tested. Sometimes the level-2 sup-port staff members participate in training during the change management process to becomemore knowledgeable about the system, the new business processes, and the users themselves.
The level-2 support staff works with users to resolve problems. Most problems are suc-cessfully resolved by the level-2 staff. However, sometimes, particularly in the first fewmonths after the system is installed, the problem turns out to be a bug in the software thatmust be fixed. In this case, the problem report becomes a change request that is passed tothe system maintenance group (see the next section).
• Time and date of the report
• Name, e-mail address, and telephone number of thesupport person taking the report
• Name, e-mail address, and telephone number of the person who reported the problem
• Software and/or hardware causing problem
• Location of the problem
• Description of the problem
• Action taken
• Disposition (problem fixed or forwarded to system maintenance)
TEMPLATEcan be found atwww.wiley.com/college/dennis
FIGURE 14-9Elements of a Problem Report
Furthermore, the South Dakota Department of Worker’sCompensation had legal hurtles to implementing a digitalsolution to handle workers’ compensation claims (seeConcepts in Action 14-A and 14-D). One hurtle was thatthe previous paper method had physical signatures fromemployees, signing off to indicate that they had receivedtreatment, or from the doctor, signing off on medical treat-ment performed.
Question
What legal aspect might arise from only having digitalsignatures or only electronic or paper copies of docu-ments instead of physical documents?
14-E Too Much Paper (Part 3)CONCEPTS
IN ACTION
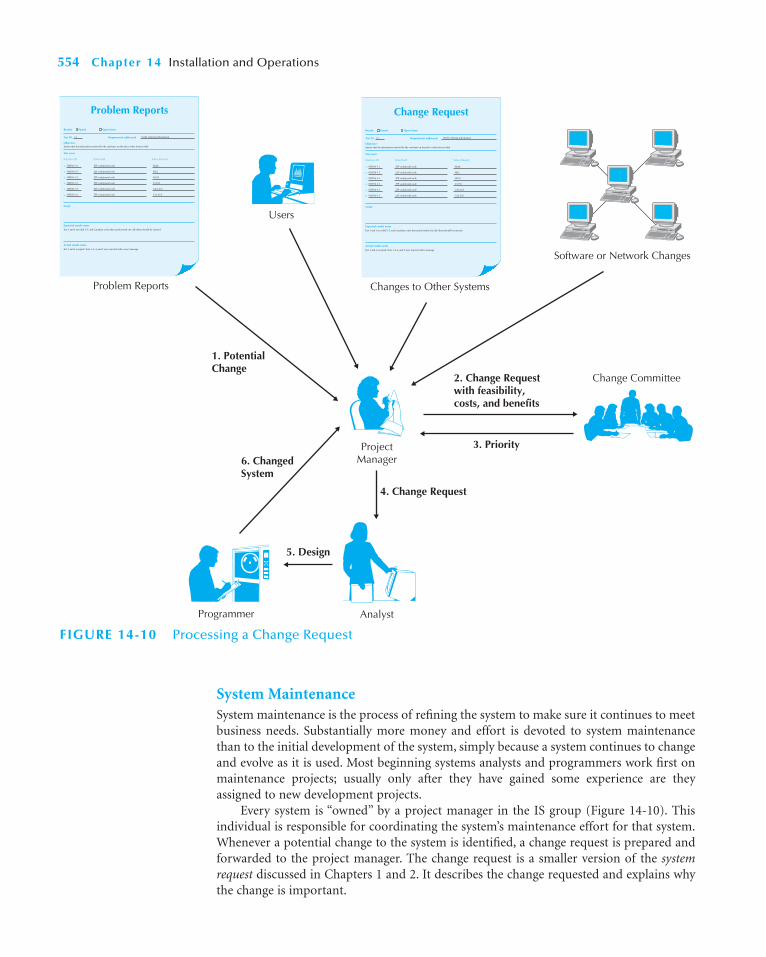
System MaintenanceSystem maintenance is the process of refining the system to make sure it continues to meetbusiness needs. Substantially more money and effort is devoted to system maintenancethan to the initial development of the system, simply because a system continues to changeand evolve as it is used. Most beginning systems analysts and programmers work first onmaintenance projects; usually only after they have gained some experience are theyassigned to new development projects.
Every system is “owned” by a project manager in the IS group (Figure 14-10). Thisindividual is responsible for coordinating the system’s maintenance effort for that system.Whenever a potential change to the system is identified, a change request is prepared andforwarded to the project manager. The change request is a smaller version of the systemrequest discussed in Chapters 1 and 2. It describes the change requested and explains whythe change is important.
554 Chapter 14 Installation and Operations
2. Change Requestwith feasibility,costs, and benefits
3. Priority
4. Change Request
5. Design
6. ChangedSystem
1. PotentialChange
Analyst
Users
Change Committee
Programmer
ProjectManager
Problem Reports
Results: Passed Open items:
Test ID: Requirement addressed:
Objective:
Test cases
Interface ID
Script
Expected results notes
Actual results notes
1.
2.
3.
4.
5.
6.
Data Field Value Entered
Problem Reports
ORD56-3.5 ZIP code/postal code blank
ORD56-3.5 ZIP code/postal code 9021
ORD56-3.5 ZIP code/postal code 90210
ORD56-3.5 ZIP code/postal code C1A58
ORD56-3.5 ZIP code/postal code CAA 2C6
ORD56-3.5
Test 3 and 6 are valid U.S. and Canadian codes that match tested city. All others should be rejected.
Test 3 and 6 accepted. Tests 1, 2, 4, and 5 were rejected with correct message.
ZIP code/postal code C1A 2C6
12 Verify ordering information
Ensure that the information entered by the customer on the place-order form is valid
Changes to Other Systems
Results: Passed Open items:
Test ID: Requirement addressed:
Objective:
Test cases
Interface ID
Script
Expected results notes
Actual results notes
1.
2.
3.
4.
5.
6.
Data Field Value Entered
Change Request
ORD56-3.5 ZIP code/postal code blank
ORD56-3.5 ZIP code/postal code 9021
ORD56-3.5 ZIP code/postal code 90210
ORD56-3.5 ZIP code/postal code C1A58
ORD56-3.5 ZIP code/postal code CAA 2C6
ORD56-3.5
Test 3 and 6 are valid U.S. and Canadian codes that match tested city. All others should be rejected.
Test 3 and 6 accepted. Tests 1, 2, 4, and 5 were rejected with z message.
ZIP code/postal code C1A 2C6
12 Verify ordering information
Ensure that the information entered by the customer on the place-order form is valid
Software or Network Changes
FIGURE 14-10 Processing a Change Request

Changes can be small or large. Change requests that are likely to require a significanteffort are typically handled in the same manner as system requests: they follow the sameprocess as the project described in this book, starting with project initiation in Chapter 2and following through installation in this chapter. Minor changes typically follow a smallerversion of this same process. There is an initial assessment of feasibility and of costs andbenefits, and the change request is prioritized. Then a systems analyst (or a program-mer/analyst) performs the analysis, which may include interviewing users, and prepares aninitial design before programming begins. The new (or revised) program is then exten-sively tested before the system is converted from the old system to the revised one.
Change requests typically come from five sources. The most common source is prob-lem reports from the operations group that identify bugs in the system that must be fixed.These are usually given immediate priority because a bug can cause significant problems.Even a minor bug can cause major problems by upsetting users and reducing their accep-tance of and confidence in the system.
The second most common source of change requests is enhancement to the systemfrom users. As users work with the system, they often identify minor changes in the designthat can make the system easier to use or identify additional functions that are needed.Such enhancements are important in satisfying the users and are often key in ensuring thatthe system changes as the business requirements change. Enhancements are often givensecond priority after bug fixes.
A third source of change requests is other system development projects. For example,if the dentist in the appointment problem decided that he or she would like to have a Web-based appointment system that would allow patients to directly interact with the currentappointment system, it is likely that other systems, such as billing, would have to be mod-ified to ensure that the two systems would work together. These changes required by theneed to integrate two systems are generally rare but are becoming more common as systemintegration efforts become more common.
A fourth source of change requests is those that occur when underlying software ornetworks change. For example, new versions of Windows often require an application tochange the way the system interacts with Windows or enables application systems to takeadvantage of new features that improve efficiency. Although users may never see thesechanges (because most changes are inside the system and do not affect its user interface orfunctionality), these changes can be among the most challenging to implement becauseanalysts and programmers must learn about the new system characteristics, understandhow application systems use (or can use) those characteristics, and then make the neededprogramming changes.
The fifth source of change requests is senior management. These change requests areoften driven by major changes in the organization’s strategy or operations. These signifi-cant change requests are typically treated as separate projects, but the project managerresponsible for the initial system is often placed in charge of the new project.
Project AssessmentThe goal of project assessment is to understand what was successful about the system andthe project activities (and, therefore, should be continued in the next system or project) andwhat needs to be improved. Project assessment is not routine in most organizations, exceptfor military organizations, which are accustomed to preparing after-action reports.Nonetheless, assessment can be an important component in organizational learning becauseit helps organizations and people understand how to improve their work. It is particularlyimportant for junior staff members because it helps promote faster learning. There are twoprimary parts to project assessment—project team review and system review.
Postimplementation Activities 555

Project Team Review A project team review focuses on the way in which the project teamcarried out its activities. Each project member prepares a short two- to three-page docu-ment that reports and analyzes his or her performance. The focus is on performanceimprovement, not penalties for mistakes made. By explicitly identifying mistakes andunderstanding their causes, project team members will, it is hoped, be better prepared forthe next time they encounter a similar situation—and less likely to repeat the same mis-takes. Likewise, by identifying excellent performance, team members will be able to under-stand why their actions worked well and how to repeat them in future projects.
The documents prepared by each team member are assessed by the project manager,who meets with the team members to help them understand how to improve their per-formance. The project manager then prepares a summary document that outlines the keylearnings from the project. This summary identifies what actions should be taken infuture projects to improve performance but is careful not to identify team members whomade mistakes. The summary is widely circulated among all project managers to helpthem understand how to manage their projects better. Often, it is also circulated amongregular staff members who did not work on the project so that they, too, can learn fromother projects.
System Review The focus of the system review is to understand the extent to which theproposed costs and benefits from the new system identified during project initiationwere actually recognized from the implemented system. Project team review is usuallyconducted immediately after the system is installed while key events are still fresh inteam members’ minds, but system review is often undertaken several months after thesystem is installed because it often takes a while before the system can be properlyassessed.
System review starts with the system request and feasibility analysis prepared at thestart of the project. The detailed analyses prepared for the expected business value (bothtangible and intangible) as well as the economic feasibility analysis are reexamined and anew analysis is prepared after the system has been installed. The objective is to compare theanticipated business value against the actual realized business value from the system. This
556 Chapter 14 Installation and Operations
One of my consulting projects was with a credit-card“bottom feeder” (let’s call them Credit Wonder). This com-pany bought credit-card accounts that were written off asuncollectable debts by major banks. Credit Wonderwould buy the write-off accounts for 1 or 2 percent of thevalue. Credit Wonder would then call the owners of thewritten-off accounts and offer a deal to the credit-cardaccount holders.
Credit Wonder wanted a database for theseaccounts. Legally, they did own the accounts and couldcontact the people who had owed the money—but asprescribed in credit law. For example, they could callonly during certain hours, could call no more than oncea week, and could speak only to the actual account
holder. Any amount collected over the 1 to 2 percent ofthe original debt would be considered a gain. In theirdatabase, they wanted a history of what settlement wasoffered, the date the account holder was contacted, andadditional notes.
Questions
1. How might a systems analyst manage such a systemproject?
2. Who would they need to interview to get systemrequirements?
3. How would a database analyst help in structuringthe database requirements?
14-F Managing a Database ProjectCONCEPTS
IN ACTION

helps the organization assess whether the system actually provided the value it was plannedto provide. Whether or not the system provides the expected value, future projects can ben-efit from an improved understanding of the true costs and benefits.
A formal system review also has important behavior implications for project initia-tion. Because everyone involved with the project knows that all statements about businessvalue and the financial estimates prepared during project initiation will be evaluated at theend of the project, they have an incentive to be conservative in their assessments. No onewants to be the project sponsor or project manager for a project that goes radically overbudget or fails to deliver promised benefits.
APPLYING THE CONCEPTS AT CD SELECTIONS
Installation of the Internet Sales System at CD Selections was somewhat simpler than theinstallation of most systems because the system was entirely new; there was no as-is systemfor the new system to replace. Also, there was not a large number of staff members whoneeded to be trained on the operation of the new system.
ConversionConversion went smoothly. First, the new hardware was purchased and installed. Then thesoftware was installed on the Web server and on the client computers to be used by the staffof the Internet sales group. There was no data conversion per se, although the systemstarted receiving data downloaded from the distribution system every day, as it would dur-ing normal operations.
Applying the Concepts at CD Selection 557
How do you avoid bugs in the commercial software youbuy? Here are six tips:
1. Know your software: Find out if the few programs youuse day in and day out have known bugs and patches,and track the Web sites that offer the latest informationon them.
2. Back up your data: This dictum should be tattooed onevery monitor. Stop reading right now and copy thedata you can’t afford to lose onto a floppy disk, secondhard disk, or Web server. We’ll wait.
3. Don’t upgrade—yet: It’s tempting to upgrade to thelatest and greatest version of your favorite software,but why chance it? Wait a few months, check out otherusers’ experiences with the upgrade on Usenet news-groups or the vendor’s own discussion forum, and thengo for it. But only if you must.
4. Upgrade slowly: If you decide to upgrade, allow your-self at least a month to test the upgrade on a separatesystem before you install it on all the computers inyour home or office.
5. Forget the betas: Installing beta software on your pri-mary computer is a game of Russian roulette. If youreally have to play with beta software, get a secondcomputer.
6. Complain: The more you complain about bugs anddemand remedies, the more costly it is for vendors toship buggy products. It’s like voting—the more peopleparticipate, the better the results.
Source: “Software Bugs Run Rampant,” PC World 17, no. 1 (January1999): 46.
14-1 Beating Buggy SoftwarePRACTICAL
TIP

Alec decided on a direct conversion (because there was no as-is system) in the onelocation (because there was only one location) of all system modules. The conversion, if wecould call it that, went smoothly through the alpha and beta tests and the system wasdeclared technically ready for operation.
Change ManagementThere were few change management issues because there were no existing staff memberswho had to change. All new staff were hired, most by internal transfer from other groupswithin CD Selections. The most likely stakeholders to be concerned by the change wouldbe managers and employees in the traditional retail stores, who might see the Internet salessystem as a threat to their stores. Alec therefore developed an information campaign (dis-tributed through the employee newsletter and internal Web site) that discussed the reasonsfor the change and explained that the Internet sales system was seen as a complement tothe existing stores, not as a competitor. The system was instead targeted at Web-based com-petitors, such as Amazon.com and CDnow.
The new management policies were developed, along with a training plan that encom-passed both the manual work procedures and computerized procedures. Alec decided touse classroom training for the Internet sales system personnel because there were not manyof them and it was simpler and more cost effective to train them all together in one class-room session.
Postimplementation ActivitiesSupport of the system was turned over to the CD Selections operations group, who hadhired four additional support staff members with expertise in networking and Web-based systems. System maintenance began almost immediately, with Alec designated asthe project manager responsible for maintenance of this version of the system plus thedevelopment of the next version. Alec began the planning to develop the next version ofthe system.
Project team review uncovered several key lessons learned, mostly involving Web-based programming and the difficulties in linking to existing SQL databases. The projectwas delivered on budget (see Figure 2-15), with the exception that more was spent on pro-gramming than was anticipated.
A preliminary system review was conducted after two months of operations. Saleswere $40,000 for the first month and $60,000 for the second, showing a gradual increase(remember that the goal for the first year of operations was $1,000,000). Operatingexpenses averaged $60,000 per month, a bit higher than the projected average, owing tostart-up costs and the initial marketing campaign. Nonetheless, Margaret Mooney, vicepresident of marketing and the project sponsor, was quite pleased. She approved the feasi-bility study for the follow-on project to develop the second version of the Internet SalesSystem, and Alec began the system development process all over again.
SUMMARY
Cultural Issues and Information TechnologyGiven the global business environment, cultural issues become even more important whendeploying information systems today. The cultural dimensions that need to be taken intoconsideration include power distance, uncertainty avoidance, individualism versus collec-tivism, masculinity versus femininity, and long- versus short-term orientation. Furthermore,
558 Chapter 14 Installation and Operations

each of these dimensions tends to interact with each other. From an information systemsdeployment perspective, the most important thing to remember is to take into considerationthe local culture before deploying the new system.
ConversionConversion, the technical process by which the new system replaces the old system, hasthree major steps: install hardware, install software, and convert data. Conversion style, theway in which users are switched between the old and new systems, can be via either directconversion (in which users stop using the old system and immediately begin using the newsystem) or parallel conversion (in which both systems are operated simultaneously toensure the new system is operating correctly). Conversion location—what parts of theorganization are converted and when—can be via a pilot conversion in one location; via aphased conversion, in which locations are converted in stages over time; or via simultane-ous conversion, in which all locations are converted at the same time. The system can beconverted module by module or as a whole at one time. Parallel and pilot conversions areless risky because they have a greater chance of detecting bugs before the bugs have wide-spread effect, but parallel conversion can be expensive.
Change ManagementChange management is the process of helping people to adopt and adapt to the to-be sys-tem and its accompanying work processes. People resist change for very rational reasons,usually because they perceive the costs to themselves of the new system (and the transitionto it) to outweigh the benefits. The first step in the change management plan is to changethe management policies (such as standard operating procedures), devise measurementsand rewards that support the new system, and allocate resources to support it. The secondstep is to develop a concise list of costs and benefits to the organization and all relevantstakeholders in the change, which will point out who is likely to support and who is likelyto resist the change. The third step is to motivate adoption both by providing informationand by using political strategies—using power to induce potential adopters to adopt thenew system. Finally, training, whether classroom, one-on-one, or computer based, is essen-tial to enable successful adoption. Training should focus on the primary functions the userswill perform and look beyond the system itself to help users integrate the system into theirroutine work processes.
Postimplementation ActivitiesSystem support is performed by the operations group, which provides online and help desksupport to the users. System support has both a level 1 support staff, which answers thephone and handles most of the questions, and level 2 support staff, which follows up onchallenging problems and sometimes generates change requests for bug fixes. System main-tenance responds to change requests (from the system support staff, users, other develop-ment project teams, and senior management) to fix bugs and improve the business valueof the system. The goal of project assessment is to understand what was successful aboutthe system and the project activities (and, therefore, should be continued in the next sys-tem or project) and what needs to be improved. Project team review focuses on the way inwhich the project team carried out its activities and usually results in documentation of keylessons learned. System review focuses on understanding the extent to which the proposedcosts and benefits from the new system that were identified during project initiation wereactually recognized from the implemented system.
Summary 559

560 Chapter 14 Installation and Operations
KEY TERMS
Change agentChange managementChange requestClassroom trainingCollectivismComputer-based training (CBT)ConversionConversion locationConversion modulesConversion strategyConversion styleCostDirect conversionFemininityFrequently asked question
(FAQ)Help deskIndividualismInformational strategyInstitutionalizationLevel 1 supportLevel 2 supportLong-term orientation
Management policiesMasculinityMeasurementsMigration planModular conversionModulesOn-demand trainingOne-on-one trainingOnline supportOperations groupParallel conversionPerceived benefitsPerceived costsPhased conversionPilot conversionPolitical strategyPostimplementationPotential adopterPower distanceProblem reportProject assessmentProject team reviewReady adopters
Real benefitsReal costsRefreezeReluctant adoptersResistant adoptersResource allocationRewardsRiskShort-term orientationSimultaneous conversionSponsorStandard operating procedure
(SOP)System maintenanceSystem requestSystem reviewSystem supportTimeTrainingTransition processUncertainty avoidanceUnfreezeWhole-system conversion
QUESTIONS
1. What are the three basic steps in managing organiza-tional change?
2. What are the cultural issues of which developers shouldbe aware?
3. What are the major components of a migration plan?4. Compare and contrast direct conversion and parallel
conversion.5. Compare and contrast pilot conversion, phased conver-
sion, and simultaneous conversion.6. Compare and contrast modular conversion and whole-
system conversion.7. Explain the trade-offs among selecting between the
types of conversion in questions 4, 5, and 6.8. What are the three key roles in any change management
initiative?9. Why do people resist change? Explain the basic model
for understanding why people accept or resist change.10. What are the three major elements of management
policies that must be considered when implementinga new system?
11. Compare and contrast an information change man-agement strategy with a political change managementstrategy. Is one better than the other?
12. Explain the three categories of adopters you are likelyto encounter in any change management initiative.
13. How should you decide what items to include in yourtraining plan?
14. Compare and contrast three basic approaches totraining.
15. What is the role of the operations group in systemdevelopment?
16. Compare and contrast two major ways of providingsystem support.
17. How is a problem report different from a change request?18. What are the major sources of change requests?19. Why is project assessment important?20. How is project team review different from system review?21. What do you think are three common mistakes that
novice analysts make in migrating from the as-is tothe to-be system?
Minicases 561
EXERCISES
A. Suppose you are installing a new accounting package inyour small business. What conversion strategy wouldyou use? Develop a conversion plan (i.e., technicalaspects only).
B. Suppose you are installing a new room reservation sys-tem for your university that tracks which courses areassigned to which rooms. Assume that all the rooms ineach building are “owned” by one college or departmentand only one person in that college or department haspermission to assign them. What conversion strategywould you use? Develop a conversion plan (i.e., techni-cal aspects only).
C. Suppose you are installing a new payroll system in avery large multinational corporation. What conversionstrategy would you use? Develop a conversion plan (i.e.,technical aspects only).
D. Consider a major change you have experienced in yourlife (e.g., taking a new job, starting a new school). Pre-pare a cost–benefit analysis of the change in terms ofboth the change and the transition to the change.
E. Suppose you are the project manager for a new librarysystem for your university. The system will improvethe way in which students, faculty, and staff can searchfor books by enabling them to search over the Web,rather than using only the current text-based systemavailable on the computer terminals in the library. Pre-pare a cost–benefit analysis of the change in terms ofboth the change and the transition to the change forthe major stakeholders.
F. Prepare a plan to motivate the adoption of the systemin exercise E.
G. Prepare a training plan that includes both what youwould train and how the training would be deliveredfor the system in exercise E.
H. Suppose you are leading the installation of a new DSSto help admissions officers manage the admissionsprocess at your university. Develop a change manage-ment plan (i.e., organizational aspects only).
I. Suppose you are the project leader for the develop-ment of a new Web-based course registration systemfor your university that replaces an old system inwhich students had to go to the coliseum at certaintimes and stand in line to get permission slips for eachcourse they wanted to take. Develop a migration plan(including both technical conversion and changemanagement).
J. Suppose you are the project leader for the developmentof a new airline reservation system that will be used bythe airline’s in-house reservation agents. The system willreplace the current command-driven system designed inthe 1970s that uses terminals. The new system uses PCswith a Web-based interface. Develop a migration plan(including both conversion and change management)for your telephone operators.
K. Develop a migration plan (including both conversionand change management) for the independent travelagencies who use the airline reservation systemdescribed in exercise J.
MINICASES
1. Nancy is the IS department head at MOTO Inc., ahuman resources management firm. The IS staff atMOTO Inc. completed work on a new client manage-ment software system about a month ago. Nancy wasimpressed with the performance of her staff on thisproject because the firm had not previously under-taken a project of this scale in-house. One of Nancy’sweekly tasks is to evaluate and prioritize the changerequests that have come in for the various applicationsused by the firm.
Right now, Nancy has five change requests for theclient system on her desk. One request is from a systemuser who would like some formatting changes made toa daily report produced by the system. Another requestis from a user who would like the sequence of menuoptions changed on one of the system menus to moreclosely reflect the frequency of use for those options.A third request came in from the billing department.This department performs billing through the use ofa billing software package. A major upgrade of this
22. Some experts argue that change management is moreimportant than any other part of system development.Do you agree or not? Explain.
23. In our experience, change management planningoften receives less attention than conversion planning.Why do you think this happens?

562 Chapter 14 Installation and Operations
software is being planned, and the interface betweenthe client system and the bill system will need to bechanged to accommodate the new software’s datastructures. The fourth request seems to be a systembug that occurs whenever a client cancels a contract(a rare occurrence, fortunately). The last request camefrom Susan, the company president. This request con-firms the rumor that MOTO Inc. is about to acquireanother new business. The new business specializes inthe temporary placement of skilled professional andscientific employees and represents a new businessarea for MOTO Inc. The client management softwaresystem will need to be modified to incorporate the spe-cial client arrangements that are associated with theacquired firm.
How do you recommend that Nancy prioritizethese change requests for the client/managementsystem?
2. Sky View Aerial Photography offers a wide range ofaerial photographic, video, and infrared imaging ser-vices. The company has grown from its early days ofsnapping pictures of client houses to its current statusas a full-service aerial image specialist. Sky View nowmaintains numerous contracts with various govern-mental agencies for aerial mapping and surveyingwork. Sky View has its offices at the airport where itsfleet of specially equipped aircraft are hangared. SkyView contracts with several free-lance pilots and pho-tographers for some of its aerial work and alsoemploys several full-time pilots and photographers.
The owners of Sky View Aerial Photography recentlycontracted with a systems development consulting firmto develop a new information system for the business.As the number of contracts, aircraft, flights, pilots, andphotographers increased, the company experienceddifficulty keeping accurate records of its business activ-ity and the utilization of its fleet of aircraft. The newsystem will require all pilots and photographers toswipe an ID badge through a reader at the beginningand conclusion of each photo flight, along with record-ing information about the aircraft used and the clientserved on that flight. These records are to be reconciledagainst the actual aircraft utilization logs maintainedand recorded by the hangar personnel.
The office staff was eagerly awaiting the installationof the new system. Their general attitude was that thesystem would reduce the number of problems anderrors that they encountered and would make theirwork easier. The pilots, photographers, and hangarstaff were less enthusiastic, being unaccustomed tohaving their activities monitored in this way.a. Discuss the factors that may inhibit the acceptance
of this new system by the pilots, photographers,and hangar staff.
b. Discuss how an informational strategy could beused to motivate adoption of the new system at SkyView Aerial Photography.
c. Discuss how a political strategy could be used tomotivate adoption of the new system at Sky ViewAerial Photography.

AA-kind-of relationships, 210A-part-of relationships, 210Abstract classes
abstraction process and, 290structural models and, 209
Abstraction, 290Abstraction levels, object-oriented systems
and, 320Acceptance tests, 518, 520Access control requirements, 486Acknowledgment messages, 432, 435Action-object order, 431Actions, activity diagrams and, 161ActiveX technology, 335Activities
activity diagrams and, 161behavioral state machines and, 250
Activity-based costing, 121Activity diagrams, 159–166
actions and activities and, 161algorithm specification and, 350black-hole activities and, 166control flows and, 162control nodes and, 162–163creation guidelines, 165–166elements of, 160–165line crossings and, 166object flows and, 162object nodes and, 161–162purpose of, 159swimlanes and, 163–165syntax for, 160
Activity elimination, 122Actors
sequence diagrams and, 241use-case diagrams and, 173–174
Adjusted project complexity (APC) scores, 73Adjusted use-case points, 185Adopters, change management and, 544Aesthetics, user interface design and, 417–419
Aggregation relationshipsclass diagrams and, 219–221factoring and, 290structural models and, 210
Agile development methodologies, 14–15Algorithm specification, 349–350
activity diagram and, 350pseudocode and, 349–350Structured English and, 349–350
Alpha testing, 518Alternate flows, use-case descriptions and, 171Alternative matrix, 306–307Analysis models
balancing functional and behavioral models, 284balancing functional and structural models, 280–284balancing structural and behavioral models, 284–287behavioral model verification and validation, 278–280collaborations and, 291evolution into design models, 287–294factoring and, 290functional model verification and validation,
275–276layers and, 292–294partitions and, 290–291sample classes and, 292structural model verification and validation,
276–278verification and validation of, 273–287walkthroughs and, 273–274
Analysis paralysis, 23Application logic, 465Application program interface (API)
components and, 335use-case points and, 182
Application systems, object-persistence formats and, 371Approval committees, 58–59Architectural components, physical architecture layer
and, 464–465Architecture centric approach, object-oriented systems
and, 18Archive files, 366
563
I N D E X

Artifacts, deployment diagrams and, 473As-is systems, 538Association class, class diagrams and, 217Association relationships
structural models and, 210use-case descriptions and, 170use-case diagrams and, 175–176
Associationscommunication diagrams and, 248conversion to attributes, 337
Attribute sets, object-oriented databases and, 368Attributes
class diagrams and, 213converting associations to, 337interaction diagrams and, 240structural models and, 209
Audit files, 366Authentication requirements, 486–487Automation, business process, 117–120Availability requirements, 483–484Average actors, use-case points and, 182
BBack-up, data, 557Balancing
functional and behavioral models, 284functional and structural models, 280–284structural and behavioral models, 284–287
Bar-code readers, 438Batch processing, 436–437Batch reports, 443Behavior diagrams, 29Behavioral models
behavioral state machines and, 250–255CRUD analysis and, 256–257functional model balancing and, 284functional model interrelationships and, 285interaction diagrams and, 239–249interrelationships among, 281purposes of, 239structural model balancing and, 284–287structural model interrelationships and, 286verification and validation and, 278–280
Behavioral state machines, 250–255activities and, 250balancing functional and behavioral models and, 284balancing structural and behavioral models and, 287elements of, 251–254events and, 250final state and, 251
guard conditions and, 250initial state and, 251sample, 251states and, 250states vs. subclasses and, 254steps for building, 254–255syntax and, 252transitions and, 250unit tests and, 517
Behaviors, interaction diagrams and, 240Beta testing, 518Bias, output design and, 443–445Binders, project, 98Black-box testing, 517–518Black-hole activities, activity diagrams and, 166Bottom-up interviews, 128Breadth of analysis, 124Break-even point determination, 53–54Brief descriptions, use-cases and, 168Business analysts, 32Business needs, design strategies and, 304Business process automation (BPA), 116–120
problem analysis and, 118root cause analysis and, 118–120
Business process improvement (BPI), 116, 120–122activity-based costing, 121duration analysis and, 120–121informal benchmarking and, 121–122
Business process reengineering (BPR), 116, 121–122Business requirements. See Requirements determination
CCall options, 55Capability Maturity Model levels, 112Capacity requirements, 483Certificate authority, 487Champions, feasibility analysis and, 57Change agents, 30, 543Change control, 509Change management, 543–552
actors and, 550challenges of, 535change agents and, 543cost and benefit analysis and, 547–548informational strategy and, 549measurements and rewards and, 546motivating adoption and, 549perceived benefits and, 544–545perceived costs and, 544–545political strategy and, 549
564 Index

potential adopters and, 544ready adopters and, 549reluctant adopters and, 549resistance to change and, 544–545resistant adopters and, 549resource allocation and, 546revising management policies and, 546sponsors and, 543standard operating procedures and, 546successful change factors and, 548training and, 550–552Unified Process and, 22, 24, 27
Change management analysts, 32Change requests, 553–555Check boxes, 439, 441Check digit checks, input validation and, 442Class and method design
coding and, 319importance of, 319today’s flat world and, 319
Class cohesion, 329–330Class diagrams, 213–222
aggregation association and, 219–221association class and, 217attributes and, 213class and, 213–216constructor operation and, 215creating, 226derived attributes and, 213elements of, 213–221generalization association and, 218–219incorporating patterns and, 227model review and, 227multiplicity and, 217object diagrams and, 221–222object identification and, 223–224operations and, 214–216private attributes and, 213protected attributes and, 213public attributes and, 213query operation and, 216relationships and, 216–218review of, 227sample, 214simplifying, 221syntax and, 215update operation and, 216visibility and, 213
Class invariant test specification, 516Class library, 335
Class test plan, 515Classes
object-oriented systems and, 320structural models and, 209
Classroom training, 1551Client-based architectures, 466Client computers, 465Client objects, CRC cards and, 211Client-server architectures, 466–468
application support and, 467critical limitations and, 467–468middleware and, 467scalability and, 467simple program statements and, 467
Client-server tiers, 468–469Closed-end questions, interviews and, 127Clustering, data access speeds and, 390–391COBIT compliance, 112COCOMO model, 76Code control, lack of, 510Cohesion, 328–330
class cohesion, 329–330generalization/specialization cohesion, 330ideal class cohesion, 329–330method cohesion, 328–329
Cohesiveness, group, 94–95Collaborations
CRC cards and, 211factoring and, 291
Collectivism vs. individualism, 536Colors, user interface design and, 417–418Combo boxes, 439, 441Command language, navigation design and, 431Command Processor pattern, 333–334Common object lists
examining, 226structural models and, 223–224
Common Object Request Broker Architecture (CORBA), 470
Communication diagrams, 246–249associations and, 248balancing functional and behavioral models and, 284balancing structural and behavioral models and, 287elements of, 246–248packages and, 248sample diagram, 246steps for building, 249syntax, 247
Communication paths, deployment diagrams and, 473Compatibility, feasibility analysis and, 47
Index 565

Completeness checks, input validation and, 442Complex actors, use-case points and, 182Components, design, 335Computer-aided software engineering (CASE)
tools, 96, 409Computer-based training, 551Computing architecture characteristics, 471Concept mapping, 140–142Concrete classes
abstraction process and, 290structural models and, 209
Confirmation messages, 432, 435Conflict, handling, 94–95Conflict-avoidance strategies, 95Connascence, 331–332Consistency
input validation and, 442user interface design and, 419–420
Constraints in object-oriented designinvariants, 343postconditions, 343preconditions, 343types of, 343–345
Constructor operation, class diagrams and, 214–216Content awareness, user interface design and, 415–417Contracts
CRC cards and, 211object-oriented designs and, 333, 346–347
Control flows, activity diagrams and, 162Control nodes, activity diagrams and, 162–163Conversions, 537–545
costs and, 542data conversion, 538direct conversion, 538hardware installation and, 537location and, 539–540modular conversion, 540–541modules and, 540–541parallel conversion, 539phased conversion, 539–542pilot conversion, 539–542risk and, 541–542selecting appropriate strategy and, 541–543simultaneous conversion, 539–542software bugs and, 541–542software installation and, 537steps in, 537–538style and, 538–539time factors and, 542whole-system conversion, 540
Coordination. See Project coordinationCosts. See also Development costs; Economic feasibility
analysis strategies and, 124conversion strategy and, 542cost-benefits identification, 48–50requirements-gathering techniques and, 144
Couplinginheritance coupling, 326–328interaction coupling, 325–328law of Demeter and, 325–326object-oriented design and, 325–328
CRC cards, 211–213balancing functional and structural models and,
283–284balancing structural and behavioral models and, 287client objects and, 211collaborations and, 211common object lists and, 226contracts and, 211creation of, 226doing responsibilities and, 211elements of, 212–213incorporating patterns and, 227invariants on, 345knowing responsibilities and, 211model review and, 227object identification and, 223–224responsibilities and, 211role-play and, 226sample, 212server objects and, 211validation and verification and, 276–278
Critical path method (CPM), 81–82CRUD (create, read, update, or delete) analysis, 256–257
balancing functional and behavioral models and, 284
balancing structural and behavioral models and, 287
major use cases and, 179verification and validation and, 280
Cultural issuesindividualism vs. collectivism, 536information technology and, 535–537long- vs. short-term orientation and, 536–537masculinity vs. femininity, 536offshoring and, 510–512plagiarism and, 511power distance, 536student learning and, 511–512uncertainty avoidance and, 536
566 Index

Cultural requirementsdata management layer design and, 394human-computer interaction layer design and, 448physical architecture layer design and, 488–490
Customizationdesign strategies and, 299–300packaged design software and, 301requirements and, 489
DData access and manipulation classes,
designing, 395–398Data access logic, 465Data access speeds
clustering and, 390–391denormalization and, 389–390indexing and, 391–393optimizing, 388–393
Data backup, 557Data capture at source, 438Data-centered methodologies, 7Data conversion, 538Data entry operators, 438Data management layer design
data access and manipulation classes and, 395–398nonfunctional requirements and, 394–395operational requirements and, 394performance requirements and, 394political and cultural requirements and, 395security requirements and, 395
Data management layer role, 293Data storage, 393, 464–465Database checks, input validation and, 442Database management systems (DMS), 363Databases
object-oriented databases, 368–369object-persistence formats and, 363object-relational databases, 368relational databases, 366–368
Decision nodes, activity diagrams and, 162Decision support systems (DSS), 371Decomposition, structural models and, 210Default values, 439Delay messages, 432, 435Denormalization, data access speeds and, 389–390Dependency relationship, package diagram and, 294–295Deployment diagrams, 473–475Derived attributes
class diagrams and, 213design optimization and, 338
Design development, 306–307alternative matrix and, 306–307request for information and, 307request for proposals and, 307
Design modeling, purpose of, 272Design optimization, 336–339Design prototypes, 13Design restructuring, 335–336Design strategies, 299–306
business need and, 304custom development and, 299–300in-house experience and, 304–305outsourcing and, 302–304packaged software and, 300–302project management and, 305project skills and, 305selection of, 304–306time frame and, 305–306
Detail reports, 445–446Detail use cases, 167Development ease, physical architecture layer design
and, 472Developmental costs
economic feasibility and, 48physical architecture layer design and, 471
Direct conversion, 538Distributed objects computing (DOC), 470Document analysis, 138Documentation, 521–522. See also Documentation
developmentguidelines for crafting, 525navigation controls and, 522procedures manuals and, 522project coordination and, 98reference documents, 521–522structure and, 522–524testing and, 518tutorials, 522
Documentation development, 520–526documentation types, 521–522identifying navigation terms and, 525–526online documentation, 521, 522–524structural design and, 522–524system documentation and, 520user documentation, 521writing documentation topics and, 524–525
Doing responsibilities, CRC cards and, 211Drop-down list boxes, 439, 441Drop-down menus, 432, 434Duration analysis, 120–121
Index 567

Dynamic bindingobject-oriented systems and, 321–322unit and integration testing and, 514
Dynamic models, 240. See also Sequence diagrams
EEase of learning, user interface design and, 419Ease of use, user interface design and, 419Economic feasibility
alternatives to traditional cost-benefit analysis, 54–56assigning values to costs-benefits, 50–51break-even point determination, 53–54cash flow determination and, 51change management and, 547–548costs and benefits identification, 48–50developmental costs and, 48example costs and benefits, 49intangible costs and, 50net present value and, 51–52operational costs and, 48option pricing models, 55–56return on investment and, 52–53steps and, 49tangible benefits and, 49
Electronic JAD, 132Electronic reports, 446Encapsulation, 321, 513–514Encryption requirements, 486–487End user database management systems, 363Enterprise data management systems, 363Enterprise JavaBeans (EJB), 470Enterprise resource planning (ERP), 301Environmental factor value (EFactor), 184–185Environmental factors, use-case points and, 184Environmental security, 487Error-discovery rates, 513Error messages, 432, 434, 435Essential use cases, 168Estimate refinement, workplans and, 82–83Event driven programs, 349Event flows, use-case descriptions and, 170–171Events
behavioral state machines and, 250method specifications and, 349
Evolutionary work breakdown structures, 86–90Exception reports, 445–446Exceptional flows, use-case descriptions and, 171Exceptions, 333Execution occurrence, sequence diagrams and, 242–243Executive information systems (EIS), 371
Exlusive-or (XOR) constraint, 339, 341Expert systems, 371Extend and include relationships, use-case diagrams and, 177Extend relationships, use-case descriptions and, 170External triggers, use-case descriptions and, 170Extreme programming, 14–15
FFactoring
design restructuring and, 335–336process of, 290
Fanout, 338Fat clients, 466Feasibility analysis, 44–46
economic feasibility, 48–56organizational feasibility, 56–57technical feasibility, 46–48
Field labels, 415Fields, content awareness and, 415Files, object-persistence formats and, 362–363Final-activity nodes, activity diagrams and, 162–163Final-flow nodes, activity diagrams and, 162Final state, behavioral state machines and, 251First movers, 43First normal form (1NF), 384Fixed-value contracts, 303Flow between interface sections, 416Fonts, text design and, 417–418Foreign key, relational databases and, 366Fork nodes, activity diagrams and, 163Formal usability testing, interface design and, 429Format checks, input validation and, 442Forwarder-Receiver pattern, 333–334Foundation layers, 293Frameworks, 335Frequently asked questions (FAQs), 552–553Function point approach, 72–77
converting to lines of code, 75estimating required effort and, 76estimating system size and, 72–75estimating time required and, 76–77worksheet and, 74
Functional area familiarity, feasibility analysis and, 47
Functional lead, 92Functional models
behavioral model balancing and, 284behavioral model interrelationships and, 285interrelationships among, 277structural model balancing and, 280–284
568 Index

structural model interrelationships and, 282verification and validation of, 275–276
Functional requirements, 12. See also Requirementsdetermination
Functionality, project identification and, 43
GGantt charts, workplans and, 79–80General information, method specifications and, 346Generalization relationships
class diagrams and, 218–219factoring and, 290structural models and, 210use-case descriptions and, 170
Generalization/specialization cohesion, 330Generic sequence diagrams, 240Global information supply chains, 113Grammar order, navigation design and, 431Graphical displays, output design and, 444–445Graphical user interface (GUI), 472Group cohesiveness, 94–95Guard conditions
activity diagrams and, 162behavioral state machines and, 250
HHallacy, Don, 46Hardcoded values, 516Hardware installation, conversion plans and, 537Hardware specification, 492–494
factors in, 493sample, 492
Has-parts relationships, structural models and, 210Help desks, 509, 553Help messages, 432, 435Help topic, 524Heteronyms, 324Heuristic evaluation, interface design and, 429History files, 366Homographs, 324Homonyms, 324Hot keys, 432HTML prototypes, 427Human-computer interaction layer design
cultural/political requirements and, 448input design, 436–442interface design principles, 412–420navigation design, 430–435nonfunctional requirements and, 447–448
operational requirements and, 447output design and, 443–446performance requirements and, 447security requirements and, 447–448user interface design process, 420–430
Human-computer interaction layer purpose, 293Hurricane model, 82–83
IID numbers, use-case, 168Ideal class cohesion, 329–330Image maps, 432, 434Impedance mismatch, 369Implementation languages, mapping problem-domain
classes to, 339–343Implementation mistakes, 510Importance levels, use-cases and, 168In-house experience, design strategies and, 304–305Inadequate testing, 510Incidents, structural models and, 223Include relationships, use-case descriptions and, 170Incremental development, object-oriented systems
and, 18–19Indexing
data access speeds and, 391–393guidelines for, 393sources of terms and, 526
Individualism vs. collectivism, 536Information hiding
object-oriented systems and, 321test design and, 513–514
Information integration, requirements-gathering techniques and, 143
Information load, managing, 443Information technology, cultural issues and, 535–537Information type, requirements-gathering techniques
and, 143Informational strategy, change management and, 549Infrastructure analysts, 32Infrastructure costs, physical architecture layer design
and, 471Infrastructure design, 473–480
deployment diagrams and, 473–475network model and, 475–480
Inheritanceabuses, 325conflicts, 323–325coupling, 326–328multiple inheritance, 324object-oriented systems and, 322–325
Index 569

Inheritance (Continued)object-oriented testing and, 514single inheritance, 323
Initial nodes, activity diagrams and, 162–163Initial state, behavioral state machines and, 251Input design, 436–442
basic principles of, 436–439data capture at the source and, 438input types, 439–440minimizing keystrokes and, 438–439online vs. batch processing, 436–437validation and, 441–442
Input typesnumbers, 439selection boxes, 439–440text, 439
Instance sequence diagrams, 240Instances, structural models and, 209Intangible costs, economic feasibility and, 50Intangible value, project identification and, 43Integration testing, 513–514, 518–520Interaction coupling, object-oriented design and, 325–328Interaction diagrams, 239–249
communication diagrams, 246–249messages and, 240objects and, 240operations and, 240sequence diagrams, 240–245
Interaction testing, 518, 519Interactions, structural models and, 223Interactive evaluation, interface design and, 429Interface actions, 425Interface capabilities, physical architecture layer design
and, 472Interface design prototyping, 426–428. See also User
interface designfor a DSS application, 428HTML prototypes and, 427language prototypes and, 427selecting appropriate techniques and, 428storyboards and, 426windows layout diagrams and, 427
Interface evaluation, 428–430formal usability testing and, 429–430heuristic evaluation and, 429interactive evaluation and, 429walkthrough evaluation and, 429
Interface icons, 425Interface metaphor, 424Interface objects, 425
Interface standards design, 424–425interface actions and, 425interface icons and, 425interface metaphor and, 424interface objects and, 425interface templates and, 425
Interface structure design, 423–424Interface templates, 425Interfile clustering, 391Internet, public key infrastructure and, 486–487Interpersonal skills
developing, 130staffing and, 92
Interrelationshipsamong behavioral models, 281among functional models, 277among object-oriented analysis models, 289among structural models, 279behavioral and functional models, 285behavioral and structural models, 286functional and structural models, 282
Interviewsbottom-up interviews, 128closed-ended questions and, 127conducting, 129–130designing questions and, 127–129fact vs. opinions, 130interview notes, 131interview reports, 131open-ended questions and, 127postinterview follow-up, 131preparing for, 129probing questions and, 127sample interview schedule, 126selecting interviewees, 125–126selecting wrong people and, 126structured interviews, 128tape-recording and, 129top-down interviews, 128unstructured interviews, 128
Intrafile clustering, 391Invariants, object-oriented design and, 343ISO 9000 compliance, 112Iterative development, 18–19Iterative workplans, 87–90
JJava 2 Enterprise Edition (J2EE), 470JavaBean technology, 335Jelled teams, 15
570 Index

Join nodes, activity diagrams and, 163Joint application development (JAD), 132–136
characteristics of, 132conducting, 134–135electronic JAD, 132follow-up, 136ground rules and, 134managing problems in, 135preparing for, 134problems and, 132selecting participants and, 132–133session design, 133–134
KKeystrokes, minimization of, 438–439Knowing responsibilities, CRC cards and, 211
LLanguage prototypes, 427Late projects, management of, 511Law of Demeter, 325–326Layers, 292–294Layout
with multiple navigation areas, 414user interface design and, 413–415
Legal requirements, 489–490Level-1 support, 553Level-2 support, 553Lewin, Kurt, 534Linked lists, 365Long- vs. short-term orientation, 536–537Lookup files, 365Low-cost personnel, 510
MMagnetic stripe readers, 438Mail-order index, 392Mainframe computers, 465Maintainability requirements, 482Maintenance, 535Maintenance oracle, walkthroughs and, 274Management information systems (MIS), 371Management policies, revising, 546Masculinity vs. femininity, 536Master files, 365Measurements, change management
and, 546Mentoring, 93Menu bars, 432, 434Menu design, 431–432
Messagesdesign and, 432–434interaction diagrams and, 240object-oriented systems and, 320specification and, 349
Method cohesion, 328–329Method specifications, 347–350
algorithm specification and, 349–350events and, 349general information and, 348message passing and, 349sample form, 348
Methodology. See Task identificationMethods
object-oriented systems and, 320structural models and, 209
Microcomputers, 465Middleware, 467Migration plans, 534, 537Minicomputers, 465Mission critical systems, 485Mistake prevention, navigation design and, 430–431Model-View-Controller (MVC) architecture, 292Modular conversion, 540–541Motivation, 94, 549Multilingual requirements, 488Multiple inheritance, 324, 339–340Multiple layout areas, 413–415Multiplicity, class diagrams and, 217Multivalued attributes, object-oriented databases and, 368
Nn-tiered architecture, 468–469Naming standards, 98Natural language, navigation design and, 431Navigation control, documentation and, 522Navigation design, 430–435
basic principles of, 430–431command language and, 431control types and, 431–432documentation and, 435menus and, 431–432messages and, 432–434mistake prevention and, 430natural language and, 431recovery from mistakes and, 431use consistent grammar order and, 431
Navigation terms, identifying, 525–526Net present value (NPV), 51–52Network change, 555
Index 571

Network models, 475–480Networks, 465Nielsen Media, 73Nodes, deployment diagrams and, 473Nonfunctional requirements, 112–113. See also
Requirements determinationdata management layer design and, 394–395human-computer interaction layer design
and, 447–448Normal event flows, use-case descriptions and, 170Normalization
design restructuring and, 336first normal form, 384relationship database management systems
and, 384–388second normal form, 384–385third normal form, 385–388
Number boxes, 439
OObject-action order, 431Object-based language, 341Object Constraint Language, 346Object data management group (ODMG), 368Object definition language (ODL), 368Object design activities, 332–343
adding specifications and, 332–333class library and, 335components and, 335design optimization, 336–339design restructuring, 335–336factoring and, 335–336frameworks and, 335mapping problem-domain classes and, 339–343normalization and, 336patterns and, 333–334reuse opportunities and, 333–335signatures and, 333
Object diagrams, 221–222Object flows, activity diagrams and, 162Object identification, 223–224, 368Object manipulating language (OML), 368Object nodes, activity diagrams and, 161–162Object-oriented analysis models, 281, 289Object-oriented database management systems
(OODBMS), 368–369data types supported, 370existing storage formats and, 371major strengths and weaknesses, 371mapping problem-domain objects to, 372–376
Object-oriented databases, 368–369Object-oriented designs, 325–331
cohesion and, 328–330connascence, 331–332constraints and, 343–345contracts and, 346–347coupling and, 325–328method specification and, 347–350
Object-oriented development, 513–515Object-oriented frameworks, 335Object-oriented methodologies, 7–8Object-oriented programming language (OOPL), 369Object-oriented software process, 26Object-oriented systems
abstraction levels and, 320basic characteristics and, 320classes and, 320design criteria and, 325–331dynamic binding and, 321–322encapsulation and, 321information hiding and, 321inheritance and, 322–325messages and, 320methods and, 320objects and, 320polymorphism and, 321–322
Object-oriented systems analysis and design (OOSAD), 17–19
architecture centric approach and, 18benefits of, 19iterative and incremental development and, 18–19use-case driven, 18
Object-persistence formatsapplication system types and, 371comparison of, 370data types supported and, 370database management systems and, 363databases and, 363end user data management systems and, 363enterprise data management systems and, 363estimating data storage size and, 393existing storage formats and, 371files and, 362–363future needs and, 371mapping problem-domain objects to, 372–382object-oriented databases and, 368–369object-relational databases, 368optimizing data access speed, 388–393optimizing storage efficiency and, 382–388random access files and, 363–366
572 Index

relational databases and, 366–368selection of, 369–371sequential access files and, 363–366strengths and weakness and, 369–370
Object query language (OQL), 368Object-relational data management systems (ORDBMS)
characteristics and role of, 368existing storage formats and, 371major strengths and weaknesses and, 370mapping problem-domain objects to, 376–379
Object-think, 19Object wrapper, 302Objects
interaction diagrams and, 240sequence diagrams and, 241
Observation, requirement-gathering and, 138–140Offshoring, 510–512On-demand training, 552On-screen list boxes, 439, 441One-on-one training, 551Online documentation, 521, 522–524Online processing, 436–437Online reference documents, organizing, 523Online support, 552Open-ended questions, interviews and, 127OPEN process, 26Operation call messages, 243Operational costs, economic feasibility and, 48Operational requirements
data management layer design and, 394human-computer interaction layer design
and, 447physical architecture layer design and, 481–482
Operationsclass diagrams and, 214–216interaction diagrams and, 240structural models and, 209
Operations group, 552Optical character recognition, 438Optimization, design, 336–339Option pricing models (OPMs), 55–56Optional characteristics, use-flow descriptions
and, 171Ordered sequence access files, 365Organizational feasibility, 56–57
champions and, 57stakeholder analysis and, 56strategic alignment and, 56system users and, 57
Outcome analysis, 121–122
Output design, 443–446basic principles of, 443–445graphical displays and, 444–445managing information load and, 443media types and, 445–446minimizing bias and, 443–445output types, 445understanding report usage and, 443
Outsourcing design, 302–304fixed-price contracts and, 303guidelines for, 304management of, 303time-and-arrangement contracts and, 303value-added contracts and, 303
Overhead requirements, database size and, 393Overview information, use-case descriptions
and, 168–170
PPackage diagrams, 294–299
creating, 297dependency relationships and, 294–295syntax for, 294verifying and validating, 297–299
Packaged softwarecustomization and, 301design strategies and, 300–302enterprise resource planning and, 301object wrapper and, 302systems integration and, 301workaround and, 301
Packages, 294–299communication diagrams and, 248object diagrams and, 221
Paper-based manuals, 521Paper reports, 446Parallel conversion, 539Parallel development methodology, 9–10Parallelization, 120–121Partitions, factoring and, 290–291Patterns
design, 333–334structural models and, 224
Payment type index, 392Perceived benefits, change and, 545Perceived costs, change and, 545Performance requirements
data management layer design and, 394human-computer interaction layer design and, 447physical architecture layer design and, 482–484
Index 573

Performance testing, 518Person-hours multiplier (PHM), 185PERT charts, workplans and, 81–82Phased conversion, 539–542Phased-development methodology, 11–12Physical architecture layer characteristics, 294Physical architecture layer design
architectural components and, 464–465client-based architectures and, 466client-server architectures and, 466–468client-server tiers and, 468–469control and security and, 472cultural/political requirements and, 488–490development ease and, 472developmental costs and, 471distributed objects computing and, 470hardware and software specification and, 492–494infrastructure costs and, 471infrastructure design and, 473–480interface capabilities and, 472nonfunctional requirements and, 480–492operational requirements and, 481–482performance requirements and, 482–484scalability and, 472security requirements and, 484–488selection of, 471–472server-based architectures and, 465–466
Pilot conversion, 539–542Plagiarism, 511Planning
avoiding mistakes and, 100enterprise resource planning, 301estimating project time and, 72staffing and, 91–93test design and, 515–517
Pointers, ordered sequential access files and, 365Political requirements
data management layer design and, 394human-computer interaction layer design
and, 448physical architecture layer design and, 488–490
Political strategy, change management and, 549Polymorphism
misuse and, 322object-oriented systems and, 321–322unit and integration testing and, 514
Pop-up menus, 432, 434Portability requirements, 481Portfolio management, 58Postconditions, object-oriented design and, 343
Postimplementation activities, 552–557project assessment and, 555–558refreezing and, 534–535system maintenance and, 554–555system support and, 552–553
Postinterview follow-up, 131Potential business value, analysis strategies and, 122–123Power distance, 536Power outages, 485Preconditions, object-oriented design and, 343Presentation logic, 465Presenter role, walkthroughs and, 274Primary actors, use-cases and, 168Primary key, relational databases and, 366Private attributes, class diagrams and, 213Private key encryption, 486Probing questions, interviews and, 127Problem analysis, business process automation and, 118Problem-domain classes, 339–341Problem-domain layer, 293Problem-domain objects
implementing in a traditional language, 341–343implementing in an object-based language, 341managing using DAM classes, 396–397mapping to object-persistence formats, 372–382mapping to object-relational data management
systems, 376–379mapping to relationship data management systems,
379–382object-oriented database management systems
and, 372–376Problem reports, 553, 555Procedure manuals, 522Process-centered methodology, 6–7Process integration, 120–121Program logs, 509Programming
assigning programmers, 507–508change control and, 509coordinating activities and, 508–509cultural issues and, 510–512management of, 507–512program log and, 509schedule management and, 509–510scope creep and, 510
Project assessment, 555–558project team review, 556system review, 556–557value of, 535
Project binders, 98
574 Index

Project charters, 95Project classification, 58Project coordination, 96–100
CASE tools and, 96documentation and, 98managing risk and, 98–99standards and, 97–98
Project identification, 43–57business needs and, 43business requirements and, 43business value and, 43economic feasibility and, 48–56feasibility analysis and, 44–46functionality and, 43intangible value and, 43size and scope and, 43system requests and, 44–45tangible value and, 43technical feasibility and, 46–48
Project initiationfeasibility analysis and, 42new systems projects and, 41–42organizational feasibility and, 56–57project identification and, 43–57system requests and, 42
Project managementdesign strategies and, 305project coordination, 96–100project size identification, 70–77staffing and, 91–95workplan creation and management, 77–91
Project manager, 32Project selection, 58–60Project size, 70–77
estimation and, 71–72feasibility analysis and, 47function point approach and, 72–77
Project skills, design strategies and, 305Project teams
review of, 556roles and, 30–32
Project timeconversion strategies and, 542design strategies and, 305–306estimating margin of error and, 83function point approach and, 72–77, 76–77methodology selection and, 17planning phase approach and, 72speed requirements and, 482–483
Protected attributes, class diagrams and, 213
Prototyping-based methodology, 12–13Pseudocode, 349–350Public attributes, class diagrams and, 213Public key encryption, 486
QQuery operation, class diagrams and, 216Questionnaires, 136–137
administering, 137designing, 136–137follow-up, 137selecting participants and, 136
RRadio buttons, 439, 441Radio frequency identification (RFID), 95Random access files, 363–366Range checks, input validation and, 442Rapid application development (RAD), 10–14
phased development methodology, 11–12prototyping-based methodology, 12–13throwaway prototyping, 13–14
Raw data, database size and, 393Ready adopters, 549Realtime information, 436, 443Recorder role, walkthroughs and, 274Reference documents, 521–522Referential integrity, 366Refinement, 290Refreezing, 534Relational databases, 366–368Relationship database management systems (RDBMS)
characteristics of, 366data access and manipulation classes and, 398data types supported and, 370estimating data storage size and, 393existing storage formats and, 371mapping problem-domain objects to, 379–382normalization and, 384–388optimizing data access speed, 388–393optimizing object storage and, 382–393weakness and strengths of, 369
Relationshipsclass diagrams and, 216–218object-oriented databases and, 368structural models and, 209–210use-case descriptions and, 170
Reliability requirements, 483–484Reluctant adopters, 549Repeating groups (fields), 368
Index 575

Report usage, understanding, 443Reporting structure, 91–92Request for information (RFI), 307Request for proposals (RFP), 307Required effort, estimating, 72–75Requirements analysis strategies, 117–124
breath of analysis and, 124business process automation and, 117–120business process improvement and, 120–122potential business value and, 122–123project cost and, 124risk and, 124selecting appropriate strategies, 122–124
Requirements determination, 111–117business process automation and, 116business process improvement and, 116business process reengineering and, 116business requirements and, 111defining requirements, 111–113functional requirements and, 112nonfunctional requirements and, 112–113requirements analysis strategies, 117–124requirements definition creation, 116–117requirements definition reports, 114–115requirements-gathering techniques, 125–144systems proposal and, 144–145systems requirements and, 112
Requirements-gathering techniquesbreadth of information and, 143combining techniques and, 144concept mapping, 140–142cost and, 144depth of information and, 142document analysis and, 138information integration and, 143information type and, 142interviews, 125–131joint application development and, 132–136observation and, 138–140questionnaires, 136–137role-playing CRC cards, 140selecting appropriate techniques, 142–143table of, 142throwaway prototyping, 140user involvement and, 143–144
Requirements testing, 518Research-oriented development, 510Resistance to change, 544–545Resistant adopters, 549Resource allocation, change management and, 546
Response time, 482Restructuring, design, 335–336Return messages, sequence diagrams and, 243Return on investment (ROI), 52–53Reuse, testing and, 514Rewards, change management and, 546Risks
analysis strategies and, 124assessment sample, 99conversion strategy and, 541–542feasibility analysis and, 45–46project coordination and, 98–99
Role-playing CRC cards, 140, 226Root cause analysis, business process automation
and, 118–120
SSarbanes-Oxley Act, 112Scalability
client-server architectures and, 467physical architecture layer design and, 472
Scenarios, use-case descriptions and, 167Schedules
avoiding classic mistakes and, 100managing late projects, 511methodology selection and, 17missed dates and, 84programming and, 509–510
Scope creep, 83, 510Scope management, workplans and, 83–85Second normal form (2NF), 384–385Security
data management layer design and, 394human-computer interaction layer design and,
447–448physical architecture layer design and, 472, 484–488testing, 518
Selection boxes, 439–440Self-delegation, sequence diagrams and, 243Senior management, change requests by, 555Sequence diagrams, 240–245
actors and, 241balancing functional and behavioral models and, 284balancing structural and behavioral models and, 287building, 243–245elements of, 240–243example of, 241execution occurrence and, 242–243generic sequence diagrams, 240instance sequence diagrams, 240
576 Index

instance-specific, 244objects and, 241operation call messages and, 243return messages and, 243self-delegation and, 243steps for building, 245syntax, 242temporary objects and, 241verification and validation and, 278–280
Sequential access files, 363–366Server-based architectures, 465–466Servers, 465Signatures, method, 333Simple actors, use-case points and, 182Simple program statements, 467Simultaneous conversion, 539–542Single inheritance, object-oriented systems and, 323Single-inheritance language, 339–341Sliders, 439, 441Smalltalk, 292, 333Smart cards, 438Software. See also Packaged software
changes in, 555conversion plans and, 537specification, 492–494upgrading of, 557
Software bugsbeating, 557conversion strategy and, 541–542
Source data automation, 438Space, user interface design and, 417Special issues, system requests and, 44–45Specialized actors, use-case diagrams and, 174Specification errors, walkthroughs and, 274Specifications, adding, 332–333Sponsors, change management and, 543Staffing, 91–95
functional lead and, 92group cohesiveness and, 94–95interpersonal skills and, 93larger team complexities, 92motivation and, 94planning, 91–93project charters and, 95reporting structure and, 91–93technical lead and, 92technical skills and, 92
Stakeholdersfeasibility analysis and, 56use-case descriptions and, 170
Standard operating procedures (SOPs), 546Standards, project coordination and, 97–98States, 250, 254Static structure diagrams, 221Storage
object-persistence formats and, 371optimizing efficiency and, 382–388
Storyboards, interface design prototyping and, 426Strategic alignment, feasibility analysis and, 56Stress, help-desks and, 509Structural models. See also Class diagrams;
CRC cardsabstract classes and, 209aggregation relationships and, 210association relationships and, 210attributes and, 209behavioral model balancing and, 284–287behavioral model interrelationships and, 286building, 225–227class diagrams and, 213–222classes and, 209common object list and, 223–224concrete classes and, 209CRC cards and, 211–213elements of, 208–210functional model balancing and, 280–284functional model interrelationships and, 282generalization relationships and, 210instances and, 209interrelationships among, 279methods and, 209object identification and, 223–224, 225operations and, 209patterns and, 224relationships and, 209–210textual analysis and, 223useful patterns and, 225verification and validation of, 276–278
Structure diagrams, 29Structured design
parallel development methodology, 9–10waterfall development methodology, 8–9
Structured English, 349–350Structured interviews, 128Structured query language (SQL), 366, 368Stubs, 516Student learning, cultural differences and, 511–512Subclasses
behavioral state machines and, 254structural models and, 210
Index 577

Subflows, use-case descriptions and, 170–171Subject boundary
extend and include relationships and, 177use-case diagrams and, 176–177
Subject-Verb-Direct object-Preposition-Indirect object(SVDPI), 226
Summary reports, 445–446Superclass, structural models and, 210SVDPI sentences, use-flow descriptions and, 172Swimlanes, activity diagrams and, 163–165Symmetric encryption algorithms, 486Synonyms, 324Syntax
activity diagrams, 160behavioral state machines, 252class diagrams, 215communication diagrams, 247package diagrams, 294sequence diagrams and, 242use-case diagrams, 174
System complexity, methodology selection and, 16System development projects, 555System enhancement, 555System integration requirements, 481System interface testing, 519System maintenance, 554–555System proposals, 144–145System prototypes, 12System reliability, methodology selection
and, 16–17System requests
project identification and, 44–45template, 45
System reviews, 556–557System support, 552–553System testing, 518, 520System users, feasibility analysis and, 57System value, security requirements and, 484–485Systems analysts, 32Systems development life cycle, 3–6
analysis phase, 4–5design phase, 5implementation phase, 6planning phase, 4
Systems development methodologies, 6–17agile development, 14–15criteria for selection, 16rapid application development, 10–14schedule visibility and, 17selection of, 15–17
short time schedules and, 17structured design and, 8–9system complexity and, 16system reliability and, 16–17technology familiarity and, 16user requirement clarity and, 15–16
Systems integration, packaged design software and, 301Systems interface testing, 518Systems requirements, 112. See also Requirements
determination
TTab menus, 432, 434Table scans, 391Talent identification, 508Tangible benefits, 49Tangible value, project identification and, 43Task dependencies, 79Task identification, workplans and, 78–79Team roles, walkthroughs and, 274Technical complexity factors, use-case points
and, 184Technical environmental requirements, 481Technical factor value (TFactor), 184–185Technical feasibility
compatibility and, 47functional area familiarity and, 47project identification and, 46–48project size and, 47technology familiarity and, 47
Technical lead, 92Technical risk analysis, 46–48Technical skills, staffing and, 92Technology analysis, 122Technology familiarity
feasibility analysis and, 47methodology selection and, 16
Temporal triggers, use-case descriptions and, 170Temporary objects, sequence diagrams and, 241Test cases, 516Test design, 512–520
acceptance testing and, 518, 520behavioral state machine and, 517black-box testing and, 517dynamic binding and, 514encapsulation and, 513–514error-discovery rates and, 513information hiding and, 513–514inheritance and, 514integration testing, 519–520
578 Index

object-oriented development and, 513–515planning and, 515–517polymorphism and, 514purpose of testing and, 512reuse and, 514stages of, 512stubs and, 516system testing, 518, 520test types and, 518unit testing and, 517–518, 518white-box testing and, 517yo-yo problem and, 520
Test plans, 515–517Test specifications, 516Testing collaborations, 514–515Text boxes, 439Text design, 417Textual analysis, structural models and, 223Thick clients, 466Thin clients, 466Third normal form (3NF), 385–388Three-tiered architecture, 468Throwaway prototyping, 13–14, 140Time-and-arrangement contracts, 303Time estimates. See Project timeTimeboxing, 85To-be systems, 538Toolbars, 432, 434Top-down interviews, 128Total adjusted function points (TAFP), 73Total unadjusted function points (TUFP), 73Traditional language, implementing problem-domain
objects in, 341–343Training, 550–552
classroom training, 551computer-based training, 551focus and, 550–551method selection and, 551–552on-demand, 552one-on-one training, 551
Transaction files, 365Transaction processing, 371, 436–437Transition process, change resistance and, 544–545Transitions, behavioral state machines and, 250Triggers
design optimization and, 338use-case descriptions and, 170
Turnaround documents, 445–446Tutorials, 522Two-tiered architecture, 468
UUnadjusted actor weight total, 184Unadjusted use-case points (UUCP), 184Unadjusted use-case weight total (UUCW), 184Uncertainty avoidance, 536Unfreezing, 534Unified modeling language (UML)
behavior diagrams and, 29objective of, 29structure diagrams and, 29UML 2.0 diagram summary, 30
Unified Process, 19–28analysis workflow and, 23business modeling workflow and, 22configuration and change management workflow
and, 24, 27construction phase and, 22deployment workflow and, 24, 27design workflow and, 23elaboration phase and, 21engineering workflows and, 22enhanced, 25–28environment workflow and, 24, 27existing workflow modifications and extensions, 27extensions to, 24–28implementation workflow and, 23inception phase and, 21infrastructure management workflow and, 26limitations of, 24 –25operations and support workflow and, 26phases of, 20–22production phase and, 26project management workflow and, 24requirements workflow and, 22–23supporting workflows and, 24testing workflow and, 23, 27transition phase and, 22workflows and, 22–24
Unit testing, 517–518Unordered sequential access files, 365Unstated norms, 489Unstructured interviews, 128Update operation, class diagrams and, 216Usability testing, 518Use-case descriptions, 166–173
alternate or exceptional flows and, 171association relationships and, 170brief descriptions and, 168confirming major use cases and, 181
Index 579

Use-case descriptions (Continued)creation of, 166, 178–182detail use cases, 168elements of, 168–171essential use cases, 168event flows and, 170–171expanding major use cases and, 180–181extend relationships and, 170generalization relationships and, 170importance levels and, 168include relationships and, 170major use-case identification and, 179normal flow of events and, 170overview information and, 168–170overview use cases, 167primary actors and, 168relationships and, 170sample, 169scenarios and, 167stakeholders and, 170steps for writing, 178subflows and, 170–171triggers and, 170UML diagramming and, 167use-case ID numbers and, 168use-case names and, 168use-case types, 167–168working with users and, 167
Use-case diagrams, 173–177actors and, 173–174association relationships and, 175–176confirming major use cases and, 181creation of, 178–182expanding major use cases and, 180–181KISS principle and, 172–173major use-case identification and, 179specialized actors and, 174steps for writing, 178subject boundary and, 176–177syntax for, 174validation and verification and, 275–276
Use-case points, 182–187adjusted use-case points, 185average actors and, 182average use cases and, 184complex actors and, 182complex use cases and, 184environmental factor value, 184–185estimation worksheet for, 183person-hours multiplier and, 185
simple actors and, 182simple use cases and, 184technical complexity factors and, 184technical factor value and, 184–185unadjusted actor weight total and, 184unadjusted use-case points and, 184unadjusted use-case weight totals, 184
Use-case testing, 518–519Use-flow descriptions
guidelines for creating, 171–173optional characteristics and, 171SVDPI sentences and, 172
Use scenario development, 421– 422User documentation, 521User experience, user interface design and, 419User interface design
aesthetics and, 417–419color and, 417–418consistency and, 419–420content awareness and, 415–417flow between interface sections and, 416fonts and, 417–418interface design prototyping and, 426–428interface evaluation and, 428–430interface standards design and, 424–425interface structure design and, 423–424layout and, 413–415minimizing user effort and, 420multiple layout areas and, 413–415principles for, 412–421process of, 420–430space and, 417text design and, 417use scenario development and, 421–422user experience and, 419
User interface testing, 518–519User involvement, requirements-gathering techniques
and, 143–144User requirement clarity, methodology selection
and, 15–16
VValidation
analysis models and, 273–287behavioral models and, 278–280functional models and, 275–276input, 441–442package diagrams and, 297–299structural models and, 276–278walkthroughs and, 273–274
580 Index
Value-added contracts, 303Verification
analysis models and, 273–287behavioral models and, 278–280functional models and, 275–276package diagrams and, 297–299structural models and, 276–278walkthroughs and, 273–274
View mechanisms, object diagrams and, 221Virtualization, 394Virus control requirements, 487Visibility, class diagrams and, 213Voiceover Internet Protocol (VolP), 511Volumetrics, 393
WWalkthroughs, 273–274, 429Waterfall development methodology, 8–9Web-based reports, 443Web commerce packages, 305White-box testing, 517, 518White space, 417
Whole-Part pattern, 333–334Whole-system conversion, 540–541Wilson, Carl, 59Window navigation diagrams (WND), 423–424, 435Windows layout diagrams, 427Work breakdown structures, 78–79, 86–90Workarounds, 301Workplans, 77–91
Gantt charts and, 79–80Hurricane model and, 82–83identifying tasks and, 78–79iterative, 87–90PERT charts and, 81–82project workplan, 79refining estimates and, 82–83scope management and, 83–85task dependencies and, 79timeboxing and, 85work breakdown structure, 78–79, 86–90
YYo-yo problem, 520
Index 581

This page intentionally left blank

1
A P P E N D I X 1
Basic Characteristics ofObject-Oriented Systems
Object-oriented systems focus on capturing the structure and behavior of informationsystems in little modules that encompass both data and process. These little modules areknown as objects. In this appendix, we describe the basic characteristics of object-orientedsystems, which include classes, objects, methods, messages, encapsulation, informationhiding, inheritance, polymorphism, and dynamic binding.1
CLASSES AND OBJECTS
A class is the general template we use to define and create specific instances, or objects.Every object is associated with a class. For example, all the objects that capture informationabout patients could fall into a class called Patient, because there are attributes (e.g., name,address, birth date, phone, and insurance carrier) and methods (e.g., make appointment,calculate last visit, change status, and provide medical history) that all patients share (seeFigure A1-1).
An object is an instantiation of a class. In other words, an object is a person, place, event,or thing about which we want to capture information. If we were building an appointmentsystem for a doctor’s office, classes might include Doctor, Patient, and Appointment. Thespecific patients, such as Jim Maloney, Mary Wilson, and Theresa Marks, are consideredinstances, or objects, of the patient class (see Figure A1-1).
Each object has attributes that describe information about the object, such as apatient’s name, birth date, address, and phone number. Attributes are also used to repre-sent relationships between objects; for example, there could be a department attribute inan employee object with a value of a department object that captures in which departmentthe employee object works. The state of an object is defined by the value of its attributesand its relationships with other objects at a particular point in time. For example, a patientmight have a state of new or current or former.
Each object also has behaviors. The behaviors specify what the object can do. Forexample, an appointment object can probably schedule a new appointment, delete anappointment, and locate the next available appointment. In object-oriented programming,behaviors are implemented as methods (see the following section).
One of the more confusing aspects of object-oriented systems development is the factthat in most object-oriented programming languages, both classes and instances of classescan have attributes and methods. Class attributes and methods tend to be used to model
1 In Chapter 9, we review the basic characteristics of object-oriented systems in more detail.

attributes (or methods) that deal with issues related to all instances of the class. For example,to create a new patient object, a message is sent to the Patient class to create a new instanceof itself. However, from a systems analysis and design point of view, we will focus primarilyon attributes and methods of objects and not of classes.
METHODS AND MESSAGES
Methods implement an object’s behavior. A method is nothing more than an action that anobject can perform. As such, they are analogous to a function or procedure in a traditionalprogramming language such as C, Cobol, or Pascal. Messages are information sent toobjects to trigger methods. A message is essentially a function or procedure call from oneobject to another object. For example, if a patient is new to the doctor’s office, the recep-tionist will send a create message to the application. The patient class will receive the cre-ate message and will execute its create() method (See Figure A1-1), which then will createa new object: aPatient (see Figure A1-2).
2 Appendix 1 Basic Characteristics of Object-Oriented Systems
FIGURE A1-1Classes and Objects
FIGURE A1-2Messages and Methods
Patient
–name–address–birthdate–phone–insurance carrier
+make appointment()+calculate last visit() +change status() +provides medical history() +create()
Jim Maloney: Patient Mary Wilson: Patient Theresa Marks: Patient
Patient
–name–address–birthdate–phone–insurance carrier
+make appointment()+calculate last visit() +change status() +provides medical history() +create()
create
Receptionist
aPatient

ENCAPSULATION AND INFORMATION HIDING
The ideas of encapsulation and information hiding are interrelated in object-oriented systems.However, neither of the terms is new. Encapsulation is simply the combination of process anddata into a single entity. Traditional approaches to information systems development tend tobe either process centric (e.g., structured systems) or data centric (e.g., information engineer-ing). Object-oriented approaches combine process and data into holistic entities (objects).
Information hiding was first promoted in structured systems development. The prin-ciple of information hiding suggests that only the information required to use a softwaremodule be published to the user of the module. Typically, this implies the informationrequired to be passed to the module and the information returned from the module arepublished. Exactly how the module implements the required functionality is not relevant.We really do not care how the object performs its functions, as long as the functions occur.In object-oriented systems, combining encapsulation with the information-hiding princi-ple suggests that the information-hiding principle be applied to objects instead of merelyapplying it to functions or processes. As such, objects are treated like black boxes.
The fact that we can use an object by calling methods is the key to reusability becauseit shields the internal workings of the object from changes in the outside system, and itkeeps the system from being affected when changes are made to an object. In Figure A1-2,notice how a message (insert new patient) is sent to an object, yet the internal algorithmsneeded to respond to the message are hidden from other parts of the system. The onlyinformation that an object needs to know is the set of operations, or methods, that otherobjects can perform and what messages need to be sent to trigger them.
INHERITANCE
Inheritance, as an information systems development characteristic, was proposed in datamodeling in the late 1970s and the early 1980s. The data modeling literature suggests usinginheritance to identify higher-level, or more general, classes of objects. Common sets ofattributes and methods can be organized into superclasses. Typically, classes are arranged ina hierarchy, whereby the superclasses, or general classes, are at the top, and the subclasses, orspecific classes, are at the bottom. In Figure A1-3, person is a superclass to the classes Doc-tor and Patient. Doctor, in turn, is a superclass to General Practitioner and Specialist. Noticehow a class (e.g., Doctor) can serve as a superclass and subclass concurrently. The relation-ship between the class and its superclass is known as the a-kind-of relationship. For examplein Figure A1-3, a General Practitioner is a-kind-of Doctor, which is a-kind-of Person.
Subclasses inherit the appropriate attributes and methods from the superclasses abovethem. That is, each subclass contains attributes and methods from its parent superclass.
Inheritance 3
Come up with a set of examples of using encapsulationand information hiding in everyday life. For example, isthere any information about yourself that you would notmind if everyone knew? How would someone retrieve
this information? What about personal information thatyou would prefer to be private? How would you preventsomeone from retrieving it?
A1-1 Encapsulation and Information HidingYOUR
TURN

For example, Figure A1-3 shows that both Doctor and Patient are subclasses of Person and,therefore, will inherit the attributes and methods of the Person class. Inheritance makes itsimpler to define classes. Instead of repeating the attributes and methods in the Doctor andPatient classes separately, the attributes and methods that are common to both are placedin the Person class and inherited by those classes below it. Notice how much more efficientinheritance hierarchies of object classes are than the same objects without an inheritancehierarchy (see Figure A1-4).
Most classes throughout a hierarchy will lead to instances; any class that has instancesis called a concrete class. For example, if Mary Wilson and Jim Maloney were instances ofthe Patient class, Patient would be considered a concrete class. Some classes do not produce
4 Appendix 1 Basic Characteristics of Object-Oriented Systems
FIGURE A1-3Class Hierarchy with Abstract and Concrete Classes
FIGURE A1-4 Inheritance Advantage?
PatientDoctor
SpecialistGeneral Practitioner
PersonAbstract Classes
Concrete Classes
Patient
–name–address–birthdate–phone–insurance carrier
+updateBirthDate()+updateInsuranceCarrier()
Patient
–insurance carrier
+updateBirthDate()+updateInsuranceCarrier()
Person
–name–address–birthdate–phone
+updateBirthDate()
Doctor
–name–address–birthdate–phone–MedicalSchoolSpecialty
+updateBirthDate()+updateMedicalSchoolSpecialty()
Doctor
–MedicalSchoolSpecialty
+updateBirthDate()+updateMedicalSchoolSpecialty()
VS.

instances because they are used merely as templates for other more specific classes (espe-cially those classes located high up in a hierarchy). The classes are referred to as abstractclasses. Person is an example of an abstract class. Instead of creating objects from Person,we create instances representing the more specific classes of Doctor and Patient, both typesof Person (see Figure A1-3). What kind of class is the General Practitioner class? Why?
POLYMORPHISM AND DYNAMIC BINDING
Polymorphism means that the same message can be interpreted differently by differentclasses of objects. For example, inserting a patient means something different than insert-ing an appointment. As such, different pieces of information need to be collected andstored. Luckily, we do not have to be concerned with how something is done when usingobjects. We can simply send a message to an object, and that object will be responsible forinterpreting the message appropriately. For example, if an artist sent the message Drawyourself to a square object, a circle object, and a triangle object, the results would be verydifferent, even though the message is the same. Notice in Figure A1-5 how each objectresponds appropriately (and differently) even though the messages are identical.
Polymorphism is made possible through dynamic binding. Dynamic, or late, bindingis a technique that delays typing the object until run-time. As such, the specific method thatis actually called is not chosen by the object-oriented system until the system is running.This is in contrast to static binding. In a statically bound system, the type of object is deter-mined at compile time. Therefore, the developer has to choose which method should becalled instead of allowing the system to do it. This is why in most traditional programming
Polymorphism and Dynamic Binding 5
See if you can come up with at least three differentclasses that you might find in a typical business situation.Select one of the classes and create at least a three-level
inheritance hierarchy using the class. Which of the classesare abstract, if any, and which ones are concrete?
A1-2 InheritanceYOUR
TURN
DrawYourself
DrawYourself
DrawYou
rself
anArtist
aSquare
aCircle
aTriangleFIGURE A1-5Polymorphism

languages we find complicated decision logic based on the different types of objects in asystem. For example, in a traditional programming language, instead of sending the mes-sage Draw yourself to the different types of graphical objects in Figure A1-5, we would haveto write decision logic using a case statement or a set of if statements to determine whatkind of graphical object we wanted to draw, and we would have to name each draw functiondifferently (e.g., draw square, draw circle, or draw triangle). This obviously would make thesystem much more complicated and more difficult to understand.
6 Appendix 1 Basic Characteristics of Object-Oriented Systems
KEY TERMS
Abstract classesA-kind-ofAttributeBehaviorClassConcrete classesDynamic binding
EncapsulationInformation hidingInheritInheritanceInstanceMessageMethod
ObjectPolymorphismStateStatic bindingSubclassSuperclass
1. What is the difference between classes and objects?2. What are methods and messages?3. Why are encapsulation and information hiding impor-
tant characteristics of object-oriented systems?
4. What is meant by polymorphism when applied toobject-oriented systems?
5. Compare and contrast dynamic and static binding.
QUESTIONS
EXERCISES
A. Using your favorite Web search engine, find alterna-tive descriptions of the basic characteristics of object-oriented systems.
B. Look up object-oriented programming in Wikipedia.Write a short report based on its entry.
C. Choose an object-oriented programming language,such as C��, Java, Smalltalk, or VB.Net, and use theWeb to find out how the language supports the basiccharacteristics of object-oriented systems.
D. Assume that you have been assigned the task to createan object-oriented system that could be used to sup-
port students in finding an appropriate apartment tolive in next semester. What are the different types ofobjects (i.e., classes) you would want to include inyour system? What attributes or methods would youwant to include in their definition? Is it possible toarrange them into an inheritance hierarchy? If so, doit. If not, why not?
E. Create an inheritance hierarchy that could be used torepresent the following classes: accountant, customer,department, employee, manager, organization, andsalesperson.
Can you think of any way in which you use polymor-phism and/or dynamic binding in your everyday life? Forexample, when you are told to do some task, do youalways perform the task like everyone else you know
does? Do you always perform the task the same way ordoes the method of performance depend on where youare when you perform the task?
A1-3 Polymorphism and Dynamic BindingYOUR
TURN

A process model describes business processes—the activities that people do. Processmodels are developed for the as-is system and/or the to-be system. This chapter describesdata flow diagramming, one of the most commonly used process modeling techniques.
OBJECTIVES
■ Understand the rules and style guidelines for data flow diagrams.■ Understand the process used to create data flow diagrams.■ Be able to create data flow diagrams.
CHAPTER OUTLINE
A P P E N D I X 2
Process Modeling
1
IntroductionData Flow Diagrams
Reading Data Flow DiagramsElements of Data Flow DiagramsUsing Data Flow Diagrams to Define
Business ProcessesProcess Descriptions
Creating Data Flow DiagramsCreating the Context DiagramCreating Data Flow Diagram
FragmentsCreating the Level 0 Data Flow
Diagram
Creating Level 1 Data Flow Diagrams(and Below)
Validating Data Flow DiagramsApplying the Concepts at Tune Source
Creating the Context DiagramCreating Data Flow Diagram FragmentsCreating the Level 0 Data Flow DiagramCreating Level 1 Data Flow Diagrams
(and Below)Validating Data Flow Diagrams
SummaryAppendix 5A: Supplemental DFDs for
Holiday Travel Vehicles
INTRODUCTION
The previous chapters discussed requirements activities, such as interviewing and JAD, andhow to transform those requirements into more detailed use cases. In this chapter, we dis-cuss how the requirements definition and use cases are further refined into a processmodel. A process model is a formal way of representing how a business system operates. Itillustrates the processes or activities that are performed and how data move among them.A process model can be used to document the current system (i.e., as-is system) or the newsystem being developed (i.e., to-be system), whether computerized or not.
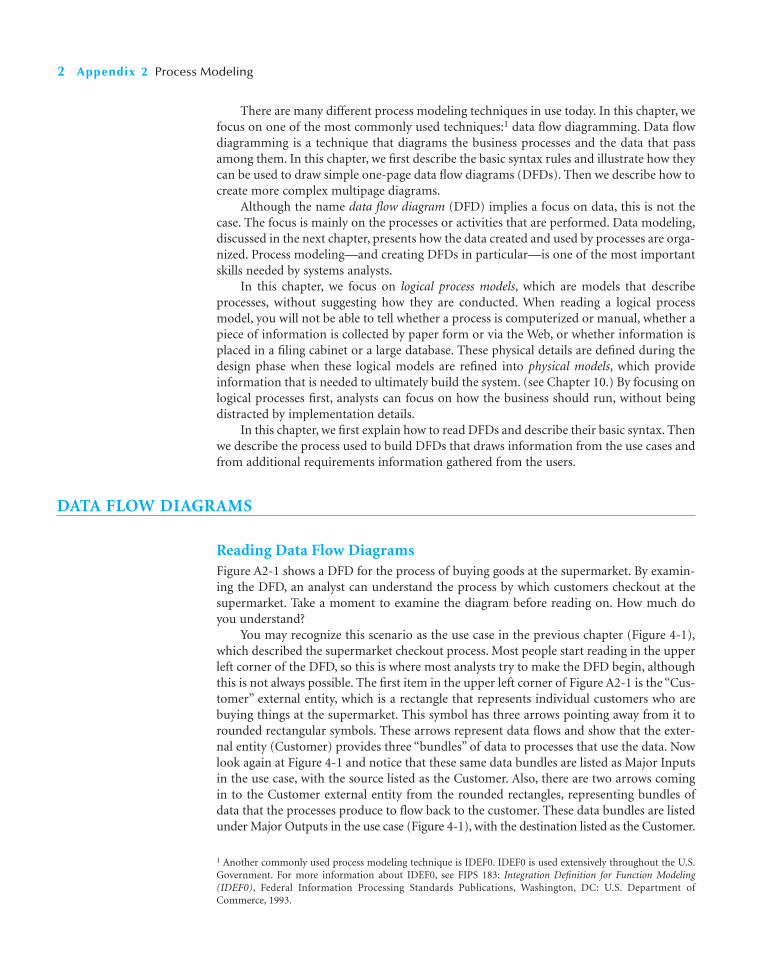
There are many different process modeling techniques in use today. In this chapter, wefocus on one of the most commonly used techniques:1 data flow diagramming. Data flowdiagramming is a technique that diagrams the business processes and the data that passamong them. In this chapter, we first describe the basic syntax rules and illustrate how theycan be used to draw simple one-page data flow diagrams (DFDs). Then we describe how tocreate more complex multipage diagrams.
Although the name data flow diagram (DFD) implies a focus on data, this is not thecase. The focus is mainly on the processes or activities that are performed. Data modeling,discussed in the next chapter, presents how the data created and used by processes are orga-nized. Process modeling—and creating DFDs in particular—is one of the most importantskills needed by systems analysts.
In this chapter, we focus on logical process models, which are models that describeprocesses, without suggesting how they are conducted. When reading a logical processmodel, you will not be able to tell whether a process is computerized or manual, whether apiece of information is collected by paper form or via the Web, or whether information isplaced in a filing cabinet or a large database. These physical details are defined during thedesign phase when these logical models are refined into physical models, which provideinformation that is needed to ultimately build the system. (see Chapter 10.) By focusing onlogical processes first, analysts can focus on how the business should run, without beingdistracted by implementation details.
In this chapter, we first explain how to read DFDs and describe their basic syntax. Thenwe describe the process used to build DFDs that draws information from the use cases andfrom additional requirements information gathered from the users.
DATA FLOW DIAGRAMS
Reading Data Flow DiagramsFigure A2-1 shows a DFD for the process of buying goods at the supermarket. By examin-ing the DFD, an analyst can understand the process by which customers checkout at thesupermarket. Take a moment to examine the diagram before reading on. How much doyou understand?
You may recognize this scenario as the use case in the previous chapter (Figure 4-1),which described the supermarket checkout process. Most people start reading in the upperleft corner of the DFD, so this is where most analysts try to make the DFD begin, althoughthis is not always possible. The first item in the upper left corner of Figure A2-1 is the “Cus-tomer” external entity, which is a rectangle that represents individual customers who arebuying things at the supermarket. This symbol has three arrows pointing away from it torounded rectangular symbols. These arrows represent data flows and show that the exter-nal entity (Customer) provides three “bundles” of data to processes that use the data. Nowlook again at Figure 4-1 and notice that these same data bundles are listed as Major Inputsin the use case, with the source listed as the Customer. Also, there are two arrows comingin to the Customer external entity from the rounded rectangles, representing bundles ofdata that the processes produce to flow back to the customer. These data bundles are listedunder Major Outputs in the use case (Figure 4-1), with the destination listed as the Customer.
2 Appendix 2 Process Modeling
1 Another commonly used process modeling technique is IDEF0. IDEF0 is used extensively throughout the U.S.Government. For more information about IDEF0, see FIPS 183: Integration Definition for Function Modeling(IDEF0), Federal Information Processing Standards Publications, Washington, DC: U.S. Department ofCommerce, 1993.

Now look at the arrow that flows in to the “Determine total due” process from the rightside. In order to determine the total amount you owe, the process has to retrieve someinformation from storage. The open-ended rectangle labeled “Items” is called a data store,and it represents a collection of stored data. The “Determine total due” process uses anitem’s UPC to find the item’s price and description and to determine whether it is subjectto sales tax from stored data about the item. Notice that “Item details” is listed as a MajorInput on the use case (Figure 4-1), with the source listed as the Item data store. Now, stillreferring to Figure 4-1, notice that every Major Input listed in the use case flows in to aprocess from an external entity or stored data (noted by the source). Also notice that everyMajor Output listed in the use case flows out to a destination (an external entity or datastorage) on the data flow diagram.
Now look more closely at the Major Steps Performed section of the use case. You cansee that four major steps are listed in the use case, and you can also see four process sym-bols on the data flow diagram. On the DFD (Figure A2-1), as you follow the arrow “ItemUPC” from the Customer to the “Determine total due” process, imagine each item in yourshopping cart, at the checkout lane, being passed over the scanner, which reads the UPC.After all items are scanned, the “Total due” data flow informs you of the total amount you
Data Flow Diagrams 3
Sold inventoryD3 Sales transactionsD2
ItemsD1Customer
Paymentclearinghouse
Subtotal,Sales tax
Paymentdetails
Itemspurchased
Determinetotal due
1.1
Processpayment
1.2
Item price,description,tax status
Paymentvalidation
Purchasedetails
Salestransaction
Sold itemsdetails
Recordsold
inventory
1.4
Recordsale
1.3
Total due
Item UPC
Itemspurchased
Paymentauthorization
Purchasereceipt
FIGURE A2-1 Supermarket Checkout DFD
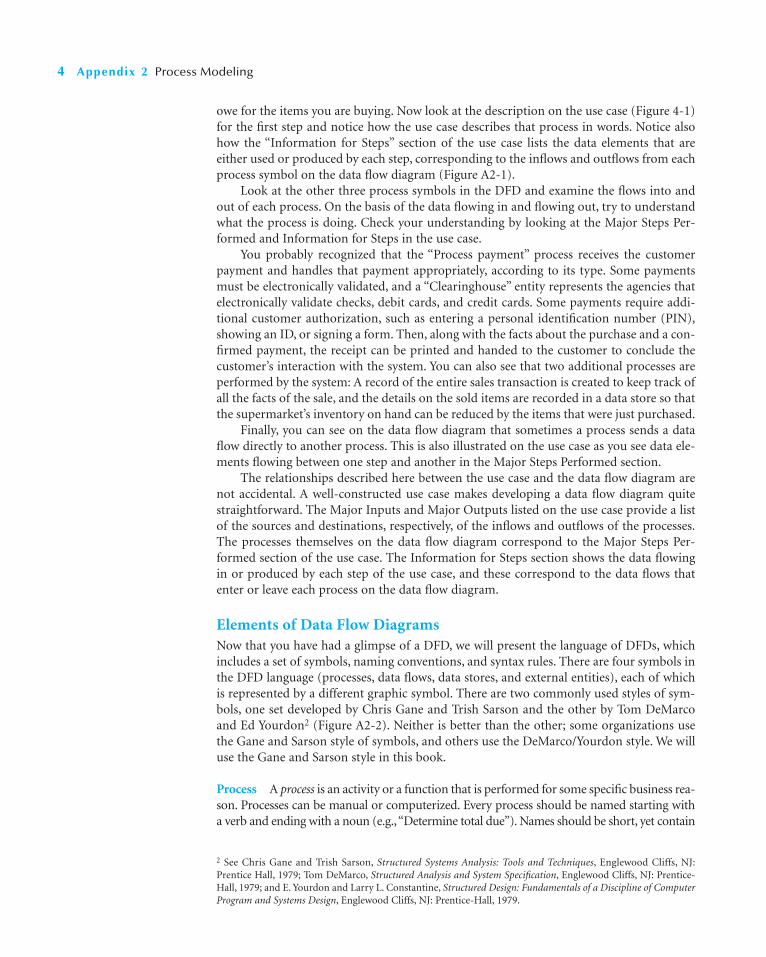
owe for the items you are buying. Now look at the description on the use case (Figure 4-1)for the first step and notice how the use case describes that process in words. Notice alsohow the “Information for Steps” section of the use case lists the data elements that areeither used or produced by each step, corresponding to the inflows and outflows from eachprocess symbol on the data flow diagram (Figure A2-1).
Look at the other three process symbols in the DFD and examine the flows into andout of each process. On the basis of the data flowing in and flowing out, try to understandwhat the process is doing. Check your understanding by looking at the Major Steps Per-formed and Information for Steps in the use case.
You probably recognized that the “Process payment” process receives the customerpayment and handles that payment appropriately, according to its type. Some paymentsmust be electronically validated, and a “Clearinghouse” entity represents the agencies thatelectronically validate checks, debit cards, and credit cards. Some payments require addi-tional customer authorization, such as entering a personal identification number (PIN),showing an ID, or signing a form. Then, along with the facts about the purchase and a con-firmed payment, the receipt can be printed and handed to the customer to conclude thecustomer’s interaction with the system. You can also see that two additional processes areperformed by the system: A record of the entire sales transaction is created to keep track ofall the facts of the sale, and the details on the sold items are recorded in a data store so thatthe supermarket’s inventory on hand can be reduced by the items that were just purchased.
Finally, you can see on the data flow diagram that sometimes a process sends a dataflow directly to another process. This is also illustrated on the use case as you see data ele-ments flowing between one step and another in the Major Steps Performed section.
The relationships described here between the use case and the data flow diagram arenot accidental. A well-constructed use case makes developing a data flow diagram quitestraightforward. The Major Inputs and Major Outputs listed on the use case provide a listof the sources and destinations, respectively, of the inflows and outflows of the processes.The processes themselves on the data flow diagram correspond to the Major Steps Per-formed section of the use case. The Information for Steps section shows the data flowingin or produced by each step of the use case, and these correspond to the data flows thatenter or leave each process on the data flow diagram.
Elements of Data Flow DiagramsNow that you have had a glimpse of a DFD, we will present the language of DFDs, whichincludes a set of symbols, naming conventions, and syntax rules. There are four symbols inthe DFD language (processes, data flows, data stores, and external entities), each of whichis represented by a different graphic symbol. There are two commonly used styles of sym-bols, one set developed by Chris Gane and Trish Sarson and the other by Tom DeMarcoand Ed Yourdon2 (Figure A2-2). Neither is better than the other; some organizations usethe Gane and Sarson style of symbols, and others use the DeMarco/Yourdon style. We willuse the Gane and Sarson style in this book.
Process A process is an activity or a function that is performed for some specific business rea-son. Processes can be manual or computerized. Every process should be named starting witha verb and ending with a noun (e.g.,“Determine total due”). Names should be short, yet contain
4 Appendix 2 Process Modeling
2 See Chris Gane and Trish Sarson, Structured Systems Analysis: Tools and Techniques, Englewood Cliffs, NJ:Prentice Hall, 1979; Tom DeMarco, Structured Analysis and System Specification, Englewood Cliffs, NJ: Prentice-Hall, 1979; and E. Yourdon and Larry L. Constantine, Structured Design: Fundamentals of a Discipline of ComputerProgram and Systems Design, Englewood Cliffs, NJ: Prentice-Hall, 1979.

enough information so that the reader can easily understand exactly what they do. In general,each process performs only one activity, so most system analysts avoid using the word “and”in process names because it suggests that the process performs several activities. In addition,every process must have at least one input data flow and at least one output data flow.
Figure A2-2 shows the basic elements of a process and how they are usually named inCASE tools. Every process has a unique identification number, a name, and a description, allof which are noted in the CASE repository. Descriptions clearly and precisely describe the stepsand details of the processes; ultimately, they are used to guide the programmers who need tocomputerize the processes (or the writers of policy manuals for noncomputerized processes).The process descriptions become more detailed as information is learned about the processthrough the analysis phase. Many process descriptions are written as simple text statementsabout what happens. More complex processes use more formal techniques such as structuredEnglish, decision tables, or decision trees, which are discussed in a later section.Data Flow A data flow is a single piece of data (e.g., item UPC) (sometimes called a dataelement), or a logical collection of several pieces of information (e.g., purchase receipt).Every data flow should be named with a noun. The description of a data flow lists exactlywhat data elements the flow contains. For example, the payment details data flow can listthe payment type, payment amount, and account number as its data elements.
Data Flow Diagrams 5
FIGURE A2-2 Data FlowDiagram Elements
Data Flow DiagramElement
Typical Computer-Aided Software Engineering
FieldsGane and
Sarson Symbol
DeMarco andYourdonSymbol
Every process has a number a name (verb phase) a description at least one output data flow at least one input data flow
Every data flow has a name (a noun) a description one or more connections to a process
Every data store has a number a name (a noun) a description one or more input data flows one or more output data flows
Every external entity has a name (a noun) a description
Label (name)Type (process)Description(what is it)Process numberProcess description(structured English)Notes
Label (name)Type (flow)DescriptionAlias (another name)Composition(description of data elements)Notes
Label (name)Type (store)DescriptionAlias (another name)Composition(description of data elements)Notes
Label (name)Type (entity)DescriptionAlias (another name)Entity descriptionNotes
NameD1 D1 Name
NameName
Name
Name Name
Name
1
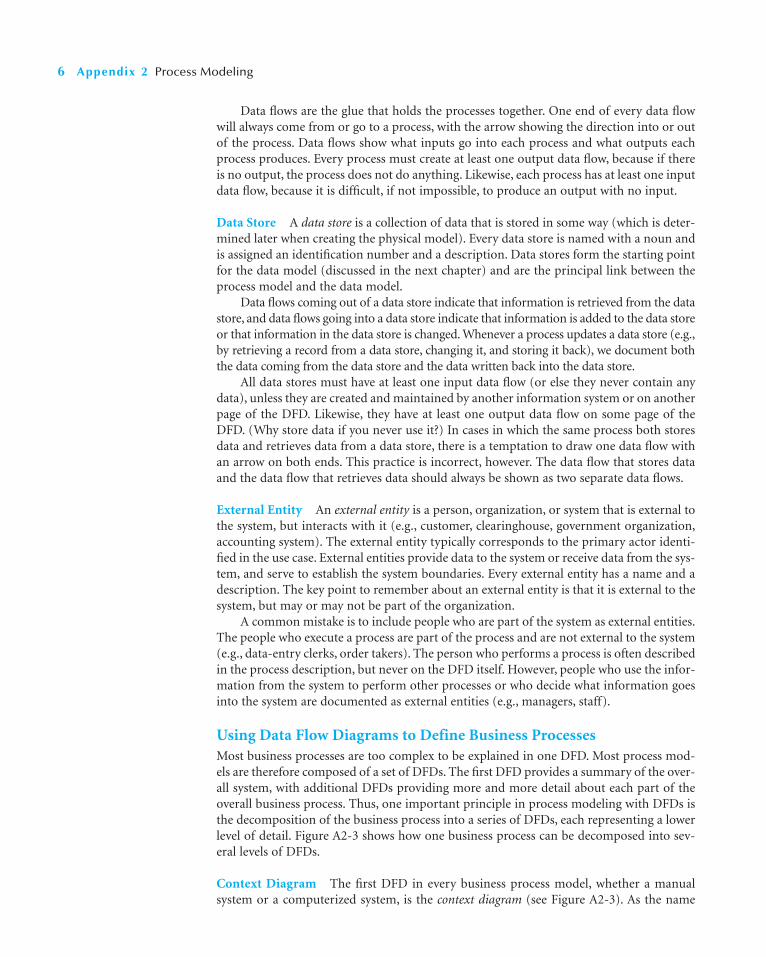
Data flows are the glue that holds the processes together. One end of every data flowwill always come from or go to a process, with the arrow showing the direction into or outof the process. Data flows show what inputs go into each process and what outputs eachprocess produces. Every process must create at least one output data flow, because if thereis no output, the process does not do anything. Likewise, each process has at least one inputdata flow, because it is difficult, if not impossible, to produce an output with no input.
Data Store A data store is a collection of data that is stored in some way (which is deter-mined later when creating the physical model). Every data store is named with a noun andis assigned an identification number and a description. Data stores form the starting pointfor the data model (discussed in the next chapter) and are the principal link between theprocess model and the data model.
Data flows coming out of a data store indicate that information is retrieved from the datastore, and data flows going into a data store indicate that information is added to the data storeor that information in the data store is changed. Whenever a process updates a data store (e.g.,by retrieving a record from a data store, changing it, and storing it back), we document boththe data coming from the data store and the data written back into the data store.
All data stores must have at least one input data flow (or else they never contain anydata), unless they are created and maintained by another information system or on anotherpage of the DFD. Likewise, they have at least one output data flow on some page of theDFD. (Why store data if you never use it?) In cases in which the same process both storesdata and retrieves data from a data store, there is a temptation to draw one data flow withan arrow on both ends. This practice is incorrect, however. The data flow that stores dataand the data flow that retrieves data should always be shown as two separate data flows.
External Entity An external entity is a person, organization, or system that is external tothe system, but interacts with it (e.g., customer, clearinghouse, government organization,accounting system). The external entity typically corresponds to the primary actor identi-fied in the use case. External entities provide data to the system or receive data from the sys-tem, and serve to establish the system boundaries. Every external entity has a name and adescription. The key point to remember about an external entity is that it is external to thesystem, but may or may not be part of the organization.
A common mistake is to include people who are part of the system as external entities.The people who execute a process are part of the process and are not external to the system(e.g., data-entry clerks, order takers). The person who performs a process is often describedin the process description, but never on the DFD itself. However, people who use the infor-mation from the system to perform other processes or who decide what information goesinto the system are documented as external entities (e.g., managers, staff).
Using Data Flow Diagrams to Define Business ProcessesMost business processes are too complex to be explained in one DFD. Most process mod-els are therefore composed of a set of DFDs. The first DFD provides a summary of the over-all system, with additional DFDs providing more and more detail about each part of theoverall business process. Thus, one important principle in process modeling with DFDs isthe decomposition of the business process into a series of DFDs, each representing a lowerlevel of detail. Figure A2-3 shows how one business process can be decomposed into sev-eral levels of DFDs.
Context Diagram The first DFD in every business process model, whether a manualsystem or a computerized system, is the context diagram (see Figure A2-3). As the name
6 Appendix 2 Process Modeling

suggests, the context diagram shows the entire system in context with its environment. Allprocess models have one context diagram.
The context diagram shows the overall business process as just one process (i.e., thesystem itself) and shows the data flows to and from external entities. Data stores usually arenot included on the context diagram, unless they are “owned” by systems or processes otherthan the one being documented. For example, an information system used by the univer-sity library that records who has borrowed books would likely check the registrar’s studentinformation database to see whether a student is currently registered at the university. Inthis context diagram, the registrar’s student information data store could be shown on thecontext diagram because it is external to the library system, but used by it. Many organiza-tions, however, would show this not as a data store, but as an external entity called “Regis-trar’s Student Information System.”
Level 0 Diagram The next DFD is called the level 0 diagram or level 0 DFD. (See Fig-ure A2-3.) The level 0 diagram shows all the processes at the first level of numbering(i.e., processes numbered 1 through 3), the data stores, external entities, and data flows amongthem. The purpose of the level 0 DFD is to show all the major high-level processes of the sys-tem and how they are interrelated. All process models have one and only one level 0 DFD.
Another key principle in creating sets of DFDs is balancing. Balancing means ensuringthat all information presented in a DFD at one level is accurately represented in the next-level DFD. This doesn’t mean that the information is identical, but that it is shown appro-priately. There is a subtle difference in meaning between these two words that will becomeapparent shortly, but for the moment, let’s compare the context diagram with the level 0DFD in Figure A2-3 to see how the two are balanced. In this case, we see that the externalentities (A, B) are identical between the two diagrams and that the data flows to and fromthe external entities in the context diagram (X, Y, Z) also appear in the level 0 DFD. Thelevel 0 DFD replaces the context diagram’s single process (always numbered 0) with threeprocesses (1, 2, 3), adds a data store (D1), and includes two additional data flows that werenot in the context diagram (data flow B from process 1 to process 2; data flow A fromprocess 2 to process 3).
These three processes and two data flows are contained within process 0. They werenot shown on the context diagram because they are the internal components of process 0.The context diagram deliberately hides some of the system’s complexity in order to makeit easier for the reader to understand. Only after the reader understands the context dia-gram does the analyst “open up” process 0 to display its internal operations by decompos-ing the context diagram into the level 0 DFD, which shows more detail about the processesand data flows inside the system.
Level 1 Diagrams In the same way that the context diagram deliberately hides some ofthe system’s complexity, so, too, does the level 0 DFD. The level 0 DFD shows only how themajor high-level processes in the system interact. Each process on the level 0 DFD can bedecomposed into a more explicit DFD, called a level 1 diagram, or level 1 DFD, which showshow it operates in greater detail. The DFD illustrated in Figure A2-1 is a level 1 DFD.
In general, all process models have as many level 1 diagrams as there are processes onthe level 0 diagram; every process in the level 0 DFD would be decomposed into its own level1 DFD, so the level 0 DFD in Figure A2-3 would have three level 1 DFDs (one for process1, one for process 2, one for process 3). For simplicity, we have chosen to show only onelevel 1 DFD in this figure, the DFD for process 2. The processes in level 1 DFDs are num-bered on the basis of the process being decomposed. In this example, we are decomposingprocess 2, so the processes in this level 1 DFD are numbered 2.1, 2.2, and 2.3.
Data Flow Diagrams 7

8 Appendix 2 Process Modeling
Data Store ND1
Data Store ND1
Data Store ND1
N
S
R
G
C
B
HK
J
H
K G
C
Q
M
M
N Y
A
Process M
2.2.3
Process F
2.3
Process E
2.2
Process D
2.1
2.2.2
Process L
2.2.1
Process K
A
X
X
Y
Z
B
Z
M
N
Y
Process V
3
Process U
2
Process T
1
InformationSystem
0
Level 0 DFD
Level 1 DFDfor Process 2
Level 2 DFDfor Process 2.2
ContextDiagram
Entity BEntity A
Entity BEntity A
FIGURE A2-3 Relationships among Levels of Data Flow Diagrams (DFDs)
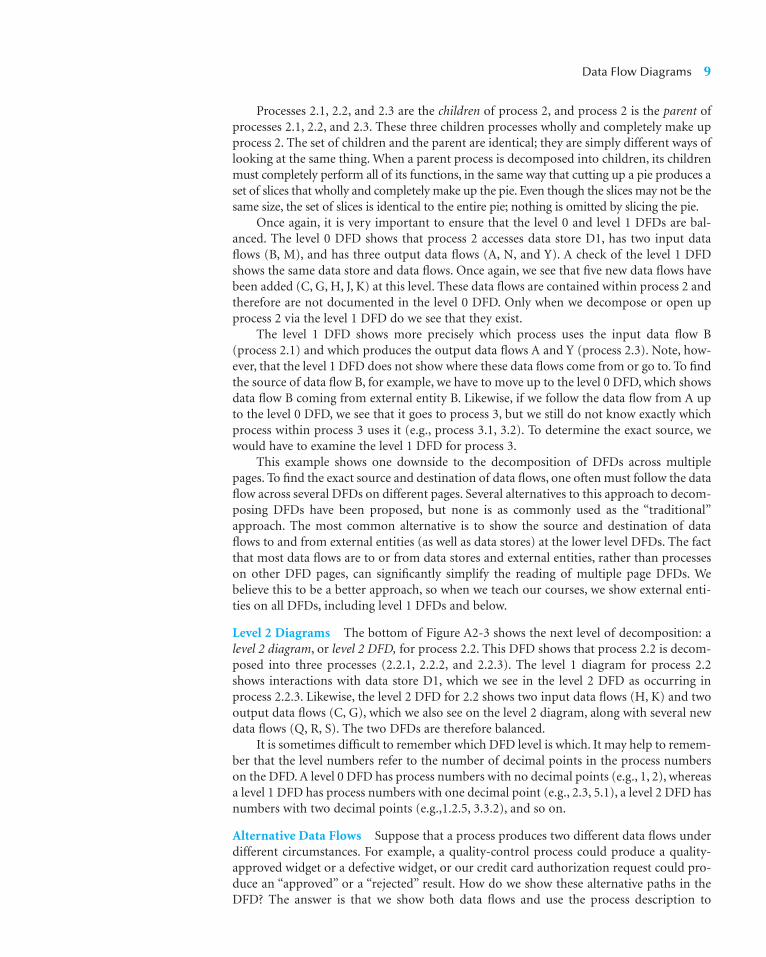
Processes 2.1, 2.2, and 2.3 are the children of process 2, and process 2 is the parent ofprocesses 2.1, 2.2, and 2.3. These three children processes wholly and completely make upprocess 2. The set of children and the parent are identical; they are simply different ways oflooking at the same thing. When a parent process is decomposed into children, its childrenmust completely perform all of its functions, in the same way that cutting up a pie produces aset of slices that wholly and completely make up the pie. Even though the slices may not be thesame size, the set of slices is identical to the entire pie; nothing is omitted by slicing the pie.
Once again, it is very important to ensure that the level 0 and level 1 DFDs are bal-anced. The level 0 DFD shows that process 2 accesses data store D1, has two input dataflows (B, M), and has three output data flows (A, N, and Y). A check of the level 1 DFDshows the same data store and data flows. Once again, we see that five new data flows havebeen added (C, G, H, J, K) at this level. These data flows are contained within process 2 andtherefore are not documented in the level 0 DFD. Only when we decompose or open upprocess 2 via the level 1 DFD do we see that they exist.
The level 1 DFD shows more precisely which process uses the input data flow B(process 2.1) and which produces the output data flows A and Y (process 2.3). Note, how-ever, that the level 1 DFD does not show where these data flows come from or go to. To findthe source of data flow B, for example, we have to move up to the level 0 DFD, which showsdata flow B coming from external entity B. Likewise, if we follow the data flow from A upto the level 0 DFD, we see that it goes to process 3, but we still do not know exactly whichprocess within process 3 uses it (e.g., process 3.1, 3.2). To determine the exact source, wewould have to examine the level 1 DFD for process 3.
This example shows one downside to the decomposition of DFDs across multiplepages. To find the exact source and destination of data flows, one often must follow the dataflow across several DFDs on different pages. Several alternatives to this approach to decom-posing DFDs have been proposed, but none is as commonly used as the “traditional”approach. The most common alternative is to show the source and destination of dataflows to and from external entities (as well as data stores) at the lower level DFDs. The factthat most data flows are to or from data stores and external entities, rather than processeson other DFD pages, can significantly simplify the reading of multiple page DFDs. Webelieve this to be a better approach, so when we teach our courses, we show external enti-ties on all DFDs, including level 1 DFDs and below.
Level 2 Diagrams The bottom of Figure A2-3 shows the next level of decomposition: alevel 2 diagram, or level 2 DFD, for process 2.2. This DFD shows that process 2.2 is decom-posed into three processes (2.2.1, 2.2.2, and 2.2.3). The level 1 diagram for process 2.2shows interactions with data store D1, which we see in the level 2 DFD as occurring inprocess 2.2.3. Likewise, the level 2 DFD for 2.2 shows two input data flows (H, K) and twooutput data flows (C, G), which we also see on the level 2 diagram, along with several newdata flows (Q, R, S). The two DFDs are therefore balanced.
It is sometimes difficult to remember which DFD level is which. It may help to remem-ber that the level numbers refer to the number of decimal points in the process numberson the DFD. A level 0 DFD has process numbers with no decimal points (e.g., 1, 2), whereasa level 1 DFD has process numbers with one decimal point (e.g., 2.3, 5.1), a level 2 DFD hasnumbers with two decimal points (e.g.,1.2.5, 3.3.2), and so on.
Alternative Data Flows Suppose that a process produces two different data flows underdifferent circumstances. For example, a quality-control process could produce a quality-approved widget or a defective widget, or our credit card authorization request could pro-duce an “approved” or a “rejected” result. How do we show these alternative paths in theDFD? The answer is that we show both data flows and use the process description to
Data Flow Diagrams 9

explain that they are alternatives. Nothing on the DFD itself shows that the data flows aremutually exclusive. For example, process 2.1 on the level 1 DFD produces three output dataflows (H, J, K). Without reading the text description of process 2.1, we do not knowwhether these are produced simultaneously or whether they are mutually exclusive.
Process DescriptionsThe purpose of the process descriptions is to explain what the process does and provideadditional information that the DFD does not provide. As we move through the SDLC, wegradually move from the general text descriptions of requirements into more and moreprecise descriptions that are eventually translated into very precise programming lan-guages. In most cases, a process is straightforward enough that the requirements definition, ause case, and a DFD with a simple text description together provide sufficient detail to supportthe activities in the design phase. Sometimes, however, the process is sufficiently complex thatit can benefit from a more detailed process description that explains the logic which occursinside the process. Three techniques are commonly used to describe more complex processinglogic: structured English, decision trees, and decision tables. Very complex processes may usea combination of structured English and either decision trees or decision tables.
Structured English uses short sentences to describe the work that a process performs.Decision trees display decision logic (IF statements) as a set of nodes (questions) andbranches (answers). Decision tables represent complex policy decisions as rules that linkvarious conditions with actions. Since these techniques are commonly discussed in pro-gramming texts, we will not elaborate on them here. They are useful to the systems analystin conveying the proper understanding of what goes on “inside” a process.
CREATING DATA FLOW DIAGRAMS
Data flow diagrams start with the information in the use cases and the requirements defi-nition. Although the use cases are created by the users and project team working together,the DFDs typically are created by the project team and then reviewed by the users. Gener-ally speaking, the set of DFDs that make up the process model simply integrates the indi-vidual use cases (and adds in any processes in the requirements definition not selected asuse cases). The project team takes the use cases and rewrites them as DFDs. However,because DFDs have formal rules about symbols and syntax that use cases do not, the pro-ject team sometimes has to revise some of the information in the use cases to make themconform to the DFD rules. The most common types of changes are to the names of the usecases that become processes and the inputs and outputs that become data flows. The sec-ond most common type of change is to combine several small inputs and outputs in theuse cases into larger data flows in the DFDs (e.g., combining three separate inputs, such as“customer name,” “customer address,” and “customer phone number,” into one data flow,such as “customer information”).
Project teams usually use process modeling tools or CASE tools to draw process models.Simple tools such as Visio are just fancy drawing tools that work like PowerPoint in thatthey do not understand the syntax or the meaning of DFD elements. Other process mod-eling tools such as BPWin understand the DFD and can perform simple syntax checking tomake sure that the DFD is at least somewhat correct. A full CASE tool, such as Visible Ana-lyst Workbench, provides many capabilities in addition to process modeling (e.g., datamodeling as discussed in the next chapter). CASE tools tend to be complex, and while theyare valuable for large and complex projects, they often cost more than they add for simpleprojects. Figure A2-4 shows a sample screen from the Visible Analyst CASE tool.
10 Appendix 2 Process Modeling

Building a process model that has many levels of DFDs usually entails several steps.Some analysts prefer to begin process modeling by focusing first on the level 0 diagram. Wehave found it useful to first build the context diagram showing all the external entities andthe data flows that originate from or terminate in them. Second, the team creates a DFDfragment for each use case that shows how the use case exchanges data flows with the exter-nal entities and data stores. Third, these DFD fragments are organized into a level 0 DFD.Fourth, the team develops level 1 DFDs, based on the steps within each use case, to betterexplain how they operate. In some cases, these level 1 DFDs are further decomposed intolevel 2 DFDs, level 3 DFDs, level 4 DFDs, and so on. Fifth, the team validates the set ofDFDs to make sure that they are complete and correct.
In the following sections, process modeling is illustrated with the Holiday Travel Vehi-cles information system.
Creating the Context DiagramThe context diagram defines how the business process or computer system interacts withits environment—primarily the external entities. To create the context diagram, you sim-ply draw one process symbol for the business process or system being modeled (numbered
Creating Data Flow Diagrams 11
FIGURE A2-4 Entering Data Flow Diagram Processes in a Computer-Aided Software EngineeringTool

0 and named for the process or system). You read through the use cases and add the inputsand outputs listed at the top of the form, as well as their sources and destinations. Usually,all the inputs and outputs will come from or go to external entities such as a person, orga-nization, or other information system. If any inputs and outputs connect directly to datastores in an external system, it is best practice to create an external entity which is namedfor the system that owns the data store. None of the data stores inside the process/systemthat are created by the process or system itself are included in the context diagram, becausethey are “inside” the system. Because there are sometimes so many inputs and outputs, weoften combine several small data flows into larger data flows.
Figure A2-5 shows the context diagram for the Holiday Travel Vehicles system. Take amoment to review this system as described in Chapter 4 and review the use cases in Figure 4-7.You can see from the Major Inputs and Outputs sections in the Figure 4-7 use cases thatthe system has many interactions with the Customer external entity. We have simplifiedthese inflows and outflows to just four primary data flows on the context diagram. Ifwe had included each small data flow, the context diagram would become too cluttered.The smaller data flows will become evident as we decompose the context diagram intomore detailed levels. Notice that we have established three external entities to representparts of the Holiday Travel Vehicle organization which receive information from or supplyinformation to this system. Payments flow to the bookkeeping department, and shop workorders flow to the shop. The company owner or manager provides information to the sys-tem. Finally, we place orders for new vehicles with our vehicle manufacturers, who thensupply the dealership with the requested vehicles.
Creating Data Flow Diagram FragmentsA DFD fragment is one part of a DFD that eventually will be combined with other DFDfragments to form a DFD diagram. In this step, each use case is converted into one DFDfragment. You start by taking each use case and drawing a DFD fragment, using the
12 Appendix 2 Process Modeling
FIGURE A2-5 Holiday Travel Vehicles Context Diagram
0
HolidayTravel
VehiclesSystem
Customerinformation
Offerinformation
Customer
VehicleManufacturer
Owner/Manager
Shop
Bookkeeping
Completedsales contract
Payments
Vehiclesreceived
Vehicleneeds
Vehicleorders
Orderedvehicles
Work ordersTrade-in
value
Offerdecisions
Customerpayments
Finalsales contract

information given on the top of the use case: the name, ID number, and major inputs andoutputs. The information about the major steps that make up each use case is ignored atthis point; it will be used in a later step. Figure A2-6 shows a use case and the DFD fragmentthat was created from it.
Creating Data Flow Diagrams 13
FIGURE A2-6 Holiday Travel Vehicles Process 3 DFD Fragment
Use case name:
Short description:
Trigger:
Major Inputs Major Outputs
Description Source Description Destination
Type: TemporalExternal /
Customer
Customer
Create an Offer
This use case describes the process of handling customer offers.
Customer decides to make an offer on a vehicle.
Signed offer form
Rejected offer
Accepted offer
use case
Salesperson's
personal file
New vehicle
Used vehicle
manager
Green book
record
Customer
Customer name
Offer price
New vehicle info
Dealer options
Trade-in value
Trade-in value estimates
ID: Importance level:3 High
Primary actor: Customer
Trade-invalue
Vehicle info New vehiclesD2
Green bookD6
3
Create offer
Offerdecision
Owner/Manager
Customer
Dealer optionsTrade-inOffer priceName
Trade-in value estimates
Salespersonoffer file
Rejectedoffer
Acceptedoffer
To Process 4: Process
Accepted Offer
D7

Once again, some subtle, but important changes are often made in converting theuse case into a DFD. The two most common changes are modifications to the processnames and the addition of data flows. There were no formal rules for use case names,but there are formal rules for naming processes on the DFD. All process names must bea verb phrase—they must start with a verb and include a noun. (See Figure A2-2.) Notall of our use case names are structured in this way, so we sometimes need to changethem. It is also important to have a consistent viewpoint when naming processes. Forexample, the DFD in Figure A2-6 is written from the viewpoint of the dealership, notof the customer. All the process names and descriptions are written as activities that thestaff performs. It is traditional to design the processes from the viewpoint of the orga-nization running the system, so this sometimes requires some additional changes innames.
The second common change is the addition of data flows. Use cases are written todescribe how the system interacts with the user. Typically, they do not describe how the sys-tem obtains data, so the use case often omits data flows read from a data store. When cre-ating DFD fragments, it is important to make sure that any information given to the useris obtained from a data store. The easiest way to do this is to first create the DFD fragmentwith the major inputs and outputs listed at the top of the use case and then verify that alloutputs have sufficient inputs to create them.
There are no formal rules covering the layout of processes, data flows, data stores,and external entities within a DFD. They can be placed anywhere you like on the page;however, because we in Western cultures tend to read from top to bottom and left toright, most systems analysts try to put the process in the middle of the DFD fragment,with the major inputs starting from the left side or top entering the process and out-puts leaving from the right or the bottom. Data stores are often written below theprocess.
Take a moment and draw a DFD fragment for the two other use cases shown in Fig-ure 4-7 (Accepted Offer and Customer Takes Delivery). We have included possible waysof drawing these fragments in Figure A2-7. (Don’t look until you’ve attempted thedrawings on your own!) For completeness, we have also included fragments for themore simple events of this system in Appendix A of this chapter. Remember that we didnot elaborate on the events of Ordering New Vehicles, Receiving New Vehicles, orAccepting Trade-Ins with use cases, because these are not complex events. Even so, theywill need to be incorporated into our system, and we have drawn the DFD fragmentsfor them now.
Creating the Level 0 Data Flow DiagramOnce you have the set of DFD fragments (one for each of the major use cases), you simplycombine them into one DFD drawing that becomes the level 0 DFD. As mentioned earlier,there are no formal layout rules for DFDs. However, most systems analysts try to put theprocess that is first chronologically in the upper left corner of the diagram and work theirway from top to bottom, left to right (e.g., Figure A2-1). Generally speaking, most analyststry to reduce the number of times that data flow lines cross or to ensure that when they docross, they cross at right angles so that there is less confusion. (Many give one line a little“hump” to imply that one data flow jumps over the other without touching it.) Minimiz-ing the number of data flows that cross is challenging.
Iteration is the cornerstone of good DFD design. Even experienced analysts seldomdraw a DFD perfectly the first time. In most cases, they draw it once to understand the pat-tern of processes, data flows, data stores, and external entities and then draw it a secondtime on a fresh sheet of paper (or in a fresh file) to make it easier to understand and to
14 Appendix 2 Process Modeling

reduce the number of data flows that cross. Often, a DFD is drawn many times before it isfinished.
Figure A2-8 combines the DFD fragments in Figures A2-6 and A2-7. Take a moment toexamine Figure A2-8 and find the DFD fragments from Figures A2-6 and A2-7 containedwithin it. You will note as you examine Figure A2-8 that there is a data flow (AcceptedOffer) shown that flows between Process 3 and Process 4. A direct flow between processes isuncommon on a level 0 diagram, since at this level the data produced by one event-handlingprocess normally would be stored, at least temporarily, before it is processed by another
Creating Data Flow Diagrams 15
FIGURE A2-7Additional DFD Frag-ments for HolidayTravel Vehicles
Recordeddeposit
From Process 3: Create Offer
Pending salesD3
4
ProcessAccepted
Offer
Acceptedoffer
Shop
Bookkeeping
Customer
Completedsales contract
AcceptanceDeposit
Customerinformation
Completedsales contract
Deliverydate
Workorder
(a) Process 4 DFD Fragment
To Process 6: Accept Trade-In
Sold vehiclesD4
Pending salesD3
New vehiclesD2
5
Take Delivery of Vehicle
Completedsales contract New vehicle
record
BookkeepingCustomer
Final sales contract
AcceptanceTrade-in
Payment
Sold vehicle
Recordedpayment
Trade-indetails
(b) Process 5 DFD Fragment

event-handling process. This issue should be evaluated by the analyst and, if necessary,a new data store created that holds Accepted Offers until process 4, Process Accepted Offer,is performed. This issue again illustrates the evolving nature of data flow diagrams. InAppendix 5A, we have included a complete level 0 diagram with all six main processesincorporated into the diagram.
16 Appendix 2 Process Modeling
FIGURE A2-8 Holiday Travel Vehicles Partial Level 0 DFD
3
Create Offer
4
ProcessAccepted
Offer
5
Take Delivery of Vehicle
Pending salesD3
Sold vehicles
Sold vehicle Trade-indetails
To Process 6: Accept Trade-In
D4
Green bookD6
New vehiclesD2
AcceptedOffer
Offerdecision
Rejectedoffer
Vehicle info
Trade-invalue
Name
Offer price
Trade-in
Trade-in
Dealer options
Completedsales contract
Final sales contract
Completedsales
contract
Owner/Manager
Customer
Shop
Bookkeeping
Salespersonoffer fileD7
Trade-in value estimates
Deliverydate
Workorder
Recordeddeposit
New vehicle record
Recordedpayment
Payment
Customerinformation
Completedsales contract
DepositAcceptance
Acceptance

Creating Level 1 Data Flow Diagrams (and Below)The team now begins to create lower-level DFDs for each process in the level 0 DFD thatneeds a level 1 DFD. Each one of the use cases is turned into its own DFD. The process forcreating the level 1 DFDs is to take the steps as written on the use cases and convert theminto a DFD in much the same way as for the level 0 DFD. Usually, each step in the use casebecomes a process on the level 1 DFD, with the inputs and outputs becoming the input andoutput data flows. Once again, however, sometimes subtle changes are required to go fromthe informal descriptions in the use case to the more formal process model, such as addinginput data flows that were not included in the use case. And because the analysts are nowstarting to think more deeply about how the processes will be supported by an informationsystem, they sometimes slightly change the use case steps to make the process easier to use.
In some approaches to creating DFDs, no source and destination are given on the level 1DFD (and lower) for the inputs that come and go between external entities (or otherprocesses outside of this process). But the source and destination of data flows for datastores and data flows that go to processes within this DFD are included (i.e., from one stepto another in the same use case, such as “Items Purchased” from process 1.1 to 1.2 in Fig-ure A2-1). This is because the information is redundant; you can see the destination of dataflows by reading the level 0 DFD.
The problem with these approaches is that in order to really understand the level 1DFD, you must refer back to the level 0 DFD. For small systems that only have one or twolevel 1 DFDs, this is not a major problem. But for large systems that have many levels ofDFDs, the problem grows; in order to understand the destination of a data flow on a level 3DFD, you have to read the level 2 DFD, the level 1 DFD, and the level 0 DFD—and if thedestination is to another activity, then you have to trace down in the lower-level DFDs inthe other process.
We believe that including external entities in level 1 and lower DFDs dramatically sim-plifies the readability of DFDs, with very little downside. In our work in several dozen pro-jects with the U.S. Department of Defense, several other federal agencies, and the militaryof two other countries, we came to understand the value of this approach and convertedthe powers that be to our viewpoint. Because DFDs are not completely standardized, eachorganization uses them slightly differently. So, the ultimate decision of whether or not toinclude external entities on level 1 DFDs is yours—or your instructor’s! In this book, wewill include them.
Ideally, we try to keep the data stores in the same general position on the page in thelevel 1 DFD as they were in the level 0 DFD, but this is not always possible. We try to drawinput data flows arriving from the left edge of the page and output data flows leaving fromthe right edge. For example, see the level 1 DFD in Figure A2-1.
One of the most challenging design questions is when to decompose a level 1 DFD intolower levels. The decomposition of DFDs can be taken to almost any level, so for example,we could decompose process 1.2 on the level 1 DFD into processes 1.2.1, 1.2.2, 1.2.3, and soon in the level 2 DFD. This can be repeated to any level of detail, so one could have level 4or even level 5 DFDs.
There is no simple answer to the “ideal” level of decomposition, because it depends onthe complexity of the system or business process being modeled. In general, you decom-pose a process into a lower-level DFD whenever that process is sufficiently complex thatadditional decomposition can help explain the process. Most experts believe that thereshould be at least three, and no more than seven to nine, processes on every DFD, so if youbegin to decompose a process and end up with only two processes on the lower-level DFD,you probably don’t need to decompose it. There seems little point in decomposing aprocess and creating another lower-level DFD for only two processes; you are better off
Creating Data Flow Diagrams 17

simply showing two processes on the original higher level DFD. Likewise, a DFD with morethan nine processes becomes difficult for users to read and understand, because it is verycomplex and crowded. Some of these processes should be combined and explained on alower-level DFD.
One guideline for reaching the ideal level of decomposition is to decompose until youcan provide a detailed description of the process in no more than one page of processdescriptions: structured English, decision trees, or decision tables. Another helpful rule ofthumb is that each lowest level process should be no more complex than what can be real-ized in about 25–50 lines of code.
We have provided level 1 DFDs for two of the processes in the Holiday Travel Vehiclesystem—Process 4, Process Accepted Offer; and Process 5, Take Delivery of Vehicle—inFigures A2-9 and A2-10, respectively. Take a moment to compare these diagrams with theMajor Steps sections of their use cases in Figure 4-7.
18 Appendix 2 Process Modeling
FIGURE A2-9Level 1 DFD forProcess AcceptedOffer
4.1
CompleteSales
Contract
4.2
FinalizeSales
Contract
4.3
PrepareShop
Work Order
Pending salesD3
Partialsales
contract
Acceptedoffer
From Process 3: Create Offer
Customerinformation
Completedsales
contract
Completedsales contract
Customer
Shop
BookkeepingRecordeddeposit
Deliverydate
Workorder
Completedsales contract
Deposit
Acceptance

The process model is more likely to be drawn to the lowest level of detail for a to-bemodel if a traditional development process is used (i.e., not rapid application development[RAD]; see Chapter 2) or if the system will be built by an external contractor. Without thecomplete level of detail, it may be hard to specify in a contract exactly what the systemshould do. If a RAD approach, which involves a lot of interaction with the users and, quiteoften, prototypes, is being used, we would be less likely to go to as low a level of detail,
Creating Data Flow Diagrams 19
FIGURE A2-10 Level 1 DFD for Take Delivery of Vehicle
5.1
AcceptVehicle
5.2
ProcessPayment
5.3
RecordSold
Vehicle
5.4
ProcessTrade-In
Pending salesD3
New vehiclesD2
Sold vehiclesD4
Signedsales
contract
Completedsales
contract
Acceptance
Finalsales
contractCustomer
BookkeepingRecorded payment
New vehicle record
Sold vehicle
Trade-indetails
To Process 6: Accept Trade-in
Final sales contract
Payment
Trade-in

because the design will evolve through interaction with the users. In our experience, mostsystems go to only level 2 at most.
There is no requirement that all parts of the system must be decomposed to the samelevel of DFDs. Some parts of the system may be very complex and require many levels,whereas other parts of the system may be simpler and require fewer.
Validating the Data Flow DiagramsOnce you have created a set of DFDs, it is important to check them for quality. Figure A2-11provides a quick checklist for identifying the most common errors. There are two funda-mentally different types of problems that can occur in DFDs: syntax errors and semanticserrors. “Syntax,” refers to the structure of the DFDs and whether the DFDs follow the rulesof the DFD language. Syntax errors can be thought of as grammatical errors made by theanalyst when he or she creates the DFD. “Semantics” refers to the meaning of the DFDs andwhether they accurately describe the business process being modeled. Semantics errors canbe thought of as misunderstandings by the analyst in collecting, analyzing, and reportinginformation about the system.
In general, syntax errors are easier to find and fix than are semantics errors, becausethere are clear rules that can be used to identify them (e.g., a process must have a name).Most CASE tools have syntax checkers that will detect errors within one page of a DFD inmuch the same way that word processors have spelling checkers and grammar checkers.Finding syntax errors that span several pages of a DFD (e.g., from a level 1 to a level 2 DFD)is slightly more challenging, particularly for consistent viewpoint, decomposition, and bal-ance. Some CASE tools can detect balance errors, but that is about all. In most cases, ana-lysts must carefully and painstakingly review every process, external entity, data flow, anddata store on all DFDs by hand to make sure that they have a consistent viewpoint and thatthe decomposition and balance are appropriate.
20 Appendix 2 Process Modeling
Shortly after the Gulf War in 1991 (Desert Storm), theU.S. Department of Defense realized that there were sig-nificant problems in its battlefield logistics systems thatprovided supplies to the troops at the division level andbelow. During the Gulf War, it had proved difficult forarmy and marine units fighting together to share suppliesback and forth because their logistics computer systemswould not easily communicate. The goal of the new sys-tem was to combine the army and marine corps logisticssystems into one system to enable units to share suppliesunder battlefield conditions.
The army and marines built separate as-is processmodels of their existing logistics systems that had 165processes for the army system and 76 processes for themarines. Both process models were developed over a 3-month time period and cost several million dollars tobuild, even though they were not intended to be compre-hensive.
I helped them develop a model for the new inte-grated battlefield logistics system that would be used byboth services (i.e., the to-be model). The initial processmodel contained 1,500 processes and went down to level6 DFDs in many places. It took 3,300 pages to print. Theyrealized that this model was too large to be useful. Theproject leader decided that level 4 DFDs was as far as themodel would go, with additional information containedin the process descriptions. This reduced the model to375 processes (800 pages) and made it far more useful.
Alan Dennis
Questions:
1. What are the advantages and disadvantages to set-ting a limit for the maximum depth for a DFD?
2. Is a level 4 DFD an appropriate limit?
A2-A U.S. Army and Marine Corps Battlefield LogisticsCONCEPTS
IN ACTION

Each data store is required to have at least one input and one output on some page ofthe DFD. In Figure A2-10, data store D2, New Vehicles, has only outputs and data store D4,Sold Vehicles, has only inputs. This situation is not necessarily an error. The analyst shouldcheck elsewhere in the DFDs to find where data is written to data store D2 or read fromdata store D4. All data stores should have at least one inflow and one outflow, but the flowsmay not be on the same diagram, so check other parts of the system. Another issue thatarises is when the data store is utilized by other systems. In that case, data may be added toor used by a separate system. This is perfectly fine, but the analyst should investigate to ver-ify that the required flows in and out of data stores exist somewhere.
In our experience, the most common syntax error that novice analysts make in creat-ing DFDs is violating the law of conservation of data.3 The first part of the law states thefollowing:
1. Data at rest stays at rest until moved by a process.In other words, data cannot move without a process. Data cannot go to or come from
a data store or an external entity without having a process to push it or pull it.
Creating Data Flow Diagrams 21
Within DFDProcess • Every process has a unique name that is an action-oriented verb phrase, a number, and a description.
• Every process has at least one input data flow.• Every process has at least one output data flow.• Output data flows usually have different names than input data flows because the process changes
the input into a different output in some way.• There are between three and seven processes per DFD.
Data Flow • Every data flow has a unique name that is a noun, and a description.• Every data flow connects to at least one process.• Data flows only in one direction (no two-headed arrows).• A minimum number of data flow lines cross.
Data Store • Every data store has a unique name that is a noun, and a description.• Every data store has at least one input data flow (which means to add new data or change existing
data in the data store) on some page of the DFD.• Every data store has at least one output data flow (which means to read data from the data store) on
some page of the DFD.External Entity • Every external entity has a unique name that is a noun, and a description.
• Every external entity has at least one input or output data flow.Across DFDs
Context diagram • Every set of DFDs must have one context diagram.Viewpoint • There is a consistent viewpoint for the entire set of DFDs.Decomposition • Every process is wholly and completely described by the processes on its children DFDs.Balance • Every data flow, data store, and external entity on a higher level DFD is shown on the lower-level
DFD that decomposes it.Semantics
Appropriate Representation • User validation• Role-play processes
Consistent Decomposition • Examine lowest-level DFDsConsistent Terminology • Examine names carefully
Syntax
FIGURE A2-11 Data Flow Diagram Quality Checklist
3 This law was developed by Prof. Dale Goodhue at the University of Georgia.
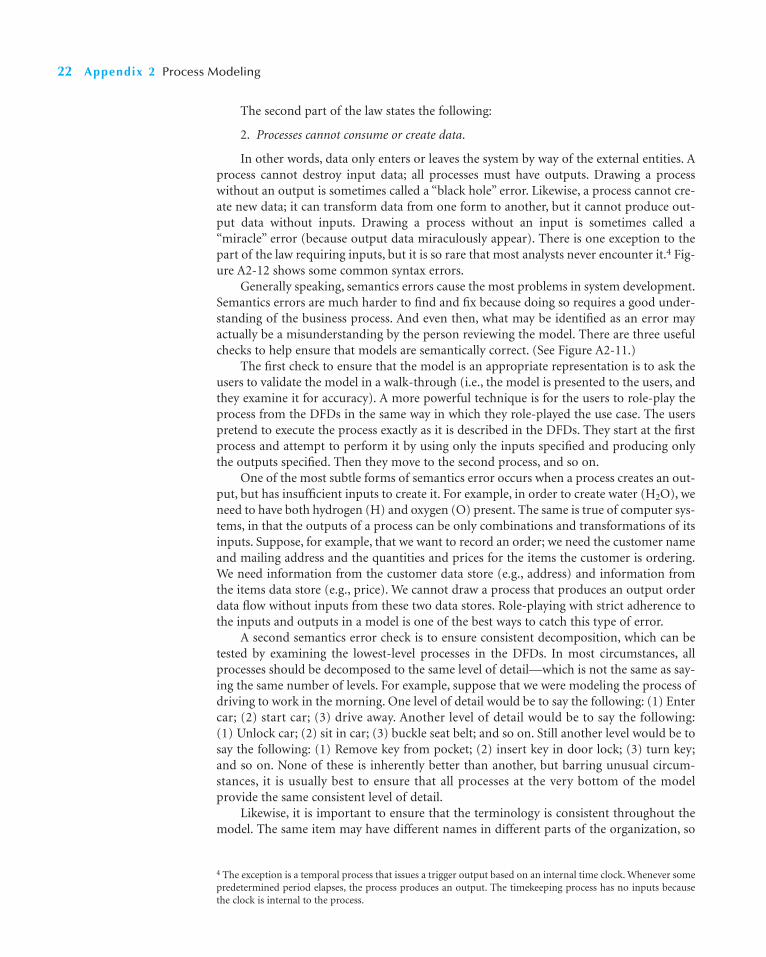
The second part of the law states the following:
2. Processes cannot consume or create data.
In other words, data only enters or leaves the system by way of the external entities. Aprocess cannot destroy input data; all processes must have outputs. Drawing a processwithout an output is sometimes called a “black hole” error. Likewise, a process cannot cre-ate new data; it can transform data from one form to another, but it cannot produce out-put data without inputs. Drawing a process without an input is sometimes called a“miracle” error (because output data miraculously appear). There is one exception to thepart of the law requiring inputs, but it is so rare that most analysts never encounter it.4 Fig-ure A2-12 shows some common syntax errors.
Generally speaking, semantics errors cause the most problems in system development.Semantics errors are much harder to find and fix because doing so requires a good under-standing of the business process. And even then, what may be identified as an error mayactually be a misunderstanding by the person reviewing the model. There are three usefulchecks to help ensure that models are semantically correct. (See Figure A2-11.)
The first check to ensure that the model is an appropriate representation is to ask theusers to validate the model in a walk-through (i.e., the model is presented to the users, andthey examine it for accuracy). A more powerful technique is for the users to role-play theprocess from the DFDs in the same way in which they role-played the use case. The userspretend to execute the process exactly as it is described in the DFDs. They start at the firstprocess and attempt to perform it by using only the inputs specified and producing onlythe outputs specified. Then they move to the second process, and so on.
One of the most subtle forms of semantics error occurs when a process creates an out-put, but has insufficient inputs to create it. For example, in order to create water (H2O), weneed to have both hydrogen (H) and oxygen (O) present. The same is true of computer sys-tems, in that the outputs of a process can be only combinations and transformations of itsinputs. Suppose, for example, that we want to record an order; we need the customer nameand mailing address and the quantities and prices for the items the customer is ordering.We need information from the customer data store (e.g., address) and information fromthe items data store (e.g., price). We cannot draw a process that produces an output orderdata flow without inputs from these two data stores. Role-playing with strict adherence tothe inputs and outputs in a model is one of the best ways to catch this type of error.
A second semantics error check is to ensure consistent decomposition, which can betested by examining the lowest-level processes in the DFDs. In most circumstances, allprocesses should be decomposed to the same level of detail—which is not the same as say-ing the same number of levels. For example, suppose that we were modeling the process ofdriving to work in the morning. One level of detail would be to say the following: (1) Entercar; (2) start car; (3) drive away. Another level of detail would be to say the following:(1) Unlock car; (2) sit in car; (3) buckle seat belt; and so on. Still another level would be tosay the following: (1) Remove key from pocket; (2) insert key in door lock; (3) turn key;and so on. None of these is inherently better than another, but barring unusual circum-stances, it is usually best to ensure that all processes at the very bottom of the modelprovide the same consistent level of detail.
Likewise, it is important to ensure that the terminology is consistent throughout themodel. The same item may have different names in different parts of the organization, so
22 Appendix 2 Process Modeling
4 The exception is a temporal process that issues a trigger output based on an internal time clock. Whenever somepredetermined period elapses, the process produces an output. The timekeeping process has no inputs becausethe clock is internal to the process.
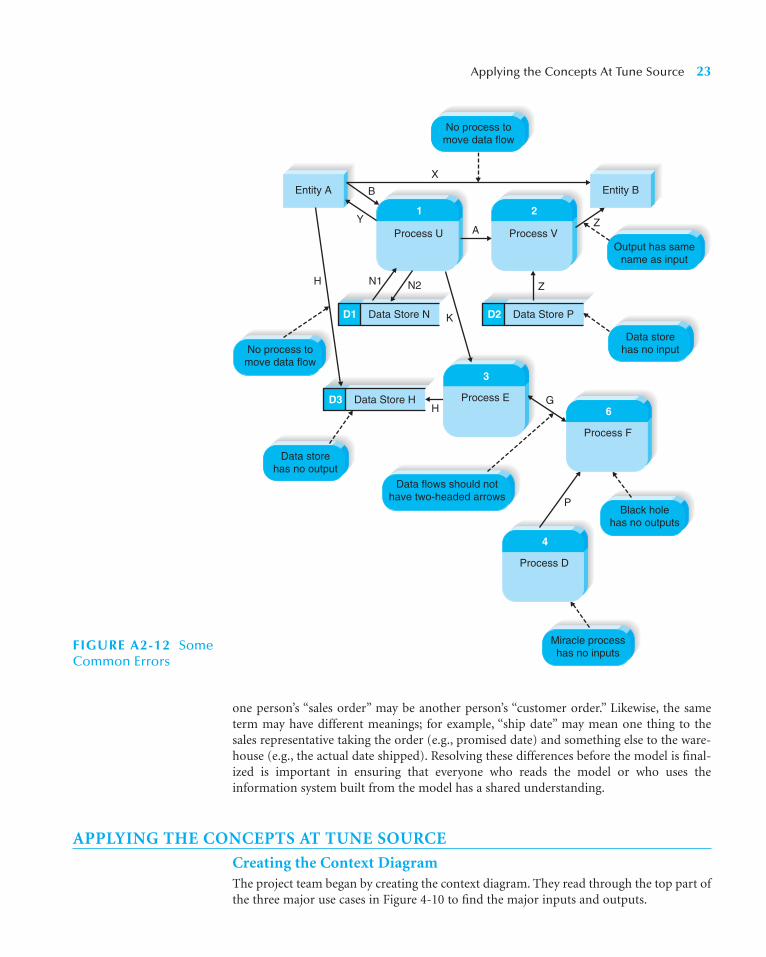
one person’s “sales order” may be another person’s “customer order.” Likewise, the sameterm may have different meanings; for example, “ship date” may mean one thing to thesales representative taking the order (e.g., promised date) and something else to the ware-house (e.g., the actual date shipped). Resolving these differences before the model is final-ized is important in ensuring that everyone who reads the model or who uses theinformation system built from the model has a shared understanding.
APPLYING THE CONCEPTS AT TUNE SOURCE
Creating the Context DiagramThe project team began by creating the context diagram. They read through the top part ofthe three major use cases in Figure 4-10 to find the major inputs and outputs.
Applying the Concepts At Tune Source 23
Data Store PD2
Output has samename as input
Data flows should nothave two-headed arrows
Data storehas no input
Data Store HD3
Data Store ND1
1
Process U
2
Process V
Entity A Entity B
Data storehas no output
Black holehas no outputs
Z
Z
X
B
A
N1H
HG
P
N2
K
Y
No process tomove data flow
Miracle processhas no inputs
3
Process E6
Process F
4
Process D
No process tomove data flow
FIGURE A2-12 SomeCommon Errors

The team noticed that the majority of data flow interactions are with the customerswho are using the Web site to browse music selections and make download purchases.There will be an interaction with the credit card clearinghouse entity that will handle pay-ment verification and processing of purchases. Finally, although it is not obvious from theuse cases, the marketing managers will be using sales information from the system todesign and implement promotional campaigns. The team used the major inflows and out-flows from the use cases and developed the context diagram shown in Figure A2-13.
Creating Data Flow Diagram FragmentsThe next step was to create one DFD fragment for each use case. This was done by draw-ing the process in the middle of the page, making sure that the process number and namewere appropriate, and connecting all the input and output data flows to it. Unlike the con-text diagram, the DFD fragment includes data flows to external entities and to internal datastores.
The completed DFD fragments are shown in Figure A2-14. Before looking at the fig-ure, take a minute and draw them on your own. There are many good ways to draw thesefragments. In fact, there are many “right” ways to create use cases and DFDs. Notice that onthe DFD fragment for process 3 we have shown a dotted line inflow labeled “Time to deter-mine promotions” into the process. Recall that we specified that the use case, PromoteTunes, was a temporal use case, triggered when it was time to update promotions and spe-cials. The dotted line flow into process 3 in Figure A2-14 is sometimes referred to as a con-trol flow and is commonly used to represent a time-based trigger for an event.
Creating the Level 0 Data Flow DiagramThe next step was to create the level 0 DFD by integrating the DFD fragments, whichproved to be anticlimactic. The team simply took the DFD fragments and drew themtogether on one piece of paper. Although it sometimes is challenging to arrange all the DFDfragments on one piece of paper, it was primarily a mechanical exercise (Figure A2-15).Compare the level 0 diagram with the context diagram in Figure A2-13. Are the two DFDsbalanced? Notice the additional detail contained in the level 0 diagram.
A careful review of the data stores in Figure A2-15 reveals that every one has both aninflow and an outflow, with one exception, D1:Available Tunes. D1:Available Tunes is readby two processes, but is not written to by any process shown. This violation of DFD syntaxneeds to be investigated by the team because it may be a serious oversight. As we will
24 Appendix 2 Process Modeling
CustomerCredit Card
Clearinghouse
MarketingManagers
0
Tune Source Digital Music
DownloadSystem
Customerinfo
Paymentinfo
Search request
Tune downloadE-mail promotions
SelectionCC charge
authorization
CC charge
Salespatterns
Promotiondecisions
FIGURE A2-13 Tune Source Context Diagram

Applying the Concepts At Tune Source 25
FIGURE A2-14Tune Source DFDFragments
(a) Tune Source Process 1 DFD Fragment
AvailableTunes
Requestedtunes D1
1
Search and BrowseTunes
Web promotions
CustomerMatching
tunesTune
samplesSelection
Searchrequest
Customerfavorites
Newfavorite
Newinterest
Tuneto buy
To Process 2: Purchase
Tunes
TargetedPromotionsD3
CustomerFavoritesD2
CustomerInterestsD4
(b) Tune Source Process 2 DFD Fragment
2
PurchaseTunes
Tune price
Customer
CreditCard
ClearinghouseCustomerinfo
Paymentinfo
Customeraccount
info
Customerdetails
CC charge authorization
Customerinfo
CCcharge
Tune to buyFrom Process1: Search/Browse Tunes Available
TunesD1
Purchaseinfo
Tunedownload
CustomersD6
SalesD5
(c) Tune Source Process 3 DFD Fragment
3
PromoteTunes
MarketingManagers
Customer
Promotiondecisions
Salespatterns
E-mailpromotions
Customerinterests
Recentsales
Time to determine promotions
SalesD5
CustomerInterestsD4
CustomerD6
TargetedPromotionsD3
New Web site promotions
Customere-mail
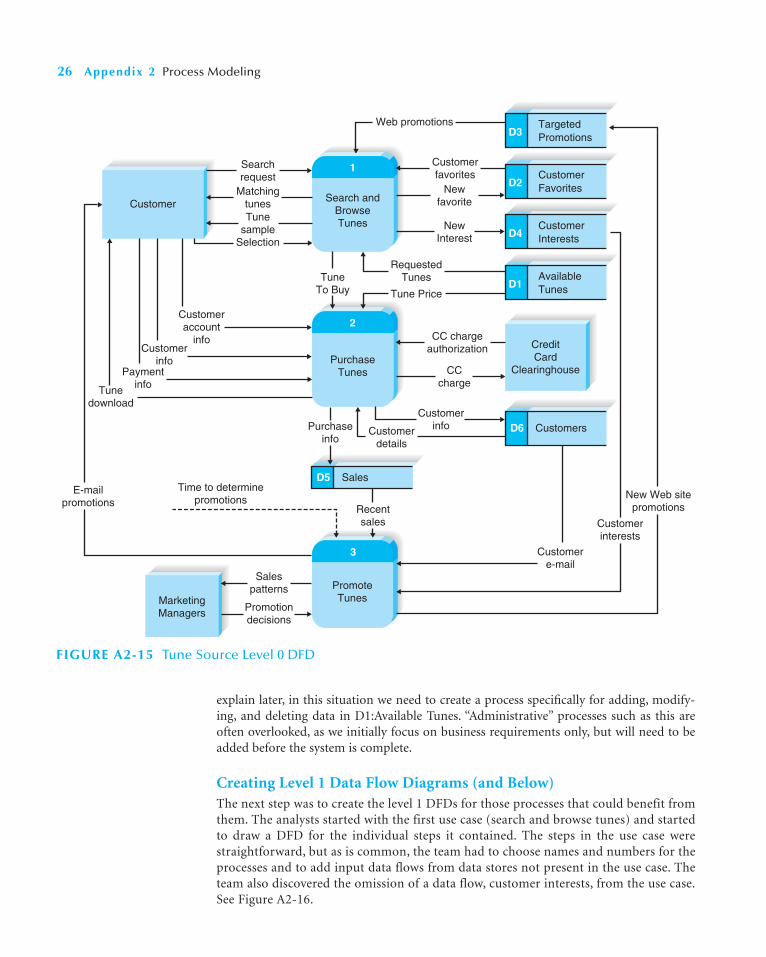
explain later, in this situation we need to create a process specifically for adding, modify-ing, and deleting data in D1:Available Tunes. “Administrative” processes such as this areoften overlooked, as we initially focus on business requirements only, but will need to beadded before the system is complete.
Creating Level 1 Data Flow Diagrams (and Below)The next step was to create the level 1 DFDs for those processes that could benefit fromthem. The analysts started with the first use case (search and browse tunes) and startedto draw a DFD for the individual steps it contained. The steps in the use case werestraightforward, but as is common, the team had to choose names and numbers for theprocesses and to add input data flows from data stores not present in the use case. Theteam also discovered the omission of a data flow, customer interests, from the use case.See Figure A2-16.
26 Appendix 2 Process Modeling
2
PurchaseTunes
1
Search and BrowseTunes
3
PromoteTunes
SalesD5
Web promotions
TuneTo Buy
Purchaseinfo
Recentsales
Time to determine promotions
Customer
CreditCard
Clearinghouse
MarketingManagers
CustomerInterests
Customerinterests
New Web site promotions
D4
AvailableTunesD1
CustomersD6
TargetedPromotionsD3
CustomerFavoritesD2
Newfavorite
NewInterest
RequestedTunes
Tune Price
Customerfavorites
CC charge authorization
Customere-mail
CCcharge
Searchrequest
MatchingtunesTune
sampleSelection
CustomerinfoCustomer
details
E-mailpromotions
Salespatterns
Promotiondecisions
Customeraccount
infoCustomer
infoPayment
infoTunedownload
FIGURE A2-15 Tune Source Level 0 DFD

Applying the Concepts At Tune Source 27
Draw a context diagram, a level 0 DFD, and a set oflevel 1 DFDs (where needed) for the campus housing
use cases that you developed for the Your Turn 4-1 box inChapter 4.
A2-1 Campus HousingYOUR
TURN
FIGURE A2-16 Level 1 DFD for Tune Source Process 1: Search and Browse Tunes
1.1
LoadWeb Site
1.2
ProcessSearch
Requests
1.3
ProcessTune
Selection
Customer Matchingtunes
Searchrequests
Web site access
CustomizedWeb content
Web promotions
Customerfavorites
Requestedtunes
Selection
Tunesample
Tunesample
Newinterest
Newfavorite
TargetedPromotionsD3
CustomerFavoritesD2
CustomerInterestsD4
AvailableTunesD1
Tuneto buy
to Process 2: Purchase
Tunes
The team also developed level 1 diagrams for the other processes, using the major stepsoutlined in their respective use cases. Some adjustments were made from the steps asshown in the use cases, but the team followed the steps fairly closely. See Figures A2-17 andA2-18, and compare them with their use cases shown in Figure 4-11.

28 Appendix 2 Process Modeling
2.1
CreateCustomerAccount
2.2
RetrieveCustomerAccount
2.3
ProcessPayment
2.4
ConfirmPurchase
Customer
CreditCard
Clearinghouse
Customerinfo
Tune to buy
Customeraccount
info
CustomerinfoCustomer
details
Tuneprice
CC charge authorization
CCcharge
Customerdetails
Tunepurchase
details
From Process1: Search/Browse Tunes
Paymentdetails
Purchaseconfirmation
CustomersD6
2.5
ReleaseDownload
Purchaseinfo
Tunepurchase
details
Downloadedtune
SalesD5
Available TunesD1
FIGURE A2-17 Level 1 DFD for Tune Source Process 2: Purchase Tunes
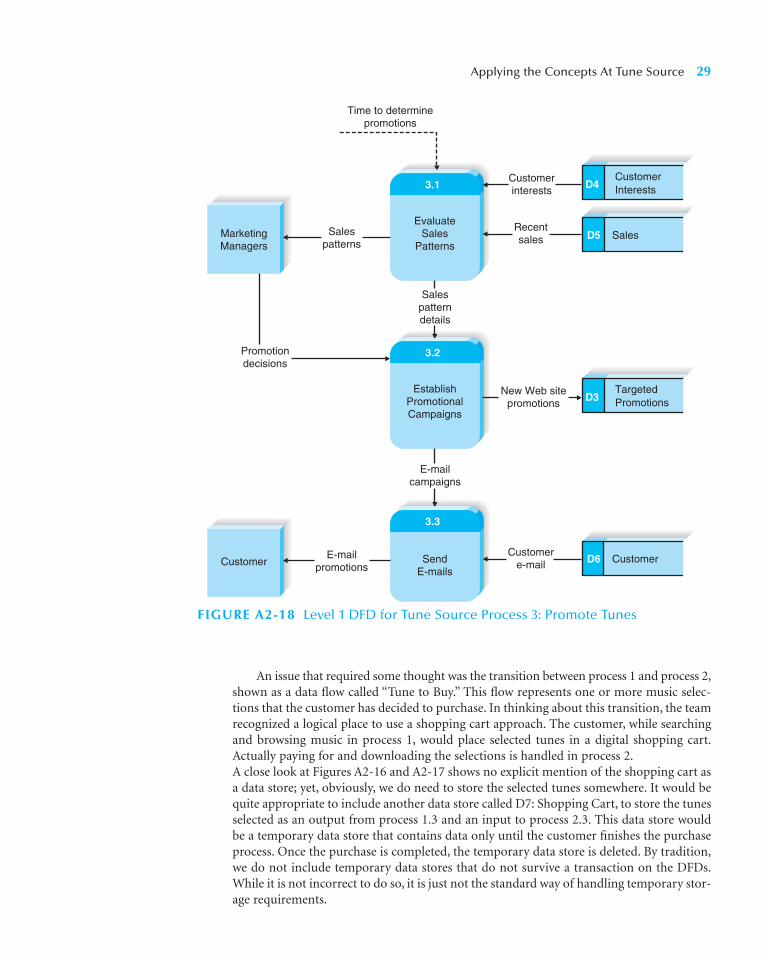
An issue that required some thought was the transition between process 1 and process 2,shown as a data flow called “Tune to Buy.” This flow represents one or more music selec-tions that the customer has decided to purchase. In thinking about this transition, the teamrecognized a logical place to use a shopping cart approach. The customer, while searchingand browsing music in process 1, would place selected tunes in a digital shopping cart.Actually paying for and downloading the selections is handled in process 2.A close look at Figures A2-16 and A2-17 shows no explicit mention of the shopping cart asa data store; yet, obviously, we do need to store the selected tunes somewhere. It would bequite appropriate to include another data store called D7: Shopping Cart, to store the tunesselected as an output from process 1.3 and an input to process 2.3. This data store wouldbe a temporary data store that contains data only until the customer finishes the purchaseprocess. Once the purchase is completed, the temporary data store is deleted. By tradition,we do not include temporary data stores that do not survive a transaction on the DFDs.While it is not incorrect to do so, it is just not the standard way of handling temporary stor-age requirements.
Applying the Concepts At Tune Source 29
FIGURE A2-18 Level 1 DFD for Tune Source Process 3: Promote Tunes
3.1
EvaluateSales
Patterns
3.2
EstablishPromotionalCampaigns
3.3
SendE-mails
CustomerE-mail
promotions
MarketingManagers
Salespatterns
Time to determine promotions
Promotiondecisions
Customerinterests
Recentsales
CustomerInterestsD4
New Web site promotions
TargetedPromotionsD3
Customere-mail
Salespatterndetails
E-mailcampaigns
SalesD5
CustomerD6

As we specified in Figure A2-2, every data store should have one or more input dataflows and one or more output data flows. A careful look at Figure A2-16, however, revealsthat D1: Available Tunes has output data flows, but no input data flows. This data store isthe main repository for the digital music library, so, clearly, it has a central role in our sys-tem. The team will need to be sure to create an administrative process for maintaining thisdata store: adding new information to it, modifying its existing contents, and removinginformation from it. These administrative tasks are sometimes omitted from the business-oriented tasks listed in the use cases, so it is up to the team to ensure that processes areincluded to add, modify, and delete the contents of data stores somewhere in the system.Simply checking the DFD syntax (all data stores must have at least one input data flow andat least one output data flow) helped discover this omission in the process model.
Although it would have been possible to decompose several of the processes on the level1 DFDs into more detail on a level 2 diagram, the project team decided that that step was notnecessary. Instead, they made sure that the process descriptions they created in the CASErepository for each of the processes was very detailed. This detail would be critical in develop-ing the data models and designing the user interface and programs during the design phase.
Validating the Data Flow DiagramsThe final set of DFDs was validated by the project team and then by Carly and her mar-keting team in a final JAD meeting. There was general approval of the customer-facingprocesses (process 1 and process 2) and considerable discussion of the specific informationthat would be required to help the marketing team make its promotional campaign deci-sions (process 3). This information was recorded in the CASE repository so that it could berecalled during the development of the system’s data model, the subject of our next chapter.
SUMMARY
Data Flow Diagram SyntaxFour symbols are used on data flow diagrams (processes, data flows, data stores, and exter-nal entities). A process is an activity that does something. Each process has a name (a verbphrase), a description, and a number that shows where it is in relation to other processesand to its children processes. Every process must have at least one output and usually hasat least one input. A data flow is a piece of data or an object and has a name (a noun) anda description and either starts or ends at a process (or both). A data store is a manual orcomputer file, and it has a number, a name (a noun), and at least one input data flow andone output data flow (unless the data store is created by a process external to the data flowdiagram [DFD]). An external entity is a person, organization, or system outside the scopeof the system and has a name (a noun) and a description. Every set of DFDs starts with acontext diagram and a level 0 DFD and has numerous level 1 DFDs, level 2 DFDs, and soon. Every element on the higher-level DFDs (i.e., data flows, data stores, and external enti-ties) must appear on lower-level DFDs, or else they are not balanced.
Creating Data Flow DiagramsThe DFDs are created from the use cases. First, the team builds the context diagram thatshows all the external entities and the data flows into and out of the system from them.Second, the team creates DFD fragments for each use case that show how the use caseexchanges data flows with the external entities and data stores. Third, these DFD fragmentsare organized into a level 0 DFD. Fourth, the team develops level 1 DFDs on the basis of
30 Appendix 2 Process Modeling

the steps within each use case to better explain how they operate. Fifth, the team validatesthe set of DFDs to make sure that they are complete and correct and contain no syntax orsemantics errors. Analysts seldom create DFDs perfectly the first time, so iteration isimportant in ensuring that both single-page and multipage DFDs are clear and easy toread.
Questions 31
KEY TERMS
Action statementBalancingBundleCase statementChildrenContext diagramData flowData flow diagram (DFD)Data storeDecision tableDecision tree
DecompositionDFD fragmentExternal entityFor statementIf statementIterationLayoutLevel 0 DFDLevel 1 DFDLevel 2 DFDLogical process model
ParentPhysical modelProcess modelProcessSemantics errorStructured EnglishSyntax errorViewpointWhile statement
QUESTIONS
1. What is a process model? What is a data flow diagram?Are the two related? If so, how?
2. Distinguish between logical process models and phys-ical process models.
3. Define what is meant by a process in a process model. Howshould a process be named? What information about aprocess should be stored in the CASE repository?
4. Define what is meant by a data flow in a process model.How should a data flow be named? What informationabout a data flow should be stored in the CASE repository?
5. Define what is meant by a data store in a processmodel. How should a data store be named? Whatinformation about a data store should be stored in theCASE repository?
6. Define what is meant by an external entity in a processmodel. How should an external entity be named?What information about an external entity should bestored in the CASE repository?
7. Why is a process model typically composed of a set ofDFDs? What is meant by decomposition of a businessprocess?
8. Explain the relationship between a DFD context dia-gram and the DFD level 0 diagram.
9. Explain the relationship between a DFD level 0 dia-gram and DFD level 1 diagram(s).
10. Discuss how the analyst knows how to stop decomposingthe process model into more and more levels of detail.
11. Suppose that a process on a DFD is numbered 4.3.2.What level diagram contains this process? What is thisprocess’s parent process?
12. Explain the use of structured English in processdescriptions.
13. Why would one use a decision tree and/or decisiontable in a process description?
14. Explain the process of balancing a set of DFDs.15. How are mutually exclusive data flows (i.e., alternative
paths through a process) depicted in DFDs?16. Discuss several ways to verify the correctness of a
process model.17. Identify three typical syntax errors commonly found
in DFDs.18. What is meant by a DFD semantic error? Provide an
example.19. Creating use cases when working with users is a recent
development in systems analysis practice. Why is thetrend today to employ use cases in user interviews orJAD sessions?
20. How can you make a DFD easier to understand? (Thinkfirst about how to make one difficult to understand.)
21. Suppose that your goal is to create a set of DFDs. Howwould you begin an interview with a knowledgeableuser? How would you begin a JAD session?
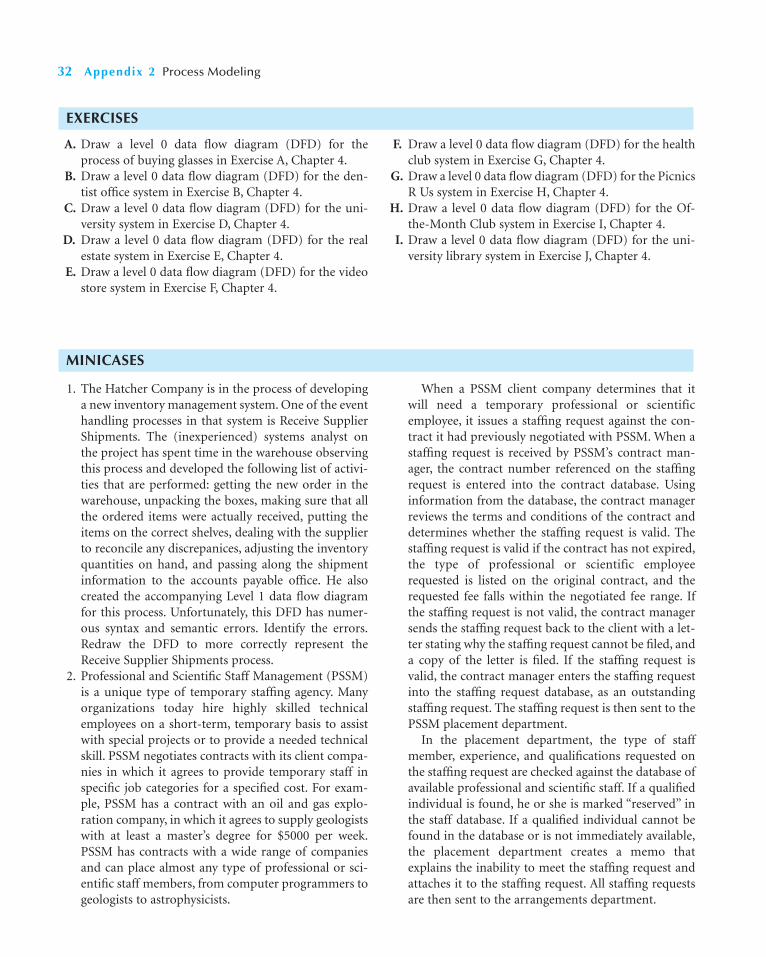
32 Appendix 2 Process Modeling
EXERCISES
A. Draw a level 0 data flow diagram (DFD) for theprocess of buying glasses in Exercise A, Chapter 4.
B. Draw a level 0 data flow diagram (DFD) for the den-tist office system in Exercise B, Chapter 4.
C. Draw a level 0 data flow diagram (DFD) for the uni-versity system in Exercise D, Chapter 4.
D. Draw a level 0 data flow diagram (DFD) for the realestate system in Exercise E, Chapter 4.
E. Draw a level 0 data flow diagram (DFD) for the videostore system in Exercise F, Chapter 4.
F. Draw a level 0 data flow diagram (DFD) for the healthclub system in Exercise G, Chapter 4.
G. Draw a level 0 data flow diagram (DFD) for the PicnicsR Us system in Exercise H, Chapter 4.
H. Draw a level 0 data flow diagram (DFD) for the Of-the-Month Club system in Exercise I, Chapter 4.
I. Draw a level 0 data flow diagram (DFD) for the uni-versity library system in Exercise J, Chapter 4.
MINICASES
1. The Hatcher Company is in the process of developinga new inventory management system. One of the eventhandling processes in that system is Receive SupplierShipments. The (inexperienced) systems analyst onthe project has spent time in the warehouse observingthis process and developed the following list of activi-ties that are performed: getting the new order in thewarehouse, unpacking the boxes, making sure that allthe ordered items were actually received, putting theitems on the correct shelves, dealing with the supplierto reconcile any discrepanices, adjusting the inventoryquantities on hand, and passing along the shipmentinformation to the accounts payable office. He alsocreated the accompanying Level 1 data flow diagramfor this process. Unfortunately, this DFD has numer-ous syntax and semantic errors. Identify the errors.Redraw the DFD to more correctly represent theReceive Supplier Shipments process.
2. Professional and Scientific Staff Management (PSSM)is a unique type of temporary staffing agency. Manyorganizations today hire highly skilled technicalemployees on a short-term, temporary basis to assistwith special projects or to provide a needed technicalskill. PSSM negotiates contracts with its client compa-nies in which it agrees to provide temporary staff inspecific job categories for a specified cost. For exam-ple, PSSM has a contract with an oil and gas explo-ration company, in which it agrees to supply geologistswith at least a master’s degree for $5000 per week.PSSM has contracts with a wide range of companiesand can place almost any type of professional or sci-entific staff members, from computer programmers togeologists to astrophysicists.
When a PSSM client company determines that itwill need a temporary professional or scientificemployee, it issues a staffing request against the con-tract it had previously negotiated with PSSM. When astaffing request is received by PSSM’s contract man-ager, the contract number referenced on the staffingrequest is entered into the contract database. Usinginformation from the database, the contract managerreviews the terms and conditions of the contract anddetermines whether the staffing request is valid. Thestaffing request is valid if the contract has not expired,the type of professional or scientific employeerequested is listed on the original contract, and therequested fee falls within the negotiated fee range. Ifthe staffing request is not valid, the contract managersends the staffing request back to the client with a let-ter stating why the staffing request cannot be filed, anda copy of the letter is filed. If the staffing request isvalid, the contract manager enters the staffing requestinto the staffing request database, as an outstandingstaffing request. The staffing request is then sent to thePSSM placement department.
In the placement department, the type of staffmember, experience, and qualifications requested onthe staffing request are checked against the database ofavailable professional and scientific staff. If a qualifiedindividual is found, he or she is marked “reserved” inthe staff database. If a qualified individual cannot befound in the database or is not immediately available,the placement department creates a memo thatexplains the inability to meet the staffing request andattaches it to the staffing request. All staffing requestsare then sent to the arrangements department.
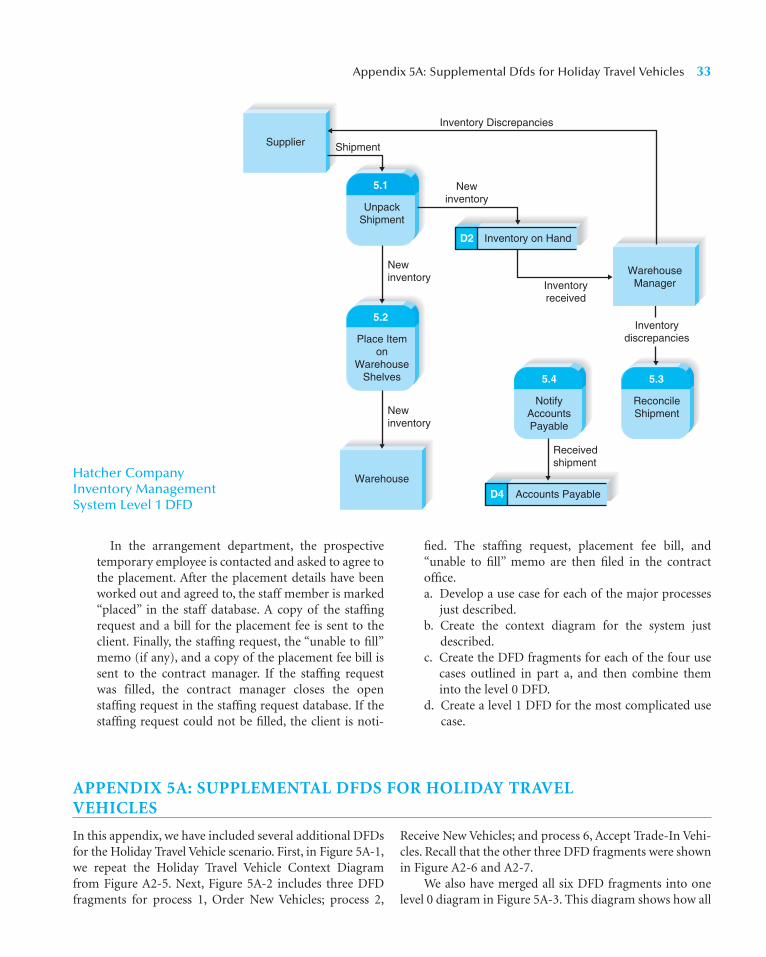
Appendix 5A: Supplemental Dfds for Holiday Travel Vehicles 33
In the arrangement department, the prospectivetemporary employee is contacted and asked to agree tothe placement. After the placement details have beenworked out and agreed to, the staff member is marked“placed” in the staff database. A copy of the staffingrequest and a bill for the placement fee is sent to theclient. Finally, the staffing request, the “unable to fill”memo (if any), and a copy of the placement fee bill issent to the contract manager. If the staffing requestwas filled, the contract manager closes the openstaffing request in the staffing request database. If thestaffing request could not be filled, the client is noti-
fied. The staffing request, placement fee bill, and“unable to fill” memo are then filed in the contractoffice.a. Develop a use case for each of the major processes
just described.b. Create the context diagram for the system just
described.c. Create the DFD fragments for each of the four use
cases outlined in part a, and then combine theminto the level 0 DFD.
d. Create a level 1 DFD for the most complicated usecase.
Hatcher CompanyInventory ManagementSystem Level 1 DFD
Accounts PayableD4
Newinventory
Newinventory
Inventoryreceived
Receivedshipment
Newinventory
Inventory Discrepancies
Inventorydiscrepancies
InventoryDiscrepancies
NotifyAccountsPayable
5.4
UnpackShipment
5.1
ReconcileShipment
5.3
Inventory on HandD2
Supplier
WarehouseManager
Warehouse
Place Itemon
WarehouseShelves
5.2
Shipment
APPENDIX 5A: SUPPLEMENTAL DFDS FOR HOLIDAY TRAVELVEHICLES
In this appendix, we have included several additional DFDsfor the Holiday Travel Vehicle scenario. First, in Figure 5A-1,we repeat the Holiday Travel Vehicle Context Diagramfrom Figure A2-5. Next, Figure 5A-2 includes three DFDfragments for process 1, Order New Vehicles; process 2,
Receive New Vehicles; and process 6, Accept Trade-In Vehi-cles. Recall that the other three DFD fragments were shownin Figure A2-6 and A2-7.
We also have merged all six DFD fragments into onelevel 0 diagram in Figure 5A-3. This diagram shows how all
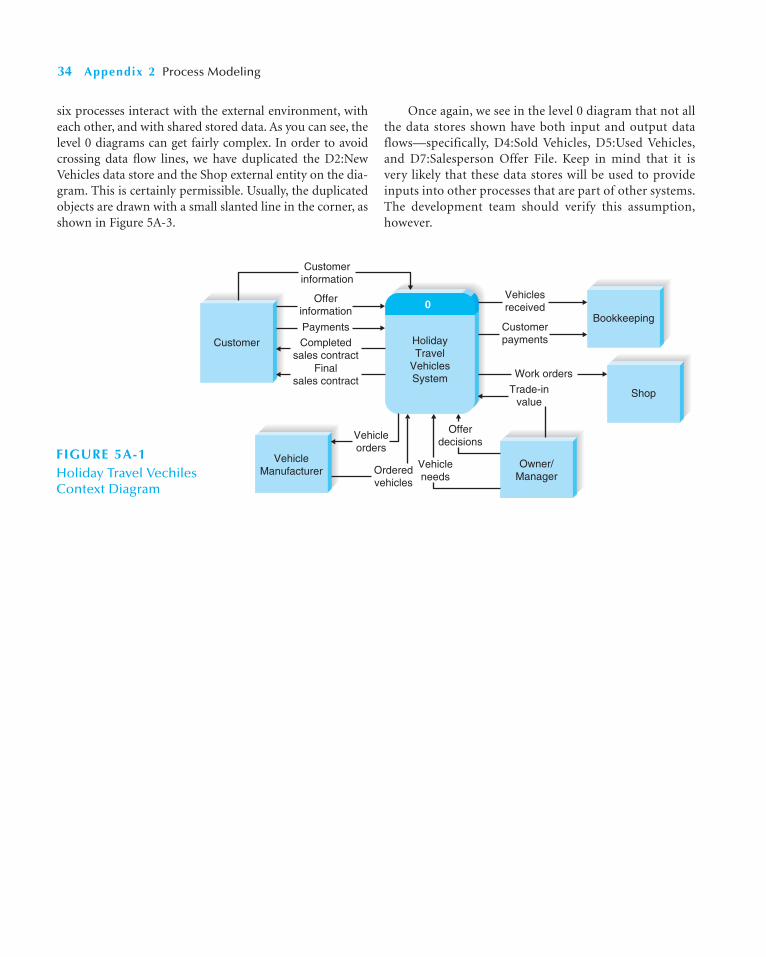
34 Appendix 2 Process Modeling
six processes interact with the external environment, witheach other, and with shared stored data. As you can see, thelevel 0 diagrams can get fairly complex. In order to avoidcrossing data flow lines, we have duplicated the D2:NewVehicles data store and the Shop external entity on the dia-gram. This is certainly permissible. Usually, the duplicatedobjects are drawn with a small slanted line in the corner, asshown in Figure 5A-3.
Once again, we see in the level 0 diagram that not allthe data stores shown have both input and output dataflows—specifically, D4:Sold Vehicles, D5:Used Vehicles,and D7:Salesperson Offer File. Keep in mind that it isvery likely that these data stores will be used to provideinputs into other processes that are part of other systems.The development team should verify this assumption,however.
0
HolidayTravel
VehiclesSystem
Bookkeeping
Shop
Owner/Manager
VehicleManufacturer
Customer
Vehiclesreceived
Offerinformation
Customerinformation
Payments
Completedsales contract
Finalsales contract
Customerpayments
Work orders
Trade-invalue
Offerdecisions
Vehicleneeds
Vehicleorders
Orderedvehicles
FIGURE 5A-1Holiday Travel Vechiles Context Diagram

Appendix 5A: Supplemental Dfds for Holiday Travel Vehicles 35
1
Order New Vehicles
VehicleManufacturer
Owner/Manager
Vehicleorders
Vehiclepurchase
orders
Vehicleneeds
(a) Process 1 DFD Fragment
Vehicle OrdersD1
2
ReceiveNew
Vehicles
BookkeepingVehicleManufacturer
Vehiclesreceived
Orderedvehicles
(b) Process 2 DFD Fragment
Newvehicle
info
Vehiclepurchase
orders
New VehiclesD2Vehicle OrdersD1
6
AcceptTrade-InVehicles
ShopWorkorder
Trade-indetails
FromProcess 5:
TakeDelivery
(c) Process 6 DFD Fragment
Usedvehicle
information
Used VehiclesD5
FIGURE 5A-2 Additional DFD Fragments for Holiday Travel Vehicles
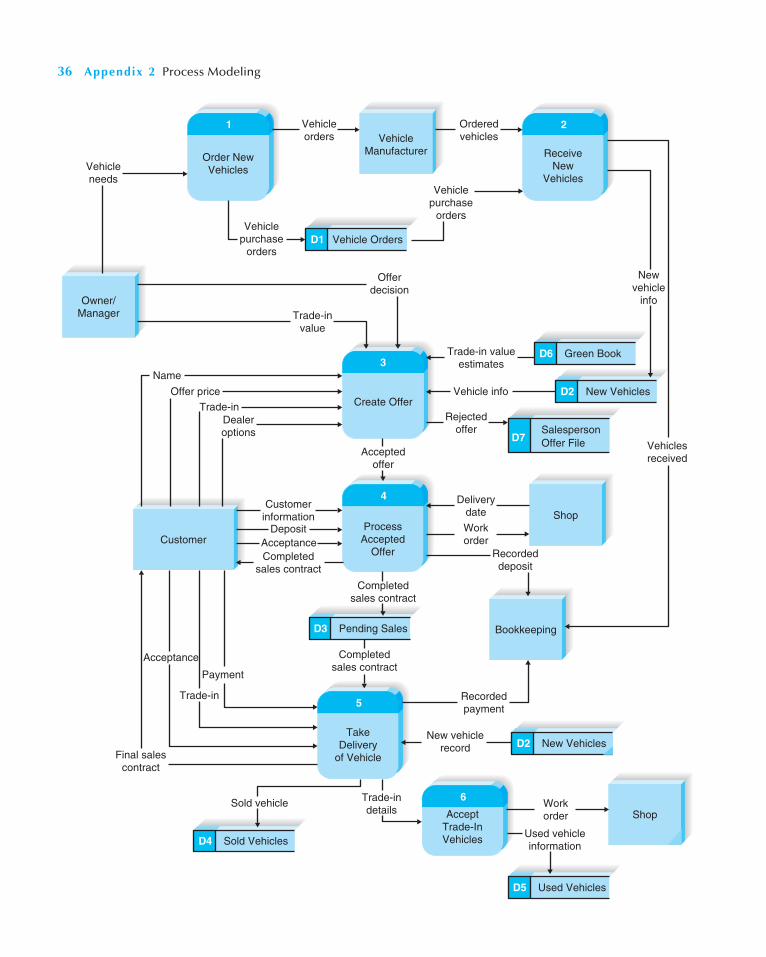
36 Appendix 2 Process Modeling
2
ReceiveNew
Vehicles
1
Order New Vehicles
Vehicle OrdersD1
VehicleManufacturer
Orderedvehicles
Vehicleorders
Vehicleneeds
Vehiclepurchase
orders
Vehiclepurchase
orders
3
Create Offer
4
ProcessAccepted
Offer
5
TakeDelivery
of Vehicle
6
AcceptTrade-InVehicles
Pending SalesD3
New VehiclesD2
Sold Vehicles
Sold vehicle Trade-indetails
D4
Used VehiclesD5
Green BookD6
New VehiclesD2
Acceptedoffer
Offerdecision
Rejectedoffer
Vehicle info
Trade-invalue
Name
Offer price
Trade-in
Trade-in
Dealeroptions
Completedsales contract
Final sales contract
Completedsales contract
Owner/Manager
Customer
Shop
Shop
Bookkeeping
SalespersonOffer FileD7
Trade-in value estimates
Vehiclesreceived
Newvehicle
info
Deliverydate
Workorder
Recordeddeposit
New vehicle record
Recordedpayment
Payment
Workorder
Used vehicle information
Customerinformation
Completedsales contract
DepositAcceptance
Acceptance

A data model describes the data that flow through the business processes in an organi-zation. During the analysis phase, the data model presents the logical organization of datawithout indicating how the data are stored, created, or manipulated so that analysts canfocus on the business without being distracted by technical details. Later, during the designphase, the data model is changed to reflect exactly how the data will be stored in databasesand files. This chapter describes entity relationship diagramming, one of the most commondata modeling techniques used in industry.
OBJECTIVES
■ Understand the rules and style guidelines for creating entity relationship diagrams.■ Be able to create an entity relationship diagram.■ Become familiar with the data dictionary and metadata.■ Understand how to balance between entity relationship diagrams and data flow
diagrams.■ Become familiar with the process of normalization.
CHAPTER OUTLINE
A P P E N D I X 3
Data Modeling
1
IntroductionThe Entity Relationship Diagram
Reading an Entity Relationship Diagram
Elements of an Entity Relationship Diagram
The Data Dictionary and MetadataCreating an Entity Relationship Diagram
Building Entity Relationship Diagrams
Advanced SyntaxApplying the Concepts at Tune Source
Validating an ERDDesign Guidelines
NormalizationBalancing Entity Relationship Diagrams
with Data Flow DiagramsSummaryAppendix 6A: Normalizing the
Data Model
INTRODUCTION
During the analysis phase, analysts create process models to represent how the business sys-tem will operate. At the same time, analysts need to understand the information that is usedand created by the business system (e.g., customer information, order information). In thischapter, we discuss how the data that flow through the processes are organized and presented.
A data model is a formal way of representing the data that are used and created by abusiness system; it illustrates people, places, or things about which information is capturedand how they are related to each other. The data model is drawn by an iterative process in

which the model becomes more detailed and less conceptual over time. During analysis,analysts draw a logical data model, which shows the logical organization of data withoutindicating how data are stored, created, or manipulated. Because this model is free of anyimplementation or technical details, the analysts can focus more easily on matching thediagram to the real business requirements of the system.
In the design phase, analysts draw a physical data model to reflect how the data willphysically be stored in databases and files. At this point, the analysts investigate ways tostore the data efficiently and to make the data easy to retrieve. The physical data model andperformance tuning are discussed in Chapter 11.
Project teams usually use CASE tools to draw data models. Some of the CASE tools aredata modeling packages, such as ERwin by Platinum Technology, that help analysts createand maintain logical and physical data models; they have a wide array of capabilities to aidmodelers, and they can automatically generate many different kinds of databases from themodels that are created. Other CASE tools (e.g., Oracle Designer) come bundled with data-base management systems (e.g., Oracle), and they are particularly good for modeling data-bases that will be built in their companion database products. A final option is to use afull-service CASE tool, such as Visible Analyst Workbench, in which data modeling is oneof many capabilities, and the tool can be used with many different databases. A benefit ofthe full-service CASE tool is that it integrates the data model information with other rele-vant parts of the project.
In this chapter, we focus on creating a logical data model. Although there are severalways to model data, we will present one of the most commonly used techniques: entityrelationship diagramming, a graphic drawing technique developed by Peter Chen1 thatshows all the data components of a business system. We will first describe how to create anentity relationship diagram (ERD) and discuss some style guidelines. Then, we will presenta technique called normalization that helps analysts validate the data models that theydraw. The chapter ends with a discussion of how data models balance, or interrelate, withthe process models that you learned about in Appendix 2.
THE ENTITY RELATIONSHIP DIAGRAM
An entity relationship diagram (ERD) is a picture which shows the information that is cre-ated, stored, and used by a business system. An analyst can read an ERD to discover theindividual pieces of information in a system and how they are organized and related toeach other. On an ERD, similar kinds of information are listed together and placed insideboxes called entities. Lines are drawn between entities to represent relationships among thedata, and special symbols are added to the diagram to communicate high-level businessrules that need to be supported by the system. The ERD implies no order, although entitiesthat are related to each other are usually placed close together.
For example, consider the supermarket checkout system that was described in Chapter 5.Although this system is just a small part of the information system for an entire grocerystore, we will use it for our discussion on how to read an entity relationship diagram. First,go back and look at the sample DFD for the checkout process in Figure A2-1. Although weunderstand how the system works from studying the data flow diagram, we have very littledetailed understanding of the information itself that flows through the system. Whatexactly is “items purchased”? What pieces of data are captured in “purchase details”? Howis an item related to the sales transaction?
2 Appendix 3 Data Modeling
1 P. Chen, “The Entity-Relationship Model—Toward a Unified View of Data,” ACM Transactions on DatabaseSystems, 1976, 1:9–36.
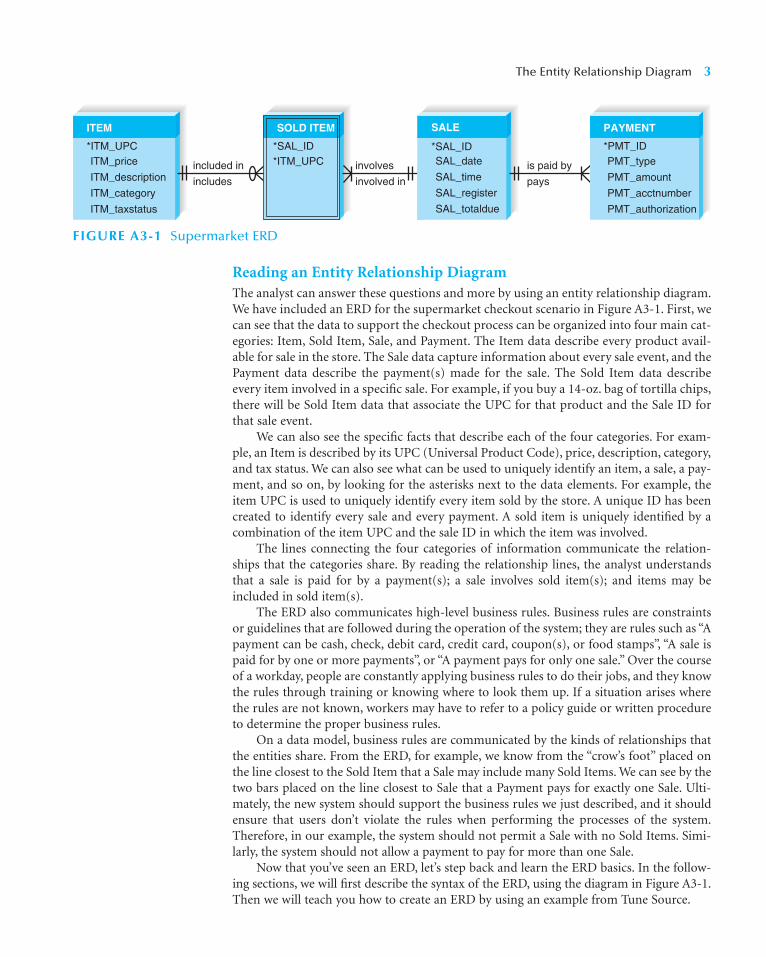
Reading an Entity Relationship DiagramThe analyst can answer these questions and more by using an entity relationship diagram.We have included an ERD for the supermarket checkout scenario in Figure A3-1. First, wecan see that the data to support the checkout process can be organized into four main cat-egories: Item, Sold Item, Sale, and Payment. The Item data describe every product avail-able for sale in the store. The Sale data capture information about every sale event, and thePayment data describe the payment(s) made for the sale. The Sold Item data describeevery item involved in a specific sale. For example, if you buy a 14-oz. bag of tortilla chips,there will be Sold Item data that associate the UPC for that product and the Sale ID forthat sale event.
We can also see the specific facts that describe each of the four categories. For exam-ple, an Item is described by its UPC (Universal Product Code), price, description, category,and tax status. We can also see what can be used to uniquely identify an item, a sale, a pay-ment, and so on, by looking for the asterisks next to the data elements. For example, theitem UPC is used to uniquely identify every item sold by the store. A unique ID has beencreated to identify every sale and every payment. A sold item is uniquely identified by acombination of the item UPC and the sale ID in which the item was involved.
The lines connecting the four categories of information communicate the relation-ships that the categories share. By reading the relationship lines, the analyst understandsthat a sale is paid for by a payment(s); a sale involves sold item(s); and items may beincluded in sold item(s).
The ERD also communicates high-level business rules. Business rules are constraintsor guidelines that are followed during the operation of the system; they are rules such as “Apayment can be cash, check, debit card, credit card, coupon(s), or food stamps”, “A sale ispaid for by one or more payments”, or “A payment pays for only one sale.” Over the courseof a workday, people are constantly applying business rules to do their jobs, and they knowthe rules through training or knowing where to look them up. If a situation arises wherethe rules are not known, workers may have to refer to a policy guide or written procedureto determine the proper business rules.
On a data model, business rules are communicated by the kinds of relationships thatthe entities share. From the ERD, for example, we know from the “crow’s foot” placed onthe line closest to the Sold Item that a Sale may include many Sold Items. We can see by thetwo bars placed on the line closest to Sale that a Payment pays for exactly one Sale. Ulti-mately, the new system should support the business rules we just described, and it shouldensure that users don’t violate the rules when performing the processes of the system.Therefore, in our example, the system should not permit a Sale with no Sold Items. Simi-larly, the system should not allow a payment to pay for more than one Sale.
Now that you’ve seen an ERD, let’s step back and learn the ERD basics. In the follow-ing sections, we will first describe the syntax of the ERD, using the diagram in Figure A3-1.Then we will teach you how to create an ERD by using an example from Tune Source.
The Entity Relationship Diagram 3
included in
includes
involves
involved in
is paid by
pays
*ITM_UPC*SAL_ID
SOLD ITEM
ITM_price
ITM_description
ITM_category
ITM_taxstatus
*ITM_UPC
ITEM
PMT_type
PMT_amount
PMT_acctnumber
PMT_authorization
*PMT_ID
PAYMENT
*SAL_ID
SALE
SAL_date
SAL_time
SAL_register
SAL_totaldue
FIGURE A3-1 Supermarket ERD

Elements of an Entity Relationship DiagramThere are three basic elements in the data modeling language (entities, attributes, and relation-ships), each of which is represented by a different graphic symbol. There are many different setsof symbols that can be used on an ERD. No one set of symbols dominates industry use, andnone is necessarily better than another. We will use crow’s foot in this book. Figure A3-2 sum-marizes the three basic elements of ERDs and the symbols we will use.
Entity The entity is the basic building block for a data model. It is a person, place, event,or thing about which data is collected—for example, an employee, an order, or a product.An entity is depicted by a rectangle, and it is described by a singular noun spelled in capi-tal letters. All entities have a name, a short description that explains what they are, and anidentifier that is the way to locate information in the entity (which is discussed later). InFigure A3-1, the entities are Item, Sold Item, Sale, and Payment.
Entities represent something for which there exist multiple instances, or occurrences.For example, John Smith and Susan Jones could be instances of the customer entity(Figure A3-3). We would expect the customer entity to stand for all of the people with whomwe have done business, and each of them would be an instance in the customer entity. Ifthere is just one instance, or occurrence, of a person, place, event, or thing, then it shouldnot be included as an entity in the data model. For example, think a little more broadlyabout the supermarket information system. Figure A3-1 focuses on just a small part of thatinformation system. If the company consists of more than one grocery store, then the datamodel that encompasses the entire company would include a Store entity so that specific
4 Appendix 3 Data Modeling
FIGURE A3-2Data Modeling Symbol Sets
IDEF1X ChenCrow's
Foot
An ENTITY is a person, place, or thing. has a singular name spelled in all capital letters. has an identifier. should contain more than one instance of data.
An ATTRIBUTE is a property of an entity. should be used by at least one business process. is broken down to its most useful level of detail.
A RELATIONSHIP shows the association between two entities. has a parent entity and a child entity. is described with a verb phrase. has cardinality (1 : 1, 1 : N, or M : N). has modality (null, not null). is dependent or independent.
Relationship-name Relationship-name
ENTITY-NAME ENTITY-NAME ENTITY-NAME
*Identifier
ENTITY-NAME ENTITY-NAME
Attribute-nameAttribute-nameAttribute-name
Identifier
Attribute-nameAttribute-nameAttribute-name
Attribute-name
Relationship-name

facts about each store could be captured. If the company owned just one grocery store,however, there would be no need to set up a store entity in the overall data model. There isno need to capture data in the system about something having just a single instance.
Attribute An attribute is some type of information that is captured about an entity. Forexample, last name, home address, and e-mail address are all attributes of a customer. It iseasy to come up with hundreds of attributes for an entity (e.g., a customer has an eye color,a favorite hobby, a religious affiliation), but only those that actually will be used by a busi-ness process should be included in the model.
Attributes are nouns that are listed within an entity. Usually, some form of the entityname is appended to the beginning of each attribute to make it clear as to what entity itbelongs (e.g., CUS_lastname, CUS_address). Without doing this, you can get confused bymultiple entities that have the same attributes—for example, a customer and an employeeboth can have an attribute called “lastname.” CUS_lastname and EMP_lastname are muchclearer ways to name attributes on the data model.
One or more attributes can serve as the identifier—the attribute(s) that can uniquely iden-tify one instance of an entity—and the attributes that serve as the identifier are noted by anasterisk next to the attribute name. If there are no customers with the same last name, then lastname can be used as the identifier of the customer entity. In this case, if we need to locate JohnBrown, the name Brown would be sufficient to identify the one instance of the Brown last name.
Suppose that we add a customer named Sarah Brown. Now we have a problem: Usingthe name Brown would not uniquely lead to one instance—it would lead to two (i.e., JohnBrown and Sarah Brown). You have three choices at this point, and all are acceptable solu-tions. First, you can use a combination of multiple fields to serve as the identifier (last nameand first name). This is called a concatenated identifier because several fields are combined,or concatenated, to uniquely identify an instance. Second, you can find a field that is uniquefor each instance, like the customer ID number. Third, you can wait to assign an identifier(like a randomly generated number that the system will create) until the design phase of theSDLC (Figure A3-4). Many data modelers don’t believe that randomly generated identifiersbelong on a logical data model, because they do not logically exist in the business process.
Relationship Relationships are associations between entities, and they are shown by linesthat connect the entities together. Every relationship has a parent entity and a child entity,the parent being the first entity in the relationship, and the child being the second.
Relationships should be clearly labeled with active verbs so that the connectionsbetween entities can be understood. If one verb is given to each relationship, it is read intwo directions. For example, we could write the verb pays alongside the relationship for thesale and payment entities, and this would be read as “a payment pays a sale” and “a sale ispaid for by a payment.” In Figure A3-1, we have included words for both directions of therelationship line; the top words are read from parent to child, and the bottom words areread from child to parent. Notice that the item entity is the parent entity in the item–sold
The Entity Relationship Diagram 5
FIGURE A3-3Entities and Instances
CustomerJohn SmithSusan JonesPeter ToddDale TurnerPat Turner
Entity Example Instances

item relationship. In addition, some CASE tools require that every relationship name beunique on the ERD, so we select unique descriptive verbs for each relationship.
Cardinality Relationships have two properties. First, a relationship has cardinality, whichis the ratio of parent instances to child instances. To determine the cardinality for a relation-ship, we ask ourselves: “How many instances of one entity are associated with an instance ofthe other?” (Remember that an instance is one occurrence of an entity, such as customer JohnBrown or item 14-oz. Nacho Cheese Dori-tosTM). For example, a payment pays for how manysales? A sale includes how many sold items? The cardinality for binary relationships (i.e., rela-tionships between two entities) is 1:1, 1:N, or M:N, and we will discuss each in turn.
The 1:1 (read as “one to one”) relationship means that one instance of the parent entityis associated with one instance of the child entity. There are no examples of 1:1 relationshipsin Figure A3-1. So, imagine for a moment that, as a reward, a company assigns a specificreserved parking place to every employee who is honored as an “employee of the month.” Onereserved parking place is assigned to each honored employee, and each honored employee isassigned one reserved parking place. If we were to draw these two entities, we would place abar next to the Employee entity and a bar next to the Reserved Parking Place entity. The car-dinality is clearly 1:1 in this case, because each honored employee is assigned exactly onereserved parking place, and a reserved parking place is assigned to exactly one employee.
More often, relationships are 1:N (read as “one to many”). In this kind of relationship,a single instance of a parent entity is associated with many instances of a child entity; how-ever, the child entity instance is related to only one instance of the parent. For example, aSale (parent entity) can be paid for by many Payments (child entity), but a particular Pay-ment pays for only one Sale, suggesting a 1:N relationship between Sale and Payment. Acharacter resembling a crow’s foot is placed closest to the Payment entity to show the“many” end of the relationship. The parent entity is always on the “1” side of the relation-ship; hence, a bar is placed next to the Sale entity. Can you identify other 1:N relationshipsin Figure A3-1? Identify the parent and child entities for each relationship.
A third kind of relationship is the M:N (read as “many to many”) relationship. In thiscase, many instances of a parent entity can relate to many instances of a child entity. Thereare no M:N relationships shown in Figure A3-1, but take a look at Figure A3-5. This figureshows an early draft version of the Supermarket ERD. In this version, an M:N relationshipdoes exist between Sale and Item. As we can see, one Sale (parent entity) can include manyItems (e.g., tortilla chips, salsa, and cheese), and an Item (child entity) can be included inmany Sales. M:N relationships are depicted on an ERD by having crow’s feet at both ends ofthe relationship line. As we will learn later, there are advantages to eliminating M:N relation-ships from an ERD, so that is why it was removed from Figure A3-1 by creating the Sold Itementity between Sale and Item. The process of “resolving” an M:N relationship will beexplained later in the chapter.
6 Appendix 3 Data Modeling
FIGURE A3-4Choices for Identifiers
CUSTOMER CUSTOMER CUSTOMER
ConcatenatedIdentifier
SingleIdentifier
Identifier to BeAdded Later
*CUS_lastname*CUS_firstname
*CUS_IDnumber CUS_lastnameCUS_firstnameCUS_lastname
CUS_firstname
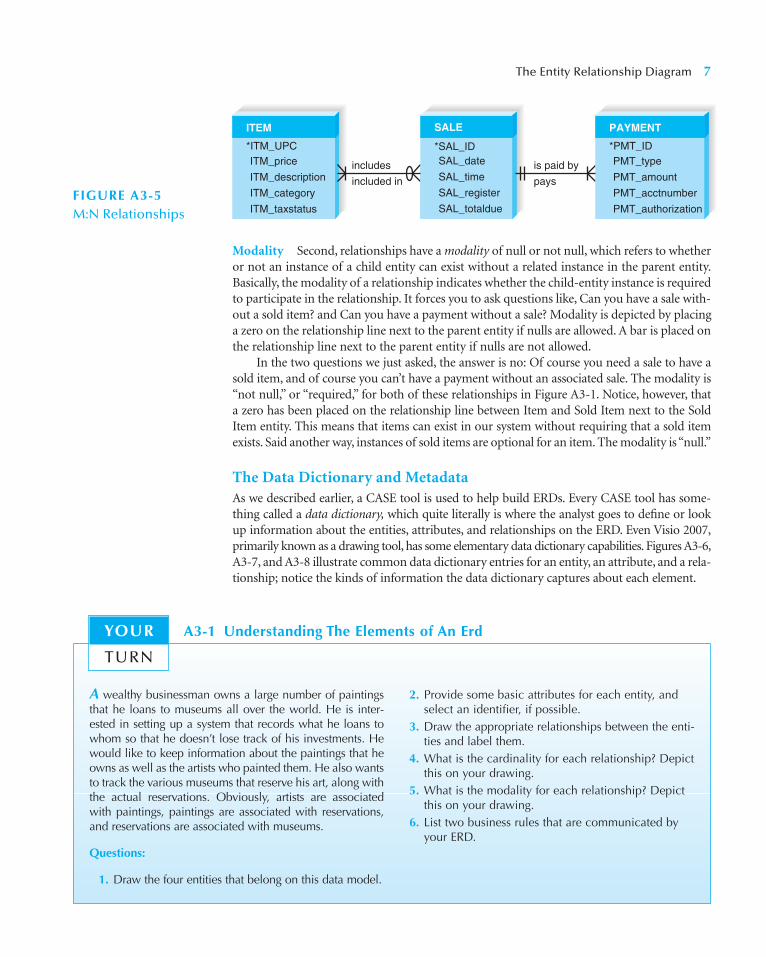
Modality Second, relationships have a modality of null or not null, which refers to whetheror not an instance of a child entity can exist without a related instance in the parent entity.Basically, the modality of a relationship indicates whether the child-entity instance is requiredto participate in the relationship. It forces you to ask questions like, Can you have a sale with-out a sold item? and Can you have a payment without a sale? Modality is depicted by placinga zero on the relationship line next to the parent entity if nulls are allowed. A bar is placed onthe relationship line next to the parent entity if nulls are not allowed.
In the two questions we just asked, the answer is no: Of course you need a sale to have asold item, and of course you can’t have a payment without an associated sale. The modality is“not null,” or “required,” for both of these relationships in Figure A3-1. Notice, however, thata zero has been placed on the relationship line between Item and Sold Item next to the SoldItem entity. This means that items can exist in our system without requiring that a sold itemexists. Said another way, instances of sold items are optional for an item. The modality is “null.”
The Data Dictionary and MetadataAs we described earlier, a CASE tool is used to help build ERDs. Every CASE tool has some-thing called a data dictionary, which quite literally is where the analyst goes to define or lookup information about the entities, attributes, and relationships on the ERD. Even Visio 2007,primarily known as a drawing tool, has some elementary data dictionary capabilities. Figures A3-6,A3-7, and A3-8 illustrate common data dictionary entries for an entity, an attribute, and a rela-tionship; notice the kinds of information the data dictionary captures about each element.
The Entity Relationship Diagram 7
FIGURE A3-5M:N Relationships
A wealthy businessman owns a large number of paintingsthat he loans to museums all over the world. He is inter-ested in setting up a system that records what he loans towhom so that he doesn’t lose track of his investments. Hewould like to keep information about the paintings that heowns as well as the artists who painted them. He also wantsto track the various museums that reserve his art, along withthe actual reservations. Obviously, artists are associatedwith paintings, paintings are associated with reservations,and reservations are associated with museums.
Questions:
1. Draw the four entities that belong on this data model.
2. Provide some basic attributes for each entity, andselect an identifier, if possible.
3. Draw the appropriate relationships between the enti-ties and label them.
4. What is the cardinality for each relationship? Depictthis on your drawing.
5. What is the modality for each relationship? Depictthis on your drawing.
6. List two business rules that are communicated byyour ERD.
A3-1 Understanding The Elements of An ErdYOUR
TURN
includes
included in
is paid by
pays
ITM_price
ITM_description
ITM_category
ITM_taxstatus
*ITM_UPC
ITEM
PMT_type
PMT_amount
PMT_acctnumber
PMT_authorization
*PMT_ID
PAYMENT
*SAL_ID
SALE
SAL_date
SAL_time
SAL_register
SAL_totaldue
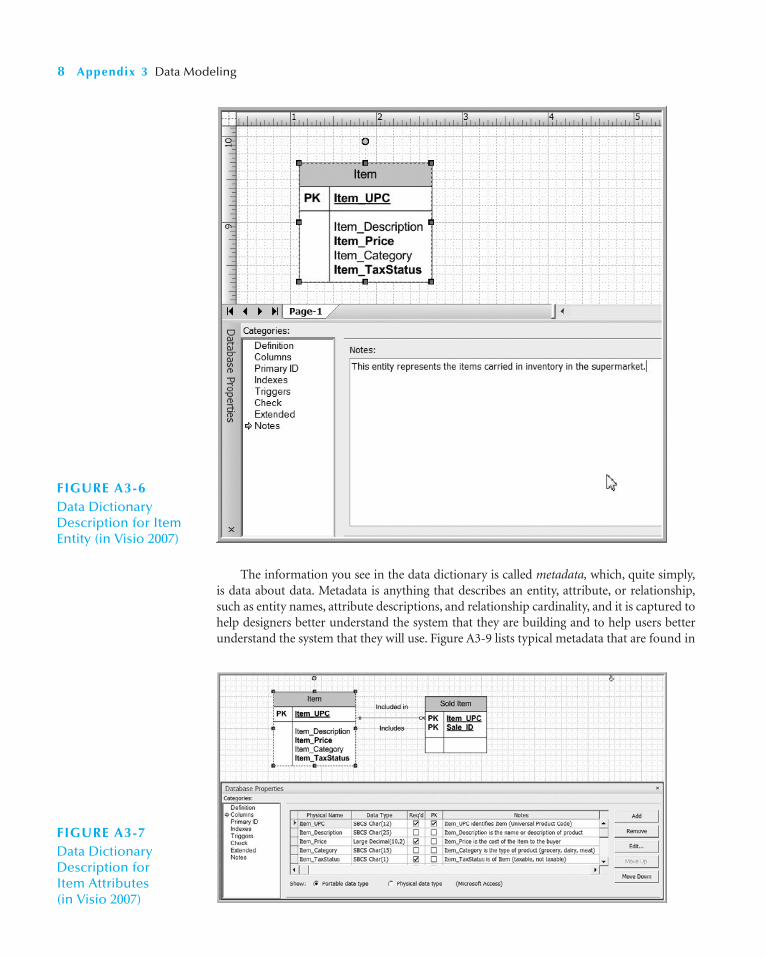
The information you see in the data dictionary is called metadata, which, quite simply,is data about data. Metadata is anything that describes an entity, attribute, or relationship,such as entity names, attribute descriptions, and relationship cardinality, and it is captured tohelp designers better understand the system that they are building and to help users betterunderstand the system that they will use. Figure A3-9 lists typical metadata that are found in
8 Appendix 3 Data Modeling
FIGURE A3-6Data DictionaryDescription for ItemEntity (in Visio 2007)
FIGURE A3-7Data DictionaryDescription for Item Attributes (in Visio 2007)

The Entity Relationship Diagram 9
FIGURE A3-8Data DictionaryDescription for Relationship(in Visio 2007)
Entity Name Item
Definition Represents any item carried in inventory in the supermarket
Special notes Includes produce, bakery, and deli items
User contact Nancy Keller (x6755) heads up the item coding department
Analyst contact John Michaels is the analyst assigned to this entity
Attribute Name Item_UPC
Definition The standard Universal Product Code for the item based on Global Trade ItemNumbers developed by GS1
Alias Item Bar Code
Sample values 036000291452; 034000126453
Acceptable values Any 12-digit set of numerals
Format 12 digit, numerals only
Type Stored as alphanumeric values
Special notes Values with the first digit of 2 are assigned locally, representing items packed in the store, such as meat, bakery, produce, or deli items. See Nancy Keller for more information.
Relationship Verb phrase Included in
Parent entity Item
Child entity Sold item
Definition An item is included in one or more sold items. A sold item includes one and only one item.
Cardinality 1:N
Modality Not null
Special notes
ERD Element Kinds of Metadata Example
FIGURE A3-9 Types of Metadata Captured by the Data Dictionary

the data dictionary. Notice that the metadata can describe an ERD element (like entityname) and also information that is helpful to the project team (like the user contact, theanalyst contact, and special notes).
Metadata are stored in the data dictionary so that they can be shared and accessed bydevelopers and users throughout the SDLC. The data dictionary allows you to record thestandard pieces of information about your elements in one place, and it makes that infor-mation accessible to many parts of a project. For example, the data attributes in a datamodel also appear on the process models as elements of data stores and data flows, and onthe user interface as fields on an input screen. When you make a change in the data dictio-nary, the change ripples to the relevant parts of the project that are affected.
When metadata are complete, clear, and shareable, the information can be used tointegrate the different pieces of the analysis phase and ultimately lead to a much betterdesign. It becomes much more detailed as the project evolves through the SDLC.
CREATING AN ENTITY RELATIONSHIP DIAGRAM
Drawing an ERD is an iterative process of trial and revision. It usually takes considerablepractice. ERDs can become quite complex—in fact, there are systems that have ERDs con-taining hundreds or thousands of entities. The basic steps in building an ERD are these:(1) Identify the entities, (2) add the appropriate attributes to each entity, and then (3) drawrelationships among entities to show how they are associated with one another. First, we willdescribe the three steps in creating ERDs, using the data model example from Figure A3-1.We will then discuss several advanced concepts of ERD’s. Finally, we will present an ERDfor Tune Source.
Building Entity Relationship DiagramsStep 1: Identify the Entities As we explained, the most popular way to start an ERD isto first identify the entities for the model, and their attributes. The entities should repre-sent the major categories of information that you need to store in your system. If theprocess models (e.g., DFDs) have been prepared, the easiest way to start is with them: Thedata stores on the DFDs, the external entities, and the data flows indicate the kinds of infor-mation that are captured and flow through the system. If you begin your data model byusing a use case, look at the major inputs to the use case, the major outputs, and the infor-mation used for the use case steps.
Examine the complete level 0 process model (Figure 5A-3) and the use cases (Figure 4-7)for the Holiday Travel Vehicle system. As you look at the level 0 diagram, you see that thereare a number of data stores: vehicle orders, new vehicles, offers, pending sales, sold vehi-cles, used vehicles, and the Green Book. Each of these unique collections of data has thepotential to become an entity on our data model.
10 Appendix 3 Data Modeling
Examine the CASE tool that you will be using for yourproject, or find a CASE tool on the Web that you areinterested in learning about. What kind of metadata
does its data dictionary capture? Does the CASE toolintegrate data model information with other parts of aproject? How?
A3-2 Evaluate Your Case ToolYOUR
TURN
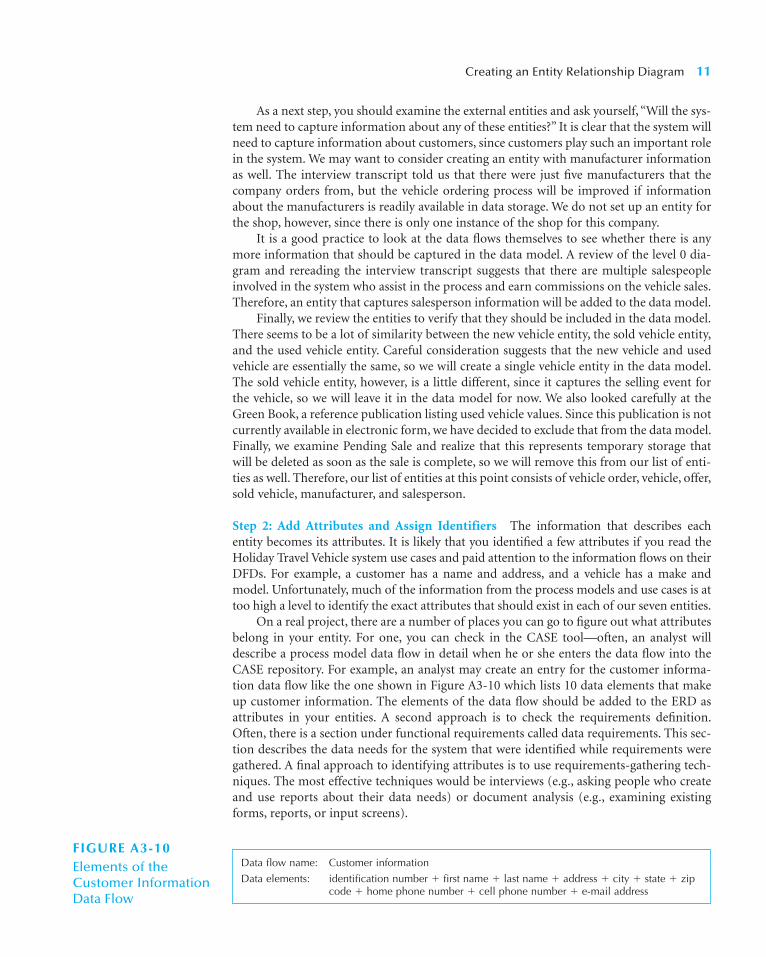
As a next step, you should examine the external entities and ask yourself, “Will the sys-tem need to capture information about any of these entities?” It is clear that the system willneed to capture information about customers, since customers play such an important rolein the system. We may want to consider creating an entity with manufacturer informationas well. The interview transcript told us that there were just five manufacturers that thecompany orders from, but the vehicle ordering process will be improved if informationabout the manufacturers is readily available in data storage. We do not set up an entity forthe shop, however, since there is only one instance of the shop for this company.
It is a good practice to look at the data flows themselves to see whether there is anymore information that should be captured in the data model. A review of the level 0 dia-gram and rereading the interview transcript suggests that there are multiple salespeopleinvolved in the system who assist in the process and earn commissions on the vehicle sales.Therefore, an entity that captures salesperson information will be added to the data model.
Finally, we review the entities to verify that they should be included in the data model.There seems to be a lot of similarity between the new vehicle entity, the sold vehicle entity,and the used vehicle entity. Careful consideration suggests that the new vehicle and usedvehicle are essentially the same, so we will create a single vehicle entity in the data model.The sold vehicle entity, however, is a little different, since it captures the selling event forthe vehicle, so we will leave it in the data model for now. We also looked carefully at theGreen Book, a reference publication listing used vehicle values. Since this publication is notcurrently available in electronic form, we have decided to exclude that from the data model.Finally, we examine Pending Sale and realize that this represents temporary storage thatwill be deleted as soon as the sale is complete, so we will remove this from our list of enti-ties as well. Therefore, our list of entities at this point consists of vehicle order, vehicle, offer,sold vehicle, manufacturer, and salesperson.
Step 2: Add Attributes and Assign Identifiers The information that describes eachentity becomes its attributes. It is likely that you identified a few attributes if you read theHoliday Travel Vehicle system use cases and paid attention to the information flows on theirDFDs. For example, a customer has a name and address, and a vehicle has a make andmodel. Unfortunately, much of the information from the process models and use cases is attoo high a level to identify the exact attributes that should exist in each of our seven entities.
On a real project, there are a number of places you can go to figure out what attributesbelong in your entity. For one, you can check in the CASE tool—often, an analyst willdescribe a process model data flow in detail when he or she enters the data flow into theCASE repository. For example, an analyst may create an entry for the customer informa-tion data flow like the one shown in Figure A3-10 which lists 10 data elements that makeup customer information. The elements of the data flow should be added to the ERD asattributes in your entities. A second approach is to check the requirements definition.Often, there is a section under functional requirements called data requirements. This sec-tion describes the data needs for the system that were identified while requirements weregathered. A final approach to identifying attributes is to use requirements-gathering tech-niques. The most effective techniques would be interviews (e.g., asking people who createand use reports about their data needs) or document analysis (e.g., examining existingforms, reports, or input screens).
Creating an Entity Relationship Diagram 11
Data flow name: Customer information
Data elements: identification number � first name � last name � address � city � state � zipcode � home phone number � cell phone number � e-mail address
FIGURE A3-10Elements of the Customer InformationData Flow
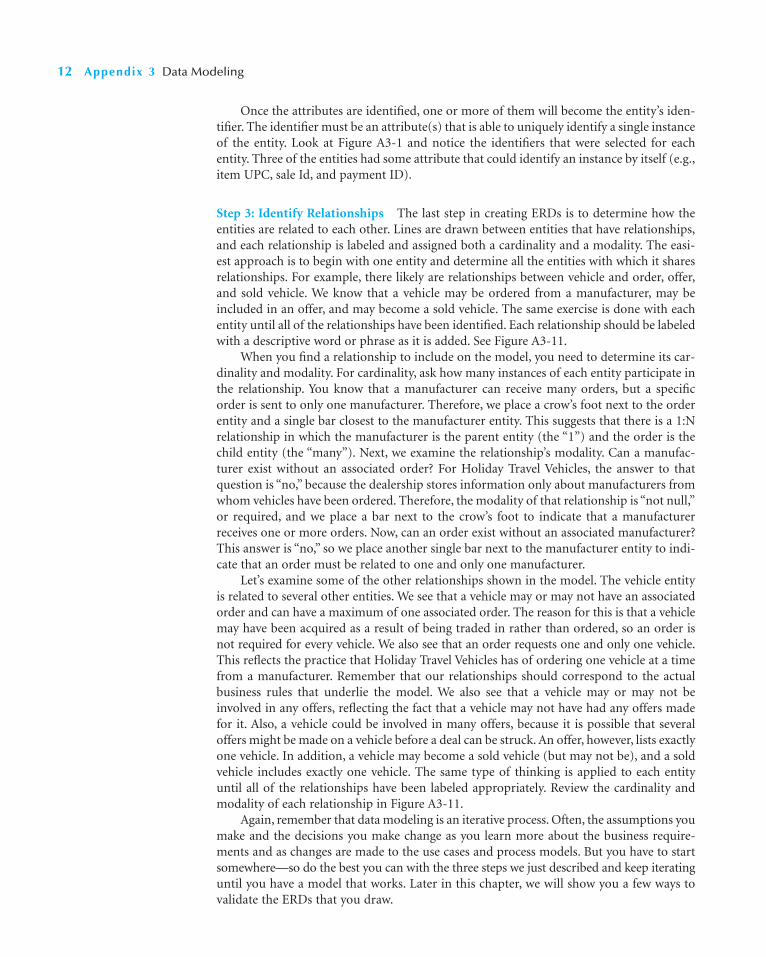
Once the attributes are identified, one or more of them will become the entity’s iden-tifier. The identifier must be an attribute(s) that is able to uniquely identify a single instanceof the entity. Look at Figure A3-1 and notice the identifiers that were selected for eachentity. Three of the entities had some attribute that could identify an instance by itself (e.g.,item UPC, sale Id, and payment ID).
Step 3: Identify Relationships The last step in creating ERDs is to determine how theentities are related to each other. Lines are drawn between entities that have relationships,and each relationship is labeled and assigned both a cardinality and a modality. The easi-est approach is to begin with one entity and determine all the entities with which it sharesrelationships. For example, there likely are relationships between vehicle and order, offer,and sold vehicle. We know that a vehicle may be ordered from a manufacturer, may beincluded in an offer, and may become a sold vehicle. The same exercise is done with eachentity until all of the relationships have been identified. Each relationship should be labeledwith a descriptive word or phrase as it is added. See Figure A3-11.
When you find a relationship to include on the model, you need to determine its car-dinality and modality. For cardinality, ask how many instances of each entity participate inthe relationship. You know that a manufacturer can receive many orders, but a specificorder is sent to only one manufacturer. Therefore, we place a crow’s foot next to the orderentity and a single bar closest to the manufacturer entity. This suggests that there is a 1:Nrelationship in which the manufacturer is the parent entity (the “1”) and the order is thechild entity (the “many”). Next, we examine the relationship’s modality. Can a manufac-turer exist without an associated order? For Holiday Travel Vehicles, the answer to thatquestion is “no,” because the dealership stores information only about manufacturers fromwhom vehicles have been ordered. Therefore, the modality of that relationship is “not null,”or required, and we place a bar next to the crow’s foot to indicate that a manufacturerreceives one or more orders. Now, can an order exist without an associated manufacturer?This answer is “no,” so we place another single bar next to the manufacturer entity to indi-cate that an order must be related to one and only one manufacturer.
Let’s examine some of the other relationships shown in the model. The vehicle entityis related to several other entities. We see that a vehicle may or may not have an associatedorder and can have a maximum of one associated order. The reason for this is that a vehiclemay have been acquired as a result of being traded in rather than ordered, so an order isnot required for every vehicle. We also see that an order requests one and only one vehicle.This reflects the practice that Holiday Travel Vehicles has of ordering one vehicle at a timefrom a manufacturer. Remember that our relationships should correspond to the actualbusiness rules that underlie the model. We also see that a vehicle may or may not beinvolved in any offers, reflecting the fact that a vehicle may not have had any offers madefor it. Also, a vehicle could be involved in many offers, because it is possible that severaloffers might be made on a vehicle before a deal can be struck. An offer, however, lists exactlyone vehicle. In addition, a vehicle may become a sold vehicle (but may not be), and a soldvehicle includes exactly one vehicle. The same type of thinking is applied to each entityuntil all of the relationships have been labeled appropriately. Review the cardinality andmodality of each relationship in Figure A3-11.
Again, remember that data modeling is an iterative process. Often, the assumptions youmake and the decisions you make change as you learn more about the business require-ments and as changes are made to the use cases and process models. But you have to startsomewhere—so do the best you can with the three steps we just described and keep iteratinguntil you have a model that works. Later in this chapter, we will show you a few ways tovalidate the ERDs that you draw.
12 Appendix 3 Data Modeling
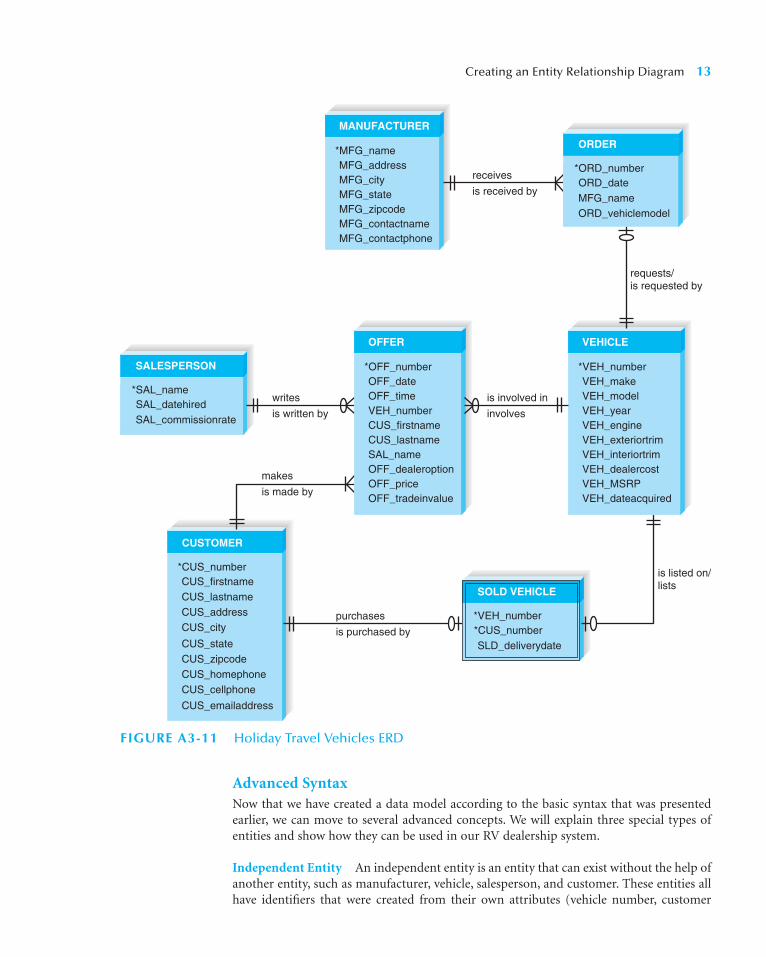
Advanced SyntaxNow that we have created a data model according to the basic syntax that was presentedearlier, we can move to several advanced concepts. We will explain three special types ofentities and show how they can be used in our RV dealership system.
Independent Entity An independent entity is an entity that can exist without the help ofanother entity, such as manufacturer, vehicle, salesperson, and customer. These entities allhave identifiers that were created from their own attributes (vehicle number, customer
Creating an Entity Relationship Diagram 13
FIGURE A3-11 Holiday Travel Vehicles ERD
*SAL_nameSAL_datehiredSAL_commissionrate
SALESPERSON
makes
is made by
*CUS_numberCUS_firstnameCUS_lastnameCUS_addressCUS_city
CUS_stateCUS_zipcodeCUS_homephoneCUS_cellphone
CUS_emailaddress
CUSTOMER
purchases
is purchased by
writes
is written by
*VEH_number*CUS_numberSLD_deliverydate
SOLD VEHICLE
*OFF_numberOFF_dateOFF_timeVEH_numberCUS_firstnameCUS_lastnameSAL_nameOFF_dealeroptionOFF_priceOFF_tradeinvalue
OFFER
*MFG_nameMFG_addressMFG_cityMFG_stateMFG_zipcodeMFG_contactnameMFG_contactphone
MANUFACTURER
*VEH_numberVEH_makeVEH_modelVEH_yearVEH_engineVEH_exteriortrimVEH_interiortrimVEH_dealercostVEH_MSRPVEH_dateacquired
VEHICLE
is involved in
involves
is listed on/lists
receives
is received by
requests/is requested by
*ORD_numberORD_dateMFG_nameORD_vehiclemodel
ORDER

number, manufacturer name). Attributes from other entities were not needed to uniquelyidentify instances of these entities. As shown in Figure A3-11, the vehicle number is suffi-cient to uniquely identify vehicles. Information from the order, offer, or sold vehicle enti-ties is not needed to identify a vehicle, even though these entities share relationships withthe vehicle entity. Independent entities are drawn as rectangles with a single border line.
When a relationship includes an independent child entity, it is called a non-identifyingrelationship. This name is derived from the fact that parent entity attributes are not neededas part of the child entity’s identifier. The customer-offer relationship is an example of anonidentifying relationship in Figure A3-11.
Dependent Entity There are situations when a child entity does require attributes fromthe parent entity to uniquely identify an instance. In these cases, the child entity is called adependent entity, and its identifier consists of at least one attribute from the parent entity.
A good example of a dependent entity is the Sold Vehicle entity shown in Figure A3-11.A sold vehicle is a specific vehicle that has been sold to a specific customer. To fully identifythe Sold Vehicle entity, we use the vehicle number from the Vehicle entity and the customernumber from the Customer entity as the sold vehicle identifiers. Since attributes from bothparent entities are used as identifier attributes in the Sold Vehicle entity, Sold Vehicle is con-sidered a dependent entity and is shown as a rectangle with a double border line.
When relationships have a dependent child entity, they are called identifying relation-ships. This name is derived from the fact that parent entity attributes are needed as part ofthe child entity’s identifier.
Intersection Entity A third kind of entity is the intersection entity. It exists in order tocapture some information about the relationship between two other entities. Typically,intersection entities are added to a data model to store information about two entitiessharing an M:N relationship. These entities are also called Associative Entities. Thinkback to the M:N relationship between Sale and Item shown in Figure A3-5. In that fig-ure, one instance of an Item (tortilla chips) could occur with many Sales, and a Sale caninclude many Items (tortilla chips, salsa, cheese). A difficulty arises if we want to cap-ture the date on which a particular item was included in a sale. We cannot put the datein the Item entity, because the Item is involved in many Sales. We also cannot put thedate in the Sale entity, because there are many items involved in the Sale. Therefore, weneed another entity that enables us to associate a specific item with a specific sale. Recallthat the version of the supermarket ERD shown in Figure A3-1 did include such anentity (Sold Item).
The process of adding an intersection entity is called “resolving an M:N relation-ship” because it eliminates the M:N relationship and its associated problems from thedata model. There are three steps involved in adding an intersection entity. Step 1:Remove the M:N relationship line and insert a new entity in between the two existingones. Step 2: Add two 1:N relationships to the model. The two original entities shouldserve as the parent entities for each 1:N, and the new intersection entity becomes thechild entity in both relationships. Step 3: Name the intersection entity. Intersection enti-ties are often named by a concatenation of the two entities that created it (e.g., SoldItem), making its meaning clear. Alternatively, the entity can be given another appropri-ate name. Figure A3-12 shows the M:N Item-Sale relationship and how it was resolvedwith the use of an intersection entity.
Are intersection entities dependent or independent? Actually, it depends. Sometimesan intersection entity has a logical identifier that can uniquely identify its instances. Forexample, an intersection entity between a student and a course (a student may take many
14 Appendix 3 Data Modeling

courses and a course is taken by many students) may be called a transcript. If transcriptshave unique transcript numbers, then the entity would be considered independent. Incontrast, the Sold Item intersection entity in Figure A3-12 requires the identifiers fromboth Sale and Item for an instance to be uniquely identified. Thus, Sold Item is a depen-dent entity.
Applying the Concepts at Tune SourceLet’s go through one more example of creating a data model by using the context of TuneSource. For now, review the use cases that were presented in Figure 4-11 and the final level 0process model presented in Figure A2-15.
Identify the Entities When you examine the Tune Source level 0 DFD, you see that thereare six data stores: customer, sale, available tunes, customer interests, customer favorites,and targeted promotions. Each of these unique types of data likely will be represented byentities on a data model.
As a next step, you should examine the external entities and ask yourself, “Will the sys-tem need to capture information about any of these entities?” You may be tempted toinclude marketing managers, but there really is no need to track information about thesein our system. Later, we may want to track system users, passwords, and data access privi-leges, but this information has to do with the use of the new system and would not beadded until the physical data model is created in the design phase.
It is good practice to also look at the data flows on your process model and make surethat all of the information that flows through the system has been covered by your ERD.Unlike the situation in Holiday Travel Vehicle, the example (which found an additionalentity by looking at the data flows), it appears that the main entities for Tune Source havebeen identified after an examination of the data stores and external entities. See Figure A3-13for the beginning of our data model.
Identify the Attributes The next step is to select which attributes should be used todescribe each entity. It is likely that you identified a handful of attributes if you read the
Creating an Entity Relationship Diagram 15
FIGURE A3-12 Resolving an M:N Relationship
included in
includes
involves
involved in
is paid by
pays*ITM_UPC*SAL_ID
SOLD ITEM
ITM_price
ITM_description
ITM_category
ITM_taxstatus
*ITM_UPC
ITEM
PMT_type
PMT_amount
PMT_acctnumber
PMT_authorization
*PMT_ID
PAYMENT
*SAL_ID
SALE
SAL_date
SAL_time
SAL_register
SAL_totaldue
is paid by
pays
ITM_price
ITM_description
ITM_category
ITM_taxstatus
*ITM_UPC
ITEM
PMT_type
PMT_amount
PMT_acctnumber
PMT_authorization
*PMT_ID
PAYMENT
*SAL_ID
SALE
SAL_date
SAL_time
SAL_register
SAL_totaldue
includes
included in

Tune Source use cases and examined the DFDs. For example, an available tune has an artist,title, genre, and length, and some attributes of customer are name and contact information,which likely includes address, phone number, and e-mail address.
The two entities customer favorite and customer interest might seem similar at firstglance, but they are used to capture different types of information about the customer’smusic preferences. A customer favorite is a tune that the customer specifically adds tohis/her Favorites list in order to monitor tunes as the Web site is searched and browsed. Ina sense, it’s like a future shopping list, so we just record the customer’s ID, the tune’s ID,and the date the tune was added to the list. The customer’s Favorites are available each timethe customer revisits the site to help in recalling tunes previously discovered and to (hope-fully) purchase them. On the other hand, the customer interest is created automatically asthe customer investigates tunes and listens to samples. Customer interests are used by themarketing department to help design promotions for the customer that will be tailored tothe types of music the customer has explored. Slightly different attributes are associatedwith these two entities because of their different purposes in the system.
Targeted promotions are special offers that will be created for a customer on the basisof his or her interests and with regard to sales patterns. A promotion will include a saleprice for a specific tune if it is purchased within a specific time frame. Attributes for the tar-geted promotions are listed in Figure A3-14. Finally, we also see that several attributes asso-ciated with a tune sale have been listed in the ERD.
To determine the entity identifiers, we consider the attribute or attributes that willuniquely identify each entity. We will establish a customer number for each customer in the
16 Appendix 3 Data Modeling
FIGURE A3-13Entities for Tune Source ERD
AVAILABLE TUNE SALE CUSTOMER INTEREST
CUSTOMER FAVORITE CUSTOMER TARGETED PROMOTION
CUSTOMER
*CUS_numberCUS_lastnameCUS_firstnameCUS_addressCUS_cityCUS_stateCUS_zipcodeCUS_phoneCUS_emailCUS_usernameCUS_password
AVAILABLE TUNE
* TUN_IDTUN_titleTUN_artistTUN_genreTUN_lengthTUN_priceTUN_mp3shortTUN_mp3full
TARGETED PROMOTION
* PRO_codeCUS_numberTUN_IDPRO_pricePRO_term
SALE
*SAL_numberSAL_dateCUS_username
one or more occurrences of: TUN_ID
*TUN_ID*FAV_dateadded
CUSTOMER FAVORITE
*CUS_number
*TUN_ID*INT_datecreated
CUSTOMER INTEREST
*CUS_number
FIGURE A3-14 Attributes and Identifiers for Tune Source ERD

system. Each available tune that we have will be assigned a unique tune ID. Each targetedpromotion will be given a unique promotion code, and each sale will be given a unique salenumber. Finally, each customer favorite and each customer interest can be uniquely iden-tified by the customer number, tune ID, and the date created.
The customer, sale, available tune, and targeted promotion entities are independententities; attributes from other entities are not needed to uniquely identify instances. Theidentifiers for customer interests and customer favorites, however, do rely on attributesfrom their parent entities: customer and available tune. This is because a customerfavorite (or a customer interest) is uniquely identified by the customer who created it,the tune involved, and the date it was created. Therefore, since these two entities drawpart of their primary keys from their parent entities, they are considered dependententities.
Identify the Relationships The last step in creating ERDs is to determine how the enti-ties are related to each other. Lines are drawn between entities that have relationships, andeach relationship is labeled and assigned a cardinality and modality. A shown in Figure A3-15,a customer may make many sales, but a sale is made by one customer. A sale is notrequired for a particular customer instance, but a customer is required for a sale. A cus-tomer may be targeted by many targeted promotions, but a targeted promotion is for onecustomer. A targeted promotion is not required for a customer, but a customer is requiredfor a targeted promotion. A customer creates many favorites, but a favorite is created byonly one customer. A favorite is not required for a customer, but a customer is requiredfor a favorite. An available tune may be included in many customers’ favorites, but afavorite includes only one tune. A favorite is not required for an available tune, but a tuneis required for a favorite. (The same relationships apply to customer–interest–availabletune). We can also see that an available tune may be promoted by many targeted promo-tions, but a targeted promotion promotes only one tune. An available tune is not requiredto have a targeted promotion, but a targeted promotion must be associated with an avail-able tune. Finally, we see that customers may place many sales, but a sale is not requiredfor a customer. A sale belongs to one and only one customer. A sale may include manytunes, and a tune may be included on many sales. A tune is required on a sale, but a saleis not required for a tune.
The customer–customer favorite, customer favorite–available tune, customer–cus-tomer interest, and customer interest–available tune relationships are identifying relation-ships. All other relationships are nonidentifying relationships.
As a final step in the creation of the Tune Source ERD, we should resolve any M:N rela-tionships in the data model. A look at Figure A3-15 shows one such relationship, betweensale and available tune. See Your Turn A3-6 and resolve this relationship on your own.
VALIDATING AN ERD
As you probably guessed from the previous section, creating ERDs is pretty tough. Ittakes a lot of experience to draw ERDs well, and there are not many black-and-whiterules to help guide you. Luckily, there are some general design guidelines that you cankeep in mind as you build ERDs, and once the ERDs are drawn, you can use a techniquecalled normalization to validate that your models are well formed. Another technique isto check your ERD against your process models to make sure that both models balanceeach other.
Validating an ERD 17
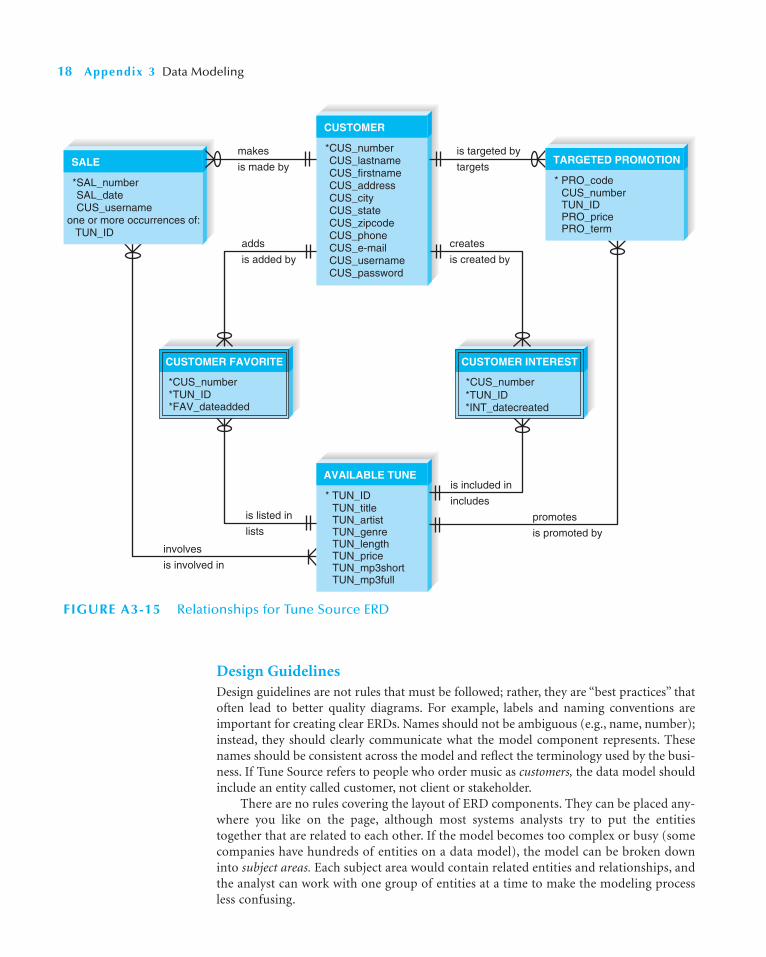
Design GuidelinesDesign guidelines are not rules that must be followed; rather, they are “best practices” thatoften lead to better quality diagrams. For example, labels and naming conventions areimportant for creating clear ERDs. Names should not be ambiguous (e.g., name, number);instead, they should clearly communicate what the model component represents. Thesenames should be consistent across the model and reflect the terminology used by the busi-ness. If Tune Source refers to people who order music as customers, the data model shouldinclude an entity called customer, not client or stakeholder.
There are no rules covering the layout of ERD components. They can be placed any-where you like on the page, although most systems analysts try to put the entitiestogether that are related to each other. If the model becomes too complex or busy (somecompanies have hundreds of entities on a data model), the model can be broken downinto subject areas. Each subject area would contain related entities and relationships, andthe analyst can work with one group of entities at a time to make the modeling processless confusing.
18 Appendix 3 Data Modeling
AVAILABLE TUNE
* TUN_IDTUN_titleTUN_artistTUN_genreTUN_lengthTUN_priceTUN_mp3shortTUN_mp3full
CUSTOMER
*CUS_numberCUS_lastnameCUS_firstnameCUS_addressCUS_cityCUS_stateCUS_zipcodeCUS_phoneCUS_e-mailCUS_usernameCUS_password
SALE
*SAL_number SAL_dateCUS_username
one or more occurrences of: TUN_ID
*TUN_ID*FAV_dateadded
CUSTOMER FAVORITE
*CUS_number*TUN_ID*INT_datecreated
CUSTOMER INTEREST
*CUS_number
is targeted by
targets
adds
is added by
is listed in
lists
involves
is involved in
creates
is created by
is included in
includes
promotes
is promoted by
makes
is made byTARGETED PROMOTION
* PRO_codeCUS_numberTUN_IDPRO_pricePRO_term
FIGURE A3-15 Relationships for Tune Source ERD
Validating an ERD 19
I have two very different stories regarding data models.First, when I worked with First American Corporation, thehead of Marketing kept a data model for the marketingsystems hanging on a wall in her office. I thought this wasa little unusual for a high-level executive, but sheexplained to me that data was critical for most of the ini-tiatives that she puts in place. Before she can approve amarketing campaign or new strategy, she likes to confirmthat the data exists in the systems and that it’s accessible toher analysts. She has become very good at understandingERDs over the years because they had been such animportant communications tool for her to use with herown people and with IT.
On a very different note, here is a story I receivedfrom a friend of mine who heads up an IT department:
“We were working on a business critical, time depen-dent development effort, and VERY senior managementdecided that the way to ensure success was to have the var-ious teams do technical design walkthroughs to senior man-agement on a weekly basis. My team was responsible forthe data architecture and database design. How couldsenior management, none of whom probably had everdesigned an Oracle architecture, evaluate the soundness ofour work?
So, I had my staff prepare the following for the one(and only) design walkthrough our group was asked to do.First, we merged several existing data models and thenduplicated each one . . . that is, every entity and relation-ship printed twice (imitating, if asked, the redundant archi-tecture). Then we intricately color coded the model andprinted the model out on a plotter and printed one copy ofevery inch of model documentation we had. On the dayof the review, I simply wheeled in the documentation andstretched the plotted model across the executive board-room table. ’Any questions,’ I asked? ’Very impressive,’they replied. That was it! My designs were never ques-tioned again.”
Barbara Wixom
Questions:
1. From these two stories, what do you think is theuser’s role in data modeling?
2. When is it appropriate to involve users in the ERDcreation process?
3. How can users help analysts create better ERDs?
A3-A The User’s Role In Data ModelingCONCEPTS
IN ACTION
Consider the accompanying system, which was describedin Chapter 4. Use the use cases and process models thatyou created in Chapters 4 and 5 to help you answer thequestions that follow.
The Campus Housing Service helps students findapartments. Owners of apartments fill in informationforms about the rental units they have available (e.g.,location, number of bedrooms, monthly rent). Studentswho register with the service can search the rentalinformation to find apartments that meet their needs(e.g., a two-bedroom apartment for $800 or less permonth within 1/2 mile of campus). They then contactthe apartment owners directly to see the apartmentand, possibly, rent it. Apartment owners call the service
to delete their listing when they have rented their apartment(s).
Questions:
1. What entities would you include on a data model?2. What attributes would you list for each entity?
Select an identifier for each entity, if possible.3. What relationships exist between the entities that
you identified? Label the relationships appropriately,and denote the cardinality and modality of eachrelationship.
A3-3 Campus Housing SystemYOUR
TURN

20 Appendix 3 Data Modeling
Locate the independent entities on Figure A3-15. Howdo you know which of the entities are independent?Locate the nonidentifying relationships. How did you
find them? Can you create a rule that describes the asso-ciation between independent entities and nonidentify-ing relationships?
A3-4 Independent EntitiesYOUR
TURN
Locate the dependent entities on Figure A3-15. Locatethe identifying relationships. How did you find them? Can
you create a rule that describes the association betweendependent entities and identifying relationships?
A3-5 Dependent EntitiesYOUR
TURN
Resolve the M:N relationship between the sale and avail-able tune that is shown in Figure A3-15. What kinds ofinformation could you capture about this relationship?What would the new ERD look like? Would the intersec-tion entity be considered dependent or independent?
Can you think of other kinds of M:N relationshipsthat exist in the real world? How would you resolve theseM:N relationships if you were to include them on anERD?
A3-6 Intersection EntitiesYOUR
TURN
A large direct health and insurance medical providerneeded an enterprise information management (EIM) systemto enable enterprisewide information management and tosupport the effective use of data for critical cross-functionaldecision making. In addition, the company needed toresolve issues related to data redundancy, inconsistency,and unnecessary expenditure. The company faced severalinformation challenges: The company data resided in multi-ple locations, the data were developed for department-specific use, and there was limited enterprise access. Inaddition, data definitions were created by individual depart-
ments and were not standardized, and data were beingmanaged by multiple departments within the company.
Source: http://www.deloitte.com/dtt/case_study/o, 1005,sid%253D26562%2526cid%253D132760,00.html
Questions:
1. What solution would you propose for this company?
2. Discuss the role that data modeling would play in a project to solve this problem.
A3-B Implementing an EIM SystemCONCEPTS
IN ACTION
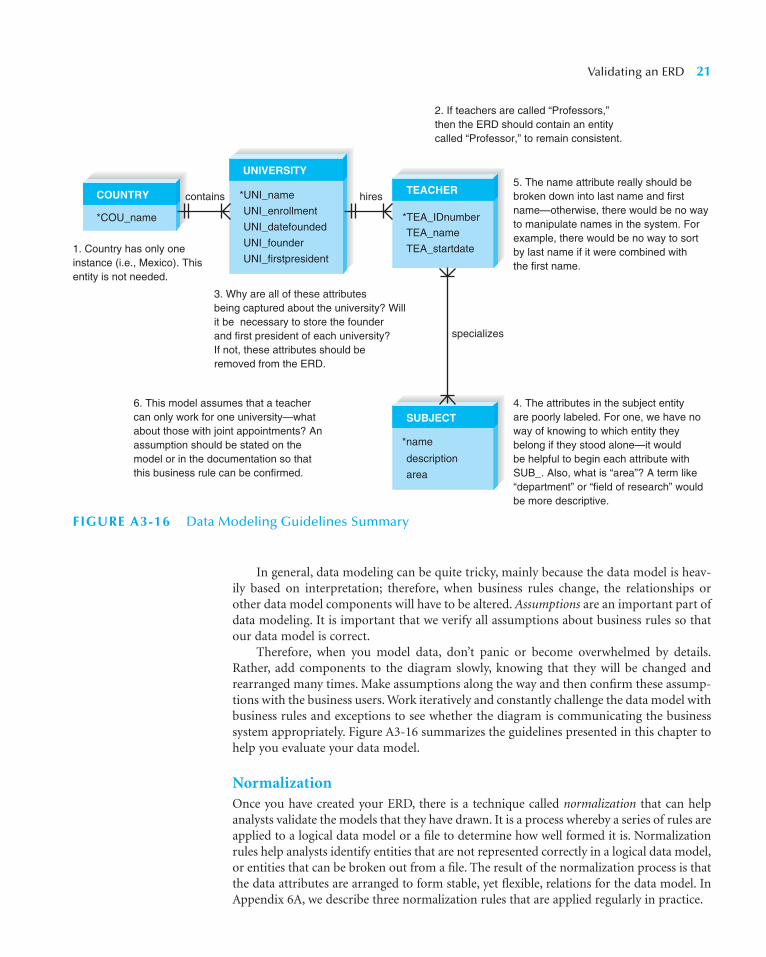
In general, data modeling can be quite tricky, mainly because the data model is heav-ily based on interpretation; therefore, when business rules change, the relationships orother data model components will have to be altered. Assumptions are an important part ofdata modeling. It is important that we verify all assumptions about business rules so thatour data model is correct.
Therefore, when you model data, don’t panic or become overwhelmed by details.Rather, add components to the diagram slowly, knowing that they will be changed andrearranged many times. Make assumptions along the way and then confirm these assump-tions with the business users. Work iteratively and constantly challenge the data model withbusiness rules and exceptions to see whether the diagram is communicating the businesssystem appropriately. Figure A3-16 summarizes the guidelines presented in this chapter tohelp you evaluate your data model.
NormalizationOnce you have created your ERD, there is a technique called normalization that can helpanalysts validate the models that they have drawn. It is a process whereby a series of rules areapplied to a logical data model or a file to determine how well formed it is. Normalizationrules help analysts identify entities that are not represented correctly in a logical data model,or entities that can be broken out from a file. The result of the normalization process is thatthe data attributes are arranged to form stable, yet flexible, relations for the data model. InAppendix 6A, we describe three normalization rules that are applied regularly in practice.
Validating an ERD 21
*COU_name
COUNTRY
UNIVERSITY
*UNI_name
UNI_datefounded
UNI_enrollment
UNI_firstpresident
UNI_founder
*TEA_IDnumber
TEA_startdate
TEA_name
*name
SUBJECT
area
description
TEACHERhires
specializes
contains
1. Country has only oneinstance (i.e., Mexico). Thisentity is not needed.
3. Why are all of these attributesbeing captured about the university? Willit be necessary to store the founderand first president of each university?If not, these attributes should beremoved from the ERD.
5. The name attribute really should bebroken down into last name and firstname—otherwise, there would be no wayto manipulate names in the system. Forexample, there would be no way to sortby last name if it were combined with the first name.
4. The attributes in the subject entityare poorly labeled. For one, we have noway of knowing to which entity theybelong if they stood alone—it would be helpful to begin each attribute withSUB_. Also, what is “area”? A term like “department” or “field of research” would be more descriptive.
6. This model assumes that a teachercan only work for one university—whatabout those with joint appointments? Anassumption should be stated on the model or in the documentation so thatthis business rule can be confirmed.
2. If teachers are called “Professors,”then the ERD should contain an entitycalled “Professor,” to remain consistent.
FIGURE A3-16 Data Modeling Guidelines Summary

Balancing Entity Relationship Diagrams with Data Flow DiagramsAll the analysis activities of the systems analyst are interrelated. For example, the requirementsanalysis techniques are used to determine how to draw both the process models and data mod-els, and the CASE repository is used to collect information that is stored and updated through-out the entire analysis phase. Now we will see how the process models and data models areinterrelated.
Although the process model focuses on the processes of the business system, itcontains two data components—the data flow (which is composed of data elements) andthe data store. The purposes of these are to illustrate what data are used and createdby the processes and where those data are kept. These components of the DFD need tobalance with the ERD. In other words, the DFD data components need to correspond withthe ERD’s data stores (i.e., entities) and the data elements that comprise the data flows(i.e., attributes) depicted on the data model.
Many CASE tools offer the feature of identifying problems with balance betweenDFDs and ERDs; however, it is a good idea to understand how to identify problems on yourown. This involves examining the data model you have created and comparing it with theprocess models that have been created for the system. Check your data model and seewhether there are any entities you have created that do not appear as data stores on yourprocess models. If there are, you should add them to your process models to reflect yourdecision to store information about that entity in your system.
Similarly, the bits of information that are contained in the data flows (these are usu-ally denned in the CASE entry for the data flow) should match up to the attributes foundin entities in the data models. For example, if the customer information data flow that goesfrom the customer entity to the purchase tunes process were denned as having customername, e-mail address, and home address, then each of these pieces of information shouldbe recorded as attributes in the customer entity on the data model. We must verify that allthe data items included in the data stores and data flows in the process model have beenincluded somewhere as an entity attribute in the data model. We want to ensure that thedata model fully incorporates all the data identified in the process model. If it does not,then the data model is incomplete. In addition, all the data elements in the data modelshould appear as a part of a data store and data flow(s) in the process model. If some dataelements have been omitted from the process model, then we need to investigate whether
22 Appendix 3 Data Modeling
A charter company owns boats that are used for chartertrips to islands. The company has created a computer sys-tem to track the boats it owns, including each boat’s IDnumber, name, and seating capacity. The company alsotracks information about the various islands, such as theirnames and populations. Every time a boat is chartered, itis important to know the date that the trip is to take placeand the number of people on the trip. The company alsokeeps information about each captain, such as SocialSecurity number, name, birthdate, and contact informa-tion for next of kin. Boats travel to only one island per visit.
Questions:
1. Create a data model. Include entities, attributes,identifiers, and relationships.
2. Which entities are dependent? Which are independent?
3. [Optinal] Use the steps of normalization to put yourdata model in 3NF. Describe how you know that itis in 3NF.
A3-7 Boat Charter CompanyYOUR
TURN
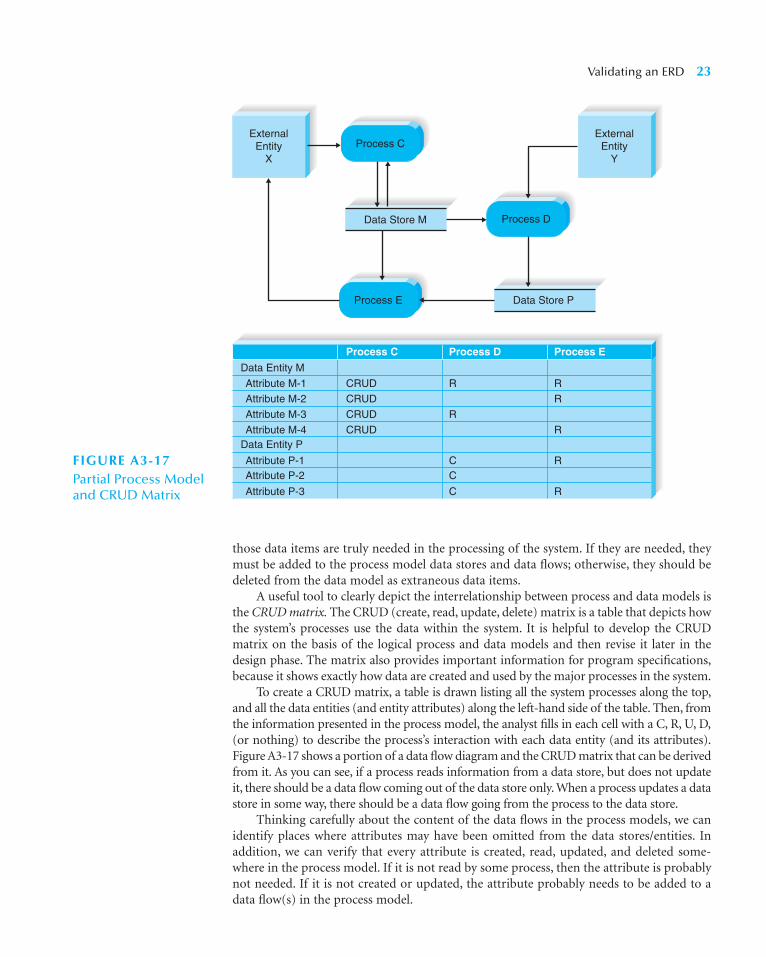
those data items are truly needed in the processing of the system. If they are needed, theymust be added to the process model data stores and data flows; otherwise, they should bedeleted from the data model as extraneous data items.
A useful tool to clearly depict the interrelationship between process and data models isthe CRUD matrix. The CRUD (create, read, update, delete) matrix is a table that depicts howthe system’s processes use the data within the system. It is helpful to develop the CRUDmatrix on the basis of the logical process and data models and then revise it later in thedesign phase. The matrix also provides important information for program specifications,because it shows exactly how data are created and used by the major processes in the system.
To create a CRUD matrix, a table is drawn listing all the system processes along the top,and all the data entities (and entity attributes) along the left-hand side of the table. Then, fromthe information presented in the process model, the analyst fills in each cell with a C, R, U, D,(or nothing) to describe the process’s interaction with each data entity (and its attributes).Figure A3-17 shows a portion of a data flow diagram and the CRUD matrix that can be derivedfrom it. As you can see, if a process reads information from a data store, but does not updateit, there should be a data flow coming out of the data store only. When a process updates a datastore in some way, there should be a data flow going from the process to the data store.
Thinking carefully about the content of the data flows in the process models, we canidentify places where attributes may have been omitted from the data stores/entities. Inaddition, we can verify that every attribute is created, read, updated, and deleted some-where in the process model. If it is not read by some process, then the attribute is probablynot needed. If it is not created or updated, the attribute probably needs to be added to adata flow(s) in the process model.
Validating an ERD 23
FIGURE A3-17Partial Process Modeland CRUD Matrix
Process D
Process E
Data Store M
Data Store P
Process C Process D Process E
Data Entity M
Attribute M-1
Attribute M-2
Attribute M-3
Data Entity P
Attribute P-1Attribute P-2
Attribute P-3
Attribute M-4
CRUD
CRUD
CRUD
CRUD
R R
R
R
R
R
R
CC
C
ExternalEntity
X
ExternalEntity
YProcess C

SUMMARY
Basic Entity Relationship Diagram SyntaxThe entity relationship diagram (ERD) is the most common technique for drawing a datamodel, a formal way of representing the data that are used and created by a business sys-tem. There are three basic elements in the data modeling language, each of which is repre-sented by a different graphic symbol. The entity is the basic building block for a datamodel. It is a person, place, or thing about which data are collected. An attribute is sometype of information that is captured about an entity.
The attribute that can uniquely identify one instance of an entity is called the identi-fier. The third data model component is the relationship, which conveys the associationsbetween entities. Relationships have cardinality (the ratio of parent instances to childinstances) and modality (a parent needs to exist if a child exists). Information about all ofthe components is captured by metadata in the data dictionary.
Creating an Entity Relationship DiagramThe basic steps in building an ERD are (1) identify the entities, (2) add the appropriateattributes to each entity, and (3) draw relationships among entities to show how they areassociated with one another. There are three special types of entities that ERDs contain.Most entities are independent, because one (or more) attribute can be used to uniquelyidentify an instance. Entities that rely on attributes from other entities to identify aninstance are dependent. An intersection entity is placed between two entities to captureinformation about their relationship. In general, data models are based on interpretation;therefore, it is important to clearly state assumptions that reflect business rules.
Validating an Entity Relationship DiagramNormalization, the process whereby a series of rules is applied to the logical data model todetermine how well formed it is, is described in the Chapter 6 Appendix. A logical datamodel is in first normal form (INF) if it does not contain repeating attributes, which areattributes that capture multiple values for a single instance. Second normal form (2NF)requires that all entities are in INF and contain only attributes whose values are dependenton the whole identifier (i.e., no partial dependency). Third normal form (3NF) occurswhen a model is in both INF and 2NF and none of the resulting attributes is dependent onnonidentifier attributes (i.e., no transitive dependency). With each violation, additionalentities should be created to remove the repeating attributes or improper dependenciesfrom the existing entities. Finally, ERDs should be balanced with the data flow diagrams(DFDs)—which were presented in Appendix 2—by making sure that data model entitiesand attributes correspond to data stores and data flows on the process model. The CRUDmatrix is a valuable tool to use when balancing process and data models.
24 Appendix 3 Data Modeling
KEY TERMS
1:1 relationship1:N relationshipAssumptionAttributeBalanceBusiness ruleCardinalityChild entityConcatenated identifier
CRUD matrixData dictionaryData modelDependentDependent entityDerived attributeEntityEntity relationship diagram (ERD)First normal form (INF)
IDEF1XIdentifierIdentifying relationshipIndependent entityInstanceIntersection entityLogical data modelM:N relationshipMetadata

Exercises 25
ModalityNonidentifying
relationshipNormalizationParent entity
Partial dependencyPhysical data modelRelationshipRepeating attributesRepeating groups
Second normal form (2NF)Subject areaThird normal form (3NF)TranscriptTransitive dependency
QUESTIONS
1. Provide three different options that are available forselecting an identifier for a student entity. What arethe pros and cons of each option?
2. What is the purpose of developing an identifier for anentity?
3. What type of high-level business rule can be stated byan ERD? Give two examples.
4. Define what is meant by an entity in a data model. Howshould an entity be named? What information aboutan entity should be stored in the CASE repository?
5. Define what is meant by an attribute in a data model.How should an attribute be named? What informa-tion about an attribute should be stored in the CASErepository?
6. Define what is meant by a relationship in a data model.How should a relationship be named? What informa-tion about a relationship should be stored in the CASErepository?
7. A team of developers is considering including “ware-house” as an entity in its data model. The company forwhom they are developing the system has just onewarehouse location. Should “ware house” be included?Why or why not?
8. What is meant by a concatenated identifier?9. Describe, in terms a businessperson could under
stand, what are meant by the cardinality and modalityof a relationship between two entities.
10. What are metadata? Why are they important to systemdevelopers?
11. What is an independent entity? What is a dependententity? How are the two types of entities differentiatedon the data model?
12. Explain the distinction between identifying and non-identifying relationships.
13. What is the purpose of an intersection entity? How doyou know whether one is needed in an ERD?
14. Describe the three-step process of creating an inter-section entity.
15. Is an intersection entity dependent or independent?Explain your answer.
16. What is the purpose of normalization?17. Describe the analysis that is applied to a data model in
order to place it in first normal form (1NF).18. Describe the analysis that is applied to a data model in
order to place it in second normal form (2NF).19. Describe the analysis that is applied to a data model in
order to place it in third normal form (3NF).20. Describe how the data model and process model
should be balanced against each other.21. What is a CRUD matrix? How does it relate to process
models and data models?
EXERCISES
A. Draw data models for the following entities:• Movie (title, producer, length, director, genre)• Ticket (price, adult or child, showtime, movie)• Patron (name, adult or child, age)
B. Draw a data model for the following entities, consider-ing the entities as representing a system for a patientbilling system and including only the attributes thatwould be appropriate for this context:• Patient (age, name, hobbies, blood type, occupation,
insurance carrier, address, phone)• Insurance carrier (name, number of patients on plan,
address, contact name, phone)
• Doctor (specialty, provider identification number,golf handicap, age, phone, name)
C. Draw the relationships that follow. Would the rela-tionships be identifying or nonidentifying? Why?• A patient must be assigned to only one doctor, and
a doctor can have many patients.• An employee has one phone extension, and a
unique phone extension is assigned to an employee.• A movie theater shows many different movies, and
the same movie can be shown at different movietheaters around town.

26 Appendix 3 Data Modeling
D. Draw an entity relationship diagram (ERD) for thefollowing situations:1. Whenever new patients are seen for the first time,
they complete a patient information form that askstheir name, address, phone number, and insurancecarrier, all of which are stored in the patient informa-tion file. Patients can be signed up with only one car-rier, but they must be signed up to be seen by thedoctor. Each time a patient visits the doctor, an insur-ance claim is sent to the carrier for payment. Theclaim must contain information about the visit, suchas the date, purpose, and cost. It would be possible fora patient to submit two claims on the same day.
2. The state of Georgia is interested in designing adatabase that will track its researchers. Informationof interest includes researcher name, title, position;university name, location, enrollment; and researchinterests. Each researcher is associated with onlyone institution, and each researcher has severalresearch interests.
3. A department store has a bridal registry. This reg-istry keeps information about the customer (usu-ally the bride), the products that the store carries,and the products for which each customer regis-ters. Customers typically register for a large num-ber of products, and many customers register forthe same products.
4. Jim Smith’s dealership sells Fords, Hondas, andToyotas. The dealership keeps information abouteach car manufacturer with whom it deals so thatemployees can get in touch with manufacturerseasily. The dealership also keeps information aboutthe models of cars that it carries from each manu-facturer. It keeps such information as list price, theprice the dealership paid to obtain the model, andthe model name and series (e.g., Honda Civic LX).The dealership also keeps information about allsales that it has made. (For instance, employees willrecord the buyer’s name, the car the buyer bought,and the amount the buyer paid for the car.) Toallow employees to contact the buyers in the future,contact information is also kept (e.g., address,phone number, e-mail).
E. Examine the data models that you created for Exer-cise D. How would the respective models change (ifat all) on the basis of these corresponding newassumptions?• Two patients have the same first and last names.• Researchers can be associated with more than one
institution.• The store would like to keep track of purchased
items.• Many buyers have purchased multiple cars from Jim
over time because he is such a good dealer.F. Visit a Web site that allows customers to order a prod-
uct over the Web (e.g., Amazon.com). Create a datamodel that the site needs to support its businessprocess. Include entities to show what types of infor-mation the site needs. Include attributes to representthe type of information the site uses and creates.Finally, draw relationships, making assumptions abouthow the entities are related.
G. Create metadata entries for the following data modelcomponents and, if possible, input the entries into acomputer-aided software engineering (CASE) tool ofyour choosing:• Entity—product• Attribute—product number• Attribute—product type• Relationship—company makes many products, and
any one product is made by only one company.H. Describe the assumptions that are implied from the
data model shown at the top of this page.I. Create a data model for one of the processes in the
end-of-chapter Exercises for Chapter 4. Explain howyou would balance the data model and process model.
J. Apply the steps of normalization to validate the mod-els you drew in Exercise D.
K. You have been given a file that contains fields relatingto CD information. Using the steps of normalization,create a logical data model that represents this file inthird normal form. The fields include the following:• Musical group name• Musicians in group• Date group was formed• Group’s agent
*CIN_name CIN_address CIN_phone
CINEMA THEATER SHOWING
*THE_number THE_capacity
*SHO_time SHO_date SHO_attendance
*MOV_ID MOV_title MOV_director MOV_rating
offers
is offered in
is shown at
shows
contains
is contained in
MOVIE

Minicases 27
• CD title 1• CD title 2• CD title 3• CD 1 length• CD 2 length• CD 3 length
The assumptions are as follows:• Musicians in group contains a list of the members
of the people in the musical group.• Musical groups can have more than one CD, so both
group name and CD title are needed to uniquelyidentify a particular CD.
MINICASES
1. West Star Marinas is a chain of 12 marinas that offerlakeside service to boaters; service and repair of boats,motors, and marine equipment; and sales of boats,motors, and other marine accessories. The systemsdevelopment project team at West Star Marinas hasbeen hard at work on a project that eventually willlink all the marina’s facilities into one unified, net-worked system.
The project team has developed a logical processmodel of the current system. This model has beencarefully checked for syntax errors. Last week, the teaminvited a number of system users to role-play the var-ious data flow diagrams, and the diagrams wererefined to the users’ satisfaction. Right now, the projectmanager feels confident that the as-is system has beenadequately represented in the process model.
The director of operations for West Star is thesponsor of this project. He sat in on the role-playingof the process model and was very pleased by thethorough job the team had done in developing themodel. He made it clear to you, the project manager,that he was anxious to see your team begin work onthe process model for the to-be system. He was a littleskeptical that it was necessary for your team to spendany time modeling the current system in the firstplace, but grudgingly admitted that the team reallyseemed to understand the business after goingthrough that work.
The methodology that you are following, however,specifies that the team should now turn its attention todeveloping the logical data model for the as-is system.When you stated this to the project sponsor, heseemed confused and a little irritated. “You are goingto spend even more time looking at the current sys-tem? I thought you were done with that! Why is thisnecessary? I want to see some progress on the waythings will work in the future!”a. What is your response to the director of operations?b. Why do we perform data modeling?
c. Is there any benefit to developing a data model ofthe current system at all?
d. How does the process model help us develop thedata model?
2. The system development team at the Wilcon Com-pany is working on developing a new customer orderentry system. In the process of designing the new sys-tem, the team has identified the following data entityattributes:
Inventory OrderOrder Number (identifier)Order DateCustomer NameStreet AddressCityStateZipCustomer TypeInitialsDistrict NumberRegion Number1 to 22 occurrences of:
Item NameQuantity OrderedItem UnitQuantity ShippedItem OutQuantity Received
a. State the rule that is applied to place an entity in firstnormal form. Revise this data model so that it is infirst normal form.
b. State the rule that is applied to place an entity into sec-ond normal form. Revise the data model (if necessary)to place it in second normal form.
c. State the rule that is applied to place an entity intothird normal form. Revise the data model to place it inthird normal form.
d. What other guidelines and rules can you follow to val-idate that your data model is in good form?

APPENDIX 3A: NORMALIZING THE DATA MODEL
In this Appendix, we describe the rules of normalization that help analysts improve thequality of the data model. These rules help identify entities that are not represented cor-rectly in the logical data model and entities that can be broken out from a file. The resultof the normalization process is that the data attributes are arranged to form stable yet flex-ible relations for the data model. Typically, three rules of normalization are applied regu-larly in practice. (See Figure 3A-1.) We describe these rules and illustrate them with anexample here.
First Normal Form A logical data model is in first normal form (INF) if it does not con-tain attributes that have repeating values for a single instance of an entity. Often, this prob-lem is called repeating attributes, or repeating groups. Every attribute in an entity shouldhave only one value per instance for the model to “pass” INF.
Let’s pretend that the Tune Source project team was given the layout for the CD pur-chase file that is used by the existing CD sales system. The team members are anxious toincorporate the data from this file into their own system, and they decide to put the file into
28 Appendix 3 Data Modeling
FIGURE 3A-1Normalization Steps
0 Normal Form
Yes: Remove the repeating attributes and repeating groups. Create an entity that describes the attributes. Usually, you will need to add a rela- tionship to connect the old and new entities.
Do any attributes have multiplevalues for a single instance ofan entity?
Yes: Remove the partial dependency. Move the attributes to an entity in which their values are dependent on the entire identifier. Usually, you will need to create a new entitiy and add a relationship to connect the old and new entities. No: The data model is in 2NF.
Is the identifier composed ofmore than one attribute? If so,are any attribute valuesdependent on just part of theidentifier?
No: The data model is in 1NF.
1 Normal Form
Yes: Remove the transitive dependency or derived attribute. Move the attributes to an entity in which their values are dependent on the identifier. Usually, you will need to create a new entity and add a relationship to connect the old and new entities.No: The data model is in 3NF.
Do any attribute values dependon an attribute that is not theentity’s identifier?
2 Normal Form
3 Normal Form

third normal form to make the information easier to understand and, ultimately, easier forthem to add to the data model for the new Digital Music Download system. See Figure 3A-2for the file layout that the project team received.
If you examine the file carefully, you should notice that there are two cases in whichmultiple values are captured for one or more attributes. The most obvious example is themultiple occurrences of CDs that are included in the purchase, a clear violation of INF. Therepeated group of attributes about each CD included in the purchase should be removedby creating a new entity called CD and placing all of the CD attributes into it. The relation-ship between purchase and CD is M:N, since a purchase can include many CDs and a CDcan be included in many purchases.
The second violation of INF may not be as readily noticed. The music preferencesattribute includes the kinds of music the customer prefers (e.g., classical, rock, jazz). Thefact that the attribute name is plural is a clue that many different preferences may be cap-tured for each instance of a sale and that music preferences is a repeating attribute. This canbe resolved by creating a new entity that contains preference information, and a relation-ship is added between CD purchase and preference. The new relationship is M:N, becausea CD purchase can be associated with many music preferences and a music preference canbe found on many CD purchases. See Figure 3A-3a for the current data model in INF.
Since we normally resolve M:N relationships as the ERD develops, we have done sonow in Figure 3A-3b. Note that a new intersection entity was inserted between CD Pur-chase and Preference to associate an instance of CD Purchase with specific instances ofpreference. Also, the intersection entity Purchased CD was inserted between CD Purchaseand CD. This intersection entity associates a CD purchase instance with specific CDinstances. The attribute ship date was moved to Purchased CD because the various CDs in
Appendix 3A: Normalizing the Data Model 29
FIGURE 3A-2Initial CD Sales System File
*Purchase date
CD Purchase
*Customer last name*Customer first namePhoneAddressE-mailBirthdateMusic preferencesOne or more occurrences of: CD UPC Title Artist Label Category PriceTotoal dueSale authorizationShip datePayment numberPayment typePayment account numberPayment authorizationPayment amount
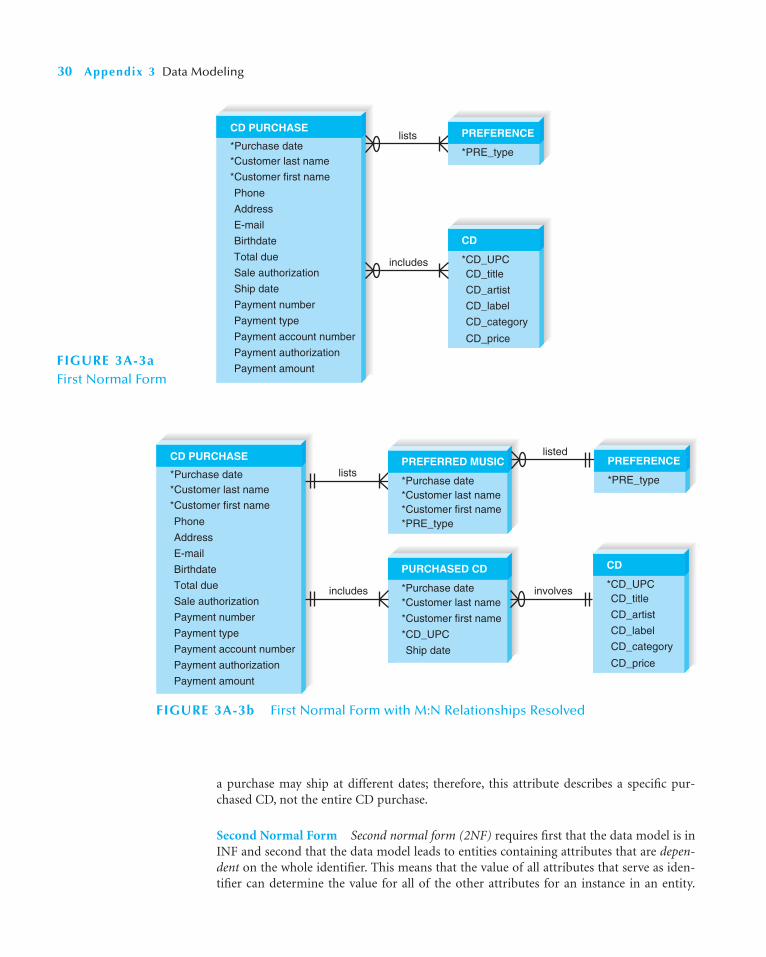
a purchase may ship at different dates; therefore, this attribute describes a specific pur-chased CD, not the entire CD purchase.
Second Normal Form Second normal form (2NF) requires first that the data model is inINF and second that the data model leads to entities containing attributes that are depen-dent on the whole identifier. This means that the value of all attributes that serve as iden-tifier can determine the value for all of the other attributes for an instance in an entity.
30 Appendix 3 Data Modeling
FIGURE 3A-3aFirst Normal Form
includes
lists
*Customer last name
*Customer first name
Phone
Address
Birthdate
Total due
Sale authorization
Payment number
Payment type
Payment account number
Payment authorization
Payment amount
*Purchase date
CD PURCHASE
*Purchase date
PURCHASED CD
*Customer last name
*Customer first name
*CD_UPC
Ship date
includes
PREFERRED MUSIC
*Purchase date*Customer last name*Customer first name*PRE_type
includes
listed
*CD_UPC
CD
CD_title
CD_artist
CD_label
CD_category
CD_price
involves
PREFERENCE
*PRE_type
includes
lists
*Customer last name
*Customer first name
Phone
Address
Birthdate
Total due
Sale authorization
Ship date
Payment number
Payment type
Payment account number
Payment authorization
Payment amount
*Purchase date
CD PURCHASE
*CD_UPC
CD
CD_title
CD_artist
CD_label
CD_category
CD_price
includes
PREFERENCE
*PRE_type
FIGURE 3A-3b First Normal Form with M:N Relationships Resolved

Sometimes, nonidentifier attributes are dependent on only part of the identifier (i.e., par-tial dependency), and these attributes belong in another entity.
Figure 3A-4 shows the CD purchase data model placed in 2NF. Notice that originally,the CD purchase entity had three attributes that were used as identifiers: purchase date, cus-tomer last name, and customer first name. The problem was that some of the attributeswere dependent on the customer last name and first name, but had no dependency on pur-chase date. These attributes were those that describe a customer: phone, address, e-mail,and birth date. To resolve this problem, a new entity called customer was created, and thecustomer attributes were moved into the new entity. A 1:N relationship exists betweencustomer and CD purchase because a customer can purchase many CDs, but a CD pur-chase is associated with only one customer.
Remember that the customer last name and first name are still used in the CD Purchaseentity—we know this because of the identifying 1:N relationship between customer and CDpurchase. The identifying relationship implies that the customer identifier (i.e., last nameand first name) are used in CD Purchase as a part of its identifier.
Notice that we moved the relationship with Preferred Music to the new Customerentity. Logically, a preference should be associated with a customer, not a particular CDpurchase.
Third Normal Form Third normal form (3NF) occurs when a model is in both INF and2NF and when, in the resulting entities, none of the attributes is dependent on a noniden-
Appendix 3A: Normalizing the Data Model 31
FIGURE 3A-4 Second Normal Form
*CUS_lastname
*CUS_firstname
Total due
Sale authorization
Payment number
Payment type
Payment account number
Payment authorization
Payment amount
*Purchase date
CD PURCHASE
*Purchase date
PURCHASED CD
*CUS_lastname
*CUS_firstname
*CD_UPC
Ship date
CUSTOMER
*CUS_lastname*CUS_firstnameCUS_phoneCUS_addressCUS_e-mailCUS_birthdate
specifies
makes
*CD_UPC
CD
CD_title
CD_artist
CD_label
CD_category
CD_price
involves
includes
PREFERENCE
*PRE_type
lists
includes
PREFERRED MUSIC
*CUS_lastname*CUS_firstname*PRE_type
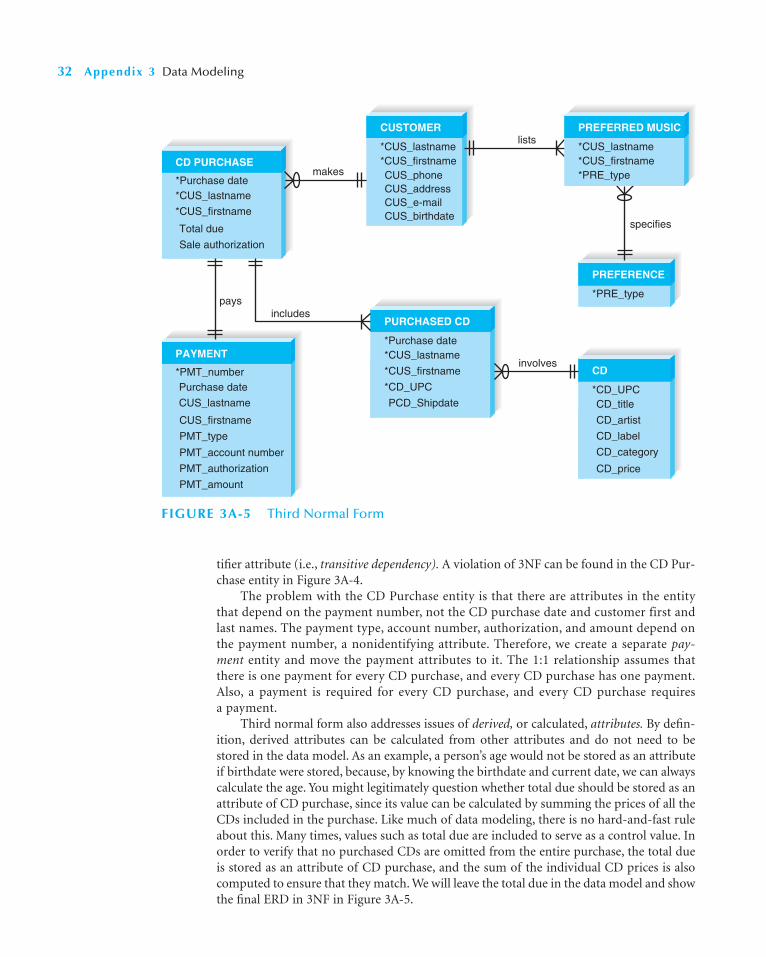
tifier attribute (i.e., transitive dependency). A violation of 3NF can be found in the CD Pur-chase entity in Figure 3A-4.
The problem with the CD Purchase entity is that there are attributes in the entitythat depend on the payment number, not the CD purchase date and customer first andlast names. The payment type, account number, authorization, and amount depend onthe payment number, a nonidentifying attribute. Therefore, we create a separate pay-ment entity and move the payment attributes to it. The 1:1 relationship assumes thatthere is one payment for every CD purchase, and every CD purchase has one payment.Also, a payment is required for every CD purchase, and every CD purchase requiresa payment.
Third normal form also addresses issues of derived, or calculated, attributes. By defin-ition, derived attributes can be calculated from other attributes and do not need to bestored in the data model. As an example, a person’s age would not be stored as an attributeif birthdate were stored, because, by knowing the birthdate and current date, we can alwayscalculate the age. You might legitimately question whether total due should be stored as anattribute of CD purchase, since its value can be calculated by summing the prices of all theCDs included in the purchase. Like much of data modeling, there is no hard-and-fast ruleabout this. Many times, values such as total due are included to serve as a control value. Inorder to verify that no purchased CDs are omitted from the entire purchase, the total dueis stored as an attribute of CD purchase, and the sum of the individual CD prices is alsocomputed to ensure that they match. We will leave the total due in the data model and showthe final ERD in 3NF in Figure 3A-5.
32 Appendix 3 Data Modeling
*CUS_lastname
*CUS_firstname
Total due
Sale authorization
*Purchase date
CD PURCHASE
Purchase date
CUS_lastname
CUS_firstname
PMT_type
PMT_account number
PMT_authorization
PMT_amount
*PMT_number
PAYMENT*Purchase date
PURCHASED CD
*CUS_lastname
*CUS_firstname
*CD_UPC
PCD_Shipdate
CUSTOMER
*CUS_lastname*CUS_firstnameCUS_phoneCUS_addressCUS_e-mailCUS_birthdate
specifies
makes
*CD_UPC
CD
CD_title
CD_artist
CD_label
CD_category
CD_price
includes
PREFERENCE
*PRE_type
lists
includespays
involves
PREFERRED MUSIC
*CUS_lastname*CUS_firstname*PRE_type
FIGURE 3A-5 Third Normal Form

Appendix 3A: Normalizing the Data Model 33
Pretend that you have been asked to build a system thattracks student involvement in activities around campus.You have been given a file with information that needs tobe imported into the system, and the file contains the fol-lowing fields:
■ Student Social Security number (identifier)■ Activity 1 code (identifier)■ Activity 1 description■ Activity 1 start date■ Activity 1 years with activity■ Activity 2 code■ Activity 2 description■ Activity 2 start date
■ Activity 3 code■ Activity 3 description■ Activity 3 start date■ Activity 3 years with activity■ Student last name■ Student first name■ Student birthdate■ Student age■ Student advisor name■ Student advisor phone
Normalize the file. Show how the logical data modelwould change as you move from 1NF to 2NF to 3NF.
3A-1 Normalizing A Student Activity FileYOUR
TURN