Recurrent Posterior Strokes in Inflammatory Bowel Disease Patients
Upload
oregonstateCategory
view
0download
0
RESEARCH Open Access
Summing the strokes: energy economy innorthern elephant seals during large-scaleforaging migrationsJL Maresh6*, T. Adachi2, A. Takahashi2,3, Y. Naito3, DE Crocker4, M. Horning5, TM Williams1 and DP Costa1
Abstract
Background: The energy requirements of free-ranging marine mammals are challenging to measure due to crypticand far-ranging feeding habits, but are important to quantify given the potential impacts of high-level predators onecosystems. Given their large body size and carnivorous lifestyle, we would predict that northern elephant seals(Mirounga angustirostris) have elevated field metabolic rates (FMRs) that require high prey intake rates, especiallyduring pregnancy. Disturbance associated with climate change or human activity is predicted to further elevateenergy requirements due to an increase in locomotor costs required to accommodate a reduction in prey or timeavailable to forage. In this study, we determined the FMRs, total energy requirements, and energy budgets of adult,female northern elephant seals. We also examined the impact of increased locomotor costs on foraging success inthis species.
Results: Body size, time spent at sea and reproductive status strongly influenced FMR. During the short foragingmigration, FMR averaged 90.1 (SE = 1.7) kJ kg−1d−1 – only 36 % greater than predicted basal metabolic rate. Duringthe long migration, when seals were pregnant, FMRs averaged 69.4 (±3.0) kJ kg−1d−1 – values approaching thosepredicted to be necessary to support basal metabolism in mammals of this size. Low FMRs in pregnant seals weredriven by hypometabolism coupled with a positive feedback loop between improving body condition and reducedflipper stroking frequency. In contrast, three additional seals carrying large, non-streamlined instrumentation saw afour-fold increase in energy partitioned toward locomotion, resulting in elevated FMRs and only half the mass gainof normally-swimming study animals.
Conclusions: These results highlight the importance of keeping locomotion costs low for successful foraging inthis species. In preparation for lactation and two fasting periods with high demands on energy reserves, migratingelephant seals utilize an economical foraging strategy whereby energy savings from reduced locomotion costs areshuttled towards somatic growth and fetal gestation. Remarkably, the energy requirements of this species,particularly during pregnancy, are 70–80 % lower than expected for mammalian carnivores, approaching or evenfalling below values predicted to be necessary to support basal metabolism in mammals of this size.
Keywords: Accelerometer, Aerobic dive limit, Body size, Disturbance, Field metabolic rate, Foraging,Hypometabolism, Locomotion, Pregnancy
* Correspondence: [email protected] of California Center for Ocean Health/Long Marine Lab, 100Shaffer Rd., Santa Cruz, CA 95060, USAFull list of author information is available at the end of the article
© 2015 Maresh et al. Open Access This article is distributed under the terms of the Creative Commons Attribution 4.0International License (http://creativecommons.org/licenses/by/4.0/), which permits unrestricted use, distribution, andreproduction in any medium, provided you give appropriate credit to the original author(s) and the source, provide a link tothe Creative Commons license, and indicate if changes were made. The Creative Commons Public Domain Dedication waiver(http://creativecommons.org/publicdomain/zero/1.0/) applies to the data made available in this article, unless otherwise stated.
Maresh et al. Movement Ecology (2015) 3:22 DOI 10.1186/s40462-015-0049-2

BackgroundUpper-trophic-level predators are important compo-nents of food webs, having disproportionate, landscape-level effects on the structure and function of ecosystems[1, 2]. Recent reductions in many species of large marinecarnivores, including marine mammals, sharks andpiscivorous fishes, have prompted calls for effectiveecosystem-based management targeted at recovering de-pleted populations, while proactively protecting intactpopulations from decline [3–5]. As a result, many stud-ies have focused on describing the distributions and for-aging success of these groups in relation to habitatfeatures [e.g., 6] and prey distributions [e.g., 7] with littleinformation available on the basic resource needs ofthese species. Assessing the prey requirements of high-level predators is also central to determinations of howresilient they might be to ongoing anthropogenic dis-turbance and rapid environmental change [8]. In con-trast to many terrestrial systems, information on energyrequirements is difficult to come by for marine animalsbecause they forage at sea, making their food habits andforaging behaviors challenging to directly measure.In general, marine mammals have large energy require-
ments that are thought to be driven by the relatively largemetabolic demands prescribed by carnivory [9] and themaintenance of a high core body temperature in water[10]. Foraging effort will reflect these requirements, andwill contribute to energetic demands via the costs associ-ated with locating, chasing and capturing prey [11]. To re-main in positive energy balance, the energy acquired fromforaging must exceed the energetic cost of foraging [12].More successful foragers will accumulate surplus energyto allocate towards somatic growth and reproduction, andthus, a high foraging efficiency via the minimization of en-ergy expenditure relative to energy gain is expected to beadaptive for all animals, and especially for predators withlarge energy requirements. Marine animals can minimizelocomotion costs by adoption of stereotyped swimmingbehaviors. For example, “widely foraging” [13] individualsregularly engage in specific swimming modes [14], swimat particular speeds and depths [15], and utilize energy-saving swimming strategies like drift diving [16, 17], burst-and-glide swimming [18], porpoising [19] and wave-riding[20]. The disruption of these routine behaviors should in-crease the amount of time and energy spent foraging,resulting in increased locomotory costs and less energydevoted to production, thereby reducing foraging success.The ecology of the northern elephant seal, Mirounga
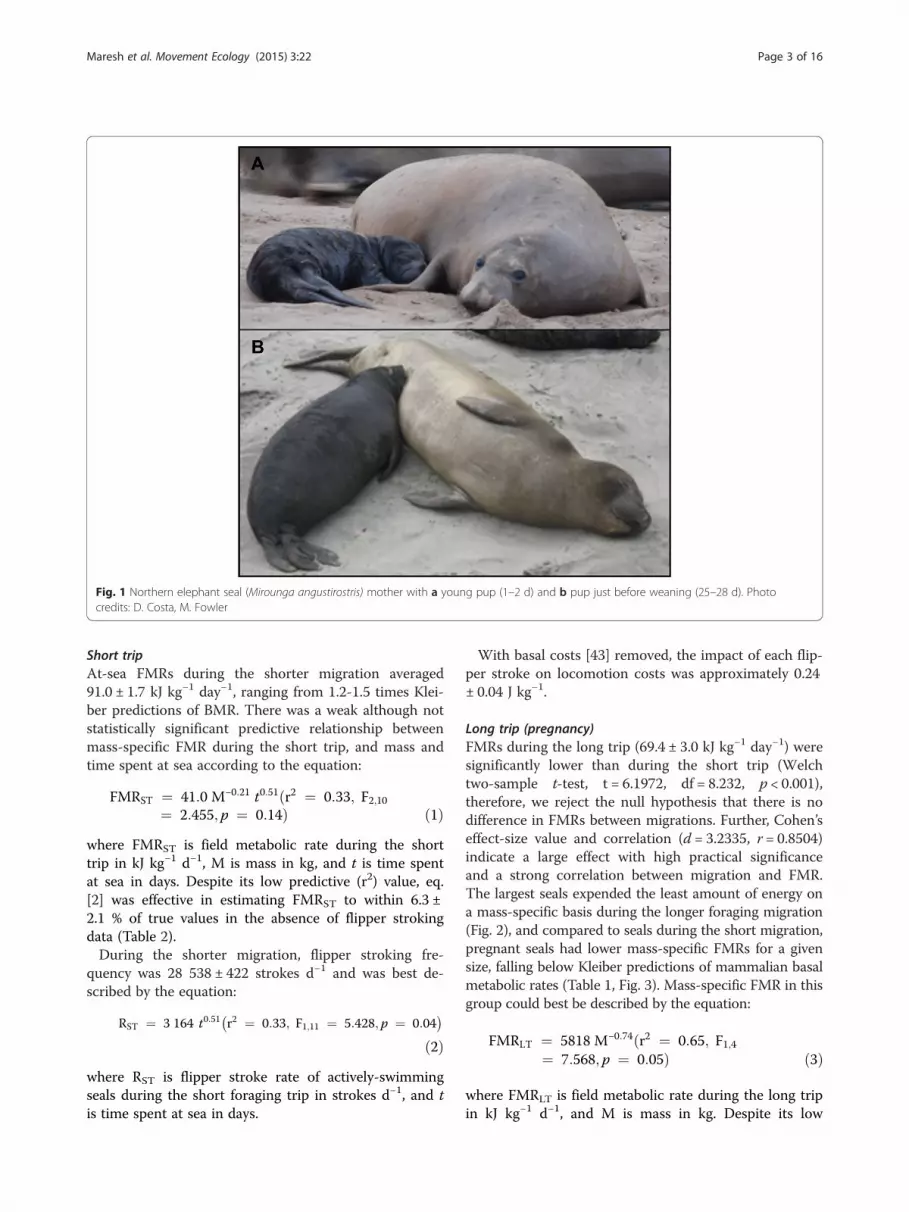
angustirostris, (Fig. 1) facilitates acquisition of foragingbehavior data using archival tagging instrumentation,making it an ideal study species to address questions onthe effects of both natural and anthropogenic disturb-ance on the foraging success of marine carnivores. Everyyear, adult females return to land for one month in
between each of two foraging migrations, once to birthand nurse a pup, and once to molt their pelage [21]. Fe-males are inseminated just prior to weaning, and thenreturn to sea to forage for 2–2.5 months before haulingout for the molt. Implantation likely occurs during orafter the molt, when seals return to sea for 7–8 monthsto forage and gestate the fetus. The demands for for-aging success are considerable during this time, as preg-nant seals must ingest sufficient energy to replace whatwas lost during the molt as well as store sufficient en-ergy reserves to support the fasting mother and hersuckling pup during the costly month-long lactationperiod [22].Our objectives in this study were to determine the total
energy requirements, and the relative partitioning of en-ergy among competing demands, for adult female north-ern elephant seals under normal foraging conditions. Wecompare these data to those from 3 seals encountering in-creased foraging costs due to increased drag, to determinehow the disruption of stereotyped locomotory behaviorsaffects energy balance. To achieve this, we constructedcomplete energy budgets by coupling measurements offoraging success (energy gain) during each foraging migra-tion with empirical measurements of locomotion costs infree-swimming seals [23]. For one of the largest predatorsin the northern Pacific Ocean, we describe (1) increased,extreme energy economy as a function of pregnancy and/or time spent at sea; (2) strong, predictive relationshipsbetween body size, flipper stroking mechanics, and at-seaenergy expenditure; and (3) reduced foraging successwhen stereotyped, energy-saving swimming behaviors aredisrupted.
ResultsEnergy expenditureEnergy expenditure for each of the 22 seals carrying accel-erometers is listed in Table 1. For each of the variables dis-cussed below – field metabolic rates (FMRs), locomotioncosts, and flipper stroking frequency – the response was in-fluenced by the interaction between body size and foragingmigration (short or long trip) (MLR results, p < 0.05 foreach). The significant interaction term indicates that the re-lationship between mass and each response variable de-pends on the migration, so we ran MLRs on each of themigrations separately. As described below, our data indicatethat, in general, locomotion behavior and the resulting fieldenergetics of seals were most influenced by time spent atsea during the short trip, and the animal’s mass during thelong trip. For both migrations, variance in calculations ofFMR was most sensitive to estimates of CPS (Additional file1: Table S.1); sensitivity of calculations of locomotion costswas spread among estimates of how ingested energy waspartitioned among the input parameters E(Feces +Urine +Digestion +Maintenance) (Additional file 1: Table S.2).
Maresh et al. Movement Ecology (2015) 3:22 Page 2 of 16
Short tripAt-sea FMRs during the shorter migration averaged91.0 ± 1.7 kJ kg−1 day−1, ranging from 1.2-1.5 times Klei-ber predictions of BMR. There was a weak although notstatistically significant predictive relationship betweenmass-specific FMR during the short trip, and mass andtime spent at sea according to the equation:
FMRST ¼ 41:0 M−0:21 t0:51ðr2 ¼ 0:33; F2;10¼ 2:455; p ¼ 0:14Þ ð1Þ
where FMRST is field metabolic rate during the shorttrip in kJ kg−1 d−1, M is mass in kg, and t is time spentat sea in days. Despite its low predictive (r2) value, eq.[2] was effective in estimating FMRST to within 6.3 ±2.1 % of true values in the absence of flipper strokingdata (Table 2).During the shorter migration, flipper stroking fre-
quency was 28 538 ± 422 strokes d−1 and was best de-scribed by the equation:
RST ¼ 3 164 t0:51 r2 ¼ 0:33; F1;11 ¼ 5:428; p ¼ 0:04� �
ð2Þwhere RST is flipper stroke rate of actively-swimmingseals during the short foraging trip in strokes d−1, and tis time spent at sea in days.
With basal costs [43] removed, the impact of each flip-per stroke on locomotion costs was approximately 0.24± 0.04 J kg−1.
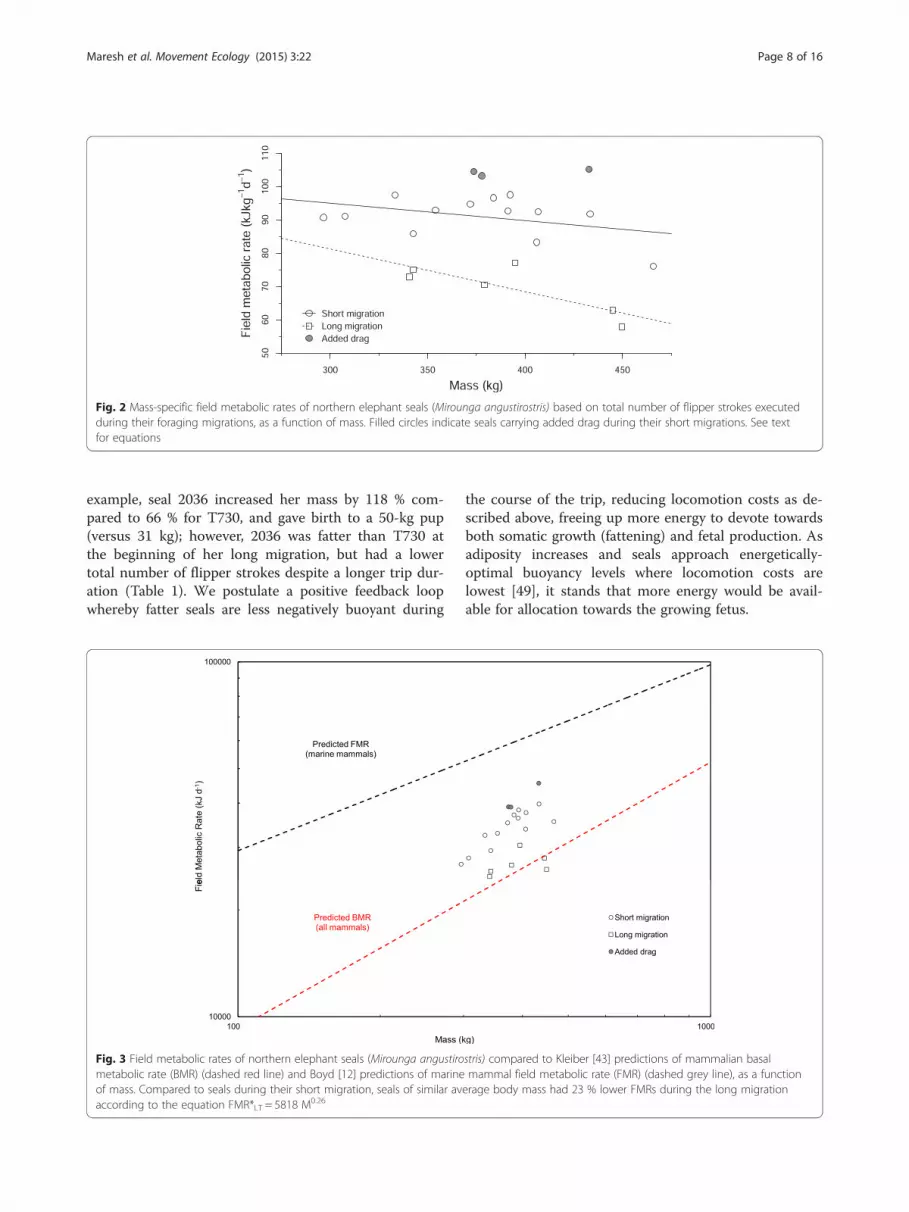
Long trip (pregnancy)FMRs during the long trip (69.4 ± 3.0 kJ kg−1 day−1) weresignificantly lower than during the short trip (Welchtwo-sample t-test, t = 6.1972, df = 8.232, p < 0.001),therefore, we reject the null hypothesis that there is nodifference in FMRs between migrations. Further, Cohen’seffect-size value and correlation (d = 3.2335, r = 0.8504)indicate a large effect with high practical significanceand a strong correlation between migration and FMR.The largest seals expended the least amount of energy ona mass-specific basis during the longer foraging migration(Fig. 2), and compared to seals during the short migration,pregnant seals had lower mass-specific FMRs for a givensize, falling below Kleiber predictions of mammalian basalmetabolic rates (Table 1, Fig. 3). Mass-specific FMR in thisgroup could best be described by the equation:
FMRLT ¼ 5818 M−0:74ðr2 ¼ 0:65; F1;4¼ 7:568; p ¼ 0:05Þ ð3Þ
where FMRLT is field metabolic rate during the long tripin kJ kg−1 d−1, and M is mass in kg. Despite its low
Fig. 1 Northern elephant seal (Mirounga angustirostris) mother with a young pup (1–2 d) and b pup just before weaning (25–28 d). Photocredits: D. Costa, M. Fowler
Maresh et al. Movement Ecology (2015) 3:22 Page 3 of 16

predictive (r2) value, eq. [4] was effective in estimatingFMRLT to within 4.3 ± 2.8 % of true values in the ab-sence of flipper stroking data (Table 2).Flipper stroking frequency was 24 % lower during the
long migration (21 568 ± 947 strokes d−1) than duringthe short migration, and larger, pregnant seals strokedless (Table 1). Stroking frequency for seals during thelong migration was best described by the equation:
RLT ¼ 2 368 645 M−0:79ðr2 ¼ 0:68; F1;4¼ 11:56; p ¼ 0:03Þ ð4Þ
where RLT is flipper stroke rate of seals during the longforaging trip in strokes d−1, and M is mass in kg. Wewere unable to detect an effect of time spent at sea onFMR or flipper stroking frequency during the long trip.With basal costs removed, the impact of each flipper
stroke on locomotion costs was calculated as −0.50 ±0.11 J kg−1, indicating an overestimation of basal costs inthis group.
Foraging success and energy budgetsMass gain, energy gain, and other indicators of foragingsuccess for each seal are listed in Table 3. This informa-tion was used in combination with energy expenditurescalculated above to determine the overall energy budgetof each seal during her respective foraging migration(Fig. 4).
Short tripDuring the shorter migration, approximately 31.4 ± 2.1 %of total energy intake was allocated towards somaticmass gain (adipose + lean tissue), while 38.1 ± 7.2 % and3.8 ± 0.1 % of total energy intake was devoted to basalmetabolism and locomotion, respectively (Fig. 4). Theremainder of total energy intake was lost as HIF and inthe formation of urine and feces, as described in themethods.
Long trip (pregnancy)During the longer migration, approximately 30.8 ± 1 %of total energy intake was allocated towards somaticmass gain (adipose + lean tissue), which was not signifi-cantly different from the shorter migration (GLS withfixed variance structure, F2,16 = −1.155, p = 0.88). Simi-larly, we were unable to detect an effect of mass on theproportion of total energy intake allocated towards som-atic mass gain during either migration (GLS with fixedvariance structure, F2,16 = −1.179, p = 0.26).In contrast to somatic mass gain, the proportion of
total energy intake utilized in locomotion was signifi-cantly lower (−7.7 ± 0.02 %) during the longer migration(GLS with fixed variance structure, F2,16 = 28.56, p <0.001). We were unable to detect an effect of body mass
on this proportion (F2,16 = 0.126, p = 0.64). Again, it islikely that locomotion results below zero are an artifactof inflated BMR estimates in this group. If we instead as-sume the energetic cost of each flipper stroke is thesame for seals during both migrations, and because sealsstroke 24 % less during the long migration (Fig. 5), wecan estimate the actual proportion of total energy intakeallocated towards locomotion in this group to be about2.9 %. Fetal gestation costs consumed approximately 3.5± 0.3 % of total energy ingested during the long trip.To “balance the budget” during the long migration,
energy must have been shuttled away from metabolicoverhead, which would require an approximately 22 ±2.7 % reduction in BMR to achieve (Fig. 4). This reduc-tion gives BMR a proportional contribution to overallcosts that is comparable with that seen in the short-tripseals because mass-specific energy expenditure waslower in long-trip seals as described above. Thus, ap-proximately 36.3 ± 1.1 % of total ingested energy was al-located towards BMR during the long trip instead of theapproximately 47 % estimated before reduction in meta-bolic overhead was accounted for.
Energy requirementsSeals in this study ingested an average of 5.02 × 10³
(±261) and 12.4 × 10³ (±645) MJ during the course ofthe short and long migrations, respectively (Fig. 4). Forboth groups, this ingestion rate is the equivalent of ap-proximately 64–141 MJ per day spent foraging at sea(56 ± 2 and 126 ± 10 days during the short and long mi-grations, respectively), or 980–2200 kJ per foraging dive(3.74 × 10³ ± 161 and 8.36 × 10³ ± 581 total foraging di-ves during the short and long migrations, respectively).
Seals with added dragSeals swimming with added drag during the short migra-tion (hereafter referred to as “drag seals,” N = 3) experi-enced a 14.5 % increase in FMR (Table 1, Fig. 2),resulting in half the mass gain of other short-trip sealsswimming without the acoustic tags (hereafter referredto as “normally-swimming seals”) (Table 3). However,this should be interpreted as a conservative estimate ofenergy expenditure in the drag group as we have as-sumed stroking costs similar to those of normally-swimming seals. Two of the drag seals were at sea for aslong as normally-swimming short-trip seals (74.6 days,S.D. = ± 4.8 days), but with substantially lower mass gain.The remaining drag seal (1234) spent 100.8 days at sea,with below normal mass gain results intermediate be-tween those of the other two drag seals (Table 3).Low mass gain in the drag seals resulted from the allo-
cation of a disproportionately large amount of energy in-take toward locomotion costs. Drag seals spent morethan four times as much energy on locomotion (16.7 ±
Maresh et al. Movement Ecology (2015) 3:22 Page 4 of 16

0.02 % of total energy intake) as the normally-swimming, short-trip seals reported above, with a result-ant one-third of the energy spent on somatic mass gain(11.7 ± 0.03 % of total energy intake) (Fig. 4). This waslikely due to increased locomotion costs associated withovercoming the added hydrodynamic drag during divingand swimming, which is supported by the increased flip-per stroking frequency demonstrated by the drag seals incomparison to normally-swimming, short-trip seals(22 % more strokes per day) (Fig. 5). The limited vari-ation in stroking frequency for drag seals compared tothe other groups suggests these individuals may havebeen pushing up against a biomechanically-constrainedlimit to swimming effort while foraging.
DiscussionEnergy economy and the effects of pregnancyThe energy requirements of adult female northern ele-phant seals are much lower than those described formost other mammalian carnivores, and particularly soduring pregnancy. Mammalian carnivores typically havehigher energy needs than other terrestrial mammals, andthus require large food supplies to fuel fast metabolisms[9, 24]. As such, FMRs tend to run high in this group,ranging from 1.99 – 4.65 times Kleiber [43] predictionsof BMR in terrestrial mammalian carnivores [summa-rized in 25, 26], and from 4.88–6.44 Kleiber predictionsin marine mammal carnivores [27, 28] [although see 29,30]. However, more recent studies on the diving metab-olism (DMR) of adult phocid seals indicate they aremore efficient than other marine carnivores [44, 33]. Forexample, Weddell seals diving in the wild for as long asthe average elephant seal in our study (21.5 min) oper-ated at 1.7 Kleiber [44].During the 2.5-month post-breeding foraging trip,
adult elephant seals were able to recover the energy re-serves lost during lactation by operating at 1.36 (range =1.21–1.48) Kleiber predictions of basal metabolism, indi-cating a high degree of metabolic efficiency in this spe-cies (Table 1, Fig. 3). These results are in line withresults from previous studies on both free-swimming[23, 31] and captive [32–34, 28] elephant seals wherelarge oxygen storage capacities combined with a hightolerance for hypoxia indicated these animals should beable to operate aerobically at 0.9–1.9 times Kleiber pre-dictions from as early as 2 months old. While measure-ments in these examples were from young animals,recent studies on other phocids in captivity were unableto detect a difference between juvenile and adult DMRs[grey seals: 33] or BMRs [harp, harbor and ringed seals:34]. As this could be an artifact of captivity, these resultsshould be interpreted with caution; nonetheless, they dosuggest that using measurements of metabolism in
juveniles to ground truth our calculations for adults is avalid approach.The degree of metabolic efficiency was correlated with
body size and reproductive status, with the largest ani-mals having the lowest mass-specific FMRs during preg-nancy (Fig. 2). During the 7.5-month post-molt foragingtrip, female seals were able to fuel gestation costs and a90 % (S.D. = ± 21 %) increase in body mass by operatingat FMRs approaching or falling below Kleiber predic-tions of basal metabolism (Fig. 3). In most mammals,pregnancy elevates metabolism [35, 36]; however, likeother phocids, elephant seals fast during the breedingseason and therefore must fuel lactation costs using on-board fuel reserves accumulated during the long for-aging trip. Suppressed metabolism and increased fueleconomy during pregnancy is likely a pre-pupping fat-tening strategy, and while it has been measured in rest-ing, captive harp seals [31, 37, 34], grey seals [32],harbor and ringed seals [34], our study is the first todemonstrate suppressed metabolism during pregnancyin actively foraging, wild seals during their months-longmigrations.Our results provide empirical support for hypotheses that
have inferred hypometabolism based on diving behavior, aselephant seals regularly dive for longer than their calculatedaerobic dive limit [38] without engaging in a long recoveryperiod afterward. These authors suggest that traditionalpredictions of diving metabolic rates based on allometricequations must be overestimates – instead, elephant sealsmust be hypometabolic while diving, and particularly soduring the long foraging trip [39–42]. Compared tosimilarly-sized short-trip females,who are themselves oper-ating at remarkably low metabolic rates (this study), long-trip seals were shown to suppress their field metabolism bya further 22 % (range = 15 % in smaller seals to 32 % in thelargest), to rates below those predicted to be necessary tosupport even basic maintenance metabolism (Fig. 3). Boyd[12] predicted a similar trend for marine mammals usingfirst principles, arguing that locomotion should be more ef-ficient, and thermoregulation costs lower or non-existent,in larger aquatic animals.The argument for a more severe degree of hypometa-
bolism in northern elephant seals compared to otherbreath-hold divers is thus well-supported, and promotesthe extreme at-sea lifestyle of this species. As part of theoxygen-conserving dive response, breath-hold triggers areduction in metabolic rate in all mammals, and moremarkedly so in diving species [43, 44]. Extreme hypome-tabolism allows elephant seals to spend upwards of 95 %of their time at sea in breath-hold, exploiting depthsdown to 1600 m for up to 2 h, entirely aerobically. Incontrast, other extreme divers such as Cuvier’s andBlainville’s beaked whales will regularly spend 60–90min recovering between deep dives [45], suggesting that
Maresh et al. Movement Ecology (2015) 3:22 Page 5 of 16

anaerobic metabolism is at least partly fuelling dives toextreme depths. These species have likely evolved adap-tations that allow them to tolerate and process largeamounts of lactic acid, whereas elephant seals seem tohave evolved the ability to mostly just avoid it altogetherwith a more pronounced degree of hypometabolism.Other slow-moving, deep-diving marine mammals withshort surface intervals, such as sperm whales [46], mightalso be expected to be hypometabolic.In our study, lower at-sea FMRs in seals during preg-
nancy were also the result of reduced flipper stroking fre-quencies during active swimming (Fig. 3). For both groups,most flipper stroking occurs during the ascent phase of thedive cycle (Fig. 6), when seals must work against theirnegative buoyancy at depth to reach the surface [47, 48].
As the foraging migrations progress, seals are able to storemore fat, becoming less negatively buoyant [16, 49], andwe would expect an inverse relationship between buoyancyand the number of flipper strokes required to surface [50–52]. As seals generally gain more adipose tissue during thelong trip (Table 3) a reduction in the number of flipperstrokes necessary to surface compared to their short-tripcounterparts is not surprising. With each flipper strokehaving a predictable effect on overall energy costs, this re-duced stroking frequency results in approximately 1700 ±90 MJ in energy savings across the long foraging migration.
Energy budgetsDespite the 5-month difference in trip duration, parti-tioning of ingested energy was remarkably similar across
Table 1 Summary of energy costs for northern elephant seals instrumented with accelerometers (N = 22)
Migration Seal Average Mass (kg) DAS (TDR) Stroke Rate (d−1) FMR (kJ kg−1d−1) Kleiber Total E Spent (MJ)
ST: Short trip U954 297 71.9 27840 90.7 1.28 1934
U605 308 69.5 28548 91.1 1.30 1946
U627 333 86.6 29972 97.4 1.42 2810
T911 343 72.5 27423 85.8 1.26 2131
1015 354 74.1 29100 92.9 1.37 2437
X851 372 71.2 28674 94.6 1.42 2506
T35 384 75.6 30385 96.6 1.46 2800
N796A 391 72.8 28534 92.7 1.41 2640
R541 392 77.7 29595 97.5 1.48 2973
1733 406 78.2 27925 83.2 1.27 2642
N796B 407 71.8 28818 92.4 1.42 2699
W1095 433 79.5 29785 91.8 1.43 3163
R382 466 69.3 24397 76.1 1.21 2459
LT: Long trip (pregnancy) U458 341 222.1 22825 72.9 1.07 5519
T730 343 218.8 23731 75.0 1.10 5623
X106 379 230.8 21770 70.5 1.06 6170
U754 395 221.1 23579 77.1 1.17 6727
2036 445 224.5 19335 62.9 0.99 6287
U203 450 224.5 18165 57.9 0.91 5841
DG: Short trip (added drag) 1234 374 100.8 34822 104.5 1.57 3932
M780 378 78.1 34299 103.2 1.55 3044
2370 433 76.6 35669 105.1 1.64 3484
Mean ST 376 75 28538 91.0 1.36 2549
(S.E.) (13.5) (1.3) (422) (1.7) (0.02) (103)
Mean LT 392 224 21568 69.4 1.05 6028
(S.E.) (19.5) (1.7) (947) (3.0) (0.04) (186)
Mean DG 395 85 34930 104.2 1.58 3487
(S.E.) (19.1) (7.8) (399) (0.6) (0.03) (256)
“Average Mass” is the seal’s mass averaged across the entire migration, based on her weight at the beginning and end of the trip. “Stroke Rate” refers to thenumber of flipper strokes per day averaged across the migration, and “FMR” refers to estimated field metabolic rates based on the total number of flipper strokesand a cost-per-stroke of 2.58 J kg−1[23] plus HIF costs. “FMR (Kleiber)” is a multiplier of Kleiber [43] predictions of mammalian basal metabolic rate. “Total E Spent”is the total amount of energy spent during foraging. See text for equations
Maresh et al. Movement Ecology (2015) 3:22 Page 6 of 16

the two migrations. During the short trip, locomotioncosts were low, constituting approximately 4 % of overallenergy expenditure, which is somewhat lower than the10 % reported for similarly-sized, freely-diving Weddellseals [calculated from eq.[3] in 44]. In contrast, locomo-tion costs of seals during the long migration were calcu-lated as being negligible; however, this is likely the resultof our assumption of an unvarying BMR equal to Kleiberpredictions in these seals. As discussed above, there areseveral lines of evidence supporting the idea that ‘basal’metabolism is less static in phocid seals than in terres-trial mammals, and that hypometabolism is commonduring pregnancy [31, 37, 32]. It is likely that this hypo-metabolism is the driver of reduced at-sea FMRs inpregnant elephant seal females rather than zero or nega-tive locomotion costs. The physiological mechanism
behind suppression is unclear, but may be a conditioningeffect of chronic oxidative stress with increased timespent at sea in elephant seals [41, 53]. If locomotioncosts on a per-stroke basis are instead assumed to be thesame during both migrations, basal maintenance costs inpregnant elephant seals must be reduced by approxi-mately 22 % (range = 14–33 %) of Kleiber predictions to“balance the budget” in terms of work costs (Fig. 4). Thiscompares to a reported 30 % and 27 % reduction in theresting metabolism of captive, pregnant harp and greyseals, respectively [31, 32].The overall net energy available to fuel production was
highly variable for both migrations, with seals who wereinitially fatter tending to acquire more prey-energy, gainmore weight, store more lipid, and birth larger pups(Table 3), even after controlling for maternal age. For
Table 2 Comparison of different metrics for estimating at-sea FMRs of northern elephant seals
Migration Seal FMR (“True”) kJ kg−1 d−1 FMR (Alternate) kJ kg−1 d−1 FMR Error: (Alternate - “True“)
ST: Short trip U954 90.7 93.6 3.03
U605 91.1 91.2 0.14
U627 97.4 99.8 2.42
T911 85.8 91.2 5.90
1015 92.9 91.4 −1.62
X851 94.6 88.9 −6.48
T35 96.6 90.8 −6.35
N796A 92.7 87.2 −6.35
R541 97.5 91.6 −6.42
1733 83.2 91.2 8.78
N796B 92.4 83.6 −10.52
W1095 91.8 79.6 −15.34
R382 76.1 83.5 8.79
LT: Long trip (pregnancy) U458 72.9 76.3 4.42
T730 75.0 76.0 1.28
X106 70.5 70.5 −0.08
U754 77.1 68.4 −12.71
2036 62.9 62.6 −0.59
U203 57.9 62.1 6.80
DG: Short trip (added drag) 1234 104.5 104.7 0.22
M780 103.2 92.5 −11.52
2370 105.1 83.3 −26.23
Mean ST 91.0 89.5 6.3
(S.E.) (2.1)
Mean LT 69.4 69.3 4.3
(S.E.) (2.8)
Mean DG 104.2 93.5 12.7
(S.E.) (7.7)
FMR (“True”) is the field metabolic rate based on total number of measured flipper strokes and individual stroke costs, and FMR (Alternate) is based on thealternate metric with the strongest predictive relationship: mass and days at sea for ST and DG seals (eq. [2] in text), and mass for LT seals (eq. [4] in text). Errorcolumn represents percent difference in FMRs estimated using the different approaches, with mean (± SE) absolute error indicated
Maresh et al. Movement Ecology (2015) 3:22 Page 7 of 16
example, seal 2036 increased her mass by 118 % com-pared to 66 % for T730, and gave birth to a 50-kg pup(versus 31 kg); however, 2036 was fatter than T730 atthe beginning of her long migration, but had a lowertotal number of flipper strokes despite a longer trip dur-ation (Table 1). We postulate a positive feedback loopwhereby fatter seals are less negatively buoyant during
the course of the trip, reducing locomotion costs as de-scribed above, freeing up more energy to devote towardsboth somatic growth (fattening) and fetal production. Asadiposity increases and seals approach energetically-optimal buoyancy levels where locomotion costs arelowest [49], it stands that more energy would be avail-able for allocation towards the growing fetus.
Fig. 2 Mass-specific field metabolic rates of northern elephant seals (Mirounga angustirostris) based on total number of flipper strokes executedduring their foraging migrations, as a function of mass. Filled circles indicate seals carrying added drag during their short migrations. See textfor equations
Fig. 3 Field metabolic rates of northern elephant seals (Mirounga angustirostris) compared to Kleiber [43] predictions of mammalian basalmetabolic rate (BMR) (dashed red line) and Boyd [12] predictions of marine mammal field metabolic rate (FMR) (dashed grey line), as a functionof mass. Compared to seals during their short migration, seals of similar average body mass had 23 % lower FMRs during the long migrationaccording to the equation FMR*LT = 5818 M0.26
Maresh et al. Movement Ecology (2015) 3:22 Page 8 of 16

Energy requirementsSeals in this study ingested an average of 5 017 (±261)and 12 426 (±645) MJ during the course of the shortand long migrations, respectively (Fig. 4). Our estimatefor short-trip seals is in complete agreement with Saka-moto et al.’s [54] estimate using an energy componentsanalysis on the TDR record of one seal. Depending onthe energy density of ingested prey items, we estimatethat elephant seals in both groups would have needed tocapture approximately 2-8 % of their average body massin prey per day spent foraging, which is in close agree-ment with the 6.2 % predicted by Le Boeuf et al. [39].This ingestion rate is the equivalent of 8–32 kg of preycaptured per day spent foraging at sea which is, again, inagreement with Le Boeuf et al.’s [39] estimate of 20 kg
based only on dive behavior. This ingestion rate is alsothe equivalent of 5–24 prey items per foraging dive,which is in agreement with Naito et al.’s [45] reportedaverage of 14.6 (S.D. = ± 3) prey capture attempts perdive. Collectively, these lines of evidence support ourstroke-based estimates of at-sea FMRs in adult femalenorthern elephant seals.
Disruption of routine swimming behaviorsThe three seals carrying the experimental acoustic tags(“drag seals”) had FMRs elevated 14.5 % above othershort-trip seals (Fig. 2), operating at approximately 1.58(±0.03) Kleiber predictions of basal metabolism (Table 1).This was likely the result of increased locomotion costs,as the experimental tags increased the seal’s frontal
Table 3 Summary of mass and energy gains for elephant seals instrumented with accelerometers (N = 22)
Migration Seal Mass Gain (%) Adipose Gain (kg) Lean Gain (kg) Net E Gain (MJ) Gross E Gain (MJ)
ST: Short trip U954 31.7 35.3 45.8 1539 4185
U605 27.8 27.1 48.0 1266 3869
U627 43.7 49.2 70.3 2187 6021
T911 20.3 23.6 39.7 1086 3877
1015 21.9 39.4 30.6 1589 4851
X851 31.1 54.1 45.9 2205 5676
T35 25.2 41.2 44.9 1742 5472
N796A 29.5 48.6 52.0 2051 5652
R541 37.2 61.9 61.1 2579 6688
1733 11.8 4.4 40.8 413 3681
N796B 26.9 42.8 53.7 1856 5488
W1095 17.9 28.1 43.2 1268 5339
R382 15.5 27.1 40.0 1215 4426
LT: Long trip (pregnancy) U458 96.0 66.4 202.6 3635 11029
T730 66.4 68.8 132.9 3280 10727
X106 89.5 98.5 183.9 4655 13042
U754 103.7 121.0 188.7 5480 14707
2036 117.6 87.3 292.2 4944 13531
U203 65.1 72.0 185.0 3721 11520
DG: Short trip (added drag) 1234 11.8 18.8 22.9 810 5714
M780 8.9 16.7 15.5 690 4499
2370 16.6 −0.4 41.7 252 4501
Mean ST 26.2 37.1 47.4 1615 5017
(S.E.) (2.5) (4.2) (2.8) (160) (261)
Mean LT 89.7 85.7 197.6 4286 12426
(S.E.) (8.5) (8.7) (21.3) (354) (645)
Mean DG 12.4 11.7 26.7 584 4905
(S.E.) (2.2) (6.1) (7.8) (170) (404)
Mass Gain (%) is the increase in mass (post-migration) as a percentage of initial body mass (pre-migration). “Net E Gained” is the net energy gained during theforaging migration, and “Gross E Gained” is gross energy intake from prey before assimilation costs are deducted. For LT seals, all terms include mass or energygained by both the mother and her gestating pup. See text for equations
Maresh et al. Movement Ecology (2015) 3:22 Page 9 of 16

surface area by about 7 %, which is large enough to in-duce increased transport costs in a number of large mar-ine organisms [e.g., 55, 56]. Our results are comparableto what has been seen in other species such as Adeliepenguins (Pygoscelis adeliae) where instruments repre-senting an approximately 10 % increase in frontal sur-face area increased the cost of transport by about 14 %[57]. Increased locomotion costs are illustrated in Fig. 5,with drag seals flipper stroking consistently faster thannormally-swimming short-trip and potentially pushingup against a biomechanically constrained maximum rate.With more energy partitioned toward the fuelling of flip-per strokes (17 % versus 4 %), drag seals were able topartition relatively little ingested energy toward somaticmass gain (12 % versus 31 %) (Fig. 6).These results suggest that elephant seals fuel their sub-
stantial mass gain during foraging migrations by en-gaging in stereotypic, energy-saving flipper strokingbehaviors that keep locomotion costs low, and that in-creasing these costs can have considerable impacts onforaging success. This may have implications for theability of elephant seals to adapt to at-sea disturbance,with avoidance behaviors predicted to reduce time spentforaging while increasing time spent in transit – a
disruption of routine swimming behaviors that inflatesnormally-low locomotion costs, thereby reducing thesurplus energy available to the seal for partitioning to-wards mass gain [as in, for example, 58, 59]. We predictthat this effect would be exacerbated in pregnant, long-trip seals, which are potentially operating at or near alower physiological limit to metabolism in order to ad-equately and rapidly build fuel reserves in support of avery costly lactation period.
ConclusionsBy accounting for each of the costs associated with for-aging, we can assess the efforts free-living animals spendacquiring resources, and thus, their overall energy re-quirements [12, 63]. Although estimates of FMR havebeen made for fin [60] and minke whales [61], the sealsin our study represent the largest carnivores measuredempirically. Northern elephant seals have adopted a for-aging strategy that utilizes a high degree of extreme en-ergy economy, with FMRs that are (1) 70–80 % lowerthan predicted for carnivores of their size [52]; (2) 35–60 % lower than predicted for marine mammals of theirsize [12]; and (3) 25–40 % lower than what has beenmeasured in freely-diving Weddell seals of similar size,
Fig. 4 Partitioning of ingested energy among work costs (grey tones) and production (warm tones) in foraging elephant seals (Miroungaangustirostris). Absolute costs for each seal are shown in the white panels (a), while proportions of total costs are averaged across the threegroups in the grey panel (b), where ST = seals during the short foraging trip, LT = seals during the long foraging trip, and DG = seals with addeddrag during the short trip. Within each group, seals are listed from left to right in order of increasing body size. If locomotion costs in LT seals aresimilar to those of ST seals, basal metabolism would have to be suppressed by approximately 22 % in pregnant seals (see text)
Maresh et al. Movement Ecology (2015) 3:22 Page 10 of 16

and for similar diving durations [44]. Body mass was themost important determinant of FMR in our study, witha particularly dramatic effect of pregnancy such that, inthe largest long-trip seals, Kleiber predictions of mam-malian basal metabolism actually overestimated total at-sea energy expenditure. Pregnant seals were able to sup-press their FMRs as body condition improved, therebyreducing the frequency of flipper strokes, and also byfurther reducing basal maintenance metabolism by anadditional 22 % compared to non-pregnant seals duringthe short trip. The very efficient FMRs of seals duringboth the short (1.4x Kleiber) and long migrations (1.1xKleiber) likely represent fattening strategies in prepar-ation for the high energy demands of a month-long fastwhile molting and nursing, respectively. In contrast tonormally-swimming seals, those instrumented withbulky, non-streamlined acoustic tags experienced ele-vated FMRs as a result of increased locomotion costs,significantly reducing foraging success and the net en-ergy available for mass gain in these seals. Collectively,these results suggest that elephant seals keep overall en-ergy requirements, and thus prey requirements, rela-tively low during their foraging migrations by engagingin adaptively stereotyped flipper stroking behaviors thatminimize locomotion costs and, most likely, mainten-ance metabolism while diving. Minimization of thesework costs frees up more of the energy ingested fromprey items for fuelling of production, namely, accumula-tion of energy reserves for support of maintenance
metabolism while fasting on land, and for pregnant seals,gestation and lactation.
MethodsStudy animalsThis project was approved by the Institutional AnimalCare and Use Committee at the University of Californiain Santa Cruz. 21 adult female elephant seals were in-strumented at their breeding colony in the Año NuevoState Reserve, California, USA (37° 5’ N, 122° 16’ W)from 2009 – 2013. We chemically immobilized the sealsfor instrument attachment and recovery using estab-lished protocols that minimize handling time and stress[21]. Apparently healthy seals were selected and 15 wereof known age ranging from 5 to 12 years old. N796 wasinstrumented in both 2009 and 2010, and we presenteach track separately. The study included both annualforaging migrations: the short, post-breeding migration(February through April; N = 16) and the long, post-molting, gestational migration (June through December;N = 7).
Flipper stroking dataSeals were instrumented with a time-depth recorder(TDR) (Wildlife Computers MK9, MK10; or Lotek, St.John’s, NL, Canada: 2310) and a tri-axis accelerometer/magnetometer (Wildlife Computers MK10-style proto-type, 16-hz sampling rate, N = 9, sample years 2009–2011;or Little Leonardo ORI2000-D3GT, 32-hz sampling rate,
Fig. 5 Flipper stroke rates were higher for northern elephant seals (Mirounga angustirostris) swimming normally during the short foraging trip (N= 13) than during the long foraging trip (N = 6). In comparison, seals swimming with added drag during their short trips (N = 3) strokedconsistently faster than normally swimming seals during the same time (Welch two-sample t-test, t = −10.9982, df = 7.471, p < 0.001). Dark horizon-tal bars represent median (50th percentile) values while the lower and upper limits of the boxes represent the 25th and 75th percentiles, respect-ively. Whiskers correspond to the 1.5 interquartile range, and points represent outliers
Maresh et al. Movement Ecology (2015) 3:22 Page 11 of 16

N = 13, sample years 2011–2013) for collection of at-seadiving and flipper stroking data, respectively. The rawtime-series of accelerometry measurements were trun-cated according to departure/arrival times identified usingthe diving record, and flipper strokes isolated using one oftwo custom-written programs in Igor Pro 6.36 (Wave-Metrics, Inc., USA), depending on the instrument modelused. In brief, side-to-side flipper movements were de-tected as fluctuations in the transverse axis – “swaying”acceleration – and the static (positional) component wasseparated from the dynamic (movement) componentusing a 1 Hz low-pass filter [62]. The remaining peaks andtroughs in the dynamic swaying acceleration with ampli-tudes greater than 1 m s−2 were considered to be individ-ual flipper strokes and were used in analyses.Output from the Wildlife Computer instruments in-
cluded raw acceleration data, and a user-written algo-rithm was used to identify and count individual flipperstrokes [23]. In contrast, with the exception of 12 h perrecord, raw data were processed on-board the Little Leo-nardo instruments with stroke rate calculated using abuilt-in algorithm. To make comparisons between algo-rithms, we processed each seal’s 12 h of raw Little Leo-nardo accelerometry data through our user-writtenalgorithm and used the percent discrepancy betweenstroke counts to correct the total number of counts out-put by the Little Leonardo algorithm. In most cases, thetotal number of strokes counted by the two algorithmswere within 10 % of each other; however, in 2 cases, thediscrepancy was greater than 10 % (14 % for T35, 20 %for T730). For this reason, and for consistency, we usedcorrected counts from the Little Leonardo instruments,rather than the processed output from the instruments,in analyses.As part of a separate study, three seals were addition-
ally outfitted with prototype acoustic tags, for testing oftheir viability in future studies. The tags were large, notstreamlined, heavy, and were as follows: cylindrical tags(537.0 x 117.4 mm, cross-sectional area 108.3 cm2, vol-ume 5447 ml, mass in air 7500 g, mass in water 2417 g)attached along the midline of the seal’s back, with theforward leading edge at the position of the seals’ max-imum girth. The tags were attached using two positivelybuoyant foam block mounts (each cross-sectional area28.2 cm2, mass in water 1151 g), hose clamp screw(cross-sectional area 2 cm2), and VHF transmitter(cross-sectional area 7.7 cm2) for a total cross-sectionalarea of approximately 174.2 cm2 that corresponds to ap-proximately 7 % of the seals’ cross-sectional area (ca.2501.9 cm2), and mass in water of 1266 g.The tags were not deployed with the intention of affect-
ing the foraging success of the animals, but upon recoverythese seals were undersized and clearly nutritionallystressed, probably due to the added hydrodynamic drag
imposed on the animals by the bulky, non-streamlined in-struments. We include these individuals in our analyseshere to determine how foraging success and efficiency areaffected by disturbance to routine swimming behaviors viaincreased locomotory costs.
Energetics dataThe surplus energy available to a seal for production ofnew tissue is a function of the difference between grossfood energy ingested at sea and energy lost or expendedwhile foraging. In our study animals, production of newtissue refers to the replenishment of spent energy re-serves as both adipose and lean tissue gain, and the ges-tation of a fetus. Production is therefore defined here asthe total mass gained from somatic and fetal growth,and can be described by the equation:
EMASSGAIN somatic þ fetalð Þ ¼ EINGESTED– EðFeces þ Urine
þ Digestion þ Maintenance þ LocomotionÞð5Þ
where some energy from ingested prey items is lost inthe production and excretion of feces and urine, andsome energy is expended to fuel digestion costs [63, 64],basal maintenance metabolism and locomotion. Collect-ively, energy expended for digestion, maintenance andlocomotion represent the animal’s field metabolic rate(FMR). We do not include heat lost for thermoregula-tion as a cost as it has been argued [12, 65] and demon-strated [66] that heat loss should not be an issue formarine mammals of this size.To estimate surplus energy gained from foraging
(EMASSGAIN (somatic + fetal)), we measured the mass ofeach seal at the beginning and end of each trip by sus-pension in a canvas sling from a tripod using a Dyna-Link scale (1,000 ± 1 kg). Mass of adult females at de-parture and upon arrival was corrected for any timespent on land after instrument attachment or before in-strument retrieval, respectively, using an equation de-rived from serial mass measurements of fasting seals[67]. During the breeding season, when female seals re-turn from their long, post-molt, gestational migrations,the mass of the pup was added to that of the mother fivedays post-parturition. Waiting a conservative 5 days tohandle the newborn pup is part of standard protocolwith this species, in order to allow adequate time formaternal contact and bonding (e.g., [68]). Adipose andlean tissue gain was estimated from mass change andbody composition, assuming that the five-day-old pupwas 13 % adipose tissue [22]. Energy gain was estimatedassuming that adipose tissue was 90 % lipid, and lean tis-sue was 27 % protein with a gross energy content of39.33 kJ g−1 for lipids and 23.5 kJ g−1 for protein [22].Additional gestation costs associated with maternal
Maresh et al. Movement Ecology (2015) 3:22 Page 12 of 16

metabolism were assumed to be negligible based on pre-vious research on other capitally breeding phocids [69,70], and so were not added to the energy budget of sealsin this group.To estimate energy expenditure (FMR) during the for-
aging migrations, we used an equation that predicts totalFMR from the total number of swim strokes in free-swimming, non-reproductive, fasting seals [FMR (J kg−1) = 2.58Sn, where Sn is the number of flipper strokes[23]]. This equation was derived from seals younger thanthe ones in this study, requiring us to rely on the as-sumption that juvenile and adult animals have similarstroke costs. This might be unrealistic as juvenile mam-mals often have elevated mass-specific metabolisms rela-tive to adults as a result of increased growth costs. Ifthis were the case, our FMR estimates for adults wouldbe too high. However, Maresh et al. [23] were unable todetect significant relationships between body size or age
and stroke costs, although this could have been due tosmall sample size and lack of statistical power. On theother hand, multiple studies have been unable to detectdifferences between juvenile and adult metabolic rates incaptive phocids [71, 72], indicating that our assumptionof similar stroking costs in juvenile and adult elephantseals is reasonable. We consider the sensitivity of ourFMR calculations to uncertainty in stroke costs in theAdditional file 1.As FMR represents the sum of all component costs
except Efeces and Eurine, (i.e., FMR = E(Digestion +Main-tenance + Locomotion) from eq.[1]), we estimated eachseparate cost and its relative contribution to total FMRusing values and equations from previous studies (de-scribed below). To account for energy lost in via fecesand urine, we used a value averaged across multiplestudies on phocid seals [63, 73, 74] whereby approxi-mately 83 % of gross energy consumed from an average
Fig. 6 Flipper stroking of northern elephant seals (Mirounga angustirostris) follows a predictable pattern along the course of each dive. The toppanel shows one foraging dive during the short migration of seal X851, where depth is shown with corresponding swaying acceleration. Greyboxes outline approximately 2.5-min segments of flipper stroking, each representing one of the three main phases of a dive cycle: (a) descent, (b)foraging at depth, and (c) ascent. Note the consistent, high-frequency flipper stroking occurring during ascent, when elephant seals are workingagainst their negative buoyancy at depth in order to surface
Maresh et al. Movement Ecology (2015) 3:22 Page 13 of 16

fish diet is usable as metabolizable energy. This value forassimilation efficiency is in line with studies on otherpinnipeds where metabolizable energy was shown torange from between 78.3–91.6 %, depending on the diet[75]. To account for digestion costs (the heat incrementof feeding (HIF)), we used the estimate of 11.6 % ofmetabolizable energy measured in juvenile elephant seals(range = 6.4–18 %) [76]. This value is in close agreementwith other studies of HIF in marine mammals: 10–13 %in sea otters [77], 10–17 % in harp seals [78, 79], and5.5 % in harbor seals [80].Basal metabolic rate (BMR) has not been measured for
adult female elephant seals, however, BMR values pre-dicted from Kleiber [81] have been shown to be within10 % of the metabolic rates of quiescent, submergedWeddell seals [82]. In addition, Lavigne et al. [63] foundno difference between Kleiber’s predicted BMRs of ter-restrial mammals and the empirically-determined BMRsof similarly-sized, adult phocid seals when measuredunder similar conditions. For these reasons, we usedKleiber’s predictions of BMR for terrestrial mammals toestimate the maintenance costs of the seals in this study.Finally, after accounting for assimilation efficiency,
HIF and BMR, any remaining cost was assumed to rep-resent energy spent on locomotion.With all costs and gains accounted for, we could then
estimate the energy ingested from prey that was neces-sary to balance each seal’s energy budget (EINGESTED).We estimated the energy from prey our study animalswould have needed to consume overall as well as on aper foraging dive basis. Foraging dives were determinedusing a custom-written dive typing script in MATLAB(IKNOS toolbox, Y. Tremblay, unpublished program),whereby the putative behavior of the seal is classifiedbased on the two-dimensional shape of each dive as re-corded by the TDR [30]. In addition to the sawtooth-shaped dives traditionally classified as foraging, we in-cluded the V-shaped dives traditionally classified as tran-sit, per recent evidence provided by Naito et al. [83] thatdemonstrates the high probability that northern elephantseals are foraging during these dives as well.
Statistical analysisThe influence of body size, time at sea and foraging mi-gration (short or long trip) on field metabolic rate, loco-motion costs and flipper stroking frequency, wasinvestigated using multiple linear regression (MLR)models. Candidate models included the interaction termbody size x migration to test whether the effect of bodysize on each of the response variables co-varied with mi-gration, in which case we ran MLR models on each ofthe migrations separately. These MLRs included time atsea and its potential interaction with body size. General-ized least squares (GLS) models with variance structure
fixed for mass were used to measure the association be-tween body size and foraging migration and the propor-tion of ingested energy allocated towards mass gain andtowards locomotion costs. All means are expressed as ±S.E. of the mean, except where noted otherwise. Ana-lyses were performed using the built-in ‘lm’ function,and the ‘gls’ function of the ‘nlme’ package in R 3.1.2[84]. All model combinations were fitted with bestmodel fits based on the lowest Akaike information cri-teria corrected for small sample size (AICc). Where p-values indicate significant differences (p < 0.05) betweenseals in the two groups, we report Cohen’s d effect sizesand effect-size correlation rγλ [85, 86], using the longforaging migration (when seals were pregnant) as the‘treatment’ effect. In addition, we analyzed the sensitivityof FMR and locomotion cost model results to uncer-tainty in the estimates of input parameters using a Latinhypercube random sampling method that takes into ac-count the range and distribution of each input param-eter, as well as their interactions [87]. Sensitivity analyseswere performed using the ‘sensitivity’ , ‘pse’ , ‘ks’ and‘Hmisc’ packages in R and the Excel ‘Apogee’ add-inv.4.9 developed by the Statistical Design Institute (Add-itional file 1).
Data accessibilityAll data used are present in the manuscript and its sup-porting information.
Additional file
Additional file 1: Table S1. Sensitivity results for calculations of fieldmetabolic rate (FMR, in kJ kg-1 day-1) in adult, female northern elephantseals (Mirounga angustirostris) during the short and long foragingmigrations. Table S2. Sensitivity results for calculations of locomotioncosts (%Locom, as a percentage of ingested prey energy used) in adult,female northern elephant seals (Mirounga angustirostris) during the shortand long foraging migrations. (DOCX 18 kb)
AbbreviationsADL: Aerobic dive limit; cADL: Calculated aerobic dive limit; BMR: Basalmetabolic rate (kJ kg−1 d−1); DAS: Time spent at sea (d−1); DG: Dragtreatment; refers to seals carrying added drag during the short foragingmigration; DMR: Diving metabolic rate (kJ kg−1 d−1); FMR: Mass-specific fieldmetabolic rate (kJ kg−1 d−1); FMR*: Absolute field metabolic rate (kJ d−1);HIF: Heat increment of feeding; LT: Long trip; refers to seals during the longforaging migration (pregnant); R: Stroke rate (strokes d−1); Sn: Total numberof strokes; ST: Short trip; refers to seals during the short foraging migration(not pregnant); TDR: Time-depth recorder.
Competing interestsThe authors declare that they have no competing interests.
Authors’ contributionsJLM and DPC conceived of the question and design of the experiment. JLM,TA, AT and YN carried out the experiment. JLM analyzed the data. TA, AT,YN, DEC and TLW contributed to data interpretation. JLM wrote the first draftof this paper, and all authors read and approved the final manuscript.
Maresh et al. Movement Ecology (2015) 3:22 Page 14 of 16

AcknowledgementsThe authors would like to thank the Japan Society for the Promotion ofScience for Grant-in-Aid 23255001 (A: 23255001 and B: 21380128) and theTagging of Pacific Predators (TOPP) project. Partial funding was also receivedfrom the Office of Naval Research (N00014-03-0651, N00014-10-1-0356,N00014-13-1-0134), the Moore, Packard and Sloan Foundations, and the E &P Sound and Marine Life Joint Industry Program (contract JIP22 07–23). JLMreceived additional support from a fellowship and several small grants ad-ministered by the Ecology and Evolutionary Biology Department at the Uni-versity of California in Santa Cruz (UCSC). All procedures were approved bythe Institutional Animal Care and Use Committee at UCSC, and the US NMFS(permits 87-1743-04 and 14636). The authors are grateful for the numerousfield volunteers involved in data collection, particularly field crew leaders M.Fowler, C. Goetsch, L. Hückstadt, S. Peterson and P. Robinson. Gratitude isalso extended to the rangers and docents at the Año Nuevo State Reservefor their collaborative spirit, their continued support of research, and theirgenuine regard for the animals in their care.
Author details1Department of Ecology & Evolutionary Biology, University of California,Santa Cruz, USA. 2Department of Polar Science, Graduate University forAdvanced Studies, Midoricho, Tachikawa, Japan. 3National Institute of PolarResearch, Midoricho, Tachikawa, Japan. 4Department of Biology, SonomaState University, Rohnert Park, USA. 5Department of Fisheries & Wildlife,Marine Mammal Institute, Oregon State University, Newport, USA. 6Universityof California Center for Ocean Health/Long Marine Lab, 100 Shaffer Rd., SantaCruz, CA 95060, USA.
Received: 2 April 2015 Accepted: 26 August 2015
References1. Ripple WJ, Estes JA, Beschta RL, Wilmers CC, Ritchie EG, Hebblewhite M, et
al. Status and ecological effects of the world’s largest carnivores. Science.2014;343:151–63.
2. Bowen WD. Role of marine mammals in aquatic ecosystems. Mar Ecol ProgSer. 1997;158:267–74.
3. Pauly D, Christensen V, Guénette S, Pitcher TJ, Sumaila UR, Walters CJ, et al.Towards sustainability in world fisheries. Nature. 2002;418:689–95.
4. Baum JK, Myers RA, Kehler DG, Worm B, Harley SJ, Doherty PA. Collapse andconservation of shark populations in the Northwest Atlantic. Science.2003;299:389–92.
5. Reynolds III JE. Marine mammal research: conservation beyond crisis.Baltimore, MD: JHU Press; 2005.
6. Block BA, Jonsen ID, Jorgensen SJ, Winship AJ, Shaffer SA, Bograd SJ, et al.Tracking apex marine predator movements in a dynamic ocean. Nature.2011;475:86–90.
7. Goetz KT, Rugh DJ, Read AJ, Hobbs RC. Habitat use in a marine ecosystem:Beluga whales Delphinapterus leucas in Cook Inlet, Alaska. Mar Ecol Prog Ser.2007;330:247–56.
8. Rutz C, Hays GC. New frontiers in biologging science. Biol Lett.2009;3:289–92.
9. McNab BK. The influence of food habits on the energetics of eutherianmammals. Ecol Monog. 1986;56:1–19.
10. Speakman JR, Król E. Maximal heat dissipation capacity and hyperthermiarisk: neglected key factors in the ecology of endotherms. J Anim Ecol.2010;79:726–46.
11. Krebs JR, Davies NB. Behavioural ecology: an evolutionary approach. Oxford:Blackwell; 2009.
12. Boyd IL. Energetics: consequences for fitness. In: Hoelzel AR, editor. Marinemammal biology: an evolutionary approach. Oxford: Blackwell Science;2002. p. 247–77.
13. Pianka ER. Convexity, desert lizards, and spatial heterogeneity. Ecol.1966;47:1055–9.
14. Fish FE. Influence of hydrodynamic design and propulsive mode onmammalian swimming energetics. Austr J Zool. 1994;42:79–101.
15. Williams TM. Swimming by sea otters: adaptations for low energetic costlocomotion. J Comp Physiol A - Sens Neur Behav Physiol. 1989;164:815–24.
16. Crocker DE, LeBoeuf BJ, Costa DP. Drift diving in female northern elephantseals: implications for food processing. Can J Zool. 1997;75:27–39.
17. Nowacek DP, Johnson MP, Tyack PL, Shorter KA, McLellan WA, Pabst DA.Buoyant balaenids: the ups and downs of buoyancy in right whales. ProcRoyal Soc B. 2001;268:1811–6.
18. Williams TM, Davis RW, Fuiman LA, Francis J, Le Boeuf BL, Horning M, et al.Sink or swim: strategies for cost-efficient diving by marine mammals.Science. 2000;288:133–6.
19. Au D, Weihs D. At high speeds dolphins save energy by leaping. Nature.1980;284:548–50.
20. Williams TM, Friedl WA, Fong ML, Yamada RM, Sedivy P, Haun JE. Travel atlow energetic cost by swimming and wave-riding bottlenose dolphins.Nature. 1992;355:821–3.
21. Le Boeuf BJ, Crocker DE, Costa DP, Blackwell SB, Webb PM, Houser DS.Foraging ecology of northern elephant seals. Ecol Monogr. 2000;70:353–82.
22. Crocker DE, Williams JD, Costa DP, Le Boeuf BJ. Maternal traits andreproductive effort in northern elephant seals. Ecol. 2001;82:3541–55.
23. Maresh JL, Simmons SE, Crocker DE, McDonald BI, Williams TM, Costa DP.Free-swimming northern elephant seals have low field metabolic rates thatare sensitive to an increased cost of transport. J Exp Biol. 2014;217:1485–95.
24. Nagy KA. Field metabolic rate and food requirement scaling in mammalsand birds. Ecol Monogr. 1987;57:111–28.
25. Nagy KA. Field metabolic rate and body size. J Exp Biol. 2005;208(Pt9):1621–5.
26. Nagy KA, Girard IA, Brown TK. Energetics of free-ranging mammals, reptiles,and birds. Ann Rev Nutr. 1999;19:247–77.
27. Reilly JJ, Fedak MA. Rates of water turnover and energy expenditure of free-living male common seals (Phoca vitulina). J Zool. 1991;223:461–8.
28. Nagy KA. Field bioenergetics of mammals: What determines field metabolicrates? Austr J Zool. 1994;42:43–53.
29. Costa DP, Trillmich F. Mass changes and metabolism during the perinatalfast: a comparison between Antarctic (Arctocephalus gazella) and Galapagosfur seals (Arctocephalus galapagoensis). Physiol Zool. 1988;61:160–9.
30. Lavigne DM, Innes S, Worthy GAJ, Kovacs KM, Schmitz OJ, Hickie JP.Metabolic rates of seals and whales. Can J Zool. 1986;64:279–84.
31. Meir JU, Champagne CD, Costa DP, Williams CL, Ponganis PJ. Extremehypoxemic tolerance and blood oxygen depletion in diving elephant seals.Am J Physiol-Regul Integr Comp Physiol. 2009;297:R927–R39.
32. Webb PM, Andrews RD, Costa DP, Le Boeuf BJ. Heart rate and oxygenconsumption of northern elephant seals during diving in the laboratory.Physiol Zool. 1998;71:116–25.
33. Houser DS, Crocker DE, Tift MS, Champagne CD. Glucose oxidation andnonoxidative glucose disposal during prolonged fasts of the northernelephant seal pup (Mirounga angustirostris). Am J Physiol-Regul Integr CompPhysiol. 2012;303:R562–R70.
34. Tift MS, Ranalli EC, Houser DS, Ortiz RM, Crocker DE. Development enhanceshypometabolism in northern elephant seal pups (Mirounga angustirostris).Func Ecol. 2013;27:1155–65.
35. Brody S. Bioenergetics and growth: with special reference to the efficiencycomplex in domestic animals. Oxford: Reinhold Publishing Corporation;1945.
36. Gittleman JL, Thompson SD. Energy allocation in mammalian reproduction.Am Zool. 1988;28:863–75.
37. Renouf D, Gales R. Seasonal variation in the metabolic rate of harp seals:unexpected energetic economy in the cold ocean. Can J Zool.1994;72:1625–32.
38. Kooyman GL, Wahrenbrock EA, Castellini MA, Davis RW, Sinnett EE. Aerobicand anaerobic metabolism during voluntary diving in Weddell seals:evidence of preferred pathways from blood chemistry and behavior. JComp Physiol. 1980;138:335–46.
39. Le Boeuf BJ, Costa DP, Huntley AC, Feldkamp SD. Continuous, deep divingin female northern elephant seals, Mirounga angustirostris. Can J Zool.1988;66:446–58.
40. Hindell MA, Slip DJ, Burton HR, Bryden MM. Physiological implications ofcontinuous, prolonged, and deep dives of the southern elephant seal(Mirounga leonina). Can J Zool. 1992;70:370–9.
41. Hassrick JL, Crocker DE, Teutschel NM, McDonald BI, Robinson PW, SimmonsSE, et al. Condition and mass impact oxygen stores and dive duration inadult female northern elephant seals. J Exp Biol. 2010;213:585–92.
42. Kooyman GL. Diverse divers: physiology and behavior. Berlin: Springer; 1989.43. Scholander PF. Experimental investigations on the respiratory function in
diving mammals and birds. Hvøalradets Skrifter. Norske Videnskaps-Akad.:Oslo; 1940.
Maresh et al. Movement Ecology (2015) 3:22 Page 15 of 16

44. Butler PJ, Jones DR. Physiology of diving of birds and mammals. PhysiolRev. 1997;77:837–99.
45. Tyack PL, Johnson M, Soto NA, Sturlese A, Madsen PT. Extreme diving ofbeaked whales. J Exp Biol. 2006;209:4238–53.
46. Watwood SL, Miller PJO, Johnson M, Madsen PT, Tyack PL. Deep-divingforaging behaviour of sperm whales (Physeter macrocephalus). J Anim Ecol.2006;75:814–25.
47. Davis RW, Fuiman LA, Williams TM, Collier SO, Hagey WP, Kanatous SB, et al.Hunting behavior of a marine mammal beneath the Antarctic fast ice.Science. 1999;283:993–6.
48. Sato K, Mitani Y, Cameron MF, Siniff DB, Naito Y. Factors affecting strokingpatterns and body angle in diving Weddell seals under natural conditions. JExp Biol. 2003;206:1461–70.
49. Adachi T, Maresh JL, Robinson PW, Peterson SH, Costa DP, Naito Y, et al.The foraging benefits of being fat in a highly migratory marine mammal.Proc Royal Soc B: Biol Sci. 2014;281:20142120.
50. Aoki K, Watanabe YY, Crocker DE, Robinson PW, Biuw M, Costa DP, et al.Northern elephant seals adjust gliding and stroking patterns with changesin buoyancy: validation of at-sea metrics of body density. J Exp Biol.2011;214(Pt 17):2973–87.
51. Miller PJ, Biuw M, Watanabe YY, Thompson D, Fedak MA. Sink fast andswim harder! Round-trip cost-of-transport for buoyant divers. J Exp Biol.2012;215(Pt 20):3622–30.
52. Watanabe Y, Baranov EA, Sato K, Naito Y, Miyazaki N. Body density affectsstroke patterns in Baikal seals. J Exp Biol. 2006;209(Pt 17):3269–80.
53. Vazquez-Medina JP, Zenteno-Savin T, Tift MS, Forman HJ, Crocker DE, OrtizRM. Apnea stimulates the adaptive response to oxidative stress in elephantseal pups. J Exp Biol. 2011;214(Pt 24):4193–200.
54. Sakamoto W, Naito Y, Huntley AC, Leboeuf BJ. Daily gross energyrequirements of a female northern elephant seal Mirounga angustirostris atsea. Nippon Suisan Gakkaishi. 1989;55:2057–63.
55. Jones TT, Van Houtan KS, Bostrom BL, Ostafichuk P, Mikkelsen J, Tezcan E,et al. Calculating the ecological impacts of animal‐borne instruments onaquatic organisms. Methods Ecol Evol. 2013;4:1178–86.
56. Hazekamp AA, Mayer R, Osinga N. Flow simulation along a seal: the impactof an external device. Euro J Wildlife Res. 2010;56:131–40.
57. Culik BM, Bannasch R, Wilson RP. External devices on penguins: howimportant is shape? Mar Biol. 1994;118:353–7.
58. New LF, Harwood J, Thomas L, Donovan C, Clark JS, Hastie G, et al.Modelling the biological significance of behavioural change in coastalbottlenose dolphins in response to disturbance. Func Ecol. 2013;27:314–22.
59. Villegas-Amtmann S, Schwarz LK, Sumich JL, Costa DP. Populationconsequences of lost foraging opportunity in eastern female gray whales.Ecosphere. 2015 (in press).
60. Brodie PF. Cetacean energetics, an overview of intraspecific size variation.Ecol. 1975;56:152–61.
61. Blix AS, Folkow LP. Daily energy expenditure in free living minke whales.Acta Physiol Scand. 1995;153:61–6.
62. Mitani Y, Andrews RD, Sato K, Kato A, Naito Y, Costa DP. Three-dimensionalresting behaviour of northern elephant seals: drifting like a falling leaf. BiolLett. 2010;6:163–6.
63. Lavigne DM, Innes S, Stewart REA, Worthy GAJ. An annual energy budgetfor north-west Atlantic harp seals. In: Beddington JR, Beverton RJH, LavigneDM, editors. Marine mammals and fisheries. London: George Allen & Unwin;1985. p. 319–36.
64. Costa DP. A bioenergetics approach to developing a populationconsequences of acoustic disturbance model. In: Popper AN, Hawkins A,editors. The effects of noise on aquatic life. Springer Science + BusinessMedia, LLC; 2012. p. 423–7.
65. Watts P, Hansen S, Lavigne DM. Models of heat loss by marine mammals:thermoregulation below the zone of irrelevance. J Theor Biol. 1993;163:505–25.
66. Noren DP. Thermoregulation of weaned northern elephant seal (Miroungaangustirostris) pups in air and water. Physiol Biochem Zool. 2002;75:513–23.
67. Simmons SE, Crocker DE, Hassrick JL, Kuhn CE, Robinson PW, Tremblay Y,et al. Climate-scale hydrographic features related to foraging success in acapital breeder, the northern elephant seal Mirounga angustirostris. EndanSpec Res. 2010;10:233–43.
68. Robinson PW, Simmons SE, Crocker DE, Costa DP. Measurements offoraging success in a highly pelagic marine predator, the northern elephantseal. J Anim Ecol. 2010;79:1146–56.
69. Hedd A, Gales R, Renouf D. Inter-annual consistency in the fluctuatingenergy requirements of captive harp seals Phoca groenlandica. Polar Biol.1997;18:311–8.
70. Sparling CE, Speakman JR, Fedak MA. Seasonal variation in the metabolicrate and body composition of female grey seals: fat conservation prior tohigh-cost reproduction in a capital breeder? J Comp Physiol B.2006;176:505–12.
71. Sparling CE, Fedak MA. Metabolic rates of captive grey seals duringvoluntary diving. J Exp Biol. 2004;207:1615–24.
72. Ochoa-Acuna HG, McNab BK, Miller EH. Seasonal energetics of northernphocid seals. Comp Biochem Physiol A. 2009;152:341–50.
73. Keiver KM, Ronald K, Beamish FWH. Metabolizable energy requirements formaintenance and faecal and urinary losses of juvenile harp seals (Phocagroenlandica). Can J Zool. 1984;62:769–76.
74. Parsons JL. Metabolic studies on the ringed seal Phoca hispida. Thesis (M.Sc.): University of Guelph; 1977.
75. Costa DP, Williams TM. Marine mammal energetics. In: Reynolds III JE,Rommel SA, editors. Biology of Marine Mammals. Washington, DC:Smithsonian Institution Press; 1999. p. 176–217.
76. Barbour AS. Heat increment of feeding in juvenile northern elephant seals.Santa Cruz: Thesis (M.Sc.); 1993.
77. Costa DP, Kooyman GL. Contribution of specific dynamic action to heatbalance and thermoregulation in the sea otter Enhydra lutris. Physiol Zool.1984;57:199–203.
78. Gallivan G, Ronald K. Apparent specific dynamic action in the harp seal(Phoca groenlandica). Comp Biochem Physiol A: Physiol. 1981;69:579–81.
79. Lavigne DM. Similarity in energy budgets of animal populations. J AnimEcol. 1982;51:195–206.
80. Ashwell-Erickson SM, Elsner R. The energy cost of free existence for BeringSea harbor and spotted seals. University of Alaska, Fairbanks: Thesis (M.Sc.);1981.
81. Kleiber M. The fire of life: an introduction to animal energetics. 2nd ed. NewYork: Kreiger; 1975.
82. Williams TM, Fuiman LA, Horning M, Davis RW. The cost of foraging by amarine predator, the Weddell seal Leptonychotes weddellii: pricing by thestroke. J Exp Biol. 2004;207:973–82.
83. Naito Y, Costa DP, Adachi T, Robinson PW, Fowler MA, Takahashi A.Unravelling the mysteries of a mesopelagic diet: a large apex predatorspecializes on small prey. Func Ecol. 2013;27:710–7.
84. R Core Team. R: a language and environment for statistical computing.Vienna, Austria: R Foundation for Statistical Computing. http://www.r-project.org; 2014.
85. Cohen J. A power primer. Psychol Bull. 1992;112:155–9.86. Rosnow RL, Rosenthal R, Rubin DB. Contrasts and correlations in effect-size
estimation. Psychol Sci. 2000;11:446–53.87. Hamby D. A review of techniques for parameter sensitivity analysis of
environmental models. Envir Monit Assess. 1994;32:135–54.
Submit your next manuscript to BioMed Centraland take full advantage of:
• Convenient online submission
• Thorough peer review
• No space constraints or color figure charges
• Immediate publication on acceptance
• Inclusion in PubMed, CAS, Scopus and Google Scholar
• Research which is freely available for redistribution
Submit your manuscript at www.biomedcentral.com/submit
Maresh et al. Movement Ecology (2015) 3:22 Page 16 of 16
Copyright © 2022 FDOKUMEN