Investigation of the Wear Resistance Properties of Cr/CrN Multilayer Coatings against Sand Erosion
Upload
khangminh22Category
view
0download
0
THERMODYNAMIC MODELING AND EXPERIMENTAL ANALYSIS OF OXIDATION/
SULFIDATION OF NI-CR-AL MODEL ALLOY COATINGS
By
ERIK M. MUELLER
A DISSERTATION PRESENTED TO THE GRADUATE SCHOOL OF THE UNIVERSITY OF FLORIDA IN PARTIAL FULFILLMENT
OF THE REQUIREMENTS FOR THE DEGREE OF DOCTOR OF PHILOSOPHY
UNIVERSITY OF FLORIDA
2007

© 2007 Erik M. Mueller

This dissertation is dedicated to all hard-working graduate students.

ACKNOWLEDGMENTS
I would like to thank my supervisory committee chair, Dr. Wolfgang Sigmund, for all his
support and last-minute assistance on this dissertation. I would also like to thank my former
advisor, Dr. Hans Seifert, for not only starting me on and supporting me with this project
financially, but for the invaluable help in teaching the Thermo-Calc computational software as
well as the challenging goals set to enable me to finish this project. I would like to thank
Damian Cupid for his help with the thermodynamic software and his insight into unique
approaches to the problems encountered in computational thermodynamics.
I would also like to thank Dr. L. Amelia Dempere for her support and use of the
characterization equipment at the Major Analytical Instrumentation Center. Wayne Acree
should be credited with the operating the electron microprobe. Dr. Gerhard Fuchs’ high-
temperature materials courses were also instrumental in exposing me to this subject area in
metallurgy. Dr. W. Greg Sawyer and Dr. Gerald Bourne also assisted in this project by serving
on my supervisory committee.
Finally, I would also like to thank the University of Florida and the Materials Science and
Engineering Department for use of their facilities and for affording me the opportunity to
complete this degree with financial assistance.
iv
TABLE OF CONTENTS page
ACKNOWLEDGMENTS ............................................................................................................. iv
LIST OF TABLES........................................................................................................................ vii
LIST OF FIGURES ..................................................................................................................... viii
ABSTRACT.....................................................................................................................................1
1 INTRODUCTION ........................................................................................................................2
2 LITERATURE REVIEW .............................................................................................................5
2.1 Turbine Engine Considerations ..........................................................................................5 2.2 Turbine Blade Materials .....................................................................................................6
2.2.1 Superalloys ...............................................................................................................6 2.2.2 Coatings for Turbine Blades.....................................................................................7
2.4 The Al-Cr-Ni Ternary System............................................................................................9 2.5 Oxidation of Al-Ni-Cr Alloys...........................................................................................17
2.5.1 General Oxidation Mechanism...............................................................................17 2.5.1.1 Oxidation of Ni.............................................................................................19 2.5.1.2 Oxidation of Al.............................................................................................20 2.5.1.3 Oxidation of Cr.............................................................................................22
2.5.2 Oxidation of Ni-Al Alloys......................................................................................23 2.5.3 Oxidation in Al-Cr-Ni Ternary and NiCrAlY Coatings.........................................26
2.6 Sulfidation and Hot Corrosion..........................................................................................28 2.6.1 Hot Corrosion .........................................................................................................28 2.6.2 Sulfidation on Metals .............................................................................................29 2.6.3 Sulfidation on Metal Oxides...................................................................................31 2.6.4 Sulfidation in Ni-Cr-Al Coatings ...........................................................................33
2.7 Calculations of Oxidation/Sulfidation ..............................................................................34
3 METHODS AND MATERIALS................................................................................................36
3.1 Thermodynamic Modeling and Simulations ....................................................................36 3.1.1 The CALPHAD Approach .....................................................................................36 3.1.2 Databases and Software..........................................................................................37
3.2 Materials and Sample Preparation ....................................................................................38 3.3 Thermogravimetric Analysis ............................................................................................39 3.4 Characterization................................................................................................................43
3.4.1 X-Ray Diffraction...................................................................................................44 3.4.2 Scanning Electron Microscopy...............................................................................44 3.4.3 Electron Microprobe...............................................................................................45
4 THERMODYNAMIC CALCULATION RESULTS.................................................................46
v

4.1 Calculations of Ni-Cr-Al Alloys and Mixtures using Phase Diagrams............................46 4.1.1 Binary Systems.......................................................................................................46 4.1.2 Ternary Systems .....................................................................................................49
4.2 Calculations of Temperature-Potential Diagrams ............................................................53 4.2.1 Calculations with O -SO Interactions2 2 ...................................................................53 4.2.2 Calculations of Metal-Gas Interactions ..................................................................57
4.3 Calculations of Potential Diagrams ..................................................................................58 4.4 Phase Fraction Diagrams ..................................................................................................73
5 EXPERIMENTAL RESULTS....................................................................................................81
5.1 TGA Experiments.............................................................................................................81 5.1.1 Oxidation Experiments in Air ................................................................................81 5.1.2 Oxidation Experiments in He + 0.21 O + 0.02 SO2 2 ..............................................88 5.1.3 Oxidation Experiments in He + 0.21 O + 0.10 SO2 2 ..............................................91
5.2 Phase Identification ..........................................................................................................95 5.3 Surface Imaging..............................................................................................................106
5.3.1 Untested Alloy Specimens ...................................................................................106 5.3.2 Oxidized Ni and Ni-Al Specimens .......................................................................113 5.3.3 Oxidized Ni-8Cr-6Al Specimens .........................................................................113
5.3.3.1 Ni-8Cr-6Al Oxidized in Air .......................................................................113 5.3.3.2 Ni-8Cr-6Al Oxidized in He + 0.21 O + 0.02 SO2 2.....................................118 5.3.3.3 Ni-8Cr-6Al Oxidized in He + 0.21 O + 0.10 SO2 2.....................................121
5.3.4 Oxidized Ni-22Cr-11Al Specimens .....................................................................124 5.3.4.1 Ni-22Cr-11Al Oxidized in Air ...................................................................124 5.3.4.2 Ni-22Cr-11Al Oxidized in He + 0.21 O + 0.02 SO2 2.................................126 5.3.4.3 Ni-8Cr-6Al Oxidized in He + 0.21 O + 0.10 SO2 2.....................................129
5.4 Cross-Sectional Analysis ................................................................................................131 5.4.1 Ni and Ni-Al Specimens ...............................................................................131 5.4.2 Ni-8Cr-6Al Specimens..................................................................................133 5.4.3 Ni-22Cr-11Al Specimens..............................................................................137 5.4.4 Electron Microprobe (EPMA) Analysis........................................................139
6 DISCUSSION AND ANALYSIS ............................................................................................142
6.1 Mechanisms of Scale Formation ....................................................................................142 6.2 Comparison of Experimental Results and Calculations .................................................148
7 CONCLUSIONS.......................................................................................................................156
LIST OF REFERENCES.............................................................................................................158
BIOGRAPHICAL SKETCH .......................................................................................................167
vi

LIST OF TABLES
Table page 2-1. List of common alloying elements in Ni-base superalloys.......................................................7
2-2. List of phases described in calculations of the Al-Cr-Ni ternary. ..........................................14
2-3. The phases present in the Ni-22Cr-11Al and Ni-8Cr-6Al (weight percent) alloys at room temperature and 1000˚C. ..........................................................................................17
2-4. Descriptions and crystallographic information on different phases of Al O [49-50].2 3 ..........21
3-1. List of experimental conditions performed for oxidation of alloys for 100 hr in 1 bar of gas at 25 mL/min. ..............................................................................................................43
4-1. Comparison of equilibria computed between two databases SPOT3 and SPIN4 at a pressure of 1 bar and T = 1073 K for Ni-22Cr-11Al alloy (by mass) with a P of 0.22 bar. This table compares number of moles of each phase, along with the composition (in weight fraction) of each phase.
O2
................................................................58
4-2. Comparison of gas species (at mole fractions > 10 ) present in the unstable equilibrium regions of Figure 4-19 at low P and high P . These mole fractions are calculated based on ideal gas behavior.
-10
O2 O2.............................................................................60
5-1. List of the parabolic rate constants obtained from steady-state oxidation of Ni, Ni-13.6Al, NiAl, Ni-8Cr-6Al, and Ni-22Cr-11Al alloys. .......................................................94
5-2. Table summarizing the phases identified using XRD for all cast, heat-treated alloys oxidized............................................................................................................................107
6-1. Table showing the equilibrium partial pressures of gases that evolve upon various mixtures of O and SO at various temperatures, calculated from the SPOT3 database.
2 2...........................................................................................................................146
vii

LIST OF FIGURES
Figure page 2-1. Schematic of a typical turbine engine.......................................................................................5
2-2. Schematic of coating configuration of modern turbine blades.................................................9
2-3. Al-Ni binary phase diagram [H. Baker. ASM Handbook Vol. 3—Alloy Phase Diagrams, ASM International: Materials Park, OH, p. 49 (1992)]. ....................................................10
2-4. Ni-Cr binary phase diagram [H. Baker. ASM Handbook Vol. 3—Alloy Phase Diagrams, ASM International: Materials Park, OH, p. 155 (1992)]. ..................................................10
2-5. Al-Cr binary phase diagram [H. Baker. ASM Handbook Vol. 3—Alloy Phase Diagrams, ASM International: Materials Park, OH, p. 43 (1992)]. ....................................................11
2-6. Liquidus projection of the Al-Ni-Cr ternary system [P. Rogl. “Al-Cr-Ni,” Ternary Alloys: A Comprehensive Compendium of Evaluated Constitutional Data and Phase Diagrams: Al-Cd-Ce to Al-Cu-Ru. 4 p. 411 (1991)]. ........................................................13
2-7. Scheil reaction scheme of the Al-Cr-Ni ternary. The δ-phase refers to Ni Al , the ζ to Al Cr -hexagonal, ζ to Al Cr -rhombodedral, and ε to Al Cr . The question marks represent areas of the ternary that were not investigated.
2 3 1
8 5 2 8 5 1 9 4..................................................13
2-8. Isothermal section of Al-Cr-Ni ternary at 1025˚C above the U reaction. The green areas denote regions of two-phase equilibria [P. Rogl. “Al-Cr-Ni,” Ternary Alloys: A Comprehensive Compendium of Evaluated Constitutional Data and Phase Diagrams: Al-Cd-Ce to Al-Cu-Ru. 4 p. 414 (1991)].
4
........................................................15
2-9. Partial Isothermal section of Al-Cr-Ni ternary at 850˚C below the U reaction. The green areas denote regions of two-phase equilibria [P. Rogl. “Al-Cr-Ni,” Ternary Alloys: A Comprehensive Compendium of Evaluated Constitutional Data and Phase Diagrams: Al-Cd-Ce to Al-Cu-Ru. 4 p. 413 (1991)].
4
........................................................15
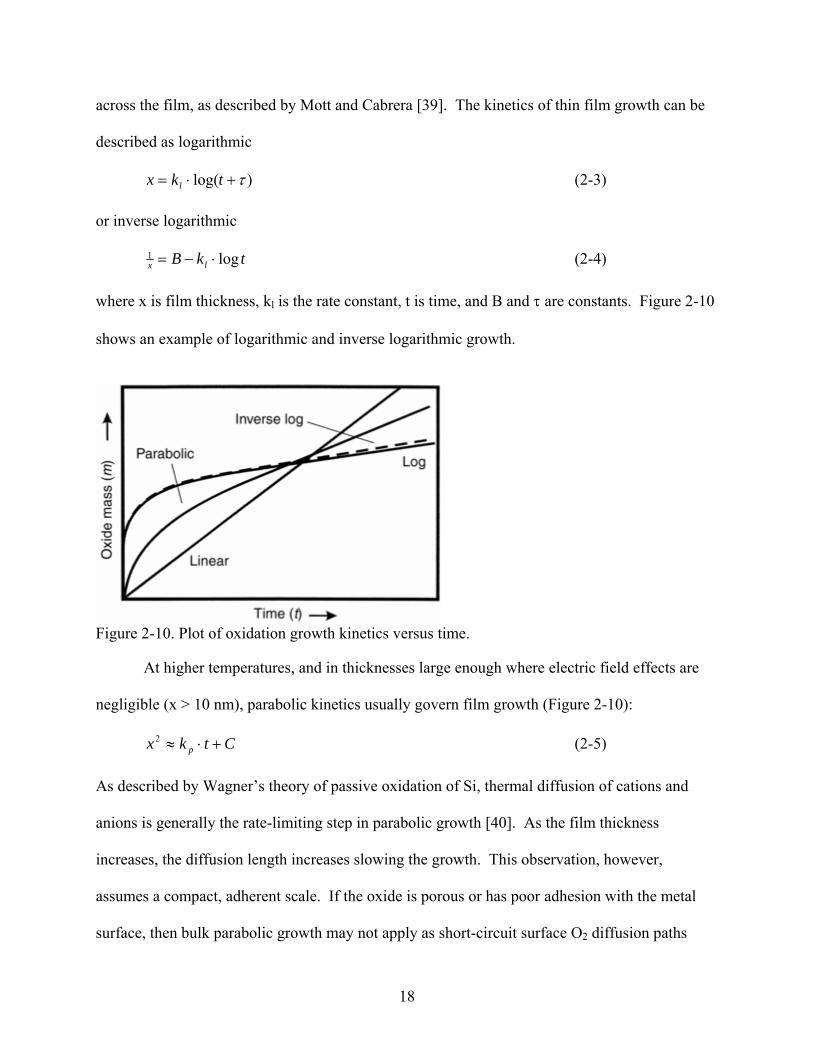
2-10. Plot of oxidation growth kinetics versus time. .....................................................................18
2-11 – Arrhenius plot of parabolic growth rates versus temperature of NiO (violet) as well as Cr O and Al O (red) [J.L. Smialek, G.M. Meier, “High-Temperature Oxidation,” Superalloys II. C.T. Sims, N.S. Stolff, W.C. Hagel, eds., John Wiley & Sons: New York p. 295 (1987)].
2 3 2 3
.........................................................................................................24
2-12. Dependence of oxidation mechanisms and scale type of Ni-Al alloys based on temperature and Al content [F.S. Pettit: Transactions of the AIME. 239, pp. 1296-1305 (1967)].......................................................................................................................25
2-13. Schematic of the stages of oxidation in Ni-Cr-Al alloys. Group I are alloys that will have a stable NiO scale, Group II will develop a stable Cr O scale, and Group III 2 3
viii
will develop a stable Al O scale [F.S. Pettit: Transactions of the AIME. 239, pp. 1296-1305 (1967)].
2 3............................................................................................................27
2-24. Schematic showing the formation of metal sulfides (a) under an initial metal oxide layer (b) in simultaneous oxidizing and sulfidizing conditions. The various proposed transport mechanisms are shown. ......................................................................................32
3-1. Flowchart detailing the Calculation of Phase Diagrams approach. This study is concerned mostly with the equilibrium calculations. ........................................................37
3-2. Schematic of the Setsys Evolution (TGA only). ....................................................................41
4-1. Temperature-composition binary phase diagram of the Ni-Al system calculated from the SPIN4 database. ...........................................................................................................47
4-2. Temperature-composition binary phase diagram of the Ni-Cr system calculated from the SPIN4 database. ...........................................................................................................47
4-3. Temperature-composition binary phase diagram of the Al-Cr system calculated from the SPIN4 database. ...........................................................................................................48
4-4. Temperature-composition binary phase diagram of the Ni-Al system calculated from the SPIN4 database with the Ni Al low-temperature phase restored.3 5 ..............................48
4-5. Isothermal section of Ni-Cr-Al ternary system at 900˚C in weight fractions. This diagram is calculated from data in the SPIN4 database.....................................................49
4-6. Partial isothermal section of Ni-Cr-Al ternary system at 850˚C in mole fractions. The axes are chosen to compare with Figure 2-9. This diagram is calculated from data in the SPIN4 database. ...........................................................................................................50
4-7. Isothermal section of Ni-Cr-Al ternary system at 1025˚C in mole fractions. The axes are chosen to compare with Figure 2-8. This diagram is calculated from data in the SPIN4 database. .................................................................................................................50
4-8. Ternary isothermal section of the Ni-Al-O system at 900˚C. The x-axis is the composition of Al in weight percent, and the y-axis is the logarithmic partial pressure of O in bar. This diagram is calculated from data in the SPIN4 database.
2
2 .......51
4-9. Ternary isothermal section of the Ni-Cr-O system at 900˚C. The x-axis is the composition of Cr in weight percent, and the y-axis is the logarithmic partial pressure of O in bar. This diagram is calculated from data in the SPIN4 database.
2
2 .......51
4-10. The Ni-Al-Cr-O system shown as a series of connected ternary subsystem isotherms at 900˚C. The outer axes are the logarithm of the partial pressure of O in bar, whereas the inner axes are the weight percents of Ni, Cr, and Al. This diagram is calculated from data in the SPIN4 database.
2
.......................................................................................52
ix

4-11. Change in partial pressure of O , SO , and SO (in bar) with temperature using the initial gas mixture of He + 0.21 O + 0.02 SO . The P is omitted due to scale. The data used for calculations is taken from the SPOT3 database.
2 2 3
2 2 He..........................................54
4-12. Change in partial pressure of O , SO , and SO (in bar) with temperature using the initial gas mixture of He + 0.21 O + 0.10 SO . The P is omitted due to scale. The data used for calculations is taken from the SPOT3 database.
2 2 3
2 2 He..........................................55
4-13. The relationship between the partial pressure of SO in an O -SO gas mixture, with varying temperature. All partial pressures are in bar.
3 2 2.......................................................55
4-14. The relationship between the partial pressure of S in an O -SO gas mixture, with varying temperature. All partial pressures are in bar.
2 2 2.......................................................56
4-15. The relationship between the partial pressure of O in an SO -SO gas mixture, with varying temperature. All partial pressures are in bar.
2 3 2.......................................................56
4-16. Stability diagram of Ni and its oxide with varying temperature and partial pressure of oxygen (in bar)...................................................................................................................59
4-17. Stability diagram of Ni and its oxide with varying temperature and partial pressure of oxygen (in bar) with a constant partial pressure of sulfur dioxide at 2 mol %. .................59
4-18. Stability diagram of Ni and its oxide with varying temperature and partial pressure of oxygen (in bar) with a constant partial pressure of sulfur dioxide at 10 mol %. ...............60
4-19. Ni potential diagrams for (a) SO -O and (b) S -O at 800˚C. U.E. is an abbreviation for undefined equilibrium. Published in [170].
2 2 2 2 .................................................................61
4-20. Ni SO -O potential diagram at 900˚C. U.E. is an abbreviation for undefined equilibrium. Published in [170].
2 2 .......................................................................................61
4-21. Ni SO -O potential diagram at 1000˚C. U.E. is an abbreviation for undefined equilibrium. Published in [170].
2 2 .......................................................................................62
4-22. Al potential diagrams for (a) SO -O and (b) S -O at 800˚C. Published in [170].2 2 2 2 .............63
4-23. Al SO -O potential diagram at 900˚C.2 2 .................................................................................64
4-24. Al SO -O potential diagram at 1000˚C.2 2 ...............................................................................64
4-25. Cr potential diagrams for (a) SO -O and (b) S -O at 800˚C. Published in [170].2 2 2 2 .............65
4-26. Cr SO -O potential diagram at 900˚C.2 2 .................................................................................65
4-27. Al SO -O potential diagram at 900˚C.2 2 .................................................................................66
4-28. Ni-13.6Al potential diagrams for (a) SO -O and (b) S -O at 800˚C. U.E. is an abbreviation for undefined equilibrium. Published in [170].
2 2 2 2 ............................................66
x
4-29. Ni Al SO -O potential diagram at 900˚C.3 2 2 ...........................................................................67
4-30. Ni Al SO -O potential diagram at 1000˚C. Published in [170].3 2 2 .........................................67
4-31. NiAl potential diagrams for (a) SO -O and (b) S -O at 800˚C. U.E. is an abbreviation for undefined equilibrium. Published in [170].
2 2 2 2 .................................................................68
4-32. NiAl SO -O potential diagram at 900˚C.2 2 .............................................................................68
4-33. NiAl SO -O potential diagram at 1000˚C. Published in [170].2 2 ..........................................69
4-34. Ni-8Cr-6Al potential diagrams for (a) SO -O and (b) S -O at 800˚C. Published in [170].
2 2 2 2 ..................................................................................................................................70
4-35. Ni-8Cr-6Al SO -O potential diagram at 900˚C. Published in [170].2 2 .................................70
4-36. Ni-8Cr-6Al SO -O potential diagram at 1000˚C. Published in [170].2 2 ...............................71
4-37. Ni-22Cr-11Al potential diagrams for (a) SO -O and (b) S -O at 800˚C. Published in [170].
2 2 2 2 ..................................................................................................................................72
4-38. Ni-22Cr-11Al SO -O potential diagram at 900˚C. Published in [170].2 2 .............................72
4-39. Ni-22Cr-11Al SO -O potential diagram at 1000˚C. Published in [170].2 2 ...........................73
4-40. Phase fraction diagram of the Ni-O system showing the change in phase percent with varying oxygen partial pressure at 800˚C in air. Calculated from the SPOT3 database..............................................................................................................................75
4-41. Phase fraction diagram of the Ni-O-S system showing the change in phase percent with varying oxygen partial pressure at 800˚C in an 0.21 O + 0.02 SO atmosphere. Calculated from the SPOT3 database.
2 2...............................................................................76
4-42. Phase fraction diagram of the Ni-O-S system showing the gas evolution (in partial pressure [bar]) with varying oxygen partial pressure at 800˚C in an 0.21 O + 0.02 SO atmosphere. Calculated from the SPOT3 database.
2
2 ..................................................76
4-43. Phase fraction diagram of the Ni-O-S system showing activity change of each component with varying oxygen partial pressure at 800˚C in an 0.21 O + 0.02 SO atmosphere. Calculated from the SPOT3 database.
2 2..........................................................77
4-44. Phase fraction diagram an Ni-8Cr-6Al alloy showing activity change of each component with varying oxygen partial pressure at 800˚C in air. Calculated from the SPIN4 database. .................................................................................................................77
4-45. Phase fraction diagram an Ni-8Cr-6Al alloy showing the change in phase percent with varying oxygen partial pressure at 800˚C in air. Calculated from the SPIN4 database..............................................................................................................................78
xi

4-46. Phase fraction diagram an Ni-8Cr-6Al alloy at 800˚C comparing the activity change calculated for Figure 4-38 using the SPIN4 database (black) and the SPOT3 database (teal). ..................................................................................................................................78
4-48. Phase fraction diagram of an Ni-8Cr-6Al alloy showing the change in phase percent with varying oxygen partial pressure at 800˚C in an 0.21 O + 0.02 SO atmosphere. Calculated from the appended SPIN4 database.
2 2................................................................79
4-49. Phase fraction diagram of an Ni-22Cr-11Al alloy showing activity change of each component with varying oxygen partial pressure at 800˚C in an 0.21 O + 0.02 SO atmosphere. Calculated from the appended SPIN4 database.
2 2...........................................80
4-50. Phase fraction diagram of an Ni-22Cr-11Al alloy showing the change in phase percent with varying oxygen partial pressure at 800˚C in an 0.21 O2 + 0.02 SO atmosphere. Calculated from the appended SPIN4 database.
2................................................................80
5-1. Plot of weight change versus time for Ni specimen at 800˚C for 24 hr in air. .......................81
5-2. Plot of weight change versus square root time for Ni specimen at 800˚C for 24 hr in air. The formula containing the slope and the coefficient of determination are listed.............82
5-3. Plot of weight change versus square root time for Ni specimen at 900˚C for 24 hr in air. The formula containing the slope and the coefficient of determination are listed.............83
5-4. Arrhenius plot of the parabolic rate constant versus inverse temperature of Ni oxidized for 24 hr in air. The formula containing the slope and the coefficient of determination are listed......................................................................................................83
5-5. Plot of weight change versus square root time for a NiAl specimen at 800˚C for 24 hr in air. The formula containing the slope and the coefficient of determination are listed. ....84
5-6. Arrhenius plot of the parabolic rate constant versus inverse temperature of NiAl oxidized for 24 hr in air. The formula containing the slope and the coefficient of determination are listed......................................................................................................85
5-7. Plot of weight change versus square root time for a Ni-8Cr-6Al specimen at 1000˚C for 100 hr in air. The formula containing the slope and the coefficient of determination are listed. ............................................................................................................................86
5-8. Plot of weight change versus square root time for a Ni-8Cr-6Al specimen at 900˚C for 100 hr in air. The formula containing the slope and the coefficient of determination are listed. ............................................................................................................................86
5-9. Plot of weight change versus square root time for a Ni-22Cr-11Al specimen at 800˚C for 100 hr in air. The formula containing the slope and the coefficient of determination are listed......................................................................................................87
xii

5-10. Arrhenius plot of the parabolic rate constant versus inverse temperature of Ni-8Cr-6Al oxidized for 100 hr in air. ..................................................................................................87
5-11. Arrhenius plot of the parabolic rate constant versus inverse temperature of Ni-22Cr-11Al oxidized for 100 hr in air. The formula containing the slope and the coefficient of determination are listed. ................................................................................................88
5-12. Plot of weight change versus square root time for a Ni-8Cr-6Al specimen at 975˚C for 100 hr in He + 0.21 O + 0.02 SO . The formula containing the slope and the coefficient of determination are listed.
2 2..............................................................................89
5-13. Plot of weight change versus square root time for a Ni-22Cr-11Al specimen at 975˚C for 100 hr in He + 0.21 O + 0.02 SO . The formula containing the slope and the coefficient of determination are listed.
2 2..............................................................................89
5-14. Arrhenius plot of the parabolic rate constant versus inverse temperature of Ni-8Cr-6Al oxidized for 100 hr in He + 0.21 O + 0.02 SO . The formula containing the slope and the coefficient of determination are listed.
2 2..................................................................90
5-15. Arrhenius plot of the parabolic rate constant versus inverse temperature of Ni-22Cr-11Al oxidized for 100 hr in He + 0.21 O + 0.02 SO . The formula containing the slope and the coefficient of determination are listed.
2 2........................................................90
5-16. Plot of weight change versus square root time for a Ni-8Cr-6Al specimen at 900˚C for 100 hr in He + 0.21 O + 0.10 SO . The formulas containing the slopes and the coefficients of determination are listed.
2 2.............................................................................91
5-17. Arrhenius plot of the parabolic rate constant versus inverse temperature of Ni-8Cr-6Al oxidized for 100 hr in He + 0.21 O + 0.10 SO . The blue data and regression correspond to the initial oxidation rates, whereas the red data and regression correspond to the later stage oxidation. The formulas containing the slope and the coefficients of determination are listed.
2 2
.............................................................................92
5-18. Plot of weight change versus square root time for a Ni-22Cr-11Al specimen at 800˚C for 100 hr in He + 0.21 O + 0.10 SO . The formula containing the slope and the coefficient of determination are listed.
2 2..............................................................................93
5-19. Arrhenius plot of the parabolic rate constant versus inverse temperature of Ni-22Cr-11Al oxidized for 100 hr in He + 0.21 O + 0.10 SO . The formula containing the slope and the coefficient of determination are listed.
2 2........................................................93
5-20. Arrhenius plot of alloys isothermally oxidized in this study for 100 hr...............................95
5-21. Histogram of the peak intensities measured from an XRD analysis of polished, heat treated Ni-8Cr-6Al. ............................................................................................................96
5-22. Histogram of the peak intensities measured from an XRD analysis of Ni-8Cr-6Al oxidized in air for 100 hr at 800˚C.....................................................................................96
xiii

5-23. Histogram of the peak intensities measured from an XRD analysis of Ni-8Cr-6Al oxidized in air for 100 hr at 900˚C.....................................................................................97
5-24. Histogram of the peak intensities measured from an XRD analysis of Ni-8Cr-6Al oxidized in air for 100 hr at 1000˚C...................................................................................97
5-25. Histogram of the peak intensities measured from an XRD analysis of Ni-8Cr-6Al oxidized in He + 0.21 O + 0.02 SO for 100 hr at 800˚C.2 2 ................................................98
5-26. Histogram of the peak intensities measured from an XRD analysis of Ni-8Cr-6Al oxidized in He + 0.21 O + 0.02 SO for 100 hr at 900˚C.2 2 ................................................98
5-27. Histogram of the peak intensities measured from an XRD analysis of Ni-8Cr-6Al oxidized in He + 0.21 O + 0.02 SO for 100 hr at 975˚C.2 2 ................................................99
5-28. Histogram of the peak intensities measured from an XRD analysis of Ni-8Cr-6Al oxidized in He + 0.21 O + 0.10 SO for 100 hr at 800˚C.2 2 ................................................99
5-29. Histogram of the peak intensities measured from an XRD analysis of Ni-8Cr-6Al oxidized in He + 0.21 O + 0.10 SO for 100 hr at 900˚C.2 2 ..............................................100
5-30. Histogram of the peak intensities measured from an XRD analysis of Ni-8Cr-6Al oxidized in He + 0.21 O + 0.10 SO for 100 hr at 975˚C.2 2 ..............................................100
5-31. Histogram of the peak intensities measured from an XRD analysis of polished, heat treated Ni-22Cr-11Al. ......................................................................................................101
5-32. Histogram of the peak intensities measured from an XRD analysis of Ni-22Cr-11Al oxidized in air for 100 hr at 800˚C...................................................................................102
5-33. Histogram of the peak intensities measured from an XRD analysis of Ni-22Cr-11Al oxidized in air for 100 hr at 900˚C...................................................................................102
5-34. Histogram of the peak intensities measured from an XRD analysis of Ni-22Cr-11Al oxidized in air for 100 hr at 1000˚C.................................................................................103
5-35. Histogram of the peak intensities measured from an XRD analysis of Ni-22Cr-11Al oxidized in He + 0.21 O + 0.02 SO for 100 hr at 800˚C.2 2 ..............................................103
5-36. Histogram of the peak intensities measured from an XRD analysis of Ni-22Cr-11Al oxidized in He + 0.21 O + 0.02 SO for 100 hr at 900˚C.2 2 ..............................................104
5-37. Histogram of the peak intensities measured from an XRD analysis of Ni-22Cr-11Al oxidized in He + 0.21 O + 0.02 SO for 100 hr at 975˚C.2 2 ..............................................104
5-38. Histogram of the peak intensities measured from an XRD analysis of Ni-22Cr-11Al oxidized in He + 0.21 O + 0.10 SO for 100 hr at 800˚C.2 2 ..............................................105
xiv

5-39. Histogram of the peak intensities measured from an XRD analysis of Ni-22Cr-11Al oxidized in He + 0.21 O + 0.10 SO for 100 hr at 900˚C.2 2 ..............................................105
5-40. Histogram of the peak intensities measured from an XRD analysis of Ni-22Cr-11Al oxidized in He + 0.21 O + 0.10 SO for 100 hr at 975˚C.2 2 ..............................................106
5-41. Optical micrograph of as cast Ni-8Cr-6Al at 125X............................................................108
5-42. Optical micrograph of heat-treated Ni-8Cr-6Al at 125X. ..................................................108
5-43. Secondary electron (SE) micrograph of as cast Ni-8Cr-6Al microstructure at 5000X. .....109
5-44. SE micrograph of heat-treated Ni-8Cr-6Al microstructure at 20000X. .............................109
5-45. Optical micrograph of as cast Ni-22Cr-11Al at 125X........................................................110
5-46. Optical micrograph of heat-treated Ni-22Cr-11Al at 125X. ..............................................111
5-47. Backscattered electron (BSE) micrograph of as cast Ni-22Cr-11Al microstructure at 5000X...............................................................................................................................111
5-48. Secondary electron (SE) micrograph of heat-treated Ni-22Cr-11Al microstructure at 15000X.............................................................................................................................112
5-49. X-ray map of the SE micrograph in Figure 5-46................................................................112
5-50. SE micrograph of NiO scale Ni oxidized in air at 800˚C for 24 hr. ...................................113
5-51. SE micrograph of NiAl oxidized at 800˚C for 36 hr at 5000X. .........................................114
5-52. SE micrograph of NiAl oxidized at 1000˚C for 36 hr at 20000X. .....................................114
5-53. SE micrograph of NiAl oxidized at 1000˚C for 36 hr at 200X. .........................................115
5-54. Backscattered electron (BSE) micrograph of Ni-8Cr-6Al oxidized in air for 100 hr at 900˚C................................................................................................................................116
5-55. X-ray map of SE micrograph at 2500X of Ni-8Cr-6Al oxidized in air for 100 hr at 800˚C................................................................................................................................116
5-56. SE micrograph of surface of Ni-8Cr-6Al after oxidation in air for 100hr at 1000˚C at 10000X.............................................................................................................................117
5-57. BSE micrograph of surface of Ni-8Cr-6Al after oxidation in air for 100hr at 1000˚C at 5000X...............................................................................................................................117
5-58. SE micrograph of surface of Ni-8Cr-6Al after oxidation in air for 0.5 hr at 800˚C at 10000X. The light oxide is NiO and the dark oxide on the right is alumina. .................118
xv

5-59. BSE micrograph of the surface of Ni-8Cr-6Al oxidized in 2% SO at 800˚C for 100 hr at 4000X.
2..........................................................................................................................119
5-60. BSE micrograph of the surface of Ni-8Cr-6Al oxidized in 2% SO at 900˚C for 100 hr at 1000X.
2..........................................................................................................................119
5-61. SE micrograph of the surface of Ni-8Cr-6Al oxidized in 2% SO at 975˚C for 100 hr at 1500X.
2..............................................................................................................................120
5-62. SE micrograph of the surface of Ni-8Cr-6Al oxidized in 2% SO at 975˚C for 100 hr at 1500X. In this area, the scale has spalled off revealing the bare metal surface.
2.............120
5-63. SE micrograph of the surface of Ni-8Cr-6Al oxidized in 10% SO at 800˚C for 100 hr at 15000X.
2........................................................................................................................121
5-64. SE micrograph of Ni-8Cr-6Al alloy oxidized in 10% SO at 800˚C for 100 hr at 1500 showing scale “blisters.”
2..................................................................................................122
5-65. SE micrograph of the surface of Ni-8Cr-6Al oxidized in 10% SO at 900˚C for 100 hr at 700X.
2............................................................................................................................122
5-66. SE micrograph of the overlying alumina regions of Ni-8Cr-6Al oxidized in 10% SO at 900˚C for 100 hr at 10000X.
2........................................................................................123
5-67. SE micrograph of the surface of Ni-8Cr-6Al oxidized in 10% SO at 975˚C for 100 hr at 5000X.
2..........................................................................................................................123
5-68. SE micrograph of the surface of Ni-8Cr-6Al oxidized in 10% SO at 975˚C for 100 hr at 1500X where the scale (top) had spalled off and began to reoxidized (bottom).
2........124
5-69. SE micrograph of Ni-22Cr-11Al oxidized in air at 800˚C for 100 hr at 1000X. ...............125
5-70. SE micrograph of Ni-22Cr-11Al oxidized in air at 800˚C for 100 hr at 5000X. ...............125
5-71. BSE micrograph of Ni-22Cr-11Al oxidized in air at 1000˚C for 100 hr at 500X..............126
5-72. SE micrograph of Ni-22Cr-11Al oxidized in 2% SO gas mixture at 800˚C for 100 hr at 1000X.
2..........................................................................................................................127
5-73. SE micrograph of Ni-22Cr-11Al oxidized in 2% SO gas mixture at 900˚C for 100 hr at 9000X.
2..........................................................................................................................127
5-74. SE micrograph of Ni-22Cr-11Al oxidized in 2% SO gas mixture at 900˚C for 100 hr at 10000X.
2........................................................................................................................128
5-75. SE micrograph of Ni-22Cr-11Al oxidized in 2% SO gas mixture at 1000˚C for 100 hr at 1900X.
2..........................................................................................................................128
xvi
5-76. SE micrograph of Ni-22Cr-11Al oxidized in 10% SO gas mixture at 800˚C for 100 hr at 100X.
2............................................................................................................................129
5-77. SE micrograph of Ni-22Cr-11Al oxidized in 10% SO gas mixture at 800˚C for 100 hr at 5000X.
2..........................................................................................................................130
5-78. SE micrograph of Ni-22Cr-11Al oxidized in 10% SO gas mixture at 1000˚C for 100 hr at 10000X.
2...................................................................................................................130
5-79. SE micrograph of Ni-22Cr-11Al oxidized in 10% SO gas mixture at 900˚C for 100 hr at 1500X.
2..........................................................................................................................131
5-80. BSE micrograph of a Ni specimen oxidized at 800˚C for 24 hr at 1900X. The top layer is the electroless Ni layer deposited for edge retention. .........................................132
5-81. BSE micrograph of a NiAl specimen oxidized at 1000˚C for 36 hr at 2000X. The top layer is the electroless Ni layer deposited for edge retention. .........................................132
5-82. BSE micrograph of Ni-8Cr-6Al oxidized at 900˚C in cross-section..................................133
5-83. SE micrograph of Ni-8Cr-6Al oxidized in 2% SO gas mixture at 800˚C for 100hr in cross-section at 10000X.
2..................................................................................................134
5-84. BSE micrograph of Ni-8Cr-6Al oxidized in 2% SO gas mixture at 900˚C for 100hr in cross-section at 3500X.
2....................................................................................................135
5-85. BSE micrograph of Ni-8Cr-6Al oxidized in 2% SO gas mixture at 900˚C for 100hr in cross-section at 3500X, showing an oxide deeply penetrating along a grain boundary.
2.135
5-86. BSE micrograph of Ni-8Cr-6Al oxidized in 2% SO gas mixture at 900˚C for 100hr in cross-section at 5000X, showing sulfides along a grain boundary.
2.................................136
5-87. SE micrograph of Ni-8Cr-6Al oxidized in 2% SO gas mixture at 800˚C for 100hr in cross-section, showing sulfides along grain boundaries and pores in the oxide layer.
2....136
5-88. BSE micrograph of Ni-22Cr-11Al oxidized in 2% SO gas mixture at 975˚C for 100hr in cross-section at 8000X. The top layer is a Ni-coating added for edge retention.
2.......138
5-89. BSE micrograph of Ni-22Cr-11Al oxidized in 2% SO gas mixture at 800˚C for 100hr in cross-section at 800X.
2..................................................................................................138
5-90. BSE micrograph of Ni-22Cr-11Al matrix that was exposed to the 2% SO gas mixture at 975˚C for 100hr 2000X. The labeled X-numbers are areas that were probed for EDS.
2
.................................................................................................................................139
5-91. EPMA linescan across scale and interface in an Ni-8Cr-6Al alloy oxidized at 900˚C in He + 0.21 O + 0.02 SO gas mixture.2 2 .............................................................................140
xvii

5-92. EPMA linescan across scale and interface in an Ni-22Cr-11Al alloy oxidized at 800˚C in He + 0.21 O + 0.02 SO gas mixture.2 2 .........................................................................141
5-93. EPMA linescan across scale and interface in a Ni-22Cr-11Al alloy oxidized at 975˚C in He + 0.21 O + 0.02 SO gas mixture.2 2 .........................................................................141
6-1. Comparison of phases observed in SPIN4 calculations versus an SO -O potential diagram of Ni-8Cr-6Al at 900˚C. The blue dots correspond to calculated equilibria where the appended SPIN4 and SPOT3 databases agree. The green cubes correspond to disagreements. The dashed lines represent the alternate reaction lines determined by the appended SPIN4 database.
2 2
.................................................................150
6-2. Comparison of phases observed in SPIN4 calculations versus an SO -O potential diagram of Ni-22Cr-11Al at 975˚C. This diagram uses the same methodology as used in Figure 6-1.
2 2
...........................................................................................................151
6-3. Comparison of the calculated activities from microprobe linescans with calculated values using the appended SPIN4 database for a Ni-8Cr-6Al alloy oxidized at 900˚C in 0.21 O + 0.02 SO .2 2 .....................................................................................................154
6-4. Comparison of the calculated activities from microprobe linescans with calculated values using the appended SPIN4 database for a Ni-22Cr-11Al alloy oxidized at 975˚C in 0.21 O + 0.02 SO .2 2 ..........................................................................................154
xviii

ABSTRACT Abstract of Dissertation Presented to the Graduate School of the University of Florida in Partial Fulfillment of the Requirements for the Degree of Doctor of Philosophy
THERMODYNAMIC MODELING AND EXPERIMENTAL ANALYSIS OF OXIDATION/ SULFIDATION OF NI-CR-AL MODEL ALLOY COATINGS
By
Erik M. Mueller
May 2007
Chair: Wolfgang Sigmund Major: Materials Science and Engineering
With the current focus on finding future energy sources, land-based power gas turbines
offer a desirable alternative to common coal-fired steam power generation. Ni-Cr-Al-X alloys
are the material basis for producing overlay bond coats for the turbine blades used in sections of
the turbine engine experiencing the most extreme environments. These overlay coatings are
designed to provide environmental protection for the blades and vanes. While the oxidation of
such alloys has been investigated and modeled in-depth, the concurrent sulfidation attack has
not. This corrosion mode is now being heavily researched with the desire to use gasified coal,
biomass, and other renewable fuel sources in gas turbines that often contain significant amounts
of sulfur. The purpose of this dissertation was to use thermodynamic calculations to describe
and predict the oxidation/sulfidation processes of two Ni-Cr-Al model alloys regarding phase
evolution, composition, and component activities. These calculations, in the form of potential
and phase fraction diagrams, combined with sulfidation experiments using kinetic measurements
and materials characterization techniques, were able to describe and predict the simultaneous
oxidation and sulfidation that occurred in these alloys.
1

CHAPTER 1 INTRODUCTION
The United States and the rest of the world today are on the verge of an energy crisis. A
situation has developed in which increasing energy demands are consuming the current supply.
Besides the United States, which consumes more than 25% of the world’s energy resources, the
growing economies of Eastern Europe, China, India, and other developing countries are taxing
world energy reserves [1]. Therefore, in order to solve this growing problem, energy supply
must be increased while the demand is reduced.
The solution to creating new energy supplies is not easy, especially considering the
environmental and political impact of the most common source, fossil fuels [2]. Fossil fuel use
has led to the production of sulfur and nitrous oxides (SOX and NOX, respectively) and the
byproducts of incomplete combustion, carbon monoxide and excess hydrocarbons, which were
the chief environmental concerns of the Environmental Protection Agency and the Department of
Energy [3]. However, with the recent recognition by the White House of manmade global
climate change due to carbon dioxide (CO2) emissions, the focus of new energy creation is
finding carbon-neutral or less carbon-positive sources [4]. In essence, this entails the maximized
reduction of carbon dioxide from not only fuel consumption, but also fuel production.
Current alternatives for traditional coal, oil, and natural gas combustion to power steam
turbines are wide and varied. However, many of these energy sources are not available in all
regions and some do not yet process the technological development to make efficient use of their
resources. Furthermore, some energy sources, such as nuclear power, have such high capital
costs and political restriction, as to make them unfeasible in many regions. One currently
developed and researched alternative is the use of land-based power gas turbines. The advantage
of this process is that it has relatively few mechanical parts, requiring small capital investment,
2

reaching stable power output quickly, and achieving high thermal efficiencies [5]. This high
thermal efficiency translates into more power production for less fuel consumption, resulting in a
reduction in CO2 emissions compared to traditional steam turbines [5]. Furthermore, the source
of fuel does not have to be limited to natural gas, but can also be synthetic combustion gases
derived from biomass, gasified coal, and steam reformation of liquid hydrocarbons.
However, the use of synthetic gases and even natural gas allow the inclusion of sulfur-
based gases, such as SO2, SO3, and H2S, into the engine itself. In the turbine industry, research
of the effects of these fuels were often overlooked since they play little role highly oxidizing
conditions found in aerospace turbines. However, with the advent of fuels from less pure
sources and the addition of later turbine blade stages, which operate at temperatures lower than
those near the combustor chamber, this has again become a concern. The blades and vanes
found in the turbine section can be attacked by these impurities, leading to catastrophic failure of
the turbine and the entire engine as a whole. New research into understanding the prevention of
this failure is key to making the placement of gas-based turbines in power plants more feasible
and cost-effective. Experimental research and testing of the alloys in the turbine section are
expensive, long, and difficult to reproduce. Therefore, efforts have been made to calculate these
conditions [6-9]. However, these efforts are usually restricted to oxidation alone, or are
performed on single elements, limiting their application to complex turbine alloys or their
coatings.
The purpose of this dissertation was to test if thermodynamic calculations can be used to
describe and predict the oxidation/sulfidation processes of two Ni-Cr-Al alloys with regard to
phase evolution, composition, and component activities. In addition, the oxidation of these
alloys was analyzed in situ to determine the rate of corrosion in air and synthetic air mixtures
3

with SO2 as the sulfidizing gas. These specimens will be characterized using a variety of
techniques to determine the evolution of various phases during oxidation and the mechanisms for
corrosion. Information garnered from these experiments was compared and contrasted to
calculations using free energy minimization software to simulate the gas corrosion conditions.
The combination of these procedures was expected to determine the effects of these coatings in
the environments given and suggest solutions for preventing their failure.
4
CHAPTER 2 LITERATURE REVIEW
As stated in Chapter 1, the corrosion mechanisms of overlay coatings on turbine blades are
the chief concern of this dissertation. This chapter introduces the turbine blade alloys and their
coatings, the thermodynamics of the coatings used, and the corrosion issues characteristic of the
Ni-Cr-Al systems that are published to date.
2.1 Turbine Engine Considerations
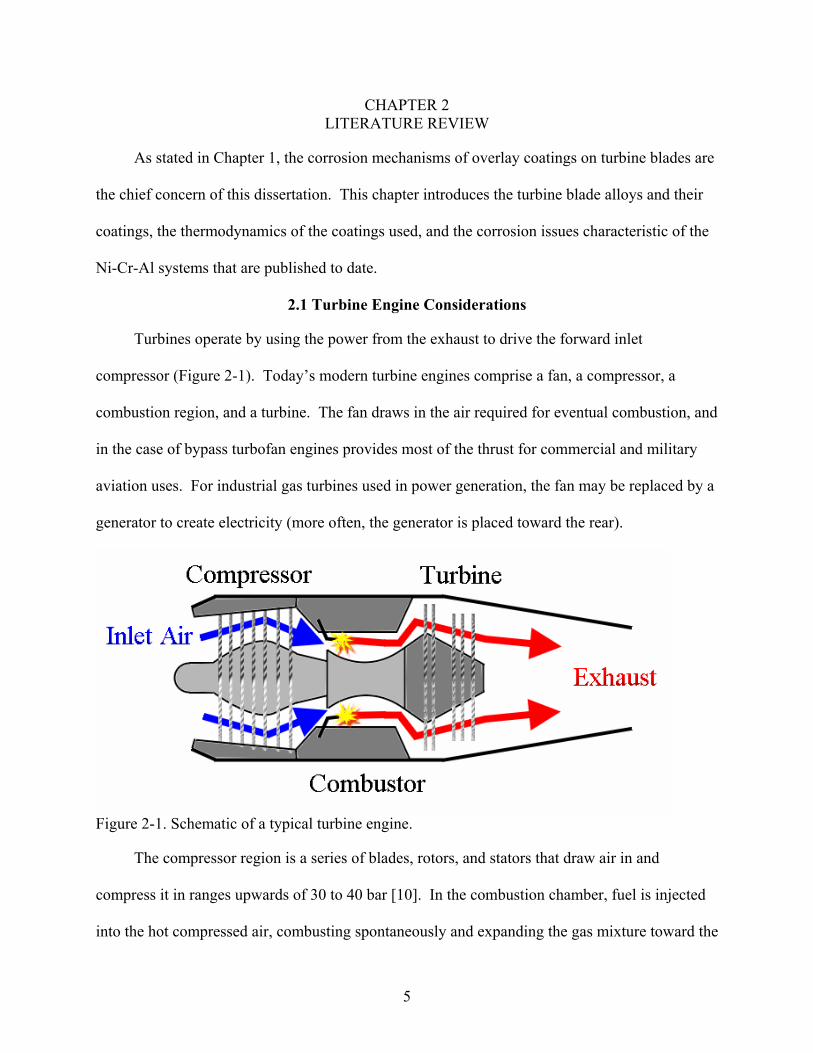
Turbines operate by using the power from the exhaust to drive the forward inlet
compressor (Figure 2-1). Today’s modern turbine engines comprise a fan, a compressor, a
combustion region, and a turbine. The fan draws in the air required for eventual combustion, and
in the case of bypass turbofan engines provides most of the thrust for commercial and military
aviation uses. For industrial gas turbines used in power generation, the fan may be replaced by a
generator to create electricity (more often, the generator is placed toward the rear).
Figure 2-1. Schematic of a typical turbine engine.
The compressor region is a series of blades, rotors, and stators that draw air in and
compress it in ranges upwards of 30 to 40 bar [10]. In the combustion chamber, fuel is injected
into the hot compressed air, combusting spontaneously and expanding the gas mixture toward the
5
exhaust of the engine. This hot, expanding exhaust drives the turbine section, comprised of a
series of blades and vanes, which powers the compressor and fan. As expected, the blades
nearest to the combustion section experience the most severe conditions, but the later stages are
greatly taxed as well. The materials contained in and the environments affecting the turbine
section are the focus of this dissertation.
2.2 Turbine Blade Materials
2.2.1 Superalloys
Nickel base superalloys are often used for applications that require high strength at
elevated temperatures, and are the material of choice for the turbine sections because, in addition
to being strong and tough, they are resistant to fatigue, creep, and environmental attack.
Common yield strengths for cast polycrystalline Ni-base superalloys are on the order of 700-
1000 MPa at room temperature [11]. Creep rupture strength are typically 75-300 MPa at 870˚C
after 1000 hrs, and 60-125 MPa at 980˚C after 1000 hr [11]. These properties stem from the
nature of the two majority phases which have a coherent interface between the FCC γ structure
and the L12 γ’ structure of Ni3Al—both having similiar lattice parameters and coherent interfaces
creating a low mismatch (less than 0.5% by length) [11-12]. The γ’ phase is a superlattice that
shows long-range ordering (LRO) to its melting point. This microstructure displays an increase
in flow stress with increasing temperature [11-12]. Extensive and complex heat treatments,
along with careful alloying, are used to create unique microstructures that will have the desired
mechanical and environmental properties. The alloying elements commonly used in superalloys
are listed in Table 2-1. Each of the elements has a tendency to partition during non-equilibrium
solidification causing some of the elements to remain in the dendrite cores and some to be
rejected into the interdendritic fluid that solidifies last. In service, these elements have a
6

tendency to diffuse and react with the environment. Therefore, careful balance and knowledge
of the effects of each of these elements must be understood. Furthermore, complex heat
treatments are employed to carefully control the microstructures, and mitigate these effects.
Table 2-1. List of common alloying elements in Ni-base superalloys. Alloying
Element
Alloying Properties Partitioning Behavior
Al γ’ former; increases anti-phase boundary energy (γAPB), increases oxidation resistance
Interdendritic / γ’
C Carbide former; oxygen getter; grain boundary strengthener n/a Co Lowers stacking fault energy (γSFE); increases γ’ melting
point; strengthens γ phase Dendrite Core / γ
Cr Oxidation/corrosion protection, lowers γAPB; can form topologically close-packed (TCP) phases
Dendrite Core / γ
Mo Increase creep strength, strength in γ; decrease oxidation/corrosion resistance; forms TCP
Dendrite Core / γ
Nb γ” former; increases coherency strain, peak strength, room temperature strength
Interdendritic / γ’ / γ”
Re Increases creep strength, strength in γ, modulus; decrease oxidation/corrosion resistance, forms TCP
Dendrite Core / γ
Ru Reduces Re partitioning; delays TCP formation; increase creep strength; decreases oxidation/corrosion resistance
Dendrite Core / γ
Ta γ’ former; increase γAPB, coherency strain, creep strength, peak strength; improves castability
Interdendritic / γ’
Ti γ’ former; increases γAPB, coherency strain Interdendritic / γ’
W Increases creep strength, strength in γ, modulus; decrease oxidation/corrosion resistance, forms TCP
Dendrite Core / γ
2.2.2Coatings for Turbine Blades
There are a variety of coatings for superalloy blades and vanes, and they are applied to
increase environmental stability and/or reduce the heat transmitted to the blade. Figure 2-2
shows the common coating configuration used in aerospace and industrial gas turbine (IGT)
engines [16]:
7

• The substrate (superalloy turbine blades) • The bond coat, which provides an environmental barrier for the substrate and a better
bonding surface for the exterior coating • The thermally grown oxide (TGO), which is sometimes manufactured before service • The thermal barrier coating (TBC), which is a porous, columnar ceramic coating usually
consisting of ZrO2 designed to reduce the heat seen by the layers underneath
The TBC effectiveness of the TBC is the change in temperature (∆T) which controlled by
TBC thickness (δ), thermal conductivity (k), and the thermal flux (Q) through the blade wall, via:
kQT δ
⋅=∆ (2-1)
The ∆T values obtained can be as high as 150˚C [10]. The focus of this study will be on bond
coats, which are generally of the MCrAlY composition design, where M is a metal base usually
Ni, Co, or both. This layer, which is higher in Cr and Al than the substrate, is designed to
oxidize first and protect the superalloy. This is because, even though the TBC is the outer
coating, it is porous and the oxidizing/corroding elements of the atmosphere directly contact and
react with the bond coat. Ni-base superalloys generally oxidize to form nickel-based oxides,
which do not adhere to the substrate and cause spallation of TBC layer [13]. The layer of
protection formed on the bond coat is generally designed to grow as aluminum oxide, α-Al2O3,
since it has the lowest oxygen diffusivity of the oxide of any of the elements listed in Table 2-1
[14]. The TGO is sometimes pre-grown before the coated blade is put into service but,
regardless, is present upon usage in the highly oxidizing high temperature conditions. Co is can
be used to increase the coating ductility, but the formation of CoO reduces the oxidation
resistance because this oxide grows at a faster rate than NiO, Al2O3, or Cr2O3 [10,13,15]. The
thermal barrier coating is said to fail when the TGO grows to a thickness so large that it spalls.
Spallation can also occur from buckling due to cyclic thermal stresses [16].
8

Figure 2-2. Schematic of coating configuration of modern turbine blades.
2.4 The Al-Cr-Ni Ternary System
The bond coats that are examined here are of the NiCrAl-type. In order to understand
these coatings, the Al-Cr-Ni ternary should be discussed. The Al-Cr-Ni ternary has been studied
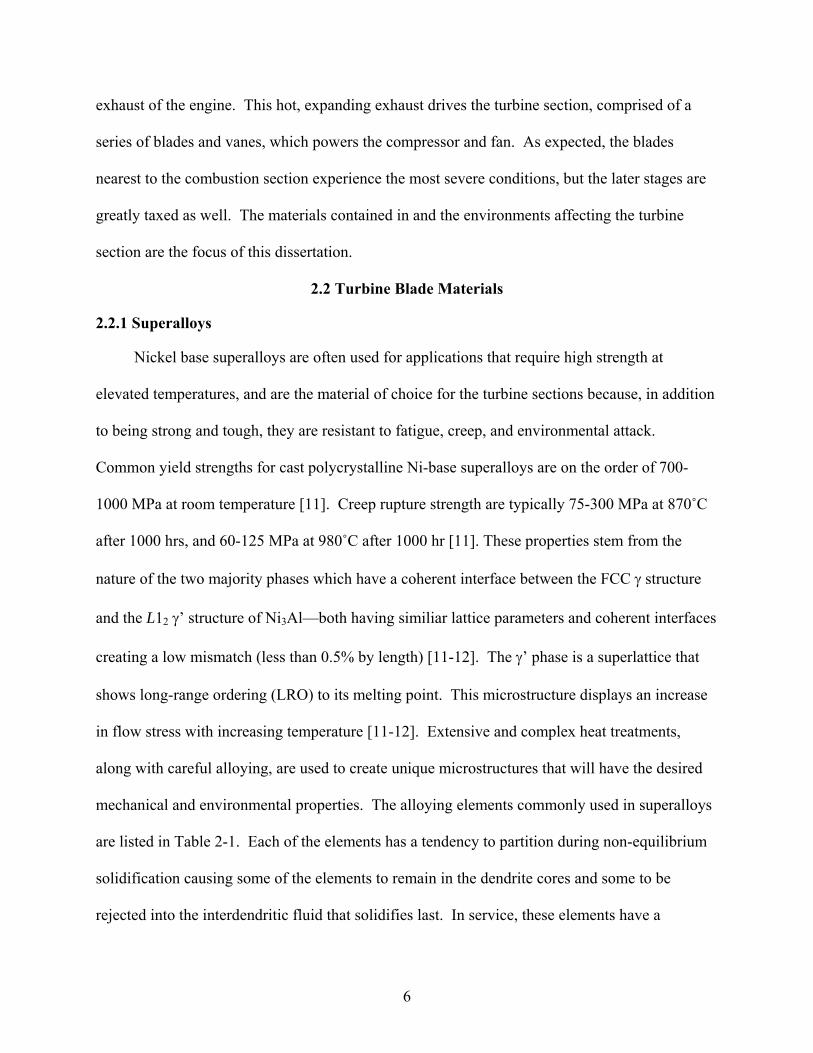
through both experiments [17-22] and thermodynamic calculations [23-29]. Figures 2-3, 2-4,
and 2-5 refer to the ASM Handbook binary phase diagrams of Al-Ni, Al-Cr, and Cr-Ni,
respectively [30]. Studies of the Al-Cr-Ni ternary were undertaken—first using powder X-ray
diffraction techniques [17], which were integrated with other techniques to determine
thermodynamic data such as the Gibbs free energies of formation (∆Gf) [18]. These other
methods included diffusion couples [19-20], differential thermal analysis (DTA) [21], and
electron microprobe (EPMA) [21]. The data were optimized to enable calculations of the ternary
system. Since the Ni-rich area (XNi > 0.5) is of more importance for practical applications, it has
been studied in more depth than the Al or Cr-rich regions [19-20, 23, 25, 27].
9
Figure 2-3. Al-Ni binary phase diagram [H. Baker. ASM Handbook Vol. 3—Alloy Phase
Diagrams, ASM International: Materials Park, OH, p. 49 (1992)].
Figure 2-4. Ni-Cr binary phase diagram [H. Baker. ASM Handbook Vol. 3—Alloy Phase
Diagrams, ASM International: Materials Park, OH, p. 155 (1992)].
10

Figure 2-5. Al-Cr binary phase diagram [H. Baker. ASM Handbook Vol. 3—Alloy Phase
Diagrams, ASM International: Materials Park, OH, p. 43 (1992)].
A recent retooling of the ∆Gf descriptions of several of the important phases has been
performed. Earlier studies described the γ and γ’ phases as having separate Gibbs energy
functions [23-24], but more recent studies by using new data [25] describe the γ and γ’ as ordered
and disordered versions of the same phase, transforming via a second-order reaction [27]. The
α-Cr and β-NiAl are also treated as having the same Gibbs energy function [26-27] as can be
described by the compound energy formalism, which attempt to simplify descriptions of
intermetallics and oxides using sublattices that can substitute multiple elements and vacancies
[31]. This methodology is used for one of the databases accessed for ternary calculations (see
Chapter 4). Debate has occurred over the exact descriptions of this sublattice model, as to
whether there should be a single sublattice [23-25] or multiple [26-27]. The most recent
11

publications, though, [27-29, 32] agree that multiple sublattice models best describe the ordered
and disordered phases present in the Al-Cr-Ni system.
The phases present in the Al-Cr-Ni ternary are listed in Table 2-2. Figure 2-6 shows the
liquidus projection taken from a review of a compilation of calculated and experimental data
[32]. The Scheil reaction scheme is shown in Figure 2-7. At 1445˚C (labeled e1), a eutectic
occurs in which α-Cr and β-NiAl solidify. Eutectics also occur for γ and γ’ at 1380˚C (e2) and
for γ and α at 1345˚C (e3). Peritectics are observed for L + β γ’ at 1385˚C (p1) and 1350˚C
for L + α ζ1 (Al8Cr5-hexagonal) (p2). At 1340˚C, Lβγ’ and Lγγ’ tie-triangles react in a ternary
invariant reaction (Class II) to form Lβγ and bγγ’ three-phase equilibria (U1). The Lβγ then
reacts with the Lαβ and Lγα tie-triangles at a ternary eutectic reaction (Class I) to solidify to α +
β + γ at 1320˚C (E1). At 990˚C, a ternary invariant reaction (U4) occurs in which the αβγ reacts
with βγγ’ to form αγγ’ and αβγ’ three-phase equilibria. Figures 2-8 and 2-9 show isothermal
sections of the ternary before and after reaction U4, respectively. Other invariant reactions occur
in the Cr-rich and Al-rich areas of the ternary, but these are ignored as they are not applicable to
this study nor the one referenced [32].
The importance of studying this ternary is to construct model alloys of Ni-Cr-Al that can
be modeled and studied as opposed to multicomponent alloys [28-29]. Results from experiments
with these model alloys can be directly correlated to bond coats containing more elements such
as rare-earths and Y (typically less than or equal to 1 wt%) and be to related to their
microstructures and corrosion results.
Overlay coatings are those in which interdiffusion is not required so that the coatings are
“laid onto” the substrate. The MCrAlY compositions are designed to provide optimum oxidation
or hot corrosion resistance, as well as strength, ductility, and thermal expansion match with the
12

Figure 2-6. Liquidus projection of the Al-Ni-Cr ternary system [P. Rogl. “Al-Cr-Ni,” Ternary
Alloys: A Comprehensive Compendium of Evaluated Constitutional Data and Phase Diagrams: Al-Cd-Ce to Al-Cu-Ru. 4 p. 411 (1991)].
Figure 2-7. Scheil reaction scheme of the Al-Cr-Ni ternary. The δ-phase refers to Ni2Al3, the ζ1
to Al8Cr5-hexagonal, ζ2 to Al8Cr5-rhombodedral, and ε1 to Al9Cr4. The question marks represent areas of the ternary that were not investigated.
13

Table 2-2. List of phases described in calculations of the Al-Cr-Ni ternary. Phase Temperature
Range (˚C) Lattice Parameter
(Å) Space Group Pearson Symbol
(Al) < 660.45 4.049 Fm 3 m cF4 α-Cr < 1863 2.884 Im 3 m cI2 γ-Ni < 1455 3.524 Fm 3 m cF4 γ’ (Ni3Al) < 1372 3.566 Pm 3 m cP4 β (NiAl) < 1638 2.886 Pm 3 m cP2 Ni2Al3 < 1133 a = 4.036
c = 4.900 P 3 m1 hP5
NiAl3 < 854 a = 6.611 b = 7.366 c = 4.8112
Pnma oP16
Al13Cr2 < 791 a = 25.19 b = 7.574 c = 10.95 β = 128.7˚
C2/m mC104
Al11Cr2 < 941 a = 12.88 b = 7.652 c = 10.639 β = 119.3˚
P2 mP48
Al4Cr < 1031 a = 8.716 b = 23.95 c = 16.39 β = 119.33˚
P2/m mP180
Al9Cr4 1172 – 1061 a = 9.123 Unknown cI52 Al9Cr4 < 1050 Unknown Unknown [Monoclinic] Al8Cr5 1352 – 1127 a = 9.047 Unknown cI52 Al8Cr5 < 1127 a = 12.733
c = 7.944 R3m hR26
AlCr2 < 911 a = 0.3004 c = 0.8648
I4/mmm tI6
Ni2Cr < 590 a = 2.524 b = 7.571 c = 3.568
oI6
14

Figure 2-8. Isothermal section of Al-Cr-Ni ternary at 1025˚C above the U4 reaction. The green
areas denote regions of two-phase equilibria [P. Rogl. “Al-Cr-Ni,” Ternary Alloys: A Comprehensive Compendium of Evaluated Constitutional Data and Phase Diagrams: Al-Cd-Ce to Al-Cu-Ru. 4 p. 414 (1991)].
Figure 2-9. Partial Isothermal section of Al-Cr-Ni ternary at 850˚C below the U4 reaction. The
green areas denote regions of two-phase equilibria [P. Rogl. “Al-Cr-Ni,” Ternary Alloys: A Comprehensive Compendium of Evaluated Constitutional Data and Phase Diagrams: Al-Cd-Ce to Al-Cu-Ru. 4 p. 413 (1991)].
15

given substrate. One application method is through electron beam physical vapor deposition
(EB-PVD). This method allows direct deposition from a metal source to a heated metal substrate
without a chemical reaction and forms a columnar structure [33]. This can also be accomplished
using an electric arc [34]. Another common method, plasma spraying, involves injecting a
prefabricated powder into a plasma-gas stream, which deposits melted pellets as splats on the
surface [35]. This leaves few voids, but the coating has a rougher surface finish than EB-PVD.
The surfaces of both coatings are often mechanically machined to create a smooth exterior and
heat-treated to better bond to the substrate. Oxidative heat treatments are sometimes employed
to begin TGO formation in a controlled manner in order to stabilize the coating system.
Overlays can also be applied by a high-velocity oxide furnace (HVOF) in which liquid fuel and
oxygen are fed at high pressure into a combustion chamber where they burn to produce a hot gas
stream that accelerates powder particles onto the substrate [36].
The phases present in the overlay coating vary with the composition of the coating and can
be approximated by the Ni-Cr-Al or Co-Cr-Al ternaries. Many of the coating processes do not
create an equilibrium microstructure due to the rapid solidification, so they heat-treated to obtain
the desired microstructure [37]. For the coatings to be used in this project, Ni-22Cr-11Al and
Ni-8Cr-6Al, the phases present are shown in Table 2-3 [37]. Upon proper heat-treatment, the Ni-
8Cr-6Al shows a microstructure of cubiodal γ’ surrounded by a matrix of γ [28], whereas Ni-
22Cr-11Al alloys show large globular β phases containing small γ' surrounded by a matrix of γ
with small irregular α [37]. At increasing temperature, the solubility of the alloying elements in
the γ and γ’ phases increase, reducing the number of stable phases. In this respect, there is more
compositional homogeneity to more easily form a stable α-Al2O3 oxide film. The oxidation
mechanisms and behavior of these coatings is discussed in the next section.
16

Table 2-3. The phases present in the Ni-22Cr-11Al and Ni-8Cr-6Al (weight percent) alloys at room temperature and 1000˚C.
Alloy Composition Phases Present (Room Temperature)
Phases Present (1000˚C)
Ni-8Cr-6Al γ, γ’ γ Ni-22Cr-11Al γ, γ’, β, α γ, γ’
2.5 Oxidation of Al-Ni-Cr Alloys
2.5.1 General Oxidation Mechanism
In general, the oxidation of a metal in a gaseous environment involves several stages.
First, the O2 molecule must adsorb (by physisorbtion) and dissociate onto two sites on the metal
surface [39-40]. The molecule then chemisorbs with the surface, at which one or more of several
processes may take place:
• Active oxidation—an MxOy molecule may desorb leaving a bare metal surface [40] • Dissolution—the oxygen may diffuse into the metal, where it may later form internal
oxides [38] • Nucleation—oxides “islands” may nucleate and grow [38] • Thin film formation—a thin film layer of oxide may form, passivating the metal [38-40] This general mechanism is the mechanism of oxide growth expected for the alloys in this study.
The reaction on the surface
)()( 22 sOMOsxM xyy →+ (2-2)
can be rate-limited by [38]
• Desorption (in the case of active oxidation) • Diffusion of species through a film • Gas transport in the substrate • Ion transport in the substrate • Oxide growth • Oxide nucleation • Surface adsorption
In the case of the formation of a thin film at lower temperatures, the rate-limiting step has
been shown to be cation transfer from metal to oxide surface driven by an electric potential
17
across the film, as described by Mott and Cabrera [39]. The kinetics of thin film growth can be
described as logarithmic
)log( τ+⋅= tkx l (2-3)
or inverse logarithmic
tkB lx log1 ⋅−= (2-4)
where x is film thickness, kl is the rate constant, t is time, and B and τ are constants. Figure 2-10
shows an example of logarithmic and inverse logarithmic growth.
Figure 2-10. Plot of oxidation growth kinetics versus time.
At higher temperatures, and in thicknesses large enough where electric field effects are
negligible (x > 10 nm), parabolic kinetics usually govern film growth (Figure 2-10):
(2-5) Ctkx p +⋅≈2
As described by Wagner’s theory of passive oxidation of Si, thermal diffusion of cations and
anions is generally the rate-limiting step in parabolic growth [40]. As the film thickness
increases, the diffusion length increases slowing the growth. This observation, however,
assumes a compact, adherent scale. If the oxide is porous or has poor adhesion with the metal
surface, then bulk parabolic growth may not apply as short-circuit surface O2 diffusion paths
18

become prevalent. Bulk diffusion is usually bypassed by diffusion along grain boundaries,
stacking faults, and dislocations, which increase the film growth rate [41].
Other kinetic oxidation models relevant to this study include linear growth:
kdtdx
= (2-6)
Linear kinetics are also observed if the oxide is volatile or above its melting point. This occurs
in oxides where the film is not protective, and is often porous. Other kinetic models include
paralinear, cubic, and subparabolic, which describe mixed growth. These models attempt to
describe transitions from one kinetic model to another (e.g. linear to parabolic) or growth limited
by several simultaneous mechanisms.
The oxidation described in this section and the rest of this report deals with isothermal
oxidation. Cyclic oxidation, where the temperature is varied (usually from room temperature to
a maximum temperature), is not covered here as thermal expansion and residual stress factors
must be taken into account, leading to more rapid failure than in isothermal conditions. For more
information on cyclic oxidation, the interested reader is referred to references 10, 14, and 15.
2.5.1.1 Oxidation of Ni
The oxidation of Ni is governed by gas absorption, oxide nucleation, and film growth as
per the chemical reaction
2Ni + O2 2NiO (2-7)
NiO, or busenite, has an NaCl-type structure and appears as a black oxide (or green in high Ni
contents). The oxide grows with a (111)Ni||(001)Ni, [ 011 ]NiO||[ 011 ]Ni orientation relationship,
although (100)NiO and (211)NiO are grown in epitaxy as well [36]. NiO is a p-type metal deficient
oxide, where every cation vacancy has two Ni3+ pairs. In p-type metal deficient oxides, cations
diffuse via vacancies in the cation sublattice to the oxide/gas surface while electrons migrate via
19

electron holes back toward the oxide/metal interface as determined by tracer experiments [38,
43].
Ni oxidation has been described by parabolic kinetics [43-46]. However, a recent study
with pure Ni in various oxygen-argon atmospheres showed that between 700°C and 1000°C,
NiO could grow “subparabolically” [44]; above 1000°C and below 600°C, parabolic growth is
observed. The reason for this is that above 1000°C, bulk diffusion via cation vacancies
dominates, and the scale exhibits columnar grains [47]. In the subparabolic regime, the scale
exhibits a duplex structure with outer columnar grains having outward Ni cation diffusion, and
inner equiaxed grains with short-circuit O2(g) diffusion inward [48].
2.5.1.2 Oxidation of Al
Al oxidation has been widely characterized for a variety of applications. Al is highly
reactive and readily ionizes at -1.662 eV [38]:
Al Al3+ + 3e- (2-8)
Al2O3 is considered an excellent passivating film due to its good Pilling-Bedworth (P-B) ratio
(1.28) [38] and having a low O2- diffusivity at sufficient thicknesses [49]. Alumina is most
prevalent in the α-Al2O3 corundum R3c phase, although other phases exist, as outlined in Table
2-4.
The initial stages of Al oxidation have been described using Al substrates in ultra-high
vacuums. In the initial stages, O2 molecules approaching an Al surface physisorb, dissociate,
and chemisorb onto the surface. This then allows for the inward diffusion of O2- and the
formation of Al2O3 tetrahedra [51]. The adsorption sites are different based on the orientation of
the metal surface. Initially, these original formula units of Al2O3 exist as amorphous “islands,”
which grow laterally, eventually covering most of the metal surface [52]. Initially cation-
20

Table 2-4. Descriptions and crystallographic information on different phases of Al2O3 [49-50]. α-Al2O3 κ-Al2O3 γ-Al2O3 θ-Al2O3 δ-Al2O3Crystal system
Trigonal
Orthorhombic Cubic Monoclinic Tetragonal
Space group
R3c
Pna21 Fd 3 m C2/m P 4 m2
Lattice parameters (Å)
a=4.7587 c= 12.9929
a=4.8351 b=8.3109 c=8.9363
a=7.92
a=11.8545 b=2.9041 c=5.6622 β=103.837
A=5.599 c=23.657
Al atoms in unit cell
12 16 63/3 n/a 14
O atoms in unit cell
18 24 32 n/a 12
Al-co-ordination
Octahedral
75% octahedral 25% tetrahedral
n/a n/a n/a
deficient, the amorphous film grows outward via interstitial Al3+ transport [49,52] driven by the
Al concentration gradient [49,53] and E-field effects [40]. At several nanometers, when
stoichiometry in the oxide is achieved [54], the amorphous alumina crystallizes into γ-Al2O3
(sometimes preceded by a γ’-Al2O3 [55]) due to a close orientation relationship between the
oxide and the substrate (111)Al||(111)γ-Al2O3 as determined by a rigorous TEM analysis [56-57].
The γ-Al2O3 is an anion-deficient n-type semiconductor, growing via inward chemical bulk O
diffusion [58]. Short-circuit paths play a role at larger thicknesses. The growth kinetics are
logarithmic at lower temperatures, and parabolic at higher temperatures.
The γ-phase is metastable and rarely seen above 800°C [58]. It will usually transition to
the stable α-phase at sufficient thicknesses, times, and temperatures. The δ and θ phases are
sometimes seen as intermediates with whisker morphologies [58-59] and generally grow by
outward cation diffusion, as determined by tracer and inert marker tests [58-60]. These transition
21

phases are undesirable compared to the α-phase because stable α-phase has a parabolic rate
constant an order of magnitude lower [61] due to slow anion-diffusion along grain boundaries
[56, 62]. This growth mechanism depletes the substrate less (in the case of Al-X alloys) than the
cation-diffusing transition aluminas. Furthermore, the kP of γ-Al2O3 is higher than that of NiO or
Cr2O3, defeating the use of Al2O3 as an impediment to oxidation in Ni-Cr-Al alloys [63].
2.5.1.3 Oxidation of Cr
The oxidation of Cr has been studied extensively due to its use as the major alloying
protectant in stainless steels [64-66]. As found with tests in steels or in elemental form, Cr reacts
with O2 to form Cr2O3 via a similar reaction as Al does with O2:
4Cr + 3O2 2Cr2O3 (2-9)
Cr2O3, or chromia, like NiO is a p-type metal deficient semiconductor [67], and therefore grows
by outward cation transport through the scale lattice [67-68] at temperatures less than 1250˚C.
Cr2O3 is commonly used because it reacts faster with O than the elements it is alloyed with and
has a low O2 diffusivity, thereby allowing a slow growth rate [69-70]. Cr oxidation is described
by parabolic kinetics above 700˚C, and shows initial logarithmic growth at lower temperatures.
Above this temperature, chromia can become amphoteric, or able to transport in both directions
simultaneously, and the growth rate increases rapidly [67]. Due to this defect structure, the
Cr2O3 can form a duplex structure with an inner layer where interstitial Cr3+ diffusion also takes
place. This tends to increase the diffusion of Cr3+ in the inner region, which is highly dependent
on the oxygen partial pressure [70]. As validated by tracer tests and diffusion coefficient
findings, short-circuit diffusion through grain boundaries, cracks, and pores dominate and
increase the scale growth rate [64, 69-70]. One oxidation study showed that this was the primary
growth mechanism [71].
22
One of the problems with Cr2O3 is the ability for the Cr cations to become hexavalent at
higher O2 partial pressures, forming CrO3, such as can be experienced in gas turbine conditions
by these reactions [72]:
2Cr + 3O2 2CrO3 (2-10)
2Cr2O3 + 3O2 4CrO3 (2-11)
The formation of this gas species removes the protective chromia layer thereby making the Cr2O3
ineffective. Volatilization also increases the Cr alloyed in the substrate, decreasing the time-to-
fail of the Cr2O3 scale. Other gas species have been studied, but are less likely to be major
contributors at high temperatures and high oxygen partial pressures [72-73]. Hexavalent Cr gas
species have been classified as carcinogens and the use of Cr coatings in some industries has
been restricted [74].
2.5.2 Oxidation of Ni-Al Alloys
Al2O3 (as well as Cr2O3) has a slower growth rate (Figure 2-11) and higher affinity for O2
than Ni [15]. Therefore, Al is commonly used as an alloying agent with Ni to provide an
environmental protection in lieu of the unprotective NiO scale. As mentioned in Section 2.2, Al
is also used to form and stabilize the intermetallics γ’ and (β).
With Ni-Al alloys, the corundum α-alumina phase is the desired TGO for its slow-growth
rate, low anion diffusivity, and overall smooth morphology. The γ-alumina phase has been
shown in studies to appear first, especially at lower temperatures (T < 850˚C) due to a lower
activation energy to form on Ni-Al alloys [75-77].
The oxidation of dilute Ni-Al alloys begins with the formation of NiO. The formation of
this oxide, though, depletes the alloy at the alloy/gas interface of Ni and reduces the PO2 in
relation to the gas/scale interface. This leads then to the formation of Al2O3 [63]. Scanning
23

Figure 2-11 – Arrhenius plot of parabolic growth rates versus temperature of NiO (violet) as well
as Cr2O3 and Al2O3 (red) [J.L. Smialek, G.M. Meier, “High-Temperature Oxidation,” Superalloys II. C.T. Sims, N.S. Stolff, W.C. Hagel, eds., John Wiley & Sons: New York p. 295 (1987)].
electron microscopy (SEM) cross-sections found that alumina scale formation will develop
fastest at the grain boundaries, since these are fast diffusion paths for Al3+ and O2- transport [77].
Hindam and Smeltzer decribed the formation of Al2O3 in the presence of NiO or Ni will lead to
“breakdown oxidation” of the alumina scale in which spinel is formed via [78]:
NiO + Al2O3 NiAl2O4 (2-12)
If the amount of Al present in the alloy is too little, a stable alumina scale may not be formed
[78]. As graphically described by Pettit in Figure 2-12, too little Al will prevent the internal
oxides of Al2O3 from coalescing to form a continuous scale [76]. Furthermore, even if a stable
scale is formed, the alloy must have enough Al to continually feed the oxide growth, and the flux
of Al in the alloy must exceed that in the oxide. If not, the alumina scale will break down, and
NiO and NiAl2O4 will stabilize [76, 78-79].
24

Figure 2-12. Dependence of oxidation mechanisms and scale type of Ni-Al alloys based on
temperature and Al content [F.S. Pettit: Transactions of the AIME. 239, pp. 1296-1305 (1967)].
In two-phase alloys, oxidation rates and oxide phases can differ over a range of
compositions. The addition of any Al to Ni will cause an increase in the rate of oxide growth,
and a decrease in activation energy [58, 79]. This fast oxidation is due to Al3+ doping of the NiO
and the formation of the open NiAl2O4 spinel that allows for rapid cation diffusion [79]. In γ + γ’
mixtures, the kinetics are more complex, showing a parabolic-linear-parabolic procedure whose
growth rate is less than alloys with Al < 6 wt% [76]. This occurs because the initial α-Al2O3
scale is being overtaken by NiO growth, and eventually reaches steady-state nickel oxide
parabolic growth [80]. For those oxides growing over γ-Ni, the only alumina seen is α-Al2O3,
and can be mixed with NiO and spinel. Transient δ and θ alumina phases are often seen growing
first over Ni3Al [81-82]. This is also observed on γ’ + β mixtures, but kinetics are always
parabolic [76, 83-84]. The presence of β causes the faster formation of α-Al2O3 and a slower
growth rate than with more dilute Ni-Al alloys. Transient alumina phases have been observed
over NiAl as well [85].
25

2.5.3 Oxidation in Al-Cr-Ni Ternary and NiCrAlY Coatings
Oxidation of Ni-Cr-Al alloys involves a complex competition of the formation and growth
of NiO, Cr2O3, and Al2O3. In addition, the nickel-chromium and nickel-aluminum spinels often
play a role. In general, the addition of Cr to Ni-Al alloys stabilizes the Al2O3 phase [85-86].
This overall process, was first described by Pettit [76] and is shown in Figure 2-13. Upon initial
oxidation, the activities of oxygen and nickel are high enough that NiO forms [87]. Any Al or Cr
that oxidizes reacts with NiO to form spinel. NiCr2O4 and NiAl2O4 allow for faster transport of
O2- anions in and Ni2+ anions out. As the initial scale grows, the PO2 at the scale/alloy interface
diminishes due to scale thickening, and the activity of Ni decreases due to Ni-depletion in the
alloy below the interface [88]. This causes internal oxidation of Cr and Al in the alloy. If there
are insufficient amounts of alloying elements, the Al and Cr oxides will remain as small
spherical and/or rodlike internal phases (Group I). If, however, there is enough Cr, a continuous
scale of Cr2O3 will form and grow at the scale/alloy interface (Group II). This has the effect of
further lowering the oxygen activity at the interface, which, if there is enough Al to sustain it,
will form a continuous Al2O3 scale that becomes rate-controlling (Group III) [86, 89-90]. In
effect, Cr “getters” O2 allowing the Al2O3 scale to stabilize. If there is not enough Al, though,
the steady-state scale that grows will be chromia (Group II) [90-92].
Kinetically, as with Ni-Al alloys, increasing the alloying elements Al and Cr in Ni-Cr-Al
will cause a decrease in the parabolic growth rate [93-94]. The exception to this is in the case of
dilute alloys wherein the alloying elements actually dope the oxide increasing ionic mobility by
introducing lattice vacancies [88, 95].
26
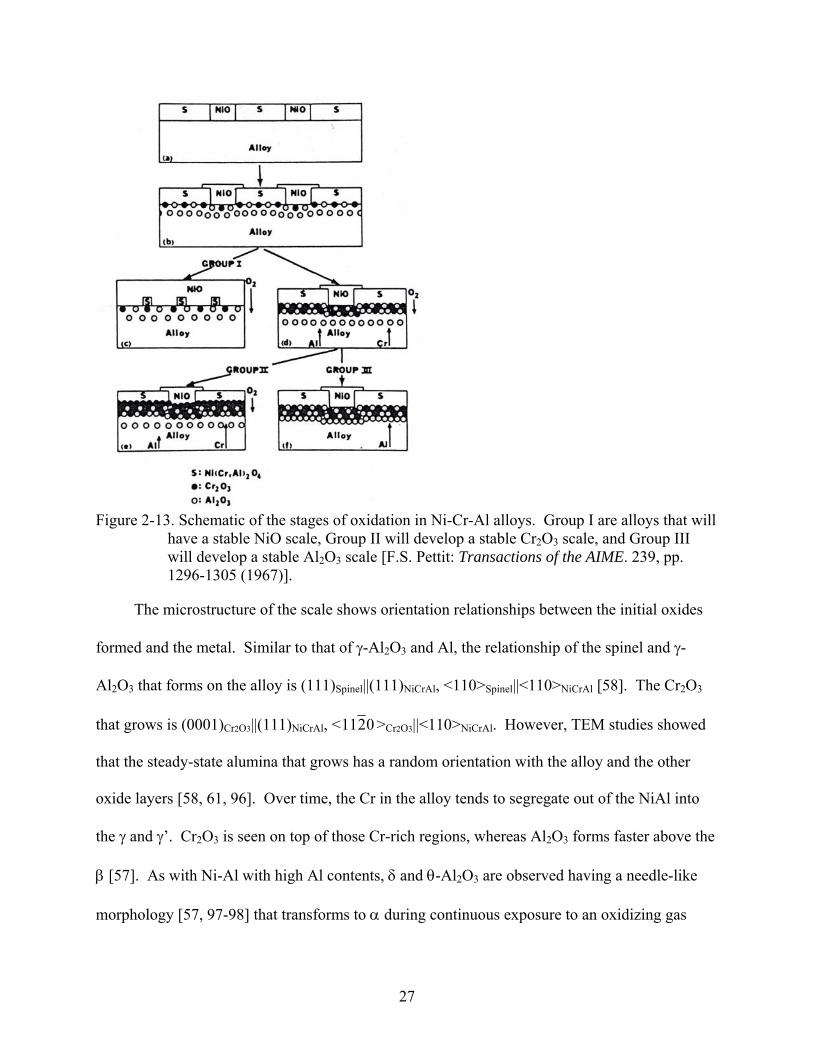
Figure 2-13. Schematic of the stages of oxidation in Ni-Cr-Al alloys. Group I are alloys that will
have a stable NiO scale, Group II will develop a stable Cr2O3 scale, and Group III will develop a stable Al2O3 scale [F.S. Pettit: Transactions of the AIME. 239, pp. 1296-1305 (1967)].
The microstructure of the scale shows orientation relationships between the initial oxides
formed and the metal. Similar to that of γ-Al2O3 and Al, the relationship of the spinel and γ-
Al2O3 that forms on the alloy is (111)Spinel||(111)NiCrAl, <110>Spinel||<110>NiCrAl [58]. The Cr2O3
that grows is (0001)Cr2O3||(111)NiCrAl, < 0211 >Cr2O3||<110>NiCrAl. However, TEM studies showed
that the steady-state alumina that grows has a random orientation with the alloy and the other
oxide layers [58, 61, 96]. Over time, the Cr in the alloy tends to segregate out of the NiAl into
the γ and γ’. Cr2O3 is seen on top of those Cr-rich regions, whereas Al2O3 forms faster above the
β [57]. As with Ni-Al with high Al contents, δ and θ-Al2O3 are observed having a needle-like
morphology [57, 97-98] that transforms to α during continuous exposure to an oxidizing gas
27

mixture [56]. A study by Levi et. al. observed these transient aluminas formed as lumps or hills
on top of the β, whereas the oxides over γ/γ’ were seen as a smooth scale [97]. The α-alumina
that forms underneath (over all alloy phases) is columnar [93, 96-97]. The absence of these
transient aluminas again shows a lower oxidation rate [98].
2.6 Sulfidation and Hot Corrosion
2.6.1 Hot Corrosion
Hot corrosion is an accelerated corrosive attack of molten salts that often occurs in the later
stages of turbine engines where the pressure is less than those near the combustor, and when salt
or ash deposits accrue on the alloy or coating surface [99]. Even for applications typically
operating above 1000°C, hot corrosion can be a problem during thermal cycling—frequently
occurring in salty marine areas or in operations with fuels containing S, V, and/or P. This
mechanism occurs when temperatures enable molten salts such as Na2SO4, K2SO4, and/or NaCl
to be in their liquid state, in which they attack the oxide scale, and eventually penetrate into the
substrate itself [99-101]. This type of corrosion can be categorized into two stages: an initiation
stage, and a propagation stage. The initiation stage is marked by either parabolic growth or slow
weight loss. The mechanism is similar to oxidation, except that sulfides form in the oxide from
an influx of sulfur anions or SOX gases. Once the propagation stage begins, severe weight loss is
observed and rapid attack of the oxide and alloy begins. The chief reaction(s) governing this
process is
Na2SO4 Na2O + SO3(g) (2-13)
SO42- O2- + SO3(g) (2-14)
28

These are the basis for the fluxing reactions in which basic fluxing
MO + O2- MO22- (2-15)
or acidic fluxing
MO M2+ + O2- (2-16)
occurs [102]. This attack can be categorized into either Type I, which occurs between 850 and
1000°C and is governed by basic fluxing, and Type II that occurs between 680 and 750°C [97]
and is governed by acidic fluxing [103-104]. Type II corrosion displays characteristic pits can be
avoided through higher Cr contents, higher temperatures, and larger gas flow velocities in the
engine. The partial pressure of SO3 is critical for the reaction where the sulfate dissolves the
metal oxide at the scale/salt interface, which then reacts with SO3 to form oxide (low PSO3) or
sulfate (high PSO3), which then repeats the process [103-105].
Type I hot corrosion is of more concern for this study, in which the formation of metal
sulfides from reactions with the sulfate create a free oxygen anion that reacts with the metal
oxide to form a metal oxyanion that dissolves in the salt [105-106]. This MOX2- then can react
with SO2 (or SOX) to form oxide particulates at the salt/gas interface that frees up oxygen anions
to repeat the process [106-107]. While originally thought to be self-sustaining, other research by
Goebel and Shores has shown that a constant supply of Na2SO4(l) is required to prolong the
reaction [100, 108] . One of the chief drivers for this corrosive attack is the production of
sulfides, and the diffusion of sulfur into the oxide itself [109]. The last sections of this chapter
will examine the role of sulfidation, which is the mechanism for the initiation stage of Type I hot
corrosion [103-105].
2.6.2 Sulfidation on Metals
Sulfidation in metallic systems has been studied in oxygen and oxygen-free environments.
Sulfur is present in unclean fuels, coal, and salts in marine environments, and behaves differently
29
depending on whether it is present in oxidizing environments, or those devoid of oxygen
(reducing environments). Reducing environments of sulfur are often modeled in H2S
atmospheres with low oxygen partial pressures and a fixed H2/H2S ratio in order to fix the partial
pressure of S2. Studies involving this have shown that Ni in H2/H2S environments form almost
exclusively β-Ni3S2 which exhibits linear sulfidation behavior initially (or at lower temperatures)
and then grows parabolically [110-111] due to rapid sulfur diffusion along grain boundaries
[112]. In Cr-containing alloys, the sulfides come closer to a 1:1 ratio of CrS as the temperature
increases as determined by XRD and TEM, with a layered structure exhibiting inward anion
diffusion, and an outer layer exhibiting outward cation diffusion [113]. This duplex sulfide layer
is also seen in alloys where the rate-limiting mechanisms are similar with an outer layer of Ni3S2
and an inner layer mix of nickel, chromium, and aluminum sulfides [114-115] due to decreased
the sulfur activity.
In sulfidation experiments performed in oxidizing conditions, which are the focus of this
study, either SO2 is mixed with the oxidizing atmosphere (usually air or O2), SO2 is used alone,
or H2S is added to oxygen. In all these situations, the PO2 is usually high enough to begin initial
oxidation of the metal, and sulfides are absent since these conditions are above their dissolution
pressure [116-117]. In oxidation, the role of S is initially one of an impurity dopant that
accelerates oxidation through the creation of vacancies [118-119]. Sulfur can diffuse rapidly
through grain boundaries, pores, and other high surface energy defects and stabilize them,
allowing fast transport of other ions [122-124]. This can be accelerated by the dissociation of
SO2 in these defects, which increases the oxygen and sulfur partial pressures [125-127].
However, sulfur can build up at sufficient scale thicknesses to cause sulfide formation. This will
be elaborated upon in section 2.6.3.
30

Whenever SO2 and O2 are present below 700˚C, they can react to form SO3 [125], a gas
above 45˚C, via the reaction
2SO2 + O2 2SO3 (2-17)
The formation of SO3 causes different reactions with the metal, as it is more oxidizing [128] and
therefore sulfidizing [129] than its dioxide counterpart. These conditions make it more likely to
form sulfates, which, as with hot corrosion, can rapidly attack the oxide or metal [130-131].
However, the effects of SO3 are minimal above 800˚C in that it becomes unstable and will
readily decompose into SO2 and O2. SO3 also chemisorbs on the oxide surface slower than SO2
[128]. Furthermore, the reaction on Equation 2-16 occurs at slow rates, requiring a platinum
catalyst to stabilize the reaction at higher temperatures [128]. Therefore, the effects of SO3 may
only be relevant in specific service conditions in modeling Type I hot corrosion.
2.6.3 Sulfidation on Metal Oxides
In metal oxide scales adherent to metal alloys, sulfur has been shown to migrate towards
the scale/alloy interface. Sulfur is also present in pores, cracks, and grain boundaries [127, 132-
135]. At the scale/alloy interface at extended times, the amount of sulfur continues to build up
while the scale/gas interface moves further away relative to the scale/alloy interface due to oxide
growth [136-139]. This reduces the amount of oxygen near the interface [140]. When the PS2 is
high enough, and the PO2 is low enough, sulfide phases begin to stabilize and their growth
becomes faster than that of the oxide [126-127, 130-131, 139, 140-146]. The formation of these
sulfides destabilizes the scale adherence to the substrate [135], causing the formation of cracks
and pores, which leads to scale spallation [120, 127, 133, 138, 140]. These cracks allow the gas
species to migrate faster to the interface, accelerating corrosion. Due to the complex and open
structures of these sulfides, ionic species are able to diffuse faster though the sulfide, which also
increases the oxidation rate [111, 121, 126, 133, 147]. This mechanism of premature oxide
31
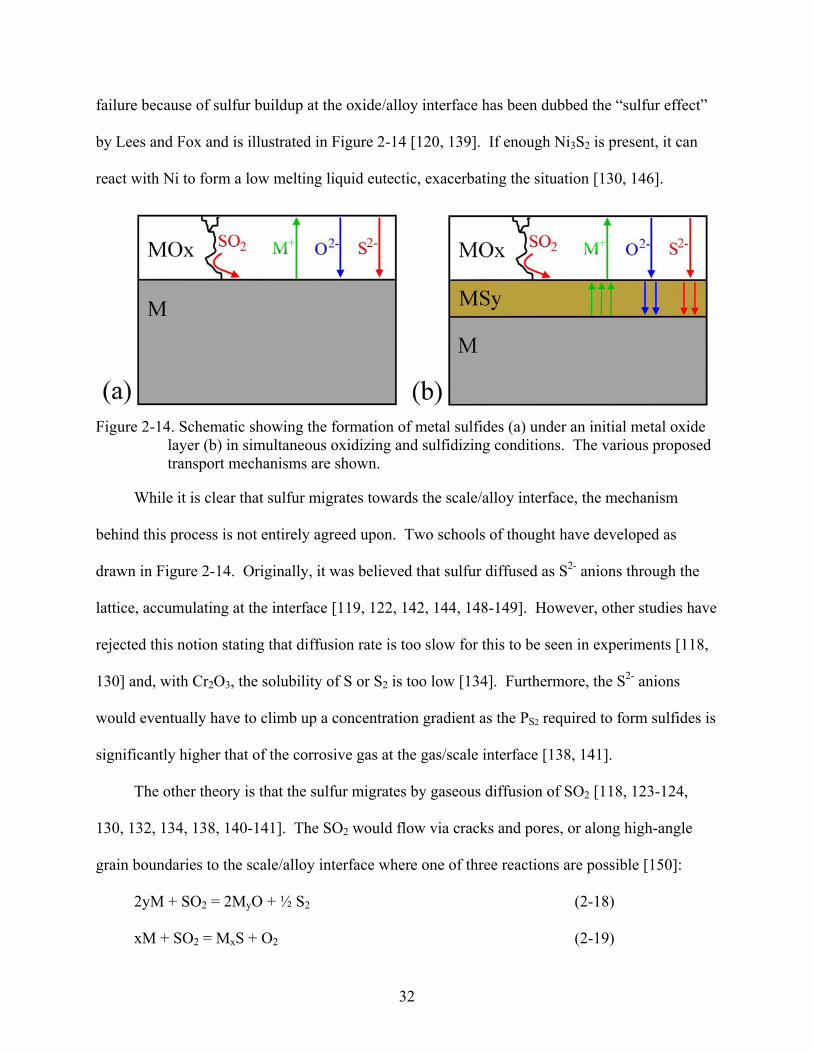
failure because of sulfur buildup at the oxide/alloy interface has been dubbed the “sulfur effect”
by Lees and Fox and is illustrated in Figure 2-14 [120, 139]. If enough Ni3S2 is present, it can
react with Ni to form a low melting liquid eutectic, exacerbating the situation [130, 146].
Figure 2-14. Schematic showing the formation of metal sulfides (a) under an initial metal oxide
layer (b) in simultaneous oxidizing and sulfidizing conditions. The various proposed transport mechanisms are shown.
While it is clear that sulfur migrates towards the scale/alloy interface, the mechanism
behind this process is not entirely agreed upon. Two schools of thought have developed as
drawn in Figure 2-14. Originally, it was believed that sulfur diffused as S2- anions through the
lattice, accumulating at the interface [119, 122, 142, 144, 148-149]. However, other studies have
rejected this notion stating that diffusion rate is too slow for this to be seen in experiments [118,
130] and, with Cr2O3, the solubility of S or S2 is too low [134]. Furthermore, the S2- anions
would eventually have to climb up a concentration gradient as the PS2 required to form sulfides is
significantly higher that of the corrosive gas at the gas/scale interface [138, 141].
The other theory is that the sulfur migrates by gaseous diffusion of SO2 [118, 123-124,
130, 132, 134, 138, 140-141]. The SO2 would flow via cracks and pores, or along high-angle
grain boundaries to the scale/alloy interface where one of three reactions are possible [150]:
2yM + SO2 = 2MyO + ½ S2 (2-18)
xM + SO2 = MxS + O2 (2-19)
32

(2x+y)M + SO2 = 2MyO + MxS (2-20)
This third reaction is unlikely to occur, while the first allows for the formation of free sulfur,
which increases the PS2, and the second causes sulfide formation (although it does raise the PO2,
which is generally counteractive to sulfide formation). Indeed, in SEM studies with Cr and Ni-
Cr alloys exposed to SO2 that developed compact chromia scales, no sulfide formation took
place at the scale/alloy interface, while porous scales developed sulfides [117, 134]. This
mechanism is disputed by other studies stating that gaseous diffusion is unlikely due to the size
of the SO2 molecule [142], and studies with high S contents at grain boundaries absent of voids
still formed sulfides at the scale/alloy interface [122, 139].
2.6.4 Sulfidation in Ni-Cr-Al Coatings
As has been shown, sulfur can reduce the effectiveness of bond coats, even in highly
oxidizing conditions. As described by previous publications, sulfidation processes for these
coatings resemble the initiation stage of Type I hot corrosion [90, 99, 107, 130]. Ni-Cr-Al alloys
have been designed to resist against sulfidation attack and are relatively high in Al and Cr,
mainly because the S and O diffusivities in Al2O3 and Cr2O3 are lower than in NiO [120, 143,
148, 151]. In sulfidation attacks, Al2O3 is slightly more susceptible to SO2 attack [99] by
3SO2 + Al2O3 2Al3+ + 3S2- + 3O2- (2-21)
Therefore, some applications, especially those experiencing hot corrosion, are designed to allow
for Cr2O3 protective scales rather than Al2O3 to grow, even though chromia grows faster [73].
In addition, rare earth elements, yttrium, and silicon are commonly added as getters for O
and S. These elements have been shown to decrease corrosion rates as well as spallation and
scale degradation in sulfidizing environments [124, 133, 151]. This occurs when reactive-
element grain boundaries phases such as Ni5Y, which react with S first [152], prevent the
sulfidation of the other alloying elements.
33
2.7 Calculations of Oxidation/Sulfidation
Thermodynamic calculations have been used to describe and predict a variety of materials
applications, especially the development of phase diagrams. Calculations of the Al-Cr-Ni
ternary have already been performed (see Section 2.4). The study of oxidation by calculations
for this system was limited until recent publications compiled and optimized thermodynamic
data. Previous studies of the Al2O3-Cr2O3 system used the quasichemical model for non-gaseous
phases and modeled the phases as a single solid solution with a miscibility gap [153]. The
quasichemical model was used for the Cr-Ni-O system [154], and, combined with the sublattice
model descriptions of the Cr-Ni-O and Al-Ni-O systems [43, 155], an Al2O3-Cr2O3-NiO ternary
was constructed [6]. Saltykov’s analysis of these ternaries allowed one of the more
comprehensive descriptions of the Al-Ni-Cr-O quaternary system using free energy minimization
[156] software to produce multiple plots that graphically described the system [6]. This
approach was also used by Seifert et. al. to assess the AlNi-Cr-Ni-O system [7]. However, little
work has been done to model sulfidation attacks of this system.
M-O-S systems for Fe, Ni, Co, and Cr were developed using Gibbs energy minimization
techniques with CO2/H2 and H2S/H2 ratios to set the PO2 and PS2, respectively [8]. The idea of
using M-O-S type diagrams was also approached in previous publications [127, 142]. An
attempt to produce Na-M-O-S quaternaries of Fe, Cr, and Al for Type II hot corrosion
applications was also performed by Li and Gesmundo [157] based on previous techniques of
overlaying “quasi-ternaries” and finding stable quadruple points [158-159]. Through all these
publications, no work has been done to attempt to describe alloys or even their mechanical
mixtures. This dissertation will fill these gaps by calculating the stability of Ni-Cr-Al alloys and
their mechanical mixtures in oxidizing and sulfidizing atmospheres. These diagrams will be
plotted as potential diagrams, described by Yokokawa [160], which plot chemical potential
34
instead of composition (a traditional phase diagram). Potential diagrams are useful for showing
diffusion paths, which are straight lines on potential diagrams, and for visualizing phases present
based on the changing activities of various reacting elements of an oxidizing and/or sulfidizing
system [160]. The chemical potentials can also be plotted as activities or partial pressures, for
easier interpretation. The exact methodology of these calculations will be described in Section
3.1.
35

CHAPTER 3 METHODS AND MATERIALS
This chapter discusses the methods and materials used in this study. This includes the
calculation of phase diagrams approach (CALPHAD) for the development of potential diagrams,
as well as the experimental design for the kinetic tests and the characterization of the materials of
this study.
3.1 Thermodynamic Modeling and Simulations
3.1.1 The CALPHAD Approach
In performing simulations by thermodynamic modeling, the CALPHAD approach was
used. This approach is shown as a flowchart in Figure 3-1. Here, one combines the information
obtained by theoretical development with that of experimental measurements and estimates to
create data that are stored as analytical expressions of thermodynamic functions with adjustable
parameters [156]. These descriptions are then optimized using a least squares regression to get
the best possible thermodynamic data [156]. From this, the data are compiled into stored
databases, from which the desired information for a particular study can be obtained. This
method prevents the use of a “black box” design and allows the data to be adjusted, as opposed
to some other calculation methodologies [161].
From these databases, one can then use a thermodynamic software program to obtain the
desired information. This is done by computing an equilibrium and then graphically presenting
the phase diagram from the initial equilibrium. These diagrams are then compared and
contrasted with the existing experimental data to determine if database adjusting is needed.
Lastly, the calculated diagrams are utilized for developing and designing applications in industry
and research. This study will stress this last part of the CALPHAD approach—the calculation of
diagrams from previously developed databases.
36
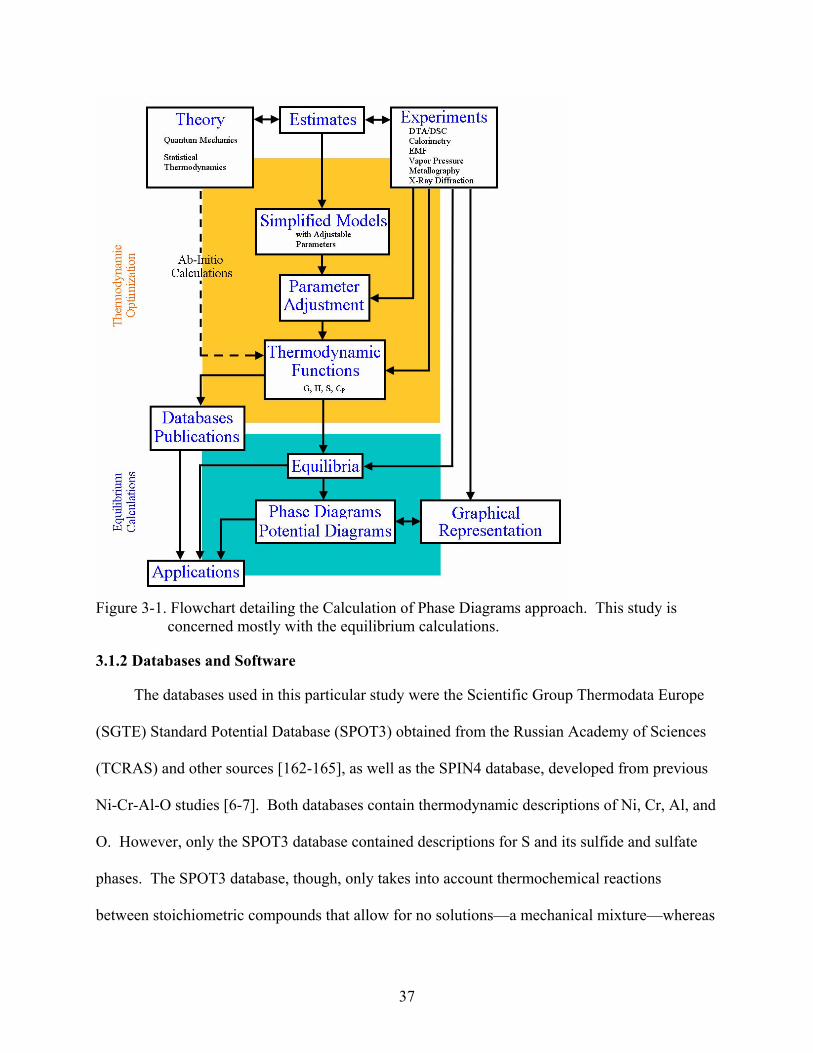
Figure 3-1. Flowchart detailing the Calculation of Phase Diagrams approach. This study is
concerned mostly with the equilibrium calculations.
3.1.2 Databases and Software
The databases used in this particular study were the Scientific Group Thermodata Europe
(SGTE) Standard Potential Database (SPOT3) obtained from the Russian Academy of Sciences
(TCRAS) and other sources [162-165], as well as the SPIN4 database, developed from previous
Ni-Cr-Al-O studies [6-7]. Both databases contain thermodynamic descriptions of Ni, Cr, Al, and
O. However, only the SPOT3 database contained descriptions for S and its sulfide and sulfate
phases. The SPOT3 database, though, only takes into account thermochemical reactions
between stoichiometric compounds that allow for no solutions—a mechanical mixture—whereas
37

the SPIN4 database allows for solution phases. The use of mechanical mixtures to model a
system has been previously published [166]. An attempt was made to append the SPIN4
database with the SPOT3 descriptions for the sulfur, sulfide, and sulfates phases.
The Gibbs’ free energy minimization software used for this study is Thermo-Calc version
Q. Using this software, the desired phase or potential diagrams was obtained by:
1. Selecting the desired elements 2. Accessing the relevant thermodynamic information on each element and compound formed
between each element 3. Setting conditions for each degree of freedom (eg. temperature, pressure, composition) so
as to satisfy Gibbs’ Phase Rule:
P + F = C + 2 (3-1)
4. Computing an equilibrium using Gibbs’ free energy minimization algorithms 5. Assigning one condition per axis of the desired diagram 6. Mapping from the initial computed equilibrium along each axis to determine phase
stability regions. From this method, graphical plots of phase and potential diagrams were created.
3.2 Materials and Sample Preparation
The materials used for the experimental aspects of this dissertation were obtained from
Alfa Aesar with the purity determined by chemical analyses from the company. The metals used
are
• Ni slugs: 99.98% metals basis • Al shot: 99.999% metals basis • Cr granules: 99.999% metals basis These metals were measured by weight and combined into either the Ni-8Cr-6Al or Ni-22Cr-
11Al alloys, which were approximately 12.5 g for Ni-8Cr-6Al and 7.5 g for the Ni-22Cr-11Al
alloys. The mixtures were placed in a Centorr chilled-copper arc-melter that used a non-
consumable tungsten electrode. The chamber was evacuated and backfilled with argon gas three
times. Titanium getters were melted initially, followed by the mixture of interest. The melted
38

and solidified button was flipped and remelted four times in order to ensure homogeneity. These
arc-melted buttons were then heat-treated at 1200˚C for 4 hours in vacuum (better than 10-4 torr)
using an Elatec Technology Corporation vacuum furnace, using a He(g) quench. In addition,
some of the Ni slugs as well as arc-melted Ni-13.6Al and NiAl were used in the oxidation
studies. The compositions were checked by energy dispersive spectroscopy.
The specimens were then sliced using an Allied Techcut 4 diamond saw at low speeds (<
300 RPM). The slices, approximately 0.7 mm in thickness, were ground with SiC abrasive paper
of 60, 180, 320, 600, 800, and 1200 grit on all sides. They were then polished on velcloth with 1
µm polycrystalline diamond suspension. The polished slices were measured using calipers to
measure the various dimensions of each specimen to determine the surface area of each
specimen. The surface area was approximately 1.7 to 2.8 cm2. Each polished sample was
ultrasonically cleaned in acetone and then methanol for 10 minutes each. Some specimens to be
characterized were etched with aqua regia for macroetching and/or equal parts HCl and ethanol
for microetching.
Some specimens had a strip of Pt paint applied to one surface. This is to allow for the
classic Pt-marker experiment to be conducted in which the movement of the scale/alloy interface
can be measured [41].
3.3 Thermogravimetric Analysis
The thermogravimetric analysis (TGA) was performed using a Setaram Setsys Evolution.
Figure 3-2 shows a schematic of the TGA used for this study. The Setsys TGA works by having
a balance whose deflection in either direction was measured using a laser. Each cleaned,
polished specimen was placed in a silica crucible suspended by a series of quartz hooks from the
balance. A counterweight is used to balance the weight. The following gas mixtures were used:
39

• Air • He + 0.21 O2 + 0.02 SO2 • He + 0.21 O2 + 0.10 SO2 In the case of air, the gas flowed over the specimen chamber and the instrument head. In the
case of the O2 + SO2 mixtures, ultra-high purity (4.5 Grade) He was passed through the
instrumentation head and into the specimen chamber via the anti-convection tube. The O2 + SO2
mixture was made possible by using analog volumetric flowmeters, which were then flowed
through the auxiliary gas inlet to the specimen chamber and mixed with the He. The Setsys had
its own digital flow controllers, so the desired gas mixture could be established. The total gas
flow used was 25 mL/min, which is the Setaram recommended flow rate for this instrument.
This flow rate was selected to prevent turbulence in the furnace chamber. The flow of the He
carrier gas was also greater than that of the corrosive auxiliary gas to prevent attack of the
instrumentation head. The gas then passed out of the chamber through an exhaust outlet. A type
S thermocouple, encased in alumina was inserted into the chamber adjacent to the specimen
crucible in order to measure the temperature of the specimen.
Each sample run was performed by flowing only carrier gas (He) through the entire
chamber at 200 mL/min for 10 minutes to remove most of the reacting oxygen and other species
in air. The flow was then decreased to 20 mL/min to allow for the measure weight of the
specimen to equilibrate for 10 minutes. The chamber, with the carrier gas still flowing, was then
raised to the desired temperature for the experimental run (either 800, 900, or 975˚C) at
50˚C/min. Those samples not exposed to sulfidizing gases did not require a silica crucible and
40

Figure 3-2. Schematic of the Setsys Evolution (TGA only).
were heated to 1000˚C instead of 975˚C in a Pt crucible. Upon reaching the desired temperature,
the chamber was held for 2 minutes to allow the specimen to reach the temperature of the
furnace, and to allow for the buoyancy of the carrier gas to equilibrate for the specimen. After
this, the desired auxiliary gas was added. In the case of those specimens in air, the carrier and
auxiliary gases were both switched to air. Each experiment was run this way for 100 hr. At the
conclusion of the test, the auxiliary gas was shut off, and the chamber was cooled at 99˚C/min.
41

No baseline calculations were performed since the desired measurement was a weight change at
a constant temperature. In addition, some oxidation tests were carried out in a Lindberg/Blue
1200˚C tube furnace to test specimens for less than 100 hr.
The data obtained from the TGA experiments were analyzed to determine the parabolic, or
other rate constants, gained from the growth of oxides and/or sulfides on each specimen. In the
previous publications on high temperature oxidation discussed in Chapter 2, the weight change
of the specimen is normalized by dividing by the surface area exposed. This way, sample of
different size and surface area can be properly compared. The specimens used in this study were
made from arc-melted buttons, as described in Section 3.2. Each specimen cut from each button
was elliptical in nature, and the resulting surface area being
tPbaA ⋅+⋅⋅= π2 (3-2)
where A is the surface area, a is the half-length of the longer dimension, b is the half-length of
the shorter dimension, t is the thickness, and P is the perimeter of the specimen as described by
)(2 222
1 baP += π (3-3)
In analyzing the growth rate constants of any oxidation study, the normalized weight
change is plotted on one axis and the time on the other so that the slope of a linear regression of
the experimental data is growth rate constant. If growth is occurring linearly, plotting
normalized weight change over time will yield a straight line with a slope equal to kL. In most
studies of oxidation and sulfidation, normalized weight change is plotted squared against time,
revealing kP. However, a study by Pieraggi argues that this method can only be used for pure
metals or simple alloys [167]. His study plots normalized weight change over the square root of
time to determine the initial kinetics and differentiate that from the steady-state kP, which is
desired. This study follows Pieraggi’s method. Lastly, the parabolic rate constants for each
42

composition and condition were plotted Arrheniusly in order to determine what, if any,
activation energy could be garnered from these experiments. Table 3-1 lists the experiments for
the alloys in this study.
Table 3-1. List of experimental conditions performed for oxidation of alloys for 100 hr in 1 bar of gas at 25 mL/min.
Alloy (Weight Percent) Atmosphere (bar) Temperature (˚C) Ni Air 800 Ni Air 900 Ni Air 1000 Ni Air 1100 Ni-13.6Al Air 800 Ni-13.6Al Air 900 Ni-13.6Al Air 1000 Ni-22Cr-11Al Air 800 Ni-22Cr-11Al Air 900 Ni-22Cr-11Al Air 1000 Ni-22Cr-11Al He + 0.21 O2 + 0.02 SO2 800 Ni-22Cr-11Al He + 0.21 O2 + 0.02 SO2 900 Ni-22Cr-11Al He + 0.21 O2 + 0.02 SO2 975 Ni-22Cr-11Al He + 0.21 O2 + 0.10 SO2 800 Ni-22Cr-11Al He + 0.21 O2 + 0.10 SO2 900 Ni-22Cr-11Al He + 0.21 O2 + 0.10 SO2 975 Ni-31Al Air 800 Ni-31Al Air 900 Ni-31Al Air 1000 Ni-8Cr-6Al Air 800 Ni-8Cr-6Al Air 900 Ni-8Cr-6Al Air 1000 Ni-8Cr-6Al He + 0.21 O2 + 0.02 SO2 800 Ni-8Cr-6Al He + 0.21 O2 + 0.02 SO2 900 Ni-8Cr-6Al He + 0.21 O2 + 0.02 SO2 975 Ni-8Cr-6Al He + 0.21 O2 + 0.10 SO2 800 Ni-8Cr-6Al He + 0.21 O2 + 0.10 SO2 900 Ni-8Cr-6Al He + 0.21 O2 + 0.10 SO2 975
3.4 Characterization
This section details the methods and procedures of materials characterization for each
specimen. Data obtained from these various techniques was used to identify the microstructures
formed from and mechanisms of oxidation and sulfidation on these alloys.
43
3.4.1 X-Ray Diffraction
Each polished and oxidized specimen was analyzed using X-Ray diffraction (XRD). The
specimens were adhered to a glass slide using double-sided tape and placed in a Philips APD
3720 XRD. The specimens were exposed from 10 to 90˚ 2θ at a rate of 0.5 s per step using 40
kV and 20 mA from a Cu Kα radiation source. The patterns were then treated according to the
software protocol of the APD 3720 to determine the d-spacings detected. These were then
compared to the files from the JCPDS International Center for Diffraction database to determine
the phases diffracting at those 2θ angles.
3.4.2 Scanning Electron Microscopy
After XRD, the specimens were then analyzed using Scanning Electron Microscopy
(SEM). First, each sample, whether oxidized or not, was affixed onto an aluminum mount using
a small amount of carbon paint and analyzed from the top of the surface. The SEM used was a
JEOL SEM 6400 equipped with Oxford Link ISIS energy dispersive spectroscopy (EDS) and
Oxford OPAL electron backscattered secondary electron detector (EBSD), operated at 15 kV.
Semi-quantitative analysis was performed using correction matrices for atomic number,
absorption, and fluorescence (ZAF) [166]. The grain size of the substrate materials was
determined by using line-intercept stereology methods from optical light micrographs taken from
a Leco Neophot 21 optical microscope.
After this analysis, the specimens were viewed in cross-section. This was performed
applying an electroless Ni layer between 1 and 5 µm thick using Buehler Edgemet chemical
system for scale adhesion and edge retention. Next, the specimens were help upright using
stainless steel clips, cast into an epoxy mixture, and allowed to cure overnight at room
temperature. These epoxy-mounted specimens were then sectioned using the Allied TechCut 4
44

and ground using 600, 800, and 1200 grit SiC abrasive paper on the Allied MetPrep3 with an
AP-3 autopolisher. They were then polished using 3 µm diamond suspension on nylon, 1 µm
diamond suspension on velcloth, and 0.1 µm diamond suspension on Chem-Pol B cloth. Lastly,
the specimens were thermally carbon coated in order to make the surface electrically conductive,
and were analyzed on the SEM.
3.4.3 Electron Microprobe
Some of the cross-sectioned epoxy-mounted specimens were analyzed using wavelength
dispersive spectroscopy (WDS) in a JEOL Superprobe 733 electron microprobe (EPMA). These
were performed using a 1 µm size beam at approximately 1 nA that was scanned at various
intervals (usually 1 µm) to detect the change in composition, not only from phase to phase, but
across the scale and alloy depletion zones. The compositions were calculated using the ZAF
correction technique also used for EDS.
The activities of the elements from each of the line scan were calculated from the Thermo-
Calc software using the appended SPIN4 database with S descriptions. This was performed by
entering the microprobe data from each point of a line scan into the software at the temperature
the sample was oxidized and computing an equilibrium to determine the equilibrium activities at
each probe.
45

CHAPTER 4 THERMODYNAMIC CALCULATION RESULTS
This section shows the diagrams created using the Thermo-Calc software. This chapter is
divided into three sections that detail the development of various phase diagrams of the Ni-Cr-Al
system, the temperature-potential diagrams, and potential diagrams at fixed temperatures and
pressures. Phase fraction diagrams are also included throughout the chapter to give a better
visual understanding of mechanisms and reactions occurring.
4.1 Calculations of Ni-Cr-Al Alloys and Mixtures using Phase Diagrams
4.1.1 Binary Systems
Before attempting to analyze the more complex systems, it is important to validate the
simpler binary systems that will be the basis for later calculations. Using the SPIN4 database,
the Ni-Al, Ni-Cr, and Al-Cr binaries were calculated as shown in Figures 4-1, 4-2, and 4-3,
respectively. The green lines represent various tie lines of two-phase equilibria. These diagrams
agree with those found in the ASM Handbooks as seen in Figures 2-3, 2-4, and 2-5 for Al-Ni,
Cr-Ni, and Al-Cr, respectively [30]. Differences include some of the solubility ranges for
several phases including the Al-Cr diagram, where all the intermetallic phases are stoichiometric
compounds with no solubility, unlike in Figure 2-5. It should be noted that the Al13Cr2 and
Al11Cr2 intermetallics in Figure 4-3 are the same as Al7Cr and Al5Cr, respectively, in Figure 2-5.
It should also be noted that the Ni-Al diagram calculated in Figure 4-4 was done without the
low-temperature Ni3Al5 phase. In Figure 4-4, this is restored. However, its position differs from
that of Figure 2-3. Since this phase is only stable at temperatures lower than the experiments to
be performed in this study, and since it is rarely discussed in literature, it will not be used for
further calculations. Lastly, the SPOT3 database was not used to describe these binaries since
each phase has no solubility for other elements, the liquids of each element are immiscible, and
46

the diagrams merely show a series of lines. However, the SPOT3 potential database contains
information on the solid-gas reactions that will be elaborated upon in Sections 4.2 and 4.3.
Figure 4-1. Temperature-composition binary phase diagram of the Ni-Al system calculated from
the SPIN4 database.
Figure 4-2. Temperature-composition binary phase diagram of the Ni-Cr system calculated from
the SPIN4 database.
47

Figure 4-3. Temperature-composition binary phase diagram of the Al-Cr system calculated from
the SPIN4 database.
Figure 4-4. Temperature-composition binary phase diagram of the Ni-Al system calculated from
the SPIN4 database with the Ni3Al5 low-temperature phase restored.
48

4.1.2 Ternary Systems
The ternary phase diagrams were calculated using the thermodynamic data in the SPIN4
database. Figure 4-5 shows the complete Ni-Cr-Al ternary isothermal section for 900˚C, where
the weight percents of the Cr and Al elements are plotted. This can be compared to the ternary
calculated by Dupin in Figures 2-9 and 2-8 with that calculated in Figure 4-6, which is in mole
percent at 850˚C and in Figure 4-7 in weight percent at 1025˚C. The fields of stability are often
different in size and shape in comparing the isotherms, and Figure 4-7 is more complete in
showing the Al rich regions of the phase diagram.
Figure 4-5. Isothermal section of Ni-Cr-Al ternary system at 900˚C in weight fractions. This
diagram is calculated from data in the SPIN4 database.
49

Figure 4-6. Partial isothermal section of Ni-Cr-Al ternary system at 850˚C in mole fractions.
The axes are chosen to compare with Figure 2-9. This diagram is calculated from data in the SPIN4 database.
Figure 4-7. Isothermal section of Ni-Cr-Al ternary system at 1025˚C in mole fractions. The axes
are chosen to compare with Figure 2-8. This diagram is calculated from data in the SPIN4 database.
50

Figure 4-8. Ternary isothermal section of the Ni-Al-O2 system at 900˚C. The x-axis is the
composition of Al in weight percent, and the y-axis is the logarithmic partial pressure of O2 in bar. This diagram is calculated from data in the SPIN4 database.
Figure 4-9. Ternary isothermal section of the Ni-Cr-O2 system at 900˚C. The x-axis is the
composition of Cr in weight percent, and the y-axis is the logarithmic partial pressure of O2 in bar. This diagram is calculated from data in the SPIN4 database.
51

Figure 4-10. The Ni-Al-Cr-O system shown as a series of connected ternary subsystem isotherms
at 900˚C. The outer axes are the logarithm of the partial pressure of O2 in bar, whereas the inner axes are the weight percents of Ni, Cr, and Al. This diagram is calculated from data in the SPIN4 database.
In addition to the Ni-Cr-Al ternary, the Ni-Al-O2 and Ni-Cr-O2 ternaries were calculated
and are shown as isotherms at 900˚C in Figure 4-8 and 4-9, respectively. Here the partial
pressure of oxygen gas (in bar) was used to plot the oxygen axes. These ternary subsystems
were then combined with the Al-Cr-O2 and Ni-Cr-Al isotherms to help depict the Ni-Cr-Al-O
system at 900˚C in Figure 4-10. In this figure, the inner axes are in weight percent, while the
outer axes are the logarithms (base 10) of the partial pressure of O2 (in bar).
52
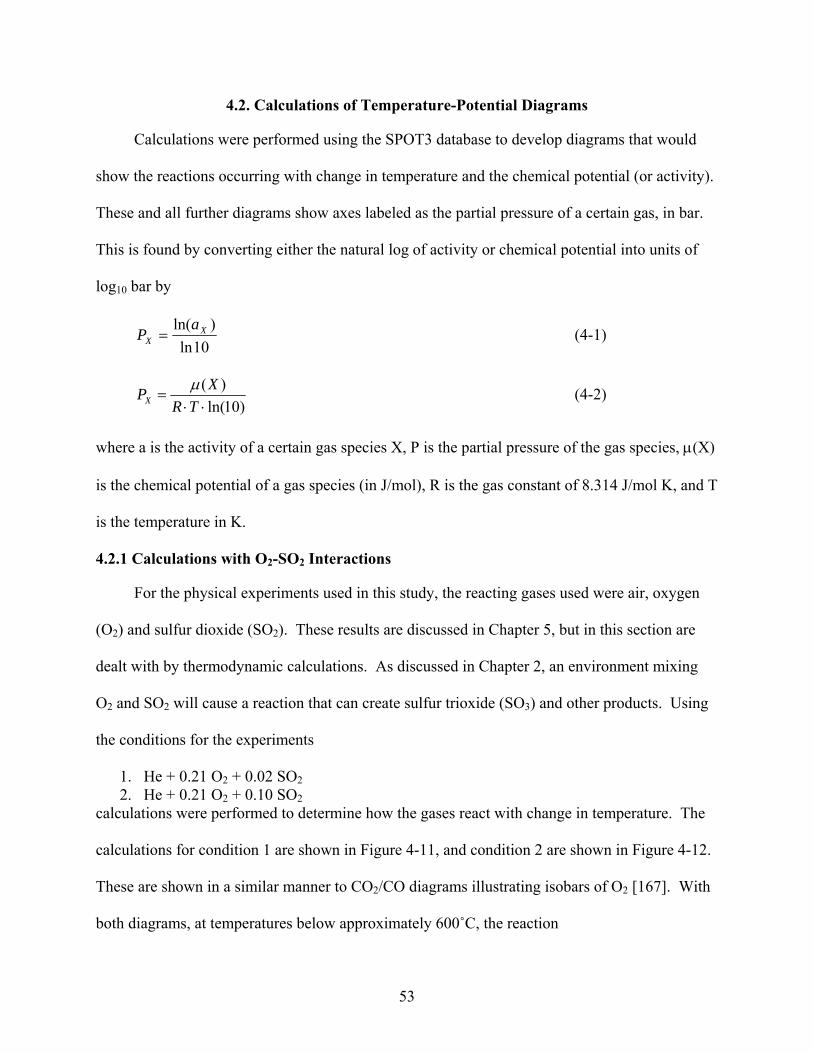
4.2. Calculations of Temperature-Potential Diagrams
Calculations were performed using the SPOT3 database to develop diagrams that would
show the reactions occurring with change in temperature and the chemical potential (or activity).
These and all further diagrams show axes labeled as the partial pressure of a certain gas, in bar.
This is found by converting either the natural log of activity or chemical potential into units of
log10 bar by
10ln)ln( X
Xa
P = (4-1)
)10ln()(
⋅⋅=
TRXPX
µ (4-2)
where a is the activity of a certain gas species X, P is the partial pressure of the gas species, µ(X)
is the chemical potential of a gas species (in J/mol), R is the gas constant of 8.314 J/mol K, and T
is the temperature in K.
4.2.1 Calculations with O2-SO2 Interactions
For the physical experiments used in this study, the reacting gases used were air, oxygen
(O2) and sulfur dioxide (SO2). These results are discussed in Chapter 5, but in this section are
dealt with by thermodynamic calculations. As discussed in Chapter 2, an environment mixing
O2 and SO2 will cause a reaction that can create sulfur trioxide (SO3) and other products. Using
the conditions for the experiments
1. He + 0.21 O2 + 0.02 SO2 2. He + 0.21 O2 + 0.10 SO2
calculations were performed to determine how the gases react with change in temperature. The
calculations for condition 1 are shown in Figure 4-11, and condition 2 are shown in Figure 4-12.
These are shown in a similar manner to CO2/CO diagrams illustrating isobars of O2 [167]. With
both diagrams, at temperatures below approximately 600˚C, the reaction
53

O2 + 2SO2 = 2SO3 (4-3)
occurs readily and SO3 is the more stable sulfur-based gas species. However, it is of much less
consequence above 900˚C. Between the two temperatures, the stability of SO2 and SO3 change
rapidly with a major vapor transition point occurring at 707˚C. He is used in the calculations as
“filler” so that the total number of moles can remain constant at unity. However, due to scale its
partial pressure is omitted.
Figure 4-11. Change in partial pressure of O2, SO2, and SO3 (in bar) with temperature using the
initial gas mixture of He + 0.21 O2 + 0.02 SO2. The PHe is omitted due to scale. The data used for calculations is taken from the SPOT3 database.
As well as these calculations, diagrams were calculated of isobaric lines of one gas in
relation to a ratio of the partial pressures of two other gases with changing temperature. For
example, Figure 4-13 shows lines of constant partial pressure of sulfur trioxide based of the ratio
of partial pressure of oxygen over sulfur dioxide. The region labeled as “unstable gas,”
occurring at high SO2 and low O2 at higher temperatures, could not be calculated due to the
54

Figure 4-12. Change in partial pressure of O2, SO2, and SO3 (in bar) with temperature using the
initial gas mixture of He + 0.21 O2 + 0.10 SO2. The PHe is omitted due to scale. The data used for calculations is taken from the SPOT3 database.
Figure 4-13. The relationship between the partial pressure of SO3 in an O2-SO2 gas mixture, with
varying temperature. All partial pressures are in bar.
55

Figure 4-14. The relationship between the partial pressure of S2 in an O2-SO2 gas mixture, with
varying temperature. All partial pressures are in bar.
Figure 4-15. The relationship between the partial pressure of O2 in an SO3-SO2 gas mixture, with
varying temperature. All partial pressures are in bar.
56
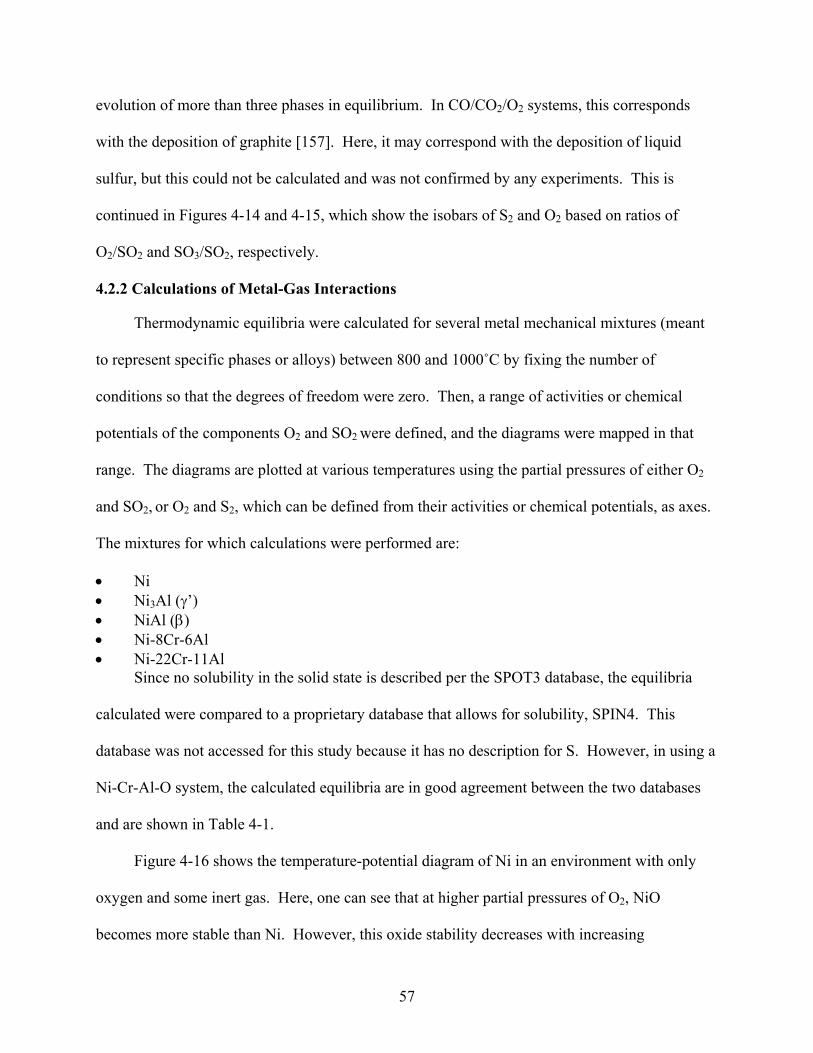
evolution of more than three phases in equilibrium. In CO/CO2/O2 systems, this corresponds
with the deposition of graphite [157]. Here, it may correspond with the deposition of liquid
sulfur, but this could not be calculated and was not confirmed by any experiments. This is
continued in Figures 4-14 and 4-15, which show the isobars of S2 and O2 based on ratios of
O2/SO2 and SO3/SO2, respectively.
4.2.2 Calculations of Metal-Gas Interactions
Thermodynamic equilibria were calculated for several metal mechanical mixtures (meant
to represent specific phases or alloys) between 800 and 1000˚C by fixing the number of
conditions so that the degrees of freedom were zero. Then, a range of activities or chemical
potentials of the components O2 and SO2 were defined, and the diagrams were mapped in that
range. The diagrams are plotted at various temperatures using the partial pressures of either O2
and SO2, or O2 and S2, which can be defined from their activities or chemical potentials, as axes.
The mixtures for which calculations were performed are:
• Ni • Ni3Al (γ’) • NiAl (β) • Ni-8Cr-6Al • Ni-22Cr-11Al
Since no solubility in the solid state is described per the SPOT3 database, the equilibria
calculated were compared to a proprietary database that allows for solubility, SPIN4. This
database was not accessed for this study because it has no description for S. However, in using a
Ni-Cr-Al-O system, the calculated equilibria are in good agreement between the two databases
and are shown in Table 4-1.
Figure 4-16 shows the temperature-potential diagram of Ni in an environment with only
oxygen and some inert gas. Here, one can see that at higher partial pressures of O2, NiO
becomes more stable than Ni. However, this oxide stability decreases with increasing
57

Table 4-1. Comparison of equilibria computed between two databases SPOT3 and SPIN4 at a pressure of 1 bar and T = 1073 K for Ni-22Cr-11Al alloy (by mass) with a PO2 of 0.22 bar. This table compares number of moles of each phase, along with the composition (in weight fraction) of each phase.
Database Phases Moles W(Ni) W(Cr) W(Al) W(O2) NiO 0.134 0.786 0 0 0.214 NiAl2O4 0.424 0.332 0 0.305 0.362 SPOT3 NiCr2O4 0.441 0.259 0.459 0 0.362 Halite (NiO) 0.138 0.777 9.87e-4 4.75e-3 0.217
SPIN4 Spin3 Ni[Cr,Al]2O4)
0.862 0.290 0.263 0.131 0.216
temperature. Figures 4-17 and 4-18 show the same conditions as that for 4.16, except for the
addition of 2 mol % SO2 and 10 mol % SO2, respectively. It is plain to see that the stability of
the Ni and the nickel oxide decrease dramatically with even small sulfur dioxide additions. At
higher partial pressures of oxygen at lower temperatures, the nickel sulfate becomes stable, and
at lower oxygen partial pressures, the nickel sulfides become stable—Ni3S2 is the most stable,
but NiS, Ni3S4, and NiS2 can also be present. The areas labeled “unstable equilibrium” are areas
where the software could not calculate, and therefore not map, a stable equilibrium. This is
likely due to the evolution of some gas, which creates too many phases to calculate a stable
equilibrium. These conditions are mostly observed at high PO2 at low temperatures, or high PSO2
at high temperatures. Diagrams for mixtures of Ni, O2, and other metals (Al and/or Cr) were not
able to be calculated and are not shown.
4.3 Calculations of Potential Diagrams
The results for the calculations of Ni in SO2/O2 environments at 800, 900, and 1000˚C are show
in Figures 4-19a, 4-20, and 4-21, respectively. Figure 4-19b also shows the S2-O2 potential
diagram for Ni at 800˚C for comparison with Figure 4-19a. As with section 4.2, all calculations
were performed using data from the SPOT3 database unless otherwise noted. At high PO2 and
low PSO2, the NiO becomes stable from the oxidation of Ni. Increasing SO2 can cause the
58
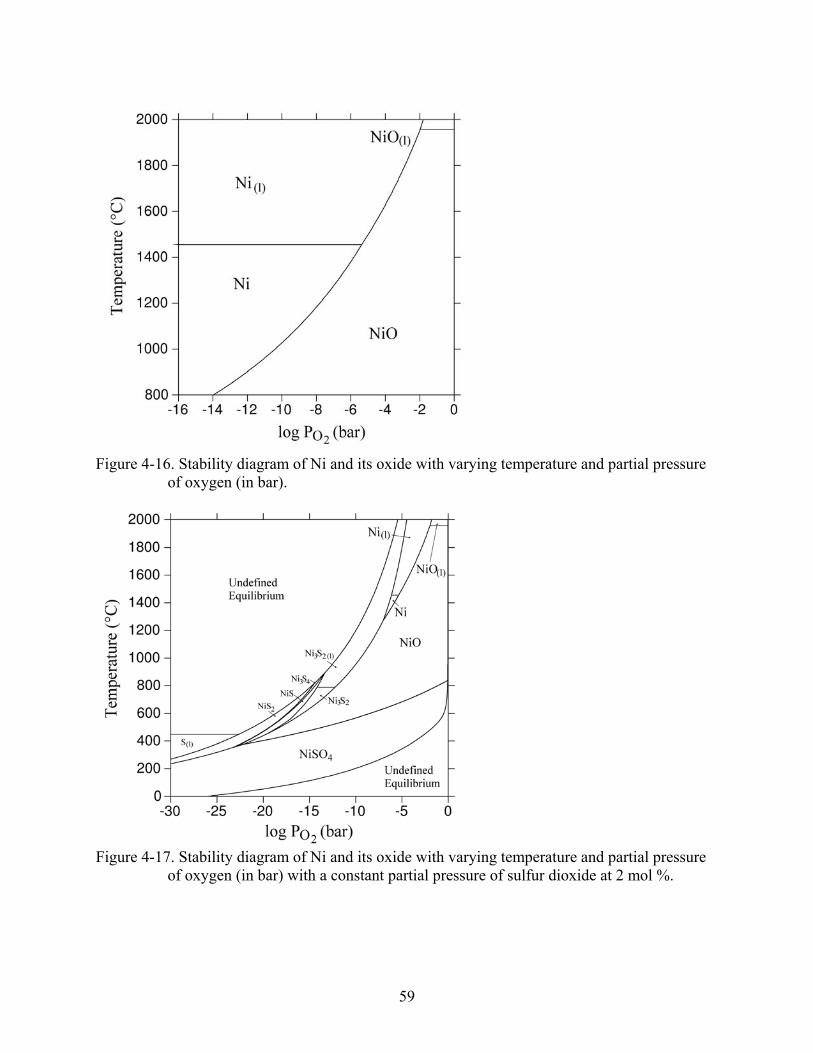
Figure 4-16. Stability diagram of Ni and its oxide with varying temperature and partial pressure
of oxygen (in bar).
Figure 4-17. Stability diagram of Ni and its oxide with varying temperature and partial pressure
of oxygen (in bar) with a constant partial pressure of sulfur dioxide at 2 mol %.
59

Figure 4-18. Stability diagram of Ni and its oxide with varying temperature and partial pressure
of oxygen (in bar) with a constant partial pressure of sulfur dioxide at 10 mol %.
formation of NiSO4. Decreasing O2 at higher SO2 contents cause the formation of Ni sulfides—
Ni3S2, NiS, Ni3S4, and NiS2 at increasing PSO2. The Ni3S2 is a liquid at these temperatures. At
high PSO2 and high or low PO2, no stable equilibrium could be calculated. It is possible that this is
a gas phase, which at low PO2 is almost entirely SO2, whereas the gas at high PO2 is a mixture of
SO2, O2, and SO3 (see Table 4-2). As temperature is increased, the resistance of Ni to oxidize
decreases, but attack by sulfur species is more prevalent.
Table 4-2. Comparison of gas species (at mole fractions > 10-10) present in the unstable equilibrium regions of Figure 4-19 at low PO2 and high PO2. These mole fractions are calculated based on ideal gas behavior.
Gas Species (low PO2) Mole Fraction Gas Species (High PO2) Mole Fraction SO2 0.999 SO2 0.356 SO 4.59e-6 O2 0.356 SO3 4.14e-6 SO3 0.288 S2O 8.92e-7 S2 3.84e-7
60

Figure 4-19. Ni potential diagrams for (a) SO2-O2 and (b) S2-O2 at 800˚C. U.E. is an
abbreviation for undefined equilibrium. Published in [170].
Figure 4-20. Ni SO2-O2 potential diagram at 900˚C. U.E. is an abbreviation for undefined
equilibrium. Published in [170].
61

Figure 4-21. Ni SO2-O2 potential diagram at 1000˚C. U.E. is an abbreviation for undefined
equilibrium. Published in [170].
Figures 4-22a, 4-23, and 4-24 show the SO2-O2 potential diagrams for Al at 800, 900, and
1000˚C, respectively. Figures 4-25a, 4-26, and 4-27 show the SO2-O2 potential diagrams for Cr
at the same respective temperatures. Figures 4-22b and 4-25b show the S2-O2 potential diagrams
for Al and Cr, respectively. Comparing these diagrams with those for Ni, one can tell that Cr
and especially Al have greater affinities for O2 as they will oxidize at a lower PO2 than Ni. In
addition, Al and Cr will also sulfidize at lower S activities, and these sulfides will oxidize at
lower PO2. Al and Cr were calculated as having only one sulfidation product each, as opposed to
the four exhibited by Ni at these temperatures. Figures 4-28, 4-29, and 4-30 show calculations of
Ni3Al, or γ’, at 800, 900, and 1000˚C, respectively. Due to the Gibbs’ Phase Rule (Equation 3-
1), each phase field contains two phases. At low partial pressures of both gases, the γ’ phase was
calculated and, to satisfy the phase rule, Al is in equilibrium as excess in the intermetallic. In
this system, Al is the more reactive element, and reacts with S and/or O at lower partial
62

pressures. In all cases, the Al2O3 phase is α. Increasing the O2 eventually depletes the γ’ phase
of Al, causing it to form the γ (Ni) phase. Further increasing PO2 causes the alumina to react with
the γ to form a spinel phase (NiAl2O4). Al forms only an Al2S3 sulfide, and similar to what is
shown in Figures 4-19-4-21, the Ni forms a variety of sulfides depending on the PSO2. At 900
and 1000˚C, the Ni3S2 becomes the most stable sulfide, as the others become degenerate cases.
Figures 4-31, 4-32, and 4-33 show calculations of NiAl, or β, at 800, 900, and 1000˚C,
respectively. These diagrams are similar to those for Ni3Al, except that β is the stable phase, and
that there is enough Al present to keep Al2O3 stable up to 1 bar PO2. Also, the γ’ phase was
shown to have a larger stability range than β.
Figure 4-22. Al potential diagrams for (a) SO2-O2 and (b) S2-O2 at 800˚C. Published in [170].
63

Figure 4-23. Al SO2-O2 potential diagram at 900˚C.
Figure 4-24. Al SO2-O2 potential diagram at 1000˚C.
64

Figure 4-25. Cr potential diagrams for (a) SO2-O2 and (b) S2-O2 at 800˚C. Published in [170].
Figure 4-26. Cr SO2-O2 potential diagram at 900˚C.
65

Figure 4-27. Al SO2-O2 potential diagram at 900˚C.
Figure 4-28. Ni-13.6Al potential diagrams for (a) SO2-O2 and (b) S2-O2 at 800˚C. U.E. is an
abbreviation for undefined equilibrium. Published in [170].
66

Figure 4-29. Ni3Al SO2-O2 potential diagram at 900˚C.
Figure 4-30. Ni3Al SO2-O2 potential diagram at 1000˚C. Published in [170].
67

Figure 4-31. NiAl potential diagrams for (a) SO2-O2 and (b) S2-O2 at 800˚C. U.E. is an
abbreviation for undefined equilibrium. Published in [170].
Figure 4-32. NiAl SO2-O2 potential diagram at 900˚C.
68

Figure 4-33. NiAl SO2-O2 potential diagram at 1000˚C. Published in [170].
Figures 4-34, 4-35, and 4-36 show calculations of the Ni-8Cr-6Al mixture at 800, 900,
and 1000˚C, respectively. As per the Gibbs’ Phase Rule, each phase field must now have three
phases in equilibrium. The base metal at low partial pressures is shown as a mixture of γ-Ni, γ’,
and Cr—in reality the alloy should have γ-Ni as the only stable phase at these temperatures.
However, the other phase fields agree with studies that show alumina and chromia stable at
lower partial pressures of O2 whereas NiO and spinel are stable at higher partial pressures.
While Al has a higher affinity for O, Cr is the element that forms sulfides (CrS) at the lowest
PSO2. At higher temperatures, Ni3S2 again becomes the dominant Ni sulfide, whereas NiO and
spinel become less stable.
69

Figure 4-34. Ni-8Cr-6Al potential diagrams for (a) SO2-O2 and (b) S2-O2 at 800˚C. Published in
[170].
Figure 4-35. Ni-8Cr-6Al SO2-O2 potential diagram at 900˚C. Published in [170].
70

Figure 4-36. Ni-8Cr-6Al SO2-O2 potential diagram at 1000˚C. Published in [170].
In the composition with higher concentrations of Cr and Al, the mixture oxidizes at lower
PO2. The potential diagrams for the Ni-22Cr-11Al mechanical mixture are shown in for 800,
900, and 1000˚C in Figures 4-37, 4-38, and 4-39, respectively. Here, the substrate alloy is shown
as a combination of γ’, β, and α-Cr. This composition reacts more readily with O2 and SO2 than
the other two as shown with the addition Al2O3-Cr-γ’ and β-γ’-CrS phase fields. Again, as with
the other two mixtures, Ni3S2 becomes the predominant Ni sulfide at higher temperatures,
alumina and chromia are more resilient against sulfidation, and NiO and spinel become less
stable at higher temperatures.
71
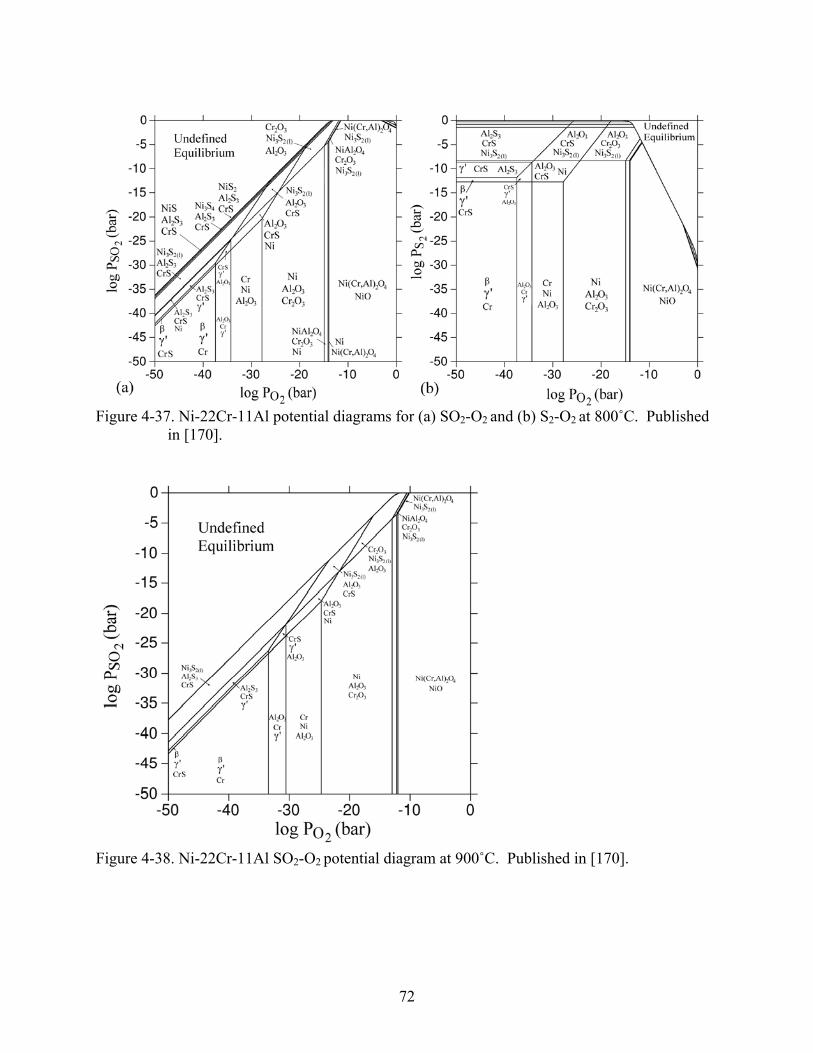
Figure 4-37. Ni-22Cr-11Al potential diagrams for (a) SO2-O2 and (b) S2-O2 at 800˚C. Published
in [170].
Figure 4-38. Ni-22Cr-11Al SO2-O2 potential diagram at 900˚C. Published in [170].
72

Figure 4-39. Ni-22Cr-11Al SO2-O2 potential diagram at 1000˚C. Published in [170].
4.4 Phase Fraction Diagrams
This section shows the calculations in the form of phase fraction diagrams, which are
diagrams with a potential, temperature, or composition of the x-axis, and a quantity on the y-
axis. This quantity can be a generic term such as phase fraction, or can be more specific like
partial pressure or composition.
Figure 4-40 shows a phase fraction diagram of the Ni-O system calculated using the
SPOT3 database at 800˚C with varying oxygen partial pressure. As predicted from Figure 4-16,
the Ni phase is stable below a PO2 of 10-14, whereas the NiO is stable above this partial pressure.
In essence, Figure 4-40 is slice of Figure 4-16 at a constant temperature. Figure 4-41 shows the
phase fraction diagram of Ni at 800˚C if 2% SO2 is added. The partial pressure of S2 is derived
using the same methods to obtain Figures 4-11 and 4-14. The addition of S to the system causes
the formation of Ni3S2 at lower PO2 and NiSO4 at higher PO2. In between is a gas that stabilizes
(mostly SO2), consisting of the species shown in Figure 4-42. In this calculation, Ar was added
73
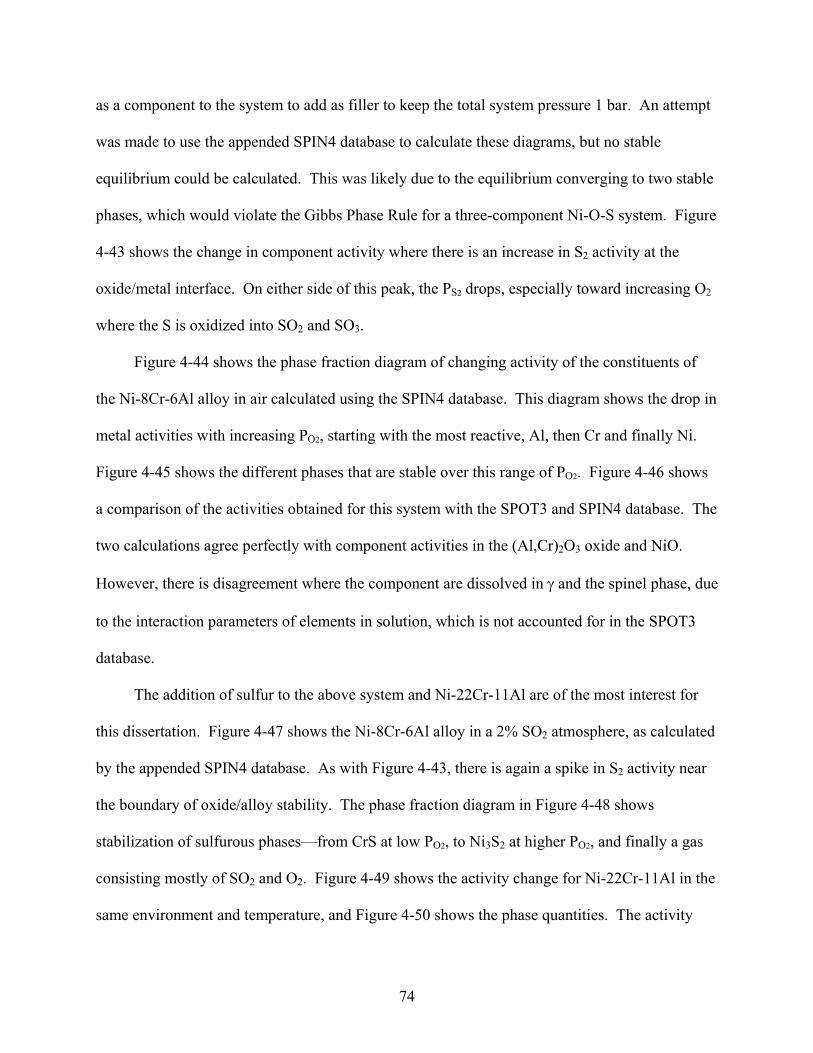
as a component to the system to add as filler to keep the total system pressure 1 bar. An attempt
was made to use the appended SPIN4 database to calculate these diagrams, but no stable
equilibrium could be calculated. This was likely due to the equilibrium converging to two stable
phases, which would violate the Gibbs Phase Rule for a three-component Ni-O-S system. Figure
4-43 shows the change in component activity where there is an increase in S2 activity at the
oxide/metal interface. On either side of this peak, the PS2 drops, especially toward increasing O2
where the S is oxidized into SO2 and SO3.
Figure 4-44 shows the phase fraction diagram of changing activity of the constituents of
the Ni-8Cr-6Al alloy in air calculated using the SPIN4 database. This diagram shows the drop in
metal activities with increasing PO2, starting with the most reactive, Al, then Cr and finally Ni.
Figure 4-45 shows the different phases that are stable over this range of PO2. Figure 4-46 shows
a comparison of the activities obtained for this system with the SPOT3 and SPIN4 database. The
two calculations agree perfectly with component activities in the (Al,Cr)2O3 oxide and NiO.
However, there is disagreement where the component are dissolved in γ and the spinel phase, due
to the interaction parameters of elements in solution, which is not accounted for in the SPOT3
database.
The addition of sulfur to the above system and Ni-22Cr-11Al are of the most interest for
this dissertation. Figure 4-47 shows the Ni-8Cr-6Al alloy in a 2% SO2 atmosphere, as calculated
by the appended SPIN4 database. As with Figure 4-43, there is again a spike in S2 activity near
the boundary of oxide/alloy stability. The phase fraction diagram in Figure 4-48 shows
stabilization of sulfurous phases—from CrS at low PO2, to Ni3S2 at higher PO2, and finally a gas
consisting mostly of SO2 and O2. Figure 4-49 shows the activity change for Ni-22Cr-11Al in the
same environment and temperature, and Figure 4-50 shows the phase quantities. The activity
74

profile is similar to that of Ni-8Cr-6Al. In addition, similar phases evolve with the Ni-22Cr-
11Al alloy, except with the formation of an α-Cr phase at low PO2. Spinel is now the most
predominant oxide at high PO2, and at intermediate partial pressures of oxygen, the oxide
dominates instead of the alloy.
Figure 4-40. Phase fraction diagram of the Ni-O system showing the change in phase percent
with varying oxygen partial pressure at 800˚C in air. Calculated from the SPOT3 database.
75
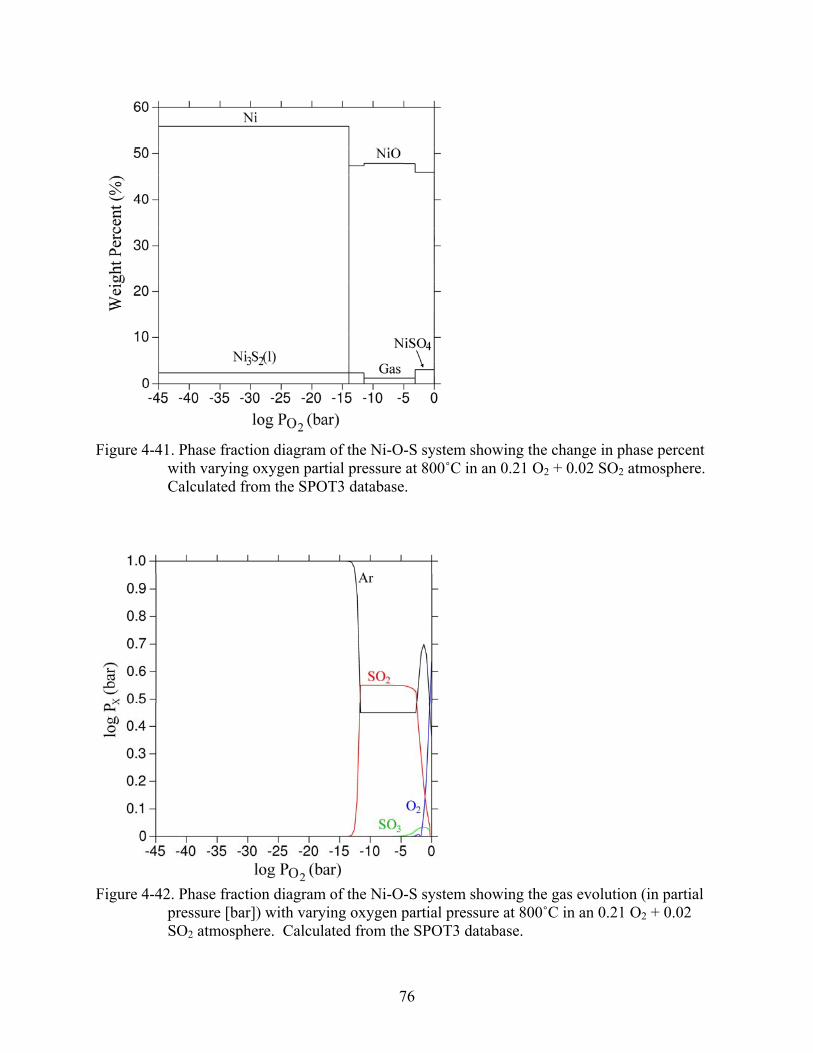
Figure 4-41. Phase fraction diagram of the Ni-O-S system showing the change in phase percent
with varying oxygen partial pressure at 800˚C in an 0.21 O2 + 0.02 SO2 atmosphere. Calculated from the SPOT3 database.
Figure 4-42. Phase fraction diagram of the Ni-O-S system showing the gas evolution (in partial
pressure [bar]) with varying oxygen partial pressure at 800˚C in an 0.21 O2 + 0.02 SO2 atmosphere. Calculated from the SPOT3 database.
76
Figure 4-43. Phase fraction diagram of the Ni-O-S system showing activity change of each
component with varying oxygen partial pressure at 800˚C in an 0.21 O2 + 0.02 SO2 atmosphere. Calculated from the SPOT3 database.
Figure 4-44. Phase fraction diagram an Ni-8Cr-6Al alloy showing activity change of each
component with varying oxygen partial pressure at 800˚C in air. Calculated from the SPIN4 database.
77
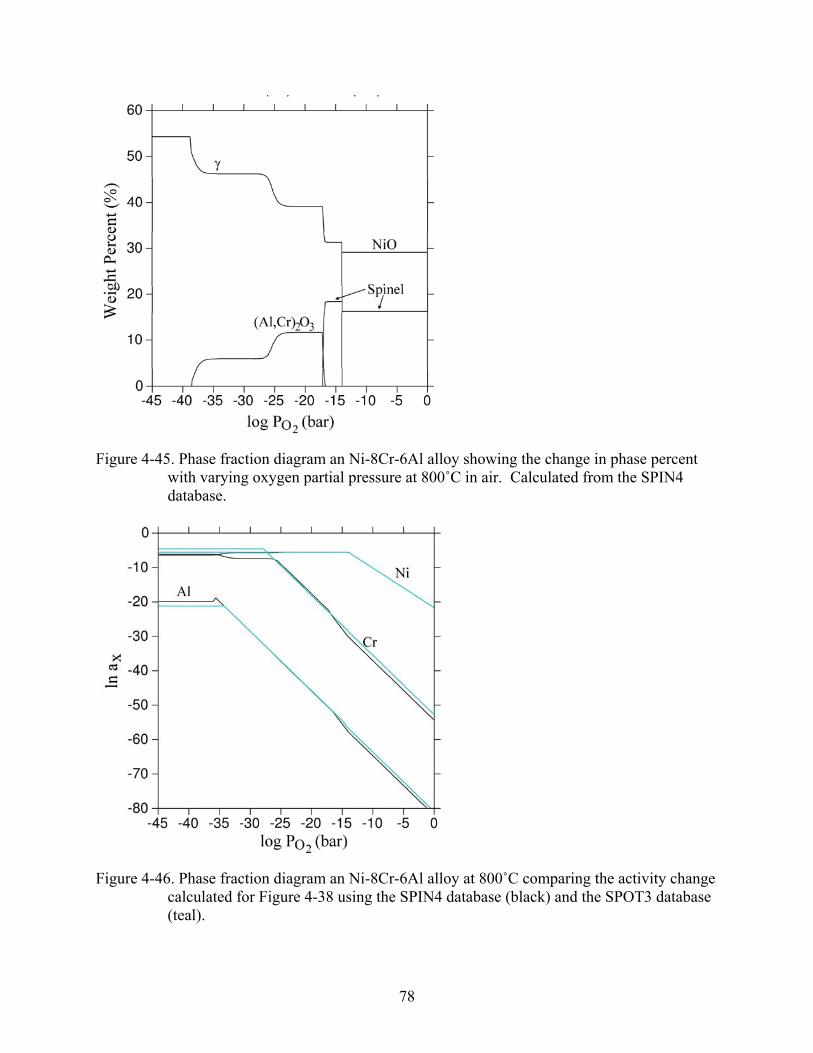
Figure 4-45. Phase fraction diagram an Ni-8Cr-6Al alloy showing the change in phase percent
with varying oxygen partial pressure at 800˚C in air. Calculated from the SPIN4 database.
Figure 4-46. Phase fraction diagram an Ni-8Cr-6Al alloy at 800˚C comparing the activity change
calculated for Figure 4-38 using the SPIN4 database (black) and the SPOT3 database (teal).
78
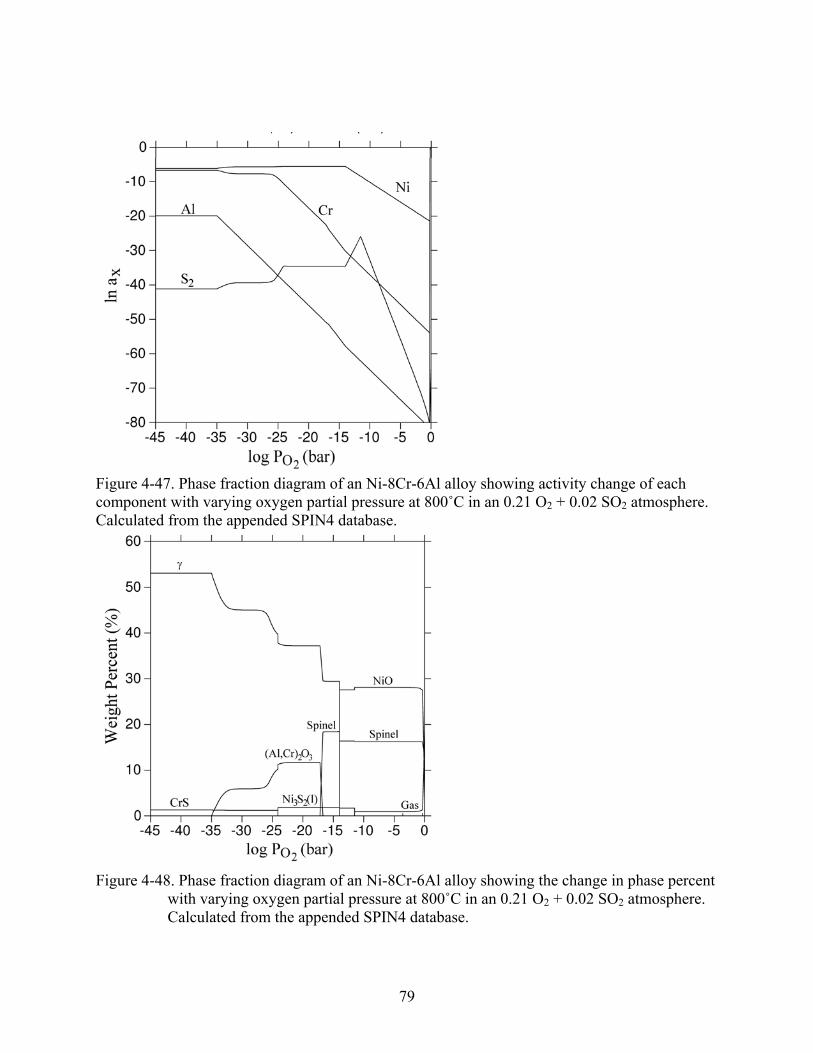
Figure 4-47. Phase fraction diagram of an Ni-8Cr-6Al alloy showing activity change of each component with varying oxygen partial pressure at 800˚C in an 0.21 O2 + 0.02 SO2 atmosphere. Calculated from the appended SPIN4 database.
Figure 4-48. Phase fraction diagram of an Ni-8Cr-6Al alloy showing the change in phase percent
with varying oxygen partial pressure at 800˚C in an 0.21 O2 + 0.02 SO2 atmosphere. Calculated from the appended SPIN4 database.
79

Figure 4-49. Phase fraction diagram of an Ni-22Cr-11Al alloy showing activity change of each
component with varying oxygen partial pressure at 800˚C in an 0.21 O2 + 0.02 SO2 atmosphere. Calculated from the appended SPIN4 database.
Figure 4-50. Phase fraction diagram of an Ni-22Cr-11Al alloy showing the change in phase
percent with varying oxygen partial pressure at 800˚C in an 0.21 O2 + 0.02 SO2 atmosphere. Calculated from the appended SPIN4 database.
80
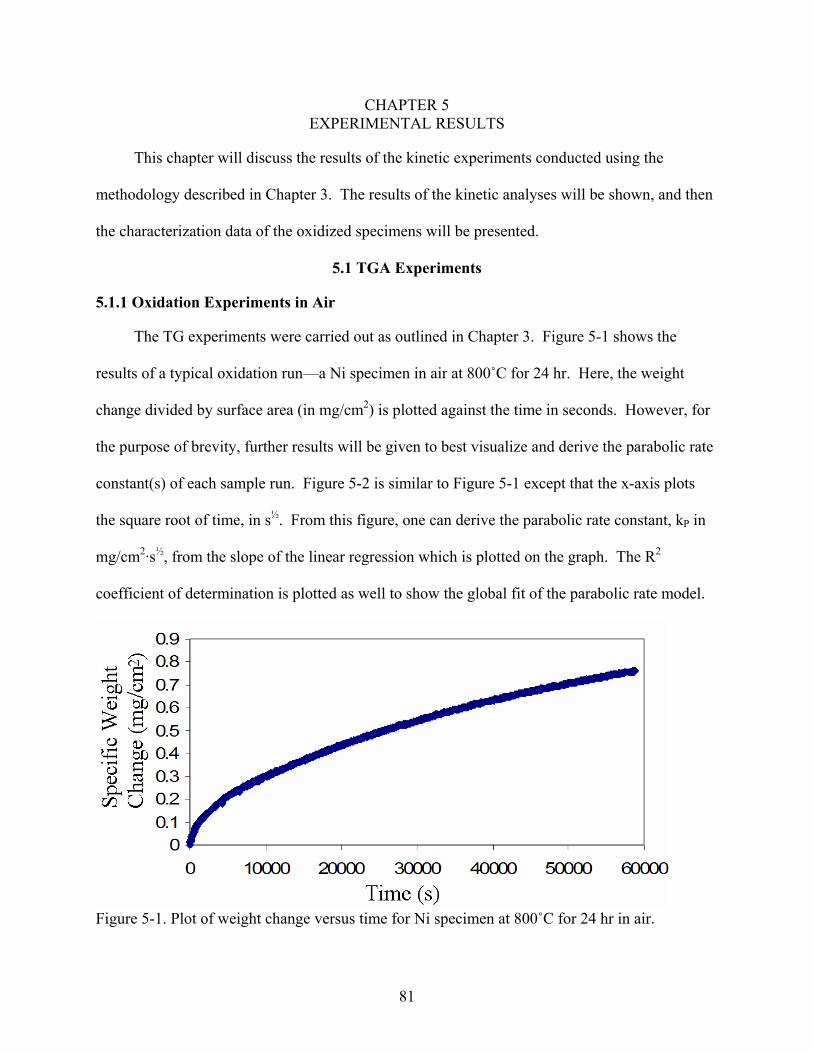
CHAPTER 5 EXPERIMENTAL RESULTS
This chapter will discuss the results of the kinetic experiments conducted using the
methodology described in Chapter 3. The results of the kinetic analyses will be shown, and then
the characterization data of the oxidized specimens will be presented.
5.1 TGA Experiments
5.1.1 Oxidation Experiments in Air
The TG experiments were carried out as outlined in Chapter 3. Figure 5-1 shows the
results of a typical oxidation run—a Ni specimen in air at 800˚C for 24 hr. Here, the weight
change divided by surface area (in mg/cm2) is plotted against the time in seconds. However, for
the purpose of brevity, further results will be given to best visualize and derive the parabolic rate
constant(s) of each sample run. Figure 5-2 is similar to Figure 5-1 except that the x-axis plots
the square root of time, in s½. From this figure, one can derive the parabolic rate constant, kP in
mg/cm2·s½, from the slope of the linear regression which is plotted on the graph. The R2
coefficient of determination is plotted as well to show the global fit of the parabolic rate model.
Figure 5-1. Plot of weight change versus time for Ni specimen at 800˚C for 24 hr in air.
81

Figure 5-2. Plot of weight change versus square root time for Ni specimen at 800˚C for 24 hr in
air. The formula containing the slope and the coefficient of determination are listed.
Figure 5-3 shows the TG data collected for Ni oxidized at 900˚C. This data is noteworthy
because the oxidation growth at the beginning of the test takes on the subparabolic behavior
described by Haugsrud [44]. This is also observed in the Ni specimen oxidized at 1100˚C.
However, it is not seen at 1000˚C. To compare the growth constants for this study with those of
most every other oxidation study, which plot the weight change squared versus time yielding
units of mg2/cm4·s, the kP values obtain were squared, and then plotted Arrheniusly against the
inverse absolute temperature to determine an activation energy, as shown in Figure 5-4. The
activation energy, QA, can be derived from the slope by:
RmQA ⋅= (5.1)
where m is the slope of the linear regression obtained from the Arrhenius plot (in K) and R is the
ideal gas constant of 8.314 J/mol·K. The oxidation of Ni specimens in this study had an
activation energy of 150.74 kJ/mol.
82

Figure 5-3. Plot of weight change versus square root time for Ni specimen at 900˚C for 24 hr in
air. The formula containing the slope and the coefficient of determination are listed.
Figure 5-4. Arrhenius plot of the parabolic rate constant versus inverse temperature of Ni
oxidized for 24 hr in air. The formula containing the slope and the coefficient of determination are listed.
Unlike the TG curves for pure Ni, the oxidation growth for all the other alloys was more
complex. In Figure 5-5, the oxidation of NiAl at 800˚C for 24 hr is plotted. This plot shows an
incubation time with possibly some minor weight loss until approximately 3 hours into the test
83
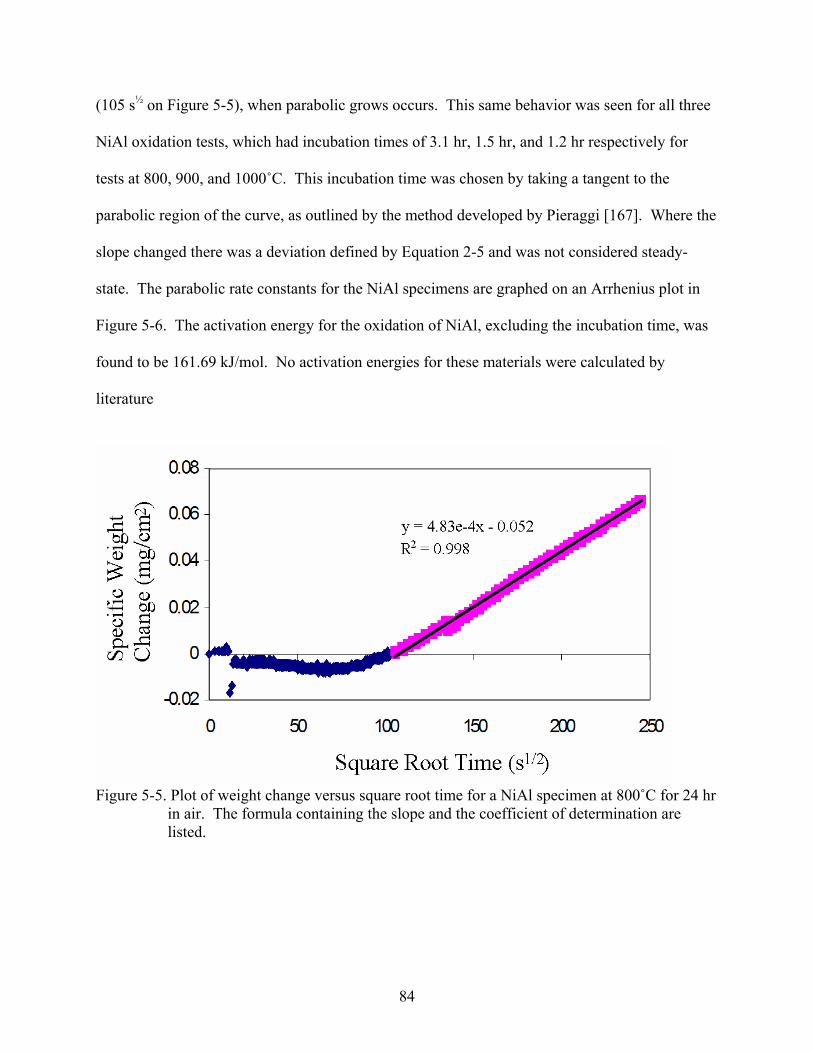
(105 s½ on Figure 5-5), when parabolic grows occurs. This same behavior was seen for all three
NiAl oxidation tests, which had incubation times of 3.1 hr, 1.5 hr, and 1.2 hr respectively for
tests at 800, 900, and 1000˚C. This incubation time was chosen by taking a tangent to the
parabolic region of the curve, as outlined by the method developed by Pieraggi [167]. Where the
slope changed there was a deviation defined by Equation 2-5 and was not considered steady-
state. The parabolic rate constants for the NiAl specimens are graphed on an Arrhenius plot in
Figure 5-6. The activation energy for the oxidation of NiAl, excluding the incubation time, was
found to be 161.69 kJ/mol. No activation energies for these materials were calculated by
literature
Figure 5-5. Plot of weight change versus square root time for a NiAl specimen at 800˚C for 24 hr
in air. The formula containing the slope and the coefficient of determination are listed.
84

Figure 5-6. Arrhenius plot of the parabolic rate constant versus inverse temperature of NiAl
oxidized for 24 hr in air. The formula containing the slope and the coefficient of determination are listed.
For the Ni-Cr-Al alloys, the TG curves were even more complex. One of the Ni-8Cr-6Al,
like Figure 5-7, had a similar shape to that of Figure 5-5. Others, like Figure 5-8 had an initial
oxidation growth rate that was faster than the “steady-state” parabolic growth. The oxidation
plots for Ni-8Cr-6Al at 800˚C has the same shape as that for 1000˚C (Figure 5-7), although the
initial oxidation stages are much less pronounced. The curves for the Ni-22Cr-11Al alloys were
all similar to those for 100 hr at 800˚C, as shown in Figure 5-9. In the experiments with these
alloys, there was an initial weight gain, then a slight weight loss, and finally steady parabolic
growth. The “steady-state” parabolic rate constants for Ni-8Cr-6Al and Ni-22Cr-11Al are
plotted versus inverse absolute temperature as Arrhenius plots in Figures 5-10 and 5-11,
respectively. No activation energy could be calculated for the Ni-8Cr-6Al alloy because there
was not an Arrhenius dependency. An activation energy of 25.07 kJ/mol was calculated for the
the oxidation of Ni-22Cr-11Al. However, the amount of variance here cannot be explained by
the Arrhenius model making this is statistic unsound.
85
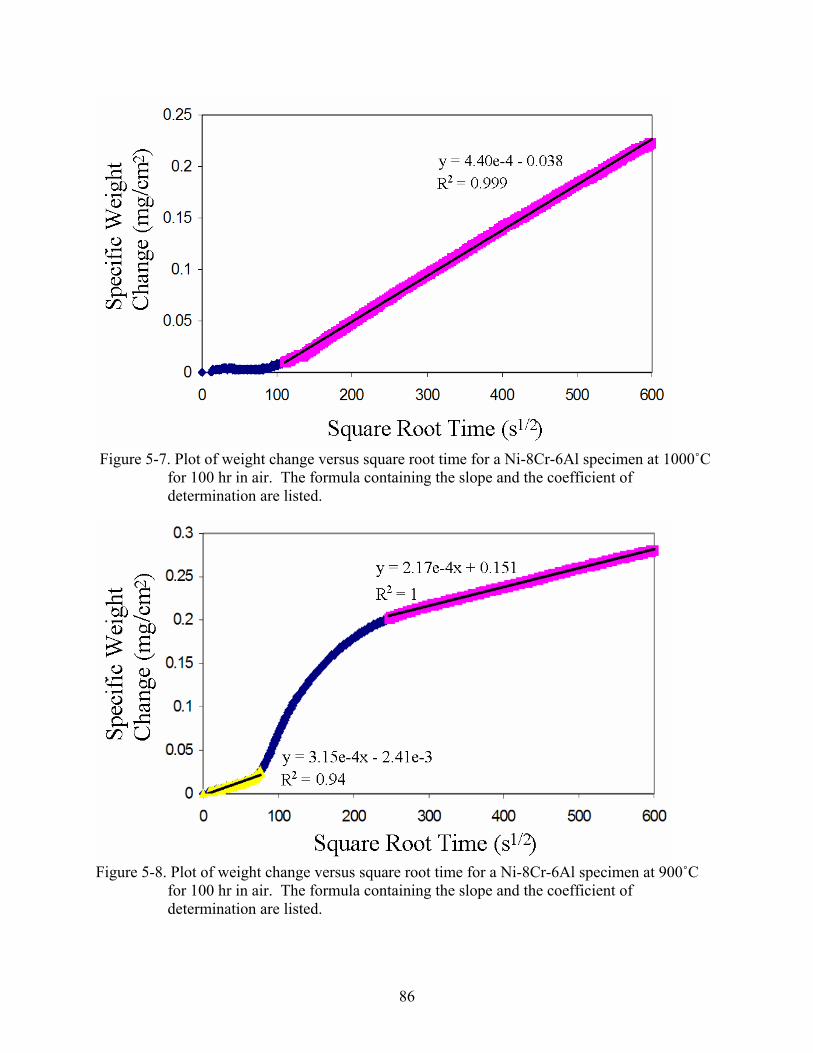
Figure 5-7. Plot of weight change versus square root time for a Ni-8Cr-6Al specimen at 1000˚C
for 100 hr in air. The formula containing the slope and the coefficient of determination are listed.
Figure 5-8. Plot of weight change versus square root time for a Ni-8Cr-6Al specimen at 900˚C
for 100 hr in air. The formula containing the slope and the coefficient of determination are listed.
86

Figure 5-9. Plot of weight change versus square root time for a Ni-22Cr-11Al specimen at 800˚C
for 100 hr in air. The formula containing the slope and the coefficient of determination are listed.
Figure 5-10. Arrhenius plot of the parabolic rate constant versus inverse temperature of Ni-8Cr-
6Al oxidized for 100 hr in air.
87

Figure 5-11. Arrhenius plot of the parabolic rate constant versus inverse temperature of Ni-22Cr-
11Al oxidized for 100 hr in air. The formula containing the slope and the coefficient of determination are listed.
5.1.2 Oxidation Experiments in He + 0.21 O2 + 0.02 SO2
The TG experiments with 2% SO2 showed more scatter in the collected data, but there
appeared to be less change in mechanism during the oxidation process. For Ni-8Cr-6Al, there
appeared to be a faster initial stage of oxidation before transitioning to the steady parabolic rate
(Figure 5-12). For all other conditions though, with this alloy and with Ni-22Cr-11Al, there
appeared to be no pronounced initial oxidation stage, as shown in Figure 5-13. The Arrhenius
plots for Ni-8Cr-6Al and Ni-22Cr-11Al are shown in Figures 5-14 and 5-15, respectively. The
activation energy for oxidation of Ni-8Cr-6Al in He + 0.21 O2 + 0.02 SO2 is 415.14 kJ/mol, and
for Ni-22Cr-11Al is 157.83 kJ/mol. This shows a higher activation energy for steady-state
oxidation in the Ni-8Cr-6Al specimens than the Ni-22Cr-11Al. No previous literature discusses
activation energies for the oxidation of these alloys.
88
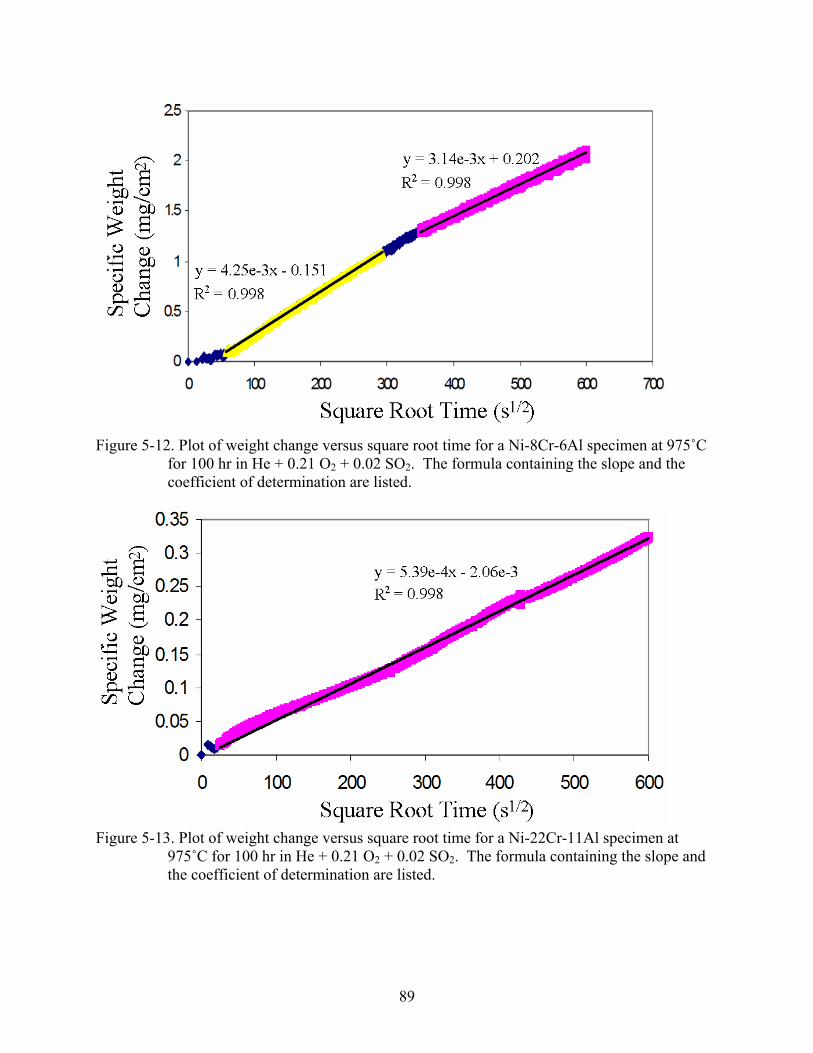
Figure 5-12. Plot of weight change versus square root time for a Ni-8Cr-6Al specimen at 975˚C
for 100 hr in He + 0.21 O2 + 0.02 SO2. The formula containing the slope and the coefficient of determination are listed.
Figure 5-13. Plot of weight change versus square root time for a Ni-22Cr-11Al specimen at
975˚C for 100 hr in He + 0.21 O2 + 0.02 SO2. The formula containing the slope and the coefficient of determination are listed.
89

Figure 5-14. Arrhenius plot of the parabolic rate constant versus inverse temperature of Ni-8Cr-
6Al oxidized for 100 hr in He + 0.21 O2 + 0.02 SO2. The formula containing the slope and the coefficient of determination are listed.
Figure 5-15. Arrhenius plot of the parabolic rate constant versus inverse temperature of Ni-22Cr-
11Al oxidized for 100 hr in He + 0.21 O2 + 0.02 SO2. The formula containing the slope and the coefficient of determination are listed.
90
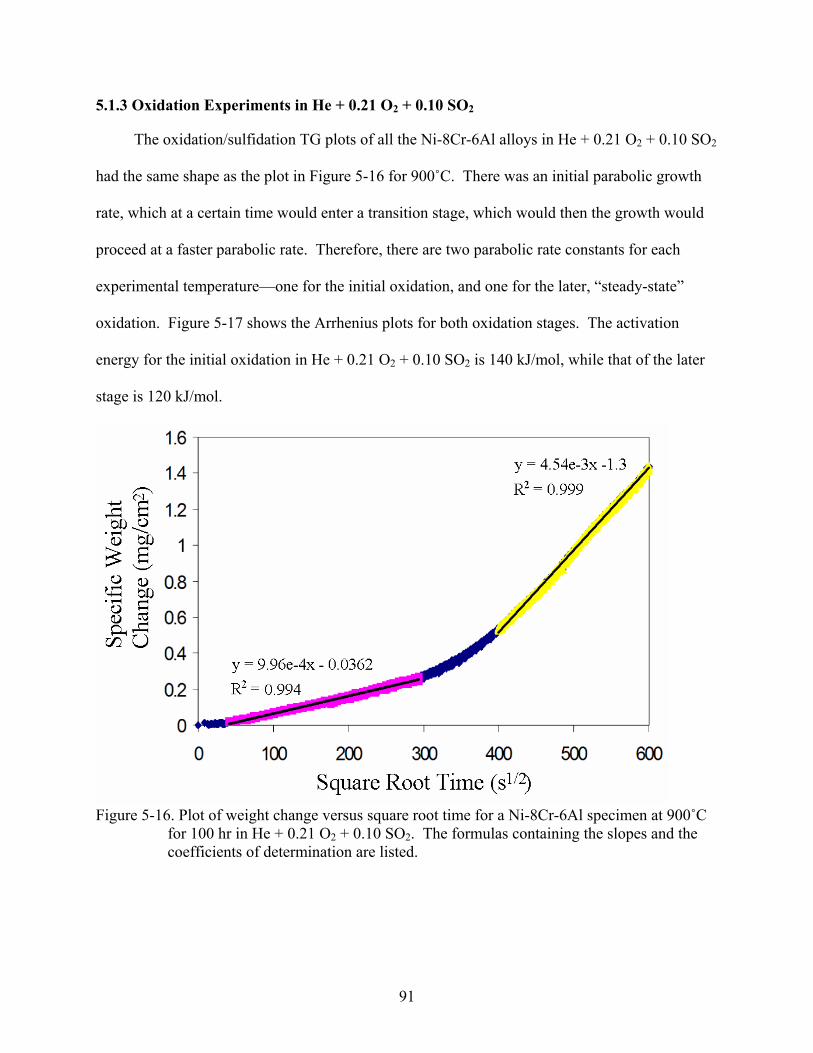
5.1.3 Oxidation Experiments in He + 0.21 O2 + 0.10 SO2
The oxidation/sulfidation TG plots of all the Ni-8Cr-6Al alloys in He + 0.21 O2 + 0.10 SO2
had the same shape as the plot in Figure 5-16 for 900˚C. There was an initial parabolic growth
rate, which at a certain time would enter a transition stage, which would then the growth would
proceed at a faster parabolic rate. Therefore, there are two parabolic rate constants for each
experimental temperature—one for the initial oxidation, and one for the later, “steady-state”
oxidation. Figure 5-17 shows the Arrhenius plots for both oxidation stages. The activation
energy for the initial oxidation in He + 0.21 O2 + 0.10 SO2 is 140 kJ/mol, while that of the later
stage is 120 kJ/mol.
Figure 5-16. Plot of weight change versus square root time for a Ni-8Cr-6Al specimen at 900˚C
for 100 hr in He + 0.21 O2 + 0.10 SO2. The formulas containing the slopes and the coefficients of determination are listed.
91
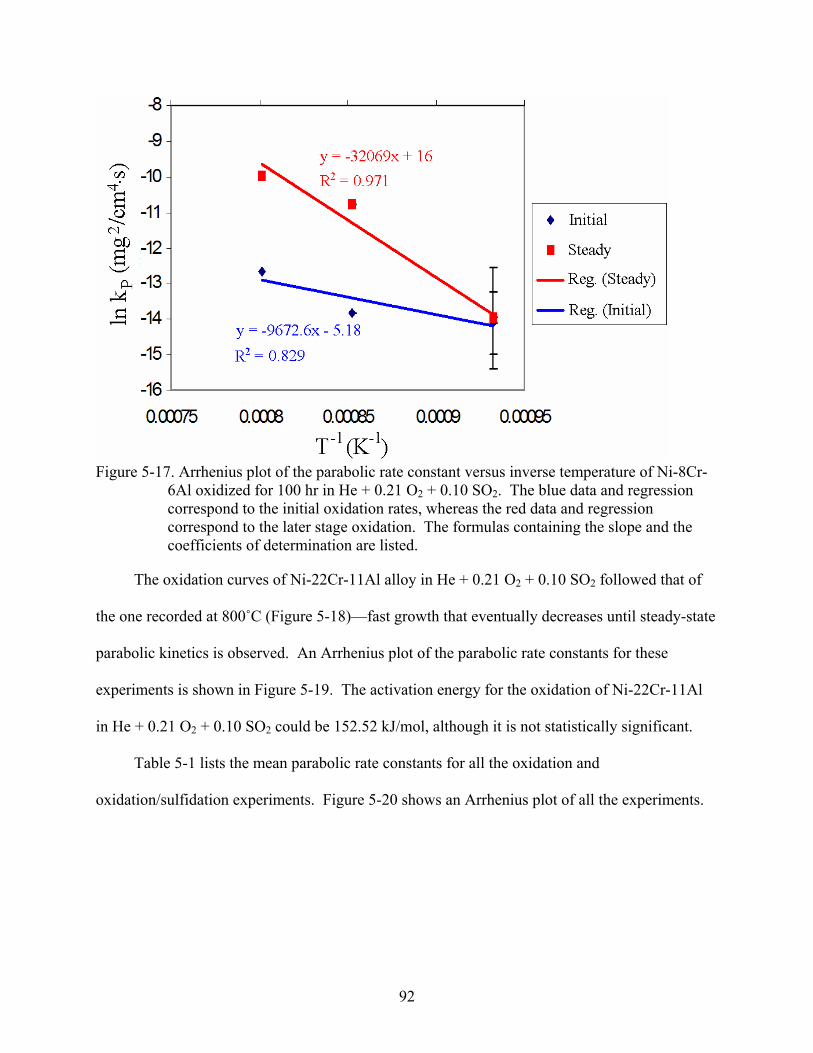
Figure 5-17. Arrhenius plot of the parabolic rate constant versus inverse temperature of Ni-8Cr-
6Al oxidized for 100 hr in He + 0.21 O2 + 0.10 SO2. The blue data and regression correspond to the initial oxidation rates, whereas the red data and regression correspond to the later stage oxidation. The formulas containing the slope and the coefficients of determination are listed.
The oxidation curves of Ni-22Cr-11Al alloy in He + 0.21 O2 + 0.10 SO2 followed that of
the one recorded at 800˚C (Figure 5-18)—fast growth that eventually decreases until steady-state
parabolic kinetics is observed. An Arrhenius plot of the parabolic rate constants for these
experiments is shown in Figure 5-19. The activation energy for the oxidation of Ni-22Cr-11Al
in He + 0.21 O2 + 0.10 SO2 could be 152.52 kJ/mol, although it is not statistically significant.
Table 5-1 lists the mean parabolic rate constants for all the oxidation and
oxidation/sulfidation experiments. Figure 5-20 shows an Arrhenius plot of all the experiments.
92
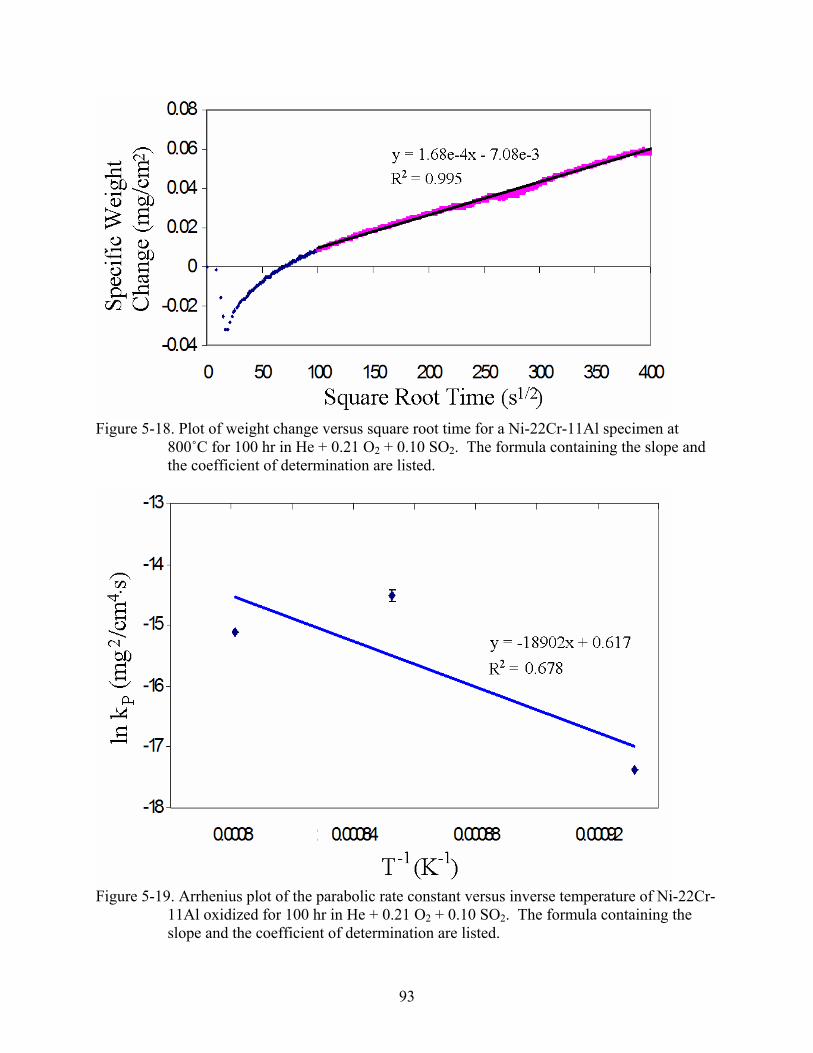
Figure 5-18. Plot of weight change versus square root time for a Ni-22Cr-11Al specimen at
800˚C for 100 hr in He + 0.21 O2 + 0.10 SO2. The formula containing the slope and the coefficient of determination are listed.
Figure 5-19. Arrhenius plot of the parabolic rate constant versus inverse temperature of Ni-22Cr-
11Al oxidized for 100 hr in He + 0.21 O2 + 0.10 SO2. The formula containing the slope and the coefficient of determination are listed.
93

Table 5-1. List of the parabolic rate constants obtained from steady-state oxidation of Ni, Ni-13.6Al, NiAl, Ni-8Cr-6Al, and Ni-22Cr-11Al alloys.
Alloy Name Atmosphere (bar)
Temperature (˚C)
kP (mg/cm2·s½) kP (mg2/cm4·s)
Ni Air 800 3.13E-03 9.82E-06 Ni Air 900 6.42E-03 4.12E-05 Ni Air 1000 1.20E-02 1.43E-04 Ni Air 1100 1.97E-02 3.89E-04 Ni-13.6Al Air 800 1.15E-04 1.31E-08 Ni-13.6Al Air 900 3.20E-04 1.02E-07 Ni-13.6Al Air 1000 2.45E-04 6.02E-08 Ni-22Cr-11Al Air 800 4.08E-04 1.66E-07 Ni-22Cr-11Al Air 900 6.10E-04 3.72E-07 Ni-22Cr-11Al Air 1000 5.05E-04 2.55E-07 Ni-22Cr-11Al He + 0.21 O2 +
0.02 SO2 800 2.28E-04 5.20E-08 Ni-22Cr-11Al He + 0.21 O2 +
0.02 SO2 900 4.00E-04 1.60E-07 Ni-22Cr-11Al He + 0.21 O2 +
0.02 SO2 975 5.39E-04 2.91E-07 Ni-22Cr-11Al He + 0.21 O2 +
0.10 SO2 800 1.68E-04 2.82E-08 Ni-22Cr-11Al He + 0.21 O2 +
0.10 SO2 900 7.05E-04 4.97E-07 Ni-22Cr-11Al He + 0.21 O2 +
0.10 SO2 975 5.19E-04 2.69E-07 Ni-31Al Air 800 4.83E-04 2.33E-07 Ni-31Al Air 900 1.10E-03 1.20E-06 Ni-31Al Air 1000 1.95E-03 3.82E-06 Ni-8Cr-6Al Air 800 1.58E-03 2.50E-06 Ni-8Cr-6Al Air 900 5.31E-04 2.82E-07 Ni-8Cr-6Al Air 1000 1.94E-03 3.76E-06 Ni-8Cr-6Al He + 0.21 O2 +
0.02 SO2 800 1.24E-04 1.54E-08 Ni-8Cr-6Al He + 0.21 O2 +
0.02 SO2 900 1.32E-03 1.74E-06 Ni-8Cr-6Al He + 0.21 O2 +
0.02 SO2 975 3.14E-03 9.86E-06 Ni-8Cr-6Al He + 0.21 O2 +
0.10 SO2 800 9.33E-04 8.70E-07 Ni-8Cr-6Al He + 0.21 O2 +
0.10 SO2 900 4.54E-03 2.06E-05 Ni-8Cr-6Al He + 0.21 O2 +
0.10 SO2 975 6.82E-03 4.64E-05
94

Figure 5-20. Arrhenius plot of alloys isothermally oxidized in this study for 100 hr.
5.2 Phase Identification
The identification of phases was performed using the APD3720 XRD and compared the d-
spacings of the peak intensities with those of cataloged JCPDS files. This section shows the
XRD results from the tests described in Section 5.1 on the Ni-8Cr-6Al and Ni-22Cr-11 Al alloys.
Figure 5-21 shows the XRD results of a polished, heat-treated specimen of Ni-8Cr-6Al.
The peaks identified show the presence of Ni, Ni3Al, and possibly some Al2O3. This oxide
might be residual from the alumina polished used in sample preparation, as it is not expected.
Figures 5-22, 5-23, and 5-24 show the XRD results of Ni-8Cr-6Al oxidized in air for 100 hr at
800, 900, and 1000˚C, respectively. Comparing these with Figure 5-21, one can see the
emergence of NiO and Al2O3. All Al2O3 identified from these XRD studies is the stable α phase.
At 800˚C, some chromia is seen, and at 1000˚C, NiAl2O4 spinel is present. The peak heights of
the Ni and γ’ fluctuate between all four figures, but they will not be used in this study to
95

determine the phase percentages. The figures with higher alumina peaks have corresponding
higher Ni peaks, and those with lower alumina and/or higher NiO have higher Ni3Al peaks. This
is likely due to a depletion of one element near the surface if one oxide is more prevalent, and
would thus show more of either γ or γ’ accordingly.
Figure 5-21. Histogram of the peak intensities measured from an XRD analysis of polished, heat
treated Ni-8Cr-6Al.
Figure 5-22. Histogram of the peak intensities measured from an XRD analysis of Ni-8Cr-6Al
oxidized in air for 100 hr at 800˚C.
96

Figure 5-23. Histogram of the peak intensities measured from an XRD analysis of Ni-8Cr-6Al
oxidized in air for 100 hr at 900˚C.
Figure 5-24. Histogram of the peak intensities measured from an XRD analysis of Ni-8Cr-6Al
oxidized in air for 100 hr at 1000˚C.
Figures 5-25, 5-26, and 5-27 show the XRD data for Ni-8Cr-6Al oxidized in 2% SO2 for
800, 900, and 975˚C, respectively. As with the samples oxidized in air, alumina and NiO are
present. However, chromia is present at all temperatures, not just at 800˚C. The spinel phase is
also shown for the higher temperatures of 900 and 975˚C. Those specimens oxidized in 10%
97
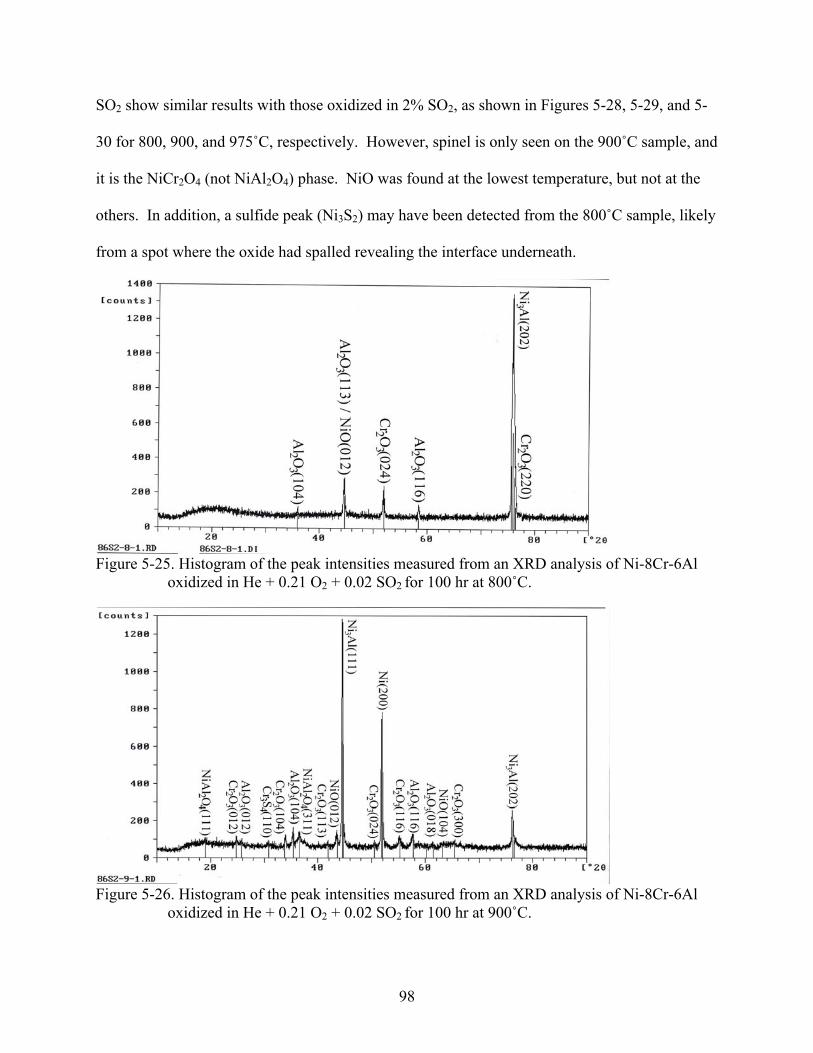
SO2 show similar results with those oxidized in 2% SO2, as shown in Figures 5-28, 5-29, and 5-
30 for 800, 900, and 975˚C, respectively. However, spinel is only seen on the 900˚C sample, and
it is the NiCr2O4 (not NiAl2O4) phase. NiO was found at the lowest temperature, but not at the
others. In addition, a sulfide peak (Ni3S2) may have been detected from the 800˚C sample, likely
from a spot where the oxide had spalled revealing the interface underneath.
Figure 5-25. Histogram of the peak intensities measured from an XRD analysis of Ni-8Cr-6Al
oxidized in He + 0.21 O2 + 0.02 SO2 for 100 hr at 800˚C.
Figure 5-26. Histogram of the peak intensities measured from an XRD analysis of Ni-8Cr-6Al
oxidized in He + 0.21 O2 + 0.02 SO2 for 100 hr at 900˚C.
98
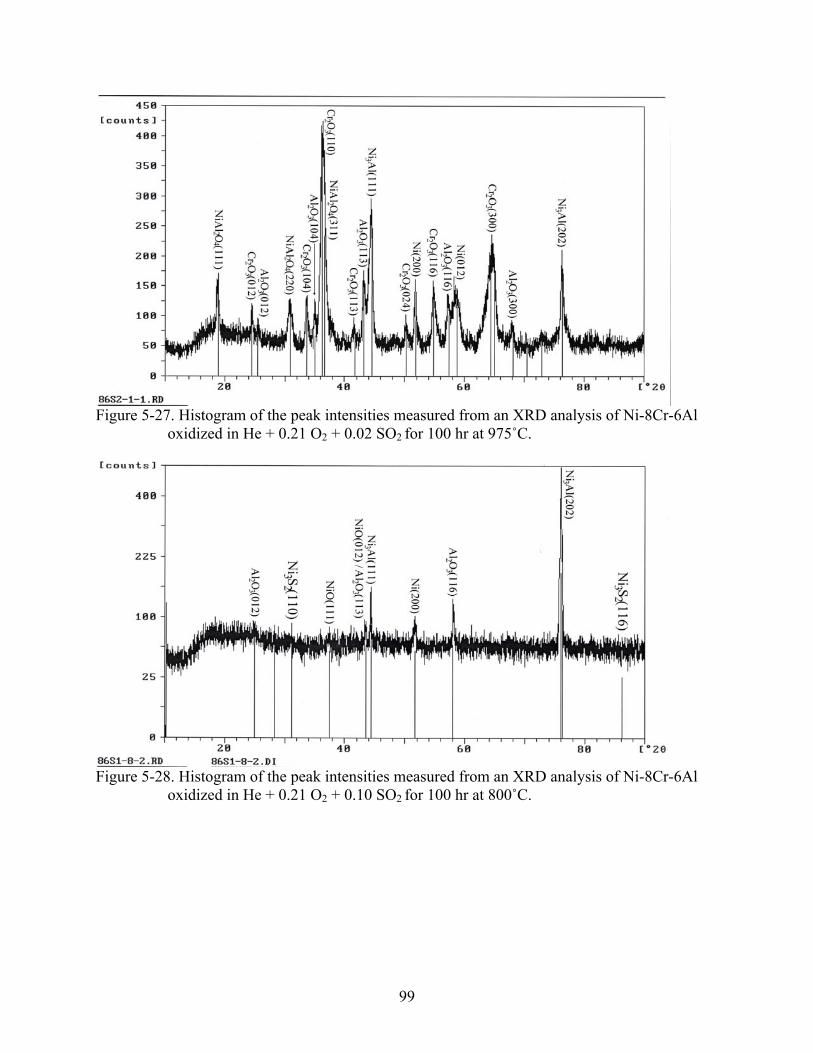
Figure 5-27. Histogram of the peak intensities measured from an XRD analysis of Ni-8Cr-6Al
oxidized in He + 0.21 O2 + 0.02 SO2 for 100 hr at 975˚C.
Figure 5-28. Histogram of the peak intensities measured from an XRD analysis of Ni-8Cr-6Al
oxidized in He + 0.21 O2 + 0.10 SO2 for 100 hr at 800˚C.
99

Figure 5-29. Histogram of the peak intensities measured from an XRD analysis of Ni-8Cr-6Al
oxidized in He + 0.21 O2 + 0.10 SO2 for 100 hr at 900˚C.
Figure 5-30. Histogram of the peak intensities measured from an XRD analysis of Ni-8Cr-6Al
oxidized in He + 0.21 O2 + 0.10 SO2 for 100 hr at 975˚C.
The XRD data of polished, heat-treated Ni-22Cr-11Al is shown in Figure 5-31, and the
samples oxidized in air at 800, 900, and 1000˚C are shown in Figures 5-32, 5-33, and 5-34,
respectively. The unoxidized specimen of Ni-22Cr-11Al contains Ni, Ni3Al, NiAl, and Cr, as
well as the one alumina peak. Upon oxidation, chromia and alumina are formed. NiAl2O4 spinel
100

was also identified for the sample oxidized at 900˚C. The formation of Al2O3 corresponded with
the loss of NiAl peaks, as this phase was likely consumed during the experiments. Also, the
amount of γ’ present decreased relative to Ni (except at 1000˚C). The addition of 2% SO2
showed little difference with the XRD data of the oxidized samples, as seen in Figures 5-35, 5-
36, and 5-37 for 800, 900, and 975˚C, respectively. Two Ni3S2 peaks were observed on the
specimen exposed at 975˚C, likely from areas of oxide spallation, which was observed on this
sample. At 10% SO2 (as seen in Figures 5-38, 5-39, and 5-40 for 800, 900, and 975˚C,
respectively), more sulfide peaks were observed. As with the 2%, some Ni3S2 was observed at
800˚C, but was a different phase at 900˚C—Ni3S4. At 975˚C, Cr sulfide in the form of Cr3S4 was
identified. Not all of these samples showed spallation, so some of the sulfides may be present in
the oxide or in larger amounts than other sample runs. Table 5-2 summarizes the phases
identified from the XRD measurements.
Figure 5-31. Histogram of the peak intensities measured from an XRD analysis of polished, heat
treated Ni-22Cr-11Al.
101
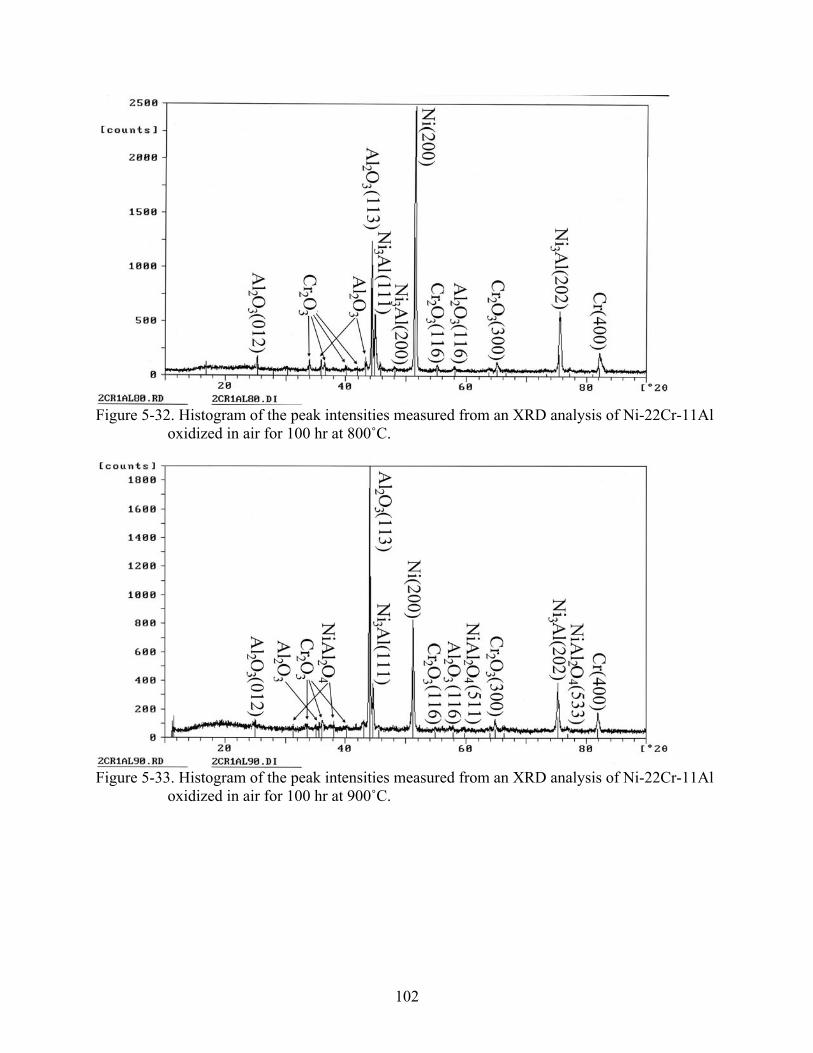
Figure 5-32. Histogram of the peak intensities measured from an XRD analysis of Ni-22Cr-11Al
oxidized in air for 100 hr at 800˚C.
Figure 5-33. Histogram of the peak intensities measured from an XRD analysis of Ni-22Cr-11Al
oxidized in air for 100 hr at 900˚C.
102

Figure 5-34. Histogram of the peak intensities measured from an XRD analysis of Ni-22Cr-11Al
oxidized in air for 100 hr at 1000˚C.
Figure 5-35. Histogram of the peak intensities measured from an XRD analysis of Ni-22Cr-11Al
oxidized in He + 0.21 O2 + 0.02 SO2 for 100 hr at 800˚C.
103

Figure 5-36. Histogram of the peak intensities measured from an XRD analysis of Ni-22Cr-11Al
oxidized in He + 0.21 O2 + 0.02 SO2 for 100 hr at 900˚C.
Figure 5-37. Histogram of the peak intensities measured from an XRD analysis of Ni-22Cr-11Al
oxidized in He + 0.21 O2 + 0.02 SO2 for 100 hr at 975˚C.
104

Figure 5-38. Histogram of the peak intensities measured from an XRD analysis of Ni-22Cr-11Al
oxidized in He + 0.21 O2 + 0.10 SO2 for 100 hr at 800˚C.
Figure 5-39. Histogram of the peak intensities measured from an XRD analysis of Ni-22Cr-11Al
oxidized in He + 0.21 O2 + 0.10 SO2 for 100 hr at 900˚C.
105

Figure 5-40. Histogram of the peak intensities measured from an XRD analysis of Ni-22Cr-11Al
oxidized in He + 0.21 O2 + 0.10 SO2 for 100 hr at 975˚C.
5.3 Surface Imaging
5.3.1 Untested Alloy Specimens
After casting, some of the specimens were inspected using optical and scanning electron
microscopy. Figure 5-41 shows an optical micrograph of the microstructure of the Ni-8Cr-6Al
composition as cast. Figure 5-42 shows the microstructure of the same composition, but after the
4 hr heat treatment at 1200˚C in vacuum. It is clear that the grain size increased due to the heat
treatment. Analysis of the grain size showed that the as cast material had a size of 260 ± 91 µm,
and after heat treatment was 432 ± 90 µm. In addition, there was less porosity seen after heat
treatment. From Figures 5-41 and 5-42, it appears as though there the grains are single-phase γ.
However, SEM reveals that there are randomly sized precipitates of γ’ throughout the
microstructure (Figure 5-43), which decreased in size and become cuboidal after heat treatment
(Figure 5-44).
106

Table 5-2. Table summarizing the phases identified using XRD for all cast, heat-treated alloys oxidized.
Alloy Environment Temperature (˚C)
Metallic Phases
Oxides Sulfides?
Ni-8Cr-6Al None None Ni, γ’ Al2O3 Air 800 γ’, Ni Al2O3, NiO,
Cr2O3
Air 900 γ’, Ni Al2O3, NiO Air 1000 γ’, Ni Al2O3,
NiAl2O4
21% O2 + 2% SO2
800 γ’ Al2O3, NiO, Cr2O3
21% O2 + 2% SO2
900 γ’, Ni Al2O3, NiO, NiAl2O4, Cr2O3
Cr3S4
21% O2 + 2% SO2
975 γ’, Ni Cr2O3, NiCr2O4, Al2O3
21% O2 + 10% SO2
800 γ’, Ni Al2O3, NiO Ni3S2
21% O2 + 10% SO2
900 γ’, Ni Al2O3, Cr2O3, NiCr2O4
21% O2 + 10% SO2
975 γ’, Ni Al2O3, Cr2O3
Ni-22Cr-11Al None None γ’, Ni, β, Cr Al2O3 Air 800 Ni, γ’, Cr Al2O3,
Cr2O3
Air 900 Ni, γ’, Cr Al2O3, Cr2O3
Air 1000 γ’, Ni, Cr Al2O3, Cr2O3
21% O2 + 2% SO2
800 γ’, Ni, Cr Al2O3, Cr2O3
21% O2 + 2% SO2
900 γ’, Ni, Cr Al2O3, Cr2O3
21% O2 + 2% SO2
975 γ’, Ni, Cr Al2O3, Cr2O3
Ni3S2
21% O2 + 10% SO2
800 Ni, γ’, Cr Al2O3, Cr2O3
Ni3S2
21% O2 + 10% SO2
900 Ni, γ’, Cr Al2O3, Cr2O3
Ni3S4
21% O2 + 10% SO2
975 γ’, Ni, Cr Al2O3, Cr2O3
Cr3S4
107

Figure 5-41. Optical micrograph of as cast Ni-8Cr-6Al at 125X.
Figure 5-42. Optical micrograph of heat-treated Ni-8Cr-6Al at 125X.
108

Figure 5-43. Secondary electron (SE) micrograph of as cast Ni-8Cr-6Al microstructure at 5000X.
Figure 5-44. SE micrograph of heat-treated Ni-8Cr-6Al microstructure at 20000X.
Figure 5-45 shows the as-cast microstructure of the Ni-22Cr-11Al composition, and Figure
5-46 shows the same alloy composition after heat-treatment. Both figures show a variety of
109

phases present with a dendritic structure in the as cast specimen. This is ameliorated in the heat-
treated specimens and grain growth is observed—185 ± 32 µm in the as cast versus 329 ± 92 µm
in the heat-treated. From the SE micrographs in Figures 5-47 and 5-48, one can see circular
regions with small precipitates surrounded by phase with a different morphology. Heat treatment
increased the size of these circular phase regions. As shown by the X-Ray map in Figure 5-49,
the circular regions were rich in Ni and Al, while the surrounding phase was rich in Cr.
Comparing these results with the XRD micrograph in Figure 5-31 with those obtained from EDS
probes of each region, the heat-treated microstructure is one of circular β-NiAl regions
containing small, cuboidal Ni3Al phases surrounded by a Cr-rich γ-Ni matrix.
Figure 5-45. Optical micrograph of as cast Ni-22Cr-11Al at 125X.
110

Figure 5-46. Optical micrograph of heat-treated Ni-22Cr-11Al at 125X.
Figure 5-47. Backscattered electron (BSE) micrograph of as cast Ni-22Cr-11Al microstructure at
5000X.
111

Figure 5-48. Secondary electron (SE) micrograph of heat-treated Ni-22Cr-11Al microstructure at
15000X.
Figure 5-49. X-ray map of the SE micrograph in Figure 5-46.
112

5.3.2 Oxidized Ni and Ni-Al Specimens
The oxide formed on all the Ni specimens was similar to that in Figure 5-50—a triangular
shaped layered oxide. The NiAl specimens showed only an external alumina scale that had the
appearance of the one showed in Figure 5-51. However, at 1000˚C, the morphology changed to
a needle- or plate-like pattern (see Figure 5-52). This could indicate transient θ or δ Al2O3. The
amount of these aluminas was increased above the grain boundaries of the substrate, indicating
faster Al transport along the substrate grain boundaries (see Figure 5-53).
Figure 5-50. SE micrograph of NiO scale Ni oxidized in air at 800˚C for 24 hr.
5.3.3 Oxidized Ni-8Cr-6Al Specimens
5.3.3.1 Ni-8Cr-6Al Oxidized in Air
The specimens oxidized in air were analyzed using SEM for analysis. All three samples
exhibited adherent scales. The specimens oxidized at 800 and 900˚C exhibited an almost
identical microstructure. Figure 5-54 shows a backscattered electron (BSE) micrograph of one
oxidized specimen. The high-Z (atomic number) phase was shown to be NiO, and the low-Z
113

Figure 5-51. SE micrograph of NiAl oxidized at 800˚C for 36 hr at 5000X.
Figure 5-52. SE micrograph of NiAl oxidized at 1000˚C for 36 hr at 20000X.
114

Figure 5-53. SE micrograph of NiAl oxidized at 1000˚C for 36 hr at 200X.
phase underneath was alumina (see Figure 5-55). Even though XRD identified chromia in the
800˚C specimen, it was not observed on the surface in the SEM. At 1000˚C, a different
morphology was seen—one with whiskers as seen with the NiAl (see Figures 5-56 and 5-57).
BSE imaging, EDS, and XRD showed these whiskers to be α-Al2O3 (when compared with
Figure 5-24) near flaky NiO on top of a mixture of Al2O3 and Ni2AlO4. Whiskers are not the
normal morphology of α-Al2O3, but it is likely that prolonged exposure at elevated temperatures
converted them from a transient phase to the more stable α. Oxidation of this alloy for 30 min
showed that there had developed a similar scale morphology as shown in Figure 5-51 (see Figure
5-58). The NiO morphology was similar the NiO that grew on pure Ni (see Figure 5-50).
115
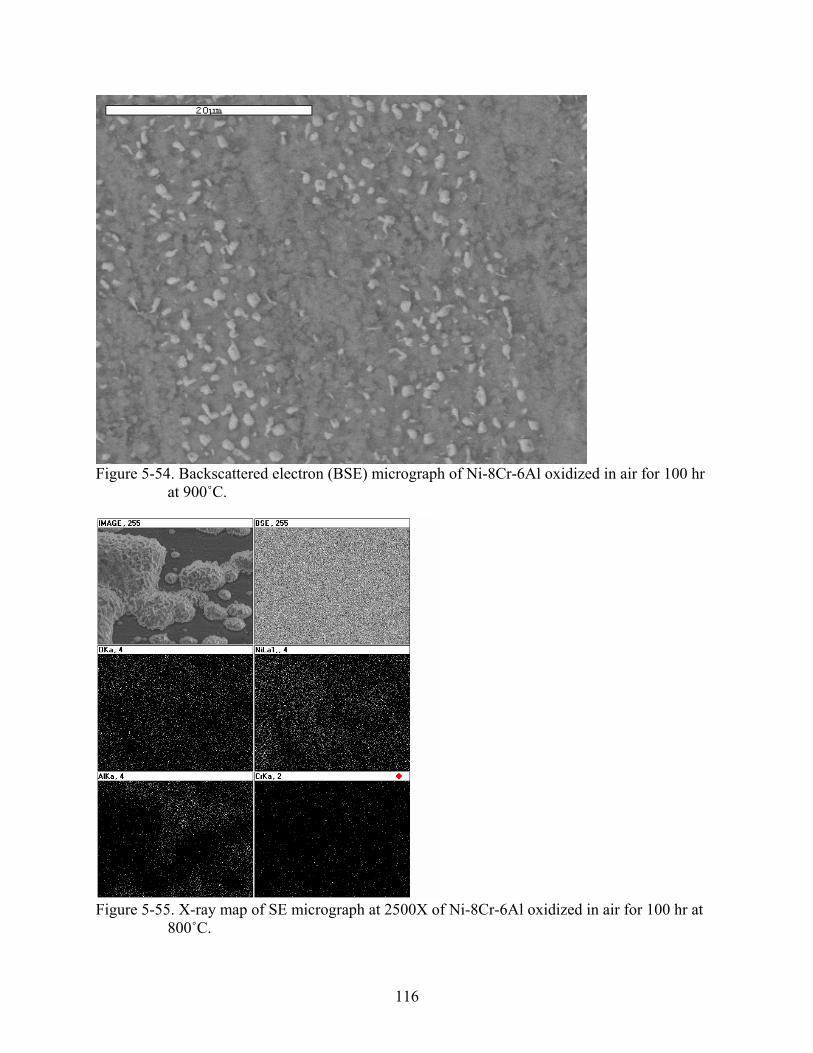
Figure 5-54. Backscattered electron (BSE) micrograph of Ni-8Cr-6Al oxidized in air for 100 hr
at 900˚C.
Figure 5-55. X-ray map of SE micrograph at 2500X of Ni-8Cr-6Al oxidized in air for 100 hr at
800˚C.
116

Figure 5-56. SE micrograph of surface of Ni-8Cr-6Al after oxidation in air for 100hr at 1000˚C
at 10000X
Figure 5-57. BSE micrograph of surface of Ni-8Cr-6Al after oxidation in air for 100hr at
1000˚C at 5000X.
117
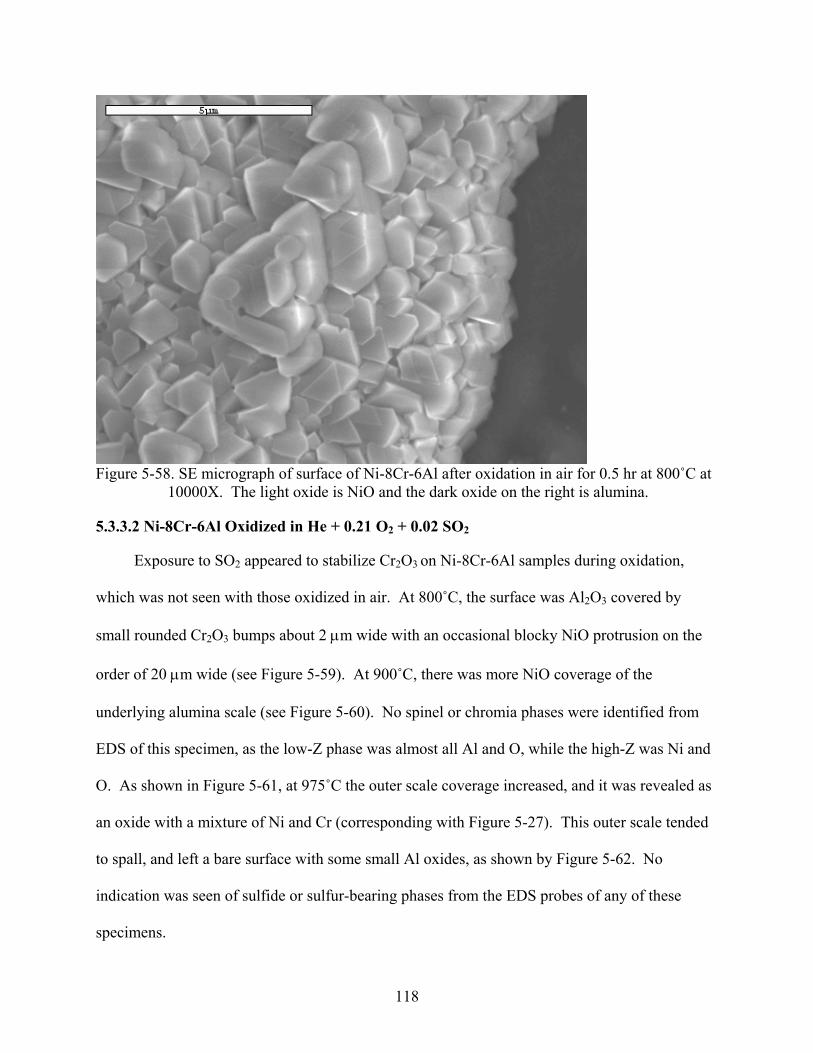
Figure 5-58. SE micrograph of surface of Ni-8Cr-6Al after oxidation in air for 0.5 hr at 800˚C at
10000X. The light oxide is NiO and the dark oxide on the right is alumina.
5.3.3.2 Ni-8Cr-6Al Oxidized in He + 0.21 O2 + 0.02 SO2
Exposure to SO2 appeared to stabilize Cr2O3 on Ni-8Cr-6Al samples during oxidation,
which was not seen with those oxidized in air. At 800˚C, the surface was Al2O3 covered by
small rounded Cr2O3 bumps about 2 µm wide with an occasional blocky NiO protrusion on the
order of 20 µm wide (see Figure 5-59). At 900˚C, there was more NiO coverage of the
underlying alumina scale (see Figure 5-60). No spinel or chromia phases were identified from
EDS of this specimen, as the low-Z phase was almost all Al and O, while the high-Z was Ni and
O. As shown in Figure 5-61, at 975˚C the outer scale coverage increased, and it was revealed as
an oxide with a mixture of Ni and Cr (corresponding with Figure 5-27). This outer scale tended
to spall, and left a bare surface with some small Al oxides, as shown by Figure 5-62. No
indication was seen of sulfide or sulfur-bearing phases from the EDS probes of any of these
specimens.
118
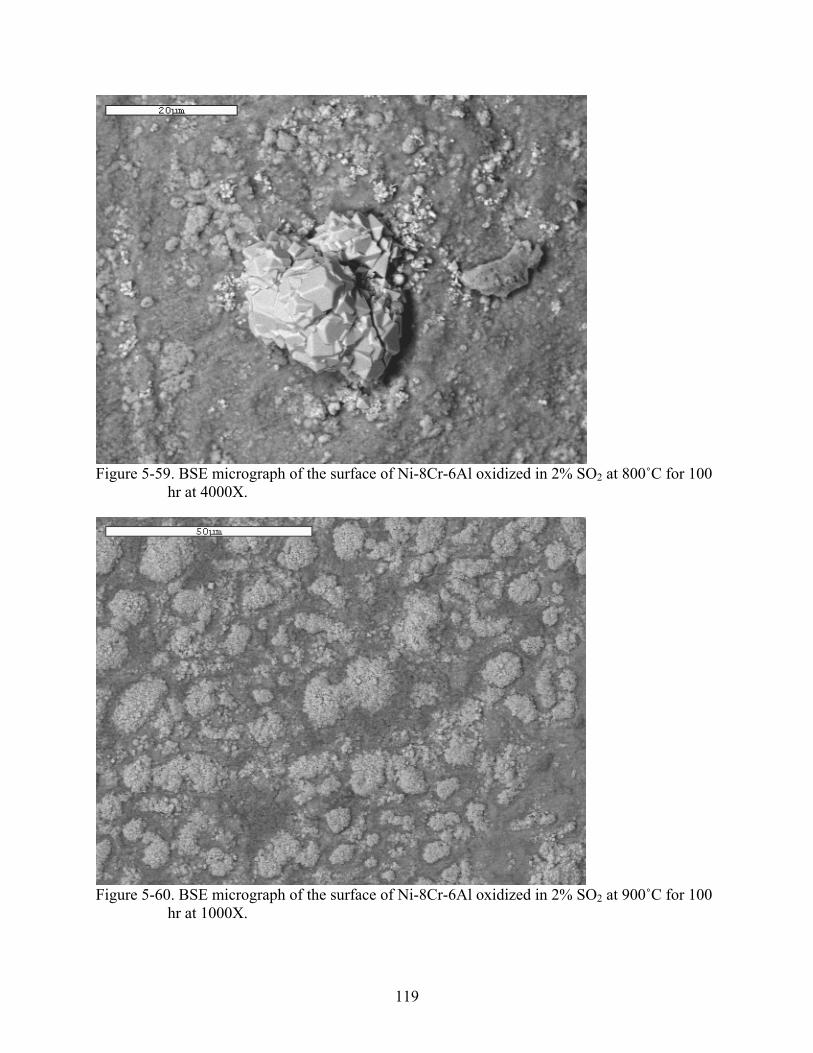
Figure 5-59. BSE micrograph of the surface of Ni-8Cr-6Al oxidized in 2% SO2 at 800˚C for 100
hr at 4000X.
Figure 5-60. BSE micrograph of the surface of Ni-8Cr-6Al oxidized in 2% SO2 at 900˚C for 100
hr at 1000X.
119
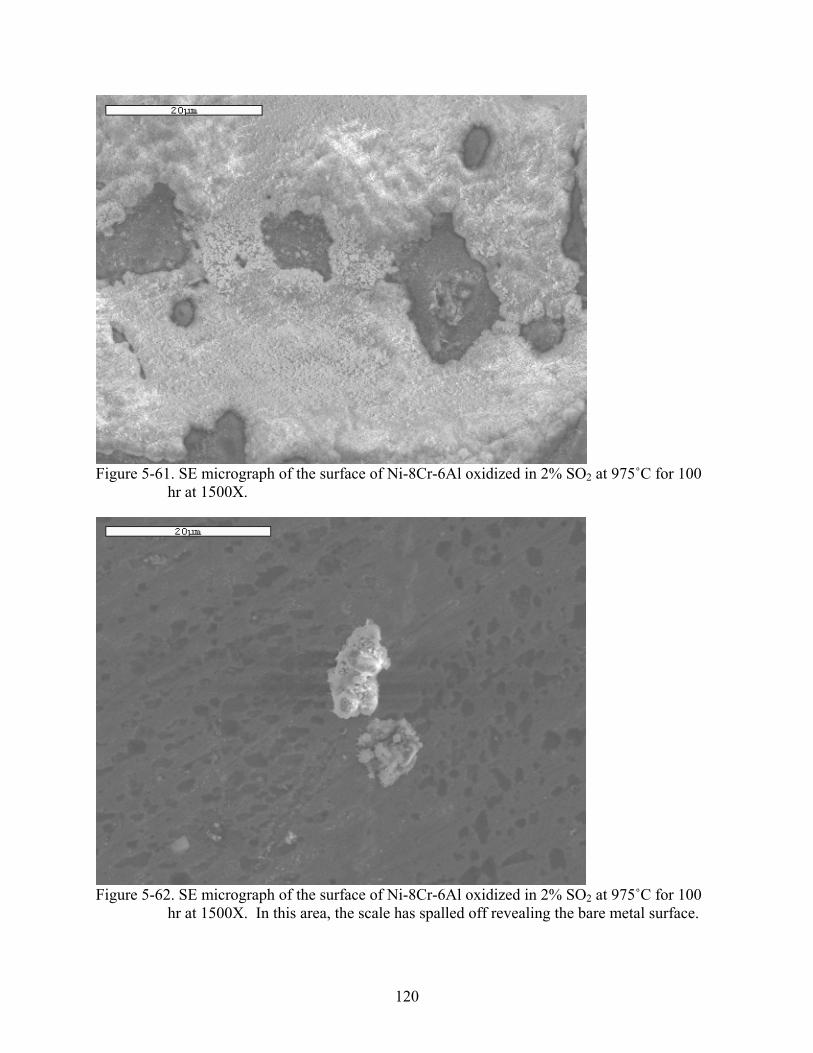
Figure 5-61. SE micrograph of the surface of Ni-8Cr-6Al oxidized in 2% SO2 at 975˚C for 100
hr at 1500X.
Figure 5-62. SE micrograph of the surface of Ni-8Cr-6Al oxidized in 2% SO2 at 975˚C for 100
hr at 1500X. In this area, the scale has spalled off revealing the bare metal surface.
120
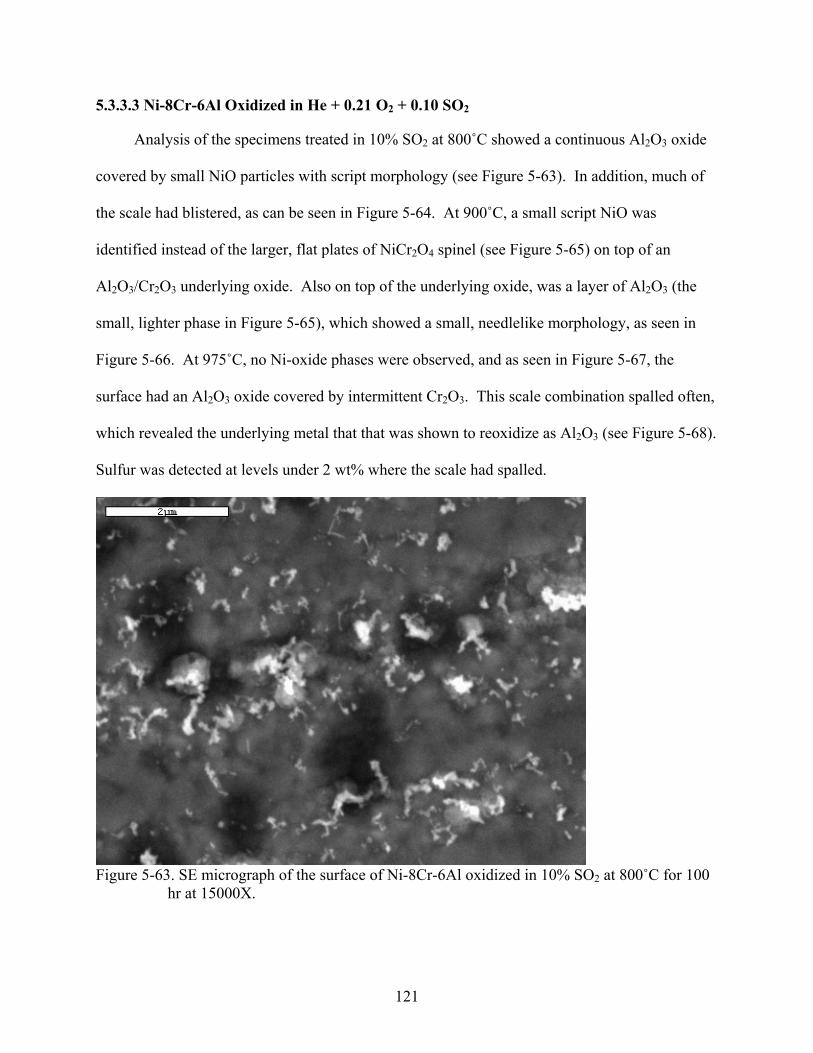
5.3.3.3 Ni-8Cr-6Al Oxidized in He + 0.21 O2 + 0.10 SO2
Analysis of the specimens treated in 10% SO2 at 800˚C showed a continuous Al2O3 oxide
covered by small NiO particles with script morphology (see Figure 5-63). In addition, much of
the scale had blistered, as can be seen in Figure 5-64. At 900˚C, a small script NiO was
identified instead of the larger, flat plates of NiCr2O4 spinel (see Figure 5-65) on top of an
Al2O3/Cr2O3 underlying oxide. Also on top of the underlying oxide, was a layer of Al2O3 (the
small, lighter phase in Figure 5-65), which showed a small, needlelike morphology, as seen in
Figure 5-66. At 975˚C, no Ni-oxide phases were observed, and as seen in Figure 5-67, the
surface had an Al2O3 oxide covered by intermittent Cr2O3. This scale combination spalled often,
which revealed the underlying metal that that was shown to reoxidize as Al2O3 (see Figure 5-68).
Sulfur was detected at levels under 2 wt% where the scale had spalled.
Figure 5-63. SE micrograph of the surface of Ni-8Cr-6Al oxidized in 10% SO2 at 800˚C for 100
hr at 15000X.
121
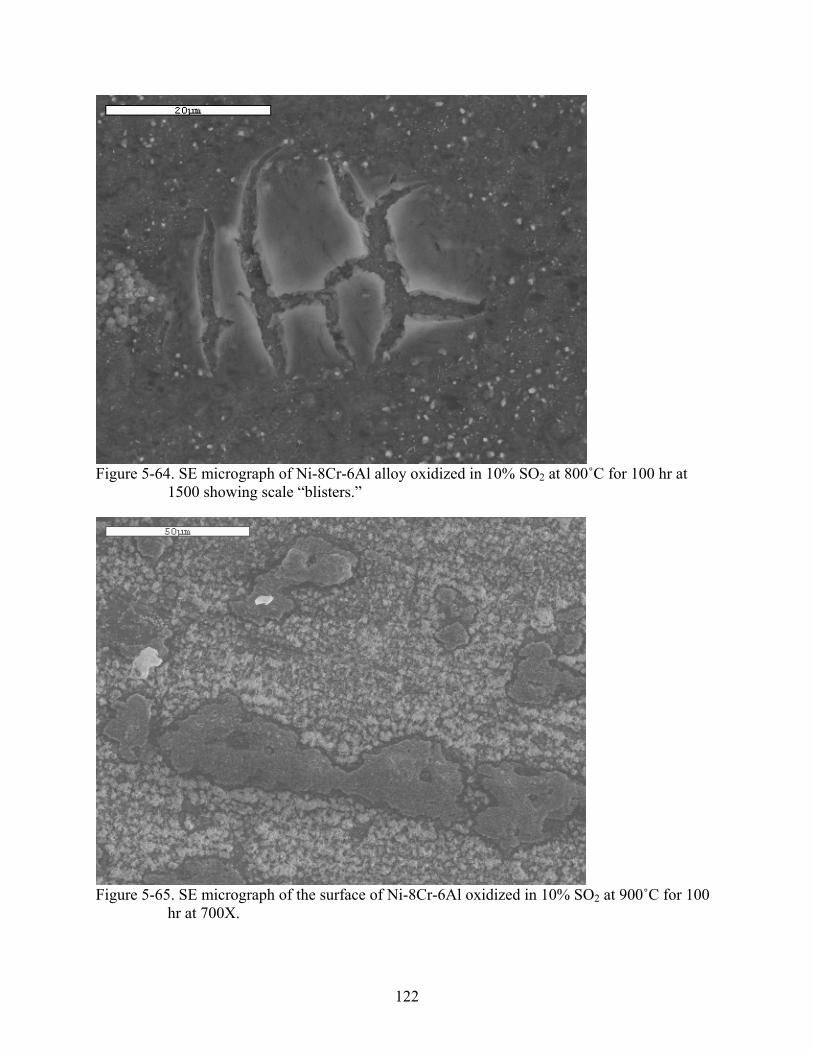
Figure 5-64. SE micrograph of Ni-8Cr-6Al alloy oxidized in 10% SO2 at 800˚C for 100 hr at
1500 showing scale “blisters.”
Figure 5-65. SE micrograph of the surface of Ni-8Cr-6Al oxidized in 10% SO2 at 900˚C for 100
hr at 700X.
122
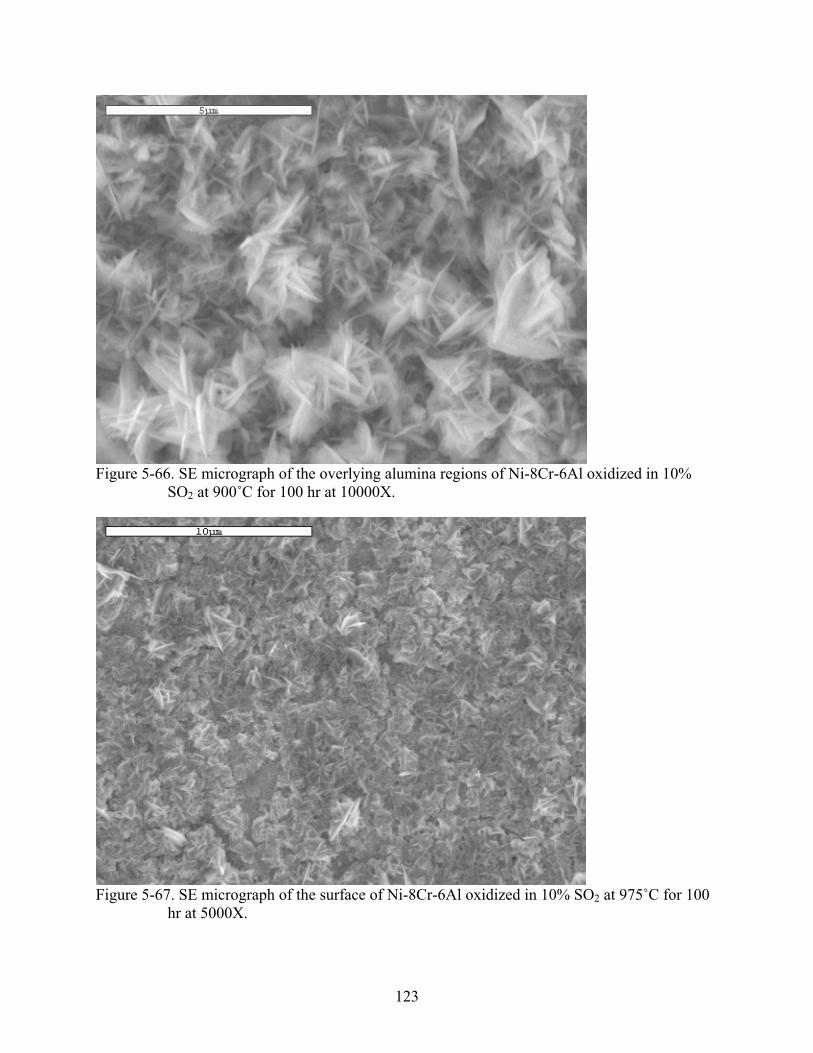
Figure 5-66. SE micrograph of the overlying alumina regions of Ni-8Cr-6Al oxidized in 10%
SO2 at 900˚C for 100 hr at 10000X.
Figure 5-67. SE micrograph of the surface of Ni-8Cr-6Al oxidized in 10% SO2 at 975˚C for 100
hr at 5000X.
123
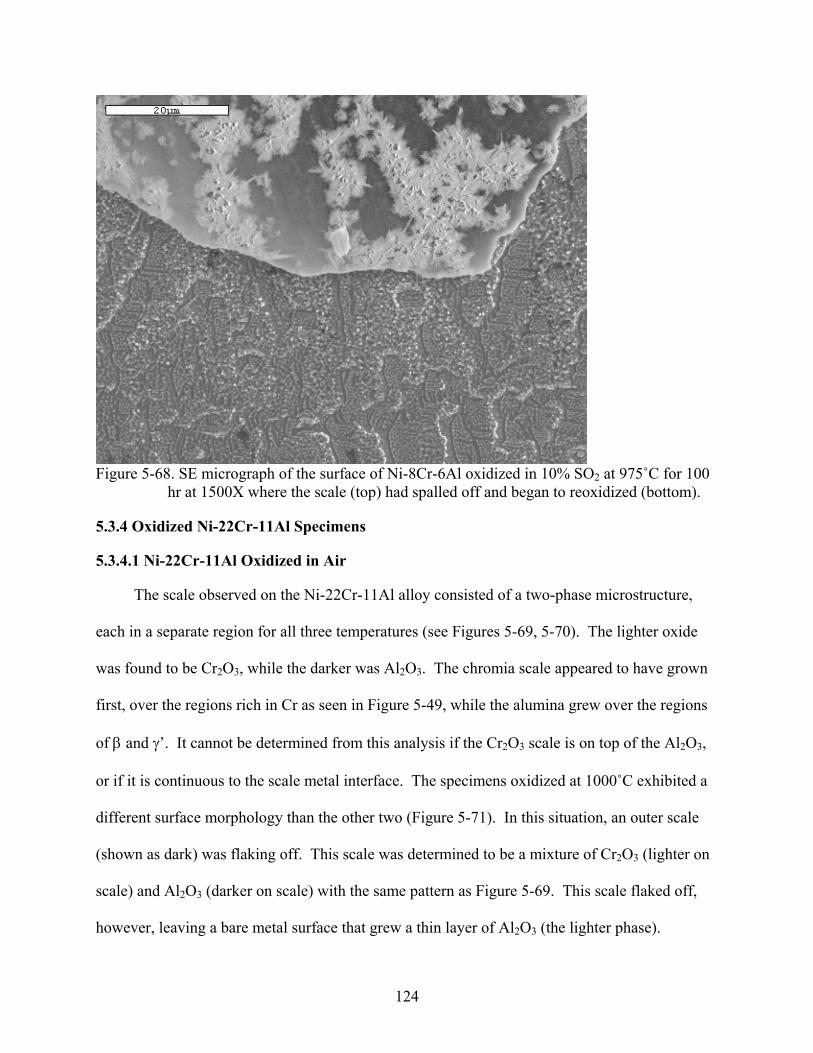
Figure 5-68. SE micrograph of the surface of Ni-8Cr-6Al oxidized in 10% SO2 at 975˚C for 100
hr at 1500X where the scale (top) had spalled off and began to reoxidized (bottom).
5.3.4 Oxidized Ni-22Cr-11Al Specimens
5.3.4.1 Ni-22Cr-11Al Oxidized in Air
The scale observed on the Ni-22Cr-11Al alloy consisted of a two-phase microstructure,
each in a separate region for all three temperatures (see Figures 5-69, 5-70). The lighter oxide
was found to be Cr2O3, while the darker was Al2O3. The chromia scale appeared to have grown
first, over the regions rich in Cr as seen in Figure 5-49, while the alumina grew over the regions
of β and γ’. It cannot be determined from this analysis if the Cr2O3 scale is on top of the Al2O3,
or if it is continuous to the scale metal interface. The specimens oxidized at 1000˚C exhibited a
different surface morphology than the other two (Figure 5-71). In this situation, an outer scale
(shown as dark) was flaking off. This scale was determined to be a mixture of Cr2O3 (lighter on
scale) and Al2O3 (darker on scale) with the same pattern as Figure 5-69. This scale flaked off,
however, leaving a bare metal surface that grew a thin layer of Al2O3 (the lighter phase).
124

Figure 5-69. SE micrograph of Ni-22Cr-11Al oxidized in air at 800˚C for 100 hr at 1000X.
Figure 5-70. SE micrograph of Ni-22Cr-11Al oxidized in air at 800˚C for 100 hr at 5000X.
125
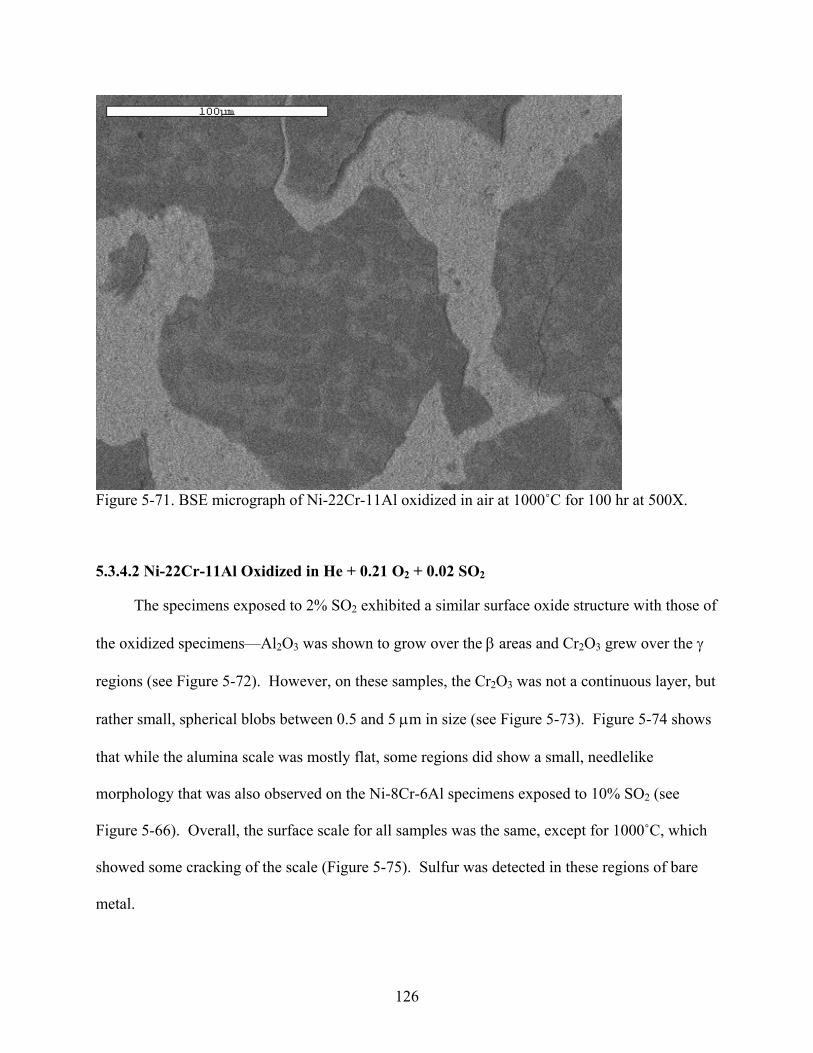
Figure 5-71. BSE micrograph of Ni-22Cr-11Al oxidized in air at 1000˚C for 100 hr at 500X.
5.3.4.2 Ni-22Cr-11Al Oxidized in He + 0.21 O2 + 0.02 SO2
The specimens exposed to 2% SO2 exhibited a similar surface oxide structure with those of
the oxidized specimens—Al2O3 was shown to grow over the β areas and Cr2O3 grew over the γ
regions (see Figure 5-72). However, on these samples, the Cr2O3 was not a continuous layer, but
rather small, spherical blobs between 0.5 and 5 µm in size (see Figure 5-73). Figure 5-74 shows
that while the alumina scale was mostly flat, some regions did show a small, needlelike
morphology that was also observed on the Ni-8Cr-6Al specimens exposed to 10% SO2 (see
Figure 5-66). Overall, the surface scale for all samples was the same, except for 1000˚C, which
showed some cracking of the scale (Figure 5-75). Sulfur was detected in these regions of bare
metal.
126
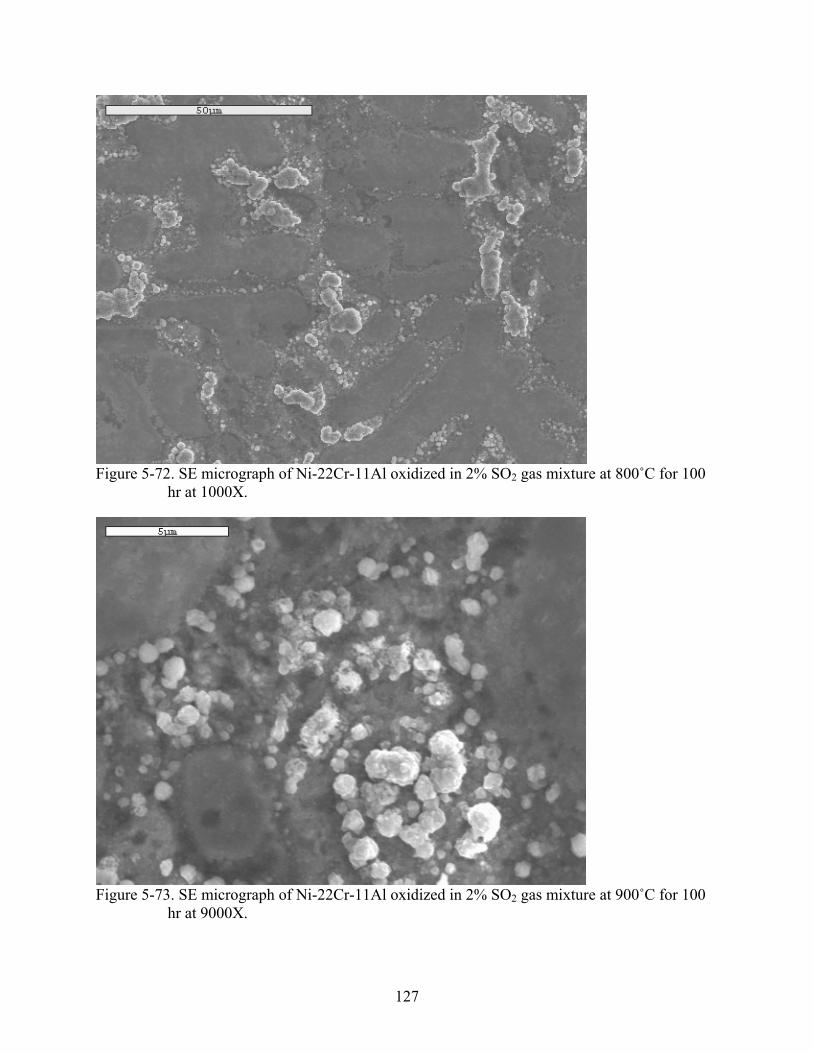
Figure 5-72. SE micrograph of Ni-22Cr-11Al oxidized in 2% SO2 gas mixture at 800˚C for 100
hr at 1000X.
Figure 5-73. SE micrograph of Ni-22Cr-11Al oxidized in 2% SO2 gas mixture at 900˚C for 100
hr at 9000X.
127

Figure 5-74. SE micrograph of Ni-22Cr-11Al oxidized in 2% SO2 gas mixture at 900˚C for 100
hr at 10000X.
Figure 5-75. SE micrograph of Ni-22Cr-11Al oxidized in 2% SO2 gas mixture at 1000˚C for 100
hr at 1900X.
128

5.3.4.3 Ni-8Cr-6Al Oxidized in He + 0.21 O2 + 0.10 SO2
The specimens oxidized in 10% SO2 had a similar morphology with that of those in 2%
(see Figure 5-76). The amount and size of the Cr2O3 particles was reduced when compared to
the 2% samples, and some of the Cr2O3 spheres had Cr2O3 whiskers, as shown in Figure 5-77.
The alumina either had a smoother blocky morphology (Figure 5-76) or would appear as
needlelike whiskers (Figure 5-78). All three specimens showed areas of spallation (Figure 5-79),
where the metal was exposed. Sulfur-based phases were detected by EDS analyses of these
regions and, as detected by XRD (Table 5-2), were found to be Ni-sulfides at 800 and 900˚C, and
Cr-sulfides at 1000˚C.
Figure 5-76. SE micrograph of Ni-22Cr-11Al oxidized in 10% SO2 gas mixture at 800˚C for 100
hr at 100X.
129

Figure 5-77. SE micrograph of Ni-22Cr-11Al oxidized in 10% SO2 gas mixture at 800˚C for 100
hr at 5000X.
Figure 5-78. SE micrograph of Ni-22Cr-11Al oxidized in 10% SO2 gas mixture at 1000˚C for
100 hr at 10000X.
130
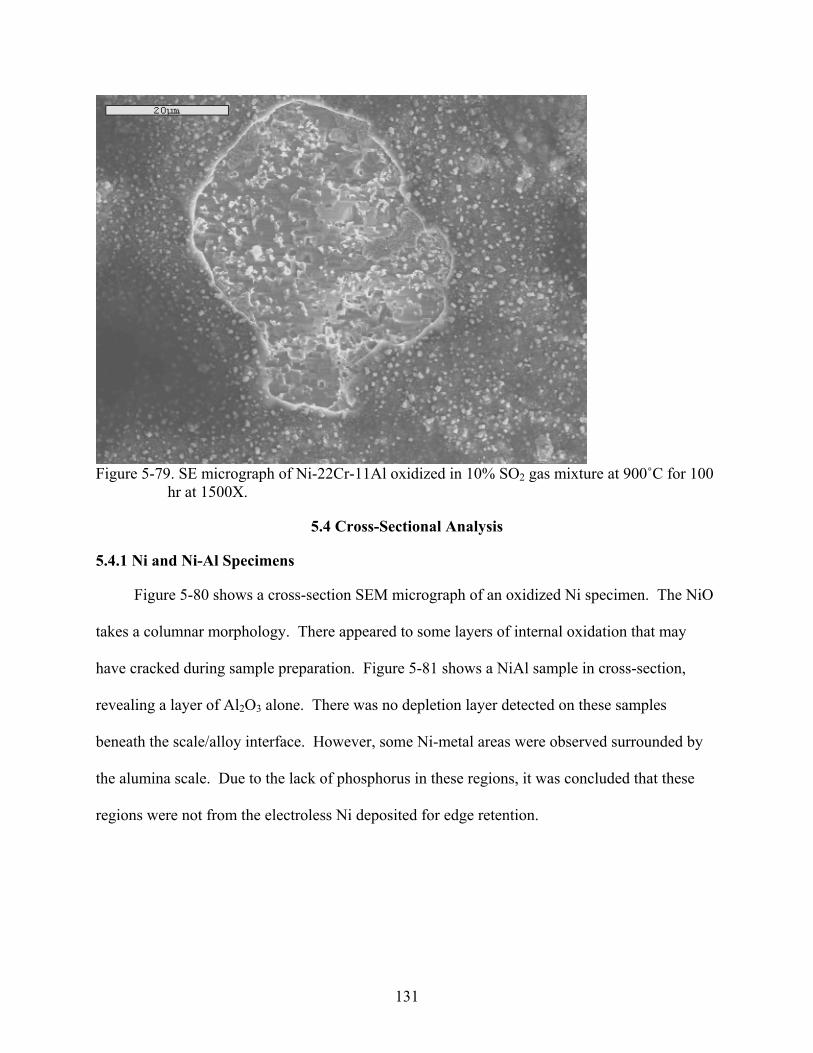
Figure 5-79. SE micrograph of Ni-22Cr-11Al oxidized in 10% SO2 gas mixture at 900˚C for 100
hr at 1500X.
5.4 Cross-Sectional Analysis
5.4.1 Ni and Ni-Al Specimens
Figure 5-80 shows a cross-section SEM micrograph of an oxidized Ni specimen. The NiO
takes a columnar morphology. There appeared to some layers of internal oxidation that may
have cracked during sample preparation. Figure 5-81 shows a NiAl sample in cross-section,
revealing a layer of Al2O3 alone. There was no depletion layer detected on these samples
beneath the scale/alloy interface. However, some Ni-metal areas were observed surrounded by
the alumina scale. Due to the lack of phosphorus in these regions, it was concluded that these
regions were not from the electroless Ni deposited for edge retention.
131

Figure 5-80. BSE micrograph of a Ni specimen oxidized at 800˚C for 24 hr at 1900X. The top
layer is the electroless Ni layer deposited for edge retention.
Figure 5-81. BSE micrograph of a NiAl specimen oxidized at 1000˚C for 36 hr at 2000X. The
top layer is the electroless Ni layer deposited for edge retention.
132
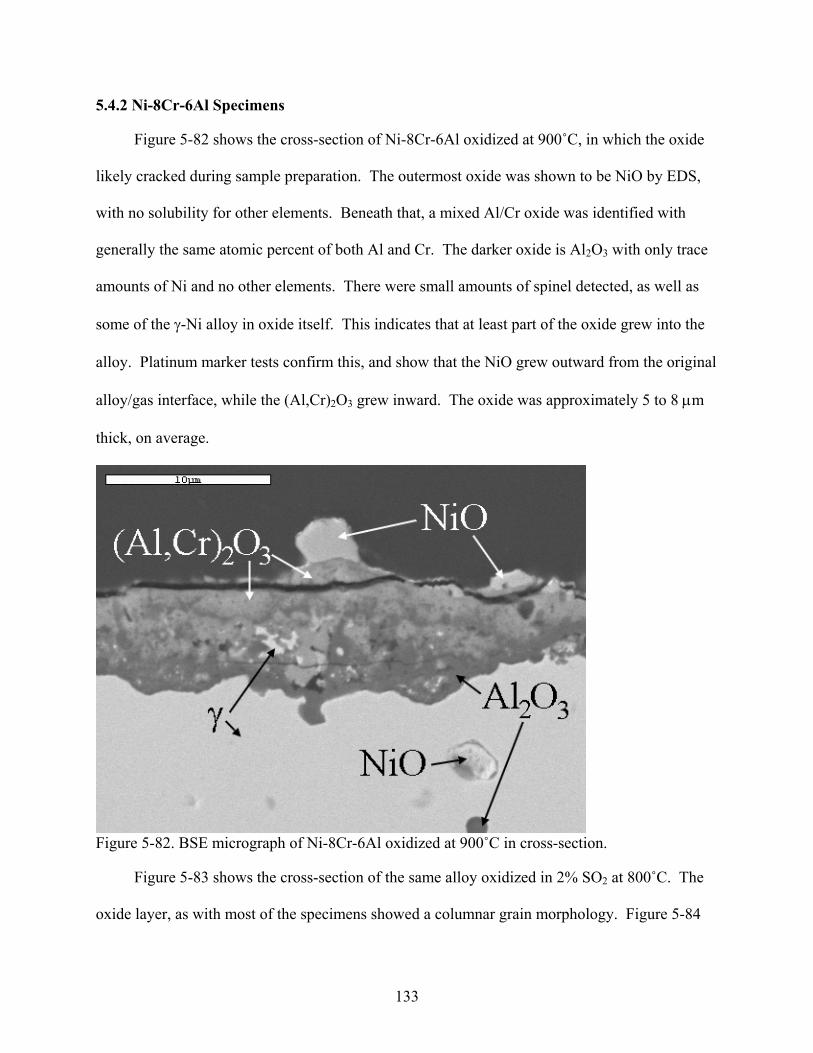
5.4.2 Ni-8Cr-6Al Specimens
Figure 5-82 shows the cross-section of Ni-8Cr-6Al oxidized at 900˚C, in which the oxide
likely cracked during sample preparation. The outermost oxide was shown to be NiO by EDS,
with no solubility for other elements. Beneath that, a mixed Al/Cr oxide was identified with
generally the same atomic percent of both Al and Cr. The darker oxide is Al2O3 with only trace
amounts of Ni and no other elements. There were small amounts of spinel detected, as well as
some of the γ-Ni alloy in oxide itself. This indicates that at least part of the oxide grew into the
alloy. Platinum marker tests confirm this, and show that the NiO grew outward from the original
alloy/gas interface, while the (Al,Cr)2O3 grew inward. The oxide was approximately 5 to 8 µm
thick, on average.
Figure 5-82. BSE micrograph of Ni-8Cr-6Al oxidized at 900˚C in cross-section.
Figure 5-83 shows the cross-section of the same alloy oxidized in 2% SO2 at 800˚C. The
oxide layer, as with most of the specimens showed a columnar grain morphology. Figure 5-84
133

shows a 900˚C sample and, in contrast with Figure 5-82, there seemed to be no detectable NiO
(even though it was seen in XRD), but a nominal amount of Cr2O3 was detected. The top oxide
was again (Al,Cr)2O3, with nearly equal amounts of Cr and Al (by mole). Below this layer was a
mix of Cr2O3 and Al2O3 each closer to stoichiometry with solubility for the other elements less
than 8 at%. Some Ni(Cr,Al)2O4 spinel phase was observed, particularly at the alloy/scale
interface, which had between 1 and 2 at% sulfur. Internally (below the oxide/alloy interface)
some Cr sulfides were detected. From the semi-quantitative EDS analyses, their composition
was observed as closest to the CrS stoichiometry, as compared to other CrxSy sulfides. At a grain
boundary, deep penetration of oxide was observed (Figure 5-85). In addition, there were sulfides
observed along the grain boundary, which continued into the alloy (see Figure 5-86). These
sulfides were also seen at 800˚C, which appeared as a mix of Ni and Cr sulfides (se Figure 5-87).
Pores were also observed in the oxide and at the oxide/alloy interface. While these could be
artifacts, they are likely actual pores due to the observation of good scale adhesion on this
specimen.
Figure 5-83. SE micrograph of Ni-8Cr-6Al oxidized in 2% SO2 gas mixture at 800˚C for 100hr
in cross-section at 10000X.
134

Figure 5-84. BSE micrograph of Ni-8Cr-6Al oxidized in 2% SO2 gas mixture at 900˚C for 100hr
in cross-section at 3500X.
Figure 5-85. BSE micrograph of Ni-8Cr-6Al oxidized in 2% SO2 gas mixture at 900˚C for 100hr
in cross-section at 3500X, showing an oxide deeply penetrating along a grain boundary.
135

Figure 5-86. BSE micrograph of Ni-8Cr-6Al oxidized in 2% SO2 gas mixture at 900˚C for 100hr
in cross-section at 5000X, showing sulfides along a grain boundary.
Figure 5-87. SE micrograph of Ni-8Cr-6Al oxidized in 2% SO2 gas mixture at 800˚C for 100hr
in cross-section, showing sulfides along grain boundaries and pores in the oxide layer.
136

As shown in Figure 5-84, several depletion layers existed in the alloy below the scale/alloy
interface. The first layer, approximately 1-2 µm, showed a Ni phase with small (less than 4
wt%) amounts of each alloying element, and 6 wt% O, likely from irresolvable internal oxides.
The second layer, which was 5 µm thick, was an Al-depletion layer with less than 1 wt% S and 3
wt% O. Lastly, the third layer (5-8 µm thick) was also depleted of Al, but had no S or O. Below
that (~12-15 µm under the interface) was the nominal alloy composition with the γ + γ’
microstructure.
5.4.3 Ni-22Cr-11Al Specimens
The Ni-22Cr-11Al oxidized samples showed thinner oxide layers than Ni-8Cr-6Al
(between 1-3 µm versus 5-8 µm for the Ni-8Cr-6Al) (see Figure 5-88). The oxide, though
showed a similar pattern in that there was an outer layer of (Al,Cr)2O3 and an inner layer of
Al2O3. At 2% SO2, no sulfides were detected at the oxide/alloy interface, or anywhere else (see
Figure 5-89). Low-Z phases were present beneath the interface, which consisted of mostly Al
with approximately 11 at% Ni. This would indicate a NiAl3 + (Al) phase, which would be liquid
at these oxidizing temperatures. In addition, NiAl2O4 was often seen near these phases. The
most striking difference in the change in microstructure from the unoxidized specimens. If
compared to Figure 5-48, there are large areas of β-NiAl and small 2-4 µm precipitates of α-Cr
(see Figure 5-90) surrounded now by a matrix of γ’. However, closest to the surface, β was less
likely to be found and there were usually only γ’ and α present. As shown with the surface SEM
images, more Cr2O3 was present above the scale/alloy interface at the lower testing temperatures.
One of these samples is shown in Figure 5-89. Beneath this oxide is the (Cr,Al)2O3 which has
been seen before, as well as NiAl2O4 spinel. In all the oxides characterized that were exposed to
2% SO2, no sulfur or sulfide phases were found.
137

Figure 5-88. BSE micrograph of Ni-22Cr-11Al oxidized in 2% SO2 gas mixture at 975˚C for
100hr in cross-section at 8000X. The top layer is a Ni-coating added for edge retention.
Figure 5-89. BSE micrograph of Ni-22Cr-11Al oxidized in 2% SO2 gas mixture at 800˚C for
100hr in cross-section at 800X.
138
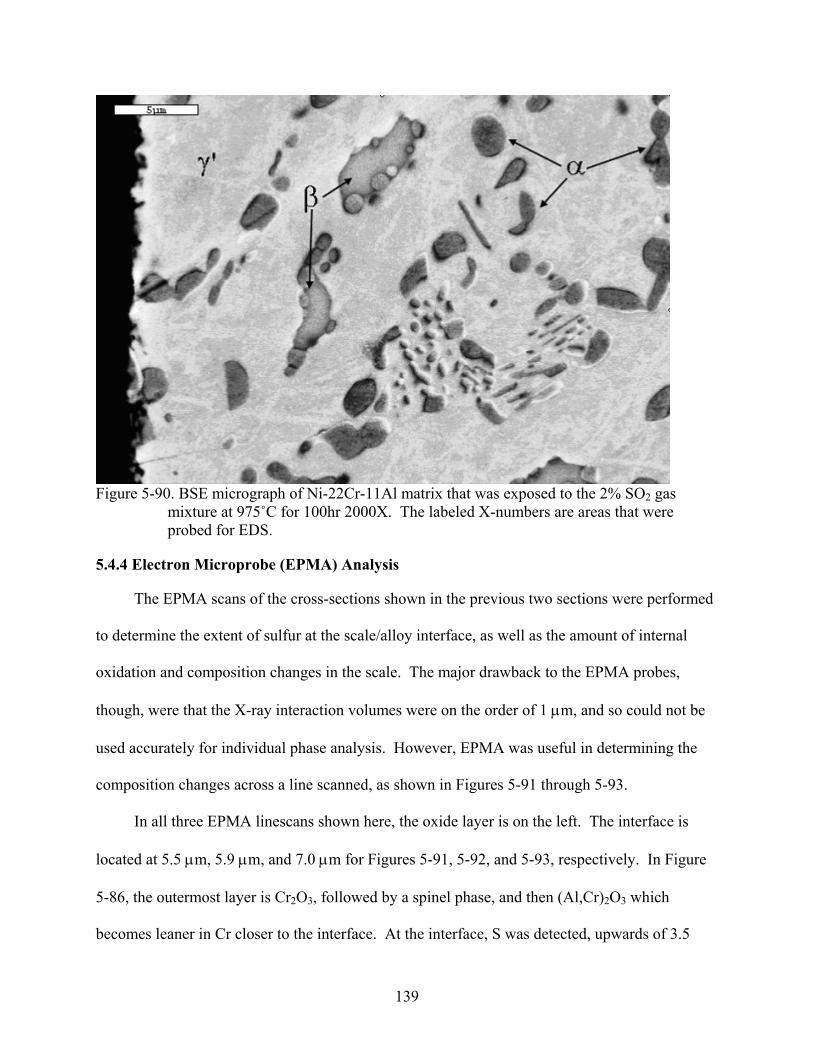
Figure 5-90. BSE micrograph of Ni-22Cr-11Al matrix that was exposed to the 2% SO2 gas
mixture at 975˚C for 100hr 2000X. The labeled X-numbers are areas that were probed for EDS.
5.4.4 Electron Microprobe (EPMA) Analysis
The EPMA scans of the cross-sections shown in the previous two sections were performed
to determine the extent of sulfur at the scale/alloy interface, as well as the amount of internal
oxidation and composition changes in the scale. The major drawback to the EPMA probes,
though, were that the X-ray interaction volumes were on the order of 1 µm, and so could not be
used accurately for individual phase analysis. However, EPMA was useful in determining the
composition changes across a line scanned, as shown in Figures 5-91 through 5-93.
In all three EPMA linescans shown here, the oxide layer is on the left. The interface is
located at 5.5 µm, 5.9 µm, and 7.0 µm for Figures 5-91, 5-92, and 5-93, respectively. In Figure
5-86, the outermost layer is Cr2O3, followed by a spinel phase, and then (Al,Cr)2O3 which
becomes leaner in Cr closer to the interface. At the interface, S was detected, upwards of 3.5
139

wt%. S continued to be found in the alloy, which was depleted in Al up to around 18 µm. With
Figure 5-92, the oxide was overall uniformly (Cr,Al)2O3, except towards the surface which may
have been spinel. An α-Cr precipitate in the matrix near the interface was included in this
linescan. This could account for the higher Cr in the oxide since the α was so close to the
interface. The last scan shown here (Figure 5-93) reveals a mostly Al oxide, with one NiCr2O4
spinel phase in the scan. In both Ni-22Cr-11Al alloy scans show here, the maximum S detected
at the interface was 0.3 wt%.
Figure 5-91. EPMA linescan across scale and interface in an Ni-8Cr-6Al alloy oxidized at 900˚C
in He + 0.21 O2 + 0.02 SO2 gas mixture.
140
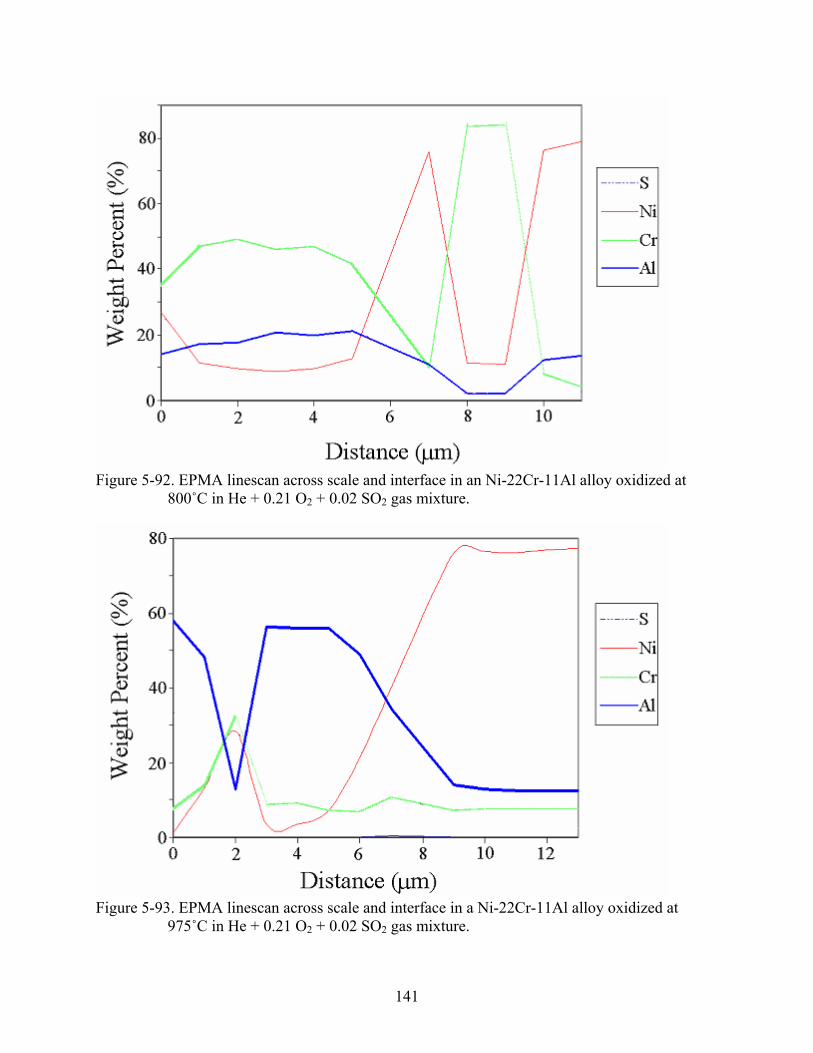
Figure 5-92. EPMA linescan across scale and interface in an Ni-22Cr-11Al alloy oxidized at
800˚C in He + 0.21 O2 + 0.02 SO2 gas mixture.
Figure 5-93. EPMA linescan across scale and interface in a Ni-22Cr-11Al alloy oxidized at
975˚C in He + 0.21 O2 + 0.02 SO2 gas mixture.
141

CHAPTER 6 DISCUSSION AND ANALYSIS
6.1 Mechanisms of Scale Formation
From the kinetic plot of Figure 5-20, the addition of alloying elements lessens the scale
growth in all the oxidizing environments examined. From the XRD and SEM analysis, the
following occurred during oxidation:
• Ni oxidized to form NiO • Ni-8Cr-6Al oxidized to form NiO, NiAl2O4, Al2O3, and some (Al,Cr)2O3 • Ni-8Cr-6Al oxidized with SO2 to form the same oxides in addition to stabilizing
chromia as well as Ni and Cr sulfides • Ni-22Cr-11Al oxidized to form “pure” Al2O3 and Cr2O3, as well as an inner layer
of (Al,Cr)2O3. Some spinel was also observed. • Ni-22Cr-11Al oxidized with SO2 produced the same oxides and sulfide were
detected by XRD but not found from EDS/EPMA analyses. With the Ni-8Cr-6Al alloys, NiO, spinel, and Al2O3 were observed in SEM. Layers of
NiO were observed on top of the Al2O3 scale that lay underneath. This alumina layer with NiO
clusters on top was uniform on all specimens tested. The heat-treated samples showed a uniform
γ + γ’ microstructure and this oxidation pattern appears valid, at least on the magnifications
afforded via SEM. In addition, it is apparent that the reaction of Ni and O2 occurs first, and the
NiO scale begins to grow by outward cation diffusion of NiO [42-44]. This oxide took triangular
plate-like morphology which grew laterally rather than transversely. This structure became
layered as new nucleates would form on the transverse surfaces and, matching the substrate
coherency, would also grow laterally although no texture was found in the oxides from EBSD.
In addition, Al2O3 would also nucleate on the surface along side the formation of NiO.
Spinel was also formed via Equation 2-12, or from Al substituting on the Ni lattice or vice-versa.
Previous studies have show that a spinel phase will often form in Ni-Al alloys [76, 78] and from
interactions of the NiO and alumina, especially in the initial oxidation [79]. The surface alumina
142

often appeared, on this alloy and others, as needles or thin plates in random orientations,
especially at high temperatures. Previous research has shown that transient aluminas, such as δ
or θ, which are tetragonal and monoclinic respectively, often evolve initially on Al, Ni-Al, and
Ni-Cr-Al specimens and grow by outward cation transport [58-59]. However, XRD scans of Ni-
8Cr-6Al oxidized at 0.5, 16, and 100 hrs show only the α corundum phase, which was been
shown to grow by inward anion transport [55, 60-61, 89]. Previous publications demonstrated
that the transient aluminas will often transform to α after the formation of a continuous α-Al2O3
scale [55, 89, 97-98], due to lattice mismatch strains at the differing alumina interfaces [55-56].
This would explain why, if they existed, that the transient alumina phases were not detected.
Cr2O3 or Cr-containing oxides and spinels were not detected on the surface of oxidized
Ni-8Cr-6Al specimens. Previous studies of compositions similar to this one by Giggins, Pettit,
and other show the formation of NiO and NiCr2O4 at the surface at high oxygen partial pressures
(0.2-1 bar) [90, 93, 127]. If not, Cr2O3 stabilized [93, 127]. Cross-sections, however, revealed a
(Cr,Al)2O3 layer present underneath, which has been previously observed [86, 97-98]. This
would agree with generally accepted mechanism that the formation of NiO (and Al2O3) on the
surface caused the transport of O2- anions and metal cations, not the surface metal/chemisorbed
oxygen reaction, to be rate limiting, causing a decrease in oxygen activity [48-40]. This allowed
for the stabilization of Cr2O3 and Al2O3, which coalesced into a continuous scale and grew in a
steady-state manner, which would be described by the parabolic, steady state growth recorded by
the TGA. Since the anion diffusion through alumina scales is slow, it would be rate-limiting [49,
88], and short-circuit processes would dominate at sufficient scale thicknesses [41]. Previous
studies, though, commented that this alloy composition might not develop a continuous alumina
scale below 1000˚C [76, 90, 127], but here was able to form a stable, adherent Al2O3 scale for
143

100 hrs of isothermal oxidation. There was, however, spallation observed in scales at higher
temperatures and in SO2 gas mixtures. However, TG tests could not confirm an Arrhenius
dependence to oxidation in air for either Ni-Cr-Al alloys. Either this is due to
measurement/preparation error, steady-state scale growth not being achieved, or
complex/competing mechanisms that vary with temperature.
The Ni-22Cr-11Al specimens oxidized and showed only Al2O3 and Cr2O3 on the surface
during oxidation. As shown by Figure 5-64, chromia would develop over the Cr-rich γ regions,
while Al2O3 would develop over the Al-rich β + γ’ regions, as had been previously observed in γ’
+ β alloys [96-97]. Comparing Figure 5-48 and 5-49 to the microstructure of the center of the
oxidized samples, it can be assumed that the heat-treatment meant to homogenize the Ni-22Cr-
11Al arc-melted buttons did not achieve its goal. Unlike the Ni-8Cr-6Al composition, which
would solidify as γ-Ni first and then precipitate the γ’, the Ni-22Cr-11Al would solidify as β
dendrites, rejecting Cr due to constitutional supercooling. This would push the interdendritic
liquid composition closer to the e3 reaction (see Figures 2-6 and 2-7) in which the liquid would
solidify as α and γ. If the center microstructure of the Ni-22Cr-11Al oxidized specimen is an
indication of an equilibrium microstructure, then the heat treatment of 4 hr at 1200°C was
neither long enough nor at a high enough temperature to fully equilibriate the microstructure.
The oxidized specimens showed, at distances far away from O-penetration, that the equilibrium
microstructure is a γ’ + γ matrix, with semi-spherical β and α phases dispersed throughout.
Regardless, the Ni-22Cr-11Al specimens that were oxidized showed a faster, outward
growing Cr2O3, and a smoother Al2O3. This oxidation stage was likely shown as initial parabolic
rates of the TG curves for this alloy, which last between two and ten hours, depending on the
temperature. No dependence could be found between temperature and this transition time. At
144
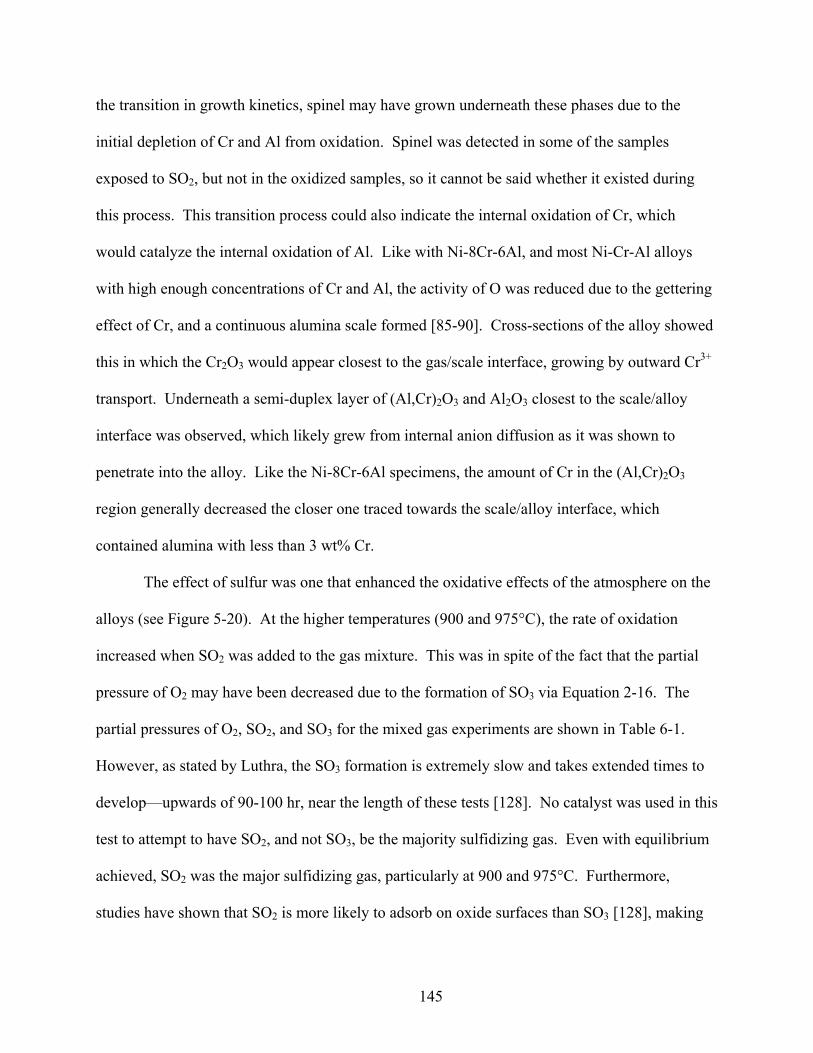
the transition in growth kinetics, spinel may have grown underneath these phases due to the
initial depletion of Cr and Al from oxidation. Spinel was detected in some of the samples
exposed to SO2, but not in the oxidized samples, so it cannot be said whether it existed during
this process. This transition process could also indicate the internal oxidation of Cr, which
would catalyze the internal oxidation of Al. Like with Ni-8Cr-6Al, and most Ni-Cr-Al alloys
with high enough concentrations of Cr and Al, the activity of O was reduced due to the gettering
effect of Cr, and a continuous alumina scale formed [85-90]. Cross-sections of the alloy showed
this in which the Cr2O3 would appear closest to the gas/scale interface, growing by outward Cr3+
transport. Underneath a semi-duplex layer of (Al,Cr)2O3 and Al2O3 closest to the scale/alloy
interface was observed, which likely grew from internal anion diffusion as it was shown to
penetrate into the alloy. Like the Ni-8Cr-6Al specimens, the amount of Cr in the (Al,Cr)2O3
region generally decreased the closer one traced towards the scale/alloy interface, which
contained alumina with less than 3 wt% Cr.
The effect of sulfur was one that enhanced the oxidative effects of the atmosphere on the
alloys (see Figure 5-20). At the higher temperatures (900 and 975°C), the rate of oxidation
increased when SO2 was added to the gas mixture. This was in spite of the fact that the partial
pressure of O2 may have been decreased due to the formation of SO3 via Equation 2-16. The
partial pressures of O2, SO2, and SO3 for the mixed gas experiments are shown in Table 6-1.
However, as stated by Luthra, the SO3 formation is extremely slow and takes extended times to
develop—upwards of 90-100 hr, near the length of these tests [128]. No catalyst was used in this
test to attempt to have SO2, and not SO3, be the majority sulfidizing gas. Even with equilibrium
achieved, SO2 was the major sulfidizing gas, particularly at 900 and 975°C. Furthermore,
studies have shown that SO2 is more likely to adsorb on oxide surfaces than SO3 [128], making
145

its the reaction-controlling sulfidizing agent. SO3, though, was found condensed in the TGA
further down the gas stream past the furnace where the gas reached room temperature. SO3 may
have had an effect beyond just lowering the oxygen partial pressure at 800°C (the growth rate
was less for SO2 exposed samples at this temperature). However, no NiSO4, or any other
sulfates were detected, which are usually signs of an SO3-dependent reaction [127, 130-131,
145].
Table 6-1. Table showing the equilibrium partial pressures of gases that evolve upon various mixtures of O2 and SO2 at various temperatures, calculated from the SPOT3 database.
Mixture (bar) Temperature (°C) PO2 (bar) PSO2 (bar) PSO3 (bar) He + 0.21 O2 + 0.02 SO2 800 0.208 0.015 5.43e-3 He + 0.21 O2 + 0.02 SO2 900 0.209 0.018 2.57e-3 He + 0.21 O2 + 0.02 SO2 975 0.209 0.019 1.50e-3 He + 0.21 O2 + 0.10 SO2 800 0.199 0.074 0.027 He + 0.21 O2 + 0.10 SO2 900 0.205 0.088 0.013 He + 0.21 O2 + 0.10 SO2 975 0.207 0.093 7.49e-3
As stated previously, the effect sulfur plays in the oxidation tests of this study is one of
accelerating the oxidation process. This appears to occur in two ways. First, the SO2 reacts with
the metal to form an oxide and free up sulfur in the form of S2, as per Equation 2-17 [150]. The
second is the faster diffusion of ions through the oxide lattice due to defects created from S
impurities [111]. This has been shown to occur from S2 substituting on the anion lattice, creating
cation vacancies [121, 171]:
221
221 OShOS OO +=++ •• (6-1)
This free oxygen then creates more cation vacancies (in this case a Ni vacancy) which increases
the overall cation diffusion rate:
•+′′+= hVOO NiO 2221 (6-2)
146
Similar reactions also occur in Cr2O3. These vacancies could migrate and be more prevalent at
the grain boundaries, increasing diffusion there.
In addition, with the Ni-8Cr-6Al samples, cross-sectional analysis showed the presence
of Cr and Ni sulfides along the grain boundaries and phase boundaries in the alloy. There was
also a higher concentration of S at the scale/alloy interface than in the matrix or scale. Studies
have shown that sulfur and SO2 are attracted to grain boundaries, pores, and surfaces with higher
surface energies [138, 142, 144-145, 151]. In studies with polycrystalline Cr [140] and
superalloys [124, 151], at these surfaces, when the PS2 is high enough, the SO2 reacts with Cr in
solution to form chromium sulfides beneath the interface (Equation 2-18). The high defect
structure of these sulfides affords rapid transport of S2-, O2-, and cations [119, 148]. Next, with
the increasing PO2 from the anion influx, the sulfide oxidizes via:
2MxSy + yO2 = 2MxOy + yS2 (6-3)
leaving free sulfur to further migrate into the alloy forming more sulfides and repeating this
process. This proposed mechanism can explain Figures 5-85 through 5-87 and was observed in
previous mixed oxidation/sulfidation studies [115, 133, 137, 140].
In all the SO2-exposed samples, Cr2O3 and/or NiCr2O4 were found, and were often more
prevalent than NiO. It appears that the presence of sulfur, at these levels, stabilizes the formation
of Cr2O3. This can be attributed to the fact that the presence of sulfur may cause the more rapid
growth diffusion of Cr, allowing its oxide to stabilize faster [119].
The mechanism for transport of sulfur through the oxide scale seems more likely to be
better described by the transport of sulfur gas molecules. The major criticism to this theory is the
inability of the SO2 molecule to diffuse through a compact scale [117, 122]. However, images of
these scales in cross-section show them to be anything but compact: they display pores, cracks,
147
and scale buckling. It should be noted, though, that some of these observed defects could be
preparation artifacts. SO2 would easily be able to travel through these paths and react by
Equation 2-18 to release S at the scale/alloy interface. While bulk diffusion of S2- may be
occuring, in these experiments, bulk transport processes would be orders of magnitude slower
than grain boundary or free surface diffusion of SO2 [112, 117, 133]. Furthermore, the presence
of S has been shown to increase the amount of voids present in an oxide scale, which would
increase SO2 transport [135, 137].
Sulfides were not observed in the Ni-22Cr-11Al samples, although one specimen did
show a small sulfur concentration at the scale/metal interface. This is likely due to the fact that
the increased concentration of Al and Cr stabilized the protective oxides faster, reducing the rate
of sulfur influx. For the length of these tests, the sulfur activity may never reached high enough
levels to begin sulfide stabilization. In addition, the grain size of the Ni-22Cr-11Al specimens
was smaller than the Ni-8Cr-6Al. Previous research of cast and forged Ni-base superalloys has
shown that a finer grain size reduces sulfidation in oxidizing environments [133]. This is due to
the faster diffusion of Al and Cr outward along more grain boundary surface area, which forms a
protective (Al,Cr)2O3 layer more rapidly.
6.2 Comparison of Experimental Results and Calculations
As shown in Chapter 4, calculations were performed to help predict and explain the
processes occurring during the oxidation and sulfidation of the Ni-Cr-Al alloys used in this
study. The diagrams calculated for the ternary subsystems of the Ni-Cr-Al-O quaternary system
appear to agree well with previous literature, except for one point [6-7, 32]. In previous
calculations by Saltykov, the Ni-Al-O and Ni-Cr-O systems produced showed that in the Ni-lean,
O-rich sections (Al/Cr)2O3 would always be a two-phase mixture with spinel [6]. However, the
results of the calculations (see Figures 4-8, 4-9, and 4-10) in this study show that there is a point
148
of stoichiometric spinel that decomposes via a peritectoid reaction into (Al/Cr)2O3 and NiO at
around 10-14 bar of O2. This decomposition reaction is supported by previous studies [121,
171], which were not contradicted by the experiments of this dissertation.
In calculations involving alloys, temperature increases corresponded to the stabilization
of oxides that were more stable at lower partial pressures of oxygen. As shown from analysis of
the Ni-8Cr-6Al alloy in all environments, NiO was not detected at higher temperatures whereas
spinel and chromia (or Cr-rich aluminas) were. This shows that the stability of these oxides
increased, causing them to form faster, reducing the amount of NiO that could form. While
thermodynamics may play a role, it should be noted that the increase in temperature would have
a kinetic effect, allowing faster cation transport that may have aided in the faster formation of the
non-Ni oxides.
For most of the calculations involving S, the SPOT3 database was accessed since it had
the S descriptions that are unavailable in the SPIN4 database as well as gas phase descriptions
for all the S and O gas species. However, the SPOT3 only simulates mechanical mixtures of
solid “solutions” and not the actual alloys (no mixing parameters). In spite of this, the phases,
activities, and reactions were close in the calculations involving SPIN4 and SPOT3 comparisons
(see Table 4-1 and Figure 4-40). The results appeared nearly identical for regions where the
(Al,Cr)2O3 oxide was predominant (described as two stoichiometric oxides by SPOT3).
Furthermore, the reactions occurring at the scale/alloy interface are stoichiometric themselves
and proceed whether the material is an alloy or mechanical mixture. For example, for the
formation of Al2O3 from a Ni-Al mixture, the software calculates either:
• Alloy: Ni + 4Al(soln) + 3O2 Ni + 2Al2O3 • Mixture: 4Ni3Al + 3O2 12Ni + 2Al2O3
149
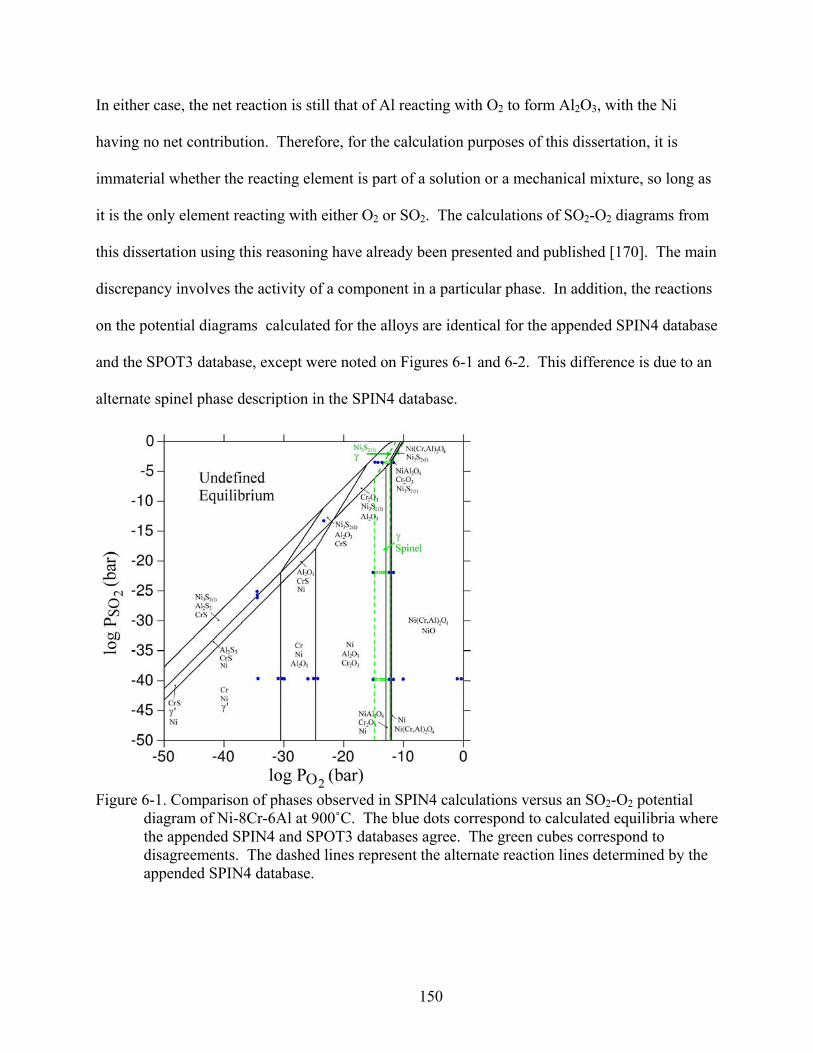
In either case, the net reaction is still that of Al reacting with O2 to form Al2O3, with the Ni
having no net contribution. Therefore, for the calculation purposes of this dissertation, it is
immaterial whether the reacting element is part of a solution or a mechanical mixture, so long as
it is the only element reacting with either O2 or SO2. The calculations of SO2-O2 diagrams from
this dissertation using this reasoning have already been presented and published [170]. The main
discrepancy involves the activity of a component in a particular phase. In addition, the reactions
on the potential diagrams calculated for the alloys are identical for the appended SPIN4 database
and the SPOT3 database, except were noted on Figures 6-1 and 6-2. This difference is due to an
alternate spinel phase description in the SPIN4 database.
Figure 6-1. Comparison of phases observed in SPIN4 calculations versus an SO2-O2 potential
diagram of Ni-8Cr-6Al at 900˚C. The blue dots correspond to calculated equilibria where the appended SPIN4 and SPOT3 databases agree. The green cubes correspond to disagreements. The dashed lines represent the alternate reaction lines determined by the appended SPIN4 database.
150

Figure 6-2. Comparison of phases observed in SPIN4 calculations versus an SO2-O2 potential
diagram of Ni-22Cr-11Al at 975˚C. This diagram uses the same methodology as used in Figure 6-1.
The results of the oxidation experiments for both Ni-8Cr-6Al and Ni-22Cr-11Al were
described qualitatively by calculations. The SO2-O2 potential diagrams showed the progression
of oxidation across the scale in the same manner as obtained from varying the oxygen partial
pressure. Closest to the gas/scale interface was NiO and spinel, which was stable at the highest
PO2. Underneath, the scale became a mix of Al2O3 and Cr2O3 (here described as separate phases,
but were often found in solution as described by the SPIN4 descriptions), as well as spinel
phases. There was generally not a second Ni phase detected in SEM (exception: Figure 5-85),
but according to Figure 4-8, is able to be in solution with (Al,Cr)2O3 up to around 25 wt%—less
than detected in the oxide by EPMA. At lower PO2, only Al2O3 was calculated to be stable using
SPOT3. All the cross-section SEM micrographs of both alloys showed this at the scale/alloy
interface. In this calculated phase region, Cr is depicted as a separate phase. While Cr was in
solution in γ-Ni in Ni-8Cr-6Al, it manifested itself as a separate phase α-Cr phase in the Ni-
151

22Cr-11Al as predicted by a previous work [37]. Lastly, for the Ni-22Cr-11Al alloy, at low
enough PO2, the β-NiAl phase is stable. The data in this dissertation showed no β near the
scale/alloy interface. It should be noted that the oxidation processes described here are ones of a
coating in direct contact with a gas atmosphere, and partial pressures of the gas species
decreasing as the oxide grows (at the scale/alloy interface). In common service conditions,
though, the application of a TBC reduces the PO2 seen at the scale/alloy interface, causing the
(desired) formation of (Al,Cr)2O3. Only after longer service times and more oxygen penetration
do spinel and NiO begin to form as part of the TGO [91, 155].
The diagrams calculated and shown in Figures 4-13 through 4-15 were useful in
determining the stability of the O2 + SO2 gas mixture at various temperatures. The diagrams
showed the significance of SO3 formation and how much of a factor it could be in the sulfidation
corrosion observed in the results. Figure 4-14 was also helpful in showing the partial pressure of
S2 in relation to the gas mixture not only at the surface, but also at the scale/alloy interface,
where higher sulfur concentrations were discovered from microprobe analyses.
In addition, the high temperatures allowed for sulfide stabilization at higher oxygen partial
pressures. The minimal activities of SO2 gas required to form sulfides varied with the alloy
composition, temperature, and oxygen partial pressure. However, the calculations did show that
Cr sulfides could form in equilibrium with Ni and Al2O3 (at the scale/alloy interface) or in
equilibrium with Ni and γ’, which was seen at the grain boundaries in the alloy in Figure 5-86 for
the Ni-8Cr-6Al alloy. The Ni-22Cr-11Al alloy, however, showed no real sulfidation at all, being
absent of sulfides. The only sulfur found present was at the scale/alloy interface, in amounts of
less than 0.30 wt%. From Figures 4-41 and 4-43, the PS2 required to stabilize sulfides in the
oxides could be calculated. At high PO2 in these alloys, if the PS2 is too low, the SO2 will remain
152
as a gas, or form oxides. Once the PS2 is high enough, as shown by the PS2 spikes in Figures 4-41
and 4.43, sulfidation of the alloy can begin. Clearly, the lower the PO2, the lower the PS2 required
to for sulfide formation/stabilization. This may explain why, in the Ni-8Cr-6Al alloys oxidized
in SO2, only Cr-sulfides were observed (see Figures 5-85 through 5-87). Where Ni3S2 is stable,
the PO2 may have been too high and the PS2 too low. However, deeper into the substrate, along
the grain boundaries, the PS2 was adequate to allow for sulfide formation in a lower PO2
environment.
Figures 6-3 and 6-4 show how activity values calculated from EPMA line scans compared
to calculated activities from Section 4.4. In both Figures, there is close agreement between the
activities Ni. However, there are discrepancies between the other components. Qualitatively,
they all follow the trends calculated—the lowering of aCr and aAl as PO2 increases. In addition,
the activity of S2 is shown to increase at the scale/alloy interface. Experimentally, activity of S2
decreases as one moves into the alloy away from the scale/alloy interface. This was not as
calculated because the calculations assumed a constant mole fraction of SO2 gas in the system,
which is not the case experimentally. There is also a higher Al activity than calculated. This
could be due to the depletion of reacting elements from the alloy near the interface, or the
linescans probing certain phases instead of the bulk such a probe of β instead of γ.
The error in correlating the experiments and calculations can come from several sources.
First, the activities calculated for the calculations and from the experimental EPMA data are both
assumed to be at some equilibrium. The activities calculated from the experimental data assume
local equilibrium at the one point, which is likely. However, the calculated diagrams assume
equilibrium across a range of PO2. This can be problematic, especially when interpreting these
diagrams in relation to the actual observed cross-sections. In Figures 5-83 to 5-89, spinel was
153

Figure 6-3. Comparison of the calculated activities from microprobe linescans with calculated
values using the appended SPIN4 database for a Ni-8Cr-6Al alloy oxidized at 900˚C in 0.21 O2 + 0.02 SO2.
Figure 6-4. Comparison of the calculated activities from microprobe linescans with calculated
values using the appended SPIN4 database for a Ni-22Cr-11Al alloy oxidized at 975˚C in 0.21 O2 + 0.02 SO2.
154

only once found in contact with the alloy substrate (usually, this was Al-rich Al2O3). However,
the calculations from the SPIN4, as well as SPOT3, databases show a mixture of γ and
(Al,Cr)2O3 bounded by γ and spinel. It has been established that the scale/alloy interface is not
usually at equilibrium due to slow rate-limiting ion transport that stabilizes (Al,Cr)2O3, or
sulfides in the case of SO2 diffusion. Nevertheless, the calculations performed in this
dissertation show promise that the Ni-Cr-Al-O-S system can be successfully modeled using
thermodynamic calculations. In the future, refinement of the SPIN4 database to allow solution
phases of sulfides and sulfates, as well as a sulfur contribution to the ionic liquid phase
description and the addition of the additional gas species, will greatly advance the calculations
completed here.
155

CHAPTER 7 CONCLUSIONS
The purpose of this research study was to calculate the stability of Ni-Cr-Al alloys and
their mechanical mixtures in oxidizing and sulfidizing atmospheres. Experiments were also
conducted to examine the impact of sulfur on the oxidation of two Ni-Cr-Al alloys. The
following conclusions can be drawn from this study:
• The oxidation, and even the simultaneous oxidation/sulfidation, kinetics can be generally described as parabolic in nature. This is due to the nature of this growth mechanism in that the rate of the oxidation reaction is dependent on ionic transport through the oxide scale, which decreases over time as the scale thickens.
• Higher temperatures showed the growth of less NiO and more Al2O3/Cr2O3 initially, as predicted by thermodynamic calculations of Ni-8Cr-6Al alloys.
• While the morphology of θ- and δ-Al2O3 was observed, particularly on the surface, XRD could not detect any alumina phases except α. It is possible that even at short oxidation times, the transient aluminas transform to corundum quickly at these temperatures.
• The addition of SO2 caused sulfur to accumulate at the scale/alloy interface.
• In the Ni-8Cr-6Al, SO2 migrated to the scale/alloy interface and oxidized the alloy releasing free sulfur. This sulfur reacted with Cr in solution to form Cr-sulfides at the alloy grain boundaries. These sulfides allowed rapid ion transport due to their high-defect structures, and oxidized themselves allowing sulfur to move further into the alloy, sulfidizing more Cr and repeating the process.
• Cr-containing oxides, which were not detected on Ni-8Cr-6Al in oxidation-only experiments, were detected on the surface when exposed to SO2. This was attributed to the vacancy creation of S in the oxide lattice, as well as SO2 at cracks and grain boundaries allowing faster diffusion of Cr3+ and was observed as a decreased activation energy.
• For the extent of these tests, the scale formed by the Ni-22Cr-11Al alloys was protective against the formation of internal sulfides.
• The thermodynamic calculations were able to predict the progression of oxidation as well as confirm the phases in equilibrium at various oxygen and sulfur dioxide partial pressures.
• In (Al,Cr)2O3 and NiO, the activities and compositions of the elements were nearly identical for calculations from each database. There were small differences in spinel and the alloy. The activities calculated from the experiments showed qualitative trends with the calculations.
156

• Combining the results from the two databases used in this dissertation, a more representative SO2-O2 potential diagram could be calculated.
• This dissertation is a first step in being able to calculate the Al-Cr-Ni-O-S quinary system for describing sulfidation and hot corrosion problems affecting NiCrAlY bond coats.
157
LIST OF REFERENCES
1. Department of Energy. International Energy Outlook 2006. Report #DOE/EIA-0484 (2006)
2. International Energy Agency. Monthly Electricity Statistics: November 2006. (2007)
3. J.P. Longwell, E.S. Rubin, J. Wilson. Progress in Energy and Combustion Science. 21 pp. 209-360 (1995)
4. Department of Energy. Annual Energy Outlook 2007 with Projections to 2030. Report #DOE/EIA-0383 (2007)
5. H.M. Kvamsel, K. Jordal, O. Bollard. Energy. 32 pp. 10-24 (2007)
6. P. Saltykov, O. Fabrichnaya, J. Golczewski, F. Aldinger. Journal of Alloys and Compounds. 381 pp. 99-113 (2004)
7. H.J. Seifert, H. Mozaffari, H.L. Lukas, F. Aldinger. “The Oxidation of Ni-Base Alloys—Thermodynamic Modeling and Calculations.” High Temperature Corrosion and Materials Chemistry V: Proceedings of the International Symposium. E. Opila, J. Fergus, Y. Maruyama, J. Mizusaki, T. Narita, D. Shifler, E. Wuchina, eds. ECS: Pennington, NJ pp. 347-360 (2005)
8. D.J. Srolovitz, T.A. Ramanarayanan. Oxidation of Metals. 22 pp. 247-275 (1984)
9. P. Berthod, S. Michon, J. Di Martino, S. Mathieu, S. Noël, R. Podor, C. Rapin. Calphad. 27 pp. 279-288 (2003)
10. Y. Tamarin: Protective Coatings for Turbine Blades, ASM International, Materials Park, OH (1992) pp. 5-23
11. J.R. Davis, ed. Heat Resistant Materials, ASM International: Materials Park, OH (1997) pp. 221-254
12. E. Ross, C.T. Sims, “Nickel-base Alloys,” Superalloys II. C.T. Sims, N.S. Stolff, W.C. Hagel, eds., John Wiley & Sons: New York (1987) pp. 97-133
13. G.H. Meier, F.S. Pettit. Materials Science and Engineering A. 153, pp. 548-560 (1992)
14. P. Kofstad. High Temperature Oxidation of Metals. John Wiley & Sons: New York, NY pp. 88-111 (1988)
15. J.L. Smialek, G.M. Meier, “High-Temperature Oxidation,” Superalloys II. C.T. Sims, N.S. Stolff, W.C. Hagel, eds., John Wiley & Sons: New York pp. 293-326 (1987)
16. D.R. Clarke, C.G. Levi. Annual Review of Materials Research. 33 pp. 383-417 (2003)
17. A. Taylor, R.W. Floyd. Journal of Institute of Metals. 81 pp. 451-464 (1952)
158

18. N.C. Oforka, B.B. Argent, Journal of Less-Common Metals. 114 pp. 97-109 (1985)
19. J.A. Nesbitt, R.W. Heckel. Metallurgical Transactions A. 18A pp. 2061-2073 (1987)
20. J.A. Nesbitt, R.W. Heckel. Metallurgical Transactions A. 18A pp. 2087-2094 (1987)
21. Y.M. Hong, Y. Mishima, T. Suzuki. “DTA Measurements of the Ni-Cr-Al Ternary System,” Materials Research Society Symposium Proceedings. 133 C.T. Liu, A.I. Taub, N.S. Stoloff, C.C. Koch. eds., MRS: Pittsburg, PA pp. 429-440 (1989)
22. C.C. Jia, K. Ishida, T. Nishizawa. Metallurgical and Materials Transactions A. 25A pp. 473-485 (1994)
23. L. Kaufman, H. Nesor. Metallurgical Transactions. 5 pp. 1623-1629 (1974)
24. S. Ochiai, Y. Oya, T. Suzuki. Acta Metallurgica. 32 pp. 289-298 (1984)
25. I. Ansara, B. Sundman, P. Willemin. Acta Metallurgica. 36 pp. 977-982 (1988)
26. I. Ansara, N. Dupin, H. L. Lukas, B. Sundman Journal of Alloys and Compounds. 247 p. 20-30 (1997)
27. N. Dupin, I. Ansara, B. Sundman. Calphad. 25 pp. 279-298 (2001)
28. D.R.G. Achar, R. Munoz-Arroyo, L. Singheiser, W.J. Quadakkers, Surface & Coatings Technology. 187 pp. 272–283 (2004)
29. P.K. Sung, D.R. Poirier, Metallurgical and Materials Transactions A. 30A, pp. 2173-2182 (1999)
30. H. Baker. ASM Handbook Volume 3—Alloy Phase Diagrams, ASM International: Materials Park, OH, pp. 43-155 (1992)
31. M. Hillert. Journal of Alloys and Compounds. 320 pp. 161-171 (2001)
32. P. Rogl. “Al-Cr-Ni,” Ternary Alloys: A Comprehensive Compendium of Evaluated Constitutional Data and Phase Diagrams: Al-Cd-Ce to Al-Cu-Ru. 4 pp. 400-415 (1991)
33. R. Bakish, ed. Introduction to Electron Beam Technology. John Wiley and Sons: New York, NY (1962) p. 395-422
34. A.M. Dorodnov. Journal Technical Physics. 51 pp. 504-524 (1981)
35. R.C. Dykhuizen, M.F. Smith. Surface and Coatings Technology. 37 pp. 349-358 (1989)
36. K.G. Schmitt-Thomas, H. Haindl, D. Fu. Surface and Coatings Technology. 94-95. pp. 149-154 (1997)
159

37. Y. Tamarin: Protective Coatings for Turbine Blades, ASM International, Materials Park, OH p. 65-67 (1992)
38. S.A. Bradford. “Fundamentals of Corrosion of Gases,” ASM Handbook Volume 13—Corrosion. ASM International: Materials Park, OH. pp. 61-76 (1992)
39. N. Cabrera, N.F. Mott. Reports on the Progress of Physics. 12 pp. 163-184 (1948-1949)
40. C. Wagner. Zeitschrift für Physikalische Chemie. B21 pp. 25-41 (1933)
41. D.A. Porter, K.E. Easterling. Phase Transformations in Metals and Alloys, 2nd Ed. Chapman & Hall: London pp. 98-103 (1993)
42. T. Homma, N.N. Khoi, W.W. Smeltzer, J.D. Embury. Oxidation of Metals. 3 pp. 463-473 (1971)
43. J.R. Taylor, A.T. Dinsdale. Zeitschrift für Metallkunde. Vol 81, pp. 354-366 (1990)
44. R. Haugsrud. Corrosion Science. 45. pp 211-235 (2003)
45. H. Hindam, D.P. Whittle. Oxidation of Metals. 18 p. 245-284 (1982)
46. M. Schuetze. Oxidation of Metals. 44 p. 29-61 (1995)
47. H.V. Atkinson. Materials Science and Technology. 4 pp. 1052-1063 (1988)
48. A.W. Harris, A. Atkinson. Oxidation of Metals. 34 pp. 229-258 (1990)
49. L.P.H. Jeurgens, W.G. Sloof, F.D. Tichelaar, E.J. Mittemeijer: Journal of Applied Physics. 92 pp. 1649-1656 (2002)
50. P. Villars. Pearson’s Handbook: Desk Edition: Crystallographic Data for Intermetallic Phases. ASM International: Materials Park, OH. (1998)
51. Y.F. Zhukovskii, P.W.M. Jacobs, M. Causa. Journal of Physics and Chemistry of Solids. 64 pp. 1317–1331 (2003)
52. L.P.H. Jeurgens, W.G. Sloof, F.D. Tichelaar, E.J. Mittemeijer. Thin Solid Films. 418 p. 89-101 (2002)
53. S.R. Pollack, C.E. Morris. Journal of Applied Physics. 35 p. 1503-1512 (1964)
54. L.P.H. Jeurgens, W.G. Sloof, F.D. Tichelaar, E.J. Mittemeijer. Surface Science. 506 pp. 313–332 (2002)
55. H.J. van Beek, E.J. Mittemeijer. Thin Solid Films. 122-151 p. 131 (1984)
56. D. Clemens, V.R. Vosberg, L.W. Hobbs, U. Breuer, W.J. Quadakkers, H. Nickel. Fresenius. Fresenius Journal of Analytical Chemistry. 355 p. 703-706 (1996)
160

57. D. Clemens, V.R. Vosberg, H.J. Penkella, U. Breuer, W.J. Quadakkers, H. Nickel. Fresenius. Fresenius Journal of Analytical Chemistry. 358 p. 122-126 (1997)
58. J.L. Smialek, R. Gibala. Metallurgical Transactions A. 14A pp. 2143-2164 (1983)
59. G.C. Rybicki, J.L. Smialek. Oxidation of Metals. 31 p. 275-304 (1989)
60. J. Doychak, J.L. Smialek, T.E. Mitchell. Metallurgical Transactions A. 20A p. 499-518 (1989)
61. A. Ul-Hamid. Corrosion Science. 46 p. 27-36 (2004)
62. R. Prescott, M.J. Graham. Oxidation of Metals. 38 p. 223-254 (1992)
63. B. Chattopadhyay, G.C. Wood. Oxidation of Metals. 2 p. 373-399 (1970)
64. M.T. Shim, W.J. Moore. Journal of Chemistry and Physics. 26 p. 802-832 (1957)
65. D. Caplan, G.I. Sproule. Oxidation of Metals. 9 p. 459-472 (1975)
66. A.U. Seybolt. Journal of the Electrochemical Society. 107 pp. 147-156 (1960)
67. W.C. Hagel, A.U. Seybolt. Journal of the Electrochemical Society. 108 pp. 1146-1152 (1961)
68. S.C. Tsai, A.M. Huntz, C. Dolin. Oxidation of Metals. 43 pp. 581-596 (1995)
69. K.P. Lillerud, P. Kofstad. Journal of the Electrochemical Society. 127 pp. 2397-2409 (1980)
70. P. Kofstad, K.P. Lillerud. Journal of the Electrochemical Society. 127 pp. 2410-2419 (1980)
71. D. Caplan, G.I. Sproule, R.J. Hussey. Corrosion Science. 10 pp. 9-17 (1970)
72. M. Skeldon, J.M. Calvert, D.G. Lees. Oxidation of Metals. 28 pp. 109-125 (1987)
73. D. Caplan, M. Cohen. Journal of the Electrochemical Society. 108 pp. 438-442 (1961)
74. C.A. Stearns, F.J. Kohl, G.C. Fryburg. Journal of the Electrochemical Society. 121 pp. 952-961 (1974)
75. T. Sorahan, D.C.L. Burges, L. Hamilton, J.M. Harrington, Occupational Environmental Medicine. 55 pp. 236–242 (1998)
76. F.S. Pettit: Transactions of the AIME. 239, pp. 1296-1305 (1967)
77. G.C. Wood, F.H. Stott: British Corrosion Journal. 6, pp. 247-256 (1971)
161

78. H.M. Hindam, W.W. Smeltzer. Journal of the Electrochemical Society. 127 pp. 1622-1630 (1980)
79. K. Fueki, H. Ishibashi. Journal of the Electrochemical Society. 108 pp. 306-311 (1961)
80. R.T. Haasch, A.M. Venezia, C.M. Loxton: Journal of Materials Research. 7, pp. 1341-1349 (1992)
81. H.C. Yi, W.W. Smeltzer, A. Petric. Oxidation of Metals. 45 pp. 281-299 (1996)
82. S.C. Choi, H.J. Cho, Y.J. Kim, D.B. Lee. Oxidation of Metals. 46 pp. 51-72 (1996)
83. H.M. Hindam, W.W. Smeltzer. Journal of the Electrochemical Society. 127 pp. 1630-1635 (1980)
84. P.Y. Hou, K. Priimak. Oxidation of Metals. 63 pp. 113-130 (2005)
85. J.L. Smialek. Metallurgical Transactions A. 9A pp. 309-320 (1978)
86. B.H. Kear, F.S. Pettit, D.E. Fornwalt, L.P. Lemaire. Oxidation of Metals. 3 pp. 557-569 (1971)
87. P. Sarrazin, A. Galerie, M. Caillet. Oxidation of Metals. 46 pp. 299-312 (1996)
88. S.W. Guan, W.W. Smeltzer. Oxidation of Metals. 42 pp. 375-391 (1994)
89. P. Sarrazin, A. Galerie, M. Caillet. Oxidation of Metals. 46 pp. 1-17 (1996)
90. C.S. Giggins, F.S. Pettit. Journal of the Electrochemical Society. 118 pp. 1782-1790 (1971)
91. F.H. Stott, G.C. Wood, M.G. Hobby. Oxidation of Metals. 3 pp. 103-113 (1971)
92. F. Gesmundo, F. Vianni, Y. Niu. Oxidation of Metals. 42 pp. 285-301 (1994)
93. G.J. Santoro, D.L. Deadmore, C.E. Lowell. NASA Technical Note. TN D-6414 (1971)
94. C.E. Lowell, G.J. Santoro. NASA Technical Note. TN D-6838 (1972)
95. F.H. Stott, I.G. Wright, T. Hodgkiess, G.C. Wood. Oxidation of Metals. 11 pp. 141-150 (1977)
96. J.L. González Carrasco, P. Adeva, M. Aballe. Oxidation of Metals. 33 pp. 1-17 (1990)
97. C.G. Levi, E. Sommer, S.G. Terry, A. Catanoiu, M. Rühle. Journal of the American Ceramic Society. 86 pp. 676-685 (2003)
98. W. Brandl, D. Toma, H.J. Grabke. Surface and Coatings Technology. 108-109 pp. 10-15 (1998)
162

99. F.S. Pettit, C.S. Giggins. “Hot Corrosion,” Superalloys II. C.T. Sims, N.S. Stolff, W.C. Hagel, eds., John Wiley & Sons: New York (1987) pp. 327-358
100. J.A. Goebel, F.S. Pettit. Metallurgical Transactions. 1 pp. 1943-1954 (1970)
101. N.S. Bornstein, M.A. DeCrescente. Metallurgical Transactions. 2 pp. 2875-2892 (1971)
102. A. Rahmel. Materials Science and Engineering. 87 pp. 345-352 (1987)
103. K.L. Luthra, D.A. Shores. Journal of the Electrochemical Society. 127 pp. 2202-2210 (1980)
104. K.L. Luthra, O.H. LeBlanc. Materials Science and Engineering. 87 pp. 329-335 (1987)
105. D.K. Gupta, R.A. Rapp. Journal of the Electochemical Society. 127 pp. 2194-2202 (1980)
106. R.A. Rapp. Materials Science and Engineering. 87 pp. 319-327 (1987)
107. R.A. Rapp. Corrosion Science. 44 pp. 209-221 (2002)
108. D.A. Shores. “New Perspectives on Hot Corrosion Mechanisms,” High Temperature Corrosion. R.A. Rapp, ed. NACE: Houston, TX. p. 493-511 (1983)
109. A.K. Roslik, V.N. Konev, A.M. Maltsev. Oxidation of Metals. 43 pp. 59-82 (1995)
110. A. Stokłosa, J. Stringer. Oxidation of Metals. 11 pp. 263-276 (1977)
111. A. Stokłosa, J. Stringer. Oxidation of Metals. 11 pp. 277-288 (1977)
112. J. Stringer, M.E. El-Dahshan, I.G. Wright. Oxidation of Metals. 8 pp. 361-377 (1974)
113. T. Narita, T. Ishikawa, K. Nishida. Oxidation of Metals. 27 pp. 221-237 (1987)
114. W. Kai, Y.T. Lin, C.C. Yu, P.C. Chen, C.H. Wu. Oxidation of Metals. 61 pp. 507-527 (2004)
115. C.J. Spengler, R. Viswanathan. Metallurgical Transactions. 3 pp. 161-166 (1972)
116. P. Singh, N. Birks. Oxidation of Metals. 13 pp. 457-474 (1979)
117. C. de Asumndis, F. Gesmundo, C. Bottino. Oxidation of Metals. 14 pp. 351-361 (1980)
118. P. Kofstad, G. Åkesson. Oxidation of Metals. 13 pp. 57-76 (1979)
119. D.G. Lees. Oxidation of Metals. 27 pp. 75-81 (1987)
120. K. Natesan. Oxidation of Metals. 30 pp. 53-83 (1988)
121. W.H. Lee. Materials Chemistry and Physics. 76 pp. 26-37 (2002)
163

122. P. Fox, D.G. Lees, G.W. Lorimer. Oxidation of Metals. 36 pp. 491-503 (1991)
123. H.J. Grabke, G. Kustonov, H.J. Schmultzer. Oxidation of Metals. 43 pp. 97-114 (1995)
124. Z. Zurek, J. Jedlinski, K. Kowalski, K. Kowalska. Solid State Ionics. 101-103 pp. 743-747 (1997)
125. J. Gawel. Oxidation of Metals. 30 pp. 139-140 (1988)
126. C. Mathieu, J.P. Larpin, S. Toesca. Oxidation of Metals. 39 pp. 211-220 (1993)
127. C.S. Giggins, F.S. Pettit. Oxidation of Metals. 14 pp. 363-413 (1980)
128. K.L. Luthra, W.L. Worrell. Metallurgical Transactions A. 10A pp. 621-631 (1979)
129. F. Gesmundo, C. de Asumndis, P. Nanni. Oxidation of Metals. 20 pp. 217-240 (1983)
130. K.P. Lillerud, B. Haflan, P. Kofstad. Oxidation of Metals. 21 pp. 119-134 (1984)
131. A.K. Misra, D.P. Whittle. Oxidation of Metals. 22 pp. 1-33 (1984)
132. K.L. Luthra, W.L. Worell. Metallurgical Transactions A. 9A pp. 1055-1061 (1978)
133. A.S. Khanna, W.J. Quadakkers, X. Yang, H. Schuster. Oxidation of Metals. 40 pp. 275-294 (1993)
134. R.E. Lobnig, H.J. Grabke, H.R. Schmidt, K. Hennessen. Oxidation of Metals. 39 pp. 353-370 (1993)
135. P.Y. Hou, K. Priimak. Oxidation of Metals. 63 pp. 113-130 (2005)
136. P. Kofstad, G. Åkesson. Oxidation of Metals. 12 pp. 503-526 (1978)
137. M.H. LaBranche, G.J. Yurek. Oxidation of Metals. 28 pp. 78-98 (1987)
138. Z. El-Majid, M. Lambertin. Oxidation of Metals. 27 pp. 333-345 (1987)
139. P. Fox, D.G. Lees, G.W. Lorimer. Oxidation of Metals. 36 pp. 491-503 (1991)
140. A.G. Andersen, P. Kofstad. Oxidation of Metals. 43 pp. 301-315 (1995)
141. P. Singh, N. Birks. Oxidation of Metals. 19 pp. 37-52 (1982)
142. D. Wang, D.L. Douglass. Oxidation of Metals. 20 pp. 111-146 (1983)
143. M.F. Chen, D.L. Douglass, F. Gesmundo. Oxidation of Metals. 33 pp. 399-423 (1990)
144. S.W. Kim, K. Ohla, H. Fischmeister, E. Fromm. Oxidation of Metals. 36 pp. 395-407 (1991)
164

145. A.K. Roslik, V.N. Koner, A.M. Maltsev. Oxidation of Metals. 43 pp. 83-95 (1995)
146. Y.R. He, D.L. Douglass. Oxidation of Metals. 40, pp. 337-371 (1993)
147. S. Mrowec. Oxidation of Metals. 44 pp. 177-209 (1995)
148. E.J. Vineberg, D.L. Douglass. Oxidation of Metals. 25 pp. 1-28 (1986)
149. P.Y. Hou, J. Stringer. Oxidation of Metals. 38 pp. 323-345 (1992)
150. F. Gesmundo. Oxidation of Metals. 13 pp. 237-244 (1979)
151. K. Natesan. Materials Science and Engineering. 87 pp. 99-106 (1987)
152. J.H. Wood, E.H. Goldman. “Protective Coatings,” Superalloys II. C.T. Sims, N.S. Stolff, W.C. Hagel, eds., John Wiley & Sons: New York pp. 359-383 (1987)
153. S. Degterov, A. Pelton. Journal of Phase Equilibria. 17 pp. 476-488 (1996)
154. A.D. Pelton, H. Schmalzried, J. Strichner. Journal of Physics and Chemistry of Solids. 40 pp. 1103-1122 (1979)
155. H. Mozaffari. Ph.D. Dissertation. Universität Stuttgart (2002)
156. H.L. Lukas, S.G. Fries. Journal of Phase Equilibria. 13 pp. 532-541 (1992)
157. L.C. Li, F. Gesmundo, F. Vianni. Oxidation of Metals. 40 pp. 395-419 (1993)
158. J.M. Quets, W.H. Dresher. Journal of Materials. 4 pp. 583-599 (1969)
159. L.C. Li, F. Gesmundo, F. Vianni, Materials Engineering. 4 p. 133-148 (1993)
160. H. Yokokawa, Journal of Phase Equilibria. 20 pp. 258-287 (1999)
161. N. Saunders, Z. Guo, X. Li, A.P. Miodownik, J-Ph. Schillé. “Modeling the Materials Properties and Behavior of Ni-Based Superalloys,” Superalloys 2004. K.A. Green, T.M. Pollock, H. Harada, T.E. Howson, R.C. Reed, J.J. Schirra, S. Watson, eds., TMS: Materials Park, OH. pp. 849-858 (2004)
162. JANAF Thermochemical Tables, 2nd ed. National Bureau of Standards: Washington, D.C., (1986)
163. B. Bergman, J. Agren. Journal of the American Ceramics Society. 68 pp. 444-450 (1985)
164. K.K. Sunil, K.D. Jordan. Journal of Physical Chemistry. 92-101 p. 2774 (1988)
165. O. Kubaschewski, C.B. Alcock. Metallurgical Thermochemistry, 6th ed. Oxford, UK: Pergamon Press (1979)
165
166. J.M. Larrain. Calphad. 4 pp. 155-171 (1980)
167. B. Pieraggi. Oxidation of Metals. 64 pp. 397-403 (2005)
168. G.I. Goldstein, D.E. Newbury, P. Echlin, D.C. Joy, A.D. Romig Jr, C.E. Lyman, C. Fiori, E. Lifshin. Scanning Electron Microscopy and X-Ray Microanalysis, 2nd Ed. Plenum: New York pp. 417-524 (1994)
169. D.V. Ragone. Thermodynamics of Materials. J. Wiley & Sons, Inc.: New York (1994)
170. E. Mueller, H. Seifert. “Thermodynamic Calculations of Mixed Sulfidation and Oxidation of Ni-Cr-Al Alloys,” Materials Science and Technology (MS&T) 2006: Fundamentals and Characterization: Vol 2. Z. Liu, C.E. Campbell, L.Q. Chen, E.B. Damm, J.E. Morral, J.L. Murray, eds. pp. 125-136 (2006)
171. M.C. Pope, N. Birks. Oxidation of Metals. 12 pp. 191-204 (1978)
166

BIOGRAPHICAL SKETCH
Erik Michael Matthew Mueller was born on July 7, 1978, to Michael J. and Sally Leona
Mueller in Jacksonville, FL. There he attended Sacred Heart Elementary and Bishop Kenny
High School, where he started at defensive line for the football team and threw shotput and
discus for the track team, lettering in both. After graduating in 1996, Erik moved to Gainesville,
FL, where he attended the University of Florida. In May 2000, he graduated cum laude with a
Bachelor of Science in materials science and engineering with a focus in engineering ceramics,
and began an internship at American Technical Ceramics. He entered graduate school later that
year at the University of Florida and redirected his focus to metallurgy, electron microscopy, and
high-temperature corrosion. He received a Master of Science degree in May 2003, and was
admitted to doctoral candidacy in December of 2005. He is currently also captain of University
of Florida mascots, who perform at various Gator sporting events, commercial appearances, and
charitable festivities. He is also a 3rd degree knight and recorder for the local Knights of
Columbus Chapter 13207. In the future, Erik plans to earn his professional engineering license
in metallurgical engineering, and to explore the fields of consulting and politics.
167
Copyright © 2022 FDOKUMEN