Subjective Sensation during Interaction between Horizontal Vestibular and Vertical Pursuit...
18
PDFlib PLOP: PDF Linearization, Optimization, Protection Page inserted by evaluation version www.pdflib.com – [email protected]
-
Upload
independent -
Category
Documents
-
view
0 -
download
0
Transcript of Subjective Sensation during Interaction between Horizontal Vestibular and Vertical Pursuit...

PDFlib PLOP: PDF Linearization, Optimization, Protection
Page inserted by evaluation versionwww.pdflib.com – [email protected]

Subjective Sensation during Interaction between Horizontal Vestibular
and Vertical Pursuit Stimulation VICENTE HONRUBIA? ALAN GREENFIELD,"
CLIFFORD LAU,b AND ANGUS RUPER'Fd a UCLA Division of Head and Neck Surgev
I0833 Le Conte Avenue Los Angeles, California 90095
bOfjce of Naval Research Arlington, Virginia 2221 7
CNASA-Johnson Space Center Houston, Texas 77058
CHS 62-132
Vestibular function is a sensorimotor integration process that facilitates the mainte- nance of gaze, posture, equilibrium, and the perception of head position and motion. This report documents the results of studies in human subjects concerning the relationship between the perception of moving objects, the vestibular subjective sensation of motion (VSSM), and associated eye movements during interactive visual and vestibular stimulation.
Studies concerning mechanisms of eye movement control have shown that both visual and vestibular input, working simultaneously, are necessary for proper gaze stabilization throughout the range of normal head movement.'-3 The visual tracking of small moving targets depends on the smooth pursuit (SP) system, whose function is to maintain objects of visual interest centered on the fovea of the retina. The operation of SP is optimal when object motion is of low velocity and low frequency. The SP functions as a closed loop velocity servo system with the effective stimulus being the retinal slip velocity, which is equal to the difference between the object velocity and the eye tracking ~e loc i ty .~ Motion of the head is detected in the inner ear by the hair cells functioning as transducers.5,6 The inner ear responses are coded in terms of head velocity during natural head movements because of underlying mechanical and physiological processes and subsequent biological signal transforma- tion in the nervous system.*s7 The operation of the vestibular system is critical for producing compensatory vestibulo-ocular reflexes (VOR) to maintain stable gaze during head motion of high velocities and/or high frequencies. In everyday activities, with diverse motion of objects and of the head, the maintenance of gaze is the result of the complementary interaction of the visual and vestibular systems working together in ways that are becoming well understood in regard to the production of r e f l e x e ~ . ~ , ~ . ~
The joint function of the vestibular and visual systems provides the information necessary for the perception of self-motion, of the relative motion between objects, and of the motion of objects in relation to the self, data that is necessary for orientation during human navigation. In contrast to the reflexes, the psychophysical
dMailing address: Angus Rupert, M.D., Code 22 NAMRL, Pensacola, FL 32508-1046. 407

408 ANNALS NEW YORK ACADEMY OF SCIENCES
mechanisms of visual and vestibular interaction are poorly understood. One difficulty associated with the psychophysical phenomena is that accepted methods to quantify the VSSM are not available. In contrast to the evaluation of hearing and vision, for example, the VSSM is not part of the clinical evaluation of vestibular patients.*
Many situations lead to illusions of motion (e.g., circularvection, oculogyration, etc.).1@'2 One type of illusion, which has been described by us, occurs when the perception of the velocity of a small visual target (VT) moving sinusoidally in the horizontal plane is predictably affected by rotational vestibular and optokinetic st im~lation. '~J~ In these experiments, the VT appears to travel for a shorter duration when it moves in the direction of the body's angular acceleration or against the direction of the optokinetic drum. Both vestibular and optokinetic stimuli resulted in a sensation of body motion (by the phenomenon of circularvection during optoki- netic stimulation).
It was then postulated that the brain judges the motion of objects in relation to the self in a relativistic manner. The brain operates as if there is an egocentric sense against which the motion of the world is evaluated. The steady-state condition of this internal reference center (IRC) can be changed by physiological stimulation of the vestibular or visual motion detectors. The following relation describes the operation of this center:
V,, = V, - IRC, (1) where V,, is the perceived object velocity, V, is the head-referenced target velocity, and IRC is the velocity of the world as perceived by the brain during vestibular or optokinetic stimulation. The difference between V,, and V, is a measure of the effect of vestibular and optokinetic inputs in the IRC or, in other words, a measure of how these stimuli affect the perception of the world by the brain.
In order to expand the information about the operation of the IRC, the sinusoidal VT trajectory was placed in a vertical orientation. This experimental paradigm allowed the generalization of equation 1 to a vector form. In addition, vestibular stimulation was provided by sinusoidal head rotation at %frequency that more closely approximated normal head movements. Let us define V,,, as the slow component VOR velocity associated with sinusoidal head rotation. If both stimuli are executed concurrently, we then can write
as a generalization of equation 1. In the present experiment, it was expected that an error will occur in the perception of motion of a vertically moving VT during horizontal vestibular stimulation. Under the influence of the visual (vertical) and vestibular (horizontal) stimuli, it is anticipated that the perceived VT trajectory will be tilted and that this error can be compensated by tilting the trajectory of this target away from true vertical. We hypothesized that the magnitude of horizontal eye velocities resulting from the tracking of this target after tilt is predicted by the magnitude of the slow component of the VOR during identical vestibular stimulation without any visual cues. During the evaluation of this hypothesis, it was found that the data provided information about the mechanism and a new approach to the quantitative measurement of the VSSM.
METHODS
Eye Movement Recording
Ten healthy young male subjects participated in this study. Subjects were not informed of the psychophysical nature of the experiment prior to testing. Subjects

HONRUBIA ef al.: VESTIBULAR AND PURSUIT STIMULATION 409
were fitted with standard electro-oculographic (EOG) electrodes. These were placed monocularly in the vertical plane and bitemporally in the horizontal plane. EOG amplifiers with a cutoff frequency of 100 Hz were used. Although care was taken in the placement of the electrodes so as to record only movement in the horizontal or vertical plane by the appropriate electrode pair, slight misalignment could occur in spite of efforts to relocate the electrodes when necessary.
Eye movements were calibrated by moving the VT -t 15" in the horizontal plane and * 8" in the vertical pIane.I5J6 The scale of the chart recorder was adjusted to give a deflection of approximately 1 mm/" at the time of calibration. Eye movements during calibration were recorded by the chart recorder. A precise calibration factor was digitally recorded in each data file. This process was repeated at least five times during every test session before every set of test conditions to compensate for EOG changes.
The tracking capability of each subject in the horizontal and vertical planes was measured at the beginning of each test session. For vertical tracking, the VT was made to move sinusoidally in the vertical plane at a peak velocity of 12"/s and a frequency of 0.2 Hz. For horizontal tracking, the VT was made to move sinusoidally in the horizontal plane at a peak velocity of 24'1s and a frequency of 0.2 Hz.
Stimulus Presentation and Eye Movement Measurement
Subjects were seated in a rotatory chair mounted on a voltage controlled servo motor. Rotation occurred in the horizontal plane. Chair velocity was measured by means of a tachometer. Subjects were restrained with seatbelts and leg and head restraints. A flat black planar surface was mounted on the chair and placed in the center of the subjects' field of vision, 30 inches from the center of the head, for the purpose of projecting a VT. The chair was placed in a light-tight darkened experimen- tal chamber. Communication between subjects and operators was accomplished by means of an intercom. Handles equipped with electronic switches (subjective sensa- tion switches) were located on the end of each armrest of the rotatory chair. The switches were used by the subjects to indicate their perceived direction of self- rotation.
The VT was created by a laser beam projected into a system of mirrors mounted on galvanometers. The motion of one mirror generated the vertical motion of the VT while the motion of another, oriented at right angles to the first, generated the horizontal motion. The amplitude of the command signal sent to the horizontal galvanometer could be continuously adjusted by the operator to give motion between 0 and 24"/s. Computer programs were written to simultaneously activate the chair and the VT motion at any desired frequency with independent amplitudes and phase values.
A Macintosh computer was used to control the experimental apparatus and to acquire and store data. Custom software (Ma~Eyebal lQ~~) was used to operate the computer. The computer recorded the command signals controlling the vertical movement of the VT, the chair tachometer signal, vertical and horizontal eye position signals, and a response indicating the subject's perceived direction of self-motion. Data was digitized at 204.8 Hz.
In addition to the computer, a digital chart recorder (Gould TA4000 8 channel) provided a hard-copy record of the experiment. The TA4000 recorded the command signals to the laser galvanometers, the chair tachometer signal, vertical and horizon- tal eye position signals, a response indicating the subject's perceived direction of self-motion, and the laser power command signal.
410 ANNALS NEW YORK ACADEMY OF SCIENCES
Measurement Conditions
Each subject was rotated sinusoidally and without any visual stimuli at a frequency of 0.2 Hz for 150 s. This test was divided into three segments, each 50 s in length. Each segment used a different rotational stimulus peak velocity, 14,21, and 28"ls. The order in which these segments were presented was randomized. A subset of six subjects was instructed to press the subjective sensation switches to indicate perceived direction of self-motion.
Three interactive tests were designed to evaluate the hypothesis of equation 2. In the FULL cycle tests, the laser power was always on. The rotational chair was driven sinusoidally at a frequency of 0.2 Hz and at one of the following three randomly presented peak velocities: 14, 21, or 28"/s. The vertical motion of the VT was sinusoidal with a frequency of 0.2 Hz and a peak velocity of 12"/s. The horizontal motion of the VT was sinusoidal with a frequency of 0.2 Hz and a peak velocity that could range between 0 and 24'1s. The combination of vertical and horizontal VT motions produced a linear trajectory with an angle from the vertical between 0 and 63". Command signals were synchronized so that as the chair moved to the left, the VT moved up and to the right, and as the chair moved to the right, the VT moved down and to the left. The trajectory of the VT may be written in vector form as a function of time (t),
VvT(i tan 8 sin o t + j sin ot), (3) where V, = 12"/s, o = 2a . 0.2 Hz, 8 is the angle of inclination with the vertical and i and j are unit vectors in the horizontal and vertical planes, respectively. The velocity of the rotatory chair may be similarly expressed as
-V,i sin ot, (4) where V, = 14,21, or 28"/s, presented as described earlier.
In the UP and DOWN cycle tests, all of the stimulus parameters were identical to those in the FULL cycle tests with the exception of the laser power control. In the UP cycle test, the laser was turned on during chair movement to the left as the VT moved up, and off as the chair moved to the right. In the DOWN cycle test, the laser was turned on during chair movement to the right as the VT moved down, and off as the chair moved to the left. These half-cycle tests were intended to isolate the measure- ment of eye movement responses to the right or to the left.
In each test, an error in the perceived motion of a vertically moving VT was created by horizontal vestibular stimulation. The underlying principles guiding the design and execution of these experiments are schematically described in FIGURE 1.
Equation 2 predicts that subjects will perceive a VT trajectory taat is other than vertica+l. With the subsequent aadition of a horizontal component to V,, it is expected that V,,, can be negated and V,, be made purely vertical. In FIGURE 1, A describes the characteristics of the stimuli and eye responses expected during an isolated vertical pursuit test. Diagram B describes stimuli and responses during horizontal head rotation in the dark. The arrows show the trajectories during the quarter cycle when the VT moves with increasing velocity upwards and when the rate table moves with increasing velocity toward the left. Diagrams C and D depict the relations of the stimuli and of the responses during conditions of interactive visual and vestibular stimulation. In addition, the lower+ diagrams skow solid arrows indicating the expected direction of the imaginary Vs,. In C, the V,, is shown inclined to the left as predicted by equation 2 due to the interaction of the visual and vestibular stimuli. Eye movement trajectories in C are vertical because of the visual suppression of the

HONRUBIA ef al.: VESTIBULAR AND PURSUIT STIMULATION 411
VOR. That is, there is no horizontal component in the eye msvement response. However, if the VT trajectory is tilted to the right, as in D, the V,, perception w31 became vertical when the horizontal component of the eye-movement trajectory V, is equal to t h s eye movement during VOR stimulation (e.g., diagram B). The magnitude of V, in the horizontal plane can be measured and is what we call the interaction velocity. According to equation 2, the magnitude of the interaction velocity is indistinguishable from eye velocities measured during rotation in the dark using identical rotatory stimuli.
For each interaction test, the VT trajectory was initially placed in the vertical plane. Subjects were told to track the VT during the test and given 20 or 25 s to view it
A B C D
- Stimulus
- Response
11111 Rotation in the dark
= Tracking - Subjective Sensation
Horiz. Purs. = VOR
FIGURE 1. Schematic representation of stimulus-response expectations underlying our experi- ments. A involves only laser tracking in the vertical direction; B represents horizontal vestibular stimulation only, with no targets for fixation; C is a superposition of the first two cases; and D represents the situation after inclination of the visual target (VT) trajectory so that it appears vertical to the subject. “Horiz. Purs.” indicates the magnitude of the horizontal component; it is expected that this will be equal to the response in B. Tracking stimuli and responses are indicated by arrows shaded with a horizontal pattern. Vestibular stimuli and responses are indicated by arrows shaded with a vertical pattern. Subjective responses are shown by solid arrows.
in the vertical plane. At the end of this period, subjects were asked to indicate by voice whether the trajectory appeared tilted left, tilted right, or was vertical. The tilt of the VT trajectory was then adjusted by the operator and the subject was again queried. This process was repeated several times using a random order of converging angles. Several reports of vertical might be found in a given test.
The initial adjustment to the horizontal VT controller was about half the rotatory head velocity taking into consideration the approximated 0.5 VOR gain of normal subjects as experienced in the laboratory. The VT velocity was adjusted to either a

412 ANNALS NEW YORK ACADEMY OF SCIENCES
more leftward or rightward direction in random order to verify the accuracy of the report. The magnitude of the horizontal vector and hence the angle of tilt was recorded in the computer file, along with all the other experimental signals. The time at which the subjective verticality was reported was noted in the hard-copy record. The procedure was repeated several times during the 30-cycle duration of the test, usually providing three opportunities for appreciation of subjective verticality mea- surements.
Interaction tests were grouped in the following order: FULL cycle, UP cycle, and DOWN cycle. There were three of these groups for each subject. Each group corresponded to one of the randomly presented rotatory chair peak velocities.
For six subjects, another FULL cycle test was performed with a peak rotatory chair velocity of 28"/s at the end of the protocol. During this test, subjects were instructed to use the subjective sensation switches to indicate their direction of self-rotation.
Data Analysis Software
Several software programs were created in the LabVIEw programming language for use in this experiment. A program to view and print raw MacEyeball data, the data viewer, was written. A second program (data splitter) was made to divide long MacEyeball data files into individual smaller segments. A program for manual removal of fast components from the horizontal EOG channel was created (the curnulator). This program reconstructs a position record of slow components by removing fast components and replacing them with a fit that connects the end points of the two adjacent slow components. The result is a cumulative record of eye position. Finally, a program was written to analyze the response from the subjective sensation switches. This program would search the subjective sensation record and identify the time of the beginning and end of perceived left and right motions for each cycle of chair motion.
Data Analysis Procedure
Data analysis was accomplished from records stored in standardized computer files and by using paper records made by the chart recorder. The tracking ability of subjects in the horizontal plane was evaluated by comparing saccade free sinusoidal responses with peak-to-peak VT trajectory amplitudes so as to compute gain. Eye movements during vertical SP were deemed to be unreliable because of the inherent inaccuracy of such EOG measurements. They are affected by the artifactual effect of eyelid movement during eye blinking.18 They were nonetheless recorded and mea- sured in all tests. As expected, these measurements reflected more variation than the horizontal recordings.
The data splitter was used to divide the VOR response (no interaction) into three segments distinguished by rotatory chair peak velocity. The horizontal EOG channel of each segment was analyzed with the data curnulator. The resulting records were analyzed in terms of trends and inspected for peak-to-peak sinusoidal amplitudes which were converted to response velocities.
To analyze the interactive tests (FULL, UP, and DOWN cycle), segments of data where subjects reported a vertical VT trajectory were identified by cycle number and placed in separate files to be analyzed. FULL cycle tests yielded one peak velocity for each segment. UP and DOWN cycle tests (HALF cycle tests) each yielded two peak velocities for each segment. One value was obtained for eye movements while the VT

HONRUBIA et a[.: VESTIBULAR AND PURSUIT STIMULATION 413
was visible, and another for eye movements while the VT was not visible and analyzed accordingly (see above).
Data from the subjective sensation switches was evaluated as described above. The perceived times when motion to the right or left began (RB or LB) and when it ended (RE or LE) were recorded for rotation in the dark and for FULL cycle interaction. These FULL cycle tests were conducted with a rotatory chair peak velocity of 28"/s. Each of these sets of measurements (RB, LB, RE, LE) were converted to phases with respect to the rotatory chair motion and means and standard deviations were computed within.a given test. The FULL cycle tests were divided to obtain results BEFORE and A R E R inclination of the VT trajectory away from true vertical.
RESULTS
Eye Movements
Vestibulo- Oculomotor Responses
An example of eye-movement responses during VOR testing is shown in FIGURE 2. FIGURE 2A, labeled horizontal EOG, is a trace of the eye position during horizontal rotations in the dark. This response shows nystagmic eye movements consisting of slow and fast components. For every cycle of head rotation, the direction of the slow component is opposite to the velocity of the head as shown in FIGURE 2F. In the vertical plane, no appreciable movements were related to the periodic movement of the head (FIG. 2C). The vertical eye position records have been edited to eliminate the corneoretinal potential variations associated with eye blinks that are common in the EOG recordings in the vertical plane.1s Also shown in this figure are responses indicating direction of subjective self-motion as recorded by hand switches under the subject's control (FIG. 2E). Clockwise motion is shown by an upward trace deflection; counterclockwise motion is shown by a downward trace deflection.
Visual-Oculomotor Response
Smooth pursuit tracking was tested in every subject with both horizontally and vertically moving stimuli. Tracking responses in the horizontal plane yielded a mean gain of 0.97 with a standard deviation of 0.06. This result indicates that subjects were capable of tracking a VT as required for a test of interaction between VOR and horizontal SP tracking. The mean gain of vertical tracking was found to be 0.91 with a standard deviation of 0.22. Vertical eye measurements were not used in the evalua- tion of our hypothesis for reasons described above.
Visual- Vestibular Interaction
The goal of these experiments is to compare eye velocities measured during rotation in the dark with corresponding eye velocities measured during visual- vestibular interaction at a time when the subject reported a vertical VT trajectory. This goal was accomplished in three different tests under the headings of FULL, UP, and DOWN cycles of interaction.

414
A-
ANNALS NEW YORK ACADEMY OF SCIENCES
VOR
Horizontal EOG
Vertical EOG
w /-J-.-- --&----- Z O a
~
Subjective Sensation
I I I I
Rate Table
105 110 115 120 125
time (sec)
FIGURE 2. Vestibulo-ocular reflexes. Raw data from rotation in the dark. (A) A standard horizontal electro-oculographic (EOG) response to rotation in the dark showing a typical nystagmus with a combination of fast and slow components. (B) Dashed line indicates that the visual target (VT) is off so that no tracking or fixation stimulus of any kind is found in the horizontal plane. (C) Shows relatively little vertical EOG response due to the horizontal stimulus. (D) Dashed line indicates that the VT is off so that no tracking or hat ion stimulus of any kind is found in the vertical plane. (E) Shows the subject's perception of self-motion as recorded by the electronic switches located on the armrests of the rotatory chair. (F) Displays a rate table motion of 0.2 Hz and 28"/s peak velocity.
Full-cycle visual-vestibufar interaction. During these tests, the subjects were ex- posed to rotatory chair motion and VT motion simultaneously. No visual stimuli were present other than the VT. A n example of the data recorded during chair rotations at 28"/s peak velocity is shown in FIGURE 3. The rate table and the vertical VT motion

HONRUBIA et aZ.: VESTIBULAR AND PURSUIT STIMULATION 415
started simultaneously. As indicated in FIGURE 1, the phase relationship was such that counterclockwise head velocity was in phase with upward VT velocity (see FIG. 3D and F). Records of eye movements are shown in FIGURE 3A (horizontal EOG) and 3C (vertical EOG). During these tests, the subject's perception of the V T motion is a straight V T trajectory, which, due to the relative phases of the interactive stimuli, appears tilted to the left. The horizontal EOG traces shown during the first two
E n
W W n
W W n
W W n
IY
-I
V W vl \ W W n
FULL
Horizontal EOG
-20 t-
Horizontal Target 20 B. 0
2 O C c* I
Vertical EOG
-20 1
Vertical Target
c Subjective Sensation
Rate Table
40 45 50 55 60 65 time (sec)
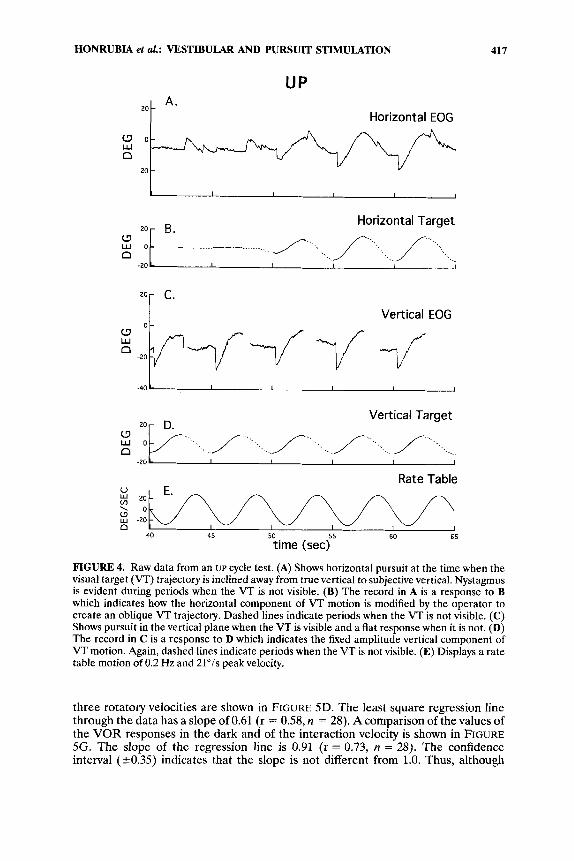
FIGURE 3. Raw data from a FULL cycle test. (A) Shows horizontal pursuit at the time when the visual target (VT) trajectory is inclined away from true vertical to subjective vertical. (B) The record in A is a response to B which indicates how the horizontal component of VT motion is modified by the operator to create an oblique VT trajectory. (C) Shows constant amplitude vertical pursuit. (D) The record in C is a response to D which indicates the fixed amplitude vertical component of VT motion. (E) Shows the subject's perception of self-motion as recorded by the electronic switches located on the armrests of the rotatory chair. (F) Displays a rate table motion of 0.2 Hz and 28"/s peak velocity.

416 ANNALS NEW YORK ACADEMY OF SCIENCES
cycles of response are almost straight traces with small sinusoidal position modula- tion due to a slight misalignment of the horizontal electrodes. At the time indicated by the arrows, the trajectory of the VT was inclined toward the right by the introduction of the command signal in the horizontal controlling galvanometer (see FIGS. 3A and B). The horizontal EOG records reflect the presence of a vector in that plane with large sinusoidal horizontal eye movements. Notice that the magnitude of the vertical vector remains unchanged and in phase with the horizontal vector. Both the VT and the eye trajectory have a rightward trajectory during upward motion and a leftward trajectory during downward motion. The inclination of the VT was changed until the subject indicated that the light appeared to move vertically.
FIGURE 3E (subjective sensation) shows a simultaneously recorded trace regard- ing subjective sensation of self-motion. Subjects reported motion responses that corresponded with the phase of the head velocity motion.
Half-cycle visual-vestibular interaction. During these tests, the subjects were ex- posed to rotatory chair motion and only a half cycle of VT visibility. In one experiment, the VT was visible only during its upward motion (UP cycle) and, in the other experiment, the VT was visible only during its downward motion (DOWN cycle).
An example of the records obtained in these experiments is shown in FIGURE 4. The data was obtained during UP cycle interaction. FIGURE 4A shows horizontal eye response during the transition period when the VT trajectory is changed from true vertical to subjective vertical. Tracking is evident during periods when the VT is visible. Nystagmus from the VOR response is present when the VT is not visible. During the first two cycles, when the VT was visible and strictly vertical, the horizontal eye trace is flat while the vertical trace shows upward SP motion; compare the target trajectories in the horizontal and vertical planes. During the horizontal nystagmic response, no vertical eye movement occurred, and the vertical eye trace (FIG. 4C) is flat except for the times when there were eye blinks that have been edited. During the last three cycles, as the horizontal command signal to the VT appears (FIG. 4B), a horizontal SP response alternates with the horizontal nystagmic response. There is no indication of discontinuity except at those moments when a fast component is associated with the VOR nystagmic response. The vertical eye move- ments remain unchanged. There is tracking during the appearance of the vertical VT and a flat response during the time of darkness and horizontal nystagmic responses.
Analysis of Horizontal Eye Movements
Vestibulo-Oculomotor Responses (Rotation in the Dark)
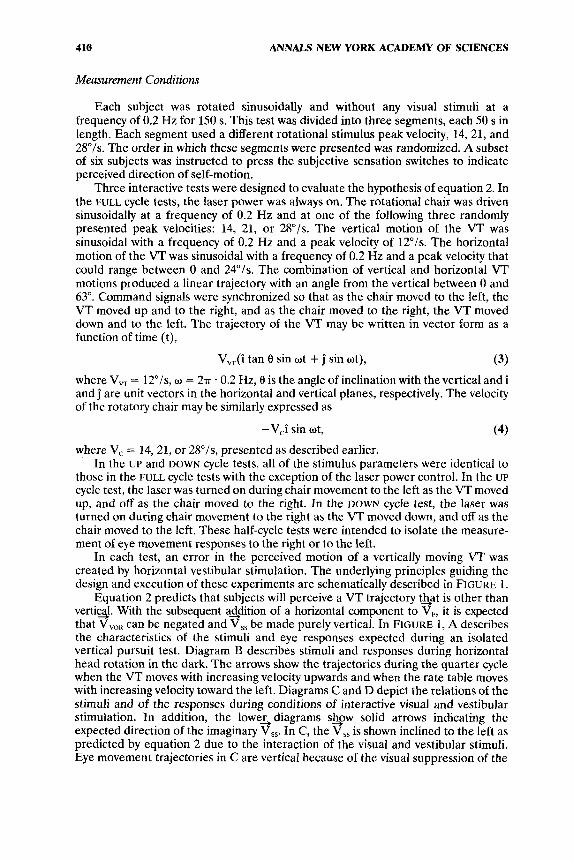
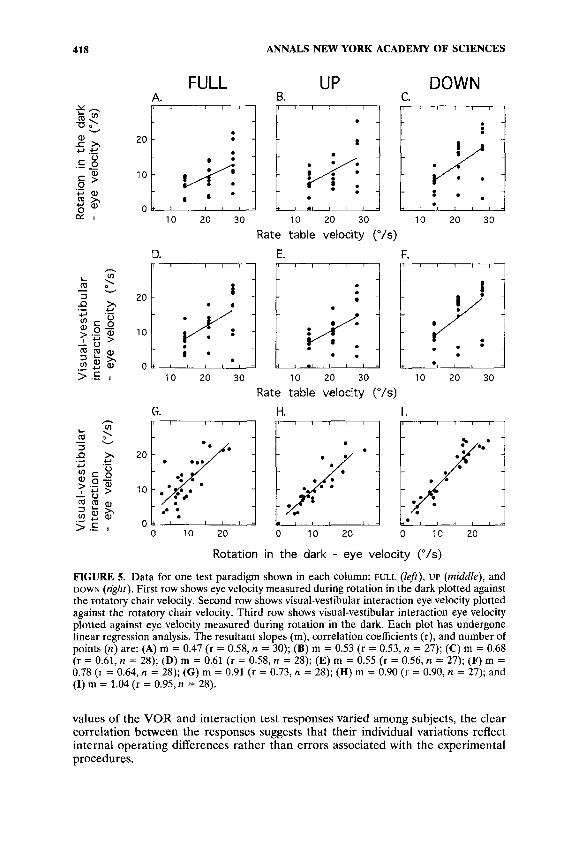
A summary of eye-velocity measurements from the 10 subjects is shown in FIGURE 5A. The response peak angular velocity is indicated for each test magnitude. The slope of the linear regression line is 0.47 (r = 0.58, n = 30). The mean gain values were also computed for each of the three head-velocity stimuli (0.47, 0.42, 0.47) independently. These gains were not statistically different from one another when subjected to a one-factor repeated ANOVA ( p > 0.05), and thus the slope of the regression line is representative of the gain for all tests.
Ksual- Vestibular Interaction
FULL cycle visual-vestibular interaction. The values of the horizontal eye movement velocity at the time of subjective verticality for all the subjects at each of the
HONRUBIA et al.: VESTIBULAR AND PURSUIT STIMULATION
UP
w o (3 n
Horizontal EOG
........ ~. /-..~., 1.. ........ .. ... ....
! -20
CJ w 0 - n
.. /p .... 1.'. ...... /p ...... /p ....
c. Vertical EOG
417
FIGURE 4. Raw data from an UP cycle test. (A) Shows horizontal pursuit at the time when the visual target (VT) trajectory is inclined away from true vertical to subjective vertical. Nystagmus is evident during periods when the VT is not visible. (B) The record in A is a response to B which indicates how the horizontal component of VT motion is modified by the operator to create an oblique VT trajectory. Dashed lines indicate periods when the VT is not visible. (C) Shows pursuit in the vertical plane when the VT is visible and a flat response when it is not. (D) The record in C is a response to D which indicates the fixed amplitude vertical component of VT motion. Again, dashed lines indicate periods when the VT is not visible. (E) Displays a rate table motion of 0.2 Hz and 21"/s peak velocity.
three rotatory velocities are shown in FIGURE 5D. The Ieast square regression line through the data has a slope of 0.61 (r = 0.58, n = 28). A comparison of the values of the VOR responses in the dark and of the interaction velocity is shown in FIGURE 5G. The slope of the regression line is 0.91 (r = 0.73, n = 28). The confidence interval (50.35) indicates that the slope is not different from 1.0. Thus, although
418
20
10
ANNALS NEW YORK ACADEMY OF SCIENCES
i - -
I /: I . I .
FULL
h
20
10
O d
0-
-
-
UP B.
P DOWN
10 20 30 10 20 30 10 20 30 Rate table velocity (o/s)
D. E. F.
0 1 ' 1 ' 1 ' 4 . 10 20 30 10 20 30 10 20 30
Rate table velocity r/s)
G. H. I.
c"'"J p/ . . . .. c
0 10 20 0 10 20 0 10 20
Rotation in the dark - eye velocity ('/s)
FIGURE 5. Data for one test paradigm shown in each column: FULL (left), UP (middle), and DOWN (right). First row shows eye velocity measured during rotation in the dark plotted against the rotatory chair velocity. Second row shows visual-vestibular interaction eye velocity plotted against the rotatory chair velocity. Third row shows visual-vestibular interaction eye velocity plotted against eye velocity measured during rotation in the dark. Each plot has undergone linear regression analysis. The resultant slopes (m), correlation coefficients (r), and number of points (n) are: (A) m = 0.47 (r = 0.58, n = 30); (B) m = 0.53 (r = 0.53, n = 27); (C) m = 0.68 (r = 0.61, n = 28); (D) m = 0.61 (r = 0.58, n = 28); (E) m = 0.55 (r = 0.56, n = 27); (F) m = 0.78 (r = 0.64, n = 28); (G) m = 0.91 (r = 0.73, n = 28); (H) m = 0.90 (r = 0.90, n = 27); and (I) m = 1.04 (r = 0.95,n = 28).
values of the VOR and interaction test responses varied among subjects, the clear correlation between the responses suggests that their individual variations reflect internal operating differences rather than errors associated with the experimental procedures.

HONRUBIA et al.: VESTIBULAR AND PURSUIT STIMULATION 419
Half-cycle visual-vestibular interaction. Horizontal eye velocities were calculated separately during the UP and DOWN cycle tests at the time of the subjective vertical perception of the VT for each subject. Thus, each of the UP or DOWN cycle visual- vestibular interaction tests yielded two sets of eye-velocity data. The first set contains measurements from the nystagmic response while rotating in the dark. The second set corresponds to the visual-vestibular interaction measurement. FIGURE 5B and C show the individual nystagmic response results plotted against each rotational velocity and the calculated linear regression lines. Slopes are 0.53 (r = 0.53, n = 27) and 0.68 (r = 0.61, n = 28), for the UP and for the DOWN cycle tests, respectively. The z-transformations of the correlation coefficients indicate that the two slopes are not significantly different.19 The result of visual-vestibular interaction measurements are shown in FIGURE 5E and F. The slope of the least square lines are 0.55 (r = 0.56, n = 27) and 0.78 (r = 0.64, n = 28) for the UP and DOWN cycle data, respectively. Finally, comparisons between the measurements obtained with the VT visible and with the VT extinguished for each of the UP and DOWN cycle tests are shown in FIGURE 5H and I. The slopes of the regression lines are 0.90 (r = 0.90, n = 27) and 1.04 (r = 0.95, n = 28) for the UP and DOWN data respectively. The slopes are not statistically significantly different from 1 as indicated by the confidence intervals of the slopes (kO.18 and a0.14, respectively). The correlation coefficients indicate a significant positive relationship between the visual interaction data and the nystag- mic measurements. In spite of the variability in the individual interactive and VOR nystagmic responses, the correlation coefficients strongly suggest the consistency of the performance of individuals to match their illusionary images to the values of their individual VORs.
Subjective Sensation of Self-Motion
Subjects were instructed during rotatory testing to activate the right-hand switch for the duration of the time that they felt they were moving to the right and the left-hand switch for the duration of the time they felt motion to the left. These times were converted to phases relative to the rotatory chair stimulus and averaged for each subject. This procedure was carried out in six subjects during rotation in the dark and during FULL cycle visual-vestibular interaction tests, both with a 28"/s rotatory chair peakvelocity. During FULL cycle interactive tests, two sets of data were obtained. The first set was obtained when the subject was fixating on the vertically moving VT at the initial part of the test, and the second set after the VT was adjusted for subjective verticality.
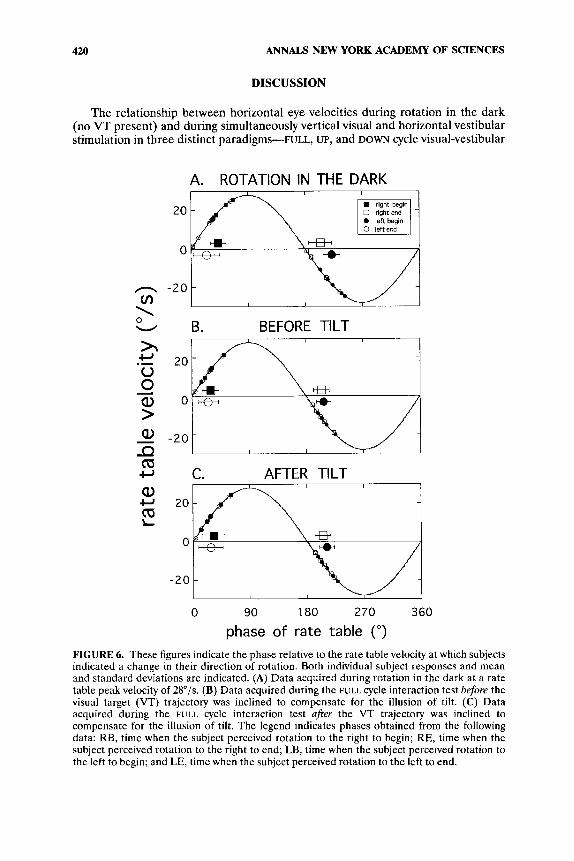
There are three sets of phase measurements: One for rotation in the dark, one for interaction before tilt, and one for interaction after tilt (FIG. 6). Each set contains measurements corresponding to RB, RE, LB, and LE. One-factor repeated ANO- VAs were performed to compare the measurements of each set with the correspond- ing measurements of the other two sets. In each of these four comparisons, p was found to exceed 0.05, indicating that no statistically recognizable difference was found between corresponding sets of measurements.
A further calculation was performed to estimate the threshold of the subjects for vestibular sensation. First, all of the RB phases were averaged. The result was 31.2". Assuming a 400-ms reaction time,2O a phase correction of 29.5" is obtained at a frequency of 0.2 Hz. The corrected RB phase is then 1.T, which corresponds to a stimulus threshold of 0.8"/s. Similar computations for RE, LB, and LE data give threshold values of 2.4"/s, 1.8"/s, and 1.8"/s, respectively. All of these values fall within the expected range for normal subjects.21
420 ANNALS NEW YORK ACADEMY OF SCIENCES
DISCUSSION
The relationship between horizontal eye velocities during rotation in the dark (no VT present) and during simultaneously vertical visual and horizontal vestibular stimulation in three distinct paradigms-FULL, UP, and DOWN cycle visual-vestibular
A. ROTATION IN THE DARK
2 o l f i '
m right begin 0 right end 0 left begin
B. BEFORE TILT
C. AFTER TILT
20
0
0 90 180 270 360 phase of rate table (")
FIGURE 6. These figures indicate the phase relative to the rate table velocity at which subjects indicated a change in their direction of rotation. Both individual subject responses and mean and standard deviations are indicated. (A) Data acquired during rotation in the dark at a rate table peak velocity of 28"/s. (B) Data acquired during the FULL cycle interaction test before the visual target (VT) trajectory was inclined to compensate for the illusion of tilt. (C) Data acquired during the FULL cycle interaction test after the VT trajectory was inclined to compensate for the illusion of tilt. The legend indicates phases obtained from the following data: RB, time when the subject perceived rotation to the right to begin; RE, time when the subject perceived rotation to the right to end; LB, time when the subject perceived rotation to the left to begin; and LE, time when the subject perceived rotation to the left to end.

HONRUBJA et al.: VESTIBULAR AND PURSUIT STIMULATION 421
interaction-provides qualitatively consistent results among subjects. In each of these paradigms, there is an error in the perception of motion of the vertically moving VT during horizontal vestibular stimulation. This error can be compensated by tilting the trajectory of this target away from true vertical. In each case, we have shown that the magnitude of horizontal eye velocities resulting from the tracking of this inclined target at subjective vertical is predicted by the magnitude of the slow component of the VOR during identical vestibular stimulation without visual cues. The results are consistent with the hypothesis stated in equation 1 that the percep- tion of a VT motion (Vreal) is made in relationship to an IRC.
The vectorial representation of these relationships, as in equation 2, is clearly justified by the results illustrated in FIGURE 5, which demonstrate that the steady- state conditions of the IRC are dependent on the vestibular system during horizontal rotations. A pragmatic interpretation of the data is to think that the visual motion sensation can be quantitatively thought of as the result of the “physical” interaction between the real VT velocity and the brain’s appreciation of the subject’s motion. That is, the VT is evaluated relative to the subject’s head, but with an important circumstance that the “subject” velocity is computed to be equal to VOR and not to the head velocity. Then it could be inversely argued that theVdR provides an estimation of the V S M . The following identity seems to be true:
V S M = -VdR
Therefore, if the VOR is an objective measurement of the VSSM, other systems, such as vision and proprioception, need to cooperate to provide the correct head- velocity sensation that is underestimated by the VSSM at the frequencies and velocities tested. The present results point to the need to document further the contribution of other systems to the brain centers which make possible error-free navigation. These results also give evidence of the interaction that must exist between the various systems to provide information adequate for orientation.
Measurements of self-motion perception using VOR during rotation in the dark and during interaction before and after inclination of the VT trajectory are statisti- cally indistinguishable. The psychophysical experience of motion is independent of the oculomotor response and is chiefly determined by head motion, i.e., vestibular stimulation. In other words, the sensation of self-motion is unaffected by the visual interaction, suggesting that the pathways to the centers for vestibular sensation are different from those that regulate VOR responses. It is likely they are also indepen- dent of other reflexes such as neck or proprioceptive inputs.22 Most, if not all, of the vestibular second-order neurons that receive primary vestibular inputs, also receive visual inputsz3 A subset of second-order neurons that project to higher centers for VSSM must exist. These neurons no doubt receive the same input from the vestibular periphery as those mediating the VOR, since the VSSM and VOR have comparable dynamic^?^,^^ That is, they are likely innervated by an aggregate of primary afferents with distributed physiological properties. The VSSM continues to be in phase with the sinusoidal head movement while the eye trajectory is completely suppressed, but where do the VSSM signals depart from the VOR signals? It is evident that the VSSM is coded in terms of head velocity just as the motion of objects is coded in terms of their velocity through the retinal slip signal acting as the SP system i n p ~ t . ~ , ~ , ~ ~ During interactive tests, subjects’ perception of VT movement was in phase with the velocity of the VT and the subjects’ VSSM was in phase with the head angular velocity, not the angular acceleration. It was also found that the timing of the subjects’ perception of a change in rotational direction is consistent with the known value of the sensation threshold to a purely vestibular stimulus and that this
422 ANNALS NEW YORK ACADEMY OF SCIENCES
perception is uninfluenced by the condition of the VT or the associated eye movements.
Although vestibular psychophysical research has been difficult in the past, the use of interactive stimuli offers new avenues to objectively evaluate vestibular subjective sensation. The progress of this approach suggests that related areas (i.e., optokinetic stimuli, neck reflexes, etc.) should also be investigated.
1.
2.
3.
4.
5.
6.
7.
8.
9.
10.
11.
12.
13.
14.
15.
16. 17.
18.
19.
20.
21.
REFERENCES
ROBINSON, D. A. 1981. Control of eye movements. In Handbook of Physiology, The Nervous Component, part 2. V. 8. Brooks, Ed.: 127551320, Williams and Wilkins. Baltimore, MD.
BALOH, R. W. & V. HONRUBIA. 1990. Clinical Neurophysiology of the Vestibular System. 2nd edit. F. A. Davis Co. Philadelphia, PA.
LISBERGER, S. G., E. J. MORRIS & L. TYCHSEN. 1987. Visual motion processing and sensory-motor integration for smooth pursuit eye movements. Annu. Rev. Neurosci. 1 0 97-129.
HORRIDGE, G. A. 1966. Study of a system, as illustrated by the optokinetic response. Symp. SOC. Exp. Biol. 2 0 179-198.
HUDSPETH, A. J. 1985. The cellular basis of hearing: The biophysics of hair cells. Science
STEINHAUSEN, W. 1927. Uber Sichtbarmachung and Funktinosprufung der Cupula termi- nalis in den Bogengangsampullen der Labyrinthes. Arch. Gesamte Physiol. 217: 747- 755.
GOLDBERG, J. M. & C. FERNANDEZ. 1975. Vestibular mechanisms. Annu. Rev. Physiol.
LAU, C. G. Y. 1978. Modeling of visual-vestibular interaction and the fast components of nystagmus. PhD thesis. University of California, Santa Barbara. Santa Barbara, CA.
ROBINSON, D. A. 1977. Vestibular and optokinetic symbiosis: An example of explaining by modeling. I n Control of Gaze by Brain Stem Neurons. R. Baker & A. Berthoz, Eds.: 1: 49-58. Elsevier/North-Holland Biomedical Press. Amsterdam.
WHITESIDE, T. C. D., A. GRAYBIEL & J. I. NIVEN. 1965. Visual illusions of movement. Brain 88: 193-210.
POST, R. B. 1986. Induced motion considered as a visually induced oculogyral illusion. Perception 15(2): 131-138.
BRANDT, T., J. DICHGANS & E. KOENIG. 1973. Differential effects of central verses peripheral vision on egocentric and exocentric motion perception. Exp. Brain Res. 16(5): 476-491.
HONRUBIA, V., R. KHALILI & R. W. BALOH. 1992. Optokinetic and vestibular interactions with smooth pursuit. Psychophysical responses. Ann. N.Y. Acad. Sci. 656 739-746.
HONRUBIA, V., R. KHALILI, C. G. LAU & R. W. BALOH. 1992. Optokinetic and vestibular interactions with smooth pursuit: Psychophysical responses. Acta Otolaryngol. 112(2):
FENN, W. 0. & J. B. HURSH. 1937. Movements of the eyes when the lids are closed. Am. J.
POWSNER, E. R. & K. S. LION. 1950. Testing eye muscles. Electronics 23 96-99. DEMER, J. L. 1992. Mechanisms of human vertical visual-vestibular interaction. J. Neuro-
physiol. 68(6): 212&2146. BARRY, W. & G. MELVILL-JONES. 1965. Influence of eye lid movement upon electro-
oculographic recording of vertical eye movements. Aerosp. Med. 3 6 855-858. COHEN, J. & P. COHEN. 1983. Applied Multiple RegressioniCorrelation Analysis for the
Behavioral Sciences. 2nd edit. L. Erlbaum Associates. Hillsdale, NJ. ZACHARIAS, G. L. & L. R. YOUNG. 1981. Influence of combined visual and vestibular cues
on human perception and control of horizontal rotation. Exp. Brain Res. 41(2): 159- 171.
230(4727): 745-752.
37: 129-162.
163-169.
Physiol. 118: 8-14.
VON B~KEsY, G. 1955. Subjective cupulometry. AMA Arch. Otol. 61: 16-28.

HONRUBIA el al.: VESTIBULAR AND PURSUIT STIMULATION 423
22. MERGNER, T., G. ROTTLER, H. KIMMIG & W. BECKER. 1992. Role of vestibular and neck inputs for the perception of object motion in space. Exp. Brain Res. 89(3): 655-668.
23. WAESPE, W. & V. HENN. 1987. Gaze stabilization in the primate. The interaction of the vestibulo-ocular reflex, optokinetic nystagmus, and smooth pursuit. Rev. Physiol. Biochem. Pharmacol. 106 37-125.
24. HONRUBIA, V., H. A. JENKINS, R. W. BALOH, H. R. KONRAD, R. D. YEE & P. H. WARD. 1982. Comparison of vestibular subjective sensation and nystagmus responses during computerized harmonic acceleration tests. Ann. Otol. Rhinol. Laryngol. 91(5 Pt. 1): 493-500.
25. YOUNG, L. R. 1971. Pursuit eye tracking movements. In The Control of Eye Movements. P. Bach-Y-Rita & C. C. Coliins, Eds.: 429443. Academic Press. New York.