study material for b.com economics for competitive exam - ii ...
25
STUDY MATERIAL FOR B.COM ECONOMICS FOR COMPETITIVE EXAM - II SEMESTER - IV, ACADEMIC YEAR 2020 - 21 Page 1 of 25 UNIT CONTENT PAGE Nr I MICRO AND MACRO ECONOMICS 02 II ECONOMIC DEVELOPMENT 08 III REGIONAL DEVELOPMENT 12 IV APTITUDE LOGICAL REASONING 18 V STATISTICAL TECHNIQUES STATISTICS 21
-
Upload
khangminh22 -
Category
Documents
-
view
1 -
download
0
Transcript of study material for b.com economics for competitive exam - ii ...

STUDY MATERIAL FOR B.COM ECONOMICS FOR COMPETITIVE EXAM - II SEMESTER - IV, ACADEMIC YEAR 2020 - 21
Page 1 of 25
UNIT CONTENT PAGE Nr
I MICRO AND MACRO ECONOMICS 02
II ECONOMIC DEVELOPMENT 08
III REGIONAL DEVELOPMENT 12
IV APTITUDE LOGICAL REASONING 18
V STATISTICAL TECHNIQUES STATISTICS 21
STUDY MATERIAL FOR B.COM ECONOMICS FOR COMPETITIVE EXAM - II SEMESTER - IV, ACADEMIC YEAR 2020 - 21
Page 2 of 25
UNIT - I MICRO AND MACRO ECONOMICS
MEANING OF ECONOMICS
➢ Economics is a social science concerned with the production, distribution, and
consumption of goods and services.
➢ It studies how individuals, businesses, governments, and nations make choices on
allocating resources to satisfy their wants and needs, trying to determine how these
groups should organize and coordinate efforts to achieve maximum output.
➢ Economics is the study of how people allocate scarce resources for production,
distribution, and consumption, both individually and collectively.
➢ Two major types of economics are microeconomics, which focuses on the behaviour of
individual consumers and producers, and macroeconomics, which examine overall
economies on a regional, national, or international scale.
➢ Economics is especially concerned with efficiency in production and exchange and uses
models and assumptions to understand how to create incentives and policies that will
maximize efficiency.
Micro economics The study of the behaviour of individual households and firms in making decisions on
the allocation of limited resources. According to Prof. Boulding, “Microeconomics is the study of a particular firm, particular
household, individual price, wage, income, industry and particular commodity.” ➢ Microeconomics studies individuals and business decisions, while macroeconomics
analyses the decisions made by countries and governments. ➢ Microeconomics focuses on supply and demand, and other forces that determine price
levels, making it a bottom-up approach. ➢ Macroeconomics takes a top-down approach and looks at the economy as a whole,
trying to determine its course and nature. ➢ Micro is a Greek word meaning ‘small’. Thus, microeconomics means economics of
small. Microeconomics deals with:
a. Determination of prices of individual products and factors; and b. Allocation of resources to their most valuable uses so as to maximise total output of the
economy (i.e., deals with central problems of ‘what, how and for whom to produce’). Microeconomics involves several key principles including:
Demand, Supply, and Equilibrium: Prices are determined by the theory of supply and demand. Under this theory, suppliers offer the same price demanded by consumers in a perfectly competitive market. This creates economic equilibrium. (rkepiy) Production Theory: This principle is the study of how goods and services are created or manufactured. Costs of Production:
According to this theory, the price of goods or services is determined by the cost of the resources used during production.
STUDY MATERIAL FOR B.COM ECONOMICS FOR COMPETITIVE EXAM - II SEMESTER - IV, ACADEMIC YEAR 2020 - 21
Page 3 of 25
Labour Economics:
This principle looks at workers and employers, and tries to understand the pattern of wages, employment, and income. Macroeconomics
➢ Macroeconomics, on the other hand, studies the behaviour of a country and how its policies affect the economy as a whole.
➢ Macroeconomics is the branch of economics that deals with the structure, performance, behaviour, and decision-making of the whole, or aggregate, economy.
➢ The two main areas of macroeconomic research are long-term economic growth and shorter-term business cycles.
➢ Macroeconomics is a branch of economics that studies how an overall economy—the market systems that operate on a large scale - behaves. Macroeconomics studies economy-wide phenomena such as inflation (tPf;fk;), price levels, rate of economic growth, national income, gross domestic product (GDP), and changes in unemployment.
➢ It focuses on the aggregate changes in the economy such as unemployment, growth rate, gross domestic product and inflation.
Inflation vs. Deflation:
➢ Inflation occurs when the prices of goods and services rise, ➢ Deflation (gzthl;lk;) occurs when those prices decrease. ➢ The balance between these two economic conditions, opposite sides of the same coin, is
delicate and an economy can quickly swing from one condition to the other. ➢ Central banks keep a keen eye on the levels of price changes and act to stem deflation
or inflation by conducting monetary policy, such as setting interest rates. Unemployment
➢ The unemployment rate is the proportion of unemployed persons in the labour force. ➢ Unemployment adversely affects the disposable income of families, erodes purchasing
power (thq;Fk; rf;jpia mspf;fpwJ), diminishes employee morale (Copah;fspd; kd cWjpiaf; Fiwf;fpwJ), and reduces an economies output.
Fiscal policy
➢ Fiscal policy refers to changes in government expenditure and taxation. Government expenditure, also called public expenditure, and taxation occur at two main levels – national and local.
➢ Governments spend money on a variety of items including benefits (for the retired, unemployed and disabled), education, health care, transport, defence and interest on national debt.Under current institutional arrangements, fiscal policy is the only arm of macroeconomic policy directly controlled by government.
Monetary Policy:
Monetary policy includes changes in the money supply, the rate of interest and the exchange rate, although some economists treat changes in the exchange rate as a separate policy. The main monetary policy measure, currently used in most countries, is changes in the rate of interest.
STUDY MATERIAL FOR B.COM ECONOMICS FOR COMPETITIVE EXAM - II SEMESTER - IV, ACADEMIC YEAR 2020 - 21
Page 4 of 25
Supply-side Policies: ➢ Supply-side policies are policies designed to increase aggregate supply and hence
increase productive potential. Such policies seek to increase the quantity and quality of resources and raise the efficiency of markets.
➢ These include improving education and training, cutting direct taxes and benefits, reforming trade unions and privatization. Improving education and training is designed to raise labour productivity.
Difference between microeconomics and macroeconomics
COMPARISON MICROECONOMICS MACROECONOMICS
Meaning The branch of economics that studies the behaviour of an individual consumer, firm, family is known as Microeconomics.
The branch of economics that studies the behaviour of the whole economy, (both national and international) is known as Macroeconomics.
Deals with Individual economic variables Aggregate economic variables
Business Application
Applied to operational or internal issues
Environment and external issues
Tools Demand and Supply Aggregate Demand and Aggregate Supply
Assumption It assumes that all macro-economic variables are constant.
It assumes that all micro-economic variables are constant.
Concerned with Theory of Product Pricing, Theory of Factor Pricing, Theory of Economic Welfare.
Theory of National Income, Aggregate Consumption, Theory of General Price Level, Economic Growth.
Scope Covers various issues like demand, supply, product pricing, factor pricing, production, consumption, economic welfare, etc.
Covers various issues like, national income, general price level, distribution, employment, money etc.
Importance Helpful in determining the prices of a product along with the prices of factors of production (land, labour, capital, entrepreneur etc.) within the economy.
Maintains stability in the general price level and resolves the major problems of the economy like inflation, deflation, reflation, unemployment and poverty as a whole.
Limitations It is based on unrealistic assumptions, i.e. In microeconomics it is assumed that there is a full employment in the society which is not at all possible.
It has been analysed that 'Fallacy of Composition' involves, which sometimes doesn't prove true because it is possible that what is true for aggregate may not be true for individuals too.
Cobb-Douglas Production Function
In 1928, Charles Cobb and Paul Douglas presented the view that production output is the result of the amount of labour and physical capital invested. This analysis produced a calculation that is still in use today, largely because of its accuracy.
The Cobb-Douglas production function reflects the relationships between its inputs -
namely physical capital and labour - and the amount of output produced. It's a means for calculating the impact of changes in the inputs, the relevant efficiencies, and the yields of a production activity.
STUDY MATERIAL FOR B.COM ECONOMICS FOR COMPETITIVE EXAM - II SEMESTER - IV, ACADEMIC YEAR 2020 - 21
Page 5 of 25
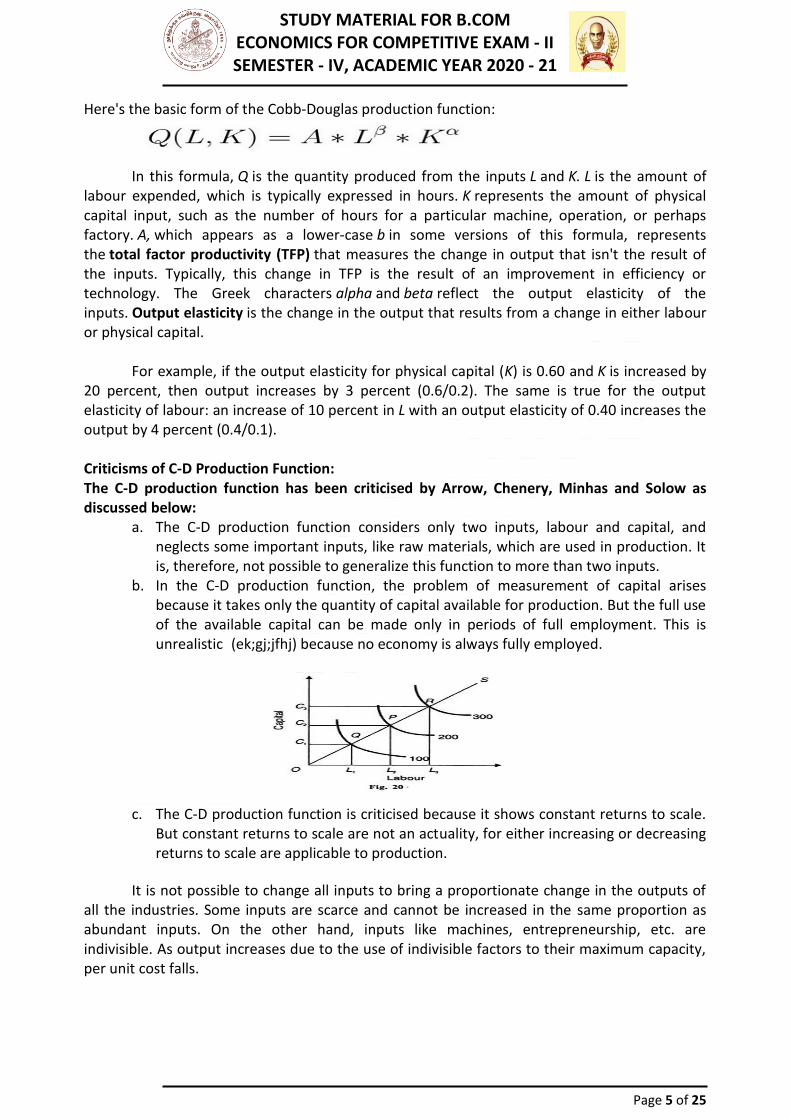
Here's the basic form of the Cobb-Douglas production function:
In this formula, Q is the quantity produced from the inputs L and K. L is the amount of labour expended, which is typically expressed in hours. K represents the amount of physical capital input, such as the number of hours for a particular machine, operation, or perhaps factory. A, which appears as a lower-case b in some versions of this formula, represents the total factor productivity (TFP) that measures the change in output that isn't the result of the inputs. Typically, this change in TFP is the result of an improvement in efficiency or technology. The Greek characters alpha and beta reflect the output elasticity of the inputs. Output elasticity is the change in the output that results from a change in either labour or physical capital.
For example, if the output elasticity for physical capital (K) is 0.60 and K is increased by
20 percent, then output increases by 3 percent (0.6/0.2). The same is true for the output elasticity of labour: an increase of 10 percent in L with an output elasticity of 0.40 increases the output by 4 percent (0.4/0.1).
Criticisms of C-D Production Function: The C-D production function has been criticised by Arrow, Chenery, Minhas and Solow as discussed below:
a. The C-D production function considers only two inputs, labour and capital, and neglects some important inputs, like raw materials, which are used in production. It is, therefore, not possible to generalize this function to more than two inputs.
b. In the C-D production function, the problem of measurement of capital arises because it takes only the quantity of capital available for production. But the full use of the available capital can be made only in periods of full employment. This is unrealistic (ek;gj;jfhj) because no economy is always fully employed.
c. The C-D production function is criticised because it shows constant returns to scale. But constant returns to scale are not an actuality, for either increasing or decreasing returns to scale are applicable to production.
It is not possible to change all inputs to bring a proportionate change in the outputs of all the industries. Some inputs are scarce and cannot be increased in the same proportion as abundant inputs. On the other hand, inputs like machines, entrepreneurship, etc. are indivisible. As output increases due to the use of indivisible factors to their maximum capacity, per unit cost falls.
STUDY MATERIAL FOR B.COM ECONOMICS FOR COMPETITIVE EXAM - II SEMESTER - IV, ACADEMIC YEAR 2020 - 21
Page 6 of 25
PARADOX OF THRIFT THEORY
The paradox of thrift (or paradox of saving) is a paradox of economics. Paradox of Thrift is a concept that was first presented by Bernard Mandeville in 1714. It was later popularized by John Maynard Keynes as one of the essential concepts in the study of macroeconomic theories.
The paradox states that an increase in autonomous saving leads to a decrease
in aggregate demand and thus a decrease in gross output which will in turn lower total saving. The paradox is, narrowly speaking, that total saving may fall because of individuals' attempts to increase their saving, and, broadly speaking, that increase in saving may be harmful to an economy. Both the narrow and broad claims are paradoxical within the assumption underlying the fallacy of composition, (fyitapd; tPo;r;rp) namely that which is true of the parts must be true of the whole. The narrow claim transparently contradicts (முரண்படுகிறது) this assumption, and the broad one does so by implication, because while individual thrift is generally averred to be good for the economy, the paradox of thrift holds that collective thrift may be bad for the economy.
Paradox of thrift refers to contrasting implications of savings to households and to
economy as a whole.Saving is treated as a virtue by households as they provide a protective umbrella against bad spells but same is treated as a vice by the economy as it retards the process of income generation.
Since start of human civilisation, it was considered a virtue to keep consumption level at
the minimum but the lasting effects and chain reactions of keeping consumption in check were not realised. People were taught that thrift or savings are good because a penny saved today will bring increased income.
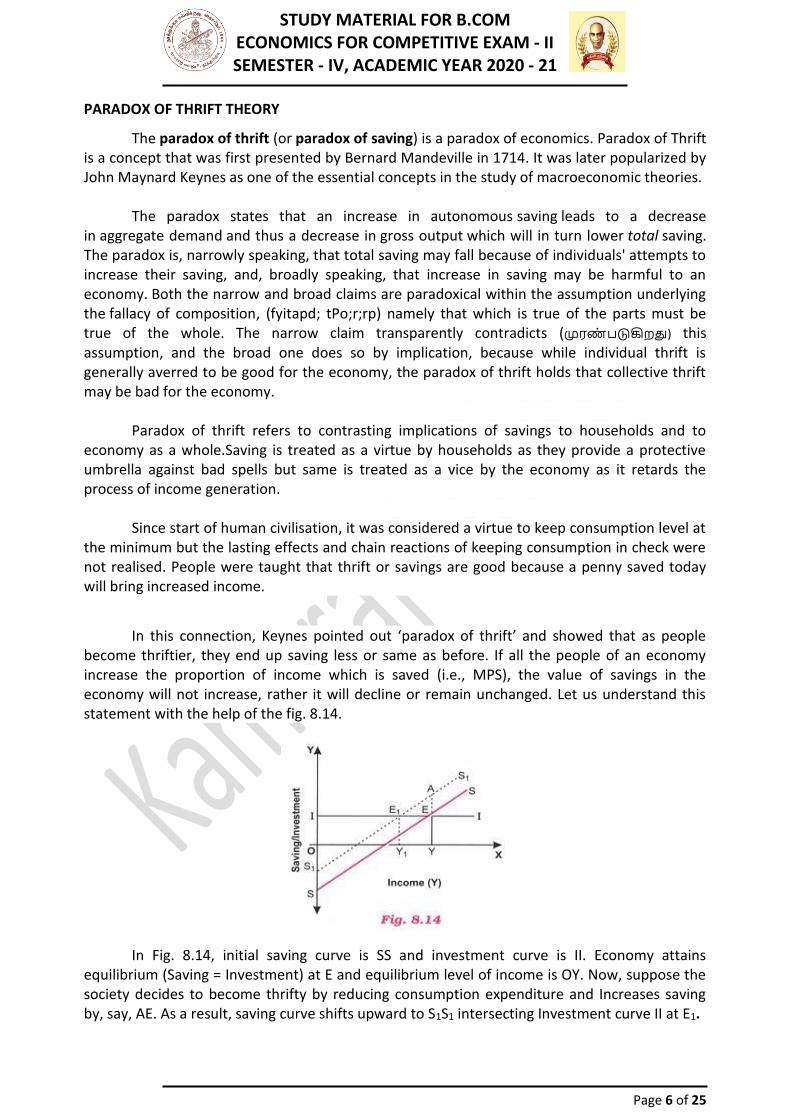
In this connection, Keynes pointed out ‘paradox of thrift’ and showed that as people become thriftier, they end up saving less or same as before. If all the people of an economy increase the proportion of income which is saved (i.e., MPS), the value of savings in the economy will not increase, rather it will decline or remain unchanged. Let us understand this statement with the help of the fig. 8.14.
In Fig. 8.14, initial saving curve is SS and investment curve is II. Economy attains equilibrium (Saving = Investment) at E and equilibrium level of income is OY. Now, suppose the society decides to become thrifty by reducing consumption expenditure and Increases saving by, say, AE. As a result, saving curve shifts upward to S1S1 intersecting Investment curve II at E1.

STUDY MATERIAL FOR B.COM ECONOMICS FOR COMPETITIVE EXAM - II SEMESTER - IV, ACADEMIC YEAR 2020 - 21
Page 7 of 25
Unplanned inventories will increase and firms will cut down production and employment and move to new equilibrium E1. The figure shows that in the end, planned saving has fallen from AY to E1Y1. Notice at new point of equilibrium E1, investment level and also realised saving remain the same (E1Y1) but level of income has fallen from OY to OY1. The decline in equilibrium level of income shows the paradox of thrift as the reverse process of multiplier has worked on reducing consumption expenditure. In fact, Increased saving is virtually a withdrawal from circular flow of income.
Keynesian School of Thought. Keynesian economics theory sometimes called Keynesianism, named after the
economist John Maynard Keynes are various macroeconomic theories about how in the short run – and especially during recessions (ke;jepiy)– economic output is strongly influenced by aggregate demand (total spending in the economy). In the Keynesian view, aggregate demand does not necessarily equal the productive capacity of the economy; instead, it is influenced by a host of factors and sometimes behaves erratically, affecting production, employment, and inflation.
Keynesian economics developed during and after the Great Depression from the ideas presented by Keynes in his 1936 book, The General Theory of Employment, Interest and Money.
Keynesian economics served as the standard economic model in the developed nations during the later part of the Great Depression, World War II, and the post-war economic expansion (1945–1973), though it lost some influence following the oil shock and resulting stagflation of the 1970s.
The advent of the financial crisis of 2007–08 caused a resurgence in Keynesian thought, which continues as new Keynesian economics.
Keynesian economists generally argue that as aggregate demand is volatile and unstable, a market economy often experiences inefficient macroeconomic outcomes in the form of economic recessions (when demand is low) and inflation (when demand is high), and that these can be mitigated by economic policy responses, in particular, monetary policy actions by the central bank and fiscal policy actions by the government, which can help stabilize output over the business cycle.
Keynesian economists generally advocate a managed market economy – predominantly private sector, but with an active role for government intervention during recessions and depressions.
UNIT - II
STUDY MATERIAL FOR B.COM ECONOMICS FOR COMPETITIVE EXAM - II SEMESTER - IV, ACADEMIC YEAR 2020 - 21
Page 8 of 25
UNIT – II ECONOMIC DEVELOPMENT
Economic development ➢ Economic development is a broader concept than economic growth. Development
reflects social and economic progress and requires economic growth. ➢ Growth is a vital and necessary condition for development, but it is not a sufficient
condition as it cannot guarantee development. ➢ Development economics is a branch of economics that focuses on improving fiscal,
economic, and social conditions in developing countries. ➢ Development economics considers factors such as health, education, working
conditions, domestic and international policies, and market condition. ➢ Economic development is usually the focus of federal, state, and local governments to
improve our standard of living through the creation of jobs, the support of innovation and new ideas, the creation of higher wealth, and the creation of an overall better quality of life.
➢ Economic development is often defined by others based on what it is trying to accomplish. Many times, these objectives include building or improving infrastructure such as roads, bridges, etc.; improving our education system through new schools; enhancing our public safety through fire and police service; or incentivizing new businesses to open a location in a community.
Economic Development Occurs ➢ An increase in real income per head – GDP per capita. ➢ The increase in levels of literacy and education standards. ➢ Improvement in the quality and availability of housing. ➢ Improvement in levels of environmental standards. ➢ Increased life expectancy.
Economic development is a process of structural transformation with continuous
technological innovation and industrial upgrading, which increase labour productivity, and accompanied improvements in infrastructure and institution, which reduce transaction costs.
Barriers to economic growth and development ➢ Poor infrastructure ➢ Human capital inadequacies ➢ Primary product dependency ➢ Declining terms of trade ➢ Savings gap; inadequate capital accumulation ➢ Foreign currency gap and capital flight ➢ Corruption, poor governance, impact of civil war ➢ Population issues
Factors affecting economic growth and development ➢ Economists generally agree that economic development and growth are influenced by
four factors: human resources, physical capital, natural resources and technology. ➢ Highly developed countries have governments that focus on these areas.
STUDY MATERIAL FOR B.COM ECONOMICS FOR COMPETITIVE EXAM - II SEMESTER - IV, ACADEMIC YEAR 2020 - 21
Page 9 of 25
➢ Less-developed countries, even those with high amounts of natural resources, will lag behind when they fail to promote research in technology and improve the skills and education of their workers.
The impact of human resources ➢ The skills, education and training of the labour force have a direct effect on the growth
of an economy. A skilled, well-trained workforce is more productive and will produce a high-quality output that adds efficiency to an economy.
➢ A shortage of skilled labour can be a deterrent to economic growth. An under-utilized, illiterate and unskilled workforce will become a drag on an economy and may possibly lead to higher unemployment.
Investment in Physical Capital ➢ Improvements and increased investment in physical capital-such as roadways,
machinery and factories –will reduce the cost and increase the efficiency of economic output.
➢ Factories and equipment that are modern and well-maintained are more productive than physical labour. Higher productivity leads to increased output.
➢ Labour becomes more productive as the ratio of capital expenditures per worker increases. An improvement in labour productivity increases the growth rate of the economy.
Quantity and Availability of Natural Resources
• The quantity and availability of natural resource affect the rate of economic growth. The discovery of more natural resources, such as oil or mineral deposits, will give a boost to the economy by increasing a country’s production capacity.
• The effectiveness of a county at utilizing and exploiting its natural resources is a function of the skills of the labour force, type of technology and the availability of capital. Skilled and educated workers are able to use these natural resources to spur the growth of the economy.
Improvements in Technology Improvements in technology have a high impact on economic growth. As the scientific community makes more discoveries, managers find ways to apply these innovations as more sophisticated production techniques.
Stages of Growth Rostow has conceived five universal stages: viz:
i. The traditional society, ii. The preparation for the take-off –a stage in which communities build up their
propensities in such a way as would be conductive to take –off, iii. The period of take off in which the productive capacity of the community registers a
distinct upward rise, iv. The stage of drive to maturity, the period of self-sustained growth in which the
economy keeps on moving, and v. The stage of high mass consumption.
STUDY MATERIAL FOR B.COM ECONOMICS FOR COMPETITIVE EXAM - II SEMESTER - IV, ACADEMIC YEAR 2020 - 21
Page 10 of 25
Indicators of development The extent to which a country has developed may be assessed by considering a range of
narrow and broad indicators, including per capita income, life expectancy, edYucation, and the extent of poverty. GDP Measures Economic Output
The gross domestic product is the economic value of a country’s output of goods and services and indicates the strength of its economy. A higher GDP per capita is a sign of a more sophisticated stage of economic development. Poverty Level Per Capita GDP
As a country’s GDP per capita grows, the poverty rate declines. People earn more money, become more prosperous and begin to accumulate wealth. Overtly rates for countries with low GDP per capita also have a higher proportion of people living in poverty. Higher Incomes and Life Expectancy:
As a country develops, its people move out of poverty, and their life expectancy increases. They earn more money and can afford better medical care. Levels of Economic Development:
Countries that have most of their population employed in agriculture are considered less developed. Countries with more urban areas and cities are considered better developed. Consequently, one of the indicators of economic growth is the percentage of people employed in agriculture.
The Human Development Index (HDI)
The HDI was introduced in1990 as part of the United Nations Development Programme (UNDP) to provide a means of measuring economic development in three broad areas- per capita income, health and education. The HDI tracks changes in the level of development of countries over time.
Each year, the UNDP produces a development report, which provides an update of changes during the year, along with a report on a special theme, such as global warming and development, migration (,lk;ngah;T) and development.
The introduction of the index was an explicit acceptance that development is a considerably broader concept than growth, and should include a range of social and economic factors.
The HDI has two main features: A scale from 0(no development) to 1 (complete development). An index, which is based on three equally, weighed components:
1. Longevity (ePz;lMAs;), measured by life expectancy at birth 2. Knowledge, measured by adult literacy and number of years children are
enrolled at Standard of school living, measured by real GDP per capita at purchasing power parity.
➢ An index of 0-0.49 means low development – for example, Nigeria was 0.42 in 2010.
STUDY MATERIAL FOR B.COM ECONOMICS FOR COMPETITIVE EXAM - II SEMESTER - IV, ACADEMIC YEAR 2020 - 21
Page 11 of 25
➢ An index of 0.5-0.69 means medium development – for example, Indonesia was 0.6.3.
➢ An index of 0.7-0.79 means high development – for example, Romania was 0.76.4.
➢ Above 0.8 means very high developed-Finland was 0.87 in 2010.
The HDI is a very useful means of comparing the level of development of countries. GDP per capita alone is clearly too narrow an indicator of economic development and fails to indicate other aspects of development, such as enrolment in school and longevity. Hence, the HDI is a broader and more encompassing indicator of development than GDP, though GDP still provides one third of the index.
GDP per capita GDP per capita is the commonest indicator of material standards of living, and hence is included in the index of development. GDP per capita its found by measuring Gross Domestic Product in a year, and diving it by the population. Evaluation of the HDI Despite widespread use of the HDI there are a number of criticisms that can be made, including:
1. The HDI index is for a single country, and as such does not distinguish between different rates of development within a country, such as between urban and traditional rural communities.
2. Critics argue that the equal weightage between the three main components is rather arbitrary.
3. Development is largely about freedom, but the index does not directly measure this. For example, access to the internet might be regarded by many as a freedom which improves the quality of people’s lives.
4. As with the narrow measures of living standards, GDP per capita, there is no indication of the distribution of income.
5. In addition, the HDI excludes many aspects of economic and social life that could be regarded as contributing to or constraining development, such as crime, corruption, poverty, deprivation (,og;G), and negative externalities.
6. GDP is calculated in terms of purchasing power parity, and the value can change.
STUDY MATERIAL FOR B.COM ECONOMICS FOR COMPETITIVE EXAM - II SEMESTER - IV, ACADEMIC YEAR 2020 - 21
Page 12 of 25
UNIT - III REGIONAL DEVELOPMENT
Regional development
➢ Regional development is a broad term but can be seen as a general effort to reduce regional disparities by supporting (employment and wealth-generating) economic activities in regions.
➢ Regional development policy tended to try to achieve these objectives by means of large-scale infrastructure development and by attracting inward investment.
➢ Regional development means wide-ranging, multi-level activities to promote wellbeing and prosperity in different regions. It is based on interaction between ministries, counties, municipalities and other operators.
➢ In regional development, the goals and measures of different counties and administrative branches are examined together both from national and regional perspectives.
➢ This examination covers both the measures and resources of regional development and the effects of policy-making (in different sectors) on regional development.
The Government’s regional development decision serves as a common regional
development strategy for the duration of the term of government. The ministries are committed to implementing the coordinated regional development targets defined in the regional development decision based on the Government Programme.
The regional development decision is prepared in cooperation between the ministries,
regions and other partners. A central task of the authorities responsible for regional development is to create conditions for this cooperation and for the formation of a shared vision.
The Ministry of Economic Affairs and Employment is responsible for regional
development and its coordination. Regional Councils serve as regional development authorities in the counties. ELY Centres
contribute to regional development by carrying out the central government’s implementation and development tasks in the regions.
The targets and programmes of regional development and the responsibilities of the
authorities have been determined in the Act on Regional Development and the Administration of Structural Funds
Regional planning also helps in reducing the conflicts and competition for resources
between cities in a region. Developing small towns or satellite towns helps in relieving the stress from higher order town thus increasing efficiency.
Regional plans take into account the economic, spatial and environmental goals and
tries to address national level issues. Integrated development and critical analysis of functional linkages is one of the keys to achieve the desired growth.

STUDY MATERIAL FOR B.COM ECONOMICS FOR COMPETITIVE EXAM - II SEMESTER - IV, ACADEMIC YEAR 2020 - 21
Page 13 of 25
Regional plans are a must when cities start to influence development even in far places which might end up in under-utilization and wastage of resources without proper planning.
Polices have a larger and longer impact on the overall growth of region and might
conflict with the land use plan or plan prepared for a specific city; Generally a new body is formed which takes up the work of coordinating between all the individual departments working in the region especially with the development authorities and local bodies.
Allocation of funds for different activities and different areas can also be taken up by the
regional planning board/authority. Government intervention such as implementing a new scheme or policy for a region can also boost the growth perspectives and aide the policy prepared by regional board.
Reduced disparities (Vw;wj;jho;Tfs;) help directly and indirectly by reducing forced
migration, reducing trip lengths, providing better and more job opportunities in nearby areas, having the required services instead of letting them emerging randomly. A special economic zone (SEZ) are also established to support the growth of a region and attract investments.
Regional Development Disparity ➢ It refers to difference in economic development and uneven economic achievement in
different geographical regions. ➢ It is reflected by the indicators like per capita income, the proportion of population
living below the poverty line, the percentage of urban population, percentage of population engaged in agriculture vice-versa engaged in industries, infrastructural development of different states.
Need for Balanced Regional Development
➢ Within democratic polity, growth and prosperity must exhibit regional balance. Thus, a democratic government striving to achieve such balance is axiomatic.
➢ India is subdivided into 29 states differing in terms of their productive potential and the type of industry they can support. The realization of their potential holds the key to increasing the competitiveness of the nation as a whole.
➢ Regional disparity in development causes challenges like violent conflicts, unplanned andhaphazard migration (,ilA+W ,lk;ngah;T) e.g. Insurgency in North-east and Left-wing extremism in large parts of central and eastern states of India.
➢ The sustainability of the growth rate and the goal of the country to achieve its development target will be difficult to meet unless India develops as an integrated whole of regional competency.
Causes of Regional Disparity Historical Factor
➢ The British government and industrialists developed only those regions of the country which possessed rich potential for prosperous manufacturing and trading activities. Thus, port cities like Bombay, and strategically important areas like Calcutta and Madras received initial development.
➢ In the absence of proper land reform measures and proper industrial policy, the country could not attain economic growth to a satisfactory level.

STUDY MATERIAL FOR B.COM ECONOMICS FOR COMPETITIVE EXAM - II SEMESTER - IV, ACADEMIC YEAR 2020 - 21
Page 14 of 25
Geographical Factors ➢ The difficult terrain surrounded by flood prone areas, hilly terrain, rivers and dense
forests leads to increase in the cost of administration, cost of developmental projects, besides making mobilization of resources particularly difficult.
➢ Himalayan states like Himachal Pradesh, Northern Kashmir, Uttarakhand, North-Eastern states remained mostly backward due to its inaccessibility and other inherent difficulties.
Location Specific Advantages
Due to some location advantage like availability of irrigation, raw materials, market, port facilities etc. some regions are getting special favour in respect of site selections of various developmental projects e.g. oil refineries are mostly located in sea area. Early Mover Advantage
New investment in the private sector has a general tendency to concentrate much on those regions having basic infrastructural facilities. Term-lending institutions and commercial banks tend to concentrate investments in the relatively more developed States. Failure of Planning Mechanism
Local needs; one size fits all approach, lack of adequate resources, poor implementation of plans, lack of planning capacity at state level reduced capacity of Planning Commission to ensure balanced development. Restricted Success of Green Revolution
➢ Green revolution improved the agricultural sector to a considerable extent through the adoption of new agricultural strategy of high yielding variety seeds, assured irrigation, provision of technical knowhow etc
➢ However, the benefit of green revolution was restricted to Punjab, Haryana and western Uttar Pradesh as this belt had advantage of irrigation facilities, we’re traditionally wheat growing states, with adequate policy support from State Governments which other areas of lacked and couldn’t reap benefits of Green Revolution.
Law and Order Problem
Extremist violence (jPtputhjtd; Kiw), law and order problem etc. have been obstructing the flow of investments into backward regions besides making flight of capital from backward states. Intra-Regional Disparity
➢ An important aspect of regional disparities in India is the significant level of disparities, which exist within different States. For example, Vidarbha in Maharashtra, Saurashtra in Gujarat.
➢ Demand for and creation of some of the States in the past in the wake of popular agitation was based on perceived neglect of certain backward regions in some of the bigger states such as creation of Andhra Pradesh and Gujarat in the fifties and creation of Punjab, Haryana and Himachal Pradesh in the sixties.
➢ In each State specific reasons exist for backwardness of regions within states e.g. the major cause of backwardness of Vidarbha and Marathwada in Maharashtra and Northern Karnataka is the scarcity of water.

STUDY MATERIAL FOR B.COM ECONOMICS FOR COMPETITIVE EXAM - II SEMESTER - IV, ACADEMIC YEAR 2020 - 21
Page 15 of 25
➢ Backwardness of certain regions in Gujarat, Madhya Pradesh, Bihar and Orissa can be associated with the distinct style of living of the inhabitants who are mostly tribal and the neglect of such regions by the ruling elite.
Main strategies for balance regional development are as follows:
1. The growth potential of each region should be fully developed, but in the precise manner in which this goal is achieved and the stages of growth will not be identical.
2. Some regional factors, such as those connected with physical features and geographical location, cannot be easily altered, but there are others which can be influenced by raising levels of education and skill, developing power and, generally, by applying science and technology on a larger scale.
3. Large scale industries, especially basic and heavy industries, frequently serve as a spearhead of intensive and broad-based development.
4. However, not all regions can offer equally favourable conditions for the development of industry.
5. It is also possible to over-estimate the significance of the location of large industrial units in relation to the living standards of the bulk of the population.
6. To initiate infrastructure development and diversified programmes, the basic and capital goods industries and other large industries.
7. Keeping in mind the availability of related raw materials possibility to develop other industries need to be fully explored, such as labour-intensive industries of the traditional type, small scale industries of the modern type, agricultural processing industries, forest industries, assembly operations and recreational industries (nghOJNghf;F njhopy;fs;).
8. Each region should endeavour to identify, plan for and promote industries which are especially suited to its conditions and for which it can provide relatively greater facilities.
Problems of reginal development disparities
Even today India suffers from several problems like those of regional disparities and income inequalities. It is because, India presents a picture of extreme regional disparities in terms of such indicators of economic development/growth as per capita income, the proportion of population living below poverty line, working population in agriculture for living, the percentage of urban population of total population, percentage of workers in manufacturing industry and services sectors.
Indian economy is richly endowed with productive resources and potential of achieving
a stage of self-sustained growth. In India, inter-regional disparities are so wide and persisting that they cannot be ignored. Economic activities which spell prosperity are not evenly spread throughout the country. In some states industries, financial institutions are concentrated whereas in some states or regions even infrastructure like roads, banks, electricity and water are not available.
In some region’s infrastructure facilities are in huge quantities, but there is no proper
use. Per capita State Domestic Products (SDP) are in variation. Some States such as Punjab, Haryana, Maharashtra are having higher per capita SDP whereas M.P., Bihar, Jharkhand have less per capita SDP.

STUDY MATERIAL FOR B.COM ECONOMICS FOR COMPETITIVE EXAM - II SEMESTER - IV, ACADEMIC YEAR 2020 - 21
Page 16 of 25
Bihar, J&K, M.P. and Orissa recorded a lower growth rate and this contributed to the slow growth in their per capita income. An important reason contributing to widespread regional economic disparities in India is the effect of Green Revolution and uneven develop-ment of infrastructural facilities.
The planning commission has tried to overcome the problem of regional disparities in the following three ways:
a. The recognition of backwardness a factor to be taken into account in the transfer of financial resources from the centre to states;
b. Special area development programmes directed at development of backward areas;
c. Measures to promote private investment. Income Inequities in India is another important problem.
This problem arises because of two things: 1. In a market economy such inequalities lead to inequalities of economic
opportunity. 2. Distribution of income and wealth is closely linked to distributive justice. 3. In India, incidence of inequality and poverty go hand in hand. Both are
widespread and feed each other. The major trends in this regard are given below:
1. The number of poor below poverty line has increased in absolute terms. 2. The structure of economic system generates inequalities. 3. Trends of public budgets and evasion of taxes strengthen inequalities in India.
Meaning of brain drain:
➢ Brain drain is a slang term indicating substantial emigration or migration (FbNaw;wk; my;yJ ,lk;ngah;T) of individuals.
➢ Brain drain can result from several factors including political turmoil or the existence of more favourable professional opportunities elsewhere.
➢ Brain drain causes countries, industries, and organizations to lose a core portion of valuable individuals.
Brain drain can be described as the process in which a country loses its most educated
and talented workers to other countries through migration. This trend is considered a problem, because the most highly skilled and competent individuals leave the country, and contribute their expertise to the economy of other countries. Definition
Brain drain can also be defined as the loss of the academic and technological labour force through the moving of human capital to more favourable geographic, economic, or professional environments. More often than not, the movement occurs from developing countries to developed countries or areas.

STUDY MATERIAL FOR B.COM ECONOMICS FOR COMPETITIVE EXAM - II SEMESTER - IV, ACADEMIC YEAR 2020 - 21
Page 17 of 25
Causes of Brain Drain There are various causes of brain drain, but they differ depending on the country that's
experiencing it. The main causes include seeking employment or higher paying jobs, political instability, and to seek a better quality of life. Causes of brain drain can be categorized into push factors and pull factors.
Push factors are negative characteristics of the home country that form the impetus for
intelligent people migrating from Lesser Developed Countries (LDC). In addition to unemployment and political instability, some other push factors are the
absence of research facilities, employment discrimination, economic underdevelopment, lack of freedom, and poor working conditions.
Pull factors are the positive characteristics of the developed country from which the
migrant would like to benefit. Higher paying jobs and a better quality of life are examples of pull factors. Other pull factors include superior economic outlook, the prestige of foreign training, relatively stable political environment, a modernized educational system to allow for superior training, intellectual freedom, and rich cultures. These lists are not complete; there may be other factors, some of which can be specific to countries or even to individuals. Effects of Brain Drain
Brain drain is prevalent in a developing country, there may be some negative repercussions that can affect the economy. These effects include but are not limited to:
➢ Loss of tax revenue ➢ Loss of potential future entrepreneurs ➢ A shortage of important, skilled workers ➢ The exodus may lead to loss of confidence in the economy. ➢ Loss of innovative ideas ➢ Loss of the country's investment in education ➢ The loss of critical health and education services
STUDY MATERIAL FOR B.COM ECONOMICS FOR COMPETITIVE EXAM - II SEMESTER - IV, ACADEMIC YEAR 2020 - 21
Page 18 of 25
UNIT – IV APTITUDE LOGICAL REASONING
Aptitude Acquired or natural ability (usually measurable with aptitude tests), for learning and
proficiency புலமை in a specific area or discipline. Aptitude is expressed in interest, and is reflected in current performancewhich is expected to improve over time with training.
The need and importance of aptitude test 1. To know whether an individual will become a good teacher, a good physician, a
good social worker or a good artist etc 2. To help individuals to choose professions according to their aptitude. 3. To select workers for particular jobs and vocations. 4. To help the counsellor to render appropriate and exact counselling service
according to aptitude. 5. To help the school authority to reduce the number of probable failures.
Aptitude tests have the following uses:
1. These tests are useful to assist high school students in the proper choice of courses such as Science, Arts and Commerce.
2. They are extensively used in helping students to make choice relating to their future occupation such as; army, air force, military etc.
3. They are sometimes used for selection of students for admission in colleges and technical institutes.
4. They are very useful to make prediction about an individual’s probable success in courses and careers.
Limitations of Aptitude Test:
The physical, social and emotional environment of the pupil is often different from the actual environment in the job or in college. This reduces the predictive value of aptitude test.
An aptitude test gives us a prediction (fzpg;G) of the probability only. There is never any certainty that predictions will always come true. It is noticed that brilliant students sometimes fail to top the list while an average student who was initially not doing well may top the list.
Various factors contribute to success in a course or career. Aptitude is not the sole factor for success in a course or career.
Logical reasoning meaning Logical reasoning tests are a broad group of aptitude tests which test candidate’s
problem-solving ability. These tests may be encountered for any position at any level of recruitment, but they may be particularly common when recruiting for positions which require significant problem-solving ability or higher use of logic.
Logical reasoning questions can be verbal or non-verbal: In verbal logical reasoning
questions, the concepts and problems are expressed in words. The candidates are required to read and understand the given text or paragraph and according choose the right answer from the given options. In non-verbal logical reasoning questions, the concepts and problems are expressed in the form of figures, images or diagrams and the candidates are required to understand them before choosing the right answer out of the given options.
STUDY MATERIAL FOR B.COM ECONOMICS FOR COMPETITIVE EXAM - II SEMESTER - IV, ACADEMIC YEAR 2020 - 21
Page 19 of 25
Logical Reasoning: Verbal Reasoning Logical reasoning (verbal reasoning) refers to the ability of a candidate to understand
and logically work through concepts and problems expressed in words. It checks the ability to extract and work with the meaning, information, and implications from the text. The logics are expressed verbally, and you have to understand the logic before solving the questions.
Logical Reasoning: Nov-Verbal Reasoning
Logical reasoning (non-verbal reasoning) refers to the ability of a candidate to understand and logically work through concepts and problems expressed in the form of images, diagrams, etc. It checks the ability to extract and work with the meaning, information, and implications from the given images or diagrams. Here, the logics are expressed non-verbally, and you have to understand the logic before solving them.
Series
A series is a continuous sequence of numbers, letters, or words that are obtained by some particular previously defined rule. Applying that predefined rule, it is possible to find out the next term of the series. Meaning of letter series:
This type of reasoning questions consists of a series of letters. The letters in the series are arranged in a particular order. One or more letters would be missing from the series. You have to understand the pattern of letters and find the missing letters.
Types of Letter Series Letter Series for Repeating Letters
In this type of questions, a group of letters, usually given a small letter, are repeated in a systematic way and thus a series is established. Some cases are presented below − A sequence of letters in a series may be formed by simply repeating the same group of letters, skipping one letter in turn, in cyclic order. For Example − Question − b-bca-a-ab A - abbca B - babac C - accbc D - bbabb Answer − Option C Letter Series for Non-Repeating Letters
In this type of questions, a series of letters is given, usually in bold letters, where the letters do not repeat. Rather there is a definite rule on the basis of which successive letters are formed. Number Series
In mathematics you must have read various types of number series. Like Arithmetic series, geometric series, arithmetic-geometric series etc. For Example − What is the next term in the following series? 1, 4, 3, 9, 5, 16, 7, 25, 9, 36, 11? A. 64 B. 49 C. 48
STUDY MATERIAL FOR B.COM ECONOMICS FOR COMPETITIVE EXAM - II SEMESTER - IV, ACADEMIC YEAR 2020 - 21
Page 20 of 25
Ans: B Solution: There are two series 1, 3, 5, 7, 9, 11& 4, 9, 16, 25, 36, 49
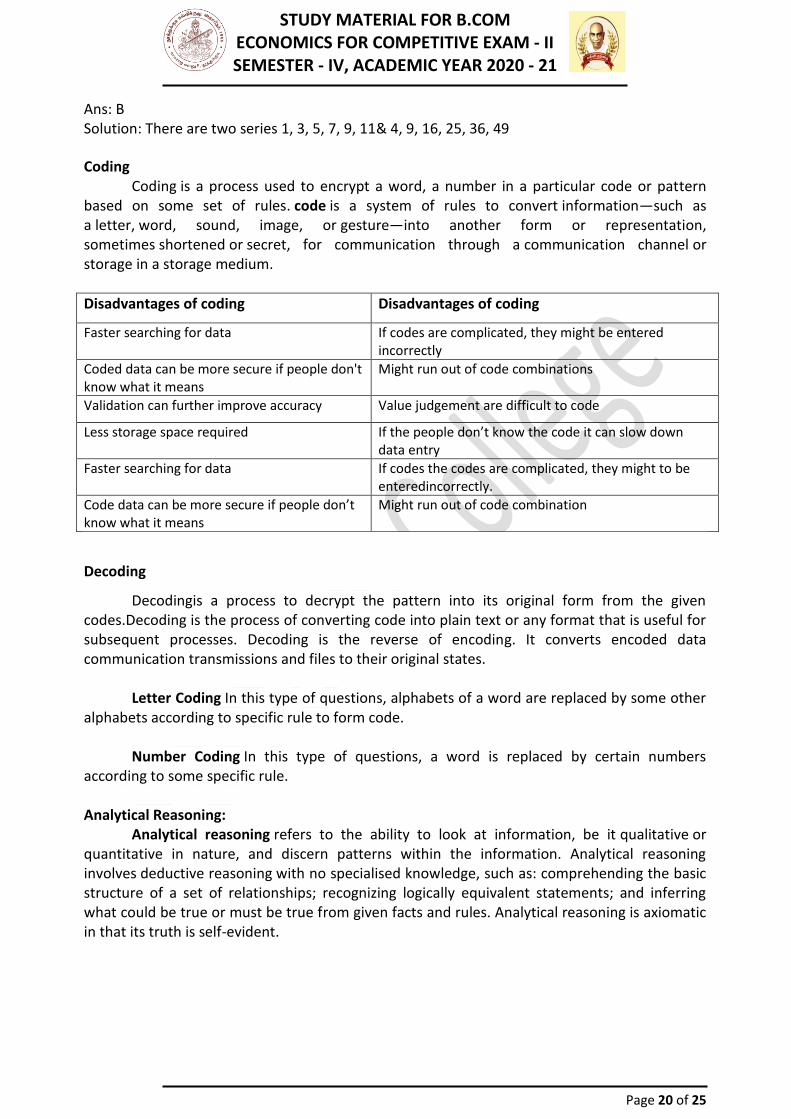
Coding Coding is a process used to encrypt a word, a number in a particular code or pattern
based on some set of rules. code is a system of rules to convert information—such as a letter, word, sound, image, or gesture—into another form or representation, sometimes shortened or secret, for communication through a communication channel or storage in a storage medium.
Disadvantages of coding Disadvantages of coding
Faster searching for data If codes are complicated, they might be entered incorrectly
Coded data can be more secure if people don't know what it means
Might run out of code combinations
Validation can further improve accuracy Value judgement are difficult to code
Less storage space required If the people don’t know the code it can slow down data entry
Faster searching for data If codes the codes are complicated, they might to be enteredincorrectly.
Code data can be more secure if people don’t know what it means
Might run out of code combination
Decoding
Decodingis a process to decrypt the pattern into its original form from the given codes.Decoding is the process of converting code into plain text or any format that is useful for subsequent processes. Decoding is the reverse of encoding. It converts encoded data communication transmissions and files to their original states.
Letter Coding In this type of questions, alphabets of a word are replaced by some other alphabets according to specific rule to form code.
Number Coding In this type of questions, a word is replaced by certain numbers
according to some specific rule.
Analytical Reasoning: Analytical reasoning refers to the ability to look at information, be it qualitative or
quantitative in nature, and discern patterns within the information. Analytical reasoning involves deductive reasoning with no specialised knowledge, such as: comprehending the basic structure of a set of relationships; recognizing logically equivalent statements; and inferring what could be true or must be true from given facts and rules. Analytical reasoning is axiomatic in that its truth is self-evident.

STUDY MATERIAL FOR B.COM ECONOMICS FOR COMPETITIVE EXAM - II SEMESTER - IV, ACADEMIC YEAR 2020 - 21
Page 21 of 25
UNIT - V STATISTICAL TECHNIQUES STATISTICS
Statistics ➢ Economic statistics is a topic in applied statistics that concerns the collection,
processing, compilation, dissemination, and analysis of economic data. ➢ It is also common to call the data themselves 'economic statistics', but for this usage
see economic data. ➢ Statistics is a form of mathematical analysis that uses quantified models,
representations and synopses for a given set of experimental data or real-life studies. ➢ Statistics studies methodologies to gather, review, analyse and draw conclusions from
data. Some statistical measures include the following: ➢ Mean ➢ Regression analysis ➢ Skewness ➢ Kurtosis ➢ Variance ➢ Analysis of variance.
Characteristics of statistics:
a. Numerical data should be aggregate of facts. Single factor isolated facts, or un-related figures do not constitute statistics,
b. Data should be affected to a marked extent by multiplicity of causes. For instance, data on malnutrition is affected not only by poverty but also by a host of other factors like hygienic rules, etc.
c. Data should be numerically expressed. d. Data should be enumerated or estimated with accuracy as far as practicable. e. Data should be collected in a systematic manner. f. Data should be collected to serve a predetermined purpose. g. Data should be placed in order in relation to each other.
Data processing 1.Editing of Data
Editing is the first step in data processing. Editing is the process of examining the data collected in questionnaires/schedules to detect errors and omissions and to see that they are corrected and the schedules are ready for tabulation. There are different types of editing. They are:
a. Editing for quality are the data free of bias, are the recordings free of errors, are the inconsistencies in responses within limits, are there evidences to show dishonesty of enumerators or interviewers and are there any desire manipulation of data.
b. Editing for tabulation does certain accepted modification to data or even rejecting certain pieces of data in order to facilitate tabulation. or instance, extremely high or low value data item may be ignored or bracketed with suitable class interval.
c. Field Editing is done by the enumerator. The schedule filled up by the enumerator or the respondent might have some abbreviated writings, illegible writings and the like. These are rectified by the enumerator. This should be done soon after the enumeration
STUDY MATERIAL FOR B.COM ECONOMICS FOR COMPETITIVE EXAM - II SEMESTER - IV, ACADEMIC YEAR 2020 - 21
Page 22 of 25
or interview before the loss of memory. The field editing should not extend to giving some guess data to fill up omissions.
d. Central Editing is done by the researcher after getting all schedules or questionnaires or forms from the enumerators or respondents. Obvious errors can be corrected. For missed data or information, the editor may substitute data or information by reviewing information provided by likely placed other respondents.
2.Coding of Data
Coding is necessary for efficient analysis and through it the several replies may be reduced to a small number of classes which contain the critical information required for analysis. Coding decisions should usually be taken at the designing stage of the questionnaire. This makes it possible to pre-code the questionnaire choices and which in turn is helpful for computer tabulation as one can straight forward key punch from the original questionnaires. The other method can be to transcribe the data from the questionnaire to a coding sheet. Whatever method is adopted, one should see that coding errors are altogether eliminated or reduced to the minimum level.
Coding is the process/operation by which data/responses are organized into classes/categories and numerals or other symbols are given to each item according to the class in which it falls. In other words, coding involves two important operations;
a) Deciding the categories to be used and b) Allocating individual answers to them.
These categories should be appropriate to the research problem, exhaustive of the data,
mutually exclusive and unit – directional Since the coding eliminates much of information in the raw data, it is important that researchers design category sets carefully in order to utilize the available data more fully.
The study of the responses is the first step in coding. In the case of pressing – coded questions, coding begins at the preparation of interview schedules.
Secondly, coding frame is developed by listing the possible answers to each question and assigning code numbers or symbols to each of them which are the indicators used for coding. The coding frame is an outline of what is coded and how it is to be coded. That is, a coding frame is an outline of what is coded and how it is to be coded. That is, coding frame is a set of explicit rules and conventions that are used to base classification of observations variable into values which are which are transformed into numbers.
Thirdly, after preparing the sample frame the gradual process of fitting the answers to
the questions must be begun. Lastly, transcription is undertaken i.e., transferring of the information from the schedules to a separate sheet called transcription sheet. Transcription sheet is a large summary sheet which contain the answer/codes of all the respondents. Transcription may not be necessary when only simple tables are required and the number of respondents are few.
3.Classification of Data
Classification or categorization is the process of grouping the statistical data under various understandable homogeneous groups for the purpose of convenient interpretation. A

STUDY MATERIAL FOR B.COM ECONOMICS FOR COMPETITIVE EXAM - II SEMESTER - IV, ACADEMIC YEAR 2020 - 21
Page 23 of 25
uniformity of attributes is the basic criterion for classification; and the grouping of data is made according to similarity.
Classification becomes necessary when there is a diversity in the data collected for meaningless for meaningful presentation and analysis. However, it is meaningless in respect of homogeneous data (xNutpjkhd juT). A good classification should have the characteristics of clarity, homogeneity, equality of scale, purposefulness and accuracy
Objectives of Classification are below:
1. The complex scattered and haphazard data is organized into concise, logical and intelligible form.
2. It is possible to make the characteristics of similarities and dis – similarities clear. 3. Comparative studies is possible. 4. Understanding of the significance is made easier and thereby good deal of human
energy is saved. 5. Underlying unity amongst different items is made clear and expressed. 6. Data is so arranged that analysis and generalization becomes possible.
Classification is of two types, viz., quantitative classification, which is on the basis of
variables or quantity and qualitative classification, in which classification according to attributes. The former is the way of, grouping the variables, say, quantifying the variables in cohesive groups, while the latter groups the data on the basis of attributes or qualities. Again, it may be multiple classification or dichotomous classification. The former is the way of making many (more than two) groups on the basis of some quality or attributes while the latter is the classification into two groups on the basis of presence or absence of a certain quality. Grouping the workers of a factory under various income (class intervals) groups come under the multiple classification; and making two groups into skilled workers and unskilled workers is the dichotomous classification. The tabular form of such classification is known as statistical series, which may be inclusive or exclusive.
4.Tabulation of Data
Tabulation is the process of summarizing raw data and displaying it in compact form for further analysis. Therefore, preparing tables is a very important step. Tabulation may be by hand, mechanical, or electronic. The choice is made largely on the basis of the size and type of study, alternative costs, time pressures, and the availability of computers, and computer programmes. If the number of questionnaires is small, and their length short, hand tabulation is quite satisfactory.
Table may be divided into:
1. Frequency tables 2. Response tables 3. Contingency tables 4. Uni-variate tables 5. Bi-variate tables 6. Statistical table 7. Time series tables.

STUDY MATERIAL FOR B.COM ECONOMICS FOR COMPETITIVE EXAM - II SEMESTER - IV, ACADEMIC YEAR 2020 - 21
Page 24 of 25
Generally, a research table has the following parts: a. table number b. title of the table c. caption d. stub (row heading) e. body f. head note g. foot note
As a general rule the following steps are necessary in the preparation of table:
1. Title of table: The table should be first given a brief, simple and clear title which may express the basis of classification.
2. Columns and rows: Each table should be prepared in just adequate number of columns and rows.
3. Captions and stubs: The columns and rows should be given simple and clear captions and stubs.
4. Ruling: Columns and rows should be divided by means of thin or thick rulings. 5. Arrangement of items; Comparable figures should be arranged side by side. 6. Deviations: These should be arranged in the column near the original data so that their
presence may easily be noted. 7. Size of columns: This should be according to the requirement. 8. Arrangements of items: This should be according to the problem. 9. Special emphasis: This can be done by writing important data in bold or special letters. 10. Unit of measurement: The unit should be noted below the lines. 11. Approximation: This should also be noted below the title. 12. Foot – notes: These may be given below the table. 13. Total: Totals of each column and grand total should be in one line. 14. Source: Source of data must be given. For primary data, write primary data.
Data Diagrams
Diagrams are charts and graphs used to present data. These facilitate getting the attention of the reader more. These help presenting data more effectively. Creative presentation of data is possible. The data diagrams classified into:
1. Charts: A chart is a diagrammatic form of data presentation. Bar charts, rectangles,
squares and circles can be used to present data. Bar charts are one-dimensional, while rectangular, squares and circles are two-dimensional.
2. Graphs: The method of presenting numerical data in visual form is called graph, A graph gives relationship between two variables by means of either a curve or a straight line. Graphs may be divided into two categories. (1) Graphs of Time Series and (2) Graphs of Frequency Distribution. In graphs of time series one of the factors is time and other or others is / are the study factors. Graphs on frequency show the distribution of by income, age, etc. of executives and so on.
Interpretation of data
Interpretation of data refers to the task of drawing inferences from the collected facts after an analytical and/or experimental study. In fact, it is a search for broader meaning of research findings. The task of interpretation has two major aspects viz.,

STUDY MATERIAL FOR B.COM ECONOMICS FOR COMPETITIVE EXAM - II SEMESTER - IV, ACADEMIC YEAR 2020 - 21
Page 25 of 25
i. the effort to establish continuity in research through linking the results of a given study with those of another, and
ii. the establishment of some explanatory concepts Uses of statistical techniques of Economics. Some of the statistical tools used in economic analysis are as follows:
1. Collection of data (Primary or secondary) 2. Editing 3. Classification and tabulation 4. Tools of presentation: Diagrams and Graphs (Of various types) 5. Measures of Central Tendency (Mean, Mode, Median, G.M, H.M) 6. Measures of dispersion (Q.D, M.D., S.D.) 7. Moments, Skewness and Kurtosis 8. Correlation and regression 9. Index numbers (Using various methods) 10. Time Series 11. Sampling (Using various methods) 12. Business Forecasting (Using Interpolation Extrapolation etc.) 13. Analysis of Variance 14. Many other methods.