
Strange particle production in proton-proton collisions at $\sqrt{s}$ = 0.9 TeV with ALICE at the...
34
arXiv:1012.3257v2 [hep-ex] 18 Dec 2010 EUROPEAN ORGANIZATION FOR NUCLEAR RESEARCH CERN-PH-EP-2010-065 6 December 2010 Strange particle production in proton-proton collisions at √ s = 0.9 TeV with ALICE at the LHC The ALICE Collaboration ∗ Abstract The production of mesons containing strange quarks (K 0 S , φ ) and both singly and doubly strange baryons (Λ, Λ, and Ξ − + Ξ + ) are measured at central rapidity in pp collisions at √ s = 0.9 TeV with the ALICE experiment at the LHC. The results are obtained from the analysis of about 250 k minimum bias events recorded in 2009. Measurements of yields (dN/dy) and transverse momen- tum spectra at central rapidities for inelastic pp collisions are presented. For mesons, we report yields (〈dN/dy〉) of 0.184 ± 0.002 (stat.) ± 0.006 (syst.) for K 0 S and 0.021 ± 0.004 (stat.) ± 0.003 (syst.) for φ . For baryons, we find 〈dN/dy〉 = 0.048 ± 0.001 (stat.) ± 0.004 (syst.) for Λ,0.047 ± 0.002 (stat.) ± 0.005 (syst.) for Λ and 0.0101 ± 0.0020 (stat.) ± 0.0009 (syst.) for Ξ − + Ξ + . The results are also compared with predictions for identified particle spectra from QCD- inspired models and provide a baseline for comparisons with both future pp measurements at higher energies and heavy-ion collisions. ∗ See Appendix A for the list of collaboration members
-
Upload
unicordoba -
Category
Documents
-
view
3 -
download
0
Transcript of Strange particle production in proton-proton collisions at $\sqrt{s}$ = 0.9 TeV with ALICE at the...

arX
iv:1
012.
3257
v2 [
hep-
ex]
18 D
ec 2
010
EUROPEAN ORGANIZATION FOR NUCLEAR RESEARCH
CERN-PH-EP-2010-0656 December 2010
Strange particle production in proton-proton collisions at√
s = 0.9TeVwith ALICE at the LHC
The ALICE Collaboration∗
Abstract
The production of mesons containing strange quarks (K0S, φ ) and both singly and doubly strange
baryons (Λ, Λ, andΞ−+Ξ+) are measured at central rapidity in pp collisions at
√s = 0.9 TeV
with the ALICE experiment at the LHC. The results are obtained from the analysis of about 250 kminimum bias events recorded in 2009. Measurements of yields (dN/dy) and transverse momen-tum spectra at central rapidities for inelastic pp collisions are presented. For mesons, we reportyields (〈dN/dy〉) of 0.184± 0.002 (stat.) ± 0.006 (syst.) for K0
S and 0.021± 0.004 (stat.) ±0.003 (syst.) for φ . For baryons, we find〈dN/dy〉 = 0.048± 0.001 (stat.) ± 0.004 (syst.) forΛ, 0.047± 0.002 (stat.) ± 0.005 (syst.) for Λ and 0.0101± 0.0020(stat.) ± 0.0009(syst.) forΞ−+Ξ+
. The results are also compared with predictions for identified particle spectra from QCD-inspired models and provide a baseline for comparisons withboth future pp measurements at higherenergies and heavy-ion collisions.
∗See Appendix A for the list of collaboration members


Strange particle production in pp at√
s = 0.9 TeV 3
1 Introduction
The production of hadrons at high transverse momenta in highenergy proton-proton collisions is reason-ably well described by perturbative Quantum Chromodynamics (pQCD) in terms of hard parton-partonscattering (large momentum transfers) followed by fragmentation [1, 2]. However, the low-momentumregion, where most particles are produced and which therefore contributes most to the underlying event,is dominated by soft interactions. In the soft regime, it hasbeen found that particle production can bedescribed effectively by models based on emission from an equilibrated system at a specific temperatureand baryo-chemical potential, with additional accountingof conserved quantities [3, 4, 5]. It can alsobe treated in the framework of QCD inspired phenomenological models, that include multi-parton pro-cesses, extrapolated to very low-momentum transfers [6]. The contribution and evolution of multi-partonprocesses as a function of
√s is difficult to establish. Measurements of identified particles at the beam in-
jection energy of the LHC and in the low transverse momentum (pT) region, along with their comparisonwith QCD-inspired models, constitute a baseline for comparisons with higher centre-of-mass energies.The low pT cutoff achievable through the low material budget, low central barrel magnetic field (0.5 T)and excellent particle identification (PID) of the ALICE detectors, allows an accurate measurement ofthe low momentum region at mid-rapidity.
The differential transverse momentum yields (pT spectra) and integrated yields at central rapidity of K0S,
φ , Λ, Λ andΞ−+Ξ+have been measured by the ALICE experiment during the commissioning phase
of the LHC (December 2009) [7] with the very first proton-proton collisions [8] and are reported inthis article. A sample of 250 k minimum bias pp collisions at
√s = 0.9 TeV has been selected with
triggers combining several fast detectors [9]. Measurements are performed using the tracking devicesand the main PID detectors of ALICE in the central rapidity region (|y| < 0.8). A comparison of thetransverse momentum shapes (mass dependence and mean transverse momentum) with PYTHIA [1] andPHOJET [2] is provided.
This article is organized as follows. Section 2 presents theexperimental conditions, the minimum biasevent selection as well as a brief description of the main detectors and the associated event reconstructiontools used for the analysis. Section 3 is dedicated to the data analysis, including track and topologicalselections, signal extraction methods and the corresponding efficiency corrections. The determinationof the systematic uncertainties are also described in this section. In section 4, thepT spectra and theintegrated yields of the studied particle species are givenand compared with previous measurements andmodel predictions. Conclusions are given in section 5.
2 Experimental set-up and data collection
A detailed description of the ALICE experimental setup and its detector subsystems can be found in [10].
2.1 Main detectors and reconstruction techniques used for the analyses
The central barrel of ALICE covers polar angles from 45 to 135 over the full azimuth. It is embedded inthe large L3 solenoidal magnet providing a nominal magneticfield B of 0.5 T. Within the barrel, the twotracking detectors used in these present analyses consist of an Inner Tracking System (ITS), composedof 6 cylindrical layers of high-resolution Silicon detectors and a cylindrical Time Projection Chamber(TPC). PID is performed using secondary (displaced) vertexreconstruction, invariant mass analysis andsingle track PID methods, which include the measurement of specific ionization in the ITS and the TPC,and the information from the Time-Of-Flight detector (TOF).
2.1.1 The Inner Tracking System
The Silicon Pixel Detector (SPD) corresponds to the two innermost ITS layers. These two layers havea very high granularity with a total of about 9.8 million pixels, each with a size of 50×425 µm2. They
4 The ALICE Collaboration
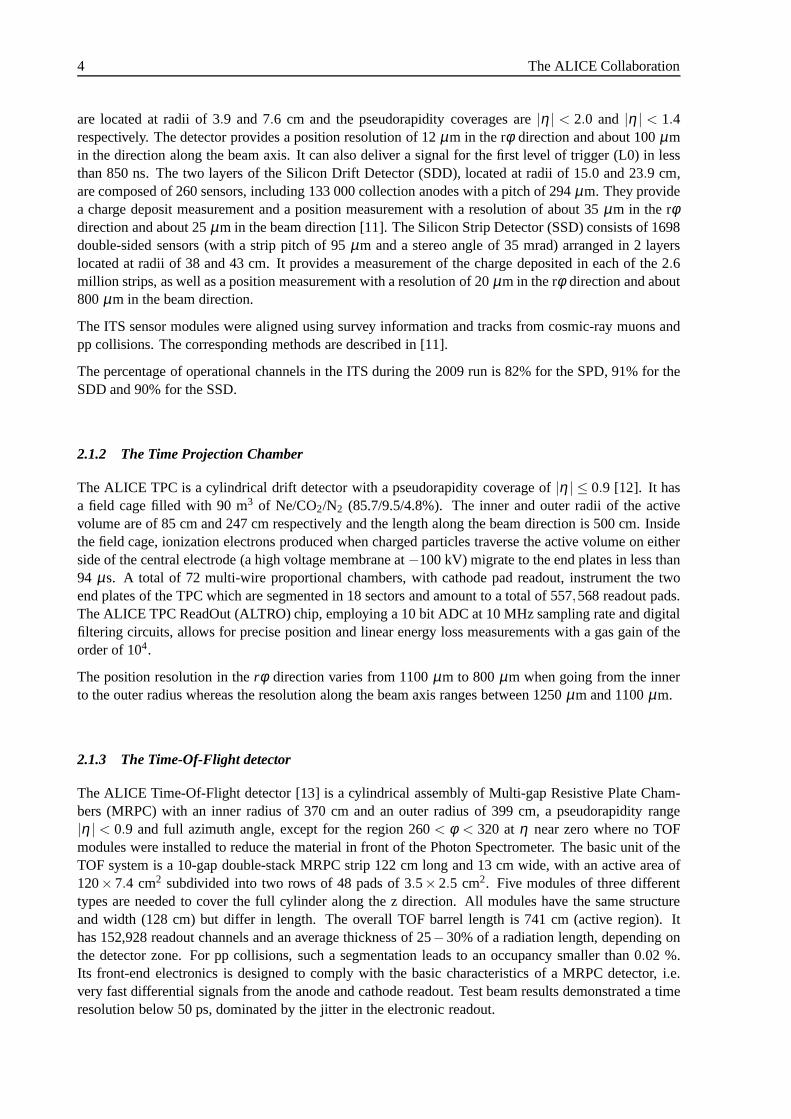
are located at radii of 3.9 and 7.6 cm and the pseudorapidity coverages are|η | < 2.0 and |η | < 1.4respectively. The detector provides a position resolutionof 12 µm in the rφ direction and about 100µmin the direction along the beam axis. It can also deliver a signal for the first level of trigger (L0) in lessthan 850 ns. The two layers of the Silicon Drift Detector (SDD), located at radii of 15.0 and 23.9 cm,are composed of 260 sensors, including 133 000 collection anodes with a pitch of 294µm. They providea charge deposit measurement and a position measurement with a resolution of about 35µm in the rφdirection and about 25µm in the beam direction [11]. The Silicon Strip Detector (SSD) consists of 1698double-sided sensors (with a strip pitch of 95µm and a stereo angle of 35 mrad) arranged in 2 layerslocated at radii of 38 and 43 cm. It provides a measurement of the charge deposited in each of the 2.6million strips, as well as a position measurement with a resolution of 20µm in the rφ direction and about800µm in the beam direction.
The ITS sensor modules were aligned using survey information and tracks from cosmic-ray muons andpp collisions. The corresponding methods are described in [11].
The percentage of operational channels in the ITS during the2009 run is 82% for the SPD, 91% for theSDD and 90% for the SSD.
2.1.2 The Time Projection Chamber
The ALICE TPC is a cylindrical drift detector with a pseudorapidity coverage of|η | ≤ 0.9 [12]. It hasa field cage filled with 90 m3 of Ne/CO2/N2 (85.7/9.5/4.8%). The inner and outer radii of the activevolume are of 85 cm and 247 cm respectively and the length along the beam direction is 500 cm. Insidethe field cage, ionization electrons produced when charged particles traverse the active volume on eitherside of the central electrode (a high voltage membrane at−100 kV) migrate to the end plates in less than94 µs. A total of 72 multi-wire proportional chambers, with cathode pad readout, instrument the twoend plates of the TPC which are segmented in 18 sectors and amount to a total of 557,568 readout pads.The ALICE TPC ReadOut (ALTRO) chip, employing a 10 bit ADC at 10 MHz sampling rate and digitalfiltering circuits, allows for precise position and linear energy loss measurements with a gas gain of theorder of 104.
The position resolution in therφ direction varies from 1100µm to 800µm when going from the innerto the outer radius whereas the resolution along the beam axis ranges between 1250µm and 1100µm.
2.1.3 The Time-Of-Flight detector
The ALICE Time-Of-Flight detector [13] is a cylindrical assembly of Multi-gap Resistive Plate Cham-bers (MRPC) with an inner radius of 370 cm and an outer radius of 399 cm, a pseudorapidity range|η | < 0.9 and full azimuth angle, except for the region 260< φ < 320 atη near zero where no TOFmodules were installed to reduce the material in front of thePhoton Spectrometer. The basic unit of theTOF system is a 10-gap double-stack MRPC strip 122 cm long and13 cm wide, with an active area of120× 7.4 cm2 subdivided into two rows of 48 pads of 3.5× 2.5 cm2. Five modules of three differenttypes are needed to cover the full cylinder along the z direction. All modules have the same structureand width (128 cm) but differ in length. The overall TOF barrel length is 741 cm (active region). Ithas 152,928 readout channels and an average thickness of 25−30% of a radiation length, depending onthe detector zone. For pp collisions, such a segmentation leads to an occupancy smaller than 0.02 %.Its front-end electronics is designed to comply with the basic characteristics of a MRPC detector, i.e.very fast differential signals from the anode and cathode readout. Test beam results demonstrated a timeresolution below 50 ps, dominated by the jitter in the electronic readout.

Strange particle production in pp at√
s = 0.9 TeV 5
2.1.4 The VZERO Counters
The VZERO counters are two scintillator hodoscopes locatedalong the beam direction at−0.9 m and3.3 m from the geometrical centre of the experiment. They correspond to a coverage of−3.7<η <−1.7and 2.8 < η < 5.1 respectively and have a time resolution close to 0.5 ns. They are used as triggerdetectors and help to remove beam-gas interaction background.
2.1.5 Track reconstruction and particle identification
The global tracking system in the ALICE central barrel (combining the ITS and the TPC) covers thepseudorapidity window|η |< 0.9.
The reconstruction in the tracking detectors begins with charge cluster finding. The two coordinates ofthe crossing points (space points) between tracks and detector sensitive elements (pad rows in the TPC,and silicon sensors in the ITS) are calculated as the centresof gravity of the clusters. The errors on thespace point positions are parametrized as functions of the cluster size and of the deposited charge. In theTPC, these errors are further corrected during the tracking, using the crossing angles between tracks andthe pad rows.
The space points reconstructed at the two innermost ITS layers (pixel detector, SPD) are then used for thereconstruction of the primary vertex. One space point from the first SPD layer and one from the secondlayer are combined into pairs called “tracklets”. The primary vertex is consequently reconstructed in 3Das the location that minimizes the sum of the squared distances to all the tracklet extrapolations. If thisfails, the algorithm instead reconstructs thez coordinate of the vertex by correlating thez coordinatesof the SPD space points, while forx and y the average position of the beam in the transverse plane(measured basis by a dedicated calibration procedure on a run-by-run basis) is assumed.
Track reconstruction in ALICE is based on the Kalman filter approach and is discussed in detail in [15].The initial approximations for the track parameters (the “seeds”) are constructed using pairs of spacepoints taken at two outer TPC pad rows separated by a few pad rows and the primary vertex. The primaryvertex position errors for this procedure are considered tobe as big as 3 cm. The seeds for the secondarytracks are created without using the primary vertex, since such a constraint would unnecessarily reducethe V0 finding efficiency. The space points are searched alongthe line connecting the pairs of pointstaken at those two outer TPC pad rows.
Once the track seeds are created, they are sorted according to the estimate of their transverse momentum(pT). Then they are extended from one pad row to another in the TPCand from one layer to anotherin the ITS towards the primary vertex. Every time a space point is found within a prolongation pathdefined by the current estimate of the covariance matrix, thetrack parameters and the covariance matrixare updated using the Kalman filter. For each tracking step, the estimates of the track parameters andthe covariance matrix are also corrected for the mean energyloss and Coulomb multiple scattering inthe traversed material. The decision on the particle mass tobe used for these corrections is based on thedE/dx information given by the TPC when available. If the information is missing or not conclusive, apion mass is assumed. Only five particle hypotheses are considered: electrons, muons, pions, kaons andprotons.
All the tracks are then propagated outwards, through the ITSand the TPC. When possible, they arematched with the hits reconstructed in the TOF detector. During this tracking phase, the track lengthand five time-of-flight hypotheses per track (correspondingto the electron, muon, pion, kaon and protonmasses) are calculated. This information is later used for the TOF PID procedure. The track parame-ters are then re-estimated at the distance of closest approach (DCA) to the primary vertex applying theKalman filter to the space points already attached. Finally,the primary vertex is fitted once again, nowusing reconstructed tracks and the information about the average position and spread of the beam-beaminteraction region estimated for this run.

6 The ALICE Collaboration
In pp collisions, the track reconstruction efficiency in theacceptance of TPC saturates at about 90%because of the effect of the dead zones between its sectors. It goes down to about 75% aroundpT =1 GeV/c and drops to 45% at 0.15 GeV/c. It is limited by particle decays (for kaons), track bendingatlow pT and absorption in the detector material. The amount of material traversed by particles nearη = 0is about 11% of of a radiation length including the beam pipe,the ITS and the TPC (with service andsupport).
The overallpT resolution is at least as good as the TPC-standalone resolution, which is typically 1% formomenta of 1 GeV/c and 7% for momenta of 10 GeV/c, and follows the parameterization(σ(pT)/pT)
2 =(0.01)2+(0.007 pT)
2 wherepT is expressed in GeV/c (see [14] for the details).
The resolution of the track transverse impact parameter (the minimal distance between a track and the pri-mary vertex in the transverse plane) depends on the precision of track and primary vertex reconstruction.These in turn depend on the momentum, and, in the case of the vertex, on the number of contributingtracks. As it was estimated from the data, the transverse impact parameter resolution for a typical ppevent could be parameterized asσ(pT) = 50+60/(pT)
0.9 (σ is in µm, andpT is in GeV/c), which wasdefined by the level of the ITS alignment achieved in 2009.
The dE/dx resolution of the TPC is estimated to be about 5% for tracks with 159 clusters [12], which isbetter than the design value [15]. When averaged over all reconstructed tracks, this resolution is about6.5%.
During the run, the preliminary calibration of the TOF detector corresponds to a resolution of 180 ps,which includes 140 ps due to the jitter in the absolute time ofthe collisions. This contribution is reducedto about 85 ps for those events with at least 3 tracks reachingthe TOF, in which case an independenttime zero determination is possible. The matching efficiency with TPC tracks (which includes geometry,decays and interaction with material) is on average 60% for protons and pions and reaches 65% abovepT = 1 GeV/c. For kaons it remains sligthly lower [16]. AbovepT = 0.5 GeV/c, the TOF PID has anefficiency larger than 60% with a very small contamination.
2.2 LHC running conditions and triggers
For the first collisions provided by the Large Hadron Collider, four low intensity proton bunches (109
protons per bunch, giving the luminosity of the order of 1026 cm−2s−1) per beam were circulated, and twopairs of them crossed at the ALICE interaction point. Under such conditions, the rate for multiple eventsin a given bunch-crossing (“pile-up”) was negligible. The energy in the centre of mass corresponded totwice the beam injection energy, that is
√s = 0.9 TeV. The data acquisition of ALICE was triggered by
requiring two coincidence conditions: i) the LHC bunch-crossing signal together with the two beam pick-up monitors (BPTX); ii) ALICE minimum bias (MB) trigger requiring a combination of signals from theSPD and from the VZERO counters. For these analyses, the MBOR was used, which is fulfilled when atleast one of the VZEROs or the SPD trigger is fired [9]. The corresponding data rate was∼ 10 Hz.
3 Data analysis
3.1 Event and track selection
The primary vertex is reconstructed using either SPD tracklets [8] (5% of the events) or global tracks(95% of the events). Events are selected by requiring that the distance between the position of primaryvertex and the geometrical centre of the apparatus along thebeam axis be less than 10 cm (z =−0.40 cmand rmsz = 4.24 cm, wherez is the average position of the primary vertex along the beam axis). Eventswith less centred primary vertices (|z| > 10 cm) are discarded in order to minimize acceptance andefficiency biases for tracks at the edge of the TPC detection volume. The average position and dispersionfor both horizontal and vertical directions are found to bex = −0.35 mm (y = +1.63 mm) and rmsx =

Strange particle production in pp at√
s = 0.9 TeV 7
Primary vertex z position (cm)
-30 -20 -10 0 10 20 30
Eve
nts
per
1.00
cm
1
10
210
310
410
510
610
Selected
Discarded
Primary vertex x,y position (cm)
-1 -0.5 0 0.5 1
Eve
nts
per
0.05
cm
1
10
210
310
410
510
610
X w/o selection
X w/ selection
Y w/o selection
Y w/ selection
Fig. 1: Primary vertex distributions for the analysed events. The left panel shows the distributions along the beamaxis. Selected events (full symbols) are required to have a reconstructed primary vertex with|z|< 10 cm. The rightpanel corresponds to the directions perpendicular to the beam axis: horizontally (i.e.x-direction, squares and fullline) and vertically (i.e.y-direction, triangles and dashed line).
0.23 mm (rmsy = 0.27 mm). No conditions were applied on thex and y position of the vertex. Thetotal number of events used for obtaining the particle spectra and yields is about 250 k events. Figure 1shows the primary vertex distribution along the beam axis (left panel) and for thex andy directions (rightpanel). The dashed lines indicate the limits of the selectedvertex region.
The normalization to the number of inelastic events (INEL) is obtained in the same way as other ALICEanalyses [8, 16]. It leads to a correction for the normalization of∼ 5% with an uncertainty of 2%. Thisuncertainty is added to the ones described in section 3.5 andmainly related to the modeling of the fractionof diffractive events with several Monte Carlo event generators.
Several quality criteria are defined for track selection. Each track is required to have been reconstructedin the TPC in the initial outward-in step of tracking and thensuccessfully refitted in the final back-propagation to the primary vertex as described in section 2.1.5. It is also required that each track has atleast 80 TPC clusters out of a maximum of 159. At the reconstruction level, split tracks are rejected aswell as those which may correspond to daughters of kaons decaying in the TPC.
As the φ particle is a strongly decaying resonance, its daughters are indistinguishable from primaryparticles at the reconstruction level and therefore primary track selections are used. As a first step, eachtrack is propagated to the reconstructed primary vertex. Ifthis operation is successful, the track is keptif it has a DCA smaller than 5 mm (3 cm) in the transverse (longitudinal) direction with the additionalconstraints of having at least one SPD cluster and aχ2 of less than 4 per cluster assignment (for eachcluster, theχ2 has two degrees of freedom).
Depending on its lifetime, a particle may cross several layers of the ITS before weakly decaying. Theprobability that the daughter tracks of K0
S, Λ, Λ andΞ−+Ξ+have a hit in this detector decreases accord-
ingly. Therefore, no specific condition on the number of ITS hits is required for the daughter tracks ofthe reconstructed secondary vertices. However, other quality criteria are applied for selecting the daugh-ter tracks of weakly decaying particles which are not considered as primaries. The selections describedare summarized in Table 1. The measurement of differential yields in rapidity andpT bins cannot beperformed simultaneously for the particles considered dueto the small available statistics. Thereforethe rapidity ranges are chosen such that i) the efficiency does not vary strongly for each species and ii)the rapidity distribution is sufficiently flat for it to be possible to rely on the Monte Carlo to obtain thecorrections.
8 The ALICE Collaboration
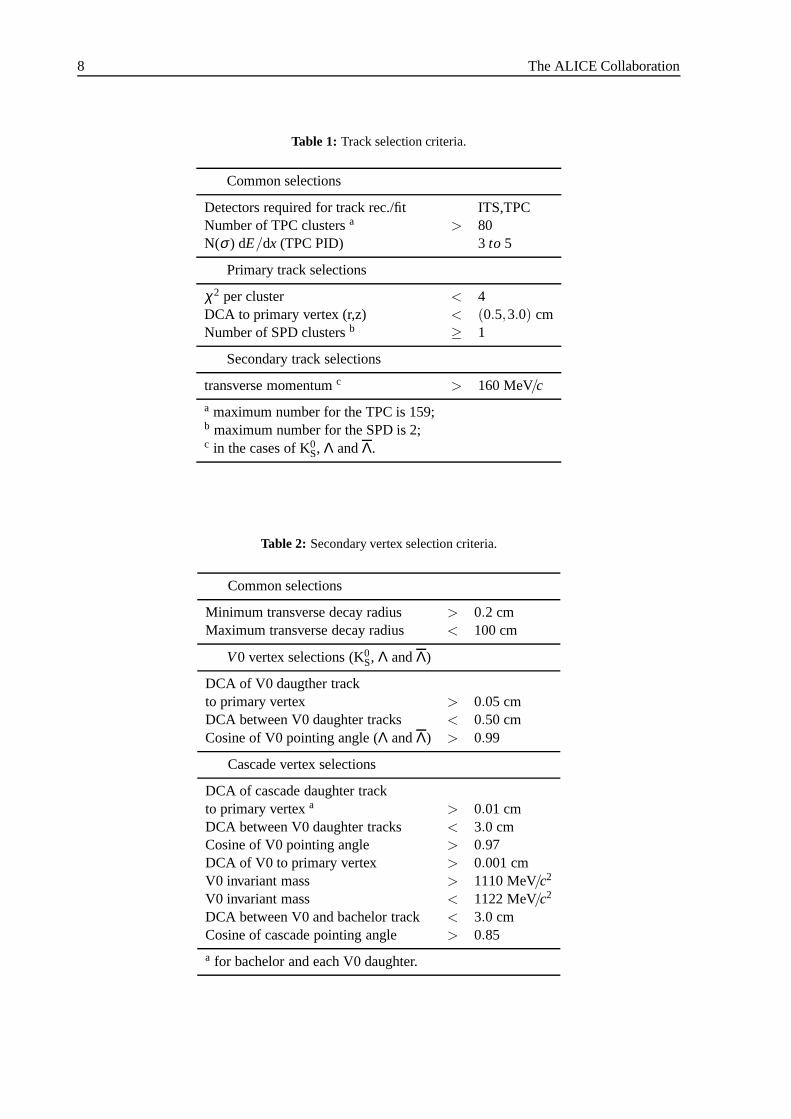
Table 1: Track selection criteria.
Common selections
Detectors required for track rec./fit ITS,TPCNumber of TPC clustersa > 80N(σ ) dE/dx (TPC PID) 3to 5
Primary track selections
χ2 per cluster < 4DCA to primary vertex (r,z) < (0.5,3.0) cmNumber of SPD clustersb ≥ 1
Secondary track selections
transverse momentumc > 160 MeV/c
a maximum number for the TPC is 159;b maximum number for the SPD is 2;c in the cases of K0S, Λ andΛ.
Table 2: Secondary vertex selection criteria.
Common selections
Minimum transverse decay radius > 0.2 cmMaximum transverse decay radius < 100 cm
V0 vertex selections (K0S, Λ andΛ)
DCA of V0 daugther trackto primary vertex > 0.05 cmDCA between V0 daughter tracks < 0.50 cmCosine of V0 pointing angle (Λ andΛ) > 0.99
Cascade vertex selections
DCA of cascade daughter trackto primary vertexa > 0.01 cmDCA between V0 daughter tracks < 3.0 cmCosine of V0 pointing angle > 0.97DCA of V0 to primary vertex > 0.001 cmV0 invariant mass > 1110 MeV/c2
V0 invariant mass < 1122 MeV/c2
DCA between V0 and bachelor track < 3.0 cmCosine of cascade pointing angle > 0.85
a for bachelor and each V0 daughter.

Strange particle production in pp at√
s = 0.9 TeV 9
Table 3: Main characteristics of the reconstructed particles: valence quark content, mass, cτ and charged decaybranching ratio (B.R.) [18].
Particles mass (MeV/c2) cτ charged decay B.R. (%)
MesonsK0
S 497.61 2.68 cm K0S→ π++π− 69.2
φ (ss) 1019.46 45 fm φ → K++K− 49.2
BaryonsΛ (uds) andΛ (uds) 1115.68 7.89 cm Λ→ p+π− andΛ→ p+π+ 63.9Ξ− (dss) andΞ+
(dss) 1321.71 4.91 cm Ξ−→ Λ+π− andΞ+→ Λ+π+ 99.9
3.2 Particle reconstruction and identification methods
3.2.1 Topological reconstruction ofK0S, Λ, Λ and Ξ−+Ξ+
The K0S, Λ, Λ andΞ−+Ξ+
are identified by applying selections on the characteristics of their daughtertracks (see Table 2) and using their weak decay topologies inthe channels listed in Table 3.
The measurement of K0S, Λ andΛ is based on the reconstruction of the secondary vertex (V0) associatedto their weak decay. The V0 finding procedure starts with the selection of secondary tracks, i.e. trackshaving a sufficiently large impact parameter with respect tothe primary vertex. All possible combinationsbetween two secondary tracks of opposite charge are then examined. They are accepted as V0 candidatesonly if the DCA between them is smaller than 0.5 cm. The minimization of the distance between thetracks is performed numerically using helix parametrizations in 3D. The V0 vertex position is a pointon the line connecting the points of closest approach between the two tracks. Its distance from eachdaughter track is taken to be proportional to the precision of the track parameter estimations. Once theirposition is determined, only the V0 candidates located inside a given fiducial volume are kept. Theinner boundary of this fiducial volume is at a radius of 0.2 cm from the primary vertex, while the outerlimit is set at 100 cm. Finally, forΛ andΛ reconstruction, the V0 finding procedure checks whether theparticle momentum (~p) associated with the V0 candidate (calculated as the sum of the track momentaextrapolated to the position of the DCA) points back to the primary vertex. This is achieved by applyinga cut on the cosine of the angle (pointing angleθ~p) between~p and a vector connecting the primary vertexand the V0 position (cosθ~p > 0.99). The invariant mass of each candidate can then be calculated eitherunder the K0S or theΛ hypothesis.
The TPC PID helps substantially to remove the combinatorialbackground for theΛ andΛ (mainly forthe baryon daughter identification, while it is not needed for the K0
S decaying into pions). TPC PIDis described in paragraph 3.2.3. The selections here concern the proton daughter only and have beenchosen to be looser for the daughter track with momentum below 0.7 GeV/c (±5σ ) and tighter forhigher momentum (±3σ ).
TheΞ−+Ξ+particles are identified via their “cascade” decay topology. The cascade finding procedure
starts from the V0 finding procedure for theΛ daughter but with less stringent selection criteria (seeTable 2 and Cascade vertex selections). This is done to increase the efficiency and to allow for the factthat the daughterΛ’s do not have to point back to the primary vertex.
The V0 candidates found within theΛ mass window (1116± 6 MeV/c2) are combined with all pos-sible secondary tracks (bachelor candidates) with the exception of both V0 daughter tracks. A cut onthe impact parameter of the bachelor track is applied to reject the primary particles which increase thecombinatorial background.
A V0-bachelor association is performed if the distance of closest approach between the bachelor trackand the V0 trajectory (DCA between V0 and bachelor track) is small (less than 3 cm). Finally, this

10 The ALICE Collaboration
)2) (GeV/c-π+πM(
0.4 0.45 0.5 0.55
2C
ount
s pe
r M
eV/c
0
500
1000
1500
S0K
)2) (GeV/c±πM(p
1.1 1.15 1.20
500
1000
ΛΛ
)2) (GeV/c-
K+M(K
0.95 1 1.05 1.1 1.15
2C
ount
s pe
r 2
MeV
/c
0
50
100
150
200
250
φ
)2) (GeV/c±π ΛM(
1.25 1.3 1.35 1.4
50
100+ Ξ + - Ξ
Fig. 2: Invariant mass distributions of K0S, Λ andΛ, φ and the sumΞ−+Ξ+. The vertical arrows indicate the
nominal mass values from PDG.
cascade candidate is selected if its reconstructed momentum points back to the primary vertex (cosine ofcascade pointing angle). The cascade finding is limited to the fiducial region used for V0 reconstruction(see Table 2).
In addition to topological selections, the reconstructionof cascades also makes use of the single-trackPID information delivered by the TPC. This is considered foreach of the three daughters (both pionsand the proton). For each track, a loose selection is required (±4σ over the whole momentum range) toreject the combinatorial background in part. The resultinginvariant mass distributions are presented inFig. 2.
3.2.2 Additional quality checks forK0S, Λ, Λ
A significant fraction of the reconstructed V0 come fromγ conversion in the detector material. This canbe clearly seen in the Armenteros-Podolanski distribution[17] shown in Fig. 3 wherep+L and p−L arethe longitudinal components of the total momentum for the positive and negative daughters respectively,relative to the direction of the V0 momentum vector. The K0
S, Λ andΛ signal regions are symmetric andclearly distinguishable.
The lifetime (cτ) distributions for K0S, Λ and Λ are also checked. All V0 candidates within a±3σ
effective mass region around the nominal value are used in the distribution without further residualbackground subtraction. The corresponding distributionsof cτ = L m
p are obtained, whereL is defined asthe distance between primary and V0 vertices, andm andp are the particle mass and momentum. Becauseof the acceptance, the single track efficiency and the topological selections applied at reconstructionlevel, the reconstruction efficiency as a function of the decay length is not constant. The correspondingcorrections are extracted from the reconstruction of full Monte Carlo simulations (see section 3.4). Thecorrectedcτ distributions are fitted using exponential functions. The results are shown with the statisticaluncertainties in Fig. 4. The extracted decay lengths of 7.9±0.1 cm, 7.7±0.1 cm and 2.72±0.03 cm forΛ, Λ and K0
S, respectively, are compatible with the PDG values given in Table 3.

Strange particle production in pp at√
s = 0.9 TeV 11
0
10
20
30
40
50
60
70
80
90
)L
-+pL
+)/(pL--p
L
+ = (pα-1 -0.8 -0.6 -0.4 -0.2 0 0.2 0.4 0.6 0.8 1
(G
eV/c
)Tq
0
0.1
0.2
0.3
Λ Λ
s0K
γ
Fig. 3: Armenteros-Podolanski distribution for V0 candidates showing a clear separation between K0S, Λ andΛ.
Theγ converting toe+e− with the detector material are located in the lowqT region, whereqT is the momentumcomponent perpendicular to the parent momentum vector.
(cm)pmL
0 5 10 15 20 25 30 35 40 45 50
Cou
nts
1
10
210
310
410
510c distributionsτ
only stat. errors included
/ndf2χ slope (cm)
(x20)Λ 114.8/97 0.1±7.9
(x5)Λ 75.35/97 0.1±7.7
(x1)S0K 111.4/96 0.03 ±2.72
Fig. 4: K0S, Λ andΛ lifetime distributions obtained for the candidates selected by the invariant mass within a±3σ
region around the nominal mass and corrected for detection efficiency. The distributions are scaled for visibilityand fitted to an exponential distribution (straight lines).Only statistical uncertainties are shown.
12 The ALICE Collaboration
momentum p (GeV/c)
0.2 0.4 0.6 0.8 1 1.2
dE/d
x in
the
TP
C (
a.u)
0
50
100
150
200
250
300
momentum p (GeV/c)
0 1 2 3 4 5
K)/
tK
(TO
F s
igna
l - t
-0.4
-0.3
-0.2
-0.1
0
0.1
0.2
0.3
0.4
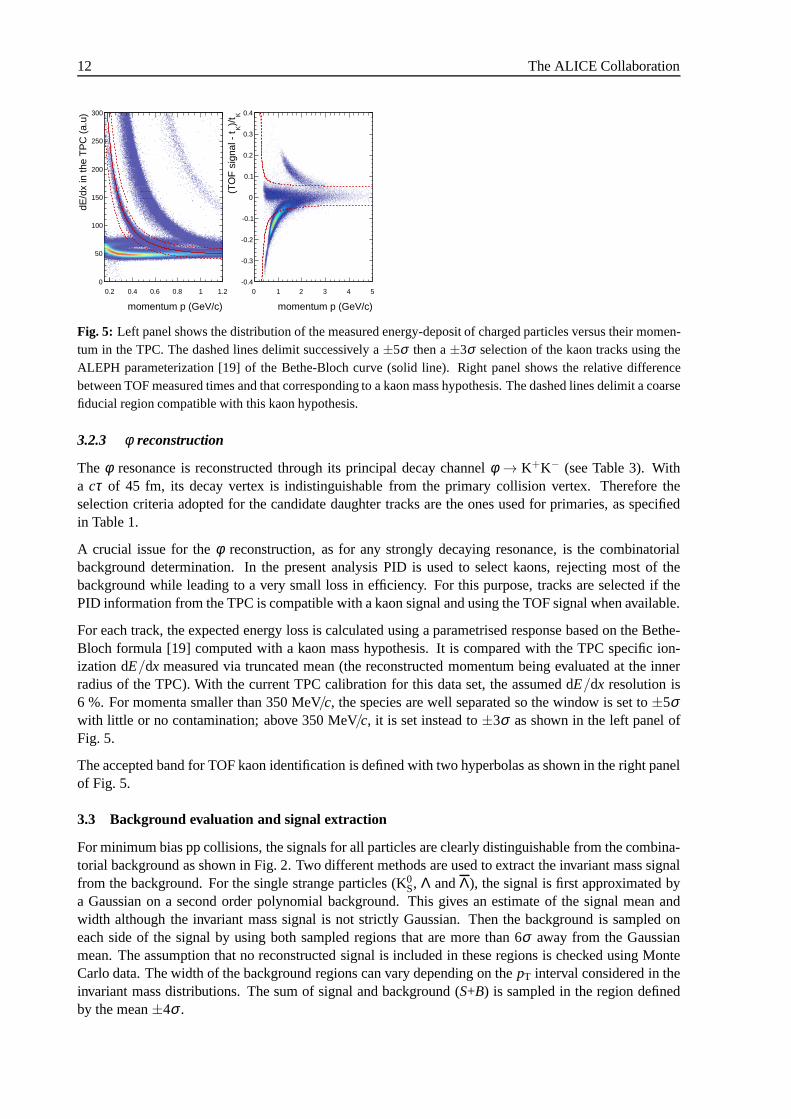
Fig. 5: Left panel shows the distribution of the measured energy-deposit of charged particles versus their momen-tum in the TPC. The dashed lines delimit successively a±5σ then a±3σ selection of the kaon tracks using theALEPH parameterization [19] of the Bethe-Bloch curve (solid line). Right panel shows the relative differencebetween TOF measured times and that corresponding to a kaon mass hypothesis. The dashed lines delimit a coarsefiducial region compatible with this kaon hypothesis.
3.2.3 φ reconstruction
The φ resonance is reconstructed through its principal decay channel φ → K+K− (see Table 3). Witha cτ of 45 fm, its decay vertex is indistinguishable from the primary collision vertex. Therefore theselection criteria adopted for the candidate daughter tracks are the ones used for primaries, as specifiedin Table 1.
A crucial issue for theφ reconstruction, as for any strongly decaying resonance, isthe combinatorialbackground determination. In the present analysis PID is used to select kaons, rejecting most of thebackground while leading to a very small loss in efficiency. For this purpose, tracks are selected if thePID information from the TPC is compatible with a kaon signaland using the TOF signal when available.
For each track, the expected energy loss is calculated usinga parametrised response based on the Bethe-Bloch formula [19] computed with a kaon mass hypothesis. It is compared with the TPC specific ion-ization dE/dx measured via truncated mean (the reconstructed momentum being evaluated at the innerradius of the TPC). With the current TPC calibration for thisdata set, the assumed dE/dx resolution is6 %. For momenta smaller than 350 MeV/c, the species are well separated so the window is set to±5σwith little or no contamination; above 350 MeV/c, it is set instead to±3σ as shown in the left panel ofFig. 5.
The accepted band for TOF kaon identification is defined with two hyperbolas as shown in the right panelof Fig. 5.
3.3 Background evaluation and signal extraction
For minimum bias pp collisions, the signals for all particles are clearly distinguishable from the combina-torial background as shown in Fig. 2. Two different methods are used to extract the invariant mass signalfrom the background. For the single strange particles (K0
S, Λ andΛ), the signal is first approximated bya Gaussian on a second order polynomial background. This gives an estimate of the signal mean andwidth although the invariant mass signal is not strictly Gaussian. Then the background is sampled oneach side of the signal by using both sampled regions that aremore than 6σ away from the Gaussianmean. The assumption that no reconstructed signal is included in these regions is checked using MonteCarlo data. The width of the background regions can vary depending on thepT interval considered in theinvariant mass distributions. The sum of signal and background (S+B) is sampled in the region definedby the mean±4σ .

Strange particle production in pp at√
s = 0.9 TeV 13
)2) (GeV/c-π+πM(0.4 0.45 0.5 0.55 0.6
2C
ount
s pe
r M
eV/c
0
50
100
150
s0K (GeV/c) < 0.50
T0.40 < p
35±Signal [0.482;0.509] = 962
15±Noise under peak = 239
Fig. 6: Plot illustrating the “bin-counting” method used to extract the raw yields. It corresponds to the invariantmass distribution of K0S for the pT bin [0.4− 0.5] GeV/c. The hashed regions show where the background issampled; they are chosen to be 6σ away from the signal approximated with a Gaussian distribution. The averagedor fitted background is subtracted from the signal region of±4σ .
The sampling method is illustrated in Fig. 6 for the K0S. Two methods are used to evaluate the background
and give consistent results. The background areas are either i) fitted simultaneously with polynomialfunctions (from first to third order) or ii) averaged by simply counting the number of entries (“bin-counting”). The backgroundB under the signalS is estimated using the normalized area sampled onboth sides of the signal region (Gaussian mean±4σ ). The signal yieldS = (B+S)−B is thus evaluatedwithout any assumption as to its shape. Systematic effects such as signal asymmetry are taken intoaccount by varying the size of the signal and background intervals up to 1σ . The difference between thetwo methods (fit and bin-counting) contributes to the evaluation of the systematic uncertainties associatedto the signal extraction.
In the case of theΞ−+Ξ+, statistical uncertainties are significant so that, in parallel to the bin-counting
method, the background level is simply estimated by a straight line fit.
Theφ invariant mass distribution has a larger combinatorial background and a function reproducing boththe background and the signal is preferred. It is found that the background can be well reproduced bya function f(M) =a
√M−b, while the peak has the shape of a Gaussian. The peak range is defined as
±4σ around the PDG mass of theφ , whereσ = Γ/2.35 andΓ is the nominal value of the resonance fullwidth at half maximum (4.5 MeV/c2) [18]. For each analyzedpT bin, several fit ranges are investigated.It is found that the fitted width matches that extracted from afull Monte Carlo simulation (as defined insection 3.4) within 5%, except for the lastpT bin where it is broader (∼ 10%). While fluctuations of the fitvalues as a function of the fit range are taken into account forthe systematic error (see section 3.5.1), thefit values used for all subsequent steps in the analysis are those that minimize the difference|χ2/NDF−1|. Figure 7 illustrates the method for the[1.0−1.5] GeV/c pT bin. Every unlike-sign track pair passingall selection criteria and falling within theφ invariant mass peak range is counted. The total number ofφis estimated by subtracting the integral of the background function alone, computed in the same invariantmass range.
The signal counts (raw yields) for each of thepT bins are histogrammed as a function ofpT for K0S, Λ,
Λ in Fig. 8 and forφ andΞ−+Ξ+in Fig. 9. The uncertainties correspond to both the statistical errors
related to the number of counts and the systematics from the bin-counting and fit methods used to extractthe signal from the background.

14 The ALICE Collaboration
)2) (GeV/c-K+M(K1 1.02 1.04 1.06 1.08
2C
ount
s pe
r 2
MeV
/c
0
50
100
150
1 1.01 1.02 1.03 1.04-20
0
20
40
60
Fig. 7: Background evaluation for theφ corresponding to thepT bin [1.0-1.5] GeV/c. The inset shows theφ signalafter background subtraction. The vertical arrows indicate the nominal mass value from PDG.
(GeV/c)T
p0 0.5 1 1.5 2 2.5 3 3.5
Raw
Yie
lds
0
500
1000S0K
Λ
Λ
Fig. 8: Reconstructed (raw) yields of K0S (open circles),Λ (open squares) andΛ (open triangles) as a function ofpT. The change of bin size results in successive offsets of the raw counts atpT = [1.4,1.6,2.4] GeV/c for K0
S andpT = [1.6,2.4,3.0] GeV/c for Λ andΛ. Uncertainties correspond to the statistics and the systematics from thesignal extraction. They are represented by the vertical error bars. The horizontal error bars give the bin width.
(GeV/c)T
p0 0.5 1 1.5 2 2.5 3 3.5
Raw
Yie
lds
50
100
150
200
250
1020φ
+Ξ + -Ξ
Fig. 9: Reconstructed (raw) yields ofφ (stars) andΞ−+Ξ+(diamonds) as a function ofpT. With the current
statistics, 4pT bins are used for theφ ([0.7-1.0], [0.7-1.5], [1.5-2.0] and [2.0-3.0] GeV/c) and 3pT bins for theΞ−+Ξ+
([0.6-1.4], [1.4-2.0] and [2.0-3.0] GeV/c). Uncertainties correspond to the statistics (i.e. the number ofreconstructed particles) and the systematics from the signal extraction. They are represented by the vertical errorbars (the horizontal ones give the bin width).

Strange particle production in pp at√
s = 0.9 TeV 15
(GeV/c)T
p0 0.5 1 1.5 2 2.5 3 3.5
Effi
cien
cy
0
0.1
0.2
0.3
0.4
0.5
0.6
0.7
S0K Λ Λ
Fig. 10: Efficiency of K0S (open circles),Λ (open squares) andΛ (open triangles) as a function ofpT. The
uncertainties correspond to the statistics in Monte Carlo samples used to compute the corrections. The efficiencyis limited by the branching ratio represented by a solid arrow for K0
S (0.692) and by a dashed arrow forΛ andΛ(0.639).
(GeV/c)T
p0 0.5 1 1.5 2 2.5 3 3.5
Effi
cien
cy
0
0.1
0.2
0.3
0.4
0.5
0.6
0.7
1020φ
+Ξ + -Ξ
Fig. 11: Efficiency ofφ (stars) andΞ−+Ξ+(diamonds) as a function ofpT. The uncertainties correspond to the
statistics in the Monte Carlo sample used to compute the corrections. The efficiency is limited by the branchingratio represented by a solid arrow forΞ−+Ξ+
(0.636) and by a dashed arrow forφ (0.492).
3.4 Efficiency corrections
The efficiency corrections are obtained by analysing Monte Carlo (MC) events in exactly the same wayas for the real events. Little dependence is found on the several MC generators which are used. Thereforethe corrections presented here are obtained using the eventgenerator PYTHIA 6.4 (tune D6T) [1, 20]and GEANT3 [21] for particle transport through the ALICE detectors.
The MC information is propagated through the whole reconstruction and identification procedure togenerate the differentialpT efficiencies as shown in Fig. 10 for K0
S, Λ andΛ and in Fig. 11 forφ and
Ξ−+Ξ+. The uncertainties correspond to the statistics of Monte Carlo samples used to compute the
corrections. For all particles, the global efficiency is limited at low pT because of the acceptance ofat least two charged daughter tracks in the detection volumeof the TPC (three tracks in the case ofΞ−+Ξ+
). It rapidly increases withpT but cannot exceed the asymptotic limits given by the chargedparticle decay branching ratios presented in Table 3. The difference between theΛ andΛ reflects theabsorption of the anti-proton daughter of theΛ. For all the variables used to select the particles andimprove the signal over noise ratio (see Tables 1 and 2), it isverified that data and MC distributionsmatch, thus possible efficiency biases can be properly managed. Examples of such distributions arepresented in Fig. 12.

16 The ALICE Collaboration
Positive Daughter DCA (cm)s0 K
0 0.5 1 1.5 2 2.5 3 3.5 4 4.5 5
arb.
uni
ts
0
0.02
0.04
0.06
0.08
0.1
0.12
0.14
0.16
Daughters (cm)s0DCA between K
0 0.1 0.2 0.3 0.4 0.5 0.6
arb.
uni
ts
0
0.1
0.2
0.3
0.4
0.5
0.6
0.7
0.8
Positive Daughter DCA (cm)Λ0 0.5 1 1.5 2 2.5 3 3.5 4 4.5 5
arb.
uni
ts
0
0.05
0.1
0.15
0.2
0.25
0.3
0.35
0.4
Data
Monte Carlo
Daughters (cm)ΛDCA between 0 0.1 0.2 0.3 0.4 0.5 0.6
arb.
uni
ts
0
0.1
0.2
0.3
0.4
0.5
0.6
Fig. 12: Comparison between data (red circles) and Monte Carlo (black open triangles) for several topological vari-ables used to select secondary vertices. The top panels correspond to the K0S candidates selected in a±20 MeV/c2
invariant mass window around the nominal mass. The distribution of the DCA between the positive daughter trackand the primary vertex and the DCA distribution between the two daughters tracks are displayed in the left and theright top panels respectively. On the bottom panels, the same distributions are shown for theΛ candidates selectedin a±8 MeV/c2 invariant mass window around the nominal mass.
Strange particle production in pp at√
s = 0.9 TeV 17
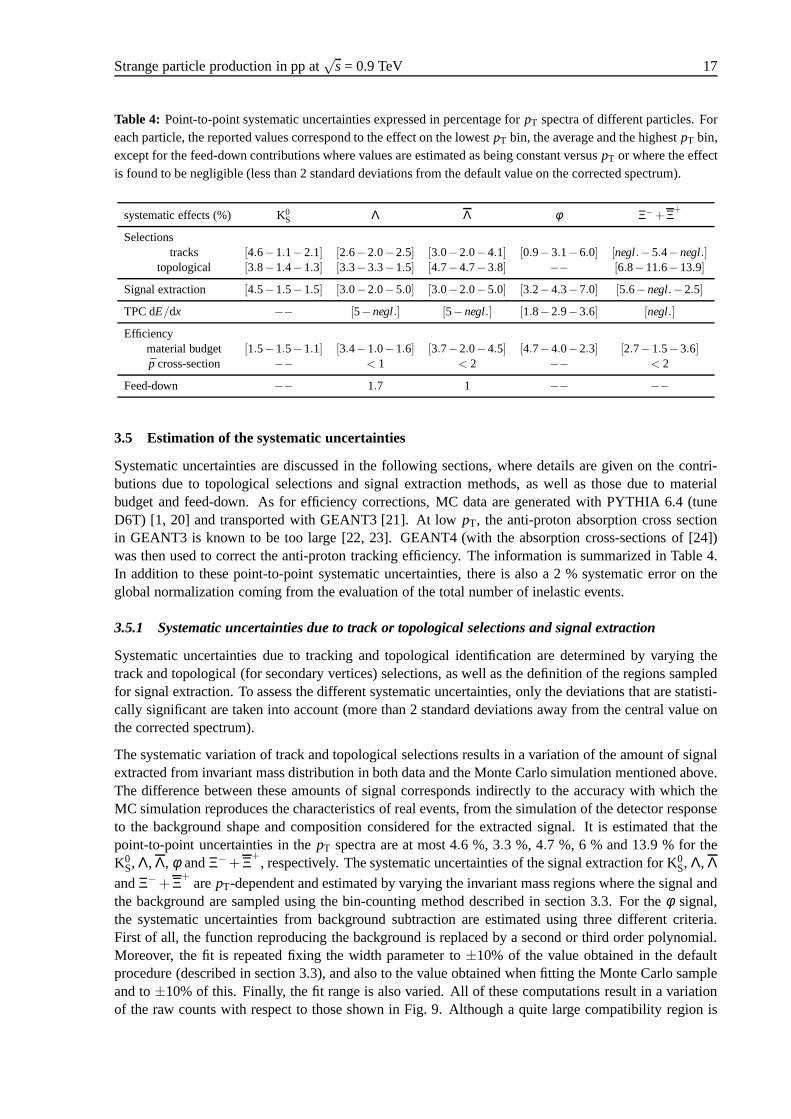
Table 4: Point-to-point systematic uncertainties expressed in percentage forpT spectra of different particles. Foreach particle, the reported values correspond to the effecton the lowestpT bin, the average and the highestpT bin,except for the feed-down contributions where values are estimated as being constant versuspT or where the effectis found to be negligible (less than 2 standard deviations from the default value on the corrected spectrum).
systematic effects (%) K0S Λ Λ φ Ξ−+Ξ+
Selectionstracks [4.6−1.1−2.1] [2.6−2.0−2.5] [3.0−2.0−4.1] [0.9−3.1−6.0] [negl.−5.4−negl.]
topological [3.8−1.4−1.3] [3.3−3.3−1.5] [4.7−4.7−3.8] −− [6.8−11.6−13.9]
Signal extraction [4.5−1.5−1.5] [3.0−2.0−5.0] [3.0−2.0−5.0] [3.2−4.3−7.0] [5.6−negl.−2.5]
TPC dE/dx −− [5−negl.] [5−negl.] [1.8−2.9−3.6] [negl.]
Efficiencymaterial budget [1.5−1.5−1.1] [3.4−1.0−1.6] [3.7−2.0−4.5] [4.7−4.0−2.3] [2.7−1.5−3.6]p cross-section −− < 1 < 2 −− < 2
Feed-down −− 1.7 1 −− −−
3.5 Estimation of the systematic uncertainties
Systematic uncertainties are discussed in the following sections, where details are given on the contri-butions due to topological selections and signal extraction methods, as well as those due to materialbudget and feed-down. As for efficiency corrections, MC dataare generated with PYTHIA 6.4 (tuneD6T) [1, 20] and transported with GEANT3 [21]. At lowpT, the anti-proton absorption cross sectionin GEANT3 is known to be too large [22, 23]. GEANT4 (with the absorption cross-sections of [24])was then used to correct the anti-proton tracking efficiency. The information is summarized in Table 4.In addition to these point-to-point systematic uncertainties, there is also a 2 % systematic error on theglobal normalization coming from the evaluation of the total number of inelastic events.
3.5.1 Systematic uncertainties due to track or topologicalselections and signal extraction
Systematic uncertainties due to tracking and topological identification are determined by varying thetrack and topological (for secondary vertices) selections, as well as the definition of the regions sampledfor signal extraction. To assess the different systematic uncertainties, only the deviations that are statisti-cally significant are taken into account (more than 2 standard deviations away from the central value onthe corrected spectrum).
The systematic variation of track and topological selections results in a variation of the amount of signalextracted from invariant mass distribution in both data andthe Monte Carlo simulation mentioned above.The difference between these amounts of signal correspondsindirectly to the accuracy with which theMC simulation reproduces the characteristics of real events, from the simulation of the detector responseto the background shape and composition considered for the extracted signal. It is estimated that thepoint-to-point uncertainties in thepT spectra are at most 4.6 %, 3.3 %, 4.7 %, 6 % and 13.9 % for theK0
S, Λ, Λ, φ andΞ−+Ξ+, respectively. The systematic uncertainties of the signalextraction for K0
S, Λ, ΛandΞ−+Ξ+
arepT-dependent and estimated by varying the invariant mass regions where the signal andthe background are sampled using the bin-counting method described in section 3.3. For theφ signal,the systematic uncertainties from background subtractionare estimated using three different criteria.First of all, the function reproducing the background is replaced by a second or third order polynomial.Moreover, the fit is repeated fixing the width parameter to±10% of the value obtained in the defaultprocedure (described in section 3.3), and also to the value obtained when fitting the Monte Carlo sampleand to±10% of this. Finally, the fit range is also varied. All of thesecomputations result in a variationof the raw counts with respect to those shown in Fig. 9. Although a quite large compatibility region is

18 The ALICE Collaboration
requested for PID (at least 3σ ) the effects of varying the dE/dx selections are taken into account for thecorresponding efficiency calculation. For bothφ andΞ−+Ξ+
, statistical errors dominate after signalextraction (see section 3.3) and consequently, some systematic effects due to PID are extrapolated fromsingle track and V0 measurements. The TOF PID selection is applied only to reject theφ background. Nosystematic effects are observed on theφ signal i) for the Monte Carlo data sample, when the selectionisapplied to theφ daughters in addition to all other cuts; ii) for real events,when comparing theφ statisticsbefore and after applying the selection.
3.5.2 Systematic uncertainties due to material budget and absorption cross-section
A dedicated study involved the variation of the detector material thickness crossed by particles. Thematerial budget uncertainty, based onγ conversion measurements, is estimated to be 7% in terms orradiation length [22]. The efficiency variation due to this material budget uncertainty depends on themomentum of each of the decay daughters. Although such a variation is also correlated with the mo-mentum of the parent particle, the corresponding systematic uncertainties are reported as point-to-pointerrors in Table 4 for the lowest, the average and the highestpT bin and eventually added in quadrature tothe total systematic errors.
Specific uncertainties are related to the (anti-)proton absorption and scattering cross-sections used forpropagating these particles through the geometry of the detectors with both GEANT3 [21] (and its defaultabsorption cross-sections) and GEANT4 (using the absorption cross-sections of [24]). More details aboutthe modifications can be found in [22, 23] and references therein. The corresponding corrections aretaken into account in the efficiency versuspT assuming that absorption cross-sections are identical forthe (anti-) hyperon and its (anti-) proton daughter. The uncertainties associated with these corrections arederived from the (anti-)proton cross-section uncertainties and the values are estimated as constant andlower than 1% (2%) forΛ (Λ) and 2% forΞ−+Ξ+
.
3.5.3 Systematic uncertainties forΛ and Λ due to feed-down
Some of the reconstructedΛ andΛ particles come from decays ofΞ-hyperons. The proportion of recon-structed secondaryΛ andΛ depends on the selection criteria used. For the parameters listed in Table 2(V0 vertex part), the impact of theΞ feed-down on the final spectra is evaluated to be 13% forΛ and12% forΛ. No pT dependence is found within uncertainties.
This assessment results in a global correction of the spectra, applied as an additional factor in the overallnormalization. Provided that both primary and secondaryΛ have similar spectral shapes, such integratedcorrection is applicable. This is tested directly using Monte Carlo data, but also with real data, changingthe fraction of the secondaryΛ by varying the DCA of reconstructed candidates. Within the availablestatistics andpT reach, no significant change in spectral shape is observed.
Using Monte Carlo, the ratiorfeed−down of the reconstructedΞ− (Ξ+) candidates to the number of recon-
structedΛ (Λ) candidates fromΞ decays is:
rfeed−down=(NΞ−)MC
(NΛ←Ξ−)MC
Assuming that this ratio is the same in both Monte Carlo and data, the whole feed-down contribution tothe spectra is estimated by dividing the number of reconstructedΞ− (Ξ+
) in data by the ratio extractedfrom Monte Carlo:
(NΛ←Ξ−)data=(NΞ−)data
rfeed−down
Besides theΞ contribution, other sources may feed theΛ population resulting in additional systematicuncertainties. In Monte Carlo simulations,Λ particles possibly generated in the detector material induce

Strange particle production in pp at√
s = 0.9 TeV 19
(GeV/c)T
p0 0.5 1 1.5 2 2.5
-1dy
(G
eV/c
)T
/dp
2)
dNev
ts1/
(N
0
0.05
0.1
0.15
0.2
0.25
0.3
s0K+K
= 0.9 TeVsALICE pp, INEL,
Fig. 13: Comparison of the corrected yields as a function ofpT for K0S (circle) and charged kaons (K+) (open
squares), identified via energy loss in the TPC and ITS, and via time of flight in the TOF. The points are plotted atthe centre of the bins. The full vertical lines associated tothe K0
S points, as well as the gray shaded areas associatedto the K+ points, correspond to the statistical and systematic uncertainties summed in quadrature whereas theinner vertical lines contain only the statistical uncertainties (i.e. the number of reconstructed particles) and thesystematics from the signal extraction.
a 1.7 % uncertainty. The same uncertainty in the case ofΛ is below 1 %. The contribution fromΩ decaysis found to be negligible. It should be noted that sinceΛ (Λ) from electromagneticΣ0 (Σ0
) decays cannotbe distinguished from the direct ones, the identifiedΛ (Λ) include these contributions.
3.6 pT spectra and global yield extraction
The K0S spectrum is first shown on a linear scale in Fig. 13 and compared with charged kaon spectra [16].
Within uncertainties, good agreement is found between K0S and K+ in the measuredpT range.
Figure 14 presents the correctedpT spectra for all species, including both statistical errorsand systematicuncertainties. The spectra are fitted with two different functional forms in order to extract the globalintegrated yields:
d2Ndyd pT
= A× pT× e−pTT (1)
d2Ndyd pT
=(n−1)(n−2)
nT [nT +m(n−2)]× dN
dy
×pT×(
1+mT−m
nT
)−n
(2)
wheremT =√
m2+ p2T. The pT exponential has two parameters: the normalizationA and the inverse
slope parameterT . The Levy function [Eq. (2)], already used at lower energies [25], is shown to be usefulwhen thepT range is wide: it includes both an exponential shape for lowpT (which can be characterizedby an inverse slope parameterT ) and a power law component (governed by the power parametern) forthe higherpT region. The results of these fits to the spectra, where statistical and systematic uncertaintiesare added in quadrature, are shown in Fig. 14 and in Table 5. Inthe case of K0S for which the statisticsand thepT range are larger than for other species, theχ2/NDF indicates clearly that thepT exponentialparameterization cannot properly reproduce the spectrum shape.
For the spectra of theφ , Λ andΛ both functions give similar and acceptableχ2/NDF. Within uncer-tainties,Λ andΛ have the same fit parameters. In the case of theΞ−+Ξ+
spectrum, the low number(i.e. 3) of pT bins cannot constrain the Levy function and therefore itsχ2/NDF in Table 5 is not de-fined. Nevertheless, for consistency and in order to extractparticle ratios, a Levy fit is performed to

20 The ALICE Collaboration
Table 5: Summary of the parameters extracted from the fits to the measured transverse momenta spectra usingpT
exponential (1) and Levy (2) functional forms and including point-to-point systematic uncertainties.
pT exponential (1) Levy (2)Particles T (MeV) χ2/NDF T (MeV) n χ2/NDF
MesonsK0
S 325±4 117.6/14 168±5 6.6±0.3 10.8/13φ 438±31 1.3/2 164±91 4.2±2.5 0.6/1
BaryonsΛ 392±6 10.2/7 229±15 10.8±2.0 9.6/6Λ 385±6 5.1/7 210±15 9.2±1.4 3.7/6
Ξ−+Ξ+421±42 2.0/1 175±50 5.2±2.3 −−
(GeV/c)T
p0 0.5 1 1.5 2 2.5 3 3.5
-1dy
(G
eV/c
)T
N/d
p2
) d
evts
1/(N
-410
-310
-210
-110
1 x10s
0K x5Λ x2Λ x1φ x0.5
+Ξ + -Ξ
= 0.9 TeVsALICE pp, INEL,
Fig. 14: Particle spectra (corrected yields) as a function ofpT for K0S (circles), Λ (squares),Λ (triangles),φ
(stars) andΞ−+Ξ+(diamonds). The data points are scaled for visibility and plotted at the centre of the bins.
Uncertainties corresponding to both statistics (i.e. the number of reconstructed particles) and systematics from thesignal extraction are shown as vertical error bars. Statistical uncertainties and systematics (summarized in Table 4)added in quadrature are shown as brackets. The fits (dotted curves) using Levy functional form [see Eq. (2)] aresuperimposed.
obtain the integrated yields and particle ratios for all species. It must be noted that the rapidity range isslightly different for each species (cf. Table 6). However,the rapidity dependence of particle productionat mid-rapidity is weak enough to allow direct comparisons of the spectra [22].
4 Results and discussion
The pT spectra for K0S, Λ, Λ andφ are shown in Fig. 14 along with the Levy fits. When comparing thedifferent spectra, it is found that the inverse slope parameter T increases with the mass of the particle.For example, it changes from 168± 5 MeV for K0
S to 229± 15 MeV for Λ when the Levy fit is used.
TheΞ−+Ξ+apparently do not follow this trend. However, this is most likely because the very limited
statistics do not allow for a well-constrained fit. The shapes of thepT spectra are also compared to PHO-JET and PYTHIA models. For PYTHIA, several tunes (109 [20], 306 [26] and 320 [27]) are presented.For all species, thepT spectra are found to be slightly harder (i.e. they have a slower decrease withpT)than the models as presented in Figs. 15, 16, 17 and 18. For transverse momenta larger than∼ 1 GeV/c,the strange particle spectra are strongly underestimated by all models, by a factor of∼ 2 for K0
S and even∼ 3 for hyperons. The discrepancy is smaller in the case of theφ .
The integrated yields (dN/dy) are obtained using the spectra in the measured range and integrating the

Strange particle production in pp at√
s = 0.9 TeV 21
-1 (
GeV
/c)
|y|<
0.75
|dy
Tdp
N2 d
ev
tsN
1
-310
-210
-110
1= 0.9 TeVspp, INEL,
s0ALICE K
PHOJETPYTHIA D6T (109)PYTHIA ATLAS-CSC (306)PYTHIA Perugia 0 (320)
(GeV/c)T
p0 0.5 1 1.5 2 2.5 3 3.5 4
0 0.5 1 1.5 2 2.5 3 3.5 4
MO
DE
L / D
ATA
0
0.5
1
Fig. 15: Comparison of the transverse momentum differential yield for the K0S particles for INEL pp collisions
with PHOJET and PYTHIA tunes 109, 306 and 320.
-1 (
GeV
/c)
|y|<
0.75
|dy
Tdp
N2 d
ev
tsN
1
-410
-310
-210
-110
1= 0.9 TeVspp, INEL,
ΛALICE PHOJETPYTHIA D6T (109)PYTHIA ATLAS-CSC (306)PYTHIA Perugia 0 (320)
(GeV/c)T
p0 0.5 1 1.5 2 2.5 3 3.5 4
0 0.5 1 1.5 2 2.5 3 3.5 4
MO
DE
L / D
ATA
0
0.2
0.4
0.6
Fig. 16: Comparison of the transverse momentum differential yield for theΛ particles for INEL pp collisions withPHOJET and PYTHIA tunes 109, 306 and 320.
-1 (
GeV
/c)
|y|<
0.6
|dy
Tdp
N2 d
ev
tsN
1
-310
-210
-110= 0.9 TeVspp, INEL,
φALICE PHOJETPYTHIA D6T (109)PYTHIA ATLAS-CSC (306)PYTHIA Perugia 0 (320)
(GeV/c)T
p0 0.5 1 1.5 2 2.5 3 3.5 4
0 0.5 1 1.5 2 2.5 3 3.5 4
MO
DE
L / D
ATA
0
0.5
1
1.5
Fig. 17: Comparison of the transverse momentum differential yield for theφ particle for INEL pp collisions withPHOJET and PYTHIA tunes 109, 306 and 320.

22 The ALICE Collaboration-1
(G
eV/c
)|y
|<0.
8|
dyT
dpN
2 d
evts
N1
-410
-310
-210
-110= 0.9 TeVspp, INEL,
+Ξ + -ΞALICE
PHOJETPYTHIA D6T (109)PYTHIA ATLAS-CSC (306)PYTHIA Perugia 0 (320)
(GeV/c)T
p0 0.5 1 1.5 2 2.5 3 3.5 4
0 0.5 1 1.5 2 2.5 3 3.5 4
MO
DE
L / D
ATA
0
0.2
0.4
0.6
Fig. 18: Comparison of the transverse momentum differential yield for theΞ−+Ξ+particle for INEL pp collisions
with PHOJET and PYTHIA tunes 109, 306 and 320.
Table 6: Rapidity andpT ranges,〈pT〉, corrected yields and extrapolated fraction at lowpT using the Levy func-tion (2).
Particles |y| pT range (GeV/c) 〈pT〉 (GeV/c) dN/dy Extrapolation (%)
MesonsK0
S < 0.75 [0.2−3.0] 0.65±0.01±0.01 0.184±0.002±0.006 12±0.4±0.5φ < 0.60 [0.7−3.0] 1.00±0.14±0.20 0.021±0.004±0.003 48±18±7
BaryonsΛ < 0.75 [0.6−3.5] 0.86±0.01±0.01 0.048±0.001±0.004 36±2±4Λ < 0.75 [0.6−3.5] 0.84±0.02±0.02 0.047±0.002±0.005 39±3±4
Ξ−+Ξ+< 0.8 [0.6−3.0] 0.95±0.14±0.03 0.0101±0.0020±0.0009 35±8±4
Levy function for the extrapolated regions at low and highpT. The uncertainties for the dN/dy and〈pT〉values are computed from the errors on the fit parameters, where both the point-to-point statistical andsystematic uncertainties of thepT spectra are taken into account. Due to the rapid decrease of the spectra,most of the extrapolation is done in the lowpT region and amounts to 12 % for K0
S and 48 % for theφ(smallest and highest values respectively). Therefore, anadditional uncertainty is added for the dN/dyto account for the uncertainty in the shape of the spectra outside the measured range: it corresponds to25% of the extrapolated particle yields at lowpT. The measuredpT ranges are specified in Table 6 foreach particle species.
Using the particle integrated yields presented in this paper along with the yields of chargedπ, K, p andp [16] and the measuredp/p ratio [22], a comparison with STAR feed-down corrected particle ratios at√
s = 0.2 TeV [25] is shown in Fig. 19. With the centre of mass energy increasing from√
s = 0.2 TeVto 0.9 TeV the measured ratios are similar except the ¯p/π− ratio which decreases slightly from 0.068±0.011 to 0.051±0.005. The strange to non-strange particle ratios seem to increase but stay compatiblewithin uncertainties: the K−/π− from 0.101±0.012 to 0.121±0.013 and theΛ/π+ from 0.027±0.004to 0.032±0.003.
The yields and〈pT〉 obtained with the ALICE experiment are compared for each particle with existingdata at the same energy and also with results at lower and higher energies. The various experimentsdiffer in acceptance and event selection (i.e. NSD or INEL) but the dependence of〈pT〉 with respect tothese variables is found to be negligible. Consequently the〈pT〉 values are directly comparable, whereasthe comparison of the yields can require further scaling because of different (pseudo)rapidity coverages.Figure 20 reports ALICE〈pT〉 measurements along with those of the STAR experiment [25, 28]. It isremarkable that the〈pT〉 remains close to the ISR parameterization [29] although thecollision energy

Strange particle production in pp at√
s = 0.9 TeV 23
Thu
Dec
2 2
3:52
:24
2010
+ π/- π
+/K-
K /pp
Λ/Λ
- π/-K
- π/p
+ π/Λ
Λ/- Ξ
ratio
-110
1
ALICE pp 0.9 TeV
STAR pp 0.2 TeV
Fig. 19: Ratios of integrated yields includingπ (±), K(±), p andp performed with the ALICE experiment [16, 22]and compared with STAR values for pp collisions at
√s = 0.2 TeV [25]. All ratios are feed-down corrected. For
the ratioΞ−/Λ of ALICE, the dN/dy|y=0 for Ξ−+Ξ+is divided by 2. Statistical and systematic uncertainties are
added in quadrature.
)2Particle mass (GeV/c0 0.5 1 1.5 2
> (
GeV
/c)
T<
p
0
0.5
1
1.5
π s0K-K
ρ*
Kp
φ Λ -Ξ+
Ξ
*Σ
*Λ -Ω
ALICE pp 0.9 TeVSTAR pp 0.2 TeV
ISR parameterization
Fig. 20: 〈pT〉 vs. particle mass for the measurements performed with the ALICE experiment and compared withSTAR values for pp collisions at
√s = 0.2 TeV [25, 28] and the ISR parameterization [29]. Both statistical (vertical
error bars) and systematic (brackets) uncertainties are shown for ALICE data.

24 The ALICE Collaboration
Table 7: The K0S mean transverse momentum and yields in INEL events from UA5,CDF, and ALICE and in
NSD events in STAR for various√
s. STAR results are taken from [25], CDF ones and yield values with “ ∗” arefrom [31]. Other UA5 values concerning〈pT〉 are from [30].
Experiment√
s (GeV) acceptance 〈pT〉 (GeV/c) dN/dy|y=0
STAR 200 |y|< 0.5 0.61±0.02 0.134±0.011UA5 200 |y|< 2.5 0.53±0.07 0.14±0.02∗
UA5 546 |y|< 2.5 0.57±0.03 0.15±0.02∗
CDF 630 |y|< 1.0 0.5±0.1 0.2±0.1∗
UA5 900 |y|< 2.5 0.62±0.08 0.18±0.02∗
ALICE 900 |y|< 0.75 0.65±0.01±0.01 0.184±0.002±0.006CDF 1800 |y|< 1.0 0.60±0.03 0.26±0.03∗
Table 8: The (Λ+Λ) mean transverse momentum and yields for NSD events and different√
s. STAR resultsare from [25] and UA5 results are from [32, 33]. ALICE and STARresults are feed-down corrected. The yieldmeasured by ALICE has been scaled to match UA5 acceptance (|y|< 2.0) using the method explained in section 4.
Experiment√
s (GeV) acceptance 〈pT〉 (GeV/c) dN/dy|y=0 〈nΛ+Λ〉 per event
measured scaled to UA5|y|STAR 200 |y|< 0.5 0.77±0.04 0.074±0.005 — 0.24±0.02UA5 200 |y|< 2.0 0.80+0.20
−0.14 — 0.27±0.07 —UA5 546 |y|< 2.0 0.62±0.08 — 0.25±0.05 —UA5 900 |y|< 2.0 0.74±0.09 — 0.38±0.08 —ALICE 900 |y|< 0.75 0.85±0.01±0.01 0.095±0.002±0.003 — 0.46±0.01±0.02
increased by a factor 36. Table 7 summarizes the K0S measurements performed by the UA5 [30], CDF [31]
and ALICE Collaborations for INEL events, and by the STAR [25] Collaboration for NSD events. TheALICE K0
S yield at central rapidity, as well as the〈pT〉, are in good agreement with UA5 results at900 GeV albeit with improved precision. The comparison of(Λ+Λ) measurements are presented inTable 8 for NSD events. ALICE yields, measured in|y| < 0.75 for INEL events, are scaled to theUA5 [32, 33] acceptance (|y| < 2.0) using PYTHIA simulations. TheΛ+Λ yield in NSD events isestimated by scaling the measured yield in inelastic eventswith the known ratio R of charged particlemultiplicities in NSD and INEL events:
R =(dN/dy)NchNSD
(dN/dy)Nch INEL= 0.830±0.024
This scaling factor is also used for the ALICE (Ξ−+Ξ+) yield presented in Table 9. The ALICE yields
and〈pT〉 for both (Λ+Λ) and (Ξ−+Ξ+) are in good agreement with the UA5 measurements [33]. Ta-
ble 10 shows the evolution of dN/dy and〈pT〉 with the collision energy for theφ particle in NSD events.It includes the ALICE measurements, which are the firstφ measurements at 900 GeV, and comparesthem to the results from the STAR experiment [34, 35] at 200 GeV and the E735 experiment [36] at1800 GeV.
The baryon to meson ratio as a function ofpT obtained with the(Λ+Λ) and K0S spectra measured by
ALICE is presented in Fig. 21. It includes the(Λ+Λ)/2K0S ratio in pp collisions at 200 GeV measured
by STAR [25], and the ratios in pp collisions at 630 GeV and 1800 GeV computed with the(Λ+Λ)and K0
S spectra published by CDF [37] and UA1 [38]. UA1 and CDF Collaborations provide inclusive

Strange particle production in pp at√
s = 0.9 TeV 25
Table 9: The (Ξ−+Ξ+) mean transverse momentum and yields for NSD events and different
√s. STAR results
are from [25] and UA5 results are from [33]. UA5 measures (Ξ−+Ξ+) for pT > 1 GeV/c. The ALICE yield has
been scaled to match the UA5 acceptance (|y|< 3.0) using the method explained in section 4.
Experiment√
s (GeV) acceptance 〈pT〉 (GeV/c) dN/dy|y=0 〈nΞ−+Ξ+〉 per event
measured scaled to UA5|y|STAR 200 |y|< 0.5 0.90±0.01 0.006±0.001 — 0.022±0.006UA5 200 |y|< 3.0 0.80+0.20
−0.14 — 0.03+0.04−0.02 —
UA5 546 |y|< 3.0 1.10±0.02 — 0.08+0.03−0.02 —
UA5 900 |y|< 3.0 0.7+0.2−0.1 — 0.05+0.04
−0.02 —ALICE 900 |y|< 0.8 0.95±0.14±0.03 0.0101±0.0020±0.0009 0.078±0.015±0.007
Table 10: The φ mean transverse momentum and yields for NSD events and different√
s. STAR results arefrom [34, 35] and E735 results are from [36]. The E735 Collaboration provided two values of〈pT〉 depending onthe functional form used to fit the data points and the uncertainties associated with each value are only statistical.ALICE yields measured for INEL events have been scaled to NSDas explained in section 4.
Experiment√
s (GeV) acceptance 〈pT〉 (GeV/c) dN/dy|y=0
STAR 200 |y|< 0.5 0.82±0.03±0.04 0.018±0.001±0.003ALICE 900 |y|< 0.6 1.00±0.14±0.20 0.021±0.004±0.003
E735 1800 −0.4< y < 1.01.06±0.18
0.0186±0.00410.94±0.26

26 The ALICE Collaboration
|<1.0)η 1.8 TeV (|pCDF p ALICE pp 0.9 TeV (|y|<0.75)
|<1.0)η 0.63 TeV (|pCDF p STAR pp 0.2 TeV (|y|<0.5)
|<2.5)η: |s
0|<2.0, Kη: |Λ+Λ 0.63 TeV (pUA1 p
(GeV/c)T
p0 0.5 1 1.5 2 2.5 3 3.5 4 4.5 5
) s0)/
(2K
Λ+Λ(
0
0.2
0.4
0.6
0.8
1
Fig. 21: (Λ+Λ)/2K0S as a function ofpT for different collision energies in pp and pp minimum bias events. The
STAR ratio is taken from [25] whereas the CDF and UA1 ratios are computed with the(Λ+Λ) and K0S spectra
published in [37] and [38] respectively. The ALICE and STAR ratios are feed-down corrected. Because the K0S
and(Λ+Λ) spectra from UA1 have incompatible binning, the K0S differential yield has been calculated for each
(Λ+Λ) pT data point using the fit function published by UA1. Such a choice is motivated by the fact that theχ2
value for the K0S spectrum fit is better than that for the(Λ+Λ) spectrum.
spectra. The associated ratios are therefore not feed-downcorrected, unlike the ALICE and STAR ones.The acceptance windows of these experiments differ significantly: ALICE measuresΛ, Λ and K0
S in|y| < 0.75, STAR in|y| < 0.5, CDF in |η | < 1.0, whereas UA1 reconstructs(Λ+Λ) in |η | < 2.0 andK0
S in |η | < 2.5. The ALICE ratio agrees very well with the STAR results in the measuredpT range,which would suggest little or no energy dependence of(Λ+Λ)/2K0
S. A similar conclusion can be drawnwhen comparing only the ratios measured by CDF at 630 GeV and 1800 GeV, although the ratio foundby CDF for pT > 1.5 GeV/c is higher than the one observed with ALICE and STAR. The ratiocomputedfrom UA1 spectra however shows a clear disagreement with theother measurements in an intermediatepT range betweenpT ≈ 1.5 GeV/c andpT ≈ 3.0 GeV/c. PYTHIA simulations show that this discrepancycan not be attributed to the differences in the acceptance orin the colliding system (i.e. pp instead of pp).
5 Conclusions
Measurements of mesons containing strange quarks (K0S andφ ) and hyperons (Λ, Λ andΞ−+Ξ+
) havebeen performed for inelastic pp collisions at
√s = 0.9 TeV with the ALICE experiment at the LHC. The
Levy function gives a good description of the transverse momentum spectra which have been comparedwith pQCD-based models. The K0
S transverse momentum spectrum is overestimated by PYTHIA tuneATLAS-CSC and PHOJET below 0.75 GeV/c but is higher by a factor of∼ 2 in the pT range[1−3] GeV/c. Within uncertainties, theφ meson spectrum is reasonably described by these models and thebest agreement is obtained by PYTHIA tune D6T. We find that strange baryons are significantly under-predicted in both PYTHIA and PHOJET by a factor of∼ 3. The feed-down corrected ratio of baryonto meson as a function ofpT, illustrated by theΛ/K0
S, is consistent with the STAR measurements at√s = 0.2 TeV but lower than UA1 and CDF results at
√s = 0.63 TeV and
√s = 1.8 TeV. The integrated
yields and average transverse momenta have been compared with earlier data collected in pp and ppinteractions at various energies. These results provide a useful baseline for comparisons with recenttunes of the PYTHIA model and a reference for future measurements in heavy-ion collisions at the LHC.These studies demonstrate the precision with which ALICE can measure resonances and topologicallyreconstructed weakly decaying particles. Measurements ofthese particles will be a substantial part ofthe ALICE programme in both pp and Pb–Pb collisions. The measurement of theφ resonance providesan unprecedented reference at this energy.
Strange particle production in pp at√
s = 0.9 TeV 27
6 Acknowledgements
The ALICE collaboration would like to thank all its engineers and technicians for their invaluable con-tributions to the construction of the experiment and the CERN accelerator teams for the outstandingperformance of the LHC complex. The ALICE collaboration acknowledges the following funding agen-cies for their support in building and running the ALICE detector: Calouste Gulbenkian Foundationfrom Lisbon and Swiss Fonds Kidagan, Armenia; Conselho Nacional de Desenvolvimento Cientıficoe Tecnologico (CNPq), Financiadora de Estudos e Projetos (FINEP), Fundacao de Amparo a Pesquisado Estado de Sao Paulo (FAPESP); National Natural Science Foundation of China (NSFC), the Chi-nese Ministry of Education (CMOE) and the Ministry of Science and Technology of China (MSTC);Ministry of Education and Youth of the Czech Republic; Danish Natural Science Research Council, theCarlsberg Foundation and the Danish National Research Foundation; The European Research Councilunder the European Community’s Seventh Framework Programme; Helsinki Institute of Physics andthe Academy of Finland; French CNRS-IN2P3, the ‘Region Paysde Loire’, ‘Region Alsace’, ‘RegionAuvergne’ and CEA, France; German BMBF and the Helmholtz Association; Greek Ministry of Re-search and Technology; Hungarian OTKA and National Office for Research and Technology (NKTH);Department of Atomic Energy and Department of Science and Technology of the Government of In-dia; Istituto Nazionale di Fisica Nucleare (INFN) of Italy;MEXT Grant-in-Aid for Specially PromotedResearch, Japan; Joint Institute for Nuclear Research, Dubna; National Research Foundation of Ko-rea (NRF); CONACYT, DGAPA, Mexico, ALFA-EC and the HELEN Program (High-Energy physicsLatin-American–European Network); Stichting voor Fundamenteel Onderzoek der Materie (FOM) andthe Nederlandse Organisatie voor Wetenschappelijk Onderzoek (NWO), Netherlands; Research Councilof Norway (NFR); Polish Ministry of Science and Higher Education; National Authority for ScientificResearch - NASR (Autoritatea Nationala pentru CercetareStiintifica - ANCS); Federal Agency of Sci-ence of the Ministry of Education and Science of Russian Federation, International Science and Technol-ogy Center, Russian Academy of Sciences, Russian Federal Agency of Atomic Energy, Russian FederalAgency for Science and Innovations and CERN-INTAS; Ministry of Education of Slovakia; CIEMAT,EELA, Ministerio de Educacion y Ciencia of Spain, Xunta de Galicia (Consellerıa de Educacion), CEA-DEN, Cubaenergıa, Cuba, and IAEA (International Atomic Energy Agency); The Ministry of Scienceand Technology and the National Research Foundation (NRF),South Africa; Swedish Reseach Council(VR) and Knut & Alice Wallenberg Foundation (KAW); Ukraine Ministry of Education and Science;United Kingdom Science and Technology Facilities Council (STFC); The United States Department ofEnergy, the United States National Science Foundation, theState of Texas, and the State of Ohio.

28 The ALICE Collaboration
A The ALICE Collaboration
K. Aamodt1 , A. Abrahantes Quintana2 , D. Adamova3 , A.M. Adare4 , M.M. Aggarwal5 , G. Aglieri Rinella6 ,A.G. Agocs7 , S. Aguilar Salazar8 , Z. Ahammed9 , N. Ahmad10 , A. Ahmad Masoodi10 , S.U. Ahn11 ,i,A. Akindinov12 , D. Aleksandrov13 , B. Alessandro14 , R. Alfaro Molina8 , A. Alici 15 ,ii, A. Alkin16 ,E. Almaraz Avina8 , T. Alt17 , V. Altini 18 , S. Altinpinar19 , I. Altsybeev20 , C. Andrei21 , A. Andronic19 ,V. Anguelov22 ,iii,iv , C. Anson23 , T. Anticic24 , F. Antinori25 , P. Antonioli26 , L. Aphecetche27 ,H. Appelshauser28 , N. Arbor29 , S. Arcelli15 , A. Arend28 , N. Armesto30 , R. Arnaldi14 , T. Aronsson4 ,I.C. Arsene19 , A. Asryan20 , A. Augustinus6 , R. Averbeck19 , T.C. Awes31 , J.Aysto32 , M.D. Azmi10 ,M. Bach17 , A. Badala33 , Y.W. Baek11 ,i, S. Bagnasco14 , R. Bailhache28 , R. Bala34 ,v, R. Baldini Ferroli35 ,A. Baldisseri36 , A. Baldit37 , J. Ban38 , R. Barbera39 , F. Barile18 , G.G. Barnafoldi7 , L.S. Barnby40 , V. Barret37 ,J. Bartke41 , M. Basile15 , N. Bastid37 , B. Bathen42 , G. Batigne27 , B. Batyunya43 , C. Baumann28 ,I.G. Bearden44 , H. Beck28 , I. Belikov45 , F. Bellini15 , R. Bellwied46 ,vi, E. Belmont-Moreno8 , S. Beole34 ,I. Berceanu21 , A. Bercuci21 , E. Berdermann19 , Y. Berdnikov47 , L. Betev6 , A. Bhasin48 , A.K. Bhati5 ,L. Bianchi34 , N. Bianchi49 , C. Bianchin25 , J. Bielcık50 , J. Bielcıkova3 , A. Bilandzic51 , E. Biolcati34 ,A. Blanc37 , F. Blanco52 , F. Blanco53 , D. Blau13 , C. Blume28 , M. Boccioli6 , N. Bock23 , A. Bogdanov54 ,H. Bøggild44 , M. Bogolyubsky55 , L. Boldizsar7 , M. Bombara56 , C. Bombonati25 , J. Book28 , H. Borel36 ,C. Bortolin25 ,vii, S. Bose57 , F. Bossu34 , M. Botje51 , S. Bottger22 , B. Boyer58 , P. Braun-Munzinger19 ,L. Bravina59 , M. Bregant60 ,viii, T. Breitner22 , M. Broz61 , R. Brun6 , E. Bruna4 , G.E. Bruno18 , D. Budnikov62 ,H. Buesching28 , O. Busch63 , Z. Buthelezi64 , D. Caffarri25 , X. Cai65 , H. Caines4 , E. Calvo Villar66 ,P. Camerini60 , V. Canoa Roman6 ,ix,x, G. Cara Romeo26 , F. Carena6 , W. Carena6 , F. Carminati6 ,A. Casanova Dıaz49 , M. Caselle6 , J. Castillo Castellanos36 , V. Catanescu21 , C. Cavicchioli6 , P. Cerello14 ,B. Chang32 , S. Chapeland6 , J.L. Charvet36 , S. Chattopadhyay57 , S. Chattopadhyay9 , M. Cherney67 ,C. Cheshkov68 , B. Cheynis68 , E. Chiavassa14 , V. Chibante Barroso6 , D.D. Chinellato69 , P. Chochula6 ,M. Chojnacki70 , P. Christakoglou70 , C.H. Christensen44 , P. Christiansen71 , T. Chujo72 , C. Cicalo73 ,L. Cifarelli15 , F. Cindolo26 , J. Cleymans64 , F. Coccetti35 , J.-P. Coffin45 , S. Coli14 , G. Conesa Balbastre49 ,xi,Z. Conesa del Valle27 ,xii, P. Constantin63 , G. Contin60 , J.G. Contreras74 , T.M. Cormier46 ,Y. Corrales Morales34 , I. Cortes Maldonado75 , P. Cortese76 , M.R. Cosentino69 , F. Costa6 , M.E. Cotallo52 ,E. Crescio74 , P. Crochet37 , E. Cuautle77 , L. Cunqueiro49 , G. D Erasmo18 , A. Dainese78 ,xiii, H.H. Dalsgaard44 ,A. Danu79 , D. Das57 , I. Das57 , A. Dash80 , S. Dash14 , S. De9 , A. De Azevedo Moregula49 , G.O.V. de Barros81 ,A. De Caro82 , G. de Cataldo83 , J. de Cuveland17 , A. De Falco84 , D. De Gruttola82 , N. De Marco14 ,S. De Pasquale82 , R. De Remigis14 , R. de Rooij70 , H. Delagrange27 , Y. Delgado Mercado66 , G. Dellacasa76 ,xiv,A. Deloff85 , V. Demanov62 , E. Denes7 , A. Deppman81 , D. Di Bari18 , C. Di Giglio18 , S. Di Liberto86 ,A. Di Mauro6 , P. Di Nezza49 , T. Dietel42 , R. Divia6 , Ø. Djuvsland1 , A. Dobrin46 ,xv, T. Dobrowolski85 ,I. Domınguez77 , B. Donigus19 , O. Dordic59 , O. Driga27 , A.K. Dubey9 , L. Ducroux68 , P. Dupieux37 ,A.K. Dutta Majumdar57 , M.R. Dutta Majumdar9 , D. Elia83 , D. Emschermann42 , H. Engel22 , H.A. Erdal87 ,B. Espagnon58 , M. Estienne27 , S. Esumi72 , D. Evans40 , S. Evrard6 , G. Eyyubova59 , C.W. Fabjan6 ,xvi,D. Fabris88 , J. Faivre29 , D. Falchieri15 , A. Fantoni49 , M. Fasel19 , R. Fearick64 , A. Fedunov43 , D. Fehlker1 ,V. Fekete61 , D. Felea79 , G. Feofilov20 , A. Fernandez Tellez75 , A. Ferretti34 , R. Ferretti76 ,xvii,M.A.S. Figueredo81 , S. Filchagin62 , R. Fini83 , D. Finogeev89 , F.M. Fionda18 , E.M. Fiore18 , M. Floris6 ,S. Foertsch64 , P. Foka19 , S. Fokin13 , E. Fragiacomo90 , M. Fragkiadakis91 , U. Frankenfeld19 , U. Fuchs6 ,F. Furano6 , C. Furget29 , M. Fusco Girard82 , J.J. Gaardhøje44 , S. Gadrat29 , M. Gagliardi34 , A. Gago66 ,M. Gallio34 , P. Ganoti91 ,xviii, C. Garabatos19 , R. Gemme76 , J. Gerhard17 , M. Germain27 , C. Geuna36 ,A. Gheata6 , M. Gheata6 , B. Ghidini18 , P. Ghosh9 , M.R. Girard92 , G. Giraudo14 , P. Giubellino34 ,xix,E. Gladysz-Dziadus41 , P. Glassel63 , R. Gomez93 , L.H. Gonzalez-Trueba8 , P. Gonzalez-Zamora52 ,H. Gonzalez Santos75 , S. Gorbunov17 , S. Gotovac94 , V. Grabski8 , R. Grajcarek63 , A. Grelli70 , A. Grigoras6 ,C. Grigoras6 , V. Grigoriev54 , A. Grigoryan95 , S. Grigoryan43 , B. Grinyov16 , N. Grion90 , P. Gros71 ,J.F. Grosse-Oetringhaus6 , J.-Y. Grossiord68 , R. Grosso88 , F. Guber89 , R. Guernane29 , C. Guerra Gutierrez66 ,B. Guerzoni15 , K. Gulbrandsen44 , T. Gunji96 , A. Gupta48 , R. Gupta48 , H. Gutbrod19 , Ø. Haaland1 ,C. Hadjidakis58 , M. Haiduc79 , H. Hamagaki96 , G. Hamar7 , J.W. Harris4 , M. Hartig28 , D. Hasch49 ,D. Hasegan79 , D. Hatzifotiadou26 , A. Hayrapetyan95 ,xvii, M. Heide42 , M. Heinz4 , H. Helstrup87 ,A. Herghelegiu21 , C. Hernandez19 , G. Herrera Corral74 , N. Herrmann63 , K.F. Hetland87 , B. Hicks4 ,P.T. Hille4 , B. Hippolyte45 , T. Horaguchi72 , Y. Hori96 , P. Hristov6 , I. Hrivnacova58 , M. Huang1 , S. Huber19 ,T.J. Humanic23 , D.S. Hwang97 , R. Ichou27 , R. Ilkaev62 , I. Ilkiv 85 , M. Inaba72 , E. Incani84 , G.M. Innocenti34 ,P.G. Innocenti6 , M. Ippolitov13 , M. Irfan10 , C. Ivan19 , A. Ivanov20 , M. Ivanov19 , V. Ivanov47 ,A. Jachołkowski6 , P.M. Jacobs98 , L. Jancurova43 , S. Jangal45 , R. Janik61 , S.P. Jayarathna53 ,xx, S. Jena99 ,L. Jirden6 , G.T. Jones40 , P.G. Jones40 , P. Jovanovic40 , H. Jung11 , W. Jung11 , A. Jusko40 , S. Kalcher17 ,

Strange particle production in pp at√
s = 0.9 TeV 29
P. Kalinak38 , M. Kalisky42 , T. Kalliokoski32 , A. Kalweit100 , R. Kamermans70 ,xiv, K. Kanaki1 , E. Kang11 ,J.H. Kang101 , V. Kaplin54 , O. Karavichev89 , T. Karavicheva89 , E. Karpechev89 , A. Kazantsev13 ,U. Kebschull22 , R. Keidel102 , M.M. Khan10 , A. Khanzadeev47 , Y. Kharlov55 , B. Kileng87 , D.J. Kim32 ,D.S. Kim11 , D.W. Kim11 , H.N. Kim11 , J.H. Kim97 , J.S. Kim11 , M. Kim11 , M. Kim101 , S. Kim97 , S.H. Kim11 ,S. Kirsch6 ,xxi, I. Kisel22 ,iv, S. Kiselev12 , A. Kisiel6 , J.L. Klay103 , J. Klein63 , C. Klein-Bosing42 ,M. Kliemant28 , A. Klovning1 , A. Kluge6 , M.L. Knichel19 , K. Koch63 , M.K. Kohler19 , R. Kolevatov59 ,A. Kolojvari20 , V. Kondratiev20 , N. Kondratyeva54 , A. Konevskih89 , E. Kornas41 ,C. Kottachchi Kankanamge Don46 , R. Kour40 , M. Kowalski41 , S. Kox29 , G. Koyithatta Meethaleveedu99 ,K. Kozlov13 , J. Kral32 , I. Kralik38 , F. Kramer28 , I. Kraus100 ,xxii, T. Krawutschke63 ,xxiii, M. Kretz17 ,M. Krivda40 ,xxiv, D. Krumbhorn63 , M. Krus50 , E. Kryshen47 , M. Krzewicki51 , Y. Kucheriaev13 , C. Kuhn45 ,P.G. Kuijer51 , P. Kurashvili85 , A. Kurepin89 , A.B. Kurepin89 , A. Kuryakin62 , S. Kushpil3 , V. Kushpil3 ,M.J. Kweon63 , Y. Kwon101 , P. La Rocca39 , P. Ladron de Guevara52 ,xxv, V. Lafage58 , C. Lara22 , D.T. Larsen1 ,C. Lazzeroni40 , Y. Le Bornec58 , R. Lea60 , K.S. Lee11 , S.C. Lee11 , F. Lefevre27 , J. Lehnert28 , L. Leistam6 ,M. Lenhardt27 , V. Lenti83 , I. Leon Monzon93 , H. Leon Vargas28 , P. Levai7 , X. Li104 , R. Lietava40 , S. Lindal59 ,V. Lindenstruth22 ,iv, C. Lippmann6 ,xxii, M.A. Lisa23 , L. Liu1 , V.R. Loggins46 , V. Loginov54 , S. Lohn6 ,D. Lohner63 , C. Loizides98 , X. Lopez37 , M. Lopez Noriega58 , E. Lopez Torres2 , G. Løvhøiden59 , X.-G. Lu63 ,P. Luettig28 , M. Lunardon25 , G. Luparello34 , L. Luquin27 , C. Luzzi6 , K. Ma65 , R. Ma4 ,D.M. Madagodahettige-Don53 , A. Maevskaya89 , M. Mager6 , D.P. Mahapatra80 , A. Maire45 , M. Malaev47 ,I. Maldonado Cervantes77 , D. Mal’Kevich12 , P. Malzacher19 , A. Mamonov62 , L. Manceau37 , L. Mangotra48 ,V. Manko13 , F. Manso37 , V. Manzari83 , Y. Mao65 ,xxvi, J. Mares105 , G.V. Margagliotti60 , A. Margotti26 ,A. Marın19 , I. Martashvili106 , P. Martinengo6 , M.I. Martınez75 , A. Martınez Davalos8 , G. Martınez Garcıa27 ,Y. Martynov16 , A. Mas27 , S. Masciocchi19 , M. Masera34 , A. Masoni73 , L. Massacrier68 , M. Mastromarco83 ,A. Mastroserio6 , Z.L. Matthews40 , A. Matyja41 ,viii, D. Mayani77 , G. Mazza14 , M.A. Mazzoni86 , F. Meddi107 ,A. Menchaca-Rocha8 , P. Mendez Lorenzo6 , J. Mercado Perez63 , P. Mereu14 , Y. Miake72 , J. Midori108 ,L. Milano34 , J. Milosevic59 ,xxvii, A. Mischke70 , D. Miskowiec19 ,xix, C. Mitu79 , J. Mlynarz46 , B. Mohanty9 ,L. Molnar6 , L. Montano Zetina74 , M. Monteno14 , E. Montes52 , M. Morando25 , D.A. Moreira De Godoy81 ,S. Moretto25 , A. Morsch6 , V. Muccifora49 , E. Mudnic94 , H. Muller6 , S. Muhuri9 , M.G. Munhoz81 ,J. Munoz75 , L. Musa6 , A. Musso14 , B.K. Nandi99 , R. Nania26 , E. Nappi83 , C. Nattrass106 , F. Navach18 ,S. Navin40 , T.K. Nayak9 , S. Nazarenko62 , G. Nazarov62 , A. Nedosekin12 , F. Nendaz68 , J. Newby109 ,M. Nicassio18 , B.S. Nielsen44 , S. Nikolaev13 , V. Nikolic24 , S. Nikulin13 , V. Nikulin47 , B.S. Nilsen67 ,M.S. Nilsson59 , F. Noferini26 , G. Nooren70 , N. Novitzky32 , A. Nyanin13 , A. Nyatha99 , C. Nygaard44 ,J. Nystrand1 , H. Obayashi108 , A. Ochirov20 , H. Oeschler100 , S.K. Oh11 , J. Oleniacz92 , C. Oppedisano14 ,A. Ortiz Velasquez77 , G. Ortona34 , A. Oskarsson71 , P. Ostrowski92 , I. Otterlund71 , J. Otwinowski19 ,G. Øvrebekk1 , K. Oyama63 , K. Ozawa96 , Y. Pachmayer63 , M. Pachr50 , F. Padilla34 , P. Pagano82 , G. Paic77 ,F. Painke17 , C. Pajares30 , S. Pal36 , S.K. Pal9 , A. Palaha40 , A. Palmeri33 , G.S. Pappalardo33 , W.J. Park19 ,V. Paticchio83 , A. Pavlinov46 , T. Pawlak92 , T. Peitzmann70 , D. Peresunko13 , C.E. Perez Lara51 , D. Perini6 ,D. Perrino18 , W. Peryt92 , A. Pesci26 , V. Peskov6 , Y. Pestov110 , A.J. Peters6 , V. Petracek50 , M. Petris21 ,P. Petrov40 , M. Petrovici21 , C. Petta39 , S. Piano90 , A. Piccotti14 , M. Pikna61 , P. Pillot27 , O. Pinazza6 ,L. Pinsky53 , N. Pitz28 , F. Piuz6 , D.B. Piyarathna46 ,xxviii, R. Platt40 , M. Płoskon98 , J. Pluta92 ,T. Pocheptsov43 ,xxix, S. Pochybova7 , P.L.M. Podesta-Lerma93 , M.G. Poghosyan34 , K. Polak105 ,B. Polichtchouk55 , A. Pop21 , V. Pospısil50 , B. Potukuchi48 , S.K. Prasad46 ,xxx, R. Preghenella35 , F. Prino14 ,C.A. Pruneau46 , I. Pshenichnov89 , G. Puddu84 , A. Pulvirenti39 , V. Punin62 , M. Putis56 , J. Putschke4 ,E. Quercigh6 , H. Qvigstad59 , A. Rachevski90 , A. Rademakers6 , O. Rademakers6 , S. Radomski63 , T.S. Raiha32 ,J. Rak32 , A. Rakotozafindrabe36 , L. Ramello76 , A. Ramırez Reyes74 , M. Rammler42 , R. Raniwala111 ,S. Raniwala111 , S.S. Rasanen32 , K.F. Read106 , J.S. Real29 , K. Redlich85 , R. Renfordt28 , A.R. Reolon49 ,A. Reshetin89 , F. Rettig17 , J.-P. Revol6 , K. Reygers63 , H. Ricaud100 , L. Riccati14 , R.A. Ricci78 ,M. Richter1 ,xxxi, P. Riedler6 , W. Riegler6 , F. Riggi39 , A. Rivetti14 , M. Rodrıguez Cahuantzi75 , D. Rohr17 ,D. Rohrich1 , R. Romita19 , F. Ronchetti49 , P. Rosinsky6 , P. Rosnet37 , S. Rossegger6 , A. Rossi25 ,F. Roukoutakis91 , S. Rousseau58 , C. Roy27 ,xii, P. Roy57 , A.J. Rubio Montero52 , R. Rui60 , I. Rusanov6 ,E. Ryabinkin13 , A. Rybicki41 , S. Sadovsky55 , K. Safarık6 , R. Sahoo25 , P.K. Sahu80 , P. Saiz6 , S. Sakai98 ,D. Sakata72 , C.A. Salgado30 , T. Samanta9 , S. Sambyal48 , V. Samsonov47 , L. Sandor38 , A. Sandoval8 ,M. Sano72 , S. Sano96 , R. Santo42 , R. Santoro83 , J. Sarkamo32 , P. Saturnini37 , E. Scapparone26 ,F. Scarlassara25 , R.P. Scharenberg112, C. Schiaua21 , R. Schicker63 , C. Schmidt19 , H.R. Schmidt19 ,S. Schreiner6 , S. Schuchmann28 , J. Schukraft6 , Y. Schutz27 ,xvii, K. Schwarz19 , K. Schweda63 , G. Scioli15 ,E. Scomparin14 , P.A. Scott40 , R. Scott106 , G. Segato25 , S. Senyukov76 , J. Seo11 , S. Serci84 , E. Serradilla52 ,A. Sevcenco79 , G. Shabratova43 , R. Shahoyan6 , N. Sharma5 , S. Sharma48 , K. Shigaki108 , M. Shimomura72 ,

30 The ALICE Collaboration
K. Shtejer2 , Y. Sibiriak13 , M. Siciliano34 , E. Sicking6 , T. Siemiarczuk85 , A. Silenzi15 , D. Silvermyr31 ,G. Simonetti6 ,xxxii, R. Singaraju9 , R. Singh48 , B.C. Sinha9 , T. Sinha57 , B. Sitar61 , M. Sitta76 , T.B. Skaali59 ,K. Skjerdal1 , R. Smakal50 , N. Smirnov4 , R. Snellings51 ,xxxiii, C. Søgaard44 , A. Soloviev55 , R. Soltz109 ,H. Son97 , M. Song101 , C. Soos6 , F. Soramel25 , M. Spyropoulou-Stassinaki91 , B.K. Srivastava112 , J. Stachel63 ,I. Stan79 , G. Stefanek85 , G. Stefanini6 , T. Steinbeck22 ,iv, E. Stenlund71 , G. Steyn64 , D. Stocco27 , R. Stock28 ,M. Stolpovskiy55 , P. Strmen61 , A.A.P. Suaide81 , M.A. Subieta Vasquez34 , T. Sugitate108 , C. Suire58 ,M. Sumbera3 , T. Susa24 , D. Swoboda6 , T.J.M. Symons98 , A. Szanto de Toledo81 , I. Szarka61 , A. Szostak1 ,C. Tagridis91 , J. Takahashi69 , J.D. Tapia Takaki58 , A. Tauro6 , M. Tavlet6 , G. Tejeda Munoz75 , A. Telesca6 ,C. Terrevoli18 , J. Thader19 , D. Thomas70 , J.H. Thomas19 , R. Tieulent68 , A.R. Timmins46 ,vi, D. Tlusty50 ,A. Toia6 , H. Torii108 , L. Toscano6 , F. Tosello14 , T. Traczyk92 , D. Truesdale23 , W.H. Trzaska32 , A. Tumkin62 ,R. Turrisi88 , A.J. Turvey67 , T.S. Tveter59 , J. Ulery28 , K. Ullaland1 , A. Uras84 , J. Urban56 , G.M. Urciuoli86 ,G.L. Usai84 , A. Vacchi90 , M. Vala43 ,xxiv, L. Valencia Palomo58 , S. Vallero63 , N. van der Kolk51 ,M. van Leeuwen70 , P. Vande Vyvre6 , L. Vannucci78 , A. Vargas75 , R. Varma99 , M. Vasileiou91 , A. Vasiliev13 ,V. Vechernin20 , M. Venaruzzo60 , E. Vercellin34 , S. Vergara75 , R. Vernet113 , M. Verweij70 , L. Vickovic94 ,G. Viesti25 , O. Vikhlyantsev62 , Z. Vilakazi64 , O. Villalobos Baillie40 , A. Vinogradov13 , L. Vinogradov20 ,Y. Vinogradov62 , T. Virgili 82 , Y.P. Viyogi9 , A. Vodopyanov43 , K. Voloshin12 , S. Voloshin46 , G. Volpe18 ,B. von Haller6 , D. Vranic19 , J. Vrlakova56 , B. Vulpescu37 , B. Wagner1 , V. Wagner50 , R. Wan45 ,xxxiv,D. Wang65 , Y. Wang63 , Y. Wang65 , K. Watanabe72 , J.P. Wessels42 , U. Westerhoff42 , J. Wiechula63 , J. Wikne59 ,M. Wilde42 , A. Wilk42 , G. Wilk85 , M.C.S. Williams26 , B. Windelband63 , H. Yang36 , S. Yasnopolskiy13 ,J. Yi114 , Z. Yin65 , H. Yokoyama72 , I.-K. Yoo114 , X. Yuan65 , I. Yushmanov13 , E. Zabrodin59 , C. Zampolli6 ,S. Zaporozhets43 , A. Zarochentsev20 , P. Zavada105 , H. Zbroszczyk92 , P. Zelnicek22 , A. Zenin55 , I. Zgura79 ,M. Zhalov47 , X. Zhang65 ,i, D. Zhou65 , X. Zhu65 , A. Zichichi15 ,xxxv, G. Zinovjev16 , Y. Zoccarato68 ,M. Zynovyev16
Affiliation notesi Also at Laboratoire de Physique Corpusculaire (LPC), Clermont Universite, Universite Blaise Pascal,CNRS–IN2P3, Clermont-Ferrand, France
ii Now at Centro Fermi – Centro Studi e Ricerche e Museo Storico della Fisica “Enrico Fermi”, Rome, Italyiii Now at Physikalisches Institut, Ruprecht-Karls-Universitat Heidelberg, Heidelberg, Germanyiv Now at Frankfurt Institute for Advanced Studies, Johann Wolfgang Goethe-Universitat Frankfurt,
Frankfurt, Germanyv Now at Sezione INFN, Turin, Italyvi Now at University of Houston, Houston, Texas, United Statesvii Also at Dipartimento di Fisica dell’Universita, Udine, Italyviii Now at SUBATECH, Ecole des Mines de Nantes, Universite de Nantes, CNRS-IN2P3, Nantes, Franceix Now at Centro de Investigacion y de Estudios Avanzados (CINVESTAV), Mexico City and Merida,
Mexicox Now at Benemerita Universidad Autonoma de Puebla, Puebla, Mexicoxi Now at Laboratoire de Physique Subatomique et de Cosmologie(LPSC), Universite Joseph Fourier,
CNRS-IN2P3, Institut Polytechnique de Grenoble, Grenoble, Francexii Now at Institut Pluridisciplinaire Hubert Curien (IPHC), Universite de Strasbourg, CNRS-IN2P3,
Strasbourg, Francexiii Now at Sezione INFN, Padova, Italyxiv Deceasedxv Also at Division of Experimental High Energy Physics, University of Lund, Lund, Swedenxvi Also at University of Technology and Austrian Academy of Sciences, Vienna, Austriaxvii Also at European Organization for Nuclear Research (CERN),Geneva, Switzerland
xviii Now at Oak Ridge National Laboratory, Oak Ridge, Tennessee,United Statesxix Now at European Organization for Nuclear Research (CERN), Geneva, Switzerlandxx Also at Wayne State University, Detroit, Michigan, United Statesxxi Also at Frankfurt Institute for Advanced Studies, Johann Wolfgang Goethe-Universitat Frankfurt,
Frankfurt, Germanyxxii Now at Research Division and ExtreMe Matter Institute EMMI,GSI Helmholtzzentrum fur
Schwerionenforschung, Darmstadt, Germanyxxiii Also at Fachhochschule Koln, Koln, Germanyxxiv Also at Institute of Experimental Physics, Slovak Academy of Sciences, Kosice, Slovakia

Strange particle production in pp at√
s = 0.9 TeV 31
xxv Now at Instituto de Ciencias Nucleares, Universidad Nacional Autonoma de Mexico, Mexico City, Mexicoxxvi Also at Laboratoire de Physique Subatomique et de Cosmologie (LPSC), Universite Joseph Fourier,
CNRS-IN2P3, Institut Polytechnique de Grenoble, Grenoble, Francexxvii Also at ”Vinca” Institute of Nuclear Sciences, Belgrade, Serbiaxxviii Also at University of Houston, Houston, Texas, United Statesxxix Also at Department of Physics, University of Oslo, Oslo, Norwayxxx Also at Variable Energy Cyclotron Centre, Kolkata, Indiaxxxi Now at Department of Physics, University of Oslo, Oslo, Norwayxxxii Also at Dipartimento Interateneo di Fisica ‘M. Merlin’ and Sezione INFN, Bari, Italyxxxiii Now at Nikhef, National Institute for Subatomic Physics andInstitute for Subatomic Physics of Utrecht
University, Utrecht, Netherlandsxxxiv Also at Hua-Zhong Normal University, Wuhan, Chinaxxxv Also at Centro Fermi – Centro Studi e Ricerche e Museo Storicodella Fisica “Enrico Fermi”, Rome, Italy
Collaboration Institutes1 Department of Physics and Technology, University of Bergen, Bergen, Norway2 Centro de Aplicaciones Tecnologicas y Desarrollo Nuclear(CEADEN), Havana, Cuba3 Nuclear Physics Institute, Academy of Sciences of the CzechRepublic,Rez u Prahy, Czech Republic4 Yale University, New Haven, Connecticut, United States5 Physics Department, Panjab University, Chandigarh, India6 European Organization for Nuclear Research (CERN), Geneva, Switzerland7 KFKI Research Institute for Particle and Nuclear Physics, Hungarian Academy of Sciences, Budapest,
Hungary8 Instituto de Fısica, Universidad Nacional Autonoma de M´exico, Mexico City, Mexico9 Variable Energy Cyclotron Centre, Kolkata, India
10 Department of Physics Aligarh Muslim University, Aligarh,India11 Gangneung-Wonju National University, Gangneung, South Korea12 Institute for Theoretical and Experimental Physics, Moscow, Russia13 Russian Research Centre Kurchatov Institute, Moscow, Russia14 Sezione INFN, Turin, Italy15 Dipartimento di Fisica dell’Universita and Sezione INFN,Bologna, Italy16 Bogolyubov Institute for Theoretical Physics, Kiev, Ukraine17 Frankfurt Institute for Advanced Studies, Johann WolfgangGoethe-Universitat Frankfurt, Frankfurt,
Germany18 Dipartimento Interateneo di Fisica ‘M. Merlin’ and SezioneINFN, Bari, Italy19 Research Division and ExtreMe Matter Institute EMMI, GSI Helmholtzzentrum fur
Schwerionenforschung, Darmstadt, Germany20 V. Fock Institute for Physics, St. Petersburg State University, St. Petersburg, Russia21 National Institute for Physics and Nuclear Engineering, Bucharest, Romania22 Kirchhoff-Institut fur Physik, Ruprecht-Karls-Universitat Heidelberg, Heidelberg, Germany23 Department of Physics, Ohio State University, Columbus, Ohio, United States24 Rudjer Boskovic Institute, Zagreb, Croatia25 Dipartimento di Fisica dell’Universita and Sezione INFN,Padova, Italy26 Sezione INFN, Bologna, Italy27 SUBATECH, Ecole des Mines de Nantes, Universite de Nantes,CNRS-IN2P3, Nantes, France28 Institut fur Kernphysik, Johann Wolfgang Goethe-Universitat Frankfurt, Frankfurt, Germany29 Laboratoire de Physique Subatomique et de Cosmologie (LPSC), Universite Joseph Fourier, CNRS-IN2P3,
Institut Polytechnique de Grenoble, Grenoble, France30 Departamento de Fısica de Partıculas and IGFAE, Universidad de Santiago de Compostela, Santiago de
Compostela, Spain31 Oak Ridge National Laboratory, Oak Ridge, Tennessee, United States32 Helsinki Institute of Physics (HIP) and University of Jyvaskyla, Jyvaskyla, Finland33 Sezione INFN, Catania, Italy34 Dipartimento di Fisica Sperimentale dell’Universita andSezione INFN, Turin, Italy35 Centro Fermi – Centro Studi e Ricerche e Museo Storico della Fisica “Enrico Fermi”, Rome, Italy36 Commissariat a l’Energie Atomique, IRFU, Saclay, France

32 The ALICE Collaboration
37 Laboratoire de Physique Corpusculaire (LPC), Clermont Universite, Universite Blaise Pascal,CNRS–IN2P3, Clermont-Ferrand, France
38 Institute of Experimental Physics, Slovak Academy of Sciences, Kosice, Slovakia39 Dipartimento di Fisica e Astronomia dell’Universita and Sezione INFN, Catania, Italy40 School of Physics and Astronomy, University of Birmingham,Birmingham, United Kingdom41 The Henryk Niewodniczanski Institute of Nuclear Physics, Polish Academy of Sciences, Cracow, Poland42 Institut fur Kernphysik, Westfalische Wilhelms-Universitat Munster, Munster, Germany43 Joint Institute for Nuclear Research (JINR), Dubna, Russia44 Niels Bohr Institute, University of Copenhagen, Copenhagen, Denmark45 Institut Pluridisciplinaire Hubert Curien (IPHC), Universite de Strasbourg, CNRS-IN2P3, Strasbourg,
France46 Wayne State University, Detroit, Michigan, United States47 Petersburg Nuclear Physics Institute, Gatchina, Russia48 Physics Department, University of Jammu, Jammu, India49 Laboratori Nazionali di Frascati, INFN, Frascati, Italy50 Faculty of Nuclear Sciences and Physical Engineering, Czech Technical University in Prague, Prague,
Czech Republic51 Nikhef, National Institute for Subatomic Physics, Amsterdam, Netherlands52 Centro de Investigaciones Energeticas Medioambientalesy Tecnologicas (CIEMAT), Madrid, Spain53 University of Houston, Houston, Texas, United States54 Moscow Engineering Physics Institute, Moscow, Russia55 Institute for High Energy Physics, Protvino, Russia56 Faculty of Science, P.J.Safarik University, Kosice, Slovakia57 Saha Institute of Nuclear Physics, Kolkata, India58 Institut de Physique Nucleaire d’Orsay (IPNO), Universite Paris-Sud, CNRS-IN2P3, Orsay, France59 Department of Physics, University of Oslo, Oslo, Norway60 Dipartimento di Fisica dell’Universita and Sezione INFN,Trieste, Italy61 Faculty of Mathematics, Physics and Informatics, ComeniusUniversity, Bratislava, Slovakia62 Russian Federal Nuclear Center (VNIIEF), Sarov, Russia63 Physikalisches Institut, Ruprecht-Karls-Universitat Heidelberg, Heidelberg, Germany64 Physics Department, University of Cape Town, iThemba Laboratories, Cape Town, South Africa65 Hua-Zhong Normal University, Wuhan, China66 Seccion Fısica, Departamento de Ciencias, Pontificia Universidad Catolica del Peru, Lima, Peru67 Physics Department, Creighton University, Omaha, Nebraska, United States68 Universite de Lyon, Universite Lyon 1, CNRS/IN2P3, IPN-Lyon, Villeurbanne, France69 Universidade Estadual de Campinas (UNICAMP), Campinas, Brazil70 Nikhef, National Institute for Subatomic Physics and Institute for Subatomic Physics of Utrecht University,
Utrecht, Netherlands71 Division of Experimental High Energy Physics, University of Lund, Lund, Sweden72 University of Tsukuba, Tsukuba, Japan73 Sezione INFN, Cagliari, Italy74 Centro de Investigacion y de Estudios Avanzados (CINVESTAV), Mexico City and Merida, Mexico75 Benemerita Universidad Autonoma de Puebla, Puebla, Mexico76 Dipartimento di Scienze e Tecnologie Avanzate dell’Universita del Piemonte Orientale and Gruppo
Collegato INFN, Alessandria, Italy77 Instituto de Ciencias Nucleares, Universidad Nacional Autonoma de Mexico, Mexico City, Mexico78 Laboratori Nazionali di Legnaro, INFN, Legnaro, Italy79 Institute of Space Sciences (ISS), Bucharest, Romania80 Institute of Physics, Bhubaneswar, India81 Universidade de Sao Paulo (USP), Sao Paulo, Brazil82 Dipartimento di Fisica ‘E.R. Caianiello’ dell’Universit`a and Gruppo Collegato INFN, Salerno, Italy83 Sezione INFN, Bari, Italy84 Dipartimento di Fisica dell’Universita and Sezione INFN,Cagliari, Italy85 Soltan Institute for Nuclear Studies, Warsaw, Poland86 Sezione INFN, Rome, Italy87 Faculty of Engineering, Bergen University College, Bergen, Norway

Strange particle production in pp at√
s = 0.9 TeV 33
88 Sezione INFN, Padova, Italy89 Institute for Nuclear Research, Academy of Sciences, Moscow, Russia90 Sezione INFN, Trieste, Italy91 Physics Department, University of Athens, Athens, Greece92 Warsaw University of Technology, Warsaw, Poland93 Universidad Autonoma de Sinaloa, Culiacan, Mexico94 Technical University of Split FESB, Split, Croatia95 Yerevan Physics Institute, Yerevan, Armenia96 University of Tokyo, Tokyo, Japan97 Department of Physics, Sejong University, Seoul, South Korea98 Lawrence Berkeley National Laboratory, Berkeley, California, United States99 Indian Institute of Technology, Mumbai, India
100 Institut fur Kernphysik, Technische Universitat Darmstadt, Darmstadt, Germany101 Yonsei University, Seoul, South Korea102 Zentrum fur Technologietransfer und Telekommunikation (ZTT), Fachhochschule Worms, Worms,
Germany103 California Polytechnic State University, San Luis Obispo,California, United States104 China Institute of Atomic Energy, Beijing, China105 Institute of Physics, Academy of Sciences of the Czech Republic, Prague, Czech Republic106 University of Tennessee, Knoxville, Tennessee, United States107 Dipartimento di Fisica dell’Universita ‘La Sapienza’ andSezione INFN, Rome, Italy108 Hiroshima University, Hiroshima, Japan109 Lawrence Livermore National Laboratory, Livermore, California, United States110 Budker Institute for Nuclear Physics, Novosibirsk, Russia111 Physics Department, University of Rajasthan, Jaipur, India112 Purdue University, West Lafayette, Indiana, United States113 Centre de Calcul de l’IN2P3, Villeurbanne, France114 Pusan National University, Pusan, South Korea
References
[1] T. Sjostrand, S. Mrenna and P. Z. Skands, J. High Energy Phys. 0605 (2006) 026.
[2] R. Engel, J. Ranft and S. Roesler, Phys. Rev. D52, (1995) 1459.
[3] F. Becattini and U. W. Heinz, Z. Phys. C76, (1997) 269.
[4] I. Kraus, J. Cleymans, H. Oeschler and K. Redlich, Phys. Rev. C79, (2009) 014901.
[5] F. Becattini, P. Castorina, A. Milov, and H. Satz, arXiv:0912.2855[hep-ph].
[6] T. Sjostrand and P. Z. Skands, Eur. Phys. J. C39, (2005) 129.
[7] L. Evans and P. Bryant, (ed. ), JINST3, (2008) S08001.
[8] ALICE Collaboration, K. Aamodtet al., Eur. Phys. J. C65, (2010) 111.
[9] ALICE Collaboration, K. Aamodtet al., Eur. Phys. J. C68, (2010) 89.
[10] ALICE Collaboration, K. Aamodtet al., JINST 364, (2008) S08002.
[11] ALICE Collaboration, K. Aamodtet al., JINST 5 (2010) P03003.
[12] J. Almeet al. Nucl. Instrum. Meth. A622, (2010) 316.
[13] A. Akindinov et al. Eur. Phys. J.C68, (2010) 601 and references therein.
[14] ALICE Collaboration, K. Aamodtet al., Phys. Lett. B693, 53 (2010).
[15] ALICE Collaboration, B. Alessandro (ed. )et al., J. Phys. G32, (2006) 1295.
[16] ALICE Collaboration, K. Aamodtet al., “Production of pions, kaons and protons in pp collision at√s = 900 GeV with ALICE at the LHC”, to be submitted to Eur. Phys. J. C.
[17] J. Podolanski and R. Armenteros, Phil. Mag.45, (1954) 13.
[18] K. Nakamuraet al. (Particle Data Group), J. Phys. G37, 075021 (2010).
[19] W. Blum and L. Rolandi, Particle Detection with Drift Chambers, Springer, Berlin, 1998.
[20] M. G. Albrow et al., Tevatron-for-LHC Conference Report of the QCD Working Group, Fermilab-Conf-06-359, hep-ph/0610012.

34 The ALICE Collaboration
[21] R. Brun et al., 1985 ”GEANT3 User Guide”, CERN Data Handling Division DD/EE/841; R. Brunet al.,1994 ”CERN Program Library Long Write- up, W5013, GEANT Detector Description and Simulation Tool”.
[22] ALICE Collaboration, K. Aamodtet al., Phys. Rev. Lett.105, (2010) 072002.
[23] P. Christakoglou et al., ALICE Internal Note ALICE-INT-2008-010 (2008); P. Christakoglou et al., ALICEInternal Note ALICE-INT-2010-006 (2010); P. Christakoglou et al. [ALICE Collaboration], PoS (EPS-HEP2009) 405.
[24] G. Bendiscioli and D. Kharzeev, Riv. Nuovo Cim. 17N6, (1994) 1.
[25] STAR Collaboration, B. I. Abelevet al., Phys. Rev. C75, (2007) 064901.
[26] A. Moraes (ATLAS Collaboration), ATLAS Note ATL-COM-PHYS-2009-119 (2009).
[27] P. Z. Skands, Contribution to the 1st International Workshop on Multiple Partonic Interactions at the LHC,Perugia, Italy, Oct. 2008, Fermilab-Conf-09-113-T, arXiv:0905.3418[hep-ph] and arXiv:1005.3457[hep-ph].
[28] STAR Collaboration, J. Adamset al., Phys. Rev. Lett.97, (2006) 132301.
[29] M. Bourquin and J. M. Gaillard, Nucl. Phys. B114, (1976) 334.
[30] UA5 Collaboration, R. E. Ansorgeet al., Z. Phys. C41, (1988) 179.
[31] CDF Collaboration, F. Abeet al., Phys. Rev. D40, (1989) 3791 RC.
[32] UA5 Collaboration, G. J. Alneret al., Phys. Rep.154(1987) 247.
[33] UA5 Collaboration, R. E. Ansorgeet al., Nucl. Phys. B328, (1989) 36.
[34] STAR Collaboration, J. Adamset al., Phys. Lett. B612(2005) 181.
[35] STAR Collaboration, B. I. Abelevet al., Phys. Rev. C79 (2009) 064903.
[36] E735 Collaboration, T. Alexopouloset al., Z. Phys. C67 (1995) 411.
[37] CDF Collaboration, D. Acostaet al., Phys. Rev. D72 (2005) 052001.
[38] UA1 Collaboration, G. Bocquetet al., Phys. Lett. B366, (1996) 441.


![First Measurement of Bose-Einstein Correlations in Proton-Proton Collisions at sqrt[s]=0.9 and 2.36 TeV at the LHC](https://static.fdokumen.com/doc/165x107/63242f87078ed8e56c0b3763/first-measurement-of-bose-einstein-correlations-in-proton-proton-collisions-at-sqrts09.jpg)

