Stearic acid-rich interesterified fat and trans-rich fat raise the LDL/HDL ratio and plasma glucose...
12
BioMed Central Page 1 of 12 (page number not for citation purposes) Nutrition & Metabolism Open Access Research Stearic acid-rich interesterified fat and trans-rich fat raise the LDL/HDL ratio and plasma glucose relative to palm olein in humans Kalyana Sundram* 1 , Tilakavati Karupaiah 2 and KC Hayes 3 Address: 1 Food Technology & Nutrition Research Unit, Malaysian Palm Oil Board, Kuala Lumpur, Malaysia, 2 Faculty of Allied Health Sciences, National University of Malaysia, Malaysia and 3 Foster Biomedical Research Lab, Brandeis University, Waltham, MA, USA Email: Kalyana Sundram* - [email protected]; Tilakavati Karupaiah - [email protected]; KC Hayes - [email protected] * Corresponding author Abstract Background: Dietary trans-rich and interesterified fats were compared to an unmodified saturated fat for their relative impact on blood lipids and plasma glucose. Each fat had melting characteristics, plasticity and solids fat content suitable for use as hardstock in margarine and other solid fat formulations. Methods: Thirty human volunteers were fed complete, whole food diets during 4 wk periods, where total fat (~31% daily energy, >70% from the test fats) and fatty acid composition were tightly controlled. A crossover design was used with 3 randomly-assigned diet rotations and repeated- measures analysis. One test fat rotation was based on palm olein (POL) and provided 12.0 percent of energy (%en) as palmitic acid (16:0); a second contained trans-rich partially hydrogenated soybean oil (PHSO) and provided 3.2 %en as trans fatty acids plus 6.5 %en as 16:0, while the third used an interesterified fat (IE) and provided 12.5 %en as stearic acid (18:0). After 4 wk the plasma lipoproteins, fatty acid profile, as well as fasting glucose and insulin were assessed. In addition, after 2 wk into each period an 8 h postprandial challenge was initiated in a subset of 19 subjects who consumed a meal containing 53 g of test fat. Results: After 4 wk, both PHSO and IE fats significantly elevated both the LDL/HDL ratio and fasting blood glucose, the latter almost 20% in the IE group relative to POL. Fasting 4 wk insulin was 10% lower after PHSO (p > 0.05) and 22% lower after IE (p < 0.001) compared to POL. For the postprandial study the glucose incremental area under the curve (IAUC) following the IE meal was 40% greater than after either other meal (p < 0.001), and was linked to relatively depressed insulin and C-peptide (p < 0.05). Conclusion: Both PHSO and IE fats altered the metabolism of lipoproteins and glucose relative to an unmodified saturated fat when fed to humans under identical circumstances. Background Partially hydrogenated oils represent a means of removing unstable polyunsaturated fatty acids (PUFA) from fats in foods that require longer shelf life. Although semisolid at room temperature, such products also technically repre- sent a monounsaturated fatty acid (MUFA) replacement for natural saturated fatty acids (SFA). Unfortunately, par- tially hydrogenated oil represents the prime source of Published: 15 January 2007 Nutrition & Metabolism 2007, 4:3 doi:10.1186/1743-7075-4-3 Received: 22 August 2006 Accepted: 15 January 2007 This article is available from: http://www.nutritionandmetabolism.com/content/4/1/3 © 2007 Sundram et al; licensee BioMed Central Ltd. This is an Open Access article distributed under the terms of the Creative Commons Attribution License (http://creativecommons.org/licenses/by/2.0 ), which permits unrestricted use, distribution, and reproduction in any medium, provided the original work is properly cited.
-
Upload
independent -
Category
Documents
-
view
1 -
download
0
Transcript of Stearic acid-rich interesterified fat and trans-rich fat raise the LDL/HDL ratio and plasma glucose...
BioMed CentralNutrition & Metabolism
ss
Open AcceResearchStearic acid-rich interesterified fat and trans-rich fat raise the LDL/HDL ratio and plasma glucose relative to palm olein in humansKalyana Sundram*1, Tilakavati Karupaiah2 and KC Hayes3Address: 1Food Technology & Nutrition Research Unit, Malaysian Palm Oil Board, Kuala Lumpur, Malaysia, 2Faculty of Allied Health Sciences, National University of Malaysia, Malaysia and 3Foster Biomedical Research Lab, Brandeis University, Waltham, MA, USA
Email: Kalyana Sundram* - [email protected]; Tilakavati Karupaiah - [email protected]; KC Hayes - [email protected]
* Corresponding author
AbstractBackground: Dietary trans-rich and interesterified fats were compared to an unmodifiedsaturated fat for their relative impact on blood lipids and plasma glucose. Each fat had meltingcharacteristics, plasticity and solids fat content suitable for use as hardstock in margarine and othersolid fat formulations.
Methods: Thirty human volunteers were fed complete, whole food diets during 4 wk periods,where total fat (~31% daily energy, >70% from the test fats) and fatty acid composition were tightlycontrolled. A crossover design was used with 3 randomly-assigned diet rotations and repeated-measures analysis. One test fat rotation was based on palm olein (POL) and provided 12.0 percentof energy (%en) as palmitic acid (16:0); a second contained trans-rich partially hydrogenatedsoybean oil (PHSO) and provided 3.2 %en as trans fatty acids plus 6.5 %en as 16:0, while the thirdused an interesterified fat (IE) and provided 12.5 %en as stearic acid (18:0). After 4 wk the plasmalipoproteins, fatty acid profile, as well as fasting glucose and insulin were assessed. In addition, after2 wk into each period an 8 h postprandial challenge was initiated in a subset of 19 subjects whoconsumed a meal containing 53 g of test fat.
Results: After 4 wk, both PHSO and IE fats significantly elevated both the LDL/HDL ratio andfasting blood glucose, the latter almost 20% in the IE group relative to POL. Fasting 4 wk insulinwas 10% lower after PHSO (p > 0.05) and 22% lower after IE (p < 0.001) compared to POL. Forthe postprandial study the glucose incremental area under the curve (IAUC) following the IE mealwas 40% greater than after either other meal (p < 0.001), and was linked to relatively depressedinsulin and C-peptide (p < 0.05).
Conclusion: Both PHSO and IE fats altered the metabolism of lipoproteins and glucose relative toan unmodified saturated fat when fed to humans under identical circumstances.
BackgroundPartially hydrogenated oils represent a means of removingunstable polyunsaturated fatty acids (PUFA) from fats infoods that require longer shelf life. Although semisolid at
room temperature, such products also technically repre-sent a monounsaturated fatty acid (MUFA) replacementfor natural saturated fatty acids (SFA). Unfortunately, par-tially hydrogenated oil represents the prime source of
Published: 15 January 2007
Nutrition & Metabolism 2007, 4:3 doi:10.1186/1743-7075-4-3
Received: 22 August 2006Accepted: 15 January 2007
This article is available from: http://www.nutritionandmetabolism.com/content/4/1/3
© 2007 Sundram et al; licensee BioMed Central Ltd. This is an Open Access article distributed under the terms of the Creative Commons Attribution License (http://creativecommons.org/licenses/by/2.0), which permits unrestricted use, distribution, and reproduction in any medium, provided the original work is properly cited.
Page 1 of 12(page number not for citation purposes)
Nutrition & Metabolism 2007, 4:3 http://www.nutritionandmetabolism.com/content/4/1/3
trans fatty acids (TFA) in the human diet. The negativeeffects of TFA on lipoproteins have been widely publi-cized [1], which led to inclusion of TFA on food labels byvarious governments. Interesterification (fatty acid rand-omization) of fat is fast becoming an alternate modifica-tion technique, whereby insertion of saturated fatty acids(SFA), typically as stearic acid (18:0), is employed toharden an oil to a plasticity comparable to earlier trans fatpreparations or to hardness of a natural saturated fat. Theassumption has been that since 18:0, as consumed in nat-ural fats at 2–4% of daily energy, is thought to have a neu-tral effect on metabolism of cholesterol and lipoproteins[2-4], the response to 18:0 at any level of intake and in anytriacylglycerol (TG) configuration would be neutral. How-ever, like partial hydrogenation, the random insertion offatty acids on the glycerol backbone of the fat moleculeassociated with chemical interesterification alters naturalTG structure, referred to as TG molecular species or TG-MS[5]. Several studies reveal that altering dietary TG-MS, ie.the natural position of specific fatty acids on the 3C glyc-erol backbone (carbons designated as sn1, sn2, and sn3),affects both lipoprotein metabolism and experimentalatherogenesis [6-9]. On the other hand, in certain situa-tions serum lipid parameters were minimally affectedwhen the intake of randomized fat was modest or acute,as in a single meal challenge with a modified fat contain-ing altered TG-MS [10-12].
Accordingly, we hypothesized that chemically modifiedvegetable oils, either partially hydrogenated or interester-ified with abundant 18:0, might not have the same meta-bolic impact as a naturally-configured saturated oil rich inpalmitic (16:0) + oleic (cis18:1) fatty acids. Three fats wereprepared as suitable hardstock for margarine and othersolid fat formulations. The natural fat was based on palmolein (POL), used extensively for many food formulationsthat still require a degree of fat saturation. Partially hydro-genated soybean oil (PHSO) was included as the typicalexample of a commonly used semisolid fat containinggeometric fatty acid isomers (cis or trans) of 18:1 and 18:2(linoleic acid). The third fat was chemically interesterified(IE), which randomly incorporated 18:0 into regular TGmolecules in soybean oil as an alternative hard fat forfood formulations. The primary focus was on blood lipidsand the lipoprotein profile in normolipemic humans,with a secondary focus on blood glucose, insulin and C-peptide.
MethodsStudy designThe study, approved by the Program Advisory Committeeat the Malaysian Palm Oil Board, Bangi, Malaysia,included informed signed consent by the human volun-teers. The 3 dietary fats were compared using a crossoverdesign with 4 wk for each fat. Specifically, diets were iden-
tified as A, B, or C, and subjects were assigned to each inrandom order until all three had been consumed by eachperson. Thus, all three diets were available during each 4wk treatment period, but individual assignment to eachwas randomized to help negate possible carryover effects.Subjects were advised to maintain their usual food intakefor all test rotations, which were identical in all aspectsexcept for the cooking fat. An electronic weighing balancein the food service area was used to weigh food portions.Blood samples were collected prior to beginning a testperiod and twice during the last week (averaged as the ter-minal value).
Within each 4 wk period, an identical subgroup of 19 sub-jects participated in an acute postprandial challenge withtheir respective test fat after 2 wk into each diet rotation.Thus, volunteers were preconditioned with the test fatduring the 14 d prior to the postprandial challenge. Afteran overnight fast of at least 12 h, volunteers reported tothe laboratory on the 15th morning. Body weight wasrecorded and baseline fasted blood was drawn. Volunteersthen consumed a standardized test meal comprisingweighed portions of fried rice, fried potatoes, a slice ofpapaya and tea. This test breakfast contributed a total of53 g test fat, and consumption of this meal was completedwithin 20 minutes of the first (baseline, 0 h) blood sam-pling. Blood samples were then taken sequentially at 2, 4,5, 6 and 8 h after the test meal was consumed. Volunteersabstained from consuming any food during this 8 hperiod, except bottled mineral water. They also refrainedfrom any strenuous activity during this interval. Followingthe 8 h sample, volunteers received a fully cooked meal.
Study subjectsEligibility criteria included absence of family history foratherosclerosis or hypertension, as well as no use oftobacco or alcohol or adherence to any weight loss pro-gram or prescribed medication. A total of 11 healthy menand 21 women (ave age 30 ± 8 y) were initially recruitedby advertisement among the 450 staff members at theresearch facilities of the Palm Oil Board. One subject wasunable to comply with the dietary protocol and subse-quently was dropped from the study, while another didnot complete the third rotation due to acute appendicitis.The baseline demographics of the remaining 30 fastingsubjects who were recruited after initial screening andwho successfully completed the study were as follows(mean ± SD): BMI 22 ± 4; body wt 56 ± 10 kg; blood lipids(total cholesterol, 5.05 ± 0.53 mmol/L; LDL-C, 3.17 ±0.51 mmol/L; HDL-C mmol/L, 1.48 ± 0.25 mmol/L; TG,0.89 ± 0.30 mmol/L) and plasma glucose concentrations(5.43 ± 0.29 mmol/L).
Page 2 of 12(page number not for citation purposes)
Nutrition & Metabolism 2007, 4:3 http://www.nutritionandmetabolism.com/content/4/1/3
Test fatsThe 3 test fats (Table 1) included palm olein, as a naturaldietary fat (POL); a partially hydrogenated soybean oil(PHSO); and an interesterified fat (IE) prepared in a 2-step procedure. Palm olein is the liquid to semisolid oilfraction obtained when palm oil is melted, followed byrapid cooling to separate the upper liquid palm olein layer(approximately 70%) from the lower solid stearin fraction(approximately 30%) by a physical fat modification proc-ess termed fractionation. POL contains more monoun-saturated cis18:1 and less16:0 and 18:0 saturates relativeto original palm oil, which has more saturated 16:0 thanmonounsaturated cis18:1. Both of the chemically modi-fied fats, namely PHSO and IE, typically have less PUFAand cis18:1 content compared to native soybean oil(SBO), but have higher solid fat content to confer moreplasticity and less susceptibility to rancidity. These threefats each provided a TG structure and plasticity thatrenders them suitable for use in common solid fat-con-taining food formulations.
To prepare the IE fat, a first-step full hydrogenation ofrefined SBO converted all unsaturated C18 fatty acids to18:0, which was then blended with refined SBO and POLthat yielded the target fatty acid composition. The blendwas then subjected to chemical interesterification. To pre-pare the PHSO, refined SBO was first partially hydrogen-ated using standard catalytic hydrogenation to obtain a
targeted amount of TFA in the oil. For the final PHSOcomposition, 40% of this partially hydrogenated SBO wasblended with 30% refined SBO and 30% POL.
The final test fats had the following slip melting points(POL, 24.0; PHSO, 38.5; IE, 43.0°C). At 20°C the % sol-ids equaled 20, 20 and 43 for POL, PHSO and IE, respec-tively. The final test diet supplying POL provided 12.0%en as 16:0, while the PHSO fat yielded a TFA content ofabout 10% by wt, but contributing 3.2 %en as TFA plus6.5 %en as 16:0 when incorporated into the final diet. Thezero-trans, IE-fat diet provided 12.5 %en as 18:0 (Table 1).
Test dietsDiets were prepared by a caterer who received detailedinstruction from the research dietitian about the menuplan, portion size, and procedures for incorporating thetest fats. A uniform menu was utilized for all 3-diet peri-ods, which differed only in the type of test fat incorpo-rated. Three meals a day, comprising breakfast, lunch andhigh tea were provided for the 4-wk period of each fatrotation. The menu, which was used to prepare the mealsfrom Monday through Saturday noon, was constructedaccording to a fixed meal plan: For breakfast, a rice or noo-dle dish and a snack item cooked with the test fat wasserved with either coffee or tea. Lunch included either fishor chicken and 2 vegetables cooked with the test fat andaccompanied by rice and fruits along with either tea or
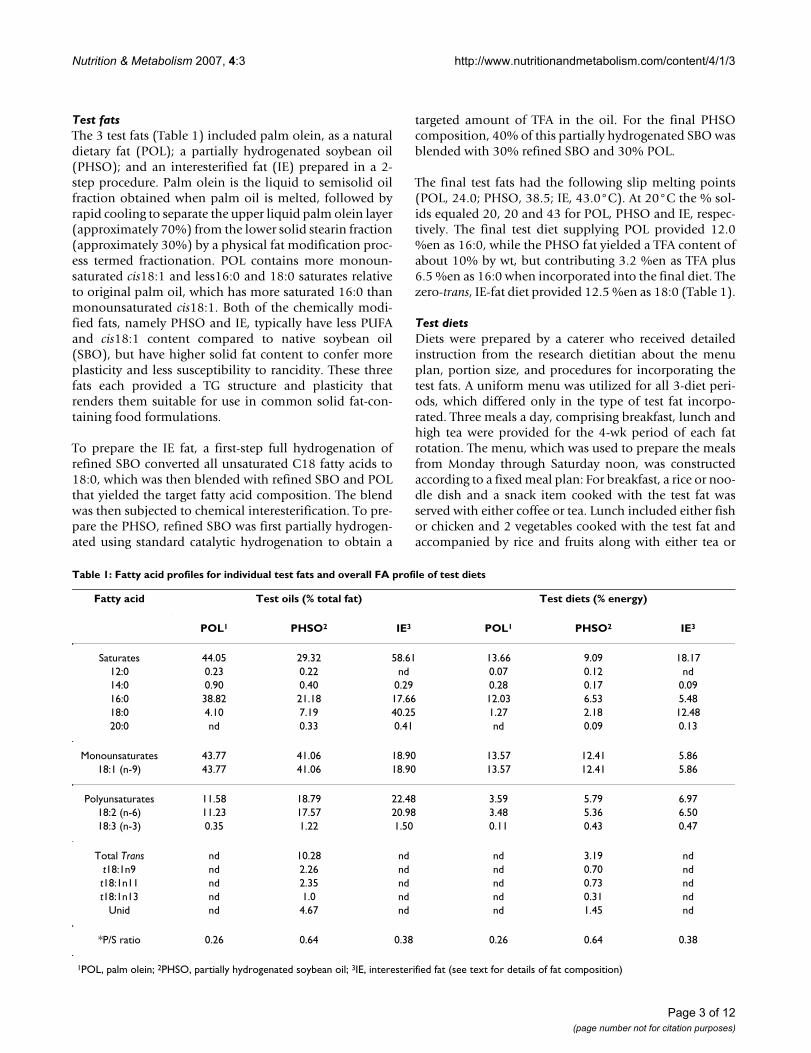
Table 1: Fatty acid profiles for individual test fats and overall FA profile of test diets
Fatty acid Test oils (% total fat) Test diets (% energy)
POL1 PHSO2 IE3 POL1 PHSO2 IE3
Saturates 44.05 29.32 58.61 13.66 9.09 18.1712:0 0.23 0.22 nd 0.07 0.12 nd14:0 0.90 0.40 0.29 0.28 0.17 0.0916:0 38.82 21.18 17.66 12.03 6.53 5.4818:0 4.10 7.19 40.25 1.27 2.18 12.4820:0 nd 0.33 0.41 nd 0.09 0.13
Monounsaturates 43.77 41.06 18.90 13.57 12.41 5.8618:1 (n-9) 43.77 41.06 18.90 13.57 12.41 5.86
Polyunsaturates 11.58 18.79 22.48 3.59 5.79 6.9718:2 (n-6) 11.23 17.57 20.98 3.48 5.36 6.5018:3 (n-3) 0.35 1.22 1.50 0.11 0.43 0.47
Total Trans nd 10.28 nd nd 3.19 ndt18:1n9 nd 2.26 nd nd 0.70 ndt18:1n11 nd 2.35 nd nd 0.73 ndt18:1n13 nd 1.0 nd nd 0.31 nd
Unid nd 4.67 nd nd 1.45 nd
*P/S ratio 0.26 0.64 0.38 0.26 0.64 0.38
1POL, palm olein; 2PHSO, partially hydrogenated soybean oil; 3IE, interesterified fat (see text for details of fat composition)
Page 3 of 12(page number not for citation purposes)
Nutrition & Metabolism 2007, 4:3 http://www.nutritionandmetabolism.com/content/4/1/3
coffee. For high tea, a fried snack item incorporated thetest fat, which was served with either tea or coffee. Becausethe subjects consumed their off-campus evening meal andSunday meals with their families at home, they were pro-vided with the appropriate cooking fat to incorporate intohome meal preparations during each dietary period.
Fat and protein content of weighed food portions weredetermined by established AOAC methods (22). Energyvalue of the diets was determined with an automatedbomb calorimeter [C5000 IKA-Calorimeter system, IKA®
WERKE, KG, Germany]. Diets contained about 31 %enfrom fat, 3.5–7 %en as linoleic acid, with each test fat pro-viding more than 70% of the total fat under controlledconditions. Dietary carbohydrate provided approximately54 %en, and protein approximately15 %en. Carbohy-drate content was indirectly estimated by difference oftotal protein and total lipid mass from the dried mass ofthe food samples. In addition, the use of the cooking fatin homes (including Sundays) was recorded in a diary toserve as an additional compliance marker. Overall, sub-jects were blind to the test fat fed during each test rotation.
Blood samplesTwenty-ml blood samples were collected at baseline andon days 28 and 29 of each test-fat rotation after overnightfasting. For the postprandial study 12-ml blood sampleswere collected (fasting baseline, and 2,4,5,6 and 8 h). Vac-cutainer® tubes [Becton Dickinson Vaccutainer, NJ, USA]with or without EDTA (0.117 ml of 15% EDTA) were usedfor plasma and serum preparations, respectively. Forserum preparation, blood was allowed to clot at roomtemperature for exactly 2 h. The Vaccutainer tubes werethen centrifuged at 3000 × g for 20 min at 4°C to separatethe serum or plasma, which was aliquoted for variouslipid and lipoprotein analyses, snap-frozen with liquidnitrogen and stored at -80°C for subsequent analyses. Toreduce intra-assay variation, samples from all 3 arms ofdietary treatment were analyzed in a single batch.
Analyses of lipids and lipoproteinsCholesterol and TG concentrations in plasma were ana-lyzed by the enzymatic procedures of Allain et al [13] andNägele et al. [14], respectively. HDL-C determination wasbased on a 2-step methodology, which required first pre-cipitating LDL and VLDL from plasma with dextran andmagnesium sulfate and then assaying the supernatantcontaining the HDL for cholesterol [15,16]. All assayswere performed using a Ciba-Corning 550 Express Auto-analyzer [Ciba-Corning Diagnostics Corp., Oberlin,Ohio, USA]. All reagents, calibrators and controls weresupplied by Bayer Corp. (Tarrytown, NY, USA), HDL-Cprecipitant by Chiron Diagnostics Corp. [E. Walpole, MA,USA/Bayer Corp., Tarrytown, NY, USA]. LDL-C and VLDL-C were calculated using Friedewald's equations [18].
TG-MS composition was determined by reverse-phaseHPLC. The fat blends were used directly and not subjectedto further purification prior to the analysis. The mobilephase was acetone/acetonitrile (Merck) at a gradient com-position beginning with 65% acetone and increasing to85% acetone in 30 min. The mobile phase flow rate was1.5 mL/min. Two commercially packed Genesis C18HPLC columns (15 cm length × 4.6 mm i.d.) of 4 um par-ticle size (Jones Chromatography, Mid Glamorgan,United Kingdom) were used to separate the TG-MS. TheTG-MS were detected by an Evaporative Light ScatterDetector, ELSD. Individual peaks were identified by com-paring the retention times with those of pure TG-MSstandards and common vegetable oils of known TG-MScomposition [17].
Determination of plasma glucose, serum insulin and C-peptidePlasma glucose was assessed from frozen samples by theglucose oxidase method, a 2-step enzymatic procedure[19]. A reagent kit for the enzymatic procedure, SERA-PAK® Glucose (which was fully Bayer Corporation, Tarry-town, NY, USA) was used in the analysis, which was auto-mated using the Ciba-Corning 550 Express Autoanalyzer(Ciba-Corning Diagnostics Corporation, Ohio, USA).Serum insulin was measured [20] for 0 wk, 4 wk, andpostprandial samples by automated immunoassay withan IMMULITE 1000 Analyzer (Euro/DPC Limited Diag-nostics Products Corporation, Los Angeles, Ca.) andexpressed as uU/ml. Circulating C-peptide was measuredin postprandial serum as an index of insulin secretion[21]. Samples were diluted (1:4) prior to immunoassaywith the IMMULITE 1000 Analyzer. All components(chemiluminescent substrate, controls, standards anddiluent) for the insulin and C-peptide immunoassayswere supplied in IMMULITE kits. Results are expressed aspmol/L.
Compliance measurementsGeneral compliance to diet was assessed by body weightchanges and the comparison between the fatty acid com-position of diets eaten and plasma TG. In the firstinstance, weight was recorded for every subject at baselineand at weekly intervals for each test rotation. This ensuredthat food intake was adequate and that weight fluctua-tions were minimized between the test-fat rotations.
Plasma TG fatty acid composition of was determined forall subjects at the end of each test rotation. Total lipidswere extracted from plasma and subjected to thin-layerchromatography to separate TG and cholesteryl esters[22,23]. In addition, fatty acids from diets as eaten wereassessed following Soxhlet extraction and conversion ofextracted lipids into fatty acid methyl esters for analysis bygas chromatography [Perkin-Elmer Autosystem, Perkin-
Page 4 of 12(page number not for citation purposes)

Nutrition & Metabolism 2007, 4:3 http://www.nutritionandmetabolism.com/content/4/1/3
Elmer, Norwalk, CT]. Test fats themselves were assayeddirectly after conversion to methyl esters [22,23]. Resultsfrom gas chromatography of fatty acids were obtained aspercentage composition (by weight), calculated by refer-ence to standards. The fatty acid profile of meals con-sumed by the subjects served to check whether theresearch diets achieved fatty acid targets, while the plasmaTG fatty acids served to check compliance with theresearch protocol.
Statistical analysisThe crossover design enabled each subject to serve as his/her own control. The Statistical Package for Social Sci-ences, SPSS® for Windows™ application (Version 11.0,SPSS Inc., Chicago, USA) was used for all required statisti-cal analyses. The mean of values for days 28 and 29 wastreated as the end of the study period. Univariate analysiswas performed for linearly independent pair-wise com-parisons between baseline and end values for plasma lip-ids, lipoproteins, glucose, and insulin, as well as for thepercent change in the measured parameters for each die-tary treatment. Multivariate analyses for repeated meas-ures (ANOVA), using the general linear model, wasperformed for all time × diet interactions for blood glu-cose, insulin and C-peptide parameters following eachpostprandial test fat challenge. Corrected models usedagainst baseline values were taken as true measures ofchange occurring during the post-absorptive period result-ing from dietary treatment. Univariate analysis was per-formed for linearly independent pair-wise comparisons ofincremental area-under-the-curve (IAUC) data for the 8-hpostprandial period calculated by the trapezoidal rule[25]. Post-hoc analyses included Bonferroni's adjustmentfor multiple paired comparisons of estimated marginalmeans as well as Duncan's test for homogeneity of theeffects generated by the test fat treatments. Significancewas set at P < 0.05 for all evaluated measures.
ResultsWeightInitial body weights were not altered during the experi-ment, as weight fluctuations between test fat rotationswere comparable (<0.25 kg gained per fat) and not statis-tically different [data not shown].
Diet intakeBased on weighed food portions and diary records, thedaily energy consumed by subjects averaged between2100 and 2200 kcal/d. Protein intake averages werebetween 80–89 g/d (about 16 %en), fat between 73–77 g/d (about 31 %en), and carbohydrate between 283–292 g/d (about 53 %en) for the 3 diet periods. Food intake pat-terns were consistent and similar between treatments[data not shown].
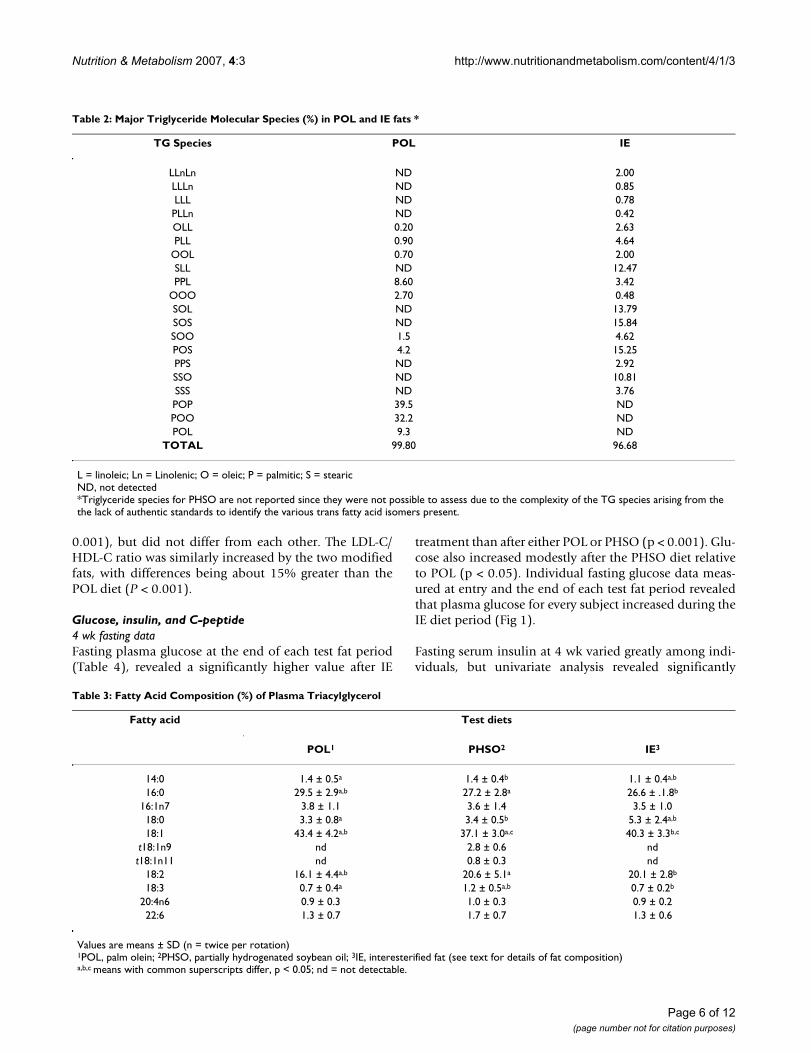
Fatty acid and TG-MS profilesAs expected, random interesterification of fully hydrogen-ated soybean oil with regular soybean oil led to a signifi-cant number of TG-MS in the IE test fat having 18:0 in sn2.By contrast, the POL test fat was represented by TG-MShaving significant unsaturated cis18:1 at sn2. Specifically,the TG-MS compositions for the natural POL and IE fats(Table 2) revealed that the sn2 (number 2 carbon of glyc-erol) was occupied by 18:0 or 16:0 in about 15% and 6%,respectively, of the TG molecules in IE. Thus, 21% of theTG molecules in IE had a saturated fatty acid at sn2. Bycontrast, no TG molecules with sn2-18:0 were detected inPOL; and only 9 % of all TG molecules in POL had a sat-urated fatty acid at sn2 (as 16:0). Thus, the total saturatedfatty acid content at sn2 was more than twice as great forIE fat (sn2-18:0+16:0). By contrast, 87% of TG moleculesin POL had cis18:1 at sn2, while only 55% TG moleculesin IE fat had cis18:1 at sn2. Surprisingly, only 1% of TG inPOL had 18:2 at sn2, compared to 21% for the IE fat; andabout 20% of TG molecules in POL had 18:2 at sn1,3,whereas 42% of the TG molecules in IE had 18:2 at theseend carbons. Because standards for the TFA-containing TGmolecules separated by this HPLC method are not availa-ble, one can only assume that partial hydrogenation ofSBO generated substantial numbers of TFA at sn2, becausemost of the monounsaturated fatty acids in PHSO (whichwould include trans18:1) are reportedly located at sn2[24].
Compliance check for test fat consumption deduced thatspecific FA of plasma TG (Table 3) reflected the TG fattyacid profile of both the test fat as well as the total diet fat(Table 1) for each fat rotation. Thus, plasma 16:0 and 18:2were highest and lowest, respectively, in dietary andplasma TG during POL; 18:0 was highest in plasma TGduring IE intake; and trans18:1 was only detected inplasma TG after feeding the PHSO diet.
Lipid and lipoprotein changesPlasma analysis revealed that HDL-C and LDL-C were theonly two lipid parameters significantly affected by dietarytreatment, with TC and TG unperturbed (Table 4). Afteradjusting for multiple comparisons between dietary treat-ments, plasma HDL-C was significantly lower (p < 0.001)both during the PHSO (-8%) and IE (-9%) diet treatmentscompared to POL. Dietary fat also affected absolutechange in LDL-C, with the concentration after the PHSObeing 7% greater than POL (P < 0.05). The IE diet effectwas intermediate and not significantly different fromeither POL or PHSO (Table 3).
Ratios derived from absolute measurements of TC, LDL-Cand HDL-C at the end of each dietary treatment (Table 3)reveal that PHSO and IE treatments both increased theTC/HDL-C ratio by about 10% relative to the POL (P <
Page 5 of 12(page number not for citation purposes)
Nutrition & Metabolism 2007, 4:3 http://www.nutritionandmetabolism.com/content/4/1/3
0.001), but did not differ from each other. The LDL-C/HDL-C ratio was similarly increased by the two modifiedfats, with differences being about 15% greater than thePOL diet (P < 0.001).
Glucose, insulin, and C-peptide4 wk fasting dataFasting plasma glucose at the end of each test fat period(Table 4), revealed a significantly higher value after IE
treatment than after either POL or PHSO (p < 0.001). Glu-cose also increased modestly after the PHSO diet relativeto POL (p < 0.05). Individual fasting glucose data meas-ured at entry and the end of each test fat period revealedthat plasma glucose for every subject increased during theIE diet period (Fig 1).
Fasting serum insulin at 4 wk varied greatly among indi-viduals, but univariate analysis revealed significantly
Table 3: Fatty Acid Composition (%) of Plasma Triacylglycerol
Fatty acid Test diets
POL1 PHSO2 IE3
14:0 1.4 ± 0.5a 1.4 ± 0.4b 1.1 ± 0.4a,b
16:0 29.5 ± 2.9a,b 27.2 ± 2.8a 26.6 ± .1.8b
16:1n7 3.8 ± 1.1 3.6 ± 1.4 3.5 ± 1.018:0 3.3 ± 0.8a 3.4 ± 0.5b 5.3 ± 2.4a,b
18:1 43.4 ± 4.2a,b 37.1 ± 3.0a,c 40.3 ± 3.3b,c
t18:1n9 nd 2.8 ± 0.6 ndt18:1n11 nd 0.8 ± 0.3 nd
18:2 16.1 ± 4.4a,b 20.6 ± 5.1a 20.1 ± 2.8b
18:3 0.7 ± 0.4a 1.2 ± 0.5a,b 0.7 ± 0.2b
20:4n6 0.9 ± 0.3 1.0 ± 0.3 0.9 ± 0.222:6 1.3 ± 0.7 1.7 ± 0.7 1.3 ± 0.6
Values are means ± SD (n = twice per rotation)1POL, palm olein; 2PHSO, partially hydrogenated soybean oil; 3IE, interesterified fat (see text for details of fat composition)a,b,c means with common superscripts differ, p < 0.05; nd = not detectable.
Table 2: Major Triglyceride Molecular Species (%) in POL and IE fats *
TG Species POL IE
LLnLn ND 2.00LLLn ND 0.85LLL ND 0.78PLLn ND 0.42OLL 0.20 2.63PLL 0.90 4.64
OOL 0.70 2.00SLL ND 12.47PPL 8.60 3.42
OOO 2.70 0.48SOL ND 13.79SOS ND 15.84SOO 1.5 4.62POS 4.2 15.25PPS ND 2.92SSO ND 10.81SSS ND 3.76POP 39.5 NDPOO 32.2 NDPOL 9.3 ND
TOTAL 99.80 96.68
L = linoleic; Ln = Linolenic; O = oleic; P = palmitic; S = stearicND, not detected*Triglyceride species for PHSO are not reported since they were not possible to assess due to the complexity of the TG species arising from the the lack of authentic standards to identify the various trans fatty acid isomers present.
Page 6 of 12(page number not for citation purposes)

Nutrition & Metabolism 2007, 4:3 http://www.nutritionandmetabolism.com/content/4/1/3
lower insulin values after IE (p < 0.001) with a tendencyfor PHSO to be lower (p < 0.10) relative to POL. Thus, thepercent change for PHSO (-10%) was approximately halfthat observed for IE (-22%) relative to POL (Table 4).Consequently the average fasting 4 wk-insulin for each fattreatment was inversely related to the respective glucoseconcentration, ie. the most elevated fasting glucose fol-lowing the IE period was associated with the lowest 4 wkfasting insulin, whereas the insulin value followingPHSO, like glucose, was intermediate between POL andIE.
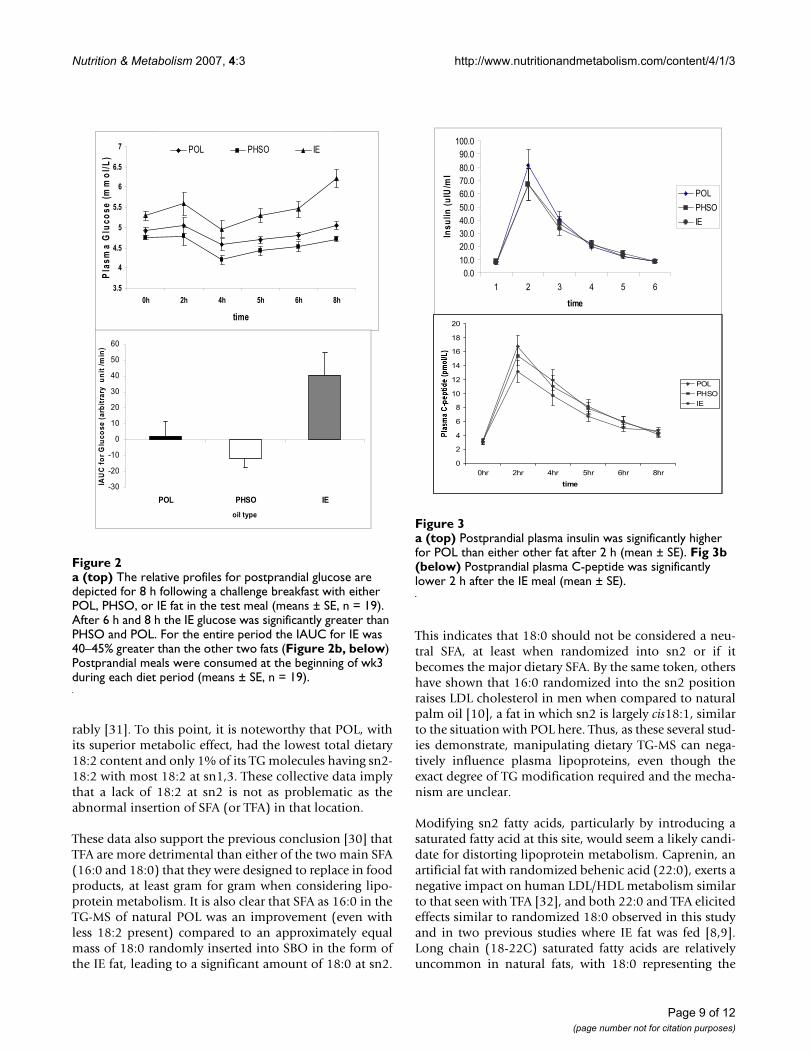
Postprandial responsesIn the postprandial meal challenge after 2 wk on the diet,plasma glucose became significantly elevated 6 h after theIE meal compared to POL and PHSO (p < 0.001). The lat-ter two fats displayed similar postprandial glucosedynamics with both returning to baseline by 6 h (Fig 2a).Based in part on the slightly higher fasting glucose valuesfor IE at the beginning of the postprandial test, the incre-mental area under the curve (IAUC) for glucose during the8 h IE fat challenge was approximately 40–45% greater (p< 0.001) than the two other fats (Fig 2b).
To explore insulin dynamics postprandially, both insulinand C-peptide were measured throughout the 8 h post-prandial period. Both parameters peaked sharply at 2 h,and C-peptide was directly related to the insulin concen-tration at this time interval (Fig 3a and 3b). The 2 h insu-lin was significantly lower after both the PHSO (p < 0.05)and IE (p < 0.05) challenge compared to POL, while C-peptide was significantly lowered only by IE (13.2 ± 6.6
pmol/L; p < 0.05)) compared to either POL (16.0 ± 7.4pmol/L) or PHSO (15.6 ± 6.4 pmol/l). POL and PHSOdid not differ from each other.
DiscussionInteresterification and lipoproteinsBased on previous data concerning TG-MS affecting lipidmetabolism [5,6], a primary objective of this study was tocompare the relative response by plasma lipoproteins tostructural differences in dietary fatty acids and TG-MSintroduced by partial hydrogenation (production of TFA)or interesterification with 18:0. In the final analysis, 15%of TG-MS in IE had 18:0 at sn2, compared to none of theTG-MS in POL having sn2-18:0. Furthermore, IE had 2.5-times more SFA at sn2 than POL; and although we werenot able to make the assessment with our assay, many ofthe sn2-FA in PHSO are reportedly trans18:1 with essen-tially no SFA at sn2 (24). Thus, our data support previousobservations that structural differences between fattyacids and TG-MS can perturb lipoprotein metabolism, eg.when TFA or 16:0 are introduced at sn2 in fat moleculeswhere MUFA or PUFA normally reside [9-11,26]. Simi-larly, our data confirm that compared to a naturally struc-tured fat, random interesterification of a polyunsaturateddietary fat with 18:0 alters its TG-MS as well as the lipo-protein metabolism encountered during its consumption[9,27].
Both partial hydrogenation and IE represent substitutesfor naturally saturated dietary fats. Our study directlyaddressed the efficacy of those substitutions by comparingunmodified TG-MS in a naturally occurring saturated fat,
Table 4: Fasting plasma lipid, lipoprotein cholesterol, glucose, and insulin concentrations after 4 wk of test diets
Test diet
POL1 PHSO2 IE3
Total cholesterol (mmol/L) 4.93 ± 0.58 5.03 ± 0.69 4.89 ± 0.63HDL-C (mmol/L) 1.43 ± 0.24a,b 1.32 ± 0.24a 1.30 ± 0.22b
% change vs POL -- -7.6 ± 6.7 -9.1 ± 6.7LDL-C (mmol/L) 3.08 ± 0.54c 3.30 ± 0.63c 3.20 ± 0.61% change vs POL -- 7.2 ± 11.5 3.8 ± 9.7VLDL-C (mmol/L) 0.42 ± 0.16 0.41 ± 0.16 0.40 ± 0.13
Triacylglycerol (mmol/L) 0.91 ± 0.34 0.88 ± 0.35 0.86 ± 0.28TC/HDL-C 3.53 ± 0.68a,b 3.91 ± 0.82a 3.88 ± 0.83b
% change vs POL -- 10.8 ± 8.5 9.7 ± 9.0LDL-C/HDL-C 2.23 ± 0.59a,b 2.59 ± 0.69a 2.56 ± 0.74b
% change vs POL -- 16.0 ± 12.1 14.7 ± 13.4Plasma glucose (mmol/L) 5.62 ± 0.48a,c, 5.91 ± 0.58b,c 6.67 ± 0.70a,b
% change vs POL -- 5.1 ± 9.6 18.7 ± 11.3Plasma insulin (uIU/mL) 10.11 ± 4.67a 9.12 ± 3.92c 7.93 ± 3.18a,c
% change vs POL --- -9.7 ± 26.0 -21.6 ± 22.2
Mean ± SD ; n = 301POL, palm olein; 2PHSO, partially hydrogenated soybean oil; 3IE, interesterified fat (see text for details of fat composition)a,b means with common superscripts differ, p < 0.001. c p < 0.05
Page 7 of 12(page number not for citation purposes)

Nutrition & Metabolism 2007, 4:3 http://www.nutritionandmetabolism.com/content/4/1/3
POL, with PHSO and IE. Approximately equal amounts oftotal SFA (14–18 %en) were provided during the two sat-urated fat test periods, ie. with POL and IE diets, while theTFA-rich diet provided about 12 %en as SFA plus TFA.Both modified fats included specific alterations in sn2-FA.Although total plasma cholesterol was minimally affectedby the 3 diets, the distribution of cholesterol among lipo-proteins was altered. PHSO (representing unnaturalincorporation of trans18:1 at sn2) elevated LDL; and bothPHSO and IE (with 18:0 atypically present at sn2) loweredHDL relative to the naturally-structured POL with mainlycis18:1 and a lesser amount of 16:0 at sn2. The increasedLDL/HDL ratio following consumption of PHSO was alsosignificant and typical of the pattern reported duringtrans-fat consumption [8,9,28-30]. It is noteworthy that inat least two of those studies when 18:0 was interesterifiedinto unsaturated oils and compared to trans18:1, cis18:1,or IE fat rich in 18:2 [8,9], both the added 18:0 in IE fat aswell as trans18:1 from partial hydrogenation were foundto raise LDL and lower HDL. Such results are similar to
our findings, where the naturally occurring fat structure inPOL served as the control fat.
The high proportion of test fat (>70%) in our diets wascoupled with specific exchanges between fatty acids andmodified TG-MS. The comparison was focused on 16:0 ina natural fat, 18:0 from a randomized fat, and 16:0 plusabout one-third the amount of TFA from partial hydro-genation. This comparison between relatively high intakesof specific SFA and TFA enhanced the potential to detectan effect induced by the concomitant change in dietaryTG-MS. Despite the fact that the TFA diet provided 50%more 18:2 than POL, and favorably increased 18:2 amongplasma TG fatty acids, the TFA diet still exerted a morenegative impact on plasma lipoproteins. One would pre-dict that reducing 18:2 in the TFA diet to that of the con-trol diet would have rendered the TFA diet even lessdesirable [9]; or alternatively, had the POL diet beenadjusted to contain an equivalent amount of 18:2 as theother two diets, it should have performed even more favo-
Individual fasting glucose values are depicted at entry and after 4 wk on each test fatFigure 1Individual fasting glucose values are depicted at entry and after 4 wk on each test fat. The rise was 3% for POL, 9% for PHSO, and 22% for IE.
PHSO diet series
3.5
4.0
4.5
5.0
5.5
6.0
6.5
7.0
7.5
8.0
zero day 29
feeding period
ind
ivid
ua
l p
lots
fo
rp
las
ma
glu
co
se
(mm
ol/
L)
IE diet series
3.5
4.0
4.5
5.0
5.5
6.0
6.5
7.0
7.5
8.0
zero day 29
feeding period
ind
ivid
ua
l p
lots
fo
r p
las
ma
glu
co
se
(mm
ol/
L)
POL diet series
3.5
4.0
4.5
5.0
5.5
6.0
6.5
7.0
7.5
8.0
zero day 29
feeding period
ind
ivid
ua
l p
lots
fo
rp
las
ma
glu
co
se
(mm
ol/
L)
Page 8 of 12(page number not for citation purposes)
Nutrition & Metabolism 2007, 4:3 http://www.nutritionandmetabolism.com/content/4/1/3
rably [31]. To this point, it is noteworthy that POL, withits superior metabolic effect, had the lowest total dietary18:2 content and only 1% of its TG molecules having sn2-18:2 with most 18:2 at sn1,3. These collective data implythat a lack of 18:2 at sn2 is not as problematic as theabnormal insertion of SFA (or TFA) in that location.
These data also support the previous conclusion [30] thatTFA are more detrimental than either of the two main SFA(16:0 and 18:0) that they were designed to replace in foodproducts, at least gram for gram when considering lipo-protein metabolism. It is also clear that SFA as 16:0 in theTG-MS of natural POL was an improvement (even withless 18:2 present) compared to an approximately equalmass of 18:0 randomly inserted into SBO in the form ofthe IE fat, leading to a significant amount of 18:0 at sn2.
This indicates that 18:0 should not be considered a neu-tral SFA, at least when randomized into sn2 or if itbecomes the major dietary SFA. By the same token, othershave shown that 16:0 randomized into the sn2 positionraises LDL cholesterol in men when compared to naturalpalm oil [10], a fat in which sn2 is largely cis18:1, similarto the situation with POL here. Thus, as these several stud-ies demonstrate, manipulating dietary TG-MS can nega-tively influence plasma lipoproteins, even though theexact degree of TG modification required and the mecha-nism are unclear.
Modifying sn2 fatty acids, particularly by introducing asaturated fatty acid at this site, would seem a likely candi-date for distorting lipoprotein metabolism. Caprenin, anartificial fat with randomized behenic acid (22:0), exerts anegative impact on human LDL/HDL metabolism similarto that seen with TFA [32], and both 22:0 and TFA elicitedeffects similar to randomized 18:0 observed in this studyand in two previous studies where IE fat was fed [8,9].Long chain (18-22C) saturated fatty acids are relativelyuncommon in natural fats, with 18:0 representing the
a (top) Postprandial plasma insulin was significantly higher for POL than either other fat after 2 h (mean ± SE)Figure 3a (top) Postprandial plasma insulin was significantly higher for POL than either other fat after 2 h (mean ± SE). Fig 3b (below) Postprandial plasma C-peptide was significantly lower 2 h after the IE meal (mean ± SE).
0.0
10.0
20.0
30.0
40.0
50.0
60.0
70.0
80.0
90.0
100.0
1 2 3 4 5 6
time
Ins
uli
n (
uIU
/ml
POL
PHSO
IE
0
2
4
6
8
10
12
14
16
18
20
0hr 2hr 4hr 5hr 6hr 8hr
time
POL
PHSO
IE
a (top) The relative profiles for postprandial glucose are depicted for 8 h following a challenge breakfast with either POL, PHSO, or IE fat in the test meal (means ± SE, n = 19)Figure 2a (top) The relative profiles for postprandial glucose are depicted for 8 h following a challenge breakfast with either POL, PHSO, or IE fat in the test meal (means ± SE, n = 19). After 6 h and 8 h the IE glucose was significantly greater than PHSO and POL. For the entire period the IAUC for IE was 40–45% greater than the other two fats (Figure 2b, below) Postprandial meals were consumed at the beginning of wk3 during each diet period (means ± SE, n = 19).
3.5
4
4.5
5
5.5
6
6.5
7
0h 2h 4h 5h 6h 8h
time
Pla
sm
a G
luc
os
e (
mm
ol/
L)
POL PHSO IE
-30
-20
-10
0
10
20
30
40
50
60
POL PHSO IE
oil type
IA
UC
fo
r G
luc
os
e(a
rbit
rary
u
nit
/m
in)
Page 9 of 12(page number not for citation purposes)

Nutrition & Metabolism 2007, 4:3 http://www.nutritionandmetabolism.com/content/4/1/3
most prevalent at intakes <2–4% daily energy. Further-more, 18:0 in natural fats is usually esterified at sn1 andsn3 on glycerol, as in beef tallow and cocoabutter [33].Artificial insertion of 18:0 at sn2 during random interest-erification, along with the shear mass of 18:0 consumed(12 %en), may have been problematic in the current studyand previously [8,9]. The mass of 18:0 consumed may becritical because a large intake (7 %en), from sheanut but-ter was found to depress HDL similar to Caprenin [34].Sheanut butter is reported to have 18% of sn2 as SFA(mostly 18:0), or 3× the amount of sn2-SFA present incocoabutter [33], a fat that does not appear to affect lipo-protein metabolism adversely [4,12]. Although consump-tion of 12 %en as 18:0 would not be feasible from naturalfats, it is possible to envision an exaggerated intake viastructurally modified fats resulting from the growingimpetus to eliminate TFA from the diet. The incorporationof 18:0 has seemed especially appealing since 18:0 fromnatural fats often has been considered neutral in itsimpact on cholesterol metabolism [2-4,35].
Glucose perturbationsAmong studies on the metabolic effects of randomized fatinvolving 18:0, metabolism of glucose and insulin has notbeen addressed. Considering global trends in obesity,insulin resistance, and diabetes, which are often associ-ated with the metabolic syndrome, our observation thataltered dietary TG-MS may adversely influence glucosemetabolism warrants attention. From epidemiologicaldata on the association between TFA intake and diabetes[36] one might have anticipated the TFA-induced rise inglucose observed after 4 wk. Even though previous exper-iments involving TFA in humans found no effect on glu-cose metabolism other than postprandial insulinhypersecretion [37,38], those studies reported essentiallyno change in the fasting lipoprotein profile either, whichis somewhat atypical. In our study IE fat had less effectthan the TFA-rich PHSO on lipoproteins, but proved moredeleterious for glucose metabolism, suggesting that mod-ified TG-MS, from either trans-rich or IE fats, was a factor.
After 4 wk on each diet, fasting insulin was inverselyrelated to glucose, ie. insulin was moderately lower afterPHSO (-10%, ns) and substantially lower after IE (-20%,p < 0.001) compared to POL, while glucose was signifi-cantly elevated by both modified fats (about 5% and 20%,respectively). The elevated 4 wk fasting glucose followingIE was foreshadowed by the 40% greater glucose IAUCobserved during the 8 h postprandial challenge with theIE test meal. The patterns of lower plasma insulin (IE,PHSO) and C-peptide (IE) postprandially following thetest meal challenge with the two modified fats relative toPOL, suggests that reduced insulin secretion, rather thaninsulin resistance, accounted for the higher glucose valuesobserved with modified fats. The 20% rise in fasting glu-
cose with IE was clinically important, as well, since it roseto a range that could be considered prediabetic after only4 wk [39]. These results appear to be in contrast to the ele-vated serum insulin and insulin resistance typical of obes-ity and type 2 diabetes associated with the metabolicsyndrome [40,41].
Our findings suggest that altered dietary fat compositionor TG-MS influenced insulin secretion to impact glucosemetabolism negatively. Others have reported initiallylower blood glucose coupled with sharply higher initialinsulin secretion 20–60 min postprandially in subjectsfed a single meal of IE palm oil compared to natural palmoil [11]. Postprandial insulin hypersecretion alsooccurred in diabetic subjects fed extreme intakes of TFA orSFA compared to cisMUFA [38]. Thus, a connection seemsto exist between dietary fat composition and insulin secre-tion. The link may include the n-3 PUFA content of fats.For example, it is noteworthy that dietary 18:3n-3 andlong chain n-3 PUFA have been linked to production ofintestinal GLP-1 [42], which enhances insulin secretion. Itmay prove ironic that partial hydrogenation of vegetableoils, or interesterification with 18:0, are implemented inpart to remove 18:3n-3 and improve product shelf life,even though fats modified in this manner may inadvert-ently suppress insulin secretion after their prolonged con-sumption. Interesterification resulting in high intake of18:0, including sn2-18:0, appeared to accentuate the neg-ative effect observed with the TFA diet. In reference toinsulin metabolism, both 18:0 and TFA fed at high levels(8% en) also induced inflammatory markers [43] that areassociated with diabetes [44].
It is not apparent whether the observed alteration in glu-cose and lipoprotein metabolism represents a fatty acideffect per se or modification of TG-MS. For example, ear-lier work in gerbils traced saturated fat intake and inositoldeficiency to a lack of PUFA needed structurally for phos-phatidyl inostitol (PI) synthesis required for fat secretionby intestinal mucosal cells [45]. Since PI is also involvedin beta-cell secretion of insulin [46], PI structure or avail-ability may be a consideration in the mechanistic aspect ofour current clinical observations. Extreme SFA consump-tion (usually to the exclusion of dietary PUFA) is typicallylinked to insulin resistance [47], while other studies havereported that dietary SFA enhances insulin secretion morethan dietary PUFA [48], a possibility suggested by ourfindings where POL diet had the lowest P/S ratio. Clarifi-cation is needed, but careful scrutiny of the dietary PUFAload as it affects dietary TG-MS and phospholipid synthe-sis related to insulin dynamics is warranted [6].
In past investigations, glucose metabolism has notreceived the intense scrutiny afforded lipoproteins inmost studies involving dietary fat. The present results link-
Page 10 of 12(page number not for citation purposes)

Nutrition & Metabolism 2007, 4:3 http://www.nutritionandmetabolism.com/content/4/1/3
ing TFA and 18:0- rich IE fats with abnormal metabolismof glucose suggest that it would be prudent to determinethe biologically tolerable mass of 18:0 that can be incor-porated in diets as IE fats.
ConclusionA natural saturated fat, palm olein, was compared to twoforms of modified replacement fats, one containing transfatty acids, the other interesterified with 18:0. Both modi-fied fats adversely altered metabolism of plasma lipopro-teins and blood glucose in humans. Further investigationis warranted before interesterification is disseminated asthe process of choice for replacing partial hydrogenationas a primary means for hardening vegetable oils for use infoods.
AbbreviationsBMI, body mass index; FA, fatty acid; IE, interesterified fat;IAUC, integrated area under the curve; MUFA, monoun-saturated fatty acids; PHSO, partially hydrogenated soy-bean oil; PI, phosphatidyl inositol; POL, palm olein;PUFA, polyunsaturated fatty acids; SFA, saturated fattyacids; TC, total plasma cholesterol; TFA, trans fatty acids;TG, triacylglycerol; TG-MS, triacylglycerol-molecular spe-cies;
Competing interestsFinancial support for this study was provided by theMalaysian Palm Oil Board where Dr Sundram wasemployed and Dr Karupaiah was a graduate student. DrHayes is a member of the Malaysian Palm Oil AdvisoryCouncil.
References1. Institute of Medicine (IOM): Report on dietary referenceintakes
for trans fatty acids. In: Dietary reference intakesfor energy,carbohydrate, fiber, fat, fatty acids, cholesterol, protein andamino acids. Institute of Medicine/Food and NutritionBoard. 2002 [http://www.iom.edu/fnb]. Washington, DC: NationalAcademy Press
2. Hegsted DM, McGandy RB, Myers ML, Stare FJ: Quantitativeeffects of dietary fat on serum cholesterol in man. Am J ClinNutr 1965, 17:281-95.
3. Bonanome A, Grundy SM: Effect of dietary stearic acid onplasma cholesterol and lipoprotein levels. N Engl J Med 1988,318:1244-48.
4. Yu S, Derr J, Etherton T, Kris-Etherton PM: Plasma cholesterol-predictive equations demonstrate that stearic acid is neutraland monounsaturated fatty acids are hypocholesterolemic.Am J Clin Nutr 1995, 61:1129-39.
5. Hunter JE: Studies on effects of dietary fatty acids as relatedto their position on triglycerides. Lipids 2001, 36:655-68.
6. Hayes KC: Synthetic and modified glycerides: effects onplasma lipids. Curr Opin Lipidology 2001, 12:55-60.
7. Kritchevsky D, Tepper SA, Chen SC, Meijer GW, Krauss RM: Cho-lesterol vehicle in experimental atherosclerosis. 23. Effectsof specific synthetic triglycerides. Lipids 2000, 35:621-25.
8. Judd JT, Baer DJ, Clevidence BA, Kris-Etherton P, Muesing RA, IwaneM: Dietary cis and trans monounsaturated and saturatedfatty acids and plasma lipids and lipoproteins in men. Lipids2002, 37:123-31.
9. Zock PL, Katan MB: Hydrogenation alternatives: effects oftrans fatty acids and stearic acid versus linoleic acid on
serum lipids and lipoproteins in humans. J Lipid Res 1992,33:399-410.
10. Zock PL, de Vries JH, de Fouw NJ, Katan MB: Positional distribu-tion of fatty acids in dietary triglycerides: effect on fastingblood lipoprotein concentrations in humans. Am J Clin Nutr1995, 61:48-55.
11. Yli-Jokipii K, Kallio H, Schwab U, Mykkanen H, Kurvinen JP, Savol-ainen MJ, Tahvonen R: Effects of palm oil and transesterifiedpalm oil on chylomicron and VLDL triacylglycerol structuresand postprandial lipid response. J Lipid Res 2001, 42:1618-25.
12. Berry SE, Sanders TAB: Influence of triacylglycerol structure ofstearic acid-rich fats on postprandial lipemia. Proc Nutr Soc2005, 64:205-212.
13. Allain CC, Poon LS, Chan CSG, Richmond W, Fu PC: Enzymaticdetermination of total serum cholesterol. Clin Chem 1974,20:470-75.
14. Nägele U, Hagele EO, Sauer G, Wiedemann E, Lehmann P, WahlefeldAW, Gruber W: Reagent for the enzymatic determination ofserum total triglycerides with improved lipolytic efficiency. JClin Chem Clin Biochem 1984, 22:165-74.
15. Warnick GH, Benderson J, Albers JJ: Dextran sulfate- Mg2+ pre-cipitation procedure for quantitation of high-density lipopro-tein cholesterol. Clin Chem 1982, 28:1379-88.
16. Finley PR, Schifman RB, Williams RJ, Lichti DA: Cholesterol in high-density lipoprotein; use of Mg2+/dextran sulfate in itsenzy-matic measurement. Clin Chem 1978, 24:931-33.
17. Noor Lida HMD, Sundram K, Siew WL, Aminah A, Mamot S: TAGcomposition and solid fat content of palm oil, sunflower oiland palm kernel olein blends before and after chemical inter-esterification. J Am Oil Chem Soc 2002, 79:1137-1144.
18. Friedewald WT, Levy RI, Frederickson DS: Estimation of the con-centration of low-density lipoprotein cholesterol in plasma,without use of the preparative ultracentrifuge. Clin Chem1972, 18:499-502.
19. Trinder P: Determination of glucose in blood using glucodeoxidase with an alternative oxygenacceptor. Ann Clin Biochem1969, 6:24.
20. Reeves WG: Insulin antiobody determination: theoretical andpractical considerations. Diabetologia 1983, 24:399-403.
21. Bonser A, Garcia-Webb P: C-peptide measurements: methodsand clinical utility. CRC Crit Rev Clin Lab Sci 1984, 19:297-352.
22. Association of Official American Chemists (AOAC): AOAC Officialmethods of analysis. Washington, DC 1980.
23. Folch JL, Lees M, Sloane-Stanley GH: A simple method for the iso-lation and purification of total lipids from animal tissues. JBiol Chem 1957, 226:497-509.
24. List GR, Byrdwell WC, Steidley KR, Adlof RO, Neff WE: Triacylg-lycerol structure and composition of hydrogenated soybeanoil margarine and shortening basestocks. J Agric Food Chem2005, 53:4692-5.
25. Matthews JNS, Altman DG, Campbell MJ, Royston P: Analysis ofserial measurements in medical research. Brit Med J 1990,300:230-235.
26. Katan MB, Zock PL, Mensink RP: Trans fatty acids and theireffects on lipoproteins in humans. Annu Rev Nutr 1995,15:473-93.
27. Judd JT, Baer DJ, Clevidence BA, Muesing RA, Chen SC, WeststrateJA, Meijer GW, Wittes J, Lichtenstein AH, Vilella-Bach M, Schaefer EJ:Effects of margarine compared with those of butter on bloodlipid profiles related to cardiovascular risk factors in normo-lipidemic adults fed controlled diets. Am J Clin Nutr 1998,68:768-77.
28. Lichtenstein AH, Ausman LA, Jalbert S, Schaefer EJ: Comparison ofdifferent forms of hydrogenated fats on serum lipid levels inmoderately hypercholesterolemic female and male subjects.N Engl J Med 1999, 340:1933-40.
29. Sundram K, French MA, Clandinin MT: Exchanging partiallyhydrogenated fat for palmitic acid in the diet increases LDL-cholesterol and endogenous cholesterol synthesis in normo-cholesterolemic women. Eur J Nutr 2003, 42:188-94.
30. Sundram K, Ismail A, Hayes KC, Jeyamalar R, Pathmanathan R: Trans(elaidic) fatty acids adversely affect the lipoprotein profilerelative to specific saturated fatty acids in humans. J Nutr1997, 127:514S-20S.
31. Hayes KC, Khosla P: Dietary fatty acid thresholds and choleste-rolemia. FASEB J 1992, 6:2600-07.
Page 11 of 12(page number not for citation purposes)
http://www.ncbi.nlm.nih.gov/entrez/query.fcgi?cmd=Retrieve&db=PubMed&dopt=Abstract&list_uids=5846902
http://www.ncbi.nlm.nih.gov/entrez/query.fcgi?cmd=Retrieve&db=PubMed&dopt=Abstract&list_uids=5846902
http://www.ncbi.nlm.nih.gov/entrez/query.fcgi?cmd=Retrieve&db=PubMed&dopt=Abstract&list_uids=3362176
http://www.ncbi.nlm.nih.gov/entrez/query.fcgi?cmd=Retrieve&db=PubMed&dopt=Abstract&list_uids=3362176
http://www.ncbi.nlm.nih.gov/entrez/query.fcgi?cmd=Retrieve&db=PubMed&dopt=Abstract&list_uids=7733039
http://www.ncbi.nlm.nih.gov/entrez/query.fcgi?cmd=Retrieve&db=PubMed&dopt=Abstract&list_uids=7733039
http://www.ncbi.nlm.nih.gov/entrez/query.fcgi?cmd=Retrieve&db=PubMed&dopt=Abstract&list_uids=1569387
http://www.ncbi.nlm.nih.gov/entrez/query.fcgi?cmd=Retrieve&db=PubMed&dopt=Abstract&list_uids=1569387
http://www.ncbi.nlm.nih.gov/entrez/query.fcgi?cmd=Retrieve&db=PubMed&dopt=Abstract&list_uids=1569387
http://www.ncbi.nlm.nih.gov/entrez/query.fcgi?cmd=Retrieve&db=PubMed&dopt=Abstract&list_uids=7825538
http://www.ncbi.nlm.nih.gov/entrez/query.fcgi?cmd=Retrieve&db=PubMed&dopt=Abstract&list_uids=7825538
http://www.ncbi.nlm.nih.gov/entrez/query.fcgi?cmd=Retrieve&db=PubMed&dopt=Abstract&list_uids=7825538
http://www.ncbi.nlm.nih.gov/entrez/query.fcgi?cmd=Retrieve&db=PubMed&dopt=Abstract&list_uids=4818200
http://www.ncbi.nlm.nih.gov/entrez/query.fcgi?cmd=Retrieve&db=PubMed&dopt=Abstract&list_uids=4818200
http://www.ncbi.nlm.nih.gov/entrez/query.fcgi?cmd=Retrieve&db=PubMed&dopt=Abstract&list_uids=6716056
http://www.ncbi.nlm.nih.gov/entrez/query.fcgi?cmd=Retrieve&db=PubMed&dopt=Abstract&list_uids=6716056
http://www.ncbi.nlm.nih.gov/entrez/query.fcgi?cmd=Retrieve&db=PubMed&dopt=Abstract&list_uids=7074948
http://www.ncbi.nlm.nih.gov/entrez/query.fcgi?cmd=Retrieve&db=PubMed&dopt=Abstract&list_uids=7074948
http://www.ncbi.nlm.nih.gov/entrez/query.fcgi?cmd=Retrieve&db=PubMed&dopt=Abstract&list_uids=7074948
http://www.ncbi.nlm.nih.gov/entrez/query.fcgi?cmd=Retrieve&db=PubMed&dopt=Abstract&list_uids=4337382
http://www.ncbi.nlm.nih.gov/entrez/query.fcgi?cmd=Retrieve&db=PubMed&dopt=Abstract&list_uids=4337382
http://www.ncbi.nlm.nih.gov/entrez/query.fcgi?cmd=Retrieve&db=PubMed&dopt=Abstract&list_uids=4337382
http://www.ncbi.nlm.nih.gov/entrez/query.fcgi?cmd=Retrieve&db=PubMed&dopt=Abstract&list_uids=6350077
http://www.ncbi.nlm.nih.gov/entrez/query.fcgi?cmd=Retrieve&db=PubMed&dopt=Abstract&list_uids=6350077
http://www.ncbi.nlm.nih.gov/entrez/query.fcgi?cmd=Retrieve&db=PubMed&dopt=Abstract&list_uids=2106931
http://www.ncbi.nlm.nih.gov/entrez/query.fcgi?cmd=Retrieve&db=PubMed&dopt=Abstract&list_uids=2106931
http://www.ncbi.nlm.nih.gov/entrez/query.fcgi?cmd=Retrieve&db=PubMed&dopt=Abstract&list_uids=8527230
http://www.ncbi.nlm.nih.gov/entrez/query.fcgi?cmd=Retrieve&db=PubMed&dopt=Abstract&list_uids=8527230
http://www.ncbi.nlm.nih.gov/entrez/query.fcgi?cmd=Retrieve&db=PubMed&dopt=Abstract&list_uids=9771853
http://www.ncbi.nlm.nih.gov/entrez/query.fcgi?cmd=Retrieve&db=PubMed&dopt=Abstract&list_uids=9771853
http://www.ncbi.nlm.nih.gov/entrez/query.fcgi?cmd=Retrieve&db=PubMed&dopt=Abstract&list_uids=9771853
http://www.ncbi.nlm.nih.gov/entrez/query.fcgi?cmd=Retrieve&db=PubMed&dopt=Abstract&list_uids=9082038
http://www.ncbi.nlm.nih.gov/entrez/query.fcgi?cmd=Retrieve&db=PubMed&dopt=Abstract&list_uids=9082038
http://www.ncbi.nlm.nih.gov/entrez/query.fcgi?cmd=Retrieve&db=PubMed&dopt=Abstract&list_uids=9082038

Nutrition & Metabolism 2007, 4:3 http://www.nutritionandmetabolism.com/content/4/1/3
Publish with BioMed Central and every scientist can read your work free of charge
"BioMed Central will be the most significant development for disseminating the results of biomedical research in our lifetime."
Sir Paul Nurse, Cancer Research UK
Your research papers will be:
available free of charge to the entire biomedical community
peer reviewed and published immediately upon acceptance
cited in PubMed and archived on PubMed Central
yours — you keep the copyright
Submit your manuscript here:http://www.biomedcentral.com/info/publishing_adv.asp
BioMedcentral
32. Wardlaw GM, Snook JT, Park S, Patel PK, Pendley FC, Lee MS, Jan-dacek RJ: Relative effects on serum lipids and apolipoproteinsof a caprenin-rich diet compared with diets rich in palm oil/palm-kernel oil or butter. Am J Clin Nutr 1995, 61:535-42.
33. Mattson FH, Lutton ES: The specific distribution of fatty acids inthe glycerides of animal and vegetable fats. J Biol Chem 1958,233:868-73.
34. Dougherty RM, Allman MA, Iacono JM: Effects of diets containinghigh or low amounts of stearic acid on plasma lipoproteinfractions and fecal fatty acid excretion of men. Am J Clin Nutr1995, 61:1120-8.
35. Khosla P, Sundram K: Effects of dietary fatty acid compositionon plasma cholesterol. Prog Lipid Res 1996, 35:93-132.
36. Salmeron J, Hu FB, Manson JE, Stampfer MJ, Colditz GA, Rimm EB,Willett WC: Dietary fat intake and risk of type 2 diabetes inwomen. Am J Clin Nutr 2001, 73:1019-26.
37. Lovejoy JC, Smith SR, Champagne CM, Most MM, Lefevre M, DeLanyJP, Denkins YM, Rood JC, Veldhuis J, Bray GA: Effects of dietsenriched in saturated (palmitic), monounsaturated (oleic),or trans (elaidic) fatty acids on insulin sensitivity and sub-strate oxidation in healthy adults. Diabetes Care 2002,25:1283-8.
38. Christiansen E, Schnider S, Palmvig B, Tauber-Lassen E, Pedersen O:Intake of a diet high in trans monounsaturated fatty acids orsaturated fatty acids. Effects on postprandial insulinemia andglycemia in obese patients with NIDDM. Diabetes Care 1997,20:881-7.
39. Gabir MM, Hanson RL, Dabelea D, Imperatore G, Roumain J, BennettPH, Knowler WC: Plasma glucose and prediction of microvas-cular disease and mortality: evaluation of 1997 AmericanDiabetes Association and 1999 World Health Organizationcriteria for diagnosis of diabetes. Diabetes Care 2000, 23:1113-8.
40. Gotto AM Jr, Blackburn GL, Dailey GE 3rd, Garber AJ, Grundy SM,Sobel BE, Weir MR: The metabolic syndrome: a call to action.Coron Artery Dis 2006, 17:77-80.
41. Chan DC, Barrett HP, Watts GF: Dyslipidemia in visceral obes-ity: mechanisms, implications, and therapy. Am J CardiovascDrugs 2004, 4:227-46.
42. Hirasawa A, Tsumaya K, Awaji T, Katsuma S, Adachi T, Yamada M,Sugimoto Y, Miyazaki S, Tsujimoto G: Free fatty acids regulategut incretin glucagon-like peptide- 1 secretion throughGPR120. Nat Med 2005, 11:90-4.
43. Baer DJ, Judd JT, Clevidence BA, Tracy RP: Dietary fatty acidsaffect plasmamarkers of inflammation in healthy men fedcontrolled diets: a randomized crossover study. Am J Clin Nutr2004, 79:969-973.
44. Schmidt MI, Duncan BB, Sharrett AR, Lindberg G, Savage PJ, Offen-bacher S, Azambuja MI, Tracy RP, Heiss G: Markers of inflamma-tion and prediction of diabetes mellitus in adults (ARICStudy): a cohort study. Lancet 1999, 353:1649-1652.
45. Kroes JF, Hegsted DM, Hayes KC: Inositol deficiency in gerbils:Dietary effects on the intestinal lipodystrophy. J Nutr 1973,103:1448-53.
46. Dyachok O, Gylfe E: Ca(++)-induced Ca(++) release via inositol1,4,5-trisphosphate receptors is amplified by protein kinaseA and triggers exocytosis in pancreatic beta-cells. J Biol Chem2004, 279:45455-61.
47. Rivellese AA, De Natale C, Lilli S: Type of dietary fat and insulinresistance. Ann NY Acad Sci 2002, 967:329-35.
48. Stein DT, Stevenson BE, Chester MW, Basit M, Daniels MB, TurleySD, McGarry JD: The insulinotropic potency of fatty acids isinfluenced profoundly by their chain length and degree ofsaturation. J Clin Invest 1997, 100:398-403.
Page 12 of 12(page number not for citation purposes)
http://www.ncbi.nlm.nih.gov/entrez/query.fcgi?cmd=Retrieve&db=PubMed&dopt=Abstract&list_uids=7872217
http://www.ncbi.nlm.nih.gov/entrez/query.fcgi?cmd=Retrieve&db=PubMed&dopt=Abstract&list_uids=7872217
http://www.ncbi.nlm.nih.gov/entrez/query.fcgi?cmd=Retrieve&db=PubMed&dopt=Abstract&list_uids=7872217
http://www.ncbi.nlm.nih.gov/entrez/query.fcgi?cmd=Retrieve&db=PubMed&dopt=Abstract&list_uids=7733038
http://www.ncbi.nlm.nih.gov/entrez/query.fcgi?cmd=Retrieve&db=PubMed&dopt=Abstract&list_uids=7733038
http://www.ncbi.nlm.nih.gov/entrez/query.fcgi?cmd=Retrieve&db=PubMed&dopt=Abstract&list_uids=7733038
http://www.ncbi.nlm.nih.gov/entrez/query.fcgi?cmd=Retrieve&db=PubMed&dopt=Abstract&list_uids=8944223
http://www.ncbi.nlm.nih.gov/entrez/query.fcgi?cmd=Retrieve&db=PubMed&dopt=Abstract&list_uids=8944223
http://www.ncbi.nlm.nih.gov/entrez/query.fcgi?cmd=Retrieve&db=PubMed&dopt=Abstract&list_uids=9135961
http://www.ncbi.nlm.nih.gov/entrez/query.fcgi?cmd=Retrieve&db=PubMed&dopt=Abstract&list_uids=9135961
http://www.ncbi.nlm.nih.gov/entrez/query.fcgi?cmd=Retrieve&db=PubMed&dopt=Abstract&list_uids=9135961
http://www.ncbi.nlm.nih.gov/entrez/query.fcgi?cmd=Retrieve&db=PubMed&dopt=Abstract&list_uids=4126828
http://www.ncbi.nlm.nih.gov/entrez/query.fcgi?cmd=Retrieve&db=PubMed&dopt=Abstract&list_uids=4126828
http://www.ncbi.nlm.nih.gov/entrez/query.fcgi?cmd=Retrieve&db=PubMed&dopt=Abstract&list_uids=9218517
http://www.ncbi.nlm.nih.gov/entrez/query.fcgi?cmd=Retrieve&db=PubMed&dopt=Abstract&list_uids=9218517