Srivastava and Gupta, IJPSR, 2012; Vol. 3(9): 3249-3258
10
Srivastava and Gupta, IJPSR, 2012; Vol. 3(9): 3249-3258 ISSN: 0975-8232 Available online on www.ijpsr.com 3249 IJPSR (2012), Vol. 3, Issue 09 (Research Article) Received on 29 May, 2012; received in revised form 11 July, 2012; accepted 19 August, 2012 QSAR STUDY TO PREDICT ANTI-AMOEBIC ACTIVITIES OF PYRAZOLINE AND DIOXAZOLE DERIVATIVES WITH THE HELP OF PM5-BASED DESCRIPTORS Anil K. Srivastava* and Ratna Gupta Department of Chemistry, M.L.K. (P.G.) College, Balrampur, Uttar Pradesh, India ABSTRACT In quest of better anti-amoebic agents, quantitative structure-activity relationship (QSAR) studies were performed on a series of pyrazoline & dioxazoles derivatives with the help of PM5 calculations and geometry optimizations using CAChe software. Multiple Linear Regression (MLR) analysis was performed to derive QSAR models using the descriptors, molecular weight (M W ), conformation minimum energy (ɛ), HOMO energy ( HOMO ), shape index, basic kappa second order (k2), absolute hardness ( ), electronegativity (), electrophilicity index (ω), molar volume (MV), molar refractivity (MR), LogP (LP), parachor (Pc) and solvent accessibility surface area (SASA). The QSAR models equations of anti-amoebic agents have been developed by using maximum of seven descriptors, in which conformation minimum energy, shape index, molar volume and parchor were present have good predictive powers of correlation coefficients. These models can successfully predict the anti-amoebic activity of any newly discovered pyrazoline and dioxazole derivatives which can later be tested in laboratory. INTRODUCTION: Parasitic infections such as amoebiosis and other protozooses are still major threats against public health, especially in developing countries and the intestinal protozoan Entamoeba histolytica is a major cause of morbidity and mortality 1, 2 . Infection occurs through the oral uptake of the pathogen in its cyst form, with contaminated food or water. Despite its socio-economic importance, intestinal and extra-intestinal amoebiasis is not yet officially listed among the “neglected infectious diseases”, obviously due to difficulties in developing effective control strategies like studies involving drug molecules and hygiene management. Amoebiasis is primarily treated with the drug metronidazole which has significant side- effects 3-6 . Diloxanide furoate, a luminal amoebicide can be used for the treatment of oligosymptomatic and asymptomatic carriers of E. histolytica where as chloroquine is a useful support to other medications in the management of invasive amoebiasis 7 . The available anti-amoebic drugs have short-comings regarding tolerability and efficacy and the range of medicaments available for the treatment of amoebiasis has not changed over the past decade. Keywords: Anti-amoebic activity, PM5, MLR, QSAR models Correspondence to Author: Anil K. Srivastava Department of Chemistry, M.L.K. (P.G.) College, Balrampur, Uttar Pradesh, India E-mail: [email protected] QUICK RESPONSE CODE IJPSR: ICV- 4.57 Website: www.ijpsr.com
-
Upload
khangminh22 -
Category
Documents
-
view
0 -
download
0
Transcript of Srivastava and Gupta, IJPSR, 2012; Vol. 3(9): 3249-3258

Srivastava and Gupta, IJPSR, 2012; Vol. 3(9): 3249-3258 ISSN: 0975-8232
Available online on www.ijpsr.com 3249
IJPSR (2012), Vol. 3, Issue 09 (Research Article)
Received on 29 May, 2012; received in revised form 11 July, 2012; accepted 19 August, 2012
QSAR STUDY TO PREDICT ANTI-AMOEBIC ACTIVITIES OF PYRAZOLINE AND DIOXAZOLE DERIVATIVES WITH THE HELP OF PM5-BASED DESCRIPTORS
Anil K. Srivastava* and Ratna Gupta
Department of Chemistry, M.L.K. (P.G.) College, Balrampur, Uttar Pradesh, India
ABSTRACT
In quest of better anti-amoebic agents, quantitative structure-activity relationship (QSAR) studies were performed on a series of pyrazoline & dioxazoles derivatives with the help of PM5 calculations and geometry optimizations using CAChe software. Multiple Linear Regression (MLR) analysis was performed to derive QSAR models using the descriptors,
molecular weight (MW), conformation minimum energy (ɛ), HOMO energy
(HOMO), shape index, basic kappa second order (k2), absolute hardness (),
electronegativity (), electrophilicity index (ω), molar volume (MV), molar refractivity (MR), LogP (LP), parachor (Pc) and solvent accessibility surface area (SASA). The QSAR models equations of anti-amoebic agents have been developed by using maximum of seven descriptors, in which conformation minimum energy, shape index, molar volume and parchor were present have good predictive powers of correlation coefficients. These models can successfully predict the anti-amoebic activity of any newly discovered pyrazoline and dioxazole derivatives which can later be tested in laboratory.
INTRODUCTION: Parasitic infections such as amoebiosis and other protozooses are still major threats against public health, especially in developing countries and the intestinal protozoan Entamoeba histolytica is a major cause of morbidity and mortality 1, 2. Infection occurs through the oral uptake of the pathogen in its cyst form, with contaminated food or water.
Despite its socio-economic importance, intestinal and extra-intestinal amoebiasis is not yet officially listed among the “neglected infectious diseases”, obviously due to difficulties in developing effective control strategies like studies involving drug molecules and hygiene management. Amoebiasis is primarily treated with the drug metronidazole which has significant side-effects 3-6.
Diloxanide furoate, a luminal amoebicide can be used for the treatment of oligosymptomatic and asymptomatic carriers of E. histolytica where as chloroquine is a useful support to other medications in the management of invasive amoebiasis 7.
The available anti-amoebic drugs have short-comings regarding tolerability and efficacy and the range of medicaments available for the treatment of amoebiasis has not changed over the past decade.
Keywords:
Anti-amoebic activity,
PM5,
MLR,
QSAR models
Correspondence to Author:
Anil K. Srivastava
Department of Chemistry, M.L.K. (P.G.) College, Balrampur, Uttar Pradesh, India
E-mail: [email protected]
QUICK RESPONSE CODE
IJPSR: ICV- 4.57
Website: www.ijpsr.com
Srivastava and Gupta, IJPSR, 2012; Vol. 3(9): 3249-3258 ISSN: 0975-8232
Available online on www.ijpsr.com 3250
Recent studies tried to improve the treatment of this infection by developing anti-amoebic therapy 8, 9, a set of dioxazoles derivatives showed better activity than the reference drug metronidazole; besides being non-toxic to human kidney epithelial cells. Recently QSAR studies have been quite helpful to identify important structural parameters responsible for anti-amoebic activity and a number of industrial research units are using classical as well as 3D QSAR techniques for contemporary drug design 10-15.
The basis of QSAR method is use of molecular descriptors which represent the structural, stereochemical and topological features of the target molecule 16-20. Recently our group is engaged in finding new drugs using QSAR study 21, 22, herein we have taken, a series of 63 1-N-substituted thiocarbamoyl-3-phenyl-2-pyrazolines 23 and 3, 5-substituted-1, 4, 2-dioxazoles 8 were subjected to QSAR study by choosing appropriate molecular descriptors incorporating important structural features of the target molecule.
A multiple linear regression (MLR) analysis was executed to obtain and select best models in the form of regression equations to predict the anti-amoebic activity of chosen molecules.
MATERIALS AND METHODS: The experimental IC50
(μM) of anti-amoebic activities of 1-N-substituted thiocarbamoyl- 3- phenyl- 2- pyrazolines and 3, 5-substituted-1, 4, 2-dioxazoles are collected from recent publications 23, 8. We have chosen the values of experimental observed activity and converted them into logarithmic scale of -logIC50 and are placed in Tables 1-4.
–logIC50 can be defined as, “It is negative of logIC50 value and because of negative sign, its magnitude has an inverse relationship with the biological activity or drug potency of the selected molecules”. Consequently a low magnitude of -logIC50 predicts a higher biological value and a high magnitude of -logIC50 indicates lower potency. QSAR studies of the compounds listed in Tables 1-4 have been made with the help of following quantum chemical and topological descriptors-
1. Molecular weight MW
2. Conformation minimum energy ɛ
3. HOMO energy HOMO
4. Shape index, basic kappa second order k2
5. Absolute hardness
6. Electronegativity
7. Electrophilicity index ω
8. Molar volume MV
9. Molar refractivity MR
10. LogP LP
11. Parachor Pc
12. Solvent accessibility surface area SASA PM5 based calculations of the above descriptors have been made on the compounds listed in Tables 1-4 with the help of Cache Software and their relationship with the known activity of the anti-amoebic drugs have been studied by developing QSAR models. The values of the descriptors have been used to prepare Multiple Linear Regression (MLR) equations for predicted activities and compared with the known activity. The correlation coefficient and cross-validation coefficient have been evaluated to adjudge the quality of QSAR model and its predictive power.
RESULT AND DISCUSSION: Descriptors in different combinations have been used for Multiple Linear Regression (MLR) analysis. The predicted activity obtained by regression equation has been examined for selecting QSAR models, which have high degree of predictive power; the correlation coefficient and cross validation coefficient of all the regression equation have been evaluated.
The best QSAR model and the combination of descriptors providing that model have been identified. On the basis of such models new derivatives can be proposed which may have better anti-amoebic activity.
Cache software has been used for the calculation of descriptors of pyrazoline and dioxazole derivatives. At first, we have optimized the geometry by using PM5 Hamiltonian and then calculated the values of descriptors with the help of project leader associated with cache programme. Values of quantum chemical and topological descriptors of anti-amoebic agents are included in Table 5.

Srivastava and Gupta, IJPSR, 2012; Vol. 3(9): 3249-3258 ISSN: 0975-8232
Available online on www.ijpsr.com 3251
TABLE 1: PYRAZOLE DERIVATIVES AND THEIR OBSERVED ANTI-AMOEBIC ACTIVITIES –logIC50
TABLE 2: DIOXAZOLE DERIVATIVES AND THEIR OBSERVED ANTI-AMOEBIC ACTIVITIES –logIC50
We have also calculated the predicted activity of anti-amoebic agents PA1-PA5 by substituting the values of descriptors in MLR equations. These values are listed in Table 6.
Several QSAR models in different combination of descriptors have been tried and five models were chosen from best five equations, whose correlation coefficients values are above 0.80. The descriptors used in these models are presented in Table 7 and the QSAR model equations after the table numbered as 1, 2, 3, 4 and 5 and their graphs (1-5), respectively.

Srivastava and Gupta, IJPSR, 2012; Vol. 3(9): 3249-3258 ISSN: 0975-8232
Available online on www.ijpsr.com 3252
TABLE 3: DIOXAZOLE DERIVATIVES AND THEIR OBSERVED ANTI-AMOEBIC ACTIVITIES –logIC50
TABLE 4: DIOXAZOLE DERIVATIVES AND THEIR OBSERVED ANTI-AMOEBIC ACTIVITIES –logIC50
MOPAC 2000 engine was used for calculating the value of descriptors of pyrazoline and dioxazole derivatives after optimizing the geometry by using PM5 Hamiltonian. These values are presented in Table 5.
TABLE 5: THE VALUES OF QUANTUM CHEMICAL AND TOPOLOGICAL DESCRIPTORS FOR ANTI-AMOEBIC AGENTS
Comp. ɛ HOMO χ η ω Mw k2 LP MR SASA MV Pc
1 63.711 -8.426 -4.365 4.061 2.345 273.395 6.635 2.86 82.66 128.891 223.5 585.9
2 67.833 -8.496 -4.5275 3.9685 2.582 352.291 6.840 3.69 90.35 143.564 236.1 629.4
3 56.235 -8.500 -4.526 3.974 2.577 307.840 6.840 3.42 87.27 139.351 232.8 614.7
4 58.698 -8.429 -4.34 4.089 2.303 301.449 8.022 3.69 91.86 137.603 255.7 663.1
5 63.650 -8.424 -4.499 3.925 2.578 380.345 8.203 4.52 99.55 150.967 268.2 706.6
6 52.055 -8.427 -4.497 3.93 2.572 335.894 8.203 4.25 96.46 146.692 265.0 691.9
7 51.028 -8.428 -4.432 3.996 2.457 315.476 8.203 4.09 96.35 143.877 270.9 694.2
8 55.061 -8.508 -4.56 3.948 2.633 394.372 8.393 4.92 104.04 160.011 283.4 737.7
9 43.463 -8.511 -4.562 3.949 2.635 349.921 8.393 4.65 100.95 155.645 280.2 723.0
10 97.659 -8.510 -4.419 4.091 2.386 323.455 8.909 4.27 99.84 152.314 287.0 732.8
11 102.88 -8.569 -4.603 3.966 2.671 402.351 9.087 5.10 107.53 164.235 299.5 776.3
12 89.974 -8.581 -4.5415 4.0395 2.552 357.900 9.087 4.83 104.44 162.516 296.3 761.6

Srivastava and Gupta, IJPSR, 2012; Vol. 3(9): 3249-3258 ISSN: 0975-8232
Available online on www.ijpsr.com 3253
13 96.678 -8.216 -4.3355 3.8805 2.421 335.466 8.131 5.01 104.28 150.461 275.4 724.1
14 100.83 -8.271 -4.44 3.831 2.572 414.362 8.347 5.84 111.97 166.591 287.9 767.7
15 89.233 -8.275 -4.4405 3.8345 2.571 369.911 8.347 5.57 108.88 161.515 284.7 753.0
16 88.005 -8.443 -4.462 3.981 2.500 309.428 8.203 4.32 96.76 146.571 264.8 679.8
17 92.048 -8.503 -4.578 3.925 2.669 388.324 8.393 5.14 103.45 162.659 277.4 723.4
18 80.256 -8.571 -4.61 3.961 2.682 343.873 8.393 4.87 100.37 158.425 274.1 708.7
19 87.129 -8.514 -4.501 4.013 2.524 309.428 8.203 4.32 95.76 149.831 264.8 679.8
20 91.258 -8.573 -4.6145 3.9585 2.689 388.324 8.393 5.14 103.45 165.406 277.4 723.4
21 79.664 -8.577 -4.6145 3.9625 2.686 343.873 8.393 4.87 100.37 161.054 274.1 708.7
22 87.006 -8.492 -4.486 4.006 2.511 309.428 8.203 4.32 95.76 149.586 264.8 679.8
23 91.128 -8.549 -4.5995 3.9495 2.678 388.324 8.393 5.14 103.45 165.999 277.4 723.4
24 79.534 -8.552 -4.5985 3.9535 2.674 343.873 8.393 4.87 100.37 161.261 274.1 708.7
25 5.538 -8.815 -4.8175 3.9975 2.902 331.382 8.393 4.14 90.68 147.693 255.4 649.1
26 9.579 -8.870 -4.897 3.973 3.018 410.279 8.590 4.97 98.37 164.307 267.9 692.6
27 -1.730 -8.929 -4.9 4.029 2.979 365.828 8.590 4.70 95.28 159.197 264.7 677.9
28 24.846 -8.463 -4.4235 4.0395 2.422 353.524 7.197 4.17 105.86 152.285 256.8 677.9
29 28.845 -8.527 -4.554 3.973 2.609 432.421 7.438 5.00 113.56 167.926 269.4 737.1
30 17.249 -8.531 -4.553 3.978 2.605 387.970 7.438 4.73 110.47 163.785 266.1 722.4
31 2.602 -9.573 -5.208 4.365 3.106 328.582 6.406 6.11 78.34 143.051 218.1 575.1
32 7.331 -9.571 -5.1725 4.3985 3.041 294.137 6.185 5.55 73.74 133.980 208.7 546.2
33 6.801 -9.355 -5.005 4.35 2.879 273.718 6.185 5.48 75.03 129.452 214.7 548.5
34 1.763 -9.408 -5.0325 4.3755 2.894 287.745 6.840 5.90 79.63 136.298 230.7 587.1
35 -1.862 -9.510 -5.122 4.388 2.989 308.163 6.012 5.91 78.6 139.078 229.3 592.2
36 -6.680 -9.487 -5.1065 4.3805 2.976 322.190 6.630 6.48 83.2 142.524 245.4 630.8
37 10.179 -9.581 -5.1265 4.4545 2.949 352.614 6.012 6.18 81.68 143.245 232.6 606.9
38 4.877 -9.514 -5.119 4.395 2.981 366.641 6.630 6.75 86.28 146.642 248.7 645.5
39 15.494 -9.425 -5.0415 4.3835 2.899 274.706 5.780 4.44 71.51 127.523 208.6 544.5
40 8.720 -9.485 -5.1285 4.3565 3.018 294.137 6.185 5.55 73.74 130.971 208.7 546.2
41 7.490 -9.585 -5.179 4.406 3.043 294.137 6.185 5.55 73.74 133.111 208.7 546.2
42 0.226 -9.613 -5.2935 4.3195 3.24 328.582 6.406 6.11 78.34 145.859 218.1 575.1
43 4.920 -9.608 -5.261 4.347 3.183 294.137 6.185 5.55 73.74 136.144 208.7 546.2
44 4.309 -9.405 -5.1015 4.3035 3.023 273.718 6.185 5.48 75.03 132.120 214.7 548.5
45 -0.727 -9.455 -5.127 4.328 3.036 287.745 6.840 5.90 79.63 138.786 230.7 587.1
46 -3.891 -9.585 -5.21 4.375 3.102 308.163 6.012 5.91 78.60 141.216 229.3 592.2
47 -8.567 -9.550 -5.1835 4.3665 3.076 322.190 6.630 6.48 83.20 146.494 245.4 630.8
48 7.751 -9.573 -5.1975 4.3755 3.086 352.614 6.012 6.18 81.68 146.328 232.6 606.9
49 2.993 -9.547 -5.1805 4.3665 3.073 366.641 6.630 6.75 86.28 151.105 248.7 645.5
50 12.879 -9.477 -5.1245 4.3525 3.016 274.706 5.780 4.44 71.51 130.273 208.6 544.5
51 6.145 -9.547 -5.215 4.332 3.138 294.137 6.185 5.55 73.74 134.069 208.7 546.2
52 5.069 -9.619 -5.2635 4.3555 3.180 294.137 6.185 5.55 73.74 135.937 208.7 546.2
53 -0.265 -9.572 -5.2855 4.2865 3.258 328.582 6.406 6.11 78.34 145.586 218.1 575.1
54 4.422 -9.519 -5.2295 4.2895 3.187 294.137 6.185 5.55 73.74 136.002 208.7 546.2
55 3.809 -9.372 -5.099 4.273 3.042 273.718 6.185 5.48 75.03 131.919 214.7 548.5
56 -1.226 -9.391 -5.1085 4.2825 3.046 287.745 6.840 5.9 79.63 138.346 230.7 587.1
57 -4.378 -9.473 -5.1685 4.3045 3.103 308.163 6.012 5.91 78.60 140.977 229.3 592.2
58 -9.058 -9.439 -5.144 4.295 3.080 322.190 6.630 6.48 83.20 146.508 245.4 630.8
59 7.272 -9.460 -5.155 4.305 3.086 352.614 6.012 6.18 81.68 146.170 232.6 606.9
60 2.502 -9.436 -5.141 4.295 3.076 366.641 6.630 6.75 86.28 151.643 248.7 645.5
61 12.386 -9.371 -5.0845 4.2865 3.015 274.706 5.780 4.44 71.51 129.978 208.6 544.5
62 5.641 -9.439 -5.1755 4.2635 3.141 294.137 6.185 5.55 73.74 134.161 208.7 546.2
63 4.578 -9.517 -5.2255 4.2915 3.181 294.137 6.185 5.55 73.74 135.821 208.7 546.2
Com = Compound, ɛ = Conformation minimum energy (kcal/mole), LP = LogP, Mw = Molecular weight, k2 = Shape Index (basic kappa,
order 2), ɛHOMO = HOMO energy, χ = Electronegativity, η = Absolute hardness, ω = Electrophilicity index, MR = Molar refractivity, SASA = Solvent accessibility surface area, MV = Molar volume, Pc = Parachor
Srivastava and Gupta, IJPSR, 2012; Vol. 3(9): 3249-3258 ISSN: 0975-8232
Available online on www.ijpsr.com 3254
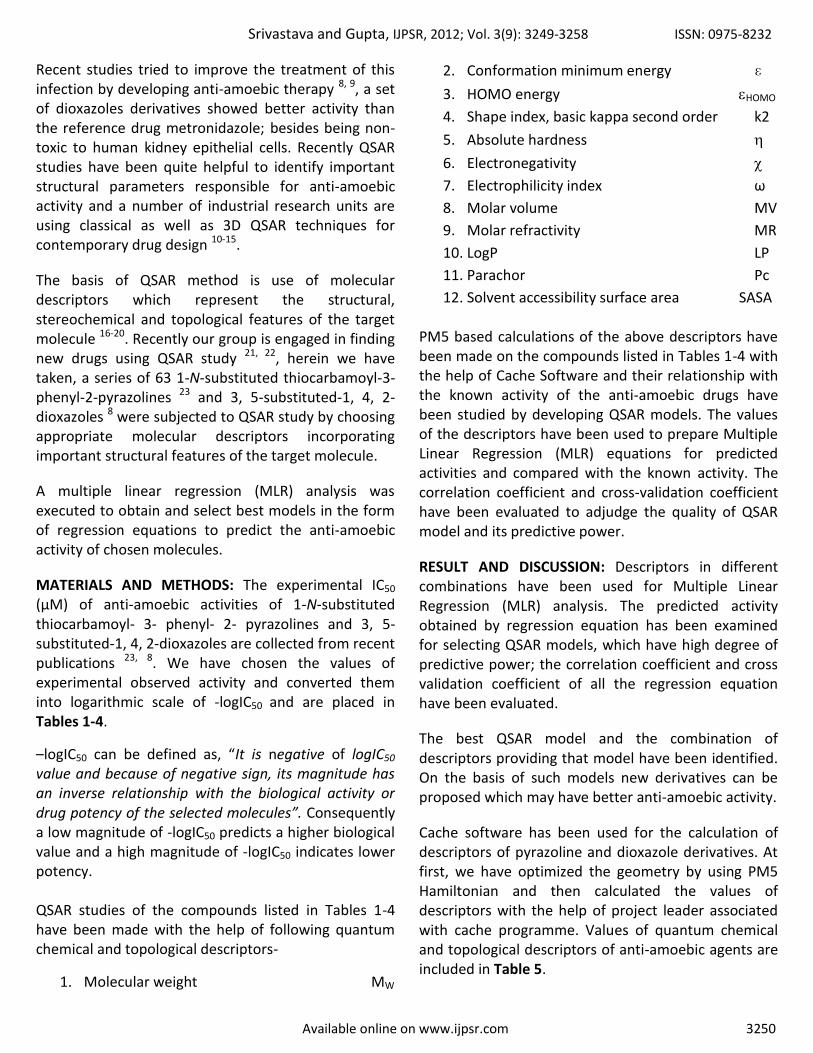
TABLE 6: CALCULATED PREDICTED ACTIVITIES FROM REGRESSION EQUATIONS PA1 TO PA5
Comp PA1 PA2 PA3 PA4 PA5 Obs. Activity
1 0.561 0.597 0.570 0.552 0.541 0.572
2 0.332 0.248 0.298 0.329 0.273 0.45
3 0.353 0.315 0.371 0.331 0.340 0.364
4 0.421 0.545 0.436 0.461 0.418 0.642
5 0.190 0.171 0.154 0.247 0.144 0.037
6 0.221 0.240 0.235 0.257 0.220 -0.051
7 0.693 0.730 0.693 0.717 0.689 0.774
8 0.501 0.466 0.477 0.518 0.465 0.72
9 0.527 0.542 0.552 0.525 0.537 0.569
10 0.843 0.938 0.865 0.853 0.852 0.864
11 0.583 0.618 0.538 0.622 0.543 0.647
12 0.677 0.695 0.712 0.673 0.693 0.464
13 0.505 0.603 0.506 0.540 0.540 0.792
14 0.315 0.344 0.296 0.344 0.320 0.444
15 0.337 0.423 0.361 0.353 0.384 0.248
16 0.739 0.736 0.720 0.740 0.747 0.679
17 0.563 0.501 0.531 0.556 0.538 0.582
18 0.556 0.541 0.571 0.531 0.577 0.225
19 0.730 0.711 0.744 0.707 0.750 0.7
20 0.552 0.475 0.538 0.525 0.537 0.525
21 0.571 0.534 0.607 0.525 0.602 0.449
22 0.740 0.714 0.754 0.718 0.759 0.98
23 0.568 0.486 0.562 0.536 0.556 0.727
24 0.585 0.547 0.625 0.537 0.617 0.38
25 0.204 0.172 0.180 0.204 0.175 0.246
26 0.051 0.034 0.013 0.038 -0.007 -0.174
27 0.072 0.037 0.076 0.047 0.056 0.292
28 0.454 0.421 0.409 0.417 0.459 0.253
29 -0.291 -0.332 -0.295 -0.304 -0.282 -0.237
30 -0.270 -0.264 -0.221 -0.303 -0.215 -0.328
31 -0.188 -0.237 -0.179 -0.183 -0.181 -0.092
32 -0.079 -0.133 -0.082 -0.067 -0.076 -0.292
33 0.473 0.393 0.439 0.483 0.470 0.494
34 0.390 0.324 0.378 0.406 0.407 0.486
35 0.484 0.470 0.497 0.477 0.488 0.461
36 0.439 0.454 0.449 0.463 0.451 0.40
37 0.462 0.376 0.422 0.476 0.420 0.364
38 0.408 0.383 0.365 0.454 0.374 0.408
39 0.230 0.213 0.240 0.234 0.215 0.21
40 -0.062 -0.099 -0.085 -0.028 -0.070 -0.387
41 -0.091 -0.143 -0.102 -0.071 -0.091 -0.143
42 -0.244 -0.215 -0.221 -0.258 -0.228 0.083
43 -0.143 -0.105 -0.138 -0.145 -0.133 -0.125
44 0.406 0.376 0.384 0.399 0.412 0.452
45 0.324 0.305 0.322 0.323 0.349 0.444
46 0.422 0.459 0.442 0.402 0.434 0.468
47 0.401 0.439 0.435 0.397 0.428 0.441
48 0.420 0.387 0.398 0.411 0.389 0.443
49 0.386 0.381 0.373 0.399 0.369 0.367
50 0.175 0.185 0.198 0.160 0.169 0.238
51 -0.118 -0.097 -0.124 -0.105 -0.115 -0.208
52 -0.146 -0.110 -0.143 -0.146 -0.137 -0.041
53 -0.242 -0.150 -0.220 -0.254 -0.226 0.053

Srivastava and Gupta, IJPSR, 2012; Vol. 3(9): 3249-3258 ISSN: 0975-8232
Available online on www.ijpsr.com 3255
54 -0.121 -0.056 -0.112 -0.123 -0.110 -0.267
55 0.405 0.401 0.381 0.399 0.410 0.433
56 0.333 0.335 0.330 0.335 0.357 0.373
57 0.452 0.515 0.476 0.431 0.463 0.433
58 0.430 0.495 0.471 0.425 0.459 0.389
59 0.451 0.445 0.433 0.442 0.420 0.417
60 0.420 0.426 0.417 0.427 0.406 0.403
61 0.202 0.232 0.229 0.188 0.197 0.199
62 -0.087 -0.032 -0.088 -0.077 -0.083 -0.319
63 -0.119 -0.055 -0.111 -0.119 -0.108 -0.066
PA = Predicted activity derived from various QSAR model equations
Examination of Table 6 suggests that compounds No. 1, 3, 7, 9, 10, 11, 17, 19, 20 and 21 of pyrazoline group show predicted activity almost at par with the observed activity in all the five selected models (PA1 to PA5).
The same is true for compounds No. 33, 35, 46, 47, 49, 55, 56, 57, 60 and 61 of dioxazole group which show highly comparable predicted activity with observed activity in all the selected five models (PA1 to PA5).
TABLE 7: VALUES OF CROSS VALIDATION AND CORRELATION COEFFICIENTS OF BEST FIVE QSAR MODELS
PAE rCV^2 r^2 Variable counts
Descriptors used in QSAR models
PA1 0.756404 0.806883 7 Conformation Minimum Energy, Electronegativity, Molecular Weight, Shape Index (2), SASA, Molar
Volume, Parachor
PA2 0.729243 0.806268 7 Conformation Minimum Energy, Electronegativity, Absolute Hardness, Electrophilicity Index, Shape Index
(2), Molar Volume, Parachor
PA3 0.747698 0.804047 7 Conformation Minimum Energy, Electronegativity, Shape Index (2), Molar Refractivity, SASA, Molar
Volume, Parachor
PA4 0.760651 0.803411 7 Conformation Minimum Energy, Electronegativity, Molecular Weight, Shape Index (2), LogP, Molar
Volume, Parachor
PA5 0.750508 0.802723 7 Conformation Minimum Energy, Electronegativity, Shape Index (2), LogP, SASA, Molar Volume, Parachor
PAE = Predicted activity equations, rCV^2 = Cross validation coefficient, r^2 = Correlation coefficient
QSAR MODEL EQUATION-1 PA1= 0.00417292*ɛ+0.802645*χ+0.00181302*Mw-0.51571*k2+0.00797046*SASA+0.0951141*MV-0.0337697*Pc+4.22522 rCV^2 = 0.756404 ----(1) r^2 = 0.806883
GRAPH 1: CORRELATION BETWEEN OBSERVED ACTIVITY AND PREDICTED ACTIVITY DERIVED FROM REGRESSION MODEL PA1
Srivastava and Gupta, IJPSR, 2012; Vol. 3(9): 3249-3258 ISSN: 0975-8232
Available online on www.ijpsr.com 3256
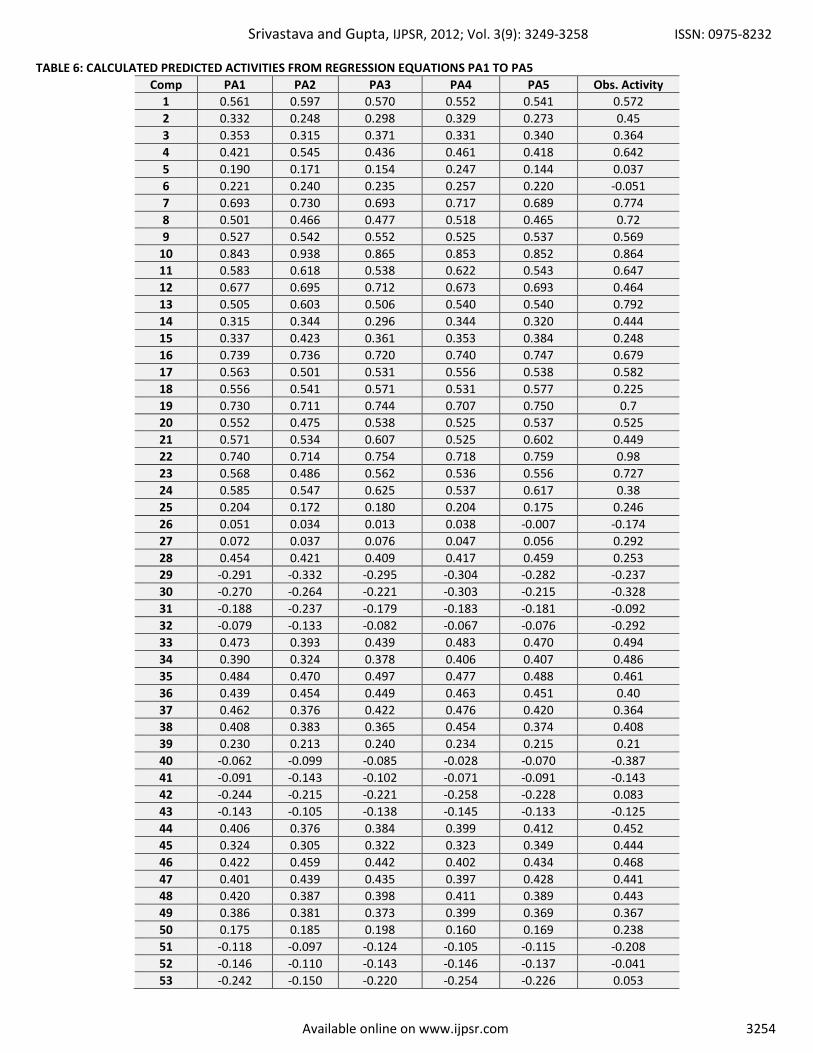
QSAR MODEL EQUATION- 2 PA2 = 0.00447077*ɛ+12.1849*χ+6.49678*η+10.2269*ω-0.556798*k2+ 0.0870785*MV-0.0274321*Pc+3.43851 rCV^2 = 0.729243 ---(2) r^2 = 0.806268
GRAPH 2. CORRELATION BETWEEN OBSERVED ACTIVITY AND PREDICTED ACTIVITY DERIVED FROM REGRESSION MODEL PA2
QSAR MODEL EQUATION-3 PA3 = 0.00337618*ɛ+0.932314*χ-0.517113*k2-0.0115611*MR+0.0161658*SASA+ 0.0869679*MV-0.0292388*Pc+4.42091 rCV^2 = 0.747698 ----(3) r^2 = 0.804047
GRAPH 3. CORRELATION BETWEEN OBSERVED ACTIVITY AND PREDICTED ACTIVITY DERIVED FROM REGRESSION MODEL PA3
QSAR Model Equation-4 PA4 = 0.00423129*ɛ+0.761142*χ+0.00256411*Mw-0.477313*k2+ 0.0198134*LP +0.0920914*MV-0.0321332*Pc+4.25876 rCV^2 = 0.760651 ----(4) r^2 = 0.803411
Srivastava and Gupta, IJPSR, 2012; Vol. 3(9): 3249-3258 ISSN: 0975-8232
Available online on www.ijpsr.com 3257
GRAPH 4. CORRELATION BETWEEN OBSERVED ACTIVITY AND PREDICTED ACTIVITY DERIVED FROM REGRESSION MODEL PA4
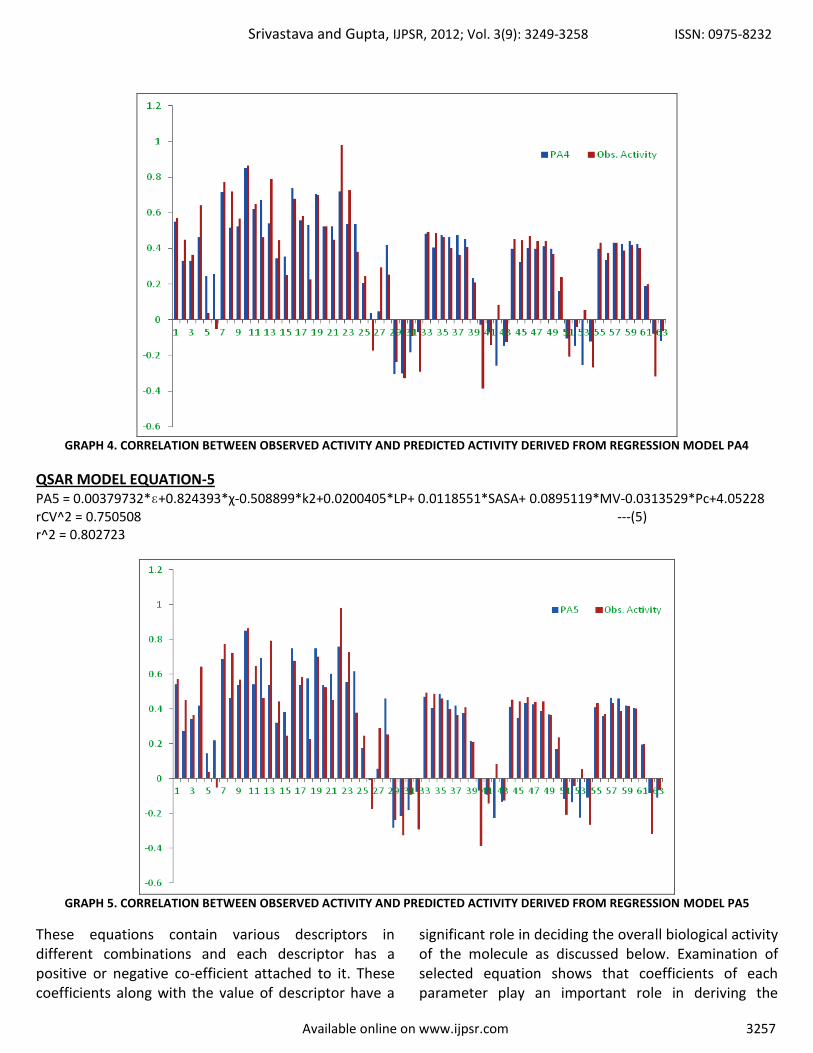
QSAR MODEL EQUATION-5 PA5 = 0.00379732*ɛ+0.824393*χ-0.508899*k2+0.0200405*LP+ 0.0118551*SASA+ 0.0895119*MV-0.0313529*Pc+4.05228 rCV^2 = 0.750508 ---(5) r^2 = 0.802723
GRAPH 5. CORRELATION BETWEEN OBSERVED ACTIVITY AND PREDICTED ACTIVITY DERIVED FROM REGRESSION MODEL PA5
These equations contain various descriptors in different combinations and each descriptor has a positive or negative co-efficient attached to it. These coefficients along with the value of descriptor have a
significant role in deciding the overall biological activity of the molecule as discussed below. Examination of selected equation shows that coefficients of each parameter play an important role in deriving the

Srivastava and Gupta, IJPSR, 2012; Vol. 3(9): 3249-3258 ISSN: 0975-8232
Available online on www.ijpsr.com 3258
biological activity. From the point of view of potency or biological activity of the drug molecule in terms of -logIC50 values, the weight of a negative co-efficient is very significant because it contributes towards a decreased value of -logIC50, meaning increased value of biological activity. So the parameters with a negative co-efficient are most important followed by parameters with low weight positive coefficients and lastly the parameters with high weight positive coefficients.
On the basis of values of these coefficients, the associated descriptors are arranged in a sequence pertaining to their contribution towards overall biological activity of the molecule, in following decreasing order of biological activity of anti amoebic agents;
Shape Index (k2) > Parachor (Pc) > Conformation
Minimum Energy (ɛ) and/or Molecular Weight (Mw) and/or Molecular Refractivity (MR) > Solvent Accessibility Surface Area (SASA) > LogP > Molar
Volume (MV) > Electronegativity (χ), HOMO, Electrophilicity Index (ω), Absolute Hardness (η)
CONCLUSION: The QSAR models developed by us in this paper represent some of the easiest ways of determining the biological activity of anti-amoebic agents. All the models are highly predictive and provides good values for cross validation coefficient (rCV^2) and correlation coefficient (r^2). Study and analysis of these models reveal that negative coefficients of regression model are most significant followed by positive coefficients of low weight and finally positive coefficients of high weight. The whole intention behind this was to facilitate the designing of new anti-amoebic drugs for the treatment against E. histolytica.
ACKNOWLEDGEMENT: We gratefully acknowledge to Dr. O. P. Mishra, Principal of M.L.K. (P.G.) College, Balrampur for providing research facilities and co-operation.
REFERENCES:
1. Walsh JA, “Prevalence of Entamoeba histolytica infection” In Amoebiasis: Human Infection by Entamoeba histolytica (Ravdin, J. I., Ed.), 1988, pp. 93-105. Wiley Medical, New York, NY, USA.
2. Walsh JA, Reviews in Infectious Diseases. 1986; 8: 228. 3. Goldman P, Koch RL, Yeung TC et al., Biochemical Pharmacology
1986; 35: 43. 4. Knight RC, Skolioowski IM, Edwards DI. Pharmacology 1986; 27:
2089. 5. Koch CJ, Lord EM, Shapiro IM et al. Advances in Experimental
Medicine and Biology 1997; 428: 585. 6. Kock RL, Beaulieu BB Jr, Chrystal EJT et al. Science 1981; 211: 398. 7. Bansal D, Sehgal R, Chawla Y, Chander MR, Malla N. Annals of
Clinical Microbiology and Antimicrobials 2004; 3: 27. 8. Bhat AR, Athar F, Azam A. Eur. J. Med. Chem. 2009; 44: 926-936. 9. Bhat AR, Athar F, Azam A. Eur. J. Med. Chem. 2009; 44: 426-431. 10. Adhikari N, Maiti MK. J. Bioorg. Med. Chem. Lett. 2010; 20: 4021. 11. Mbarki S, Dguigui K, El Hallaoui M. J. Mater. Environ. Sci. 2011; 2:
61-70. 12. Trinajstic N. Chemical Graph Theory 1992; 225-273. 13. a) Bazoui H, Zahouily M, Boulaajaj S, Sebti S, Zakarya D., SAR QSAR
Environ. Res. 2002; 13: 567. b) Bazoui H, Zahouily M, Sebti S, Boulaajaj S, Zakarya DJ. Mol. Model. 2002; 8: 1-7. c) Agrawala VK, Singha J, Mishra KC, Khadikar PV, Jaliwalac YA. Arkivoc 2006; 162.
14. Kubinyi H. QSAR: Hansch analysis and related approaches. In: Mannhold R, Krogsgarrd Larsen P, Timmerman H (eds) Methods and principles in medicinal chemistry. Wiley, Weinheim; 1 (1993).
15. Kubinyi H. (ed) 3D QSAR in drug design: theory, methods and applications. ESCOM, Leiden (1993).
16. Todeschini R, Consonni V. Handbook of Molecular Descriptors; Wiley-VCH: (2000) Germany.
17. Karelson M. Molecular Descriptors in QSAR/QSPR; John Wiley & Sons: New York, (2000).
18. Diudea MV. Ed. QSPR/QSAR Studies by Molecular Descriptors; Nova Science: Huntington, NY, (2001).
19. Balaban AT. Ed. From Chemical Graphs to Three-Dimensional Geometry; (1997). New York.
20. Balaban A. SAR QSAR Environ. Res. 1998; 8: 1. 21. Srivastava AK, Gupta R. J. Chem. Pharm. Res. 2012; 4: 2228-2241. 22. Srivastava AK, Gupta R, Srivastava R, Mishra DK. Int. J. Pharm. Sci.
Res. 2012; 8: 2648-2654. 23. Abid M, Bhat AR, Athar F, Azam A. Eur J. Med. Chem. 2009; 44:
417-425.
How to cite this article: Srivastava AR and Gupta R: QSAR Study to predict Anti-Amoebic Activities of Pyrazoline and Dioxazole Derivatives with the help of Pm5-Based Descriptors. Int J Pharm Res Sci. 3(9); 3249-3258.