Specific effects of caring for a spouse with dementia: differences in depressive symptoms between...
13
International Psychogeriatrics (2008), 20:3, 508–520 C 2007 International Psychogeriatric Association doi:10.1017/S1041610207006278 Printed in the United Kingdom Specific effects of caring for a spouse with dementia: differences in depressive symptoms between caregiver and non-caregiver spouses .............................................................................................................................................................................................................................................................................. Kathryn Betts Adams The Mandel School of Applied Social Sciences and University Memory and Aging Center, Case Western Reserve University, Cleveland, Ohio, U.S.A. ABSTRACT Background: Caring for spouses with dementia is a risk factor for increased levels of depression. Less is known about specific symptom differences between groups of caregivers and non-caregivers. This study characterizes differences on the CES-D depression screening scale between caregiving and non-caregiving spouses. Methods: Data were obtained from 391 spouse caregivers of persons with dementia and 226 control subjects. Significant between-group differences on demographic variables determined covariates used in two multivariate ANCOVA analyses, on the set of four CES-D subscales and on the set of the 20 CES-D individual items. Significant multivariate analyses were followed by univariate tests between the two groups. Results: Dementia caregiving spouses had significantly more depressive symptoms than non-caregiving married adults, after controlling for group differences. Proportion of variance in the set of CES-D subscales explained by caregiver group status was 13.4%. The greatest between-groups difference in univariate analysis was found in the Positive Affect subscale, and significant differences were found in 11 of the 20 CES-D items. Caregiver spouses experienced less hope for the future and less happiness and enjoyment in life than the non-caregiving spouses. They also reported greater degrees of sadness, being bothered, and loneliness than the non-caregivers. Conclusions: The differences, particularly caregivers’ lack of positive affect, suggest the need for appropriate intervention approaches to assist spouse caregivers. Key words: dementia caregiving, depression, CES-D, positive affect, two-group MANCOVA Correspondence should be addressed to: Dr. Kathryn Betts Adams, Assistant Professor of Social Work, The Mandel School of Applied Social Sciences, Case Western Reserve University, 10600 Euclid Avenue, Cleveland, OH 44106, U.S.A. Phone: +1 216 368 6155. Email: [email protected]. Received 28 May 2007; revision requested 25 Jun 2007; revised version received 30 Jul 2007; accepted 31 Jul 2007. First published online 15 October 2007. 508
-
Upload
independent -
Category
Documents
-
view
2 -
download
0
Transcript of Specific effects of caring for a spouse with dementia: differences in depressive symptoms between...
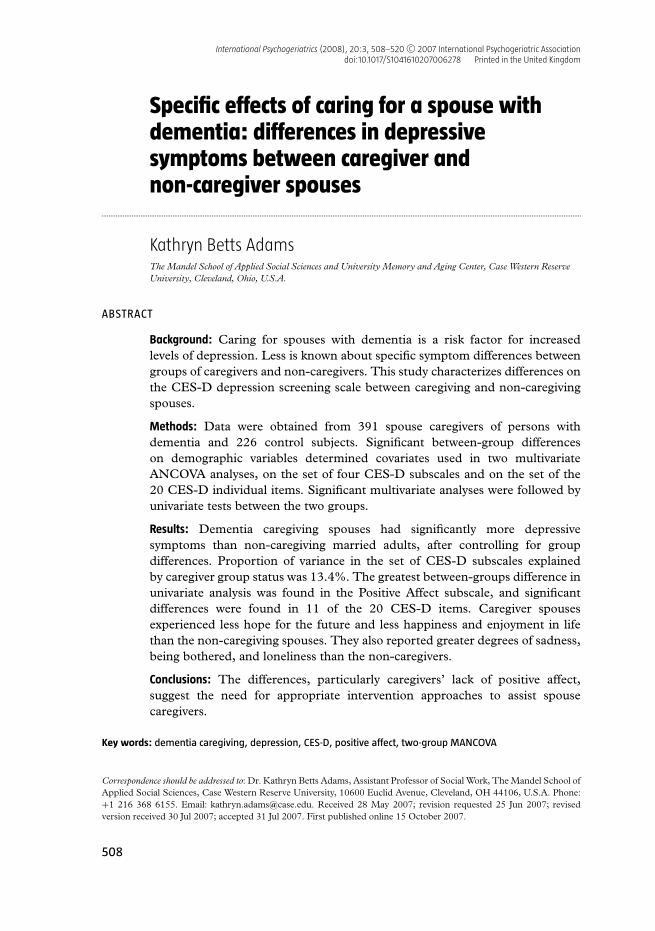
International Psychogeriatrics (2008), 20:3, 508–520 C© 2007 International Psychogeriatric Associationdoi:10.1017/S1041610207006278 Printed in the United Kingdom
Specific effects of caring for a spouse withdementia: differences in depressivesymptoms between caregiver andnon-caregiver spouses
..............................................................................................................................................................................................................................................................................
Kathryn Betts AdamsThe Mandel School of Applied Social Sciences and University Memory and Aging Center, Case Western ReserveUniversity, Cleveland, Ohio, U.S.A.
ABSTRACT
Background: Caring for spouses with dementia is a risk factor for increasedlevels of depression. Less is known about specific symptom differences betweengroups of caregivers and non-caregivers. This study characterizes differences onthe CES-D depression screening scale between caregiving and non-caregivingspouses.
Methods: Data were obtained from 391 spouse caregivers of persons withdementia and 226 control subjects. Significant between-group differenceson demographic variables determined covariates used in two multivariateANCOVA analyses, on the set of four CES-D subscales and on the set of the20 CES-D individual items. Significant multivariate analyses were followed byunivariate tests between the two groups.
Results: Dementia caregiving spouses had significantly more depressivesymptoms than non-caregiving married adults, after controlling for groupdifferences. Proportion of variance in the set of CES-D subscales explainedby caregiver group status was 13.4%. The greatest between-groups difference inunivariate analysis was found in the Positive Affect subscale, and significantdifferences were found in 11 of the 20 CES-D items. Caregiver spousesexperienced less hope for the future and less happiness and enjoyment in lifethan the non-caregiving spouses. They also reported greater degrees of sadness,being bothered, and loneliness than the non-caregivers.
Conclusions: The differences, particularly caregivers’ lack of positive affect,suggest the need for appropriate intervention approaches to assist spousecaregivers.
Key words: dementia caregiving, depression, CES-D, positive affect, two-group MANCOVA
Correspondence should be addressed to: Dr. Kathryn Betts Adams, Assistant Professor of Social Work, The Mandel School ofApplied Social Sciences, Case Western Reserve University, 10600 Euclid Avenue, Cleveland, OH 44106, U.S.A. Phone:+1 216 368 6155. Email: [email protected]. Received 28 May 2007; revision requested 25 Jun 2007; revisedversion received 30 Jul 2007; accepted 31 Jul 2007. First published online 15 October 2007.
508
Differences in depressive symptoms in caregiver and non-caregiver spouses 509
Introduction
The Stress Process Model for Family Caregiving (Pearlin et al., 1990) providesthe theoretical pathways to the mental health and physical health consequences ofcaring for a family member with Alzheimer’s disease or another related disorder(ADRD). These family caregivers tend to suffer from depression and othernegative mental health and physical health problems at higher rates than non-caregivers do (Schulz et al., 1995; Schulz and Martire, 2004). In an attempt toquantify these differences, Cuijpers (2005) summarized findings from six studieswith comparison groups of non-caregivers in a systematic review of researchreporting actual diagnoses of depressive disorders among dementia caregivers,which placed the relative risk for a depressive disorder for caregivers versus non-caregivers from 2.80 to 38.68. Haley and colleagues (1995) compared blackand white caregivers and non-caregivers, and found that the group differenceswere greatest between caregivers and non-caregivers in depressive symptoms,although this difference only held for the white caregivers. Research on moregeneral negative effects of dementia caregiving comparing family caregivers withnon-caregivers was summarized in a meta-analysis of 84 studies (Pinquart andSorenson, 2003). These authors found between-group effect sizes averaged inthe medium range, with greater differences in mental health outcomes, includingdepression, than in physical health outcomes, and for spouses as opposed to adultchildren caregivers. However, many of the studies they reviewed did not controlfor other group differences that might influence depressive symptoms, inflatingthe differences between the caregivers and non-caregivers. Furthermore, veryfew studies were available that focused on depressive symptoms of homogeneouscaregiver groups, including spouses, with comparable non-caregivers, and hencewe have only a limited understanding of the effects of caregiving on spouses fromcontrolled studies (Pinquart and Sorenson, 2003).
A number of researchers have asserted that depression associated withcaregiving is a complex phenomenon that may have multiple pathways (Covinskyet al., 2003). As suggested by the Stress Process Model, depression amongcaregivers is likely to be induced by a complex illness and caregiving situation, incontrast to a more endogenous, biologically based depression or a more chronic,dysthymic or neurotic depression. For example, increased depressive symptomsmay be due to fatigue from less sleep or interrupted sleep (Teel and Press,1999; Carter, 2002), lack of the self-efficacy or personal mastery specific tothe caregiving situation (Pinquart and Sorenson, 2003; Adams et al., 2005),and grieving the ongoing losses, such as personality changes and diminishingcapabilities in the family member (Marwit and Meuser, 2001; Sanders andAdams, 2005). The situational depression experienced by many caregivers mayactually manifest with different symptoms than other depression (Pinquart andSorenson, 2003; O’Rourke, 2004).
Although many studies have reported that caregivers are more depressedthan similar non-caregivers, examinations of differences in depressive symptomsbetween caregivers and non-caregivers at a more molecular level are not wellrepresented in the literature. How do caregivers and non-caregivers differ atthe symptom level? Which types of symptoms are found in greater proportion
510 K. B. Adams
among the caregivers than among the non-caregivers? It seems likely that certaindepressive symptoms may be endorsed more regularly by caregivers than non-caregivers, partly due to the nature of their daily lives and the tasks andobstacles they face. These questions may help illuminate effects of the stressprocess specific to spousal caregiving, particularly if other differences betweenthe caregivers and non-caregivers can be minimized by matching or statisticalcontrols. This sort of precise examination of the differences between caregivingand non-caregiving spouses should help to further our understanding of spousaldementia caregiving and identify targets for intervention.
The current study compared depressive symptoms in a group of people caringfor their spouses with Alzheimer’s disease (AD) or another form of dementiawith the depressive symptoms in a group of married adults who served asa non-caregiving control group. Symptoms were measured by the Center forEpidemiological Studies Depression Scale (CES-D; Radloff, 1977) subscalescores and individual item scores. Although fully matching subjects in the twogroups would have been difficult, entering variables as covariates in the analysesserved as a way to control for between-group differences in relevant demographicvariables. The two objectives of the study were the following:
� to determine the effects of caregiving on CES-D scores among spousecaregivers, when compared to non-caregivers, after controlling forbetween-group differences in potential demographic predictors ofdepression; and
� to locate differences in subscales and particular items on the CES-D Scale between caregiver and non-caregiver spouses and calculateeffect sizes for caregiving on the individual areas represented bythese subscales and items, again controlling for differences in relevantcharacteristics. The hypothesis to be tested was that the greatestdifference between groups would be on the depressive affect subscale,followed by the positive affect and somatic subscales. In terms ofindividual items, certain items were expected to be seen to have asignificantly higher endorsement by the caregiving spouses, includingfeeling things are an effort, feeling sad or depressed, experiencingloneliness, not feeling happy, and not feeling hopeful about the future.
Methods
SubjectsThis study utilized existing data from a sample of 391 spouse caregivers ofpersons with AD or other progressive dementia, and from 226 middle-aged andolder married adult volunteers, both recruited by the Case Western ReserveUniversity/University Hospitals Medical Center Alzheimer’s Disease ResearchCenter (ADRC) in first visits between 1993 and 2003, during which the Centersponsored a Research Registry for people with cognitive impairments as well
Differences in depressive symptoms in caregiver and non-caregiver spouses 511
as cognitively normal older adults, who were recruited concurrently throughoutthat timeframe. Individuals with some cognitive symptoms or concerns makinga first visit to the ADRC received a complete neurological exam and diagnosis. Aresearch partner, usually a close family member and the self-identified caregiver,accompanied each individual entering the Research Registry. The current studyhas limited this group to spouse caregivers. During the first visit, these spousecaregivers were recruited and consented to participate in research studies oncaregiving, after which they completed a battery of instruments about their ownhealth and well-being.
One of the ongoing missions of the ADRC has been to characterize cognitivelynormal older adults and follow them longitudinally. Comparison participantswere recruited by the ADRC to serve as “normal” controls in various studies,generally to be compared with patients with dementia. These volunteers wererecruited by advertisements for specific case-control studies, by communityoutreach efforts, such as talks given in the community, or by word of mouth.They were not paid by the ADRC, but were given the same neurological work-up as dementia patients free of charge, and also completed a number of self-administered social and health instruments, all strictly for research purposes.For the current study, those in the comparison group who indicated they werecaregivers for an older or disabled family member, whether for dementia oranother condition, were omitted from these analyses to be assured that thecomparison was cleanly between a dementia caregiving sample and a non-caregiving sample. All of the participants in both groups were co-residing withtheir spouses.
Diagnosis of AD in the care recipients (spouses of the caregiver group) wasmade in accordance with NINCDS/ADRDA criteria (McKhann et al., 1984) anddiagnosis of Mild Cognitive Impairment (MCI) was based on Petersen’s criteria(Petersen et al., 1999). Diagnosis was assigned at a consensus conference afterreviewing all completed evaluations.
MeasuresDemographic data for each subject – the caregivers and comparison groupmembers – included age in years, gender, white vs. non-white race, level ofeducation, and a total household income level variable with a range from lessthan $10,000 per year to $80,000 or more. The sum of a possible 11 currentillnesses (plus “other”) was used as an index of health. The illnesses indexed werearthritis, asthma/emphysema, prostate/urinary conditions, heart condition, highblood pressure, diabetes, cancer/leukemia, back problems, circulation problems,digestive problems, or problems resulting from a stroke.
Depressive symptoms were measured by the 20-item CES-D Scale (Radloff,1977). Originally developed for use in research with adults in the community,there is considerable evidence of its efficacy with older adults as a screening toolfor depressive symptoms (Radloff and Teri, 1986; Arean and Miranda, 1997).Sheehan and colleagues (1995) noted the opinion of some researchers that theCES-D should be considered an indicator of the distress that may accompanydepression, rather than clinical depression. The items ask about frequency of
512 K. B. Adams
experiences during the past week, with four response categories, from rarely(0 points) to most or all of the time (3 points) allowing a range of total scorefrom 0 to 60. Four subscales of the CES-D have been identified and replicated,and are widely used in the literature. These are depressive affect, seven items;positive affect, four items reverse scored; somatic symptoms, seven items; andinterpersonal, two items (Radloff, 1977; Davidson et al., 1994; Sheehan et al.,1995). Cronbach’s α measuring inter-item reliability of the CES-D for this studywas 0.89 for the caregivers, and 0.80 for the non-caregivers.
Results
The group of care recipients of the spousal caregivers had a mean Mini-mentalState Examination score (MMSE; Folstein et al., 1975) of 19.65, with a standarddeviation of 6.675. Of this group, 50% were diagnosed with mild dementia bya Clinical Dementia Rating (CDR) of 1 (Morris, 1983) and another 37% withmoderate or severe dementia (CDR of 2 or greater). These diagnoses consistedof possible or probable Alzheimer’s disease, vascular dementia, frontal temporallobe, or a combination of dementias. The remaining 13% were diagnosed withMCI or given an “uncertain” diagnosis (CDR of 0.5). In a one-item ratingof how burdened they felt because of the spouse’s impairments, 23% of thecaregivers reported they were not at all burdened, 36% reported feeling “a little”burdened, 29% reported feeling moderately burdened, with the remaining 12%saying “greatly” or “very greatly” burdened.
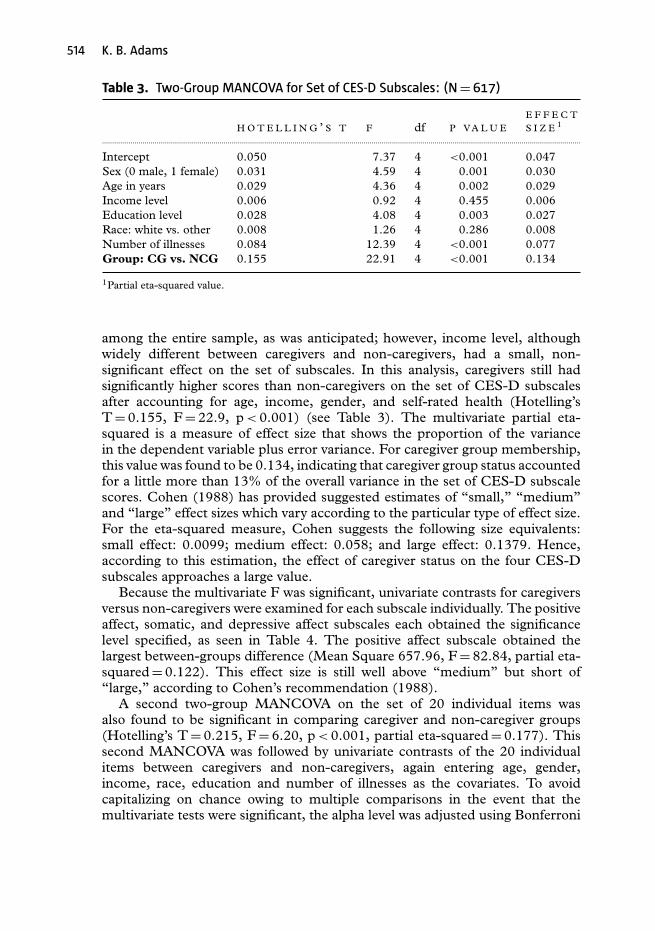
Tables 1 and 2 display the variables shared by both the caregiver and non-caregiver groups. Table 1 displays frequencies for the ordinal level variables,education and income. Table 2 displays unadjusted comparative data for the twogroups on continuous and dichotomous demographic variables to determinewhether there were between-groups differences. Dichotomized measures ofincome level and education level were created for these analyses. For income,the median for the combined groups was used to divide the variable at the$40,000 level. Education level was divided at high school graduation or lessversus any college or beyond. There were statistically significant unadjusteddifferences between the spousal caregivers and married comparison groupin gender distribution, age, and number of chronic illnesses, along with thedichotomous education and income variables. Mean total CES-D scores of thesetwo groups were also compared using a Student’s t test. Total CES-D mean scorefor the caregivers was 11.54, compared with 4.31 for the comparison group(t = −12.53, p < 0.001). Just over 25% of the caregivers would be classifiedas “probable depression” (16 points or more; Radloff, 1977) on the scale, incontrast to the non-caregiver group, of whom approximately 5% could be soclassified.
Because the caregiver and non-caregiver groups were found to have between-group differences in demographic characteristics, e.g. age (comparison subjectswere about three years older on average), gender and racial distributions,education level, income range, and total number of chronic illnesses,these demographic variables were selected as covariates in the multivariate
Differences in depressive symptoms in caregiver and non-caregiver spouses 513
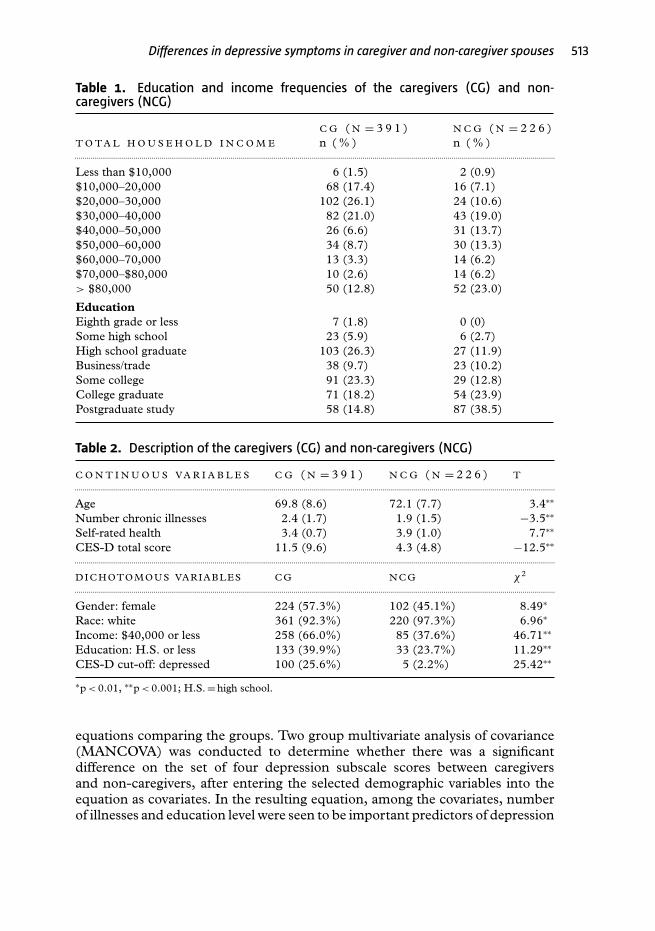
Table 1. Education and income frequencies of the caregivers (CG) and non-caregivers (NCG)
C G ( N = 3 9 1 ) N C G ( N = 2 2 6 )T O T A L H O U S E H O L D I N C O M E n ( % ) n ( % ).............................................................................................................................................................................................................................................
Less than $10,000 6 (1.5) 2 (0.9)$10,000–20,000 68 (17.4) 16 (7.1)$20,000–30,000 102 (26.1) 24 (10.6)$30,000–40,000 82 (21.0) 43 (19.0)$40,000–50,000 26 (6.6) 31 (13.7)$50,000–60,000 34 (8.7) 30 (13.3)$60,000–70,000 13 (3.3) 14 (6.2)$70,000–$80,000 10 (2.6) 14 (6.2)> $80,000 50 (12.8) 52 (23.0)
EducationEighth grade or less 7 (1.8) 0 (0)Some high school 23 (5.9) 6 (2.7)High school graduate 103 (26.3) 27 (11.9)Business/trade 38 (9.7) 23 (10.2)Some college 91 (23.3) 29 (12.8)College graduate 71 (18.2) 54 (23.9)Postgraduate study 58 (14.8) 87 (38.5)
Table 2. Description of the caregivers (CG) and non-caregivers (NCG)
C O N T I N U O U S V A R I A B L E S C G ( N = 3 9 1 ) N C G ( N = 2 2 6 ) T.............................................................................................................................................................................................................................................
Age 69.8 (8.6) 72.1 (7.7) 3.4∗∗
Number chronic illnesses 2.4 (1.7) 1.9 (1.5) −3.5∗∗
Self-rated health 3.4 (0.7) 3.9 (1.0) 7.7∗∗
CES-D total score 11.5 (9.6) 4.3 (4.8) −12.5∗∗.............................................................................................................................................................................................................................................
D ICHOTOMOUS VARIABLES CG NCG χ2
.............................................................................................................................................................................................................................................
Gender: female 224 (57.3%) 102 (45.1%) 8.49∗
Race: white 361 (92.3%) 220 (97.3%) 6.96∗
Income: $40,000 or less 258 (66.0%) 85 (37.6%) 46.71∗∗
Education: H.S. or less 133 (39.9%) 33 (23.7%) 11.29∗∗
CES-D cut-off: depressed 100 (25.6%) 5 (2.2%) 25.42∗∗
∗p < 0.01, ∗∗p < 0.001; H.S. = high school.
equations comparing the groups. Two group multivariate analysis of covariance(MANCOVA) was conducted to determine whether there was a significantdifference on the set of four depression subscale scores between caregiversand non-caregivers, after entering the selected demographic variables into theequation as covariates. In the resulting equation, among the covariates, numberof illnesses and education level were seen to be important predictors of depression
514 K. B. Adams
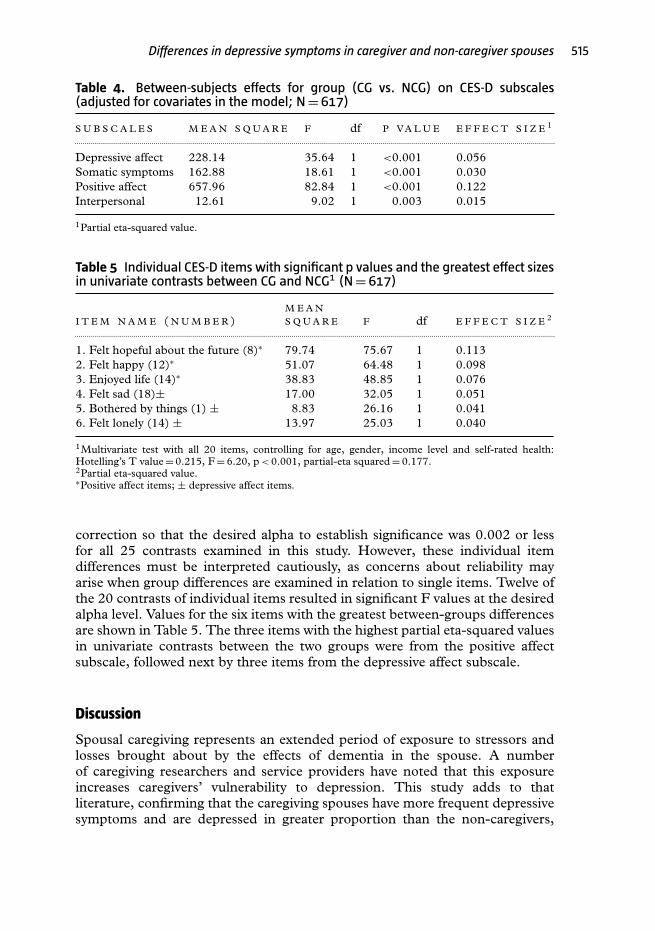
Table 3. Two-Group MANCOVA for Set of CES-D Subscales: (N = 617)
H O T E L L I N G ’ S T F df P V A L U EE F F E C TS I Z E 1
............................................................................................................................................................................................................................................
Intercept 0.050 7.37 4 <0.001 0.047Sex (0 male, 1 female) 0.031 4.59 4 0.001 0.030Age in years 0.029 4.36 4 0.002 0.029Income level 0.006 0.92 4 0.455 0.006Education level 0.028 4.08 4 0.003 0.027Race: white vs. other 0.008 1.26 4 0.286 0.008Number of illnesses 0.084 12.39 4 <0.001 0.077Group: CG vs. NCG 0.155 22.91 4 <0.001 0.134
1Partial eta-squared value.
among the entire sample, as was anticipated; however, income level, althoughwidely different between caregivers and non-caregivers, had a small, non-significant effect on the set of subscales. In this analysis, caregivers still hadsignificantly higher scores than non-caregivers on the set of CES-D subscalesafter accounting for age, income, gender, and self-rated health (Hotelling’sT = 0.155, F = 22.9, p < 0.001) (see Table 3). The multivariate partial eta-squared is a measure of effect size that shows the proportion of the variancein the dependent variable plus error variance. For caregiver group membership,this value was found to be 0.134, indicating that caregiver group status accountedfor a little more than 13% of the overall variance in the set of CES-D subscalescores. Cohen (1988) has provided suggested estimates of “small,” “medium”and “large” effect sizes which vary according to the particular type of effect size.For the eta-squared measure, Cohen suggests the following size equivalents:small effect: 0.0099; medium effect: 0.058; and large effect: 0.1379. Hence,according to this estimation, the effect of caregiver status on the four CES-Dsubscales approaches a large value.
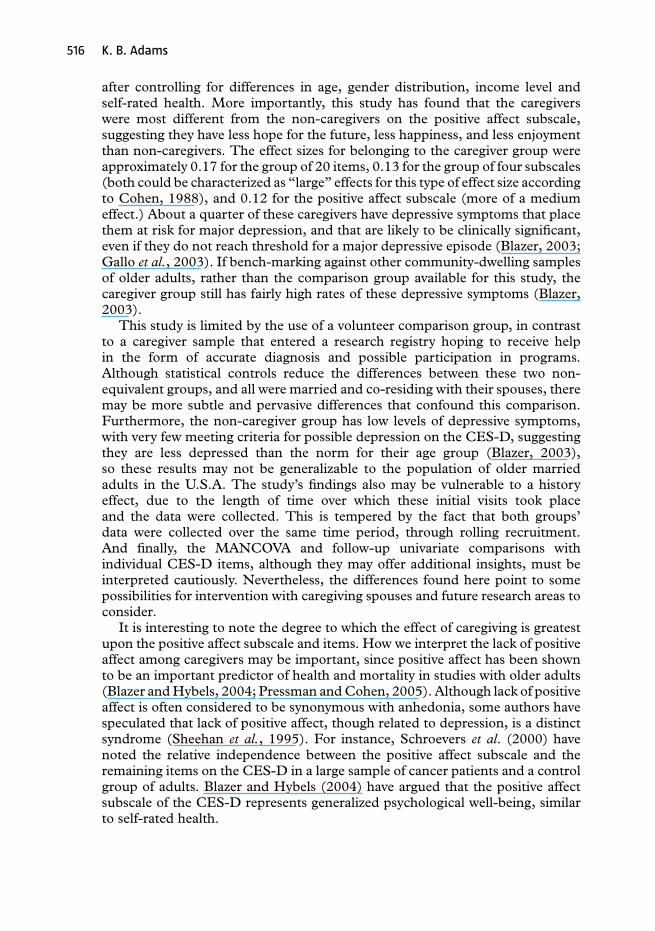
Because the multivariate F was significant, univariate contrasts for caregiversversus non-caregivers were examined for each subscale individually. The positiveaffect, somatic, and depressive affect subscales each obtained the significancelevel specified, as seen in Table 4. The positive affect subscale obtained thelargest between-groups difference (Mean Square 657.96, F = 82.84, partial eta-squared = 0.122). This effect size is still well above “medium” but short of“large,” according to Cohen’s recommendation (1988).
A second two-group MANCOVA on the set of 20 individual items wasalso found to be significant in comparing caregiver and non-caregiver groups(Hotelling’s T = 0.215, F = 6.20, p < 0.001, partial eta-squared = 0.177). Thissecond MANCOVA was followed by univariate contrasts of the 20 individualitems between caregivers and non-caregivers, again entering age, gender,income, race, education and number of illnesses as the covariates. To avoidcapitalizing on chance owing to multiple comparisons in the event that themultivariate tests were significant, the alpha level was adjusted using Bonferroni
Differences in depressive symptoms in caregiver and non-caregiver spouses 515
Table 4. Between-subjects effects for group (CG vs. NCG) on CES-D subscales(adjusted for covariates in the model; N = 617)
S U B S C A L E S M E A N S Q U A R E F df P V A L U E E F F E C T S I Z E 1
.............................................................................................................................................................................................................................................
Depressive affect 228.14 35.64 1 <0.001 0.056Somatic symptoms 162.88 18.61 1 <0.001 0.030Positive affect 657.96 82.84 1 <0.001 0.122Interpersonal 12.61 9.02 1 0.003 0.015
1Partial eta-squared value.
Table 5 Individual CES-D items with significant p values and the greatest effect sizesin univariate contrasts between CG and NCG1 (N = 617)
I T E M N A M E ( N U M B E R )M E A NS Q U A R E F df E F F E C T S I Z E 2
.............................................................................................................................................................................................................................................
1. Felt hopeful about the future (8)∗ 79.74 75.67 1 0.1132. Felt happy (12)∗ 51.07 64.48 1 0.0983. Enjoyed life (14)∗ 38.83 48.85 1 0.0764. Felt sad (18)± 17.00 32.05 1 0.0515. Bothered by things (1) ± 8.83 26.16 1 0.0416. Felt lonely (14) ± 13.97 25.03 1 0.040
1Multivariate test with all 20 items, controlling for age, gender, income level and self-rated health:Hotelling’s T value = 0.215, F = 6.20, p < 0.001, partial-eta squared = 0.177.2Partial eta-squared value.∗Positive affect items; ± depressive affect items.
correction so that the desired alpha to establish significance was 0.002 or lessfor all 25 contrasts examined in this study. However, these individual itemdifferences must be interpreted cautiously, as concerns about reliability mayarise when group differences are examined in relation to single items. Twelve ofthe 20 contrasts of individual items resulted in significant F values at the desiredalpha level. Values for the six items with the greatest between-groups differencesare shown in Table 5. The three items with the highest partial eta-squared valuesin univariate contrasts between the two groups were from the positive affectsubscale, followed next by three items from the depressive affect subscale.
Discussion
Spousal caregiving represents an extended period of exposure to stressors andlosses brought about by the effects of dementia in the spouse. A numberof caregiving researchers and service providers have noted that this exposureincreases caregivers’ vulnerability to depression. This study adds to thatliterature, confirming that the caregiving spouses have more frequent depressivesymptoms and are depressed in greater proportion than the non-caregivers,
516 K. B. Adams
after controlling for differences in age, gender distribution, income level andself-rated health. More importantly, this study has found that the caregiverswere most different from the non-caregivers on the positive affect subscale,suggesting they have less hope for the future, less happiness, and less enjoymentthan non-caregivers. The effect sizes for belonging to the caregiver group wereapproximately 0.17 for the group of 20 items, 0.13 for the group of four subscales(both could be characterized as “large” effects for this type of effect size accordingto Cohen, 1988), and 0.12 for the positive affect subscale (more of a mediumeffect.) About a quarter of these caregivers have depressive symptoms that placethem at risk for major depression, and that are likely to be clinically significant,even if they do not reach threshold for a major depressive episode (Blazer, 2003;Gallo et al., 2003). If bench-marking against other community-dwelling samplesof older adults, rather than the comparison group available for this study, thecaregiver group still has fairly high rates of these depressive symptoms (Blazer,2003).
This study is limited by the use of a volunteer comparison group, in contrastto a caregiver sample that entered a research registry hoping to receive helpin the form of accurate diagnosis and possible participation in programs.Although statistical controls reduce the differences between these two non-equivalent groups, and all were married and co-residing with their spouses, theremay be more subtle and pervasive differences that confound this comparison.Furthermore, the non-caregiver group has low levels of depressive symptoms,with very few meeting criteria for possible depression on the CES-D, suggestingthey are less depressed than the norm for their age group (Blazer, 2003),so these results may not be generalizable to the population of older marriedadults in the U.S.A. The study’s findings also may be vulnerable to a historyeffect, due to the length of time over which these initial visits took placeand the data were collected. This is tempered by the fact that both groups’data were collected over the same time period, through rolling recruitment.And finally, the MANCOVA and follow-up univariate comparisons withindividual CES-D items, although they may offer additional insights, must beinterpreted cautiously. Nevertheless, the differences found here point to somepossibilities for intervention with caregiving spouses and future research areas toconsider.
It is interesting to note the degree to which the effect of caregiving is greatestupon the positive affect subscale and items. How we interpret the lack of positiveaffect among caregivers may be important, since positive affect has been shownto be an important predictor of health and mortality in studies with older adults(Blazer and Hybels, 2004; Pressman and Cohen, 2005). Although lack of positiveaffect is often considered to be synonymous with anhedonia, some authors havespeculated that lack of positive affect, though related to depression, is a distinctsyndrome (Sheehan et al., 1995). For instance, Schroevers et al. (2000) havenoted the relative independence between the positive affect subscale and theremaining items on the CES-D in a large sample of cancer patients and a controlgroup of adults. Blazer and Hybels (2004) have argued that the positive affectsubscale of the CES-D represents generalized psychological well-being, similarto self-rated health.

Differences in depressive symptoms in caregiver and non-caregiver spouses 517
There are several possible interpretations for this greater between-groupsdifference in lack of positive affect. First, the exposure to stress and loss,perhaps along with fatigue from sleep deprivation, may “numb” the caregiveremotionally, so that he or she experiences fewer positive emotions, even thoughperhaps not aware of negative emotions, such as sadness or anger. This makessense when seen in the context of the busy, task-oriented daily life of someonecaring for a family member with special needs.
A second interpretation is that the caregivers’ responses may have focusedmore specifically on their feelings about the person with dementia. Those inthis sample were responding to these CES-D items under the auspices of theUniversity Memory and Aging Center, an ADRC, so they would naturallyassociate the questionnaire with the spouse’s illness, about which they may havelittle happiness or hope for the future, and this may have influenced their answerson a more global scale. Gupta and colleagues (2006) noted this phenomenon intheir study of caregivers in India; the context in which the CES-D is given has aneffect upon the respondent’s mindset and responses. Thus, some of the CES-Dquestions may be interpreted differently by dementia caregivers than they wouldbe by other respondents.
Finally, another consideration regarding the caregivers’ greater endorsementof the (lack of) positive affect items, particularly lack of hope for the future,is that these responses may simply be a way of expressing the reality of livingwith a marital partner who is not going to get better (Schulz et al., 1995), and asituation in which there is little time or energy for fun or pleasurable activities.Spouse caregivers tend to ignore their own needs for recreation or socializing,both because of the practical difficulties of arranging these activities (Markutand Crane, 2005; Adams, 2006), and because they may feel they cannot in goodconscience enjoy themselves when the spouse with dementia is no longer able toparticipate in the same way (Walker et al., 1994).
The spouse caregivers in this study reported lower rates of positive affect andhigher rates of general depressive affect and somatic symptoms on the CES-D than the non-caregiving spouses. There may be different ways to address thevarious elements that make up the spectrum of depressive symptoms represented.Spouse caregivers’ marked lack of positive affect appears to reflect low levels ofhope, pleasure or enjoyment and may have implications for how we interpretand intervene with them. Some of this lack of positive affect may be completelycircumstantial, and may respond to supportive, instrumental assistance orrespite. In addition, skill building to become better at the “job” of caregiving mayhelp increase the level of personal mastery by increasing successful interactionswith the person with dementia, and that may indirectly increase positive affect(Hepburn et al., 2003; Adams et al., 2005). Behavioral interventions to increasepleasurable activities and self-care, along with “permission” to do so from serviceproviders, or from other caregivers in the context of a support group, may alsobe particularly salient to address these symptoms (Markut and Crane, 2005).
Among the available avenues to help with depressive affect and somaticconcerns are acknowledging the losses inherent in the dementia process,normalizing mixed emotions such as anger and guilt, and facilitating grief(Walker et al., 1994; Adams and Sanders, 2004; Adams, 2006). Moreover,
518 K. B. Adams
psychosocial intervention using active problem-solving, cognitive restructuring,and attempts to find meaning in the caregiving role may assist spousal caregiversin regaining realistic hopes and personal enjoyment, effectively increasingpositive affect and reducing negative affect and somatic symptoms.
Future research is needed in the area of the meanings and functionalimportance of different types of depressive symptoms, particularly differentiatingsituational sadness (or situational lack of happiness or hope) from a depressivedisorder. We do not fully understand the implications of caregivers’ lack ofpositive affect. Research on aspects of dementia caregivers’ experiences from aqualitative perspective may be helpful, as well as research comparing responsesacross a variety of measures of affective states. The current study might bereplicated in an independent sample of caregivers and with different measures ofdepressive symptoms. Additionally, future studies should examine whether thosecaregivers with lower positive affect are in fact more likely to have a diagnosabledepressive disorder, or whether this may be a qualitatively different responsepattern related to the everyday experience of being a caregiver.
Conflict of interest
None.
Acknowledgments
This research was funded by a grant from the National Institute onAging Alzheimer’s Disease Centers Program: (P50 AG08012). The authoracknowledges the important contribution of faculty and staff members ofthe Case Western Reserve University/University Hospitals Memory and AgingCenter in collecting and managing the data used in this study. Special thanksgo to Kathleen A. Smyth, McKee J. McClendon, Paula Ogrocki, Linda Rechlinand Nancy Catalani. Thanks also go to Craig W. LeCroy for his comments onthe analyses, and to the anonymous manuscript reviewers.
References
Adams, K. B. (2006). The transition to caregiving: Experiences of family members embarkingon the dementia caregiving career. Journal of Gerontological Social Work, 47 (3/4), 3–30.
Adams, K. B. and Sanders, S. (2004). Caregiver differences in experience of loss, griefreactions, and depressive symptoms across the stages of Alzheimer’s disease: a mixed methodsanalysis. Dementia: The International Journal of Social Research and Practice, 3, 195–210.
Adams, K. B., Smyth, K. A. and McClendon, M. J. (2005). Psychosocial resources asmoderators of the impact of spousal dementia caregiving on depression. Journal of AppliedGerontology, 24, 475–489.
Arean, P. A. and Miranda, J. (1997). The utility of the Center for EpidemiologicalStudies-Depression Scale in older primary care patients. Aging and Mental Health, 1, 47–56.
Differences in depressive symptoms in caregiver and non-caregiver spouses 519
Blazer, D. G. (2003). Depression in late life: review and commentary. Journal of Gerontology:Medical Sciences, 58A, 249–265.
Blazer, D. G. and Hybels, C. F. (2004). What symptoms of depression predict mortality incommunity-dwelling elders? Journal of the American Geriatrics Society, 52, 2052–2056.
Carter, P. A. (2002). Caregivers’ descriptions of sleep changes and depressive symptoms.Oncology Nursing Forum, 29, 1277–1283.
Cohen, J. (1988). Statistical Power Analysis for the Behavioral Sciences, 2nd edn. Hillsdale, NJ:Erlbaum.
Covinsky, K. E. et al. (2003). Patient and caregiver characteristics associated with depression incaregivers of patients with dementia. Journal of General and Internal Medicine, 18, 1006–1014.
Cuijpers, P. (2005). Depressive disorders in caregivers of dementia patients: a systematic review.Aging and Mental Health, 9, 325–330.
Davidson, H., Feldman, P. H. and Crawford, S. (1994). Measuring depressive symptoms inthe frail elderly. Journals of Gerontology: Psychological Sciences, 49, P159–P164.
Folstein, M. F., Folstein, S. E. and McHugh, P. R. (1975). “Mini-mental state”: a practicalmethod for grading the cognitive state of patients for the clinician. Journal of PsychiatricResearch, 12, 189–198.
Gallo, J. J., Rebok, G. W., Tennstedt, S., Wadley, V. G. and Horgas, A. (2003). Linkingdepressive symptoms and functional disability in late life. Aging and Mental Health, 7, 460–480.
Gupta, R., Punetha, D. and Diwan, S. (2006). The revised CES-D scale for caregivers of theelderly in India. International Journal of Aging and Human Development, 62, 61–78.
Haley, W. E. et al. (1995). Psychological, social, and health impact of caregiving: a comparisonof black and white dementia family caregivers and non-caregivers. Psychology and Aging, 10,540–552.
Hepburn, K. W., Lewis, M., Sherman, C. W. and Tornatore, J. (2003). The SavvyCaregiver Program: developing and testing a transportable dementia family caregiver trainingprogram. The Gerontologist, 43, 908–915.
Markut, L. A. and Crane, A. (2005). Dementia Caregivers Share their Stories. Nashville, TN:Vanderbilt University Press.
Marwit, S. J. and Meuser, T. M. (2001). A comprehensive, stage-sensitive model of grief indementia caregiving. The Gerontologist, 41, 658–670.
McKhann, G. et al. (1984). Clinical diagnosis of Alzheimer’s disease: report of theNINCDS-ADRDA Work Group under the auspices of Department of Health and HumanServices Task Force on Alzheimer’s Disease. Neurology, 34, 939–944.
Morris, J. C. (1993). The Clinical Dementia Rating (CDR): current version and scoring rules.Neurology, 43, 2412–2414.
O’Rourke, N. (2004). Reliability generalization of responses by care providers to the Center forEpidemiologic Studies-Depression (CES-D) Scale. Educational and Psychological Measurement,64, 973–990.
Pearlin, L. I, Mullan, J. T., Semple, S. J. and Skaff, M. M. (1990). Caregiving and the stressprocess: an overview of concepts and their measures. The Gerontologist, 30, 583–594.
Petersen, R. C. et al. (1999). Mild Cognitive Impairment: clinical characterization andoutcome. Archives of Neurology, 56, 303–308.
Pinquart, M. and Sorenson, S. (2003). Differences between caregivers and non-caregivers inpsychological health and physical health: a meta-analysis. Psychology and Aging, 18, 250–267.
Pinquart, M. and Sorenson, S. (2004). Associations of caregiver stressors and uplifts withsubjective well-being and depressive mood: a meta-analytic comparison. Aging and MentalHealth, 8, 438–449.
Pressman, S. D. and Cohen, S. (2005). Does positive affect influence health? PsychologicalBulletin, 131, 925–971.
520 K. B. Adams
Radloff, L. S. (1977). The CES-D Scale: a self-report depression scale for research in thegeneral population. Applied Psychological Measurement, 1, 385–401.
Radloff, L. S. and Teri, L. (1986). Use of the Center for Epidemiological Studies-DepressionScale with older adults. Clinical Gerontologist, 5, 119–135.
Sanders, S. and Adams, K. B. (2005). Grief reactions and depression in caregivers ofindividuals with Alzheimer’s disease: results from a pilot study in an urban setting. Health andSocial Work, 30, 287–295.
Schroevers, M. J., Sanderman, R., van Sonderen, and Ranchor, A. V. (2000). Theevaluation of the Center for Epidemiologic Studies Depression (CES-D) scale: depressed andpositive affect in cancer patients and healthy reference subjects. Quality of Life Research, 9,1015–1029.
Schulz, R. and Martire, L. (2004). Family caregiving of persons with dementia: prevalence,health effects, and support strategies. American Journal of Geriatric Psychiatry, 12, 240–248.
Schulz, R., O’Brien, A. T., Bookwala, J. and Fleissner, K. (1995). Psychiatric and physicalmorbidity effects of dementia caregiving: prevalence, correlates, and causes. The Gerontologist,35, 771–791.
Sheehan, T. J., Fifield, J., Reisine, S. and Tennen, H. (1995). The measurement structure ofthe Center for Epidemiologic Studies Depression Scale. Journal of Personality Assessment, 64,507–521.
Teel, C. S. and Press, A. N. (1999). Fatigue among elders in caregiving and noncaregivingroles. Western Journal of Nursing Research, 21, 498–520.
Walker, R. J., Pomeroy, E. C., McNeil, J. S. and Franklin, C. (1994). Anticipatory grief andAlzheimer’s disease: strategies for intervention. Journal of Gerontological Social Work, 22, 21–39.