social media and the new customer relationship management
80
SOCIAL MEDIA AND THE NEW CUSTOMER RELATIONSHIP MANAGEMENT MODEL: A CASE OF SAFARICOM MUTUGI CAROLINE KANANA K50/79745/2012 A RESEARCH PROJECT SUBMITTED IN PARTIAL FULFILLMENT OF THE REQUIREMENT OF THE DEGREE OF MASTER OF ARTS IN COMMUNICATION STUDIES, UNIVERSITY OF NAIROBI NOVEMBER, 2014
-
Upload
khangminh22 -
Category
Documents
-
view
2 -
download
0
Transcript of social media and the new customer relationship management
SOCIAL MEDIA AND THE NEW CUSTOMER RELATIONSHIP MANAGEMENT
MODEL: A CASE OF SAFARICOM
MUTUGI CAROLINE KANANA
K50/79745/2012
A RESEARCH PROJECT SUBMITTED IN PARTIAL FULFILLMENT OF THE
REQUIREMENT OF THE DEGREE OF MASTER OF ARTS IN
COMMUNICATION STUDIES, UNIVERSITY OF NAIROBI
NOVEMBER, 2014
ii
DECLARATION
I, Mutugi Caroline Kanana, do hereby declare that the content in this project is my original
work, has not been published or submitted for publication in any other learning institution.
Sign ……………………………………………….Date …………………………………
Ms. Mutugi Caroline Kanana
This project has been submitted for examination following my approval as University
Supervisor.
Sign ……………………………………………. Date ………………………………………
Mr. Edwin Nyutho
iii
ABSTRACT
Previous research reveals an increase in the use of the social media in business, but not much has been done, from the customer’s perspective, on the success of the use of these social networks in customer relations. This research aimed at establishing whether the use of social media (Facebook and Twitter) by Safaricom has been effective in the management of its relationship with the customer when compared to the conventional means of managing customer relations. Success in the use of the social media customer relations was examined from a client perspective through their own attitudes and opinions related to the response time to their communications. The findings from the study will be useful in informing the organizations and others in the service industry on the impact of their use of the social customer relations strategy. The theoretical framework that was used in the research is the Uses and Gratifications Theory. The researcher used a mixed method research design collecting both quantitative and qualitative data. Quantitative data were collected using questionnaires which were distributed to 200 participants, purposively sampled from the population of Nairobi. Qualitative data were collected from a virtual ethnography where the researcher engaged in a study through the Internet to find out the response time and opinions of the users on the Internet. A sample of 20 users was selected from the Internet using purposive sampling, for the virtual ethnographic study. The data from the two methods was analyzed, using descriptive statistics for quantitative data and content analysis of the qualitative data. Findings from the analysis led to the conclusion that the use of social media in customer relations was more effective as it has reduced response time, compared to use of conventional models such as telephone communications, like the traditional 100 line. The researcher therefore, recommends that business organizations use the social media applications to communicate with their consumers but should seek to reduce the response time.

iv
ACKNOWLEDGEMENT
First, I would like to express my heartfelt gratitude to the Lord Almighty for the perseverance
and wisdom he has bestowed upon me throughout the course and particularly, in doing this
project. His power has seen me through the challenges involved.
Secondly, I would wish to extend my gratitude to my supportive supervisor Mr. Edwin
Nyutho. He has been a source of support, encouragement and guidance in completing this
tasking work. I am grateful to Dr Hezron Mogambi, Senior Lecturer and Coordinator, MA
Program, School of Journalism and Mass Communication, for his support. To all my
colleagues, especially Sarah, Keziah, Nasra, Grace, Effie, Sam and others, thank you for your
assistance and moral support throughout the MA program.
Last but not least, I would wish to thank my mother for always cheering me on and my
pastor, Bishop Peter Obiero for continued prayers and spiritual support. My partner and
friend, Michael Nyongesa, thank you for your support, emotionally and financially.

v
DEDICATION
I dedicate this project to my mom, Lucy Mwendwa, who has supported me tirelessly
throughout my life, to my love Michael, my beautiful girls Kiki and Jess, and my nephew
Sam. This is the team that has made me the person I am today.
vi
TABLE OF CONTENTS
DECLARATION ...................................................................................................................... ii
ABSTRACT ............................................................................................................................. iii
ACKNOWLEDGEMENT ....................................................................................................... iv
DEDICATION ...........................................................................................................................v
LIST OF FIGURES ................................................................................................................. ix
LIST OF TABLES .....................................................................................................................x
ACRONYMS AND ABBREVATIONS ................................................................................. xi
CHAPTER ONE:INTRODUCTION TO THE STUDY ......................................................1
1.1 Background of the Study .................................................................................................... 1
1.2 Statement of the Problem .................................................................................................... 2
1.3 Purpose of the Study ........................................................................................................... 3
1.4 Significance of the Study .................................................................................................... 4
1.5 Objective of the Study ........................................................................................................ 4
1.6 Research Questions ............................................................................................................. 5
1.7 Scope of the Study .............................................................................................................. 5
1.8 Theoretical Framework ....................................................................................................... 6
CHAPTER TWO:LITERATURE REVIEW ........................................................................8
2.1 Social Networking .............................................................................................................. 8
2.2 Social Media in Business .................................................................................................... 9
2.3 Customer Relations Management (CRM) ........................................................................ 11
2.4 Social Customer Relations Model .................................................................................... 16
2.5 Gaps in Research............................................................................................................... 21
CHAPTER THREE:METHODOLOGY ............................................................................23
3.1 Introduction ....................................................................................................................... 23
3.2 Research Design................................................................................................................ 23
3.3 The Population .................................................................................................................. 25
3.4 Sample Size ....................................................................................................................... 26
3.5 Sampling Method .............................................................................................................. 26
3.6 Eligibility Criteria ............................................................................................................. 27
3.7 Data Collection Techniques .............................................................................................. 27
vii
3.8 Data Analysis and Presentation ........................................................................................ 28
CHAPTER FOUR:DATA ANALYSIS AND PRESENTATION......................................29
4.1 Introduction ....................................................................................................................... 29
4.2 Response Rate ................................................................................................................... 29
4.3 Profile of the Respondents ................................................................................................ 29
4.3.1 Gender of the Respondents ..................................................................................... 29
4.3.2 Age of the Respondents .......................................................................................... 30
4.3.3 Occupation of the Respondents .............................................................................. 30
4.3.4 Highest Educational Qualification of the Participants ........................................... 31
4.4 Internet Usage ................................................................................................................... 32
4.4.1 Frequency of Internet Usage ................................................................................... 32
4.4.2 Platforms Used in Accessing the Internet ............................................................... 32
4.4.3 Internet Access Location ........................................................................................ 33
4.5 Social Networking Sites Usage ......................................................................................... 34
4.5.1 The Duration for which they have been on SNSs .................................................. 34
4.5.2 Average Use of Social Media in a Day .................................................................. 34
4.5.3 Hours of the day the Participants are on the Social Media ..................................... 35
4.5.4 Purpose for using Social Networking Sites ............................................................ 36
4.6Social Media Connections ................................................................................................. 37
4.6.1 Number of Social Networking Communities, Groups or Fan-pages Participated in ......................................................................................................................................... 37
4.6.2 Reasons for Joining a Community, Group or Fan Page ......................................... 37
4.6.3 Fans of Safaricom on Facebook ............................................................................. 38
4.6.4 Followers of Facebook on Twitter .......................................................................... 39
4.7 Frequency of Communication with Safaricom on Social Media ...................................... 39
4.7.1 Frequency of Seeking Help from the Organization Concerning Services .............. 39
4.7.2 Frequency of Seeking Information and News Posted by the Organization ............ 40
4.7.3 Frequency of Recommending Use of the Page and Handle to Others ................... 40
4.7.4 Participants who have contacted the Organization for Information or to Solve an Issue ................................................................................................................................. 41
4.7.4.1 Frequency of Contact ........................................................................................... 42

viii
4.7.4.2 Effectiveness in Addressing the Request ............................................................. 42
4.7.5 Timeliness in Addressing Requests ........................................................................ 43
4.7.6 The opinion of Participants on Whether the Company is being Effective in Addressing Issues from the Customers through Social Media ........................................ 44
4.8 Online Ethnography Data Analysis .................................................................................. 44
4.8.1 The Average Time Taken to Reply to a Request or Tweet .................................... 44
4.8.2 The Opinions of the Users ...................................................................................... 45
CHAPTER FIVE:DISCUSSION, CONCLUSION AND RECOMMENDATIONS .......47
5.1 Discussions of Findings ................................................................................................ 47
6.2 Conclusion ..................................................................................................................... 53
6.3 Recommendations ......................................................................................................... 55
6.4 Suggestions for Further Research ................................................................................. 57
REFERENCES .......................................................................................................................58
APPENDICES ........................................................................................................................62
Appendix I: Questionnaire .................................................................................................. 62
Online Ethnography Guide.................................................................................................. 68
ix
LIST OF FIGURES
Figure1: Gender of the research participants ...........................................................................29
Figure 2: Where Internet is used most frequently ....................................................................33
Figure 3: Duration for which respondents have been using SNSs ...........................................34
Figure 4: Number of Social Networking communities, groups or fan-pages participated in ..37
Figure 5: Fans of Safaricom on Facebook ...............................................................................38
Figure 6: Followers of Facebook on Twitter ...........................................................................39
Figure 7: Contact with the organization for information or to solve an issue .........................41
Figure 8: Frequency of contact ................................................................................................42
Figure 9: Effectiveness in addressing the request ....................................................................43
Figure 10: Timeliness in addressing requests ..........................................................................43

x
LIST OF TABLES
Table1: Age distribution ..........................................................................................................30
Table 2: Occupation of the research participants .....................................................................31
Table 3: Highest education qualification .................................................................................31
Table 4: Frequency of Internet Usage ......................................................................................32
Table 5: Tools used to access the internet ...............................................................................33
Table 6: Average use of social media in a day ........................................................................35
Table 7: Hours during which respondents use social media ....................................................35
Table 8: Purpose for using Social Networking Sites ...............................................................36
Table 9: Reasons for joining a community, group or fan page ...............................................38
Table 10: Frequency of seeking help from the organization concerning services ...................40
Table 11: Frequency of seeking information and news posted by the organization ................40
Table 12: Frequency of seeking information and news posted by the organization ................41
Table 13: Requests sent to Facebook fan page ........................................................................44
Table 14: Requests sent to Safaricom Twitter Handle .............................................................45
Table 15: Opinions of users .....................................................................................................46

xi
ACRONYMS AND ABBREVATIONS
CRM - Customer Relationship Management
ICT- Information and Communication Technology
SCRM - Social Customer Relations Model
SNSs – Social Networking Sites
SPSS - Statistical Package for the Social Sciences
WWW - World Wide Web
1
CHAPTER ONE
INTRODUCTION TO THE STUDY
1.1 Background of the Study
The main aim of this study was to find out how effective social media is in customer
relationship management as compared to the conventional face-to-face customer relationship
management model.
Social media networks are the technologies which are used in turning communication into
interactive discussions between individuals, communities as well as organizations. These
social networks either take the form of web-based or mobile-based networks. Kaplan and
Haenlein (2010: 59) defines social media as “a group of Internet-based applications that build
on the ideological and technological foundations of Web 2.0, and that allow the creation and
exchange of user-generated content.” This means that social media networks are social
applications which are utilized in mediating communication between individuals and groups.
Social networks provide various services such as personal unique space, and enable the users
to develop blogs, photos and video sharing, and motivating group interactions through
applications like instance messaging and chat rooms (Heinrichs, Lim & Lim, 2011).
Social media has become a major force in consumer culture and has as a result been
exploited by some of the global leading businesses as their new arena for customer relations.
Various companies are using social media as the means for strengthening their customer
relations. Their customers are able to connect and have conversations with the customer
relationship representatives in the organizations. Development of the social media has

2
attracted many people to its use, and has led many businesses and other organizations to
adopt the trend as a means of taking advantage of the presence of their clients online. Many
organizations, both in the public and the private sector; have developed a presence in the
social media, such as Twitter and Facebook (Peppers & Rogers, 2011). More and more
companies are becoming present and available on social media 24/7, allowing the customers
to communicate with them round the clock. Customer service via social media is no longer
being seen by the organizations as a luxury, but as a major component of any customer
service strategy adopted by the organization.
1.2 Statement of the Problem
The trends in social media in the modern-day can be summed up in only one single word:
Convergence. Since the emergence of the social media, practitioners as well as the industry
itself has tried to define and redefined the concept, and it is apparent that almost all forms of
communication have assumed this aspect: becoming social. At the same time,
communications, sales, and customer service has grappled with its utilization, measurement
its mastery, conducting business and generally working around it. Thus, it is not a surprise
that the social media sector can be said to have converged (Lund, 2012). It is this
convergence that companies are taking advantage of.
The use of the social media in organizations for various purposes such as marketing is an
area attracting a lot of interest in research and practice. A study carried out by Universal
McCann (2009), Social Media Research Wave 4, revealed that the social media is a global
phenomenon present in all markets. The study revealed an astonishing growth in all kinds of
social media applications, with customers gaining a strong presence in sites such as Facebook
and Twitter among others. The shift of the customers from the conventional means of
3
communication, such a face-to-face and even telephone conversations, to the use of the social
media, have revealed the need for companies to take advantage of these applications in
managing their customer relations. Social media has been used as the avenue for the
companies to keep in touch with their customers, real and potential.
However, regardless of the increase in the use of social media by business organizations, the
effectiveness of the move into management of customer relations is a new area of research.
This has led to an interest in research on this topic. This research investigated the
effectiveness of the move to the social media by companies in addressing the needs of their
customers (customer relations). This research used Safaricom as a case study, in its move to
the twitter and Facebook as a means of directly interacting with the section of its clientele
that is present in the social media. The impact on customer relations in the use of the social
media by this organization is the focus of this study.
1.3 Purpose of the Study
While there is an increase in the number of companies using the social media to
communicate with the customers, there is no much research done in establishing whether the
companies are achieving their objectives (by being more effective in their customer
relationship management). This research therefore, sought to establish whether the use of the
social media has an impact on the need to achieve better communications with the customers
and improving customer satisfaction. The main purpose of this study was to determine
whether the use of social media (Facebook and Twitter) by Safaricom has been better in the
management of its relationship with the customers when compared to conventional means
such as telephone. The effectiveness in the use of the social media customer relations was
examined from a client perspective.

4
1.4 Significance of the Study
Companies are more and more investing in the social media as the means of reaching more of
their clients directly, with the aim of enhancing customer relations. This is slowly changing
the conventional business model where the clients had to visit or call for any assistance. This
is perceived as an effective means of enhancing communications and improving customer
satisfaction. This is a huge investment for most of these companies and organizations. This
research therefore sought to establish whether the investment is worthwhile. The findings
from the research will be beneficial to the company in development of its customer relations
strategies. The findings will also be applicable to other organizations that are using the social
media in the management of customer relations and others that are considering this strategy.
1.5 Objective of the Study
General Objective:
The main objective of this study is to find out how social media (Facebook and Twitter) are
being used in customer relationship management by Kenyan Companies
Specific Objectives:
i. To study the social media habits of Kenyans
ii. To find out the impact of the social media on consumer attitudes towards
organizations and their services
iii. To establish how the response time has improved since the introduction of social
media in customer relations in comparison to conventional customer relations
models such a telephone

5
iv. To establish how the companies can improve their use of the social media to
enhance their relationship with the customers
1.6 Research Questions
The questions that this study seeks to answer are:
i. How are the social media (Facebook and Twitter) being used in customer
relationship management by Kenyan Companies?
ii. What are the social networking habits of Kenyans?
iii. What is the impact of the social media on consumer attitudes towards
organizations and their services?
iv. How has, the response time has improved since the introduction of social media in
customer relations in comparison to conventional customer relations models such
a telephone?
v. How can the companies improve their use of the social media to enhance their
relationship with their customers?
1.7 Scope of the Study
This study covers the use of social media (specifically Facebook and Twitter) in the
management of customer relationship by Safaricom. Customer Relationship Management
(CRM) includes the area of communications with the customer and the provision of
feedback. The people surveyed are the users of the social media in Nairobi. The study was
limited to the use of Facebook and Twitter as they are the most common sites used by the
organization, as well as the most famous among Kenyan social media users.
6
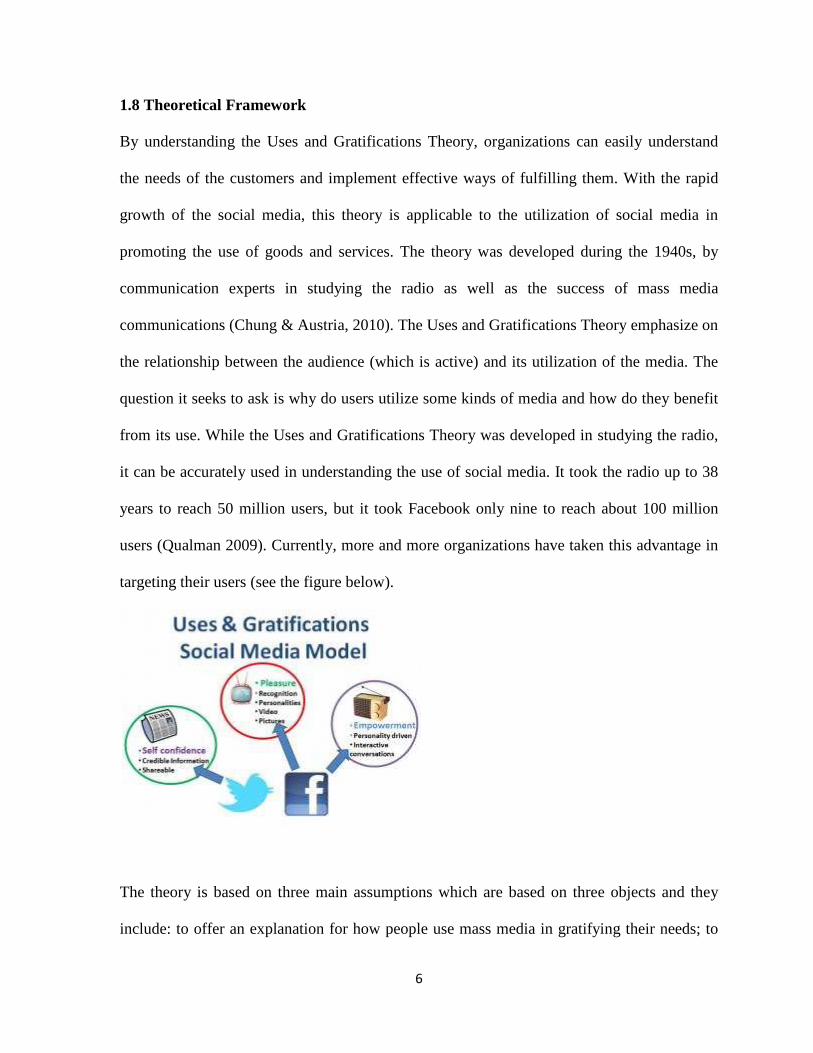
1.8 Theoretical Framework
By understanding the Uses and Gratifications Theory, organizations can easily understand
the needs of the customers and implement effective ways of fulfilling them. With the rapid
growth of the social media, this theory is applicable to the utilization of social media in
promoting the use of goods and services. The theory was developed during the 1940s, by
communication experts in studying the radio as well as the success of mass media
communications (Chung & Austria, 2010). The Uses and Gratifications Theory emphasize on
the relationship between the audience (which is active) and its utilization of the media. The
question it seeks to ask is why do users utilize some kinds of media and how do they benefit
from its use. While the Uses and Gratifications Theory was developed in studying the radio,
it can be accurately used in understanding the use of social media. It took the radio up to 38
years to reach 50 million users, but it took Facebook only nine to reach about 100 million
users (Qualman 2009). Currently, more and more organizations have taken this advantage in
targeting their users (see the figure below).
The theory is based on three main assumptions which are based on three objects and they
include: to offer an explanation for how people use mass media in gratifying their needs; to

7
find out the basic motivations for the individuals in their mass media usage; and to find out
the consequences (both positive and negative) of individual media usage. With the use of the
three objectives, the theory holds the assumption that the audience uses particular media in
order to achieve a particular goal (which is gratification). The needs can be cognitive,
including information and knowledge; affective, which includes aesthetic and emotional
experiences; personal integrative that allows for self-improvement or to enhance confidence;
social integrative, which include improving interactions with others via networks; and
tension release as well as reality diversion (Chung & Austria, 2010).
The theory also reveals that there is the freedom of choice within the audience of the medium
that they will use, which is determined by their personal needs. The level of freedom is what
is referred to as activeness. This identification has become very important to those involved
in public relations and customer relations. The theory is an important tool for understanding
audience. The reason the audience will use the media is either for entertainment or
information. By understanding the theory, it is possible to understand why and how the
audience uses social media. It is also possible to understand how organizations can
effectively engage with the audience (Sundar & Limperos, 2013). The customer relationship
management is already using the social media, but the theory can be used in determining
whether or not they are satisfying the needs of the customers. Given that the users already
know what they want, the theory is applicable in determining whether these needs are being
met, and in a way that satisfies the customers.

8
CHAPTER TWO
LITERATURE REVIEW
2.1 Social Networking
Social networking has emerged as one of the most interesting topics in communication. The
social networking sites are providing important resources for sharing information, photos,
videos and blogging (Luo & Zhang, 2013). The society has continued to experience and
witness heated debates, hype, theorizing and bogging around the role played by the social
media in the modern age. Kaplan & Haenlein (2010) posit that the social media applications
enable the users to create and share user-generated contents, and they have been linked with
diverse positive and negative developments in society. The social media applications are
designed in such a manner that they offer a means for people to connect or communicate.
According to Kaplan & Haenlein (2010) in the last two decades or so, social networking was
new and different. This is because it was still a developing and uncertain phenomenon in
society. Nonetheless, within the last few years, the role of social networking has come to be
more exceptional, with its usage increasing. Nielsen/NetRatings have suggested that the
social networking sites make up five out of the ten fastest growing Web brands in the world.
These sites have played an important role and are becoming an important part of the lives of
many, especially teenagers and young adults. Social networking sites like Facebook, Twitter,
MySpace, YouTube, and Flickr come in diverse forms and types. The user-generated sites
which offer the means for connecting or communicating can either be business-related or for
social purposes. People are able to join the sites and connect with ease via online registration
or via an existing offline connection.

9
According to Peppers & Rogers (2011), various ways exist through which the social
networks engage the users by enabling them to create their desired content. They are
providing the users with a high level of freedom in the manner in which they engage with the
sites as well as how they communicate and interact with one another. The information shared
tends to be what the user desired due to the capability to generate content. Kane et al (2014)
elucidates that the information tends to be extremely targeted.
Kane, et al (2014) posits that users join the social networking sites for diverse reasons. In a
research carried out by the authors some people are in these sites for the sole purpose of
connecting with their friends, others to make new friends, and others to reconnect with past
friends. There are those who have a presence to be able to follow up on events. Other reasons
why users join the sires include a sense of association and belonging, in search for
information, self-identity, achievement of certain objectives, ideas of accepted behavior and
values. While using these sites, various other needs are met, such as getting important
information and news and getting updates on events among others.
2.2 Social Media in Business
During the initial years in the development of social media applications, it was only viewed
as a means for communicating for social purposes (Peppers & Rogers, 2011). In the world of
business, it was viewed as an accessory of some kind, a kind of marketing that was just for
experts. While the assumption remains in some areas of business, the tools have come to be
accepted in the modern business world as a marketing tool, and for conducting other business
operations all over the world. This means that it is no longer a new phenomenon in the
business world. It is increasingly becoming a part of the way marketing is carried out today.

10
Edosomwan, et al (2011) suggests an increase in the use of the social media as a marketing
tool, bringing in a new face in e-marketing. Businesses are using the social media
increasingly as a means of reading their consumers and their target markets. Research carried
out in the last two decades has shown an increased interest in the use of the social media by
business globally (Luo & Zhang, 2013; Scott, Mende & Bolton, 2013). The use of the social
media has played an important role in marketing and advertising. Advertisers are the main
users of social media in organizations in marketing their brands to the real and potential
users.
According to Kaltcheva, et al (2014) from the point of view of players in the world of
business, it is has become important to see the social media as an evolution instead of a
revolution. However, in the research done by Oestreicher-Singer & Zalmanson (2013) is
might be misleading to suggest that every person is using the social media in gaining
advantages in business. While some in the social media might believe that all persons in
business are using the social media, this is very far from the truth. Edosomwan, et al (2011)
suggests that it is individuals who use the social media but not businesses. This unfortunate
for the businesses that have not adopted the trend, as Kaltcheva, et al (2014) puts it not using
the social media is the similar to not using cell phones, cars or electricity in the 21st century
business world.
Regardless of the conventional means of marketing like advertising, referrals and public
relations remaining important in the modern business world, social media networks have
become very critical fabric in marketing. Edosomwan, et al (2011) argues that businesses
considering these tools at the strategic level and in making business decisions are bound to
benefit. The authors add that rather than asking whether the organization should use the tools,

11
they should be considering how these tools can be utilized in achieving the marketing
objectives of the business. Looking at the statistics of the users of the social media, it
becomes evident that businesses can gain a lot from using them. Various studies have been
carried out looking at the numbers of individuals using the social media sites. The findings
are overwhelming as they show a skyrocketing increase in the users of these sites. A study
carried out by the online competitive intelligence service Compete.com, showed that the top
three social sites (Facebook, Twitter, and LinkedIn) had more than 2.5 billion visits in
September 2009 only. Twitter grew by more than 600% in 2009, while Facebook grew by
210% and LinkedIn by 85%. As a matter of fact, if Facebook was a country, it was revealed
in the study that it would be the fourth largest internationally (Edosomwan, et al 2011). This
means that any business would benefit from using these sites to target and interact with their
customers.
2.3 Customer Relations Management (CRM)
CRM refers to a model for managing interactions of a company with its real and potential
customers. Kaltcheva, et al (2014) posits that CRM entails the use of technology in
organizing, automating, and synchronizing sales, marketing, technical support, and customer
service. It is often seen as a business strategy which makes it possible for a business to:
understand its customer; retain the current customers via better customer experience; attract
and win new customers; lower customer management costs and increase profitably.
CRM is defined by Reynolds (2002) as the way a company finds, gets and maintains its
customers. The author borrows this definition from the Gartner Group, which suggests that
CRM is a management function or discipline which necessitates that a business recognizes
and nurture relationships with real and potential customers. It is a process used in collecting

12
information about real and potential customers regarding their needs. Kotler et al (2005)
define it as consisting of software as well as analytical tools for integrating customer
information from various sources, analyzing it in-depth and applying the results to building
stronger customer relations.
During this current era of technological convergence, companies are more and more using
information and communication technology (ICT) in organizing, automating and
synchronizing business processes, basically customer service, sales and marketing activities.
According to Kaltcheva, et al (2014) the general objectives are finding, attracting, and
winning new customers, nurturing and retaining the customers that the company already has,
enticing back to the company former customers, and reducing the costs of customer service
and marketing.
Practically speaking, a lot of people view CRM as simply a technology for enhancing
customer service, a perception that might cause failure in its implementation, according to
Kaltcheva, et al (2014). Thus, the author suggests that it is important for the CRM initiatives
to be viewed as a strategy for momentous improvement of customer services by improving
loyalty, satisfaction, as well as advocacy via ICT. Thus, issues concerning people like culture
transformation, customer behavior, personal agendas, as well as new interactions between
persons and groups should be part of the CRM initiatives. It is important, as argued by Luo &
Zhang (2013) for companies to understand the behaviors and expectations of the clients that
continue to transform over time. As a result, CRM should be able to take into consideration
the dynamic nature of the needs of the customers and therefore implement adjustments
strategies integrated in CRM.
13
It is from this perspective that Greenberg (2004) defined CRM as a business strategy and
philosophy, which is facilitated by technology and a system that is designed with the aim of
improving human interactions in business settings. It refers to the operational, transactional
strategy or approach to customer management. It is focused around customer-facing divisions
or departments, sales, marketing as well as customer service.
CRM initiatives, earlier, was the process of culture change, modification, technology as well
as automation via utilization of data in supporting customer management such that it would
achieve the business value of organizational objectives like increase in revenue (income),
increase in selling time, higher margins, campaign effectiveness, as well as reduction in call
queuing time. Nowadays, CRM is designed with the aim of engaging customers in a
conversation that is collaborative so as to offer mutually beneficial value in a transparent and
trusted business environment. Scott, Mende & Bolton (2013) argue that when the strategy is
developed and implemented into a proper planning as well as a good choice of supporting
technology, the model is anticipated to have the capability to manage the relationships.
While the development of CRM can be argued to have attained maturity, many challenges
have encountered its adoption in many organizations. Because of the complexity of the
nature of business in organizations and their operating environment, there are various issues
in the provision of services that should be put into consideration. The service industry is
experiencing a paradigm shift from industrial age model to an information age model. This
change is shaping various systems within the service sector (Scott, Mende & Bolton, 2013).
It is also changing the organization-client relationship. For example, the development of the
World Wide Web has changed the manner in which the public is engaging with
organizations’ information. Many of the clients will agree that they are largely depending on
14
the Internet in their search for information on services and products offered by an
organization. There is an increase in the number of the people who are using the Internet in
this manner (Scott, Mende & Bolton, 2013).
Information communication technology, according to Scott, Mende & Bolton (2013) has
created an environment in which the customers are exploring business records and other
sources of information at anytime and anywhere. This has brought about the need to align
CRM strategy to the mission and objectives of the organization so as to achieve sustainable
performance of the objectives as well as achieve effective customer relationships. The
organization should adopt the perspective of the customer and put efforts towards
development of an integrated plan containing the specific objectives of the organization.
These strategies should be developed in such a manner that they offer benefits to the
organizations and the customers; greater involvement of the customers in service
development; shorter cycle times; and reduced operation costs through designing of business
process eliminating work that does not add value to the customers.
Within the service sector, relationship between the organization and the customers vary
depending on the diverse levels of complexity. However, in the operating environment,
organizations are being challenged to get potential customers, retain them, and extend
various services into the future. To be able to navigate the modern complex working
environment, it is important for organizations to develop close and effective relationships
with their clients to provide convenience of services, and offer transparency in services,
achievable via information sharing. Oestreicher-Singer & Zalmanson (2013 have identified
the need for the organizations to re-engineer their business strategies to adopt their CRM
strategy and tool in order to get potential customers coming for the service, and the

15
prevailing CRM which has been developed in the company requires some adjustment to be
able to accommodate the changing preferences of the customers as a result of technology
development.
Business Strategy and CRM Model (Marketingteacher.com)
Figure 1 shows a business strategy on CRM. This model is hybrid and has three main phases
as well as three contextual factors. The three phases include: customer acquisition; retention,
and extension. The three contextual factors include: marketing orientation; value creation,
and innovative information technology (Marketingteacher, 2010). Customer acquisition is
defined as the process of attracting customers to the company for the very first time.
Customer retention is ensuring that the customers return to the company and use the products
of services of the company over and over; the company can retain them as its customers.
Customer extension refers to the introduction of new product or service line to the original
16
product or service to the loyal customers which might not be related to the service or product.
The new and retained customers are able to use the service or product via marketing
orientation, value creation of innovative information technology. Once the organization
acquires a new customer for a service or product via through marketing orientation, the
customer determines the value of the activities provided by the organization. Nonetheless, it
has not incorporated the social network within the process. This might have an impact on the
processes of retention and extension (Klaus & Maklan, 2013)
Oestreicher-Singer & Zalmanson (2013) suggest the cost of failure for a company to
implement an effective model of managing customer relations, for example not having in
place an effective system to handle customer complaints. Inappropriate respond or lack of
effective response can lead the customer to lose its customers in the future. Thus, the
company requires having in place the right strategy in addressing and managing its customer
relationships.
2.4 Social Customer Relations Model
The increase in the social media is changing the manner in which people send/receive, given
that it is possible for any person to create the message and share their experiences or opinions
with others. It has revolutionized how people communicate. It enables peer-to-peer
collaboration as well as easy access to real-time communication. Customers participate in the
social network sharing information regarding their experiences. This is normally in form of
unstructured communication that can offer insight in the management of customer relations
by business organizations. Wagner & Hughes (2009) has defined Social customer relations
model as a philosophy as well as a business strategy that is supported by a technology
platforms, business rules, processes, as well as social characteristics, and which are designed
17
to engage the customer in a collaborative conversation so as to offer mutually beneficial
value in a trusted and transparent environment. It is the response of the company to
ownership of the communication by the customer. This model provides new special abilities
of social media that offer powerful new approaches which surpass traditional customer
relations.
Organizations are increasingly seeking to capitalize on the trend toward social customer
relations model as they seek specific strategies as well as tactics to drive value for their
customers. According to research carried out in this area, it has been revealed that when
effectively used social media can enable marketing professionals, salespersons,, as well as
customer service agents, to establish positive relationships with their real and potential
customers in innovative ways. Companies should consider their main business processes as
well as customer management strategies, and identify the way social media can further
improve and enhance the strategies. A white paper by Organic, Inc. (2010) revealed that
Social CRM (SCRM), which is a complement to the conventional CRM, has a primary focus
on relationships. The white paper acknowledges that with the development of the new media,
individuals are developing their own consumption needs, greatly influenced by the social
networks. The blending of the two offers a strong basis for organizations to influence
business results by enhancing brand awareness as well as brand preference. SCRM is
founded on the simple idea that one is capable of interacting with the customers based on
their own needs and not the rules of the company (Oestreicher-Singer & Zalmanson, 2013).
Social CRM is simply an extension of CRM; it is not a replacement, and one of the
significant benefits it provides is adding vale back to the customers (more adoption).
Heinrichs, Lim & Lim (2011) elucidate that it is an important component of the social

18
business strategy addressing the way organizations required to adapt to the customers in a
world that has become social, and addressing the expectations of these important
stakeholders. The expectations of the customers from the companies have changed, and it is
important that the organizations adapt accordingly (Oestreicher-Singer & Zalmanson, 2013).
SCRM has become possible as a result of the Social CRM strategy, which is defined by Lund
(2012) as an operation model, which is supported by information technology as well as
business processes developed to the most important element of the SCRM operating model is
an extremely flexible framework which makes it possible for the firm to observe what is
being done and said by the customers, and then experiment with various customer
experiences in discovering those that reverberate with customers (Wagner & Hughes, 2009).
The major benefactor in the use of social networking in businesses is the marketer. Social
networks are providing marketing businesses with novel insights into their products and
brands, innovative means of executing and tracking grass-roots marketing programs, as well
as novel means of turning online conversations that are fragmented into actionable insights.
However, as suggested by Wagner & Hughes (2009) to achieve these benefits, the
organizations should monitor, understand, as well as participate in an effective way in the
conversations and leverage them in connection with the current marketing processes and
programs.
The design of social marketing is such that they interact with the social media applications
such as Facebook and Twitter to enhance marketing activities and processes. The tools focus
on providing optimization on the basis of the way they are able to interpret the activity of the
individuals on the social network as well as the data on their profiles. The tools also provide
a high level of mobility. There is accessibility to the comments and ratings of the customers,

19
and it is possible to track the real-time activities of the customers. This can happen at any
time and anywhere given the availability of the applications on mobile devices (Greenberg,
2009). Social media monitoring can also result in quantitative and qualitative reactions to
adverts and campaigns for promotions, provide the necessary information for the
improvement of the products, services or brands of the company, uncover major needs of the
customers that are still unmet, and find out the individuals who are making a difference for
the company by consuming its products or services.
With the increase in fragmentation, business organizations will be forced to continue
adapting to highly sophisticated analytics as well as dynamic optimization abilities to be able
to effectively capitalize on social networking. Business organizations will continue to witness
more and more fragmentation in various aspects of their user experiences and in marketing
performance. This increase in fragmentation requires that analytics is focused on various
forms of communication with the customers; what customers tell the company through
Twitter feeds and Facebook posts; what they are saying to other users in relation to the
products or services of the company, and their interactions with products and services offered
by other companies. This continues to necessitate much more than just spreadsheets and gut
feeling. To be able to create optimal customer experiences, companies will have to be able to
interpret and effectively respond to these communications (Wagner & Hughes, 2009).
Social networking also provides the benefit to service companies by offering them with new
means of finding, connecting with, and understanding their customers. Regardless of the
opportunities, there are still uncertainties regarding the use of social networking in this sense.
Cautious and even more established sales personnel might look at social networking as an
untested channel taking them away from the conventional core sales activities. However, for

20
every hesitant sales person, there is another resourceful seeking the next way of attaining
competitive advantage. More and more, organizations are realizing the importance of
adopting social networking into their conventional sales and customer relations functions
(Wagner & Hughes, 2009; Klaus & Maklan, 2013)
The use of social CRM tools is revealed by Lund (2012) to exceed the traditional CRM tools.
This is due to the fact that their design is such that they optimize the success rate for dealing
with customer needs. The traditional means looks into the internal histories with the
customers who are able to define the same kinds of deals and the way they are effective in
handling external unstructured data which is removed from the conventional corporate
information. On the other hand, the social CRM capitalizes on the information that is
removed from the social media tools, which is more current and up-to-date. The information
is the analyzed as well as compiled into a more detailed and richer view of the chance to
fulfill the needs of the customers. Customers also use the social media tools in finding,
receiving, and communicating information regarding the products and services that they
consume. This suggests that the social networks can be source of unfiltered feedback as well
as dialogues that can be very important in pointing to issues with products or services and
thus an opportunity to address the issue and improve on the product and service quality.
Lund (2012) suggests that generally suggest that if used correctly, social network
applications can assist customer relations and make companies become more effective, while
creating value for the organization. Additionally, these platforms offer an interaction and
communication channel which plays an important role in eliminating the perceived barriers
to communication and interaction between companies and their customers (Klaus & Maklan,
2013). Customer Service 2.0 tools and applications are founded on noticeably different

21
model from conventional CRM ones. Services which scan communities, ranging from
Facebook to Twitter, seek complaints from customers and make use of analytic tools in
determining the emotional depth- bad or good-of the complaint. This ensures that the
complaints and issues raised from the customers are addressed, leading to greater levels of
customer satisfaction.
2.5 Gaps in Research
There is still limited on organizational use of social media applications in enhancing
customer relations. This is regardless of the fact that many business organizations such as
Safaricom among others have established a presence in social media as a way of interacting
with their customers. The use of these applications has played a major role in the relationship
between the organizations and the customers especially given the need for reciprocity of
relationship. From a study carried out by Organic, Inc. (2010), the interactions most likely to
benefit from the use of social media in companies are those related to customer experience
and service. The focus for the companies should be placed on expeditiously and
appropriately dealing with the interactions emanating from customers as well as potential
customers.
Much of the social media research has focused on impression management as well as
friendship performance, online/offline connections networks and network structures, and
privacy issues related to the use of these applications. Researching on technology
organization, Klaus & Maklan (2013) has revealed considerable body of existing research on
methods of application of social media in general in a corporate setting. Also, the
examination of these studies has been restricted to skilled workers on of technology
organizations. Therefore, the studied cannot be regarded as being applicable to general

22
businesses. Klaus & Maklan (2013) has followed a practical approach in studying general
companies to essentially find out how much of the social media applications have penetrated
the non-technology as well as traditional organizations. Research has revealed that that 15%
of general working population use social media at work though but they use them outside the
work context, mostly for personal use. The researchers have pointed out that the general
understanding as well as use of social media applications for business purposes is somewhat
low and uncommon.
Regardless of the proliferation of corporate Facebook pages and Twitter accounts in the last
few years, much research is yet to be done in establishing the perceptions of the customers of
their effectiveness in improving customer relations. Business organizations continue to invest
in these applications and thus the importance of more research to establish whether these
investments are worthwhile.

23
CHAPTER THREE
METHODOLOGY
3.1 Introduction
The methodology chapter is a description of the way the study was carried out; the study
design; the methods that was used in collecting data for the research, the population and the
sample; and the method that was used in data analysis and presentation.
3.2 Research Design
This research used a concurrent mixed research design. This means that the researcher used
both qualitative and quantitative data to answer the research questions. Generally, there are
two main kinds of research designs that are used in research, quantitative and qualitative.
Patton (2001) suggests that the two research designs greatly differ from the point of view of
the type of data collected. Thus, while the two designs have a common objective of
scientifically establishing a truth regarding a social phenomenon, the two designs tend to
differ in terms of the type of information or data that is collected. Glesne (2011) argues that
quantitative research collects data in the form of numbers of numeric data. The quantitative
research approach focuses on counts and measures of things. Quantitative research uses
scientific techniques as well as hypothesis testing to collect data. According to Bogdan and
Biklen (2007) the data collected on the use of quantitative research include calculated coding
tallies, operationalized variables, numbers and statistics. To collect the quantitative data, the
research used questionnaire.
Lichtman (2010) elucidates that unlike quantitative research approach, qualitative research is
based on naturalistic philosophies that are also based on the perception that there are multiple
24
worlds’ realities as well as multiple interpretations that are all valid and depend on the
creation or construction of the observer. From the perspective of being a naturalistic inquiry,
the approach tries to provide a detailed analysis of social phenomena in their naturalistic
settings. The chief focus is ‘why’ as opposed to ‘what’. According to Biklen & Casella
(2007), the design entails collection of data or information in form of narratives. The research
concerns itself with meanings, definitions, concepts, characteristics, metaphors, symbols, and
descriptions of what is being studied or observed. This approach is generally effective in the
cases where the researcher is seeking to collect culturally-specific information concerning the
subject(s) under study like the behaviours, opinions, attitudes and values of a particular
population. To collect qualitative data for this study, virtual (online) ethnography was used.
Virtual ethnography is basically an ethnographic research approach, which is one of the
various qualitative research designs, performed in an online environment, or on the Internet.
The ethnographer, who focused on understanding the culture or social context of the subjects
under study, engages in fieldwork immersing oneself within the culture under study (Hakken,
2014). Similarly, online ethnography studies online culture and communities. The study is
carried out on the World Wide Web.
The current research used both qualitative and quantitative research methods as a way of
capitalizing on the strengths of each, catering for their weaknesses to achieve more reliable
and valid findings. Quantitative research design has a number of advantages that made it
appropriate for this research. One of the advantages of quantitative research design is that it
is more objective and reliable and that it uses statistics in generalizing findings. Creswell
(1994) suggests that with collection of data in form or numbers, the approach eliminates the
issue of researcher bias and subjectivity. Another advantage of quantitative research design is
25
that it often restructures and reduces a complex problem to a few variables which are easily
measured. Sampling is very important in the use of quantitative research design, and assumes
that a sample is representative of the target population. The approach is much more
appropriate for large samples and is much less expensive in such studies that require bigger
samples and highly distributed geographically. Rubin and Babbie (2010) argue that a high
level of reliability is achieved in quantitative research due to the use of mass surveys as well
as controlled observations, and other kinds of manipulations.
Qualitative research design has various advantages which inform its importance for the
study. Unlike quantitative research, with the use of qualitative researcher, the researcher
does not have to establish a hypothesis. This is also because the researcher does not require a
firm design plan prior to the beginning of the research. Biklen and Casella (2007) suggest
that this allows the research to unfold in a more natural manner. Another importance in the
use of the qualitative research design is that the researcher has the opportunity to gain more
detailed understanding of the phenomenon under study. Collection of narratives from the
participants allows the researcher to collect more detailed and rich information in form of
visual evidence or inclusive written descriptions. The approach looks into the context as well
as the social significance of the phenomenon under study, as well as the way the individuals
are affected, which is very important especially in social sciences. It is important to be able to
capture the perceptions of the participants from what is said, experiences, stories,
interactions, as well as observations.
3.3 The Population
A research population, in general, refers to the collection of units, individuals or objects,
which is the main focus of study. It is for the gain of the population that studies are carried
26
out. Nevertheless, because of the large sizes of populations, it is not possible for the
researcher to investigate all the individuals or units in the population as it is extremely
expensive and time-consuming. This is the reason why samples are obtained from the
population using sampling techniques. The population for this study was the people in
Nairobi who are using the social media, preferably Facebook and Twitter. The population of
Nairobi was estimated at 3 million people. It was estimated that there are over 16 million
Internet users in the country, though the exact number of users in Nairobi is unknown
(Gichane, 2013).
3.4 Sample Size
A sample is obtained from the population and should, therefore, be representative of the
population.The sample for this study was 200 participants, which was drawn from the
population of Nairobi. This is the sample that was involved in the survey that used
questionnaires. No sampling was required for the virtual ethnography.
3.5 Sampling Method
There are two general groups of sampling techniques that are used in research, as identified
by Patton (2002). These two categories are probability and non-probability. The former
requires for the researcher to have a sampling frame from which to get the sample. The
sampling frame is defined by Patton (2002) as a list of cases from the population from which
to get the sample from. The researcher performs random sampling from the list of cases,
making up the sample. On the other hand, the latter does not require a sampling frame. This
is the easiest sampling method to use in research. This research opted for this sampling
method to select the sample for the research. The research used the purposive heterogeneity
sampling, which is a sampling method used where the researcher seeks to get a homogeneous
27
sample, a sample with units (people) sharing the same traits or characteristics (a group of
people that is similar in terms of the use of the social media. The use of this method is
justified by the fact that the research question being addressed is particular to the
characteristics (social media use) of the specific group of interest. The sample was then being
examined in more detail. The researcher purposely chose participants who were similar in
terms of the identified characteristic (Patton, 2001). To ensure that the entire county was
represented the eight constituencies: Makadara, Starehe, Kamukunji, Dagoretti, Langata,
Westlands, Kasarani, and Embakasi were included. Thus, from each constituency, 25 cases
were chosen purposively.
3.6 Eligibility Criteria
To be able to obtain the homogeneous sample, it was important that each case included in the
survey uses the social media, and more specifically Facebook and Twitter. Social media use
is the characteristic that was used.
3.7 Data Collection Techniques
The researcher used two methods in collecting data. One of the methods that were used in
collecting data for the study was the survey method. Primary data was utilized for the study
to measure how effective social media is as a tool for CRM. The instruments that were used
for the collection of this data were self-administered questionnaires which were filled by the
participants (see appendix 1 for a copy of the questionnaire). In the month of August the
questionnaires were administered to the 200 participants; they were filled and collected by
the researcher within the same month. The questionnaire was selected for the study as it
allowed a number of variables to be studied at the same time. Another important factor
considered is the use of self-administered questionnaires, suggesting that the participants

28
would fill the questionnaires on their own providing the information required by the
researcher (Savin-Baden, 2013).
The other method that was used to collect the data was online ethnography. The instrument
that was used to collect this data was virtual ethnography guide (see appendix 2 for a copy of
the virtual ethnography guide). During the month of September, the researcher spent 7 days
(21st to 27th September 2014) going through the activities on the Safaricom fan page and
Twitter Handle. Guided by the virtual ethnography guide important data on the use of the
page and the handle was recorded for analysis. An interview was carried out on a sample of
20 users identified from the two platforms. The interview was done online and the main
focus was on the opinion of the users on the use of social media for customer relations by the
Safaricom, in comparison to the conventional face-to-face customer relationship management
model.
3.8 Data Analysis and Presentation
The method that was used in data analysis is descriptive statistics. Percentages and
frequencies were derived using SPSS. The collected data was keyed into the program and the
findings established from the output. The results will be presented using graphs, charts and
tables. For the data collected using online ethnography, discourse analysis was used. The
collected data was first transcribed and analysis done to establish what was said by the
participants concerning each of the main topics of the research. Presentation of the data was
provided in terms of the main themes identified from the transcribed data. From the analysis,
the researcher was able to come up with practical findings and conclusions in relation to the
research question.

29
CHAPTER FOUR
DATA ANALYSIS AND PRESENTATION
4.1 Introduction
This chapter presents the analysis and findings from the data collected using the
questionnaires and the virtual ethnography. The analysis is presented in the form of tables,
figures, frequencies and percentages.
4.2 Response Rate
This study was done over a period of two months between July 2014 and August 2014. The
response rate was 100% as all 200 targeted participants responded.
4.3 Profile of the Respondents
4.3.1 Gender of the Respondents
The study was carried out on 200 participants, 90 (45%) male and 110 (55%) female. The
study sought to establish the gender balance in the Social Networking Site usage. The figure
below shows this more clearly.
Figure1: Gender of the research participants
Home
Workplace

30
4.3.2 Age of the Respondents
From the data, most of the participants were youth, ages between 18 and 37 years. 94.5% of
the participants were within this age bracket. Table 1 one below shows this more clearly.
Table1: Age distribution Age Bracket Frequency Percentage
18-22 22 11
23-27 137 68.5
28-32 25 12.5
33-37 9 4.5
38-42 4 2
43-47 1 0.5
48+ 2 1
4.3.3 Occupation of the Respondents
Most of the respondents were students, at 55.5%. Besides the students, 30.5% were
employed, and 12.5% were self-employed. The table below shows this data

31
Table 2: Occupation of the research participants Occupation Frequency Percentage
Employed 61 30.5
Self-employed 25 12.5
Student 111 55.5
Other 3 1.5
4.3.4 Highest Educational Qualification of the Participants
The majority of the respondents, at 41% had a secondary school education qualification, 29%
had a diploma/ certificate, and 21% had a degree, while 9% had a postgraduate qualification.
Table 3: Highest educational qualification Primary School 0 0
Secondary School 82 41
Diploma/ Certificate 58 29
Degree 42 21
Post Graduate Degree(s) 18 9
32
4.4 Internet Usage
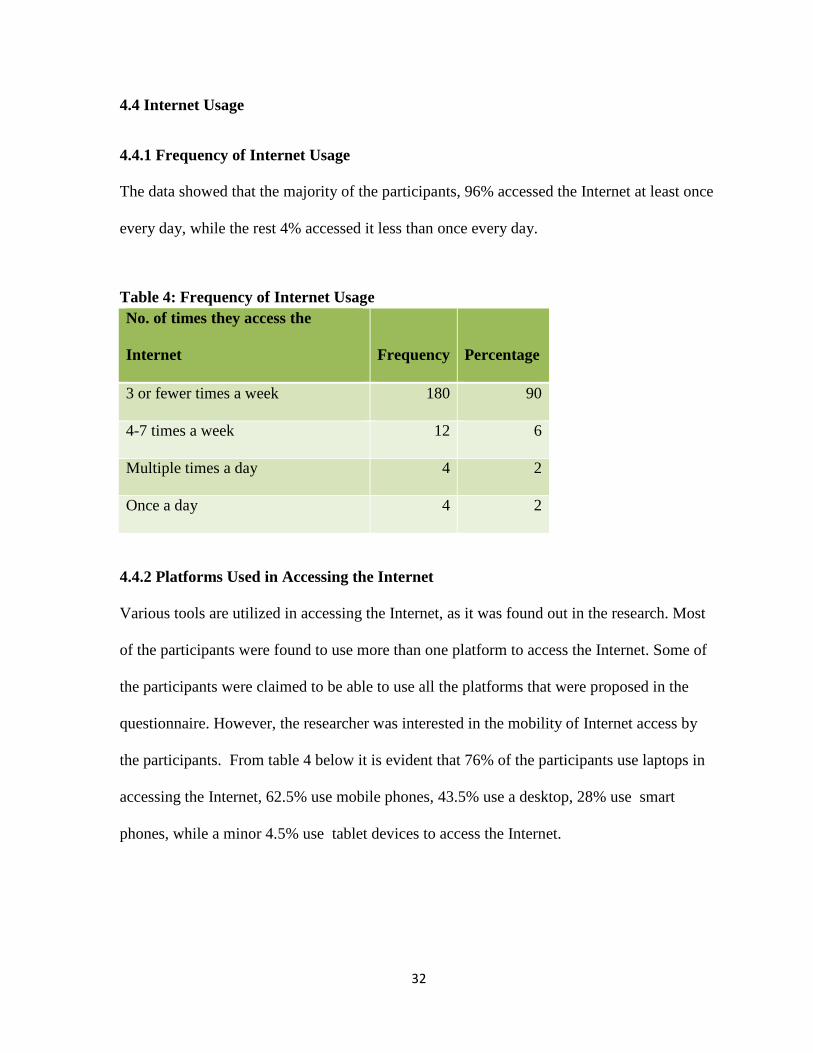
4.4.1 Frequency of Internet Usage
The data showed that the majority of the participants, 96% accessed the Internet at least once
every day, while the rest 4% accessed it less than once every day.
Table 4: Frequency of Internet Usage No. of times they access the
Internet Frequency Percentage
3 or fewer times a week 180 90
4-7 times a week 12 6
Multiple times a day 4 2
Once a day 4 2
4.4.2 Platforms Used in Accessing the Internet
Various tools are utilized in accessing the Internet, as it was found out in the research. Most
of the participants were found to use more than one platform to access the Internet. Some of
the participants were claimed to be able to use all the platforms that were proposed in the
questionnaire. However, the researcher was interested in the mobility of Internet access by
the participants. From table 4 below it is evident that 76% of the participants use laptops in
accessing the Internet, 62.5% use mobile phones, 43.5% use a desktop, 28% use smart
phones, while a minor 4.5% use tablet devices to access the Internet.
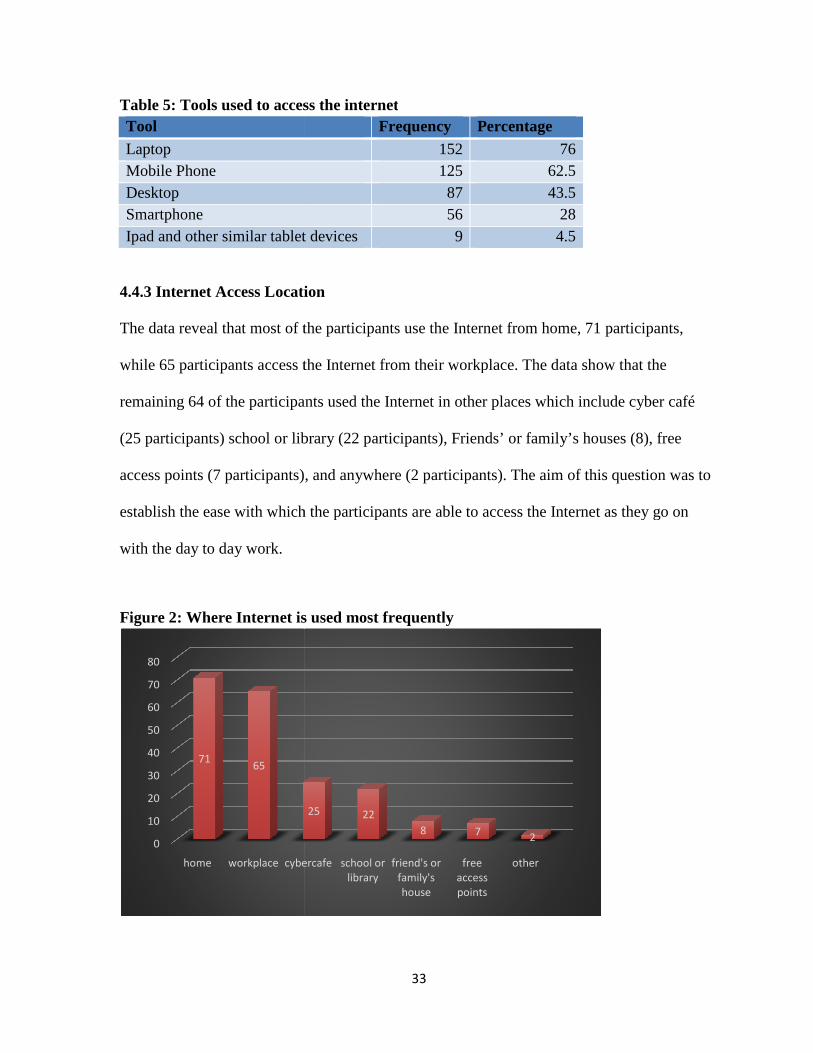
Table 5: Tools used to access the internetTool Laptop Mobile Phone Desktop Smartphone Ipad and other similar tablet devices
4.4.3 Internet Access Location
The data reveal that most of the participants use the
while 65 participants access the
remaining 64 of the participants used the
(25 participants) school or library (22 participants),
access points (7 participants), and anywhere (2 participants). The aim of this question was to
establish the ease with which the participants are able to access the
with the day to day work.
Figure 2: Where Internet is used most frequen
0
10
20
30
40
50
60
70
80
home workplace cybercafe
7165
33
Table 5: Tools used to access the internet Frequency Percentage
152 76 125 62.5 87 43.5 56 28
Ipad and other similar tablet devices 9 4.5
Access Location
that most of the participants use the Internet from home, 71 participants,
s access the Internet from their workplace. The data show that the
remaining 64 of the participants used the Internet in other places which include cyber café
(25 participants) school or library (22 participants), Friends’ or family’s houses (8),
ss points (7 participants), and anywhere (2 participants). The aim of this question was to
establish the ease with which the participants are able to access the Internet as they go on
is used most frequently
cybercafe school or
library
friend's or
family's
house
free
access
points
other
25 22
8 72
from home, 71 participants,
from their workplace. The data show that the
in other places which include cyber café
Friends’ or family’s houses (8), free
ss points (7 participants), and anywhere (2 participants). The aim of this question was to
as they go on

34
4.5 Social Networking Sites Usage
4.5.1 The Durationfor which they have been on SNSs
Out of the 200 participants, a majority, 122 (61%) had been using social media for more than
3 years; 57 (28.5% had been using the social networking sites 2-3 years. The remaining 21
(10.5%) had been using them for less than 2 years. This is illustrated in figure 3 below
Figure 3: The duration for which respondents have been using SNSs
4.5.2 Average Use of Social Media in a Day
Out of the 200, 129 used social media for 1 –4 hours a day; 37 used them 5 – 8 hours a day;
12 used them 9 –12 hours a day whereas 9 used them more than 13 hours a day. In this
question, the researcher sought to establish the amount of time exposure the participants had
to content on SNSs per day. The data are illustrated in table 6 below
35
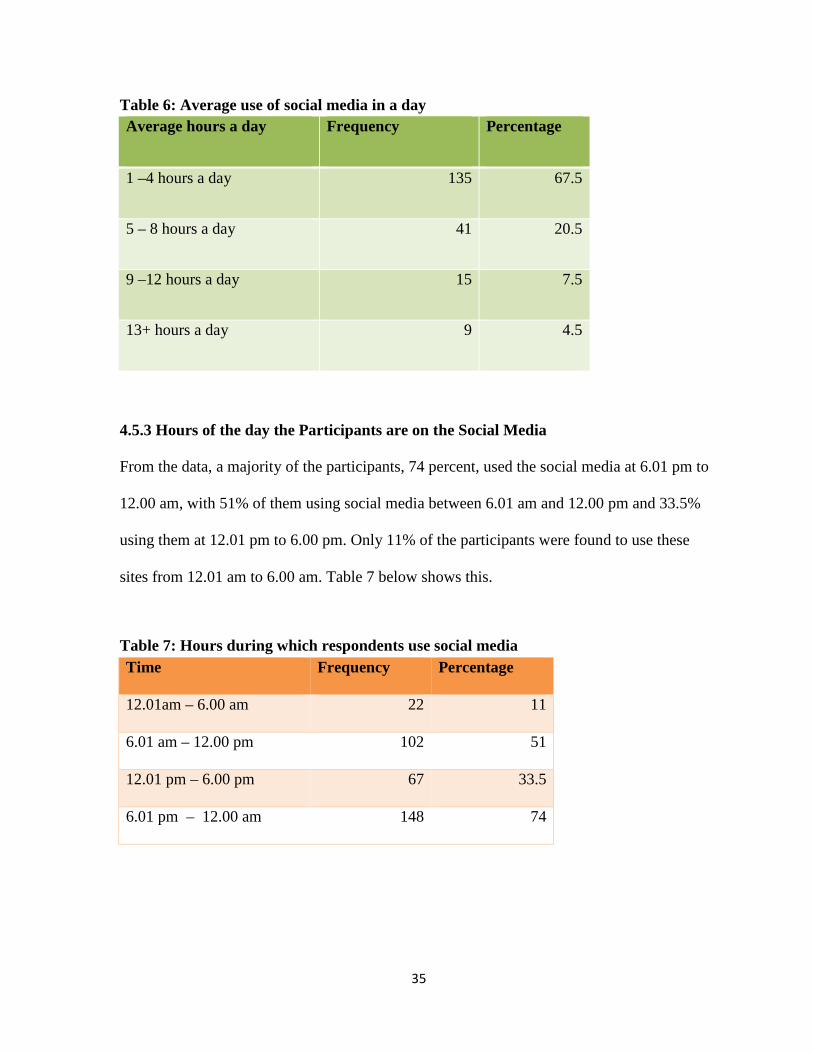
Table 6: Average use of social media in a day Average hours a day Frequency Percentage
1 –4 hours a day 135 67.5
5 – 8 hours a day 41 20.5
9 –12 hours a day 15 7.5
13+ hours a day 9 4.5
4.5.3 Hours of the day the Participants are on the Social Media
From the data, a majority of the participants, 74 percent, used the social media at 6.01 pm to
12.00 am, with 51% of them using social media between 6.01 am and 12.00 pm and 33.5%
using them at 12.01 pm to 6.00 pm. Only 11% of the participants were found to use these
sites from 12.01 am to 6.00 am. Table 7 below shows this.
Table 7: Hours during which respondents use social media Time Frequency Percentage
12.01am – 6.00 am 22 11
6.01 am – 12.00 pm 102 51
12.01 pm – 6.00 pm 67 33.5
6.01 pm – 12.00 am 148 74
36
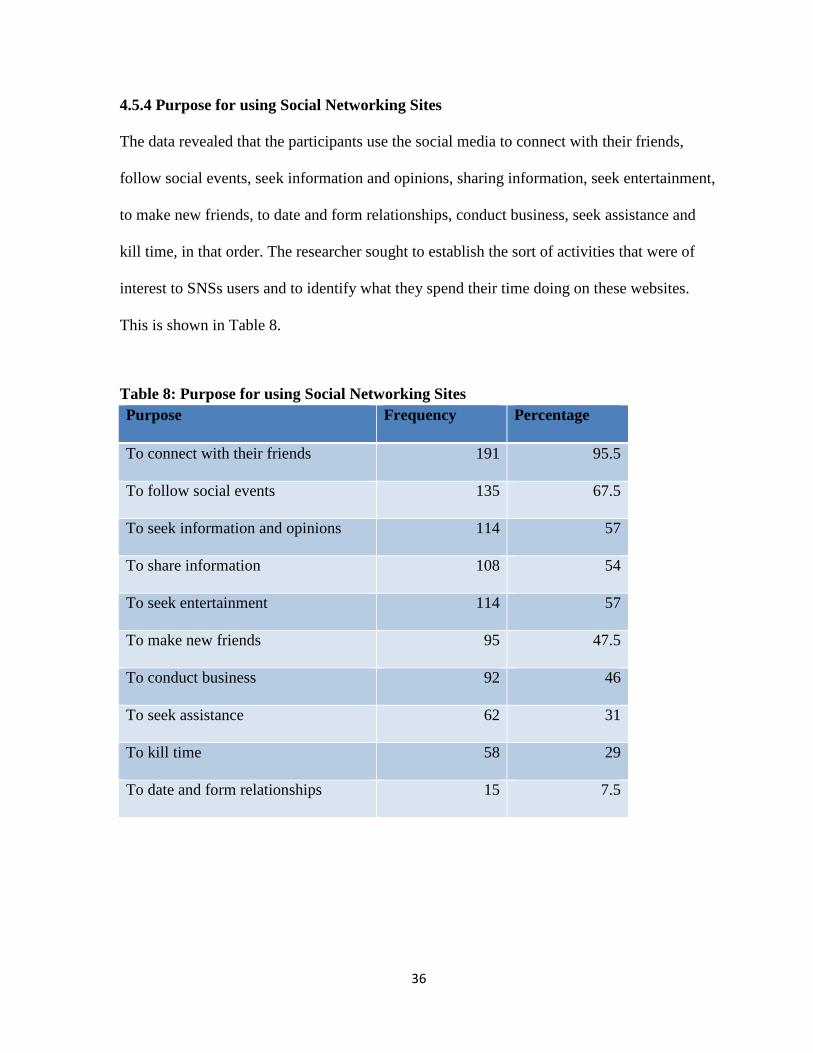
4.5.4 Purpose for using Social Networking Sites
The data revealed that the participants use the social media to connect with their friends,
follow social events, seek information and opinions, sharing information, seek entertainment,
to make new friends, to date and form relationships, conduct business, seek assistance and
kill time, in that order. The researcher sought to establish the sort of activities that were of
interest to SNSs users and to identify what they spend their time doing on these websites.
This is shown in Table 8.
Table 8: Purpose for using Social Networking Sites Purpose Frequency Percentage
To connect with their friends 191 95.5
To follow social events 135 67.5
To seek information and opinions 114 57
To share information 108 54
To seek entertainment 114 57
To make new friends 95 47.5
To conduct business 92 46
To seek assistance 62 31
To kill time 58 29
To date and form relationships 15 7.5

37
4.6 Social Media Connections
4.6.1 Number of Social Networking Communities, Groups or Fan-pages Participated in
Most of the participants, 88 were members of 1-10 communities; 41 were members of 21-50
communities; 34 were members of 11-20 communities; 31 were members of more than 50
communities with a minority of 6 not participating in any communities. Here, the researcher
sought to establish how many communities of people or fan-pages formed by product
marketers. The average number of communities per participant was 11 –20. The figure below
shows this.
Figure 4: Number of Social Networking communities, groups or fan-pages participated in
4.6.2 Reasons for Joining a Community, Group or Fan Page
The participants showed to have joined the communities, groups and fan pages for various
reasons. The data showed that 72.5% joined because it was a relevant, active community,
61.5% because it would keep them informed about community news and updates, 57.5% joined to seek

information about various aspects of the community, 42.
community and membership was necessary.
new, useful connections. The reason for this question was to find the reasons that motivated
people to join communities on social medi
Table 9: Reasons for joining a community, group or fan pageReason It is a relevant, active and interesting communityTo let me stay up to date with the community news/updates To seek information about variocommunity To have an opinion To get new useful connections
4.6.3Fans of Safaricom on Facebook
From the data, it was showed that those who have liked and followed the Safaricom page on
Facebook were 146 while the rema
Figure 5: Fans of Safaricom on Facebook
38
information about various aspects of the community, 42.5% wished to have an opinion on the
community and membership was necessary. 22.5% because they believed it would get them
new, useful connections. The reason for this question was to find the reasons that motivated
people to join communities on social media.
Table 9: Reasons for joining a community, group or fan page Frequency
It is a relevant, active and interesting community 145 To let me stay up to date with the community
123 To seek information about various aspects of the
115 85
To get new useful connections 45
4.6.3Fans of Safaricom on Facebook
From the data, it was showed that those who have liked and followed the Safaricom page on
e the remaining 54 were not fans. Figure 5 below indicates this.
Figure 5: Fans of Safaricom on Facebook
fans
non-fans
5% wished to have an opinion on the
believed it would get them
new, useful connections. The reason for this question was to find the reasons that motivated
Percentage 72.5
61.5
57.5 42.5 22.5
From the data, it was showed that those who have liked and followed the Safaricom page on
below indicates this.
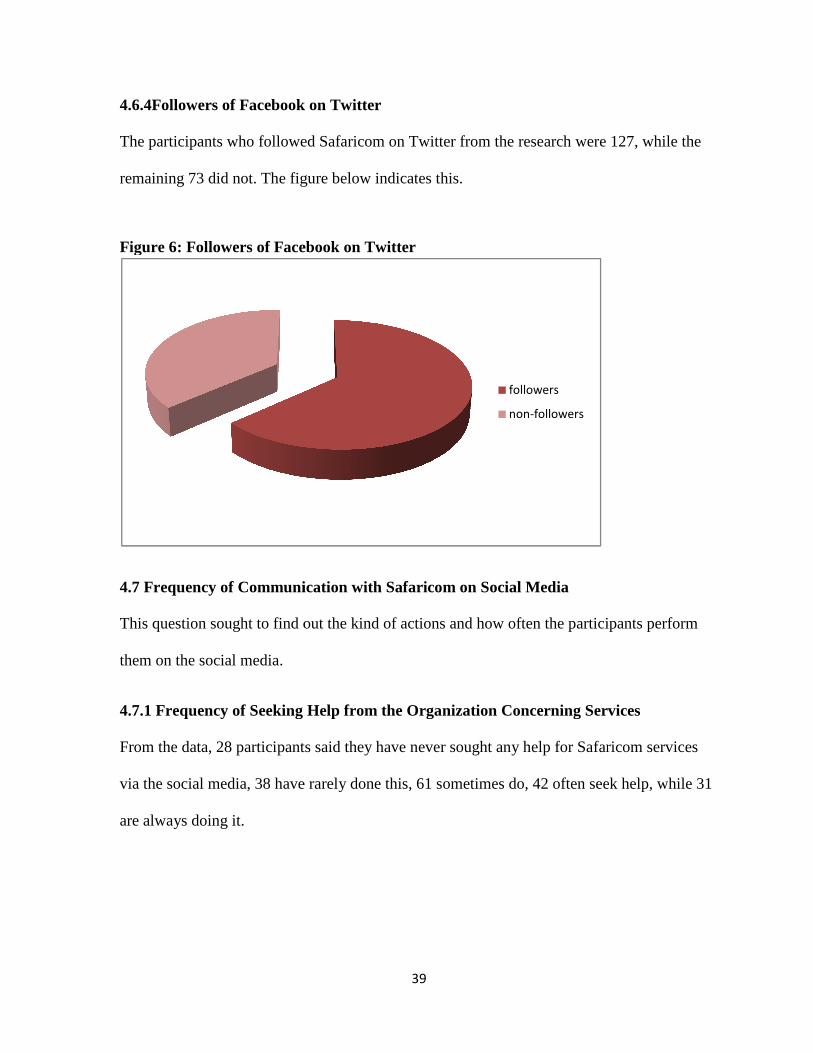
4.6.4Followers of Facebook on Twitter
The participants who followed Safaricom on Twitter from the research were 127, while the
remaining 73 did not. The figure below indicates this.
Figure 6: Followers of Facebook on Twitter
4.7 Frequency of Communication
This question sought to find out the kind of actions and how often the participants perform
them on the social media.
4.7.1 Frequency of Seeking Help
From the data, 28 participants said they have never sought any help for Safaricom services
via the social media, 38 have rarely done this, 61 sometimes do, 42 often seek help, w
are always doing it.
39
4.6.4Followers of Facebook on Twitter
The participants who followed Safaricom on Twitter from the research were 127, while the
The figure below indicates this.
Figure 6: Followers of Facebook on Twitter
Communication with Safaricom on Social Media
This question sought to find out the kind of actions and how often the participants perform
Seeking Help from the Organization Concerning Services
From the data, 28 participants said they have never sought any help for Safaricom services
via the social media, 38 have rarely done this, 61 sometimes do, 42 often seek help, w
followers
non-followers
The participants who followed Safaricom on Twitter from the research were 127, while the
This question sought to find out the kind of actions and how often the participants perform
Organization Concerning Services
From the data, 28 participants said they have never sought any help for Safaricom services
via the social media, 38 have rarely done this, 61 sometimes do, 42 often seek help, while 31

40
Table 10: Frequency of seeking help from the organization concerning services Frequency of seeking help on services Frequency Percentage Never 59 29.5 Rarely 33 16.5 Sometimes 57 28.5 Often 31 15.5 Always 20 10
4.7.2Frequency of Seeking Information and News Posted by the Organization
Majority of the participants, 40.5% have never gone to the Safaricom page or Twitter Handle
seeking for information and news on the organization. 21.5% rarely does this, 22.5%
sometimes seek information and news on Safaricom, 9.5% often do and only 6% always
seeks information and news.
Table 11: Frequency of seeking information and news posted by the organization Frequency of seeking information and news Frequency Percentage Never 81 40.5 Rarely 43 21.5 Sometimes 45 22.5 Often 19 9.5 Always 12 6
4.7.3 Frequency of Recommending Use of the Page and Handle to Others
Of the 200 participants, 96 have never recommended the Page or Handle to others, 46 rarely
do, 30 sometimes recommend, 22 often recommend, while only 6 participants always
recommend.
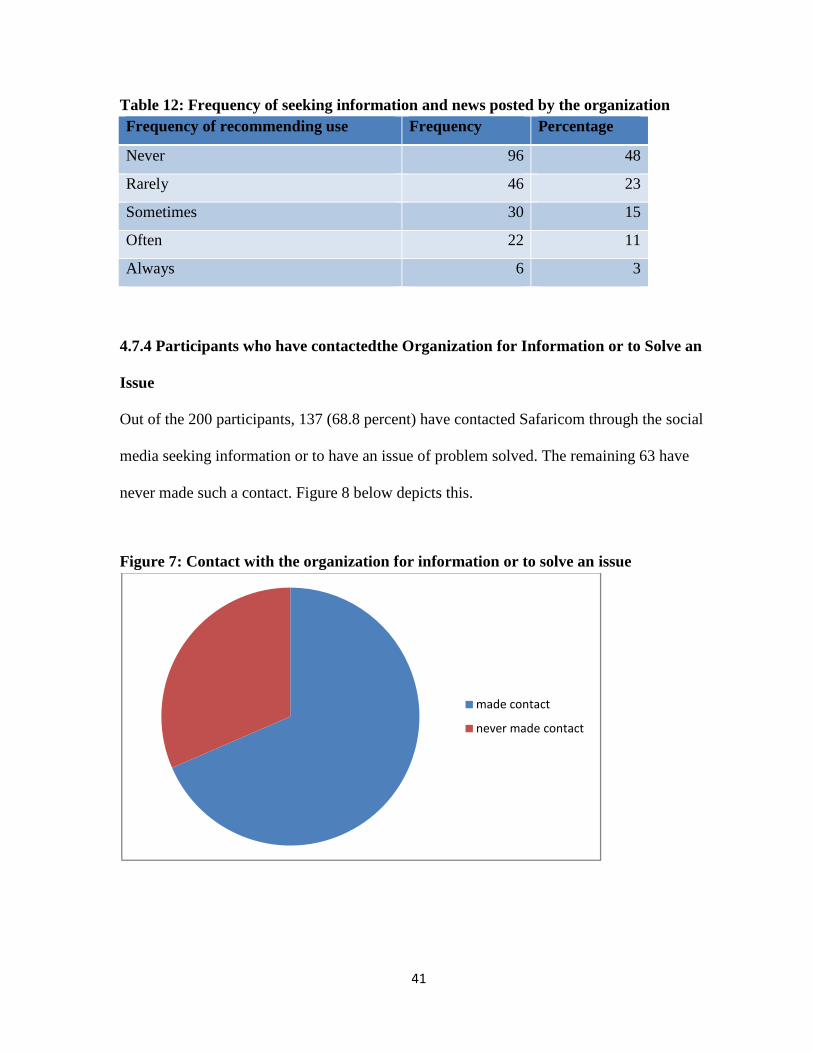
41
Table 12: Frequency of seeking information and news posted by the organization Frequency of recommending use Frequency Percentage
Never 96 48
Rarely 46 23
Sometimes 30 15
Often 22 11
Always 6 3
4.7.4 Participants who have contactedthe Organization for Information or to Solve an
Issue
Out of the 200 participants, 137 (68.8 percent) have contacted Safaricom through the social
media seeking information or to have an issue of problem solved. The remaining 63 have
never made such a contact. Figure 8 below depicts this.
Figure 7: Contact with the organization for information or to solve an issue
made contact
never made contact

42
4.7.4.1 Frequency of Contact
For those who have made a contact with the organization through social media, the
researcher sought to find out how many times this has happened. 50 of those participants had
contacted the organization between 1 and 5 times, 41 between 6 and 10 times, 25 between 11
and 15 times, 12 between 16 and 20 times, with only 9 participants contacting the company
for more than 20 times. The figure bellow depicts this.
Figure 8: Frequency of Contact
4.7.4.2 Effectiveness in Addressing the Request
The question sought the feeling of the participants, who had made contact with the
organization through social media, regarding the effectiveness of the organization in
responding to their request and addressing the issue(s) they raised. This question suggests
whether or not the organization was helpful to the user. From the 137 who had made contact
with the organization in the past, 73 (53.3 percent) felt that their request was addressed in an
effective manner and thus their use of social media was helpful.
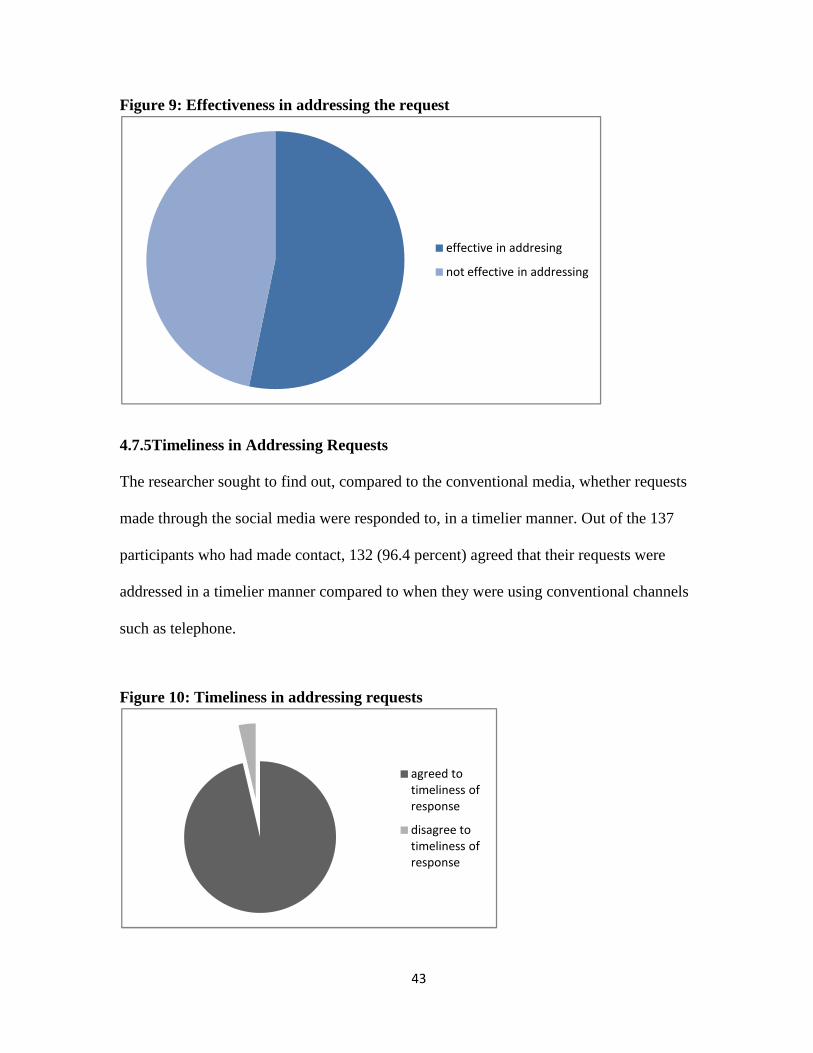
43
Figure 9: Effectiveness in addressing the request
4.7.5Timeliness in Addressing Requests
The researcher sought to find out, compared to the conventional media, whether requests
made through the social media were responded to, in a timelier manner. Out of the 137
participants who had made contact, 132 (96.4 percent) agreed that their requests were
addressed in a timelier manner compared to when they were using conventional channels
such as telephone.
Figure 10: Timeliness in addressing requests
effective in addresing
not effective in addressing
agreed to
timeliness of
response
disagree to
timeliness of
response

44
4.7.6The opinion of Participants on Whether the Company is being Effectivein
Addressing Issues from the Customers through Social Media
Out of the 200 participants, including those who are not fans or followers in social media,
157 agreed that the company is doing a good job in addressing issues from the customers
through social media.
4.8Online Ethnography Data Analysis
4.8.1 The Average Time Taken to Reply to a Request or Tweet
From 10 days (21st to 30th September) the researcher sent a request through the Safaricom fan
page and the Twitter Handle to find out, on average, how long it took to get a response. The
table below clearly shows the data.
Table 13: Requests sent to Facebook fan page Date Time taken to respond
Sunday, 21/09/14 20 minutes
Monday, 22/09/14 17 minutes
Tuesday, 23/09/14 16 minutes
Wednesday, 24/09/14 14 minutes
Thursday, 25/09/14 11 minutes
Friday, 26/09/14 10 minutes
Saturday, 27/09/14 16 minutes
To calculate the average time taken to get a response from the Facebook fan page, the total
time taken is 104 minutes, this number divided by the seven days is 14.86
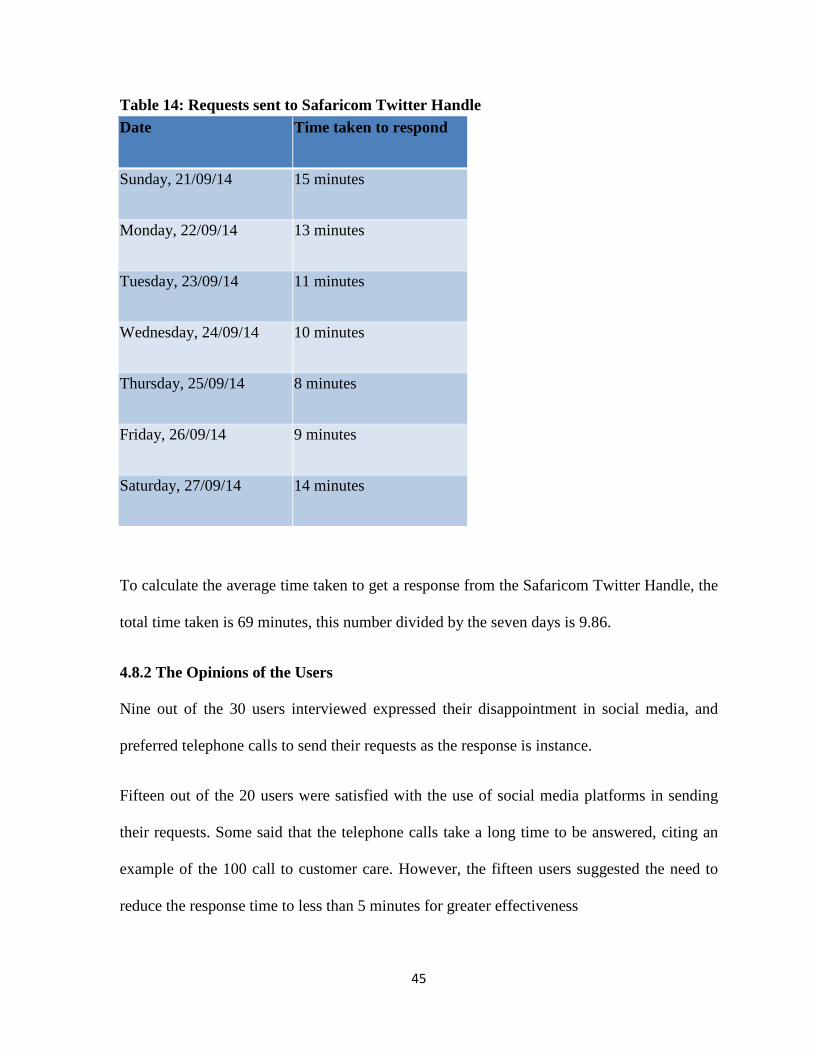
45
Table 14: Requests sent to Safaricom Twitter Handle Date Time taken to respond
Sunday, 21/09/14 15 minutes
Monday, 22/09/14 13 minutes
Tuesday, 23/09/14 11 minutes
Wednesday, 24/09/14 10 minutes
Thursday, 25/09/14 8 minutes
Friday, 26/09/14 9 minutes
Saturday, 27/09/14 14 minutes
To calculate the average time taken to get a response from the Safaricom Twitter Handle, the
total time taken is 69 minutes, this number divided by the seven days is 9.86.
4.8.2 The Opinions of the Users
Nine out of the 30 users interviewed expressed their disappointment in social media, and
preferred telephone calls to send their requests as the response is instance.
Fifteen out of the 20 users were satisfied with the use of social media platforms in sending
their requests. Some said that the telephone calls take a long time to be answered, citing an
example of the 100 call to customer care. However, the fifteen users suggested the need to
reduce the response time to less than 5 minutes for greater effectiveness

46
Six out of the 20 users were indifferent, suggesting that they were yet to use the social media
platform to send a request to the organization.
Table 15: Opinions of users Opinion on social media use Frequency Percentage
Dissatisfied 9 30
Satisfied 15 50
Indifferent 6 20

47
CHAPTER FIVE
DISCUSSION, CONCLUSION AND RECOMMENDATIONS
5.1 Discussions of Findings
The response rate from the questionnaires was 100% / which means that all those who were
given the questionnaires filled and gave them back. The data analyzed was from the 200
participants, 90 males and 110 females. From this data, it is evident that the women were
more than the men, who participated in the study, and the majority of the participants were
youth aged between 18 and 37 years. It emerges from the data that most of the users of the
Internet are the young people as opposed to the older ones. Only 5.5% were between above
37 years old.
The researcher was also interested in finding out the occupation of the social media users.
Most of the respondents were students, at 55.5%. Besides the students, 30.5% were
employed, and 12.5% were self-employed. This shows that students are the majority users of
the social media, and are also expected to seek services from Safaricom as most of them are
subscribers. This, again, confirms that the youth are the majority users of the social media.
Related to this, the researcher was interested in finding out the highest level of education
attained by the participants. Given that most of the participants were students, 41% had
secondary school education qualification and some were pursuing degrees, certificates or
diploma from higher learning institutions. 29% already had a diploma/ certificate and 21%
had a degree. Only 9% had a post graduate qualification.

48
Given that a majority of the users of the social media were the youth and students, it was
expected that majority (at 96%) would access the social media sites at least once every day,
with others accessing even more than once every day. only 4% accessed it less than once per
day. Various platforms are used to access the social media. This data was necessary to find
out ease of access of the social media by the participants. Most of the participants were
found to have access to multiple platforms to access the Internet. From the research, it
became evident that many of the participants (76%) used laptops, alongside other platforms.
Another significant proportion of the participants used the Internet from their mobile phones.
62.5%. 43.5% use a desktop, 28% use smart phones, while a minor 4.5% use tablet devices
to access the Internet. Generally, it would emerge from the research that the users of the
social media use more than a single platform to access the social media and in different
places as it seen in the following section. An inference can be made that most users of SNSs
are frequent users of the internet, and that most of them access it using desktop and laptop
computers.
The data revealed that most of the users of the Internet use it from home, 71 participants,
while 65 participants access the Internet from their workplace. The data shows that the
remaining 64 of the participants used the Internet in other places which include cyber café
(25 participants) school or library (22 participants), Friends’ or family’s houses (8), free
access points (7 participants), and anywhere (2 participants). Establishing the location from
which the Internet is accessed is also important to understanding the ease of access.
It was important for the researcher to establish the duration in which the users of social media
have been using. This was a background question to understand the general social media
usage by the participants. Out of the 200 participants it was revealed that most of them, 61%

49
had been using social media for more than 3 years. Those who have been using social media
for between 2 and 3 years were 57, 28.5%, while the rest had been using is from less than 2
years. The response to this question was important as it is expected to have major impact on
what the users are likely to use the social media for.
In this question, it was important to establish the amount of time exposure of the participants
to then social media content. It is important to note that this relates to any content the
participants are exposed to. Most of the participants, 129 used social media for 1 –4 hours a
day, while 37 used them 5 – 8 hours a day; 12 used them 9 –12 hours a day whereas 9 used
them more than 13 hours a day. This reveals that most of the participants spend a lot of time
accessing the social media. The time of the day that this happens was also an area of interest
to the researcher. It was revealed that most of the participants, 74% used the social media at
6.01 pm to 12.00 am, with 51% of them using social media between 6.01 am and 12.00 pm
and 33.5% using them at 12.01 pm to 6.00 pm. Only 11% of the participants were found to
use these sites from 12.01 am to 6.00 am. This information is important as it has a lot to tell
about the likelihood of getting a fast or delayed response from the customer care department
of Safaricom.
There are various reasons why the users of the social media do so. The questionnaire gave
options for the participants, in relation to the common reasons for social media usage. Most
of the users are shown to be interested in connecting with friends, and this is their reason for
being on social media. This would be expected for most young people and students. others
use the social media to follow social events, seek information and opinions, sharing
information, seek entertainment, to make new friends, to date and form relationships, conduct

50
business, seek assistance and kill time. Whatever the reason, it is evident that search for
information and communication are important reasons for social media usage.
For social media users, being members of communities or groups is very important.
Especially on Facebook, it was revealed that there are very many groups and pages that one
can join or like. Also on Twitter, there are very many communities of interest that one can
follow. Most of the participants, 88 were showed in the data to be members of 1-10
communities, 41 were members of 21-50 communities, 34 were members of 11-20
communities, 31 were members of more than 50 communities with a minority of 6 not
participating in any communities. This is important for most of the social marketers as they
target the membership of the users of social media.
Another area of interest for the researcher was finding out why the members of the social
media groups and communities joined, liked or followed them. Various reasons would
emerge, but the researcher restricted the participants to the most common reasons. The data
showed that 72.5% joined because it was a relevant, active community, 61.5% because it
would keep them informed about community news and updates, 57.5% joined to seek information
about various aspects of the community, 42.5% wished to have an opinion on the community
and membership was necessary. 22.5% because they believed it would get them new, useful
connections. It should be noted that a member would join for more than one of the states
reasons.
Proceeding to the phenomenon of interest, the researcher sought to find out the number of
participants who had liked and followed the Safaricom page on Facebook. The data showed
that a majority, 146 liked the page, while the remaining 54 were not fans. Clearly, most of

51
those who participated in the research found it relevant to like the page. The participants who
followed Safaricom on Twitter from the research were 127, while the remaining 73 did not.
Similarly, most of the participants found it relevant to follow Safaricom on Twitter.
The researcher was interested in finding out how frequent the followers and fans of
Safaricom communicated with the customer care department of the company. It was also
important to establish the sort of actions and how often the participants performed them on
the social media. This was very important in establishing the effectiveness of social media
customer relations model as used by Safaricom. The question seeking to understand the
frequency of seeking help from the organization concerning services was set in a Likert scale
and it was revealed that 28 participants said they have never sought any help for Safaricom
services via the social media, 38 have rarely done this, 61 sometimes do, 42 often seek help,
while 31 are always doing it. Additionally, majority of the participants, 40.5% have never
gone to the Safaricom page or Twitter Handle seeking for information and news on the
organization. 21.5% rarely does this, 22.5% sometimes seek information and news on
Safaricom, 9.5% often do and only 6 % always seeks information and news. The information
was very important in answering the research question.
Social media is a platform for information sharing and it was interesting to know if the
participants have in the past recommended use of the Safaricom fan page and Twitter Handle
to others. data showed that 96 participants have never recommended the Page or Handle to
others, 46 rarely do, 30 sometimes recommend, 22 often recommend, while only 6
participants always recommend. Generally, it is interesting to note that other users of the
social media get information on social media customer care from others.

52
Data was sought by the researcher on the number of participants who have ever contacted
Safaricom for information or assistance through the social media. A majority (68.8%) of
those who have a social media connection with the company have used the social media to
contact Safaricom customer service. Only 63 have never made such a contact. Of those who
have made such a contact, the researcher was interested in finding out the frequency of
contact. Data revealed that 50 of those participants had contacted the organization between 1
and 5 times, 41 between 6 and 10 times, 25 between 11 and 15 times, 12 between 16 and 20
times, with only 9 participants contacting the company for more than 20 times. While the
question in itself was not very significant, the importance is revealed in the opinion of the
participants regarding whether they received the needed help or not, and whether the
response of to their satisfaction. From the 137 who had made contact with the organization
in the past, a majority, 73% felt that their request was addressed in an effective manner and
thus their use of social media was helpful. In relation to timeliness of response, the idea was
to compare conventional ways of making contact with the organization to the social media.
Out of the 137 participants who had made contact, 132 (96.4 percent) agreed that their
requests were addressed in a timelier manner compared to when they were using
conventional channels such as telephone.
Finally, on the questionnaire, the researcher sought the opinion of the participants on whether
the company is doing a good job in addressing issues from the customers through social
media. Out of the 200 participants, including those who are not fans or followers in social
media, 157 agreed that the company is doing a good job in addressing issues from the
customers through social media. However, there is always room for improvement.

53
Besides the questionnaires, the researcher obtained data through an online ethnographic
study. In this study, the researcher was interested in two major topics, presented as themes in
the analysis of data. The first one was the average time taken in responding to request on
Facebook and Twitter. In Safaricom fan page, the average time taken to respond to a request
was 14.86 minutes, while in the Twitter Handle the average time taken was 9.86 minutes.
With this in mind, the researcher wanted to find out the opinion of some of the users of the
social media on the success and timeliness of the responses compared to when they used
conventional means of communication such as the telephone. From the 30 participants
interviewed online, 9 expressed their disappointment in social media, and preferred telephone
calls to send their requests as the response is instance, 15 were satisfied with the use of social
media platforms in sending their requests. Some said that the telephone calls take a long time
to be answered, citing an example of the 100 call to customer care. However, the fifteen
users suggested the need to reduce the response time to less than 5 minutes for greater
effectiveness and only 6 out of the 20 users were indifferent, suggesting that they were yet to
use the social media platform to send a request to the organization.
6.2 Conclusion
Important conclusions can be made from the data. Evidently, most of the users of the social
media are young people, mostly students and with a level of education higher than high
school. This is an important segment of users of Safaricom services. Therefore, for
developers of social media marketing strategies, this is a very important market segment to
target. These users also access the Internet at least once a day and they do so mainly using
laptops, mobile phones and desktop computers. They access the Internet wither from the
comfort of their homes, at work and at school or the library.
54
Another important data from the research is the time of usage. While the customer care
representatives have no control over where, when and how the users use the social media, it
is important to note of the time of the day the majority are online. Given that most of the
participants use the social media at 6.01 pm to 12.00 am and between 6.01 am and 12.00 pm,
this should be the time that the customer service department in Safaricom should be most
active. At this time, it is expected that the company will have a lot of requests. Having
adequate representatives is important during these hours of the day.
Communication and information sharing are the most important reasons for social media
usage. All other identified reasons boil down to these two important reasons and it is
important that customer care and marketing departments realize this in the development of
social media strategies. Making it easier for users to communicate and share information is
critical for their success.
Membership to communities and groups on social media is very important for the users. Data
reveals that there is no limit to the number of communities and groups that the users can
become members of. Therefore, organizations should establish communities, groups and
pages, and make them interesting for the members. This creates a platform for the members
to interact with other likeminded users of social media. Safaricom has created such an online
presence through a Facebook fan page and a Twitter handle. More and more users are
learning about the existence of such as they use the social media and interact with other
people.
The presence of Safaricom on Facebook and Twitter has emerged as an important platform
for the users of the social media to communicate with the company. The data reveals that

55
most of the participants are using these platforms to send requests to the company and also
recommending them to other users. Therefore, the experience of the users of social media
from the company is very important as one satisfied user will contact and share the
information with many others.
It was revealed from the research that most of the users of the social media are satisfied with
the rate and speed of response to requests made to safaricom through the social media. Most
agree that the social media is much faster and more reliable compared to the use of
conventional means of communicating such as telephone. The users who agree with this also
convey their disappointment with telephone conversations such the 100 line. Most of these
calls go unanswered or the user has to wait for as long as 20 minutes for the call to go
through.
In terms of the time taken to respond to a request on Facebook and Twitte, I Safaricom fan
page, the average time taken to respond to a request was 14.86 minutes, while in the Twitter
Handle the average time taken was 9.86 minutes. This time is an improvement compared to
the use of telephone calls, but most of the users interviewed online suggested a further
improvement to less than 5 minutes on both platforms.
6.3 Recommendations
For the company to take advantage of and continue benefiting from the social media usage in
customer relations there is need for the customer relations representatives to listen. Listening
to what the users are saying about the company and its services is very important. Users in
the social media say a lot of things, information that can be used by the company to improve

56
its services to the users. Listening to the customers is the best way of getting what they are
saying and addressing any concerns (Lipsman, et al 2012).
Besides listening, it is important that the organization use the social media applications to
communicate with their consumers at least once a day. The organization should not always
wait for the users to initiate communication. The researcher recommends that organization
have a website and pages on the Internet that are customized for mobile access to enable
easier access for users. Organization’s pages and groups should be easy to read in various
environments, with content that is easy to understand and decipher.
Effective analysis of the data produced in social media is critical in making proper use of
social media in customer relations. Use of the social media generally generates and leverages
diverse kinds of data that should be analyzed to make decisions about the social media
strategy of the company. Collection, organizing and preparing the data for analysis can be a
challenge and the company should have in place effective tools and resources for this
purpose. It is also important that the data should be integrated with other third-party and
corporate data so as to come up with the metrics as well as analytics for determining Return
on Investment. The data is important in making the most out of social media in marketing
and customer relations (Lipsman, et al 2012).
It should be noted that customer experience is very important in social media, due to the
tendency of social media content to go viral (Lipsman, et al 2012). The social media can
either improve or damage reputation of the company. Therefore, it is highly recommended
that the company has in place adequate number of customer care representatives to

57
adequately address the requests of customers in a timely manner. Response time need to be
reduced to less than 5 minutes for better customer experience.
6.4 Suggestions for Further Research
The researcher recommends that further research be carried out on the impact of social on
online consumer behavior. This is because the extent to which social media influence pre-
purchase, purchase and post-purchase behavior of online consumers are not exhaustively
established in this research, yet it is also important for organizations and marketers to
understand this impact as well. It is important to understand how consumers make the
important decision to use either products or services offered by one company and not the
other. This will be beneficial to business organizations seeking to capitalize on social media
usage.

58
REFERENCES
Biklen, S. K. and Casella, R. (2007). A practical guide to the qualitative dissertation. New
York: Teachers College Press
Bogdan, R.C. and Biklen, S.K., (2007). Qualitative Research for Education: An Introduction
to Theories and Methods (5th Ed.), New York, NY: Pearson Education, Inc.
Chung, C., & Austria, K. (2010). Social Media Gratification and Attitude toward Social
Media Marketing Messages: A Study of the Effect of Social Media Marketing
Messages on Online Shopping Value. Proceedings Of The Northeast Business &
EconomicsAssociation, 581-586.
Creswell, J.W. (2007). Qualitative inquiry and research design: Choosing among five
approaches (2nd ed.). Thousand Oaks, CA: Sage.
Edosomwan, S., Prakasan, S.K., Kouame, D. Watson, J. & Seymour, T. (2011). The History
ofSocial Media and Its Impact on Business, Journal of Applied Management and
Entrepreneurship 16(3): 79-82
Gichane, C. (2013). Kenya’s Internet users hit 16.2mn, Business & Tech, retrieved
fromhttp://www.capitalfm.co.ke/business/2013/04/kenyas-internet-users-hit-16-2mn/

59
Glesne, C. (2011). Becoming qualitative researchers: An introduction (4th ed.). Boston, MA:
Pearson.
Greenberg, P. (2004). CRM at the Speed of Light: Essential Customer Strategies for the
21stCentury, New York: McGraw-Hill/Osborne.
Greenberg, P. (2009). CRM at the Speed of Light, Fourth Edition: Social CRM 2.0 Strategies,
Tools, and Techniques for Engaging Your Customers, 4th ed. New York: McGraw-
Hill Osborne Media.
Hakken, D. (2014). Ethnography and Virtual Worlds: A Handbook of Methods. Journal Of
TheAssociation For Information Science & Technology, 65(10), 2155-2157
Heinrichs, J.H., Lim, J. & Lim, K. (2011). Influence of social networking site and user
accessmethod on social media evaluation. Journal of Consumer Behaviour, 10(6):
347-355
Kaltcheva, V. D., Patino, A., Laric, M. V., Pitta, D. A., & Imparato, N. (2014).
Customers'relational models as determinants of customer engagement value. Journal
Of Product &Brand Management, 23(1): 55-61.
Kane, G. C., Alavi, M., Labianca, G., & Borgatti, S. P. (2014). WHAT'S DIFFERENT
ABOUTSOCIAL MEDIA NETWORKS? A FRAMEWORK AND RESEARCH
AGENDA. MISQuarterly, 38(1): 275-304.
Kaplan, A. M. & Haenlein, M. (2010). "Users of the world, unite! The challenges
andopportunities of Social Media". Business Horizons 53(1): 59–68.
Klaus, P., & Maklan, S. (2013). Towards a better measure of customer experience.
International Journal Of Market Research, 55(2): 227-246
Kotler, P. (2003). Marketing Management. New Jersey: Pearson Education Ltd.
60
Kotler, P., Wong, V.,Saunders, J., &Armstrong, G. (2005). Principles of Marketing.
Essex:Pearson Education Lt
Lichtman, M. (2010). Qualitative Research in Education: A User’s Guide (2nd Ed.),
Washington, DC: Sage Publications, Inc
Lipsman, A., Mud, G., Rich, M., & Bruich, S. (2012). The Power of "Like": How Brands
Reach (and Influence) Fans Through Social-Media Marketing. Journal Of
Advertising Research, 52(1), 40-52.
Lund, P. (2012). Massively Networked: How the convergence of social media and technology
ischanging your life, PLI Media
Luo, X., & Zhang, J. (2013). How Do Consumer Buzz and Traffic in Social Media
MarketingPredict the Value of the Firm?. Journal Of Management Information
Systems, 30(2): 213 238.
Marketingteacher,(2010). “CRM Business Strategy," retrieved
fromhttp://marketingteacher.com/lessonstore/lesson-crm-business-strategy.html,
Oestreicher-Singer, G., & Zalmanson, L. (2013). Content or Community? A Digital
BusinessStrategy For Content Providers in The Social Age. MIS Quarterly, 37(2):
591-616.
Organic, Inc. (2010). CRM moves from Elite to Everyman: Four Elements for Creating a
Social CRM Strategy. San Francisco: Organic Inc.
Patton, M. (2001). Qualitative Research & Evaluation Methods. Thousand Oaks, CA:
SagePublications.
Peppers, D. & Rogers, M. (2011). Managing Customer Relationships: A Strategic
Framework, Malden MA: Wiley Blackwell
61
Qualman, E. (2009). Socialnomics: How Social Media Transforms the Way We Live and
DoBusiness, John Wiley & Sons
Reynolds, J. (2002). A Practical Guide to CRM: Building more profitable
CustomerRelationships. New York: CMP Books.
Rubin, A, and Babbie, E. 2010, Essential Research Methods for Social Work. 7thed.Belmont,
CA: Brooks/Cole Cengage Learning
Sundar, S.S. & Limperos, A.M. (2013). Uses and Grats 2.0: New Gratifications for New
Media. Journal Of Broadcasting & Electronic Media, 57(4), 504-525.
Universal McCann (2009). Wave 4: Power to the people Social Media Tracker.
UniversalMcCann. Retrieved
fromhttp://universalmccann.bitecp.com/wave4/Wave4.pdf
Wagner, T.R., & Hughes, J. (2009). Social CRM: The New Frontier of Marketing, Sales
and Service.Dublin:Accenture. Retrieved from
http://www.accenture.com/NR/rdonlyres/77B89E69-781D-4BC4-8E2B
D518B3A7EA27/0/Accenture_SocialCRMPOV_v10.pdf

62
APPENDICES
Appendix I: Questionnaire
The researcher is a student from University of Nairobi that hopes to establish how Safaricom
marketers can use Social Networking Sites (Facebook and Twitter) for Customer
Relationship Management. Please indicate your answer using either a tick or a cross. Your
answers will remain anonymous as no identification is required. The information is also
confidential and will not be shared with third parties.
Thank you in advance for your cooperation and assistance.
1. Gender
a) Male □
b) Female □
2. Age
a) 18 - 22 years □
b) 23 – 27 years □

63
c) 28- 32 years □
d) 33 - 37 years □
e) 38-47 years □
f) 48+ □
3. What is your occupation?
a) Employed □
b) Self-employed □
c) Student □
d) Other (specify) ……………………………………………………………………..
4. What is your highest education qualification?
a) Primary School □
b) Secondary School □
c) Diploma/ Certificate □
d) Degree □
e) Post Graduate Degree(s) □
5. How often do you use the internet?
a) Multiple times a day □
b) Once a day □
c) 4-7 times a week □
d) 3 or fewer times a week □
e) Once or twice a month □
f) Less than once a month □

64
6. What tool do you use in accessing the Internet? (you can tick more than one option)
a) Desktop computer □
b) Laptop □
c) Mobile phone □
d) Smartphone □
e) Ipad or tablet □
7. Where do you mostly use the internet?
a) Home □
b) Workplace □
c) Cybercafé □
d) School or library □
e) Friends’ or family’s houses □
f) Free access points □
g) Other (please specify) ………………………………………………………….
8. How long have you been using Social Networking Sites?
a) Less than a month □
b) 1-6 months □
c) 6-12 months □
d) 1-2 years □
e) 2-3 years □
f) 3+ years □
9. How many hours per day do you use the social media?
a) 1 –4 hours a day □

65
b) 5 – 8 hours a day □
c) 9 –12 hours a day □
d) more than 13 hours a day □
10. During what hours are you on the social media (you may select more than one
option)
a) 12.01am – 6.00 am □
b) 6.01 am – 12.00 pm □
c) 12.01 pm – 6.00 pm □
d) 6.01 pm – 12.00 am □
11. What do you mostly use these sites for? (you may select more than one option)
a) Connecting with friends □
b) Making new friends □
c) Entertainment Sharing information □
d) Following social events □
e) Seeking information and opinions □
f) Killing time □
g) Conducting business □
h) Seeking assistance □
i) Dating and relationships □
j) Other (Specify) …………………

66
12. How many social networking communities, groups and fan pages are you a member
of?
a) None □
b) 1-10 □
c) 11-20 □
d) 21-50 □
e) 51+ □
13. What is the key reason for you to join a community, group or fan page? (you may
select more than one option)
a) It is a relevant, active and interesting community □
b) To let me stay up to date with the community news/updates □
c) To seek information about various aspects of the community □
d) I would like to have my say and membership is required □
e) I believe it will get me new useful connections □
f) Other (please specify) ………………………………………
14. Are you a fan of the Safaricom page or Twitter?
a) Yes □
b) No □
15. Are you a follower of Safaricom on Twitter?
a) Yes □
b) No □
16. How often do you do the following?
Never Rarely Sometimes Often Always

67
Seek help
from the
organization
concerning
services
Seek
information
and news
posted by
the
organization
Recommend
use of the
page to
others
17. Have you ever contacted the organization for information or to solve an issue?
a) Yes □
b) No □
b. If yes, how many times have you done this
a) 1-5 times □
b) 6-10 times □
c) 11-15 times □
d) 16-20 times □
68
e) 20+ times □
18. If the answer to (16 above) is yes, has the organization been helpful in providing the
information or addressing the issue
a) Yes □
b) No □
19. Compared to conventional channels such as phone calls, do you feel that your
requests were addressed in a timely manner?
a) Yes □
b) No □
20. In your opinion, is the company doing a good job in addressing issues from the
customers posted on the social media?
a) Yes □
b) No □
Online Ethnography Guide
1. On average, how long does it take for a request to get a response on Facebook?
2. On average, how long does it take for a request to get a response on Twitter?
3. What are the opinions of the users on the use of social media for customer relations
by the organization?

69