Slovenian Youth 2013: Living in times of disillusionment, risk and precarity: First CEPYUS –...
268
Living in times of disillusionment, risk and precarity SLOVENIAN YOUTH 2013 First CEPYUS – Friedrich-Ebert-Stiftung (FES) Youth Survey
Transcript of Slovenian Youth 2013: Living in times of disillusionment, risk and precarity: First CEPYUS –...
Living in times of disillusionment, risk and precarity
SLOVENIAN
YOUTH2013
First CEPYUS – Friedrich-Ebert-Stiftung (FES) Youth Survey
Slovenian YO
UT
H 20
13 - Living in times of disillusionm
ent, risk, and precarity
Slovenian YOUTH 2013
Living in times of disillusionment, risk and precarity
First CEPYUS – Friedrich-Ebert-Stiftung (FES)
Youth Survey


Sergej FLERERudi KLANJŠEKMiran LAVRIČAndrej KIRBIŠ
Marina TAVČAR KRAJNCMarko DIVJAKTjaša BOROJA
Barbara ZAGORCAndrej NATERER
Center for the Study of Post-Yugoslav Societies (CEPYUS), MariborFriedrich-Ebert-Stiftung (FES), Zagreb
Zagreb, 2014
Slovenian YOUTH 2013
Living in times of disillusionment, risk and precarity

Published by: CEPYUS, Maribor and Friedrich-Ebert-Stiftung, ZagrebTitle Page and Printing Preparation: Global Studio d.o.o. | Printed by: Gaea Studio© Friedrich-Ebert-Stiftung, © CEPYUS | ISBN 978-953-7043-49-0 | A CIP catalogue record for this publication is available from the National and University Library in Zagreb under No. 866689 | Any commercial use of Friedrich-Ebert-Stiftung (FES) publications is prohibited without prior written authorization from the Friedrich-Ebert-Stiftung
CONTENTS 5
CONTENTS
LIST OF TABLES ........................................................................................................................9
LIST OF FIGUrES .................................................................................................................... 10
INTrOdUCTION ...................................................................................................................... 151 On the study of youth .......................................................................................................15
1.1 Youth culture and youth as a subgroup ...................................................................15
1.2 Transition and what shapes it ...................................................................................16
2 Comprehension of contemporary youth ...........................................................................17
ThE STUdY ANd ITS OPErATIONALIZATION .............................................................................. 211 Objectives .........................................................................................................................21
2 The structure of the study ...............................................................................................22
3 Target population and sample ...........................................................................................23
4 data collection ..................................................................................................................25
4.1 response rate and reasons for non-response ...........................................................26
4.2 data weighting .......................................................................................................26
5 references ........................................................................................................................28
PArT I - LIvING CONdITIONS ANd SOCIOECONOMIC SITUATION OF YOUTh ............................... 311 Introduction ......................................................................................................................312 Poverty among young Slovenians (still) below the European average ...............................323 Incomes of young people in Slovenia – stagnating and falling behind .............................354 Slovenian youth still relatively satisfied with their lives in general,
but the effect of economic crisis is showing .....................................................................395 Young males still earning more than young females, but the gap is small
and shrinking ....................................................................................................................406 Living in relatively small households, together with more educated parents -
“The Mediterranean” pattern continues ...........................................................................416.1 The material opportunities for moving out are narrowing .........................................466.2 Low levels of family discord, short distances, adequate infrastructure and
high education enrollment levels all weaken the pressure to leave home ................486.3 What about culture? ..................................................................................................506.4 Why girls move out sooner? ......................................................................................51
7 Key findings ......................................................................................................................52
8 references ........................................................................................................................53
PArT II - EMPLOYMENT ANd MOBILITY ................................................................................... 571 Employment ......................................................................................................................57
1.1 Youth unemployment is high and rising ...................................................................571.2 The subjectively perceived unemployment is even higher ........................................591.3 has the safe haven of formal education reached its limits? ......................................611.4 The increasing gender gap in transition from school to work ....................................621.5 Youth as the flexible workforce .................................................................................64
6 CONTENTS
1.5.1 Flexible forms of employment ........................................................................641.5.2 Taking a job outside the area of one’s education ...........................................661.5.3 What would young people do to get a job? ....................................................67
1.6 Expectations regarding the employment confirm high levels of flexibility .................692 Mobility .............................................................................................................................72
2.1 Young people feel little need to move within Slovenian borders ...............................732.2 International mobility: Austria, Germany and the US are prevailing targets ..............75
3 Key findings ......................................................................................................................77 3.1 Employment ..............................................................................................................773.2 Mobility ...................................................................................................................78
4 references ........................................................................................................................79
PArT III - EdUCATION ............................................................................................................. 831 Introduction ......................................................................................................................832 Basics: structural aspects in comparative perspective .....................................................833 Preferences and experiences ...........................................................................................864 Key findings ......................................................................................................................89
5 references ........................................................................................................................89
PArT Iv - LEISUrE ANd LIFESTYLE .......................................................................................... 911 Introduction ......................................................................................................................912 Leisure activities ...............................................................................................................933 Lifestyle – What is “in”? ....................................................................................................954 Consumption patterns – “Where does the money go?” .....................................................985 Self-image – “do I look O.K.”? .......................................................................................... 1006 Key findings .................................................................................................................... 101
7 references ...................................................................................................................... 102
PArT v - MEdIA USE ............................................................................................................ 1071 Introduction .................................................................................................................... 107
1.1 Media as a source of political information ............................................................. 1102 The internet .................................................................................................................... 112
2.1 Internet access ....................................................................................................... 1142.2 Time spent on the Internet ..................................................................................... 1162.3 Purposes of Internet use ......................................................................................... 1182.4 Conclusion: The Internet ......................................................................................... 121
3 Television ........................................................................................................................ 1213.1 Time spent watching television ............................................................................... 1213.2 What Tv contents do young people watch? ............................................................. 1233.3 Conclusion: Television ............................................................................................. 124
4 Trust in media ................................................................................................................. 1265 Key findings .................................................................................................................... 128
6 references ...................................................................................................................... 129
PArT vI - hEALTh, hEALTh rISK BEhAvIOrS ANd LIFESTYLE .................................................. 1391 Introduction .................................................................................................................... 1392 Self-rated health ............................................................................................................. 1403 Alcohol use and attitudes toward alcohol ....................................................................... 142
CONTENTS 7
4 Tobacco use .................................................................................................................... 1475 Body-mass index ............................................................................................................. 1496 An unhealthy lifestyle and self-rated health ................................................................... 1517 Key findings .................................................................................................................... 153
8 references ...................................................................................................................... 154
PArT vII - ThE FAMILY ......................................................................................................... 1631 Introduction .................................................................................................................... 1632 Family structure .............................................................................................................. 1653 Family relations .............................................................................................................. 166
3.1 decision making by young people .......................................................................... 1674 Coupledom ...................................................................................................................... 168
4.1 Preferred status as to coupledom ........................................................................... 1694.2 Characteristics important for prospective spouse ................................................... 1714.3 Age appropriate for marriage .................................................................................. 172
5 Key findings/Final remarks .............................................................................................. 173
6 references ...................................................................................................................... 174
PArT vIII - ANxIETIES ANd ASPIrATIONS .............................................................................. 1771 Introduction .................................................................................................................... 177
2 Psychological foundations: narcissism and time orientation ........................................... 177
2.1 Narcissism .............................................................................................................. 177
2.2 Time orientation ...................................................................................................... 179
2.3 xenophobia and social distance .............................................................................. 180
3 Experience of discrimination ........................................................................................... 182
4 value orientations .......................................................................................................... 183
5 Life satisfaction, wellbeing, and happiness ..................................................................... 184
5.1 The presence and correlates of life satisfaction ..................................................... 185
5.1.1 Welfare system ............................................................................................. 185
5.1.2 Age ............................................................................................................... 186
5.1.3 Gender .......................................................................................................... 186
5.1.4 Psychological correlates ................................................................................ 187
5.1.5 Schooling ...................................................................................................... 187
5.1.6 Work and unemployment ............................................................................. 187
5.1.7 Family and friends ........................................................................................ 188
5.1.8 Economic conditions ..................................................................................... 189
5.1.9 Political influence ......................................................................................... 190
5.1.10 Institutional trust ......................................................................................... 190
5.1.11 discrimination .............................................................................................. 190
5.1.12 voluntary activities ....................................................................................... 190
5.2.13 Partnership ................................................................................................ 190
5.2 Explanation of life satisfaction among Slovenian youth .......................................... 191
6 vision of personal future................................................................................................. 191
7 Key findings and final remarks ....................................................................................... 192
8 references ...................................................................................................................... 193
8 CONTENTS
PArT Ix - TrUST ANd BELONGING ......................................................................................... 1971 Social trust ...................................................................................................................... 197
1.1 Level of trust in social groups is relatively low ...................................................... 1981.2 Future orientation and expectations as a dimension of social trust ........................ 2001.3 Presentification does not seem to be a prevalent trend among
Slovenian Youth ...................................................................................................... 2012 religiosity of young people in Slovenia ........................................................................... 202
2.1 Losing my religion: pronounced secularization among Slovenian youth .................. 2023 Key findings .................................................................................................................... 206
3.1 Trust ....................................................................................................................... 2063.2 Belonging and religion ............................................................................................ 207
4 references ...................................................................................................................... 207
PArT x - POLITICS ANd dEMOCrACY .....................................................................................2111 Politics and democracy ................................................................................................... 211
2 Political attitudes and participation ................................................................................ 214
2.1 The (un)popularity of political participation ............................................................ 214
2.2. Political interest ...................................................................................................... 215
2.3 Ideology no more? .................................................................................................. 218
2.4 Participation in elections......................................................................................... 219
2.5 Satisfaction with democracy ................................................................................... 222
2.6 Youth do not feel represented by young politicians .................................................. 223
2.7 (dis)belief in political influence and its consequences ........................................... 224
2.8 Political/institutional trust ...................................................................................... 225
3 Sources and influences of political attitudes and participation ....................................... 227
3.1 Sources of information about politics ..................................................................... 227
3.2 Who watches televised political debates? ............................................................... 229
3.3 Parental influence ................................................................................................... 230
4 recommendations for the future: youth’s input .............................................................. 232
5 Key findings .................................................................................................................... 234
6 references ...................................................................................................................... 235
PArT xI - GOvErNANCE ANd dEvELOPMENT ........................................................................ 2451 Introduction .................................................................................................................... 245
2 Youth not satisfied with the functioning of democracy ................................................... 246
3 Youth not satisfied with the results of the European integration .................................... 251
4 Key findings .................................................................................................................... 253
5 references ...................................................................................................................... 253
CONCLUSION - SLOvENIAN YOUTh IN PrECArIOUS TIMES ...................................................... 2571 Is the social situation of Slovenian young people one of a “cushioned precariat”? ......... 257
1.1 Who succeeds among young adults (24-27)? ........................................................... 260
1.1.1 Gender .......................................................................................................... 260
1.1.2 Schooling ...................................................................................................... 260
1.1.3 In depth predictors ....................................................................................... 261
2 references ...................................................................................................................... 265
LiST Of TabLES 9
LIST OF TABLES
Table 1: Structure of the required sample ...................................................................... 24
Table 2: reasons for non-response ................................................................................ 26
Table 3: Comparison of demographic structure of target population with
unweighted and weighted sample .................................................................... 27
Table 4: Mean analysis (ANOvA) of “What will, in your opinion, be economic situation
in your country in the next 10 years?” 16-25 yrs., by country .......................... 39
Table 5: Mean analysis (t-test) of respondents’ income (16-25), by gender and
occupational status .......................................................................................... 41
Table 6: Association between living preference and attitudes, Slovenian youth 16-27 ... 50
Table 7: Youth (16-27) by type of employment and by working hours per week ............ 65
Table 8: Principal component analysis of lifestyle indicators performed on Slovenian
youth sample (16–27 years) .............................................................................. 98
Table 9: Principal component analysis of Tv contents, Slovenian youth sample
(16–27 years) ....................................................................................................125
Table 10: Correlation coefficients on association between narcissism dimensions,
deviance, time orientations and parenting styles, 19-27 years ....................... 178
Table 11: Feelings about hypothetical situation where families belonging to a certain
minority or foreign group would move in youth’s neighborhood .................. 180Table 12: Means of experiencing discrimination, by category ........................................ 182Table 13: First rated values, by share of youth (in percent), by country ........................183Table 14: Factor matrix of time perspectives ................................................................. 201
Table 15: Youth’s (16-27) perception of problems, Slovenia and Croatia (in percent) ..... 248
Table 16: Main activity and status of youth (24-27), 2000-2013, in percent of sample ... 259
Table 17: Mean differences between employed and unemployed for “success”
relevant variables, 24-27 age group ................................................................ 262
10 LiST Of fiGURES
LIST OF FIGUrES
Figure 1: At-risk-of-poverty rate (cut-off point: 60% of median equivalent income
after social transfers) by age, sex, and region, 2011 ......................................... 33
Figure 2: Attitudes of young people (16-25) towards wealth distribution
between generations, Slovenia and Germany, 2010, 2013 ................................ 34
Figure 3: Average annual equivalent disposable net income*
of youth (16-24), expressed in EUr 1999 and in PPP**),
by countries neighboring Slovenia, 2005–2011 .................................................. 36
Figure 4: Estimate of average monthly disposable income of young people
(16–25 yrs.) by employment status, in Euros*, 2000 - 2013 ............................... 37
Figure 5: Self-assessment of material situation of respondents’ family,
Youth (16-25 yrs.), 2000-2013 ............................................................................ 38
Figure 6: Assessment of subjective well-being, Youth 18-25, 1992-2013 ........................... 40
Figure 7: Average household size, by country ................................................................. 42
Figure 8: Education level, respondents’ parents, Slovenia, 2000 and 2013,
Croatia 2012 ...................................................................................................... 42
Figure 9: Percentage of households NOT having a specific item, by country ................... 43
Figure 10: Persons with whom youth (16-25) is living, by country ....................................44
Figure 11: Share of young adults aged 18-34 living with their parents,
Slovenia and EU, 2005-2011 ............................................................................... 45
Figure 12: Attitudes of youth (16-27) toward various living conditions/arrangements,
Slovenia and Croatia (Which of the following statements best describe your
situation/your wish regarding living arrangement?) ......................................... 47
Figure 13: Family (disharmony) among Slovenian, Croatian and German youth (16-25) ..... 48
Figure 14: Mean comparisons, various attitudes, Slovenian and German youth
(aged 16-25) ...................................................................................................... 49
Figure 15: Persons with whom Slovenian youth (16-25) is living, by age and gender ........ 52
Figure 16: Unemployment rate of the age group 15-25 years and 25-74 years,
EU-27 and Slovenia, 2003-2012 .......................................................................... 58
Figure 17: Employment and unemployment of economically active young people
(16–27 years), ................................................................................................... 59
Figure 18: Youth unemployment rates based on self-perception of the young,
by major socio-demographic groups ................................................................. 60
Figure 19: Predominant activities, including schooling, of young people (aged 16–27) ..... 61
Figure 20: Predominant activities, including schooling, of young people
(16–27 years), Slovenia (2013) and Croatia (2012) .............................................. 62
Figure 21: Three basic social activities of young people (16-27), by gender ...................... 63
Figure 22: Basic types of economic activity, by gender ..................................................... 64

LiST Of fiGURES 11
Figure 23: Young people (16-27) in fixed term and permanent employment ..................... 64
Figure 24: Young men and women (16-27) by type of employment,
including student work ..................................................................................... 66
Figure 25: horizontal skills mismatch among Slovenian Youth .......................................... 67
Figure 26: Willingness of young people (16-27 years) to take action to reduce
the risk of unemployment, Youth 2010 and Youth 2013 .................................... 68
Figure 27: Expectations regarding the ability to find a job soon after graduation ............. 70
Figure 28: The preferred sectors for employment ............................................................. 71
Figure 29: Perceived most important factors in finding a job ........................................... 71Figure 30: Most important factors with regards to accepting or declining a job................ 72
Figure 31: Willingness to migrate somewhere else in Slovenia, by gender and
educational attainment .................................................................................... 73
Figure 32: Motives for migration somewhere else in Slovenia (only those expressing
willingness) ...................................................................................................... 74
Figure 33: Willingness to emigrate from the home country ............................................... 74
Figure 34: Preferred target countries of immigration among those expressing
willingness to emigrate ..................................................................................... 75
Figure 35: Preferred target countries for immigration, by region ....................................... 76
Figure 36: Main reasons for wishing to emigrate from Slovenia among those
expressing willingness to emigrate ................................................................... 77
Figure 37: The relative importance of economic reasons for emigration from
Slovenia, by basic demographic groups ............................................................ 79
Figure 38: Tertiary students as a share of 20-24 age group, Slovenia and EU-27 ............... 84
Figure 39: Total public expenditure on education as % of GdP , Slovenia 2001-2010 ......... 85
Figure 40: Percent of students by field of study, Slovenia and EU-27 ................................ 86
Figure 41: Educational institutions by students’ choice in Slovenia, Croatia, Kosovo ....... 87
Figure 42: Perception of everyday life in school; Slovenia, Croatia and Kosovo................. 88
Figure 43: Average daily number of hours of study in Slovenia, Kosovo and Croatia ........ 88
Figure 44: Leisure activities (% doing the activity “frequently”) among Slovenian,
Croatian and Kosovo youth (16–25 years) ......................................................... 94
Figure 45: What is “in” among Slovenian, Croatian, Kosovo and German youth
(16–25 years) ..................................................................................................... 96
Figure 46: What is “in” among Slovenian, Croatian, Kosovo and German youth
(16–25 years) ..................................................................................................... 97
Figure 47: Structure of average monthly expenditure (in €) of Slovenian,
Croatian and Kosovo youth (16–25 years) ......................................................... 99
Figure 48: Satisfaction with own look among Slovenian, Croatian and Kosovo youth
(16–25 years) ................................................................................................... 100
Figure 49: Media use among Slovenian, Croatian and Kosovo youth (16–25 years) ......... 108
Figure 50: The percentage of Slovenian youth (16–27 years) that “often” read
books/newspapers, (total sample, and by gender, respondent’s
educational level, age and size of residential settlement) .............................. 109

12
Figure 51: The use of different media as a source of information about current
political events among Slovenian youth (16–27 years) .....................................111
Figure 52: The use of the Internet as a source of information about current political
events among Slovenian youth (16–27 years), total sample and by
socio-demographic groups...............................................................................112
Figure 53: Percentage of households with Internet access in EU-27,
Slovenia and Croatia ........................................................................................115
Figure 54: Percentage of households accessing Internet through mobile phones
(GPrS, UMTS) in EU-27, Slovenia and Croatia ...................................................116
Figure 55: Average hours (M) per day spent using the Internet, including standard
deviations (Sd), among Slovenian, Croatian, Kosovo and German youth
(16–25 years) ....................................................................................................117
Figure 56: Types of Internet activities among Slovenian youth (16–27 years) ...................119
Figure 57: Average hours per day spent watching Tv and using the Internet,
including standard deviations (Sd), among Slovenian, Croatian and
Kosovo youth (16–25 years) ............................................................................ 122
Figure 58: Frequency of watching Tv contents/genres among Slovenian youth
(16–27 years) ................................................................................................... 124
Figure 59: Trust in media among Slovenian, Croatian and Kosovo youth (16–25 years) ... 127
Figure 60: Self-rated health of Slovenian youth (16–27 years) (in percent) .......................141
Figure 61: Frequency of alcohol use among Slovenian youth (16–27 years)
in 2010 and 2013 ............................................................................................. 144
Figure 62: Attitudes toward alcohol among Slovenian, Croatian and Kosovo youth
(16-25 years) ................................................................................................... 145
Figure 63: Frequency of alcohol use among Slovenian, Croatian and Kosovo youth
(16–25 years) ................................................................................................... 146
Figure 64: Frequency of tobacco use among Slovenian youth (16–27 years)
in 2010 and 2013 ............................................................................................. 148
Figure 65: Frequency of tobacco use among Slovenian, Croatian and Kosovo youth
(16–25 years) ................................................................................................... 149
Figure 66: Body mass index of Slovenian youth (16–27 years) in 2010 and 2013 ..............151
Figure 67: Proportion of overweight and obese Slovenian youth (16–27 years),
by major socio-demographic groups ............................................................... 152
Figure 68: Average household size, by country ............................................................... 165
Figure 69: Perceptions of relationship with parents ........................................................ 166
Figure 70: Perceived influence of parents on young people’s decisions ...........................167
Figure 71: The relative power of influence of individual family members on the
decisions of young people .............................................................................. 168
Figure 72: visions of future partnership .......................................................................... 169
Figure 73: Importance of factors in choosing husband or wife (in %) ............................. 170
Figure 74: Mean values on relevance of potential spouse characteristics, by gender ..... 172
Figure 75: The average perceived best age for marriage ..................................................173
LiST Of fiGURES

13
Figure 76: Mean presence of three time orientations, Slovenian youth, 16-27 years,
2010 and 2013 ...................................................................................................... 179
Figure 77: Subjective well-being, by age group and gender ............................................ 186
Figure 78: Subjective well-being and material well-being of respondent’s family ........... 189
Figure 79: Self-appraisal of own future, by age and country ............................................191
Figure 80: Trust toward main social groups; average on a 1 to 10 scale .......................... 198
Figure 81: Self declared religious affiliation, Slovenian youth ......................................... 202
Figure 82: Self declared religious affiliation; youth from Slovenia, Germany,
Croatia and Kosovo ......................................................................................... 203
Figure 83: Importance of God, Youth 2000, Youth 2010 and Youth 2013 .......................... 203
Figure 84: Frequency of church attendance, Youth 2000, Youth 2010 and Youth 2013 ..... 204
Figure 85: Frequency of prayer among youth from Slovenia and Croatia ........................ 205
Figure 86: Presence of religious coping among Slovenian youth ..................................... 205
Figure 87: religiosity of Slovenian youth, by major socio-demographic groups .............. 206
Figure 88: Popularity of political and civic participation among Slovenian,
Croatian, Kosovo and German youth (aged 16–25) ...........................................214
Figure 89: Interest in world politics, EU politics, politics in the Balkans and Slovenian
politics among Slovenian youth (aged 16–27) ................................................. 216
Figure 90: Percentages of “interested/very interested” in national politics,
EU politics, world politics and politics in the Balkans among Slovenian,
Croatian and Kosovo youth (16–25 years) ........................................................217
Figure 91: Percentages of left, right and centrist political-ideological orientations of
Slovenian youth (16-27 years) in 2000, 2010 and 2013, including “don’t
knows” ........................................................................................................... 218
Figure 92: Frequency of voting in past elections since turning eligible to vote
among Slovenian youth (18–27 years), total sample and by respondent’s
education level ............................................................................................... 220
Figure 93: Party choice and electoral participation of Slovenian youth (18–27 years) ..... 222
Figure 94: Satisfaction with democracy of Slovenian youth (aged 16–27) in
2000, 2010, and 2013 ...................................................................................... 223
Figure 95: Self-perceived influence on national and local institutions among
Slovenian youth (aged 16–27) ......................................................................... 225
Figure 96: Trust in institutions among Slovenian youth (16–27 years) ............................. 226
Figure 97: Sources of information about political events among Slovenian,
Croatian, Kosovo and German youth (aged 16–25) .......................................... 228
Figure 98: Percentages of Slovenian youth’s (16–27 years) watching political
debates on Tv, total sample and by age groups ............................................. 229
Figure 99: Self-perceived match between respondents’ political beliefs and their
parents’ beliefs among Slovenian youth (16–27 years), total sample
and by educational levels ............................................................................... 230
Figure 100: Parents’ interest in politics (as assessed by respondents) among
Slovenian youth (16–27 years) ........................................................................ 231
LiST Of fiGURES

Figure 101: Objectives Slovenian government should focus on, as assessed
by Slovenian youth (16-27 years) .................................................................... 233
Figure 102: Percentage of those who are completely satisfied with the state of
democracy, youth (16-25), by country ............................................................. 247
Figure 103: Evaluating the results of “Euro project” - how Slovenian youth
(16-27) sees the effects of Slovenia’s integration into the European Union
in terms of economic and political system (in percent) ................................. 252
14 LiST Of fiGURES

Sergej Flere IntroductIon 15
INTrOdUCTION
1 On the study of youth
Youth is not a universal human condition. A number of scholars have previously argued that
childhood and youth cannot be comprehended as a unique period (Aries, 1962); nor can youth be
considered as a special, homogeneous social group. Nevertheless, studies of youth, both as group
and a concept were first articulated in the 19th century, predominantly in urban centers of the
countries at the forefront of industrialization and modernization.
The first understandings of youth phenomenon came from hall (1904), a psychologist who con-
ceptualized adolescence as a time of “storm and stress”. however, in asserting the concept of ‘ad-
olescence’ as the initial framework for youth studies, it seemed that physiological and psychologi-
cal processes had not been understood well enough to treat youth as a separate social group. The
trajectory of youth studies changed when Mannheim (1923/1952) delineated the essence of youth
in his study of generations. According to him, youth is the generation that apprehends the social
world, fostering attitudes substantively different from their elders.
The crux of youth studies is in grasping the substance, not particularly of the social and cul-
tural changes themselves, but of how they mold new generations from their experiences, group
identity, and behavioral patterns, as well as their expectations, ideologies, and “anxieties and as-
pirations”. This includes the common peculiarities evident in the transition pattern from childhood
to adulthood. As such, the study of youth seeks to not only depict and explain the group, but as
well assess the group’s particular transition, identity, subculture, and other features indicative of
the society as a whole, and of the times to come. Of course, it is important to avoid hyperbolic
and mechanical claims, i.e., that the characteristics of youth always reflect the changes found in
society. More specifically, the particularities of youth do not necessarily indicate the direction of
social change. Nevertheless, youth studies have become a prominent topic in the social sciences,
including but not limited to sociology, psychology, political science, criminology, and economics.
Consequently, this has not only generated a multitude of arguments on what factors make up
youth, but also has raised many issues of how and what should be studied.
1.1 Youth culture and youth as a subgroup
Marcuse (1968) asserted that youth could be a potential revolutionary and emancipatory agent
in society. Whereas he viewed the alleged phenomenon with hope (1969), others regarded it as
dangerous and subversive. The latter was associated with “moral panics” towards particular youth
styles, groups, and youth in general (Cohen, 1972). Such variations notwithstanding, this particu-
lar study focuses on youth subcultures, lifestyles, and identity. Comprehensions of the so-called
16 introduction Sergej Flere
“essence” of youth first received attention in the late 1960s and 1970s, and largely corresponded
to the emergence of a number of different social phenomena, including the appearance of drug
and psychedelic subcultures, the communes, peace and anti-war movements, which depict an at-
tempt by youth to withdraw from the general course of social life. The landmark studies of youth
subcultures focused heavily on their unique characteristics, particularly where they distinguished
themselves from adult, i.e., “mainstream” culture; the understanding was that this was politically
motivated, which differed from adult modes of thought (McWilliams, 2000). Furlong (2013) is crit-
ical of this strand of literature, arguing that it bypasses social inequalities and forms a false idea
of a uniform youth culture. Moreover, too much attention was allotted to the deviant and spectac-
ular, which contrasted heavily with mainstream youth culture. This type of study could be traced
to Mannheim (1923/1952), who considered the generation of youth to be determined by specific
historical conditions that affect directly upon its worldview and value system.1
1.2 Transition and what shapes it
While the issues above relate to youth attributes, the question remains as to what shapes the
transition process itself. Among those who understand youth primarily via the concept of transi-
tion,2 a number have focused on the individualization of transition (although it should be noted
that the true limits of individualization are often contested). Beck and Beck Gernsheim (2002), in
addressing the concept of individualization, argue that it is typical for today’s youth to “reflexive-
ly” trace their individual routes. In other words, the authors find that “reflexive individualization”
has become the crux of living in the “second modernization” stage (the conditions are supple-
mented by a socially induced, generalized risk permeating current living conditions). The institu-
tional framework, which had previously suppressed the concept of liberty in earlier generations
and molded behavior into rigid patterns, is gradually eroding. One of the casualties is the ‘family,’
which has become “a zombie” (a term suggesting that it is lifeless, although not officially dead).
Arnett extends this argument further in claiming that this type of living peaks during “emerging
adulthood”, i.e., from the late teens lasting into one’s 30s. It is typified by qualities like explo-
ration, instability, so-called feelings of “in between” (adolescence or even possibly youth and
adulthood), focus on the self, and wonderment to life’s possibilities; it is a time “when people
are highly optimistic about how life will eventually work out for them” (2006, 114)3. Arnett, after
having consulted Chisholm and hurrelmann (1995), frames this portrayal within a psychological
development perspective, and allows independence to be the prime trait of emerging adulthood;
i.e., to be in Europe while “remaining at home”, as “autonomy and relatedness are complementa-
1 It should be noted that Mannheim specifically asserted that the entire generation does not necessarily embrace all of the same concepts, rather only those affected by certain changes.
2 Furlong (2013, 3) sees youth as “semi-dependence”, which contrasts to the dependence of childhood and independence of adulthood. Other possibilities of defining youth are either imprecise or difficult to operationalize. Moreover, some are imposing and arbitrary, e.g., the legal definitions of “coming of age” and attaining the right to vote. The United Nations presently defines youth as the group aged between 15 and 35; this definition replaced an earlier statistical formulation of 15-24 (UNESCO, n.d.).
3 Arnett condemns the general term “’youth”; he claims that it lacks content, boundaries, and definition. “Emerging adulthood” is preferable because it is a new term for a new phenomenon: “the long period of years that lies between attainment of biological maturity and entrance into stable adult roles” (2006, 119).
Sergej Flere IntroductIon 17
ry” (2000, 475). Such claims lead to the conclusion that the actions of youth are more individually
(rather than socially) determined. however, one could argue that many of the problems affecting
transition concern education and work, specifically the inequalities encountered by youth in these
two spheres. Transition itself is heavily structured by social conditions and often in a manner un-
friendly towards youth. Moreover, it should be noted that the conditions affecting youth are highly
varied, particularly those between the so-called underclass and the elite. And of course, there are
obvious diverging possibilities of independence and of independent navigation.
The possibilities allowing youth entry into adulthood are seriously limited, even blocked by the
changes found in the workplace, i.e., the ever-greater precariousness of employment. To counter
these limitations, the social system allows for more permissiveness in one’s personal life. Another
instrument the social system disposes of is “qualification inflation” (Furlong, 2013, 73). This is not
to say that joblessness is absolute, but if there are jobs for youth in contemporary Europe, they
tend to be casual, part-time, and lacking in security. reflexively, some have termed the present
generation as “the scarred generation” (Morsy, 2012); thus, it is not surprising that Angela Merkel
finds this problem to be “the most pressing one in Europe” (Conolly, 2013).
In sum, one of the main issues found within youth studies concerns the wider question of
whether man is able to mold his own social destiny. This is often expressed as the dichotomy
between structure and agency with regard to explanatory power. Structural approaches focus
on identifying patterns of normative life courses, which undoubtedly had a stronger explanatory
power in the past when transition was understood as having stricter norms enabling a more gen-
eralized approach. The study of the individual as an agent implies that the destinations of indi-
viduals are, to a significant and possibly decisive extent, the product of their conscious activity
and choice. As such, destinations may substantially differ because of each individual’s actions.
The idea of agency in the study of youth development converges on the idea of individual “nav-
igation”, “recognizing the capacity to act, the skills individuals develop to enable them to read
signals, anticipate problems and develop life management strategies” (Furlong, 2013, 9). Such an
approach also encourages qualitative studies of individual biographies (Chamberlayne, rustin and
Wengraf, 2003).
2 Comprehension of contemporary youth
The nature of today’s youth, whether identified as “Generation Y” or the “Millenials,” has re-
ceived a voluminous amount of debate and speculation. drawing on howe and Strauss, Furlong
summarizes that they “are presented as optimistic, engaged, and accepting of authority. They are
viewed as team players who place a premium on achievement both in the classroom and in the
world of work ... the Millenials are presented as conformists who value learning and are committed
to “making something of themselves”… so committed to achievement they sometimes regard work
as better than sex” (2013, 15). Still, others find contemporary youth to be “outer fixated, group
oriented and civically minded” and “cooperative team players” (Twenge et al., 2008, 879). While
this may be typical of contemporary American youth, there are substantial differences across cul-
tures. In Greece, it has become common to refer to youth as E 700 (i.e., those who cannot expect
a monthly wage higher than 700 EUr). “They’re overeducated, underemployed and, for the most

18 introduction Sergej Flere
part, still dependent financially on their parents. And, as the wave of riots that shook Greece last
december sharply illustrated, they’re also increasingly disillusioned” (Itano, 2009). The French, in
referring to this same phenomenon, refer to their youth as “the precarious generation” (Itano,
2009).
Another issue at the forefront of contemporary youth studies considers the characteristics of
narcissism and entitlement. Numerous authors have noted that contemporary youth have come to
harbor unrealistic attitudes, specifically where it concerns special treatment and entitlement com-
ponents, including exploitativeness. Thus, numerous expressions have appeared for young people,
including the “me generation” and the “whatever” generation, as well as the “me first” genera-
tion, which depict a nominal “we don’t care” attitude towards the world (Kirbiš, 2011). Lessard et
al. (2005, 522) consider narcissism and other expectations of entitlement to be increasing among
youth, i.e., they have “expectations of special privileges and exemptions”. Twenge and Foster fo-
cused on “the narcissism epidemic,” and in particular, how this increase can be quantified with a
measure of exactness. They have found that not all ethnic groups are affected in the same manner.
however, they do note that there has been a general increase since the onset of the 21st century
(Twenge and Foster, 2008). Once again, these findings must be viewed with some caution as his
work focused on the United States. Questions remain on whether a similar evolution has trans-
pired in Europe, particularly when factoring in the new social condition of youth transition. One
may speculate: if it is true that narcissism in on the rise, the confrontation with precarious social
conditions will be dramatic. The above notwithstanding, narcissism has also been noted to be a
typical feature of Slovenian youth by Godina (2010), a domestic social science scholar.
A further issue worth consideration is whether the youth period is followed not by adulthood
itself, but by the so-called emerging adulthood, i.e., a post-youth period where many of the major
transitions have yet to be completed. This issue should not be determined subjectively with an in-
tent to investigate and experiment with different lifestyles, but by examining the constraints found
within the social system, e.g., the lack of employment possibilities (Cote and Bynner, 2008; Fur-
long, 2009; 2013). however, this does not appear to be a period of what Arnett called independence
and exploration, but rather as an imposed period, whereby the possibilities to enter adulthood
are constrained. This report shall identify how this issue is particularly relevant in Slovenia. Not
only is emerging adulthood seen as a new transition, but also adulthood—as a state—has become
a questionable concept. As noted by Wyn, “boundaries between age categories are increasingly
fluid” (this should be understood as yet another component of the “fluid” nature of society itself
underscored by Bauman, and quoted by Wyn). Furthermore, “for those born after 1975”…”transi-
tions into adulthood are routinely seen as flawed, slow, [and] partial” (2011, 36).
In sum, youth are a historically and socially determined group. The changes found within con-
temporary social life may enhance its prominence; however, such changes primarily affect its na-
ture. Further, it has been argued that the concept of youth often eludes a specific definition, along
with other basic social notions like religion and family. however, certain indicators and features of
youth are prominent and beyond dispute:
ΔΔ ΔYouth is a transitional stage, although the commencement, duration, and finality of its
transition are disputable; it leads to adulthood and independence;
Sergej Flere IntroductIon 19
ΔΔ ΔIt is closely associated with degrees of education;
ΔΔ ΔIt is associated with sexual bonding, with marriage possibly occurring at later stages of
life than was the case for previous generations. Moreover, “marriage has lost much of its
significance for youth-adult transitions” (Furlong, 2013, 112);
ΔΔ ΔAn agency nature of youth is limited, constrained by objective factors;
ΔΔ ΔCultural specificity is also limited and constrained, although youth cultural styles abound
and often replace one another;
ΔΔ ΔYouth are always socially stratified; moreover, major social inequalities are reproduced
through the period of youth;
ΔΔ Δdespite numerous and universal technological and social influences on youth, it should
still be acknowledged that the nature of youth is not universally identical.
One characteristic noted above is particularly relevant for youth in Slovenia, where they are
often termed the “independence generation”. Namely, they are those who have experienced the
dissolution of Yugoslavia and the establishment of an independent Slovenian state at an early life
stage. Such events have likely molded the institutional framework for their social future. In addi-
tion, they are also experiencing the first major economic downturn, i.e., the so-called “economic
depression generation”, when even tertiary education fails to offer reliable job placement. As will
be elaborated on in the following chapters, permanent employment is within reach only for a small
minority, whereas the majority will likely face unemployment and career casualization (Lavrič and
Klanjšek, 2011).
The current study represents the latest contribution to Slovenia’s long history of youth research
(see: Naterer and Lavrič, 2011, 35-37), and aims to capture how and why today’s youth “feels and
breathes” in the context of fluid, reflexive, and risk-prone social reality.4
4 List of references on pp. 28-29.

Sergej flere and Marko Divjak ThE STUDy aND iTS OpERaTiONaLizaTiON 21
ThE STUdY ANd ITS OPErATIONALIZATION
1 Objectives
The current study follows, on the one hand, the longitudinal and comparative Shell series of
studies that began in Germany, specifically where it concerns its foci and methodology (hurrel-
mann et al., 2010), and, on the other hand, the more longitudinal Slovenian studies of youth (Ule,
2001; Lavrič et al., 2011). Thus, the present study, which is limited to survey and quantitative meth-
odologies, may help indicate the extent to which Slovenian youth have changed, whether any pos-
sible turnabouts may be noticed, and whether any comparative insights may be drawn. As noted
above, this study is the result of a survey investigation. The data was collected In June and July
of 2013, a period associated with tremendous economic crisis in Slovenia. Since the beginning of
2008, Slovenia’s gross domestic product (GdP) has fallen by approximately 8.5 percent; all indica-
tions are that this trend will continue in the near future. It is generally understood that this is the
most important basic social fact currently impacting youth in Slovenia.
Our main objectives were to uncover:
ΔΔ Δdescriptive factors, i.e., observing and analyzing youth transition processes, youth identity,
and youth behavior patterns in 2013;
ΔΔ Δstructural factors, i.e., analyzing phenomena and constructs that affect the issues under
description. These include both social and psychological factors, including the patterning
and association of the very phenomena under study, and their components;
ΔΔ Δlongitudinal factors, i.e., determining the changes of transition, identity, and behavioral
patterns over time, when preexisting data allow for such analyses;
ΔΔ Δcomparative factors, i.e., contextualizing Slovenian youth among national youth groups in
other European countries, when preexisting data allow for such analyses.
As such, this study corresponds primarily to the strand of research underscoring transition as
the essence of youth; an issue that has become ever more acute, particularly as it relates to length
(which has apparently expanded) and destination (which has increasingly become questionable).
22 ThE STUDy aND iTS OpERaTiONaLizaTiON Sergej flere and Marko Divjak
2 The structure of the study
The main guidelines of this study were established by Friedrich Ebert Stiftung (FES). The follow-
ing fields have been stressed as the fundamental research goals:
ΔΔ ΔLiving conditions and socioeconomic status;
ΔΔ ΔEducation, employment, and mobility;
ΔΔ ΔLifestyle - leisure, health, and media use;
ΔΔ ΔFamily and social networks;
ΔΔ ΔTrust and belonging;
ΔΔ ΔAnxieties and aspirations;
ΔΔ ΔPolitics and democracy;
ΔΔ ΔGovernance and development
These fields served also as fundamental guidelines for processing and classifying the data in
the final report. Thus, this study analyses young people in Slovenia from various aspects. Like-
wise, the scope of the research (the eight fields listed above) attempts to address broader social
phenomena.
ΔΔ ΔPart One provides a detailed view of the youth socioeconomic positions, and includes an
analysis of the income available to young people, poverty, and other similar conditions.
This section concludes with an analysis of the most important factors contributing to the
postponement of young people leaving their parental home.
ΔΔ ΔPart Two provides an overview of youth in the labor market; special attention is given to
unemployment and temporary employment. here, there appears to be degrees of special
treatment, particularly for women and university educated young people. This part also
deals with the issue of geographical mobility.
ΔΔ ΔPart Three begins with an analysis of the (considerably high) involvement of young people
in the education system. Special attention is given to the academic success of today’s
youth and how they feel about school. This section offers insight into how young people
regard non-formal forms of education and their activities in this field.
ΔΔ ΔParts Four, Five and Six offer general insights on how young people live their lives in terms
of leisure activities, media use, and health considerations.
ΔΔ ΔPart Seven examines family structures and youth attitudes toward marriage.
ΔΔ ΔPart Eight presents a general discussion of youth anxieties, and as well their aspirations
and value orientations. This part also taps into the personality traits of young people, and
presents a unique discussion on how youth envision their social and personal futures.
ΔΔ ΔPart Nine deals with youth trust and belonging, where special attention is given to their
feelings on religion and religiosity.
Δ Parts Ten and Eleven examine youth political attitudes and political participation,

Sergej flere and Marko Divjak ThE STUDy aND iTS OpERaTiONaLizaTiON 23
together with their views of politics, democracy, and challenges faced by youth in the
contemporary world.
ΔΔ ΔThe final chapter concludes with a brief summary of the main findings in this study and
attempts to place them within wider social and theoretical contexts.
3 Target population and sample
The target population of the Slovenian Youth Study consists of all citizens of the republic of
Slovenia aged 16 to 27. According to the Statistical Office of the republic of Slovenia (SUrS, 2013),
there were altogether N = 282,194 Slovenian citizens in that age group in 2012. As a means to re-
search this target population, a sample size of n = 900 respondents has been chosen as sufficient-
ly reliable in order to draw inferences to the whole population. The standard sampling error in this
case, assuming a 95 percent level of reliability, accounts for +/- 3.3 percentage points. This means
that population parameters differentiate from sample statistics by a maximum of +/- 3.3 percent-
age points, which is below the standard sampling error’s threshold value of +/- 5.0 percentage
points. hence, samples of this size are generally considered sufficiently representative for study-
ing large populations in Slovenia.
Of course, the representativeness of a sample does not only depend upon the sample size.
Consideration must be given to how the sample was drawn from the target population. due to
some technical and administrative issues, it was not possible to sample randomly from the Central
registry of the Slovenian Population, which normally generates the most representative samples.
In order to achieve the best substitute for a random sample, a stratified quota sample was used.
The target population was first stratified according to 12 statistical regions and 5 community types
(communities with a maximum of 2,000 residents; communities with 2,000 to 10,000 residents;
and communities with more than 10,000 residents, Maribor and Ljubljana), which resulted in 35
independent strata. Next, a two-stage sampling method was implemented within each stratum.
First, target settlements (primary sampling units) were randomly selected from the complete list
of settlements corresponding to particular statistical regions and settlement types (stratum). Sec-
ond, respondents were then chosen from the selected primary sampling units according to the
pre-set quota requirements.
To be more specific, the shares of the target population within each stratum were first comput-
ed. Based on these shares, it was then assessed how many respondents would be required to se-
lect from each stratum to achieve the net sample size of n = 900 respondents, so that the structure
of the sample would proportionally fit the structure of the target population according to statistical
regions and settlement types. The number of primary sampling units selected in the first sampling
stage within each stratum depended on the number of respondents required to select within each
stratum in the second sampling stage. As a rule of thumb, no more than 10 respondents were
generally selected per each primary sampling unit (Maribor and Ljubljana are exceptions as both
cities are categorized as one settlement and it was required to select more than 10 respondents
from each city in the sample). For example, in Podravska region there were 12 respondents to se-
lect from settlements with 2,000 to 10,000 residents. As a means to achieve more variability, two

24 ThE STUDy aND iTS OpERaTiONaLizaTiON Sergej flere and Marko Divjak
primary sampling units were selected (Slovenska Bistrica and Lenart) with six respondents being
interviewed in each primary sampling unit (instead of having all 12 respondents selected from one
primary sampling unit). Altogether 100 primary sampling units were selected. A detailed structure
of the sample is summarized in Table 1 below.
Table 1: Structure of the required sample
StatiStical region Settlement type* Stratum population
Sharerequired Sample (reSpondentS)
primary Sampling unitS (SettlementS)
Pomurska1 1 0.051 46 52 2 0.007 6 13 3 0.006 5 1
Podravska
1 4 0.095 85 92 5 0.013 12 23 6 0.008 7 14 7 0.035 32 3
Koroska1 8 0.023 20 22 9 0.017 15 2
Savinjska1 10 0.085 77 82 11 0.019 17 23 12 0.031 28 3
Zasavska1 13 0.009 8 12 14 0.006 6 13 15 0.008 7 1
Spodnjeposavska1 16 0.027 24 32 17 0.010 9 1
Jugovzhodna Slovenija1 18 0.053 48 52 19 0.014 13 23 20 0.011 10 1
Osrednjeslovenska
1 21 0.089 80 82 22 0.030 27 33 23 0.013 12 25 24 0.110 99 10
Gorenjska1 25 0.057 51 52 26 0.017 15 23 27 0.031 28 3
Notranjsko-kraska1 28 0.015 13 12 29 0.010 9 1
Goriska1 30 0.040 36 42 31 0.011 10 13 32 0.005 5 1
Obalno-kraska1 33 0.021 19 22 34 0.010 9 13 35 0.013 12 2
1.000 900 100
Note: *Settlement types: 1 – settlements with a maximum of 2,000 residents, 2 – settlements with 2,000 to 10,000 residents, 3 – settlements with more than 10,000 residents, 4 – Maribor, 5 – Ljubljana.

Sergej flere and Marko Divjak ThE STUDy aND iTS OpERaTiONaLizaTiON 25
The interviewers were instructed to search for potential respondents only within the selected
primary sampling units that were allocated to them. during the selection process, each interviewer
had to fulfill pre-set quota requirements with respect to gender, age, and completed level of edu-
cation. For each primary sampling unit, interviewers were given detailed instructions on (a) how
many males and females to select, (b) how many respondents from each of the three age groups
(16-19 years, 20-23 years, 24-27 years) to recruit, and (c) how many respondents with different
levels of completed education (primary education, secondary education, higher education) to in-
terview. Quotas were non-interlocking, which means the structure of respondents with respect
to gender, age, and education was only controlled at the level of the overall sample (not in each
stratum, nor in each primary sampling unit respectively).
4 data collection
data collection took place between May 29 and July 20,, 2013. The data was collected by means
of personal, face-to-face interviewing in the field, mostly in households. Before conducting field-
work, all of the interviewers attended one of the three introductory seminars (in Maribor, Ljublja-
na, or Koper), where they received detailed instructions about interviewing and the selection of
proper respondents. Besides quota requirements, interviewers were also instructed to interview
only one person per household, which is a common practice in sample selection due to the likely
greater similarity of respondents from the same household. Besides, if the potential respondent
had refused to participate in the survey, the interviewer had to write down the reason for his/her
non-response.
The questionnaire consisted of an oral and written part. The oral part was administered by an
interviewer, which means that the interviewer read aloud the questions and filled in the answers
of the respondent (for certain questions the interviewers were instructed to use show-cards to
make it easier for respondents to choose among the answers that were provided). After complet-
ing the oral part of the questionnaire, the interviewer distributed the written part of the ques-
tionnaire to the respondent and asked him/her to fill in the answers personally. The written part
of the questionnaire included more personal and intimate questions. It was assumed that the re-
spondents would likely give more sincere answers when being able to go through the questions
on their own.
After an interviewer had finished with the fieldwork and returned the filled-in questionnaires,
the validity of his/her questionnaires was checked with control phone calls to the respondents
that were interviewed in order to prevent fraud. Interviewers asked respondents to provide their
personal and contact information only for checking the quality of the fieldwork. To ensure ano-
nymity and confidentiality of collected information, a number of precautions were implemented to
prevent the potential abuse of personal data. Personal data was treated separately from respon-
dents’ answers to survey questions, so there has been no possibility to link the given answers
with particular respondents.
26 ThE STUDy aND iTS OpERaTiONaLizaTiON Sergej flere and Marko Divjak
4.1 response rate and reasons for non-response
during the fieldwork, 1,163 potential respondents were invited to participate in the survey.
Among them, 907 valid interviews were completed and incorporated into the data, while others re-
fused to participate. Thus, the overall response rate was 78.0 percent. The response rate is some-
what higher than would have probably been achieved had this study utilized a random sample of
respondents drawn from the Central registry of the Slovenian Population. Because this study used
stratified quota sampling, interviewers were not given a list of respondents to interview; instead,
they could select potential respondents among their friends, peers, acquaintances, and family
members, etc., which probably resulted in a higher response rate.
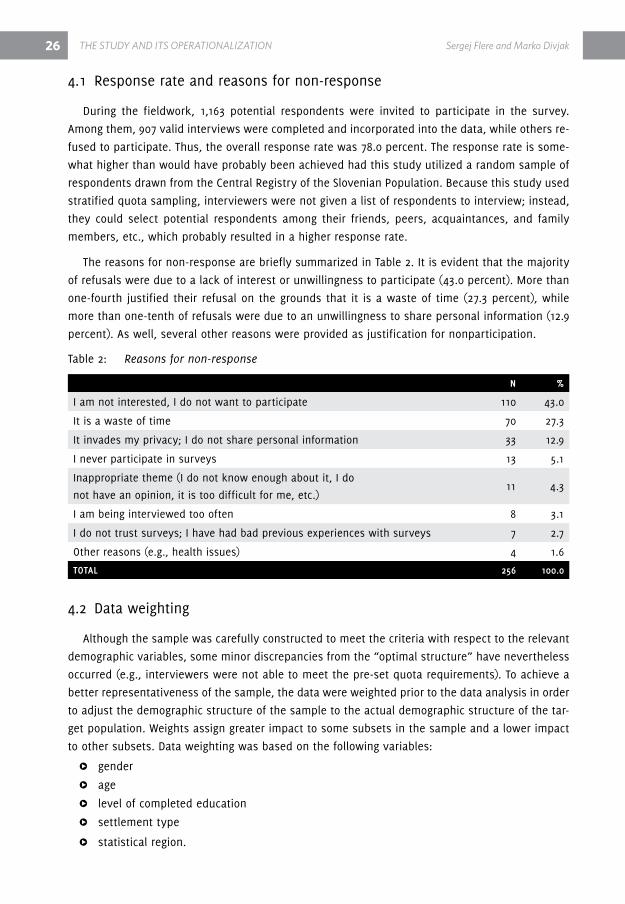
The reasons for non-response are briefly summarized in Table 2. It is evident that the majority
of refusals were due to a lack of interest or unwillingness to participate (43.0 percent). More than
one-fourth justified their refusal on the grounds that it is a waste of time (27.3 percent), while
more than one-tenth of refusals were due to an unwillingness to share personal information (12.9
percent). As well, several other reasons were provided as justification for nonparticipation.
Table 2: Reasons for non-response
n %
I am not interested, I do not want to participate 110 43.0
It is a waste of time 70 27.3
It invades my privacy; I do not share personal information 33 12.9
I never participate in surveys 13 5.1
Inappropriate theme (I do not know enough about it, I do
not have an opinion, it is too difficult for me, etc.) 11 4.3
I am being interviewed too often 8 3.1
I do not trust surveys; I have had bad previous experiences with surveys 7 2.7
Other reasons (e.g., health issues) 4 1.6
total 256 100.0
4.2 data weighting
Although the sample was carefully constructed to meet the criteria with respect to the relevant
demographic variables, some minor discrepancies from the “optimal structure” have nevertheless
occurred (e.g., interviewers were not able to meet the pre-set quota requirements). To achieve a
better representativeness of the sample, the data were weighted prior to the data analysis in order
to adjust the demographic structure of the sample to the actual demographic structure of the tar-
get population. Weights assign greater impact to some subsets in the sample and a lower impact
to other subsets. data weighting was based on the following variables:
ΔΔ Δgender
ΔΔ Δage
ΔΔ Δlevel of completed education
ΔΔ Δsettlement type
ΔΔ Δstatistical region.

Sergej flere and Marko Divjak ThE STUDy aND iTS OpERaTiONaLizaTiON 27
First, a post-stratification based on the combination of gender and the three age groups was
administered. Afterwards, a ranking method was implemented to adjust the weights according to
the level of completed education, settlement type, and statistical region.
Table 3: Comparison of demographic structure of target population with unweighted and weighted sample
Variable
population (%) unweighted Sample (%)
weighted Sample (%)
n = 282,194 n = 907 n = 907
GenderMale 51.7 48.4 51.7
Female 48.3 51.6 48.3
Total 100.0 100.0 100.0
Age 16-19 28.6 26.0 28.5
20-23 32.6 35.0 32.6
24-27 38.9 39.0 39.0
Total 100.0 100.0 100.0
Level of completed educationPrimary 30.2 29.8 30.2
Secondary 60.9 58.5 60.9
higher 8.9 11.7 8.9
Total 100.0 100.0 100.0
Settlement type up to 2,000 residents 56.4 57.0 56.3
2,000 to 10,000 residents 16.5 15.2 16.5
more than 10,000 residents 12.6 12.3 12.6
Maribor 3.5 3.6 3.5
Ljubljana 11.0 11.8 11.0
Total 100.0 100.0 100.0
Statistical region Pomurska 6.3 6.3 6.3
Podravska 15.1 15.1 15.1
Koroska 3.9 3.9 4.0
Savinjska 13.6 13.5 13.6
Zasavska 2.3 2.3 2.3
Spodnjeposavska 3.7 3.6 3.6
Jugovzhodna Slovenija 7.8 7.8 7.8
Osrednjeslovenska 24.2 24.9 24.2
Gorenjska 10.5 10.4 10.5
Notranjsko-kraska 2.5 2.4 2.5
Goriska 5.6 5.4 5.6
Obalno-kraska 4.4 4.4 4.4
Total 100.0 100.0 100.0

28 ThE STUDy aND iTS OpERaTiONaLizaTiON Sergej flere and Marko Divjak
Unweighted and weighted data are summarized in Table 3 above. here is evident that the demo-
graphic characteristics of the sample only slightly deviate from the demographic characteristics of
the target population, which means that a good quality sample has been achieved. Further proof
that the sample required only minor adjustments can be attributed to the relatively small range of
weights: the smallest weight accounts for 0.61 and the largest weight accounts for 1.60.
5 referencesAries, P. (1962). Centuries of Childhood. A Social history of Family Life. harmondsworth: Penguin.
Arnett, J.J. (2007). Emerging adulthood. What it is and what it is good for. Child development Per-
spectives, 1, 68-73.
Beck, U. and Beck Gernsheim, E. (2002). Individualization. Institutionalized Individualism and its
Social and Political Consequences. New delhi: Sage.
Chamberlayne, P. rustin, M. and Wengraf T. /eds./ (2003). Biography and Social Exclusion in Eu-
rope. Bristol: Policy Press.
Chisholm, L. and hurrelmann, K. (1995). Adolescence in modern Europe: Pluralized transition pat-
terns and their implications for personal and social risks. Journal of Adolescence, 18, 129-158.
Cohen, S. (1972). Folk devils and Moral Panics. London: MacGibbon and Kee.
Conolly, K. (2013). Angela Merkel: youth unemployment is most pressing problem facing Europe.
(http://www.guardian.co.uk/world/2013/jul/02/angela-merkel-youth-unemployment-europe (July,
2013).
Cote, J. and Bynner, J. (2008). Changes in the transition to adulthood in the UK and Canada: the
role of structure and agency in emerging adulthood. Journal of Youth Studies, 11, 251-68.
Eurostat (2013). data available: http://epp.eurostat.ec.europa.eu/tgm/table.do?tab=ta-
ble&init=1&language=en&pcode=tec00115&plugin=1 (June, 2013).
Godina, v.v. (2010). Narcisizem kot nevidna značilnost in dimenzija vedenja slovenske mladine.
Pp. 125-143 in Mladi 2010, ed. A. Natrerer. Maribor. Subkulturni azil.
hurrelmann, K., Albert M. and Quenzel, G. (2010). Shell Jugendstudie. Frankfurt: S. Fischer.
Itano, N. (2009). In Greece, education isn’t the answer. Global Post, 14 May.
Lavrič, M., Flere, S., Tavčar Krajnc, M., Klanjšek, r., Musil, B., Naterer, A., Kirbiš, A., divjak, M.
and Lešek, P. (2011). Youth 2010. The Social Profile of Young People in Slovenia. Ljubljana: Minis-
try of Education and Sports.
Lessard, M., Greenberger, E., Chuansheng, C. and Farruggia, S. (2011). Are youth’s feelings of enti-
tlement always ‘bad’? Journal of Adolescence, 34, 521-529.
Mannheim, K. (1923/1952). The problem of generations. In: Essays in the Sociology of Knowledge.
London: routledge and Kegan Paul.
Marcuse, h. (1969). Essay on Liberation. Boston, MA: Beacon.

Sergej flere and Marko Divjak ThE STUDy aND iTS OpERaTiONaLizaTiON 29
McWilliams, J.C. (2000). The 1960s Cultural revolution. Westport, CT: Greenwood.
Morsy, h. (2012). Scarred Generation. Finance and development 49(1), 15-17.
Twenge, J.M. and Foster, J. (2008). Mapping the scale of the narcissism epidemic: Increases in
narcissism 2002–2007 within ethnic groups. Journal of research in Personality, 42, 1619-1622.
UNESCO (n.d.). What do we mean by youth. Available at: http://www.unesco.org/new/en/so-
cial-and-human-sciences/themes/youth/youth-definition/, accessed 2 June, 2013.
Wyn, J. (2011). The sociology of youth: A reflection on its contribution to the field and future di-
rections. Youth Studies Australia, 30 (3) 34-39.

Rudi Klanjšek LiViNG CONDiTiONS aND SOCiOECONOMiC SiTUaTiON Of yOUTh 31
PArT I LIvING CONdITIONS ANd
SOCIOECONOMIC SITUATION OF YOUTh
1 Introduction
Living conditions and socioeconomic status, often understood as indicators of the position that
an individual or a group hold in a social structure, are among the most analyzed categories of
social life. This corresponds to the idea that at the core of the social sciences lies the question of
social stratification, namely what determines one’s position in a given social structure, and how
does that position influence an individual’s life(style) and worldview. Consequently, there is not
only an abundance of literature which deals with the issue of social structure and stratification,
but as well there are a great number of studies that hypothesize some sort of relationship between
the individual’s social (class) position, developmental outcomes, lifestyles, and world views, etc.
As such, questions pertaining to living conditions and socioeconomic status are of paramount im-
portance when analyzing youth. More specifically, the socioeconomic situation of youth is often
associated with the formation of their values and attitudes (Lewis, 1959; 1961), behavioral prob-
lems (Merton, 1968; Cohen, 1955; Cloward and Ohlin, 1961; Miller, 1958), and success in educational
endeavors (Bourdieu and Boltanski, 1981; Bourdieu and Passeron, 1977; Bernstein, 1971; Boudon,
1974). The latter point is of particular importance since it is often argued that in modern societies,
the socioeconomic position of individuals is largely seen as being heavily dependent on educa-
tional achievement. In short, the socioeconomic situation of youth is commonly a factor of degree
attainment (Considine and Zappalà, 2003; Graetz, 1995). Of course, the issue of whether schools
function as a “just” system, i.e., awarding those that are the most hardworking, or whether they
are merely mechanisms that enable social reproduction and legitimize social inequality (Apple,
1992) is still highly contested. Of course, this debate does not change the fact that the socioeco-
nomic situation of youth matters for a number of reasons.
Assessments on youth socioeconomic situations vary tremendously, but most scholarly re-
search focuses on poverty rates among youth, disposable incomes and their primary sources,
before analyzing the factors that determine the level income and their correlates. here, scholars
generally emphasize categories like employment status and levels of educational qualifications;
however, it is not possible to ignore other associative issues, e.g., access to the labor market and
education, mobility, housing and social policies, and social protection, etc. In this light, the eco-
nomic and social statuses of youth are closely associated with policies relating to the labor market,

32 LiViNG CONDiTiONS aND SOCiOECONOMiC SiTUaTiON Of yOUTh Rudi Klanjšek
welfare state measures, education, family, and other social policies. Inside this framework, most
studies also include indicators such as household income, where emphasis is given to parents’
social, cultural, and material capital.
2 Poverty among young Slovenians (still) below the European average
As Nagode, Smolej, and Boljka (2009) argue, when it comes to poverty, young Slovenians are in
a relatively good position compared to their European peers. however, they added that this favor-
able position “cannot be attributed to the labor market, which is hard for young people to get into,
but primarily to the functioning of an informal support network evident in young adults extending
the time they live in their original family [home], and the relatively successful functioning of the
social protection system” (Nagode, Smolej and Boljka, 2009, 57).
According to Eurostat (cut-off point: 60% of median equivalent income after social transfers),
the situation had not changed significantly between 2009 and 2011 (the last year for which the
data is available). The percentage of youth that was at risk of poverty was still at a markedly
lower level than it was for those in the EU-27 or EU-15 (see Figure 1). Specifically, the data indicate
that the poverty rate for Slovenia in 2011 was around half of the EU-27 or EU-15 rate. This suggests
that Slovenian youth (aged 16-24) ”enjoy” the second best relative position in the whole EU-27
area (only Cyprus has a lower official at-risk of poverty rate for this age group). however, it is also
true that the level of poverty risk in Slovenia is also below the European average (13.6 percent vs.
16.9 percent for the EU-15; see Figure 1). This data contrasts Slovenian public opinion. In 2010, 78
percent of Slovenians believed that poverty was very widespread (compared to 73 percent of Euro-
peans) (Eurobarometer, 2010). In addition, social transfers in 2011 lowered the poverty rate in Slo-
venia by 10.6 percent, which was higher than the EU-27 average (9.2 percent) (UMAr, 2013). Thus,
the social safety net in Slovenia is clearly working, both for youth and the general population.
The Eurostat data also indicate that while young people in Europe (aged 16-24) were more ex-
posed to poverty risk than the average European (aged 16-64; data not shown), in Slovenia the
opposite was true. The same discrepancy could be observed for the oldest segment of the popula-
tion (65+; Figure 1) or for the total population (Figure 1). Furthermore, for the period 2008-2011, the
increase in the share of those who were at risk of poverty was relatively smaller for youth (aged
16-24; +0.5 percent) than for the general population (+1.3 percent). Interestingly, a large part of
Slovenian youth (43 percent) believes that elderly subsidies should be cut in favor of the younger
generation (Figure 2).
As indicated in Figure 2, negative sentiments are much more common among Slovenian youth
than among German youth (43 percent vs. 30 percent, respectively), regardless of which Slovenian
study is considered (Youth 2010 or Youth 2013). This is especially surprising when considering the
fact that German youth are at greater risk of poverty than Germans aged 65+ (the opposite is
true when observing the same age cohorts in Slovenia). In addition, the share of Slovenian youth
who believe that the young should reduce their claims in favor of the elderly has also dropped
significantly, indicating that solidarity among generations is decreasing from already low levels.

Rudi Klanjšek LiViNG CONDiTiONS aND SOCiOECONOMiC SiTUaTiON Of yOUTh 33
Figure 1: At-risk-of-poverty rate (cut-off point: 60% of median equivalent income after social transfers) by age, sex, and region, 2011
Note: The level of poverty risk is expressed as the percentage of persons living in households with disposable equivalent income below the threshold of poverty risk (60 percent of median income per equivalent member)5.
Source: Eurostat (2013) – Population and social conditions/Employment and unemployment (Labor Force Survey).
While this “lack of objectivity” (a factor often associated with perceptions of poverty) is hard
to explain without more in-depth analysis, the relatively low levels of poverty among Slovenian
youth may be partly ascribed to the system of informal support, and to the fact that young people
in Slovenia tend to remain in the parental home longer (Mandič, 2009; for an in-depth analysis of
why young Slovenians stay at home for longer periods, consult Section 6 of this chapter, and see
Lavrič and Klanjšek, 2011). This suggests that the late departure from home is actually functional
in terms of maintaining this relatively favorable picture of youth social standing.
5 disposable equivalent income or disposable income per equivalent member is obtained by first calculating for each household the annual disposable net income (all net incomes from all household members are added up: employment, including reimbursement for food and travelling to work, self-employment, pension, unemployment benefit, reimbursement for sick leave, stipends, family and social benefits, interest, dividends, cash transfers received from other households, credit for the use of a company car for private purposes and part of the proprietary production of self-employed persons – the value of products transferred to the household from one’s own workshop, company or shop; transfers paid to other households and property tax, including compensation for the use of building land) are deducted from this. Then, for each household, disposable net income per equivalent member is calculated using the OECd adjusted equivalence scale. The scale gives the first adult member a weighting of 1, the second member aged 14 or over a weighting of 0.5, and children under 14 a weighting of 0.3. A four-member household of two adults and two children will thus have 2.1 equivalent adult members (calculation: 1 * 1 + 1 * 0.5 + 2 * 0.3 = 2.1). Income per equivalent member of household is calculated by dividing annual disposable net income of the household by the number of equivalent members of the household.
TotalEU 15
TotalEU 28
TotalSLO
16-24EU 15
16-24EU 28
16-24SLO
65+EU 15
65+EU 28
65+SLO
Total 16,9 16,7 13,6 21,9 22,0 10,8 16,4 16,0 20,9
Males 16,1 15,8 12,2 20,3 20,6 10,2 13,9 13,2 10,5
Females 17,6 17,5 15,0 23,5 23,6 11,5 18,1 18,4 27,8
0
5
10
15
20
25
30

34 LiViNG CONDiTiONS aND SOCiOECONOMiC SiTUaTiON Of yOUTh Rudi Klanjšek
Figure 2: Attitudes of young people (16-25) towards wealth distribution between generations, Slovenia and Germany, 2010, 2013
Sources: Eurostat – Population and social conditions/Living conditions and welfare/Income and living condition/Income distribution and monetary poverty; Youth 2010, SHELL 2010, and CEPYUS-FES Slovenian 2013 Youth Study.
Another factor seen as an indirect net against youth poverty is the mass inclusion of Slovenian
youth into the formal education system. here, Slovenia ranks first in the EU-27 in terms of youth
inclusion in regular education (in 2011, 71.7 percent of youth (aged 15-24) were included in some
sort of formal education). Enrollment bequeaths a number of benefits to the youth, including the
possibility of receiving subsidized food and transportation, access to the state grant system, and
access to student labor, which enables those who are enrolled (aged 15+) to enjoy a “privileged”6
position in the labor market. In previous research (Lavrič et al., 2011), respondents were asked
whether they were supplementing their income through earnings from occasional work, working
via the student employment service, or receiving earnings by other means. Among full-time stu-
dents, 78.3 percent answered in the affirmative in 2000, while 84.1 percent did so in 2010. In other
words, the vast majority of students use this scheme as a means to improve their economic posi-
tion, at least for the period in which they are enrolled in the education system (which in Slovenia
is above the EU-27 average). In addition, the proportion of working students has increased mark-
edly over the past decade.
6 These privileges should be understood in the context of lower taxes that the employer needs to pay when employing someone under the student work scheme. In addition, the employer has almost no obligation towards the employee - there are no health insurance expenses to be paid (those who work under this scheme are insured either via their parents or via their own contributions). The time spent under this scheme also does not count as an official work experience, and thus does not count as worktime when an individual reaches retirement age.
35
25
40
54
16
30
44
13
43
0
10
20
30
40
50
60
The wealth is distributed fairlybetween the young and the elderly
The young should reduce theirclaims in favor of the elderly
The elderly should cut back in favorof the younger
SLO Youth 2010
GER Youth 2010
SLO Youth 2013
AT RISK OF POVERTY (2010/2011):
GER (16-24): 19,1 /18,5SLO (16-24): 10,5 /10,8
GER (65+): 14,1 /14,2SLO (65+): 20,2 /20,9

Rudi Klanjšek LiViNG CONDiTiONS aND SOCiOECONOMiC SiTUaTiON Of yOUTh 35
Nevertheless, this “parallel” hiring system gives rise to several (potential) negative external-
ities, which over the long-term, could actually worsen the economic situation of young people.
Problems include the fact that the hiring system only benefits young people enrolled in the formal
education system, generates less tax revenues, creates opportunities for abuse among student
employees, and provides an incentive for young people to cheat the system by prolonging edu-
cational enrollment. The program also promotes uneven competition on the labor market. Specif-
ically, it creates less demand for those seeking a “regular”, full-time job, including young grad-
uates, as employers move to turn more and more jobs over to a temporary work staff. Klanjšek
and Lavrič’s recent study (2011) reveals that the proportion of temporarily and partly employed
persons (aged 15–24) in Slovenia exceeds the proportion of the same group in the economically
most advanced countries of Europe (EU-15) and the EU as a whole (EU-27); this has been on the
rise over the past decade. Specifically, while the proportion of those that were permanently em-
ployed was almost cut in half between 2000 and 2010, the proportion of young people performing
contract work has almost doubled. In 2010, contract workers accounted for more than one-quarter
of those performing steady work. As this scheme exerts a downward pressure on earnings (see
the section on incomes), and given that temporary employment increases the risk of poverty (the
rate is higher among temporary employees than those with permanent jobs, UMAr, 2010, 138),
it is reasonable to anticipate that this will negatively affect the current rates of poverty. In fact,
recent statistics show that this has already begun. Slovenia was one of seven countries that in
2009-2011 experienced the fastest increase in at-risk-of-poverty rate (2.3 percent; EU-27 average
0.6 percent) (UMAr, 2013).
3 Incomes of young people in Slovenia – stagnating and falling behind
A longitudinal analysis of Eurostat data indicates that for 2005, the average annual equivalent
net disposable income of young people in the EU-15 (aged 16–24) was approximately 70 percent
higher than the income of young people in Slovenia (or 35 percent higher against the EU-27 aver-
age). By 2009, the gap had shrunk to around 38 percent (or 15 percent using the EU-27 average),
suggesting that Slovenia was a success story. however, from 2009 onward the gap has begun to
widen, and as of 2011, stood at 45 percent. The current negative economic situation in Slovenia
suggests that this gap will likely increase in the coming years. Similar trends can be seen for
neighboring EU countries (particularly Croatia, and to some extent Italy and hungary) and diverg-
es when compared to those less affected by the economic crisis (Austria). Until 2009, Slovenia had
been able to close the gap somewhat with its northern neighbor; however, this has widened from
around 70 percent (in 2009) to more than 83 percent (in absolute terms) in just over two years
(Figure 3).
however, as can be seen in Figure 3, the differences in disposable incomes are smaller when
prices differentials are taken into account (PPP - right side of Figure 3). In this way, the aforemen-
tioned difference between the net disposable income of Austrian and Slovenian youth falls from

36 LiViNG CONDiTiONS aND SOCiOECONOMiC SiTUaTiON Of yOUTh Rudi Klanjšek
80 to 50 percent.7 The reduction in the difference is even more noticeable when young Slovenians
are compared to their Italian counterparts. Whereas young Italians in 2011 had a disposable in-
come that was, in absolute terms, just over 30 percent higher than the disposable income of young
Slovenians, that same income would buy them only 9 percent more (of comparable goods). Never-
theless, the data indicate that from 2009 onwards the purchasing power of Slovenian youth has
decreased alongside their Croatian counterparts. In all other neighboring countries, the purchasing
power of youth (aged 16-24) strengthened.
Figure 3: Average annual equivalent disposable net income* of youth (16-24), expressed in EUR 1999 and in PPP**), by countries neighboring Slovenia, 2005–2011
Notes: * The basis for the calculation is the annual equivalent disposable net income of households that participated in the survey of income and living conditions (SILC) on the basis of which the disposable net income per equivalent member is computed. This provides the basis for calculating average income for Slovenia overall, and by specific age groups. Average income is thus not calculated on the basis of income received by persons at a certain age, but on the basis of the equivalent income of persons of a certain age (which depends on the income of the household in which the persons live). The (weighted) equivalent income of persons in the age group is added up and divided by the number of persons (weighted) in the age group.
** PPP – purchasing power parity (excludes the effect of price differences).
Source: Eurostat (2013) – Population and social conditions/Living conditions and welfare/Income and living condition/Income distribution and monetary poverty.
7 It is important to note that in 2009, this ratio was 70 to 30. Thus, in just two years Slovenian youth lost a significant part of their purchasing power when compared to their Austrian peers. The same holds true when comparing Slovenia against hungary and Italy.
0,0
5000,0
10000,0
15000,0
20000,0
25000,0
2005 2008 2009 2010 2011 2005 2008 2009 2010
€
16 - 24 EU 15
16 - 24 Croatia
16 - 24 Italy
16 - 24 Hungary
16 - 24 Austria
16 - 24 Slovenia
in EUR 1999 in PPP

Rudi Klanjšek LiViNG CONDiTiONS aND SOCiOECONOMiC SiTUaTiON Of yOUTh 37
As indicated by Klanjšek (2011), this process started even before 2009 for those who had been
working via contract or the student work scheme (Figure 4). In other words, the economic situa-
tion of some groups worsened even when the average disposable net income for the whole grew.
Figure 4: Estimate of average monthly disposable income of young people (16–25 yrs.) by employment status, in Euros*, 2000 - 2013
Note: *Average disposable income for 2000 was converted at the official exchange rate into EUR and then revalued, with the start and end date taken as 15 June (2000/2013). The same procedure was employed (sans conversion) for 2010 data.
Sources: Youth 2000, Youth 2010 and CEPYUS-FES Slovenian 2013 Youth Study.
Based on the total disposable net income estimates for young people, one could argue that in
the last 13 years only certain groups of young people have gained, mainly those that are steadily
employed or those who are self-employed. However, in 2013 even these groups have experienced
income reductions. The results show that after 2010, the situation deteriorated for all occupation-
al groups except for the economically weakest group, i.e., those with no steady employment and
the unemployed. The situation appears to be even worse for those performing contract work and
those doing a variety of jobs via the student employment service. In real terms, their position was
better than that of their peers in 2000.8 All this has led to a situation where the average monthly
8 The reduction in earnings from contract work can doubtlessly be linked to the increased scope of student work, which also includes increasingly poorly paid work, for which growing numbers of eligible people are competing (expansion of tertiary education).
736663
611510
219
1007
847923
457
250
880 856905
401
285
0
200
400
600
800
1000
1200
Permanentemployment
Fixedterm/temporary
employement
Self-employed (incl.farmers)
Contract/studentwork
No steadyemployment/Does
not work
Youth 2000 Youth 2010 Youth 2013

38 LiViNG CONDiTiONS aND SOCiOECONOMiC SiTUaTiON Of yOUTh Rudi Klanjšek
disposable income of young people today is practically identical to what it was 13 years ago (2000:
410 EUr; 2010: 389 EUr; 2013: 385 EUr).9
Further, young Slovenians today live in a far more unequal society in terms of income distribu-
tion than was the case 13 years ago. According to Eurostat, the Gini coefficient for Slovenia rose
from 22 in 2000 to 23.8 in 2011 (last available data).10 Mirroring these statistics is the growing gap
between the number of young people who feel that their family’s material position is “below/well
below average” and those who feel it to be “above/well above average” (Figure 5).
Figure 5: Self-assessment of material situation of respondents’ family, Youth (16-25 yrs.), 2000-2013
Sources: Youth 2000, Youth 2010 and CEPYUS-FES Slovenian 2013 Youth Study.
despite the constant push for a more flexible labor market (i.e., a remedy for Slovenia’s slipping
competitiveness; WEF [2012]) and for less social security (considered necessary to close the grow-
ing budget deficit increasing public debt; SUrS [2012]), it is not surprising that Slovenian youth are
relatively pessimistic about the country’s economic outlook (Table 4).
9 The data also show that the amounts presented are noticeably lower than those given by Eurostat. Specifically, our research indicates that the average disposable annual income of young people (16–24 years) hovers around 4,600 EUr, the equivalent annual disposable income in 2011 for the same age group in Slovenia amounted to 11,794 EUr. Although this can be attributed to a different method of calculation (“equivalisation”), it still seems that the Eurostat data is somewhat inflated. Namely, the amount for 2011, listed by Eurostat is higher than the amount obtained by multiplying the average net monthly pay, which according to the Slovenian statistical office (SUrS), amounted to around 980 EUr in September 2011.
10 however, it should be noted that this is still well below the EU-28 (30.7) or the EU-15 (30.8) average, making Slovenia still one of the most egalitarian societies in the European community.
0,4
10,0
81,3
8,0
0,31,4
17,0
77,0
4,10,6
3,7
39,844,1
11,0
1,40
10
20
30
40
50
60
70
80
90
Well aboveaverage
Above average Average Below average Well belowaverage
Youth 2000
Youth 2010
Youth 2013

Rudi Klanjšek LiViNG CONDiTiONS aND SOCiOECONOMiC SiTUaTiON Of yOUTh 39
Table 4: Mean analysis (ANOVA) of “What will, in your opinion, be economic situation in your country in the next 10 years?” 16-25 yrs., by country
SloVenian=677
croatian=926
KoSoVon=870
What will, in your
opinion, be the economic
situation in your country
in the next 10 years?
(1=will be much worse;
5=will be much better)
Mean Sd Mean Sd Mean Sd F Sig.
2.74a 1.12 3.44b 0.89 3.90c 0.85 284.2 p<0.001
Note: Means having different superscript letters are significantly different at the p<0.001 based on Tamhane’s T2 post hoc comparisons.
Sources: CEPYUS-FES Slovenian 2013 Youth Study, IDIZ-FES Croatian 2012 Youth Study, IDRA-FES Kosovo 2012 Youth Study.
The results of the mean analysis (ANOvA) indicate that Slovenian youth (aged 16-25) are signifi-
cantly (p < 0.001) more pessimistic about the future economic situation of the country than their
peers in Croatia and Kosovo (although both are socially and economically worse off)11. More spe-
cifically, almost 44 percent of Slovenian youth expect that the economic situation in Slovenia over
the next ten years will be much or somewhat worse than it is today (by comparison, for Croatia
13 percent; and for Kosovo, 8 percent).
4 Slovenian youth still relatively satisfied with their lives in general, but the effect of economic crisis is showing
Given the current economic situation in Slovenia, one could surmise that the country’s youth
feel less satisfied with their lives than previous generations had. More precisely, various studies
indicate that subjective well being (SWB), income (security), and economic stability mutually rein-
force one another (see for e.g., Inglehart, 1997, 2000; diener and Seligman, 2004; Lima and Novo,
2006; diener, Tay and Oishi, 2013).
Indeed, the below longitudinal analysis clearly indicates a fall in subjective well-being among
youth, which had been climbing between 1991 to 2005 (Figure 6).
One indication of the relationship between economic turmoil (since 2009) and SWB can be seen
in the statistically significant correlation (r=0.10 p<0.05) between respondents’ income (which, on
11 Although there is no official UN data for Kosovo (it is still included under Serbia), Serbia ranks lower (64) on hdI than Croatia (43) and Croatia ranks lower than Slovenia (21) .

40 LiViNG CONDiTiONS aND SOCiOECONOMiC SiTUaTiON Of yOUTh Rudi Klanjšek
average, is stagnating or even decreasing for some occupational groups) and SWB (controlling for
the effect of age, gender, occupational status, health, social ties and appearance)12.
Figure 6: Assessment of subjective well-being, Youth 18-25, 1992-2013
Note: 1=very dissatisfied, 10=very satisfied
Sources: World Values Survey (2009; aggregated file), Youth 2010, CEPYUS-FES Slovenian 2013 Youth Study.
5 Young males still earning more than young females, but the gap is small and shrinking
A mean comparison of disposable income by gender indicates that young men have significant-
ly (p < 0.05) higher disposable incomes (424 EUr) than young women (342 EUr). This remains true
for each occupational group. however, when performing a mean analysis (t-tests) across different
occupational groups (see Table 5), the results show that the only statistically significant difference
(p < 0.05) could be observed for those in a “fixed-term employment” group (“permanent employ-
ment” being close).
12 The selection of controlling variables was made after analyzing zero-order correlations, which for example indicate that the effect of age on SWB is negative, while the effect of age on income is positive, weakening the effect of income on SWB.
55,25,45,65,8
66,26,46,66,8
77,27,47,67,8
8
1992 1995 1999 2005 2010 2013
Year

Rudi Klanjšek LiViNG CONDiTiONS aND SOCiOECONOMiC SiTUaTiON Of yOUTh 41
Table 5: Mean analysis (t-test) of respondents’ income (16-25), by gender and occupational status
permanent employment
Fixed term/ temporary employment
SelF-employed Student unemployed
Mean t/Sig. Mean t/Sig. Mean t/Sig. Mean t/Sig. Mean t/Sig.
Males
(disposable
income,
in EUr)
931 1.94 897 2.40 981 0.53 274 0.33 353 0.15
Females
(disposable
income,
in EUr)
773 0.06 750 0.02* 600 0.64 281 0.74 368 0.89
Note: *p<0.05.
Source: CEPYUS-FES Slovenian 2013 Youth Study.
This corresponds to the official Eurostat data, which indicates that the Gender Pay Gap13 in Slo-
venia (for the whole population) is the lowest (2.3 in 2011, down from 5.0 in 2007) among all EU
countries for which data exist and well below the EU-27 level (2011: 16.2). For example, in Austria
the Gender Pay Gap remains around 24; by comparison, hungary (18), Croatia (17), and Italy (16)
are further behind (all data is for 2011).
6 Living in relatively small households, together with more educated parents - “The Mediterranean” pattern continues
The current study reveals that Slovenian youth live in comparatively smaller households in
terms of the number of people living under one roof (Figure 7).
Specifically, the average household size in Slovenia is comprised of 3.4 persons. For compara-
tive purposes, Croatian households are made up of 3.6 persons, and Kosovar households average
5.7 persons.14 Slovenian youth also tend to have better-educated parents than was the case in
2000, but comparatively, parents of Slovenian youth have achieved (on average) the same educa-
tional level as those in Croatia. however, both the percentage of those having tertiary education,
and the share of those who have finished the primary level are higher in Slovenia (Figure 8).
13 The unadjusted Gender Pay Gap (GPG) represents the difference between average gross hourly earnings of male paid employees and female paid employees as a percentage of the average gross hourly earnings of male paid employees. The numbers presented are for industry, construction, and services (and exclude the activities of households acting as employers and extra-territorial organizations and bodies).
14 These numbers are understandably higher than the official data published by national statistical offices or Eurostat since all youth surveys used in the current study exclude households that did not include a young person.

42 LiViNG CONDiTiONS aND SOCiOECONOMiC SiTUaTiON Of yOUTh Rudi Klanjšek
Figure 7: Average household size, by country
Sources: CEPYUS-FES Slovenian 2013 Youth Study, IDIZ-FES Croatian 2012 Youth Study, IDRA-FES Kosovo 2012 Youth Study.
Figure 8: Education level, respondents’ parents, Slovenia, 2000 and 2013, Croatia 2012
Sources: Youth 2000, CEPYUS-FES Slovenian 2013 Youth Study, and IDIZ-FES Croatian 2012 Youth Study.
3,44 3,58
5,65
0
1
2
3
4
5
6
Slovenia Croatia Kosovo
27,1 21,613,3 11,3 6,2 3,8
56 60,7
60,2 66,6 75 77,3
16,9 17,726,9 22,1 18,9 18,9
0
20
40
60
80
100
120
Mother Father Mother Father Mother Father
SLO Youth 2000 SLO Youth 2013 CRO Youth 2012
Tertiary level
Secondary level
Primary level or less
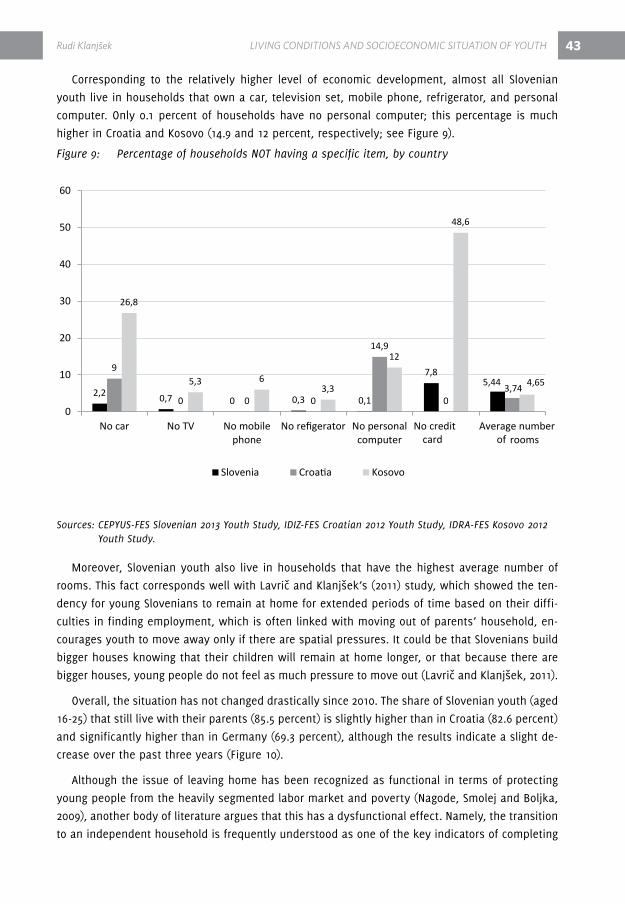
Rudi Klanjšek LiViNG CONDiTiONS aND SOCiOECONOMiC SiTUaTiON Of yOUTh 43
Corresponding to the relatively higher level of economic development, almost all Slovenian
youth live in households that own a car, television set, mobile phone, refrigerator, and personal
computer. Only 0.1 percent of households have no personal computer; this percentage is much
higher in Croatia and Kosovo (14.9 and 12 percent, respectively; see Figure 9).
Figure 9: Percentage of households NOT having a specific item, by country
Sources: CEPYUS-FES Slovenian 2013 Youth Study, IDIZ-FES Croatian 2012 Youth Study, IDRA-FES Kosovo 2012 Youth Study.
Moreover, Slovenian youth also live in households that have the highest average number of
rooms. This fact corresponds well with Lavrič and Klanjšek’s (2011) study, which showed the ten-
dency for young Slovenians to remain at home for extended periods of time based on their diffi-
culties in finding employment, which is often linked with moving out of parents’ household, en-
courages youth to move away only if there are spatial pressures. It could be that Slovenians build
bigger houses knowing that their children will remain at home longer, or that because there are
bigger houses, young people do not feel as much pressure to move out (Lavrič and Klanjšek, 2011).
Overall, the situation has not changed drastically since 2010. The share of Slovenian youth (aged
16-25) that still live with their parents (85.5 percent) is slightly higher than in Croatia (82.6 percent)
and significantly higher than in Germany (69.3 percent), although the results indicate a slight de-
crease over the past three years (Figure 10).
Although the issue of leaving home has been recognized as functional in terms of protecting
young people from the heavily segmented labor market and poverty (Nagode, Smolej and Boljka,
2009), another body of literature argues that this has a dysfunctional effect. Namely, the transition
to an independent household is frequently understood as one of the key indicators of completing
2,2 0,7 0 0,3 0,1
7,85,44
9
0 0 0
14,9
03,74
26,8
5,3 63,3
12
48,6
4,65
0
10
20
30
40
50
60
No car No TV No mobilephone
No refigerator No personalcomputer
No credit card
Average number of rooms
Slovenia Croatia Kosovo
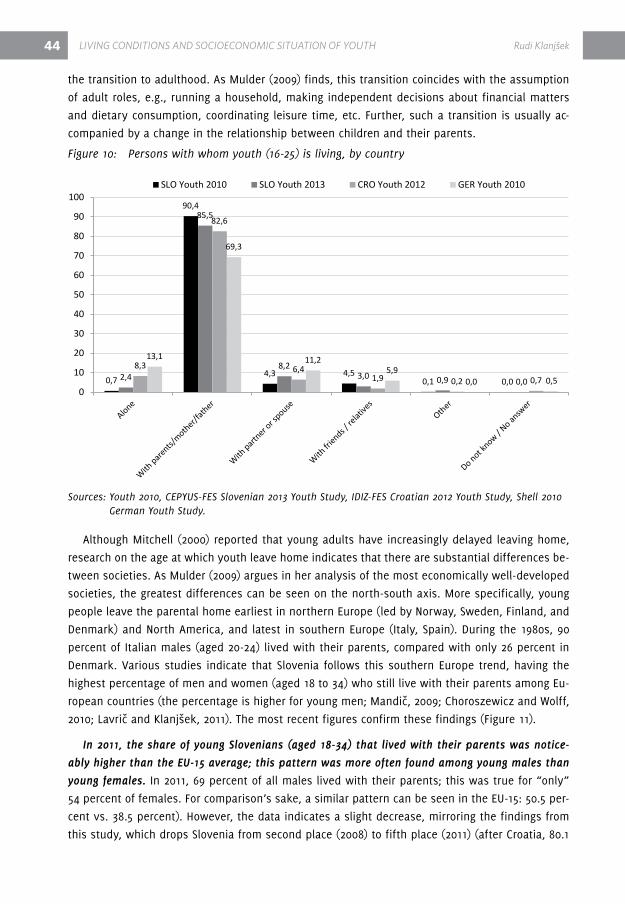
44 LiViNG CONDiTiONS aND SOCiOECONOMiC SiTUaTiON Of yOUTh Rudi Klanjšek
the transition to adulthood. As Mulder (2009) finds, this transition coincides with the assumption
of adult roles, e.g., running a household, making independent decisions about financial matters
and dietary consumption, coordinating leisure time, etc. Further, such a transition is usually ac-
companied by a change in the relationship between children and their parents.
Figure 10: Persons with whom youth (16-25) is living, by country
Sources: Youth 2010, CEPYUS-FES Slovenian 2013 Youth Study, IDIZ-FES Croatian 2012 Youth Study, Shell 2010 German Youth Study.
Although Mitchell (2000) reported that young adults have increasingly delayed leaving home,
research on the age at which youth leave home indicates that there are substantial differences be-
tween societies. As Mulder (2009) argues in her analysis of the most economically well-developed
societies, the greatest differences can be seen on the north-south axis. More specifically, young
people leave the parental home earliest in northern Europe (led by Norway, Sweden, Finland, and
denmark) and North America, and latest in southern Europe (Italy, Spain). during the 1980s, 90
percent of Italian males (aged 20-24) lived with their parents, compared with only 26 percent in
denmark. various studies indicate that Slovenia follows this southern Europe trend, having the
highest percentage of men and women (aged 18 to 34) who still live with their parents among Eu-
ropean countries (the percentage is higher for young men; Mandič, 2009; Choroszewicz and Wolff,
2010; Lavrič and Klanjšek, 2011). The most recent figures confirm these findings (Figure 11).
In 2011, the share of young Slovenians (aged 18-34) that lived with their parents was notice-
ably higher than the EU-15 average; this pattern was more often found among young males than
young females. In 2011, 69 percent of all males lived with their parents; this was true for “only”
54 percent of females. For comparison’s sake, a similar pattern can be seen in the EU-15: 50.5 per-
cent vs. 38.5 percent). however, the data indicates a slight decrease, mirroring the findings from
this study, which drops Slovenia from second place (2008) to fifth place (2011) (after Croatia, 80.1
0,7
90,4
4,3 4,50,1 0,02,4
85,5
8,23,0 0,9 0,0
8,3
82,6
6,41,9 0,2 0,7
13,1
69,3
11,25,9
0,0 0,50
10
20
30
40
50
60
70
80
90
100SLO Youth 2010 SLO Youth 2013 CRO Youth 2012 GER Youth 2010
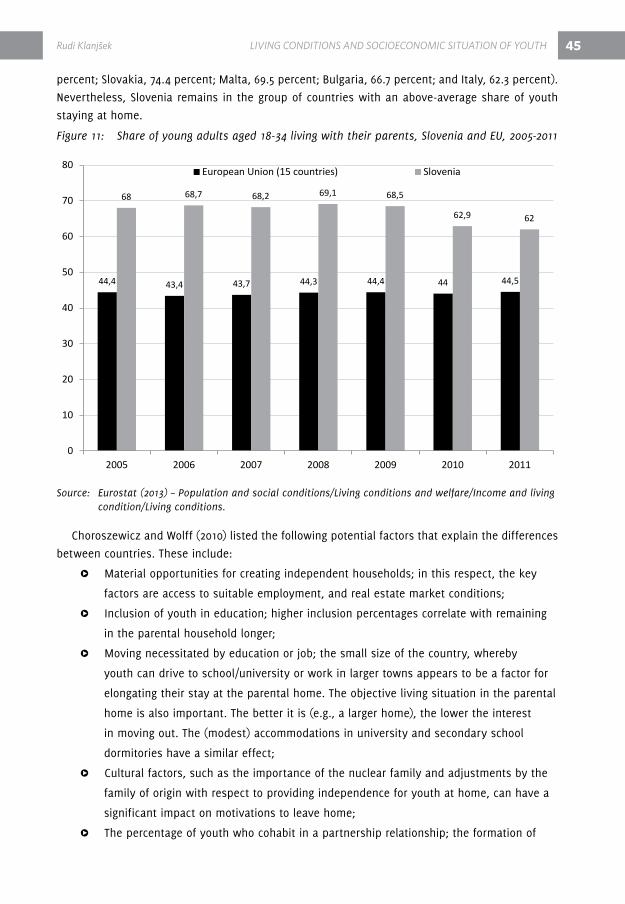
Rudi Klanjšek LiViNG CONDiTiONS aND SOCiOECONOMiC SiTUaTiON Of yOUTh 45
percent; Slovakia, 74.4 percent; Malta, 69.5 percent; Bulgaria, 66.7 percent; and Italy, 62.3 percent).
Nevertheless, Slovenia remains in the group of countries with an above-average share of youth
staying at home.
Figure 11: Share of young adults aged 18-34 living with their parents, Slovenia and EU, 2005-2011
Source: Eurostat (2013) – Population and social conditions/Living conditions and welfare/Income and living condition/Living conditions.
Choroszewicz and Wolff (2010) listed the following potential factors that explain the differences
between countries. These include:
ΔΔ ΔMaterial opportunities for creating independent households; in this respect, the key
factors are access to suitable employment, and real estate market conditions;
ΔΔ ΔInclusion of youth in education; higher inclusion percentages correlate with remaining
in the parental household longer;
ΔΔ ΔMoving necessitated by education or job; the small size of the country, whereby
youth can drive to school/university or work in larger towns appears to be a factor for
elongating their stay at the parental home. The objective living situation in the parental
home is also important. The better it is (e.g., a larger home), the lower the interest
in moving out. The (modest) accommodations in university and secondary school
dormitories have a similar effect;
ΔΔ ΔCultural factors, such as the importance of the nuclear family and adjustments by the
family of origin with respect to providing independence for youth at home, can have a
significant impact on motivations to leave home;
ΔΔ ΔThe percentage of youth who cohabit in a partnership relationship; the formation of
44,4 43,4 43,7 44,3 44,4 44 44,5
68 68,7 68,2 69,1 68,5
62,9 62
0
10
20
30
40
50
60
70
80
2005 2006 2007 2008 2009 2010 2011
European Union (15 countries) Slovenia

46 LiViNG CONDiTiONS aND SOCiOECONOMiC SiTUaTiON Of yOUTh Rudi Klanjšek
cohabitation partnership relationships increases the likelihood of moving away from the
parental home earlier.
While the above list indicates the general reasons why Slovenians choose to remain at home
longer, there are as well as number of individual factors (described below).
6.1 The material opportunities for moving out are narrowing
various studies indicate that material factors such as regular employment, income, housing
prices, and rents are a key factor in why youth decide to leave the parental home (cf. Nillson and
Strandh, 1999; vertot, 2009; Choroszewicz and Wolff, 2010). Given that the percentage of fully em-
ployed youth (aged 16-27) has decreased from 39 percent in 2000 to 21 percent in 2013 (see also
the section on employment), and that the percentage of temporarily employed youth (aged 15-
24) has increased dramatically over the same time period, from 43.2 to 72 percent (Slovenia is “a
leader” in this regard among all EU-27 countries), some could argue that the position of youth on
the labor market during the last decade has worsened with regard to stability and employment
security. Lavrič and Klanjšek (2011) note the relationship between employment and the likelihood
of leaving the parental home. Their study shows that 59.3 percent of young people (aged 25-29)
who were employed in a permanent position lived at home, while this share was much higher
(70.9 percent) for all other respondents in the same age group. Similar findings were obtained in
the current study (albeit a different age group was analyzed). The share of youth living with their
parents was lower among those permanently employed (70 percent, down from 72.5 percent in
2010) than it was for those in all other employment categories (82 percent, down from 86 per-
cent in 2010). however, as noted above, Lavrič and Klanjšek’s study (2011) clearly demonstrates
that employment encourages youth to move away from home if there are spatial pressures and
if one’s employment generates a sufficiently high income (which enables renting a flat or paying
off a housing loan).
Support for the latter hypothesis can be seen in mean comparisons of disposable incomes (for
those who are permanently employed) and place of living. Namely, the results indicate that those
permanently employed and living with their parents had on average lower disposable incomes
(872 EUr) than those who lived alone (1140 EUr) or with their partner (975 EUr). The importance of
material factors can also be traced to the major discrepancy between wishes and reality regarding
moving out. Among the permanently employed but still living with their parents (aged 16-27), 78
percent expressed that they would leave home if financial circumstances allowed. This sentiment
was shared across all occupational groups. Specifically, among those living with their parents,
regardless of occupational group, more than half stated that they would rather live in their own
household if they had the financial means to do so. This sentiment was markedly different among
Croatian youth, where percentages were much lower. This possibly indicates why Croatia ranks
first in the EU-28 in terms of the share of young adults (aged 18-34) who cohabitate with their par-

Rudi Klanjšek LiViNG CONDiTiONS aND SOCiOECONOMiC SiTUaTiON Of yOUTh 47
ents (i.e., indicating why the share of young people living with their parents in Croatia drops less15
with age when compared to Slovenia; see Figure 12).
Figure 12: Attitudes of youth (16-27) toward various living conditions/arrangements, Slovenia and Croatia (Which of the following statements best describe your situation/your wish regarding living arrangement?)
Sources: CEPYUS-FES Slovenian 2013 Youth Study, IDIZ-FES Croatian 2012 Youth Study.
15 In Slovenia, the share of youth (aged 16-27) that lives with their parents is around 80 percent, dropping to around 62 percent when the older cohort is included (aged 18-34) (Eurostat data). In Croatia, around 74 percent of youth (aged 16-27) live with their parents (IdIZ-FES Croatian Youth Survey, 2012), while the share of those aged 18-34 is approximately 80 percent (Eurostat, 2013).
17,0 11,822,5 23,4 17,3
48,662,9 65,4
57,6
39,9
78,276,3
68,0 66,7 74,7
47,5
37,117,6 35
52,6
0%
10%
20%
30%
40%
50%
60%
70%
80%
90%
100%
Perm
anen
t em
ploy
men
t
Fixe
d te
rm/t
empo
rary
em
ploy
emen
t
Self-
empl
oyed
(inc
l. fa
rmer
s)
Stud
ent
Une
mpl
oyed
Perm
anen
t em
ploy
men
t
Fixe
d te
rm/t
empo
rary
em
ploy
emen
t
Self-
empl
oyed
(inc
l. fa
rmer
s)
Stud
ent
Une
mpl
oyed
SLO Youth 2013 CRO Youth 2012
Don’t know / No answerOtherI would like to live alone but my parents disagreeI would live alone if financial circumstances allowed itI (would) live with my parents because it is the simplest solution for our family

48 LiViNG CONDiTiONS aND SOCiOECONOMiC SiTUaTiON Of yOUTh Rudi Klanjšek
6.2 Low levels of family discord, short distances, adequate infrastructure and high education enrollment levels all weaken the pressure to leave home
Among the many factors for leaving the parental home, authors also note the level of family
discord (less harmony contributes to sooner departure) (Mulder, 2009). In terms of relationship
quality between children and parents, Slovenia ranks first among European countries. According
to data from 2010, 84.5 percent of all respondents consider their relationship with their mothers to
be good or very good; with respect to fathers, this figure is 76.4 percent. 88.8 percent mostly or
entirely agree that their parents love them (Lavrič et al., 2011). however, as Figure 13 indicates, the
level of family (dis)harmony between Slovenian, Croatian, and German youth reveals no significant
differences. It should be noted here that the share of German youth (aged 16-25) who still live with
their parents is considerably smaller than in Slovenia and Croatia (Figure 10).
Figure 13: Family (disharmony) among Slovenian, Croatian and German youth (16-25)
Sources: CEPYUS-FES Slovenian 2013 Youth Study, IDIZ-FES Croatian 2012 Youth Study, Shell 2010 German Youth Study.
In fact, the highest level of family harmony can be found among German youth, regardless of
which group was analyzed (all/only those that still live with their family). On the other hand, the
highest level of family disharmony is in Croatia, which as indicated above, ranks first across the
entire EU-28 in terms of the share of youth (aged 18-34) still living with their parents.
As such, one could argue that family (dis)harmony among Slovenian youth is not a decisive
factor in terms of leaving the parental home when compared to other issues (e.g., the position of
youth on the labor market and stagnating/falling incomes). Along with good living and emotional
conditions of parental (co)habitation, and the fact that over 91 percent of youth travel to school or
work by car, bus, or train (where the average distance to work or school is only 22 km), this seems
to alleviate the pressure on youth to move away from their parents.
33,8 29,336,7 32,8 28,6
35,5
58,557,2
54,8 60,358,1
58,5
5,411,4 6,1 5,5
11,75,3
0%
10%
20%
30%
40%
50%
60%
70%
80%
90%
100%
SLO Youth2013
CRO Youth2012
GER Youth2010
SLO Youth2013
CRO Youth2012
GER Youth2010
All Still living with their parents
Don’t know / No answer
We have a very conflictualrelationship
In general, we do not get along, weoften argue
We get along, although sometimeswe have differences in opinion
We get along very well

Rudi Klanjšek LiViNG CONDiTiONS aND SOCiOECONOMiC SiTUaTiON Of yOUTh 49
Figure 14: Mean comparisons, various attitudes, Slovenian and German youth (aged 16-25)
Notes: *Mean is significantly different at p<0.001.
Sources: CEPYUS-FES Slovenian Youth Study 2013, Shell 2010 German Youth Study.
Moreover, it is worth reiterating that Slovenia sits at the top of the EU-27 in terms of youth inclu-
sion in regular education. According to data cited by Choroszewicz and Wolff, Slovenia (77 percent)
ranks first in Europe by a wide margin in terms of the percentage of youth (aged 18-24) who live
at home and are simultaneously enrolled in the education system (for the entire EU-27, this figure
is 58.8 percent). however, as indicated by Kuhar, Slovenia has a relatively high student dropout
rate (one-third of all thsoe enrolled) and an above-average length of study period (seven years on
average). In her opinion, higher education “serves mainly as a kind of incubator which enables
people to delay their entry onto the labor market” (2009, 29). As mentioned above, enrollment in
regular education enables youth to participate in the student labor scheme, which contributes con-
siderably to extending the study period and to the mass enrollment in higher education. however,
the downside of this is lower (security) income, which likely prevents youth from pooling enough
material resources to leave the parental home.
0,000,501,001,502,002,503,003,504,004,505,00
It is necessary to know what onewants to achieve in life*
He who does not risk, does notget anything
Those who care for others willultimately be rewarded*
It makes no sense to set goalstoday because everything is so
uncertain*
In order for society to function weneed moral values*
Today it is impossible tosympathize with others in grief*
It is necessary to believe in fateand accept what life has to
offer*
In life you have to surroundyourself with people, who can
be leaned on*
In life, it is enough to have somefriends and have fun*
It is necessary to focus on acareer, everything else is less
important*
It is necessary to distance awayfrom the outside world and live in
your own world, becauseotherwise life is very difficult*
An important part of liferepresents an interest in current
events in society*
In life, it is the best to adapt andto do what others are doing*
SLO Youth 2013 GER Youth 2010
1=Completely disagree 5=Completely agree
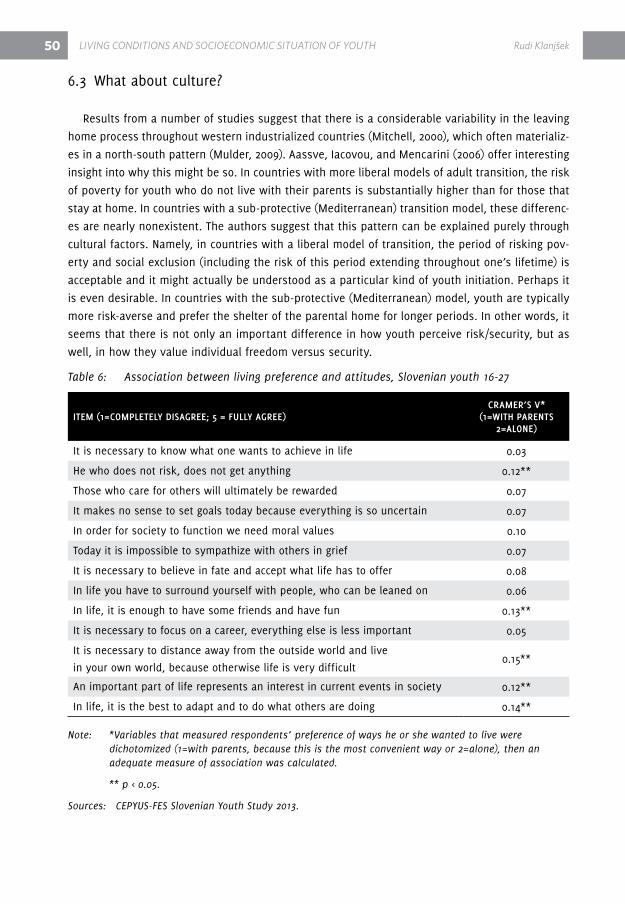
50 LiViNG CONDiTiONS aND SOCiOECONOMiC SiTUaTiON Of yOUTh Rudi Klanjšek
6.3 What about culture?
results from a number of studies suggest that there is a considerable variability in the leaving
home process throughout western industrialized countries (Mitchell, 2000), which often materializ-
es in a north-south pattern (Mulder, 2009). Aassve, Iacovou, and Mencarini (2006) offer interesting
insight into why this might be so. In countries with more liberal models of adult transition, the risk
of poverty for youth who do not live with their parents is substantially higher than for those that
stay at home. In countries with a sub-protective (Mediterranean) transition model, these differenc-
es are nearly nonexistent. The authors suggest that this pattern can be explained purely through
cultural factors. Namely, in countries with a liberal model of transition, the period of risking pov-
erty and social exclusion (including the risk of this period extending throughout one’s lifetime) is
acceptable and it might actually be understood as a particular kind of youth initiation. Perhaps it
is even desirable. In countries with the sub-protective (Mediterranean) model, youth are typically
more risk-averse and prefer the shelter of the parental home for longer periods. In other words, it
seems that there is not only an important difference in how youth perceive risk/security, but as
well, in how they value individual freedom versus security.
Table 6: Association between living preference and attitudes, Slovenian youth 16-27
item (1=completely diSagree; 5 = Fully agree)cramer’S V*
(1=with parentS2=alone)
It is necessary to know what one wants to achieve in life 0.03
he who does not risk, does not get anything 0.12**
Those who care for others will ultimately be rewarded 0.07
It makes no sense to set goals today because everything is so uncertain 0.07
In order for society to function we need moral values 0.10
Today it is impossible to sympathize with others in grief 0.07
It is necessary to believe in fate and accept what life has to offer 0.08
In life you have to surround yourself with people, who can be leaned on 0.06
In life, it is enough to have some friends and have fun 0.13**
It is necessary to focus on a career, everything else is less important 0.05
It is necessary to distance away from the outside world and live
in your own world, because otherwise life is very difficult0.15**
An important part of life represents an interest in current events in society 0.12**
In life, it is the best to adapt and to do what others are doing 0.14**
Note: *Variables that measured respondents’ preference of ways he or she wanted to live were dichotomized (1=with parents, because this is the most convenient way or 2=alone), then an adequate measure of association was calculated.
** p < 0.05.
Sources: CEPYUS-FES Slovenian Youth Study 2013.

Rudi Klanjšek LiViNG CONDiTiONS aND SOCiOECONOMiC SiTUaTiON Of yOUTh 51
Although cross-cultural research is plagued by problems (how does one adequately “measure
culture”), the following analysis represents an attempt to identify differences/similarities among
youth living in two different developmental contexts (Slovenia and Germany). This study uses a
wide set of measures in order to identify better the differences and potentially extract useful in-
formation with regard to culture’s influence on leaving home (Figure 14).
The results indicate that on average, Slovenian youth are significantly (p < 0.001) more “pas-
sive-fatalistic” (e.g., “It makes no sense to set goals today because everything is so uncertain;”
“It is necessary to believe in fate and accept what life has to offer”), “apathetic” (“An important
part of life represents an interest in current events in society”), “hedonistic” (“In life, it is enough
to have some friends and have fun), “conformant” (“In life, it is the best to adapt and to do what
others are doing”), less career-driven (“It is necessary to focus on a career, everything else is less
important”) and less goal-oriented (“It is necessary to know what one wants to achieve in life).
Interestingly, there is one particular attitude type —risk-taking— where mean analysis reveals no
statistical significance (although it was close: Sig.= 0.06). In other words, while there are import-
ant differences in attitudes on surroundings, the question remains as to whether and how much
they contribute to leaving the parental home. The following section, including Table 6, attempts to
explain these attitudes.
The results above show that a preference to live (or plan to live) with parents is significantly
associated with different attitudes to risk, hedonism, reclusivism, apathy, and conformity. Thus,
it is possible to argue that differences in the selected attitudes matter (to some extent) and that
such differences between Slovenian and German youth do play a role in decisions to leave home.
6.4 Why girls move out sooner?
As indicated by this study and others (Lavrič, et al., 2011), the percentage of young men who
live full-time in their parental home is higher than the percentage of women regardless of age
group. For example, one study in 2010 (Lavrič et al., 2011) found that while nearly 40 percent of
women (aged 25-29) do not live with their parents, this is true only for 19 percent of men in the
same age group. Similar discrepancies can be seen in this study (see Figure 15).
Mulder (2009) hypothesizes that the difference between men and women is a matter of maturi-
ty, i.e., moving away from home requires a certain level of maturity, and women move away soon-
er because they tend to mature earlier than men. One question here is whether women are simply
able to leave home sooner because of help they receive from an (older) partner, or whether they
want to live alone as suggested by Mulder (2009; see also hooimeijer and Mulder, 1998). For young
Slovenian women, the latter explanation seems unlikely given that among all women who do not
live at home (aged 24-27) only 13 percent live alone. For men, the share is much higher (30 per-
cent). This is also discernible from figures concerning the whole population of women (aged 24-27):
around 5 percent live alone (men, 8 percent) and around 31 percent live with their partner (men,
16 percent). Therefore, one can conclude that women probably do not leave the parental homes
sooner than men only because they mature earlier or want to live alone. rather, they on average
form partnership relationships with slightly older men who are “willing/able to support them and
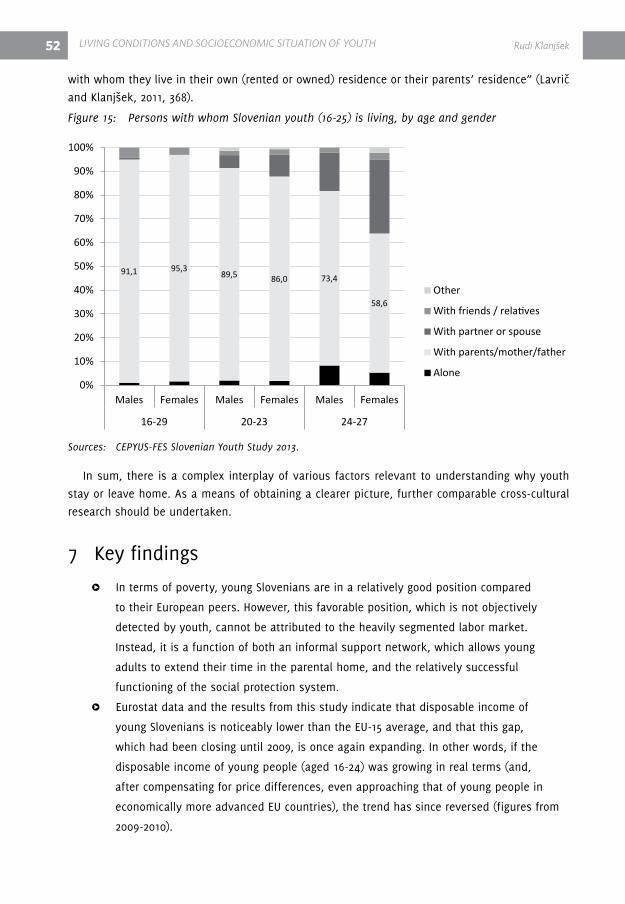
52 LiViNG CONDiTiONS aND SOCiOECONOMiC SiTUaTiON Of yOUTh Rudi Klanjšek
with whom they live in their own (rented or owned) residence or their parents’ residence” (Lavrič
and Klanjšek, 2011, 368).
Figure 15: Persons with whom Slovenian youth (16-25) is living, by age and gender
Sources: CEPYUS-FES Slovenian Youth Study 2013.
In sum, there is a complex interplay of various factors relevant to understanding why youth
stay or leave home. As a means of obtaining a clearer picture, further comparable cross-cultural
research should be undertaken.
7 Key findings
ΔΔ ΔIn terms of poverty, young Slovenians are in a relatively good position compared
to their European peers. however, this favorable position, which is not objectively
detected by youth, cannot be attributed to the heavily segmented labor market.
Instead, it is a function of both an informal support network, which allows young
adults to extend their time in the parental home, and the relatively successful
functioning of the social protection system.
ΔΔ ΔEurostat data and the results from this study indicate that disposable income of
young Slovenians is noticeably lower than the EU-15 average, and that this gap,
which had been closing until 2009, is once again expanding. In other words, if the
disposable income of young people (aged 16-24) was growing in real terms (and,
after compensating for price differences, even approaching that of young people in
economically more advanced EU countries), the trend has since reversed (figures from
2009-2010).
91,1 95,389,5 86,0 73,4
58,6
0%
10%
20%
30%
40%
50%
60%
70%
80%
90%
100%
Males Females Males Females Males Females
16-29 20-23 24-27
Other
With friends / relatives
With partner or spouse
With parents/mother/father
Alone
Rudi Klanjšek LiViNG CONDiTiONS aND SOCiOECONOMiC SiTUaTiON Of yOUTh 53
ΔΔ ΔAnalysis of the estimated total monthly disposable income of young people (aged 16-
25) in Slovenia reveals a significantly lower figure than is depicted by Eurostat data.
Moreover, these figures have been stagnant (in real terms) over the previous 13
years. This is perhaps a consequence of the reduction in the number of young people
with steady employment (who are on average higher earners), and an increase in
the proportion of contract workers (whose incomes are falling because of increased
numbers). Further, detailed analysis indicates that after 2010, the situation has
deteriorated for all occupational groups except for the economically weakest group
(composed of those with no steady employment or the unemployed).
ΔΔ ΔOfficial Eurostat data and the current study indicate that economic inequality in
Slovenia is on the rise.
ΔΔ Δresults from a mean analysis indicate that Slovenian youth (aged 16-25) are
significantly (p<0.001) more pessimistic about the future economic situation of their
country when compared to their peers in Croatia and Kosovo (although in both these
countries, the youth are socially and economically worse off). Almost 44 percent of
Slovenian youth expect that the economic situation in Slovenia over the next ten years
will be much or somewhat worse than it is today (compared to Croatia (13 percent) and
Kosovo (8%)). Consequently, a longitudinal analysis of subjective well-being indicates a
negative trend.
ΔΔ ΔAlthough young men earn more than young women irrespective of employment status,
the differences continue to fall, putting Slovenia at the bottom of the gender pay gap
among countries with the lowest gender pay gap.
ΔΔ ΔSlovenian youth live in relatively small, materially well-equipped households (almost all
households have a car, personal computer, access to the Internet, and a mobile phone,
etc.). Moreover, parents tend to be better-educated. On the other hand, the results
indicate that “the Mediterranean” pattern continues in terms of the share of youth that
still live in the parental home (Slovenians are far above the European average). Yet the
results from this study indicate a break in the trend, i.e., that the share has begun to
decrease. This finding is supported by Eurostat data, which indicate that Slovenia fell
from second to fifth place in the EU-27.
8 referencesAassve, A., Iacovou, M., and Mencarini, L. (2006). Youth poverty and transition to adulthood in.
Europe. demographic research, 15 (2), 21–50.
Apple, M. W. (1992). Šola, učitelj in oblast. Ljubljana: Znanstveno in publicistično središče, zbirka
družboslovje.
Bernstein, B. (1971). Class, Codes and Control, vol. I. London: routledge & Kegan Paul.
54 LiViNG CONDiTiONS aND SOCiOECONOMiC SiTUaTiON Of yOUTh Rudi Klanjšek
Boudon, r. (1974). Education, Opportunity and Social Inequality. New York: John Willey and Sons.
Bourdieu, P. & Boltanski, L. (1981) The Educational System and the Economy: Titles and Jobs, in:
C. Lemeret (Ed.) French Sociology: rupture and renewal since 1968. New York: Columbia Univer-
sity Press.
Bourdieu, P. & Passeron, J-C. (1977) reproduction in Education, Society and Culture. London:
Sage.
Choroszewicz, M., and Wolff, P. (2010). 51 million young EU adults lived with their parent(s) in
2008. Statistics in focus 50/2010. Eurostat.
Cloward, r.A., Ohlin, L.E. (1961). delinquency and Opportunity. Glencoe: The Free Press.
Cohen, A.K. (1955). delinquent Boys. Glencoe: The Free Press.
Considine, G., Zappalà, G. (2003). The Influence of Social And Economic disadvantage in the Aca-
demic Performance of School Students in Australia. Journal of Sociology, 38 (2): 129–148.
diener E., Tay L., Oishi S. (2013). rising income and the subjective well-being of nations. J Pers
Soc Psychol., 104(2): 267-76.
diener, E. Seligman, M. E.P. (2004): Beyond Money: Toward an Economy of Well-Being. Psycholog-
ical Science in the Public Interest, 5(1): 1–31.
Eurobarometer 321 (2010). Poverty and Social Exclusion. Fieldwork: August - September 2009.
www.ec.europa.eu/public_opinion/archives/ebs/ebs_321_en.pdf ,9. 12. 2010
Eurostat (2013). various databases. Available at: http://epp.eurostat.ec.europa.eu/portal/page/
portal/statistics/search_database [8. 8. 2013].
Graetz, Brian (1995): Socioeconomic Status in Education research and Policy. v J. Ainley, B. Grae-
tz, M. Long and M. Batten (ur.): Socioeconomic Status and School Education: 32–35. Canberra:
dEET/ACEr.
hooimeijer, P., & Mulder, C.h. (1998). Changing ways of leaving the parental home: With apart-
ner or alone. In A. Kuijsten, h. de Gans, & h. de Feijter (Eds.), The joy of demography... and other
disciplines. (pp. 137-151). Amsterdam: Thela Thesis
hurrelman, K. et al. (2010). Shell-Jugendstudie 2010. [data file]. München: TNS Infratest.
Ilišin, v., Bouillet, d., Gvozdanović, A. And Potočnik, d. (2012). Mladi u dinamičnom društvu: hr-
vatska 2012 [SPSS database]. Zagreb: Institut za društvena istraživanja u Zagrebu and Friedrich
Ebert Stiftung.
Inglehart, r. (1997): Modernization and Postmodernization. Cultural, Economic and Political
Change in 43 Countries. New Jersey: Princeton University Press.
Inglehart, r. (2000): Globalization and Postmodern values. Washington Quarterly. 23(1): 215–228.
Klanjšek, r. (2011). Economic status of young people. In M. Lavrič (Ed.). Youth 2010: The social
profile of young people in Slovenia, (pp. 349–365). Ljubljana: Ministry of Education and Sports,
Office for Youth; Maribor: Aristej.

Rudi Klanjšek LiViNG CONDiTiONS aND SOCiOECONOMiC SiTUaTiON Of yOUTh 55
Klanjšek, r., & Lavrič, M. (2011). Employment and enterpreneurship. In M. Lavrič (Ed.). Youth
2010: The social profile of young people in Slovenia, (pp. 131–186). Ljubljana: Ministry of Educa-
tion and Sports, Office for Youth; Maribor: Aristej.
Kuhar, M. (2009). Prehodi mladih v odraslost. In: Andrej Fištravec et al., (ed.), Modeli izo-
braževanja za mladinsko delo: strokovne podlage: razvoj modelov neformalnega in formalnega
izobraževanja za mladinskega delavca za vključevanje v programe organizacij, 1–30. Maribor:
IrdO –Institute for the development of Social responsibility.
Lavrič , M., & Klanjšek, r. (2011). Residential and housing conditions of young people. In M.
Lavrič (Ed.). Youth 2010: The social profile of young people in Slovenia, (pp. 367–395). Ljubljana:
Ministry of Education and Sports, Office for Youth; Maribor: Aristej.
Lavrič, M. et al. (2011). Youth 2010: Social profile of youth in Slovenia [data file]. Slovenia, Mari-
bor: Univerza v Mariboru = University of Maribor, Filozofska fakulteta = Faculty of Arts [produc-
tion], 2010. Slovenia, Ljubljana: Univerza v Ljubljani = University of Ljubljana, Arhiv družboslovnih
podatkov = Social Science data Archive [distribution].
Lewis, O. (1959). Five families. New York: Basic Books.
Lewis, O. (1961). Children of Sanches. New York: random house.
Lima, ML., Novo, r. (2006): So far so good? Subjective and social well-being in Portugal and Eu-
rope. Portugal Journal of Social Science, 5(1): 5–33.
Mandič, S. (2009). Stanovanjske razmere mladih. v: rakar, Tatjana, in Boljka, Urban (ur.), Med
otroštvom in odraslostjo, 57–75. Ljubljana: Ministry of Education and Sports, Office of the repub-
lic of Slovenia for Youth: Social Protection Institute.
Merton, r.K. (1968). Sociological Theory and Social Structure. New York: The Free Press.
Miheljak, v., Ule, M., rener, T., Mencin Čeplak, M., Tivadar, B., Kuhar, M. (2001).Mladina, 2000/
Youth 2000 [datoteka podatkov]. Ljubljana: Fakulteta za družbene vede. Center za socialno psi-
hologijo [izdelava], 2000. Ljubljana: Univerza v Ljubljani. Arhiv družboslovnih podatkov [distribu-
cija], februar 2001.
Miller, W. (1958). Lower Class Culture as a Generating Milieu of Gang delinquency. Journal of So-
cial Issues 14 (3): 5–20.
Mitchell, B. A. (2000). Integrating Conceptual, Theoretical and Methodological developments in
homeleaving research. Paper submitted to the workshop entitled, “Leaving home: A European
Focus,” Max Planck Institute for demographic research, research Group on the demography of
Early Adulthood, rostock, Germany, 6-8 September, 2000.
Mulder, C. h. (2009). Leaving the parental home in young adulthood. In: Andy Furlong (ed.),
handbook of Youth and Young Adulthood, pp: 203–209. London & New York: roudtledge.
Mulder, Clara. h. and Clark, W. A. v. (2000). Leaving home and leaving the State: evidence from
the United States. International Journal of Population Geography, 6:423–437.

56 LiViNG CONDiTiONS aND SOCiOECONOMiC SiTUaTiON Of yOUTh Rudi Klanjšek
Nagode, M., Smolej, S., Boljka, U. 2009. Socialni in ekonomski položaj mladih. v: rakar, Tatjana,
in Boljka, Urban (ur.), Med otroštvom in odraslostjo, 57–75. Ministry of Education and Sports, Of-
fice of the republic of Slovenia for Youth: Social Protection Institute.
Nilsson, K. and Strandh, M. (1999). “Nest Leaving in Sweden: The Importance of Early Educational
and Labor Market Careers.” Journal of Marriage and the Family 61:1068–1079.
Pasha, A., xhangolli, K., dundo, J. Gjokuta, B, Tahiri, Z. and Lena, O. (2012). Kosovo Youth Study
2012 [SPSS database]. Friedrich Ebert Stiftung and IdrA Kosova.
SUrS (2012). Statistični letopis, LI (51). Ljubljana: SUrS
UMAr (The Institute of Macroeconomic Analysis and development of the republic of Slovenia).
(2013). Poročilo o razvoju. Ljubljana: UMAr.
UMAr (The Institute of Macroeconomic Analysis and development of the republic of Slovenia)
(2010). Poročilo o razvoju 2010. Ljubljana: UMAr.
vertot, N. (2009). Mladi v Sloveniji. Ljubljana: Statistical Office of the republic of Slovenia.
WEF (2012). The Global Competitiveness report 2012–2013. Geneva: World Economic Forum.
World values Survey 1981–2008 Official Aggregate v.20090901. (2009). World values Survey Associ-
ation (www.worldvaluessurvey.org). Aggregate File Producer: ASEP/JdS, Madrid.

Miran Lavrič EMpLOyMENT aND MObiLiTy 57
PArT II EMPLOYMENT ANd MOBILITY
1 Employment
The transition of young people from education to employment is among the most active areas
of youth studies (Furlong, 2013, 73). Over the preceding decades, this particular area of studies
has become complex given that the transition to employment is taking longer and appears less
certain. Some authors even cast doubt on the term “transition”, since for an increasing portion of
the population, stable employment seems simply unattainable.
Like most European countries, Slovenia has undergone radical changes in the labor market, par-
ticularly over the last decade. On the one hand, unemployment rates are considerably high and
continue to rise. On the other hand, traditional forms of permanent employment have increasingly
been replaced by less secure and more flexible forms of employment. Such changes tend to be
more pronounced when it concerns young people. Some authors even speak about the “age-segre-
gation of the labor market” (Ignjatović and Trbanc, 2009), a reference to the disproportionally high
levels of unemployment and temporary employment among young people.
1.1 Youth unemployment is high and rising
As evident in Figure 16, between 2007 and 2012 the youth unemployment rate has increased
dramatically, both in Slovenia and in the EU. For the most part, it is a direct consequence of the
broader European economic crisis.
Another important finding in this period is that Slovenian youth have lost their favorable posi-
tion among the EU-27. In fact, according to the latest data (June 2013), the youth unemployment
rate in Slovenia was 24.1 percent (European Union Youth Unemployment rate Chart, n.d.), whereas
the EU-27 average was 23.2 percent (Slovenia Youth Unemployment rate Chart, n.d.). This is likely
a direct consequence of the recent severe macroeconomic problems that have swept through Slo-
venia as similar trends can be seen in adult unemployment rates.
A third finding evident in Figure 16 is the growing difference in the unemployment rate between
young people and the rest of the economically active population. In 2007, the difference between
the two groups was 5.9 percentage points; by 2012, this had risen to 12.7. A similar trend can be
observed in the EU-27, whereby one can conclude that the age gap regarding unemployment has
increased during the past ten years. This falls in line with the findings of other youth unemploy-
ment studies, which argue that this group is much more sensitive to economic fluctuations, i.e.,

58 EMpLOyMENT aND MObiLiTy Miran Lavrič
in times of recession, youth unemployment rates rise with greater velocity, while in periods of re-
covery, these same rates fall dramatically (Makeham, 1980; O’higgins, 2001).
Figure 16: Unemployment rate of the age group 15-25 years and 25-74 years, EU-27 and Slovenia, 2003-2012
Source: Eurostat (n.d.) – Population and social conditions/Employment and unemployment (Labor Force Survey)
It should be noted that the age gap in the labor market tends to persist regardless of the gen-
eral macroeconomic conditions. Already in the early 1980s, this systematic pattern began to ap-
pear in western societies following the recession in the United States and Western Europe (Furlong
and Cartmel, 2007, 36-37). In general, Furlong (2013, 77) identifies two basic reasons for the higher
unemployment rates among young people. First, young people are typically transitioning out of
school and seeking employment; thus, when macroeconomic conditions experience a downturn,
employers cease to recruit. Second, young people are more likely to find temporary employment,
which makes them more susceptible to layoffs in times of crises.
For Slovenia in particular, it should be stressed that the observed age gap parallels the long-
term pattern of developed countries, where the unemployment rate of young people is on aver-
age two to three times higher compared to the adult unemployment rate. Scarpetta, Sonnet and
Manfredi (2010) show that in 2008 the youth unemployment in OECd countries was on average 2.8
times higher than adult unemployment; by comparison, Slovenia’s youth unemployment rate was
2.6 times higher in 2012.
0,0
5,0
10,0
15,0
20,0
25,0
2003 2004 2005 2006 2007 2008 2009 2010 2011 2012
EU-27, 15-24 years
Slovenia, 15-24 years
EU-27, 25-74 years
Slovenia, 25-74 years
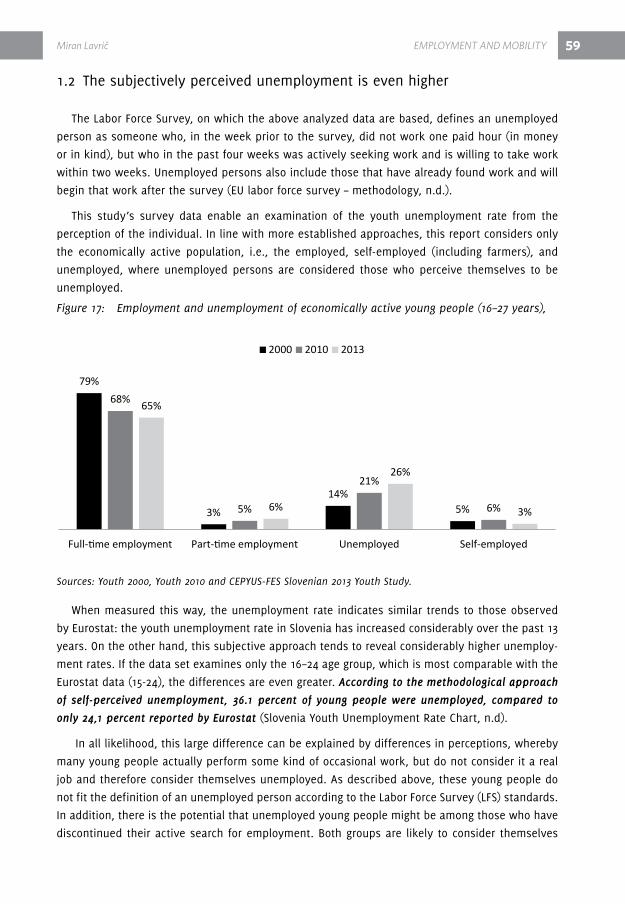
Miran Lavrič EMpLOyMENT aND MObiLiTy 59
1.2 The subjectively perceived unemployment is even higher
The Labor Force Survey, on which the above analyzed data are based, defines an unemployed
person as someone who, in the week prior to the survey, did not work one paid hour (in money
or in kind), but who in the past four weeks was actively seeking work and is willing to take work
within two weeks. Unemployed persons also include those that have already found work and will
begin that work after the survey (EU labor force survey – methodology, n.d.).
This study’s survey data enable an examination of the youth unemployment rate from the
perception of the individual. In line with more established approaches, this report considers only
the economically active population, i.e., the employed, self-employed (including farmers), and
unemployed, where unemployed persons are considered those who perceive themselves to be
unemployed.
Figure 17: Employment and unemployment of economically active young people (16–27 years),
Sources: Youth 2000, Youth 2010 and CEPYUS-FES Slovenian 2013 Youth Study.
When measured this way, the unemployment rate indicates similar trends to those observed
by Eurostat: the youth unemployment rate in Slovenia has increased considerably over the past 13
years. On the other hand, this subjective approach tends to reveal considerably higher unemploy-
ment rates. If the data set examines only the 16–24 age group, which is most comparable with the
Eurostat data (15-24), the differences are even greater. According to the methodological approach
of self-perceived unemployment, 36.1 percent of young people were unemployed, compared to
only 24,1 percent reported by Eurostat (Slovenia Youth Unemployment rate Chart, n.d).
In all likelihood, this large difference can be explained by differences in perceptions, whereby
many young people actually perform some kind of occasional work, but do not consider it a real
job and therefore consider themselves unemployed. As described above, these young people do
not fit the definition of an unemployed person according to the Labor Force Survey (LFS) standards.
In addition, there is the potential that unemployed young people might be among those who have
discontinued their active search for employment. Both groups are likely to consider themselves
79%
3%
14%5%
68%
5%
21%
6%
65%
6%
26%
3%
Full-time employment Part-time employment Unemployed Self-employed
2000 2010 2013

60 EMpLOyMENT aND MObiLiTy Miran Lavrič
as unemployed, while the LFS standards consider them as either employed or economically inac-
tive. Of course, such indicators are well-known by the research community. Andy Furlong, one of
the leading authors in the field of youth studies, argues that ”unemployment is a term with an
internationally agreed definition that is applied in ways that exclude large numbers of workless
people” (2013, 74).
Using a subjective approach, this report observes further the presence of unemployment among
different groups of young people.
Figure 18: Youth unemployment rates based on self-perception of the young, by major socio-demographic groups
Source: CEPYUS-FES Slovenian 2013 Youth Study.
The sizable gender gap with regards to youth unemployment has increased substantially since
2000, when there were virtually no differences between young men and women. In 2010, the un-
employment rate for women was 12 percentage points higher that it was for men (Klanjšek and
Lavrič, 2011, 153); this difference remained approximately the same in 2013.
Not surprisingly, sharp differences can be observed according to age. Once again, younger age
groups are more likely to be unemployed. This is at least partially connected to the fact that old-
er age groups have attained higher levels of education. Indeed, the differences in unemployment
are the most salient when factoring in achieved educational levels; 50 percent of the unemployed
have received only a primary level of education, while 13 percent have attained a tertiary level
degree. Similar patterns were observed in a recent youth study in Croatia (Ilišin et al., 2012, 11).
28%
17%
34%
25%
13%
50%
26%
13%
48%
43%
19%
22%
33%
up to 2.000 inhabitants
2.001 to 10.000 inhabitants
10.001 and more inhabitants
Maribor
Ljubljana
Elementary school or less
Secondary level
Tertiary level
16-19
20-23
24-27
Male
Female
Size
of r
esid
entia
lsett
lem
ent
Educ
ation
al le
vel
Age
Gen
der

Miran Lavrič EMpLOyMENT aND MObiLiTy 61
The only (and somewhat surprising) exception between these two studies is that young Croatians
who have attained only a primary level of education have a relatively lower unemployment rate.
Some of the more interesting differences appear when looking at community sizes. Not surpris-
ingly, Slovenia’s capital Ljubljana has the lowest youth unemployment rate, while as many as one-
third of the young population in middle-sized towns (from 10,000 to 50,000 inhabitants) consider
themselves unemployed.
1.3 has the safe haven of formal education reached its limits?
Some scholars argue that rising youth unemployment rates can be attributed to falling school
enrollment rates. As Furlong (2013, 78) notes, the youth unemployment rate in some European
countries did not increase sharply (primarily) because increased educational participation had re-
moved a sizable segment of the population from the labor market. According to data presented in
the Youth 2010 study, Slovenia had the highest school enrollment rate in the EU (in 2008) and at
the same time a comparatively low youth unemployment rate (Klanjšek and Lavrič, 2011). Further,
Metka Kuhar, one of the leading youth researchers in Slovenia, also noted that the country’s inclu-
sive education system “serves mainly as a kind of incubator which enables people to delay their
entry onto the labor market” (2009, 29).
Figure 19: Predominant activities, including schooling, of young people (aged 16–27)
Source: CEPYUS-FES Slovenian 2013 Youth Study.
Figure 19 illustrates the relationship between rising school enrollment rates and the falling
share of economically active youth. While these figures were largely stable between 2000 and
2010, they have seemingly reversed over the last three years. Thus, the stability of the education
enrollment rate appears to be among the most important factors affecting the unemployment
rate, i.e., the high education enrollment rate in Slovenia over the past decade likely prevented the
youth unemployment rate from increasing even more.
Support for this conclusion can be drawn from the 2012 study comparing Croatian and Slovenian
youth, which revealed similar results.
39%
1% 2%7%
48%
3%
22%
2% 2%7%
68%
1%
21%
2% 1%8%
67%
1%
Full-timeemployment
Part-timeemployment
Sef-employed Unemployed Student / Pupil Other
2000 2010 2013

62 EMpLOyMENT aND MObiLiTy Miran Lavrič
Figure 20: Predominant activities, including schooling, of young people (16–27 years), Slovenia (2013) and Croatia (2012)
Note: In order to make a comparison more clear, the category “other” was excluded from both samples.
Sources: CEPYUS-FES Slovenian 2013 Youth Study and IDIZ-FES Croatian 2012 Youth Study.
Figure 20 shows the large number of young Slovenians enrolled in the formal education sys-
tem. At least partially, these results show higher shares of employed youth in Croatia (31 percent
opposed to 24 percent in Slovenia); overall, however, this difference translates into much higher
unemployment rates among Croatian youth.
Thus, the argument that high education enrollment levels act as a buffer against unemploy-
ment is quite convincing. however, a hasty glance at the data suggests that this macro-economic
buffer has reached its limits in Slovenia. This is the result of (at least) two factors: the high cost of
financing high numbers of students by the state, and the increased saturation of the labor market
by tertiary degree graduates (Lavrič, 2011).
1.4 The increasing gender gap in transition from school to work
Lower rates of participation among women are one of the common patterns found in youth em-
ployment. According to a special report by the International Labor Organization (n.d.), men made
up 54 percent of the labor force in developed economies in 2005, compared to 49.6 percent for
women. The difference was even larger if one considers the world as a whole (63 percent vs. 46
percent, respectively).
A similar pattern can be observed in Slovenia if one combines the different basic activities into
three main groups (as seen in Figure 21).16 Further, the presented data clearly show a longitudinal
16 It should be noted that official statistics considers students performing student work as employed persons, whereas in our analysis we regard them rather as students, since this is (in most cases) in fact their primary activity. Consequently, the presented data are not directly comparable with official rates of labour force participation.
21%
2% 1%9%
68%
26%
4% 1%
24%
45%
Full-time employed Part-time employed Self-employed Unemployed Pupil/student
What do you do at the moment? Are you:
Slovenia Croatia
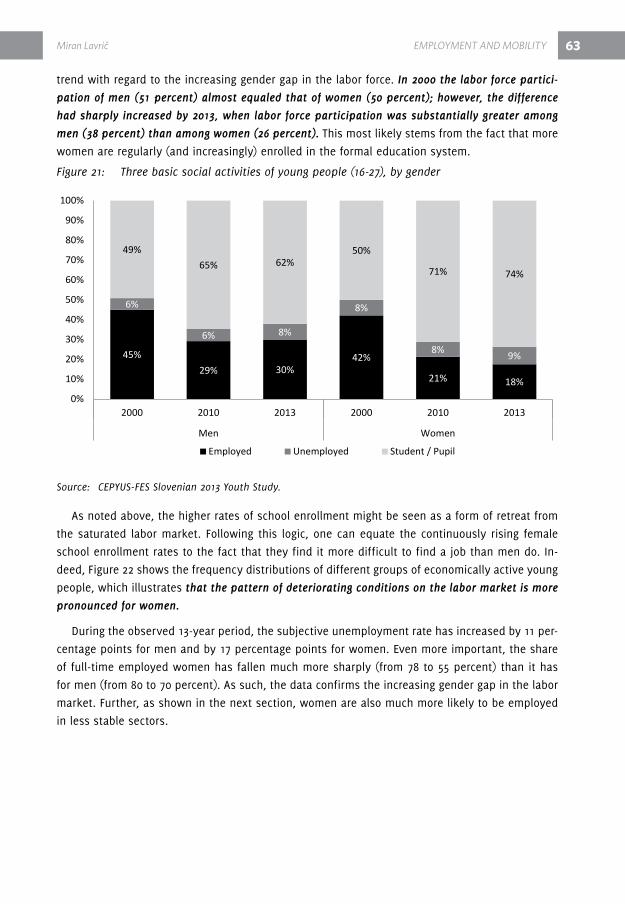
Miran Lavrič EMpLOyMENT aND MObiLiTy 63
trend with regard to the increasing gender gap in the labor force. In 2000 the labor force partici-
pation of men (51 percent) almost equaled that of women (50 percent); however, the difference
had sharply increased by 2013, when labor force participation was substantially greater among
men (38 percent) than among women (26 percent). This most likely stems from the fact that more
women are regularly (and increasingly) enrolled in the formal education system.
Figure 21: Three basic social activities of young people (16-27), by gender
Source: CEPYUS-FES Slovenian 2013 Youth Study.
As noted above, the higher rates of school enrollment might be seen as a form of retreat from
the saturated labor market. Following this logic, one can equate the continuously rising female
school enrollment rates to the fact that they find it more difficult to find a job than men do. In-
deed, Figure 22 shows the frequency distributions of different groups of economically active young
people, which illustrates that the pattern of deteriorating conditions on the labor market is more
pronounced for women.
during the observed 13-year period, the subjective unemployment rate has increased by 11 per-
centage points for men and by 17 percentage points for women. Even more important, the share
of full-time employed women has fallen much more sharply (from 78 to 55 percent) than it has
for men (from 80 to 70 percent). As such, the data confirms the increasing gender gap in the labor
market. Further, as shown in the next section, women are also much more likely to be employed
in less stable sectors.
45%29% 30%
42%
21% 18%
6%
6% 8%
8%
8% 9%
49%65% 62%
50%
71% 74%
0%
10%
20%
30%
40%
50%
60%
70%
80%
90%
100%
2000 2010 2013 2000 2010 2013
Men Women
Employed Unemployed Student / Pupil

64 EMpLOyMENT aND MObiLiTy Miran Lavrič
Figure 22: Basic types of economic activity, by gender
Source: CEPYUS-FES Slovenian 2013 Youth Study.
1.5 Youth as the flexible workforce
1.5.1 Flexible forms of employment
As discernible from the previous two figures, the share of young people in part-time employ-
ment has gradually risen since 2000. More precisely, the share of part-time employment has in-
creased from 3 to 6 percent.
Perhaps an even more important dimension of the increasing workforce flexibility is the grow-
ing share of fixed-term jobs (i.e., contracts typically lasting three-months to one-year).
Figure 23: Young people (16-27) in fixed term and permanent employment
Sources: Youth 2000, Youth 2010 and CEPYUS-FES Slovenian 2013 Youth Study.
80%70% 70%
78%66%
55%
3%5% 4%
3%
5%8%
6%8% 4%
4%
3%2%
11% 17% 22% 16%26%
33%
0%
10%
20%
30%
40%
50%
60%
70%
80%
90%
100%
2000 2010 2013 2000 2010 2013
Men Women
Full-time employment Part-time employment Self-employed (farmers included) Unemployed
42%53% 47%
59%47% 53%
2000 2010 2013
Fixed term employment Permanent employment

Miran Lavrič EMpLOyMENT aND MObiLiTy 65
As shown in Figure 23, the share of fixed-term jobs increased substantially between 2000 and
2010, but has curiously declined over the past three years (though these fluctuations are rather
small).
Further, student labor, particularly in Slovenia, represents the most common form of flexible
youth employment. The Labor Force survey considers young people performing student work as
employed persons. According to the data in this report, young people devote a substantial amount
of time to their student work. On average, student work amounts to 26.3 hours per week, which
is more than half of the average number of working hours per week (41.5) for formally employed
youth. The importance of student work becomes even more apparent when comparing the total
number of working hours per week for each of the relevant groups.
Table 7: Youth (16-27) by type of employment and by working hours per week
aVerage number oF
worKing hourS
number oF reSpondentS
Sum oF worKing hourS
percent oF reSpondentS
percent oF worKing hourS
Full-time employment 43 107 4585 20% 28%
Part-time employment 31 97 3017 18% 19%
Student labor 26 313 8232 60% 51%
Self-employed* 42 9 375 2% 2%
Total 32 526 16209 100.0% 100.0%
Note: *Including farmers.
Source: CEPYUS-FES Slovenian 2013 Youth Study.
Based on the above calculation, it can be assumed that student work is by far the most import-
ant form of youth participation in the labor market. Almost 60 percent of young people who work
use this form of employment, making up more than half of all the (taxed) work done by youth in
Slovenia.
Previous studies on Slovenia have noted the relative and increasing importance of student
work. Most recently, Klanjšek and Lavrič (2011, 161) argued that student labor played an increas-
ingly important role in the lives of young people in Slovenia between 2000 and 2010. For the pur-
pose of this study, the current situation is compared against the Eurostudent SI 2007 survey, which
showed that student work was performed by 65 percent of Slovenian students at the tertiary lev-
el (Eurostudent, 2007). According to this project’s data, the current number is about 63 percent,
which indicates that, along with enrollment in education, the student labor pool has reached its
peak and begun to gradually decline. One of the many reasons for this decline can be linked to
the increased taxation of student labor, which began in June 2012 as part of the national austerity
measures. In broad terms, there is reduced demand for any kind of work given the current eco-
nomic forecast.
Nevertheless, student work remains by far the most important form of youth employment. To-
gether with the other two types (part-time and self-employment), flexible forms of employment
represent 82 percent of the officially recognized work done by young people. In other words, only

66 EMpLOyMENT aND MObiLiTy Miran Lavrič
28 percent of the total working hours by Slovenian youth fall within the category of regular full-
time employment.
As previously mentioned, there is a pronounced gender gap with regard to flexible forms of
employment.
Figure 24: Young men and women (16-27) by type of employment, including student work
Source: CEPYUS-FES Slovenian 2013 Youth Study.
While only one in four young working women hold a full-time regular job, nearly half of these
positions are held by young working men (46 percent). The primary reason for this difference can
be traced to the larger share of women enrolled in the education system (70 percent, compared
to 49 percent of men).
1.5.2 Taking a job outside the area of one’s education
Another dimension of workforce flexibility results from the level of preparedness and ability to
work in different kinds of jobs.
According to Figure 25, Slovenian youth generally appear to be flexible labor force participants,
especially if those performing student work are factored in. Only 25 percent of employed young
people work within their profession. however, even if student workers are excluded, it appears
that the majority perform jobs that they have not been formally educated to do.
here, the gender gap is most pronounced. Whereas one-third of working men are employed
within the profession for which they were (or are being) educated, the same is true for only 16
percent of women. Once again, much of this difference can be traced to the fact that women are
more involved in student work. Yet even if student work is excluded from the data, the ratio re-
mains relatively high (50 to 37 percent in favor of men).
46%
25%
3%
4%
49%70%
3% 1%
0%
10%
20%
30%
40%
50%
60%
70%
80%
90%
100%
Men Women
Full-time employment Part-time employment Student labour Self-employed

Miran Lavrič EMpLOyMENT aND MObiLiTy 67
The horizontal skills mismatch is somewhat less for those who have attained a tertiary level of
education. If student work is included, 44 percent of this group works in their field.
Figure 25: Horizontal skills mismatch among Slovenian Youth
Source: CEPYUS-FES Slovenian 2013 Youth Study.
Among all levels of graduates in Slovenia, flexibility can be observed in terms of prepared-
ness, i.e., taking on a job that does not require tertiary education. In Slovenia, approximately 35
percent of graduates perform jobs for which they are overeducated to do. Overall, 42 percent of
young graduates work within the profession for which they have studied, and at the same time
perform a job that requires their level of education or higher. On the other extreme, 21 percent of
graduates work in jobs outside their profession and without requirements for their achieved level
of education.
Once again, it should be noted that the education-employment match is much better if the data
excludes graduates performing student work. In this case, 58 percent of employed graduates work
within their profession, among which 27 percent are considered overeducated for the jobs they
are performing.
In sum, if student work is included in the analysis, the majority of employed young people in
Slovenia, including graduates, work outside the professional boundaries of their education, which
points to a relatively high degree of workforce flexibility.
1.5.3 What would young people do to get a job?
Another way to approach the flexibility of the youth workforce is to measure the respondents’
declared standpoints and intentions. Figure 26 presents the frequency distributions for several
such items. Where possible, this study compares data measured within the Youth 2010 study.
9%
25%
18%
47%
1%
8%
45%
16%
31%
1%
I have noprofessionalqualification
Yes, I work in theprofession for which
I was / am beingeducated
Yes, in a way No, I do not work inthe profession for
which I waseducated
Don’t know
Including student work Not including student work
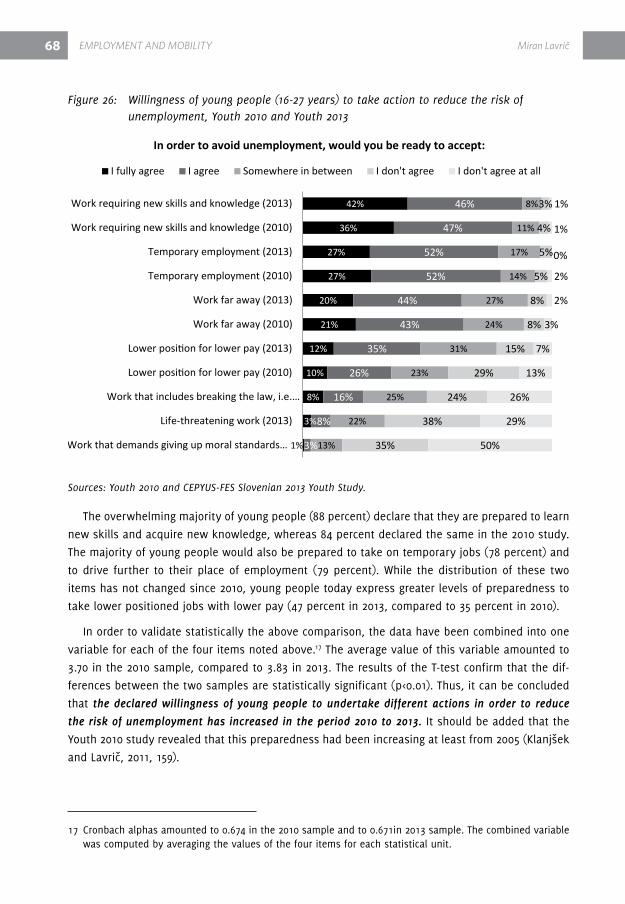
68 EMpLOyMENT aND MObiLiTy Miran Lavrič
Figure 26: Willingness of young people (16-27 years) to take action to reduce the risk of unemployment, Youth 2010 and Youth 2013
Sources: Youth 2010 and CEPYUS-FES Slovenian 2013 Youth Study.
The overwhelming majority of young people (88 percent) declare that they are prepared to learn
new skills and acquire new knowledge, whereas 84 percent declared the same in the 2010 study.
The majority of young people would also be prepared to take on temporary jobs (78 percent) and
to drive further to their place of employment (79 percent). While the distribution of these two
items has not changed since 2010, young people today express greater levels of preparedness to
take lower positioned jobs with lower pay (47 percent in 2013, compared to 35 percent in 2010).
In order to validate statistically the above comparison, the data have been combined into one
variable for each of the four items noted above.17 The average value of this variable amounted to
3.70 in the 2010 sample, compared to 3.83 in 2013. The results of the T-test confirm that the dif-
ferences between the two samples are statistically significant (p<0.01). Thus, it can be concluded
that the declared willingness of young people to undertake different actions in order to reduce
the risk of unemployment has increased in the period 2010 to 2013. It should be added that the
Youth 2010 study revealed that this preparedness had been increasing at least from 2005 (Klanjšek
and Lavrič, 2011, 159).
17 Cronbach alphas amounted to 0.674 in the 2010 sample and to 0.671in 2013 sample. The combined variable was computed by averaging the values of the four items for each statistical unit.
1%
3%
8%
10%
12%
21%
20%
27%
27%
36%
42%
3%
8%
16%
26%
35%
43%
44%
52%
52%
47%
46%
13%
22%
25%
23%
31%
24%
27%
14%
17%
11%
8%
35%
38%
24%
29%
15%
8%
8%
5%
5%
4%
3%
50%
29%
26%
13%
7%
3%
2%
2%
0%
1%
1%
Work that demands giving up moral standards…
Life-threatening work (2013)
Work that includes breaking the law, i.e.…
Lower position for lower pay (2010)
Lower position for lower pay (2013)
Work far away (2010)
Work far away (2013)
Temporary employment (2010)
Temporary employment (2013)
Work requiring new skills and knowledge (2010)
Work requiring new skills and knowledge (2013)
In order to avoid unemployment, would you be ready to accept:
I fully agree I agree Somewhere in between I don't agree I don't agree at all
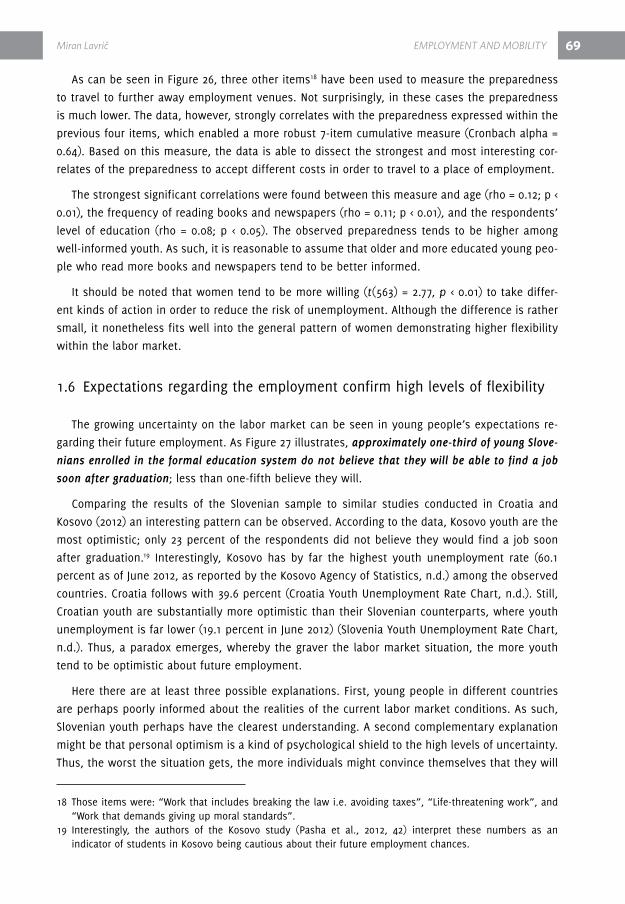
Miran Lavrič EMpLOyMENT aND MObiLiTy 69
As can be seen in Figure 26, three other items18 have been used to measure the preparedness
to travel to further away employment venues. Not surprisingly, in these cases the preparedness
is much lower. The data, however, strongly correlates with the preparedness expressed within the
previous four items, which enabled a more robust 7-item cumulative measure (Cronbach alpha =
0.64). Based on this measure, the data is able to dissect the strongest and most interesting cor-
relates of the preparedness to accept different costs in order to travel to a place of employment.
The strongest significant correlations were found between this measure and age (rho = 0.12; p <
0.01), the frequency of reading books and newspapers (rho = 0.11; p < 0.01), and the respondents’
level of education (rho = 0.08; p < 0.05). The observed preparedness tends to be higher among
well-informed youth. As such, it is reasonable to assume that older and more educated young peo-
ple who read more books and newspapers tend to be better informed.
It should be noted that women tend to be more willing (t(563) = 2.77, p < 0.01) to take differ-
ent kinds of action in order to reduce the risk of unemployment. Although the difference is rather
small, it nonetheless fits well into the general pattern of women demonstrating higher flexibility
within the labor market.
1.6 Expectations regarding the employment confirm high levels of flexibility
The growing uncertainty on the labor market can be seen in young people’s expectations re-
garding their future employment. As Figure 27 illustrates, approximately one-third of young Slove-
nians enrolled in the formal education system do not believe that they will be able to find a job
soon after graduation; less than one-fifth believe they will.
Comparing the results of the Slovenian sample to similar studies conducted in Croatia and
Kosovo (2012) an interesting pattern can be observed. According to the data, Kosovo youth are the
most optimistic; only 23 percent of the respondents did not believe they would find a job soon
after graduation.19 Interestingly, Kosovo has by far the highest youth unemployment rate (60.1
percent as of June 2012, as reported by the Kosovo Agency of Statistics, n.d.) among the observed
countries. Croatia follows with 39.6 percent (Croatia Youth Unemployment rate Chart, n.d.). Still,
Croatian youth are substantially more optimistic than their Slovenian counterparts, where youth
unemployment is far lower (19.1 percent in June 2012) (Slovenia Youth Unemployment rate Chart,
n.d.). Thus, a paradox emerges, whereby the graver the labor market situation, the more youth
tend to be optimistic about future employment.
here there are at least three possible explanations. First, young people in different countries
are perhaps poorly informed about the realities of the current labor market conditions. As such,
Slovenian youth perhaps have the clearest understanding. A second complementary explanation
might be that personal optimism is a kind of psychological shield to the high levels of uncertainty.
Thus, the worst the situation gets, the more individuals might convince themselves that they will
18 Those items were: “Work that includes breaking the law i.e. avoiding taxes”, “Life-threatening work”, and “Work that demands giving up moral standards”.
19 Interestingly, the authors of the Kosovo study (Pasha et al., 2012, 42) interpret these numbers as an indicator of students in Kosovo being cautious about their future employment chances.

70 EMpLOyMENT aND MObiLiTy Miran Lavrič
(eventually) gain employment. Finally, there might be substantial differences in defining what real-
ly constitutes a job. For example, Slovenian youth might be more demanding than youth in Kosovo.
Unfortunately, the parameters of this study limit testing of these and other possible hypotheses.
Figure 27: Expectations regarding the ability to find a job soon after graduation
Sources: IDRA-FES Kosovo 2012 Youth Study, IDIZ-FES Croatian 2012 Youth Study, CEPYUS-FES Slovenian 2013 Youth Study.
When considering future employment, 45 percent of young people in Slovenia prefer employ-
ment in private sector. This is a huge increase compared to data compiled in 2005, when only 26
percent showed a preference for the private sector. For comparative purposes, this figure was 34
percent in 2010 (Klanjšek and Lavrič, 2011, 166). In this dimension, young people in Slovenia also
differ significantly from their counterparts in Kosovo (28 percent) and Croatia (32 percent). In both
countries, young people still heavily favor employment in the public administration.
As can be expected, substantial gender differences can be noted: young women tend to favor
employment in public administration (37 percent, compared to 29 percent for men).
Among Slovenian youth, connections and friends represent by far the most important factor
in finding a job. Almost half (46 percent) ranked this as the number one factor in finding a job;
by comparison, 33 percent of Croatians, and 37 percent of Kosovars agreed. Further, Slovenian
youth place a relatively low importance on professional skills. Only 11 percent ranked this factor
as the most important in finding a job, while this share was 26 percent in Croatia and 23 percent
in Kosovo.
Connections and friends seem more important to younger respondents (rho = -0.11; p < 0.01),
while professional skills are acknowledged more among older respondents (rho = -0.13; p < 0.01),
as well as those with higher levels of income (rho = 0.09; p < 0.01) and education (rho = 0.07; p <
22%
17%
19%
48%
51%
41%
7%
7%
8%
23%
25%
33%
Kosovo
Croatia
Slovenia
Do you believe that you will be able to find a job soon after graduation?
Yes, I believe I will be able to find a job soon after graduation
Yes, I believe I will be able to find a job after some time
I don’t know / I hope
No, I do not believe that I will be able to find a job soon after graduation
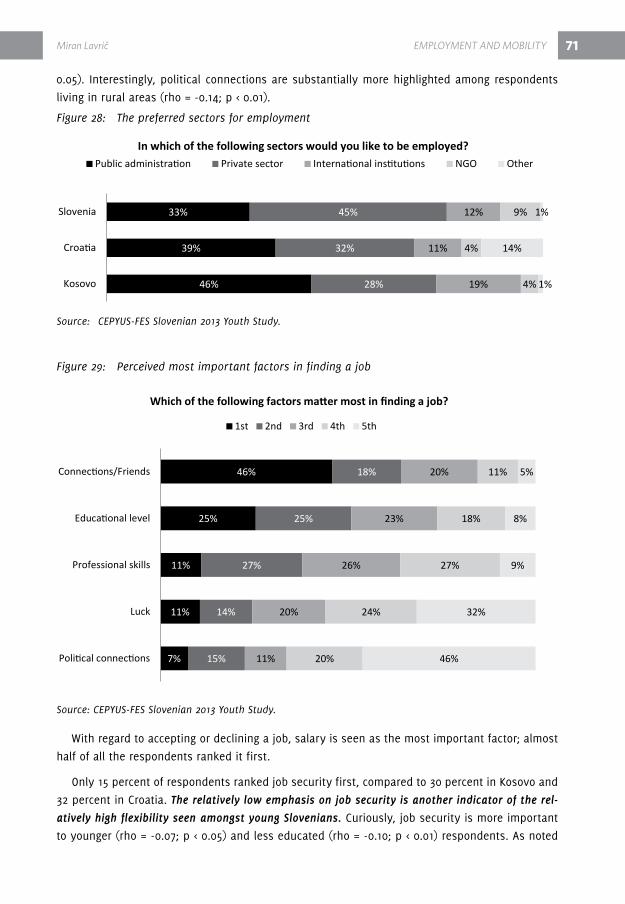
Miran Lavrič EMpLOyMENT aND MObiLiTy 71
0.05). Interestingly, political connections are substantially more highlighted among respondents
living in rural areas (rho = -0.14; p < 0.01).
Figure 28: The preferred sectors for employment
Source: CEPYUS-FES Slovenian 2013 Youth Study.
Figure 29: Perceived most important factors in finding a job
Source: CEPYUS-FES Slovenian 2013 Youth Study.
With regard to accepting or declining a job, salary is seen as the most important factor; almost
half of all the respondents ranked it first.
Only 15 percent of respondents ranked job security first, compared to 30 percent in Kosovo and
32 percent in Croatia. The relatively low emphasis on job security is another indicator of the rel-
atively high flexibility seen amongst young Slovenians. Curiously, job security is more important
to younger (rho = -0.07; p < 0.05) and less educated (rho = -0.10; p < 0.01) respondents. As noted
46%
39%
33%
28%
32%
45%
19%
11%
12%
4%
4%
9%
1%
14%
1%
Kosovo
Croatia
Slovenia
In which of the following sectors would you like to be employed?Public administration Private sector International institutions NGO Other
7%
11%
11%
25%
46%
15%
14%
27%
25%
18%
11%
20%
26%
23%
20%
20%
24%
27%
18%
11%
46%
32%
9%
8%
5%
Political connections
Luck
Professional skills
Educational level
Connections/Friends
Which of the following factors matter most in finding a job?
1st 2nd 3rd 4th 5th
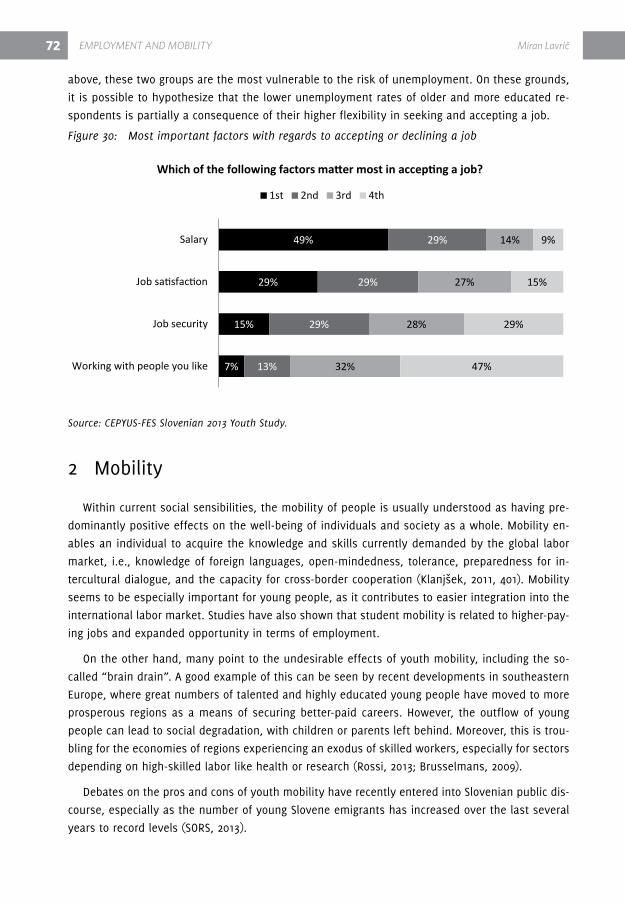
72 EMpLOyMENT aND MObiLiTy Miran Lavrič
above, these two groups are the most vulnerable to the risk of unemployment. On these grounds,
it is possible to hypothesize that the lower unemployment rates of older and more educated re-
spondents is partially a consequence of their higher flexibility in seeking and accepting a job.
Figure 30: Most important factors with regards to accepting or declining a job
Source: CEPYUS-FES Slovenian 2013 Youth Study.
2 Mobility
Within current social sensibilities, the mobility of people is usually understood as having pre-
dominantly positive effects on the well-being of individuals and society as a whole. Mobility en-
ables an individual to acquire the knowledge and skills currently demanded by the global labor
market, i.e., knowledge of foreign languages, open-mindedness, tolerance, preparedness for in-
tercultural dialogue, and the capacity for cross-border cooperation (Klanjšek, 2011, 401). Mobility
seems to be especially important for young people, as it contributes to easier integration into the
international labor market. Studies have also shown that student mobility is related to higher-pay-
ing jobs and expanded opportunity in terms of employment.
On the other hand, many point to the undesirable effects of youth mobility, including the so-
called “brain drain”. A good example of this can be seen by recent developments in southeastern
Europe, where great numbers of talented and highly educated young people have moved to more
prosperous regions as a means of securing better-paid careers. however, the outflow of young
people can lead to social degradation, with children or parents left behind. Moreover, this is trou-
bling for the economies of regions experiencing an exodus of skilled workers, especially for sectors
depending on high-skilled labor like health or research (rossi, 2013; Brusselmans, 2009).
debates on the pros and cons of youth mobility have recently entered into Slovenian public dis-
course, especially as the number of young Slovene emigrants has increased over the last several
years to record levels (SOrS, 2013).
7%
15%
29%
49%
13%
29%
29%
29%
32%
28%
27%
14%
47%
29%
15%
9%
Working with people you like
Job security
Job satisfaction
Salary
Which of the following factors matter most in accepting a job?
1st 2nd 3rd 4th

Miran Lavrič EMpLOyMENT aND MObiLiTy 73
2.1 Young people feel little need to move within Slovenian borders
In terms of national mobility, the data show that about one-quarter of young people in Slove-
nia express the willingness to migrate somewhere else in the country, with minor differences seen
across major groups.
Figure 31: Willingness to migrate somewhere else in Slovenia, by gender and educational attainment
Source: CEPYUS-FES Slovenian 2013 Youth Study.
The only statistically significant predictor of the willingness to move within national borders
seems to be gender (C = 0.124; p < 0.01), with females expressing somewhat higher willingness lev-
els. In addition, a systematic, although not statistically significant, impact corresponds to the ed-
ucation level attained by the respondent. Although differences between groups may appear mar-
ginal at first, the differences in the proportion of those not willing to move are quite noticeable.
The willingness amongst young Slovenians to move compares broadly to data obtained in Cro-
atia and Kosovo. however, a closer look at the motives for internal migration reveals some inter-
esting differences.
Among the motives for relocation, young Slovenians rank improving living standards first (39
percent), which is followed by better employment chances (22 percent). Both motives are less
common in Croatia and Kosovo. The same national comparisons can be seen within the category
on opportunities in starting a business. Thus, compared to Croatia and Kosovo, as well as the inter-
national mobility data, (see the following subchapter), the economic pressures for intra-national
migration among youth in Slovenia appear to be relatively low. Since macroeconomic conditions
have worsened, one would expect the above reasons to fall in the opposite direction. however, at
least two possible explanations should be considered.
21,5%
29,9%
24,1%
26,1%
27,2%
71,0%
59,1%
67,2%
64,7%
63,0%
7,5%
11,0%
8,8%
9,2%
9,9%
Male
Female
Primary
Secondary
Tertiary
Gen
der
Educ
ation
a le
vel
Would you like to move somewhere else in Slovenia?
Yes No DK/NA
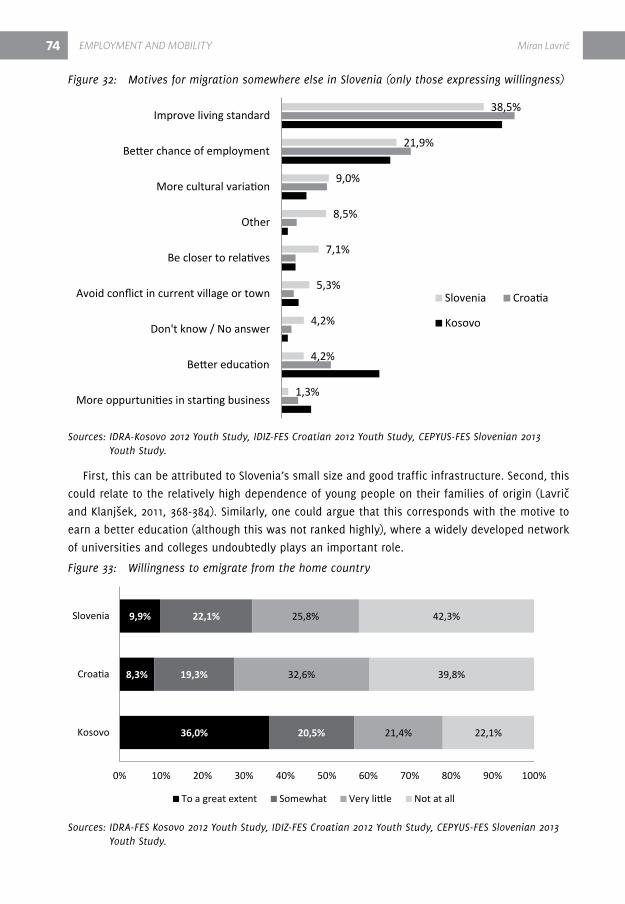
74 EMpLOyMENT aND MObiLiTy Miran Lavrič
Figure 32: Motives for migration somewhere else in Slovenia (only those expressing willingness)
Sources: IDRA-Kosovo 2012 Youth Study, IDIZ-FES Croatian 2012 Youth Study, CEPYUS-FES Slovenian 2013 Youth Study.
First, this can be attributed to Slovenia’s small size and good traffic infrastructure. Second, this
could relate to the relatively high dependence of young people on their families of origin (Lavrič
and Klanjšek, 2011, 368-384). Similarly, one could argue that this corresponds with the motive to
earn a better education (although this was not ranked highly), where a widely developed network
of universities and colleges undoubtedly plays an important role.
Figure 33: Willingness to emigrate from the home country
Sources: IDRA-FES Kosovo 2012 Youth Study, IDIZ-FES Croatian 2012 Youth Study, CEPYUS-FES Slovenian 2013 Youth Study.
1,3%
4,2%
4,2%
5,3%
7,1%
8,5%
9,0%
21,9%
38,5%
More oppurtunities in starting business
Better education
Don't know / No answer
Avoid conflict in current village or town
Be closer to relatives
Other
More cultural variation
Better chance of employment
Improve living standard
Slovenia Croatia
Kosovo
36,0%
8,3%
9,9%
20,5%
19,3%
22,1%
21,4%
32,6%
25,8%
22,1%
39,8%
42,3%
0% 10% 20% 30% 40% 50% 60% 70% 80% 90% 100%
Kosovo
Croatia
Slovenia
To a great extent Somewhat Very little Not at all

Miran Lavrič EMpLOyMENT aND MObiLiTy 75
2.2 International mobility: Austria, Germany and the US are prevailing targets
The willingness to move out of Slovenia seems to be somewhat higher when compared to the
data concerning international migration. About one-third of young Slovenians are at least some-
what willing to emigrate from their country.
In this regard, young people in Slovenia are slightly more mobile compared to young Croatians,
but far less when compared to Kosovar youth. The difference between Slovenian and Croatian
youth can be at least partly explained by the closeness of Slovenia to Austria as a viable target for
young jobseekers (Figure 34).
The willingness to emigrate from Slovenia is substantially more present among young people
from larger (and more urban) residential communities (rho = 0.148; p < 0.01), and among those
whose parents have achieved higher levels of education (rho = 0.128; p < 0.01 (for mother) and rho
= 0.104; p < 0.01 (for father)).
Figure 34: Preferred target countries of immigration among those expressing willingness to emigrate
Sources: IDRA-FES Kosovo 2012 Youth Study, IDIZ-FES Croatian 2012 Youth Study, CEPYUS-FES Slovenian 2013 Youth Study.
When compared to Croatia and Kosovo, Slovenia has a high share of young people that prefer
Austria as a possible destination. The obvious reason is that Austria not only neighbors Slovenia,
but also is, at least relatively speaking, economically stable. This is strongly supported by the fact
0,7%
1,5%
2,9%
4,3%
6,9%
7,2%
10,8%
13,6%
16,9%
17,4%
0,0% 5,0% 10,0% 15,0% 20,0% 25,0% 30,0% 35,0%
Switzerland
Italy
DK/NA
Canada
Australia
UK
Germany
Other EU countries
Austria
USA
Slovenia Croatia
Kosovo

76 EMpLOyMENT aND MObiLiTy Miran Lavrič
that Austria is disproportionally popular among young people from northern regions neighboring
Austria (Gorenjska, Koroška, Štajerska and Pomurska).
Figure 35: Preferred target countries for immigration, by region
Source: CEPYUS-FES Slovenian 2013 Youth Study.
While youth from northern regions prefer Austria (31 percent; compared to only 10 percent of
all others), young people from other regions prefer Germany (15 percent, compared to only 5 per-
cent of northern Slovenian youth). The only other country that can match the region’s two stron-
gest economies is the United States (17 percent). however, it should be noted that intentions to
relocate to the US rapidly decline as the age of the respondent increases. While 27 percent of those
aged 16-19 would choose this option, only 15 percent of those aged 24-27 would do the same. On
the other hand, the inclination towards Austria increases substantially with age. While Austria is
the first choice (15 percent) amongst 16-19 year olds, it is by far the most desired for those aged
24-27 (23 percent).
The preferred countries of immigration appear to be a good reflection of the reasons respon-
dents gave for possible migration.
Young people wish to emigrate from Slovenia mainly for economic reasons (77 percent).20 This
is particularly true for males aged 24-27 (86 percent).
20 In the category of economic reasons we combined search for (1) a better living standard, (2) employment opportunities and (3) opportunities for starting one’s own business.
31,4%
1,9%4,8% 5,7%
12,4%15,2%
6,7%
21,0%
1,0%
10,3%
1,7%
15,4%
9,1%
16,0%
21,1%
3,4%
18,3%
4,6%
Austria Italy Germany UK Other EUcountries
USA Canada Other DK/NA
Northern regions Other regions
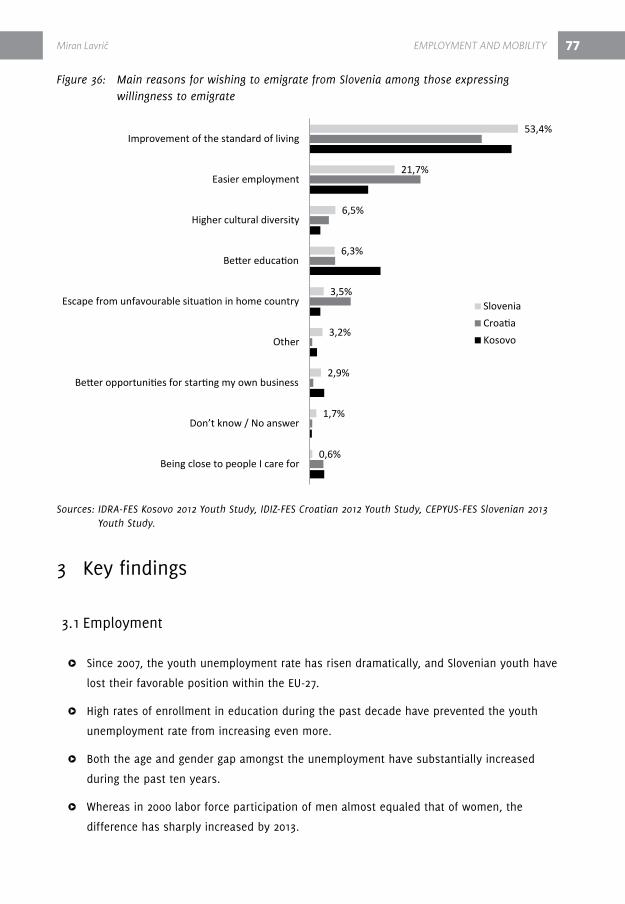
Miran Lavrič EMpLOyMENT aND MObiLiTy 77
Figure 36: Main reasons for wishing to emigrate from Slovenia among those expressing willingness to emigrate
Sources: IDRA-FES Kosovo 2012 Youth Study, IDIZ-FES Croatian 2012 Youth Study, CEPYUS-FES Slovenian 2013 Youth Study.
3 Key findings
3.1 Employment
ΔΔ ΔSince 2007, the youth unemployment rate has risen dramatically, and Slovenian youth have
lost their favorable position within the EU-27.
ΔΔ Δhigh rates of enrollment in education during the past decade have prevented the youth
unemployment rate from increasing even more.
ΔΔ ΔBoth the age and gender gap amongst the unemployment have substantially increased
during the past ten years.
ΔΔ ΔWhereas in 2000 labor force participation of men almost equaled that of women, the
difference has sharply increased by 2013.
0,6%
1,7%
2,9%
3,2%
3,5%
6,3%
6,5%
21,7%
53,4%
Being close to people I care for
Don’t know / No answer
Better opportunities for starting my own business
Other
Escape from unfavourable situation in home country
Better education
Higher cultural diversity
Easier employment
Improvement of the standard of living
SloveniaCroatiaKosovo

78 EMpLOyMENT aND MObiLiTy Miran Lavrič
ΔΔ ΔAccording to the methodological approach of self-perceived unemployment, 36.1 percent of
young people were unemployed as of June 2013, compared to only 24.1 percent as reported
by Eurostat.
ΔΔ ΔThe inter-group differences in unemployment rates are the sharpest in terms of achieved
educational level, e.g., 50 percent of the unemployed have attained a primary level
education; and an additional 13 percent have received a tertiary level degree.
ΔΔ ΔStudent work is by far the most important form of youth participation in the labor market,
representing more than half of all the (taxed) working hours done by youth in Slovenia.
ΔΔ ΔWhile only one in four working young women holds a full-time regular job, nearly half of
young working men do so. The major reason for this difference can be attributed to the
larger share of women working as students.
ΔΔ ΔThe majority of employed young people in Slovenia work outside the professional
boundaries of their education.
ΔΔ ΔThe declared willingness of young people to take various actions in order to reduce the
risk of unemployment has been increasing since at least 2005.
ΔΔ ΔThe relative majority (45 percent) of young people in Slovenia prefer employment in the
private sector. This is considerably high when compared to previous surveys conducted in
Slovenia, Kosovo, and Croatia.
ΔΔ ΔThe relatively low emphasis on job security, particularly where it concerns accepting or
declining a job, is one of the several indicators pointing to the high levels of flexibility
amongst young people in the Slovenian labor market.
3.2 Mobility
ΔΔ ΔThe economic pressures for intra-national migrations of youth in Slovenia appear to
be relatively low. Only one-quarter of Slovenian youth has the willingness to migrate
somewhere else in Slovenia.
ΔΔ ΔAbout one-third of young Slovenians declare their willingness to emigrate. The most
preferred destinations are Austria (especially by youth from northern regions), the United
States, and Germany.
ΔΔ ΔEconomic reasons for international mobility are on average substantially more important
for males, older age groups, and urban youth.

Miran Lavrič EMpLOyMENT aND MObiLiTy 79
Figure 37: The relative importance of economic reasons for emigration from Slovenia, by basic demographic groups
Source: CEPYUS-FES Slovenian 2013 Youth Study.
Figure 37 illustrates that economic reasons are on average substantially more important for
males, older age groups, and urban youth, i.e. those living in residential communities with more
than 10,000 inhabitants.
4 referencesBrusselmans, Y. (2009): The dark sides of European mobility. Available at: http://www.orangelog.
eu/en/topics/aer-youth-regional-network/articles/article/article/295/ (2.9.2013).
Eurostat (n.d.). EU labor force survey – methodology. retrieved from: http://epp.eurostat.ec.eu-
ropa.eu/statistics_explained/index.php/EU_labor_force_survey_-_methodology (24.7.2013).
Eurostat (n.d.). Population and social conditions/Employment and unemployment (Labor Force
Survey). retrieved from: http://epp.eurostat.ec.europa.eu/portal/page/portal/population/data/da-
tabase/ (25.7.2013).
Furlong, A. (2013). Youth Studies: An Introduction. Abingdon, Oxon : routledge.
Furlong, A., and Cartmel, F. (2007). Young people and social change. Berkshire: Open University
Press.
Ignjatović, M., and Trbanc, M. (2009). Zaposlovanje in brezposelnost mladih: aktivni, fleksibilni in
prilagodljivi. In: Tatjana rakar and Urban Boljka (ed.), Med otroštvom in odraslostjo, pp. 39–55.
76,0%
81,0%
69,1%
77,4%
81,7%
84,5%
71,0%
Rural (up to 10.000)
Urban (more than 10.000)
16-19
20-23
24-27
Male
Female
Type
of r
esid
entia
lsett
lem
ent
Age
Gen
der

Ljubljana: Ministry of Education and Sport, Office of the republic of Slovenia for Youth: Social
Protection Institute of the republic of Slovenia.
Ilišin, v., Bouillet, d., Gvozdanović, A. And Potočnik, d. (2012). Mladi u dinamičnom društvu: hr-
vatska 2012. Zagreb: Institut za društvena istraživanja u Zagrebu and Friedrich Ebert Stiftung.
International Labor Organization (n.d.). Gender inequality in youth unemployment across regions.
retrieved from: http://www.ilo.org/global/research/global-reports/global-employment-trends/
youth/2013/WCMS_212433/lang--en/index.htm (26.7.2013).
Klanjšek, r. (2011). Globalisation and youth mobility. In M. Lavrič (Ed.). Youth 2010: The social
profile of young people in Slovenia, (pp. 397–418). Ljubljana: Ministry of Education and Sports,
Office for Youth; Maribor: Aristej.
Klanjšek, r., & Lavrič, M. (2011). Employment and enterpreneurship. In M. Lavrič (Ed.). Youth
2010: The social profile of young people in Slovenia, (pp. 131–186). Ljubljana: Ministry of Educa-
tion and Sports, Office for Youth; Maribor: Aristej.
Kosovo Agency of Statistics (n.d.). retrieved from: http://esk.rks-gov.net/eng/ (2.8.2013).
Kuhar, M. (2009). Prostočasne (in) participatorne dejavnosti mladih, 1–30. In: Andrej Fištravec et
al., (ed.), Modeli izobraževanja za mladinsko delo: strokovne podlage: razvoj modelov neformal-
nega in formalnega izobraževanja za mladinskega delavca za vključevanje v programe organ-
izacij, 1–30. Maribor: IrdO –Institute for the development of Social responsibility.
Lavrič, M. (2011). Mladi med zavetjem družine in šole ter prepihom na trgu dela. Subkulture:
prispevki za kritiko in analizo družbenih gibanj (Frontier). Maribor: Subkulturni azil.
Lavrič, M., & Klanjšek, r. (2011). residential and housing conditions of young people. In M. Lavrič
(Ed.). Youth 2010: The social profile of young people in Slovenia, (pp. 367–396). Ljubljana: Minis-
try of Education and Sports, Office for Youth; Maribor: Aristej.
Lavrič, Miran et al. (2011). Youth 2010: Social profile of youth in Slovenia [data file]. Slovenia, Mar-
ibor: Univerza v Mariboru = University of Maribor, Filozofska fakulteta = Faculty of Arts [produc-
tion], 2010. Slovenia, Ljubljana: Univerza v Ljubljani = University of Ljubljana, Arhiv družboslovnih
podatkov = Social Science data Archive [distribution].
Makeham, P. (1980). Youth Unemployment. department of Employment research Paper, No.10.
London: hMSO.
Miheljak, vlado, Mirjana Ule, Tanja rener, Metka Mencin Čeplak, Blanka Tivadar in Metka Ku-
har (2001): Youth, 2000 [data file]. Ljubljana: Faculty of Social Sciences. Social Psychology re-
search Centre [production], 2000. Ljubljana: University of Ljubljana. Social Science data Archive
[distribution].
O’higgins, N. (2001). Youth Unemployment and Employment Policy: A Global Perspective. Geneva:
ILO.
Pasha, A., xhangolli, K., dundo, J. Gjokuta, B, Tahiri, Z. and Lena, O. (2012). Kosovo Youth Study
2012. Friedrich Ebert Stiftung and IdrA Kosova.
80 EMpLOyMENT aND MObiLiTy Miran Lavrič

rossi, d. (2013): Brain drain or just Mobility? Available at: http://www.greeneuropeanjournal.eu/
brain-drain-or-just-mobility/ (2.9.2013).
Scarpetta, S., A. Sonnet and T. Manfredi (2010). rising Youth Unemployment during The Crisis:
how to Prevent Negative Long-term Consequences on a Generation, OECd Social, Employment
and Migration Working Papers No. 106, OECd Publishing, Paris.
SOrS – Statistical office of the republic of Slovenia (2013). International Youth day 2013. http://
www.stat.si/eng/novica_prikazi.aspx?id=5652 (2.9.2013).
YCharts (2013b): European Union Youth Unemployment rate Chart. Avaliable at: http://ycharts.
com/indicators/europe_youth_unemployment_rate_lfs (3.8.2013).
YCharts (2013c): Croatia Youth Unemployment rate Chart. Avaliable at: http://ycharts.com/indica-
tors/croatia_youth_unemployment_rate_lfs (29.7.2013).
YCharts (n.d.): Slovenia Youth Unemployment rate Chart. Avaliable at: http://ycharts.com/indica-
tors/slovenia_youth_unemployment_rate_lfs (3.8.2013).
Miran Lavrič EMpLOyMENT aND MObiLiTy 81


Marina Tavčar Krajnc, Sergej flere and Miran Lavrič EDUCaTiON 83
PArT III EdUCATION
1 Introduction
Education is constitutive of youth. Youth as a notion and as a social reality (in contrast to young
people) appears alongside the development of secondary education, i.e., when tertiary education
being more frequent and less of an exception. The Enlightenment, socialism, and more generally,
the entire “progressive” ideological camp also favorably influenced the expansion of education.
In short, one could have seen no limits to education being both positive and emancipatory. Later,
market-oriented economists also applauded education as an “investment” in “human capital”.
Finally, the European Union has set out to become the most competitive and dynamic knowl-
edge-based economy in the world, by—among other things—the expansion of tertiary education.
2 Basics: structural aspects in comparative perspective
Upon attaining independence, Slovenia expanded its upper secondary level education (making
it practically universal), alongside tertiary level education. This was not an exception among coun-
tries in transition, or among established western democracies (Kwiek, 2013). Expansion was the
result of both policy and objective factors, including cohort size. however, one might argue that
the expansion of tertiary level education over this period resulted from the impossibility to offer
employment to everyone who finished upper secondary school.
Figure 38 reveals that there has been a small decrease in the relative number of tertiary stu-
dents in the last year observed, which may be attributed to the declining impact of university de-
gree attainment on employment (Klanjšek and Lavrič, 2011). however, the more notable finding in
this research concerns the relative number of tertiary students in Slovenia is well above the Euro-
pean Union average. In fact, Slovenia together with a handful of other post-communist countries
was among the highest in the EU-27 with respect to tertiary education.
Unfortunately, this finding cannot be assessed favorably in light of the fact that recent grad-
uates have found it particularly difficult to find employment, especially within the area of their
expertise (see chapter on Employment). Further, given the constructs of the present economic sit-
uation, Wolfe (2002) convincingly argues that the association of educational and economic growth
is in general a “myth”. In spite of the rise in the number of students and of tertiary graduates,
Slovenia’s economy is performing poorly. When compared to the EU-27, Slovenia’s GdP has fallen
each of the last five years consecutively. Gintis and Bowles (1975) offer an economic justification
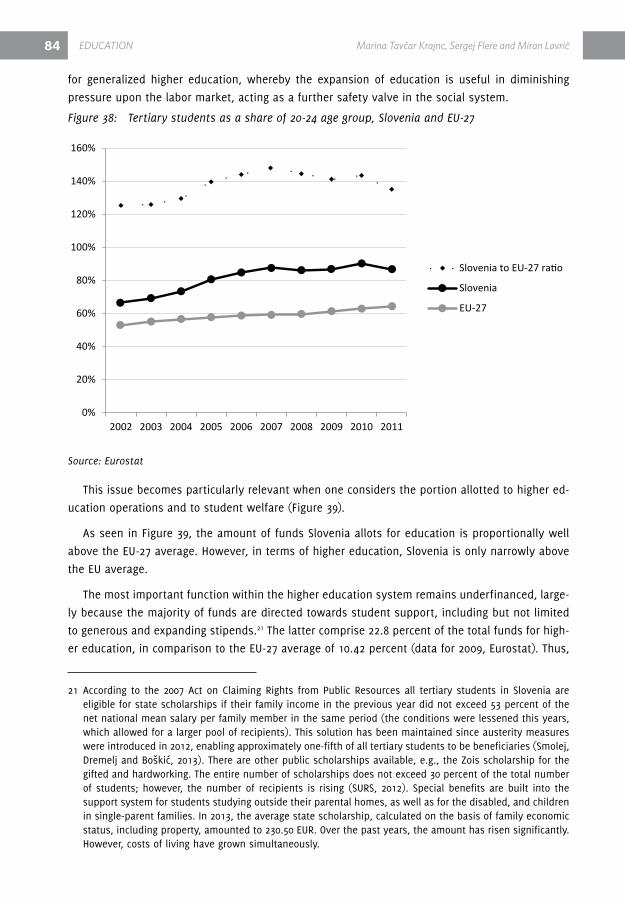
84 EDUCaTiON Marina Tavčar Krajnc, Sergej flere and Miran Lavrič
for generalized higher education, whereby the expansion of education is useful in diminishing
pressure upon the labor market, acting as a further safety valve in the social system.
Figure 38: Tertiary students as a share of 20-24 age group, Slovenia and EU-27
Source: Eurostat
This issue becomes particularly relevant when one considers the portion allotted to higher ed-
ucation operations and to student welfare (Figure 39).
As seen in Figure 39, the amount of funds Slovenia allots for education is proportionally well
above the EU-27 average. however, in terms of higher education, Slovenia is only narrowly above
the EU average.
The most important function within the higher education system remains underfinanced, large-
ly because the majority of funds are directed towards student support, including but not limited
to generous and expanding stipends.21 The latter comprise 22.8 percent of the total funds for high-
er education, in comparison to the EU-27 average of 10.42 percent (data for 2009, Eurostat). Thus,
21 According to the 2007 Act on Claiming rights from Public resources all tertiary students in Slovenia are eligible for state scholarships if their family income in the previous year did not exceed 53 percent of the net national mean salary per family member in the same period (the conditions were lessened this years, which allowed for a larger pool of recipients). This solution has been maintained since austerity measures were introduced in 2012, enabling approximately one-fifth of all tertiary students to be beneficiaries (Smolej, dremelj and Boškić, 2013). There are other public scholarships available, e.g., the Zois scholarship for the gifted and hardworking. The entire number of scholarships does not exceed 30 percent of the total number of students; however, the number of recipients is rising (SUrS, 2012). Special benefits are built into the support system for students studying outside their parental homes, as well as for the disabled, and children in single-parent families. In 2013, the average state scholarship, calculated on the basis of family economic status, including property, amounted to 230.50 EUr. Over the past years, the amount has risen significantly. however, costs of living have grown simultaneously.
0%
20%
40%
60%
80%
100%
120%
140%
160%
2002 2003 2004 2005 2006 2007 2008 2009 2010 2011
Slovenia to EU-27 ratio
Slovenia
EU-27

Marina Tavčar Krajnc, Sergej flere and Miran Lavrič EDUCaTiON 85
Slovenia is ranked second in the EU in terms of the share of higher education funds directed to-
wards student welfare (below only denmark). Critics point out that this comes at the expense of
investment into the actual education. Consequently, higher education’s core activity is (in relative
terms) underfinanced by EU and OECd averages.
Figure 39: Total public expenditure on education as % of GDP , Slovenia 2001-2010
Source: Eurostat.
The lack of investment into core education facilities reduces the overall qualities of the universi-
ties; only one Slovenian university made the 2012 QS list (QS WUr, 2013). Further, the 19.2 student
to teach ratio is far behind the OECd average of 15.6 (OECd 2013, 375).
In terms of public discourse, the former Minister of Education, Science, and Culture Žiga Turk
has been vocal in promoting the idea that too many students specialize in social sciences, while
too few enter engineering and natural science programs (Ivelja, 2012). however, as depicted in Fig-
ure 40, Slovenia has long been ahead of the European average in this domain, and yet economic
problems remain. Compared to the EU-27, the share of Slovenian students in engineering and nat-
ural sciences has grown, while the share of students in social sciences has declined. Thus, there
appears to be no established link between producing higher numbers of “hard” scientists and
expanding employment opportunities.
0,00
1,00
2,00
3,00
4,00
5,00
6,00
7,00
2001 2002 2003 2004 2005 2006 2007 2008 2009 2010
Slovenia (for all levels ofeducation)
EU-27 (for all levels ofeducation)
Slovenia (for tertiary level ofeducation)
EU-27 (for tertiary level ofeducation)

86 EDUCaTiON Marina Tavčar Krajnc, Sergej flere and Miran Lavrič
Figure 40: Percent of students by field of study, Slovenia and EU-27
Source: Eurostat.
3 Preferences and experiences
how do young people experience education in Slovenia? Answers to these types of questions
of course need context. By comparison, the youth in Slovenia discuss the idea of “friendliness,”
particularly when compared to their counterparts in Croatia and Kosovo.
Slovenian education is predominantly public, although there are a growing number of private
institutions that also receive public subsidies as their main source of financing. Today, 16.1 percent
(SUrS, 2012) study in private tertiary institutions.
Students at the secondary and tertiary levels were asked their preference of the type of institu-
tion and location of institution that they have attended, both in Slovenia and abroad. The results
are presented in Figure 41.
It is interesting to consider that the number of Slovenian respondents that wish to study abroad
is substantially larger than the number of existing Slovenian students currently studying abroad
(in 2007, this share amounted to 2.1 percent (Komljenovič and Marjetič, 2010)). The motivation for
studying abroad is on the rise, when compared to the data from 2005, when 12 percent of tertiary
students opted in this direction (Flere et al., 2006). Such aspirations likely have to do both with
education and with the potential of expanding the possibilities of employment. By comparison,
the number of Croatian respondents indicating a desire to study in their home country is higher, in
spite of the recent higher education corruption scandals. The number of Kosovo students seeking
to study abroad requires special attention given that their certification and accreditation systems
0,0
5,0
10,0
15,0
20,0
25,0
30,0
35,0
40,0
45,0
50,0
2002 2003 2004 2005 2006 2007 2008 2009 2010 2011
% o
f all
stud
ents
(ISC
ED 5
,6)
Students by field of study, Slovenia and EU-27 (%)
EU-27: Social science,business and law field
Slovenia: Social science,business and law field
EU-27: Mathematics,computing, engineering,manufacturing, orconstruction
Slovenia: Mathematics,computing, engineering,manufacturing, orconstruction

Marina Tavčar Krajnc, Sergej flere and Miran Lavrič EDUCaTiON 87
are in the process of being developed. As such, the high rate of Slovenians seeking an education
abroad appears to do with an authentic wish to attain a quality higher education.
Figure 41: Educational institutions by students’ choice in Slovenia, Croatia, Kosovo
Sources: CEPYUS-FES Slovenian 2013 Youth Study, IDIZ-FES 2012 Croatian Youth Study, IDRA-FES 2012 Kosovo Youth Study.
how difficult is education? respondents in each of the three countries indicate the difficulty
and stressful nature of their educational experience. While the majority in each country stated
that it was “hard and stressful,” practically none of the respondents in Croatia or Kosovo indicated
that it was “very easy and completely stress free”. however, in Slovenia one in twelve students
answered that their education was “easy and not particularly stressful.”
despite the occasional public discourse on how the education system in Slovenia is too strict,
unfriendly, and “inimical” towards students (Mencin Čeplak, 2002), the present findings confirm
those by Flere and Tavčar Krajnc (2011). Education in Slovenia appears to be a friendly experience
for students (their findings pertained to secondary education only, where 60 percent of respond-
ents assessed the subjective experience to be predominantly favorable (Flere and Tavčar Krajnc,
2011, 107). Similar findings were recorded in 2000 (Flere and Tavčar Krajnc, 2011, 107).
respondents in this study were also asked how much time they devote to their studies. Figure
43 presents these findings.
The data in Figure 43 illustrates clearly that Slovenian young people, regardless of their level of
schooling, devote the least amount of time to their studies when compared to Croatia and Koso-
vo. Almost two-fifths of Slovenians study up to one hour per day, which is half the amount of time
young people in Kosovo study. Croatians fall in between these two data sets.
Looking at the data more specifically, it is apparent that the amount of time Slovenians ded-
icate to their studies depends on the level of study. Slovenian upper secondary school students
study on average 1.2 hours per day; in the higher education first cycle students study 1.7 hours
25%
41%
34%
10%
17%
12%
44%
14%
21%
17%
14%
19%
5%
15%
14%
Kosovo
Croatia
Slovenia
If you could choose, where would you prefer to get your education?
In a public educational institution in home country
In a private educational institution in home country
In a public educational institution abroad
In a private educational institution abroad
Don’t know / No answer

per day, and in the second cycle 1.6 hours, which would seemingly enable them sufficient time to
extracurricular activities.
Figure 42: Perception of everyday life in school; Slovenia, Croatia and Kosovo
Note: Only those respondents that are taking part in education, including part time students, are included.
Source: FES CEPYUS Slovenian 2013 Youth Study, FES 2012 Croatian Youth Study; FES 2012 Kosovo Youth Study.
Figure 43: Average daily number of hours of study in Slovenia, Kosovo and Croatia
Source: FES CEPYUS Slovenian 2013 Youth Study, FES 2012 Croatian Youth Study; FES 2012 Kosovo Youth Study.
More generally, these figures suggest why student perceive their educational experience to be
friendly and stress-free.
38%
28%
19%
24%
24%
26%
19%
25%
31%
6%
10%
15%
3%
4%
8%
8%
9%
1%
Slovenia
Croatia
Kosovo
On average, how many hours a day do you study?
Up to 1 hour 1-2 hours daily on average 2-3 hours daily on average
3-4 hours daily on average More than 4 hours daily Don’t know / No answer
3%
7%
7%
16%
21%
23%
47%
56%
48%
24%
12%
18%
8%
2%
3%
Slovenia
Croatia
Kosovo
In your opinion, what is everyday life in your school / university like?
Very hard and stressful Hard and stressful
Hard and stressful to some extent Easy and not particularly stressful
Very easy and completely stress free Don’t know / No answer
88 EDUCaTiON Marina Tavčar Krajnc, Sergej flere and Miran Lavrič
4 Key findings
Δ While per capita funding for elementary and secondary education in Slovenia is above the
OECd average, financing for the core higher education system is below average.
Δ Secondary education in Slovenia is perceived to be relatively stress-free.
Δ Slovenia allots relatively little core funding to higher education, whereby a
disproportionately high amount is channeled into student welfare, allowing for a
diminution of funding for curricular education over the long-term (OECd, 2013, 169).
Δ Slovenian secondary and higher education is perceived to be “friendly” and not very
demanding by students. Moreover, social benefits are extended to students and tuition is
required only in exceptional cases. Further, students have sufficient free time to pursue
extracurricular activities, or “casual” work.
Δ Systemic and structural policy changes are advisable, particularly those that encompass
social and employment policy in relation to educational policy, and address the
“babysitting” features of higher education, thereby returning higher education its
immanent cognitive, intellectual, and applicative nature.
5 referencesFlere, S. and Tavčar Krajnc, M. (2011). Education and training. In Lavrič, M. (Ed.). Youth 2010: The
social profile of young people in Slovenia, (pp. 97- 128). Ljubljana: Ministry of Education and
Sports, Office for Youth; Maribor: Aristej.
Flere, S., Tavčar Krajnc, M., Lavrič, M., Klanjšek, Fištravec, A., r., Šipuš, K., Klenovšek, T. (2006).
družbeni profil študentov 2005. Maribor: ŠOS.
Gintis, h. and Bowles, S. (1975). The problem with human capital. American Economic review, 89,
291-302.
Ivelja, r. (2012). Minister Turk z mesarico nad družboslovje, dnevnik, 24 dec., 2012. Available at:
http://www.dnevnik.si/slovenija/v-ospredju/minister-turk-z-mesarico-nad-druzboslovje- (Sept.,
2013).
Klanjšek, r., & Lavrič, M. (2011). Employment and enterpreneurship. In M. Lavrič (Ed.). Youth
2010: The social profile of young people in Slovenia, (pp. 131–186). Ljubljana: Ministry of Educa-
tion and Sports, Office for Youth; Maribor: Aristej.
Komljenovič, J., Marjetič, E. (2010). drzna Slovenija: na poti v družbo znanja. Avaliable at: http://
www.arhiv.mvzt.gov.si/fileadmin/mvzt.gov.si/pageuploads/pdf/visoko_solstvo/statistika_visoke-
ga_solstva_07072010.pdf (Sept., 2013).
Kwiek, M. (2013). From system expansion to system contraction. Access to higher education in
Poland. Comparative Education review. 57, 553-576.
Marina Tavčar Krajnc, Sergej flere and Miran Lavrič EDUCaTiON 89

90
Mencin Čeplak, M. (2002). Šola, služba in tiha nezadovoljstva. In v. Miheljak (ed). Mladina 2000.
Slovenska mladina na prehodu v tretje tisočletje. Ljubljana: Ministrstvo za polstvo, znanost in
šport.
Organisation for Economic Cooperation and development (OECd). (2013). Education at a Glance.
Paris.
QS WUr (2013). QS Top Universities. Worldwide University rakings, Guides and Events. Avail-
able at: http://www.topuniversities.com/university-rankings/world-university-rankings/2012.
(Aug.,2013)
Smolej, S., dremelj, Boškić, r. (2013). Ocena učinkovitosti izvajanja nove socialne zakonodaje.
Ljubljana: Inštitut za socialno varstvo.
SUrS - Statistični urad rS. (2012). Mednarodni dan študentov 2012. Available at: http://www.stat.
si/novica_prikazi.aspx?id=5136 (Aug., 2013).
Wolfe, A. (2002). does Education Matter? Myths about Education and Economic Growth. London:
Penguin.
EDUCaTiON Marina Tavčar Krajnc, Sergej flere and Miran Lavrič

andrej Kirbiš and Marina Tavčar Krajnc LEiSURE aND LifESTyLE 91
PArT Iv LEISUrE ANd LIFESTYLE
1 Introduction
In modern societies, leisure time preoccupies a large part of a person’s day. The UK 2000 Time
Use Survey found that adults in Great Britain spent 22 percent of their lifetime pursuing leisure
activities, with only sleep taking up more time (35 percent). Paid work and study occupy only 13
percent of one’s lifetime (roberts, 2006, 11). Moreover, leisure is important because of its numer-
ous functions. It can have a positive effect on the quality of life; it also has an important social
dimension (i.e., it may bind people together), and it has economic and political implications (rob-
erts, 2006). Finally, leisure is considered especially important for younger generations, providing a
frame within which youth identity is shaped and developed (hendry et al., 2005; roberts, 2006).
Leisure has traditionally been defined as a crossover of 1) free time (discretionary time), 2)
activity and 3) attitude. here, free time is defined as time left after other commitments and obli-
gations (e.g., work, school, household and family requirements) have been met. Activities within
leisure time may be diverse, yet traditionally they are recreational, entertaining, and/or sports re-
lated. Finally, attitude/state of mind as a component of leisure refers to psychological dispositions
and expectations (freedom to choose activities, intrinsic motivation for doing them, enjoyment, re-
laxation, etc.) (Csikszentmihalyi, 1980, in Zuzanek, 2006, 186; also see deem, 2001, 78–80; russell,
2009). In sum, leisure can be viewed as an activity, attitude, dimension of time, or all three com-
bined. More eloquently, leisure activities can be understood as “inherently pleasurable activities
in which individuals indulge voluntarily in order to amuse themselves, to add to their knowledge
or skill levels, or to enhance the life of the community, in the residual time left over after discharg-
ing personal, social, and professional duties” (Walmsley and Jenkins, 2005, 279).
Parents, media, and policymakers alike often promote particular ideas of what constitutes “pro-
ductive” and “healthy” leisure (Furlong, 2013, 147). Specifically, organized (structured) activities
are usually regarded as beneficial for youth development and for society as a whole. On the top-
ic of “youth and leisure”, the concept of youth-at-risk is often given prominence, indicating that
leisure not only plays an important role in young people’s lives, but as well facilitates both the
political and moral implications of leisure research and practice (Caldwell, 2000, 2). here there is
a tremendous body of literature on the benefits of organized, structured activities (leisure, extra-
curricular, and others), particularly as it relates to different positive youth outcomes (for a short
review see Kirbiš, 2011a; also see, Blomfield and Barber, 2010; Fletcher et al., 2003; Fredricks and
Eccles, 2006; for long-term effects of different types of leisure and out-of-school activities see
Lowe vandell et al., 2007; Persson, et al., 2007; for positive effects of (leisure-time) physical ac-
tivities in diverse populations see, for instance, Nettlefold, 2011; Ortega et al., 2013; Parekh et al.,
2012; Park, 2007; Yang et al., 2010; but compare to ruffin, 2012; Wagnsson et al., 2013). On the oth-

92 LEiSURE aND LifESTyLE andrej Kirbiš and Marina Tavčar Krajnc
er hand, today’s youth allot a large portion of their leisure time to hanging out with friends, using
electronic media, watching television, playing computer games, etc. (Furlong, 2013, 147; also see
Kirbiš, 2011a; 2011b).
Questions remain as to whether these are “unproductive” leisure time activities, particularly
given that empirical evidence corroborates that they are to a degree “unhealthy”. While structured
activities were previously found to be associated with positive psychosocial development and vice
versa, unstructured activities often produce negative outcomes and risk behaviors (Bohnert et al.,
2009; Busseri and rose-Krasnor, 2009; Caldwell and Smith, 2006; denault and Poulin, 2009; Mchale,
et al., 2009; Osgood et al., 1996; vazsonyi, 2002; Watts and Caldwell, 2008). however, “unproduc-
tive” leisure activities are not necessarily harmful to youth. For example, “hanging out” in public
spaces may function “as ‘chilling out’ away from adult surveillance and of absenting themselves
from the stresses of modern living” (Abbott-Chapman and robertson, 2009); of course, very few
groups who partake in these types of activities become “gangs”, or engage in anti-social activities.
The concept of lifestyle is often discussed and examined alongside leisure, in the sense that
leisure is considered “one of the prime vehicles within which young people develop expressions of
lifestyle” (hendry et al., 2005, 21; also see Blaxter, 2005, 8). Indeed, different lifestyles can also be
expressed through leisure activities in the sense that leisure represents a context where different
forms of identity can be defined. This is particularly true for the period of youth, when important
developmental tasks can be realized and independence from one’s guardians can be negotiated
(hendry et al., 2005, 2,22).
Similarly, Miles (2011, 17) notes that the construction of lifestyles is an interactive process that
includes diverse aspects of life, such as fun and pleasure, which are for many young people of-
ten synonyms with leisure activities. In other words, lifestyle is an arena of society within which
young people adapt and transform the society (Miles, 2011, 19). In this sense, Bellah discusses
“lifestyle enclaves” (groups of people with common lifestyles) that “express their identity through
shared patterns of appearance, consumption, and leisure activities” (Bellah et al., 1985, 355; cited
in Miles, 2011, 24). Finally, youth (and people in general) are concerned with establishing a sense
of who they are; in this context, a lifestyle can be understood as an “outward expression of an
identity” (Miles, 2011, 26). In sum, leisure and lifestyle are often intrinsically linked and may be
analyzed as two interrelated concepts. here Furlong and Cartmel (2007) understand this as “lei-
sure lifestyles”, indicating that the concepts have a high degree of overlap.
As lifestyle involves values, ideals, and moral and aesthetic judgments (Sulkunen, 2009, 4), this
project uses Miles’ (2011, 16) broader definition of youth lifestyle, i.e., “young people’s active ex-
pression of a way of life”. In view of the discussion above, the main aim of this chapter is to ana-
lyze patterns of leisure and lifestyle of Slovenian youth.
Second, the project analyzes the socio-demographic determinants (life chances) of leisure ac-
tivities and lifestyle of Slovenian youth, or what Miles (2011, 17) refers to as the structures that
shape the lifestyles of young people. This is of particular interest as recent studies confirm that
correspondence between social structure (e.g., class) and lifestyles has weakened in recent de-
cades (Furlong and Cartmel, 2007).
andrej Kirbiš and Marina Tavčar Krajnc LEiSURE aND LifESTyLE 93
Third, as Furlong (2013, 147) notes, youth lifestyles in western societies show great similarities.
The aim here has been to examine the degree to which this assumption holds true for youth in
post-communist countries, i.e., Slovenia, Croatia, and Kosovo. One of the key assumptions was
that there would be greater similarities between youth in these societies, when compared to the
leisure activities and lifestyle of German youth. On the other hand, roberts (2006, 5) argues that
“western” leisure is now becoming more widespread and that the collapse of communism has
contributed to the globalization of western leisure, although the latter is far from universal. In this
sense, studies of today’s youth (when compared to previous generations) reveal that values across
regions are increasingly similar. For example, today’s youth have higher levels of tolerance toward
groups seen as different; they are also more open to cultural diversity (vala and Costa-Lopes,
(2010). Moreover, young people’s lifestyles increasingly cut across class and national boundaries
(Karvonen et al., 2012); thus, it can be assumed that there will not be a high degree of national
variance when it concerns youth leisure and lifestyles patterns.
Finally, as Karvonen et al. (2012) suggest, the (broadly defined) media often present a “nar-
cissistic and pleasure-oriented lifestyles” image of youth (also see Abbott-Chapman and robert-
son, 2009, 243; Kirbiš and Flere, 2011a). Thus, this project (using survey data) attempts to confirm
whether this image has merit (see also the chapter on youth anxieties and aspirations), although
the available lifestyle indicators were far from all-inclusive.
2 Leisure activities
Past studies of Slovenian youth found leisure patterns similar to those mentioned above. Slove-
nian youth leisure activities most frequently involve hanging out with friends and partners, listen-
ing to music, using the computer/Internet, watching Tv, and playing sports (for a review, see Kir-
biš, 2011a; for patterns of media and information-communication technology use among Slovenian
youth, see Kirbiš, 2011b; also see the chapter on media use in the present research report). The
most recent representative study of Slovenian youth ranked the frequency of everyday activities
in descending order: using the computer, socializing with friends/peers, socializing with partners,
watching Tv, and shopping. When asked specifically about leisure time activities, activities ranked
in the following order: sports, visiting relatives, going to the cinema, theatre, and concerts, en-
gagement with music, theatre, and arts, taking family trips, and involvement with humanitarian
activities and others (Kirbiš, 2011a).
This study uses both behavioral indicators, (e.g., lifestyle defined as an integrated set of prac-
tices that give a material form to a particular identity; Giddens, 1991, 81; in Miles, 2011, 28) and dis-
positional/attitudinal indicators. Figure 44 shows the frequency of various youth leisure activities
from most to least preferred among Slovenian youth, and indicates the percentage of youth who
“frequently” do the listed activities. Listening to music is the most frequently experienced activi-
ty (84 percent of Slovenian youth), followed by socializing with friends. Watching television ranks
third (54 percent). Nearly half of Slovenian youth frequently do sports and watch movies, while
only one-fifth read newspapers/magazines in their free time. These findings corroborate earlier
studies on Slovenian youth leisure time, where listening to music and socializing were also among
the most frequent leisure activities (Kirbiš, 2011a).

94 LEiSURE aND LifESTyLE andrej Kirbiš and Marina Tavčar Krajnc
Figure 44: Leisure activities (% doing the activity “frequently”) among Slovenian, Croatian and Kosovo youth (16–25 years)
Note: The figure presents percentage of respondents “frequently” active in listed activities.
Sources: CEPYUS-FES Slovenian 2013 Youth Study, IDIZ-FES Croatian 2012 Youth Study and IDRA-FES Kosovo 2012 Youth Study.
A cross-national comparison of leisure activities shows similar leisure patterns. Listening to mu-
sic is the most preferred activity among youth from all three post-Yugoslav societies, which could
be explained by not only the popularity of the activity, but also by the fact that listening to music
can be done in conjunction with other activities (hanging out with friends, playing sports, etc.).
Slovenian youth socialize with their friends most frequently, while Kosovo youth socialize least fre-
quently; nevertheless, over one-half of Kosovar youth frequently hang out with their friends. The
largest cross-national differences relate to the amount of time spent watching television (Kosovar
youth watch Tv most frequently) and for reading magazines (again, Kosovar youth read more often
than Slovenian and Croatian youth; among Kosovars almost one-half frequently read books and
magazines in their leisure time).
In sum, youth from all three countries are rather similar with regard to leisure activities; Slo-
venian and Croatian youth often listen to music and socialize, while Kosovo youth seem to prefer
more solitary activities (e.g., reading and watching Tv).22 Of course, factors other than preferences
can influence leisure time use; e.g., parental supervision, developed infrastructure, geographical
density of infrastructure for certain leisure activities, etc.
Statistical analyses have also shown that there is some heterogeneity regarding leisure activi-
ties among Slovenian youth. Age is a significant determinant for the majority of leisure activities.
Older youth more frequently read newspapers and magazines (rho = 0.14, n = 906; p < 0.001), while
watching movies (rho = -0.10, n = 901; p < 0.01), socializing with friends (rho = -0.09, n = 904; p
< 0.01) and listening to music (rho = -0.07, n = 905; p < 0.05) are more frequent among younger
respondents.
22 Watching Tv, of course, can also be done with friends and family.
84 83
5445 42
20
8474
54
31
55
25
81
55
36
79
43
0
20
40
60
80
100
Listen to themusic
Go out withfriends
Watch movies Do sports Watch TV Readbooks/magazines
SLO CRO KOS
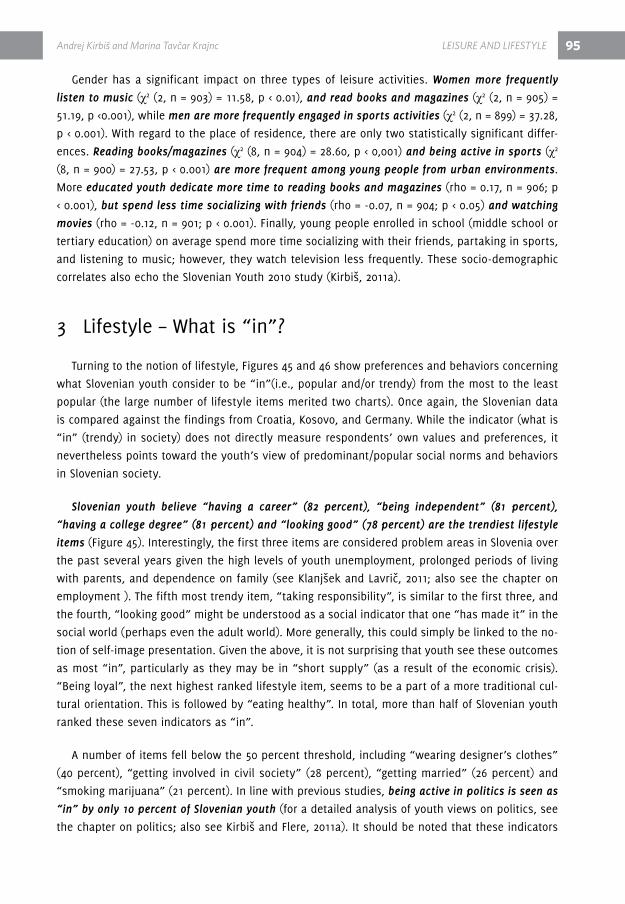
andrej Kirbiš and Marina Tavčar Krajnc LEiSURE aND LifESTyLE 95
Gender has a significant impact on three types of leisure activities. Women more frequently
listen to music (χ2 (2, n = 903) = 11.58, p < 0.01), and read books and magazines (χ2 (2, n = 905) =
51.19, p <0.001), while men are more frequently engaged in sports activities (χ2 (2, n = 899) = 37.28,
p < 0.001). With regard to the place of residence, there are only two statistically significant differ-
ences. Reading books/magazines (χ2 (8, n = 904) = 28.60, p < 0,001) and being active in sports (χ2
(8, n = 900) = 27.53, p < 0.001) are more frequent among young people from urban environments.
More educated youth dedicate more time to reading books and magazines (rho = 0.17, n = 906; p
< 0.001), but spend less time socializing with friends (rho = -0.07, n = 904; p < 0.05) and watching
movies (rho = -0.12, n = 901; p < 0.001). Finally, young people enrolled in school (middle school or
tertiary education) on average spend more time socializing with their friends, partaking in sports,
and listening to music; however, they watch television less frequently. These socio-demographic
correlates also echo the Slovenian Youth 2010 study (Kirbiš, 2011a).
3 Lifestyle – What is “in”?
Turning to the notion of lifestyle, Figures 45 and 46 show preferences and behaviors concerning
what Slovenian youth consider to be “in”(i.e., popular and/or trendy) from the most to the least
popular (the large number of lifestyle items merited two charts). Once again, the Slovenian data
is compared against the findings from Croatia, Kosovo, and Germany. While the indicator (what is
“in” (trendy) in society) does not directly measure respondents’ own values and preferences, it
nevertheless points toward the youth’s view of predominant/popular social norms and behaviors
in Slovenian society.
Slovenian youth believe “having a career” (82 percent), “being independent” (81 percent),
“having a college degree” (81 percent) and “looking good” (78 percent) are the trendiest lifestyle
items (Figure 45). Interestingly, the first three items are considered problem areas in Slovenia over
the past several years given the high levels of youth unemployment, prolonged periods of living
with parents, and dependence on family (see Klanjšek and Lavrič, 2011; also see the chapter on
employment ). The fifth most trendy item, “taking responsibility”, is similar to the first three, and
the fourth, “looking good” might be understood as a social indicator that one “has made it” in the
social world (perhaps even the adult world). More generally, this could simply be linked to the no-
tion of self-image presentation. Given the above, it is not surprising that youth see these outcomes
as most “in”, particularly as they may be in “short supply” (as a result of the economic crisis).
“Being loyal”, the next highest ranked lifestyle item, seems to be a part of a more traditional cul-
tural orientation. This is followed by “eating healthy”. In total, more than half of Slovenian youth
ranked these seven indicators as “in”.
A number of items fell below the 50 percent threshold, including “wearing designer’s clothes”
(40 percent), “getting involved in civil society” (28 percent), “getting married” (26 percent) and
“smoking marijuana” (21 percent). In line with previous studies, being active in politics is seen as
“in” by only 10 percent of Slovenian youth (for a detailed analysis of youth views on politics, see
the chapter on politics; also see Kirbiš and Flere, 2011a). It should be noted that these indicators
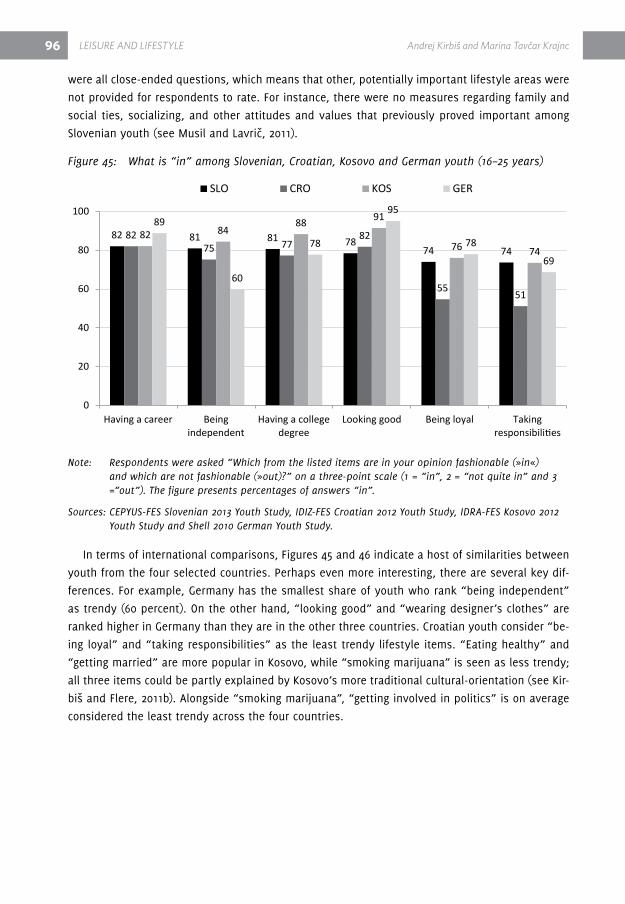
96 LEiSURE aND LifESTyLE andrej Kirbiš and Marina Tavčar Krajnc
were all close-ended questions, which means that other, potentially important lifestyle areas were
not provided for respondents to rate. For instance, there were no measures regarding family and
social ties, socializing, and other attitudes and values that previously proved important among
Slovenian youth (see Musil and Lavrič, 2011).
Figure 45: What is “in” among Slovenian, Croatian, Kosovo and German youth (16–25 years)
Note: Respondents were asked “Which from the listed items are in your opinion fashionable (»in«) and which are not fashionable (»out)?” on a three-point scale (1 = “in”, 2 = “not quite in” and 3 =“out”). The figure presents percentages of answers “in”.
Sources: CEPYUS-FES Slovenian 2013 Youth Study, IDIZ-FES Croatian 2012 Youth Study, IDRA-FES Kosovo 2012 Youth Study and Shell 2010 German Youth Study.
In terms of international comparisons, Figures 45 and 46 indicate a host of similarities between
youth from the four selected countries. Perhaps even more interesting, there are several key dif-
ferences. For example, Germany has the smallest share of youth who rank “being independent”
as trendy (60 percent). On the other hand, “looking good” and “wearing designer’s clothes” are
ranked higher in Germany than they are in the other three countries. Croatian youth consider “be-
ing loyal” and “taking responsibilities” as the least trendy lifestyle items. “Eating healthy” and
“getting married” are more popular in Kosovo, while “smoking marijuana” is seen as less trendy;
all three items could be partly explained by Kosovo’s more traditional cultural-orientation (see Kir-
biš and Flere, 2011b). Alongside “smoking marijuana”, “getting involved in politics” is on average
considered the least trendy across the four countries.
82 81 81 7874 74
8275 77
82
55 51
82 8488 91
76 74
89
60
78
95
78
69
0
20
40
60
80
100
Having a career Beingindependent
Having a collegedegree
Looking good Being loyal Takingresponsibilities
SLO CRO KOS GER
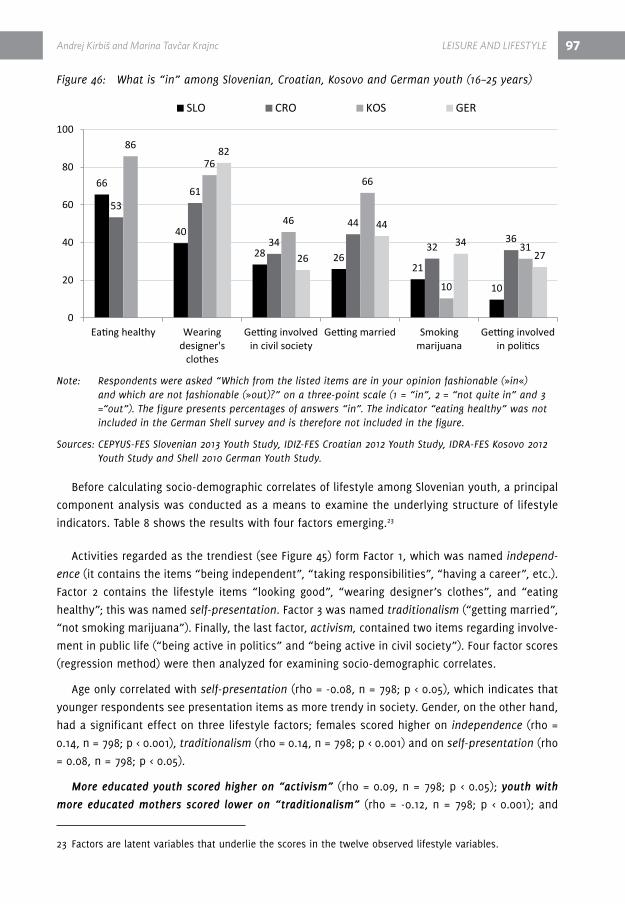
andrej Kirbiš and Marina Tavčar Krajnc LEiSURE aND LifESTyLE 97
Figure 46: What is “in” among Slovenian, Croatian, Kosovo and German youth (16–25 years)
Note: Respondents were asked “Which from the listed items are in your opinion fashionable (»in«) and which are not fashionable (»out)?” on a three-point scale (1 = “in”, 2 = “not quite in” and 3 =“out”). The figure presents percentages of answers “in”. The indicator “eating healthy” was not included in the German Shell survey and is therefore not included in the figure.
Sources: CEPYUS-FES Slovenian 2013 Youth Study, IDIZ-FES Croatian 2012 Youth Study, IDRA-FES Kosovo 2012 Youth Study and Shell 2010 German Youth Study.
Before calculating socio-demographic correlates of lifestyle among Slovenian youth, a principal
component analysis was conducted as a means to examine the underlying structure of lifestyle
indicators. Table 8 shows the results with four factors emerging.23
Activities regarded as the trendiest (see Figure 45) form Factor 1, which was named independ-
ence (it contains the items “being independent”, “taking responsibilities”, “having a career”, etc.).
Factor 2 contains the lifestyle items “looking good”, “wearing designer’s clothes”, and “eating
healthy”; this was named self-presentation. Factor 3 was named traditionalism (“getting married”,
“not smoking marijuana”). Finally, the last factor, activism, contained two items regarding involve-
ment in public life (“being active in politics” and “being active in civil society”). Four factor scores
(regression method) were then analyzed for examining socio-demographic correlates.
Age only correlated with self-presentation (rho = -0.08, n = 798; p < 0.05), which indicates that
younger respondents see presentation items as more trendy in society. Gender, on the other hand,
had a significant effect on three lifestyle factors; females scored higher on independence (rho =
0.14, n = 798; p < 0.001), traditionalism (rho = 0.14, n = 798; p < 0.001) and on self-presentation (rho
= 0.08, n = 798; p < 0.05).
More educated youth scored higher on “activism” (rho = 0.09, n = 798; p < 0.05); youth with
more educated mothers scored lower on “traditionalism” (rho = -0.12, n = 798; p < 0.001); and
23 Factors are latent variables that underlie the scores in the twelve observed lifestyle variables.
66
40
28 2621
10
5361
34
44
3236
86
76
46
66
10
31
82
26
44
3427
0
20
40
60
80
100
Eating healthy Wearingdesigner's
clothes
Getting involvedin civil society
Getting married Smokingmarijuana
Getting involvedin politics
SLO CRO KOS GER

98 LEiSURE aND LifESTyLE andrej Kirbiš and Marina Tavčar Krajnc
youth with more educated fathers scored higher on “activism” (rho = 0.13, n = 798; p < 0.001). Last-
ly, young people enrolled in school scored higher on self-presentation and activism.
Table 8: Principal component analysis of lifestyle indicators performed on Slovenian youth sample (16–27 years)
Factor 1independence
Factor 2SelF-preSentation
Factor 3traditionaliSm
Factor 4actiViSm
Being loyal 0.62
Taking responsibilities 0.80
Being independent 0.87
having a college degree 0.43
having a career 0.38
Getting involved in politics 0.88
Getting involved in civil society 0.67
Getting married 0.73
Looking good 0.83
Wearing designer’s clothes 0.69
Eating healthy 0.55
Smoking marijuana -0.78
Note: Extraction method employed was Principal Component Analysis; Rotation Method was Promax with Kaiser Normalization.
Source: CEPYUS-FES Slovenian 2013 Youth Study.
4 Consumption patterns – “Where does the money go?”
Lifestyle may also be understood as a material form of self-identity, and in late modern societ-
ies this is often constituted through the consumption of consumer goods, which in itself may be
regarded as “the primary indicator of lifestyles” (Miles, 2011, 28-29). Consumer lifestyle is thus
a prominent sphere of a person’s life in modern society and, as Miles (2002, 142) notes, young
people “use consumption as a means of establishing lifestyles that make the world a manageable
place”. Moreover, young people routinely face social and cultural changes in their daily lives and
the “main way in which they deal with this is through the maintenance of consumer lifestyle”
(Miles, 2002, 7).
The next part of this chapter examines consumer lifestyles (consumption patterns) of Slovenian
youth by analyzing how they spend their money. respondents were asked, “What is your average
monthly expenditure for the following activities/products?” Figure 47 shows the data for Slovenian,
Croatian,24 and Kosovar youth.25
24 Monthly expenditures in Croatia were expressed in Croatian kuna (hrK). They were converted to EUr with the exchange rate of 1 hrK = 0.133 Euros (exchange rate valid for August 5th 2013).
25 With regard to each expenditure item, data was only analyzed on those respondents who provided an answer to individual expenditure item, while answers “I don’t know (how much I spend)” were excluded from the analysis.

andrej Kirbiš and Marina Tavčar Krajnc LEiSURE aND LifESTyLE 99
Figure 47: Structure of average monthly expenditure (in €) of Slovenian, Croatian and Kosovo youth (16–25 years)
Sources: CEPYUS-FES Slovenian 2013 Youth Study, IDIZ-FES Croatian 2012 Youth Study, IDRA-FES Kosovo 2012 Youth Study.
Figure 47 lists the areas of expenditure of Slovenian youth from highest expenditure (on the left
side of the figure) to the smallest. Slovenian youth spend most of their money on clothes, foot-
wear, and fashion accessories (48 EUR per month), and on socializing (going out to cafes, clubs,
and restaurants; 41 EUR). Approximately 25 EUR per month is spent on (mobile) phone bills, while
watching movies (6 EUR) and buying books (4 EUR) are the smallest monthly expenditures.26 A
quick glance of Figures 45 and 46 indicate that youth tend to prioritize their looks (clothes and ac-
cessories; Factor 2 – self-presentation – in Table 8) and socializing (going out with peers and com-
municating with them (and probably also with family) via the use of information-communication
technology). In fact, socializing constitutes the second and third highest expenditures. If these
two are added together, it is apparent that young people spend the most money on socializing. Of
course, it is not surprising that socializing and self-presentation often go hand in hand.
In terms of cross-national comparisons, the relative positions of expenditure types are practi-
cally identical, with youth from all three countries spending the most amount of money on clothes
and accessories. Nevertheless, two findings should be noted. As expected, Slovenian youth spend
the most money combined (Slovenia has the most developed economy among the three post-Yu-
goslav states; hdr, 2013; Kosovo human development report, 2012), and the most money on four
out of the five items. Curiously, according to self-report data, Kosovar youth outspend Croatian
youth on clothes and accessories. In addition, young Kosovars spend more money on books than
their Slovenian and Croatian counterparts.
26 The list of items on expenditure was, of course, limited and youth may spend their money on other things as well. In this context let us note that one other answer was provided (“Other expenditure”), which was selected by 15 respondents in Slovenian sample (the average was 117 EUr/monthly), but is not shown in the figure because of small number of respondents.
4841
25
6 4
29 28
154 3
40
25
122
9
0102030405060708090
100
Clothes, footwearand fashionaccessories
Going out to coffeebars, clubs and
restaurants
Mobile phone cards,telephone bills
Watching movies(cinema, buying
DVDs, etc.)
Buying books
SLO CRO KOS
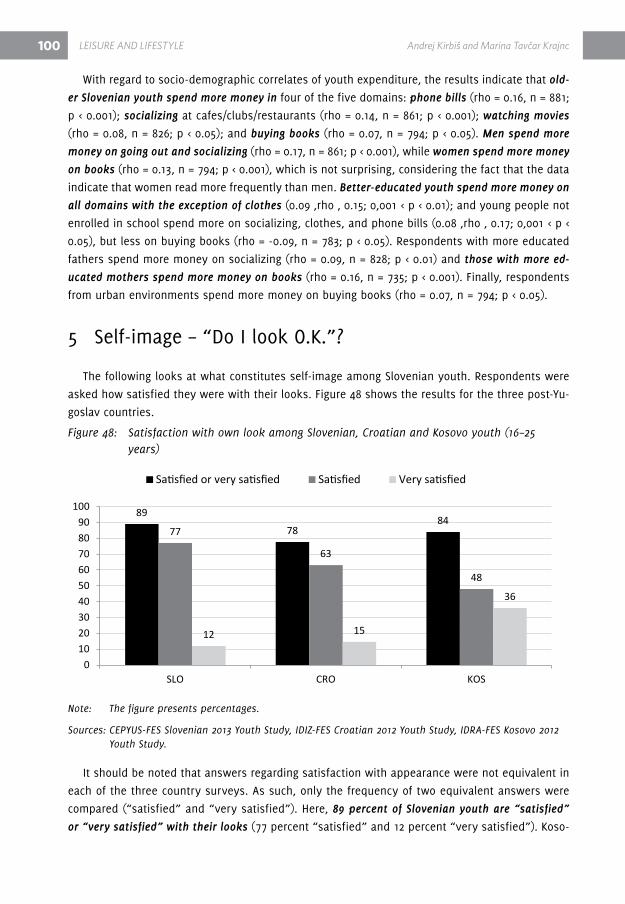
100 LEiSURE aND LifESTyLE andrej Kirbiš and Marina Tavčar Krajnc
With regard to socio-demographic correlates of youth expenditure, the results indicate that old-
er Slovenian youth spend more money in four of the five domains: phone bills (rho = 0.16, n = 881;
p < 0.001); socializing at cafes/clubs/restaurants (rho = 0.14, n = 861; p < 0.001); watching movies
(rho = 0.08, n = 826; p < 0.05); and buying books (rho = 0.07, n = 794; p < 0.05). Men spend more
money on going out and socializing (rho = 0.17, n = 861; p < 0.001), while women spend more money
on books (rho = 0.13, n = 794; p < 0.001), which is not surprising, considering the fact that the data
indicate that women read more frequently than men. Better-educated youth spend more money on
all domains with the exception of clothes (0.09 ≤rho ≤ 0.15; 0,001 < p < 0.01); and young people not
enrolled in school spend more on socializing, clothes, and phone bills (0.08 ≤rho ≤ 0.17; 0,001 < p <
0.05), but less on buying books (rho = -0.09, n = 783; p < 0.05). respondents with more educated
fathers spend more money on socializing (rho = 0.09, n = 828; p < 0.01) and those with more ed-
ucated mothers spend more money on books (rho = 0.16, n = 735; p < 0.001). Finally, respondents
from urban environments spend more money on buying books (rho = 0.07, n = 794; p < 0.05).
5 Self-image – “do I look O.K.”?
The following looks at what constitutes self-image among Slovenian youth. respondents were
asked how satisfied they were with their looks. Figure 48 shows the results for the three post-Yu-
goslav countries.
Figure 48: Satisfaction with own look among Slovenian, Croatian and Kosovo youth (16–25 years)
Note: The figure presents percentages.
Sources: CEPYUS-FES Slovenian 2013 Youth Study, IDIZ-FES Croatian 2012 Youth Study, IDRA-FES Kosovo 2012 Youth Study.
It should be noted that answers regarding satisfaction with appearance were not equivalent in
each of the three country surveys. As such, only the frequency of two equivalent answers were
compared (“satisfied” and “very satisfied”). here, 89 percent of Slovenian youth are “satisfied”
or “very satisfied” with their looks (77 percent “satisfied” and 12 percent “very satisfied”). Koso-
89
7884
77
63
48
12 15
36
0102030405060708090
100
SLO CRO KOS
Satisfied or very satisfied Satisfied Very satisfied

andrej Kirbiš and Marina Tavčar Krajnc LEiSURE aND LifESTyLE 101
vo youth are second (84 percent “satisfied” or “very satisfied”), followed by Croatian youth (78
percent “satisfied” and “very satisfied”). Among Slovenian youth, the only socio-demographic
correlate of satisfaction with one’s looks was gender, with men being more satisfied with their
appearance (rho = 0.11, n = 909; p < 0.001).
In view of the aims of this chapter, some conclusions can be drawn. First, the results of the
leisure and lifestyle analysis of Slovenian youth largely corroborate previous studies, which illus-
trate that media use (listening to music, watching television; also see chapter on media use) and
socializing are the most frequent leisure activities of Slovenian youth (Kirbiš, 2011a).
Second, with regard to life chances or structures (Miles, 2011, 17) that shape the lifestyles
of young people, age, gender and education (both respondents and parental) most frequently
emerged as determinants of youth lifestyles and consumption patterns.
Third, comparing the leisure patterns and lifestyles of Slovenian, Croatian, and Kosovar youth, a
number of similarities can be seen between them, (as well, there are commonalities with German
youth). The results do seem to corroborate the view that “western” leisure is becoming more wide-
spread in post-communist countries, which is especially evident in terms of consumption patterns.
At the same time, the results show that there is some cross-national variance and that social and
cultural contexts influence the leisure patterns of Slovenian and post-Yugoslav youth.
Finally, analyzing the perceptions of popular social goals in life, “having a career”, “being inde-
pendent”, and “having a college degree” are considered the most popular among Slovenian youth.
Ironically, this image strays from that which is depicted by the media, where youth are frequently
associated with “narcissistic and pleasure-oriented lifestyles”, as Karvonen et al. (2012) note. The
survey data taken here does not support this view, as young people described their main life goals
as “making it in life”, by means of becoming independent through work and education. Lifestyle
patterns of Slovenian youth parallel the processes of individualization (Beck and Beck Gernsheim,
2002). Of course, available lifestyle indicators were, as already noted, far from all-inclusive, which
present limitations on drawing firm conclusions. As always, future studies in this field are needed.
6 Key findings
Listening to music is the most preferred leisure activity among youth from all three post-Yugo-
slav societies; 84 percent of Slovenian youth frequently listen to music and 54 percent frequently
watch Tv. Nearly one-half of Slovenian youth frequently play sports and watch movies, while only
one-fifth read newspapers/magazines in their free time.
Older youth more frequently read newspapers/magazines, while their younger cohorts more
frequently socialize with friends and listen to music. Women more frequently listen to music and
read books and magazines, while men more frequently engage in sport-related activities. reading
books/magazines and being active in sports is more frequent among young people from urban en-
vironments. Better-educated youth spend more time reading books and magazines, but dedicate
less time socializing with friends.
82 percent of Slovenian youth believe “having a career” is “in” (i.e., trendy, popular), followed
by “being independent” (81 percent), “having a college degree” (81 percent) and “looking good”
(78 percent). Better-educated youth, who have well-educated fathers scored higher on “activism”,
and youth with more educated mothers scored lower on “traditionalism”.
Slovenian youth spend most of their money on clothes, footwear, and fashion accessories (on
average 48 EUr per month), followed by socializing (going out to cafes, clubs, and restaurants; 41
EUr). Approximately 25 EUr per month is spent on phone bills. Older Slovenian youth spend more
money on phone bills, socializing at cafes, clubs, and restaurants, watching movies, and buying
books. Men spend more money on going out and socializing, while women spend more money on
books. Better-educated youth spend more money on all domains with the exception of clothing.
89 percent of Slovenian youth are “satisfied” or “very satisfied” with their looks; men are sig-
nificantly more satisfied than women.
7 referencesAbbott-Chapman, J., and robertson, M. (2009). Leisure activities, place and identity. In Furlong,
A. (Ed.). handbook of youth and young adulthood: New perspectives and agendas, (pp. 243–248).
Milton Park: routledge.
Beck, U., and Beck-Gernsheim, E. (2002). Individualization, London: Sage.
Blaxter, M. (2005). health and Lifestyles. London: routledge.
Blomfield, C., and Barber, B. (2010). Australian Adolescents’ Extracurricular Activity Participation
and Positive development: Is the relationship Mediated by Peer Attributes? Australian Journal of
Educational & developmental Psychology, 10, 108 –122.
Bohnert, A. M., et al., (2009). relationships Between discretionary Time Activities, Emotional Ex-
periences, delinquency and depressive Symptoms Among Urban African American Adolescents.
Journal of youth and adolescence, 38, 587–601.
Busseri, M. A., and rose-Krasnor, L. (2009). Breadth and intensity: Salient, separable, and devel-
opmentally significant dimensions of structured youth activity involvement. British Journal of de-
velopmental Psychology, 27, 907–933.
Caldwell, L. (2000). Introductory Comments: Special Issue on Youth and Leisure. Journal of Park
and recreation Administration, 18 (1), 1–4.
Caldwell, L. L., and Smith, E. A. (2006). Leisure as a Context for Youth development and delin-
quency Prevention. The Australian and New Zealand Journal Of Criminology, 39, 398–418.
deem, r. (2001). Work, Unemployment, and Leisure. routledge: London.
102 LEiSURE aND LifESTyLE andrej Kirbiš and Marina Tavčar Krajnc

denault, A. S., and Poulin, F. (2009). Intensity and Breadth of Participation in Organized Activities
during the Adolescent Years: Multiple Associations with Youth Outcomes. Journal of youth and
adolescence, 38, 1199–1213.
Fletcher, A. C., et al (2003). Structured leisure activities in middle childhood: Links to well-being.
Journal of Community Psychology, 31, 641-659.
Fredricks, J. A., and Eccles, J. S. (2006). Is Extracurricular Participation Associated With Beneficial
Outcomes? Concurrent and Longitudinal relations. developmental Psychology, 42 (4), 698–713.
Furlong, A. (2013). Youth Studies: An Introduction. Abingdon, Oxon: routledge.
Furlong, A., and Cartmel, F. (2007). Young people and social change. Berkshire: Open University
Press.
hdr (2013). human development report 2013: The rise of the South: human Progress in a di-
verse World. New York. United Nations development Programme. Available at: http://hdr.undp.
org/en/ media/hdr_2013_EN_complete.pdf, September 5th, 2013.
hendry, L. et al. (2005). Young people’s leisure and lifestyles. New York: routledge.
Karvonen, S., et al. (2012). value orientations among late modern youth - a cross-cultural study.
Journal of Youth Studies, 15 (1), 33–52.
Kirbiš, A. (2011a). Creativity, culture and leisure. In Lavrič, M. (Ed.). Youth 2010: The social profile
of young people in Slovenia, (pp. 261–292). Ljubljana: Ministry of Education and Sports, Office for
Youth; Maribor: Aristej.
Kirbiš, A. (2011b). The virtualisation of everyday life. In Lavrič, M. (Ed.). Youth 2010: The social
profile of young people in Slovenia, (pp. 293–320). Ljubljana: Ministry of Education and Sports,
Office for Youth; Maribor: Aristej.
Kirbiš, A, and Flere, S. (2011a). Participation. In Lavrič, M. (Ed.). Youth 2010: The social profile of
young people in Slovenia, (pp. 187–260). Ljubljana: Ministry of Education and Sports, Office for
Youth; Maribor: Aristej.
Kirbiš, A., and Flere, S. (2011b). Podložniška politična kultura v postkomunističnih družbah: prim-
erjalna študija postjugoslovanskih študentov [Subject political culture in post-communist socie-
ties: a comparative study of post-Yugoslav students]. družboslovne razprave, 27 (66), 45-66.
Klanjšek, r., and Lavrič, M. (2011). Employment and enterpreneurship. In Lavrič, M. (Ed.). Youth
2010: The social profile of young people in Slovenia, (pp. 131–186). Ljubljana: Ministry of Educa-
tion and Sports, Office for Youth; Maribor: Aristej.
Kosovo human development report (2012). Kosovo human development report 2012. Prishtinë:
United Nations development Programme. Available at: http://hdr.undp.org/en/reports/national/
europethecis/kosovo/Khdr2012-Eng.pdf, September 5th, 2013.
Lowe vandell, d. et al. (2007). Outcomes Linked to high-Quality Afterschool Programs Longitudi-
nal Findings from the Study of Promising Afterschool Programs, October 2007. Available at: http://
www.newdayforlearning.org/docs/hIllPPreport.pdf, September 5th, 2013.
andrej Kirbiš and Marina Tavčar Krajnc LEiSURE aND LifESTyLE 103

Mchale, S. M., Updegraff, K. A., Kim, J. Y., and Cansler, E. (2009). Cultural Orientations, daily
Activities, and Adjustment in Mexican American Youth. Journal of youth and adolescence, 38,
627–641.
Miles, S. (2002). Consuming youth: consuming lifestyles. In Miles, S., et al. (Eds.). The Changing
Consumer: Markets and Meanings, (pp. 131–144). London: routledge.
Miles, S. (2011). Youth Lifestyles in a Changing World. Buckingham: Open University Press.
Musil, B., and Lavrič, M. (2011). values, sustainable social functioning and visions of the future.
In Lavrič, M. (Ed.). Youth 2010: The social profile of young people in Slovenia, (pp. 419–448). Lju-
bljana: Ministry of Education and Sports, Office for Youth; Maribor: Aristej.
Nettlefold, L. A. (2011). Patterns of physical activity and sedentary behaviour and Cardiovascular
health in children. A Phd Thesis. Available at: https://circle.ubc.ca/bitstream/id/125861/ubc_2011_
fall_nettlefold_lindsay.pdf, September 5th, 2013.
Ortega F. B. et al. (2013). Physical activity, physical fitness, and overweight in children and ado-
lescents: evidence from epidemiologic studies. Endocrinol Nutr, doi: 10.1016/j.endonu.2012.10.006.
Osgood, W., et al. (1996). routine Activities and Individual deviant Behavior. American Sociologi-
cal review, 61, 635–655.
Parekh, N. et al. (2012). Longitudinal Associations of Leisure-Time Physical Activity and Cancer
Mortality in the Third National health and Nutrition Examination Survey (1986–2006). Journal of
Obesity, vol. 2012, Article Id 518358, 9 pages, 2012. doi:10.1155/2012/518358.
Park, h. (2007). Longitudinal relationships Between Physical Activity, Sedentary Behaviors, And
Obesity In Children And Adolescents. Phd Thesis. Available at: https://cdr.lib.unc.edu/indexable
content?id=uuid:b50b0e4a-3179-4c5f-b86f-fcb3ac4f92e3&ds=dATA_FILE, September 5th, 2013.
Persson, A. et al. (2007). Staying in or moving away from structured activities: Explanations in-
volving parents and peers. developmental Psychology, 43 (1), 197–207.
roberts, K. (2006). Leisure in Contemporary Society. Wallingford: CABI Publishing.
ruffin, B. A. (2012). The longitudinal influence of physical activity on adolescent alcohol use. Phd
Thesis. Available at: http://digitalcommons.fiu.edu/cgi/viewcontent.cgi?article=1714&context=etd,
September 5th, 2013.
russell, r. v. (2009). Pastimes: The Context of Contemporary Leisure (4th edition). Champaign,
Illinois: Sagamore Publishing, L.L.C.
Sulkunen, P. (2009). The Saturated Society: Governing risk and Lifestyles in Consumer Culture.
London: Sage.
vala, J., and Costa-Lopes, r. (2010). Youth attitudes toward difference and diversity: a cross-na-
tional analysis. Análise Social, 45 (195), 255–275.
vazsonyi, A. T. (2002). routine Activities and deviant Behaviors: American, dutch, hungarian, and
Swiss Youth. Journal of Quantitative Criminology, 18, 397–422.
104 LEiSURE aND LifESTyLE andrej Kirbiš and Marina Tavčar Krajnc
Wagnsson, S., et al. (2013). Associations Between Sport Involvement and Youth Psychosocial de-
velopment in Sweden: A Longitudinal Study. Journal of Sport for development, 1 (1), 37–47.
Walmsley, J. and Jenkins, J. (2005). In Walmsley, J. and Jenkins, J. (Eds). Encyclopedia of Leisure
and Outdoor recreation, (pp. 297–282). London: routledge.
Watts, C. E., and Caldwell, L. L. (2008). Self-determination and free time activity participation as
predictors of initiative. Journal of Leisure research, 40, 156–181.
Yang, x. et al. (2010). The benefits of sustained leisure-time physical activity on job strain. Occu-
pational Medicine, 60 (5), 369–375.
Zuzanek, J. (2006). Leisure and Time. In rojek, C. et al. (Eds). A handbook of Leisure Studies, (pp.
185-202). hampshire: Palgrave Macmillan.
andrej Kirbiš and Marina Tavčar Krajnc LEiSURE aND LifESTyLE 105


andrej Kirbiš and barbara zagorc MEDia USE 107
PArT v MEdIA USE
1 Introduction
Mass media has a tremendous and burgeoning role within society (Silverstone, 1999; Living-
stone, 2002; devereux, 2007; Buckingham, 2008). Silverstone, in taking a phrase from Isaiah Ber-
lin, describes the media role as providing “the general texture of experience” (1999, 2). In mod-
ern societies, characterized as having a “media saturation” (devereux, 2007), the media play an
especially important role in the lives of young people (Livingstone, 2002; Berns et al., 2007; Kirsh,
2010; Mesch and Talmud, 2010; Subrahmanyam and Šmahel, 2010; Brown and Bobkowski, 2011).
In the 21st century, the media can hardly be described as static. Whereas the previous century
was marked by the telephone, television, film, radio, newspapers, and magazines, the 21st century
has seen an ever-increasing use of the Internet, cell phones, and social networking (Silverstone,
1999, 4; devereux, 2007, 10; Brown and Bobkowski, 2011, 95). Unlike traditional media, new media
have the potential to activate greater audiences (Meikle, 2002; devereux, 2007, 10; Subrahmanyam
and Šmahel, 2010; Garcia-Castañon et al., 2011; hirzalla et al., 2011).
On media research, several relevant points merit mentioning. First, researchers largely examine
media in terms of new and emerging technologies. Like media, technology is constantly changing,
particularly in terms of how it affects society (Silverstone, 1999, 19; harrington, 2009). Second,
many previous studies on media have attempted to examine its effect on a variety of subthemes,
e.g., education, health, risk behavior, political participation, and communication, among others
(Levine et al., 2007; Leung and Kier, 2010; Sharabi and Margalit, 2011; Skoric and Kwan, 2011; Casia-
no et al., 2012; Quisto et al., 2012; AlGhamdi, 2013; Jung et al., 2013; for Slovenia see dolničar and
Nadoh, 2004; vreg, 2004; Kink, 2009; Oblak Črnič, 2010; Kirbiš, 2011; Kirbiš and Naterer, 2011; Oblak
Črnič, 2011; Praprotnik, 2011; Zagorc and Kirbiš, 2013).
Some authors have emphasized that young people, as active media users, are able to sift
through a multitude of media forms (e.g., Berns et al., 2007; Kirsh, 2010) and consequently at-
tach different meanings to specific content, depending on culture and contextual circumstances
(Kirmse, 2010; Ahmad et al., 2012). On the other hand, research has shown the negative impacts
of media use, which is addressed later in this chapter (Fallahi, 2011; Kirbiš, 2011; Tudor-Locke et
al., 2011; Casiano et al., 2012; Coyne et al., 2012; Kowalewska and Mazur, 2012; Krasnova et al.,
2013; Kross et al., 2013; Walsh et al., 2013) (for a review of media effects, also see Bryant and Ol-
iver, 2009).
This section presents the use of media by Slovenian youth in 2013, and offers comparative
cross-national perspectives. Figure 49 illustrates the frequency of different forms of media use

108 MEDia USE andrej Kirbiš and barbara zagorc
among youth (aged 16–25) from Slovenia, Croatia, and Kosovo.27 Survey participants reported the
frequency of different types of media use on a three-point scale (1 = never, 2 = sometimes, 3 =
frequently). It should be noted that only four media use items were provided in the survey. As
such, several frequently used media forms are missing; nevertheless, several new ICT technolo-
gies are discussed later in the chapter. Listening to music is the most frequent media use activity
among youth in all three countries; it is the most frequent among Slovenian and Croatian youth
(84 percent), but closely followed by Kosovo youth (81 percent). As noted in the previous chapter,
this in part can be explained by the fact that listening to music is not only a popular activity, but
also one that can be done while engaged in other (leisure and non-leisure) activities. In each of
the three countries, the least popular activity is reading; 20 percent of Slovenian youth often read
books and newspapers, compared to Croatia (25 percent) and Kosovo (43 percent). Overall, Slo-
venian youth do not spend a great deal of time watching television (42 percent) when compared
to Kosovo youth (79 percent).
Figure 49: Media use among Slovenian, Croatian and Kosovo youth (16–25 years)
Note: Respondents were asked how often they use specific forms of media (1 = never, 2 = sometimes, 3 = often). Percentages represent the answers “often”. In the Kosovo survey respondents were not asked about frequency of watching videos, therefore the Kosovo column is missing in the figure.
Sources: CEPYUS-FES Slovenian 2013 Youth Study, IDIZ-FES Croatian 2012 Youth Study, IDRA-FES Kosovo 2012 Youth Study.
An analysis of the correlates of media use among Slovenian youth (aged 16–27) reveals that
women more often listen to music (rho = 0.11, n = 905, p < 0.001) and read books/newspapers (rho
= 0.24, n = 906, p < 0.001). Older youth are also more likely to read books (rho = 0.13, n = 906, p
< 0.001), while younger youth are more likely to watch movies (rho = -0.11, n = 901, p < 0.01). Ad-
ditionally, better-educated youth more often read books (rho = 0.17, n = 906, p < 0.001), while the
less educated are more likely to watch videos (rho = -0.12, n = 901, p < 0.001). respondents whose
mother had a lower educational level (rho = -0.08, n = 869, p < 0.05) are more likely to watch Tv;
27 Media use in the context of leisure time and other free-time activities are analyzed in greater detail in the chapter on leisure in the present research report.
84 %
54 %
42 %
20 %
84 %
54 % 55 %
25 %
81 % 79 %
43 %
0 %
20 %
40 %
60 %
80 %
100 %
Listening to music Watching videos Watching TV Readingbooks/newspapers
SLO CRO KOS
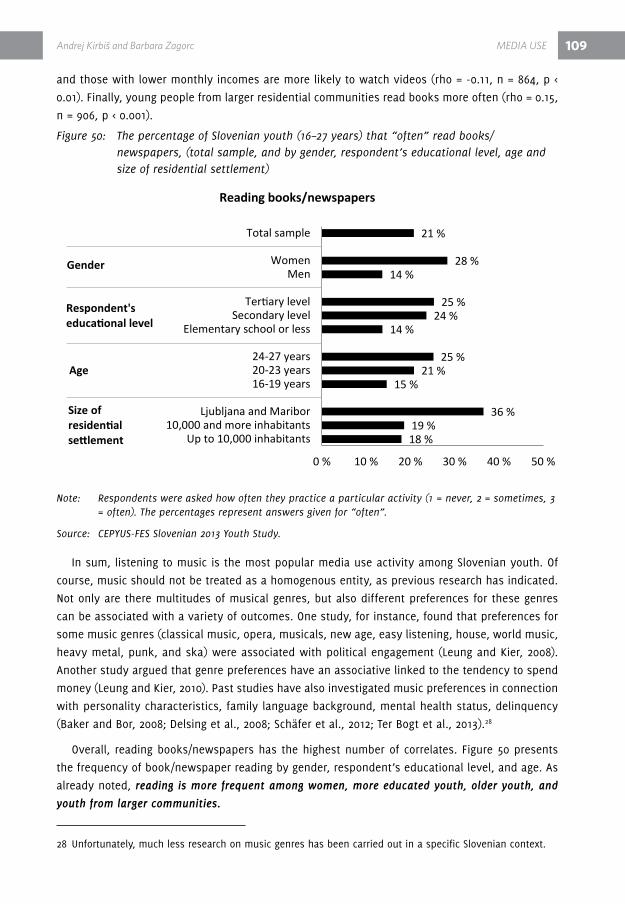
andrej Kirbiš and barbara zagorc MEDia USE 109
and those with lower monthly incomes are more likely to watch videos (rho = -0.11, n = 864, p <
0.01). Finally, young people from larger residential communities read books more often (rho = 0.15,
n = 906, p < 0.001).
Figure 50: The percentage of Slovenian youth (16–27 years) that “often” read books/newspapers, (total sample, and by gender, respondent’s educational level, age and size of residential settlement)
Note: Respondents were asked how often they practice a particular activity (1 = never, 2 = sometimes, 3 = often). The percentages represent answers given for “often”.
Source: CEPYUS-FES Slovenian 2013 Youth Study.
In sum, listening to music is the most popular media use activity among Slovenian youth. Of
course, music should not be treated as a homogenous entity, as previous research has indicated.
Not only are there multitudes of musical genres, but also different preferences for these genres
can be associated with a variety of outcomes. One study, for instance, found that preferences for
some music genres (classical music, opera, musicals, new age, easy listening, house, world music,
heavy metal, punk, and ska) were associated with political engagement (Leung and Kier, 2008).
Another study argued that genre preferences have an associative linked to the tendency to spend
money (Leung and Kier, 2010). Past studies have also investigated music preferences in connection
with personality characteristics, family language background, mental health status, delinquency
(Baker and Bor, 2008; delsing et al., 2008; Schäfer et al., 2012; Ter Bogt et al., 2013).28
Overall, reading books/newspapers has the highest number of correlates. Figure 50 presents
the frequency of book/newspaper reading by gender, respondent’s educational level, and age. As
already noted, reading is more frequent among women, more educated youth, older youth, and
youth from larger communities.
28 Unfortunately, much less research on music genres has been carried out in a specific Slovenian context.
18 %19 %
36 %
15 %21 %
25 %
14 %24 %
25 %
14 %28 %
21 %
0 % 10 % 20 % 30 % 40 % 50 %
Up to 10,000 inhabitants10,000 and more inhabitants
Ljubljana and Maribor
16-19 years20-23 years24-27 years
Elementary school or lessSecondary level
Tertiary level
MenWomen
Total sample
Reading books/newspapers
Gender
Respondent's educational level
Age
Size of residential settlement

110 MEDia USE andrej Kirbiš and barbara zagorc
Population studies (including youth) of the United States show a decline in reading frequency
(NEA, 2004, 26, 27; NEA, 2007), which is comparable to the findings from a number of other coun-
tries, particularly where it concerns youth. Young people more frequently use other types of me-
dia (especially the Internet) (Lenhart et al., 2001, 13-14; Parratt Fernández, 2010). The results here
indicate a similar trend, i.e., a decline in print media’s popularity among Slovenian youth. This is
problematic if one considers previous data noting the many positive effects reading has on youth
development and health. For example, reading has been shown to enhance concentration (Levine
et al., 2007), reduce prejudice toward immigrants (vezzali et al., 2012), and produce positive aca-
demic outcomes (Walsh et al., 2013). however, reading books does not necessarily have a positive
net impact per se. Indeed, behavior outcomes that stem from reading are dependent on the spe-
cific content of the book (Udermann et al., 2004; Coyne et al., 2012).
1.1 Media as a source of political information
Young people today obtain information from a variety of different sources. When compared to
previous generations, they are far less likely to read print media (although this is less true for older
youth). On the other hand, they are more frequent consumers of technology-driven media content
(Parratt Fernández, 2010). Using the project’s survey data, this section addresses how young peo-
ple obtain information about political events (for more on this topic, see the chapter on politics).
Focusing on different media as a source of political information,29 Figure 51 shows that 82 percent
of Slovenian youth (aged 16–27) use the Internet as their main source for acquiring information
on current political events. Likewise, 71 percent of Slovenian youth obtain information about pol-
itics from television.
Grouped by age (16-27) and by socio-demographic data, Figure 52 shows the percentage of re-
spondent reporting that Internet is their main source of information for political events. Better-ed-
ucated young people (rho = 0.09, n = 909, p < 0.01), those with more educated fathers (rho = 0.10,
n = 838, p < 0.01) and more educated mothers (rho = 0.09, n = 871, p < 0.01), and those from larger
residential communities (rho = 0.07, n = 909, p < 0.05) use the Internet more often as a source of
information. Interestingly, all four patterns are linear across all three education level measures.
For example, 88 percent of respondents with fathers who earned a tertiary level education use
the Internet for political information, while only 73 percent of respondents with fathers who only
finished or did not finish elementary school use the Internet for political information. The results
of this study largely corroborate previous research on information sources. For example, a study of
Canadian youth showed that those with higher levels of education were more likely to use the In-
ternet as a source of information for politics (Gidengil, et al., 2003), though the difference between
the highest and the lowest educational group was relatively low (12 percentage points).
On the other hand, there are some reservations regarding the extent to which the Internet is
actually used as a source of political information. In the case of russia, volkov (2012) warned not
29 respondents were asked to choose one or more sources of information on current political events from the list of provided responses. Other provided sources of information were television, newspapers, radio, discussions with their family, and discussions with friends/acquaintances.

andrej Kirbiš and barbara zagorc MEDia USE 111
to overestimate the size of Internet audiences (in his study on russian Internet use) and similarly,
Zoroja (2011, 128) found that in post-socialist countries there are less overall Internet users.
Figure 51: The use of different media as a source of information about current political events among Slovenian youth (16–27 years)
Note: Respondents were asked to choose one or more sources of information on current political events from the list of provided responses. Provided sources of information were the Internet, television, newspapers, radio, discussions with their family, and discussions with friends/acquaintances. The numbers present percentage of respondents choosing specific media source.
Source: CEPYUS-FES Slovenian 2013 Youth Study.
This analysis of Internet use patterns among Slovenian youth, on the other hand, indicates
that the Internet is the most popular source for acquiring political information. however, it must
be taken into account that Slovenian youth are generally not interested in (conventional) politics,
have low trust in political and state institution, are overwhelmingly dissatisfied with the state of
democracy in Slovenia (60 percent), and four out of ten would not participate in elections if they
were held today. These factors, when combined, indicate that although the Internet is the main
source of political information among youth, acquiring information about political events (which
respondents most likely understood in the sense of information relating to conventional party
politics) is a relatively infrequent activity (also see Kirbiš and Flere, 2011). On the other hand, the
Internet is often used by Slovenian youth for communicating and online socializing (see below).
82 %
71 %
33 % 32 % 30 %26 %
0 %0 %
20 %
40 %
60 %
80 %
100 %
Internet TV Radio Newspapers Discussions with
friends/…
Discussionswith family
Other

112 MEDia USE andrej Kirbiš and barbara zagorc
Figure 52: The use of the Internet as a source of information about current political events among Slovenian youth (16–27 years), total sample and by socio-demographic groups
Note: Respondents were asked to choose one or more sources of information on current political events from the list of provided responses. Other provided sources of information were television, newspapers. The percentage of respondents choosing “Internet” as source of political information.
Source: CEPYUS-FES Slovenian 2013 Youth Study.
2 The internet
Numerous authors highlight the growing importance of new ICT (information and communica-
tions technology) for youth, and the widespread access to ICT by large segments of the popula-
tion in different countries (La Ferle et al., 2000; Mesch, 2003; Subrahmanyam and Lin, 2007; Wan
and Gut, 2008; Peng and Zhu, 2010; Fallahi, 2011; Chow et al., 2012; Gaskin et al., 2012; Bernal and
Angulo, 2013). Some authors see ICT in a relatively positive light, while others are more pessimis-
tic. In general, the majority agree that new technologies can have both positive implications (e.g.,
fulfillment of young people’s needs; see La Ferle et al., 2000) and negative implications (Internet
addiction and social isolation; see Fallahi, 2011; for a review of studies on the effects of the Inter-
net, see Lin, 2009).
As noted above, many studies corroborate the positive aspects of Internet use. One important
finding in the context of democratic states is that online political participation leads to increasing
offline participation (Garcia-Castañon et al., 2011; hirzalla et al., 2011), which was also found in a
75 %82 %
86 %
73 %82 %
88 %
80 %85 %87 %
78 %83 %
90 %
82%
0 % 20 % 40 % 60 % 80 % 100 %
Elementary school or lessSecondary level
Tertiary level
Elementary school or lessSecondary level
Tertiary level
Up to 10,000 inhabitants10,000 and more inhabitants
Ljubljana and Maribor
Elementary school or lessSecondary level
Tertiary level
Total sample
Internet as a source of information about political events
Respondent'seducational level
Size of residental settlement
Father's educational level
Mother'seducational level
andrej Kirbiš and barbara zagorc MEDia USE 113
study of Slovenian youth (Kirbiš and Naterer, 2011). In this sense, ICT can stimulate offline (and, of
course, online) political participation. There is also great potential in forming new social commu-
nities, i.e., social networks (Collin, 2008).
In contrast, studies on the negative effects of the Internet have found a positive link between
loneliness and Internet use (Matsuba, 2006; Ceyhan and Ceyhan, 2008; Ghassemzadeh et al., 2008;
Cotten et al., 2013). Specifically, those who report feelings of loneliness are more likely to use the
Internet to communicate with others (Erdogan, 2008). On the other hand, some forms of Internet
use (e.g., communication) are associated with lower levels of loneliness among older adults (Sum
et al., 2008; Cotten et al., 2013) and among adolescents (Sharabi and Margalit, 2011). however,
the negative aspects should not be understated, as links have been seen between loneliness and
problematic Internet use (see Matsuba, 2006; Ceyhan and Ceyhan, 2008; Ghassemzadeh et al.,
2008; Odaci and Kalkan, 2010). In sum, the data are mixed, and can be found within a number
of individual studies. Ong (2011), for example, found that participants who more frequently used
online chatting sites exhibited greater “familial” loneliness because their online time reduced the
amount of time they spent with their families. On the other hand, online chatters exhibited less
“romantic” loneliness because of the greater ease of maintaining online romantic relationships.
Turning to the more explicitly negative consequences of Internet use, some authors examined
problematic Internet use (PIU) among youth. It has been found that boys are more likely to exhibit
PIU. Predictors of PIU, interestingly, differ between genders. In one study, predictors of PIU among
men were phobic anxiety, wishful thinking, and preoccupation with being overweight; while pre-
dictors among women were depression and keeping to oneself (hetzel-riggin and Pritchard, 2011).
Some authors also discuss the role of the Internet as an initiator for terrorist activities (Lennings
et al., 2010).
Besides PIU, several studies have been conducted on the growing problem of Internet addiction
(Johansson and Götestam, 2004; Gencer and Koc, 2012). One study highlighted Internet addiction
as a pressing problem among youth in hong Kong (Cheng and Ko, 2010), while a study of Iranian
students showed that 13.8 percent of them could be classified as having a “severe Internet ad-
diction” (Nasiri et al., 2011). Studies also found that Internet addiction is often associated with
several negative online activities, i.e., watching online pornography and online gaming (Siomos et
al., 2012). Internet addiction is also related to insomnia and both are associated with depression
(Cheung and Wong, 2011, 315). Positive links between Internet addiction, shyness, and low locus
of control were also previously found (Chak and Leung, 2004). One study showed that reading is
declining among American youth (NEA, 2004, 26-27; NEA, 2007), while instant messaging (IM) is
increasing; and they are both connected to greater difficulties in concentrating (reading predicts
lower difficulties, while IM predicts greater difficulties in concentrating; see Levine et al., 2007).
One of the key questions related to the above is whether young people are aware of the negative
aspects of Internet usage. A study of danish youth found that young people are mostly aware of
how to use Internet chatting safely; however, online harassment was found to be relatively fre-
quent (helweg-Larsen et al., 2011).
Previous studies have also identified a “technological gap” that exists between youth and
adults, indicating a gap in knowledge of new technologies and their use. For example, parents are

114 MEDia USE andrej Kirbiš and barbara zagorc
less familiar with new technologies and are therefore less likely to protect their children from the
potential negative consequences of ICT usage (Mishna et al., 2009, 1226). A study of Chinese and
American adolescents showed that only a little more than half of the participants reported that
their parents have rules regarding respondents’ media use (Wan and Gut, 2008, 37). Paradoxically,
several studies have pointed to the importance of parental control and knowledge of youth media
use (Fallahi, 2011; helweg-Larsen et al., 2011, 537; Ang et al., 2012; Siomos et al., 2012). Most nota-
bly, parental bonding correlates with the lower likelihood of Internet addiction. On the other hand,
overprotection may also lead to negative effects (Siomos et al., 2012, 216-217). In this context, ex-
perts see a solution in preventive education (Wan and Gut, 2008; Cheng and Ko, 2010; Brown and
Bobkowski, 2011).
The following describes Internet use patterns among Slovenian youth. In some cases, the re-
sults are compared to Croatian, Kosovar, and German youth survey data. The first part looks pre-
cisely at Internet access, before proceeding to the subject of youth as Internet users. Two partic-
ular factors are analyzed: the amount of time spent online, and the reasons why young people
use the Internet.
2.1 Internet access
The importance and popularity of new technologies for young people has been extensively
documented (La Ferle et al., 2000; Mesch, 2003; Subrahmanyam and Lin, 2007; Fallahi, 2011; Chow
et al., 2012; Bernal and Angulo, 2013). Youth are also accessing ICT at younger ages (Mishna et al.,
2009, 1224). Comparing the data across countries, the highest proportion of youth with Internet
access is in Slovenia. More specifically, 99.8 percent of Slovenian youth have Internet access (as
usual, 16–25 year-olds were compared cross-nationally), though percentages in other countries are
also relatively high: 95.6 percent of Germans, 94.9 percent of Croatians, and 91.5 percent of Koso-
vars reported having Internet access.
It should be noted that the question concerning Internet access has several limitations. For ex-
ample, respondents may have understood the question in different ways. One possible perception
of how respondents understood the meaning “Internet access” was that they had Internet access
in their households. Second, respondents may have perceived this question to mean any Internet
access, regardless of the locale (for example libraries, friends’ homes, cyber cafes). Because of
these possible different perceptions, the survey included questions on the percentage of house-
holds with Internet access in countries with accessible data, i.e., the EU-27, Slovenia, and Croatia,
according to Eurostat (2013b). As Figure 53 illustrates, the percentage of households with Internet
access has increased across Europe from 2004 to 2012. In 2004, 47 percent of Slovenian households
had Internet access (6 percentage points more than the EU-27 average). Until 2008, Slovenia had a
higher percentage of households with Internet access than the EU-27. From 2007 to 2012, Croatia
had lower Internet access than the EU-27 average (from 14-17 percentage points lower in earlier
years to 8-10 percentage points lower in 2012). however, over the last year Croatia has approached
both the Slovenian and EU-27 average. In 2012, 76 percent of the EU-27, 74 percent of Slovenians,
and 66 percent of Croatians had access to the Internet in their households (Eurostat, 2013b).
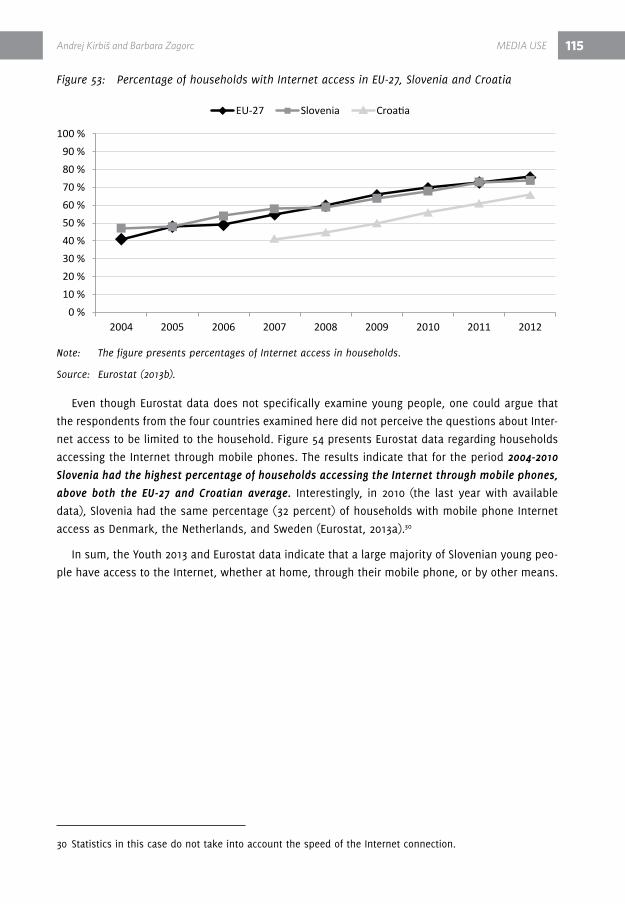
andrej Kirbiš and barbara zagorc MEDia USE 115
Figure 53: Percentage of households with Internet access in EU-27, Slovenia and Croatia
Note: The figure presents percentages of Internet access in households.
Source: Eurostat (2013b).
Even though Eurostat data does not specifically examine young people, one could argue that
the respondents from the four countries examined here did not perceive the questions about Inter-
net access to be limited to the household. Figure 54 presents Eurostat data regarding households
accessing the Internet through mobile phones. The results indicate that for the period 2004-2010
Slovenia had the highest percentage of households accessing the Internet through mobile phones,
above both the EU-27 and Croatian average. Interestingly, in 2010 (the last year with available
data), Slovenia had the same percentage (32 percent) of households with mobile phone Internet
access as denmark, the Netherlands, and Sweden (Eurostat, 2013a).30
In sum, the Youth 2013 and Eurostat data indicate that a large majority of Slovenian young peo-
ple have access to the Internet, whether at home, through their mobile phone, or by other means.
30 Statistics in this case do not take into account the speed of the Internet connection.
0 %10 %20 %30 %40 %50 %60 %70 %80 %90 %
100 %
2004 2005 2006 2007 2008 2009 2010 2011 2012
EU-27 Slovenia Croatia
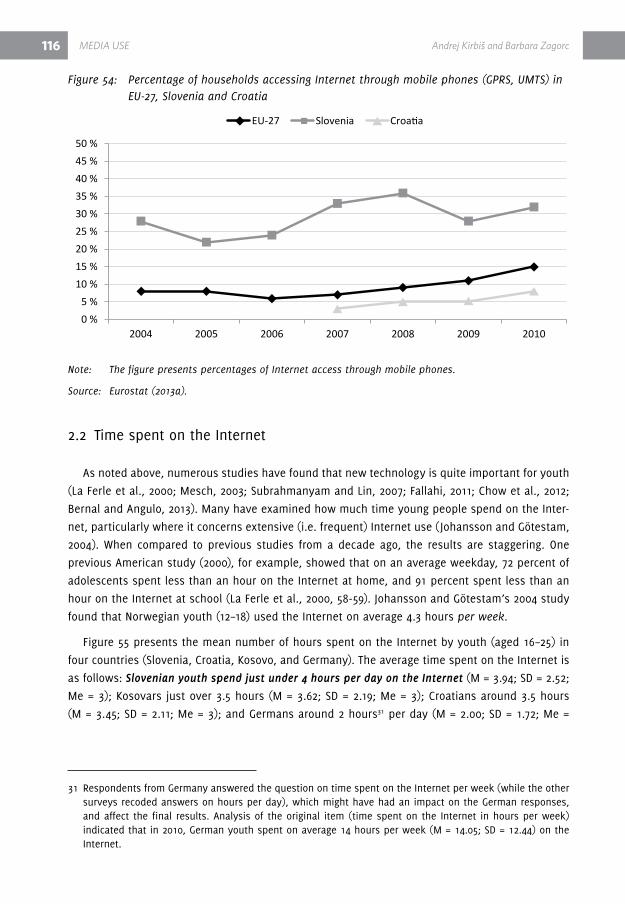
116 MEDia USE andrej Kirbiš and barbara zagorc
Figure 54: Percentage of households accessing Internet through mobile phones (GPRS, UMTS) in EU-27, Slovenia and Croatia
Note: The figure presents percentages of Internet access through mobile phones.
Source: Eurostat (2013a).
2.2 Time spent on the Internet
As noted above, numerous studies have found that new technology is quite important for youth
(La Ferle et al., 2000; Mesch, 2003; Subrahmanyam and Lin, 2007; Fallahi, 2011; Chow et al., 2012;
Bernal and Angulo, 2013). Many have examined how much time young people spend on the Inter-
net, particularly where it concerns extensive (i.e. frequent) Internet use (Johansson and Götestam,
2004). When compared to previous studies from a decade ago, the results are staggering. One
previous American study (2000), for example, showed that on an average weekday, 72 percent of
adolescents spent less than an hour on the Internet at home, and 91 percent spent less than an
hour on the Internet at school (La Ferle et al., 2000, 58-59). Johansson and Götestam’s 2004 study
found that Norwegian youth (12–18) used the Internet on average 4.3 hours per week.
Figure 55 presents the mean number of hours spent on the Internet by youth (aged 16–25) in
four countries (Slovenia, Croatia, Kosovo, and Germany). The average time spent on the Internet is
as follows: Slovenian youth spend just under 4 hours per day on the Internet (M = 3.94; Sd = 2.52;
Me = 3); Kosovars just over 3.5 hours (M = 3.62; Sd = 2.19; Me = 3); Croatians around 3.5 hours
(M = 3.45; Sd = 2.11; Me = 3); and Germans around 2 hours31 per day (M = 2.00; Sd = 1.72; Me =
31 respondents from Germany answered the question on time spent on the Internet per week (while the other surveys recoded answers on hours per day), which might have had an impact on the German responses, and affect the final results. Analysis of the original item (time spent on the Internet in hours per week) indicated that in 2010, German youth spent on average 14 hours per week (M = 14.05; Sd = 12.44) on the Internet.
0 %5 %
10 %15 %20 %25 %30 %35 %40 %45 %50 %
2004 2005 2006 2007 2008 2009 2010
EU-27 Slovenia Croatia
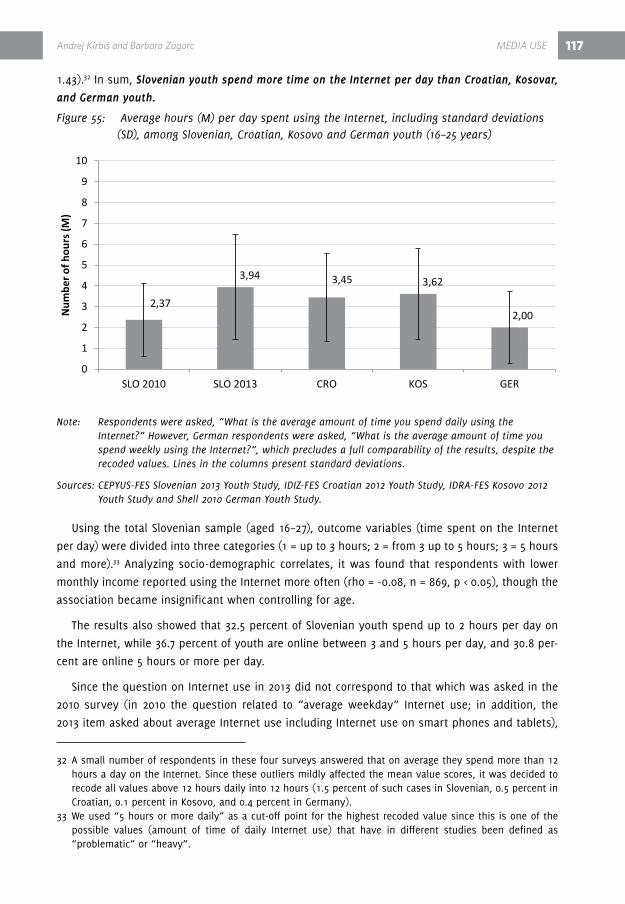
andrej Kirbiš and barbara zagorc MEDia USE 117
1.43).32 In sum, Slovenian youth spend more time on the Internet per day than Croatian, Kosovar,
and German youth.
Figure 55: Average hours (M) per day spent using the Internet, including standard deviations (SD), among Slovenian, Croatian, Kosovo and German youth (16–25 years)
Note: Respondents were asked, “What is the average amount of time you spend daily using the Internet?” However, German respondents were asked, “What is the average amount of time you spend weekly using the Internet?”, which precludes a full comparability of the results, despite the recoded values. Lines in the columns present standard deviations.
Sources: CEPYUS-FES Slovenian 2013 Youth Study, IDIZ-FES Croatian 2012 Youth Study, IDRA-FES Kosovo 2012 Youth Study and Shell 2010 German Youth Study.
Using the total Slovenian sample (aged 16–27), outcome variables (time spent on the Internet
per day) were divided into three categories (1 = up to 3 hours; 2 = from 3 up to 5 hours; 3 = 5 hours
and more).33 Analyzing socio-demographic correlates, it was found that respondents with lower
monthly income reported using the Internet more often (rho = -0.08, n = 869, p < 0.05), though the
association became insignificant when controlling for age.
The results also showed that 32.5 percent of Slovenian youth spend up to 2 hours per day on
the Internet, while 36.7 percent of youth are online between 3 and 5 hours per day, and 30.8 per-
cent are online 5 hours or more per day.
Since the question on Internet use in 2013 did not correspond to that which was asked in the
2010 survey (in 2010 the question related to “average weekday” Internet use; in addition, the
2013 item asked about average Internet use including Internet use on smart phones and tablets),
32 A small number of respondents in these four surveys answered that on average they spend more than 12 hours a day on the Internet. Since these outliers mildly affected the mean value scores, it was decided to recode all values above 12 hours daily into 12 hours (1.5 percent of such cases in Slovenian, 0.5 percent in Croatian, 0.1 percent in Kosovo, and 0.4 percent in Germany).
33 We used “5 hours or more daily” as a cut-off point for the highest recoded value since this is one of the possible values (amount of time of daily Internet use) that have in different studies been defined as “problematic” or “heavy”.
2,37
3,94 3,45 3,62
2,00
0
1
2
3
4
5
6
7
8
9
10
SLO 2010 SLO 2013 CRO KOS GER
Num
ber o
f hou
rs (M
)

118 MEDia USE andrej Kirbiš and barbara zagorc
comparability has been hindered. Moreover, in 2013 respondents may have also had weekends in
mind, when Internet use might be higher. Nevertheless, Figure 55 shows a number of interesting
results. In 2010, Slovenian youth spent 2.37 hours per day using the Internet, while in 2013 they
spend 3.94 hours per day, a substantial increase of 1.75 hours per day. Furthermore, the 2013 sur-
vey data indicate that 44.5 percent of Slovenian youth are “heavy” Internet users, using 4 or more
hours of Internet use daily as a cut-off point. This is problematic since several studies have found
that heavy Internet use is associated with various negative health outcomes (Chou, 2001; Mythily
et al., 2008; Kim et al., 2010; Baek and So, 2011; do et al., 2013; Peltzer et al., 2013).
As noted above, Slovenian youth use the Internet more frequently than Croatian, Kosovar, and
German youth, but it is important to question what these results mean in a wider comparative
context. In other words, how often do Slovenian youth use the Internet in comparison to youth
from other countries? despite an extensive review of the literature on youth Internet use, no pre-
vious studies have been found which have employed representative national youth data samples
where daily mean Internet use was higher than 4 hours daily, as it was among Slovenian youth. A
study of Thai university students (Peltzer, 2013) found that students spent on average 5.3 hours
(Sd = 2.6) per day on the Internet, which is more than the current usage rate among Slovenian
youth. however, their study examined students’ Internet use, while this survey calculated mean
Internet use on a representative sample of Slovenian youth.
In sum, Slovenian youth are frequent Internet users, but questions remain as to the reasons
why they use the Internet.
2.3 Purposes of Internet use
Past studies have shown that positive attitudes and feelings toward the Internet are associated
with higher Internet use (Al Otaibi, 2012). One of the key elements of Internet use, i.e., (perceived)
anonymity, also has an important consequence: youth behave differently online (Mishna et al.,
2009). As such, the Internet can be an important social environment, particularly for those who
have difficulties integrating in offline communities (Lim et al., 2013; Anderson and McCabe, 2012).
In a 1997 survey-driven study of teenagers (before the Internet was omnipresent), La Ferle et
al. found that only 6.5 percent of Internet users used it for leisure and 7 percent for entertainment
(2000, 59). A study of Turkish students from 2005 showed that they mostly use Internet for sending
e-mails (64 percent), reading news and sports information (61 percent), research for homework (58
percent) and chatting (57 percent) (ruzgar, 2005, 129). A 2012 study found that the main reason for
Internet use was communication (Gencer and Koc, 2012, 28-29).
Figure 56 indicates specific types of Internet activities among Slovenian youth. The majority of
youth (aged 16–27) use the Internet for socializing with their friends, acquaintances, and/or rel-
atives. In fact, communication with friends and others is the most frequent Internet activity (86
percent of respondents reported using the Internet for communication). Accessing social networks
is the next most frequent online activity (85 %) (e.g., Facebook, My Space, hi5, etc.), while send-
ing e-mails is the third most frequent activity (84 percent). All three categories relate to different
forms of communication. Searching for information, watching videos, listening to music, reading
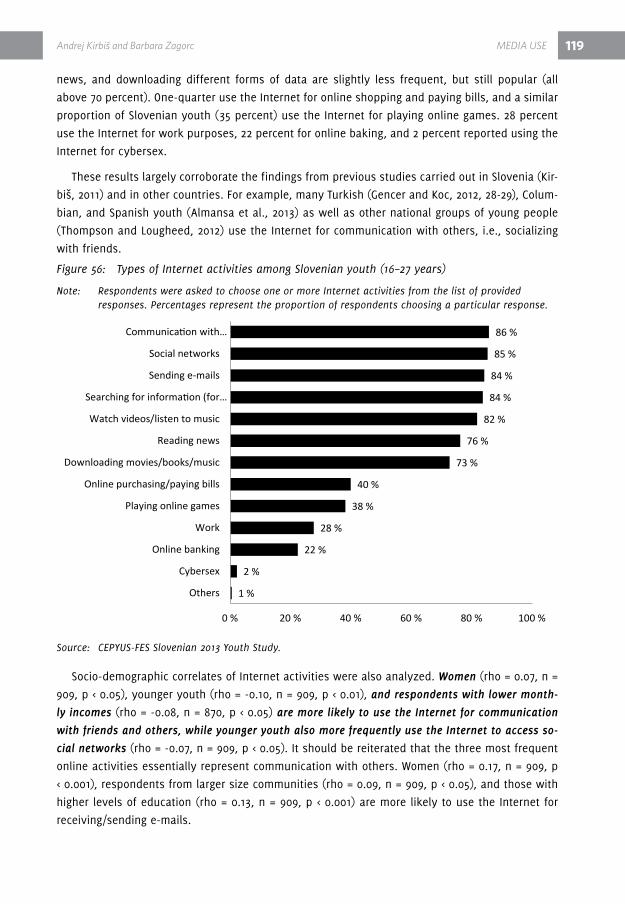
andrej Kirbiš and barbara zagorc MEDia USE 119
news, and downloading different forms of data are slightly less frequent, but still popular (all
above 70 percent). One-quarter use the Internet for online shopping and paying bills, and a similar
proportion of Slovenian youth (35 percent) use the Internet for playing online games. 28 percent
use the Internet for work purposes, 22 percent for online baking, and 2 percent reported using the
Internet for cybersex.
These results largely corroborate the findings from previous studies carried out in Slovenia (Kir-
biš, 2011) and in other countries. For example, many Turkish (Gencer and Koc, 2012, 28-29), Colum-
bian, and Spanish youth (Almansa et al., 2013) as well as other national groups of young people
(Thompson and Lougheed, 2012) use the Internet for communication with others, i.e., socializing
with friends.
Figure 56: Types of Internet activities among Slovenian youth (16–27 years)
Note: Respondents were asked to choose one or more Internet activities from the list of provided responses. Percentages represent the proportion of respondents choosing a particular response.
Source: CEPYUS-FES Slovenian 2013 Youth Study.
Socio-demographic correlates of Internet activities were also analyzed. Women (rho = 0.07, n =
909, p < 0.05), younger youth (rho = -0.10, n = 909, p < 0.01), and respondents with lower month-
ly incomes (rho = -0.08, n = 870, p < 0.05) are more likely to use the Internet for communication
with friends and others, while younger youth also more frequently use the Internet to access so-
cial networks (rho = -0.07, n = 909, p < 0.05). It should be reiterated that the three most frequent
online activities essentially represent communication with others. Women (rho = 0.17, n = 909, p
< 0.001), respondents from larger size communities (rho = 0.09, n = 909, p < 0.05), and those with
higher levels of education (rho = 0.13, n = 909, p < 0.001) are more likely to use the Internet for
receiving/sending e-mails.
1 %
2 %
22 %
28 %
38 %
40 %
73 %
76 %
82 %
84 %
84 %
85 %
86 %
0 % 20 % 40 % 60 % 80 % 100 %
Others
Cybersex
Online banking
Work
Playing online games
Online purchasing/paying bills
Downloading movies/books/music
Reading news
Watch videos/listen to music
Searching for information (for…
Sending e-mails
Social networks
Communication with…

120 MEDia USE andrej Kirbiš and barbara zagorc
Online banking users are more frequently older youth (rho = 0.25, n = 909, p < 0.001), with high-
er monthly incomes (rho = 0.24, n = 870, p < 0.001), and higher educational levels (rho = 0.23, n
= 909, p < 0.001). Men (rho = -0.09, n = 909, p < 0.01), older youth (rho = 0.26, n = 909, p < 0.001),
those with higher educational levels (rho = 0.27, n = 909, p < 0.001), lower subjective family ma-
terial status (rho = -0.10, n = 909, p < 0.01) with higher monthly incomes (rho = 0.29, n = 870, p <
0.001) are more likely to use the Internet for work purposes. In addition, men (rho = -0.27, n = 909,
p < 0.001) and those with lower educational levels (rho = -0.12, n = 909, p < 0.001) more often use
the Internet for playing online games.
Past studies have also shown the existence of gender differences regarding Internet activities.
dowell et al. (2009) found that girls use the Internet more often to send e-mails. According to this
same study, girls reported their most frequent online activities as instant messaging and visiting
web sites. By contrast, boys indicated that they use the Internet to play online games (as well
to instant message others) (dowell et al., 2009, 549). A study by Thompson and Lougheed (2012)
showed some interesting results regarding Facebook usage: women were more likely to be Face-
book users, to be addicted to it, to sleep less because of Facebook use, to feel closer to online
friends than those offline, to report stress as a result of Facebook use, and to report that Face-
book pictures induced a negative self-image. The survey used here indicates that Slovenian young
women also more frequently socialize and communicate over the Internet, but it remains to be
determined to what extent this usage is problematic.
A number of studies have addressed Internet use and political participation. Several note that
social networks are an important, if not main tool, of youth participation (Collin, 2008; david,
2013). Stornaiuolo et al. (2013) argue that the Internet has the potential to expand “community”
and that “educationally focused social networks can be designed for, or their uses primed toward,
communicative purposes and activities foregrounding reciprocal exchange that is ethically alert
and socially aware”. A study of Chilean youth found that news consumption and use of online
social networks (e.g., Facebook) positively correlated with a young person’s disposition to vote in
future elections (i.e., expected future electoral turnout), while entertainment news consumption
negatively correlated with voting dispositions (Scherman and Arriagada, 2012). Spanish youth em-
phasized the many positive aspects of social networks, namely that they are an important ele-
ment of youth mobilization, and encourage social and political engagement (García Galera and del
hoyo hurtado, 2013).
As previously mentioned, young people use social networks mainly to communicate with their
friends and others (Gencer and Koc, 2012, 28-29; Thompson and Lougheed, 2012; Almansa et al.,
2013), a finding confirmed by the results of this survey. however, this raises questions regarding
the influences of online friends. On the one hand, online peer influence can be positive. For ex-
ample, a study of juvenile delinquents found online social networks to be beneficial for their reha-
bilitation (Lim et al., 2013). On the other hand, it noted the potential dangers of peer influence, if
for example, “youths post their delinquent acts online and receive positive appraisals from Face-
book peers, such peer affirmation may offer validation and encourage greater delinquency” (Lim
et al., 2013). Yet another line of research found both positive and negative aspects. For instance,
acquired social capital can be transmitted offline, which may generate new forms of social capital;
however, this could also have a displacing effect (Williams, 2007).

andrej Kirbiš and barbara zagorc MEDia USE 121
2.4 Conclusion: The Internet
While past research highlights both the positive and negative aspects of new ICT and ICT usage
(Suhail and Bargees, 2006; Williams, 2007; Lim, 2013; for Slovenian context, see Kirbiš and Flere,
2011; Kirbiš and Naterer, 2011), several points are clear where it regards Slovenian youth. First, ac-
cess to the Internet is widely available. Second, they report spending a relatively large amount of
time online. Finally, they are involved in different Internet activities, but communication and so-
cializing are the most frequent. In sum, it is worth considering Fallahi’s statement (2011, 397) that
“the internet is useful if only used in the correct way”. Of course, there is no true definition of
“correct”, and more importantly, this should be defined by further empirical investigation.
3 Television
despite the increase of Internet use over the last decade, and the fact that Internet use has
been found to decrease television use (Liebowitz and Zentner, 2010), television remains not only
the dominant medium among the general population, but also among younger media users, e.g.,
children (Gutnick et al., 2010). In the United States, for example, Tv viewing is the third most com-
monly reported activity, after work and sleep, and consumes more than half of all leisure time
(BLS, 2013).
3.1 Time spent watching television
Though a number of different methodologies have been employed to track time and television
viewing, a Ball State University study showed that the average American adult is exposed to 5
hours and 9 minutes of live Tv each day. Beyond television, the average American spends up to
8.5 hours daily in front of some type of screen (including Tvs, cell phones, even G.P.S. devices,
etc.) (Stelter, 2009; Barrett, 2010). According to the American Time Use Survey (BLS, 2013), however,
daily television use is considerably lower, approximately 2 hours and 50 minutes/daily. Similarly, a
study carried out in 13 countries found that watching Tv consumes about 40 percent of free time
in most countries (Office for Official Publications of the European Communities, 2003). As these
studies use different methodologies, it is impossible to draw firm time conclusions. however, lon-
gitudinal studies using the same methodology nevertheless indicate that over the last decade
there has been a marked increase in the time young people devote to computer use (including the
Internet), while the time devoted to watching entertainment television has somewhat decreased.
Nevertheless, television use was still among the most frequent leisure activities for Slovenian
youth in 2010 (Kirbiš, 2011).
A number of studies on television have attempted to undercover its effect on health. The find-
ings show that those who frequently watch Tv are generally less healthy and physically active;
avid viewers have higher obesity rates, less healthy dietary habits, and higher levels of risk be-
havior (dietz and Gortmaker, 1985; Simons and Silveira, 1994; Singer et al., 1998; Marshall, et al.,
2004; Feldman et al., 2007; Barr-Anderson et al., 2009; Manios et al., 2009; richter et al., 2009;
Bersamin et al., 2010; Tudor-Locke et al., 2011; Casiano et al., 2012; Kowalewska and Mazur, 2012;
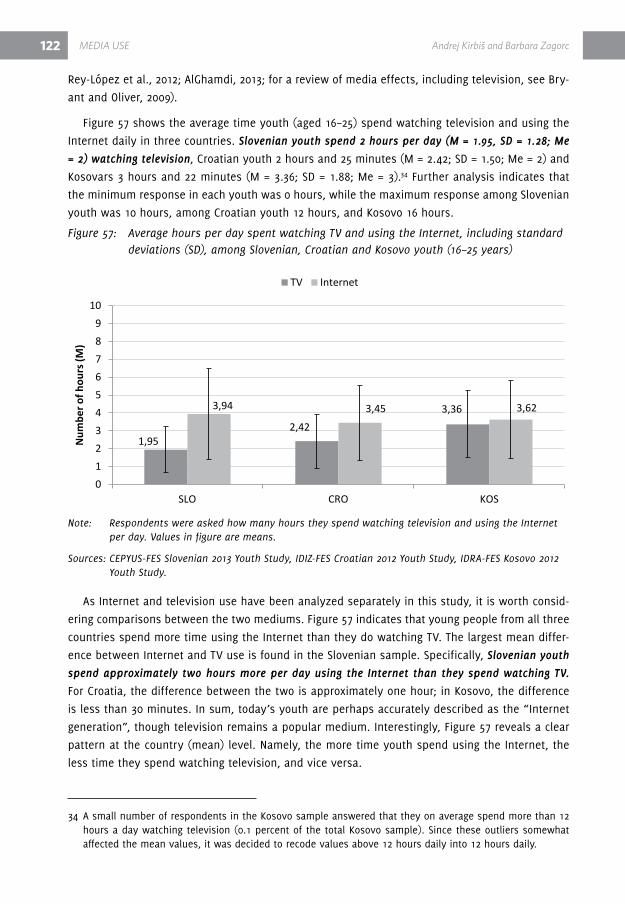
122 MEDia USE andrej Kirbiš and barbara zagorc
rey-López et al., 2012; AlGhamdi, 2013; for a review of media effects, including television, see Bry-
ant and Oliver, 2009).
Figure 57 shows the average time youth (aged 16–25) spend watching television and using the
Internet daily in three countries. Slovenian youth spend 2 hours per day (M = 1.95, SD = 1.28; Me
= 2) watching television, Croatian youth 2 hours and 25 minutes (M = 2.42; Sd = 1.50; Me = 2) and
Kosovars 3 hours and 22 minutes (M = 3.36; Sd = 1.88; Me = 3).34 Further analysis indicates that
the minimum response in each youth was 0 hours, while the maximum response among Slovenian
youth was 10 hours, among Croatian youth 12 hours, and Kosovo 16 hours.
Figure 57: Average hours per day spent watching TV and using the Internet, including standard deviations (SD), among Slovenian, Croatian and Kosovo youth (16–25 years)
Note: Respondents were asked how many hours they spend watching television and using the Internet per day. Values in figure are means.
Sources: CEPYUS-FES Slovenian 2013 Youth Study, IDIZ-FES Croatian 2012 Youth Study, IDRA-FES Kosovo 2012 Youth Study.
As Internet and television use have been analyzed separately in this study, it is worth consid-
ering comparisons between the two mediums. Figure 57 indicates that young people from all three
countries spend more time using the Internet than they do watching Tv. The largest mean differ-
ence between Internet and Tv use is found in the Slovenian sample. Specifically, Slovenian youth
spend approximately two hours more per day using the Internet than they spend watching TV.
For Croatia, the difference between the two is approximately one hour; in Kosovo, the difference
is less than 30 minutes. In sum, today’s youth are perhaps accurately described as the “Internet
generation”, though television remains a popular medium. Interestingly, Figure 57 reveals a clear
pattern at the country (mean) level. Namely, the more time youth spend using the Internet, the
less time they spend watching television, and vice versa.
34 A small number of respondents in the Kosovo sample answered that they on average spend more than 12 hours a day watching television (0.1 percent of the total Kosovo sample). Since these outliers somewhat affected the mean values, it was decided to recode values above 12 hours daily into 12 hours daily.
1,952,42
3,363,94 3,45 3,62
0123456789
10
SLO CRO KOS
Num
ber o
f hou
rs (M
)
TV Internet
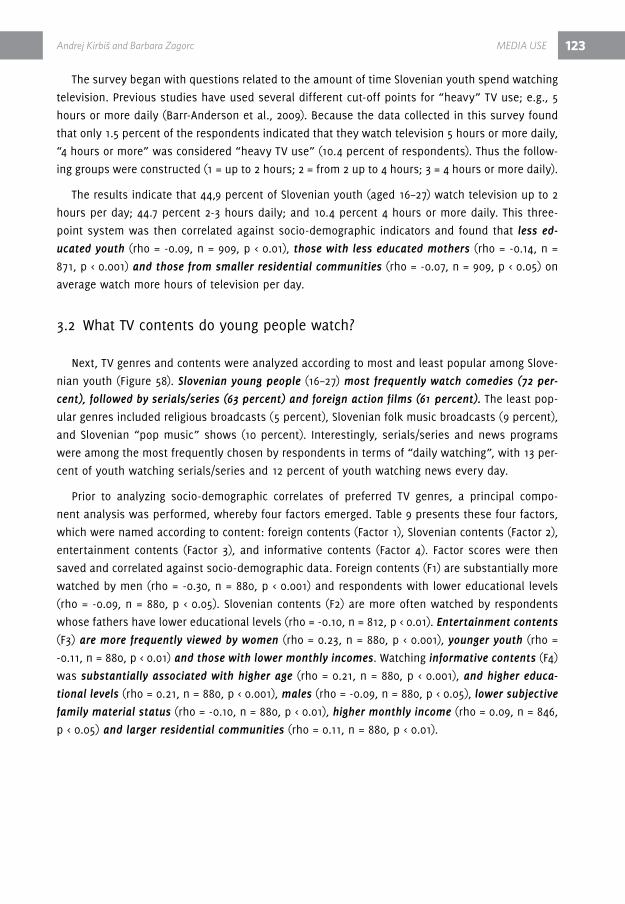
andrej Kirbiš and barbara zagorc MEDia USE 123
The survey began with questions related to the amount of time Slovenian youth spend watching
television. Previous studies have used several different cut-off points for “heavy” Tv use; e.g., 5
hours or more daily (Barr-Anderson et al., 2009). Because the data collected in this survey found
that only 1.5 percent of the respondents indicated that they watch television 5 hours or more daily,
“4 hours or more” was considered “heavy Tv use” (10.4 percent of respondents). Thus the follow-
ing groups were constructed (1 = up to 2 hours; 2 = from 2 up to 4 hours; 3 = 4 hours or more daily).
The results indicate that 44,9 percent of Slovenian youth (aged 16–27) watch television up to 2
hours per day; 44.7 percent 2-3 hours daily; and 10.4 percent 4 hours or more daily. This three-
point system was then correlated against socio-demographic indicators and found that less ed-
ucated youth (rho = -0.09, n = 909, p < 0.01), those with less educated mothers (rho = -0.14, n =
871, p < 0.001) and those from smaller residential communities (rho = -0.07, n = 909, p < 0.05) on
average watch more hours of television per day.
3.2 What Tv contents do young people watch?
Next, Tv genres and contents were analyzed according to most and least popular among Slove-
nian youth (Figure 58). Slovenian young people (16–27) most frequently watch comedies (72 per-
cent), followed by serials/series (63 percent) and foreign action films (61 percent). The least pop-
ular genres included religious broadcasts (5 percent), Slovenian folk music broadcasts (9 percent),
and Slovenian “pop music” shows (10 percent). Interestingly, serials/series and news programs
were among the most frequently chosen by respondents in terms of “daily watching”, with 13 per-
cent of youth watching serials/series and 12 percent of youth watching news every day.
Prior to analyzing socio-demographic correlates of preferred Tv genres, a principal compo-
nent analysis was performed, whereby four factors emerged. Table 9 presents these four factors,
which were named according to content: foreign contents (Factor 1), Slovenian contents (Factor 2),
entertainment contents (Factor 3), and informative contents (Factor 4). Factor scores were then
saved and correlated against socio-demographic data. Foreign contents (F1) are substantially more
watched by men (rho = -0.30, n = 880, p < 0.001) and respondents with lower educational levels
(rho = -0.09, n = 880, p < 0.05). Slovenian contents (F2) are more often watched by respondents
whose fathers have lower educational levels (rho = -0.10, n = 812, p < 0.01). Entertainment contents
(F3) are more frequently viewed by women (rho = 0.23, n = 880, p < 0.001), younger youth (rho =
-0.11, n = 880, p < 0.01) and those with lower monthly incomes. Watching informative contents (F4)
was substantially associated with higher age (rho = 0.21, n = 880, p < 0.001), and higher educa-
tional levels (rho = 0.21, n = 880, p < 0.001), males (rho = -0.09, n = 880, p < 0.05), lower subjective
family material status (rho = -0.10, n = 880, p < 0.01), higher monthly income (rho = 0.09, n = 846,
p < 0.05) and larger residential communities (rho = 0.11, n = 880, p < 0.01).
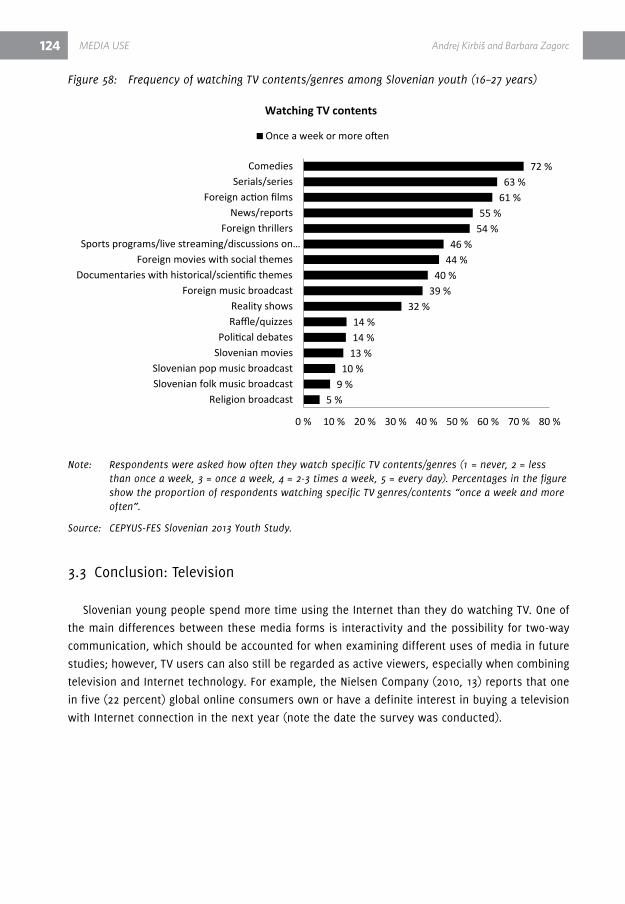
124 MEDia USE andrej Kirbiš and barbara zagorc
Figure 58: Frequency of watching TV contents/genres among Slovenian youth (16–27 years)
Note: Respondents were asked how often they watch specific TV contents/genres (1 = never, 2 = less than once a week, 3 = once a week, 4 = 2-3 times a week, 5 = every day). Percentages in the figure show the proportion of respondents watching specific TV genres/contents “once a week and more often”.
Source: CEPYUS-FES Slovenian 2013 Youth Study.
3.3 Conclusion: Television
Slovenian young people spend more time using the Internet than they do watching Tv. One of
the main differences between these media forms is interactivity and the possibility for two-way
communication, which should be accounted for when examining different uses of media in future
studies; however, Tv users can also still be regarded as active viewers, especially when combining
television and Internet technology. For example, the Nielsen Company (2010, 13) reports that one
in five (22 percent) global online consumers own or have a definite interest in buying a television
with Internet connection in the next year (note the date the survey was conducted).
5 %9 %
10 %13 %14 %14 %
32 %39 %
40 %44 %46 %
54 %55 %
61 %63 %
72 %
0 % 10 % 20 % 30 % 40 % 50 % 60 % 70 % 80 %
Religion broadcastSlovenian folk music broadcastSlovenian pop music broadcast
Slovenian moviesPolitical debates
Raffle/quizzesReality shows
Foreign music broadcastDocumentaries with historical/scientific themes
Foreign movies with social themesSports programs/live streaming/discussions on…
Foreign thrillersNews/reports
Foreign action filmsSerials/series
Comedies
Watching TV contents
Once a week or more often
andrej Kirbiš and barbara zagorc MEDia USE 125
Table 9: Principal component analysis of TV contents, Slovenian youth sample (16–27 years)
F1Foreign
contentS
F2SloVenian contentS
F3entertainment
contentS
F4inFormatiVe
contentS
Slovenian folk music broadcast 0.83
Slovenian pop music broadcast 0.82
Foreign music broadcast 0.46
Slovenian movies 0.55
Foreign movies with social themes 0.50
Foreign action films 0.87
Foreign thrillers 0.83
documentaries-historical/scientific 0.53
Serials/series 0.64
News/reports 0.68
Political debates 0.83
Sports programs/live streaming/
discussions on sport0.44
religion broadcast 0.49
Comedies 0.55
raffle/quizzes 0.57
reality shows 0.84
Note: Extraction Method was Principal Component Analysis. Rotation Method was Promax with Kaiser Normalization. Factor loadings below 0.4 are not shown.
Source: CEPYUS-FES Slovenian 2013 Youth Study.
In sum, the analysis indicates that Slovenian youth mostly watch entertainment Tv program-
ming. As other studies have shown, watching entertainment Tv (or being exposed to other forms
of media entertainment) is often associated with unpleasant (e.g., stressful) life events, experi-
ences, and escapism. In a series of studies by Anderson et al. (1996), stressful life events were
positively related to scores on a scale of television addiction scale; further, stress was associated
with respondents watching more comedies and less news programming. Women with higher stress
levels reported watching more game and variety programming, and as well more overall Tv, while
stressed men watched more action and violent Tv programming. (Anderson et al., 1996; for earli-
er research on entertainment media use, see Pearlin, 1959; Mendelsohn, 1963; for a recent review
of research on entertainment media, see vorderer and hartman, 2009; also see Meyrowitz; 1985;
Giles, 2003; Shrum, 2004; romer et al., 2009). Similarly, in a study of Slovenian youth, Kirbiš (2011)
found that more frequent entertainment media use was associated with decreased satisfaction for
life body image, and increased self-reported stress, feelings of anomie and alienation, hedonistic
and fatalistic outlooks, authoritarian orientation, narcissistic exploitativeness, deviance, and per-
missive socialization. Consequently, future studies of Slovenian youth should more closely exam-
ine correlates of entertainment media use.

126 MEDia USE andrej Kirbiš and barbara zagorc
4 Trust in media
Media freedom and autonomy, in part, form the basis for democratic life (Baker, 2006; hamelink
and Nordenstreng, 2006; Makarovič et al., 2008; Amos et al., 2012). In Europe, such freedoms are
often taken for granted (Czepek et al., 2009, 9). In this way, legislation has been instrumental in
protecting media freedoms, and preventing the formation of monopolies. In addition, media cre-
ators have themselves played an equally important role. Their professionalism leads to a coun-
tering of pressures, which prevent the potential impact of narrow political interests (Makarovič et
al., 2008, 119).
Where it regards Slovenian youth, it is important to outline briefly the Slovenian media space.
According to Freedom house’s (2013) Freedom of the Press index, only 14.5 percent of the world’s
citizens, including Slovenians, live in countries with a free press.35 however, Bašić-hrvatin et al.
note that the Slovenian media is densely concentrated, which allows owners to have rather strict
control over media content. One examination of supervisory Slovenian media supervisory boards
revealed that most are made up of a small circle of individuals that are board members in several
different newspaper houses (Bašić-hrvatin et al., 2004, 89-90; for problems regarding ownership
concentration see: Baker, 2006).
There are additional external pressures. An analysis of media subsidies revealed that the Slove-
nian state supported specific actors without any pre-analysis of the media market. Such practice
may lead to “political trade” (Bašić-hrvatin and Petković, 2007, 179-180). In contrast, Makarovič
(2008) argues that there is a difference between an “attempt to influence” (which may be sup-
pressed) and an “effective pressure” (which likely cannot). This study also revealed that the Slove-
nian media market is often permeated by different political and economic groups (or single actors)
intent on shaping news coverage; however, the authors noted that effective pressure is difficult to
examine. In sum, Slovenia’s media problems are no different from those found in other developed
countries. In view of these characteristics, this study examined Slovenian youth attitudes toward
the media, and in particular the extent to which young people trust the media. While a more in-
depth analysis of trust in institutions and groups 36 is provided in the chapter on politics, Figure
59 illustrates the level of trust in the media among Slovenian youth (aged 16–25). The results in-
dicate that Slovenian youth, as compared to youth in Croatia and Kosovo, express the lowest lev-
el of trust in the media. 36 percent of Slovenian youth have “little” trust in the media, which is
slightly less than in Croatia (40 percent). however, the number of Slovenian young people with “no
trust at all” outnumbers their Croatian counterparts by 5 percentage points. Kosovars tend to put
more faith in the media. Most of the respondents (39 percent) report trusting the media “to some
extent,” while an additional 12-13 percent claimed to have “a lot” of trust in the media. It should
be noted that the relatively low levels of media trust expressed by Slovenian youth parallel the
general criticism of politics, institutions, and democracy over the past several years (Kirbiš, 2013a;
2013b; Kirbiš and Flere, 2011). Again, the chapter on politics shows that the media ranks some-
35 Based on evaluations of the degree of print, broadcast, and Internet freedom in every country in the world, researchers ranked every country’s media as free, partly free or not free.
36 respondents were asked to rate the level of trust among a list of institutions. Trust in the media was measured on a four-point scale (1 = not at all, 2 = a little, 3 = to some extent, 4 = very much).
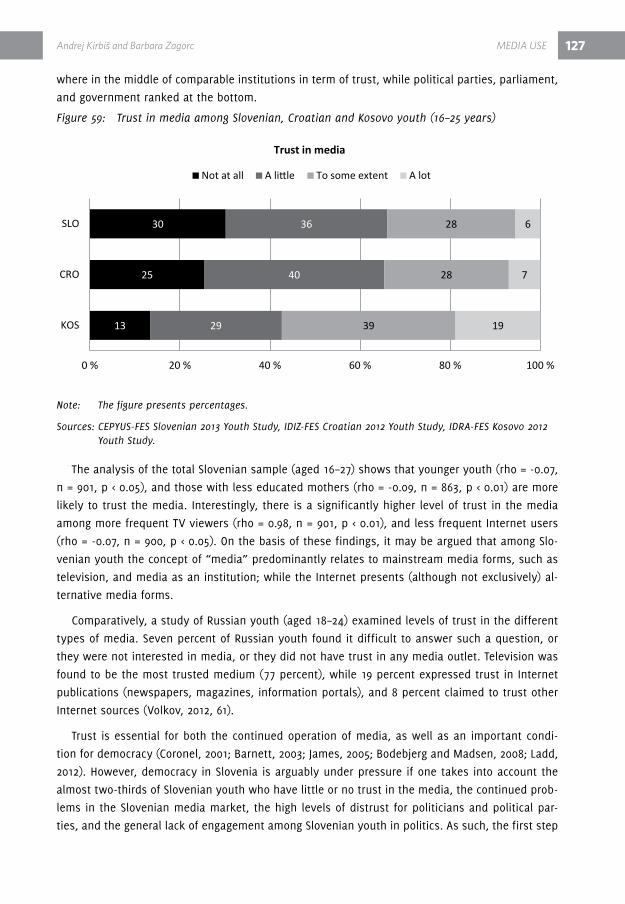
andrej Kirbiš and barbara zagorc MEDia USE 127
where in the middle of comparable institutions in term of trust, while political parties, parliament,
and government ranked at the bottom.
Figure 59: Trust in media among Slovenian, Croatian and Kosovo youth (16–25 years)
Note: The figure presents percentages.
Sources: CEPYUS-FES Slovenian 2013 Youth Study, IDIZ-FES Croatian 2012 Youth Study, IDRA-FES Kosovo 2012 Youth Study.
The analysis of the total Slovenian sample (aged 16–27) shows that younger youth (rho = -0.07,
n = 901, p < 0.05), and those with less educated mothers (rho = -0.09, n = 863, p < 0.01) are more
likely to trust the media. Interestingly, there is a significantly higher level of trust in the media
among more frequent Tv viewers (rho = 0.98, n = 901, p < 0.01), and less frequent Internet users
(rho = -0.07, n = 900, p < 0.05). On the basis of these findings, it may be argued that among Slo-
venian youth the concept of “media” predominantly relates to mainstream media forms, such as
television, and media as an institution; while the Internet presents (although not exclusively) al-
ternative media forms.
Comparatively, a study of russian youth (aged 18–24) examined levels of trust in the different
types of media. Seven percent of russian youth found it difficult to answer such a question, or
they were not interested in media, or they did not have trust in any media outlet. Television was
found to be the most trusted medium (77 percent), while 19 percent expressed trust in Internet
publications (newspapers, magazines, information portals), and 8 percent claimed to trust other
Internet sources (volkov, 2012, 61).
Trust is essential for both the continued operation of media, as well as an important condi-
tion for democracy (Coronel, 2001; Barnett, 2003; James, 2005; Bodebjerg and Madsen, 2008; Ladd,
2012). however, democracy in Slovenia is arguably under pressure if one takes into account the
almost two-thirds of Slovenian youth who have little or no trust in the media, the continued prob-
lems in the Slovenian media market, the high levels of distrust for politicians and political par-
ties, and the general lack of engagement among Slovenian youth in politics. As such, the first step
13
25
30
29
40
36
39
28
28
19
7
6
0 % 20 % 40 % 60 % 80 % 100 %
KOS
CRO
SLO
Trust in media
Not at all A little To some extent A lot

128 MEDia USE andrej Kirbiš and barbara zagorc
toward resolving these issues is identifying the problem. Engaging young people seems to be a
good place to start.
5 Key findings
ΔΔ ΔListening to music is the most frequent media use activity among Slovenian (84
percent), Croatian, and Kosovar youth. The least popular activity is reading; only
20 percent of Slovenian youth frequently read books/newspapers. reading is more
frequent among women, those with higher levels of educated, older Slovenian youth,
and those from larger residential communities.
ΔΔ ΔThe Internet is the primary source of information on political events for Slovenian youth
(82 percent).
ΔΔ ΔCompared to Croatia and Kosovo, Slovenia has the highest proportion of youth with
Internet access (> 99 percent).
ΔΔ ΔIn 2012, 76 percent of the EU-27, 74 percent of Slovenian, and 66 percent of Croatian
households had Internet access.
ΔΔ ΔBetween 2004 and 2010, Slovenia had a higher percentage of households with access to
the Internet via mobile phones than the EU-27 average and Croatia.
ΔΔ ΔIn 2010 Slovenian youth spent 2.37 hours per day using the Internet, while in 2013 they
spend 3.94 hours; an increase of 1.75 hours per day. This current survey also indicates
that 44.5 percent of Slovenian youth are “heavy” Internet users.
ΔΔ ΔSlovenian youth spend more time using the Internet per day than Croatian, Kosovar, or
German youth.
ΔΔ ΔCommunication with friends and other people is the most frequent Internet activity (86
percent), closely followed by the use of online social networks (85 percent).
ΔΔ ΔSlovenian youth spend almost 2 hours per day watching television, which is
approximately two hours less than using the Internet.
ΔΔ ΔSlovenian young people most frequently watch comedies (72 percent), followed by
serials/series (63 percent) and foreign action films (61 percent).
ΔΔ ΔFor television, women, younger youth, and those with lower monthly income levels
more frequently view entertainment programs. Information-based programs are favored
by older youth, those with higher educational levels, males, those with lower subjective
family material status, those with higher monthly incomes, and those from larger
residential communities.
ΔΔ ΔCompared to Croatia and Kosovo, Slovenian youth express the lowest level of trust in
the media, with 36 percent having “little” trust. relatively low levels of trust in the
media parallel the general criticisms of politics, institutions, and democracy seen over
the past several years (Kirbiš, 2013a; 2013b; Kirbiš and Flere, 2011).

andrej Kirbiš and barbara zagorc MEDia USE 129
6 referencesAhmad, F., et al. (2012). representation of Sexuality on Television: values and Attitudes of Young
Malaysian. Asian Social Science, 8 (7), 77–85.
Al Otaibi, K. N. (2012). Attitudes Towards the Use of the Internet. Psychology research, 2 (3),
151–159.
AlGhamdi, S. h. (2013). The association between watching television and obesity in children of
school-age in Saudi Arabia. Journal of Family and Community Medicine, 20 (2), 83–89.
Almansa, A. et al. (2013). Social Networks and Young People. Comparative Study of Facebook be-
tween Colombia and Spain. Comunicar, 40 (20), 127–134.
Amos, M., et al. (Eds.)(2012). Freedom of Expression and the Media. Boston: Martinus Nijhoff
Publishers, 2012.
Anderson, d. r., et al., (1996). Stressful Life Events and Television viewing. Communication re-
search, 23, 243–260.
Anderson, L., and McCabe, d. B. (2012). A Coconstructed World: Adolescent Self-Socialization on
the Internet. Journal of Public Policy & Marketing, 31 (2), 240–253.
Ang, r. P., et al. (2012). Loneliness and generalized problematic Internet use: Parents’ perceived
knowledge of adolescents’ online activities as a moderator. Computers in human Behavior, 28
(4), 1342–1347.
Baek, S. I., and So, W. Y. (2011). Association between Times Spent on the Internet and Weight Sta-
tus in Korean Adolescents. Iranian Journal Of Public health, 40 (4), 37–43.
Baker, C. E. (2006). Media Concentration and democracy: Why Ownership Matters. New York and
Cambridge: Cambridge University Press.
Baker, F., and Bor, W. (2008). Can music preference indicate mental health status in young peo-
ple? Australasian Psychiatry, 16 (4), 284–288.
Barnett, C. (2003). Culture and democracy: Media, Space and representation. Edinburgh: Edin-
burgh University Press.
Barr-Anderson, d. J., et al. (2009). does television viewing predict dietary intake five years later
in high school students and young adults? International Journal of Behavioral Nutrition and Phys-
ical Activity, 6, 7.
Barrett, d. (2010). Television still master of the media universe. retrieved from: http://www.the-
star.com/opinion/editorialopinion/2010/05/31/television_still_master_of_the_media_universe.html
(31.8.2013).
Bašić-hrvatin, S., and Petković, B. (2007). In temu pravite medijski trg?: vloga države v medi-
jskem sektorju v Sloveniji. Ljubljana: Mirovni inštitut.
Bašić-hrvatin, S., et al. (2004). Medijsko lastništvo: vpliv lastništva na neodvisnost in pluralizem
medijev v Sloveniji in drugih post-socialističnih državah. Ljubljana: Mirovni inštitut.

130 MEDia USE andrej Kirbiš and barbara zagorc
Bernal, C., and Angulo, F. (2013). Interactions of Young Andalusian People inside Social Networks.
Comunicar, 40 (20), 25–30.
Berns, M., et al. (Eds.) (2007). In the Presence of English: Media and European Youth. New York:
Springer.
Bersamin, M. M., et al. (2010). Television Use, Sexual Behavior, and relationship Status at Last
Oral Sex and vaginal Intercourse. Sexuality & Culture, 14 (2), 157–168.
BLS (2013). American Time Use Survey – 2012 results. retrieved from: http://www.bls.gov/news.
release/pdf/atus.pdf (31.8.2013).
Bodebjerg, I., and Madsen, P. (Eds.) (2008). Media, democracy and European Culture. Bristol:
Intellect.
Brown, J. d., and Bobkowski, P. S. (2011). Older and Newer Media: Patterns of Use and Effects on
Adolescents’ health and Well-Being. Journal of research on Adolescence, 21 (1), 95–113.
Bryant, J., and Oliver, M. B. (2009). Media Effects: Advances in Theory and research (3rd Edition).
New York: routledge.
Buckingham, d. (Ed.)(2008). Youth, Identity, and digital Media. Cambridge, MA: The MIT Press.
Casiano, h., et al. (2012). Media Use and health Outcomes in Adolescents: Findings from a Na-
tionally representative Survey. Journal of the Canadian Academy of Child & Adolescent Psychia-
try, 21 (4), 296–301.
Ceyhan, A. A., and Ceyhan, E. C. (2008). Loneliness, depression, and Computer Self-Efficacy as
Predictors of Problematic Internet Use. Cyber Psychology & Behavior, 11 (6), 699–701.
Chak, K., and Leung, L. (2004). Shyness and Locus of Control as Predictors of Internet Addiction
and Internet Use. Cyber Psychology & Behavior, 7 (5), 559–570.
Cheng, S. Y. L., and Ko, A. W. S. (2010). Youth Internet Addiction: The Importance of Preventive
Education. Journal of Youth Studies, 13 (2), 74–85.
Cheung, L. M., and Wong, W. S. (2011). The effects of insomnia and internet addiction on depres-
sion in hong Kong Chinese adolescents: an exploratory cross-sectional analysis. Journal of Sleep
research, 20, 311–317.
Chou, C. (2001). Internet heavy use and addiction among Taiwanese college students: an online
interview study. Cyber Psychology & Behavior, 4 (5), 573–585.
Chow, A. S. et al. (2012). Youth as design Partners: Age-Appropriate Websites for Middle and high
School Students. Educational Technology & Society, 15 (4), 89–103.
Collin, P. (2008). The internet, youth participation policies, and the development of young peo-
ple’s political identities in Australia. Journal of Youth Studies, 11 (5), 527–542.
Coronel, S. (2001). The role of the Media in deepening democracy. retrieved from: http://unpan1.
un.org/intradoc/groups/public/documents/un/unpan010194.pdf (30.8.2013).

andrej Kirbiš and barbara zagorc MEDia USE 131
Cotten, S. r., et al. (2013). Impact of Internet Use on Loneliness and Contact with Others Among
Older Adults: Cross-Sectional Analysis. Journal of Medical Internet research, 15 (2), e39.
Coyne, S. M., et al. (2012). Backbiting and bloodshed in books: Short-term effects of reading
physical and relational aggression in literature. British Journal of Social Psychology, 51, 188–196.
Czepek, A., et al. (2009). Introduction: structural inhabitation of media freedom and plurality
across Europe. In: A. Czepek et al. (Eds.). Press Freedom and Pluralism in Europe: Concepts and
Conditions, (pp. 9–22). Bristol: Intellect.
david, C. (2013). ICTs in political engagement among youth in the Philippines. International Com-
munication Gazette, 75 (3), 322–337.
delsing, M. J. M. h., et al. (2008). Adolescents’ music preferences and personality characteristics.
European Journal of Personality, 22 (2), 109–130.
devereux, E. (2007). Understanding the media. 2nd edition. London: SAGE Publications.
dietz, W. h., and Gortmaker, S. L. (1985). do we fatten our children at the television set? Obesity
and television viewing in children and adolescents. Pediatrics, 75 (5), 807–812.
do, Y. K., et al. (2013). The associations between self-reported sleep duration and adolescent
health outcomes: What is the role of time spent on Internet use? Sleep Medicine, 14 (2), 195–200.
dolničar, v., and Nadoh, J. (2004). Medijske navade med slovenskimi mladostniki. Ljubljana: ŠOU.
dowell, E. B., et al. (2009). Clustering of Internet risk Behaviors in a Middle School Student Popu-
lation. Journal of School health, 79 (11), 547–553.
Erdogan, Y. (2008). Exploring the relationships among Internet Usage, Internet Attitudes and
Loneliness of Turkish Adolescents. Cyberpsychology: Journal of Psychosocial research on Cyber-
space, 2 (2), article 1.
Eurostat (2013a). households - devices to access the Internet. retrieved from: http://appsso.eu-
rostat.ec.europa.eu/nui/submitviewTableAction.do (22.8.2013).
Eurostat (2013b). households - level of Internet access. retrieved from: http://appsso.eurostat.
ec.europa.eu/nui/show.do?dataset=isoc_ci_in_h&lang=en (22.8.2013).
Fallahi, v. (2011). Effects of ICT on the youth: A study about the relationship between internet
usage and social isolation among Iranian students. Procedia Social and Behavioral Sciences, 15,
394–398.
Feldman, S., et al. (2007). Associations between Watching Tv during Family Meals and dietary In-
take Among Adolescents. Journal of Nutrition Education & Behavior, 39 (5), 257–263.
Freedom house (2013). Freedom of the Press. retrieved from: http://www.freedomhouse.org/re-
port-types/freedom-press (31.8.2013).
García Galera, M. and del hoyo hurtado, M. (2013). redes sociales, un medio para la movilización
juvenile. Zer, 18 (35), 111–125.

132 MEDia USE andrej Kirbiš and barbara zagorc
Garcia-Castañon, M., et al. (2011). Plugged In or Tuned Out? Youth, race, and Internet Usage in
the 2008 Election. Journal of Political Marketing, 10, 115–138.
Gaskin, G. L., et al. (2012). Internet Access and Attitudes Toward Online Personal health Informa-
tion Among detained Youth. Pediatrics, 130 (5), 914–917.
Gencer, S. L., and Koc, M. (2012). Internet Abuse among Teenagers and Its relations to Internet
Usage Patterns and demographics. Educational Technology & Society, 15 (2), 25–36.
Ghassemzadeh, L., et al. (2008). Prevalence of Internet Addiction and Comparison of Internet Ad-
dicts and Non-Addicts in Iranian high Schools. Cyber Psychology & Behavior, 11 (6), 731–733.
Gidengil, E. et al. (2003). Turned off or turned out? Youth participation in politics. retrieved
from: http://www.elections.ca/res/eim/article_search/article.asp?id=48&lang=e&frmPageSize
(15.8.2013).
Giles, d. (2003). Media Psychology. Mahwah, New Jersey: Lawrence Erlbaum Associates.
Gutnick, A. L., et al. (2010). Always connected: The new digital media habits of young children.
New York: The Joan Ganz Cooney Center at Sesame Workshop.
hamelink, C. J., and Nordenstreng, K. (2006). Towards democratic media governance. In E. de
Bens (Ed.). Media between culture and commerce, (pp. 225–240). Bristol: Intellect books.
harrington, J. L. (2009). Technology and Society. Boston, MA: Jones and Bartlett Publishers.
helweg-Larsen, K., et al. (2011). Predictors and protective factors for adolescent Internet victim-
ization: results from a 2008 nationwide danish youth survey. Foundation Acta Pædiatrica, 101,
533–539.
hetzel-riggin, M. d., and Pritchard J. r. (2011). Predicting Problematic Internet Use in Men and
Women: The Contributions of Psychological distress, Coping Style, and Body Esteem. Cyber Psy-
chology, Behavior, and Social Networking, 14 (9), 519–525.
hirzalla, F., et al. (2011). Internet Use and Political Participation: reflections on the Mobilization/
Normalization Controversy. The Information Society, 27, 1–15.
Ilišin, v., Bouillet, d., Gvozdanović, A. And Potočnik, d. (2012). Mladi u dinamičnom društvu: hr-
vatska 2012 [SPSS database]. Zagreb: Institut za društvena istraživanja u Zagrebu and Friedrich
Ebert Stiftung.
James, B. (Ed.) (2005). Media and good governance. Paris: United Nations Educational, Scientific
and Cultural Organization.
Johansson, A., and Götestam, K. G. (2004). Internet addiction: Characteristics of a question-
naire and prevalence in Norwegian youth (12–18 years). Scandinavian Journal of Psychology, 45,
223–229.
Joiner, r. (2006). Internet Identification and Future Internet Use. Cyber Psychology & Behavior, 9
(4), 410–414.

andrej Kirbiš and barbara zagorc MEDia USE 133
Jung, M., et al. (2013). Effect of Media Use on hIv/AIdS-related Knowledge and Condom Use in
Sub-Saharan Africa: A Cross-Sectional Study. Plos One, 8 (7), 1–9.
Kim, J. h. (2010). Brief report: Predictors of heavy Internet use and associations with health-pro-
moting and health risk behaviors among hong Kong university students. Journal of Adolescence,
33 (1), 215-220.
Kink, S. (2009). Medijski vpliv na mlado občinstvo nasilne medijske vsebine. Sodobna pedagogi-
ka, 60/126 (2), 62–73.
Kirbiš, A. (2011). The virtualization of everyday life. In M. Lavrič (Ed.). Youth 2010: The social pro-
file of young people in Slovenia, (pp. 293–320). Ljubljana: Ministry of Education and Sports, Office
for Youth; Maribor: Aristej.
Kirbiš, A. (2013a). Political participation and non-democratic political culture in Western Europe,
East-Central Europe and post-Yugoslav countries. In K. N. demetriou (Ed.). Political Participa-
tion in the European Union (democracy in Transition Series), (pp. 225-251). Berlin: Springer Berlin
heidelberg.
Kirbiš, A. (2013b). determinants of political participation in Western Europe, East-Central Europe
and post-Yugoslav countries. In S. Flere (Ed.). 20 years later: problems and prospects of countries
of former Yugoslavia, (pp. 21-46). Maribor: Center for the Study of Post-Yugoslav Societes, Faculty
of Arts.
Kirbiš, A., and Flere, S. (2011). Participation. In M. Lavrič (Ed.). Youth 2010: The social profile of
young people in Slovenia, (pp. 187–259). Ljubljana: Ministry of Education and Sports, Office for
Youth; Maribor: Aristej.
Kirbiš, A., and Naterer, A. (2011). Effect of Internet use on protest and conventional political par-
ticipation among Slovenian youth. In: 20 years after: problems and prospects of countries of for-
mer Yugoslavia: book of abstracts: 19.
Kirmse, S. B. (2010). In the marketplace for styles and identities: globalization and youth culture
in southern Kyrgyzstan. Central Asian Survey, 29 (4), 389–403.
Kirsh, S. J. (2010). Media and youth: a developmental perspective. Malden: Wiley-Blackwell.
Kononova, A., and Alhabash, S. (2012). When one medium is not enough: Media use and media
multitasking among college students in Kuwait. Journal of Middle East Media, 8 (1). retrieved
from: http://www2.gsu.edu/~wwwaus/vol8/JMEM2012_Kononova_and_Alhabash.pdf (31.8.2013).
Kowalewska, A., and Mazur, J. (2012). Smoking initiation and watching television, video, dvd
among adolescents in Poland. Przegla d Lekarski, 69 (10), 863–866.
Krasnova, h., et al. (2013). Envy on Facebook: A hidden Threat to Users’ Life Satisfaction? 11th
International Conference on Wirtschaftsinformatik, 27th February – 01st March 2013, Leipzig,
Germany.
Kross, E., et al. (2013). Facebook Use Predicts declines in Subjective Well-Being in Young Adults.
PLoS ONE, 8 (8).
134
La Ferle, C., et al. (2000). Teens’ Use of Traditional Media and the Internet. Journal of Advertising
research, 40 (3), 55–65.
Ladd, J. M. (2012). Why Americans hate the Media and how It Matters. Princeton, NJ: Princeton
University Press.
Lavrič, Miran et al. (2011). Youth 2010: Social profile of youth in Slovenia [data file]. Slovenia, Mar-
ibor: Univerza v Mariboru = University of Maribor, Filozofska fakulteta = Faculty of Arts [produc-
tion], 2010. Slovenia, Ljubljana: Univerza v Ljubljani = University of Ljubljana, Arhiv družboslovnih
podatkov = Social Science data Archive [distribution].
Lenhart, A., et al. (2001). Teenage life online—the rise of the instant-message generation and the
Internet’s impact on friendships and family relationships. Pew Internet and American Life Pro-
ject. retrieved from: http://www.pewinternet.org/pdfs/PIP_Teens_report.pdf (31.8.2013).
Lennings, C. J., et al. (2010). Grooming for Terror: The Internet and Young People. Psychiatry, Psy-
chology and Law, 17 (3), 424–437.
Leung, A., and Kier, C. (2008). Music preferences and civic activism of young people. Journal of
Youth Studies, 11 (4), 445–460.
Leung, A., and Kier, C. (2010). Music preferences and young people’s attitudes towards spending
and saving. Journal of Youth Studies, 13 (6), 681–698.
Levine, L. E., et al. (2007). Electronic Media Use, reading, and Academic distractibility in College
Youth. Cyber Psychology & Behavior, 10 (4), 560–566.
Liebowitz, S. J., and Zentner, A. (2010). Clash of the Titans: does Internet use reduce Television
viewing? CAPrI Publication 09-02.
Lim, S. S., et al. (2013). Managing peer relationships online – Investigating the use of Facebook by
juvenile delinquents and youths-at-risk. Computers in human Behavior, 29, 8–15.
Lin, C. (2009). Effects of the Internet. In J. Bryant, and M. B. Oliver (Eds). Media Effects: Advances
in Theory and research (3rd Edition), (pp. 567 – 591). New York: routledge.
Livingstone, S. (2002). Young People and New Media: Childhood and the Changing Media Environ-
ment. London, Thousand Oaks, New delhi: Sage Publications.
Makarovič, M., et al. (2008). Slovenski mediji v družbi in slovenska družba v medijih. Nova Gori-
ca: Fakulteta za uporabne družbene študije.
Manios, Y., et al. (2009). Television viewing and food habits in toddlers and preschoolers in
Greece: the GENESIS study. European Journal of Pediatrics, 168, 801–808.
Marshall, S. J. (2004). relationships between media use, body fatness and physical activity in
children and youth: a meta-analysis. International Journal of Obesity, 28, 1238–1246.
Matsuba, M. K. (2006). Searching for Self and relationships Online. Cyber Psychology & Behavior,
9 (3), 275–284.
Meikle, G. (2002). Future Active: Media Activism and the Internet. New South Whales: Pluto Press.
MEDia USE andrej Kirbiš and barbara zagorc

135
Mendelsohn, h. (1963). Socio-psychological perspectives on the mass media and public anxiety.
Journalism Quarterly, 40, 511–516.
Mesch, G. S. (2003). The Family and the Internet: The Israeli Case. Social Science Quarterly, 84
(4), 1068–1050.
Mesch, G. S., and Talmud, I. (2010). Wired Youth: The Social World of Adolescence in the Informa-
tion Age. London: routledge.
Meyrowitz, Joshua (1985). No Sense of Place: The Impact of Electronic Media on Social Behavior.
Oxford : Oxford University Press.
Miheljak, vlado, Mirjana Ule, Tanja rener, Metka Mencin Čeplak, Blanka Tivadar in Metka Ku-
har (2001): Youth, 2000 [data file]. Ljubljana: Faculty of Social Sciences. Social Psychology re-
search Centre [production], 2000. Ljubljana: University of Ljubljana. Social Science data Archive
[distribution].
Mishna, F., et al. (2009). Ongoing and online: Children and youth’s perceptions of cyber bullying.
Children and Youth Services review, 31, 1222–1228.
Mythily, S., et al. (2008). Prevalence and Correlates of Excessive Internet Use among Youth in Sin-
gapore. Annals, Academy of Medicine, Singapore, 37, 9–14.
Nasiri, E., et al. (2011). Survey the Prevalence of Internet Addiction and its Influential Factors in
Persian College Student in 2011. Middle-East Journal of Scientific research, 10 (1), 50–53.
NEA (2004). reading At risk: A Survey of Literary reading in America. retrieved from: http://
www.arts.gov/pub/readingAtrisk.pdf (2.9.2013).
NEA (2007). To read or not to read: a question of national consequence. retrieved from: http://
www.nea.gov/research/toread.pdf (2.9.2013).
Oblak Črnič, T. (2010). Preobrazbe na spletu: od infopromocijske k individualizirani politiki? Teori-
ja in praksa, 47 (1), 22–40.
Oblak Črnič, T. (2011). Mladost na ekranu digitalizacija vsakdana in mladostniška računalniška
kultura. Šolsko polje, 22 (3/4), 19–40.
Odaci, h., and Kalkan, M. (2010). Problematic Internet use, loneliness and dating anxiety among
young adult university students. Computers & Education, 55 (3), 1091–1097.
Office for Official Publications of the European Communities (2003). Time use at different stages
of life. results from 13 European countries July 2003. retrieved from: http://epp.eurostat.ec.eu-
ropa.eu/cache/ITY_OFFPUB/KS-CC-03-001/EN/KS-CC-03-001-EN.PdF (30.8.2013).
Ong, C. S., et al. (2011). Comparative loneliness of users versus nonusers of online chatting. Cy-
berpsychology, Behavior, and Social Networking, 14 (1-2), 35–40.
Parratt Fernández, S. (2010). Consumo de medios de comunicación y actitudes hacia ia prensa
por parte de ios universitarios. Zer, 15 (28), 133–149.
andrej Kirbiš and barbara zagorc MEDia USE
136
Pasha, A., xhangolli, K., dundo, J. Gjokuta, B, Tahiri, Z. and Lena, O. (2012). Kosovo Youth Study
2012 [SPSS database]. Friedrich Ebert Stiftung and IdrA Kosova.
Pearlin, L. I. (1959). Social and personal stress and escape television viewing. Public Opinion
Quarterly, 23, 255–259.
Peltzer, K., et al. (2013). heavy Internet use and its associations with health risk and health-pro-
moting behaviours among Thai university students. International Journal of Adolescent Medicine
and health, 1–8.
Peng, T., and Zhu, J. J. h. (2010). Youth and the Internet in East Asia. Journal of Youth Studies, 13
(2), 13–30.
Praprotnik, T. (2011). Mlade generacije in vsakdanja uporaba medijskih novic. Monitor ISh, 13 (2),
77–92.
Quisto, S., et al. (2012). Social Media in Education: The relationship between Past Use and Cur-
rent Perceptions. Journal of Agricultural Education, 53 (3), 137–153.
rey-López, J. P., et al. (2012). Physical activity does not attenuate the obesity risk of Tv viewing
in youth. Pediatric Obesity, 7 (3), 240–250.
richter, M., et al. (2009). The role of behavioural factors in explaining socio-economic differenc-
es in adolescent health: a multilevel study in 33 countries. Social Science & Medicine, 69 (3),
396–403.
romer, d., et al. (2009). Building Social Capital in Young People: The role of Mass Media and Life
Outlook. Political Communication, 26, 65–83.
ruzgar, N. S. (2005). The profiles of the use of the Internet for study purposes among university
students. The Turkish Online Journal of Educational Technology, 6 (3), 129–144.
Schäfer, T., et al. (2012). The functions of music and their relationship to music preference in In-
dia and Germany. International Journal of Psychology, 47 (5), 370–380.
Scherman, A., and Arriagada, A. (2012). disposition to vote and media consumption patterns
among Chilean youth. Comunicación y Sociedad, 25 (1), 85–112.
Sharabi, A., and Margalit, M. (2011). The Mediating role of Internet Connection, virtual Friends,
and Mood in Predicting Loneliness Among Students With and Without Learning disabilities in dif-
ferent Educational Environments. Journal of Learning disabilities, 44 (3), 215–227.
Shell-Jugendstudie (2010). hurrelman, K. et al. (Eds.). [data file]. München: TNS Infratest.
Shrum, L. J. (Ed.). (2004). The Psychology of Entertainment Media: Blurring The Lines Between
Entertainment and Persuasion. Mahwah, New Jersey: Lawrence Erlbaum Associates.
Silverstone, r. (1999). Why Study the Media? London: SAGE Publications.
Simons, d., and Silveira, W. r. (1994). Post-traumatic stress disorder in children after television
programmes. BMJ, 308, 389–390.
MEDia USE andrej Kirbiš and barbara zagorc
137
Singer, M. I., et al. (1998). viewing preferences, symptoms of psychological trauma, and violent
behaviors among children who watch television. American Academy of Child & Adolescent Psy-
chiatry, 37 (10), 1041–1048.
Siomos, K., et al. (2012). Evolution of Internet addiction in Greek adolescent students over a
two-year period: the impact of parental bonding. European Child and Adolescent Psychiatry, 21,
211–219.
Skoric, M. M., and Kwan, G.(2011). do Facebook and video Games Promote Political Participation
Among Youth? Evidence from Singapore. JedEM, 3 (1), 70–79.
Stelter, B. (2009). 8 hours a day Spent on Screens, Study Finds. retrieved from: http://www.ny-
times.com/2009/03/27/business/media/27adco.html?_r=1& (31.8.2013).
Stornaiuolo, A., et al. (2013). Expanding Community: Youth, Social Networking, and Schools. Co-
municar, 40 (20), 79–87.
Subrahmanyam, K., and Lin, G. (2007). Adolescents on the Net: Internet Use and Well-Being. Ado-
lescence, 42 (168), 659–677.
Subrahmanyam, K., and Šmahel, d. (2010). digital Youth: The role of Media in development. New
York: Springer.
Suhail, K., and Bargees, Z. (2006). Effects of Excessive Internet Use on Undergraduate Students in
Pakistan. Cyber Psychology & behavior, 9 (3), 297–307.
Sum, S., et al. (2008). Internet use and loneliness in older adults. Cyber Psychology & Behavior,
11 (2), 208–211.
Ter Bogt, T. F., et al. (2013). Early adolescent music preferences and minor delinquency. Pediat-
rics, 131 (2), 380–389.
The Nielsen Company (2010). how People Watch: A Global Nielsen Consumer report. retrieved
from: http://www.nielsen.com/content/dam/corporate/us/en/reports-downloads/Global%20
video%20report%20how%20People%20Watch.pdf (30.8.2013).
Thompson, S. h., and Loughheed, E. (2012). Frazzled by Facebook? An Exploratory Study of Gen-
der differences in Social Network Communication among Undergraduate Men and Women. Col-
lege Student Journal, 88–98.
Tudor-Locke, C., et al. (2011). Canadian children’s and youth’s pedometer-determined steps/day,
parent-reported Tv watching time, and overweight/obesity: The CANPLAY Surveillance Study. In-
ternational Journal of Behavioral Nutrition and Physical Activity, 8 (66), 1–10.
Udermann, B. E., et al. (2004). Can a patient educational book change behavior and reduce pain
in chronic low back pain patients? Spine Journal, 4 (4), 425–435.
vezzali, L., et al. (2012). Indirect contact through book reading: Improving adolescents’ attitudes
and behavioral intentions toward immigrants. Psychology in the Schools, 49 (2), 148–162.
volkov, d. (2012). The Internet and Political Involvement in russia. russian Education and Socie-
ty, 54 (9), 49–87.
andrej Kirbiš and barbara zagorc MEDia USE
138
vorderer, P., and hartman, T. (2009). Entertainment and Enjoyment as Media Effects. In J. Bryant,
and M. B. Oliver (Eds). Media Effects: Advances in Theory and research (3rd Edition), (pp. 551 –
566). New York: routledge.
vreg, F. (2004). Politični marketing in demokracija: politične kampanje, komunikacijska strategija,
politični tržni prostor, izvajanje političnih kampanj, volilna propaganda, globalizacija, elektronska
demokracija. Ljubljana: Fakulteta za družbene vede.
Walsh, J. L., et al. (2013). Female College Students’ Media Use and Academic Outcomes results
From a Longitudinal Cohort Study. Emerging Adulthood, 1 (3), 219–232.
Wan, G., and Gut, d. (2008). roles of Media and Media Literacy Education: Lives of Chinese and
American Adolescents. New horizons in Education, 56 (2), 28–42.
Williams, d. (2007). The Impact of Time Online: Social Capital and Cyberbalkanization. Cyber Psy-
chology & behavior, 10 (3), 398–406.
Winfried, S. (2011). Music Preferences and Family Language Background: A Computer-Supported
Study of Children’s Listening Behavior in the Context of Migration. Journal of research in Music
Education, 59 (2), 174–195.
Zagorc, B. and Kirbiš, A. (2013). Two way communication? Analysis of websites of Slovene parlia-
mentary parties. Invited lecture at ACTA - active citizens take action, international conference,
Maribor, March 15-16, 2013.
Zoroja, J. (2011). Internet, e-commerce and e-government: measuring the gap between Europe-
an developed and post-communist countries. Interdisciplinary description of Complex Systems, 9
(2), 119–133.
MEDia USE andrej Kirbiš and barbara zagorc
andrej Kirbiš hEaLTh, hEaLTh RiSK bEhaViORS aND LifESTyLE 139
PArT vI hEALTh, hEALTh rISK BEhAvIOrS
ANd LIFESTYLE
1 Introduction
Within the scope of this study, there are three primary reasons to study health and health be-
haviors among youth. First, numerous studies have shown that childhood, adolescence, and youth
health and risk behaviors are predictive, meaning that they identify health conditions occurring
later in life (Larson et al., 2012; Sanchez et al., 2013). Second, health is considered one of the most
important societal values, and as this study indicates, this is also true among Slovenian youth
(Musil and Lavrič, 2011). Third, at the aggregate country level, health is a widely accepted indica-
tor of a country’s socioeconomic development. For example, the human development Index, an
indicator of socioeconomic development published annually in the United Nations’ human devel-
opment report (hdr, 2013), consists of three elements: gross national income, educational levels,
and life-expectancy at birth; the latter is of course an important indicator of a population’s health.
With regard to research, scholars often focus on health outcomes and health behaviors (e.g.,
healthy lifestyles). Although the concept of lifestyle has previously been discussed in the chapter
on leisure, it should be noted that the notion of lifestyle has also played a prominent role within
youth studies, and especially in health studies (e.g., Annandale, 1998; Cockerham, 1997; Nettle-
ton, 2006). For the purposes of this report, health lifestyles are defined as “collective patterns of
health-related behavior based on choices from options available to people according to their life
chances” (Cockerham et al., 1997, 338). The emphasis on the constraint and determinants of life-
style largely stem from sociological literature. Indeed, hansen and Easthope (2006, 38) note that
the sociological position on lifestyle is often attributed to Weber (1978):
“…who considered that while choice is ‘the major factor in the opera-
tionalization of a lifestyle’, ‘the actualization of choices is influenced by
life chances’ (Cockerham et al., 1997, 325). Life chances are the chances
that people have because of their position in life. This includes factors
such as gender, age, education, employment, income and property as
well as rights, norms and social relationships. ‘Hence, lifestyles are not
random behaviours unrelated to structure but are typically deliberate
choices influenced by life chances’ (Cockerham et al., 1997, 325).
hansen and Easthope further emphasize this point: “...lifestyle approach has a tendency to
blame the victim and is thus moralistic and potentially discriminatory” (2006, 52). here this study

140 hEaLTh, hEaLTh RiSK bEhaViORS aND LifESTyLE andrej Kirbiš
attempts to avoid conceptual and methodological individualism that emerged in the 1950s, which
emphasized the role in chronic disease of individual lifestyle choices (particularly the “big four”
of smoking, drinking, diet, and exercise), rather than the structural and environmental conditions
that influence patterns of health and behaviors (Gabe et al., 2004, 25). When considering so-
cio-structural determinants of health lifestyle, it is important to investigate not only socio-struc-
tural and behavioral (lifestyle) determinants of health, but also the socio-structural determinants
of health lifestyles themselves – healthy behaviors or, specifically, health risk behaviors.
This chapter begins by examining the self-reported health status of Slovenian youth. Subse-
quently, risk behaviors and the link between the three types of health “risk behaviors” – smoking
(tobacco use), alcohol use and attitudes toward alcohol use, and obesity/overweight – are exam-
ined, particularly as they are most frequently discussed in the scientific literature (Bonino et. al,
2005; hurrelmann and richter, 2006 ; richter, 2010; Sutton, 2004). The final part of the chapter
assesses the link between the three risk behaviors and self-rated health. risk behaviors refer to
“behaviors that can, directly or indirectly, compromise the well-being, the health, and even the
life course of young people” (Jessor, 1998, 1); in other words, behaviors that can compromise psy-
chosocial aspects of development, which are negatively associated with health and well-being
(richter, 2010, 26).
2 Self-rated health
Self-rated health (Srh) is one of the most common methods of measurement in survey-based
studies. A number of empirical studies have demonstrated that Srh is a powerful predictor of fu-
ture morbidity, mortality, functional (dis)ability, and other quality of life indicators, even after con-
trolling for objective health status and other physical, socio-demographic, and psychosocial health
indicators (Idler and Angel, 1990; Idler and Kasl, 1995; Idler, russell and davis, 2000; Kaplan and
Camacho, 1983; for a meta-analysis see deSalvo et al., 2006; for review of longitudinal studies on
Srh predicting future mortality see Idler and Benyamini, 1997). As well, Srh has been previous-
ly found to be a valid measure of a variety of physical and emotional dimensions of adolescent
well-being (Fosse and haas, 2009). Past studies have identified multiple determinants of Srh in
western and post-communist countries (e.g., Baubinas et al., 2009), including in Slovenia (see,
for example, EhIS, 2009; Farkas et al., 2009; Farkas and Zaletel-Kragelj, 2011; Jeriček Klanšček and
Žiberna, 2012; Kamin, Kolar and Steiner, 2013; Tomsič and Orožen, 2012; Ule and Kurdija, 2013), and
cross-national studies in post-communist countries also exist (Pikhart, 2002).
Analysis of the Slovenian data from the European health Interview Survey (EhIS, 2009) shows
that 61.7 percent of respondents (aged 15+) rated their health as “good” or “very good”. The same
data also indicate that the highest levels of self-rated health are among youth (aged 15–29) with
87.1 percent rating their health as “good” or “very good” (Božič and Zupanič, 2009). Similar re-
sults were presented in a CINdI study of Slovenian adults aged 25 and older (Tomšič and Orožen,
2012), with the youngest age group (25–39) reporting the highest levels of self-rated health. In ad-
dition, data from the 2001–2008 indicate that self-rated health increased during the observed years
among all three age groups.
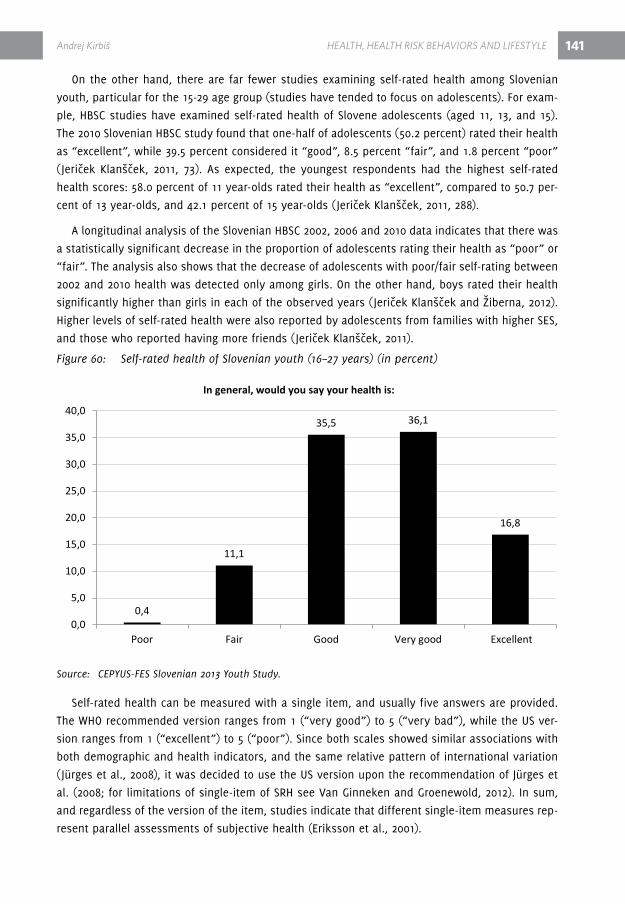
andrej Kirbiš hEaLTh, hEaLTh RiSK bEhaViORS aND LifESTyLE 141
On the other hand, there are far fewer studies examining self-rated health among Slovenian
youth, particular for the 15-29 age group (studies have tended to focus on adolescents). For exam-
ple, hBSC studies have examined self-rated health of Slovene adolescents (aged 11, 13, and 15).
The 2010 Slovenian hBSC study found that one-half of adolescents (50.2 percent) rated their health
as “excellent”, while 39.5 percent considered it “good”, 8.5 percent “fair”, and 1.8 percent “poor”
(Jeriček Klanšček, 2011, 73). As expected, the youngest respondents had the highest self-rated
health scores: 58.0 percent of 11 year-olds rated their health as “excellent”, compared to 50.7 per-
cent of 13 year-olds, and 42.1 percent of 15 year-olds (Jeriček Klanšček, 2011, 288).
A longitudinal analysis of the Slovenian hBSC 2002, 2006 and 2010 data indicates that there was
a statistically significant decrease in the proportion of adolescents rating their health as “poor” or
“fair”. The analysis also shows that the decrease of adolescents with poor/fair self-rating between
2002 and 2010 health was detected only among girls. On the other hand, boys rated their health
significantly higher than girls in each of the observed years (Jeriček Klanšček and Žiberna, 2012).
higher levels of self-rated health were also reported by adolescents from families with higher SES,
and those who reported having more friends (Jeriček Klanšček, 2011).
Figure 60: Self-rated health of Slovenian youth (16–27 years) (in percent)
Source: CEPYUS-FES Slovenian 2013 Youth Study.
Self-rated health can be measured with a single item, and usually five answers are provided.
The WhO recommended version ranges from 1 (“very good”) to 5 (“very bad”), while the US ver-
sion ranges from 1 (“excellent”) to 5 (“poor”). Since both scales showed similar associations with
both demographic and health indicators, and the same relative pattern of international variation
(Jürges et al., 2008), it was decided to use the US version upon the recommendation of Jürges et
al. (2008; for limitations of single-item of Srh see van Ginneken and Groenewold, 2012). In sum,
and regardless of the version of the item, studies indicate that different single-item measures rep-
resent parallel assessments of subjective health (Eriksson et al., 2001).
0,4
11,1
35,5 36,1
16,8
0,0
5,0
10,0
15,0
20,0
25,0
30,0
35,0
40,0
Poor Fair Good Very good Excellent
In general, would you say your health is:

142
Figure 60 presents self-rated health measurements among Slovenian youth in 2013. 16,8 per-
cent of respondents rated their health as “excellent”, 36.1 percent “very good” and 35.5 percent
“good”. On the other side of the spectrum, only 0,4 percent of respondents rated their health as
“poor” and 11.1 percent as “fair”.
The responses were then dichotomized to the self-rated health question: “fair/poor” and
“good/very good/excellent” and compared the percentage of respondents with “fair/poor” Srh in
the samples of Slovenian youth with other studies. 11.5 percent of Slovenian youth people report-
ed “fair” or “poor” Srh. Chaney et al. (2007) found that among American adults, 16.2 percent of
respondents reported “fair/poor” Srh. The lower percentage of respondents with “fair/poor” Srh
in the Slovenian sample is not surprising since young people are generally healthier than adults.
Perhaps a better comparison is with the results of Foti and Eaton’s study (2010), which ana-
lyzed Srh among American high school students (9th-12th grade; aged approximately 14–18) and
found that 15.0 percent reported “fair/poor” Srh (13.4 percent among non-hispanic whites). Ismail
(2013) analyzed Srh in Egypt among 15–29 year-olds, where 13,8 percent of men and 11.6 percent
of women reported “fair/poor” Srh. Both studies report a higher percentage of people with “fair/
poor” Srh compared to Slovenian youth.
On the other hand, vingilis et al. (2002) studied Srh among Canadians aged 12–19, and found
that 4.20 percent reported “fair/poor” health. In a different study of American adolescents (aged
12–18), Fosse and haas (2009) found 5.1 percent reported “fair/poor” health. Both studies indicate
that the proportion of youth reporting “poor/fair” health among Canadian and American youth
was lower than in Slovenia. Taking into account that older respondents tend to report lower Srh
(vingilis et al., 2002), it seems that Slovenian youth (aged 16–27) report similar Srh levels when
compared to youth in other developed countries.
Analyses of socio-demographic Srh correlates indicate that only two variables are statistically
significant: men (rho = 0.16, n = 909; p < 0.001) and those with higher educated mothers (rho = 0.11,
n = 838; p < 0.01) reported higher SRH levels. Interestingly, SES as measured by parental education,
proved significant only for mother’s education, and even here the association was small, which
indicates that Srh among Slovenian youth does not largely depend on family SES. Similar findings
were presented in international hBSC reports of adolescents, where Slovenia had the smallest and
least significant link between self-rated health and family affluence (Currie et al., 2010, 67). Never-
theless, the results from this survey are consistent with other youth studies that show males and
those with higher SES have better Srh (e.g. Page et al., 2009; Spein et al., 2013; vingilis et al., 2002;
for Slovenia see Buzeti et al., 2011; EhIS, 2009; Jeriček Klanšček and Žiberna, 2012). Interestingly,
other socio-demographic variables that were previously found to be associated with Srh proved
insignificant among Slovenian youth.
3 Alcohol use and attitudes toward alcohol
According to a 2002 WhO report, alcohol use is among the top ten risks, globally and regionally,
related to disease. Together these diseases account for more than one-third of all deaths world-
hEaLTh, hEaLTh RiSK bEhaViORS aND LifESTyLE andrej Kirbiš

143
wide.37 Global alcohol consumption has increased in recent decades, particularly in developed
countries. According to the 2002 report, alcohol caused 1.8 million deaths (3.2 percent) worldwide,
which was equal to 4 percent of the global disease burden; the highest proportions of which were
in the Americas and Europe. Causal relationships have been found between average volume of al-
cohol consumption and more than 60 types of disease and injury. Most (though not all)38 of these
relationships are detrimental to health (WhO, 2002, 7, 10, 66).
Young people and adults who frequently consume alcohol are also more often involved in oth-
er types of risky behavior, e.g., tobacco use, drug use, low physical activity, sedentary behavior,
risky sexual behavior, obesity, and victimization (Monti et al., 2004; Nikula et al., 2009; Santel-
li et al., 2001; Torrente and vazsonyi, 2012; vazsonyi et al., 2003; Zalk et al., 2011; Windle, 1994).
Nevertheless, most alcohol related (health) problems affecting young people do not result from
chronic heavy drinking but from occasional heavy drinking and intoxication (Ahlström and Öster-
berg, 2004), and from co-occurring risk activities (e.g., drunk driving, consuming alcohol prior to
sexual intercourse, etc.) (Windle, 2003).
The European School Survey Project on Alcohol and Other drugs (ESPAd, 2011) collected com-
parable data on substance use among 15–16 year-old European students as a means to monitor
trends within and between countries. data for 2011 show that among 36 participating countries,
at least 70 percent of adolescents in all countries but Iceland have drunk alcohol at least once
during their lifetime; the average was 87 percent. For the preceding 12 months, the study showed
that 79 percent of adolescents had consumed alcohol; 57 percent had over the preceding 30 days.
Similarly, there are some worrisome trends in the Slovenian data. Between 1995 and 2011, there
was an increase in the proportion of adolescent respondents reporting the consumption of any
alcoholic beverage during the past 12 months (87 percent in 2011; 5th highest among participating
countries, the use of any alcoholic beverage during the past 30 days (65 percent), and an increase
in the proportion reporting having had five or more drinks on one occasion during the past 30
days (53 percent; 5th highest among participant countries in 2011). Between 2007 and 2011 there
was an increase in estimated average alcohol consumption among those who reported to use al-
cohol (ESPAd, 2011, 127–131).
results from the Slovenian Youth 2010 study show similar results: 89.5 percent of youth report-
ed occasional alcohol consumption (Musil, 2011, 340). Comparing national data on youth (aged
15-19) from 1993 and 2010, Musil found that the proportion of young people that do not consume
37 According to the WhO 2002 health report, the ten leading health risk factors globally are: underweight, unsafe sex, high blood pressure, tobacco consumption, alcohol consumption, unsafe water, sanitation and hygiene, iron deficiency, indoor smoke from solid fuels, high cholesterol, and obesity (WhO, 2002, 7).
38 There are some studies that indicate that moderate alcohol use may be more beneficial for health outcomes than abstention. holahan et al. (2010), for example, examined the association between alcohol consumption and all-cause mortality over 20 years among 1,824 older adults, controlling for a wide range of potential confounding factors associated with abstention and found abstainers and heavy drinkers had increased mortality risks of 51 and 45 percent, respectively, compared to moderate drinkers. In other words, moderate drinker had the lowest rates of mortality.
andrej Kirbiš hEaLTh, hEaLTh RiSK bEhaViORS aND LifESTyLE
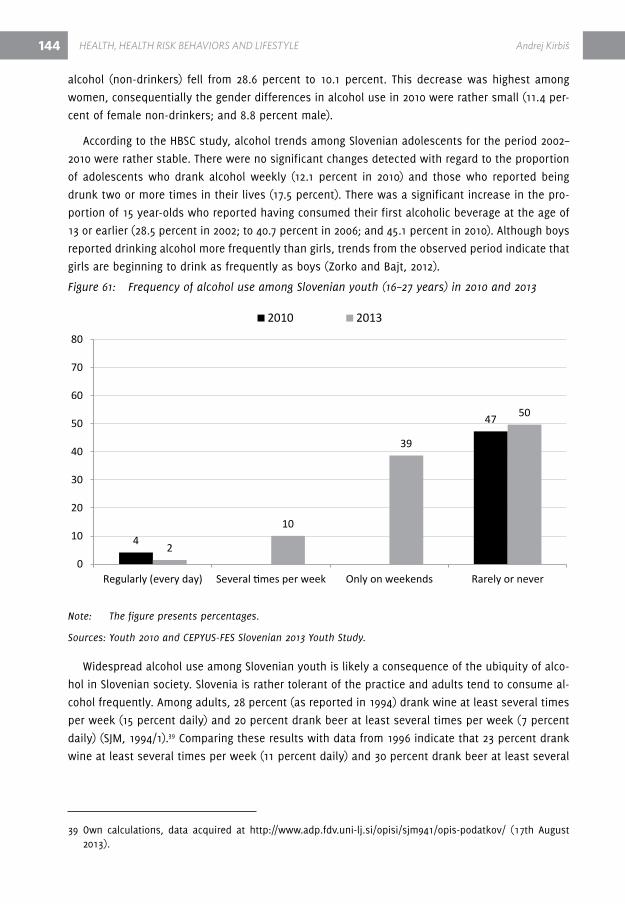
144
alcohol (non-drinkers) fell from 28.6 percent to 10.1 percent. This decrease was highest among
women, consequentially the gender differences in alcohol use in 2010 were rather small (11.4 per-
cent of female non-drinkers; and 8.8 percent male).
According to the hBSC study, alcohol trends among Slovenian adolescents for the period 2002–
2010 were rather stable. There were no significant changes detected with regard to the proportion
of adolescents who drank alcohol weekly (12.1 percent in 2010) and those who reported being
drunk two or more times in their lives (17.5 percent). There was a significant increase in the pro-
portion of 15 year-olds who reported having consumed their first alcoholic beverage at the age of
13 or earlier (28.5 percent in 2002; to 40.7 percent in 2006; and 45.1 percent in 2010). Although boys
reported drinking alcohol more frequently than girls, trends from the observed period indicate that
girls are beginning to drink as frequently as boys (Zorko and Bajt, 2012).
Figure 61: Frequency of alcohol use among Slovenian youth (16–27 years) in 2010 and 2013
Note: The figure presents percentages.
Sources: Youth 2010 and CEPYUS-FES Slovenian 2013 Youth Study.
Widespread alcohol use among Slovenian youth is likely a consequence of the ubiquity of alco-
hol in Slovenian society. Slovenia is rather tolerant of the practice and adults tend to consume al-
cohol frequently. Among adults, 28 percent (as reported in 1994) drank wine at least several times
per week (15 percent daily) and 20 percent drank beer at least several times per week (7 percent
daily) (SJM, 1994/1).39 Comparing these results with data from 1996 indicate that 23 percent drank
wine at least several times per week (11 percent daily) and 30 percent drank beer at least several
39 Own calculations, data acquired at http://www.adp.fdv.uni-lj.si/opisi/sjm941/opis-podatkov/ (17th August 2013).
4
47
2
10
39
50
0
10
20
30
40
50
60
70
80
Regularly (every day) Several times per week Only on weekends Rarely or never
2010 2013
hEaLTh, hEaLTh RiSK bEhaViORS aND LifESTyLE andrej Kirbiš

145
times per week (13 percent daily) (SJM, 1996/2).40 As such, between 1994 and 1996, adults con-
sumed less wine and more beer (for results of other studies on alcohol use among Slovenian adult
population see, Tomšič et al., 2009). In short, most studies verify that Slovenia ranks high globally
in alcohol consumption, which presents an important public health issue (Tomšič et al., 2009, 22).
Figure 61 compares alcohol use among Slovenian youth in 2010 and 2013. Not all of the provid-
ed answers on this question were identical in both studies; therefore, only equivalent answers
were compared (“regularly/every day” and “rarely or never”), shown in the left and right column
of Figure 61 for 2010 and 2013, while the two middle columns show data only for 2013. In 2013, 2
percent of Slovenian youth reported consuming alcohol daily, which is a slight decrease from 2010
(4 percent). Additionally, 50 percent of youth reported rarely or never drinking alcohol in 2010,
which is a 3 percent increase over 2010 (47 percent). despite these positive trends, the two middle
columns reveal a somewhat different picture. 10 percent of youth drink alcohol several times per
week and almost 40 percent drink alcohol on the weekends. When combining these responses,
more than half (51 percent) of Slovenian youth drink alcohol at least once a week. Although this
survey did not ask questions on the amount of alcohol consumed, the data indicate that alcohol
use is widespread among Slovenian youth.
Figure 62: Attitudes toward alcohol among Slovenian, Croatian and Kosovo youth (16-25 years)
Note: The figure presents percentages.
Sources: CEPYUS-FES Slovenian 2013 Youth Study, IDIZ-FES Croatian 2012 Youth Study and IDRA-FES Kosovo 2012 Youth Study.
These findings are also in accordance with Figure 62, which indicates attitudes toward alcohol
among Slovenian, Croatian, and Kosovar youth (aged 16-25). Three-quarters (74 percent) of Slove-
40 Own calculations, data acquired at http://www.adp.fdv.uni-lj.si/opisi/sjm962/opis-podatkov/ (17th August 2013).
22
56
74
11
16
14
67
29
12
0 10 20 30 40 50 60 70 80 90 100
KOS
CRO
SLO
Acceptable Needed to belong in society Unacceptable
andrej Kirbiš hEaLTh, hEaLTh RiSK bEhaViORS aND LifESTyLE
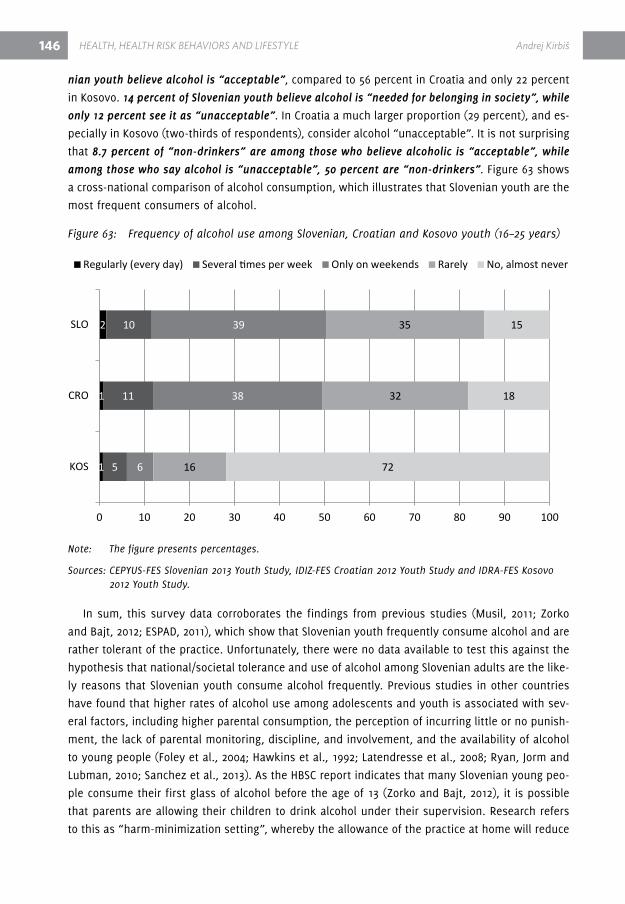
146
nian youth believe alcohol is “acceptable”, compared to 56 percent in Croatia and only 22 percent
in Kosovo. 14 percent of Slovenian youth believe alcohol is “needed for belonging in society”, while
only 12 percent see it as “unacceptable”. In Croatia a much larger proportion (29 percent), and es-
pecially in Kosovo (two-thirds of respondents), consider alcohol “unacceptable”. It is not surprising
that 8.7 percent of “non-drinkers” are among those who believe alcoholic is “acceptable”, while
among those who say alcohol is “unacceptable”, 50 percent are “non-drinkers”. Figure 63 shows
a cross-national comparison of alcohol consumption, which illustrates that Slovenian youth are the
most frequent consumers of alcohol.
Figure 63: Frequency of alcohol use among Slovenian, Croatian and Kosovo youth (16–25 years)
Note: The figure presents percentages.
Sources: CEPYUS-FES Slovenian 2013 Youth Study, IDIZ-FES Croatian 2012 Youth Study and IDRA-FES Kosovo 2012 Youth Study.
In sum, this survey data corroborates the findings from previous studies (Musil, 2011; Zorko
and Bajt, 2012; ESPAd, 2011), which show that Slovenian youth frequently consume alcohol and are
rather tolerant of the practice. Unfortunately, there were no data available to test this against the
hypothesis that national/societal tolerance and use of alcohol among Slovenian adults are the like-
ly reasons that Slovenian youth consume alcohol frequently. Previous studies in other countries
have found that higher rates of alcohol use among adolescents and youth is associated with sev-
eral factors, including higher parental consumption, the perception of incurring little or no punish-
ment, the lack of parental monitoring, discipline, and involvement, and the availability of alcohol
to young people (Foley et al., 2004; hawkins et al., 1992; Latendresse et al., 2008; ryan, Jorm and
Lubman, 2010; Sanchez et al., 2013). As the hBSC report indicates that many Slovenian young peo-
ple consume their first glass of alcohol before the age of 13 (Zorko and Bajt, 2012), it is possible
that parents are allowing their children to drink alcohol under their supervision. research refers
to this as “harm-minimization setting”, whereby the allowance of the practice at home will reduce
1
1
2
5
11
10
6
38
39
16
32
35
72
18
15
0 10 20 30 40 50 60 70 80 90 100
KOS
CRO
SLO
Regularly (every day) Several times per week Only on weekends Rarely No, almost never
hEaLTh, hEaLTh RiSK bEhaViORS aND LifESTyLE andrej Kirbiš
147
the development of adolescent alcohol problems. however, studies have shown that this strategy
has proved ineffective in other western countries (Gilligan and Kypri, 2012; McMorris et al., 2011).
McMorris et al. (2011) therefore suggest parents adopt a “no-use” standard to reduce harmful al-
cohol use among their children. Yet given the frequency and tolerance toward alcohol among Slo-
venian adults, this seems an undesired and unlikely strategy among parents.
An examination of socio-demographic correlates of alcohol consumption showed gender had
the highest effect; men drink alcohol more frequently (rho = 0.23, n = 906; p < 0.01), a result con-
sistent with other Slovenian youth studies (Tomšič et al., 2009; Musil, 2011). As with smoking (see
results below), youth who have more educated parents drink alcohol somewhat more frequently
(higher levels of father’s education (rho = 0.08, n = 868; p < 0.05), higher levels of mother’s edu-
cation (rho = 0.11, n = 835; p < 0.001), while other standard socio-demographic correlates proved
insignificant.
4 Tobacco use
Tobacco use is the leading cause of preventable death, and kills more than 5 million people
each year worldwide, with most of these deaths occurring in low- and middle-income countries
(WhO, 2009, 8). Smoking, however, is also a problem in high-income countries. According to data
from 2000 tobacco use is the leading cause of death in the United States (18.1 percent of total
deaths), followed by poor diet and physical inactivity (365,000 deaths; 15.2 percent), and by alco-
hol consumption (85,000 deaths; 3.5 percent) (Mokdad et al., 2004). Further, more than three-quar-
ters of cardiovascular disease—the world’s leading cause of death—results from tobacco use, high
blood pressure or cholesterol, or a combination of the three (WhO, 2002, 8). Experimenting with
smoking and the onset of regular smoking usually occur in the early teenage years and adoles-
cence (Conrad et al., 1992; Jarvis, 2004; Prokhorov et al., 2006) and early nicotine exposure directly
increases the level of later nicotine dependence. By age 20, 80 percent of smokers regret having
started to smoke, and in general, less than 3 percent of attempts to quit smoking result in sus-
tained (12 month) cessation (Jarvis, 2004).
The results of the Youth 2010 study revealed that 44.5 percent of Slovenian youth occasionally
smoke tobacco (Musil, 2011, 340). Comparing national data on youth smoking (aged 15–19) from
1993 and 2010, Musil (2011) found that there was an increase in the proportion of young non-smok-
ers, among both males and females. Slovenian hBSC data from 2002 to 2010 indicated that there
was a decrease in the proportion of adolescents who have tried smoking (29.2 percent in 2010); of
those who smoked at the time of the survey (10.9 percent in 2010); those who smoke weekly (7.6
percent in 2010) and those who smoke daily (5.2 percent) (Koprivnikar, 2012). Similar declining to-
bacco use trends have been reported in the Slovenian Global Youth Tobacco Survey (Juričič, 2008).
According to the ESPAd report, 54 percent of adolescents in 36 participating European countries
reported that they had smoked cigarettes at least once in their lifetime; 28 percent reported that
they had smoked during the past 30 days. 2 percent of all the respondents had smoked at least
one pack of cigarettes per day during the past 30 days. According to ESPAd data, the proportion
andrej Kirbiš hEaLTh, hEaLTh RiSK bEhaViORS aND LifESTyLE

148
of Slovenian adolescents who reported smoking during the past 30 days increased between 1995
and 2011 (from 26 percent to 32 percent), but decreased from 2003 to 2007 (ESPAd, 2011, 125, 341).
Figure 64 shows the frequency of tobacco use among Slovenian youth in 2010 and 2013. Since
the answers provided to the respondents on this question were not identical in both years, data
were only compared when identical answers were available. In 2013 every fourth young person
reported smoking daily and 40 percent of Slovenian youth smoke at least occasionally (regularly
or occasionally). On the other hand, 60 percent of youth are “non-smokers”. Comparing the two
answers with the Youth 2010 study, the proportion of regular smokers increased (although min-
imally) in 2013, while at the same time, the percentage of non-smokers also increased (from 54
percent to 60 percent).
Since smoking has remained popular among one-quarter of Slovenian youth, policies should be
implemented to help them break the habit. Equally worrying is the fact that 4 out of 10 young Slo-
venians smoke at least occasionally, particularly as it has been found that occasional tobacco use
has a negative impact on health and should be discouraged. The increasing number of non-smok-
ers among Slovenian youth, on the other hand, is a positive trend. however, this might also indi-
cate that there is an increasing polarization toward smoking attitudes among young people.
Figure 64: Frequency of tobacco use among Slovenian youth (16–27 years) in 2010 and 2013
Note: The figure presents percentages.
Sources: Youth 2010 and CEPYUS-FES Slovenian 2013 Youth Study.
Figure 65’s cross-national perspective shows that out of four countries, Slovenia has the second
lowest proportion of regular smokers (25 percent), while Croatia has the most regular smokers (31
24
54
25
60
0
10
20
30
40
50
60
70
80
Regularly (every day) Non-smoker
2010 2013
hEaLTh, hEaLTh RiSK bEhaViORS aND LifESTyLE andrej Kirbiš
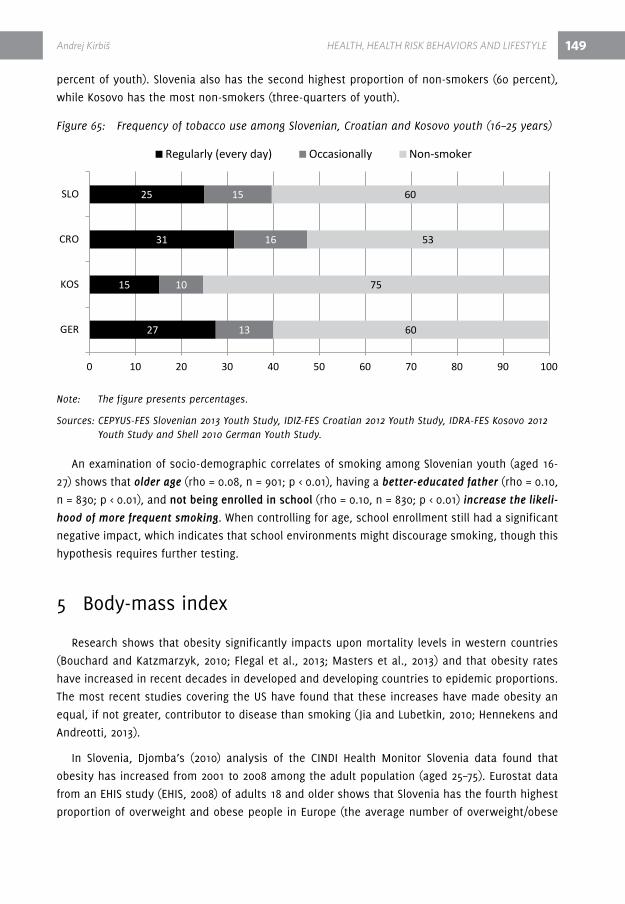
149
percent of youth). Slovenia also has the second highest proportion of non-smokers (60 percent),
while Kosovo has the most non-smokers (three-quarters of youth).
Figure 65: Frequency of tobacco use among Slovenian, Croatian and Kosovo youth (16–25 years)
Note: The figure presents percentages.
Sources: CEPYUS-FES Slovenian 2013 Youth Study, IDIZ-FES Croatian 2012 Youth Study, IDRA-FES Kosovo 2012 Youth Study and Shell 2010 German Youth Study.
An examination of socio-demographic correlates of smoking among Slovenian youth (aged 16-
27) shows that older age (rho = 0.08, n = 901; p < 0.01), having a better-educated father (rho = 0.10,
n = 830; p < 0.01), and not being enrolled in school (rho = 0.10, n = 830; p < 0.01) increase the likeli-
hood of more frequent smoking. When controlling for age, school enrollment still had a significant
negative impact, which indicates that school environments might discourage smoking, though this
hypothesis requires further testing.
5 Body-mass index
research shows that obesity significantly impacts upon mortality levels in western countries
(Bouchard and Katzmarzyk, 2010; Flegal et al., 2013; Masters et al., 2013) and that obesity rates
have increased in recent decades in developed and developing countries to epidemic proportions.
The most recent studies covering the US have found that these increases have made obesity an
equal, if not greater, contributor to disease than smoking (Jia and Lubetkin, 2010; hennekens and
Andreotti, 2013).
In Slovenia, djomba’s (2010) analysis of the CINdI health Monitor Slovenia data found that
obesity has increased from 2001 to 2008 among the adult population (aged 25–75). Eurostat data
from an EhIS study (EhIS, 2008) of adults 18 and older shows that Slovenia has the fourth highest
proportion of overweight and obese people in Europe (the average number of overweight/obese
27
15
31
25
13
10
16
15
60
75
53
60
0 10 20 30 40 50 60 70 80 90 100
GER
KOS
CRO
SLO
Regularly (every day) Occasionally Non-smoker
andrej Kirbiš hEaLTh, hEaLTh RiSK bEhaViORS aND LifESTyLE

150
women and men is 56,6 percent according to EhIS data), behind Malta,41 the United Kingdom, and
the Czech republic. The high average rates of overweight/obesity in Slovenia are due primarily to
higher rates among men (66.2 percent) than among women (47.0 percent). In fact, Slovenia has the
second highest overweight/obesity rate among men in Europe (EhIS, 2008).
In a study of Slovenian children and adolescents, Avbelj et al. (2005) analyzed the prevalence of
overweight/obese children (aged 5). 18.4 percent of boys and 20.9 percent of Slovenian girls were
overweight, while 9.0 percent of boys and 7.9 of girls were obese. Among adolescents, 17.1 percent
of boys and 15.4 percent of girls were overweight, while 6.2 percent of boys and 3.8 percent of girls
were obese. Avbelj concluded that the prevalence of obesity among Slovenian youth was similar
to other developed European countries. The latest data on youth obesity, however, shows even
more worrying results. Among young males (aged 18–24), Slovenia has the third highest propor-
tion of overweight/obese men (35.1 percent) (EhIS, 2008). This is especially problematic given that
previous studies have shown that early life (youth) obesity (body mass index (BMI) 30 or above)
predicts adult obesity (Trudeau, 2010).
Past research also suggests that the proportion of overweight and obese youth is on the rise
in Slovenia. Kovač et al. (2008) compared body-mass index of young boys (aged 7–18) for 1991 and
2006 and found that the proportion of overweight boys increased by 40 percent (from 13.5 percent
to 18.8 percent), whereas the proportion of obese boys more than doubled (from 2.8 percent to
6.1 percent). The prevalence of overweight/obesity was found to be highest in childhood and early
adolescence; more than double the number of those aged 18). The international hBSC data (where
mostly European and North American countries participate) indicate that Slovenia ranks seventh,
ninth, and fifth with regard to the highest proportion of overweight/obese 11, 13, and 15-year-olds,
respectively. For example, among those aged 15, 23 percent of Slovenian boys and 13 percent of
Slovenian girls are overweight/obese (Currie et al., 2010, 91). In analyzing available Slovenian data
of older youth BMI index rates, Musil (2011, 337) reported an increase in the proportion of youth
being weight/obese from 2001 to 2010, although the increase was rather minimal.
This study compared youth study data from 2010 and 2013. As is customary, BMI was calculated
with the formula: Weight in kilograms divided by height in meters squared (weight (kg) / [height
(m)2]). In addition, this study used classified BMI using the same criteria as the World health Or-
ganization with the following general categories; “underweight” (BMI below 18.5 kg/m2), “normal
weight/range” (BMI between 18.5 and 24.99 kg/m2), “overweight” (BMI between 25 and 29.99 kg/
m2) and “obese” (BMI 30 kg/m2 or over).
Figure 66 shows the average body max indices of Slovenian youth (aged 16–27) in 2010 and
2013 (note: this is a relatively short period of time). As Figure 66 indicates, the proportion of obese
youth remained practically the same in this window, while the proportion of overweight young
people increased minimally by 1.3 percent. The difference between the percentage of overweight/
obese youth between 2010 (22.1 percent) and 2013 (23.4 percent) was not statistically significant
(p > 0.05), which means that no trend has been detected. On the other hand, the proportion of
youth within the “normal” range fell from 74.1 percent to 71.6 percent, which is largely due to the
increase of underweight youth from 3.8 percent to 5.0 percent. Future research is needed to deter-
41 EUrOSTAT notes that data on Malta has low reliability.
hEaLTh, hEaLTh RiSK bEhaViORS aND LifESTyLE andrej Kirbiš

151
mine the factors contributing to the increase in underweight youth, particularly as it may concern
the impact of the “ideal” body image advertised in mass media, poor nutrition (economic crisis
might have a negative effect on nutrition patterns), or other related factors.
Figure 66: Body mass index of Slovenian youth (16–27 years) in 2010 and 2013
Note: The figure presents percentages.
Sources: Youth 2010 and CEPYUS-FES Slovenian 2013 Youth Study.
Figure 67 shows the proportion of overweight and obese Slovenian youth (aged 16-27) by major
socio-demographic groups. The proportion of overweight/obese youth is higher among men (rho
= 0.20, n = 901; p < 0.001), older youth (rho = 0.14, n = 901; p < 0.001), and those not enrolled in
school (rho = 0.11, n = 888; p < 0.001). Similarly, the Youth 2010 study found women and younger
youth to have a lower likelihood of being overweight/obese (Musil, 2011), as did other cross-nation-
al studies (e.g., Currie et al., 2010). Educational levels also play a role. Young people with less ed-
ucated mothers and fathers are more frequently overweight/obese; however, the association was
not significant. Interestingly, those with higher levels of education were disproportionally more
overweight/obese, but the association became insignificant when controlling for age.
6 An unhealthy lifestyle and self-rated health
Past research consistently shows that unhealthy (i.e. risk) behaviors are frequently associated.
Moreover, the findings indicate positive associations between different behaviors, such as higher
body-mass index, more frequent sedentary behavior (e.g., watching television), less physical ac-
tivity, and unhealthy dietary habits (e.g., less frequent consumption of fruit and vegetables) (see,
among others, Al-hazzaa et al., 2012; Al-Nakeeb et al., 2012; Crowe et al., 2011; Isasi et al., 2006;
Kruger et al., 2013; Mensink, Loose and Oomen, 1997; Sandercock et al., 2012; Sisson et al., 2010;
also see Cockerham, 2010). In their study of fifteen-year olds, Alamian and Paradis (2009; 2012)
found that 26 percent of the study participants reported three or more risk behaviors, while 30
percent reported two. As such, this study explored the extent to which three examined risk be-
5,0
71,6
19,1
4,2
3,8
74,1
17,8
4,3
0,0 10,0 20,0 30,0 40,0 50,0 60,0 70,0 80,0
Underweight
Normal range
Overweight
Obese
SLO 2010
SLO 2013
andrej Kirbiš hEaLTh, hEaLTh RiSK bEhaViORS aND LifESTyLE

152
haviors (alcohol use, smoking, and overweight/obesity) among Slovenian youth contribute to an
unhealthy lifestyle. In other words, are these behaviors (positively) interrelated, which can be un-
derstood as forming a risk behavior pattern? Second, how are these behaviors associated with the
health of Slovenian youth?
Figure 67: Proportion of overweight and obese Slovenian youth (16–27 years), by major socio-demographic groups
Note: The figure presents percentages.
Source: CEPYUS-FES Slovenian 2013 Youth Study.
As illustrated above, statistical analyses indicate that the anticipated social gradient, which
would indicate more unhealthy/risky behaviors among youth who are worse off, did not general-
ly emerge, at least when measured by respondents’ and parental educational levels. In fact, the
opposite was found to be true in terms of the effect of parental education on the frequency of
drinking and smoking. On the other hand, socio-demographic characteristics (especially gender
and age) were found to influence lifestyle (risk behaviors). For this reason, a partial correlation
analysis of body-mass index (BMI),42 alcohol use and tobacco use, controlling for age, sex, and re-
spondents’ and maternal and paternal educational levels was performed.
42 BMI was re-coded into two categories for the purpose of these analyses (1 = underweight and normal range weight; 2 = overweight/obesity).
22,028,1
26,0
20,431,4
34,021,4
23,2
32,522,022,2
18,026,0
23,8
16,119,6
31,9
31,115,0
0,0 5,0 10,0 15,0 20,0 25,0 30,0 35,0 40,0
Up to 10,000 inhabitants
10,00 and more inhabitants
Ljubljana and Maribor
In school
Out of school
Elementary school or less
Secondary level
Tertiary level
Elementary school or less
Secondary level
Tertiary level
Elementary school or less
Secondary level
Tertiary level
16-19
20-23
24-27
Male
Female
Size
of
resid
entia
lsettl
emen
tSc
hool
enro
llmen
t
Mot
her's
educ
ation
alle
vel
Fath
er's
educ
ation
alle
vel
Resp
onde
nt's
educ
ation
alle
vel
Age
Gend
er
hEaLTh, hEaLTh RiSK bEhaViORS aND LifESTyLE andrej Kirbiš
153
Controlling for socio-demographic correlates, smoking was found to be significantly associated
with alcohol use (rho = 0.21, p < 0.001), indicating that those who reported a higher frequency of
smoking also consume alcohol more frequently. Smoking was not significantly associated with
BMI, while BMI was associated with alcohol use (rho = 0.08, p < 0.05).
Finally, associations between the three risk behaviors and self-rated health (Srh) were exam-
ined, controlling for the same standard socio-demographic variables. Interestingly, alcohol use
was not significantly associated with SRH, while more frequent tobacco use (r = 0.16, p < 0.01)
and higher body-mass index (r = 0.13, p < 0.01) were associated with poorer self-health ratings. In
other words, the healthiest youth (as measured by Srh) were non-smokers and those within the
normal range weight, as expected.
In conclusion, the data indicate that men and young people with more educated mothers report
better Srh. Two of the analyzed health risk behaviors, tobacco use and obesity/overweight, cluster
together into an “unhealthy lifestyle”. Further, tobacco use and obesity/overweight also seem to
affect significantly the health of Slovenian youth. Future studies should also examine other indica-
tors of health and health risk behaviors (e.g., using more fine-tuned measurements of alcohol use).
7 Key findings
Self-rated health (Srh) levels among Slovenian youth are similar to youth populations from oth-
er countries. 16.8 percent of Slovenian young people rate their health as “excellent”, 36.1 percent
as “very good”, and 35.5 percent as “good”. Only 0.4 percent of respondents rated their health as
“poor” and 11.1 percent as “fair”.
Srh is significantly higher among men. Socioeconomic status (SES) as measured by parental
education proved to be a significant correlate of Srh only for mother’s education (though the
correlation was small), indicating that Srh among Slovenian youth does not strongly depend on
family SES. These findings echo the results of previous studies on Slovenian youth (see Currie et
al., 2010, 67). Nevertheless, future studies should examine other structural determinants, such as
living conditions, employment status, socialization patterns, etc. (see Cockerham, 2010) and other
measures of health, lifestyles, and risk behaviors.
In 2013, 2 percent of Slovenian youth report consuming alcohol “regularly/daily”, which is a
decrease over 2010, when 4 percent reported being “daily” drinkers. 50 percent “rarely” or “nev-
er” drank alcohol in 2013, which shows an increase in the non-drinking population from 2010 (47
percent). Almost three-quarters (74 percent) of Slovenian youth believe alcohol is “acceptable”,
compared to 56 percent in Croatia and 22 percent in Kosovo. Men and those with higher educated
parents more frequently consume alcohol.
Compared to 2010 the proportion of “regular” smokers remained rather stable in 2013, while
the percentage of “non-smokers” increased (from 54 percent to 60 percent). 40 percent of young
Slovenians smoke tobacco at least “occasionally” or more frequently. Men, young people not en-
rolled in school, and those with higher parental education levels (father’s education) are more
frequent tobacco smokers.
andrej Kirbiš hEaLTh, hEaLTh RiSK bEhaViORS aND LifESTyLE

154
Between 2010 and 2013, the proportion of obese youth remained stable, while the proportion
of overweight youth increased by only 1.3 percentage points (19.1 percent). The proportion of un-
derweight youth increased by 1.2 percentage points (from 3.8 to 5.0 percent).
Youth who smoke also consume alcohol more frequently. Smoking is not significantly associ-
ated with the risk of being overweight/obese, while being overweight/obese is associated with
alcohol use.
The healthiest youth in Slovenia (as measured by self-rated health) are non-smokers and those
within the normal weight range.
8 referencesAhlström, S. K., and Österberg, E. L. (2004). International Perspectives on Adolescent and Young
Adult drinking. Alcohol research & health, 28 (4), 258–268.
Al-hazzaa, h. M., et al. (2012). Lifestyle factors associated with overweight and obesity among
Saudi adolescents. BMC Public health, 12, 354.
Al-Nakeeb, Y., et al. (2012). Obesity, physical activity, and sedentary behavior amongst British
and Saudi youth: a cross-cultural study. International Journal Of Environmental research And
Public health, 9 (4), 1490–1506.
Alamian, A., and Paradis, G. (2009). Correlates of Multiple Chronic disease Behavioral risk Factors
in Canadian Children and Adolescents. American Journal of Epidemiology, 170 (10), 1279–1289.
Alamian, A., and Paradis, G. (2012). Individual and social determinants of multiple chronic dis-
ease behavioral risk factors among youth. BMC Public health, 12, 224.
Annandale, E. (1998). The Sociology of health and Medicine: A Critical Introduction. Cambridge:
Polity Press.
Avbelj, M., et al. (2005). Prevalenca čezmerne prehranjenosti in debelosti med pet let starimi
otroki in 15 oziroma 16 let starimi mladostnicami in mladostniki v Sloveniji. Zdravniški vestnik,
74 (12), 753–759.
Baubinas, A., et al. (2009). Self-rated health among physicians. Medicina (Kaunas), 45 (7),
557–564.
Bonino, S. et al. (Eds.) (2005). Adolescents and risk: Behavior, Functions, and Protective Factors.
Bologna: Springer-verlag Italia.
Bouchard, C., and Katzmarzyk, P. T. (2010). Physical Activity and Obesity (2nd Edition). Cham-
paign: human Kinetics.
Božič, A., and Zupanič, T. (2009). health and health care in Slovenia. Ljubljana: Statistični urad
republike Slovenije [Statistical Office of the republic of Slovenia].
Buzeti T., et al. (2011). Neenakosti v zdravju v Sloveniji. Ljubljana: Inštitut za varovanje zdravja.
retrieved from: http://czr.si/files/neenakosti_v_zdravju_v_sloveniji_615.pdf (09.09.2013).
hEaLTh, hEaLTh RiSK bEhaViORS aND LifESTyLE andrej Kirbiš
155
Chaney, E.h., Chaney, J.d., Wang, M.Q., Eddy, J.M. (2007). Lifestyle behaviors and mental health
of American adults. Psychological report, 100 (1), 294–302.
Cockerham, W. C. (1997). The Social determinants of the decline of Life Expectancy in russia and
Eastern Europe: A Lifestyle Explanation. Journal of health and Social Behavior, 38 (2), 117–130.
Cockerham, W.C., rütten, A., and Abel, T. (1997). Conceptualising contemporary health lifestyles:
moving beyond Weber. The Sociological Quarterly, 38 (2), 321–342.
Cockerham, W. C. (2010). health Lifestyles: Bringing Structure Back. In: W. Cockerham (Ed.). The
New Blackwell Companion to Medical Sociology, (pp. 159–183). Oxford: Wiley-Blackwell.
Conrad, K. M., et al. (1992). research report. Why children start smoking cigarettes: predictors of
onset. British Journal of Addiction, 87, 1711–1724.
Crowe, F. L., et al. (2011). Fruit and vegetable intake and mortality from ischaemic heart disease:
results from the European Prospective Investigation into Cancer and Nutrition (EPIC)-heart study.
European heart Journal, 32 (10), 1235–1243.
Currie, C. et al. (2010). Social determinants of health and well-being among young people. health
Behaviour In School-Aged Children (hBSC) Study: International report From The 2009/2010 Survey.
Copenhagen: WhO regional Office for Europe, 2012 (health Policy for Children and Adolescents,
No. 6). retrieved from: http://www.euro.who.int/__data/assets/pdf_file/0003/163857/Social-deter-
minants-of-health-and-well-being-among-young-people.pdf (09.09.2013).
de Salvo, K. B., Bloser, N., reynolds, K., he, J., Muntner, P. (2006). Mortality prediction with a sin-
gle general self-rated health question. A meta-analysis. Journal of General Internal Medicine, 21
(3), 267–275.
diClemente, r. (2009). Adolescent health: Understanding and Preventing risk Behaviors. San
Francisco: Jossey-Bass.
djomba, J. K., et al. (2010). Prehranske navade kot dejavnik tveganja za kronične nalezljive
bolezni. In: C. hlastan-ribič (Ed.). Cvahtetovi dnevi javnega zdravja 2010, Ljubljana, oktober 2010.
Zdrava prehrana in javno zdravje: zbornik prispevkov, (pp. 69–84. Ljubljana: Medicinska fakulte-
ta, Katedra za javno zdravje. retrieved from: http://www.zzv-lj.si/promocija-zdravja-in-zdravstve-
na-statistika/zdrave-sole/Prehrana_KNB_djomba.pdf (09.09.2013).
EhIS (2008). health determinants – overweight and obesity. Eurostat. retrieved from: http://epp.
eurostat.ec.europa.eu/statistics_explained/images/4/41/EhIS_overweight_obesity.xls (09.09.2013).
EhIS (2009). x. European health Interview Survey. Ljubjana: Inštitut za varovan-
je zdravja republike Slovenije. retrieved from: https://www.google.si/url?sa=t&rct=-
j&q=&esrc=s&source=web&cd=1&ved=0CCwQFjAA&url=http%3A%2F%2Fwww.ivz.
si%2Fpodatkovne_zbirke%3Fpi%3d5%26_5_Filename%3d422.xls%26_5_MediaId%3d422%26_5_Au-
toresize%3dfalse%26pl%3d46-5.3.&ei=0wEqUtv0B-eI4gSklYCoBQ&usg=AFQjCNFroU_gUmyvlkc-
jOvKdrdGN5c7-GQ&sig2=BGcvveI-pdZwbe7ahSJefA (09.09.2013).
Eriksson, I., et al. (2001). Self-rated health. Comparisons between three different measures. re-
sults from a population study. International Journal of Epidemiology, 30 (2), 326–333.
andrej Kirbiš hEaLTh, hEaLTh RiSK bEhaViORS aND LifESTyLE
156
ESPAd (2011). The 2011 Espad report Substance Use Among Students in 36 European Coun-
tries. Stockholm: The Swedish Council for Information on Alcohol and Other drugs (CAN). re-
trieved from: http://www.espad.org/Uploads/ESPAd_reports/2011/The_2011_ESPAd_report_
FULL_2012_10_29.pdf (09.09.2013).
Farkas, J., et al. (2009). Self-rated health and mortality in patients with chronic heart failure. Eu-
ropean Journal of heart Failure, 11, 518–524.
Farkas, J., and Zaletel-Kragelj, L. (2011). Self-rated health and social classes in Slovenia: is there
any relationship? Anali PAZU, 1 (1), 67–75.
Flegal, K. M., Kit, B. K., Orpana, h., Graubard, B. I. (2013). Association of all-cause mortality with
overweight and obesity using standard body mass index categories: a systematic review and
meta-analysis. JAMA, 309 (1), 71–82.
Foley, K. L., Altman, d., durant, r. h., Wolfson, M. (2004). Adults’ approval and adolescents’ alco-
hol use. Journal of Adolescent health, 35 (4), 17–26.
Fosse, N. E., and haas, S. A. (2009). validity and stability of self-reported health among adoles-
cents in a longitudinal, nationally representative survey. Pediatrics, 123 (3), 496–501.
Foti, K., and Eaton, d. (2010). Associations of selected health risk behaviors with self-rated health
status among U.S. high school students. Public health reports, 125 (5), 771–781.
Gabe, J., et al., (2004). Key Concepts in Medical Sociology. London: Sage Publications.
Gilligan, C., and Kypri, K. (2012). Parent attitudes, family dynamics and adolescent drinking:
qualitative study of the Australian parenting guidelines for adolescent alcohol use. BMC Public
health, 12, 491.
hansen, E., and Easthope, G. (2006). Lifestyle in Medicine. Lifestyle in Medicine. Critical Studies
in health and Society. London: routledge.
hawkins, J. d., Catalano, r. F., Miller, J. Y. (1992). risk and protective factors for alcohol and other
drug problems in adolescence and early adulthood: Implications for substance abuse prevention.
Psychological Bulletin, 112 (1), 64–105.
hdr (2013). human development report 2013. The rise of the South: human Progress in a di-
verse World. New York: United Nations development Programme (UNdP). retrieved from: http://
hdr.undp.org/en/media/hdr_2013_EN_complete.pdf (09.09.2013).
hennekens, C. h., and Andreotti, F. (2013). Leading Avoidable Cause of Premature deaths World-
wide: Case for Obesity. The American Journal of Medicine, 126 (2), 97–98.
holahan, C. J., et al. (2010). Late-Life Alcohol Consumption and 20-Year Mortality. Alcoholism:
Clinical and Experimental research, 34 (11), 1961–1971.
hurrelmann, K., and richter, M. (2006). risk behaviour in adolescence: the relationship between
developmental and health problems. Journal of Public health, 14 (1), 20–28.
Idler, E. L., and Angel, r. J. (1990). Self-rated health and mortality in the NhANES- epidemiologic
follow-up study. American Journal of Public health, 80, 446–52.
hEaLTh, hEaLTh RiSK bEhaViORS aND LifESTyLE andrej Kirbiš

157
Idler, E. L., and Kasl, S. v. (1995). Self-ratings of health: do they also predict change in functional
ability? The Journals of Gerontology Series B: Psychological Sciences and Social Sciences, 50 (6),
344–353.
Idler, E. L., and Benyamini, Y. (1997). Self-rated health and mortality: a review of twenty-seven
community studies. Journal of health and Social Behavior, 38, 21–37.
Idler, E. L., russell, L. B., davis, d. (2000). Survival, functional limitations, and self-rated health in
the NhANES I Epidemiologic Follow-up Study, 1992. First National health and Nutrition Examina-
tion Survey. American Journal of Epidemiology, 152, 874–883.
Ilišin, v., Bouillet, d., Gvozdanović, A. And Potočnik, d. (2012). Mladi u dinamičnom društvu: hr-
vatska 2012 [SPSS database]. Zagreb: Institut za druatvena istra~ivanja u Zagrebu and Friedrich
Ebert Stiftung.
Isasi, C. r., et al. (2006). Youth WAvE Screener: Addressing Weight-related Behaviors With School-
Age Children. The diabetes Educator, 32 (3), 415–422.
Ismail, E. A. A. (2013). The role of Education and Wealth in health Inequalities in Egypt. Life Sci-
ence Journal, 10 (3), 272–279.
Jarvis, M. J. (2004). Why people smoke. BMJ, 328 (31), 277–279.
Jeriček Klanšček, h. (2011). Samoocena zdravja. In h. Jeriček Klanšček et al. (Eds.). Neenakosti v
zdravju in z zdravjem povezanih vedenjih slovenskih mladostnikov, (pp. 71–86). Ljubljana: Inšti-
tut za varovanje zdravja v Sloveniji.
Jeriček Klanšček, h., et al. (2011). Sumarnik. In h. Jeriček Klanšček et al. (Eds.). Neenakosti v
zdravju in z zdravjem povezanih vedenjih slovenskih mladostnikov, (pp. 282–306). Ljubljana: In-
štitut za varovanje zdravja v Sloveniji.
Jeriček Klanšček, h., and Žiberna, J. (2012). Trendi v samooceni zdravja. In: h. Jeriček Klanšček
et al. (Eds.). Spremembe v vedenjih, povezanih z zdravjem mladostnikov v Sloveniji v obdobju
2002–2010, (pp. 67–77). Ljubljana : Inštitut za varovanje zdravja.
Jessor, r. (1998). New perspectives on adolescent risk behaviour. In: r. Jessor (Ed). New perspec-
tives on adolescent risk behaviour, (pp. 1–12). Cambridge: Cambridge University Press.
Jia, h., and Lubetkin, E. I. (2010). Trends in Quality-Adjusted Life-Years Lost Contributed by Smok-
ing and Obesity. American Journal of Preventive Medicine, 38 (2), 138–144.
Juričič, M. (2008). Odnos mladih do tobaka v Sloveniji v letih 2003 in 2007. retrieved from: http://
www.zzv-lj.si/aktualno/juricic-odnosmladihdotobaka.pdf (09.09.2013).
Jürges, h., et al. (2008). Are different measures of self-rated health comparable? An assessment
in five European countries. European Journal of Epidemiology, 23 (12), 773–781.
Kamin, T., Kolar, A., Steiner, P. M. (2013). The role of cultural capital in producing good health: a
propensity score study. Zdravstveno varstvo, 52 (2), 108–118.
Kaplan, G. A., and Camacho, T. (1983). Perceived health and mortality: a nine-year follow-up of
the human population laboratory cohort. American Journal of Epidemiology, 117, 292–304.
andrej Kirbiš hEaLTh, hEaLTh RiSK bEhaViORS aND LifESTyLE
158
Koprivnikar, h. (2012). Trendi v kajenju tobaka. In: h. Jeriček Klanšček et al. (Eds.). Spremembe
v vedenjih, povezanih z zdravjem mladostnikov v Sloveniji v obdobju 2002–2010, (pp. 165–182).
Ljubljana : Inštitut za varovanje zdravja.
Kovač, M., et al. (2008). Overweight and obesity trends in Slovenian boys from 1991 to 2006. Acta
Universitatis Palackianae Olomucensis: Gymnica, 38 (1), 17–26.
Kruger, A. K. et al. (2013). do sleep-deprived adolescents make less healthy food choices? Pre-
sented at Population Association of America, 2013 Annual meeting; Session 33: Nutrition, Obesity
and Overweight in Children and Youth, April 11th. retrieved from: http://paa2013.princeton.edu/
papers/132004 (09.09.2013).
Larson, N., et al. (2012). Predictors of fruit and vegetable intake in young adulthood. Journal of
the Academy of Nutrition and dietetics, 112 (8), 1216–1222.
Latendresse, S. J., et al. (2008). Parenting Mechanisms in Links between Parents’ and Adoles-
cents’ Alcohol Use Behaviors. Alcoholism: Clinical and Experimental research, 32 (2), 322–330.
Masters, r., et al. (2013). The Impact of Obesity on US Mortality Levels: The Importance of Age
and Cohort Factors in Population Estimates. American Journal of Public health. e-view Ahead of
Print.
McMorris, B., et al. (2011). Influence of Family Factors and Supervised Alcohol Use on Adolescent
Alcohol Use and harms: Similarities Between Youth in different Alcohol Policy Contexts. Journal
of Studies on Alcohol and drugs, 72 (3), 418–428.
Mensink, G. B., Loose, N., Oomen, C. M. (1997). Physical activity and its association with other
lifestyle factors. European Journal of Epidemiology, 13 (7), 771–778.
Mokdad, A. h., et al. (2004). Actual Causes of death in the United States, 2000. JAMA, 291 (10),
1238–1245.
Monti, P. M., et al. (2004). drinking Among Young Adults: Screening, Brief Intervention, and Out-
come. Alcohol research and health, 28 (4), 236–244.
Musil, B. (2011). health and wellbeing. In M. Lavrič (Ed.). Youth 2010: The social profile of young
people in Slovenia, (pp. 321–348). Ljubljana: Ministry of Education and Sports, Office for Youth;
Maribor: Aristej.
Musil, B., and Lavrič, M. (2011). values, sustainable social functioning and visions of the future.
In M. Lavrič (Ed.). Youth 2010: The social profile of young people in Slovenia, (pp. 419–448). Lju-
bljana: Ministry of Education and Sports, Office for Youth; Maribor: Aristej.
Nettleton, S. (2006). The Sociology of health and Illness [2nd ed.]. Cambridge: Polity Press.
Nikula, M., et al. (2009). Sexual behaviour and lifestyles of young men in Finland, 1998–2005.
Cross-sectional survey of military conscripts. The European Journal of Contraception and repro-
ductive health Care February, 14 (1), 17–26.
hEaLTh, hEaLTh RiSK bEhaViORS aND LifESTyLE andrej Kirbiš

159
Page, r. M., et al. (2009). Self-rated health, psychosocial functioning, and other dimensions of
adolescent health in Central and Eastern European adolescents. The European Journal of Psychia-
try, 23 (2), 101–114.
Pasha, A., xhangolli, K., dundo, J. Gjokuta, B, Tahiri, Z. and Lena, O. (2012). Kosovo Youth Study
2012 SPSS database. Friedrich Ebert Stiftung and IdrA Kosova.
Pikhart, h. (2002). Social and Psychosocial determinants of Self-rated health in Central and East-
ern Europe. Boston: Kluwer Academic Publishers.
Prokhorov, A. v., et al. (2006). Youth Tobacco Use: A Global Perspective for Child health Care Clini-
cians. Pediatrics, 118 (3), 890–903.
richter, M. (2010). risk Behaviour in Adolescence: Patterns, determinants and Consequences.
Wiesbaden: vS research.
ryan, S. M., Jorm, A. F., Lubman, d. I. (2010). Parenting factors associated with reduced adoles-
cent alcohol use: a systematic review of longitudinal studies. Australian & New Zealand Journal
of Psychiatry, 44 (9), 774–783.
Sanchez, Z. M., et al. (2013). Childhood Alcohol Use May Predict Adolescent Binge drinking: A
Multivariate Analysis among Adolescents in Brazil. Journal of Pediatrics, 163 (2), 363–368.
Sandercock, G. r. h., et al. (2012). Screen time and physical activity in youth: thief of time or life-
style choice? Journal Of Physical Activity & health, 9 (7), 977–984.
Santelli, J. S., robin, L., Brener, N. d., Lowry, r. (2001). Timing of alcohol and other drug use and
sexual risk behaviors among unmarried adolescents and young adults. Family Planning Perspec-
tives, 33 (5), 200–205.
Shell-Jugendstudie (2010). hurrelman, K. et al. (Eds.). [data file]. München: TNS Infratest.
Sisson, S. B., et al. (2010). Screen time, physical activity, and overweight in U.S. youth: national
survey of children’s health 2003. The Journal Of Adolescent health, 47 (3), 309–311.
SJM (1994/1). Toš, N., et al. (1994). Slovensko javno mnenje 1994/1: razvojne vrednote in prostor
in stališča o zdravju in zdravstvu [datoteka podatkov]. Ljubljana: Univerza v Ljubljani, Fakulteta
za družbene vede, Center za raziskovanje javnega mnenja in množičnih komunikacij [izdelava],
1994. Arhiv družboslovnih podatkov [distribucija], 2000. retrieved from: http://www.adp.fdv.uni-
lj.si/opisi/sjm941/opis-podatkov/ (09.09.2013).
SJM (1996/2). Toš, N., et al. (1996). Slovensko javno mnenje 1996/2: Stališča o zdravju in zdravst-
vu, športne aktivnosti in stališča o športu in mednarodna raziskava volilnih sistemov [datoteka
podatkov]. Ljubljana: Univerza v Ljubljani, Fakulteta za družbene vede, Center za raziskovanje
javnega mnenja in množičnih komunikacij [izdelava ], junij 1996. Arhiv družboslovnih podatk-
ov [distribucija], 2000. retrieved from: http://www.adp.fdv.uni-lj.si/opisi/sjm962/opis-podatkov/
(09.09.2013).
andrej Kirbiš hEaLTh, hEaLTh RiSK bEhaViORS aND LifESTyLE

160
Spein, A. r., et al. (2013). Self-rated health among Greenlandic Inuit and Norwegian Sami adoles-
cents: associated risk and protective correlates. International Journal of Circumpolar health, 72,
19793.
Sutton, S. (2004). determinants of health-related behaviours: Theoretical and methodological
issues. In. S. Sutton, A. B. et al. (Eds.). The Sage handbook of health Psychology, (pp. 94 – 126).
London. Sage
Tomšič, S., et al. (2009). duševno zdravje v Sloveniji. In: h. Jeriček Klanšček et al. (Ed.). duševno
zdravje v Sloveniji, (pp. 20–83). Ljubljana : Inštitut za varovanje zdravja republike Slovenije.
Tomšič, S., and Orožen, K. (2012). Samoocena zdravja. In: J. Maučec Zakotnik et al. (Ed.). Zdrav-
je in vedenjski slog prebivalcev Slovenije. Trendi v raziskavah CINdI 2001–2004–2008, (pp. 15–30).
Ljubljana : Inštitut za varovanje zdravja republike Slovenije.
Torrente, G., and vazsonyi, A. T. (2012). Personality, Parenting and deviance among Spanish Ado-
lescents. Anales de psicología, 28 (3), 654–664.
Trudeau, F. (2010). Childhood Obesity and the risk of Adult Obesity. In: Bouchard, C., and Katz-
marzyk, P. T. (Eds). Physical Activity and Obesity (2nd Edition), (pp. 114–166). Champaign: human
Kinetics.
Ule, M., and Kurdija, S. (2013). Self-rated health among women and their assessment of the
health care system. Zdravstveno varstvo, 52, 87–98.
van Ginneken, J.K.S., and Groenewold, W.G.F. (2012). A single- vs. multi-item self-rated health sta-
tus measure: a 21-country study. The Open Public health Journal, 5, 1–9.
vazsonyi, A. T., hibbert, J. r., and Snider, J. B. (2003). Exotic Enterprise No More? Adolescent re-
ports of Family and Parenting Processes From Youth in Four Countries. Journal of research on
Adolescence, 13 (2), 129–160.
vingilis, E. r., et al. (2002). Predictors of Adolescent Self-rated health: Analysis of the National
Population health Survey. Canadian Journal of Public health, 93 (3), 193–197.
Weber, M. (1978). Economy and Society: An Outline of Interpretive Sociology. Berkeley: University
of California Press.
WhO (2002). The World health report 2002. reducing risks, promoting healthy life. Geneva: World
health Organization. retrieved from: http://www.who.int/whr/2002/en/whr02_en.pdf (09.09.2013).
WhO (2009). WhO report on the Global Tobacco Epidemic, 2009: Implementing smoke-free envi-
ronments. Geneva: World health Organization. retrieved from: http://whqlibdoc.who.int/publica-
tions/2009/9789241563918_eng_full.pdf (09.09.2013).
Windle, M. (1994). Substance use, risky behaviors, and victimization among a US national adoles-
cent sample. Addiction, 89 (2), 175–182.
Windle, M. (2003). Alcohol Use Among Adolescents and Young Adults. Alcohol research & health,
27 (1), 79–85.
hEaLTh, hEaLTh RiSK bEhaViORS aND LifESTyLE andrej Kirbiš

161
Zalk, N., et al. (2011). Shyness as a moderator of the link between advanced maturity and early
adolescent risk behaviour. Scandinavian Journal of Psychology, 52 (4), 341–353.
Zorko, M., and Bajt, M. (2012). Trendi v pitju alkohola. In: h. Jeriček Klanšček et al. (Ed.). Spre-
membe v vedenjih, povezanih z zdravjem mladostnikov v Sloveniji v obdobju 2002–2010, (pp.
183–198). Ljubljana : Inštitut za varovanje zdravja.
andrej Kirbiš hEaLTh, hEaLTh RiSK bEhaViORS aND LifESTyLE


Marina Tavčar Krajnc, Sergej flere and Miran Lavrič ThE faMiLy 163
PArT vII ThE FAMILY
1 Introduction
As a means to understand contemporary family dynamics, one must look to wider societal
changes. A branch of sociologists have over the past decade argued that major social notions and
phenomena are in a state of flux, liquidity, and uncertainty (Bauman 2000, Beck, 2006, 78-82),
which disputes early positivistic claims that the development of the field is through greater discov-
eries of “laws” and “determinisms”. More contemporary sociologists have begun to examine “the
liquid” nature of modern social life (Bauman, 2000), which includes uncertainty, ambivalence, and
fluidity. Such notions can be applied to the family, particularly in Europe. The liquidizing powers
have moved from the “system” to “society”, from “politics” to “life-policies”, or have descend-
ed from the “macro” to the “micro” level of habitation (Bauman, 2000, 7), i.e., the family. here,
liquidizing processes refer to the idea that the individual is forced to choose his own life course,
constantly “reflexing” on his changing situation. Some may hail this as emancipation and libera-
tion from entrenched traditional patterns, while more sober thinkers criticize the inherent anomie:
“the absence, or mere inclarity of norms – anomie – is the worst lot which may occur to people”
(Bauman, 2000, 21).
As such, it is difficult to question whether the European family is undergoing rapid and fun-
damental change. daly summarizes several of these changes: on family forms, living alone has
increased sharply, particularly over the second half of the 20th century; on fertility, a downward
trend has been noticeable, particularly in the recent context of Europe; and on marriage, a similar
decline has been apparent, particularly how it relates to parenthood outside wedlock. These three
major changes have brought about “an increasing variation in the composition of households and
families” (2005, 282). As to family organization, she finds “the two income family is now the dom-
inant form in most EU 15 states” (2005, 383), although the two incomes are not typically equal (a
trend which is not limited to EU-15 countries). She further claims that household chores are not yet
equally distributed (2005, 384). daly also observes that this change is purely economic and that
the Parsonian model of breadwinner-homemaker is no longer (if it ever had been) the dominant
pattern of family organization. Finally, as to family relations and values, daly finds a troubling un-
coiling between “coupledom (partnership) and parenthood”. “Partnership demands mobility and
is typically not founded in a long-term commitment, whereas the increasingly child-centered fami-
ly of today requires immobility and stability” (2005, 386), which would amount to an internal con-
tradiction within the structure of daily relations. Of course, these trends vary throughout Europe.
however, as Flere and Klanjšek (2011) have established, inter-country variations between family
patterns are diminishing in favor of some basic general trends.

164 ThE faMiLy Marina Tavčar Krajnc, Sergej flere and Miran Lavrič
Another observed feature concerns the so-called decline of the family institution, namely that
it exerts less influence over its members (Popenoe 1993, 537). Popenoe’s concern relates to the
family as a societal component: “Breaking up the nucleus of anything is a serious matter” (1993,
539). This contradicts the logic noted above, namely that individuals are finding new spaces of lib-
erty in choice and open-endedness (Beck and Beck-Gernsheim, 2002).
This picture of the European family is based on empirical data. Theoretical interpretations,
however, diverge significantly. As early as 1992, Giddens argued in favor of “pure relationships”
(1992, 88-9) amongst partners, i.e., previous institutionalization, heteronomy, and imposition were
all waived, ceasing to being a “social fact” in durkheim’s terms; relationships were no longer co-
erced, patterned, and uniform. “Pure relationships” are entered into consensually, for their own
sake and the partners’ enjoyment, extracting their maintenance solely from their satisfaction,
i.e., the tightly molded conventional life plan did not apply. Beck and Beck-Gernsheim follow this
line of reasoning, concluding that society has reached a point where “individuals have to invent
or find their own social setting, love become[ing] the central meaning to their lives” (1995, 170).
Thus, Giddens finds the family to be “a shell institution” (“emptied of content”, 1999, 19), while
Beck and Beck-Gernsheim consider it “a zombie institution” (2002, 203). More traditional sociolo-
gists have been less vocal in their dissent, although the family remains a ubiquitous part of any
standard sociology textbook, statistical studies, and data collection. Gilding (2010) is among the
few authors who have attempted to reaffirm the institutional nature of the family. he finds three
indicators supporting a diagnosis of its enduring institutional nature: paternity matching (where
he documents the rarity and exceptionality of mismatching); and inheritance, referring to histori-
cal-comparative findings on the stability of estate succession by descendants and family business-
es, which have “an enduring role”, even “at the commanding heights of capitalism” (2010, 769).
The endurance of family businesses across cultures runs in the face of simplistic rational choice
explanations and can be attributed only to the immanence of the family linking at different gen-
erations, not only in succession, but also in operation.
According to Beck and Beck Gernsheim, if the family exists at all it is increasingly subjugated
to the logic of individually designed lives. “The family is becoming more of an elective relation-
ship, an association of individual persons, who each bring to it their own interests, experiences,
and plans and who are each subjected to different controls, risks and constraints” (2002, 98). This
means that the founding of one’s own family is often extended to later points in life. It may be
reorganized by remarriage, or some other partnership, or even without partnership. Internal rela-
tions are adjusted to the individual wants and desires of its members, and these take precedence
over family pattern. Medically assisted fertilization also fundamentally alters the course of family
relations (Beck and Beck Gernsheim, 2002).
Given the above, this study seeks out the underlying question of whether individualism is pres-
ent amongst Slovenian youth, and if so, how does it manifest, and to what degree.
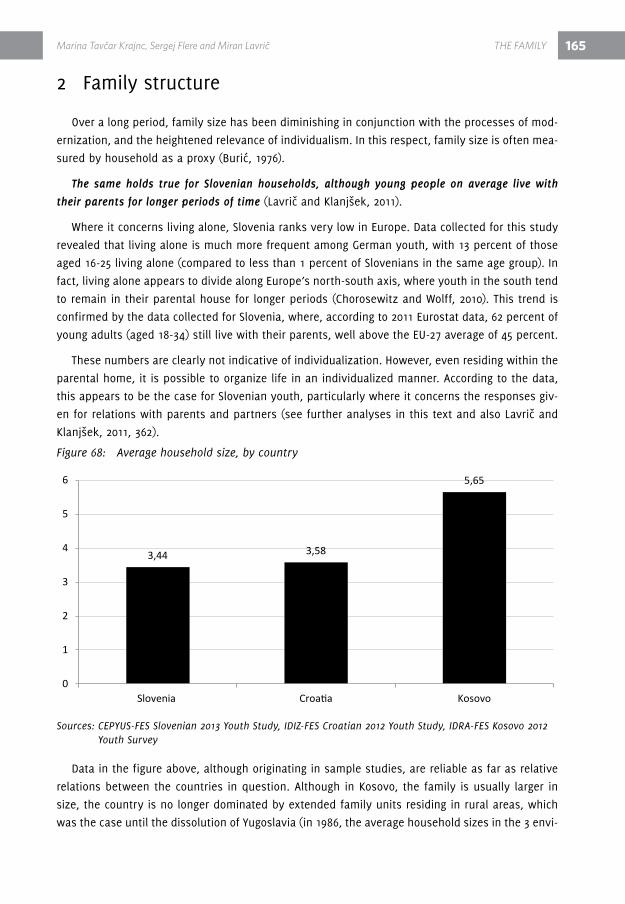
Marina Tavčar Krajnc, Sergej flere and Miran Lavrič ThE faMiLy 165
2 Family structure
Over a long period, family size has been diminishing in conjunction with the processes of mod-
ernization, and the heightened relevance of individualism. In this respect, family size is often mea-
sured by household as a proxy (Burić, 1976).
The same holds true for Slovenian households, although young people on average live with
their parents for longer periods of time (Lavrič and Klanjšek, 2011).
Where it concerns living alone, Slovenia ranks very low in Europe. data collected for this study
revealed that living alone is much more frequent among German youth, with 13 percent of those
aged 16-25 living alone (compared to less than 1 percent of Slovenians in the same age group). In
fact, living alone appears to divide along Europe’s north-south axis, where youth in the south tend
to remain in their parental house for longer periods (Chorosewitz and Wolff, 2010). This trend is
confirmed by the data collected for Slovenia, where, according to 2011 Eurostat data, 62 percent of
young adults (aged 18-34) still live with their parents, well above the EU-27 average of 45 percent.
These numbers are clearly not indicative of individualization. however, even residing within the
parental home, it is possible to organize life in an individualized manner. According to the data,
this appears to be the case for Slovenian youth, particularly where it concerns the responses giv-
en for relations with parents and partners (see further analyses in this text and also Lavrič and
Klanjšek, 2011, 362).
Figure 68: Average household size, by country
Sources: CEPYUS-FES Slovenian 2013 Youth Study, IDIZ-FES Croatian 2012 Youth Study, IDRA-FES Kosovo 2012 Youth Survey
data in the figure above, although originating in sample studies, are reliable as far as relative
relations between the countries in question. Although in Kosovo, the family is usually larger in
size, the country is no longer dominated by extended family units residing in rural areas, which
was the case until the dissolution of Yugoslavia (in 1986, the average household sizes in the 3 envi-
3,44 3,58
5,65
0
1
2
3
4
5
6
Slovenia Croatia Kosovo

166 ThE faMiLy Marina Tavčar Krajnc, Sergej flere and Miran Lavrič
ronments were 3.80, 3.96 and 8.02; Flere and Klanjšek, 2011). According to this figure, the Slovenian
household is the smallest in average size, with relative changes comparable to Croatia.
3 Family relations
Family relations combine a complex set of variables, including emotionality, household chores,
finance, child upbringing, etc. Each involves some level of decision-making. The contemporary
family has been under stress due to the changes in basic patterns, from the Parsonian model to
other models and model-free relations, as underscored by Beck and Beck-Gernsheim (2002). Thus,
in light of these rapidly occurring changes, relations among family members may be under stress.
This issue is given further illumination be the responses found in this report’s survey.
Figure 69: Perceptions of relationship with parents
Sources: CEPYUS-FES Slovenian 2013 Youth Study, IDIZ-FES Croatian 2012 Youth Study, IDRA-FES Kosovo 2012 Youth Study.
In the above figure showing harmony/disharmony in the family, the Kosovo sample indicates
an almost idyllic situation. This could be the result of the influence of social desirability, in view
of the exceedingly rapid family changes found in this environment. Social desirability may be ab-
sent in the other two national samples, though the Slovenian data indicate the presence of a more
harmonious and amicable situation than what is found in Croatia. Taking into account the more
permissive family patterns observed already in the 19th century in Slovenia, this variance is per-
haps not surprising (LePlay, see Flere and Klanjšek, 2011). The two answers indicating a negative
situation comprise only 7 percent of the total for Slovenia. The youngest group reports having the
best relations with their parents (M = 1.82), whereas this seems to decrease as young people age
(M = 1.72 in both age groups). Good relations are related positively with authoritative parenting
(.250** - a very high magnitude, considering that these are separate phenomena), future orienta-
tion (.152**), and negatively with authoritarian parenting (-.182**).
34%
31%
62%
59%
55%
33%
5%
12%
5%
2%
2%
Slovenia
Croatia
Kosovo
Which of the following statements best describes your relationship with your parents?
We get along very wellWe get along, although sometimes we have differences in opinionIn general, we do not get along, we often argueVery conflictual relationshipMy parents are not aliveDon’t know / No answer
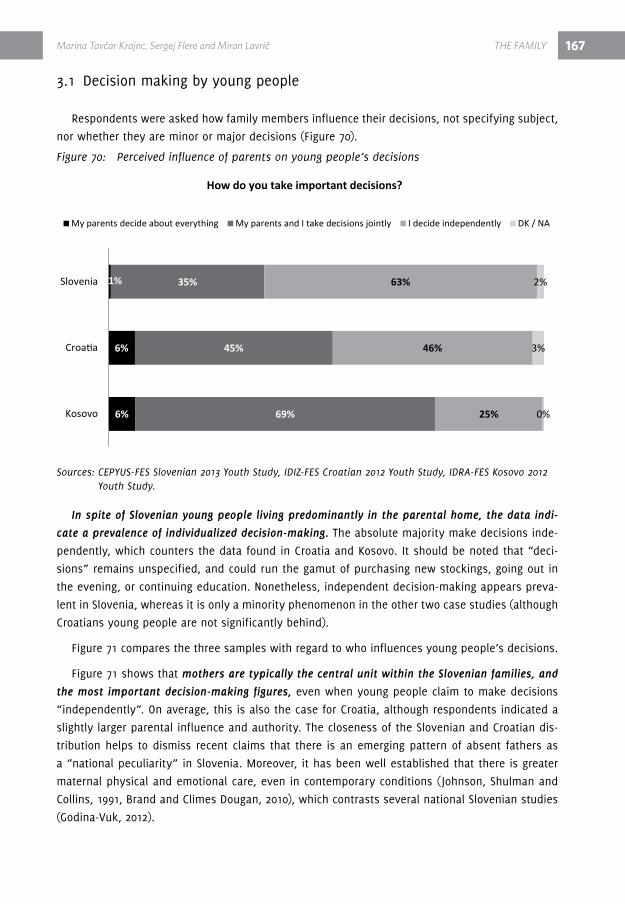
Marina Tavčar Krajnc, Sergej flere and Miran Lavrič ThE faMiLy 167
3.1 decision making by young people
respondents were asked how family members influence their decisions, not specifying subject,
nor whether they are minor or major decisions (Figure 70).
Figure 70: Perceived influence of parents on young people’s decisions
Sources: CEPYUS-FES Slovenian 2013 Youth Study, IDIZ-FES Croatian 2012 Youth Study, IDRA-FES Kosovo 2012 Youth Study.
In spite of Slovenian young people living predominantly in the parental home, the data indi-
cate a prevalence of individualized decision-making. The absolute majority make decisions inde-
pendently, which counters the data found in Croatia and Kosovo. It should be noted that “deci-
sions” remains unspecified, and could run the gamut of purchasing new stockings, going out in
the evening, or continuing education. Nonetheless, independent decision-making appears preva-
lent in Slovenia, whereas it is only a minority phenomenon in the other two case studies (although
Croatians young people are not significantly behind).
Figure 71 compares the three samples with regard to who influences young people’s decisions.
Figure 71 shows that mothers are typically the central unit within the Slovenian families, and
the most important decision-making figures, even when young people claim to make decisions
“independently”. On average, this is also the case for Croatia, although respondents indicated a
slightly larger parental influence and authority. The closeness of the Slovenian and Croatian dis-
tribution helps to dismiss recent claims that there is an emerging pattern of absent fathers as
a “national peculiarity” in Slovenia. Moreover, it has been well established that there is greater
maternal physical and emotional care, even in contemporary conditions (Johnson, Shulman and
Collins, 1991, Brand and Climes dougan, 2010), which contrasts several national Slovenian studies
(Godina-vuk, 2012).
6%
6%
1%
69%
45%
35%
25%
46%
63%
0%
3%
2%
Kosovo
Croatia
Slovenia
How do you take important decisions?
My parents decide about everything My parents and I take decisions jointly I decide independently DK / NA
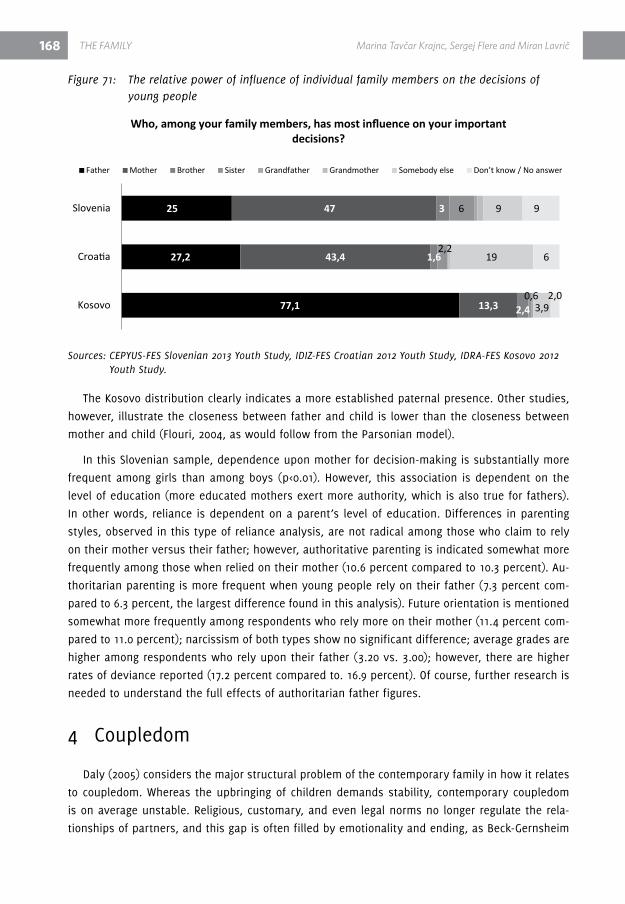
168 ThE faMiLy Marina Tavčar Krajnc, Sergej flere and Miran Lavrič
Figure 71: The relative power of influence of individual family members on the decisions of young people
Sources: CEPYUS-FES Slovenian 2013 Youth Study, IDIZ-FES Croatian 2012 Youth Study, IDRA-FES Kosovo 2012 Youth Study.
The Kosovo distribution clearly indicates a more established paternal presence. Other studies,
however, illustrate the closeness between father and child is lower than the closeness between
mother and child (Flouri, 2004, as would follow from the Parsonian model).
In this Slovenian sample, dependence upon mother for decision-making is substantially more
frequent among girls than among boys (p<0.01). however, this association is dependent on the
level of education (more educated mothers exert more authority, which is also true for fathers).
In other words, reliance is dependent on a parent’s level of education. differences in parenting
styles, observed in this type of reliance analysis, are not radical among those who claim to rely
on their mother versus their father; however, authoritative parenting is indicated somewhat more
frequently among those when relied on their mother (10.6 percent compared to 10.3 percent). Au-
thoritarian parenting is more frequent when young people rely on their father (7.3 percent com-
pared to 6.3 percent, the largest difference found in this analysis). Future orientation is mentioned
somewhat more frequently among respondents who rely more on their mother (11.4 percent com-
pared to 11.0 percent); narcissism of both types show no significant difference; average grades are
higher among respondents who rely upon their father (3.20 vs. 3.00); however, there are higher
rates of deviance reported (17.2 percent compared to. 16.9 percent). Of course, further research is
needed to understand the full effects of authoritarian father figures.
4 Coupledom
daly (2005) considers the major structural problem of the contemporary family in how it relates
to coupledom. Whereas the upbringing of children demands stability, contemporary coupledom
is on average unstable. religious, customary, and even legal norms no longer regulate the rela-
tionships of partners, and this gap is often filled by emotionality and ending, as Beck-Gernsheim
77,1
27,2
25
13,3
43,4
47
2,4
1,6
3
0,6
2,2
6
3,9
19
9
2,0
6
9
Kosovo
Croatia
Slovenia
Who, among your family members, has most influence on your important decisions?
Father Mother Brother Sister Grandfather Grandmother Somebody else Don’t know / No answer
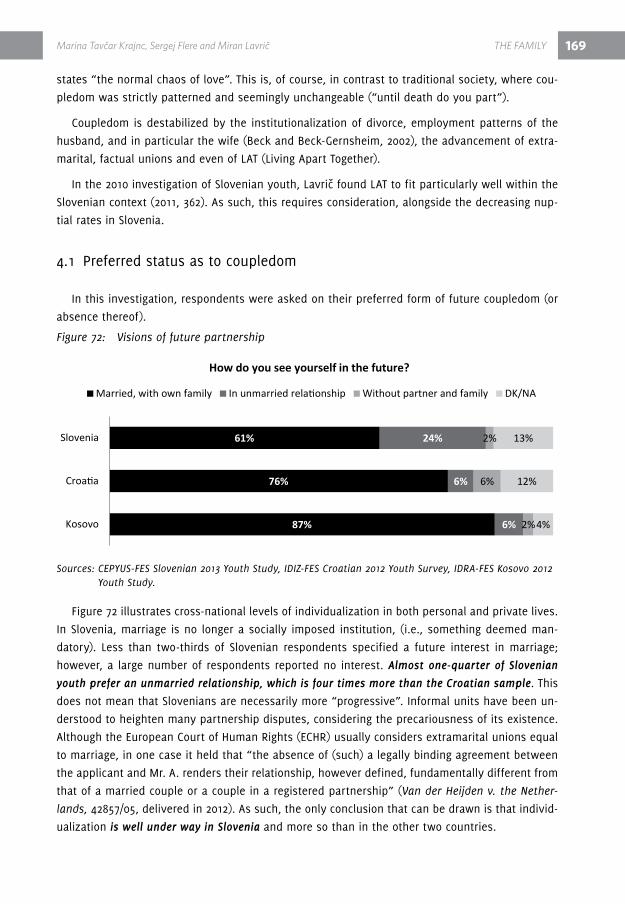
Marina Tavčar Krajnc, Sergej flere and Miran Lavrič ThE faMiLy 169
states “the normal chaos of love”. This is, of course, in contrast to traditional society, where cou-
pledom was strictly patterned and seemingly unchangeable (“until death do you part”).
Coupledom is destabilized by the institutionalization of divorce, employment patterns of the
husband, and in particular the wife (Beck and Beck-Gernsheim, 2002), the advancement of extra-
marital, factual unions and even of LAT (Living Apart Together).
In the 2010 investigation of Slovenian youth, Lavrič found LAT to fit particularly well within the
Slovenian context (2011, 362). As such, this requires consideration, alongside the decreasing nup-
tial rates in Slovenia.
4.1 Preferred status as to coupledom
In this investigation, respondents were asked on their preferred form of future coupledom (or
absence thereof).
Figure 72: Visions of future partnership
Sources: CEPYUS-FES Slovenian 2013 Youth Study, IDIZ-FES Croatian 2012 Youth Survey, IDRA-FES Kosovo 2012 Youth Study.
Figure 72 illustrates cross-national levels of individualization in both personal and private lives.
In Slovenia, marriage is no longer a socially imposed institution, (i.e., something deemed man-
datory). Less than two-thirds of Slovenian respondents specified a future interest in marriage;
however, a large number of respondents reported no interest. Almost one-quarter of Slovenian
youth prefer an unmarried relationship, which is four times more than the Croatian sample. This
does not mean that Slovenians are necessarily more “progressive”. Informal units have been un-
derstood to heighten many partnership disputes, considering the precariousness of its existence.
Although the European Court of human rights (EChr) usually considers extramarital unions equal
to marriage, in one case it held that “the absence of (such) a legally binding agreement between
the applicant and Mr. A. renders their relationship, however defined, fundamentally different from
that of a married couple or a couple in a registered partnership” (Van der Heijden v. the Nether-
lands, 42857/05, delivered in 2012). As such, the only conclusion that can be drawn is that individ-
ualization is well under way in Slovenia and more so than in the other two countries.
87%
76%
61%
6%
6%
24%
2%
6%
2%
4%
12%
13%
Kosovo
Croatia
Slovenia
How do you see yourself in the future?
Married, with own family In unmarried relationship Without partner and family DK/NA
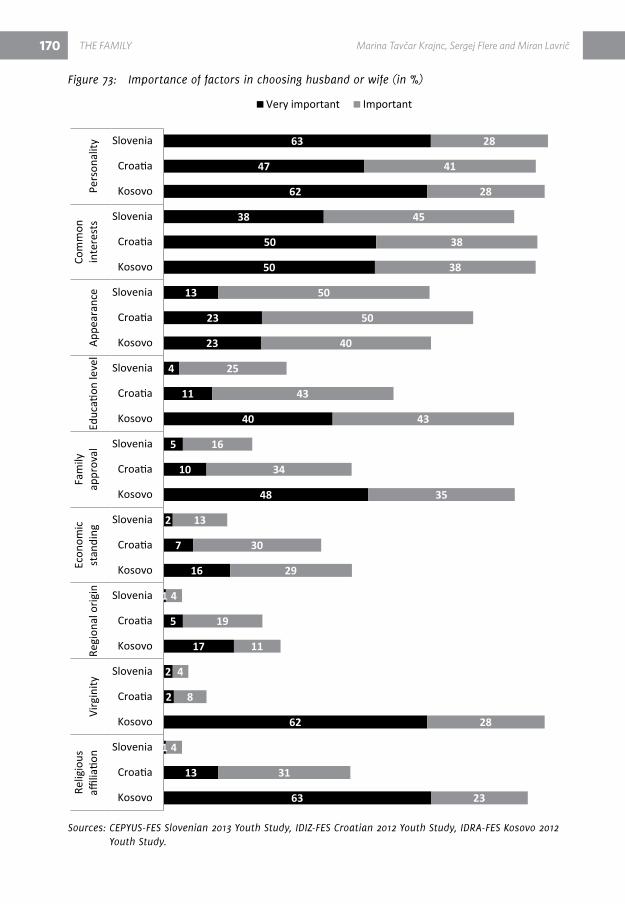
170
Figure 73: Importance of factors in choosing husband or wife (in %)
Sources: CEPYUS-FES Slovenian 2013 Youth Study, IDIZ-FES Croatian 2012 Youth Study, IDRA-FES Kosovo 2012 Youth Study.
ThE faMiLy Marina Tavčar Krajnc, Sergej flere and Miran Lavrič
63
13
1
62
2
2
17
5
1
16
7
2
48
10
5
40
11
4
23
23
13
50
50
38
62
47
63
23
31
4
28
8
4
11
19
4
29
30
13
35
34
16
43
43
25
40
50
50
38
38
45
28
41
28
Kosovo
Croatia
Slovenia
Kosovo
Croatia
Slovenia
Kosovo
Croatia
Slovenia
Kosovo
Croatia
Slovenia
Kosovo
Croatia
Slovenia
Kosovo
Croatia
Slovenia
Kosovo
Croatia
Slovenia
Kosovo
Croatia
Slovenia
Kosovo
Croatia
Slovenia
Relig
ious
affiliatio
nVi
rgin
ityRe
gion
al o
rigin
Econ
omic
stan
ding
Fam
ilyap
prov
alEd
ucati
on le
vel
Appe
aran
ceCo
mm
onin
tere
sts
Pers
onal
ityVery important Important
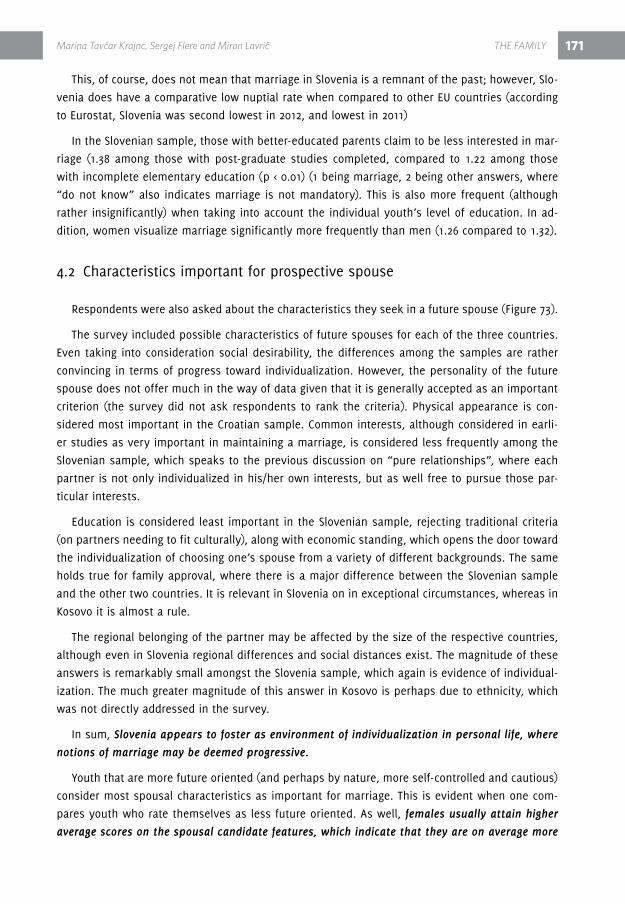
171
This, of course, does not mean that marriage in Slovenia is a remnant of the past; however, Slo-
venia does have a comparative low nuptial rate when compared to other EU countries (according
to Eurostat, Slovenia was second lowest in 2012, and lowest in 2011)
In the Slovenian sample, those with better-educated parents claim to be less interested in mar-
riage (1.38 among those with post-graduate studies completed, compared to 1.22 among those
with incomplete elementary education (p < 0.01) (1 being marriage, 2 being other answers, where
“do not know” also indicates marriage is not mandatory). This is also more frequent (although
rather insignificantly) when taking into account the individual youth’s level of education. In ad-
dition, women visualize marriage significantly more frequently than men (1.26 compared to 1.32).
4.2 Characteristics important for prospective spouse
respondents were also asked about the characteristics they seek in a future spouse (Figure 73).
The survey included possible characteristics of future spouses for each of the three countries.
Even taking into consideration social desirability, the differences among the samples are rather
convincing in terms of progress toward individualization. however, the personality of the future
spouse does not offer much in the way of data given that it is generally accepted as an important
criterion (the survey did not ask respondents to rank the criteria). Physical appearance is con-
sidered most important in the Croatian sample. Common interests, although considered in earli-
er studies as very important in maintaining a marriage, is considered less frequently among the
Slovenian sample, which speaks to the previous discussion on “pure relationships”, where each
partner is not only individualized in his/her own interests, but as well free to pursue those par-
ticular interests.
Education is considered least important in the Slovenian sample, rejecting traditional criteria
(on partners needing to fit culturally), along with economic standing, which opens the door toward
the individualization of choosing one’s spouse from a variety of different backgrounds. The same
holds true for family approval, where there is a major difference between the Slovenian sample
and the other two countries. It is relevant in Slovenia on in exceptional circumstances, whereas in
Kosovo it is almost a rule.
The regional belonging of the partner may be affected by the size of the respective countries,
although even in Slovenia regional differences and social distances exist. The magnitude of these
answers is remarkably small amongst the Slovenia sample, which again is evidence of individual-
ization. The much greater magnitude of this answer in Kosovo is perhaps due to ethnicity, which
was not directly addressed in the survey.
In sum, Slovenia appears to foster as environment of individualization in personal life, where
notions of marriage may be deemed progressive.
Youth that are more future oriented (and perhaps by nature, more self-controlled and cautious)
consider most spousal characteristics as important for marriage. This is evident when one com-
pares youth who rate themselves as less future oriented. As well, females usually attain higher
average scores on the spousal candidate features, which indicate that they are on average more
Marina Tavčar Krajnc, Sergej flere and Miran Lavrič ThE faMiLy
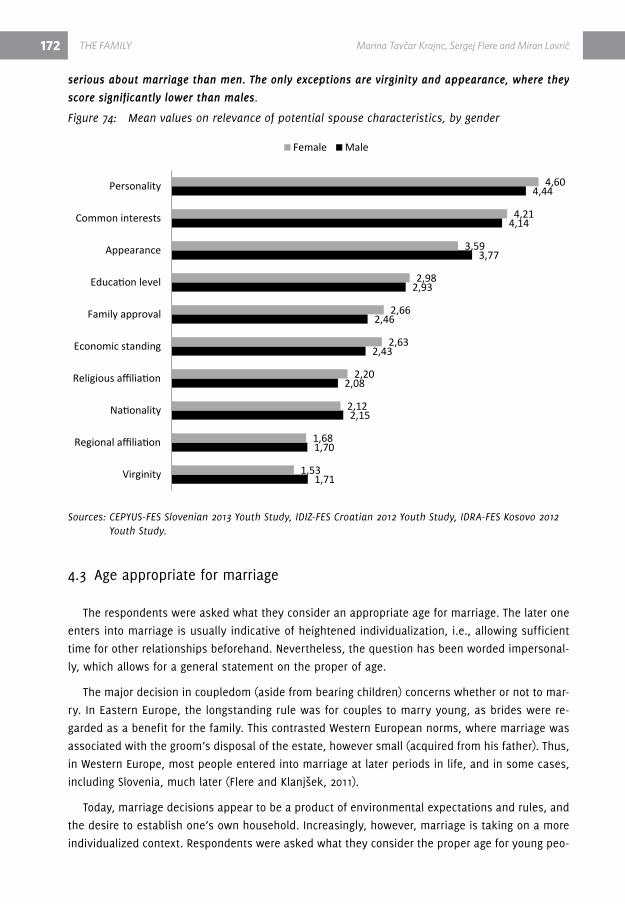
172
serious about marriage than men. The only exceptions are virginity and appearance, where they
score significantly lower than males.
Figure 74: Mean values on relevance of potential spouse characteristics, by gender
Sources: CEPYUS-FES Slovenian 2013 Youth Study, IDIZ-FES Croatian 2012 Youth Study, IDRA-FES Kosovo 2012 Youth Study.
4.3 Age appropriate for marriage
The respondents were asked what they consider an appropriate age for marriage. The later one
enters into marriage is usually indicative of heightened individualization, i.e., allowing sufficient
time for other relationships beforehand. Nevertheless, the question has been worded impersonal-
ly, which allows for a general statement on the proper of age.
The major decision in coupledom (aside from bearing children) concerns whether or not to mar-
ry. In Eastern Europe, the longstanding rule was for couples to marry young, as brides were re-
garded as a benefit for the family. This contrasted Western European norms, where marriage was
associated with the groom’s disposal of the estate, however small (acquired from his father). Thus,
in Western Europe, most people entered into marriage at later periods in life, and in some cases,
including Slovenia, much later (Flere and Klanjšek, 2011).
Today, marriage decisions appear to be a product of environmental expectations and rules, and
the desire to establish one’s own household. Increasingly, however, marriage is taking on a more
individualized context. respondents were asked what they consider the proper age for young peo-
ThE faMiLy Marina Tavčar Krajnc, Sergej flere and Miran Lavrič
1,71
1,70
2,15
2,08
2,43
2,46
2,93
3,77
4,14
4,44
1,53
1,68
2,12
2,20
2,63
2,66
2,98
3,59
4,21
4,60
Virginity
Regional affiliation
Nationality
Religious affiliation
Economic standing
Family approval
Education level
Appearance
Common interests
Personality
Female Male
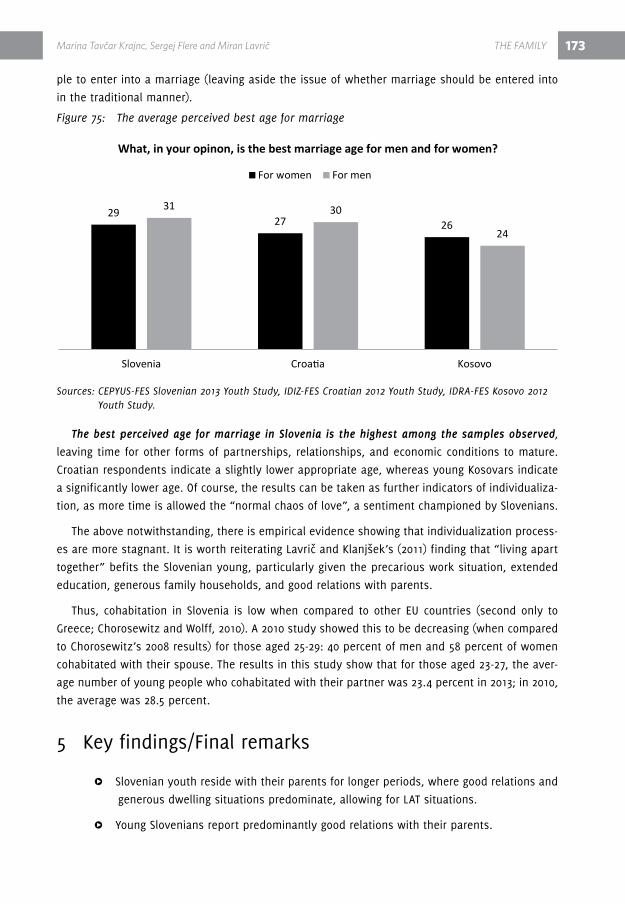
173
ple to enter into a marriage (leaving aside the issue of whether marriage should be entered into
in the traditional manner).
Figure 75: The average perceived best age for marriage
Sources: CEPYUS-FES Slovenian 2013 Youth Study, IDIZ-FES Croatian 2012 Youth Study, IDRA-FES Kosovo 2012 Youth Study.
The best perceived age for marriage in Slovenia is the highest among the samples observed,
leaving time for other forms of partnerships, relationships, and economic conditions to mature.
Croatian respondents indicate a slightly lower appropriate age, whereas young Kosovars indicate
a significantly lower age. Of course, the results can be taken as further indicators of individualiza-
tion, as more time is allowed the “normal chaos of love”, a sentiment championed by Slovenians.
The above notwithstanding, there is empirical evidence showing that individualization process-
es are more stagnant. It is worth reiterating Lavrič and Klanjšek’s (2011) finding that “living apart
together” befits the Slovenian young, particularly given the precarious work situation, extended
education, generous family households, and good relations with parents.
Thus, cohabitation in Slovenia is low when compared to other EU countries (second only to
Greece; Chorosewitz and Wolff, 2010). A 2010 study showed this to be decreasing (when compared
to Chorosewitz’s 2008 results) for those aged 25-29: 40 percent of men and 58 percent of women
cohabitated with their spouse. The results in this study show that for those aged 23-27, the aver-
age number of young people who cohabitated with their partner was 23.4 percent in 2013; in 2010,
the average was 28.5 percent.
5 Key findings/Final remarks
Δ Slovenian youth reside with their parents for longer periods, where good relations and
generous dwelling situations predominate, allowing for LAT situations.
Δ Young Slovenians report predominantly good relations with their parents.
Marina Tavčar Krajnc, Sergej flere and Miran Lavrič ThE faMiLy
2927 26
31 30
24
Slovenia Croatia Kosovo
What, in your opinon, is the best marriage age for men and for women?
For women For men

174
Δ LAT befits Slovenian youth due to the precarious work situation, extended education,
generous family households, and predominantly harmonious relations with parents.
Δ The individualization of personal life has progressed in Slovenia, whereby two-fifths of
respondents either do not wish to marry in the future, or want to wait until they are
much older before getting married. Further, the share of those living with a partner
has been declining at least since 2008.
Δ Slovenian young people tend to rate themselves as independent in their decision-making
(i.e., emancipated from their parents), which is also indicative of individualization
of personal and private life. Upon closer inspection, however, it appears as though
mothers tend to influence decision-making.
Δ however, given conflicting evidence, individualization does not entirely dominate the
private lives of young Slovenians. The majority still envisage marriage in the future. It
can be concluded though that Slovenian young people believe marriage should allow
for individualization in some aspects of life.
6 referencesBauman, Z. (2000). Liquid Modernity, Cambridge: Polity Press.
Beck, U. (2006). Cosmopolitan vision, Cambridge: Polity Beck, U. and Beck-Gernsheim, E. (1995)
The Normal Chaos of Love, Cambridge: Polity.
Beck, U. and Beck-Gernsheim, E. (2002). Individualization, London: Sage.
Brand, A. and Climes dougan, B. (2010). Emotion Socialization in Adolescence: The roles of
Mothers and Fathers. New directions for Child and Adolescent development, 128, 85-100.
Burić, O. (1976). The zadruga and the contemporary family in Yugoslavia. In r. Byrnes (eds.),
Communal Families in the Balkans. Essays by Philip E. Mosely and in his honor (pp. 117–138).
South Bend, IN: University of Notre dame Press.
Choroszewicz, M. and Wolff, P. (2010). 51 million EU adults lived with their parents in 2008. Eu-
rostat Statistics in Focus 50, 2010, 1-12.
daly, M. (2005). Changing family life in Europe: Significance for state and society. European Soci-
eties 7: 379-398.
Flere, S. and Klanjšek, r. (2011). recent changes in the post-Yugoslav family: the disappearance
of the last extended family in Europe. Journal of Comparative Family Studies. 43: 249-264.
Flouri, E. (2004). Subjective wellbeing at midlife: The role of involvement and closeness to par-
ents and children. Journal of happiness Studies, 48, 335-358.
Giddens, A. (1992). The Transformation of Intimacy: Sexuality, Love and Eroticism in Modern Soci-
eties. Cambridge: Polity.
ThE faMiLy Marina Tavčar Krajnc, Sergej flere and Miran Lavrič

175
Gilding, M. (2010). reflexivity over and above convention: The new orthodoxy in the sociology of
personal life, formerly sociology of the family. British Journal of Sociology 61: 757-777.
Godina-vuk, v. (2012). Prijazna vzgoja - resen problem. Available at: http://www.youtube.com/
watch?v=7QyNj3sOtvA (July, 2013).
Johnson, B. M., Shulman, S. and Collins, W. A. (1991). Systemic patterns of parenting as reported
by adolescents: developmental differences and implications for psychosocial outcomes. Journal
of Adolescent research, 6, 235–252.
Lavrič, M. and Klanjšek, r. (2011). residential and housing conditions of young people. Pp. 367-
393 In: Lavrič, M. et al. 2011. Youth 2010. Social Profile of Young People in Slovenia. Ljubljana:
Ministry of Education, Science and Sports.
Popenoe, d. (2009). Cohabitation, marriage and child well-being: A cross-national perspective.
Society, 46: 429-436.
van der heijden v. the Netherlands (42857/05, delivered in 2012). Available at: http://hudoc.echr.
coe.int/sites/eng/Pages/search.aspx#{“documentcollectionid2”:[“GrANdChAMBEr”,”ChAMBEr”]}
(Aug., 2013).
Marina Tavčar Krajnc, Sergej flere and Miran Lavrič ThE faMiLy

Sergej flere aNXiETiES aND aSpiRaTiONS 177
PArT vIII ANxIETIES ANd ASPIrATIONS
1 Introduction
Youth is widely considered a time of development toward future life plans, and the commence-
ment of “navigation”, which is to bring young people into a “port”, or instead temporary situations
of work, settlement, and intimacy. In the contemporary situation, the trend favors the latter, which
subsequently becomes the basis of both anxieties and aspirations.
2 Psychological foundations: narcissism and time orientation
Many psychological constructs and traits are known to be strong predictors of behavior and
attitudes. This study, however, ignores authoritarianism, a trait which has been examined in pre-
vious studies (Flere and Musil, 2011), and which is known to produce socially undesirable behavior,
like dogmatism. Instead, this study focuses on other significant psychological traits as possible
predictors of anxieties, aspirations, and behavior.
2.1 Narcissism
Narcissism is a widely used term, originally introduced by Freud to indicate the feeling of gran-
diosity, and inflated self-esteem, among others, and is presumably the product of internal conflict
within the personality. In contemporary personality studies, narcissism has been widely expanded
into a multidimensional construct. Lasch (1991) asserts that narcissistic grandiosity is typical of
contemporary times, related to mass consumption, and the attention paid to “beautification”, and
“remaining young”. Other maladaptive traits and attitudes have also been mentioned, e.g., being
manipulative and callous; having disregard for others; lacking empathy, etc. On the other hand,
some types and degrees of narcissism are necessary and positive in the era of individualism and
individualization. Within Slovenian public discourse, it has been widely noted that Slovenian young
people are narcissistic and that this phenomenon is related to negative features in their behavior
and attitudes (Godina vuk, 2011). It should be noted that these sentiments lack empirical proof.
This study (Flere and Musil, 2011, 427-9) intends to shed light on this phenomenon. Using Mar-
golis and Thomas’ (1980) conceptualization, two dimensions of grandiose narcissism were exam-
ined: exploitative and non-exploitative. Non-exploitative, i.e., (pure) grandiose narcissism, was
found to be a common trait among a slight majority of respondents. It was often associated with
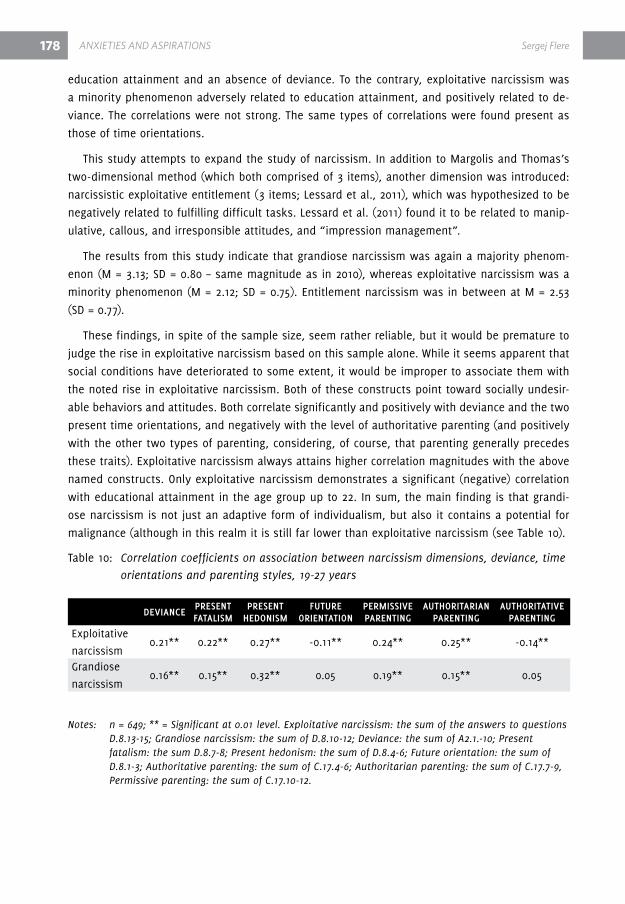
178 aNXiETiES aND aSpiRaTiONS Sergej flere
education attainment and an absence of deviance. To the contrary, exploitative narcissism was
a minority phenomenon adversely related to education attainment, and positively related to de-
viance. The correlations were not strong. The same types of correlations were found present as
those of time orientations.
This study attempts to expand the study of narcissism. In addition to Margolis and Thomas’s
two-dimensional method (which both comprised of 3 items), another dimension was introduced:
narcissistic exploitative entitlement (3 items; Lessard et al., 2011), which was hypothesized to be
negatively related to fulfilling difficult tasks. Lessard et al. (2011) found it to be related to manip-
ulative, callous, and irresponsible attitudes, and “impression management”.
The results from this study indicate that grandiose narcissism was again a majority phenom-
enon (M = 3.13; Sd = 0.80 – same magnitude as in 2010), whereas exploitative narcissism was a
minority phenomenon (M = 2.12; Sd = 0.75). Entitlement narcissism was in between at M = 2.53
(Sd = 0.77).
These findings, in spite of the sample size, seem rather reliable, but it would be premature to
judge the rise in exploitative narcissism based on this sample alone. While it seems apparent that
social conditions have deteriorated to some extent, it would be improper to associate them with
the noted rise in exploitative narcissism. Both of these constructs point toward socially undesir-
able behaviors and attitudes. Both correlate significantly and positively with deviance and the two
present time orientations, and negatively with the level of authoritative parenting (and positively
with the other two types of parenting, considering, of course, that parenting generally precedes
these traits). Exploitative narcissism always attains higher correlation magnitudes with the above
named constructs. Only exploitative narcissism demonstrates a significant (negative) correlation
with educational attainment in the age group up to 22. In sum, the main finding is that grandi-
ose narcissism is not just an adaptive form of individualism, but also it contains a potential for
malignance (although in this realm it is still far lower than exploitative narcissism (see Table 10).
Table 10: Correlation coefficients on association between narcissism dimensions, deviance, time orientations and parenting styles, 19-27 years
deViance preSentFataliSm
preSenthedoniSm
Futureorientation
permiSSiVeparenting
authoritarianparenting
authoritatiVeparenting
Exploitative
narcissism0.21** 0.22** 0.27** -0.11** 0.24** 0.25** -0.14**
Grandiose
narcissism0.16** 0.15** 0.32** 0.05 0.19** 0.15** 0.05
Notes: n = 649; ** = Significant at 0.01 level. Exploitative narcissism: the sum of the answers to questions D.8.13-15; Grandiose narcissism: the sum of D.8.10-12; Deviance: the sum of A2.1.-10; Present fatalism: the sum D.8.7-8; Present hedonism: the sum of D.8.4-6; Future orientation: the sum of D.8.1-3; Authoritative parenting: the sum of C.17.4-6; Authoritarian parenting: the sum of C.17.7-9, Permissive parenting: the sum of C.17.10-12.

Sergej flere aNXiETiES aND aSpiRaTiONS 179
2.2 Time orientation
Time orientation, originally conceived by Zimbardo and Boyd (1999; 2009), is one of the major
innovations in socio-psychological studies of personality, behavior, and attitudes. It builds on pre-
viously reliable constructs such as self-control. It has proven very predictive in studies of behavior.
The study does not apply all of the dimensions of time orientation, only the present hedonistic,
present fatalistic, and future oriented. A mean analysis of the data indicate that future orientation
prevailed (M=3.67 on a 1-5 scale, followed by the hedonistic present orientation of M=3.13, and
fatalistic present orientation M=3.12; see Figure 76).
Figure 76: Mean presence of three time orientations, Slovenian youth, 16-27 years, 2010 and 2013
Sources: Youth 2010 and CEPYUS-FES Slovenian 2013 Youth Study.
results from the mean analysis show that the picture remained relatively stable across the last
few years; no statistically significant change has occurred in any dimension during this period. Fu-
ture time orientation still prevails over the other two dimensions, although all are above the nor-
mal mean level. The results also indicate that constructs confirmed their predictive validity, which
corroborates findings from other studies. Future orientation correlated positively with scholastic
attainment (r = 0.14; p < 0.001) in the group aged up to 22 (the other two orientations did not pro-
vide results at the level of significance). In general, the more future orientated a respondent, the
less inclined he/she is toward problem behavior (r = -0.13; p < 0.001), while just the opposite held
true for the other two time dimensions (r = 0.27; p < 0.001 for present-fatalistic; r = 0.15; p < 0.001
for present-hedonistic). More in depth analysis indicated that time orientations were significantly
associated with the three types of parenting styles (robinson and Mandleco, 1995). Specifically,
while future orientation was associated positively with authoritative parenting styles (rho = 0.26;
p < 0.001), both present hedonistic and present fatalistic were positively associated with authori-
tarian (rho = 0.12; p < 0.001; rho = 0.17; p < 0.001) and permissive parenting styles (rho = 0.15; p <
0.001; rho = 0.22; p < 0.001). however, it is important to note that within the 23 and over age group,
3,72
3,08 3,13
3,67
3,13 3,12
0,00
0,50
1,00
1,50
2,00
2,50
3,00
3,50
4,00
4,50
5,00
Future orient. Hedonistic-present orient. Fatalistic-present orient.
Youth 2010
Youth 2013

180 aNXiETiES aND aSpiRaTiONS Sergej flere
there were no findings that provided support for time orientation being a predictor of income,
which indicate that societal factors were more prominent.
2.3 xenophobia and social distance
Social distance and xenophobia are nearly universal traits that enable the disambiguation of
group identity, as well as life inside structured societies. however, a darker side prevails. In gen-
eral, there is a significant association between these two phenomena and prejudice and perse-
cution. In contemporary Europe, combating and suppressing prejudice and persecution (primarily
directed against minorities, weak and marginal groups) is highly relevant. here it bears noting
that the social status and protection of roma people, an ethnic group present throughout Europe
(ethnicity is a prime target of prejudice and persecution in general) have received major attention
from the Council of Europe and the European Union (see for e.g., EC, 2011). Even the roman Cath-
olic Church has recently changed its position on homosexuality, opting for “integration”, although
this came long after the European Court of human rights recognized homosexuality as a form of
legitimate “private” life (hodson, 2012).
In this study, respondents were asked to express their opinions about situations where families
belonging to a certain minority or foreign group would move into their neighborhood.
Table 11: Feelings about hypothetical situation where families belonging to a certain minority or foreign group would move in youth’s neighborhood
mean Sd
roma family 2.38 0.9
homosexual/lesbian family 3.00 1.1
Group of students 3.66 0.9
retired couple 3.54 0.9
Family from other part of Slovenia 3.72 0.8
Family from Western Europe (France, etc.) 3.73 0.8
Family from the USA 3.68 0.9
Family from some Balkan country (Albania, Bosnia, etc.) 3.19 1.0
Note: 1=it would be very bad, 5=it would be very good.
Sources: CEPYUS-FES Slovenian 2013 Youth Study.
The following results were found:
Δ Although overall, positive feelings prevail, there is a relative lack of acceptance of
“aliens” and those considered “different”. In some cases, not even those from other
parts of Slovenia would be welcomed at a level of average “good feelings” (4; no
group attains such a welcome). Although one may interpret these findings within an
environmental perspective (i.e., a form of protection for one’s own neighborhood), the
respondents also indicated that there is a level of social distance. Namely, the method
Sergej flere aNXiETiES aND aSpiRaTiONS 181
of measuring social distance by this item is established by the very construction of this
notion (Bogardus, 1926).
Δ The results show that roma families would be the least welcome. roma problems in
Slovenia are widespread. Physical conflicts have been reported and the roma are only
beginning to be integrated into Slovenian society, although active policies are under
way. This finding corresponds to the actual problematic nature of the roma population
in Slovenia, namely their stigmatization and failure to integrate (MZŠŠ, 2011).
Δ A homosexual-lesbian family would be accepted at the normative mean level, which
suggests that youth are inclined toward recognizing this group as a form of “family
life”, as expressed by the European Court of human rights (Schalk and Falke v. Austria,
30141/04, pronounced in 2010). This falls in contrast to the results of a 2012 referendum
that would have allowed gay couples to adopt children in Slovenia. 55 percent of
those taking part in the referendum voted against it. In this context, it seems that the
youth are slightly more inclined toward accepting same sex families than are older
generations.
Δ Families from other parts of Slovenia would receive wide acceptance; however, this
indicates an articulate social distance. In fact, this parallels the data from other Western
European countries (though it should be noted that many of these are much larger and
more varied).
Δ While a group of students hardly meets the criteria of family (even if defined by “liking
each other”), but for the purposes of this study, it does constitute a household. The
introduction of a student household would be most welcomed by those aged 19-21
(although never reaching an average of 4); the relative number sharply drops with the
age of respondents.
In general, the respondents noted a favorable reaction to families from other Balkan countries,
which could indicate that the wars in the 1990s have less relevance among Slovenian youth, par-
ticularly where it concerns social distance.
It is well documented that this type of social distance can be explained by authoritarian per-
sonalities (Adorno et al., 1950; Flere and Molnar, 1992). In this sample, distance (the two major
forms observed jointly) is largely demonstrated by those with lower educational levels (rho = 0.11;
p < 0.05, among those aged 19 and over) and by male respondents (rho = 0.26; p < 0.001). As could
be expected, total social distance is significantly predicted by grandiose narcissism and by future
orientation: distances rise alongside exploitative narcissism (rho = 0.9; p < 0.01).
By comparison, distance towards roma is smaller in Croatia (M=2.66, Sd = 1.10), whereas dis-
tance towards homosexuals is higher (M=2.87, Sd = 1.00), which may be attributed to the specific
problems of roma in Slovenia, and to the general tolerance (among all populations) towards ho-
mosexuals in Slovenia. Moreover, Slovenians on average have little regard for traditional Catholic
prescripts. The differences found in this study replicate the data in the European values Survey
2008-10, where Slovenians (general population sample) expressed a dislike of roma (as neighbors)

182 aNXiETiES aND aSpiRaTiONS Sergej flere
at a frequency mean level of 0.39, whereas Croatians were at a level of 0.25 (0-1 scale); the corre-
sponding figures for homosexuals are 0.34 and 0.51, respectively (EvS, 2011).
3 Experience of discrimination
The experience of discrimination contributes to the problems referred to in the previous ques-
tion. Thus, respondents were asked whether they themselves experienced any form of discrimi-
nation. The question was worded: “have you ever experienced being discriminated against?” The
factors are enumerated in Table 12.
Table 12: Means of experiencing discrimination, by category
mean
(Sd)
Your gender (male/female) 1.28 (0.92)
Your economic background (poor/wealthy) 1.65 (1.01)
Your religion (Catholic, Orthodox, Muslim, etc.) 1.39 (1.00)
Your ethnic origin 1.43 (1.07)
Your education level (eight-year primary school, secondary school etc.) 1.51 (0.99)
Your political party affiliation 1.41 (1.28)
Your regional origin 1.48 (0.99)
Your country/city origin (settlement type) 1.50 (0.99)
Note: 1 = never, 5 = very frequently.
Source: FES CEPYUS Slovenian 2013 Youth Study.
The results indicate that the perception of discrimination is always a minority phenomenon.
however, discrimination is still apparent. The highest level of discrimination was found in two
stratification dimensions: economic background, which may be expected to be ascriptive, and ed-
ucational level attained, which is an achieved trait (although it is often determined by parental
status and activity). The results also indicate that female respondents perceived higher levels of
discrimination than males, which may be due to the general lower social status of females as well
to greater sensitivity.
higher levels of perceived discrimination were also found among respondents coming from
what may be called the lower-middle class, which possibly suggests that the lowest and higher
classes are socially separate as cultural and network environments, or it may well be that political
correctness does not allow those segments to be targeted.
On the issue of religion, with denomination being the subject of discrimination, it is discernible
that a cultural conflict exists between the religious and non-religious: those declared Catholics
also declared the largest number of instances of being discriminated against. Approximately one-
fourth of Catholics and those declaring having no confession declared being discriminated against
on religious grounds with a frequency of “periodically” or “rarely”. These differences could depict
a certain “cultural battle” between pro-Church and “anti-clericalist”, which is a relatively well
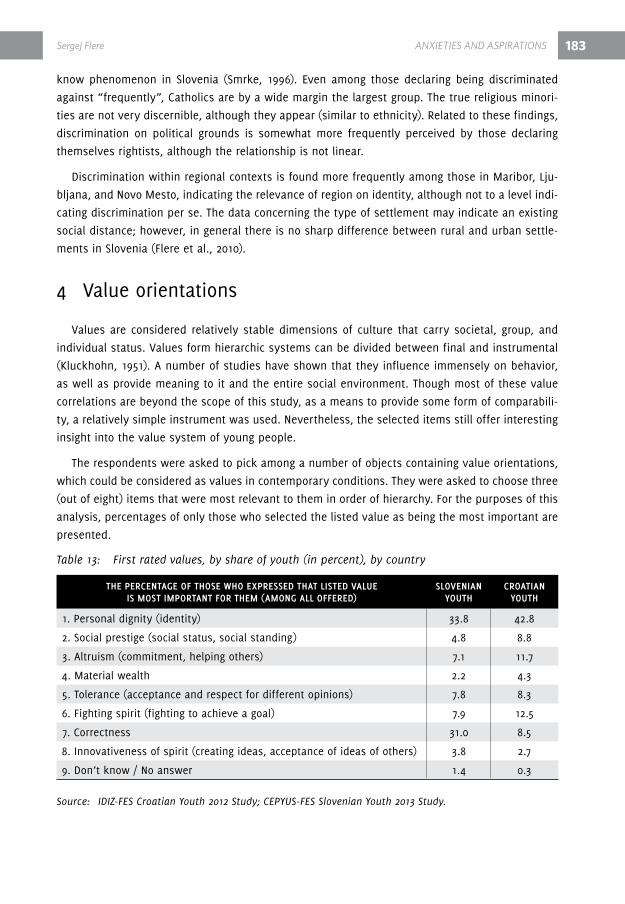
Sergej flere aNXiETiES aND aSpiRaTiONS 183
know phenomenon in Slovenia (Smrke, 1996). Even among those declaring being discriminated
against “frequently”, Catholics are by a wide margin the largest group. The true religious minori-
ties are not very discernible, although they appear (similar to ethnicity). related to these findings,
discrimination on political grounds is somewhat more frequently perceived by those declaring
themselves rightists, although the relationship is not linear.
discrimination within regional contexts is found more frequently among those in Maribor, Lju-
bljana, and Novo Mesto, indicating the relevance of region on identity, although not to a level indi-
cating discrimination per se. The data concerning the type of settlement may indicate an existing
social distance; however, in general there is no sharp difference between rural and urban settle-
ments in Slovenia (Flere et al., 2010).
4 value orientations
values are considered relatively stable dimensions of culture that carry societal, group, and
individual status. values form hierarchic systems can be divided between final and instrumental
(Kluckhohn, 1951). A number of studies have shown that they influence immensely on behavior,
as well as provide meaning to it and the entire social environment. Though most of these value
correlations are beyond the scope of this study, as a means to provide some form of comparabili-
ty, a relatively simple instrument was used. Nevertheless, the selected items still offer interesting
insight into the value system of young people.
The respondents were asked to pick among a number of objects containing value orientations,
which could be considered as values in contemporary conditions. They were asked to choose three
(out of eight) items that were most relevant to them in order of hierarchy. For the purposes of this
analysis, percentages of only those who selected the listed value as being the most important are
presented.
Table 13: First rated values, by share of youth (in percent), by country
the percentage oF thoSe who expreSSed that liSted Value iS moSt important For them (among all oFFered)
SloVenianyouth
croatian youth
1. Personal dignity (identity) 33.8 42.8
2. Social prestige (social status, social standing) 4.8 8.8
3. Altruism (commitment, helping others) 7.1 11.7
4. Material wealth 2.2 4.3
5. Tolerance (acceptance and respect for different opinions) 7.8 8.3
6. Fighting spirit (fighting to achieve a goal) 7.9 12.5
7. Correctness 31.0 8.5
8. Innovativeness of spirit (creating ideas, acceptance of ideas of others) 3.8 2.7
9. don’t know / No answer 1.4 0.3
Source: IDIZ-FES Croatian Youth 2012 Study; CEPYUS-FES Slovenian Youth 2013 Study.
184 aNXiETiES aND aSpiRaTiONS Sergej flere
In both samples, personal dignity was chosen as being the most important, although the per-
centage is lower among Slovenian youth. This value corresponds to the individualization of society,
i.e., the emancipation of the individual from traditional groups (Beck and Beck Gernsheim, 2002).
Opting for this as the first value in the Slovenian sample, personal dignity was marginally related
to grandiose and exploitative narcissism, which is not coincidental. The biggest difference among
the samples could be observed in relation to the status of “correctness”, which “attracted” a sig-
nificantly higher share of youth in Slovenia than in Croatia. Allowing for somewhat different un-
derstandings of “correctness”, one can hypothesize that Slovenians are more accepting of current,
i.e., post-modern, understandings of values. This may also confirm a more limited understanding
of values as setting limits on behavior without expressly searching for what is good, beautiful, and
true. It is also possible that Slovenians are more acquainted with the prohibitions contained within
“political correctness”, i.e., to not express bigotry and prejudice towards minorities of race, class,
sex, religion, orientation, and other contemporary faux pas (Perry, 1992). however, this value does
not correlate significantly with the other psychological predictors used in this study.
Slovenians rank correspondingly lower on all other indicators. A relative exception is “toler-
ance”, which is supported at roughly the same rate between young Slovenians and Croatians. This
contrasts with “material wealth” and “social prestige”, which add up to approximately one-half of
what is found among Croatians. These two values are also positively (and significantly) related to
narcissistic variables, in contrast to altruism tolerance, which are negatively related. At this stage
of study, this study can corroborate Ilišin’s findings, which indicate that the distribution show “a
combination of (values) in relation of others towards oneself and of oneself towards others” (Ilišin
et al., 2013, 97).
5 Life satisfaction, wellbeing, and happiness
Issues related to the questions above are important given that they summarize much of the
anxieties and aspirations among Slovenian youth. An empirical study of well-being may provide
further insight on the major social issues raised by Marx (alienation at work) and durkheim (sat-
isfaction from work proceeding from “social attachments formed in the occupational sphere”)
(Khattab and Fenton, 2009, 12). On the other hand, happiness also “becomes a major policy goal in
nations ranging from the United Kingdom and France to Japan and China” (Oishi et al., 2013, 574).
Thus, this raises a major theoretical, practical (policy), and research issue. here, several points
must be kept in mind. First, happiness is a multifaceted concept that attaches different meanings
at different times and among cultures and even nations. Thus, in previous historical periods, hap-
piness was associated more with external forces of luck, chance, fortune, even the action of ex-
ternal forces as deities and fate. The modern understanding is more “agential”; happiness has to
do with activities of the subject. Certainly, St. Augustine’s understanding of the “earthly quest of
happiness being doomed” and “unattainable in present life” (Oishi et al., 2013, 560) have become
irrelevant. Yet even in present times, there are differences in how people comprehend happiness.
For example, where happiness is understood as luck and fortune, it tends to be perceived rarer
than in environments where it is comprehended agentially (or rather, attainable) (Oishi et al. 2013,
563). Attainable happiness is commonly understood to be associated with economic wealth, which

Sergej flere aNXiETiES aND aSpiRaTiONS 185
scholars note is an American cultural contribution (Oishi et al., 2013, 561). Thus, per capita GdP is
associated positively with perceptions of happiness at the level of inter-state analysis (Oishi et al.,
2013, 573). Oishi et al. contend that even within Europe there are basic differences in understand-
ing happiness, where the Germans and Norwegians tend to understand luck as bringing about
happiness, while the Spanish do not (2013, 573), which leads to the second point.
Not only is happiness usually perceived as something within reach, it can also be operational
zed. differences in the understanding of happiness abound. Some question whether it is individ-
ual or collective in nature (Triandis, 1995); the importance of certain referents (i.e., the welfare
system of a country, at the individual level of analysis, work) (and what is the direction of work’s
impact); the relevance of health, types of dwellings, social embeddedness (political participation,
voluntary activities, trust, income) (Pichler, 2006; Khattab and Fenton, 2009).
Third, the use of the term “happiness” has been under criticism for denoting only the emotional
component in reaction to one’s objective position in society and “life”, whereas “life satisfaction”
is more objective in denoting the “cognitive aspect” of satisfaction with life (Pichler, 2006, 425).
however, the terms are close, and scholars often use them interchangeably.
Fourth, as this study is primarily concerned with youth, these issues are pronounced and artic-
ulated differently, as subjective well-being generally decreases with age. however, in the particu-
lar here and now of this study, this question is relevant given that many social statuses of youth
have been deteriorating at least since the beginning of the 1990s, with the global economic crisis
adding an even harsher dimension (Pichler, 2006). Pichler even questions how youth can possi-
bly be satisfied with their lives when so many socially adverse factors are working against them.
5.1 The presence and correlates of life satisfaction
The respondents in this study were asked to express themselves on the basis of “life satisfac-
tion” given the uncertain current perspective (“these days”). They were asked to express them-
selves on a 10-point scale from “completely dissatisfied” to “completely satisfied”. The prelimi-
nary findings indicated that only 0.6 percent of respondents fell in the first two grades, while the
entire distribution tilted toward favorable evaluations (M=7.33, Sd = 1.58), which mirrors the find-
ings from 2010 (Kirbiš, 2011, 316). It is interesting that in view of the detrimental societal chang-
es, life satisfaction did not fall. This is in keeping with Pichler’s findings (2006) that employment
among youth does not have a substantial detrimental effect, as long as (young) individuals remain
socially embedded, i.e., neither isolated nor lonely.
5.1.1 Welfare system
Slovenia had an elaborate welfare system prior to the imposed austerity measures of 2012.
however, many protective measures, particularly with respect to tertiary level students, including
dwellings, catering, scholarships, and transportation are still in effect and even opulent, e.g., stu-
dents may eat meals in regular restaurants, paying with subsidized coupons (ŠOS, 2012). This most
likely does not influence the general situation at the point of evaluation, bearing in mind that this

186 aNXiETiES aND aSpiRaTiONS Sergej flere
study was conducted after the enforcement of the austerity measures. Particular forms of social
benefits were not observed, as stipends are generally made available to (and taken by) Slovenian
youth in tertiary education, where the majority find themselves (Flere and Lavrič, 2011).
5.1.2 Age
It is well documented that life satisfaction drops significantly with age. The study observed
similar results when observing the means by age groups; however, a noticeable decline was only
observed among the oldest group, which could be termed “emerging adult”.
5.1.3 Gender
Males, as confirmed by other such studies (EvS 2008-10, for all countries), are significantly more
likely to state that they are more satisfied with their lives. This is also true for the current study. In
view of these differences being confirmed by larger data sets, they may be considered to parallel
contemporary European circumstances. Furlong extends an array of explanations that require fur-
ther research (2013, 35-37), which unfortunately are beyond the scope of this study (see Figure 77).
Figure 77: Subjective well-being, by age group and gender
Note: 1=very dissatisfied, 10=very satisfied.
Sources: CEPYUS-FES Slovenian 2013 Youth Study.
6,90
7,00
7,10
7,20
7,30
7,40
7,50
7,60
SWB Total SWB Males SWB Females
16-19
20-23
24-27

Sergej flere aNXiETiES aND aSpiRaTiONS 187
5.1.4 Psychological correlates
respondents were divided into three groups regarding attitude distances (low, medium, and
high presence of respective attitude/trait/orientation), with respect to the distributions among the
three dimensions of narcissism and time orientation. Within these dimensions, significant linear
differences appeared for overall life satisfaction:
Δ Life satisfaction rises along with narcissistic grandiosity: inflated images of one’s ego
also indicate greater satisfaction, which is understandable (the rise is from 7.11 to 7.50)
(r = 0.08; p < 0.05).
Δ Life satisfaction minutely, but with regularity, decreases with a rise in narcissistic
entitlement: those feeling entitled will tend to be dissatisfied with what life presents
them (continuous decrease from 7.39 to 7.21) (r = -0.03).
Δ The predictive dimension of future time orientation shows a rise in life satisfaction:
those who work on controlling themselves, planning (and implementing) their activities
over the long-term, are also more satisfied with their life. The rise is from 6,01 among
low future-oriented to 7.55 among highly future-oriented (r = 0.22; p < 0.001). The other
two time orientation dimensions were not associated with subjective well-being.
Overall, no other trends were observable, but these findings are relevant, particularly as they
confirm the validity of future orientation constructs, and their operation in contemporary sur-
roundings, where much depends on one’s own initiative and psychological make-up.
5.1.5 Schooling
It is likely that the level of educational attainment brings about a certain general life satisfac-
tion. viewing only those respondents aged up to 23 (i.e., the age when most students complete
a bachelor-level education), and omitting those not enrolled in any kind of schooling, the mean
subjective well-being score for those failing or barely passing was 6.39. This rose to 7.40 for those
who passed with the highest grades (this was true regardless of the type of studies undertaken;
r = 0.10; p < 0.05).
5.1.6 Work and unemployment
As is well documented, unemployment is a major problem for today’s youth and even the focus
of an EU-wide policy (the European Commission in 2012 and 2013 adopted a series of measures;
EC, 2013) to remedy the problem. Observing only the group aged 23 and over, i.e., those likely to
be seeking employment, those considering themselves unemployed rank their life satisfaction at
the mean level of 6.93. For those employed part time, the mean level was 7.28, whereas those
employed regularly were at the level 7.39. Whether it is employment that brings about greater sat-
isfaction (or factors bringing about employment) has yet to be answered empirically. Although it is
worth noting that the future oriented tend to be more satisfied. The test of reliability of correlation
188 aNXiETiES aND aSpiRaTiONS Sergej flere
by regression analysis indicated that future orientation and proper (authoritative) parenting are
the only factors more relevant and significant (employment loses significance). This indicates a
relatively low relevance of employment as a direct source of happiness; however, the issue needs
to be considered in a wider psychological and social context. Nevertheless, when controlled for
occupational status, income was significantly associated with well-being, although the association
was surprisingly low (r = 0.07; p < 0.05).
These differences accrue primarily from male responses, extending some support for the thesis
that males are more career-oriented. For females, whether they are employed or not, this produces
no difference in life satisfaction (Khattab and Fenton, 2009).
however, the absence of significant differences and correlations between employment and sat-
isfaction indirectly supports the thesis that emerging adults (24-27) in Slovenia have “internalized
some uncertainties of the labor market” (Khattab and Fenton, 2009, 14). Further, this has little
“bearing on life satisfaction”, which is exactly the question raised by the authors (with respect to
England in 2008).
5.1.7 Family and friends
As Pichler argues, social setting and the absence of loneliness are decisive for youth happiness,
even in the presence of other adverse circumstances (2006). Since family and friends/peers play an
important role in the lives of every (young) individual, it is reasonable to expect that the nature of
relations with (in) these primary social groups is closely associated with well-being. For example,
many studies suggest that attachments to parents and peers can predict life satisfaction (see for
e.g., Nickerson and Nagle, 2004; raja, McGee and Stanton, 1992).
Previous studies indicate that youth in Slovenia maintain strong connections with their fam-
ily of origin. Although these connections could be of an imposed nature, (i.e., related to scarce
employment opportunities, and the difficulty in attaining one’s own dwelling), previous research
has indicated that Slovenian youth, woven into the life of family of origin, are satisfied with this
arrangement (Klanjšek, 2011, 356). Building on these findings, the results from the current study
indicate that subjective well-being positively correlates with the following:
Δ having good relations with parents (r = 0.17; p < 0.001);
Δ being a part of a larger group of friends (i.e., having friends: r = 0.10; p < 0.05); and
Δ satisfaction with friends (r = 0.25; p < 0.001).
Further, the results also indicate that subjective well-being is significantly and positively asso-
ciated with the following:
Δ authoritative parenting (r = 0.31; p < 0.01), and permissive parenting (only minimally:
r = -0.09; r < 0.05); the relationships between subjective well-being and authoritarian
parenting style also proved to be significant, but negative (r = -0.14; p < 0.01); and
Δ measures of paternal closeness (r = 0.15; p < 0.01), support (r = 0.25; p < 0.01), and
control (r = 0.18; p < 0.01).
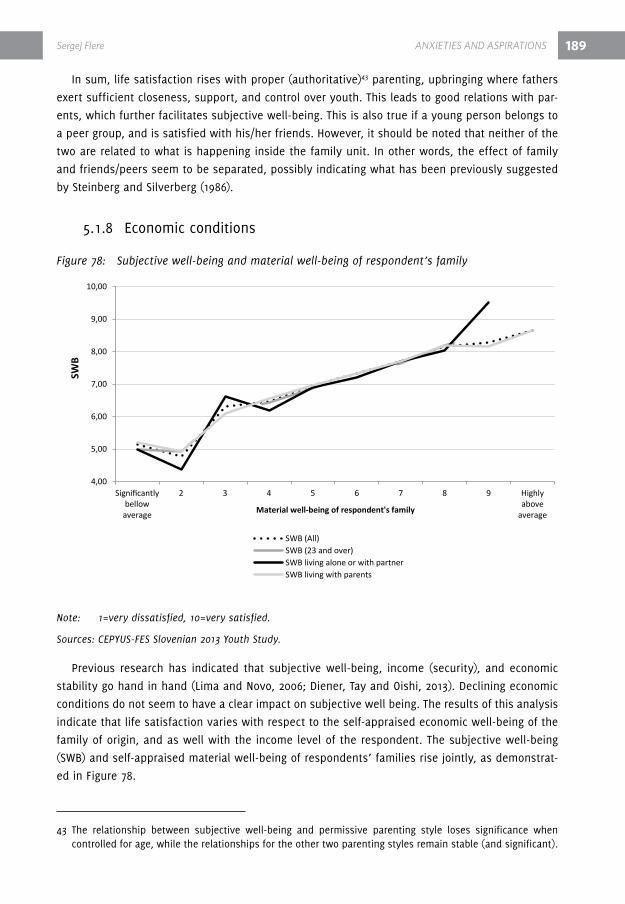
Sergej flere aNXiETiES aND aSpiRaTiONS 189
In sum, life satisfaction rises with proper (authoritative)43 parenting, upbringing where fathers
exert sufficient closeness, support, and control over youth. This leads to good relations with par-
ents, which further facilitates subjective well-being. This is also true if a young person belongs to
a peer group, and is satisfied with his/her friends. however, it should be noted that neither of the
two are related to what is happening inside the family unit. In other words, the effect of family
and friends/peers seem to be separated, possibly indicating what has been previously suggested
by Steinberg and Silverberg (1986).
5.1.8 Economic conditions
Figure 78: Subjective well-being and material well-being of respondent’s family
Note: 1=very dissatisfied, 10=very satisfied.
Sources: CEPYUS-FES Slovenian 2013 Youth Study.
Previous research has indicated that subjective well-being, income (security), and economic
stability go hand in hand (Lima and Novo, 2006; diener, Tay and Oishi, 2013). declining economic
conditions do not seem to have a clear impact on subjective well being. The results of this analysis
indicate that life satisfaction varies with respect to the self-appraised economic well-being of the
family of origin, and as well with the income level of the respondent. The subjective well-being
(SWB) and self-appraised material well-being of respondents’ families rise jointly, as demonstrat-
ed in Figure 78.
43 The relationship between subjective well-being and permissive parenting style loses significance when controlled for age, while the relationships for the other two parenting styles remain stable (and significant).
material well-being of respondent’s family
4,00
5,00
6,00
7,00
8,00
9,00
10,00
Significantlybellow
average
2 3 4 5 6 7 8 9 Highlyabove
average
SWB (All)SWB (23 and over)SWB living alone or with partnerSWB living with parents
SWB
Material well-being of respondent's family
190
5.1.9 Political influence
Studies show that youth are generally privatized in their interests, and their thoughts are rarely
directed to the societal level (particularly where it concerns political articulation). Miheljak was
among the first to note this within the Slovenian context (2001, 129-130). Thus, this study analyzed
only one political issue in this context: whether respondents of legal age perceive themselves able
to exert electoral influence at the national and local levels. here, one could see a difference in the
level of life satisfaction: those who perceived having an impact, also experience greater life satis-
faction. The difference is greater among males, rising from 7.09 to 7.86 (among those perceiving to
have a strong level of influence).
5.1.10 Institutional trust
The survey’s list of institutions (both state and non-governmental) proved to be one-dimen-
sional where it regards levels of trust; however, no significant relationship with life satisfaction
was found.
5.1.11 discrimination
A summation of the discrimination experience items reveals no relationship with life satisfac-
tion. Although this may be attributed to the small amount of respondents who reported being dis-
criminated against, it runs similar to Pichler’s findings, i.e., that young people are not particularly
sensitive to discrimination (Pichler, 2006, 440).
5.1.12 voluntary activities
Many young people take part in voluntary activities. Such activities, in keeping with other
findings (Pichler, 2006), raise general life satisfaction (7.22 among those who have not taken part
during the last year, compared to 7.51 for those who have).
5.2.13 Partnership
Bearing in mind the changing nature of intimacy (Beck and Beck Gernsheim, 2002), this study
considered that those in the oldest group (aged 24 years and above), living in a joint household
with their partner, might raise total life satisfaction. The mean was 7.15 among those living in oth-
er arrangements and 7.51 among those living with their partner; however, an association analysis
did not produce any real significance.
aNXiETiES aND aSpiRaTiONS Sergej flere
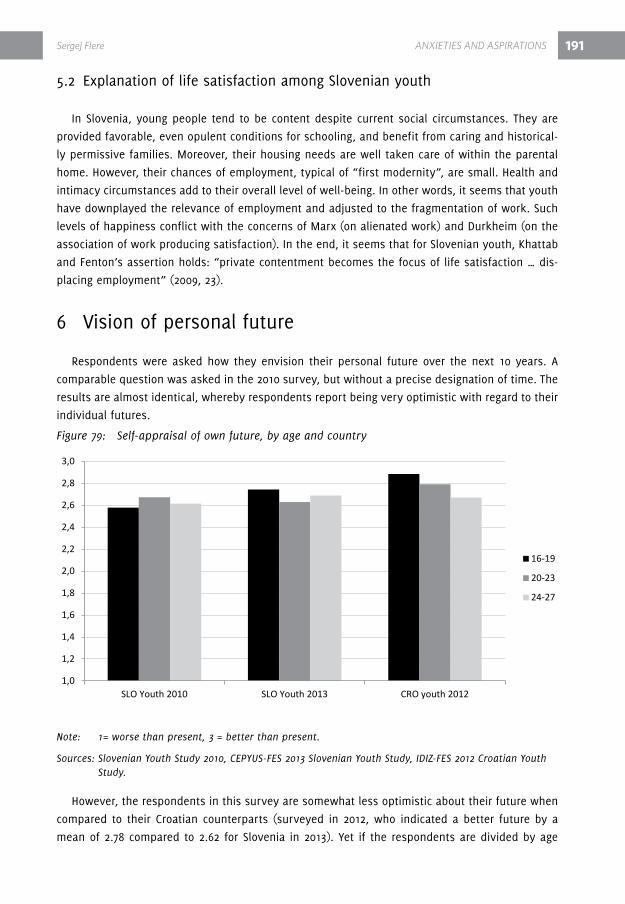
191
5.2 Explanation of life satisfaction among Slovenian youth
In Slovenia, young people tend to be content despite current social circumstances. They are
provided favorable, even opulent conditions for schooling, and benefit from caring and historical-
ly permissive families. Moreover, their housing needs are well taken care of within the parental
home. however, their chances of employment, typical of “first modernity”, are small. health and
intimacy circumstances add to their overall level of well-being. In other words, it seems that youth
have downplayed the relevance of employment and adjusted to the fragmentation of work. Such
levels of happiness conflict with the concerns of Marx (on alienated work) and durkheim (on the
association of work producing satisfaction). In the end, it seems that for Slovenian youth, Khattab
and Fenton’s assertion holds: “private contentment becomes the focus of life satisfaction … dis-
placing employment” (2009, 23).
6 vision of personal future
respondents were asked how they envision their personal future over the next 10 years. A
comparable question was asked in the 2010 survey, but without a precise designation of time. The
results are almost identical, whereby respondents report being very optimistic with regard to their
individual futures.
Figure 79: Self-appraisal of own future, by age and country
Note: 1= worse than present, 3 = better than present.
Sources: Slovenian Youth Study 2010, CEPYUS-FES 2013 Slovenian Youth Study, IDIZ-FES 2012 Croatian Youth Study.
however, the respondents in this survey are somewhat less optimistic about their future when
compared to their Croatian counterparts (surveyed in 2012, who indicated a better future by a
mean of 2.78 compared to 2.62 for Slovenia in 2013). Yet if the respondents are divided by age
1,0
1,2
1,4
1,6
1,8
2,0
2,2
2,4
2,6
2,8
3,0
SLO Youth 2010 SLO Youth 2013 CRO youth 2012
16-19
20-23
24-27
Sergej flere aNXiETiES aND aSpiRaTiONS

192
groups, a somewhat different picture appears. In Croatia the most pessimistic group are those
aged 16-19, while in Slovenia this is true for the middle group aged 20-23. This may be attributable
to the oldest coming to terms with the casualization of work, working part time, and changing
jobs, whereas the youngest have not yet grasped problems of emerging adulthood. The central
group, however, is likely facing more uncertainty, particularly as the once generous Slovenian so-
cial welfare system has come to an end.
7 Key findings and final remarks
Δ The findings indicate that both forms of narcissism have a malignant nature in terms
of attitudes and behavior, which shows a variance with previous findings, when only
narcissistic exploitativeness was found to be malignant. Exploitativeness, a minority
phenomenon, is found to be more malignant of the two. Further studies on this subject
are needed.
Δ Time orientations prove relatively stable when compared to 2010, although there is a
slight decrease in the future oriented group. The predominance of the latter is necessary
for successful integration into adult life. Further research should assess whether a
change has come about and how it correlates with social conditions.
Δ value orientations parallel the processes of individualization, as much as could be
discerned from the indicators applied, although less so when compared to Croatian
youth.
Δ As of 2013, Slovenian youth are satisfied in life and optimistic; worries and frustrations
are rather rare. This is to be expected in view of other findings, indicating youth to be
satisfied as long as they are not lonely (nor afflicted by a scarcity of resources). Specific
economic conditions have little influence on life satisfaction. The societal difficulties
in integrating youth into adulthood, particularly where it regards employment, also
seem to have little effect. It is possible that youth have accepted the problematic
employment within their otherwise relatively opulent living conditions. Experiences of
discrimination are relatively rare, whereas social distance is notable only with respect
to the roma. The possible effects of an unfavorable societal situation can be seen in
the diminishing levels of future orientation (when compared to 2010).
Δ Adverse social conditions, particularly in terms of employment possibilities, have not
had a dominant effect upon young people’s attitudes and orientations.
Δ The presence of negative attitudes towards the roma demands special action as a
means to eradicate misconceptions and foster joint life.
aNXiETiES aND aSpiRaTiONS Sergej flere

193
8 referencesAdorno, T. et al. (1950). The Authoritarian Personality. New York, harper.
Beck, U. and Beck Gernsheim, E. (2002). Individualization. London: Sage.
Bogardus, E. S. (1926). Social distance in the City. Proceedings and Publications of the American
Sociological Society, 20, 1926, 40–46.
diener E., Tay L., Oishi S. (2013). rising income and the subjective well-being of nations. J Pers
Soc Psychol., 104(2): 267-76.
European Commision-EC (2011). COMMUNICATION FrOM ThE COMMISSION TO ThE EUrOPEAN PAr-
LIAMENT, ThE COUNCIL, ThE EUrOPEAN ECONOMIC ANd SOCIAL COMMITTEE ANd ThE COMMITTEE
OF ThE rEGIONS. An EU Framework for National roma Integration Strategies up to 2020. Brussels,
5.4.2011 COM(2011) 173 final. Available at: http://ec.europa.eu/justice/policies/discrimination/
docs/com_2011_173_en.pdf (Aug., 2013).
European Commision-EC (2013). Youth Initiative. Available at: http://ec.europa.eu/social/main.
jsp?langId=en&catId=89&newsId=1829&furtherNews=yes (Sept., 2013)
EvS (2011). European values Study 2008: Integrated dataset (EvS 2008). GESIS data Archive, Co-
logne. ZA4800 data file version 3.0.0
Flere, S. and Lavrič, M. (2011). defining youth and milestones in reaching adulthood. Pp. 65-95 in
Lavrič, M. et al: Youth 2010. Social Profile of Young People in Slovenia. Ljubljana: Ministry of Edu-
cation and Sports.
Flere, S. and Molnar, A. (1992). Avtoritarizam, etnocentizam i retradicionalizacija. Zbornik radova
filozofskog fakulteta (Beograd), xvI, 413-425.
Flere, S. and Musil, B. (2011). Youth personality traits and religiousness. Pp. 449-470 in Lavrič, M.
et al: Youth 2010. Social Profile of Young People in Slovenia. Ljubljana: Ministry of Education and
Sports.
Flere, S., Tavčar Krajnc, M., Musil, B. and Kirbiš A. (2010). Cultural capital and intellectual ability
as predictors of scholastic achievement: a study of Slovenian secondary school students. British
Journal of Sociology of Education, 31, 47-58.
Godina vuk, vesna. (2011). Narcisizem kot nevidna značilnost in dimenzija vedenja slovenske
mladine. In A. Naterer (ed.): Mladi 2010. Maribor: Subkulturni azil, 125-144.
hodson, L. (2012). Ties that bind: Towards child-centred approach to lesbian, gay, bi-sexual and
transgender families under EChr. International Journal of Children’s rights, 20 501-522
Ilišin, v., Bouillet, d., Gvozdanović A. and Potočnik, d. (2013). Youth in a Time of Crisis. First IdIS
FES Youth Survey. Zagreb: Institute for Social research-FES.
Khattab, N. and Fenton, S. (2009). What makes young adults happy? Employment and non-work
as determinants of life satisfaction. Sociology, 43 (1), 10-27.
Sergej flere aNXiETiES aND aSpiRaTiONS
194
Kirbiš, A. (2011). virtualization of everday life. Pp. 293-320 Lavrič, M. et al: Youth 2010. Social Pro-
file of Young People in Slovenia. Ljubljana: Ministry of Education and Sports.
Klanjšek, r. (2011). Economic status of young people. Pp. 349-366 in Lavrič, M. et al: Youth 2010.
Social Profile of Young People in Slovenia. Ljubljana: Ministry of Education and Sports.
Kluckhohn, C. (1951). values and value Orientations in the Theory of Action. Cambridge, MA: har-
vard University Press.
Lasch, C. (1991). The Culture of Narcissism. American Way of Life in an Age of diminishing Expec-
tations. New York: W.W. Norton.
Lessard, J., Greenberg, E., Chen, C. and Farruggia, S. (2011). Are youth’s feelings of entitlement
always vad? Journal of Adolescence, 34, 521-9.
Lima, ML., Novo, r. (2006). So far so good? Subjective and social well-being in Portugal and Eu-
rope. Portugal Journal of Social Science, 5(1): 5–33.
Margolis, h. d., & Thomas, v. (1980). The measurement of narcissism in adolescents with and
without behavioural and emotional disabilities. Unpublished master’s thesis, United States Inter-
national University, San diego, CA.
Miheljak, v. (2001). Mladi kot subject in object politike. Pp. 105-164, in v. Milhejak (ed.). Mladina
2000. Slovenska mladina na prehodu v tretje tisočletje. Ljubljana: Ministrstvo za šolstvo, znanost
in sport.
MZŠŠ - Ministrstvo za šolstvo in šport. (2011). Strategija vzgoje in izobraževanja romov v repub-
liki Sloveniji, Ljubljana. http://www.mizs.gov.si/fileadmin/mizs.gov.si/pageuploads/podrocje/raz-
voj_solstva/projekt/Strategija_romi_dopolnitev_2011.pdf
Nickerson, A. B., & Nagle, r. J. (2004). The Influence of Parent and Peer Attachments on Life Sat-
isfaction in Middle Childhood and Early Adolescence. Social Indicators research, 66(1-2), 35-60.
Oishi, S., Graham, J., Kesebir, S. and Costa Galinha, I. (2013). Concepts of happiness across times.
Personality and Social Psychology Bulletin, 39 (5), 559-577.
Perry, r. (1992). A Short history of the Term ‘Politically Correct’, in Beyond PC: Toward a Politics
of Understanding , ed. P. Aufderheide. Minneapolis, MI: Greywolf Press.
Pichler, F. (2006). Subjective quality of life of young Europeans. Feeling happy, but why? Social
Indicators research, 75: 419-444.
robinson, C. C., & And, O. (1996). Psychometric Support for a New Measure of Authoritative, Au-
thoritarian, and Permissive Parenting Practices: Cross-Cultural Connections.
robinson, C. C., & Mandleco, B. (1995). Authoritative, authoritarian, and permissive parenting
practices: development of a new measure. Psychological reports, 77(3), 819.
raja, S. N., McGee,r., Stanton, W.r. (1992). Perceived attachments to parents and peers and psy-
chological well-being in adolescence. Journal of Youth and Adolescence, volume 21, Issue 4, pp
471-485
aNXiETiES aND aSpiRaTiONS Sergej flere
195
Schalk and Falke v. Austria, 30141/04, pronounced in 2010. http://hudoc.echr.coe.int/sites/eng/
pages/search.aspx?i=001-99605.
Smrke, M. (1996). religija in politika. Ljubljana: Znanstveno in publicistično središče.
Steinberg, L., and Silverberg, S. B. (1986). The vicissitudes of autonomy in early adolescence.Child
Develop. 57: 841–851.
ŠOS-Študentska organizacija Slovenije. (2012). PrEGLEd UKrEPOv NA POdrOČJU SOCIALNEGA
vArSTvA ŠTUdENTOv NA SLOvENSKEM. Ljubljana.
Triandis, h. C. (1995). Individualism and Collectivism. Boulder, CO: Westview Press.
Zimbardo, P. and Boyd, J.J. (1999). Putting time in perspective: A valid, reliable individual differ-
ences metric. Journal of Personality and Social Psychology, 17, 1271-1288.
Zimbardo, P. and Boyd, J.J. (2009). The Time Paradox. New York: The Free Press.
Sergej flere aNXiETiES aND aSpiRaTiONS


Miran Lavrič and Tjaša boroja TRUST aND bELONGiNG 197
PArT Ix TrUST ANd BELONGING
1 Social trust
Social trust is widely accepted as an essential “synthetic force” in modern society (Simmel,
1950). As Mechanic and Meyer (2000, 657) note, social trust is “fundamental to effective interper-
sonal relationships and community living”. Ward and Meyer (2009) convincingly argue that social
trust underpins a number of social systems that play an important role in the development and
maintenance of social quality.
According to delhey and Newton (2004), there are three main approaches to the explanation
of social trust. Proponents of the social-psychological school (e.g. Erikson, 1950; rosenberg, 1956)
argue that social trust is an integral part of personality that is mainly developed by early child-
hood socialization. A second group of authors (e.g., Patterson, 1999; Newton, 1999) explains social
trust as a function of individual characteristics and circumstances associated with such factors as
class, income, education, gender, ethnicity, and age. A third school sees trust as a collective char-
acteristic of social groups or systems, rather than individuals (e.g., Luhmann, 1979, Giddens, 1990).
According to several studies (e.g., Mechanic and Meyer, 2000; russell, 2005) many modern
societies suffer from a substantial erosion of interpersonal and institutional trust. regardless of
the reasons for such a decline, there is broad consensus among scholars that the erosion of trust
leads to severe social consequences, including a “culture of anxiety” (Crawford, 2004), or an “era
of insecurity” (Bauman, 1999).
Putnam (2000) offered one possible solution to these problems, namely that social trust might
be promoted by integrating individuals into different social institutions. This idea ensues from the
simple proposition that trust depends (mostly) on how much contact people have with others.
Thus, people who belong to such associations tend to become more trusting.
however, a study by hajdeja Iglič (2004) revealed that in the Slovenian context, integration in
institutions and social networks has not proven to be a significant casual factor of generalized
trust. While membership in such networks bolsters trust at the local level, it has no significant ef-
fect on generalized social trust. The latter appears to be mainly a function of the quality of public
institutions and individual characteristics, including achieved educational level, life satisfaction,
and post-materialist values (Iglič, 2004, 149).

198 TRUST aND bELONGiNG Miran Lavrič and Tjaša boroja
1.1 Level of trust in social groups is relatively low
In this survey, respondents were asked to indicate their level of trust towards different social
groups on a 1 to 10 scale (1 = do not trust at all, 10 = trust a lot). Not surprisingly, family is the most
trusted among the listed groups. In Slovenia (and Croatia), family is closely followed by friends,
which is in line with previous findings. According to the Youth 2010 study, relations with friends
and leisure time are the two values that gained the most importance over the period 1992-2008.
Further, in 2010, true friendship and family life ranked second and third among Slovenian youth
values; health ranked first (Musil and Lavrič, 2011, 420-421).
In this respect, Kosovo differs from Slovenia and Croatia as relatives and religious leaders rank
higher than friends. This can be partially understood in terms of the generally less modernized
state of Kosovo society. Namely, the declining role of expanded family and religious institutions
are generally considered important elements of modernization (e.g. Goode, 1963; Inglehart and
Norris, 2004).
Figure 80: Trust toward main social groups; average on a 1 to 10 scale
Sources: CEPYUS-FES Slovenian 2013 Youth Study, IDIZ-FES Croatian 2012 Youth Study, IDRA-FES Kosovo 2012 Youth Study.
9,38,6
7,7
5,75 4,9 4,6
3,6
9,4
8,68,1
6 6,4 6,2 6,15,2
9,8
7,2
8,3
5,95
5,9
4,6
7,7
1
2
3
4
5
6
7
8
9
10
Family Friends Relatives Neighbours People of aDifferentReligious
Faith
WorkColleagues
People withDifferentPolitical
Affiliation
ReligiousLeaders
Trust a lot
Do not trust at all
Please imagine a scale with values ranging from 1 to 10, where 1 stands for people who you trust least, and 10 for people who you trust most.Where on this scale would you put the following people?
Slovenia CroatiaKosovo
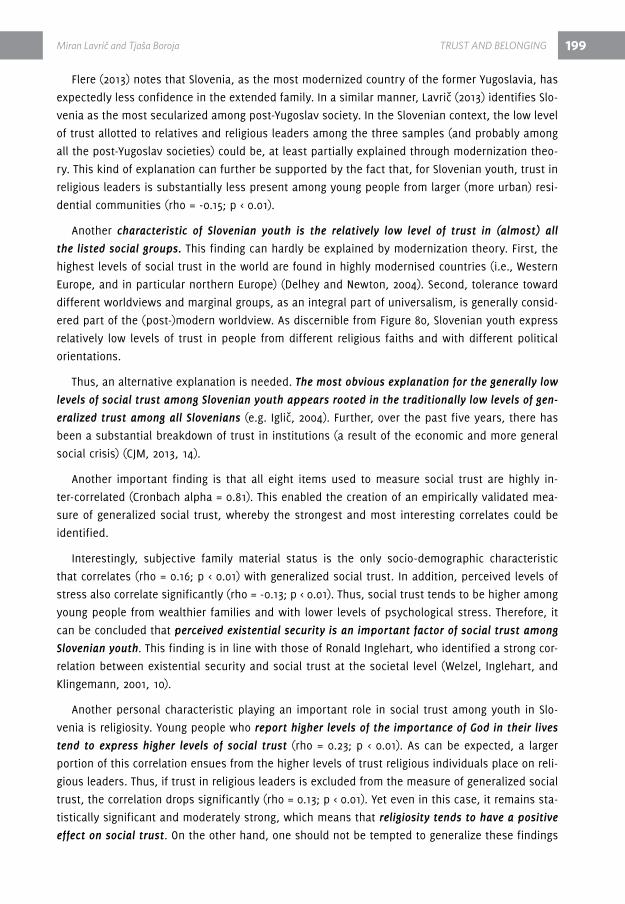
Miran Lavrič and Tjaša boroja TRUST aND bELONGiNG 199
Flere (2013) notes that Slovenia, as the most modernized country of the former Yugoslavia, has
expectedly less confidence in the extended family. In a similar manner, Lavrič (2013) identifies Slo-
venia as the most secularized among post-Yugoslav society. In the Slovenian context, the low level
of trust allotted to relatives and religious leaders among the three samples (and probably among
all the post-Yugoslav societies) could be, at least partially explained through modernization theo-
ry. This kind of explanation can further be supported by the fact that, for Slovenian youth, trust in
religious leaders is substantially less present among young people from larger (more urban) resi-
dential communities (rho = -0.15; p < 0.01).
Another characteristic of Slovenian youth is the relatively low level of trust in (almost) all
the listed social groups. This finding can hardly be explained by modernization theory. First, the
highest levels of social trust in the world are found in highly modernised countries (i.e., Western
Europe, and in particular northern Europe) (delhey and Newton, 2004). Second, tolerance toward
different worldviews and marginal groups, as an integral part of universalism, is generally consid-
ered part of the (post-)modern worldview. As discernible from Figure 80, Slovenian youth express
relatively low levels of trust in people from different religious faiths and with different political
orientations.
Thus, an alternative explanation is needed. The most obvious explanation for the generally low
levels of social trust among Slovenian youth appears rooted in the traditionally low levels of gen-
eralized trust among all Slovenians (e.g. Iglič, 2004). Further, over the past five years, there has
been a substantial breakdown of trust in institutions (a result of the economic and more general
social crisis) (CJM, 2013, 14).
Another important finding is that all eight items used to measure social trust are highly in-
ter-correlated (Cronbach alpha = 0.81). This enabled the creation of an empirically validated mea-
sure of generalized social trust, whereby the strongest and most interesting correlates could be
identified.
Interestingly, subjective family material status is the only socio-demographic characteristic
that correlates (rho = 0.16; p < 0.01) with generalized social trust. In addition, perceived levels of
stress also correlate significantly (rho = -0.13; p < 0.01). Thus, social trust tends to be higher among
young people from wealthier families and with lower levels of psychological stress. Therefore, it
can be concluded that perceived existential security is an important factor of social trust among
Slovenian youth. This finding is in line with those of ronald Inglehart, who identified a strong cor-
relation between existential security and social trust at the societal level (Welzel, Inglehart, and
Klingemann, 2001, 10).
Another personal characteristic playing an important role in social trust among youth in Slo-
venia is religiosity. Young people who report higher levels of the importance of God in their lives
tend to express higher levels of social trust (rho = 0.23; p < 0.01). As can be expected, a larger
portion of this correlation ensues from the higher levels of trust religious individuals place on reli-
gious leaders. Thus, if trust in religious leaders is excluded from the measure of generalized social
trust, the correlation drops significantly (rho = 0.13; p < 0.01). Yet even in this case, it remains sta-
tistically significant and moderately strong, which means that religiosity tends to have a positive
effect on social trust. On the other hand, one should not be tempted to generalize these findings

200 TRUST aND bELONGiNG Miran Lavrič and Tjaša boroja
too broadly. For example, a recent study by Berggren and Bjørnskov (2009) revealed that there is
a negative relationship between religiosity and trust at the societal level, both internationally and
within the US. Further, richard Traunmüller (2010, 346) found that, at the German regional level,
there is a strong positive effect of Protestantism, while social trust is less developed in the more
Catholic-dominated regions, although it is also true that Catholic individuals tend to be more trust-
ing than non-religious individuals. Thus, in the case of Slovenian youth, Catholicism might even
be a factor that hinders social trust at the macro-level, despite the fact that religiosity amongst
individuals tends to play a positive role in developing social trust.
1.2 Future orientation and expectations as a dimension of social trust
As noted above, this study incorporated part of Zimbardo and Boyd’s time orientation measure-
ment (1999), which identifies whether people are focused mostly on the past, present, or future.
If, for instance, someone is focused on the future, he/she makes long-term plans and subordinates
his/her actions to the fulfillment of these goals and plans. This focus is mostly regarded as hav-
ing positive effects upon individual success, as it motivates young people to focus their efforts
towards the achievment of long-term goals, such as education, or employment.
According to Zimbardo and Boyd (2009, 100), political and economic instability generally leads
people to trust only what they can hold in their hands, thus making them fatalistically or hedo-
nistically present-oriented. Future time orientation thus presupposes stability and consistency of
the social context, allowing for individuals to make rational judgments about the consequences
of their actions.
In this way, there is a close connection between future orientation and social trust, whereas
the latter is an important condition for the development of the former. One could also argue that
future orientation makes individual’s behavior more predictable and therefore contributes to gen-
eral levels of social trust in society. Social crisis, such as the one Slovenia has been experiencing
over the past five years, hinders an individual’s ability to focus on the future, which is especially
important during youth when it is necessary to prepare for life as an adult (Flere and Musil, 2011,
449-450).
In this light, Italian sociologist Carmen Leccardi has identified “presentification” (2005, 141)
as the prevailing response of young people to the increasing uncertainties regarding their future.
Presentification is understood as the absence (or low presence) of long-term planning, and the
self-placement of young people within a logical continuum between the present and the future,
which leaves the present as the dominating reference period of time. Needless to say, presentifi-
cation represents an obstacle in young peoples’ paths to successful adulthood, while on the other
hand future orientation increases the likelihood of successful social integration over the long-term.
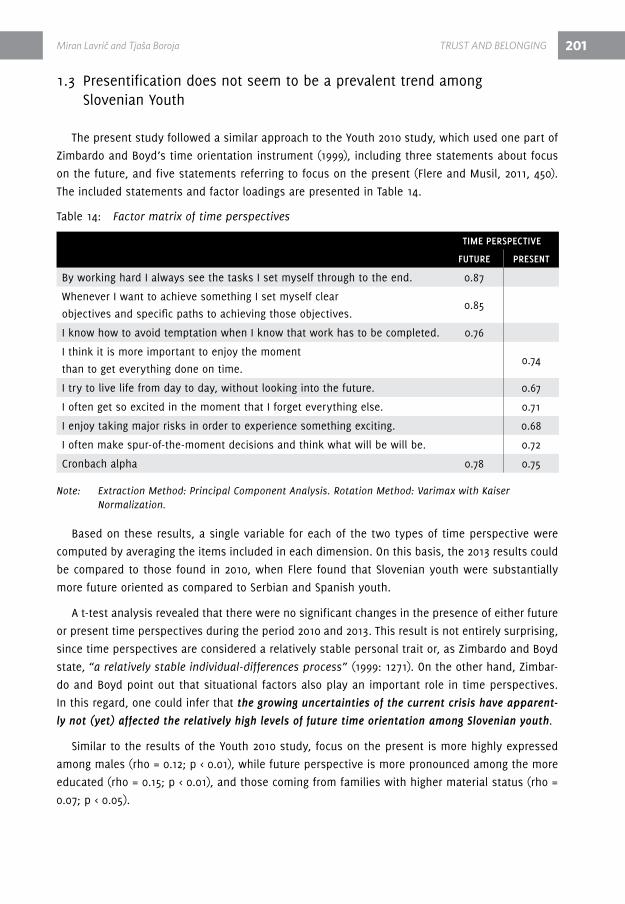
Miran Lavrič and Tjaša boroja TRUST aND bELONGiNG 201
1.3 Presentification does not seem to be a prevalent trend among Slovenian Youth
The present study followed a similar approach to the Youth 2010 study, which used one part of
Zimbardo and Boyd’s time orientation instrument (1999), including three statements about focus
on the future, and five statements referring to focus on the present (Flere and Musil, 2011, 450).
The included statements and factor loadings are presented in Table 14.
Table 14: Factor matrix of time perspectives
time perSpectiVe
Future preSent
By working hard I always see the tasks I set myself through to the end. 0.87
Whenever I want to achieve something I set myself clear
objectives and specific paths to achieving those objectives.0.85
I know how to avoid temptation when I know that work has to be completed. 0.76
I think it is more important to enjoy the moment
than to get everything done on time.0.74
I try to live life from day to day, without looking into the future. 0.67
I often get so excited in the moment that I forget everything else. 0.71
I enjoy taking major risks in order to experience something exciting. 0.68
I often make spur-of-the-moment decisions and think what will be will be. 0.72
Cronbach alpha 0.78 0.75
Note: Extraction Method: Principal Component Analysis. Rotation Method: Varimax with Kaiser Normalization.
Based on these results, a single variable for each of the two types of time perspective were
computed by averaging the items included in each dimension. On this basis, the 2013 results could
be compared to those found in 2010, when Flere found that Slovenian youth were substantially
more future oriented as compared to Serbian and Spanish youth.
A t-test analysis revealed that there were no significant changes in the presence of either future
or present time perspectives during the period 2010 and 2013. This result is not entirely surprising,
since time perspectives are considered a relatively stable personal trait or, as Zimbardo and Boyd
state, “a relatively stable individual-differences process” (1999: 1271). On the other hand, Zimbar-
do and Boyd point out that situational factors also play an important role in time perspectives.
In this regard, one could infer that the growing uncertainties of the current crisis have apparent-
ly not (yet) affected the relatively high levels of future time orientation among Slovenian youth.
Similar to the results of the Youth 2010 study, focus on the present is more highly expressed
among males (rho = 0.12; p < 0.01), while future perspective is more pronounced among the more
educated (rho = 0.15; p < 0.01), and those coming from families with higher material status (rho =
0.07; p < 0.05).

202
Another important finding is that there is a statistically significant correlation (rho = 0.11; p <
0.01) between future time perspective and social trust, confirming the study’s hypothesis of future
time perspective as an important factor of trust.
2 religiosity of young people in Slovenia
Evidence has shown that religion plays a relatively unimportant role in the lives of individu-
als, at least when compared to other countries in the region (Flere and Klanjšek, 2007; Toš, 2012;
Lavrič, 2013). Further, the Youth 2010 study revealed a long-term trend of gradual decline in youth
religiousness (Flere and Musil, 2011, 471).
2.1 Losing my religion: pronounced secularization among Slovenian youth
Within the present survey, respondents were first asked which religion they belong to. As seen
in Figure 81, traditional Catholic identification remains prevalent and relatively stable with about
two-thirds of young people declaring their belonging to the roman Catholic Church. The proportion
of youth not practicing any religion has slightly increased between 2000 and 2013, which is most
likely an indication of increased secularization.
Figure 81: Self declared religious affiliation, Slovenian youth
Sources: Youth 2000, Youth 2010 and CEPYUS-FES Slovenian 2013 Youth Study.
In terms of religious pluralism, Slovenian youth resemble their counterparts in Croatia and
Kosovo, but differ significantly from German youth, who are characteristically more religiously di-
verse (according to the results of a similar survey in 2010). On the other hand, where it regards
religiously unaffiliated, Slovenian youth are much more similar to German youth (Figure 82).
72%
3% 2% 0% 1%
22%
66%
4% 3% 1% 2%
24%
68%
3% 3% 1% 1%
24%
Catholic ChristianOrthodox
Muslim Protestant Another religion I do not belongto any religion
Which religion do you belong to?
2000 2010 2013
TRUST aND bELONGiNG Miran Lavrič and Tjaša boroja

203
The second question on religion asked respondents to rate the importance of God in their lives
(1 = not at all important, 10 = very important). According to rodney Stark (2004, 145-146), this can
be considered a central indicator of religiosity, especially where it impacts upon moral behav-
ior, social values, and political orientations. Figure 83 shows the combined results of the present
study, the World values Survey and the Youth 2010 study.
Figure 82: Self declared religious affiliation; youth from Slovenia, Germany, Croatia and Kosovo
Note: In order to ensure comparability, young people between 16 and 25 years of age were analyzed in all samples.
Sources: CEPYUS-FES Slovenian 2013 Youth Study, IDIZ-FES Croatian 2012 Youth Study, IDRA-FES Kosovo 2012 Youth Study.
Figure 83: Importance of God, Youth 2000, Youth 2010 and Youth 2013
Sources: World Values Survey, Youth 2010 and CEPYUS-FES Slovenian 2013 Youth Study.
3%
89%
30%
70%
9%
2%
0%
3%
87%
1%
7%
3%
35%
1%
2%
3%
27%
1%
1%
3%
23%
23%
Kosovo
Croatia
German
Slovenia
Which religion do you belong to?
Catholic Christian Orthodox Muslim
Protestant Another religion I do not belong to any religion
5,42 5,23
3,71 3,57
2005 2008 2010 2013
How important is God in your life?
Miran Lavrič and Tjaša boroja TRUST aND bELONGiNG

204
As seen in Figure 83, between 2005 and 2013, the importance of God has declined quite sub-
stantially. Further, only one-third of declared young Catholics report that God is important in their
lives (by choosing an answer 6 or more on a 1 to 10 scale). This is in line with Flere and Klanjšek’s
(2007) claim that the religiosity of Slovenians is mainly an expression of religious identification
based on traditional grounds.
The respondents were further asked how often they attend church or other places of worship
(1 = never, 6 = regularly, several times a week). Public worship is undoubtedly one of the central
elements of religiousness. It represents the fulfillment of religious duty, and both a public and pri-
vate confirmation of one’s religiousness.
Between 2000 and 2013, the percentage of youth who never attended church or other places
of worship increased by 5 percentage points (Figure 84). More importantly, during the last three
years the proportion of young people who attended church at least several times a year fell from
37 percent to only 23 percent. This indicates an increasing trend toward secularization among
Slovenian youth. however, others note a slightly more specific interpretation of this enormous
change. According to Smrke (2012), the sharp decline of confidence of young Slovenians in the
church is mostly a result of the financial scandals of the Catholic church, which exploded in 2010;
the media referred to this as the ”holy mess”.
Figure 84 also reveals a substantial increase in the share of Slovenian youth who attend reli-
gious rituals only on rare occasions, such as religious holidays. Again, this can be understood in
terms of secularization, i.e., religion remains mainly at the level of tradition, while a deep faith in
God and the moral influence of religion appear to decline.
Figure 84: Frequency of church attendance, Youth 2000, Youth 2010 and Youth 2013
Source: Youth 2000, Youth 2010 and CEPYUS-FES Slovenian 2013 Youth Study.
Low levels of religiosity among Slovenian youth are also reflected at the level of prayer, particu-
larly when compared to Croatian youth. As discernible from Figure 85, the proportion of those who
25%30%
22%
12% 10%
1%
32% 31%
23%
8% 5%1%
30%
47%
14%
4% 5%0%
Never Only on rareoccasions
I go several timesa year
At least once amonth
At least once aweek
Regularly, severaltimes a week
How often do you visit religious ceremonies in a church or other religious institution?
2000 2010 2013
TRUST aND bELONGiNG Miran Lavrič and Tjaša boroja

205
never pray in Slovenia is relatively high. When compared against the results for Croatia, more than
twice as many young Slovenians report never praying.
Figure 85: Frequency of prayer among youth from Slovenia and Croatia
Sources: CEPYUS-FES Slovenian 2013 Youth Study and IDIZ-FES Croatian 2012 Youth Study.
More evidence of the declining role of religion in the lives of young people in Slovenia can be
seen in the extremely small proportion of youth who use religion as a mechanism to deal with the
difficulties of life (Figure 86).
Figure 86: Presence of religious coping among Slovenian youth
Source: CEPYUS-FES Slovenian 2013 Youth Study.
35%47%
30%23%
28% 19%
6% 7%1% 4%
When I'm faced with greater difficulties in life, mylife is many times seen as part of a larger spiritual
force
When I'm faced with greater difficulties in life, Ioften address God for strength, support and
guidance
Totally disagree Disagree Niether agree or disagree Agree Totally agree
58%
33%
1%
8%
24%
41%
20%15%
Never Sometimes Often Regulary
How often do you pray?
Slovenia Croatia
Miran Lavrič and Tjaša boroja TRUST aND bELONGiNG
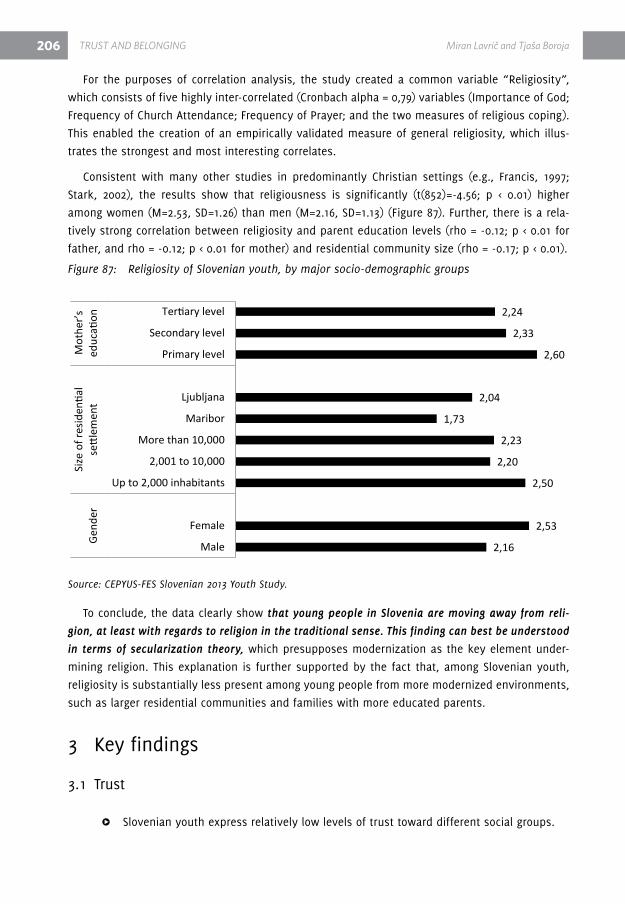
206
For the purposes of correlation analysis, the study created a common variable “religiosity”,
which consists of five highly inter-correlated (Cronbach alpha = 0,79) variables (Importance of God;
Frequency of Church Attendance; Frequency of Prayer; and the two measures of religious coping).
This enabled the creation of an empirically validated measure of general religiosity, which illus-
trates the strongest and most interesting correlates.
Consistent with many other studies in predominantly Christian settings (e.g., Francis, 1997;
Stark, 2002), the results show that religiousness is significantly (t(852)=-4.56; p < 0.01) higher
among women (M=2.53, Sd=1.26) than men (M=2.16, Sd=1.13) (Figure 87). Further, there is a rela-
tively strong correlation between religiosity and parent education levels (rho = -0.12; p < 0.01 for
father, and rho = -0.12; p < 0.01 for mother) and residential community size (rho = -0.17; p < 0.01).
Figure 87: Religiosity of Slovenian youth, by major socio-demographic groups
Source: CEPYUS-FES Slovenian 2013 Youth Study.
To conclude, the data clearly show that young people in Slovenia are moving away from reli-
gion, at least with regards to religion in the traditional sense. This finding can best be understood
in terms of secularization theory, which presupposes modernization as the key element under-
mining religion. This explanation is further supported by the fact that, among Slovenian youth,
religiosity is substantially less present among young people from more modernized environments,
such as larger residential communities and families with more educated parents.
3 Key findings
3.1 Trust
Δ Slovenian youth express relatively low levels of trust toward different social groups.
2,16
2,53
2,50
2,20
2,23
1,73
2,04
2,60
2,33
2,24
Male
Female
Up to 2,000 inhabitants
2,001 to 10,000
More than 10,000
Maribor
Ljubljana
Primary level
Secondary level
Tertiary level
Gen
der
Size
of r
esid
entia
lsett
lem
ent
Mot
her’s
educ
ation
TRUST aND bELONGiNG Miran Lavrič and Tjaša boroja

207
Δ The most obvious explanation for the generally low levels of social trust among
Slovenian youth appears to be rooted in the traditionally low levels of general trust
throughout Slovenia.
Δ Perceived existential security is an important factor of social trust among Slovenian
youth.
Δ Young people who rank highly the importance of God in their lives tend to express
higher levels of social trust.
Δ The growing uncertainties of the current crisis have apparently not (yet) affected the
relatively high levels of future time orientation among Slovenian youth.
3.2 Belonging and religion
Δ About two-thirds of young people declare their belonging to the roman Catholic faith.
Yet only about one-third of the declared young Catholics report that God is important
in their lives.
Δ In only three years, the proportion of young people who attend church at least several
times a year fell from 37 percent to only 23 percent.
Δ The fact that young people in Slovenia are moving away from religion can best be
understood in terms of secularization theory.
4 referencesBauman, Z. (1999). In Search of Politics. Stanford, CA: Stanford University Press.
Berggren, N. & Bjørnskov, C. (2009). Is the Importance of religion in daily Life related to Social
Trust? Cross-Country and Cross-State Comparisons. Journal of Economic Behavior & Organization,
Elsevier, vol. 80(3), pages 459-480.
Beyer, P. (1994). religion and globalization. London: Sage.
CJM-Center za raziskovanje javnega mnenja/Centre for Public Opinion reserach (2013). Politba-
rometer 1/2013. dostopno na: https://www.ip-rs.si/fileadmin/user_upload/Pdf/razno/politbarome-
ter_1-2013.pdf, 21.8.2013.
Crawford, r. (2004). risk ritual and the Management of Control and Anxiety in Medical Culture.
health, An Interdisciplinary Journal for the Social Study of health, Illness and Medicine, 8(4),
505-528.
Flere S. and Musil B. (2011). Youth personality traits and religiousness. In M. Lavrič (Ed.). Youth
2010: The social profile of young people in Slovenia. Ljubljana: Ministry of Education and Sports,
Office for Youth; Maribor: Aristej, str. 449-474.
Flere S. and Klanjšek r. (2007). Ali je votlost značilnost vernosti na Slovenskem? družboslovne
razprave, 23(56), 7-20.
Miran Lavrič and Tjaša boroja TRUST aND bELONGiNG

208
Flere, S. (2013). 20 years later: Problems and prospects of countries of former Yugoslavia. Mari-
bor: Faculty of arts, Center for the Study of Post-Yugoslavia Societes.
Flere, S. (2013). recent changes in the post-Yugoslav family. In: Flere, S. (2013). 20 years later:
Problems and prospects of countries of former Yugoslavia. Maribor: Faculty of arts, Center for the
Study of Post-Yugoslavia Societes.
Francis, L. (1997). The Psychology of gender differences in religion: a review of empirical re-
search. religion, 27, 81-96.
Giddens, A. (1990). The Consequences of Modernity. Stanford: Stanford University Press.
Goode, W. J. (1963). World revolution and Family Patterns. New York: Free Press.
Iglič, h. (2004). dejavniki nizke stopnje zaupanja v Sloveniji. družboslovne razprave, 20(46/47),
149-175.
Inglehart, r. F., and Norris P. (2004). Sacred and Secular: reexamining the Secularization Thesis.
Cambridge: University Press.
Lavrič, M. (2013). religious Change and the Impact of religiosity upon Emancipative values in
Post-Yugoslav Countries. In: Flere, S. (2013). 20 years later: Problems and prospects of countries
of former Yugoslavia. Maribor: Faculty of arts, Center for the Study of Post-Yugoslavia Societes.
Leccardi, C. (2005). Facing Uncertainty: Temporality and Biographies in the New Century. Young,
Nordic Journal of Youth research, 13(2), 123–146.
Luhmann, N. (1979). Trust and Power. New York: Wiley.
Mechanic, d., and Meyer S. (2000). Concepts of Trust among Patients with Serious Illness. Social
Science and Medicine 51(5), 657-668.
Musil B. And Lavrič, M. (2011). Youth values, sustainable social functioning and visions of the fu-
ture. In M. Lavrič (Ed.). Youth 2010: The social profile of young people in Slovenia. Ljubljana: Min-
istry of Education and Sports, Office for Youth; Maribor: Aristej, str. 449-474.
Newton, K. (1999). Social capital and democracy in modern Europe. In van deth J., Maraffi M.,
Newton K., and Whiteley P. (1999). Social Capital and European democracy. London: routledge,
str. 3-24.
Patterson, O. (1999). Liberty against the democratic state: on the historical and contemporary
sources of American distrust. In Warren M. E. democracy and Trust. Cambridge. Cambridge: Uni-
versity Press, str. 151-207.
Putnam, r. d. (2000). Bowling Alone: The Collapse and revival of American Community. New
York: Simon & Schuster.
rosenberg, M. (1956). Misanthropy and political ideology. American Sociological review, (21),
690-5.
russell, S. (2005). “Treatment-seeking Behaviour in Urban Sri Lanka: Trusting the State, Trusting
Private Providers.” Social Science and Medicine 61(7), 1396-1407.
TRUST aND bELONGiNG Miran Lavrič and Tjaša boroja

209
Simmel, G. 1950.The Sociology of Georg Simmel. Transl., ed. and intr. by K. h. Wolff. New York:
Free Press. [German original, 1908.]
Smrke, M (2012). Učinki “svete polomije” na zaupanje v cerkev. Teorija in praksa, 49(1), 9-31.
Stark, r. (2002). Psychology and Faith: Addressing the “Universal” Gender difference in religious
Commitment. Journal for the Scientific Study of religion, 41(3), 495-507.
Stark, r. (2004). Exploring the religious life. Baltimore: hopkins University Press.
Toš, N. (2012). vrednote v prehodu vI.: Slovenija v mednarodni primerjavah 1992-2011. Wien:
Echoraum; Ljubljana: Fdv.
Traunmüller, r. (2010). Moral Communities? religion as a Source of Social Trust in a Multilevel
Analysis of 97 German regions. European Sociological review, 27 (3), 346-363.
Ward, P.r. and Meyer, S. (2009). Trust, social quality and wellbeing: a sociological exegesis. de-
velopment and Society, 38(2), 339-363.
Welzel, C.; Inglehart, r.; Klingemann, h. d. (2001). human development as a general theory of
social change: a multi-level and cross-cultural perspective. Paper FS III01-201, Wissenschaftszen-
trum Berlin für Sozialforschung, 2001, Berlin, Germany.
Wilson, B. (1993). reflection on a many sided contoversy. In: Bruce, E. (ur.). religion and Modern-
ization: Sociologists and historians debate the Secularization Thesis. Oxford: Clarendon Press.
Zimbardo, P., and Boyd, J.J. (1999). Putting time in perspective: A valid, reliable individual-differ-
ences metric. Journal of Personality and Social Psychology 17, 1271–1288.
Miran Lavrič and Tjaša boroja TRUST aND bELONGiNG

andrej Kirbiš and barbara zagorc pOLiTiCS aND DEMOCRaCy 211
PArT x POLITICS ANd dEMOCrACY
1 Politics and democracy
For many politics is what they see on television, read in newspapers, or discuss with oth-
er people. More eloquently stated, politics is “a passing parade of abstract symbols” (Edelman,
1985, 5). Politics can also be more precisely defined as “the activity through which people make,
preserve and amend the general rules under which they live” (heywood, 2002, 4; 2011, 2). This
chapter examines politics in a broader sense, and in particular youth perceptions of politics and
their political participation. This active part of politics, i.e., the inclusion of the masses in the
decision-making through means of political participation, is a critical component of democracy
(Young, 2000, 52).
Although democracy may refer to “rule by the people” (Banfield, 1991, 311; Parry et al., 1992,
3; Sruk, 1995, 58), the majority of decisions in democratic countries are de facto made by a small
group of elite. In the case of today’s representative democracy (Urbinati, 2006; Young, 2000, 121),
where people’s participation is to some extent limited (Parry et al., 1992, 5), democracy is better
described as “a political system in which ordinary citizens exercise control over elites; and such
control is legitimate” (Almond and verba, 1989, 136). Nevertheless, classical theorists like Aris-
totle, rousseau, de Tocqueville, J. S. Mill, and as well contemporary authors have in one way or
another emphasized the importance of citizen participation (see Almond and verba, 1989; Barnes,
2004; dahl, 1972; dalton, 1996; Lipset, 1959). Indeed, both proponents of participatory democracy
(Barber, 2003; Pateman, 1970) and of democratic realism (Sartori, 1987; Schumpeter, 1943) agree
that political participation is an integral condition of democracy (Parry and Moyser, 1994, 46; also
see Almond and verba, 1989; Easton, 1975; Inglehart, 1997; Norris, 2002). In other words, wheth-
er talking about strong democracy (Barber, 2003), deliberative democracy (Bohman, 1996; Elster,
1998), participatory-deliberative democracy (Fung, 2004), deep democracy (Young, 2000) or cosmo-
politan democracy (held, 1995), authors generally emphasize that publicly active and engaged cit-
izens play a vital role in effective democracy (Schlozman, 2002, 433; verba et al., 1995, 1). In sum,
for a democracy to work, citizens44 need to participate politically (Almond and verba, 1989; Norris,
2002; Parry and Moyser, 1994; Pateman, 1970). Citizen participation is so valuable that “any book
about political participation is also a book about democracy” (Parry et al., 1992, 3).
44 Of course, the actions of political elites are just as important; for instance, their levels of political integrity (or the opposite, the levels of corruption of political elites). Yet research has shown that mass participation from democratically-oriented public who exerts pressure on political elites is one of the main factors of an effective democracy (see Inglehart and Welzel, 2007).
212 pOLiTiCS aND DEMOCRaCy andrej Kirbiš and barbara zagorc
Within this context, youth political participation has become a prominent research issue in the
social sciences for several reasons. First, scholars have argued that political participation and atti-
tudes developed in childhood, adolescence, and youth impact one’s level of political engagement
in adulthood (Flanagan and Levine, 2010; Obradović and Masten, 2007; Pacheco, 2008; Plutzer,
2002; van hamel, 2011). In this same vein, many have noted that youth political participation has
a positive impact on the formation of young people’s identities (Flanagan and Levine, 2010, 160;
Youniss, 2009; also see Brezovšek, 1995, 199–200), and on the overall functioning of democracy
(Flanagan and Levine, 2010, 160; Ilišin, 2003, 55).
Second, researchers of late have detected low levels of youth political participation in estab-
lished democracies (see, for example, Cherry, 2012; dostie-Goulet, 2009; Edwards, 2007; Edwards,
2009; Print, 2007). Young people from Slovenia (Kirbiš et al., 2010; Kirbiš and Flere, 2011) and other
post-socialist countries (Ilišin, 2003; Ilišin et al., 2012, 118; Pasha et al., 2012, 46; Tworzecki, 2008)
show participation patterns similar to their western peers. Across different countries, youth also
express low levels of interest in politics (Gauthier, 2003; Ilišin, 2003, 49; Ilišin et al., 2012, 111; Pa-
sha et al., 2012, 46; Ward, 2008; Zarycki, 2009, 5; Zeglovits and Zandonella, 2013), and are distrust-
ful of political leaders and of politics in general (Bay and Blekesaune, 2002; Ilišin et al., 2012, 121;
Mitton, 2009; Pasha et al., 2012, 51; Tworzecki, 2008, 58). Young people are more and more dis-
engaged from formal politics, even though they support the broader “democratic process”. More
specifically, young people express scepticism towards and feel alienated from political institutions
and political elites (henn et al., 2005; Schwirtz, 2007). Livingston even speaks of an “undoubted
irony”, given that the general decline in youth political participation exists alongside omnipresent
discussions of youth participative rights (2008, 561).
When discussing the declining levels of youth political engagement, one must be careful to
distinguish between conventional (i.e., formal) and unconventional (civic/social, protest, and in-
dividualized) political participation. Though research has shown that youth are less politically
motivated and engaged, there has been a slight reversal of this trend over recent decades, with
young people increasingly engaged in unconventional types of political participation (Gauthier,
2003; Gidengil, 2003; henn et al., 2005; Ilišin, 2003; Ødegård and Berglund, 2008; Quintelier, 2007a;
russell, 2004; Schwirtz, 2007; Ward, 2008).
Nevertheless, declining levels of political participation present challenges to the “participato-
ry” element of democracy (Brezovšek, 1995, 199-200). Barber, for instance, argues that “without
participating in the common life that defines them and in the decision-making that shapes their
social habitat, women and men cannot become individuals” (2003, xxxv). Since declining levels of
political participation are rather universal in both consolidated and newer democracies, research-
ers, policymakers, and the media have long asked the big question: how can we get young people
to participate in politics? The majority here concede the importance of education (Li, 2009; Print,
2007; Youniss et al., 2002, 130-131); however a number of studies have also shown other factors in
play: parents (diemer and Li, 2011; dostie-Goulet, 2009, 416-418; Quintelier et al., 2007b; Wong and
Tseng, 2008; Youniss et al., 2002, 129-130), teachers and friends (diemer and Li, 2011; dostie-Gou-
let, 2009, 418; Lopes et al., 2009), and the media (Bennett, 2008, 9; Buckingham, 1999; hoffman
and Thomson, 2009; Scherman and Arriagada, 2012; Youniss et al., 2002, 137–139). Of course, the
wider political context and political environment (competitive vs. uncompetitive) can also play
andrej Kirbiš and barbara zagorc pOLiTiCS aND DEMOCRaCy 213
an important role (i.e., higher levels of party competition in the political arena increases political
participation; Pacheco, 2008). As well, some have argued that the benefits of participation are an
important determinant (Lopes et al., 2009, 11).
Within the fields of youth and politics, many scholars have researched and debated the issue
of early involvement in conventional political participation (Chan and Clayton, 2006; Matthews et
al., 1999; Zeglovits and Zandonella, 2013), and also on the expansion of new technology’s impact
on political activity (Bae et al., 2013; Buckingham, 1999; volkov, 2012; vreg, 2004; Ward, 2008). As
noted above, it has been shown that political participation can have an important effect on the
formation of youth identity; and debating politics with others impacts the crystallization of one’s
opinions and beliefs (Flanagan and Levine, 2010, 160–161).
Still, scholars disagree on a number of different issues where it concerns youth and politics
(Matthews et al., 1999). In terms of minimum age requirements for political participation, one
study found an increased interest among young people when the voting age was lowered (Zeglo-
vits and Zandonella, 2013). On the other side, many emphasize the lack of political competence
and the immaturity of younger youth (e.g., lower political interest, lower political knowledge; see
Chan and Clayton, 2006).
With regard to expanding opportunities to participate, more recent literature has focused on the
role of information-communication technologies (ICT) (Buckingham, 1999; Norris, 2002, 212; Oblak,
2003b; vreg, 2004), particularly given that young people use new technologies most often (see Kir-
biš and Naterer, 2011; van hamel, 2013, 3). Moreover, youth commonly have a high level of self-ef-
ficacy in their Internet use, and often favorably regard the quality and usefulness of the Internet
(Chung et al., 2010). It is therefore not surprising that researchers emphasize the importance of
new technologies in the context of political participation (see harris, 2008).
Nevertheless, some authors have pointed to several potential limitations (and the importance
of context) of ICT use, and in particular the Internet. here research has shown that although some
post-socialist countries have become EU members, and more generally made progress in the de-
velopment and use of ICT, their citizens are still less frequent Internet users (including less fre-
quent users of e-government) (Zoroja, 2011, 122, 126), and have more limited access to the Inter-
net, including broadband (Seybert, 2011; see also Wallsten, 2005). In sum, although ICT in general
and the Internet in particular are a promising venue for participation, in numerous countries these
opportunities are not necessarily realized (see Gibson et al., 2003; Oblak, 2003a; Ward, 2005; Za-
gorc and Kirbiš, 2013).
This chapter assesses youth attitude towards politics, beginning with general images regard-
ing the popularity of political participation. Next, questions on specific political attitudes and
behaviours are addressed, including whether young Slovenians are interested in politics, their
ideological orientation, and their self-reported levels of electoral participation. The chapter then
analyzes political attitudes (satisfaction with democracy, representation by young people active
in politics, belief in political influence, institutional trust, etc.) that are often characterized in the
literature as providing a dispositional/attitudinal basis toward the functioning of democracy. This
is followed by an analysis of the sources of potential influence on youth political perceptions, at-
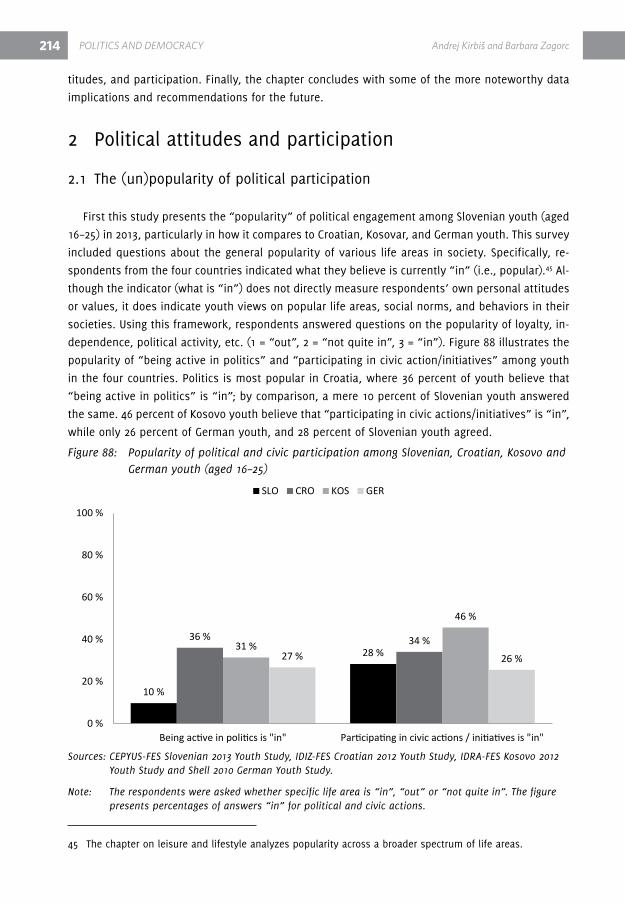
214 pOLiTiCS aND DEMOCRaCy andrej Kirbiš and barbara zagorc
titudes, and participation. Finally, the chapter concludes with some of the more noteworthy data
implications and recommendations for the future.
2 Political attitudes and participation
2.1 The (un)popularity of political participation
First this study presents the “popularity” of political engagement among Slovenian youth (aged
16–25) in 2013, particularly in how it compares to Croatian, Kosovar, and German youth. This survey
included questions about the general popularity of various life areas in society. Specifically, re-
spondents from the four countries indicated what they believe is currently “in” (i.e., popular).45 Al-
though the indicator (what is “in”) does not directly measure respondents’ own personal attitudes
or values, it does indicate youth views on popular life areas, social norms, and behaviors in their
societies. Using this framework, respondents answered questions on the popularity of loyalty, in-
dependence, political activity, etc. (1 = “out”, 2 = “not quite in”, 3 = “in”). Figure 88 illustrates the
popularity of “being active in politics” and “participating in civic action/initiatives” among youth
in the four countries. Politics is most popular in Croatia, where 36 percent of youth believe that
“being active in politics” is “in”; by comparison, a mere 10 percent of Slovenian youth answered
the same. 46 percent of Kosovo youth believe that “participating in civic actions/initiatives” is “in”,
while only 26 percent of German youth, and 28 percent of Slovenian youth agreed.
Figure 88: Popularity of political and civic participation among Slovenian, Croatian, Kosovo and German youth (aged 16–25)
Sources: CEPYUS-FES Slovenian 2013 Youth Study, IDIZ-FES Croatian 2012 Youth Study, IDRA-FES Kosovo 2012 Youth Study and Shell 2010 German Youth Study.
Note: The respondents were asked whether specific life area is “in”, “out” or “not quite in”. The figure presents percentages of answers “in” for political and civic actions.
45 The chapter on leisure and lifestyle analyzes popularity across a broader spectrum of life areas.
10 %
28 %36 % 34 %31 %
46 %
27 % 26 %
0 %
20 %
40 %
60 %
80 %
100 %
Being active in politics is "in" Participating in civic actions / initiatives is "in"
SLO CRO KOS GER

andrej Kirbiš and barbara zagorc pOLiTiCS aND DEMOCRaCy 215
An analysis of socio-demographic correlates of political participation among Slovenian youth
(aged 16–27) indicates that having a well educated father (rho = 0.13, n = 810, p < 0.001), having
a high level of education (rho = 0.10, n = 877, p < 0.01) and being female (rho = 0.08, n = 877, p <
0.05) increase the likelihood of agreeing with the statement “being active in politics is ‘in’”. As
well, youth from larger residential communities (rho = 0.08, n = 864, p < 0.05) and those with bet-
ter-educated mothers (rho = 0.07, n = 831, p < 0.05) are more likely to agree that “participating in
civic actions/initiatives is ‘in’”. Young people who think that politics is “in” are more likely (rho =
0.25, n = 854, p < 0.001) to think that civic action is “in”, corroborating previous studies that found
a positive association between conventional and unconventional (e.g., civic) political participation
(McFarland and Thomas, 2006; Kirbiš and Flere, 2011). While it is interesting that women feel stron-
ger about political participation, this does not necessarily indicate that they themselves are more
inclined to participate (this hypothesis will be tested at the end of the chapter when the resulted
are presented for individual respondents’ political engagement). In sum, 28 percent of Slovenian
youth believe participating in civic actions or initiatives is popular, but only 10 percent believe be-
ing active in politics is “in”. Previous studies of Belgian and Canadian youth, for example, showed
that young people perceive the term politics very narrowly. Its meaning generally does not extend
beyond “formal politics”, i.e., conventional politics (Quintelier, 2007a, 177). Therefore, one could
reasonably conclude that the respondents in this study understood the concept of politics in the
first item (i.e., being active in politics) as a conventional form of political participation, where-
as the second item (civic actions) clearly represents unconventional political participation. These
findings corroborate the results of the Youth 2010 study, where Slovenian youth also indicated that
they participate more frequently in social and unconventional – e.g., protest and individualized
– forms of political participation (Kirbiš and Flere, 2011, 214-215). The protest movements against
political corruption that took place in Slovenia in 2012 and 2013 (see below), which included young
people, can be seen as an expression of the general dissatisfaction with politics, political elites,
and the state of democracy in Slovenia.
Past studies of Slovenian adult and youth populations have shown that politics does not play
an important role in people’s everyday lives (at least according to their opinion; see Kirbiš and
Flere, 2011). Further these studies incidate an overall negative view of politics since Slovenia
gained independence in the 1990s. In the early 1990s, Slovenians perceived politics mostly as a
“struggle for power” and as a “dirty matter”. Bibič (1997, 194–197), a Slovenian author, has recount-
ed some explanations for these largely negative views: Slovenian people had previously never
had their own state and therefore perceived politics and the state throughout history as a foreign
supremacy; the negative impact of political scandals; and the low level of political culture among
Slovenian politicians, among others (also see rus and Toš, 2005, 283).46
2.2. Political interest
A wide body of research has been conducted on the level of political interest among young
people in established democracies (e.g., Gauthier, 2003; Zeglovits and Zandonella, 2013) and in
46 On the other hand, political party life has existed in Slovenia at least since the second half of the 19th century (see, among others, Kržišnik, 1994; Perovšek, 2005).

216 pOLiTiCS aND DEMOCRaCy andrej Kirbiš and barbara zagorc
post-socialist countries (see Ilišin, 2003; Zarycki, 2009). This section analyzes the more concrete
political orientations and political engagement of Slovenian youth. Figure 89 shows the percent-
ages of Slovenian young people’s (aged 16 to 27) interest in world politics, EU politics, politics in
the Balkans, and politics in Slovenia. The Youth 2010 study (Kirbiš and Flere, 2011, 198-199) showed
that young people have a low interest in politics; therefore, this study did not expect the results to
change drastically. Indeed, as Figure 89 indicates, a minimal percentage of respondents are “very
interested” in politics, regardless of whether it was for the Balkans, the EU, world politics, or na-
tional politics. Over 50 percent of respondents are “absolutely not interested” or “not interested”
in Balkan, EU, and world politics, while national politics attracts the highest proportion of “inter-
ested” and “very interested” youth (25 percent). This is followed by EU politics, with 16 percent
“interested/very interested”.
Figure 89: Interest in world politics, EU politics, politics in the Balkans and Slovenian politics among Slovenian youth (aged 16–27)
Source: CEPYUS-FES Slovenian 2013 Youth Study.
The general picture is as expected: Slovenian youth are not interested in politics. As already
argued, Slovenian youth probably understand the term politics as conventional politics, similar to
youth in other countries (see Quintelier, 2007a).
Figure 90 indicates the percentage of youth “interested” or “very interested” in different areas
of politics in Slovenia, Croatia, and Kosovo. The least interested in all areas of politics are Slovenian
youth, while Kosovars are the most interested.47 Not surprisingly, Slovenian, Croatian, and Koso-
var youth are most interested in politics in their own country. What separates the three countries
is the following: after national politics, Kosovar youth are interested in politics in the Balkans,
whereas Croatian and Slovenian youth favor EU politics. This is not surprising given that Slovenia
and Croatia are EU members, while Kosovo is not.
47 Kosovo youth were not asked about their interest in EU politics, so this item could not be included in the comparative analysis.
23
40
28
31
18
32
25
24
34
21
31
31
20
6
15
12
5
0
1
2
0 % 20 % 40 % 60 % 80 % 100 %
Politics in Slovenia
Politics in the Balkans
EU politics
World politics
Absolutely not interested Not interested Neither interested nor disinterested Interested Very interested

andrej Kirbiš and barbara zagorc pOLiTiCS aND DEMOCRaCy 217
Figure 90: Percentages of “interested/very interested” in national politics, EU politics, world politics and politics in the Balkans among Slovenian, Croatian and Kosovo youth (16–25 years)
Note: Political interest items were scored on a five point scale. Percentages for each country represent the sum of “interested” and “very interested” youth.
Sources: CEPYUS-FES Slovenian 2013 Youth Study, IDIZ-FES Croatian 2012 Youth Study, IDRA-FES Kosovo 2012 Youth Study .
All four political interest items were found to be associated (p < 0.001), indicating that those
who are interested in one area of politics are also more likely to be interested in other areas. Be-
cause the analysis of socio-demographic correlates provided similar results for all four items, they
were added together on a political interest scale (Cronbach’s alpha = 0.91).
An analysis of socio-demographic correlates within the political interest scale indicate that
there is no statistically significant correlation with gender, which was already found in the Youth
2010 study (Kirbiš and Flere, 2011, 216). however, there is a statistically significant correlation be-
tween respondent’s educational level (rho = 0.21, n = 905, p < 0.001), age (rho = 0.17, n =905, p <
0.001), father’s educational level (rho = 0.15, n = 834, p < 0.001), mother’s educational level (rho =
0.09, n = 867, p < 0.01), size of residential community (rho = 0.10, n = 905, p < 0.01), and political
interest. In sum, more educated, older young people, who come from larger communities and have
more well educated fathers and mothers are more interested in politics.48
These results, showing low levels of political interest among socio-demographic correlates, are
largely in accordance with the findings of previous studies on Slovenian youth (Kirbiš and Flere,
2011, 199, 216) and youth from other countries; for example, russia and Poland (Zarycki, 2009, 5),
Croatia (Ilišin, 2003, 49), Austria (Zeglovits and Zandonella, 2013), and Canada (Gauthier, 2003).
Previous studies have also found that social class, educational career, and qualifications signifi-
48 These results also largely hold true for individual areas of political interest.
25 %16 % 13 %
6 %
35 %25 %
17 % 17 %
54 %
21 %26 %
0 %
20 %
40 %
60 %
80 %
100 %
Politics in their county EU politics World politics Politics in the Balkans
Interest in areas of politics
SLO CRO KOS

218 pOLiTiCS aND DEMOCRaCy andrej Kirbiš and barbara zagorc
cantly impact young people’s interest in politics (henn et al., 2005, 564), which also holds true
for Slovenia.
2.3 Ideology no more?
The following section analyzes the ideological orientations of Slovenian youth. One frequently
used measure of ideological orientation is the left-right distinction, which has been extensive-
ly researched over the last decade (see, among others, ho et al., 2003; Jou, 2011; Laufer et al.,
2009). In this study’s questionnaire, respondents were asked to position themselves as “left” or
“right” on a 1-10 point scale (in 2000 and 2010, a 0-10 point scale was used). The 2013 mean was
only slightly off center, a value of 5.5 (M = 5.06, Sd = 1.63). To enable a longitudinal comparison,
both original scales were re-recorded in the following way: values 1–3 (or 0–3 for 2010 and 2000)
were coded as “left”, values 4–7 (or 4–6) as “center” and 8–10 (or 7–10) as “right”. The results are
shown in the figure below; note that due to the different scales, the longitudinal results are not
completely comparable.
Figure 91: Percentages of left, right and centrist political-ideological orientations of Slovenian youth (16-27 years) in 2000, 2010 and 2013, including “don’t knows”
Note: Respondents were asked to position themselves on a 1–10 left-right scale (in 2013) and 0–10 left-right scale (in 2010 and 2000). For the purpose of comparison, both original scales were re-recorded into three categories; 1–3 (0–3 in 2000 and 2010) as “left”, 4–7 (4–6 in 2000 and 2010) as “center” and 8–10 (7–10) as “right”. The percentages for each category are shown in the figure.
Sources: Youth 2000, Youth 2010 and CEPYUS-FES Slovenian 2013 Youth Study.
The majority of youth in 2013 (55 percent) identified themselves as centrists; there are slightly
more left-oriented (a difference of 4 percentage points) than right-oriented youth. Interestingly, 29
percent of respondents claimed they are not familiar with the meaning of the left-right distinc-
tion. Between 2000 and 2013, there has been an increase in center-oriented youth, as well as an
increase in the incomprehension of the left-right distinction. Adding together the percentages of
19
17
10
47
61
55
10
10
6
23
12
29
0 % 20 % 40 % 60 % 80 % 100 %
2000
2010
2013
Left-right orientation in political spectrum
Left Center Right Don't know what "left-right" means
andrej Kirbiš and barbara zagorc pOLiTiCS aND DEMOCRaCy 219
centrist youth with those who claimed they “don’t know”, the percentages increase from 70 per-
cent in 2000, to 73 percent in 2010, and up to 84 percent in 2013.
After that, the “don’t knows” were excluded, which showed an increase in center-oriented
youth; from 61 percent in 2000 to 78 percent in 2013. In 2000, 25 percent of youth claimed to be
left-oriented, whereas only 14 percent did the same in 2013. Similiarly, 14 percent claimed to be
right-oriented youth in 2000, 11 percent in 2010, and 8 percent in 2013. Consequently, and after
taking into account the methodological issues, the longitudinal analysis indicates that the propor-
tion of left- and right-oriented youth is declining; overall, youth are increasingly becoming more
center-oriented.
On the other hand, it would be premature to conclude that ideological self-positioning reflects
only upon political ideology. It is likely that they also reflect the general disinterest in formal poli-
tics, distrust of political institutions, and especially political parties, and the perceived unrespon-
siveness of political institutions to citizen demands (see the latter part of this chapter; also see
Kirbiš and Flere, 2011). In other words, if youth are distrustful of established left and right political
parties, it is possible to speculate that as a consequence, they position themselves more to the
center (or, as 29 percent of respondents indicated, they do not understand the meaning of left and
right, which might also be understood as youth separation from formal (“old school”) politics). In
this context, it is worth reiterating that a wave of mass protests have taken place over 2012 and
2013 in Slovenia, whereby the common current was a general belief that allpolitical parties (over
the entire left-right spectrum) are basically “the same”. In short, politicians, regardless of the
ideological stance, do not care about citizens and are overwhelmingly corrupt.49 Such attitudes
echo a deep distrust in politics, which had already been detected in the Youth 2010 study (Kirbiš
and Flere, 2011).
In perusing the 2013 sample, there appear to be significant associations (rho = -0.17, n = 651,
p < 0.001) between the size of one’s residential community and left-right orientation, e.g., youth
in Ljubljana and Maribor tend to be more left-oriented. Also, by a margin of 10 percentage points,
young people from smaller-size residential communities do not know what left-right signifies. In
addition, the more right-oriented tend to be men (rho = -0.08, n = 651, p < 0.05), youth with less
educated mothers (rho = -0.12, n = 633, p < 0.01) and less educated fathers (rho = -0.08, n = 609,
p < 0.05). In sum, the results indicate that Slovenian youth are not a homogeneous group in terms
of ideological political orientations. different factors impact upon and indvidiual’s left-right orien-
tation, including the size of one’s residential commniity, gender, and his/her level of education.
2.4 Participation in elections
Previous studies of electoral participation have shown that young people are less likely to vote,
whereas the middle-aged are most likely (see Kirbiš and Flere, 2011; Norris, 2002, 90; Quintelier,
49 Corruption by Slovenian elites as perceived by the public is not necessarily in accordance with the more widely used corruption indices. For instance, in 2012 Slovenia ranked 37 out of 174 world countries regarding corruption in the public sector (Transparency International, 2013). Slovenia has a similar position in the World Bank’s Control of Corruption Index (2013).

220 pOLiTiCS aND DEMOCRaCy andrej Kirbiš and barbara zagorc
2007a). This trend is evident in almost every included country, with the rare exception of countries
like Australia, where voting is compulsory (Norris, 2002, 90).
Figure 92 shows electoral participation among Slovenian youth of legal age (aged 18 to 27)50;
the total sample, and by the three educational levels: young people who only finished or did not
finish elementary school, secondary educational level, and tertiary level. Looking at the total sam-
ple data, the majority of respondents (37 percent) have voted in “a few elections”, followed by
“voted in most elections” (31 percent). Curiously, only 15 percent have voted in all elections. Fur-
ther, there is a positive correlation (rho = 0.21, n = 787, p < 0.001) between electoral participation
and respondents’ educational levels. More specifically, 60 percent of respondents with tertiary
education participated in “most” or “all elections”, while 49 percent of respondents with second-
ary education, and only 27 percent of respondents with primary education or less participated in
“most” or “all elections”, indicating that the frequency of voting in past elections increases with
respondents’ levels of education.
Figure 92: Frequency of voting in past elections since turning eligible to vote among Slovenian youth (18–27 years), total sample and by respondent’s education level
Note: Analysis includes only those respondents who already turned eligible to vote at the time of the survey (18 years or older).
Source: CEPYUS-FES Slovenian 2013 Youth Study.
It was also found that older youth (rho = 0.13, n = 787, p < 0.001), and those with better-educat-
ed fathers (rho = 0.11, n = 728, p < 0.01) are more likely to attend elections.
These findings support the data from previous research of Slovenian youth (e.g., Kirbiš and
Flere, 2011, 217) and youth in other countries (Caprara, 2008; Gidengil et al., 2003; Lopes et al.,
50 In Slovenia, the voting age is 18. Thus, the data includes only those aged 18+.
35 %
12 %
12 %
17 %
38 %
38 %
27 %
37 %
14 %
34 %
43 %
31 %
13 %
15 %
17 %
15 %
0 % 20 % 40 % 60 % 80 % 100 %
Elementary education or less
Secondary education
Tertiary education
Total sample
How many times have you voted since since turning eligible to vote?
Never In a few elections In most elections In all elections since I've obtained the right to vote
Respondent'seducational level

andrej Kirbiš and barbara zagorc pOLiTiCS aND DEMOCRaCy 221
2009). It has further been found that political participation does not depend as much on age co-
hort, as it does on the level of one’s education (Quintelier, 2007a, 176). Interestingly, a study by
Kam and Palmer (2008) has shown that higher education by itself does not necessarily contribute
to greater participation. Instead, they conclude that pre-adult characteristics seem to be the cause
of political participation, and higher education a proxy of pre-adult experiences and influences
(Kam and Palmer, 2008, 613).
various studies have shown that young people perceive elections as inefficient. For example,
a study of British youth concluded that they view elections as a limited option of political partici-
pation. In short, they disagree that participation in elections can impact society. Curiously, these
same youth still believe in the idea of democracy (henn et al., 2005). In post-socialist Poland, the
basic values of the people (i.e., cultural causes) and the self-perceptions of the representativeness
of political institutions (i.e., institutional cause) are important factors that affect political partici-
pation (Tworzecki, 2008). Finally, the 2010 Youth study also found (via both quantitative methods
and via interviews) that voting and elections are seen as ineffective and unable to bring about
meaningful political change (Kirbiš and Flere, 2011, 201).
Of course, political parties are one of the key actors in the electoral process. As Bibič noted
(1997, 133, 135), they are “the main condition of (political) democracy”. Thus, it can be argued that
without parties there is no modern democracy, yet with parties, and without the participation of
the masses, partitocracy can occur.51 As the results at the end of this section indicate, Slovenian
youth are highly distrustful of political parties, which is perhaps the strongest reason in favor of
their low electoral turnout.
The respondents were next asked which party they “would vote for if elections were held to-
morrow”. Below are the results for all answers including “don’t know” and “I wouldn’t participate
in the elections” for the group aged 18–27.
As Figure 93 illustrates, the majority of respondents indicated that they would not participate in
elections (41.8 percent of those aged 18–27) and 26 percent “do not know” which party they would
vote. Only 32.2 percent of Slovenian youth (aged 18-27) would attend elections, which presents a
serious problem for democracy as a system of government, as it presupposes citizen participation
(Almond and verba, 1989; Arendt, 1998; Brezovšek, 1995, 199; Norris, 2002).
regarding socio-demographic determinants, gender was the primary correlate (χ2 (9, n = 807)
= 23.94, p < 0.01, C = 0.17), with more women than men (by a difference of 8 percentage points)
reporting they do not know which party they would vote for.
51 Partitocracy can be defined as “party-rule or rule of the parties” (García-Trevijano, 2009, 9). In other words, it is “a form of government in which influential personages within the political parties, rather than an executive accountable to parliament, are the primary basis of rule, determining the use of public resources, the allocation of important posts and ultimately the development of policy” (Partridge, 1998, 69).

222 pOLiTiCS aND DEMOCRaCy andrej Kirbiš and barbara zagorc
Figure 93: Party choice and electoral participation of Slovenian youth (18–27 years)
Note: Political parties provided to choose from in the survey were parliamentary political parties at the time of the survey.
Source: CEPYUS-FES Slovenian 2013 Youth Study.
2.5 Satisfaction with democracy
This survey also questioned youth satisfaction with democracy, which may shed light on their
attitude toward the overall functioning of the democratic system in Slovenia, rather than the
broader question of democracy as a political system. Longitudinal observations (see Figure 94) in-
dicate that satisfaction with democracy is decreasing among Slovenian youth (as well, the oppo-
site also holds true, dissatisfaction with democracy is increasing). More specifically, when adding
together the two extreme scores on both sides of the continuum, one can see that 23 percent of
youth were “satisfied/very satisfied” with democracy in 2000. In 2010, this figure decreased to 14
percent, and by 2013, only 8 percent of respondents claimed to be satisfied with democracy. On
the other hand, 21 percent of young people were very dissatisfied or dissatisfied with democracy
in 2000 (compared to 47 percent in 2010 and a staggering 60 percent in 2013).
higher self-assessed family material status (rho = 0.13, n = 909, p < 0.001), lower age (rho = -0.13,
n = 909, p < 0.001) and lower monthly income (rho = -0.11, n = 870, p < 0.001) are all associated with
higher satisfaction with democracy.
In the 2010 Youth study (Kirbiš and Flere, 2011, 218-219), it was found that youth who are not
satisfied with democracy are less politically active. In contrast, the 2013 data (among those aged
18–27) show that there is no significant correlation (p > 0.05) between satisfaction with democracy
1,7%
2,1%
2,5%
2,9%
4,4%
5,0%
6,3%
7,3%
26,0%
41,8%
New Slovenia (Nsi – Ljudmila Novak)
Slovenian People's Party (SLS – Franc Bogovič)
Other party
Democratic Party of Pensioners of Slovenia …
Civic List (DL – Gregor Virant)
Slovenian Democratic Party (SDS – Janez Janša)
Social Democrats (SD – Igor Lukšič)
Positive Slovenia (PS – Alenka Bratušek)
I don't know
I wouldn't attend elections
If parliamentary elections were held tomorrow, which political party would you vote for?
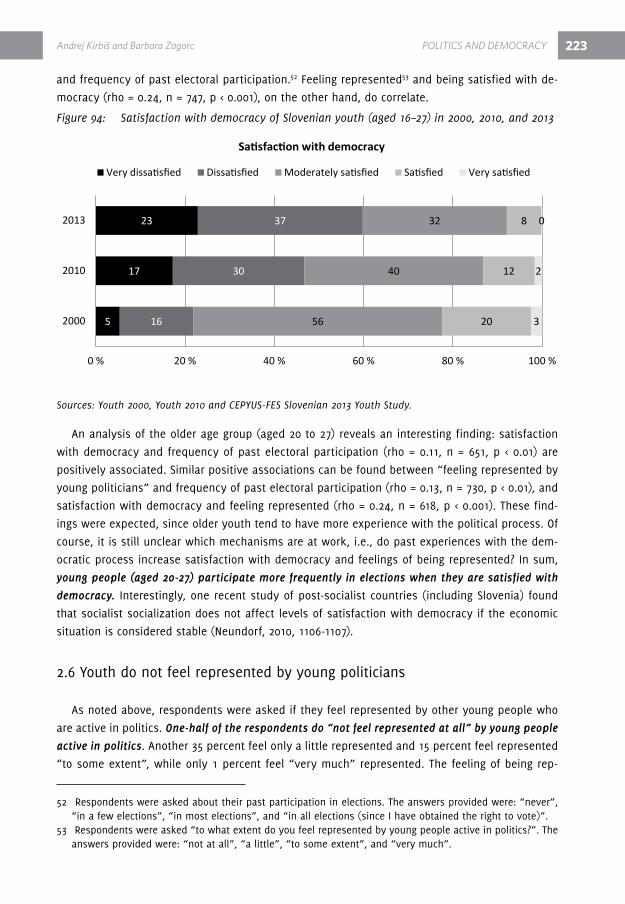
andrej Kirbiš and barbara zagorc pOLiTiCS aND DEMOCRaCy 223
and frequency of past electoral participation.52 Feeling represented53 and being satisfied with de-
mocracy (rho = 0.24, n = 747, p < 0.001), on the other hand, do correlate.
Figure 94: Satisfaction with democracy of Slovenian youth (aged 16–27) in 2000, 2010, and 2013
Sources: Youth 2000, Youth 2010 and CEPYUS-FES Slovenian 2013 Youth Study.
An analysis of the older age group (aged 20 to 27) reveals an interesting finding: satisfaction
with democracy and frequency of past electoral participation (rho = 0.11, n = 651, p < 0.01) are
positively associated. Similar positive associations can be found between “feeling represented by
young politicians” and frequency of past electoral participation (rho = 0.13, n = 730, p < 0.01), and
satisfaction with democracy and feeling represented (rho = 0.24, n = 618, p < 0.001). These find-
ings were expected, since older youth tend to have more experience with the political process. Of
course, it is still unclear which mechanisms are at work, i.e., do past experiences with the dem-
ocratic process increase satisfaction with democracy and feelings of being represented? In sum,
young people (aged 20-27) participate more frequently in elections when they are satisfied with
democracy. Interestingly, one recent study of post-socialist countries (including Slovenia) found
that socialist socialization does not affect levels of satisfaction with democracy if the economic
situation is considered stable (Neundorf, 2010, 1106-1107).
2.6 Youth do not feel represented by young politicians
As noted above, respondents were asked if they feel represented by other young people who
are active in politics. One-half of the respondents do “not feel represented at all” by young people
active in politics. Another 35 percent feel only a little represented and 15 percent feel represented
“to some extent”, while only 1 percent feel “very much” represented. The feeling of being rep-
52 respondents were asked about their past participation in elections. The answers provided were: “never”, “in a few elections”, “in most elections”, and “in all elections (since I have obtained the right to vote)”.
53 respondents were asked “to what extent do you feel represented by young people active in politics?”. The answers provided were: “not at all”, “a little”, “to some extent”, and “very much”.
5
17
23
16
30
37
56
40
32
20
12
8
3
2
0
0 % 20 % 40 % 60 % 80 % 100 %
2000
2010
2013
Satisfaction with democracy
Very dissatisfied Dissatisfied Moderately satisfied Satisfied Very satisfied
224 pOLiTiCS aND DEMOCRaCy andrej Kirbiš and barbara zagorc
resented by politically active youth correlates only with those who have better-educated fathers
(rho = 0.08, n = 771, p < 0.05).
These results corroborate data found in other countries, including the U.K. (henn et al., 2005)
and Croatia (Ilišin, 2003). Young people across Europe do not feel represented by politically active
young people, which can negatively affect the likelihood of youth turnout on election day.
As mentioned, in the sample of 18–27 year-olds there is a positive link between feeling repre-
sented and electoral participation54 (rho = 0.13, n = 730, p < 0.001). As well, feeling represented and
satisfaction with democracy55 (rho = 0.24, n = 747, p < 0.001) also correlate. In sum, young people
who feel less represented by politically active peers are less likely to attend elections and are less
satisfied with democracy.
2.7 (dis)belief in political influence and its consequences
Numerous authors (e.g., Burns et al., 2001, 33) have noted that one of the key psychological de-
terminers facilitating political participation is the feeling that one can influence the political scene
(i.e., external political efficacy/competence), which in this context refers to the sense of perceived
responsiveness by political institutions to citizen demands. This has been corroborated in numer-
ous empirical studies on (conventional) political participation (Burns et al., 2001, 268; Schulz, 2005;
Mannarini et al., 2008; among Slovenian youth (Kirbiš and Flere, 2011, 218).56 External political ef-
ficacy is also associated with other motivational variables, such as political interest (Kenski and
Stroud, 2006). Further, a panel study conducted by Finkel (1985) found that political participation
positively affects external political efficacy.
This study used external political efficacy measures for perceived political influence on national
institutions, and perceived influence on local institutions (i.e., their perceived responsiveness to
citizen demands). In general, more young people (aged 16–27) have higher self-perceived influence
on local institutions than on national institutions (Figure 95). In fact, by a margin of 10 percentage
points, young people (25 percent) believe they are able to influence local institutions more than
national institutions. Only 15 percent of youth believe that they have “a lot/some” influence on
national institutions, while 25 percent believe that they have “a lot/some” influence on local insti-
tutions. These results are in accordance with other studies; for example, a study of Britain’s youth
showed that they feel unable to influence political institutions (henn et al., 2005, 566).
54 respondents were asked about their past participation in elections. The provided answers were: “never”, “in a few elections”, “in most elections”, and “in all elections (since I have obtained the right to vote)”.
55 Satisfaction with democracy was measured on a 5-point scale (1 = very dissatisfied, 2 = dissatisfied, 3 = moderately satisfied, 4 = satisfied, 5 = very satisfied).
56 Interestingly, according to some studies people with a high degree of internal political efficacy (feeling competent to participate and understand politics) and a low degree of external political efficacy are more likely to engage in protest activities (see Chang and Chyi, 2009).
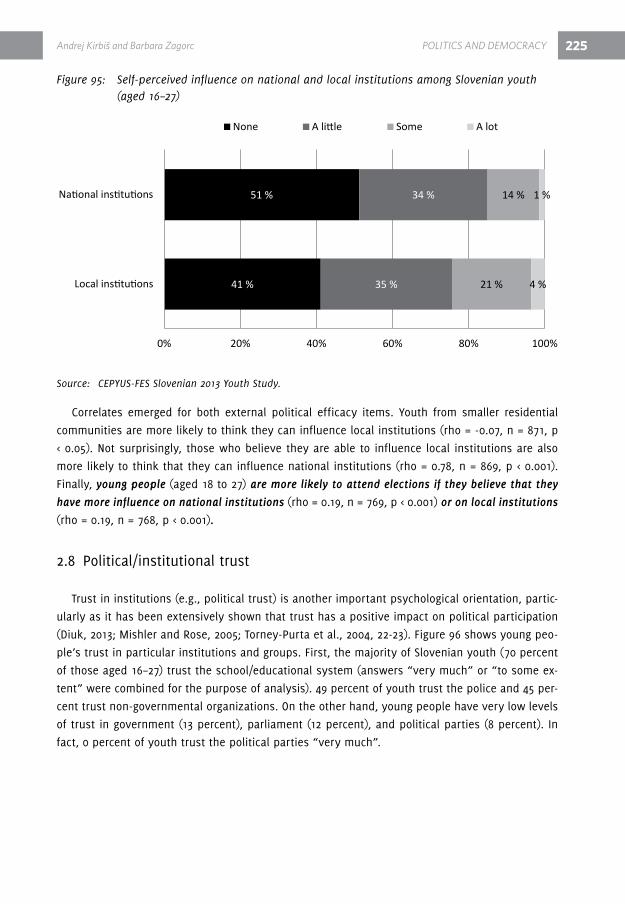
andrej Kirbiš and barbara zagorc pOLiTiCS aND DEMOCRaCy 225
Figure 95: Self-perceived influence on national and local institutions among Slovenian youth (aged 16–27)
Source: CEPYUS-FES Slovenian 2013 Youth Study.
Correlates emerged for both external political efficacy items. Youth from smaller residential
communities are more likely to think they can influence local institutions (rho = -0.07, n = 871, p
< 0.05). Not surprisingly, those who believe they are able to influence local institutions are also
more likely to think that they can influence national institutions (rho = 0.78, n = 869, p < 0.001).
Finally, young people (aged 18 to 27) are more likely to attend elections if they believe that they
have more influence on national institutions (rho = 0.19, n = 769, p < 0.001) or on local institutions
(rho = 0.19, n = 768, p < 0.001).
2.8 Political/institutional trust
Trust in institutions (e.g., political trust) is another important psychological orientation, partic-
ularly as it has been extensively shown that trust has a positive impact on political participation
(diuk, 2013; Mishler and rose, 2005; Torney-Purta et al., 2004, 22-23). Figure 96 shows young peo-
ple’s trust in particular institutions and groups. First, the majority of Slovenian youth (70 percent
of those aged 16–27) trust the school/educational system (answers “very much” or “to some ex-
tent” were combined for the purpose of analysis). 49 percent of youth trust the police and 45 per-
cent trust non-governmental organizations. On the other hand, young people have very low levels
of trust in government (13 percent), parliament (12 percent), and political parties (8 percent). In
fact, 0 percent of youth trust the political parties “very much”.
41 %
51 %
35 %
34 %
21 %
14 %
4 %
1 %
0% 20% 40% 60% 80% 100%
Local institutions
National institutions
None A little Some A lot
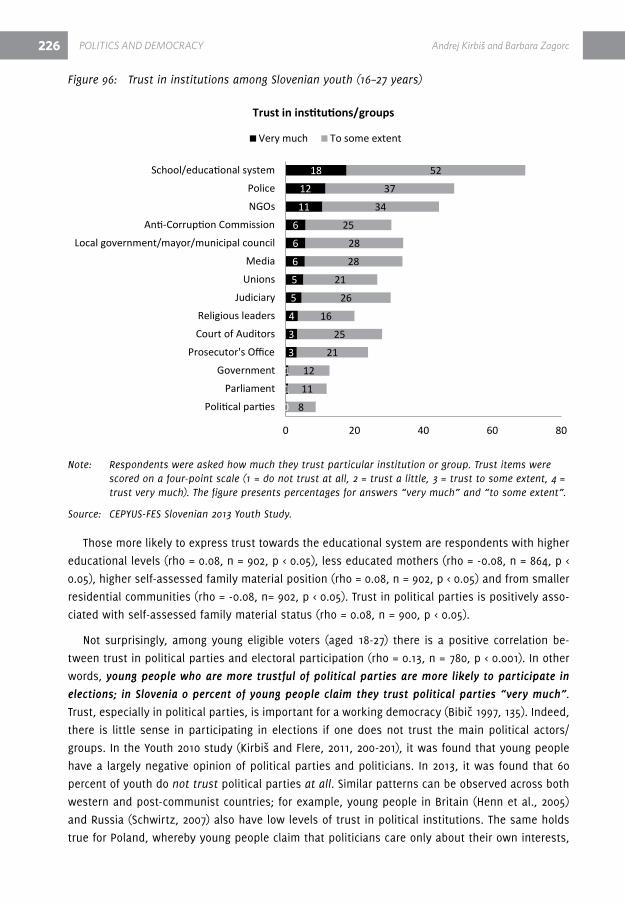
226 pOLiTiCS aND DEMOCRaCy andrej Kirbiš and barbara zagorc
Figure 96: Trust in institutions among Slovenian youth (16–27 years)
Note: Respondents were asked how much they trust particular institution or group. Trust items were scored on a four-point scale (1 = do not trust at all, 2 = trust a little, 3 = trust to some extent, 4 = trust very much). The figure presents percentages for answers “very much” and “to some extent”.
Source: CEPYUS-FES Slovenian 2013 Youth Study.
Those more likely to express trust towards the educational system are respondents with higher
educational levels (rho = 0.08, n = 902, p < 0.05), less educated mothers (rho = -0.08, n = 864, p <
0.05), higher self-assessed family material position (rho = 0.08, n = 902, p < 0.05) and from smaller
residential communities (rho = -0.08, n= 902, p < 0.05). Trust in political parties is positively asso-
ciated with self-assessed family material status (rho = 0.08, n = 900, p < 0.05).
Not surprisingly, among young eligible voters (aged 18-27) there is a positive correlation be-
tween trust in political parties and electoral participation (rho = 0.13, n = 780, p < 0.001). In other
words, young people who are more trustful of political parties are more likely to participate in
elections; in Slovenia 0 percent of young people claim they trust political parties “very much”.
Trust, especially in political parties, is important for a working democracy (Bibič 1997, 135). Indeed,
there is little sense in participating in elections if one does not trust the main political actors/
groups. In the Youth 2010 study (Kirbiš and Flere, 2011, 200-201), it was found that young people
have a largely negative opinion of political parties and politicians. In 2013, it was found that 60
percent of youth do not trust political parties at all. Similar patterns can be observed across both
western and post-communist countries; for example, young people in Britain (henn et al., 2005)
and russia (Schwirtz, 2007) also have low levels of trust in political institutions. The same holds
true for Poland, whereby young people claim that politicians care only about their own interests,
0
1
1
3
3
4
5
5
6
6
6
11
12
18
8
11
12
21
25
16
26
21
28
28
25
34
37
52
0 20 40 60 80
Political parties
Parliament
Government
Prosecutor's Office
Court of Auditors
Religious leaders
Judiciary
Unions
Media
Local government/mayor/municipal council
Anti-Corruption Commission
NGOs
Police
School/educational system
Trust in institutions/groups
Very much To some extent
andrej Kirbiš and barbara zagorc pOLiTiCS aND DEMOCRaCy 227
that their policies do not represent ordinary people, and that they are not to be trusted because
they are in general dishonest (77 percent of respondents agree with these views) (Tworzecki, 2008;
also see Kirbiš and Flere, 2011).
The low levels of trust in political institutions across western and post-communist democracies
are worrisome. Aside from the purely negative effect on political participation, distrust in polit-
ical institutions has also been linked to “permissiveness to law breaking behavior” (Marien and
hooghe, 2011).
3 Sources and influences of political attitudes and participation
This section analyzes youth sources of information about politics. Where relevant, the results
were compared to data from Croatia, Kosovo, and Germany. Parental influence on youth political
participation was also investigated.
3.1 Sources of information about politics
A number of recent studies have analyzed the levels and consequences of information about
politics among democratic publics. In general, research confirms the positive impact of informa-
tion on political participation (Lewis, 2011; rekklang, 2012; but compare to Levendusky, 2011). As
such, this study focused on the main sources of political information for young people in Slovenia.
Figure 97 shows that 81 percent of Slovenian youth (aged 16–25) acquire information about
politics from the Internet, and 71 percent from television.57 Among the provided answers, only 26
percent claimed their source of information derived from conversations with family (for friends,
30 percent). By and large, Slovenian youth acquire information from the Internet more so than
in other countries. While Tv is the second most important source of political information for Slo-
venian youth, it is nevertheless the lowest among comparable countries. Interestingly, twice as
many Germans acquire information from newspapers than youth from other countries. In addition,
a rather high proportion (20 percent) of Kosovars said that they gain information about politics
from “other sources”.
Among Slovenians aged 16-27, several correlates of sources of information about politics
emerged. The Internet as a political source correlates with higher education levels (χ2 (2, n = 907)
= 6.82, p < 0.05, C = 0.09), better-educated fathers (χ2 (2, n = 835) = 9.25, p < 0.01, C = 0.11) and bet-
ter-educated mothers (χ2 (2, n = 869) = 6.55, p < 0.05, C = 0.09). Tv as a source correlates with living
in smaller size residential communities (χ2 (2, n = 907) = 11.76, p < 0.01, C = 0.11).
57 Watching political debates on television is analyzed more in depth in the following sections.

228 pOLiTiCS aND DEMOCRaCy andrej Kirbiš and barbara zagorc
Figure 97: Sources of information about political events among Slovenian, Croatian, Kosovo and German youth (aged 16–25)
Note: Respondents were asked to choose from a list of sources of political information with the possibility of choosing more than one source. The figure above presents the percentages of respondents choosing specific political sources.
Sources: CEPYUS-FES Slovenian 2013 Youth Study, IDIZ-FES Croatian 2012 Youth Study, IDRA-FES Kosovo 2012 Youth Study and Shell 2010 German Youth Study.
These results are consistent with data found in other countries (e.g., Canada). Specifically, the
Internet as a source of information about politics was found to increase among young people with
higher levels of education (Gidengil et al., 2003). The results in this survey also corroborate Zoro-
ja’s (2011) study, which found that in post-socialist countries there are less Internet users, though
the rates of Internet use in Estonia and Slovenia are comparable to more well-developed European
countries.
Studies have also shown that Internet usage can mobilize youth political participation within
certain limits (e.g., hirzalla et al., 2011). here the results indicate that the Internet has the potential
to encourage political participation among Slovenian youth (similar to other countries). In Chile,
for example, a positive correlation was found between news consumption, Facebook use, and po-
litical participation. On the other hand, entertainment media consumption had a negative impact
on political participation (Scherman and Arriagada, 2012). The positive effects of Internet use were
also found In Kirbiš and Naterer’s youth study (2011), whereby several types of online political/civ-
ic activities (use of social media sites, writing opinions on forums and/or blogs, signing electronic
petitions, and writing or forwarding emails with political content) were positively associated with
offline conventional and unconventional political participation. They also found a strong positive
association between online and offline political participation (r ≥ 0.45; p < 0.001). The authors con-
cluded that since the use of new technologies, and especially the Internet, has been increasing in
81
71
32 32 3026
0
57
73
12
3022 24
1
62
83
17
3424
17 20
64
78
61
12
0
20
40
60
80
100
The Internet Television Radio Newspapers Discussionswith friends /acquaintances
Discussions inthe family
Other
Sources of information about politics
SLO CRO KOS GER
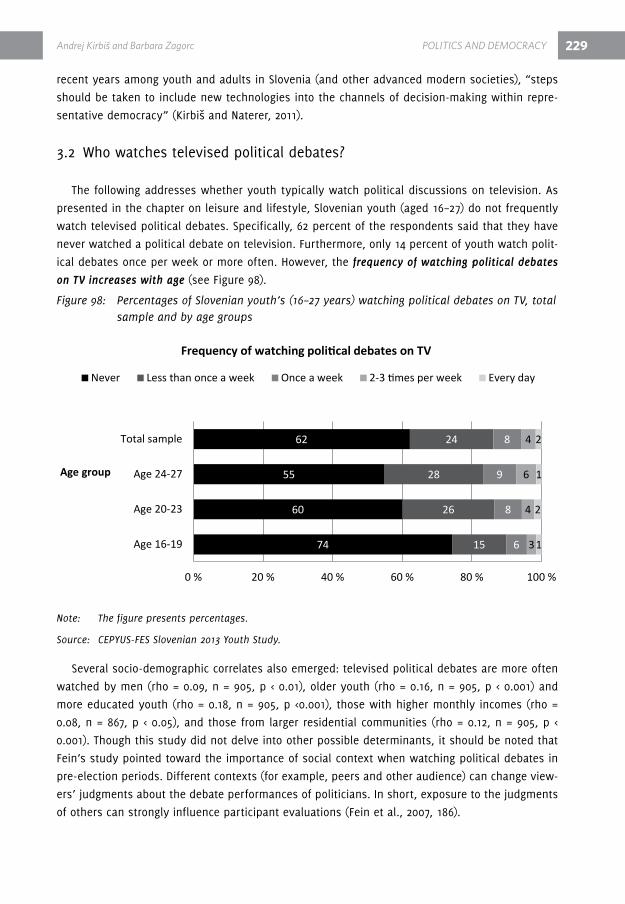
andrej Kirbiš and barbara zagorc pOLiTiCS aND DEMOCRaCy 229
recent years among youth and adults in Slovenia (and other advanced modern societies), “steps
should be taken to include new technologies into the channels of decision-making within repre-
sentative democracy” (Kirbiš and Naterer, 2011).
3.2 Who watches televised political debates?
The following addresses whether youth typically watch political discussions on television. As
presented in the chapter on leisure and lifestyle, Slovenian youth (aged 16–27) do not frequently
watch televised political debates. Specifically, 62 percent of the respondents said that they have
never watched a political debate on television. Furthermore, only 14 percent of youth watch polit-
ical debates once per week or more often. however, the frequency of watching political debates
on TV increases with age (see Figure 98).
Figure 98: Percentages of Slovenian youth’s (16–27 years) watching political debates on TV, total sample and by age groups
Note: The figure presents percentages.
Source: CEPYUS-FES Slovenian 2013 Youth Study.
Several socio-demographic correlates also emerged: televised political debates are more often
watched by men (rho = 0.09, n = 905, p < 0.01), older youth (rho = 0.16, n = 905, p < 0.001) and
more educated youth (rho = 0.18, n = 905, p <0.001), those with higher monthly incomes (rho =
0.08, n = 867, p < 0.05), and those from larger residential communities (rho = 0.12, n = 905, p <
0.001). Though this study did not delve into other possible determinants, it should be noted that
Fein’s study pointed toward the importance of social context when watching political debates in
pre-election periods. different contexts (for example, peers and other audience) can change view-
ers’ judgments about the debate performances of politicians. In short, exposure to the judgments
of others can strongly influence participant evaluations (Fein et al., 2007, 186).
74
60
55
62
15
26
28
24
6
8
9
8
3
4
6
4
1
2
1
2
0 % 20 % 40 % 60 % 80 % 100 %
Age 16-19
Age 20-23
Age 24-27
Total sample
Frequency of watching political debates on TV
Never Less than once a week Once a week 2-3 times per week Every day
Age group
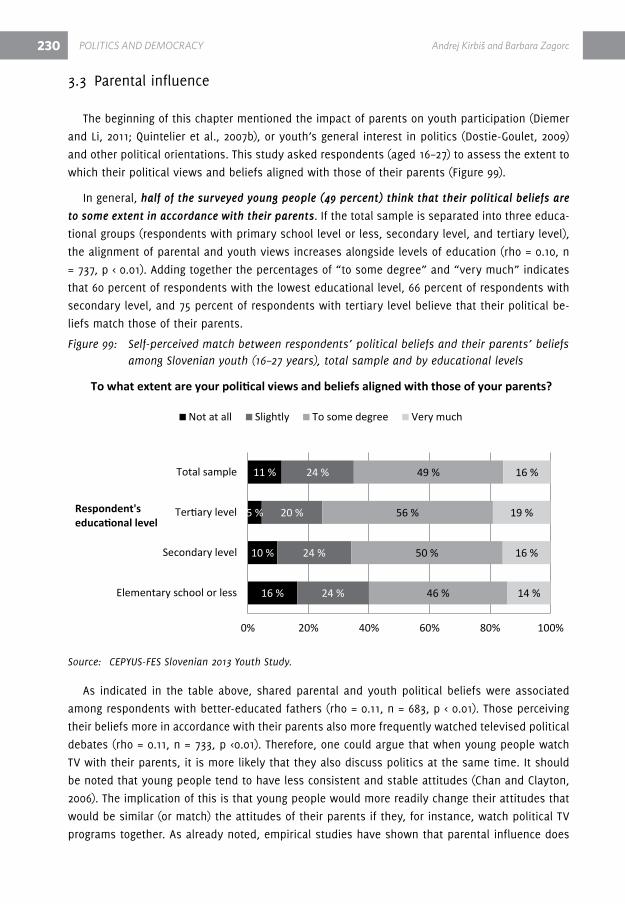
230 pOLiTiCS aND DEMOCRaCy andrej Kirbiš and barbara zagorc
3.3 Parental influence
The beginning of this chapter mentioned the impact of parents on youth participation (diemer
and Li, 2011; Quintelier et al., 2007b), or youth’s general interest in politics (dostie-Goulet, 2009)
and other political orientations. This study asked respondents (aged 16–27) to assess the extent to
which their political views and beliefs aligned with those of their parents (Figure 99).
In general, half of the surveyed young people (49 percent) think that their political beliefs are
to some extent in accordance with their parents. If the total sample is separated into three educa-
tional groups (respondents with primary school level or less, secondary level, and tertiary level),
the alignment of parental and youth views increases alongside levels of education (rho = 0.10, n
= 737, p < 0.01). Adding together the percentages of “to some degree” and “very much” indicates
that 60 percent of respondents with the lowest educational level, 66 percent of respondents with
secondary level, and 75 percent of respondents with tertiary level believe that their political be-
liefs match those of their parents.
Figure 99: Self-perceived match between respondents’ political beliefs and their parents’ beliefs among Slovenian youth (16–27 years), total sample and by educational levels
Source: CEPYUS-FES Slovenian 2013 Youth Study.
As indicated in the table above, shared parental and youth political beliefs were associated
among respondents with better-educated fathers (rho = 0.11, n = 683, p < 0.01). Those perceiving
their beliefs more in accordance with their parents also more frequently watched televised political
debates (rho = 0.11, n = 733, p <0.01). Therefore, one could argue that when young people watch
Tv with their parents, it is more likely that they also discuss politics at the same time. It should
be noted that young people tend to have less consistent and stable attitudes (Chan and Clayton,
2006). The implication of this is that young people would more readily change their attitudes that
would be similar (or match) the attitudes of their parents if they, for instance, watch political Tv
programs together. As already noted, empirical studies have shown that parental influence does
16 %
10 %
5 %
11 %
24 %
24 %
20 %
24 %
46 %
50 %
56 %
49 %
14 %
16 %
19 %
16 %
0% 20% 40% 60% 80% 100%
Elementary school or less
Secondary level
Tertiary level
Total sample
To what extent are your political views and beliefs aligned with those of your parents?
Not at all Slightly To some degree Very much
Respondent'seducational level

andrej Kirbiš and barbara zagorc pOLiTiCS aND DEMOCRaCy 231
matter for youth’s political participation (diemer and Li, 2011; Quintelier et al., 2007b), political
attitudes (Quintelier et al., 2007b) and political interest (dostie-Goulet, 2009). Interestingly, par-
ents with higher socio-economic statuses are more effective in transmitting their attitudes and
behaviors onto their children, and intergenerational transmission has been found to be more pro-
nounced in stable democracies than in post-communist countries (Quintelier et al., 2007b, 24-25).
respondents were next asked to assess the extent to which their parents are interested in
politics (Figure 100). Most respondents (45 percent) reported that their parents are “slightly in-
terested” in “political events/politics in general”, while only 6 percent are “strongly interested”
in politics. Since mother’s educational level emerged as the only substantial (though still weak)
socio-demographic correlate (see below), the responses “very interested” and “interested” were
added together, while mother’s education level was separated into three groups. Figure 100 shows
that parents’ interest in politics increases with mother’s higher educational level. Specifically, 26
percent of respondents with only elementary school educated mothers, 30 percent with secondary
levels, and 38 percent with tertiary levels have parents that are “interested” or “strongly interest-
ed” in politics. Of course, this might indicate that respondents mostly had their mothers’ political
interest in mind when answering this particular question.
Figure 100: Parents’ interest in politics (as assessed by respondents) among Slovenian youth (16–27 years)
Source: CEPYUS-FES Slovenian 2013 Youth Study.
As noted above, assessments of parental political interest correlate with mother’s educational
levels (rho = 0.11, n = 827, p < 0.01). In addition, respondents who assessed their parents as more
interested in politics are more likely to watch political debates on TV (rho = 0.10, n = 851, p < 0.01).
The last finding can be an indication of parental influence on respondents’ interest in politics,
which has been established in previous studies (dostie-Goulet, 2009).
17 %
11 %
9 %
11 %
13 %
13 %
10 %
12 %
44 %
46 %
44 %
45 %
20 %
25 %
31 %
26 %
6 %
5 %
7 %
6 %
0 % 20 % 40 % 60 % 80 % 100 %
Elementary school or less
Secondary level
Tertiary level
Total sample
To what extent are your parents interested in political events/politics in general?
Not interested at all Not interested Slightly interested Interested Strongly interested
Mother's educational level

232 pOLiTiCS aND DEMOCRaCy andrej Kirbiš and barbara zagorc
The results in this study point toward the importance of family in the process of political so-
cialization, defined as “the process by which the individual acquires attitudes, beliefs, and val-
ues relating to the political system of which he is a member and to his own role as citizen within
that political system” (Greenberg, 2009, 3), and which begins in an individual’s early years (Nes-
bitt-Larking, 2007). Indeed, authors generally attribute the family to be important, if not the cen-
tral role in the political socialization process (davies, 1965; George, 2013; Quintelier, 2007b). Inter-
estingly, evidence suggests that those able to participate in family decisions in their earlier years
score higher on the scale of subjective political competence (Almond and verba, 1989, 284–286).
The results in this study indicate that family has a direct (via concordance of political attitudes,
discussions about politics, paternal political interest, following political news, etc.) and indirect
(paternal education, family socioeconomic status) effect on Slovenian youth political engagement.
4 recommendations for the future: youth’s input
The final section of the chapter presents youth views on the actions that should be taken by the
state or areas that the state/government should focus on in terms of political engagement. First,
however, it is important to note some findings in the recent report by UMAr; the link between
both positions is discussed at the end of this section.
In June 2005, the government issued a Strategy of development for Slovenia (SrS 2005–2013).
As well, the Institute of Macroeconomic Analysis and development (UMAr, 2013) recently reviewed
the realization of SrS priorities (economic growth and competitive economy; the use of knowledge
for economic development; efficiency of the state; labor market and welfare state; and sustainable
development) in their report on development 2013. Based on UMAr’s methodology, the report’s
authors have evaluated development within each of the selected indicators (priorities) over recent
years. Economic development indicators fared worst compared to other priorities. The labor mar-
ket was found especially problematic in 2011 and 2012, with high unemployment rates, particular-
ly among youth, which have been increasing since 2008 and are highest among those aged 15-24
(UMAr, 2013, 159; see also the chapter on youth employment).
Turning the focus to what Slovenian young people (aged 16-27) think about priorities or prob-
lems that should be dealt with, Figure 101 indicates several objectives (listed by level of impor-
tance) the Slovenian government should undertake. Each item was scored on a four-point scale
of importance (1 = not important at all, 4 = very important). The most important objectives the
Slovenian government should focus on according to Slovenian youth are employment, economic
growth and development, social justice and security, and crime and corruption. Among the least
important goals are spiritual renewal, the strengthening of military power and national security,
and fostering population growth. In sum, 86 percent of young people believe that the reduction of
unemployment is a “very important” objective that the Slovenian government should focus on.
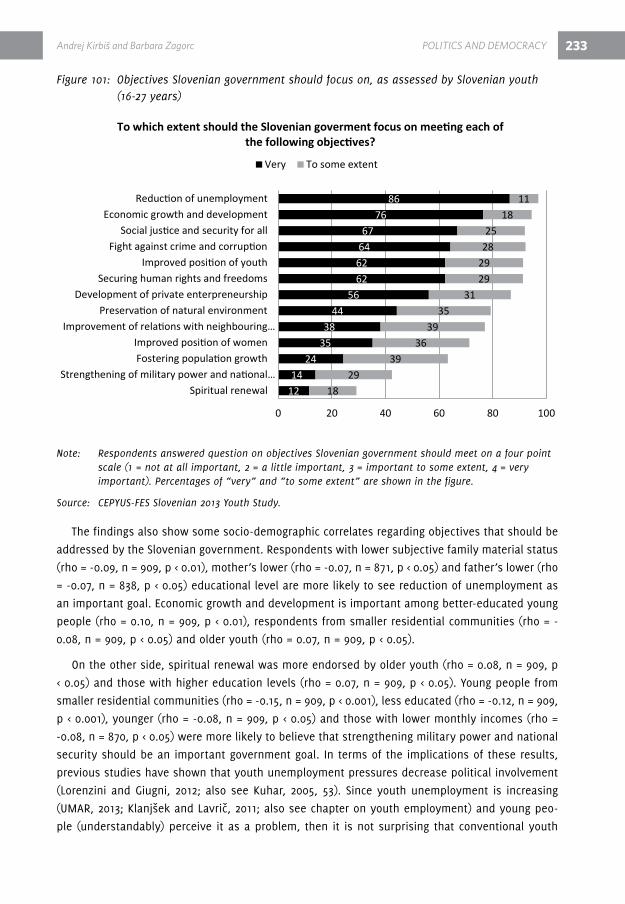
andrej Kirbiš and barbara zagorc pOLiTiCS aND DEMOCRaCy 233
Figure 101: Objectives Slovenian government should focus on, as assessed by Slovenian youth (16-27 years)
Note: Respondents answered question on objectives Slovenian government should meet on a four point scale (1 = not at all important, 2 = a little important, 3 = important to some extent, 4 = very important). Percentages of “very” and “to some extent” are shown in the figure.
Source: CEPYUS-FES Slovenian 2013 Youth Study.
The findings also show some socio-demographic correlates regarding objectives that should be
addressed by the Slovenian government. respondents with lower subjective family material status
(rho = -0.09, n = 909, p < 0.01), mother’s lower (rho = -0.07, n = 871, p < 0.05) and father’s lower (rho
= -0.07, n = 838, p < 0.05) educational level are more likely to see reduction of unemployment as
an important goal. Economic growth and development is important among better-educated young
people (rho = 0.10, n = 909, p < 0.01), respondents from smaller residential communities (rho = -
0.08, n = 909, p < 0.05) and older youth (rho = 0.07, n = 909, p < 0.05).
On the other side, spiritual renewal was more endorsed by older youth (rho = 0.08, n = 909, p
< 0.05) and those with higher education levels (rho = 0.07, n = 909, p < 0.05). Young people from
smaller residential communities (rho = -0.15, n = 909, p < 0.001), less educated (rho = -0.12, n = 909,
p < 0.001), younger (rho = -0.08, n = 909, p < 0.05) and those with lower monthly incomes (rho =
-0.08, n = 870, p < 0.05) were more likely to believe that strengthening military power and national
security should be an important government goal. In terms of the implications of these results,
previous studies have shown that youth unemployment pressures decrease political involvement
(Lorenzini and Giugni, 2012; also see Kuhar, 2005, 53). Since youth unemployment is increasing
(UMAr, 2013; Klanjšek and Lavrič, 2011; also see chapter on youth employment) and young peo-
ple (understandably) perceive it as a problem, then it is not surprising that conventional youth
1214
243538
4456
62626467
7686
1829
3936
3935
3129292825
1811
0 20 40 60 80 100
Spiritual renewalStrengthening of military power and national…
Fostering population growthImproved position of women
Improvement of relations with neighbouring…Preservation of natural environment
Development of private enterpreneurshipSecuring human rights and freedoms
Improved position of youthFight against crime and corruption
Social justice and security for allEconomic growth and development
Reduction of unemployment
To which extent should the Slovenian goverment focus on meeting each of the following objectives?
Very To some extent

234 pOLiTiCS aND DEMOCRaCy andrej Kirbiš and barbara zagorc
political participation is low. In addition, unemployed youth are also more distrustful of politics
(Bay and Blekesaune, 2002), and trusting political leaders and politics in general is an important
element of effective democracy (Almond and verba, 1989; Putnam et al., 1993; Bibič, 1997, 135;
Györffy, 2006). In sum, youth unemployment rates, together with their perception that reducing
unemployment should be the top governmental priority, should provoke political decision-mak-
ers to action.
Beginning with some findings on the fulfillment of conditions which lead to a functioning (i.e.,
effective) democracy, one may conclude that much more can be done in Slovenia, especially where
it regards youth political engagement. First, of course, political elites should send a clear message
whether high(er) levels of youth conventional political participation is also their priority. Further, it
can be argued that future youth political engagement (with or without the aid of new technologies,
and within or outside the realm of conventional forms) will be similar to what rizman (2010, 389)
concluded about globalization – it is what people are willing to make of it. Further, Bennett’s ques-
tion is particularly relevant in this context: “Are politicians, parents, educators, policymakers, and
curriculum developers willing to allow young citizens to more fully explore, experience, and ex-
pand democracy, or will they continue to force them to just read all about it?” (Bennett, 2008, 21).
5 Key findings
Δ 28 percent of Slovenian youth believe participating in civic actions and initiatives is
popular; however, only 10 percent claim that being active in politics is popular.
Δ Slovenian youth are generally not interested in politics. When they are, they tend to
focus on domestic political issues. Better-educated, older youth, with educated fathers
and mothers, and who live in larger sized communities are more interested in politics.
Δ 29 percent of Slovenian youth are not familiar with the left-right ideological distinction,
which is a substantial increase since 2000. In addition, the proportions of left- and
right-oriented Slovenian youth are declining. Youth in Slovenia are increasingly
center-oriented.
Δ The frequency of participating in elections increases with levels of education.
Δ Only 32.2 percent of Slovenian youth (aged 18-27) would attend parliamentary elections
if they were held tomorrow, which presents a serious problem for democracy, especially
with regard to legitimacy.
Δ Satisfaction with democracy has been decreasing since 2000. Young people (aged 20–
27) who are more satisfied with democracy participate in elections more frequently.
Δ half of Slovenian youth “do not feel represented at all” by young people who are active
in politics.
Δ Only 15 percent of youth claim that they have “a lot/some” influence on national
institutions, and 25 percent of youth believe that they have “a lot/some” influence on
andrej Kirbiš and barbara zagorc pOLiTiCS aND DEMOCRaCy 235
local institutions. Slovenian youth will more likely vote if they believe that they have
more influence on national or local institutions.
Δ Youth who are more trustful of political parties are more likely to participate in elections;
in Slovenia, 0 percent of young people expressed having “very much” trust in political
parties.
Δ 81 percent of Slovenian youth (aged 16–25) acquire information about politics from the
Internet.
Δ 62 percent of youth never watch political debates on television, though the frequency
of watching televised political debates increases with age.
Δ Almost half (49 percent) say that their political beliefs to some extent match those of
their parents.
Δ Youth who assess their parents as more interested in politics, are more likely to watch
televised political debates.
Δ 86 percent of Slovenian youth believe that reduction of unemployment is a “very
important” objective for the Slovenian government, followed by economic growth and
development, and social justice and security.
6 referencesAlmond, G., and verba, S. (1989). The Civic Culture: Political Attitudes and democracy in Five Na-
tions. Newbury Park: Sage Publications.
Arendt, h. (1998). The human Condition. 2nd edition. Chicago & London: The University of Chica-
go Press.
Bae et al., (2013). Who will cross the border? – The transition of political discussion into the new-
ly emerged venues. Computers in human Behavior, 29, 2081–2089.
Banfield, E. C. (1991). here the people rule: selected essays. Washington: The AEI Press.
Barber, B. r. (2003). Strong democracy: Participatory Politics for a New Age. Berkeley and Los An-
geles: University of California Press.
Barnes, S. h. (2004). Political participation in post-communist Central and Eastern Europe. Center
for the Study of democracy, Paper 04010. retrieved from: http://repositories.cdlib.org/csd/04-10
(10.11.2007).
Bay, A., and Blekesaune, M. (2002). Youth, unemployment and political marginalisation. Interna-
tional Journal of Social Welfare, 11, 132–139.
Bennett, W.L. (2008). Changing citizenship in the digital age. In W.L. Bennett (Ed.). Civic life on-
line: learning how digital media can engage youth, (pp. 1–24). Cambridge, MA: MIT Press.
Bibič, A. (1997). Politološki preseki: civilna družba in politični pluralizem. Ljubljana: Fakulteta za
družbene vede.
236
Bohman, J. (1996). Public deliberation: Pluralism, Complexity, and democracy. Cambridge, MA:
MIT Press.
Brezovšek, M. (1995). Politična participacija. Prispevek k analizi “participativne demokracije”. Te-
orija in praksa, 32 (3–4), 199–211.
Buckingham, d. (1999). Young People, Politics and News Media: beyond political socialization. Ox-
ford review of Education, 25 (1–2), 171–184.
Burns, N., et al. (2001). The private roots of public action: gender, equality, and political partici-
pation. Cambridge, Mass.: harvard University Press.
Caprara, G. v. (2008). Will democracy Win? Journal of Social Issues, 64 (3), 639–659.
Chan, T. W., and Clayton, M. (2006). Should the voting Age be Lowered to Sixteen? Normative and
Empirical Considerations. Political Studies, 54, 533–558.
Chang, h., and Chyi, h. I. (2009). voting with their feet: The relationship between political effica-
cy and protest propensity among hong Kong residents. Taiwan Journal of democracy, 5, 127–144.
Cherry, C. (2012). Increasing youth participation: The case for a national voter pre- registration
law. University of Michigan Journal of Law reform, 45, 481-515.
Chung, J. E., et al. (2010). Age differences in perceptions of online community participation
among non-users: An extension of the Technology Acceptance Model. Computers in human Be-
havior, 26, 1674–1684.
dahl, r. A. (1972). Polyarchy: Participation and opposition. New haven: Yale University Press.
dalton, r. J. (1996). democracy and its citizens: Patterns of political change. Center for the
Study of democracy (University of California, Irvine). retrieved from: http://escholarship.org/uc/
item/9pn25985 (21.3.2010).
davies, J. C. (1965). The Family’s role in Political Socialization. The ANNALS of the American Acad-
emy of Political and Social Science, 361 (1), 10–19.
diemer, M., and Li, C. (2011). Critical Consciousness development and Political Participation
Among Marginalized Youth. Child development, 82 (6), 1815–1833.
diuk, N. (2013). Youth as an agent for change: The next generation in Ukraine. demokratizatsiya,
21 (2), 179-196.
dostie-Goulet, E. (2009). Social networks and the development of political interest. Journal of
Youth Studies, 12 (4), 405–421.
Easton, d. (1975). A re-assessment of the concept of political support. British Journal of Political
Science, 5, 435–457.
Edelman, M. J. (1985). The symbolic uses of politics. Urbana, IL: University of Illinois Press.
Edwards, K. (2007). From deficit to disenfranchisement: reframing Youth Electoral Participation.
Journal of Youth Studies, 10 (5), 539–555.
pOLiTiCS aND DEMOCRaCy andrej Kirbiš and barbara zagorc

237
Edwards, K. (2009). disenfranchised Not ‘deficient’: how the (Neoliberal) State disenfranchises
Young People. Australian Journal of Social Issues, 44 (1), 23–37.
Elster, J. (1998). deliberative democracy. Cambridge: Cambridge University Press.
Fein et al. (2007). Social Influence on Political Judgments: The Case of Presidential debates. Politi-
cal Psychology, 28 (2): 165–192.
Finkel, S. E. (1985). reciprocal Effects of Participation and Political Efficacy: A Panel Analysis.
American Journal of Political Science, 29, 891–913.
Flanagan, C., and Levine, P. (2010). Civic Engagement and the Transition to Adulthood. The Future
of Children, 20, 159–179.
Fung, A. (2004). Empowered participation: reinventing urban democracy. Princeton: Princeton
University Press.
García-Trevijano, A. (2009). A Pure Theory of democracy. Lanham, Md: University Press of
America.
Gauthier, M. (2003). The Inadequacy of Concepts: The rise of Youth Interest in Civic Participation
in Quebec [1]. Journal of Youth Studies, 6 (3), 265–276.
George, r. (2013). ‘What’s a vendetta?’ Political socialization in the everyday interactions of Los
Angeles families. discourse & Society, 24 (1), 46–65.
Gibson, r. K. et al. (2003). Election campaigning on the www in the USA and UK. A comparative
analysis. Party Politics, 9 (1), 47–75.
Gidengil, E. et al. (2003). Turned off or turned out? Youth participation in politics. retrieved
from: http://www.elections.ca/res/eim/article_search/article.asp?id=48&lang=e&frmPageSize
(15.8.2013).
Greenberg, E. S. (2009). Consensus and dissent: Trends in Political Socialization research. In E. S.
Greenberg (Ed.). Political Socialization (pp. 1–18). New Jersey: Transaction Publishers.
Györffy, d. (2006). Governance in a Low-Trust Environment: The difficulties of Fiscal Adjustment
in hungary. Europe-Asia Studies, 58 (2), 239–259.
harris, A. (2008). Young women, late modern politics, and the participatory possibilities of online
cultures. Journal of Youth Studies, 11 (5), 481–495.
held, d. (1995). democracy and the Global Order: From the Modern State to Cosmopolitan Govern-
ance. Oxford: Polity Press.
henn et al. (2005). Uninterested Youth? Young People’s Attitudes towards Party Politics in Britain.
Political studies, 53 (3), 556–578.
heywood, A. (2002). Politics. Second edition. New York: Palgrave Macmillan.
heywood, A. (2011). Global politics. New York: Palgrave Macmillan.
andrej Kirbiš and barbara zagorc pOLiTiCS aND DEMOCRaCy

238
hirzalla, F., et al. (2011). Internet Use and Political Participation: reflections on the Mobilization/
Normalization Controversy. The Information Society, 27, 1–15.
ho et al. (2003). Ideological Orientation and Political Transition in hong Kong: Confidence in the
Future. Political Psychology, 24 (2), 403–413.
hoffman, L. h., and Thomson, T. L. (2009). The Effect of Television viewing on Adolescents’ Civic
Participation: Political Efficacy as a Mediating Mechanism. Journal of Broadcasting & Electronic
Media, 53 (1), 3–21.
Ilišin, v. (2003). Politička participacija mladih i politika prema mladima: hrvatska u europskom
kontekstu. Politička misao, 40 (3), 37–57.
Ilišin, v., Bouillet, d., Gvozdanović, A. And Potočnik, d. (2012). Mladi u dinamičnom društvu: hr-
vatska 2012. Zagreb: Institut za društvena istraživanja u Zagrebu and Friedrich Ebert Stiftung.
Ilišin, v., Bouillet, d., Gvozdanović, A. And Potočnik, d. (2012). Mladi u dinamičnom društvu: hr-
vatska 2012 [SPSS database]. Zagreb: Institut za društvena istraživanja u Zagrebu and Friedrich
Ebert Stiftung.
Inglehart, r. (1997). Modernization and postmodernization: Cultural, economic, and political
change in 43 societies. Princeton/Chichester: Princeton University Press.
Inglehart, r., and Welzel, C. (2007): Modernization, Cultural Change, and democracy: The human
development Sequence. New York: Cambridge University Press.
Jou, W. (2011). Left-right Orientations and Ideological voting in New democracies: A Case Study of
Slovenia. Europe-Asia Studies, 63 (1), 27–47.
Kam, C. d., and Palmer, C. L. (2008). reconsidering the Effects of Education on Political Participa-
tion. The Journal of Politics, 70 (3), 612–631.
Kenski, K., and Stroud, N. J. (2006). Connections between Internet Use and Political Efficacy,
Knowledge, and Participation. Journal of Broadcasting & Electronic Media, 50 (2), 173–192.
Kirbiš, A., Flere, S. & Tavčar Krajnc, M. (2010). Longitudinalna analiza politične udeležbe sloven-
ske mladine ter njenih stališč do demokracije: Primerjava z državami EU / [Longitudinal analysis
of political participation of Slovenian youth and its attitudes toward democracy: A comparison
with EU countries]. Paper presented at the annual meeting of Slovenian Sociological Association,
Portorož, Slovenia, November 18-20, 2010.
Kirbiš, A., and Flere, S. (2011). Participation. In M. Lavrič (Ed.). Youth 2010: The social profile of
young people in Slovenia, (pp. 187–259). Ljubljana: Ministry of Education and Sports, Office for
Youth; Maribor: Aristej.
Kirbiš, A., and Naterer, A. (2011). Effect of Internet use on protest and conventional political par-
ticipation among Slovenian youth. In: 20 years after: problems and prospects of countries of for-
mer Yugoslavia: book of abstracts: 19.
pOLiTiCS aND DEMOCRaCy andrej Kirbiš and barbara zagorc
239
Klanjšek, r., and Lavrič, M. (2011). Employment and enterpreneurship. In M. Lavrič (Ed.). Youth
2010: The social profile of young people in Slovenia, (pp. 131–186). Ljubljana: Ministry of Educa-
tion and Sports, Office for Youth; Maribor: Aristej.
Kržišnik, Z. (1994). Slovenski politiki izza pomladi narodov. Ljubljana: Grafa.
Kuhar, M. (2005). Youth and politics in Slovenia: a pre-political group in a post-political age. In
J. Forbrig (Ed.). revisiting youth political participation. Challenges for research and democratic
practice in Europe, (pp. 53-60). Strasbourg: Council of Europe.
Laufer et al. (2009). The Association Between right-Wing Political Ideology and Youth distress.
Child and Adolescent Social Work Journal, 26, 1–13.
Lavrič, Miran et al. (2011). Youth 2010: Social profile of youth in Slovenia [data file]. Slovenia, Mar-
ibor: Univerza v Mariboru = University of Maribor, Filozofska fakulteta = Faculty of Arts [produc-
tion], 2010. Slovenia, Ljubljana: Univerza v Ljubljani = University of Ljubljana, Arhiv družboslovnih
podatkov = Social Science data Archive [distribution].
Levendusky, M. S. (2011). rethinking the role of political information. Public Opinion Quarterly, 75
(1), 42–64.
Lewis, M. (2011). An Analysis of the relationship Between Political Blog reading, Online Political
Activity, and voting during the 2008 Presidential Campaign. The International Journal of Interdis-
ciplinary Social Sciences, 6 (3), 11–28.
Li, J. (2009). Fostering citizenship in China’s move from elite to mass higher education: An analy-
sis of students’ political socialization and civic participation. International Journal of Educational
development, 29, 382–398.
Lipset, S. M. (1959). Some social requisites of democracy: Economic development and political le-
gitimacy. American Political Science review, 53, 69–105.
Livingston, S. (2008). Afterword. Learning the lessons of research on youth participation and the
internet. Journal of Youth Studies, 11 (5), 561–564.
Lopes, J., et al. (2009). Young people’s intended civic and political participation: does education
matter? Journal of Youth Studies, 12 (1), 1–20.
Lorenzini, J., and Giugni, M. (2012). Employment Status, Social Capital, and Political Participation:
A Comparison of Unemployed and Employed Youth in Geneva .Swiss Political Science review vol-
ume, 18 (3), 332–351.
Mannarini, T. et al. (2008). determinants of Political and Social Participation among Youth. A pre-
liminary study. Psicologia Politica, 36, 95–117.
Marien, S., and hooghe, M. (2011). does political trust matter? An empirical investigation into the
relation between political trust and support for law compliance. European Journal of Political re-
search, 50, 267–291.
Matthews, h., et al. (1999). Young people’s participation and representation in society. Geoforum,
30, 135–144.
andrej Kirbiš and barbara zagorc pOLiTiCS aND DEMOCRaCy
240
McFarland, d. A., and Thomas, J.r. (2006). Bowling Young: how Youth voluntary Associations In-
fluence Adult Political Participation. American Sociological review, 71, 401–425.
Miheljak, vlado, Mirjana Ule, Tanja rener, Metka Mencin Čeplak, Blanka Tivadar in Metka Ku-
har (2001): Youth, 2000 [data file]. Ljubljana: Faculty of Social Sciences. Social Psychology re-
search Centre [production], 2000. Ljubljana: University of Ljubljana. Social Science data Archive
[distribution].
Mishler, W., and rose, r. (2005). What are the political consequences of trust? Comparative Polit-
ical Studies, 38 (9), 1050–1078.
Mitton, K. (2009). reconstructing Trust in Sierra Leone. The round Table, 98 (403), 461–471.
Nesbitt-Larking, P. (2007). Politics, Society, and the Media. 2nd edition. Peterborough, ON: Broad-
view Press.
Neundorf, A. (2010). democracy in Transition: A Micro perspective on System Change in Post-So-
cialist Societies. The Journal of Politics, 72 (4), 1096–1108.
Norris, P. (2002). democratic phoenix: reinventing political activism. Cambridge: Cambridge Uni-
versity Press.
Oblak, T. (2003a). Ali kaj E-participirate? Časopis za kritiko znanosti, 31 (211), 57–73.
Oblak, T. (2003b). Izzivi e-demokracije. Ljubljana: Fakulteta za družbene vede.
Obradović, J., and Masten, A. S. (2007). developmental Antecedents of Young Adult Civic Engage-
ment. Applied developmental Science, 11, 2–19.
Ødegård, G., and Berglund, F. (2008). Political participation in late modernity among Norwe-
gian youth: an individual choice or a statement of social class? Journal of Youth Studies, 11 (6),
593–610.
Pacheco, J. S. (2008). Political Socialization in Context: The Effect of Political Competition on
Youth voter Turnout. Political Behaviour, 30, 415–436.
Parry, G., et al. (1992). Political Participation and democracy in Britain. Cambridge: Cambridge
University Press.
Parry, G., and Moyser, G. (1994). More Participation, More democracy? In d. Beetham (Ed.). defin-
ing and Measuring democracy, (pp. 44–62). London: Sage Publications.
Partridge, h. (1998). Italian Politics Today. Manchester and New York: Manchester University
Press.
Pasha, A., xhangolli, K., dundo, J. Gjokuta, B, Tahiri, Z. and Lena, O. (2012). Kosovo Youth Study
2012. Friedrich Ebert Stiftung and IdrA Kosova.
Pasha, A., xhangolli, K., dundo, J. Gjokuta, B, Tahiri, Z. and Lena, O. (2012). Kosovo Youth Study
2012 [SPSS database]. Friedrich Ebert Stiftung and IdrA Kosova.
Pateman, C. (1970). Participation and democratic theory. Cambridge: Cambridge University Press.
pOLiTiCS aND DEMOCRaCy andrej Kirbiš and barbara zagorc
241
Perovšek, J. (2005). Na poti v moderno: Poglavja iz zgodovine evropskega in slovenskega liberal-
izma 19. in 20. stoletja. Ljubljana: Inštitut za novejšo zgodovino.
Plutzer, E. (2002). Becoming a habitual voter: Inertia, resources and Growth in Young Adulthood.
American Political Science review, 96, 41–56.
Print, M. (2007). Citizenship Education and Youth Participation in democracy. British Journal of
Educational Studies, 55 (3), 325–345.
Putnam, r. d., et al. (1993). Making democracy Work: Civic Traditions in Modern Italy. Princeton :
Princeton University Press.
Quintelier, E. (2007a). differences in political participation between young and old people. Con-
temporary Politics, 13 (2), 165–180.
Quintelier, E., et al. (2007b). Parental Influence on Adolescents’ Political Participation. A Compar-
ison of Belgian, Canadian and romanian Survey data. Paper presented at the International Con-
ference on Political Socialisation, Örebro, Sweden, October 8-10, 2007.
rekklang, P. (2012). Political Information Exposures, Politicians’ Perceptions, Political Attitudes
and Political Participations among People in Bangkok Metropolitan Area. World Academy of Sci-
ence, Engineering and Technology, 71, 1169–1172.
rizman, r. (2010). Globalizacija – odprta sociološka agenda. Teorija in praksa, 47 (2–3), 374–391.
rus, v., and Toš, N. (2005). vrednote Slovencev in Evropejcev: analiza vrednotnih orientacij
Slovencev ob koncu stoletja. Ljubljana: Fakulteta za druz bene vede, Idv, CJMMK.
russell, A. (2004). The truth about youth? Media portrayals of young people and politics in Brit-
ain. Journal of Public Affairs, 4 (4), 347–357.
Sartori, G. (1987). The theory of democracy revisited (vol. 2). Chatham: Chatham house
Publishers.
Scherman, A., and Arriagada, A. (2012). disposition to vote and media consumption patterns
among Chilean youth. Comunicación y Sociedad, 25 (1), 85–112.
Schlozman, L. K. (2002). Citizen participation in America: What do we know? Why do we care?
In I. Katznelson & h. v. Milner (Eds.). Political science: The state of the discipline, (pp. 433–461).
New York: W.W. Norton.
Schulz, W. (2005). Political Efficacy and Expected Political Participation among Lower and Upper
Secondary Students. A Comparative Analysis with data from the IEA Civic Education Study. Paper
prepared for the ECPr General Conference in Budapest, 8 - 10 September 2005.
Schumpeter, J. (1943/2003). Capitalism, socialism and democracy. New York: routledge.
Schwirtz, M. (2007). russia’s Political Youths. demokratizatsiya, 15 (1), 73–85.
Seybert, h. (2011). Internet use in households and by individuals in 2011. retrieved from: http://
epp.eurostat.ec.europa.eu/cache/ITY_OFFPUB/KS-SF-11-066/EN/KS-SF-11-066-EN.PdF (7.9.2013).
Shell-Jugendstudie (2010). hurrelman, K. et al. (Eds.). [data file]. München: TNS Infratest.
andrej Kirbiš and barbara zagorc pOLiTiCS aND DEMOCRaCy

242
Sruk, v. (1995). Leksikon politike. Maribor: Obzorja.
Torney-Purta, J., et al. (2004). Trust in Government-related Institutions and Civic Engagement
among Adolescents: Analysis of Five Countries from the IEA Civic Education Study. CIrCLE WOrK-
ING PAPEr 17.
Transparency International (2013). Transparency International’s Corruption Perceptions Index
2012. retrieved from: http://cpi.transparency.org/cpi2012/results/ (09.09).
Tworzecki, h. (2008). A disaffected new democracy? Identities, institutions and civic engagement
in post-communist Poland. Communist and Post-Communist Studies, 41, 47–62.
UMAr (2013). Poročilo o razvoju 2013. Ljubljana: UMAr.
Urbinati, N. (2006). representative democracy: principles and genealogy. Chicago: The University
of Chicago Press.
van hamel, A. (2011). From Consumer to Citizen. digital Media and Youth Civic Engagement. Otta-
wa: Media Awarness Network.
verba, S., Schlozman, K., & Brady, h. (1995). voice and equality: Civic voluntarism in American
politics. Cambridge, MA: harvard University Press.
volkov, d. (2012). The Internet and Political Involvement in russia. russian Education and Socie-
ty, 54 (9), 49–87.
vreg, F. (2004). Politični marketing in demokracija: politične kampanje, komunikacijska strategija,
politični tržni prostor, izvajanje političnih kampanj, volilna propaganda, globalizacija, elektronska
demokracija. Ljubljana: Fakulteta za družbene vede.
Wallsten, S. (2005). regulation and Internet Use in developing Countries. Economic development
& Cultural Change, 53 (2), 501–523.
Ward, J. (2005). An opportunity for engagement in cyberspace: Political youth Web sites during
the 2004 European Parliament election campaign. Information Polity, 10, 233–246.
Ward, J. (2008). The online citizen-consumer: addressing young people’s political consumption
through technology. Journal of Youth Studies, 11 (5), 513–526.
Wong, J., and Tseng, v. (2008). Political Socialisation in Immigrant Families: Challenging Top-down
Parental Socialisation Models. Journal of Ethnic and Migration Studies, 34 (1), 151–168.
World Bank (2013). World Bank’s Control of Corruption Index. retrieved from: http://info.world
bank.org/governance/wgi/pdf/wgidataset.xlsx (09.09).
Young, I. M. (2000). Inclusion and democracy. New York: Oxford University Press.
Youniss, J., et al. (2002). Youth Civic Engagement in the Twenty-First Century. Journal of research
on Adolescence, 12 (1), 121–148.
Youniss, J. (2009). When morality meets politics in development. Journal of Moral Education, 38
(2), 129–144.
pOLiTiCS aND DEMOCRaCy andrej Kirbiš and barbara zagorc

243
Zagorc, B. and Kirbiš, A. (2013). Two way communication? Analysis of websites of Slovene parlia-
mentary parties. Invited lecture at ACTA - active citizens take action, international conference,
Maribor, March 15-16, 2013.
Zarycki, T. (2009). Cultural Capital and the Political Orientations of the Younger Generation of the
russian and Polish Intelligentsia. russian Education and Society, 51 (2), 3–43.
Zeglovits, E., and Zandonella, M. (2013). Political interest of adolescents before and after lower-
ing the voting age: the case of Austria. Journal of Youth Studies.
Zoroja, J. (2011). Internet, e-commerce and e-government: measuring the gap between Europe-
an developed and post-communist countries. Interdisciplinary description of Complex Systems, 9
(2), 119–133.
andrej Kirbiš and barbara zagorc pOLiTiCS aND DEMOCRaCy


Rudi Klanjšek GOVERNaNCE aND DEVELOpMENT 245
PArT xI GOvErNANCE ANd dEvELOPMENT
1 Introduction
The concept of governance is undoubtedly one of the central issues in the social sciences, par-
ticularly as it relates to the issues of managing and organizing a social group in order to maintain
stability and enable improvement to living conditions. On the latter, concepts like development (or
progress) initially seem easy to define and understand; however, in reality they are much more
complex. One body of literature in particular portrays the wealth of issues surrounding the con-
cept of development and progress (see for e.g., ryan, 1969; Sklair, 1970; Nisbet, 1980; Lauer, 1991;
Sztompka, 1994), asking questions like what it really means to improve living conditions and move
forward.
For example, is increasing food production by pesticides and herbicides that have an adverse
effect on drinking water and the environment an improvement? Is being “connected” (and thus
traceable) all the time a step forward? does the infinite selection of goods heighten an individual’s
inclination toward that which is unattainable? As expressed by durkheim (1951; cf. Traub and Little,
1999, 132), a society that nourishes the idea that “the sky is the limit” continuously generates in-
satiability and thus dissatisfaction and misery. While many similar examples could be given, some
suggest that these types of questions are irrelevant as concepts (both historically and theoretical-
ly). In short, there is no such thing as development or progress. rather, there is only “an incessant
variation of the main recurrent themes” (Sorokin, 1957, 671). These types of ideas, however, are
very much alien to social evolutionism, which serves as the theoretical foundation to (neo)mod-
ernization theory, equating economic development, modernization, and progress.
Although doubts regarding the question of whether economic growth/development (consid-
ered core processes of modernization) actually means development or even progress can be
traced back to rousseau’s Discourse on Arts and Sciences/ Discours sur les sciences et les arts
(1750/2004). Today economic growth is often seen as the central pillar of social development (Wel-
zel, Inglehart, and Kligemann, 2003), and thus the belief in a better future. With the falling of the
Berlin Wall, symbolizing the collapse of “a tragically flawed experiment”, as Lenski and Nolan
(1999, 365) call efforts to build a communist society, it was also clarified how to achieve this better
future (i.e., which is the best way for modern societies to develop). By following in the footsteps of
those who had already achieved Fukuyama’s “The End of history” (1992), i.e., by embracing a mar-
ket economy, economic liberalism, and capitalist globalization. Or, as was eloquently expressed by
Margaret Thatcher in the 80s, “There Is No Alternative” (Berlinski, 2008).
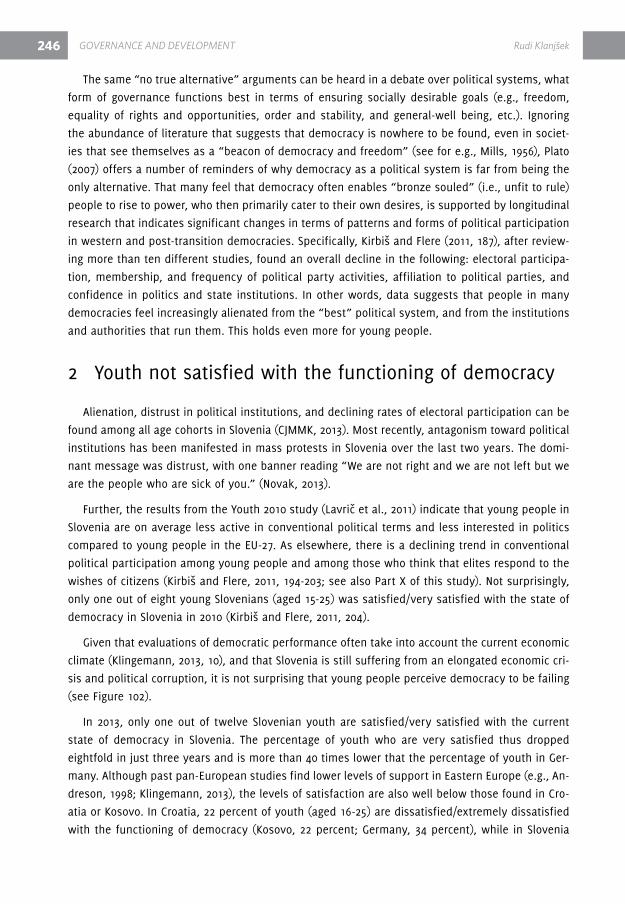
246 GOVERNaNCE aND DEVELOpMENT Rudi Klanjšek
The same “no true alternative” arguments can be heard in a debate over political systems, what
form of governance functions best in terms of ensuring socially desirable goals (e.g., freedom,
equality of rights and opportunities, order and stability, and general-well being, etc.). Ignoring
the abundance of literature that suggests that democracy is nowhere to be found, even in societ-
ies that see themselves as a “beacon of democracy and freedom” (see for e.g., Mills, 1956), Plato
(2007) offers a number of reminders of why democracy as a political system is far from being the
only alternative. That many feel that democracy often enables “bronze souled” (i.e., unfit to rule)
people to rise to power, who then primarily cater to their own desires, is supported by longitudinal
research that indicates significant changes in terms of patterns and forms of political participation
in western and post-transition democracies. Specifically, Kirbiš and Flere (2011, 187), after review-
ing more than ten different studies, found an overall decline in the following: electoral participa-
tion, membership, and frequency of political party activities, affiliation to political parties, and
confidence in politics and state institutions. In other words, data suggests that people in many
democracies feel increasingly alienated from the “best” political system, and from the institutions
and authorities that run them. This holds even more for young people.
2 Youth not satisfied with the functioning of democracy
Alienation, distrust in political institutions, and declining rates of electoral participation can be
found among all age cohorts in Slovenia (CJMMK, 2013). Most recently, antagonism toward political
institutions has been manifested in mass protests in Slovenia over the last two years. The domi-
nant message was distrust, with one banner reading “We are not right and we are not left but we
are the people who are sick of you.” (Novak, 2013).
Further, the results from the Youth 2010 study (Lavrič et al., 2011) indicate that young people in
Slovenia are on average less active in conventional political terms and less interested in politics
compared to young people in the EU-27. As elsewhere, there is a declining trend in conventional
political participation among young people and among those who think that elites respond to the
wishes of citizens (Kirbiš and Flere, 2011, 194-203; see also Part x of this study). Not surprisingly,
only one out of eight young Slovenians (aged 15-25) was satisfied/very satisfied with the state of
democracy in Slovenia in 2010 (Kirbiš and Flere, 2011, 204).
Given that evaluations of democratic performance often take into account the current economic
climate (Klingemann, 2013, 10), and that Slovenia is still suffering from an elongated economic cri-
sis and political corruption, it is not surprising that young people perceive democracy to be failing
(see Figure 102).
In 2013, only one out of twelve Slovenian youth are satisfied/very satisfied with the current
state of democracy in Slovenia. The percentage of youth who are very satisfied thus dropped
eightfold in just three years and is more than 40 times lower that the percentage of youth in Ger-
many. Although past pan-European studies find lower levels of support in Eastern Europe (e.g., An-
dreson, 1998; Klingemann, 2013), the levels of satisfaction are also well below those found in Cro-
atia or Kosovo. In Croatia, 22 percent of youth (aged 16-25) are dissatisfied/extremely dissatisfied
with the functioning of democracy (Kosovo, 22 percent; Germany, 34 percent), while in Slovenia
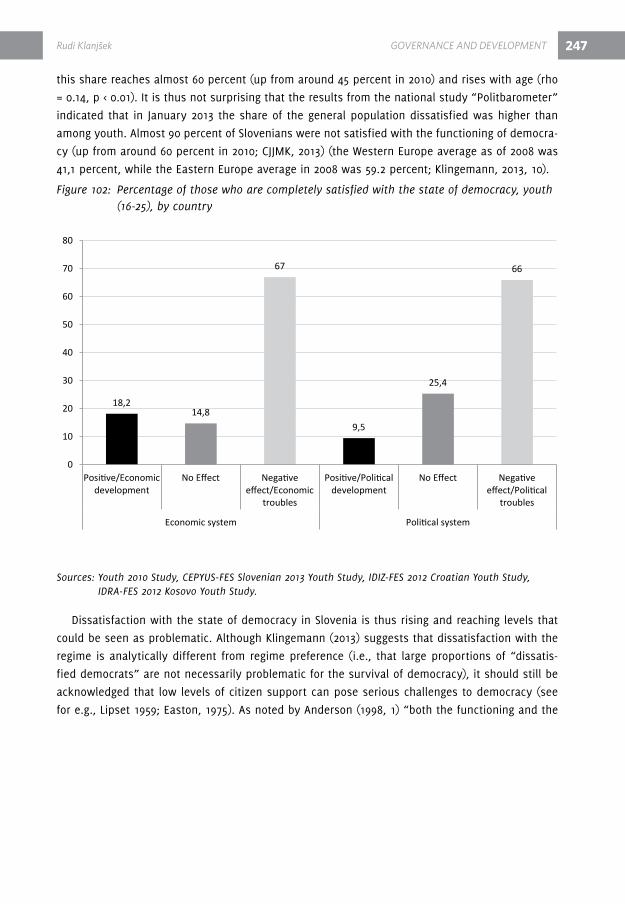
Rudi Klanjšek GOVERNaNCE aND DEVELOpMENT 247
this share reaches almost 60 percent (up from around 45 percent in 2010) and rises with age (rho
= 0.14, p < 0.01). It is thus not surprising that the results from the national study “Politbarometer”
indicated that in January 2013 the share of the general population dissatisfied was higher than
among youth. Almost 90 percent of Slovenians were not satisfied with the functioning of democra-
cy (up from around 60 percent in 2010; CJJMK, 2013) (the Western Europe average as of 2008 was
41,1 percent, while the Eastern Europe average in 2008 was 59.2 percent; Klingemann, 2013, 10).
Figure 102: Percentage of those who are completely satisfied with the state of democracy, youth (16-25), by country
Sources: Youth 2010 Study, CEPYUS-FES Slovenian 2013 Youth Study, IDIZ-FES 2012 Croatian Youth Study, IDRA-FES 2012 Kosovo Youth Study.
dissatisfaction with the state of democracy in Slovenia is thus rising and reaching levels that
could be seen as problematic. Although Klingemann (2013) suggests that dissatisfaction with the
regime is analytically different from regime preference (i.e., that large proportions of “dissatis-
fied democrats” are not necessarily problematic for the survival of democracy), it should still be
acknowledged that low levels of citizen support can pose serious challenges to democracy (see
for e.g., Lipset 1959; Easton, 1975). As noted by Anderson (1998, 1) “both the functioning and the
18,214,8
67
9,5
25,4
66
0
10
20
30
40
50
60
70
80
Positive/Economicdevelopment
No Effect Negativeeffect/Economic
troubles
Positive/Politicaldevelopment
No Effect Negativeeffect/Political
troubles
Economic system Political system

248
maintenance of democratic polities are intimately linked with what and how citizens think about
democratic governance”. 58
Table 15: Youth’s (16-27) perception of problems, Slovenia and Croatia (in percent)
how alarming/preSSing are the Following problemS For SloVenian/croatian Society?
not alarming
at all
moderately/Slightly
alarming
Veryalarming
m (Sd)1 2 3
Poverty - SI 8.4 41.9 49.6 2.4a (0.6)
- CrO 3.2 26.8 70.0 2.7b (0.5)
Unemployment3.3 25.2 71.5 2.7a (0.5)0.7 18.9 80.5 2.8b (0.4)
Environment pollution26.3 51.0 22.6 2.0a (0.7)7.4 60.8 31.7 2.2b (0.6)
Terrorist threat69.1 21.5 9.4 1.4a (0.7)23.4 52.9 23.7 2.0b (0.7)
AIdS /hIv threat59.9 28.0 12.0 1.5a (0.7)16.2 58.7 25.1 2.1b (0.6)
Incidence of chronic diseases 24.3 45.6 30.1 2.1a (0.7)8.6 58.4 33.0 2.3b (0.6)
Laws not implemented properly9.5 33.7 56.8 2.5a (0.7)3.6 52.2 44.2 2.4b (0.6)
Job insecurity4.7 23.8 71.4 2.7a (0.6)1.8 32.8 65.3 2.7a (0.5)
Workplace safety 27.7 43.7 28.6 2.0a (0.8)5.2 55.8 39.0 2.4b (0.6)
Street crime36.4 44.0 19.7 1.8a (0.7)6.6 55.2 38.2 2.3b (0.6)
Smuggling42.9 39.4 17.8 1.8a (0.7)5.2 52.1 42.7 2.4b (0.6)
Climate change46.6 38.0 15.4 1.7a (0.7)14.0 60.9 25.1 2.1b (0.6)
Notes: Means having different superscript letters are significantly different at the p<0.001 based on Independent samples Mann-Whitney U Test.
Sources: CEPYUS-FES Slovenian 2013 Youth Study, IDIZ-FES 2012 Croatian Youth Study.
As indicated, the potential factors that can help explain democratic performance evaluation are
numerous59 (see Anderson, 1998; Kirbiš and Flere, 2011; Klingemann, 2013; but also Part x of the
current study). One of the more interesting factors, although it was not evaluated in the current
58 Although Kirbiš (2011, 205) found that in 2010, 42.3 percent of youth (aged 15-25) in Slovenia thought that democracy in general is not a good political system, only 8 percent thought the same in what used to be the former “West” Germany (Shell, 2010). It should be noted that the same population scored low on measures of authoritarianism, potentially indicating that respondents again evaluated democracy in terms of general system performance. Specifically, less than 15 percent of those who said that democracy is not a good system thought that Slovenia needs a strong single leader/party (85 percent opted for other options).
59 Usually they are grouped into two categories: while the first includes cultural factors (e.g., democratic history, political culture, values, etc.), the second includes factors that are associated with general system performance (Anderson, 1998).
GOVERNaNCE aND DEVELOpMENT Rudi Klanjšek
249
study, is the idea that high levels of dissatisfaction in Slovenian politics are a result of “a collective
memory” of the past (regime), which is commonly used as a reference point when evaluating the
current state of affairs. This was previously suggested by Kirbiš and Flere (2011; see also Flere and
Kirbiš, 2011), who pointed out that criticism of democracy in Slovenia should be understood in the
context of nostalgia for Yugoslavia.
results from the Youth 2010 study (Lavrič et al., 2011) indicated that nostalgia for Yugoslavia,
although a relatively minor phenomenon (15 percent), was greater than the nostalgia East Germans
had for the Gdr. Further, among those who thought that democracy in general is not a good sys-
tem (42,3 percent; Kirbiš and Flere, 2011, 205), 38,3 percent expressed that a “socialist system sim-
ilar to the former Yugoslavia” would be better. This longing for a socialism-type regime increased
with the sample’s dissatisfaction with democracy. In addition, results from the current study also
indicate a strong affinity towards other parts of the former Yugoslavia; 42 percent thought that
Slovenian diplomacy (and policy-makers in general) should invest and do more to strengthen ties
with the other former Yugoslav republics.
As indicated by Klanjšek (2012), this should be understood in the context of what the former
regime represented, and not simply that it was a centrally-planned, single-party regime. Such rep-
resentations include the collective fight against fascism and Nazism during World War II. Moreover,
the old regime championed (youth) employability, stability, and (social) security (whereby, it dif-
fered from other non-democratic systems in Eastern Europe).
In sum, while the declining trend in the country’s democratic performance could be explained
by the deteriorating economic situation, high levels of dissatisfaction can be better understood in
the context of how Slovenians perceive the previous regime.
however, as indicated in Table 15, the views presented above are not sufficient when trying
to understand levels and trends of democratic performance evaluation. Namely, Table 15, which
compares the most troubling issues as perceived by Slovenian and Croatian youth, indicates that
youth in Croatia perceives their country as a more problem-ridden (yet they are still more satis-
fied with the state of democracy).60 This is important from both “system performance” and “nos-
talgia” perspectives.
Almost all of the averages listed in Table 15 are significantly (p < 0.001) higher in Croatia. There
are only two exceptions: “job insecurity”, which has no significant difference, and “laws not being
implemented properly”, which was significantly higher in Slovenia. This subjective perception of
system performance in Croatia is not without merit. Namely, a quick overview of the basic mac-
ro socio-economic indicators reveals that Slovenia enjoys higher levels of GdP per capita (2012:
20,900 vs. 15,600, in PPP EUr per inhabitant), lower poverty rates (2011: 13.6 percent vs. 21.1 per-
cent, cut-off point: 60 percent of median equivocal income after social transfers), lower inequality
(2011: 23.8 vs. 31 Gini coefficient) (Eurostat, 2013), lower unemployment rates (Jun./Jul 2013: 12.8
percent vs. 18.5 percent, registered unemployment rates) (National Labor Bureau of Slovenia/ZrSZ
and Croatia/hZZ, 2013), higher hdI rank (22 vs. 47, UNdP, 2013), and higher Freedom house rating
60 This is also true for Kosovo, but since measures listed in Table 15 were not asked in the Kosovo survey, this section is only able to compare Croatia and Slovenia.
Rudi Klanjšek GOVERNaNCE aND DEVELOpMENT
250
(1 vs. 1.5) (Freedom house, 2013). In sum, it seems that system performance is subjectively and
objectively better in Slovenia than in Croatia, yet still Slovenians are more dissatisfied with the
current state of the political system (p < 0.001).
There are at least four possible explanations for these results. First, as indicated by Anderson
(1998), besides system performance explanations, there are also views that try to explain cross-na-
tional differences in satisfaction with democratic performance via cultural factors (length of demo-
cratic rule, democratic history, political culture, etc.). Yet as noted above, both Slovenia and Croatia
were part of the same political entity, both are predominately Catholic, both gained independence
at the beginning of the 1990s (when both also transformed their political system). Thus, at least
some reservations can be expressed towards the “cultural” hypothesis.
Second, it might be argued that the Slovenian public suffers from some sort of collective shock
as the picture of a “success story”61 (i.e., “the best among post-socialist countries”, “honest and
hardworking”) (Jakhel, 2010) has been continuously shattered since the onset of the financial cri-
sis. In other words, it is possible that disappointment stems from the fact that many previously
held ideas of what Slovenia is and where it will go, are suddenly lost. This consequently trans-
forms reactions from shock to identity crisis.62 In addition, this disappointment has been fueled
by the realization that the end is nowhere to be seen, and that Slovenia is becoming increasingly
(and objectively) poorer and less equal (see Part I of this study), with pressures to adopt more
neoliberal policies (i.e., to thin the social security net, overhaul the public sector, the retirement
scheme, and labor market; to privatize publicly owned companies; to lower public expenses, etc.),
which would probably increase inequality further. That this does not bode well with the Slovenian
voter is evident from the fact that despite being the most egalitarian society in the EU-27 (when
it comes to income distribution)63, public opinion polls in 2009 indicated that 95 percent agreed
with the statement that income inequality in Slovenia is too big, and 90 percent agreed with the
idea that income inequality should be reduced, and the government is responsible to reform these
issues (hafner-Fink et al., 2009).
Third, and paralleling the above, the results could also indicate that Slovenian youth (and the
general public) ties all economic issues and problems to what they consider a disfunctioning po-
litical system. If true, this would suggest two scenarios: first, a lack of understanding of what it
61 From 1994 to 2009 the annual growth rate in Slovenia stood at 4.6 percent, a fact which, together with other reform efforts, enabled Slovenia to be the first of the former Yugoslav republics to be accepted into the European Union (May 2004) and first among all post-socialist countries to be accepted into the European Monetary Union (EMU; Slovenia joined the third stage of the EMU in 2007, when the national currency, the Slovenian tolar, was replaced by the euro). According to Eurostat, in 2008 Slovenian GdP per capita (using Purchasing Power Parity/Standard – PPP/PPS) reached around 91 percent of the EU-27 average GdP per capita, exceeding even the “old” member state of Portugal, whose GdP per capita stood at 78 percent of the EU-27 average (in 2012 this figure fell to 82 percent in Slovenia). Slovenia also enjoyed the highest hdI rank among all post-socialist countries (hdr, 2013).
62 In this regard, Croatia shares a somewhat different picture. Besides having experienced war, Croatia also “walked” a long way before it was finally formally recognized as a full member of the European community. This fact alone undoubtedly contributed to the sentiment that “Croatia is moving in the right way” and thus to a more positive evaluation of system performance.
63 According to the Eurostat data for 2011, Slovenia was the most egalitarian society in the EU-28, with the Gini coefficient of 23.8 (EU-28 = 30.7).
GOVERNaNCE aND DEVELOpMENT Rudi Klanjšek
251
means to have a market economy (legacy of “old regime”)64; and second, a lack of understanding
of what national governments can really do in the context of the global economy, which is “driv-
en by a culture of competitive individualism at whose fringe is a resurrected social darwinism in
which norms and values of collective survival have all but disappeared” (robinson, 2001, 171).
however, this explanation is also problematic because it implies that youth in Croatia are more
aware of these dilemmas.
Finally, these answers could be summarized within the so-called “critical citizen” hypothesis
(Kirbiš and Flere, 2011; Klingemann, 2013). This refers to “the increasing cognitive mobilization and
rising levels of expectation among modern mass publics” (Klingemann, 2013, 2), which means that
the discrepancies indicated in Table 15 show that Slovenian youth are more critical than youth in
Croatia. Again, due to the limits of the current study, this assumption cannot be adequately tested.
3 Youth not satisfied with the results of the European integration
Many expected that Slovenian accession to the EU would bring about economic prosperity and
political stability. As indicated by Bučar and Brinar this was believed true because the “EU, by
facilitating democracy and rule of law, helps potential member states with the transformation of
their political and economic systems so they will become functioning market economies and de-
mocracies” (2002, 655).
Although one could question the definition of “functioning”, results from previous studies sug-
gest that the majority of Slovenians evaluate accession through this lens. Namely, in March 2003,
roughly one year before Slovenia became a member of the EU, 81 percent of Slovenians (aged 18-
30) thought that joining “will benefit Slovenia as a whole” (Toš et al., 2003). Ten years later, almost
half (45 percent) of the youth (aged 16-27) surveyed think that Slovenia should drop the euro and
leave the EU altogether (only 30 percent oppose this idea, while the remaining are undecided).
As indicated by the following figure, Euroscepticism can largely be attributed to the fact that
young people in Slovenia are not very enthusiastic in terms of what “the end of history” has
brought to their lives.
More than 65 percent see European integration as something that has a largely negative effect
on both the economic climate (66 percent) and political system (67 percent). This is in stark con-
trast to what youth expected from the integration process in 2000. At that point, only 19 percent
thought that the economic condition would be worse if Slovenia joined the EU (40 percent expect-
ed no change, 26 percent expected positive developments; no comparable question about the po-
litical situation was asked) (Miheljak et al., 2001).
Unsurprisingly, the results from a simple correlation analysis indicate that there is a significant
associative relationship between (dis)satisfaction with the results of EU membership and the de-
64 Although few would ever argue that economics and political systems are not interrelated, it is also hard to argue that all economic issues and problems in a market economy result from a disfunctioning democracy.
Rudi Klanjšek GOVERNaNCE aND DEVELOpMENT
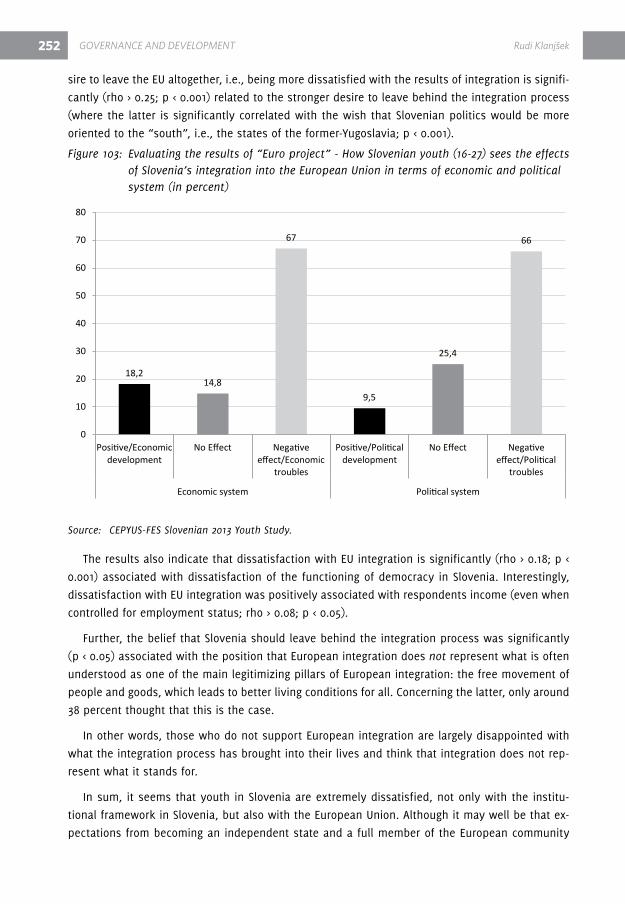
252
sire to leave the EU altogether, i.e., being more dissatisfied with the results of integration is signifi-
cantly (rho > 0.25; p < 0.001) related to the stronger desire to leave behind the integration process
(where the latter is significantly correlated with the wish that Slovenian politics would be more
oriented to the “south”, i.e., the states of the former-Yugoslavia; p < 0.001).
Figure 103: Evaluating the results of “Euro project” - How Slovenian youth (16-27) sees the effects of Slovenia’s integration into the European Union in terms of economic and political system (in percent)
Source: CEPYUS-FES Slovenian 2013 Youth Study.
The results also indicate that dissatisfaction with EU integration is significantly (rho > 0.18; p <
0.001) associated with dissatisfaction of the functioning of democracy in Slovenia. Interestingly,
dissatisfaction with EU integration was positively associated with respondents income (even when
controlled for employment status; rho > 0.08; p < 0.05).
Further, the belief that Slovenia should leave behind the integration process was significantly
(p < 0.05) associated with the position that European integration does not represent what is often
understood as one of the main legitimizing pillars of European integration: the free movement of
people and goods, which leads to better living conditions for all. Concerning the latter, only around
38 percent thought that this is the case.
In other words, those who do not support European integration are largely disappointed with
what the integration process has brought into their lives and think that integration does not rep-
resent what it stands for.
In sum, it seems that youth in Slovenia are extremely dissatisfied, not only with the institu-
tional framework in Slovenia, but also with the European Union. Although it may well be that ex-
pectations from becoming an independent state and a full member of the European community
GOVERNaNCE aND DEVELOpMENT Rudi Klanjšek
18,214,8
67
9,5
25,4
66
0
10
20
30
40
50
60
70
80
Positive/Economicdevelopment
No Effect Negativeeffect/Economic
troubles
Positive/Politicaldevelopment
No Effect Negativeeffect/Political
troubles
Economic system Political system

253
might have been too high, the data still point to the fact that youth believe the current institutional
framework (i.e., the current form of democracy and market economy) does not offer or generate
enough income/material/social security and justice. In other words, the fact that the current “sen-
sate” (Sorokin, 1957) model of development does not offer any real possibility for the individual to
“ever be completely satisfied” (Bauman, 2002, 38), various data and trends, including those shown
in Part I and Part x of this study, do not mean that youth dissatisfaction has no objective compo-
nent. It rather seems that despite the auspicious claims of reaching the end of history, the current
phase of human history, with its capacity to connect globally and generate extreme wealth, cre-
ates immense uncertainty, risk, and imbalances, and continues to spawn numerous reservations
about the current path to “heaven on earth”.
4 Key findings
Δ The perception of youth, in terms of how democracy functions in Slovenia, continues to
deteriorate (from already high levels recorded in 2010). Much of this can be explained
by poor system performance (which makes the past regime more appealing) and
pessimistic outlooks of the future.
Δ The most alarming problems according to Slovenian youth are poverty, unemployment,
job (in)security, and laws not being implemented properly. Issues related to the
environment, physical security, and well-being are mainly perceived as not alarming/
slightly alarming.
Δ Although in 2003, 81 percent of Slovenians (aged 18-30) thought that joining the EU “will
benefit Slovenia as a whole” (Toš et al., 2003), ten years later, almost half (45 percent)
(aged 16-27) think that Slovenia should drop the euro and leave the EU altogether.
Δ More than 65 percent consider European integration to have an overall negative effect
on both the economic climate (66 percent) and the political system (67 percent). This is
in sharp contrast to what the youth expected from the integration processes in 2000,
when only 19 percent thought that the economic conditions would be worse if Slovenia
joined the EU.
5 referencesAnderson, CJ. (1998). Political Satisfaction in Old and New democracies. Working Paper. Center on
democratic Performance. Binghamton University.
Berlinski, C. (2008). “There is no alternative”: why Margaret Thatcher matters. New York: Basic
Books.
Bučar, B., I. Brinar. 2002. Nekateri pre(po)misleki ob vstopanju v EU.Teorija in praksa 39 (4):
654–668
CJMMK - Center za raziskovanje javnega mnenja (2013). Politbarometer 1/2013. dostopno na:
https://www.ip-rs.si/fileadmin/user_upload/Pdf/razno/politbarometer_1-2013.pdf, 21.8.2013.
Rudi Klanjšek GOVERNaNCE aND DEVELOpMENT

254
Easton, d. (1975). A re-assessment of the concept of political support. British Journal of Political
Science, 5, 435-457.
Eurostat (2013). various databases. data available at: http://epp.eurostat.ec.europa.eu/portal/
page/portal/statistics/search_database [Sept. 2013].
Freedom house (2013). data retrieved from: http://www.freedomhouse.org/report/free-
dom-world/2012/slovenia (Sept. 2013)
Fukuyama, F. (1992). The end of history and the last man. New York, Toronto: Free Press;Maxwell
Macmillan Canada
Gibson, J. L., & Caldeira, Gregory A. (2003). Measuring attitudes toward the United States Su-
preme Court. American Journal of Political Science 47(2), 354-36
hafner Fink, M., J. Štebe, B. Malnar, S. Uhan, S. Kurdija. Slovensko javno mnenje 2009/1: Medn-
arodna raziskava: religija (ISSP 2008) in družbene neenakosti (ISSP 2009) [datoteka podatkov].
Slovenija, Ljubljana: Fakulteta za družbene vede, Center za raziskovanje javnega mnenja in
množičnih komunikacij [izdelava], 2009. Slovenija, Ljubljana: Univerza v Ljubljani, Arhiv druž-
boslovnih podatkov [distribucija], 2011.
hurrelman, K. et al. (2010). Shell-Jugendstudie 2010. [data file]. München: TNS Infratest.
hZZ - National Labor Bureau of Croatia. (2013). data retrieved from: http://www.hzz.hr/default.
aspx?id=8353 (Sept. 2013)
Ilišin, v., Bouillet, d., Gvozdanović, A. and Potočnik, d. (2012). Mladi u dinamičnom društvu: hr-
vatska 2012 [SPSS database]. Zagreb: Institut za društvena istraživanja u Zagrebu and Friedrich
Ebert Stiftung.
Jakhel, Č. (2010). Slovenija republjik. Finance 4/2010.
Flere, S. and Kirbiš, A. (2011). The image of Yugoslavia among post-yugoslav youth in 2009. In
ristić, I. (Ed.). defragmenting Yugoslavia, (Südosteuropa, Jg. 59, h. 3), 330-348. regensburg:
Südost-Institut.
Kirbiš, A., and Flere, S. (2011). Participation. In M. Lavrič (Ed.). Youth 2010: The social profile of
young people in Slovenia, (pp. 187–259). Ljubljana: Ministry of Education and Sports, Office for
Youth; Maribor: Aristej.
Klanjšek, r. (2012). 20 Years Later: (Socio)Economic development after the Breakup of Yugoslavia.
In Flere, S. (eds.), 20 years later: problems and prospects of countries of former Yugoslavia. Mari-
bor: Center for the Study of Post-Yugoslav Societes, Faculty of Arts.
Klingemann, hd (2013). dissatisfied democrats. Evidence from Old and New democracies. In
Lauer, h. r. (1991). Perspectives on social change. Fourth edition. Boston: Allyn and Bacon, Inc.
Lavrič, M. et al. (2011). Youth 2010: Social profile of youth in Slovenia [data file]. Slovenia, Mari-
bor: Univerza v Mariboru = University of Maribor, Filozofska fakulteta = Faculty of Arts [produc-
tion], 2010. Slovenia, Ljubljana: Univerza v Ljubljani = University of Ljubljana, Arhiv družboslovnih
podatkov = Social Science data Archive [distribution].
GOVERNaNCE aND DEVELOpMENT Rudi Klanjšek

255
Lenski, G. E., & Nolan, P. (1999). human societies : an introduction to macrosociology (8th ed.).
New York: McGraw hill College
Lipset, S. M. (1959). Political Man: The Social Bases of Politics . Garden City, NY: doubleday.
Miheljak, v., M. Ule, T. rener, M. Mencin Čeplak, B.Tivadar in M. Kuhar: Mladina, 2000 [datoteka
podatkov]. Ljubljana: Fakulteta za družbene vede. Center za socialno psihologijo [izdelava], 2000.
Ljubljana: Univerza v Ljubljani. Arhiv družboslovnih podatkov [distribucija], februar 2001
Nisbet, r. (1980). history of the Idea of Progress. New York: Basic Books.
Pasha, A., xhangolli, K., dundo, J. Gjokuta, B, Tahiri, Z. and Lena, O. (2012). Kosovo Youth Study
2012 [SPSS database]. Friedrich Ebert Stiftung and IdrA Kosova.
Plato (2007). The republic. (Translated by desmond Lee; with an introduction by Melissa Lane.
2nd ed., reissued with new introduction). London [etc.]: Penguin Books.
Powell, G. B. (1986). Extremist Parties and Political Turmoil: Two Puzzles. American Journal of Po-
litical Science 30 (May):357-78.
robinson, W. (2001). Social theory and globalization: The rise of a transnational state. Theory and
Society, 30/2, 157-200.
rousseau, J.-J., & Berchtold, J. (2004). discours sur les sciences et les arts. Paris: Le livre de
poche.
russell J. dalton and Christian Welzel (Eds.), The Civic Culture revisited: From Allegiant to Asser-
tive Citizens. Cambridge: Cambridge University Press.
ryan, F. B. (1969). Social and Cultural Change. New York: The ronald Press Company.
Sklair, L. (1970). The sociology of progress. London: routhledge & Kagan Paul.
Sorokin, P. (1957). Social & Cultural dynamics. Boston: Porter Sargent Publisher.
Sztompka, P. (1994). The Sociology of Social Change. Oxford: Blackwell Publishers.
Toš, Niko eb al. Politbarometer PB3/03, Slovenija: Marec 2003 [datoteka podatkov]. Slovenija, Lju-
bljana: Univerza v Ljubljani, Center za raziskovanje javnega mnenja in množičnih komunikacij
[izdelava], marec 2003. Slovenija, Ljubljana: Univerza v Ljubljani, Arhiv družboslovnih podatkov
[distribucija], 2008.
Traub, S., h., & Little, C., B. (1999). Theories of deviance (5th Edition). Illinois: F. E. Peacock
Publishers.
United Nations development Program. (2013). human development report. retrieved from: http://
hdr.undp.org/en/reports/global/hdr2013/ (Sept. 2013).
Welzel, C., Inglehart, r., & Kligemann, h.-d. (2003). The theory of human develop-
ment: A cross-cultural analysis. European Journal of Political research, 42(3), 341-379. doi:
10.1111/1475-6765.00086
ZrSZ - National Labor Bureau of Slovenia (2013). data retrieved from: http://www.ess.gov.si/trg_
dela/trg_dela_v_stevilkah/stopnja_registrirane_brezposelnosti (Sept. 2013)
Rudi Klanjšek GOVERNaNCE aND DEVELOpMENT

Sergej flere and Rudi Klanjšek CONCLUSiON - SLOVENiaN yOUTh iN pRECaRiOUS TiMES 257
CONCLUSION - SLOvENIAN YOUTh IN PrECArIOUS TIMES
1 Is the social situation of Slovenian young people one of a “cushioned precariat”?
various youth studies have underscored the change in the social position and overall nature of
youth. Over time, a number of perceptions and ideas have faded, including the linear depiction of
youth transition from childhood to adulthood, the one-time issues surrounding a so-called “youth
identity crisis”, and the image of it being a time of “storm and stress”. Instead, focus has shifted
to the difficulties and blockages that prolong entry into adulthood. Initially, this was understood
as a multidimensionality of the transitional nature of youth (transition into adulthood achieved at
different paces in various dimensions). however, this proved insufficient when the nature of work
was taken into consideration. It is not simply employment at a later stage, but the very perma-
nent and stable nature of inclusion into the societal work process that has become questionable,
uncertain, and fragmented; this is often referred to as “precarity”.
The “precariat” social class to which the young disproportionately belong, has advanced (Stand-
ing, 2011), and come to be known as the “brazilianisation” process, referring to the country where
insecurity and unforeseeable work climates permeate society (Furlong and Kelly, 2005).
This current study comes at a unique time as Slovenia enters its sixth straight year of econom-
ic recession. Government austerity measures did not arrive until it was perhaps too late. On the
contrary, some welfare and social protection rights were expanded between 2008 and 2010, in-
cluding state scholarships, which became available to a larger minority of tertiary students. Later,
austerity measures began to marginally affect tertiary students, too (who account for almost half
of all youth), particularly with respect to their special privileged (low-taxed) position as part-time
workers (i.e., “student services”). however, as indicated in Part II, the extended economic reces-
sion has stymied youth employment programs. This could also be understood as the fundamental
feature of the social and economic situation at the time this study was carried out.
A brief perusal of the relevant indicators of youth employment in Slovenia, suggests that young
people fit into this recent historical pattern of work casualization and precarity (Furlong and Kelly,
2005; Furlong, 2013). ”Permanent employment” as an option, has decreased since at least 1991.
This trend has recently escalated, affecting females and including tertiary graduates, who had pre-
viously been almost exempt from unemployment.

258 CONCLUSiON - SLOVENiaN yOUTh iN pRECaRiOUS TiMES Sergej flere and Rudi Klanjšek
however, as indicated in Part I, the social position of young Slovenians can not be character-
ized as poor or deteriorating. While some aspects of their social position have worsened, others
have improved.
Δ Slovenian youth have progressively been included into the education system, and
in particular into tertiary education programs. Slovenia even ranks first in some EU
education comparisons (see Part III). Not only has tertiary education been expanded,
but also the economic and social conditions of this process have continued to be
relatively kind to youth. The general absence of tuition fees at all levels of study should
be noted (with some exceptions). This absence has been complemented by a series of
social benefits to students at all levels of schooling, including subsidized meals, and
the expansion of scholarships under the Pahor government.
Δ In their private lives, Slovenian youth do not encounter many particular burdens and
obstacles. Families are understanding and supportive, which is perhaps one reason why
young people remain at home longer. Although Slovenia is experiencing an elongated
economic recession, family support builds on decades of progressive family housing
construction. Parental relations are not usually burdened by old-fashioned limitations,
creating conditions for relatively obstacle-free relations with peers and partners alike.
Δ Youth economic conditions remain relatively favorable (poverty-wise), showing less
deterioration than for other societal groups (for older youth, this more or less only
holds for students).
Δ however, some trends are increasingly negative among youth, including rising
unemployment, and declining or stagnating income, which most often derives from
part-time or fixed-time employment. Further, the positive effect of education on
employment is weakening, and the Slovenian labor market is still heavily segmented.
Δ In spite of this relatively favorable situation (especially when considering the troublesome
macroeconomic condition), young Slovenians demonstrate a high degree of political
dissatisfaction and pessimism toward the future. The overall negative assessment of
politics and democracy is part of the general Slovenian picture, which culminated in
the “uprising movement” of 2012 and 2013 that illustrated the basic delegitimation of
the political system (see Parts x and xI).
Δ Although politically dissatisfied and disenchanted, Slovenian young people are not
without political influence when it comes to defending their social position. The
tax privileges for youth work were only partly cut in 2012, and the government has
yet to approach the issue of tuition (which is particularly rare in tertiary education
programs), as was recommended by a 2011 OECd study (Eris, 2011). The Slovenian
Student Organization, as a representative organization, is very active in defending
these interests.
Δ In contrast to their assessments of the political situation and the general state of
democracy, young people are still predominantly satisfied with their life conditions (as
depicted in Part I and vIII), which stems from their relatively comfortable position within
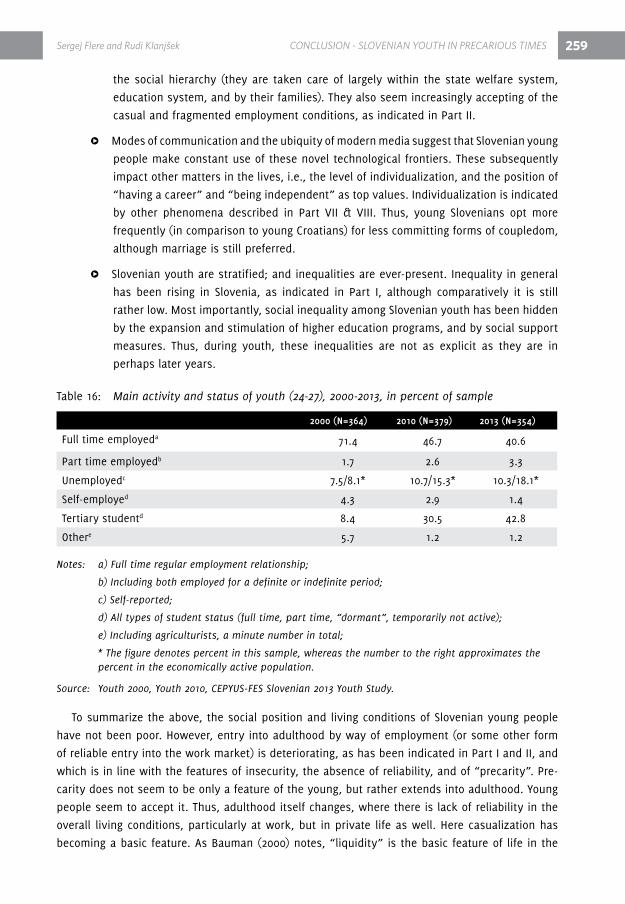
Sergej flere and Rudi Klanjšek CONCLUSiON - SLOVENiaN yOUTh iN pRECaRiOUS TiMES 259
the social hierarchy (they are taken care of largely within the state welfare system,
education system, and by their families). They also seem increasingly accepting of the
casual and fragmented employment conditions, as indicated in Part II.
Δ Modes of communication and the ubiquity of modern media suggest that Slovenian young
people make constant use of these novel technological frontiers. These subsequently
impact other matters in the lives, i.e., the level of individualization, and the position of
“having a career” and “being independent” as top values. Individualization is indicated
by other phenomena described in Part vII & vIII. Thus, young Slovenians opt more
frequently (in comparison to young Croatians) for less committing forms of coupledom,
although marriage is still preferred.
Δ Slovenian youth are stratified; and inequalities are ever-present. Inequality in general
has been rising in Slovenia, as indicated in Part I, although comparatively it is still
rather low. Most importantly, social inequality among Slovenian youth has been hidden
by the expansion and stimulation of higher education programs, and by social support
measures. Thus, during youth, these inequalities are not as explicit as they are in
perhaps later years.
Table 16: Main activity and status of youth (24-27), 2000-2013, in percent of sample
2000 (n=364) 2010 (n=379) 2013 (n=354)
Full time employeda 71.4 46.7 40.6
Part time employedb 1.7 2.6 3.3
Unemployedc 7.5/8.1* 10.7/15.3* 10.3/18.1*
Self-employed 4.3 2.9 1.4
Tertiary studentd 8.4 30.5 42.8
Othere 5.7 1.2 1.2
Notes: a) Full time regular employment relationship;
b) Including both employed for a definite or indefinite period;
c) Self-reported;
d) All types of student status (full time, part time, “dormant”, temporarily not active);
e) Including agriculturists, a minute number in total;
* The figure denotes percent in this sample, whereas the number to the right approximates the percent in the economically active population.
Source: Youth 2000, Youth 2010, CEPYUS-FES Slovenian 2013 Youth Study.
To summarize the above, the social position and living conditions of Slovenian young people
have not been poor. however, entry into adulthood by way of employment (or some other form
of reliable entry into the work market) is deteriorating, as has been indicated in Part I and II, and
which is in line with the features of insecurity, the absence of reliability, and of “precarity”. Pre-
carity does not seem to be only a feature of the young, but rather extends into adulthood. Young
people seem to accept it. Thus, adulthood itself changes, where there is lack of reliability in the
overall living conditions, particularly at work, but in private life as well. here casualization has
becoming a basic feature. As Bauman (2000) notes, “liquidity” is the basic feature of life in the
260
second modernity. This is largely supported by the results in Table 16, which indicate the changes
in the main activity structure of Slovenian young people (aged 24-27) (“young adults”).
Over the observed period, one can easily see the most radical changes concern those who
are fully employed (the figure has radically dropped) and tertiary students (the figure has risen
fivefold). Evidently, the lack of employment possibilities was rarely registered as unemployment;
young adults were instead channeled into various forms and types of tertiary study (as well as
part-time work). however, as can be seen in Table 16, two figures are indicative of self-perceived
unemployed: as part of the total sample (rising slowly), and as part of the economically active
population, for which the figure has more than doubled over the past 13 years.
If one accepts that entry into the workforce is the best indicator of a successfully completed
transition into adulthood, the issue of (un)employment becomes even more important. In other
words, finding one’s place in the labor market aids in the consolidation of other transitions (child
rearing, supporting a home, being “independent”)65. Therefore, it is very important to analyze the
data centering on this domain. It is thus even more interesting to see who, under these evermore
stringent conditions, is able to obtain the status of full- and part-time employment.
1.1 Who succeeds among young adults (24-27)?
1.1.1 Gender
Male respondents from this age group are significantly more likely to be fully employed in 2013
(40.0 percent compared to 30,3 percent of females); however, the relationship inverts when taking
into account student status (50.8 percent of females, compared to 35.8 percent of males). This is
quite different from 2000 (Miheljak et al., 2000), when the number of females employed in this age
group was 70 percent, compared to 65 percent of males, which indicates that the current crisis is
afflicting young women disproportionately.
1.1.2 Schooling
In this age group, having a tertiary degree is still a somewhat wider conduit to employment
than an upper secondary degree. Among tertiary degree holders, 25 percent are employed, com-
pared to 20 percent of upper secondary degree holders. however, the number of fully employed
tertiary degree holders is one-third of what it was in 2000, when 74.5 percent were fully employed
(Miheljak et al., 2000).
65 It is important to note that many do not share this view. For example, Arnett, in his study of the United States, writes of parenthood as the most critical transition (2000, 473). however, in an age of low child birth in Europe, this may not have the same indicative value as it does in the US (EU birth rates are mainly within the 1.3-1.5 range, Slovenia 1.3, whereas the US rate amounts to 2.01 (CIA, 2013). Even Furlong, who in his most recent book (2013) writes of the transition to employment as one of the two foci in youth studies (the other being youth identity, 2013, 9), shies away from giving his own judgment. heinz, another authority in the field, would also not state directly that the transition to the world of work is the most critical. Specifically, he admits only that “a more down to earth explanation would take into account the labour markets and social policies… which have restructured youth transitions” (2010, 3), thus also avoiding a clear position on the matter.
CONCLUSiON - SLOVENiaN yOUTh iN pRECaRiOUS TiMES Sergej flere and Rudi Klanjšek

261
In terms of unemployment, tertiary degree holders were in a somewhat better position (7.4
percent compared to 9.9 percent of those who hold secondary degrees. By comparison, 5.5 percent
of those who had completed higher education were unemployed (though the scale of degrees has
changed). however, a stark change can be seen when taking into account the number of tertiary
students. Among those with a higher education degree, 33.8 percent declared themselves to be
students again (in 2000 this share stood at 5.2 percent). The main finding that can be deduced
from the observed vertical and horizontal expansion of tertiary education is that it now functions
as a “parallel social system”. In other words, it may be argued that tertiary schooling in Slovenia
operates increasingly as a “safety valve” in the social system, and less as something that leads
to better employment opportunities, as viewed by human capital proponents of the past (Becker,
1964).66 Whereas gender disparities have increased with regards to who will be employed, the val-
ue of education has sharply diminished (although it still enhances the possibility of employment).
1.1.3 In depth predictors
There are a number of sociological and psychological predictors capable of discerning who will
truly succeed, finish school, and find employment. Among the best-known predictors are intelli-
gence quotients (not accounted for in this study; see Flere et al., 2010), parental cultural capital,
parental economic capital, parental social capital, and time orientations, as conceptualized and
operationalized by Zimbardo and Boyd (2006). This study also considered narcissistic exploitative-
ness, particularly as exploitativeness presumes a will to achieve instrumental ends at the illegiti-
mate expense of others (Margolis and Thomas, 1980).
Parental cultural capital, operationalized by Bourdieu, works in such a manner as to inculcate
offspring with knowledge, values, and abilities. These are allegedly common to the family and
the social system, whereby the social system recognizes them as appropriate for recruitment into
higher social positions, after having gratified the child scholastically. The association has been
confirmed numerous times in various settings, although the precise contents of cultural capital
have varied. Cultural capital is more frequently operationalized via parental education levels. This
association has been confirmed in Slovenia as well (Flere et al., 2010).
Family economic status needs no particular explanation: it works both through schooling, en-
abling offspring additional economic support in their education, and independent of school, some-
times making even schooling itself irrelevant due to the family’s economic resources.
Time orientation is a relatively new construct, built mainly from concepts known in psychology,
but re-established by Zimbardo and Boyd (2006) into a framework that is able to channel various
types of attitudes to the past, present, and future. For the purposes of this study, future time ori-
entation was of particular interest. It points to the presence of long-term planning and subjecting
one’s behavior to such plans. This is the subjugation of one’s present behavior with a view to-
ward future gratification. Most of the content of the construct has been previously known within
66 Nevertheless, it should not be forgotten that expanding tertiary education has other, non-material effects that are positive for both the individual and the society as a whole (e.g., being more tolerant and more open-minded) (Bobo and Licari, 1989).
Sergej flere and Rudi Klanjšek CONCLUSiON - SLOVENiaN yOUTh iN pRECaRiOUS TiMES

262
hirschi’s “self-control”/”self-regulation”. Zimbardo and Boyd explicitly state that future-orientation
is not only associated with the psychological necessities of work, but also that “being future-ori-
ented can get you a job in the first place” (2006, 142). Moreover, “because they have more edu-
cation, they getter better jobs” (2006, 150). In contrast, present hedonist- and present fatalist- ori-
entations were hypothesized to have a negative impact on schooling.
Taking into account both that narcissism manifestations are time dependent, and that the cur-
rent situation is marked by a scarcity of employment, exploitative narcissism could be expected
to manifest itself by higher employment. As hill and roberts (2011) suggest, narcissism may lead
to the “better achievement of occupational goals”. Exploitative narcissism is also characterized by
the quality of being manipulative, which could in present conditions lead to employment if viewed
as an ego gratifying “reward”.
The following table offers a summarized view on the differences between those employed and
those unemployed (aged 24-27) with regard to the variables noted above.67
Table 17: Mean differences between employed and unemployed for “success” relevant variables, 24-27 age group
employed(n=163)
unemployed(n=71)
Family economic status 6.00 5.85
Maternal education 2.85 2.90
Paternal education 2.84 2.70
Future orientation 3.82 3.62
Present hedonist orientation 3.04 3.05
Present fatalist orientation 3.05 2.90
Narcissistic exploitativeness 1.91 2.00
Educational achievement 3.18 2.99*
Notes: *p <0.05.
Family economic status was measured by self-appraisal, on a 1-10 scale, in the pro-trait direction. Future orientation, Present hedonist orientation, Present fatalist orientation and Narcissistic exploitativeness were measured on a 1-5 scale, in the pro-trait direction. Maternal, paternal, and respondent’s education (achievement) was measured on a 1 (less than completed elementary school) to 5 (completed some form of post-graduate studies) scale.
Source: CEPYUS-FES 2013 Slovenian Youth Study.
Although family economic status and parental educational attainment indicate some social re-
production among the privileged, no variable can adequately explain the absence of employment
67 Students will not be taken into consideration, as many are students only formally, i.e., to relieve and mask their true unemployed status. Thus, they could be composed of true and “fictitious” students. however, the findings would not be different.
CONCLUSiON - SLOVENiaN yOUTh iN pRECaRiOUS TiMES Sergej flere and Rudi Klanjšek

263
among those aged 24-27. The only significant difference between the employed and unemployed
could be found in their own educational achievement. Specifically, looking at the structure of the
employed and unemployed by educational attainment, the results indicate that among the em-
ployed, 37 percent completed higher education, whereas 68 percent completed only secondary ed-
ucation. Among the unemployed, 70 percent completed secondary education, whereas 13 percent
had completed higher education. Those with higher levels of education would thus be more likely
to find themselves among the employed, although this was “no insurance”.
Nevertheless, the entire picture seems far less clear than what was expected by the validity
of the variables applied. In particular, there is no confirmation that psychological variables are of
any explanatory value, which largely supports the findings from the Youth 2010 study (Lavrič et
al., 2011). Overall, the impression is that the main culprit is systemic in nature. Specifically, the
diminution of the national product by 8.5 percent since 2008 has obviously afflicted all groups and
frustrated the effects of factors that should lead to a differentiation among those who succeed
and those who do not. It could be argued that crisis conditions have muddled the effects of most
predictors, with the exception of gender, which became an even stronger predictor. As such, there
seems to be no “reflexion” and no “navigation” (Beck, 2007) on the part of young adults when
there are so few jobs. It is not possible to navigate towards new economic niches, outside manu-
facturing, if there are none. however, there is another point, which was not directly disconfirmed
by this study. Although according to Beck and Bauman, all institutions and entities are melting in
liquid society, including class, religion, and family, and each individual is forced to undertake his
life project, this is also “the beginning of radicalized inequalities” (Beck, 2007, 680). One cannot
expect that out of individual choice and navigation, meritocracy or social equity would arise. rath-
er, inequalities perpetuate because the risks are concentrated at the bottom of the social scale, as
Beck argues. Only the mode of status attainment has changed, including individual judgment and
striving on the part of the young recently emancipated from direct parental guidance. Yet basic
determinisms of class inequality remain, or are even more acute. Social inequality in Slovenia is
on the rise, although cushioned for youth by the instruments depicted above.
The relatively low explanatory potency of otherwise reliable predictive constructs cannot yet
be taken as confirmation of Beck’s notion of individualization, according to which the individual
acting reflexively creates his/her own “life trajectory” and is relatively independent of social de-
terminisms (see Farrugia, 2013). rather than finding indications of trajectory passing by individual
plans, and predictors indicative of planning achievement, this study found that trajectory passing
and arrival are mainly arrested. For those who have made such a passage, the input of individual
specific factors is low. This can be acutely seen by the absence of future orientation among those
aged 24-27. At this age, orientation should at least impart a partial psychological basis of reflex-
ive thinking and action, containing time deferment and calculation, not to mention, instrumental
rationality.
In sum, there is little knowledge on how individual “navigation” towards adulthood takes place.
In the entire sample, 62 percent of respondents claim that they make their major decisions inde-
pendently. Among the oldest group in this sample, the percentage rises to 80 percent.
Sergej flere and Rudi Klanjšek CONCLUSiON - SLOVENiaN yOUTh iN pRECaRiOUS TiMES
264
Nearly half of the 24+ age group have taken part in courses over the past year as a means of at-
taining new and relevant skills. This is significantly higher than in previous years, but it seems that
even more will be demanded from them. Moreover, this by itself cannot raise the number of jobs,
even casual ones. Future research should focus on how friends and partners act as social capital
by means of helping others attain work, particularly as it is well known that Slovenian families
often give their children sound economic and emotional backing, which is one of the conditions
where Slovenian youth are predominantly satisfied (life satisfaction among those aged 24-27 is at
7,3 on a 1-10 scale and is positively related to good family relations).
Yet some inequalities are present and the absence of future orientation suggests that young
people in general lack “navigation”, and stand an even less chance of bringing the subject into a
safe haven.
In terms of the general population’s perceptions, acquaintances, i.e., social capital, are con-
sidered the best means in finding employment. In the oldest age group, half of the respondents
favored social capital, whereas only 7 percent believe that political associations are the best
job-hunting mechanism. however, generalities in these matters may be questionable, as they are
often associated with hearsay.
As indicated in Part vIII, Slovenian youth tend to accept the “casualization” of work, and are
adjusting well to the flexibility needed on the labor market. Slovenia also has one of the lowest
nuptial rates in the EU (Eurostat, 2013), particularly as young people maintain relatively good
housing conditions in their parents’ dwellings. Unemployment among those aged 24-27 claim an
average “income” of only 271 EUr, but their life satisfaction is not radically below those employed
full-time (6.68 vs. 7.40). In both cases, the magnitude is well above the EU average. One could say
that the absence of employment is not a cause of general dissatisfaction, although it seems to
diminish general life satisfaction. Gender and age are not significant explanatory variables behind
these findings (it has been indicated that women and older youth designate lower values for life
satisfaction).
Another way of observing the employment problem is assessing whether the unemployed are
significantly more willing to leave Slovenia. however, one should bear in mind that Slovenia is a
small country and that such willingness should be expected less than in larger systems. On a 1-4
scale (1 and 2 = leaning toward staying, 3 and 4 = indicating a wish to emigrate), there is no dif-
ference in the willingness to move out among those who employed full-time (M = 2.00) and those
unemployed (1.99). despite the inconclusiveness of this data, it should not be disposed of entirely.
Interestingly, these figures have risen in comparison to data fielded in the first decade of the cen-
tury.68 Nevertheless, the majority of young Slovenians claim to be most comfortable in Slovenia.
As such, these are indirect indicators that young Slovenians have come to terms with the absence
of permanent employment. Nevertheless, young Slovenians are generally satisfied with life, irre-
spective of their employment status, and even if they are older than 24.
68 In 2006, 44 percent of higher education students were prepared to look for work outside Slovenia (Flere et al., 2006), whereas in our study (2013) 33 percent of higher education students would like to go abroad to live for reasons unspecified. however, the question was worded too differently in the studies to make an accurate comparison.
CONCLUSiON - SLOVENiaN yOUTh iN pRECaRiOUS TiMES Sergej flere and Rudi Klanjšek

265
One could ponder on their happiness not being related to Marxian labor emancipation, or
durkheim’s networking, i.e., achieving sociality through labor. Their networking and social rela-
tions seem to be lowly related to work. One could say they take work “casually”. Their sociality is
mainly outside work.
In sum, the entry into adulthood is becoming more protracted and less orderly, riddled with
uncertainty and fluidity, where “everything melts” and nothing remains solid (Bauman, 2000).
This includes the trend of casualization and precarity of work, where employment, especially that
which is permanent, has been an ever-rarer phenomenon, not only in Slovenia, but also elsewhere.
2 referencesArnett, J.J. (2000). Emerging adulthood. A theory of development from the late teens through the
twenties. American Psychologist, 55, 469-480.
Bauman, Z. (2000). Liquid Modernity. Cambridge: Polity.
Beck, U. (2007). Beyond class and nation: reframing social inequalities in a globalizing world.
British Journal of Sociology, 58, 679-705.
Becker, G. (1964). human Capital: A Theoretical and Empirical Analysis, with Special reference to
Education. Chicago: University of Chicago Press.
Bobo, L, Licari, F.C. (1989). Education and Political Tolerance: Testing the Effects of Cognitive So-
phistication and Target Group Affect. Public Opinion Quarterly 53(5): 285- 308.
CIA - Central Intelligence Agency. (2013). The World Factbook 2013, Available at:
https://www.cia.gov/library/publications/the-world-factbook/geos/si.html (Jul., 2013).
Eris, M. (2011). Improving educational outcomes in Slovenia. OECD Economics Working Papers,
no. 915. Paris: OECd.
Eurostat (2013). Marriage indicators sheet 2013. Available at: http://epp.eurostat.ec.europa.eu/
portal/page/portal/population/data/database (Sept.,2013).
Farrugia, d. (2013). Addressing the problem of reflexivity in theories of reflexive modernisation.
Journal of Sociology, 1-15.
Flere, S. Tavčar Krajnc, M., Musil, B. and Kirbiš A. (2010). Cultural capital and intellectual ability
as predictors of scholastic achievement: a study of Slovenian secondary school students. British
Journal of Sociology of Education, 31, 47-58.
Flere, S., Lavrič, M. Fištravec, A., Krajnc Tavčar, M., Klenovšek, T. (2006). družbeni profil študen-
tov 2005. Ljubljana: Študentska organizacija Slovenije.
Furlong, A. (2013). Youth Studies. An Introduction. Milton Park: routledge.
Furlong, A. and Kelly, P. (2005). The Brazilianisation of youth transitions in Australia and the UK?
Australian Journal of Social Issues, 40, 2, 207-225.
Sergej flere and Rudi Klanjšek CONCLUSiON - SLOVENiaN yOUTh iN pRECaRiOUS TiMES

266
heinz, W. r. (2010). Youth transitions in an age of uncertainty. Pp. 3-13. In A. Furlong (Ed.) Hand-
book of Youth and Young Adulthood. Milton Park: routledge.
hill, P.L. and roberts, B. W. (2011). Examining ‘developmental me’: A review of narcissism as a
life span construct. Ch. 17 in Handbook of Narcissism and Narcissistic Personality Disorder, ed.
W. K. Campbell and J.d. Miller. hoboken, NJ: Wiley.
Margolis, h. d., & Thomas, v. (1980). The measurement of narcissism in adolescents with and
without behavioural and emotional disabilities. Unpublished master’s thesis, United States Inter-
national University, San diego, CA.
Miheljak, v., M. Ule, T. rener, M. Mencin Čeplak, B.Tivadar in M. Kuhar: Mladina, 2000 [datoteka
podatkov]. Ljubljana: Fakulteta za družbene vede. Center za socialno psihologijo [izdelava], 2000.
Ljubljana: Univerza v Ljubljani. Arhiv družboslovnih podatkov [distribucija], februar 2001
Phan, h.P. (2009). Amalgamation of future time orientation, epistemological beliefs, achievement
goals and study strategies: Empirical evidence established. British Journal of Educational Psy-
chology, 79, 155-173.
Standing, G. (2011). The Precariat – The new dangerous class. Policy Network, 24 May, 2011.
Zimbardo, P. and Boyd, J. (2006). The Time Paradox. The New Psychology of Time that Can Change
Your Life. New York: Free Press.
CONCLUSiON - SLOVENiaN yOUTh iN pRECaRiOUS TiMES Sergej flere and Rudi Klanjšek

Living in times of disillusionment, risk and precarity
SLOVENIAN
YOUTH2013
First CEPYUS – Friedrich-Ebert-Stiftung (FES) Youth Survey
Slovenian YO
UT
H 20
13 - Living in times of disillusionm
ent, risk, and precarity