Siting of sanitary landfills using GIS modelling: Empirical analysis in Tinos Island, Greece
30
Siting of sanitary landfills using GIS modelling: Empirical analysis in Tinos Island, Greece 1 Kalogeropoulos K.*, 1 Roumelis S., 1 Apostolidis V., 1 Digkas K., 1 Dimopoulou E., 1 Karkaletsou A., 1 Kefalas G., 1 Lorilla R. S., 1 Matala A., 1 Mavrokefalou G., 1 Psarogiannis A., 1 Salonikidi A., 1 Sofianopoulos S., 1 Stamellou E., 1 Stathopoulos N., 1 Voutos G., 1 Chalkias C. 1 Department of Geography, Postgraduate Programme in Applied Geography and Spatial Management, Geoinformatics Sector, Harokopio University of Athens, El. Venizelou str. 70, 176 71, Greece Email: * [email protected] Abstract
Transcript of Siting of sanitary landfills using GIS modelling: Empirical analysis in Tinos Island, Greece

Siting of sanitary landfills using GIS modelling:
Empirical analysis in Tinos Island, Greece
1Kalogeropoulos K.*, 1Roumelis S., 1Apostolidis V., 1Digkas
K., 1Dimopoulou E., 1Karkaletsou A., 1Kefalas G., 1Lorilla
R. S., 1Matala A., 1Mavrokefalou G., 1Psarogiannis A.,
1Salonikidi A., 1Sofianopoulos S., 1Stamellou E.,
1Stathopoulos N., 1Voutos G., 1Chalkias C.
1Department of Geography, Postgraduate Programme in Applied
Geography and Spatial Management, Geoinformatics Sector,
Harokopio University of Athens, El. Venizelou str. 70, 176
71, Greece
Email: * [email protected]
Abstract

Integrated and sustainable urban solid waste management is
one of the most important environmental problems in Europe
and worldwide. According to modern legislations and newly
promoted practices and trends in Europe as well as
internationally, a complex way of urban solid waste
management tends to prevail. This management method
combines the Processing Unit and the Sanitary Landfill for
the Residues of the process. A variety of parameters and
restrictions apply when planning the siting of Residue
Sanitary Landfills (RSL). The urban solid waste management
problem and specifically the matter of RSL siting is
constantly becoming more and more important in developed
and developing countries due to pressures coming from
population and urbanization growth, continuously increasing
living needs and many other factors. Technology evolution
and especially Geoinformatics tools, such as Geographic
Information Systems (GIS) and Remote Sensing (RS),

constitute rather effective ways to approach and research
issues like the problem of urban solid waste management and
mainly the optimal delimitation of RSL.
The aim of this paper is to locate suitable – optimal areas
that can be used for placing RSL in the island of Tinos,
based on legislation, environmental, economic and social
criteria. The methodology followed in this research effort
is developed via Geographic Information Systems (GIS) by
creating a spatial database which contains all the above-
mentioned criteria. This research procedure includes an
important number of different method trials. The result of
this process indicate several places for placing RSL in
Tinos Island.
Key Words: waste management, Residue Sanitary Landfills
(RSL), spatial database, GIS-based zonation, cartographic
overlay analysis
1. Introduction
Integrated and sustainable municipal solid waste management
is a major environmental problem in our country and
worldwide. In recent years the growing urbanization of
areas in combination with the astonishing growth of mass
tourism as well as the improvement of living standards and
the changes in consumption models have led to a dramatic
increase of municipal solid waste. In order to address this
problem, new laws and practices in Europe and worldwide
have created a new way of solid waste management that
combines the processing unit and the sanitary landfill.
This new way is called Sanitary Landfill for Residuals
where only the residues from the processing of municipal
solid waste are buried. Permit solid waste sanitary
landfills to be developed in locations where: (1) the

landfill will not be readily visible from major roads and
development; (2) there will not be major conflicts with
existing and planned development; (3) adequate lands are
available to buffer adjacent lands from disposal
activities; and (4) groundwater quality would not be
adversely affected
(https://planning.smcgov.org/sites/planning.smcgov.org/file
s/documents/files/GP%20Ch%2013-Solid%20Waste
%20Policies.pdf)
The aim of this study is to locate suitable sites to
establish a RSL in the island of Tinos using GIS technology
and taking into account the legislation and factors such as
environmental, economic and social. In order to attain the
optimal location for the RSL the method of geographically
overlay will be used. Geographically overlay can locate the
most suitable sites in the form of zones that vary from the

most inappropriate areas to the most appropriate areas to
build a RSL site.
Initially an analysis of the study area will take place
that will present all the physical and human
characteristics of this area. Next the methodology of
geographically overlay is presented. This methodology will
be launched by setting the criteria for analysis and
creating a database that will be used later in the process.
These criteria are derived from legislation and similar
studies. They consist of physical, environmental and
socioeconomic criteria. Similar studies have been carried
all over the world thus some of the criteria are already
taken into consideration to be in the database. The case
studies are coming from Greece as well as other countries
like China, Turkey, Iran, Serbia and India. These countries
are chosen because the primary form of municipal solid
waste management is Sanitary Landfills like in Greece.
A study in China that took place in Beijing used as
criteria the distance to residential areas, the distance to
rivers and lakes, the distance to the airport, the
underground aquifer criterion, the types of land use, the
percentage of slope, the land price, the distance to the
road network and finally the distance to production areas
(Guiqin et al. 2009). In Turkey a study that took place in
Corlu and in Trabzon, the criteria consisted of the depth
of underwater aquifer, the lithology, the permeability of
the soil and rocks, the degree of slope, the distance to
rivers and lakes, the distance to the airport, the distance
to residential areas, the distance to industrial areas,
road network criterion, the distance to faults and the
distance to cultural important areas (Orhan 2013, Ersoy et
al. 2009). In Iran the study took place in Hamedan province
and in Mahshahr County and the criteria taken into
consideration consisted of the wind direction, the soil
permeability, the groundwater quality, the type of land
use, the sensitivity of the ecosystem, the distance to
urban and rural areas, the slope percentage, the distance
to waste generation places and the distance to water
surfaces (Ghobadi et al. 2012, Alavi et al. 2013). Next in
Serbia the study took place in Srem region and the criteria
consisted of the geomorphology criterion, the litho-
structural criterion, the depth of underground water table,
the lineaments restriction factor, the regional resource
for water supply restriction, the protected areas
criterion, the land use criterion, the surface waters
factor, the aspect criterion, the settlements factor, the
cultural heritage restriction, the slope criterion, the
traffic infrastructure criterion, the airports criterion,
the nonferrous exploitation fields criterion, the energy
infrastructure criterion, the seismic criterion and finally
the state border criterion (Vasiljevic et al. 2012). Moving

to India the study took place in Varanasi area and the
criteria consisted of the proximity to settlements and to
city area, the proximity to highways, the proximity to
water bodies, the proximity to other roads, the proximity
to airports, the type of soil, the degree of slope, the
proximity to forest area, the proximity to railways and if
there is a flood plain (Ohri 2013).
Finally, in Greece a study that took place in Thrace region
and the criteria chosen consisted of the lithology types,
Natura 2000 areas, the distance to rivers and water bodies,
Forest areas, the rainfall criterion, wetlands criterion,
the distance to residential areas, the distance to
commercial-industrial areas, the types of land use, areas
with strong winds, the distance to road network, the
distance to the airport, the distance to transportation
network, the distance to ancient monuments- parks,

socioeconomic criteria and the salt marshes criterion
(Demesouka et al. 2010).
Once the database is created, it is imported into GIS
environment in order to create the levels of analysis for
the multi-criteria grid analysis (using especially tools
like map algebra). The result of this process is the
zonation of the study area according to suitability for the
placement of the Residual Sanitary Landfill. Next,
following the outputs of this analysis, the exact location
of the landfill will be decided. Finally the results will
be presented in the form of maps, which then they will be
analyzed in order to present the final conclusions.
2. Materials and Methods
2.1 Study area

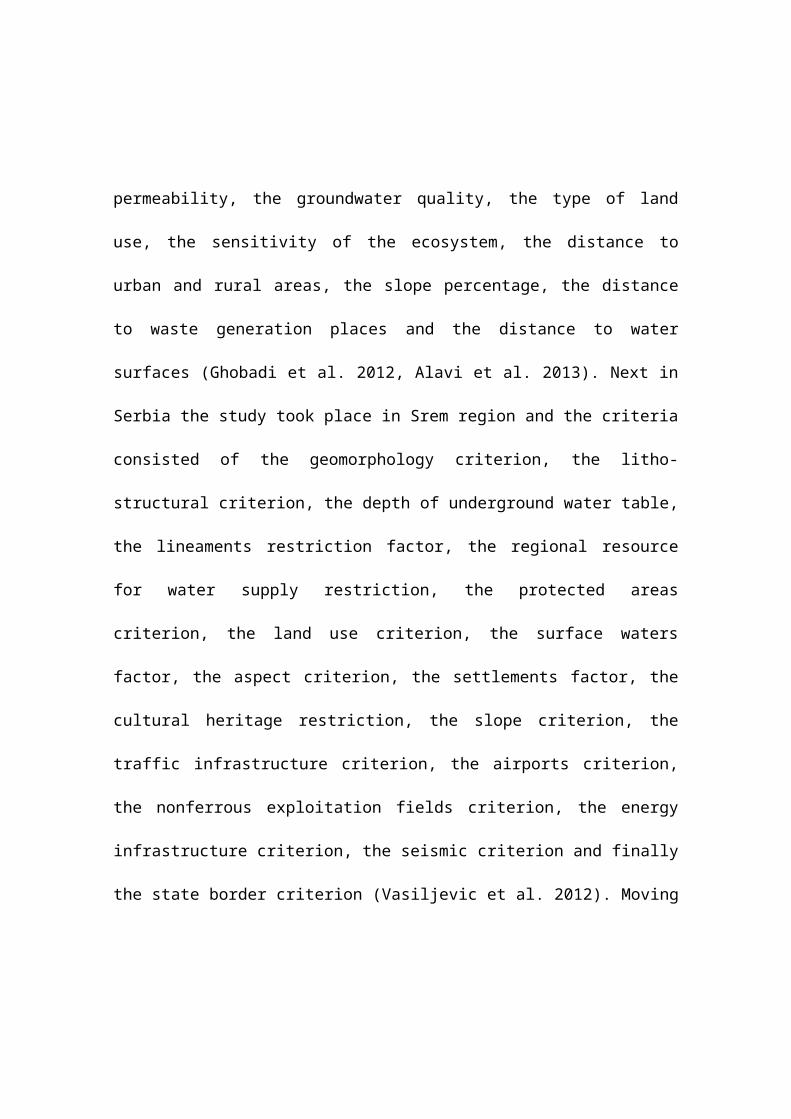
Tinos Island (Fig. 1) is located in the Northern part of
Cyclades (thus, an insular environment which is very
important factor for the above mentioned methodology),
southeast of Andros Island and northwest of Mykonos Island.
Covering an area of 197km2, is the third larger island in
Cyclades following Andros and Naxos. The coastline is
deeply partitioned, with many inlets and capes, and a total
length of 114 km. The topography is characterized as semi-
mountainous, with a highest altitude of 726 m. The island
is covered only by a very small percentage of forest areas.
The plain areas are also limited in extent, covering 29% of
the island’s surface and are mainly created in the
estuaries of its largest torrents. Tinos ground surface is
rocky with intense erosion phenomena. Finally, the climate
is temperate Mediterranean and is characterized by cool
summers and mild winters. According to the latest
population census in 2011 the island’s permanent residents
are 8.590. Tinos suffers from strong population pressures
due to intense tourism mainly during the summer period,
fact that sets the problem of urban solid waste management
as extremely important.
Fig. 1 Study area
2.2 Data
For the geographical analysis of the spatial data and the
creation of a Spatial Database, ESRI ArcMAP version 10.2

was used. The spatial data which are used for the analysis
and are restricted by a number of criteria, are based on
the Greek legislation for RSL. The primary geographical
data that were produced or obtained for the creation of the
Spatial GeoDataBase are the followings:
ASTER GDEM version 2 (obtained from
http://www.jspacesystems.or.jp/ersdac/GDEM/E/4.ht
ml).
Rivers (digitized using Google Earth).
Coastline (digitized using Google Earth).
Reservoir and Dam areas (digitized using Google
Earth).
Forest, olive groves, vineyards and irrigated
areas (Ilot program).
Natura areas (obtained from www.geodata.gov.gr).
City – village centers (digitized using Google
Earth).

Cultural areas (digitized using Google Earth).
Heliport (digitized using Google Earth).
Scenic areas (Volax area, ΑΤ5011031, obtained
from
http://filotis.itia.ntua.gr/biotopes/d/1381/).
Faults (digitized from Tinos’ geological map,
IGME)
Unconsolidated surfaces (digitized from Tinos’
geological map, IGME).
Road network (digitized using Google Earth).
2.3 Methodology
The methodology of this research paper lies on the creation
of a suitable GeoDataBase which consists by the above-
mentioned primary data. The general idea is through a
literature and Greek legislation review to generate this

appropriate GeoDataBase in order to apply the proposed
methodology (Fig. 2).
Fig. 2 Flow chart of the methodology
After the creation of the GeoDataBase, the secondary
geographical data are produced based on specific criteria.
The criteria are applied through the spatial analysis in a
binary format, whereas the value 0 is for the areas that
are suitable for instalment of a RSL and the value 1 is for
the unsuitable areas. The main secondary data (criteria)
which are based on their suitability are:
Distance from rivers more than 500m (>500m)

Distance from dam and reservoir more than 1000m
(>1000m)
Distance from coastline more than 500m (>500m)
Non forest areas
Non olive groves, vineyards and irrigated areas
Non Natura 2000 areas
Distance from cities – villages more than 500m
(>500m)
Non cultural areas
Distance from heliport more than 1000m (>1000m)
Non scenic areas
Slope lower than 15% (<15%)
Distance from tectonic lines (faults) more than
500m (>500m)
Non pervious surface
Distance from roads more than 100m (>100m)

The next step after the creation of the secondary
geographical datasets was the cartographic overlay and the
creation of an output layer which represents suitable and
unsuitable areas for placing a RSL. Afterwards, emphasizing
in special characteristics that Tinos has, such as being a
touristic attractive area and also an island region, the
visibility of the possible RSL areas from a city / village
center and odor nuisance based on the prevailing direction
of the wind were considered.
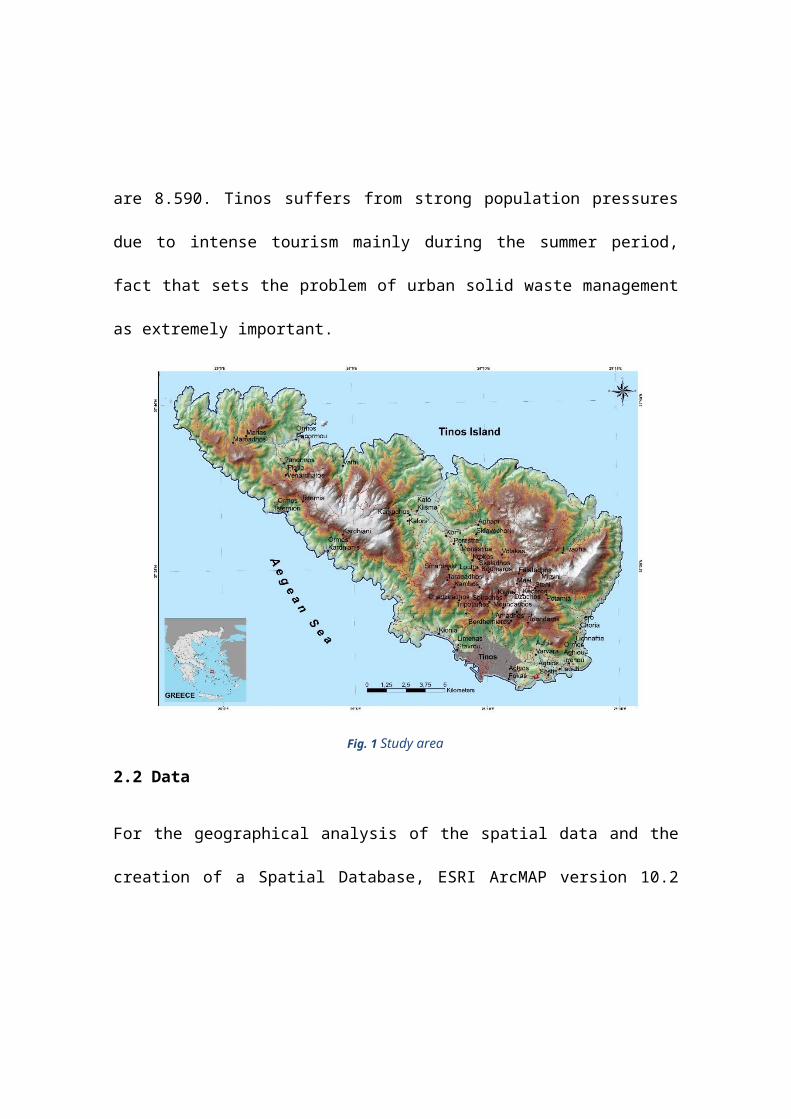
Therefore, two more layers are created and in addition an
overlay is produced combining them with previously main
overlay (Fig. 3). The geographical data that were created
in a respective binary format and their criteria are:
a) The visible and not visible areas from cities /
villages.

b) A layer that will indicate the areas that are been
affecting by the prevailing winds (prevailing wind
direction for Tinos Island is North and Southwest).
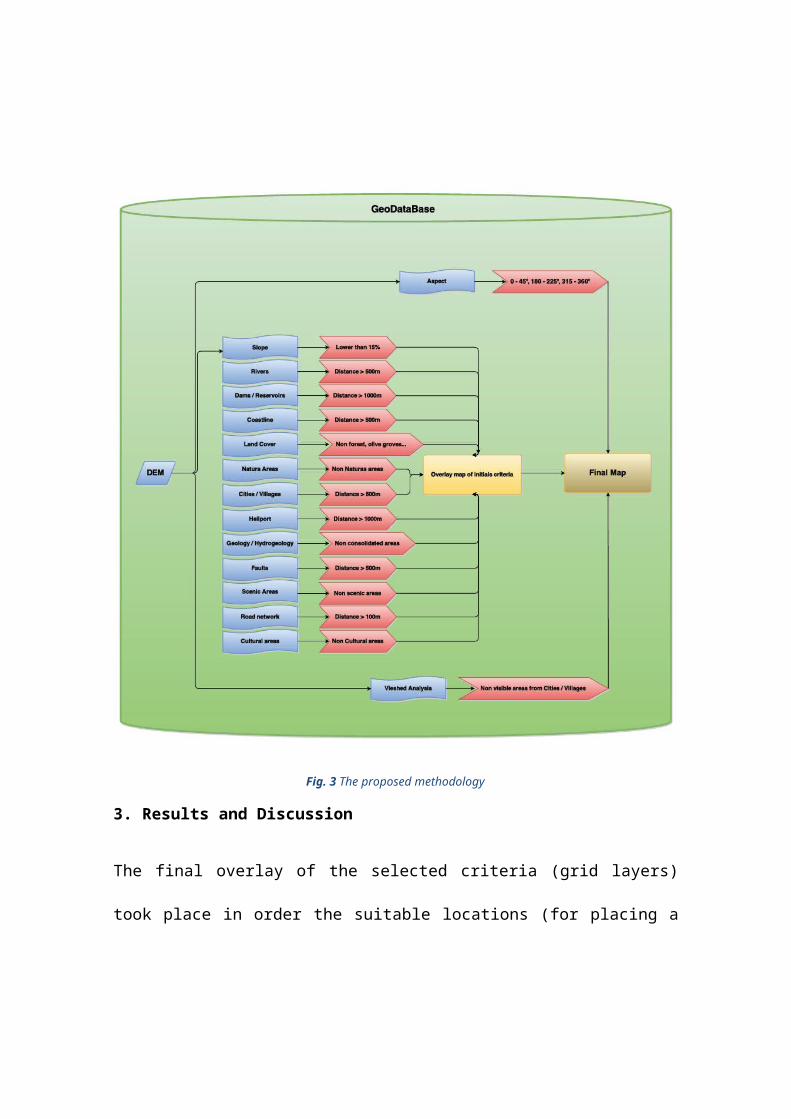
Fig. 3 The proposed methodology
3. Results and Discussion
The final overlay of the selected criteria (grid layers)
took place in order the suitable locations (for placing a

RSL) to be revealed. As it mentioned before the final 14
selected criteria are: Distance from rivers >500m, Distance
from dam and reservoir >1000m, Distance from coastline
>500m, Non forest areas, Non olive groves, vineyards and
irrigated areas, Non Natura 2000 areas, Distance from
cities – villages >500m, Non cultural areas, Distance from
heliport >1000m, Non scenic areas, Slope lower than 15%,
Distance from faults 500m, Non pervious surfaces, Distance
from roads >100m. The map that is produced from the overlay
of these layers is presented in the next picture (Fig. 4).
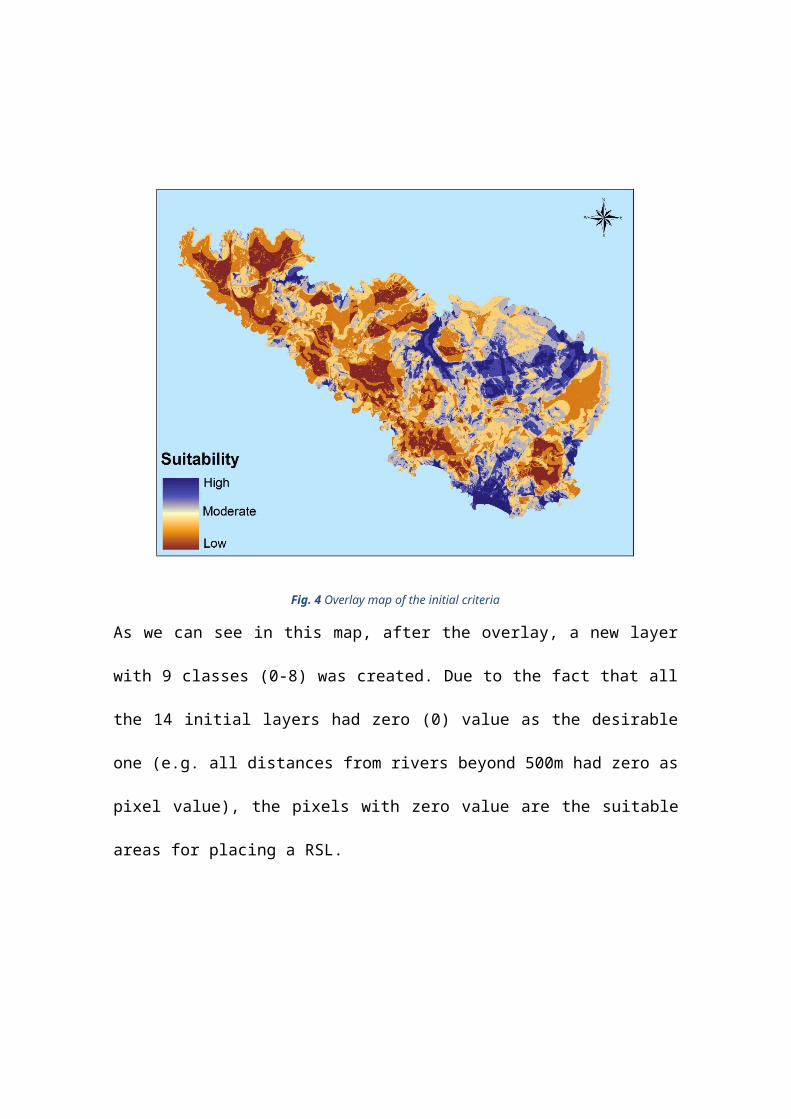
Fig. 4 Overlay map of the initial criteria
As we can see in this map, after the overlay, a new layer
with 9 classes (0-8) was created. Due to the fact that all
the 14 initial layers had zero (0) value as the desirable
one (e.g. all distances from rivers beyond 500m had zero as
pixel value), the pixels with zero value are the suitable
areas for placing a RSL.

As Tinos is a touristic island, it is desirable to avoid
conflicts between touristic activities and municipal
wastes. For this reasons a new criterion (visibility of the
RSL from cities / villages) was adopted (visibility
analysis). This new criterion is presented below (Fig. 5).
Fig. 5 Map of the visibility criterion (Dark areas are visually protected)

Besides this aesthetic criterion, another one, criterion
was adopted. This, actually, is a nuisance criterion of
scents carried due to the wind. In this criterion the areas
that are been affected from the prevailing winds are
excluded. The map of this criterion is presented in the
next figure (Fig. 6).
Fig. 6 Map of the nuisance criterion (Black areas are protected)

The final overlay of the last three layers is the final
product of this methodology. It is a layer that
demonstrates the areas that are suitable for placing the
RSL, and is presented in the following figure (Fig. 7).
Fig. 7 Suitable areas for siting a RSL (blue color) and the 10 biggest areas for siting a RSL (yellow color)

From this last map it is obvious that there are several
places, that this current methodology revealed, that can be
used for siting a RSL. Quantifying this layer, it is easy
to measure all the suitable areas. The values of the ten
biggest areas based on the above quantification are
presented in the next table (Table 1).
Table 1 The 10 biggest suitable areas
ID AREA (Km2)1 0.492 0.343 0.264 0.265 0.236 0.237 0.218 0.219 0.2110 0.19

From this table it is obvious that for siting a RSL with
all the necessary installations the available areas vary
from almost 0.5Km2 (the biggest one) to very small areas.
Most of the suitable areas are at the north part of the
island (without road and river network, without Natura
areas etc).
The final selection for siting the RSL depends on many
other parameters. First of all, it depends on the amount of
the municipal wastes (this will give the size of the RSL).
It, also, depends on what kind of RSL will be installed.
This methodology revealed many places that are suitable
based on the adopted criteria, but some of them have very
small areas. Therefore, based on the size of the RSL must
be excluded.

4. Conclusion
This current research paper is a pointing effort for
locating suitable places for placing RSL. The chosen study
area is Tinos Island, which is an insular environment which
is under great pressure especially during the summer period
due to the tourists. The proposed methodology is based on
legislation, environmental, economic and social criteria.
In order to locate suitable places for RSL the GIS
technology was adopted. Several layers which represent the
above-mentioned criteria were the elements of a GeoDataBase
which was created.
The appropriate secondary processing of these data
demonstrated the proper positions for each of them. The
superposition of all these layers has shown the final
positions for placing RSL. Two extra criteria were used in
order this modeling to be closer to the reality of a region

which is very crowded during the summer period. The first
is an aesthetic criterion (visibility) and the second is a
nuisance criterion of scents carried due to the wind.
The final product of this current methodology is a map that
indicates the suitable areas for placing RSL. There are
several places (ten different areas were indicated) in the
island of Tinos based on this methodology, which are
suitable for placing RSL.
References
Alavi, N., Goudarzi, G., Babaei, A. A., Jaafarzadeh,
N., & Hosseizadeh M. (2013) Municipal solid waste
landfill site selection with geographic information
systems and analytical hierarchy process a case study
in Mahshahr County, Iran. Waste Management and
Research,Vol.31(1), pp 98–105

Demesouka, O.E., Varatsikos, A.P., & Anagnostopoulos,
K.P. (2013) Suitability analysis for siting MSW
landfills and its multicriteria spatial decision
support system: Method, Implementation and case study.
Waste Management, Vol. 33, pp 1190-1206
Ersoy, H., & Bulut, F. (2009) Spatial and multi-
criteria decision analysis-based methodology for
landfill site selection in growing urban regions.
Waste Management & Research, Vol.27, pp 489–500
Ghobadi, M.H., Babazadeh, R., & Bagheri, V. (2013)
Siting MSW landfills by combining AHP with GIS in
Hamedan province, western Iran. Environment Earth
Science, Vol. 70, pp. 1823-1840
Guiqin, W., Li, Q., Guoxue, L., & Lijun, C. (2009)
Landfill site selection using spatial information
technologies and AHP: A case study in Beijing, China.
Journal of Environmental Management, Vol.90, pp 2414–
2421
Ohri, A. (2013) GIS based environmental decision
support system for municipal landfill site selection.
Management of Environmental Quality: An International
Journal, Vol. 24, pp 583-598
Orhan, A. (2013) Municipal solid waste landfill site
selection using geographical information systems: a
case study from Corlu, Turkey, Saudi Society for
Geosciences 2013
Zelenovic´ Vasiljevic´, T., Srdjevic´, Z., Bajcˇetic´,
R., & Vojinovic´ Miloradov, M. (2012) GIS and the
Analytic Hierarchy Process for Regional Landfill Site
Selection in Transitional Countries: A Case Study from
Serbia. Environmental Management, Vol. 49, pp 445-458