Sep2014-TBR Coverpage.cdr - SIDTM Pune
87
ISSN: 0973-9114 1. Flexible Spectrum Management: 9 Approaches for India Arturo Basaure, Heikki Kokkinen, Heikki Hämmäinen, V. Sridhar 2. Management of Service Gaps by Infusion 17 of Technology Roshan Kazi, Sandeep Prabhu 3. Exploration of Product Centric Factors 27 in Telecom Industry Swati Ganeti, Rajat Agarwal, Murali Krishna Medudula, Mahim Sagar 4. On the History of Telecommunication: Patents, 36 Disputes and Rivalries that Shaped the Modern Telecommunication Industry Indraneel Dabhade, Mohan Dewan 5. Social Networking Sites Continuance: An Application 47 of Extended Theory of Planned Behaviour Himanshu Rajput 6. Analyzing the Indian Subscriber Behavior Towards 62 Mobile Social Media - A Data Monetization & Customer Engagement Perspective Sohag Sarkar 7. Innovative Product Management Driving Enhanced 68 Customer Experience Management (CEM) Niladri Shekhar Dutta 8. Wrist Wars: Smart Watches vs Traditional Watches 79 Rahul Darmwal Volume 8 Issue 1 SEPTEMBER 2015
-
Upload
khangminh22 -
Category
Documents
-
view
0 -
download
0
Transcript of Sep2014-TBR Coverpage.cdr - SIDTM Pune
ISSN: 0973-9114
1. Flexible Spectrum Management: 9Approaches for India Arturo Basaure, Heikki Kokkinen, Heikki Hämmäinen, V. Sridhar
2. Management of Service Gaps by Infusion 17of Technology Roshan Kazi, Sandeep Prabhu
3. Exploration of Product Centric Factors 27 in Telecom Industry
Swati Ganeti, Rajat Agarwal, Murali Krishna Medudula, Mahim Sagar
4. On the History of Telecommunication: Patents, 36Disputes and Rivalries that Shaped the ModernTelecommunication IndustryIndraneel Dabhade, Mohan Dewan
5. Social Networking Sites Continuance: An Application 47of Extended Theory of Planned Behaviour Himanshu Rajput
6. Analyzing the Indian Subscriber Behavior Towards 62Mobile Social Media - A Data Monetization &Customer Engagement PerspectiveSohag Sarkar
7. Innovative Product Management Driving Enhanced 68Customer Experience Management (CEM) Niladri Shekhar Dutta
8. Wrist Wars: Smart Watches vs Traditional Watches 79Rahul Darmwal
Volume 8 Issue 1 SEPTEMBER 2015
Telecom Business Review
A Journal of SITM (TBR) is an annual journal of Symbiosis Institute Of telecom Management. TBR is a referred journal with a process of double blind review
The Journal is published every year by SITM with the objective of participating and promoting research in the field of Telecom, IT and Business. TBR contains valuable inputs in the different areas related to technology as well as business and helps the readers to keep abreast of the current trends in the area of telecom business. Papers are invited from authors in varied areas related to telecom business such as:
•Wire-line & Wireless Networks.•Telecom Regulation, Spectrum Allocation, Interconnection, Quality of Service (QoS) etc.•E-Governance.•Marketing: Trends in Telecom / IT at Global/ Indian Level.•Financial, Accounting Issues in Telecom/ IT.•OSS/BSS, Network Security, Telecom Network Management.•Project Management in Telecom/ IT.•IT Risk Management and IT Infrastructure Management.
Plot No. 56, 1st Floor, Deepali EnclavePitampura, New Delhi-110034, India
Tel.: +91-9899775880Email: [email protected]
Website: www.publishingindia.com
Publishing India Group
Journal in Association With:
Te
leco
m B
usin
ess R
ev
iew
Vo
lum
e 8
Issue
1S
ep
tem
be
r 20
15
ISSN 0973-9114
9 770973 911009
Constituent of Symbiosis International University (SIU). (Established under Section 3 of
the UGC Act 1956, by notification No. F 9-12/2001-U 3 of the Government of India),
Symbiosis Knowledge Village, Village Lavale, Mulshi Taluka, Pune-412115.
Phone: +91-20-3911 6177 (Office Direct), 39116180. Fax: 39116181
Email: [email protected], Website: www.sitm.ac.in
Accredited by NAAC with “A” Grade
SYMBIOSIS INSTITUTE OF TELECOM MANAGEMENT
Chairman of the Editorial Board: Prof. Sunil PatilDirector Symbiosis Institute of Telecom Management, Pune.
Secretary and Member of the Editorial Board: Dr Sujata JoshiAssociate Professor (Marketing), Symbiosis Institute of Telecom Management, Pune.
Dr. Sam DzeverProfessor, Telecom Ecole de Management, France.
Dr. Maria Bruna ZolinDeputy-head of the School of Asian Studies and Business Management, Department of Economics, Ca' Foscari University of Venice, Italy.
Dr. N.K. ChidambaranAssistant Professor in Finance, Graduate School of Business, Fordham University, New York, USA.
Dr. Vidyasagar PotdarSenior Research Fellow, School of Information Systems, Curtin Business School, Curtin University, Perth, Western Australia.
Dr. Archana Bhosale DeshmukhAdjunct faculty (Electronics and Computer Engineering) at ITT Technical School, Austin.
Dr. Bhumika GuptaAssociate Professor, Telecom Ecole de Management, France.
Dr. Yogesh PatilResearch Mentor - Faculty of Management, Symbiosis International University (SIU) &Associate Professor (Energy & Environmental Management), Symbiosis Institute of International Business (SIIB), India
Dr. Omkarprasad VaidyaProfessor of SCM & Operations, Indian Institute of Management (IIM), Lucknow, India.Dr. Rameshwar DubeyAssociate Professor-Operations Management, Symbiosis International University, Pune, India.
Dr. R. VenkateshwaranSr. Vice President & CTO, Persistent Systems Ltd., India.
Dr. V. SridharProfessor, Centre for Information Technology and Public Policy (CITAPP), International Institute of Information Technology Bangalore, India
Dr. Kirankumar S. MomayaProfessor, Technology Management, IB and CompetitivenessShailesh J. Mehta School of Management (SJMSOM)Indian Institute of Technology Bombay (IITB), Powai, Mumbai, India.
Dr. KSS IyerHonorary Adjunct Professor, Symbiosis Institute of Telecom Management, Pune., India.
Dr. Pramod DamleProfessor (Telecom &IT) Symbiosis Institute of Telecom Management, Pune, India.
Prof. Prasanna KulkarniAssociate Professor, Symbiosis Institute of Telecom Management, Pune, India.
Dr. Giri HallurAssistant Professor (Telecom), Symbiosis Institute of Telecom Management, Pune, India.
Dr. Trupti DhoteAssistant Professor (Marketing), Symbiosis Institute of Telecom Management, Pune, India.
Telecom Business Review(Annual Journal)
SUBSCRIPTION DETAILS
*Students or Individual academicians need to provide copy of ID card & letter from relevant authorities to avail the pricing offered. Postal charges extra i.e. Rs 150 for annual subscription.
Payment can be made through Demand Draft/Cheque (at par) in favour of “Publishing India Group” payable at New Delhi and send to below mentioned address.
TELECOM BUSINESS REVIEW
India Foreign
Print Print + Online
Institutional/corporate Rs. 1500
Despatch Address:-The Manager,Telecom Business ReviewPlot No-56, 1st FloorDeepali Enclave, PitampuraNew Delhi -110034Ph - 9899775880
Disclaimer
The views expressed in the journal are of authors. Publisher, editor or editorial team cannot be held responsible for errors or consequences arising from the use of information contained herein. While care has been taken to ensure the authencity of the published material, still publisher accepts no responsibility for their accuracy.
Copyright
Rs. 2000 USD 100 USD 120
Individual/students *Rs. 900 USD 90 USD 120*Rs. 1200
Copyright-© Symbiosis Institute of Telecom Management (SITM). Neither this publication nor any part of it may be reproduced, stored or transmitted in any form or by any means without prior permission in writing from copyright holder.
Exclusive Rights
Publishing India Group, holds exclusive and transferable marketing rights for the journal in all form of media.
Print Print + Online
Editorial Board
Editorial Review Board
Editorial Message
It gives me immense pleasure in presenting to you the eighth issue of Telecom Business Review (TBR 2015). The TBR has been a platform for scholars, teachers, professionals and students to contribute and showcase their knowledge, research, experience, study results and findings in the relevant areas of Technology, Business and Management. In the TBR 2014 Issue, we published articles on diverse topics such as Data Quality and Integrity Management for Telecom Operators, New age Telecom Business Models, Monetizing SDN, CSPs in the world of OTT’s, Internet of Things, Business Case for an FTTX provider in a smart city, Comparative Analysis of Regulatory Frameworks, Analysis of Recent Cross Border M & A Trends in Telecom Industry.
I am sure this year’s issue of the TBR will also help to trigger quality studies in the field of Telecom Business Management and enlighten and educate the Telecom fraternity.
At the release of the eighth issue, I thank all the contributors for their thought provoking articles. I also express my heartfelt gratitude to the members of the Editorial Review Board and all our esteemed reviewers. I also seek the support of the telecom fraternity in our efforts of making the TBR global by contributing research papers that highlight global issues in telecom business.
Prof. Sunil Patil.Director SITM
Telecom Business ReviewVolume 8 Issue 1 September 2015
ISSN: 0973-9114
Contents
1. Flexible Spectrum Management: Approaches for India Arturo Basaure, Heikki Kokkinen, Heikki Hämmäinen, V. Sridhar 1-9
2. Management of Service Gaps by Infusion of Technology Roshan Kazi, Sandeep Prabhu 10-17
3. Exploration of Product Centric Factors in Telecom Industry Swati Ganeti, Rajat Agarwal, Murali Krishna Medudula, Mahim Sagar 18-27
4. On the History of Telecommunication: Patents, Disputes and Rivalries that Shaped the Modern Telecommunication Industry
Indraneel Dabhade, Mohan Dewan 28-36
5. Social Networking Sites Continuance: An Application of Extended Theory of Planned Behaviour
Himanshu Rajput 37-47
6. Analyzing the Indian Subscriber Behavior Towards Mobile Social Media - A Data Monetization & Customer Engagement Perspective
Sohag Sarkar 48-62
7. Innovative Product Management Driving Enhanced Customer Experience Management (CEM)
Niladri Shekhar Dutta 63-68
8. Wrist Wars: Smart Watches vs Traditional Watches Rahul Darmwal 69-79
Journal is available online at www.publishingindia.com
Abstract
Radio spectrum for commercial mobile services continues to be scarce. Countries around the world have recognized the importance of efficient utilization of this scarce resource and have initiated regulatory and policy steps towards flexible approaches to spectrum management, including sharing of licensed spectrum, and releasing unlicensed spectrum for mobile services. Technologies for shared access and the associated standardization activities have also progressed towards possible large scale deployments. In this paper, we analyze the evolution of spectrum management policies using a causal model and indicate how the markets can lock in to either centralized or flexible approach. We also cite a use case of a flexible spectrum management approach using “spectrum band fill” option and indicate its suitability to the Indian context.
Keywords: Flexible Spectrum Management, Spectrum Harmonization, Licensed Shared Access, Cognitive Radio, Spectrum Scarcity, Spectrum Fragmentation
Flexible Spectrum Management: Approaches for India
Arturo Basaure*, Heikki Kokkinen**, Heikki Hämmäinen***, V. Sridhar*****PhD candidate, Aalto University, Espoo, Finland.
**CEO, Fairspectrum, Helsinki, Finland.***Professor, Aalto University, Espoo, Finland.
****Professor, International Institute of Information Technology Bangalore, Karnataka, India. E-mail: [email protected]
Introduction
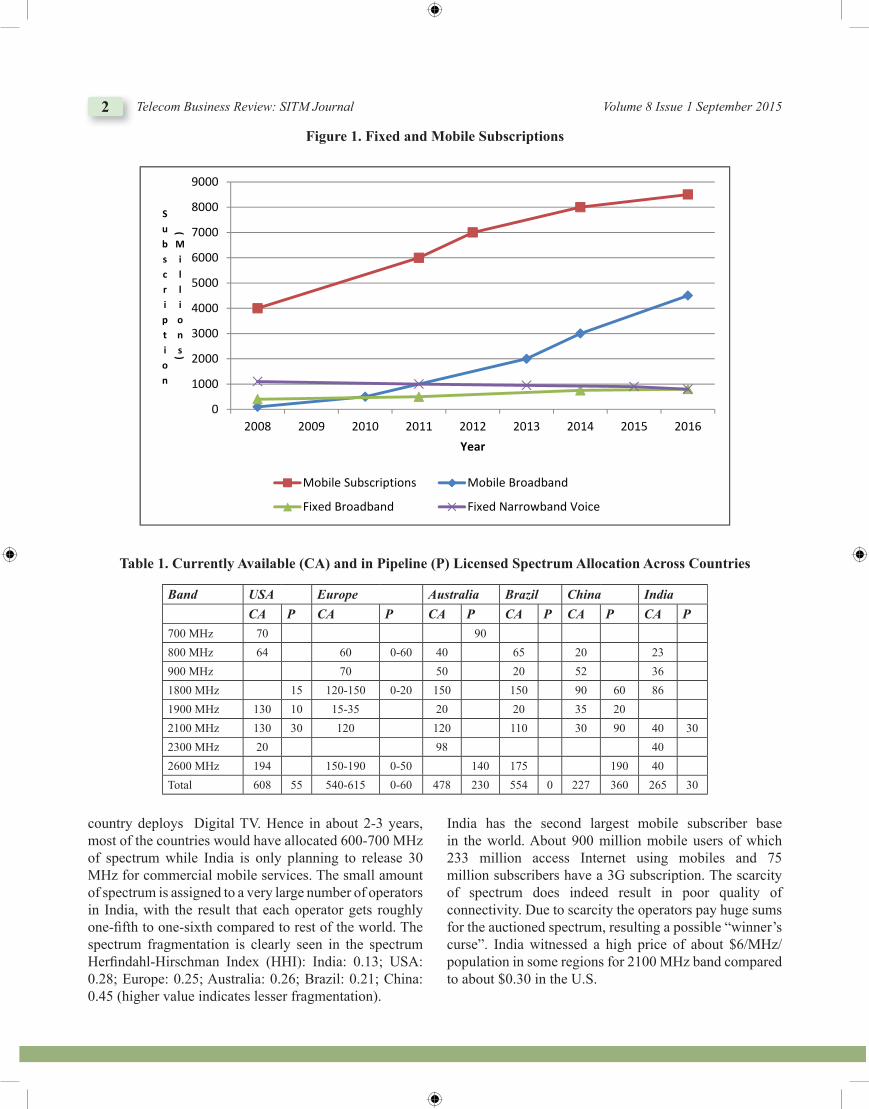
The ‘mobile-only’ Internet population will grow 56-fold from 14 million at the end of 2010 to 788 million by the end of 2015 (Sridhar & Hämmäinen, 2011). In emerging economies, including India, wireless access is expected to be the main driver for the uptake of broadband services. The rate of growth of mobile data traffic is expected to continue to be higher than that of fixed line data traffic. The following figure illustrates the above trends. Potential of wireless broadband for economic development is well documented (Ericsson, 2013).
Radio spectrum is an essential scarce resource for the provisioning of mobile services. While the demand for wireless services is growing exponentially, the capacity of networks has also been increasing. Wireless networks have been able to attain superior spectral efficiencies and are capable of providing hundreds of Megabits/sec. However, the spectrum available for access networks remains a constraint.
India in certain ways is unique with respect to licensed spectrum management. There are, on average, 10 operators in each Licensed Service Area in India. Typically, an operator holds miniscule 2 X 10 MHz across all the 800, 900, 1800, and 2100 MHz bands. Out of the globally harmonized 2 X 60 MHz in 2100 MHz (Band I) for 3G services, only 20 MHz has been released by the government so far. Each of the 4 operators has 2 X 5 MHz. In the 1800 MHz band, only about 2 X 40 MHz has been assigned to mobile operators out of the total available block of 2 × 75 MHz. Table 1 indicates the amount of licensed spectrum currently assigned and in pipeline, across different countries (Peha, 2012; Prasad & Sridhar, 2014).
In India, the allocation for mobile services is less than half of that in the rest of other countries, with the exception of China. However, most of the countries including China have initiated the process of vacating some of the spectrum held by incumbents such as government and public utilities as shown under the column “P”. For example, in addition to the 360 MHz shown in the table, unpaired Digital Dividend band 703-803 MHz may also be made available in China for mobile services once the
Article can be accessed online at http://www.publishingindia.com
2 Telecom Business Review: SITM Journal Volume 8 Issue 1 September 2015
country deploys Digital TV. Hence in about 2-3 years, most of the countries would have allocated 600-700 MHz of spectrum while India is only planning to release 30 MHz for commercial mobile services. The small amount of spectrum is assigned to a very large number of operators in India, with the result that each operator gets roughly one-fi fth to one-sixth compared to rest of the world. The spectrum fragmentation is clearly seen in the spectrum Herfi ndahl-Hirschman Index (HHI): India: 0.13; USA: 0.28; Europe: 0.25; Australia: 0.26; Brazil: 0.21; China: 0.45 (higher value indicates lesser fragmentation).
India has the second largest mobile subscriber base in the world. About 900 million mobile users of which 233 million access Internet using mobiles and 75 million subscribers have a 3G subscription. The scarcity of spectrum does indeed result in poor quality of connectivity. Due to scarcity the operators pay huge sums for the auctioned spectrum, resulting a possible “winner’s curse”. India witnessed a high price of about $6/MHz/population in some regions for 2100 MHz band compared to about $0.30 in the U.S.
Figure 1. Fixed and Mobile Subscriptions
0
1000
2000
3000
4000
5000
6000
7000
8000
9000
2008 2009 2010 2011 2012 2013 2014 2015 2016
Subscription
(
Millions)
Year
Mobile Subscriptions Mobile Broadband
Fixed Broadband Fixed Narrowband Voice
Table 1. Currently Available (CA) and in Pipeline (P) Licensed Spectrum Allocation Across Countries
Band USA Europe Australia Brazil China IndiaCA P CA P CA P CA P CA P CA P
700 MHz 70 90800 MHz 64 60 0-60 40 65 20 23900 MHz 70 50 20 52 361800 MHz 15 120-150 0-20 150 150 90 60 861900 MHz 130 10 15-35 20 20 35 202100 MHz 130 30 120 120 110 30 90 40 302300 MHz 20 98 402600 MHz 194 150-190 0-50 140 175 190 40Total 608 55 540-615 0-60 478 230 554 0 227 360 265 30
Flexible Spectrum Management: Approaches for India 3
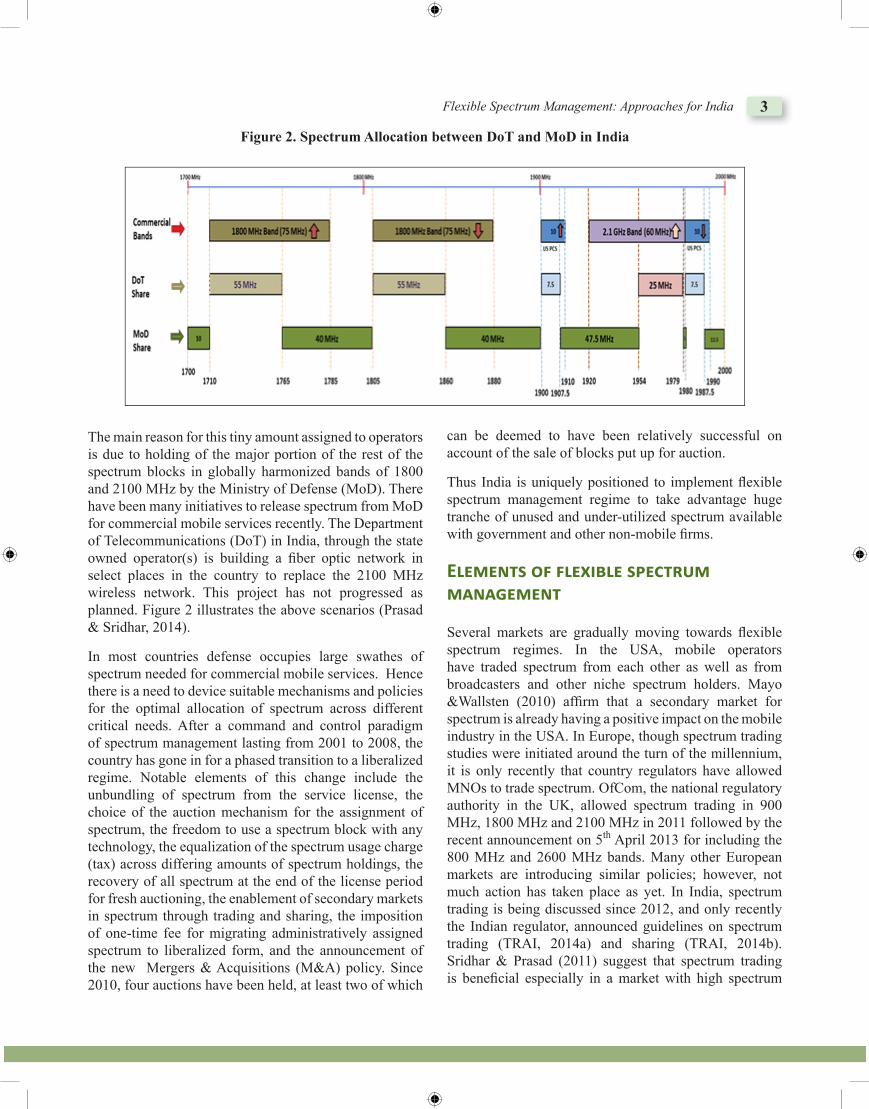
The main reason for this tiny amount assigned to operators is due to holding of the major portion of the rest of the spectrum blocks in globally harmonized bands of 1800 and 2100 MHz by the Ministry of Defense (MoD). There have been many initiatives to release spectrum from MoD for commercial mobile services recently. The Department of Telecommunications (DoT) in India, through the state owned operator(s) is building a fi ber optic network in select places in the country to replace the 2100 MHz wireless network. This project has not progressed as planned. Figure 2 illustrates the above scenarios (Prasad & Sridhar, 2014).
In most countries defense occupies large swathes of spectrum needed for commercial mobile services. Hence there is a need to device suitable mechanisms and policies for the optimal allocation of spectrum across different critical needs. After a command and control paradigm of spectrum management lasting from 2001 to 2008, the country has gone in for a phased transition to a liberalized regime. Notable elements of this change include the unbundling of spectrum from the service license, the choice of the auction mechanism for the assignment of spectrum, the freedom to use a spectrum block with any technology, the equalization of the spectrum usage charge (tax) across differing amounts of spectrum holdings, the recovery of all spectrum at the end of the license period for fresh auctioning, the enablement of secondary markets in spectrum through trading and sharing, the imposition of one-time fee for migrating administratively assigned spectrum to liberalized form, and the announcement of the new Mergers & Acquisitions (M&A) policy. Since 2010, four auctions have been held, at least two of which
can be deemed to have been relatively successful on account of the sale of blocks put up for auction.
Thus India is uniquely positioned to implement fl exible spectrum management regime to take advantage huge tranche of unused and under-utilized spectrum available with government and other non-mobile fi rms.
E����nt� o� ����i��� ���ctru� ��n�����nt
Several markets are gradually moving towards fl exible spectrum regimes. In the USA, mobile operators have traded spectrum from each other as well as from broadcasters and other niche spectrum holders. Mayo &Wallsten (2010) affi rm that a secondary market for spectrum is already having a positive impact on the mobile industry in the USA. In Europe, though spectrum trading studies were initiated around the turn of the millennium, it is only recently that country regulators have allowed MNOs to trade spectrum. OfCom, the national regulatory authority in the UK, allowed spectrum trading in 900 MHz, 1800 MHz and 2100 MHz in 2011 followed by the recent announcement on 5th April 2013 for including the 800 MHz and 2600 MHz bands. Many other European markets are introducing similar policies; however, not much action has taken place as yet. In India, spectrum trading is being discussed since 2012, and only recently the Indian regulator, announced guidelines on spectrum trading (TRAI, 2014a) and sharing (TRAI, 2014b).Sridhar & Prasad (2011) suggest that spectrum trading is benefi cial especially in a market with high spectrum
Figure 2. Spectrum Allocation between DoT and MoD in India
4 Telecom Business Review: SITM Journal Volume 8 Issue 1 September 2015
fragmentation such as India. Table 2 illustrates the differences of these two modes of spectrum management (Prasad & Sridhar, 2014).
T�� C�u��� Mod�� o� Po�ic� D�ci�ion�
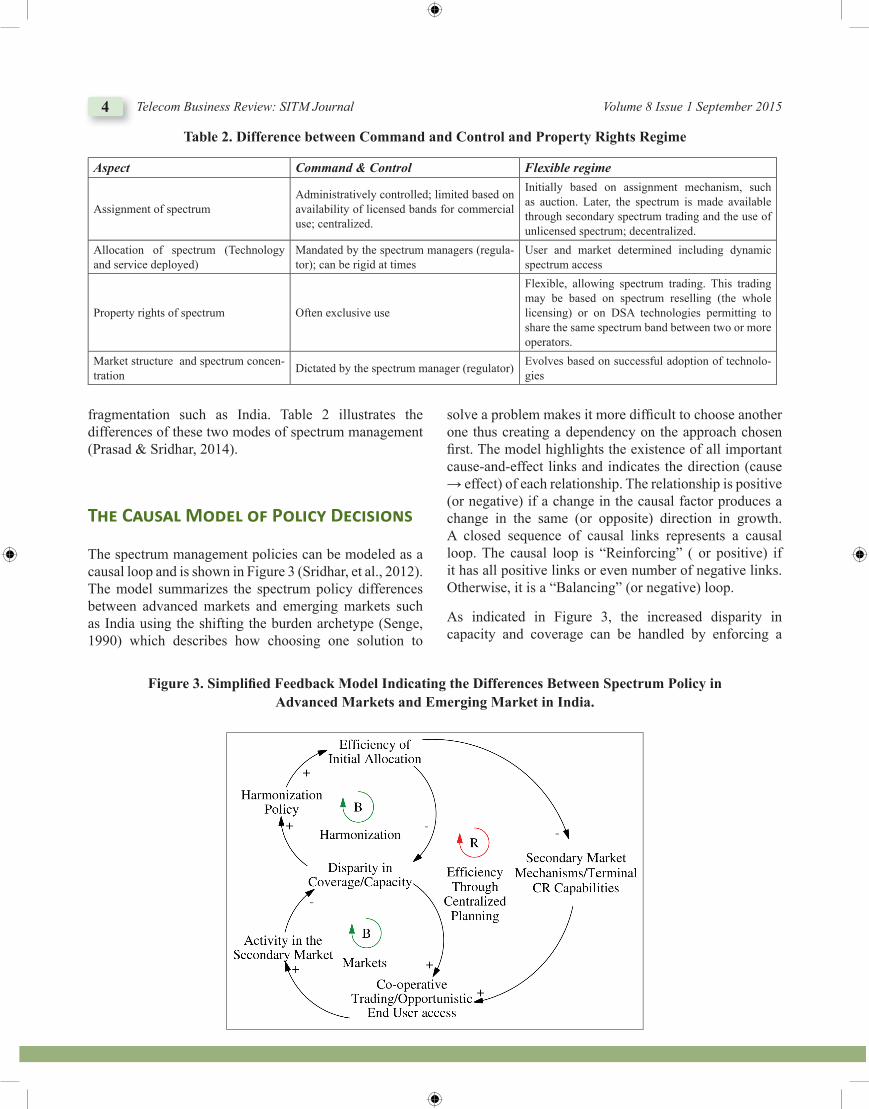
The spectrum management policies can be modeled as a causal loop and is shown in Figure 3 (Sridhar, et al., 2012). The model summarizes the spectrum policy differences between advanced markets and emerging markets such as India using the shifting the burden archetype (Senge, 1990) which describes how choosing one solution to
solve a problem makes it more diffi cult to choose another one thus creating a dependency on the approach chosen fi rst. The model highlights the existence of all important cause-and-effect links and indicates the direction (cause → effect) of each relationship. The relationship is positive (or negative) if a change in the causal factor produces a change in the same (or opposite) direction in growth. A closed sequence of causal links represents a causal loop. The causal loop is “Reinforcing” ( or positive) if it has all positive links or even number of negative links. Otherwise, it is a “Balancing” (or negative) loop.
As indicated in Figure 3, the increased disparity in capacity and coverage can be handled by enforcing a
Table 2. Difference between Command and Control and Property Rights Regime
Aspect Command & Control Flexible regime
Assignment of spectrumAdministratively controlled; limited based on availability of licensed bands for commercial use; centralized.
Initially based on assignment mechanism, such as auction. Later, the spectrum is made available through secondary spectrum trading and the use of unlicensed spectrum; decentralized.
Allocation of spectrum (Technology and service deployed)
Mandated by the spectrum managers (regula-tor); can be rigid at times
User and market determined including dynamic spectrum access
Property rights of spectrum Often exclusive use
Flexible, allowing spectrum trading. This trading may be based on spectrum reselling (the whole licensing) or on DSA technologies permitting to share the same spectrum band between two or more operators.
Market structure and spectrum concen-tration Dictated by the spectrum manager (regulator) Evolves based on successful adoption of technolo-
gies
F igure 3. Simplifi ed Feedback Model Indicating the Differences Between Spectrum Policy inAdvanced Markets and Emerging Market in India.
Flexible Spectrum Management: Approaches for India 5
stronger harmonization policy leading to a more equal and effi cient initial allocation and assignment of spectrum. This subsequently leads to the decrease of the disparity and a balancing loop ‘B-Harmonization’. On the other hand effi cient centralized allocation means that operators do not need to conduct much market based sharing (or trading) and that end users do not have many options in terms of the different radio access possibilities which subsequently means that secondary market sharing or trading mechanisms between operators (such as national roaming) and cognitive radio type of capabilities (such as a multi-SIM functionality) in devices are not required. This in turn leads to a lower possibility for co-operative trading between operators and opportunistic end user access and subsequently to lower activity in the secondary market. The inability of the market to redistribute the spectrum resources in turn leads to a reinforcing loop (‘R-Effi ciency through Centralized Planning’) that possibly locks the market on a path of enforcing a harmonization policy.
The market in India has followed the opposite dynamics. Increased disparity in capacity and coverage in India has been handled by the market in the form of co-operative trading between operators and opportunistic end user access (i.e. many data plans and multi-SIM phones). This in turn has led to what can be seen as a kind of a secondary market activity and subsequently to the decrease of the disparity and a balancing loop (‘B-Markets’).
When the markets tackle the disparities in coverage and capacity it leaves a smaller space for a harmonization policy which in turn leads to less effi cient initial allocation and thus to a larger need of secondary market sharing and trading mechanisms between operators and cognitive radio capabilities of end-user terminals in order to effi ciently use and redistribute the radio resources. This in turn leads to a reinforcing loop (‘R-Effi ciency through Centralized Planning’) that works typically in the opposite direction
when compared to that in advanced markets and can lock the market on a path of tackling disparity in coverage and capacity via the markets.
The corresponding path dependency and the fact that these two market types can be seen as being locked on two opposite paths can have a signifi cant impact on which market for cognitive radio type of systems will diffuse fi rst (Sridhar & Basaure, 2014).
D�n��ic S��ctru� Acc��� T�c�no�o�i��
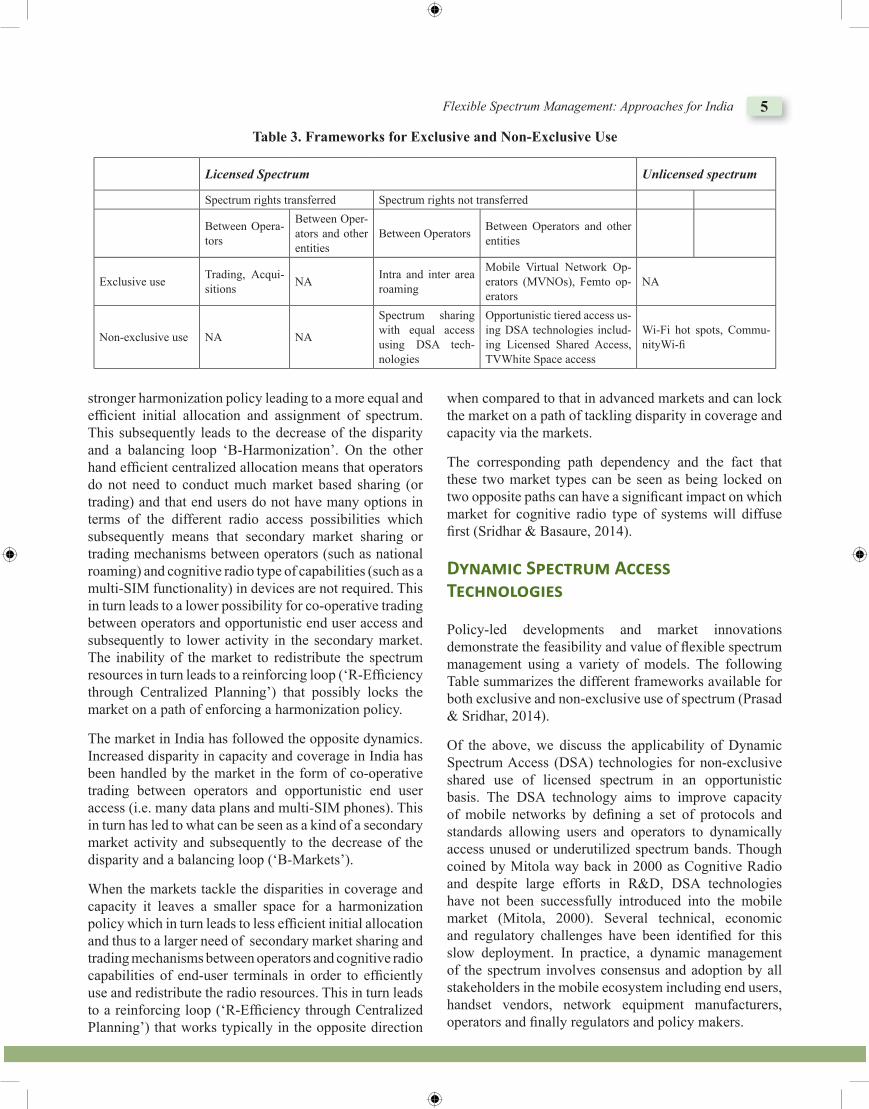
Policy-led developments and market innovations demonstrate the feasibility and value of fl exible spectrum management using a variety of models. The following Table summarizes the different frameworks available for both exclusive and non-exclusive use of spectrum (Prasad & Sridhar, 2014).
Of the above, we discuss the applicability of Dynamic Spectrum Access (DSA) technologies for non-exclusive shared use of licensed spectrum in an opportunistic basis. The DSA technology aims to improve capacity of mobile networks by defi ning a set of protocols and standards allowing users and operators to dynamically access unused or underutilized spectrum bands. Though coined by Mitola way back in 2000 as Cognitive Radio and despite large efforts in R&D, DSA technologies have not been successfully introduced into the mobile market (Mitola, 2000). Several technical, economic and regulatory challenges have been identifi ed for this slow deployment. In practice, a dynamic management of the spectrum involves consensus and adoption by all stakeholders in the mobile ecosystem including end users, handset vendors, network equipment manufacturers, operators and fi nally regulators and policy makers.
Table 3. Frameworks for Exclusive and Non-Exclusive Use
Licensed Spectrum Unlicensed spectrum
Spectrum rights transferred Spectrum rights not transferred
Between Opera-tors
Between Oper-ators and other entities
Between Operators Between Operators and other entities
Exclusive use Trading, Acqui-sitions NA Intra and inter area
roaming
Mobile Virtual Network Op-erators (MVNOs), Femto op-erators
NA
Non-exclusive use NA NA
Spectrum sharing with equal access using DSA tech-nologies
Opportunistic tiered access us-ing DSA technologies includ-ing Licensed Shared Access, TVWhite Space access
Wi-Fi hot spots, Commu-nityWi-fi
6 Telecom Business Review: SITM Journal Volume 8 Issue 1 September 2015
Presently, there are several DSA technology standards being developing to offer different functionalities. On one hand, ETSI focuses on the development of sensing technologies, embedded in Software Defi ned Radio (SDR) in mobile devices to access spectrum spaces (Mueck et al., 2010). On the other hand, IETF has been investing efforts towards the standardization of spectrum database, and the associated protocol for accessing white spaces (Manusco, Probasco & Patil, 2013). Similarly, the European Communication Commission (ECC) has defi ned technical and operational requirements for accessing white space devices in geolocation databases (ECC, 2013). Finally, 3GPP is aiming to improve spectrum effi ciency through LTE carrier aggregation that creates virtual wide band carrier from segments of spectrum across all licensed bands (Yuan et al., 2010).
In practice, DSA technologies may evolve towards two scenarios: (i) user-centric; and (ii) mobile operator-centric. In a user-centric scenario, the user accesses the available spectrum space through the DSA capable mobile handsets in a dynamic basis, along the lines of frameworks defi ned by ETSI. The user or an application in the device decides to some extent on the spectrum and the time of access. Most of the logic will be based on cognitive radio capabilities, such as described by Chapin & Lehr (2007). Sridhar et al. (2013) describe how multi-SIM handsets in markets such as India have initiated cognitive-like responses from end users. On the other hand, in an operator-centric scenario, the DSA capabilities and associated dynamic spectrum management services are provided by the operator to employ spectrum more effi ciently. The network operator installed devices access spectrum spaces much as described in IETF and ECC standards.
The user-centric scenario is similar to unbundled handsets that have DSA capabilities that can be purchased directly from a retailer without any intermediation of a mobile operator. In an operator-centric model, the practice is similar to bundling of handsets with associated contract for services that is being practiced today in certain
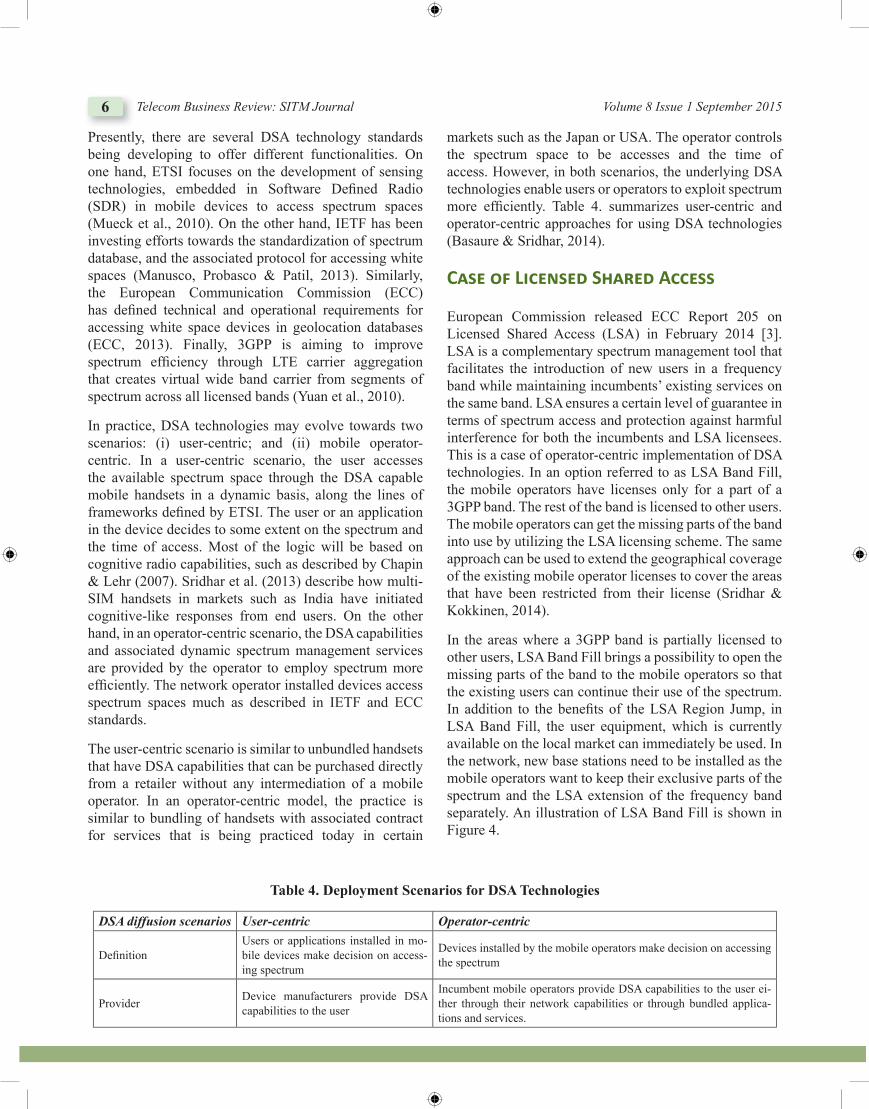
markets such as the Japan or USA. The operator controls the spectrum space to be accesses and the time of access. However, in both scenarios, the underlying DSA technologies enable users or operators to exploit spectrum more effi ciently. Table 4. summarizes user-centric and operator-centric approaches for using DSA technologies (Basaure & Sridhar, 2014).
C��� o� Lic�n��d S��r�d Acc���
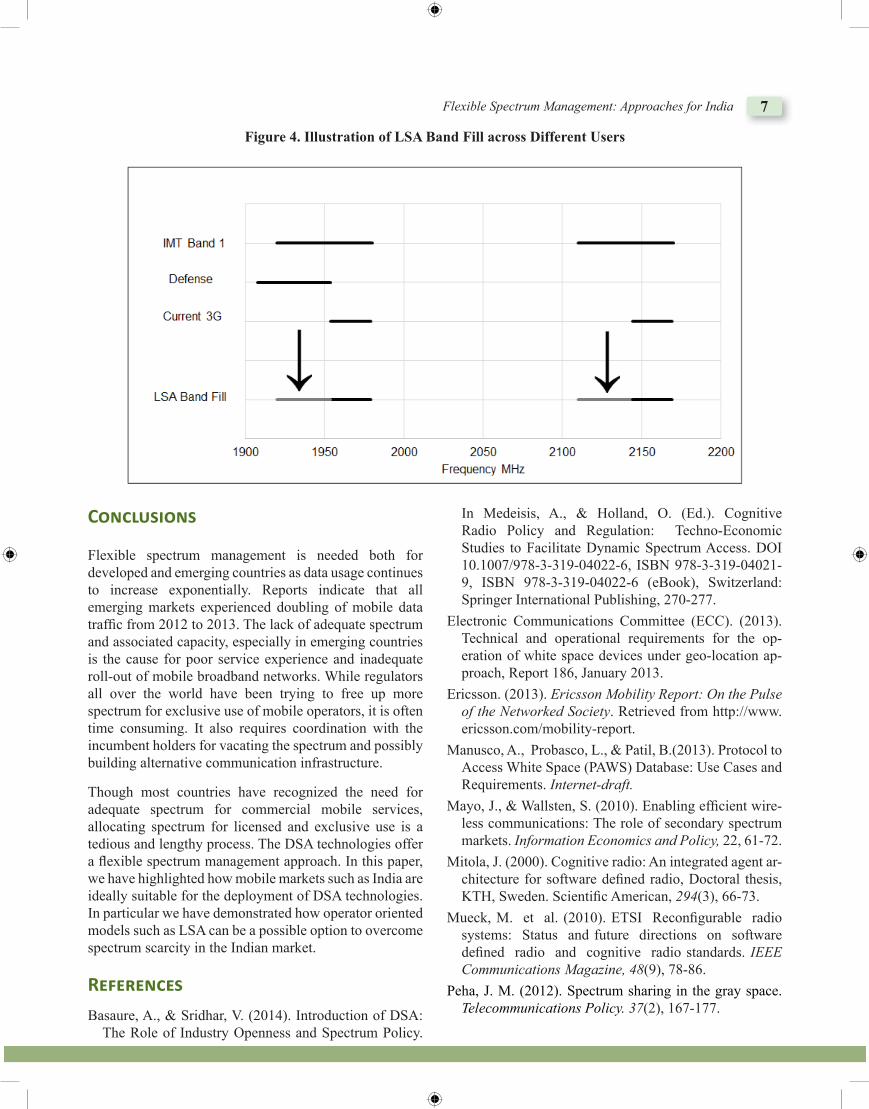
European Commission released ECC Report 205 on Licensed Shared Access (LSA) in February 2014 [3]. LSA is a complementary spectrum management tool that facilitates the introduction of new users in a frequency band while maintaining incumbents’ existing services on the same band. LSA ensures a certain level of guarantee in terms of spectrum access and protection against harmful interference for both the incumbents and LSA licensees. This is a case of operator-centric implementation of DSA technologies. In an option referred to as LSA Band Fill, the mobile operators have licenses only for a part of a 3GPP band. The rest of the band is licensed to other users. The mobile operators can get the missing parts of the band into use by utilizing the LSA licensing scheme. The same approach can be used to extend the geographical coverage of the existing mobile operator licenses to cover the areas that have been restricted from their license (Sridhar & Kokkinen, 2014).
In the areas where a 3GPP band is partially licensed to other users, LSA Band Fill brings a possibility to open the missing parts of the band to the mobile operators so that the existing users can continue their use of the spectrum. In addition to the benefi ts of the LSA Region Jump, in LSA Band Fill, the user equipment, which is currently available on the local market can immediately be used. In the network, new base stations need to be installed as the mobile operators want to keep their exclusive parts of the spectrum and the LSA extension of the frequency band separately. An illustration of LSA Band Fill is shown in Figure 4.
Table 4. Deployment Scenarios for DSA Technologies
DSA diffusion scenarios User-centric Operator-centric
Defi nitionUsers or applications installed in mo-bile devices make decision on access-ing spectrum
Devices installed by the mobile operators make decision on accessing the spectrum
Provider Device manufacturers provide DSA capabilities to the user
Incumbent mobile operators provide DSA capabilities to the user ei-ther through their network capabilities or through bundled applica-tions and services.
Flexible Spectrum Management: Approaches for India 7
Conc�u�ion�
Flexible spectrum management is needed both for developed and emerging countries as data usage continues to increase exponentially. Reports indicate that all emerging markets experienced doubling of mobile data traffi c from 2012 to 2013. The lack of adequate spectrum and associated capacity, especially in emerging countries is the cause for poor service experience and inadequate roll-out of mobile broadband networks. While regulators all over the world have been trying to free up more spectrum for exclusive use of mobile operators, it is often time consuming. It also requires coordination with the incumbent holders for vacating the spectrum and possibly building alternative communication infrastructure.
Though most countries have recognized the need for adequate spectrum for commercial mobile services, allocating spectrum for licensed and exclusive use is a tedious and lengthy process. The DSA technologies offer a fl exible spectrum management approach. In this paper, we have highlighted how mobile markets such as India are ideally suitable for the deployment of DSA technologies. In particular we have demonstrated how operator oriented models such as LSA can be a possible option to overcome spectrum scarcity in the Indian market.
R���r�nc��
Basaure, A., & Sridhar, V. (2014). Introduction of DSA: The Role of Industry Openness and Spectrum Policy.
In Medeisis, A., & Holland, O. (Ed.). Cognitive Radio Policy and Regulation: Techno-Economic Studies to Facilitate Dynamic Spectrum Access. DOI 10.1007/978-3-319-04022-6, ISBN 978-3-319-04021-9, ISBN 978-3-319-04022-6 (eBook), Switzerland: Springer International Publishing, 270-277.
Electronic Communications Committee (ECC). (2013). Technical and operational requirements for the op-eration of white space devices under geo-location ap-proach, Report 186, January 2013.
Ericsson. (2013). Ericsson Mobility Report: On the Pulse of the Networked Society. Retrieved from http://www.ericsson.com/mobility-report.
Manusco, A., Probasco, L., & Patil, B.(2013). Protocol to Access White Space (PAWS) Database: Use Cases and Requirements. Internet-draft.
Mayo, J., & Wallsten, S. (2010). Enabling efficient wire-less communications: The role of secondary spectrum markets. Information Economics and Policy, 22, 61-72.
Mitola, J. (2000). Cognitive radio: An integrated agent ar-chitecture for software defi ned radio, Doctoral thesis, KTH, Sweden. Scientifi c American, 294(3), 66-73.
Mueck, M. et al. (2010). ETSI Reconfi gurable radio systems: Status and future directions on software defi ned radio and cognitive radio standards. IEEE Communications Magazine, 48(9), 78-86.
Peha, J. M. (2012). Spectrum sharing in the gray space. Telecommunications Policy. 37(2), 167-177.
Figure 4. Illustration of LSA Band Fill across Different Users
8 Telecom Business Review: SITM Journal Volume 8 Issue 1 September 2015
Prasad, R., & Sridhar, V. (2014). The dynamics of spec-trum management: Legacy, technology, and econom-ics. Oxford University Press, 2014.
Senge, P. M. (1990). The fi fth discipline: The art & practice of the learning organization. New York, NY: Doubleday.
Sridhar, V., & Hämmäinen, H. (15 July 2011). Mobile internet: Indian telecom leading the way, DataQuest, 34-35.
Sridhar, V., & Prasad, R. (2011). Towards a new pol-icy framework for spectrum management in India. Telecommunications Policy (Elsevier), 35, 172-184, DOI: 10.1016/j.telpol.2010.12.004.
Sridhar, V., Casey, T., & Hämmäinen , H. (2012). Systems Dynamics Approach to Analyzing Spectrum Management Policies for Mobile Broadband Services in India. International Journal of Business Data Communications and Networking, 8(1), 37-55.
Sridhar, V., & Basaure, A. (2014). DSA Applications and Scenerios: Cases of Finland and India. In Medeisis, A., & Holland, O. (Ed.). Cognitive Radio Policy and Regulation: Techno-Economic Studies to Facilitate Dynamic Spectrum Access. DOI 10.1007/978-3-319-04022-6, ISBN 978-3-319-04021-9, ISBN 978-3-319-04022-6 (eBook), Switzerland: Springer International Publishing, 75-79.
Sridhar, V., & Kokkinen, H.. (15 September 2014). Defence must vacate spectrum for wireless broadband. Financial Express.
Telecommunications Regulatory Authority of India (TRAI). (2014a). Recommendations on working guide-lines for spectrum trading. Retrieved from http:// traui.gov.in
Telecommunications Regulatory Authority of India (TRAI).(2014b). Recommendations on guidelines on spectrum sharing. Retrieved from http:// traui.gov.in
Yuan, G.; Zhang, X.; Wang, W.; Yang, Y. (2010). Carrier Aggregation for LTE-Advanced Mobile Communication Systems, IEEE Communications Magazine, 48(2), 88-93
Bri�� Bio o� Aut�or/�:
Arturo Basaure, PhD candidate, Aalto University, Espoo,FINLAND, received his M.Sc. in telecommunications engineering from Helsinki University of Technology (HUT), Finland, in 2005. He has worked as an IT consultant and in the fi nancial industry. Currently, he is a doctoral candidate at Aalto University, Finland, and Pontifi cia Universidad Católica (PUC), Chile. He is involved in a number of European research projects. His main research area is in the regulation of mobile telecommunications.
E-mail: [email protected]
Dr. Heikki Kokkinen, CEO, Fairspectrum, Helsinki, FINLAND, is the founder and CEO of Fairspectrum. Fairspectrum is a Finnish company, which provided the geolocation database service for the Europe’s fi rst TV White Space radio licence based on a geolocation database and the repository service in the world’s fi rst Licensed Shared Access (LSA) 2.3 GHz fi eld trial. He holds a doctoral degree in Computer Science, an academic entrepreneur degree from Aalto School of Business, licentiate degree in telecommunications and industrial economics, and Master’s degree in electronics. Heikki is a requested speaker in spectrum sharing events globally. He is devoted to marketing, research and development, fi nancing, system integration, piloting and deploying of spectrum sharing technologies.
E-mail: [email protected]
Flexible Spectrum Management: Approaches for India 9
Dr. Heikki Hämmäinen, Professor, Aalto University, Espoo, FINLAND, is a professor of Network Economics at Department of Communications and Networking, Aalto University, Finland. His main research interests are in techno-economics and regulation of mobile Internet services and networks. Special topics recently include measurement and analysis of mobile usage, value networks of 5G, and diffusion of Internet protocols in mobile. He is also active in journal editorial boards (Telecommunication Policy, Nordic Baltic Journal of ICT), conference program committees, and national research foundations in Finland. Prior to academic career he has served in ICT industry both on research and business duties.
E-mail: [email protected]
Dr. V. Sridhar, Professor, Centre for IT and Public Policy, International Institute of Information Technology Bangalore, INDIA, Dr. V. Sridhar is Professor at the Centre for IT and Public Policy at the International Institute of Information Technology Bangalore, India. He has published many articles in peer-reviewed leading telecom and information systems journals. His book titled The Telecom Revolution in India: Technology, Regulation and Policy was published by the Oxford University Press in 2012. He has co-authored a recent book titled The Dynamics of Spectrum Management: Legacy, Technology, and Economics published by the Oxford University Press in 2014. Dr. Sridhar has taught at many Institutions in the USA, New Zealand and India. He was also a visiting scholar at Aalto University, Finland and was the recipient of Nokia Visiting Fellowship. Prior to joining IIIT-B Dr. Sridhar was a Research Fellow at Sasken Communication Technologies. He has been a member of Government of India committees on Telecom and IT. He has written more than 200 articles in prominent business newspapers and magazines relating to telecom regulation and policy in India. Dr. Sridhar has a Ph.D. from the University of Iowa, U.S.A.
URL: http://www.vsridhar.info
E-mail: [email protected]
Abstract
The purpose of this research paper is to study infusion of technology in services marketing; and to investigate role of technology as an enabler to manage service gaps. Service gaps are theorized to be arising from internal organizational inconsistencies; and affect service quality perceptions of the customers.The research design comprised of bibliometric analysis, citation count, and review of literature in services marketing in relation to its engagements with technology aspect. The major findings point to, extensive use of technology by service firms to minimize internal and external service gaps. Various technologies are contributing towards interlinking stakeholders by creating seamless service processes.Newer technologies has potential of efficiently interlinking stakeholders, thus improving service quality by minimizing external (customer) and internal service gaps.Technology though being adopted by service industry extensively, its implication in relation to service gaps model has not been discussed by researchers.
Keywords: Service Quality, Service Gaps Model, Technology, Service Triangle, Service Encounter, Services Marketing
Management of Service Gaps by Infusion of Technology
Roshan Kazi*, Sandeep Prabhu*** HOD & Professor- Allana Institute of Management Sciences (AIMS),
Pune, Maharashtra, India. E-mail: [email protected]** Assistant Professor, Symbiosis Institute of Telecom Management (SITM),
Symbiosis International University, Pune, Maharashtra, India. E-mail: [email protected]
Introduction
In recent past, the services concept has received increased attention from academic scholars, and practitioners. However infusion of technology in services marketing has been discussed to a limited extent by research scholars, even though being used extensively by practitioners.
While quality of tangible goods can be measured and main-tained; the service quality is a challenge to measure and maintain. Parasuraman et al. conceptualized service qual-ity as a five dimension structure of; tangibles, reliability, responsiveness, assurance, and empathy (Parasuraman, Zeithaml, & Berry, 1988). Parasuraman et al. initially proposed a service quality gaps model comprising of an external customer gap; as a cause of internal service gaps in knowledge, specifications, performance, and commu-nication (Parasuraman, Zelthami, & Berry, 1985). While service gaps are hypothesized to be caused by internal in-
consistencies; technology offers away to improve opera-tional performance of organizational functions.
The paper is structured as follows; firstly, it reviews service quality literature related to service gaps model; secondly it identifies conceptual foundation of technology in services marketing; and finally, it identifies and proposes technology infusion as an enabler to reduce service gaps
Objectives
The objective of the paper is; first, to identify service gaps literature in view of service quality measurement; second, to identify literature related to conceptual foundation of technology in services marketing; and third, to identify technologies in services marketing and propose a service gaps model with technology infusion.
Article can be accessed online at http://www.publishingindia.com
Management of Service Gaps by Infusion of Technology 11
Met�odo�o��
The paper uses bibliometric analysis and citation counts to identify signifi cant literature related to service gaps model. SCOPUS bibliographic database (“Scopus,” 2015) is used to identify signifi cant research in the area. Then the research contributing to conceptual importance of technology in services was studied. Later important research related to services marketing & technology was identifi ed suggesting technological applications in service process improvement. Based on the above inputs, an im-proved service quality model infused with technology is proposed.
Findin�s �nd discussion
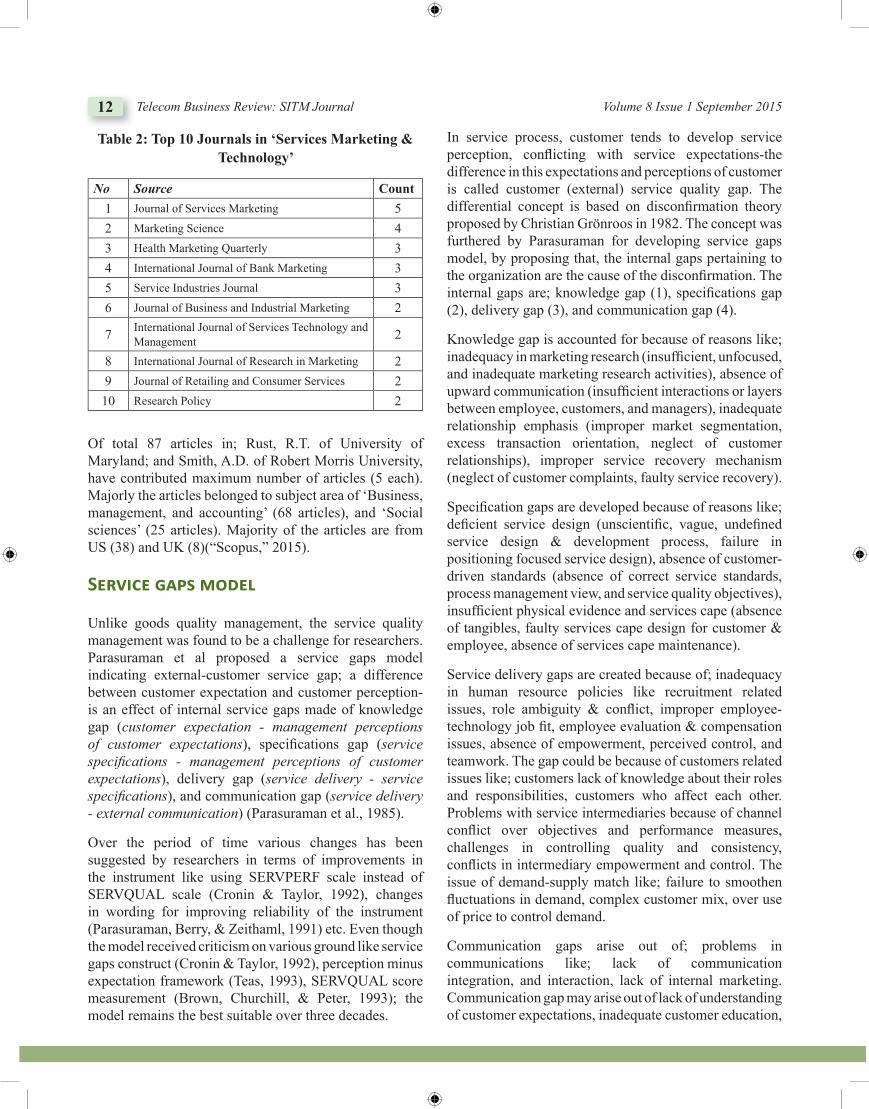
Initial search criterion related to ‘services management and technology’, listed 87 relevant articles, but just 3 articles related to ‘service gaps & technology’. Top 10 of 87 most cited articles, are listed in table 1. ‘Marketing models of service relationship’ by Rust & Chung, 2006, cited 136 times is the most cited article, discusses advancements in information technology facilitating services and relationship management. Second most cited article is ‘Self-service technology adoption: Comparing three technologies’ by Curran & Meuter, 2005, cited
128 times discusses customer reactions to different technologies serving similar purpose.
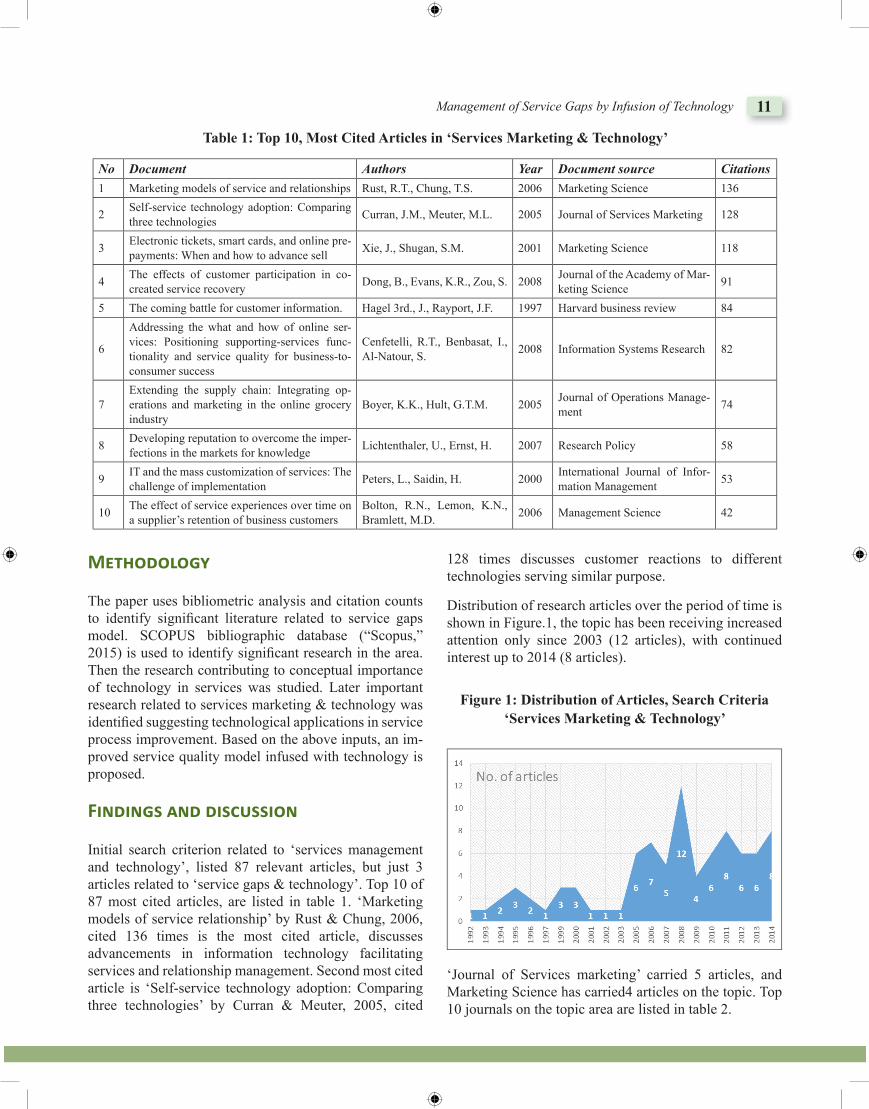
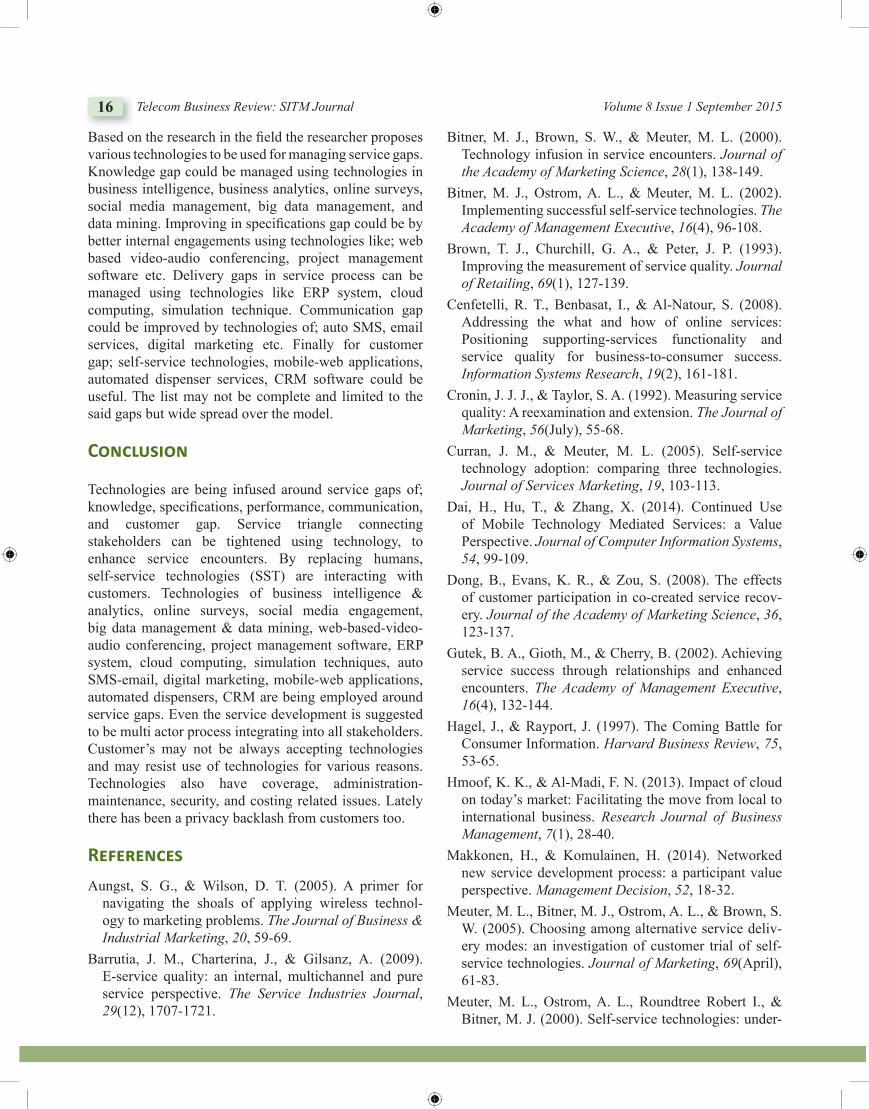
Distribution of research articles over the period of time is shown in Figure.1, the topic has been receiving increased attention only since 2003 (12 articles), with continued interest up to 2014 (8 articles).
Figure 1: Distribution of Articles, Search Criteria ‘Services Marketing & Technology’
‘Journal of Services marketing’ carried 5 articles, and Marketing Science has carried4 articles on the topic. Top 10 journals on the topic area are listed in table 2.
Table 1: Top 10, Most Cited Articles in ‘Services Marketing & Technology’
No Document Authors Year Document source Citations 1 Marketing models of service and relationships Rust, R.T., Chung, T.S. 2006 Marketing Science 136
2 Self-service technology adoption: Comparing three technologies Curran, J.M., Meuter, M.L. 2005 Journal of Services Marketing 128
3 Electronic tickets, smart cards, and online pre-payments: When and how to advance sell Xie, J., Shugan, S.M. 2001 Marketing Science 118
4 The effects of customer participation in co-created service recovery Dong, B., Evans, K.R., Zou, S. 2008 Journal of the Academy of Mar-
keting Science 91
5 The coming battle for customer information. Hagel 3rd., J., Rayport, J.F. 1997 Harvard business review 84
6
Addressing the what and how of online ser-vices: Positioning supporting-services func-tionality and service quality for business-to-consumer success
Cenfetelli, R.T., Benbasat, I., Al-Natour, S. 2008 Information Systems Research 82
7Extending the supply chain: Integrating op-erations and marketing in the online grocery industry
Boyer, K.K., Hult, G.T.M. 2005 Journal of Operations Manage-ment 74
8 Developing reputation to overcome the imper-fections in the markets for knowledge Lichtenthaler, U., Ernst, H. 2007 Research Policy 58
9 IT and the mass customization of services: The challenge of implementation Peters, L., Saidin, H. 2000 International Journal of Infor-
mation Management 53
10 The effect of service experiences over time on a supplier’s retention of business customers
Bolton, R.N., Lemon, K.N., Bramlett, M.D. 2006 Management Science 42
12 Telecom Business Review: SITM Journal Volume 8 Issue 1 September 2015
Table 2: Top 10 Journals in ‘Services Marketing & Technology’
No Source Count1 Journal of Services Marketing 52 Marketing Science 43 Health Marketing Quarterly 34 International Journal of Bank Marketing 35 Service Industries Journal 36 Journal of Business and Industrial Marketing 2
7 International Journal of Services Technology and Management 2
8 International Journal of Research in Marketing 29 Journal of Retailing and Consumer Services 210 Research Policy 2
Of total 87 articles in; Rust, R.T. of University of Maryland; and Smith, A.D. of Robert Morris University, have contributed maximum number of articles (5 each).Majorly the articles belonged to subject area of ‘Business, management, and accounting’ (68 articles), and ‘Social sciences’ (25 articles). Majority of the articles are from US (38) and UK (8)(“Scopus,” 2015).
Service ���s �ode�
Unlike goods quality management, the service quality management was found to be a challenge for researchers. Parasuraman et al proposed a service gaps model indicating external-customer service gap; a difference between customer expectation and customer perception-is an effect of internal service gaps made of knowledge gap (customer expectation - management perceptions of customer expectations), specifi cations gap (service specifi cations - management perceptions of customer expectations), delivery gap (service delivery - service specifi cations), and communication gap (service delivery - external communication) (Parasuraman et al., 1985).
Over the period of time various changes has been suggested by researchers in terms of improvements in the instrument like using SERVPERF scale instead of SERVQUAL scale (Cronin & Taylor, 1992), changes in wording for improving reliability of the instrument (Parasuraman, Berry, & Zeithaml, 1991) etc. Even though the model received criticism on various ground like service gaps construct (Cronin & Taylor, 1992), perception minus expectation framework (Teas, 1993), SERVQUAL score measurement (Brown, Churchill, & Peter, 1993); the model remains the best suitable over three decades.
In service process, customer tends to develop service perception, confl icting with service expectations-the difference in this expectations and perceptions of customer is called customer (external) service quality gap. The differential concept is based on disconfi rmation theory proposed by Christian Grönroos in 1982. The concept was furthered by Parasuraman for developing service gaps model, by proposing that, the internal gaps pertaining to the organization are the cause of the disconfi rmation. The internal gaps are; knowledge gap (1), specifi cations gap (2), delivery gap (3), and communication gap (4).
Knowledge gap is accounted for because of reasons like; inadequacy in marketing research (insuffi cient, unfocused, and inadequate marketing research activities), absence of upward communication (insuffi cient interactions or layers between employee, customers, and managers), inadequate relationship emphasis (improper market segmentation, excess transaction orientation, neglect of customer relationships), improper service recovery mechanism (neglect of customer complaints, faulty service recovery).
Specifi cation gaps are developed because of reasons like; defi cient service design (unscientifi c, vague, undefi ned service design & development process, failure in positioning focused service design), absence of customer-driven standards (absence of correct service standards, process management view, and service quality objectives), insuffi cient physical evidence and services cape (absence of tangibles, faulty services cape design for customer & employee, absence of services cape maintenance).
Service delivery gaps are created because of; inadequacy in human resource policies like recruitment related issues, role ambiguity & confl ict, improper employee-technology job fi t, employee evaluation & compensation issues, absence of empowerment, perceived control, and teamwork. The gap could be because of customers related issues like; customers lack of knowledge about their roles and responsibilities, customers who affect each other. Problems with service intermediaries because of channel confl ict over objectives and performance measures, challenges in controlling quality and consistency, confl icts in intermediary empowerment and control. The issue of demand-supply match like; failure to smoothen fl uctuations in demand, complex customer mix, over use of price to control demand.
Communication gaps arise out of; problems in communications like; lack of communication integration, and interaction, lack of internal marketing. Communication gap may arise out of lack of understanding of customer expectations, inadequate customer education,
Management of Service Gaps by Infusion of Technology 13
overpromising in advertising, personal sales, and physical evidence. Inadequate horizontal communications in interdepartmental and inter-branch inadequate communication (Zeithaml, Gremler, Bitner, & Pandit, 2011).
Conce�tu�� ro�e o� tec�no�o�� in Services ��n��e�ent
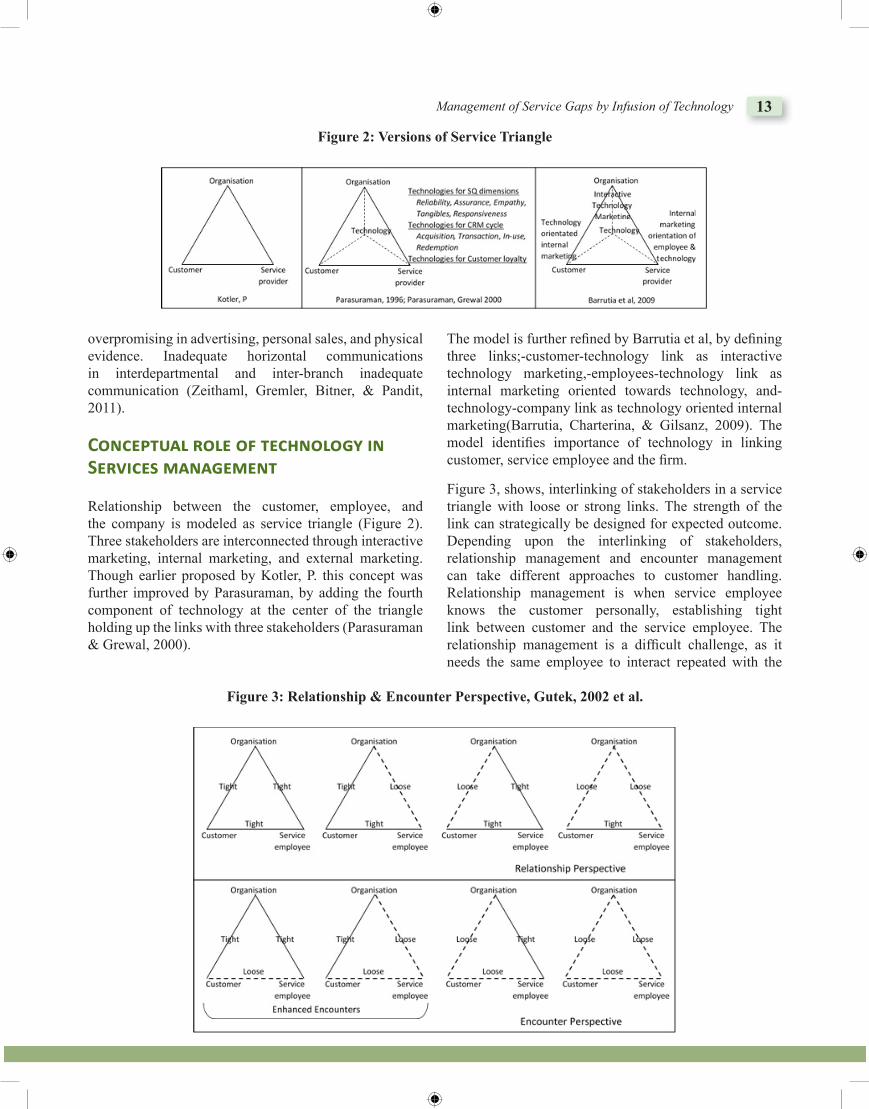
Relationship between the customer, employee, and the company is modeled as service triangle (Figure 2). Three stakeholders are interconnected through interactive marketing, internal marketing, and external marketing. Though earlier proposed by Kotler, P. this concept was further improved by Parasuraman, by adding the fourth component of technology at the center of the triangle holding up the links with three stakeholders (Parasuraman & Grewal, 2000).
The model is further refi ned by Barrutia et al, by defi ning three links;-customer-technology link as interactive technology marketing,-employees-technology link as internal marketing oriented towards technology, and-technology-company link as technology oriented internal marketing(Barrutia, Charterina, & Gilsanz, 2009). The model identifi es importance of technology in linking customer, service employee and the fi rm.
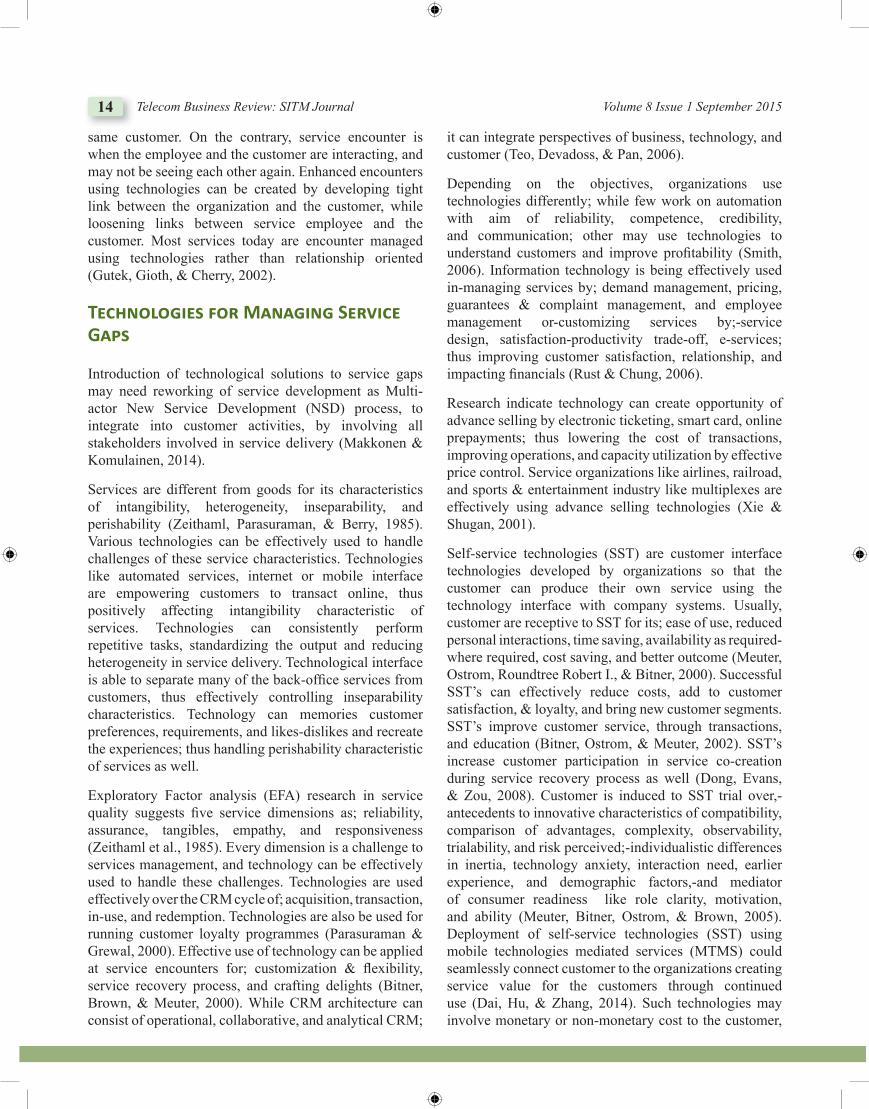
Figure 3, shows, interlinking of stakeholders in a service triangle with loose or strong links. The strength of the link can strategically be designed for expected outcome. Depending upon the interlinking of stakeholders, relationship management and encounter management can take different approaches to customer handling. Relationship management is when service employee knows the customer personally, establishing tight link between customer and the service employee. The relationship management is a diffi cult challenge, as it needs the same employee to interact repeated with the
Figure 2: Versions of Service Triangle
Figure 3: Relationship & Encounter Perspective, Gutek, 2002 et al.
14 Telecom Business Review: SITM Journal Volume 8 Issue 1 September 2015
same customer. On the contrary, service encounter is when the employee and the customer are interacting, and may not be seeing each other again. Enhanced encounters using technologies can be created by developing tight link between the organization and the customer, while loosening links between service employee and the customer. Most services today are encounter managed using technologies rather than relationship oriented (Gutek, Gioth, & Cherry, 2002).
Tec�no�o�ies �or M�n��in� Service G��s
Introduction of technological solutions to service gaps may need reworking of service development as Multi-actor New Service Development (NSD) process, to integrate into customer activities, by involving all stakeholders involved in service delivery (Makkonen & Komulainen, 2014).
Services are different from goods for its characteristics of intangibility, heterogeneity, inseparability, and perishability (Zeithaml, Parasuraman, & Berry, 1985). Various technologies can be effectively used to handle challenges of these service characteristics. Technologies like automated services, internet or mobile interface are empowering customers to transact online, thus positively affecting intangibility characteristic of services. Technologies can consistently perform repetitive tasks, standardizing the output and reducing heterogeneity in service delivery. Technological interface is able to separate many of the back-offi ce services from customers, thus effectively controlling inseparability characteristics. Technology can memories customer preferences, requirements, and likes-dislikes and recreate the experiences; thus handling perishability characteristic of services as well.
Exploratory Factor analysis (EFA) research in service quality suggests fi ve service dimensions as; reliability, assurance, tangibles, empathy, and responsiveness (Zeithaml et al., 1985). Every dimension is a challenge to services management, and technology can be effectively used to handle these challenges. Technologies are used effectively over the CRM cycle of; acquisition, transaction, in-use, and redemption. Technologies are also be used for running customer loyalty programmes (Parasuraman & Grewal, 2000). Effective use of technology can be applied at service encounters for; customization & fl exibility, service recovery process, and crafting delights (Bitner, Brown, & Meuter, 2000). While CRM architecture can consist of operational, collaborative, and analytical CRM;
it can integrate perspectives of business, technology, and customer (Teo, Devadoss, & Pan, 2006).
Depending on the objectives, organizations use technologies differently; while few work on automation with aim of reliability, competence, credibility, and communication; other may use technologies to understand customers and improve profi tability (Smith, 2006). Information technology is being effectively used in-managing services by; demand management, pricing, guarantees & complaint management, and employee management or-customizing services by;-service design, satisfaction-productivity trade-off, e-services; thus improving customer satisfaction, relationship, and impacting fi nancials (Rust & Chung, 2006).
Research indicate technology can create opportunity of advance selling by electronic ticketing, smart card, online prepayments; thus lowering the cost of transactions, improving operations, and capacity utilization by effective price control. Service organizations like airlines, railroad, and sports & entertainment industry like multiplexes are effectively using advance selling technologies (Xie & Shugan, 2001).
Self-service technologies (SST) are customer interface technologies developed by organizations so that the customer can produce their own service using the technology interface with company systems. Usually, customer are receptive to SST for its; ease of use, reduced personal interactions, time saving, availability as required-where required, cost saving, and better outcome (Meuter, Ostrom, Roundtree Robert I., & Bitner, 2000). Successful SST’s can effectively reduce costs, add to customer satisfaction, & loyalty, and bring new customer segments. SST’s improve customer service, through transactions, and education (Bitner, Ostrom, & Meuter, 2002). SST’s increase customer participation in service co-creation during service recovery process as well (Dong, Evans, & Zou, 2008). Customer is induced to SST trial over,-antecedents to innovative characteristics of compatibility, comparison of advantages, complexity, observability, trialability, and risk perceived;-individualistic differences in inertia, technology anxiety, interaction need, earlier experience, and demographic factors,-and mediator of consumer readiness like role clarity, motivation, and ability (Meuter, Bitner, Ostrom, & Brown, 2005). Deployment of self-service technologies (SST) using mobile technologies mediated services (MTMS) could seamlessly connect customer to the organizations creating service value for the customers through continued use (Dai, Hu, & Zhang, 2014). Such technologies may involve monetary or non-monetary cost to the customer,
Management of Service Gaps by Infusion of Technology 15
it may create hedonic as well as utilitarian benefi t to the customer (Dai et al., 2014). Wireless technologies of mobile phones are able to add quality to internal system, speed up the processes, improve internal planning, and enhance customer experience (Aungst & Wilson, 2005).
Relationships in services are developed around technologies of computing, database management, and communication by analytical and empirical modeling (Rust & Chung, 2006). Market oriented organizations are effectively using CRM technologies for customer management (Richard, Thirkell, & Huff, 2002). New improvements in technologies will connect customer, employees, and the organization tighter, technologies like cloud computing are decentralizing business models and taking CRM and communication to a higher-desired level (Hmoof & Al-Madi, 2013) reducing service quality gaps.
Beyond core services, service companies are using technologies in Supporting Service Functionality (SSF)as well to augment their services (Cenfetelli, Benbasat, & Al-Natour, 2008). Organizations are also using Automatic Identifi cation, and Data Capture (AIDC) technologies like barcodes, RFID, Enterprise Resource Planning (ERP) System, fraud-detection technology using image fi les, magnetic ink character recognition, six-sigma methodology etc. (Smith, 2006).
Tec�no�o�� �s � diss�tis�ier
Technologies has its fl ip side as well; customers has differing level of acceptance to various technologies; ATM, mobile banking, and on-line banking has varying dynamics with customers based on factors like; ease-of-use, usefulness, need of interactions, and risk perception (Curran & Meuter, 2005). SST’s like telephone banking, automated checkouts, online investment trading, also has varying degree of customer attitude (Meuter et al., 2005).
Dissatisfaction related to technology could be factors like, failure of technology to operate, failure of technical process, technology and service design related problems, or customer caused technology failures (Meuter et al., 2000). Customers has concerns related to; failure of technology, poordesign, and possibility of customer messing up the technology (Bitner et al., 2002). Wireless technologies still has issues related to coverage, technology platform, upgrades, applications, enterprise mobile integration, administration & maintenance, security, scalability, prototyping & development costs, cost of ownership, and interoperability & interconnections (Aungst & Wilson, 2005). Though technological tools effectively collect information about customers, increasing privacy backlash of customers could set a new trend in limiting technology use (Hagel & Rayport, 1997).
Figure 4: Service Gaps Model Enabled with Technologies
16 Telecom Business Review: SITM Journal Volume 8 Issue 1 September 2015
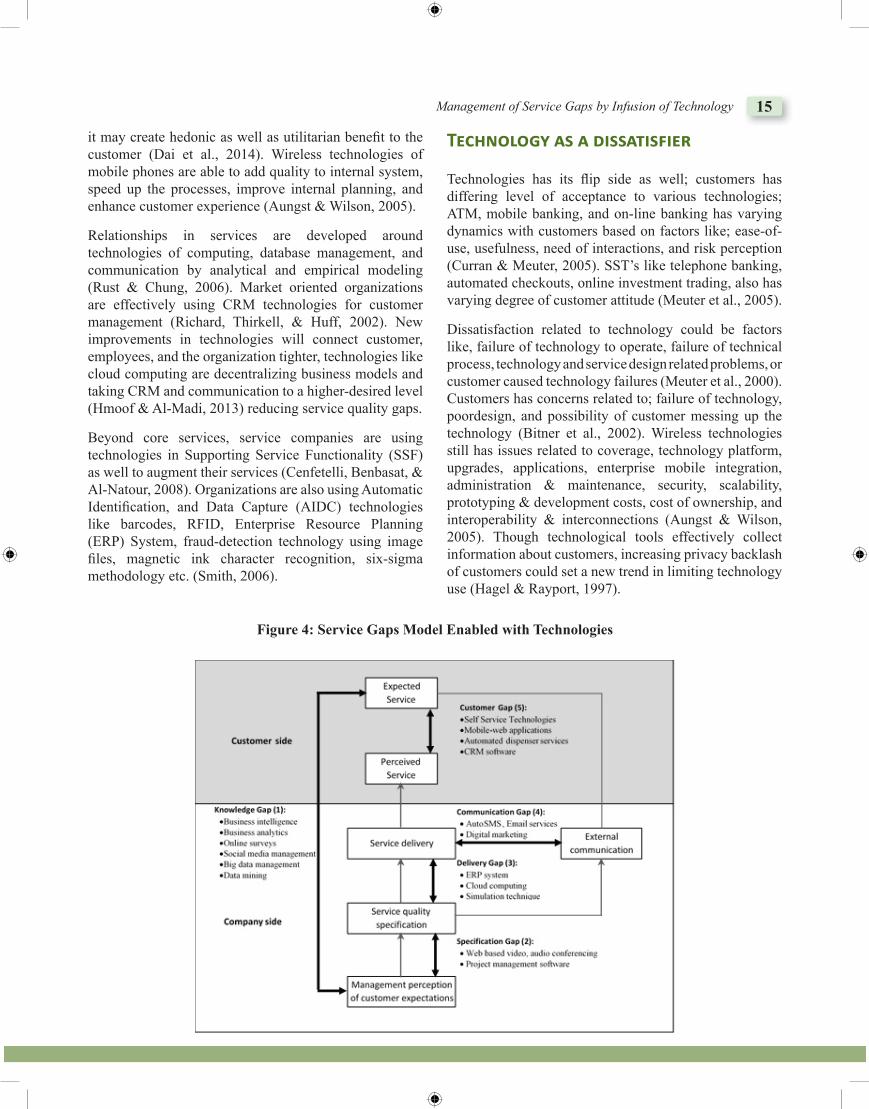
Based on the research in the fi eld the researcher proposes various technologies to be used for managing service gaps. Knowledge gap could be managed using technologies in business intelligence, business analytics, online surveys, social media management, big data management, and data mining. Improving in specifi cations gap could be by better internal engagements using technologies like; web based video-audio conferencing, project management software etc. Delivery gaps in service process can be managed using technologies like ERP system, cloud computing, simulation technique. Communication gap could be improved by technologies of; auto SMS, email services, digital marketing etc. Finally for customer gap; self-service technologies, mobile-web applications, automated dispenser services, CRM software could be useful. The list may not be complete and limited to the said gaps but wide spread over the model.
Conc�usion
Technologies are being infused around service gaps of; knowledge, specifi cations, performance, communication, and customer gap. Service triangle connecting stakeholders can be tightened using technology, to enhance service encounters. By replacing humans, self-service technologies (SST) are interacting with customers. Technologies of business intelligence & analytics, online surveys, social media engagement, big data management & data mining, web-based-video-audio conferencing, project management software, ERP system, cloud computing, simulation techniques, auto SMS-email, digital marketing, mobile-web applications, automated dispensers, CRM are being employed around service gaps. Even the service development is suggested to be multi actor process integrating into all stakeholders. Customer’s may not be always accepting technologies and may resist use of technologies for various reasons. Technologies also have coverage, administration-maintenance, security, and costing related issues. Lately there has been a privacy backlash from customers too.
Re�erences
Aungst, S. G., & Wilson, D. T. (2005). A primer for navigating the shoals of applying wireless technol-ogy to marketing problems. The Journal of Business & Industrial Marketing, 20, 59-69.
Barrutia, J. M., Charterina, J., & Gilsanz, A. (2009). E-service quality: an internal, multichannel and pure service perspective. The Service Industries Journal, 29(12), 1707-1721.
Bitner, M. J., Brown, S. W., & Meuter, M. L. (2000). Technology infusion in service encounters. Journal of the Academy of Marketing Science, 28(1), 138-149.
Bitner, M. J., Ostrom, A. L., & Meuter, M. L. (2002). Implementing successful self-service technologies. The Academy of Management Executive, 16(4), 96-108.
Brown, T. J., Churchill, G. A., & Peter, J. P. (1993). Improving the measurement of service quality. Journal of Retailing, 69(1), 127-139.
Cenfetelli, R. T., Benbasat, I., & Al-Natour, S. (2008). Addressing the what and how of online services: Positioning supporting-services functionality and service quality for business-to-consumer success. Information Systems Research, 19(2), 161-181.
Cronin, J. J. J., & Taylor, S. A. (1992). Measuring service quality: A reexamination and extension. The Journal of Marketing, 56(July), 55-68.
Curran, J. M., & Meuter, M. L. (2005). Self-service technology adoption: comparing three technologies. Journal of Services Marketing, 19, 103-113.
Dai, H., Hu, T., & Zhang, X. (2014). Continued Use of Mobile Technology Mediated Services: a Value Perspective. Journal of Computer Information Systems, 54, 99-109.
Dong, B., Evans, K. R., & Zou, S. (2008). The effects of customer participation in co-created service recov-ery. Journal of the Academy of Marketing Science, 36, 123-137.
Gutek, B. A., Gioth, M., & Cherry, B. (2002). Achieving service success through relationships and enhanced encounters. The Academy of Management Executive, 16(4), 132-144.
Hagel, J., & Rayport, J. (1997). The Coming Battle for Consumer Information. Harvard Business Review, 75, 53-65.
Hmoof, K. K., & Al-Madi, F. N. (2013). Impact of cloud on today’s market: Facilitating the move from local to international business. Research Journal of Business Management, 7(1), 28-40.
Makkonen, H., & Komulainen, H. (2014). Networked new service development process: a participant value perspective. Management Decision, 52, 18-32.
Meuter, M. L., Bitner, M. J., Ostrom, A. L., & Brown, S. W. (2005). Choosing among alternative service deliv-ery modes: an investigation of customer trial of self-service technologies. Journal of Marketing, 69(April), 61-83.
Meuter, M. L., Ostrom, A. L., Roundtree Robert I., & Bitner, M. J. (2000). Self-service technologies: under-
Management of Service Gaps by Infusion of Technology 17
standing customer satisfaction with technology-based service encounters. Journal of Marketing, 64(July), 50-64.
Parasuraman, A., Berry, L. L., & Zeithaml, V. A. (1991). Refi nement and Reassessment of SERVQUAL Scale. Journal of Retailing, 67(4), 420-450.
Parasuraman, A., & Grewal, D. (2000). The impact of technology on the quality-value-loyalty chain: a re-search agenda. Journal of the Academy of Marketing Science, 28(1), 168-174.
Parasuraman, A., Zeithaml, V. A., & Berry, L. L. (1988). SERVQUAL : A Multiple-Item Scale for Measuring Consumer Perceptions of Service Quality. Journal of Retailing, 64(1), 12-40.
Parasuraman, A., Zelthami, V. A., & Berry, L. L. (1985). A Conceptual Model of Service Quality and Its Implications for Future Research. Journal of Marketing, 49(Fall), 41-50.
Richard, J. E., Thirkell, P. C., & Huff, S. L. (2002). The impact of the Customer Relationship Management (CRM) technology on business-to-business customer relationships: Developmen, (c).
Rust, R. T., & Chung, T. S. (2006). Marketing Models of Service and Relationships. Marketing Science, 25(6), 560-580.
Scopus. (2015). Elsevier. Retrieved from http://www.sco-pus.com
Smith, A. D. (2006). Technology advancements for ser-vice marketing and quality improvement: multi-fi rm case study. Services Marketing Quarterly, 27(4), 99-114.
Teas, R. K. (1993). Expectations, performance evalua-tion, and consumers’ perceptions of quality. Journal of Marketing, 57, 18-34.
Teo, T., Devadoss, P., & Pan, S. L. (2006). Towards a ho-listic perspective of customer relationship management (CRM) implementation: A case study of the Housing and Development Board, Singapore. Decision Support Systems, 42(3), 1613-1627.
Xie, J., & Shugan, S. M. (2001). Electronic Tickets, Smart Cards, and Online Prepayments: When and How to Advance Sell. Marketing Science, 20(3), 219-243.
Zeithaml, V. A., Gremler, D. D., Bitner, M. J., & Pandit, A. (2011). Services Marketing (4th ed., p. 546). The McGraw Hill Companies.
Zeithaml, V. A., Parasuraman, A., & Berry, L. L. (1985). Problems and Strategies in Services Marketing. Journal of Marketing, 48(Spring), 33-46.
Brie� Bio o� Aut�or/s:
Dr. Roshan Kazi is a Professor and Head of Department, MBA Programme at AllanaInstitute of Management Sciences, Pune. He specializes in Marketing and Quantitative methods. He has taught Marketing and Business Statistics over several years. He is asought-aftertrainer,in statistical software SPSS.
He has a Ph.D. in Business Administration from the University of Pune and Post-Doctoral fellow in Management from Indian Institute of Management Indore. He has national and international publications to his credit. His papers have been published in referred journals like Journal of Marketing and Communication, Indian Journal of Management, Prabandhan, International Journal of Management Cases, Darwen, Lancashire, UK.”
Mr. Sandeep Prabhu is a Management Faculty at Symbiosis Institute of Telecom Management, Pune. He is BE (Mech), MBA (Marketing), MBA (Finance), and UGC-NET Certifi ed.
He has industry, business, and teaching experience of over 19 years. He has been teaching Business Analytics, Services Marketing. He has a special interest in Structural Equation Modeling.
Abstract
PurposeTelecom industry is one of those industries which has changed dramatically during the past decade. With more and more players entering in this industry, competition is ever increasing. The war between these players is slowly shifting from the price to the augmentation. This paper aims at exploring such factors which influence a customer’s preference of one telecom service provider (TSP) over the other. It is a descriptive research where study has been conducted among the consumers of different telecom service providers (TSPs). Design/methodology/approachBy reviewing the existing literature in this domain, we explored different factors which affect the consumer’s decision to prefer one telecom service provider over the other. A consumer targeted questionnaire was designed where consumers were asked about the factors they consider (with their relative importance quantified using Likert scale), before buying a new network connection to know the relative importance of the various factors. Factor Analysis was performed to club various variables into distinct factors. Statistical techniques then helped in identifying the relative importance. FindingsFrom the Factor Loading matrix the following five factors were generated:- Overall service quality, Point of Purchase Differentiator, Promotion Measures, Tariff Plans and Size of the Network. Further study in the behavioural perceptions of consumer shows that the most important factor in influencing the customer buying behavior is Service Quality. The second most important factor is cost and various plans offered by the telecom service provider. Network connectivity was considered by almost all the respondents and consumers prefer the largest network player. The study also found that promotional measures don’t influence the customers as expected.
Keywords: Customer Preference, Product Centric Factors, Telecom Industry, Buying Behaviour, Factors Analysis, Telecom Service Provider, Point of Purchase, Telecom Service Quality, Telecom Subscribers, Behavioral Perceptions
Exploration of Product Centric Factors in Telecom Industry
Swati Ganeti*, Rajat Agarwal**, Murali Krishna Medudula***, Mahim Sagar*****Senior Associate Consultant, India Office of Bain and Company. E-mail: [email protected]
**MBA Student, IIM Calcutta, West Bengal, India. E-mail: [email protected]***Research Scholar, Bharti School of Telecommunication Technology and Management, IIT Delhi, Delhi,
India. E-mail: [email protected]****Associate Professor- IIT Delhi, Delhi, India. E-mail: [email protected]
Introduction
Telecom industry has changed a lot over the past few years. Previously, mobile phones were considered a luxury product but now, they have not only become affordable but also a necessity. By June 2014, the number of subscribers including wireless and wireline stood at 942.95 million (TRAI, 2014). The overall wireless tele-density in India has reached 75.80 with the total Urban wireless Tele-density as high as 146.24. Thus, with improvement in technology and lifestyle, mobile phones have indeed become an integral part of our lives.
In this era of liberalization, privatization and globalization, service organizations in emerging economies are facing tremendous competition which has forced them to focus their strategy on customer satisfaction through better service quality. Telecom Industry gives a more priority to service quality in comparison to technical aspects. In this competitive environment where the customer has 4-6 choices when it comes to operator selection in a circle, maintaining loyalty and profitability of the operators heavily depends upon the quality of services being offered. Customer’s need, values, ethics, and wants are changing. Today, the consumer is constantly looking out
Article can be accessed online at http://www.publishingindia.com
Exploration of Product Centric Factors in Telecom Industry 19
for different options in search for better alternatives at minimal cost. Thomas (1978) argued that determining the price for a service in service industry is extremely diffi cult. On one side high prices leads to raised expectations by customers while price-cutting can hamper the revenue as the consumers resent the normal price (DelVecchio, Krishnan & Smith, 2007). The ever increasing quest for deriving maximum value for money has resulted in the market to become customer driven rather than being seller driven.
Considering such a scenario in this industry, there is a need to identify various factors which affect the decision of a consumer to select a particular TSP. Similar studies have been done in the past but with the advent of new technology and services offered by the telecom sector, the preferences and choices of its consumers have changed.
This paper focuses on fi nding what the customers look for when they choose a telecom service provider? This study will help companies to know what they should focus on to increase their market share?
Lit�r�tur� R��i��
Garbacz and Thompson (2005) studied price elasticity for mobile telephone service providers. Chabossou et al. (2008) corroborated that the relationship between the income of customer and his/her expenditure on the usage of mobile services is in-elastic in nature. This clearly states that for every one percentage increase in income of the customer, the increase in proportion of mobile services expenditure to individual income is less than one percentage increase. Batt & Katz (1998) found out that income is not a good factor to judge the customer preferences and choices towards their mobile usage and other telecom services. Hence it is common to observe in the research studies which reveals the fact that smaller income customer group has more spending than the higher income group in terms of percentage of their income towards cellular mobile services. Overall, consumers don’t spend a major chunk of their income on mobile phones.
Quality of service being offered in conjunction with consumer satisfaction and the value added to the customer are vital for the telecom service providers. These factors determine the success of the organization in terms of higher average revenue per user (ARPU). According to the research done by Wang & Lo (2002) service quality, customer value and satisfaction are being driven by network quality. They observed a negative impact by customer perceived sacrifi ce on customer value which
also includes the price element. This leads to negative infl uences on behavior intentions and satisfaction of the customers. Kuo, Wu & Deng (2009) identifi ed four dimensions of service quality which looks at the quality of the content being provided, ease of use in terms of visual presentation and navigation on the screen, reliability of the system and the quality of the connection, better management and friendly customer service. In their study, all the dimensions of service quality had signifi cant effect on perceived value and they both had infl uenced customer satisfaction positively (except navigation and design). They also found that relationship between post-purchase intention and service quality is not that signifi cant to be reported. Their study ranked customer service and system reliability as the most infl uencing dimension on perceived value. Lim, Widdows & Park (2006) in their exploratory factor analysis on mobile service quality, they have identifi ed fi ve dimensions and later studied their direct and indirect effect on loyalty intention through economic, emotional value and customer satisfaction. Grönroos (1984) proposed Technical Quality and Functional Quality as the two distinctive service quality dimensions. He stated that in service industry customer satisfaction would depend on the service functional attributes whenever the technical attributes of service fail and no longer can create the differentiation among the competitors. Lai, Griffi n & Babin (2009) found that image perceptions by the customer and the perceive value would get infl uenced directly by the service quality. Vanka (2011) concluded that customer’s rate service quality as a more important factor in their purchase decisions than the brand.
Anckar & D’incau (2002) stated that mobile VAS (Value added Services) has the future potential among all m-commerce applications in the telecom industry as it caters to the needs of the subscribers which are time-critical, spontaneous, mobility, effi ciency and entertainment related. Wang & Li (2012) corroborated that new services to cater the needs of the consumers are being launched all the time, the revenue generation of these services will depend upon how the services appeal to the consumers with their key m-commerce attributes and the way the consumer attitudes are being shaped by the brand equity components and the ability of the brand to generate positive purchase intentions. The movement of market from the growth stage to maturity results in development and introduction of more homogenous services and the increased diffi culty level to acquire and retain the subscribers. According to Zhao et al. (2012), states in competitive environment customer satisfaction plays a prominent role and will be the key for sustainability in the market place.In their research model they mentioned
20 Telecom Business Review: SITM Journal Volume 8 Issue 1 September 2015
two cognitive bases of customer satisfaction to be Justice and Service Quality. Zeithaml (1988) viewed satisfaction as broader concept than assessment of service quality even though both of the concepts have certain common attributes.
Davidow (2003) found that word of mouth activity affects the perceived fairness during the complaint management process and also has an infl uential role in impacting the customer satisfaction and repurchase intentions. In mobile industry, Dierkes, Bichler & Krishnan (2011) observed that word of mouth (WOM) has a prominent role in affecting the level of churn and cross buying decisions of the neighbours. Kisioglu & Topcu (2011) corroborated that negative relationship exists between the customer switching tendencies and attributes such as brand credibility, Word of Mouth, commitment and satisfaction. They also observed the prominent role the Brand credibility plays in enhancing the word of mouth activity.
Network size of an operator plays an important role in getting new subscribers. Sobolewski & Czajkowski (2012) studied the effect of the size of the network as an additional source of value. This is known as the network effect. Kim & Kwon (2003) revealed using conditional logic analysis that consumers would like to associate with largest operators in terms of subscribers when other parameters are equal. Upon further investigation they found out the discounts given in intra-network calls and the signal quality effectwere likely to be the sources of the size effect. Regulatory policy measures are needed and are very important to maintain healthy competition and provide enough opportunities for new operators in the market place.
Aydin & Özer (2005) found that telecommunication sector consists of highly price sensitive customers. For such customersthe purchase decisions are highly infl uenced and impacted by pricing decisions of the organization (Vanka, 2011). Kisioglu & Topcu (2011) analyzed customer churn by applying Bayesian Belief Network approach and found that customer churn can be explained by the important variables such as call frequency from other operators, tariff type, average minutes of calls and billing amount. Liu (2002) ascertained that step-down brand availability at affordable prices caters to the need of a new consumer groups who are enthusiastic about such offers and this results in the increased sales of both the mobile phone franchisee and in turn adds on more number of subscribers to the service providers as well.
Batt & Katz (1998) noted that there exists a very narrow margin regarding the price range that is acceptable and at the upper end of the range we can see a dramatic drop in willingness to pay. In certain services, more than half of the customer base is lost by shifting from perceived inexpensive to somewhat expensive prices. Lee, Lee & Feick (2001) found that the link between customer loyalty and satisfaction can be best explained by the switching costs which play a prominent role and give insights regarding this link. Thus price/tariff is a crucial variable in determining customer churn.
Research done by Sweeney & Swait (2008) explains the long term customer relationships are anchored by the signifi cant role the brand plays. It is true that the brand creates a mental picture in the mindset of the customer which helps him/her to differentiate various service providers at the point of purchase. They mentioned that customers indicate the defensive role is being played by brand credibility as per the results from the sample of Long Distance Telephone Company and the Retail Bank.
Louis & Lombart (2010) have examined the impact of brand personality on the customers’ trust, attachment and commitment to the brand. Vanka (2011) states that right positioning at the right time would be the key for long term relationships in the market place for a corporate brand. The bench mark in the market place should be looked into and the efforts of the organization should be directed towards achieving that bench mark.
R����rc� G��
The increasing competition is making it diffi cult for the telecom service providers to increase their market share. With new players entering into the segment due to the relaxation of government policies, it has become a major challenge for the TSPs to preserve their customer base. For this purpose, it is essential for them to identify the necessary parameters responsible for customer’s preference. In account of such scenario in this industry, there is a need to identify the various factors which affect the consumer buying behavior at the point of purchase. Similar studies have been done in the past but with the advent of new technology and services offered by the telecom sector, the preferences of the consumers have changed signifi cantly. The consumers have now become more aware about their alternatives and this has led to the increased expectations. Hence a fresh perspective to the factors exploration was required to accommodate the changing mindset of the consumers and the changing scenario of the Telecom Industry.
Exploration of Product Centric Factors in Telecom Industry 21
R����rc� O���cti���
The primary problem of this research is to explore the product centric factors affecting customer preferences in telecom industry.
To achieve this, the following objectives have been stated for our study:- i. Research Objective 1:- To fi nd the factors affect-
ing the consumer buying preferences for telecom service providers.
ii. Research Objective 2:- To obtain the relative im-portance of these factors.
R����rc� M�t�odo�o��
To explore the factors, following methods were used:- i. Research Methodology 1- Reviewing the existing
literature in this domain, we explored different fac-tors which affect the consumer’s decision to prefer one telecom service provider over the other.
ii. Research Methodology 2 - A consumer targeted questionnaire was designed where consumers were asked about the factors they consider (with their relative importance quantifi ed using Likert scale), before buying a new network connection to know the relative importance of the various fac-tors. Factor Analysis was performed to club various variables into distinct factors. Statistical techniques then helped in identifying the relative importance.
F�ctor� O�t�in�d
The various factors obtained from the secondary research are as follows:- i. Tariff and Data Plans -The amount the consumer
pays for the services. It is the cost incurred by the user for using various services and communication network provided by the TSP.
ii. Service Quality- Customer perception regarding the specifi c dimensions of services is being mea-sured by the service quality. This is a very impor-tant factor where the dimensions include the reli-ability of the service being offered, responsiveness, tangible benefi ts, empathy and assurance (Zeithaml & Bitner, 2000). It represents the overall quality of
the calls, services and the network provided by the TSP.
iii. Word of Mouth- It is the interpersonal/oral com-munication an individual (mostly not employed by the organization) identify preferences either explic-itly or subconsciously and these preferences are communicated with other people within their net-works. Itrepresents the recommendations by fam-ily or friends regarding the services provided by TSPs.
iv. Value Added Services- These are the additional services a TSP offers to its consumers. These in-clude any non-voice based services such as vid-eo on demand, access to internet services, SMS/ MMS, Video Conferencing and gaming.
v. Advertising- This communication platform is non-personal in nature and is usually paid form where the company promotes their products, ideas, services by sponsors through different media chan-nels available (Bovee & Arens, 1992). It aims at making the consumers aware of the services of-fered by the TSPs. These are the promotional ac-tivities which lead to the positioning of the brand.
vi. Brand Ambassador- A brand ambassador is an individual who helps the organization in convey-ing the brand identity to the customer by endors-ing and representing the product/service. Brand Ambassador in our context includes celebrities hired by the TSPs to endorse their brand.
vii. Size of the Network- The geographical span cov-ered by the network service provider. It refers to the various regions (nationwide and worldwide) where the TSP provides service.
viii. Point of Purchase- The place where consumer buys the product. These are the brand outlets or stores where a network connection can be bought.
D����o���nt o� Qu��tionn�ir�
To develop the questionnaire, each of the factors defi ned above were taken into consideration. Few Factors were further sub-divided into different dimensions. For example:- a. Tariff was divided into cost and plans offered. b. Service Quality was divided into frequency of call
blocked, sound quality, overall call quality, net-work reachability, customer care service.
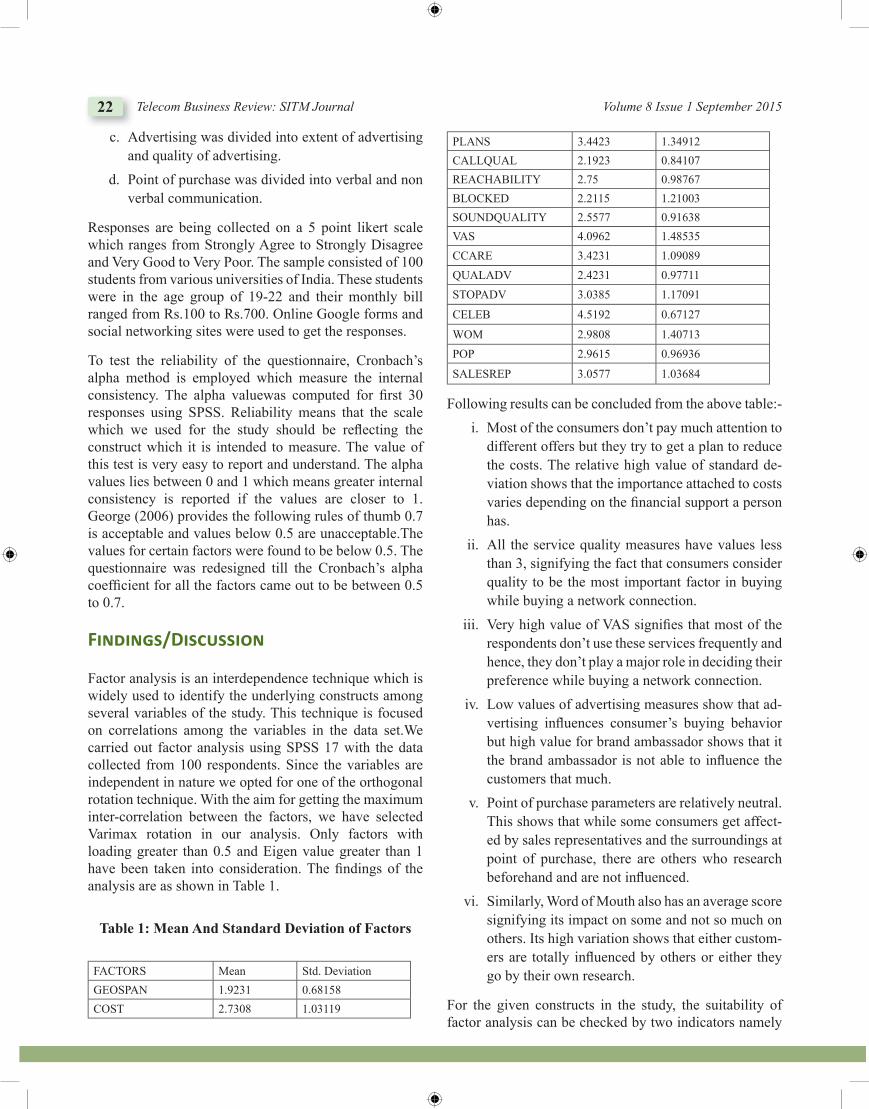
22 Telecom Business Review: SITM Journal Volume 8 Issue 1 September 2015
c. Advertising was divided into extent of advertising and quality of advertising.
d. Point of purchase was divided into verbal and non verbal communication.
Responses are being collected on a 5 point likert scale which ranges from Strongly Agree to Strongly Disagree and Very Good to Very Poor. The sample consisted of 100 students from various universities of India. These students were in the age group of 19-22 and their monthly bill ranged from Rs.100 to Rs.700. Online Google forms and social networking sites were used to get the responses.
To test the reliability of the questionnaire, Cronbach’s alpha method is employed which measure the internal consistency. The alpha valuewas computed for fi rst 30 responses using SPSS. Reliability means that the scale which we used for the study should be refl ecting the construct which it is intended to measure. The value of this test is very easy to report and understand. The alpha values lies between 0 and 1 which means greater internal consistency is reported if the values are closer to 1. George (2006) provides the following rules of thumb 0.7 is acceptable and values below 0.5 are unacceptable.The values for certain factors were found to be below 0.5. The questionnaire was redesigned till the Cronbach’s alpha coeffi cient for all the factors came out to be between 0.5 to 0.7.
Findin��/Di�cu��ion
Factor analysis is an interdependence technique which is widely used to identify the underlying constructs among several variables of the study. This technique is focused on correlations among the variables in the data set.We carried out factor analysis using SPSS 17 with the data collected from 100 respondents. Since the variables are independent in nature we opted for one of the orthogonal rotation technique. With the aim for getting the maximum inter-correlation between the factors, we have selected Varimax rotation in our analysis. Only factors with loading greater than 0.5 and Eigen value greater than 1 have been taken into consideration. The fi ndings of the analysis are as shown in Table 1.
Table 1: Mean And Standard Deviation of Factors
FACTORS Mean Std. DeviationGEOSPAN 1.9231 0.68158COST 2.7308 1.03119
PLANS 3.4423 1.34912CALLQUAL 2.1923 0.84107REACHABILITY 2.75 0.98767BLOCKED 2.2115 1.21003SOUNDQUALITY 2.5577 0.91638VAS 4.0962 1.48535CCARE 3.4231 1.09089QUALADV 2.4231 0.97711STOPADV 3.0385 1.17091
CELEB 4.5192 0.67127
WOM 2.9808 1.40713POP 2.9615 0.96936
SALESREP 3.0577 1.03684
Following results can be concluded from the above table:- i. Most of the consumers don’t pay much attention to
different offers but they try to get a plan to reduce the costs. The relative high value of standard de-viation shows that the importance attached to costs varies depending on the fi nancial support a person has.
ii. All the service quality measures have values less than 3, signifying the fact that consumers consider quality to be the most important factor in buying while buying a network connection.
iii. Very high value of VAS signifi es that most of the respondents don’t use these services frequently and hence, they don’t play a major role in deciding their preference while buying a network connection.
iv. Low values of advertising measures show that ad-vertising infl uences consumer’s buying behavior but high value for brand ambassador shows that it the brand ambassador is not able to infl uence the customers that much.
v. Point of purchase parameters are relatively neutral. This shows that while some consumers get affect-ed by sales representatives and the surroundings at point of purchase, there are others who research beforehand and are not infl uenced.
vi. Similarly, Word of Mouth also has an average score signifying its impact on some and not so much on others. Its high variation shows that either custom-ers are totally infl uenced by others or either they go by their own research.
For the given constructs in the study, the suitability of factor analysis can be checked by two indicators namely
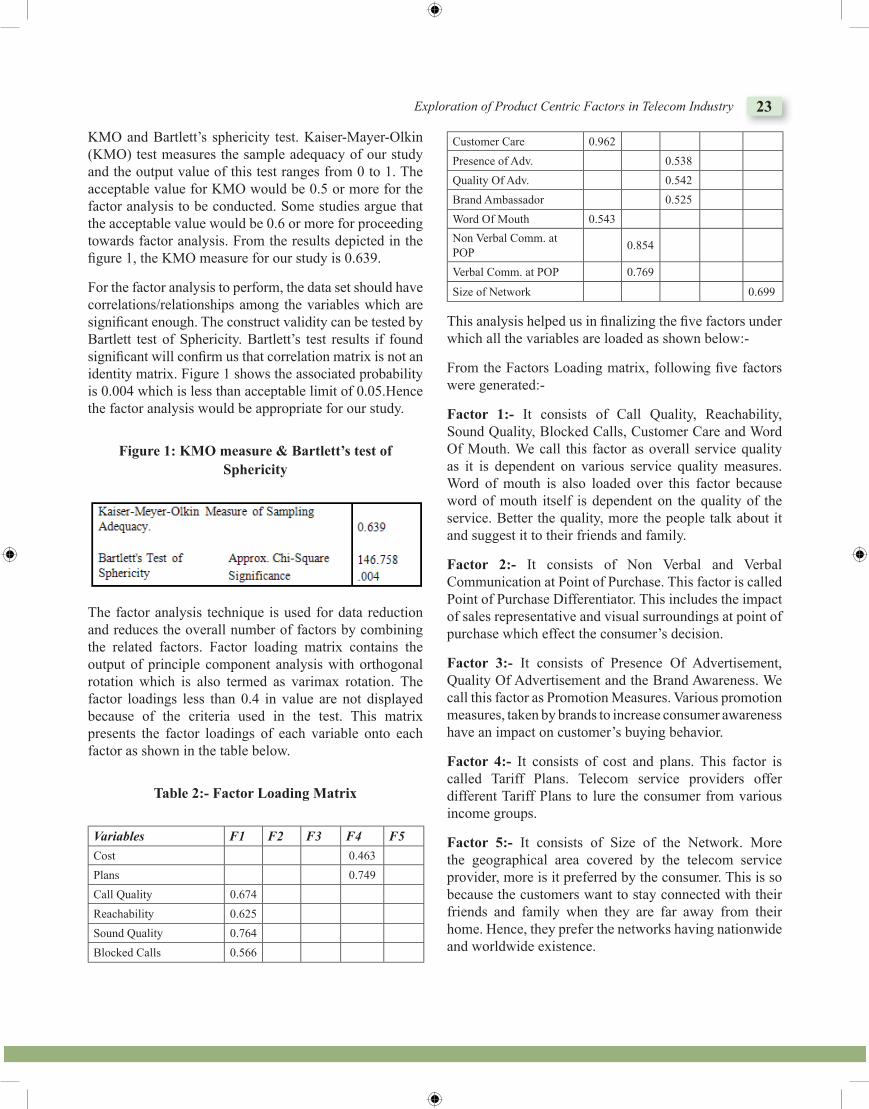
Exploration of Product Centric Factors in Telecom Industry 23
KMO and Bartlett’s sphericity test. Kaiser-Mayer-Olkin (KMO) test measures the sample adequacy of our study and the output value of this test ranges from 0 to 1. The acceptable value for KMO would be 0.5 or more for the factor analysis to be conducted. Some studies argue that the acceptable value would be 0.6 or more for proceeding towards factor analysis. From the results depicted in the fi gure 1, the KMO measure for our study is 0.639.
For the factor analysis to perform, the data set should have correlations/relationships among the variables which are signifi cant enough. The construct validity can be tested by Bartlett test of Sphericity. Bartlett’s test results if found signifi cant will confi rm us that correlation matrix is not an identity matrix. Figure 1 shows the associated probability is 0.004 which is less than acceptable limit of 0.05.Hence the factor analysis would be appropriate for our study.
Figure 1: KMO measure & Bartlett’s test of Sphericity
The factor analysis technique is used for data reduction and reduces the overall number of factors by combining the related factors. Factor loading matrix contains the output of principle component analysis with orthogonal rotation which is also termed as varimax rotation. The factor loadings less than 0.4 in value are not displayed because of the criteria used in the test. This matrix presents the factor loadings of each variable onto each factor as shown in the table below.
Table 2:- Factor Loading Matrix
Variables F1 F2 F3 F4 F5Cost 0.463Plans 0.749Call Quality 0.674Reachability 0.625Sound Quality 0.764Blocked Calls 0.566
Customer Care 0.962Presence of Adv. 0.538Quality Of Adv. 0.542Brand Ambassador 0.525Word Of Mouth 0.543Non Verbal Comm. at POP 0.854
Verbal Comm. at POP 0.769
Size of Network 0.699
This analysis helped us in fi nalizing the fi ve factors under which all the variables are loaded as shown below:-
From the Factors Loading matrix, following fi ve factors were generated:-
Factor 1:- It consists of Call Quality, Reachability, Sound Quality, Blocked Calls, Customer Care and Word Of Mouth. We call this factor as overall service quality as it is dependent on various service quality measures. Word of mouth is also loaded over this factor because word of mouth itself is dependent on the quality of the service. Better the quality, more the people talk about it and suggest it to their friends and family.
Factor 2:- It consists of Non Verbal and Verbal Communication at Point of Purchase. This factor is called Point of Purchase Differentiator. This includes the impact of sales representative and visual surroundings at point of purchase which effect the consumer’s decision.
Factor 3:- It consists of Presence Of Advertisement, Quality Of Advertisement and the Brand Awareness. We call this factor as Promotion Measures. Various promotion measures, taken by brands to increase consumer awareness have an impact on customer’s buying behavior.
Factor 4:- It consists of cost and plans. This factor is called Tariff Plans. Telecom service providers offer different Tariff Plans to lure the consumer from various income groups.
Factor 5:- It consists of Size of the Network. More the geographical area covered by the telecom service provider, more is it preferred by the consumer. This is so because the customers want to stay connected with their friends and family when they are far away from their home. Hence, they prefer the networks having nationwide and worldwide existence.
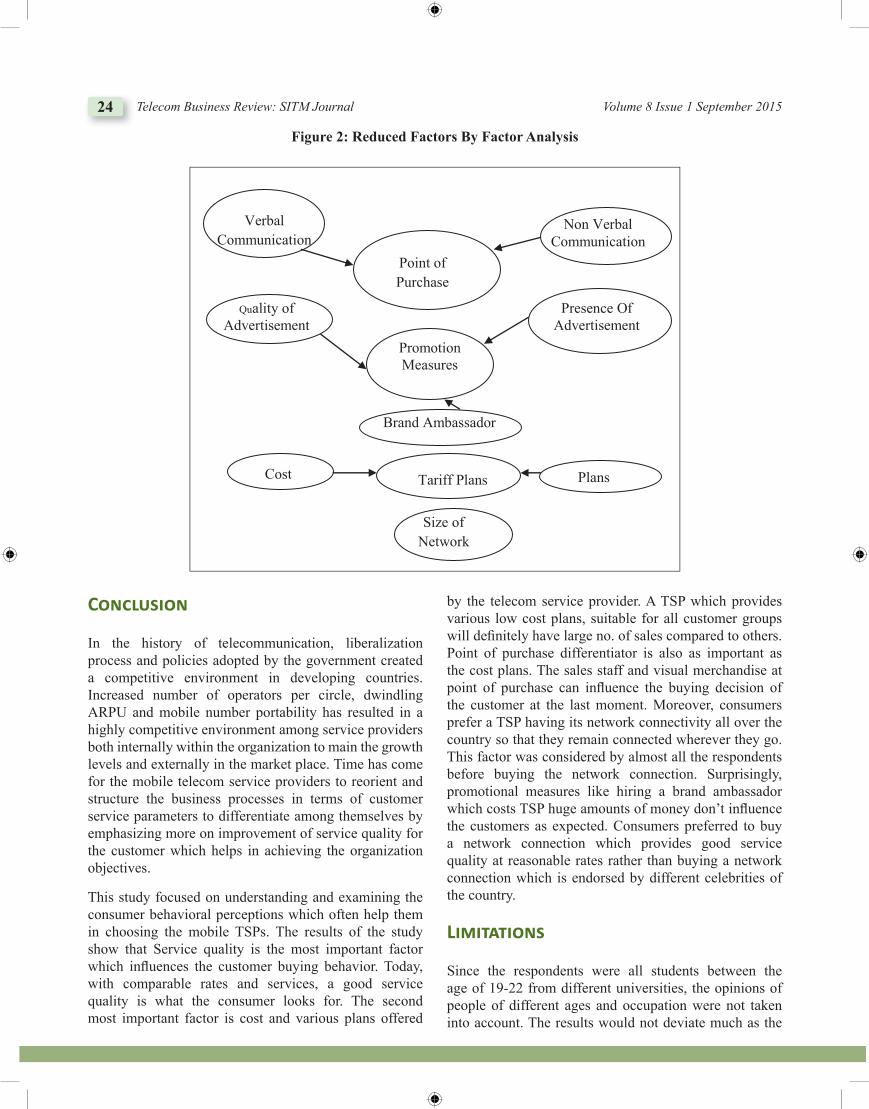
24 Telecom Business Review: SITM Journal Volume 8 Issue 1 September 2015
Conc�u�ion
In the history of telecommunication, liberalization process and policies adopted by the government created a competitive environment in developing countries. Increased number of operators per circle, dwindling ARPU and mobile number portability has resulted in a highly competitive environment among service providers both internally within the organization to main the growth levels and externally in the market place. Time has come for the mobile telecom service providers to reorient and structure the business processes in terms of customer service parameters to differentiate among themselves by emphasizing more on improvement of service quality for the customer which helps in achieving the organization objectives.
This study focused on understanding and examining the consumer behavioral perceptions which often help them in choosing the mobile TSPs. The results of the study show that Service quality is the most important factor which infl uences the customer buying behavior. Today, with comparable rates and services, a good service quality is what the consumer looks for. The second most important factor is cost and various plans offered
by the telecom service provider. A TSP which provides various low cost plans, suitable for all customer groups will defi nitely have large no. of sales compared to others. Point of purchase differentiator is also as important as the cost plans. The sales staff and visual merchandise at point of purchase can infl uence the buying decision of the customer at the last moment. Moreover, consumers prefer a TSP having its network connectivity all over the country so that they remain connected wherever they go. This factor was considered by almost all the respondents before buying the network connection. Surprisingly, promotional measures like hiring a brand ambassador which costs TSP huge amounts of money don’t infl uence the customers as expected. Consumers preferred to buy a network connection which provides good service quality at reasonable rates rather than buying a network connection which is endorsed by different celebrities of the country.
Li�it�tion�
Since the respondents were all students between the age of 19-22 from different universities, the opinions of people of different ages and occupation were not taken into account. The results would not deviate much as the
Figure 2: Reduced Factors By Factor Analysis
Size of Network
Promotion Measures
Quality of Advertisement
Presence Of Advertisement
Brand Ambassador
Tariff Plans Cost Plans
Point of Purchase
Verbal Communication
Non Verbal Communication
Exploration of Product Centric Factors in Telecom Industry 25
youth represents the majority of the consumers using the telecom services.
Moreover, the respondents were all from metropolitan cities and hence, the rural population is not taken into account. However, the students in these universities were a mix of diverse economic backgrounds where people from different parts of the country including the rural segment come for fulfi lling their dreams. Due to time and resource constraint, the sample size of 100 was taken which is relatively moderate for such study. For future researchers it would be interesting to observe the factor analysis results with increased sample size.
R���r�nc��
Anckar, B., & D’incau, D. (2002). Value creation in mobile commerce: Findings from a consumer sur-vey. Journal of Information Technology Theory and Application (JITTA), 4(1), 43-64.
Aydin, S., & Özer, G. (2005). The analysis of anteced-ents of customer loyalty in the Turkish mobile telecom-munication market. European Journal of Marketing, 39(7/8), 910-925.
Batt, C. E., & Katz, J. E. (1998). Consumer spending be-havior and telecommunications services. A multi-meth-od inquiry. Telecommunications Policy, 22(1), 23-46.
Bovee, C. L., & Arens, W. F. (1992). Contemporary ad-vertising. Homewood, IL: Irwin.
Chabossou, A., Stork, C., Stork, M., & Zahonogo, P. (2008). Mobile telephony access and usage in Africa. African Journal of Information and Communication, (9), 17-41.
Davidow, M. (2003). Have you heard the word? The effect of word of mouth on perceived justice, satisfaction and repurchase intentions following complaint handling. Journal of Consumer Satisfaction Dissatisfaction and Complaining Behavior, 16(1), 67-80.
DelVecchio, D., Krishnan, H. S., & Smith, D. C. (2007). Cents or percent? The effects of promotion framing on price expectations and choice. Journal of Marketing, 71(3), 158-170.
Dierkes, T., Bichler, M., & Krishnan, R. (2011). Estimating the effect of word of mouth on churn and cross-buying in the mobile phone market with Markov logic net-works. Decision Support Systems, 51(3), 361-371.
Garbacz, C., & Thompson Jr, H. G. (2005). Universal telecommunication service: a world perspective. Information Economics and Policy, 17(4), 495-512.
George, D. (2006). SPSS for Windows Step by Step: A Simple Study Guide and Reference, 17.0 Update, 10/e. Pearson Education India.
Grönroos, C. (1984). A service quality model and its mar-keting implications. European Journal of marketing, 18(4), 36-44.
Kim, H. S., & Kwon, N. (2003). The advantage of net-work size in acquiring new subscribers: a conditional logit analysis of the Korean mobile telephony market. Information Economics and Policy, 15(1), 17-33.
Kisioglu, P., & Topcu, Y. I. (2011). Applying Bayesian Belief Network approach to customer churn analysis: A case study on the telecom industry of Turkey. Expert Systems with Applications, 38(6), 7151-7157.
Kuo, Y. F., Wu, C. M., & Deng, W. J. (2009). The relation-ships among service quality, perceived value, custom-er satisfaction, and post-purchase intention in mobile value-added services. Computers in human behavior, 25(4), 887-896.
Lai, F., Griffi n, M., & Babin, B. J. (2009). How qual-ity, value, image, and satisfaction create loyalty at a Chinese telecom. Journal of Business Research, 62(10), 980-986.
Lee, J., Lee, J., & Feick, L. (2001). The impact of switch-ing costs on the customer satisfaction-loyalty link: mo-bile phone service in France. Journal of services mar-keting, 15(1), 35-48.
Lim, H., Widdows, R., & Park, J. (2006). M-loyalty: win-ning strategies for mobile carriers. Journal of Consumer Marketing, 23(4), 208-218.
Liu, C. M. (2002). The effects of promotional activities on brand decision in the cellular telephone industry. Journal of product & brand management, 11(1), 42-51.
Louis, D., & Lombart, C. (2010). Impact of brand per-sonality on three major relational consequences (trust, attachment, and commitment to the brand). Journal of Product & Brand Management, 19(2), 114-130.
Sobolewski, M., & Czajkowski, M. (2012). Network ef-fects and preference heterogeneity in the case of mo-bile telecommunications markets. Telecommunications Policy, 36(3), 197-211.
Sweeney, J., & Swait, J. (2008). The effects of brand cred-ibility on customer loyalty. Journal of Retailing and Consumer Services, 15(3), 179-193.
TRAI. (2014, 16 July). Telecom Subscription Data. Retrieved from: http://www.trai.gov.in/WriteReadData/WhatsNew/Documents/PR-TSD-June,%2014.pdf
Thomas, D. R. (1978). Strategy is different in service businesses. Harvard Business Review, 56(4), 158-165.
26 Telecom Business Review: SITM Journal Volume 8 Issue 1 September 2015
Vanka, G. (2011). Corporate Branding Effects On Consumer Purchase Preferences In Serbian Telecom Market. APSTRACT: Applied Studies in Agribusiness and Commerce, 5(1/2), 91-104.
Wang, W. T., & Li, H. M. (2012). Factors infl uencing mobile services adoption: a brand-equity perspective. Internet Research, 22(2), 142-179.
Wang, Y., & Lo, H. P. (2002). Service quality, customer satisfaction and behavior intentions: Evidence from China’s telecommunication industry. info, 4(6), 50-60.
Zeithaml, V. A. (1988). Consumer perceptions of price, quality, and value: a means-end model and synthesis of evidence. The Journal of Marketing, 52(3), 2-22.
Zeithaml, V.A., & Bitner, M. J. (2000). Services Marketing: integrating customer focus across the fi rm,2/e. NY: McGrawHill.
Zhao, L., Lu, Y., Zhang, L., & Chau, P. Y. (2012). Assessing the effects of service quality and justice on customer satisfaction and the continuance intention of mobile value-added services: An empirical test of a multidimensional model. Decision Support Systems, 52(3), 645-656.
Bri�� Bio o� �ut�or/�:
Swati Ganeti is a Senior Associate Consultant at India Offi ce of Bain and Company, a US based management consulting fi rm . She has worked with various big corporations across the industries like real estate, airlines, textiles, healthcare to help them design their growth strategy and improve performance and sales. She is B.Tech in Electrical Engineering and M.Tech in IT and Communications from IIT Delhi. Her areas of interest include customer strategy and performance improvement, and industries of interest include healthcare, telecom and airlines. She can be reached at [email protected]
Rajat Agarwal is currently pursuing his MBA from Indian Institute of Management, Calcutta. Previously, he was working as Senior Analyst in Emerging Markets Trading division of global Investment Bank. He completed his B.Tech and M.Tech in Electrical Engineering along with a minor degree in Business Management from Indian Institute of Technology, Delhi . His areas of interest include structured trading, credit research, portfolio management and business valuations. He can be reached [email protected]
Mr. Murali Krishna Medudula is presently doing his doctoral work at IIT Delhi in the area of Mobile Data Security focused on product innovations, consumer awareness and absorption issues. In the past has been associated with the various organizations such as Aditya Birla Group (Transworks) & Wipro Technologies Ltd. He worked at a Sr. Executive level as the Bid Manager for Asia-Pacifi c region in Wipro Technologies Ltd. before joining the Ph.D. programme at IIT Delhi. He holds B.Tech degree in Information Technology from CBIT, Hyderabad and MBA degree from IIT Delhi. His research areas include Technology Innovation, Consumer Behaviour & Telecom Marketing. He actively took part in organizing and attending several workshops & conferences in the area of Marketing, Telecommunication Technology & Management. He can be reached [email protected]
Exploration of Product Centric Factors in Telecom Industry 27
Dr. Mahim Sagar is Associate Professor in the area of Marketing Management & Strategy. He has done his doctoral work on Brand Positioning in Cross Cultural & Ethical Context from Indian Institute of Information Technology & Management (IIITM) and has done seminal work on Ethical Brand Positioning. Dr. Sagar has wide academic and administrative experience and
has been associate with various institutes of repute like IIM-Ahmedabad (IIM-A), National Institute of Fashion Technology (NIFT) and IIITM. At IIM-A he was in Marketing area and was involved in various courses of Marketing like Brand Management and Consumer Based Business Strategy. At NIFT he headed and established the Post Graduate Programme in Fashion Management. At IIITM he developed various new courses in the area of Marketing. Dr. Sagar’s interest areas are Brand Management, Product Development, Strategic Management & Telecom Policy & Marketing. His work has been published in various reputed journals and has recently authored a text book on Brand Management. He can be reached at [email protected] / [email protected]
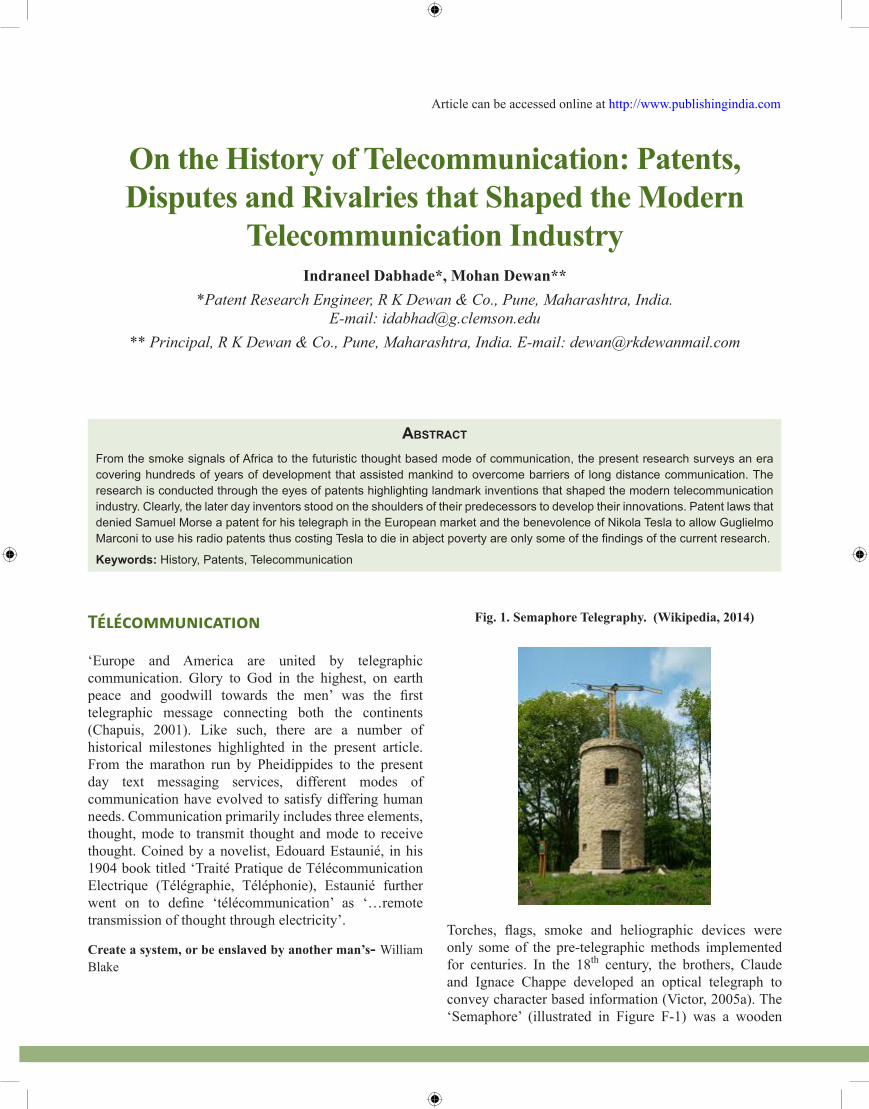
Abstract
From the smoke signals of Africa to the futuristic thought based mode of communication, the present research surveys an era covering hundreds of years of development that assisted mankind to overcome barriers of long distance communication. The research is conducted through the eyes of patents highlighting landmark inventions that shaped the modern telecommunication industry. Clearly, the later day inventors stood on the shoulders of their predecessors to develop their innovations. Patent laws that denied Samuel Morse a patent for his telegraph in the European market and the benevolence of Nikola Tesla to allow Guglielmo Marconi to use his radio patents thus costing Tesla to die in abject poverty are only some of the findings of the current research.
Keywords: History, Patents, Telecommunication
On the History of Telecommunication: Patents, Disputes and Rivalries that Shaped the Modern
Telecommunication IndustryIndraneel Dabhade*, Mohan Dewan**
*Patent Research Engineer, R K Dewan & Co., Pune, Maharashtra, India. E-mail: [email protected]
** Principal, R K Dewan & Co., Pune, Maharashtra, India. E-mail: [email protected]
Télécommunication
‘Europe and America are united by telegraphic communication. Glory to God in the highest, on earth peace and goodwill towards the men’ was the first telegraphic message connecting both the continents (Chapuis, 2001). Like such, there are a number of historical milestones highlighted in the present article. From the marathon run by Pheidippides to the present day text messaging services, different modes of communication have evolved to satisfy differing human needs. Communication primarily includes three elements, thought, mode to transmit thought and mode to receive thought. Coined by a novelist, Edouard Estaunié, in his 1904 book titled ‘Traité Pratique de Télécommunication Electrique (Télégraphie, Téléphonie), Estaunié further went on to define ‘télécommunication’ as ‘…remote transmission of thought through electricity’.
Create a system, or be enslaved by another man’s- William Blake
Fig. 1. Semaphore Telegraphy. (Wikipedia, 2014)
Torches, flags, smoke and heliographic devices were only some of the pre-telegraphic methods implemented for centuries. In the 18th century, the brothers, Claude and Ignace Chappe developed an optical telegraph to convey character based information (Victor, 2005a). The ‘Semaphore’ (illustrated in Figure F-1) was a wooden
Article can be accessed online at http://www.publishingindia.com
On the History of Telecommunication: Patents, Disputes and Rivalries that Shaped the Modern Telecommunication... 29
structure mounted on top of buildings, church steeples and on hills which made them visible over great distances. Each wooden structure consisted of an arm arrangement whose positions were manipulated with ropes and pulleys to display different confi gurations. Robert Hooke, the English physicist made signifi cant contributions in refi ning the semaphore telegraph by introducing a character based system. One important contribution from Claude was the introduction of a fi ve bit binary code. Inspired by the works of the Chappe brothers, Abraham N. Clewberg - Edelcrantz set off to build his own optical telegraph (Victor, 2005b). Calling it a shutter telegraph, it was initially based on the semaphore telegraph but later Edelcrantz decided to move away to a matrix design with three rows and three columns of shutters with a tenth shutter built on top. The opening and closing of the shutters visually transmitted a code which on the receiving end was decoded into a message. The shutter telegraph found large military applications including setting up the fi rst international network connection between Sweden and Denmark in 1801.
From the 1600 treatise by William Gilbert ‘De Magnete’ (Gilbert and Mottelay, 1958) to Benjamin Franklin’s famous kite fl ying experiment in 1752, the discovery of electricity passed through the hands of a number of scientists (Joy, 1878). In a 1753 letter signed by ‘C.M’ to the editor of the Scot’s Magazine includes the fi rst ever mention of applying electric current to a telegraph. With the identity of ‘C.M’ shrouded in mystery this letter is often hailed as the most important document in the history of telegraphy (Sabine, 1867). The fi rst ever electric telegraph working on static electricity was thus constructed by a nearly blind physicist, George Louis Le Sage in 1774. A Leyden jar invented in 1745 by Petrus van Musschenbroek at the University of Leiden, was a fi rst of a kind receptacle to store static electricity. In 1678, Jan Swammerdam had demonstrated to the Grand Duke of Tuscany the contraction of frog legs in an electrical convulsion when brought in contact with silver or copper (Hegel, 1970) thus concluding on the presence of animal electricity. Questioning the claim of the presence of animal electricity (Verkhratsky et al., 2006), Alessandro Volta conducted his own research to uncover the secrets of storing electricity. This effort led to building a voltaic pile for storing galvanic current. Eventually the voltaic cell took the form of a battery. Static electricity was a well-known phenomenon and efforts had been taken in the past to develop a messaging system using static electricity. A telegraph based on static electricity was built by Francisco Salvá y Campillo in 1795 (Yuste, 2008). Following Volta’s invention of the voltaic pile, William
Nicholson and Anthony Carlisle discovered electrolysis of water. The discovery played a major role in constructing an electrochemical telegraph.
In 1809, Samuel Thomas von Sömmerring, a German anatomist built the fi rst electrochemical telegraph. Sömmerring’s telegraph worked with contact points inserted into individual glass tubes signifying alphabetic characters and numbers. The contact points produced bubbles when the sender connected his end of the wire with electric current derived from the voltaic pile. This also marked the fi rst demonstration of moving electricity over wires (Rudolph, 2014).
Hans Christian Ørsted’s results in electromagnetism greatly infl uenced the work of Andre Marie Ampere. Ampere’s vision of the telegraph consisted of individual setups of circuits circulating electric current with a defl ecting magnetic needle placed within the magnetic fi eld for every alphabet and number. In 1820, Johann Schweigger and Johann Poggendorf invented a galvanometer working on Ampere’s discovered principles. Utilizing the multiplier principle, Schweigger later modifi ed Sömmerring’s telegraph. Building on Ampere’s discovery, William Sturgeon, an electrical engineer from Whittington, United Kingdom (UK), successfully built the fi rst working electromagnet. On March 12th, 1832, Michael Faraday, who had made signifi cant contributions in the fi eld of electromagnetism had submitted a sealed envelope containing a letter to the Secretary of the Royal Society which was left unopened for more than a century until 1937. The letter contained early ideas on wave propagation (Garratt, 1994). In 1832, Pavel Schilling invented the fi ve needle telegraph (Burns, 1988).
T�� B��t Wa� to P���ict t�� Futu�� i� to In��nt It. – Alan Ka�
In 1833, Carl Friedrich Gauss along with Wilhelm Weber invented an electromagnetic telegraph (Rodriguez et al., 2010). The world’s fi rst telegraph line constructed between Gauss’s workplace in an astronomical laboratory and Weber’s laboratory consisted of an emitter- receiver system. The system further consisted of a coil wound around a magnetic needle at the receiver end and connected to a battery via a switch at the emitter end. The Gauss-Weber code consisted of ‘+’ and ‘-’ rather than ‘0’ and ‘1’. A signal pulse consisted of movement of the magnetic needle to either side of a horizontal structure. The telegraph had reached a stage of being a single wire system. In 1844, Samuel Morse introduced a code system, a version different from the Morse code
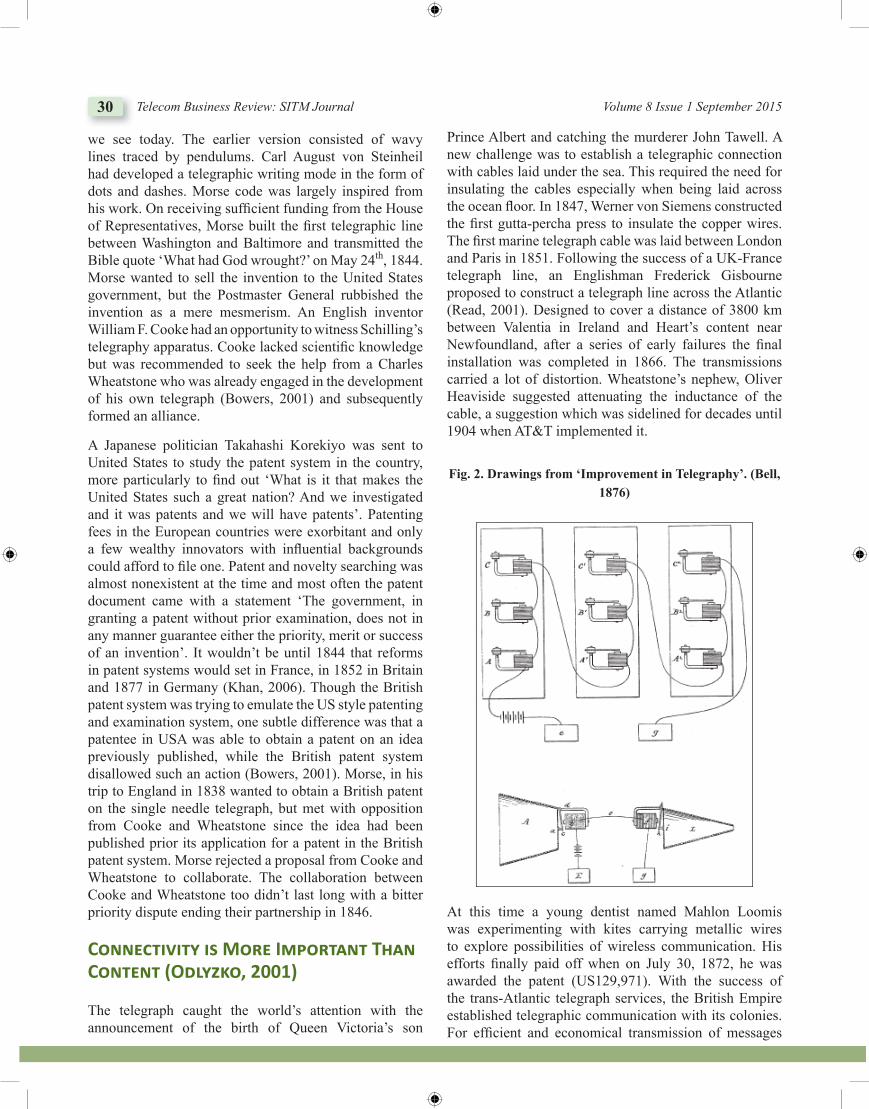
30 Telecom Business Review: SITM Journal Volume 8 Issue 1 September 2015
we see today. The earlier version consisted of wavy lines traced by pendulums. Carl August von Steinheil had developed a telegraphic writing mode in the form of dots and dashes. Morse code was largely inspired from his work. On receiving suffi cient funding from the House of Representatives, Morse built the fi rst telegraphic line between Washington and Baltimore and transmitted the Bible quote ‘What had God wrought?’ on May 24th, 1844. Morse wanted to sell the invention to the United States government, but the Postmaster General rubbished the invention as a mere mesmerism. An English inventor William F. Cooke had an opportunity to witness Schilling’s telegraphy apparatus. Cooke lacked scientifi c knowledge but was recommended to seek the help from a Charles Wheatstone who was already engaged in the development of his own telegraph (Bowers, 2001) and subsequently formed an alliance.
A Japanese politician Takahashi Korekiyo was sent to United States to study the patent system in the country, more particularly to fi nd out ‘What is it that makes the United States such a great nation? And we investigated and it was patents and we will have patents’. Patenting fees in the European countries were exorbitant and only a few wealthy innovators with infl uential backgrounds could afford to fi le one. Patent and novelty searching was almost nonexistent at the time and most often the patent document came with a statement ‘The government, in granting a patent without prior examination, does not in any manner guarantee either the priority, merit or success of an invention’. It wouldn’t be until 1844 that reforms in patent systems would set in France, in 1852 in Britain and 1877 in Germany (Khan, 2006). Though the British patent system was trying to emulate the US style patenting and examination system, one subtle difference was that a patentee in USA was able to obtain a patent on an idea previously published, while the British patent system disallowed such an action (Bowers, 2001). Morse, in his trip to England in 1838 wanted to obtain a British patent on the single needle telegraph, but met with opposition from Cooke and Wheatstone since the idea had been published prior its application for a patent in the British patent system. Morse rejected a proposal from Cooke and Wheatstone to collaborate. The collaboration between Cooke and Wheatstone too didn’t last long with a bitter priority dispute ending their partnership in 1846.
Conn�cti�it� i� Mo�� Im�o�tant T�an Cont�nt (O�l���o, 2001)
The telegraph caught the world’s attention with the announcement of the birth of Queen Victoria’s son
Prince Albert and catching the murderer John Tawell. A new challenge was to establish a telegraphic connection with cables laid under the sea. This required the need for insulating the cables especially when being laid across the ocean fl oor. In 1847, Werner von Siemens constructed the fi rst gutta-percha press to insulate the copper wires. The fi rst marine telegraph cable was laid between London and Paris in 1851. Following the success of a UK-France telegraph line, an Englishman Frederick Gisbourne proposed to construct a telegraph line across the Atlantic (Read, 2001). Designed to cover a distance of 3800 km between Valentia in Ireland and Heart’s content near Newfoundland, after a series of early failures the fi nal installation was completed in 1866. The transmissions carried a lot of distortion. Wheatstone’s nephew, Oliver Heaviside suggested attenuating the inductance of the cable, a suggestion which was sidelined for decades until 1904 when AT&T implemented it.
Fig. 2. Drawings from ‘Improvement in Telegraphy’. (Bell, 1876)
At this time a young dentist named Mahlon Loomis was experimenting with kites carrying metallic wires to explore possibilities of wireless communication. His efforts fi nally paid off when on July 30, 1872, he was awarded the patent (US129,971). With the success of the trans-Atlantic telegraph services, the British Empire established telegraphic communication with its colonies. For effi cient and economical transmission of messages
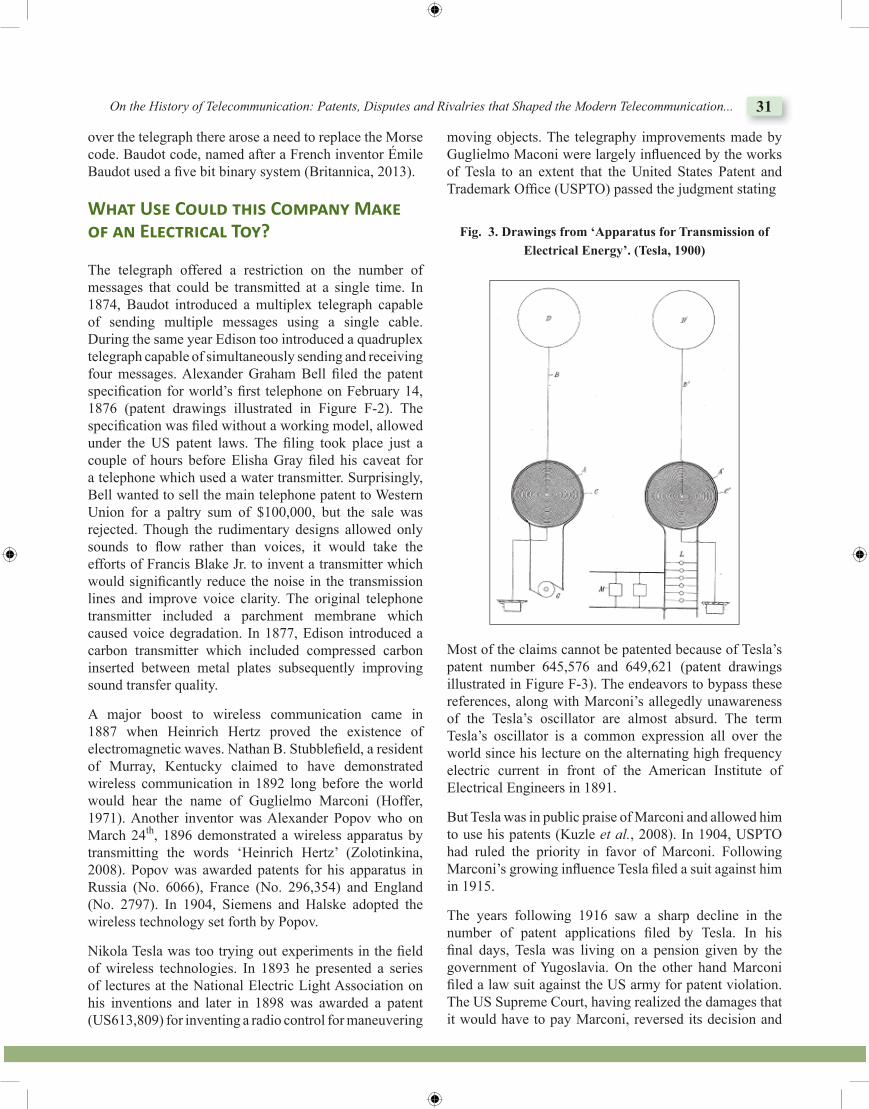
On the History of Telecommunication: Patents, Disputes and Rivalries that Shaped the Modern Telecommunication... 31
over the telegraph there arose a need to replace the Morse code. Baudot code, named after a French inventor Émile Baudot used a fi ve bit binary system (Britannica, 2013).
W�at U�� Coul� t�i� Com�an� Ma�� o� an El�ct�ical To�?
The telegraph offered a restriction on the number of messages that could be transmitted at a single time. In 1874, Baudot introduced a multiplex telegraph capable of sending multiple messages using a single cable. During the same year Edison too introduced a quadruplex telegraph capable of simultaneously sending and receiving four messages. Alexander Graham Bell fi led the patent specifi cation for world’s fi rst telephone on February 14, 1876 (patent drawings illustrated in Figure F-2). The specifi cation was fi led without a working model, allowed under the US patent laws. The fi ling took place just a couple of hours before Elisha Gray fi led his caveat for a telephone which used a water transmitter. Surprisingly, Bell wanted to sell the main telephone patent to Western Union for a paltry sum of $100,000, but the sale was rejected. Though the rudimentary designs allowed only sounds to fl ow rather than voices, it would take the efforts of Francis Blake Jr. to invent a transmitter which would signifi cantly reduce the noise in the transmission lines and improve voice clarity. The original telephone transmitter included a parchment membrane which caused voice degradation. In 1877, Edison introduced a carbon transmitter which included compressed carbon inserted between metal plates subsequently improving sound transfer quality.
A major boost to wireless communication came in 1887 when Heinrich Hertz proved the existence of electromagnetic waves. Nathan B. Stubblefi eld, a resident of Murray, Kentucky claimed to have demonstrated wireless communication in 1892 long before the world would hear the name of Guglielmo Marconi (Hoffer, 1971). Another inventor was Alexander Popov who on March 24th, 1896 demonstrated a wireless apparatus by transmitting the words ‘Heinrich Hertz’ (Zolotinkina, 2008). Popov was awarded patents for his apparatus in Russia (No. 6066), France (No. 296,354) and England (No. 2797). In 1904, Siemens and Halske adopted the wireless technology set forth by Popov.
Nikola Tesla was too trying out experiments in the fi eld of wireless technologies. In 1893 he presented a series of lectures at the National Electric Light Association on his inventions and later in 1898 was awarded a patent (US613,809) for inventing a radio control for maneuvering
moving objects. The telegraphy improvements made by Guglielmo Maconi were largely infl uenced by the works of Tesla to an extent that the United States Patent and Trademark Offi ce (USPTO) passed the judgment stating
Fig. 3. Drawings from ‘Apparatus for Transmission of Electrical Energy’. (Tesla, 1900)
Most of the claims cannot be patented because of Tesla’s patent number 645,576 and 649,621 (patent drawings illustrated in Figure F-3). The endeavors to bypass these references, along with Marconi’s allegedly unawareness of the Tesla’s oscillator are almost absurd. The term Tesla’s oscillator is a common expression all over the world since his lecture on the alternating high frequency electric current in front of the American Institute of Electrical Engineers in 1891.
But Tesla was in public praise of Marconi and allowed him to use his patents (Kuzle et al., 2008). In 1904, USPTO had ruled the priority in favor of Marconi. Following Marconi’s growing infl uence Tesla fi led a suit against him in 1915.
The years following 1916 saw a sharp decline in the number of patent applications fi led by Tesla. In his fi nal days, Tesla was living on a pension given by the government of Yugoslavia. On the other hand Marconi fi led a law suit against the US army for patent violation. The US Supreme Court, having realized the damages that it would have to pay Marconi, reversed its decision and
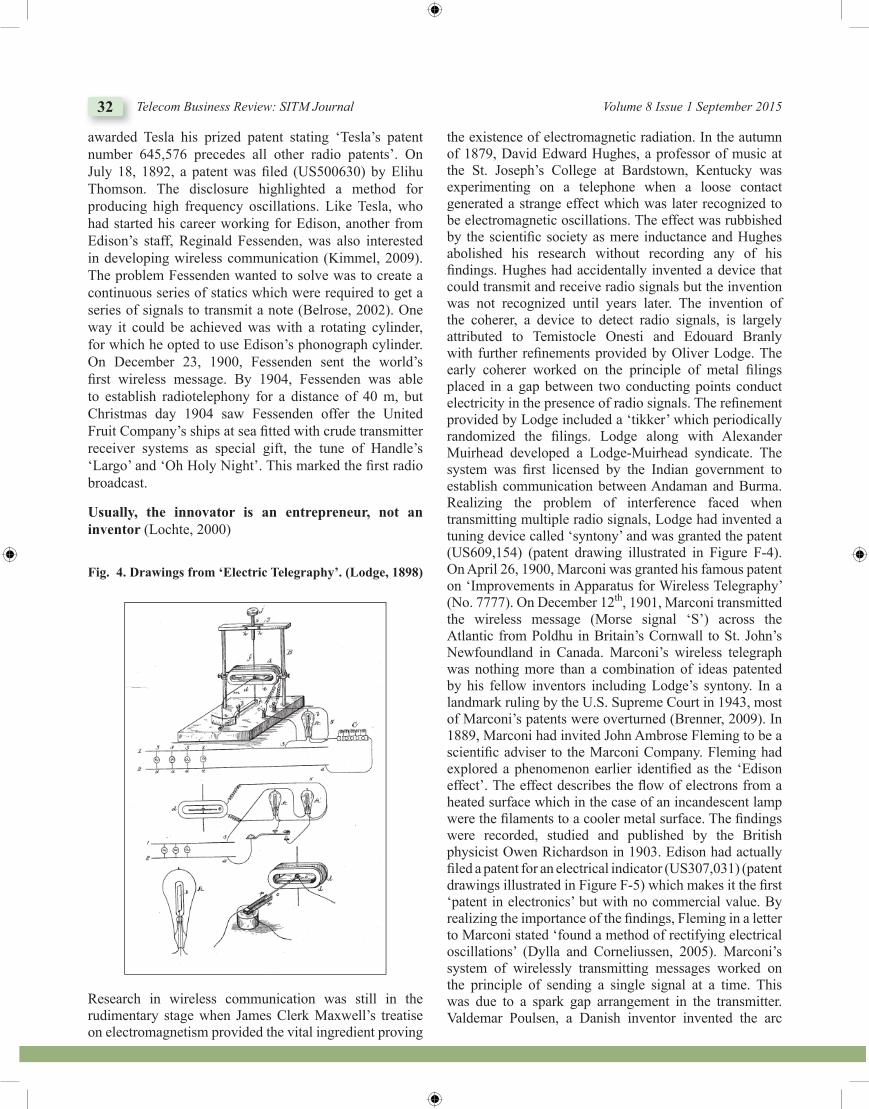
32 Telecom Business Review: SITM Journal Volume 8 Issue 1 September 2015
awarded Tesla his prized patent stating ‘Tesla’s patent number 645,576 precedes all other radio patents’. On July 18, 1892, a patent was fi led (US500630) by Elihu Thomson. The disclosure highlighted a method for producing high frequency oscillations. Like Tesla, who had started his career working for Edison, another from Edison’s staff, Reginald Fessenden, was also interested in developing wireless communication (Kimmel, 2009). The problem Fessenden wanted to solve was to create a continuous series of statics which were required to get a series of signals to transmit a note (Belrose, 2002). One way it could be achieved was with a rotating cylinder, for which he opted to use Edison’s phonograph cylinder. On December 23, 1900, Fessenden sent the world’s fi rst wireless message. By 1904, Fessenden was able to establish radiotelephony for a distance of 40 m, but Christmas day 1904 saw Fessenden offer the United Fruit Company’s ships at sea fi tted with crude transmitter receiver systems as special gift, the tune of Handle’s ‘Largo’ and ‘Oh Holy Night’. This marked the fi rst radio broadcast.
Usually, the innovator is an entrepreneur, not an inventor (Lochte, 2000)
Fig. 4. Drawings from ‘Electric Telegraphy’. (Lodge, 1898)
Research in wireless communication was still in the rudimentary stage when James Clerk Maxwell’s treatise on electromagnetism provided the vital ingredient proving
the existence of electromagnetic radiation. In the autumn of 1879, David Edward Hughes, a professor of music at the St. Joseph’s College at Bardstown, Kentucky was experimenting on a telephone when a loose contact generated a strange effect which was later recognized to be electromagnetic oscillations. The effect was rubbished by the scientifi c society as mere inductance and Hughes abolished his research without recording any of his fi ndings. Hughes had accidentally invented a device that could transmit and receive radio signals but the invention was not recognized until years later. The invention of the coherer, a device to detect radio signals, is largely attributed to Temistocle Onesti and Edouard Branly with further refi nements provided by Oliver Lodge. The early coherer worked on the principle of metal fi lings placed in a gap between two conducting points conduct electricity in the presence of radio signals. The refi nement provided by Lodge included a ‘tikker’ which periodically randomized the fi lings. Lodge along with Alexander Muirhead developed a Lodge-Muirhead syndicate. The system was fi rst licensed by the Indian government to establish communication between Andaman and Burma. Realizing the problem of interference faced when transmitting multiple radio signals, Lodge had invented a tuning device called ‘syntony’ and was granted the patent (US609,154) (patent drawing illustrated in Figure F-4). On April 26, 1900, Marconi was granted his famous patent on ‘Improvements in Apparatus for Wireless Telegraphy’ (No. 7777). On December 12th, 1901, Marconi transmitted the wireless message (Morse signal ‘S’) across the Atlantic from Poldhu in Britain’s Cornwall to St. John’s Newfoundland in Canada. Marconi’s wireless telegraph was nothing more than a combination of ideas patented by his fellow inventors including Lodge’s syntony. In a landmark ruling by the U.S. Supreme Court in 1943, most of Marconi’s patents were overturned (Brenner, 2009). In 1889, Marconi had invited John Ambrose Fleming to be a scientifi c adviser to the Marconi Company. Fleming had explored a phenomenon earlier identifi ed as the ‘Edison effect’. The effect describes the fl ow of electrons from a heated surface which in the case of an incandescent lamp were the fi laments to a cooler metal surface. The fi ndings were recorded, studied and published by the British physicist Owen Richardson in 1903. Edison had actually fi led a patent for an electrical indicator (US307,031) (patent drawings illustrated in Figure F-5) which makes it the fi rst ‘patent in electronics’ but with no commercial value. By realizing the importance of the fi ndings, Fleming in a letter to Marconi stated ‘found a method of rectifying electrical oscillations’ (Dylla and Corneliussen, 2005). Marconi’s system of wirelessly transmitting messages worked on the principle of sending a single signal at a time. This was due to a spark gap arrangement in the transmitter. Valdemar Poulsen, a Danish inventor invented the arc
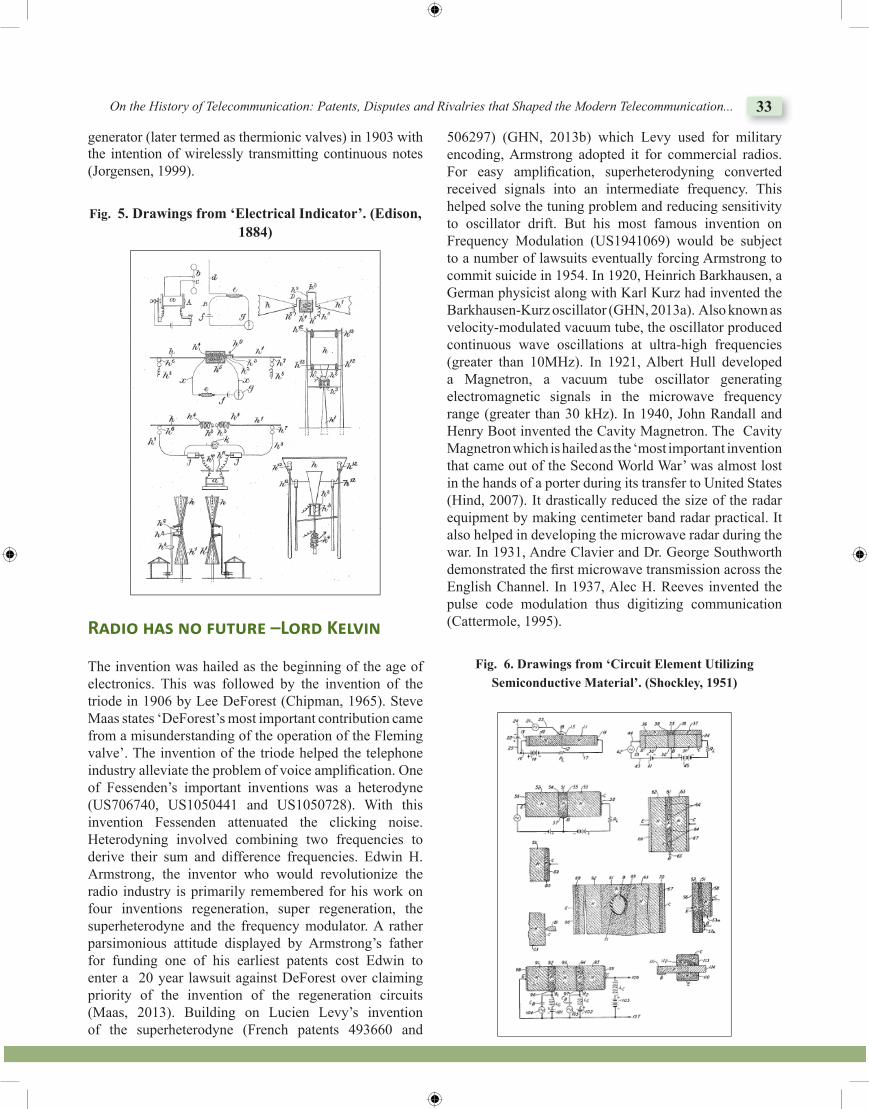
On the History of Telecommunication: Patents, Disputes and Rivalries that Shaped the Modern Telecommunication... 33
generator (later termed as thermionic valves) in 1903 with the intention of wirelessly transmitting continuous notes (Jorgensen, 1999).
Fig. 5. Drawings from ‘Electrical Indicator’. (Edison, 1884)
Ra�io �a� no �utu�� –Lo�� K�l�in
The invention was hailed as the beginning of the age of electronics. This was followed by the invention of the triode in 1906 by Lee DeForest (Chipman, 1965). Steve Maas states ‘DeForest’s most important contribution came from a misunderstanding of the operation of the Fleming valve’. The invention of the triode helped the telephone industry alleviate the problem of voice amplifi cation. One of Fessenden’s important inventions was a heterodyne (US706740, US1050441 and US1050728). With this invention Fessenden attenuated the clicking noise. Heterodyning involved combining two frequencies to derive their sum and difference frequencies. Edwin H. Armstrong, the inventor who would revolutionize the radio industry is primarily remembered for his work on four inventions regeneration, super regeneration, the superheterodyne and the frequency modulator. A rather parsimonious attitude displayed by Armstrong’s father for funding one of his earliest patents cost Edwin to enter a 20 year lawsuit against DeForest over claiming priority of the invention of the regeneration circuits (Maas, 2013). Building on Lucien Levy’s invention of the superheterodyne (French patents 493660 and
506297) (GHN, 2013b) which Levy used for military encoding, Armstrong adopted it for commercial radios. For easy amplifi cation, superheterodyning converted received signals into an intermediate frequency. This helped solve the tuning problem and reducing sensitivity to oscillator drift. But his most famous invention on Frequency Modulation (US1941069) would be subject to a number of lawsuits eventually forcing Armstrong to commit suicide in 1954. In 1920, Heinrich Barkhausen, a German physicist along with Karl Kurz had invented the Barkhausen-Kurz oscillator (GHN, 2013a). Also known as velocity-modulated vacuum tube, the oscillator produced continuous wave oscillations at ultra-high frequencies (greater than 10MHz). In 1921, Albert Hull developed a Magnetron, a vacuum tube oscillator generating electromagnetic signals in the microwave frequency range (greater than 30 kHz). In 1940, John Randall and Henry Boot invented the Cavity Magnetron. The Cavity Magnetron which is hailed as the ‘most important invention that came out of the Second World War’ was almost lost in the hands of a porter during its transfer to United States (Hind, 2007). It drastically reduced the size of the radar equipment by making centimeter band radar practical. It also helped in developing the microwave radar during the war. In 1931, Andre Clavier and Dr. George Southworth demonstrated the fi rst microwave transmission across the English Channel. In 1937, Alec H. Reeves invented the pulse code modulation thus digitizing communication (Cattermole, 1995).
Fig. 6. Drawings from ‘Circuit Element Utilizing Semiconductive Material’. (Shockley, 1951)
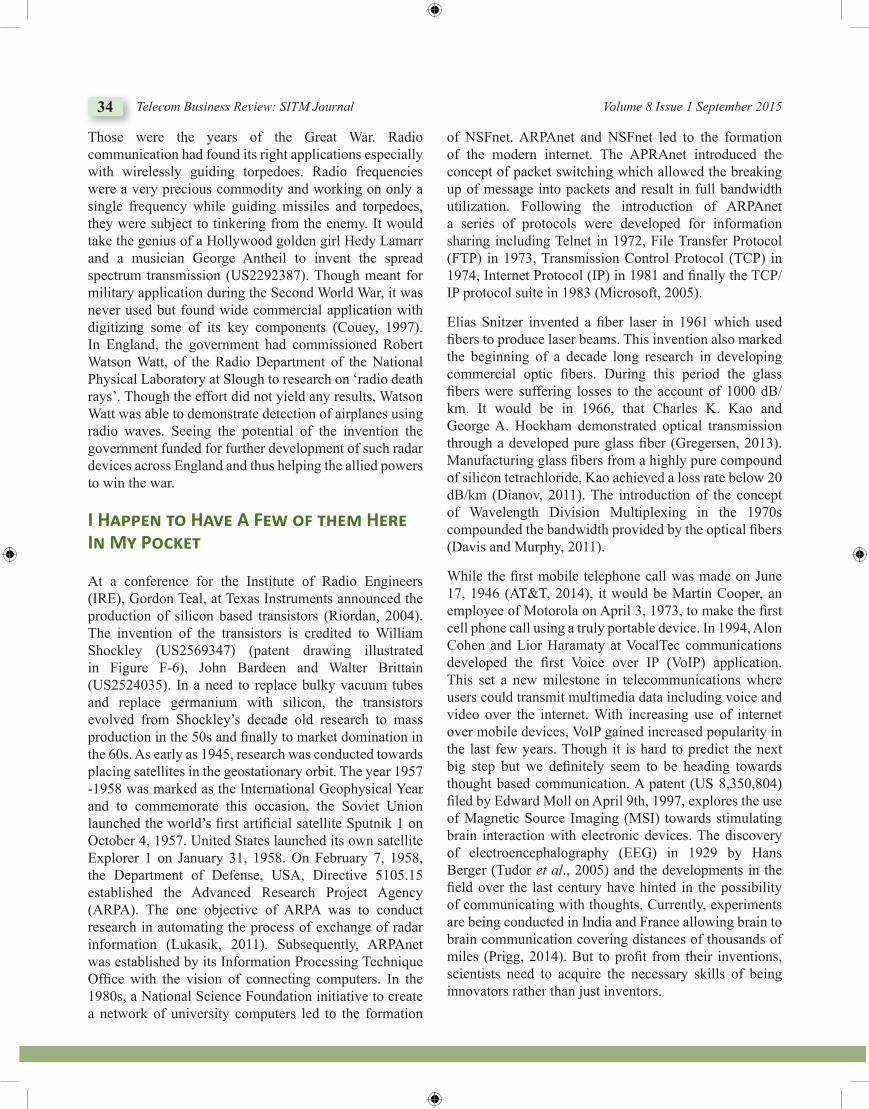
34 Telecom Business Review: SITM Journal Volume 8 Issue 1 September 2015
Those were the years of the Great War. Radio communication had found its right applications especially with wirelessly guiding torpedoes. Radio frequencies were a very precious commodity and working on only a single frequency while guiding missiles and torpedoes, they were subject to tinkering from the enemy. It would take the genius of a Hollywood golden girl Hedy Lamarr and a musician George Antheil to invent the spread spectrum transmission (US2292387). Though meant for military application during the Second World War, it was never used but found wide commercial application with digitizing some of its key components (Couey, 1997). In England, the government had commissioned Robert Watson Watt, of the Radio Department of the National Physical Laboratory at Slough to research on ‘radio death rays’. Though the effort did not yield any results, Watson Watt was able to demonstrate detection of airplanes using radio waves. Seeing the potential of the invention the government funded for further development of such radar devices across England and thus helping the allied powers to win the war.
I Ha���n to Ha�� A F�� o� t��m H��� In M� Poc��t
At a conference for the Institute of Radio Engineers (IRE), Gordon Teal, at Texas Instruments announced the production of silicon based transistors (Riordan, 2004). The invention of the transistors is credited to William Shockley (US2569347) (patent drawing illustrated in Figure F-6), John Bardeen and Walter Brittain (US2524035). In a need to replace bulky vacuum tubes and replace germanium with silicon, the transistors evolved from Shockley’s decade old research to mass production in the 50s and fi nally to market domination in the 60s. As early as 1945, research was conducted towards placing satellites in the geostationary orbit. The year 1957 -1958 was marked as the International Geophysical Year and to commemorate this occasion, the Soviet Union launched the world’s fi rst artifi cial satellite Sputnik 1 on October 4, 1957. United States launched its own satellite Explorer 1 on January 31, 1958. On February 7, 1958, the Department of Defense, USA, Directive 5105.15 established the Advanced Research Project Agency (ARPA). The one objective of ARPA was to conduct research in automating the process of exchange of radar information (Lukasik, 2011). Subsequently, ARPAnet was established by its Information Processing Technique Offi ce with the vision of connecting computers. In the 1980s, a National Science Foundation initiative to create a network of university computers led to the formation
of NSFnet. ARPAnet and NSFnet led to the formation of the modern internet. The APRAnet introduced the concept of packet switching which allowed the breaking up of message into packets and result in full bandwidth utilization. Following the introduction of ARPAnet a series of protocols were developed for information sharing including Telnet in 1972, File Transfer Protocol (FTP) in 1973, Transmission Control Protocol (TCP) in 1974, Internet Protocol (IP) in 1981 and fi nally the TCP/IP protocol suite in 1983 (Microsoft, 2005).
Elias Snitzer invented a fi ber laser in 1961 which used fi bers to produce laser beams. This invention also marked the beginning of a decade long research in developing commercial optic fi bers. During this period the glass fi bers were suffering losses to the account of 1000 dB/km. It would be in 1966, that Charles K. Kao and George A. Hockham demonstrated optical transmission through a developed pure glass fi ber (Gregersen, 2013). Manufacturing glass fi bers from a highly pure compound of silicon tetrachloride, Kao achieved a loss rate below 20 dB/km (Dianov, 2011). The introduction of the concept of Wavelength Division Multiplexing in the 1970s compounded the bandwidth provided by the optical fi bers (Davis and Murphy, 2011).
While the fi rst mobile telephone call was made on June 17, 1946 (AT&T, 2014), it would be Martin Cooper, an employee of Motorola on April 3, 1973, to make the fi rst cell phone call using a truly portable device. In 1994, Alon Cohen and Lior Haramaty at VocalTec communications developed the fi rst Voice over IP (VoIP) application. This set a new milestone in telecommunications where users could transmit multimedia data including voice and video over the internet. With increasing use of internet over mobile devices, VoIP gained increased popularity in the last few years. Though it is hard to predict the next big step but we defi nitely seem to be heading towards thought based communication. A patent (US 8,350,804) fi led by Edward Moll on April 9th, 1997, explores the use of Magnetic Source Imaging (MSI) towards stimulating brain interaction with electronic devices. The discovery of electroencephalography (EEG) in 1929 by Hans Berger (Tudor et al., 2005) and the developments in the fi eld over the last century have hinted in the possibility of communicating with thoughts. Currently, experiments are being conducted in India and France allowing brain to brain communication covering distances of thousands of miles (Prigg, 2014). But to profi t from their inventions, scientists need to acquire the necessary skills of being innovators rather than just inventors.
On the History of Telecommunication: Patents, Disputes and Rivalries that Shaped the Modern Telecommunication... 35
Ac�no�l����m�nt
We would like to thank Clemson University Libraries for providing us the necessary resources to make this article possible.
R�����nc��
AT & T. (2014). 1946: First Mobile Telephone Call. Retrieved from http://www.corp.att.com/attlabs/repu-tation/timeline/46mobile.html
Barnes, S. B. (2007). Alan Kay: Transforming the com-puter into a communication Medium. IEEE Annals of the History of Computing, 29(2), 18-30. doi:10.1109/MAHC.2007.17
Belrose, J. (2002, April). Reginald Aubrey Fessenden and the Birth of Wireless Telephony. IEEE Antenna’s and Propogation Magazine, 38-46.
Bowers, B. (2001). Cooke and Wheatstone, and Morse : A comparative view. In Conference on the History of Telecommunications organized by the IEEE History Center and the IEEE History Committee (pp. 1-9). St. John’s, Newfoundland: IEEE.
Brenner, P. (2009). Tesla against Marconi: The dispute for the radio patent paternity. In EUROCON 2009, EUROCON ’09. IEEE (pp. 1035-1042). St.-Petersburg: IEEE.
Britannica. (2013). Jean-Maurice-Émile Baudot. Encyclopædia Britannica. Retrieved, from http://www.britannica.com/EBchecked/topic/56369/Jean-Maurice-Emile-Baudot
Burns, R. W. (1988). Sömmerring, Schilling, Cooke and Wheatstone, and the electric telegraph. In History of Electrical Engineering, Papers Presented at the Sixteenth I.E.E. Week-End Meeting on the (pp. 70-79). Twickenham: IET.
Cattermole, K. (1995). Pulse code modulation: invent-ed for microwaves, used everywhere. In 100 Years of Radio., Proceedings of the 1995 International Conference on (pp. 184-186). London: IET.
Chapuis, R. (2001). Transatlantic telecom relations: some short stories about them.
Chipman, R. (1965). De forest and the triode detector. Scientifi c American, 212(3), 92-100.
Couey, A. (1997). The birth of spread spectrum how the bad boy of music and “the most beautiful girl in the world, catalyzed a wireless revolution--In 1941. Retrieved from http://people.seas.harvard.edu/~jones/cscie129/nu_lectures/lecture7/hedy/lemarr.htm
Davis, C., & Murphy, T. (2011). Fiber-optic communica-tions. IEEE Signal Processing Magazine, 148-152.
Dianov, E. M. (2011). Laser and Fiber Optics. Vestnik Rossiiskoi Akademi Nauk, 81(6), 514-520.
Dylla, H. F., & Corneliussen, S. (2005). John ambrose fl eming and the beginning of electronics. Journal of Vacuum Science and Technology, 23(4), 1244-1251.
Garratt, G. R. (1994). The early history of radio: From faraday to marconi. In The Early History of Radio: From Faraday to Marconi (p. 11). The Institution of Engineering and Technology.
GHN. (2013a). Heinrich Barkhausen. Retrieved September 20, 2014, from http://www.ieeeghn.org/wiki/index.php/Heinrich_Barkhausen
GHN. (2013b). Superheterodyne Receiver. IEEE Global History Network. Retrieved September 17, 2014, from http://www.ieeeghn.org/wiki/index.php/Superheterodyne_Receiver
Gilbert, W. P. F. M. (1958). De Magnete. Courier Dover Publications.
Gregersen, E. (2013). Charles Kao. Encyclopaedia Britannica. Retrieved from http://www.britannica.com/EBchecked/topic/1567923/Charles-Kao
Hegel, G. W. F. (1970). Hegel’s Philosophy of Nature: Volume II. In M. Petry (Ed.), Hegel’s Philosophy of Nature: Volume II (2nd ed.), p. 416. Routledge.
Hind, A. (2007). Briefcase “that changed the world.”BBC Radio 4’s The World in a Briefcase. Retrieved from http://news.bbc.co.uk/2/hi/science/nature/6331897.stm
Hoffer, T. (1971). Nathan B. Stubblefi eld and his wireless telephone. Journal of Broadcasting, 15(3), 317–330.
Jorgensen, F. (1999). The inventor Valdemar Poulsen. Journal of Magnetism and Magnetic Materials, 193, 1–7.
Joy, C. (1878). The history of electricity. Frank Leslie’s Popular Monthly, 759.
Khan, Z. B. (2006). An Economic History of Patent Institutions. EH.net. Retrieved from http://eh.net/ency-clopedia/an-economic-history -of-patent-institutions/
Kimmel, L. H. (2009). Reginald Aubrey Fessenden. In A. K. Benson (Ed.), Great Lives from History. Inventors & Inventions (pp. 369–371). Salem Pr Inc.
Kuzle, I., Pandzic, H., & Bosnjak, D. (2008). The True Inventor of the Radio Communications. In Telecommunications Conference (HISTELCON), 2008 IEEE History of (pp. 20–23). Paris: IEEE.
Lochte, R. H. (2000). Invention and innovation of early ra dio technology. Journal of Radio Studies, 7(1), 93-115.
36 Telecom Business Review: SITM Journal Volume 8 Issue 1 September 2015
Lukasik, S. (2011). Why the arpanet was built. IEEE Annals of the History of Computing, 33(3), 4-20.
Maas, S. (2013). Armstrong and the Superheterodyne. IEEE Microwave Magazine, 34-39.
Microsoft. (2005). TCP/IP background. TechNet. Retrieved September 22, 2014, from http://technet.mi-crosoft.com/en-us/library/cc775383(v=ws.10).aspx
Odlyzko, A. (2001). Content is not king. First Monday, 6(2).
Prigg, M. (2014). Groundbreaking experiments allow fi rst brain to brain communication over the internet-be-tween people 5000 miles apart. Mail Online. Retrieved September 29, 2014, from http://www.dailymail.co.uk/sciencetech/article-2742486/Groundbreaking-experiment-allows-brain-brain-communication-internet-people-5-000-miles-apart.html
Read, W. S. (2001). Connecting Continents. Newfoundland.
Riordan, M. (2004, May). The Lost History of the Transistor. IEEE Spectrum, 44-49.
Rodriguez, F; Garcia, G; Lires, M. A. (2010). Technological archaeology: Technical description of the Gauss-Weber telegraph. In Telecommunications Conference (HISTELCON), 2010 Second IEEE Region 8 Conference on the History of (pp. 1–4). Madrid: IEEE.
Rudolph, W. S. T. V. S. (2014). Samuel Thomas Von Sommering’s Leben Und Verkehr Mit Seinen Zeitgenossen, Erster Band. Nabu Press.
Sabine, R. (1867). The electric telegraph. In The Electric Telegraph (p. 6). London: Virtue Brothers and Company.
Tudor, M., Tudor, L., & Tudor, K. (2005). Hans Berger (1873-1941)--the history of electroencephalography. Acta Med Croatica. Retrieved September 22, 2014, from http://www.ncbi.nlm.nih.gov/pubmed/16334737
Verkhratsky, A., Krishtal, O., & Petersen, O. (2006). From Galvani to patch clamp: the development of electro-physiology. European Journal of Physiology, 3(453), 233-247.
Victor, J. (2005a). Optical Telegraphy The Chappe Telegraph Systems. Retrieved September 20, 2014, from http://people.seas.harvard.edu/~jones/cscie129/images/history/chappe.html
Victor, J. (2005b). Abraham N. Edelcrantz. Retrieved from http://people.seas.harvard.edu/~jones/cscie129/papers/Early_History_of_Data_Networks/Chapter_3.pdf
Wikipedia. (2014). Semaphore line. Wikipedia. Retrieved September 29, 2014, from http://en.wikipedia.org/wiki/Semaphore_line.
Yuste, A. P. (2008). Salvá ’ s Electric Telegraph Based on Volta ’ s Battery. In Telecommunications Conference (HISTELCON), 2008 IEEE History of (pp. 6–11). Paris: IEEE.
Zolotinkina, L. I. (2008). Contribution of Russian scientist A. S. Popov to the development of wireless communi-cations. In 2008 IEEE History of Telecommunications Conference (pp. 115–118). Paris: IEEE. doi:10.1109/HISTELCON.2008.4668725
DrawingsBell, A. G. (1876). Improvement in Telegraphy. United
States.Edison, T. (1884). Electrical Indicator. United States.Lodge, O. J. (1898). Electric Telegraphy. United States.Shockley, W. (1951). Circuit Element Utilizing
Semiconductive Material. United States.Tesla, N. (1900a). Apparatus for Transmission of
Electrical Energy. United States.
B�i�� Bio o� Aut�o�/�:
Indraneel Dabhade, Patent Research Engineer, R K Dewan & Co., holds a M.S from Clemson University.
Dr. Mohan Dewan is an Electronics Engineer and a Systems Analyst. He has over 40 years of experience in the fi eld of Intellectual Property Rights. He is a practicing advocate and jurist and a registered Patent & Trademark attorney. Dr. Dewan is also extensively involved in IPR teaching and training.
Abstract
Social networking sites (SNSs) have become popular in India with the proliferation of Internet. SNSs have gained the interests of academicians and researchers. The current study is an endeavor to understand the continuance of social networking sites in India. The study applies an extended version of theory of planned behavior. Additional factors privacy concerns and habits were incorporated into the standard theory of planned behaviour. A survey was conducted in a Central University in India. Overall, data was collected from 150 respondents. PLS-SEM was used to test the proposed model. All the hypotheses except the moderating role of habits between intentions and continued use of social networking sites, were supported by the results. Habits were found to affect continued use of social networking sites indirectly through continued intentions.
Keywords: Habits, Theory of Planned Behaviour, SNS Continuance; Social Networking Sites
Social Networking Sites Continuance: An Applica-tion of Extended Theory of Planned Behaviour
Himanshu Rajput**Research Scholar, School of Business & Management Studies, Central University of Himachal Pradesh,
Himachal Pradesh, India. E-mail: [email protected]
Introduction
On 30th June, 2014, Google announced the discontinuance of its social networking site (SNS), Orkut from September, 2014 as it was losing its user base to other SNSs (Anwar, 2014). Before that, another SNS, Google Buzz was also shut down. After the initial adoption by internet users these sites could not engage their users for long. The continued use of an SNS is must for their survival in today’s digital world. In a digital market like India where people are adopting Internet and Internet-based services at a fast pace, SNSs have already become the mainstream online services. India is already home to second largest Facebook users in the world (Nayak, 2014). The SNS sector is witnessing the heat of competition. Google’s effort to make a mark in SNS through launching Google plus, despite the setbacks, signifies the importance that online players give to SNS sector. India with second-largest population in the world is an emerging online market that can cater to the growth need of these players. But only initial adoption of an SNS cannot ensure the long term success of their service (Kang et al., 2013). The companies have to make sure the continued use over the time as the monetary cost of switching for users is minimal in this sector. This study is an endeavour to address the same issue. To understand the continued use of SNSs is the primary aim of this study. For this purpose, the study uses the theory of planned behaviour as a framework.
Habit and privacy concerns are added to the standard TPB to predict the continued use of SNSs in India
Theoretical background and research model
Social Networking Sites Continuance
Traditionally, the emphasis of IS research studies has been on initial adoption and use of IS and there has been very little work on continued use or post adoption use of IS (Al-Debei, 2013). Particularly, in new fields like SNSs the studies have been more or less centred on initial adoption, behavioural and demographic pattern of users, interplay between SNS use and personality etc. But to sustain in today’s highly competitive and dynamic digital market the initial adoption or success is not enough. IT service providers have to be relevant in changing times and they have to engage their user base. Thus, the continued use of SNSs by the users is the key to their success. Of late, a little academic work has been conducted to understand the continuance of these applications. The work so far revolves around the prior-established theories from social psychology, consumer behaviour, media studies, like the theory of planned behaviour, the expectancy-confirmation theory (ECM), technology adoption model (TAM) and uses and gratification (U & G) framework. For example, Kefi et al. (2010), Al-Debei et al. (2013) and
Article can be accessed online at http://www.publishingindia.com
38 Telecom Business Review: SITM Journal Volume 8 Issue 1 September 2015
Hsu et al. (2013) used an extended form of TPB to predict continued use of SNSs. Islam & Mantymaki (2012), Kim (2011) and Hsu et al. (2013) used ECM. Ku et al. (2013) used U & G approach to study the continued use of SNSs. Most of these studies have been conducted in western cultural setup, which makes the fi ndings of these studies less relevant in a different cultural context like India. The cultural difference between Western countries and India warrants such studies to be conducted in Indian context.
Theory of Planned Behaviour (TPB)
TPB (Ajzen, 1985; 1987) is an extension of the theory of planned behaviour (Ajzen & Fishbein, 1975;1980) for explaining the behaviour that are not fully under the volitional control of human beings (Ajzen, 1991). According to TPB, the actual behaviour (AB) of an individual can be explained by her/his intention (IN) to perform that task and her/his perceived behavioural control (PBC) over performing that task. PBC also affects actual behaviour directly. Furthermore, the intention to perform a task is determined by the attitude (A) of the individual towards the behaviour; the subjective norms (SN) held by individual and perceived behavioural control. TPB has become one of the most infl uential and frequently used models for predicting human behaviour (Ajzen, 2011) and thus has got the attention of researchers to explain various human activities. TPB has been successfully used in context of general human activities like explaining conservation technology adoption decisions (Lynne et al.,1995), understanding exercise during breast cancer treatment (Courneya & Friedenreich,1999), predicting recycling behaviour (Tonglet et al., 2004), understanding the intentions to attend a sport event (Cunningham & kwon, 2003), explaining literary reading (Miesen, 2003), understanding parasuicide behaviour (O’Conner & Armitage, 2003), predicting voluntary employee turnover (Van Breukelen et al., 2004), predicting safe lifting behaviour (Johnson & Hall, 2005), understanding intentions of drinking and driving (Chan et al. ,2010) etc.
In IS studies, TPB has been used frequently to explain the adoption and use of IT (e.g., Lin et al., 2006; Baker et al., 2007; Ozer & Yilmez, 2010; Darvell et al., 2011; Cameron, 2012 etc.)
The fi ndings of these studies have demonstrated high predictive power of TPB in explaining the acceptance and use of IT (Hsu et al., 2006). Despite the high use of TPB in studies to understand the acceptance and use of IT,its use in understanding the continuance of IT has been very limited (Al-Debei et al., 2013).
Along with the standard TPB, researchers have used decomposed and extended TPB to better explain the various human behaviours ( e.g., Morris et al., 2005; Hsu et al., 2006; Pavlou & Fygenson, 2006; Thorbjornsen et al., 2007; Liao et al., 2007). Ajzen (1991) himself favoured such anextension or decomposition of TPB if additional factors capture a signifi cant proportion of the variance in intentions or actual behaviour.
Atti tude
Attitude represents an individual’s evaluation of a particular stimulus (Ajzen & Fishbein, 1977) and thus refers to the degree to which a person has a favourable or an unfavourable evaluation of the behaviour in question (Ajzen, 1991). In this study, attitude is defi ned as the evaluation of an individual towards social networking sites.
The capability of attitude to anticipate behavioural intentions has been a crucial subject of research and theory. Attitude is presently, by and large perceived as an important factor to understand and predict social behaviour (Ajzen, 2001). In TPB, the attitude has been assumed a predictor of intention to perform a particular behaviour. The more favourable a person assumes the result from performing a task, the more willingness she/he has to perform that task.Previous studies have supported the positive relationship between attitude and intentions (Ajzen & Fishbein, 1980).
According to basic assumption of TPB, this study posits:
H1: Attitude towards SNSs will positively affect the intentions to continue the use of SNSs.
Subjecti ve Norm
Subjective norm refers to an individual’s perceived social pressure to perform a behaviour (Ajzen, 1991). It represents the subjective evaluation of the pressure to or not to perform a behaviour from the people an individual considers important. In this study subjective norm refers to perceived pressure from important ones to continue the use of SNSs.
In TPB, subjective norm is considered to positively infl uence the intentions to perform the behaviour. Social networking sites are social in nature and thus it is imperative to consider that the perceived pressure from peers, friends and family members will have a positive infl uence over the continuance of SNSs. Previous studies on SNSs have reinforced the relationship (e.g., Pelling &
Social Networking Sites Continuance: An Application of Extended Theory of Planned Behaviour 39
White, 2009). In the light of the assumption of TPB and results from previous studies, this study proposes:
H2: Subjective norm will positively affect the intention to continue the use of SNSs.
Perceived Behavioural Control
Added to the theory of reasoned action to explain behaviours that are not solely under the control of individuals, PBC refers to the perceived ease or diffi culty of performing the behaviour (Ajzen, 1991). Accordingly, in this study PBC is defi ned as an individual’s perceived ease or diffi culty in continuing the use of SNSs. In TPB, PBC is assumed to be a direct determinant of intentions and as well as the actual behaviour. In the studies cited by Ajzen (1991) the correlation coeffi cient between PBC and intention varied between 0.2 and .76 while the correlation between PBC and behaviour varied between .2 and .87. Thus, the relationship between PBC and intentions and PBC and actual behaviour has been weak to strong varying from studies to studies. Going by the TPB, the study proposes that PBC will positively infl uence the intentions to continue the use of SNSs as well the continued use of SNSs.
H3: Perceived behavioural control positively infl uence the intentions to continue the use of SNSs.
H4: Perceived behavioural control positively infl uence the continued use of SNSs.
Intenti ons
In TPB, intentions are assumed to include motivational factors that infl uence the performance of abehaviour by an individual. Intentions represent how hard an individual is willing to try to perform a behaviour (Beck & Ajzen, 1991). In this study intentions simply represents the willingness of an individual to continue the use of SNSs. TPB assumes that stronger intentions to perform behaviour leads to higher chances of performing it. Sheeran (2002) in his review of the intention-behaviour relationship reported a mean overall correlation of .53 between the constructs; McEachan et al. (2011) in their meta-analysis of TPB in health-related behaviour reported a correlation of .43 between intention and behaviour. Based upon the basic assumption of TPB and considering the positive results of prior studies, following hypothesis is proposed:
H5: Intentions to continue the use of SNSs positively infl uence the continued use of the SNSs
Habit
Verplanken et al. (1997) defi ne habits as ‘learned sequences of acts that become automatic responses to specifi c situations which may be functional in obtaining certain goals or end states’. An individual develops habits to perform a behaviour after its repetition over a time. Triandis (1977) observed that the probability of performing a behaviour is a function of both intentions and habits.The latest developments in psychology have exhibited supremacy of habits in the explaining automatic use of a system (Ko, 2013). Furthermore, the effect of IS habits on IS use may be steady and unaltered while the effect of intentions may vary over the time (Lee, 2014).
IS researchers have used habits as a construct to explain the use and continuance of IS by users (e.g.,Limayem & Cheung, 2008). Limayem et al. (2007) defi ne IS habits as the extent to which individuals tend to make automatic use of a target IS because of learning effect and demonstrated that continued use of an IS is a result of habits along with intentions. In case of SNSs continuance, habits formed over the prolonged use may play a critical role as a behaviour performed repeatedly becomes automatic and less reasoned-based as explained by TPB (Verplanken et al., 1998; Limayem et al, 2007).
Kang et al (2013) observed that past research on IS continuance and habits demonstrated direct, moderate and mediation relationship between habits and continuance. They empirically supported the role of habits as moderator between continuance intention and continued use. Assuming that after initial adoption of SNSs by users, it will become more automatic and the role of conscious or rational decision will become less effective, the study posits the negative moderating role of habits between continuance intention and the continuance of SNSs.
H6: Habits moderately affect the relationship between continuance intentions and the continuance of SNSs.
Privacy Concerns
For this study, privacy concern is defi ned as ‘a person’s awareness and assessment of risks related to privacy violations on SNSs’ (Tan et al., 2012). People share their personal information on SNSs. The information can be used for the purposes other than the intended ones and thus may lead to intrusion into privacy of an individual. Of late, online privacy is becoming a critical issue among internet users (Baek et al., 2014). Personal information on the internet can easily be copied by unauthorised persons.
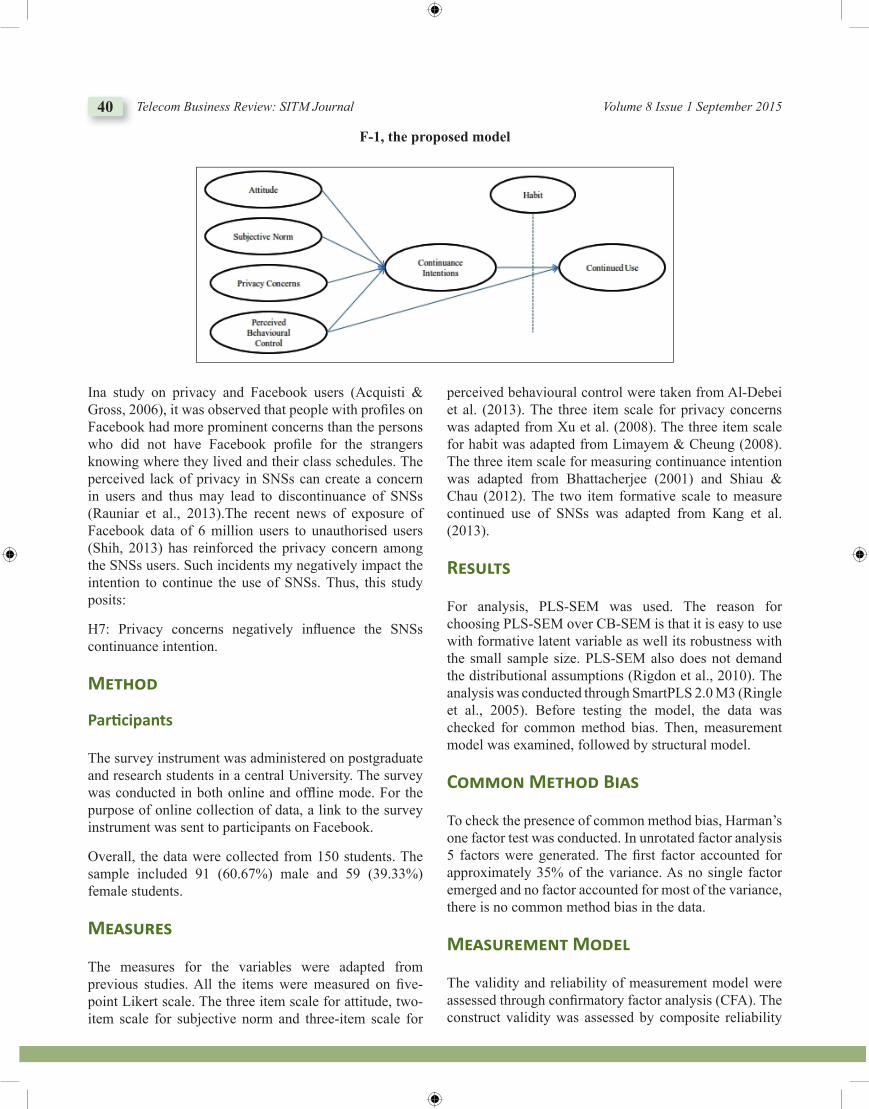
40 Telecom Business Review: SITM Journal Volume 8 Issue 1 September 2015
Ina study on privacy and Facebook users (Acquisti & Gross, 2006), it was observed that people with profi les on Facebook had more prominent concerns than the persons who did not have Facebook profi le for the strangers knowing where they lived and their class schedules. The perceived lack of privacy in SNSs can create a concern in users and thus may lead to discontinuance of SNSs (Rauniar et al., 2013).The recent news of exposure of Facebook data of 6 million users to unauthorised users (Shih, 2013) has reinforced the privacy concern among the SNSs users. Such incidents my negatively impact the intention to continue the use of SNSs. Thus, this study posits:
H7: Privacy concerns negatively infl uence the SNSs continuance intention.
Method
Parti cipants
The survey instrument was administered on postgraduate and research students in a central University. The survey was conducted in both online and offl ine mode. For the purpose of online collection of data, a link to the survey instrument was sent to participants on Facebook.
Overall, the data were collected from 150 students. The sample included 91 (60.67%) male and 59 (39.33%) female students.
Measures
The measures for the variables were adapted from previous studies. All the items were measured on fi ve-point Likert scale. The three item scale for attitude, two-item scale for subjective norm and three-item scale for
perceived behavioural control were taken from Al-Debei et al. (2013). The three item scale for privacy concerns was adapted from Xu et al. (2008). The three item scale for habit was adapted from Limayem & Cheung (2008). The three item scale for measuring continuance intention was adapted from Bhattacherjee (2001) and Shiau & Chau (2012). The two item formative scale to measure continued use of SNSs was adapted from Kang et al. (2013).
Results
For analysis, PLS-SEM was used. The reason for choosing PLS-SEM over CB-SEM is that it is easy to use with formative latent variable as well its robustness with the small sample size. PLS-SEM also does not demand the distributional assumptions (Rigdon et al., 2010). The analysis was conducted through SmartPLS 2.0 M3 (Ringle et al., 2005). Before testing the model, the data was checked for common method bias. Then, measurement model was examined, followed by structural model.
Common Method Bias
To check the presence of common method bias, Harman’s one factor test was conducted. In unrotated factor analysis 5 factors were generated. The fi rst factor accounted for approximately 35% of the variance. As no single factor emerged and no factor accounted for most of the variance, there is no common method bias in the data.
Measurement Model
The validity and reliability of measurement model were assessed through confi rmatory factor analysis (CFA). The construct validity was assessed by composite reliability
F-1, the proposed model
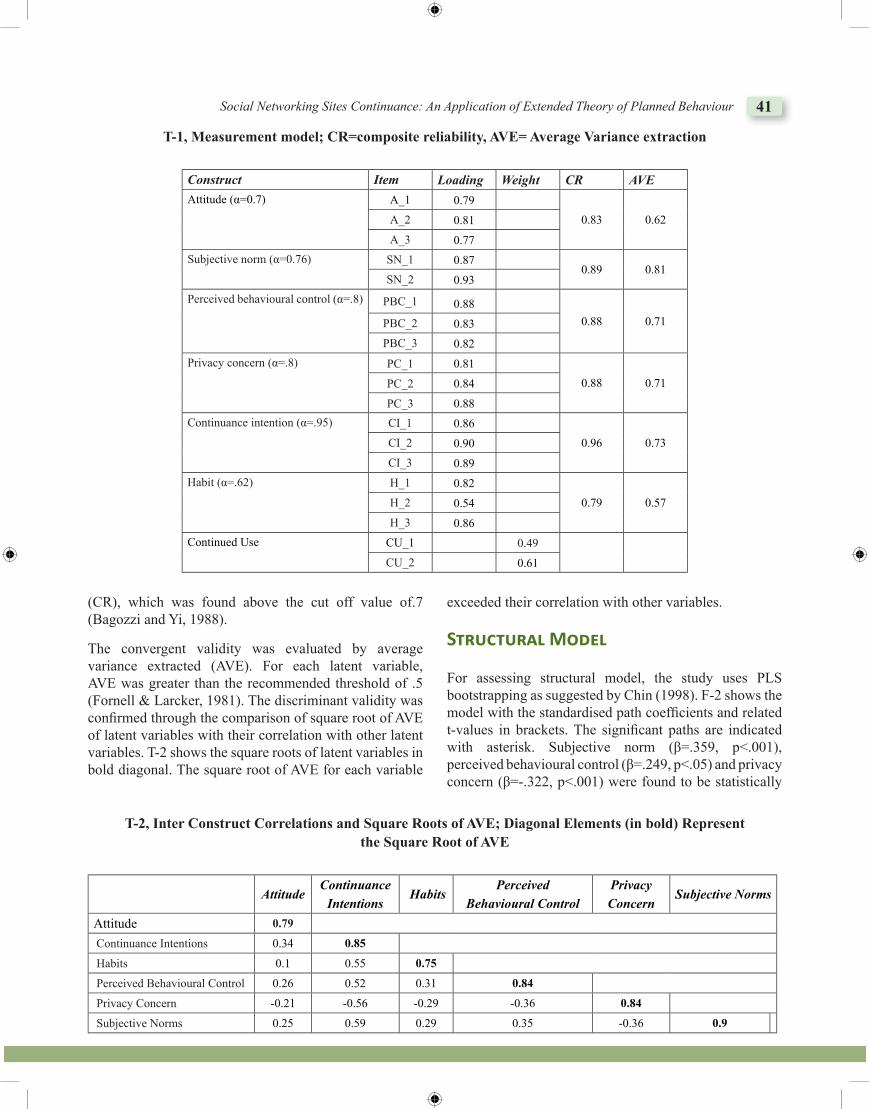
Social Networking Sites Continuance: An Application of Extended Theory of Planned Behaviour 41
(CR), which was found above the cut off value of.7 (Bagozzi and Yi, 1988).
The convergent validity was evaluated by average variance extracted (AVE). For each latent variable, AVE was greater than the recommended threshold of .5 (Fornell & Larcker, 1981). The discriminant validity was confi rmed through the comparison of square root of AVE of latent variables with their correlation with other latent variables. T-2 shows the square roots of latent variables in bold diagonal. The square root of AVE for each variable
exceeded their correlation with other variables.
Structural Model
For assessing structural model, the study uses PLS bootstrapping as suggested by Chin (1998). F-2 shows the model with the standardised path coeffi cients and related t-values in brackets. The signifi cant paths are indicated with asterisk. Subjective norm (β=.359, p<.001), perceived behavioural control (β=.249, p<.05) and privacy concern (β=-.322, p<.001) were found to be statistically
T-1, Measurement model; CR=composite reliability, AVE= Average Variance extraction
Construct Item Loading Weight CR AVEAttitude (α=0.7) A_1 0.79
0.83 0.62A_2 0.81A_3 0.77
Subjective norm (α=0.76) SN_1 0.870.89 0.81
SN_2 0.93Perceived behavioural control (α=.8) PBC_1 0.88
0.88 0.71PBC_2 0.83PBC_3 0.82
Privacy concern (α=.8) PC_1 0.810.88 0.71PC_2 0.84
PC_3 0.88Continuance intention (α=.95) CI_1 0.86
0.96 0.73CI_2 0.90CI_3 0.89
Habit (α=.62) H_1 0.820.79 0.57H_2 0.54
H_3 0.86Continued Use CU_1 0.49
CU_2 0.61
T-2, Inter Construct Correlations and Square Roots of AVE; Diagonal Elements (in bold) Representthe Square Root of AVE
AttitudeContinuance
Intentions Habits
Perceived Behavioural Control
Privacy Concern
Subjective Norms
Attitude 0.79
Continuance Intentions 0.34 0.85
Habits 0.1 0.55 0.75
Perceived Behavioural Control 0.26 0.52 0.31 0.84
Privacy Concern -0.21 -0.56 -0.29 -0.36 0.84
Subjective Norms 0.25 0.59 0.29 0.35 -0.36 0.9
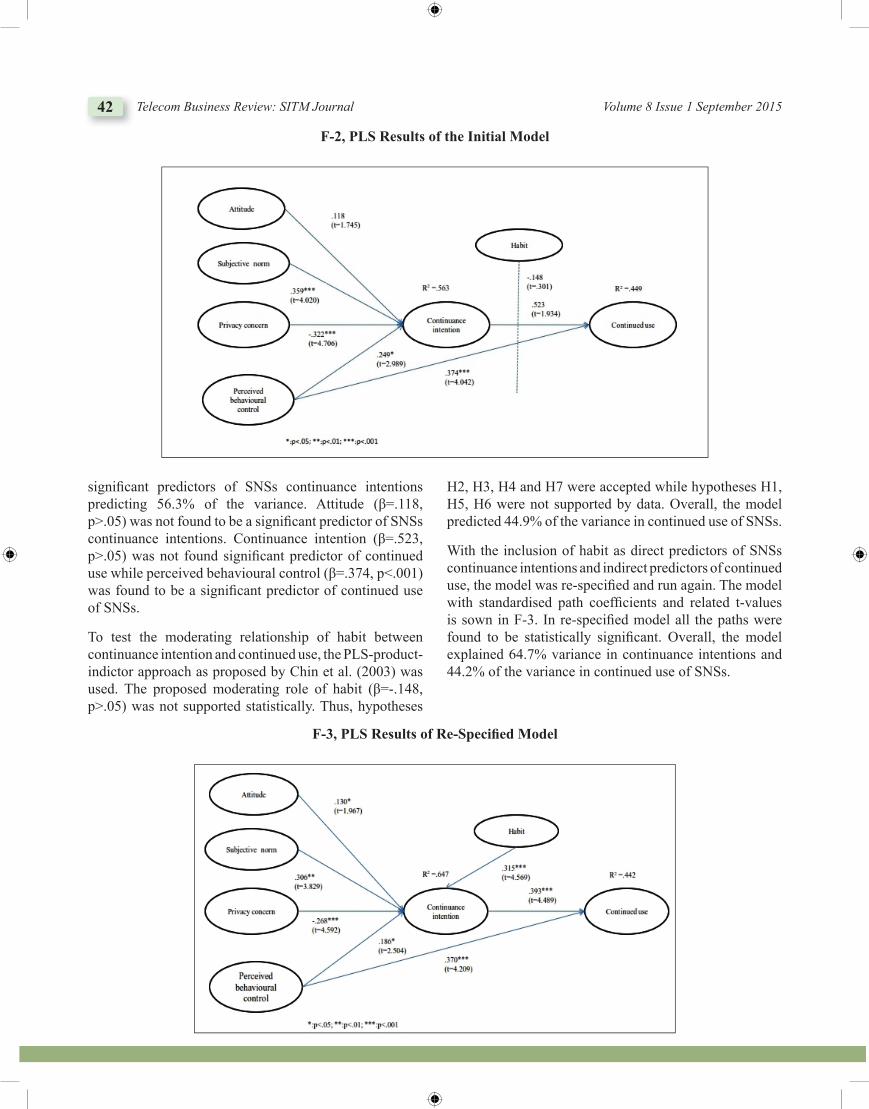
42 Telecom Business Review: SITM Journal Volume 8 Issue 1 September 2015
signifi cant predictors of SNSs continuance intentions predicting 56.3% of the variance. Attitude (β=.118, p>.05) was not found to be a signifi cant predictor of SNSs continuance intentions. Continuance intention (β=.523, p>.05) was not found signifi cant predictor of continued use while perceived behavioural control (β=.374, p<.001) was found to be a signifi cant predictor of continued use of SNSs.
To test the moderating relationship of habit between continuance intention and continued use, the PLS-product-indictor approach as proposed by Chin et al. (2003) was used. The proposed moderating role of habit (β=-.148, p>.05) was not supported statistically. Thus, hypotheses
H2, H3, H4 and H7 were accepted while hypotheses H1, H5, H6 were not supported by data. Overall, the model predicted 44.9% of the variance in continued use of SNSs.
With the inclusion of habit as direct predictors of SNSs continuance intentions and indirect predictors of continued use, the model was re-specifi ed and run again. The model with standardised path coeffi cients and related t-values is sown in F-3. In re-specifi ed model all the paths were found to be statistically signifi cant. Overall, the model explained 64.7% variance in continuance intentions and 44.2% of the variance in continued use of SNSs.
F-2, PLS Results of the Initial Model
F-3, PLS Results of Re-Specifi ed Model
Social Networking Sites Continuance: An Application of Extended Theory of Planned Behaviour 43
Discussion
The continued use of SNSs is necessary for their success (Chen, 2013). India is an emerging digital market, home to the world’s third largest base of Internet users and second largest in terms of Facebook users. Drawing upon the theory of planned behaviour, this study proposes and empirically tests a model to predict the continued use of SNSs in India. Along with elements of standard TPB, study includes two other elements that affect the continued use of SNSs: privacy concern and habit. The initial model hypothesised moderating role of habits between continuance intentions and continued use, which was not supported by the data. The re-specifi ed model that hypothesised direct impact of habit on continuance intention was tested. All the paths in re-specifi ed model were found to be signifi cant. The indirect relationship between continued use and habit through continuance intention reinforces the fi ndings of Wilson et al. (2010) and Barnes (2011). It seems that habits formed as a result of prior use of SNSs contribute to the conscious intentions to continue the use of SNSs. Privacy concern was found to be a negative factor in continued use of SNSs. The result is not surprising, as many studies (e.g. Ku et al., 2013) have demonstrated the similar fi ndings. The recent incidents of intrusion on the privacy of users have reinforced the concerns among the users. The basic hypotheses of TPB were also supported. As previous studies have shown the high predicting power of TPB in explaining the actual behaviour, the results are not surprising in the case of SNSs continuance.
Im�lications
The study contributes to the IS literature in Indian context. There is a dearth of literature on Indian culture that deals with the issue of use of IS. The study tries to fi ll this gap in literature by extending the theory of planned behaviour to Indian SNS context. The study provides valuable inputs for SNSs. The privacy concerns emerge a hurdle in continued uses of SNSs. SNSs have to address the issue of perceived privacy concern among users as a serious matter in policy formulation. On one hand, SNSs have to strengthen their privacy policy, on the other hand, they have to, make users more aware about their privacy policy and settings. More customisation ofand simplifi cation in privacy settings may be introduced. Habits play an important role in forming the intentions to continue the use of SNSs. SNSs in collaboration with internet service providers, may introduce inexpensive or free trial packages to engage new users and to develop a
habit among the users. Furthermore, SNSs have to make an effort to make a positive attitude among the users by promoting the positive outcomes of use. The multi-platform promotion through success stories may be used for the purpose.
Limitations and Further Direction
The study uses students as a sample. This limits the generalisation of the fi ndings. A further study with a more diversifi ed sample may be conducted to test the proposed model. The study uses Facebook as a proxy for SNS in the survey. SNSs differ in nature and features, thus Facebook may not represent other SNSs. The study uses self-reported measures for collecting data which may result in biased data. A further study with recording of actual usage may be carried out. Scope of including other social-psychological factors in the model can be considered by researcher in further study.
Re�erences
Acquisti, A., & Gross, R. (2006, January). Imagined com-munities: Awareness, information sharing, and privacy on the Facebook. In Privacy enhancing technologies(pp. 36-58). Springer Berlin Heidelberg.
Ajzen, I ,Fishbein, M. (1975). Belief, attitude, intention and behaviour: An introduction to theory and research.Reading, MA: Addison-Wesley
Ajzen, I, & Fishbein, M. (1980). Predicting and under-standing consumer behaviour: Attitude-behaviour cor-respondence. Understanding attitudes and predicting social behaviour, 148-172. Englanwood cliffs, NJ: Prentice-Hall
Ajzen, I. (1985). From intentions to actions: A theory of planned behaviour. J. Kuhl, & J. Beckman (Eds.), Action-control: From cognition to behaviour (pp. 11-39). Heidelberg: Springer
Ajzen, I. (1987). Attitudes, traits, and actions: Dispositional prediction of behaviour in personality and social psychology. In L. Berkowitz (Ed.). Advances in experimental social psychology, 20 (1), 1-63.New York: Academic Press
Ajzen, I. (1991). The theory of planned behavior. Organizational Behavior and Human Decision,50 (2),179-211 Retrieved from http://www.sciencedirect.com/science/article/pii/074959789190020T
Ajzen, I. (2001). Nature and operations of attitudes. Annual Review of Psychology,52.27-58
44 Telecom Business Review: SITM Journal Volume 8 Issue 1 September 2015
Ajzen, I. (2011). The theory of planned behaviour: re-actions and refl ections. Psychology & Health, 26(9), 1113–27. doi:10.1080/08870446.2011.613995
Ajzen, I., & Fishbein, M. (1977). Attitude-behavior re-lations: A theoretical analysis and review of empiri-cal research. Psychological Bulletin, 84 (5), 888–918. doi:10.1037//0033-2909.84.5.888
Al-Debei, M. M., Al-Lozi, E., & Papazafeiropoulou, A. (2013). Why people keep coming back to Facebook: Explaining and predicting continuance participation from an extended theory of planned behaviour per-spective. Decision Support Systems, 55 (1), 43–54. doi:10.1016/j.dss.2012.12.032
Anwar, J. (2014, June 30). Google says tchau Orkut, will shut down social network on September 30. The times of India. Retrieved from http://timesofi ndia.indiatimes.com/tech/tech-news/Google-says-tchau-Orkut-will-shut-down-social-network-on-September-30/article-show/37534749.cms
Baek, Y. M., Kim, E., & Bae, Y. (2014). My privacy is okay, but theirs is endangered: Why comparative op-timism matters in online privacy concerns. Computers in Human Behavior, 31, 48-56. doi:10.1016/j.chb.2013.10.010
Bagozzi, R. P., & Yi, Y. (1988). On the evaluation of structural equation models. Journal of the academy of marketing science, 16 (1), 74-94.
Baker, E. W., Al-Gahtani, S. S., & Hubona, G. S. (2007). The effects of gender and age on new tech-nology implementation in a developing coun-try: Testing the theory of planned behavior (TPB). Information Technology & People, 20 (4), 352-375. doi:10.1108/09593840710839798
Barnes, S. J. (2011). Understanding use continuance in virtual worlds: Empirical test of a research mod-el. Information & Management, 48 (8), 313-319. doi:10.1016/j.im.2011.08.004
Beck, L., & Ajzen, I. (1991). Predicting dishon-est actions using the theory of planned behavior. Journal of Research in Personality, 25 (3), 285–301. doi:10.1016/0092-6566 (91) 90021-H
Bhattacherjee, A. (2001). An empirical analysis of the antecedents of electronic commerce service continu-ance. Decision support systems, 32 (2), 201-214.
Cameron, R., Ginsburg, H., Westhoff, M., & Mendez, R. V. (2012). Ajzen’s theory of planned behaviour and so-cial media use by college students. American Journal of Psychological research,8 (1),1-20
Chan, D. C. N., Wu, A. M. S., & Hung, E. P. W. (2010). Invulnerability and the intention to drink and drive:
an application of the theory of planned behavior. Accident; Analysis and Prevention, 42 (6), 1549–55. doi:10.1016/j.aap.2010.03.011
Chen, R. (2013). Living a private life in public social networks: An exploration of member self-disclo-sure. Decision Support Systems, 55 (3), 661-668.
Chin, W. W., Marcolin, B. L., & Newsted, P. R. (2003). A partial least squares latent variable modeling approach for measuring interaction effects: Results from a Monte Carlo simulation study and an electronic-mail emotion/adoption study. Information systems research, 14 (2), 189-217.
Chin, W.W. (1998). Commentary: issues and opinion on structural equation modelling. MIS Quarterly. 22 (1).7-16
Courneya, K. S., & Friedenreich, C. M. (1999). Utility of the theory of planned behavior for understand-ing exercise during breast cancer treatment. Psycho-oncology, 8 (2), 112-122.
Cunningham, G. B., & Kwon, H. (2003). The Theory of Planned Behaviour and Intentions to Attend a Sport Event. Sport Management Review, 6 (2), 127-145. doi:10.1016/S1441-3523 (03) 70056-4
Darvell, M. J., Walsh, S. P., & White, K. M. (2011). Facebook tells me so: applying the theory of planned behaviour to understand partner-monitoring behav-ior on Facebook. Cyberpsychology, Behavior and Social Networking, 14 (12), 717-22. doi:10.1089/cyber.2011.0035
Fornell, C., & Larcker, D.F. (1981). Evaluating struc-tural equation models with unobservable variables and measurement error. Journal of Marketing research.18 (1).39-50
Hsu, C.-L., Yu, C.-C., & Wu, C.-C. (2013). Exploring the continuance intention of social networking websites: an empirical research. Information Systems and E-Business Management. doi:10.1007/s10257-013-0214-3
Hsu, M.-H., Yen, C.-H., Chiu, C.-M., & Chang, C.-M. (2006). A longitudinal investigation of continued on-line shopping behavior: An extension of the theory of planned behavior. International Journal of Human-Computer Studies, 64 (9), 889–904. doi:10.1016/j.ijhcs.2006.04.004
Islam, A. K. M., & Mäntymäki, M. (2012). Continuance of Professional Social Networking Sites: A Decomposed Expectation-Confi rmation Approach. Paper pre-sented at the Thirty Second International Conference on Information Systems. Shanghai. Retrieved from http://aisel.aisnet.org/icis2012/proceedings/DigitalNetworks/5/
Social Networking Sites Continuance: An Application of Extended Theory of Planned Behaviour 45
Johnson, S. E., & Hall, A. (2005). The prediction of safe lifting behavior: an application of the theory of planned behavior. Journal of Safety Research, 36 (1), 63-73. doi:10.1016/j.jsr.2004.12.004
Kang, Y. S., Min, J., Kim, J., & Lee, H. (2013). Roles of alternative and self-oriented perspectives in the context of the continued use of social network sites. International Journal of Information Management, 33 (3), 496–511. doi:10.1016/j.ijinfomgt.2012.12.004
Kefi , H., Mlaiki, A., & Kalika, M. (2010). Shy people and Facebook continuance of usage: does gender matters? Proceedings of the sixteenth American Conference of Information Systems. Lima, Peru: AIS electronic Library
Kim, B. (2011). Understanding antecedents of con-tinuance intention in social-networking services. Cyberpsychology, Behavior and Social Networking, 14 (4), 199–205. doi:10.1089/cyber.2010.0009
Ko, H.-C. (2013). The determinants of continuous use of social networking sites: An empirical study on Taiwanese journal-type bloggers’ continuous self-disclosure behavior. Electronic Commerce Research and Applications, 12 (2), 103-111. doi:10.1016/j.elerap.2012.11.002
Ku, Y.-C., Chen, R., & Zhang, H. (2013). Why do us-ers continue using social networking sites? An ex-ploratory study of members in the United States and Taiwan. Information & Management, 50 (7), 571-581. doi:10.1016/j.im.2013.07.011
Lee, W.-K. (2014). The temporal relationships among habit, intention and IS uses. Computers in Human Behavior, 32, 54-60. doi:10.1016/j.chb.2013.11.010
Liao, C., Chen, J.-L., & Yen, D. C. (2007). Theory of planning behavior (TPB) and customer satisfaction in the continued use of e-service: An integrated model. Computers in Human Behavior, 23 (6), 2804-2822. doi:10.1016/j.chb.2006.05.006
Limayem, M., & Cheung, C. M. K. (2008). Understanding information systems continuance: The case of Internet-based learning technologies. Information & Management, 45 (4), 227–232. doi:10.1016/j.im.2008.02.005
Limayem,M., Hirt, S. G., & Cheung, C. M. K. (2007). How habit limits the predictive power of intention: The case of information systems continuance. MIS Quarterly, 31 (4),705-737.
Lin, J., Chan, H. C., & Wei, K. K. (2006). Understanding competing application usage with the theory of planned behavior. Journal of the American Society
for Information Science and Technology, 57 (10), 1338-1349.
Lynne, G. D., Franklin Casey, C., Hodges, A., & Rahmani, M. (1995). Conservation technology adoption deci-sions and the theory of planned behavior.Journal of economic psychology, 16 (4), 581-598.
McEachan, R. R. C., Conner, M., Taylor, N. J., & Lawton, R. J. (2011). Prospective prediction of health-related behaviours with the theory of planned behaviour: A me-ta-analysis. Health Psychology Review, 5 (2), 97-144.
Miesen, H. W. J. M. (2003). Predicting and explaining lit-erary reading. Poetics, 31 (3-4), 189-212. doi:10.1016/S0304-422X (03) 00030-5
Morris, M. G., Venkatesh, V., & Ackerman, P. L. (2005). Gender and Age Differences in Employee Decisions About New Technology: An Extension to the Theory of Planned Behavior. IEEE Transactions on Engineering Management, 52 (1), 69-84. doi:10.1109/TEM.2004.839967
Nayak, V. ( 2014, January 7). 92 Million users make India the second largest country (study). Retrieved from http://www.dazeinfo.com/2014/01/07/facebook-inc-fb-india-demographic-users-2014/
O’Connor, R. C., & Armitage, C. J. (2003). Theory of planned behaviour and parasuicide: An explor-atory study. Current Psychology, 22 (3), 196-205. doi:10.1007/s12144-003-1016-4
Ozer,G., & Yilmaz,E. (2011). Comparison of the theory of reasoned action and the theory of planned behaviour : an application on accountants’ information technol-ogy usage. African Journal of Business Management, 5 (1), 50-58
Pavlou, P. A., & Fygenson, M. (2006). Understanding and predicting electronic commerce adoption: an exten-sion of the theory of planned behavior. MIS quarterly, 115-143.
Pelling, E. L., & White, K. M. (2009). The theory of planned behavior applied to young people’s use of social networking web sites. CyberPsychology & Behavior, 12 (6), 755-759.
Rauniar, R., Rawski, G., Johnson, B., & Yang, J. (2013). Social media user satisfaction-theory development and research fi ndings. Journal of Internet Commerce. 12 (2).195-224
Rigdon, E.E., Ringle, C.M., & Sarstedt, M. (2010). Structural modelling of heterogeneous data with partial least squares. In N.K. Malhotra (Ed.), Review of mar-keting research, (Vol.-7). (pp.255-296) . Armonk, NY: M.E. Sharpe
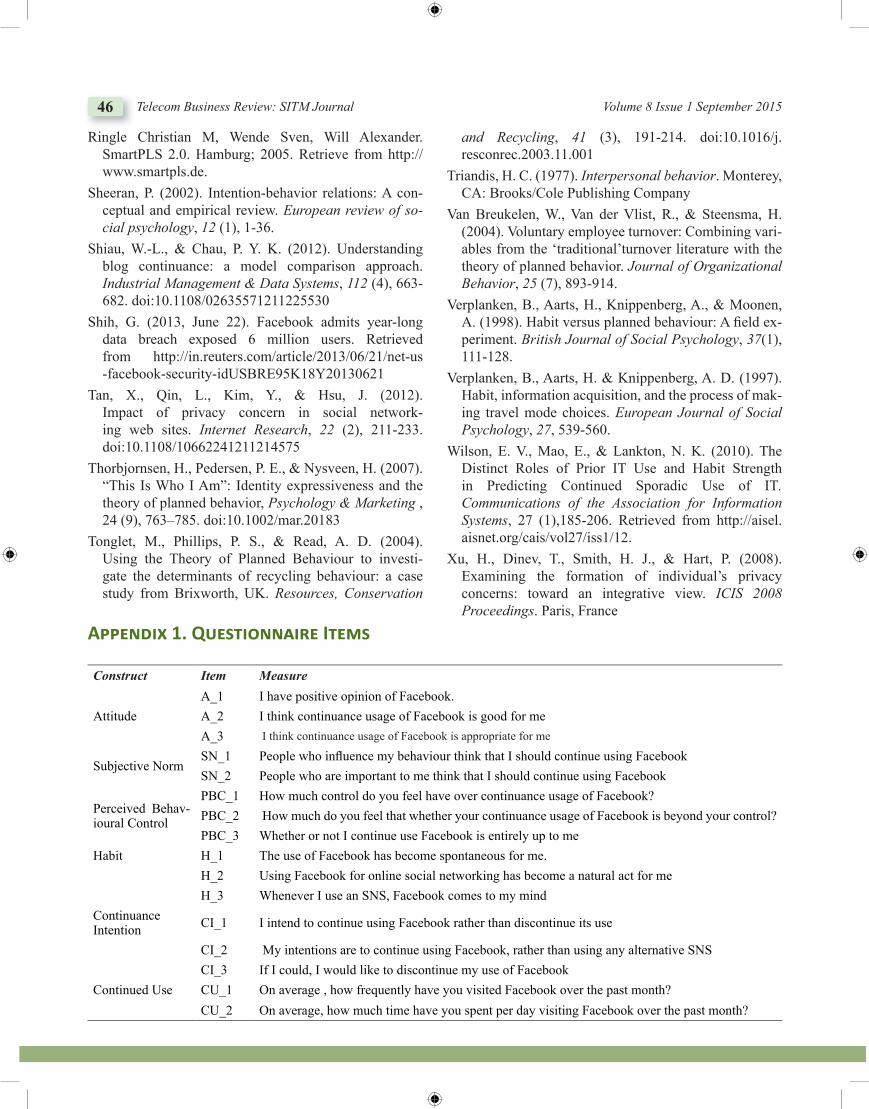
46 Telecom Business Review: SITM Journal Volume 8 Issue 1 September 2015
Ringle Christian M, Wende Sven, Will Alexander. SmartPLS 2.0. Hamburg; 2005. Retrieve from http://www.smartpls.de.
Sheeran, P. (2002). Intention-behavior relations: A con-ceptual and empirical review. European review of so-cial psychology, 12 (1), 1-36.
Shiau, W.-L., & Chau, P. Y. K. (2012). Understanding blog continuance: a model comparison approach. Industrial Management & Data Systems, 112 (4), 663-682. doi:10.1108/02635571211225530
Shih, G. (2013, June 22). Facebook admits year-long data breach exposed 6 million users. Retrieved from http://in.reuters.com/article/2013/06/21/net-us -facebook-security-idUSBRE95K18Y20130621
Tan, X., Qin, L., Kim, Y., & Hsu, J. (2012). Impact of privacy concern in social network-ing web sites. Internet Research, 22 (2), 211-233. doi:10.1108/10662241211214575
Thorbjornsen, H., Pedersen, P. E., & Nysveen, H. (2007). “This Is Who I Am”: Identity expressiveness and the theory of planned behavior, Psychology & Marketing , 24 (9), 763–785. doi:10.1002/mar.20183
Tonglet, M., Phillips, P. S., & Read, A. D. (2004). Using the Theory of Planned Behaviour to investi-gate the determinants of recycling behaviour: a case study from Brixworth, UK. Resources, Conservation
and Recycling, 41 (3), 191-214. doi:10.1016/j.resconrec.2003.11.001
Triandis, H. C. (1977). Interpersonal behavior. Monterey, CA: Brooks/Cole Publishing Company
Van Breukelen, W., Van der Vlist, R., & Steensma, H. (2004). Voluntary employee turnover: Combining vari-ables from the ‘traditional’turnover literature with the theory of planned behavior. Journal of Organizational Behavior, 25 (7), 893-914.
Verplanken, B., Aarts, H., Knippenberg, A., & Moonen, A. (1998). Habit versus planned behaviour: A fi eld ex-periment. British Journal of Social Psychology, 37(1), 111-128.
Verplanken, B., Aarts, H. & Knippenberg, A. D. (1997). Habit, information acquisition, and the process of mak-ing travel mode choices. European Journal of Social Psychology, 27, 539-560.
Wilson, E. V., Mao, E., & Lankton, N. K. (2010). The Distinct Roles of Prior IT Use and Habit Strength in Predicting Continued Sporadic Use of IT. Communications of the Association for Information Systems, 27 (1),185-206. Retrieved from http://aisel.aisnet.org/cais/vol27/iss1/12.
Xu, H., Dinev, T., Smith, H. J., & Hart, P. (2008). Examining the formation of individual’s privacy concerns: toward an integrative view. ICIS 2008 Proceedings. Paris, France
A��endi� 1. Questionnaire Items
Construct Item Measure
AttitudeA_1 I have positive opinion of Facebook.A_2 I think continuance usage of Facebook is good for meA_3 I think continuance usage of Facebook is appropriate for me
Subjective NormSN_1 People who infl uence my behaviour think that I should continue using FacebookSN_2 People who are important to me think that I should continue using Facebook
Perceived Behav-ioural Control
PBC_1 How much control do you feel have over continuance usage of Facebook?PBC_2 How much do you feel that whether your continuance usage of Facebook is beyond your control?PBC_3 Whether or not I continue use Facebook is entirely up to me
Habit H_1 The use of Facebook has become spontaneous for me.H_2 Using Facebook for online social networking has become a natural act for meH_3 Whenever I use an SNS, Facebook comes to my mind
ContinuanceIntention CI_1 I intend to continue using Facebook rather than discontinue its use
CI_2 My intentions are to continue using Facebook, rather than using any alternative SNSCI_3 If I could, I would like to discontinue my use of Facebook
Continued Use CU_1 On average , how frequently have you visited Facebook over the past month?CU_2 On average, how much time have you spent per day visiting Facebook over the past month?

Social Networking Sites Continuance: An Application of Extended Theory of Planned Behaviour 47
Brie� Bio o� Author/s:
Himanshu Rajput is research fellow in School of Business & Management Studies, Central University of Himachal Pradesh. He has done his Master in Business Administration from H.N.B. Garhwal University, Srinagar, Uttrakhand. H e is currently working on socio-psychological aspects of social media usage. His research interests are consumer behaviour, online marketing, and social media studies.
Abstract
The Indian Mobile Services Industry is going through a paradigm shift in terms of their business model-moving away from a “Voice centric” business to a “Data focused” business. Mobile Operators are looking at new and innovative avenues to increase the data penetration or the contribution of non-voice revenue (currently hovering around 11%) with respect to their overall service revenue.A similar paradigm shift is also being witnessed in the manner in which communication and social interaction happens-with Social Media emerging as a front runner when compared to hitherto popular communication mediums: email and instant messaging service. The immense popularity of social media has attracted advertisers and enterprise users to effectively engage their prospective as well as existing customers using social media. In emerging markets like India, Social Media has been used for customer engagement and monetization. Every day innovation in the mobile social media space is defining a win-win monetizing model for all the players in the value chain-device manufacturers, technology providers, telecom operators, and social media players. Operators are recognizing the need to investigate the subscriber behavior and aspirations relating to Mobile based Social Media. The extra-large investments in next generation high-bandwidth technologies like 3G & Broadband Wireless Access (BWA) will provide the required momentum to the mobile operators as subscribers resort to user generated content over social media. The paper analyzes the subscriber behavior to ascertain the avenues for customer engagement and monetization using this channel.
Keywords: Mobile Social Media, Social Media Monetization, Mobile Subscriber Engagement Using Social Media
Analyzing the Indian Subscriber Behavior Towards Mobile Social Media - A Data Monetization &
Customer Engagement PerspectiveSohag Sarkar*
*Research Scholar, Pacific University, Mumbai, Maharashtra, India. E-mail: [email protected]
Introduction
The hype and hoopla around social media and the disruption of the socializing framework has made the Mobile Industry awestruck. Global cues are indicative of the fact that the web based social revolution will transcend into the next generation mobile based model and the Indian online users have already gone head-over-heels to rewrite history in this space. As Indian Telcos struggle to increase the share of non-voice or data revenue; an effective social media monetization strategy might work to their advantage.
Paradigm Shift in Communication
The popularity and growth of social media has impacted popular communication media like Email and Instant Messaging Service (IM). By 2011, Social Media has emerged as the preferred communication medium
amongst the online users; in the process by uprooting Email from the number one position.
Like we witnessed in the past, that with the increasing popularity of emails, the username to register or sign-in to a new site transitioned from a generic user name to the email id of the user. Similar transition is now being seen with the present day online users who are using their social media username and password to register or login to new (and existing) sites and Apps. The key driver for this phenomenon has been the increase in mobile based social media sites or apps which has been resulted due to the growth of mobile Internet penetration.
Another paradigm shift which is being observed globally amongst the online user community is the preference for mobile devices like Smart Phones, Tablet PCs or gaming consoles as opposed to hitherto popular conventionally Desktops or Laptops. The easy and convenience provided by these mobile devices has enabled the present-day
Article can be accessed online at http://www.publishingindia.com
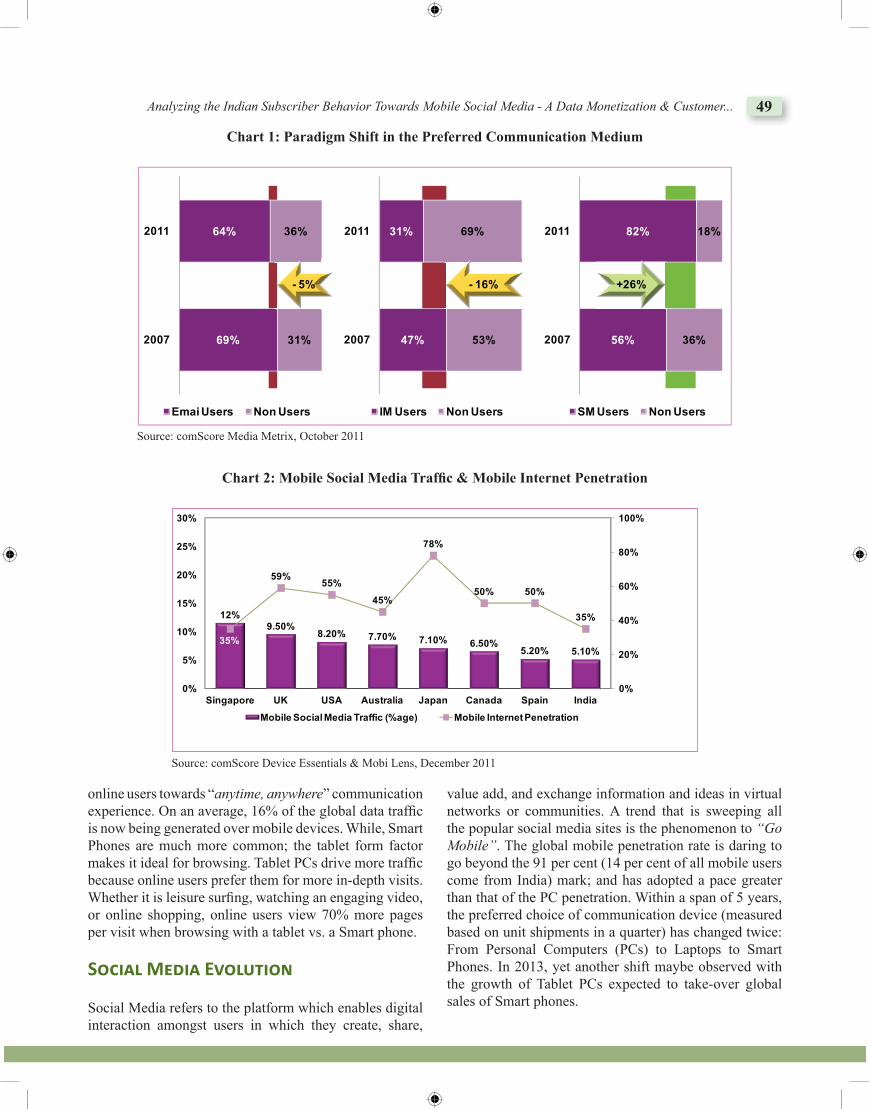
Analyzing the Indian Subscriber Behavior Towards Mobile Social Media - A Data Monetization & Customer... 49
online users towards “anytime, anywhere” communication experience. On an average, 16% of the global data traffi c is now being generated over mobile devices. While, Smart Phones are much more common; the tablet form factor makes it ideal for browsing. Tablet PCs drive more traffi c because online users prefer them for more in-depth visits. Whether it is leisure surfi ng, watching an engaging video, or online shopping, online users view 70% more pages per visit when browsing with a tablet vs. a Smart phone.
Socia� M�dia E�o�ution
Social Media refers to the platform which enables digital interaction amongst users in which they create, share,
value add, and exchange information and ideas in virtual networks or communities. A trend that is sweeping all the popular social media sites is the phenomenon to “Go Mobile”. The global mobile penetration rate is daring to go beyond the 91 per cent (14 per cent of all mobile users come from India) mark; and has adopted a pace greater than that of the PC penetration. Within a span of 5 years, the preferred choice of communication device (measured based on unit shipments in a quarter) has changed twice: From Personal Computers (PCs) to Laptops to Smart Phones. In 2013, yet another shift maybe observed with the growth of Tablet PCs expected to take-over global sales of Smart phones.
Chart 1: Paradigm Shift in the Preferred Communication Medium
69%
64%
31%
36%
2007
2011
Emai Users Non Users
47%
31%
53%
69%
2007
2011
IM Users Non Users
56%
82%
36%
18%
2007
2011
SM Users Non Users
- 5% - 16% +26%
Source: comScore Media Metrix, October 2011
Chart 2: Mobile Social Media Traffi c & Mobile Internet Penetration
12%9.50%
8.20% 7.70% 7.10% 6.50%5.20% 5.10%
35%
59%55%
45%
78%
50% 50%
35%
0%
20%
40%
60%
80%
100%
0%
5%
10%
15%
20%
25%
30%
Singapore UK USA Australia Japan Canada Spain India
Mobile Social Media Traffic (%age) Mobile Internet Penetration
Source: comScore Device Essentials & Mobi Lens, December 2011
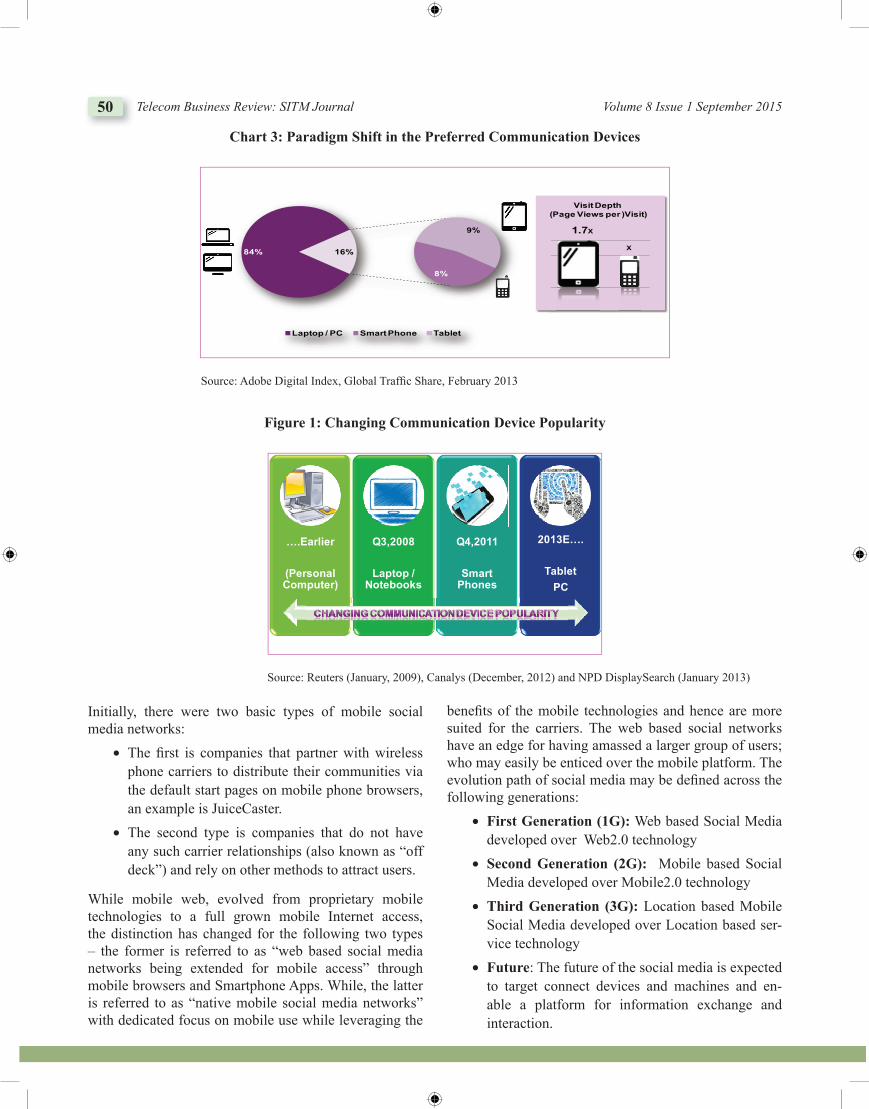
50 Telecom Business Review: SITM Journal Volume 8 Issue 1 September 2015
Initially, there were two basic types of mobile social media networks:
∑ The fi rst is companies that partner with wireless phone carriers to distribute their communities via the default start pages on mobile phone browsers, an example is JuiceCaster.
∑ The second type is companies that do not have any such carrier relationships (also known as “off deck”) and rely on other methods to attract users.
While mobile web, evolved from proprietary mobile technologies to a full grown mobile Internet access, the distinction has changed for the following two types – the former is referred to as “web based social media networks being extended for mobile access” through mobile browsers and Smartphone Apps. While, the latter is referred to as “native mobile social media networks” with dedicated focus on mobile use while leveraging the
benefi ts of the mobile technologies and hence are more suited for the carriers. The web based social networks have an edge for having amassed a larger group of users; who may easily be enticed over the mobile platform. The evolution path of social media may be defi ned across the following generations:
∑ First Generation (1G): Web based Social Media developed over Web2.0 technology
∑ Second Generation (2G): Mobile based Social Media developed over Mobile2.0 technology
∑ Third Generation (3G): Location based Mobile Social Media developed over Location based ser-vice technology
∑ Future: The future of the social media is expected to target connect devices and machines and en-able a platform for information exchange and interaction.
Chart 3: Paradigm Shift in the Preferred Communication Devices
84%
8%
9%
16%
Laptop / PC Smart Phone Tablet
X
1.7X
Visit Depth (Page Views per )Visit)
Source: Adobe Digital Index, Global Traffi c Share, February 2013
Figure 1: Changing Communication Device Popularity
….Earlier
(Personal Computer)
Q3,2008
Laptop / Notebooks
Q4,2011
Smart Phones
2013E….
Tablet
PC
Source: Reuters (January, 2009), Canalys (December, 2012) and NPD DisplaySearch (January 2013)
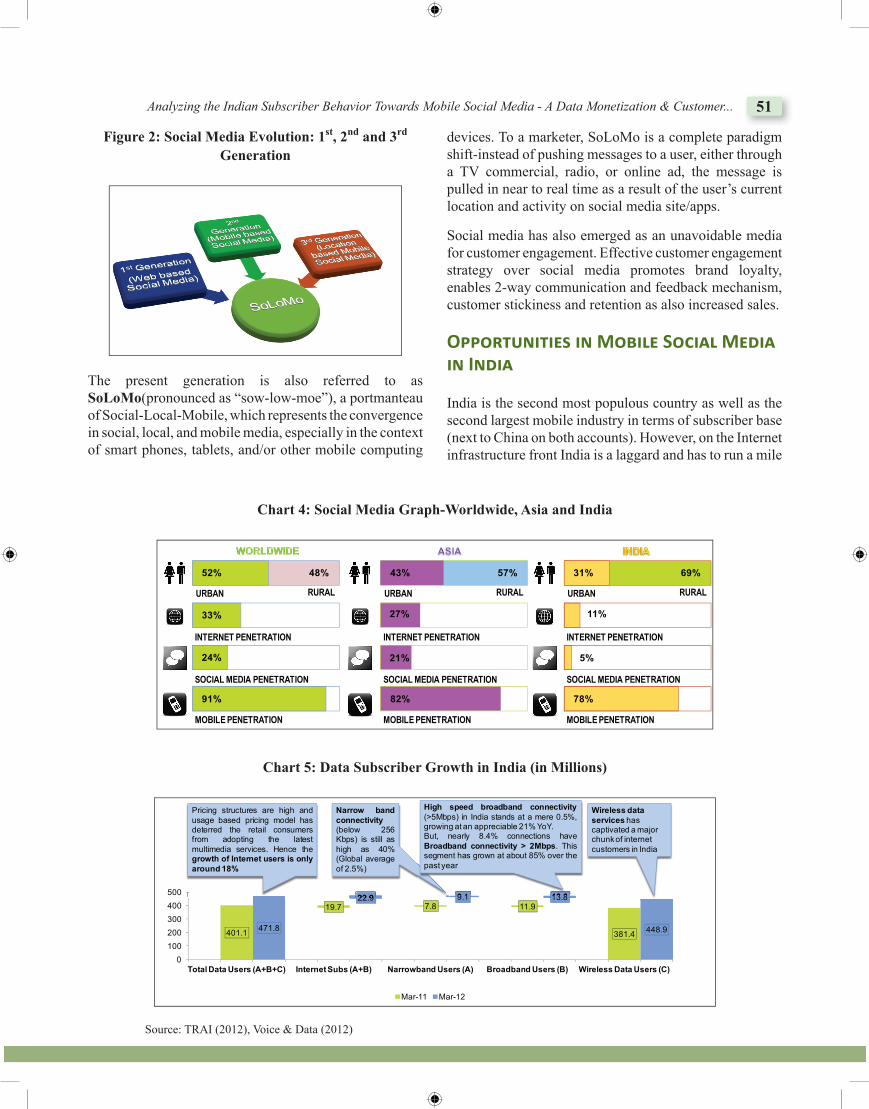
Analyzing the Indian Subscriber Behavior Towards Mobile Social Media - A Data Monetization & Customer... 51
Figure 2: Social Media Evolution: 1st, 2nd and 3rd Generation
The present generation is also referred to as SoLoMo(pronounced as “sow-low-moe”), a portmanteau of Social-Local-Mobile, which represents the convergence in social, local, and mobile media, especially in the context of smart phones, tablets, and/or other mobile computing
devices. To a marketer, SoLoMo is a complete paradigm shift-instead of pushing messages to a user, either through a TV commercial, radio, or online ad, the message is pulled in near to real time as a result of the user’s current location and activity on social media site/apps.
Social media has also emerged as an unavoidable media for customer engagement. Effective customer engagement strategy over social media promotes brand loyalty, enables 2-way communication and feedback mechanism, customer stickiness and retention as also increased sales.
O��ortuniti�� in Mo�i�� Socia� M�dia in India
India is the second most populous country as well as the second largest mobile industry in terms of subscriber base (next to China on both accounts). However, on the Internet infrastructure front India is a laggard and has to run a mile
Chart 4: Social Media Graph-Worldwide, Asia and India
48%52%
URBAN RURAL
33%
INTERNET PENETRATION
24%
SOCIAL MEDIA PENETRATION
91%
MOBILE PENETRATION
69%31%
URBAN RURAL
11%
INTERNET PENETRATION
5%
SOCIAL MEDIA PENETRATION
78%
MOBILE PENETRATION
57%43%
URBAN RURAL
27%
INTERNET PENETRATION
21%
SOCIAL MEDIA PENETRATION
82%
MOBILE PENETRATION
Chart 5: Data Subscriber Growth in India (in Millions)
401.1
19.7 7.8 11.9
381.4471.8
22.9 9.1 13.8
448.9
0100200300400500
Total Data Users (A+B+C) Internet Subs (A+B) Narrowband Users (A) Broadband Users (B) Wireless Data Users (C)
Mar-11 Mar-12
22.9
Narrow bandconnectivity(below 256Kbps) is still ashigh as 40%(Global averageof 2.5%)
Pricing structures are high andusage based pricing model hasdeterred the retail consumersfrom adopting the latestmultimedia services. Hence thegrowth of Internet users is onlyaround 18%
Wireless data services has captivated a major chunk of internet customers in India
9.1 13.8
High speed broadband connectivity(>5Mbps) in India stands at a mere 0.5%,growing at an appreciable 21% YoY.But, nearly 8.4% connections haveBroadband connectivity > 2Mbps. Thissegment has grown at about 85% over thepast year
Source: TRAI (2012), Voice & Data (2012)
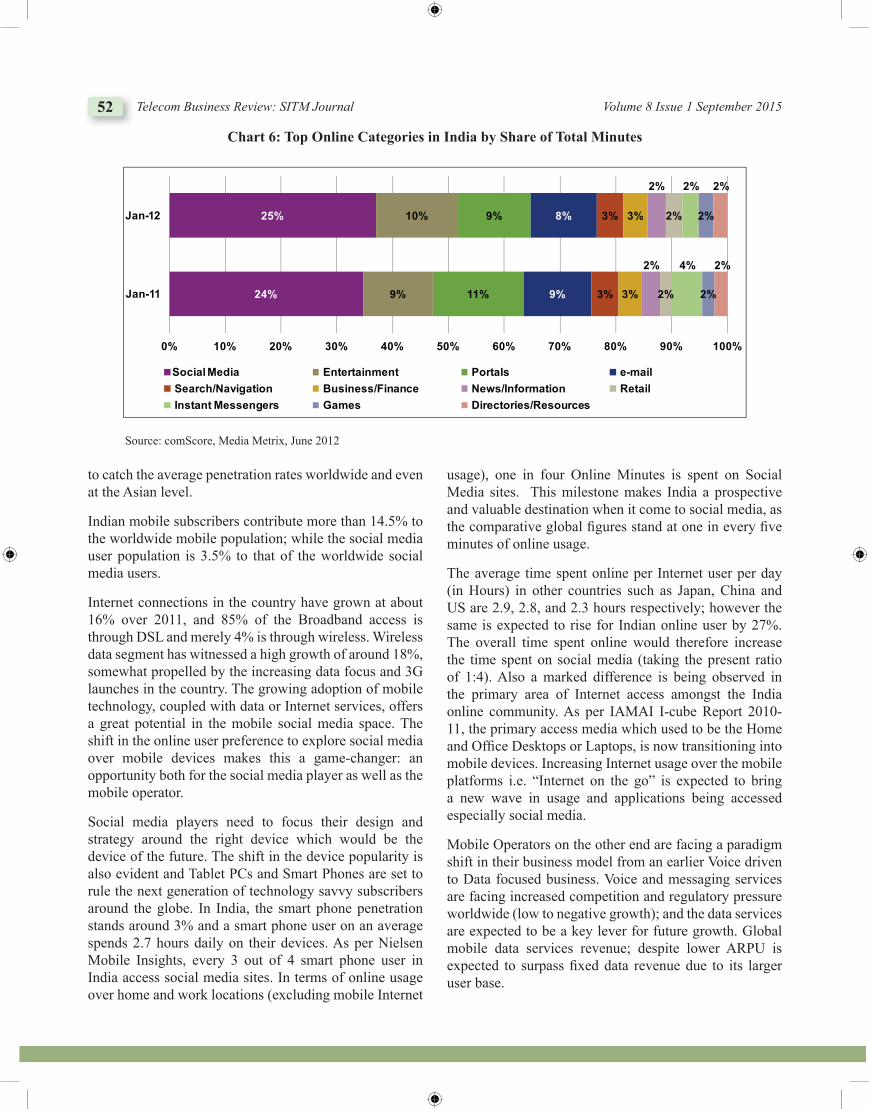
52 Telecom Business Review: SITM Journal Volume 8 Issue 1 September 2015
to catch the average penetration rates worldwide and even at the Asian level.
Indian mobile subscribers contribute more than 14.5% to the worldwide mobile population; while the social media user population is 3.5% to that of the worldwide social media users.
Internet connections in the country have grown at about 16% over 2011, and 85% of the Broadband access is through DSL and merely 4% is through wireless. Wireless data segment has witnessed a high growth of around 18%, somewhat propelled by the increasing data focus and 3G launches in the country. The growing adoption of mobile technology, coupled with data or Internet services, offers a great potential in the mobile social media space. The shift in the online user preference to explore social media over mobile devices makes this a game-changer: an opportunity both for the social media player as well as the mobile operator.
Social media players need to focus their design and strategy around the right device which would be the device of the future. The shift in the device popularity is also evident and Tablet PCs and Smart Phones are set to rule the next generation of technology savvy subscribers around the globe. In India, the smart phone penetration stands around 3% and a smart phone user on an average spends 2.7 hours daily on their devices. As per Nielsen Mobile Insights, every 3 out of 4 smart phone user in India access social media sites. In terms of online usage over home and work locations (excluding mobile Internet
usage), one in four Online Minutes is spent on Social Media sites. This milestone makes India a prospective and valuable destination when it come to social media, as the comparative global fi gures stand at one in every fi ve minutes of online usage.
The average time spent online per Internet user per day (in Hours) in other countries such as Japan, China and US are 2.9, 2.8, and 2.3 hours respectively; however the same is expected to rise for Indian online user by 27%. The overall time spent online would therefore increase the time spent on social media (taking the present ratio of 1:4). Also a marked difference is being observed in the primary area of Internet access amongst the India online community. As per IAMAI I-cube Report 2010-11, the primary access media which used to be the Home and Offi ce Desktops or Laptops, is now transitioning into mobile devices. Increasing Internet usage over the mobile platforms i.e. “Internet on the go” is expected to bring a new wave in usage and applications being accessed especially social media.
Mobile Operators on the other end are facing a paradigm shift in their business model from an earlier Voice driven to Data focused business. Voice and messaging services are facing increased competition and regulatory pressure worldwide (low to negative growth); and the data services are expected to be a key lever for future growth. Global mobile data services revenue; despite lower ARPU is expected to surpass fi xed data revenue due to its larger user base.
Chart 6: Top Online Categories in India by Share of Total Minutes
24%
25%
9%
10%
11%
9%
9%
8%
3%
3%
3%
3%
2%
2%
2%
2%
4%
2%
2%
2%
2%
2%
0% 10% 20% 30% 40% 50% 60% 70% 80% 90% 100%
Jan-11
Jan-12
Social Media Entertainment Portals e-mail
Search/Navigation Business/Finance News/Information Retail
Instant Messengers Games Directories/Resources
Source: comScore, Media Metrix, June 2012
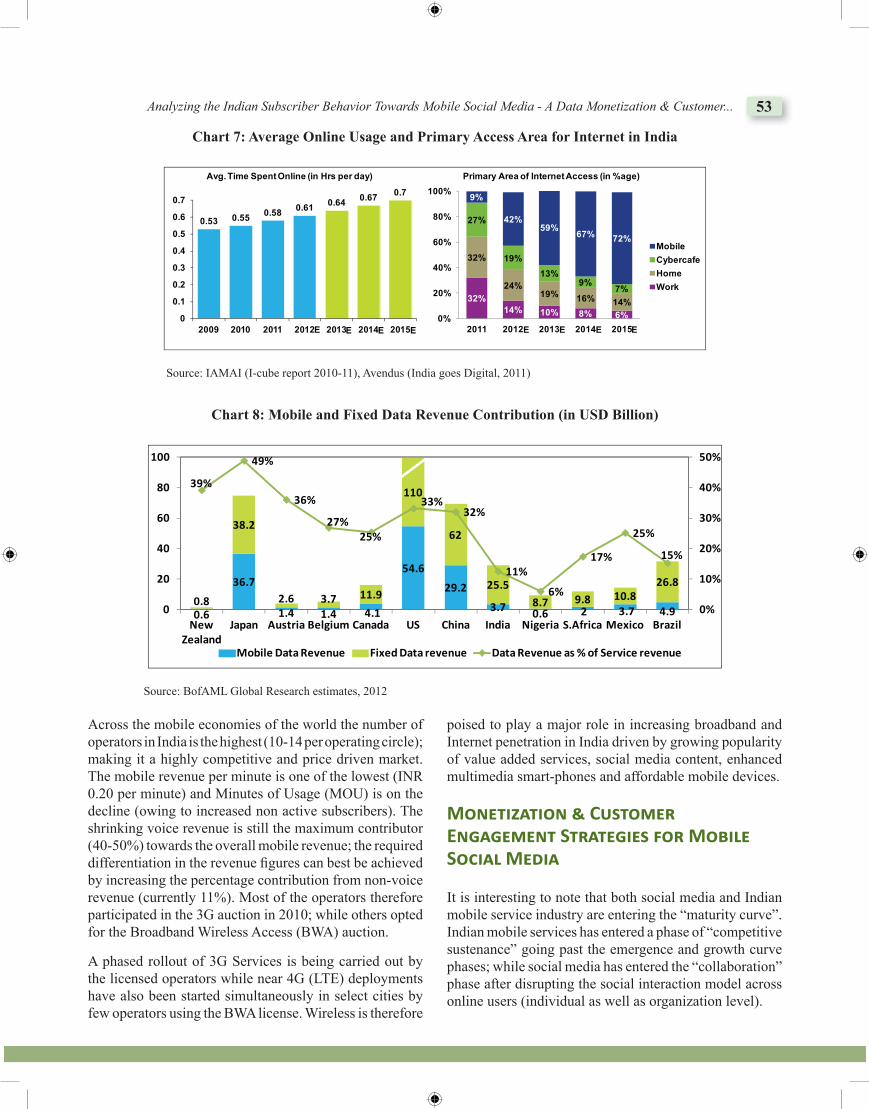
Analyzing the Indian Subscriber Behavior Towards Mobile Social Media - A Data Monetization & Customer... 53
Across the mobile economies of the world the number of operators in India is the highest (10-14 per operating circle); making it a highly competitive and price driven market. The mobile revenue per minute is one of the lowest (INR 0.20 per minute) and Minutes of Usage (MOU) is on the decline (owing to increased non active subscribers). The shrinking voice revenue is still the maximum contributor (40-50%) towards the overall mobile revenue; the required differentiation in the revenue fi gures can best be achieved by increasing the percentage contribution from non-voice revenue (currently 11%). Most of the operators therefore participated in the 3G auction in 2010; while others opted for the Broadband Wireless Access (BWA) auction.
A phased rollout of 3G Services is being carried out by the licensed operators while near 4G (LTE) deployments have also been started simultaneously in select cities by few operators using the BWA license. Wireless is therefore
poised to play a major role in increasing broadband and Internet penetration in India driven by growing popularity of value added services, social media content, enhanced multimedia smart-phones and affordable mobile devices.
Mon�ti�ation � Cu�tom�r Engag�m�nt Strat�gi�� for Mo�i�� Socia� M�dia
It is interesting to note that both social media and Indian mobile service industry are entering the “maturity curve”. Indian mobile services has entered a phase of “competitive sustenance” going past the emergence and growth curve phases; while social media has entered the “collaboration” phase after disrupting the social interaction model across online users (individual as well as organization level).
Chart 7: Average Online Usage and Primary Access Area for Internet in India
0.53 0.550.58
0.610.64
0.670.7
0
0.1
0.2
0.3
0.4
0.5
0.6
0.7
2009 2010 2011 2012 2013 2014 2015
32%14% 10% 8% 6%
32%
24%19% 16% 14%
27%
19%
13%9%
7%
9%
42%59%
67% 72%
0%
20%
40%
60%
80%
100%
2011 2012 2013 2014 2015
Mobile
Cybercafe
Home
Work
Avg. Time Spent Online (in Hrs per day) Primary Area of Internet Access (in %age)
E E E E E EE E
Source: IAMAI (I-cube report 2010-11), Avendus (India goes Digital, 2011)
Chart 8: Mobile and Fixed Data Revenue Contribution (in USD Billion)
0.6
36.7
1.4 1.4 4.1
54.6
29.2
3.7 0.6 2 3.7 4.90.8
38.2
2.6 3.7 11.9
110
62
25.5
8.7 9.8 10.826.8
39%
49%
36%
27%25%
33%32%
11%
6%
17%
25%
15%
0%
10%
20%
30%
40%
50%
0
20
40
60
80
100
New Zealand
Japan Austria Belgium Canada US China India Nigeria S.Africa Mexico Brazil
Mobile Data Revenue Fixed Data revenue Data Revenue as % of Service revenue
Source: BofAML Global Research estimates, 2012
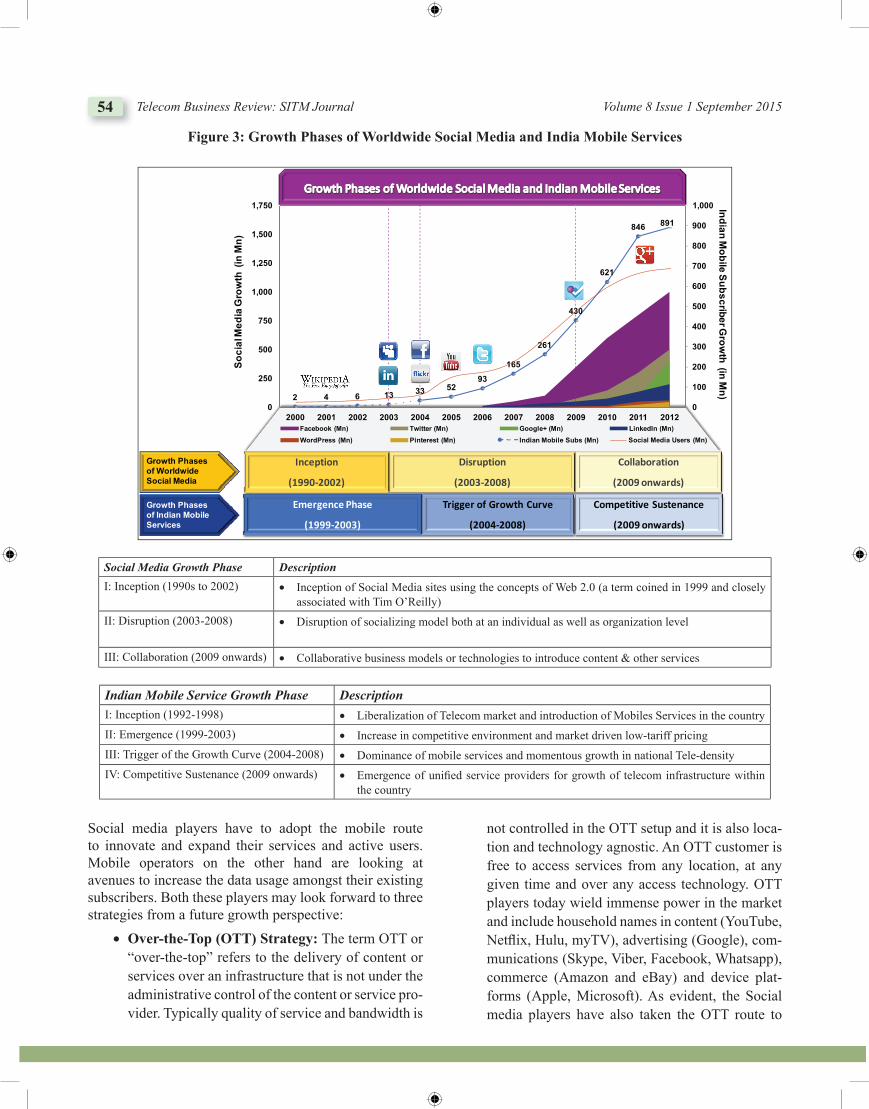
54 Telecom Business Review: SITM Journal Volume 8 Issue 1 September 2015
Social media players have to adopt the mobile route to innovate and expand their services and active users. Mobile operators on the other hand are looking at avenues to increase the data usage amongst their existing subscribers. Both these players may look forward to three strategies from a future growth perspective: ∑ Over-the-Top (OTT) Strategy: The term OTT or
“over-the-top” refers to the delivery of content or services over an infrastructure that is not under the administrative control of the content or service pro-vider. Typically quality of service and bandwidth is
not controlled in the OTT setup and it is also loca-tion and technology agnostic. An OTT customer is free to access services from any location, at any given time and over any access technology. OTT players today wield immense power in the market and include household names in content (YouTube, Netfl ix, Hulu, myTV), advertising (Google), com-munications (Skype, Viber, Facebook, Whatsapp), commerce (Amazon and eBay) and device plat-forms (Apple, Microsoft). As evident, the Social media players have also taken the OTT route to
Figure 3: Growth Phases of Worldwide Social Media and India Mobile Services
Growth Phases of Worldwide Social Media
Growth Phases of Indian Mobile Services
Inception
(1990-2002)
Disruption
(2003-2008)
Collaboration
(2009 onwards)
2 4 6 13 33 5293
165
261
430
621
846 891
0
100
200
300
400
500
600
700
800
900
1,000
0
250
500
750
1,000
1,250
1,500
1,750
2000 2001 2002 2003 2004 2005 2006 2007 2008 2009 2010 2011 2012Facebook (Mn) Twitter (Mn) Google+ (Mn) LinkedIn (Mn)
WordPress (Mn) Pinterest (Mn) Indian Mobile Subs (Mn)
Emergence Phase
(1999-2003)
Trigger of Growth Curve
(2004-2008)
Competitive Sustenance
(2009 onwards)
Social Media Users (Mn)
So
cia
l Me
dia
Gro
wth
(in
Mn
)
Ind
ian
Mo
bile
Su
bs
crib
er G
row
th (in
Mn
)
Social Media Growth Phase DescriptionI: Inception (1990s to 2002) ∑ Inception of Social Media sites using the concepts of Web 2.0 (a term coined in 1999 and closely
associated with Tim O’Reilly)II: Disruption (2003-2008) ∑ Disruption of socializing model both at an individual as well as organization level
III: Collaboration (2009 onwards) ∑ Collaborative business models or technologies to introduce content & other services
Indian Mobile Service Growth Phase DescriptionI: Inception (1992-1998) ∑ Liberalization of Telecom market and introduction of Mobiles Services in the countryII: Emergence (1999-2003) ∑ Increase in competitive environment and market driven low-tariff pricingIII: Trigger of the Growth Curve (2004-2008) ∑ Dominance of mobile services and momentous growth in national Tele-densityIV: Competitive Sustenance (2009 onwards) ∑ Emergence of unifi ed service providers for growth of telecom infrastructure within
the country
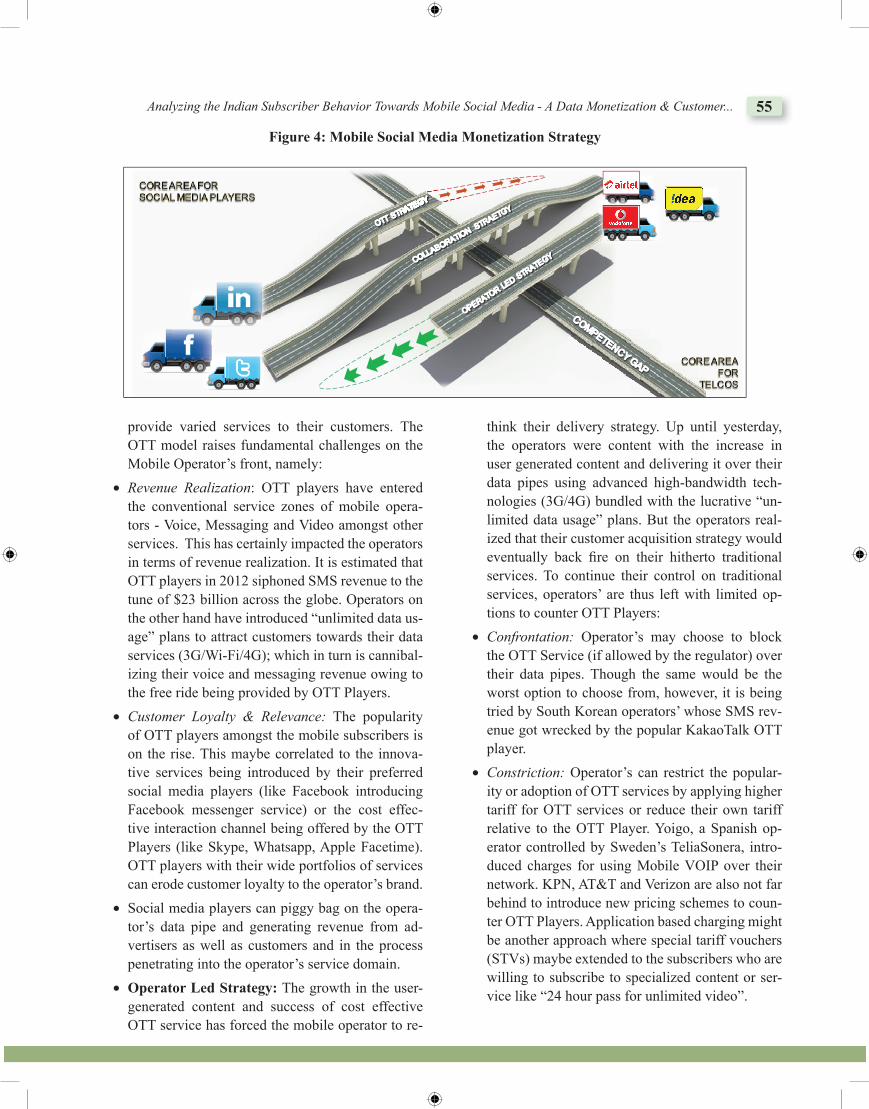
Analyzing the Indian Subscriber Behavior Towards Mobile Social Media - A Data Monetization & Customer... 55
provide varied services to their customers. The OTT model raises fundamental challenges on the Mobile Operator’s front, namely:
∑ Revenue Realization: OTT players have entered the conventional service zones of mobile opera-tors - Voice, Messaging and Video amongst other services. This has certainly impacted the operators in terms of revenue realization. It is estimated that OTT players in 2012 siphoned SMS revenue to the tune of $23 billion across the globe. Operators on the other hand have introduced “unlimited data us-age” plans to attract customers towards their data services (3G/Wi-Fi/4G); which in turn is cannibal-izing their voice and messaging revenue owing to the free ride being provided by OTT Players.
∑ Customer Loyalty & Relevance: The popularity of OTT players amongst the mobile subscribers is on the rise. This maybe correlated to the innova-tive services being introduced by their preferred social media players (like Facebook introducing Facebook messenger service) or the cost effec-tive interaction channel being offered by the OTT Players (like Skype, Whatsapp, Apple Facetime). OTT players with their wide portfolios of services can erode customer loyalty to the operator’s brand.
∑ Social media players can piggy bag on the opera-tor’s data pipe and generating revenue from ad-vertisers as well as customers and in the process penetrating into the operator’s service domain.
∑ Operator Led Strategy: The growth in the user-generated content and success of cost effective OTT service has forced the mobile operator to re-
think their delivery strategy. Up until yesterday, the operators were content with the increase in user generated content and delivering it over their data pipes using advanced high-bandwidth tech-nologies (3G/4G) bundled with the lucrative “un-limited data usage” plans. But the operators real-ized that their customer acquisition strategy would eventually back fi re on their hitherto traditional services. To continue their control on traditional services, operators’ are thus left with limited op-tions to counter OTT Players:
∑ Confrontation: Operator’s may choose to block the OTT Service (if allowed by the regulator) over their data pipes. Though the same would be the worst option to choose from, however, it is being tried by South Korean operators’ whose SMS rev-enue got wrecked by the popular KakaoTalk OTT player.
∑ Constriction: Operator’s can restrict the popular-ity or adoption of OTT services by applying higher tariff for OTT services or reduce their own tariff relative to the OTT Player. Yoigo, a Spanish op-erator controlled by Sweden’s TeliaSonera, intro-duced charges for using Mobile VOIP over their network. KPN, AT&T and Verizon are also not far behind to introduce new pricing schemes to coun-ter OTT Players. Application based charging might be another approach where special tariff vouchers (STVs) maybe extended to the subscribers who are willing to subscribe to specialized content or ser-vice like “24 hour pass for unlimited video”.
Figure 4: Mobile Social Media Monetization Strategy
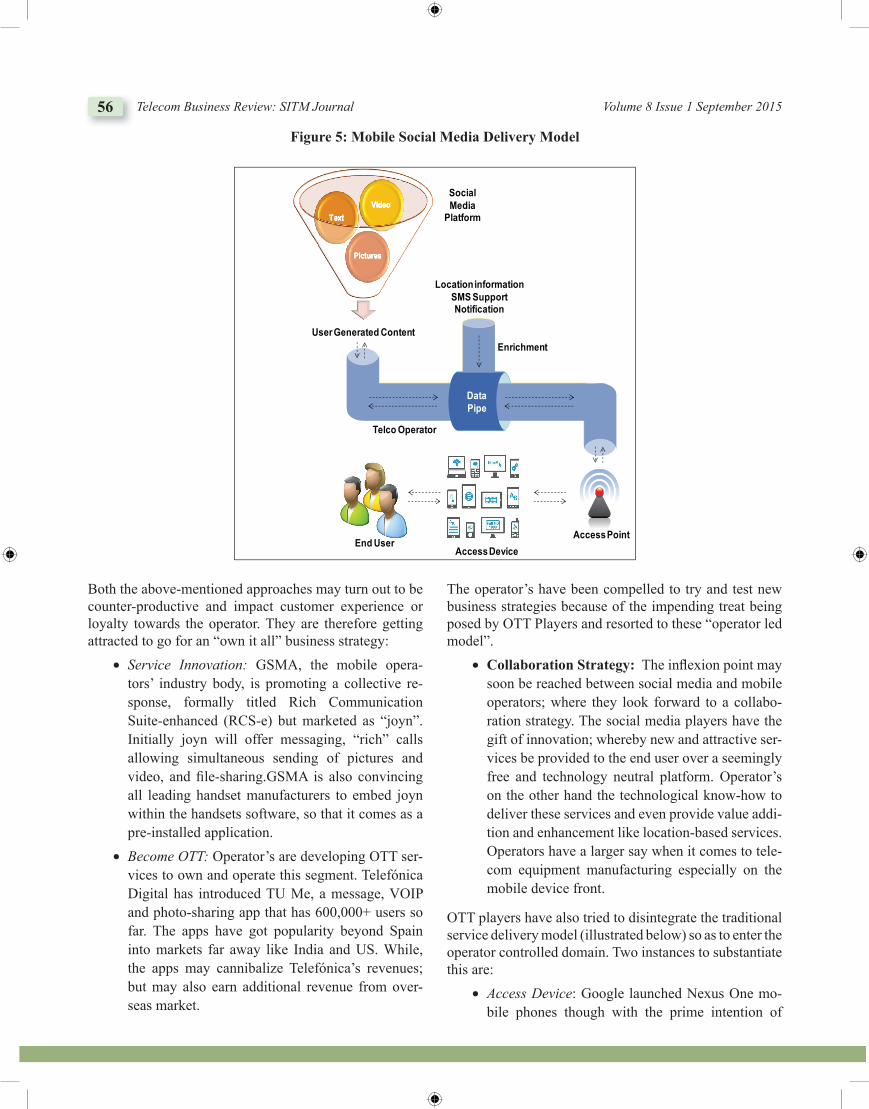
56 Telecom Business Review: SITM Journal Volume 8 Issue 1 September 2015
Both the above-mentioned approaches may turn out to be counter-productive and impact customer experience or loyalty towards the operator. They are therefore getting attracted to go for an “own it all” business strategy: ∑ Service Innovation: GSMA, the mobile opera-
tors’ industry body, is promoting a collective re-sponse, formally titled Rich Communication Suite-enhanced (RCS-e) but marketed as “joyn”. Initially joyn will offer messaging, “rich” calls allowing simultaneous sending of pictures and video, and fi le-sharing.GSMA is also convincing all leading handset manufacturers to embed joyn within the handsets software, so that it comes as a pre-installed application.
∑ Become OTT: Operator’s are developing OTT ser-vices to own and operate this segment. Telefónica Digital has introduced TU Me, a message, VOIP and photo-sharing app that has 600,000+ users so far. The apps have got popularity beyond Spain into markets far away like India and US. While, the apps may cannibalize Telefónica’s revenues; but may also earn additional revenue from over-seas market.
The operator’s have been compelled to try and test new business strategies because of the impending treat being posed by OTT Players and resorted to these “operator led model”. ∑ Collaboration Strategy: The infl exion point may
soon be reached between social media and mobile operators; where they look forward to a collabo-ration strategy. The social media players have the gift of innovation; whereby new and attractive ser-vices be provided to the end user over a seemingly free and technology neutral platform. Operator’s on the other hand the technological know-how to deliver these services and even provide value addi-tion and enhancement like location-based services. Operators have a larger say when it comes to tele-com equipment manufacturing especially on the mobile device front.
OTT players have also tried to disintegrate the traditional service delivery model (illustrated below) so as to enter the operator controlled domain. Two instances to substantiate this are: ∑ Access Device: Google launched Nexus One mo-
bile phones though with the prime intention of
Figure 5: Mobile Social Media Delivery Model
User Generated Content
Pictures
Text
Video
Pictures
Text
Video
Data Pipe
Location informationSMS SupportNotification
Enrichment
Access PointEnd User
Access Device
Social Media
Platform
Telco Operator
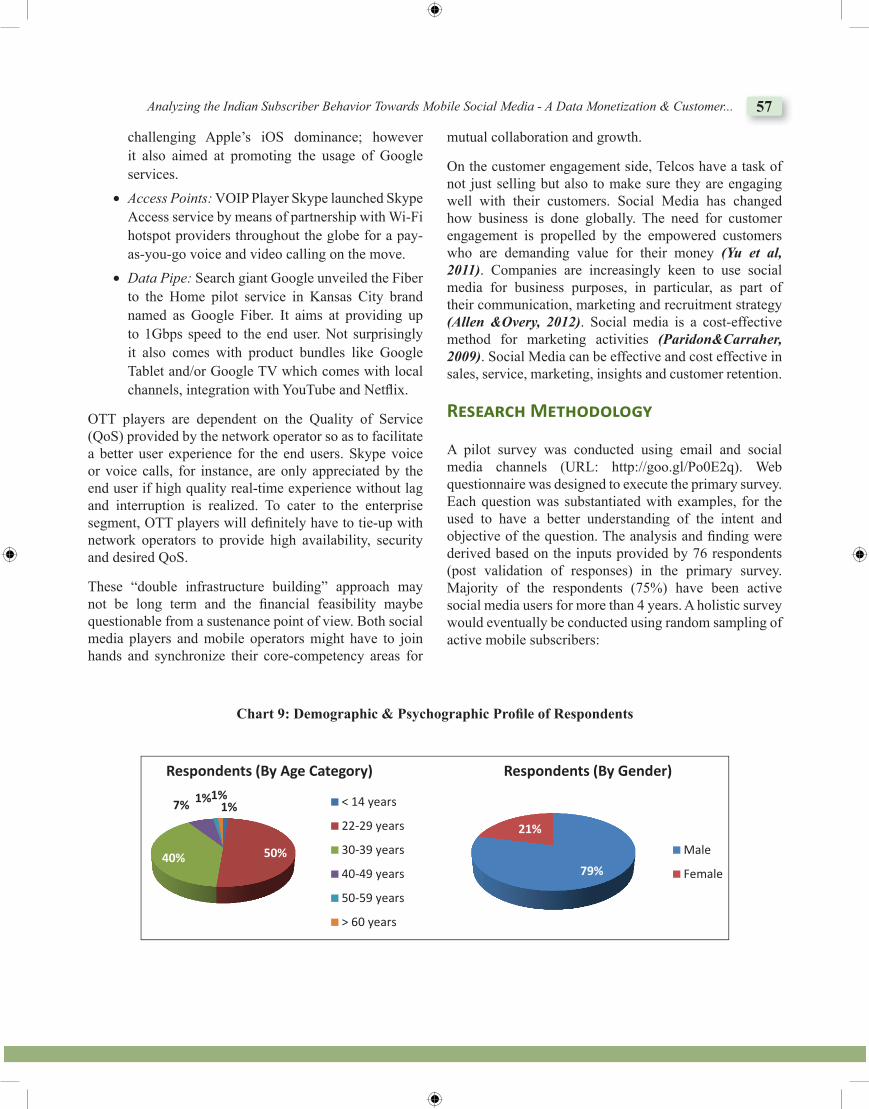
Analyzing the Indian Subscriber Behavior Towards Mobile Social Media - A Data Monetization & Customer... 57
challenging Apple’s iOS dominance; however it also aimed at promoting the usage of Google services.
∑ Access Points: VOIP Player Skype launched Skype Access service by means of partnership with Wi-Fi hotspot providers throughout the globe for a pay-as-you-go voice and video calling on the move.
∑ Data Pipe: Search giant Google unveiled the Fiber to the Home pilot service in Kansas City brand named as Google Fiber. It aims at providing up to 1Gbps speed to the end user. Not surprisingly it also comes with product bundles like Google Tablet and/or Google TV which comes with local channels, integration with YouTube and Netfl ix.
OTT players are dependent on the Quality of Service (QoS) provided by the network operator so as to facilitate a better user experience for the end users. Skype voice or voice calls, for instance, are only appreciated by the end user if high quality real-time experience without lag and interruption is realized. To cater to the enterprise segment, OTT players will defi nitely have to tie-up with network operators to provide high availability, security and desired QoS.
These “double infrastructure building” approach may not be long term and the fi nancial feasibility maybe questionable from a sustenance point of view. Both social media players and mobile operators might have to join hands and synchronize their core-competency areas for
mutual collaboration and growth.
On the customer engagement side, Telcos have a task of not just selling but also to make sure they are engaging well with their customers. Social Media has changed how business is done globally. The need for customer engagement is propelled by the empowered customers who are demanding value for their money (Yu et al, 2011). Companies are increasingly keen to use social media for business purposes, in particular, as part of their communication, marketing and recruitment strategy (Allen &Overy, 2012). Social media is a cost-effective method for marketing activities (Paridon&Carraher, 2009). Social Media can be effective and cost effective in sales, service, marketing, insights and customer retention.
R���arch M�thodo�og�
A pilot survey was conducted using email and social media channels (URL: http://goo.gl/Po0E2q). Web questionnaire was designed to execute the primary survey. Each question was substantiated with examples, for the used to have a better understanding of the intent and objective of the question. The analysis and fi nding were derived based on the inputs provided by 76 respondents (post validation of responses) in the primary survey. Majority of the respondents (75%) have been active social media users for more than 4 years. A holistic survey would eventually be conducted using random sampling of active mobile subscribers:
Chart 9: Demographic & Psychographic Profi le of RespondentsChart 9:
Respondents
(By City) Respondent
Bangalore 8 Bhopal 1 Chennai 2 Delhi / NCR 16 Ghaziabad 1 Gurgaon 7 Hyderabad 7 Indore 1 Karjat 1 Kolkata 1 Lucknow 1 Mumbai 10 Navi Mumbai 1 Pratapgarh 1 Pune 17 Siliguri 1
Total 76
1%
50% 40%
7% 1% 1%
Respondents (By Age Category)
< 14 years
22-29 years
30-39 years
40-49 years
50-59 years
> 60 years
79%
21%
Respondents (By Gender)
Male
Female
34%
1%
17%
3% 3%
42%
Respondents (By Mobile Operator)
Airtel
BSNL / MTNL
IDEA
Reliance
Tata DoCoMo
Vodafone
16%
56% 1%
8% 19%
Respondents (By Type of Service)
Postpaid (2G)
Postpaid (3G)
Postpaid (4G)
Prepaid (2G)
Prepaid (3G)
3% 3%
18% 1%
75%
Respondents (By Social Media usage) 1 to 2 years
1 to 6 months
2 to 4 years
Less than amonthMore than 4years
63%
7%
25%
5%
Respondents (By Primary access area for Social Media)
All of theabove placesOutdoor
Home
Office orInstitute
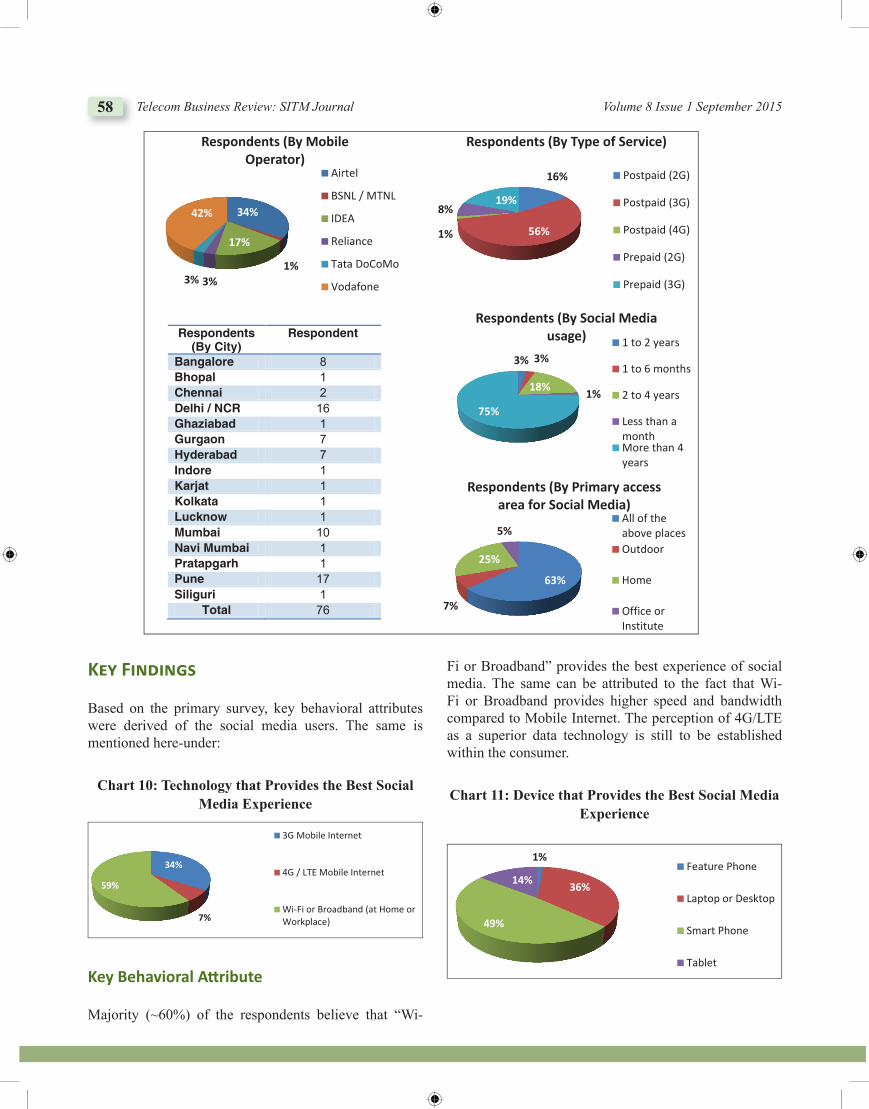
58 Telecom Business Review: SITM Journal Volume 8 Issue 1 September 2015
K�� Finding�
Based on the primary survey, key behavioral attributes were derived of the social media users. The same is mentioned here-under:
Chart 10: Technology that Provides the Best Social Media Experience
34%
7%
59%
3G Mobile Internet
4G / LTE Mobile Internet
Wi-Fi or Broadband (at Home orWorkplace)
1%
36%
49%
14%
Feature Phone
Laptop or Desktop
Smart Phone
Tablet
Key Behavioral Att ribute
Majority (~60%) of the respondents believe that “Wi-
Chart 9:
Respondents
(By City) Respondent
Bangalore 8 Bhopal 1 Chennai 2 Delhi / NCR 16 Ghaziabad 1 Gurgaon 7 Hyderabad 7 Indore 1 Karjat 1 Kolkata 1 Lucknow 1 Mumbai 10 Navi Mumbai 1 Pratapgarh 1 Pune 17 Siliguri 1
Total 76
1%
50% 40%
7% 1% 1%
Respondents (By Age Category)
< 14 years
22-29 years
30-39 years
40-49 years
50-59 years
> 60 years
79%
21%
Respondents (By Gender)
Male
Female
34%
1%
17%
3% 3%
42%
Respondents (By Mobile Operator)
Airtel
BSNL / MTNL
IDEA
Reliance
Tata DoCoMo
Vodafone
16%
56% 1%
8% 19%
Respondents (By Type of Service)
Postpaid (2G)
Postpaid (3G)
Postpaid (4G)
Prepaid (2G)
Prepaid (3G)
3% 3%
18% 1%
75%
Respondents (By Social Media usage) 1 to 2 years
1 to 6 months
2 to 4 years
Less than amonthMore than 4years
63%
7%
25%
5%
Respondents (By Primary access area for Social Media)
All of theabove placesOutdoor
Home
Office orInstitute
Fi or Broadband” provides the best experience of social media. The same can be attributed to the fact that Wi-Fi or Broadband provides higher speed and bandwidth compared to Mobile Internet. The perception of 4G/LTE as a superior data technology is still to be established within the consumer.
Chart 11: Device that Provides the Best Social Media Experience
34%
7%
59%
3G Mobile Internet
4G / LTE Mobile Internet
Wi-Fi or Broadband (at Home orWorkplace)
1%
36%
49%
14%
Feature Phone
Laptop or Desktop
Smart Phone
Tablet
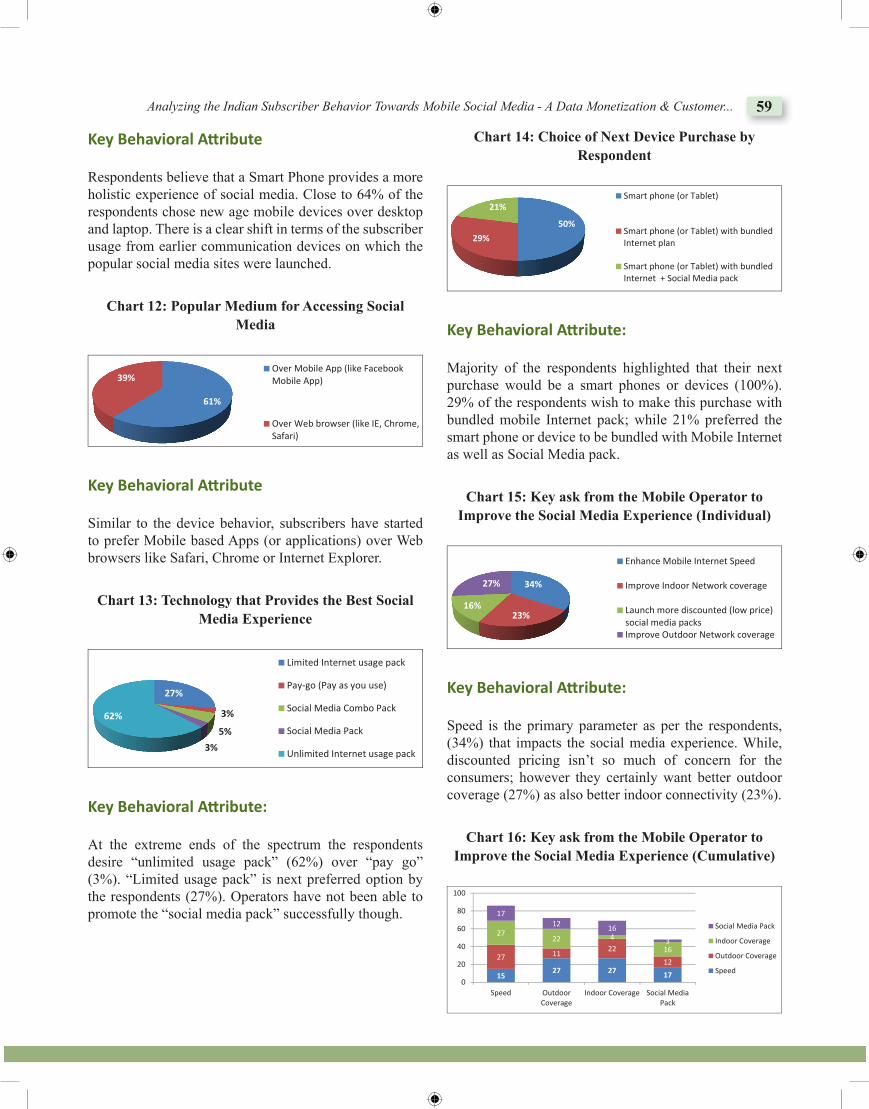
Analyzing the Indian Subscriber Behavior Towards Mobile Social Media - A Data Monetization & Customer... 59
Key Behavioral Att ribute
Respondents believe that a Smart Phone provides a more holistic experience of social media. Close to 64% of the respondents chose new age mobile devices over desktop and laptop. There is a clear shift in terms of the subscriber usage from earlier communication devices on which the popular social media sites were launched.
Chart 12: Popular Medium for Accessing Social Media
though.
61%
39%
Over Mobile App (like FacebookMobile App)
Over Web browser (like IE, Chrome,Safari)
27%
3%
5%
3%
62%
Limited Internet usage pack
Pay-go (Pay as you use)
Social Media Combo Pack
Social Media Pack
Unlimited Internet usage pack
50%
29%
21%
Smart phone (or Tablet)
Smart phone (or Tablet) with bundledInternet plan
Smart phone (or Tablet) with bundledInternet + Social Media pack
Key Behavioral Att ribute
Similar to the device behavior, subscribers have started to prefer Mobile based Apps (or applications) over Web browsers like Safari, Chrome or Internet Explorer.
Chart 13: Technology that Provides the Best Social Media Experience
though.
61%
39%
Over Mobile App (like FacebookMobile App)
Over Web browser (like IE, Chrome,Safari)
27%
3%
5%
3%
62%
Limited Internet usage pack
Pay-go (Pay as you use)
Social Media Combo Pack
Social Media Pack
Unlimited Internet usage pack
50%
29%
21%
Smart phone (or Tablet)
Smart phone (or Tablet) with bundledInternet plan
Smart phone (or Tablet) with bundledInternet + Social Media pack
Key Behavioral Att ribute:
At the extreme ends of the spectrum the respondents desire “unlimited usage pack” (62%) over “pay go” (3%). “Limited usage pack” is next preferred option by the respondents (27%). Operators have not been able to promote the “social media pack” successfully though.
Chart 14: Choice of Next Device Purchase byRespondent
though.
61%
39%
Over Mobile App (like FacebookMobile App)
Over Web browser (like IE, Chrome,Safari)
27%
3%
5%
3%
62%
Limited Internet usage pack
Pay-go (Pay as you use)
Social Media Combo Pack
Social Media Pack
Unlimited Internet usage pack
50%
29%
21%
Smart phone (or Tablet)
Smart phone (or Tablet) with bundledInternet plan
Smart phone (or Tablet) with bundledInternet + Social Media pack
Key Behavioral Att ribute:
Majority of the respondents highlighted that their next purchase would be a smart phones or devices (100%). 29% of the respondents wish to make this purchase with bundled mobile Internet pack; while 21% preferred the smart phone or device to be bundled with Mobile Internet as well as Social Media pack.
Chart 15: Key ask from the Mobile Operator toImprove the Social Media Experience (Individual)
34%
23% 16%
27%
Enhance Mobile Internet Speed
Improve Indoor Network coverage
Launch more discounted (low price)social media packsImprove Outdoor Network coverage
15 27 27 17
27 11 22
12
27 22 4
16
17 12 16
3
0
20
40
60
80
100
Speed OutdoorCoverage
Indoor Coverage Social MediaPack
Social Media Pack
Indoor Coverage
Outdoor Coverage
Speed
Key Behavioral Att ribute:
Speed is the primary parameter as per the respondents, (34%) that impacts the social media experience. While, discounted pricing isn’t so much of concern for the consumers; however they certainly want better outdoor coverage (27%) as also better indoor connectivity (23%).
Chart 16: Key ask from the Mobile Operator toImprove the Social Media Experience (Cumulative)
34%
23% 16%
27%
Enhance Mobile Internet Speed
Improve Indoor Network coverage
Launch more discounted (low price)social media packsImprove Outdoor Network coverage
15 27 27 17
27 11 22
12
27 22 4
16
17 12 16
3
0
20
40
60
80
100
Speed OutdoorCoverage
Indoor Coverage Social MediaPack
Social Media Pack
Indoor Coverage
Outdoor Coverage
Speed
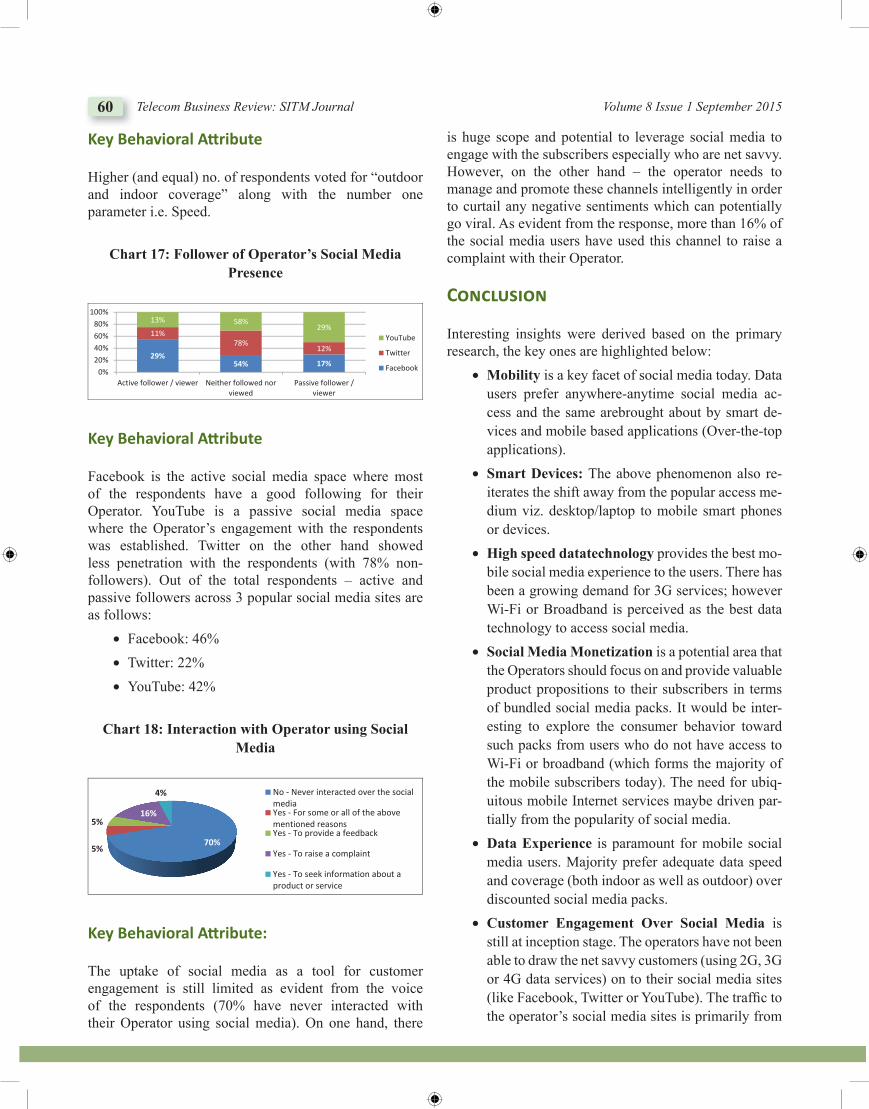
60 Telecom Business Review: SITM Journal Volume 8 Issue 1 September 2015
Key Behavioral Att ribute
Higher (and equal) no. of respondents voted for “outdoor and indoor coverage” along with the number one parameter i.e. Speed.
Chart 17: Follower of Operator’s Social MediaPresence
29% 54% 17%
11% 78%
12%
13% 58% 29%
0%20%40%60%80%
100%
Active follower / viewer Neither followed norviewed
Passive follower /viewer
YouTube
70% 5%
5% 16%
4%
No - Never interacted over the socialmediaYes - For some or all of the abovementioned reasonsYes - To provide a feedback
Yes - To raise a complaint
Yes - To seek information about aproduct or service
Key Behavioral Att ribute
Facebook is the active social media space where most of the respondents have a good following for their Operator. YouTube is a passive social media space where the Operator’s engagement with the respondents was established. Twitter on the other hand showed less penetration with the respondents (with 78% non-followers). Out of the total respondents – active and passive followers across 3 popular social media sites are as follows:
∑ Facebook: 46%∑ Twitter: 22%∑ YouTube: 42%
Chart 18: Interaction with Operator using Social Media
29% 54% 17%
11% 78%
12%
13% 58% 29%
0%20%40%60%80%
100%
Active follower / viewer Neither followed norviewed
Passive follower /viewer
YouTube
70% 5%
5% 16%
4%
No - Never interacted over the socialmediaYes - For some or all of the abovementioned reasonsYes - To provide a feedback
Yes - To raise a complaint
Yes - To seek information about aproduct or service
Key Behavioral Att ribute:
The uptake of social media as a tool for customer engagement is still limited as evident from the voice of the respondents (70% have never interacted with their Operator using social media). On one hand, there
is huge scope and potential to leverage social media to engage with the subscribers especially who are net savvy. However, on the other hand – the operator needs to manage and promote these channels intelligently in order to curtail any negative sentiments which can potentially go viral. As evident from the response, more than 16% of the social media users have used this channel to raise a complaint with their Operator.
Conc�u�ion
Interesting insights were derived based on the primary research, the key ones are highlighted below: ∑ Mobility is a key facet of social media today. Data
users prefer anywhere-anytime social media ac-cess and the same arebrought about by smart de-vices and mobile based applications (Over-the-top applications).
∑ Smart Devices: The above phenomenon also re-iterates the shift away from the popular access me-dium viz. desktop/laptop to mobile smart phones or devices.
∑ High speed datatechnology provides the best mo-bile social media experience to the users. There has been a growing demand for 3G services; however Wi-Fi or Broadband is perceived as the best data technology to access social media.
∑ Social Media Monetization is a potential area that the Operators should focus on and provide valuable product propositions to their subscribers in terms of bundled social media packs. It would be inter-esting to explore the consumer behavior toward such packs from users who do not have access to Wi-Fi or broadband (which forms the majority of the mobile subscribers today). The need for ubiq-uitous mobile Internet services maybe driven par-tially from the popularity of social media.
∑ Data Experience is paramount for mobile social media users. Majority prefer adequate data speed and coverage (both indoor as well as outdoor) over discounted social media packs.
∑ Customer Engagement Over Social Media is still at inception stage. The operators have not been able to draw the net savvy customers (using 2G, 3G or 4G data services) on to their social media sites (like Facebook, Twitter or YouTube). The traffi c to the operator’s social media sites is primarily from
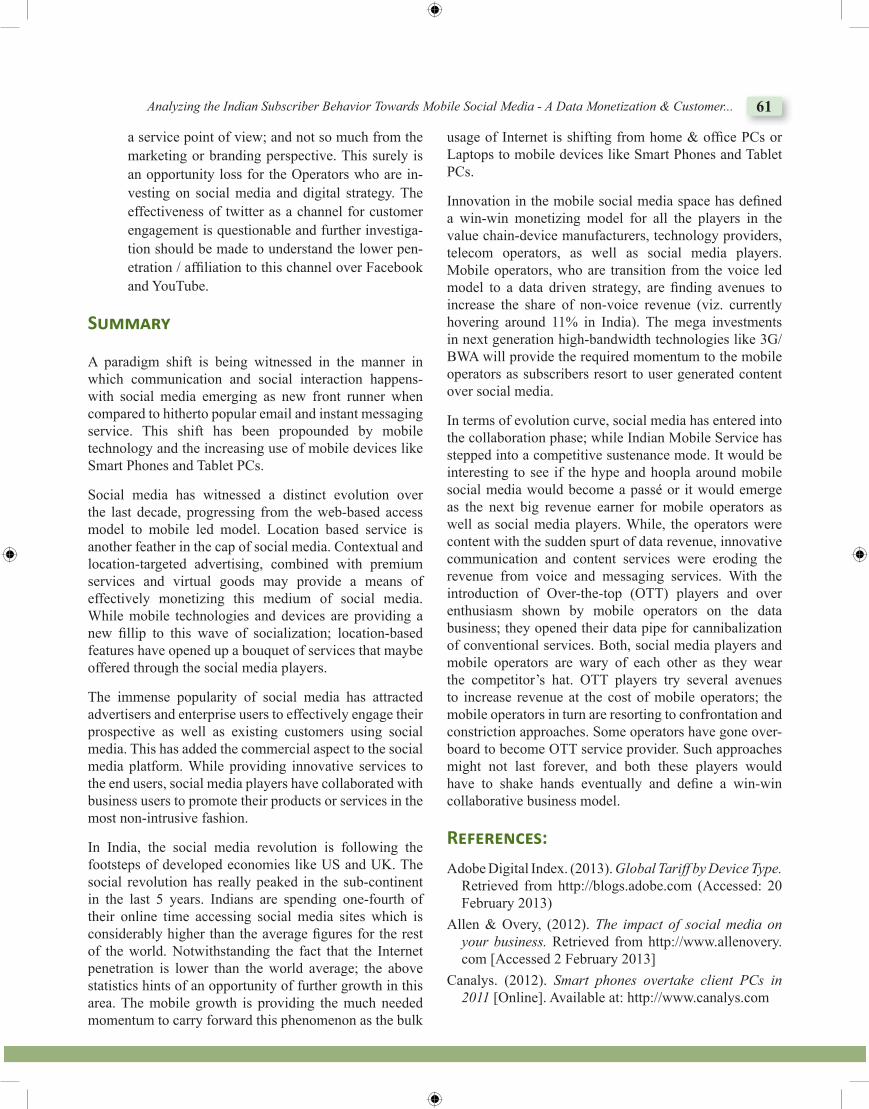
Analyzing the Indian Subscriber Behavior Towards Mobile Social Media - A Data Monetization & Customer... 61
a service point of view; and not so much from the marketing or branding perspective. This surely is an opportunity loss for the Operators who are in-vesting on social media and digital strategy. The effectiveness of twitter as a channel for customer engagement is questionable and further investiga-tion should be made to understand the lower pen-etration / affi liation to this channel over Facebook and YouTube.
Summar�
A paradigm shift is being witnessed in the manner in which communication and social interaction happens-with social media emerging as new front runner when compared to hitherto popular email and instant messaging service. This shift has been propounded by mobile technology and the increasing use of mobile devices like Smart Phones and Tablet PCs.
Social media has witnessed a distinct evolution over the last decade, progressing from the web-based access model to mobile led model. Location based service is another feather in the cap of social media. Contextual and location-targeted advertising, combined with premium services and virtual goods may provide a means of effectively monetizing this medium of social media. While mobile technologies and devices are providing a new fi llip to this wave of socialization; location-based features have opened up a bouquet of services that maybe offered through the social media players.
The immense popularity of social media has attracted advertisers and enterprise users to effectively engage their prospective as well as existing customers using social media. This has added the commercial aspect to the social media platform. While providing innovative services to the end users, social media players have collaborated with business users to promote their products or services in the most non-intrusive fashion.
In India, the social media revolution is following the footsteps of developed economies like US and UK. The social revolution has really peaked in the sub-continent in the last 5 years. Indians are spending one-fourth of their online time accessing social media sites which is considerably higher than the average fi gures for the rest of the world. Notwithstanding the fact that the Internet penetration is lower than the world average; the above statistics hints of an opportunity of further growth in this area. The mobile growth is providing the much needed momentum to carry forward this phenomenon as the bulk
usage of Internet is shifting from home & offi ce PCs or Laptops to mobile devices like Smart Phones and Tablet PCs.
Innovation in the mobile social media space has defi ned a win-win monetizing model for all the players in the value chain-device manufacturers, technology providers, telecom operators, as well as social media players. Mobile operators, who are transition from the voice led model to a data driven strategy, are fi nding avenues to increase the share of non-voice revenue (viz. currently hovering around 11% in India). The mega investments in next generation high-bandwidth technologies like 3G/BWA will provide the required momentum to the mobile operators as subscribers resort to user generated content over social media.
In terms of evolution curve, social media has entered into the collaboration phase; while Indian Mobile Service has stepped into a competitive sustenance mode. It would be interesting to see if the hype and hoopla around mobile social media would become a passé or it would emerge as the next big revenue earner for mobile operators as well as social media players. While, the operators were content with the sudden spurt of data revenue, innovative communication and content services were eroding the revenue from voice and messaging services. With the introduction of Over-the-top (OTT) players and over enthusiasm shown by mobile operators on the data business; they opened their data pipe for cannibalization of conventional services. Both, social media players and mobile operators are wary of each other as they wear the competitor’s hat. OTT players try several avenues to increase revenue at the cost of mobile operators; the mobile operators in turn are resorting to confrontation and constriction approaches. Some operators have gone over-board to become OTT service provider. Such approaches might not last forever, and both these players would have to shake hands eventually and defi ne a win-win collaborative business model.
R�f�r�nc��:
Adobe Digital Index. (2013). Global Tariff by Device Type. Retrieved from http://blogs.adobe.com (Accessed: 20 February 2013)
Allen & Overy, (2012). The impact of social media on your business. Retrieved from http://www.allenovery.com [Accessed 2 February 2013]
Canalys. (2012). Smart phones overtake client PCs in 2011 [Online]. Available at: http://www.canalys.com
62 Telecom Business Review: SITM Journal Volume 8 Issue 1 September 2015
com Score. (2012). 2012 Mobile Future in Focus. Retrieved from http://www.mchn.com
comScore. (2012). In India, 1 in 4 Online Minutes are Spent on Social Networking Sites [Online]. Retrieved from http://www.comscore.com
NPD DisplaySearch. (2013). Tablet PC market forecast to surpass notebooks in 2013. Retrieved from http://www.displaysearch.com
Paridon, T., & Carraher, S. M. (2009). Entrepreneurial marketing: Customer shopping value and patron-age behavior. Journal of Applied Management & Entrepreneurship, 14(2), 3-28.
Reuters (2009). Is it the end of the Desktop PC? Retrieved from http://www.reuters.com
The Economist. (2012). Joyn them or Join them. Retrieved from http://www.economist.com (Accessed: 01 February 2013)
The Telegraph (2009), Google to launch mobile phone to challenge iPhone’s dominance. Retrieved from http://www.tepegraoh.co.uk
Ridden, P. (2011). Skype launches global WiFi hotspot program. Retrieved from http://gizmag.com
Wikipedia. (2013). Over-the-top Content. Retrieved from http://www.wikipedia.com
G�o��ar�:
3G Third Generation Mobile Services OTT Over-the-Top
4G Fourth Generation Mobile Services PC Personal Computers
A-GPS Assisted Global Positioning System QoS Quality of Service
BWA Broadband Wire-less Access RCS-e
Rich Communica-tion Suite - En-hanced
DSL Digital Subscriber Line SM Social Media
Gbps Gigabit per second SMP Social Media Player
GPRS General Packet Radio Service SMS Short Messaging
Service
GPS Global Positioning System SoLoMo Social-Local-
Mobile
GSMAGlobal System for Mobile Communi-cation Association
STV Special Tariff Vouchers
IAMAIInternet & Mobile Association of India
TV Television
ID Identifi cation UK United Kingdom
IM Instant Messaging Service US United States of
America
LBSM Location based Social Media VAS Value Added Ser-
vices
LTE Long Term Evolu-tion VOIP Voice Over Internet
ProtocolMOU Minutes of Usage Wi-Fi Wireless Fidelity
Bri�f Bio of Author/�:
Sohag Sarkar is a Management Consultant in Strategy & Operations with key expertise in Business Transformation and large-scale Program Management. His area of specialization is in the Telecommunications industry. He has worked with international as well as Indian telecom players. He is currently undertaking Research in Management Studies from Pacifi c Academy of Higher Education & Research University (PAHER, and also serves as a visiting faculty for Management with one of the leading telecom management institutes in India. Several of his white papers and thought leaderships have been published in leading journals.
Abstract
Customer Experience Management (CEM) has been a buzzword in both ‘demand’ and ‘supply’ side dynamics of the Telecom value chain. However emphasis is being given around CEM, it never feels just enough! Telecom ISP’s are looking to generate more awareness of revenue generation and realization, so that it not only is about the increase of top line but also about consolidation of various products and services, almost being an aggregator at one stage to deliver with the help of a single service delivery platform. In other words, what is commonly known as ‘VAS-Value added services’ in the industry. The key to this is real ‘innovation’, of newer ideas and productizing these concepts to market. For innovative product management, Telcos are opting to look for ‘value added’ services, ‘value added’ delivery as well as enhanced business models and operational frameworks. This is primarily done to carve out an innovation which leads to a differentiator non-existent in the market. A very common, yet unique one such concept can be the ‘Balanced Scorecard’ perspective and mapping these different perspectives into various domains of a Telecom business. These are obviously very common in present days and widely used by all Telcos to arrive at a definitive decision for any strategic cause. It can be mapped to perspectives ranging from ‘financial’, ‘customer-centricity and ‘orientation’, internal process management, functionality & delivery, lastly ‘internal learning & growth’. We need to understand the context of ‘innovation’ of ‘products & services’ under all of these above perspectives. This will give us immense clarity in creating such a differentiated offering to render enhanced Customer experience for better sustainability and thus thriving on market competition. Each layer of a Telco enterprise set up follows specific blueprint, whether it’s the business or operations or technology. This will ensure that all company strategies which are focused towards creating and delivering differentiated offerings and delivery are being realized appropriately hence the delta of perception versus reality is minimized to a great extent. This would definitely increase ‘customer experience’ in all possible forms. Product life cycle management which forms the heart of CEM, should be certainly driven by ‘cost of sale’ as well as ‘price of product’. Both of these parameters should be populated through a Balanced scorecard from a financial perspective to decide on a ‘go-no go’ decision for concepts to be marketed in a Telco. These need to be realized through specific derivatives of business processes following best practices to ensure enhanced customer experience and better delivery of services to the end customer. Perhaps, the most important perspective of creating a balanced scorecard matrix will be the ‘customer centricity’ perspective. Two fundamental aspects which drive this would be ‘price’ and ‘quality’. Both of these should be focused on to deliver ‘value augmentation’. The difference between what becomes a product or a service ‘asset’ with regards to what transforms into a ‘liability’ is this value differentiation through the process described. This leads to customer ‘delight’ or a differentiated customer ‘experience’ thus enhanced CEM.
Keywords: Balanced Scorecard, Customer Experience, Demand, Kpis, OEM, Supply Side, Service Delivery, Value Chain, VAS
Innovative Product Management Driving Enhanced Customer Experience Management (CEM)
Niladri Shekhar Dutta** Customer Principal, Ericsson Region Middle East & Africa. E-mail: [email protected]
Introduction
The intent of this paper is to provide both the Supply side and the Demand side dynamics that exist within the CEM (Customer Experience Management) domain of the Telco industry. Our aim would be to objectively isolate each entity within the Supply side and see how they contribute towards enhanced CEM. As far as the Demand side is concerned, our objective would be to understand what
it takes for the product management function within the Telecom operator to realize the ‘concepts’ and to market them as Products and Services. With the advent of newer technologies like 4G / LTE, some of these product concepts, which until 5 years back seen as a distant dream, is becoming a reality and will soon be commoditized at the user level to ensure mass acceptance.
The holistic view of the Telecom Value Chain is shown below.
Article can be accessed online at http://www.publishingindia.com
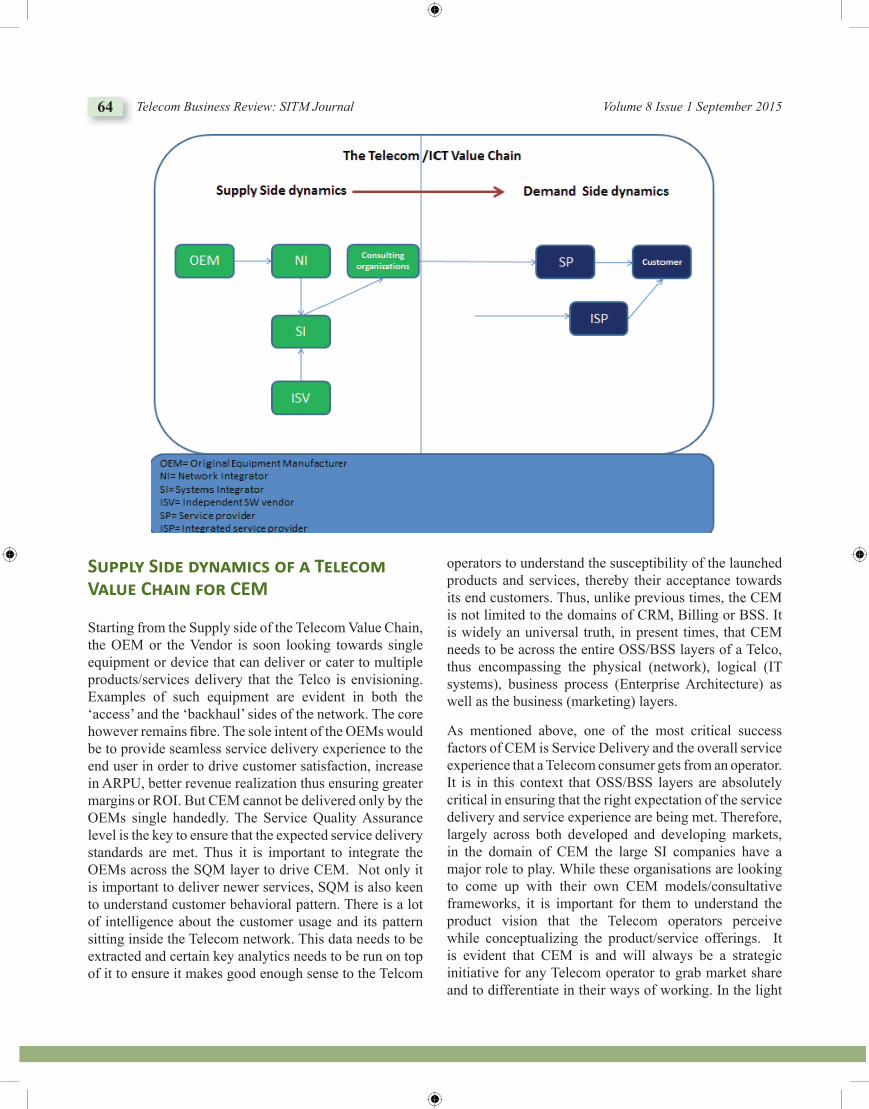
64 Telecom Business Review: SITM Journal Volume 8 Issue 1 September 2015
Su���� Sid� d�n��ic� o� � T���co� V��u� C��in �or CEM
Starting from the Supply side of the Telecom Value Chain, the OEM or the Vendor is soon looking towards single equipment or device that can deliver or cater to multiple products/services delivery that the Telco is envisioning. Examples of such equipment are evident in both the ‘access’ and the ‘backhaul’ sides of the network. The core however remains fi bre. The sole intent of the OEMs would be to provide seamless service delivery experience to the end user in order to drive customer satisfaction, increase in ARPU, better revenue realization thus ensuring greater margins or ROI. But CEM cannot be delivered only by the OEMs single handedly. The Service Quality Assurance level is the key to ensure that the expected service delivery standards are met. Thus it is important to integrate the OEMs across the SQM layer to drive CEM. Not only it is important to deliver newer services, SQM is also keen to understand customer behavioral pattern. There is a lot of intelligence about the customer usage and its pattern sitting inside the Telecom network. This data needs to be extracted and certain key analytics needs to be run on top of it to ensure it makes good enough sense to the Telcom
operators to understand the susceptibility of the launched products and services, thereby their acceptance towards its end customers. Thus, unlike previous times, the CEM is not limited to the domains of CRM, Billing or BSS. It is widely an universal truth, in present times, that CEM needs to be across the entire OSS/BSS layers of a Telco, thus encompassing the physical (network), logical (IT systems), business process (Enterprise Architecture) as well as the business (marketing) layers.
As mentioned above, one of the most critical success factors of CEM is Service Delivery and the overall service experience that a Telecom consumer gets from an operator. It is in this context that OSS/BSS layers are absolutely critical in ensuring that the right expectation of the service delivery and service experience are being met. Therefore, largely across both developed and developing markets, in the domain of CEM the large SI companies have a major role to play. While these organisations are looking to come up with their own CEM models/consultative frameworks, it is important for them to understand the product vision that the Telecom operators perceive while conceptualizing the product/service offerings. It is evident that CEM is and will always be a strategic initiative for any Telecom operator to grab market share and to differentiate in their ways of working. In the light
Innovative Product Management Driving Enhanced Customer Experience Management (CEM) 65
of CEM, it is important to understand also what the main strategic driver is. For example, if the strategic driver were ‘Customer Experience’, the parameters for transformation of doing and delivering products and services would be different than if the driver is ‘Revenue and Margins’. The objective of the SI in order to assist the Telecom operator would be to defi ne the boundaries of CEM when it comes to deliver their products and services through integration of business process as well as technology solutions. Industry best practices are key to ensure the universal acceptance of the defi ned process logic as well as solution architecture around CEM. These can be referred from TMF frameworks model and other artifacts. The creation of a CEM critical business process layer is pertinent to understand the larger implications of CEM within the overall enterprise architecture of a Telecom operator. These business processes will eventually be impacting and catering to certain critical performance indicators (KPIs) which the Telecom operators would be measuring to drive QoS (Quality of Service) of customer churn, time to market. Not to forget, that these KPIs would also be refl ected on the CxOs dashboards to drive their individual KRAs. The perseverance of such business critical KPIs driving CEM across length and breadth of product/service portfolio of a Telco would refl ect the effi ciency and effi cacy of conceptualizing CEM as a key differentiator for a Telco. Needless to say that all mission critical systems like Order Management, CRM, Billing and Point of Sale(PoS) are absolutely key to drive and deliver enhanced CEM.
As far as the consulting fraternity is concerned for Telcos, they are keen to advise them on newer business models around content/service aggregation. They are also responsible for ideating newer operating models to realize the business model. Each of these companies has their individual patented CEM framework, which would enable service quality for Telcos that is eventually enhanced when implemented. Consulting organisations play a mission critical role from the supply side within the Telco industry. It’s these organisations that defi ne and come up with newer adaptable concepts of CEM that ensures the rationale of seamless integration between business, process and technology layer is clearly understood by multiple stakeholders within the telecom enterprise. The TMF frameworx concept along with The basic intent of these CEM frameworks must be to reduce time to market and enhance customer experience management KPIs for the Telco to stimulate ROI and boost their top
line, thus achieving the critical differentiators within the demographic context of the market. One must also note that these organisations play a vital role in major OSS/BSS transformation engagements, which are often CEM driven. Thus a major task for these companies is complimenting the task of delivering such transformation projects along with SIs (system integrators).
Demand side dynamics of Telecom value chain around CEM
In order to better understand the ‘demand’ side dynamics, its important to know the functions and their basic role in CEM in general. Once that’s well understood, it becomes meaningful then to de-mystify the truth behind Product Management and CEM correlation. The objectives of this section would be to detail out each function’s role around CEM within the Telco and try to see how well that maps to product management innovation.
To start with if we consider a classic case of an integrated service provider of todays’ day and age who aims in delivering multiple services to the end customer starting from fi xed line, broadband, mobile, IpTV, CEM is the ONLY differentiator and services and experience offered around CEM ends up being the only strategy. Such a phenomenon is mostly seen in saturated and over saturated markets.
The two most fundamental functions from a Telecom organization perspective driving the CEM strategic agenda would be Sales and Marketing. ‘Sales’ function, for any organization and any industry are all about numbers, fi gures, growth, RoI and profi ts. For a Telecom industry certain other parameters like ARPU and AMPU gets added along with this basic list. However when you are looking at Sales only function and its role in driving CEM its also about the market penetration timelines reduction which we call ‘Time to market’ commonly as well as increase in sales and customer touch points to create greater customer reach and accessibility.
The Marketing responsibilities and scope when it comes to driving CEM gets more complex and needs to incorporate certain key academic methods to analyze trends, subjectivity and innovation. The Telco may classify CEM protocols into two different kitties. They might think ‘strategic’ when it comes to the CORE Product offering
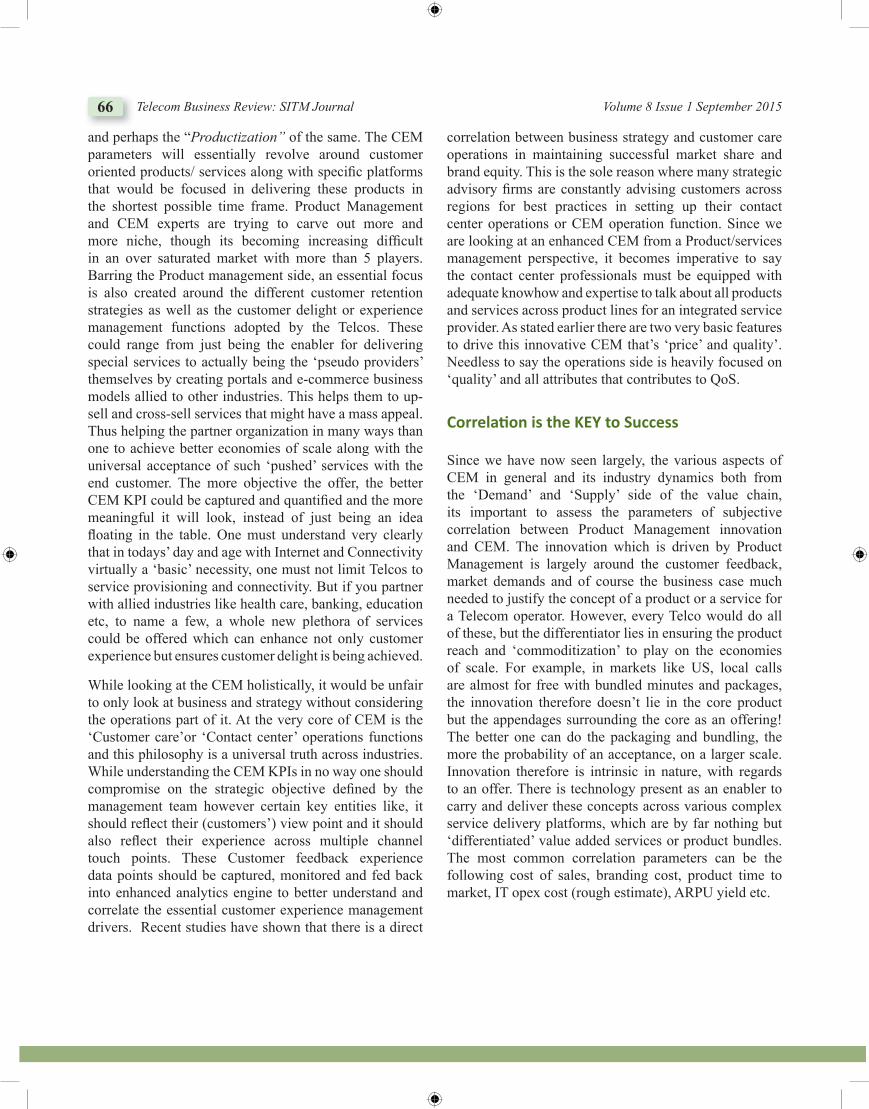
66 Telecom Business Review: SITM Journal Volume 8 Issue 1 September 2015
and perhaps the “Productization” of the same. The CEM parameters will essentially revolve around customer oriented products/ services along with specifi c platforms that would be focused in delivering these products in the shortest possible time frame. Product Management and CEM experts are trying to carve out more and more niche, though its becoming increasing diffi cult in an over saturated market with more than 5 players. Barring the Product management side, an essential focus is also created around the different customer retention strategies as well as the customer delight or experience management functions adopted by the Telcos. These could range from just being the enabler for delivering special services to actually being the ‘pseudo providers’ themselves by creating portals and e-commerce business models allied to other industries. This helps them to up-sell and cross-sell services that might have a mass appeal. Thus helping the partner organization in many ways than one to achieve better economies of scale along with the universal acceptance of such ‘pushed’ services with the end customer. The more objective the offer, the better CEM KPI could be captured and quantifi ed and the more meaningful it will look, instead of just being an idea fl oating in the table. One must understand very clearly that in todays’ day and age with Internet and Connectivity virtually a ‘basic’ necessity, one must not limit Telcos to service provisioning and connectivity. But if you partner with allied industries like health care, banking, education etc, to name a few, a whole new plethora of services could be offered which can enhance not only customer experience but ensures customer delight is being achieved.
While looking at the CEM holistically, it would be unfair to only look at business and strategy without considering the operations part of it. At the very core of CEM is the ‘Customer care’or ‘Contact center’ operations functions and this philosophy is a universal truth across industries. While understanding the CEM KPIs in no way one should compromise on the strategic objective defi ned by the management team however certain key entities like, it should refl ect their (customers’) view point and it should also refl ect their experience across multiple channel touch points. These Customer feedback experience data points should be captured, monitored and fed back into enhanced analytics engine to better understand and correlate the essential customer experience management drivers. Recent studies have shown that there is a direct
correlation between business strategy and customer care operations in maintaining successful market share and brand equity. This is the sole reason where many strategic advisory fi rms are constantly advising customers across regions for best practices in setting up their contact center operations or CEM operation function. Since we are looking at an enhanced CEM from a Product/services management perspective, it becomes imperative to say the contact center professionals must be equipped with adequate knowhow and expertise to talk about all products and services across product lines for an integrated service provider. As stated earlier there are two very basic features to drive this innovative CEM that’s ‘price’ and quality’. Needless to say the operations side is heavily focused on ‘quality’ and all attributes that contributes to QoS.
Correlati on is the KEY to Success
Since we have now seen largely, the various aspects of CEM in general and its industry dynamics both from the ‘Demand’ and ‘Supply’ side of the value chain, its important to assess the parameters of subjective correlation between Product Management innovation and CEM. The innovation which is driven by Product Management is largely around the customer feedback, market demands and of course the business case much needed to justify the concept of a product or a service for a Telecom operator. However, every Telco would do all of these, but the differentiator lies in ensuring the product reach and ‘commoditization’ to play on the economies of scale. For example, in markets like US, local calls are almost for free with bundled minutes and packages, the innovation therefore doesn’t lie in the core product but the appendages surrounding the core as an offering! The better one can do the packaging and bundling, the more the probability of an acceptance, on a larger scale. Innovation therefore is intrinsic in nature, with regards to an offer. There is technology present as an enabler to carry and deliver these concepts across various complex service delivery platforms, which are by far nothing but ‘differentiated’ value added services or product bundles. The most common correlation parameters can be the following cost of sales, branding cost, product time to market, IT opex cost (rough estimate), ARPU yield etc.
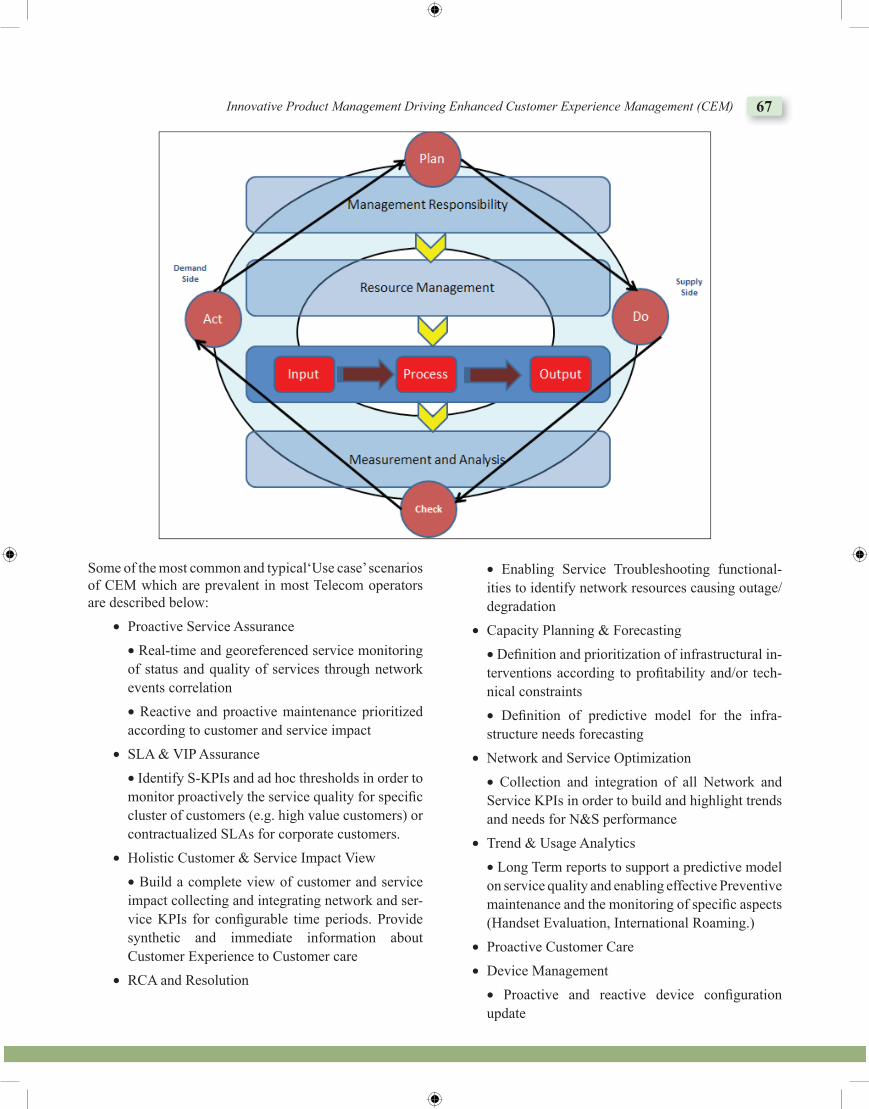
Innovative Product Management Driving Enhanced Customer Experience Management (CEM) 67
Some of the most common and typical‘Use case’ scenarios of CEM which are prevalent in most Telecom operators are described below:
∑ Proactive Service Assurance∑ Real-time and georeferenced service monitoring of status and quality of services through network events correlation ∑ Reactive and proactive maintenance prioritized according to customer and service impact
∑ SLA & VIP Assurance∑ Identify S-KPIs and ad hoc thresholds in order to monitor proactively the service quality for specifi c cluster of customers (e.g. high value customers) or contractualized SLAs for corporate customers.
∑ Holistic Customer & Service Impact View∑ Build a complete view of customer and service impact collecting and integrating network and ser-vice KPIs for confi gurable time periods. Provide synthetic and immediate information about Customer Experience to Customer care
∑ RCA and Resolution
∑ Enabling Service Troubleshooting functional-ities to identify network resources causing outage/degradation
∑ Capacity Planning & Forecasting∑ Defi nition and prioritization of infrastructural in-terventions according to profi tability and/or tech-nical constraints∑ Defi nition of predictive model for the infra-structure needs forecasting
∑ Network and Service Optimization∑ Collection and integration of all Network and Service KPIs in order to build and highlight trends and needs for N&S performance
∑ Trend & Usage Analytics∑ Long Term reports to support a predictive model on service quality and enabling effective Preventive maintenance and the monitoring of specifi c aspects (Handset Evaluation, International Roaming.)
∑ Proactive Customer Care∑ Device Management
∑ Proactive and reactive device confi guration update
68 Telecom Business Review: SITM Journal Volume 8 Issue 1 September 2015
Conc�u�ion-� �uturi�tic ro�d��� o� CEM
CEM is a reality for all Telecom operators and ICT service providers globally. Let’s not hide behind the fallacy of fi ction in stating that CEM is just a concept. It isn’t. It’s a reality and a very pragmatic measure of Telecom operators’ success in any market, irrespective of services portfolio, demography and market dynamics. It’s true that CEM does have a mission critical role to play in judging the effi cacy of a Telco business and the organization culture which is prevalent amongst CxOs. Most of them have CEM metrics linked to their individual balanced scorecard metrics. The key is innovations in the side of Product Management for Telcos offering the services towards their end customers as well as innovative product/solution/services offering for vendors who are in the Consulting, SI or Network integration space to assure the service delivery excellence is achieved. CEM will always be associated and linked to market differentiation. Customer Experience Management (CEM) has a direct bearing on perception at different customer touch points. Today’s user is looking for seamless transition from offl ine to online channels and anticipates seamless levels of information accuracy and consistency during these change phases.
The usage of mobile and social media channels is increasing rapidly for sharing views and ideas. Telco companies must frequently monitor these channels and follow up with their customers by understanding their needs and wants for improving customer loyalty and experience. In the competitive world, leading Telco companies will be focusing on customer-centric approach rather than company-centric approach. Towards this, enterprises will be adapting newer ways to connect customers with organizations for regular feedback.
There would be an increased focus on the latest trends and advancements in customer experience solutions that provide strategies, process models, and Information Technology (IT) to design, manage, and optimize the end-to-end customer experience process. The report also includes service quality management market analysis and forecasts various channels, types of analytical tools, vertical segments, size of the organization, and geographical regions. Telco service providers must also focus on certain key initiatives by taking into consideration aspects of Service Quality Management (SQM), Service Level Agreement (SLA) monitoring, service monitoring,
fault management, and performance management with respect to network planning and network management. The Telco Customer Experience Management Market is segmented into fi ve geographical regions, namely North America, Latin America, Europe, Asia-Pacifi c, and Middle East and Africa.
For a successful CEM project or an exercise it becomes imperative to seamlessly integrate the business and technology stack through the process layer. Marketing and IT has to work hand in hand in order to ensure that products and services are effortlessly rolled out and supported by solutions, systems and service delivery platforms. This holds true irrespective of the domain being Networks, Operations or Customer service or any other assurance function. Thus, with the advent of customer analytics, high end solutions and intelligent product/service bundling CEM will evolve with days to come and soon be the ONLY service differentiator which will prevail among all Telcos globally thus driving more investments and strategic initiatives focused towards CEM and allied areas.
Bri�� Bio o� Aut�or/�:
Niladri is a seasoned professional with close to a decade of global consulting experience. He is a Consulting practitioner with focus on operations and transformation consulting for top-tier telecommunication operators globally; He has worked in more than 30+ consulting engagements in varied culture and markets across Western Europe, Middle East, North & Central Africa, India and New Zealand. His expertise is primarily around Pre-Sales, Enterprise Architecture, Business and Operational Process Management, IT Operational Strategy & Revenue Management Consulting. In his present role as a Customer Principal with Ericsson he works in the OSS/BSS Consulting engagement practice where he drives and delivers various forms of engagements right from Pre-Sales, Concept realization, business case preparation, proposal presentations to project delivery.
Abstract
Wearable technology is the latest buzzword doing rounds in Technology forums with humongous growth expected in next few years. Of various devices, “Smart Watches” have shown most promise. A lot of companies have already launched Smart Watches or have indicated an interest to explore this area.In this paper, we try to understand the following: Definition of Watch and how a “Watch” has changed over years, What are the Mechanism to keep time. How does a watch function. What is a Smart Watch? Its Past and Present, What are features that Smart Watch provides. How useful are these features?, Target Segment for Smart Watch. What factors could dictate decision of consumer to buy Smart Watch?, What is the outlook for Smart watch Market? How would Traditional watches fare once Smart watches become mainstream, Authors Conclusion around Smart Watches ability to disrupt the Traditional Watch market.
Keywords: Mechanical Movement, Quartz Movement, Smart Watches, Traditional Watches, Market Analysis
Wrist Wars: Smart Watches vs Traditional WatchesRahul Darmwal*
*Senior Business Consultant, Ericsson India Global Services, Pune, Maharashtra, India. E-mail: [email protected]
Introduction
Everyone knows what time it is. Thanks to tiny and hardly noticeable Wrist Watch. The concept of Watch dates back many centuries, however, Wrist Watches are relatively new concept. Since 1868, when first wrist watch was produced by Patek Philippe (for women), there has been a steady growth in acceptance of Wrist Watches. The first mass produced Wrist Watches for men were ordered by German Army and made by Girard-Perregaux and today, a Wrist Watch has become a common phenomenon.
The latest to stake claim on wrist are Smart Watches. These are Wearable Devices that do much more than just tell time. Typically, they integrate with your Smart Phone and help users by logging lifestyle information, show alerts and interact with Smartphones. In this paper, we try to explore the World of Traditional and Smart Watches. Analyse the main features of these watches, understand market dynamics and challenges that both these types of Watches face. We also try to investigate how overall Watch Industry may behave after Smart Watches become main-stream.
What is a Watch
Watch is a device used to measure the passage of time. Over years, there have been many different ways in which
time was measured. Time measurement initially started out by looking at shadows determining time. These devices were called Sundials. The oldest record that is available shows sundials in use in ancient Egypt in 1500BC. The positions of shadows are used to determine approximate time of day. Over years, a lot of improvements were done on Sundial and many were installed. One of the famous Sun-dials in India is Jantar Mantar which was built in 1724.
Another interesting way of measuring time was using an hour glass. They was quite popular in Europe and there are documented references dating back to 13th century. Hour glasses are still used for ornamentation or in children’s games where accurate time measurements are not required.
In recent centuries, mechanical clocks were built to tell time. These were huge in size and expensive to own. They were deployed in clock towers, churches and other public buildings. Then, came the watches that we are familiar with today. Small Pocket Watches dominated the 17th-18th century. These were small watches that were typically carried in ones pockets. In early 19th Century, the wrist watches were mass manufactured and are now a globally accepted. Today, Wrist Watch industry is a Multi-Billion Dollar industry churning out hundreds of Millions of Watches each year.
Article can be accessed online at http://www.publishingindia.com
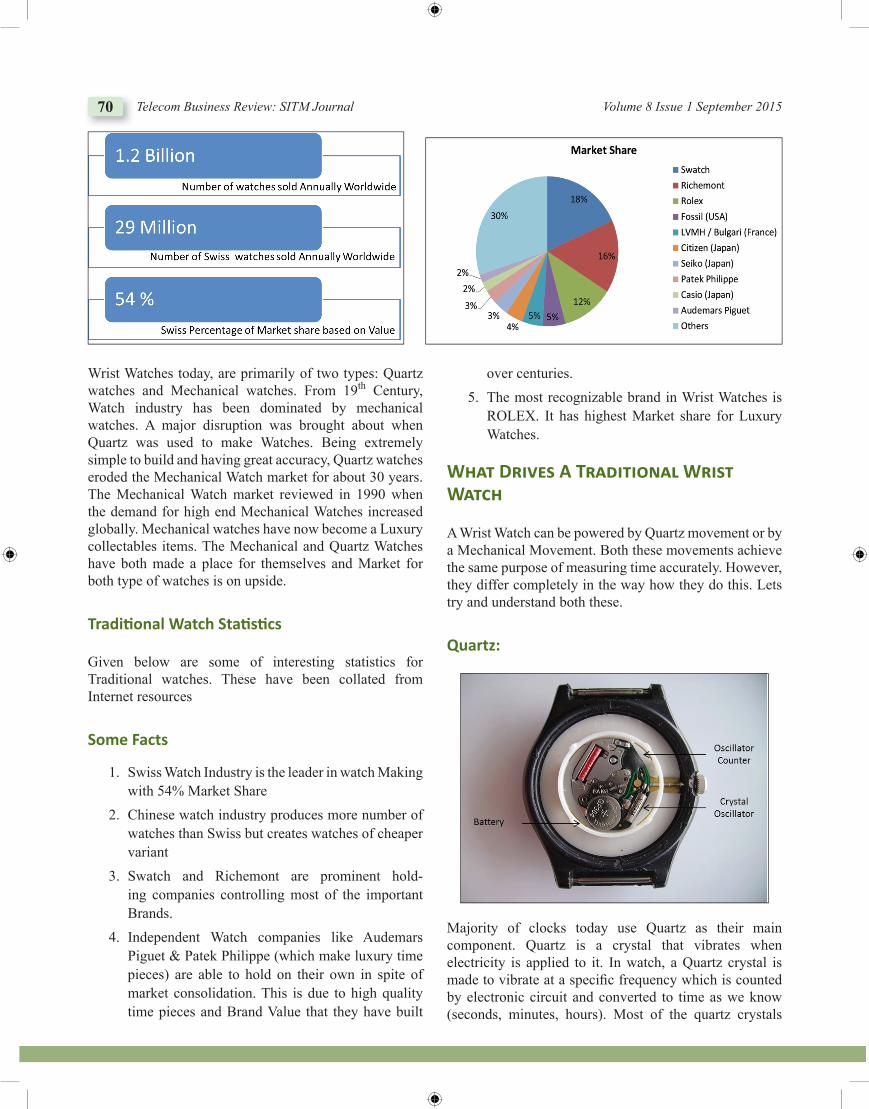
70 Telecom Business Review: SITM Journal Volume 8 Issue 1 September 2015
Wrist Watches today, are primarily of two types: Quartz watches and Mechanical watches. From 19th Century, Watch industry has been dominated by mechanical watches. A major disruption was brought about when Quartz was used to make Watches. Being extremely simple to build and having great accuracy, Quartz watches eroded the Mechanical Watch market for about 30 years. The Mechanical Watch market reviewed in 1990 when the demand for high end Mechanical Watches increased globally. Mechanical watches have now become a Luxury collectables items. The Mechanical and Quartz Watches have both made a place for themselves and Market for both type of watches is on upside.
Traditi onal Watch Stati sti cs
Given below are some of interesting statistics for Traditional watches. These have been collated from Internet resources
Some Facts
1. Swiss Watch Industry is the leader in watch Making with 54% Market Share
2. Chinese watch industry produces more number of watches than Swiss but creates watches of cheaper variant
3. Swatch and Richemont are prominent hold-ing companies controlling most of the important Brands.
4. Independent Watch companies like Audemars Piguet & Patek Philippe (which make luxury time pieces) are able to hold on their own in spite of market consolidation. This is due to high quality time pieces and Brand Value that they have built
over centuries. 5. The most recognizable brand in Wrist Watches is
ROLEX. It has highest Market share for Luxury Watches.
What Dri��s A Traditiona� Wrist Watch
A Wrist Watch can be powered by Quartz movement or by a Mechanical Movement. Both these movements achieve the same purpose of measuring time accurately. However, they differ completely in the way how they do this. Lets try and understand both these.
Quartz:
Majority of clocks today use Quartz as their main component. Quartz is a crystal that vibrates when electricity is applied to it. In watch, a Quartz crystal is made to vibrate at a specifi c frequency which is counted by electronic circuit and converted to time as we know (seconds, minutes, hours). Most of the quartz crystals
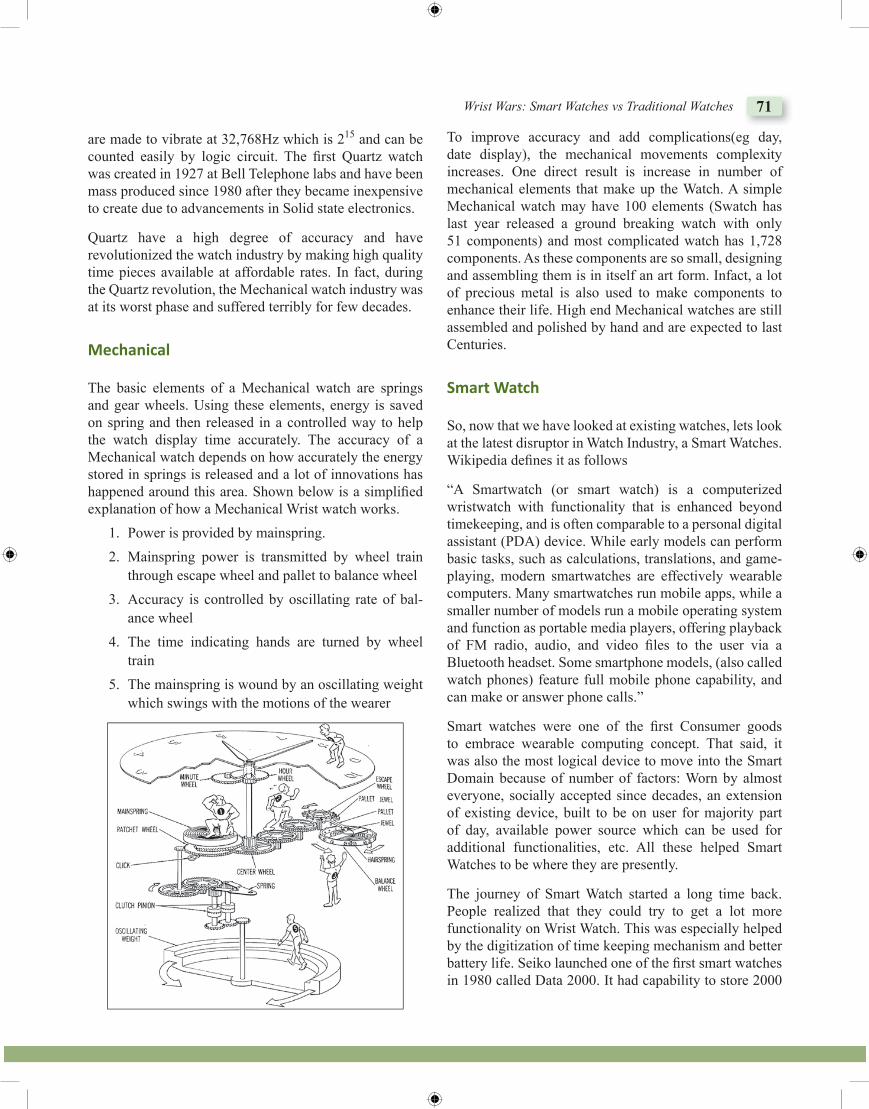
Wrist Wars: Smart Watches vs Traditional Watches 71
are made to vibrate at 32,768Hz which is 215 and can be counted easily by logic circuit. The fi rst Quartz watch was created in 1927 at Bell Telephone labs and have been mass produced since 1980 after they became inexpensive to create due to advancements in Solid state electronics.
Quartz have a high degree of accuracy and have revolutionized the watch industry by making high quality time pieces available at affordable rates. In fact, during the Quartz revolution, the Mechanical watch industry was at its worst phase and suffered terribly for few decades.
Mechanical
The basic elements of a Mechanical watch are springs and gear wheels. Using these elements, energy is saved on spring and then released in a controlled way to help the watch display time accurately. The accuracy of a Mechanical watch depends on how accurately the energy stored in springs is released and a lot of innovations has happened around this area. Shown below is a simplifi ed explanation of how a Mechanical Wrist watch works. 1. Power is provided by mainspring. 2. Mainspring power is transmitted by wheel train
through escape wheel and pallet to balance wheel 3. Accuracy is controlled by oscillating rate of bal-
ance wheel 4. The time indicating hands are turned by wheel
train 5. The mainspring is wound by an oscillating weight
which swings with the motions of the wearer
To improve accuracy and add complications(eg day, date display), the mechanical movements complexity increases. One direct result is increase in number of mechanical elements that make up the Watch. A simple Mechanical watch may have 100 elements (Swatch has last year released a ground breaking watch with only 51 components) and most complicated watch has 1,728 components. As these components are so small, designing and assembling them is in itself an art form. Infact, a lot of precious metal is also used to make components to enhance their life. High end Mechanical watches are still assembled and polished by hand and are expected to last Centuries.
Smart Watch
So, now that we have looked at existing watches, lets look at the latest disruptor in Watch Industry, a Smart Watches. Wikipedia defi nes it as follows
“A Smartwatch (or smart watch) is a computerized wristwatch with functionality that is enhanced beyond timekeeping, and is often comparable to a personal digital assistant (PDA) device. While early models can perform basic tasks, such as calculations, translations, and game-playing, modern smartwatches are effectively wearable computers. Many smartwatches run mobile apps, while a smaller number of models run a mobile operating system and function as portable media players, offering playback of FM radio, audio, and video fi les to the user via a Bluetooth headset. Some smartphone models, (also called watch phones) feature full mobile phone capability, and can make or answer phone calls.”
Smart watches were one of the fi rst Consumer goods to embrace wearable computing concept. That said, it was also the most logical device to move into the Smart Domain because of number of factors: Worn by almost everyone, socially accepted since decades, an extension of existing device, built to be on user for majority part of day, available power source which can be used for additional functionalities, etc. All these helped Smart Watches to be where they are presently.
The journey of Smart Watch started a long time back. People realized that they could try to get a lot more functionality on Wrist Watch. This was especially helped by the digitization of time keeping mechanism and better battery life. Seiko launched one of the fi rst smart watches in 1980 called Data 2000. It had capability to store 2000
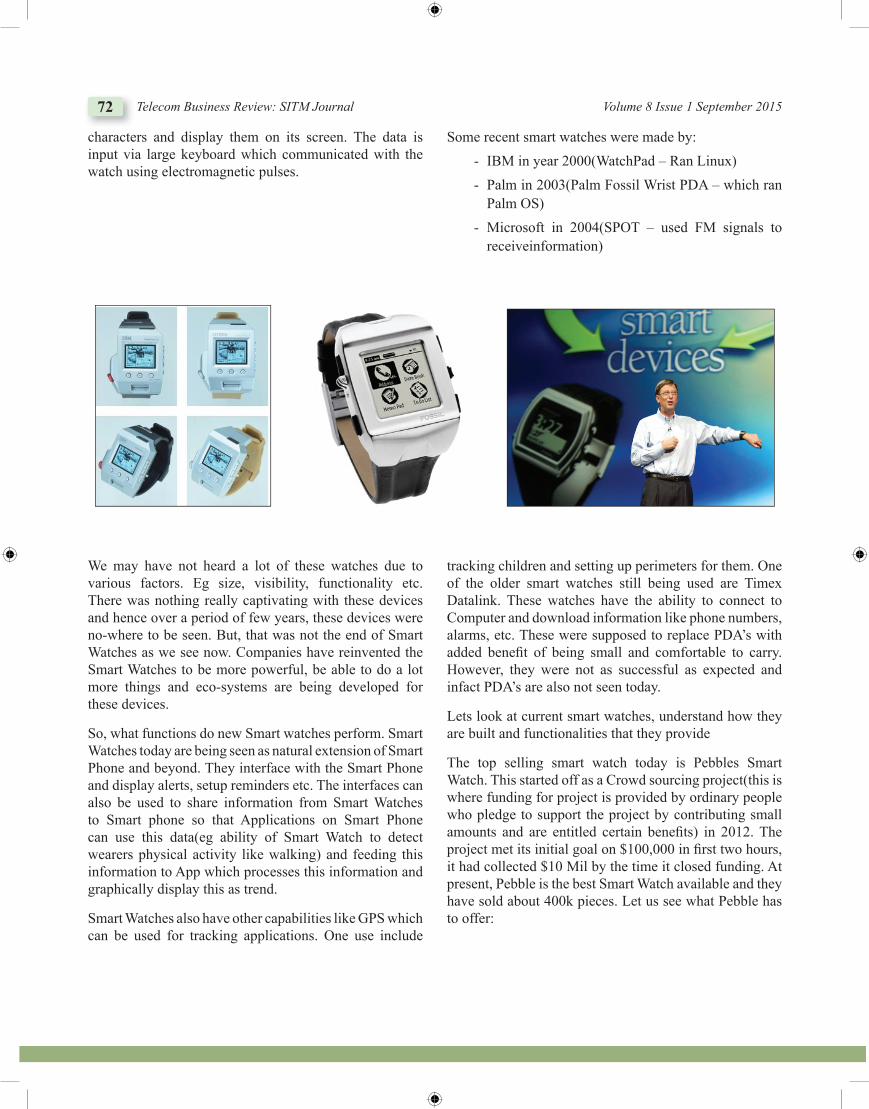
72 Telecom Business Review: SITM Journal Volume 8 Issue 1 September 2015
characters and display them on its screen. The data is input via large keyboard which communicated with the watch using electromagnetic pulses.
Some recent smart watches were made by: - IBM in year 2000(WatchPad – Ran Linux) - Palm in 2003(Palm Fossil Wrist PDA – which ran
Palm OS) - Microsoft in 2004(SPOT – used FM signals to
receiveinformation)
We may have not heard a lot of these watches due to various factors. Eg size, visibility, functionality etc. There was nothing really captivating with these devices and hence over a period of few years, these devices were no-where to be seen. But, that was not the end of Smart Watches as we see now. Companies have reinvented the Smart Watches to be more powerful, be able to do a lot more things and eco-systems are being developed for these devices.
So, what functions do new Smart watches perform. Smart Watches today are being seen as natural extension of Smart Phone and beyond. They interface with the Smart Phone and display alerts, setup reminders etc. The interfaces can also be used to share information from Smart Watches to Smart phone so that Applications on Smart Phone can use this data(eg ability of Smart Watch to detect wearers physical activity like walking) and feeding this information to App which processes this information and graphically display this as trend.
Smart Watches also have other capabilities like GPS which can be used for tracking applications. One use include
tracking children and setting up perimeters for them. One of the older smart watches still being used are Timex Datalink. These watches have the ability to connect to Computer and download information like phone numbers, alarms, etc. These were supposed to replace PDA’s with added benefi t of being small and comfortable to carry. However, they were not as successful as expected and infact PDA’s are also not seen today.
Lets look at current smart watches, understand how they are built and functionalities that they provide
The top selling smart watch today is Pebbles Smart Watch. This started off as a Crowd sourcing project(this is where funding for project is provided by ordinary people who pledge to support the project by contributing small amounts and are entitled certain benefi ts) in 2012. The project met its initial goal on $100,000 in fi rst two hours, it had collected $10 Mil by the time it closed funding. At present, Pebble is the best Smart Watch available and they have sold about 400k pieces. Let us see what Pebble has to offer:
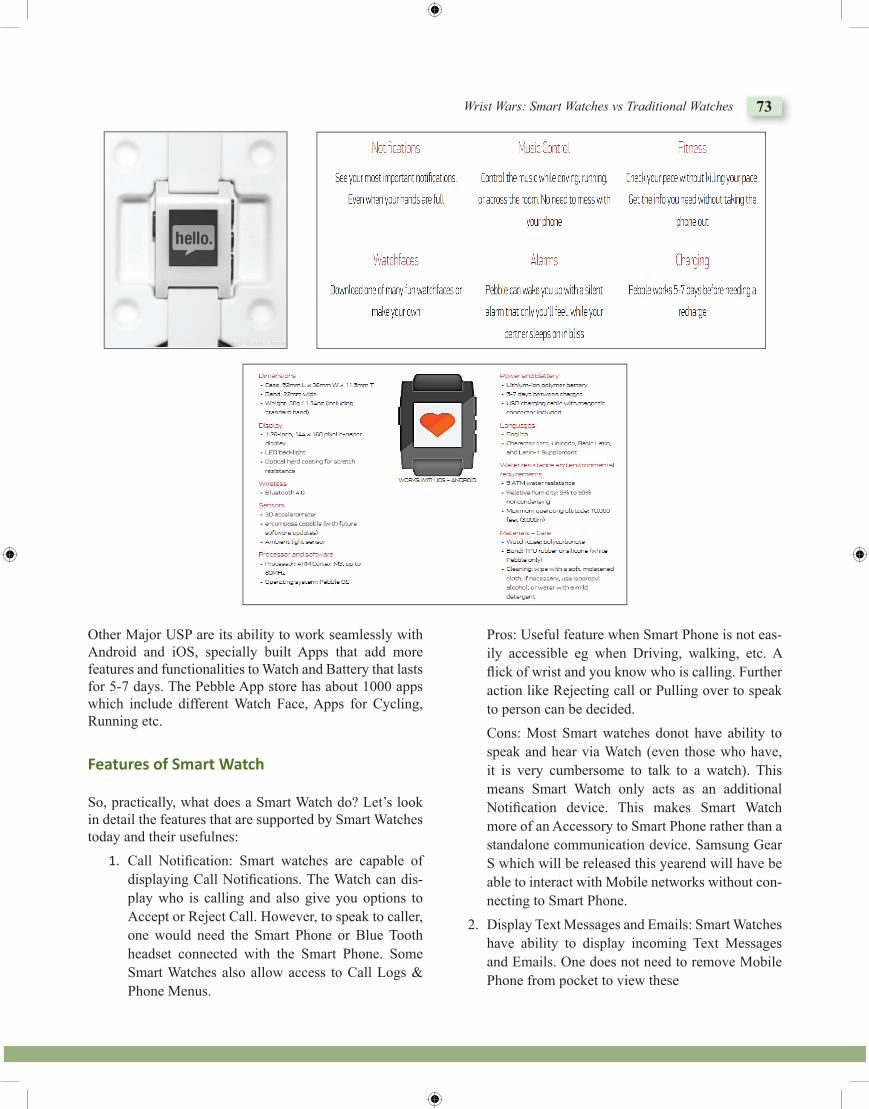
Wrist Wars: Smart Watches vs Traditional Watches 73
Other Major USP are its ability to work seamlessly with Android and iOS, specially built Apps that add more features and functionalities to Watch and Battery that lasts for 5-7 days. The Pebble App store has about 1000 apps which include different Watch Face, Apps for Cycling, Running etc.
Features of Smart Watch
So, practically, what does a Smart Watch do? Let’s look in detail the features that are supported by Smart Watches today and their usefulnes: 1. Call Notifi cation: Smart watches are capable of
displaying Call Notifi cations. The Watch can dis-play who is calling and also give you options to Accept or Reject Call. However, to speak to caller, one would need the Smart Phone or Blue Tooth headset connected with the Smart Phone. Some Smart Watches also allow access to Call Logs & Phone Menus.
Pros: Useful feature when Smart Phone is not eas-ily accessible eg when Driving, walking, etc. A fl ick of wrist and you know who is calling. Further action like Rejecting call or Pulling over to speak to person can be decided.
Cons: Most Smart watches donot have ability to speak and hear via Watch (even those who have, it is very cumbersome to talk to a watch). This means Smart Watch only acts as an additional Notifi cation device. This makes Smart Watch more of an Accessory to Smart Phone rather than a standalone communication device. Samsung Gear S which will be released this yearend will have be able to interact with Mobile networks without con-necting to Smart Phone.
2. Display Text Messages and Emails: Smart Watches have ability to display incoming Text Messages and Emails. One does not need to remove Mobile Phone from pocket to view these
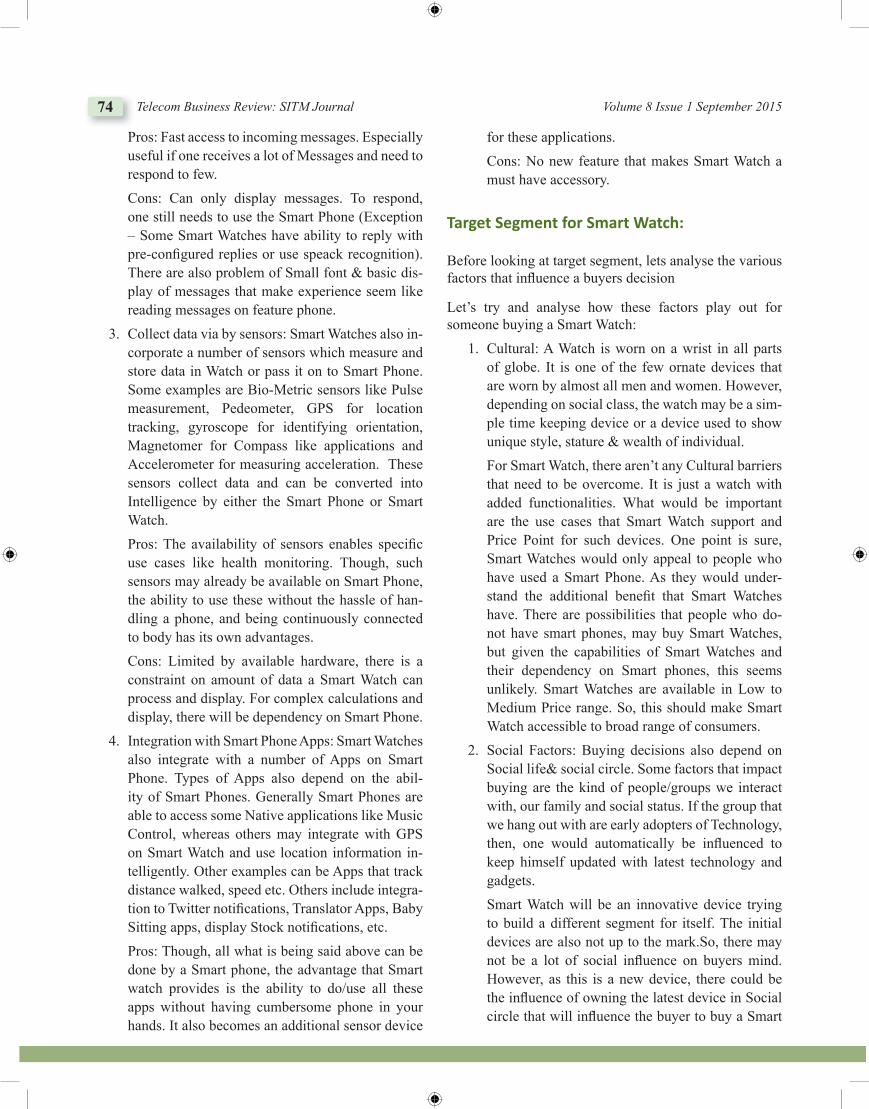
74 Telecom Business Review: SITM Journal Volume 8 Issue 1 September 2015
Pros: Fast access to incoming messages. Especially useful if one receives a lot of Messages and need to respond to few.
Cons: Can only display messages. To respond, one still needs to use the Smart Phone (Exception – Some Smart Watches have ability to reply with pre-confi gured replies or use speack recognition). There are also problem of Small font & basic dis-play of messages that make experience seem like reading messages on feature phone.
3. Collect data via by sensors: Smart Watches also in-corporate a number of sensors which measure and store data in Watch or pass it on to Smart Phone. Some examples are Bio-Metric sensors like Pulse measurement, Pedeometer, GPS for location tracking, gyroscope for identifying orientation, Magnetomer for Compass like applications and Accelerometer for measuring acceleration. These sensors collect data and can be converted into Intelligence by either the Smart Phone or Smart Watch.
Pros: The availability of sensors enables specifi c use cases like health monitoring. Though, such sensors may already be available on Smart Phone, the ability to use these without the hassle of han-dling a phone, and being continuously connected to body has its own advantages.
Cons: Limited by available hardware, there is a constraint on amount of data a Smart Watch can process and display. For complex calculations and display, there will be dependency on Smart Phone.
4. Integration with Smart Phone Apps: Smart Watches also integrate with a number of Apps on Smart Phone. Types of Apps also depend on the abil-ity of Smart Phones. Generally Smart Phones are able to access some Native applications like Music Control, whereas others may integrate with GPS on Smart Watch and use location information in-telligently. Other examples can be Apps that track distance walked, speed etc. Others include integra-tion to Twitter notifi cations, Translator Apps, Baby Sitting apps, display Stock notifi cations, etc.
Pros: Though, all what is being said above can be done by a Smart phone, the advantage that Smart watch provides is the ability to do/use all these apps without having cumbersome phone in your hands. It also becomes an additional sensor device
for these applications. Cons: No new feature that makes Smart Watch a
must have accessory.
Target Segment for Smart Watch:
Before looking at target segment, lets analyse the various factors that infl uence a buyers decision
Let’s try and analyse how these factors play out for someone buying a Smart Watch: 1. Cultural: A Watch is worn on a wrist in all parts
of globe. It is one of the few ornate devices that are worn by almost all men and women. However, depending on social class, the watch may be a sim-ple time keeping device or a device used to show unique style, stature & wealth of individual.
For Smart Watch, there aren’t any Cultural barriers that need to be overcome. It is just a watch with added functionalities. What would be important are the use cases that Smart Watch support and Price Point for such devices. One point is sure, Smart Watches would only appeal to people who have used a Smart Phone. As they would under-stand the additional benefi t that Smart Watches have. There are possibilities that people who do-not have smart phones, may buy Smart Watches, but given the capabilities of Smart Watches and their dependency on Smart phones, this seems unlikely. Smart Watches are available in Low to Medium Price range. So, this should make Smart Watch accessible to broad range of consumers.
2. Social Factors: Buying decisions also depend on Social life& social circle. Some factors that impact buying are the kind of people/groups we interact with, our family and social status. If the group that we hang out with are early adopters of Technology, then, one would automatically be infl uenced to keep himself updated with latest technology and gadgets.
Smart Watch will be an innovative device trying to build a different segment for itself. The initial devices are also not up to the mark.So, there may not be a lot of social infl uence on buyers mind. However, as this is a new device, there could be the infl uence of owning the latest device in Social circle that will infl uence the buyer to buy a Smart
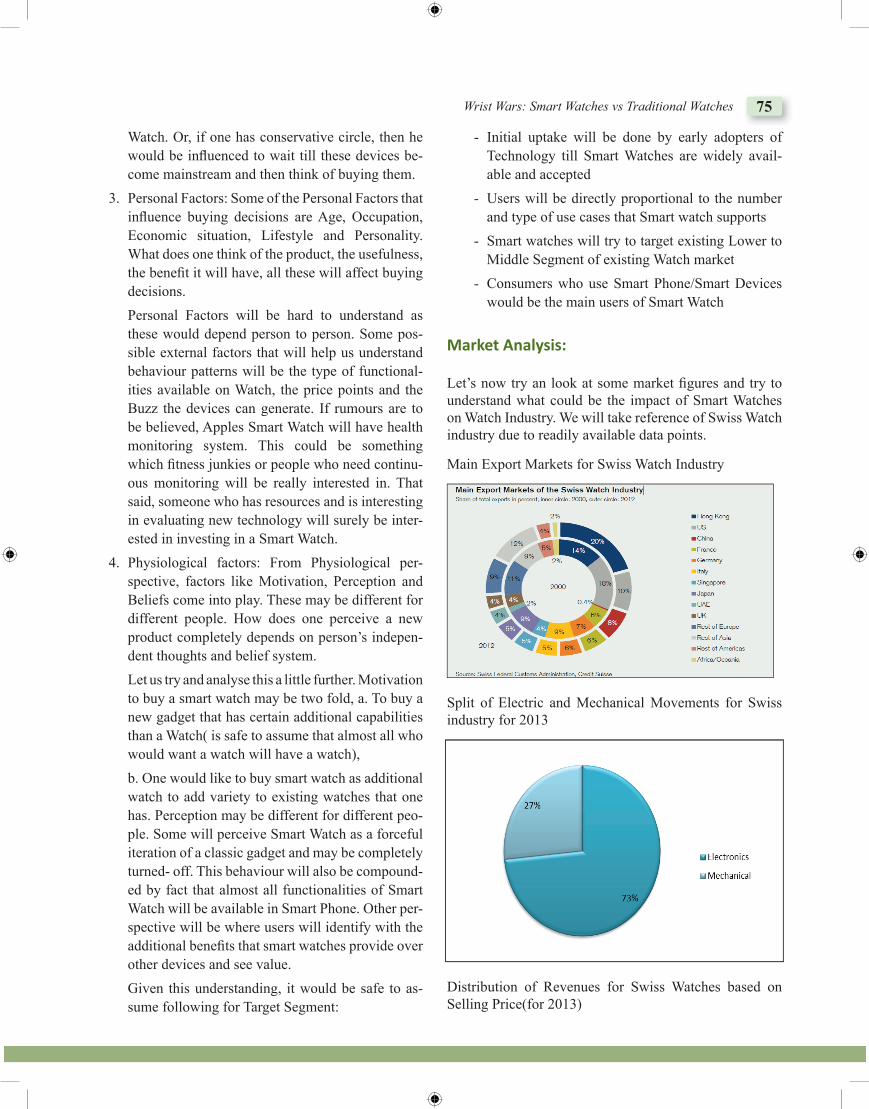
Wrist Wars: Smart Watches vs Traditional Watches 75
Watch. Or, if one has conservative circle, then he would be infl uenced to wait till these devices be-come mainstream and then think of buying them.
3. Personal Factors: Some of the Personal Factors that infl uence buying decisions are Age, Occupation, Economic situation, Lifestyle and Personality. What does one think of the product, the usefulness, the benefi t it will have, all these will affect buying decisions.
Personal Factors will be hard to understand as these would depend person to person. Some pos-sible external factors that will help us understand behaviour patterns will be the type of functional-ities available on Watch, the price points and the Buzz the devices can generate. If rumours are to be believed, Apples Smart Watch will have health monitoring system. This could be something which fi tness junkies or people who need continu-ous monitoring will be really interested in. That said, someone who has resources and is interesting in evaluating new technology will surely be inter-ested in investing in a Smart Watch.
4. Physiological factors: From Physiological per-spective, factors like Motivation, Perception and Beliefs come into play. These may be different for different people. How does one perceive a new product completely depends on person’s indepen-dent thoughts and belief system.
Let us try and analyse this a little further. Motivation to buy a smart watch may be two fold, a. To buy a new gadget that has certain additional capabilities than a Watch( is safe to assume that almost all who would want a watch will have a watch),
b. One would like to buy smart watch as additional watch to add variety to existing watches that one has. Perception may be different for different peo-ple. Some will perceive Smart Watch as a forceful iteration of a classic gadget and may be completely turned- off. This behaviour will also be compound-ed by fact that almost all functionalities of Smart Watch will be available in Smart Phone. Other per-spective will be where users will identify with the additional benefi ts that smart watches provide over other devices and see value.
Given this understanding, it would be safe to as-sume following for Target Segment:
- Initial uptake will be done by early adopters of Technology till Smart Watches are widely avail-able and accepted
- Users will be directly proportional to the number and type of use cases that Smart watch supports
- Smart watches will try to target existing Lower to Middle Segment of existing Watch market
- Consumers who use Smart Phone/Smart Devices would be the main users of Smart Watch
Market Analysis:
Let’s now try an look at some market fi gures and try to understand what could be the impact of Smart Watches on Watch Industry. We will take reference of Swiss Watch industry due to readily available data points.
Main Export Markets for Swiss Watch Industry
Split of Electric and Mechanical Movements for Swiss industry for 2013
Distribution of Revenues for Swiss Watches based on Selling Price(for 2013)
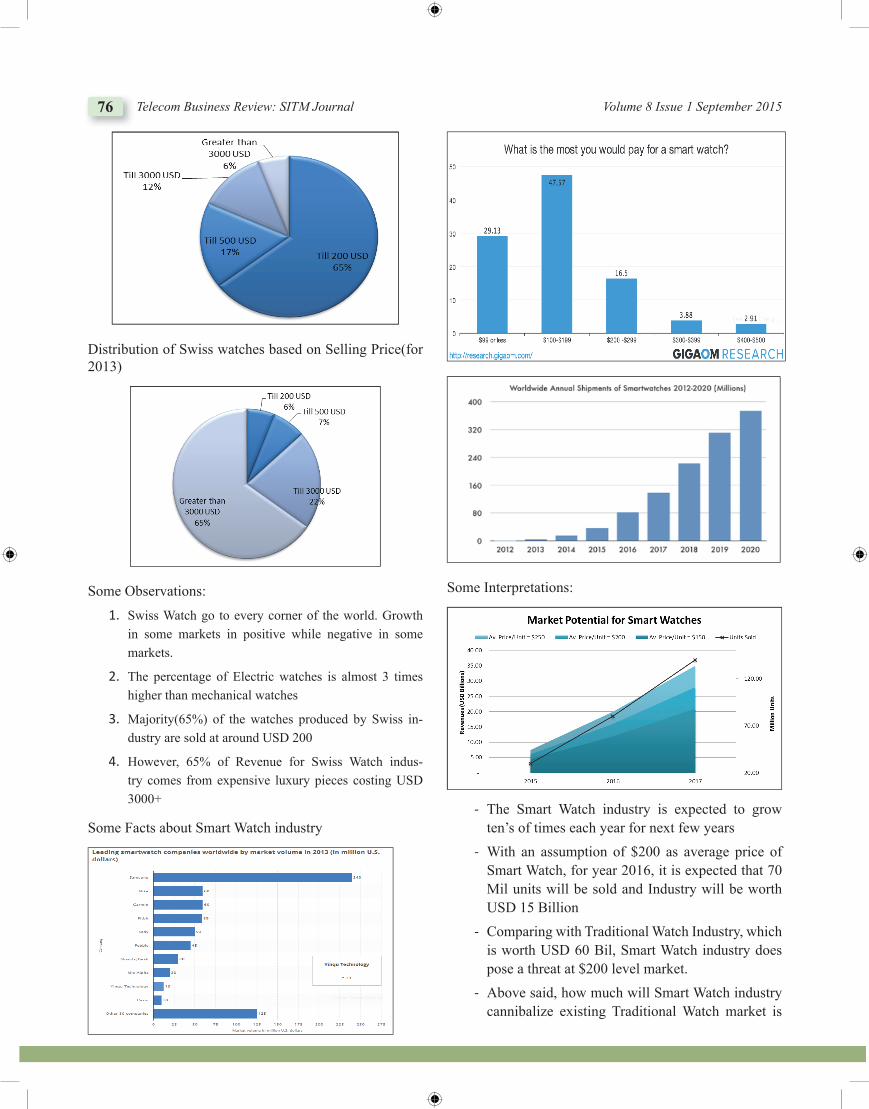
76 Telecom Business Review: SITM Journal Volume 8 Issue 1 September 2015
Distribution of Swiss watches based on Selling Price(for 2013)
Some Observations: 1. Swiss Watch go to every corner of the world. Growth
in some markets in positive while negative in some markets.
2. The percentage of Electric watches is almost 3 times higher than mechanical watches
3. Majority(65%) of the watches produced by Swiss in-dustry are sold at around USD 200
4. However, 65% of Revenue for Swiss Watch indus-try comes from expensive luxury pieces costing USD 3000+
Some Facts about Smart Watch industry
Some Interpretations:
- The Smart Watch industry is expected to grow ten’s of times each year for next few years
- With an assumption of $200 as average price of Smart Watch, for year 2016, it is expected that 70 Mil units will be sold and Industry will be worth USD 15 Billion
- Comparing with Traditional Watch Industry, which is worth USD 60 Bil, Smart Watch industry does pose a threat at $200 level market.
- Above said, how much will Smart Watch industry cannibalize existing Traditional Watch market is
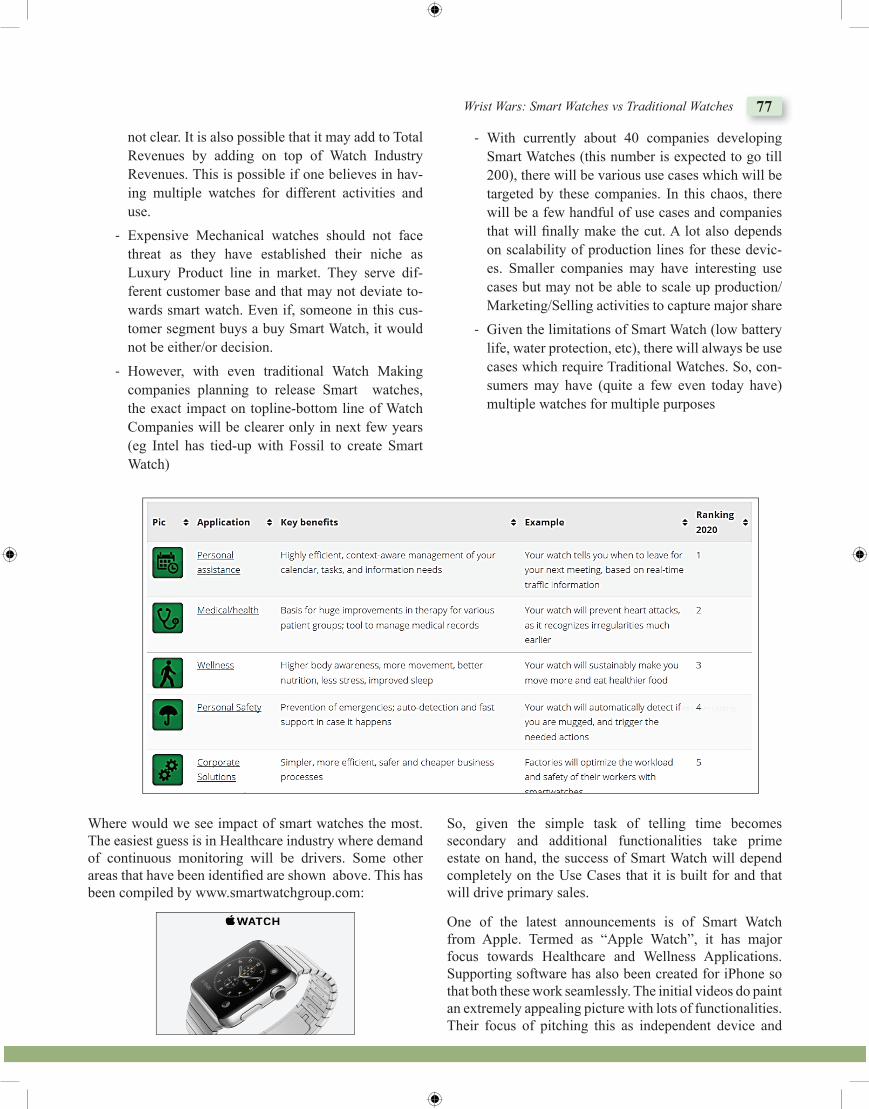
Wrist Wars: Smart Watches vs Traditional Watches 77
not clear. It is also possible that it may add to Total Revenues by adding on top of Watch Industry Revenues. This is possible if one believes in hav-ing multiple watches for different activities and use.
- Expensive Mechanical watches should not face threat as they have established their niche as Luxury Product line in market. They serve dif-ferent customer base and that may not deviate to-wards smart watch. Even if, someone in this cus-tomer segment buys a buy Smart Watch, it would not be either/or decision.
- However, with even traditional Watch Making companies planning to release Smart watches, the exact impact on topline-bottom line of Watch Companies will be clearer only in next few years (eg Intel has tied-up with Fossil to create Smart Watch)
- With currently about 40 companies developing Smart Watches (this number is expected to go till 200), there will be various use cases which will be targeted by these companies. In this chaos, there will be a few handful of use cases and companies that will fi nally make the cut. A lot also depends on scalability of production lines for these devic-es. Smaller companies may have interesting use cases but may not be able to scale up production/Marketing/Selling activities to capture major share
- Given the limitations of Smart Watch (low battery life, water protection, etc), there will always be use cases which require Traditional Watches. So, con-sumers may have (quite a few even today have) multiple watches for multiple purposes
Where would we see impact of smart watches the most. The easiest guess is in Healthcare industry where demand of continuous monitoring will be drivers. Some other areas that have been identifi ed are shown above. This has been compiled by www.smartwatchgroup.com:
So, given the simple task of telling time becomes secondary and additional functionalities take prime estate on hand, the success of Smart Watch will depend completely on the Use Cases that it is built for and that will drive primary sales.
One of the latest announcements is of Smart Watch from Apple. Termed as “Apple Watch”, it has major focus towards Healthcare and Wellness Applications. Supporting software has also been created for iPhone so that both these work seamlessly. The initial videos do paint an extremely appealing picture with lots of functionalities. Their focus of pitching this as independent device and
78 Telecom Business Review: SITM Journal Volume 8 Issue 1 September 2015
not as a perifery to existing Smart Phone should help its cause. It would be really interesting to see if this watch is the breakthorough that revolutionies and pushes Smart Watch industry towards its predicted growth.
Conc�usion
Smart watches signify next evolutionary leap in Smart Devices. Smart Wearable devices which remain on person for major part of day and help interacting with Physical and Digital world should turn a lot of heads. As this is a new market, there is no tried and tested winning formula. However, one thing is sure that this is an extremly interesting device that would be explored by lots of people. The availability of various and distinct use cases that device can do will directly impact Sales. Till the time a leader is clearly identifi ed with mass market proposition, the industry will be fragemented and we should see plathora of devices satisfying diverse use cases.
For Traditional Watch industry, Smart Watches should come as a Wake up call. At present, it doesnot seem as a major disruptor due to lack of acceptability, high entry barriers (Watch + Mobile combination), low battery life(as compared to currnet watches), etc to overall industry. We are also seeing interest of major Tech Companies in development of Smart watches. This should surely throw a lot of interesting propositions to consumers. The High End Traditional Watch Market dominated by Mechanical Watches may not be inpacted by Smart Watch growth, but the mid segment watch makers should keep a very close tab on this as this is the market that will heat up.
R���r�nc�s
Guinness World Record for fi rst wrist watch. Retrieved from http://www.guinnessworldrecords.com/re-cords-10000/fi rst -wristwatch/
Brief history of watches. Retrieved from http://web.ar-chive.org/web/20110828010223/http://steelwatch.co/history-of-watches.php
Jantar Mantar Sun Dial. Retrieved from http://www.delhitourism.gov.in/delhitourism/tourist_place/jantar_mantar.jsp
Watch Industry statistics. Retrieved from http://www.statisticbrain.com/wrist-watch-industry-statistics/
Watch Companies Statistics. Retrieved from ht tp: / /www.adammcfarland.com/2010/03/25/do-people-wear-watches-to-tell-time/
First Quartz Watch by Seiko. Retrieved from http://inven-tion.smithsonian.org/centerpieces/quartz/coolwatches/seiko.html
Watch Industry statistics ->http://www.statisticbrain.com/wrist-watch-industry-statistics/, http://www.fhs.ch/scripts/getstat.php?file=histo_gp_140606_a.pdf, http://www.fhs.ch/eng/statistics.html
How does a mechanical watch work. Retrieved from http://irondance.blogspot.in/2011/03/how-mechanical-watch-works.html
Most Complicated watch. Retrieved from http://g i z m o d o . c o m / 5 9 9 4 8 1 4 / t h i s - i s - t h e - w o r l d s -most-complicated-timepiece
History of Smart Watches. Retrieved from http://www.ibtimes.co.uk/smartwatch-history-apple-iwatch-sam-sung-galaxy-gear-503752
Watch for kids with GPS for Tracking. Retrieved from http://www.myfi lip.com/
Pebble Smart Watch. Retrieved from https://www.get-pebble.com/discoverhttp://en.wikipedia.org/wiki/Pebble_(watch)
Details of Samsung Gear Apps -> http://blog.gsmare-na.com/a/showpic.php?sImg=/14/08/samsung-gear-1000-apps/gsmarena_002.jpg>
Factors that affect Buyers decision. Retrieved from http://www.aipmm.com/html/newsletter/archives/000434.php
Smart Watch Statistics. Retrieved from http://www.forbes.com/sites/arieladams/2014/03/07/the-size-of-the-smartwatch-market-its-key-players/,http://www.forbes.com/sites/arieladams/2014/03/07/the-size-of-the-smartwatch-market-its-key-players/,http://www.statista.com/statistics/302544/leading-smart-watch-companies-worldwide/,http://nextmarket.co/blogs/news-1/9278081-smartwatch-market-forecast-to-grow-from-15-million-in-2014-to-373-million-by-2020
Citi Research report on Smart Watch Industry with expect-ed impact on Traditional Watch Companies. Retrieved from https://ir.citi.com/lefzvOcuXGCWa6TPs5y4HMc5unsGpVaNYPrgSsTpXP5+g1C0338+7Q
Trends impacting Watch Industry. Retrieved from http://www.europastar.com/world-watch-report/ 1004086164-the-worldwatchreport-tm-2013-high-lights-the.html
Watch statistics. Retrieved from http://www.statista.com/statistics/302573/units-shipped-of-the-leading-smart-watch-companies-worldwide/

Wrist Wars: Smart Watches vs Traditional Watches 79
Smart Watch Research Company. Retrieved from http://www.smartwatchgroup.com/
Rolex First Waterproof Watch. Retrieved from http://www.rolex.com/about-rolex/rolex-history/1926-1947.html
Bri�� Bio o� Author:
Rahul is a Senior Business Consultant working with Ericsson India Global Services. He has 11+ years of Industry experienced and has worked with Mobile Operators and Telecom Vendors. He has experience in various areas like Core Networks, VAS and Next Generation products like NGIN & SDP. He is also local subject matter expert for M2M. Rahul has an Engineering degree from Mumbai University. In his prior roles, he has worked in NOC & Operations teams, Corporate Planning teams and as a Pre-Sales Solution Architect in organizations such as Loop Mobile, Tata Teleservices Ltd and Ericsson India.
Guidelines For Author
Please use the checklist provided below to ensure that your paper meets the requirements prior to submission. In case of noncompliance to these guidelines, your paper will be excluded from being published. Please send us your paper in MS word format, not PDF files for blind review. 1. The maximum size should be 3000 words including tables, references etc. 2. Title of the paper is no more than 15 words, centered and in 16pt font. 3. Section/sub-titles are in numbered sequentially, in bold and 14pt font. 4. All text should be in 12-point Times New Roman Font, Justified, Double spaced, 1 inch margin on all four sides.
Professionally drawn graphs and diagrams must be provided wherever necessary along with the manuscript. 5. Figures, tables and charts are included within the body of the paper. 6. Footnotes, figures, tables and graphs should be numbered serially and should appear at desirable place in the text
itself, with proper reference made in the text. Wherever necessary, the source should be indicated at the bottom. 7. Figures, text or tables are not colored or shaded. 8. Tables or figures do not break across two pages. 9. No footnotes, but End-notes are included. 10. Paper has been checked for grammar and spelling. 11. References should be given separately at the end of the paper and arranged in alphabetical order APA style. The
list should include only work the author/s has cited.
The Following Style Should be Strictly Followed
For Periodicals
The author/s name, year of publication, title of the article, journal name, volume and number, and the page numbers of the article should be provided. For example: Tobin, J. 1958. Liquidity preference as behavior towards risk. Review of Economic Studies, 25(2): 65-86.
For Books
Dubrin, A. 1984. Foundations of organizationalbehavior: An applied approach. New Jersey: Prentice Hall Taylor, B. and Willis, G. (Eds.). 1970. Pricing strategy. Princeton, NJ: Brandon System.
If an Article Has no Author, The Periodical or Newspaper is Referenced as Follows
Business Standard. 2003. TCL beats Baron in FIPB war. December 16: 12.
For Chapters in Books, Follow This Form
Srinivas, E.S. 1994. Perceived Quality of Working Life (PQWL) and organisational commitment: A study of managers in select organisations. In N.K. Gupta and A. Ahmad (Eds.), Management Research: Contemporary Issues. New Delhi: South Asia Publications.
For Working Papers, Dissertations and Papers Presented at Meetings
Sachs, J.D., Bajpai N. and Ramiah, A. 2002. Understanding regional growth in India. CID Working Paper No. 88. Center for International Development, Harvard University, Massashusetts.
For Electronic Documents
Give the author’s name, if known and year of publication; or give the periodical/newspaper’s name or the organisation’s name asauthor. This should be followed by the full title of the document; the http, or other addresses; and the date the document was posted or accessed. Basu, I. 2004. India’s thorny FDI rule under scrutiny. Asia Times.
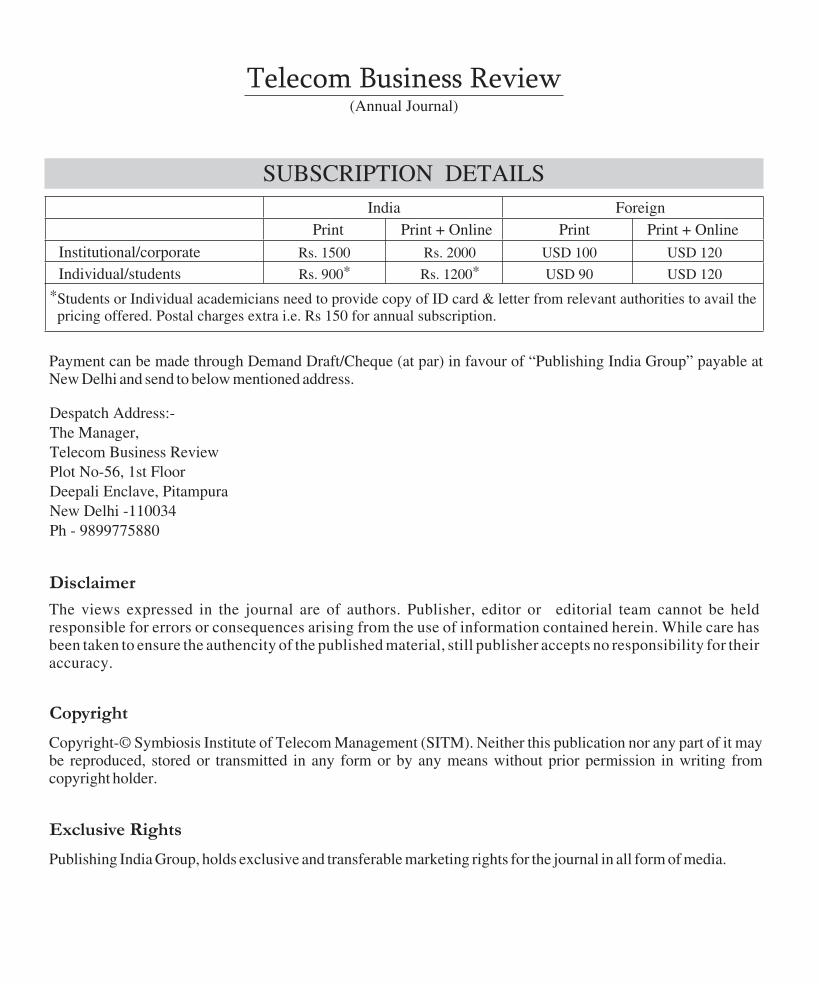
Chairman of the Editorial Board: Prof. Sunil PatilDirector Symbiosis Institute of Telecom Management, Pune.
Secretary and Member of the Editorial Board: Dr Sujata JoshiAssociate Professor (Marketing), Symbiosis Institute of Telecom Management, Pune.
Dr. Sam DzeverProfessor, Telecom Ecole de Management, France.
Dr. Maria Bruna ZolinDeputy-head of the School of Asian Studies and Business Management, Department of Economics, Ca' Foscari University of Venice, Italy.
Dr. N.K. ChidambaranAssistant Professor in Finance, Graduate School of Business, Fordham University, New York, USA.
Dr. Vidyasagar PotdarSenior Research Fellow, School of Information Systems, Curtin Business School, Curtin University, Perth, Western Australia.
Dr. Archana Bhosale DeshmukhAdjunct faculty (Electronics and Computer Engineering) at ITT Technical School, Austin.
Dr. Bhumika GuptaAssociate Professor, Telecom Ecole de Management, France.
Dr. Yogesh PatilResearch Mentor - Faculty of Management, Symbiosis International University (SIU) &Associate Professor (Energy & Environmental Management), Symbiosis Institute of International Business (SIIB), India
Dr. Omkarprasad VaidyaProfessor of SCM & Operations, Indian Institute of Management (IIM), Lucknow, India.Dr. Rameshwar DubeyAssociate Professor-Operations Management, Symbiosis International University, Pune, India.
Dr. R. VenkateshwaranSr. Vice President & CTO, Persistent Systems Ltd., India.
Dr. V. SridharProfessor, Centre for Information Technology and Public Policy (CITAPP), International Institute of Information Technology Bangalore, India
Dr. Kirankumar S. MomayaProfessor, Technology Management, IB and CompetitivenessShailesh J. Mehta School of Management (SJMSOM)Indian Institute of Technology Bombay (IITB), Powai, Mumbai, India.
Dr. KSS IyerHonorary Adjunct Professor, Symbiosis Institute of Telecom Management, Pune., India.
Dr. Pramod DamleProfessor (Telecom &IT) Symbiosis Institute of Telecom Management, Pune, India.
Prof. Prasanna KulkarniAssociate Professor, Symbiosis Institute of Telecom Management, Pune, India.
Dr. Giri HallurAssistant Professor (Telecom), Symbiosis Institute of Telecom Management, Pune, India.
Dr. Trupti DhoteAssistant Professor (Marketing), Symbiosis Institute of Telecom Management, Pune, India.
Telecom Business Review(Annual Journal)
SUBSCRIPTION DETAILS
*Students or Individual academicians need to provide copy of ID card & letter from relevant authorities to avail the pricing offered. Postal charges extra i.e. Rs 150 for annual subscription.
Payment can be made through Demand Draft/Cheque (at par) in favour of “Publishing India Group” payable at New Delhi and send to below mentioned address.
TELECOM BUSINESS REVIEW
India Foreign
Print Print + Online
Institutional/corporate Rs. 1500
Despatch Address:-The Manager,Telecom Business ReviewPlot No-56, 1st FloorDeepali Enclave, PitampuraNew Delhi -110034Ph - 9899775880
Disclaimer
The views expressed in the journal are of authors. Publisher, editor or editorial team cannot be held responsible for errors or consequences arising from the use of information contained herein. While care has been taken to ensure the authencity of the published material, still publisher accepts no responsibility for their accuracy.
Copyright
Rs. 2000 USD 100 USD 120
Individual/students *Rs. 900 USD 90 USD 120*Rs. 1200
Copyright-© Symbiosis Institute of Telecom Management (SITM). Neither this publication nor any part of it may be reproduced, stored or transmitted in any form or by any means without prior permission in writing from copyright holder.
Exclusive Rights
Publishing India Group, holds exclusive and transferable marketing rights for the journal in all form of media.
Print Print + Online Editorial Board
Editorial Review Board
ISSN: 0973-9114
1. Flexible Spectrum Management: 9Approaches for India Arturo Basaure, Heikki Kokkinen, Heikki Hämmäinen, V. Sridhar
2. Management of Service Gaps by Infusion 18Model’ – of Technology Roshan Kazi, Sandeep Prabhu
3. Exploration of Product Centric Factors 28 in Telecom Industry
Swati Ganeti, Rajat Agarwal, Murali Krishna Medudula, Mahim Sagar
4. On the History of Telecommunication: Patents, 37Disputes and Rivalries that Shaped the ModernTelecommunication IndustryIndraneel Dabhade, Mohan Dewan
5. Social Networking Sites Continuance: An Application 48of Extended Theory of Planned Behaviour Himanshu Rajput
6. Analyzing the Indian Subscriber Behavior Towards 63Mobile Social Media - A Data Monetization &Customer Engagement PerspectiveSohag Sarkar
7. Innovative Product Management Driving Enhanced 69Customer Experience Management (CEM) Niladri Shekhar Dutta
8. Wrist Wars: Smart Watches vs Traditional Watches 80Rahul Darmwal
Volume 8 Issue 1 SEPTEMBER 2015
Telecom Business Review
A Journal of SITM (TBR) is an annual journal of Symbiosis Institute Of telecom Management. TBR is a referred journal with a process of double blind review
The Journal is published every year by SITM with the objective of participating and promoting research in the field of Telecom, IT and Business. TBR contains valuable inputs in the different areas related to technology as well as business and helps the readers to keep abreast of the current trends in the area of telecom business. Papers are invited from authors in varied areas related to telecom business such as:
•Wire-line & Wireless Networks.•Telecom Regulation, Spectrum Allocation, Interconnection, Quality of Service (QoS) etc.•E-Governance.•Marketing: Trends in Telecom / IT at Global/ Indian Level.•Financial, Accounting Issues in Telecom/ IT.•OSS/BSS, Network Security, Telecom Network Management.•Project Management in Telecom/ IT.•IT Risk Management and IT Infrastructure Management.
Plot No. 56, 1st Floor, Deepali EnclavePitampura, New Delhi-110034, India
Tel.: +91-9899775880Email: [email protected]
Website: www.publishingindia.com
Publishing India Group
Journal in Association With:
Te
leco
m B
usin
ess R
ev
iew
Vo
lum
e 8
Issue
1S
ep
tem
be
r 20
15
ISSN 0973-9114
9 770973 911009
Constituent of Symbiosis International University (SIU). (Established under Section 3 of
the UGC Act 1956, by notification No. F 9-12/2001-U 3 of the Government of India),
Symbiosis Knowledge Village, Village Lavale, Mulshi Taluka, Pune-412115.
Phone: +91-20-3911 6177 (Office Direct), 39116180. Fax: 39116181
Email: [email protected], Website: www.sitm.ac.in
Accredited by NAAC with “A” Grade
SYMBIOSIS INSTITUTE OF TELECOM MANAGEMENT