
Securing Collaborative Spectrum Sensing against Untrustworthy Secondary Users in Cognitive Radio...
15
Hindawi Publishing Corporation EURASIP Journal on Advances in Signal Processing Volume 2010, Article ID 695750, 15 pages doi:10.1155/2010/695750 Research Article Securing Collaborative Spectrum Sensing against Untrustworthy Secondary Users in Cognitive Radio Networks Wenkai Wang, 1 Husheng Li, 2 Yan (Lindsay) Sun, 1 and Zhu Han 3 1 Department of Electrical, Computer and Biomedical Engineering, University of Rhode Island, Kingston, RI 02881, USA 2 Department of Electrical Engineering and Computer Science, University of Tennessee, Knoxville, TN 37996, USA 3 Department of Electrical and Computer Engineering, University of Houston, Houston, TX 77004, USA Correspondence should be addressed to Wenkai Wang, [email protected] Received 14 May 2009; Revised 14 September 2009; Accepted 1 October 2009 Academic Editor: Jinho Choi Copyright © 2010 Wenkai Wang et al. This is an open access article distributed under the Creative Commons Attribution License, which permits unrestricted use, distribution, and reproduction in any medium, provided the original work is properly cited. Cognitive radio is a revolutionary paradigm to migrate the spectrum scarcity problem in wireless networks. In cognitive radio networks, collaborative spectrum sensing is considered as an effective method to improve the performance of primary user detection. For current collaborative spectrum sensing schemes, secondary users are usually assumed to report their sensing information honestly. However, compromised nodes can send false sensing information to mislead the system. In this paper, we study the detection of untrustworthy secondary users in cognitive radio networks. We first analyze the case when there is only one compromised node in collaborative spectrum sensing schemes. Then we investigate the scenario that there are multiple compromised nodes. Defense schemes are proposed to detect malicious nodes according to their reporting histories. We calculate the suspicious level of all nodes based on their reports. The reports from nodes with high suspicious levels will be excluded in decision-making. Compared with existing defense methods, the proposed scheme can effectively differentiate malicious nodes and honest nodes. As a result, it can significantly improve the performance of collaborative sensing. For example, when there are 10 secondary users, with the primary user detection rate being equal to 0.99, one malicious user can make the false alarm rate (P f ) increase to 72%. The proposed scheme can reduce it to 5%. Two malicious users can make P f increase to 85% and the proposed scheme reduces it to 8%. 1. Introduction Nowadays the available wireless spectrum becomes more and more scarce due to increasing spectrum demand for new wireless applications. It is obvious that current static fre- quency allocation policy cannot meet the needs of emerging applications. Cognitive radio networks [1–3], which have been widely studied recently, are considered as a promising technology to migrate the spectrum shortage problem. In cognitive radio networks, secondary users are allowed to opportunistically access spectrums which have already been allocated to primary users, given that they do not cause harmful interference to the operation of primary users. In order to access available spectrums, secondary users have to detect the vacant spectrum resources by themselves without changing the operations of primary users. Existing detection schemes include matched filter, energy detection, cyclosta- tionary detection, and wavelet detection [2–6]. Among these schemes, energy detection is commonly adopted because it does not require a priori information of primary users. It is known that wireless channels are subject to fading and shadowing. When secondary users experience multipath fading or happen to be shadowed, they may fail to detect the existence of primary signal. As a result, it will cause interference to primary users if they try to access this occupied spectrum. To cope with this problem, collaborative spectrum sensing [7–12] is proposed. It combines sensing results of multiple secondary users to improve the probability of primary user detection. There are many works that address the cooperative spectrum sensing schemes and challenges. The performance of hard-decision combining scheme and soft-decision combining scheme is investigated in [7, 8]. In these schemes, all secondary users send sensing reports to a common decision center. Cooperative sensing can also be done in a distributed way, where secondary users collect reports from their neighbors and make the decision
Transcript of Securing Collaborative Spectrum Sensing against Untrustworthy Secondary Users in Cognitive Radio...

Hindawi Publishing CorporationEURASIP Journal on Advances in Signal ProcessingVolume 2010, Article ID 695750, 15 pagesdoi:10.1155/2010/695750
Research Article
Securing Collaborative Spectrum Sensing against UntrustworthySecondary Users in Cognitive Radio Networks
WenkaiWang,1 Husheng Li,2 Yan (Lindsay) Sun,1 and Zhu Han3
1Department of Electrical, Computer and Biomedical Engineering, University of Rhode Island, Kingston, RI 02881, USA2Department of Electrical Engineering and Computer Science, University of Tennessee, Knoxville, TN 37996, USA3Department of Electrical and Computer Engineering, University of Houston, Houston, TX 77004, USA
Correspondence should be addressed to Wenkai Wang, [email protected]
Received 14 May 2009; Revised 14 September 2009; Accepted 1 October 2009
Academic Editor: Jinho Choi
Copyright © 2010 Wenkai Wang et al. This is an open access article distributed under the Creative Commons Attribution License,which permits unrestricted use, distribution, and reproduction in any medium, provided the original work is properly cited.
Cognitive radio is a revolutionary paradigm to migrate the spectrum scarcity problem in wireless networks. In cognitive radionetworks, collaborative spectrum sensing is considered as an effective method to improve the performance of primary userdetection. For current collaborative spectrum sensing schemes, secondary users are usually assumed to report their sensinginformation honestly. However, compromised nodes can send false sensing information to mislead the system. In this paper,we study the detection of untrustworthy secondary users in cognitive radio networks. We first analyze the case when there isonly one compromised node in collaborative spectrum sensing schemes. Then we investigate the scenario that there are multiplecompromised nodes. Defense schemes are proposed to detect malicious nodes according to their reporting histories. We calculatethe suspicious level of all nodes based on their reports. The reports from nodes with high suspicious levels will be excluded indecision-making. Compared with existing defense methods, the proposed scheme can effectively differentiate malicious nodes andhonest nodes. As a result, it can significantly improve the performance of collaborative sensing. For example, when there are 10secondary users, with the primary user detection rate being equal to 0.99, one malicious user can make the false alarm rate (Pf )increase to 72%. The proposed scheme can reduce it to 5%. Two malicious users can make Pf increase to 85% and the proposedscheme reduces it to 8%.
1. Introduction
Nowadays the available wireless spectrum becomes more andmore scarce due to increasing spectrum demand for newwireless applications. It is obvious that current static fre-quency allocation policy cannot meet the needs of emergingapplications. Cognitive radio networks [1–3], which havebeen widely studied recently, are considered as a promisingtechnology to migrate the spectrum shortage problem. Incognitive radio networks, secondary users are allowed toopportunistically access spectrums which have already beenallocated to primary users, given that they do not causeharmful interference to the operation of primary users. Inorder to access available spectrums, secondary users have todetect the vacant spectrum resources by themselves withoutchanging the operations of primary users. Existing detectionschemes include matched filter, energy detection, cyclosta-tionary detection, and wavelet detection [2–6]. Among these
schemes, energy detection is commonly adopted because itdoes not require a priori information of primary users.
It is known that wireless channels are subject to fadingand shadowing. When secondary users experience multipathfading or happen to be shadowed, they may fail to detectthe existence of primary signal. As a result, it will causeinterference to primary users if they try to access thisoccupied spectrum. To cope with this problem, collaborativespectrum sensing [7–12] is proposed. It combines sensingresults of multiple secondary users to improve the probabilityof primary user detection. There are many works that addressthe cooperative spectrum sensing schemes and challenges.The performance of hard-decision combining scheme andsoft-decision combining scheme is investigated in [7, 8].In these schemes, all secondary users send sensing reportsto a common decision center. Cooperative sensing canalso be done in a distributed way, where secondary userscollect reports from their neighbors and make the decision
2 EURASIP Journal on Advances in Signal Processing
individually [13–15]. Optimized cooperative sensing is stud-ied in [16, 17]. When the channel that forwards sensingobservations experiences fading, the sensing performancedegrades significantly. This issue is investigated in [18, 19].Furthermore, energy efficiency in collaborative spectrumsensing is addressed in [20].
There are some works that address the security issues ofcognitive radio networks. Primary user emulation attack isanalyzed in [21, 22]. In this attack, malicious users transmitfake signals which have similar feature of primary signal.In this way attacker can mislead legitimate secondary usersto believe that primary user is present. The defense schemein [21] is to identify malicious user by estimating locationinformation and observing received signal strength (RSS).In [22], it uses signal classification algorithms to distinguishprimary signal and secondary signal. Primary user emulationattack is an outsider attack, targeting both collaborativeand noncollaborative spectrum sensing. Another type ofattack is insider attack that targets collaborative spectrumsensing. In current collaborative sensing schemes, secondaryusers are often assumed to report their sensing informationhonestly. However, it is quite possible that wireless devicesare compromised by malicious parties. Compromised nodescan send false sensing information to mislead the system.A natural defense scheme [23] is to change the decisionrule. The revised rule is, when there are k − 1 maliciousnodes, the decision result is on only if there are at least knodes reporting on. However, this defense scheme has threedisadvantages. First, the scheme does not specify how toestimate the number of malicious users, which is difficult tomeasure in practice. Second, the scheme will not work insoft-decision case, in which secondary users report sensedenergy level instead of binary hard decisions. Third, thescheme has very high false alarm rate when there are multipleattackers. This will be shown by the simulation results inSection 4. The problem of dishonest users in distributedspectrum sensing is discussed in [24]. The defense scheme inthis work requires secondary users to collect sensing reportsfrom their neighbors when confirmative decision cannotbe made. The scheme is also only applied to hard-decisionreporting case. Finally, current security issues in cognitiveradio networks, including attacks and corresponding defenseschemes, are concluded in [25].
In this paper, we develop defense solutions againstone or multiple malicious secondary users in soft-decisionreporting collaborative spectrum sensing. We first analyzethe single malicious user case. The suspicious level of eachnode is estimated by their reporting histories. When thesuspicious level of a node goes beyond certain threshold,it will be considered as malicious and its report will beexcluded in decision-making. Then, we extend this defensemethod to handle multiple attackers by using an “onion-peeling approach.” The idea is to detect malicious users ina batch-by-batch way. The nodes are classified into two sets,honest set and malicious set. Initially all users are assumedto be honest. When one node is detected to be maliciousaccording to its accumulated suspicious level, it will bemoved into malicious set. The way to calculate suspiciouslevel will be updated when the malicious node set is updated.
This procedure continues until no new malicious node canbe found.
Extensive simulations are conducted. We simulate thecollaborative sensing scheme without defense, the straight-forward defense scheme in [23], and the proposed schemewith different parameter settings. We observe that even a sin-gle malicious node can significantly degrade the performanceof spectrum sensing when no defense scheme is employed.And multiple malicious nodes can make the performanceeven much worse. Compared with existing defense methods,the proposed scheme can effectively differentiate honestnodes from malicious nodes and significantly improve theperformance of collaborative spectrum sensing. For example,when there are 10 secondary users, with the primary userdetection rate being equal to 0.99, one malicious user canmake the false alarm rate (Pf ) increase to 72%. While asimple defense scheme can reduce Pf to 13%, the proposedscheme reduces it to 5%. Two malicious users can make Pf
increase to 85%, the simple defense scheme can reduce Pf
to 23%, the proposed scheme reduces it to 8%. We studythe scenario that malicious nodes dynamically change theirattack behavior. Results show that the scheme can effectivelycapture the dynamic change of nodes. For example, if a nodebehaves well for a long time and suddenly turns bad, theproposed scheme rapidly increases the suspicious level of thisnode. If it only behaves badly for a few times, the proposedscheme allows slow recovery of its suspicious level.
The rest of paper is organized as follows. Section 2describes the system model. Attack models and the proposedscheme are presented in Section 3. In Section 4, simulationresults are demonstrated. Conclusion is drawn in Section 5.
2. SystemModel
Studies show that collaborative spectrum sensing can signif-icantly improve the performance of primary user detection[7, 8]. While most collaborative spectrum sensing schemesassume that secondary users are trustworthy, it is possiblethat attackers compromise cognitive radio nodes and makethem send false sensing information. In this section, wedescribe the scenario of collaborative spectrum sensing andpresent two attack models.
2.1. Collaborative Spectrum Sensing. In cognitive radionetworks, secondary users are allowed to opportunisti-cally access available spectrum resources. Spectrum sensingshould be performed constantly to check vacant frequencybands. For the detection based on energy level, spectrumsensing performs the hypothesis test
yi =⎧⎨
⎩
ni, H0 (channel is idle),
his + ni, H1(channel is busy
),
(1)
where yi is the sensed energy level at the ith secondary user, sis the signal transmitted by the primary user, ni is the additivewhite Gaussian noise (AWGN), and hi is the channel gainfrom the primary transmitter to the ith secondary user.
We denote by Yi the sensed energy for the ith cognitiveuser in T time slots, γi the received signal-to-noise ratio
EURASIP Journal on Advances in Signal Processing 3
(SNR), and TW the time-bandwidth product. Accordingto [7], Yi follows centralized χ2 distribution under H0 andnoncentralized χ2 distribution under H1:
Yi ∼⎧⎨
⎩
χ22TW , H0,
χ22TW
(2γi), H1.
(2)
From (2), we can see that under H0 the probability P(Yi =yi | H0) depends on TW only. Under H1, P(Yi = yi | H1)depends on TW and γi. Recall that γi is the received SNR ofsecondary user i, which can be estimated according to pathloss model and location information.
By comparing yi with a threshold λi, secondary usermakes a decision about whether the primary user is present.As a result, the detection probability Pi
d and false alarmprobability Pi
f are given by
Pid = P
(yi > λi | H1
), (3)
Pif = P
(yi > λi | H0
), (4)
respectively.Notice that (3) and (4) are detection rate and false rate
for single secondary user. In practice it is known that wirelesschannels are subject to multipath fading or shadowing.The performance of spectrum sensing degrades significantlywhen secondary users experience fading or happen tobe shadowed [7, 8]. Collaborative sensing is proposed toalleviate this problem. It combines sensing information ofseveral secondary users to make more accurate detection. Forexample, considering collaborative spectrum sensing with Nsecondary users. When OR-rule, that is, the detection resultof primary user is on if any secondary user reports on, isthe decision rule, the detection probability and false-alarmprobability for collaborative sensing are [7, 8]
Qd = 1−N∏
i=1
(
1− Pid
)
, (5)
Qf = 1−N∏
i=1
(
1− Pif
)
, (6)
respectively. A scenario of collaborative spectrum sensing isdemonstrated in Figure 1. We can see that with OR rule,decision center will miss detect the existence of primary useronly when all secondary users miss detect it.
2.2. Attack Model. The compromised secondary users canreport false sensing information to the decision center.According to the way they send false sensing reports,attackers can be classified into two categories: selfish usersand malicious users. The selfish users report yes or highenergy level when their sensed energy level is low. In thisway they intentionally cause false alarm such that they canuse the available spectrum and prevent others from using it.The malicious users report no or low signal level when theirsensed energy is high. They will reduce the detection rate,which yields more interference to the primary user. When
the primary user is not detected, the secondary users maytransmit in the occupied spectrum and interfere with thetransmission of the primary user. In this paper, we investigatetwo attack models, False Alarm (FA) Attack and False Alarm&Miss Detection (FAMD) Attack, as presented in [26, 27].
In energy spectrum sensing, secondary users send reportsto decision center in each round. Let Xn(t) denote theobservation of node n about the existence of the primary userat time slot t. The attacks are modeled by three parameters:the attack threshold (η), attack strength (Δ), and attackprobability (Pa). The two attack models are the following.
(i) False Alarm (FA) Attack: for time slot t, if sensedenergy Xn(t) is higher than η, it will not attack in this round,and just report Xn(t); otherwise it will attack with probabilityPa by reporting Xn(t)+Δ. This type of attack intends to causefalse alarm.
(ii) False Alarm & Miss Detection (FAMD) Attack: fortime slot t, attacker will attack with probability Pa. If it doesnot choose to attack this round, it will just report Xn(t);otherwise it will compare Xn(t) with η. If Xn(t) is higherthan η, the attacker reports Xn(t) − Δ; Otherwise, it reportsXn(t)+Δ. This type of attack causes both false alarm and missdetection.
3. Secure Collaborative Sensing
In this paper, we adopt the centralized collaborative sensingscheme in which N cognitive radio nodes report to acommon decision center. Among these N cognitive radionodes, one or more secondary users might be compromisedby attackers. We first study the case when only one secondarynode is malicious. By calculating the suspicious level, wepropose a scheme to detect malicious user according totheir report histories. Then we extend the scheme to handlemultiple attackers. As we will discuss later, malicious userscan change their attack parameters to avoid being detected,so the optimal attack strategy is also analyzed.
3.1. Single Malicious User Detection. In this section, weassume that there is at most one malicious user. Define
πn(t) � P(Tn =M | Ft) (7)
as the suspicious level of node n at time slot t, where Tn is thetype of node, which could be H(Honest) or M(Malicious),and Ft is observations collected from time slot 1 to time slott. By applying Bayesian criterion, we have
πn(t) = P(Ft | Tn =M)P(Tn =M)∑N
j=1 P(
Ft | Tj =M)
P(
Tj =M) . (8)
Suppose that P(Tn =M) = ρ for all nodes. Then, we have
πn(t) = P(Ft | Tn =M)∑N
j=1 P(
Ft | Tj =M) . (9)

4 EURASIP Journal on Advances in Signal Processing
It is easy to verify
P(Ft | Tn =M)
=t∏
τ=1
P(X(τ) | Tn =M,Fτ−1)
=t∏
τ=1
⎡
⎣N∏
j=1, j /=n
P(
Xj(τ) | Tj = H)⎤
⎦P(Xn(τ) | Fτ−1)
=t∏
τ=1
ρn(τ),
(10)
where
ρn(t) = P(Xn(t) | Fτ−1)N∏
j=1, j /=n
P(
Xj(t) | Tj = H)
, (11)
which represents the probability of reports at time slot tconditioned that node n is malicious. Note that the firstequation in (10) is obtained by repeatedly applying thefollowing equation:
P(Ft | Tn =M)
= P(X(t) | Tn =M,Ft−1)P(Ft−1 | Tn =M).(12)
Let pB and pI denote the observation probabilities underbusy and idle states, respectively, that is,
pI(
Xj(t))
= P(
Xj(t) | S(t) = I)
,
pB(
Xj(t))
= P(
Xj(t) | S(t) = B)
.(13)
Note that calculation in (13) is based on the fact that thesensed energy level follows centralized χ2 distribution underH0 and noncentralized χ2 distribution under H1 [7]. The χ2
distribution is stated in (2), in which the channel gain γishould be estimated based on (i) the distance between theprimary transmitter and secondary users and (ii) the pathloss model. We assume that the primary transmitter (TVtower, etc.) is stationary and the position of secondary userscan be estimated by existing positioning algorithms [28–32].Of course, the estimated distance may not be accurate. InSection 4.5, the impact of distance estimation error on theproposed scheme will be investigated.
Therefore, the honest user report probability is given by
P(
Xj(t) | Tj = H)
= P(
Xj(t), S(t)B | Tj = H)
+ P(
Xj(t), S(t)I | Tj = H)
= pB(
Xj(t))
qB(t) + pI(
Xj(t))
qI(t).
(14)
The malicious user report probability, P(Xn(t) | Ft−1),depends on the attack model. When FA attack is adopted,
Primary user
Secondary userSecondary user
Secondary user
Decision centerTask 1: Malicious secondary user?
Task 2: Primary user existing?
Figure 1: Collaborative spectrum sensing.
there are two cases that malicious user will report Xn(t) inround t. In the first case, Xn(t) is the actual sensed result,which means that Xn(t) is greater than η. In the second case,Xn(t) is the actual sensed result plus Δ. So the actual sensedenergy is Xn(t) − Δ and is less than η. In conclusion, themalicious user report probability under FA is,
P(Xn(t) | Ft−1)
= P(Xn(t), S(t)B | Ft−1) + P(
Xj(t), S(t)I | Ft−1
)
= pB(Xn(t))P(Xn(t) ≥ η
)qB(t)
+ pB(Xn(t)− Δ)P(Xn(t) < η + Δ
)qB(t)
+ pI(Xn(t))P(Xn(t) ≥ η
)qI(t)
+ pI(Xn(t)− Δ)P(Xn(t) < η + Δ
)qI(t).
(15)
Similarly, when FAMD attack is adopted,
P(Xn(t) | Ft−1)
= P(Xn(t), S(t)B | Ft−1) + P(
Xj(t), S(t)I | Ft−1
)
= pB(Xn(t) + Δ)P(Xn(t) ≥ η − Δ
)qB(t)
+ pB(Xn(t)− Δ)P(Xn(t) < η + Δ
)qB(t)
+ pI(Xn(t) + Δ)P(Xn(t) ≥ η − Δ
)qI(t)
+ pI(Xn(t)− Δ)P(Xn(t) < η + Δ
)qI(t).
(16)
In (14)–(16), qB(t) and qI(t) are the priori probabilitiesof whether the primary user is present or not, which can beobtained through a two-state Markov chain channel model[33]. The observation probabilities, pB(Xj(t)), pB(Xn(t) −Δ), and other similar terms can be calculated by (13).P(Xn(t) ≥ η), P(Xn(t) < η + Δ), and similar terms, aredetection probabilities or false alarm probabilities, which canbe evaluated under specific path loss model [7, 8]. Therefore,we can calculate the value of ρn(t) in (11) as long as Δ, η,

EURASIP Journal on Advances in Signal Processing 5
qB(t), qI(t), TW , and γi are known or can be estimated.In this derivation, we assume that the common receiverhas the knowledge of the attacker’s policy. This assumptionallows us to obtain the performance upper bound of theproposed scheme and reveal insights of the attack/defensestrategies. In practice, the knowledge about the attacker’spolicy can be obtained by analyzing previous attackingbehaviors. For example, if attackers were detected previously,one can analyze the reports from these attackers and identifytheir attack behavior and parameters. Investigation on theunknown attack strategies will be investigated in the futurework.
The computation of πn(t) is given by
πn(t) =∏t
τ=1ρn(τ)∑N
j=1
∏tτ=1ρj(τ)
. (17)
We convert suspicious level πn(t) into trust value φn(t) as
φn(t) = 1− πn(t). (18)
Trust value is the measurement for honesty of secondaryusers. But this value alone is not sufficient to determinewhether a node is malicious or not. In fact, we find thattrust values become unstable if there is no malicious userat all. The reason is that above deduction is based on theassumption that there is one and only one malicious user.When there is no attacker, the trust values of honest usersbecome unstable. To solve this problem, we define trustconsistency value of user n (i.e., ψn(t)) as
μn(t) =
⎧⎪⎪⎪⎪⎨
⎪⎪⎪⎪⎩
∑tτ=1 φn(t)
t, t < L
∑tτ=t−L+1 φn(t)
L, t ≥ L,
(19)
ψn(t) =
⎧⎪⎪⎪⎪⎪⎨
⎪⎪⎪⎪⎪⎩
t∑
τ=1
(φn(t)− μn(t)
)2, t < L
t∑
τ=t−L+1
(φn(t)− μn(t)
)2, t ≥ L,
(20)
where L is the size of the window in which the variationof recent trust values is compared with overall trust valuevariation.
Procedure 1 shows the process of by applying the trustvalue φn(t) and the consistency value ψn(t) in primary userdetection algorithm. The basic idea is to eliminate the reportsfrom users who have consistent low trust values. The value ofthreshold1 and threshold2 can be chosen dynamically. Thisprocedure can be used together with many existing primaryuser detection algorithms such as hard decision combing andsoft decision combing. The study in [23] has shown thathard decision performs almost the same as soft decision interms of achieving performance gain when the cooperativeusers (10–20) face independent fading. For simplicity, in thispaper, we will use the hard decision combining algorithmin [7, 8] to demonstrate the performance of the proposedscheme and other defense schemes.
(1) receive reports from N secondary users.(2) calculate trust values and consistency values for all users.(3) for each user n do(4) if φn(t) < threshold1 and ψn(t) < threshold2 then(5) the report from user n is removed(6) end if(7) end for(8) perform primary user detection algorithm based on theremaining reports.
Procedure 1: Primary user detection.
3.2. Multiple Malicious Users Detection. The detection ofsingle attacker is to find the node that has the largestprobability to be malicious. We can extend this method tomultiple attackers case. The idea is enumerating all possiblemalicious nodes set and trying to identify the set with thelargest suspicious level. We call this method “ideal maliciousnode detection.” However, as we will discuss later, thismethod faces the curse of dimensionality when the numberof secondary users N is large. As a result, we propose aheuristic scheme named “Onion-peeling approach” which isapplicable in practice.
3.2.1. Ideal Malicious Node Detection. For any Ω ⊂{1, . . . ,N} (note that Ω could be an empty set, i.e., there isno attacker), we define
πΩ(t) � P(Tn =M,∀n ∈ Ω,Tm = H ,∀m /∈Ω | Ft), (21)
as the belief that all nodes in Ω are malicious nodes while allother nodes are honest.
Given any particular set of malicious nodes Θ, byapplying Bayesian criterion, we have
πΩ(t) = P(Ft | Ω)P(Ω)∑
Θ P(Ft | Θ)P(Θ). (22)
Suppose that P(Tn =M) = ρ for all nodes. Then, we have
P(Ω) = ρ|Ω|(1− ρ
)N−|Ω|, (23)
where |Ω| is the cardinality of Ω.Next, we can calculate
P(Ft | Ω)
=t∏
τ=1
∏
j /∈Ω
P(
Xj(τ) | Tj = H)∏
j∈ΩP(
Xj(τ) | F,Fτ−1
)
=t∏
τ=1
ρn(τ),
(24)
where
ρn(t) =∏
j /∈Ω
P(
Xj(τ) | Tj = H)∏
j∈ΩP(
Xj(τ) | F,Fτ−1
)
.
(25)
For each possible malicious node set Ω, using (22)–(25),we can calculate the probability that this Ω contains only

6 EURASIP Journal on Advances in Signal Processing
malicious users and no honest users. And we can find theΩ(t) with the largest πΩ(t) value. Then compare this πΩ(t)with certain threshold, if it is beyond this threshold, thenodes in Ω are considered to be malicious.
However, for a cognitive radio network with N secondaryusers, there are 2N different choices of set Ω. Thus, the com-plexity grows exponentially with N . So this ideal detection ofattackers faces the curse of dimensionality. When N is large,we have to use approximation.
3.2.2. Onion-Peeling Approach. To make the detection ofmultiple malicious nodes feasible in practice, we proposea heuristic “onion-peeling approach” that detects the mali-cious user set in a batch-by-batch way. Initially all nodes areassumed to be honest. We calculate suspicious level of allusers according to their reports. When the suspicious levelof a node is beyond certain threshold, it will be consideredas malicious and moved into the malicious user set. Reportsfrom nodes in malicious user set are excluded in primaryuser detection. And the way to calculate suspicious level isupdated once the malicious node set is updated. We continueto calculate the suspicious level of remaining nodes until nomalicious node can be found.
In the beginning, we initialize the set of malicious nodes,Ω, as an empty set. In the first stage, compute the a posterioriprobability of attacker for any node n, which is given by
πn(t)
= P(Tn =M | Ft)
= P(Ft | Tn =M)P(Tn =M)P(Ft | Tn =M)P(Tn =M) + P(Ft | Tn = H)P(Tn = H)
,
(26)
where we assume that all other nodes are honest whencomputing P(Ft | Tn = M) and P(Ft | Tn = H). In (26) weonly calculate the suspicious level for each node rather thanthat of a malicious nodes set, the computation complexity isreduced from O(2N ) to O(N).
Recall that X(t) denote the collection of Xn(t), that is,reports from all secondary nodes at time slot t. It is easy toverify
P(Ft | Tn =M)
=t∏
τ=1
P(X(τ) | Tn =M,Fτ−1)
=t∏
τ=1
⎡
⎣N∏
j=1, j /=n
P(
Xj(τ) | Tj = H)⎤
⎦P(Xn(τ) | Fτ−1)
=t∏
τ=1
ρn(τ),
(27)
where
ρn(t) = P(Xn(t) | Fτ−1)N∏
j=1, j /=n
P(
Xj(t) | Tj = H)
. (28)
Here, P(Ft | Tn = M) means the probability of reports attime slot t conditioned that node n is malicious. Note thatthe first equation in (27) is obtained by repeatedly applying(12).
Similarly, we can calculate P(Ft | Tn = H) by
P(Ft | Tn = H)
=t∏
τ=1
P(X(τ) | Tn = H ,Fτ−1)
=t∏
τ=1
⎡
⎣N∏
j=1
P(
Xj(τ) | Tj = H)⎤
⎦
=t∏
τ=1
θn(τ),
(29)
where
θn(t) =N∏
j=1
P(
Xj(t) | Tj = H)
. (30)
As mentioned before, qB(t) and qI(t) are the prioriprobabilities of whether the primary user exists or not,pB(Xj(t)) and pI(Xj(t)) are the observation probabilities ofXj(t) under busy and idle states. An honest user’s reportprobability can be calculated by (14).
Then for each reporting round, we can update eachnode’s suspicious level based on above equations. We set athreshold ξ and consider n1 as a malicious node when n1 isthe first node such that
P(Tn1 =M | Ft
) ≥ threshold3. (31)
Then, add n1 into Ω.Through (26)–(31), we have shown how to detect the
first malicious node. In the kth stage, we compute the aposteriori probability of attacker in the same manner of (26).The only difference is that when computing P(Ft | Tn = M)and P(Ft | Tn = H), we assume that all nodes in Ω aremalicious. Equations (28) and (30) now become (32) and(33), respectively, and they can be seen as the special casesof (32) and (33) when Ω is empty.
ρn(t) = P(Xn(t) | Fτ−1)
×⎛
⎝N∏
j=1, j /=n, j /∈Ω
P(
Xj(t) | Tj = H)
·N∏
j=1, j /=n, j∈ΩP(
Xj(t) | Tj =M)⎞
⎠,
(32)
θn(t) =⎛
⎝N∏
j=1, j /∈Ω
P(
Xj(t) | Tj = H)
·N∏
j=1, j∈ΩP(
Xj(t) | Tj =M)⎞
⎠
(33)

EURASIP Journal on Advances in Signal Processing 7
(1) initialize the set of malicious nodes.(2) collect reports from N secondary users.(3) calculate suspicious level for all users.(4) for each user n do(5) if πn(t) >= threshold3 then(6) move node n to malicious nodes set, the report
from user n is removed(7) exit loop(8 ) end if(9) end for(10) perform primary user detection algorithm based
nodes that are currently assumed to be honest.(11) go to step 2 and repeat the procedure
Procedure 2: Primary user detection.
Add nk to Ω when nk is the first node (not in Ω) such that
P(Tnk =M | Ft
) ≥ threshold3. (34)
Repeat the procedure until no new malicious node can befound.
Based on the above discussion, the primary user detec-tion process is shown in Procedure 2. The basic idea is toexclude the reports from users who have suspicious levelhigher than threshold. In this procedure, threshold3 can bechosen dynamically. This procedure can be used togetherwith many existing primary user detection algorithms. Asdiscussed in Section 3.1, hard decision performs almost thesame as soft decision in terms of achieving performance gainwhen the cooperative users (10–20) face independent fading.So for simplicity, we still use the hard decision combiningalgorithm in [7, 8] to demonstrate the performance of theproposed scheme.
3.3. Optimal Attack. As presented in Section 2.2, the attackmodel in this paper has three parameters: the attack thresh-old (η), attack strength (Δ), and attack probability (Pa).These parameters determine the power and covertness of theattack. Here, the power of attack can be described by theprobability that the attack is successful (i.e., causing falsealarm and/or miss detection). The covertness of the attackcan be roughly described by the likelihood that the attack willnot be detected.
Briefly speaking, when η or Pa increases, the attackhappens more frequently. When Δ increases, the attack goalis easier to achieve. Thus, the power of attack increases withη, Pa, and Δ. On the other hand, when the attack powerincreases, the covertness reduces. Therefore, there is thetradeoff between attack power and covertness.
The attacker surely prefers maximum attack power andmaximum covertness. Of course, these two goals cannotbe achieve simultaneously. Then, what is the “best” wayto choose attack parameters from the attacker’s point ofview? In this section, we define a metric called damage thatconsiders the tradeoff between attack power and covertness,and find the attack parameters that maximize the damage. To
simplify the problem, we only consider one attacker case inthis study.
We first make the following arguments.
(i) The attacker can damage the system if it achievesthe attack goal and is not detected by the defensescheme. Thus, the total damage can be described bythe number of successful attacks before the attacker isdetected.
(ii) Through experiments, we found that the defensescheme cannot detect some conservative attackers,who use very small η, Δ, and Pa values. It can beproved that all possible values of {η,Δ,Pa} that willnot trigger the detector form a continuous 3D region,referred to as the undetectable region.
(iii) Thus, maximizing the total damage is equivalent tofinding attack parameters in the undetectable regionthat maximize the probability of successful attack.
Based on the above arguments, we define damage D asthe probability that the attacker achieves the attack goal (i.e.,causing false alarm) in one round of collaborative sensing.Without loss of generality, we only consider FA attack in thissection. In FA attack, when sensed energy y is below attackthreshold η, the attacker will report Δ+ y with probability Pa.When Δ + y is greater than the decision threshold λ and theprimary user does not present, the attacker causes false alarmand the attack is successful. Thus, the damage D is calculatedas:
D = PaP(y < η
)P(y + Δ ≥ λ | y < η
)
= Pa(
P̃IP(y < η | H0
)P(y + Δ ≥ λ | H0, y < η
)
+P̃BP(y < η | H1
)P(y + Δ ≥ λ | H1, y < η
))
,
(35)
where P̃I is the priori probability that channel is idle and P̃Bis the priori probability that channel is busy.
From the definition of Pd and Pf in (3) and (4), we have,
P(y < η | H0
) = 1− Pf(η), (36)
P(y < η | H1
) = 1− Pd(η). (37)
Similarly,
P(y + Δ ≥ λ | H0, y < η
) = P(λ− Δ ≤ y < η | H0
)
= Pf (λ− Δ)− Pf(η),
(38)
P(y + Δ ≥ λ | H1, y < η
) = P(λ− Δ ≤ y < η | H1
)
= Pd(λ− Δ)− Pd(η),
(39)
Substitute (36)–(39) to (35), then we have
D = Pa(
P̃I(
1− Pf(η))(
Pf (λ− Δ)− Pf(η))
+P̃B(1− Pd
(η))(
Pd(λ− Δ)− Pd(η)))
.(40)
8 EURASIP Journal on Advances in Signal Processing
Table 1: False Alarm Rate (when detection rate = 0.99).
OR Ki Proposed Proposed
Rule Rule (t = 250) (t = 500)
FA, Pa = 1 0.72 0.13 0.07 0.05
FA, Pa = 0.5 0.36 0.07 0.06 0.04
FAMD, Pa = 1 0.74 0.20 0.08 0.05
FAMD, Pa = 0.5 0.37 0.10 0.06 0.04
Under the attack models presented in this paper, the attackershould choose the attack parameters that maximize D andare in the undetectable region.
Finding optimal attack has two purposes. First, with thestrongest attack (in our framework), we can evaluate theworst-case performance of the proposed scheme. Second, itreveals insights of the attack strategies. Since it is extremelydifficult to obtain the close form solution of the undetectableregion, we will find undetectable region through simulationsand search for optimal attack parameters using numericalmethods. Details will be presented in Section 4.4.
4. Simulation Results
We simulate a cognitive radio network with N(=10) sec-ondary users. Cognitive radio nodes are randomly locatedaround the primary user. The minimum distance from themto primary transmitter is 1000 m and maximum distanceis 2000 m. The time-bandwidth product [7, 8] is m = 5.Primary transmission power and noise level are 200 mw and−110 dBm, respectively. The path loss factor is 3 and Rayleighfading is assumed. Channel gains are updated based onnode’s location for each sensing report. The attack thresholdis η = 15, the attack strength is Δ = 15, and the attackprobability Pa is 100% or 50%. We conduct simulationsfor different choices of thresholds. Briefly speaking, if trustvalue threshold threshold1 is set too high or suspicious levelthreshold threshold3 is set too low, it is possible that honestnodes will be regarded as malicious. If trust consistency valuethreshold2 is set too low, it will take more rounds to detectmalicious users. In simulation, for single malicious nodedetection, we choose the trust value threshold threshold1 =0.01, the consistency value threshold threshold2 = 0.1, andthe window size for calculating consistency value is L = 10.For multiple malicious users detection, the suspicious levelthreshold threshold3 is set to 0.99.
4.1. Single Attacker. Three schemes of primary user detectionare compared.
(i) OR Rule: the presence of primary user is detectedif one or more secondary users’ reported value isgreater than certain threshold. This is the mostcommon hard fusion scheme.
(ii) Ki Rule: the presence of primary user is detected if i ormore secondary users’ reported value is greater thancertain threshold. This is the straightforward defensescheme proposed in [23].
(iii) Proposed Scheme: Use OR rule after removingreports from malicious nodes.
Pa = 100%, FA attack
0.975
0.98
0.985
0.99
0.995
1
Pro
b.of
dete
ctio
n
0 0.1 0.2 0.3 0.4 0.5 0.6 0.7 0.8 0.9
Prob. of false alarm
No attacker, N = 10, ORNo attacker, N = 9, OROne attacker, N = 10, OROne attacker, N = 10, K2Proposed scheme, t = 250Proposed scheme, t = 500
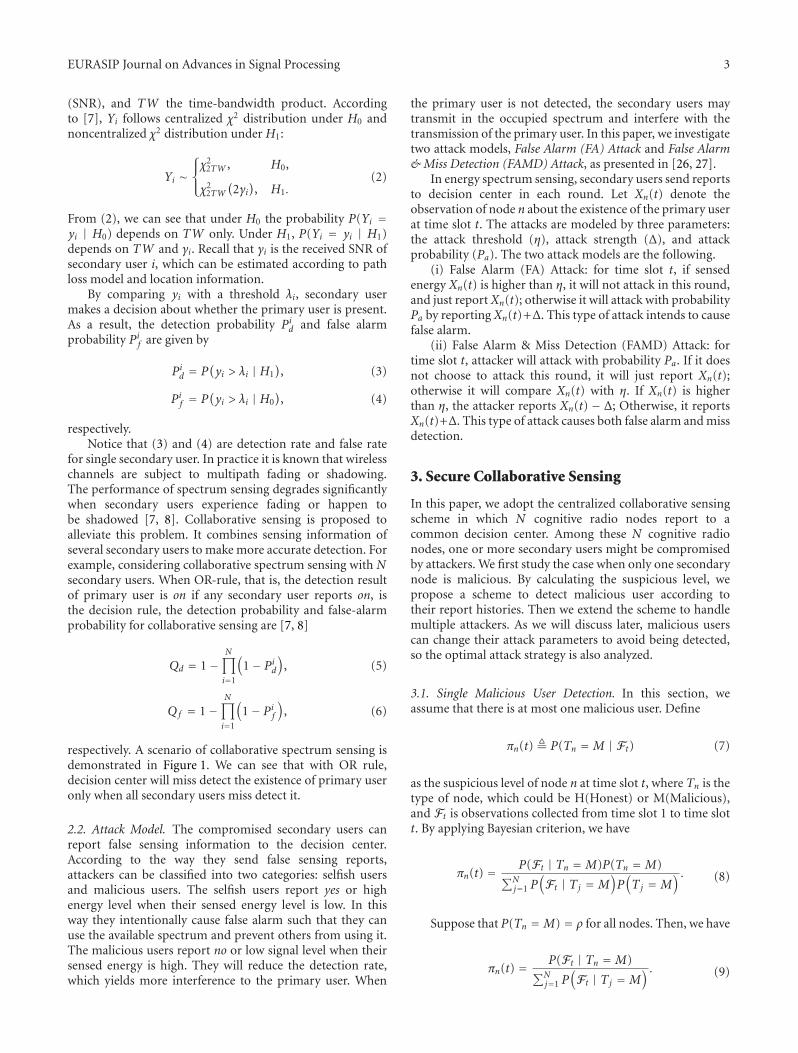
Figure 2: ROC curves for different collaborative sensing schemes(Pa = 100%, False Alarm Attack).
Performance of these schemes are shown by ReceiverOperating Characteristic (ROC) curves, which is a plot ofthe true positive rate versus the false positive rates as itsdiscrimination threshold is varied. Figures 2–5 show ROCcurves for primary user detection in 6 cases when only onesecondary user is malicious. Case 1 is for OR rule with Nhonest users. Case 2 is for OR rule with N − 1 honest users.In Case 3–6, there are N − 1 honest users and one malicioususer. Case 3 is for OR rule. Case 4 is for K2 rule. Case 5 isfor the proposed scheme with t = 250, where t is the indexof detection rounds. Case 6 is for the proposed scheme witht = 500.
When the attack strategy is the FA Attack, Figures 2and 3 show the ROC curves when the attack probability is100% and 50%, respectively. The following observations aremade.
(i) By comparing the ROC for Case 1 and Case 3, wesee that the performance of primary user detection degradessignificantly even when there is only one malicious user.This demonstrates the vulnerability of collaborative sensing,which leads inefficient usage of available spectrum resource.
(ii) The proposed scheme demonstrates significant per-formance gain over the scheme without defense (i.e., ORrule) and the straightforward defense scheme (i.e., K2 rule).For example, Table 1 shows the false alarm rate (Pf ) fortwo given detection rate (Pd), when attack probability (Pa)is 1. When the attack probability is 0.5, the performanceadvantage is smaller but still large.
(iii) In addition, as t increases, the performance of theproposed scheme gets close to the performance of Case 2,which represents perfect detection of the malicious nodes.

EURASIP Journal on Advances in Signal Processing 9
Pa = 50%, FA attack
0.975
0.98
0.985
0.99
0.995
1
Pro
b.of
dete
ctio
n
0 0.1 0.2 0.3 0.4 0.5 0.6 0.7 0.8 0.9
Prob. of false alarm
No attacker, N = 10, ORNo attacker, N = 9, OROne attacker, N = 10, OROne attacker, N = 10, K2Proposed scheme, t = 250Proposed scheme, t = 500
Figure 3: ROC curves for different collaborative sensing schemes(Pa = 50%, False Alarm Attack).
4.2. Multiple Attackers. Figures 6–9 are the ROC curves forsix cases when there are multiple attackers. Similarly, Case 1is N honest users, no malicious node, and OR rule. Case 2is N − 2 (or N − 3) honest users, no attacker, and OR rule.Case 3–6 are N − 2 (or N − 3) honest users and 2 (or 3)malicious users. OR rule is used in Case 3 and Ki rule is usedin case 4. Case 5 and Case 6 are with the proposed schemewith different detection rounds. Case 5 is the performanceevaluated at round t = 500 and Case 6 is at round t = 1000.
When the attack strategy is the FA Attack, Figures 6 and7 show the ROC curves when the attacker number is 2 and 3,respectively. We still compare the three schemes described inSection 4.1. Similarly, following observations are made.
(i) By comparing the ROC curves for Case 1 and Case 3,we see that the performance of primary user detec-tion degrades significantly when there are multiplemalicious users. And the degradation is much moresevere than single malicious user case.
(ii) The proposed scheme demonstrates significant per-formance gain over the scheme without defense (i.e.,OR rule) and the straightforward defense scheme(i.e., Ki rule). Table 2 shows the false alarm rate (Pf )when detection rate is Pd = 99%.
(iii) When there are three attackers, false alarm ratesfor all these schemes become larger, but the perfor-mance advantage of the proposed scheme over otherschemes is still large.
(iv) In addition, as t increases, the performance of theproposed scheme becomes close to the performanceof Case 2, which is the performance upper bound.
Pa = 100%, FAMD attack
0.975
0.98
0.985
0.99
0.995
1
Pro
b.of
dete
ctio
n
0 0.1 0.2 0.3 0.4 0.5 0.6 0.7 0.8 0.9
Prob. of false alarm
No attacker, N = 10, ORNo attacker, N = 9, OROne attacker, N = 10, OROne attacker, N = 10, K2Proposed scheme, t = 250Proposed scheme, t = 500
Figure 4: ROC curves for different collaborative sensing schemes(Pa = 100%, False Alarm & Miss Detection Attack).
Table 2: False Alarm Rate (when detection rate = 0.99).
OR Ki Proposed Proposed
Rule Rule (t = 500) (t = 1000)
FA, 2 Attackers 0.85 0.23 0.10 0.08
FA, 3 Attackers 0.88 0.41 0.22 0.16
FAMD, 2 Attackers 0.88 0.31 0.15 0.09
FAMD, 3 Attackers 0.89 0.50 0.26 0.16
Figures 4 and 5 show the ROC performance when themalicious user adopts the FAMD attack. We observe that theFAMD attack is stronger than FA. In other words, the OR ruleand K2 rule have worse performance when facing the FAMDattack. However, the performance of the proposed scheme isalmost the same under both attacks. That is, the proposedscheme is highly effective under both attacks, and muchbetter than the traditional OR rule and the simple defenseK2 rule. The example false alarm rates are listed as follows.
Figures 8 and 9 shows the ROC performance when theschemes face the FAMD attack for multiple malicious users.We observe that the FAMD attack is stronger than FA.Compared to the cases with FA attack, performance of theOR rule and Ki rule is worse when facing the FAMD attack.However, the performance of the proposed scheme is almostthe same under both attacks. That is, the proposed schemeis highly effective under both attacks, and much better thanthe traditional OR rule and the simple defense Ki rule. Theexamples of false alarm rate are listed in Table 1.
4.3. Dynamic Behaviors. We also analyze the dynamicchange in behavior of malicious nodes for FAMD attack.

10 EURASIP Journal on Advances in Signal Processing
Pa = 50%, FAMD attack
0.975
0.98
0.985
0.99
0.995
1
Pro
b.of
dete
ctio
n
0 0.1 0.2 0.3 0.4 0.5 0.6 0.7 0.8 0.9
Prob. of false alarm
No attacker, N = 10, ORNo attacker, N = 9, OROne attacker, N = 10, OROne attacker, N = 10, K2Proposed scheme, t = 250Proposed scheme, t = 500
Figure 5: ROC curves for different collaborative sensing schemes(Pa = 50%, False Alarm & Miss Detection Attack).
Two attackers, FA attack
0.97
0.975
0.98
0.985
0.99
0.995
1
Pro
b.of
dete
ctio
n
0.1 0.2 0.3 0.4 0.5 0.6 0.7 0.8 0.9 1
Prob. of false alarm
No attacker, N = 10, ORNo attacker, N = 8, ORTwo attackers, N = 10, ORTwo attackers, N = 10, K3Proposed scheme, t = 500Proposed scheme, t = 1000
Figure 6: ROC curves (False Alarm Attack, Two Attackers).
Figures 10 and 11 are for single malicious user. In Figure 10,the malicious user changes the attack probability from 0 to 1at t = 50 and from 1 to 0 at time t = 90. The dynamic changeof trust value can be divided into three intervals. In Interval1, t ∈ [0, 50], malicious user does not attack. The trust valueof malicious user and honest user are not stable since there
Three attackers, FA attack
0.97
0.975
0.98
0.985
0.99
0.995
1
Pro
b.of
dete
ctio
n
0.1 0.2 0.3 0.4 0.5 0.6 0.7 0.8 0.9 1
Prob. of false alarm
No attacker, N = 10, ORNo attacker, N = 7, ORThree attackers, N = 10, ORThree attackers, N = 10, K4Proposed scheme, t = 500Proposed scheme, t = 1000
Figure 7: ROC curves (False Alarm Attack, Three Attackers).
Two attackers, FAMD attack
0.97
0.975
0.98
0.985
0.99
0.995
1
Pro
b.of
dete
ctio
n
0.1 0.2 0.3 0.4 0.5 0.6 0.7 0.8 0.9 1
Prob. of false alarm
No attacker, N = 10, ORNo attacker, N = 8, ORTwo attackers, N = 10, ORTwo attackers, N = 10, K3Proposed scheme, t = 500Proposed scheme, t = 1000
Figure 8: ROC curves (False Alarm & Miss Detection Attack, TwoAttackers).
is no attacker. Note that the algorithm will not declare anymalicious nodes because the trust consistency levels are high.In Interval 2, t ∈ [50, 65], malicious user starts to attack, andits trust value quickly drops when it turns from good to bad.In Interval 3, where t > 60, the trust value of malicious user isconsistently low. In Figure 11, one user behaves badly in only

EURASIP Journal on Advances in Signal Processing 11
Three attackers, FAMD attack
0.97
0.975
0.98
0.985
0.99
0.995
1
Pro
b.of
dete
ctio
n
0.1 0.2 0.3 0.4 0.5 0.6 0.7 0.8 0.9 1
Prob. of false alarm
No attacker, N = 10, ORNo attacker, N = 7, ORThree attackers, N = 10, ORThree attackers, N = 10, K4Proposed scheme, t = 500Proposed scheme, t = 1000
Figure 9: ROC curves (False Alarm & Miss Detection Attack, ThreeAttackers).
0
0.1
0.2
0.3
0.4
0.5
0.6
0.7
0.8
0.9
1
Tru
stva
lue
0 50 100 150 200
Detection round
Interval 3Interval 2Interval 1
Malicious node
Figure 10: Dynamic trust value in proposed scheme (a user attacksduring time [50, 90], Pa = 1).
5 rounds starting at t = 50. We can have similar observations.In Interval 1, malicious user does not attack. It has high trustvalue. Please note that these dynamic figures are just snapshots of trust values. In Figure 11, the trust value in Region1 does not fluctuate as frequently as that in Figure 10. Thisis also normal. The reason for unstable trust value may dueto channel variation or unintentional errors. In Interval 2,t ∈ [50, 55], malicious user starts to attack, its trust valuedrops quickly. In Interval 3, where t > 55, trust value ofmalicious user recovers very slowly.
Similarly, we also make observations for dynamic changein behaviors for multiple attackers. Suspicious level of honest
0.6
0.65
0.7
0.75
0.8
0.85
0.9
0.95
1
Tru
stva
lue
50 100 150 200 250 300
Detection round
Interval 3Interval 2Interval 1
Malicious nodeHonest nodes
Figure 11: Dynamic trust value in proposed scheme (a user attacksduring time [50, 55], Pa = 1).
0
0.1
0.2
0.3
0.4
0.5
0.6
0.7
0.8
0.9
1
Susp
icio
us
leve
l
0 20 40 60 80 100
Detection round
Malicious node 1Malicious node 2Honest node
Figure 12: Dynamic suspicious level in proposed scheme (twomalicious nodes perform FA attack during time [20, 100]).
users and malicious users are shown in Figures 12 and 13.Please note that we only demonstrate suspicious level curvefor one honest node. The malicious user adopts the FA attackand dynamically chooses which round to start attack andwhich round to stop attack. In Figure 12, the malicious usersstart to attack at t = 20 and stop to attack at time t =100. In Figure 13, one user behaves badly in only 10 roundsstarting at t = 5. Similar observations can be made. Wecan see that the suspicious level of malicious nodes increasessteadily when nodes turn from good to bad. And the schemeallows slow recovery of suspicious level for occasional badbehavior.

12 EURASIP Journal on Advances in Signal Processing
0
0.1
0.2
0.3
0.4
0.5
0.6
0.7
0.8
0.9
1
Susp
icio
us
leve
l
0 20 40 60 80 100
Detection round
Malicious node 1Malicious node 2Honest node
Figure 13: Dynamic suspicious level in proposed scheme (twomalicious nodes perform FA attack during time [5, 15]).
4.4. Optimal Attack. As discussed in Section 3.3, given thedefense scheme, the attacker can find the optimal attackparameters that maximize the damage. In this set of exper-iments, we find the optimal attack parameters and evaluatethe worst performance of the proposed scheme.
We assume that there are N = 10 cognitive radionodes performing collaborative sensing. We set the decisionthreshold λ so that the overall detection rate Pd is 99% whenall users are honest. When OR rule is used, λ = 28 leads to Pd= 99%.
Obviously, the practical values of η and Δ cannot be overcertain range. Within the range, for each pair of (η, Δ), werun simulations to identify the maximum attack probabilityPa that the attacker can use and avoid being detected. Inparticular, binary search is used to find the maximum Pa.We first try an initial Pa, which is usually the Pa value ofa neighbor pair. For example, if we already obtain the Pafor pair (η − 1, Δ) through simulation, then normally themaximum Pa for pair (η, Δ) is a little bit smaller than thatof pair (η − 1, Δ). Then, we run the simulation for 2000rounds. If the attacker is not detected within 2000 rounds,we will search the middle value of range (Pa, 1), otherwise wesearch the middle value of range (0, Pa). The search continuesuntil the maximum Pa is found. Then, the boundary ofundetectable region is determined. We would like to pointout that there exists more computational efficient ways tosearch for the undetectable region, which can be exploitedin the future work.
Figure 14 shows the undetectable region when N =10 and other simulation parameters are the same as thesein Section 4. The X-axis and Y-axis are attack thresholdη and attack strength Δ, respectively, and Z-axis is attackprobability Pa. The following observations are made. Whenη and Δ are small, Pa can be as large as 100%. This is easy tounderstand. If η is small, the probability that sensed energy
25
20
1510
5
0
Attack threshold00
5
10
1520
25
Attack strength
1
0.5
Att
ack
prob
abili
ty
Figure 14: Region that detection is impossible.
is below η is small. If Δ is small, the reporting values are justa little higher than true sensed values. Thus, when both ηand Δ are small, the behavior of malicious node is not verydifferent from that of honest nodes. Each attack is very weakand the attacker can do more attacks (i.e., larger Pa) withouttriggering the detector. As η or Δ increases, the maximumallowed attack probability Pa decreases. When both η and Δare large, Pa should be very small (0–5%).
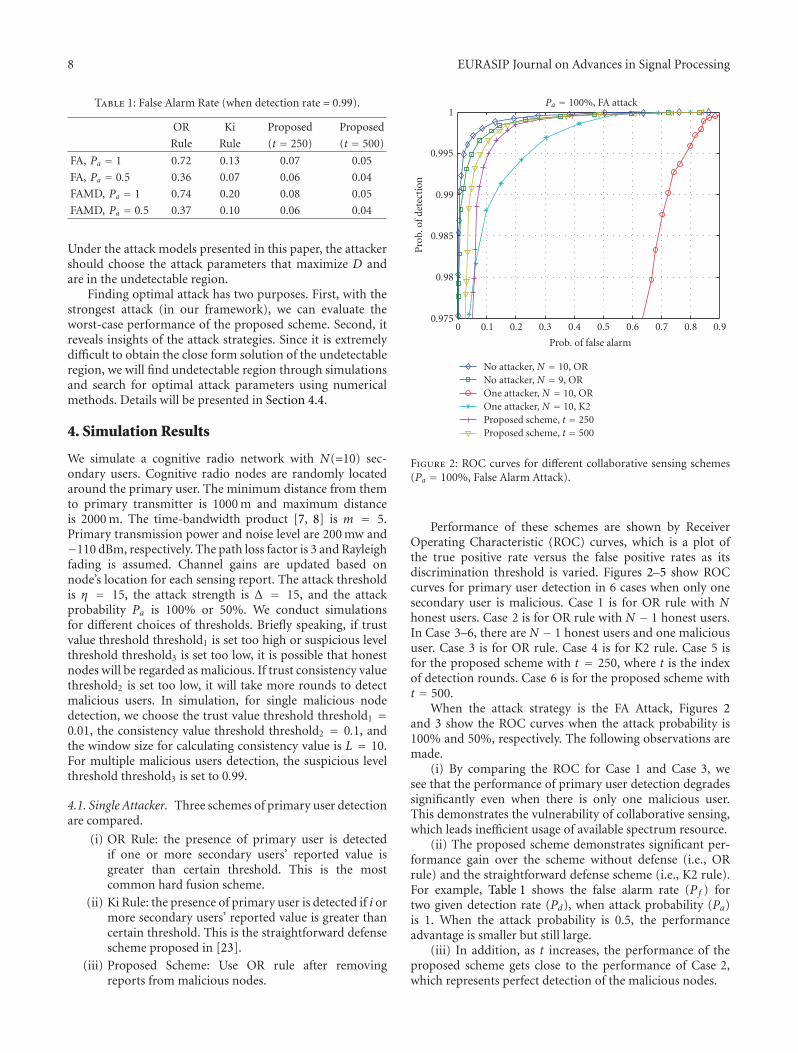
According to (40), we know that the maximum damagewill occur at the boundary of the undetectable region. Using(40), we can find the point (i.e., attack parameters) thatmaximizes the damage in the undetectable region. In thisexperiment, the optimal attack parameters are η = 16, Δ =23, and Pa = 0.05, the maximum damage is 0.02.
We also plot the damage in Figure 15. The X-axis andY-axis are η and Δ, respectively, and Z-axis is damage D.The damage value is calculated for the boundary pointsof the undetectable region. We do not show the Pa valuebecause each (η, Δ) pair corresponds to one Pa value on theboundary. From this figure, we can see that when η and Δ arelow, the damage is 0. The attacker can cause larger damage bychoosing relatively large η and Δ values and small Pa values.
With the optimal attack parameters, for decision thresh-old λ = 28, the overall false alarm rate will increasefrom 1% to 3%. Recall that the decision threshold wasdetermined to ensure 99% detection rate. This is the worst-case performance of the proposed scheme. Please note thatthis is the worst case when the attackers are undetectable.When malicious users can be detected, as discussed inSection 4.1, the performance will get close to upper bound(the performance of N − 1 honest nodes) as detection roundt increases.
For K2 rule with N = 10 secondary users, to maintainoverall detection rate Pd being 99%, the decision thresholdλ should be decreased to 22. Because K2 rule does nottry to detect malicious users, attacker has no risk of beingdetected even they launch the strongest attack. For ourattack model, they can set attack probability Pa to 1, andset attack threshold η and attack strength Δ as large aspossible. For K2 rule, when two or more secondary usersreport on, the decision result is on. The attacker can launch
EURASIP Journal on Advances in Signal Processing 13
0.02
0.01
0
Attack
threshold
2520
15
105
0
Attack strength0
5
10
15
20
25
Att
ack
prob
abili
ty
Figure 15: Damage in region.
0
50
100
150
200
250
Ave
rage
nu
mbe
rof
rou
nds
tode
tect
mal
icio
us
nod
e
0 1 2 3 4 5
Normalised position estimation error
FA attackFAMD attack
Figure 16: Impact of Position Estimation Error.
the strongest attack which is similar to report on in hard-decision reporting case. But only when another one or morehonest nodes also make false alarm, the attacker can misleadthe decision center. So the overall false alarm rate is not 1.In the simulation, we set Pa to 1, η and Δ both to 1000.The overall false alarm rate is 17.5% for K2 rule under thesesettings, which is much larger than the worst case of theproposed scheme. For OR rule, the overall false alarm rate is1. This result is summarized in Table 3. In this table, the idealcase means all N secondary users are honest, and other threecolumns are the worse performance for different schemeswhen one of the N cognitive radio nodes is malicious.
Finally, we would like to point out that the optimalattack is only optimal under certain attack model and certaindefense scheme. The method of finding the optimal attackcan be extended to study other attack models. We believethe proposed scheme will still work very well under manyother attack models, since the attacker’s basic philosophiesare similar.
Table 3: False Alarm Rate (when detection rate = 0.99).
Ideal Case Proposed Scheme Ki Rule OR Rule
0.01 0.03 0.175 1
4.5. Impact of Position Estimation Error upon Performance.Recall that the proposed scheme needs to know the channelgains that are estimated based on the position of secondarynodes. There are many existing schemes that estimate thelocation of wireless devices in sensor networks [27–31].These schemes can be classified into two categories: rangebased and range free. The range based methods first estimatethe distances between pairs of wireless nodes and thencalculate the position of individual nodes. Examples of rangebased schemes are Angle of Arrival (AoA) [28], ReceivedSignal Strength Indicator (RSSI) [29], Time of Arrival (ToA)[30], and Time Difference of Arrival (TDoA) [31]. The rangefree methods usually use connectivity information to identifythe beacon nodes within radio range and then estimate theabsolute position of non-beacon nodes [32].
The performance of these schemes are measured by thelocation estimate error, which is usually normalized to theunits of node radio transmission range (R). Most currentalgorithms can achieve the accuracy that the estimation erroris less than one unit of radio transmission range [28–32].
In this section, we study the impact of position estima-tion error on the proposed scheme. The simulation settingsare mostly the same as the settings in previous experiments.We choose the decision threshold λ = 28 to ensure the overalldetection rate Pd be 99% when there are no malicious nodes.The radio transmission range is set to 50 m, which is a typicalvalue for wireless sensor nodes. Both FA attack and FAMDattack with single attacker are simulated.
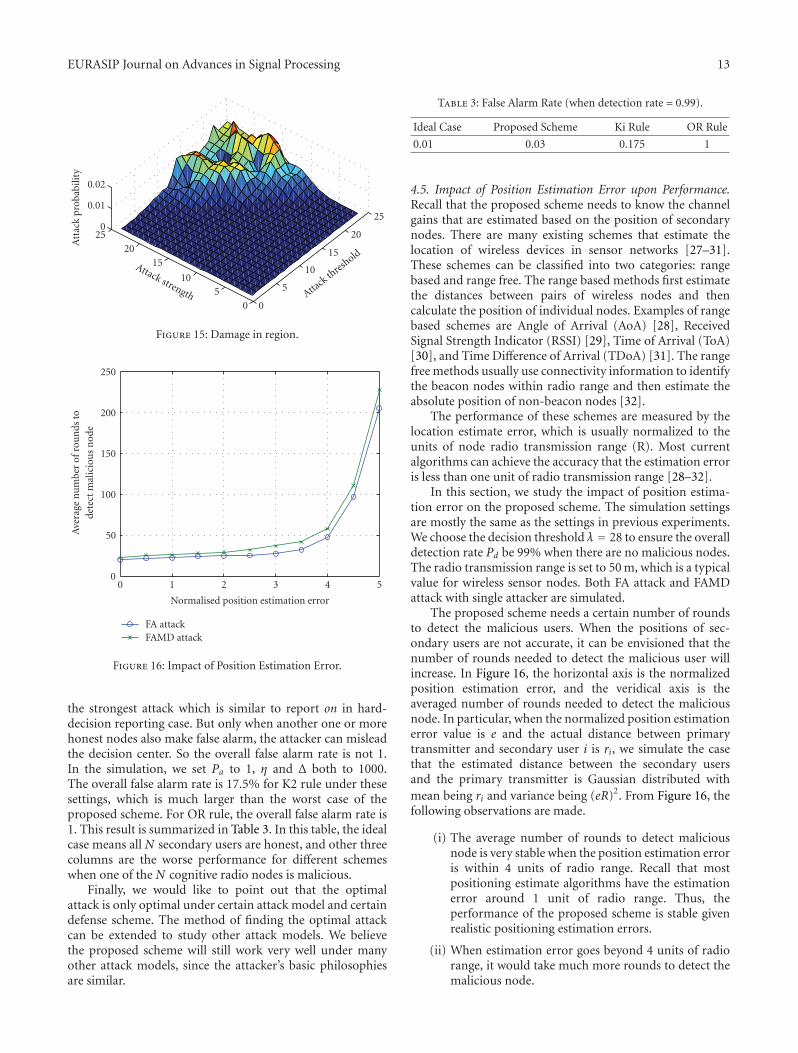
The proposed scheme needs a certain number of roundsto detect the malicious users. When the positions of sec-ondary users are not accurate, it can be envisioned that thenumber of rounds needed to detect the malicious user willincrease. In Figure 16, the horizontal axis is the normalizedposition estimation error, and the veridical axis is theaveraged number of rounds needed to detect the maliciousnode. In particular, when the normalized position estimationerror value is e and the actual distance between primarytransmitter and secondary user i is ri, we simulate the casethat the estimated distance between the secondary usersand the primary transmitter is Gaussian distributed withmean being ri and variance being (eR)2. From Figure 16, thefollowing observations are made.
(i) The average number of rounds to detect maliciousnode is very stable when the position estimation erroris within 4 units of radio range. Recall that mostpositioning estimate algorithms have the estimationerror around 1 unit of radio range. Thus, theperformance of the proposed scheme is stable givenrealistic positioning estimation errors.
(ii) When estimation error goes beyond 4 units of radiorange, it would take much more rounds to detect themalicious node.

14 EURASIP Journal on Advances in Signal Processing
(iii) The position estimation error has similar impact onthe FA attack and the FAMD attack.
In conclusion, the performance of the proposed schemeis not sensitive to the position estimate error as long as itis within a reasonable range. This reasonable range can beachieved by existing positioning algorithms.
5. Conclusions
Untrustworthy secondary users can significantly degrade theperformance of collaborative spectrum sensing. We proposetwo attack models, FA attack and FAMD attack. The firstattack intends to cause false alarm and the second attackcauses both false alarm and miss detection. To deal with theseattacks, we first propose a defense scheme to detect singlemalicious user. The basic idea is to calculate the trust valueof all secondary nodes based on their reports. Only reportsfrom nodes that have consistent high trust value will be usedin primary user detection. Then we extend the method forsingle attacker to multiple attacker case. This defense schemeuses an onion-peeling approach and does not need priorknowledge about the attacker number. Finally, we define thedamage metric and investigate the attack parameters thatmaximize the damage.
Comprehensive simulations are conducted to study theROC curves and suspicious level dynamics for differentattack models, attacker numbers and different collaborativesensing schemes. The proposed schemes demonstrate sig-nificant performance advantage. For example, when thereare 10 secondary users, with the primary user detection rateequals to 0.99, one malicious user can make the false alarmrate (Pf ) increases to 72%. Whereas the K2 rule defensescheme can reduce Pf to 13%, the proposed scheme reducesPf to 5%. Two malicious users can make the false alarmrate (Pf ) increases to 85%. Whereas the K3 defense schemecan reduce Pf to 23%, the proposed scheme reduces Pf to8%. Furthermore, when a good user suddenly turns bad,the proposed scheme can quickly increase the suspiciouslevel of this user. If this user only behaves badly for a fewtimes, its suspicious level can recover after a large numberof good behaviors. For single attacker case, we find optimalattack parameters for the proposed scheme. When facing theoptimal attack, the proposed scheme yield 3% false alarmrate, with 99% detection rate. On the other hand, when theK2 rule scheme faces the strongest attack against the K2 rule,the false alarm rate can be 17.5% with 99% detection rate.With the proposed scheme, the impact from malicious usersis greatly reduced even if the attacker adopts optimal attackparameters and remains undetected.
Acknowledgment
This work is supported by CNS-0905556, NSF Award no.0910461, no. 0831315, no. 0831451 and no. 0901425.
References
[1] J. Mitola III and G. Q. Maguire Jr., “Cognitive radio: makingsoftware radios more personal,” IEEE Personal Communica-tions, vol. 6, no. 4, pp. 13–18, 1999.
[2] S. Haykin, “Cognitive radio: brain-empowered wireless com-munications,” IEEE Journal on Selected Areas in Communica-tions, vol. 23, no. 2, pp. 201–220, 2005.
[3] E. Hossain, D. Niyato, and Z. Han, Dynamic Spectrum Accessin Cognitive Radio Networks, Cambridge University Press,Cambridge, UK, 2008.
[4] D. Cabric, S. M. Mishra, and R. W. Brodersen, “Implemen-tation issues in spectrum sensing for cognitive radios,” inProceedings of the 38th Asilomar Conference on Signals, Systemsand Computers (ACSSC ’04), pp. 772–776, Pacific Grove, Calif,USA, November 2004.
[5] H. Urkowitz, “Energy detection of unknown deterministicsignals,” Proceedings of the IEEE, vol. 55, no. 4, pp. 523–531,1967.
[6] D. Cabric, A. Tkachenko, and R. W. Brodersen, “Experimentalstudy of spectrum sensing based on energy detection and net-work cooperation,” in Proceedings of the 1st ACM InternationalWorkshop on Technology and Policy for Accessing Spectrum(TAPAS ’06), Pacific Grove, Calif, USA, August 2006.
[7] A. Ghasemi and E. S. Sousa, “Collaborative spectrum sensingfor opportunistic access in fading environments,” in Proceed-ings of the 1st IEEE International Symposium on New Frontiersin Dynamic Spectrum Access Networks (DySPAN ’05), pp. 131–136, November 2005.
[8] A. Ghasemi and E. S. Sousa, “Opportunistic spectrum accessin fading channels through collaborative sensing,” Journal ofCommunications, vol. 2, no. 2, pp. 71–82, 2007.
[9] A. Ghasemi and E. S. Sousa, “Spectrum sensing in cognitiveradio networks: the cooperation-processing tradeoff,” WirelessCommunications and Mobile Computing, vol. 7, no. 9, pp.1049–1060, 2007.
[10] K. B. Letaief and W. Zhang, “Cooperative spectrum sensing,”in Cognitive Wireless Communication Networks, Springer, NewYork, NY, USA, 2007.
[11] Z. Han and K. J. R. Liu, Resource Allocation for WirelessNetworks: Basics, Techniques, and Applications, CambridgeUniversity Press, Cambridge, UK, 2008.
[12] E. Visotsky, S. Kuffher, and R. Peterson, “On collaborativedetection of TV transmissions in support of dynamic spec-trum sharing,” in Proceedings of the 1st IEEE InternationalSymposium on New Frontiers in Dynamic Spectrum AccessNetworks (DySPAN ’05), pp. 338–345, Baltimore, Md, USA,November 2005.
[13] G. Ganesan and Y. Li, “Agility improvement through cooper-ative diversity in cognitive radio,” in Proceedings of the IEEEGlobal Communications Conference (GLOBECOM ’05), pp.2505–2509, St. Louis, Mo, USA, November 2005.
[14] G. Ganesan and Y. Li, “Cooperative spectrum sensing incognitive radio, part I: two user networks,” IEEE Transactionson Wireless Communications, vol. 6, no. 6, pp. 2204–2212,2007.
[15] G. Ganesan and Y. Li, “Cooperative spectrum sensing in cog-nitive radio, part II: multiuser networks,” IEEE Transactions onWireless Communications, vol. 6, no. 6, pp. 2214–2222, 2007.
[16] Z. Quan, S. Cui, and A. H. Sayed, “Optimal linear cooperationfor spectrum sensing in cognitive radio networks,” IEEEJournal on Selected Topics in Signal Processing, vol. 2, no. 1, pp.28–40, 2008.
[17] J. Unnikrishnan and V. V. Veeravalli, “Cooperative sensing forprimary detection in cognitive radio,” IEEE Journal on SelectedTopics in Signal Processing, vol. 2, no. 1, pp. 18–27, 2008.
[18] C. Sun, W. Zhang, and K. B. Letaief, “Cooperative spectrumsensing for cognitive radios under bandwidth constraints,”in Proceedings of the IEEE Wireless Communications and
EURASIP Journal on Advances in Signal Processing 15
Networking Conference (WCNC ’07), pp. 1–5, Hong Kong,March 2007.
[19] C. Sun, W. Zhang, and K. B. Letaief, “Cluster-based coopera-tive spectrum sensing in cognitive radio systems,” in Proceed-ings of IEEE International Conference on Communications (ICC’07), pp. 2511–2515, Glasgow, UK, June 2007.
[20] C.-H. Lee and W. Wolf, “Energy efficient techniques for coop-erative spectrum sensing in cognitive radios,” in Proceedingsof the 5th IEEE Consumer Communications and NetworkingConference (CCNC ’08), pp. 968–972, Las Vegas, Nev, USA,January 2008.
[21] R. Chen, J.-M. Park, and J. H. Reed, “Defense against primaryuser emulation attacks in cognitive radio networks,” IEEEJournal on Selected Areas in Communications, vol. 26, no. 1, pp.25–37, 2008.
[22] T. Newman and T. Clancy, “Security threats to cognitive radiosignal classifiers,” in Proceedings of the Virginia Tech WirelessPersonal Communications Symposium, Blacksburg, Va, USA,June 2009.
[23] S. M. Mishra, A. Sahai, and R. W. Brodersen, “Cooperativesensing among cognitive radios,” in Proceedings of the IEEEInternational Conference on Communications (ICC ’06), vol. 4,pp. 1658–1663, Istanbul, Turkey, June 2006.
[24] R. Chen, J.-M. Park, and K. Bian, “Robust distributed spec-trum sensing in cognitive radio networks,” in Proceedings ofIEEE International Conference on Computer Communications(INFOCOM ’08), pp. 31–35, Phoenix, Ariz, USA, April 2008.
[25] T. Clancy and N. Goergen, “Security in cognitive radionetworks: threats and mitigation,” in Proceedings of the 3rdInternational Conference on Cognitive Radio Oriented WirelessNetworks and Communications (CrownCom ’08), Singapore,May 2008.
[26] W. Wang, H. Li, Y. Sun, and Z. Han, “Attack-proof collab-orative spectrum sensing in cognitive radio networks,” inProceedings of the 43rd Annual Conference on InformationSciences and Systems (CISS ’09), pp. 130–134, March 2009.
[27] W. Wang, H. Li, Y. Sun, and Z. Han, “CatchIt: detect maliciousnodes in collaborative spectrum sensing,” in Proceedings of theIEEE Global Communications Conference (GLOBECOM ’09),Honolulu, Hawaii, USA, November 2009.
[28] R. Peng and M. L. Sichitiu, “Angle of arrival localizationfor wireless sensor networks,” in Proceedings of the 3rdAnnual IEEE Communications Society on Sensor and Ad HocCommunications andNetworks (Secon ’06), vol. 1, pp. 374–382,September 2006.
[29] P. Bahl and V. N. Padmanabhan, “RADAR: an in-building RF-based user location and tracking system,” in Proceedings ofIEEE International Conference on Computer Communications(INFOCOM ’00), pp. 775–784, Tel Aviv, Israel, March 2000.
[30] B. H. Wellenhoff, H. Lichtenegger, and J. Collins, Global Posi-tions System: Theory and Practice, Springer, Berlin, Germany,4th edition, 1997.
[31] A. Savvides, C.-C. Han, and M. B. Strivastava, “Dynamicfine-grained localization in ad-hoc networks of sensors,” inProceedings of the 7th Annual International Conference onMobile Computing and Networking (MOBICOM ’01), pp. 166–179, Rome, Italy, July 2001.
[32] T. He, C. Huang, B. M. Blum, J. A. Stankovic, and T. Abdelza-her, “Rangefree localization schemes for large scale sensornetworks,” in Proceedings of the 9th Annual InternationalConference onMobile Computing and Networking (MOBICOM’03), San Diego, Calif, USA, 2003.
[33] Q. Zhao, L. Tong, A. Swami, and Y. Chen, “Decentralizedcognitive MAC for opportunistic spectrum access in ad hocnetworks: a POMDP framework,” IEEE Journal on SelectedAreas in Communications, vol. 25, no. 3, pp. 589–599, 2007.