
A Systems Approach to Energy Resiliency in Pacific Northwest Communities
Upload
swarthmoreCategory
view
0download
0
School-Based Prevention of Depressive Symptoms: A Randomized ControlledStudy of the Effectiveness and Specificity of the Penn Resiliency Program
Jane E. GillhamUniversity of Pennsylvania and Swarthmore College
Karen J. Reivich, Derek R. Freres, Tara M. Chaplin,Andrew J. Shatte, Barbra Samuels,
Andrea G. L. Elkon, Samantha Litzinger,and Marisa Lascher
University of Pennsylvania
Robert GallopWest Chester University
Martin E. P. SeligmanUniversity of Pennsylvania
The authors investigated the effectiveness and specificity of the Penn Resiliency Program (PRP; J. E.Gillham, L. H. Jaycox, K. J. Reivich, M. E. P. Seligman, & T. Silver, 1990), a cognitive–behavioraldepression prevention program. Children (N � 697) from 3 middle schools were randomly assigned toPRP, Control (CON), or the Penn Enhancement Program (PEP; K. J. Reivich,1996; A. J. Shatte, 1997),an alternate intervention that controls for nonspecific intervention ingredients. Children’s depressivesymptoms were assessed through 3 years of follow-up. There was no intervention effect on average levelsof depressive symptoms in the full sample. Findings varied by school. In 2 schools, PRP significantlyreduced depressive symptoms across the follow-up relative to both CON and PEP. In the 3rd school, PRPdid not prevent depressive symptoms. The authors discuss the findings in relation to previous researchon PRP and the dissemination of prevention programs.
Keywords: depression, prevention, children, adolescence
Several cognitive– behavioral interventions show promise inpreventing depressive symptoms in youths (for recent reviews,
see Horowitz & Garber, 2006; Merry, McDowell, Hetrick, Bir,& Muller, 2004). Among these are the Coping with StressCourse (Clarke & Lewinsohn, 1995), the Resourceful Adoles-cent Program (RAP; Shochet, Whitefield, & Holland, 1997), theLISA-T Program (Possel, Horn, Groen, & Hautzinger, 2004),and the Penn Resiliency Program1 (PRP; Gillham, Jaycox,Reivich, Seligman, & Silver, 1990). Despite this promise, how-ever, depression prevention programs that demonstrate positiveeffects are rarely incorporated into school or clinical settings,and little is known about the effectiveness of most programswhen delivered by the individuals who work in these settings.
In addition, when these programs do work, it is usually unclearwhether the cognitive–behavioral therapy skills or other nonspe-cific factors (e.g., time spent in a structured after-school activity,attention from an adult, support from peers) are responsible. Themajority of depression prevention studies compare cognitive–behavioral interventions with a no-intervention control. Only a fewstudies have compared prevention programs with attention controlgroups or alternate interventions. Pattison and Lynd-Stevenson(2001) found that PRP did not significantly reduce or preventdepressive symptoms relative to both no-intervention and attentioncontrol groups. The small sample size (N � 63) may have limitedpower to detect effects, however. Merry, McDowell, Wild, Bir,and Cunliffe (2004) compared RAP with a placebo control groupconsisting primarily of group arts and crafts activities and found
1 PRP materials are available for use in research. Requests for thecurriculum should be made to [email protected].
Jane E. Gillham, Department of Psychology, University of Pennsylvania,and Psychology Department, Swarthmore College; Karen J. Reivich, Tara M.Chaplin, Andrew J. Shatte, Barbra Samuels, Andrea G. L. Elkon, SamanthaLitzinger, Marisa Lascher, and Martin E. P. Seligman, Department of Psy-chology, University of Pennsylvania; Derek R. Freres, Annenberg School forCommunication, University of Pennsylvania; Robert Gallop, Department ofMathematics Applied Statistics Program, West Chester University.
Barbra Samuels is now at the Treatment Research Institute (Philadel-phia). Andrea G. L. Elkon is now at the Georgia Regional Hospital atAtlanta (Atlanta, Georgia). Samantha Litzinger is now at the Department ofPsychology, University of Tennessee. Marisa Lascher is now at LehmanBrothers (New York).
The Penn Resiliency Program for Children and Adolescents is owned bythe University of Pennsylvania. The University of Pennsylvania has li-censed this program to Adaptiv Learning Systems (King of Prussia, Penn-sylvania). Andrew J. Shatte is employed part-time by Adaptiv LearningSystems, and Karen J. Reivich, Andrew J. Shatte, and Martin E. P.Seligman own stock in Adaptiv Learning Systems and could profit fromthe sale of this program. The other authors do not have financial relation-ships with Adaptiv Learning Systems.
This research was funded by National Institute of Mental Health GrantMH52270. We are grateful to the children and parents who participated inthe project, and to the school teachers, counselors, administrators, andpersonnel who assisted us in carrying out the project.
Correspondence concerning this article should be addressed to Jane E.Gillham, Psychology Department, Swarthmore College, 500 College Av-enue, Swarthmore, PA 19081. E-mail: [email protected] [email protected]
Journal of Consulting and Clinical Psychology Copyright 2007 by the American Psychological Association2007, Vol. 75, No. 1, 9–19 0022-006X/07/$12.00 DOI: 10.1037/0022-006X.75.1.9
9
some support for the efficacy of RAP relative to placebo, but theeffect size was small, and effects were not found across differentmeasures of depressive symptoms. The placebo condition used byMerry et al. controlled for several factors that are not specific tocognitive–behavioral interventions, including adult attention andopportunities to interact with peers. A stronger test of thecognitive–behavioral model would control for additional nonspe-cific factors, such as the discussion of stressors and topics relevantto depression.
Shatte (1997) and Reivich (1996) took this approach in theirstudies, which compared PRP with an alternate intervention (thePenn Enhancement Program [PEP]) and a no-intervention control.A total of 152 middle school students were randomly assigned toone of the three conditions. Group leaders were school teachers,school counselors, and psychology graduate students not affiliatedwith the research team. PRP and PEP both reduced depressivesymptoms relative to the no-intervention control. PRP and PEPparticipants’ depression scores were not significantly different atmost of the follow-up assessments. The lack of differences mayreflect limited power, as very large cell sizes are often needed todetect differences between active interventions. In addition, it ispossible that differences would have emerged had the researchersfollowed participants for more than 1 year postintervention.
In the present study, we evaluated PRP’s effectiveness as com-pared with PEP and a no-intervention control in a large sample(baseline N � 697) over a 3-year follow-up period. Our majorgoals were as follows: (a) to investigate the effectiveness of PRPwhen delivered in schools by school teachers, school counselors,and other group leaders not affiliated with a research team, and (b)to evaluate intervention specificity. We examined two conceptu-alizations of depression prevention: (a) reduced levels of symp-toms across an extended period of time (Jaycox, Reivich, Gillham,& Seligman, 1994), and (b) reduced onset of symptoms above acertain threshold (Gillham, Shatte, & Freres, 2000).
Method
Participants
This study was approved by the Institutional Review Board and byschool administrators and school boards in each of the participating schooldistricts. Figure 1 shows the participant flow from recruitment through the3-year follow-up. Starting in 1997, two consecutive cohorts of studentsparticipated in this study. Each year, the research team sent letters andconsent forms describing the project to parents of students in three middleschools (henceforth referred to as Schools A, B, and C) in a suburbanmetropolitan area in the United States. Recruitment materials described thestudy as an investigation of two interventions designed to help studentscope with day-to-day stressors that are common in adolescence. We in-formed parents that those children who reported elevated symptoms atbaseline would first be offered spots in the project and that other childrenwould be included as space allowed. In total, parents of approximately4,000 children received recruitment materials. Because the response ratewas lower than anticipated, we decided to evaluate PRP with all childrenfor whom we received consent as long as they were not suffering from adepressive disorder at baseline.
A total of 718 children and their parents consented to participate in theproject. Response rates ranged from 15% to 22% across the three schools.These children completed baseline measures, including the Children’sDepression Inventory (CDI; Kovacs, 2001). The 175 children with baselineCDI � 13 were administered the depressive disorders section of the
Diagnostic Interview for Children and Adolescents (Reich, 2000). Eightchildren scored positive for major depressive disorder on the DiagnosticInterview for Children and Adolescents and were referred to therapy.Thirteen families dropped from the study after baseline and prior torandomization.
The remaining 697 children (376 boys and 321 girls) entered the inter-vention phase. Within cohort and school, we stratified children by grade,gender, and baseline CDI score (on the basis of a median split) and thenused a computer-generated random numbers sequence to randomly assignparticipants to one of three study conditions: PRP (n � 232), PEP (n �231), or Control (CON; n � 234). Within each school and across all threeschools combined, there were no significant between-conditions differ-ences on baseline demographic characteristics or depressive symptoms.
At baseline, children’s mean age was 12.13 years (SD � 1.03). A totalof 268 children (39%) were in sixth grade, 237 (34%) were in seventhgrade, and 191 (27%) were in eighth grade (grade information was missingfor 1 student). Age and grade did not significantly differ by school. Otherdemographic characteristics differed by school (see Table 1).
At baseline, mean levels of depressive symptoms (M � 8.45, SD � 7.35,range � 0–45) were in the range typically found in community samples(Kovacs, 2001). Mean depressive symptoms differed by school, F(1,694) � 9.52, p � .01. Students in School A (M � 7.03, SD � 7.41)reported lower levels of depressive symptoms than those in School B (M �9.51, SD � 7.11) or School C (M � 8.71, SD � 7.34), both ps � .01,whereas children in Schools B and C did not differ on baseline depressivesymptoms.
Intervention Conditions
PRP (Gillham et al., 1990) is a group intervention that teachescognitive–behavioral and social problem-solving skills. PRP strives toteach students to think flexibly and accurately about the challenges andproblems that they confront. Students learn about (a) the link betweenbeliefs, feelings, and behaviors; (b) cognitive styles, including pessimisticexplanatory styles; and (c) cognitive restructuring skills, including how tochallenge negative thinking by evaluating the accuracy of beliefs andgenerating alternative interpretations. Students also learn a variety oftechniques for coping and problem-solving, including assertiveness, nego-tiation, decision making, and relaxation. Students apply the cognitive andproblem-solving techniques in their lives through group discussions andweekly homework assignments.
PEP (Reivich, 1996; Shatte, 1997) is a group intervention that focuses onmany of the stressors associated with adolescent depression. Topics includepeer pressure, ethical dilemmas, trust and betrayal, improving communi-cation, friendships, family conflict, setting and achieving goals, self-esteem, and body image. Each session includes structured activities, role-playing, and guided discussion. PEP was designed to control for adultattention, group cohesion, social support, the discussion of depression-relevant topics, sharing thoughts and feelings with peers, and engagementin homework and in-session activities. A detailed description of PEP isavailable from the authors on request.
PRP and PEP groups met after school once each week for a total oftwelve 90-min sessions. Group leaders were school teachers, school coun-selors, and graduate students in school psychology, education, and clinicalpsychology (not affiliated with the research team) who participated in a30-hr training workshop and biweekly group supervision with the PRP andPEP developers. During the study, 19 PRP groups and 19 PEP groups wereimplemented, each containing between 6 and 14 children. Teachers andcounselors led 25 groups, and graduate students led 11 groups. Because ofscheduling difficulties and a shortage of group leaders, research teammembers led one PRP group and one PEP group. No difference was foundin effects for school staff (teachers and counselors) versus graduate stu-dents and researchers. Parents of children in PRP and PEP received $5 persession that their child attended and a $15 bonus if their child attended atleast eight sessions.
10 GILLHAM ET AL.

In meetings and correspondence with group leaders and potential par-ticipants, we described both PRP and PEP as interventions that aim toincrease well-being and help to buffer students against the effects ofcommon stressors. We informed leaders and parents that the programs usedifferent strategies to achieve this goal: PRP teaches specific coping andproblem-solving skills, whereas PEP is more discussion oriented.
Students in the CON condition did not participate in PRP or PEP butcompleted the same assessments as students in the active interventions. Inall three conditions, students and their families were permitted to seekcounseling or therapy.
Intervention Integrity and Attendance
Intervention sessions were audio-recorded. Following the interventionphase, we selected four lessons from each group for intervention adherence
coding. We chose these lessons because they contained key content andincluded early, middle, and later sessions. Group leaders were not informedwhich lessons would be rated. Two research assistants rated each lesson onthe presentation of 11–14 concepts, skills, or activities. For each contentitem, raters used a 7-point scale ranging from 1 (no coverage) to 4(satisfactory coverage) to 7 (excellent coverage). Interrater reliability forthe 1–7 ratings was good (PRP intraclass correlation [ICC] � .65; PEPICC � .77). We computed two integrity scores for each group: (a) thedegree covered score, calculated by averaging both raters’ integrity itemscores for each session and then averaging the session averages, and (b) thepercentage covered score, calculated by averaging the percentage of itemscovered satisfactorily (�4) across the sessions. Degree covered and per-centage covered scores were highly correlated (r � .83, p � .01). Integrityscores could not be computed for three PRP and two PEP groups becauseleaders forgot to tape sessions or experienced equipment malfunctions.
n = 534 Scored <13 on baseline CDI
n = 167 DICA-R negative for MD
n = 8 DICA-R positive for MD, referred to therapy & excluded
n = 710 Eligible for study following baseline
n = 718 Returned consent form andcompleted baseline
n = 234 Randomized to CON
n = 232 Randomized to PRP
n = 231 Randomized to PEP
n = 212 Completed post
n = 210 Completed post
n = 215 Completed post
n = Approximately 4,000Received mailing
n = 175 Scored >= 13 on baseline CDI & administered DICA-R
= 13 Withdrew from study prior to randomization
n = 697 Randomization sample
n = 103 n = 96 n = 104 Completed 3 year follow-up
Completed 3 year follow-up
Completed 3 year follow-up
n
Figure 1. Flow diagram of recruitment, screening, and follow-up. CDI � Children’s Depression Inventory;DICA-R � depressive disorders section of the Diagnostic Interview for Children and Adolescents; MD � majordepressive disorder; PRP � Penn Resiliency Program; PEP � Penn Enhancement Program; CON � control;post � postintervention.
11SCHOOL-BASED PREVENTION

Average integrity scores for PRP groups were 4.9 (SD � 0.48) fordegree covered and 80% (SD � 7.5%) for percentage covered. Averagescores for PEP groups were 4.4 (SD � 0.36) for degree covered and 68%(SD � 5.7%) for percentage covered. Integrity scores were higher for PRPthan PEP groups, likely reflecting the increased structure of the PRPcurriculum. Mean integrity scores for PRP and PEP groups did not differsignificantly by school.
On average, the 232 children assigned to PRP attended 6.71 (SD � 4.22)sessions, and the 231 children assigned to PEP attended 7.11 (SD � 4.43)sessions, t(461) � �1.01, ns. Thirty-seven children (16%) assigned to PRPand 35 (15%) assigned to PEP did not attend any sessions. Of these, 27 ineach condition completed at least one follow-up assessment, and their datawere included in analyses. PRP attendance differed by school, F(1, 231) �5.58, p � .01. Attendance was higher in School A (M � 7.30, SD � 3.97)
and School C (M � 7.38, SD � 4.04) than School B (M � 5.40, SD �4.40), ps � .05. PRP attendance was not significantly different in SchoolsA and C. PEP attendance did not differ significantly by school.
Assessment Schedule and Depressive Symptom Measures
Children in all three conditions completed questionnaires at baseline andat follow-up assessments 2 weeks postintervention and every 6 monthsthereafter for 3 years. Families received $12 for each assessment.
This article focuses on results for the study’s primary outcome variable:depressive symptoms, as assessed with the CDI and the Children’s De-pression Rating Scale—Revised (CDRS–R; Poznanski & Mokros, 1996).The CDI is a widely used measure of depressive symptoms in children andadolescents, which has adequate reliability and validity (Kovacs, 2001).
Table 1Demographic Characteristics by School
Variable
School A (n � 212) School B (n � 222) School C (n � 263)
Statisticn % M SD n % M SD n % M SD
Gender �2(2, N � 697) � 16.86, p � .001Boys 135 63 97 44 145 55Girls 78 37 125 56 118 45
Race/ethnicity �2(8, N � 684) � 68.42, p � .001African American 12 6 40 18 10 4Asian American 13 6 5 2 6 2Caucasian 153 74 132 60 227 88Latino/Latina 3 2 8 4 2 1Other 25 12 35 16 13 5Total with data 206 220 258
Parents’ marital status �2(6, N � 672) � 79.39, p � .001Married 141 73 75 34 134 51Separated 1 1 15 7 10 4Divorced 35 18 52 24 69 26Other 16 8 76 35 48 18Total with data 193 218 261
Family income level (1997–1998)Mean level 4.49a 1.54 2.58c 1.22 3.16b 1.28 F(2, 437) � 69.50, p � .001Level 1: �$20,000 3 2 29 23 14 8 �2(10, N � 440) � 142.04, p � .001Level 2: From $20,000 to �$40,000 19 14 28 22 43 24Level 3: From $40,000 to �$60,000 15 11 49 39 60 34Level 4: From $60,000 to �$80,000 22 16 13 10 34 19Level 5: From $80,000 to �$100,000 23 17 4 3 18 10Level 6: $100,000 or more 52 39 4 3 10 6Total with data 134 127 179
Mother’s education—Highest levelcompleted
Mean level 4.24a 1.29 3.16b 1.31 3.08b 1.28 F(2, 454) � 32.40, p � .0011. Some high school 0 0 8 6 8 4 �2(10, N � 457) � 74.16, p � .0012. High school graduate 10 9 47 33 72 363. Some college 23 21 33 23 66 334. College graduate 37 33 34 24 24 125. Some graduate training 12 11 11 8 19 96. Graduate/advanced degree 29 26 10 7 14 7Total with data 111 143 203
Father’s education—Highest levelcompleted
Mean level 4.44a 1.29 2.84b 1.41 3.00b 1.36 F(2, 435) � 45.84, p � .0011. Some high school 1 1 15 11 13 7 �2(10, N � 438) � 83.99, p � .0012. High school graduate 17 16 59 44 80 413. Some college 14 13 22 16 42 214. College graduate 22 20 21 16 32 165. Some graduate training 10 9 5 4 13 76. Graduate or advanced degree 44 41 12 9 16 8Total with data 108 134 196
Note. In each row, means with the same subscripts do not significantly differ.
12 GILLHAM ET AL.

We used recommended cutpoints of CDI greater than or equal to 13 tocategorize depressive symptoms as at least mild in intensity (referred to aselevated symptoms within), and greater than or equal to 19 to denotedepressive symptoms as at least moderate in intensity (referred to as highsymptoms within). These cutpoints are near the 70th and 90th percentiles,respectively, for this age group on the basis of the CDI standardizationnorms (Kovacs, 2001).
We also examined clinical symptoms with the CDRS–R. At eachfollow-up assessment, we invited children with a CDI score greater than orequal to 13 to participate in the CDRS–R, a semistructured interviewassessing symptoms of depression in children and adolescents (Poznanski& Mokros, 1996). Trained research assistants conducted the interviews,and a second research assistant coded the interview tape for reliabilitypurposes. Interviewers and coders were not informed of participants’condition assignments. Interrater reliability was good (ICC � .79). ACDRS–R t score greater than or equal to 65 identified children likely to besuffering from a depressive disorder. Clinical psychologists working on theproject contacted parents of these children to inform them of the assess-ment results and offer referrals. For analytic purposes, children with CDIscores less than 13 were assumed to have a CDRS–R t score less than 65.
During the 3-year follow-up, 235 (36%) of the 651 children whocompleted follow-up assessments scored greater than or equal to 13 on theCDI and were invited to interviews at one or more follow-up points. Ofthese 235 children, 62 (20 from PRP, 21 from PEP, and 21 controls) did notcomplete CDRS–R interviews and so were excluded from the CDRS–Ranalyses. Thus, CDRS–R analyses used data from 589 children: the 173children with CDI scores greater than or equal to 13 who completed theinterviews and the 416 children who consistently scored less than 13 on theCDI during the follow-up.
Data Analytic Strategy
Power analyses. Our goal was to detect small-to-medium interventioneffects (d � 0.30) allowing for 20% attrition. We planned an initial cellsize greater than or equal to 220 (final cell size of n � 176) to achieve apower of greater than or equal to .80 to detect a difference at � � .05(two-tailed). Attrition was higher than expected, however, and our finalsample size at the 3-year follow-up assessment allowed us to detect effectsizes greater than or equal to .45 at a power of greater than or equal to .80and � � .05 (two-tailed).
Inspection and transformation of data. We evaluated assumptions ofnormality of continuous variables by examining histograms and calculatingskewness and kurtosis scores at each assessment point. CDI scores wereskewed at several assessment points so square root transformations wereused for these data. Table 2 shows raw means to ease interpretation.
Attrition and baseline differences. We used analysis of variance(ANOVA) and chi-square analyses to compare baseline depressive symp-toms and demographic characteristics of children who did and did notcomplete any follow-up assessments. The possibility of differential attri-tion was examined by testing for between-conditions differences in thesevariables among children who did not complete any follow-up assessments,as well as among children who did not complete the final (3-year)follow-up assessment.
We used ANOVAs and chi-square analyses to compare baseline depres-sive symptoms and demographic characteristics across the three studyconditions. These analyses tested for differences among all participantswho completed baseline (baseline sample) and among participants forwhom we had follow-up data (follow-up sample).
Intervention effects. We evaluated intervention effects on depressivesymptoms using intent-to-treat analyses that included data from all partic-ipants selected into the study who completed the baseline assessment andany of the follow-up assessments (the follow-up sample). We operation-alized prevention in two ways, as (a) prevention of symptoms over time, orlower levels of depressive symptoms relative to the comparison group overthe follow-up period, and (b) prevention of onset of symptoms above
specified levels of severity: CDI scores greater than or equal to 13 or 19,and CDRS–R t scores greater than or equal to 65.
Mixed-model (MM) ANOVAs tested prevention of symptoms over time.These analyses predicted depression scores over time from condition withbaseline depression scores covaried. Additional analyses examined poten-tial school effects by predicting depression scores over time from condi-tion, school, and the Condition � School interaction with baseline scorescovaried. Examination of the model fit statistics, such as the Akaikeinformation criterion and the Bayesian information criterion, as well as thelikelihood ratio tests, for several covariance structures indicated that theunstructured covariance structure was appropriate. When the MM ANOVAanalyses revealed a significant or marginally significant main effect ofcondition, t tests (with test statements) compared the estimated marginalmeans for each pair of conditions from the overall MM ANOVA. We alsoconducted analyses of covariance (ANCOVAs) for each assessment (pre-dicting depressive symptoms at the given assessment from condition, withbaseline depression score covaried) to enable comparisons with preventionstudies that report effects at each assessment point.
We calculated effect sizes based on Cohen’s d using the difference (PRPminus CON, PRP minus PEP) in estimated marginal means. For MMANOVAs, we divided the difference in estimated marginal means by thesquare root of the covariance estimate following recommendations fromRaudenbush and Xiao-Feng (2001). For ANCOVAs, we divided the dif-ference in estimated marginal means by the pooled standard deviation.Negative effect sizes indicate that PRP group depression scores were lowerthan CON (or PEP) scores over the follow-up period. For PEP versus CONcomparisons, negative effect sizes indicate lower scores in PEP than CON.We used two-tailed alphas. We report significant effects and nonsignificanttrends ( p � .10, referred to as tendencies within).
Chi-square analyses tested prevention of onset of elevated, high, andclinical levels of symptoms. Analyses examining prevention of elevatedand high levels of symptoms used data from participants who scored belowthe given cutpoint (CDI � 13 and CDI � 19, respectively) at baseline.
Hypotheses. We predicted that PRP would prevent depressive symp-toms relative to CON and PEP. Specifically, we expected that during thefollow-up, PRP participants would (a) report lower mean levels of depres-sive symptoms and (b) show lower rates of onset of elevated, high, orclinical levels of symptoms than participants in the other conditions.
Results
Overall
Attrition and baseline differences. Of the 697 children whocompleted baseline, 46 did not complete any follow-up assess-ments. These children were evenly distributed across the studyconditions and represented between 6% and 7% of the children ineach condition. Children who did not complete any follow-upswere older than the children who completed follow-ups, F(1,663) � 6.99, p � .01. We found no significant between-conditionsdifferences in depressive symptoms or demographic characteristicsamong children who did not complete any follow-up assessments.
A total of 396 participants did not complete the final 3-yearfollow-up assessment. These children were evenly distributedacross the study conditions and represented between 56% and 59%of the baseline samples in each condition. Children who did notcomplete the 3-year follow-up assessment were older, came fromhouseholds with lower incomes, and were less likely to haveparents who were married than children who completed this as-sessment, F(1, 662) � 5.01, p � .05; F(1, 438) � 5.83, p � .05;and �2(1, N � 672) � 10.28, p � .01. We found no significantbetween-conditions differences in depressive symptoms or demo-
13SCHOOL-BASED PREVENTION
graphic characteristics among children who did not complete thefinal 3-year follow-up.
We found no significant differences by condition on baselinedepressive symptoms or demographic variables in the baseline sam-ple. In the follow-up sample, parents’ marital status varied by condi-
tion, �2(6, N � 643) � 13.03, p � .05, with PEP participants lesslikely than PRP participants or controls to have parents whose maritalstatus was listed as “other.” PRP and CON conditions did not differ onparental marital status. Analyses covarying parents’ marital status areconsistent with the outcome analyses reported within.
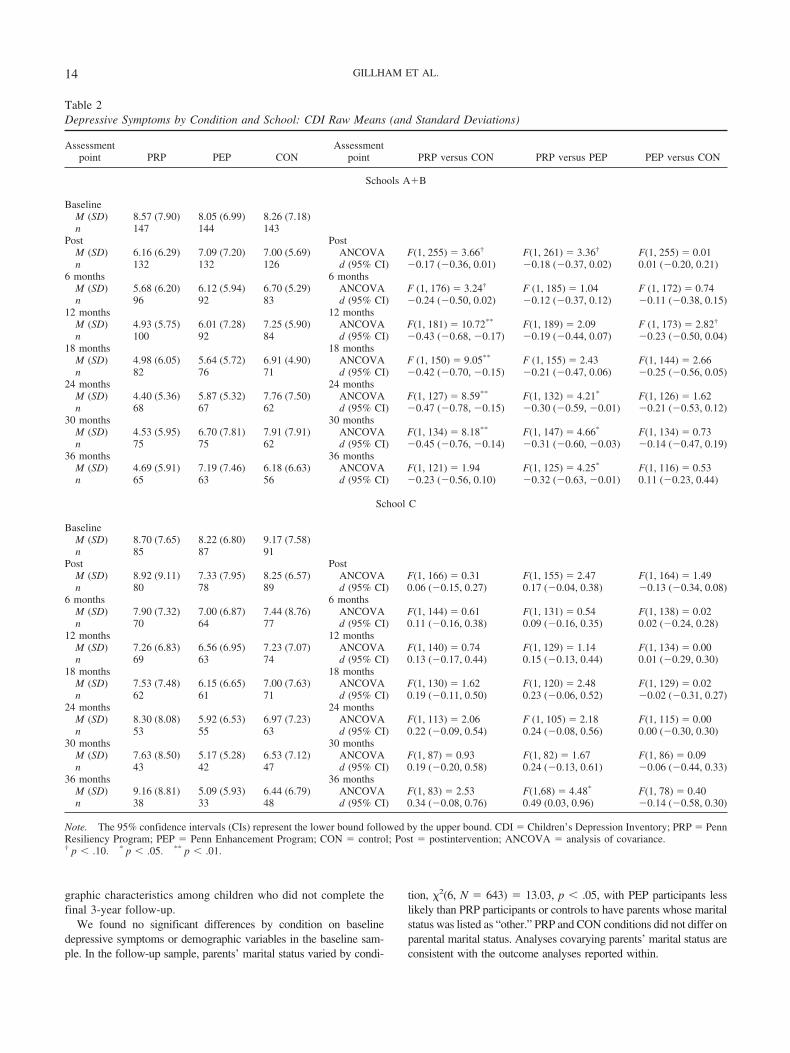
Table 2Depressive Symptoms by Condition and School: CDI Raw Means (and Standard Deviations)
Assessmentpoint PRP PEP CON
Assessmentpoint PRP versus CON PRP versus PEP PEP versus CON
Schools A�B
BaselineM (SD) 8.57 (7.90) 8.05 (6.99) 8.26 (7.18)n 147 144 143
Post PostM (SD) 6.16 (6.29) 7.09 (7.20) 7.00 (5.69) ANCOVA F(1, 255) � 3.66† F(1, 261) � 3.36† F(1, 255) � 0.01n 132 132 126 d (95% CI) �0.17 (�0.36, 0.01) �0.18 (�0.37, 0.02) 0.01 (�0.20, 0.21)
6 months 6 monthsM (SD) 5.68 (6.20) 6.12 (5.94) 6.70 (5.29) ANCOVA F (1, 176) � 3.24† F (1, 185) � 1.04 F (1, 172) � 0.74n 96 92 83 d (95% CI) �0.24 (�0.50, 0.02) �0.12 (�0.37, 0.12) �0.11 (�0.38, 0.15)
12 months 12 monthsM (SD) 4.93 (5.75) 6.01 (7.28) 7.25 (5.90) ANCOVA F(1, 181) � 10.72** F(1, 189) � 2.09 F (1, 173) � 2.82†
n 100 92 84 d (95% CI) �0.43 (�0.68, �0.17) �0.19 (�0.44, 0.07) �0.23 (�0.50, 0.04)18 months 18 months
M (SD) 4.98 (6.05) 5.64 (5.72) 6.91 (4.90) ANCOVA F (1, 150) � 9.05** F (1, 155) � 2.43 F(1, 144) � 2.66n 82 76 71 d (95% CI) �0.42 (�0.70, �0.15) �0.21 (�0.47, 0.06) �0.25 (�0.56, 0.05)
24 months 24 monthsM (SD) 4.40 (5.36) 5.87 (5.32) 7.76 (7.50) ANCOVA F(1, 127) � 8.59** F(1, 132) � 4.21* F(1, 126) � 1.62n 68 67 62 d (95% CI) �0.47 (�0.78, �0.15) �0.30 (�0.59, �0.01) �0.21 (�0.53, 0.12)
30 months 30 monthsM (SD) 4.53 (5.95) 6.70 (7.81) 7.91 (7.91) ANCOVA F(1, 134) � 8.18** F(1, 147) � 4.66* F(1, 134) � 0.73n 75 75 62 d (95% CI) �0.45 (�0.76, �0.14) �0.31 (�0.60, �0.03) �0.14 (�0.47, 0.19)
36 months 36 monthsM (SD) 4.69 (5.91) 7.19 (7.46) 6.18 (6.63) ANCOVA F(1, 121) � 1.94 F(1, 125) � 4.25* F(1, 116) � 0.53n 65 63 56 d (95% CI) �0.23 (�0.56, 0.10) �0.32 (�0.63, �0.01) 0.11 (�0.23, 0.44)
School C
BaselineM (SD) 8.70 (7.65) 8.22 (6.80) 9.17 (7.58)n 85 87 91
Post PostM (SD) 8.92 (9.11) 7.33 (7.95) 8.25 (6.57) ANCOVA F(1, 166) � 0.31 F(1, 155) � 2.47 F(1, 164) � 1.49n 80 78 89 d (95% CI) 0.06 (�0.15, 0.27) 0.17 (�0.04, 0.38) �0.13 (�0.34, 0.08)
6 months 6 monthsM (SD) 7.90 (7.32) 7.00 (6.87) 7.44 (8.76) ANCOVA F(1, 144) � 0.61 F(1, 131) � 0.54 F(1, 138) � 0.02n 70 64 77 d (95% CI) 0.11 (�0.16, 0.38) 0.09 (�0.16, 0.35) 0.02 (�0.24, 0.28)
12 months 12 monthsM (SD) 7.26 (6.83) 6.56 (6.95) 7.23 (7.07) ANCOVA F(1, 140) � 0.74 F(1, 129) � 1.14 F(1, 134) � 0.00n 69 63 74 d (95% CI) 0.13 (�0.17, 0.44) 0.15 (�0.13, 0.44) 0.01 (�0.29, 0.30)
18 months 18 monthsM (SD) 7.53 (7.48) 6.15 (6.65) 7.00 (7.63) ANCOVA F(1, 130) � 1.62 F(1, 120) � 2.48 F(1, 129) � 0.02n 62 61 71 d (95% CI) 0.19 (�0.11, 0.50) 0.23 (�0.06, 0.52) �0.02 (�0.31, 0.27)
24 months 24 monthsM (SD) 8.30 (8.08) 5.92 (6.53) 6.97 (7.23) ANCOVA F(1, 113) � 2.06 F (1, 105) � 2.18 F(1, 115) � 0.00n 53 55 63 d (95% CI) 0.22 (�0.09, 0.54) 0.24 (�0.08, 0.56) 0.00 (�0.30, 0.30)
30 months 30 monthsM (SD) 7.63 (8.50) 5.17 (5.28) 6.53 (7.12) ANCOVA F(1, 87) � 0.93 F(1, 82) � 1.67 F(1, 86) � 0.09n 43 42 47 d (95% CI) 0.19 (�0.20, 0.58) 0.24 (�0.13, 0.61) �0.06 (�0.44, 0.33)
36 months 36 monthsM (SD) 9.16 (8.81) 5.09 (5.93) 6.44 (6.79) ANCOVA F(1, 83) � 2.53 F(1,68) � 4.48* F(1, 78) � 0.40n 38 33 48 d (95% CI) 0.34 (�0.08, 0.76) 0.49 (0.03, 0.96) �0.14 (�0.58, 0.30)
Note. The 95% confidence intervals (CIs) represent the lower bound followed by the upper bound. CDI � Children’s Depression Inventory; PRP � PennResiliency Program; PEP � Penn Enhancement Program; CON � control; Post � postintervention; ANCOVA � analysis of covariance.† p � .10. * p � .05. ** p � .01.
14 GILLHAM ET AL.
Intervention effects. PRP did not significantly reduce depres-sive symptoms over the follow-up period relative to CON,t(622) � �1.29, ns, d � �0.09 (95% CI � �0.23, 0.05); or PEP,t(623) � �0.31, ns, d � �0.02 (95% CI � �0.16, 0.11). PEP alsodid not reduce depressive symptoms significantly relative to CON,t(628) � �0.97, ns, d � �0.07 (95% CI � �0.21, 0.07).ANCOVAs comparing pairs of conditions at each assessmentrevealed no significant intervention effects and only one trend.PRP tended to prevent depressive symptoms relative to CON at the12-month follow-up, F(1, 324) � 3.11, p � .10, d � �0.18 (95%CI � �0.37, 0.02).
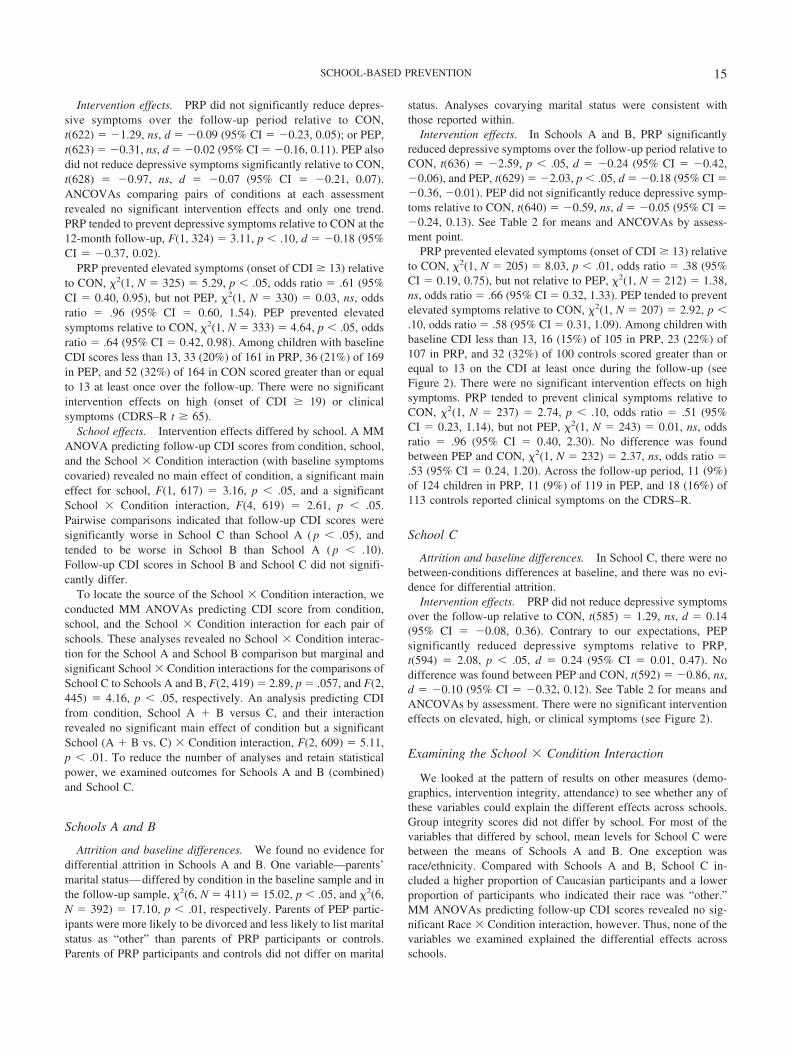
PRP prevented elevated symptoms (onset of CDI � 13) relativeto CON, �2(1, N � 325) � 5.29, p � .05, odds ratio � .61 (95%CI � 0.40, 0.95), but not PEP, �2(1, N � 330) � 0.03, ns, oddsratio � .96 (95% CI � 0.60, 1.54). PEP prevented elevatedsymptoms relative to CON, �2(1, N � 333) � 4.64, p � .05, oddsratio � .64 (95% CI � 0.42, 0.98). Among children with baselineCDI scores less than 13, 33 (20%) of 161 in PRP, 36 (21%) of 169in PEP, and 52 (32%) of 164 in CON scored greater than or equalto 13 at least once over the follow-up. There were no significantintervention effects on high (onset of CDI � 19) or clinicalsymptoms (CDRS–R t � 65).
School effects. Intervention effects differed by school. A MMANOVA predicting follow-up CDI scores from condition, school,and the School � Condition interaction (with baseline symptomscovaried) revealed no main effect of condition, a significant maineffect for school, F(1, 617) � 3.16, p � .05, and a significantSchool � Condition interaction, F(4, 619) � 2.61, p � .05.Pairwise comparisons indicated that follow-up CDI scores weresignificantly worse in School C than School A ( p � .05), andtended to be worse in School B than School A ( p � .10).Follow-up CDI scores in School B and School C did not signifi-cantly differ.
To locate the source of the School � Condition interaction, weconducted MM ANOVAs predicting CDI score from condition,school, and the School � Condition interaction for each pair ofschools. These analyses revealed no School � Condition interac-tion for the School A and School B comparison but marginal andsignificant School � Condition interactions for the comparisons ofSchool C to Schools A and B, F(2, 419) � 2.89, p � .057, and F(2,445) � 4.16, p � .05, respectively. An analysis predicting CDIfrom condition, School A � B versus C, and their interactionrevealed no significant main effect of condition but a significantSchool (A � B vs. C) � Condition interaction, F(2, 609) � 5.11,p � .01. To reduce the number of analyses and retain statisticalpower, we examined outcomes for Schools A and B (combined)and School C.
Schools A and B
Attrition and baseline differences. We found no evidence fordifferential attrition in Schools A and B. One variable—parents’marital status—differed by condition in the baseline sample and inthe follow-up sample, �2(6, N � 411) � 15.02, p � .05, and �2(6,N � 392) � 17.10, p � .01, respectively. Parents of PEP partic-ipants were more likely to be divorced and less likely to list maritalstatus as “other” than parents of PRP participants or controls.Parents of PRP participants and controls did not differ on marital
status. Analyses covarying marital status were consistent withthose reported within.
Intervention effects. In Schools A and B, PRP significantlyreduced depressive symptoms over the follow-up period relative toCON, t(636) � �2.59, p � .05, d � �0.24 (95% CI � �0.42,�0.06), and PEP, t(629) � �2.03, p � .05, d � �0.18 (95% CI ��0.36, �0.01). PEP did not significantly reduce depressive symp-toms relative to CON, t(640) � �0.59, ns, d � �0.05 (95% CI ��0.24, 0.13). See Table 2 for means and ANCOVAs by assess-ment point.
PRP prevented elevated symptoms (onset of CDI � 13) relativeto CON, �2(1, N � 205) � 8.03, p � .01, odds ratio � .38 (95%CI � 0.19, 0.75), but not relative to PEP, �2(1, N � 212) � 1.38,ns, odds ratio � .66 (95% CI � 0.32, 1.33). PEP tended to preventelevated symptoms relative to CON, �2(1, N � 207) � 2.92, p �.10, odds ratio � .58 (95% CI � 0.31, 1.09). Among children withbaseline CDI less than 13, 16 (15%) of 105 in PRP, 23 (22%) of107 in PRP, and 32 (32%) of 100 controls scored greater than orequal to 13 on the CDI at least once during the follow-up (seeFigure 2). There were no significant intervention effects on highsymptoms. PRP tended to prevent clinical symptoms relative toCON, �2(1, N � 237) � 2.74, p � .10, odds ratio � .51 (95%CI � 0.23, 1.14), but not PEP, �2(1, N � 243) � 0.01, ns, oddsratio � .96 (95% CI � 0.40, 2.30). No difference was foundbetween PEP and CON, �2(1, N � 232) � 2.37, ns, odds ratio �.53 (95% CI � 0.24, 1.20). Across the follow-up period, 11 (9%)of 124 children in PRP, 11 (9%) of 119 in PEP, and 18 (16%) of113 controls reported clinical symptoms on the CDRS–R.
School C
Attrition and baseline differences. In School C, there were nobetween-conditions differences at baseline, and there was no evi-dence for differential attrition.
Intervention effects. PRP did not reduce depressive symptomsover the follow-up relative to CON, t(585) � 1.29, ns, d � 0.14(95% CI � �0.08, 0.36). Contrary to our expectations, PEPsignificantly reduced depressive symptoms relative to PRP,t(594) � 2.08, p � .05, d � 0.24 (95% CI � 0.01, 0.47). Nodifference was found between PEP and CON, t(592) � �0.86, ns,d � �0.10 (95% CI � �0.32, 0.12). See Table 2 for means andANCOVAs by assessment. There were no significant interventioneffects on elevated, high, or clinical symptoms (see Figure 2).
Examining the School � Condition Interaction
We looked at the pattern of results on other measures (demo-graphics, intervention integrity, attendance) to see whether any ofthese variables could explain the different effects across schools.Group integrity scores did not differ by school. For most of thevariables that differed by school, mean levels for School C werebetween the means of Schools A and B. One exception wasrace/ethnicity. Compared with Schools A and B, School C in-cluded a higher proportion of Caucasian participants and a lowerproportion of participants who indicated their race was “other.”MM ANOVAs predicting follow-up CDI scores revealed no sig-nificant Race � Condition interaction, however. Thus, none of thevariables we examined explained the differential effects acrossschools.
15SCHOOL-BASED PREVENTION

DiscussionThe full sample findings provide little evidence for PRP’s
effectiveness or specificity. PRP prevented the onset of elevatedsymptoms relative to a no-intervention control but not relativeto PEP (an intervention that controlled for noncognitive–
behavioral therapy specific factors). PRP did not reduce meanlevels of depressive symptoms over the follow-up and did notprevent high or clinical levels of symptoms relative to eithercomparison group. PRP’s effects varied by school, however. Intwo schools, PRP reduced depressive symptoms over the
Schools A+B
0%
5%
10%
15%
20%
25%
30%
35%
pre post 6 months 12months
18months
24months
30months
36months
PRP
PEP
CON
School C
0%
5%
10%
15%
20%
25%
30%
35%
pre post 6 months 12months
18months
24months
30months
36months
PRP
PEP
CON
Figure 2. Onset of elevated symptoms by school: Cumulative proportion of participants with a Children’sDepression Inventory score greater than or equal to 13. PRP � Penn Resiliency Program; PEP � PennEnhancement Program; CON � Control; pre � preintervention; post � postintervention.
16 GILLHAM ET AL.

follow-up relative to CON and PEP. In contrast, PRP was noteffective in the third school.
In Schools A and B, PRP’s effects on depressive symptomswere long lasting. PRP participants reported fewer depressivesymptoms than controls through the 30-month follow-up. Effectsizes were moderate at several assessment points. In addition, PRPprevented the onset of elevated symptoms and tended to preventclinical levels of symptoms relative to no intervention control.
These findings indicate that school teachers and counselors canbe trained to implement the intervention effectively and thatschools are a viable setting in which to teach depression preventionskills. Given that depression is both very common and under-treated in youths (Hirschfeld et al., 1997), the importance of thesefindings should be underscored. Skills-based depression preven-tion programs, like PRP, may be an important addition to theeducational goals of our school systems. By offering programs likePRP, schools may play a vital role in preventing a growingnational health concern.
An important direction for future research is to determinewhether PRP can prevent clinical levels of depressive symptomswhen delivered by school teachers and counselors. The presentfindings provide more evidence for the prevention of mild-to-moderate depressive symptoms than for the prevention of clinicaldepression. This could reflect several factors, including (a) a limitof the PRP intervention, (b) the fact that most of our group leadersdid not have clinical training and thus may have been unpreparedto help the children at greatest risk, or (c) the low attendance ofmany PRP participants. The lack of findings for clinical depressionalso could be a function of statistical power as only a smallproportion of children reported clinical levels of symptoms duringthe follow-up period.
PRP’s Inconsistent Effects
Despite the positive findings in Schools A and B, PRP did notprevent depression in School C. We were unable to identify thesource of the differential effects observed in the present study.Group leaders in the three schools received similar training andsupervision, and adherence to the PRP and PEP protocols did notvary significantly by school. Children’s baseline depressionscores, demographic characteristics, and attendance also did notaccount for the differential effects observed. We also are not awareof any differences in school services, curriculum, or in events thattranspired within schools that could account for the discrepancy.Subtle differences among the schools in program endorsements,students’ needs, or general school climate may have enhancedPRP’s effectiveness in two schools and/or hindered its effective-ness in the third.
The inconsistency in PRP’s effects within the present studymirrors its inconsistent effects across studies. PRP has reduced andprevented depressive symptoms relative to control in several stud-ies (e.g., Gillham, Reivich, Jaycox, & Seligman, 1995; Yu &Seligman, 2002). For example, in the original evaluation of PRP,PRP halved the rate of moderate to severe symptoms. Effect sizeswere moderate to large (d � 0.60) 12–24 months postintervention(Gillham et al., 1995). However, other studies failed to replicatethese findings (e.g., Pattison & Lynd-Stevenson, 2001; Roberts,Kane, Bishop, & Matthews, 2004). A review of PRP researchsuggests that PRP’s effects are strongest when group leaders are
the intervention developers, members of their research team, andgraduate students who receive extensive training and supervisionfrom the intervention developers. PRP’s effects on depression areoften smaller or nonsignificant when group leaders are schoolteachers, clinicians, or other researchers not affiliated with the PRPlaboratory (Gillham, Hamilton, Freres, Patton, & Gallop, 2006). Inother words, as research on PRP moves along the path fromefficacy to real world implementation, intervention effects wane orbecome inconsistent. This pattern corresponds with recent findingsfor the RAP intervention (Harnett & Dadds, 2004) and with theobservation that psychological interventions that yield substantialeffects in research settings often produce small or no effects whendelivered by community providers (Weisz, Donenberg, Han, &Weiss, 1995). A critical priority for prevention research is thedevelopment of effective dissemination strategies.
Specificity
The School A and School B findings provide some support forspecificity as mean depression scores were lower in PRP than PEPparticipants over the follow-up. Contrary to our expectations,however, PEP participants reported fewer depressive symptomsover the follow-up than PRP participants in School C. BecausePRP was not beneficial relative to CON in School C, it is unclearwhether PEP’s superiority reflects the limited value of cognitive–behavioral skills or a more general failure of the PRP interventionin that school.
Limitations
The study’s limits include the low recruitment rate, substantialattrition, incomplete assessment of clinical depression, and theinclusion of graduate students as group leaders. In each school,fewer than 25% of students enrolled in the study. Enrollment rateswere so much lower than we expected that we revised our originalplan to select children with elevated symptoms and offered theprogram to all children who were not clinically depressed at thestart of the study. The children who enrolled reported a wide rangeof symptoms at baseline, but we did not evaluate the interventionsas delivered to most school students in a school setting as in therecent study by Spence, Sheffield, and Donovan (2005). Ourparticipants’ demographic characteristics reflected the communi-ties from which they came, but it is likely that these children (andtheir parents) differed in other important ways from those who didnot sign up for the study. This limits the extent to which we cangeneralize from our findings.
Fewer than 50% of the original baseline sample completed the3-year follow-up. Attrition was due to vicissitudes across schoolsbut did not seem to vary by condition. For example, in School A,because of a change in administration, school staff stopped re-minding children to attend assessment sessions. School B has hada high student attrition rate in general, with 10%–20% of studentsleaving the school each year. We tried to follow participants whomoved through the mail, but compliance with these assessmentswas low, and we were often unable to find forwarding addresses.Attrition and noncompletion of assessments are common problemsin longitudinal depression prevention studies. Attrition is often40% or more in studies with 3 and 4 years of follow-up (e.g.,Roberts et al., 2004; Spence et al., 2005). In our current work, we
17SCHOOL-BASED PREVENTION

are implementing several strategies to minimize attrition, includingincreased incentives for complete assessments and strategies fortracking participants, such as requesting contact information forrelatives.
Because of budget and staffing constraints, CDRS–R interviewswere only conducted with children with elevated CDI scores(CDI � 13). CDI manual norms suggest that 8% of children whoscore below this cutpoint may have depressive disorders (Kovacs,2001). In addition, only about 75% of children who were invited tointerviews actually participated. Thus, we probably failed to detectclinical levels of symptoms in several children. During the study,we became concerned about another possible limitation of thetriggered interview procedure—that it influenced questionnaireresponses. Children may have become aware that elevated ques-tionnaire scores triggered interviews, and children who wanted toavoid interviews may have endorsed few symptoms of depressionon the CDI. It is striking that during a developmental phase whendepression rates generally increase (Angold, Costello, & Worth-man, 1998), depressive symptoms declined in all three conditionsin our sample. In the end, the triggered interviews may havelimited our ability to find intervention effects on both depressionmeasures.
The inclusion of graduate students as group leaders is alsosomewhat problematic. The graduate students who led groupswere not affiliated with our research laboratory and most plannedto pursue careers as school psychologists or school counselors.Still, these graduate students may differ from the school personnelwho would deliver an intervention like PRP once disseminated. Animportant finding is that analyses revealed no significant differ-ences in intervention effects for graduate students versus schoolteachers and counselors.
Future research may also benefit from more sophisticated anal-yses of intervention implementation. Our intervention integrityscoring system weighted specific content items equally, but it islikely that some skills are more beneficial or require more expla-nation and discussion than others. An examination of the relation-ship between specific content covered and intervention outcomecould yield valuable information about the mechanisms of PRP’seffects and help set priorities for group leader training andsupervision.
Our integrity coding system was designed to measure leaders’adherence to the intervention protocol and probably did not fullycapture the variability in leaders’ competence, or skill, in inter-vention delivery (McGlinchey & Dobson, 2003). Although com-petence and adherence are related, competent leaders may sacrificeadherence at times to allow for more in-depth discussion of groupmembers’ specific problems, review of concepts that seem con-fusing to group members, or more attention to group process. Anassessment of competence could help to explain our differentialfindings; it may be that PRP group leaders in School C adhered tothe manual but did not show true competence.
Clinical Significance
We found little evidence for PRP’s effectiveness or specificityin preventing depression in the full sample. However, in two of thethree schools, PRP reduced depressive symptoms over a 2.5-yearperiod and prevented elevated depressive symptoms. This suggeststhat PRP can have long-lasting effects when delivered by school
teachers, counselors, and other providers in a school setting. Al-though PRP’s effects are inconsistent, we believe that research thatevaluates interventions in real world settings will lead to thedevelopment of dissemination procedures that enable schools toinclude powerful depression prevention programs as part of theireducational mission.
References
Angold, A., Costello, E. J., & Worthman, C. M. (1998). Puberty anddepression: The roles of age, pubertal status, and pubertal timing. Psy-chological Medicine, 28, 51–61.
Clarke, G. N., & Lewinsohn, P. M. (1995). Instructor’s manual for theAdolescent Coping with Stress Course. Retrieved December 2, 2005,from Kaiser Permanente Center for Health Research Web site: http://www.kpchr.org/acwd/acwd.html
Gillham, J. E., Hamilton, J., Freres, D. R., Patton, K., & Gallop, R. (2006).Preventing depression among early adolescents in the primary caresetting: A randomized controlled study of the Penn Resiliency Program.Journal of Abnormal Child Psychology, 34, 203–219.
Gillham, J. E., Jaycox, L. H., Reivich, K. J., Seligman, M. E. P., & Silver,T. (1990). The Penn Resiliency Program. Unpublished manual, Univer-sity of Pennsylvania, Philadelphia.
Gillham, J. E., Reivich, K. J., Jaycox, L. H., & Seligman, M. E. P. (1995).Preventing depressive symptoms in schoolchildren: Two year follow-up.Psychological Science, 6, 343–351.
Gillham, J. E., Shatte, A. J., & Freres, D. R. (2000). Depression prevention:A review of cognitive–behavioral and family interventions. Applied &Preventive Psychology, 9, 63–88.
Harnett, P. H., & Dadds, M. R. (2004). Training school personnel toimplement a universal school-based prevention of depression programunder real-world conditions. Journal of School Psychology, 42, 343–357.
Hirschfeld, R., Keller, M., Panico, S., Arons, B., Barlow, D., Davidoff, F.,et al. (1997). The National Depressive and Manic-Depressive Associa-tion consensus statement on the undertreatment of depression. Journal ofthe American Medical Association, 277, 333–340.
Horowitz, J. L., & Garber, J. (2006). The prevention of depressive symp-toms in children and adolescents: A meta-analytic review. Journal ofConsulting and Clinical Psychology, 74, 401–415.
Jaycox, L. H., Reivich, K. J., Gillham, J., & Seligman, M. E. P. (1994).Prevention of depressive symptoms in school children. Behaviour Re-search & Therapy, 32, 801–816.
Kovacs, M. (2001). Children’s Depression Inventory manual. NorthTonawanda, NY: Multi-Health Systems.
McGlinchey, J. G., & Dobson, K. S. (2003). Treatment integrity concernsin cognitive therapy for depression. Journal of Cognitive Psychotherapy,17, 299–317.
Merry, S., McDowell, H., Hetrick, S., Bir, J., & Muller, N. (2004).Psychological and/or educational interventions for the prevention ofdepression in children and adolescents. Cochrane Database of System-atic Reviews, 2, Article CD003380. Retrieved June 16, 2004, from TheCochrane Library Database.
Merry, S., McDowell, H., Wild, C. J., Bir, J., & Cunliffe, R. (2004). Arandomized placebo-controlled trial of a school-based depression pre-vention program. Journal of the American Academy of Child and Ado-lescent Psychiatry, 43, 538–547.
Pattison, C., & Lynd-Stevenson, R. M. (2001). The prevention of depres-sive symptoms in children: The immediate and long-term outcomes of aschool based program. Behaviour Change, 18, 92–102.
Possel, P., Horn, A. B., Groen, G., & Hautzinger, M. (2004). School-basedprevention of depressive symptoms in adolescents: A 6-month follow-up. Journal of the American Academy of Child and Adolescent Psychi-atry, 43, 1003–1010.
18 GILLHAM ET AL.
Poznanski, E. O., & Mokros, H. B. (1996). Children’s Depression RatingScale—Revised (CDRS–R). Los Angeles: Western Psychological Ser-vice.
Raudenbush, S. W., & Xiao-Feng, L. (2001). Effects of study duration,frequency of observation, and sample size on power in studies of groupdifferences in polynomial change. Psychological Methods, 6, 387–401.
Reich, W. (2000). Diagnostic Interview for Children and Adolescents(DICA). Journal of the American Academy of Child and AdolescentPsychiatry, 39, 59–66.
Reivich, K. J. (1996). The prevention of depressive symptoms in adoles-cents. Unpublished doctoral dissertation, University of Pennsylvania,Philadelphia.
Roberts, C., Kane, R., Bishop, B., & Matthews, H. (2004). The preventionof depressive symptoms in rural children: A follow-up study. Interna-tional Journal of Mental Health Promotion, 6, 4–16.
Shatte, A. J. (1997). Prevention of depressive symptoms in adolescents:Issues of dissemination and mechanisms of change. Unpublished doc-toral dissertation, University of Pennsylvania, Philadelphia.
Shochet, I., Whitefield, K., & Holland, D. (1997). Resourceful AdolescentProgram: Group leader’s manual. Brisbane, Australia: Griffith Univer-sity.
Spence, S. H., Sheffield, J. K., & Donovan, C. L. (2005). Long-termoutcome of a school-based, universal approach to prevention of depres-sion in adolescents. Journal of Consulting and Clinical Psychology, 73,160–167.
Weisz, J. R., Donenberg, G. R., Han, S. S., & Weiss, B. (1995). Bridgingthe gap between laboratory and clinic in child and adolescent psycho-therapy. Journal of Consulting and Clinical Psychology, 63, 688–701.
Yu, D. L., & Seligman, M. E. P. (2002). Preventing depressive symptomsin Chinese children. Prevention and Treatment, 5.
Received December 5, 2005Revision received May 31, 2006
Accepted July 10, 2006 �
Members of Underrepresented Groups:Reviewers for Journal Manuscripts Wanted
If you are interested in reviewing manuscripts for APA journals, the APA Publications andCommunications Board would like to invite your participation. Manuscript reviewers are vital to thepublications process. As a reviewer, you would gain valuable experience in publishing. The P&CBoard is particularly interested in encouraging members of underrepresented groups to participatemore in this process.
If you are interested in reviewing manuscripts, please write to the address below. Please note thefollowing important points:
• To be selected as a reviewer, you must have published articles in peer-reviewed journals. Theexperience of publishing provides a reviewer with the basis for preparing a thorough, objectivereview.
• To be selected, it is critical to be a regular reader of the five to six empirical journals that are mostcentral to the area or journal for which you would like to review. Current knowledge of recentlypublished research provides a reviewer with the knowledge base to evaluate a new submissionwithin the context of existing research.
• To select the appropriate reviewers for each manuscript, the editor needs detailed information.Please include with your letter your vita. In the letter, please identify which APA journal(s) youare interested in, and describe your area of expertise. Be as specific as possible. For example,“social psychology” is not sufficient—you would need to specify “social cognition” or “attitudechange” as well.
• Reviewing a manuscript takes time (1–4 hours per manuscript reviewed). If you are selected toreview a manuscript, be prepared to invest the necessary time to evaluate the manuscriptthoroughly.
Write to Journals Office, American Psychological Association, 750 First Street, NE, Washington,DC 20002-4242.
19SCHOOL-BASED PREVENTION
Copyright © 2022 FDOKUMEN