sbgi-2003 - Sinclair Broadcast Group
74
-
Upload
khangminh22 -
Category
Documents
-
view
1 -
download
0
Transcript of sbgi-2003 - Sinclair Broadcast Group


Table of Contents
Television Broadcasting 2
Selected Financial Data 4
Management’s Discussion and Analysis 5
Quantitative and Qualitative Disclosures about Market Risk 20
Consolidated Balance Sheets 21
Consolidated Statements of Operations 22
Consolidated Statements of Shareholders’ Equity 23
Consolidated Statements of Cash Flows 26
Notes to Consolidated Financial Statements 28
Report of Independent Auditors 68
Management’s Report on Consolidated Financial Statements andInternal Controls 69
2 0 0 3 A n n u a l R e p o r t 1

S i n c l a i r B r o a d c a s t G r o u p2
TELEVISION BROADCASTING
Markets and Stations
We own and operate, provide programming services to, provide sales services to, or have agreed to acquire the followingtelevision stations:
Tampa, Florida 13 WTTA LMA 38 WB 9 6 D 2/01/05
Minneapolis/St. Paul, Minnesota 14 KMWB O&O 23 WB 7 6 D 4/01/06
Sacramento, California 19 KOVR O&O 13 CBS 7 2 D 12/01/06
St. Louis, Missouri 21 KDNL O&O 30 ABC 7 4 D 2/01/06
Pittsburgh, Pennsylvania 22 WPGH O&O 53 FOX 8 4 D 8/01/07WCWB O&O 22 WB 5 D 8/01/07
Baltimore, Maryland 23 WBFF O&O 45 FOX 6 4 D 10/01/04WNUV LMA (f ) 54 WB 5 D 10/01/04
Raleigh-Durham, North Carolina 29 WLFL O&O 22 WB 7 6 D 12/01/04WRDC O&O 28 UPN 5 D 12/01/04
Nashville, Tennessee 30 WZTV O&O 17 FOX 8 4 D 8/01/05WUXP O&O 30 UPN 5 D 8/01/05WNAB OSA(g) 58 WB 6 D 8/01/05
Kansas City, Missouri 31 KSMO O&O 62 WB 7 5 D 2/01/06
Cincinnati, Ohio 32 WSTR O&O 64 WB 6 5 D 10/01/05
Milwaukee, Wisconsin 33 WCGV O&O 24 UPN 8 5 D 12/01/05WVTV O&O 18 WB 6 D 12/01/05
Columbus, Ohio 34 WSYX O&O 6 ABC 5 2 D 10/01/05WTTE LMA (f ) 28 FOX 4 D 10/01/05
Asheville, North Carolina and 35 WLOS O&O 13 ABC 8 3 D 12/01/04Greenville/Spartanburg/ WBSC LMA(f ) 40 WB 5 D 12/01/04Anderson, South Carolina
San Antonio, Texas 37 KABB O&O 29 FOX 7 4 D 8/01/06KRRT O&O 35 WB 5 P 8/01/06
Birmingham, Alabama 40 WTTO O&O 21 WB 7 5 D 4/01/05WABM O&O 68 UPN 6 D 4/01/05WDBB LMA (h) 17 WB 5 D 4/01/05
Norfolk, Virginia 41 WTVZ O&O 33 WB 7 5 D 10/01/04
Buffalo, New York 44 WUTV O&O 29 FOX 8 4 P 6/01/07WNYO O&O 49 WB 5 P 6/01/07
Oklahoma City, Oklahoma 45 KOCB O&O 34 WB 10 5 D 6/01/06KOKH O&O 25 FOX 4 D 6/01/06
Greensboro/Winston-Salem/ 46 WXLV O&O 45 ABC 7 4 D 12/01/04Highpoint, North Carolina WUPN O&O 48 UPN 6 D 12/01/04
Las Vegas, Nevada 51 KVWB O&O 21 WB 7 5 D 10/01/06KFBT O&O 33 IND (i) 7 D 10/01/06
Richmond, Virginia 58 WRLH O&O 35 FOX 5 4 D 10/01/04
Dayton, Ohio 59 WKEF O&O 22 NBC 8 3 D 10/01/05WRGT LMA (f ) 45 FOX 4 D 10/01/05
Mobile, Alabama and 62 WEAR O&O 3 ABC 9 2 D 2/01/05Pensacola, Florida WFGX LMA (j) 35 IND (i) 8 P 2/01/05
Charleston and Huntington, 63 WCHS O&O 8 ABC 6 3 D 10/01/04West Virginia WVAH LMA (f ) 11 FOX 4 P 10/01/04
Flint/Saginaw/Bay City, Michigan 64 WSMH O&O 66 FOX 5 4 P 10/01/05
Lexington, Kentucky 65 WDKY O&O 56 FOX 7 4 D 8/01/05
Des Moines, Iowa 73 KDSM O&O 17 FOX 5 4 D 2/01/06
Portland, Maine 74 WGME O&O 13 CBS 6 2 D 4/01/07
Rochester, New York 75 WUHF O&O 31 FOX 6 4 P 6/01/07
Cape Girardeau, Missouri/ 76 KBSI O&O 23 FOX 7 4 D 2/01/06Paducah, Kentucky WDKA LMA 49 WB 5 D 8/01/05
Syracuse, New York 79 WSYT O&O 68 FOX 6 4 D 6/01/07WNYS LMA 43 WB 5 P 6/01/07
MarketMarket
Rank (a) Stations Status (b) Channel Affiliation
Number ofCommercialStations in
the Market (c)Station
Rank (d)
DigitalBroadcastStatus (e)
ExpirationDate of
FCC License

Springfield/Champaign, Illinois 82 WICS O&O 20 NBC 6 2 D 12/01/05
WICD O&O 15 NBC 2 (k) D 12/01/05
Madison, Wisconsin 85 WMSN O&O 47 FOX 6 4 D 12/01/05
Cedar Rapids, Iowa 88 KGAN O&O(l) 2 CBS 5 3 D 2/01/06
Tri-Cities, Tennessee 91 WEMT O&O 39 FOX 6 4 D 8/01/05
Charleston, South Carolina 104 WMMP O&O 36 UPN 5 5 D 12/01/04
WTAT LMA (f ) 24 FOX 4 D 12/01/04
Springfield, Massachusetts 106 WGGB O&O 40 ABC 2 2 D 4/01/07
Tallahassee, Florida 111 WTWC O&O 40 NBC 5 3 D 2/01/05
WTXL OSA(m) 27 ABC 2 D 2/01/05
Peoria/Bloomington, Illinois 117 WYZZ O&O(n) 43 FOX 5 4 D 12/01/05
2 0 0 3 A n n u a l R e p o r t 3
a) Rankings are based on the relative size of a station's designated market area (DMA) among the 210 generally recognized DMAs in the United States asestimated by Nielsen as of November 2003.
b) "O & O" refers to stations that we own and operate. "LMA" refers to stations to which we provide programming services pursuant to a local marketingagreement. "OSA" refers to stations to which we provide sales services pursuant to an outsourcing agreement.
c) Represents the estimated number of television stations designated by Nielsen as "local" to the DMA, excluding public television stations and stations that donot meet the minimum Nielsen reporting standards (weekly cumulative audience of at least 0.1%) for the Monday-Sunday, 7:00 a.m. to 1:00 a.m. timeperiod as of November 2003.
d) The rank of each station in its market is based upon the November 2003 Nielsen estimates of the percentage of persons tuned to each station in the marketfrom 7:00 a.m. to 1:00 a.m., Monday-Sunday.
e) All stations currently broadcast an analog signal. In addition, many stations broadcast a digital signal. "D" refers to stations that currently broadcast a digitalsignal. "P" refers to stations which have not commenced digital operations because they are awaiting grant of construction permits from the FCC or areawaiting delivery of equipment or are awaiting approval from the FCC to operate at low power.
f ) The license assets for these stations are currently owned by Cunningham Broadcasting Corporation, a related party or one of its subsidiaries. In December2001, the FCC denied our application to acquire the license of WBSC-TV. We filed a petition for reconsideration of that decision and recently amended ourapplication to acquire the license in light of the FCC's new multiple ownership rules adopted in June 2003. However, the new rules have been stayed by theU.S. Court of Appeals for the Third Circuit, pending its review of the rules. We also filed applications in November 2003 to acquire the license assets of theremaining five Cunningham stations. These applications are pending and may also be impacted by the existence of the stay of the FCC's new multipleownership rules. The Rainbow/PUSH Coalition has filed a petition to deny these five applications and to revoke all of Sinclair's licenses. We believe thepetition is without merit and as with past petitions filed by Rainbow/PUSH, will not result in the revocation of any of Sinclair's licenses.
g) Sinclair has entered into an outsourcing agreement with the unrelated third party owner of WNAB-TV to provide certain non-programming related sales,operational and administrative services to WNAB-TV.
h) WDBB-TV simulcasts the programming broadcast on WTTO-TV pursuant to a programming services agreement.
i) "IND" or "Independent" refers to a station that is not affiliated with any of ABC, CBS, NBC, Fox, WB or UPN.
j) In November 2003, following our exercise of an option to acquire the intangible assets of WFGX-TV, we filed an assignment application with the FCC toobtain its consent for the transfer of the WFGX-TV broadcast license from an unrelated third party to us. The assignment application is currently pending.
k) WICD-TV, a satellite of WICS-TV, under FCC rules, simulcasts all of the programming aired on WICS-TV and the station rank applies to the combinedviewership of these stations.
l) Sinclair has entered into a five-year outsourcing agreement with an unrelated third party under which the unrelated third party provides certain non-programming related sales, operational and managerial services to KGAN-TV. Sinclair continues to own all of the assets of KGAN-TV and to program andcontrol the station's operations.
m) Sinclair has entered into an outsourcing agreement with the unrelated third party owner of WTXL-TV to provide certain non-programming related sales,operational and managerial services for WTXL-TV.
n) Sinclair has entered into an outsourcing agreement with an unrelated third party, under which the unrelated third party provides certain non-programmingrelated sales, operational and managerial services to WYZZ-TV. Sinclair continues to own all of the assets of WYZZ-TV and to program and control thestation's operations.
MarketMarket
Rank (a) Stations Status (b) Channel Affiliation
Number ofCommercialStations in
the Market (c)Station
Rank (d)
DigitalBroadcastStatus (e)
ExpirationDate of
FCC License

S i n c l a i r B r o a d c a s t G r o u p4
SELECTED FINANCIAL DATA
The selected consolidated financial data for the years ended December 31, 2003, 2002, 2001, 2000 and 1999 havebeen derived from our audited consolidated financial statements. The consolidated financial statements for the yearsended December 31, 2003, 2002 and 2001 are included elsewhere in this report.
The information below should be read in conjunction with Management's Discussion and Analysis of FinancialCondition and Results of Operations and the Consolidated Financial Statements included elsewhere in this report.
STATEMENT OF OPERATIONS DATA
(dollars in thousands, except per share data)
Statement of Operations Data:
Net broadcast revenues (a) $ 661,778. $ 670,534. $ 623,837. $ 699,422. $ 643,088.
Revenues realized from station barter arrangements 62,395. 60,911. 53,889. 54,595. 60,052.
Other operating divisions' revenues 14,568. 4,344. 6,925. 4,494. —
Total revenues 738,741. 735,789. 684,651. 758,511. 703,140.
Station production expenses 147,937. 140,060. 142,696. 149,048. 140,651.
Station selling, general and administrative expenses 145,895. 143,348. 140,138. 142,388. 116,795.
Expenses recognized from station barter arrangements 57,365. 54,567. 48,159. 48,543. 54,463.
Depreciation and amortization (b) (c) 171,393. 185,939. 260,526. 230,889. 204,612.
Stock-based compensation 1,498. 1,399. 1,559. 1,762. 2,467.
Other divisions' operating expenses 16,375. 6,051. 8,910. 7,076. —
Corporate general and administrative expenses 25,255. 19,795. 19,750. 22,305. 18,646.
Impairment and write down charge of long-lived assets — — 16,075. — —
Restructuring costs — — 3,700. — —
Contract termination costs — — 5,135. — —
Cumulative adjustment for change in assets held for sale — — — 619. —
Operating income 173,023. 184,630. 38,003. 155,881 165,506.
Interest expense (c) (128,228) (126,500) (143,574) (152,219) (181,569)
Subsidiary trust minority interest expense (d) (11,246) (23,890) (23,890) (23,890) (23,890)
Net (loss) gain on sale of broadcast assets (517) (478) 204. — (418)
Unrealized gain (loss) on derivative instrument 17,354. (30,939) (32,220) (296) 15,747.
Loss from extinguishment of securities (15,187) (15,362) (22,010) — —
Income (loss) related to investments 1,193. (1,189) (7,616) (16,764) —
Interest and other income 2,028. 3,585. 3,758. 2,812. 3,082.
Income (loss) before income taxes 38,420. (10,143) (187,345) (34,476) (21,542)
(Provision) benefit for income taxes (15,669) 4,162. 59,675. (3,355) (23,281)
Income (loss) from continuing operations 22,751. (5,981) (127,670) (37,831) (44,823)
Discontinued Operations:
Income (loss) from discontinued operations, net of related income taxes 1,641. 372. (52) 6,932. 20,235.
Gain on sale of broadcast assets, net of related income taxes — 7,519. — 108,264. 192,372.
Cumulative adjustment for change in accounting principle, net of related income taxes — (566,404) — — —
Net income (loss) $ 24,392. $ (564,494) $ (127,722) $ 77,365. $ 167,784.
Net income (loss) available to common shareholders $ 14,042. $ (574,844) $ (138,072) $ 67,015. $ 157,434.
2003 2002 2001 2000 1999Years Ended December 31,

2 0 0 3 A n n u a l R e p o r t 5
Per Share Data:
Basic earnings (loss) per share from continuing operations $ 0.14 $ (0.19) $ (1.64) $ (0.53) $ (0.57)
Basic earnings per share from discontinued operations $ 0.02 $ 0.09. $ — $ 1.26. $ 2.20.
Basic loss per share from cumulative effect of accounting change $ — $ (6.64) $ — $ — $ —
Basic earnings (loss) per share $ 0.16 $ (6.74) $ (1.64) $ 0.73. $ 1.63.
Diluted earnings (loss) per share from continuing operations $ 0.14 $ (0.19) $ (1.64) $ (0.53) $ (0.57)
Diluted earnings per share from discontinued operations $ 0.02 $ 0.09. $ — $ 1.26. $ 2.20.
Diluted loss per share from cumulative effect of accounting change $ — $ (6.64) $ — $ — $ —
Diluted earnings (loss) per share $ 0.16 $ (6.74) $ (1.64) $ 0.73. $ 1.63.
Balance Sheet Data:
Cash and cash equivalents $ 28,730 $ 5,327. $ 32,063. $ 4,091. $ 16,408.
Total assets $ 2,564,582 $2,606,773. $3,289,426. $3,324,435. $3,543,305.
Total debt (e) $ 1,732,457 $1,551,970. $1,685,630. $1,616,426. $1,792,339.
HYTOPS (f ) $ — $ 200,000. $ 200,000. $ 200,000. $ 200,000.
Total shareholders' equity $ 229,005 $ 211,180. $ 771,960. $ 912,530. $ 974,917.
(a) "Net broadcast revenues" is defined as broadcast revenues net of agency commissions.
(b) Depreciation and amortization includes amortization of program contract costs and net realizable value adjustments, depreciation and amortization ofproperty and equipment and amortization of acquired intangible broadcasting assets, other assets and costs related to excess syndicated programming.
(c) Depreciation and amortization and interest expense amounts differ from prior presentations for the fiscal years ended December 31, 2000 and 1999.Previously the amortized costs associated with the issuance of indebtedness had been classified as depreciation and amortization instead of being classified asinterest expense. Accordingly, we reclassified $3,313 and $3,288 as interest expense for the fiscal years ended December 31, 2000 and 1999, respectively.
(d) Subsidiary trust minority interest expense represents the distributions on the HYTOPS and amortization of deferred finance costs. See footnote (f ).
(e) "Total debt" is defined as long-term debt, net of unamortized discount and capital lease obligations, including the current portion thereof. Total debt doesnot include the HYTOPS or our preferred stock.
(f ) HYTOPS represents our high yield trust originated preferred securities representing $200 million aggregate liquidation value, which were redeemed in 2003.
MANAGEMENT'S DISCUSSION AND ANALYSIS OF FINANCIAL CONDITIONAND RESULTS OF OPERATIONS
Introduction
We are a diversified television broadcasting company that owns and operates, provides programming services pursuantto LMAs or provides sales services pursuant to outsourcing agreements to more television stations than all but one othercommercial broadcasting group in the United States. We currently own, provide programming services pursuant toLMAs or provide sales services to 62 television stations in 39 markets. We currently have duopolies, where we own andoperate two stations, in ten markets; own and operate a station and provide programming and operating services to asecond station in nine markets; and own a station and provide or are provided sales, operational and managerial servicesto a second station in four markets.
Our operating revenues are derived from local and national advertisers and to a much lesser extent, from politicaladvertisers and television network compensation. Our revenues from local advertisers have continued to trend upwardand revenues from national advertisers have continued to trend downward when measured as a percentage of grossbroadcast revenue. We believe this trend is the result of our focus on increasing local advertising revenues as a percentageof total advertising revenues, from a decrease in overall spending by national advertisers and from a competitive increasein the number of media outlets providing national advertisers a means by which to advertise their goods or services. Ourefforts to mitigate the effect of increasing national media outlets include continuing our efforts to increase local revenuesand developing innovative marketing strategies to sell traditional and non-traditional services to our advertisers.
Our primary operating expenses are syndicated program rights fees, commissions on revenues, employee salaries andnewsgathering and station promotional costs. Amortization and depreciation of costs other than goodwill associated withthe acquisition of the stations and interest carrying charges are significant factors in determining our overall profitability.
2003 2002 2001 2000 1999Years Ended December 31,

Sinclair Television Group, Inc. (STG) is a wholly owned subsidiary of Sinclair Broadcast Group, Inc. that we createdin 2003. As part of our redemption of our HYTOPS, on September 30, 2003, we completed the creation of a modifiedholding company structure, whereby we transferred substantially all of our television broadcast assets and liabilities toSTG. As such, STG has become the primary obligor under our existing Bank Credit Agreement, the 8.75% SeniorSubordinated Notes due 2011 and the 8% Senior Subordinated Notes due 2012. Our class A Common Stock, class BCommon Stock, Series D Convertible Exchangeable Preferred Stock and the 4.875% Convertible Senior SubordinatedNotes remain at Sinclair Broadcast Group, Inc. and are not obligations or securities of STG.
Critical Accounting Policies and Estimates
Our discussion and analysis of our financial condition and results of our operations are based on our consolidatedfinancial statements which have been prepared in accordance with accounting principles generally accepted in the UnitedStates. The preparation of these financial statements requires us to make estimates and judgments that affect the reportedamount of assets, liabilities, revenues and expenses and related disclosure of contingent assets and liabilities. On an on-going basis, we evaluate our estimates, including those related to bad debts, income taxes, program contract costs,property and equipment, intangible assets, investments and derivative contracts. We base our estimates on historicalexperience and on various other assumptions that are believed to be reasonable under the circumstances, the results ofwhich form the basis for making judgments about the carrying values of assets and liabilities that are not readily apparentfrom other sources. Actual results may differ from these estimates under different assumptions or conditions.
We have identified the policies below as critical to our business operations and the understanding of our results ofoperations. For a detailed discussion on the application of these and other accounting policies, see the Notes to theConsolidated Financial Statements.
Allowance for Doubtful Accounts. We maintain an allowance for doubtful accounts for estimated losses resulting fromextending credit to our customers that are unable to make required payments. If the economy and/or the financialcondition of our customers were to deteriorate, resulting in an impairment of their ability to make their payments,additional allowances may be required.
Program Contract Costs. We have agreements with distributors for the rights to television programming over contractperiods, which generally run from one to seven years. Contract payments are made in installments over terms that aregenerally equal to or shorter than the contract period. Each contract is recorded as an asset and a liability at an amountequal to its gross contractual commitment when the license period begins and the program is available for its firstshowing. The portion of program contracts which become payable within one year is reflected as a current liability inthe Consolidated Balance Sheets.
The rights to program materials are reflected in the Consolidated Balance Sheets at the lower of unamortized cost orestimated net realizable value (NRV). Estimated net realizable values are based upon management's expectation of futureadvertising revenues net of sales commissions to be generated by the remaining program material. Amortization ofprogram contract costs is generally computed using either a four year accelerated method or based on usage, whicheveryields the greater amortization for each program. Program contract costs, estimated by management to be amortized inthe succeeding year, are classified as current assets. Payments of program contract liabilities are typically paid on ascheduled basis and are not affected by adjustments for amortization or estimated net realizable value. If our estimate offuture advertising revenues declines, then additional write downs to net realizable value may be required.
Valuation of Goodwill, Long-Lived Assets and Intangible Assets. We periodically evaluate our goodwill, broadcast licenses,long-lived assets and intangible assets for potential impairment indicators. Our judgments regarding the existence ofimpairment indicators are based on estimated future cash flows, market conditions, operational performance of ourstations and legal factors. Future events could cause us to conclude that impairment indicators exist and that the net bookvalue of long-lived assets and intangible assets is impaired. Any resulting impairment loss could have a material adverseimpact on our financial condition and results of operations.
We have determined our broadcast licenses to be indefinite-lived intangible assets under SFAS No. 142, which requires
S i n c l a i r B r o a d c a s t G r o u p6

such assets to be tested for impairment on an annual basis. We test our broadcast licenses by estimating the fair marketvalue of each FCC license using a discounted cash flow model. We then compare the estimated fair market value to thebook value to determine if an impairment exists. Our discounted cash flow model is based on our judgment of futuremarket conditions within the designated marketing area of each broadcast license as well as discount rates that would beused by market participants in an arms-length transaction. Future events could cause us to conclude that marketconditions have declined or discount rates have increased to the extent that our broadcast licenses could be impaired.Any resulting impairment loss could have a material adverse impact on our financial condition and results of operations.
Income Taxes. We recognize deferred tax assets and liabilities based on the differences between the financial statementcarrying amounts and the tax bases of assets and liabilities. A valuation allowance has been provided for deferred tax assetsrelating to various state net operating loss (NOL) carry forwards based on historical taxable income, projected futuretaxable income and the expected timing of the reversals of existing temporary differences. Although realization is notassured for the remaining deferred tax assets, we believe that it is more likely than not that they will be realized throughfuture taxable earnings or alternative tax strategies. If we are unable to generate sufficient taxable income, if there is amaterial change in our projected future taxable income or if there is a change in our ability to utilize the state NOL carryforwards due to changes in state laws, we will make any necessary adjustments to the valuation allowance. This may resultin a substantial increase in our effective tax rate and a material adverse impact on our financial condition and results ofoperations. Management periodically performs a comprehensive review of our tax positions and accrues amounts for taxcontingencies. Based on these reviews, the status of ongoing audits and the expiration of applicable statute of limitations,accruals are adjusted as necessary. The resolution of audits is unpredictable and could result in tax liabilities that aresignificantly higher or lower than that which has been provided by us.
Set forth below are the principal types of broadcast revenues received by our stations for the periods indicated and thepercentage contribution of each type to our total gross broadcast revenues:
BROADCAST REVENUE(dollars in thousands)
2 0 0 3 A n n u a l R e p o r t 7
2003 2002 2001Years Ended December 31,
Local/regional advertising $ 437,380. 57.3% $ 413,428. 53.3% $ 391,872. 54.3%
National advertising 300,198. 39.3% 309,923. 40.0% 307,514. 42.7%
Network compensation 17,436. 2.3% 16,450. 2.1% 16,754. 2.3%
Political advertising 6,506. 0.9% 33,176. 4.3% 2,559. 0.4%
Production 1,817. 0.2% 1,966. 0.3% 2,069. 0.3%
Broadcast revenues 763,337. 100.0% 774,943. 100.0% 720,768. 100.0%
Less: agency commissions (101,560) (104,409) (96,931)
Broadcast revenues, net 661,778. 670,534. 623,837.
Barter revenues 62,395. 60,911. 53,889.
Other revenues 14,568. 4,344. 6,925.
Total revenues $ 738,741. $ 735,789. $ 684,651.
Our primary types of programming and their approximate percentages of 2003 net broadcast revenues were syndicatedprogramming (43.5%), network programming (29.4%), news (14.5%), direct advertising programming (7.1%), sportsprogramming (3.0%), children's programming (0.5%) and other programming (2.0%). Similarly, our five largestcategories of advertising and their approximate percentages of 2003 net broadcast revenues were automotive (24.0%),professional services (11.5%), fast food (6.4%), paid programming including religious programming (8.2%) and retaildepartment stores (6.2%). No other advertising category accounted for more than 4.2% of our broadcast revenues in2003. No individual advertiser accounted for more than 3.0% of our consolidated net broadcast revenues in 2003.

The following table sets forth certain of our operating data for the years ended December 31, 2003, 2002 and 2001.For definitions of items, see footnotes to table in Item 6. Selected Financial Data.
OPERATING DATA
(dollars in thousands)
S i n c l a i r B r o a d c a s t G r o u p8
2003 2002 2001Years Ended December 31,
Net broadcast revenue $ 661,778 $ 670,534. $ 623,837.
Revenues realized from station barter arrangements 62,395 60,911. 53,889.
Other operating divisions' revenue 14,568 4,344. 6,925.
Total revenue 738,741 735,789. 684,651.
Station production expenses 147,937 140,060. 142,696.
Station selling, general and administrative expenses 145,895 143,348. 140,138.
Expenses recognized from station barter arrangements 57,365 54,567. 48,159.
Depreciation and amortization 171,393 185,939. 260,526.
Stock-based compensation 1,498 1,399. 1,559.
Other operating divisions' expenses 16,375 6,051. 8,910.
Corporate general and administrative expenses 25,255 19,795. 19,750.
Impairment and write down charge of long-lived assets — — 16,075.
Restructuring costs — — 3,700.
Contract termination costs — — 5,135.
Operating income $ 173,023 $ 184,630. $ 38,003.
Cumulative effect of change in accounting principle $ — $ (566,404) $ —
Net income (loss) $ 24,392 $ (564,494) $ (127,722)
Net income (loss) available to common shareholders $ 14,042 $ (574,844) $ (138,072)
RESULTS OF OPERATIONS
Overview
During the beginning of 2003, our operating results reflected an overall increase in advertising revenues experiencedby the broadcasting industry, partially offset by the negative effect of the war in Iraq. Excluding the effect of politicaladvertising revenue, we continued to see an increase in local advertising spending primarily due to our direct mailinitiatives and growth in our largest categories of automotive and services. National sales declined due to loweradvertising spending primarily by soft drink, fast food and movie advertisers. Due to the biennial cycle for politicalraces and elections, we expect to benefit in 2004 from additional political revenues due to the Presidential and otherfederal, state and local elections, as well as benefit from additional revenues from our direct mail initiatives.
Our results also include increased expenses reflecting continued expansion of our News Central operations, our directmail sales effort and our continued expenditures related to our conversion to digital television. Using our News Centralmodel, we continued to implement local news programming, which brought our total news franchise to 38 stations in31 markets with 13 of those stations in 11 markets operating under News Central. Our focus for 2004 will primarilybe on adding additional news dayparts and converting certain existing news stations to the more cost effective NewsCentral model. We continue to target direct mail advertisers and introduce the direct mail advertisers to television as amedium to reach their customers. We are expanding our direct mail initiatives with plans to add more mailings during2004. We expect capital expenditures for the year of approximately $40 million, as described later in this section underthe heading, Liquidity and Capital Resources.
Years Ended December 31, 2003 and 2002Net income available to common shareholders for the year ended December 31, 2003 was $14.0 million or $0.16 per
share, compared to a net loss of $574.8 million or a loss of $6.74 per common share for the year ended December 31,2002. The primary reason for the reduction in the net loss was the adoption of SFAS No. 142, Goodwill and OtherIntangible Assets during the first quarter of 2002. As a result of adopting SFAS No. 142, we recorded an impairmentcharge of $566.4 million, related to our broadcast licenses and goodwill, which was reflected as a cumulative effect of achange in accounting principle in our consolidated statement of operations, net of related tax benefit of $30.4 millionduring the first quarter of 2002. We also recorded an unrealized gain on derivative instruments of $17.4 million for theyear ended December 31, 2003 compared to an unrealized loss on derivative instruments of $30.9 million for the yearended December 31, 2002. These were non-cash charges which had no effect on our liquidity or capital resourcescurrently or prospectively. (See Note 1, Summary of Significant Accounting Policies, Note 3, Goodwill and Other IntangibleAssets and Note 7, Derivative Instruments in the Notes to our Consolidated Financial Statements.)
Net broadcast revenues decreased to $661.8 million for the year ended December 31, 2003 from $670.5 million forthe year ended December 31, 2002, or 1.3%. During the year ended December 31, 2003, we had decreased revenuedue to cyclical or non-recurring events as follows: $2.2 million related to the war in Iraq; $23.1 million related topolitical advertising; $1.6 million related to the Super Bowl; and $1.0 million related to the Olympics. The decline inSuper Bowl revenue occurred because the Super Bowl aired on our eight ABC stations during 2003 versus our twentyFOX stations during 2002. The Super Bowl aired on our three CBS stations in 2004 and will air on our twenty Foxstations in 2005 and on our eight ABC stations in 2006. The decreased revenue due to cyclical or non-recurring eventswas greatly offset by increased revenue of $14.7 million related to our direct mail initiative. From a revenue categorystandpoint, the year ended December 31, 2003 was positively impacted by higher advertising revenue generated fromthe automotive, professional service, school, paid programming, restaurant and home product sectors, offset by decreasesin political, soft drink, fast food, movie, telecommunication and retail sectors.
During the year ended December 31, 2003, national revenues decreased to $251.9 million or 7.4%, from $271.9million during the same period last year. National political revenues decreased $16.5 million or 82.1%. During the yearended December 31, 2003, local revenues increased to $379.2 million or 2.8% from $369.0 million during the sameperiod last year. Local political revenues decreased $6.5 million or 79.8%, offsetting 1.8% of the increase in total localrevenues. The decrease in political revenues was primarily the result of many more elections held during the 2002 period,as compared to the same period in 2003.
2 0 0 3 A n n u a l R e p o r t 9

National revenues, excluding political revenues, decreased $3.4 million to $248.3 million or 1.4%, during the yearended December 31, 2003 from $251.7 million for the same period last year. Local revenues, excluding politicalrevenues, increased $16.7 million to $377.5 million or 4.6%, during the year ended December 31, 2003 from $360.8million for the same period last year. Excluding political revenues, national revenues declined due to lower advertisingspending primarily in the soft drink, fast food, telecommunications and movie sectors. The increase in local revenues isrelated to our continued focus on local sales and our direct mail conversion initiative that, as noted above, generatedincreased revenues of $14.7 million during the year ended December 31, 2003, as compared to the same period last year.
From a network affiliate perspective, broadcast revenue from time sales at our FOX affiliates, which represents 37.6%of the total, decreased $3.8 million to $237.1 million, or 1.6% during the year ended December 31, 2003 from $240.9million for the same period last year. Excluding the political revenue decrease of $4.7 million in the year endedDecember 31, 2003 as compared to the same period last year, our FOX affiliate would have experienced growth of 0.4%.Our ABC, CBS, and NBC network affiliates, representing 16.6%, 7.4%, and 4.2%, respectively, of total net time salesexperienced similar results. Excluding political revenue decreases in the year ended December 31, 2003 as compared tothe same period last year of $9.5 million, $4.5 million, and $2.9 million, respectively, ABC, CBS, and NBC affiliateswould have experienced growth of 2.6%, 2.5%, and 5.5%. Our UPN and WB affiliates experienced growth for the yearended December 31, 2003 excluding political revenue, of 9.4% and 2.2%, respectively, compared with the year endedDecember 31, 2002.
During the year ended December 31, 2003, the G1440 operating division's revenue that related to software developmentand consulting increased by $0.4 million to $4.7 million or 9.3%, from $4.3 million for the same period last year. Otheroperating divisions' revenue related to our interest in Acrodyne increased by $9.9 million because beginning January 1,2003, we commenced consolidating the financial statements of Acrodyne and discontinued accounting for the investmentsunder the equity method of accounting. Other operating divisions' expenses increased by $10.3 million, of which $11.4million resulted from the consolidation of Acrodyne, offset by a decrease in general and administrative costs of $1.1 millionfor G1440, primarily related to the consolidation from three offices to one office and continued focus on cost reduction,for the year ended December 31, 2003, as compared to the year ended December 31, 2002.
Station production expenses were $147.9 million for the year ended December 31, 2003 compared to $140.1 millionfor the year ended December 31, 2002, an increase of $7.8 million or 5.6%. The increase in station production costsprimarily related to an increase in promotion costs of $3.3 million during the February 2003 ratings sweeps comparedto February 2002, when we reduced our spending due to direct competition from the Olympics, offset by decreasedpromotional spending in the second and third quarter of $0.3 million in six of our markets. We also experiencedincreases in spending of $2.6 million for the News Central expansions in our Tampa, Flint, Milwaukee, Birmingham,Las Vegas, Cincinnati, and Greensboro markets, Nielsen rating service fees of $1.1 million related to new contracts foreleven stations, $1.1 million in affiliate fees, engineering costs of $0.5 million related to news expansions in the fourthquarter, the full year effect of the addition of our WNAB-TV outsourcing agreement during the second quarter of 2002and increased electricity costs related to digital TV of $0.4 million. These increases were offset by a decrease inprogramming and production costs of $0.5 million related to our outsourcing and LMA agreements, a decrease in musiclicense fees of $0.3 million and other miscellaneous decreases of $0.1 million. Going forward we will continue our newsexpansion by bringing news to new markets, converting certain existing news stations to the more cost effective NewsCentral model and adding additional news dayparts at other stations.
Station selling, general and administrative expenses were $145.9 million for the year ended December 31, 2003compared to $143.3 million for the year ended December 31, 2002, an increase of $2.6 million or 1.8%. We experiencedincreases in direct mail marketing campaign costs of $3.2 million, sales expense for the addition of our WNAB-TVoutsourcing agreement of $0.5 million, an increase in sales compensation costs of $2.9 million, legal fees of $0.5 millionand miscellaneous general and administrative costs of $0.1 million. We will continue our direct mail initiative with plansto add additional mailings during 2004. These increases were offset by a decrease in selling, general and administrativeexpenses related to a reduction of $2.4 million in bad debt expense as a result of improvements in the economy, nationalcommissions of $0.9 million, expenses for Cunningham of $0.6 million, trade expense of $0.3 million, property taxesof $0.3 million and vacation expense of $0.1 million
S i n c l a i r B r o a d c a s t G r o u p10

Depreciation and amortization decreased $14.5 million to $171.4 million for the year ended December 31, 2003 from$185.9 million for the year ended December 31, 2002. The decrease in depreciation and amortization for the year endedDecember 31, 2003, as compared to the year ended December 31, 2002 was related to a decrease in amortization of$20.2 million related to our program contract costs and NRV adjustments as a result of a lower cost of additions of newprogramming during 2003, as compared to 2002 and a decrease in NRV adjustments, offset by an increase in fixed assetdepreciation of $5.7 million related to our property additions, primarily resulting from our digital television conversionand centralized news investments. We expect amortization related to our program contract costs will decrease from 2003but it will be a smaller decrease than we had from 2002 to 2003. We will have additional property additions in 2004related to the completion of our digital roll-out and the expansion of our news.
Corporate general and administrative expenses increased $5.5 million to $25.3 million for the year ended December31, 2003 from $19.8 million for the year ended December 31, 2002, or 27.8%. Corporate general and administrativeexpense represents the cost to operate our corporate headquarters location. Such costs include corporate departmentalsalaries, bonuses and fringe benefits, directors and officers' liability insurance, rent, telecommunications, consulting fees,legal and accounting fees and director fees. Corporate departments include executive committee, treasury, finance andaccounting, human resources, technology, corporate relations, legal, sales, operations, purchasing, programming,corporate direct mail administration and centralized news. The increase in corporate general and administrative expensesprimarily relates to an increase of $3.2 million for the launch of our centralized news and weather format, as well as thecentralization of our promotion and programming operations, consulting fees of $0.9 million, increased costs fortelecommunications related to upgrades of $0.5 million, insurance costs of $0.5 million, administrative expenses relatedto our direct mail initiative of $0.2 million and other miscellaneous increases in expense of $0.2 million.
Interest expense increased to $128.2 million for the year ended December 31, 2003 from $126.5 million for the yearended December 31, 2002 or 1.3%. The increase in interest expense resulted from the higher interest expense from theredemption of HYTOPS, offset by financing of indebtedness at lower interest rates during July, November, andDecember 2002 and May 2003. Subsidiary trust minority interest expense decreased to $11.2 million for the year endedDecember 31, 2003 from $23.9 million for the year ended December 31, 2002, or 53.1%, as a result of the redemptionof HYTOPS in June of 2003.
Our income tax provision was $15.7 million for the year ended December 31, 2003 compared to an income taxprovision of $4.2 million for the year ended December 31, 2002. Our tax rate changed to a provision in 2003, from abenefit in 2002, because we reported taxable net income in 2003, compared to a net loss in 2002. The effective tax ratefrom continuing operations decreased slightly to 40.8% for the year ended December 31, 2003 from 41.0% for the yearended December 31, 2002.
Years Ended December 31, 2002 and 2001During 2002, we continued to see strengthening in our broadcast business even without regard to the significant
inflow of political advertising revenues. Net broadcast revenues, excluding political revenues, grew despite the economynot being in a full recovery and a threat of war looming. The growth came from both the local and national markets.Throughout 2002, our quarterly revenues, excluding political, grew at successively higher growth rates.
Net loss available to shareholders for the year ended December 31, 2002 was $574.8 million or net loss of $6.74 pershare compared to net loss of $138.1 million or loss of $1.64 per share for the year ended December 31, 2001. The netloss for the year ended December 31, 2002 was largely the result of the cumulative effect of change in accountingprinciple of $566.4 million, net of taxes.
As a result of adopting SFAS No. 142, we recorded an impairment charge of $566.4 million related to our broadcastlicenses and goodwill reflected as a cumulative effect of a change in accounting principle on our consolidated statementof operations, net of the related tax benefit of $30.4 million during the first quarter 2002. This was a non-cash chargewhich had no effect on our liquidity or capital resources currently or prospectively. Without this charge, our net lossavailable to shareholders during the year ended December 31, 2002 would have been $8.4 million. (See Note 3, Goodwilland Other Intangible Assets, in our Notes to our Consolidated Financial Statements.)
2 0 0 3 A n n u a l R e p o r t 11

Net broadcast revenues increased to $670.5 million for the year ended December 31, 2002 from $623.8 million forthe year ended December 31, 2001 or 7.5%. The year ending December 31, 2002 was positively impacted by higheradvertising revenues generated from the political, automotive, services, restaurants, home products, schools andbeer/wine, offset by weakness in the fast food and soft drink sectors. During the year ended December 31, 2002, nationalrevenues increased to $271.9 million or 7.0%, from $254.0 million during 2001. National political revenues increased$19.1 million or 1,888.0%. During the year ended December 31, 2002, local revenues increased to $369.0 million, or8.3%, from $340.6 million during 2001. Local political revenues increased $6.9 million, or 556.0%, representing 2.0%of the increase in total local revenues. The increase in political revenues was primarily the result of the several primaryand general elections during 2002. During the year ended December 31, 2002, we had increased revenue of $6.6 millionrelated to our direct mail initiative, $2.2 million related to the Super Bowl and $1.0 million related to the Olympics.During the year ended December 31, 2001 we estimate that we had decreased revenues of $5.4 million related to theterrorist attacks of September 11, 2001.
National revenues, excluding political revenues, declined $1.3 million to $251.7 million or 0.5%, during the yearended December 31, 2002 from $253.0 million during the year ended December 31, 2001. Local revenues, excludingpolitical revenues, increased $21.5 million to $360.8 million, or 6.3%, during the year ended December 31, 2002 from$339.3 million during 2001.
Same station basis is a comparison of only the stations that we owned or provided programming and operating servicespursuant to an LMA for both entire years ending December 31, 2002 and 2001. Comparing results on a "same stationsbasis" enhances the understanding of our business and revenue growth because we are able to disclose our ability to growrevenue at television stations owned and operated during the two most recent fiscal years. This enables us to eliminatethe impact of partial year activity of acquisitions and dispositions occurring during the two most recent fiscal years. Whilereporting actual historical results for all stations owned and operated during the fiscal year is vital to understanding ourperformance, we believe that it is important to analyze stations owned during both fiscal years as a measure of ouroperating performance. On a same station basis for the year ended December 31, 2002, national revenues includingpolitical revenues increased $17.2 million or 6.8%, and local sales increased $29.4 million or 8.8%, over 2001. Theincrease in national revenues was primarily due to the increase in political revenues. The increase in local revenues isrelated to our continued focus on developing a strong local sales force at each of our stations.
In addition, for the year ended December 31, 2001, the events of September 11, 2001 had a direct impact on therevenues of media related businesses. The terrorist attacks led to the pre-emption and cancellation of advertisements,which caused an estimated $5.4 million revenue loss during 2001.
The network affiliations that experienced the largest revenue growth for the year ended December 31, 2002 were ourNBC and CBS affiliates which increased 21.3% and 19.3%, respectively, compared with the year ended December 31,2001. Our ABC and FOX affiliates experienced revenue growth of 11.3% and 9.1%, respectively, for the year endedDecember 31, 2002 as compared to the year ended December 31, 2001. The WB affiliates' revenue increased 2.0% forthe year ended December 31, 2002 as compared to the year ended December 31, 2001. The UPN affiliates' revenuedecreased 1.7% for the year ended December 31, 2002 as compared to the year ended December 31, 2001.
Other operating division revenue decreased to $4.3 million for the year ended December 31, 2002 from $6.9 millionfor the year ended December 31, 2001 or 37.7%. The decrease in revenue relates to a decreased demand for services fromour software development and consulting company, due to the slow economy and a decrease in revenue of $0.4 millionrelated to the closing of the San Francisco office during the first quarter 2001.
Station production expenses decreased $2.6 million to $140.1 million for the year ended December 31, 2002 from$142.7 million for the year ended December 31, 2001. The decrease in operating costs related to a decrease of $6.5million related to our LMA fees, due to the acquisition of 15 television broadcast licenses during the three months endedMarch 31, 2002. Our results of operations from LMA stations are typically lower than they would have been if we hadowned the televisions stations. The results of operations of our LMA stations was lower because of higher programmingand production expenses due to the incurrence of the LMA fees. News costs decreased by $3.5 million related to thediscontinuation of news at our stations KDNL-TV, St. Louis, Missouri and WXLV-TV, Winston Salem, North Carolina.
S i n c l a i r B r o a d c a s t G r o u p12

In addition, other miscellaneous production expense decreased by $0.4 million. These decreases were offset by increasesof $2.1 million in engineering costs, $1.7 million related to music license fees, $1.5 million in programming fees relatedto increased costs for affiliate agreements, $1.3 million in rating service fees and $1.2 million related to increasedpromotional spending during the May Sweeps.
Station selling, general and administrative expenses increased $0.4 million to $149.4 million for the year ended December31, 2002 from $149.0 million for the year ended December 31, 2001. Sales commissions increased by $3.3 million as aresult of improved sales. This increase was offset by decreases of $1.6 million related to a decrease in national representationcommissions, $1.2 million related to a reduction in bad debt expense and $0.1 million related to traffic costs.
Depreciation and amortization decreased $74.6 million to $185.9 million for the year ended December 31, 2002 from$260.5 million for the year ended December 31, 2001. The decrease in depreciation and amortization for the year endedDecember 31, 2002 as compared to the year ended December 31, 2001 was related to the adoption of SFAS No. 142which resulted in the discontinuation of amortization of our goodwill and broadcast licenses. Amortization of intangibleassets decreased by $93.0 million, offset by an increase aggregating $15.0 million related to amortization of our programcontract costs and net realizable value adjustments related to our addition of new programming primarily consisting ofDharma & Greg and Will & Grace as well as write downs primarily related to additional seasons for Frasier, Drew Carey,Spin City, Just Shoot Me, and Third Rock from the Sun and an increase in fixed asset depreciation of $3.4 million relatedto our property additions, primarily resulting from our digital television conversion.
For the year ended December 31, 2002, we did not incur any restructuring charges, impairment and write down oflong-lived assets (except for the impact of adopting SFAS No. 142) or contract termination costs. During the threemonths ended March 31, 2001, we offered a voluntary early retirement program to our eligible employees andimplemented a restructuring program to reduce operating and overhead costs. As a result, we reduced our staff by 186employees and incurred a restructuring charge of $2.3 million, which is included in the accompanying consolidatedstatements of operations. During September 2001, our station KDNL-TV in St. Louis, Missouri, discontinuedprogramming its local news broadcast. As a result, we incurred a restructuring charge of $1.1 million. During December2001, WXLV-TV in Winston Salem, North Carolina discontinued programming its local news broadcast. As a result weincurred a restructuring charge of $0.3 million. The restructuring charges related to severance and operating contracttermination costs. During the year ended December 31, 2001, we incurred an impairment and write down of long-livedassets of $5.5 million and contract termination costs of $5.1 million.
Operating income increased $146.6 million to $184.6 million for the year ended December 31, 2002 from $38.0million for the year ended December 31, 2001, or 385.8%. The net increase in operating income for the year endedDecember 31, 2002 as compared to the year ended December 31, 2001 was primarily attributable to a decrease inamortization due to the adoption of SFAS No. 142 which resulted in the discontinuation of amortization of our goodwilland FCC licenses offset by an increase in program contract amortization expense and property and equipmentdepreciation expense as discussed above. Operating income was also affected by a decrease in program and productionexpenses due to the acquisition of 15 television broadcast licenses, resulting in our ability to operate at a cost lower thanoperating those stations as LMA structures and reduced spending for sweeps promotion due to direct competition fromthe Olympics. During the year ended December 31, 2001, we incurred a loss of $16.1 million related to a write downcharge of long-lived assets. This charge is comprised of goodwill related to our software development company and ourstation KBSI-TV in Paducah, Kentucky and a write off of fixed assets which represent the net book value of damaged,obsolete or abandoned property. We also incurred contract termination costs of $5.1 million and restructuring chargesof $3.7 million as a result of a voluntary early retirement program and cancellation of local news programs during theyear ended December 2001. We did not incur any write down charge of long-lived assets, contract termination orrestructuring charges for the year ended December 31, 2002.
Interest expense decreased to $126.5 million for the year ended December 31, 2002 from $143.6 million for the yearended December 31, 2001, or 11.9%. The decrease in interest expense for the year ended December 31, 2002 resultedfrom the refinancing of indebtedness at lower interest rates during December 2001, March 2002, July 2002, November2002 and December 2002 and an overall lower interest rate environment.
2 0 0 3 A n n u a l R e p o r t 13

Our income tax provision was $4.2 million for the year ended December 31, 2002 compared to an income tax benefitof $59.6 million for the year ended December 31, 2001. The effective tax rate from continuing operations increased to41.0% for the year ended December 31, 2002, from 31.3% for the year ended December 31, 2001. The increase isprimarily because (prior to the implementation of SFAS No. 142 for 2002) our reported income in 2001 was reducedby amortization of goodwill, which was non-deductible for tax purposes.
Loss related to investments decreased to $1.2 million for the year ended December 31, 2002 as compared to $7.6million for the year ended December 31, 2001. The loss related to investments for the year ended December 31, 2002primarily relates to a loss of $1.4 million as a result of a write down of our investment in Allegiance Capital LimitedPartnership, a loss of $0.1 million from the sale of our interest in Synergy Brands, Inc., offset by a gain of $0.3 millionrelated to proceeds of a settlement to shareholders of Acrodyne.
We recognized income from discontinued operations of $7.9 million, which includes a gain on the sale of WTTV-TVin Indianapolis, Indiana of $7.5 million for the year ended December 31, 2002 as compared to a loss from discontinuedoperations of $52,000 for the year ended December 31, 2001.
For the year ended December 31, 2002, we reported a $9.8 million loss related to the call premium and write off ofdeferred financing costs and interest, net of taxes, resulting from the repayment of our $300.0 million Term Loan Facilityand 1998 Bank Credit Agreement and the early redemption of our 9% senior subordinated notes due 2007 and our8.75% senior subordinated notes due 2007.
For the year ended December 31, 2001, we reported a $14.2 million loss related to the call premium and write off ofdeferred financing costs and interest, net of taxes, resulting from the early redemption of our 10% senior subordinatednotes due 2005 and amendments to our bank credit agreement.
As a result of the implementation of SFAS No. 133, Accounting for Derivative Instruments and Hedging Activities,one of our derivatives does not qualify for special hedge accounting treatment. Therefore, this derivative must berecognized in the balance sheet at fair market value and the changes in fair market value are reflected in earnings. As aresult, we recognized $32.2 million of losses during 2001 and $30.9 million of losses during 2002.
Recent Accounting Pronouncements
We adopted Statement of Financial Accounting Standard (SFAS) No. 145, Rescission of FASB Statements Nos. 4, 44 and64, Amendment of FASB Statement No,. 13 and Technical Corrections on January 1, 2003. SFAS No. 145 requires us torecord gains and losses on extinguishment of debt as a component of income from continuing operations rather than asan extraordinary item and we have reclassified such items for all periods presented. There are other provisions containedin SFAS No. 145 that do not have a material effect on our financial statements. For the year ended December 31, 2002,net loss from continuing operations increased to $6.0 million from net income of $3.9 million and the related loss pershare increased to $0.19 per share from $0.08 loss per share after we reclassified our extraordinary item.
In January 2003, the Financial Accounting Standards Board (FASB) issued Interpretation No. 46, Consolidation ofVariable Interest Entities, an Interpretation of Accounting Research Bulletin (ARB) No. 51 (FIN 46). FIN 46 introduces thevariable interest consolidation model, which determines control and consolidation based on potential variability in gainsand losses of the entity being evaluated for consolidation. The FASB delayed the effective date of FIN 46 for certainvariable interest entities until the first interim period ending after December 15, 2003. We are currently assessing varioustransactions to determine whether they could be considered a variable interest entity (VIE) and whether we would bethe primary beneficiary under the amended guidance of FIN 46.
We have determined that the unrelated third-party owner of WNAB-TV in Nashville may be a VIE and that we maybe the primary beneficiary of the variable interests as a result of the terms of our outsourcing agreement, put options andcall options. As a result, we may be required to consolidate the assets and liabilities of WNAB-TV at their fair marketvalues as of March 31, 2004 and we are currently assessing the impact of consolidating WNAB-TV on our results ofoperations. We have not completed our analysis at this time. We made payments to the unrelated third party owner of
S i n c l a i r B r o a d c a s t G r o u p14

WNAB-TV of $2.3 million and $2.8 million related to our outsourcing agreement for the twelve months endedDecember 31, 2003 and December 31, 2002, respectively. On January 2, 2003, we made an $18.0 million non-refundable deposit against the purchase price of the put or call option on the non-license assets. We believe that ourmaximum exposure to loss as a result of our involvement with WNAB-TV consists of the fees that we pay related to theoutsourcing agreement as well as any payments that we would be required to make under the put options held by thecurrent owner related to the license and non-license assets. (See Note 9, Commitments and Contingencies, WNAB Optionsin the Notes to our Consolidated Financial Statements.).
We have determined that Cunningham Broadcasting Corporation (Cunningham) is a VIE and that we are the primarybeneficiary of the variable interests. We already consolidate Cunningham; therefore, the implementation of FIN 46 willnot have a material effect on our financial statements with respect to our variable interest in Cunningham. We madeLMA payments to Cunningham of $4.7 million, $4.0 million, and $11.8 million for the years ended December 31,2003, 2002 and 2001, respectively. We received payments from Cunningham of $0.5 million and $0.2 million for theyears ended December 31, 2003 and 2002, respectively. We believe that our maximum exposure to loss as a result of ourinvolvement with Cunningham consists of the fees that we pay related to the LMA agreements as well as payments thatwe would make as a result of exercising our option to acquire Cunningham, which provides for an option exercise pricebased on a formula that provides a 10% annual return to Cunningham. (See Note 9, Commitments and Contingencies inthe Notes to our Consolidated Financial Statements.)
We are currently evaluating the applicability of FIN 46 on our LMAs and outsourcing agreements and the possibleimpact on our results of operations and financial position. We are currently reviewing these agreements to determine ifthe licensor represents a variable interest entity to us. We believe the exposure to loss because of our involvement withthe license holder for each station is minimal and can be measured by the incremental depreciation expense from theaddition of the fixed assets of the license holder.
In January 2003, the Emerging Issues Task Force (EITF) issued EITF 00-21, Accounting for Revenue Arrangements withMultiple Deliverables. EITF 00-21 addresses the determination of whether an arrangement involving multipledeliverables contains more than one unit of accounting and how arrangement consideration should be measured andallocated to the separate units of accounting in the arrangement. EITF 00-21 does not otherwise change the applicablerevenue recognition criteria. We adopted issue 00-21 on July 1, 2003 and have determined that our direct mailagreements constitute revenue arrangements with multiple deliverables that contain more than one unit of accounting.Consequently, we allocate the consideration that we receive for certain of these agreements between television accountingunits and direct mail accounting units and we recognize the revenue and related expenses when the television spots areaired and when the direct mail pieces are mailed, respectively.
Liquidity and Capital ResourcesOur primary sources of liquidity are cash provided by operations and availability under our 2002 Bank Credit
Agreement. The 2002 Bank Credit Agreement consists of a $225.0 million Revolving Credit Facility maturing on June30, 2008 and a $500.0 million Term Loan B Facility repayable in consecutive quarterly installments, amortizing 0.25%per quarter, commencing June 30, 2004 and continuing through its maturity on December 31, 2009. The applicableinterest rate on the Revolving Credit Facility is either LIBOR plus 1.25% to 2.25% or the alternative base rate plus0.25% to 1.25% adjusted quarterly based on the ratio of total debt, net of cash, to four quarters' trailing earnings beforeinterest, taxes, depreciation and amortization, as adjusted in accordance with the 2002 Bank Credit Agreement. Theapplicable interest rate on the Term Loan B Facility is either LIBOR plus 2.25% or the alternative base rate plus 1.25%.Availability under the Revolving Credit Facility does not reduce incrementally and terminates at maturity. We arerequired to prepay the Term Loan Facility and reduce the Revolving Credit Facility with (i) 100% of the net proceeds ofany casualty loss or condemnation and; (ii) 100% of the net proceeds of any sale or other disposition of our assets inexcess of $100 million in the aggregate for any fiscal year, to the extent not used to acquire new assets.
As of December 31, 2003, we had $28.7 million in cash balances and working capital of approximately $15.6 million.We anticipate that cash flow from our operations and revolving credit facility will be sufficient to satisfy our debt service
2 0 0 3 A n n u a l R e p o r t 15

obligations, dividend requirements, capital expenditure requirements and operating cash needs for the next year. As ofFebruary 13, 2004, we had borrowed $460.9 million under our Term Loan B Facility and had not borrowed under ourrevolving credit facility. The remaining balance available under the revolving credit facility was $225.0 million as ofFebruary 13, 2004. Our ability to draw down our line of credit is based on pro forma trailing cash flow levels as definedin our 2002 Bank Credit Agreement and for the twelve months ended December 31, 2003, we had approximately$225.0 million available of current borrowing capacity under our revolving credit facility.
On April 19, 2002, we filed a $350.0 million universal shelf registration statement with the Securities and ExchangeCommission which will permit us to offer and sell various types of securities from time to time. Offered securities mayinclude common stock, debt securities, preferred stock, depositary shares or any combination thereof in amounts, pricesand on terms to be announced when the securities are offered. If we determine it is in our best interest to offer any suchsecurities, we intend to use the proceeds for general corporate purposes, including, but not limited to, the reduction,redemption or refinancing of debt or other obligations, acquisitions, capital expenditures and working capital.
During May 2003, we completed a private placement of $150.0 million aggregate principal amount of 4.875%Convertible Senior Subordinated Notes due 2018 (Convertible Notes). The Convertible Notes were issued at par,mature on July 15, 2018 and have the following characteristics:
• The notes are convertible into shares of our Class A common stock at the option of the holder uponcertain circumstances. The conversion price is $22.37 until March 31, 2011 at which time theconversion price increases quarterly until reaching $28.07 on July 15, 2018.
• The notes may be put to us at par on January 15, 2011 or called thereafter by us.
• The notes bear cash interest at an annual rate of 4.875% until January 15, 2011 and bear cashinterest at an annual rate of 2.00% from January 15, 2011 through maturity.
• The principal amount of the notes will accrete to 125.66% of the original par amount from January15, 2011 to maturity so that when combined with the cash interest, the yield to maturity of thenotes will be 4.875% per year.
• Under certain circumstances, we will pay contingent cash interest to the holders of the ConvertibleNotes during any six month period from January 15 to July 14 and from July 15 to January 14,commencing with the six month period beginning January 15, 2011. This contingent interestfeature is an embedded derivative which had a negligible fair value as of December 31, 2003.
We used the net proceeds from this private placement, along with the net proceeds from the issuance of $100.0 millionof 8% Senior Subordinated Notes due 2012, to finance the redemption of the 11.625% High Yield Trust OriginatedPreferred Securities due 2009 (HYTOPS) to repay debt outstanding under our bank credit agreement and for generalcorporate purposes. Net costs associated with the offering totaled $4.7 million. These costs were capitalized and arebeing amortized as interest expense over the term of the Convertible Notes.
During May 2003, we completed a private placement of $100.0 million aggregate principal amount of SeniorSubordinated Notes, which was an add-on issuance under the indenture relating to our 8% Senior Subordinated Notesdue 2012. The Senior Subordinated Notes were issued at a price of $105.3359 plus accrued interest from March 15,2003 to May 28, 2003, yielding a rate of 7.00%. We used the net proceeds, along with the net proceeds received inconnection with our issuance of the Convertible Notes, to finance the redemption of the HYTOPS and for generalcorporate purposes. Net costs associated with the offering totaled $1.4 million. These costs were capitalized and arebeing amortized to interest expense over the term of the Senior Subordinated Notes.
On June 20, 2003, we redeemed the $200.0 million aggregate principal amount of the HYTOPS, plus the associated4.65% call premium and accrued interest thereon. The redemption was funded through the issuance of the 8% SeniorSubordinated Notes due 2012 and the Convertible Notes. We recognized a loss on debt extinguishment of $15.2 millionconsisting of a $9.3 million call premium, a write off of the previous debt acquisition costs of $3.7 million andconsideration and other fees of $2.2 million.
S i n c l a i r B r o a d c a s t G r o u p16

The guarantors of our registered debt securities are 100% owned by the parent and are comprised of certain of oursubsidiaries whose guarantees are full and unconditional and joint and several. (See Note 18, Condensed ConsolidatingFinancial Statements in our Notes to our Consolidated Financial Statements.) Neither the parent nor the guarantors haveany significant restrictions on their ability to obtain funds from their subsidiaries in the form of dividends or loans.
We hold two interest rate swap agreements that have a total notional amount of $575 million that expire on June 5,2006. During June 2003, we assigned $200 million of the notional amount to a second financial institution. Theinstrument with a notional amount of $375 million contains a European style (that is, exercisable only on the expirationdate) termination option and can be terminated partially or in full by the counterparty on June 3, 2004 and June 3, 2005at its fair market value. We estimate the fair market value of the $375 million agreement at December 31, 2003 to be$35.1 million based on a quotation from the counterparty and this amount is reflected as a component of other long-term liabilities on our consolidated balance sheet as of December 31, 2003. If the counterparty chooses to partially orfully exercise its option to terminate the agreement, we will fund the payment from cash generated from our operatingactivities and/or borrowings under our bank credit agreement.
The weighted average interest rates for outstanding indebtedness relating to our Bank Credit Agreement during 2002and as of December 31, 2002 were 5.14% and 4.12%, respectively. The weighted average interest rates of our BankCredit Agreement during 2003 and as of December 31, 2003 were 3.64% and 3.41%, respectively. During 2003, theinterest expense relating to the Bank Credit Agreements was $18.0 million. This trend primarily relates to a lowerinterest rate environment and there can be no assurances that this trend will continue.
Net cash flows from operating activities decreased to $148.8 million for the year ended December 31, 2003 from$149.6 million for the year ended December 31, 2002. We received income tax refunds net of payments of $38.3 millionfor the year ended December 31, 2003 as compared to income tax refunds, net of payments of $44.1 million for the yearended December 31, 2002. Interest payments on outstanding indebtedness and payments for subsidiary trust minorityinterest expense decreased $15.0 million, to $127.9 million for the year ended December 31, 2003 as compared to$142.9 million for the year ended December 31, 2002. The decrease in interest payments was primarily due to therefinancing of indebtedness during November 2002, December 2002 and May 2003 and the lower rates on our BankCredit Agreement described above. (See Note 4 - Notes Payable and Commercial Bank Financing in our Notes to ourConsolidated Financial Statements for more details regarding the refinancing of our indebtedness.) Program rightspayments decreased to $105.5 million for the year ended December 31, 2003 from $106.3 million for the year endedDecember 31, 2002 or 0.8%.
Net cash flows used in investing activities were $93.0 million for the year ended December 31, 2003 as compared tonet cash flows from investing activities of $52.8 million for the year ended December 31, 2002. The positive cash flowfrom investing activities for the year ended December 31, 2002 was primarily due to the sale of WTTV-TV broadcastassets and repayments of notes receivable. For the year ended December 31, 2002, we received proceeds of $124.5million from the sale of WTTV-TV, $0.7 million related to the sale of broadcast assets and $30.3 million for therepayment of notes receivable. During 2003, there was no similar activity.
During the year ended December 31, 2003, we made cash payments of $18.0 million for the acquisition of broadcastassets, $5.7 million for the purchase of equity investments and payments for property and equipment of $69.5 million,of which $30.9 million related to digital conversion costs and $24.1 million related to implementation of our NewsCentral format. During the year ended December 31, 2002, we made equity investments of approximately $25.8million and we made payments for property and equipment of $62.9 million, of which $49.6 million related to digitalconversion costs. We funded these acquisitions using cash provided by operating activities and borrowings under ourRevolving Credit Facility.
For 2004, we anticipate incurring approximately $40.0 million of capital expenditures, of which approximately $18.0million is intended to substantially complete our digital television roll-out, $10.0 million is for station maintenance andequipment replacement, $8.0 million is to consolidate building and tower needs in some markets and $4.0 million is forthe addition of News Central in two additional markets. In addition, we anticipate that future requirements forexpenditures will include expenditures incurred during the ordinary course of business and additional strategic station
2 0 0 3 A n n u a l R e p o r t 17

acquisitions and equity investments if suitable investments can be identified on acceptable terms. We expect to fund suchcapital expenditures with cash generated from operating activities and funding from our Revolving Credit Facility, issuanceof securities pursuant to our universal shelf registration statement described above or a private placement of securities.
Net cash flows used in financing activities were $32.4 million for the year ended December 31, 2003 compared to netcash flows used in financing activities of $229.2 million for the year ended December 31, 2002. During the year endedDecember 31, 2003, we repaid a net of $10.8 million, whereas in the comparable period in 2002, we repaid a net of$229.5 million in indebtedness. We incurred deferred financing costs of $7.4 million related to the add-on issuance ofour 8% Senior Subordinated Notes and issuance of our Convertible Notes, we redeemed $200.0 million aggregateprincipal amount of the HYTOPS utilizing $209.3 million from the net issuances for the HYTOPS principal and callpremium and we repurchased $1.5 million of our Class A common stock for the year ended December 31, 2003. Incomparison, during the year ended December 31, 2002, we paid deferred financing costs of $10.5 million. During theyear ended December 31, 2002, we received $21.8 million related to the termination of two of our derivative instrumentswith no similar activity occurring during 2003. For the year ended December 31, 2003 and 2002, we paid quarterlydividends of $10.4 million on our Series D Preferred Stock. We expect to incur these dividend payments in each of ourfuture quarters and expect to fund these dividends with cash generated from operating activities and borrowings underour Bank Credit Agreement.
Income Taxes
The income tax provision from continuing operations increased to $15.7 million for the year ended December 31,2003, from a benefit of $4.2 million for the year ended December 31, 2002. For the year ended December 31, 2003,our pre-tax book income from continuing operations was $38.4 million and for the year ended December 31, 2002, ourpre-tax book loss from continuing operations was $10.1 million.
As of December 31, 2003, we have a net deferred tax liability of $178.2 million as compared to a net deferred taxliability of $167.2 million as of December 31, 2002. The increase in deferred taxes primarily relates to deferred taxliabilities associated with book and tax differences relating to the amortization and depreciation of intangible assets andfixed assets, offset by deferred tax assets resulting from Federal and state net operating losses (NOLs) generated during2003. Our tax rate changed to a provision in 2003 from a benefit in 2002 because we reported net income in 2003compared to a net loss in 2002. The effective tax rate from continuing operations decreased to 40.8% for the year endedDecember 31, 2003 from 41.0% for the year ended December 31, 2002.
Seasonality/Cyclicality
Our results usually are subject to seasonal fluctuations, which usually cause fourth quarter operating income to begreater than first, second and third quarter operating income. This seasonality is primarily attributable to increasedexpenditures by advertisers in anticipation of holiday season spending and an increase in viewership during this period.In addition, revenues from political advertising and the Olympics are higher in even numbered years.
Indebtedness and Other Commitments
Indebtedness under the bank credit agreement, as amended. As of December 31, 2003, we owed $485.9 million underthe Bank Credit Agreement, as amended and had a $225.0 million remaining balance available.
Indebtedness under notes. We have issued and outstanding three series of senior subordinated notes with aggregateprincipal amount issued and outstanding of $1.1 billion.
Series D convertible exchangeable preferred stock. We have issued 3,450,000 shares of series D convertible exchangeablepreferred stock with an aggregate liquidation preference of approximately $172.5 million. The liquidation preference
S i n c l a i r B r o a d c a s t G r o u p18

means we would be required to pay the holders of series D convertible exchangeable preferred stock $172.5 millionbefore we paid holders of common stock (or any other stock that is junior to the series D convertible exchangeablepreferred stock) in any liquidation of Sinclair. We are not obligated to buy back or retire the series D convertibleexchangeable preferred stock, but may do so at our option at a conversion rate of $22.8125 per share. In somecircumstances, we may also exchange the series D convertible exchangeable preferred stock for 6% subordinateddebentures due 2012 with an aggregate principal amount of $172.5 million.
Program contracts payable and programming commitments. Total current and long-term program contracts payable atDecember 31, 2003 were $120.9 million and $92.3 million, respectively. In addition, we enter into commitments topurchase future programming. Under these commitments, we were obligated on December 31, 2003 to make futurepayments totaling $120.5 million.
Other. Our commitments also include capital leases, operating leases, sports programming, personnel contracts andother liabilities. The amount of these commitments may be material.
CONTRACTUAL CASH OBLIGATIONS, COMMERCIAL COMMITMENTS AND OFF-BALANCE SHEET ARRANGEMENTS
We have various contractual obligations which are recorded as liabilities in our consolidated financial statements. Otheritems, such as certain purchase commitments and other executory contracts are not recognized as liabilities in ourconsolidated financial statements but are required to be disclosed. For example, we are contractually committed to acquirefuture programming and make certain minimum lease payments for the use of property under operating lease agreements.
The following tables reflect a summary of our contractual cash obligations and other commercial commitments as ofDecember 31, 2003:
2 0 0 3 A n n u a l R e p o r t 19
2004 2005 20062007
and thereafter Total
Notes payable, capital leases and commercial bank financing (1) $ 62,514 $ 63,863 $ 63,957 $ 2,016,688 $ 2,207,022
Notes and capital leases payable to affiliates 6,737 7,661 5,303 28,367 48,068
Fixed rate derivative instrument 36,078 36,078 15,633 — 87,789
Operating leases 3,539 3,047 2,675 13,263 22,524
Employment contracts 7,694 2,678 449 5 10,826
Film liability - active 120,873 57,645 27,141 7,513 213,172
Film liability - future (2) 9,730 31,995 30,731 48,030 120,486
Programming services 14,243 3,520 971 1,416 20,150
Maintenance and support 3,810 1,696 344 1,623 7,473
Other operating contracts 3,657 1,866 1,257 2,758 9,538
Total contractual cash obligations $ 268,875 $ 210,049 $ 148,461 $ 2,119,663 $ 2,747,048
Payments Due By Year (in thousands)

(1) Only includes interest on fixed rate debt.
(2) Future film liabilities reflect a license agreement for program material that is not yet available for its first showing or telecast. Per SFAS No. 63, Financial Reporting forBroadcasters, an asset and a liability for the rights acquired and obligations incurred under a license agreement are reported on the balance sheet when the cost of each program isknown or reasonably determinable, the program material has been accepted by the licensee in accordance with the conditions of the license agreement and the program is availablefor its first showing or telecast.
(3) Commitments to contribute capital to Allegiance Capital, LP and Sterling Ventures Partners, LP.
(4) We have entered into an agreement with a third party, whereby the third party may require us to purchase certain license and non-license broadcast assets at the option of the thirdparty, no earlier than July 1, 2005. The contractual commitment for 2006 and beyond represents the increase in purchase option price should the exercise occur in 2006 or 2007.
(5) Certain LMAs require us to reimburse the licensee owner their operating costs. Certain outsourcing agreements require us to pay a fee to another station for providing non-programming services. The amount will vary each month and accordingly, these amounts were estimated through the date of the agreements' expiration, based on historical costexperience.
QUANTITATIVE AND QUALITATIVE DISCLOSURES ABOUT MARKET RISK
We are exposed to market risk from changes in interest rates. To manage our exposure to changes in interest rates, we enter intointerest rate derivative hedging agreements.
Interest Rate Risks
We are exposed to market risk from changes in interest rates, which arise from our floating rate debt. As of December 31, 2003,we were obligated on $485.9 million of indebtedness carrying a floating interest rate. We enter into interest rate derivative agreementsto reduce the impact of changing interest rates on our floating rate debt.
As of December 31, 2003, we had two floating-to-fixed interest rate swap agreements, which expire on June 5, 2006. The swapagreements effectively set fixed rates on our floating rate debt in the range of 6.25% to 7.00%. Floating interest rates are based uponthe three month LIBOR and the measurement and settlement is performed quarterly. Settlements of these agreements are recordedas adjustments to interest expense in the relevant periods. The notional amount related to these agreements was $575.0 million atDecember 31, 2003. In addition, as of December 31, 2003, we had four fixed-to-floating rate derivatives with notional amounts of$180.0 million, $120.0 million and two at $50.0 million. At December 31, 2003, we had $485.9 million of floating rate debt allwhich was effectively converted to fixed rate debt by way of a swap. Additionally, we had $1.1 billion of fixed rate debt at December31, 2003 of which $400.0 million was converted to floating rate debt by way of a swap. Consequently, we had $400.0 million offloating rate debt at December 31, 2003 and a 1.0% increase in LIBOR rate would result in annualized interest expense ofapproximately $4.0 million.
We are also exposed to risk from a change in interest rates to the extent we are required to refinance existing fixed rate indebtednessat rates higher than those prevailing at the time the existing indebtedness was incurred. As of December 31, 2003, we had seniorsubordinated notes totaling $310.0 million, $650.0 million and $150.0 million expiring in the years 2011, 2012 and 2018,respectively. Based upon the quoted market price, the fair value of the notes was $1.2 billion as of December 31, 2003. Generally,the fair market value of the notes will decrease as interest rates rise and increase as interest rates fall. We estimate that a 1.0% increasefrom prevailing interest rates would result in a decrease in fair value of the notes by approximately $73.4 million as of December 31,2003.
We are exposed to market risk from changes in interest rates related to one of our derivative instruments. Our $575.0 millionnotional amount interest rate swap agreement does not qualify for hedge accounting treatment under SFAS No. 133; therefore,changes in its fair market value are reflected currently in earnings as unrealized gain (loss) on derivative instruments. We incurredan unrealized gain of $17.4 million during the year ended December 31, 2003 and an unrealized loss of $30.9 million during theyear ended December 31, 2002. We estimate that a 1.0% increase in interest rates would result in a gain of $14.4 million, while a1.0% decrease would result in a loss of $14.4 million.
S i n c l a i r B r o a d c a s t G r o u p20
2004 2005 20062007
and thereafter Total
Other Commercial Commitments
Letters of credit $ 82 $ 82 $ 82 $ 734 $ 980
Guarantees 119 122 31 — 272
Investments (3) 9,045 — — — 9,045
Network affiliation agreements 12,810 7,423 1,874 1,893 24,000
Purchase options (4) — 13,250 5,000 4,000 22,250
LMA and outsourcing agreements (5) 7,637 5,020 3,375 3,282 19,314
Total other commercial commitments $ 29,693 $ 25,897 $ 10,362 $ 9,909 $ 75,861
Payments Due By Year (in thousands)

CONSOLIDATED BALANCE SHEETS(in thousands)
ASSETSCURRENT ASSETS:
Cash and cash equivalents $ 28,730. $ 5,327.
Accounts receivable, net of allowance for doubtful accounts of $4,809 and $5,946, respectively 139,761. 147,002.
Current portion of program contract costs 61,053. 76,472.
Taxes receivable 1,952. 38,906.
Prepaid expenses and other current assets 14,091. 20,807.
Deferred barter costs 2,763. 2,539.
Deferred tax assets 12,443. 6,001.
Total current assets 260,793. 297,054.
PROGRAM CONTRACT COSTS, less current portion 34,218. 51,229.
LOANS TO AFFILIATES 1,381. 1,489.
PROPERTY AND EQUIPMENT, net 355,817. 337,250.
OTHER ASSETS 106,749. 91,119.
GOODWILL 1,118,534. 1,123,403.
BROADCAST LICENSES 429,507. 429,507.
DEFINITE-LIVED INTANGIBLE ASSETS, net 257,583. 275,722.
Total Assets $ 2,564,582. $ 2,606,773.
LIABILITIES AND SHAREHOLDERS' EQUITYCURRENT LIABILITIES:
Accounts payable $ 8,301. $ 15,573.
Accrued liabilities 70,609. 64,165.
Notes payable, capital leases and commercial bank financing - current portion 38,986. 292.
Notes and capital leases payable to affiliates - current portion 3,296. 4,157.
Current portion of program contracts payable 120,873. 121,396.
Deferred barter revenues 3,153. 2,971.
Total current liabilities 245,218. 208,554.
LONG-TERM LIABILITIES:
Notes payable, capital leases and commercial bank financing, less current portion 1,664,534. 1,518,690.
Notes and capital leases payable to affiliates, less current portion 25,641. 28,831.
Program contracts payable, less current portion 92,299. 124,658.
Deferred tax liabilities 190,614. 173,209.
Other long-term liabilities 114,705. 138,905.
Total liabilities 2,333,011. 2,192,847.
MINORITY INTEREST IN CONSOLIDATED ENTITIES 2,566. 2,746.COMMITMENTS AND CONTINGENCIESCOMPANY OBLIGATED MANDATORILY REDEEMABLE SECURITIES OF SUBSIDIARY
TRUST HOLDING SOLELY KDSM SENIOR DEBENTURES — 200,000.
SHAREHOLDERS’ EQUITY:Series D Preferred Stock, $.01 par value, 3,450,000 shares authorized, issued and outstanding; liquidation
preference of $172,500,000 35. 35.Class A Common Stock, $.01 par value, 500,000,000 shares authorized and 44,598,278 and
43,866,259 shares issued and outstanding, respectively 446. 439.Class B Common Stock, $.01 par value, 140,000,000 shares authorized and 41,213,653
and 41,705,678 shares issued and outstanding, respectively 412. 417.
Additional paid-in capital 762,720. 760,478.
Additional paid-in capital - deferred compensation (132) (551)
Accumulated deficit (533,916) (547,958)
Accumulated other comprehensive loss (560) (1,680)
Total shareholders' equity 229,005. 211,180.
Total Liabilities and Shareholders' Equity $ 2,564,582. $ 2,606,773.
The accompanying notes are an integral part of these consolidated statements.
2 0 0 3 A n n u a l R e p o r t 21
2003 2002As of December 31,

S i n c l a i r B r o a d c a s t G r o u p22
CONSOLIDATED STATEMENTS OF OPERATIONSFOR THE YEARS ENDED DECEMBER 31, 2003, 2002 AND 2001(in thousands, except per share data)
REVENUES:Station broadcast revenues, net of agency commissions of $101,560, $104,409 and $96,932, respectively $ 661,778. $ 670,534. $ 623,837.
Revenues realized from station barter arrangements 62,395. 60,911. 53,889.Other operating divisions' revenue 14,568. 4,344. 6,925.
Total revenues 738,741. 735,789. 684,651.
OPERATING EXPENSES:Station production expenses 147,937. 140,060. 142,696.Station selling, general and administrative expenses 145,895. 143,348. 140,138.Expenses recognized from station barter arrangements 57,365. 54,567. 48,159.Amortization of program contract costs and net realizable value adjustments 105,082. 125,264. 110,265.Stock-based compensation 1,498. 1,399. 1,559.Other operating divisions' expenses 16,375. 6,051. 8,910.Corporate general and administrative expenses 25,255. 19,795. 19,750.Depreciation and amortization of property and equipment 47,023. 41,219. 37,802.Amortization of definite-lived intangible assets and other assets 19,288. 19,456. 112,459.Impairment and write down charge of long-lived assets — — 16,075.Restructuring costs — — 3,700.Contract termination costs — — 5,135.
Total operating expenses 565,718. 551,159. 646,648.Operating income 173,023. 184,630. 38,003.
OTHER INCOME (EXPENSE):Interest and amortization of deferred financing costs and debt premium and discount (128,228) (126,500) (143,574)Subsidiary trust minority interest expense (11,246) (23,890) (23,890)Net (loss) gain on sale of broadcast assets (517) (478) 204..Interest income 560. 1,484. 2,643..Unrealized gain (loss) on derivative instrument 17,354. (30,939) (32,220)Loss from extinguishment of securities (15,187) (15,362) (22,010)Income (loss) related to investments 1,193. (1,189) (7,616)Other income 1,468. 2,101. 1,115.
Income (loss) before income taxes 38,420. (10,143) (187,345)(PROVISION) BENEFIT FOR INCOME TAXES (15,669) 4,162. 59,675.
Net income (loss) from continuing operations 22,751. (5,981) (127,670)DISCONTINUED OPERATIONS:
Income (loss) from discontinued operations, net of related income tax benefit (provision) of $1,641, $(347) and $(193), respectively 1,641. 372. (52)
Gain on disposal of discontinued operations, net of taxes of $8,175 — 7,519. —CUMULATIVE EFFECT OF CHANGE IN ACCOUNTING PRINCIPLE, net of tax benefit of $30,383 — (566,404) —NET INCOME (LOSS) 24,392. (564,494) (127,722)PREFERRED STOCK DIVIDENDS 10,350. 10,350. 10,350.NET INCOME (LOSS) AVAILABLE TO COMMON SHAREHOLDERS $ 14,042. $ (574,844) $ (138,072)
BASIC EARNINGS (LOSS) PER SHARE:Earnings (loss) per share from continuing operations $ 0.14. $ (0.19) $ (1.64)Earnings per share from discontinued operations $ 0.02. $ 0.09. $ —Loss per share from cumulative effect of change in accounting principle $ — $ (6.64) $ —Earnings (loss) per common share $ 0.16. $ (6.74) $ (1.64)Weighted average common shares outstanding 85,651. 85,337. 84,352.
DILUTED EARNINGS (LOSS) PER SHARE:Earnings (loss) per share from continuing operations $ 0.14. $ (0.19) $ (1.64)Earnings per share from discontinued operations $ 0.02. $ $0.09. $ —Loss per share from cumulative effect of change in accounting principle $ — $ (6.64) $ —Earnings (loss) per common share $ 0.16. $ (6.74) $ (1.64)Weighted average common and common equivalent shares outstanding 85,793. 85,580. 84,624.
The accompanying notes are an integral part of these consolidated statements.
2003 2002 2001

CONSOLIDATED STATEMENTS OF SHAREHOLDERS' EQUITYFOR THE YEARS ENDED DECEMBER 31, 2003, 2002 AND 2001(in thousands)
BALANCE, December 31, 2000 $ 35. $ 390. $ 455. $ 750,372. $ (2,618) $ 164,958. $ (1,062) $ 912,530.
Repurchase and retirement of 618,600 shares of Class A Common Stock — (6) — (4,391) — — — (4,397)
Stock options exercised — 1. — 582. — — — 583.
Class B Common Stock converted into Class A Common Stock — 23. (23) — — — — —
Dividend paid on Series D preferred stock — — — — — (10,350) — (10,350)
Termination of equity put options — — — 78. — — — 78.
Class A Common Stock issued to employee benefit plans — 3. — 2,643. — — — 2,646.
Amortization of deferred compensation — — — — 865. — — 865.
Deferred compensation adjustment related to forfeited stock options — — — (931) 301. — — (630)
Net loss — — — — — (127,722) — (127,722)
Other comprehensive loss:
Reclass of derivative instruments upon implementation of SFAS No. 133, net of tax benefit of $1,509 — — — — — — (2,777) (2,777)
Amortization of derivative instruments — — — — — — 225. 225.
Unrealized loss on investment, net of tax benefit of $231 — — — — — — (345) (345)
Realized loss on investments, net of tax benefit of $825 — — — — — — 1,254. 1,254.
Comprehensive loss (129,365)
BALANCE, December 31, 2001 $ 35. $ 411. $ 432. $ 748,353. $ (1,452) $ 26,886. $ (2,705) $ 771,960.
The accompanying notes are an integral part of these consolidated statements.
2 0 0 3 A n n u a l R e p o r t 23
Series DPreferred
Stock
Class ACommon
Stock
Class BCommon
Stock
AdditionalPaid-InCapital
AdditionalPaid-In
Capital -Deferred
CompensationRetainedEarnings
AccumulatedOther
ComprehensiveLoss
TotalShareholders’
Equity

S i n c l a i r B r o a d c a s t G r o u p24
CONSOLIDATED STATEMENTS OF SHAREHOLDERS' EQUITYFOR THE YEARS ENDED DECEMBER 31, 2003, 2002 AND 2001(in thousands)
BALANCE, December 31, 2001 $ 35. $ 411. $ 432. $ 748,353. $ (1,452) $ 26,886. $ (2,705) $ 771,960.
Class B Common Stock converted into Class A Common Stock — 15. (15) — — — — —
Dividends paid on Series D preferred stock — — — — — (10,350) — (10,350)
Stock options exercised — 3. — 2,803. — — — 2,806.
Class A Common Stock issued pursuant to employee benefit plans — 2. — 1,754. — — — 1,756.
Class A Common Stock issued to acquire broadcast licenses — 8. — 7,695. — — — 7,703.
Issuance of shares under ESPP — — — 338. — — — 338.
Amortization of deferred compensation — — — — 730. — — 730.
Deferred compensation adjustment relatedto forfeited stock option — — — (465) 171. — — (294)
Net income — — — — — (564,494) — (564,494)
Other comprehensive loss:
Amortization of derivative instruments, net of tax benefit of $716 — — — — — — 871. 871.
Realized loss on investment, net of tax benefit of $101 — — — — — — 154. 154.
Comprehensive loss (563,469)
BALANCE, December 31, 2002 $ 35. $ 439. $ 417. $ 760,478. $ (551) $ (547,958) $ (1,680) $ 211,180.
The accompanying notes are an integral part of these consolidated statements.
Series DPreferred
Stock
Class ACommon
Stock
Class BCommon
Stock
AdditionalPaid-InCapital
AdditionalPaid-In
Capital -Deferred
Compensation
RetainedEarnings
(AccumulatedDeficit)
AccumulatedOther
ComprehensiveLoss
TotalShareholders’
Equity

2 0 0 3 A n n u a l R e p o r t 25
CONSOLIDATED STATEMENTS OF SHAREHOLDERS' EQUITYFOR THE YEARS ENDED DECEMBER 31, 2003, 2002 AND 2001(in thousands)
BALANCE, December 31, 2002 $ 35. $ 439. $ 417. $ 760,478. $ (551) $ (547,958) $ (1,680) $ 211,180.
Class B converted into Class A common stock — 5. (5) — — — — —
Dividends paid on Series D preferred stock — — — — — (10,350) — (10,350)
Stock options exercised — 2. — 1,429. — — — 1,431.
Class A Common Stock issued pursuant to employee benefit plans — 2. — 2,508. — — — 2,510.
Repurchase of 194,500 shares of Class A Common Stock — (2) — (1,542) — — — (1,544)
Amortization of deferred compensation — — — — 494. — — 494.
Deferred compensation adjustment related to forfeited stock option — — — (153) (75) — — (228)
Net income — — — — — 24,392. — 24,392.
Other comprehensive income:
Amortization of derivative instruments, net of tax provision of $608 — — — — — — 1,120. 1,120.
Comprehensive income 25,512.
BALANCE, December 31, 2003 $ 35. $ 446. $ 412. $ 762,720. $ (132) $ (533,916) $ (560) $ 229,005.
The accompanying notes are an integral part of these consolidated statements.
Series DPreferred
Stock
Class ACommon
Stock
Class BCommon
Stock
AdditionalPaid-InCapital
AdditionalPaid-In
Capital -Deferred
Compensation
RetainedEarnings
(AccumulatedDeficit)
AccumulatedOther
ComprehensiveLoss
TotalShareholders’
Equity

S i n c l a i r B r o a d c a s t G r o u p26
CONSOLIDATED STATEMENTS OF CASH FLOWSFOR THE YEARS ENDED DECEMBER 31, 2003, 2002 AND 2001(in thousands)
CASH FLOWS FROM (USED IN) OPERATING ACTIVITIES:
Net income (loss) $ 24,392. $ (564,494) $ (127,722)
Adjustments to reconcile net income (loss) to net cash flows from operating activities-
Amortization of debt (premium) discount (838) 98. 98.
Depreciation of property and equipment 47,023. 41,513. 38,848.
Recognition of deferred revenue (4,942) (4,942) —
Non-cash (gain)/loss from equity investments (976) 1,519. 7,616.
Gain on sale of broadcast assets related to discontinued operations — (12,413) —
Loss (gain) on sale of property 517. 478. (204)
Impairment and write down of long-lived assets — — 16,229.
Contract termination costs — — 5,135.
Unrealized (gain) loss on derivative instrument (17,354) 30,939. 32,220.
Amortization of definite-lived intangible assets and other assets 19,288. 19,581. 116,383.
Amortization of program contract costs and net realizable value adjustments 105,082. 130,832. 119,437.
Amortization of deferred financing costs 2,990. 3,954. 4,071.
Amortization of deferred compensation 266. 435. 235.
Extinguishment of securities, non-cash portion 3,705. 12,307. 5,601.
Cumulative effect of change in accounting principle — 596,787. —
Amortization of derivative instruments 1,658. 1,409. 763.
Deferred tax provision (benefit) related to operations 17,250. 49,490. (10,595)
Deferred tax benefit related to sale of broadcast assets from discontinued operations —- (11,582) —
Deferred tax provision (benefit) related to extraordinary loss — 649. (97)
Deferred tax benefit related to change in accounting principle — (30,383) —
Net effect of change in deferred barter revenues and deferred barter costs (112) (571) (345)
Changes in assets and liabilities, net of effects of acquisitions and dispositions
Decrease (increase) in accounts receivable, net 11,363. (2,871) 22,102.
Decrease (increase) in taxes receivable 36,954. 7,244. (43,395)
Decrease (increase) in prepaid expenses and other current assets 9,319. (2,680) (8,051)
Decrease in other long-term assets 3,659. 3,173. —
(Decrease) increase in accounts payable and accrued liabilities (1,478) (12,926) 7,941.
Decrease in income taxes payable — — (42,126)
(Decrease) increase in other long-term liabilities (3,298) 58. 17,643.
Payments on program contracts payable (105,535) (106,327) (102,256)
Decrease in minority interest (180) (1,662) (643)
Net cash flows from operating activities 148,753. 149,615. 58,888.
CASH FLOWS FROM (USED IN) INVESTING ACTIVITIES:
Acquisition of property and equipment (69,531) (62,909) (29,017)
Payments relating to the acquisition of broadcast assets (18,000) (21,178) (490)
Distributions from investments 307. 654. 408.
Additional investments (5,699) (25,820) (1,500)
Proceeds from sale of property 138. 694. 983.
Proceeds from sale of broadcast assets — 124,472. —
Repayment of note receivable — 30,257. —
Deposits received on future sale of broadcast assets — — 125.
Loans to affiliates (1,115) (104) (4,078)
Proceeds from loans to affiliates 903. 6,756. 231.
Net cash flows (used in) from investing activities (92,997) 52,822. (33,338)
The accompanying notes are an integral part of these consolidated statements.
2003 2002 2001

2 0 0 3 A n n u a l R e p o r t 27
CONSOLIDATED STATEMENTS OF CASH FLOWSFOR THE YEARS ENDED DECEMBER 31, 2003, 2002 AND 2001(in thousands)
CASH FLOWS FROM (USED IN) FINANCING ACTIVITIES:
Proceeds from commercial bank financing and notes payable 318,336. 1,263,075. 1,334,000.
Repayments of notes payable, commercial bank financing and capital leases (129,100) (1,492,548) (1,291,000)
Accretion of capital leases 723. 621. 1,794.
Redemption of High Yield Trust Originated Preferred Securities (200,000) — —
Repurchases of Class A Common Stock (1,544) — (4,397)
Proceeds from exercise of stock options 1,431. 2,807. 583.
Proceeds from termination of derivative instruments — 21,849. —
Payments for deferred financing costs (7,402) (10,503) (11,993)
Payment from equity put options premium — — (7,733)
Dividends paid on Series D Convertible Preferred Stock (10,350) (10,350) (10,350)
Repayments of notes and capital leases to affiliates (4,447) (4,124) (8,482)
Net cash flows (used in) from financing activities (32,353) (229,173) 2,422.
NET INCREASE (DECREASE) IN CASH AND CASH EQUIVALENTS 23,403. (26,736) 27,972.
CASH AND CASH EQUIVALENTS, beginning of period 5,327. 32,063. 4,091.
CASH AND CASH EQUIVALENTS, end of period $ 28,730. $ 5,327. $ 32,063.
The accompanying notes are an integral part of these consolidated statements.
2003 2002 2001

NOTES TO CONSOLIDATED FINANCIAL STATEMENTSDECEMBER 31, 2003, 2002 AND 2001
1. SUMMARY OF SIGNIFICANT ACCOUNTING POLICIES:Basis of Presentation
The accompanying consolidated financial statements include the accounts of Sinclair Broadcast Group, Inc. and allother consolidated subsidiaries, which are collectively referred to hereafter as "We" or "Our". We own and operate,provide sales services, or provide programming and operating services pursuant to local marketing agreements to 62television stations in 39 designated marketing areas (DMAs) throughout the United States. The operating results ofWTTV-TV are not included in our consolidated results from continuing operations for the years ended December 31,2002 and 2001. (See Note 12. Discontinued Operations). We own equity interests in Internet companies includingG1440, Inc., an Internet consulting and development company.
We have a controlling interest in and a strategic alliance with Acrodyne Communications, Inc. (Acrodyne), amanufacturer of television transmitters and other television broadcast equipment. The financial statements of Acrodynehave been consolidated for the year ended December 31, 2003. We have an equity interest in Summa Holdings, Ltd.,a holding company that owns automobile dealerships and a leasing company.
Cunningham Broadcasting Corporation (Cunningham) owns the license assets of WNUV-TV, WTTE-TV, WRGT-TV, WVAH-TV, WTAT-TV and WBSC-TV. Cunningham owns, operates and controls these television stations. Wedo not own or control these television stations, but we have entered into local marketing agreements (LMA) withCunningham to program each of these stations. Effective February 1, 2002, we restructured our LMA relationship withCunningham and, as a result, Cunningham met the definition of a special purpose entity and pursuant to EmergingIssues Task Force Topic D-14, Transactions Involving Special Purpose Entities, for accounting purposes only, the financialstatements of Cunningham have been consolidated. (See Note 10, Related Party Transactions).
Principles of Consolidation
The consolidated financial statements include our accounts and those of our wholly owned and majority-ownedsubsidiaries and a company that meets the definition of a special purpose entity. Minority interest represents a minorityowner's proportionate share of the equity in certain of our consolidated entities. All significant intercompanytransactions and account balances have been eliminated in consolidation.
Use of Estimates
The preparation of financial statements in accordance with accounting principles generally accepted in the UnitedStates requires management to make estimates and assumptions that affect the reported amounts of assets, liabilities,revenues and expenses in the financial statements and in the disclosures of contingent assets and liabilities. Actual resultscould differ from those estimates.
Cash and Cash Equivalents
We consider all highly liquid investments with an original maturity of three months or less when purchased to be cash equivalents.
Accounts Receivable
Management regularly reviews accounts receivable and determines an appropriate estimate for the allowance fordoubtful accounts based upon the impact of economic conditions on the merchant's ability to pay, past collectionexperience and such other factors which, in management's judgment, deserve current recognition. In turn, a provisionis charged against earnings in order to maintain the allowance level.
S i n c l a i r B r o a d c a s t G r o u p28

ProgrammingWe have agreements with distributors for the rights to television programming over contract periods, which generally
run from one to seven years. Contract payments are made in installments over terms that are generally equal to or shorterthan the contract period. Each contract is recorded as an asset and a liability at an amount equal to its gross contractualcommitment when the license period begins and the program is available for its first showing. The portion of programcontracts which become payable within one year is reflected as a current liability in the accompanying consolidatedbalance sheets.
The rights to program materials are reflected in the accompanying consolidated balance sheets at the lower ofunamortized cost or estimated net realizable value. Estimated net realizable values are based upon management'sexpectation of future advertising revenues, net of sales commissions, to be generated by the program material.Amortization of program contract costs is generally computed using either a four year accelerated method or based onusage, whichever method yields the greater amortization for each program. Program contract costs, estimated bymanagement to be amortized in the succeeding year, are classified as current assets. Payments of program contractliabilities are typically paid on a scheduled basis and are not affected by adjustments for amortization or estimated netrealizable value.
Barter ArrangementsCertain program contracts provide for the exchange of advertising airtime in lieu of cash payments for the rights to
such programming. These contracts are recorded as the programs are aired at the estimated fair value of the advertisingairtime given in exchange for the program rights. Network programming is excluded from these calculations. Revenuesare recorded as revenues realized from station barter arrangements and the corresponding expenses are recorded toexpenses recognized from station barter arrangements.
We broadcast certain customers' advertising in exchange for equipment, merchandise and services. The estimated fairvalue of the equipment, merchandise or services received is recorded as deferred barter costs and the correspondingobligation to broadcast advertising is recorded as deferred barter revenues. The deferred barter costs are expensed orcapitalized as they are used, consumed or received and are included in the station production expenses and the stationselling, general and administrative expenses. Deferred barter revenues are recognized as the related advertising is airedand are recorded in revenues realized from station barter arrangements.
Other Assets
Other assets as of December 31, 2003 and 2002 consisted of the following (in thousands):
2 0 0 3 A n n u a l R e p o r t 29
Investments $ 40,594 $ 35,400
Deposits and other costs relating to future acquisitions 20,486 3,123
Unamortized costs relating to securities issuances 20,397 19,691
Fair value of derivative instruments 18,884 26,309
Other 6,388 6,596
$ 106,749 $ 91,119
2003 2002

Investments
We use the equity method of accounting for investments in which we have a 20% to 50% ownership interest or whenwe exercise significant influence over the operating and financial policies of the investee. For investments in which wehave less than a 20% interest and do not exercise significant influence over the operating and financial policies of theinvestee, we use the lower of cost or fair market value method of accounting.
As of December 31, 2002, we had a 35% ownership interest in Acrodyne Communications, Inc. (Acrodyne).Acrodyne designs, manufactures, and markets digital and analog television broadcast transmitters for domestic andinternational television stations, broadcasters, government agencies, not-for-profit organizations and educationalinstitutions. We accounted for our investment in Acrodyne under the equity method of accounting.
During 2001, we advanced and guaranteed loans to Acrodyne under various credit facilities which were fully reservedas of December 31, 2001. Accordingly, we incurred a loss of $4.2 million during 2001, which has also been reflected inthe accompanying consolidated statements of operations as loss related to investments.
On January 1, 2003, we forgave indebtedness owed to us by Acrodyne in the aggregate amount of $9.0 million inexchange for 20.3 million additional shares of Acrodyne common stock. The terms of the agreement also committed usto an additional investment of $1.0 million, which we funded on January 1, 2003. As a result of the agreement, we ownan 82.5% interest in Acrodyne and beginning January 1, 2003 we consolidated the financial statements of AcrodyneCommunications, Inc. and ceased accounting for the investment under the equity method of accounting.
In November 1999, we acquired an 82.5% equity interest in an entity that is now known as G1440 Holdings, Inc.,which has since grown to 89.6%. G1440 Holdings, Inc. and its subsidiaries (G1440) provide single source, end-to-ende-Business solutions and a number of services and products, including a homebuilder application, an immigrationtracking tool application, a syndicated television program management and scheduling application and a procurementapplication.
We own a 76.3% limited partnership interest in Allegiance Capital Limited Partnership (Allegiance). Allegiance is aprivate mezzanine venture capital fund, which invests in the subordinated debt and equity of privately held companies.The partnership is structured as a debenture Small Business Investment Company (SBIC) and is a federally licensedSBIC. Since we do not have significant control, but only significant influence, we account for our investment inAllegiance under the equity method of accounting.
On December 30, 2002, we invested $20 million in Summa Holdings, Ltd. (Summa), resulting in a 17.5% equityinterest. Summa is a holding company, which owns automobile dealerships and a leasing company. David D. Smith,our President and Chief Executive Officer, has a controlling interest in Summa and is on the Board of Directors. Wehave significant influence by holding a board seat (in addition to the board seat personally held by David D. Smith);therefore we account for this investment under the equity method of accounting.
We have other cost and equity investments in Internet related activities and venture capital companies. Managementdoes not believe these investments individually, or in the aggregate, are material to the accompanying consolidatedfinancial statements.
Impairment of Long-lived Assets
During June 2001, the San Francisco office of our Internet consulting and development subsidiary (G1440) wasreorganized. The office reduced staff due to a significant slow down of business activity in the San Francisco market. Inaddition, the focus of the San Francisco office has shifted toward marketing an existing product. As a result, managementdetermined that the San Francisco office's goodwill was permanently impaired and as such, recorded a write off ofgoodwill in the amount of $2.8 million during June 2001.
During 2001, we evaluated our long-lived assets for impairment under the provisions of SFAS No. 121, Accounting forthe Impairment of Long-Lived Assets and for Long-Lived Assets to be Disposed Of, which was superceded by SFAS No. 144
S i n c l a i r B r o a d c a s t G r o u p30

during 2002. Based on these evaluations, we determined that our station KBSI-TV in Paducah, Kentucky had animpairment to goodwill and in accordance with SFAS No. 144, recorded a charge to write off goodwill in the amountof $9.2 million during December 2001.
Under the provisions of SFAS No. 144, Accounting for the Impairment or Disposal of Long-Lived Assets, we evaluatedour long-lived assets for impairment and will continue to evaluate them as events or changes in circumstances indicatethat the carrying amount of such assets may not be fully recoverable. We evaluate the recoverability of long-lived assetsby measuring the carrying amount of the assets against the estimated undiscounted future cash flows associated withthem. At the time such evaluations indicate that the future undiscounted cash flows of certain long-lived assets are notsufficient to recover the carrying value of such assets, the assets are adjusted to their fair values. As of December 31,2003, management believes that the carrying amounts of the remainder of our tangible and definite-lived intangibleassets have not been impaired under SFAS No. 144.
During 2002, we wrote-off $0.8 million of fixed assets which represents the net book value of damaged, obsolete orabandoned property.
Accrued LiabilitiesAccrued liabilities consisted of the following as of December 31, 2003 and 2002 (in thousands):
Compensation $ 16,890 $ 17,383
Interest 23,859 21,457
Other accruals relating to operating expenses 29,860 25,325
$ 70,609 $ 64,165
Supplemental Information - Statements of Cash FlowsDuring 2003, 2002 and 2001, we incurred the following transactions (in thousands):
Capital leases obligations incurred $ 2,699 $ 29,526 $ 27,878
Income taxes paid from operations $ 2,128 $ 2,879 $ 3,593
Income taxes paid related to sale of discontinued operations $ 200 $ 111 $ 31,876
Income tax refunds received $ 40,643 $ 47,077 $ 2,405
Subsidiary trust minority interest payments $ 10,979 $ 23,250 $ 23,250
Interest paid $ 116,884 $ 119,669 $ 150,312
Payments related to extinguishment of debt $ 11,482 $ 2,411 $ 16,409
Stock issued to acquire broadcast licenses $ — $ 7,703 $ —
Non-cash barter and trade revenue and expense are presented in the consolidated statements of operations.
2 0 0 3 A n n u a l R e p o r t 31
2003 2002
2003 2002 2001

Local Marketing Agreements
We generally enter into local marketing agreements (LMA) and similar arrangements with stations located in marketsin which we already own and operate a station, and in connection with acquisitions, pending regulatory approval oftransfer of license assets. Under the terms of these agreements, we make specific periodic payments to the owner-operatorin exchange for the right to program and sell advertising on a specified portion of the station's inventory of broadcasttime. Nevertheless, as the holder of the FCC license, the owner-operator retains control and responsibility for theoperation of the station, including responsibility over all programming broadcast on the station.
Included in the accompanying consolidated statements of operations for the years ended December 31, 2003, 2002and 2001 are net revenues of $101.7 million, $111.6 million and $235.8 million, respectively, that relate to LMAs.
Outsourcing Agreements
We have entered into outsourcing agreements in which our stations provide or are provided various non-programmingrelated services such as sales, operational and managerial services to or by other stations.
Revenue Recognition
Advertising revenues, net of agency and national representatives' commissions, are recognized in the period duringwhich time spots are aired. Total revenues include: cash and barter advertising revenues, net of agency and nationalrepresentatives' commissions; network compensation; and other revenues.
Financial Instruments
Financial instruments as of December 31, 2003 and 2002 consist of cash and cash equivalents, trade accountsreceivable, notes receivable (which are included in other current assets), accounts payable, accrued liabilities and notespayable. The carrying amounts approximate fair value for each of these financial instruments except for the notespayable. See Note 4, Notes Payable and Commercial Bank Financing for determination of fair value of notes payable.
Recent Accounting Pronouncements
We adopted Statement of Financial Accounting Standard (SFAS) No. 145, Rescission of FASB Statements Nos. 4, 44 and64, Amendment of FASB Statement No. 13 and Technical Corrections on January 1, 2003. SFAS No. 145 requires us torecord gains and losses on extinguishment of debt as a component of income from continuing operations rather than asan extraordinary item and we have reclassified such items for all periods presented. There are other provisions containedin SFAS No. 145 that do not have a material effect on our financial statements. For the year ended December 31, 2002,net loss from continuing operations increased to $6.0 million from a net income of $3.9 million and the related loss pershare increased to $0.19 per share from a loss of $0.08 per share after we reclassified our extraordinary item. For the yearended December 31, 2001, net loss from continuing operations increased to $127.7 million from $113.5 million andthe related loss per share increased to $1.64 per share from $1.47 per share after we reclassified our extraordinary item.
In January 2003, the Financial Accounting Standards Board (FASB) issued Interpretation No. 46, Consolidation ofVariable Interest Entities, an Interpretation of Accounting Research Bulletin (ARB) No. 51 (FIN 46). FIN 46 introduces thevariable interest consolidation model, which determines control and consolidation based on potential variability in gainsand losses of the entity being evaluated for consolidation. The FASB delayed the effective date of FIN 46 for certainvariable interest entities until the first interim period ending after December 15, 2003. We are currently assessingvarious transactions to determine whether they could be considered a variable interest entity (VIE) and whether wewould be the primary beneficiary under the amended guidance of FIN 46.
S i n c l a i r B r o a d c a s t G r o u p32

We have determined that the unrelated third-party owner of WNAB-TV in Nashville may be a VIE and that we maybe the primary beneficiary of the variable interests as a result of the terms of our outsourcing agreement, put options andcall options. As a result, we may be required to consolidate the assets and liabilities of WNAB-TV at their fair marketvalues as of March 31, 2004 and we are currently assessing the impact of consolidating WNAB-TV on our results ofoperations. We have not completed our analysis at this time. We made payments to the unrelated third party owner ofWNAB-TV of $2.3 million and $2.8 million related to our outsourcing agreement for the twelve months endedDecember 31, 2003 and December 31, 2002, respectively. On January 2, 2003, we made an $18.0 million non-refundable deposit against the purchase price of the put or call option on the non-license assets. We believe that ourmaximum exposure to loss as a result of our involvement with WNAB-TV consists of the fees that we pay related to theoutsourcing agreement as well as any payments that we would be required to make under the put options held by thecurrent owner related to the license and non-license assets. (See Note 9, Commitments and Contingencies, WNAB Options).
We have determined that Cunningham Broadcasting Corporation (Cunningham) is a VIE and that we are the primarybeneficiary of the variable interests. We already consolidate Cunningham; therefore, the implementation of FIN 46 willnot have a material effect on our financial statements with respect to our variable interest in Cunningham. We madeLMA payments to Cunningham of $4.7 million, $4.0 million and $11.8 million for the years ended December 31,2003, 2002 and 2001, respectively. We received payments from Cunningham of $0.5 million and $0.2 million for theyears ended December 31, 2003 and 2002, respectively. The creditors of Cunningham have no recourse with respect tous. We believe that our maximum exposure to loss as a result of our involvement with Cunningham consists of the feesthat we pay related to the LMA agreements as well as payments that we would make as a result of exercising our optionto acquire Cunningham, which provides for an option exercise price based on a formula that provides a 10% annualreturn to Cunningham. (See Note 9, Commitments and Contingencies).
We are currently evaluating the applicability of FIN 46 on our LMAs and outsourcing agreements and the possibleimpact on our results of operations and financial position. We are currently reviewing these agreements to determine ifthe licensor represents a variable interest entity to us. We believe the exposure to loss because of our involvement withthe license holder for each station is minimal and can be measured by the incremental depreciation expense from theaddition of the fixed assets of the license holder.
In January 2003, the Emerging Issues Task Force (EITF) issued EITF 00-21, Accounting for Revenue Arrangements withMultiple Deliverables. EITF 00-21 addresses the determination of whether an arrangement involving multipledeliverables contains more than one unit of accounting and how arrangement consideration should be measured andallocated to the separate units of accounting in the arrangement. EITF 00-21 does not otherwise change the applicablerevenue recognition criteria. We adopted issue 00-21 on July 1, 2003 and have determined that our direct mailagreements constitute revenue arrangements with multiple deliverables that contain more than one unit of accounting.Consequently, we allocate the consideration that we receive for certain of these agreements between television accountingunits and direct mail accounting units and we recognize the revenue and related expenses when the television spots areaired and when the direct mail pieces are mailed, respectively.
Reclassifications
Certain reclassifications have been made to the prior years' financial statements to conform to the current year presentation.
Pro-Forma Information Related To Stock-Based Compensation
As permitted under SFAS No. 123, Accounting for Stock-Based Compensation, we measure compensation expense forour stock-based employee compensation plans using the intrinsic value method prescribed by Accounting PrinciplesBoard Option No. 25, Accounting for Stock Issued to Employees and provide pro-forma disclosures of net income andearnings per share as if the fair value-based method prescribed by SFAS No. 123 had been applied in measuringcompensation expense.
2 0 0 3 A n n u a l R e p o r t 33

S i n c l a i r B r o a d c a s t G r o u p34
Had compensation cost for our 2003, 2002 and 2001 grants for stock-based compensation plans been determinedconsistent with SFAS No. 123, our net income (loss) available to common shareholders for these years wouldapproximate the pro-forma amounts below (in thousands, except per share data):
We have computed for pro-forma disclosure purposes the value of all options granted during 2003, 2002 and 2001using the Black-Scholes option pricing model as prescribed by SFAS No. 123 using the following weighted averageassumptions:
Adjustments are made for options forfeited prior to vesting.
2. PROPERTY AND EQUIPMENT:
Property and equipment are stated at cost, less accumulated depreciation. Depreciation is computed under thestraight-line method over the following estimated useful lives:
Property and equipment consisted of the following as of December 31, 2003 and 2002 (in thousands):
Buildings and improvements 10 - 35 years
Station equipment 5 - 10 years
Office furniture and equipment 5 - 10 years
Leasehold improvements 10 - 31 years
Automotive equipment 3 - 5 years
Property and equipment under capital leases Lease term
Land and improvements $ 17,150. $ 17,077.
Buildings and improvements 106,944. 108,661.
Station equipment 359,554. 306,786.
Office furniture and equipment 43,715. 37,340.
Leasehold improvements 12,437. 10,615.
Automotive equipment 10,900. 9,802.
Construction in progress 30,234. 33,465.
580,934. 523,746.
Less - Accumulated depreciation (225,117) (186,496)
$ 355,817. $ 337,250.
2003 2002
Risk-free interest rate 3.00% 4.24% 4.68%
Expected lives 5 years 5 years 6 years
Expected volatility 48% 55% 59%
Weighted average fair value $ 4.63 $ 6.34 $ 4.96
2003 2002 2001For the Years Ended December 31,
Net income (loss) available to common shareholders $ 14,042 $ 6,344 $(574,844) $ (581,955) $ (138,072) $ (140,988)
Basic earnings (loss) per share $ 0.16 $ 0.07 $ (6.74) $ (6.82) $ (1.64) $ (1.67)
Diluted earnings (loss) per share $ 0.16 $ 0.07 $ (6.74) $ (6.82) $ (1.64) $ (1.67)
2003 2002 2001As Reported Pro-Forma As Reported Pro-Forma As Reported Pro-Forma
For the Years Ended December 31,

2 0 0 3 A n n u a l R e p o r t 35
3. GOODWILL AND OTHER INTANGIBLE ASSETS:
In June 2001, the Financial Accounting Standards Board (FASB) approved Statement of Financial AccountingStandard (SFAS) No. 141, Business Combinations and SFAS No. 142, Goodwill and Other Intangible Assets. SFAS No.141 prospectively prohibits the pooling of interest method of accounting for business combinations initiated after June30, 2001. SFAS No. 142 requires companies to cease amortizing goodwill and certain other intangible assets includingbroadcast licenses. Effective January 1, 2002, SFAS No. 142 also establishes a new method of testing goodwill andbroadcast licenses for impairment on an annual basis or on an interim basis if an event occurs or circumstances changethat would reduce the fair value of a reporting unit below its carrying value. The adoption of SFAS No. 142 resulted indiscontinuation of amortization of our goodwill and broadcast licenses commencing January 1, 2002; however, we wererequired to test goodwill and broadcast licenses for impairment under the new standard during 2002.
During the three months ended March 31, 2002, we tested our broadcast licenses for impairment in accordance withSFAS No. 142 based on the estimated fair value of such licenses in their respective markets. We estimated the fair valuesof our broadcast licenses using discounted cash flow models. The estimated fair value was compared to the book valueto determine whether any impairment had occurred. As a result of this analysis, we recorded a pretax impairment chargeof $64.0 million.
SFAS No. 142 requires that goodwill be tested for impairment at the reporting unit level at adoption and at leastannually thereafter, utilizing a two-step methodology. The initial step required us to determine the fair value of eachreporting unit and compare it to the carrying value, including goodwill, of such unit. If the fair value exceeded thecarrying value, no impairment loss was recognized. However, if the carrying value of the reporting unit exceeded its fairvalue, the goodwill of this unit might have been impaired. The amount, if any, of the impairment would then bemeasured in the second step. The second step requires us to calculate the fair value of goodwill by allocating the fairvalue of the reporting unit to each of the assets and liabilities of the reporting unit based on their fair values. Thiscalculated goodwill is then compared to the book value of the goodwill and an impairment loss is recognized to the extentthat the book value exceeds the fair value.
We determined that our designated marketing areas (DMAs) were reporting units under SFAS No. 142. In connectionwith adopting this standard during 2002, we completed step one of the test for impairment by comparing the book valueof our reporting units, including goodwill, to the estimated fair value of our reporting units as of January 1, 2002. Weestimated the fair value of our reporting units using a combination of quoted market prices, observed earnings multiplespaid for comparable television stations and discounted cash flow models.
We performed the second step of the goodwill impairment test for those DMAs whose goodwill was found to bepotentially impaired as a result of the first step. We performed the second step by allocating the estimated fair value ofthe reporting unit to each of the assets and liabilities of the reporting unit based on their estimated fair values. Weestimated the fair values of the assets and liabilities using a combination of observed prices paid for similar assets andliabilities, discounted cash flow models and appraisals.
As a result of such testing, we recorded a pre-tax impairment charge of $532.8 million related to nine of our DMAsand our software development and consulting company during 2002. The total impairment charge of $596.8 millionrelated to our broadcast licenses and goodwill is reflected as a cumulative effect of a change in accounting principle onour consolidated statement of operations for the twelve months ended December 31, 2002, before the related tax benefitof $30.4 million.
SFAS No. 142 requires goodwill and definite lived intangible assets to be tested for impairment on an annual basis;therefore, we tested these assets for impairment as of October 1, 2002 and 2003 by comparing their book values to theirestimated fair values. There was no impairment charge recorded based on the results of such testing.

The following table shows the effect on net income (loss) available to common shareholders and earnings (loss) pershare, had we adopted SFAS No. 142 on January 1, 2001 (in thousands, except per share data):
The following table shows the effect on net income (loss) from continuing operations and earnings (loss) fromcontinuing operations per share had we adopted SFAS No. 142 on January 1, 2001 (in thousands, except per share data):
S i n c l a i r B r o a d c a s t G r o u p36
Reported net income (loss) available to common shareholders $ 14,042 $ (574,844) $ (138,072)
Add: goodwill amortization — — 56,501.
Add: broadcast license amortization — — 15,133.
Adjusted net income (loss) available to common shareholders $ 14,042 $ (574,844) $ (66,438)
Basic and diluted earnings (loss) per share:
Reported earnings (loss) available to common shareholders $ 0.16 $ (6.74) $ (1.64)
Goodwill amortization — — 0.67.
Broadcast license amortization — — 0.18.
Adjusted earnings (loss) available to common shareholders $ 0.16 $ (6.74) $ (0.79)
2003 2002 2001For the Years Ended December 31,
Reported net income (loss) from continuing operations $ 22,751 $ (5,981) $ (127,670)
Add: goodwill amortization — — 55,049.
Add: broadcast license amortization — — 14,353.
Adjusted net income (loss) from continuing operations $ 22,751 $ (5,981) $ (58,268)
Basic earnings (loss) per share:
Reported earnings (loss) from continuing operations $ 0.14 $ (0.19) $ (1.64)
Goodwill amortization — — 0.65.
Broadcast license amortization — — 0.17.
Adjusted earnings (loss) from continuing operations $ 0.14 $ (0.19) $ (0.82)
Diluted earnings (loss) per share:
Reported earnings (loss) from continuing operations $ 0.14 $ (0.19) $ (1.64)
Goodwill amortization — — 0.65.
Broadcast license amortization — — 0.17.
Adjusted earnings (loss) from continuing operations $ 0.14 $ (0.19) $ (0.82)
2003 2002 2001For the Years Ended December 31,

Definite-lived intangible assets and other assets subject to amortization are being amortized on a straight-line basis overperiods of 5 to 25 years. These amounts result from the acquisition of certain television station non-license assets. Thefollowing table shows the gross carrying amount and accumulated amortization of intangibles and estimatedamortization (in thousands):
The amortization expense of the definite-lived intangible assets and other assets for the years ended December 31,2003 and 2002 was $19.3 million and $19.5 million, respectively. The following table shows the estimated amortizationexpense of the definite-lived intangible assets and other assets for the next five years.
For the year ended December 31, 2004 $ 19,027
For the year ended December 31, 2005 18,328
For the year ended December 31, 2006 18,080
For the year ended December 31, 2007 18,078
For the year ended December 31, 2008 18,078
The change in the carrying amount of goodwill for the twelve months ended December 31, 2003 is as follows:
Balance as of January 1, 2003 $ 1,123,403
Reversal of prior year acquisitions' tax
contingencies and other (4,869)
Balance as of December 31, 2003 $ 1,118,534
During 2003, tax contingencies recorded in connection with the purchase accounting for prior year acquisitions werereversed because those contingencies were either settled or eliminated.
4. NOTES PAYABLE AND COMMERCIAL BANK FINACING:
1998 Bank Credit Agreement
On May 16, 2001, we closed on an amendment and restatement of the 1998 Bank Credit Agreement (the Amendedand Restated Bank Credit Agreement) allowing us more operating capacity and liquidity. The Amended and RestatedBank Credit Agreement reduced the aggregate borrowing capacity from $1.6 billion to $1.1 billion. We repaid theunamortized outstanding balance of the $750.0 million Term Loan Facility with the proceeds from the Amended andRestated Bank Credit Agreement. The Amended and Restated Bank Credit Agreement consisted of a $600 millionRevolving Credit Facility and a $500 million Incremental Term Loan Facility repayable in consecutive quarterlyinstallments, amortizing 1% per year, commencing March 31, 2003 and continuing through its maturity on September30, 2009.
The applicable interest rate for the Revolving Credit Facility was either LIBOR plus 1.25% to 3% or the alternative
2 0 0 3 A n n u a l R e p o r t 37
Amortized intangible assets:
Network affiliation 15-25 years $ 244,288 $ (58,662) $ 244,288 $ (48,856)
Decaying advertiser base 15 years 119,264 (60,590) 119,264 (53,337)
Other 5-25 years 26,932 (13,649) 26,932 (12,569)
Total $ 390,484 $ (132,901) $ 390,484 $ (114,762)
Unamortized intangible assets:
Broadcast licenses $ 504,212 $ (74,705) $ 504,212 $ (74,705)
Goodwill 1,423,742 (305,208) 1,428,611 (305,208)
Total $ 1,927,954 $ (379,913) $ 1,932,823 $ (379,913)
AmortizationPeriod
Gross CarryingAmount
AccumulatedAmortization
Gross CarryingAmount
AccumulatedAmortization
2003 2002For the Years Ended December 31,

base rate plus zero to 1.75%. The applicable interest rate for the Revolving Credit Facility was adjusted based on theratio of total debt to four quarters' trailing earnings before interest, taxes, depreciation and amortization. The applicableinterest rate on the Incremental Term Loan Facility was LIBOR plus 3.50% or the alternative base rate plus 2.25%through maturity.
As a result of amending our 1998 Bank Credit Agreement, we incurred debt acquisition costs of $8.5 million andrecognized a loss of $4.7 million, net of a tax benefit of $2.6 million. The loss represents the write off of certain debtacquisition costs associated with indebtedness replaced by the new facility. The loss was computed based on the guidanceof EITF No. 96-19 Debtor's Accounting for a Modification or Exchange of Debt Instrument and EITF No. 98-14 Debtor'sAccounting for changes in Line of Credit or Revolving Debt Arrangements.
On October 30, 2001, we closed on a short-term amendment of our 1998 Bank Credit Agreement, as amended andrestated in May 2001. The amendment, which was effective through September 30, 2002, provided for relaxed leverageand interest coverage ratios and increased the interest rate by 50 basis points during the amendment period. As a resultof the amendment, our interest rate on the Revolving Credit Facility and Incremental Term Loan Facility was LIBORplus 3.5% and LIBOR plus 4.00%, respectively. We incurred $3.4 million of debt acquisition costs as a result ofamending our 1998 Bank Credit Agreement. These costs were capitalized in accordance with EITF No. 96-19 and EITFNo. 98-14 and were amortized to interest expense over the remaining life of the debt.
The weighted average interest rates for outstanding indebtedness relating to the Amended and Restated Bank CreditAgreement during 2001 and as of December 31, 2001 were 6.57% and 5.85%, respectively. Interest expense relating tothe 1998 Bank Credit Agreement was $61.1 million for year ended December 31, 2001. The 1998 Bank CreditAgreement was paid off on July 15, 2002 with the proceeds from the 2002 Bank Credit Agreement.
2002 Bank Credit AgreementOn July 15, 2002, we closed on a new Bank Credit Agreement (the 2002 Bank Credit Agreement), allowing us more
operating capacity and liquidity. The proceeds of the 2002 Bank Credit Agreement were used to pay off the 1998 BankCredit Agreement. The 2002 Bank Credit Agreement consists of a $225.0 million Revolving Credit Facility maturingon June 30, 2008 and a $375.0 million Term Loan B Facility repayable in consecutive quarterly installments, amortizing0.25% per quarter, commencing June 30, 2004 and continuing through its maturity on December 31, 2009. As ofDecember 31, 2003, no amounts were outstanding under the Revolving Credit Facility. Additionally, we are requiredto pay a 0.5% annual commitment fee on the unused credit facility.
The applicable interest rate on the Revolving Credit Facility is either LIBOR plus 1.25% to 2.25% or the alternativebase rate plus 0.25% to 1.25%, adjusted quarterly based on the ratio of total debt, net of cash, to four quarters' trailingearnings before interest, taxes, depreciation and amortization, as adjusted in accordance with the 2002 Bank CreditAgreement. The applicable interest rate on the Term Loan B Facility is either LIBOR plus 2.25% or the alternative baserate plus 1.25%.
Availability under the Revolving Credit Facility does not reduce incrementally and terminates at maturity. We arerequired to prepay the Term Loan Facility and reduce the Revolving Credit Facility with: 100% of the net proceeds ofany casualty loss or condemnation; and 100% of the net proceeds of any sale or other disposition of our assets in excessof $100 million in the aggregate for any fiscal year, to the extent not used to acquire new assets. The 2002 Bank CreditAgreement contains representations and warranties, and affirmative and negative covenants, including among otherrestrictions, limitations on additional indebtedness, customary for credit facilities of this type.
As a result of closing on the 2002 Bank Credit Agreement, we incurred debt acquisition costs of $3.2 million andrecognized a loss of $4.2 million, net of tax benefit of $2.4 million. The loss represents the write off of certain debtacquisition costs associated with indebtedness replaced by the new facility. The loss was computed based on the guidanceof EITF No. 96-19 and EITF No. 98-14.
On December 31, 2002 we closed on an additional $125 million Term Loan Facility repayable in consecutive quarterly
S i n c l a i r B r o a d c a s t G r o u p38

installments, amortizing 0.25% per quarter, commencing June 30, 2004 continuing through its maturity on December31, 2009. The proceeds from this additional borrowing, together with $125 million added on to our $300 million 8%Senior Subordinated Notes due 2012 and cash on hand was used to redeem our 8.75% Senior Subordinated Notes due2007.
The weighted average interest rates of the 2002 Bank Credit Agreement during 2003 and as of December 31, 2003were 3.64% and 3.41%, respectively. During 2003 and 2002, the interest expense relating to the Bank CreditAgreements was $18.0 million and $27.9 million, respectively.
8.75% Senior Subordinated Notes Due 2007 and 2002 Tender OfferIn December 1997, we completed an issuance of $250 million aggregate principal amount of 8.75% Senior
Subordinated Notes due 2007 (8.75% Notes) pursuant to a shelf registration statement and we received net proceeds of$242.8 million. Of the net proceeds from the issuance, $106.2 million was utilized to tender our 1993 Notes with theremainder retained for general corporate purposes. Interest on the 8.75% Notes was payable semiannually on June 15and December 15 of each year. Interest expense was $20.2 million for the year ended December 31, 2002 and $21.9million for the year ended December 31, 2001. The 8.75% Notes were issued under an Indenture among us, oursubsidiaries (the guarantors) and the trustee. Costs associated with the offering totaled $5.8 million, including anunderwriting discount of $5.0 million. These costs were capitalized and were being amortized over the life of the debt.
During December 2002, we completed a tender offer of $213.0 million aggregate principal amount of the 8.75%Notes (2002 Tender Offer). Total consideration per $1,000 principal amount note tendered was $1,043.74 resulting intotal consideration paid to consummate the Tender Offer of $223.2 million. Also in December 2002, we redeemed theremaining 8.75% Notes for total consideration of $39.0 million. The Tender Offer and redemption were fundedthrough the issuance of a $125 million add-on to our existing 8.0% $300 million Senior Subordinated Notes due 2012,a $125 million additional funding on our Term Loan B Facility, a draw down on our revolving line of credit of $7.0million and cash on hand for a total consideration paid of $262.2 million. We recognized a loss of $2.5 million, net oftax benefit of $1.4 million, representing a write off of the previous debt acquisition costs of $3.2 million andconsideration of $0.7 million.
9% Senior Subordinated Notes Due 2007In July 1997, we completed an issuance of $200 million aggregate principal amount of 9% Senior Subordinated Notes
due 2007 (9% Notes). We utilized $162.5 million of the approximately $195.6 million net proceeds of the issuance torepay outstanding revolving credit indebtedness and utilized the remainder to fund acquisitions. Interest on the 9%Notes was payable semiannually on January 15 and July 15 of each year, commencing January 15, 1998. Interest expensewas $16.2 million and $18.0 million for the years ended December 31, 2002 and 2001, respectively. The 9% Noteswere issued under an Indenture among us, our subsidiaries (the guarantors) and the trustee. Costs associated with theoffering totaled $4.8 million, including an underwriting discount of $4.0 million. These costs were capitalized and werebeing amortized over the life of the debt.
On November 8, 2002, the 9% Notes were redeemed for an aggregate principal amount of $200 million. Theredemption occurred through the issuance of a $125 million add-on to our 8% $300 million Senior Subordinated Notesdue 2012 and available cash on hand for total consideration of $218.5 million including accrued interest of $7.2 million.We recognized a loss of $2.4 million, net of deferred taxes of $1.3 million, representing a write off of the previous debtacquisition costs of $2.3 million and consideration of $1.4 million.
10% Senior Subordinated Notes Due 2005
In August 1995, we completed an issuance of $300 million aggregate principal amount of 10% Senior SubordinatedNotes (the "1995 Notes"), due 2005. We received net proceeds of $293.2 million. The net proceeds of this offeringwere utilized to repay outstanding indebtedness under the then existing Bank Credit Agreement of $201.8 million with
2 0 0 3 A n n u a l R e p o r t 39

the remainder being retained and eventually utilized to make payments related to certain acquisitions consummatedduring 1996. Interest on the 1995 Notes was payable semiannually on March 30 and September 30 of each year.Interest expense was $28.3 million for the year ended December 31, 2001. The 1995 Notes were issued under anindenture among us, our subsidiaries (the guarantors) and the trustee. Costs associated with the offering totaled $6.8million, including an underwriting discount of $6.0 million. These costs were capitalized and were being amortized overthe life of the debt.
In December 2001, we redeemed the $300 million aggregate principal amount of the 1995 Notes for a totalconsideration of $318.3 million, including accrued interest of $6.1 million. We recognized a loss of $9.5 million, netof a tax benefit of $5.2 million. The loss represented a write off of the previous debt acquisition costs of $2.5 millionand consideration of $12.2 million.
8.75% Senior Subordinated Notes Due 2011In December 2001, we completed an issuance of $310 million aggregate principal amount of 8.75% Senior
Subordinated Notes (the 2001 Notes), due 2011. We received net proceeds of $306.2 million. The net proceeds of thisoffering were utilized to repay the 1995 Notes. Interest on the 2001 Notes is payable semiannually on June 15 andDecember 15 of each year. Interest expense was $27.0 million for each of the years ended December 31, 2003 and 2002.The 2001 Notes were issued under an indenture among us, our subsidiaries (the guarantors) and the trustee. Costsassociated with the offering totaled $4.1 million, including an underwriting discount of $3.8 million. These costs werecapitalized and are being amortized over the life of the debt. Based on the quoted market price, the fair value of the 2001Notes as of December 31, 2003 and 2002 was $331.9 million and $335.1 million, respectively.
8% Senior Subordinated Notes Due 2012In March 2002, we completed an issuance of $300.0 million aggregate principal amount of 8% Senior Subordinated
Notes (the 2002 Notes), due 2012, generating gross proceeds to us of $300.0 million. The gross proceeds of this offeringwere utilized to repay $300.0 million of the Term Loan Facility. We recognized a loss of $0.7 million, net of a tax benefitof $0.4 million. The loss represented the write off of certain debt acquisition costs associated with indebtedness replacedby the 2002 Notes. Interest on the 2002 Notes is payable semiannually on March 15 and September 15 of each year,beginning September 15, 2002. Interest expense was $23.9 million and $19.2 million for the years ended December31, 2003 and 2002, respectively. The 2002 Notes were issued under an indenture among us, certain of our subsidiaries(the guarantors) and the trustee. Net costs associated with the offering totaled $3.4 million. These costs were capitalizedand are being amortized to interest expense over the term of the 2002 Notes.
On November 8, 2002, we completed an issuance of $125.0 million aggregate principal amount of 8% SeniorSubordinated Notes due 2012 at a price of 100.5% of par, plus accrued interest from September 15, 2002 to November7, 2002. Interest expense was $10.0 million and $1.4 million for the years ended December 31, 2003 and 2002,respectively. After deducting discount and commission and estimated expenses of the offering of $1.9 million, wereceived approximately $125.8 million from the sale of the notes. We used the net proceeds together with available cashon hand and a draw down of $10.0 million on the revolving line of credit under the 2002 Bank Credit Agreement, toredeem our existing 9% Senior Subordinated Notes including an early redemption premium of $9.0 million and accruedinterest of $7.2 million. Net costs associated with the offering totaled $1.6 million. These costs were capitalized and arebeing amortized to interest expense over the term of the 2002 Notes.
On December 31, 2002, we completed an add-on issuance of $125.0 million aggregate principle amount of 8% SeniorSubordinated Notes due 2012 at a premium of $3.8 million. Interest expense was $10.0 million for the year endedDecember 31, 2003. We received net proceeds of approximately $130.4 million from the sale of the notes. We usedthe net proceeds together with additional funding from our term loan of $125 million, a draw down of $7.0 million onthe revolving line of credit under the 2002 Bank Credit Agreement and available cash on hand of $0.2 million, to redeemour existing 8.75% Senior Subordinated Notes due 2007, including an early redemption premium of $10.9 million. Net
S i n c l a i r B r o a d c a s t G r o u p40

costs associated with the offering totaled $1.7 million. Of these costs, $1.3 million were capitalized and are beingamortized to interest expense over the term of the 2002 Notes.
On May 29, 2003, we completed an add-on issuance of $100.0 million aggregate principal amount of 8% SeniorSubordinated Notes, which was an add-on issuance under the indenture relating to our 8% Senior Subordinated Notesdue 2012. Interest expense for the year ended December 31, 2003 was $4.7 million. The Notes were issued at a priceof $105.3359 plus accrued interest from March 15, 2003 to May 28, 2003, yielding a rate of 7.00%. We used the netproceeds, along with the net proceeds received in connection with our issuance of $150.0 million of Convertible SeniorSubordinated Notes due 2018, to finance the redemption of the 11.625% High Yield Trust Originated PreferredSecurities due 2009 and for general corporate purposes. Net costs associated with the offering totaled $1.3 million.These costs were capitalized and are being amortized to interest expense over the term of the Senior Subordinated Notes.
Based on the quoted market price, the fair market value of the 8% Senior Subordinated Notes due 2012 was $671.3million at December 31, 2003 and $572.2 million at December 31, 2002.
4.875% Convertible Senior Subordinated Notes Due 2012
During May 2003, we completed a private placement of $150.0 million aggregate principal amount of 4.875%Convertible Senior Subordinated Notes due 2018 (Convertible Notes). The Convertible Notes were issued at par,mature on July 15, 2018, and have the following characteristics:
• The notes are convertible into shares of our class A common stock at the option of the holder uponcertain circumstances. The conversion price is $22.37 until March 31, 2011 at which time theconversion price increases quarterly until reaching $28.07 on July 15, 2018.
• The notes may be put to us at par on January 15, 2011 or called thereafter by us.
• The notes bear cash interest at an annual rate of 4.875% until January 15, 2011 and bear cash interestat an annual rate of 2.00% from January 15, 2011 through maturity. Interest expense was $4.5million for the year ended December 31, 2003.
• The principal amount of the notes will accrete to 125.66% of the original par amount from January15, 2011 to maturity so that when combined with the cash interest, the yield to maturity of the noteswill be 4.875% per year.
• Under certain circumstances, we will pay contingent cash interest to the holders of the ConvertibleNotes during any six month period from January 15 to July 14 and from July 15 to January 14,commencing with the six month period beginning January 15, 2011. This contingent interest featureis an embedded derivative which had a negligible fair value as of December 31, 2003.
We used the net proceeds, along with the net proceeds from the issuance on May 29, 2003 of $100.0 million of 8%Senior Subordinated Notes due 2012, to finance the redemption of the 11.625% High Yield Trust Originated PreferredSecurities due 2009, to repay debt outstanding under our bank credit agreement and for general corporate purposes. Netcosts associated with the offering totaled $4.6 million. These costs were capitalized and are being amortized as interestexpense over the term of the Convertible Notes.
Based on the quoted market price, the fair market value of the 4.875% Convertible Senior Subordinated Notes Due2012 was $162.2 million at December 31, 2003.
2 0 0 3 A n n u a l R e p o r t 41

Summary
Notes payable, capital leases and the 2002 Bank Credit Agreement consisted of the following as of December 31, 2003and 2002 (in thousands):
Indebtedness under the notes payable, capital leases and 2002 Bank Credit Agreement as of December 31, 2003mature as follows (in thousands):
Substantially all of our stock in our wholly owned subsidiaries has been pledged as security for notes payable andcommercial bank financing.
As of December 31, 2003, we had 26 capital leases with non-affiliates, including 24 tower leases, one building lease anda computer hardware lease. All of our tower leases will expire within the next 30 years, the building leases will expire withinthe next 12 years and our computer hardware lease will expire within the next year. Most of our leases have a 5-10 yearrenewal option and it is expected that these leases will be renewed or replaced within the normal course of business.
S i n c l a i r B r o a d c a s t G r o u p42
Bank Credit Agreement, Term Loan $ 485,900. $ 500,000.
Bank Credit Agreement, Revolving Credit Facility — 52,000.
8.75% Senior Subordinated Notes, due 2011 310,000. 310,000.
Note payable of consolidated entity (Cunningham) 35,000. 35,000.
8% Senior Subordinated Notes, due 2012 650,000. 550,000.
4.875% Convertible Senior Subordinated Notes due 2012 150,000. —
Capital leases 46,799. 43,763.
Installment note for certain real estate interest at 8.0% 51. 61.
1,677,750. 1,490,824.
Plus: Premium on 8% Senior Subordinated Notes, due 2012 8,873. 4,375.
Plus: SFAS No. 133 derivatives, net 16,897. 23,783.
Less: Current portion (38,986) (292)
$ 1,664,534. $ 1,518,690.
2003 2002For the Years Ended December 31,
2004 $ 38,750 $ 4,326. $ 43,076.
2005 5,000 4,425. 9,425.
2006 5,000 4,519. 9,519.
2007 5,000 4,612. 9,612.
2008 5,000 4,689. 9,689.
2009 and thereafter 1,572,150 102,179. 1,674,329.
Total minimum payments 1,630,900 124,750. 1,755,650.
Plus: SFAS No. 133 derivatives, net 16,897 — 16,897.
Plus: Premium on 8% Senior Subordinated Notes due 2012 8,873 — 8,873.
Less: Amount representing interest — (77,900) (77,900)
$ 1,656,670 $ 46,850. $ 1,703,520.
Notes and 2002Bank CreditAgreement Capital Leases Total

5. PROGRAM CONTRACTS PAYABLE:
Future payments required under program contracts payable as of December 31, 2003 were as follows (in thousands):
Included in the current portion amounts are payments due in arrears of $27.4 million. In addition, we have enteredinto non-cancelable commitments for future program rights aggregating $120.5 million as of December 31, 2003.
We perform a net realizable value calculation for each of our non-cancelable commitments in accordance with SFASNo. 63, Financial Reporting by Broadcasters. We utilize sales information to estimate the future revenue of eachcommitment and measure that amount against the amount of the commitment. If the estimated future revenue is lessthan the amount of the commitment, a loss is recorded.
We have estimated the fair value of our program contract payables and non-cancelable commitments at approximately$204.9 million and $108.8 million, respectively, as of December 31, 2003, and $233.6 million and $53.6 million,respectively, as of December 31, 2002. These estimates were based on future cash payments discounted at our currentborrowing rate.
6. COMPANY OBLIGATED MANDATORILY REDEEMABLE PREFERRED SECURITIES OFSUBSIDIARY TRUST, COMMON STOCK, AND PREFERRED STOCK:
1997 Offering of Company Obligated Mandatorily Redeemable Preferred Securities of Subsidiary Trust
In March 1997, we completed a private placement of $200 million aggregate liquidation value of 11.625% High YieldTrust Offered Preferred Securities (HYTOPS) of our subsidiary trust, Sinclair Capital. The HYTOPS were issued March12, 1997, mature March 15, 2009, and provided for quarterly distributions to be paid in arrears beginning June 15,1997. The HYTOPS were sold to "qualified institutional buyers" (as defined in Rule 144A under the Securities Act of1933, as amended) and a limited number of institutional "accredited investors" and the offering was exempt fromregistration under the Securities Act of 1933, as amended (the Securities Act), pursuant to Section 4(2) of the SecuritiesAct and Rule 144A thereunder. We utilized $135.0 million of the approximately $192.8 million net proceeds of theprivate placement to repay outstanding debt and retained the remainder for general corporate purposes.
Pursuant to a Registration Rights Agreement entered into in connection with the private placement of the HYTOPS,we offered holders of the HYTOPS the right to exchange the HYTOPS for new HYTOPS having the same terms as theexisting securities, except that the exchange of the new HYTOPS for the existing HYTOPS has been registered underthe Securities Act. On May 2, 1997, we filed a registration statement on Form S-4 with the Commission for the purposeof registering the new HYTOPS to be offered in exchange for our aforementioned existing HYTOPS issued in March1997 (the Exchange Offer). The Exchange Offer was closed and became effective August 11, 1997, at which time all ofthe existing HYTOPS were exchanged for new HYTOPS. Annual preferred dividends, payable to the holders ofHYTOPS, are recorded as "Subsidiary trust minority interest expense" in the accompanying financial statements andwere $11.0 million, $23.3 million and $23.3 million for the three years ended December 31, 2003, 2002 and 2001.
On June 20, 2003, we redeemed the $200.0 million aggregate principal amount of the 11.625% HYTOPS. Theredemption occurred through the issuance on May 29, 2003 of the 8% Senior Subordinated Notes due 2012 and the
2 0 0 3 A n n u a l R e p o r t 43
2004 $ 120,873.
2005 57,645.
2006 27,141.
2007 7,385.
2008 128.
Total 213,172.
Less: Current portion (120,873)
Long-term portion of program contracts payable $ 92,299.

Convertible Notes. We recognized a loss on debt extinguishment of $15.2 million consisting of a $9.3 million callpremium, a write off of the previous deferred financing costs of $3.7 million and other fees of $2.2 million.
Common Stock
Holders of Class A Common Stock are entitled to one vote per share and holders of Class B Common Stock areentitled to ten votes per share except for votes relating to "going private" and certain other transactions. The Class ACommon Stock and the Class B Common Stock vote altogether as a single Class except as otherwise may be requiredby Maryland law on all matters presented for a vote. Holders of Class B Common Stock may at any time convert theirshares into the same number of shares of Class A Common Stock.
Preferred Stock
During 1997, we completed a public offering of 3,450,000 shares of Series D Convertible Exchangeable PreferredStock (the 1997 Preferred Stock Offering). The Convertible Exchangeable Preferred Stock has a liquidation preferenceof $50 per share and a stated annual cumulative dividend of $3.00 per share, payable quarterly out of legally availablefunds and are convertible into shares of Class A Common Stock at the option of the holders thereof at a conversion priceof $22.813 per share, subject to adjustment. The Convertible Exchangeable Preferred Stock is convertible into7,561,644 shares of Class A common stock, all of which we have reserved for future issuance. The shares of ConvertibleExchangeable Preferred Stock are exchangeable at our option, for 6% Convertible Subordinated Debentures, due 2012and are redeemable at our option on or after September 20, 2000 at specified prices plus accrued dividends. Holders ofConvertible Exchangeable Preferred Stock do not have any voting rights in ordinary circumstances. In exercising anyvoting rights, each outstanding share of Series D Convertible Exchangeable Preferred Stock will be entitled to one vote.
7. DERIVATIVE INSTRUMENTS:
We enter into derivative instruments primarily for the purpose of reducing the impact of changing interest rates onour floating rate debt and to reduce the impact of changing fair market values of our fixed rate debt.
Statement of Financial Accounting Standard No. 133
On January 1, 2001, we adopted SFAS No. 133, Accounting for Derivative Instruments and Hedging Activities, SFASNo. 137, Accounting for Derivative Instruments and Hedging Activities -Deferral of the Effective Date of SFAS 133 and SFASNo. 138, Accounting for Certain Derivative Instruments and Certain Hedging Activities, an amendment of FASB StatementNo. 133. SFAS No. 133, as amended, establishes accounting and reporting standards requiring that every derivativeinstrument be recorded in the balance sheet as either an asset or liability measured at its fair value. SFAS No. 133 requiresthat changes in the derivative instrument's fair value be recognized currently in earnings unless specific hedge accountingcriteria are met. Special accounting for qualifying hedges allows a derivative instrument's gains and losses to offset relatedresults on the hedged item in the income statement, to the extent effective, and requires that a company must formallydocument, designate, and assess the effectiveness of transactions that receive hedge accounting. SFAS No. 133 had thefollowing impact on our financial statements.
Our losses resulting from prior year terminations of fixed to floating interest rate agreements are reflected as a discounton our fixed rate debt and are being amortized to interest expense through December 15, 2007, the expiration date ofthe terminated swap agreements. For each of the years ended December 31, 2003, 2002 and 2001, amortization of $0.5million of the discount was recorded as interest expense for each respective period.
We experienced deferred net losses in prior years related to terminations of floating to fixed interest rate swapagreements. These deferred net losses are reflected as other comprehensive loss, net of tax effect and are being amortizedto interest expense through June 3, 2004, the expiration dates of the terminated swap agreements. For the years endedDecember 31, 2003, 2002 and 2001, we amortized $1.7 million, $1.3 million and $0.3 million, respectively, fromaccumulated other comprehensive loss and deferred tax asset to interest expense.
S i n c l a i r B r o a d c a s t G r o u p44

Interest Rate Derivative Instruments
During the twelve months ended December 31, 2003, we held the following derivative instruments:
• An interest rate swap agreement with a financial institution that has a notional amount of $575 million,which expires of June 5, 2006. During June 2003, we assigned $200 million of the notional amountto a second financial institution. Both agreements expire on June 5, 2006. These swap agreementsrequire us to pay a fixed rate, which is set in the range of 6.25% to 7.00% and receive a floating ratebased on the three month London Interbank Offered Rate (LIBOR) (measurement and settlement isperformed quarterly). These swap agreements are reflected as a derivative obligation based on their fairvalue of $54.1 million and $71.5 million as a component of other long-term liabilities in theaccompanying consolidated balance sheets as of December 31, 2003 and December 31, 2002,respectively. These swap agreements do not qualify for hedge accounting treatment under SFAS No.133; therefore, changes in their fair market values are reflected currently in earnings as gain (loss) onderivative instruments. We incurred an unrealized gain of $17.4 million for the year ended December31, 2003 and an unrealized loss of $30.9 million and $34.4 million during the years ended December31, 2002 and 2001, respectively, related to these instruments. The instrument with a notional amountof $375 million contains a European style (that is, exercisable only on the expiration date) terminationoption and can be terminated partially or in full by the counterparty on June 3, 2004 and June 3, 2005at its fair market value.
• In March 2002, we entered into two interest rate swap agreements with notional amounts totaling $300million which expire on March 15, 2012 in which we receive a fixed rate of 8% and pay a floating ratebased on LIBOR (measurement and settlement is performed quarterly). These swaps are accounted foras a hedge of our 8% debenture in accordance with SFAS No. 133 whereby changes in the fair marketvalue of the swaps are reflected as adjustments to the carrying amount of the debenture. These swapsare reflected in the accompanying balance sheet as a derivative asset and as a premium on the 8%debenture based on their fair value of $18.6 million.
• In November 2003, we entered into two interest rate swap agreements with notional amounts totaling$100 million, which expire March 15, 2012, in which we receive a fixed rate of 8% and pay a floatingrate based on LIBOR (measurement and settlement is performed quarterly). These swaps are accountedfor as a hedge of our 8% Senior Subordinated Notes in accordance with SFAS No. 133, wherebychanges in the fair market value of the swaps are reflected as adjustments to the carrying amount of theSenior Subordinated Notes. These swaps are reflected on the accompanying balance sheet as a derivativeasset and as a premium on the 8% debenture based on their fair value of $0.3 million.
The counterparties to these agreements are international financial institutions. We estimate the net fair value of theseinstruments at December 31, 2003 to be a liability of $35.2 million. The fair value of the interest rate swap agreementsis estimated by obtaining quotations from the financial institutions, which are a party to our derivative contracts. Thefair value is an estimate of the net amount that we would pay on December 31, 2003 if we cancelled the contracts ortransferred them to other parties.
In June 2001, we entered into an interest rate swap agreement with a notional amount of $250 million which expireson December 15, 2007 in which we received a fixed rate of 8.75% and paid a floating rate based on LIBOR(measurement and settlement is performed quarterly). This swap was accounted for as a hedge of our 8.75% debenturein accordance with SFAS No. 133, whereby changes in the fair market value of the swap were reflected as adjustmentsto the carrying amount of the debenture. During December 2002, we terminated this interest rate swap agreement. Wereceived $10.9 million upon termination, which offset the premium that we paid on the 8.75% notes redemption.
In June 2001, we entered into an interest rate swap agreement with a notional amount of $200 million which expireson July 15, 2007 in which we received a fixed rate of 9% and paid a floating rate based on LIBOR (measurement andsettlement is performed quarterly). This swap was accounted for as a hedge of our 9% Notes in accordance with SFASNo. 133 whereby changes in the fair market value of the swap were reflected as adjustments to the carrying amount of
2 0 0 3 A n n u a l R e p o r t 45

the debenture. During November 2002, we terminated this interest rate swap agreement and received $9.0 million,which offset the premium that we paid on the 9% notes redemption.
During May 2003, we completed an issuance of $150.0 million aggregate principal amount of 4.875% ConvertibleSenior Subordinated Bonds. See Note 4 - Notes Payable and Commercial Bank Financing. Under certain circumstances,we will pay contingent cash interest to the holder of the convertible notes during any six month period from January 15to July 14 and from July 15 to January 14, commencing with the six month period beginning January 15, 2011. Thecontingent interest feature is an embedded derivative which had a negligible fair value as of December 31, 2003.
8. INCOME TAXES
We file a consolidated federal income tax return and separate company state tax returns. The provision (benefit) forthe income taxes consisted of the following for the years ended December 31, 2003, 2002 and 2001 (in thousands):
The following is a reconciliation of federal income taxes at the applicable statutory rate to the recorded provision(benefit) from continuing operations:
S i n c l a i r B r o a d c a s t G r o u p46
Provision for (benefit) from income taxes -continuing operations $ 15,669. $ (4,162) $ (59,675)
(Benefit) from provision for income taxes - discontinued operations (1,641) 347. 193.
Provision for income taxes - sale of discontinued operations — 8,175. —
Benefit from income taxes - cumulative adjustment for change in accounting principle — (30,383) —
$ 14,028. $ (26,023) $ (59,482)
Current:
Federal $ (1,176) $ (37,357) $ (47,880)
State (2,046) 3,160. (910)
(3,222) (34,197) (48,790)
Deferred:
Federal 16,424. 7,894. (9,792)
State 826. 280. (900)
17,250. 8,174. (10,692)
$ 14,028. $ (26,023) $ (59,482)
Statutory federal income taxes 35.0% (35.0%) (35.0%)
Adjustments-
State income and franchise taxes, net of federal effect 1.0% 7.2%. 0.4%.
Goodwill amortization — — 7.2%.
Non-deductible expense items 3.8% 8.8%. 0.6%.
Reversal of income tax accruals — — (3.8%)
Adjustment to valuation allowance — (14.1%) (4.0%)
Tax return true-up items — (9.9%) 5.3%.
Other 1.0% 2.0%. (2.0%)
Provision (benefit) for income taxes 40.8% (41.0%) (31.3%)
2003 2002 2001
2003 2002 2001

2 0 0 3 A n n u a l R e p o r t 47
Temporary differences between the financial reporting carrying amounts and the tax basis of assets and liabilities giverise to deferred taxes. We had a net deferred tax liability of $178.2 million and $167.2 million as of December 31, 2003and 2002, respectively.
Our remaining federal and state net operating losses will expire during various years from 2004 to 2023, and in certaincases, are subject to annual limitations under Internal Revenue Code Section 382 and similar state provisions. The taxeffects of these net operating losses are recorded in the deferred tax accounts in the accompanying consolidated balancesheets.
Total deferred tax assets and deferred tax liabilities as of December 31, 2003 and 2002 were as follows (in thousands):
We establish valuation allowances in accordance with the provisions of SFAS No. 109, Accounting for Income Taxes.A valuation allowance has been provided for deferred tax assets relating to various federal and state net operating loss(NOL) carry forwards. The realization of deferred tax assets associated with federal and state NOL carry forwards isdependent upon generating sufficient taxable income prior to their expiration. Management believes that there is a riskthat certain of these federal and state NOL carry forwards may expire unused and accordingly, has established a valuationallowance against them. The valuation allowance increased $10.8 million in 2003, principally related to acquired NOLs.Although realization is not assured for the remaining deferred tax assets, management believes it is more likely than notthat they will be realized through future taxable earnings or alternative tax strategies. We periodically review the adequacyof the valuation allowance and make any necessary adjustments to the extent that management's estimates of taxableincome during the carryforward period significantly change. Any subsequent changes to the valuation allowance will bereported in accordance with SFAS No. 109.
In the third and fourth quarter 2003, the statute of limitations expired for certain tax returns related to discontinuedoperations in 1999. As a result, our 2003 benefit for income taxes - discontinued operations reflects $1.6 millionreduction of taxes provided in prior periods.
In December 2001, the Internal Revenue Service (IRS) completed its examination of our federal income tax returnsfiled through 1997. As a result of this settlement, our 2001 benefit for income taxes reflects $6.3 million reduction oftaxes provided in prior periods. The IRS has initiated an examination of federal tax returns subsequent to 1998.
Deferred Tax Assets:
Accruals and reserves $ 10,248. $ 12,259.
Net operating losses 114,837. 75,448.
Program contracts 13,838. 7,995.
Other comprehensive income net deferred tax assets 305. 913.
Other 9,838. 11,037.
149,066. 107,652.
Valuation allowance for deferred tax assets (71,481) (60,680)
$ 77,585. $ 46,972.
Deferred Tax Liabilities:
FCC license $ (45,809) $ (37,682)
Parent Preferred Stock deferred tax liability (25,833) (25,833)
Fixed assets and intangibles (177,850) (141,628)
Cunningham net deferred tax liabilities (1,069) (1,069)
Other (5,195) (7,968)
(255,756) (214,180)
Net tax liabilities $ (178,171) $ (167,208)
2003 2002

Management periodically performs a comprehensive review of our tax positions and accrues amounts for taxcontingencies. Based on these reviews, the status of ongoing audits and the expiration of applicable statute of limitations,accruals are adjusted as necessary. The resolution of audits is unpredictable and could result in tax liabilities that aresignificantly higher or lower than that which has been provided by us. Amounts accrued for these tax matters areincluded in long-term liabilities in our consolidated balance sheet. We believe that adequate accruals have been providedfor all years.
9. COMMITMENTS AND CONTINGENCIES:
Litigation
Lawsuits and claims are filed against us from time to time in the ordinary course of business. These actions are invarious preliminary stages and no judgments or decisions have been rendered by hearing boards or courts. Management,after reviewing developments to date with legal counsel, is of the opinion that the outcome of such matters will not havea material adverse effect on our consolidated financial position, consolidated results of operations or consolidated cashflows.
Operating LeasesWe have entered into operating leases for certain property and equipment under terms ranging from three to ten years.
The rent expense under these leases, as well as certain leases under month-to-month arrangements for the years endedDecember 31, 2003, 2002 and 2001 was approximately $4.6 million, $5.1 million and $5.7 million, respectively.
Future minimum payments under the leases are as follows (in thousands):
At December 31, 2003 and 2002, we had an outstanding letter of credit of $0.98 million and $1.06 million,respectively, under our revolving credit facility. The letter of credit acts as a guarantee of lease payments for the propertyoccupied by WTTA-TV in Tampa, FL pursuant to the terms and conditions of the lease agreement.
Affiliation AgreementsSixty of the 62 television stations that we own and operate or to which we provide programming services or sales
services, currently operate as affiliates of FOX (20 stations), WB (19 stations), ABC (8 stations), NBC (4 stations), UPN(6 stations) and CBS (3 stations). The remaining two stations are independent. The networks produce and distributeprogramming in exchange for each station's commitment to air the programming at specified times and for commercialannouncement time during the programming. In addition, networks other than FOX generally pay each station anaffiliation agreement fee for each network-sponsored program broadcast by the station or fees for entering into theaffiliation agreement. In some markets, we pay certain fees if we have certain ratings successes.
The affiliation agreements of three ABC stations (WEAR-TV in Pensacola, Florida, WCHS-TV in Charleston, WestVirginia and WXLV-TV in Greensboro/Winston-Salem, North Carolina) have expired. We continue to operate thesestations as ABC affiliates and we do not believe ABC has any current plans to terminate the affiliation agreements withany of these stations. As of December 31, 2003, the corresponding net book values for the affiliation agreements are$3.9 million, $2.6 million and $12.4 million.
S i n c l a i r B r o a d c a s t G r o u p48
2004 $ 3,539
2005 3,047
2006 2,675
2007 2,307
2008 1,843
2009 and thereafter 9,113
$ 22,524

The following affiliate agreements are scheduled to expire during 2004. The ABC affiliate agreements with WLOS-TV and WSYX-TV are scheduled to expire on September 8, 2004. The UPN affiliate agreements with WABM-TV,WMMP-TV, WCGV-TV, WUXP-TV and WRDC-TV are scheduled to expire on July 31, 2004. The UPN affiliateagreement with WUPN-TV is scheduled to expire in June 2004. The CBS affiliate agreements with KGAN-TV andWGME-TV are scheduled to expire on December 31, 2004.
The NBC affiliation agreements with WICS/WICD (Champaign/Springfield, Illinois) and WKEF-TV (Dayton,Ohio) were scheduled to expire on April 1, 2004. On February 25, 2004, NBC informed us that they intend toterminate our affiliations with WKEF-TV (Dayton, Ohio) and WICS/WICD (Champaign/Springfield, Illinois)effective on or about September 2004 and September 2005, respectively, in order to affiliate with another station in eachof these markets. We are currently engaged in discussion with ABC Television Network regarding affiliating with ABCin these two markets since the stations which are scheduled to acquire the NBC affiliations in Dayton andChampaign/Springfield are currently ABC affiliates and would be giving up that affiliation to become NBC affiliates.As of December 31, 2003, the corresponding net book values of the affiliation agreements are $14.5 million and $10.3million, respectively.
The non renewal or termination of one or more of these or any of our other network affiliation agreements would resultin us no longer being able to carry programming of the relevant network. This loss of programming would require us toobtain replacement programming, which may involve higher costs and which may not be as attractive to our targetaudiences, resulting in reduced revenues. Upon the termination of any of the above affiliation agreements, we would berequired to establish new affiliations with other networks or operate as an independent. At such time, the remaining valueof the network affiliation asset could become impaired and we would be required to write down the value of the asset.
Local Marketing Agreements
Certain of our stations have entered into what have commonly been referred to as local marketing agreements orLMAs. One typical type of LMA is a programming agreement between two separately owned television stations servingthe same market, whereby the licensee of one station programs substantial portions of the broadcast day and sellsadvertising time during such program segments on the other licensee's station subject to the ultimate editorial and othercontrols being exercised by the latter licensee. We believe these arrangements allow us to reduce our operating expensesand enhance profitability. Although under the new FCC ownership rules we would be allowed to continue to programmost of the stations with which we have an LMA, in the absence of a waiver, the new rules would require us to terminateor modify three of our LMAs in markets where both the stations we own and the station with which we have an LMAare ranked among the top four stations in their particular DMA. The FCC's new ownership rules include specificprovisions permitting waivers of this "top four restriction." Although there can be no assurances, we have studied theapplication of the new rules to our markets and believe we are qualified for waivers. We believe an issue exists regardingwhether the FCC has any current legal right to enforce any rules prohibiting the acquisition of television stations becausethe new rules have been stayed and the FCC concluded the old rules could not be justified as necessary to the publicinterest. The Third Circuit Court of Appeals has stayed the application of the new rules as a result of numerous legalchallenges, including one filed by Sinclair. Oral argument regarding the legality of the new rules was held on February11, 2004 and a decision is currently pending. During the pendency of the review, the Third Circuit has ordered theFCC to continue to apply the existing ownership rules.
On November 15, 1999, we entered into five separate plans and agreements of merger, pursuant to which we wouldacquire through merger with subsidiaries of Cunningham, television broadcast stations WABM-TV, Birmingham,Alabama, KRRT-TV, San Antonio, Texas, WVTV-TV, Milwaukee, Wisconsin, WRDC-TV, Raleigh, North Carolinaand WBSC-TV (formerly WFBC-TV), Anderson, South Carolina. The consideration for these mergers was the issuanceto Cunningham, of shares of our Class A Common voting stock. In December 2001, we received FCC approval on allthe transactions except WBSC-TV. Accordingly, on February 1, 2002, we closed on the purchase of the FCC licenseand related assets of WABM-TV, KRRT-TV, WVTV-TV, and WRDC-TV. The total value of the shares issued inconsideration for the approved mergers was $7.7 million. We have filed a petition for reconsideration with the FCC toreconsider its denial of the acquisition of WBSC-TV and recently amended our application to acquire the license in light
2 0 0 3 A n n u a l R e p o r t 49

of the FCC's new multiple ownership rules adopted in June 2003. However, the new rules have been stayed by the U.S.Court of Appeals for the Third Circuit, pending its review of the rules. We also filed applications in November 2003 toacquire the license assets of the remaining five Cunningham stations, WRGT-TV, Dayton, Ohio, WTAT-TV,Charleston, South Carolina, WVAH-TV, Charleston, West Virginia, WNUV-TV, Baltimore, Maryland and WTTE-TV,Columbus, Ohio. These applications are pending and may also be impacted by the existence of the stay of the FCC'snew multiple ownership rules. The Rainbow/PUSH Coalition has filed a petition to deny these five applications and torevoke all of Sinclair's licenses. We believe the petition is without merit and as with past petitions filed byRainbow/PUSH, will not result in the revocation of any of Sinclair's licenses.
If we are required to terminate or modify our LMAs, our business could be affected in the following ways:
• Losses on investments. As part of our LMA arrangements, we own the non-license assets used by thestations with which we have LMAs. If certain of these LMA arrangements are no longer permitted, wewould be forced to sell these assets, restructure our agreements or find another use for them. If LMAsare prohibited, the market for such assets may not be as good as when we purchased them and we wouldneed to sell the assets to the owner or purchaser of the related license assets. Therefore, we cannot becertain we will recoup our investments.
• Termination penalties. If the FCC requires us to modify or terminate existing LMAs before the termsof the LMAs expire, or under certain circumstances, we elect not to extend the term of the LMAs, wemay be forced to pay termination penalties under the terms of some of our LMAs. Any suchtermination penalty could be material.
WNAB Options
We have entered into an agreement with a third party to purchase certain license and non-license television broadcastassets of WNAB-TV at our option (the call option) and additionally, the third party may require us to purchase these licenseand non-license broadcast assets at the option of the third party (the put option). On January 2, 2003, we made an $18.0million non-refundable deposit against the purchase price of the put or call option on the non-license assets in return for areduction of $0.1 million in our profit sharing arrangements. Under current law, we have no right to buy WNAB-TV. Ifor when the put option becomes exercisable and if the current law has not changed, we may assign our option to an eligiblebuyer. There can be no assurance that we will find an eligible buyer or recover our commitment. Upon exercise, we maysettle the call or put options entirely in cash or at our option, we may pay one-half of the purchase price by issuing additionalshares of our Class A common stock. The call and put option exercise prices vary depending on the exercise dates and havebeen adjusted for the deposit. The license asset call option exercise price is $5.0 million prior to March 31, 2005, $5.6million from March 31, 2005 until March 31, 2006 and $6.2 million after March 31, 2006. The non-license asset calloption exercise price is $8.3 million prior to March 31, 2005, $12.6 million from March 31, 2005 to March 31, 2006 and$16.0 million after March 31, 2006. The license asset put option price is $5.4 million from July 1, 2005 to July 31, 2005,$5.9 million from July 1, 2006 to July 31, 2006 and $6.3 million from July 1, 2007 to July 31, 2007. The non-licenseasset put option price is $7.9 million from July 1, 2005 to July 31, 2005, $12.4 million from July 1, 2006 to July 31, 2006and $16.0 million from July 1, 2007 to July 31, 2007.
S i n c l a i r B r o a d c a s t G r o u p50

10. RELATED PARTY TRANSACTIONS:
Notes and capital leases payable to affiliates consisted of the following as of December 31, 2003 and 2002 (inthousands):
Notes and capital leases payable to affiliates as of December 31, 2003 mature as follows (in thousands):
During the year ended December 31, 1993, we loaned Gerstell Development Limited Partnership (a partnershipowned by class B Shareholders) $2.1 million. The note bears interest at 6.18%, with principal payments beginning onNovember 1, 1994 and had a final maturity date of October 1, 2013. As of December 31, 2003 and 2002, the balanceoutstanding was approximately $1.4 million and $1.5 million, respectively. The note was paid in full in February 2004.
On September 30, 1990, we issued certain notes (the founders' notes) maturing on May 31, 2005, payable to the lateJulian S. Smith and Carolyn C. Smith, former majority owners of Sinclair and the parents of class B shareholders. Thefounders' notes, which were issued in consideration for stock redemptions equal to 72.65% of the then outstanding stockof Sinclair, have principal amounts of $7.5 million and $6.7 million, respectively. The founders' notes include statedinterest rates of 8.75%, which were payable annually from October 1990 until October 1992, then payable monthlycommencing April 1993 to December 1996 and then semi-annually thereafter until maturity. The effective interest rateapproximates 9.4%. The founders' notes are secured by security interests in substantially all of Sinclair's assets andsubsidiaries and are personally guaranteed by class B shareholders.
Principal and interest payments on the founders' notes is payable, in various amounts, each April and October,beginning October 1991 until October 2005, with a balloon payment due at maturity in the amount of $1.5 million.Principal and interest paid on the founders' note was $1.5 million for the year ended December 31, 2003, $1.6 millionfor the year ended December 31, 2002 and $1.7 million for the year ended December 31, 2001. At December 31, 2003,$3.1 million of this founders' note remained outstanding.
2 0 0 3 A n n u a l R e p o r t 51
Subordinated installment notes payable to former majority owners, interest at 8.75%, principal payments in varying amounts due annually beginning October 1991, with a balloon payment due at maturity in May 2005 $ 3,133. $ 4,244.
Capital lease for building, interest at 7.93% 1,569. 2,041.
Capital lease for building, interest at 6.62% 5,900. 6,652.
Capital leases for broadcasting tower facilities, interest at 9.0% 2,030. 2,436.
Capital leases for broadcasting tower facilities, interest at 10.5% 3,011. 2,968.
Capitalization of time brokerage agreements, interest at 6.20% to 8.25% 7,387. 8,611.
Capital leases for building and tower, interest at 8.25% 5,907. 6,036.
28,937. 32,988.
Less: Current portion (3,296) (4,157)
$ 25,641. $ 28,831.
2003 2002
2004 $ 6,737.
2005 7,661.
2006 5,303.
2007 4,512.
2008 3,939.
2009 and thereafter 19,916.
Total minimum payments due 48,068.
Less: Amount representing interest (19,131)
$ 28,937.

Concurrently with our initial public offering, we acquired options from certain shareholders of Cunningham that willgrant us the right to acquire, subject to applicable FCC rules and regulations, 100% of the capital stock of Cunningham.The Cunningham option exercise price is based on a formula that provides a 10% annual return to Cunningham.Cunningham is the owner-operator and FCC licensee of WNUV-TV, Baltimore, Maryland, WRGT-TV, Dayton, Ohio,WVAH, Charleston, West Virginia, WTAT-TV, Charleston, South Carolina, WBSC-TV, Anderson, South Carolina andWTTE-TV, Columbus, Ohio. We have entered into five-year LMA agreements (with five-year renewal terms at ouroption) with Cunningham pursuant to which we provide programming to Cunningham for airing on WNUV-TV,WRGT-TV, WVAH-TV, WTAT-TV, WBSC-TV and WTTE-TV. During the years ended December 31, 2003, 2002and 2001, we made payments of $4.7 million, $4.0 million and $11.8 million, respectively, to Cunningham under theseLMA agreements.
In connection with our sale of WCWB in Pittsburgh to WPTT, Inc., WPTT, Inc. issued to us a 15-year senior securedterm note of $6.0 million (the WPTT Note). We subsequently sold the WPTT Note to the late Julian S. Smith andCarolyn C. Smith, the parents of the controlling shareholders and both former shareholders of Sinclair, in exchange forthe payment of $50,000 and the issuance of a $6.6 million note receivable, which bears interest at 7.21% per annum.During the year ended December 31, 2001, we received $0.5 million in interest payments on this note. At December31, 2001, the balance on this note was $6.6 million. We acquired the assets of WCWB-TV and the note was paid infull on January 7, 2002.
During the years ended December 31, 2003, 2002 and 2001, we from time to time entered into charter arrangements tolease aircraft owned by certain Class B Shareholders. During the years ended December 31, 2003, 2002 and 2001, weincurred expenses of approximately $0.2 million, $0.3 million and $55,000 related to these arrangements, respectively.
Certain assets used by us and our operating subsidiaries are leased from Cunningham Communications Inc., KeyserInvestment Group, Gerstell Development Limited Partnership and Beaver Dam, LLC (entities owned by the Class BShareholders). Lease payments made to these entities were $4.1 million, $3.6 million and $3.1 million for the yearsended December 31, 2003, 2002 and 2001, respectively.
In January 1999, we entered into a Local Marketing Agreement with Bay Television, Inc., which owns the televisionstation WTTA-TV in Tampa, FL. The controlling stockholders own a substantial portion of the equity of BayTelevision, Inc. The Local Marketing Agreement provides that we deliver television programming to Bay Television, Inc.,which broadcasts the programming in return for a monthly fee to Bay Television, Inc. of $143,500. We must also makean annual payment equal to 50% of the annual broadcast cash flow, as defined in the Local Marketing Agreement, ofthe station, which is in excess of $1.7 million. The additional payment is reduced by 50% of the broadcast cash flow, asdefined in the Local Marketing Agreement that was below zero in prior calendar years. During 2003, we made paymentsof approximately $1.7 million related to the Local Marketing Agreement. No payment was made in 2003 related to thebroadcast cash flow that exceeded $1.7 million for the year ended December 31, 2003 as it was offset by the negativebroadcast cash flow of prior years.
On December 30, 2002, we invested $20 million in Summa Holdings, Ltd. (Summa), resulting in a 17.5% equityinterest. Summa is a holding company, which owns automobile dealerships and a leasing company. David D. Smith,our President and Chief Executive Officer, has a controlling interest in Summa and is a member of the Board ofDirectors. We have significant influence by holding a board seat (in addition to the board seat held personally by DavidD. Smith); therefore, we account for this investment under the equity method of accounting.
We sold advertising time to Summa on WBFF-TV and WNUV-TV and received payments totaling $0.4 million, $0.3million and $0.2 million during the twelve months ended December 31, 2003, 2002 and 2001, respectively. Wepurchased a total of $0.2 million in vehicles and related vehicle services from Summa during the twelve months endedDecember 31, 2003. Summa leases certain dealership properties from a partnership in which David D. Smith has a 50%ownership interest. Summa made lease payments to this partnership of $6.3 million, $4.9 million, and $4.6 million forthe years ended December 31, 2003, 2002 and 2001, respectively. Aggregate future minimum lease payments due tothe partnership are $50.0 million through 2013.
S i n c l a i r B r o a d c a s t G r o u p52

In August 1999, Allegiance Capital Limited Partnership (Allegiance), with the controlling shareholders, our Chief FinancialOfficer and Executive Vice President and Allegiance Capital Management Corporation (ACMC), the general partner,established a small business investment company. ACMC, as the general partner, controls all decision making, investing, andmanagement of operations in exchange for a monthly management fee based on actual expenses incurred which currentlyaverages approximately $35,600 paid by the limited partners. We, along with the other limited partners, have committed toinvesting up to a combined total of $15.0 million of which $7.5 million was invested as of December 31, 2003.
11. ACQUISITIONS AND DISPOSITIONS:WNYO Acquisition
In August 2000, we entered into an agreement to purchase the stock of Grant Television, Inc., the owner of WNYO-TVin Buffalo, New York, for a purchase price of $51.5 million. In October 2000, we completed the stock acquisition of Grant,obtaining the non-license assets of WNYO-TV and began programming the television station under a local marketingagreement. The acquisition was accounted for under the purchase method of accounting whereby the purchase price wasallocated to property and programming assets, definite-lived intangible broadcast assets and other intangible assets for $2.9million, $3.9 million and $39.8 million, respectively. In December 2001, we received FCC approval and on January 25,2002, we completed the purchase of the FCC license and related assets of WNYO-TV for a purchase price of $6.7 million.
Cunningham/WPTT, Inc. Acquisition On November 15, 1999, we entered into an agreement to purchase substantially all of the assets of television stations
WCWB-TV, Channel 22, Pittsburgh, Pennsylvania, from the owner of that television station, WPTT, Inc. In December2001, we received FCC approval and on January 7, 2002, we closed on the purchase of the FCC license and related assetsof WCWB-TV for a purchase price of $18.8 million.
On November 15, 1999, we entered into five separate plans and agreements of merger, pursuant to which we wouldacquire through merger with subsidiaries of Cunningham, television broadcast stations WABM-TV, Birmingham,Alabama, KRRT-TV, San Antonio, Texas, WVTV-TV, Milwaukee, Wisconsin, WRDC-TV, Raleigh, North Carolina,and WBSC-TV (formerly WFBC-TV), Anderson, South Carolina. The consideration for these mergers is the issuanceto Cunningham of shares of our Class A Common voting Stock. In December 2001, we received FCC approval on allthe transactions except for WBSC-TV. Accordingly, on February 1, 2002, we closed on the purchase of the FCC licenseand related assets of WABM-TV, KRRT-TV, WVTV-TV and WRDC-TV. The total value of the shares issued inconsideration for the approved mergers was $7.7 million.
Mission Acquisition Pursuant to our merger with Sullivan Broadcast Holdings, Inc. which was effective July 1, 1998, we acquired options
to acquire television broadcast station WUXP-TV in Nashville, Tennessee from Mission Broadcasting I, Inc. andtelevision broadcast station WUPN-TV in Greensboro, North Carolina from Mission Broadcasting II, Inc. OnNovember 15, 1999, we exercised our option to acquire both of the foregoing stations. In December 2001, we receivedFCC approval and in January 2002, we closed on the purchase of the FCC licenses and related assets of WUXP-TV andWUPN-TV for the assumption of notes payable aggregating $4.2 million and $0.1 million of cash. Prior to closing, weprogrammed these stations pursuant to an LMA.
Sullivan AcquisitionIn December 2001, we received FCC approval to acquire 100% of the stock of Sullivan Broadcasting Company II,
Inc. and Sullivan Broadcasting Company IV, Inc. which in the aggregate, own the FCC license and related assets of sixtelevision stations. In January 2002, we completed the purchase of the FCC license and related assets of WZTV-TV,WUTV-TV, WXLV-TV, WRLH-TV, WMSN-TV and KOKH-TV. Prior to closing, we programmed these stationspursuant to LMA's. As consideration for the purchase of the FCC license and related assets of KOKH, we forgave a notereceivable to Sullivan IV in the amount of $16.6 million.
2 0 0 3 A n n u a l R e p o r t 53

WUHF Acquisition
In December 1999, we entered into a stock purchase agreement with BS&L Broadcasting, Inc. (BS&L) and its soleshareholder to acquire the stock of BS&L, the licensee of WUHF-TV, Rochester, New York. BS&L acquired the licenseof WUHF-TV from Sullivan II. One of the conditions to our acquisition of the stock of BS&L was the receipt of FCCapproval. On April 30, 2002, we acquired the stock of BS&L Broadcasting, Inc. (BS&L), from its sole shareholder,which owned the FCC license and related assets of WUHF-TV in Rochester, New York. As consideration for thepurchase of the FCC license and related assets, we forgave a note receivable from BS&L in the amount of $8.4 million.Prior to the completion of the acquisition, we programmed WUHF-TV pursuant to a local marketing agreement.
12. DISCONTINUED OPERATIONS:
On April 18, 2002, we entered into an agreement to sell the television station of WTTV-TV in Bloomington, Indianaand its satellite station, WTTK-TV in Kokomo, Indiana to a third party. On July 24, 2002, WTTV-TV had net assetsand liabilities held for sale of $108.8 million and we completed such sale for $124.5 million and recognized a gain, netof taxes, of $7.5 million, which was used to pay down indebtedness. As a result of adopting SFAS No. 144, we reportedthe results of operations of WTTV-TV as discontinued operations in the accompanying statements of operations.Discontinued operations have not been segregated in the Statement of Consolidated Cash Flows and, therefore, amountsfor certain captions will not agree with the accompanying consolidated statements of operations. The operating resultsof WTTV-TV are not included in our consolidated results from continuing operations for the years ended December31, 2002 and 2001.
Accounts receivable related to discontinued operations, which we will continue to own the rights to and collect, isincluded in accounts receivable, net of allowance for doubtful accounts, in the accompanying consolidated balance sheetsfor all periods presented. Such amounts were $187,628 (net of allowance of $168,105) and $220,667 (net of allowanceof $144,253) as of December 31, 2003 and 2002, respectively. Net income from discontinued operations includes netbroadcast revenues of $10.2 million and $21.0 million for the years ended December 31, 2002 and 2001, respectively.
During 2003, we reduced our income tax liability by $1.6 million as a result of the expiration of certain statutes oflimitations related to the sale of radio stations in prior years. This adjustment was recorded in discontinued operations.
13. RESTRUCTURING CHARGES:
During February 2001, we offered a voluntary early retirement program to our eligible employees and implemented arestructuring program to reduce operating and overhead costs. As a result, we reduced our staff by 186 employees andincurred a restructuring charge of $2.3 million, which is included in the accompanying Consolidated Statements ofOperations.
During September 2001, KDNL-TV in St. Louis, Missouri discontinued programming its local news broadcast. Asa result, we incurred a restructuring charge of $1.1 million. During December 2001, WXLV-TV in Winston-Salem,North Carolina, discontinued programming its local news broadcast. As a result we incurred a restructuring charge of$0.3 million. The restructuring charges are related to severance and operating contract termination costs.
S i n c l a i r B r o a d c a s t G r o u p54
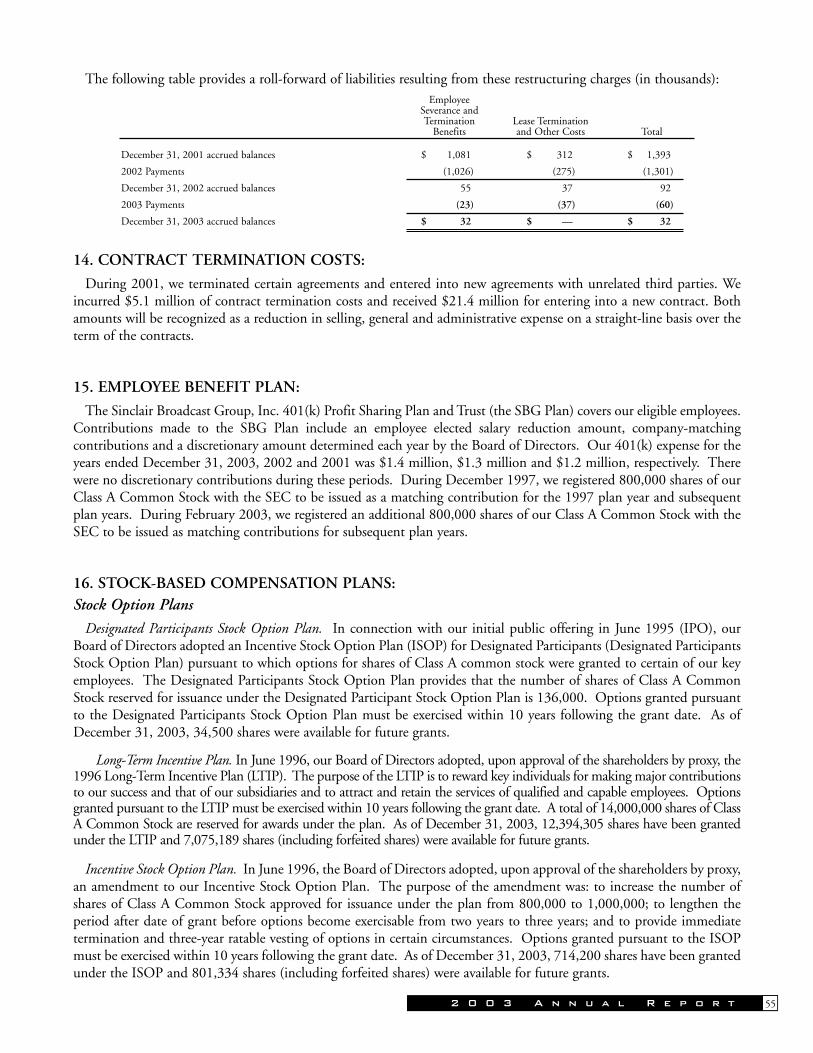
The following table provides a roll-forward of liabilities resulting from these restructuring charges (in thousands):
14. CONTRACT TERMINATION COSTS:
During 2001, we terminated certain agreements and entered into new agreements with unrelated third parties. Weincurred $5.1 million of contract termination costs and received $21.4 million for entering into a new contract. Bothamounts will be recognized as a reduction in selling, general and administrative expense on a straight-line basis over theterm of the contracts.
15. EMPLOYEE BENEFIT PLAN:
The Sinclair Broadcast Group, Inc. 401(k) Profit Sharing Plan and Trust (the SBG Plan) covers our eligible employees.Contributions made to the SBG Plan include an employee elected salary reduction amount, company-matchingcontributions and a discretionary amount determined each year by the Board of Directors. Our 401(k) expense for theyears ended December 31, 2003, 2002 and 2001 was $1.4 million, $1.3 million and $1.2 million, respectively. Therewere no discretionary contributions during these periods. During December 1997, we registered 800,000 shares of ourClass A Common Stock with the SEC to be issued as a matching contribution for the 1997 plan year and subsequentplan years. During February 2003, we registered an additional 800,000 shares of our Class A Common Stock with theSEC to be issued as matching contributions for subsequent plan years.
16. STOCK-BASED COMPENSATION PLANS:Stock Option Plans
Designated Participants Stock Option Plan. In connection with our initial public offering in June 1995 (IPO), ourBoard of Directors adopted an Incentive Stock Option Plan (ISOP) for Designated Participants (Designated ParticipantsStock Option Plan) pursuant to which options for shares of Class A common stock were granted to certain of our keyemployees. The Designated Participants Stock Option Plan provides that the number of shares of Class A CommonStock reserved for issuance under the Designated Participant Stock Option Plan is 136,000. Options granted pursuantto the Designated Participants Stock Option Plan must be exercised within 10 years following the grant date. As ofDecember 31, 2003, 34,500 shares were available for future grants.
Long-Term Incentive Plan. In June 1996, our Board of Directors adopted, upon approval of the shareholders by proxy, the1996 Long-Term Incentive Plan (LTIP). The purpose of the LTIP is to reward key individuals for making major contributionsto our success and that of our subsidiaries and to attract and retain the services of qualified and capable employees. Optionsgranted pursuant to the LTIP must be exercised within 10 years following the grant date. A total of 14,000,000 shares of ClassA Common Stock are reserved for awards under the plan. As of December 31, 2003, 12,394,305 shares have been grantedunder the LTIP and 7,075,189 shares (including forfeited shares) were available for future grants.
Incentive Stock Option Plan. In June 1996, the Board of Directors adopted, upon approval of the shareholders by proxy,an amendment to our Incentive Stock Option Plan. The purpose of the amendment was: to increase the number ofshares of Class A Common Stock approved for issuance under the plan from 800,000 to 1,000,000; to lengthen theperiod after date of grant before options become exercisable from two years to three years; and to provide immediatetermination and three-year ratable vesting of options in certain circumstances. Options granted pursuant to the ISOPmust be exercised within 10 years following the grant date. As of December 31, 2003, 714,200 shares have been grantedunder the ISOP and 801,334 shares (including forfeited shares) were available for future grants.
2 0 0 3 A n n u a l R e p o r t 55
December 31, 2001 accrued balances $ 1,081. $ 312. $ 1,393.
2002 Payments (1,026) (275) (1,301)
December 31, 2002 accrued balances 55. 37. 92.
2003 Payments (23) (37) (60)
December 31, 2003 accrued balances $ 32. $ —. $ 32.
EmployeeSeverance andTermination
Benefits Lease Terminationand Other Costs Total

A summary of changes in outstanding stock options is as follows:
Additional information regarding stock options outstanding at December 31, 2003 is as follows:
17. Earnings Per Share:
The following table reconciles income (numerator) and shares (denominator) used in our computations of earningsper share for the years ended December 31, 2003, 2002, and 2001 (in thousands):
S i n c l a i r B r o a d c a s t G r o u p56
Outstanding at end of 2000 7,408,945. $ 17.73 3,886,793 $ 14.88
2001 Activity:
Granted 676,400. 8.93 — —
Exercised (63,287) 9.20 — —
Forfeited (792,613) 18.94 — —
Outstanding at end of 2001 7,229,445. 16.85 4,666,669 15.65
2002 Activity:
Granted 295,400. 12.15 — —
Exercised (283,812) 9.23 — —
Forfeited (645,275) 20.67 — —
Outstanding at end of 2002 6,595,758. 16.66 5,073,533 16.08
2003 Activity:
Granted 428,500. 9.45 — —
Exercised (159,162) 9.24 — —
Forfeited (356,213) 20.83 — —
Outstanding at end of 2003 6,508,883. 16.07 5,531,870 16.09
Options
Weighted-Average Exercise
Price Exercisable
Weighted-Average Exercise
Price
498,550 $ 6.10 - 9.06 7.9 261,287 $ 8.61
1,271,463 $ 9.22 - 13.68 7.0 934,538 $ 9.87
3,165,870 $ 13.87 - 18.88 2.6 3,151,170 $ 15.27
1,573,000 $ 20.94 - 28.42 4.4 1,184,875 $ 24.84
6,508,883 $ 6.10 - 28.42 4.3 5,531,870 $ 16.09
Outstanding Exercise Price
Weighted-AverageRemaining
Contractual Life(in years) Exercisable
Weighted-AverageExercise Price
Numerator
Net income (loss) from continuing operations $ 22,751. $ (5,981) $ (127,670)
Net income from discontinued operations, including gain on sale of broadcast assets related to discontinued operations $ 1,641. $ 7,891. $ (52)
Cumulative adjustment for change in accounting principle $ — $ (566,404) $ —
Net income (loss) $ 24,392. $ (564,494) $ (127,722)
Preferred stock dividends payable (10,350) (10,350) (10,350)
Net income (loss) available to common shareholders $ 14,042. $ (574,844) $ (138,072)
Denominator
Weighted-average number of common shares 85,651. 85,337. 84,352.
Dilutive effect of outstanding stock options 142. 243. 31.
Dilutive effect of equity put options — — 241.
Weighted-average number of common equivalent shares outstanding 85,793. 85,580. 84,624.
2003 2002 2001

Basic earnings per share (EPS) is calculated using the weighted average number of shares outstanding during theperiod. Diluted earnings per share (Diluted EPS) includes the potentially dilutive effect, if any, which would occur ifoutstanding options to purchase common stock were exercised using the treasury stock method. Stock options topurchase 0.2 million and 0.3 million incremental shares of common stock were outstanding during the years endedDecember 31, 2002 and December 31, 2001, respectively, but were not included in the computation of diluted EPS asthe effect would be anti-dilutive. Stock options to purchase shares of common stock were outstanding during the yearsended December 31, 2003, 2002 and 2001, but were not included in the computation of diluted EPS because theoption's exercise price was greater than the average market price of the common shares. Common shares that would beissued upon conversion of our convertible notes are not included in the computation of diluted EPS because theconversion price was greater than the average market price of the common shares. Common shares that would be issuedupon conversion of our preferred stock were not included in the computation of diluted EPS because the effect wouldbe anti-dilutive.
18. CONDENSED CONSOLIDATING FINANCIAL STATEMENTS:
Sinclair Television Group, Inc. (STG) is a 100% owned subsidiary of Sinclair Broadcast Group, Inc. that was createdin 2003. On September 30, 2003, we completed the creation of a modified holding company structure, whereby wetransferred substantially all of our television broadcast assets and liabilities to STG. As such, STG has become the primaryobligor under our existing bank credit agreement, the 8.75% Senior Subordinated Notes due 2011 and the 8% SeniorSubordinated Notes due 2012. Our class A Common Stock, class B Common Stock, Series D Convertible ExchangeablePreferred Stock and the 4.875% Convertible Senior Subordinated Notes remain at Sinclair Broadcast Group, Inc. andare not obligations or securities of STG.
Sinclair Broadcast Group, Inc. has fully and unconditionally guaranteed all of STG's obligations and those guaranteesare joint and several. KDSM, LLC is a 100% owned subsidiary of Sinclair Broadcast Group, Inc. and has fully andunconditionally guaranteed all of STG's obligations and those guarantees are joint and several. Neither Sinclair BroadcastGroup, Inc. nor the guarantors have any significant restrictions on their ability to obtain funds from their subsidiaries inthe form of dividends or loans.
Although STG was created on September 30, 2003, we have presented balance sheets, statements of operations andcash flows as if STG was in existence in prior periods.
The following condensed consolidating financial statements present the results of operations, financial position andcash flows of Sinclair Broadcast Group, Inc., STG, KDSM LLC, the direct and indirect non-guarantor subsidiaries ofSinclair Broadcast Group, Inc. and the eliminations necessary to arrive at our information on a consolidated basis.
2 0 0 3 A n n u a l R e p o r t 57

BALANCE SHEET AS OF DECEMBER 31, 2003(in thousands)
Cash $ — $ 25,440. $ 44. $ 3,246. $ — $ 28,730.
Accounts receivable 521. 136,300. 1,502. 1,438. — 139,761.
Other current assets 1,605. 83,557. 878. 6,487. (225) 92,302.
Total current assets 2,126. 245,297. 2,424. 11,171. (225) 260,793.
Property and equipment, net 11,772. 336,636. 5,520. 1,889. — 355,817.
Investment in consolidated subsidiaries 332,374. — — — (332,374) —
Other long term assets 53,219. 95,040. 281. 6,106. (12,298) 142,348.
Total other long term assets 385,593. 95,040. 281. 6,106. (344,672) 142,348.
Acquired intangible assets — 1,769,434. 5,913. 30,277. — 1,805,624.
Total Assets $ 399,491. $ 2,446,407. $ 14,138. $ 49,443. $ (344,897) $ 2,564,582.
Accounts payable and accrued liabilities $ 7,200. $ 65,567. $ 506. $ 5,864. $ (227) $ 78,910.
Current portion of long-term debt 1,117. 6,165. — 35,000. — 42,282.
Other current liabilities — 122,184. 1,842. — — 124,026.
Total current liabilities 8,317. 193,916. 2,348. 40,864. (227) 245,218.
Long-term debt 161,613. 1,526,329. 2,233. — — 1,690,175.
Other liabilities — 407,505. 1,024. 3,953. (12,298) 400,184.
Total liabilities 169,930. 2,127,750. 5,605. 44,817. (12,525) 2,335,577.
Preferred stock 35. — — — — 35.
Common stock 858. — — — — 858.
Additional paid-in capital 762,584. 655,036. 21,542. 38,479. (715,053) 762,588.
Retained earnings (533,916) (335,819) (13,009) (33,853) 382,681. (533,916)
Other comprehensive income — (560) — — — (560)
Total shareholders' equity 229,561. 318,657. 8,533. 4,626. (332,372) 229,005.
Total liabilities and shareholders' equity $ 399,491. $ 2,446,407. $ 14,138. $ 49,443. $ (344,897) $ 2,564,582.
S i n c l a i r B r o a d c a s t G r o u p58
SinclairBroadcast
Group, Inc.
SinclairTelevision
Group, Inc. KDSM, LLCNon-Guarantor
Subsidiaries EliminationsSinclair
Consolidated
Guarantor Subsidiaries

2 0 0 3 A n n u a l R e p o r t 59
PRO-FORMA BALANCE SHEET AS OF DECEMBER 31, 2002(in thousands)
Cash $ — $ 3,704. $ 5 $ 1,618. $ — $ 5,327.
Accounts receivable 157 144,675. 1,421 749. — 147,002.
Other current assets 1,759 141,801. 2,456 4,614. (5,905) 144,725.
Total current assets 1,916 290,180. 3,882 6,981. (5,905) 297,054.
Property and equipment, net 13,051 314,802. 6,143 3,254. — 337,250.
Investment in parent preferred securities — — 206,200 — (206,200) —
Investment in consolidated subsidiaries 386,413 — — — (386,413) —
Other long-term assets 40,534 102,523. 4,671 6,268. (10,159) 143,837.
Total other long term assets 426,947 102,523. 210,871 6,268. (602,772) 143,837.
Acquired intangible assets — 1,792,278. 6,077 30,277. — 1,828,632.
Total Assets $ 441,914 $ 2,499,783. $ 226,973 $ 46,780. $ (608,677) $ 2,606,773.
Accounts payable and accrued liabilities $ 8,227 $ 73,935. $ 1,529 $ 1,952. $ (5,905) $ 79,738.
Current portion of long term debt 1,111 3,338. — — — 4,449.
Other current liabilities — 122,603. 1,764 — — 124,367.
Total current liabilities 9,338 199,876. 3,293 1,952. (5,905) 208,554.
Long-term debt 13,519 1,496,821. 2,181 35,000. — 1,547,521.
Other liabilities — 440,989. 1,780 6,908. (10,159) 439,518.
Total liabilities 22,857 2,137,686. 7,254 43,860. (16,064) 2,195,593.
Mandatorily redeemable preferred stock — — 200,000 — — 200,000.
Preferred stock 35. — — — — 35.
Common stock 856. — — — — 856.
Additional paid-in capital 966,124. 767,267. 18,751 30,893. (1,023,108) 759,927.
Retained earnings (547,958) (403,490) 968 (27,973) 430,495. (547,958)
Other comprehensive income — (1,680) — — — (1,680)
Total shareholders' equity 419,057. 362,097. 19,719 2,920. (592,613) 211,180.
Total liabilities and shareholders' equity $ 441,914. $ 2,499,783. $ 226,973 $ 46,780. $ (608,677) $ 2,606,773.
SinclairBroadcast
Group, Inc.
SinclairTelevision
Group, Inc. KDSM, LLCNon-Guarantor
Subsidiaries EliminationsSinclair
Consolidated
Guarantor Subsidiaries

S i n c l a i r B r o a d c a s t G r o u p60
PRO-FORMA STATEMENT OF OPERATIONS FOR THE YEAR ENDED DECEMBER 31, 2003(in thousands)
Net revenue $ — $ 716,101. $ 8,072. $ 14,568. $ — $ 738,741.
Program and production — 146,256. 1,681. — — 147,937.
Selling, general and administrative 14,536. 152,279. 2,363. 1,972. — 171,150.
Depreciation, amortization and other operating expenses 2,673. 222,790. 3,382. 17,786. — 246,631.
Total operating expenses 17,209. 521,325. 7,426. 19,758. — 565,718.
Operating income (17,209) 194,776. 646. (5,190) — 173,023.
Equity in earnings of subsidiaries 47,814. — — — (47,814) —
Interest income 468. 92. — — — 560.
Interest expense (5,187) (120,383) (582) (2,076) — (128,228)
Other income (expense) 3,874. 17,381. (14,041) (1,849) (12,300) (6,935)
Total other income (expense) 46,969. (102,910) (14,623) (3,925) (60,114) (134,603)
Income taxes 6,932. (24,195) — 3,235. — (14,028)
Net income (loss) $ 36,692. $ 67,671. $ (13,977) $ (5,880) $ (60,114) $ 24,392.
SinclairBroadcast
Group, Inc.
SinclairTelevision
Group, Inc. KDSM, LLCNon-Guarantor
Subsidiaries EliminationsSinclair
Consolidated
Guarantor Subsidiaries

2 0 0 3 A n n u a l R e p o r t 61
PRO-FORMA STATEMENT OF OPERATIONS FOR THE YEAR ENDED DECEMBER 31, 2002(in thousands)
Net revenue $ — $ 723,198. $ 8,247. $ 4,344. $ — $ 735,789.
Program and production — 140,127. 1,753. (1,820) — 140,060.
Selling, general and administrative 18,900. 142,369. 2,431. (557) — 163,143.
Depreciation, amortization and other operating expenses 1,918. 235,219. 3,166. 7,653. — 247,956.
Total operating expenses 20,818. 517,715. 7,350. 5,276. — 551,159.
Operating income (20,818) 205,483. 897. (932) — 184,630.
Equity in earnings of subsidiaries (553,207) — — — 553,207. —
Interest income 1,461. 22. 1. — — 1,484.
Interest expense (30) (124,402) (248) (1,820) — (126,500)
Other income (expense) 41,595. (87,172) 3,183. (1,330) (26,033) (69,757)
Total other income (expense) (510,181) (211,552) 2,936. (3,150) 527,174. (194,773)
Income taxes (7,462) 10,547. — 1,077. — 4,162.
Discontinued operations — 7,891. — — — 7,891.
Cumulative effect on change in accounting principle — (539,712) (23,178) (3,514) — (566,404)
Net income (loss) $ (538,461) $ (527,343) $ (19,345) $ (6,519) $ 527,174. $ (564,494)
SinclairBroadcast
Group, Inc.
SinclairTelevision
Group, Inc. KDSM, LLCNon-Guarantor
Subsidiaries EliminationsSinclair
Consolidated
Guarantor Subsidiaries

S i n c l a i r B r o a d c a s t G r o u p62
PRO-FORMA STATEMENT OF OPERATIONS FOR THE YEAR ENDED DECEMBER 31, 2001(in thousands)
Net revenue $ — $ 669,200. $ 8,526. $ 6,925. $ — $ 684,651.
Program and production — 140,961. 1,735. — — 142,696.
Selling, general and administrative 19,613. 137,522. 2,543. 210. 159,888.
Depreciation, amortization and other operating expenses 2,262. 323,942. 4,113. 13,747. — 344,064.
Total operating expenses 21,875. 602,425. 8,391. 13,957. 646,648.
Operating income (21,875) 66,775. 135. (7,032) — 38,003.
Equity in earnings of subsidiaries (96,533) — — — 96,533 —
Interest income 2,637. 6. — — — 2,643.
Interest expense (901) (142,592) (81) — — (143,574)
Other income (expense) (85,678) (68,367) 2,948. (3,821) 70,501 (84,417)
Total other income (expense) (180,475) (210,953) 2,867. (3,821) 167,034 (225,348)
Income taxes 4,127. 52,083. — 3,465. — 59,675.
Discontinued operations — (52) — — — (52)
Net income (loss) $ (198,223) $ (92,147) $ 3,002. $ (7,388) $ 167,034 $ (127,722)
SinclairBroadcast
Group, Inc.
SinclairTelevision
Group, Inc. KDSM, LLCNon-Guarantor
Subsidiaries EliminationsSinclair
Consolidated
Guarantor Subsidiaries

2 0 0 3 A n n u a l R e p o r t 63
PRO-FORMA STATEMENT OF CASH FLOWS FOR THE YEAR ENDED DECEMBER 31, 2003(in thousands)
NET CASH FLOWS FROM OPERATING ACTIVITIES $ (14,201) $ 187,676. $ (8,774) $ (3,648) $ (12,300) $ 148,753.
CASH FLOWS FROM INVESTING ACTIVITIES:
Acquisition of property and equipment (884) (68,494) (153) — — (69,531)
Payment for acquisition of television station licenses and related assets — (18,000) — — — (18,000)
Distributions from investments — 307. — — — 307.
Contributions in investments (2,361) (3,338) — — — (5,699)
Proceeds from the sale of property — 138. — — — 138.
Repayments of loans to affiliates (1,115) — — — — (1,115)
Proceeds from loans to affiliates 903. — — — — 903.
Net cash flows used in investing activities (3,457) (89,387) (153) — — (92,997)
CASH FLOWS FROM FINANCING ACTIVITIES:
Proceeds from notes payable and commercial bank financing 150,000. 168,336. — — — 318,336.
Repayments of notes payable, commercial bank financing and capital leases (1,901) (127,199) — — — (129,100)
Accretion of capital leases — 723. — — — 723.
Redemption of High Yield Trust Originated Preferred Securities — — (200,000) — — (200,000)
Proceeds from exercise of stock options 1,431. — — — — 1,431.
Payments for deferred financing costs (4,820) (2,582) — — — (7,402)
Increase (decrease) in intercompany payables 103,342. (111,384) 2,766. 5,276 — —
Dividends paid on Series D Preferred Stock (10,350) — — — — (10,350)
Repurchase of Class A common stock (1,544) — — — — (1,544)
Payment of KDSM dividend (12,300) — — — 12,300 —
Redemption of parent preferred securities (206,200) — 206,200. — — —
Repayment of notes and capital leases to affiliates — (4,447) — — — (4,447)
Net cash flows (used in) from financing activities 17,658. (76,553) 8,966. 5,276 12,300 (32,353)
NET INCREASE IN CASH AND CASH EQUIVALENTS — 21,736. 39. 1,628 — 23,403.
CASH AND CASH EQUIVALENTS, beginning of period — 3,704. 5. 1,618 — 5,327.
CASH AND CASH EQUIVALENTS, end of period $ — $ 25,440. $ 44. $ 3,246 $ — $ 28,730.
SinclairBroadcast
Group, Inc.
SinclairTelevision
Group, Inc. KDSM, LLCNon-Guarantor
Subsidiaries EliminationsSinclair
Consolidated
Guarantor Subsidiaries

S i n c l a i r B r o a d c a s t G r o u p64
PRO-FORMA STATEMENT OF CASH FLOWSFOR THE YEAR ENDED DECEMBER 31, 2002 (in thousands)
NET CASH FLOWS FROM OPERATING ACTIVITIES $ 5,891. $ 161,215. $ 5,370. $ 3,172. $ (26,033) $ 149,615.
CASH FLOWS FROM INVESTING ACTIVITIES:
Acquisition of property and equipment (1,629) (60,540) (808) 68. — (62,909)
Payment for acquisition of television station licenses and related assets — (20,625) — (553) — (21,178)
Distributions from investments — 654. — — — 654.
Contributions in investments (22,745) (1,992) — (1,083) — (25,820)
Proceeds from sale of property — 94. 600 — — 694.
Proceeds from the sale of broadcast assets — 124,472. — — — 124,472.
Repayment of note receivable — 30,257. — — — 30,257.
Repayments of loans to affiliates (104) — — — — (104)
Proceeds from loans to affiliates 6,756. — — — — 6,756.
Net cash flows used in investing activities (17,722) 72,320. (208) (1,568) — 52,822.
CASH FLOWS FROM FINANCING ACTIVITIES:
Proceeds from notes payable and commercial bank financing — 1,263,075. — — — 1,263,075.
Repayments of notes payable, commercial bank financing and capital leases (1,846) (1,490,702) — — — (1,492,548)
Accretion of capital leases — 621. — — — 621.
Proceeds from exercise of stock options 2,807. — — — — 2,807.
Payments for deferred financing costs — (10,503) — — — (10,503)
Increase (decrease) in intercompany payables 47,253. (42,088) (5,165) — — —
Dividends paid on Series D Preferred Stock (10,350) — — — — (10,350)
Proceeds from derivative termination — 21,849. — — — 21,849.
Payment of KDSM dividend (26,033) — — — 26,033. —
Repayment of notes and capital leases to affiliates — (4,124) — — — (4,124)
Net cash flows used in financing activities 11,831. (261,872) (5,165) — 26,033. (229,173)
NET INCREASE (DECREASE) IN CASH AND CASH EQUIVALENTS — (28,337) (3) 1,604. — (26,736)
CASH AND CASH EQUIVALENTS, beginning of period — 32,041. 8. 14. — 32,063.
CASH AND CASH EQUIVALENTS, end of period $ — $ 3,704. $ 5. $ 1,618. $ — $ 5,327.
SinclairBroadcast
Group, Inc.
SinclairTelevision
Group, Inc. KDSM, LLCNon-Guarantor
Subsidiaries EliminationsSinclair
Consolidated
Guarantor Subsidiaries

2 0 0 3 A n n u a l R e p o r t 65
PRO-FORMA STATEMENT OF CASH FLOWS FOR THE YEAR ENDED DECEMBER 31, 2001 (in thousands)
NET CASH FLOWS FROM OPERATING ACTIVITIES $ (97,086) $ 175,201. $ 6,220. $ 586. $ (26,033) $ 58,888.
CASH FLOWS FROM INVESTING ACTIVITIES:
Acquisition of property and equipment (576) (26,443) (1,727) (271) — (29,017)
Payment for acquisition of television station licenses and related assets — (490) — — — (490)
Distributions from investments 79. 329. — — — 408.
Contributions in investments (850) (250) — (400) — (1,500)
Proceeds from the sale of property 9. 974. — — — 983.
Deposits received on future sale of broadcast assets — 125. — — — 125.
Repayments of loans to affiliates (4,078) — — — — (4,078)
Proceeds from loans to affiliates 231. — — — — 231.
Net cash flows used in investing activities (5,185) (25,755) (1,727) (671) — (33,338)
CASH FLOWS FROM
FINANCING ACTIVITIES:
Proceeds from notes payable and commercial bank financing — 1,334,000 — — — 1,334,000.
Repayments of notes payable, commercial bank financing and capital leases — (1,291,000) — — — (1,291,000)
Accretion of capital leases — 1,794. — — — 1,794.
Repurchase of Class A Common Stock (4,397) — — (4,397) — —
Proceeds from exercise of stock options 583. — — — — 583.
Payments for deferred financing costs — (11,993) — — — (11,993)
Payment for equity put option premium (7,733) — — — — (7,733)
Increase (decrease) in intercompany payables 151,968. (147,411) (4,557) — — —
Dividends paid on Series D Preferred Stock (10,350) — — — — (10,350)
Payment of KDSM dividend (26,033) — — — 26,033. —
Repayment of notes and capital leases to affiliates (1,767) (6,715) — — — (8,482)
Net cash flows used in financing activities 102,271. (121,325) (4,557) — 26,033. 2,422.
NET INCREASE (DECREASE) IN CASH AND CASH EQUIVALENTS — 28,121. (64) (85) — 27,972.
CASH AND CASH EQUIVALENTS, beginning of period — 3,920. 72. 99. — 4,091.
CASH AND CASH EQUIVALENTS, end of period $ — $ 32,041. $ 8. $ 14. $ — $ 32,063.
SinclairBroadcast
Group, Inc.
SinclairTelevision
Group, Inc. KDSM, LLCNon-Guarantor
Subsidiaries EliminationsSinclair
Consolidated
Guarantor Subsidiaries

S i n c l a i r B r o a d c a s t G r o u p66
19. QUARTERLY FINANCIAL INFORMATION (UNAUDITED):(in thousands, except per share data)
Total revenues $ 170,677. $ 195,775. $ 179,437 $ 192,852
Operating income 30,014. 55,530. 41,711 45,768
Net income (loss) from continuing operations (1,348) 670. 6,462 16,966
Net income (loss) available to common shareholders (3,936) (1,917) 3,875 16,020
Basic earnings (loss) per share from continuing operations (0.05) (0.02) 0.05 0.17
Basic earnings (loss) per share (0.05) (0.02) 0.05 0.19
Diluted earnings (loss) per share from continuing operations (0.05) (0.02) 0.05 0.17
Diluted (loss) earnings per share (0.05) (0.02) 0.05 0.19
Total revenues $ 160,379. $ 190,670. $ 178,567. $ 206,173
Operating income 28,854. 49,078. 42,998. 63,700
Net income (loss) from continuing operations (900) (2,009) (29,205) 26,133
Income (loss) from discontinued operations (458) 585. 7,764. —
Loss from change in accounting principle (566,404) — — —
Net income (loss) available to common shareholders (570,350) (4,011) (24,029) 23,546
Basic earnings (loss) per share from continuing operations (0.04) (0.05) (0.37) 0.28
Basic earnings (loss) per share from discontinued operations (0.01) 0.01 0.09 —
Basic loss per share from change in accounting principle (6.67) — — —
Basic earnings (loss) per share (6.72) (0.05) (0.28) 0.28
Diluted earnings (loss) per share from continuing operations (0.04) (0.05) (0.37) 0.27
Diluted earnings (loss) per share from discontinued operations (0.01) 0.01 0.09 —
Diluted loss per share from change in accounting principle (6.67) — — —
Diluted earnings (loss) earnings per share (6.72) (0.05) (0.28) 0.27
(1) The results previously reported in our Form 10-Q for the quarters ended March 31, 2002, September 30, 2002 and our Form 10-K for the year endedDecember 31, 2002 have been restated to reflect the adoption of SFAS No. 145 as discussed in Note 1 to record gains and losses on extinguishment of debtas a component of income from continuing operations rather than as an extraordinary item.
03/31/03 06/30/03 09/30/03 12/31/03For the Quarter Ended,
03/31/02(1) 06/30/02 09/30/02(1) 12/31/02(1)For the Quarter Ended,

MARKET FOR REGISTRANT'S COMMON EQUITY AND RELATED STOCKHOLDER MATTERS
Our class A common stock is listed for trading on the NASDAQ stock market under the symbol SBGI. The followingtable sets forth for the periods indicated the high and low sales prices on the NASDAQ stock market.
As of February 13, 2004, there were approximately 71 shareholders of record of our common stock. This number doesnot include beneficial owners holding shares through nominee names. Based on information available to us, we believewe have more than 5,000 beneficial owners of our class A common stock.
We generally have not paid a dividend on our common stock and do not expect to pay dividends on our commonstock in the foreseeable future. Our 2002 Bank Credit Agreement and some of our subordinated debt instrumentsgenerally restrict us from paying dividends on our common stock. Under the indentures governing our 8.75% seniorsubordinated notes due 2011 and 8% senior subordinated notes due 2012, we are restricted from paying dividends onour common stock unless certain specified conditions are satisfied, including that:
• no event of default then exists under the indenture or certain other specified agreements relating to ourindebtedness; and
• we, after taking account of the dividend, are in compliance with certain net cash flow requirementscontained in the indenture. In addition, under certain of our senior unsecured debt, the payment ofdividends is not permissible during a default thereunder.
2 0 0 3 A n n u a l R e p o r t 67
First Quarter $ 12.02 $ 7.68
Second Quarter 13.24 7.76
Third Quarter 12.20 9.63
Fourth Quarter 15.43 10.12
High Low2003
First Quarter $ 13.78 $ 9.00
Second Quarter 17.75 11.95
Third Quarter 14.97 9.97
Fourth Quarter 14.16 10.35
High Low2002

REPORT OF INDEPENDENT AUDITORS
To the Board of Directors and Shareholders of Sinclair Broadcast Group, Inc.
We have audited the accompanying consolidated balance sheets of Sinclair Broadcast Group, Inc. (a Marylandcorporation) and subsidiaries as of December 31, 2003 and 2002, and the related consolidated statements of operations,shareholders' equity and cash flows for each of the three years in the period ended December 31, 2003. These financialstatements are the responsibility of the Company's management. Our responsibility is to express an opinion on thesefinancial statements based on our audits.
We conducted our audits in accordance with auditing standards generally accepted in the United States. Thosestandards require that we plan and perform the audit to obtain reasonable assurance about whether the financialstatements are free of material misstatement. An audit includes examining, on a test basis, evidence supporting theamounts and disclosures in the financial statements. An audit also includes assessing the accounting principles used andsignificant estimates made by management, as well as evaluating the overall financial statement presentation. We believethat our audits provide a reasonable basis for our opinion.
In our opinion, the financial statements referred to above present fairly, in all material respects, the financial positionof Sinclair Broadcast Group, Inc. and subsidiaries as of December 31, 2003 and 2002, and the results of their operationsand their cash flows for each of the three years in the period ended December 31, 2003, in conformity with accountingprinciples generally accepted in the United States.
As discussed in Note 3 to the notes to the consolidated financial statements, during the year ended December 31,2002, the Company changed the method in which it accounts for goodwill and other intangible assets upon adoptionof Statement of Financial Accounting Standard No. 142, "Goodwill and Other Intangible Assets" on January 1, 2002.
As discussed in Note 7 to the notes to the consolidated financial statements, the Company changed its method ofaccounting for derivative transactions effective January 1, 2001.
ERNST & YOUNG LLP
Baltimore, MarylandFebruary 3, 2004 (except for Note 9,as to which the date is February 25, 2004)
S i n c l a i r B r o a d c a s t G r o u p68

MANAGEMENT'S REPORT ON CONSOLIDATED FINANCIAL STATEMENTSAND INTERNAL CONTROLS
The accompanying consolidated financial statements have been prepared by the management of Sinclair BroadcastGroup, Inc. in accordance with accounting principles generally accepted in the United States, and accordingly, includecertain amounts which are based upon informed judgements and estimates. The other financial information appearingelsewhere in this Annual Report is consistent with that in the consolidated financial statements.
Management maintains a system of internal accounting controls designed to meet their responsibility for reliablefinancial information. Management believes that its accounting controls provide reasonable assurance, at an appropriatecost, that assets are safeguarded, that transactions are properly authorized and that established policies and proceduresare followed. Among these policies is a corporate code of conduct which requires employees to maintain the highestethical standards in conducting Company affairs.
The Company's consolidated financial statements have been audited by Ernst & Young LLP, independent auditors,who express their opinion with respect to the fairness of the Company's reported results of operations and financialposition and who also obtain a sufficient understanding of the internal control structure to establish a basis for reliancethereon in determining the nature, extent and timing of audit tests applied in the examination of the consolidatedfinancial statements.
The Audit Committee of the Board of Directors, comprised solely of outside directors, meets with management andErnst & Young LLP periodically to review planned audit scope and results, and to discuss other matters affecting theCompany's internal accounting controls and financial reporting. The independent auditors have free access to the AuditCommittee, with or without management present, to discuss appropriate matters.
David D. SmithChairman of the Board, President andChief Executive Officer
David B. AmyExecutive Vice President and Chief Financial Officer
David R. BochenekChief Accounting Officer/Controller
2 0 0 3 A n n u a l R e p o r t 69

S i n c l a i r B r o a d c a s t G r o u p70
Les T. VannAsheville, NC
William J. FanshaweBaltimore, MD
Scott D. Campbell Birmingham, AL
Donald Moran Buffalo, NY
Theodore J. Stephens Cape Girardeau, MO
Gary Hackler Champaign, IL
Jack Connors Champaign & Springfield, IL
David Tynan Charleston, SC
Alan B. Frank Charleston, WV
Merry Ewing Cincinnati, OH
John Quigley Columbus, OH
Bill Ross Dayton, OH
Theodore J. Stephens Des Moines, IA
David Schwartz Flint, MI
Leesa Wilcher Johnson City, TN
Mark L. Martin Kansas City, KS
Robert D. Weisbord Las Vegas, NV
James L. Ottolin Lexington, KY
Marshall Porter Madison, WI
David Ford Milwaukee, WI
Art A. Lanham Minneapolis, MN
Steve Mann Nashville, TN
Scott J. Sanders Norfolk, VA
Randy Pratt Oklahoma City, OK
Carl M. Leahy Pensacola, FL
Alan B. Frank Pittsburgh, PA
Alan Cartwright Portland, ME
Neal Davis Raleigh, NC
William Lane Richmond, VA
Matthew L. Kreiner Rochester, NY
Daniel P. Mellon Sacramento, CA
John Seabers San Antonio, TX
Chris Westerkamp Springfield, MA
Thomas L. Tipton St. Louis, MO
Aaron R. Olander Syracuse, NY
Bob Franklin Tallahassee, FL
Julie Nelson Tampa, FL
Beth Worsham Winston-Salem, NC
G1440, Inc. Lawrence M. Fiorino, CEO
GENERAL MANAGERS / STATION MANAGERS