Lecture 3: methods and terminology, part I - Spin Dynamics ...

1
SANDARS LECTURES 2007: CONVERSATIONS WITH MAPS
Sarah Tyacke CB
Lecture III: There are maps and there are maps – motives, markets and users As Christian Jacob put it ‘There are maps and there are maps’. More prosaically the
nature of them depends on what you want the map or chart for and how you the reader
perceive it? This third lecture is about what drove the cartographic activity internally
and externally and how did it manifest itself in England and the rest of maritime
Europe through its distributors, patrons and readers. This is probably the most
challenging subject, first articulated in embryonic form as part of the history of
cartography’s remit in the 1970s by David Woodward (as we saw in lecture I) and
developed thereafter as the history of cartography took a ‘second turn’ and embraced
social context.
This ‘second turn’ challenged the inevitability of progress in cartography and
understood that cartography was just as much a product of its society as other texts. In
the case of Brian Harley he took this further arguing powerfully, from the examples
he found, that in the early modern period with the rise of the nation state and
European expansion ‘cartography was primarily a form of political discourse
concerned with the acquisition and maintenance of power’ (Imago Mundi 1988, 40
pp. 57-76). One might say the same of archives and libraries which spent (and do
spend) their time ordering knowledge in the shape of books and manuscripts. In the
case of a National Archives there is a clear explicit connection between the state and
the archive; but even here within the archive and within the map there are other
human elements at work as well, even subversive at least when it comes to
interpreting them.
This lecture is thus the third conversation; that between the clients and sponsors of
mapping in maritime Europe like the sovereigns and their ministers, who set fashion
(as they always had done), other patrons and clients of mapping, including the
commercial companies we mentioned in lecture II, like the East India Companies of

2
the Dutch and the English, and the markets for maps and the readers of maps at the
time. And of course, the permanent discourse what we historians might make of their
use of maps and charts today as discussed in lecture I.
In spite of a great deal of work on the readership for maps in the early modern period,
for example, in bibles which must have been a common way of seeing maps for many
people, or in the rooms and libraries of Cambridge Fellows, on which Catherine
Delano Smith has worked in depth (C. Delano Smith ‘Map ownership in sixteenth
century Cambridge: the evidence of probate inventories’ Imago Mundi vol.47(1995)
pp.67-93) much more basic work needs to be done to uncover more evidence e.g. the
presence of atlases and maps (with annotations) in libraries to understand this aspect
of the history of cartography. The map as a commodity being bought and sold and, in
particular, the ‘little’ maps which were cheapest to produce has been recently
explored, again by Catherine Delano Smith, and she has clearly set us the parameters
for further research in this particular area. (C Delano Smith, ‘The map as commodity ‘
in Plantejaments I objectius d’una historia universal de la cartographia. Barcelona,
2001 pp.91-109). In this lecture I also want to address the question, which has been
running through these lectures, what was the relationship between the manuscript and
printed map?
As we have seen the Mercator projection, although in print as a world map from
1569, (Slide 3) and mathematically explained by Wright in 1599, was not used for
some considerable time at a practical level at sea.
The published map of the world of 1569 was very impressive and came from an
authorative leader in the geographical and thus the scientific publishing world, Gerard
Mercator. Its size, like the Martellus and other wall maps, made it equally imposing
and distinctive; its engraving was beautiful and its information comprehensive. It was
in itself an archive of the known world, incorporating the latest graphical invention of
the Mercator projection which gave the reader a sense of the correct direction in
which the countries of the world lay one from another and their relative distances. It
was in print and could be sold throughout Europe by the distributive mechanisms of
the markets. So it could become well known as a printed world map for display on a
wall or for teaching perhaps, certainly for reference. Versions of it appeared in the
Dutch atlases of the day and it was referred to in literature. While it was a great
success amongst academics, as far as we know, and presumably with the

3
knowledgeable public, it failed to satisfy the seamen until Wright’s explanation of it
in 1599 made it more accessible, but even then it failed to catch on. This was not just
case of ignorance, but as we have seen of disagreements as to its efficacy at sea and
even more importantly as to its ease of use. Indeed it is hard to imagine what a
seaman would have made of this printed map at all. Perhaps the Mercator world map
can serve as an extreme example of the likely differing perceptions of different groups
of users and readers of the same map.
We need therefore in the history of the cartography of the time, to take into account
the different uses of the maps and charts and the drivers for them at the various
levels of society e.g. at the levels of crown or state patronage, at the level of
interested aristocratic, other patrons and clients of mapping, and at the level of the
European markets for prints and books, dominated by the mid-seventeenth century by
production in Amsterdam which monopolised the buying and therefore the use of
printed maps and atlases in most of western Europe. At state level we may ask how
far was the drive to better cartography dependent upon other factors like trade, or
religious, political, scientific competition or even competition between the leading
personalities of the day? The answer to this sort of question is not by just juxtaposing
contemporary events with mapping and implying that it is self-evident that there is a
causal relationship, but in carefully examining whether there is any evidence of a
causal connection beyond zeitgeist.
Inevitably at present the bulk of our knowledge tends to come from the existing
known sources, although there have been successful attempts to extend these to more
obscure sources of information like advertisements and annotations in relevant books
and atlases, newspapers etc. We know quite a lot about sovereigns and patrons, those
with money and influence who bought maps and charts both manuscript and printed.
We have already seen (in Lecture II) that the collecting and use of maps and charts
was common in court circles in the sixteenth century, and even before. This area is, of
course, where most collections and records are still partially extant.
It is more difficult to know what they made of the maps, even at this level. If we take
Spain, as an active example of royal patronage, then we see Philip II in 1566
evaluating a report from the Council of the Indies about the voyage of Miguel Lopez
de Legazpi to the Philippines. ‘Tell the councillors’, Philip instructed his secretary
Francisco de Erasso, ‘that they are to make every effort to find all the charts which
exist on this… indeed the originals should be put in the archives at Simancas, and

4
authenticated copies taken to the Council… I think I have some myself and I tried to
find them when I was in Madrid the other day ….’ (Geoffrey Parker, ‘ Philip II, maps
and power’ in Empire war and faith in early modern Europe (2002).Philip’s personal
interest was deep and cartographic activities at state level were clearly dependent to
an appreciable extent on him. In 1582 he had founded a mathematical academy at his
court in Madrid. For England Lord Burghley seems to have performed the same role
as the patron and user of maps. R.A Skelton, and John Andrews in respect of his Irish
maps and, more recently, Peter Barber in Monarchs Ministers and Maps (1992) in his
chapters for the period 1550-1625 have considered Burghley as an accumulator and
user of maps and charts, mostly for state business, but also for reference. Barber has
drawn attention to Burghley’s use of maps for display at Theobalds close to London
where he did his official entertaining. This fashion for maps on walls, noted famously
by John Dee, was presumably taken up by gentlemen across England and it can be
surmised that some of the very large estate plans as well as map tapestries, of which
fragments survive, must have adorned the walls of country houses, although the
evidence for this is hard to come by.
A particular illustrative example of Burghley’s attention to discovery (slide 4),no
doubt for economic purposes and of course world maps, is his acquisition of Ortelius
Atlas in the first edition of 1570, (now at Burghley House, Stamford): on the back of
the first map of the world Cecil has made a note of Frobisher’s third voyage in Latin:
saying that he had left the Thames on ‘25 May 1577 for islands in the frozen sea
situated in latitude 64.17, longitude [gap] on 19 July. Left there 24 August arrived
back in Plymouth 20 September’: a voyage home of just under a month. Burghley’s
map collection was a working collection not a ‘gentleman’s library’ in the sense that
we would understand a ‘country house library’ of the Eighteenth century or later. In
his use of maps, his approach was not much different from Pepys nearly a century
later. Pepys features later in this lecture as patron, client, critic of maps and charts in
his official capacities as Secretary to the Navy Board and Master of Trinity House as
well as being a serious promoter of all things cartographical in his own collecting
interests.
The markets
What sort of markets were there?

5
We have already seen in lecture II, something of the internal motivations of the
practitioners at sea and the work they provided to the various chart makers and
cosmographers of Lisbon, Seville, Dieppe and the Mediterranean ports of Venice,
Genoa, and Marseilles, and later in Enkhuisen and Edam on the Zuyder Zee,
Amsterdam and London. They actively engaged in the chart -making activity and
production by providing surveys to be copied as well as requesting charts to be
made or buying what the chart copyists had to offer and often criticised the
cosmographers and the chart-makers’ work. How this bespoke trade compares with
the dissemination of printed cartography which was going on at the same time, but not
at this stage necessarily superseding it, through the publishing markets is again a big
subject and one of the building blocks still to be completed for the history of
cartography. I can only use some specific examples as illustration.
The bespoke market
The MS market was not of course the same as the book and print trade and had its
own practices and methods of distribution. In London we know that both William
Borough the navigator, and Thomas Hood, the mathematician and physician made
charts for others because they said so, and they may be regarded as the founders of the
commercial trade of chart-making. Hood in his 1592 edition of William Bourne’s
Regiment of the Sea remarks that if the student Philomathes, in the Marriners Guide,
(which was published with the Regiment) wanted to know more he should ‘repaire
unto my lodging being a little from the Minories toward the Towar, you shall not only
have the cardes [i.e.charts] readie to serve your turne for all places to which there is
any trafficque used: but I will be readie to farther you in any other mathematicall
conceit [ i.e. art], to the uttermost of my power.’ Here the market is evidently a
bespoke one for charts and one that offered an additional educational service in
mathematics and scientific instruments, relevant presumably to navigation. Hood
was not solely a chart-maker but a graduate of Trinity College, Cambridge and a
physician who later reverted to his medical profession and moved to Worcester where
he practised as a physician. The part-time nature of this bespoke service reveals chart-
making as a small paid activity in London at the time; not enough to provide full time
employment and one which was very new requiring training which Hood offered
similar to the services offered to consumers of the Internet today.

6
The MS chart trade on the Thames continued until the mid-eighteenth century:
certainly from 1612 it mostly functioned, but not exclusively, within in the master-
apprenticeship arrangements of the London Draper’s Company. The reason for the
connection with the Drapers has never been satisfactorily explained. Tony Campbell
showed in 1973, that the first Draper chart maker John Daniel was apprenticed to a
seaman James Walsh who had been in the Drapers Company since 1554, and who had
then turned to instrument making and had taken on apprentices. A plausible reason for
the Drapers as the Company involved, at least for James Walsh’s presence in it, is that
the Drapers were intent upon finding new markets for their cloth, on the collapse of
the Antwerp market in 1570. They were active in voyages to the Mediterranean, the
Baltic, even to the North East Passage and via the Cape of Good Hope to the East
Indies; it would follow therefore that the ships masters on these voyages were the
potential market for nascent chart making craft and that they might see themselves as
plying that trade after time at sea like James Walsh. Whatever the actual connection,
the Drapers chart makers supplied charts of the Mediterranean and for the coasts of
any where ‘there was traffique.’
Some of this MS cartographical information was turned into printed atlases right at
the end of the seventeenth century when presumably there was enough of a market to
warrant doing so. John Seller (c.1630-97) and John Thornton (1641-1708), for
example, were both manuscript chart-makers and sea atlas publishers. The main
London MS chart trade seems to have finally come to an end at some point after
Robert Friend’s last dated land survey in 1739. Surveys and particular charts of
coasts, places and harbours continued in MS as they were needed locally but not
apparently in such numbers to warrant engraving. The continued use of MS sea
charts was also a feature of the Dutch who had a flourishing group of makers, at
Enkhuizen and Edam on the Zuyder Zee, besides the production of charts and
mapping for the VOC in Amsterdam, which Kees Zandvliet has described in Mapping
for Money (1998). For the highly competitive routes to the East Indies the Dutch
charts remained in MS until the 1750s although we know that the English acquired
them and copied them from the early Seventeenth century onwards; likewise the
Dutch copied anything useful from the English.
Although the chart makers supplied manuscript copies of charts to ships masters for
use at sea, they also made them for specifically decorative purposes for governmental,
aristocratic and mercantile patrons for reference and for display. In the mid-

7
seventeenth century these included, for example, in London Samuel Pepys (1633-
1703) Secretary to the Navy and Master of Trinity House (Slide 5) Painted at much
the same time as the painting for the Mathematical School - slide 6) who had John
Burston’s highly decorated charts on his Admiralty office walls as well as
Gomboust’s map of Paris 1652 on his own library walls (slide 7). The drawing, which
shows Gomboust’s map of Paris 1652 on the wall of the library, was originally bound
up as a frontispiece to one of the volumes of Pepys’s general catalogue and is now
hanging on the wall of the present Library at Magdalene College, Cambridge. (For an
account and full list of Pepys’s maps and atlases see S. Tyacke in R. Latham (ed.)
Catalogue of the Pepys Library …vol. IV maps section., Cambridge, 1989).
Pepys knew Burston (fl.1628-65) whose father had been a sailor and who was the
apprentice of Nicholas Comberford (d.1673). Slide 8 shows a typical Drapers’
Company chart of 1642 made by John Daniel, Comberford’s master. It is a highly
decorative chart of the Mediterranean and would have graced the collections and
walls of the merchants of London, of the ship masters themselves, and later of
collectors of antiquarian items. Burston copied plans and charts for Pepys and his
circle. In particular he made copies of the plan of the harbour of Portsmouth for
Pepys, the King, and the Duke of York and for the Earl of Sandwich. The relationship
with Burston continued over a number of years and Pepys subsequently employed his
apprentice John Thornton (1641-1708).
Where the charts were not copies of original surveys they were usually versions or
copies of Dutch charts. A case in point is the work of Gabriel Tatton (d.1621) and the
Dutch Hydrographer Hessel Gerritsz., Hydrographer to the Dutch United East India
Company (VOC) c. 1617-32. Gerritsz. had prepared a set of experimental charts from
Bantam to Japan in 1618 and then a more definitive set in 1619 for the Dutch
Company, neither of which survive. Gabriel Tatton went on an English East India
Company voyage to the East Indies and Japan in 1619 and drew a set of charts in
Japan probably in 1620. They evidently owe much to the Dutch since Dutch names
are used, although they apparently record the English ships routes on the voyage.
These Tatton charts also cover the same coastlines as envisaged by Gerrtisz. in his
sets of charts 1618 and 1619. (slide 9, Eighteenth century index to Gabriel Tatton’s
atlas probably written in the Hydrographic Office on Alexander Dalrymple’s
instructions, whose correction in his own hand can be seen for chart 6: ‘It is the coast
of Patani on east coast of Malaya.’ Slide 10 East Indies chart by Hessel Gerritsz 1621

8
showing the new shape of the northern portion of Celebes. Slide 11 Tatton’s chart of
Celebes. At the northern tip of Celebes the Dutch place name ‘St. Pieter’ is written
one of a number of names known only on later Gerritsz.’s extant charts).
There was thus a continuing exchange of information between the maritime powers at
professional level irrespective of any hostilities or regulations to the contrary. Harley
and others have pointed out the official objectives of the Dutch East India Company
were to keep material secret, but selling charts evidently went on, as well as other
means of acquiring them. A later example of this practice is part of the Joan Blaeu
series of MS charts on vellum for the Oriental Navigation dating from the late 1660s,
recently bought by Rotterdam Museum from Corpus Christi College, Oxford. The
group of maps was originally presented to Corpus Christi College by their President
Thomas Turner at some point before 1714, when he died. The group of charts and
maps, also includes English pen and ink copies of the Dutch ones and other English
drafts and a proof pull of a map of the river Ganges, perhaps for some English
publishing project. (S. Tyacke et al in S. de Meer, Het Zeekartenboek Zutphen, 2007).
Indeed the practice of the English, and the French seems to have been, to acquire
Dutch charts of the Oriental Navigation, in particular, for that was where their own
markets were, and to copy the Dutch charts exactly in, we suppose multiple copies,
for use at sea or to use them as the basis for compilations and revisions for specific
navigational requirements. From time to time the English also made their own surveys
of particular coasts e.g. around Surat and in this case we know the Dutch had the
English charts on board their ships in the 1620s (personal communication from G.
Schilder). In London this type of activity - copying and compilation and some original
surveying - eventually led to the publication of John Thornton’s English Pilot Third
Volume in 1703.
At the same time the number of MS charts for the Oriental Navigation seems to have
increased considerably in line with Dutch, English and French activity in those waters
at least until the 1750s, when the Dutch finally allowed the publication of Van
Keulen’s Zee-Fakkel Part VI for the Oriental Navigation in 1753. In England,
William Herbert translated into English, D’Apres de Mannevillette’s Neptune
Oriental as the New Directory for the East Indies in 1758, after which all basic
English navigation was printed, supplemented by MS plans of river mouths, harbours
and the like. This seems to have been the tipping point. Far from being superseded by
printed charts, therefore, the MS chart continued to flourish and indeed the numbers

9
of MS charts grew as the carrying trade of the French, English and Dutch grew world-
wide. At any one time there must have been thousands of such MS charts in multiple
copies onboard the various fleets.
Royal and other patrons and ‘better’ maps
Both the quality of the cartography and the map makers’ trade were dependent upon
royal and other important clients often for financial support and for setting the fashion
for buying maps. While the attention and interest could be maintained at that high
level of society, then matters also often improved cartographically; once that interest
failed then things did not improve. The costs of new surveys were very great and the
potential markets for printed maps and atlases either small or specialised or already
dominated by the Dutch across maritime Europe.
At the end of lecture II, I opined, that it was not until the education of the
professionals met the requirements of the Mercator projection (and other requirements
for understanding geometry and mathematics) that more accurately produced
cartography at sea or on land became useful. Scales and distances, geometry and
trigonometry are not necessarily practised much today, but we suppose the relevant
professions can deal with them without our having to know much about them. This
comforting knowledge was not the case then. Not many knew mathematics at all
although the practitioners made their livings from it. As is well known Pepys had to
have lessons in multiplication and division. The drivers for this mathematical
improvement were the patrons certainly in France and England.
To illustrate this point and others, I now return to the picture by Antonio Verrio (slide
12 Antonio Verrio: Foundation of the Mathematical School 1673, finished eventually
in 1684) at Christ’s Hospital with which I began these three ‘Conversations’. First we
need to consider the significance of the design of the picture and then the map or chart
held aloft in this commemorative picture. The map held aloft is usually described
merely as a ‘canvas’ but I find it difficult to believe that was all it was. The person
holding what I prefer to think is a chart in his left hand is undoubtedly Samuel Pepys.
In order to explain the picture further I have to go to France.
10
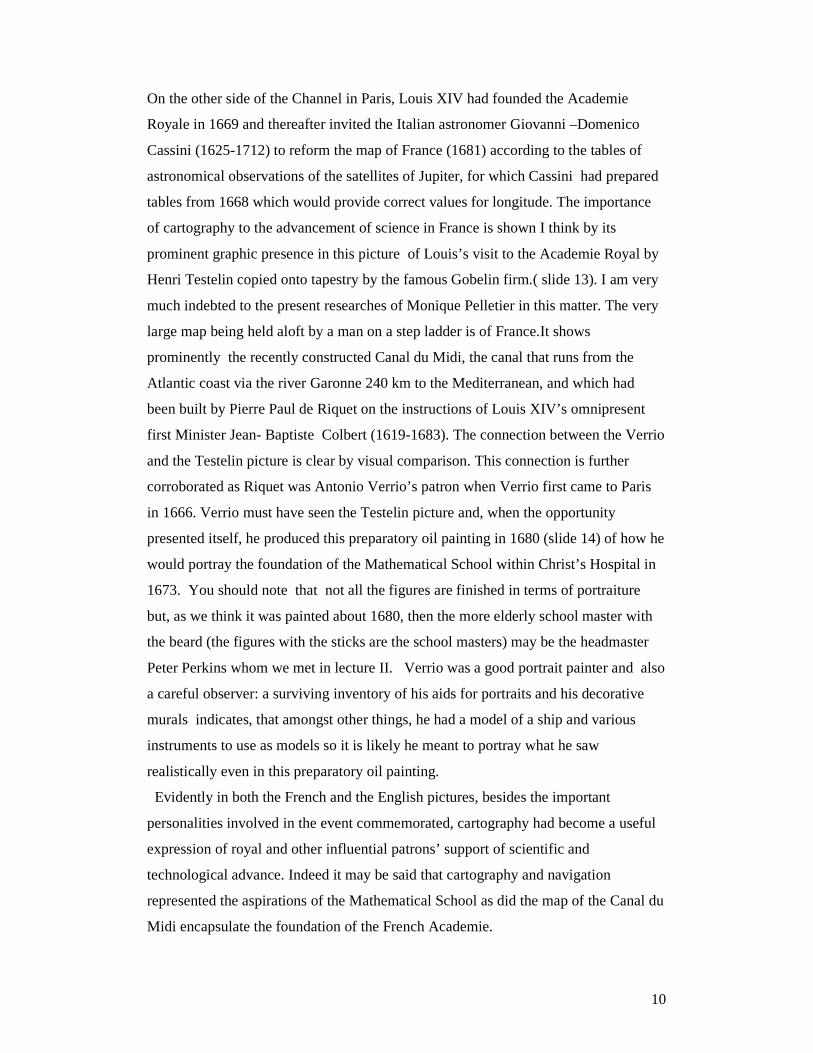
On the other side of the Channel in Paris, Louis XIV had founded the Academie
Royale in 1669 and thereafter invited the Italian astronomer Giovanni –Domenico
Cassini (1625-1712) to reform the map of France (1681) according to the tables of
astronomical observations of the satellites of Jupiter, for which Cassini had prepared
tables from 1668 which would provide correct values for longitude. The importance
of cartography to the advancement of science in France is shown I think by its
prominent graphic presence in this picture of Louis’s visit to the Academie Royal by
Henri Testelin copied onto tapestry by the famous Gobelin firm.( slide 13). I am very
much indebted to the present researches of Monique Pelletier in this matter. The very
large map being held aloft by a man on a step ladder is of France.It shows
prominently the recently constructed Canal du Midi, the canal that runs from the
Atlantic coast via the river Garonne 240 km to the Mediterranean, and which had
been built by Pierre Paul de Riquet on the instructions of Louis XIV’s omnipresent
first Minister Jean- Baptiste Colbert (1619-1683). The connection between the Verrio
and the Testelin picture is clear by visual comparison. This connection is further
corroborated as Riquet was Antonio Verrio’s patron when Verrio first came to Paris
in 1666. Verrio must have seen the Testelin picture and, when the opportunity
presented itself, he produced this preparatory oil painting in 1680 (slide 14) of how he
would portray the foundation of the Mathematical School within Christ’s Hospital in
1673. You should note that not all the figures are finished in terms of portraiture
but, as we think it was painted about 1680, then the more elderly school master with
the beard (the figures with the sticks are the school masters) may be the headmaster
Peter Perkins whom we met in lecture II. Verrio was a good portrait painter and also
a careful observer: a surviving inventory of his aids for portraits and his decorative
murals indicates, that amongst other things, he had a model of a ship and various
instruments to use as models so it is likely he meant to portray what he saw
realistically even in this preparatory oil painting.
Evidently in both the French and the English pictures, besides the important
personalities involved in the event commemorated, cartography had become a useful
expression of royal and other influential patrons’ support of scientific and
technological advance. Indeed it may be said that cartography and navigation
represented the aspirations of the Mathematical School as did the map of the Canal du
Midi encapsulate the foundation of the French Academie.

11
A further question occurs. What was the item in the Verrio picture analogous to
Riquet’s technological triumph, the Canal du Midi on the map of France - the triumph
of joining two seas by a canal? Well if the item being held up on the Verrio is a large
chart as it may be, and certainly the boys of the school are using compasses on other
charts scattered about them. Then what is the image on the chart? What takes the
place of Riquet’s Canal du Midi? Could it be a lighthouse? If so then the critically
important Eddystone Lighthouse off the treacherous Lizard in the Channel guarding
the approaches to Plymouth, often proposed at this time but not completed until 1698,
could be a candidate. Pepys as Master of Trinity House had just renovated Lowestoft
lighthouse in 1678. In another context the titles of English text Dutch sea atlases, like
The Lightning Sea Column or The Sea Beacon all implied that the sea atlases and
charts were as safe a guide to navigation as a lighthouse. In the preparatory oil
painting of 1680 Pepys is the figure pointing to the chart and the item on the chart
seems to be a large tall object. It remains unfortunately doubtful if we can identify
whether the item is a real object like a light house or just a few strokes of a paint
(Slide 15 and then back to 14).The visual evidence is not quite able to support this
speculation however desirable.
I do however think it is a chart, whatever is on it, and thus it may even so allude to
Charles II‘s ‘Mastery of the Seas’ and in particular of the Channel - a conceit well
known at the time and there a number of paintings and medals representing this claim
Whatever the symbolic intention of the chart, with or without a lighthouse, and clearly
there was one, the inspiration for some mathematical improvement in navigation and
in mathematics as a whole for boys is being represented. This had been proposed by
Pepys in 1672 to James Duke of York, Lord High Admiral of England. James appears
in the 1680 painting standing to the left of Charles II. After his deposition in 1688
James fled to France and is known to have spent at least three hours on a visit to the
French Royal Observatory, so presumably his support for the English Mathematical
School was not just ornamental. The French were also concerned enough to establish
a school of navigation as well and eventually did so after the shipwreck of seven ships
in 1678! Colbert remarked ruefully that: their ignorance of navigation was such that
the Marine could not ‘commander les navigations les plus difficiles, ils ayment mieux
se donner aux marchands.’ (They could not manage the most difficult navigations so
preferred to give themselves over to merchantmen’ - who presumably could navigate).

12
The other enthusiasts in the Verrio picture and for the English Mathematical School
were the ‘mathematicus regius’, or more commonly known as the Astronomer Royal,
John Flamsteed (1646-1719), and the Master of the Ordnance Sir Jonas Moore (1617-
79) both fellows of the Royal Society. Moore was in charge of the school’s
curriculum and is probably the figure standing next to Pepys (slide 12 again). He
began to compile a textbook for the school's use, writing parts himself and
incorporating contributions by Flamsteed, Halley (another of his protégés), and the
school's master, Peter Perkins. Moore's sons-in-law, William Hanway and John
Pottenger, saw the work completed and posthumously published, in lavish style, as A
New Systeme of the Mathematicks (2 vols., 1681). Flamsteed examined the students. .
Flamsteed may be the figure kneeling. Peter Perkins, whom we met in lecture II,
writing about plane sailing was the master of the school at this formative period and
the boys were finally to be examined by Trinity House at the age of sixteen, with
Flamsteed examining their mathematics. Flamsteed and Pepys were not always very
happy about the results, but the point here is to realise the very close attention the
political elite and the best academic minds in the country paid to this specialist
education and to the nautical cartography of the time which was felt necessary for
military and competitive commercial reasons on both sides of the Channel and
supported thus by the state. It was not left to the markets.
England and France and better maps
In this respect its worth comparing two state supported cartographic endeavours in
France and England. The surveying and publication of the Neptune François in 1693
and Great Britain’s Coasting Pilot by Captain Greenvile Collins in the same year.
The Coasting Pilot was the first survey of English waters (1681-88) and Greenvile
Collins was given the Royal yacht Merlin ‘to make a survey of the sea coasts of the
kingdom by measuring all the sea coasts with a chain and taking all the bearings of
all the headlands with their exact latitudes … ‘. The Coasting Pilot, as its name
implies, was as much a textual guide as a collection of charts and remained in print
probably more for that reason for a hundred years. The last edition was issued in
1792. (Slide 15 Detail from Greenvile Collins’s Coasting Pilot 1693 showing the
battle between the English and the Dutch fleets in the Medway, obscuring part of

13
Brittany.) The Dutch Wars were still an unpleasant memory and gave the lie to
Charles II’s mastery of the seas.
On the other side of the Channel in 1671 Colbert decided to have the coasts of France
surveyed from Dunkirk to Bayonne for ostensibly ‘defensive’ reasons against the
Dutch and even more so, like the English at the time, to try to become independent of
the Dutch in published cartographical matters. He also wanted to ensure the French
kept abreast, if not able to surpass, the English. (Monique Pelletier and Alain Morgat
have written extensively on this period and I follow them in my account). In 1670
Colbert had sent Pierre Arnoul, later intendant de la marine to Holland and England
to gather information about France’s commercial rivals and returned with a very
precise report on numbers and types of ships and port installations etc. Colbert read
both reports so we know that he was greatly interested in these spying activities and
thus in maritime and cartographic competition. In 1675 the Ingenieure du Roi, La
Favoliere and other surveyors received instructions ‘ pour en faire une description
générale, et en dresser des cartes marines pour la sûreté de la navigation.’ These
maps were to be certified by the best pilots in each region, by mariners and principal
officers as correct and a written certificate was to be provided with a wax seal to be
attached on each map as a sign of approval. Maps with the seals of the local officers
still exist in the Bibliothèque Nationale in Paris. The resulting Neptune Francois,
which was designed to rival the output of the Dutch in sea atlases, was greeted by the
French Navy with supreme indifference and they declined to buy the atlas. The
minister of the marine had to force them to buy the atlas by taking away the price of
the volume from their wages!
In London similarly a long standing issue for Samuel Pepys was the relative strengths
of the English and French in maritime affairs and in navigational ones in particular.
As early as 1669 he and his friend and wine merchant William Battelier were
discussing a French ‘discourse which he [Battelier ] hath brought over with him for
me, to invite the people of France to apply themselves to Navigacion; which it doth do
very well and is certainly their interest, and which will undo us in a few years if the
king of France goes on to fit up his navy and encrease it and his trade as he hath
begun.’ Nearly thirty years later with the publication of the two sea atlases, one
French and the other English, Pepys determined to assess their relative accuracy. He
instructed John Thornton to compare the two for accuracy, specifically to compare the

14
‘sea and land measures … both as to their contents i.e. length and waterlines [i.e.
length of the coastlines and their directions]. He did not stipulate the positional
accuracy (latitudes and longitudes) as such as a matter for comparison. The impetus
for this commission to Thornton, whom Pepys evidently regarded, as being the most
competent chart maker around, was the critical view of the map maker Philip Lea,
who had himself produced ‘a new map of the sea costs of Europe and ye straits’ with
Robert Morden about 1693 . Pepys had bound this map in with Collins’s Coasting
Pilot and seems to have distrusted Collin’s abilities quite considerably, no doubt
egged on by Lea who had visited Pepys and pointed out some of Collin’s errors.
The results of Thornton’s exercise should have been hardly in doubt given the
surveying differences between the work in France by astronomical observation
including longitudes and confirmation from land surveys done by triangulation of the
points along the coasts so recorded. This very thorough exercise has to be compared
with the results of Collins’s running survey carried out by him at sea with the
positioning by observed latitudes, and distances established by chain on land.(Slide
17 Greenvile Collins’s Coasting Pilot is on the left, the Neptune François on the right,
distinguished by its degrees of longitude running along the bottom margin) ) In the
Neptune François its quite clear the Brittany coastline is better surveyed than the
English, as you would expect. What however is the case if we look at the English
coasts, however, for example, the Lizard which you might assume Greenvile Collins
would have surveyed well, as it is the most southerly point of England and the most
useful Channel landfall for ships sailing from the south west into Plymouth as already
mentioned. The Lizard lies in 49 degrees 57’ and 32’’ N at modern latitude values.
Bill Ravenhill (1987) with the help of David Waters showed that it was the Neptune
François which got the latitudes reasonably correct at 49 degrees 58’ N, still a little
too far north. By comparison Collins managed 50 degrees north which was 2.5
minutes too far north or in terms of English nautical miles about ¾ mile. Should you
be unwise enough to rely upon it, you would hit some of the outlying rocks off the
Lizard as you sailed north, rather sooner than you expected. In reality ships masters
used their own experience and written guides and/or pilots for these waters and would
not have relied on charts alone. A light house, however, would have been very useful!
If we consider Thornton’s ‘Coasting Lines’ (slide 17 Map 1 of a set of six sea charts
drawn by John Thornton in 1694 for Pepys to compare the accuracy of the coastlines

15
of the British Isles with those of France, the Netherlands and Spain as depicted in
Collins’s Coasting Pilot and the Neptune François.) Thornton gives the value of the
lizard at 50 degrees .5’north which on the face of it is even worse than Greenvile
Collins’s value. The directions and shape of the coastline and the distances in
Thornton follow the Greenvile Collin’s configuration.
Pepys had asked Thornton to compare the distances and directions but not the
geographical positioning in latitude and longitude values and he got this answer.
Perhaps it is no coincidence that Thornton’s apprentice Joel Gascoyne, who first made
charts in London and then in 1694-9 made his living from land surveying for the Lord
Lieutenant of Cornwall Charles Bodville, made a map of Cornwall himself. He fixed
the point of the Lizard at 49 degrees 55’ and 58’’ which was considerably better than
Collins and Thornton and certainly better than the doyen of navigation, Edmond
Halley who in 1701 determined the Lizard to be in 49 degrees 55.’ Halley’s value
held sway until 1740; a triumph of personal celebrity, and consequent authority, over
reality: so much for progress.
This vignette has I hope demonstrated both the competition in such matters present
between France an England at the time, the active interest of the state Louis XIV,
Charles II and James II and government patrons in the case of Pepys and Colbert in
cartography itself. It also reveals the respective methods of survey and perhaps most
importantly the different levels of understanding and thus approaches to the actual
methods of measurement and its calculation. It is also illustrates the perennial
seduction of the authorative professional person, in this case Edmond Halley, over the
more accurate but disregarded land surveyor Joel Gascoyne - social forces at work.
In particular however the comparison made for Pepys of the two atlases was not done
for a scientific purpose, per se, but rather for a navigational purpose and did not lead
to a resolution of the matter in modern terms i.e. in positional accuracy. The answers
you get always depend on the questions you ask. Thornton’s ‘Coasting Lines’ remain
as far as I know the only example of such an explicit comparative graphic
cartographic exercise for the seventeenth century, certainly in England. As such it
reveals the client, in this case Pepys, not only reading maps but getting them critically
examined by a professional chart maker even if the result to our eyes is strange.
Buyers and Readers

16
If the more specialist cartographic activities and markets for sea atlases I have
described illustrate some of the motives for accurate measurement in their terms at
the time which prompted the patrons, clients and the chart makers to act, not
necessarily to the acclaim of the putative consumers, matters were a little different in
the general printed map world. Here the consumer if not king was at least paying for
the maps directly, rather than through the subsidised cartographical programmes of
the State, which did command a market but it was hardly a market which drove
commercial production.
In the sixteenth century the centres of production of printed world maps ( Slide 19)
had been Venice and Rome, Strasbourg, Basle, Antwerp and Cologne. In the
seventeenth century these continued, but declined in importance, and production
accelerated in Amsterdam and then also began to rise in Paris and London. ( for a
analytical overview see R. Karrow, ‘Centers of map publishing in Europe,1472-1600’
Woodward, D. History of Cartography vol.3 pt 1 pp. 611-621). Karrow estimates that
the number of maps as a ratio to the population of the main western European
countries would have been perhaps one map per 720 people in 1500 and one map for
every four people in 1600. Obviously the accessibility would vary depending where
you were in relation to the centres of production. Even so, as he says, crude though
the figures are they signal a sea change in map availability and presumably in the
general awareness of them as everyday items which people could buy.
David Woodward was an early venturer into the field of consumers in his Panizzi
lectures of 1995, where he explored the issues in respect of the customers of the print
workshops of Renaissance Florence, Venice and Rome. There he makes the case for
the attraction to consumers of the immediacy of the geographical print or map in
informing them about events like the Siege of Malta in 1565 or of new discoveries
and refutes the view that such prints were in the hands of the few. The buying of sheet
maps alongside other geographical prints was a social activity clearly present in Italy
from at least from the late fifteenth century. Catherine Delano Smith has pointed out
we need to distinguish between those who at any period needed the latest information
to do their job, or to persuade others to do a better job as we have just seen with Pepys
and Colbert; or else to contribute to their academic or scholarly endeavour (Peter
Heylin and Nicolas Blankaart) or for educational purposes, like the governors of the
Mathematical School ( Moore, Flamsteed and the French and English navies) and
those who wanted the maps and charts for less formal uses. They might want them for

17
decoration, for hanging on walls to be admired by themselves and their friends or to
give them up to date information about the discovery and geography of the world and
events, usually battles, in places both in Europe and far away. Nor as we have seen in
the case of Burghley and of Pepys were the categories mutually exclusive. The map, if
it escapes from its strictly geographic bounds, had and has many uses like books;
collectors, readers and professional users were often one and the same person.
So who exactly sold and bought the maps?
If the production side of printed mapping and maps is relatively well-known the same
cannot be true of the users. Maps were, for example, imported into England but we do
not know who bought them. An early source of information is the Port Books of
London which provide a glimpse for the year 1567/8. Amongst notices of paper being
imported from Rouen we find the stationer Lucas Harrison importing '2 small rolls of
maps ad valorem 40s' and George Bishop also a stationer importing 40 reams of
unbound books, 1 roll with maps ad valorem £2.' The entries run from November
1567 to August 1568 and the amounts indicated are the sole examples of map
importation recorded for London at that period. As we know at that time a folio map
might cost in the region of 12 pence, when valued for the purposes of an inventory: no
doubt this was far lower than the sale price we may assume, therefore, that 2 rolls of
maps comprised say 30 or 40 maps. Thus the two stationers could have conceivably
imported 90-120 maps a year. A later note of an importation tells us that on 12 June
1609 in the Plough from Amsterdam, Danyell Heringhook imported ‘1 rowle mappes
ad valorem £4 12d.’ What the maps were and who then sold the maps on or bought
them I do not know.
Probate inventories are one of the best sources of information about map purchase and
use. For London there are no inventories for the sixteenth century and it is very patchy
for the seventeenth century. For Cambridge we are indebted to the work of Elizabeth
Leedham Green and for Oxford to the work of John Newman. A systematic trawl
through contemporary libraries as well as diaries etc might advance our knowledge,
but this has yet to be attempted. In the case of the Cambridge probate inventories
1535/6-1600 Catherine Delano Smith noted, that with the exception of Andrew Perne
(d 1589) Master of Peterhouse, who had in mind to build up his book and map
collection with a view to presenting them to his college, readers as late as 1600 would

18
have encountered few maps at Cambridge. Perne had 28 maps at his death and the
best atlases of the day.
In the case of Trinity College there were apparently fewer than half a dozen books in
the library in which maps or plans were prominent, no atlases and no sign of
separately printed maps or wall maps anywhere. Yet six college members owned their
own maps. The owners were distinguished, unsurprisingly, in their map ownership for
the purposes for which they had bought the maps into those whose interests were
biblical or religious, to those who required maps for teaching or even for map-making
purposes.
What can we say about Oxford? For the period 1507-1602 there are 67 inventories.
Only eleven of them list maps or globes. Thomas Keys Master of University College
1572 had in ‘the gallerie, a mappe of the whole world of Mercators’ (1569). He also
had Mercator's Europe, maps of Germany, Spain, France, Hungary, Greece, the
peregrinations of St Paul, Iceland, Egypt, Switzerland, and Ortelius's world map. I
wonder what Peter Heylin had?
In the seventeenth century the same genres seem to have continued, that is religious
and historical, hence Jansson’s investment in historical maps for his atlases of the
world and its parts, to which, as we saw in lecture II, Nicholas Blankaart Professor of
Greek in Friesland contributed. These were followed by the popularity of the new
regional and provincial maps and especially in England, atlases of county maps.
Professional collections continued of course like Pepys‘s contemporaries, Sir William
Blathwayt, and Sir Joseph Williamson, (whose maps and atlases are at Queens
College Oxford) and George Clarke, Secretary at War for Ireland 1690-2.
If we know little about the customers individually, we do know that for the English
market, English text editions of the Dutch sea atlases, for example, increased in
production numbers decade by decade. From 1600-30, nine English text editions,
were produced in the 1630s, five English text editions, in the 1640s, 11 English text
editions, 1650s 5 English text editions and in the 1660s 19 English text editions. The
1670s saw 12 English text editions and 1680s 23 English text editions.
Unfinished business - some other sources for clues
As is well known it was the fashion for drawing maps in Dutch paintings of interiors
and portraits. A trawl through the far fewer portraits of the time in England in the

19
hope of finding pictures of owners with their maps and atlases has not so far produced
very much. But there are a few; normally the genre was to have a globe in the picture
revealing the sitter’s commercial or other interests rather than a map or atlas. The
amateur painter Sir Nathaniel Bacon (1585-1627), however, who owned East Anglian
estates at Culford and Brome made a visit to the Netherlands in 1613 and thereafter
painted still lives and self portraits in the Dutch manner. One of these painted c. 1618-
20 shows him in his study with an atlas open at Germania. I also have no doubt the
libraries of the seventeenth century, so admirably discussed in the Cambridge
Histories of Libraries in Britain and Ireland, will provide further research clues into
who exactly bought the atlases and maps and even, if we examine them, what they
said about them through their annotations. Another conversation for another day. To
sum up in the early modern period we may see small audiences for maps in the
major cities, perhaps chapmen selling sheet maps in and outside the metropolis,
people reading bibles and books with maps as illustrations, university men educating
their fellows and themselves, participating in the discourse of mapping and historical
geography, the crown, minsters, and patrons doing likewise, but with the added edge
of personal, commercial and military competition, and mariners and other specialists
disputing about and using charts and other specialist maps for their jobs: all of these
aspects made up the early modern world of mapping and users: far from the mass
production and consumption models of today.
Conclusion
When one examines the history of manuscript and printed maps and charts from the
clients’ or users’ perspective rather than from the assumption that the introduction of
printing altered everything or that technical advances in cartography were taken up
forthwith, we find a more complex and richer pattern of production and use.
Manuscript maps and charts (with exception of mappa mundi) continued to be made
at the same time as printing took off. The manuscript had some practical benefits over
printing. In particular at sea vellum is superior to paper in terms of being resistant to
damp and Blaeu printed some of his charts on vellum no doubt for that reason.
Although somewhat quicker than the manuscript copyist in reproduction, printing

20
from the copperplate press was still an arduous activity and expensive. The
manuscript could be altered by scraping the vellum; this was infinitely easier than
altering a copper plate. While the printed map and chart was obviously able to reach a
wider audience through the publishers and distributors, like book and print shops and
street vendors, the assumption that the old technology of manuscript production in
this field was dead as the printing technology arrived for books is probably wrong.
Printing did allow more people to see and buy maps but it is clear that in terms of
accuracy the printed versions were not necessarily better unless a new survey at vast
expense was mounted. The Greenvile Collins charts, like the Hondius charts in
Purchas ‘s Pilgrimes, had a long and increasingly erroneous life, and there are many
other examples of this phenomenon. Only when, as in the case of England and
France, the state provided support did a new up- to-date survey happen and
publication take place.
Because of the hegemony of the Dutch in publication the mid to later seventeenth
century the English and the French states, quite clearly in terms of nautical charts,
wanted to make themselves independent of them, and thus we see the two sea Atlas
projects coming to fruition in the 1690s.
Print technology was best for dissemination in large quantities and that was where the
markets begun to grow in this period, but the mechanisms for acquiring knowledge
and skills were much more complex as I hope I have shown in respect of the
government and sea fraternity in lectures II and III. Any cartographical advance
required the mariners in the first place to understand what the improvement was and
to accept it from their practical point of view, and later as we have seen to be able to
teach boys destined for the sea proper mathematics in the navigational schools set up
in England and France. This of course depended on the teachers and in London they
were a poor lot, after Peter Perkins.
Manuscript thus continued, notably in specialist areas like maritime charts and in
local surveying on land where the numbers of people likely to buy such artefacts was
very small. The combination of manuscript for local areas and specialist purposes,
with print for more popular general sales of geographic and topographic and topical
maps, town plans and the like seems to have been the way forward in the sixteenth
and seventeenth centuries and later.

21
Thus the ‘triumph of print’ is a not a very helpful concept in seeking to understand
mapping and maps and its total context in the early modern period and, has of itself,
sometimes led to the misunderstanding of what actually happened e.g. the
contemporary experience of the Mercator map of 1569, and has equally led to the
marginalisation of some critical manuscript mapping and trades, especially those
associated with the sea, which do not fit the production and consumerist assumptions
prevalent today nor when, as today, the land (and sky?) is privileged.
The advance of better mapping was clearly a contemporary goal, but not necessarily
measured in the same way as we would today. They saw the importance of better
cartography in avoiding ship wrecks in giving them a technological competitive edge;
this drive was ultimately, for example, to control the fastest way to the East Indies at
the beginning of the period in the 1500s and later, for example, to ensure their own
coasts and colonies were carefully mapped for defensive and warlike activities. All of
this activity also was coloured by the wish to emulate and compete at personal levels
e.g. Charles II and Louis XIV. The need to improve the quality of the marine service,
its charts and its use of charts was also necessary but part of the wider picture.
We used to call all of this endeavour part of the ‘scientific revolution’ but this phrase
has fallen out of favour since the 1980s as more sceptical commentators have
questioned whether the period saw the ‘well-spring of modernity.’ This does not
mean however that there were no ‘advances’ which contemporaries could see and
who indeed campaigned for them, but these were continually disputed and sometimes
ignored or had to be in some way promoted or even imposed. They do not constitute a
path to 'modern' cartography in any inevitable way, but have their, perhaps, more
nuanced place in the present writing of the history of cartography and of scientific
endeavour.
As David Woodward put it, ‘if maps are defined only in terms of the measured
accuracy of longitude and latitude [as known today] it reduces mapping to a
mathematical activity and ignores the possibility that it could be a cultural activity.’
Certainly in the early modern period there was no such mental dichotomy and even
where mathematics and navigation were the serious intent of the patrons and the
practitioners, the mapping activity was not divorced from society or art: indeed it
was accorded royal patronage if, in the case of Charles II, no real money. The later
dichotomy between the humanities and science was not evident in this period and the
history of the cartography of the period reflects this visually.

22
The third lecture has returned in some senses to both the first and second to juxtapose
'our ' preoccupations and those of the various groups/ individuals involved at the time.
In the history of cartography the focus, in my view, should always be on the mapping
and maps themselves, the elements that go to make them, their form, their content and
the users in the widest sense from the crown to the public, whoever they were at any
one time, set in their own historical periods, but inevitably seen through the prism of
our own preoccupations. In this comment I see I echo a recent Lyell lecturer on print
and manuscript in the book world David Mckitterick. ‘It remains that the primary
evidence is the book or other printed or manuscript object, not the record made of it.’
While assuredly many maps have a geographical function and that is their main
spatial representation, they have many more functions and meanings in the societies
in which they were produced. Hence their use as decoration, as art itself, and as
symbols in art – as in the case of the Verrio and the Testelin pictures we have just
looked at.
Beyond production and dissemination or even the transfer of knowledge, the
difficulty, as Christian Jacob has reminded us, lies precisely in the art of finding the
specific meanings of the maps and charts which are constructed by the ways a society
‘gazes upon the maps that circulate within its space.’ The questions we ask of maps
and mapping, including those concerning the diversity of users and their relationship
to the activity of mapping and to maps themselves, - but especially the questions we
ask of mapping and maps themselves - determine the type of history of cartography
we make. For me it has to be based on evidence, but written with imagination to
understand the thinking (mentalité) of the time.
Sarah Tyacke
London
November 2007
Copyright © 2022 FDOKUMEN