The PAT Scheme: Analysis, Insights and Way Forward - Shakti ...
Upload
khangminh22Category
view
1download
0
PAT-I Safety Analysis Report Addendum Docket No. 71-0361 Rev. I
2.12.5 Component Analyses Using Complete ModelThe following section describes the full model analyses of the TB-I containment vessel and itsdetailed components. As discussed in Section 1, the components within the titanium T-Ampouleconsist of either cast plutonium (Pu) cylinders with a mass of 831 g or 731 g, small samplecontainers (SC-1), or medium sample containers (SC-2) containing Pu material or a Becomposite material. Each component will be analyzed for three orientations, the end-on impact,the side-on impact, and the CGOC impact for the high-speed aircraft impact. For the hypotheticalaccident conditions (HAC) dynamic crush analyses, the same sets of analyses were performed.In the NCT 4-ft-drop scenario, only the side and end impact for the SC-I and SC-2 cases wereanalyzed to assure the positioning of the sample containers did not require adjustment for theHAC and high-speed aircraft impact analyses.
2.12.5.1 Finite Element Model
2.12.5.].1 Common Model Components
The common components of the models are presented in Figures 2-65 and 2-66. The T-Ampouleis designed to fit snugly inside the TB-I and to be loaded primarily in compression duringimpact. The finite element models of the T-Ampoule and TB-I have a plane of symmetry alongthe center axis of the TB-I (Z=0). Figure 2-65 shows the T-Ampoule and the TB-i model forthe top impact orientation. A hexagonal mesh with .015-in. elements is used to model the top ofthe T-Ampoule. This results in four elements through the thickness of the T-Ampoule shell.Since the primary strains are compressive, this allows for a time step which keeps the problemtractable, while providing adequate resolution of the T-Ampoule strain field. The mesh of theTB-I is refined in the upper region with a hexagonal element size of 0.040 in. to adequatelymodel the contact between the T-Ampoule top and the TB-1. The titanium Ring Filler, whichfills the small void between the T-Ampoule and the TB-1 near the bottom of the TB-I lid, isinstalled during preparations for shipment to provide uniform support to the ellipsoidT-Ampoule. As shown in Figure 2-66, the Ring Filler is not modeled explicitly, but is modeledas an integral part of the TB-I body, with PH13-8-Mo material properties. Although the elasticmoduli do differ, the yield strengths of the 13-8 (141 ksi) vs. Ti-6-4 (141.7 ksi) materials do notdiffer significantly, and this small gap-filling component was simplified to be continuous withthe TB-I since it provides no additional strength and only provides a smoothed inner surface forcontact with the T-Ampoule and its contents. The stresses in this region are monitored to ensurethat they do not threaten the integrity of the Ring Filler. For end impacts, the lower region of theTB-I is modeled with a coarser mesh; for side impacts, the non-impact side has the coarsermesh. The TB-I halves are tied together using the tied contact algorithm.
In the TB-I finite element model, the lid and the body are modeled as one unit. The boltedconnection is not modeled. There is a separate analytical bolt analysis in Section 2.12.6. Thisanalysis uses the peak impulse force from the component finite element models to determine thebolt loading.
The model developed for the side-on impact analyses is presented in Figure 2-66. The model issimilar to the top impact model except that the mesh for the TB-1 is refined on the sides of thecomponent. The mesh discretization of the T-Ampoule top and T-Ampoule bottom is the same
2-105

PAT-I Safety Analysis Report Addendum Docket No. 71-0361 Rev. I
0.015-in. hexagonal element size as that used in the end-on impact analysis. The thread region,where the top and bottom of the T-Ampoule are joined, is modeled using coincident nodes.
The SC-I and SC-2 are fit inside a support structure within the T-Ampoule. This structure,shown in Figures 2-67 and 2-68, is constructed from Titanium 6AI-4V (see Section 2.12.4.14).The support structure consists of two dishes placed on each end of the T-Ampoule for verticalpositioning (with a thickness that varies from 0.055 in. at the edge to 0.025 in. at the center), 4upper and lower legs which centrally position the containers within the T-Ampoule (with athickness of 0.063 in.), two rings which hold the legs in place (0.094 in. diameter), and either oneor two spacers for the SC-I and SC-2, respectively to separate the containers (with a thickness of0.043 in. and a height of 0.749 in. and 1.008 in., respectively). The legs and rings were meshedto have 4 elements through the thickness, while the dishes have 5 elements through the thickness(see Figure 2-69 for mesh refinement). Figure 2-67 shows the support structure as used for the0' rotated models while Figure 2-68 shows the structure used for the 450 rotated models. Thesetwo orientations were used to ensure worst cases analyses were performed in terms of loads onthe support structure and loads on the T-Ampoule.
As detailed in Section 2.12.4.9, the high-strength PHI3-8Mo stainless steel TB-I is modeledusing an elastic-plastic, power-law constitutive model to assure accurate capture of dentinginternally within the TB-i. The Ti-6A1-4V T-Ampoule and support structure are modeled usingan elastic-plastic, power-law constitutive model.
The PRONTO3D code used in this analysis uses the Flanagan-Belytschko hexahedral elementwith one center integration point. The results are presented with contour plots showing elementintegration point values; they are not smoothed contours of extrapolated nodal values. Althoughthe plots will look rough, the integration point strains are the primary variable of concern, sincethese values will be used in the strain locus plots. Therefore, integration point contours will beused throughout the analysis.
Included in the high speed aircraft analysis results and the HAC results are plots of kinetic energyversus time. These were included to demonstrate that the peak loads were captured in the analyses.The models were all run without built-in units, thus the kinetic energy plots presented for the highspeed aircraft analyses and HAC analyses do not have labels. The x-axis of these plots, time, is inunits of seconds. The y-axis of these plots, kinetic energy, is in units of pounds inches.
2-106

PAT-I Safety Analysis Report Addendum Docket No. 71-0361 Rev. I
T-Ampoule top
Bkow-up to show mesh density
bottom
Figure 2-65. Common Components of the Model for Top and CGOC Impact Orientation
Location of Shipping Ring_-,_
4 __
Blow-Up to Show Mesh Density
treaded Region in T-Ampoule Modeled Using Coincident Nodes
Figure 2-66. Common Components of the Model for a Side Impact Orientation
2-107
PAT-I Safety Analysis Report Addendum Docket No. 71-0361 Rev. I
Upper Dish
Upper Legs
Rings
>--,Spacers
Lower Legs
Lower Dish
Figure 2-67. Support Structure with 00 Rotation and Spacers for SC-I
Upper Dish
Upper Legs
Rings
Spacer
Lower Legs
Lower Dish
Figure 2-68. Support Structure with 450 Rotation and Spacer for SC-2
02-108

PAT-I Safety Analysis Report Addendum Docket No. 71-0361 Rev. I
Figure 2-69. Mesh Refinement in Support Structure with00 Rotation and Spacer for SC-I
2.12.5.2 Component Models
Models of the content components consist of an 831 -g plutonium metal hollow cylinder, a 73 1 -gplutonium metal hollow cylinder, a small sample container (SC- I) and a medium samplecontainer (SC-2). The sample containers will be used to transport Pu and a Pu/Be composite.These components are presented in Figures 2-70 through 2-73. The 831-g plutonium metalhollow cylinder shown in Figure 2-70 has a 2.51-in. diameter and a 2.903-in. length. The wallthickness is 0.118 in. It is modeled using 0.018 in. hexahedral elements, which results in 6elements through the thickness. The material of the cylinder is modeled as alpha-plutonium asdescribed in Section 2.12.4.16. The 731-g plutonium metal hollow cylinder model is verysimilar to the 83 1 -g model, except that the length is reduced to account for the reduced materialweight. It is also modeled as an alpha-plutonium material.
The finite element models for the sample containers are also similar to each other. The SC-1model shown in Figure 2-72 is 3 in. in diameter and 2 in. high. The shell thickness is 0.065 in.The container is meshed with 0.020-in. hexagonal elements, which results in 3 elements throughthe shell thickness. The model is shown with the 0.88-in. diameter X 0.88-in. long right circularcylinder, which is modeled as delta-plutonium and has a mass of 174 g. Note that the Pucylinder is located in the bottom of the sample container, which is farthest away from theT-Ampoule for a top-end impact (producing the highest net velocity difference between the twoupon impact, and thus the highest load to the T-Ampoule). For a right side impact case, the Pucylinder would be located on the far left side of the sample container, for the same reason. Thecontents of the sample containers are packed in the T-Ampoule with the support structure shownin Figures 2-67 and 2-68. The SC-2, shown in Figure 2-73, has the same basic geometry andmesh as the SC-I. The length of the sidewall has been lengthened by 1 in., and the mass of the
2-109

PAT-I Safety Analysis Report Addendum Docket No. 71-0361 Rev. I
contents has been increased. The contents of the SC-2 are modeled using a 1.1 in. diameter X1.1-in. long right circular cylinder, which has a mass of 338 g.
2.903 hich
1 -~'- 0.118 inch
2.510 inch
Figure 2-70. 831-g Cylinder Finite Element Model
2.555 inch
2.510 inch 0.118 inch
Figure 2-71. 731-g Cylinder Finite Element Model
2-110

PAT-I Safety Analysis Report Addendum Docket No. 71-0361 Rev. I
2.0 inchl
0.065 inch 0.88 inch
Figure 2-72. Finite Element Model of SC-1 with Pu Cylinder Contents
3.0 inch
3.0 inch
I -- 1.1 inch
Figure 2-73. Finite Element Model of SC-2 with Pu Cylinder Contents
2-111
PAT-I Safety Analysis Report Addendum Docket No. 71-0361 Rev. I
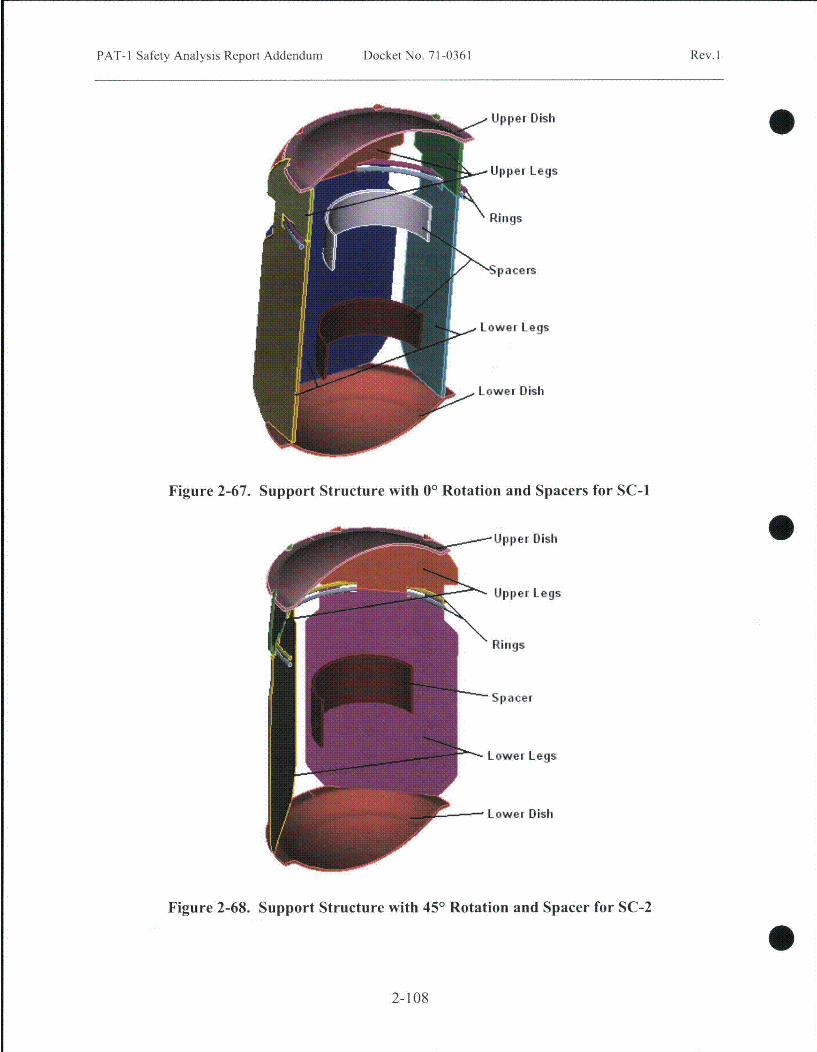
2.12.5.3 Normal Conditions of Transport Displacement Analyses
The plutonium contents in the sample containers will be packaged in the T-Ampoule using thesupport structure shown in Figures 2-67 and 2-68. Under the NCT free drop, the supportstructure integrity must be assessed to assure the positioning of the sample containers for HACand high-speed crash need not be adjusted. Therefore, the SC-I and SC-2 were evaluated for4-ft-drop end and side impacts. Under side impact, the model was oriented with the supportstructure at 0 and 45 degrees.
These analyses were completed for only the sample container components. The design of thesupport structure is meant to prevent the sample containers from shifting during normal operatingconditions. If the Pu and Pu/Be-composite cylinders did shift to the outer edge of the T-Ampoule,and subsequently traveled across its entire width during an HAC or high speed impact, this wouldincrease loads on the T-Ampoule and TB-I vessel. Due to the thin walls and open shape of thehollow cylinder components which are extremely soft, the positioning of the plutonium metalhollow cylinders did not need restriction, and no support structure was designed to cradle thecylinders. The Ta foil packing material for the plutonium metal hollow cylinders and the samplecontainer contents was conservatively neglected to allow for bounding higher net impact velocitiesbetween contents and T-Ampoule wall, and to conservatively omit any energy absorbing or loadspreading from the packing material. In the high-speed impact analyses, the cylinders werepositioned to allow for the maximum displacement (most conservative with the largest velocitydifference between the cylinder and T-Ampoule at time of contact). The NCT analyses wereperformed to assure the positioning of the sample containers does not change after the 4-ft-drop.This was done by confirming the support structure does not undergo large plastic deformationthroughout its thickness.
Three examples of the models created to determine the behavior of the support structure andsample containers when subjected to the NCT (10 CFR 71.71) performance tests are shown inFigures 2-74 through 2-76. Not shown are the SC-1 side impact at 45 degrees, the SC-2 sideimpact at 0 degrees, and the SC-2 end impact at 0 degrees, due to their similarity to the modelsshown. The support structure, sample containers, and plutonium are given an initial velocity of192 in/sec, corresponding to the NCT regulatory condition. The models are half symmetrymodels, with the plane of symmetry passing through the center of the TB-I.
Figure 2-74. NCT SC-2 Side Impact with Support Structure Rotated 450
2-112

PAT-I Safety Analysis Report Addendum Docket No. 71-0361 Rev. I
..... ... . . 4..
Figure 2-75. NCT SC-I Side Impact with Support Structure Rotated 00
Fi 2
Figure 2-76. NCT SC-I End Impact with Support Structure Rotated 00
2-113

PAT-I Safety Analysis Report Addendum Docket No. 71-0361 Rev. I
2.12.5.3.1 NCT End Drop Analysis
The models created for the 4-ft-drop end impact for the SC-I and SC-2 at time 0 are shown in 0Figures 2-76 and 2-77, respectively. The post-4-ft-drop models are shown in Figures 2-78 and2-79, although almost no discernable difference can be seen since the package overpack lid ringis only slightly dented. The kinetic energy histories for these two impacts are shown in Figures2-80 and 2-81, indicating that sufficient analysis time transpired to capture the entire impactevent, and the PAT- 1 package actually bounced after impact. As shown in Figures 2-82 through2-86 and Table 2-16, the minimal plasticity (less than 4%, and only in small localized areas ofinternal or external comers) observed in the titanium support structure, or cradle, verifies that theoverall structure remained essentially elastic and the original position of the sample containerswould remain unchanged.
.\I.
t0
Figure 2-77. NCT SC-2 End Impact with Support Structure Rotated 0'
2-114

PAT-I Safety Analysis Report Addendum Docket No. 71-0361 Rev. I
Figure 2-78. NCT SC-I End Impact with SupportStructure Rotated 0' - Final Displacement
Figure 2-79. NCT SC-2 End Impact with SupportStructure Rotated 00 - Final Displacement
2-115

PAT-1 Safety Analysis Report Addendum Docket No. 71-0361 Rev. I
12
O
8
6
I I
N
-I In0.0 0.1 0.8 1 .2 1.6
TIME t ý10 -2.0 2.4 2.8
Figure 2-80. NCT SC-1 End Impact with Support StructureRotated 0' - Kinetic Energy Time History
12 -- \
10
8
0.0 G.1 0.8 3.2 1 .6 2.0
TIME 1 I-0' 1
2.1 2.8
Figure 2-81. NCT SC-2 End Impact with Support StructureRotated 00 - Kinetic Energy Time History
02-116

PAT-1 Safety Analysis Report Addendum Docket No. 71-0361 Rev. I
Figure 2-82. NCT SC-I End Impact with Support StructureRotated 0' - EQPS in Bottom Legs
4 = 0.375'1E- 3
Figure 2-83. NCT SC-1 End Impact with Support StructureRotated 00 - EQPS in Top Legs
2-117

PAT-1 Safety Analysis Report Addendum Docket No. 71-0361 Rev. I
0
)= 21.1 9E- 3
Figure 2-84. NCT SC-1 End Impact with Support StructureRotated 0' - EQPS in Top Dish
Figure 2-85. NCT SC-2 End Impact with Support StructureRotated 0°- EQPS in Bottom Legs
2-118

PAT-I Safety Analysis Report Addendum Docket No. 71-0361 Rev. I
O.OOE- 36.75E- 3
1350E- 320.25E- 327.OOE- 333.75E- 34 O.50E- 3
X= 39.03E-3
Figure 2-86. NCT SC-2 End Impact with Support StructureRotated 0' - EQPS in Top Dish
Table 2-16. Maximum Strains in 4 ft End Drop Models
Model/Part EQPSSC-I End Impact
Bottom Legs 1.52e-2
Upper Legs 3.75e-4
Upper Dish 2.42e-2SC-2 End Impact
Bottom Legs 1.12e-2
Upper Dish 3.90e-2
2.12.5.3.2 NCT Side Drop Analysis
The models created for the 4-ft-drop side impact for the SC-I AND SC-2 (0 and 45 degreerotated) at time 0 are shown in Figure 2-87 and Figure 2-88. The post-4-ft-drop models areshown in Figure 2-89 through Figure 2-92, and for these side impact cases more localizeddenting of the overpack lid rings is visible than for the end impact cases. The kinetic energyhistories for these four impacts are shown in Figure 2-93 through Figure 2-96, indicating thatsufficient analysis time transpired to capture the entire impact event, and the PAT-I packageactually bounced after impact. As shown in Figure 2-97 through Figure 2-105 and Table 2-17,the minimal plasticity (less than 7% and only in small localized areas of internal or externalcomers) observed in the titanium support structure, or inner cradle, verifies that the overallstructure remained essentially elastic and the original position of the sample containers wouldremain unchanged. The zero plasticity post-drop condition of the T-Ampoule is shown in Figure2-106, as well as zero plasticity in the TB-I in Figure 2-107 and extremely low through-thickness stress intensities in Figure 2-108, below ASME limits shown in Table 2-4.
2-119

PAT-I Safety Analysis Report Addendum Docket No. 71-0361 Rev. I
Figure 2-87. NCT SC-1 Side Impact with Support Structure Rotated 450
IrA<
Figure 2-88. NCT SC-2 Side Impact with Support Structure Rotated 00
2-120

PAT-I Safety Analysis Report Addendum Docket No. 71-0361 Rev. I
Figure 2-89. NCT SC-I Side Impact with SupportStructure Rotated 450 - Final Displacement
Figure 2-90. NCT SC-I Side Impact with Support StructureRotated 00 - Final Displacement
2-121

PAT-I Safety Analysis Report Addendum Docket No. 71-0361 Rev. I
Figure 2-91. NCT SC-2 Side Impact with Support StructureRotated 450 - Final Displacement
Figure 2-92. NCT SC-2 Side Impact with Support Structure Rotated 00 - FinalDisplacement
2-122

PAT-I Safety Analysis Report Addendum Docket No. 71-0361 Rev. I
10 -
6
41
0 I I I I I I I I
0.0 1.0 2.0 3.0 q ' .0TIME 10-
5.0 6.0 7.0
Figure 2-93. NCT SC-I Side Impact with Support StructureRotated 450 - Kinetic Energy Time History
12 [
1 0 -
6
2
0I I - I I I I I
0.0 1.0 2.0 3.0 4.0TIME I 1 0-' I
5.0 6.0 7.0
Figure 2-94. NCT SC-2 Side Impact with Support StructureRotated 45' - Kinetic Energy Time History
2-123

PAT-I Safety Analysis Report Addendum Docket No. 71-0361 Rev. I
I I I I
2-
o1 -
ý2 6
0I ] I I I I I [
0.0 1 .0 2.0 3.0 4 .0TIM0E IO-10'
5.0 6.0 7.0
Figure 2-95. NCT SC-1 Side Impact with Support StructureRotated 0' - Kinetic Energy Time History
I I I I I I I I
12
10
V 6
A
2
0 1--i I I I I I i i I
0.0 1.0 2.0 3.0 1.0TIME 1O-' j
5.0 6.0 7.0
Figure 2-96. NCT SC-2 Side Impact with Support StructureRotated 00 - Kinetic Energy Time History
2-124

PAT-1 Safety Analysis Report Addendum Docket No. 71-0361 Rev. I
Figure 2-97. NCT SC-I Side Impact with Support StructureRotated 450 - EQPS in Bottom Dish
Figure 2-98. NCT SC-1 Side Impact with Support StructureRotated 450 - EQPS in Top Legs
2-125

PAT-I Safety Analysis Report Addendum Docket No. 71-0361 Rev. I
Figure 2-99. NCT SC-1 Side Impact with Support StructureRotated 450 - EQPS in Top Dish
Figure 2-100. NCT SC-2 Side Impact with Support StructureRotated 450 - EQPS in Bottom Dish 0
2-126

PAT-I Safety Analysis Report Addendum Docket No. 71-0361 Rev, I
0.O000E-30.0417E-30.0833E-30.1250E-30 .1 667E-30. 2083E1-30.250017E-3
)= 68.5 6E-3
Figure 2-101. NCT SC-2 Side Impact with Support StructureRotated 450 - EQPS in Top Legs
O.OOE-3
2.50E- 35.001E-37.50E-3
10.00E-32.50E- 35.001E-3
Figure 2-102. NCT SC-2 Side Impact with Support StructureRotated 450 - EQPS in Top Dish
2-127

PAT-1 Safety Analysis Report Addendum Docket No. 71-0361 Rev. I
LOF5
0.00E- 34 .OOE- 38.00E- 3
1 2.00E- 326.OOE-320.00E-321.00E- 3
)= 22.87E- 3
Figure 2-103. NCT SC-I Side Impact with Support StructureRotated 00 - EQPS in Bottom Legs
Figure 2-104. NCT SC-I Side Impact with Support StructureRotated 00 - EQPS in Top Dish
2-128

PAT-I Safety Analysis Report Addendum Docket No. 71-0361 Rev. I
Figure 2-105. NCT SC-2 Side Impact with Support StructureRotated 0' - EQPS in Bottom Legs
Table 2-17. Maximum Strains in 4 It Side Dro ModelsModel/Part EQPS
SC-1 450 Side Impact
Bottom Dish 2.61 e-2
Upper Legs 6.28e-2
Upper Dish 1.30e-2
SC-2 450 Side Impact
Bottom Dish 2.91 e-2
Upper Legs 6.86e-2
Upper Dish 1.41 e-2
SC-1 0' Side Impact
Bottom Legs 2.29e-2
Upper Dish 1.82e-3
SC-2 00 Side Impact
Bottom Legs 2.22e-2
2-129

PAT-I Safety Analysis Report Addendum Docket No. 71-0361 Rev. I
•v.•X./ • '01" 1OP 5O.OODO
I0,0000.00000.0000
0.2030
Figure 2-106. NCT SC-2 Side Impact with Support Structure Rotated 450 -EQPS in T-Ampoule
Figure 2-107. NCT SC-2 Side Impact with Support Structure Rotated 45' - EQPS in TB-I
2-130

PAT-1 Safety Analysis Report Addendum Docket No. 71-0361 Rev, I
TR15CAI .2DE ,O.OE :3
620.O OE3S0.DE 320.0E, 3
ED 6 E.0 9E-I< I 8. BE ,3
Figure 2-108. NCT SC-2 Side Impact with Support Structure Rotated 450 - Tresca Stressin TB-I
2.12.5.3.1 NCT End and Side Drop Analysis Summary
The two previous sections highlight the fact that the position of the contents within their samplecontainers and support cradle is essentially unchanged after 4-ft NCT drops. The titanium InnerCradle remains essentially undeformed and the contents' positions no farther from the T-Ampoule than pre-drop, as well as no plasticity in the TB-I and the T-Ampoule, all means thatHAC and aircraft impact analyses are justified in assuming an undamaged PAT- I package andcontents before those events.
2.12.5.4 Aircraft Accident Impact Analyses
Detailed PAT-I package models identical to those shown in the previous NCT section, exceptfor neglecting the rolled ring lid ends, were analyzed to determine the response of theT-Ampoule and TB-1 when subjected to the loading of 10 CFR 71.74 (accident conditions for airtransport of plutonium). Each combination of package orientation (lid end, side, and CG-over-comer) and contents was analyzed at an initial velocity of 422 ft/sec and each package impactsonto an analytically unyielding target.
The TB-I was shown in the SAR' aircraft impact tests to remain elastic and maintaincontainment. With similar mass contents, similar TB-I response would be expected, exceptingthe possibility of minor localized denting due to more dense contents (solid Pu vs. oxidepowder). Effective or von Mises stresses (which capture three-dimensional stress states well andis more conservative than Tresca stress to show avoidance of yielding) were calculated and anacceptance criterion of "below through-thickness yielding" used to demonstrate similar TB-I
2-131

PAT-I Safety Analysis Report Addendum Docket No. 71-0361 Rev. I
behavior as in the original regulatory testing. This also means zero plasticity in the seal area ofthe TB-1, ensuring similar containment requirements performance of the containment vessel.
A total of twenty-seven high speed impact analyses were conducted for the five potentialcontents in various orientations; the analyses are listed below in Table 2-18. In the hollow-cylinder (ER cylinder) component models, as well as the sample container models, no credit istaken for the positioning of the cylinders with the tantalum packing foil. Each form contents areassumed to be unconstrained and are placed in the worst orientation and most severe location foreach impact. The delta-plutonium in the sample containers is relatively soft and has a greaterdegree of plasticity, so although its location will affect T-Ampoule loading, its local orientationwould not. However, the beryllium composite cylinders are much harder and stronger, so theirorientation is always rotated such that they present a sharp comer (CGOC, actually) towards thenormal surface of the T-Ampoule, parallel with the impact direction.
Table 2-18. Aircraft Accident Impact Analyses, Components, and Orientations
Run Component Submodel OrientationNo.
1 831 g Plutonium Metal Hollow Bottom position, top impactCylinder, alpha Pu
2 831 g Plutonium Metal Hollow Bottom position (angled), top impactCylinder, alpha Pu
3 831 g Plutonium Metal Hollow Bottom position (angled), CGOC impactCylinder, alpha Pu
4 831 g Plutonium Metal Hollow Far side position, side impactCylinder, alpha Pu
5 831 g Plutonium Metal Hollow Far side position (angled), side impactCylinder, alpha Pu
6 731 g Plutonium Metal Hollow Bottom position, top impactCylinder, alpha Pu
7 731 g Plutonium Metal Hollow Bottom position (angled), top impactCylinder, alpha Pu
8 731 g Plutonium Metal Hollow Bottom position (angled), CGOC impactCylinder, alpha Pu
9 731 g Plutonium Metal Hollow Far side position, side impactCylinder, alpha Pu
10 731 g Plutonium Metal Hollow Far side position (angled), side impactCylinder, alpha Pu
11 SC-1 - Pu Bottom position, support structure 00, top impact
12 SC-1 - Pu Far side position, support structure 0°,side impact
13 SC-1 - Pu Far side position, support structure 450, side impact
14 SC-1 - Pu Bottom position, support structure 0', CGOC impact
15 SC-1 - Pu Bottom position, support structure 450, CGOC impact
0
2-132

PAT-1 Safety Analysis Report Addendum Docket No. 71-0361 Rev. I
Table 2-18. Aircraft Accident Impact Analyses, Components, and Orientations (Continued)
Run Component Submodel OrientationNo.
16 SC-2 - Pu Bottom position, support structure 00, top impact
17 SC-2 - Pu Far side position, support structure 00,side impact
18 SC-2 - Pu Far side position, support structure 450, side impact
19 SC-2 - Pu Bottom position, support structure 0', CGOC impact
20 SC-2 - Pu Bottom position, support structure 450, CGOC impact
21 SC-1 - Be Bottom position, angled Be, support structure 00, top impact
22 SC-1 - Be Far side position, angled Be, support structure 00, side impact
23 SC-1 - Be Far side position, angled Be, support structure 45', side impact
24 SC-1 - Be Bottom position, angled Be, support structure 00, CGOCimpact
25 SC-1 - Be Bottom position, angled Be, support structure 450, CGOCimpact
26 SC-2 - Pu Far side position, support structure 45', side impact, friction 0.4
27 SC-2 - Pu Far side position, support structure 450, side impact, friction 0.2
2.12.5.4.1 ER Cylinder Analyses
Ten separate plutonium metal hollow cylinder, high-speed impact analyses were conducted.There are several inherent conservatisms in this model:
1. The tantalum foil used to package the plutonium metal hollow cylinders inside the T-Ampoule is not modeled. The small quantity of energy it would absorb, and loadspreading it would provide, is conservatively ignored. In addition, any initial positioningthat would be provided by the foil is also ignored. Each analysis is run with theplutonium metal hollow cylinder in a location farthest from the impact surface.
2. The Pu material is modeled using a power-law hardening constitutive model withoutfracture. Hecker and Stevens3 present two curves for alpha-plutonium; one curve depictsa very brittle material, and the other represents a finer-grain material with more ductility.To maximize the energy and impulse load applied to the T-Ampoule wall, the plutoniummetal was modeled as a continuously hardening material that does not fracture, which isextremely conservative in terms of the reaction loading of the T-Ampoule. Thisconservatism (stronger alpha material, continuously hardening) allows for the possibilitythat the cylinder could also consist of delta Pu, if transport of that material were desiredinstead.
3. The dimensions of the plutonium metal hollow cylinders are conservatively assumed tobe the "strongest" possible. Within the bounds of LANL-defined tolerances ofmachining these cylinders, they are the most resistant to buckling (shortest, thickest wall,
2-133

PAT-I Safety Analysis Report Addendum Docket No. 71-0361 Rev. I
maximum OD and minimum ID, see Figures 2-70and 2-7 1), which allows for the greatestloading of the T-Ampoule.
2.12.5.4.2 Run I - 831-g Plutonium Metal Hollow Cylinder with Bottom Initial Location and aTop Impact
The top end impact model for the plutonium metal hollow cylinder, oriented axially (with theimpact direction, as opposed to angled) is shown in Figure 2-109. Note that the cylinder islocated at the bottom of the T-Ampoule so that its net impact velocity with the top of the T-Ampoule is maximized. The post-impact deformation is shown in Figure 2-110 and its kineticenergy history in Figure 2-111. Note the similar degree of overpack crush up as compared to thecertification test end impact analysis in Figure 2-12, despite the slightly reduced impact velocityof 422 ft/sec versus the tested 445 ft/sec. The plutonium metal hollow cylinder exhibitssignificant buckling, despite its conservatively "strongest shape" definition.
Equivalent Plastic Strain (EQPS) in the TB-I vessel is shown in Figures 2-112 and 2-113 to be lessthan 2.3%, and only in some localized outer contact regions with the redwood overpack. Thislocalized ring of plasticity in the top outer surface of the TB-I lid is due to a minor contact overclosure between the TB-I and the redwood; it is only a minor modeling artifact. This minormodeling artifact is not a concern because even though it produces elevated localized stressesand even miniscule plasticity, it does not increase through-thickness stresses or in any waynegatively affect the integrity of the containment vessel. The von Mises stresses (see Figures2-114 and 2-115) peak at 147.5 ksi, just above the elevated-temperature minimum yield strengthfor the TB-I of 141 ksi, but more importantly, through-thickness TB-I stress values are in the less-than-50 ksi range, below yield. The time at which the peak value of the von Mises stress occurscoincides with the peak value of the contact force (summed over the lid area). A plot of this forceas a function of time is shown in Figure 2-116. A maximum contact load of 66,000 lbs is appliedto the inner surface of the TB-I lid during the impact, which is below the 108,000 lb preload in thebolts. No T-Ampoule elements exceeded the tested B-W strain locus, and the peak TearingParameter value (see Table 2-11, High Velocity (Aircraft) Impact Analyses Peak TearingParameter Values, run #1) of 0.0528 was below the critical Tearing Parameter value of 1.012 forTi-6A1-4V.
2-134

PAT-] Safety Analysis Report Addendum Docket No. 71-0361 Rev.1I
Figure 2-109. Finite Element Mesh for the 831-g, Plutonium Metal Hollow Cylinder,Bottom Position, End Impact
1 7
Figure 2-110. Finite Element Mesh for the 831-g, Plutonium Metal Hollow Cylinder,Bottom Position, End Impact - Final Displacement
2-135

PAT-I Safety Analysis Report Addendum Docket No. 71-0361 Rev. 1
8.0-
7.0-
6.0
5.0
1.0
3.0
2.0
1.0
0.0 I I I
0.0 0.4 0.8 ].2 1 .6 2.0 2.4 2.8TIME t.10 J
Figure 2-111. Kinetic Energy Time History for the 831-g,ER Cylinder, Bottom Position, End Impact
EOF5
O.OOE- 33.75E- 37.50E- 3
1 1.25E-3I5.OOE-318.75E-322.50E-3
)f= 22.17E-3
Figure 2-112. EQPS in the TB-I for the 831-g,ER Cylinder, Bottom Position, End Impact
0
2-136

PAT-I Safety Analysis Report Addendum Docket No. 71-0361 Rev. I
O.O00E- 3I.167E-30. 333E-3
0 .667E-30.833E-31.000E-3
---- A-"-= 22.17E-3
Figure 2-113. EQPS in TB-I (Range Zoomed in to Show All Elements with non-zeroEQPS) for the 831-g, Hollow Cylinder, Bottom Position, End Impact
25.0E,. 350.OE,. 375.0E. 3
100 .OE- 3125 .OE-'3150.OE-3
G= 0. 2E: 3>= I 17.5E 3
Figure 2-114. von Mises Stress in the TB-1 for the 831-g Plutonium Metal HollowCylinder, Bottom Position, End Impact (Rotated Forward for Ease of Viewing)
2-137

PAT-I Safety Analysis Report Addendum Docket No. 71-0361 Rev. I
VEJNM ]5L5
O.OE- 325.OEý 350 OE. 3I75.OE 3
10 O. OE 3125.OEý 315O.OEý 3
G = O.2Lý 3)f = A7.5E-.3
Figure 2-115. von Mises Stress in the TB-I for the 831-g, Plutonium Metal HollowCylinder, Bottom Position, End Impact (Rotated Backward for Ease of Viewing)
Sum of Contact Force in TB-i Top for High Speed 831 g ER CylinderFull Model with Top Impact
70000
60000
400000
30000
20000 -
10000 -
00 0.0005 0.001 0,0015 0.002 0.0025 0.003
Time (sec)
Figure 2-116. Summed Contact Force on the TB-iTop for a 831-g, Plutonium Metal Hollow Cylinder, Top Impact
02-138

PAT-I Safety Analysis Report Addendum Docket No. 71-0361 Rev. I
2.12.5.4.3 Run 2 - 831-g Angled Cylinder with Bottom Initial Location and a Top Impact
The top end impact model for the plutonium metal hollow cylinder with angled orientation isshown in Figure 2-117. The cylinder is located at the bottom of the T-Ampoule so that its netimpact velocity with the top of the T-Ampoule is maximized. The post-impact deformation isshown in Figure 2-118 and its kinetic energy history in Figure 2-119. The plutonium metalhollow cylinder deforms but maintains much of its original shape because of its conservativelyassumed "infinitely ductile," with hardening material constitutive model definition (despite itsalpha Pu being a relatively brittle material in reality). If the plutonium metal hollow cylinderwere modeled as a brittle material with very low ductility, it would effectively shatter andpresent a much less concentrated load on the T-Ampoule and TB-1.
Average stress-triaxiality versus EQPS is shown in Figures 2-120 and 2-121 for the 19 elementsextending beyond the tested Bao-Wierzbicki strain locus. All of these elements are at high stresstriaxiality and low EQPS. The Tearing Parameter values for these same 19 elements are shownin Figure 2-122, and all are below the critical Tearing Parameter value of 1.012 for Ti-6AI-4V.These elements are highlighted in red Figure 2-123, but note that these elements are still beloweven the initiation of a ductile tear.
Peak EQPS in the TB-1 vessel is shown in Figures 2-124 and 2-125 to be about 2.4%, and onlyin some localized outer contact regions with the redwood overpack (contact modeling artifact).The von Mises stresses (see Figures 2-126 and 2-127) peak at 148.2 ksi, just above the elevated-temperature minimum yield strength for the TB- 1 of 141 ksi, but more importantly, through-thickness TB-I stress values are less than 50 ksi, below yield. The time at which the peak valueof the von Mises stress occurs coincides with the peak value of the contact force (summed overthe lid area). A plot of this force as a function of time is shown in Figure 2-128. A maximumcontact load of 54,509 lbs is applied to the inner surface of the TB-1 lid during the impact.
Figure 2-117. Finite Element Mesh for the 831-g, Angled,ER Cylinder, Bottom Position, End Impact
2-139

PAT-I Safety Analysis Report Addendum Docket No. 71-0361 Rev. I
Figure 2-118. Finite Element Mesh for the 831-g, Angled, ER,Cylinder, Bottom Position, End Impact - Final Displacement
8.0
7.0
5.0
•.0
~I I I I i I I
3.0
2.0
1.0
0.0
0.0 0.1 0.8 1.2 1.6 2.0TIME i . 1 0
2.1 2.8
Figure 2-119. Kinetic Energy Time History for the 831-g,Angled, Plutonium Metal Hollow Cylinder, Bottom Position, End Impact
2-140

PAT-I Safety Analysis Report Addendum Docket No. 71-0361 Rev. I
Comparison Graph Avg. Stress Triaxiality
Titanium Impact Test and High Speed 831g Cylinder Full Model
0.8 Angled for End Impact
----- Strain Locus
E16217
0.6I-.E 7713>'; E18705
' • E I 7 0 5
>, 0.4 E•2265" " ' - E22654"• i -• E22858"(5• E236990.2 ,E24157
6." • E24195
I•= _ .E23137
Cn 0.0 E28141{/)• • E30 :25
( •E 3. 1 9
E9935:
L_ -0.2 - E9350E88362
- - . . . . . . . . . . . . .- - - - - - - - - -" E287495
-0.4 - 1..
0.0 0.1 0.2 0.3 0.4 0.5 0.6
EQPS
Figure 2-120. Graph of Average Stress Triaxiality versus EQPS of Elements Exceeding theExperimental Strain Locus for the 831-g, Angled, Plutonium Metal Hollow Cylinder,
Bottom Position, End Impact
Comparison Graph Avg. Stress TriaxialityTitanium Impact Test and High Speed 831g Cylinder Full Model
0.8 Angled for End Impact
E17713> 0.8
v • E19705
- EZ2654- E22659
'•'= E24195EZ28137
E28141
£fl - E3"625
0 .7 T .....-- E883SO
ESS350
E68362E287485
0.6 1 T I I
0.000 0.002 0.004 0.006 0.008 0.010
EQPS
Figure 2-121. Graph of Average Stress Triaxiality versus EQPS of Elements Exceeding theExperimental Strain Locus (Zoomed In) for the 831-g, Angled, Plutonium Metal Hollow
Cylinder, Bottom Position, End Impact
2-141

PAT-1 Safety Analysis Report Addendum Docket No. 71-0361 Rev. I
1.0
S0.8
E•= 0.6
0.
CLcm
' 0.4-
I--
0.2
0.00.000
Comparison Graph Tearing ParameterTitanium Impact Test and High Speed 831g Cylinder Full Model
Angled for End Impact
.~~~ ~~ . ... .t~n~l te . .......
E17701(17113
E19705(l5705
E22650-E2 2€54
1[23 Iso
E24157(74165
E(7137
E(2141
E:30625
E3062S
- E19350
E(8358
E(9362
(707400
0.002 0.004 0.006
00.008
I0.010
EQPS
Figure 2-122. Graph of Tearing Parameter versus EQPS for Elements Exceeding theExperimental Strain Locus for the 831-g, Angled, Plutonium Metal Hollow Cylinder,
Bottom Position, End Impact
Figure 2-123. Plot of Elements Exceeding the Experimental Strain Locus for the 831-g,Angled, Plutonium Metal Hollow Cylinder, Bottom Position, End Impact
02-142

PAT-I Safety Analysis Report Addendum Docket No. 71-0361 Rev. I
Figure 2-124. Plot of EQPS in the TB-I for the 831-g Angled,ER, Cylinder, Bottom Position, End Impact
rOF5
fl.OOOE- 30.1 67E-30.333E-30.500E- 30.667E- 30 . 833E- 3I .OOOE- 3
X= 24.1 9E-3
Figure 2-125. Plot of EQPS in the TB-i (Range Zoomed in to Show all Elements with Non-Zero EQPS) for the 831-g, Angled, Plutonium Metal Hollow Cylinder, Bottom Position,
End Impact
2-143

PAT-I Safety Analysis Report Addendum Docket No. 71-0361 Rev. I
0
VONrI15E5
O.OEý3I25.OE. 350.OE. 375.OE- 3
10 . OEý 3I 25 .01 3150. OE 3
b 0. 7E: 3)r I 18.2E 3
Figure 2-126. Plot of von Mises Stress in the TB-I for the 831-g,Angled, Plutonium Metal Hollow Cylinder, Bottom Position, End Impact
O.OE- 325.OE - 350.OE. 37O .OE- 3
100O..OE 3125.OE 3-150.OE,3
(= 0.7E-3- _= 1 •I 8.2E- 3
Figure 2-127. Plot of von Mises Stress in the TB-I for the 831-g,Angled, Plutonium Metal Hollow Cylinder, Bottom Position, End Impact
2-144

PAT-I Safety Analysis Report Addendum Docket No. 71-0361 Rev. I
Sum of Contact Force in TB-1 Top for High Speed 831 g Angled ERCylinder Full Model with Top Impact
60000 F
50000
" 40000
L 30000
S20000
10000//
0 i0 00005 0001 00015 0002 00025 0003
Timne (sec)
Figure 2-128. Plot of Contact Force in the TB-I for the 831-g,Angled Plutonium Metal Hollow Cylinder, Bottom Position, End Impact
2.12.5.4.4 Run 3 - 831-g Angled Plutonium Metal Hollow Cylinder with Bottom Initial Locationand a CGOC Impact
The lid end CG-over-corner impact model for the plutonium metal hollow cylinder is shown inFigure 2-129. The cylinder is located at the bottom of the T-Ampoule so that its net impactvelocity with the top of the T-Ampoule is maximized. The post-impact deformation is shown inFigure 2-130 and its kinetic energy history in Figure 2-131. The plutonium metal hollowcylinder deforms slightly more than the previous case because of the slightly more side-impact-like orientation but maintains much of its original shape because of its conservatively "infinitelyductile" material constitutive model definition. If the plutonium metal hollow cylinder weremodeled as a brittle material with very low ductility, it would effectively shatter and present amuch less concentrated load on the T-Ampoule and TB-1.
Average stress-triaxiality versus EQPS is shown in Figures 2-132 and 2-133 for the 126 elementsextending beyond the tested Bao-Wierzbicki strain locus. All of these elements are at relativelyhigh stress triaxiality and low EQPS. The Tearing Parameter values for these same 126 elementsare shown in Figure 2-134 and all are still safely below the critical Tearing Parameter value of1.012 for Ti-6A1-4V. These elements are highlighted in red in Figures 2-135 through 2-137, butthese elements are still below the critical value. Note that this impact analysis case produced thehighest value of Tearing Parameter, 0.6177, which still yields a minimum factor of safety of1.012 divided by 0.6177 equals 1.64 against even the initiation of a ductile tear. With all theanalysis conservatisms in the model, the factor of safety is greater, and the T-Ampoule eutecticbarrier integrity is maintained.
2-145

PAT-] Safety Analysis Report Addendum Docket No. 71-0361 Rev. I
Peak EQPS in the TB-I containment vessel is shown in Figures 2-138 and 2-139 to be about18.5%, although this peak is only in a highly, localized, outer comer region where there is aslight contact over closure issue with the redwood overpack. This is a minor modeling artifactthat produces localized plasticity that otherwise would not exist. It occurs when the redwoodcompresses well into its "lock-up" phase and becomes analytically stiffer than it wouldrealistically be, due to limitations in the orthotropic crush constitutive model of the redwood.Nonetheless, through-thickness plasticity is non-existent and the TB-I integrity is maintained.The von Mises stresses (see Figure 2-140) peak is 196 ksi (due to the localized redwood contact),above the elevated-temperature minimum yield strength for the TB-I of 141 ksi, but moreimportantly, through-thickness TB-I stress values are less than 35 ksi, below yield.
Figure 2-129. Finite Element Mesh for the 831-g, Angled,ER Cylinder, Bottom Position, CGOC Impact
2-146

PAT-I Safety Analysis Report Addendum Docket No. 71-0361 Rev. I
Figure 2-130. Finite Element Mesh for the 831-g, Angled,ER Cylinder, Bottom Position, CGOC Impact - Final Displacement
8.0
6.0
5 -
~1. 0
I I
2.0 k
1.0
0.0 1.0 2.0 3.0TIME I 1 I0'
4.0 5.0 6.0
Figure 2-131. Kinetic Energy Time History for the 831-g, Angled, Plutonium Metal HollowCylinder, Bottom Position, CGOC Impact
2-147

PAT-I Safety Analysis Report Addendum Docket No. 71-0361 Rev. I
Comparison Graph Avg. Stress TriaxialityTitanium Impact Test with 831g Cylinder Full Model ........ ......
1.3 Angled for CGOC Impact
0.8 -- ....
0.3
- -- -- -- -- -- -- -- -- - . .= . .... .... - =.
0.7
-1.2,
0.0 0.1 0.2 0.3 0.4 0.5 0.6EQPS
Figure 2-132. Graph of Average Stress Triaxiality versus EQPS of Elements Exceeding theExperimental Strain Locus for the 831-g, Angled, Plutonium Metal Hollow Cylinder,
Bottom Position, CGOC Impact
Comparison Graph Avg. Stress TriaxialityTitanium Impact Test with 831g Cylinder Full Model
Angled for CGOC Impact1.3
- 0.8h
0.3
-0.2
-0.7
-1.2
. . ....... .......
0.00 0.01 0.02 0.03EQPS
0.04 0.05 0.06
Figure 2-133. Graph of Average Stress Triaxiality versus EQPS of Elements Exceeding theExperimental Strain Locus (Zoomed in) for the 831-g, Angled, Plutonium Metal Hollow
Cylinder, Bottom Position, CGOC Impact
2-148

PAT-I Safety Analysis Report Addendum Docket No. 71-0361 Rev. I
Comparison Graph Tearing Parameter
Titanium Impact Test with 831 g Cylinder Full ModelAngled for CGOC Impact --:::::;: .
1 .2 - . ........ ,,.... . . ,.,,.,.
0 .8..............
0.8E ........
0.2
0.0 0..1 .. = II0.00 0.01 0.02 0.03 0.04 0.05 0.06
EQPS .. '
Figure 2-134. Graph of Tearing Parameter versus EQPS of Elements Exceeding theExperimental Strain Locus for the 831-g Angled, Plutonium Metal Hollow Cylinder,
Bottom Position, CGOC Impact
Figure 2-135. Plot of Elements Exceeding the Experimental Strain Locus for the 831-g,Angled, Plutonium Metal Hollow Cylinder, Bottom Position, CGOC Impact
2-149

PAT-I Safety Analysis Report Addendum Docket No. 71-0361 Rev. I
Figure 2-136. Plot of Elements Exceeding the Experimental Strain Locus for the 831-g,Angled, Plutonium Metal Hollow Cylinder, Bottom Position, CGOC Impact
Figure 2-137. Plot of Elements Exceeding the Experimental Strain Locus for the 831-g,Angled, Plutonium Metal Hollow Cylinder, Bottom Position, CGOC Impact
2-150

PAT-I Safety Analysis Report Addendum Docket No. 71-0361 Rev. I
)X= 0.1819
Figure 2-138. Plot of EQPS in the TB-I for the 831-g, Angled, Plutonium Metal HollowCylinder, Bottom Position, CGOC Impact
4= 0.1849
Figure 2-139. Plot of EQPS in the TB-I for the 831-g, Angled, Plutonium Metal HollowCylinder, Bottom Position, CGOC Impact
2-151

PAT-1 Safety Analysis Report Addendum Docket No. 71-0361 Rev. I
Figure 2-140. Plot of von Mises Stress in the TB-1 for the 831-g,Angled, Plutonium Metal Hollow Cylinder, Bottom Position, CGOC Impact
2.12.5.4.5 Run 4 - 831-g Plutonium Metal Hollow Cylinder Side Impact
The side impact model for the hollow plutonium metal hollow cylinder is shown in Figure 2-141.The cylinder is located at the far side of the T-Ampoule so that its net impact velocity with theside of the T-Ampoule is maximized. The post-impact deformation is shown in Figure 2-142and its kinetic energy history in Figure 2-143. The plutonium metal hollow cylinder deformsmuch more than the previous case because of its weaker side-impact orientation.
Average stress-triaxiality versus EQPS is shown in Figures 2-144 and 2-145 for the 67 elementsextending beyond the tested Bao-Wierzbicki strain locus. All of these elements are at relativelyhigh stress triaxiality and low EQPS. The Tearing Parameter values for these same 67 elementsare shown in Figure 2-146 and all are still below the critical Tearing Parameter value of 1.012 forTi-6AI-4V. These elements are highlighted in red in Figures 2-147 and 2-148, but theseelements are still below the critical value and do not indicate failure; T-Ampoule integrity ismaintained.
Peak EQPS in the TB-1 containment vessel is shown in Figures 2-149 and 2-150 to be about27.4%, although this peak is only in a highly localized outer comer region where there is a slightcontact overclosure issue with the redwood overpack. A slight (<1% EQPS) dent is visible inFigure 2-150 from the internal impact of the plutonium metal hollow cylinder with the TB-1 wall(via the T-Ampoule). Through-thickness plasticity is non-existent and the TB- 1 integrity ismaintained. The von Mises stresses (see Figures 2-151 and 2-152) peak at 222 ksi (due to thelocalized redwood contact), which is above the elevated-temperature minimum yield strength forthe TB-I of 141 ksi, but more importantly, through-thickness TB-I stress values are less than37.5 ksi, below yield.
2-152

PAT-I Safety Analysis Report Addendum Docket No. 71-0361 Rev. I
Figure 2-141. Finite Element Mesh for the 831-g, ER,Cylinder, Far Side Position, Side Impact
Figure 2-142. Finite Element Mesh for the 831-g, Plutonium Metal Hollow Cylinder, FarSide Position, Side Impact - Final Displacement
2-153

PAT-I Safety Analysis Report Addendum Docket No. 71-0361 Rev. 1
8.0
7.0
6.0
5.0
1.0
I I I I I
I I I I
0
3.0
2.0
1.0
0.0
0.0 0.1 0.8 1 .2 1 .6T)ME I[ 10- j
2.0 2.1 2.8
Figure 2-143. Kinetic Energy Time History for the 831-g,ER, Cylinder, Far Side Position, Side Impact
In
Comparison Graph Avg. Stress TriaxialityTitanium Impact Test and High Speed 831g Cylinder Full Model
End Orientation with Side Impact1.0
0.8
0.6
0.4 -
0.2 -
0.0 "
-0 .2 --
-0.4 1..
Lus E 6 874E 8599 go E86046
E 6IS214 E186270- E186326 E186382
E8 6438 EI8609
* E186662 E1867 18E186774 EI E1830E186886 El 6 42E18699: .-- E1887054
E l8 2,2 E;I81727____ W_ 1834 -.-- E 813 o
-E 87l -. E 8738E187894 -.-- E187950EI88006 E1189062
E;88230 E188286E_____ 9168S7 E191843E319989 -- E3199S3E319997 E320001E 77044 -.-- E377100E377156 E3;;212E 3772:8 E.---37324
E3773 0 E377436- E377492 E3---~77548
-.-- E377604 E377660- E377716 - . E377772
E377828 E37784E405 13 B~OW9
0.0 0.1 0.2 0.3EQPS
0.4 0.5 0.6
Figure 2-144. Graph of Stress Triaxiality versus EQPS of Elements Exceeding theExperimental Strain Locus for the 831-g, Plutonium Metal Hollow Cylinder, Far Side
Position, Side Impact
2-154

PAT-I Safety Analysis Report Addendum Docket No. 71-0361 Rev. I
Comparison Graph Avg. Stress TriaxialityTitanium Impact Test and High Speed 831g Cylinder Full Model
End Orientation with Side Impact
1.0
-0.9
>0.8
'x 0.7
n0.6
(,,,0n .5
- * - StiL.... =-E!64674E 85 90 E186046
•E;861012 •E18 158
. E 86214 E18"271E186326 E1JR382E186438 E186494E186550 E18:4"SE186662 E186718E;86774 E186830E1S8686 E186944?E 9 998 - E 987054
SE88722Z - E 87278- Et87334 -.-- E197390
- E 87446 .----- E8 750O- E187558 - E187914
Et87670 - E187726E 877 2 E187938E187894 - E187950E 188006 E188062
• E::8118 • E;88174
E88230 E 88286E 11687 EI 1843
. E319989 * E319993E3199'7 E321001,E3771044 - E77100
- E377156 E- E377212E377268 UE377324
-...------ E377380 E37743FE377492 -.-- E377548
- E 377F 04 . . .. E 3 77 14'
-- E377716 E377772
E377828 E377884E405913 E405917E405921 E470551
E470551 E472951
A -
0.4
0.000 0.002 0.004 0.006 0.008 0.010EQPS
Figure 2-145. Graph of Stress Triaxiality versus EQPS of Elements Exceeding theExperimental Strain Locus (Zoomed In) for the 831-g, Plutonium Metal Hollow Cylinder,
Far Side Position, Side Impact
Comparison Graph Tearing ParameterTitanium Impact Test and High Speed 831g Cylinder Full Model
End Orientation with Side Impact
1.2
1.0
0.8
cL0.6
C~0. 4
0.2
0.0
i
-- - - TeaPa-aMa, -- E164674
E185990 E182046
E186102 - E186158
EI86214 E186270
E18632F E:86382
E186438 EI 8494
E186550 - E16S60E186662 E186718
E186774 E186830E186886 E186942
E18998 - 0E87054
EI87t10 • E187166
E1872 .. E187276-- El87334 4E 18730
E744 --R..RE 187502
E1'7558 E1872!4E187677 - £187726
El87782 E187838
E187894 E 50
E188006 - E188062
E;88118 - E188174
E £188230 E188286
E191687 E191803
E319989 * E313993E319997 E320001
E377044 E377100
- E377156 -- E 377212
E377268 UE377324
E377380 E377436
E377892 UE377548
E377604 - E377660
-- E377716 E377772
E377828 E377884
E405913 E405"17
- E405921 E470551
E470555 - E472951
ý-S
0.000 0.002 0.004 0.006 0.008 0.010EQPS
Figure 2-146. Graph of Tearing Parameter versus EQPS of Elements Exceeding theExperimental Strain Locus for the 831-g, Plutonium Metal Hollow Cylinder, Far Side
Position, Side Impact
2-155

PAT-I Safety Analysis Report Addendum Docket No. 71-0361 Rev. I
Figure 2-147. Plot of Elements Exceeding the Experimental Strain Locus for the 831-g,Plutonium Metal Hollow Cylinder, Far Side Position, Side Impact
Figure 2-148. Plot of Elements Exceeding the Experimental Strain Locus for the 831-g,Plutonium Metal Hollow Cylinder, Far Side Position, Side Impact
2-156

PAT-] Safety Analysis Report Addendum Docket No. 71-0361 Rev. I
Figure 2-149. Plot of EQPS in the TB-I for the 831-g,ER, Cylinder, Far Side Position, Side Impact
0 .OOE- 3* .67E- 33 .33E- 35.00/ 36.67E_3~~8.33 E -3
10.279,t
Figure 2-150. Plot of EQPS in the TB-1 for the 831-g,ER Cylinder, Far Side Position, Side Impact
2-157

PAT-1 Safety Analysis Report Addendum Docket No. 71-0361 Rev. I
Figure 2-151. Plot of von Mises Stress in the TB-1 for the 831-g,ER Cylinder, Far Side Position, Side Impact
37.5E: 375.OE 3I I2.5E 3
50.OE-3187.5E 3225.OE 3
= 0.2Eý 3)= 222.6E13
Figure 2-152. Plot of von Mises Stress in the TB-I for the 831-g,ER, Cylinder, Far Side Position, Side Impact
2-158

PAT-I Safety Analysis Report Addendum Docket No. 71-0361 Rev. I
2.12.5.4.6 Run 5 - 831-g Angled Plutonium Metal Hollow Cylinder Side Impact
The side impact model for the plutonium metal hollow cylinder, angled orientation, is shown inFigure 2-153. The cylinder is located at the far side of the T-Ampoule so that its net impactvelocity with the side of the T-Ampoule is maximized, but also angled to present a sharp comerimpact with the T-Ampoule surface. The post-impact deformation is shown in Figure 2-154 andits kinetic energy history in Figure 2-155. The plutonium metal hollow cylinder deformsmoderately but maintains much of its original shape because of its conservatively "infinitelyductile" material constitutive model definition.
Average stress-triaxiality versus EQPS is shown in Figures 2-156 and 2-157 for the 91 elementsextending beyond the tested Bao-Wierzbicki strain locus. All of these elements are at relativelyhigh stress triaxiality and low EQPS. The Tearing Parameter values for these same 91 elementsare shown in Figure 2-158, and all are still below the critical Tearing Parameter value of 1.012for Ti-6A1-4V. These elements are highlighted in red Figure 2-159, but these elements are stillbelow the critical value and do not indicate failure; T-Ampoule integrity is maintained.
Peak EQPS in the TB-I vessel is shown in Figures 2-160 and 2-161 to be about 26.7%, althoughthis peak is only in a highly localized outer comer region where there is a slight contactoverclosure issue with the redwood overpack. Through-thickness plasticity is non-existent andthe TB-1 integrity is maintained. The von Mises stresses (see Figures 2-162 and 2-163) peak at221 ksi (due to the localized redwood contact), which is above the elevated-temperatureminimum yield strength for the TB-1 of 141 ksi, but more importantly, through-thickness TB-Istress values are less than 112.5 ksi, below yield.
Figure 2-153. Finite Element Mesh for the 831-g, Angled,ER Cylinder, Far Side Position, Side Impact
2-159

PAT-I Safety Analysis Report Addendum Docket No. 71-0361 Rev. I
0
Figure 2-154. Finite Element Mesh for the 831-g, Angled,ER Cylinder, Far Side Position, Side Impact - Final Displacement
8,0I I
7.0 V
6.0 V
•4.0
3.0 V
2.0 H
1.0 P
0.0 I I I
0.0 0.1 0.8 1.2 1.6 2.0TIME t.10-5 j
2.4 2.8
Figure 2-155. Kinetic Energy Time History for the 831-g, Angled, Plutonium Metal HollowCylinder, Far Side Position, Side Impact
2-160

PAT-I Safety Analysis Report Addendum Docket No. 71-0361 Rev. I
Comparison Graph Avg. Stress TriaxialityTitanium Impact Test and High Speed 831g Cylinder Full Model
Angled for Side Impact - ...... .......1.0 1- -ios - €8s5Ds•
0I$• 1IS? E155630
0.8 '1656.1 .(losslo
-0(150414 E15013.-- [1501,30 .......... E110216 E150302
S0.6- 10526 . 150582 - EM(0638
11.108o62 (1so518 (1..5?,
0.4 - (1s13o (.s1o86 E1S112"U -- 151264 -4----- 2151310
EISIS3O ( 151550 E151646
- 0.2 -E111.o2 (151558 E111,14
68 -.---- i- (151810 . (51526 E151382
o "0361161 (361564 E 0362161
•ý 0.0-3621511 -- - E362555 •E362M5
"E362343 E363146 E3633A3
'. i E363540 U3-3I3 1 3-113
-0.2 ( E376652 E316106 E316164E376820 E3768168 . . . E376,332
EV-[36-8 E377044 E37?DO0
E 3??156 E-311212 -- 37726I-0.4 , ,
0.0 0.1 0.2 0.3 0.4 0.5 0.6 (10•1562 ý-15 .'-'-( 0 o(055660 E3182816 E33718.
Figure 2-156. Graph of Average Stress Triaxiality versus EQPS of Elements Exceeding theExperimental Strain Locus for the 831-g, Angled, Plutonium Metal Hollow Cylinder, Far
Side Position, Side Impact
Comparison Graph Avg. Stress TriaxialityTitanium Impact Test and High Speed 831g Cylinder Full Model
Angled for Side Impact
0.7 9 nsooo 112 - (555 •so410 .8 (1$0526 ( 20582 - E1(0638
0.8 (01O6588 £ 105504 - (11080
E- 110862 E13O31A E- 11sOS?
[I~S3 . E214$ 111~S&
- - - ................ - (- (32- -- (355265-110.000 0.05....0. 0 ....00 0......(361160 E3661 (055112
bJ • [36235a • E362555 M2 36752
E62. 033 5 -..... .........0. E363510 E363131 1E363M3
E376652 E316105 ..... . 53675
E7 20 E376876 E316532
.. E376388 ......... s6~ O - - ... E3?1000.4 ... 1 1. ......311......112.2......I
SE3':.. - 1377380 -... I I77130.000 0.005 0.010 0.015 0.020 0.025 0.030 ........ . ...... . ......1111660 - E311116 311772EQPS . ...... ......
Figure 2-157. Graph of Average Stress Triaxiality versus EQPS of Elements Exceeding theExperimental Strain Locus (Zoomed In) for the 831-g, Angled, Plutonium Metal Hollow
Cylinder, Far Side Position, Side Impact
2-161

PAT-I Safety Analysis Report Addendum Docket No. 71-0361 Rev. I
Comparison Graph Tearing ParameterTitanium Impact Test and High Speed 831g Cylinder Full
-•Angled for Side ImpactI Model
A-1.z -
1.0
Z 0.8E
0.4I-
0.2
0.0
0.1
(151030 ------ (1513660
E-41 02 E156158
(ElS030 -- 0-8(106
(31716 . . . 142
(37s324 (311366l
E:'5O02'2 E130O0T
(E3701N E130216
- V---- -3m2.076
• E15D6Sn E130582
• E1-8. EMI0SO
"ýI1158 OM1S25,
... E1513"• 1:1:1422
EI1353. .... 3 1• 0
IES10 E151?.
0S20n M[12031
E361767 E361364
• E362356 E... E362•55
E3623.3 E3631.6
E363540 E363737
E3T665. E3160T6
13Te2 .... ""0
'3T1756 137•21
• E377324 --- - 31360
1111:142 :[3 1146
E37?6&0 • 3?1".
E186o.6
(12514
E2M5602
__1_____(6275
(3s6353
- 3 E150302
Vý1,038
EIM0SO
•E362161
•E362?52
E363343
.... E363334
E376332
•E377100
-- -- E377268
-k E311.36
•E31-10
S E37?712
I
000 0.005 0.010 0.015 0.020 0.025
EQPS
Figure 2-158. Graph of Tearing Parameter versus EQPS of Elements Exceeding theExperimental Strain Locus for the 831-g, Angled, Plutonium Metal Hollow Cylinder, Far
Side Position, Side Impact
2-162

PAT-1 Safety Analysis Report Addendum Docket No. 71-0361 Rev. I
Figure 2-159. Plot of Elements Exceeding the Experimental Strain Locus for the 831-g,Angled, Plutonium Metal Hollow Cylinder, Far Side Position, Side Impact
2-163

PAT-I Safety Analysis Report Addendum Docket No. 71-0361 Rev. I
0
Figure 2-160. Plot of EQPS in the TB-I for the 831-g, Angled,ER Cylinder, Far Side Position, Side Impact
Figure 2-161. Plot of EQPS in the TB-1 for the 831-g, Angled,ER Cylinder, Far Side Position, Side Impact
2-164

PAT-I Safety Analysis Report Addendum Docket No. 71-0361 Rev. I
Figure 2-162. Plot of von Mises Stress in the TB-I for the 831-g, Angled, Plutonium MetalHollow Cylinder, Far Side Position, Side Impact
VONI 1]5E5
0.0OE ý337. 5Eý 375.OE 3
I I 2.5E 3150.0OE- 3187 .5E 3225.OE'3
@= 1.4E•3220.6E- 3
Figure 2-163. Plot of von Mises Stress in the TB-1 for the 831-g, Angled, Plutonium MetalHollow Cylinder, Far Side Position, Side Impact
2-165

PAT-I Safety Analysis Report Addendum Docket No. 71-0361 Rev. I
2.12.5.4.7 Run 6 - 731-g Plutonium Metal Hollow Cylinder Top Impact
The top end impact model for the slightly smaller (731 g) plutonium metal hollow cylinder,oriented axially (with the impact direction, as opposed to angled) is shown in Figure 2-164. Notethat the cylinder is located at the bottom of the T-Ampoule so that its net impact velocity withthe top of the T-Ampoule is maximized. The post-impact deformation is shown in Figure 2-165and its kinetic energy history in Figure 2-166. This slightly shorter plutonium metal hollowcylinder still exhibits buckling, despite its conservatively "strongest shape" definition.
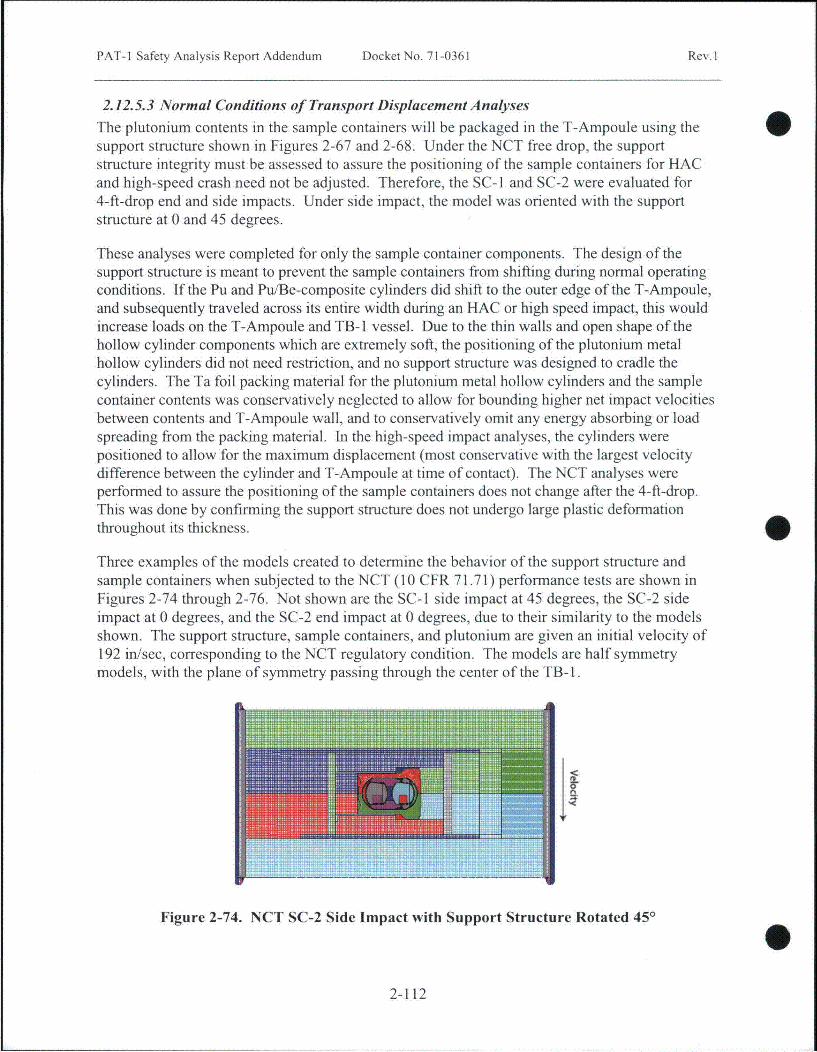
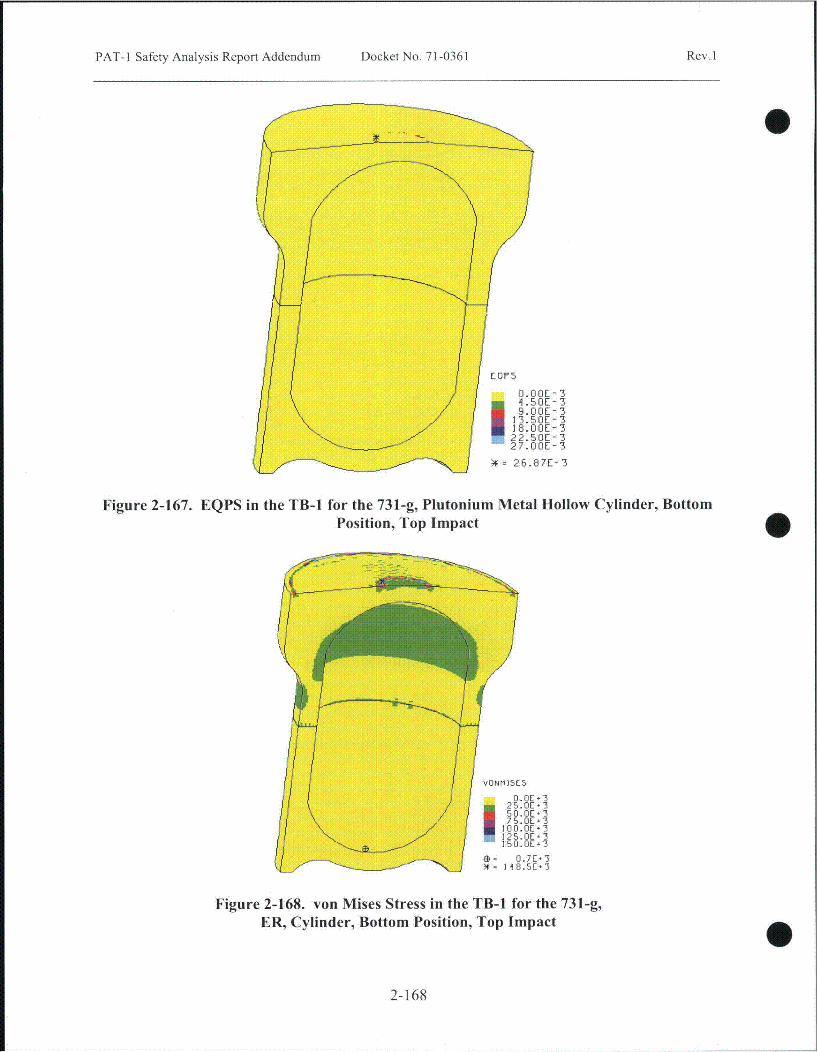
Equivalent Plastic Strain (EQPS) in the TB-I vessel is shown in Figure 2-167 to be less than2.7%, and only in some localized outer contact regions with the redwood overpack. The vonMises stresses (see Figures 2-168 and 2-169) peak at 148.5 ksi, is just above the elevated-temperature minimum yield strength for the TB- 1 of 141 ksi, but more importantly, through-thickness TB-I stress values are in the less-than-25 ksi range, below yield. The time at whichthe peak value of the von Mises stress occurs coincides with the peak value of the contact force(summed over the lid area). A plot of this force as a function of time is shown in Figure 2-170.A maximum contact load of 66,273 lbs is applied to the inner surface of the TB-I lid during theimpact. No T-Ampoule elements exceeded the tested B-W strain locus, and the peak TearingParameter value (see Table 2-11, run #6) of 0.1507 was below the critical Tearing Parametervalue of 1.012 for Ti-6AI-4V. Note that the peak Tearing Parameter value for the T-Ampoule inthis 731 g, plutonium metal hollow cylinder impact case is slightly larger than that of the 831 gcylinder impact, because the shorter plutonium metal hollow cylinder has a slightly higher netimpact velocity with the T-Ampoule.
Figure 2-164. Finite Element Mesh for the 731-g,ER, Cylinder, Bottom Position, Top Impact
2-166

PAT-I Safety Analysis Report Addendum Docket No. 71-0361 Rev. I
I
Figure 2-165.Cylinder, Bottom
Finite Element Mesh for the 731-g, ER,Position, Top Impact - Final Displacement
8.0
7.0
S.0
:4.
I I
3.0
2.0
1.0
0.0
0.0 0.4 0.8 1 .2 2.6 2.0TRIC k 10- J
2.4 2.8
Figure 2-166. Kinetic Energy Time History for the 731-g,ER, Cylinder, Bottom Position, Top Impact
2-167
PAT-1 Safety Analysis Report Addendum Docket No. 71-0361 Rev. I
0.0OE- 31.50E-39.00E- 3
I 3.50E- 3I 8.00E- 322.50E-327.00E- 326.871- 3
Figure 2-167. EQPS in the TB-I for the 731-g, Plutonium Metal Hollow Cylinder, BottomPosition, Top Impact
O.OEý 325.0OE 350.0E -3
100 .OE 3125 .OE 3150.0E -3
)r 14 18:5E* 3
Figure 2-168. von Mises Stress in the TB-1 for the 731-g,ER, Cylinder, Bottom Position, Top Impact
0
2-168

PAT-I Safety Analysis Report Addendum Docket No. 71-0361 Rev. I
VONtI ]5E5
O.OEý '350.OE 3I 25.0E 3725.01.3
S150.OE 3
= 0.7E- '3= 1 8.5E[3
Figure 2-169. von Mises Stress in the TB-i for the 731-g,ER, Cylinder, Bottom Position, Top Impact
Sum of Contact Force in TB-1 Top for High Speed 731 g ER CylinderFull Model with Top Impact
70000
60000
50000
40000
30000
20000
10000
0
U1
0 0.0005 0.001 0.0015 0002
Time (sec)
0.0025 0.003 0.0035
Figure 2-170. Contact Forces in the TB-i for the 731-g,ER, Cylinder, Bottom Position, Top Impact
2-169

PAT-I Safety Analysis Report Addendum Docket No. 71-0361 Rev. I
2.12.5.4.8 Run 7 - 731-g, Angled, Plutonium Metal Hollow Cylinder Top Impact
The top end impact model for the shorter 731 g plutonium metal hollow cylinder, orientedangled, is shown in Figure 2-171. The cylinder is located at the bottom of the T-Ampoule so thatits net impact velocity with the top of the T-Ampoule is maximized. The post-impactdeformation is shown in Figure 2-172 and its kinetic energy history in Figure 2-173. Theplutonium metal hollow cylinder deforms but maintains much of its original shape because of itsconservatively "infinitely ductile" material constitutive model definition (despite its alpha Pubeing a relatively brittle material in reality).
Average stress-triaxiality versus EQPS is shown in Figures 2-174 and 2-175 for the 21 elementsextending beyond the tested Bao-Wierzbicki strain locus. All of these elements are at high stresstriaxiality and low EQPS. The Tearing Parameter values for these same 21 elements are shownin Figure 2-176, and all are below the critical Tearing Parameter value of 1.012 for Ti-6A1-4V.These elements are highlighted in red Figure 2-177, but note that these elements are still belowthe initiation of a ductile tear, thus T-Ampoule integrity is maintained.
Peak EQPS in the TB-1 vessel, shown in Figure 2-178, is about 2.4% and is only in somelocalized outer contact regions with the redwood overpack. The von Mises stresses (see Figures2-179 and 2-180) peak at 148.5 ksi, is just above the elevated-temperature minimum yieldstrength for the TB-I of 141 ksi, but more importantly, through-thickness TB-I stress values areless than 25 ksi, below yield. The time at which the peak value of the von Mises stress occurscoincides with the peak value of the contact force (summed over the lid area). A plot of thisforce as a function of time is shown in Figure 2-181. A maximum contact load of 58,873 lbs isapplied to the inner surface of the TB-I during the impact.
Figure 2-171. Finite Element Mesh for the 731-g, Angled,
ER Cylinder, Bottom Position, Top Impact 0
2-170

PAT-I Safety Analysis Report Addendum Docket No. 71-0361 Rev. I
Figure 2-172. Finite Element Mesh for the 731-g, Angled,ER Cylinder, Bottom Position, Top Impact - Final Displacement
8.0
7.0 1
6.0 V
5.0 V
:4.0
3.0
2.0 F-
1.0k[
0.0
0.0 0.4 0.8 1.2 1.6 2.0TM t1 ), 0 )
2.4 2.8
Figure 2-173. Kinetic Energy Time History for the 731-g, Angled, Plutonium Metal HollowCylinder, Bottom Position, Top Impact
2-171

PAT-I Safety Analysis Report Addendum Docket No. 71-0361 Rev. 1
Comparison Graph Avg. Stress TriaxialityTitanium Impact Test and High Speed 731g Cylinder
Angled with End Impact
0.8..E15563
E16055
6 0.6 .- E16551• • £27849
4 .- E28345
> 0.4 E28837-"" i E28841
E30545
E305530 .2~ E30557
1 £E30561
- . E30565u• 0.0 ... .. E3ý0017
cn 00631525•}• • -- 631828
- -. £E31833
-0.2 E_£31037- - . . . . . . . . . . . . . . . . . . . . . . . . . . ..- E31541
E £31545
-0.4 I I I E32033
0.0 0.1 0.2 0.3 0.4 0.5 0.6
EQPS
0
Figure 2-174. Graph of Average Stress Triaxiality versus EQPS of Elements Exceeding theExperimental Strain Locus for the 731-g, Angled, Plutonium Metal Hollow Cylinder,
Bottom Position, Top Impact
Comparison Graph Avg. Stress TriaxialityTitanium Impact Test and High Speed 731g Cylinder
Angled with End Impact
0.8 - ------- -- tanou
0.7 E,£15563- - ----------------------- --- -- -- -- -- -- -- £E16055
> 0.6 E16551
0.5E28837
0.4 E28841
E38545
0.3E30557
0.2 E30561- E30565
w 0.1 £38865(4) £31017
(1) £31025L- 0.0 -6 E31029- E31033
-0.1 E31037
E31541-0.2 I E31545
0.000 0.005 0.010 0.015 0.020 0.025 0.030 0.035 0.040 320233
EQPS
Figure 2-175. Graph of Average Stress Triaxiality versus EQPS of Elements Exceeding theExperimental Strain Locus (Zoomed In) for the 731-g, Angled, Plutonium Metal Hollow
Cylinder, Bottom Position, Top Impact 02-172

PAT-I Safety Analysis Report Addendum Docket No. 71-0361 Rev. I
Comparison Graph Tearing ParameterTitanium Impact Test and High Speed 731g Cylinder
Angled with End Impact
- -- Tea- ngPra
1.0 --.--.----------------.-.-.-.-.-.-. -------------------- ------------- - E155£15563
•a EI6055
0.8 ..... .E - 1127849
( 0.6 - E28345
CL- E28837•0 E28 4,
• 0.4 E30545
3E3553I--0.2 E30557
0E30561E30565
0.000 0.010 0.020 0.030 0.040
EQPS
Figure 2-176. Graph of Tearing Parameter versus EQPS of Elements Exceeding theExperimental Strain Locus for the 731-g, Angled, Plutonium Metal Hollow Cylinder,
Bottom Position, Top Impact
Figure 2-177. Plot of Elements Exceeding the Experimental Strain Locus for the 731-g,Angled, Plutonium Metal Hollow Cylinder, Bottom Position, Top Impact
2-173

PAT-I Safety Analysis Report Addendum Docket No. 71-0361 Rev. 1
O.OOE- 3p 1.25E- 38.50E-3
02.75E-317. OOE -321.25E-325 .50E-5
X= 21.82E-'3
Figure 2-178. Plot of EQPS in the TB-I for the 731-g, Angled, Plutonium Metal HollowCylinder, Bottom Position, Top Impact
VONrI15[5
0.0E1 325.0Eý 350.0E 375.0LE35 00.0E- 3
a= 0.8E:3X= I IJ 8.3E" 3
Figure 2-179. Plot of von Mises Stress for the 731-g, Angled, Plutonium Metal HollowCylinder, Bottom Position, Top Impact
2-174

PAT-1 Safety Analysis Report Addendum Docket No. 71-0361 Rev. I
VON1I5L5
0.0E. 3* 25.0E 3
50 OE 375 0E 3
100 -OE 3125. OE 3150.OE 3
,D 0.7E- 3)0= I 8.5E 3
Figure 2-180. Plot of von Mises Stress for the 731-g, Angled, Plutonium Metal HollowCylinder, Bottom Position, Top Impact
Sum of Contact Force in TB-1 Top for High Speed 731 g Angled ERCylinder Full Model with Top Impact
70000
60000 /I
40000 /
30000
20000 -
10000 ./\,
0 V,' ''\,, ,r ,) ,
0 0.0005 0.001 0.0015 0002 0.0025 0.003
Tine (sec)
Figure 2-181. Plot of Contact Force for the 731-g, Angled, Plutonium Metal HollowCylinder, Bottom Position, Top Impact
2-175

PAT-I Safety Analysis Report Addendum Docket No. 71-0361 Rev. I
2.12.5.4.9 Run 8 - 731-g Angled Plutonium Metal Hollow Cylinder CGOC Impact
The lid end CG-over-corner impact model for the shorter 731 g plutonium metal hollow cylinderis shown in Figure 2-182. The cylinder is located at the bottom of the T-Ampoule so that its netimpact velocity with the top of the T-Ampoule is maximized. The post-impact deformation isshown in Figure 2-183 and its kinetic energy history in Figure 2-184. The plutonium metalhollow cylinder deforms slightly more than the previous case because of the slightly more side-impact-like orientation but maintains much of its original shape because of its conservatively"infinitely ductile" material constitutive model definition.
Average stress-triaxiality versus EQPS is shown in Figures 2-185 and 2-186 for the 84 elementsextending beyond the tested Bao-Wierzbicki strain locus. All of these elements are at relativelyhigh stress triaxiality and low EQPS. The Tearing Parameter values for these same 84 elementsare shown in Figure 2-187 and all are still safely below the critical Tearing Parameter value of1.012 for Ti-6A1-4V. These elements are highlighted in red in Figures 2-188 and 2-189 but theseelements are still below the critical value, thus the T-Ampoule eutectic barrier integrity ismaintained.
Peak EQPS in the TB-1 vessel is shown in Figure 2-190 to be about 28.5%, although this peak isonly in a highly localized outer corner region where there is a slight contact over closure issuewith the redwood overpack. Through-thickness plasticity is non-existent and the TB-1 integrityis maintained. The von Mises stress (see Figure 2-191) peak at 225 ksi (due to the localizedredwood contact) is above the elevated-temperature minimum yield strength for the TB-I of141 ksi, but more importantly, through-thickness TB-I stress values are less than 37.5 ksi, belowyield.
Figure 2-182. Finite Element Mesh for the 731-g, Angled, Plutonium Metal HollowCylinder, Bottom Position, CGOC Impact
2-176

PAT- I Safety Analysis Report Addendum Docket No, 71-0361 Rev. I
Figure 2-183. Finite Element Mesh for the 731-g, Angled, Plutonium Metal HollowCylinder, Bottom Position, CGOC Impact - Final Displacement
8.0
7.0 F
6.0 k
ti.0
I I I I I
3.0 F
2.0 F
1.0
0.0 1.0 2.0 3.0
TIME I 10-'1.0 5.0 6.0
Figure 2-184. Kinetic Energy Time History for the 731-g, Angled, Plutonium Metal HollowCylinder, Bottom Position, CGOC Impact
2-177

PAT-I Safety Analysis Report Addendum Docket No. 71-0361 Rev. I
Comparison Graph Avg. Stress TriaxialityTitanium Impact Test and 731g Angled Cylinder Full Model
CGOC Impact-,1.0
0.8
5 0.6
0.4>8
.i0.2
Xm
. 0.0I.-
-0.2I-
ca -0.4
-0.6
-0.8
... S7..,L-cu - E 250E17281 E18677
E18685 - E18689
E £20165 E20173
E£0177 E28093
E188678 E188734
E188790 E188846
* E'88982 E188958E189014 - E189070
E 189126 E189182
E £189238 E £189294- E 189742 E189798
_ E189854 .......... ...... E189910
E189966 - E:90022
- E190078 - E 90134- E190190 8E190 246
E190302 - E£90358
- E:90414 - E190470
E£90526 -- E190582
E190638 - E190694..........E• 71 EI90806
. 90862 E190918
E-.E190974 E191030E191086 E £191142
E191198 E£91254
E191310 E- £19366
E£91422 - E-91478E191534 - E191590
S191646 E£917 2
E191756 E Et91758
- E191812 E £191868
D M365707 E365904
E366101 E366298E366495 E366692
S £366889 E367086
E367283 E367480
E367677 E367874
E368071 - E368268
E368465 -- E368662* E368859 E369056
- E369253 E-4£369450
E369687 - E3S9844
13170Z8
0.0 0.1 0.2 0.3 0.4EQPS
0.5 0.6
Figure 2-185. Graph of Average Stress Triaxiality versus EQPS of Elements Exceeding theExperimental Strain Locus for the 731-g, Angled, Plutonium Metal Hollow Cylinder,
Bottom Position, CGOC Impact
- - - StinLocus - E £250Comparison Graph Avg. Stress Triaxiality E17201 E18677
Et8685 E18689
Titanium Impact Test and 731g Angled Cylinder Full Model EE20173E201778 E 80S33
E188G78 E188734
CGOC Impact E188790 E1888461.0 188902 E188958
- £189014 E189070
0.8 E189126 E189182E £189238 - E189294
- E189742 E- £189798E189854 E189910
............... V E189966 - E198022
>.-- £190978 E-- 190134- E190 Er E90246SE90382 - E19'358
0.4 E190414 £E190470E190526 -- E190582
E190638 - E£196980.2 EX190750 - E19806
2 £190862 - E£19918
-- E190974 £E19130
0.0 . EI91086 E19142£E191198 E191254
E19310 - E191366~A -02 - P9,422 E.191.70-0. E191534 - E191590
E- 964 E£191702.E.191756 E £ ;11758
-U.4__ E191812 - 0£9186
E365707 £3659"4
E366101 E366298
-0.6 £366495 £368692E3M8889 E367086E367283 E367480
E 367677 E367874E368071 . £368268E368865 E38662
0.00 0.01 0.02 0.03 0.04 0.05 - E38859 E369S369253 - E369450
S--- 369647 - E369844EQPS £E370041
Figure 2-186. Graph of Average Stress Triaxiality versus EQPS of Elements Exceeding theExperimental Strain Locus (Zoomed In) for the 731-g, Angled, Plutonium Metal Hollow
Cylinder, Bottom Position, CGOC Impact
2-178

PAT-I Safety Analysis Report Addendum Docket No. 71-0361 Rev. 1
.... T-aPw-a - E9250
Comparison Graph Tearing Parameter E1720, E18677- EI86885 - E186789
Titanium Impact Test and 731g Angled Cylinder Full Model INE2'0177 E2893
E188678 E188734
1.2 CGOC ImpactE19, 0E1890O2 E189858
E189014 EIO470E189126 EE90182
* E189238 1EIS294
• E107 * E189708
-1.0E1 9054 - E189910-= ---_ E189966 E190022
2 ---- E190078 E 90134
E 0190 - E190246-E190302 E:9 358
0.8 . E190414 E90470
E E, :-- 0-5291-6 EI97052
E130750 . E190S80
E130862 - E190918
E.. 0.6 EE190974E19
SE3S198 E193254
E1391310 - E191366
0.4 E;;4728 -- E36;718
- E191642 E191702
0~~ S 756 -E1914El1758
- E131812 E191868
0.2 -"i'7____ E365707 E365904
E361071 - E366298
E368495 E366692
E E36688 E 67086
E 3 72:9 E674800.0E367677 E367874
I ~~ I 368071 - E368268
0.00 0.05 0.10 0.15 0.20 0.25 0.30 - E, "' -- E1'60.. .. .E3::253 - E3I9450EQPS E369647 - E369844
EE370041
Figure 2-187. Graph of Tearing Parameter versus EQPS of Elements Exceeding theExperimental Strain Locus for the 731-g, Angled, Plutonium Metal Hollow Cylinder,
Bottom Position, CGOC Impact
Figure 2-188. Plot of Elements Exceeding the Experimental Strain Locus for the 731-g,Angled, Plutonium Metal Hollow Cylinder, Bottom Position, CGOC Impact
2-179

PAT-I Safety Analysis Report Addendum Docket No. 71-0361 Rev. I
-7
Figure 2-189. Plot of Elements Exceeding the Experimental Strain Locus for the 731-g,Angled, Plutonium Metal Hollow Cylinder, Bottom Position, CGOC Impact
Figure 2-190. Plot of EQPS in the TB-1 for the 731-g, Angled, Plutonium Metal HollowCylinder, Bottom Position, CGOC Impact 0
2-180

PAT-I Safety Analysis Report Addendum Docket No. 71-0361 Rev. I
VtJNrl 15E5
O.OE 337.5E- 375.OE- 3
I 50.OE- 31 87.5E4 3225.OEý 3
D 0. 2E-3X= 2 2 A.9E4 3
Figure 2-191. Plot of von Mises Stress in the TB-I for the 731-g, Angled, Plutonium MetalHollow Cylinder, Bottom Position, CGOC Impact
2.12.5.4.10 Run 9 - 731 -g Plutonium Metal Hollow Cylinder Side Impact
The side impact model for the shorter and lighter 731 g plutonium metal hollow cylinder isshown in Figure 2-192. The cylinder is located at the far side of the T-Ampoule so that its netimpact velocity with the side of the T-Ampoule is maximized. The post-impact deformation isshown in Figure 2-193 and its kinetic energy history in Figure 2-194. The plutonium metalhollow cylinder deforms much more than the previous case because of its weaker side-impact-like orientation.
Average stress-triaxiality versus EQPS is shown in Figures 2-195 and 2-196 for the 63 elementsextending beyond the tested Bao-Wierzbicki strain locus. All of these elements are at relativelyhigh stress triaxiality and low EQPS. The Tearing Parameter values for these same 63 elementsare shown in Figure 2-197 and all are still below the critical Tearing Parameter value of 1.012 forTi-6A1-4V. These elements are highlighted in red Figure 2-198 but these elements are stillbelow the critical value and do not indicate failure; T-Ampoule integrity is maintained.
Peak EQPS in the TB-1 vessel is shown in Figures 2-199 through 2-202 and is about 30%,although this peak is only in a highly localized outer comer region where there is a slight contactoverclosure issue with the redwood overpack. A slight (<1% EQPS) dent is visible in Figure2-202 from the internal impact of the plutonium metal hollow cylinder into the TB-1 wall (viathe T-Ampoule). Through-thickness plasticity is non-existent and the TB-I integrity ismaintained. The von Mises stresses (see Figures 2-203 and 2-204) peak at 225 ksi (due to thelocalized redwood contact), above the elevated-temperature minimum yield strength for the TB-I
2-181

PAT-I Safety Analysis Report Addendum Docket No. 71-0361 Rev. I
of 141 ksi, but more importantly, through-thickness TB-I stress values are less than 80 ksi,below yield.
Figure 2-192. Finite Element Mesh for the 731-g, ER,Cylinder, Far Side Position, Side Impact
A
Figure 2-193. Finite Element Mesh for the 731-g, Plutonium Metal Hollow Cylinder, FarSide Position, Side Impact - Final Displacement
2-182

PAT-I Safety Analysis Report Addendum Docket No. 71-0361 Rev. I
8.0
7.0
6.0
4,.0
I I I I
3.0
2.0
1.0
0.0
0.0 0.1 0.8 1 .2 1 .6TIME I -10-5
2.0 2.'q 2.8
Figure 2-194. Kinetic Energy Time HistoryER, Cylinder, Far Side Position, Side
for the 731-g,Impact
- ,- L .. S -i~ou EI85990
Comparison Graph Avg. Stress Triaxiality - 189046 E,86102
Titanium Impact Test and High Speed 731g Cylinder Full Model E186158 - E,186•42- E186210 - EI8632ý
With End Orientation and Side Impact E186382 ,86438E186494 E186550
1 .0 - ---- E 186606 E186662
E186718 E186774
E186830 E1868886
0.8 E186942 E186998
E - 8187054 • E187110
E187166 P 8187222
0.6 -- E187278 • E187334
I . E187502 E187558
-.--E187614 E-.--187670-0.4
M E187726 - E187782
S8 E187838 E187894
E187937 - E187950.- -'E-8187383 •8 188006
E188062 - E188118
0.0 -8•E188174 -E1882300.0 ........ E188286 E320001
E320005 . E320009
-- . E377044 E377100
-0.2 E8377156 - E- 377212
E377288 - E377324
-0.4 1 - ..... 8377492 8377548- -,- E377642 E377660
0.00 0.10 0.20 0.30 0.40 0.50 0.60 E 377716E377762
EQPS - E377828 E377884
Figure 2-195. Graph of Average Stress Triaxiality versus EQPS of Elements Exceeding theExperimental Strain Locus for the 731-g, Plutonium Metal Hollow Cylinder, Far Side
Position, Side Impact
2-183

PAT-I Safety Analysis Report Addendum Docket No. 71-0361 Rev. I
-..- .. nrmoc.- ----,---- E185990
Comparison Graph Avg. Stress Triaxiality E186046 E186,82618,158 -.--- 186214
Titanium Impact Test and High Speed 731g Cylinder Full Model E:86270 -- 1,e6321
W ith End Orientation and Side Impact E186382 E186438E186494 E186550
* E186718 E186774
E186830 E186886
E186942 £186998-0. E 187054 E~-- 187110
E187166 E187222>-.--- E187278 .......... 6187334
. . £187614 E187670
E187726 E187782
.- 187838 E187894
- . . . . .. - - - - - - - - -.. - - - - - - - - - - -- - - - - - - - -187337 - £187950
£1M87993 E188008
0.6-- E188062 E188118
0". -- .-- £188174 £E88238
...... ... £188286 £320001
U-) E-£328005 E £3280090.5 - E377804 £377100
E377156 E377212
E377268 -------- E 377324
0.4 I E377380 E377436
E377492 E377548
0.000 0.002 0.004 0.006 0.008 0.010 E377604 E377660
EOPS E377716 -- 377772E377828 E377884
Figure 2-196. Graph of Average Stress Triaxiality versus EQPS of Elements Exceeding theExperimental Strain Locus (Zoomed In) for the 731-g, Plutonium Metal Hollow Cylinder,
Far Side Position, Side Impact
Comparison Graph Tearing Parameter
Titanium Impact Test and High Speed 731g Cylinder
With End Orientation and Side ImpactFull Model
1.0
-0.881)E,0.6
09 0 0.4I.--
0.2
* - - - T4.1.flP ,lamelM,.--- --- E185990
E186046 E186182
£186158 - E186214
E-£186270 E186326
E186382 E186438
E186894 E1885580
E186606 E £186662
* E188718 E186774
E186830 E186886
E186942 E186888
E £187854 - E18711
E187166 E187222£[187278 .. . . £187334
IM 87390 . E187446
E187502 • E187558
E187614 - E187670
E187726 - E£87782
E187838 E187894
£187937 - E187950
E187933 . E188006
E188062 PE£88118
. E188174 1E88230
E £188286 E320801
E £328005 E320009
E377048 E37710D
E377156 - E377212
- E377268 E377324
E377380 - E377436
E377492 E377548
E377604 - E37768
E37771 £3717772
E377828 E 6377884
n n
0.000 0.002
1
0.004EQPS
00.006
00.008 0.010
Figure 2-197. Graph of Tearing Parameter versus EQPS of Elements Exceeding theExperimental Strain Locus for the 731-g, Plutonium Metal Hollow Cylinder, Far Side
Position, Side Impact
2-184

PAT-I Safety Analysis Report Addendum Docket No. 71-0361 Rev. I
Figure 2-198. Plot of Elements Exceeding the Experimental Strain Locus for the 731-g,Plutonium Metal Hollow Cylinder, Far Side Position, Side Impact
Figure 2-199. Plot of EQPS in the TB-I for the 731-g,ER Cylinder, Far Side Position, Side Impact
2-185

PAT-1 Safety Analysis Report Addendum Docket No. 71-0361 Rev. I
Figure 2-200. Plot of EQPS in the TB-I for the 731-g,ER Cylinder, Far Side Position, Side Impact
o.OOE- 3
/.67E- 3
8.33E_ 30 0.OOE - 3
)*= 0.3006
Figure 2-201. Plot of EQPS in the TB-i for the 731-g,ER Cylinder, Far Side Position, Side Impact
2-186

PAT-I Safety Analysis Report Addendum Dockct No. 71-0361 Rev. I
O.OOOE- '3I. 67E- 30. 333E- 30.500E- 30. 667E-_3
.O000E- 3
- = 0.3006
Figure 2-202. Plot of EQPS in the TB-I for the 731-g, Plutonium Metal Hollow Cylinder,Far Side Position, Side Impact (Range Adjusted to Highlight Small Stains in the TB-I Not
Visible in Figure 2-201)
Figure 2-203. Plot of von Mises Stress in the TB-I for the 731-g, Plutonium Metal HollowCylinder, Far Side Position, Side Impact
2-187

PAT- I Safety Analysis Report Addendum Docket No. 71-0361 Rev. I
I O.OE 3
80.OE- 3120.0E 3160.OE 3200.OE• 321 O.OE- 3
ED 0. 3E: 3f= 22S.1E 3
Figure 2-204. Plot of von Mises Stress in the TB-I for the 731-g, Plutonium Metal HollowCylinder, Far Side Position, Side Impact (see Figure 2-203 Rotated to Show Internal
Stresses)
2.12.5.4.11 Run 10 - 731-g Angled Plutonium Metal Hollow Cylinder Side Impact
The side impact model for the lighter, 731 g plutonium metal hollow cylinder, angledorientation, is shown in Figure 2-205. The cylinder is located at the far side of the T-Ampoule sothat its net impact velocity with the side of the T-Ampoule is maximized, but also angled topresent a sharp comer impact with the T-Ampoule surface. The post-impact deformation isshown in Figure 2-206 and its kinetic energy history in Figure 2-207. The plutonium metalhollow cylinder deforms moderately but maintains much of its original shape because of itsconservatively "infinitely ductile" material constitutive model definition.
Average stress-triaxiality versus EQPS is shown in Figures 2-208 and 2-209 for the 94 elementsextending beyond the tested Bao-Wierzbicki strain locus. All of these elements are at relativelyhigh stress triaxiality and low EQPS. The Tearing Parameter values for these same 94 elementsare shown in Figure 2-2 10 and all are still below the critical Tearing Parameter value of 1.012 forTi-6AI-4V. These elements are highlighted in red Figure 2-211 but these elements are stillbelow the critical value and do not indicate failure; T-Ampoule integrity is maintained.
Peak EQPS in the TB-I vessel is shown in Figures 2-212 and 2-213 and is about 27.6%,although this peak is only in a highly localized outer comer region where there is a slight contactover closure issue with the redwood overpack. Through-thickness plasticity is non-existent andthe TB-1 integrity is maintained. The von Mises stresses (see Figures 2-214 and 2-215) peak at224 ksi (due to the localized redwood contact), above the elevated-temperature minimum yieldstrength for the TB-I of 141 ksi, but more importantly, through-thickness TB- 1 stress values areless than 112.5 ksi, below yield. in
2-188

PAT-I Safety Analysis Report Addendum Docket No. 71-0361 Rev. I
Figure 2-205. Finite Element Mesh for the 731-g, Angled,ER Cylinder, Far Side Position, Side Impact
Figure 2-206. Finite Element Mesh for the 731-g, Angled,ER Cylinder, Far Side Position, Side Impact - Final Displacement
2-189

PAT-1 Safety Analysis Report Addendum Docket No. 71-0361 Rev. I
8.0
7.0 ý
6.0 I-
5.0 F-
4.0
3.0 V
2.0 j-
1.0 H
0.0
0.0 0.1 0.8 1 .2 ..6 2.0TIME i .10' j
2.4 2.8
Figure 2-207. Kinetic Energy Time History for the 731-g, Angled,Cylinder, Far Side Position, Side Impact
Plutonium Metal Hollow
Comparison Graph Avg. Stress TriaxialityTitanium Impact Test and 731g Angled Cylinder Full Model
1.0 ............. Side Im pact
0.8
0.6
0.4
0.2
0.0
-0.2
EW2 E18615 EIB214
E189182 01423$ P829
E189350 EV9406 EM9462Z
E189518 E18"574 E189630
E18%868 E--- 189742 E183798
E:8 954 E189910 E 018366
- 910022 E-.--- £130078 E130134
- E190190 E 130246 E130302
E190358 --- 04-- E19IO ---- I0470
E190526 - EW £352 EISMO3
-E130694 E190750 -- E 19M96
£13082 E.--- 190918 E109074
E___ 191030 E - 191090 -.-- 0l 182
E191198 E13l254 E -3100
0931366 * 013122 . 131478
-0191534 £131590 £151646
- P91702 E098758 E-- 191814
E191870 E.--. E19t926 E..--£19982
E192038 E192094 E.---361964
- E__ 0362161 E- - 362358 0362555
E302752 E362949 E363146
0363343 E363540 E363737
E363904 E364131 E364328
E364525 E364722 E364319
E365118 E395313 E--.-- 365510
E365707 E365904 E. 0366101
£366238 E.~-. 377212 ---. E377268
E____ 377324 E.377390 E.--- 377436
£377432 E3754 E 077604
--- E376 "D 3E7716 - E--3777772E377828 E.---- 377884
-0.4 1 1
0.0 0.1 0.2 0.3 0.4 0.5 0.6
EOPS
Figure 2-208. Graph of Average Stress Triaxiality versus EQPS of Elements Exceeding theExperimental Strain Locus for the 731-g, Angled, Plutonium Metal Hollow Cylinder, Far
Side Position, Side Impact
2-190
Copyright © 2022 FDOKUMEN


![Kabasilas 20120206 revised[1]](https://static.fdokumen.com/doc/165x107/6312229a706da55dc20bc86d/kabasilas-20120206-revised1.jpg)