San Miguel Community Services District
356
Page 1 of 3 9-10-2020 Special Board Meeting San Miguel Community Services District BOARD OF DIRECTORS Ashley Sangster, President Anthony Kalvans, Vic-President John Green, Director Hector Palafox, Director Raynette Gregory, Director THURSDAY, SEPTEMBER 10 th , 2020 6:00 P.M. Opened Session *STATEGIC PLANNING WORK SESSION* BOARD OF DIRECTORS SPECIAL MEETING AGENDA IMPORTANT NOTICE REGARDING COVID-19 AND TELECONFERENCE MEETINGS: Based on the mandates by the Governor in Executive Order 33-20 and the County Public Health Officer to shelter in place and the guidance from the CDC, to minimize the spread of the Corona Virus, please note the following changes to the District’s ordinary meeting procedures: • The District offices are not opened to the public at this time, please call 805-467-3388 • The Meeting will be conducted with social distancing observed. • All members of the public seeking to observe and comment to the local legislative body may do so in person or telephonically/email in the manner described below. HOW TO SUBMIT PUBLIC COMMENT IF NOT ATTENDING MEETING: Written / Read Aloud: Please email your comments to [email protected] (Board Clerk), write “Public Comment” in the subject line. In the body of the email, include the agenda item number and title, as well as your comments. If you would like your comment to be read aloud at the meeting (keep to three minutes) prominently write “Read Aloud at Meeting” at the top of your email. All comments received before 4:00 PM the day of the meeting will be included as agenda supplement on the District’s website under relevant meeting date and will be provided to the Board of Directors. Voice Mail: Leave a message on the District phone line at 805-467-3388 after 4:30pm before 4:30pm District Staff will take down message. Voice “Public Comment” at beginning of message and include agenda item number and title. All comments received before 4:00 PM the day of the meeting will be included as agenda supplement on the District’s website under relevant meeting date and will be provided to the Board of Directors. PUBLIC RECORD Public records that relate to any item on the open session agenda for a meeting are available for public inspection. Those records that are distributed after the agenda posting deadline for the meeting are available for public inspection at the same time, they are distributed to all of the members of the Board. The documents may also be obtained by calling the District Board Clerk. Please see: www.sanmiguelcsd.org
-
Upload
khangminh22 -
Category
Documents
-
view
1 -
download
0
Transcript of San Miguel Community Services District

Page 1 of 3
9-10-2020 Special Board Meeting
San Miguel Community Services District BOARD OF DIRECTORS
Ashley Sangster, President Anthony Kalvans, Vic-President John Green, Director Hector Palafox, Director Raynette Gregory, Director
THURSDAY, SEPTEMBER 10th, 2020 6:00 P.M. Opened Session
*STATEGIC PLANNING WORK SESSION* BOARD OF DIRECTORS SPECIAL MEETING AGENDA
IMPORTANT NOTICE REGARDING COVID-19 AND TELECONFERENCE MEETINGS:
Based on the mandates by the Governor in Executive Order 33-20 and the County Public Health Officer to shelter in place and the guidance from the CDC, to minimize the spread of the Corona Virus, please note the following changes to the District’s ordinary meeting procedures:
• The District offices are not opened to the public at this time, please call 805-467-3388 • The Meeting will be conducted with social distancing observed. • All members of the public seeking to observe and comment to the local legislative body may do so in person or
telephonically/email in the manner described below. HOW TO SUBMIT PUBLIC COMMENT IF NOT ATTENDING MEETING: Written / Read Aloud: Please email your comments to [email protected] (Board Clerk), write “Public Comment” in the subject line. In the body of the email, include the agenda item number and title, as well as your comments. If you would like your comment to be read aloud at the meeting (keep to three minutes) prominently write “Read Aloud at Meeting” at the top of your email. All comments received before 4:00 PM the day of the meeting will be included as agenda supplement on the District’s website under relevant meeting date and will be provided to the Board of Directors. Voice Mail: Leave a message on the District phone line at 805-467-3388 after 4:30pm before 4:30pm District Staff will take down message. Voice “Public Comment” at beginning of message and include agenda item number and title. All comments received before 4:00 PM the day of the meeting will be included as agenda supplement on the District’s website under relevant meeting date and will be provided to the Board of Directors. PUBLIC RECORD Public records that relate to any item on the open session agenda for a meeting are available for public inspection. Those records that are distributed after the agenda posting deadline for the meeting are available for public inspection at the same time, they are distributed to all of the members of the Board. The documents may also be obtained by calling the District Board Clerk. Please see: www.sanmiguelcsd.org

Page 2 of 3
9-10-2020 Special Board Meeting
I. Call to Order: 6:00 PM II. Pledge of Allegiance: ______________________________________ III. Roll Call: Sangster___ Kalvans___ Palafox___ Green___ Gregory___ IV. Approval of Special Meeting Agenda:
M S V V. ADJOURN TO CLOSED SESSION: None VI. Call to Order for Regular Board Meeting/Report out of Closed Session: None
VII. Public Comment and Communications for items not on the Agenda: None Persons wishing to speak on a matter not on the agenda may be heard at this time; however, no action will be taken until placed on a future agenda. Speakers are limited to three minutes. Please complete a “Request to Speak” form and place in basket provided. VIII. Special Presentations/Public Hearings/Other: None IX. Staff & Committee Reports – Receive & File: None X. CONSENT CALENDAR: None
The items listed below are scheduled for consideration as a group and one vote. Any Director or a member of the public may request an item be withdrawn from the Consent Agenda to discuss or to change the recommended course of action. Unless an item is pulled for separate consideration by the Board, the following items are recommended for approval without further discussion.
XI. BOARD WORK SESSION ITEMS:
1. District Strategic Planning Work Session. Recommendation: Discuss and provide direction to staff.
Public Comments: (Hear public comments prior to Board Direction)
XII. BOARD COMMENT:
This section is intended as an opportunity for Board members to make brief announcements, request information from staff request future agenda item(s) and/or report on their own activities related to District business. No action is to be taken until an item is placed on a future agenda.
XIII. ADJOURNMENT TO NEXT MEETING
Page 3 of 3
9-10-2020 Special Board Meeting
ATTEST: STATE OF CALIFORNIA ) COUNTY OF SAN LUIS OBISPO ) ss. COMMUNITY OF SAN MIGUEL )
I, Tamara Parent, Board Clerk/Accounts Manager of San Miguel Community Services District, hereby certify that I caused the posting of this agenda at the SMCSD office on 09-03-2020
Robert Roberson Interim General Manager
Ashley Sangster, President of the Board of Directors, SMCSD
Tamara Parent Board Clerk/ Accounts Manager
Page 1 of 3 9-10-2020 BOD Meeting
San Miguel Community Services District
Board of Directors Report
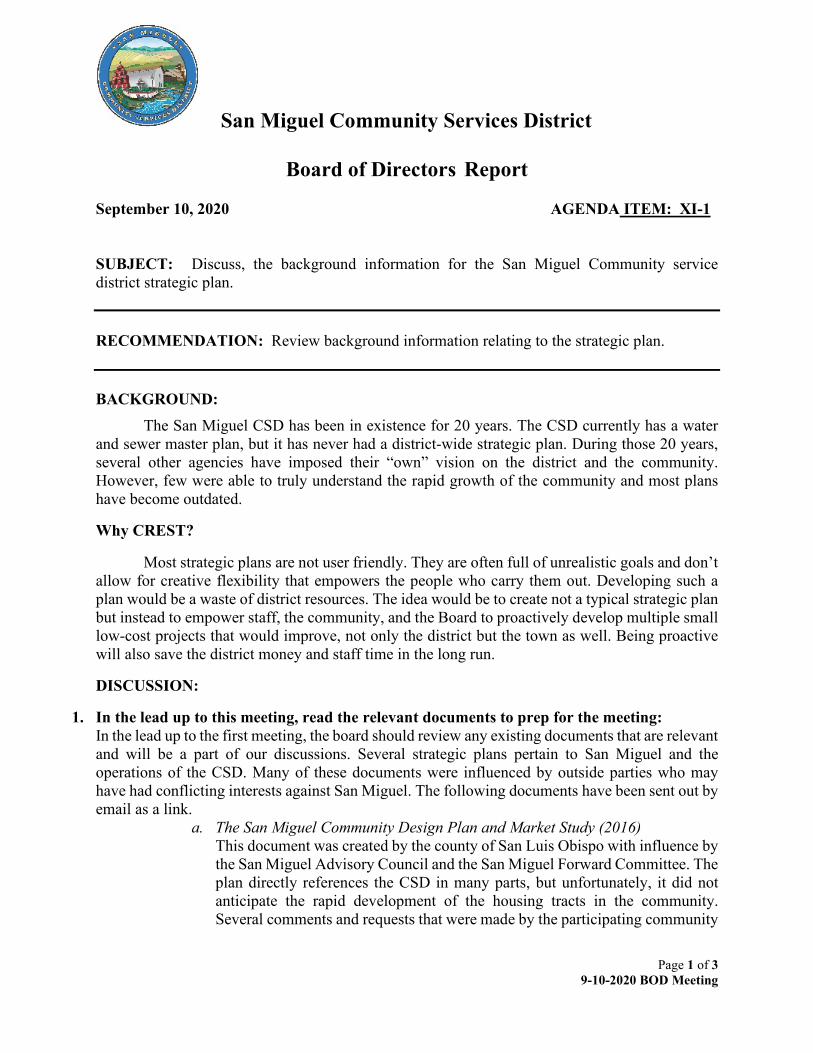
September 10, 2020 AGENDA ITEM: XI-1 SUBJECT: Discuss, the background information for the San Miguel Community service district strategic plan. RECOMMENDATION: Review background information relating to the strategic plan. BACKGROUND:
The San Miguel CSD has been in existence for 20 years. The CSD currently has a water and sewer master plan, but it has never had a district-wide strategic plan. During those 20 years, several other agencies have imposed their “own” vision on the district and the community. However, few were able to truly understand the rapid growth of the community and most plans have become outdated.
Why CREST?
Most strategic plans are not user friendly. They are often full of unrealistic goals and don’t allow for creative flexibility that empowers the people who carry them out. Developing such a plan would be a waste of district resources. The idea would be to create not a typical strategic plan but instead to empower staff, the community, and the Board to proactively develop multiple small low-cost projects that would improve, not only the district but the town as well. Being proactive will also save the district money and staff time in the long run.
DISCUSSION:
1. In the lead up to this meeting, read the relevant documents to prep for the meeting: In the lead up to the first meeting, the board should review any existing documents that are relevant and will be a part of our discussions. Several strategic plans pertain to San Miguel and the operations of the CSD. Many of these documents were influenced by outside parties who may have had conflicting interests against San Miguel. The following documents have been sent out by email as a link.
a. The San Miguel Community Design Plan and Market Study (2016) This document was created by the county of San Luis Obispo with influence by the San Miguel Advisory Council and the San Miguel Forward Committee. The plan directly references the CSD in many parts, but unfortunately, it did not anticipate the rapid development of the housing tracts in the community. Several comments and requests that were made by the participating community
Page 2 of 3 9-10-2020 BOD Meeting
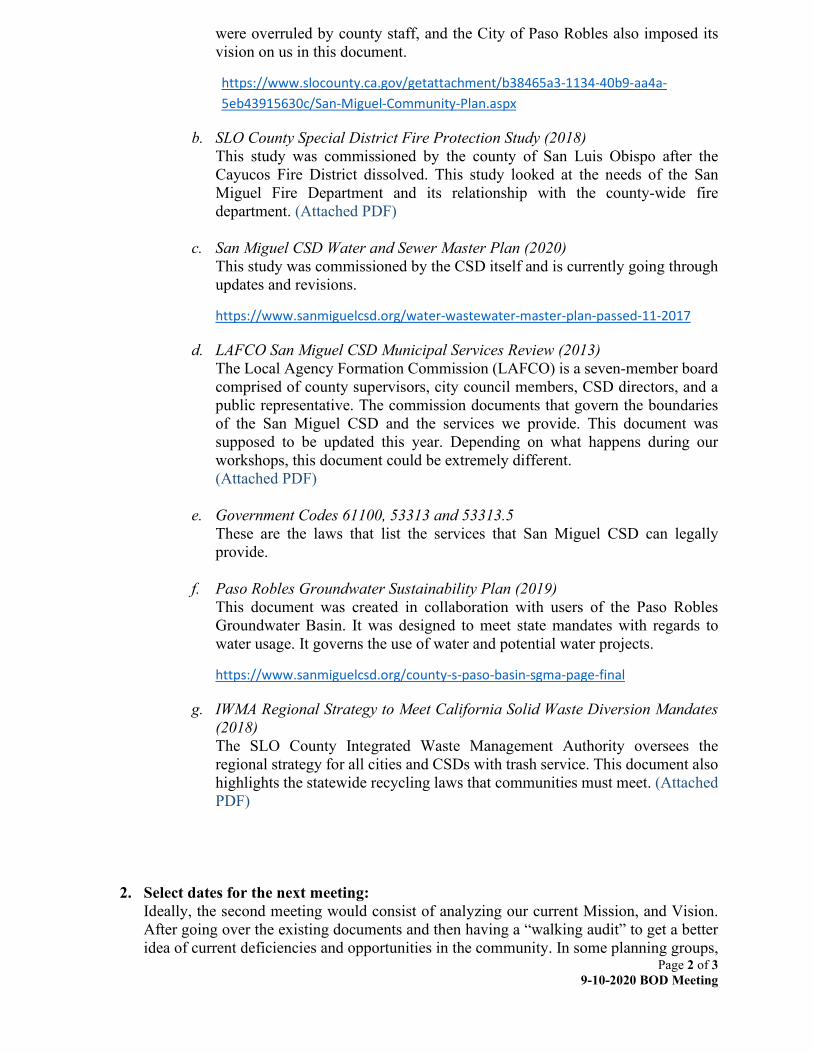
were overruled by county staff, and the City of Paso Robles also imposed its vision on us in this document.
https://www.slocounty.ca.gov/getattachment/b38465a3-1134-40b9-aa4a-5eb43915630c/San-Miguel-Community-Plan.aspx
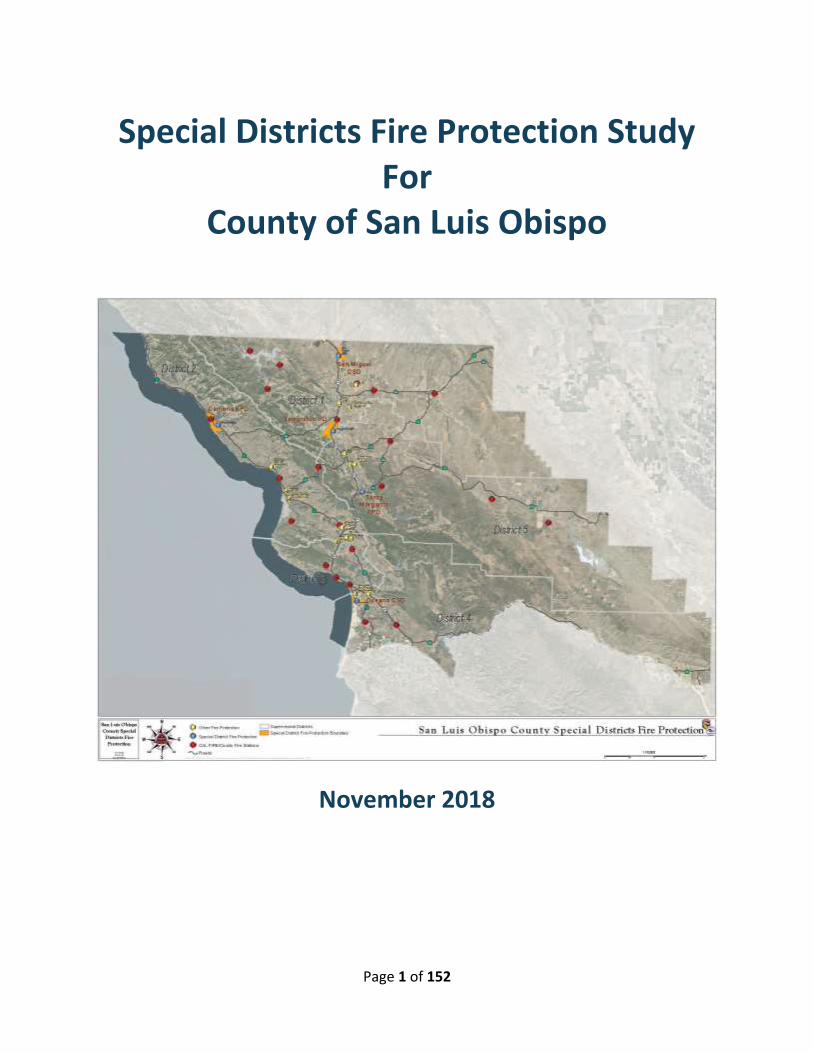
b. SLO County Special District Fire Protection Study (2018) This study was commissioned by the county of San Luis Obispo after the Cayucos Fire District dissolved. This study looked at the needs of the San Miguel Fire Department and its relationship with the county-wide fire department. (Attached PDF)
c. San Miguel CSD Water and Sewer Master Plan (2020) This study was commissioned by the CSD itself and is currently going through updates and revisions.
https://www.sanmiguelcsd.org/water-wastewater-master-plan-passed-11-2017
d. LAFCO San Miguel CSD Municipal Services Review (2013) The Local Agency Formation Commission (LAFCO) is a seven-member board comprised of county supervisors, city council members, CSD directors, and a public representative. The commission documents that govern the boundaries of the San Miguel CSD and the services we provide. This document was supposed to be updated this year. Depending on what happens during our workshops, this document could be extremely different. (Attached PDF)
e. Government Codes 61100, 53313 and 53313.5
These are the laws that list the services that San Miguel CSD can legally provide.
f. Paso Robles Groundwater Sustainability Plan (2019)
This document was created in collaboration with users of the Paso Robles Groundwater Basin. It was designed to meet state mandates with regards to water usage. It governs the use of water and potential water projects.
https://www.sanmiguelcsd.org/county-s-paso-basin-sgma-page-final
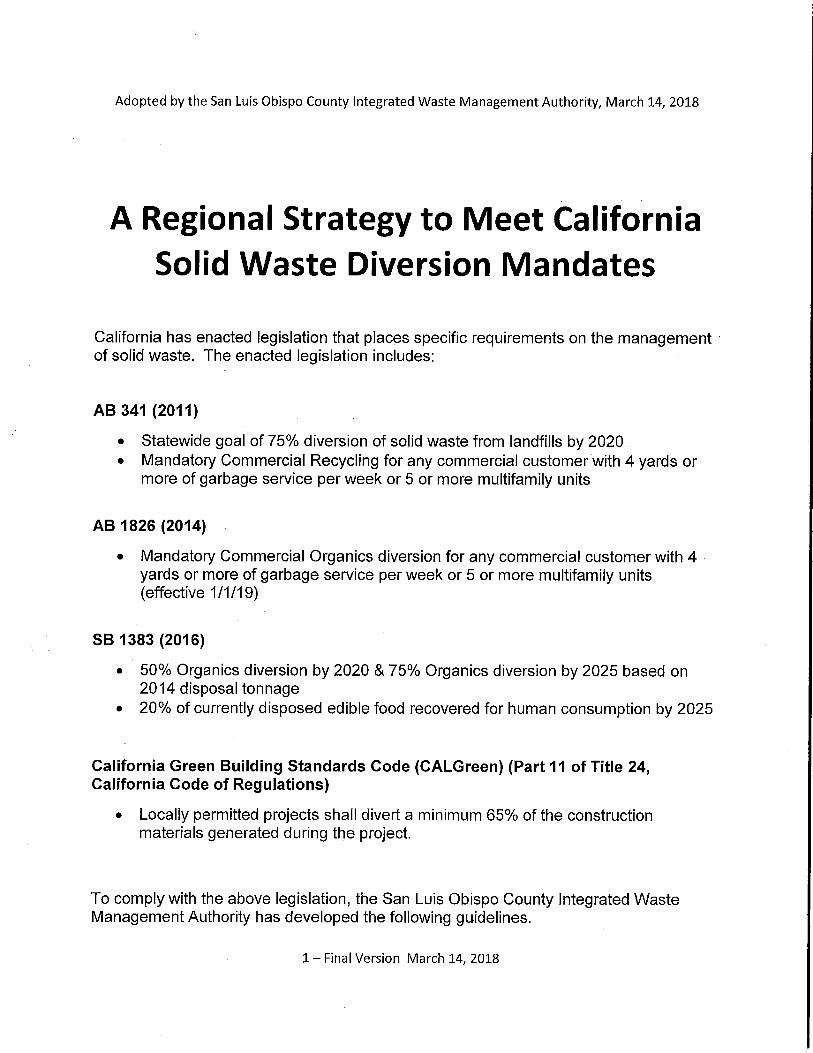
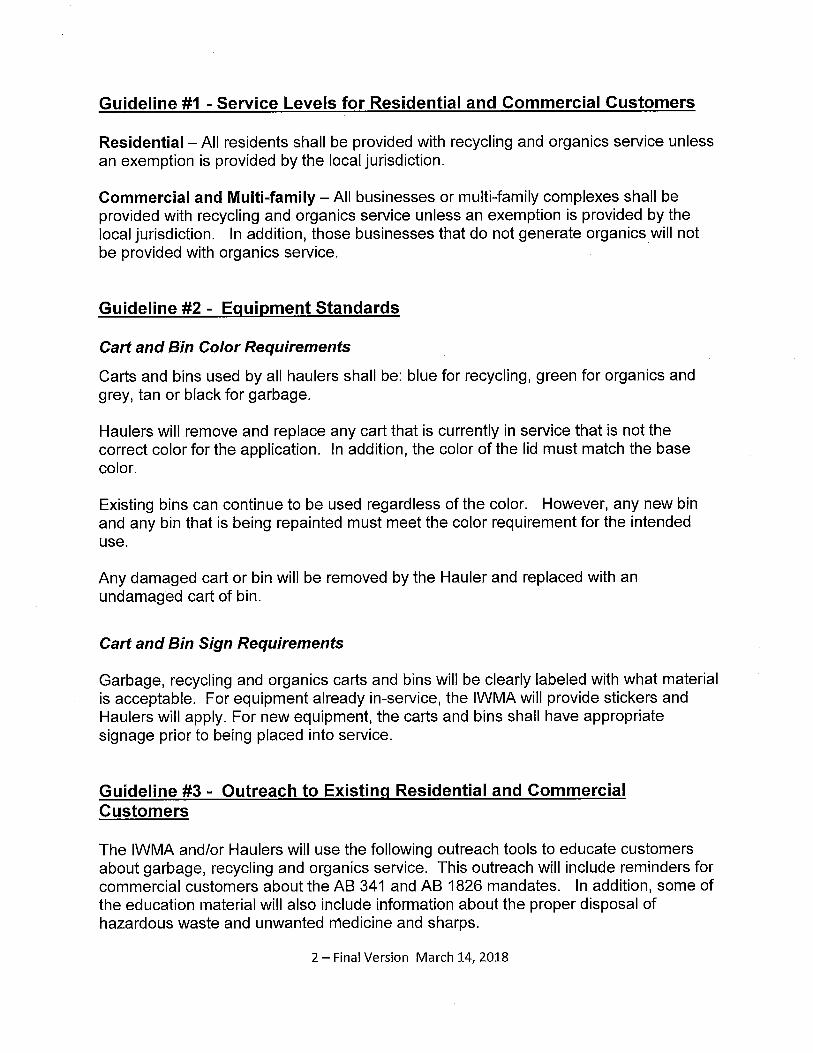
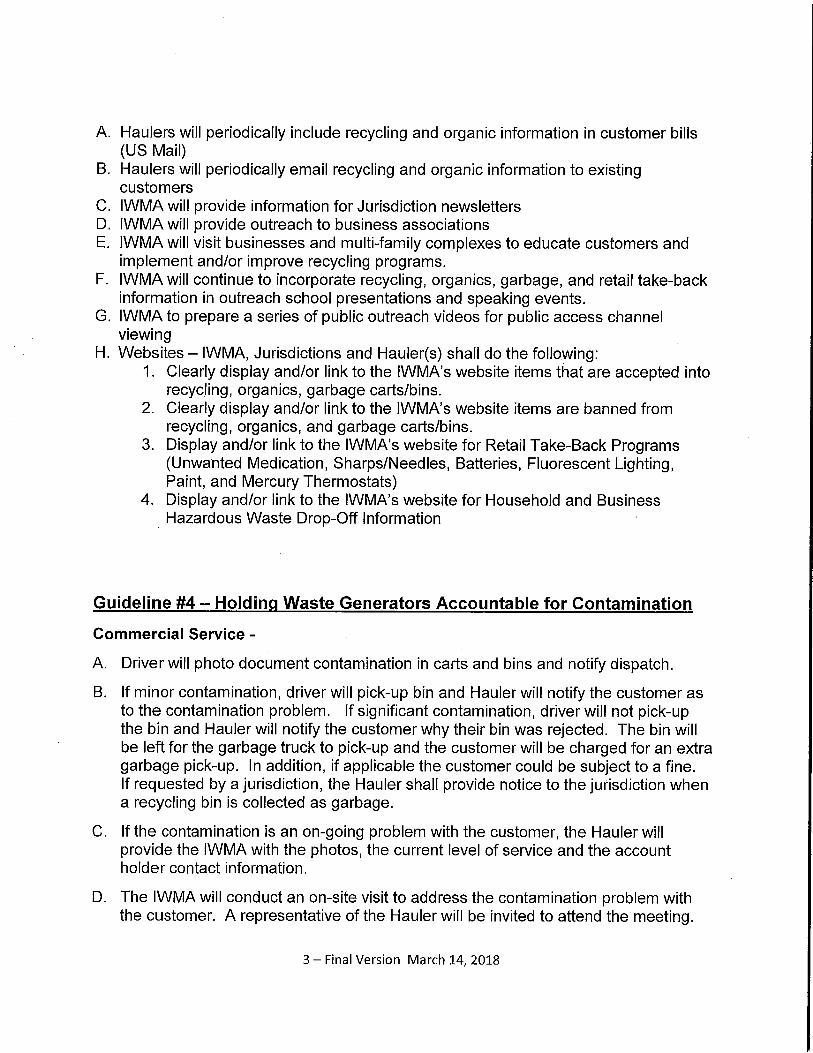
g. IWMA Regional Strategy to Meet California Solid Waste Diversion Mandates (2018) The SLO County Integrated Waste Management Authority oversees the regional strategy for all cities and CSDs with trash service. This document also highlights the statewide recycling laws that communities must meet. (Attached PDF)
2. Select dates for the next meeting: Ideally, the second meeting would consist of analyzing our current Mission, and Vision. After going over the existing documents and then having a “walking audit” to get a better idea of current deficiencies and opportunities in the community. In some planning groups,
Page 3 of 3 9-10-2020 BOD Meeting
a “walking audit” is highly encouraged as it allows staff and elected officials to slow down and experience the existing spaces in our community, how they connect, and how residents, businesses, and tourists interact with those spaces. On top of that, having input in an outdoor setting would allow the public to participate while socially distancing.
---------------------------------------------------------------------------------------------------------------------
FISCAL IMPACT
Staff time to research and refresh on the existing documents impacting San Miguel and the CSD.
PREPARED BY:
Anthony Kalvans
Anthony Kalvans, Director
Page 1 of 152
Special Districts Fire Protection Study For
County of San Luis Obispo
November 2018
Page 2 of 152
Special Districts Fire Protection Study
For
County of San Luis Obispo
November 2018
COUNTY BOARD OF SUPERVISORS
John Peschong First Supervisorial District, Chair Bruce Gibson Second Supervisorial District Adam Hill Third Supervisorial District Lynn Compton Fourth Supervisorial District Debbie Arnold Fifth Supervisorial District, Vice Chair
COUNTY ADMINISTRATIVE OFFICE
Wade Horton, County Administrative Officer Lisa Howe, Administrative Analyst
COUNTY FIRE DEPARTMENT
Scott Jalbert, Fire Chief
STUDY TEAM
Dan Turner, Fire Chief (retired), Cal Fire, San Luis Obispo Mike McMurry, Fire Chief (retired), Scotts Valley Fire Protection District
Page 3 of 152
Acknowledgements
This study was supported by several organizations and people that contributed invaluable time and information. The study team of Turner and McMurry are very grateful for the assistance we received; the study would not be possible without their cooperation. The Study Special Districts:
• Cambria Community Services District
• Oceano Community Services District
• San Miguel Community Services District
• Santa Margarita Fire Protection District
• Templeton Community Services District
The district representatives we met with were professional, engaged, and committed to helping us understand, and report, the fire protection situation in their districts. They clearly care about their communities and are dedicated to the future of fire service delivery.
County Offices and Departments:
• County Administrative Office
• County Tax Assessor
• County Auditor-Controller-Treasurer-Tax Collector
• County Clerk-Recorder
• County Counsel
• County Fire
The study team is immensely grateful to Lisa Howe, County Administrative Office, for joining us during our district interviews and providing insight and guidance.
Aaronne Kessler, County Auditor-Controller-Treasurer-Tax Collector’s Office provided excellent assistance in special district tax rate area and tax distribution information.
Hannah Panno, County Fire GIS Specialist was outstanding in analyzing data and creating professional map displays.
San Luis Obispo County Local Agency Formation Commission (LAFCO):
David Church, LAFCO Executive Officer was very helpful in district history, district processes, and organizational dynamics.
Page 4 of 152
Table of Contents Executive Summary ......................................................................................................................... 5
Special District Study Scope of Work ............................................................................................ 14
Study Methodology....................................................................................................................... 15
Special District Organization ......................................................................................................... 17
LAFCO Process to Change Fire Protection Service Delivery Model .............................................. 20
Change in Fire Service Provider .................................................................................................... 21
New Governance Models for Fire Protection Service Delivery .................................................... 22
Overview of Challenges Facing Districts ....................................................................................... 24
Special District Funding ................................................................................................................. 33
Property Tax .................................................................................................................................. 34
Other Funding Sources ................................................................................................................. 41
Benefit Assessment Districts (Proposition 218) ............................................................................ 41
Grants ............................................................................................................................................ 48
Fire Agency Staffing ...................................................................................................................... 51
County Fire Strategic Plan ............................................................................................................. 59
County Fire Interview .................................................................................................................... 59
Cambria Community Services District .......................................................................................... 61
Oceano Community Services District ............................................................................................ 77
San Miguel Community Services District ...................................................................................... 96
Santa Margarita Fire Protection District ..................................................................................... 111
Templeton Community Services District .................................................................................... 129
List of Figures .............................................................................................................................. 150
Page 5 of 152
EXECUTIVE SUMMARY
During the hearings for the dissolution process the Cayucos Fire Protection District, the County
Board of Supervisors directed county staff to conduct a study of five (5) independent special
districts that deliver fire protection in the unincorporated area of the county. The study’s
purpose was to determine the operational and financial sustainability of the districts.
The study districts are:
• Cambria Community Services District
• Oceano Community Services District
• San Miguel Community Services District
• Santa Margarita Fire Protection District
• Templeton Community Services District
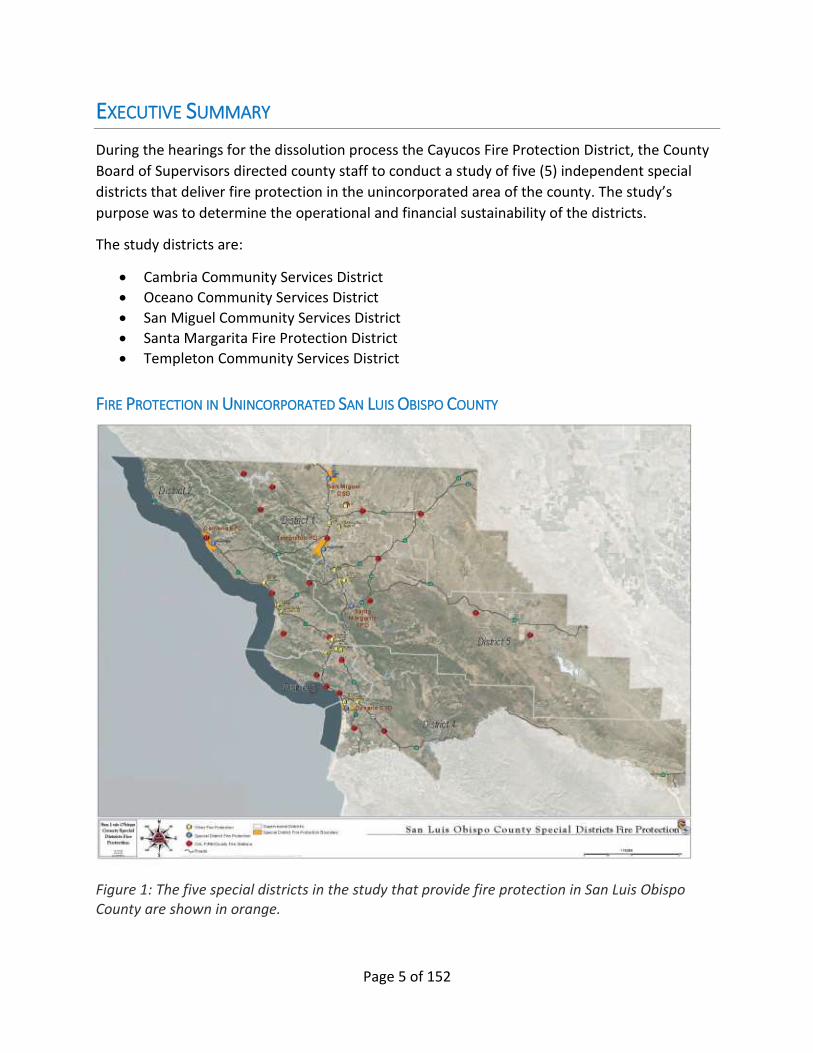
FIRE PROTECTION IN UNINCORPORATED SAN LUIS OBISPO COUNTY
Figure 1: The five special districts in the study that provide fire protection in San Luis Obispo County are shown in orange.
Page 6 of 152
ISSUES FACING DISTRICTS The districts are proud of their fire department traditions and identity as an important part of
each community. District concerns range from the immediate potential for fire service delivery
failure to a significant change expected in the five-year horizon. Inadequate revenue,
community growth, greater expectations for fire service delivery, reduction in volunteerism and
cost of full-time firefighting staff have combined to create funding problems for special districts
providing fire protection in San Luis Obispo County and throughout California.
• The districts are very different in demographics, funding, and fire service demand. In the
event of dissolution/divestiture, the County’s plan for service would need to be specifically
tailored to the individual community based on those factors.
• Because property taxes are the primary source of funding, Proposition 13 (passed by the
voters forty years ago) and subsequent allocation formulas limit districts’ funding to provide
services.
• Districts with low assessed valuations, limited growth, and relatively small share of
property tax have limited revenues while costs have risen exponentially.
• The increase in the cost from staffing with all volunteers compared to paid/career staff is
approximately $1.3 million annually. A fire chief and station operation costs are in addition
to engine staffing.
• The community service districts studied allocate varying percentages of property tax for fire
protection service from 62 - 93% of total property tax; Santa Margarita FPD allocates 100%
of property taxes to fire protection.
• To permanently transfer funding between agencies, a property tax exchange agreement is
necessary. Increasing a district’s property tax share requires a reduction of County’s share.
• Special districts do not receive any sales tax (including Prop 172 Public Safety sales tax) or
transient occupancy tax (TOT) and are not authorized to levy such a tax.
• SAFER Grants were used to augment staffing in three of the districts, but existing tax
revenue could not sustain staffing cost after grants ended.
• All five districts in this study included volunteer fire departments. Volunteer firefighters
have all but vanished in San Luis Obispo County.
• Significant factors that have impacted a reduction of volunteer firefighters:
o Increase in training and incident hour requirements.
o Volunteer firefighters experience difficulty with time commitments due to their “real
job” along with conflicts with family and other volunteer opportunities.
• Various forms of compensation to recruit and retain Paid Call (PCF) and Reserve firefighters
are in use by the districts.
• Recruitment and retention of PCFs and development of PCF fire officers and fire chiefs
requires a long-term plan and ongoing community commitment.
• Reserve Firefighters (intern firefighters) are currently being used in place of career staffing.
Page 7 of 152
ORGANIZATION AND CHANGE OF FIRE SERVICE DELIVERY PROVIDER Any jurisdictional change for the delivery of fire protection involves a thorough review and
approval process through LAFCO. The method is different for community service districts (CSD)
and fire protection districts (FPD). CSDs must divest their fire protection authority while
retaining their other responsibilities. A FPD must dissolve since they provide no other services.
Dissolution was the process utilized in the case of the Cayucos Fire Protection District.
COUNTY FIRE STRATEGIC PLAN The County Fire Department strategic plan includes a service level strategy to determine
appropriate service level for communities of differing demographics and fire department
demand.
• Urban, Suburban, and Rural service levels are determined by analyzing population, land use
type, building characteristics, assets at risk, incident activity, special hazards, and risks.
• The primary difference between the service levels is response time and effectiveness of the
response.
• There are areas in County Fire’s jurisdiction that are currently underserved.
• Each of the districts in this study was evaluated to determine the level of service
recommended utilizing the County Fire formula.
• County Fire staff expressed concerns that reductions of County Fire’s budget to support a
divesting/dissolving district would cause reductions of services in other areas of the County.
• County Fire staff reported they are at their “tipping point” for certain of their overhead and support positions and may need augmentation in the event one or more of the districts divests fire protection and increases workload, including: 1. Fire Prevention/Fire Marshal 2. Mechanic/fleet service 3. Battalion chief coverage (Depending on region of the County)
Page 8 of 152
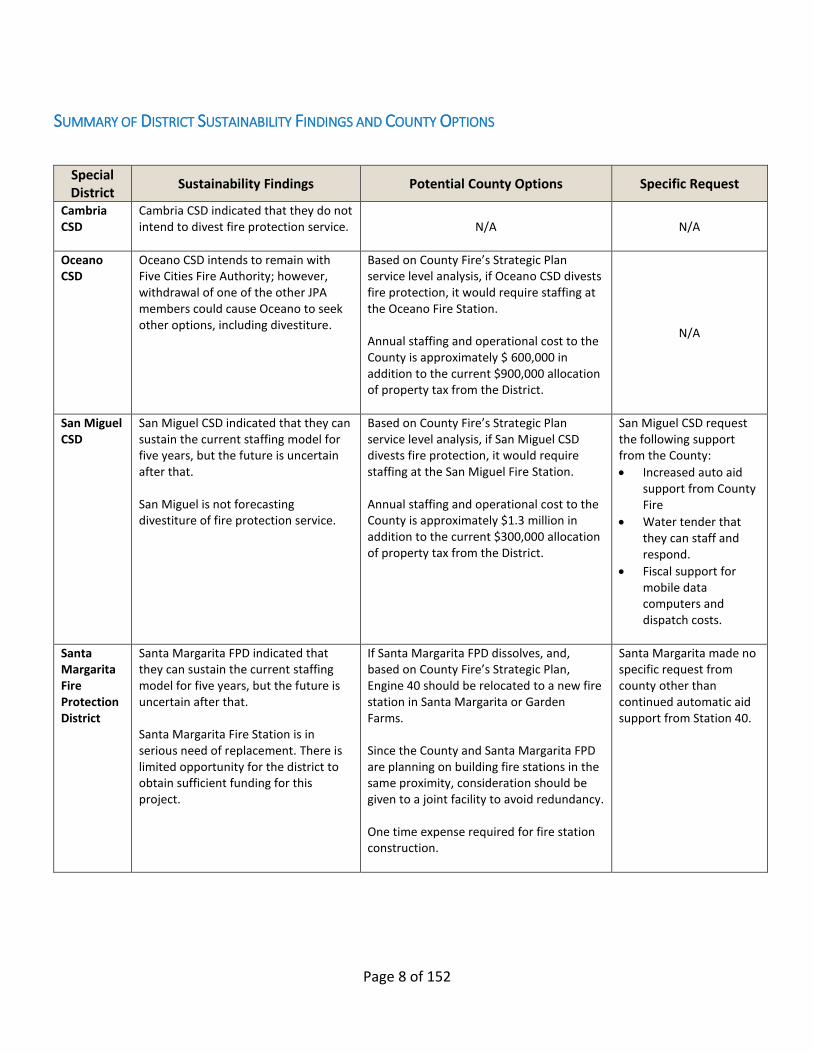
SUMMARY OF DISTRICT SUSTAINABILITY FINDINGS AND COUNTY OPTIONS
Special District
Sustainability Findings Potential County Options Specific Request
Cambria CSD
Cambria CSD indicated that they do not intend to divest fire protection service.
N/A N/A
Oceano CSD
Oceano CSD intends to remain with Five Cities Fire Authority; however, withdrawal of one of the other JPA members could cause Oceano to seek other options, including divestiture.
Based on County Fire’s Strategic Plan service level analysis, if Oceano CSD divests fire protection, it would require staffing at the Oceano Fire Station. Annual staffing and operational cost to the County is approximately $ 600,000 in addition to the current $900,000 allocation of property tax from the District.
N/A
San Miguel CSD
San Miguel CSD indicated that they can sustain the current staffing model for five years, but the future is uncertain after that. San Miguel is not forecasting divestiture of fire protection service.
Based on County Fire’s Strategic Plan service level analysis, if San Miguel CSD divests fire protection, it would require staffing at the San Miguel Fire Station. Annual staffing and operational cost to the County is approximately $1.3 million in addition to the current $300,000 allocation of property tax from the District.
San Miguel CSD request the following support from the County:
• Increased auto aid support from County Fire
• Water tender that they can staff and respond.
• Fiscal support for mobile data computers and dispatch costs.
Santa Margarita Fire Protection District
Santa Margarita FPD indicated that they can sustain the current staffing model for five years, but the future is uncertain after that. Santa Margarita Fire Station is in serious need of replacement. There is limited opportunity for the district to obtain sufficient funding for this project.
If Santa Margarita FPD dissolves, and, based on County Fire’s Strategic Plan, Engine 40 should be relocated to a new fire station in Santa Margarita or Garden Farms. Since the County and Santa Margarita FPD are planning on building fire stations in the same proximity, consideration should be given to a joint facility to avoid redundancy. One time expense required for fire station construction.
Santa Margarita made no specific request from county other than continued automatic aid support from Station 40.
Page 9 of 152
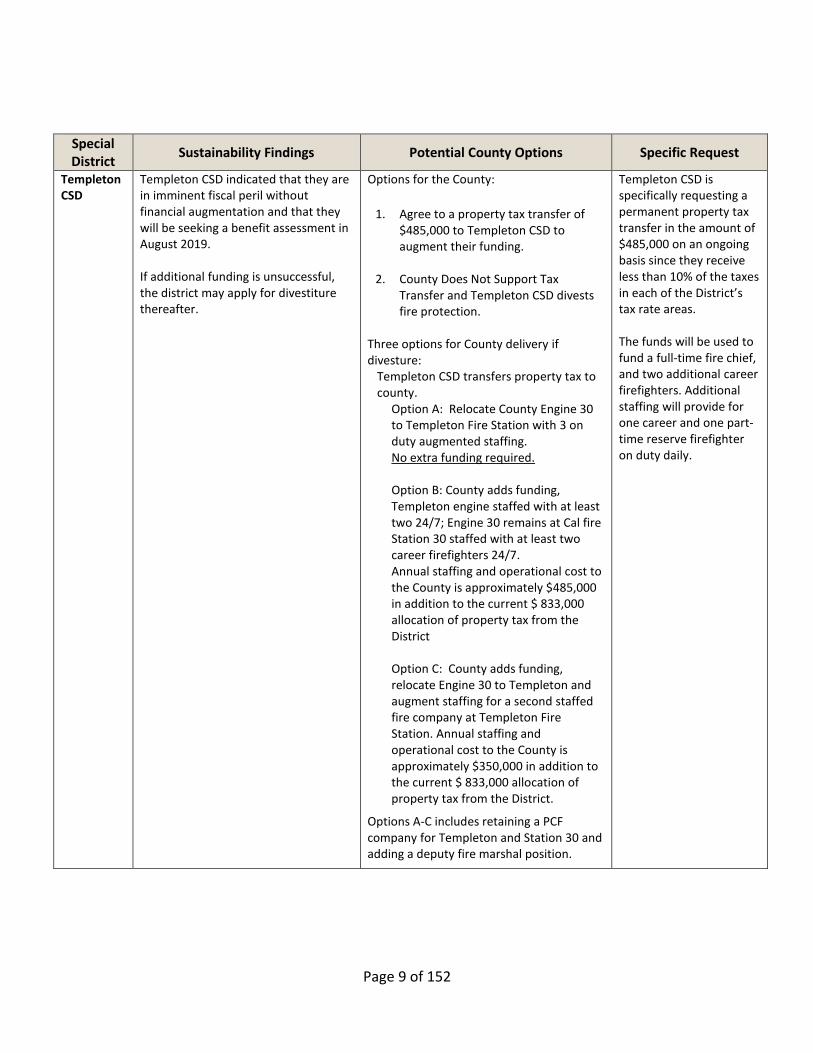
Special District
Sustainability Findings Potential County Options Specific Request
Templeton CSD
Templeton CSD indicated that they are in imminent fiscal peril without financial augmentation and that they will be seeking a benefit assessment in August 2019. If additional funding is unsuccessful, the district may apply for divestiture thereafter.
Options for the County:
1. Agree to a property tax transfer of $485,000 to Templeton CSD to augment their funding.
2. County Does Not Support Tax
Transfer and Templeton CSD divests fire protection.
Three options for County delivery if divesture:
Templeton CSD transfers property tax to county.
Option A: Relocate County Engine 30 to Templeton Fire Station with 3 on duty augmented staffing. No extra funding required. Option B: County adds funding, Templeton engine staffed with at least two 24/7; Engine 30 remains at Cal fire Station 30 staffed with at least two career firefighters 24/7. Annual staffing and operational cost to the County is approximately $485,000 in addition to the current $ 833,000 allocation of property tax from the District Option C: County adds funding, relocate Engine 30 to Templeton and augment staffing for a second staffed fire company at Templeton Fire Station. Annual staffing and operational cost to the County is approximately $350,000 in addition to the current $ 833,000 allocation of property tax from the District.
Options A-C includes retaining a PCF company for Templeton and Station 30 and adding a deputy fire marshal position.
Templeton CSD is specifically requesting a permanent property tax transfer in the amount of $485,000 on an ongoing basis since they receive less than 10% of the taxes in each of the District’s tax rate areas. The funds will be used to fund a full-time fire chief, and two additional career firefighters. Additional staffing will provide for one career and one part-time reserve firefighter on duty daily.
Page 10 of 152
STUDY BACKGROUND This study is authorized by the County Board of Supervisors to determine the current status of
fire protection delivery by special districts in the unincorporated area of San Luis Obispo County.
Concerns about funding and sustainability of fire protection provided by multiple special
districts warranted the examination. Of particular concern is any urgent action required and
resultant impact if any other district is in similar circumstances that led to the dissolution of the
Cayucos Fire Protection District.
The County Fire Department was in the process of updating their 2012 Fire Protection Strategic
Plan and Service Level Analysis. Retired Fire Chief Dan Turner is updating the strategic plan and
the Board of Supervisors accepted staff’s recommendation to add this study to the scope of
work of Strategic Plan update. Retired Fire Chief Mike McMurry from Scotts Valley FPD and
former President of the Fire Districts Association of California assisted in the study.
The Board of Supervisors directed a study of five (5) of those districts be completed:
1. Cambria Community Services District (CCSD)
2. Oceano Community Services District (OCSD)
3. San Miguel Community Services District (SM CSD)
4. Santa Margarita Fire Protection District (SM FPD)
5. Templeton Community Services District (TEM CSD)
Fire PROTECTION: UNINCORPORATED AREA OF SAN LUIS OBISPO COUNTY There are eight (8) local government agencies and four (4) state agencies that provide fire
protection from 29 fire stations in the unincorporated area of the county.
Local Government:
1. County of San Luis Obispo*
2. Avila Beach Community Services District (CSD)*
3. Cambria Community Services District (CSD)
4. Los Osos Community Services District (CSD)*
5. Oceano Community Services District (CSD)
6. San Miguel Community Services District (CSD)
7. Santa Margarita Fire Protection District (FPD)
8. Templeton Community Services District (CSD)
9. Cayucos Fire Protection District (Completed dissolution in October 2018; now part of
County Fire Department)
*Avila Beach CSD and Los Osos CSD have active fire protection authority, but do not maintain
their own fire departments; instead, they contract through the County for fire protection
service delivery from the County contract with CAL FIRE.
Page 11 of 152
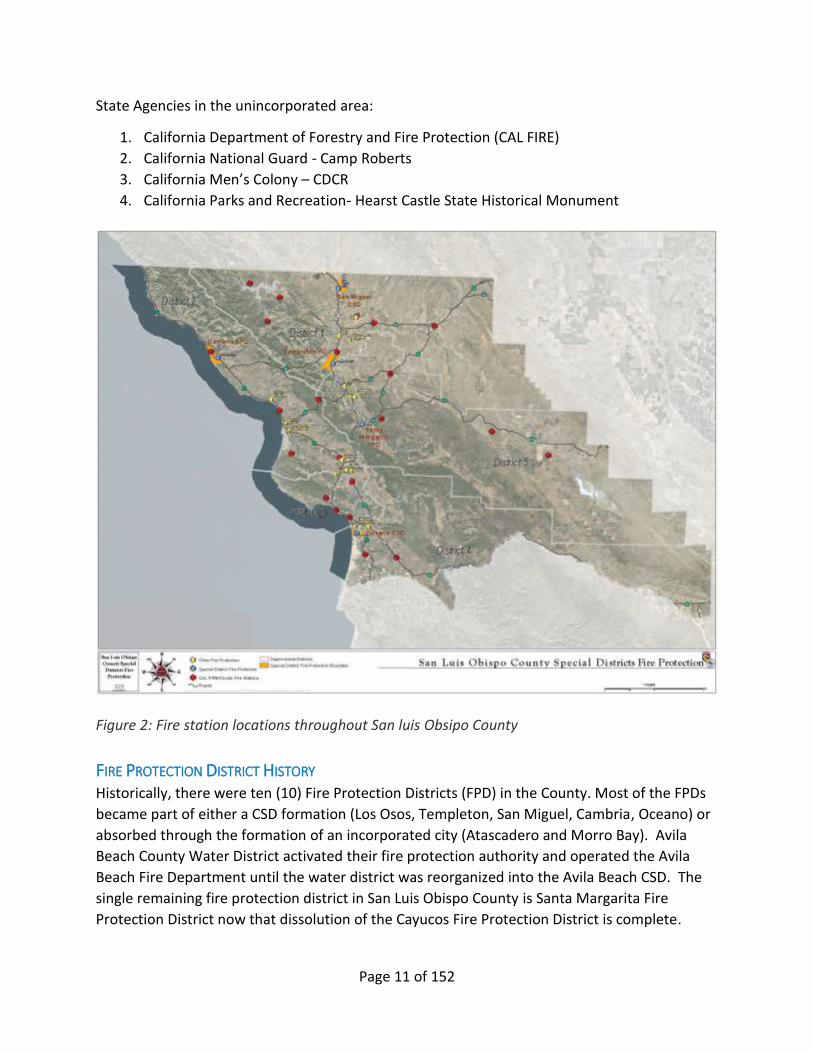
State Agencies in the unincorporated area:
1. California Department of Forestry and Fire Protection (CAL FIRE)
2. California National Guard - Camp Roberts
3. California Men’s Colony – CDCR
4. California Parks and Recreation- Hearst Castle State Historical Monument
Figure 2: Fire station locations throughout San luis Obsipo County
FIRE PROTECTION DISTRICT HISTORY Historically, there were ten (10) Fire Protection Districts (FPD) in the County. Most of the FPDs
became part of either a CSD formation (Los Osos, Templeton, San Miguel, Cambria, Oceano) or
absorbed through the formation of an incorporated city (Atascadero and Morro Bay). Avila
Beach County Water District activated their fire protection authority and operated the Avila
Beach Fire Department until the water district was reorganized into the Avila Beach CSD. The
single remaining fire protection district in San Luis Obispo County is Santa Margarita Fire
Protection District now that dissolution of the Cayucos Fire Protection District is complete.
Page 12 of 152
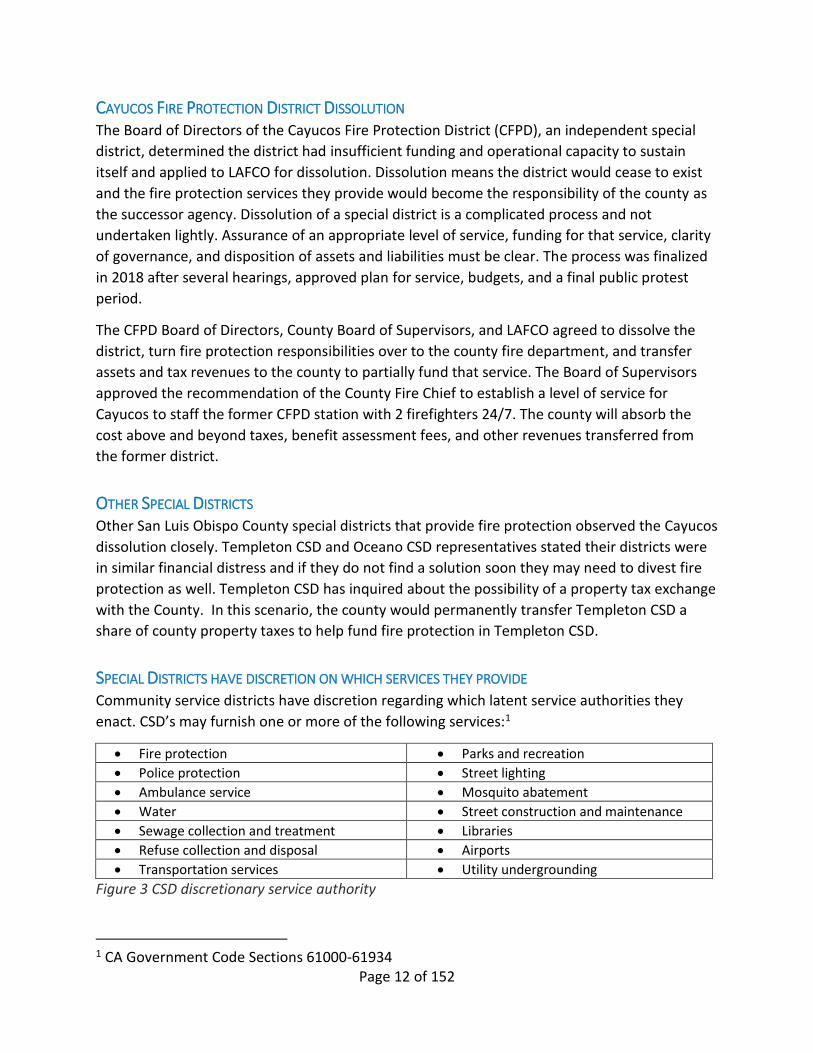
CAYUCOS FIRE PROTECTION DISTRICT DISSOLUTION The Board of Directors of the Cayucos Fire Protection District (CFPD), an independent special
district, determined the district had insufficient funding and operational capacity to sustain
itself and applied to LAFCO for dissolution. Dissolution means the district would cease to exist
and the fire protection services they provide would become the responsibility of the county as
the successor agency. Dissolution of a special district is a complicated process and not
undertaken lightly. Assurance of an appropriate level of service, funding for that service, clarity
of governance, and disposition of assets and liabilities must be clear. The process was finalized
in 2018 after several hearings, approved plan for service, budgets, and a final public protest
period.
The CFPD Board of Directors, County Board of Supervisors, and LAFCO agreed to dissolve the
district, turn fire protection responsibilities over to the county fire department, and transfer
assets and tax revenues to the county to partially fund that service. The Board of Supervisors
approved the recommendation of the County Fire Chief to establish a level of service for
Cayucos to staff the former CFPD station with 2 firefighters 24/7. The county will absorb the
cost above and beyond taxes, benefit assessment fees, and other revenues transferred from
the former district.
OTHER SPECIAL DISTRICTS Other San Luis Obispo County special districts that provide fire protection observed the Cayucos
dissolution closely. Templeton CSD and Oceano CSD representatives stated their districts were
in similar financial distress and if they do not find a solution soon they may need to divest fire
protection as well. Templeton CSD has inquired about the possibility of a property tax exchange
with the County. In this scenario, the county would permanently transfer Templeton CSD a
share of county property taxes to help fund fire protection in Templeton CSD.
SPECIAL DISTRICTS HAVE DISCRETION ON WHICH SERVICES THEY PROVIDE Community service districts have discretion regarding which latent service authorities they
enact. CSD’s may furnish one or more of the following services:1
• Fire protection • Parks and recreation
• Police protection • Street lighting
• Ambulance service • Mosquito abatement
• Water • Street construction and maintenance
• Sewage collection and treatment • Libraries
• Refuse collection and disposal • Airports
• Transportation services • Utility undergrounding
Figure 3 CSD discretionary service authority
1 CA Government Code Sections 61000-61934
Page 13 of 152
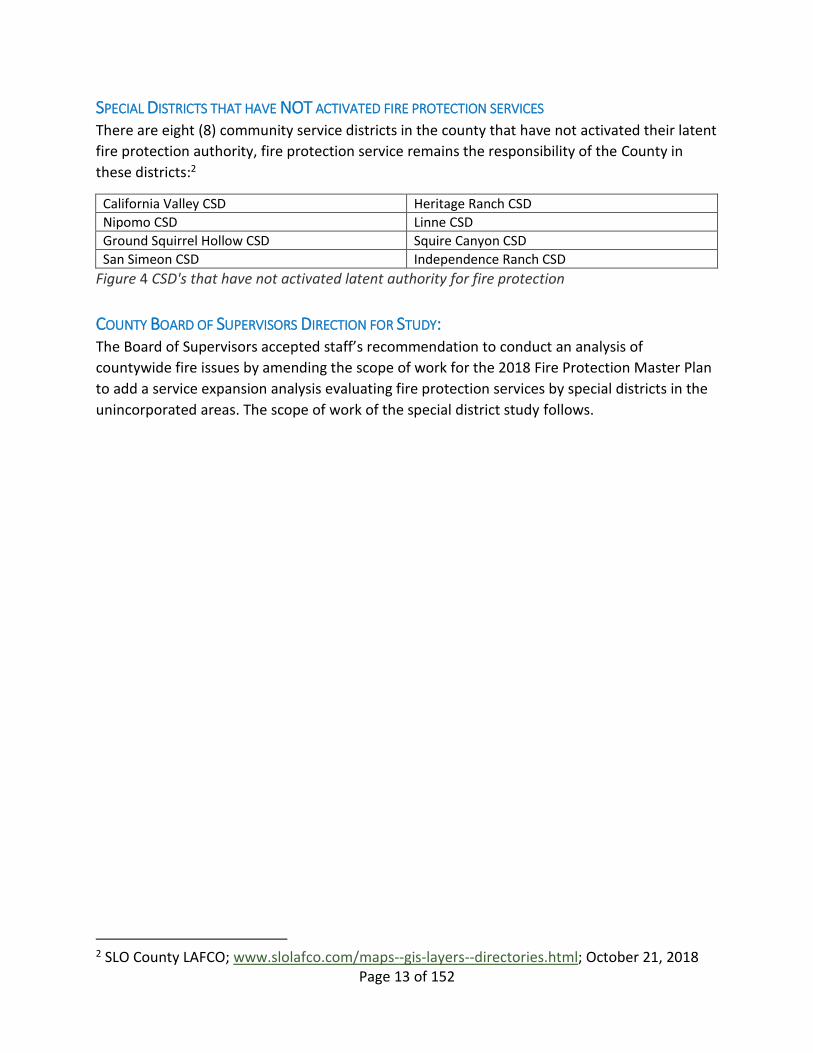
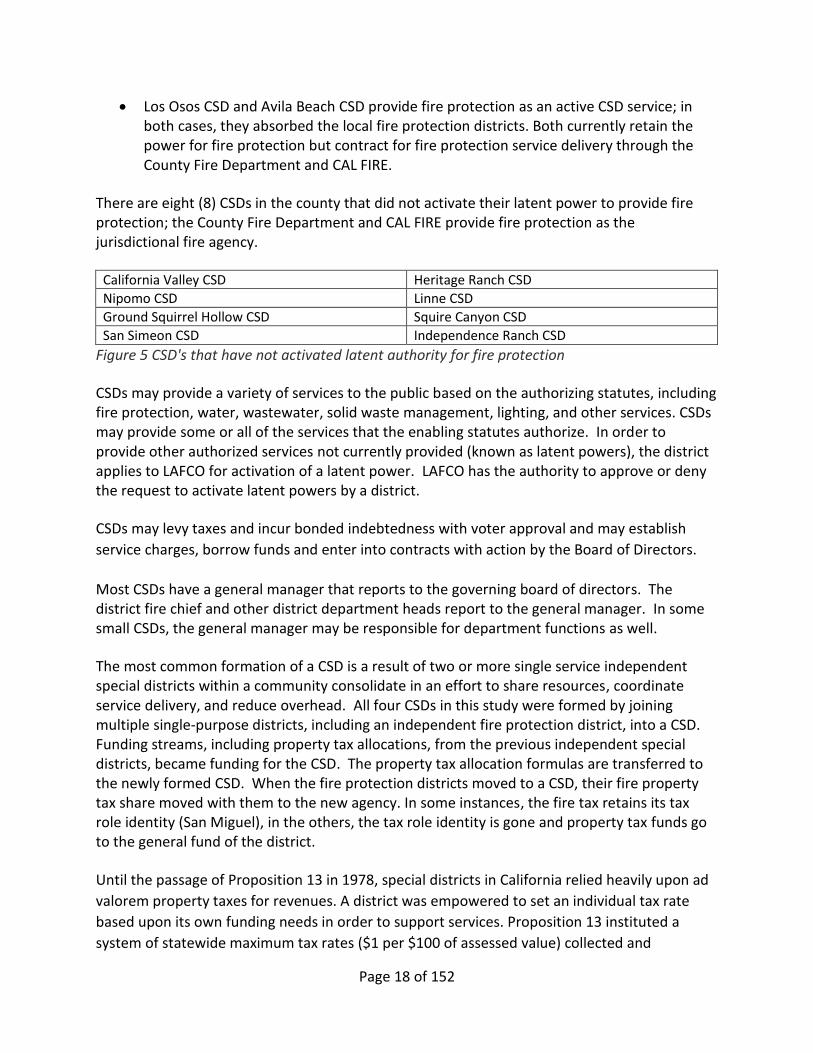
SPECIAL DISTRICTS THAT HAVE NOT ACTIVATED FIRE PROTECTION SERVICES There are eight (8) community service districts in the county that have not activated their latent
fire protection authority, fire protection service remains the responsibility of the County in
these districts:2
California Valley CSD Heritage Ranch CSD
Nipomo CSD Linne CSD
Ground Squirrel Hollow CSD Squire Canyon CSD
San Simeon CSD Independence Ranch CSD
Figure 4 CSD's that have not activated latent authority for fire protection
COUNTY BOARD OF SUPERVISORS DIRECTION FOR STUDY: The Board of Supervisors accepted staff’s recommendation to conduct an analysis of
countywide fire issues by amending the scope of work for the 2018 Fire Protection Master Plan
to add a service expansion analysis evaluating fire protection services by special districts in the
unincorporated areas. The scope of work of the special district study follows.
2 SLO County LAFCO; www.slolafco.com/maps--gis-layers--directories.html; October 21, 2018
Page 14 of 152
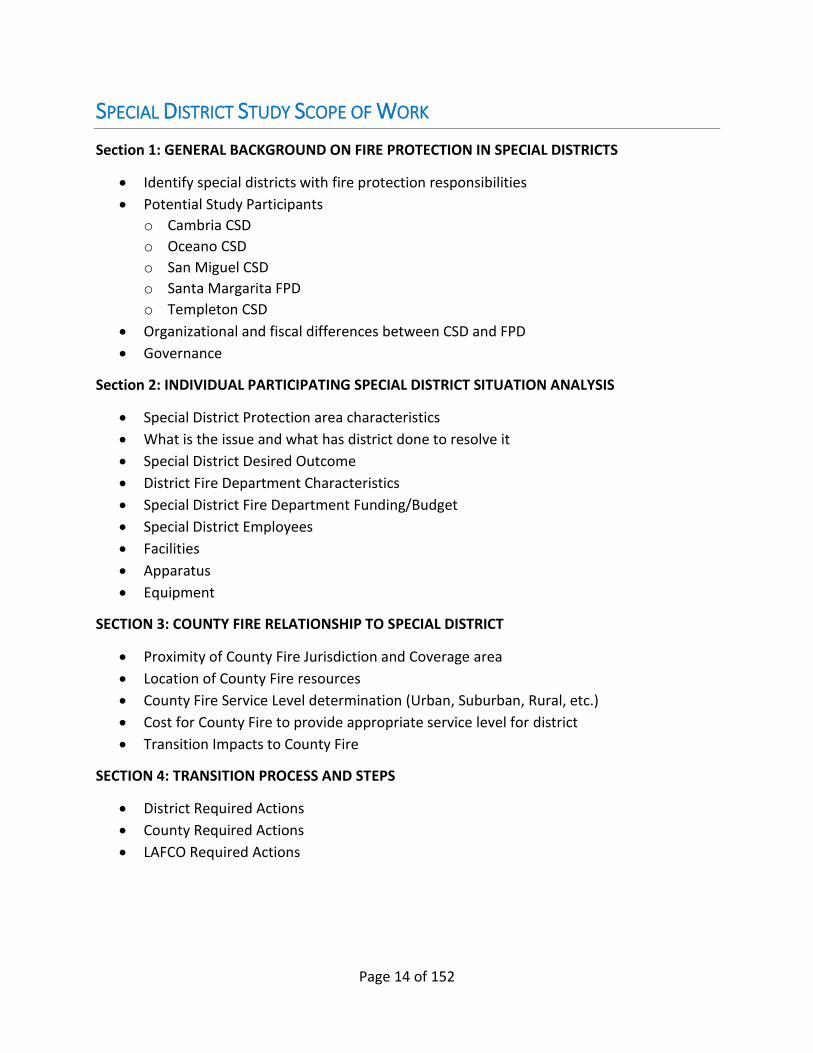
SPECIAL DISTRICT STUDY SCOPE OF WORK
Section 1: GENERAL BACKGROUND ON FIRE PROTECTION IN SPECIAL DISTRICTS
• Identify special districts with fire protection responsibilities
• Potential Study Participants
o Cambria CSD
o Oceano CSD
o San Miguel CSD
o Santa Margarita FPD
o Templeton CSD
• Organizational and fiscal differences between CSD and FPD
• Governance
Section 2: INDIVIDUAL PARTICIPATING SPECIAL DISTRICT SITUATION ANALYSIS
• Special District Protection area characteristics
• What is the issue and what has district done to resolve it
• Special District Desired Outcome
• District Fire Department Characteristics
• Special District Fire Department Funding/Budget
• Special District Employees
• Facilities
• Apparatus
• Equipment
SECTION 3: COUNTY FIRE RELATIONSHIP TO SPECIAL DISTRICT
• Proximity of County Fire Jurisdiction and Coverage area
• Location of County Fire resources
• County Fire Service Level determination (Urban, Suburban, Rural, etc.)
• Cost for County Fire to provide appropriate service level for district
• Transition Impacts to County Fire
SECTION 4: TRANSITION PROCESS AND STEPS
• District Required Actions
• County Required Actions
• LAFCO Required Actions
Page 15 of 152
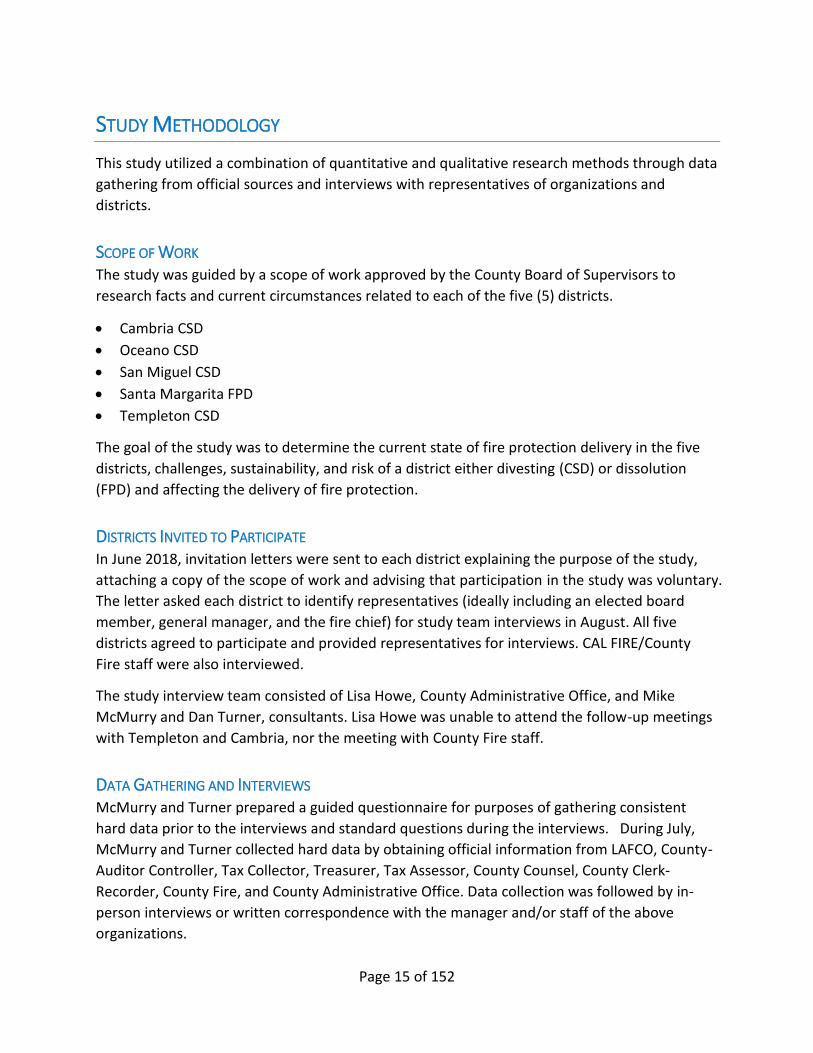
STUDY METHODOLOGY
This study utilized a combination of quantitative and qualitative research methods through data
gathering from official sources and interviews with representatives of organizations and
districts.
SCOPE OF WORK The study was guided by a scope of work approved by the County Board of Supervisors to
research facts and current circumstances related to each of the five (5) districts.
• Cambria CSD
• Oceano CSD
• San Miguel CSD
• Santa Margarita FPD
• Templeton CSD
The goal of the study was to determine the current state of fire protection delivery in the five
districts, challenges, sustainability, and risk of a district either divesting (CSD) or dissolution
(FPD) and affecting the delivery of fire protection.
DISTRICTS INVITED TO PARTICIPATE In June 2018, invitation letters were sent to each district explaining the purpose of the study,
attaching a copy of the scope of work and advising that participation in the study was voluntary.
The letter asked each district to identify representatives (ideally including an elected board
member, general manager, and the fire chief) for study team interviews in August. All five
districts agreed to participate and provided representatives for interviews. CAL FIRE/County
Fire staff were also interviewed.
The study interview team consisted of Lisa Howe, County Administrative Office, and Mike
McMurry and Dan Turner, consultants. Lisa Howe was unable to attend the follow-up meetings
with Templeton and Cambria, nor the meeting with County Fire staff.
DATA GATHERING AND INTERVIEWS McMurry and Turner prepared a guided questionnaire for purposes of gathering consistent
hard data prior to the interviews and standard questions during the interviews. During July,
McMurry and Turner collected hard data by obtaining official information from LAFCO, County-
Auditor Controller, Tax Collector, Treasurer, Tax Assessor, County Counsel, County Clerk-
Recorder, County Fire, and County Administrative Office. Data collection was followed by in-
person interviews or written correspondence with the manager and/or staff of the above
organizations.
Page 16 of 152
The study team was aided by the Fire Districts Association of California in conducting a simple
email survey with fire districts across California. The survey asked if any districts; 1. receive any
funding support from their county general fund; 2. receive any sales or TOT; 3. receive any
Proposition 172 funding from their county.
During August, interviews were held with Cambria CSD, San Miguel CSD, Templeton CSD, and
Santa Margarita FPD. Oceano CSD was unable to schedule an interview day and time until late
September. Follow-up interviews were held with Cambria CSD and Templeton CSD to clarify
information and, in the case of Cambria CSD, to include an elected official who was not able to
attend the previous meeting. All districts had at least one meeting with the fire chief and one or
more elected members of the board of directors. All CSD general managers were present for
the interviews except Cambria CSD. Santa Margarita FPD’s fire chief also serves as the general
manager/executive officer which is common for fire districts. San Miguel’s fire chief is also
serving as the interim general manager for the district. Interview team also interviewed the CAL
FIRE/County Fire Department Fire Chief and key staff members.
The purpose of the interview was to hear from the districts about their circumstances, plans,
requests, and potential for change in fire service delivery model. Team questions to district
representatives included district governance, finance and administration, employment status of
fire staff, current fire department staffing models, success and challenges in recruiting and
retaining firefighters, challenges to sustaining their model, funding sources and revenue
enhancement tools utilized, plans for new revenue, outstanding liabilities, district
demographics and unique fire protection special hazards affecting service level, facilities,
apparatus, and equipment, training, fire marshal/prevention, disaster planning, fleet
maintenance, and dispatch service.
During the interviews, presentations were made by the team on the purpose and scope of the
study, Proposition 13, Tax Rate Areas for each district, assessed value growth, sales taxes,
Transient Occupancy Taxes (TOT), incident activities and response concentration patterns. The
team provided response time studies for mutual aid and other agency response times that
reflect coverage for the district if the district fire station were to close.
FINDINGS AND REPORT McMurry and Turner analyzed the gathered data and interview information to prepare a report
that identifies facts, statements from districts, and findings. Facts are based on quantifiable or
observable circumstances. Statements from district representatives are presented in the report
as opinions or statements. Findings are published as either fact, statement, or opinion of
district representatives.
The Study team prepared findings, but no recommendations.
Page 17 of 152
SPECIAL DISTRICT ORGANIZATION
INDEPENDENT SPECIAL DISTRICTS Independent special districts are autonomous government agencies with locally elected boards
of directors. Special districts are often formed to deliver services the community needs or
desires above and beyond current service levels. Community Service Districts (CSD) are
independent, autonomous government agencies authorized by the Principal Act, California
Government Code Sections 61000-619343. Special districts are governed by Principal Acts
(state law) and can deliver and fund a range of services. They are fully independent in
governance, the provision of services, and funding; neither governed nor financed by county
government. Special districts can include both incorporated (city) and unincorporated territory
within its boundaries.
Special districts can be single service, such as Santa Margarita Fire Protection District, or can
deliver a range of allowed services, including fire protection, such as the four community
service districts in the study (Cambria CSD, Oceano CSD, San Miguel CSD, Templeton CSD). A
separate Principal Act (State Law) regulates each type of District. The powers of a district are
subject to activation by LAFCO when it is formed or through a separate process.
DEPENDENT SPECIAL DISTRICTS Dependent special districts are also autonomous government agencies. The significant
difference is they are governed by the County Board of Supervisors, or in the case of a city, the
city council, as the board of directors of the dependent special district. The governing actions
the Board takes must be separate from general government activities. County Service Areas
(CSA) are a common dependent special district that can provide a variety of services pursuant
to the Principal Act authorizing CSAs. The County currently has a number of CSA’s providing
various services to unincorporated communities.
COMMUNITY SERVICE DISTRICTS (CSD)
This study includes four (4) Community Service Districts (CSD) that provide fire protection service. When the CSDs were formed, several single service districts were dissolved and those services, including fire, became part of the CSD. The following CSDs provide fires services:
• Cambria CSD was formed and the Cambria Fire Protection District was dissolved
• Oceano CSD was formed and the Oceano Fire Protection District was dissolved
• San Miguel CSD was formed and the San Miguel Fire Protection District was dissolved
• Templeton CSD was formed and the Templeton Fire Protection District was dissolved
3 California Government Code, Sections 61000-61934
Page 18 of 152
• Los Osos CSD and Avila Beach CSD provide fire protection as an active CSD service; in both cases, they absorbed the local fire protection districts. Both currently retain the power for fire protection but contract for fire protection service delivery through the County Fire Department and CAL FIRE.
There are eight (8) CSDs in the county that did not activate their latent power to provide fire protection; the County Fire Department and CAL FIRE provide fire protection as the jurisdictional fire agency.
California Valley CSD Heritage Ranch CSD
Nipomo CSD Linne CSD
Ground Squirrel Hollow CSD Squire Canyon CSD
San Simeon CSD Independence Ranch CSD
Figure 5 CSD's that have not activated latent authority for fire protection
CSDs may provide a variety of services to the public based on the authorizing statutes, including fire protection, water, wastewater, solid waste management, lighting, and other services. CSDs may provide some or all of the services that the enabling statutes authorize. In order to provide other authorized services not currently provided (known as latent powers), the district applies to LAFCO for activation of a latent power. LAFCO has the authority to approve or deny the request to activate latent powers by a district.
CSDs may levy taxes and incur bonded indebtedness with voter approval and may establish
service charges, borrow funds and enter into contracts with action by the Board of Directors.
Most CSDs have a general manager that reports to the governing board of directors. The district fire chief and other district department heads report to the general manager. In some small CSDs, the general manager may be responsible for department functions as well.
The most common formation of a CSD is a result of two or more single service independent special districts within a community consolidate in an effort to share resources, coordinate service delivery, and reduce overhead. All four CSDs in this study were formed by joining multiple single-purpose districts, including an independent fire protection district, into a CSD. Funding streams, including property tax allocations, from the previous independent special districts, became funding for the CSD. The property tax allocation formulas are transferred to the newly formed CSD. When the fire protection districts moved to a CSD, their fire property tax share moved with them to the new agency. In some instances, the fire tax retains its tax role identity (San Miguel), in the others, the tax role identity is gone and property tax funds go to the general fund of the district.
Until the passage of Proposition 13 in 1978, special districts in California relied heavily upon ad
valorem property taxes for revenues. A district was empowered to set an individual tax rate
based upon its own funding needs in order to support services. Proposition 13 instituted a
system of statewide maximum tax rates ($1 per $100 of assessed value) collected and
Page 19 of 152
distributed by counties. For special districts that relied heavily on property taxes to provide
public services, the Proposition 13 measure had particularly adverse consequences. Because
the distribution formula was based on each district’s historical proportional share, those
districts with a low proportionate share were faced with very lean financial prospects in the
future. This is particularly true where fire protection was by a volunteer fire department. Many
of those financial limits that were established forty years ago continue to bind the finances of
special districts.
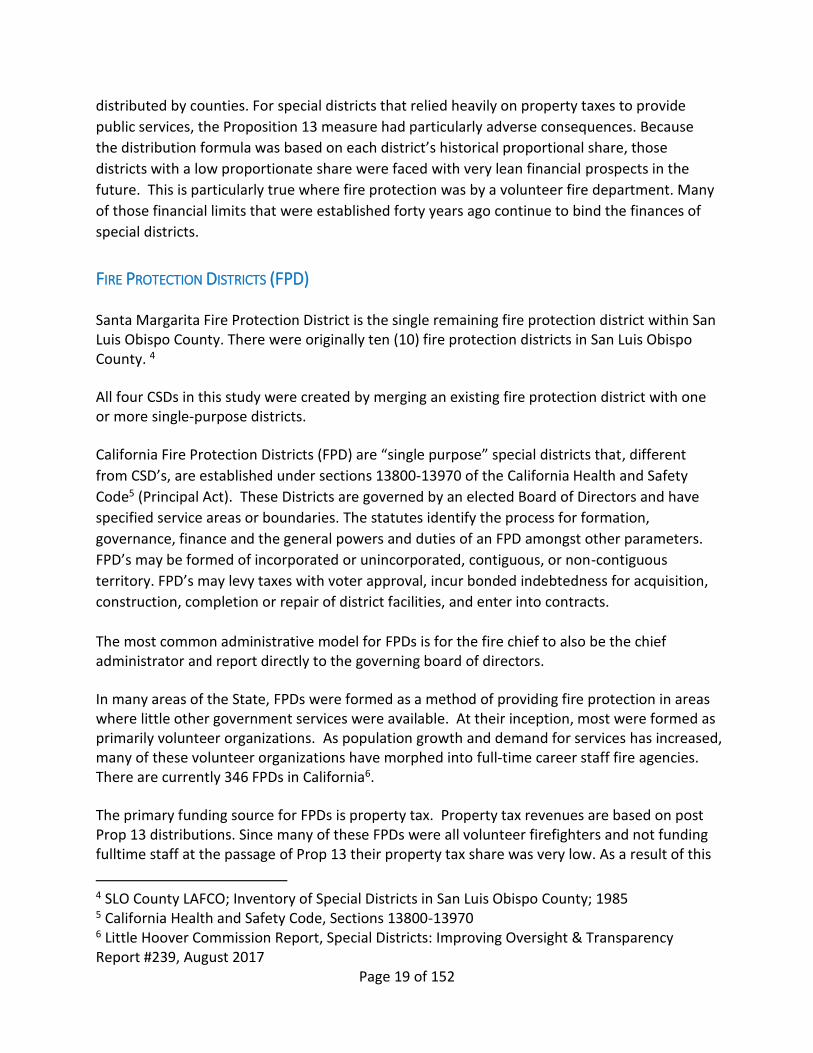
FIRE PROTECTION DISTRICTS (FPD)
Santa Margarita Fire Protection District is the single remaining fire protection district within San Luis Obispo County. There were originally ten (10) fire protection districts in San Luis Obispo County. 4
All four CSDs in this study were created by merging an existing fire protection district with one or more single-purpose districts.
California Fire Protection Districts (FPD) are “single purpose” special districts that, different
from CSD’s, are established under sections 13800-13970 of the California Health and Safety
Code5 (Principal Act). These Districts are governed by an elected Board of Directors and have
specified service areas or boundaries. The statutes identify the process for formation,
governance, finance and the general powers and duties of an FPD amongst other parameters.
FPD’s may be formed of incorporated or unincorporated, contiguous, or non-contiguous
territory. FPD’s may levy taxes with voter approval, incur bonded indebtedness for acquisition,
construction, completion or repair of district facilities, and enter into contracts.
The most common administrative model for FPDs is for the fire chief to also be the chief administrator and report directly to the governing board of directors.
In many areas of the State, FPDs were formed as a method of providing fire protection in areas where little other government services were available. At their inception, most were formed as primarily volunteer organizations. As population growth and demand for services has increased, many of these volunteer organizations have morphed into full-time career staff fire agencies. There are currently 346 FPDs in California6.
The primary funding source for FPDs is property tax. Property tax revenues are based on post Prop 13 distributions. Since many of these FPDs were all volunteer firefighters and not funding fulltime staff at the passage of Prop 13 their property tax share was very low. As a result of this
4 SLO County LAFCO; Inventory of Special Districts in San Luis Obispo County; 1985 5 California Health and Safety Code, Sections 13800-13970 6 Little Hoover Commission Report, Special Districts: Improving Oversight & Transparency Report #239, August 2017

Page 20 of 152
low tax rate when Prop 13 distributions were made, the FPDs were allocated a small percentage of the 1% tax allocation. Changing from all volunteer to career staff is extremely expensive (about $1.3 million per year) and without large increases in assessed value in the district, property tax revenue alone cannot fund the cost difference. The disparity of rates of growth in communities throughout the State and the formulas for allocation of property tax revenues has led to an inability to adequately fund emergency services in some communities (particularly small communities) and rural areas.
LAFCO PROCESS TO CHANGE FIRE PROTECTION SERVICE DELIVERY MODEL
ACTIONS BY LAFCO
LAFCO has several mechanisms that can help address the fire service issues faced by local
communities7. LAFCO actions are typically applied for by the District, City, County, or through a
petition of the landowners or registered voters. LAFCO can also initiate an application if a
special study or Municipal Service Review calls for certain action. The following is a brief
summary of the tools that LAFCO can use to facilitate a change in the service model.
LAFCO STUDIES
MUNICIPAL SERVICE REVIEW LAFCO is required to update the Sphere of Influence and Municipal Service Review (MSR) every
five years or as necessary. A MSR can be completed for each jurisdiction or focused on a
particular service, like fire. Similarly, LAFCO can undertake a Municipal Service Review of the
fire service as a service function by reviewing fire service delivery for the entire county across
all jurisdictions or for a particular geographic part of the County.
Creation of a new fire protection district that combines multiple special district territories or a
countywide district is often based on a fire service special study or municipal services review
similar to the study completed in San Diego County.8 However, the formation of a new fire
district can also be applied for directly by a County, a City or by a community.
LAFCO SPECIAL STUDIES The Cortese-Knox-Hertzberg Act allows LAFCO to conduct special studies the Commission
deems necessary to complete its mission. For example, a special study could be completed to
analyze the fire service situation in the County. This has been done by other LAFCOs around the
7 Communication with David Church, Executive Director, San Luis Obispo County LAFCO 8 Communication with David Church, Executive Director, SLO County LAFCO

Page 21 of 152
State, most notably San Diego. There are consultants around the state that specialize in this
topic and the study could be focused on the selected issues and topics.
CHANGE IN FIRE SERVICE PROVIDER
ACTIVATION OF A LATENT POWER OF COMMUNITY SERVICES DISTRICT A Community Service District can choose to activate their latent powers to provide fire
protection within the boundaries of their district. The application to activate the Community
Service District’s latent fire authority must be considered and approved by LAFCO.
A Plan for Service must be approved by the district and agency that currently provides fire
protection service in the district. The plan must include financing and any tax transfers, level of
service to be provided, transition plans of any personnel and assets, and timetable so no lapse
of service occurs.
DISSOLUTIONS Dissolution means the district dissolves and no longer exists; all services provided by the district
would be assumed by another agency. For example, the Cayucos Fire Protection District board
of directors applied to LAFCO for dissolution. The required Plan for Service, approved by the
county, district, and LAFCO was followed by a local protest period opportunity for voters and
landowners to protest the dissolution. There were less than 25% protests filed and the
dissolution was approved. The Cayucos FPD will cease to exist once the full transition is
accomplished. Fire protection delivery, assets, property tax and special tax revenues of the
former district will transfer to the county as the successor agency.
For this study, “dissolution” would only apply to the Santa Margarita Fire Protection District
(SM FPD, which is a single purpose independent special district). To dissolve the fire district,
the SM FPD board of directors must agree that relinquishing fire protection is in the best
interest of the district and apply to LAFCO for dissolution.
A Plan for Service must be approved by the district and submitted as part of the LAFCO
application. The successor agency that will assume fire protection service in the district is also
identified. The plan must include financing and tax transfers, level of service to be provided,
transition plans of any personnel and assets, and timetable so no lapse of service occurs.
LAFCO must follow state law to consider approval or denial of a district’s dissolution process.
Dissolution is also subject to the protest process.
DIVESTITURE OF A CSD POWER A divestiture would result in a CSD relinquishing authority to provide a service and enable a
successor agency to provide said service. The Board of Directors must agree that relinquishing
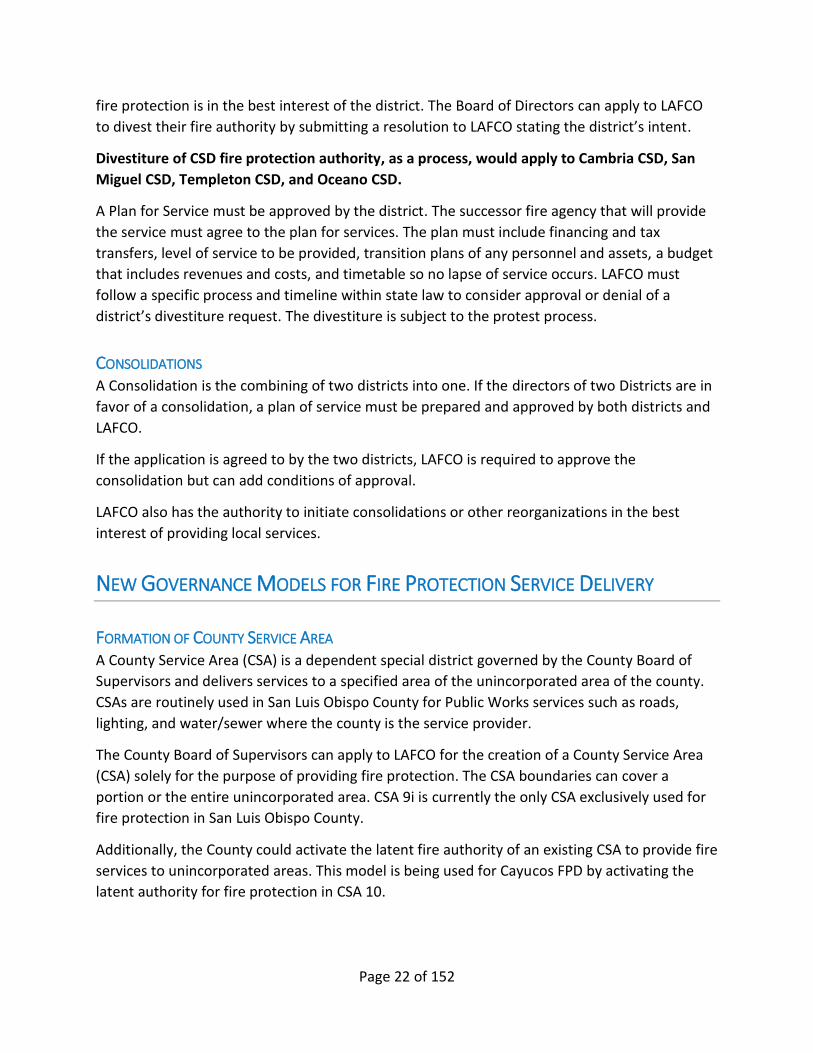
Page 22 of 152
fire protection is in the best interest of the district. The Board of Directors can apply to LAFCO
to divest their fire authority by submitting a resolution to LAFCO stating the district’s intent.
Divestiture of CSD fire protection authority, as a process, would apply to Cambria CSD, San
Miguel CSD, Templeton CSD, and Oceano CSD.
A Plan for Service must be approved by the district. The successor fire agency that will provide
the service must agree to the plan for services. The plan must include financing and tax
transfers, level of service to be provided, transition plans of any personnel and assets, a budget
that includes revenues and costs, and timetable so no lapse of service occurs. LAFCO must
follow a specific process and timeline within state law to consider approval or denial of a
district’s divestiture request. The divestiture is subject to the protest process.
CONSOLIDATIONS A Consolidation is the combining of two districts into one. If the directors of two Districts are in
favor of a consolidation, a plan of service must be prepared and approved by both districts and
LAFCO.
If the application is agreed to by the two districts, LAFCO is required to approve the
consolidation but can add conditions of approval.
LAFCO also has the authority to initiate consolidations or other reorganizations in the best
interest of providing local services.
NEW GOVERNANCE MODELS FOR FIRE PROTECTION SERVICE DELIVERY
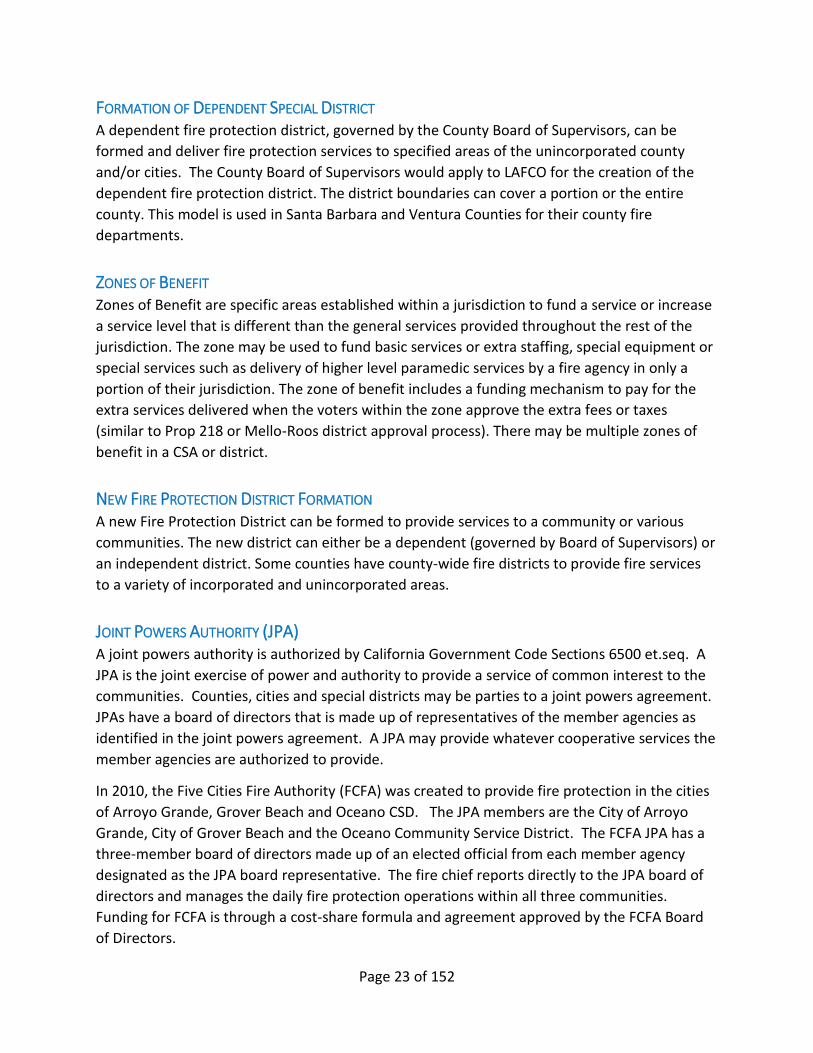
FORMATION OF COUNTY SERVICE AREA A County Service Area (CSA) is a dependent special district governed by the County Board of
Supervisors and delivers services to a specified area of the unincorporated area of the county.
CSAs are routinely used in San Luis Obispo County for Public Works services such as roads,
lighting, and water/sewer where the county is the service provider.
The County Board of Supervisors can apply to LAFCO for the creation of a County Service Area
(CSA) solely for the purpose of providing fire protection. The CSA boundaries can cover a
portion or the entire unincorporated area. CSA 9i is currently the only CSA exclusively used for
fire protection in San Luis Obispo County.
Additionally, the County could activate the latent fire authority of an existing CSA to provide fire
services to unincorporated areas. This model is being used for Cayucos FPD by activating the
latent authority for fire protection in CSA 10.
Page 23 of 152
FORMATION OF DEPENDENT SPECIAL DISTRICT A dependent fire protection district, governed by the County Board of Supervisors, can be
formed and deliver fire protection services to specified areas of the unincorporated county
and/or cities. The County Board of Supervisors would apply to LAFCO for the creation of the
dependent fire protection district. The district boundaries can cover a portion or the entire
county. This model is used in Santa Barbara and Ventura Counties for their county fire
departments.
ZONES OF BENEFIT Zones of Benefit are specific areas established within a jurisdiction to fund a service or increase
a service level that is different than the general services provided throughout the rest of the
jurisdiction. The zone may be used to fund basic services or extra staffing, special equipment or
special services such as delivery of higher level paramedic services by a fire agency in only a
portion of their jurisdiction. The zone of benefit includes a funding mechanism to pay for the
extra services delivered when the voters within the zone approve the extra fees or taxes
(similar to Prop 218 or Mello-Roos district approval process). There may be multiple zones of
benefit in a CSA or district.
NEW FIRE PROTECTION DISTRICT FORMATION A new Fire Protection District can be formed to provide services to a community or various
communities. The new district can either be a dependent (governed by Board of Supervisors) or
an independent district. Some counties have county-wide fire districts to provide fire services
to a variety of incorporated and unincorporated areas.
JOINT POWERS AUTHORITY (JPA) A joint powers authority is authorized by California Government Code Sections 6500 et.seq. A
JPA is the joint exercise of power and authority to provide a service of common interest to the
communities. Counties, cities and special districts may be parties to a joint powers agreement.
JPAs have a board of directors that is made up of representatives of the member agencies as
identified in the joint powers agreement. A JPA may provide whatever cooperative services the
member agencies are authorized to provide.
In 2010, the Five Cities Fire Authority (FCFA) was created to provide fire protection in the cities
of Arroyo Grande, Grover Beach and Oceano CSD. The JPA members are the City of Arroyo
Grande, City of Grover Beach and the Oceano Community Service District. The FCFA JPA has a
three-member board of directors made up of an elected official from each member agency
designated as the JPA board representative. The fire chief reports directly to the JPA board of
directors and manages the daily fire protection operations within all three communities.
Funding for FCFA is through a cost-share formula and agreement approved by the FCFA Board
of Directors.
Page 24 of 152
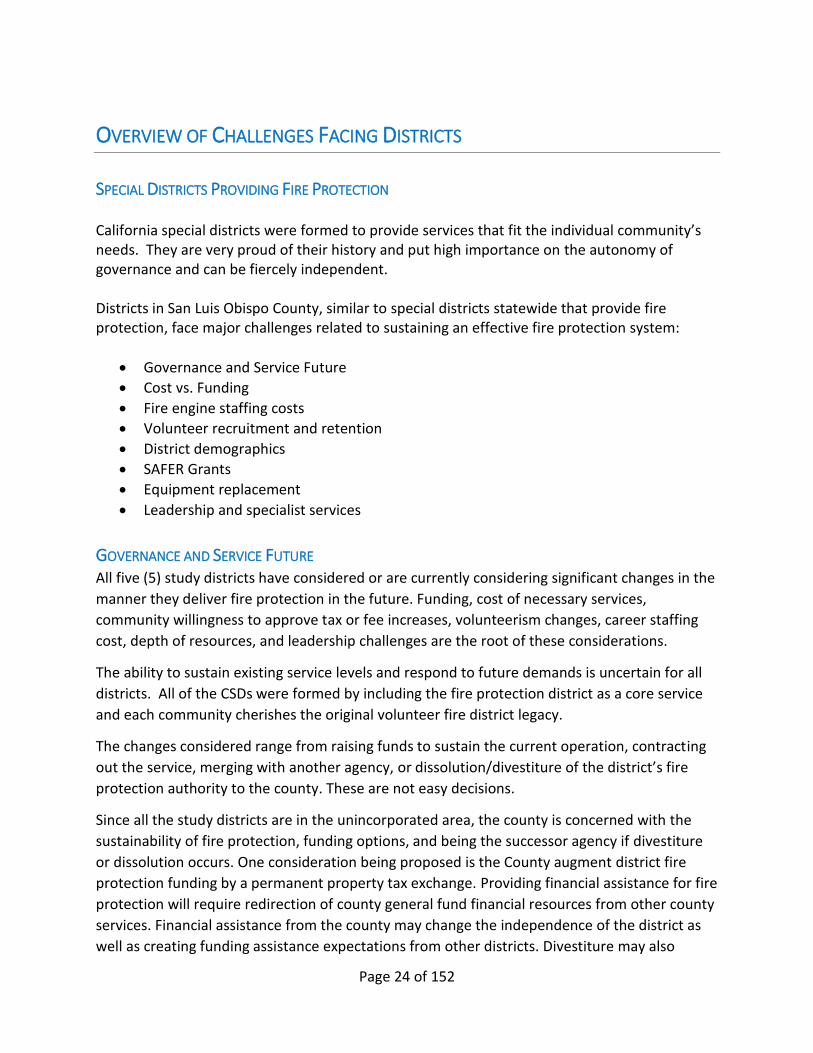
OVERVIEW OF CHALLENGES FACING DISTRICTS
SPECIAL DISTRICTS PROVIDING FIRE PROTECTION
California special districts were formed to provide services that fit the individual community’s needs. They are very proud of their history and put high importance on the autonomy of governance and can be fiercely independent. Districts in San Luis Obispo County, similar to special districts statewide that provide fire protection, face major challenges related to sustaining an effective fire protection system:
• Governance and Service Future
• Cost vs. Funding
• Fire engine staffing costs
• Volunteer recruitment and retention
• District demographics
• SAFER Grants
• Equipment replacement
• Leadership and specialist services
GOVERNANCE AND SERVICE FUTURE All five (5) study districts have considered or are currently considering significant changes in the
manner they deliver fire protection in the future. Funding, cost of necessary services,
community willingness to approve tax or fee increases, volunteerism changes, career staffing
cost, depth of resources, and leadership challenges are the root of these considerations.
The ability to sustain existing service levels and respond to future demands is uncertain for all
districts. All of the CSDs were formed by including the fire protection district as a core service
and each community cherishes the original volunteer fire district legacy.
The changes considered range from raising funds to sustain the current operation, contracting
out the service, merging with another agency, or dissolution/divestiture of the district’s fire
protection authority to the county. These are not easy decisions.
Since all the study districts are in the unincorporated area, the county is concerned with the
sustainability of fire protection, funding options, and being the successor agency if divestiture
or dissolution occurs. One consideration being proposed is the County augment district fire
protection funding by a permanent property tax exchange. Providing financial assistance for fire
protection will require redirection of county general fund financial resources from other county
services. Financial assistance from the county may change the independence of the district as
well as creating funding assistance expectations from other districts. Divestiture may also
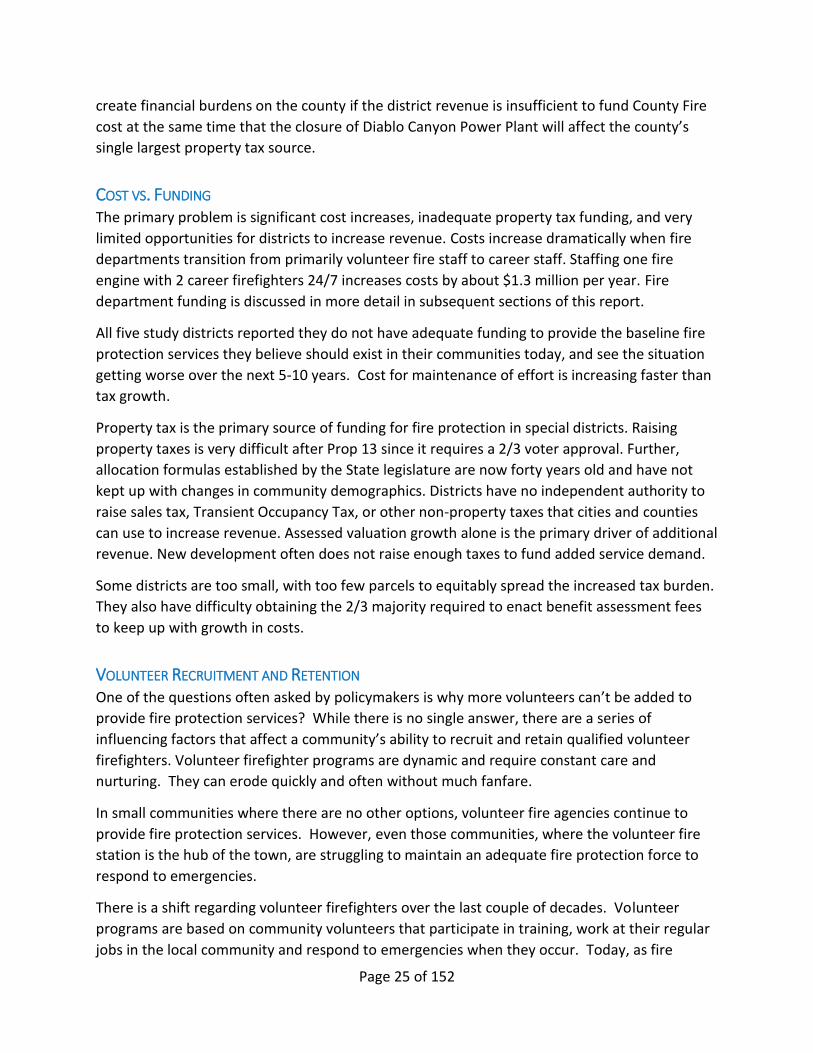
Page 25 of 152
create financial burdens on the county if the district revenue is insufficient to fund County Fire
cost at the same time that the closure of Diablo Canyon Power Plant will affect the county’s
single largest property tax source.
COST VS. FUNDING The primary problem is significant cost increases, inadequate property tax funding, and very
limited opportunities for districts to increase revenue. Costs increase dramatically when fire
departments transition from primarily volunteer fire staff to career staff. Staffing one fire
engine with 2 career firefighters 24/7 increases costs by about $1.3 million per year. Fire
department funding is discussed in more detail in subsequent sections of this report.
All five study districts reported they do not have adequate funding to provide the baseline fire
protection services they believe should exist in their communities today, and see the situation
getting worse over the next 5-10 years. Cost for maintenance of effort is increasing faster than
tax growth.
Property tax is the primary source of funding for fire protection in special districts. Raising
property taxes is very difficult after Prop 13 since it requires a 2/3 voter approval. Further,
allocation formulas established by the State legislature are now forty years old and have not
kept up with changes in community demographics. Districts have no independent authority to
raise sales tax, Transient Occupancy Tax, or other non-property taxes that cities and counties
can use to increase revenue. Assessed valuation growth alone is the primary driver of additional
revenue. New development often does not raise enough taxes to fund added service demand.
Some districts are too small, with too few parcels to equitably spread the increased tax burden.
They also have difficulty obtaining the 2/3 majority required to enact benefit assessment fees
to keep up with growth in costs.
VOLUNTEER RECRUITMENT AND RETENTION One of the questions often asked by policymakers is why more volunteers can’t be added to
provide fire protection services? While there is no single answer, there are a series of
influencing factors that affect a community’s ability to recruit and retain qualified volunteer
firefighters. Volunteer firefighter programs are dynamic and require constant care and
nurturing. They can erode quickly and often without much fanfare.
In small communities where there are no other options, volunteer fire agencies continue to
provide fire protection services. However, even those communities, where the volunteer fire
station is the hub of the town, are struggling to maintain an adequate fire protection force to
respond to emergencies.
There is a shift regarding volunteer firefighters over the last couple of decades. Volunteer
programs are based on community volunteers that participate in training, work at their regular
jobs in the local community and respond to emergencies when they occur. Today, as fire
Page 26 of 152
departments respond to more than fires and the amount of emergency incident activity
increases, volunteers need and are expected to spend more time with the fire department at
the expense of family or work time. This leads to volunteer burnout. Competing volunteer
opportunities for community-oriented people along with other demands for time contribute to
a reduction of fire service volunteers.
Secondarily, there is a significant shift towards people using volunteer firefighter positions as an
internship for a career in the fire service and turnover in this group is high. Developing
volunteer/PCF fire officers takes time and experience. When PCF turnover is high developing
officers is difficult.
INDEPENDENT VS. DEPENDENT VOLUNTEER OPERATIONS There are two scenarios for fire agency volunteer operations. The first is the independent fire
department model. The independent model is inclusive of all fire agency responsibilities. In
addition to emergency response, the agency is responsible for governance, administration,
incident command, fire prevention, training and all other aspects of the operation. Santa
Margarita and San Miguel are two examples of independent primarily volunteer operations.
The cost of the independent model tends to be somewhat higher since, in these examples, the
districts are responsible for all aspects of fire protection within their jurisdiction and associated
costs, including funding a fire chief.
The dependent fire department model is typically viewed as a satellite station within a larger
organization where the volunteers provide emergency response service under the management
of the fire chief of a larger organization. Governance, administration, incident command, fire
prevention, training, and other support services are provided by the larger organization.
County Fire operates two fire stations as dependent volunteer fire stations: Station 34 at Oak
Shores and Station 14 at Morro Toro. County fire provides the overhead and logistical support
for those stations.

Page 27 of 152
VOLUNTEER FIRE OPERATION MODEL BUDGET For illustration purposes, a model budget for an independent volunteer fire operation is
included here. The illustration does not include fire chief compensation or benefits but does
provide a stipend for all volunteers. The intent is to illustrate the cost of operating an
independent volunteer company as a baseline.
Volunteer/PCF Fire Budget No career employees salary or benefits (Fire Chief costs are
separate and unique to each agency) Salaries and Benefits Salaries/Stipends 25,000
Payroll taxes 3,000 Workers Comp 15,000 Uniforms 4,000 Extra help/contract labor 5,500
Sub Total 52,500
Services and Supplies Personal protective equipment 10,000
Building and facility maintenance 8,000 Fleet Maintenance 9,500 Misc. expense 10,000 Office expense 3,000 Supplies 25,000 Professional services or admin (legal, accounting, election) 32,000 Dues, permits and fees 7,000 Communications/Dispatch 24,000 Employee travel and training 10,000 Utilities 5,000 Bank fees 1,800
Sub Total 145,300
Other Charges Contributions to Govt. Agencies 5,000
Sub Total 5,000
Equipment Replacement Fund (varies by number of apparatus/equip) 30,000
Contingency (5%) 11,640
Total Budget 244,440
Figure 6 Model Budget for Independent Volunteer/PCF Fire Station
While this model budget is intended to be representative of the costs of a baseline independent
volunteer operation, the specifics within each district will vary.
Page 28 of 152
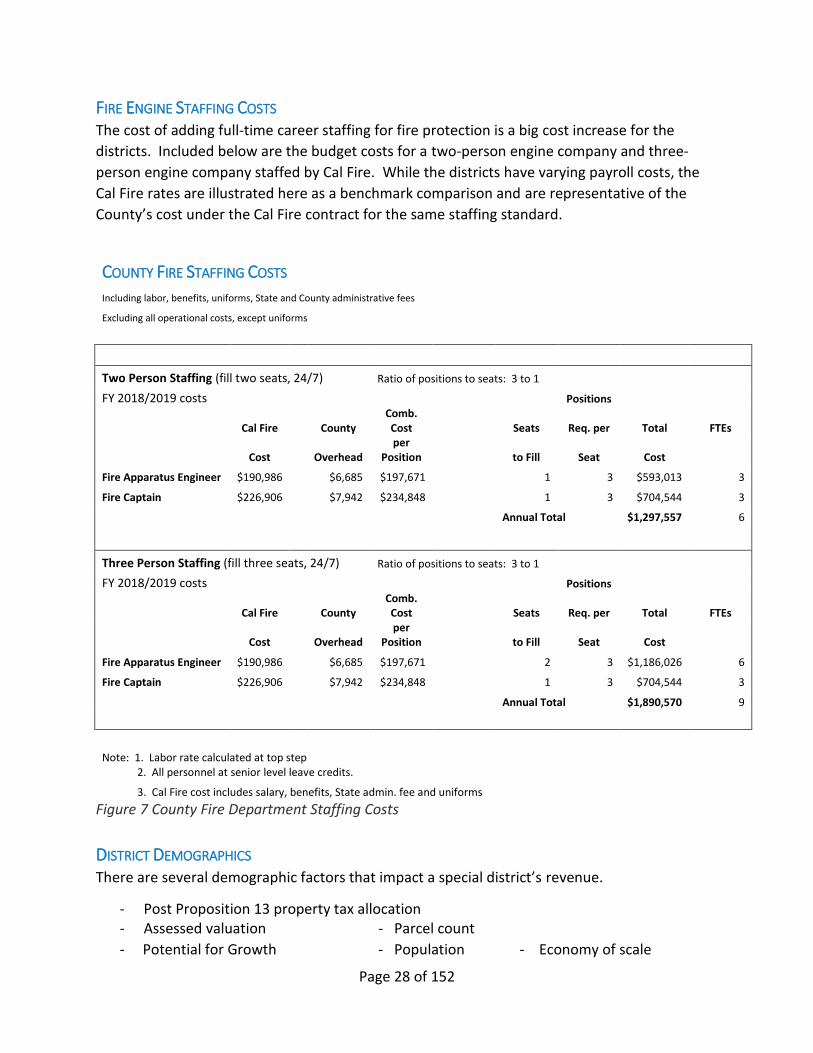
FIRE ENGINE STAFFING COSTS The cost of adding full-time career staffing for fire protection is a big cost increase for the
districts. Included below are the budget costs for a two-person engine company and three-
person engine company staffed by Cal Fire. While the districts have varying payroll costs, the
Cal Fire rates are illustrated here as a benchmark comparison and are representative of the
County’s cost under the Cal Fire contract for the same staffing standard.
COUNTY FIRE STAFFING COSTS
Including labor, benefits, uniforms, State and County administrative fees
Excluding all operational costs, except uniforms
Two Person Staffing (fill two seats, 24/7) Ratio of positions to seats: 3 to 1
FY 2018/2019 costs
Positions
Cal Fire
County Comb. Cost
Seats Req. per Total FTEs
Cost
Overhead per
Position
to Fill Seat Cost
Fire Apparatus Engineer $190,986
$6,685 $197,671
1 3 $593,013 3
Fire Captain $226,906
$7,942 $234,848
1 3 $704,544 3
Annual Total $1,297,557 6
Three Person Staffing (fill three seats, 24/7) Ratio of positions to seats: 3 to 1
FY 2018/2019 costs
Positions
Cal Fire
County Comb. Cost
Seats Req. per Total FTEs
Cost
Overhead per
Position
to Fill Seat Cost
Fire Apparatus Engineer $190,986
$6,685 $197,671
2 3 $1,186,026 6
Fire Captain $226,906
$7,942 $234,848
1 3 $704,544 3
Annual Total $1,890,570 9
Note: 1. Labor rate calculated at top step 2. All personnel at senior level leave credits.
3. Cal Fire cost includes salary, benefits, State admin. fee and uniforms Figure 7 County Fire Department Staffing Costs
DISTRICT DEMOGRAPHICS There are several demographic factors that impact a special district’s revenue.
- Post Proposition 13 property tax allocation - Assessed valuation - Parcel count
- Potential for Growth - Population - Economy of scale
Page 29 of 152
Post-Proposition 13 Property Tax Allocation
The amount of property taxes a district receives is based on two (2) factors: 1. Assessed
valuation, 2: percentage of the Prop 13 tax allocation received by the district. A district with a
high percentage of the Prop 13 allocation and high assessed valuation will generate the most
revenue and has the best potential for sustainability. Districts having either low assessed
valuation or low percentage of tax share are very susceptible to financial shortfalls. Districts
that had all volunteer fire departments at the passage of Prop13 usually receive very low
percentages of the tax allocation.
Assessed Valuation
Assessed valuation is the most important factor influencing district revenue, even districts with
a high percentage of TRA allocation in a district with low AV receive little tax growth. Low-value
development will generate low property taxes that may be less than the cost of services
required. Likewise, a high-value development with low service demand can be a major financial
assist. Districts have no land use control over the type of development in their district.
Parcel Count
One method for districts to raise revenue is charging voter-approved benefit assessment fees to
each parcel. If there are too few parcels, the rate per parcel will be too high to reasonably
spread the tax burden. Districts with more parcels to spread the cost across can achieve their
revenue needs at a lower rate per parcel.
Potential for Growth
Vacant land inside the district is the future tax base needed to fund fire service. If a district is
built out with little room for expansion or infill, the revenue future is bleak. Even districts with
large growth potential do not control land use or development inside the district. However,
they are required to provide services to the newly developed growth areas even if the growth
does not generate enough revenue to cover costs.
Population
There is a difference in fire protection impact and revenue generated by resident and mobile
populations. More people in a district’s service area equates to more emergencies and a higher
workload. However, more people do not equate to higher revenues for the district providing
the service, especially if the population increase is from non-residents (commuters, tourists,
etc.) since they do not contribute to property taxes. Mobile populations primarily contribute tax
revenue through sales tax and Transient Occupancy Tax (TOT). Sales taxes and transient
occupancy taxes are funding sources not available to special districts.
Economy of scale
Special districts have finite resources and flexibility. Economies of scale can be difficult in small
districts where staff costs or equipment costs (which are the same costs as bigger districts) are
spread over a smaller base. Districts attempt to economize by sharing with other agencies,
Page 30 of 152
where practical, for specialized resources they need access to but do not need to own. For
example, this is common practice with very expensive ladder truck apparatus and specialty
response teams, such as hazardous materials and certain specialty rescue teams.
SAFER GRANTS Three of the study districts used SAFER grants (Cambria, Oceano, and Templeton). The Staffing
for Adequate Fire and Emergency Response Grants (SAFER) was created to provide federal
funding directly to fire departments to help them increase or maintain the number of trained,
"front line" firefighters available in their communities. The goal of SAFER is to enhance local fire
departments' abilities to comply with staffing, response and operational standards established
by the NFPA (NFPA 1710 and/or NFPA 1720).9 The grants are awarded by FEMA.
SAFER grants typically cover costs of staffing for three years based on the fire agency’s cost.
Once the grant runs out, the expectation is the local agency will continue to employ and fund
the positions the grant funded. In this study, none of the three districts had a funding
mechanism in place to sustain the positions when the grant expired. Cambria attempted a
benefit assessment fee ballot measure for funding, but there was not enough voter support to
succeed. In all three cases, the SAFER funded firefighters were cut back.
EQUIPMENT REPLACEMENT SINKING OR DEPRECIATION FUND Costs of fire apparatus (fire engines, rescue vehicles, and ladder trucks), portable equipment,
and safety equipment (personal protective equipment and self-contained breathing apparatus)
have skyrocketed over the past decade. Costs have increased faster than CPI and property
taxes. As an example, the County’s most recent purchase of a basic Type 1 fire engine for
County Fire was $580,000. Inflationary increases have historically been about 3% per year.
According to County Fire, the recently purchased fire engine is estimated to cost about
$ 1,000,000 when it is replaced after 20 years; typically 15 years in first line and 5 years as a
reserve.
To fund equipment replacement districts either budget a replacement sinking fund or borrow
funds and repay over extended time. To replace an average structure protection Type 1 fire
engine with a twenty-year lifespan (Part in first-line service, part in reserve status), an agency
should set aside $30-50,000 per year based on County Fire’s replacement schedule. Each
district may have varying life spans and formulas.
9 https://www.fema.gov/staffing-adequate-fire-emergency-response-grant
Page 31 of 152
FACILITY COSTS With the exception of Santa Margarita FPD, fire station facilities were observed to generally be
in good condition. Space and facilities for housing full-time staff will need further examination.
The cost of constructing “essential services” facilities has become quite expensive. The added
structural requirements to meet earthquake standards have driven the costs to more than
triple the cost of ordinary construction. This is in addition to meeting current fire service
standards for training, crew quarters for mixed genders and adequate apparatus space.
Specifics about each district’s facilities can be found in their section that follows.
LEADERSHIP AND SPECIALIST SERVICES Volunteer Fire Chiefs are becoming increasingly rare; even part paid fire chiefs are unique.
Finding a community member to serve as a volunteer or part-time fire chief has become very
difficult. Qualified volunteers, who face increased legal mandates and personal liability, are
often dissuaded from taking on the workload. Additionally, the fire chief of a small fire
department (paid or volunteer) needs to be the “go to” manager, supervisor, budget director,
emergency incident commander, fire marshal, investigator, and trainer for members of the
agency. Frequently, due to expense, there is no assistant chief or other chief officer. Essentially,
the fire chief is always on duty. Therefore, it is difficult to take time off or being out of the
district for professional or personal purposes.
There is less incentive for shift firefighters to promote to leadership positions. They see the day
to day work obligations of fire chiefs and do not aspire to take on that load.
As development, technology, and new hazards become more complex, the demand for
specialists increases. Applying the fire code to one of a kind development, or an industrial
hazard that creates special fire department impacts, or managing computer-based “systems”
requires contracting out for professional specialist services. Funding for these services is limited.
Page 32 of 152
IN-DEPTH ANALYSIS OF SPECIAL DISTRICTS
LITTLE HOOVER COMMISSION
Two separate reports have been published by California’s Little Hoover Commission related to special districts:
Little Hoover Commission Report: Special Districts: Relics of the Past or Resources for the Future? in 200010Make districts more visible/transparent
o LAFCOs as catalysts for district consolidations, reorganizations, and disillusions o Guidelines for consolidations o Management and designation of reserves o Illustrates issues relative to taxes to enterprise districts and reserve levels
LITTLE HOOVER COMMISSION REPORT: SPECIAL DISTRICTS: IMPROVING OVERSIGHT & TRANSPARENCY
IN 201711
o Recognizes the variety and different approaches regarding districts statewide o Renews concerns related to property tax allocation and financial reserves of special
districts o Recommends that the legislature address several issues related to
consolidation/dissolutions o Recommends grant funding for studies related to pending
dissolutions/consolidations
10 http://www.lhc.ca.gov/report/special-districts-relics-past-or-resources-future
11 http://www.lhc.ca.gov/sites/lhc.ca.gov/files/Reports/239/Report239.pdf
Page 33 of 152
SPECIAL DISTRICT FUNDING
Special Districts’ have few options for generating revenue to fund fire protection and are even
more limited with Proposition 13’s passage 40 years ago. Districts use property taxes as the
primary funding source for fire protection and non-enterprise services they provide. Property
taxes have not kept up with the increased cost of delivering those services. Districts have no
authority to use sales tax, transient occupancy tax, or many non-property related funding
sources that have enabled cities and counties to keep up with the cost of fire protection and
other services. In some cases, Special Benefit Assessment or Mello-Roos districts are being
used to bolster property taxes.
At the time of passage of Proposition 13 in 1978, all five (5) of the special districts in this study
were volunteer fire departments with very small operational budgets. The three (3) largest
districts in this study have transitioned to using only paid staff and have serious funding
problems (Cambria, Oceano, and Templeton). San Miguel and Santa Margarita, the two
smallest, still use Paid Call Firefighters (incentivized volunteers) but are still facing funding
problems. San Miguel and Santa Margarita may need to fund full-time staff in the 5-10 year
horizon.
EVOLUTION OF COSTS VERSUS PROP 13 TAX RATES Special districts are living today with budget decisions their governing boards made forty years
ago when voters passed Prop 13. In 1978, community demographics of the study districts only
warranted a volunteer fire agency. Fire protection costs were limited to funding equipment
and operating expenses while payroll costs were virtually nonexistent. The District Board
passed a budget based on these minimal financial needs to support the volunteer operation.
Prop 13 and subsequent legislation established those small budgets as the fire protection
baseline percentage of the tax rate areas. Small budgets equal a small share of taxes.
Changes in the ability to recruit and retain volunteer firefighters along with desired faster reflex
time standards (time to assemble the crew and respond to an incident) have created the need
to hire career staff. Staffing costs are significant and, once the transition to career staffing
begins, the cost changes are abrupt and ongoing. The incremental approach of adding part-
time staffing has some limited success as a phased transition from a volunteer operation to full-
time staffing. Part-time staffing is not a long-term solution. Cost of full-time staffing and the
revenue to fund that cost is the most significant issue facing many special districts in the state
that provide fire protection. Assessed valuation increases, and resultant property taxes allowed
by Prop 13 ususally cannot keep up with the cost increase from volunteer to full-time staff in
small districts.
As the community demographics changes and hiring career staff becomes necessary, the
revenue vs. cost gap has grown exponentially. 24/7 staffing of a fire engine with two full-time
firefighters costs about $1.3 million annually, significantly more than minimal cost of
Page 34 of 152
volunteers/PCFs. Hiring career staff to provide service is the biggest impact on local special
district budgets.
FACTORS THAT INFLUENCE A SPECIAL DISTRICT’S FINANCES
• Proposition 13
• ERAF
• Property tax allocation
• Assessed value
• Growth in Assessed Valuation
• Number of Parcels
• Enterprise Funds
PROPERTY TAX
PROPOSITION 13 APPROVED IN 1978
Since fire protection provided by special districts is funded primarily by property tax, it is important to understand California’s Proposition 13 passed as an amendment to the State constitution in 1978. Prior to Prop 13, local agencies (counties, cities, special districts, and schools) independently levied property taxes within their jurisdictions. An annual budget, based on necessary service delivery cost for the coming fiscal year, was passed and authorized by the local agency governing body. The budget was then submitted to the County Tax Collector to develop a tax rate for each property based on all the local agencies that serve that property. The controls on the tax rates were limited and concerns were raised that property owners could not afford the taxes. The average statewide property taxes were 2.67% of the property’s assessed value. Post Prop 13, the tax rate was set at 1% per year of the assessed valuation of real property (which is split between agencies providing services); down from 2.67% statewide average. The initial fiscal year used to establish the baseline assessed values of property and to determine the base property tax was 1975/1976. Growth of property tax is limited to 2% per year. For the most part, reassessment happens at the time of sale of the property. Any special tax that exceeds the 1% baseline requires 2/3 voter approval. The allocation of pro-rated property taxes to public entities is established by State law. Fundamentally, Prop 13 changed how public agencies fund services. Service levels are often determined based on the amount of revenue received as compared to the previous method of determining the cost of the service and setting the funding level. It also significantly changed the relationship between State and local policymakers regarding funding for local services. The comparison below illustrates a side by side comparison of the approaches.
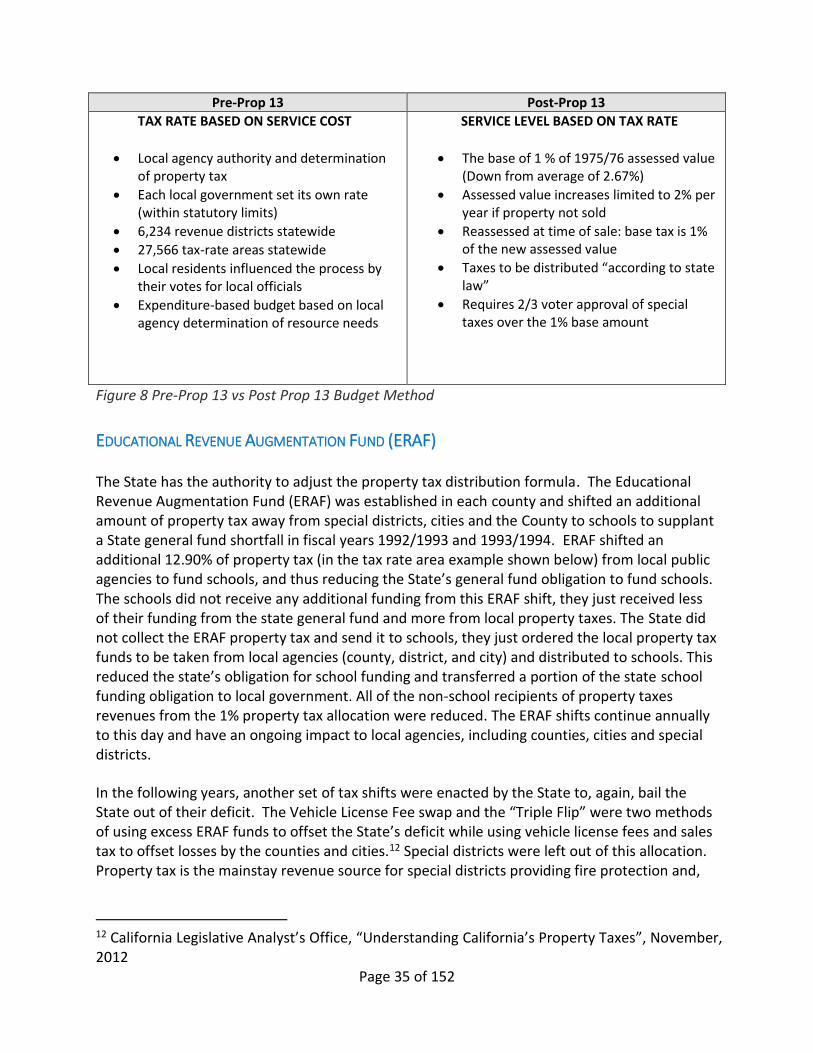
Page 35 of 152
Pre-Prop 13 Post-Prop 13
TAX RATE BASED ON SERVICE COST
• Local agency authority and determination of property tax
• Each local government set its own rate (within statutory limits)
• 6,234 revenue districts statewide
• 27,566 tax-rate areas statewide
• Local residents influenced the process by their votes for local officials
• Expenditure-based budget based on local agency determination of resource needs
SERVICE LEVEL BASED ON TAX RATE
• The base of 1 % of 1975/76 assessed value (Down from average of 2.67%)
• Assessed value increases limited to 2% per year if property not sold
• Reassessed at time of sale: base tax is 1% of the new assessed value
• Taxes to be distributed “according to state law”
• Requires 2/3 voter approval of special taxes over the 1% base amount
Figure 8 Pre-Prop 13 vs Post Prop 13 Budget Method
EDUCATIONAL REVENUE AUGMENTATION FUND (ERAF)
The State has the authority to adjust the property tax distribution formula. The Educational Revenue Augmentation Fund (ERAF) was established in each county and shifted an additional amount of property tax away from special districts, cities and the County to schools to supplant a State general fund shortfall in fiscal years 1992/1993 and 1993/1994. ERAF shifted an additional 12.90% of property tax (in the tax rate area example shown below) from local public agencies to fund schools, and thus reducing the State’s general fund obligation to fund schools. The schools did not receive any additional funding from this ERAF shift, they just received less of their funding from the state general fund and more from local property taxes. The State did not collect the ERAF property tax and send it to schools, they just ordered the local property tax funds to be taken from local agencies (county, district, and city) and distributed to schools. This reduced the state’s obligation for school funding and transferred a portion of the state school funding obligation to local government. All of the non-school recipients of property taxes revenues from the 1% property tax allocation were reduced. The ERAF shifts continue annually to this day and have an ongoing impact to local agencies, including counties, cities and special districts.
In the following years, another set of tax shifts were enacted by the State to, again, bail the State out of their deficit. The Vehicle License Fee swap and the “Triple Flip” were two methods of using excess ERAF funds to offset the State’s deficit while using vehicle license fees and sales tax to offset losses by the counties and cities.12 Special districts were left out of this allocation. Property tax is the mainstay revenue source for special districts providing fire protection and,
12 California Legislative Analyst’s Office, “Understanding California’s Property Taxes”, November, 2012
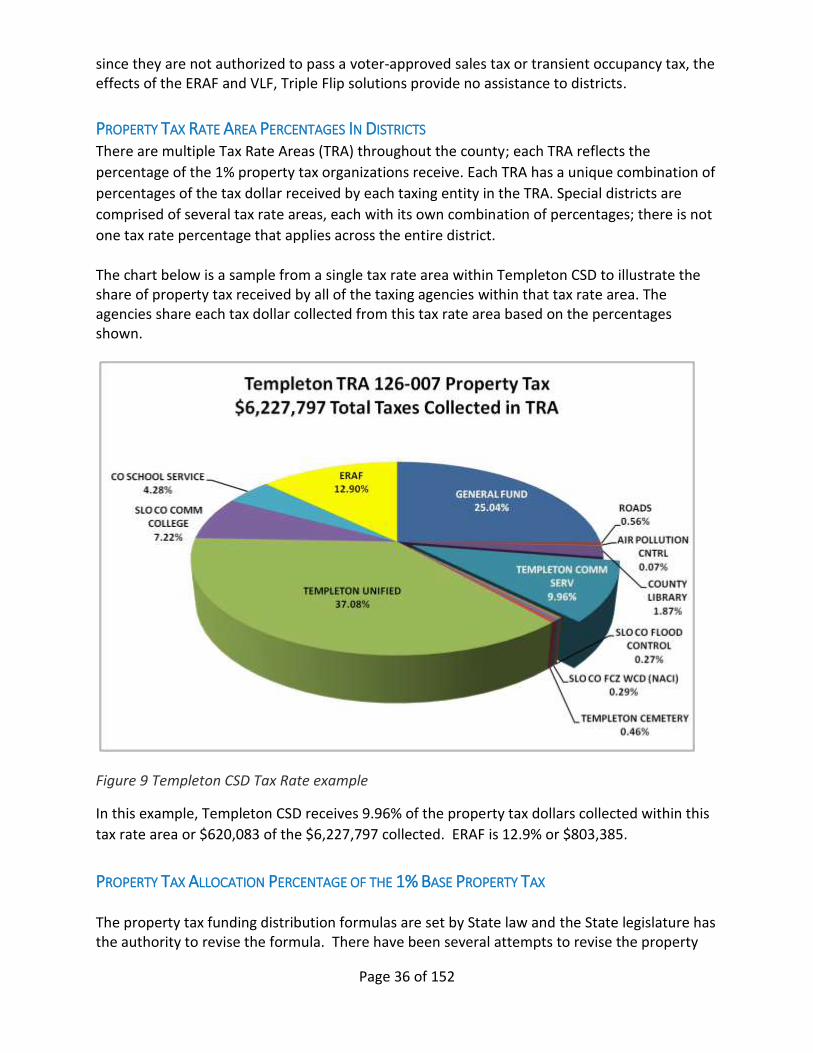
Page 36 of 152
since they are not authorized to pass a voter-approved sales tax or transient occupancy tax, the effects of the ERAF and VLF, Triple Flip solutions provide no assistance to districts.
PROPERTY TAX RATE AREA PERCENTAGES IN DISTRICTS There are multiple Tax Rate Areas (TRA) throughout the county; each TRA reflects the
percentage of the 1% property tax organizations receive. Each TRA has a unique combination of
percentages of the tax dollar received by each taxing entity in the TRA. Special districts are
comprised of several tax rate areas, each with its own combination of percentages; there is not
one tax rate percentage that applies across the entire district.
The chart below is a sample from a single tax rate area within Templeton CSD to illustrate the share of property tax received by all of the taxing agencies within that tax rate area. The agencies share each tax dollar collected from this tax rate area based on the percentages shown.
Figure 9 Templeton CSD Tax Rate example
In this example, Templeton CSD receives 9.96% of the property tax dollars collected within this
tax rate area or $620,083 of the $6,227,797 collected. ERAF is 12.9% or $803,385.
PROPERTY TAX ALLOCATION PERCENTAGE OF THE 1% BASE PROPERTY TAX
The property tax funding distribution formulas are set by State law and the State legislature has the authority to revise the formula. There have been several attempts to revise the property
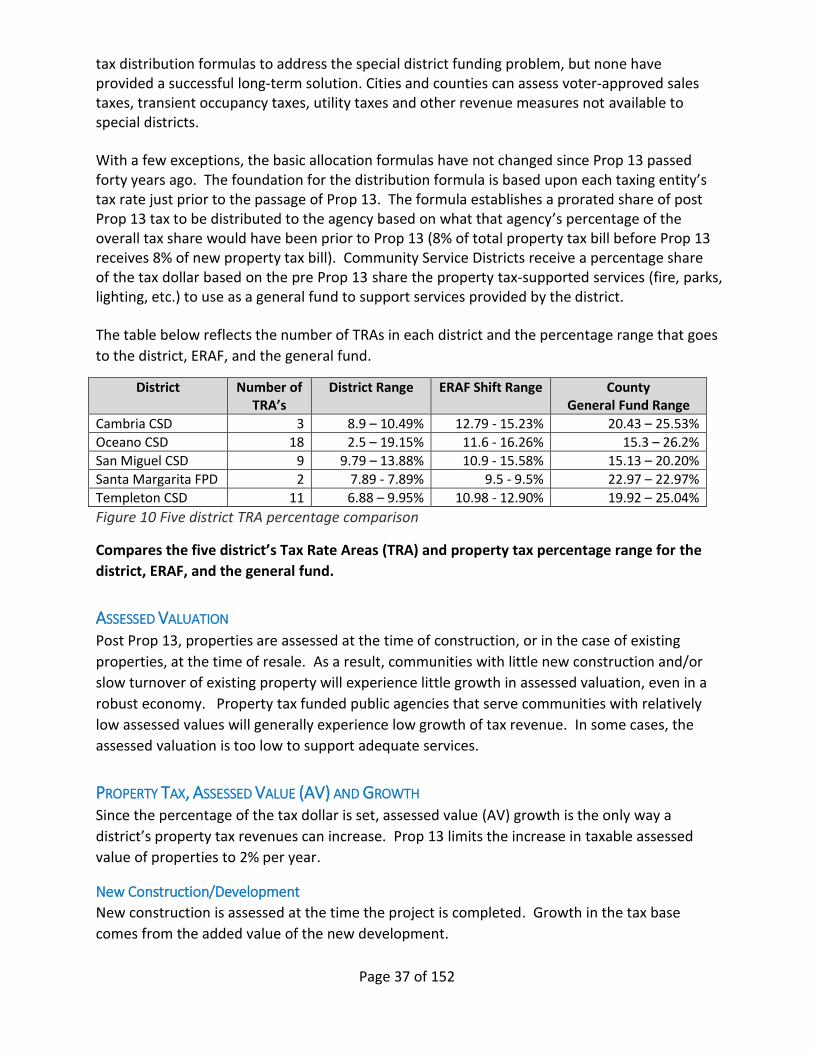
Page 37 of 152
tax distribution formulas to address the special district funding problem, but none have provided a successful long-term solution. Cities and counties can assess voter-approved sales taxes, transient occupancy taxes, utility taxes and other revenue measures not available to special districts.
With a few exceptions, the basic allocation formulas have not changed since Prop 13 passed forty years ago. The foundation for the distribution formula is based upon each taxing entity’s tax rate just prior to the passage of Prop 13. The formula establishes a prorated share of post Prop 13 tax to be distributed to the agency based on what that agency’s percentage of the overall tax share would have been prior to Prop 13 (8% of total property tax bill before Prop 13 receives 8% of new property tax bill). Community Service Districts receive a percentage share of the tax dollar based on the pre Prop 13 share the property tax-supported services (fire, parks, lighting, etc.) to use as a general fund to support services provided by the district.
The table below reflects the number of TRAs in each district and the percentage range that goes
to the district, ERAF, and the general fund.
District Number of TRA’s
District Range ERAF Shift Range County General Fund Range
Cambria CSD 3 8.9 – 10.49% 12.79 - 15.23% 20.43 – 25.53%
Oceano CSD 18 2.5 – 19.15% 11.6 - 16.26% 15.3 – 26.2%
San Miguel CSD 9 9.79 – 13.88% 10.9 - 15.58% 15.13 – 20.20%
Santa Margarita FPD 2 7.89 - 7.89% 9.5 - 9.5% 22.97 – 22.97%
Templeton CSD 11 6.88 – 9.95% 10.98 - 12.90% 19.92 – 25.04%
Figure 10 Five district TRA percentage comparison
Compares the five district’s Tax Rate Areas (TRA) and property tax percentage range for the
district, ERAF, and the general fund.
ASSESSED VALUATION Post Prop 13, properties are assessed at the time of construction, or in the case of existing
properties, at the time of resale. As a result, communities with little new construction and/or
slow turnover of existing property will experience little growth in assessed valuation, even in a
robust economy. Property tax funded public agencies that serve communities with relatively
low assessed values will generally experience low growth of tax revenue. In some cases, the
assessed valuation is too low to support adequate services.
PROPERTY TAX, ASSESSED VALUE (AV) AND GROWTH Since the percentage of the tax dollar is set, assessed value (AV) growth is the only way a
district’s property tax revenues can increase. Prop 13 limits the increase in taxable assessed
value of properties to 2% per year.
New Construction/Development
New construction is assessed at the time the project is completed. Growth in the tax base
comes from the added value of the new development.
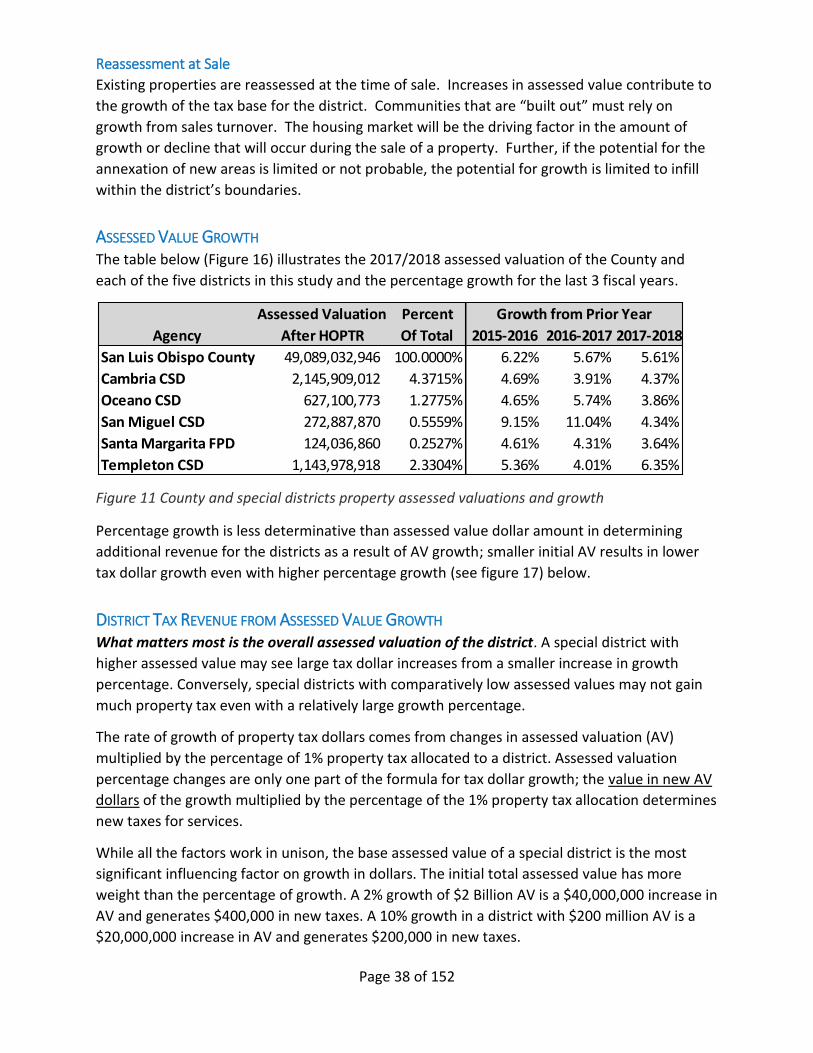
Page 38 of 152
Reassessment at Sale
Existing properties are reassessed at the time of sale. Increases in assessed value contribute to
the growth of the tax base for the district. Communities that are “built out” must rely on
growth from sales turnover. The housing market will be the driving factor in the amount of
growth or decline that will occur during the sale of a property. Further, if the potential for the
annexation of new areas is limited or not probable, the potential for growth is limited to infill
within the district’s boundaries.
ASSESSED VALUE GROWTH The table below (Figure 16) illustrates the 2017/2018 assessed valuation of the County and
each of the five districts in this study and the percentage growth for the last 3 fiscal years.
Figure 11 County and special districts property assessed valuations and growth
Percentage growth is less determinative than assessed value dollar amount in determining
additional revenue for the districts as a result of AV growth; smaller initial AV results in lower
tax dollar growth even with higher percentage growth (see figure 17) below.
DISTRICT TAX REVENUE FROM ASSESSED VALUE GROWTH What matters most is the overall assessed valuation of the district. A special district with
higher assessed value may see large tax dollar increases from a smaller increase in growth
percentage. Conversely, special districts with comparatively low assessed values may not gain
much property tax even with a relatively large growth percentage.
The rate of growth of property tax dollars comes from changes in assessed valuation (AV)
multiplied by the percentage of 1% property tax allocated to a district. Assessed valuation
percentage changes are only one part of the formula for tax dollar growth; the value in new AV
dollars of the growth multiplied by the percentage of the 1% property tax allocation determines
new taxes for services.
While all the factors work in unison, the base assessed value of a special district is the most
significant influencing factor on growth in dollars. The initial total assessed value has more
weight than the percentage of growth. A 2% growth of $2 Billion AV is a $40,000,000 increase in
AV and generates $400,000 in new taxes. A 10% growth in a district with $200 million AV is a
$20,000,000 increase in AV and generates $200,000 in new taxes.
Assessed Valuation Percent Growth from Prior Year
Agency After HOPTR Of Total 2015-2016 2016-2017 2017-2018
San Luis Obispo County 49,089,032,946 100.0000% 6.22% 5.67% 5.61%
Cambria CSD 2,145,909,012 4.3715% 4.69% 3.91% 4.37%
Oceano CSD 627,100,773 1.2775% 4.65% 5.74% 3.86%
San Miguel CSD 272,887,870 0.5559% 9.15% 11.04% 4.34%
Santa Margarita FPD 124,036,860 0.2527% 4.61% 4.31% 3.64%
Templeton CSD 1,143,978,918 2.3304% 5.36% 4.01% 6.35%
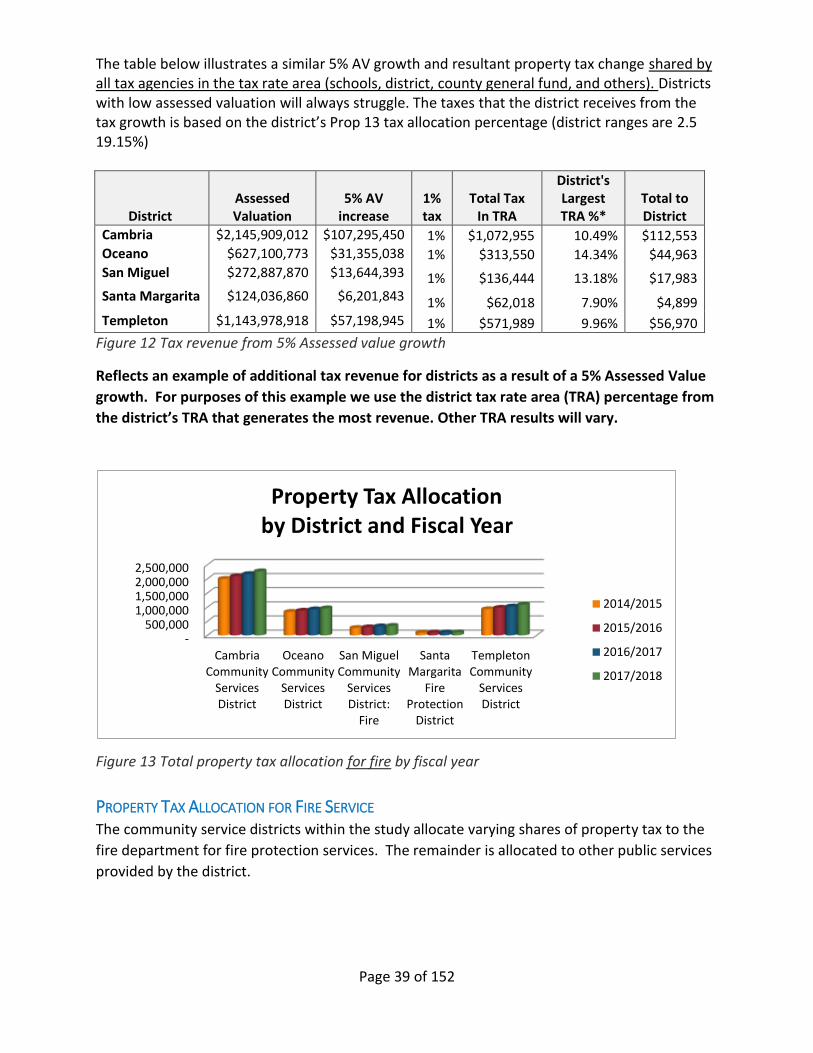
Page 39 of 152
The table below illustrates a similar 5% AV growth and resultant property tax change shared by all tax agencies in the tax rate area (schools, district, county general fund, and others). Districts with low assessed valuation will always struggle. The taxes that the district receives from the tax growth is based on the district’s Prop 13 tax allocation percentage (district ranges are 2.5 19.15%)
District Assessed Valuation
5% AV increase
1% tax
Total Tax In TRA
District's Largest TRA %*
Total to District
Cambria $2,145,909,012 $107,295,450 1% $1,072,955 10.49% $112,553 Oceano $627,100,773 $31,355,038 1% $313,550 14.34% $44,963 San Miguel $272,887,870 $13,644,393 1% $136,444 13.18% $17,983 Santa Margarita $124,036,860 $6,201,843 1% $62,018 7.90% $4,899 Templeton $1,143,978,918 $57,198,945 1% $571,989 9.96% $56,970
Figure 12 Tax revenue from 5% Assessed value growth
Reflects an example of additional tax revenue for districts as a result of a 5% Assessed Value
growth. For purposes of this example we use the district tax rate area (TRA) percentage from
the district’s TRA that generates the most revenue. Other TRA results will vary.
Figure 13 Total property tax allocation for fire by fiscal year
PROPERTY TAX ALLOCATION FOR FIRE SERVICE The community service districts within the study allocate varying shares of property tax to the
fire department for fire protection services. The remainder is allocated to other public services
provided by the district.
- 500,000
1,000,000 1,500,000 2,000,000 2,500,000
CambriaCommunity
ServicesDistrict
OceanoCommunity
ServicesDistrict
San MiguelCommunity
ServicesDistrict:
Fire
SantaMargarita
FireProtection
District
TempletonCommunity
ServicesDistrict
Property Tax Allocationby District and Fiscal Year
2014/2015
2015/2016
2016/2017
2017/2018
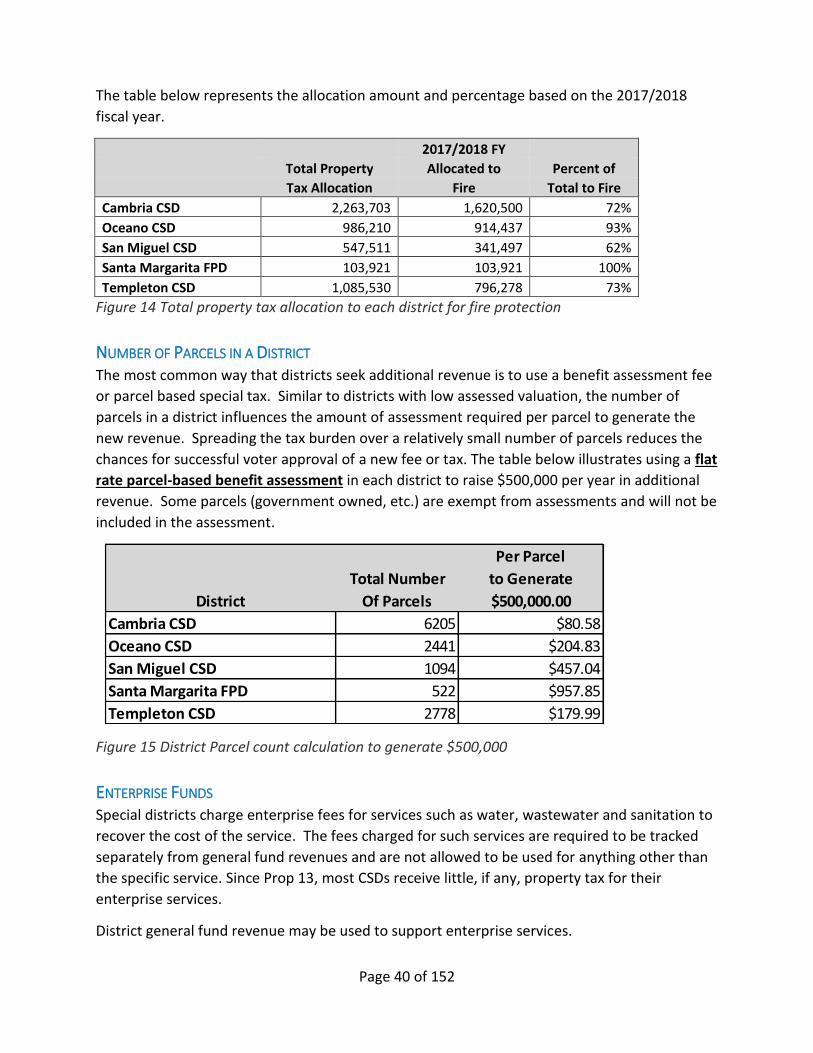
Page 40 of 152
The table below represents the allocation amount and percentage based on the 2017/2018
fiscal year.
2017/2018 FY Total Property Allocated to Percent of Tax Allocation Fire Total to Fire Cambria CSD 2,263,703 1,620,500 72% Oceano CSD 986,210 914,437 93% San Miguel CSD 547,511 341,497 62% Santa Margarita FPD 103,921 103,921 100%
Templeton CSD 1,085,530 796,278 73% Figure 14 Total property tax allocation to each district for fire protection
NUMBER OF PARCELS IN A DISTRICT The most common way that districts seek additional revenue is to use a benefit assessment fee
or parcel based special tax. Similar to districts with low assessed valuation, the number of
parcels in a district influences the amount of assessment required per parcel to generate the
new revenue. Spreading the tax burden over a relatively small number of parcels reduces the
chances for successful voter approval of a new fee or tax. The table below illustrates using a flat
rate parcel-based benefit assessment in each district to raise $500,000 per year in additional
revenue. Some parcels (government owned, etc.) are exempt from assessments and will not be
included in the assessment.
Figure 15 District Parcel count calculation to generate $500,000
ENTERPRISE FUNDS Special districts charge enterprise fees for services such as water, wastewater and sanitation to
recover the cost of the service. The fees charged for such services are required to be tracked
separately from general fund revenues and are not allowed to be used for anything other than
the specific service. Since Prop 13, most CSDs receive little, if any, property tax for their
enterprise services.
District general fund revenue may be used to support enterprise services.
Per Parcel
Total Number to Generate
District Of Parcels $500,000.00
Cambria CSD 6205 $80.58
Oceano CSD 2441 $204.83
San Miguel CSD 1094 $457.04
Santa Margarita FPD 522 $957.85
Templeton CSD 2778 $179.99
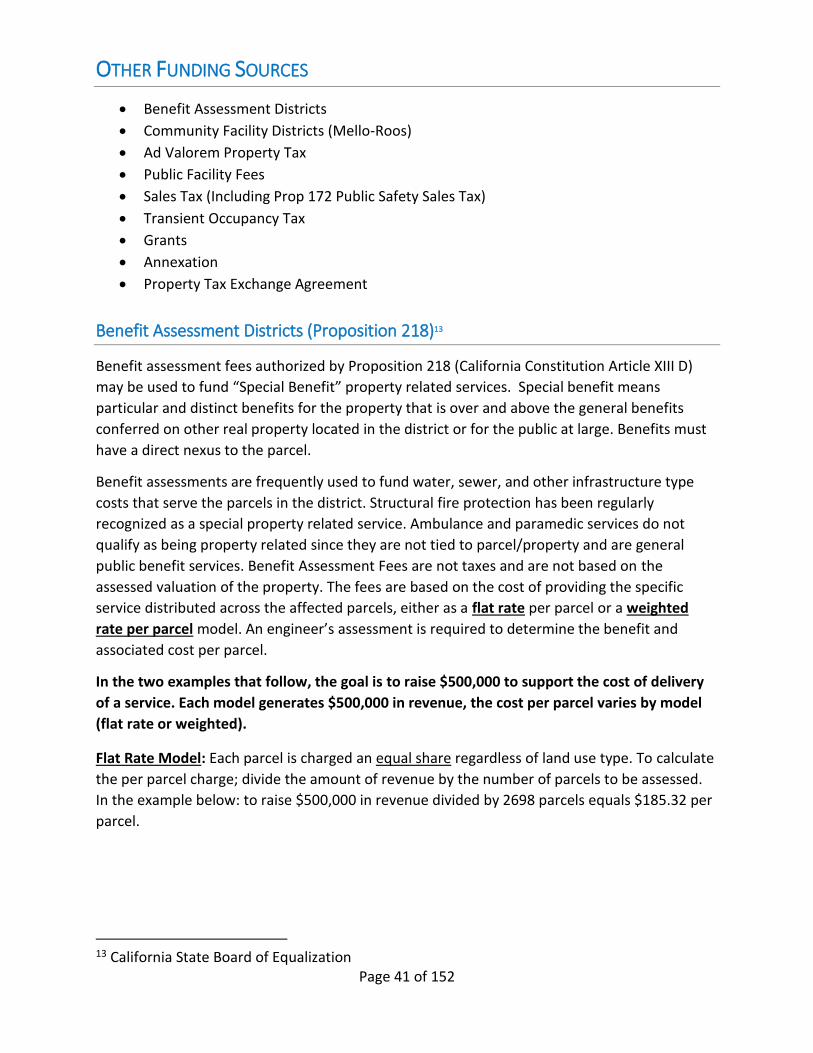
Page 41 of 152
OTHER FUNDING SOURCES
• Benefit Assessment Districts
• Community Facility Districts (Mello-Roos)
• Ad Valorem Property Tax
• Public Facility Fees
• Sales Tax (Including Prop 172 Public Safety Sales Tax)
• Transient Occupancy Tax
• Grants
• Annexation
• Property Tax Exchange Agreement
Benefit Assessment Districts (Proposition 218)13
Benefit assessment fees authorized by Proposition 218 (California Constitution Article XIII D)
may be used to fund “Special Benefit” property related services. Special benefit means
particular and distinct benefits for the property that is over and above the general benefits
conferred on other real property located in the district or for the public at large. Benefits must
have a direct nexus to the parcel.
Benefit assessments are frequently used to fund water, sewer, and other infrastructure type
costs that serve the parcels in the district. Structural fire protection has been regularly
recognized as a special property related service. Ambulance and paramedic services do not
qualify as being property related since they are not tied to parcel/property and are general
public benefit services. Benefit Assessment Fees are not taxes and are not based on the
assessed valuation of the property. The fees are based on the cost of providing the specific
service distributed across the affected parcels, either as a flat rate per parcel or a weighted
rate per parcel model. An engineer’s assessment is required to determine the benefit and
associated cost per parcel.
In the two examples that follow, the goal is to raise $500,000 to support the cost of delivery
of a service. Each model generates $500,000 in revenue, the cost per parcel varies by model
(flat rate or weighted).
Flat Rate Model: Each parcel is charged an equal share regardless of land use type. To calculate
the per parcel charge; divide the amount of revenue by the number of parcels to be assessed.
In the example below: to raise $500,000 in revenue divided by 2698 parcels equals $185.32 per
parcel.
13 California State Board of Equalization
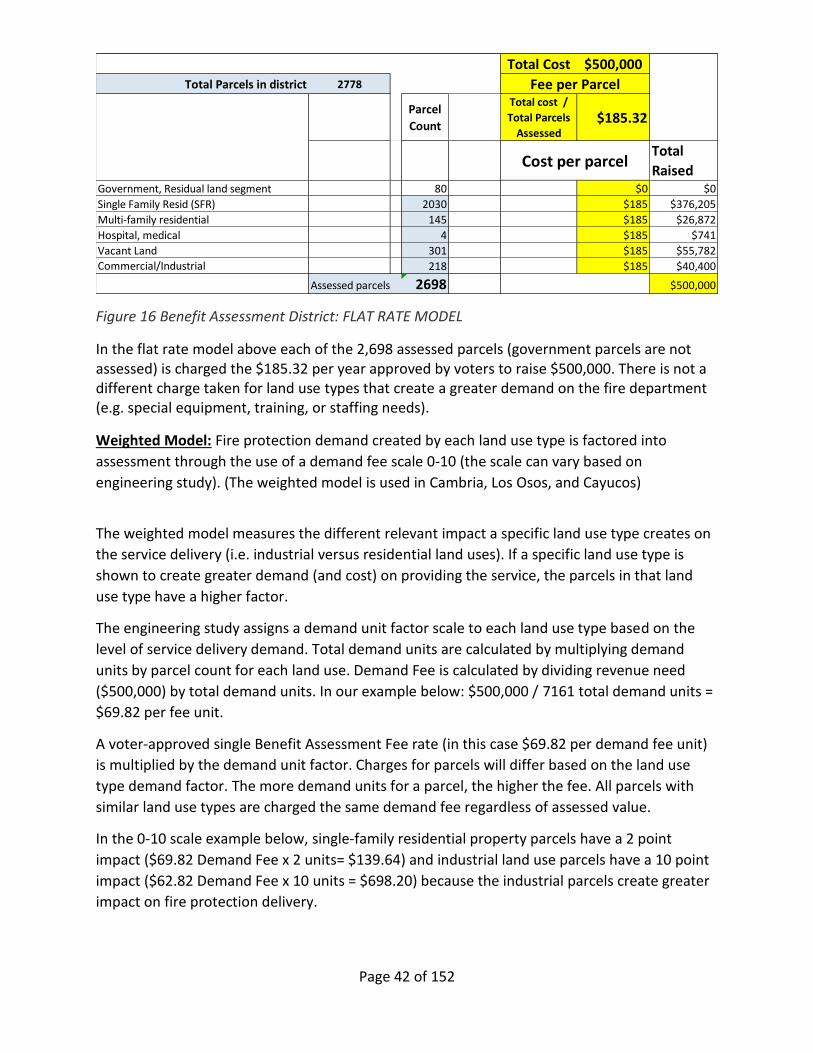
Page 42 of 152
Figure 16 Benefit Assessment District: FLAT RATE MODEL
In the flat rate model above each of the 2,698 assessed parcels (government parcels are not assessed) is charged the $185.32 per year approved by voters to raise $500,000. There is not a different charge taken for land use types that create a greater demand on the fire department (e.g. special equipment, training, or staffing needs).
Weighted Model: Fire protection demand created by each land use type is factored into
assessment through the use of a demand fee scale 0-10 (the scale can vary based on
engineering study). (The weighted model is used in Cambria, Los Osos, and Cayucos)
The weighted model measures the different relevant impact a specific land use type creates on
the service delivery (i.e. industrial versus residential land uses). If a specific land use type is
shown to create greater demand (and cost) on providing the service, the parcels in that land
use type have a higher factor.
The engineering study assigns a demand unit factor scale to each land use type based on the
level of service delivery demand. Total demand units are calculated by multiplying demand
units by parcel count for each land use. Demand Fee is calculated by dividing revenue need
($500,000) by total demand units. In our example below: $500,000 / 7161 total demand units =
$69.82 per fee unit.
A voter-approved single Benefit Assessment Fee rate (in this case $69.82 per demand fee unit)
is multiplied by the demand unit factor. Charges for parcels will differ based on the land use
type demand factor. The more demand units for a parcel, the higher the fee. All parcels with
similar land use types are charged the same demand fee regardless of assessed value.
In the 0-10 scale example below, single-family residential property parcels have a 2 point
impact ($69.82 Demand Fee x 2 units= $139.64) and industrial land use parcels have a 10 point
impact ($62.82 Demand Fee x 10 units = $698.20) because the industrial parcels create greater
impact on fire protection delivery.
Total Cost $500,000
Total Parcels in district 2778
Parcel
Count
Total cost /
Total Parcels
Assessed$185.32
Total
RaisedGovernment, Residual land segment 80 $0 $0
Single Family Resid (SFR) 2030 $185 $376,205
Multi-family residential 145 $185 $26,872
Hospital, medical 4 $185 $741
Vacant Land 301 $185 $55,782
Commercial/Industrial 218 $185 $40,400
Assessed parcels 2698 $500,000
Fee per Parcel
Cost per parcel
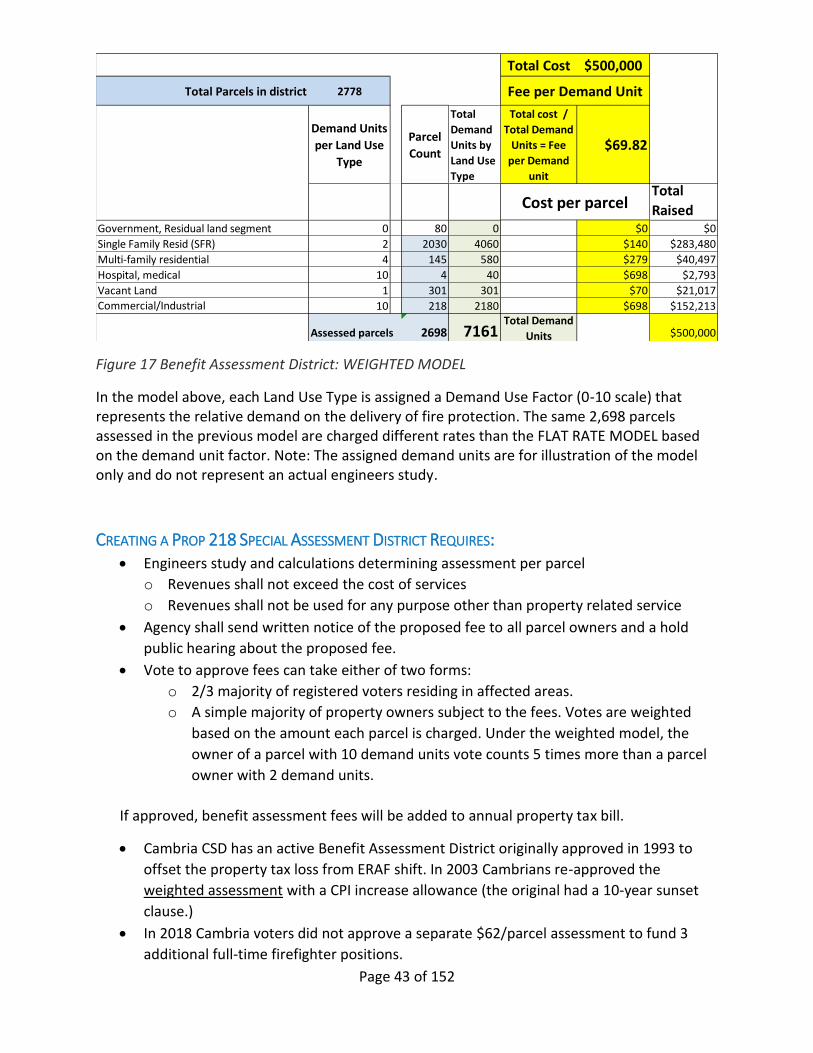
Page 43 of 152
Figure 17 Benefit Assessment District: WEIGHTED MODEL
In the model above, each Land Use Type is assigned a Demand Use Factor (0-10 scale) that represents the relative demand on the delivery of fire protection. The same 2,698 parcels assessed in the previous model are charged different rates than the FLAT RATE MODEL based on the demand unit factor. Note: The assigned demand units are for illustration of the model only and do not represent an actual engineers study.
CREATING A PROP 218 SPECIAL ASSESSMENT DISTRICT REQUIRES: • Engineers study and calculations determining assessment per parcel
o Revenues shall not exceed the cost of services
o Revenues shall not be used for any purpose other than property related service
• Agency shall send written notice of the proposed fee to all parcel owners and a hold
public hearing about the proposed fee.
• Vote to approve fees can take either of two forms:
o 2/3 majority of registered voters residing in affected areas.
o A simple majority of property owners subject to the fees. Votes are weighted
based on the amount each parcel is charged. Under the weighted model, the
owner of a parcel with 10 demand units vote counts 5 times more than a parcel
owner with 2 demand units.
If approved, benefit assessment fees will be added to annual property tax bill.
• Cambria CSD has an active Benefit Assessment District originally approved in 1993 to
offset the property tax loss from ERAF shift. In 2003 Cambrians re-approved the
weighted assessment with a CPI increase allowance (the original had a 10-year sunset
clause.)
• In 2018 Cambria voters did not approve a separate $62/parcel assessment to fund 3
additional full-time firefighter positions.
Total Cost $500,000
Total Parcels in district 2778
Demand Units
per Land Use
Type
Parcel
Count
Total
Demand
Units by
Land Use
Type
Total cost /
Total Demand
Units = Fee
per Demand
unit
$69.82
Total
RaisedGovernment, Residual land segment 0 80 0 $0 $0
Single Family Resid (SFR) 2 2030 4060 $140 $283,480
Multi-family residential 4 145 580 $279 $40,497
Hospital, medical 10 4 40 $698 $2,793
Vacant Land 1 301 301 $70 $21,017
Commercial/Industrial 10 218 2180 $698 $152,213
Assessed parcels 2698 7161Total Demand
Units $500,000
Cost per parcel
Fee per Demand Unit
Page 44 of 152
• The assessment approved in 2003 remains in effect which will generate $464,000
in2018-19 FY.
Cambria’s 2003 approved assessment generated $455,500 in fiscal year 2017/2018.
• Oceano CSD is considering a benefit assessment district ballot measure for 2019 or 2020
to provide fire department funding to meet their Five Cities Fire Authority obligation to
fund 3 full-time firefighters on duty daily at the Oceano fire station. No previous
attempts have been made and they do not have a Mello Roos CFD District.
• San Miguel does not have a benefit assessment district
• Santa Margarita does not have a benefit assessment district
• Templeton CSD unsuccessfully attempted a $77/parcel benefit assessment in 2009.
In 2015 the Templeton CSD Board hired a consulting firm to survey the community to
determine support for a benefit assessment fee for the fire department. The survey
opinion showed insufficient community support for the assessment.
The Templeton CSD Board of Directors is considering another attempt at a benefit
assessment ballot measure to support fire department funding for August of 2019.
• Los Osos CSD and Cayucos FPD have approved benefit assessment districts for fire
protection.
COMMUNITY FACILITIES DISTRICTS (MELLO-ROOS) Community Facilities Districts (Mello-Roos) are authorized by Government Code 53311 et seq.
to fund several types of services.
Mello-Roos Districts are most frequently used as a condition of new development to fund extra
public services necessitated by the development. Mello-Roos districts can also be created in an
existing community to fund either existing or new services.
GC 53311 specifically authorizes the use of Mello-Roos Community Facilities Districts for
funding of fire protection and suppression services, ambulance, and paramedic services.14
Mello-Roos districts use the same cost calculation and voting methods as Benefit Assessment
Districts.
Creating a Mello-Roos Community Facilities District Requires:
- Determination of cost of services to be covered by tax
- Analysis of parcels in the proposed district and pro-rated annual service cost per
parcel
14 California Government Code Sections 53311 - 53313
Page 45 of 152
- Governing body places measure to establish district and parcel costs on the ballot
- General election or mail-in ballot voting by registered voters in the proposed district
- Requires 2/3 majority registered voter approval to pass; or, a simple majority of
weighted parcel fee vote by assessed property owners. During new development,
there is usually only one owner (the developer) until lots sell so approval from the
developer is all that is needed.
• Cambria does not have a Mello-Roos CFD District.
• Oceano does not have a Mello Roos CFD District.
• San Miguel does not have a Mello-Roos CFD District.
• Santa Margarita does not have a Mello-Roos CFD District.
• Templeton CSD enacted a Mello-Roos Community Facilities District. The district expects to
begin receiving revenue from these districts in 2022 and full build-out funding of $300,000
by 2032.
AD VALOREM15 SPECIAL PROPERTY TAX (PROPOSITION 13) Proposition 13 amended the state constitution (Article XIII A) to restrict the increase of Ad
Valorem property taxes. Assessed valuation changes are limited to a maximum of 2% increase
per year and new taxes based on assessed value require voter approval.
If the property tax is restricted for a special purpose, such as fire protection, 2/3 majority of
voters is required. If the tax is for general purposes, then a simple majority of voters is required
for approval. The new tax is applied as a percentage of the assessed valuation (Ad Valorem) of
parcels in the approved tax rate area.
Because of the difficulty in obtaining 2/3 majority voter approval, post-Proposition 13 Ad
Valorem property tax measures are rarely used to fund fire protection in special districts.
Ad Valorem Tax Increases
Assessed value (AV) of the taxed area is the determinate of the new tax rate, the higher the AV the smaller the tax increase percentage required to generate a target dollar amount. The tax rate percentage increase required to raise the same amount of revenue in a high AV district is much lower than the percentage required in low AV districts. Conversely, if a district with a low assessed value chooses to seek a voter-approved ad valorem special tax, the associated tax rate percentage will often be too large to garner voter approval since the assessed values are too low to reasonably spread the tax burden.
15 Ad Valorem tax: is a tax based on assessed valuation of property; CA State Board of Equalization
Page 46 of 152
PUBLIC FACILITY FEES (PFF) Public Facility Fees (PFF) are used throughout San Luis Obispo County to mitigate the
incremental agency impact of new development.16 The fees are needed to finance Public
Facilities and to assure that new development projects pay their fair share for these facilities.
The use of the collected fees is restricted to expenditures that increase the capacity or
capability of the agency in response to the demand caused by development. "Public Facilities"
includes public improvements, public services and community amenities. County PFF are used
to fund impacts to County General Government and Administration, Sheriff, Parks, Library, and
Fire impacts. District directors may choose to implement PFF for their districts through local
ordinance or through County Planning and Building Department.
SALES TAXES IN UNINCORPORATED AREA The San Luis Obispo County unincorporated area 7.25% sales tax rate17 is comprised of several
components:
A. 3.6875% State general fund sales tax
B. 0.2500% State general fund sales tax
C. 0.5000% State local health and social services revenue fund
D. 1.0625% Local revenue Fund 2011
E. 0.2500% County transportation fund
F. 1.0000% County general operations
G. 0.5000% Proposition 172 special tax for public safety services. 18
7.2500% Total State and County Sales tax
The 7.25% rate applies to the entire unincorporated area.
The county’s 1% portion of the sales tax revenue is added to the county general fund for
general county government services.
All cities in San Luis Obispo County have a 7.75% or higher sales tax rate. Incorporated city
voters set their own sales tax rate which may differ from the county rate. Special districts do
not receive sales tax nor are they authorized to levy a sales tax.
PROPOSITION 172 PUBLIC SAFETY SALES TAX
Proposition 172 was passed by the voters on November 2, 1993, which added an additional sales tax for public safety to offset some of the ERAF property tax losses by counties and cities. Since special districts do not receive any sales tax, the shifts of property tax to ERAF became
16 Public Facilities Fees are required in accordance with Section 18.04.010 of Title 18 of the County Code. The fee amount is determined through an annual review of the program by the Board of Supervisors. 17 http: www.cdtfa.ca.gov/taxes-and-fees-/sut-rates-description.htm 18 California Government Code Section 30052
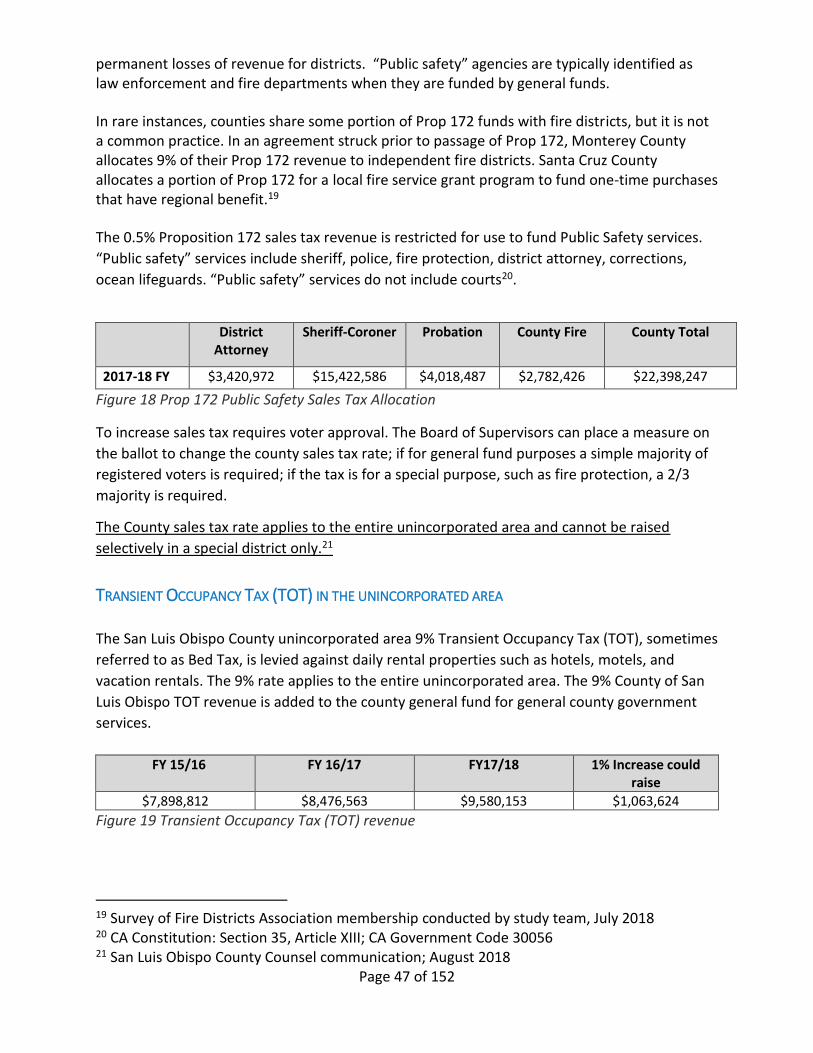
Page 47 of 152
permanent losses of revenue for districts. “Public safety” agencies are typically identified as law enforcement and fire departments when they are funded by general funds.
In rare instances, counties share some portion of Prop 172 funds with fire districts, but it is not a common practice. In an agreement struck prior to passage of Prop 172, Monterey County allocates 9% of their Prop 172 revenue to independent fire districts. Santa Cruz County allocates a portion of Prop 172 for a local fire service grant program to fund one-time purchases that have regional benefit.19
The 0.5% Proposition 172 sales tax revenue is restricted for use to fund Public Safety services.
“Public safety” services include sheriff, police, fire protection, district attorney, corrections,
ocean lifeguards. “Public safety” services do not include courts20.
District Attorney
Sheriff-Coroner Probation County Fire County Total
2017-18 FY $3,420,972 $15,422,586 $4,018,487 $2,782,426 $22,398,247
Figure 18 Prop 172 Public Safety Sales Tax Allocation
To increase sales tax requires voter approval. The Board of Supervisors can place a measure on
the ballot to change the county sales tax rate; if for general fund purposes a simple majority of
registered voters is required; if the tax is for a special purpose, such as fire protection, a 2/3
majority is required.
The County sales tax rate applies to the entire unincorporated area and cannot be raised
selectively in a special district only.21
TRANSIENT OCCUPANCY TAX (TOT) IN THE UNINCORPORATED AREA
The San Luis Obispo County unincorporated area 9% Transient Occupancy Tax (TOT), sometimes
referred to as Bed Tax, is levied against daily rental properties such as hotels, motels, and
vacation rentals. The 9% rate applies to the entire unincorporated area. The 9% County of San
Luis Obispo TOT revenue is added to the county general fund for general county government
services.
FY 15/16 FY 16/17 FY17/18 1% Increase could raise
$7,898,812 $8,476,563 $9,580,153 $1,063,624
Figure 19 Transient Occupancy Tax (TOT) revenue
19 Survey of Fire Districts Association membership conducted by study team, July 2018 20 CA Constitution: Section 35, Article XIII; CA Government Code 30056 21 San Luis Obispo County Counsel communication; August 2018
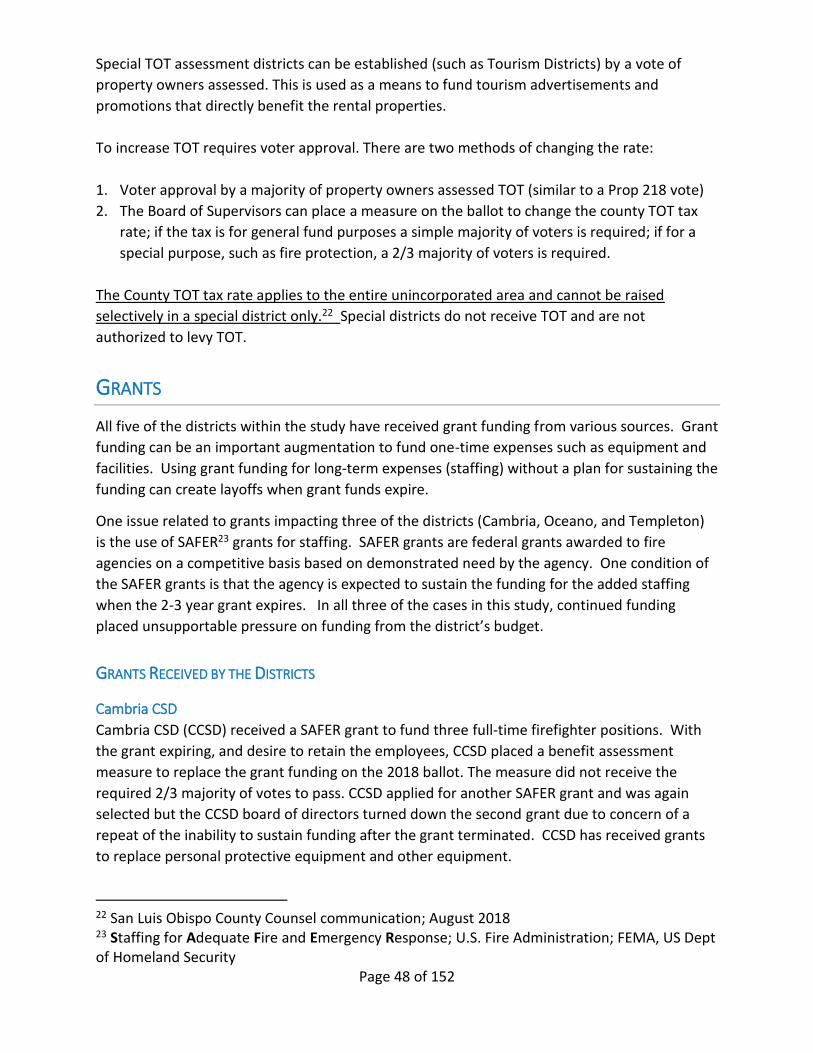
Page 48 of 152
Special TOT assessment districts can be established (such as Tourism Districts) by a vote of
property owners assessed. This is used as a means to fund tourism advertisements and
promotions that directly benefit the rental properties.
To increase TOT requires voter approval. There are two methods of changing the rate:
1. Voter approval by a majority of property owners assessed TOT (similar to a Prop 218 vote)
2. The Board of Supervisors can place a measure on the ballot to change the county TOT tax
rate; if the tax is for general fund purposes a simple majority of voters is required; if for a
special purpose, such as fire protection, a 2/3 majority of voters is required.
The County TOT tax rate applies to the entire unincorporated area and cannot be raised
selectively in a special district only.22 Special districts do not receive TOT and are not
authorized to levy TOT.
GRANTS
All five of the districts within the study have received grant funding from various sources. Grant
funding can be an important augmentation to fund one-time expenses such as equipment and
facilities. Using grant funding for long-term expenses (staffing) without a plan for sustaining the
funding can create layoffs when grant funds expire.
One issue related to grants impacting three of the districts (Cambria, Oceano, and Templeton)
is the use of SAFER23 grants for staffing. SAFER grants are federal grants awarded to fire
agencies on a competitive basis based on demonstrated need by the agency. One condition of
the SAFER grants is that the agency is expected to sustain the funding for the added staffing
when the 2-3 year grant expires. In all three of the cases in this study, continued funding
placed unsupportable pressure on funding from the district’s budget.
GRANTS RECEIVED BY THE DISTRICTS
Cambria CSD
Cambria CSD (CCSD) received a SAFER grant to fund three full-time firefighter positions. With
the grant expiring, and desire to retain the employees, CCSD placed a benefit assessment
measure to replace the grant funding on the 2018 ballot. The measure did not receive the
required 2/3 majority of votes to pass. CCSD applied for another SAFER grant and was again
selected but the CCSD board of directors turned down the second grant due to concern of a
repeat of the inability to sustain funding after the grant terminated. CCSD has received grants
to replace personal protective equipment and other equipment.
22 San Luis Obispo County Counsel communication; August 2018 23 Staffing for Adequate Fire and Emergency Response; U.S. Fire Administration; FEMA, US Dept of Homeland Security
Page 49 of 152
Oceano CSD/Five Cities Fire Authority
Oceano CSD is a member of the Five Cities Fire Authority (FCFA), which provides fire protection
in Oceano. FCFA received a SAFER grant to augment staffing in their three stations (including
Oceano fire station). The grant has expired and reductions of staff occurred since FCFA
member agencies were unable to provide funding for the grant-funded full-time positions.
San Miguel CSD
San Miguel has received grants for portable equipment, and personal protective equipment.
Santa Margarita FPD
Santa Margarita FPD relies heavily on grant funding since their property tax revenue is very
limited.
Santa Margarita FPD has received grants for apparatus, portable equipment and personal
protective equipment.
Templeton CSD
Templeton CSD received a SAFER grant for staffing that ran out in 2016/2017, conversion of
full-time grant funded firefighters to part-time reserves was necessary due to insufficient
funding to replace grant funds. The district directors considered a benefit assessment district
ballot measure to provide sustained funding but surveys showed inadequate voter support for
the measure. Templeton CSD has received grants for personal protective equipment and
apparatus upgrades.
ANNEXATION Annexation of new territory adds to the district’s tax base typically via a property tax rate
transfer agreement with the agency previously providing services. There are no new taxes
generated, but rather a transfer of the existing revenue stream to the annexing agency. Once
annexed, property tax growth within the newly annexed area will mirror the rest of the district.
Community Service Districts cannot annex a single service (fire protection for example). As a
result, annexation as a method of growth for the district is not a practical option for CSDs
unless they can provide the range of other CSD services.
PROPERTY TAX EXCHANGE
A property tax exchange agreement is the only option for supporting the district(s) on a permanent basis or funding county operations in event of a district opting for divestiture. Long-term expenses, such as staffing, require a sustainable funding source. Any other form of County General Fund revenue support for the district is subject to annual budget priorities, and is therefore less dependable. Districts should treat it like one-time grant funding.
A property tax exchange agreement is a negotiated change in two or more local agencies tax
percentage share of the 1% property tax base. The property tax exchange does not generate
new revenue it merely redistributes the existing tax dollars. It is commonly utilized when one
Page 50 of 152
agency annexes territory previously served by another jurisdiction. The exchange results in the
successor agency receiving property tax revenue the former agency collected for delivering the
service in the annexed area. The amount of property tax transferred is negotiable and is usually
based on the amount of tax necessary to provide the service. The property taxes exchanged go
to the receiving agency’s general fund and may be used for any purpose based on the board of
directors’ priorities.
Since the property tax revenue amount is set by Prop 13, a property tax exchange to another
agency means a reduction of the same amount to either one or all of the other taxing entities in
each affected tax rate area. Since property tax exchanges are “zero-sum” propositions, any
increase in one agency requires a corresponding decrease in another.
If the County agrees to a property tax exchange to support one or more of the districts,
negotiations would be necessary to establish the amount of the transfer. The transfer would
result in a reduction of the County’s percentage share of property tax within the District’s tax
rate areas and a corresponding increase to the District’s percentage. The District would then
receive a higher share of property tax and associated growth.
One nuance in the law is, for property tax exchanges, the County represents the district and the
County in negotiations.
If similar to the Cayucos FPD dissolution, a special district board of directors decides to dissolve
or divest fire protection, a property tax exchange will be negotiated between the district and
successor agency (most likely the County). District property taxes used to support fire
protection will transfer to the successor agency to fund the new service provider. If the County
is the successor agency, the negotiated property tax transfer will be used to fund the County
Fire Department delivery of fire protection.
Page 51 of 152
FIRE AGENCY STAFFING
FIRE AGENCY STAFF ISSUES The biggest challenge facing these five districts, and districts across the state, is the cost of
transitioning from volunteer to full-time firefighter staffing. The transition from volunteer
firefighter organizations to paid staff is a huge financial change. A single fire engine staffed with
the minimum industry safe standard of two career firefighters is about $1.3 million per year.
While two firefighters per apparatus is considered the minimum safe staffing, many fire
agencies staff with three firefighters, some with four. Three of the study districts (Cambria,
Oceano, Templeton) strive for minimum staffing of three firefighters. The two districts that are
still volunteer/PCF based (San Miguel and Santa Margarita) anticipate the need to have at least
two career engine staffing in the 5-10 year horizon. In addition to fire engine staffing, districts
will ultimately face the cost for a fire chief, fire marshal, prevention and development
inspections, administrative and legal support, fleet replacement, dispatch, and training costs.
Full-time career staffing is the most expensive component of a fire agency budget. All of the fire
departments in this study were originally all volunteer firefighter organizations. Cambria,
Oceano (Five Cities Fire Authority), and Templeton no longer use volunteers nor paid call
firefighters. These three districts currently utilize reserve firefighters; Oceano and Cambria
want to phase reserves out completely in favor of all career staff. San Miguel CSD and Santa
Margarita FPD utilize paid call firefighters exclusively and have no career firefighters.
REDUCTION IN VOLUNTEERISM There is a nationwide decrease in volunteer firefighters and trend toward part-time reserve
firefighters on an internship track. The three primary reasons for the decline in community
volunteers is; 1. increased training hours required to operate safely and meet mandates; 2.
incident activity increasing to the point the volunteer can no longer be away from home/work
that much time, and; 3. perceived lack of appreciation by career staff.
Training requirements have grown exponentially during the last 40 years to the point
community volunteers find it hard to find time to stay current. There are fewer and fewer non-
career track community member volunteers or paid call firefighters. Again, there are variations
of each of these approaches by different fire agencies, but the trend is that the volunteer, paid
call, or reserve firefighter programs have changed from community-based members and are
now often viewed primarily as an internship opportunity to achieve a career fire service
position.
The time commitment to family, work and other community/service volunteer opportunities
limit the potential for community members to become fire service volunteers.
Page 52 of 152
FIREFIGHTER CATEGORIES AND TITLES There is an evolution in nomenclature for volunteer firefighter titles. Added training
requirements and changes in how recruitment is approached along with filling the gap between
volunteer and career firefighters bring revisions to the position titles for many fire agencies.
Each fire agency is unique and each may have slight nuances to these definitions.
VOLUNTEER FIREFIGHTER The traditional volunteer firefighter historically has a separate career from the fire service.
They are community members who work in town or are stay at home parents and, when
dispatched, take time away from their regular duties to respond to emergencies. Training
usually occurs after work hours and on weekends, mostly conducted at the fire station by in-
house members. Typically, there is no compensation for true volunteers; however, some
agencies added a stipend to compensate for expenses for incidents and training. No fire
agencies in San Luis Obispo County currently use uncompensated volunteer firefighters.
PAID CALL FIREFIGHTERS As many agencies with a volunteer staffing model evolve, stipends and/or hourly rates for
response or training were added as incentives. These “Paid Call” firefighters (PCF), like
volunteers, usually respond from home or work and are not assigned to work shifts at the
station. PCF programs are also implemented as the agency evolves from a primarily volunteer
fire agency to a combination career/paid call agency. PCFs provide needed depth of resources
for major emergencies. Candidates for PCF programs are a combination of community
volunteers and people seeking careers in the fire service. For community volunteers, the
change to PCF serves as a recruitment and retention tool. People seeking careers use the
emergency response experience and training gained as a PCF as an internship to build their
resume’. PCFs are required to complete approximately 200 hours of firefighter academy,
emergency medical service, and hazardous materials training before being eligible to respond
to emergencies. San Miguel and Santa Margarita use PCFs exclusively; County Fire uses PCFs as
part of their staffing models (2 county stations are all PCF; most of the others have a PCF
company to augment the career staff). Cambria, Oceano, and Templeton no longer use PCFs.
RESERVE FIREFIGHTERS Reserve Firefighters are part-time employees that work shifts at the fire station in addition to
being on-call like a volunteer or paid call firefighter. The reserve firefighter may be required to
work as few as 1-2 shifts per month or, in some agency programs, the reserves work the same
shift patterns and hours as fulltime career firefighters. Reserve programs are designed to either
enhance crew cohesion between career and “call” firefighters or to augment the daily staffing
levels on duty. Unlike volunteer and PCF programs, reserves are not required to live or work in
the community they serve. Some reserve firefighters work for multiple fire agencies to afford to
live on the central coast or to obtain experience quickly to enhance their career employment

Page 53 of 152
chances. While effective at augmenting daily staffing numbers, reserve programs are viewed as
a relatively short-term solution for attaining desired career staffing. All three of the agencies
that use reserves we interviewed, prefer fulltime staffing instead of reserves but cannot afford
the cost difference.
Agencies pursuing the use of only career firefighters will often establish a reserve firefighter
program as a step toward the all career staff goal. Candidates for a reserve firefighter program
can be entry level with little training or, more frequently, fully trained to meet at least the entry
level requirements for a career firefighter position. Reserves are usually compensated while on
duty at the station augmenting on-duty career staff. Generally, since they are considered
interns, reserves are compensated at a significantly lower level than career firefighters and
usually receive no health insurance or retirement benefits. Compensation is usually insufficient
for the reserve to continue in the position as a career and therefore turnover is high. Further,
in some instances, the 2 tiered compensation approach can cause animosity between reserves
and career staff.
Cambria, Templeton, and Oceano use shift assigned Reserve Firefighters to augment on-duty
career staff and do not have PCFs. Cambria’s plan is to add a third career firefighter to replace
their current reserve they use now for third firefighter engine staffing; the reserve will become
the fourth firefighter on duty. Oceano (Five Cities Fire Authority) strategic plan calls for the
elimination of the reserve program and replace with only career staff. Templeton plans to use
reserves for the second firefighter on their staffed engine for the next 5-10 years. Neither San
Miguel nor Santa Margarita uses Reserves.
CAREER FIREFIGHTERS Career firefighters are full-time employees with salary, health benefits, and retirement. Staffing
with career firefighters assures availability for an immediate response without the added reflex
time of responding from work or home that is associated with volunteer/paid call operations.
Typically, districts with career firefighters utilize a 3 platoon scheduling plan to assure 24-hour
coverage requiring 3+ people per position to cover the week (Cal Fire’s workweek, while slightly
different, uses a variation of this shift pattern.) Additional staff and/or overtime are utilized to
cover shift absences caused by sick leave, injuries, and vacation. Compensation is the primary
cost driver for districts with career firefighter staffing. In addition to the base salary, other
personnel cost impacts include overtime and retirement, health care, and workers’
compensation. Districts have found that the compensation packages must be competitive, or
they risk higher rates of turnover as career firefighters seek better compensation packages or
situations.
COMBINATION OF CAREER, VOLUNTEER, PCF, AND RESERVE
Most agencies transitioning from volunteer to career operations have some combination of career and volunteer/PCF/reserve staffing. The advantage of combination programs is most
Page 54 of 152
day to day routine calls can be handled by the on-duty career staff, and for significant emergencies where more personnel are needed, volunteers/PCF/Reserve firefighters augment the response force.
FIREFIGHTER RETENTION A number of factors influence an agency’s ability to recruit and retain high caliber firefighter
personnel. On the volunteer/PCF/Reserve front, firefighters want to be appreciated, utilized,
well prepared and get experience. A solid training program and opportunities to exercise skills
along with a supportive culture will contribute toward retaining good volunteers. Work location
and distance from home will also influence participation and retention.
It is commonly understood that an emergency workload of 500 calls per year starts to
dramatically impact the availability of volunteer and PCF responders. Since most calls occur
during daytime hours, 500 calls/year equates to almost 2 calls per day which exceeds how
much time an employee or business owner can leave their work to respond without negative
impact.
Career firefighters are motivated by many of the same factors. Compensation and benefit
packages must be competitive to retain qualified staff.
EMPLOYMENT RULES, COMPENSATION AND BENEFIT ISSUES Regardless of the title, issues for fire agencies that utilize volunteer/PCFs/Reserves on a shift
basis are the employment rules for pay, overtime, benefits, and retirement.
Salary
Some reserve programs have used minimum wage or slightly higher as the base pay. In these
instances, a two-tiered system develops, which can lead to morale issues if compared to career
personnel pay scales. As a result, the high turnover of reserve personnel can occur.
Overtime
The Federal Fair Labor Standards Act (FLSA) delineates the threshold of hours of work for
firefighters before they must be compensated at premium rates. Under 24-hour coverage
models utilizing a three platoon system, some level of scheduled overtime is usually necessary.
Based on the model for staffing coverage and hours worked, the same standard applies to
volunteers/PCFs/Reserves for “scheduled overtime”24.
24 29 USC Title 29 Fair Labor Standards, Chapter 8 Section 207 K
Page 55 of 152
Retirement
All the districts in this study with career staff contract with Cal PERS for retirement benefits. Cal PERS conducts an annual actuary for those districts. Funding for the retirement program is provided by contributions from the employee and the employer. The employee pays a rate based on a percentage of payroll as established in the authorizing statute for the contracted plan. The employer rates are established by a Cal PERS actuary as a percentage of payroll. Double-digit percentage increases in those employer rates have caused significant financial hardship for some districts.
Agencies contracting with Cal PERS for retirement benefits must be aware of the rules
regarding the threshold of number of hours worked that trigger the requirement that personnel
will be treated as “employees”. Of particular importance, are those volunteer/PCF/Reserve
personnel that work on a shift basis. Exceeding the hours identified in the PERS law will trigger
the requirement that the special district pays for the Employer’s share of retirement and add
the person to the employed roster for retirement benefits.25
Since the actuary considers the unfunded liability of the retirement plan, investment returns by Cal PERS influence the actuarial output. As a result, poor financial returns typically mean that the local agency’s employer contribution will be higher to make up for the poor portfolio performance. Poor investment returns typically occur when the economy is lagging, coincidental to the district’s declining or flat revenues. This creates a perfect storm of increased pension costs that occur simultaneously with declining ability to pay. This cycle has been repeating for many years. Cal PERS has made several attempts to “smooth” the rates, but this is still a significant problem, particularly for small districts where revenue is very limited in the first place and unexpected cost increases can deplete reserves. The growth of the unfunded liability deficit has outpaced the growth in revenue in many areas. Cal PERS provides industrial disability retirement in lieu of disability for member firefighters who are hurt on the job and cannot return to work.26 An industrial disability retirement for a young firefighter who retires after an injury is not only a huge loss for the individual and the district but could have a significant financial impact on the district for years. Actuaries have difficulty statistically accounting for such a loss on a small scale, thus there can be a huge increase in the employer rate to make up for such a loss.
OTHER POST EMPLOYMENT BENEFITS (OPEB) Health care is the most common post-employment benefit. Many public agencies have agreed
to provide health care after the employee retires. Agencies are now required to determine the
liability of those costs by conducting an actuary. Cambria, Oceano, and Templeton have all had
actuaries completed to determine the liability. They have taken individual approaches on
25 California Government Code Section 20305 26 California Government Code Section 21400
Page 56 of 152
funding that liability. While not insignificant, the districts have recognized the liability and
established plans for managing it, including changing benefit levels for new employees. San
Miguel and Santa Margarita do not have the issue since they do not have career personnel or
retirees.
WORKERS COMPENSATION
Firefighting is a high-risk occupation and, unfortunately, injuries (sometimes serious) occur. As employers, special districts providing fire protection are required to provide workers compensation coverage for firefighters. Insurance providers are often joint powers authorities, State Comp, or self-insurance. Claim costs incurred by the district will most often result in rate increases in the following years, sometimes significant. In addition to the standard worker's compensation coverage for medical expenses, career firefighters are subject to Labor Code 4850 et. seq27. This body of law requires that the firefighter is compensated at his/her full salary and benefit levels during periods of missed work due to a job-related injury. The nature of 24-hour response availability means that the missing firefighter’s shifts will need to be backfilled with either shift transfers or overtime. This equates to 2 to 2 ½ times the normal cost of filling the position, a cost not often easily absorbed into the budget. Workers compensation costs can also be impacted by presumptions of cause of illness or injury. Since firefighting is a very stressful and hazardous occupation, certain claims for illness or injury are presumed to be job-related within the Labor Code. The foundation of the requirement is that the cumulative effect of exposure to toxins and physically demanding work is presumed to be job-related. Cancer, heart trouble, hernia, and tuberculosis are some of the illnesses/injuries to be presumed to arise out of and in the course of employment.28 Such claims can have a serious negative impact on a district in terms of lost time, finance and morale.
FIREFIGHTER TRAINING AND MANDATES Firefighters must train to manage extremely dangerous and complicated situations safely and
effectively. Fires, vehicle accidents, medical emergencies, rescues, hazardous materials releases,
structural collapses, cliff and water rescues, and a multitude of other complex emergencies. To
prepare for these challenges firefighter skills and training requirements have grown
exponentially.
Regardless of their pay status, all firefighter candidates are required to meet the same basic
skills requirements before responding to incidents. These mandates have been put in place
largely to improve firefighter safety in one of the nation’s most dangerous occupations.
27 California Labor Code, Section 4850 et. seq. 28 California Labor Code, Section 3212
Page 57 of 152
Over two hundred hours of training are required before a recruit is allowed to respond to
emergencies. The training below is mandated in addition to basic firefighting and emergency
medical response skills candidates must learn to be safe and effective.
• Hazardous environment entry, (2 in, 2 out) CCR, Title 8, Section 5144.
• Respiratory Protection (Including requirements for firefighter physicals)
• Standardized Emergency Management (SEMS) (CCR Title 19, Section 2400)
• Advanced First Aid and CPR (Cal. H&S Code 13969)
• Hazardous Materials First Responder, Operational (CFR 1910)
• Harassment (1964 Civil Rights Act)
• Wildland firefighting certification (RT 130)
• Blood Borne Pathogens (CCR Title 8, Section 5193)
• Sudden Infant Death Syndrome (Cal. H&S Code)
• DMV licensing: Class B (with physical) with air brake and tank or Firefighter
Endorsement (For driving fire apparatus)
DEPTH OF FORCE Sufficient numbers of staff on the roster for day to day routine incidents is necessary to provide
a basic level of service. There are suggested standards for various fire operations, but the local
fire agency determines the numbers and associated levels of service.
The level of staffing different fire agencies use is based on funding, demographics, assets at risk,
and community tolerance of risk. Similarly, affordability of the approach to staffing (Volunteer,
PCF, Reserve, Career) is a key factor to the number of people the agency can maintain on their
roster.
A basic level of fire protection service requires staffing available on a regular basis. For
volunteer/PCF operations, the ratio of three volunteers/PCF’s to one (3:1) is utilized to plan for
the number of actual responders to an emergency29. So, for every three volunteers/PCF, the
general rule is that one will be available for response to an incident. This ratio takes into
account absences, unavoidable family or work commitments, and other commitments. If the
response requires four personnel (such as the 2 in – 2 out rule for structure fires) a roster of
twelve PCF/volunteers would be in order to assure 4 responders.
MUTUAL AID AND AUTOMATIC AID TO ADD DEPTH OF RESOURCES Mutual and Automatic aid with neighboring agencies are crucial parts of assuring adequate
depth of resources for larger emergencies. No single agency can afford to have all the career
resources on duty necessary for the range of hazards they face. So, collectively, they help each
29 Insurance Services Office
Page 58 of 152
other through mutual aid for larger emergencies. When volunteer firefighter company member
numbers were larger and turnout high, the need for mutual aid was limited. Today, with smaller
volunteer company strength and lower turnout, mutual aid is a common occurrence.
Automatic aid is an enhanced form of mutual aid. Rather than just assisting on large
emergencies under mutual aid, automatic aid agreements call for assistance on most daily
emergencies, even small ones. To some degree, automatic aid agreements constitute a
boundary drop so the closest resource responds regardless of jurisdiction. Automatic aid
requires a delicate balance of service exchange; there is an expectation that the aid agreement
is reciprocal and not lopsided. Agencies that receive a lot more aid than they provide create
strained relationships.
FIRE SERVICE STANDARDS THAT DRIVE COSTS In addition to statutory and regulatory requirements, various industry standards impact
districts. The National Fire Protection Association30 (NFPA) promulgates the most significant
fire service standards. Of the dozens of NFPA standards, some of the major standards that
impact fire agencies are:
• NFPA 1582: Standard on Comprehensive Occupational Medical Program for Fire
Departments (Firefighter physical requirements)
• NFPA 1710: Standard for the Organization and Deployment of Fire Suppression
Operations, Emergency Medical Operations, and Special Operations to the Public by
Career Fire Departments (Staffing deployment of career personnel and response
standards)
• NFPA 1720: Standard for the Organization and Deployment of Fire Suppression
Operations, Emergency Medical Operations and Special Operations to the Public by
Volunteer Fire Departments (Staffing deployment of volunteer personnel and response
standards)
• NFPA 1901: Standard for Automotive Fire Apparatus (Fire engine standards)
While not legally mandated, many fire agencies strive to meet much of the standards as best
practices, which contributes to rising costs.
30 https://www.nfpa.org/Codes-and-Standards/All-Codes-and-Standards/List-of-Codes-and-Standards

Page 59 of 152
COUNTY FIRE STRATEGIC PLAN
The County Fire Strategic Plan is currently being updated from the last significant update in
2012.
Part of the County Fire strategic planning process is to identify the appropriate fire protection
service level based on community demographics, hazards at risk and growth trends. The
strategic plan has a Service Level Analysis tool that considers several variables to determine the
appropriate service level deployment model for a community. The five (5) service levels are
Urban, Suburban, Rural, Remote, and Undeveloped. The tool is utilized to assess hazards;
people and assets at risk; incident workload; response time standards for first arriving fire
resource, the balance of first alarm response; and expected performance goals. Each of the
districts in the study was evaluated using the Service Level Analysis tool to determine the
appropriate service level County Fire should deliver if the district divested fire protection to the
County.
Response time is a major factor in determining the appropriate combination of staffing; PCF
only, combination, or career staffing. Surrounding fire resources and deployment locations
available for automatic or mutual aid are critical in meeting response time standards.
Of specific importance for this study is the 2012 Strategic Plan recommendation to relocate
County Engine 40 and staffing from Parkhill Fire Station to the Garden Farms/Santa Margarita
area. Existing incident workload and planned development in the Santa Margarita Ranch area
are the driving forces behind the recommendation to relocate the resource. A new fire station
will be required to accommodate this move. Santa Margarita FPD also has a need for a new fire
station in Santa Margarita. Building two new fire stations in close proximity would be very
expensive and duplicative.
COUNTY FIRE INTERVIEW
September 6, 2018 meeting: Fire Chief Scott Jalbert, Deputy Chief Geoff Money, Division Chief Dennis Carreiro, Administrative Officer Bill Winter.
- Lisa Howe, County Administrative Office was unable to attend the September 6 meeting.
During the interview the study team asked County Fire staff to describe their approach if one or
all of the districts chose to divest fire protection to the county. County Fire staff said each
district presents unique challenges to provide service based on demographics, location,
geography, and proximity of other County Fire resources. Each will require an analysis based on
projected added workload and specific circumstances. Each of the options presented in this
report was validated during the discussion to assure that they are operationally sound.
Page 60 of 152
Additionally, County Fire staff reports they are at their “tipping point” for certain overhead and support positions. They may need augmentation in the event one or more of the districts divests fire protection, including:
1. Battalion chief coverage (Depending on the region of the County) 2. Fire Prevention/Fire Marshal 3. Mechanic/fleet service
County Fire currently has identified unmet resource needs in specific parts of the current
County Fire service area (Oak Shores, Adelaide, Shandon, Garden Farms, and Nipomo). Any new
service would require the necessary additional funding to support the workload.
Because of their own service area needs, County Fire staff are concerned reductions of County
Fire’s budget to support a divesting/dissolving district would cause reductions of services in
other areas of the County.
All of the districts have different needs and varying approaches to providing service in the event
of divestiture/dissolution, each must be considered individually as to the impact to County Fire,
the options for County Fire service delivery are detailed in the district-specific sections of this
report.
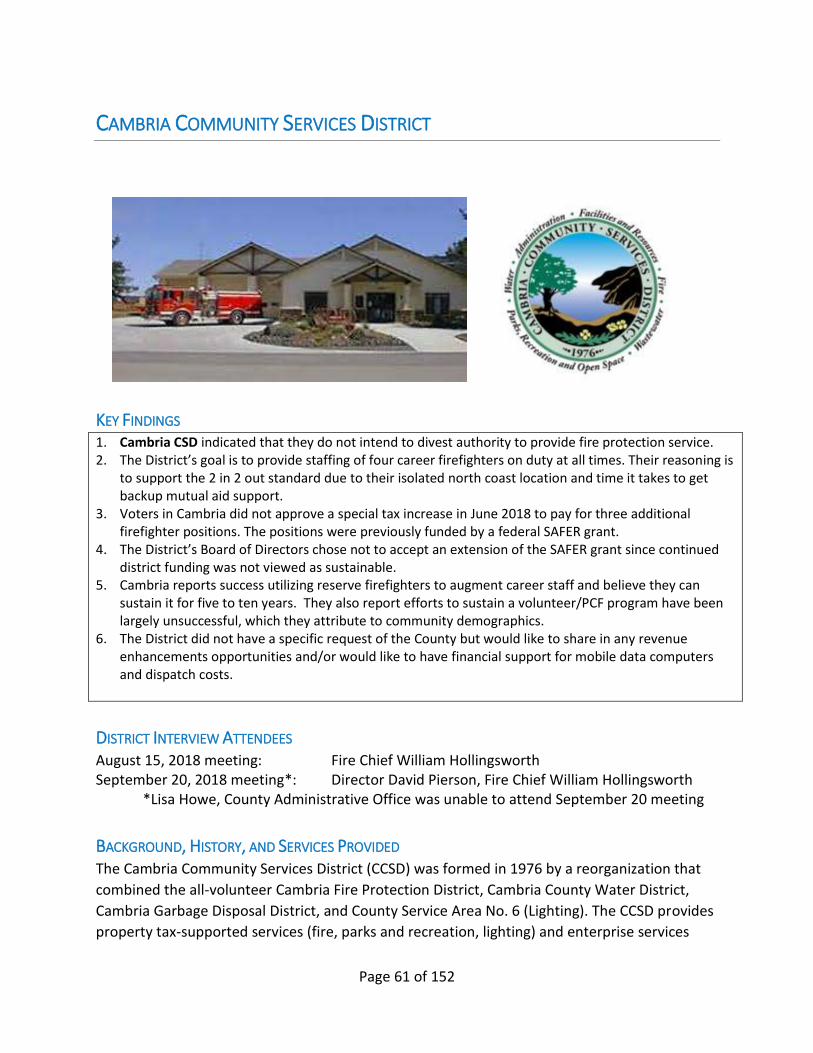
Page 61 of 152
CAMBRIA COMMUNITY SERVICES DISTRICT
KEY FINDINGS 1. Cambria CSD indicated that they do not intend to divest authority to provide fire protection service. 2. The District’s goal is to provide staffing of four career firefighters on duty at all times. Their reasoning is
to support the 2 in 2 out standard due to their isolated north coast location and time it takes to get backup mutual aid support.
3. Voters in Cambria did not approve a special tax increase in June 2018 to pay for three additional firefighter positions. The positions were previously funded by a federal SAFER grant.
4. The District’s Board of Directors chose not to accept an extension of the SAFER grant since continued district funding was not viewed as sustainable.
5. Cambria reports success utilizing reserve firefighters to augment career staff and believe they can sustain it for five to ten years. They also report efforts to sustain a volunteer/PCF program have been largely unsuccessful, which they attribute to community demographics.
6. The District did not have a specific request of the County but would like to share in any revenue enhancements opportunities and/or would like to have financial support for mobile data computers and dispatch costs.
DISTRICT INTERVIEW ATTENDEES August 15, 2018 meeting: Fire Chief William Hollingsworth September 20, 2018 meeting*: Director David Pierson, Fire Chief William Hollingsworth
*Lisa Howe, County Administrative Office was unable to attend September 20 meeting
BACKGROUND, HISTORY, AND SERVICES PROVIDED The Cambria Community Services District (CCSD) was formed in 1976 by a reorganization that
combined the all-volunteer Cambria Fire Protection District, Cambria County Water District,
Cambria Garbage Disposal District, and County Service Area No. 6 (Lighting). The CCSD provides
property tax-supported services (fire, parks and recreation, lighting) and enterprise services
Cambria Community Services District
Page 62 of 152
(water, wastewater). The 2018-19 CCSD budget is $11,917,000; $2,439,636 is from property
taxes; the balance of the budget is from water and wastewater enterprise funds.
Primary funding for 2018-19 FY $2,330,660 CCSD fire protection budget is from property taxes
($1,707,910) and a voter-approved benefit assessment district ($464,610). The assessment was
originally approved in 1993 to replace funding lost due to ERAF shift and reapproved in 2003
after a 10-year sunset period.
Fire protection is provided from the CCSD Fire Station on Burton Drive with daily station staffing
of a career Captain, career Engineer, and a part-time Reserve Firefighter. Automatic aid is
provided by the Cal Fire/County Fire Station 10 on Coventry Lane in the District. Next, closest
mutual aid fire stations are County Fire Station 16 and CAL FIRE station 11 in Cayucos. Both
Cayucos area stations have approximately 15 minutes driving time to Cambria.
The CCSD fire department consists of a Fire Chief, 3 career Captains, 3 career Engineers, and 10
active part-time Reserve Firefighters. An Assistant Chief/Fire Marshal and Administrative
Assistant positions were previously eliminated. The Cambria Fire Chief has very good success
recruiting Reserve Firefighters from Allan Hancock College Fire Academy, hiring 3-6 per year
with a similar turnover. CCSD’s goal is to be 100% fulltime career firefighters in 8-10 years.
CCSD received a SAFER31 grant in 2015 that funded 3 additional full-time firefighters to allow for
4 firefighters to be on duty daily (1 career Captain, 1 career Engineer, 1 career Firefighter and 1
part-time Reserve Firefighter). The grant expired and a 2018 ballot measure to approve an extra
$62/year/parcel flat rate fee to continue funding the 3 additional career firefighters did not
receive the required 66% vote. The 2003 benefit assessment was not impacted by the vote and
continues. CCSD is reviewing internal funding transfers and another benefit assessment ballot
measure for 2019 to support fire protection and/or parks.
CCSD did not request a property tax transfer from SLO County however, they are interested in
sharing any new revenue source or cost reductions for fire protection services such as dispatch
cost.
UNIQUE RISKS AND HAZARDS As a coastal community, Cambria is a destination for tourism and retirement. Tourism brings a
high volume of visitors and short-term renters, which corresponds to higher emergency call
volume above those caused by residents.
The District responds to coastal emergencies including ocean and high angle cliff rescue.
Specialized training and equipment are required to respond to this unique hazard.
The pine forest that is intermixed with the community presents an increased hazard for
wildfires. The forest is currently in very dangerous condition with high tree mortality due to
31 SAFER Grant: Dept. of Homeland Security; FEMA, US Fire Administration grant program

Cambria Community Services District
Page 63 of 152
drought and pests. All of Cambria CSD is classified as State Responsibility Area (SRA), therefore
fire protection is shared with Cal Fire.
The Fire Safe Council has worked cooperatively with the District to remove hazardous dead
trees, other fire safety fuel reduction projects, and conducted public outreach programs for
personal preparedness.

Cambria Community Services District
Page 64 of 152
CAMBRIA CSD DATA SHEET Authorizing Code Cal. Govt. Code 61000 et. seq.
Address: 1316 Tamsen Drive Cambria CA 93428
Date of Formation November 2, 1976
Telephone: 805-927-6223
FAX: 805-927-5584
Website: www.cambriacsd.org
Board of Directors President Amanda Rice Vice President Jim Bahringer Director Harry Farmer Director Aaron Wharton Director David Pierson
District Manager: Position Open
Fire Chief: William Hollingsworth
Board of Directors Meetings Fourth Thursday of the month
Acreage 2,928 acres
Square miles 4.58 sq. miles
Number of parcels 6,205
Population 6,029
Assessed Valuation 2017/2018 $2,145,909,012
Actual Property Tax Revenue 2017/2018 $2,263,703
Property Tax Allocation for Fire 2017/2018 $1,620,500 72%
Special Fire Assessment 2017/2018 $ 455,500
Number of Career/Paid personnel 7
Number of Active Reserves 10
Annual calls for service (2017 cy) 1019
Figure 20 Cambria CSD Data Sheet
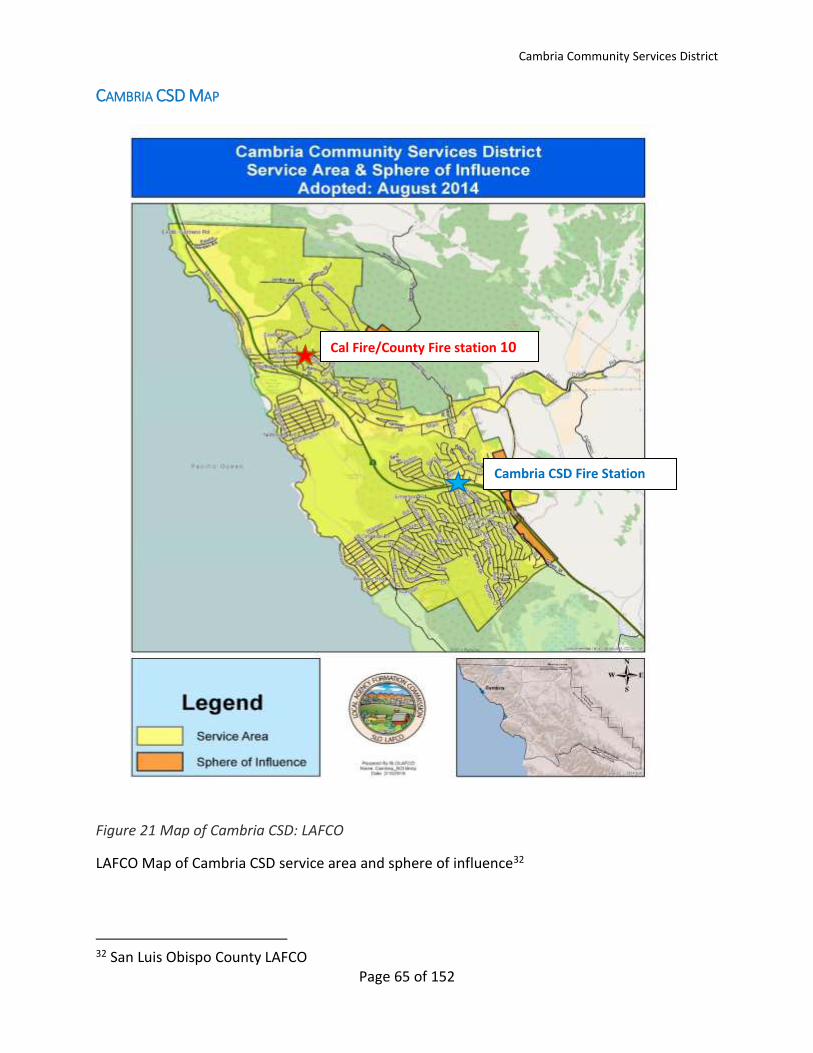
Cambria Community Services District
Page 65 of 152
CAMBRIA CSD MAP
Figure 21 Map of Cambria CSD: LAFCO
LAFCO Map of Cambria CSD service area and sphere of influence32
32 San Luis Obispo County LAFCO
Cal Fire/County Fire station 10
Cambria CSD Fire Station
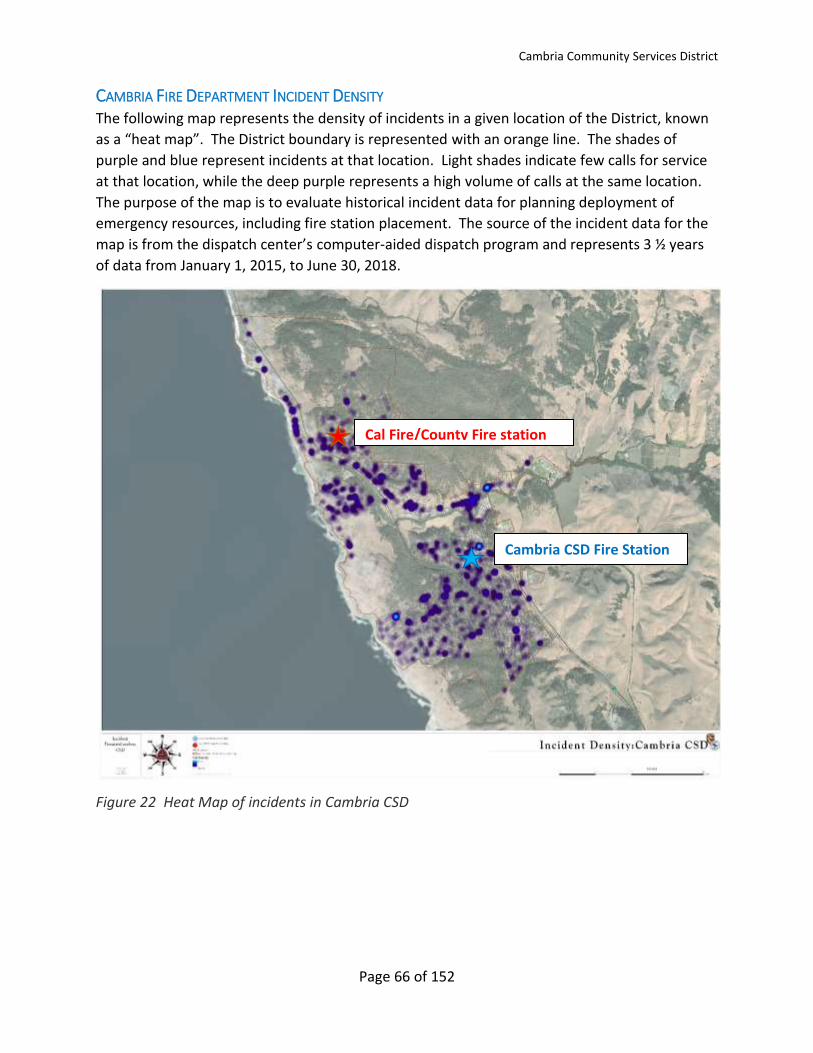
Cambria Community Services District
Page 66 of 152
CAMBRIA FIRE DEPARTMENT INCIDENT DENSITY The following map represents the density of incidents in a given location of the District, known
as a “heat map”. The District boundary is represented with an orange line. The shades of
purple and blue represent incidents at that location. Light shades indicate few calls for service
at that location, while the deep purple represents a high volume of calls at the same location.
The purpose of the map is to evaluate historical incident data for planning deployment of
emergency resources, including fire station placement. The source of the incident data for the
map is from the dispatch center’s computer-aided dispatch program and represents 3 ½ years
of data from January 1, 2015, to June 30, 2018.
Figure 22 Heat Map of incidents in Cambria CSD
Cal Fire/County Fire station
10
Cambria CSD Fire Station

Cambria Community Services District
Page 67 of 152
RESPONSE TIME ANALYSIS: CAMBRIA CSD
Figure 23 Response time from Cambria CSD fire station
This map represents the response times from only the Cambria CSD Fire Station on Burton
Drive. CCSD can cover 80% of the district in 7 minute response time; and 90% of the district in
less than 8 minutes, the Liemert Tract in the northernmost portion exceeds an 8-minute
response.
The shaded green area represents a drive time of up to four (4) minutes, the blue shaded area
represents a drive time of over four (4) minutes and under five (5) minutes, while the yellow
shaded area represents a drive time of five (5) to twelve (12) minutes. In all cases, 3 minutes
are added for “reflex” time. Reflex time includes the time required to dispatch the call,
assemble the crew, don the appropriate gear for the response and get out the door. The
resulting total response times of seven, eight and fifteen minutes are based on industry
standards for levels of service and fire progression. While not absolute, these tools are
effective for planning purposes.
Cambria CSD Fire Station
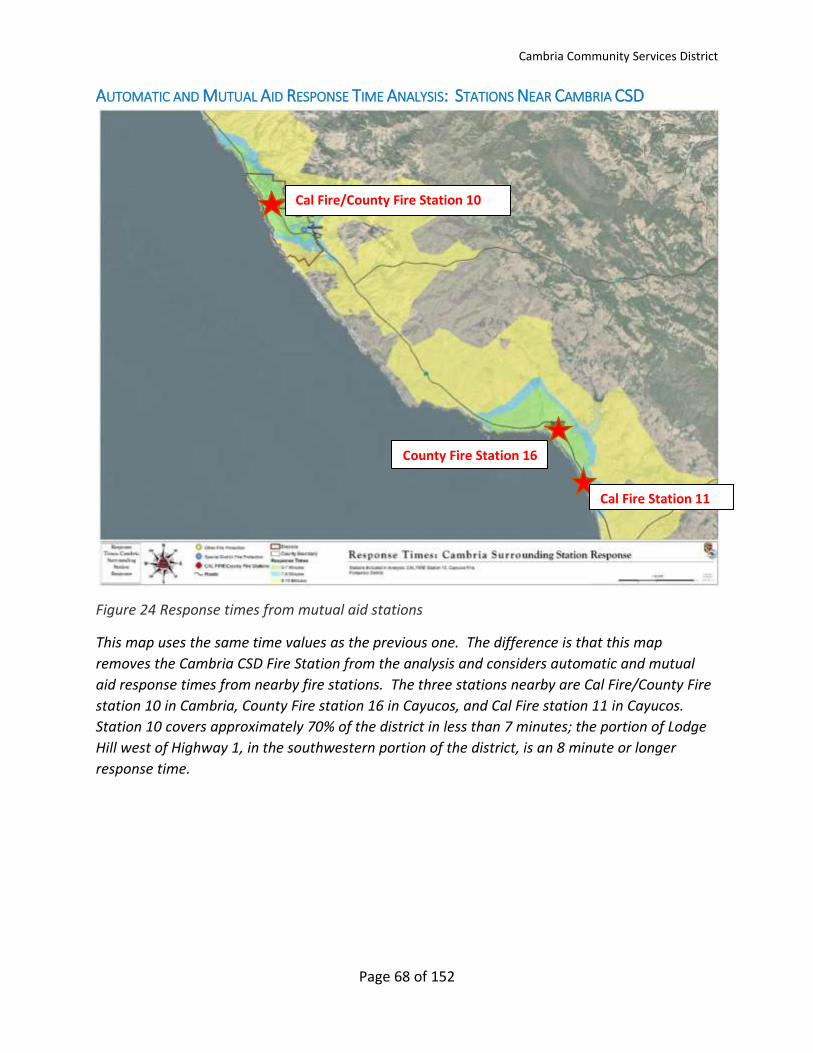
Cambria Community Services District
Page 68 of 152
AUTOMATIC AND MUTUAL AID RESPONSE TIME ANALYSIS: STATIONS NEAR CAMBRIA CSD
Figure 24 Response times from mutual aid stations
This map uses the same time values as the previous one. The difference is that this map
removes the Cambria CSD Fire Station from the analysis and considers automatic and mutual
aid response times from nearby fire stations. The three stations nearby are Cal Fire/County Fire
station 10 in Cambria, County Fire station 16 in Cayucos, and Cal Fire station 11 in Cayucos.
Station 10 covers approximately 70% of the district in less than 7 minutes; the portion of Lodge
Hill west of Highway 1, in the southwestern portion of the district, is an 8 minute or longer
response time.
Cal Fire Station 11
County Fire Station 16
Fire Station
Cal Fire/County Fire Station 10
tion # 10

Cambria Community Services District
Page 69 of 152
CAMBRIA CSD FUNDING
ASSESSED VALUATION The assessed value along with a percentage increase of growth of the district is listed in the
table below. The total for San Luis Obispo County is listed as well for comparison purposes.
Secured and Utility Growth from Prior Year
Agency 2017-2018 Assessed Valuation (after HOPTR*)
Percent of Total 2015-2016
2016-2017
2017-2018
San Luis Obispo County $49,089,032,946 100.0000% 6.22% 5.67% 5.61%
Cambria CSD $ 2,145,909,012 4.3715% 4.69% 3.91% 4.37%
Figure 25 Cambria Assessed Valuation
*HOPTR-Homeowners Property Tax Relief
DISTRICT PROPERTY TAX As stated in the section regarding special district funding, the primary source of revenue for fire
protection in special districts is a property tax. The assessed value (chart above) and allocation
formulas impact the amount of property tax allocated to the Cambria CSD.
PROPERTY TAX GROWTH TREND
Cambria CSD Property Tax33
Fiscal Year 2014/2015 2015/2016 2016/2017 2017/2018
Property Tax Allocation
1,995,643 2,086,064
2,168,058
2,263,703
Growth from Previous Year
99,107 90,420
81,994
95,645
Incremental Growth % 4.89% 4.53% 3.93%
4.41%
Figure 26 Cambria CSD Property Tax Collections 2014 -2018
33 San Luis Obispo County Auditor, Controller, Treasurer, Tax Collector’s Office
1,800,000
2,000,000
2,200,000
2,400,000
2014/2015 2015/2016 2016/2017 2017/2018
Property Tax Growth
Property Tax Allocation
Figure 27 Cambria Property Tax growth 2014-2018

Cambria Community Services District
Page 70 of 152
CAMBIA CSD TAX RATE AREAS Cambria CSD has three tax rate areas within the district, which are listed below along with the
total taxes collected in each TRA, percentage allocated to the District, and associated dollar
allocation amounts.
Figure 28 Map of Cambria CSD Tax Rate Areas (TRA)
Tax rate Area 061-033 Tax Rate Area 061-037
Tax Rate Area 061-038
2017/2018 Tax Revenue % and $ by TRA34
TRA Percent to
CSD Total Tax for TRA Tax Dollars to CSD
061-033 8.97838 $8 $1
061-037 10.49195 $22,574,494 $2,368,504
061-038 8.97838 $0 $0
Total $22,574,502 $2,368,505
Figure 29 Cambria CSD 2017-18 Tax Revenue % and $ by TRA
34 San Luis Obispo County Auditor, Controller, Treasurer, Tax Collector’s Office
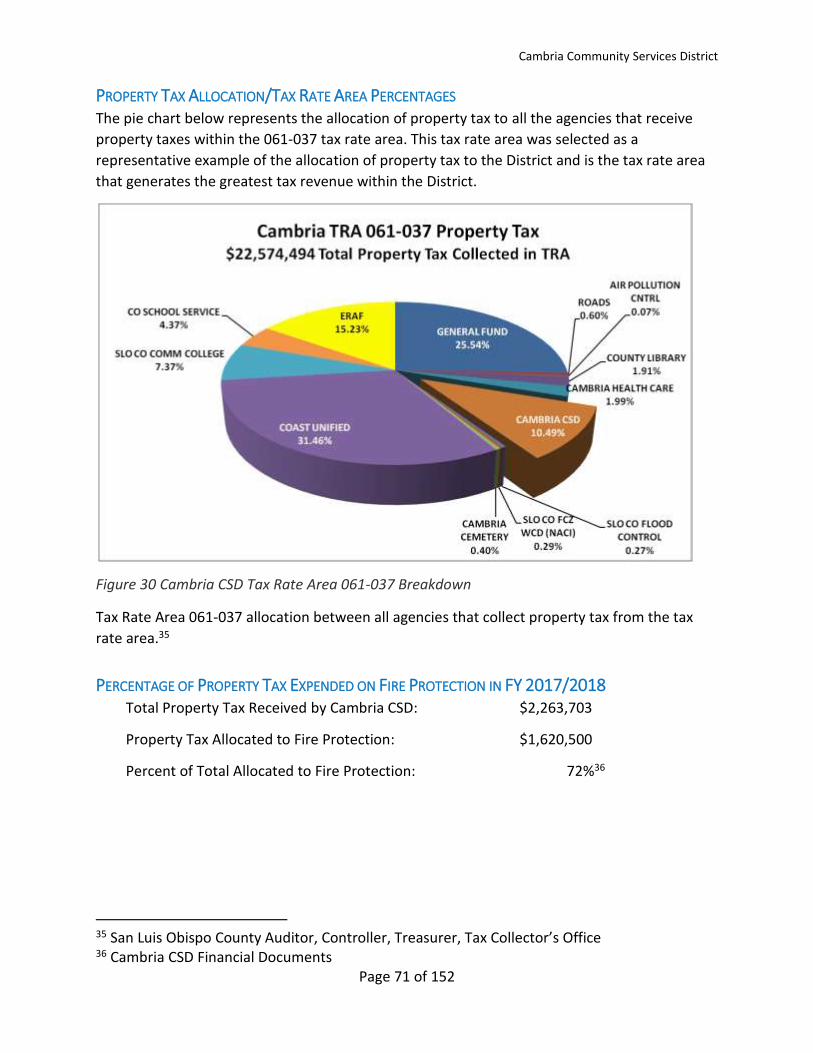
Cambria Community Services District
Page 71 of 152
PROPERTY TAX ALLOCATION/TAX RATE AREA PERCENTAGES The pie chart below represents the allocation of property tax to all the agencies that receive
property taxes within the 061-037 tax rate area. This tax rate area was selected as a
representative example of the allocation of property tax to the District and is the tax rate area
that generates the greatest tax revenue within the District.
Figure 30 Cambria CSD Tax Rate Area 061-037 Breakdown
Tax Rate Area 061-037 allocation between all agencies that collect property tax from the tax
rate area.35
PERCENTAGE OF PROPERTY TAX EXPENDED ON FIRE PROTECTION IN FY 2017/2018 Total Property Tax Received by Cambria CSD: $2,263,703
Property Tax Allocated to Fire Protection: $1,620,500
Percent of Total Allocated to Fire Protection: 72%36
35 San Luis Obispo County Auditor, Controller, Treasurer, Tax Collector’s Office 36 Cambria CSD Financial Documents
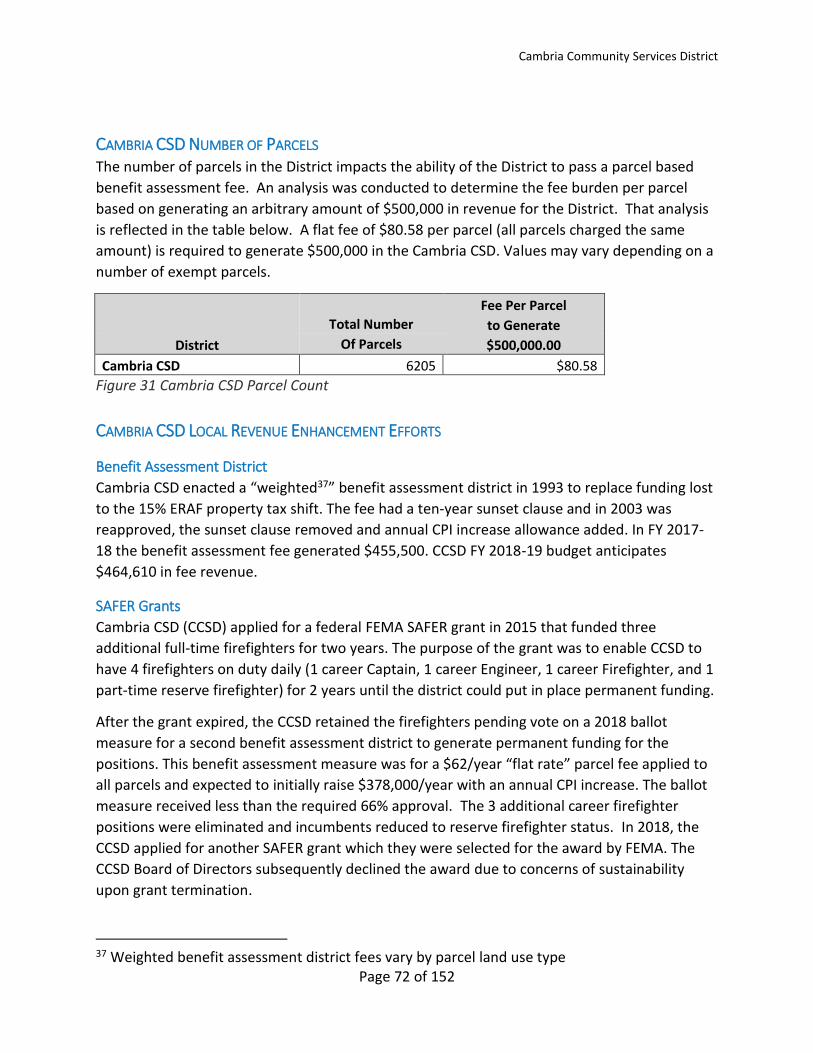
Cambria Community Services District
Page 72 of 152
CAMBRIA CSD NUMBER OF PARCELS The number of parcels in the District impacts the ability of the District to pass a parcel based
benefit assessment fee. An analysis was conducted to determine the fee burden per parcel
based on generating an arbitrary amount of $500,000 in revenue for the District. That analysis
is reflected in the table below. A flat fee of $80.58 per parcel (all parcels charged the same
amount) is required to generate $500,000 in the Cambria CSD. Values may vary depending on a
number of exempt parcels.
Fee Per Parcel Total Number to Generate
District Of Parcels $500,000.00
Cambria CSD 6205 $80.58 Figure 31 Cambria CSD Parcel Count
CAMBRIA CSD LOCAL REVENUE ENHANCEMENT EFFORTS
Benefit Assessment District
Cambria CSD enacted a “weighted37” benefit assessment district in 1993 to replace funding lost
to the 15% ERAF property tax shift. The fee had a ten-year sunset clause and in 2003 was
reapproved, the sunset clause removed and annual CPI increase allowance added. In FY 2017-
18 the benefit assessment fee generated $455,500. CCSD FY 2018-19 budget anticipates
$464,610 in fee revenue.
SAFER Grants
Cambria CSD (CCSD) applied for a federal FEMA SAFER grant in 2015 that funded three
additional full-time firefighters for two years. The purpose of the grant was to enable CCSD to
have 4 firefighters on duty daily (1 career Captain, 1 career Engineer, 1 career Firefighter, and 1
part-time reserve firefighter) for 2 years until the district could put in place permanent funding.
After the grant expired, the CCSD retained the firefighters pending vote on a 2018 ballot
measure for a second benefit assessment district to generate permanent funding for the
positions. This benefit assessment measure was for a $62/year “flat rate” parcel fee applied to
all parcels and expected to initially raise $378,000/year with an annual CPI increase. The ballot
measure received less than the required 66% approval. The 3 additional career firefighter
positions were eliminated and incumbents reduced to reserve firefighter status. In 2018, the
CCSD applied for another SAFER grant which they were selected for the award by FEMA. The
CCSD Board of Directors subsequently declined the award due to concerns of sustainability
upon grant termination.
37 Weighted benefit assessment district fees vary by parcel land use type
Cambria Community Services District
Page 73 of 152
CAMBRIA CSD SIGNIFICANT COST FACTORS
Payroll
The District is utilizing Reserve Firefighters to augment career firefighters in an effort to reduce
payroll costs until permanent funding for career firefighters is in place.
Other Post Employment Benefits (OPEB)
The District has taken steps to reduce its exposure for OPEB. An actuary has been completed.
Two retirees receive post-retirement health care benefits while a total of four active employees
qualify to receive post-retirement health care benefits. Employees hired after October 1, 2012
do not qualify to receive the benefit.
Retirement
The District has a contract with Cal PERS for retirement benefits. A second tier for the Safety
contract has been implemented to manage future costs of retirement benefits.
Workers’ Compensation
No significant open workers’ compensation claims were reported by the fire chief.
Equipment Replacement Fund
The District utilizes lease-purchase agreements for significant equipment purchases rather than
a sinking fund. They have also had success with grant funding to pay for some equipment.
Liabilities
The District reported that they do not have any pending lawsuits against the fire department.
Facility Costs
The Cambria Fire Station in relatively new and in good condition. District staff state that future
remodels may be necessary to accommodate more on-duty staff.
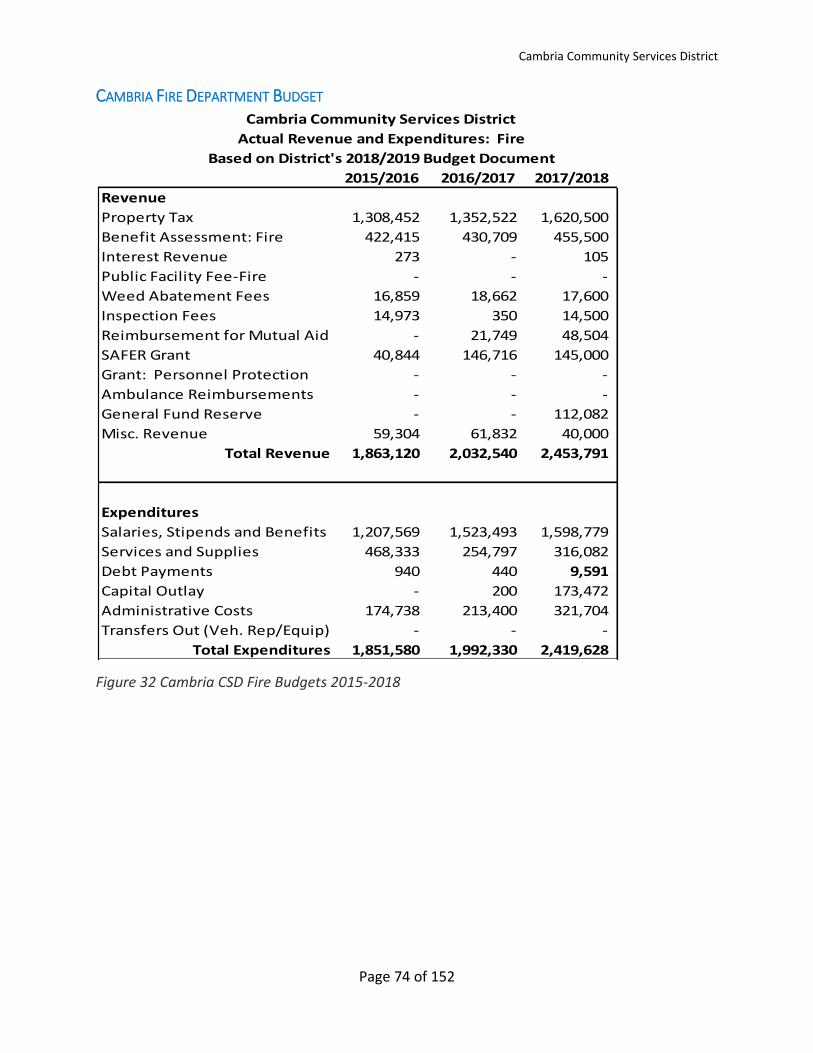
Cambria Community Services District
Page 74 of 152
CAMBRIA FIRE DEPARTMENT BUDGET
Figure 32 Cambria CSD Fire Budgets 2015-2018
Cambria Community Services District
Actual Revenue and Expenditures: Fire
Based on District's 2018/2019 Budget Document
2015/2016 2016/2017 2017/2018
Revenue
Property Tax 1,308,452 1,352,522 1,620,500
Benefit Assessment: Fire 422,415 430,709 455,500
Interest Revenue 273 - 105
Public Facility Fee-Fire - - -
Weed Abatement Fees 16,859 18,662 17,600
Inspection Fees 14,973 350 14,500
Reimbursement for Mutual Aid - 21,749 48,504
SAFER Grant 40,844 146,716 145,000
Grant: Personnel Protection - - -
Ambulance Reimbursements - - -
General Fund Reserve - - 112,082
Misc. Revenue 59,304 61,832 40,000
Total Revenue 1,863,120 2,032,540 2,453,791
Expenditures
Salaries, Stipends and Benefits 1,207,569 1,523,493 1,598,779
Services and Supplies 468,333 254,797 316,082
Debt Payments 940 440 9,591
Capital Outlay - 200 173,472
Administrative Costs 174,738 213,400 321,704
Transfers Out (Veh. Rep/Equip) - - -
Total Expenditures 1,851,580 1,992,330 2,419,628
Cambria Community Services District
Page 75 of 152
CAMBRIA FIRE DEPARTMENT STAFFING PLAN
Current Staffing Provides for 2 career and 1 reserve on duty daily
• 1 Fire Chief
• 3 Fire Captains
• 3 Engineer/Driver Operator
• 10-14 Reserves (Part-time)
Recruitment and Retention
• Fulltime firefighter turnover rate is low, more than 50% spend an entire career with Cambria.
• Reserve firefighters turn over on average every 2-3 years.
• Cambria CSD no longer recruits PCF.
• Assistant Chief/Fire Marshal and Administrative Assistant position were eliminated
several years ago for cost savings.
Proposed Career and Part Time Provides for 3 career and 1 reserve on duty daily plus additional
chief officer and administrative support
• 1 Fire Chief
• 1 Assistant Fire Chief/Fire Marshal
• 1 Administrative Assistant
• 3 Fire Captain
• 3 Engineer/Driver-Operator
• 3 Firefighter
• 10-14 Reserve (Part-time)
Timeline for Implementation
• 3 career firefighter positions desired immediately to provide 3 career and 1 reserve on
duty daily; This staffing plan was the reason for funding measure on 2018 ballot
• Assistant Chief and Admin Assistant positions to be added in future
CAMBRIA CSD RESOURCE NEEDS The CCSD did not make a specific request for any County financial assistance; however, they are
interested in sharing any new revenue source or cost reductions for fire protection services
such as dispatch cost.
CAMBRIA CSD OPTIONS CONSIDERED • Cambria CSD has considered contracting fire protection to Cal Fire multiple times over
the last 20 years; deciding in every instance to retain the service.
• Cambria CSD has no plans or intention to divest fire protection.
• Cambria CSD is examining internal budget redirection from other CCSD tax-supported
programs for fire protection.

Cambria Community Services District
Page 76 of 152
• Cambria CSD is considering a new benefit assessment ballot measure to fund extra fire
department staff and possibly new funding for parks in 2019 or 2020.
COUNTY OPTIONS IN THE EVENT OF DIVESTITURE Cambria CSD does not intend to divest fire protection services and as such, a detailed analysis
of County service options was not conducted.
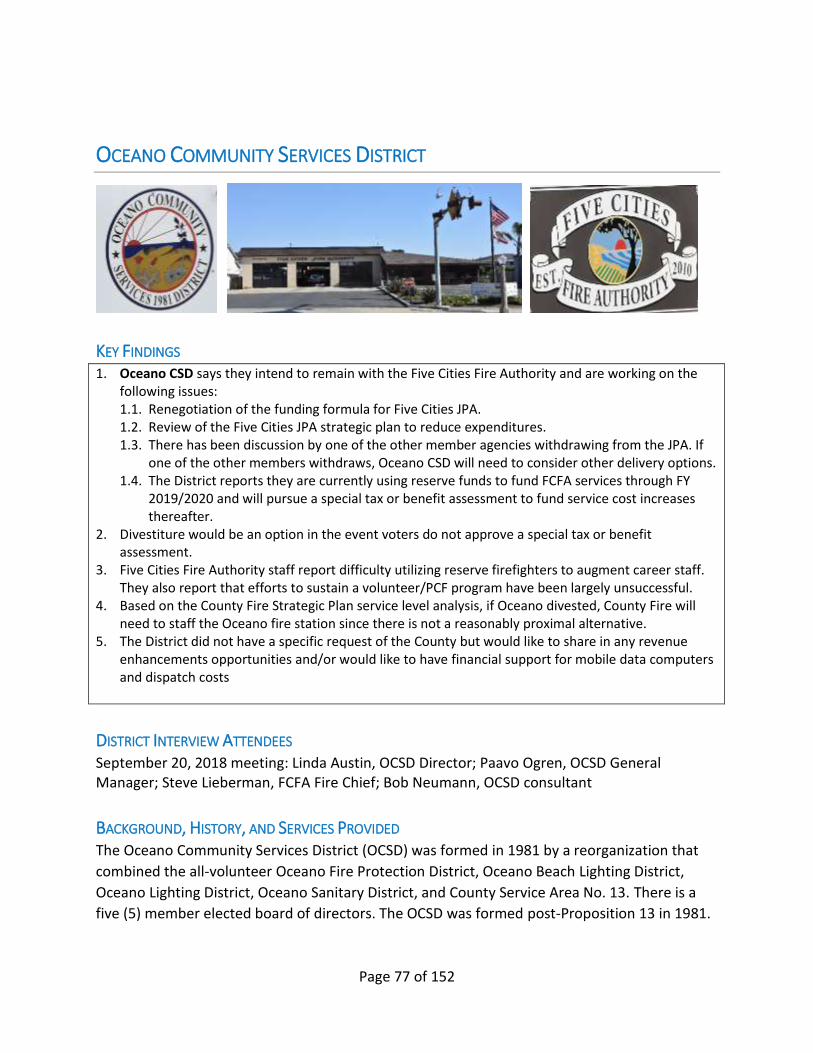
Page 77 of 152
OCEANO COMMUNITY SERVICES DISTRICT
KEY FINDINGS 1. Oceano CSD says they intend to remain with the Five Cities Fire Authority and are working on the
following issues: 1.1. Renegotiation of the funding formula for Five Cities JPA. 1.2. Review of the Five Cities JPA strategic plan to reduce expenditures. 1.3. There has been discussion by one of the other member agencies withdrawing from the JPA. If
one of the other members withdraws, Oceano CSD will need to consider other delivery options. 1.4. The District reports they are currently using reserve funds to fund FCFA services through FY
2019/2020 and will pursue a special tax or benefit assessment to fund service cost increases thereafter.
2. Divestiture would be an option in the event voters do not approve a special tax or benefit assessment.
3. Five Cities Fire Authority staff report difficulty utilizing reserve firefighters to augment career staff. They also report that efforts to sustain a volunteer/PCF program have been largely unsuccessful.
4. Based on the County Fire Strategic Plan service level analysis, if Oceano divested, County Fire will need to staff the Oceano fire station since there is not a reasonably proximal alternative.
5. The District did not have a specific request of the County but would like to share in any revenue enhancements opportunities and/or would like to have financial support for mobile data computers and dispatch costs
DISTRICT INTERVIEW ATTENDEES September 20, 2018 meeting: Linda Austin, OCSD Director; Paavo Ogren, OCSD General Manager; Steve Lieberman, FCFA Fire Chief; Bob Neumann, OCSD consultant
BACKGROUND, HISTORY, AND SERVICES PROVIDED The Oceano Community Services District (OCSD) was formed in 1981 by a reorganization that
combined the all-volunteer Oceano Fire Protection District, Oceano Beach Lighting District,
Oceano Lighting District, Oceano Sanitary District, and County Service Area No. 13. There is a
five (5) member elected board of directors. The OCSD was formed post-Proposition 13 in 1981.
Oceano Community Services District
Page 78 of 152
The OCSD provides property tax-supported services (fire, parks, and lighting) and enterprise
services (water, wastewater, garbage and recycling). The 2018-19 OCSD budget is $5,451,519;
$997,150 is from property taxes; the balance of the budget is from service enterprise funds and
other sources.
FIVE CITIES FIRE AUTHORITY Fire protection to Oceano CSD is from the fire station collocated with the OCSD offices and is
staffed daily with a career Fire Captain and a Reserve firefighter provided by Five Cities Fire
Authority.
Fire protection in OCSD is provided through the Five Cities Fire Authority (FCFA), a Joint Powers
Authority (JPA) formed in 2010, which includes Oceano CSD, City of Grover Beach, and the City
of Arroyo Grande. FCFA operates as a single fire agency utilizing fire stations and equipment
from the three member’s agencies, each of which previously operated their own separate fire
departments. FCFA has a three (3) member board of directors comprised of an elected official
from each of the three member agencies. The fire chief reports to the FCFA board of directors
and administers all three fire stations. Funding for the FCFA is based on a cost formula agreed
to by member agencies. In September 2017, the FCFA board adopted a five (5) year strategic
plan that has a staffing plan for a complete phase-out of volunteer/PCF and reserve firefighters.
All firefighter positions are planned to be full-time career positions and daily staffing at each
fire station will be minimum of three (3) on duty. Oceano Fire Station’s current daily staffing is
one (1) career and one (1) reserve. The FCFA strategic plan implementation will result in a
significant cost increase to OCSD to fund the additional career positions need to provide 3
career firefighters on duty daily. OCSD adopted the FCFA strategic plan in April 2018 contingent
on a new Memorandum of Agreement which modified the original JPA. The modification allows
for amendment of the current funding formula and establishment of procedures for a member
of the FCFA to withdraw from the JPA. The amendments must be agreed upon by April 1,
2019.38
The additional jurisdictional response is from FCFA stations in Grover Beach and Arroyo Grande.
Automatic aid is provided to FCFA by the two City of Pismo Beach fire stations on Bello Street
and Shell Beach Road and County Fire Station 22 on Highway 1. Next closest mutual aid fire
stations are Cal Fire Station 20 in Nipomo and County Fire Station 62 in Avila Valley. Both
Nipomo and Avila Valley area stations have approximately 15 minutes driving time to Oceano.
FCFA reported having poor success recruiting Reserve Firefighters from Allan Hancock College
Fire Academy. The FCFA strategic plan goal is to be 100% fulltime career firefighters in 5 years.
OCSD’s primary funding source for their 2018-19 portion of the FCFA budget comes from
property taxes in the amount of $997,150. The budgeted amount for 2018/2019 fiscal year for
fire protection is $1,030,790. Reserve funding will be utilized to balance the budget. FCFA
38 2018 Fire Service Analysis for Oceano Community Services District; Category Five Professional Consultants

Oceano Community Services District
Page 79 of 152
received a SAFER39 grant that concluded in 2015 that funded additional full-time firefighters.
The grant expired and no sustainable funding source was identified to continue funding and the
positions were eliminated.
OCSD believes they have adequate budgetary reserve funding to carry them through 2019-20
fiscal year and to cover cost increases with the FCFA strategic plan. OCSD is considering a
benefit assessment ballot measure to fund their future cost increases beyond 2019-20.
OCSD states their preferred action is to remain with the FCFA, renegotiate the JPA cost formula,
determine possible cost reductions, service level changes, or new revenue options. They do not
have a desire to divest fire protection to the county.
However, their caution is if the new JPA cost formula is not approved, which results in another
FCFA member agency withdrawing, the JPA may not be sustainable. OCSD may not be able to
afford to operate a standalone fire department. If the JPA dissolves, a new fire protection
delivery plan will be required, which could include divestiture as one option.
OCEANO CSD UNIQUE RISKS AND HAZARDS As a coastal community, Oceano is a destination for tourism, particularly as people pass
through on their way to the Oceano Dunes State Vehicular Recreation Area. Tourism brings a
high volume of visitors and short-term renters, which corresponds to higher emergency call
volume above those caused by residents.
The District responds to coastal emergencies including beach accidents and surf rescue.
Specialized training and equipment are required to respond to this unique hazard.
There are vegetable packing plants in Oceano that present a special hazard of use of ammonia
as a coolant for fresh vegetables. Ammonia emergencies require very specialized training.
The Union Pacific railroad runs through Oceano which presents specialized training and
equipment needs to manage railroad emergencies involving freight and passenger accidents.
39 SAFER Grant: Dept. of Homeland Security; FEMA, US Fire Administration grant program

Oceano Community Services District
Page 80 of 152
OCEANO CSD DATA SHEET
Authorizing Code Cal. Govt. Code 61000 et. seq.
Address: P.O. Box 599
1655 Front Street
Oceano CA 93475-0599
Telephone: 805-481-6730
FAX: 805-481-6836
Website: www.oceanocsd.org
District Manager: Paavo Ogren
Fire Chief: Steve Lieberman (Five Cities Fire Authority)
Board Representative Linda Austin
Board of Directors Meetings Second and fourth Wednesday of the month at
5:30 p.m. in the OCSD Board Room
Board Members Karen White
Linda Austin
Shirley Gibson
Cynthia Replogle
Vacant Position
Acreage 1163
Square miles 1.8
Population 7508
Number of parcels 2441
Assessed Valuation $627,100,773
2017/2018 Fire Actual Tot. Exp. $963,592
2017/2018 Property Tax: District $979,424
2017/2018 Property Tax: Fire $940,004 (96% of Property Tax)
Special Tax or Assessment 0
Number of Career/Paid personnel 19.5 (Total for Five Cities Fire Authority)
Number of Reserves 18 (Total for Five Cities Fire Authority)
Annual calls for service (2017 cy) 583 in Oceano CSD for Five Cities FA
Date of Formation January 1, 1981
Figure 33 Oceano CSD Data Sheet
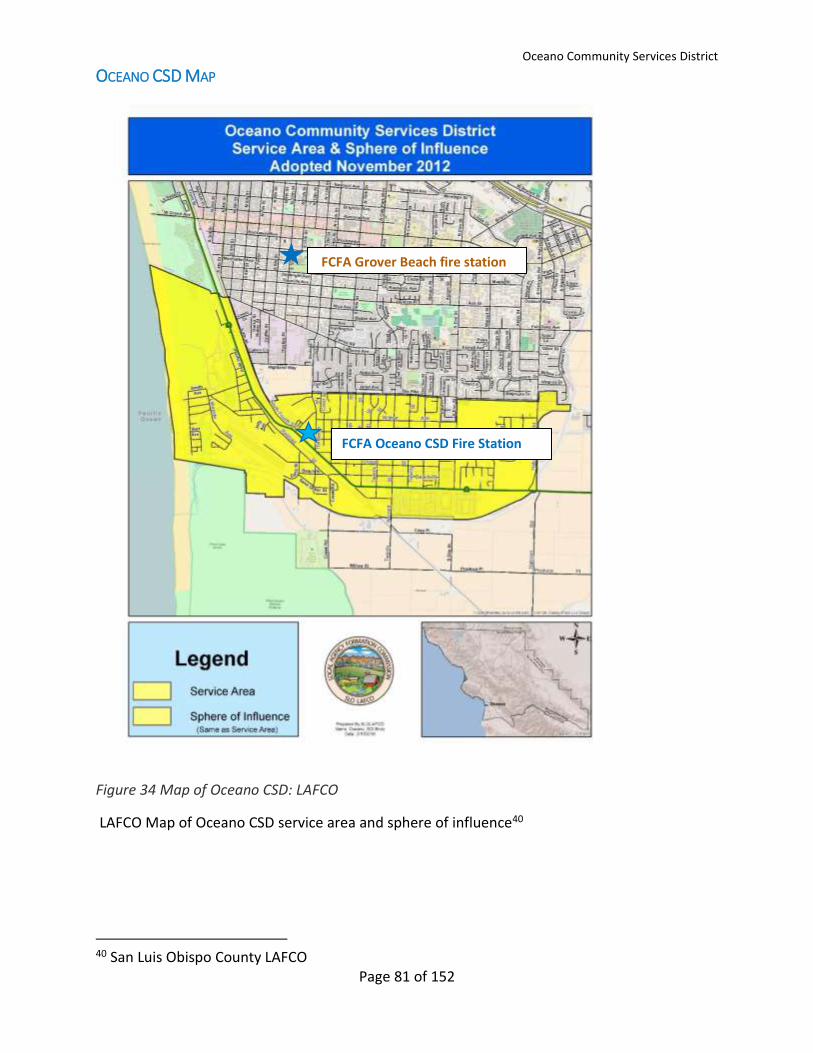
Oceano Community Services District
Page 81 of 152
OCEANO CSD MAP
Figure 34 Map of Oceano CSD: LAFCO
LAFCO Map of Oceano CSD service area and sphere of influence40
40 San Luis Obispo County LAFCO
FCFA Oceano CSD Fire Station
FCFA Grover Beach fire station

Oceano Community Services District
Page 82 of 152
OCEANO CSD FIRE DEPARTMENT INCIDENT DENSITY The following map represents the density of incidents in a given location of the District, known
as a “heat map”. The District boundary is represented with an orange line. The shades of
purple and blue represent incidents at that location. Light shades indicate few calls for service
at that location, while the deep purple represents a high volume of calls at the same location.
The purpose of the map is to evaluate historical incident data for planning deployment of
emergency resources, including fire station placement.
Figure 35 Heat Map of Incident locations in Oceano
FCFA Grover Beach fire station
FCFA Oceano CSD Fire Station
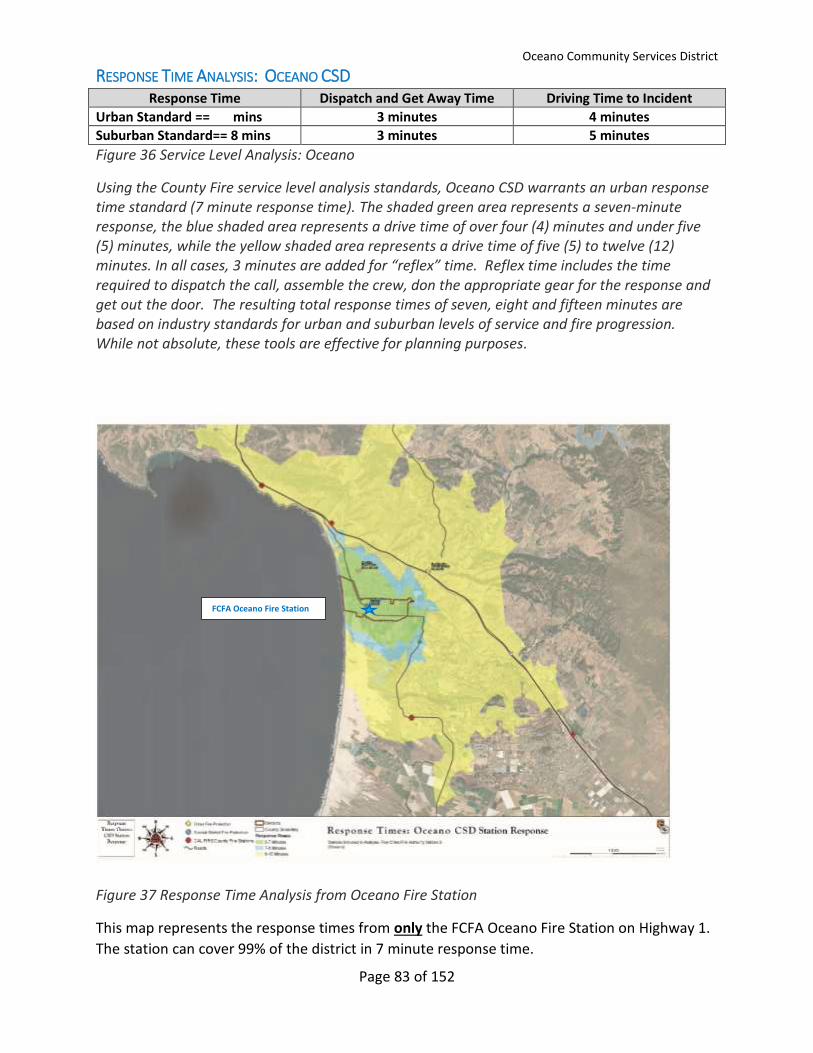
Oceano Community Services District
Page 83 of 152
RESPONSE TIME ANALYSIS: OCEANO CSD Response Time Dispatch and Get Away Time Driving Time to Incident
Urban Standard == mins 3 minutes 4 minutes
Suburban Standard== 8 mins 3 minutes 5 minutes
Figure 36 Service Level Analysis: Oceano
Using the County Fire service level analysis standards, Oceano CSD warrants an urban response time standard (7 minute response time). The shaded green area represents a seven-minute response, the blue shaded area represents a drive time of over four (4) minutes and under five (5) minutes, while the yellow shaded area represents a drive time of five (5) to twelve (12) minutes. In all cases, 3 minutes are added for “reflex” time. Reflex time includes the time required to dispatch the call, assemble the crew, don the appropriate gear for the response and get out the door. The resulting total response times of seven, eight and fifteen minutes are based on industry standards for urban and suburban levels of service and fire progression. While not absolute, these tools are effective for planning purposes.
Figure 37 Response Time Analysis from Oceano Fire Station
This map represents the response times from only the FCFA Oceano Fire Station on Highway 1.
The station can cover 99% of the district in 7 minute response time.
FCFA Oceano Fire Station
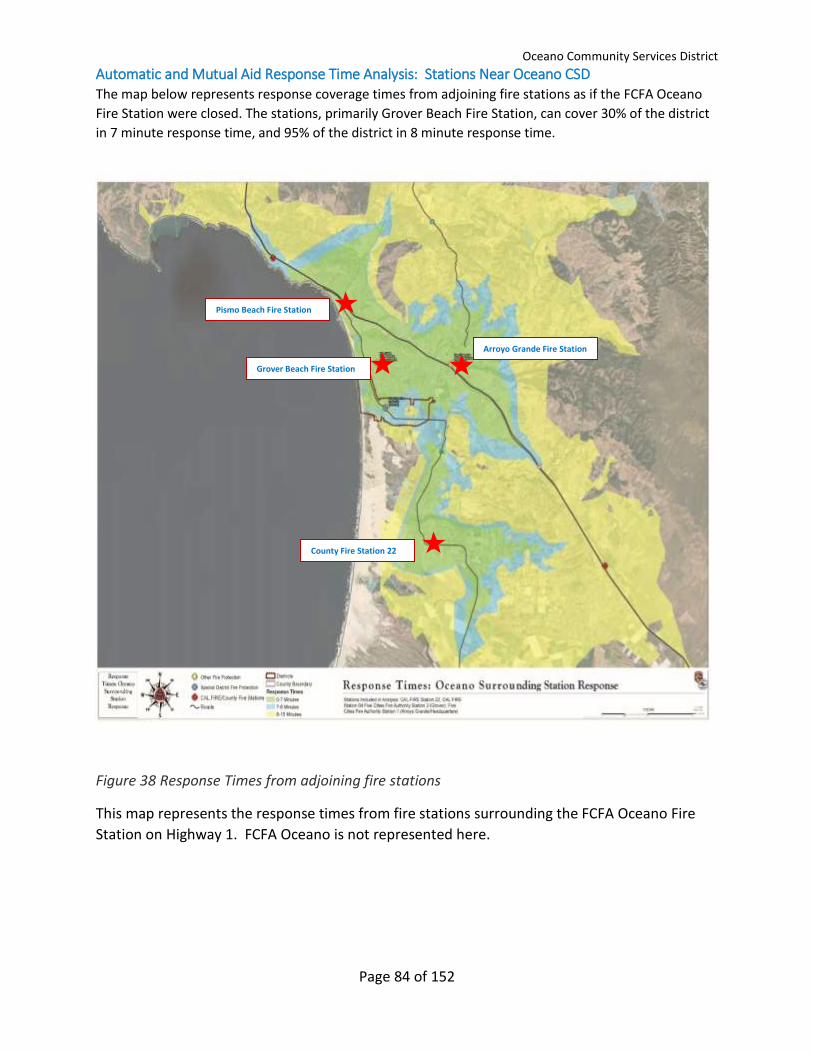
Oceano Community Services District
Page 84 of 152
Automatic and Mutual Aid Response Time Analysis: Stations Near Oceano CSD The map below represents response coverage times from adjoining fire stations as if the FCFA Oceano
Fire Station were closed. The stations, primarily Grover Beach Fire Station, can cover 30% of the district
in 7 minute response time, and 95% of the district in 8 minute response time.
Figure 38 Response Times from adjoining fire stations
This map represents the response times from fire stations surrounding the FCFA Oceano Fire
Station on Highway 1. FCFA Oceano is not represented here.
Pismo Beach Fire Station
Grover Beach Fire Station
Arroyo Grande Fire Station
County Fire Station 22
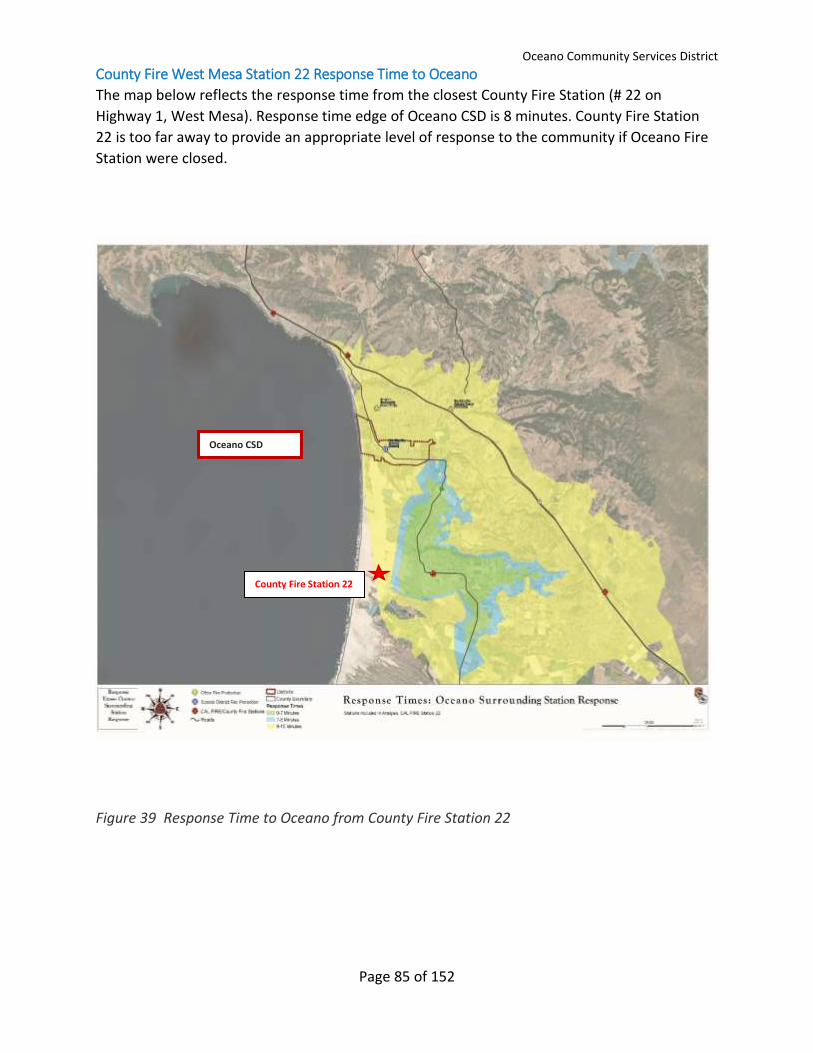
Oceano Community Services District
Page 85 of 152
County Fire West Mesa Station 22 Response Time to Oceano
The map below reflects the response time from the closest County Fire Station (# 22 on
Highway 1, West Mesa). Response time edge of Oceano CSD is 8 minutes. County Fire Station
22 is too far away to provide an appropriate level of response to the community if Oceano Fire
Station were closed.
Figure 39 Response Time to Oceano from County Fire Station 22
Oceano CSD
County Fire Station 22
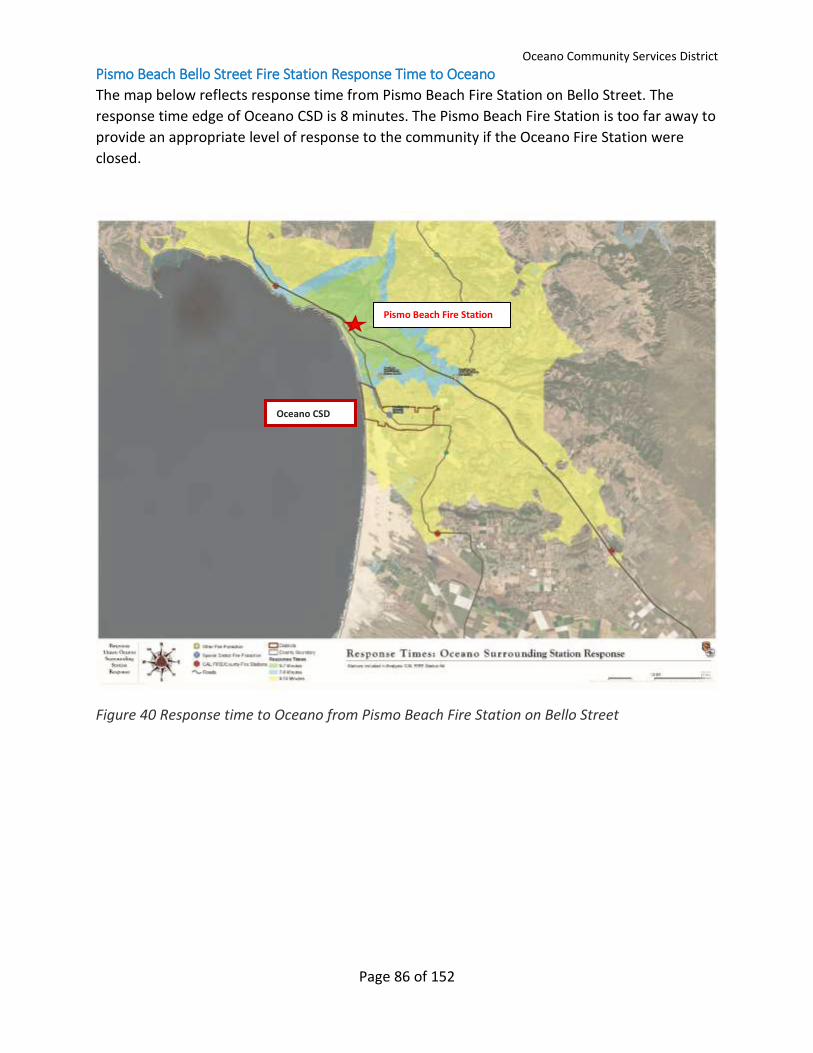
Oceano Community Services District
Page 86 of 152
Pismo Beach Bello Street Fire Station Response Time to Oceano
The map below reflects response time from Pismo Beach Fire Station on Bello Street. The
response time edge of Oceano CSD is 8 minutes. The Pismo Beach Fire Station is too far away to
provide an appropriate level of response to the community if the Oceano Fire Station were
closed.
Figure 40 Response time to Oceano from Pismo Beach Fire Station on Bello Street
Pismo Beach Fire Station
Station
Oceano CSD
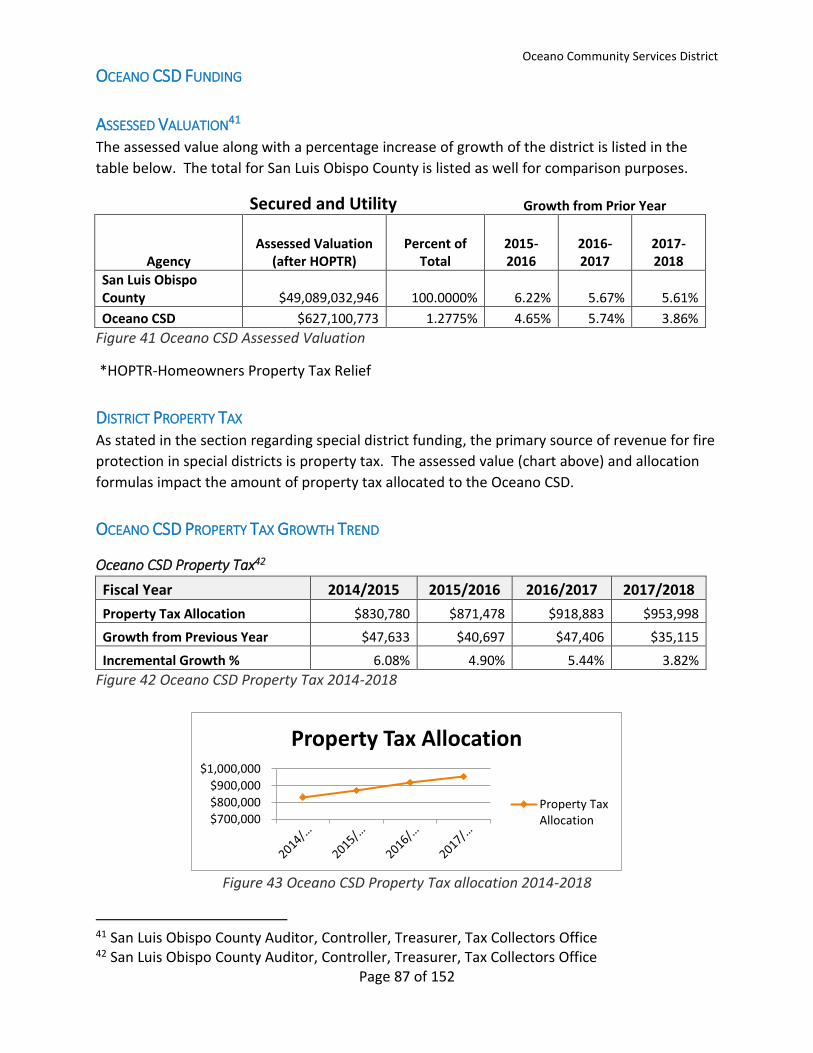
Oceano Community Services District
Page 87 of 152
OCEANO CSD FUNDING
ASSESSED VALUATION41 The assessed value along with a percentage increase of growth of the district is listed in the
table below. The total for San Luis Obispo County is listed as well for comparison purposes.
Secured and Utility Growth from Prior Year
Agency Assessed Valuation
(after HOPTR) Percent of
Total 2015-2016
2016-2017
2017-2018
San Luis Obispo County $49,089,032,946 100.0000% 6.22% 5.67% 5.61%
Oceano CSD $627,100,773 1.2775% 4.65% 5.74% 3.86% Figure 41 Oceano CSD Assessed Valuation
*HOPTR-Homeowners Property Tax Relief
DISTRICT PROPERTY TAX As stated in the section regarding special district funding, the primary source of revenue for fire
protection in special districts is property tax. The assessed value (chart above) and allocation
formulas impact the amount of property tax allocated to the Oceano CSD.
OCEANO CSD PROPERTY TAX GROWTH TREND
Oceano CSD Property Tax42
Fiscal Year 2014/2015 2015/2016 2016/2017 2017/2018
Property Tax Allocation $830,780 $871,478 $918,883 $953,998
Growth from Previous Year $47,633 $40,697 $47,406 $35,115
Incremental Growth % 6.08% 4.90% 5.44% 3.82% Figure 42 Oceano CSD Property Tax 2014-2018
Figure 43 Oceano CSD Property Tax allocation 2014-2018
41 San Luis Obispo County Auditor, Controller, Treasurer, Tax Collectors Office 42 San Luis Obispo County Auditor, Controller, Treasurer, Tax Collectors Office
$700,000
$800,000
$900,000
$1,000,000
Property Tax Allocation
Property TaxAllocation
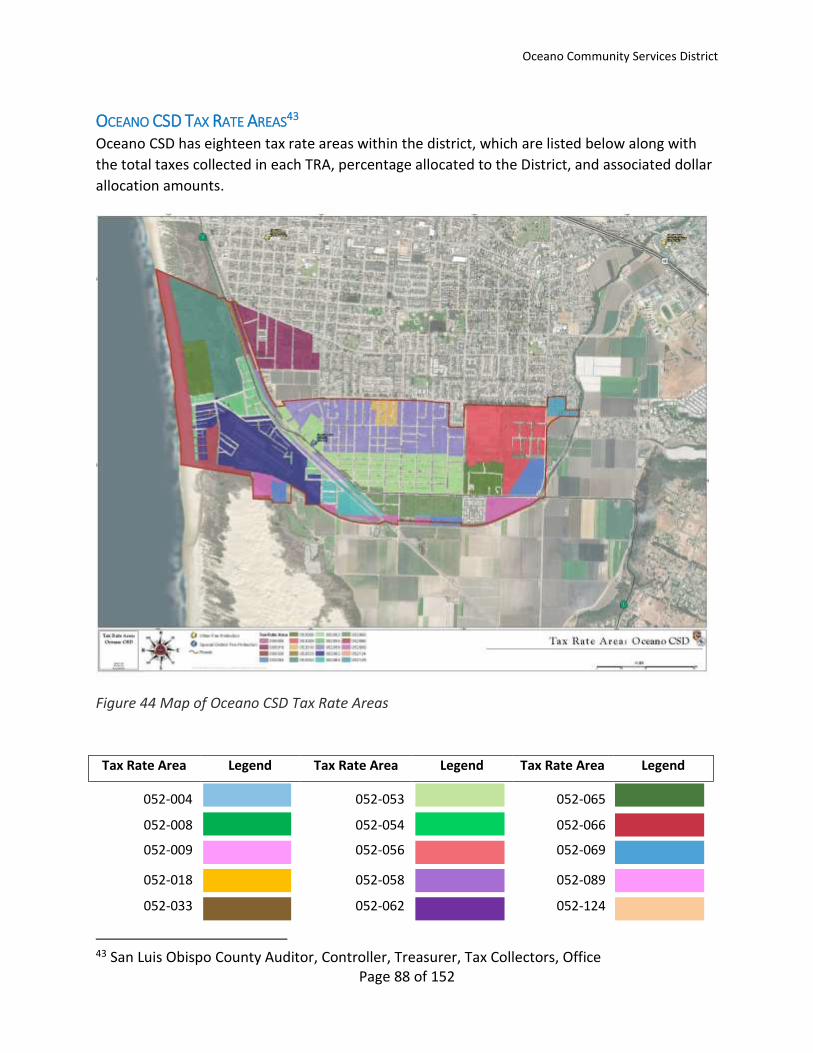
Oceano Community Services District
Page 88 of 152
OCEANO CSD TAX RATE AREAS43 Oceano CSD has eighteen tax rate areas within the district, which are listed below along with
the total taxes collected in each TRA, percentage allocated to the District, and associated dollar
allocation amounts.
Figure 44 Map of Oceano CSD Tax Rate Areas
Tax Rate Area Legend Tax Rate Area Legend Tax Rate Area Legend
052-004
052-053
052-065
052-008
052-054
052-066
052-009 052-056 052-069
052-018
052-058
052-089
052-033
052-062
052-124
43 San Luis Obispo County Auditor, Controller, Treasurer, Tax Collectors, Office
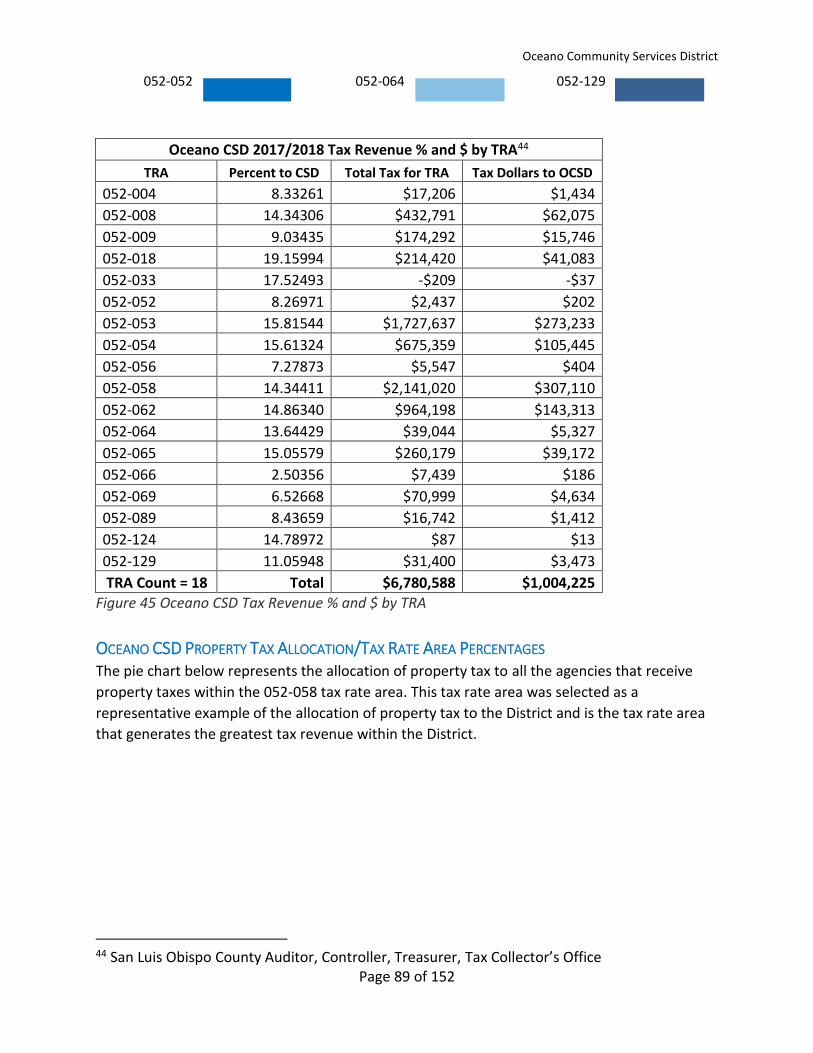
Oceano Community Services District
Page 89 of 152
052-052
052-064
052-129
Oceano CSD 2017/2018 Tax Revenue % and $ by TRA44
TRA Percent to CSD Total Tax for TRA Tax Dollars to OCSD
052-004 8.33261 $17,206 $1,434
052-008 14.34306 $432,791 $62,075
052-009 9.03435 $174,292 $15,746
052-018 19.15994 $214,420 $41,083
052-033 17.52493 -$209 -$37
052-052 8.26971 $2,437 $202
052-053 15.81544 $1,727,637 $273,233
052-054 15.61324 $675,359 $105,445
052-056 7.27873 $5,547 $404
052-058 14.34411 $2,141,020 $307,110
052-062 14.86340 $964,198 $143,313
052-064 13.64429 $39,044 $5,327
052-065 15.05579 $260,179 $39,172
052-066 2.50356 $7,439 $186
052-069 6.52668 $70,999 $4,634
052-089 8.43659 $16,742 $1,412
052-124 14.78972 $87 $13
052-129 11.05948 $31,400 $3,473
TRA Count = 18 Total $6,780,588 $1,004,225
Figure 45 Oceano CSD Tax Revenue % and $ by TRA
OCEANO CSD PROPERTY TAX ALLOCATION/TAX RATE AREA PERCENTAGES The pie chart below represents the allocation of property tax to all the agencies that receive
property taxes within the 052-058 tax rate area. This tax rate area was selected as a
representative example of the allocation of property tax to the District and is the tax rate area
that generates the greatest tax revenue within the District.
44 San Luis Obispo County Auditor, Controller, Treasurer, Tax Collector’s Office
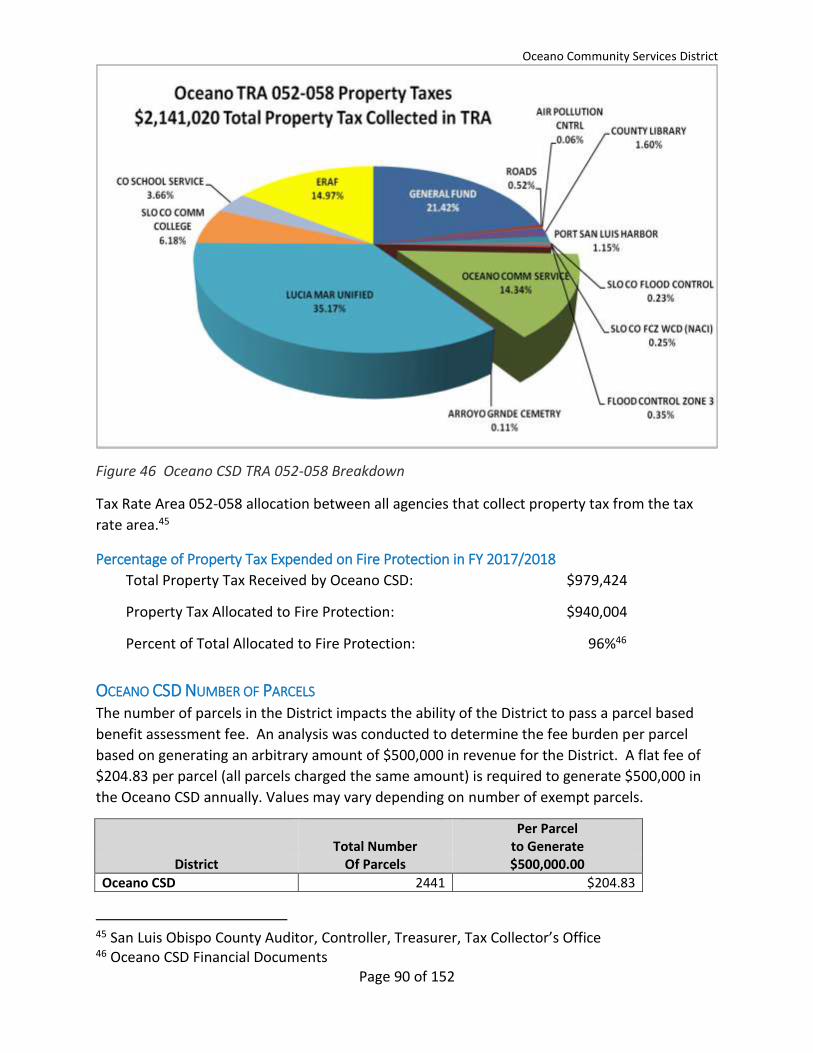
Oceano Community Services District
Page 90 of 152
Figure 46 Oceano CSD TRA 052-058 Breakdown
Tax Rate Area 052-058 allocation between all agencies that collect property tax from the tax
rate area.45
Percentage of Property Tax Expended on Fire Protection in FY 2017/2018
Total Property Tax Received by Oceano CSD: $979,424
Property Tax Allocated to Fire Protection: $940,004
Percent of Total Allocated to Fire Protection: 96%46
OCEANO CSD NUMBER OF PARCELS The number of parcels in the District impacts the ability of the District to pass a parcel based
benefit assessment fee. An analysis was conducted to determine the fee burden per parcel
based on generating an arbitrary amount of $500,000 in revenue for the District. A flat fee of
$204.83 per parcel (all parcels charged the same amount) is required to generate $500,000 in
the Oceano CSD annually. Values may vary depending on number of exempt parcels.
Per Parcel Total Number to Generate
District Of Parcels $500,000.00 Oceano CSD 2441 $204.83
45 San Luis Obispo County Auditor, Controller, Treasurer, Tax Collector’s Office 46 Oceano CSD Financial Documents
Oceano Community Services District
Page 91 of 152
Figure 47 Oceano CSD Parcel Count
OCEANO CSD LOCAL REVENUE ENHANCEMENT EFFORTS
Benefit Assessment District
Oceano is considering a benefit assessment district ballot measure to fund their portion of the
FCFA cost. District reserves can carry them through 2020 and expectations are for the ballot
measure to be voted on in 2020. If the FCFA strategic plan is implemented, OCSD estimates
their annual deficit will rise from $75,800 in year one to $223,500 in year five.47 Preliminary
estimates show a required parcel fee of $87.66 to generate enough revenue to meet the
projected cost at year five.
SAFER Grants
Five Cities Fire Authority (FCFA) applied for a federal FEMA SAFER grant that funded additional
full-time firefighters for two years. The purpose of the grant was to enable FCFA to have
additional full-time firefighters on duty daily. There was no source of funding to continue
funding the firefighters after the grant expired.
OCEANO CSD SIGNIFICANT COST FACTORS
Payroll
FCFA is utilizing Reserve Firefighters to augment career firefighters in an effort to reduce payroll
costs until permanent funding for career firefighters is in place. The FCFA strategic plan calls for
the conversion of the Reserve Firefighter program to a fully staffed career operation.
Other Post Employment Benefits (OPEB)
FCFA employees are employees of the City of Arroyo Grande and the FCFA member agencies
cost-sharing formula includes payment to Arroyo Grande for employment costs. An actuary has
been completed regarding the OPEB liability for the FCFA. Four retirees currently receive
benefits. Payment for retiree health care is funded out of the current year budget.48
Workers’ Compensation
No significant open workers’ compensation claims were reported by the District, which would
be managed by the City of Arroyo Grande as the employer of the FCFA firefighters.
Retirement
The City of Arroyo Grande has a contract with Cal PERS for retirement benefits for FCFA
members. The unfunded liability for the retirement plan for both safety and miscellaneous
employees is estimated at $2.2 million.49
47 2018 Fire Service Analysis for the Oceano Community Services District; page 5 48 Correspondence from Chief Lieberman, FCFA, Sept. 24, 2018 49 Correspondence from Chief Lieberman, FCFA, Sept. 24, 2018
Oceano Community Services District
Page 92 of 152
Liabilities
The District reported that there are not any pending lawsuits involving fire protection.
Equipment Replacement Fund
The FCFA utilizes both lease-purchase agreements and a sinking fund for significant equipment
purchases. The current fund balance is $558,000 with no contributions budgeted for 2018-19
FY; FCFA will restart sinking fund contributions in 2019-20 fiscal year50. They have also had
success with grant funding to pay for some equipment.
Facility Costs
Oceano Fire Station is part of the Oceano CSD administrative complex. Fire apparatus garage is
physically in the same building as the administrative staff. On duty, crew quarters are a
separate mobile home building at the rear of the property.
50 Five Cities Fire Authority 2018-19 FY budget
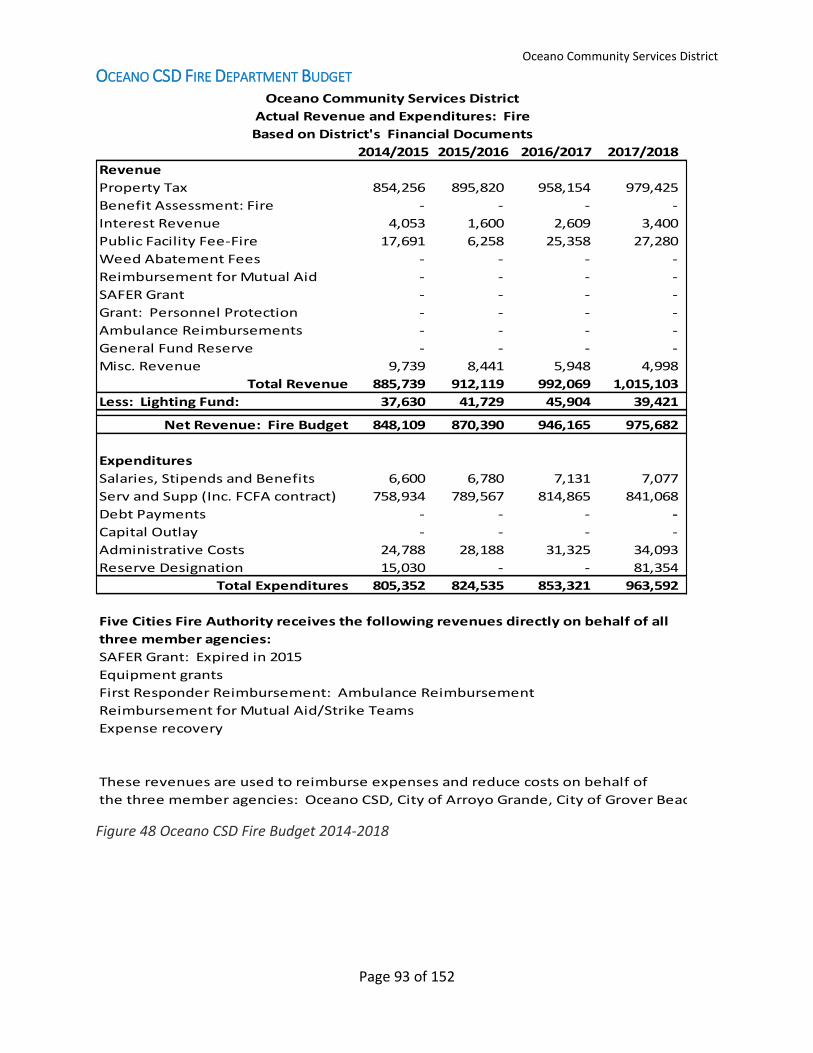
Oceano Community Services District
Page 93 of 152
OCEANO CSD FIRE DEPARTMENT BUDGET
Figure 48 Oceano CSD Fire Budget 2014-2018
Oceano Community Services District
Actual Revenue and Expenditures: Fire
Based on District's Financial Documents
2014/2015 2015/2016 2016/2017 2017/2018
Revenue
Property Tax 854,256 895,820 958,154 979,425
Benefit Assessment: Fire - - - -
Interest Revenue 4,053 1,600 2,609 3,400
Public Facility Fee-Fire 17,691 6,258 25,358 27,280
Weed Abatement Fees - - - -
Reimbursement for Mutual Aid - - - -
SAFER Grant - - - -
Grant: Personnel Protection - - - -
Ambulance Reimbursements - - - -
General Fund Reserve - - - -
Misc. Revenue 9,739 8,441 5,948 4,998
Total Revenue 885,739 912,119 992,069 1,015,103
Less: Lighting Fund: 37,630 41,729 45,904 39,421
Net Revenue: Fire Budget 848,109 870,390 946,165 975,682
Expenditures
Salaries, Stipends and Benefits 6,600 6,780 7,131 7,077
Serv and Supp (Inc. FCFA contract) 758,934 789,567 814,865 841,068
Debt Payments - - - -
Capital Outlay - - - -
Administrative Costs 24,788 28,188 31,325 34,093
Reserve Designation 15,030 - - 81,354
Total Expenditures 805,352 824,535 853,321 963,592
Five Cities Fire Authority receives the following revenues directly on behalf of all
three member agencies:
SAFER Grant: Expired in 2015
Equipment grants
First Responder Reimbursement: Ambulance Reimbursement
Reimbursement for Mutual Aid/Strike Teams
Expense recovery
These revenues are used to reimburse expenses and reduce costs on behalf of
the three member agencies: Oceano CSD, City of Arroyo Grande, City of Grover Beach.
Oceano Community Services District
Page 94 of 152
OCEANO CSD FIRE DEPARTMENT STAFFING PLAN
Current Staffing Provides for 1 career and 1 reserve on duty daily at Oceano Fire Station
• 1 Fire Chief -FCFA
• 3 Fire Captains
• 3 Reserves (Part-time)
Recruitment and Retention
• Fulltime firefighter turnover rate is low. FCFA has existed for only 8 years
• Reserve firefighters turn over on average every 2-3 years.
• FCFA no longer recruits PCF.
Proposed FCFA Staffing Plan Provides for 3 career on duty daily plus additional chief officer and
administrative support
• 1 Fire Chief-FCFA
• 3 Battalion Chiefs-FCFA
• 1 Fire Marshal- FCFA
• 1 Administrative Assistant-FCFA For Oceano Fire Station staffing:
• 3 Fire Captain
• 3 Engineer/Driver-Operator
• 3 Firefighter
Timeline for Implementation
3 career engineers and 3 firefighter positions desired within 5 years to provide 3 career on duty
daily at each fire station;
OCEANO CSD RESOURCE NEEDS The OCSD did not make a specific request for any County financial assistance; however, they
are interested in sharing any new revenue source or cost reductions for fire protection services
such as dispatch cost. In the event of an FCFA member agency withdrawing from the JPA, OCSD
will need to develop a new fire protection delivery system that may include divestiture as one
option.
OCEANO CSD OPTIONS CONSIDERED • Oceano CSD has no plans or intention to divest fire protection. However, their caution is
if the new JPA cost formula is not approved, which results in another Five Cities Fire
Authority member agency withdrawing, the JPA may not be sustainable. If the JPA
dissolves, a new fire protection delivery plan will be required, which could include
divestiture as one option.
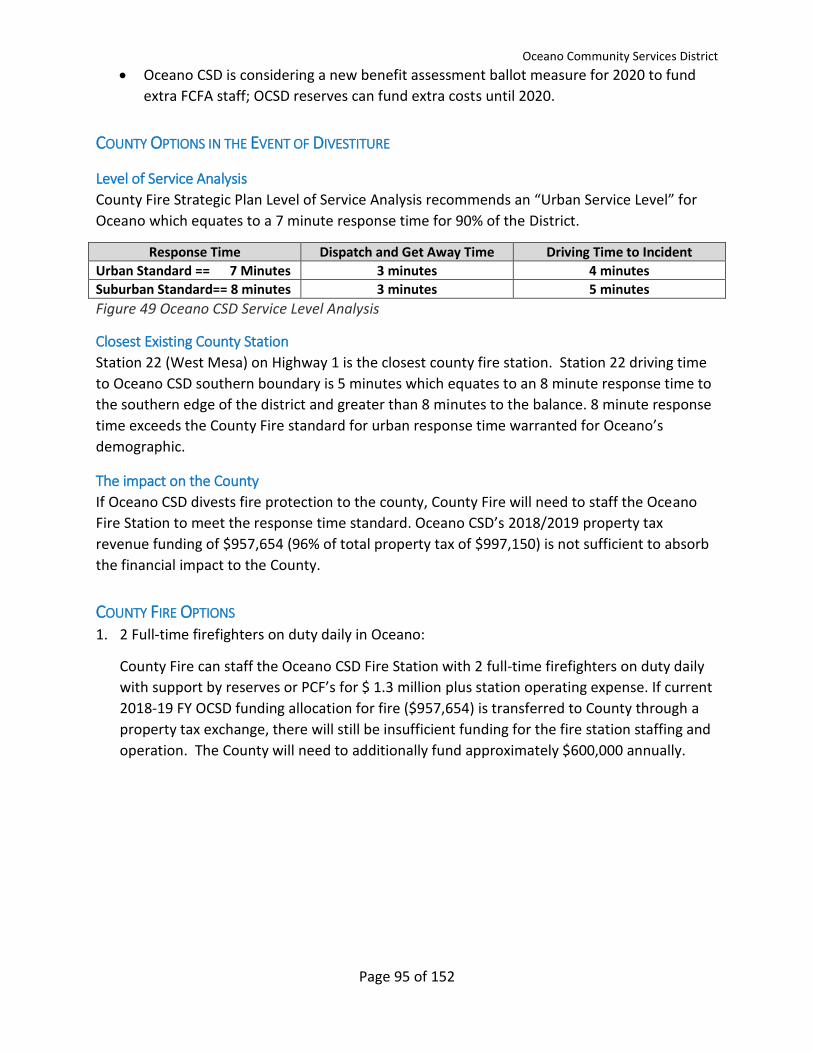
Oceano Community Services District
Page 95 of 152
• Oceano CSD is considering a new benefit assessment ballot measure for 2020 to fund
extra FCFA staff; OCSD reserves can fund extra costs until 2020.
COUNTY OPTIONS IN THE EVENT OF DIVESTITURE
Level of Service Analysis
County Fire Strategic Plan Level of Service Analysis recommends an “Urban Service Level” for
Oceano which equates to a 7 minute response time for 90% of the District.
Response Time Dispatch and Get Away Time Driving Time to Incident
Urban Standard == 7 Minutes 3 minutes 4 minutes
Suburban Standard== 8 minutes 3 minutes 5 minutes
Figure 49 Oceano CSD Service Level Analysis
Closest Existing County Station
Station 22 (West Mesa) on Highway 1 is the closest county fire station. Station 22 driving time
to Oceano CSD southern boundary is 5 minutes which equates to an 8 minute response time to
the southern edge of the district and greater than 8 minutes to the balance. 8 minute response
time exceeds the County Fire standard for urban response time warranted for Oceano’s
demographic.
The impact on the County
If Oceano CSD divests fire protection to the county, County Fire will need to staff the Oceano
Fire Station to meet the response time standard. Oceano CSD’s 2018/2019 property tax
revenue funding of $957,654 (96% of total property tax of $997,150) is not sufficient to absorb
the financial impact to the County.
COUNTY FIRE OPTIONS 1. 2 Full-time firefighters on duty daily in Oceano:
County Fire can staff the Oceano CSD Fire Station with 2 full-time firefighters on duty daily
with support by reserves or PCF’s for $ 1.3 million plus station operating expense. If current
2018-19 FY OCSD funding allocation for fire ($957,654) is transferred to County through a
property tax exchange, there will still be insufficient funding for the fire station staffing and
operation. The County will need to additionally fund approximately $600,000 annually.
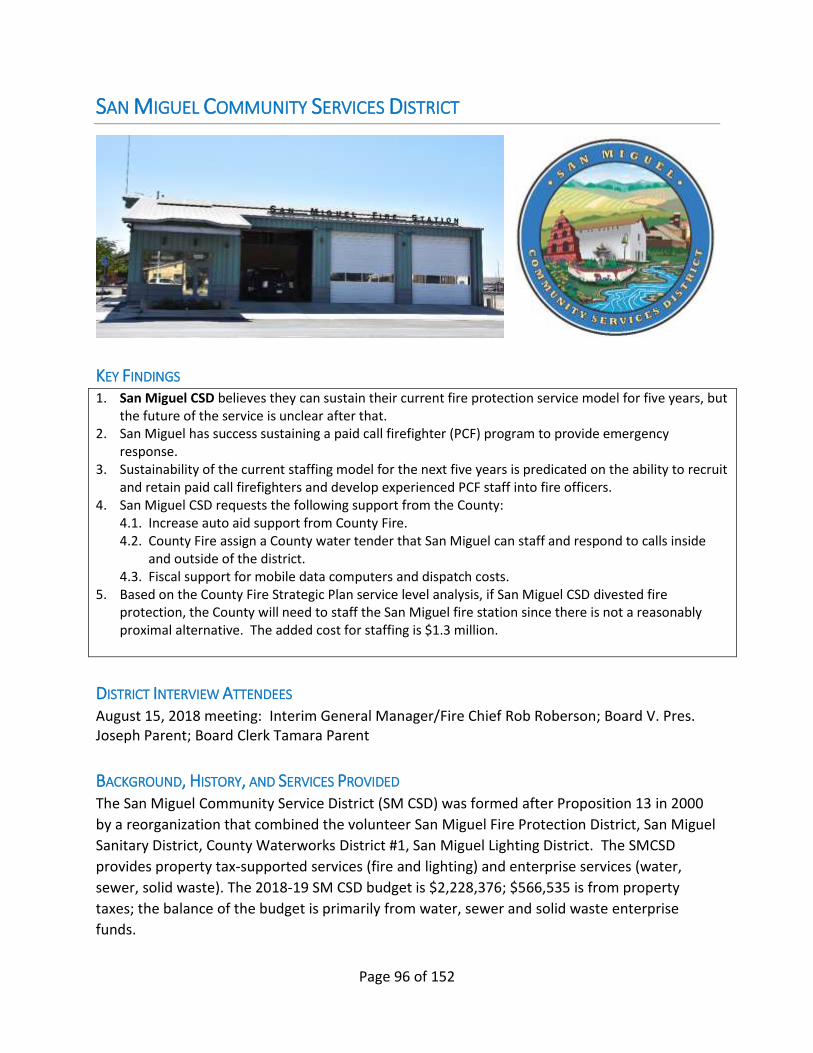
Page 96 of 152
SAN MIGUEL COMMUNITY SERVICES DISTRICT
KEY FINDINGS 1. San Miguel CSD believes they can sustain their current fire protection service model for five years, but
the future of the service is unclear after that. 2. San Miguel has success sustaining a paid call firefighter (PCF) program to provide emergency
response. 3. Sustainability of the current staffing model for the next five years is predicated on the ability to recruit
and retain paid call firefighters and develop experienced PCF staff into fire officers. 4. San Miguel CSD requests the following support from the County:
4.1. Increase auto aid support from County Fire. 4.2. County Fire assign a County water tender that San Miguel can staff and respond to calls inside
and outside of the district. 4.3. Fiscal support for mobile data computers and dispatch costs.
5. Based on the County Fire Strategic Plan service level analysis, if San Miguel CSD divested fire protection, the County will need to staff the San Miguel fire station since there is not a reasonably proximal alternative. The added cost for staffing is $1.3 million.
DISTRICT INTERVIEW ATTENDEES August 15, 2018 meeting: Interim General Manager/Fire Chief Rob Roberson; Board V. Pres. Joseph Parent; Board Clerk Tamara Parent
BACKGROUND, HISTORY, AND SERVICES PROVIDED The San Miguel Community Service District (SM CSD) was formed after Proposition 13 in 2000
by a reorganization that combined the volunteer San Miguel Fire Protection District, San Miguel
Sanitary District, County Waterworks District #1, San Miguel Lighting District. The SMCSD
provides property tax-supported services (fire and lighting) and enterprise services (water,
sewer, solid waste). The 2018-19 SM CSD budget is $2,228,376; $566,535 is from property
taxes; the balance of the budget is primarily from water, sewer and solid waste enterprise
funds.

San Miguel Community Services District
Page 97 of 152
Fire protection is provided from the SM CSD fire station on Mission Street. There are no
firefighters on duty at the fire station; response staffing is from on-call Paid Call Firefighters
(PCF). The SM CSD fire department consists of a part paid Fire Chief, 1 part paid Assistant Fire
Chief, 2 PCF-Captains, 2 PCF-Engineer/Driver Operator, and 11 Paid Call Firefighters.
Administrative support is provided by SM CSD staff.
Automatic aid is provided by Camp Roberts-CA National Guard Fire Department, 5 miles north
with a response time of 13 minutes. Next closest mutual aid fire stations are City of Paso
Robles, 10 miles south; and Cal Fire/County Fire Station 30, 12 miles south, in south Paso Robles,
and County Fire Station 52 on Branch Road and Hwy 46 east, 14 miles away. City of Paso Robles
apparatus have 15 minute response time; Station 30 has a response time of 16 minutes, and
Station 52’s response time is 19 minutes.
SAN MIGUEL FIRE PROTECTION CONCERNS San Miguel is an isolated community with no close fire agency neighbors; the closest are 5-9
miles away. San Miguel Fire Department responds to approximately 380 emergencies per year,
38% of which are mutual aid outside of the district. SM CSD is occasionally experiencing long
response delays or no response from PCFs. The closest ambulance is 15 minutes away also
responding from Paso Robles.
SM CSD Fire Department is totally dependent on community members volunteering for Paid
Call Firefighter and Fire Officer positions. To date, they have been effective at recruiting
community members. Chief Roberson believes this model is sustainable for the next five (5)
years. However, Chief Roberson is concerned that increased response demand and training
requirements will significantly impact the ability to sustain the PCF model long term. His belief
is exceeding 500 incidents a year will create a serious deterioration of volunteer or PCF
response because of the time demand and absence from work or home. Chief Roberson is also
concerned about continued automatic aid from Camp Roberts Fire may be at risk.
Primary funding for 2018-19 FY $517,456 SM CSD fire protection budget is from property taxes
in the amount of $390,856. Anticipated grants and response reimbursement make up the
remainder.
SAN MIGUEL UNIQUE RISKS AND HAZARDS The Union Pacific railroad runs through San Miguel and presents unique training requirements
for rail and passenger emergencies. Highway 101 also passes through the community and
results in frequent vehicle accidents, inside and outside of the district that San Miguel responds
to.
Specialized training and equipment are required to respond to these unique hazards.
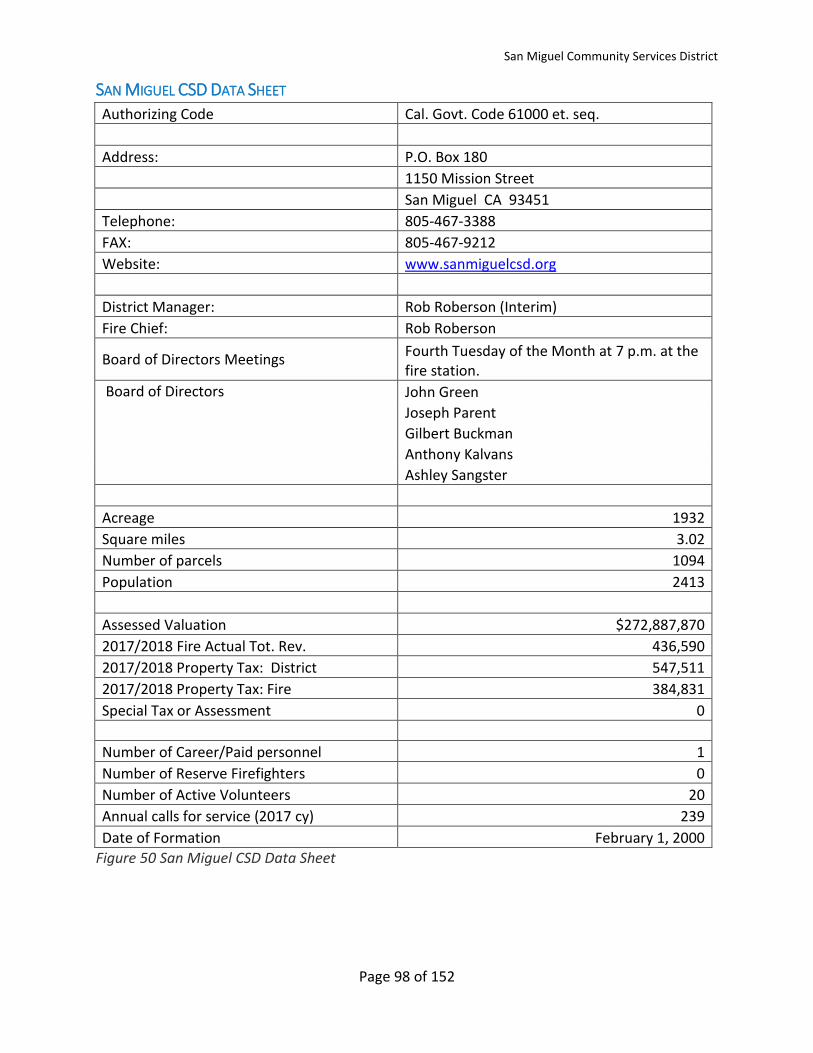
San Miguel Community Services District
Page 98 of 152
SAN MIGUEL CSD DATA SHEET
Authorizing Code Cal. Govt. Code 61000 et. seq.
Address: P.O. Box 180
1150 Mission Street
San Miguel CA 93451
Telephone: 805-467-3388
FAX: 805-467-9212
Website: www.sanmiguelcsd.org
District Manager: Rob Roberson (Interim)
Fire Chief: Rob Roberson
Board of Directors Meetings Fourth Tuesday of the Month at 7 p.m. at the fire station.
Board of Directors John Green
Joseph Parent
Gilbert Buckman
Anthony Kalvans
Ashley Sangster
Acreage 1932
Square miles 3.02
Number of parcels 1094
Population 2413
Assessed Valuation $272,887,870
2017/2018 Fire Actual Tot. Rev. 436,590
2017/2018 Property Tax: District 547,511
2017/2018 Property Tax: Fire 384,831
Special Tax or Assessment 0
Number of Career/Paid personnel 1
Number of Reserve Firefighters 0
Number of Active Volunteers 20
Annual calls for service (2017 cy) 239
Date of Formation February 1, 2000
Figure 50 San Miguel CSD Data Sheet
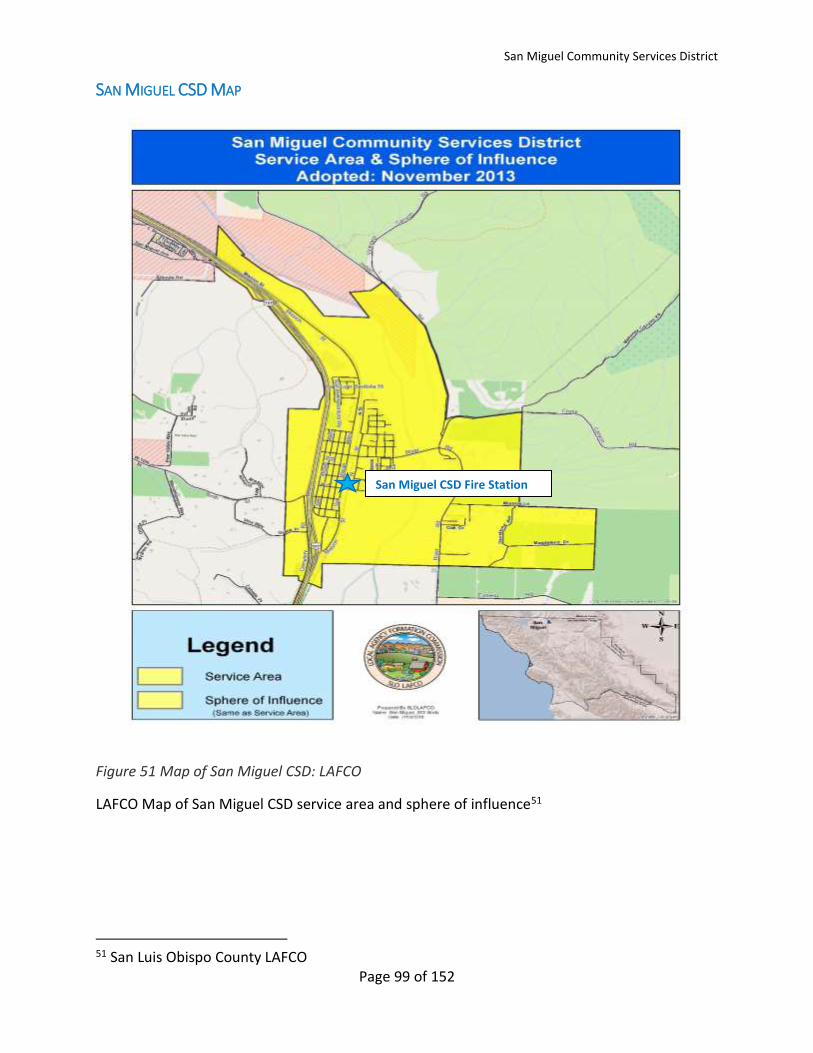
San Miguel Community Services District
Page 99 of 152
SAN MIGUEL CSD MAP
Figure 51 Map of San Miguel CSD: LAFCO
LAFCO Map of San Miguel CSD service area and sphere of influence51
51 San Luis Obispo County LAFCO
San Miguel CSD Fire Station
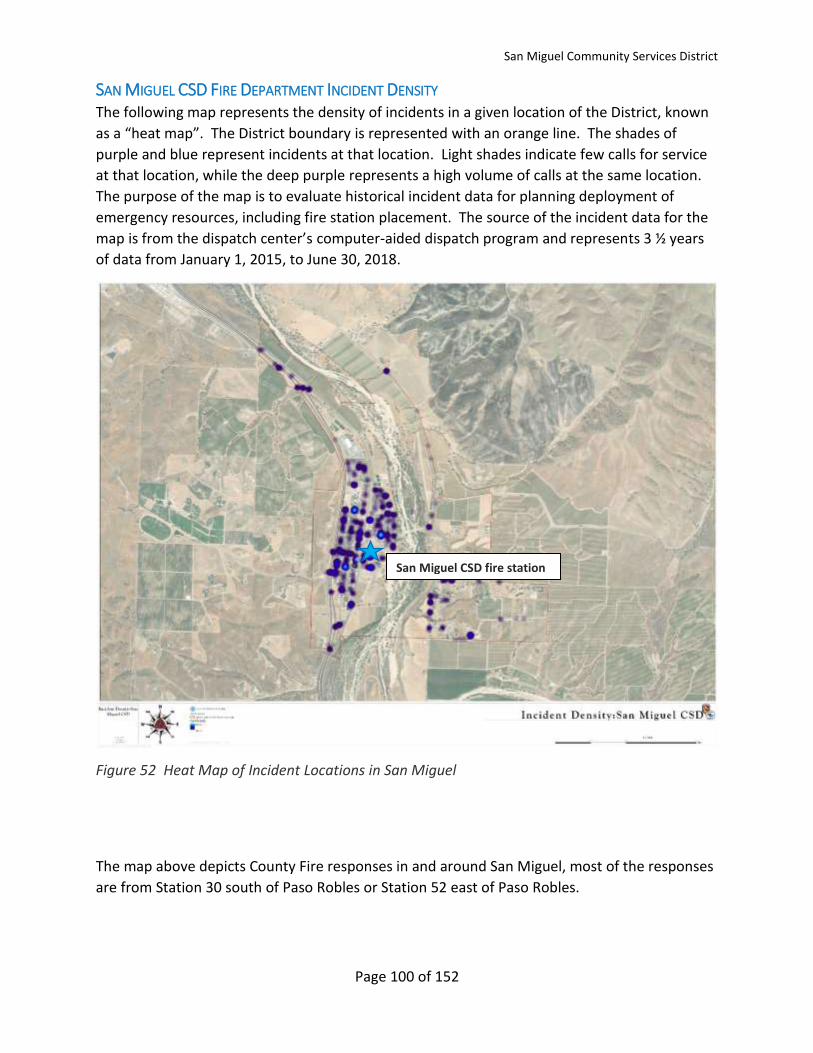
San Miguel Community Services District
Page 100 of 152
SAN MIGUEL CSD FIRE DEPARTMENT INCIDENT DENSITY The following map represents the density of incidents in a given location of the District, known
as a “heat map”. The District boundary is represented with an orange line. The shades of
purple and blue represent incidents at that location. Light shades indicate few calls for service
at that location, while the deep purple represents a high volume of calls at the same location.
The purpose of the map is to evaluate historical incident data for planning deployment of
emergency resources, including fire station placement. The source of the incident data for the
map is from the dispatch center’s computer-aided dispatch program and represents 3 ½ years
of data from January 1, 2015, to June 30, 2018.
Figure 52 Heat Map of Incident Locations in San Miguel
The map above depicts County Fire responses in and around San Miguel, most of the responses
are from Station 30 south of Paso Robles or Station 52 east of Paso Robles.
San Miguel CSD fire station

San Miguel Community Services District
Page 101 of 152
RESPONSE TIME ANALYSIS: SAN MIGUEL CSD
Figure 53 Response Times from San Miguel Fire Station
This map represents the response times from only the San Miguel CSD Fire Station on Mission
Street. SM CSD can cover 95% of the district in 7 minute response time, and 100% of the
district in less than 8 minutes.
The shaded green area represents a drive time of up to four (4) minutes, the blue shaded area
represents a drive time of over four (4) minutes and under five (5) minutes, while the yellow
shaded area represents a drive time of five (5) to twelve (12) minutes. In all cases, 3 minutes
are added for “reflex” time. Reflex time includes the time required to dispatch the call,
assemble the crew, don the appropriate gear for the response and get out the door. The
resulting total response times of seven, eight and fifteen minutes are based on industry
standards for levels of service and fire progression. While not absolute, these tools are
effective for planning purposes.
San Miguel CSD Fire Station
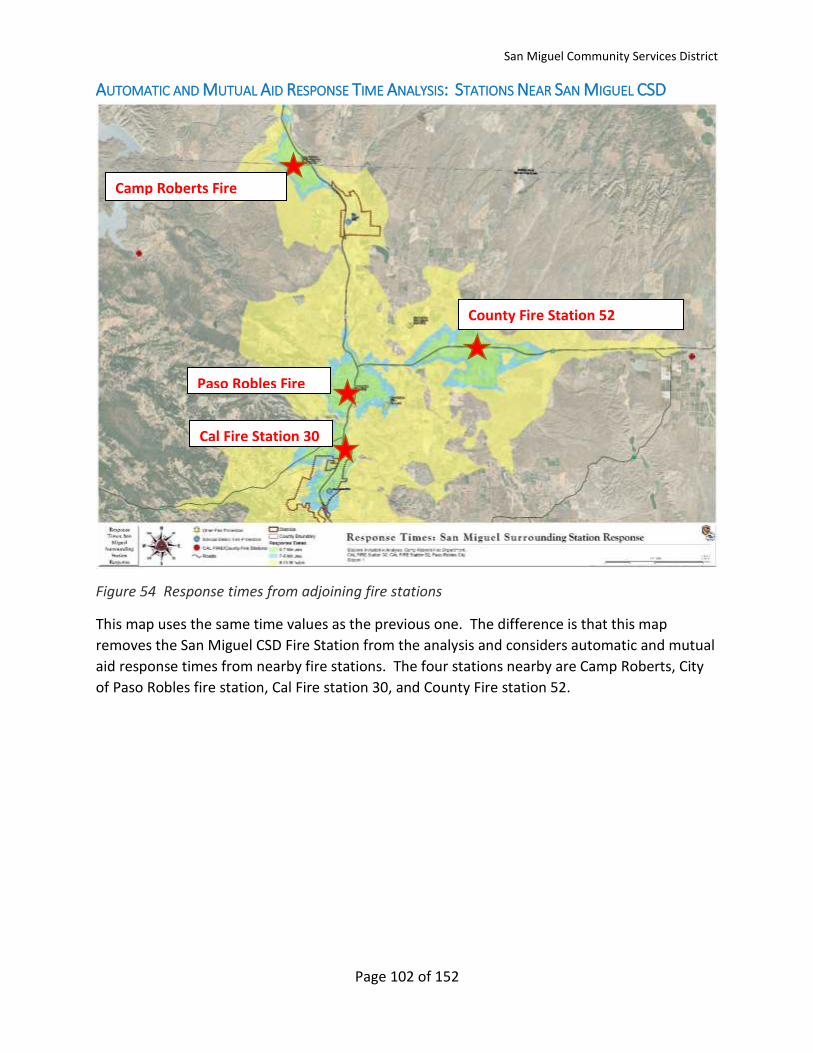
San Miguel Community Services District
Page 102 of 152
AUTOMATIC AND MUTUAL AID RESPONSE TIME ANALYSIS: STATIONS NEAR SAN MIGUEL CSD
Figure 54 Response times from adjoining fire stations
This map uses the same time values as the previous one. The difference is that this map
removes the San Miguel CSD Fire Station from the analysis and considers automatic and mutual
aid response times from nearby fire stations. The four stations nearby are Camp Roberts, City
of Paso Robles fire station, Cal Fire station 30, and County Fire station 52.
Cal Fire Station 30
30
Camp Roberts Fire
Station 16 Fire Station
County Fire Station 52
Paso Robles Fire
Station 30 30
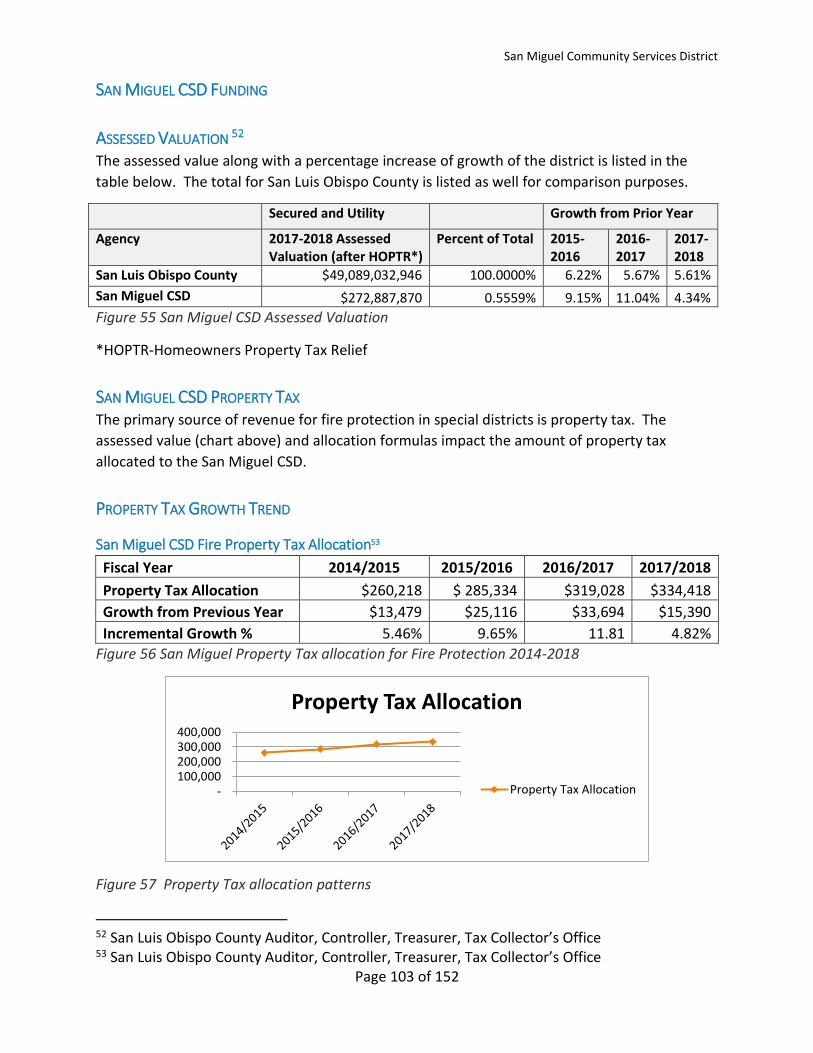
San Miguel Community Services District
Page 103 of 152
SAN MIGUEL CSD FUNDING
ASSESSED VALUATION 52 The assessed value along with a percentage increase of growth of the district is listed in the
table below. The total for San Luis Obispo County is listed as well for comparison purposes.
Secured and Utility Growth from Prior Year
Agency 2017-2018 Assessed Valuation (after HOPTR*)
Percent of Total 2015-2016
2016-2017
2017-2018
San Luis Obispo County $49,089,032,946 100.0000% 6.22% 5.67% 5.61%
San Miguel CSD $272,887,870 0.5559% 9.15% 11.04% 4.34%
Figure 55 San Miguel CSD Assessed Valuation
*HOPTR-Homeowners Property Tax Relief
SAN MIGUEL CSD PROPERTY TAX The primary source of revenue for fire protection in special districts is property tax. The
assessed value (chart above) and allocation formulas impact the amount of property tax
allocated to the San Miguel CSD.
PROPERTY TAX GROWTH TREND
San Miguel CSD Fire Property Tax Allocation53
Fiscal Year 2014/2015 2015/2016 2016/2017 2017/2018
Property Tax Allocation $260,218 $ 285,334 $319,028 $334,418
Growth from Previous Year $13,479 $25,116 $33,694 $15,390
Incremental Growth % 5.46% 9.65% 11.81 4.82%
Figure 56 San Miguel Property Tax allocation for Fire Protection 2014-2018
Figure 57 Property Tax allocation patterns
52 San Luis Obispo County Auditor, Controller, Treasurer, Tax Collector’s Office 53 San Luis Obispo County Auditor, Controller, Treasurer, Tax Collector’s Office
- 100,000 200,000 300,000 400,000
Property Tax Allocation
Property Tax Allocation
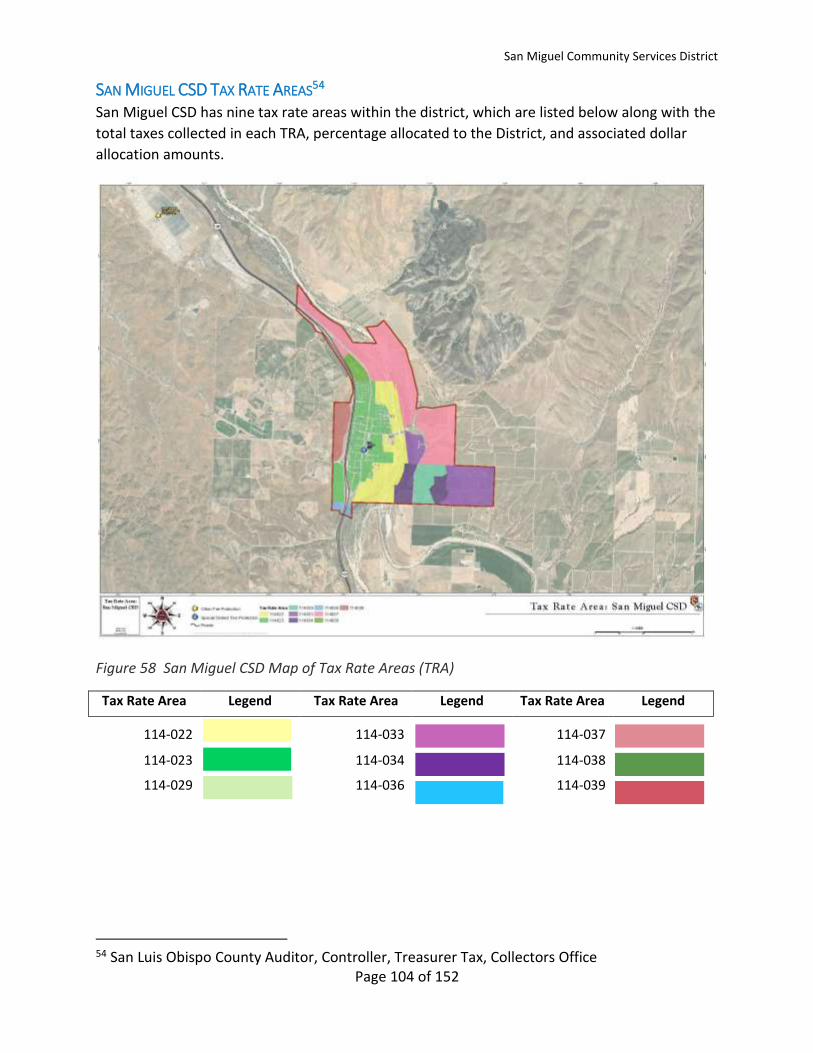
San Miguel Community Services District
Page 104 of 152
SAN MIGUEL CSD TAX RATE AREAS54 San Miguel CSD has nine tax rate areas within the district, which are listed below along with the
total taxes collected in each TRA, percentage allocated to the District, and associated dollar
allocation amounts.
Figure 58 San Miguel CSD Map of Tax Rate Areas (TRA)
Tax Rate Area Legend Tax Rate Area Legend Tax Rate Area Legend
114-022
114-033
114-037
114-023
114-034
114-038
114-029
114-036
114-039
54 San Luis Obispo County Auditor, Controller, Treasurer Tax, Collectors Office
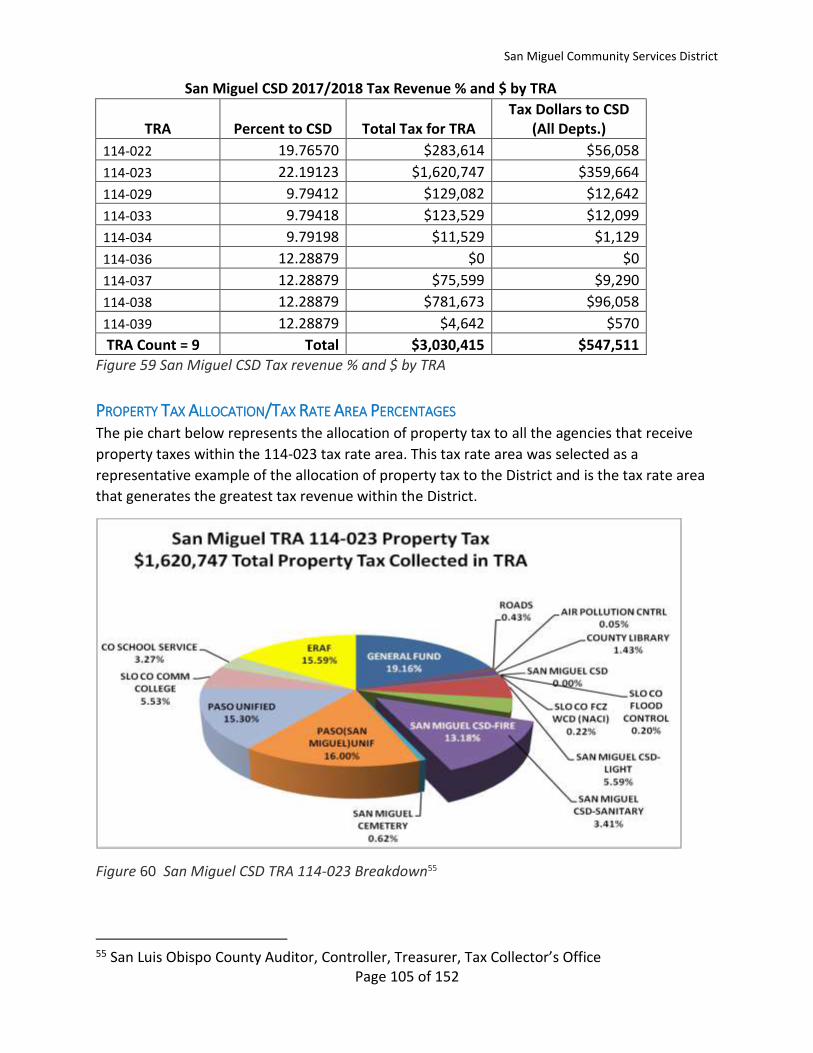
San Miguel Community Services District
Page 105 of 152
San Miguel CSD 2017/2018 Tax Revenue % and $ by TRA
TRA Percent to CSD Total Tax for TRA Tax Dollars to CSD
(All Depts.)
114-022 19.76570 $283,614 $56,058
114-023 22.19123 $1,620,747 $359,664
114-029 9.79412 $129,082 $12,642
114-033 9.79418 $123,529 $12,099
114-034 9.79198 $11,529 $1,129
114-036 12.28879 $0 $0
114-037 12.28879 $75,599 $9,290
114-038 12.28879 $781,673 $96,058
114-039 12.28879 $4,642 $570
TRA Count = 9 Total $3,030,415 $547,511
Figure 59 San Miguel CSD Tax revenue % and $ by TRA
PROPERTY TAX ALLOCATION/TAX RATE AREA PERCENTAGES The pie chart below represents the allocation of property tax to all the agencies that receive
property taxes within the 114-023 tax rate area. This tax rate area was selected as a
representative example of the allocation of property tax to the District and is the tax rate area
that generates the greatest tax revenue within the District.
Figure 60 San Miguel CSD TRA 114-023 Breakdown55
55 San Luis Obispo County Auditor, Controller, Treasurer, Tax Collector’s Office
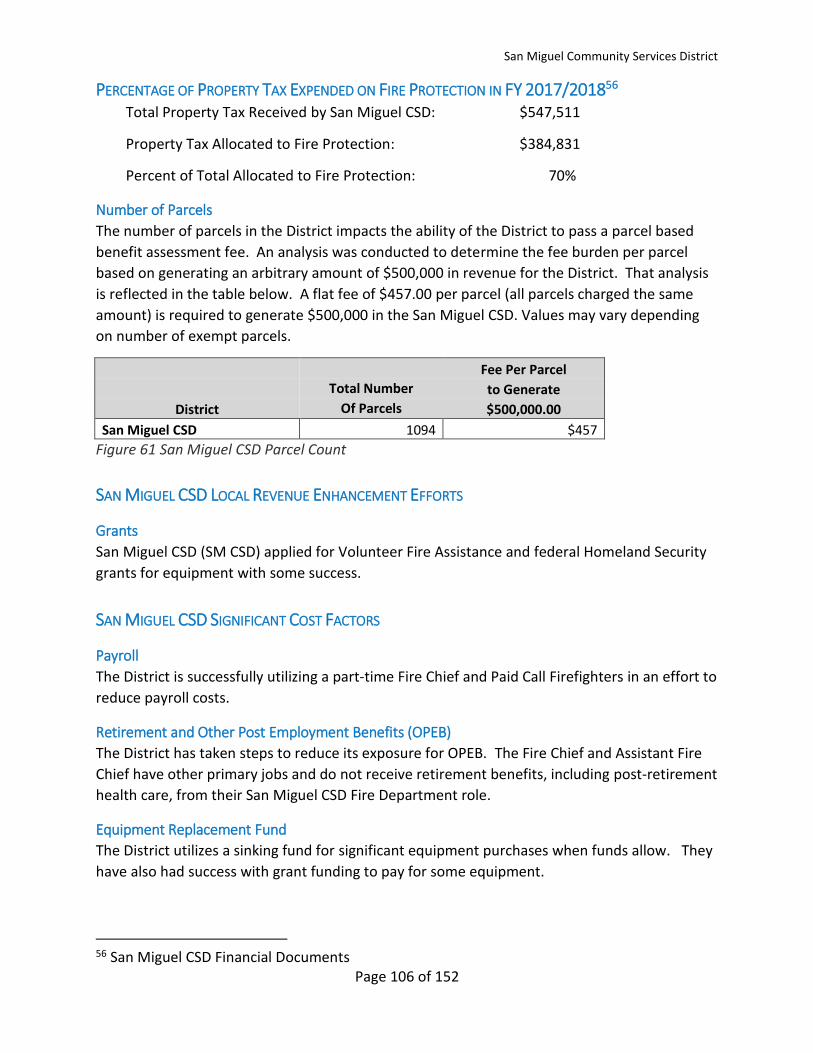
San Miguel Community Services District
Page 106 of 152
PERCENTAGE OF PROPERTY TAX EXPENDED ON FIRE PROTECTION IN FY 2017/201856 Total Property Tax Received by San Miguel CSD: $547,511
Property Tax Allocated to Fire Protection: $384,831
Percent of Total Allocated to Fire Protection: 70%
Number of Parcels
The number of parcels in the District impacts the ability of the District to pass a parcel based
benefit assessment fee. An analysis was conducted to determine the fee burden per parcel
based on generating an arbitrary amount of $500,000 in revenue for the District. That analysis
is reflected in the table below. A flat fee of $457.00 per parcel (all parcels charged the same
amount) is required to generate $500,000 in the San Miguel CSD. Values may vary depending
on number of exempt parcels.
Fee Per Parcel Total Number to Generate
District Of Parcels $500,000.00
San Miguel CSD 1094 $457 Figure 61 San Miguel CSD Parcel Count
SAN MIGUEL CSD LOCAL REVENUE ENHANCEMENT EFFORTS
Grants
San Miguel CSD (SM CSD) applied for Volunteer Fire Assistance and federal Homeland Security
grants for equipment with some success.
SAN MIGUEL CSD SIGNIFICANT COST FACTORS
Payroll
The District is successfully utilizing a part-time Fire Chief and Paid Call Firefighters in an effort to
reduce payroll costs.
Retirement and Other Post Employment Benefits (OPEB)
The District has taken steps to reduce its exposure for OPEB. The Fire Chief and Assistant Fire
Chief have other primary jobs and do not receive retirement benefits, including post-retirement
health care, from their San Miguel CSD Fire Department role.
Equipment Replacement Fund
The District utilizes a sinking fund for significant equipment purchases when funds allow. They
have also had success with grant funding to pay for some equipment.
56 San Miguel CSD Financial Documents

San Miguel Community Services District
Page 107 of 152
Workers’ Compensation
The District reported having no significant open workers’ compensation claims.
Liability
The District reported not have any pending lawsuits involving the fire department.
Facility Costs
San Miguel Fire Station is part of the administrative offices for the San Miguel CSD and appears
to be in good condition. San Miguel staff stated they are considering adding additional square
footage to either this building or a separate facility.
Further examination is required to determine if there are adequate spaces for on-duty crew.
SAN MIGUEL CSD FIRE DEPARTMENT BUDGET
Figure 62 San Miguel CSD Fire Budget 2014-2018
San Miguel Community Services District
Actual Revenue and Expenditures: Fire
As of 6/25/2018
2014/2015 2015/2016 2016/2017 2017/2018
Revenue
Property Tax 45,034 289,090 327,678 341,497
Benefit Assessment/Special Tax - - - -
Interest Revenue 425 - 304 249
Public Facility Fee-Fire 4,016 55,217 72,090 25,467
Weed Abatement Fees 1,788 1,646 1,097 -
Inspection Fees - - - -
Reimbursement for Mutual Aid 220,130 61,224 9,983 60,457
CDBG Grant - - 105,000 -
VFA Assistance Grant - 10,000 8,424 -
Ambulance Reimbursements 4,364 4,431 4,486 4,584
Other Revenue 5,983 2,897 37,538 4,336
Total Revenue 281,740 424,505 566,600 436,590
Expenditures
Salaries, Stipends and Benefits 46,996 119,000 143,852 218,584
Services and Supplies 93,990 232,563 83,185 154,347
Debt Payments - - - -
Capital Outlay 2,272 6,055 30,289 227,265
Other Expenses 30,789 - - -
Transfers Out (Veh. Rep/Equip) 71,395 - 88,150 -
Total Expenditures 245,442 357,618 345,476 600,196
San Miguel Community Services District
Page 108 of 152
SAN MIGUEL CSD FIRE DEPARTMENT STAFFING
CURRENT STAFFING: • 1 Fire Chief-Part Time
• 1 Assistant Chief-Part Time
• 2 PCF-Fire Captains
• 3 PCF- Engineer/Driver Operator
• 11 PCF
RECRUITMENT AND RETENTION • San Miguel actively recruits Paid Call Firefighters (PCF) with moderate success.
• There is a turnover of 2-3 PCFs per year (15-20% of 11 member PCF force).
• Some PCFs are deployed to summer seasonal firefighter jobs and are not available to
the CSD.
• Developing PCF fire officers (Asst. Chief and Captains) is difficult due to time and
experience requirements. If the fire department loses an experienced fire officer due to
work commitment or relocating from the area, it can take years to replace them.
• Out of district assignments (major fire mutual aid) can serve as a retention tool for
(PCFs) if they can be committed away from town for two weeks.
• Chief Roberson is a native of San Miguel and has a fulltime job outside of the district.
He is the Fire Chief for SM CSD, and also the Interim General Manager of SM CSD, which
is a significant commitment.
• Chief Roberson will retire in 5 years and does not have a community member identified
yet as his successor; hiring a career fire chief may exceed the available budget.
PROPOSED STAFFING Chief Roberson believes the current PCF model can operate for up to another 5 years. The
major concerns are:
• Incident activity exceeding 500 calls per year will cause a negative impact on
volunteer/PCF response.
• Community demographics being able to support recruitment of new PCFs due to
training and time commitments.
SAN MIGUEL CSD RESOURCE NEEDS SM CSD did not request a property tax transfer from SLO County.
SM CSD is interested in:
• Receiving additional automatic aid from County Fire
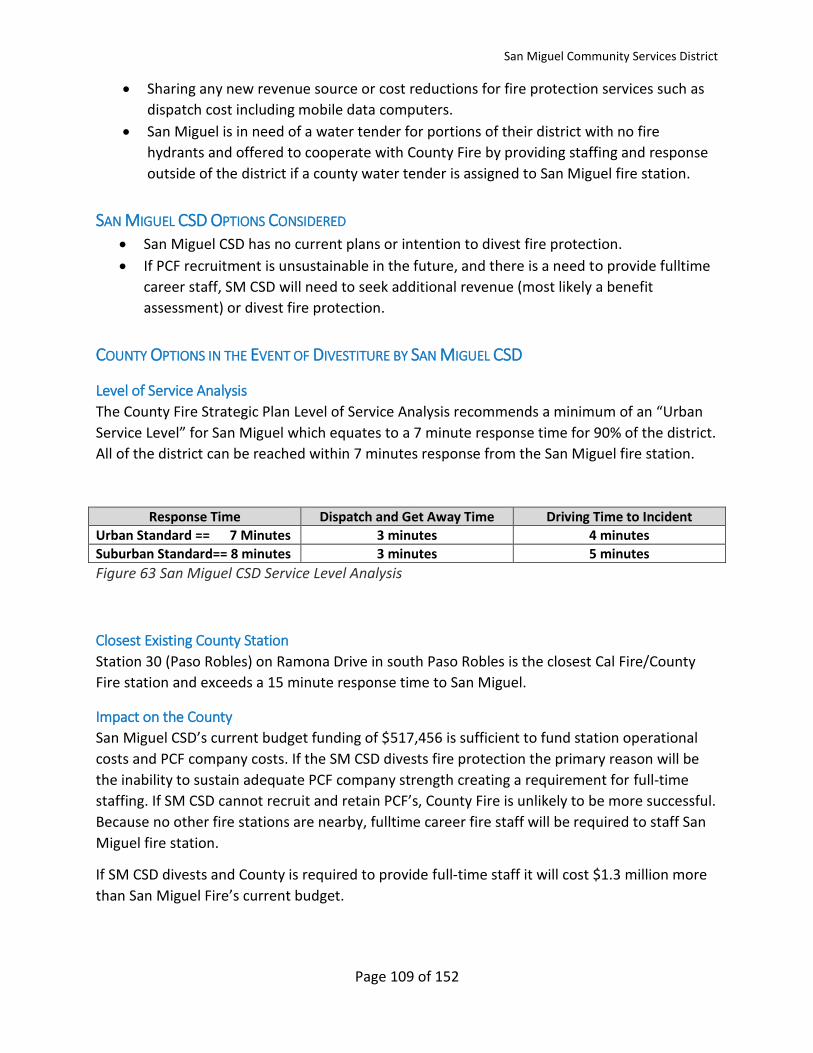
San Miguel Community Services District
Page 109 of 152
• Sharing any new revenue source or cost reductions for fire protection services such as
dispatch cost including mobile data computers.
• San Miguel is in need of a water tender for portions of their district with no fire
hydrants and offered to cooperate with County Fire by providing staffing and response
outside of the district if a county water tender is assigned to San Miguel fire station.
SAN MIGUEL CSD OPTIONS CONSIDERED • San Miguel CSD has no current plans or intention to divest fire protection.
• If PCF recruitment is unsustainable in the future, and there is a need to provide fulltime
career staff, SM CSD will need to seek additional revenue (most likely a benefit
assessment) or divest fire protection.
COUNTY OPTIONS IN THE EVENT OF DIVESTITURE BY SAN MIGUEL CSD
Level of Service Analysis
The County Fire Strategic Plan Level of Service Analysis recommends a minimum of an “Urban
Service Level” for San Miguel which equates to a 7 minute response time for 90% of the district.
All of the district can be reached within 7 minutes response from the San Miguel fire station.
Response Time Dispatch and Get Away Time Driving Time to Incident
Urban Standard == 7 Minutes 3 minutes 4 minutes
Suburban Standard== 8 minutes 3 minutes 5 minutes
Figure 63 San Miguel CSD Service Level Analysis
Closest Existing County Station
Station 30 (Paso Robles) on Ramona Drive in south Paso Robles is the closest Cal Fire/County
Fire station and exceeds a 15 minute response time to San Miguel.
Impact on the County
San Miguel CSD’s current budget funding of $517,456 is sufficient to fund station operational
costs and PCF company costs. If the SM CSD divests fire protection the primary reason will be
the inability to sustain adequate PCF company strength creating a requirement for full-time
staffing. If SM CSD cannot recruit and retain PCF’s, County Fire is unlikely to be more successful.
Because no other fire stations are nearby, fulltime career fire staff will be required to staff San
Miguel fire station.
If SM CSD divests and County is required to provide full-time staff it will cost $1.3 million more
than San Miguel Fire’s current budget.

San Miguel Community Services District
Page 110 of 152
COUNTY FIRE OPTIONS 2 Full-time firefighters on duty daily at San Miguel fire station:
County Fire can staff the San Miguel CSD Fire Station with 2 full-time firefighters on duty daily
with support by PCF’s for $ 1.3 million plus station operating expense. If current 2018-19 FY SM
CSD property tax funding allocation for fire ($347,000) is transferred to the County through
property tax exchange, there will still be insufficient funding for the fire station staffing and
operation.
The County will need to fund an additional annual $1.3 million for full-time staffing in addition
to the current $347,000 district property tax allocation.
Page 111 of 152
SANTA MARGARITA FIRE PROTECTION DISTRICT
KEY FINDINGS 1. Santa Margarita FPD believes they can sustain their current fire protection service model for five
years, but the future of the service is unclear after that. 2. The District reports success with recruiting and retaining paid call firefighters (PCF) with a current
roster of eight active and goal of ten active PCF. 3. Sustainability of the current staffing model for the next five years is predicated on the ability to recruit
and retain PCF and develop experienced PCF staff into fire officers. 4. As a result of low revenue amounts, the District’s budget falls short of revenue necessary to fund
equipment replacement and replacement facility costs 5. The District has utilized grants and donations extensively for support equipment procurement and
operations. 6. The District has a low comparative assessed value and a small number of parcels, resulting in slow
growth of revenue and limited revenue generation through benefit assessment. 7. The District’s sphere of influence is the same as the existing boundary and the District is surrounded
by a single property owner (Santa Margarita Ranch), which is outside of the sphere of influence. 8. Santa Margarita’s fire station has flooded in the past and they report that it is inadequate to support
District operations. 9. Santa Margarita FPD is planning on building a new fire station on a lot owned by the District. 10. The District has approximately $100,000 set aside, but the funding gap is substantial for the multi-
million dollar cost to build a fire station that meets essential services standards. 11. County Fire Strategic Plan identifies the need to relocate County Engine 40 to Garden Farms or Santa
Margarita. 12. One option for the County is a joint fire station between the District and County Fire. Best
government practices would suggest that a cooperative approach in a joint fire station is more efficient than duplicating expensive construction projects.
13. If Santa Margarita FPD dissolves, priority should be given to expediting the relocation of Engine 40 to a new facility in Santa Margarita or Garden Farms.
14. The District did not have a specific request of the County but would like to share in any revenue enhancements opportunities and/or would like to have the County cover some costs, such as dispatch service costs.
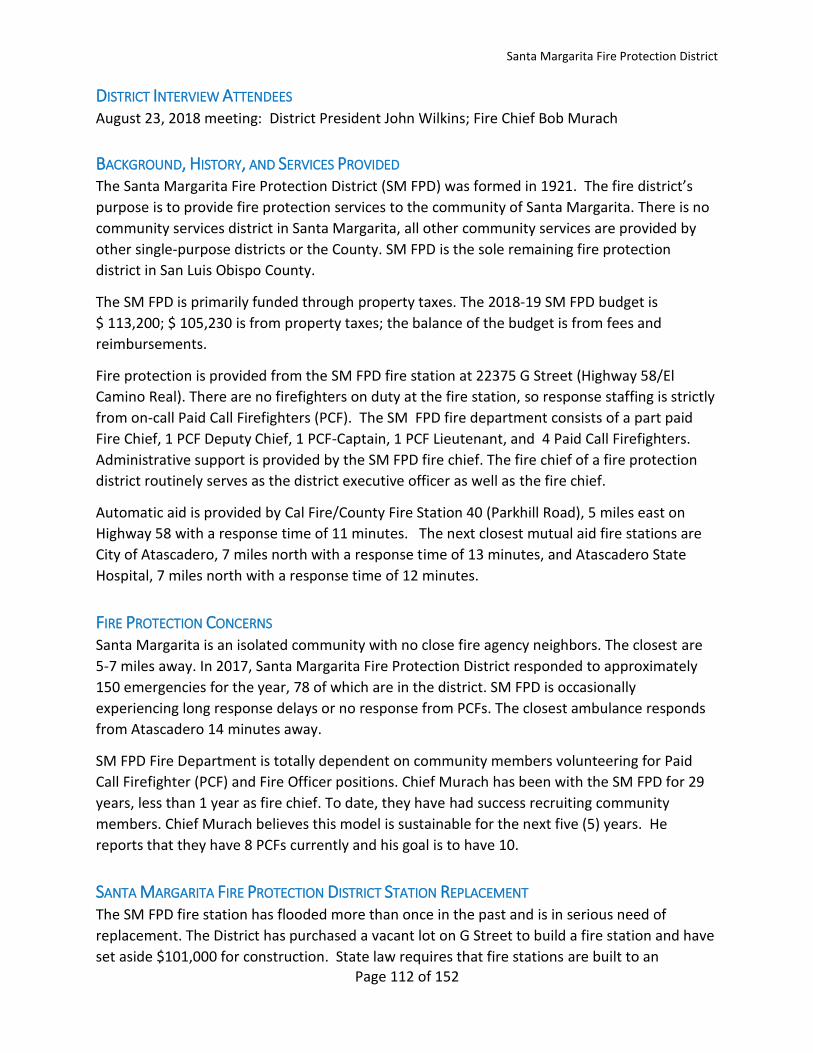
Santa Margarita Fire Protection District
Page 112 of 152
DISTRICT INTERVIEW ATTENDEES August 23, 2018 meeting: District President John Wilkins; Fire Chief Bob Murach
BACKGROUND, HISTORY, AND SERVICES PROVIDED The Santa Margarita Fire Protection District (SM FPD) was formed in 1921. The fire district’s
purpose is to provide fire protection services to the community of Santa Margarita. There is no
community services district in Santa Margarita, all other community services are provided by
other single-purpose districts or the County. SM FPD is the sole remaining fire protection
district in San Luis Obispo County.
The SM FPD is primarily funded through property taxes. The 2018-19 SM FPD budget is
$ 113,200; $ 105,230 is from property taxes; the balance of the budget is from fees and
reimbursements.
Fire protection is provided from the SM FPD fire station at 22375 G Street (Highway 58/El
Camino Real). There are no firefighters on duty at the fire station, so response staffing is strictly
from on-call Paid Call Firefighters (PCF). The SM FPD fire department consists of a part paid
Fire Chief, 1 PCF Deputy Chief, 1 PCF-Captain, 1 PCF Lieutenant, and 4 Paid Call Firefighters.
Administrative support is provided by the SM FPD fire chief. The fire chief of a fire protection
district routinely serves as the district executive officer as well as the fire chief.
Automatic aid is provided by Cal Fire/County Fire Station 40 (Parkhill Road), 5 miles east on
Highway 58 with a response time of 11 minutes. The next closest mutual aid fire stations are
City of Atascadero, 7 miles north with a response time of 13 minutes, and Atascadero State
Hospital, 7 miles north with a response time of 12 minutes.
FIRE PROTECTION CONCERNS Santa Margarita is an isolated community with no close fire agency neighbors. The closest are
5-7 miles away. In 2017, Santa Margarita Fire Protection District responded to approximately
150 emergencies for the year, 78 of which are in the district. SM FPD is occasionally
experiencing long response delays or no response from PCFs. The closest ambulance responds
from Atascadero 14 minutes away.
SM FPD Fire Department is totally dependent on community members volunteering for Paid
Call Firefighter (PCF) and Fire Officer positions. Chief Murach has been with the SM FPD for 29
years, less than 1 year as fire chief. To date, they have had success recruiting community
members. Chief Murach believes this model is sustainable for the next five (5) years. He
reports that they have 8 PCFs currently and his goal is to have 10.
SANTA MARGARITA FIRE PROTECTION DISTRICT STATION REPLACEMENT The SM FPD fire station has flooded more than once in the past and is in serious need of
replacement. The District has purchased a vacant lot on G Street to build a fire station and have
set aside $101,000 for construction. State law requires that fire stations are built to an
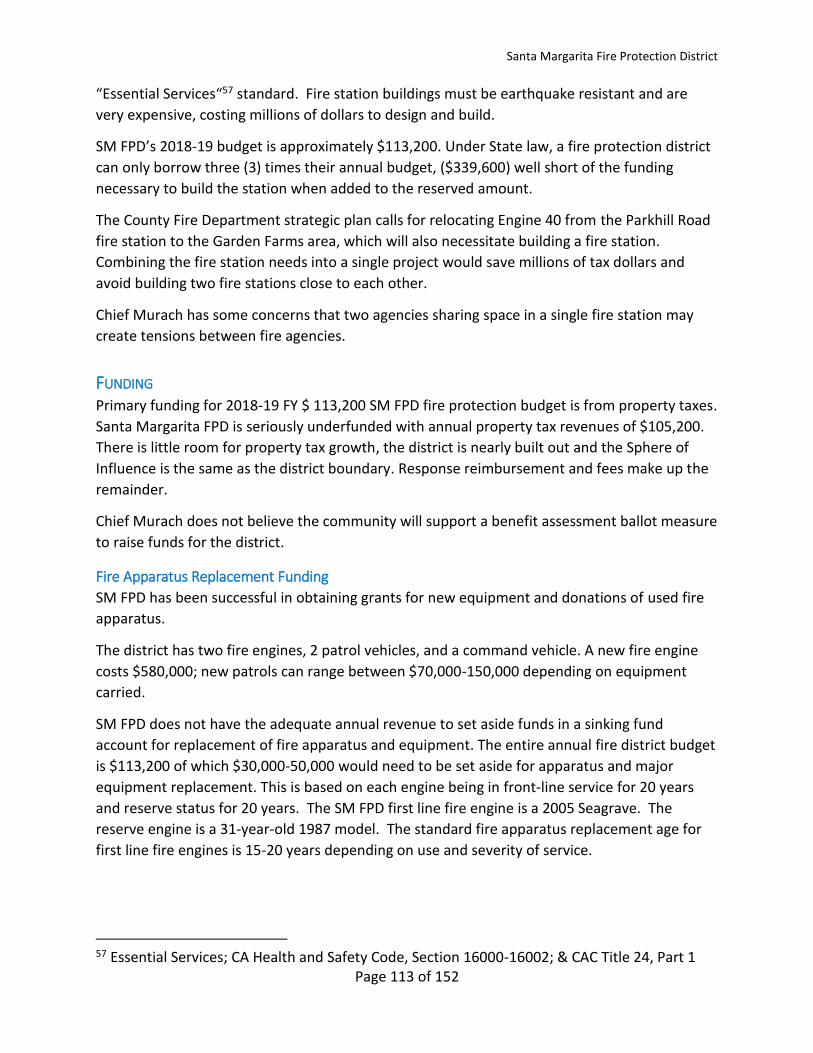
Santa Margarita Fire Protection District
Page 113 of 152
“Essential Services“57 standard. Fire station buildings must be earthquake resistant and are
very expensive, costing millions of dollars to design and build.
SM FPD’s 2018-19 budget is approximately $113,200. Under State law, a fire protection district
can only borrow three (3) times their annual budget, ($339,600) well short of the funding
necessary to build the station when added to the reserved amount.
The County Fire Department strategic plan calls for relocating Engine 40 from the Parkhill Road
fire station to the Garden Farms area, which will also necessitate building a fire station.
Combining the fire station needs into a single project would save millions of tax dollars and
avoid building two fire stations close to each other.
Chief Murach has some concerns that two agencies sharing space in a single fire station may
create tensions between fire agencies.
FUNDING Primary funding for 2018-19 FY $ 113,200 SM FPD fire protection budget is from property taxes.
Santa Margarita FPD is seriously underfunded with annual property tax revenues of $105,200.
There is little room for property tax growth, the district is nearly built out and the Sphere of
Influence is the same as the district boundary. Response reimbursement and fees make up the
remainder.
Chief Murach does not believe the community will support a benefit assessment ballot measure
to raise funds for the district.
Fire Apparatus Replacement Funding
SM FPD has been successful in obtaining grants for new equipment and donations of used fire
apparatus.
The district has two fire engines, 2 patrol vehicles, and a command vehicle. A new fire engine
costs $580,000; new patrols can range between $70,000-150,000 depending on equipment
carried.
SM FPD does not have the adequate annual revenue to set aside funds in a sinking fund
account for replacement of fire apparatus and equipment. The entire annual fire district budget
is $113,200 of which $30,000-50,000 would need to be set aside for apparatus and major
equipment replacement. This is based on each engine being in front-line service for 20 years
and reserve status for 20 years. The SM FPD first line fire engine is a 2005 Seagrave. The
reserve engine is a 31-year-old 1987 model. The standard fire apparatus replacement age for
first line fire engines is 15-20 years depending on use and severity of service.
57 Essential Services; CA Health and Safety Code, Section 16000-16002; & CAC Title 24, Part 1

Santa Margarita Fire Protection District
Page 114 of 152
REQUEST FROM COUNTY SM FPD did not request a property tax transfer from SLO County; however, they are interested
in continuing to receive automatic aid from County Fire. They are also interested in sharing any
new revenue source or cost reductions for fire protection services such as dispatch cost.
SANTA MARGARITA UNIQUE RISKS AND HAZARDS The Union Pacific railroad runs through Santa Margarita and presents unique training
requirements for rail and passenger emergencies.
Highway 58 is the main street of Santa Margarita.
Highway 101 also passes adjacent to the community and results in frequent vehicle accidents
that SM FPD responds to under automatic aid with County Fire.
Specialized training and equipment are required to respond to these hazards.
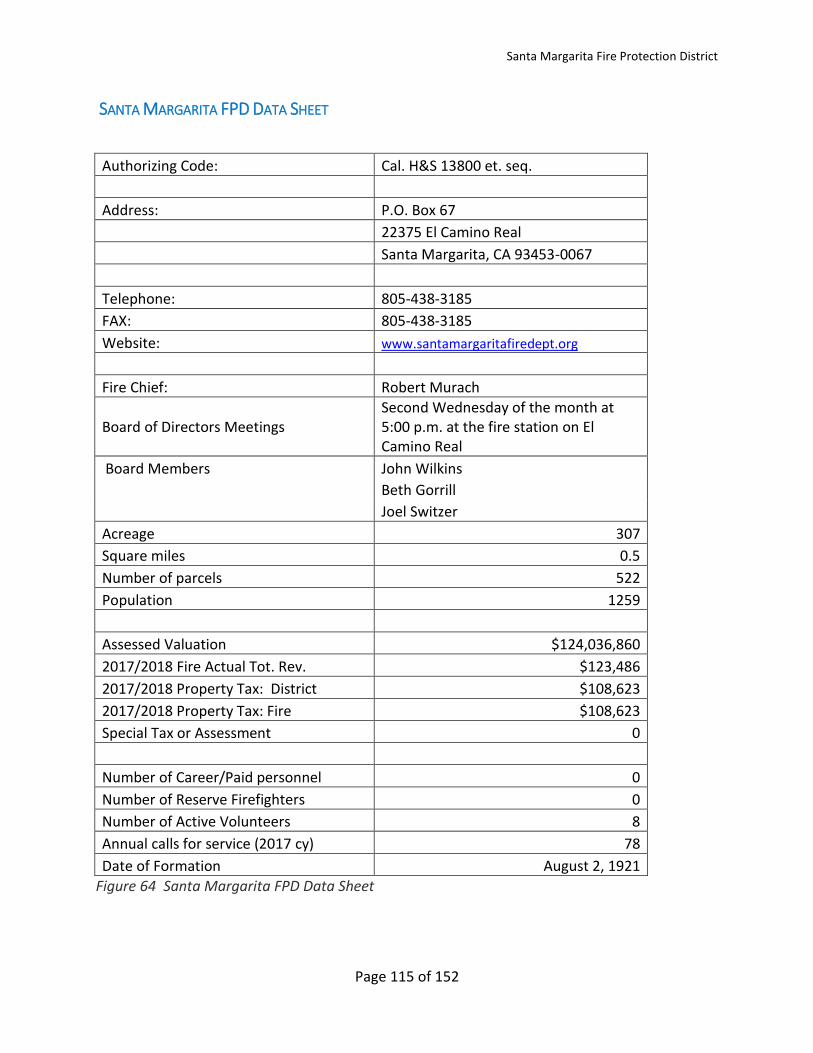
Santa Margarita Fire Protection District
Page 115 of 152
SANTA MARGARITA FPD DATA SHEET
Authorizing Code: Cal. H&S 13800 et. seq.
Address: P.O. Box 67
22375 El Camino Real
Santa Margarita, CA 93453-0067
Telephone: 805-438-3185
FAX: 805-438-3185
Website: www.santamargaritafiredept.org
Fire Chief: Robert Murach
Board of Directors Meetings Second Wednesday of the month at 5:00 p.m. at the fire station on El Camino Real
Board Members John Wilkins
Beth Gorrill
Joel Switzer
Acreage 307
Square miles 0.5
Number of parcels 522
Population 1259
Assessed Valuation $124,036,860
2017/2018 Fire Actual Tot. Rev. $123,486
2017/2018 Property Tax: District $108,623
2017/2018 Property Tax: Fire $108,623
Special Tax or Assessment 0
Number of Career/Paid personnel 0
Number of Reserve Firefighters 0
Number of Active Volunteers 8
Annual calls for service (2017 cy) 78
Date of Formation August 2, 1921
Figure 64 Santa Margarita FPD Data Sheet
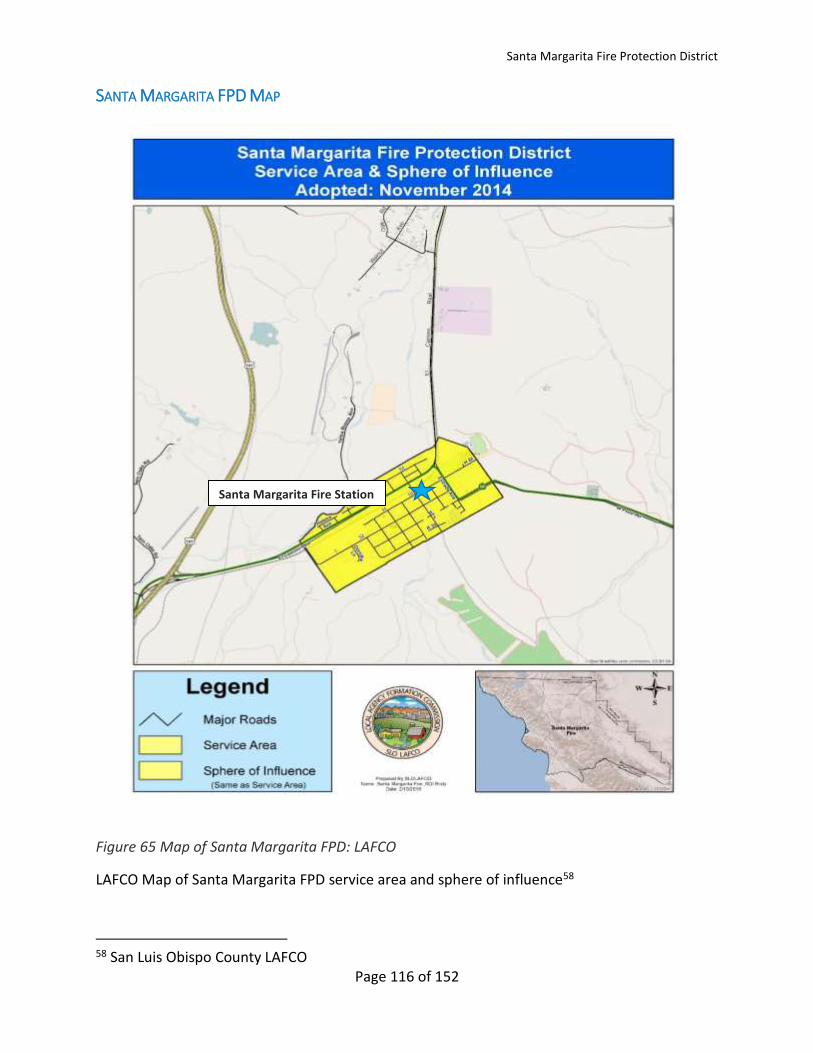
Santa Margarita Fire Protection District
Page 116 of 152
SANTA MARGARITA FPD MAP
Figure 65 Map of Santa Margarita FPD: LAFCO
LAFCO Map of Santa Margarita FPD service area and sphere of influence58
58 San Luis Obispo County LAFCO
Santa Margarita Fire Station
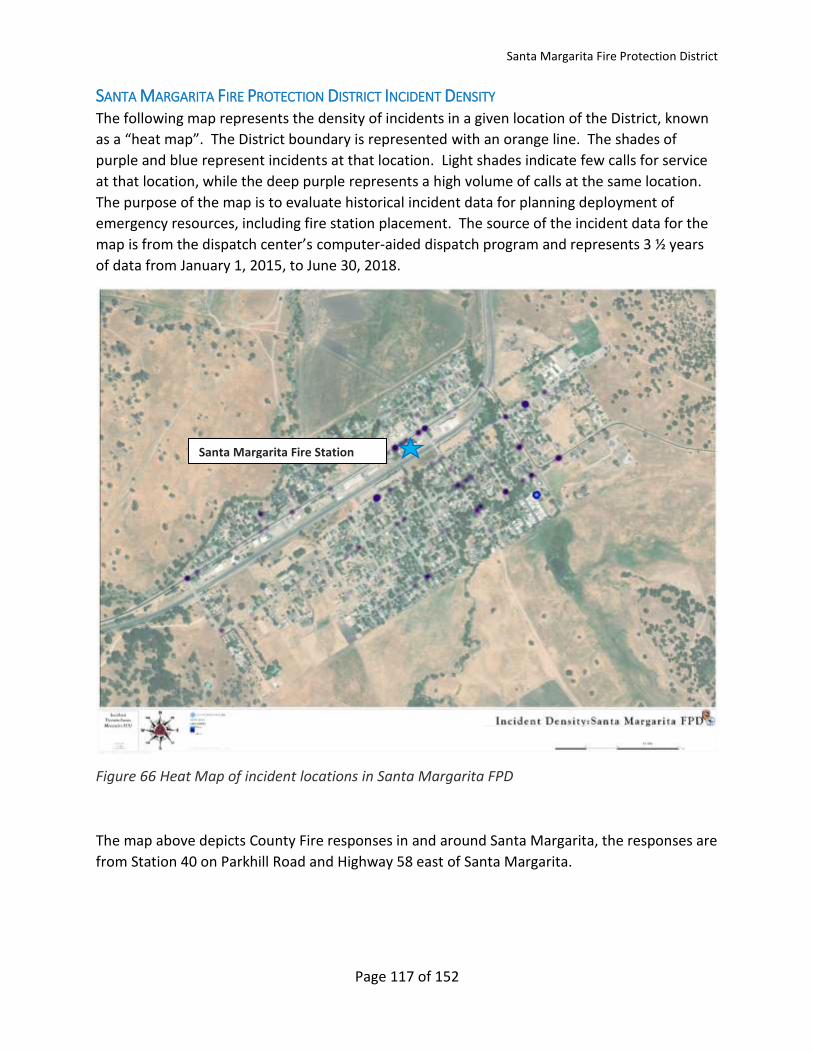
Santa Margarita Fire Protection District
Page 117 of 152
SANTA MARGARITA FIRE PROTECTION DISTRICT INCIDENT DENSITY The following map represents the density of incidents in a given location of the District, known
as a “heat map”. The District boundary is represented with an orange line. The shades of
purple and blue represent incidents at that location. Light shades indicate few calls for service
at that location, while the deep purple represents a high volume of calls at the same location.
The purpose of the map is to evaluate historical incident data for planning deployment of
emergency resources, including fire station placement. The source of the incident data for the
map is from the dispatch center’s computer-aided dispatch program and represents 3 ½ years
of data from January 1, 2015, to June 30, 2018.
Figure 66 Heat Map of incident locations in Santa Margarita FPD
The map above depicts County Fire responses in and around Santa Margarita, the responses are
from Station 40 on Parkhill Road and Highway 58 east of Santa Margarita.
Santa Margarita Fire Station
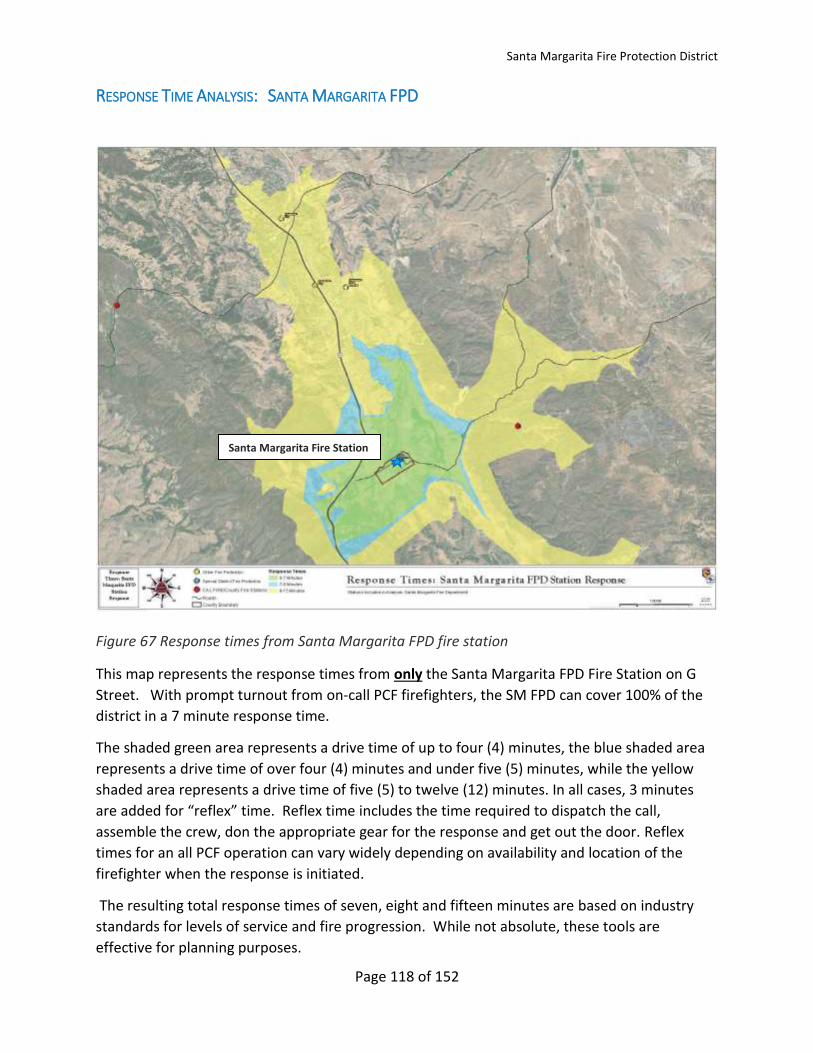
Santa Margarita Fire Protection District
Page 118 of 152
RESPONSE TIME ANALYSIS: SANTA MARGARITA FPD
Figure 67 Response times from Santa Margarita FPD fire station
This map represents the response times from only the Santa Margarita FPD Fire Station on G
Street. With prompt turnout from on-call PCF firefighters, the SM FPD can cover 100% of the
district in a 7 minute response time.
The shaded green area represents a drive time of up to four (4) minutes, the blue shaded area
represents a drive time of over four (4) minutes and under five (5) minutes, while the yellow
shaded area represents a drive time of five (5) to twelve (12) minutes. In all cases, 3 minutes
are added for “reflex” time. Reflex time includes the time required to dispatch the call,
assemble the crew, don the appropriate gear for the response and get out the door. Reflex
times for an all PCF operation can vary widely depending on availability and location of the
firefighter when the response is initiated.
The resulting total response times of seven, eight and fifteen minutes are based on industry
standards for levels of service and fire progression. While not absolute, these tools are
effective for planning purposes.
Santa Margarita Fire Station
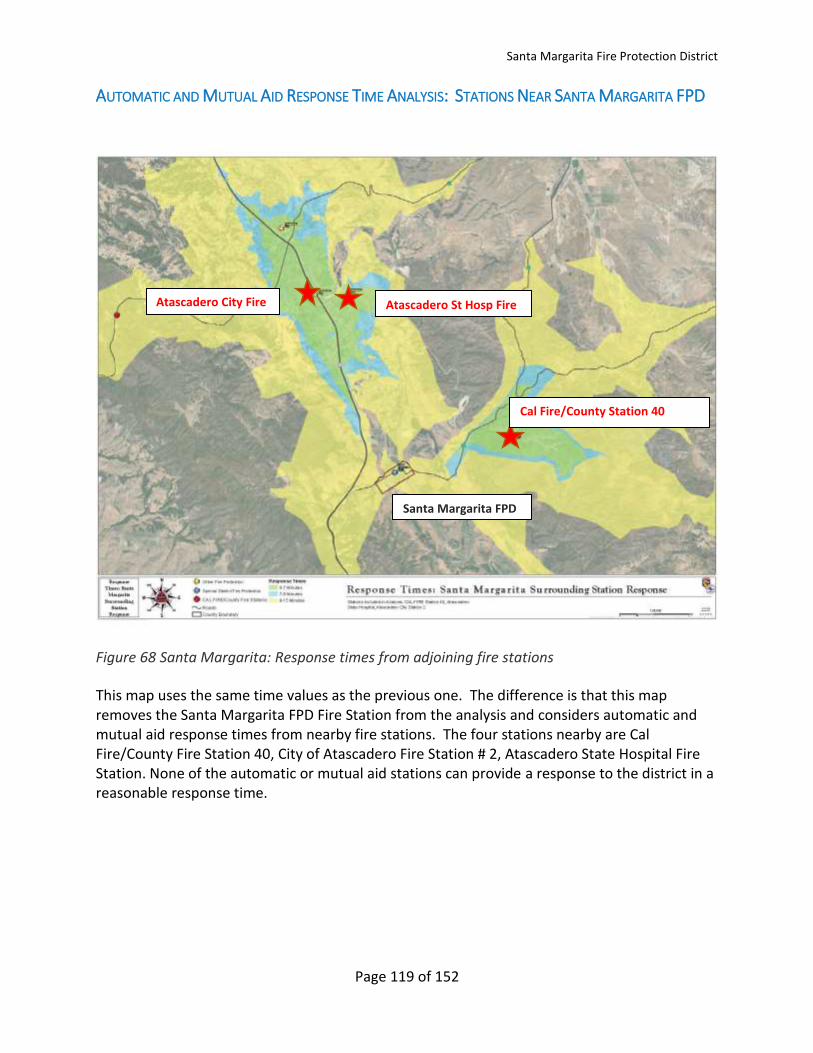
Santa Margarita Fire Protection District
Page 119 of 152
AUTOMATIC AND MUTUAL AID RESPONSE TIME ANALYSIS: STATIONS NEAR SANTA MARGARITA FPD
Figure 68 Santa Margarita: Response times from adjoining fire stations
This map uses the same time values as the previous one. The difference is that this map removes the Santa Margarita FPD Fire Station from the analysis and considers automatic and mutual aid response times from nearby fire stations. The four stations nearby are Cal Fire/County Fire Station 40, City of Atascadero Fire Station # 2, Atascadero State Hospital Fire Station. None of the automatic or mutual aid stations can provide a response to the district in a reasonable response time.
Atascadero St Hosp Fire
Cal Fire/County Station 40
Atascadero City Fire
Santa Margarita FPD
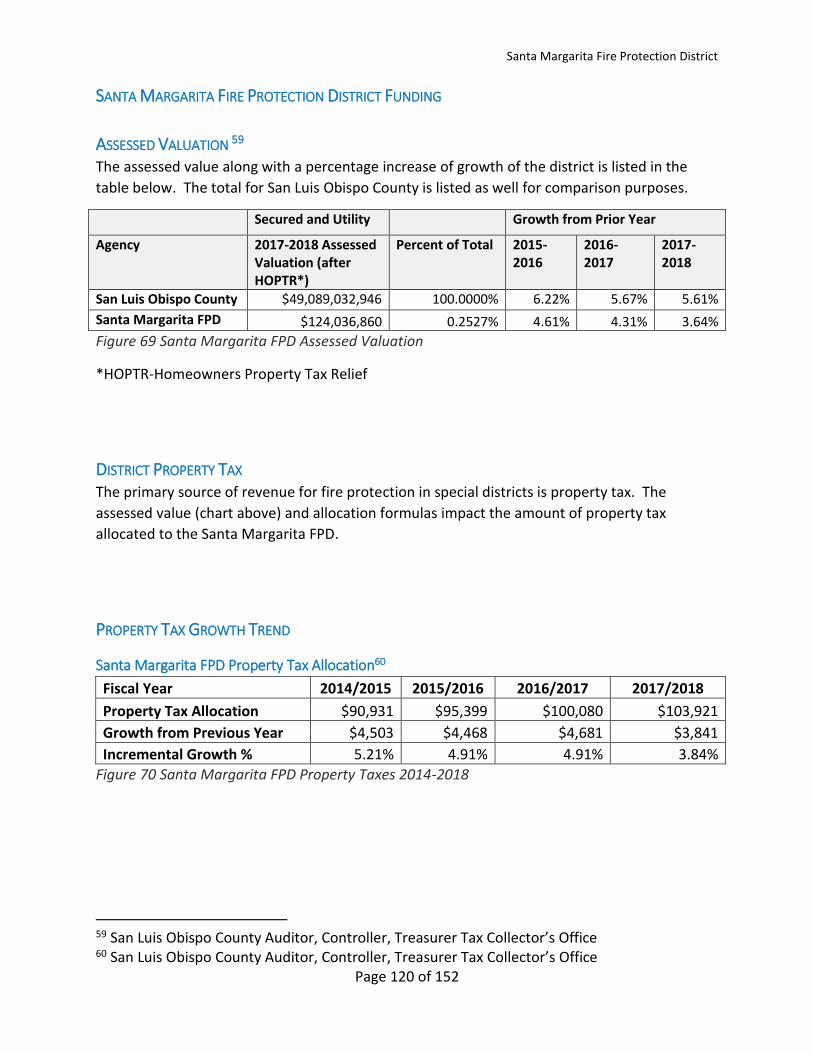
Santa Margarita Fire Protection District
Page 120 of 152
SANTA MARGARITA FIRE PROTECTION DISTRICT FUNDING
ASSESSED VALUATION 59 The assessed value along with a percentage increase of growth of the district is listed in the
table below. The total for San Luis Obispo County is listed as well for comparison purposes.
Secured and Utility Growth from Prior Year
Agency 2017-2018 Assessed Valuation (after HOPTR*)
Percent of Total 2015-2016
2016-2017
2017-2018
San Luis Obispo County $49,089,032,946 100.0000% 6.22% 5.67% 5.61%
Santa Margarita FPD $124,036,860 0.2527% 4.61% 4.31% 3.64%
Figure 69 Santa Margarita FPD Assessed Valuation
*HOPTR-Homeowners Property Tax Relief
DISTRICT PROPERTY TAX The primary source of revenue for fire protection in special districts is property tax. The
assessed value (chart above) and allocation formulas impact the amount of property tax
allocated to the Santa Margarita FPD.
PROPERTY TAX GROWTH TREND
Santa Margarita FPD Property Tax Allocation60
Fiscal Year 2014/2015 2015/2016 2016/2017 2017/2018
Property Tax Allocation $90,931 $95,399 $100,080 $103,921
Growth from Previous Year $4,503 $4,468 $4,681 $3,841
Incremental Growth % 5.21% 4.91% 4.91% 3.84%
Figure 70 Santa Margarita FPD Property Taxes 2014-2018
59 San Luis Obispo County Auditor, Controller, Treasurer Tax Collector’s Office 60 San Luis Obispo County Auditor, Controller, Treasurer Tax Collector’s Office
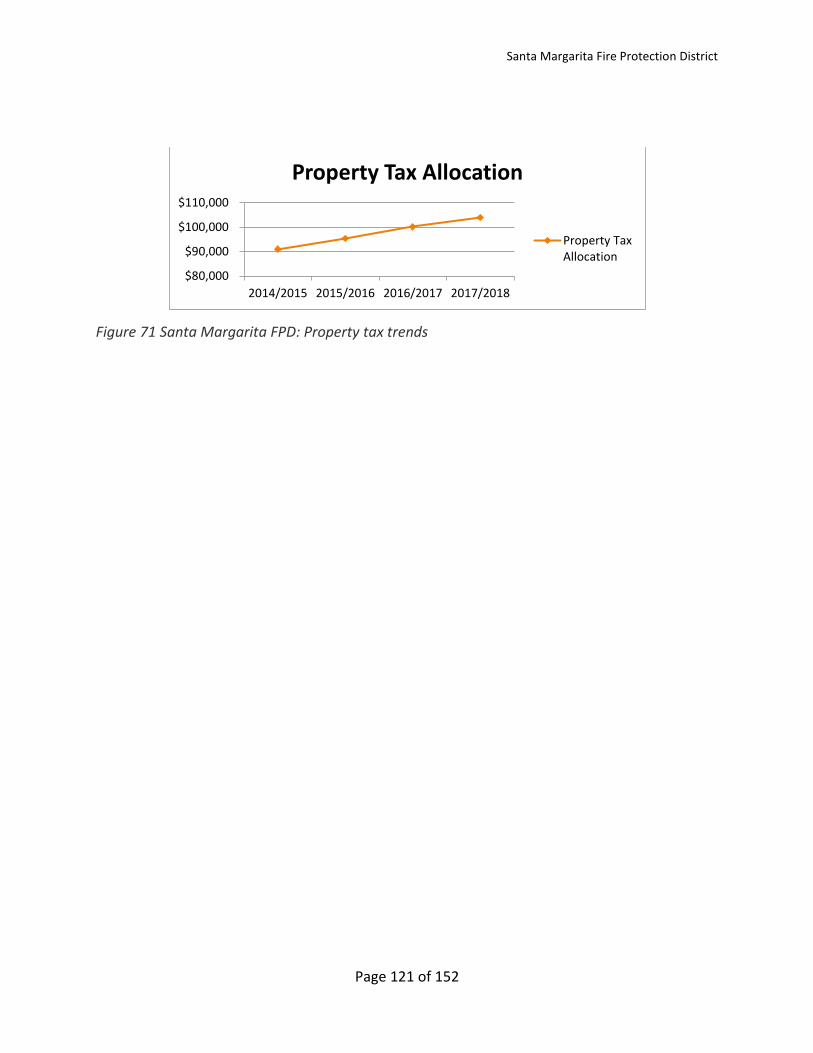
Santa Margarita Fire Protection District
Page 121 of 152
Figure 71 Santa Margarita FPD: Property tax trends
$80,000
$90,000
$100,000
$110,000
2014/2015 2015/2016 2016/2017 2017/2018
Property Tax Allocation
Property TaxAllocation
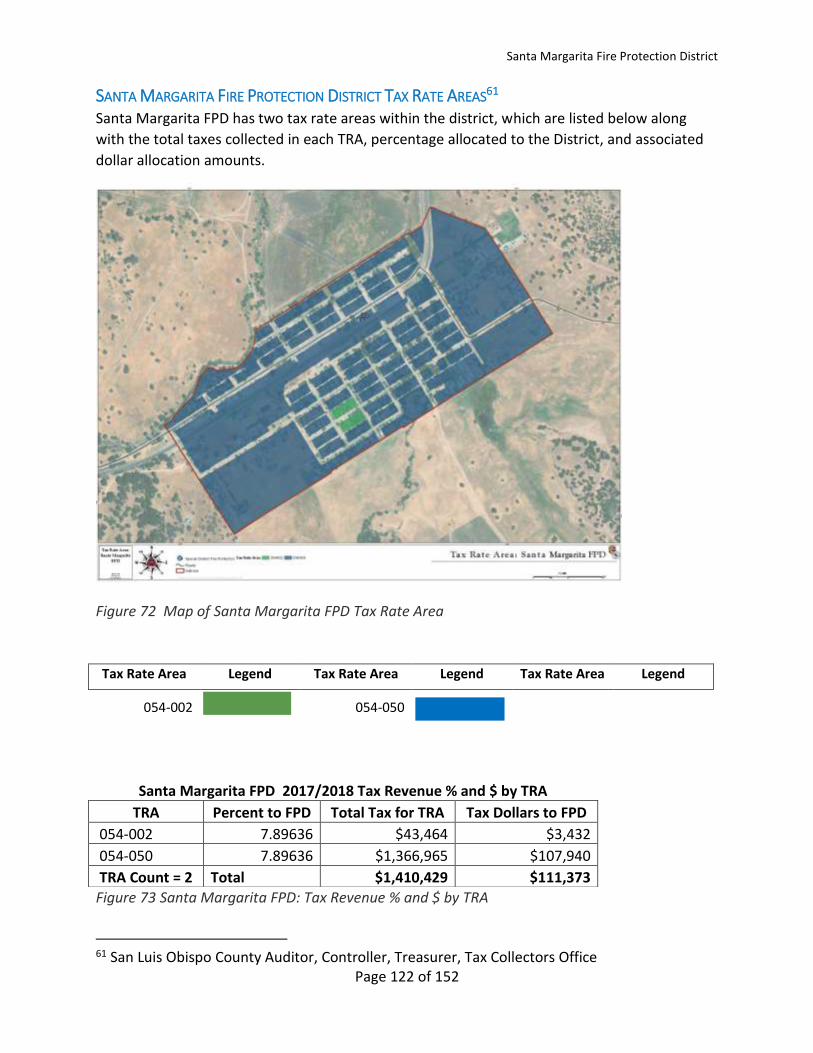
Santa Margarita Fire Protection District
Page 122 of 152
SANTA MARGARITA FIRE PROTECTION DISTRICT TAX RATE AREAS61 Santa Margarita FPD has two tax rate areas within the district, which are listed below along
with the total taxes collected in each TRA, percentage allocated to the District, and associated
dollar allocation amounts.
Figure 72 Map of Santa Margarita FPD Tax Rate Area
Tax Rate Area Legend Tax Rate Area Legend Tax Rate Area Legend
054-002
054-050
61 San Luis Obispo County Auditor, Controller, Treasurer, Tax Collectors Office
Santa Margarita FPD 2017/2018 Tax Revenue % and $ by TRA
TRA Percent to FPD Total Tax for TRA Tax Dollars to FPD
054-002 7.89636 $43,464 $3,432
054-050 7.89636 $1,366,965 $107,940
TRA Count = 2 Total $1,410,429 $111,373
Figure 73 Santa Margarita FPD: Tax Revenue % and $ by TRA
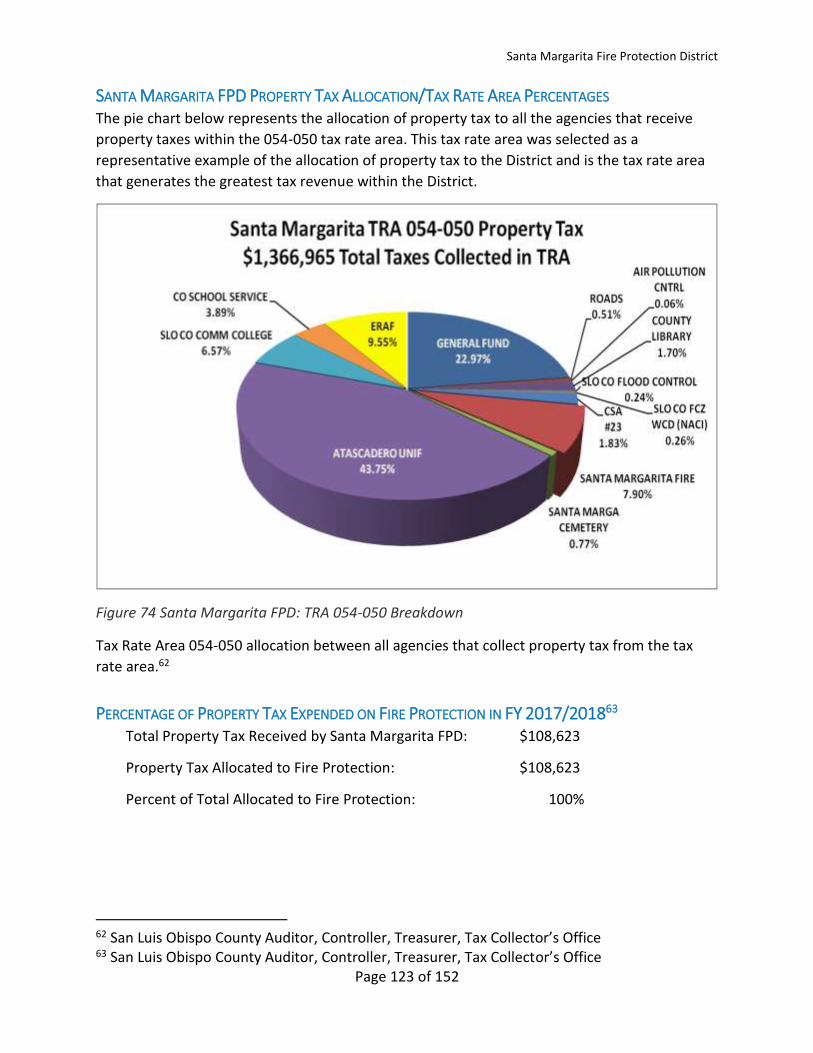
Santa Margarita Fire Protection District
Page 123 of 152
SANTA MARGARITA FPD PROPERTY TAX ALLOCATION/TAX RATE AREA PERCENTAGES The pie chart below represents the allocation of property tax to all the agencies that receive
property taxes within the 054-050 tax rate area. This tax rate area was selected as a
representative example of the allocation of property tax to the District and is the tax rate area
that generates the greatest tax revenue within the District.
Figure 74 Santa Margarita FPD: TRA 054-050 Breakdown
Tax Rate Area 054-050 allocation between all agencies that collect property tax from the tax
rate area.62
PERCENTAGE OF PROPERTY TAX EXPENDED ON FIRE PROTECTION IN FY 2017/201863 Total Property Tax Received by Santa Margarita FPD: $108,623
Property Tax Allocated to Fire Protection: $108,623
Percent of Total Allocated to Fire Protection: 100%
62 San Luis Obispo County Auditor, Controller, Treasurer, Tax Collector’s Office 63 San Luis Obispo County Auditor, Controller, Treasurer, Tax Collector’s Office
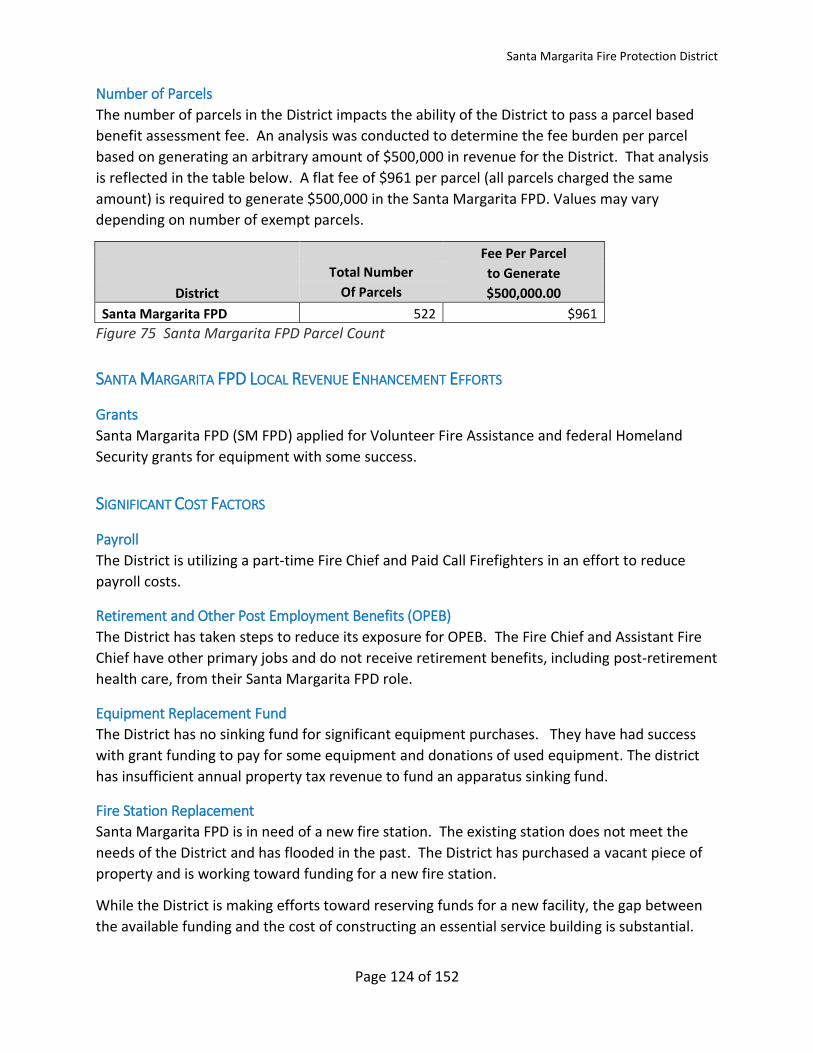
Santa Margarita Fire Protection District
Page 124 of 152
Number of Parcels
The number of parcels in the District impacts the ability of the District to pass a parcel based
benefit assessment fee. An analysis was conducted to determine the fee burden per parcel
based on generating an arbitrary amount of $500,000 in revenue for the District. That analysis
is reflected in the table below. A flat fee of $961 per parcel (all parcels charged the same
amount) is required to generate $500,000 in the Santa Margarita FPD. Values may vary
depending on number of exempt parcels.
Fee Per Parcel Total Number to Generate
District Of Parcels $500,000.00
Santa Margarita FPD 522 $961 Figure 75 Santa Margarita FPD Parcel Count
SANTA MARGARITA FPD LOCAL REVENUE ENHANCEMENT EFFORTS
Grants
Santa Margarita FPD (SM FPD) applied for Volunteer Fire Assistance and federal Homeland
Security grants for equipment with some success.
SIGNIFICANT COST FACTORS
Payroll
The District is utilizing a part-time Fire Chief and Paid Call Firefighters in an effort to reduce
payroll costs.
Retirement and Other Post Employment Benefits (OPEB)
The District has taken steps to reduce its exposure for OPEB. The Fire Chief and Assistant Fire
Chief have other primary jobs and do not receive retirement benefits, including post-retirement
health care, from their Santa Margarita FPD role.
Equipment Replacement Fund
The District has no sinking fund for significant equipment purchases. They have had success
with grant funding to pay for some equipment and donations of used equipment. The district
has insufficient annual property tax revenue to fund an apparatus sinking fund.
Fire Station Replacement
Santa Margarita FPD is in need of a new fire station. The existing station does not meet the
needs of the District and has flooded in the past. The District has purchased a vacant piece of
property and is working toward funding for a new fire station.
While the District is making efforts toward reserving funds for a new facility, the gap between
the available funding and the cost of constructing an essential service building is substantial.
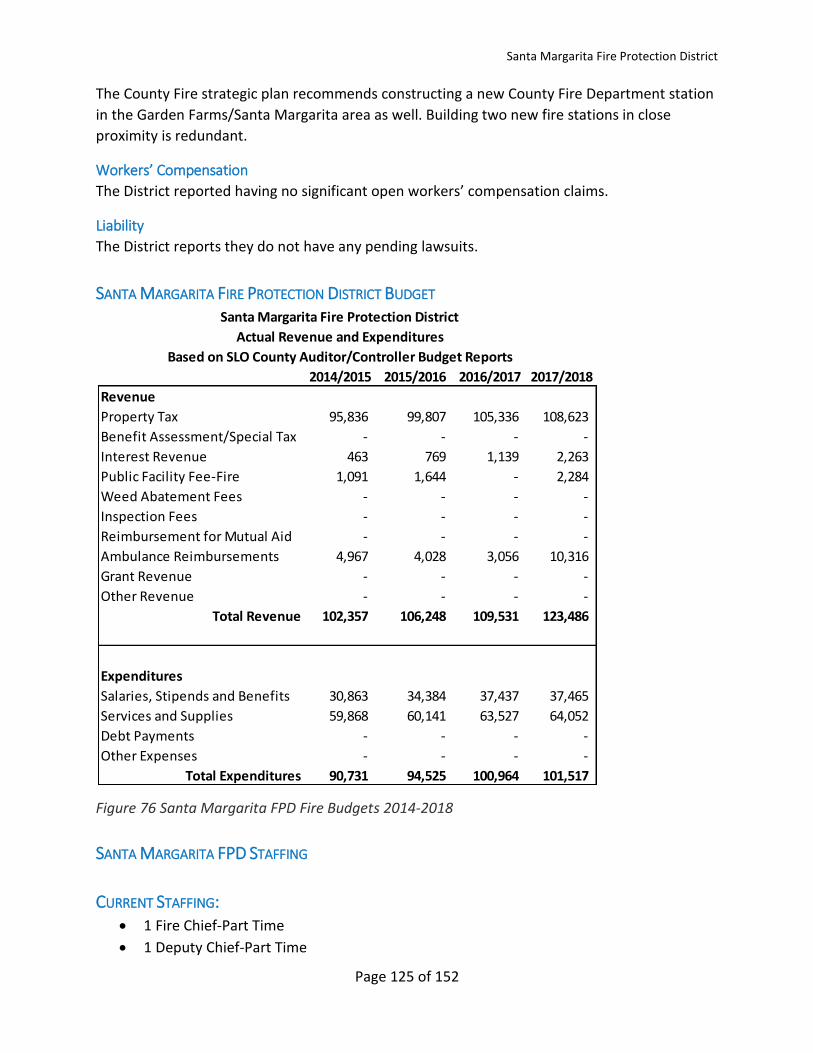
Santa Margarita Fire Protection District
Page 125 of 152
The County Fire strategic plan recommends constructing a new County Fire Department station
in the Garden Farms/Santa Margarita area as well. Building two new fire stations in close
proximity is redundant.
Workers’ Compensation
The District reported having no significant open workers’ compensation claims.
Liability
The District reports they do not have any pending lawsuits.
SANTA MARGARITA FIRE PROTECTION DISTRICT BUDGET
Figure 76 Santa Margarita FPD Fire Budgets 2014-2018
SANTA MARGARITA FPD STAFFING
CURRENT STAFFING: • 1 Fire Chief-Part Time
• 1 Deputy Chief-Part Time
Santa Margarita Fire Protection District
Actual Revenue and Expenditures
Based on SLO County Auditor/Controller Budget Reports
2014/2015 2015/2016 2016/2017 2017/2018
Revenue
Property Tax 95,836 99,807 105,336 108,623
Benefit Assessment/Special Tax - - - -
Interest Revenue 463 769 1,139 2,263
Public Facility Fee-Fire 1,091 1,644 - 2,284
Weed Abatement Fees - - - -
Inspection Fees - - - -
Reimbursement for Mutual Aid - - - -
Ambulance Reimbursements 4,967 4,028 3,056 10,316
Grant Revenue - - - -
Other Revenue - - - -
Total Revenue 102,357 106,248 109,531 123,486
Expenditures
Salaries, Stipends and Benefits 30,863 34,384 37,437 37,465
Services and Supplies 59,868 60,141 63,527 64,052
Debt Payments - - - -
Other Expenses - - - -
Total Expenditures 90,731 94,525 100,964 101,517
Santa Margarita Fire Protection District
Page 126 of 152
• 1 PCF-Fire Captains
• 1 PCF Lieutenant
• 4 Paid Call Firefighters
RECRUITMENT AND RETENTION • Santa Margarita actively recruits Paid Call Firefighters (PCF) with moderate success.
• There is a turnover of 2-3 PCFs per year (30-40% of 8 member PCF force).
• Some PCFs are deployed to summer seasonal firefighter jobs and are not available to
the FPD.
• Developing PCF fire officers (Asst. Chief and Captains) is difficult due to time and
experience requirements. If the fire department loses an experienced fire officer due to
work commitment or relocating from the area, it can take years to replace them.
• Out of district assignments (major fire mutual aid) can serve as a retention tool for
(PCFs) if they can be committed away from town for two weeks.
• Chief Murach has been with Santa Margarita FPD for 29 years, he has a fulltime job
outside of the district. This level of community member commitment is becoming scarce.
• Chief Murach has plans to retire in 5 years and is working on identifying a community
member as his successor; hiring a career fire chief may exceed the available budget.
PROPOSED STAFFING Chief Murach believes the current PCF model can operate for up to another 5 years. The major
concerns are:
• Incident activity and training requirements causing a negative impact on volunteer/PCF
response.
• Community demographics being able to support recruitment of new PCFs due to
training and time commitments.
SANTA MARGARITA FIRE PROTECTION DISTRICT RESOURCE NEEDS SM FPD did not request a property tax transfer from SLO County.
SM FPD is interested in:
• Continuing to receive automatic aid from County Fire
• Sharing any new revenue source or cost reductions for fire protection services such as
dispatch cost including mobile data computers.
• Santa Margarita is in serious need of a replacement fire station and knowing County
Fire is also interested in building a fire station in the immediate area. There may be
some opportunities for sharing the station. There are also concerns about friction
between two agencies in one fire station.
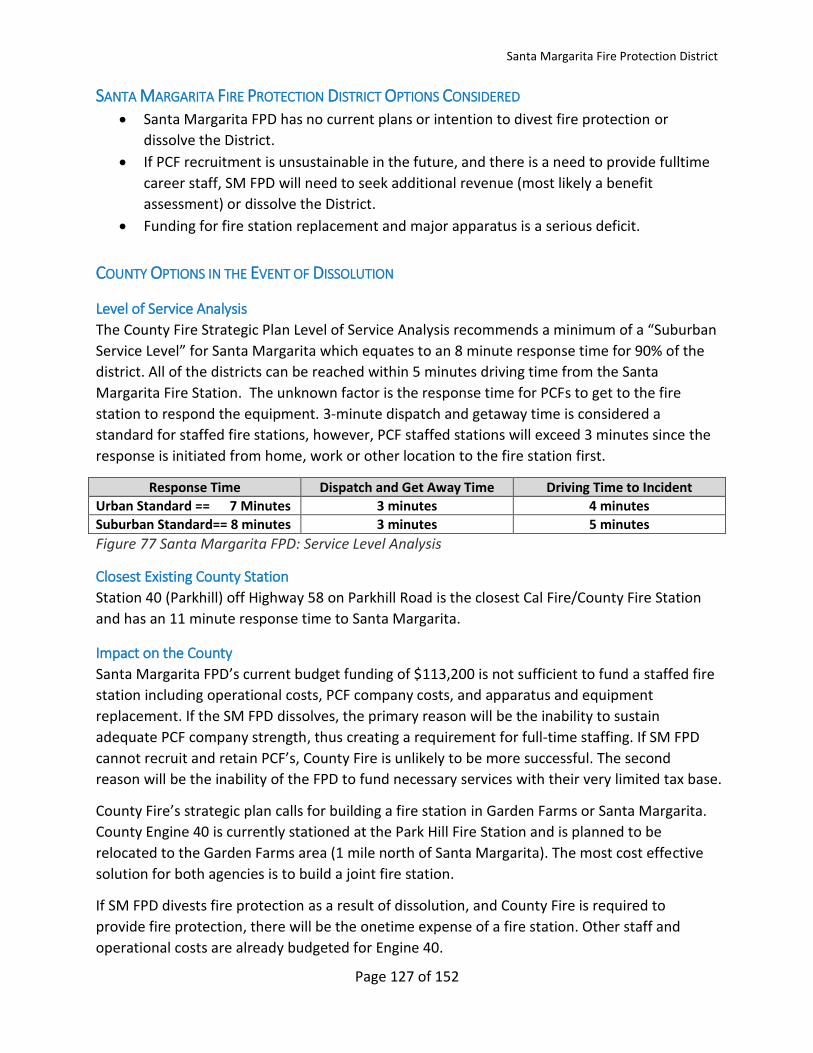
Santa Margarita Fire Protection District
Page 127 of 152
SANTA MARGARITA FIRE PROTECTION DISTRICT OPTIONS CONSIDERED • Santa Margarita FPD has no current plans or intention to divest fire protection or
dissolve the District.
• If PCF recruitment is unsustainable in the future, and there is a need to provide fulltime
career staff, SM FPD will need to seek additional revenue (most likely a benefit
assessment) or dissolve the District.
• Funding for fire station replacement and major apparatus is a serious deficit.
COUNTY OPTIONS IN THE EVENT OF DISSOLUTION
Level of Service Analysis
The County Fire Strategic Plan Level of Service Analysis recommends a minimum of a “Suburban
Service Level” for Santa Margarita which equates to an 8 minute response time for 90% of the
district. All of the districts can be reached within 5 minutes driving time from the Santa
Margarita Fire Station. The unknown factor is the response time for PCFs to get to the fire
station to respond the equipment. 3-minute dispatch and getaway time is considered a
standard for staffed fire stations, however, PCF staffed stations will exceed 3 minutes since the
response is initiated from home, work or other location to the fire station first.
Response Time Dispatch and Get Away Time Driving Time to Incident
Urban Standard == 7 Minutes 3 minutes 4 minutes
Suburban Standard== 8 minutes 3 minutes 5 minutes
Figure 77 Santa Margarita FPD: Service Level Analysis
Closest Existing County Station
Station 40 (Parkhill) off Highway 58 on Parkhill Road is the closest Cal Fire/County Fire Station
and has an 11 minute response time to Santa Margarita.
Impact on the County
Santa Margarita FPD’s current budget funding of $113,200 is not sufficient to fund a staffed fire
station including operational costs, PCF company costs, and apparatus and equipment
replacement. If the SM FPD dissolves, the primary reason will be the inability to sustain
adequate PCF company strength, thus creating a requirement for full-time staffing. If SM FPD
cannot recruit and retain PCF’s, County Fire is unlikely to be more successful. The second
reason will be the inability of the FPD to fund necessary services with their very limited tax base.
County Fire’s strategic plan calls for building a fire station in Garden Farms or Santa Margarita.
County Engine 40 is currently stationed at the Park Hill Fire Station and is planned to be
relocated to the Garden Farms area (1 mile north of Santa Margarita). The most cost effective
solution for both agencies is to build a joint fire station.
If SM FPD divests fire protection as a result of dissolution, and County Fire is required to
provide fire protection, there will be the onetime expense of a fire station. Other staff and
operational costs are already budgeted for Engine 40.

Santa Margarita Fire Protection District
Page 128 of 152
COUNTY FIRE OPTIONS 2 Full-time firefighters on duty daily at a new Santa Margarita or Garden Farms fire station:
County Fire could staff a new fire station in Santa Margarita or Garden Farms area and provide
fire protection within the service level analysis “Suburban” service level (8 minute response
time).
If current 2018-19 FY SM FPD property tax funding allocation for fire ($113,200) is transferred
to the County through a property tax exchange, there will still be insufficient funding for the fire
station staffing and operation on its own. However, the County’s long-term plan to relocate
Engine 40 would not require additional staffing. The revenue transferred from the District
could be utilized toward partial payment for fire station construction and/or equipment
replacement.
The County’s current allocation for Engine 40 staff and operational support should be sufficient
to fund the ongoing cost of fire protection service.
Page 129 of 152
TEMPLETON COMMUNITY SERVICES DISTRICT
KEY FINDINGS 1. Templeton CSD indicated that they are in imminent fiscal peril of divestiture without financial
augmentation 2. Templeton CSD has success augmenting their two career personnel with reserve firefighters but
report high turnover of reserve firefighters. 3. The voters in Templeton did not approve a special tax of $77 per parcel in 2009 to augment the
District’s budget. 4. A subsequent 2015 survey by SCI Consulting indicated that the District would not be successful
passing a special tax or benefit assessment measure. 5. The District formed a Mello Roos Community Facilities District for new development. Those funds will
start to accrue in three to ten years and go to the district’s general fund. 6. The district is considering a new benefit assessment district ballot measure for 2019. 7. The District is specifically requesting:
7.1. A property tax transfer of $485,000 on an ongoing basis to support fire operations. since they receive less than 10% of the property taxes in the District’s tax rate areas.
7.2. The funds will be used to fund a full-time fire chief and add two additional career staff to allow for one career and one reserve firefighter on duty 24/7.
Templeton CSD Options include possible divestiture: 8. Templeton CSD reports they intend to go to the voters requesting passage of a special tax or benefit
assessment district in August 2019. 9. If unsuccessful, the District states they will have no choice, but to divest fire protection service.
County options for Templeton include: 10. Agree to property tax transfer:
10.1. Execute a property tax transfer agreement to support the District’s request for net $485,000 transfer or some variation.

Templeton Community Services District
Page 130 of 152
11. DO NOT agree to property tax transfer: 11.1. The County can decide to not transfer property taxes.
Based on the County Fire Strategic Plan service level analysis, if Templeton CSD divested, the County will have three options: 12. Options assume TEM CSD transfers $ 833,400 property tax currently used for fire protection to
County, maintain and share PCF company 30, and adding a Deputy Fire Marshal position: Option A: Relocate County Engine 30 to Templeton Fire Station with 3 career firefighters 24/7
(augmented staffing). No additional funding required
Option B: County adds funding, Templeton engine staffed with at least two career firefighters 24/7;
Engine 30 remains at Cal Fire Station 30 staffed with at least two career firefighters 24/7. $485,000 additional annual funding required in addition to $833,000 current district property tax allocation.
Option C: County adds funding, relocate Engine 30 to Templeton and augment staffing for a second
staffed fire company at Templeton Fire Station. 3 career firefighters on duty daily $350,000 additional annual funding required in addition to $833,000 current district property tax allocation.
DISTRICT INTERVIEW ATTENDEES August 16, 2018 meeting: Board Directors Gwen Pelfry and Pamela Jardini, General Manager Jeff Briltz, Fire Chief Bill White September 19, 2018 meeting*: Board Directors Gwen Pelfry and Pamela Jardini, General Manager Jeff Briltz, Fire Chief Bill White, Finance Officer Natalie Klock
• Lisa Howe was unable to attend the September 19, 2018 meeting
BACKGROUND, HISTORY, AND SERVICES PROVIDED The Templeton Community Services District (Templeton CSD) was formed in 1976 by a
reorganization that combined the volunteer Templeton Fire Protection District, Templeton
Sanitary District, Templeton Lighting District, and County Waterworks # 5. The Templeton CSD
provides property tax-supported services (fire, lighting, parks, and recreation) and enterprise
services (water, sewer, solid waste). The 2018-19 Templeton CSD budget is $6,024,73464;
$1,149,630 is from property taxes; the balance of the budget is primarily from water, sewer and
solid waste enterprise funds. Templeton CSD has an elected five (5) member board of directors
with a General Manager for the CSD and serves a population of 7,700 people.
64 Templeton CSD budget document
Templeton Community Services District
Page 131 of 152
TEMPLETON CSD FUNDING Primary funding for 2018-19 FY $947,628 Templeton CSD fire protection budget is from
property taxes in the amount of $833,482. The fire budget is allocated 72.5% of the total
property tax allocation. Fees and reimbursements make up the remainder in addition to
reserve transfers. Templeton CSD has enacted a Mello-Roos Community Facility District for new
developments which the district will realize revenue in 3-10 years.
Fire protection is provided from the Templeton CSD fire station on 5th and Crocker Streets. The
fire station is staffed during the day with a career Captain and a Reserve Firefighter and with
Reserve Firefighters at night. Additional response staffing is from on-call Reserve and Paid Call
Firefighters (PCF). The Templeton CSD fire department consists of a part paid Fire Chief, 2
career-Captains, and 9 PCF/Reserves. Administrative support is provided by Templeton CSD
staff.
Automatic aid is provided by Cal Fire Station 30 located at the northern boundary of the district.
The next closest mutual aid fire stations are City of Paso Robles, 6 miles north; and City of
Atascadero, 6 miles south. Cal Fire Station 30 has a response time of 3-8 minutes. The City of
Paso Robles apparatus has a 13 minute response time. The City of Atascadero apparatus has an
11 minute response time.
TEMPLETON CSD FIRE PROTECTION CONCERNS Templeton CSD staff state their primary need is $485,000 in annual funding to increase the
number of career firefighters to provide a minimum of one career firefighter on duty for 24/7
coverage. Templeton CSD is occasionally experiencing an inability to schedule Reserve
Firefighters for nighttime coverage or receiving no response from PCFs during nighttime
coverage periods. Templeton Fire Department responded to 83165 emergencies in 2017 within
the District boundary. The closest ambulance is located on Main Street in Templeton.
Templeton CSD Fire Department recruits Reserve Firefighters from community college fire
academies at Allan Hancock College and Monterey Peninsula College. To date, they have not
had much success in recruiting community members for Paid Call Firefighter positions, with 5
living in Templeton. Most of the paid call firefighters are full-time firefighters for other agencies.
Chief White reported using reserves is sustainable for the next five (5) years but is currently
having difficulty scheduling for 24 hours per day coverage, especially when one of the 2 career
firefighters is on vacation or ill. Templeton CSD experienced 38 night shifts with no Reserve
Firefighter coverage; 44 incidents occurred during those shifts and response was delayed while
off duty and paid call responded from home. Concern was expressed that if one or both of the
career staff were to be unavailable for an extended period of time, the department will not be
able to support response. One of the career Fire Captains announced his retirement effective
the end of December 2018.
65SLO County Fire/ Cal Fire Computer Aided Dispatch
Templeton Community Services District
Page 132 of 152
TEMPLETON CSD REQUEST FROM COUNTY Templeton CSD requests a permanent property tax exchange that increases the percentage of
1% property tax that goes to the CSD. The first year goal is to increase the net revenue to
Templeton CSD by $485,000 and accrue growth in assessed valuation based on the new
percentage allocation share in the future. The request will correspondingly reduce the County’s
property tax share within the affected tax rate areas.
The basis for the request is the district’s belief the low percentage of property tax allocation to
the District based on the post Prop 13 formula for property tax distribution is inappropriate.
Templeton CSD receives less than 10% of the property taxes in each of its tax rate areas.
TEMPLETON CSD UNIQUE RISKS AND HAZARDS Twin Cities Hospital and associated medical facilities are located in TEM CSD which require
special skills and inspections.
The Union Pacific railroad runs through Templeton and presents unique training requirements
for rail and passenger emergencies. Highway 101 also passes through the community and
results in frequent vehicle accidents, inside and outside of the district. Specialized training and
equipment are required to respond to these unique hazards.
Templeton CSD Fire department operates one of four specialized mobile breathing support
units (BSU) in the County. BSU’s are dispatched to support any fire or other hazardous incident
where self-contained breathing apparatus are used by firefighters. The BSU is designed to fill
the breathing apparatus air bottles at the incident.
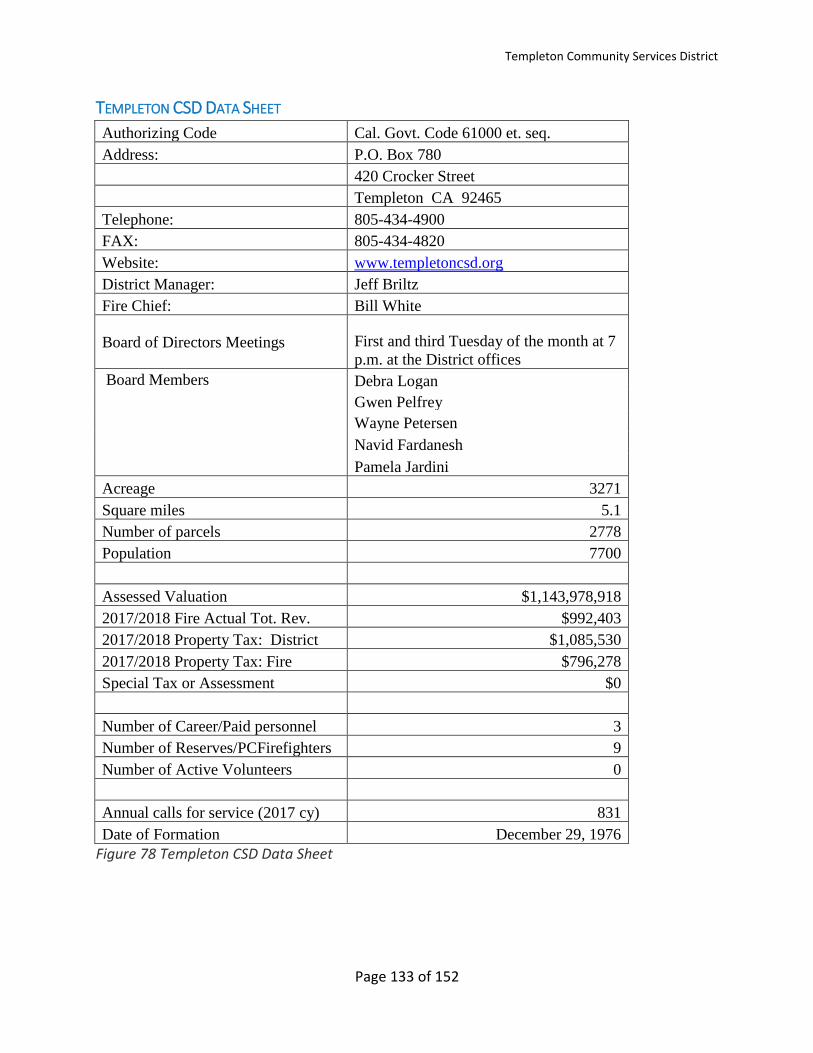
Templeton Community Services District
Page 133 of 152
TEMPLETON CSD DATA SHEET
Authorizing Code Cal. Govt. Code 61000 et. seq.
Address: P.O. Box 780
420 Crocker Street
Templeton CA 92465
Telephone: 805-434-4900
FAX: 805-434-4820
Website: www.templetoncsd.org
District Manager: Jeff Briltz
Fire Chief: Bill White
Board of Directors Meetings First and third Tuesday of the month at 7
p.m. at the District offices
Board Members Debra Logan
Gwen Pelfrey
Wayne Petersen
Navid Fardanesh
Pamela Jardini
Acreage 3271
Square miles 5.1
Number of parcels 2778
Population 7700
Assessed Valuation $1,143,978,918
2017/2018 Fire Actual Tot. Rev. $992,403
2017/2018 Property Tax: District $1,085,530
2017/2018 Property Tax: Fire $796,278
Special Tax or Assessment $0
Number of Career/Paid personnel 3
Number of Reserves/PCFirefighters 9
Number of Active Volunteers 0
Annual calls for service (2017 cy) 831
Date of Formation December 29, 1976
Figure 78 Templeton CSD Data Sheet
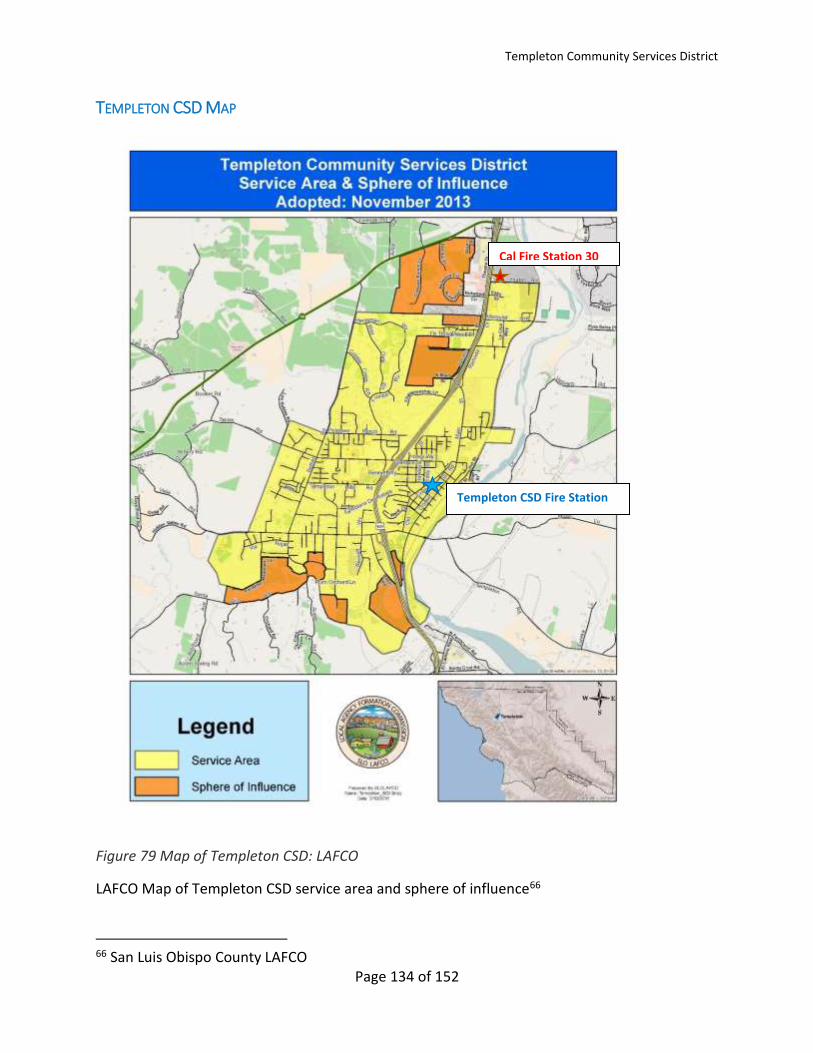
Templeton Community Services District
Page 134 of 152
TEMPLETON CSD MAP
Figure 79 Map of Templeton CSD: LAFCO
LAFCO Map of Templeton CSD service area and sphere of influence66
66 San Luis Obispo County LAFCO
Templeton CSD Fire Station
Cal Fire Station 30

Templeton Community Services District
Page 135 of 152
TEMPLETON CSD FIRE DEPARTMENT INCIDENT DENSITY The following map represents the density of incidents in a given location of the District, known
as a “heat map”. The District boundary is represented with an orange line. The shades of
purple and blue represent incidents at that location. Light shades indicate few calls for service
at that location, while the deep purple represents a high volume of calls at the same location.
The purpose of the map is to evaluate historical incident data for planning deployment of
emergency resources, including fire station placement. The source of the incident data for the
map is from the dispatch center’s computer-aided dispatch program and represents 3 ½ years
of data from January 1, 2015, to June 30, 2018.
Figure 80 Templeton CSD: Heat Map of incident locations
The map above depicts County Fire responses in and around Templeton, the responses are
from Station 30 on Ramada Drive at the northern boundary of Templeton.
Templeton CSD Fire Station
Cal Fire Station 30
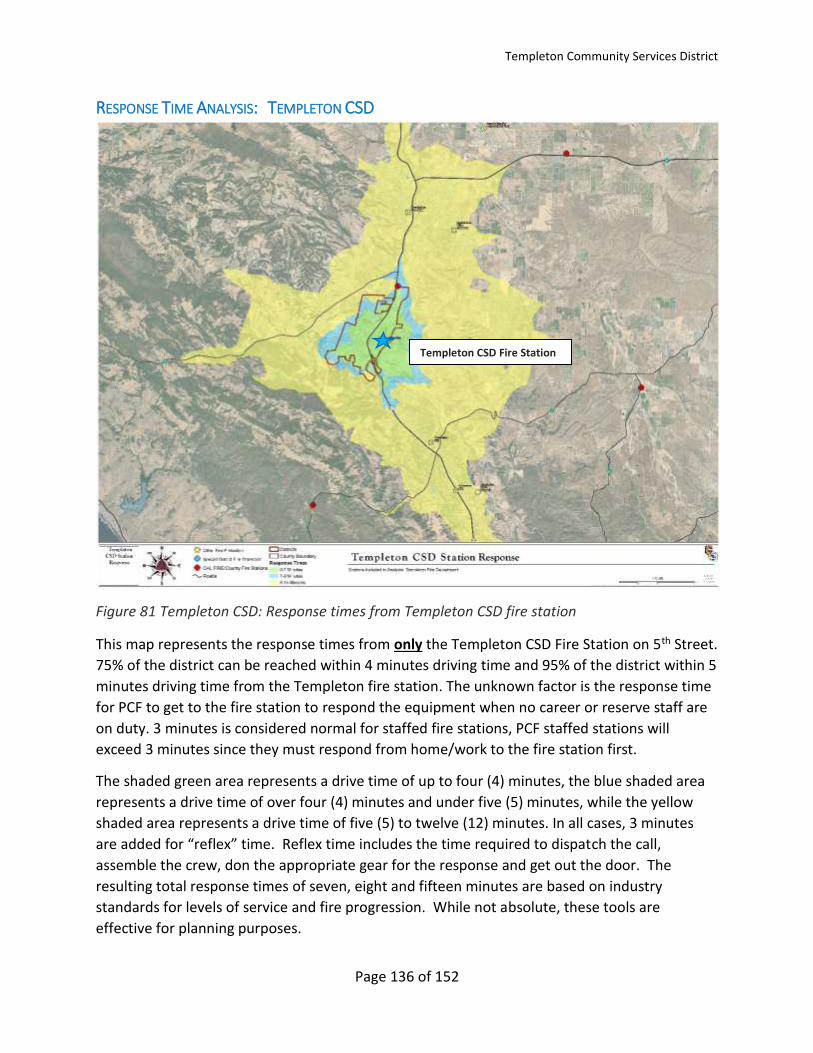
Templeton Community Services District
Page 136 of 152
RESPONSE TIME ANALYSIS: TEMPLETON CSD
Figure 81 Templeton CSD: Response times from Templeton CSD fire station
This map represents the response times from only the Templeton CSD Fire Station on 5th Street.
75% of the district can be reached within 4 minutes driving time and 95% of the district within 5
minutes driving time from the Templeton fire station. The unknown factor is the response time
for PCF to get to the fire station to respond the equipment when no career or reserve staff are
on duty. 3 minutes is considered normal for staffed fire stations, PCF staffed stations will
exceed 3 minutes since they must respond from home/work to the fire station first.
The shaded green area represents a drive time of up to four (4) minutes, the blue shaded area
represents a drive time of over four (4) minutes and under five (5) minutes, while the yellow
shaded area represents a drive time of five (5) to twelve (12) minutes. In all cases, 3 minutes
are added for “reflex” time. Reflex time includes the time required to dispatch the call,
assemble the crew, don the appropriate gear for the response and get out the door. The
resulting total response times of seven, eight and fifteen minutes are based on industry
standards for levels of service and fire progression. While not absolute, these tools are
effective for planning purposes.
Templeton CSD Fire Station
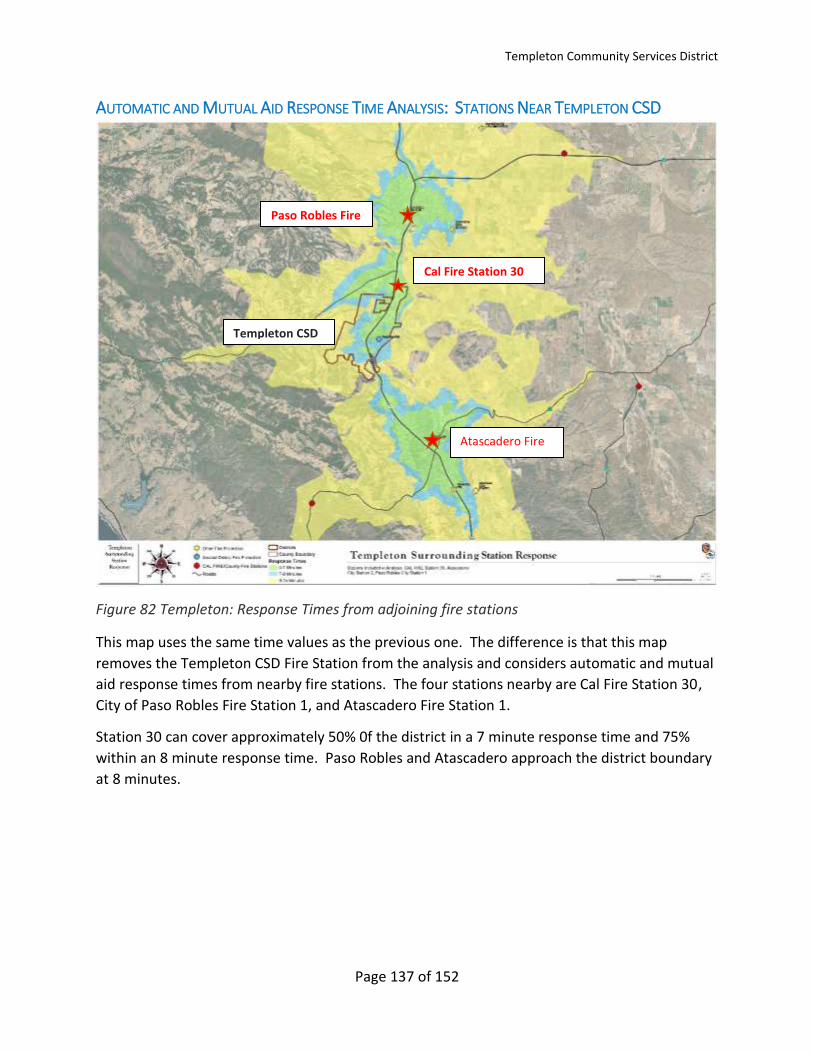
Templeton Community Services District
Page 137 of 152
AUTOMATIC AND MUTUAL AID RESPONSE TIME ANALYSIS: STATIONS NEAR TEMPLETON CSD
Figure 82 Templeton: Response Times from adjoining fire stations
This map uses the same time values as the previous one. The difference is that this map
removes the Templeton CSD Fire Station from the analysis and considers automatic and mutual
aid response times from nearby fire stations. The four stations nearby are Cal Fire Station 30,
City of Paso Robles Fire Station 1, and Atascadero Fire Station 1.
Station 30 can cover approximately 50% 0f the district in a 7 minute response time and 75%
within an 8 minute response time. Paso Robles and Atascadero approach the district boundary
at 8 minutes.
Cal Fire Station 30
Atascadero Fire
Paso Robles Fire
Station 30 30
Templeton CSD
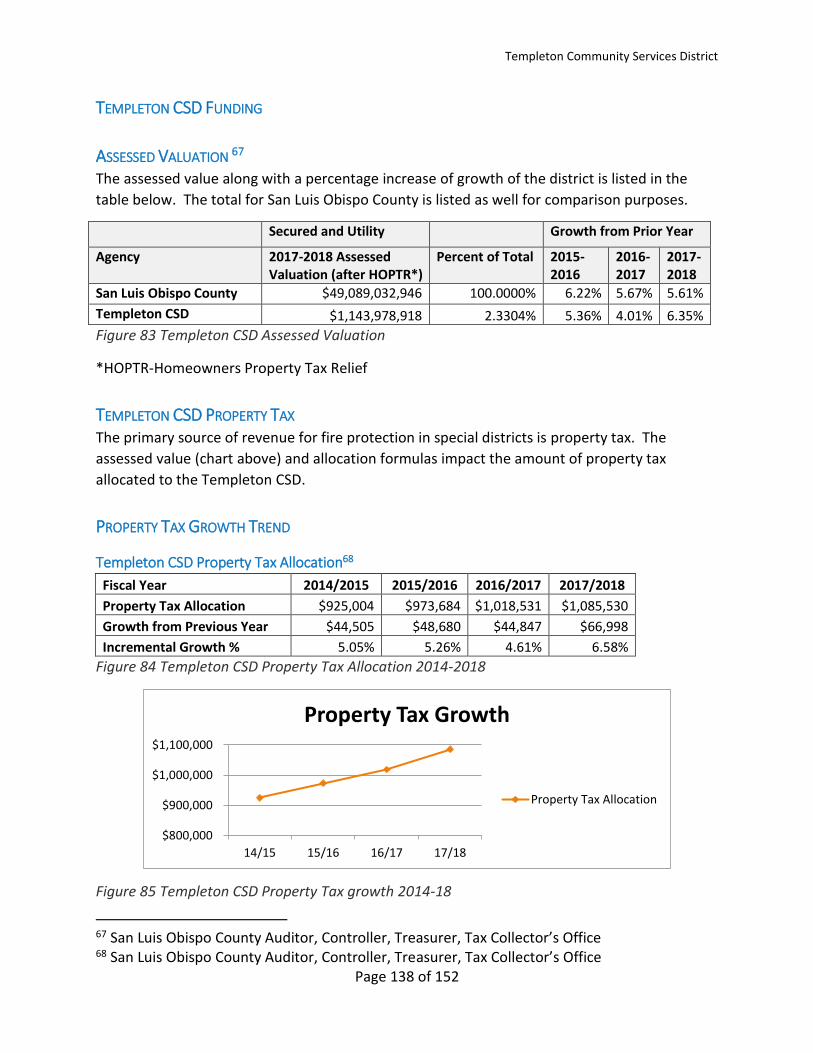
Templeton Community Services District
Page 138 of 152
TEMPLETON CSD FUNDING
ASSESSED VALUATION 67 The assessed value along with a percentage increase of growth of the district is listed in the
table below. The total for San Luis Obispo County is listed as well for comparison purposes.
Secured and Utility Growth from Prior Year
Agency 2017-2018 Assessed Valuation (after HOPTR*)
Percent of Total 2015-2016
2016-2017
2017-2018
San Luis Obispo County $49,089,032,946 100.0000% 6.22% 5.67% 5.61%
Templeton CSD $1,143,978,918 2.3304% 5.36% 4.01% 6.35%
Figure 83 Templeton CSD Assessed Valuation
*HOPTR-Homeowners Property Tax Relief
TEMPLETON CSD PROPERTY TAX The primary source of revenue for fire protection in special districts is property tax. The
assessed value (chart above) and allocation formulas impact the amount of property tax
allocated to the Templeton CSD.
PROPERTY TAX GROWTH TREND
Templeton CSD Property Tax Allocation68
Fiscal Year 2014/2015 2015/2016 2016/2017 2017/2018
Property Tax Allocation $925,004 $973,684 $1,018,531 $1,085,530
Growth from Previous Year $44,505 $48,680 $44,847 $66,998
Incremental Growth % 5.05% 5.26% 4.61% 6.58% Figure 84 Templeton CSD Property Tax Allocation 2014-2018
Figure 85 Templeton CSD Property Tax growth 2014-18
67 San Luis Obispo County Auditor, Controller, Treasurer, Tax Collector’s Office 68 San Luis Obispo County Auditor, Controller, Treasurer, Tax Collector’s Office
$800,000
$900,000
$1,000,000
$1,100,000
14/15 15/16 16/17 17/18
Property Tax Growth
Property Tax Allocation
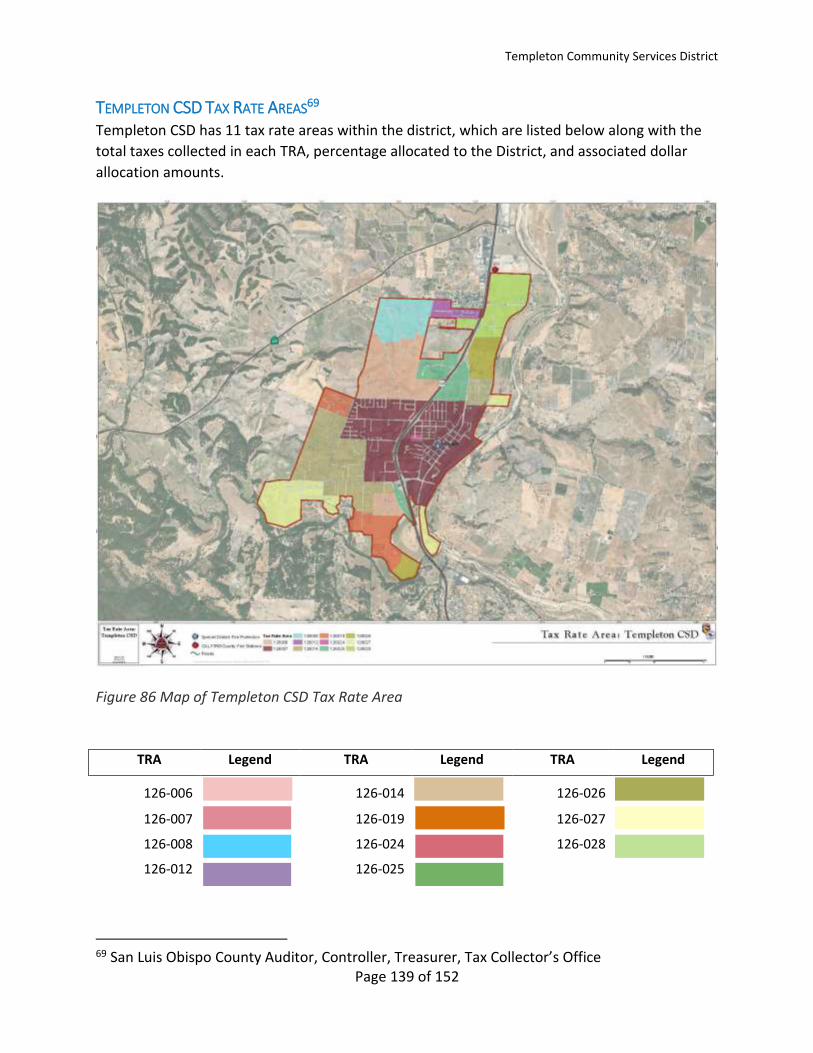
Templeton Community Services District
Page 139 of 152
TEMPLETON CSD TAX RATE AREAS69 Templeton CSD has 11 tax rate areas within the district, which are listed below along with the
total taxes collected in each TRA, percentage allocated to the District, and associated dollar
allocation amounts.
Figure 86 Map of Templeton CSD Tax Rate Area
TRA Legend TRA Legend TRA Legend
126-006
126-014
126-026
126-007
126-019
126-027
126-008
126-024
126-028
126-012
126-025
69 San Luis Obispo County Auditor, Controller, Treasurer, Tax Collector’s Office

Templeton Community Services District
Page 140 of 152
Templeton CSD 2017/2018 Tax Revenue % and $ by TRA
TRA Percent to CSD Total Tax for TRA Tax Dollars to CSD
126-006 8.55835 $970,216 $82,988
126-007 9.95670 $6,227,797 $620,083
126-008 8.55251 $337,845 $28,894
126-012 6.88568 $350,883 $24,161
126-014 8.55351 $2,243,984 $191,939
126-019 6.88508 $371,929 $25,608
126-024 9.95670 $60,146 $5,989
126-025 8.47741 $357,520 $30,308
126-026 9.24903 $25,593 $2,367
126-027 9.19422 $819,116 $75,311
126-028 8.47741 $770,232 $65,296
TRA Count =11 Total $12,535,261 $1,152,944
Figure 87 Templeton CSD Tax Revenue % and $ by TRA
TEMPLETON CSD PROPERTY TAX ALLOCATION/TAX RATE AREA PERCENTAGES The pie chart below represents the allocation of property tax to all the agencies that receive
property taxes within the 126-007 tax rate area. This tax rate area was selected as a
representative example of the allocation of property tax to the District and is the tax rate area
that generates the greatest tax revenue within the District.
Figure 88 Templeton CSD TRA 126-007 Breakdown70
70 San Luis Obispo County Auditor, Controller, Treasurer, Tax Collector’s Office

Templeton Community Services District
Page 141 of 152
TEMPLETON CSD PERCENTAGE OF PROPERTY TAX EXPENDED ON FIRE PROTECTION IN FY
2017/201871 Total Property Tax Received by Templeton CSD: $1,098,314
Property Tax Allocated to Fire Protection: $796,278
Percent of Total Allocated to Fire Protection: 72.5%
Templeton CSD Number of Parcels
The number of parcels in the District impacts the ability of the District to pass a parcel based
benefit assessment fee. An analysis was conducted to determine the fee burden per parcel
based on generating an arbitrary amount of $500,000 in revenue for the District. That analysis
is reflected in the table below. A flat fee of $179.98 per parcel (all parcels charged the same
amount) is required to generate $500,000 in the Templeton CSD. Values may vary depending
on number of exempt parcels.
Fee Per Parcel Total Number to Generate
District Of Parcels $500,000.00
Templeton CSD 2778 $180 Figure 89 Templeton CSD Parcel Count
TEMPLETON CSD LOCAL REVENUE ENHANCEMENT EFFORTS
Benefit Assessment District
• Templeton CSD placed a $77/per parcel benefit assessment district ballot measure in 2009;
the measure received 38% support.
• Templeton CSD hired a consultant to survey support for a similar benefit assessment
measure in 2015, the survey showed insufficient support.
Mello-Roos-Community Facilities District
• Templeton CSD enacted a Mello-Roos Community Facilities District (CFD) for areas of
new development. Each new parcel will contribute $957 annually toward the Templeton
CSD for support of fire, lighting, parks and recreation services. District staff expects CFD
fees will begin to accrue in 3-10 years as parcels sell and develop.
SAFER Grant
Templeton CSD applied for a federal FEMA SAFER grant in 2012 that funded additional full-time
firefighter for four (4) years. The purpose of the grant was to enable Templeton CSD to have
additional full-time firefighters on duty daily. There was no source of funding to continue
funding the firefighters after the grant expired in 2016 and staffing was reduced.
71 Templeton CSD Financial Documents

Templeton Community Services District
Page 142 of 152
TEMPLETON CSD SIGNIFICANT COST FACTORS
Payroll
The District is successfully utilizing Part-time Fire Chief and Paid Call Firefighters in an effort to
reduce payroll costs until permanent funding for career firefighters is secured.
Retirement and Other Post Employment Benefits (OPEB)
The District has taken steps to reduce its exposure for OPEB. An actuary has been conducted
and the District is fully funding the liability. The District reported having legacy costs for retired
fire department employees.
Equipment Replacement Fund
The District utilizes a sinking fund for significant equipment purchases when funds allow. They
have also had success with grant funding to pay for some equipment.
Workers’ Compensation
The District reported having two open significant workers’ compensation claims for fire
department personnel.
Liabilities
The District staff stated they do not have any pending litigation regarding the fire department.
Facilities
Templeton CSD Fire Station is part of the administrative office complex. The facilities appear to
be in good condition.
Further examination of facilities for housing crews is required.
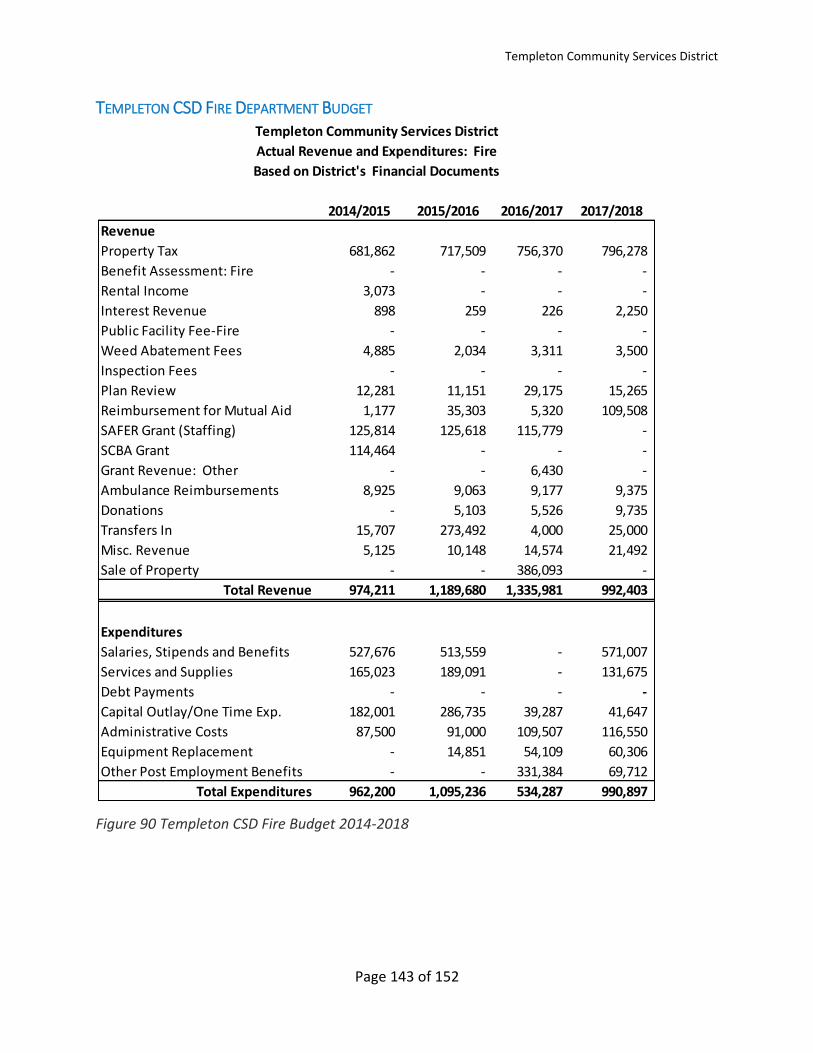
Templeton Community Services District
Page 143 of 152
TEMPLETON CSD FIRE DEPARTMENT BUDGET
Figure 90 Templeton CSD Fire Budget 2014-2018
2014/2015 2015/2016 2016/2017 2017/2018
Revenue
Property Tax 681,862 717,509 756,370 796,278
Benefit Assessment: Fire - - - -
Rental Income 3,073 - - -
Interest Revenue 898 259 226 2,250
Public Facility Fee-Fire - - - -
Weed Abatement Fees 4,885 2,034 3,311 3,500
Inspection Fees - - - -
Plan Review 12,281 11,151 29,175 15,265
Reimbursement for Mutual Aid 1,177 35,303 5,320 109,508
SAFER Grant (Staffing) 125,814 125,618 115,779 -
SCBA Grant 114,464 - - -
Grant Revenue: Other - - 6,430 -
Ambulance Reimbursements 8,925 9,063 9,177 9,375
Donations - 5,103 5,526 9,735
Transfers In 15,707 273,492 4,000 25,000
Misc. Revenue 5,125 10,148 14,574 21,492
Sale of Property - - 386,093 -
Total Revenue 974,211 1,189,680 1,335,981 992,403
Expenditures
Salaries, Stipends and Benefits 527,676 513,559 - 571,007
Services and Supplies 165,023 189,091 - 131,675
Debt Payments - - - -
Capital Outlay/One Time Exp. 182,001 286,735 39,287 41,647
Administrative Costs 87,500 91,000 109,507 116,550
Equipment Replacement - 14,851 54,109 60,306
Other Post Employment Benefits - - 331,384 69,712
Total Expenditures 962,200 1,095,236 534,287 990,897
Templeton Community Services District
Actual Revenue and Expenditures: Fire
Based on District's Financial Documents
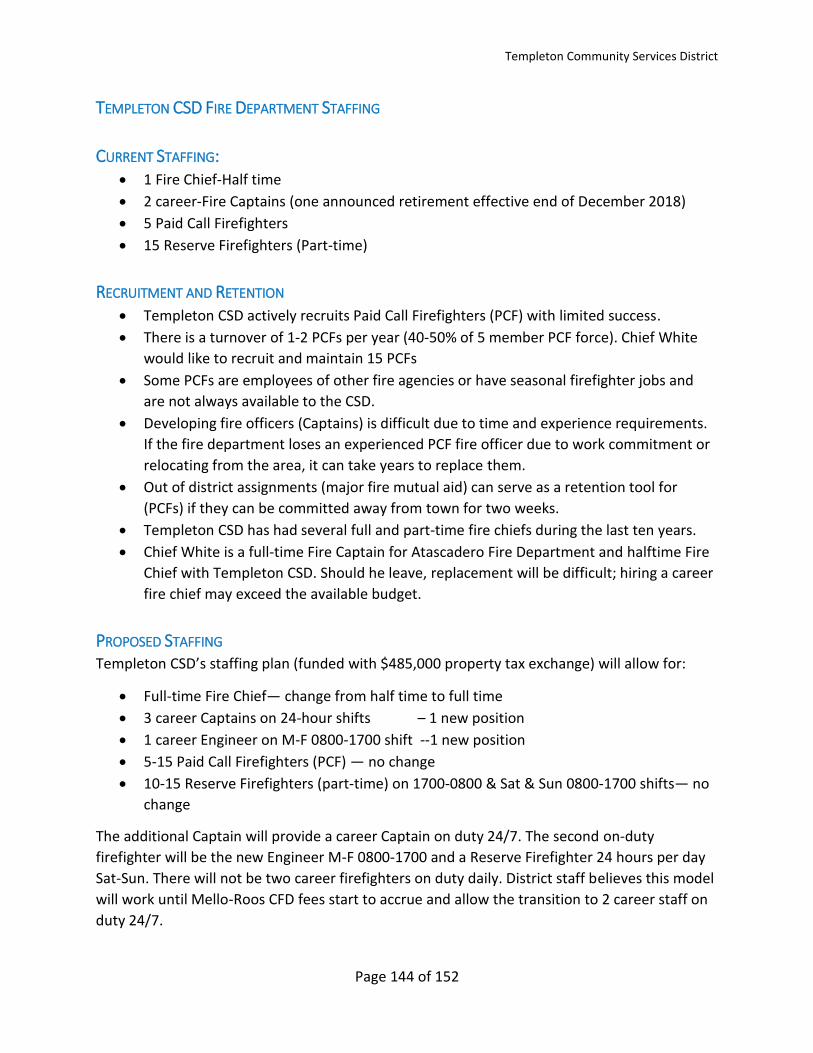
Templeton Community Services District
Page 144 of 152
TEMPLETON CSD FIRE DEPARTMENT STAFFING
CURRENT STAFFING: • 1 Fire Chief-Half time
• 2 career-Fire Captains (one announced retirement effective end of December 2018)
• 5 Paid Call Firefighters
• 15 Reserve Firefighters (Part-time)
RECRUITMENT AND RETENTION • Templeton CSD actively recruits Paid Call Firefighters (PCF) with limited success.
• There is a turnover of 1-2 PCFs per year (40-50% of 5 member PCF force). Chief White
would like to recruit and maintain 15 PCFs
• Some PCFs are employees of other fire agencies or have seasonal firefighter jobs and
are not always available to the CSD.
• Developing fire officers (Captains) is difficult due to time and experience requirements.
If the fire department loses an experienced PCF fire officer due to work commitment or
relocating from the area, it can take years to replace them.
• Out of district assignments (major fire mutual aid) can serve as a retention tool for
(PCFs) if they can be committed away from town for two weeks.
• Templeton CSD has had several full and part-time fire chiefs during the last ten years.
• Chief White is a full-time Fire Captain for Atascadero Fire Department and halftime Fire
Chief with Templeton CSD. Should he leave, replacement will be difficult; hiring a career
fire chief may exceed the available budget.
PROPOSED STAFFING Templeton CSD’s staffing plan (funded with $485,000 property tax exchange) will allow for:
• Full-time Fire Chief— change from half time to full time
• 3 career Captains on 24-hour shifts – 1 new position
• 1 career Engineer on M-F 0800-1700 shift --1 new position
• 5-15 Paid Call Firefighters (PCF) — no change
• 10-15 Reserve Firefighters (part-time) on 1700-0800 & Sat & Sun 0800-1700 shifts— no
change
The additional Captain will provide a career Captain on duty 24/7. The second on-duty
firefighter will be the new Engineer M-F 0800-1700 and a Reserve Firefighter 24 hours per day
Sat-Sun. There will not be two career firefighters on duty daily. District staff believes this model
will work until Mello-Roos CFD fees start to accrue and allow the transition to 2 career staff on
duty 24/7.
Templeton Community Services District
Page 145 of 152
Note: Oceano CSD (FCFA) and Cambria CSD have both determined that use of Reserve
Firefighters to fill 24/7 positions is not a reliable long-term solution to staffing. Both agencies
have plans to abandon this model and pursue career staffing for 24/7 positions.
TEMPLETON CSD RESOURCE NEEDS • Templeton CSD requested a property tax transfer from SLO County.
• The goal of a property tax exchange is to net $485,000 to the District in the first year
and added property tax growth in following years.
TEMPLETON CSD OPTIONS CONSIDERED • Templeton CSD does not wish to divest fire protection but is concerned that without a
property tax exchange or new benefit assessment fees they will be unable to sustain fire
protection and will need to divest fire services to the County.
• Templeton CSD also believes a loss of current career employee(s) could trigger the
inability to assure emergency response. One of two career Fire Captains announced his
retirement effective end of December 2018.
• Templeton CSD is considering a $188/parcel annual Benefit Assessment District ballot
measure in 2019 to serve as a funding source or match for county property tax exchange.
Templeton Community Services District
Page 146 of 152
COUNTY OPTIONS
COUNTY AGREES TO DISTRICT’S REQUESTED PROPERTY TAX EXCHANGE • County can agree to fund Templeton CSD’s request by transferring property tax received
by the County to the District utilizing a property tax exchange agreement.
• Negotiate property tax exchange that will net Templeton CSD $485,000 in year one and
growth in successive years.
o Note: County serves as the negotiator for both parties in a tax exchange
COUNTY DOES NOT AGREE WITH DISTRICT’S PROPERTY TAX TRANSFER REQUEST • Templeton CSD initiates Benefit Assessment District ballot measure in 2019.
Templeton CSD Initiates Divestiture of Fire Protection to County
• In the event Templeton CSD is unable to sustain fire protection services financially, the
Board of Directors may initiate divestiture through LAFCO
• County and Templeton CSD must agree to Fire Protection Service Plan
• County and Templeton CSD must agree to property tax exchange from the District to the
County
• There are various options for consideration by the County to provide fire protection
service in the event of divestiture by the District (Outlined below).
STUDY ASSUMPTIONS FOR DIVESTITURE • Templeton warrants an Urban Response using County Fire Service level analysis
• This study assumes a property tax exchange where the County receives the current
Templeton CSD $833,490 property tax allocation for fire protection and future growth
associated with the percentage of the property tax rate areas.
• Templeton CSD fulltime fire protection employees will be offered fulltime Cal Fire
employment consistent with state law and protocols.
• Templeton CSD PCFs will be retained and combined with County Fire Company 30 PCFs.
• All assets dedicated to fire protection delivery in Templeton will be transferred to the
County for purposes of delivering fire protection in Templeton. Use of Templeton fire
station facilities, which are part of CSD administrative building complex, will require a
use agreement between Templeton CSD and County.
• Cal Fire budgets all employees at the top step and senior levels for leave credits; actual
cost are commonly less because employees are rarely all at top step.
• County Fire resources are available for immediate response throughout their jurisdiction.
• Engine 30’s primary response area is large and there are chances that simultaneous
incidents may occur (26 occurred in calendar year 2017). Operational policies address
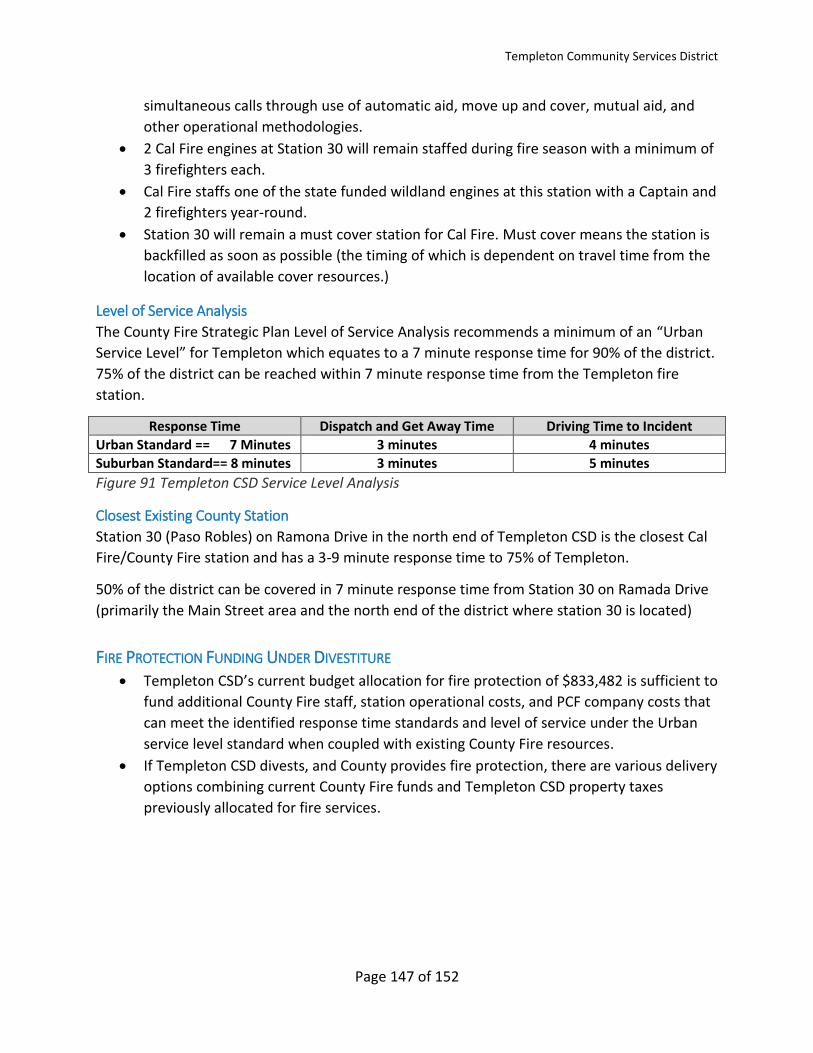
Templeton Community Services District
Page 147 of 152
simultaneous calls through use of automatic aid, move up and cover, mutual aid, and
other operational methodologies.
• 2 Cal Fire engines at Station 30 will remain staffed during fire season with a minimum of
3 firefighters each.
• Cal Fire staffs one of the state funded wildland engines at this station with a Captain and
2 firefighters year-round.
• Station 30 will remain a must cover station for Cal Fire. Must cover means the station is
backfilled as soon as possible (the timing of which is dependent on travel time from the
location of available cover resources.)
Level of Service Analysis
The County Fire Strategic Plan Level of Service Analysis recommends a minimum of an “Urban
Service Level” for Templeton which equates to a 7 minute response time for 90% of the district.
75% of the district can be reached within 7 minute response time from the Templeton fire
station.
Response Time Dispatch and Get Away Time Driving Time to Incident
Urban Standard == 7 Minutes 3 minutes 4 minutes
Suburban Standard== 8 minutes 3 minutes 5 minutes
Figure 91 Templeton CSD Service Level Analysis
Closest Existing County Station
Station 30 (Paso Robles) on Ramona Drive in the north end of Templeton CSD is the closest Cal
Fire/County Fire station and has a 3-9 minute response time to 75% of Templeton.
50% of the district can be covered in 7 minute response time from Station 30 on Ramada Drive
(primarily the Main Street area and the north end of the district where station 30 is located)
FIRE PROTECTION FUNDING UNDER DIVESTITURE • Templeton CSD’s current budget allocation for fire protection of $833,482 is sufficient to
fund additional County Fire staff, station operational costs, and PCF company costs that
can meet the identified response time standards and level of service under the Urban
service level standard when coupled with existing County Fire resources.
• If Templeton CSD divests, and County provides fire protection, there are various delivery
options combining current County Fire funds and Templeton CSD property taxes
previously allocated for fire services.
Templeton Community Services District
Page 148 of 152
COUNTY FIRE OPTIONS- FIRE PROTECTION SERVICE DELIVERY POSSIBLE USING EXISTING FUNDING
A. Relocate County Engine 30 to Templeton Fire Station –1 Captain and 2 Engineers on duty daily
(3 career + PCF company)
A. County Fire will relocate County Engine 30 to the Templeton Fire Station and increase
career staffing to 3 on duty daily.
B. Assumes use of current funding for Engine 30 and property tax transferred from
Templeton CSD to the County.
C. Daily staffing at the Templeton Fire Station will be a minimum of Fire Captain, two (2)
Engineers, and PCF company. Based on Cal Fire shift schedule, budgeted staffing of 3
Captains and 6 Engineers allows for 4th person on duty 1/3 of the year depending on
employee leave.
D. Second engine will be staffed by 3rd and/or 4th Engineer, and/or PCF company.
E. Breathing Support Unit and Rescue will be retained and supported.
F. Add a fulltime Deputy Fire Marshal position for public occupancy inspections and fire
prevention in Templeton and north county.
G. Engine 30’s response area is large, and the engine will continue to serve an area outside
of Templeton in addition to Templeton CSD.
H. Station 30 would continue to be staffed by two Cal Fire State engines during fire season
and continue to be a must cover station.
I. Moving Engine 30 to Templeton is a better strategic location for response into County
Fire’s jurisdiction in El Pomar area because of a bridge across the Salinas River.
COUNTY FIRE OPTIONS- $485,000 REQUESTED BY TEMPLETON CSD ALLOCATED TO COUNTY FIRE
FOR FIRE PROTECTION
B. Staff Templeton Fire Station–1 Captain and 1 Engineer on duty daily (2 career + PCF company) and
staff Engine 30 at Station 30; 1 Captain and 1 Engineer on duty daily (2 career + PCF company)
A. Daily staffing at the Templeton Fire Station will be a minimum of Fire Captain and
one (1) Engineer and PCF company. Based on Cal Fire shift schedule, budgeted
staffing of 3 Captains and 3 Engineers allows for 3rd person on duty 1/3 of the year
or more, depending on employee leave.
B. Engine 30 will remain at Station 30 staffed with minimum of Fire Captain and (1)
Engineer, plus PCF company
C. Assumes utilization of current funding for Engine 30, Templeton property tax
transfer to County and added $485,000 by the County.
D. Second engine at Templeton station will be staffed by PCF company.
E. Breathing Support Unit and Rescue will be retained and supported.
F. Add a fulltime Deputy Fire Marshal position for public occupancy inspections and
fire prevention in Templeton and north county.
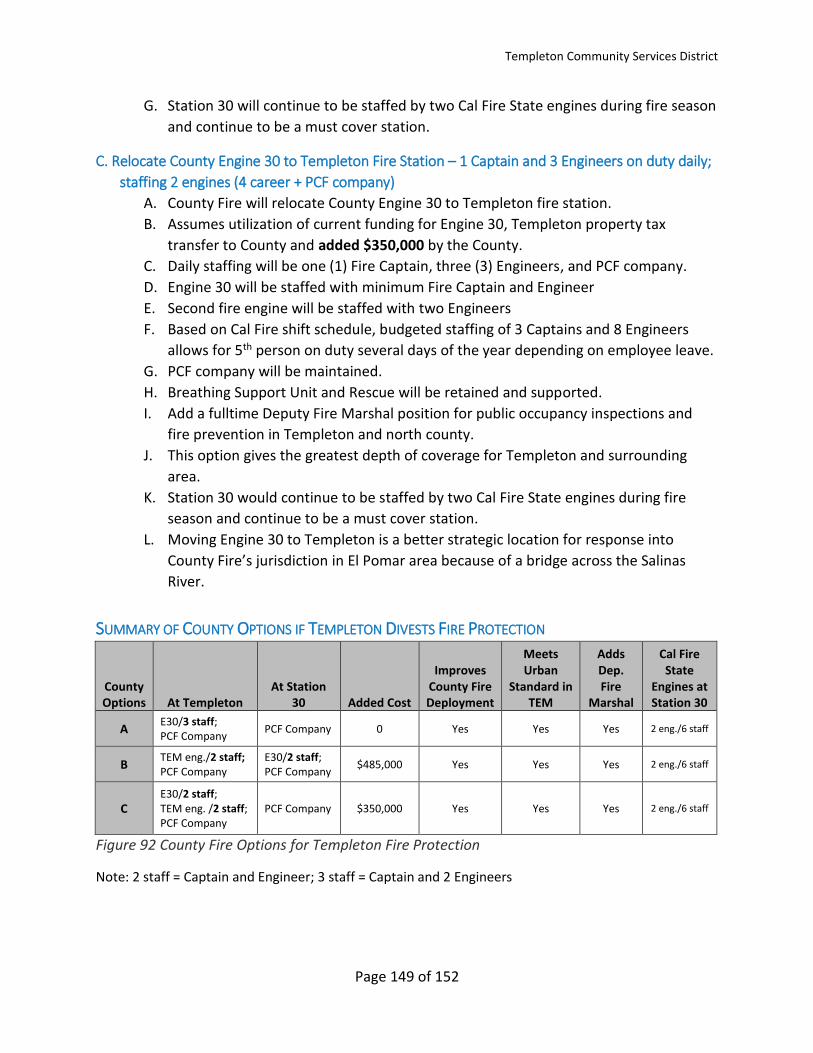
Templeton Community Services District
Page 149 of 152
G. Station 30 will continue to be staffed by two Cal Fire State engines during fire season
and continue to be a must cover station.
C. Relocate County Engine 30 to Templeton Fire Station – 1 Captain and 3 Engineers on duty daily;
staffing 2 engines (4 career + PCF company)
A. County Fire will relocate County Engine 30 to Templeton fire station.
B. Assumes utilization of current funding for Engine 30, Templeton property tax
transfer to County and added $350,000 by the County.
C. Daily staffing will be one (1) Fire Captain, three (3) Engineers, and PCF company.
D. Engine 30 will be staffed with minimum Fire Captain and Engineer
E. Second fire engine will be staffed with two Engineers
F. Based on Cal Fire shift schedule, budgeted staffing of 3 Captains and 8 Engineers
allows for 5th person on duty several days of the year depending on employee leave.
G. PCF company will be maintained.
H. Breathing Support Unit and Rescue will be retained and supported.
I. Add a fulltime Deputy Fire Marshal position for public occupancy inspections and
fire prevention in Templeton and north county.
J. This option gives the greatest depth of coverage for Templeton and surrounding
area.
K. Station 30 would continue to be staffed by two Cal Fire State engines during fire
season and continue to be a must cover station.
L. Moving Engine 30 to Templeton is a better strategic location for response into
County Fire’s jurisdiction in El Pomar area because of a bridge across the Salinas
River.
SUMMARY OF COUNTY OPTIONS IF TEMPLETON DIVESTS FIRE PROTECTION
County Options At Templeton
At Station 30 Added Cost
Improves County Fire Deployment
Meets Urban
Standard in TEM
Adds Dep. Fire
Marshal
Cal Fire State
Engines at Station 30
A E30/3 staff; PCF Company
PCF Company 0 Yes Yes Yes 2 eng./6 staff
B TEM eng./2 staff; PCF Company
E30/2 staff; PCF Company
$485,000 Yes Yes Yes 2 eng./6 staff
C E30/2 staff; TEM eng. /2 staff; PCF Company
PCF Company $350,000 Yes Yes Yes 2 eng./6 staff
Figure 92 County Fire Options for Templeton Fire Protection
Note: 2 staff = Captain and Engineer; 3 staff = Captain and 2 Engineers
Page 150 of 152
LIST OF FIGURES
Figure 1: The five special districts in the study that provide fire protection in San Luis Obispo
County are shown in orange. .......................................................................................................... 5
Figure 2: Fire station locations throughout San luis Obsipo County ............................................ 11
Figure 3 CSD discretionary service authority ................................................................................ 12
Figure 4 CSD's that have not activated latent authority for fire protection ................................ 13
Figure 5 CSD's that have not activated latent authority for fire protection ................................ 18
Figure 6 Model Budget for Independent Volunteer/PCF Fire Station .......................................... 27
Figure 7 County Fire Department Staffing Costs .......................................................................... 28
Figure 8 Pre-Prop 13 vs Post Prop 13 Budget Method ................................................................. 35
Figure 9 Templeton CSD Tax Rate example .................................................................................. 36
Figure 10 Five district TRA percentage comparison ..................................................................... 37
Figure 11 County and special districts property assessed valuations and growth ....................... 38
Figure 12 Tax revenue from 5% Assessed value growth .............................................................. 39
Figure 13 Total property tax allocation for fire by fiscal year ...................................................... 39
Figure 14 Total property tax allocation to each district for fire protection ................................. 40
Figure 15 District Parcel count calculation to generate $500,000 ............................................... 40
Figure 16 Benefit Assessment District: FLAT RATE MODEL .......................................................... 42
Figure 17 Benefit Assessment District: WEIGHTED MODEL ......................................................... 43
Figure 18 Prop 172 Public Safety Sales Tax Allocation ................................................................. 47
Figure 19 Transient Occupancy Tax (TOT) revenue ...................................................................... 47
Figure 20 Cambria CSD Data Sheet ............................................................................................... 64
Figure 21 Map of Cambria CSD: LAFCO ........................................................................................ 65
Figure 22 Heat Map of incidents in Cambria CSD ........................................................................ 66
Figure 23 Response time from Cambria CSD fire station ............................................................. 67
Figure 24 Response times from mutual aid stations .................................................................... 68
Figure 25 Cambria Assessed Valuation ......................................................................................... 69
Figure 26 Cambria CSD Property Tax Collections 2014 -2018 ...................................................... 69
Figure 27 Cambria Property Tax growth 2014-2018 .................................................................... 69
Figure 28 Map of Cambria CSD Tax Rate Areas (TRA) .................................................................. 70
Figure 29 Cambria CSD 2017-18 Tax Revenue % and $ by TRA .................................................... 70
Figure 30 Cambria CSD Tax Rate Area 061-037 Breakdown ......................................................... 71
Figure 31 Cambria CSD Parcel Count ............................................................................................ 72
Figure 32 Cambria CSD Fire Budgets 2015-2018 .......................................................................... 74
Figure 33 Oceano CSD Data Sheet ................................................................................................ 80
Figure 34 Map of Oceano CSD: LAFCO .......................................................................................... 81
Figure 35 Heat Map of Incident locations in Oceano ................................................................... 82
Figure 36 Service Level Analysis: Oceano ..................................................................................... 83
Figure 37 Response Time Analysis from Oceano Fire Station ...................................................... 83
Figure 38 Response Times from adjoining fire stations ............................................................... 84
Page 151 of 152
Figure 39 Response Time to Oceano from County Fire Station 22 .............................................. 85
Figure 40 Response time to Oceano from Pismo Beach Fire Station on Bello Street .................. 86
Figure 41 Oceano CSD Assessed Valuation ................................................................................... 87
Figure 42 Oceano CSD Property Tax 2014-2018 ........................................................................... 87
Figure 43 Oceano CSD Property Tax allocation 2014-2018 .......................................................... 87
Figure 44 Map of Oceano CSD Tax Rate Areas ............................................................................. 88
Figure 45 Oceano CSD Tax Revenue % and $ by TRA ................................................................... 89
Figure 46 Oceano CSD TRA 052-058 Breakdown ......................................................................... 90
Figure 47 Oceano CSD Parcel Count ............................................................................................. 91
Figure 48 Oceano CSD Fire Budget 2014-2018 ............................................................................. 93
Figure 49 Oceano CSD Service Level Analysis ............................................................................... 95
Figure 50 San Miguel CSD Data Sheet........................................................................................... 98
Figure 51 Map of San Miguel CSD: LAFCO .................................................................................... 99
Figure 52 Heat Map of Incident Locations in San Miguel .......................................................... 100
Figure 53 Response Times from San Miguel Fire Station ........................................................... 101
Figure 54 Response times from adjoining fire stations ............................................................. 102
Figure 55 San Miguel CSD Assessed Valuation ........................................................................... 103
Figure 56 San Miguel Property Tax allocation for Fire Protection 2014-2018 ........................... 103
Figure 57 Property Tax allocation patterns ............................................................................... 103
Figure 58 San Miguel CSD Map of Tax Rate Areas (TRA) ........................................................... 104
Figure 59 San Miguel CSD Tax revenue % and $ by TRA ............................................................. 105
Figure 60 San Miguel CSD TRA 114-023 Breakdown ................................................................. 105
Figure 61 San Miguel CSD Parcel Count ...................................................................................... 106
Figure 62 San Miguel CSD Fire Budget 2014-2018 ..................................................................... 107
Figure 63 San Miguel CSD Service Level Analysis ....................................................................... 109
Figure 64 Santa Margarita FPD Data Sheet................................................................................ 115
Figure 65 Map of Santa Margarita FPD: LAFCO .......................................................................... 116
Figure 66 Heat Map of incident locations in Santa Margarita FPD ............................................ 117
Figure 67 Response times from Santa Margarita FPD fire station ............................................. 118
Figure 68 Santa Margarita: Response times from adjoining fire stations .................................. 119
Figure 69 Santa Margarita FPD Assessed Valuation ................................................................... 120
Figure 70 Santa Margarita FPD Property Taxes 2014-2018 ........................................................ 120
Figure 71 Santa Margarita FPD: Property tax trends .................................................................. 121
Figure 72 Map of Santa Margarita FPD Tax Rate Area .............................................................. 122
Figure 73 Santa Margarita FPD: Tax Revenue % and $ by TRA ................................................... 122
Figure 74 Santa Margarita FPD: TRA 054-050 Breakdown ......................................................... 123
Figure 75 Santa Margarita FPD Parcel Count ............................................................................. 124
Figure 76 Santa Margarita FPD Fire Budgets 2014-2018 ............................................................ 125
Figure 77 Santa Margarita FPD: Service Level Analysis .............................................................. 127
Figure 78 Templeton CSD Data Sheet ......................................................................................... 133
Figure 79 Map of Templeton CSD: LAFCO .................................................................................. 134
Page 152 of 152
Figure 80 Templeton CSD: Heat Map of incident locations ........................................................ 135
Figure 81 Templeton CSD: Response times from Templeton CSD fire station ........................... 136
Figure 82 Templeton: Response Times from adjoining fire stations .......................................... 137
Figure 83 Templeton CSD Assessed Valuation ........................................................................... 138
Figure 84 Templeton CSD Property Tax Allocation 2014-2018 .................................................. 138
Figure 85 Templeton CSD Property Tax growth 2014-18 ........................................................... 138
Figure 86 Map of Templeton CSD Tax Rate Area ........................................................................ 139
Figure 87 Templeton CSD Tax Revenue % and $ by TRA ............................................................ 140
Figure 88 Templeton CSD TRA 126-007 Breakdown .................................................................. 140
Figure 89 Templeton CSD Parcel Count ...................................................................................... 141
Figure 90 Templeton CSD Fire Budget 2014-2018 ...................................................................... 143
Figure 91 Templeton CSD Service Level Analysis ........................................................................ 147
Figure 92 County Fire Options for Templeton Fire Protection ................................................... 149
Templeton Community Services District San Miguel Community Services District and Heritage Ranch Community Services District
ADOPTED
SPHERE OF INFLUENCE UPDATE
MUNICIPAL SERVICE REVIEW
PREPARED BY:
SAN LUIS OBISPO
LOCAL AGENCY FORMATION COMMISSION
NOVEMBER 21, 2013
NORTH COUNTY AREA
ADOPTED 2 NOVEMBER 2013
SAN LUIS OBISPO LOCAL AGENCY FORMATION COMMISSION
Commissioners
Chairman: Muril Clift, Special District Member
Vice Chairman: Kris Vardas, City Member
Marshall Ochylski, Special District Member
Frank Mecham, County Member
Bruce Gibson, County Member
Tom Murray, Public Member
Duane Picanco, City Member
Alternates
Roberta Fonzi, City Member
Vacant, County Member
Vacant, Special District Member
David Brooks, Public Member
Staff
David Church, AICP, Executive Officer
Raymond A. Biering, Legal Counsel
Mike Prater, LAFCO Analyst
Donna J. Bloyd, Commission Clerk
NORTH COUNTY AREA
ADOPTED 3 NOVEMBER 2013
TABLE OF CONTENTS
CHAPTER 1: INTRODUCTION AND EXECUTIVE SUMMARY Introduction ..................................................................................................................... 1-1 Service Review and Sphere of Influence Update Process .............................................. 1-2 California Environmental Quality Act ............................................................................... 1-3 Executive Summary ......................................................................................................... 1-4 Recommendation ............................................................................................................ 1-12
CHAPTER 2: SPHERE OF INFLUENCE UPDATE
Introduction ...................................................................................................................... 2-1 Templeton Community Services District
Existing Sphere of Influence ............................................................................................ 2-4 Sphere of Influence Study Areas ..................................................................................... Study Area 1-Creekside Ranch .............................................................................. 2-4 Study Area 2-Ramberg Property ............................................................................ 2-6 Memorandum of Agreement ............................................................................................ 2-8 Conditions of Approval ..................................................................................................... 2-8 Present and Planned Land Use ....................................................................................... 2-9 Present/Probable Need for Public Services ..................................................................... 2-9 Present Capacity of Public Facilities and Adequacy of Public Services .......................... 2-9 Social and Economic Communities of Interest ................................................................. 2-10
Present and Probable need for Public Facilities and Services of Disadvantaged Unincorporated Communities ........................................................................................... 2-10
San Miguel Community Services District
Present and Planned Land Use ....................................................................................... 2-11 Present/Probable Need for Public Services ..................................................................... 2-11 Present Capacity of Public Facilities and Adequacy of Public Services .......................... 2-12 Social and Economic Communities of Interest ................................................................. 2-12
Present and Probable need for Public Facilities and Services of Disadvantaged Unincorporated Communities ........................................................................................... 2-12
Heritage Ranch Community Services District
Present and Planned Land Use ....................................................................................... 2-14 Present/Probable Need for Public Services ..................................................................... 2-14 Present Capacity of Public Facilities and Adequacy of Public Services .......................... 2-14 Social and Economic Communities of Interest ................................................................. 2-15 Present and Probable need for Public Facilities and Services of Disadvantaged Unincorporated Communities ........................................................................................... 2-15
CHAPTER 3: TEMPLETON COMMUNITY SERVICES DISTRICT
Growth and Population ..................................................................................................... 3-5 Location and Characteristics of any Disadvantaged Unincorporated Communities ........ 3-20 Infrastructure Needs and Deficiencies ............................................................................. 3-21 Financing Constraints and Opportunities ......................................................................... 3-49 Opportunities for Shared Facilities ................................................................................... 3-58 Local Accountability/Governance ..................................................................................... 3-60 Other Matters ................................................................................................................... 3-63
NORTH COUNTY AREA
ADOPTED 4 NOVEMBER 2013
CHAPTER 4: SAN MIGUEL COMMUNITY SERVICES DISTRICT Growth and Population ..................................................................................................... 4-4 Location and Characteristics of any Disadvantaged Unincorporated Communities ........ 4-14 Infrastructure Needs and Deficiencies ............................................................................. 4-15 Financing Constraints and Opportunities ......................................................................... 4-28 Opportunities for Shared Facilities ................................................................................... 4-36 Local Accountability/Governance ..................................................................................... 4-37 Other Matters ................................................................................................................... 4-40
CHAPTER 5: HERITAGE RANCH COMMUNITY SERVICES DISTRICT
Growth and Population ..................................................................................................... 5-4 Location and Characteristics of any Disadvantaged Unincorporated Communities ........ 5-15 Infrastructure Needs and Deficiencies ............................................................................. 5-16 Financing Constraints and Opportunities ......................................................................... 5-36 Opportunities for Shared Facilities ................................................................................... 5-45 Local Accountability/Governance ..................................................................................... 5-47 Other Matters ................................................................................................................... 5-50
CHAPTER ONE FIGURES
Figure 1-1 Recommended Sphere of Influence Area – Templeton CSD ......................... 1-13 Figure 1-2 Recommended Sphere of Influence Area – San Miguel CSD ........................ 1-14 Figure 1-3 Recommended Sphere of Influence Area – Heritage Ranch CSD ................. 1-15
CHAPTER TWO, SPHERE OF INFLUENCE UPDATE Figure 2-1 Templeton-San Miguel-Heritage Ranch CSDs ............................................... 2-1 Figure 2-2 Templeton Study Area #1 .............................................................................. 2-5 Figure 2-3 Templeton Study Area #2 .............................................................................. 2-6 Figure 2-4 Templeton CSD .............................................................................................. 2-7 Figure 2-5 San Miguel CSD ............................................................................................. 2-13 Figure 2-6 Heritage Ranch CSD ...................................................................................... 2-16
CHAPTER THREE, TEMPLETON CSD Figure 3-1 Existing Sphere of Influence ........................................................................... 3-3 Figure 3-2 Templeton CSD Study Areas .......................................................................... 3-4 Figure 3-3 Existing County Land Use .............................................................................. 3-8 Figure 3-4 Urban Reserve Line ........................................................................................ 3-17 Figure 3-5 Monthly Groundwater Production as percentage ........................................... 3-23 Figure 3-6 TCSD Current Water Supply .......................................................................... 3-26 Figure 3-7 Other Water Providers .................................................................................... 3-33 Figure 3-8 Bill Comparison Monthly Residential Water .................................................... 3-37 Figure 3-9 Bill Comparison Monthly Residential Sewer ................................................... 3-37 Figure 3-10 Total Comparison Monthly Water & Sewer ................................................... 3-37 Figure 3-11 Fire Station Incidents 2010-11 ...................................................................... 3-40 Figure 3-12 Operating Budget .......................................................................................... 3-50 Figure 3-13 Property Tax Revenues ................................................................................ 3-50 Figure 3-14 Long-term Debts/Liabilities ........................................................................... 3-51 Figure 3-15 Changes in Fund Balance ............................................................................ 3-51 Figure 3-16 Revenue Sources ......................................................................................... 3-52 Figure 3-17 Rates for Water Use @ 20 CCF ................................................................... 3-54 Figure 3-18 Organizational Chart ..................................................................................... 3-61
NORTH COUNTY AREA
ADOPTED 5 NOVEMBER 2013
CHAPTER FOUR, SAN MIGUEL CSD Figure 4-1 Service Area & Sphere of Influence Adopted April 2006 ................................ 4-3 Figure 4-2 Williamson Act Contract near San Miguel ...................................................... 4-6 Figure 4-3 Existing County Land Use .............................................................................. 4-11 Figure 4-4 Monthly Comparison Water Rates .................................................................. 4-21 Figure 4-5 Monthly Comparison Sewer Rates ................................................................. 4-21 Figure 4-6 Total Comparison Monthly Rates Water & Sewer .......................................... 4-21 Figure 4-7 Operating Budget ............................................................................................ 4-28 Figure 4-8 Property Tax Revenues .................................................................................. 4-29 Figure 4-9 Long-term Debts/Liabilities ............................................................................. 4-29 Figure 4-10 Changes in Fund Balance ............................................................................ 4-30 Figure 4-11 Revenue Sources ......................................................................................... 4-31 Figure 4-12 Rates for Water Use @ 20 CCF ................................................................... 4-32 Figure 4-13 Organizational Chart ..................................................................................... 4-38
CHAPTER FIVE, HERITAGE RANCH CSD Figure 5-1 Service Area & Sphere of Influence Adopted December 2007 ....................... 5-3 Figure 5-2 Existing County Land Use .............................................................................. 5-7 Figure 5-3 Land Use ....................................................................................................... 5-12 Figure 5-4 Projected Water Supply & Demand ............................................................... 5-23 Figure 5-5 Private Water Purveyors ................................................................................ 5-26 Figure 5-6 Monthly Comparison Water Rates .................................................................. 5-30 Figure 5-7 Monthly Comparison Sewer Rates ................................................................. 5-30 Figure 5-8 Total Comparison Water & Sewer .................................................................. 5-30 Figure 5-9 North County Fire Station Heritage Ranch ..................................................... 5-32 Figure 5-10 Operating Budget .......................................................................................... 5-37 Figure 5-11 Tax Revenues ............................................................................................... 5-37 Figure 5-12 Long-term Debt/Liabilities ............................................................................. 5-38 Figure 5-13 Changes in Fund Balance ............................................................................ 5-38 Figure 5-14 Revenue Sources ......................................................................................... 5-39 Figure 5-15 Rats for Water Use @ 20 CCF ..................................................................... 5-41 Figure 5-16 Organizational Chart ..................................................................................... 5-48
TABLES, CHAPTER ONE Table 1-1 Historical & Projected Population Growth Templeton, .................................... 1-6 Table 1-2 Historical & Projected Population Growth San Miguel, .................................... 1-7 Table 1-3 Historical & Projected Population Growth Heritage Ranch .............................. 1-7
TABLES, TEMPLETON CSD Table 3-1 Proposed Service 2006 .................................................................................... 3-5 Table 3-2 Projected Population Growth TCSD, SLOCOG Projections ............................ 3-6 Table 3-3 Existing Land Use ............................................................................................ 3-9 Table 3-4 Historical & Projected Population Growth Templeton CSD, RMS Data ........... 3-10 Table 3-5 Historical & Projected Population Growth ........................................................ 3-11 Table 3-6 Buildout Summary: Land within the CSD ........................................................ 3-12 Table 3-7 2007-2014 SLOGOG Regional Housing Needs Allocation .............................. 3-18 Table 3-8 TCSD Current Water Supply ............................................................................ 3-25 Table 3-9 Future Available Water Supply ........................................................................ 3-26 Table 3-10 TSCD Water Produced .................................................................................. 3-27 Table 3-11 Future Hydraulic Demand Parameters .......................................................... 3-28 Table 3-12 Annual & Projected Demand .......................................................................... 3-28 Table 3-13 TCSD Water Use Estimates, AFY ................................................................. 3-29
NORTH COUNTY AREA
ADOPTED 6 NOVEMBER 2013
Table 3-14 Single Family Water Rates ............................................................................ 3-35 Table 3-15 Single Family Sewer Rates ............................................................................ 3-36 Table 3-16 Major Road Improvements ............................................................................. 3-38 Table 3-17 Residential Water Rates Comparison ............................................................ 3-53 Table 3-18 Single Family Water Rates & Monthly Bill ...................................................... 3-55 Table 3-19 Single Family Sewer Rates ............................................................................ 3-56
TABLES, SAN MIGUEL CSD Table 4-1 Projected Population Growth, SLOCOG Projections ....................................... 4-5 Table 4-2 Historical & Projected Population Growth: Census & RMS Data .................... 4-7 Table 4-3 Long-term Category Acreage Breakdown Density ........................................... 4-8 Table 4-4 Land-Use Breakdown ...................................................................................... 4-10 Table 4-5 2007-2014 SLOCOG Regional Housing Needs Allocation .............................. 4-12 Table 4-6 Current Water Use ........................................................................................... 4-17 Table 4-7 Existing & Future Water Supply & Demand ..................................................... 4-17 Table 4-8 Summary of Well Capacity & Production ......................................................... 4-18 Table 4-9 Single Family Water Rates .............................................................................. 4-20 Table 4-10 Single Family Sewer Rates ............................................................................ 4-20 Table 4-11 Single Family Rates & Monthly Bill ................................................................ 4-33 Table 4-12 Single Family Sewer Rates ............................................................................ 4-34
TABLES, HERITAGE RANCH CSD Table 5-1 Projected Population Growth Nacimiento, SLOCOG Projections .................... 5-5 Table 5-2 Historical & Projected population Growth, County of SLO Data ...................... 5-8 Table 5-3 Historical & Projected Population Growth RMS 2010-2012 Data .................... 5-8 Table 5-4 2007-2014 SLOCOG Regional Housing Needs Allocation .............................. 5-13 Table 5-5 Water Production ............................................................................................. 5-22 Table 5-6 Per Capita Water Use ...................................................................................... 5-22 Table 5-7 Single Family Water Rates .............................................................................. 5-28 Table 5-8 Singly Family Monthly Sewer Rates ................................................................ 5-29 Table 5-9 Single Family Water Rates & Monthly Bill ........................................................ 5-42 Table 5-10 Single Family Sewer Rates ............................................................................ 5-43
REFERENCES
APPENDICES Appendix A: Notice of Exemption
ADOPTED 1-1 NOVEMBER 2013
Sphere of Influence
“…a plan for the
probable physical
boundary and
service area of a
local agency or
municipality…”.
CHAPTER 1 - INTRODUCTION & EXECUTIVE SUMMARY
INTRODUCTION
The Cortese/Knox/Hertzberg Local Government Reorganization Act of 2000 (CKH Act) requires
the Local Agency Formation Commission (LAFCO) to update the Spheres of Influence (SOI) for
all applicable jurisdictions in the County every five years or as needed. A Sphere of Influence is
defined by Government Code 56425 as “…a plan for the probable physical boundary and
service area of a local agency or municipality…”. A SOI is generally considered a 20-year, long-
range planning tool. The Act further requires that a Municipal Service Review (MSR) be
conducted prior to, or in conjunction with, the update of a Sphere of Influence. The MSR
evaluates the capability of a jurisdiction to serve their existing residents and future development
in their Sphere of Influence.
Chapter Two is the Sphere of Influence Update and describes the
requirements of the Cortese-Knox-Hertzberg Act. It also makes
recommendations for updating the Spheres of Influence for each of the
jurisdictions. The Sphere Update is based upon Municipal Service
Review Chapters Three, Four, and Five that analyze each jurisdiction’s
capability to provide services to existing and future residents. The SOI
Update and Municipal Service Review are prepared to meet the
requirements of the Cortese/Knox/Hertzberg Local Government
Reorganization Act of 2000 (CKH). These Sphere of Influence Updates and Municipal Service
Reviews have been prepared for the following agencies: Templeton Community Services
District, San Miguel Community Services District and the Heritage Ranch Community Services
District in accordance with Section 56430 of the California Government Code. The San Luis
Obispo LAFCO’s Municipal Service Review Guidelines were used to develop information,
perform analysis and organize this study. The update of the Sphere of Influence for these
jurisdictions recognizes the existing circumstances and recommends no changes to the SOIs (a
“Status Quo” recommendation) with the exception of a small District owned parcel to be added
to Templeton’s Sphere of Influence.
The legislative authority for conducting Service Reviews is provided in section 56430 of the
CKH Act. The Act states, (“That in order to prepare and to update Spheres of Influence in
accordance with Section 56425, the Commission shall conduct a service review of the municipal
CHAPTER 1 INTRODUCTION AND EXECUTIVE SUMMARY
ADOPTED NOVEMBER 2013
1-2
SEVEN SERVICE REVIEW FACTORS
1. Growth and Population projections for the
affected area
2. Location and characteristics of any
disadvantaged unincorporated communities
3. Present and planned capacity of public
facilities and adequacy of public services
including infrastructure needs or deficiencies
4. Financial ability of agencies to provide
services
5. Status of, and opportunity for, shared
facilities
6. Accountability for community service needs
including governmental structure and
operational efficiencies
7. Any other matter related to effective or
efficient service delivery, as required by
commission policy
services provided in the County or other appropriate area designated by the Commission …”) A
Service Review must have written determinations that address the legislative factors in order to
update a Sphere of Influence.
Information that addresses each of the seven factors is provided in Chapters 3, 4, & 5 – the
Municipal Service Reviews for each jurisdiction. The seven factors are listed below, and Written
Determinations for each factor are found in each chapter.
LAFCOs are encouraged to compile a variety of information in preparing a Service Review.
LAFCOs also may use a significant proposal (general plan update, master plan, specific plan,
etc.) as a way to compile the information needed for a Service Review. Administrative,
organizational, and financial information is also collected and evaluated.
SERVICE REVIEW & SPHERE OF
INFLUENCE UPDATE PROCESS The process for updating the Agencies Sphere’s
of Influence includes several steps:
1. Gathering and compiling information regarding the jurisdictions service capability.
2. Update of or develop a Memorandum of
Agreement (MOA) regarding SOI boundaries and development provisions for the Sphere of Influence area.
3. Preparation and release of a Public Review
Draft Sphere of Influence Update and Municipal Service Review. Completion of the environmental review process consistent with the California Environmental Quality Act (CEQA). Public Review and Comment period for all documents.
4. If agreed to, District and County approval of
a Memorandum of Agreement (Appendix B). LAFCO is required by the CKH Act to give “great weight” to an agreement between the District and the County when considering the Sphere of Influence Update.
CHAPTER 1 INTRODUCTION AND EXECUTIVE SUMMARY
ADOPTED NOVEMBER 2013
1-3
5. LAFCO consideration of Sphere of Influence Update, Municipal Service Review, Memorandum of Agreement, and Environmental Review documentation.
Current LAFCO Action. LAFCO is being asked to consider the following actions as a part of
this Sphere of Influence Update:
1. Approve and adopt the environmental documentation pursuant to CEQA; 2. Approve the Municipal Service Reviews found in Chapters Three-Templeton
CSD, Four-San Miguel CSD, and Five-Heritage Ranch CSD of this document; and
3. Approve and adopt the Sphere of Influence Updates for each of the jurisdictions
in Chapter Two of this document.
Environmental Determination
The California Environmental Quality Act ("CEQA") requires that the Commission undertake and
review an environmental analysis before granting approval of a project, as defined by CEQA.
The MSR’s are categorically exempt from the preparation of environmental documentation
under a classification related to information gathering (Class 6 - Regulation Section 15306),
which states: "Class 6 consists of basic data collection, research, experimental management,
and resource evaluation activities which do not result in a serious or major disturbance to an
environmental resource. These may be strictly for information gathering purposes, or as part of
a study leading to an action which a public agency has not yet approved, adopted, or funded."
Furthermore, the SOI updates qualify for a general exemption from environmental review based
upon CEQA Regulation Section 15061(b)(3), which states: "The activity is covered by the
general rule that CEQA applies only to projects which have the potential for causing a significant
effect on the environment. Where it can be seen with certainty that there is no possibility that the
activity in question may have a significant effect on the environment, the activity is not subject to
CEQA." There is no possibility that the MSR or SOI updates would have a significant effect on
the environment because there is no land use changes associated with the documents. If the
Commission approves and adopts the MSR’s and SOI updates and determines that the project
are exempt from CEQA, staff will prepare and file a notice of exemption with the Clerk of the
County of San Luis Obispo, as required by CEQA Regulation Section 15062.
CHAPTER 1 INTRODUCTION AND EXECUTIVE SUMMARY
ADOPTED NOVEMBER 2013
1-4
EXECUTIVE SUMMARY
The following is a summary of the key information contained in the Sphere of Influence Update
and Municipal Service Review completed for the Templeton Community Services District, San
Miguel Community Services District and the Heritage Ranch Community Services District. The
seven factors that are required to be addressed by the CKH Act are covered in this summary
section. The analysis in the chapters that follow evaluates and addresses the factors unique to
LAFCO’s role and decision-making authority pursuant to the CKH Act.
Chapter Two focuses on the actions being proposed for each jurisdiction’s
Sphere of Influence and includes maps showing the proposed Sphere of
Influence. This chapter effectively proposes the update of the Spheres of
Influences based on the information found in the Municipal Service Review
chapters that follow. The only change is the proposed addition of an existing
District owned parcel to Templeton Community Services District’s Sphere of
Influence.
Chapter Three is the Municipal Service Review for Templeton Community
Services District and addresses the seven factors required by the CKH. A small
existing District owned parcel Study Area 1 is proposed to be added to the
District’s Sphere of Influence further detail is provided in Chapter Two.
Chapter Four is the Municipal Service Review for San Miguel Community
Services District and addresses the seven factors required by the CKH. No
changes are proposed for the District’s Sphere of Influence.
Chapter Five is the Municipal Service Review for the Heritage Ranch
Community Service District and addresses the seven factors required by the
CKH. No changes are proposed for the District’s Sphere of Influence. More
detail can be found in Chapter Two.

CHAPTER 1 INTRODUCTION AND EXECUTIVE SUMMARY
ADOPTED NOVEMBER 2013
1-5
CHAPTER 2 SPHERE OF INFLUENCE UPDATE The Sphere of Influence Chapter describes the requirements of the Cortese-Knox-Hertzberg Act
and provides background regarding the existing SOI for each jurisdiction. It also identifies the
Study Areas that were evaluated in determining the SOI’s, a District-County agreement between
Templeton Community Services District and the County, and the LAFCO staff recommendation
for each jurisdiction. Also covered are the factors that are required by CKH for establishing a
SOI. The Staff Recommendation is to maintain the existing SOI for San Miguel Community
Services District and the Heritage Ranch Community Services District and add a small existing
District owned parcel to the Templeton Community Services District.
CHAPTERS 3, 4, & 5 MUNICIPAL SERVICE REVIEW
1. Growth & Population
Templeton Community Services District According to the 2010 US Census, Templeton had a population of 6,838. Total housing units
were estimated to be 2,580 units. The estimated build-out population within the current service
area is estimated to be 8,993 by the District. The Salinas River Inland Area Plan estimates that
the existing Templeton CSD boundary has enough land for future residential, commercial, and
industrial development. Due to its location in the center of the urban corridor, it has a large
capacity for regional commercial and industrial development. According to the 2010-2012
Biennial Resource Management System Report, the community saw a steady growth rate in the
years 2000 to 2010, when population growth averaged slightly over 3% per year. A lower growth
rate is expected through 2020. Templeton is at about 76% of its buildout population of about
9,170 per the County General Plan. The following table shows the past census data and uses
demographic information from the District’s Water Master Plan.

CHAPTER 1 INTRODUCTION AND EXECUTIVE SUMMARY
ADOPTED NOVEMBER 2013
1-6
Table 1-1: Historical & Projected Population Growth
Templeton California: Census and WMP Data
1980(1) 1990
(1) 2000(2) 2005
(2) 2010(2) 2015
(2) 2030(2)
Population 1,216 2,887 5,160 6,417* 6,838 7,042 8,548
10 Year
Increase -- 1,671 2,273 1,257 421 204 1,506
10 year Avg.
Increase -- 57.8% 44% 19.5% 6% 2.8% 17.6%
Average per
Year -- 5.7% 4.4% 3.9% 1% <1% 1.1%
(1) Source: U.S. Census (2) Source: Templeton CSD 2013 adjusted Census for District area (3) * Per 2005 Master Plan Update
Over the last 20 years, Templeton’s population has increased by approximately 4,000 people.
From 1990 to 2000, the community of Templeton increased by 2,273, a 44% increase, an
average growth rate of 4.4% per year. In the 2000’s, Templeton’s population increased by 1,678
residents, a 10 year growth rate of 24.5%. The annual growth rate for that last decade was an
average of 2.4%.
Templeton is one of the fastest growing communities in the county. Templeton has available
residential multi-family zoned land. Templeton produced 135 multi-family units as well as 360
single family units from 2001-June 30, 2008.
San Miguel Community Services District According to the 2010 US Census, San Miguel had a population of 2,3371. Total housing units
were estimated to be 736 units. The estimated build-out population within the current service
area is estimated to be 3,338.
According to the 2010-2012 Biennial Resource Management System Report, San Miguel’s
population has increased by approximately 963 people. This equates to 3.3% per year rate of
population increase over the period. In the 2002 Water Master Plan, San Miguel CSD estimates
1 The Census Data may have captured the entire San Miguel area which extends beyond the District service area
boundary. According to the District records in 2010 the District had approximately 700 water service connections and an estimated corresponding population of 1,700 to 1,800 residents within the service area boundary.
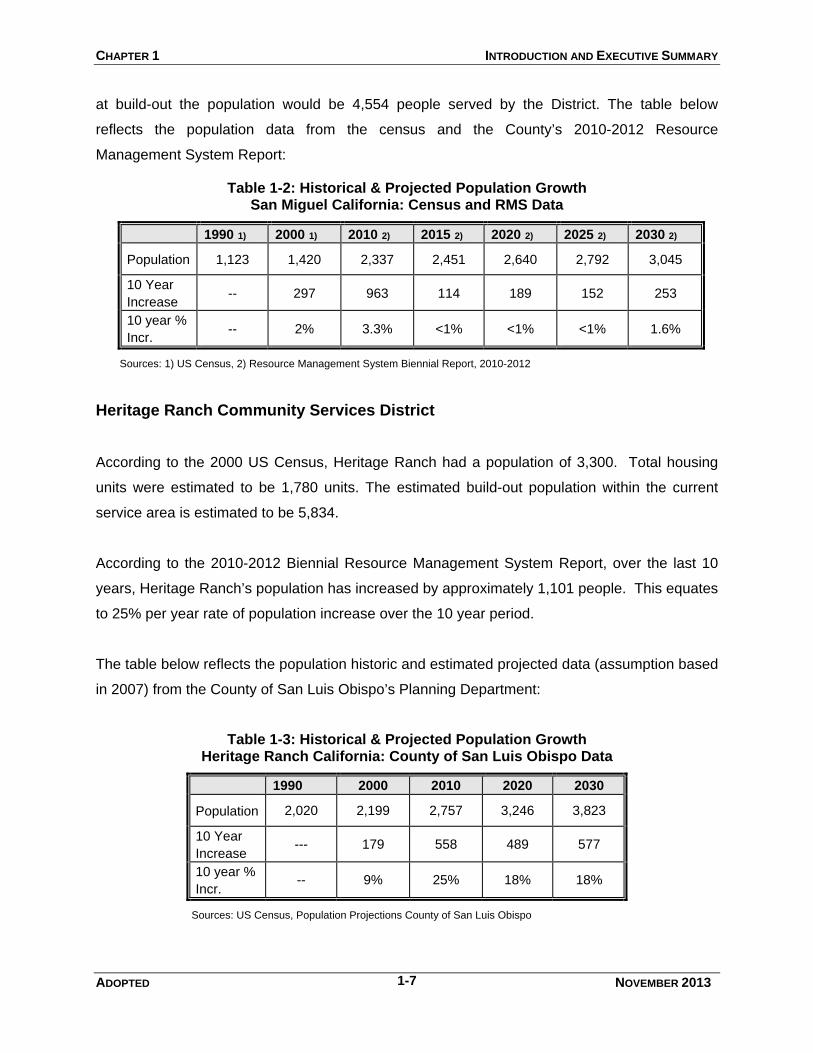
CHAPTER 1 INTRODUCTION AND EXECUTIVE SUMMARY
ADOPTED NOVEMBER 2013
1-7
at build-out the population would be 4,554 people served by the District. The table below
reflects the population data from the census and the County’s 2010-2012 Resource
Management System Report:
Table 1-2: Historical & Projected Population Growth San Miguel California: Census and RMS Data
1990 1) 2000 1) 2010 2) 2015 2) 2020 2) 2025 2) 2030 2)
Population 1,123 1,420 2,337 2,451 2,640 2,792 3,045
10 Year
Increase -- 297 963 114 189 152 253
10 year %
Incr. -- 2% 3.3% <1% <1% <1% 1.6%
Sources: 1) US Census, 2) Resource Management System Biennial Report, 2010-2012
Heritage Ranch Community Services District
According to the 2000 US Census, Heritage Ranch had a population of 3,300. Total housing
units were estimated to be 1,780 units. The estimated build-out population within the current
service area is estimated to be 5,834.
According to the 2010-2012 Biennial Resource Management System Report, over the last 10
years, Heritage Ranch’s population has increased by approximately 1,101 people. This equates
to 25% per year rate of population increase over the 10 year period.
The table below reflects the population historic and estimated projected data (assumption based
in 2007) from the County of San Luis Obispo’s Planning Department:
Table 1-3: Historical & Projected Population Growth Heritage Ranch California: County of San Luis Obispo Data
1990 2000 2010 2020 2030
Population 2,020 2,199 2,757 3,246 3,823
10 Year
Increase --- 179 558 489 577
10 year %
Incr. -- 9% 25% 18% 18%
Sources: US Census, Population Projections County of San Luis Obispo

CHAPTER 1 INTRODUCTION AND EXECUTIVE SUMMARY
ADOPTED NOVEMBER 2013
1-8
2. Infrastructure Needs & Deficiencies Location and characteristics of
any disadvantaged unincorporated communities LAFCO is responsible for determining the location and characteristics of any disadvantaged
unincorporated communities within or contiguous to the sphere of influence. If a jurisdiction is
reasonably capable of providing needed resources and basic infrastructure to disadvantaged
unincorporated communities within the sphere of influence or contiguous to the sphere of
influence, it is important that such findings of infrastructure and resource availability occur when
revisions to the SOI and annexations are proposed by the agency or property owners.
The North County area has a variety of economic diversity that resides within the Community
Service Districts and/or surrounding area including within the Spheres of Influence.
Disadvantaged community means a community with an annual median household income that
is less than 80 percent of the statewide annual median household income. None of the
communities in the North County area qualify under the definition of disadvantage community
for the present and probable need for public facilities and services nor are the areas contiguous
to the sphere of influence qualify as a disadvantage community.
3. Infrastructure Needs & Deficiencies LAFCO is responsible for determining that a jurisdiction is reasonably capable of providing
needed resources and basic infrastructure to serve areas already within the District or service
area and in the Sphere of Influence. It is important that such findings of infrastructure and
resource availability occur when revisions to the SOI and annexations are proposed by the
jurisdiction or property owners. In the case of this SOI Update, it is prudent for LAFCO to
analyze present and long-term infrastructure demands and resource capabilities for the
Templeton CSD, San Miguel CSD and Heritage Ranch CSD. LAFCO accomplishes this by
evaluating 1) the resources and services that are currently available, and 2) the ability of the
jurisdiction to expand such resources and services in line with increasing demands.
Water
Templeton. In 2012, the District reported annual water use of 1,480 acre-feet. The District’s
current population is 6,838 with the current per capita water use at a relatively moderate 196
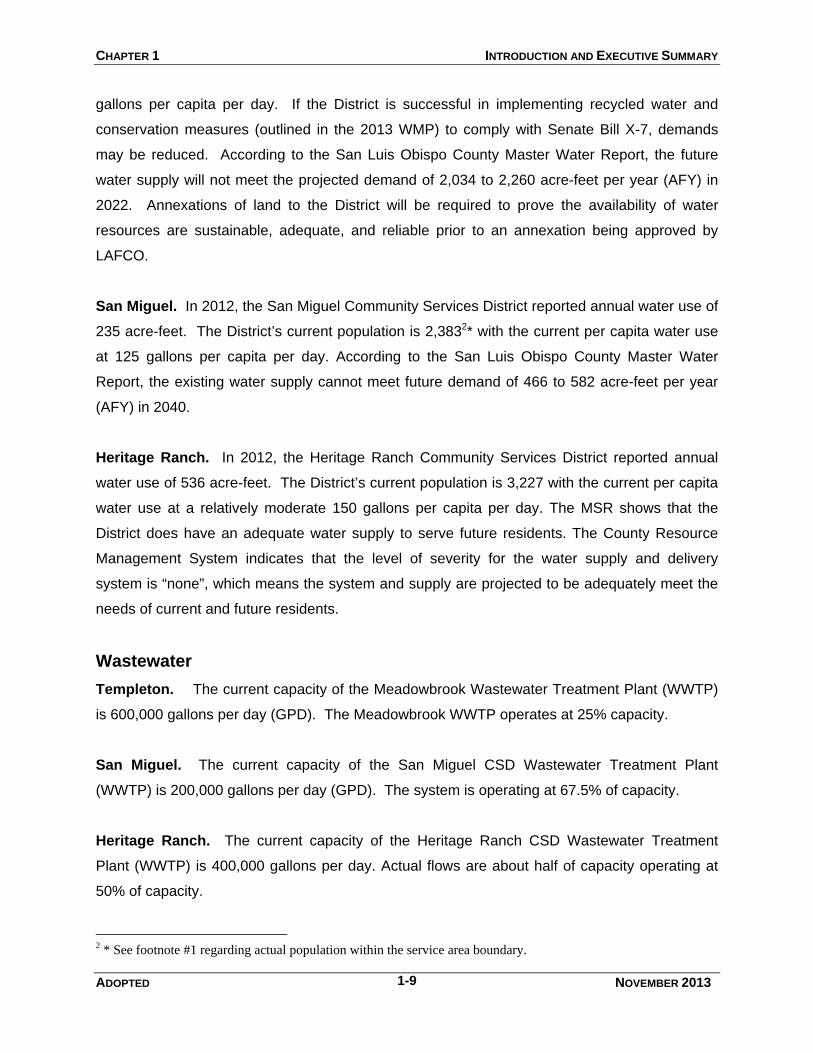
CHAPTER 1 INTRODUCTION AND EXECUTIVE SUMMARY
ADOPTED NOVEMBER 2013
1-9
gallons per capita per day. If the District is successful in implementing recycled water and
conservation measures (outlined in the 2013 WMP) to comply with Senate Bill X-7, demands
may be reduced. According to the San Luis Obispo County Master Water Report, the future
water supply will not meet the projected demand of 2,034 to 2,260 acre-feet per year (AFY) in
2022. Annexations of land to the District will be required to prove the availability of water
resources are sustainable, adequate, and reliable prior to an annexation being approved by
LAFCO.
San Miguel. In 2012, the San Miguel Community Services District reported annual water use of
235 acre-feet. The District’s current population is 2,3832* with the current per capita water use
at 125 gallons per capita per day. According to the San Luis Obispo County Master Water
Report, the existing water supply cannot meet future demand of 466 to 582 acre-feet per year
(AFY) in 2040.
Heritage Ranch. In 2012, the Heritage Ranch Community Services District reported annual
water use of 536 acre-feet. The District’s current population is 3,227 with the current per capita
water use at a relatively moderate 150 gallons per capita per day. The MSR shows that the
District does have an adequate water supply to serve future residents. The County Resource
Management System indicates that the level of severity for the water supply and delivery
system is “none”, which means the system and supply are projected to be adequately meet the
needs of current and future residents.
Wastewater
Templeton. The current capacity of the Meadowbrook Wastewater Treatment Plant (WWTP)
is 600,000 gallons per day (GPD). The Meadowbrook WWTP operates at 25% capacity.
San Miguel. The current capacity of the San Miguel CSD Wastewater Treatment Plant
(WWTP) is 200,000 gallons per day (GPD). The system is operating at 67.5% of capacity.
Heritage Ranch. The current capacity of the Heritage Ranch CSD Wastewater Treatment
Plant (WWTP) is 400,000 gallons per day. Actual flows are about half of capacity operating at
50% of capacity.
2 * See footnote #1 regarding actual population within the service area boundary.
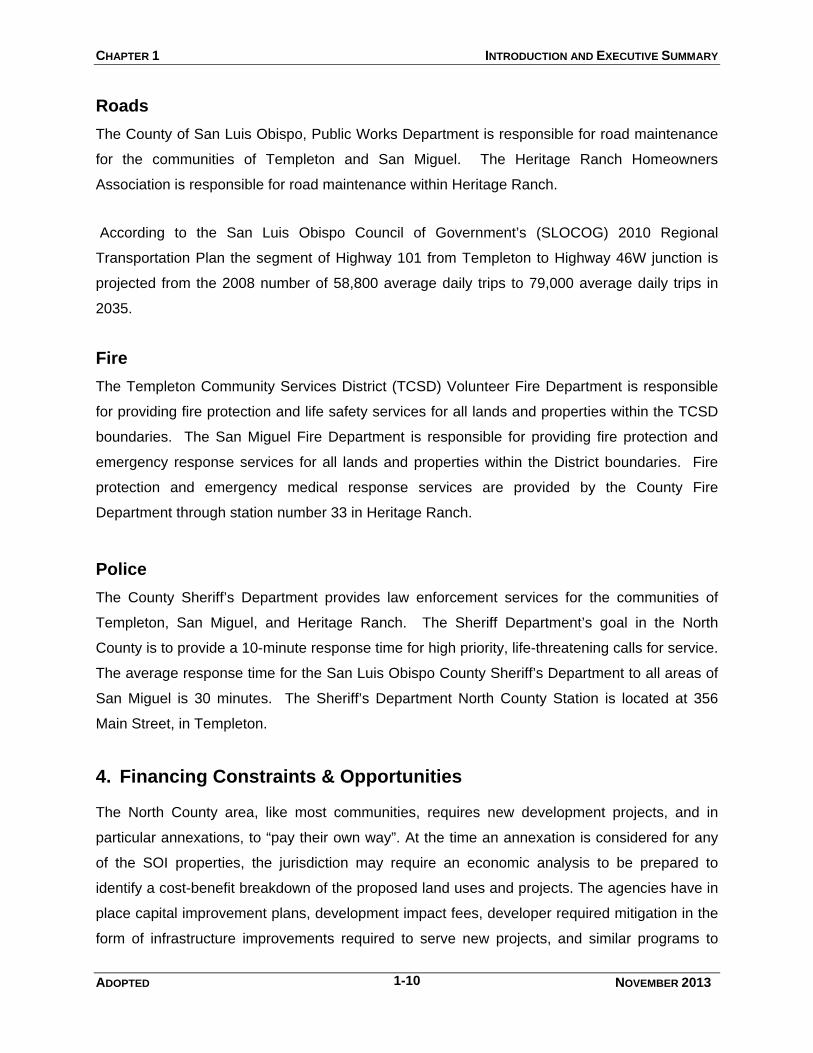
CHAPTER 1 INTRODUCTION AND EXECUTIVE SUMMARY
ADOPTED NOVEMBER 2013
1-10
Roads
The County of San Luis Obispo, Public Works Department is responsible for road maintenance
for the communities of Templeton and San Miguel. The Heritage Ranch Homeowners
Association is responsible for road maintenance within Heritage Ranch.
According to the San Luis Obispo Council of Government’s (SLOCOG) 2010 Regional
Transportation Plan the segment of Highway 101 from Templeton to Highway 46W junction is
projected from the 2008 number of 58,800 average daily trips to 79,000 average daily trips in
2035.
Fire
The Templeton Community Services District (TCSD) Volunteer Fire Department is responsible
for providing fire protection and life safety services for all lands and properties within the TCSD
boundaries. The San Miguel Fire Department is responsible for providing fire protection and
emergency response services for all lands and properties within the District boundaries. Fire
protection and emergency medical response services are provided by the County Fire
Department through station number 33 in Heritage Ranch.
Police
The County Sheriff’s Department provides law enforcement services for the communities of
Templeton, San Miguel, and Heritage Ranch. The Sheriff Department’s goal in the North
County is to provide a 10-minute response time for high priority, life-threatening calls for service.
The average response time for the San Luis Obispo County Sheriff’s Department to all areas of
San Miguel is 30 minutes. The Sheriff’s Department North County Station is located at 356
Main Street, in Templeton.
4. Financing Constraints & Opportunities The North County area, like most communities, requires new development projects, and in
particular annexations, to “pay their own way”. At the time an annexation is considered for any
of the SOI properties, the jurisdiction may require an economic analysis to be prepared to
identify a cost-benefit breakdown of the proposed land uses and projects. The agencies have in
place capital improvement plans, development impact fees, developer required mitigation in the
form of infrastructure improvements required to serve new projects, and similar programs to
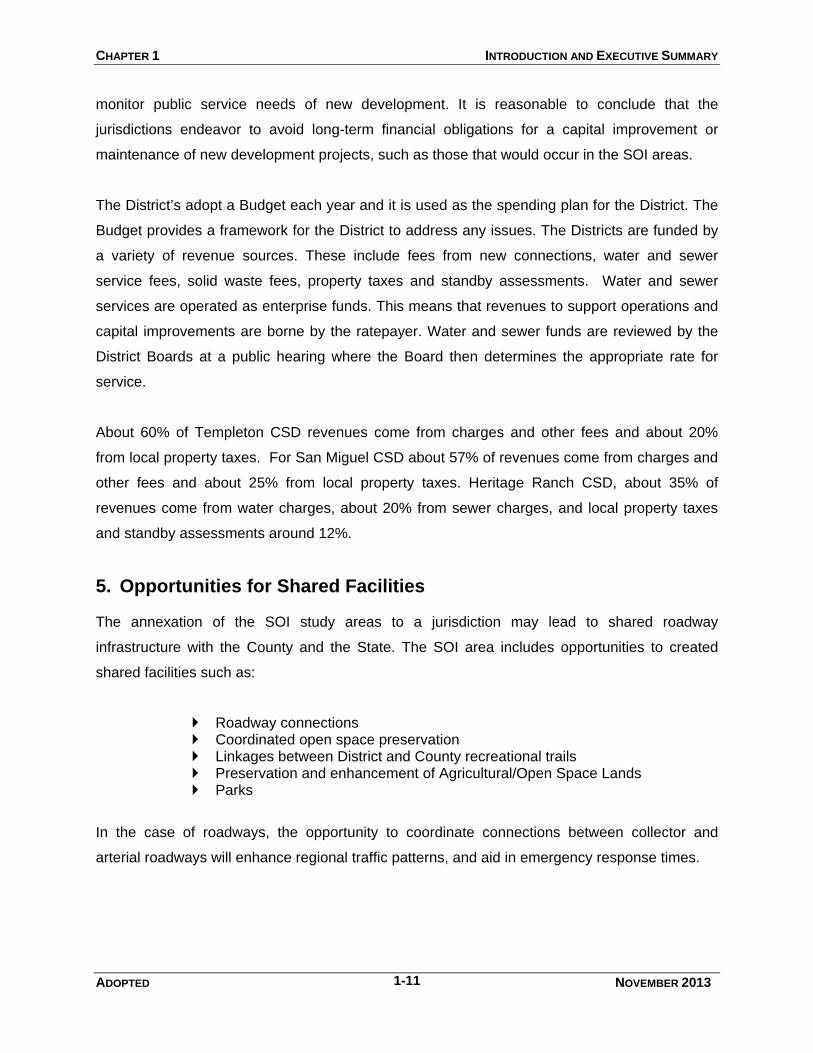
CHAPTER 1 INTRODUCTION AND EXECUTIVE SUMMARY
ADOPTED NOVEMBER 2013
1-11
monitor public service needs of new development. It is reasonable to conclude that the
jurisdictions endeavor to avoid long-term financial obligations for a capital improvement or
maintenance of new development projects, such as those that would occur in the SOI areas.
The District’s adopt a Budget each year and it is used as the spending plan for the District. The
Budget provides a framework for the District to address any issues. The Districts are funded by
a variety of revenue sources. These include fees from new connections, water and sewer
service fees, solid waste fees, property taxes and standby assessments. Water and sewer
services are operated as enterprise funds. This means that revenues to support operations and
capital improvements are borne by the ratepayer. Water and sewer funds are reviewed by the
District Boards at a public hearing where the Board then determines the appropriate rate for
service.
About 60% of Templeton CSD revenues come from charges and other fees and about 20%
from local property taxes. For San Miguel CSD about 57% of revenues come from charges and
other fees and about 25% from local property taxes. Heritage Ranch CSD, about 35% of
revenues come from water charges, about 20% from sewer charges, and local property taxes
and standby assessments around 12%.
5. Opportunities for Shared Facilities The annexation of the SOI study areas to a jurisdiction may lead to shared roadway
infrastructure with the County and the State. The SOI area includes opportunities to created
shared facilities such as:
Roadway connections Coordinated open space preservation Linkages between District and County recreational trails Preservation and enhancement of Agricultural/Open Space Lands Parks
In the case of roadways, the opportunity to coordinate connections between collector and
arterial roadways will enhance regional traffic patterns, and aid in emergency response times.
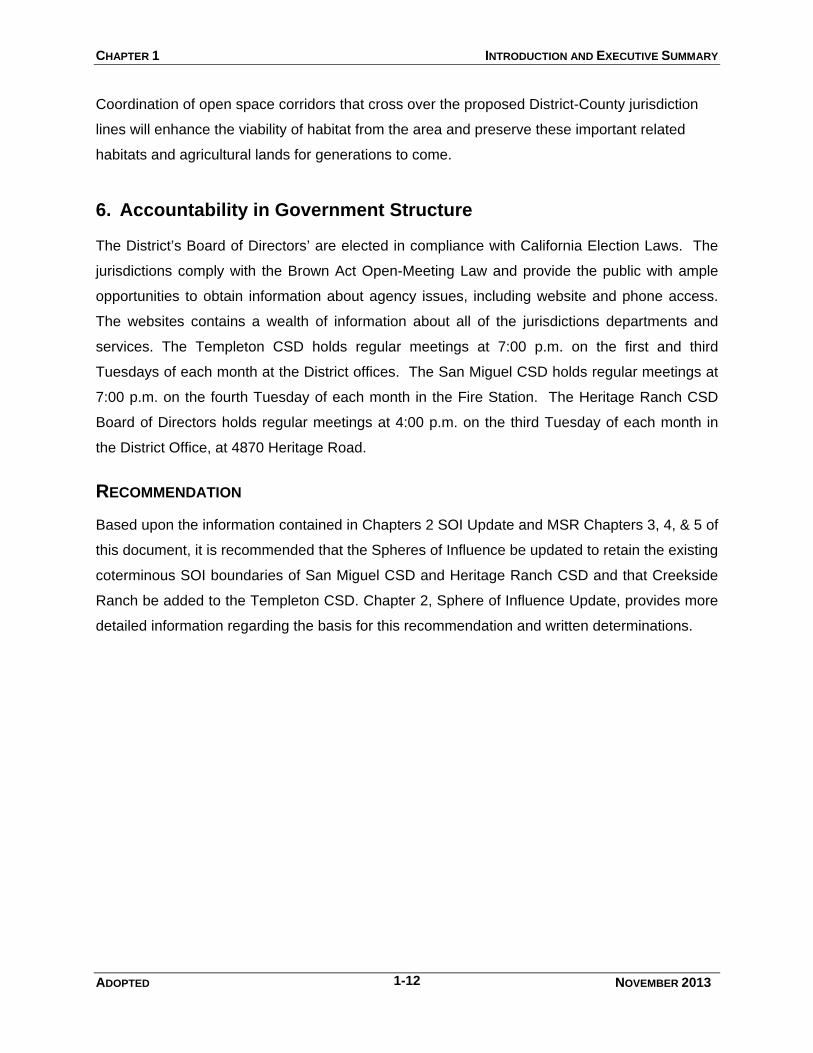
CHAPTER 1 INTRODUCTION AND EXECUTIVE SUMMARY
ADOPTED NOVEMBER 2013
1-12
Coordination of open space corridors that cross over the proposed District-County jurisdiction
lines will enhance the viability of habitat from the area and preserve these important related
habitats and agricultural lands for generations to come.
6. Accountability in Government Structure The District’s Board of Directors’ are elected in compliance with California Election Laws. The
jurisdictions comply with the Brown Act Open-Meeting Law and provide the public with ample
opportunities to obtain information about agency issues, including website and phone access.
The websites contains a wealth of information about all of the jurisdictions departments and
services. The Templeton CSD holds regular meetings at 7:00 p.m. on the first and third
Tuesdays of each month at the District offices. The San Miguel CSD holds regular meetings at
7:00 p.m. on the fourth Tuesday of each month in the Fire Station. The Heritage Ranch CSD
Board of Directors holds regular meetings at 4:00 p.m. on the third Tuesday of each month in
the District Office, at 4870 Heritage Road.
RECOMMENDATION
Based upon the information contained in Chapters 2 SOI Update and MSR Chapters 3, 4, & 5 of
this document, it is recommended that the Spheres of Influence be updated to retain the existing
coterminous SOI boundaries of San Miguel CSD and Heritage Ranch CSD and that Creekside
Ranch be added to the Templeton CSD. Chapter 2, Sphere of Influence Update, provides more
detailed information regarding the basis for this recommendation and written determinations.
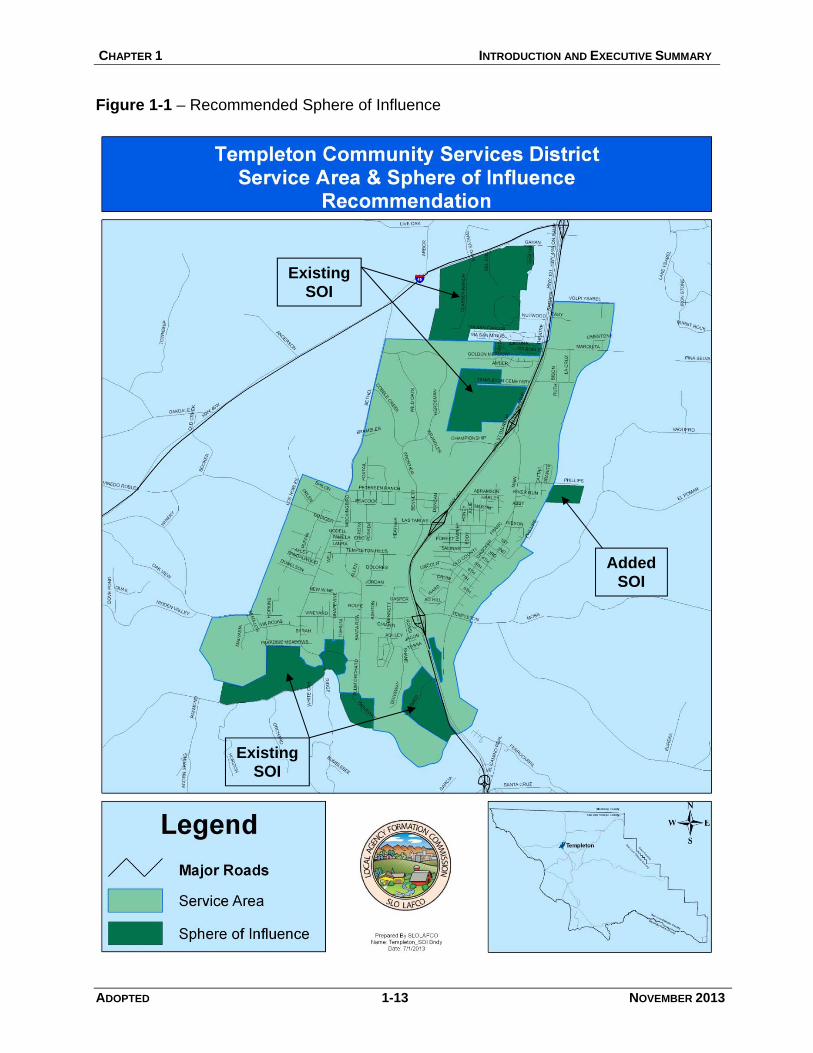
CHAPTER 1 INTRODUCTION AND EXECUTIVE SUMMARY
ADOPTED 1-13 NOVEMBER 2013
Figure 1-1 – Recommended Sphere of Influence
Added
SOI
Existing SOI
Existing
SOI
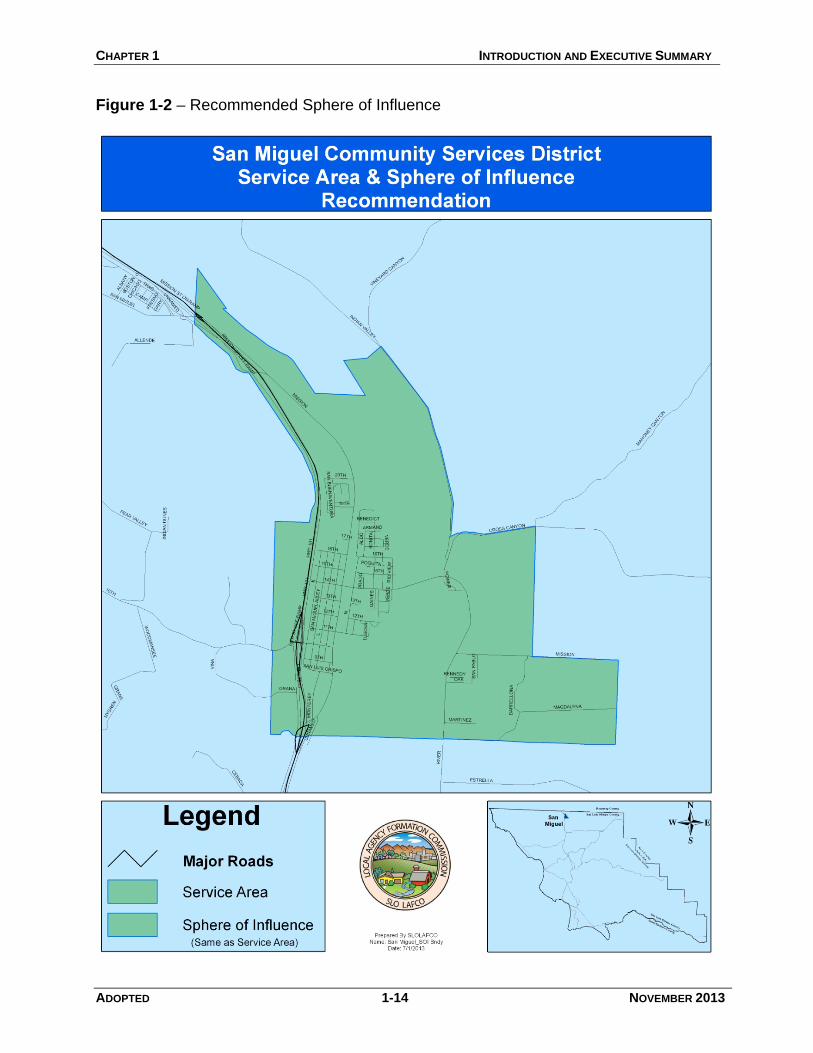
CHAPTER 1 INTRODUCTION AND EXECUTIVE SUMMARY
ADOPTED 1-14 NOVEMBER 2013
Figure 1-2 – Recommended Sphere of Influence
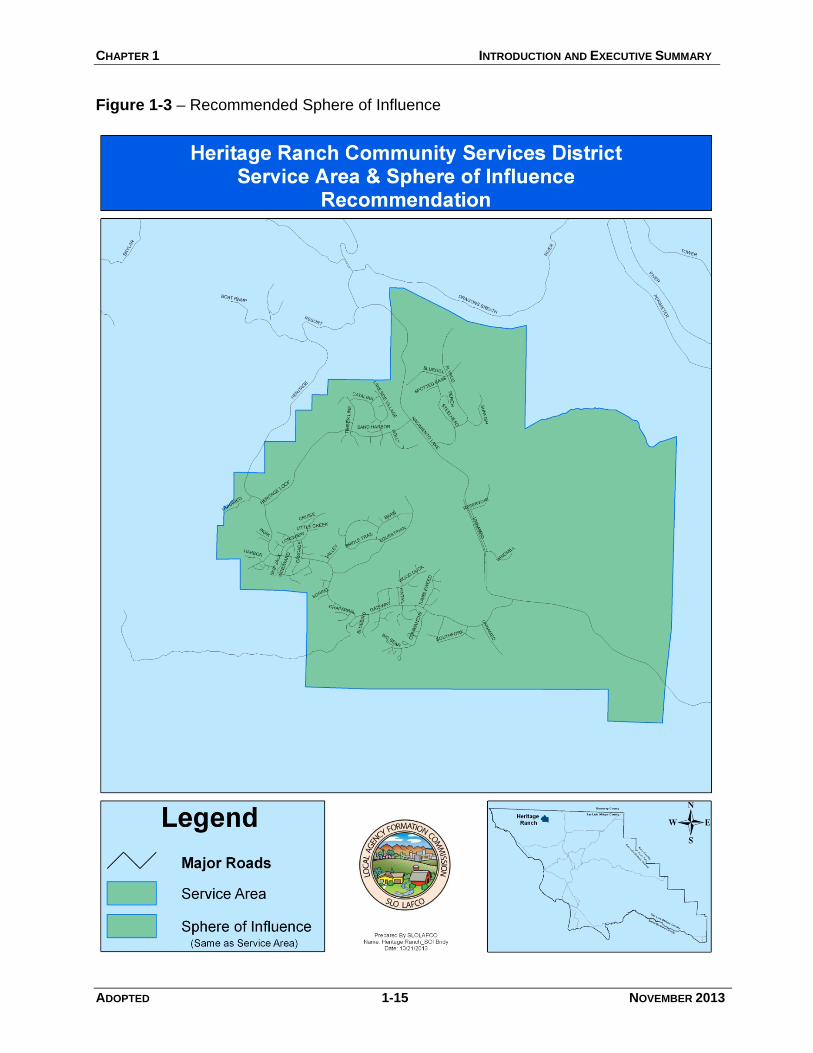
CHAPTER 1 INTRODUCTION AND EXECUTIVE SUMMARY
ADOPTED 1-15 NOVEMBER 2013
Figure 1-3 – Recommended Sphere of Influence
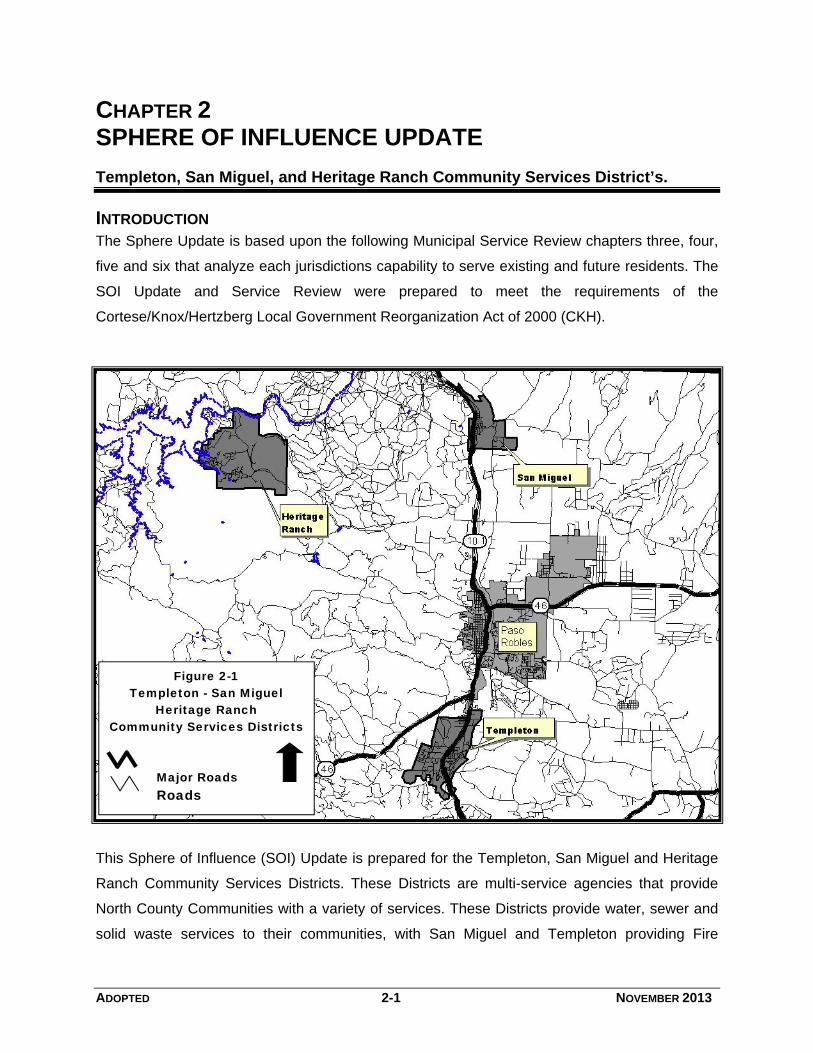
ADOPTED 2-1 NOVEMBER 2013
CHAPTER 2 SPHERE OF INFLUENCE UPDATE
Templeton, San Miguel, and Heritage Ranch Community Services District’s.
INTRODUCTION The Sphere Update is based upon the following Municipal Service Review chapters three, four,
five and six that analyze each jurisdictions capability to serve existing and future residents. The
SOI Update and Service Review were prepared to meet the requirements of the
Cortese/Knox/Hertzberg Local Government Reorganization Act of 2000 (CKH).
This Sphere of Influence (SOI) Update is prepared for the Templeton, San Miguel and Heritage
Ranch Community Services Districts. These Districts are multi-service agencies that provide
North County Communities with a variety of services. These Districts provide water, sewer and
solid waste services to their communities, with San Miguel and Templeton providing Fire
Figure 2-1 Templeton - San Miguel
Heritage Ranch Community Services Districts Major Roads Roads
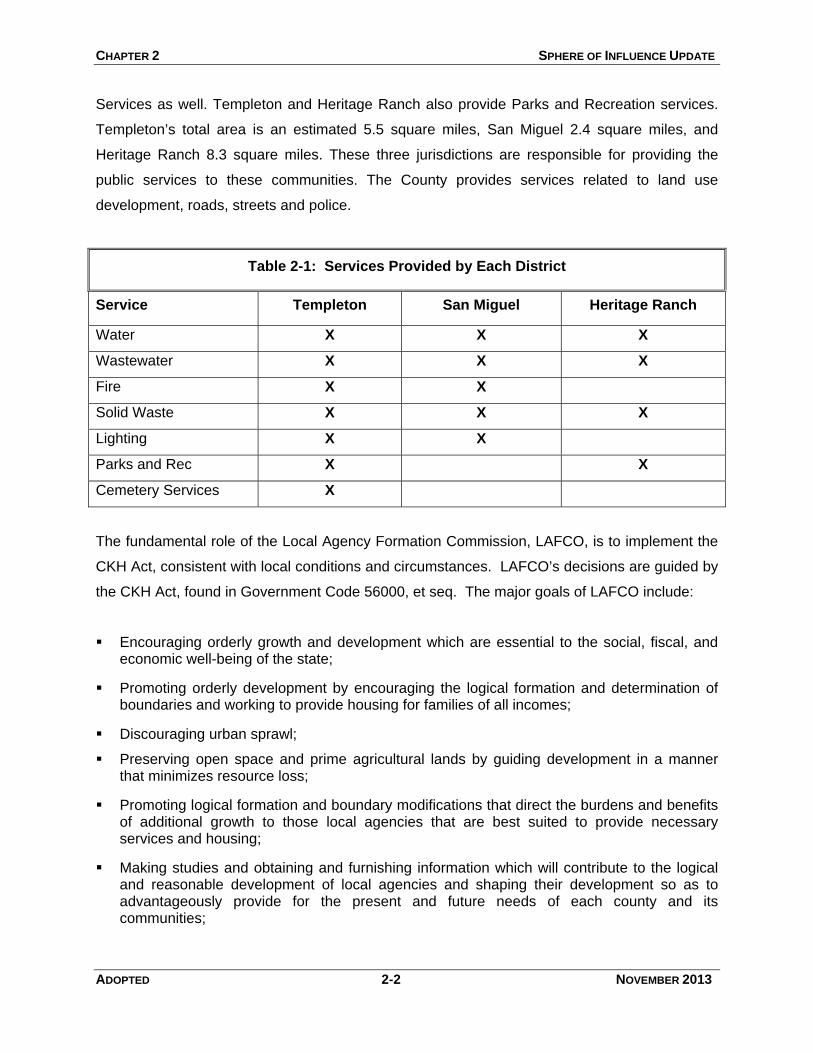
CHAPTER 2 SPHERE OF INFLUENCE UPDATE
ADOPTED 2-2 NOVEMBER 2013
Services as well. Templeton and Heritage Ranch also provide Parks and Recreation services.
Templeton’s total area is an estimated 5.5 square miles, San Miguel 2.4 square miles, and
Heritage Ranch 8.3 square miles. These three jurisdictions are responsible for providing the
public services to these communities. The County provides services related to land use
development, roads, streets and police.
Table 2-1: Services Provided by Each District
Service Templeton San Miguel Heritage Ranch
Water X X X
Wastewater X X X
Fire X X
Solid Waste X X X
Lighting X X
Parks and Rec X X
Cemetery Services X
The fundamental role of the Local Agency Formation Commission, LAFCO, is to implement the
CKH Act, consistent with local conditions and circumstances. LAFCO’s decisions are guided by
the CKH Act, found in Government Code 56000, et seq. The major goals of LAFCO include:
Encouraging orderly growth and development which are essential to the social, fiscal, and economic well-being of the state;
Promoting orderly development by encouraging the logical formation and determination of boundaries and working to provide housing for families of all incomes;
Discouraging urban sprawl;
Preserving open space and prime agricultural lands by guiding development in a manner that minimizes resource loss;
Promoting logical formation and boundary modifications that direct the burdens and benefits of additional growth to those local agencies that are best suited to provide necessary services and housing;
Making studies and obtaining and furnishing information which will contribute to the logical and reasonable development of local agencies and shaping their development so as to advantageously provide for the present and future needs of each county and its communities;
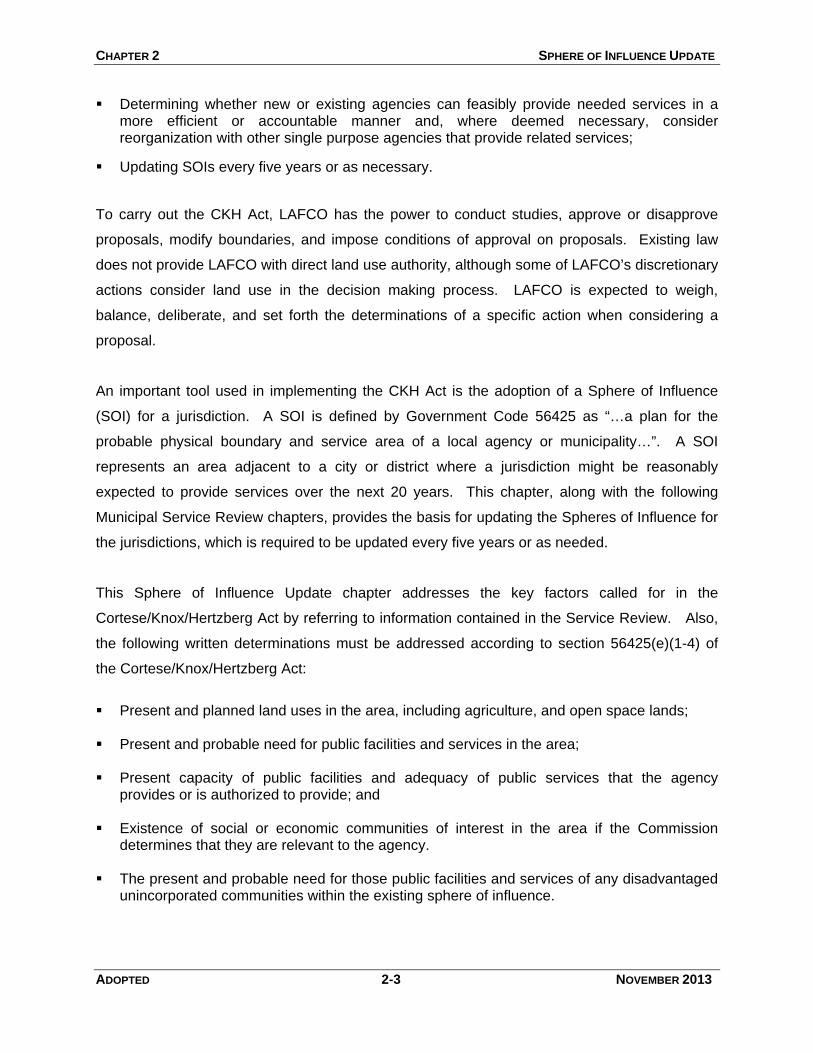
CHAPTER 2 SPHERE OF INFLUENCE UPDATE
ADOPTED 2-3 NOVEMBER 2013
Determining whether new or existing agencies can feasibly provide needed services in a more efficient or accountable manner and, where deemed necessary, consider reorganization with other single purpose agencies that provide related services;
Updating SOIs every five years or as necessary.
To carry out the CKH Act, LAFCO has the power to conduct studies, approve or disapprove
proposals, modify boundaries, and impose conditions of approval on proposals. Existing law
does not provide LAFCO with direct land use authority, although some of LAFCO’s discretionary
actions consider land use in the decision making process. LAFCO is expected to weigh,
balance, deliberate, and set forth the determinations of a specific action when considering a
proposal.
An important tool used in implementing the CKH Act is the adoption of a Sphere of Influence
(SOI) for a jurisdiction. A SOI is defined by Government Code 56425 as “…a plan for the
probable physical boundary and service area of a local agency or municipality…”. A SOI
represents an area adjacent to a city or district where a jurisdiction might be reasonably
expected to provide services over the next 20 years. This chapter, along with the following
Municipal Service Review chapters, provides the basis for updating the Spheres of Influence for
the jurisdictions, which is required to be updated every five years or as needed.
This Sphere of Influence Update chapter addresses the key factors called for in the
Cortese/Knox/Hertzberg Act by referring to information contained in the Service Review. Also,
the following written determinations must be addressed according to section 56425(e)(1-4) of
the Cortese/Knox/Hertzberg Act:
Present and planned land uses in the area, including agriculture, and open space lands;
Present and probable need for public facilities and services in the area;
Present capacity of public facilities and adequacy of public services that the agency
provides or is authorized to provide; and Existence of social or economic communities of interest in the area if the Commission
determines that they are relevant to the agency. The present and probable need for those public facilities and services of any disadvantaged
unincorporated communities within the existing sphere of influence.
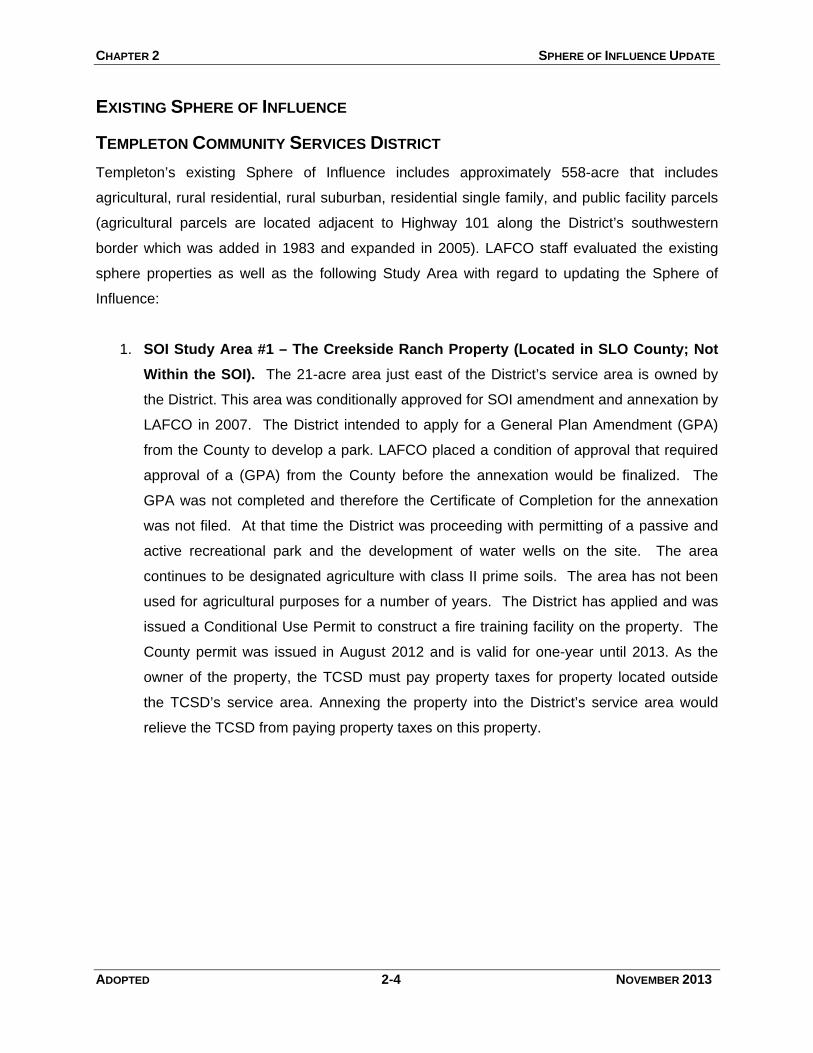
CHAPTER 2 SPHERE OF INFLUENCE UPDATE
ADOPTED 2-4 NOVEMBER 2013
EXISTING SPHERE OF INFLUENCE
TEMPLETON COMMUNITY SERVICES DISTRICT
Templeton’s existing Sphere of Influence includes approximately 558-acre that includes
agricultural, rural residential, rural suburban, residential single family, and public facility parcels
(agricultural parcels are located adjacent to Highway 101 along the District’s southwestern
border which was added in 1983 and expanded in 2005). LAFCO staff evaluated the existing
sphere properties as well as the following Study Area with regard to updating the Sphere of
Influence:
1. SOI Study Area #1 – The Creekside Ranch Property (Located in SLO County; Not
Within the SOI). The 21-acre area just east of the District’s service area is owned by
the District. This area was conditionally approved for SOI amendment and annexation by
LAFCO in 2007. The District intended to apply for a General Plan Amendment (GPA)
from the County to develop a park. LAFCO placed a condition of approval that required
approval of a (GPA) from the County before the annexation would be finalized. The
GPA was not completed and therefore the Certificate of Completion for the annexation
was not filed. At that time the District was proceeding with permitting of a passive and
active recreational park and the development of water wells on the site. The area
continues to be designated agriculture with class II prime soils. The area has not been
used for agricultural purposes for a number of years. The District has applied and was
issued a Conditional Use Permit to construct a fire training facility on the property. The
County permit was issued in August 2012 and is valid for one-year until 2013. As the
owner of the property, the TCSD must pay property taxes for property located outside
the TCSD’s service area. Annexing the property into the District’s service area would
relieve the TCSD from paying property taxes on this property.
CHAPTER 2 SPHERE OF INFLUENCE UPDATE
ADOPTED 2-5 NOVEMBER 2013
LAFCO Staff Recommendation. Staff recommendation is to add Study Area 1 Creekside
Ranch to the Sphere of Influence.
Figure 2-2 SOI Study Area #1
Study Area Existing SOI
Service Area
21 acres
Existing SOI
CHAPTER 2 SPHERE OF INFLUENCE UPDATE
ADOPTED 2-6 NOVEMBER 2013
2. SOI Study Area #2 – The Ramberg Property (Located in SLO County; Not Within
the SOI). The 9.9-acre area just west of the District’s service area is owned by
Ramberg Ventures LLC. The property currently has a residential unit approved for
vacation rental. The property owner has discussed with the TCSD the possibility of
annexing into the District to provide water and wastewater services. The property owner
also owns adjacent land that’s within the TCSD service boundary. To date the property
owner has not indicated if they have future plans to further develop the property. The
site is located in the County designated Agricultural with class II soils (prime) and
planted with a vineyard. The adjacent land within the District boundary is designated
Residential Suburban planted in rotational field corps with class IV soil.
LAFCO Staff Recommendation. Staff’s recommendation is to exclude Study Area 2 Ramberg
from the Sphere of Influence.
Figure 2-3 SOI Study Area #2
Study Area Existing SOI
Service Area
9 acres
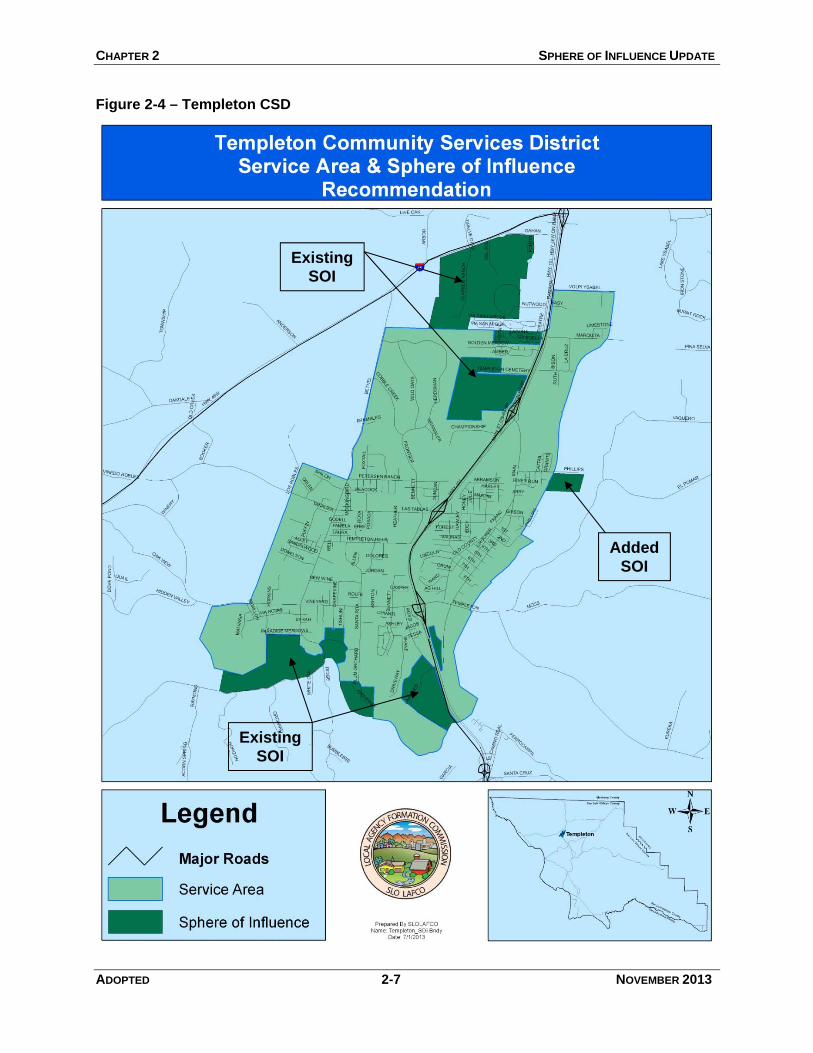
CHAPTER 2 SPHERE OF INFLUENCE UPDATE
ADOPTED 2-7 NOVEMBER 2013
Figure 2-4 – Templeton CSD
Added
SOI
Existing
SOI
Existing SOI
CHAPTER 2 SPHERE OF INFLUENCE UPDATE
ADOPTED 2-8 NOVEMBER 2013
Memorandum of Agreement
The County and District staffs are in discussions with regards to a Memorandum of Agreement
(MOA). If agreed to, the Board of Directors of Templeton CSD and County Board of Supervisors
may consider the MOA between Templeton CSD and the County of San Luis Obispo in coming
months. A Draft MOA is being considered by the County and Templeton CSD that would create
better cooperation between the two agencies. The approach of this MOA is to ensure improved
coordination and cooperation between the District and County on the future planning and
development within the District’s service area and SOI boundaries. The County and TCSD
recognize that a more coordinated and proactive approach towards development projects,
planning issues, and public infrastructure would result in better outcomes and improved services
for the residents of Templeton. The intent of this agreement is to ensure that feedback from both
jurisdictions regarding project proposals is considered early in the process and in a timely
manner. The MOA is not required as part of the Sphere of Influence Update process.
Conditions of Approval
The following conditions of approval are adopted based on the Sphere of Influence Update,
Municipal Service Review, Memorandum of Agreement, and public input and to reflect the
current situation.
WATER
a. As a condition of an annexation application being filed with LAFCO, the District shall
document with a water supply analysis that an adequate, reliable, and sustainable water
supply is available and deliverable to serve the areas proposed for annexation.
AGRICULTURE & OPEN SPACE
a. The County shall identify all agricultural and open space lands to be protected in the SOI
areas when preparing land use plans.
b. Prior to LAFCO filing the certificate of completion (if an annexation is approved),
conservation easement(s) shall be recorded on the deed(s) of the properties affected by
the annexation specifying the areas to be protected in perpetuity.

CHAPTER 2 SPHERE OF INFLUENCE UPDATE
ADOPTED 2-9 NOVEMBER 2013
Present and Planned Land Use The present and planned uses are described in detail in Chapter Three factor number one,
Growth and Population, of this document. Templeton had been one of the fastest growing
communities in the County. From 1990 to 2010 Templeton grew with a 2% average annual
increase in the number of dwelling units constructed in the unincorporated Community. The
population of the community of Templeton was 2,887 in 1990, 5,160 in 2000 and is estimated to
be 6,838 in 2013. The community’s population is expected to increase by 31 percent in the next
25 years according to the County Planning and Building Department. The Salinas River Inland
Area Plan estimates that the existing Templeton CSD boundary has enough land for future
residential, commercial, and industrial development. Due to its location in the center of the
urban corridor, it has a large capacity for regional commercial and industrial development.
Present and Probable Need for Public Services
The present and probable need for public services is described in detail in Chapter Three, the
Infrastructure Needs and Deficiencies section. A small 21-acre parcel (Creekside Ranch) is
proposed for addition to the Sphere of Influence which would not increase the current need for
services significantly.
The water analysis completed in Chapter Three identifies the need for development of
supplemental water supplies and increased conservation over the next 20 years. According to
the San Luis Obispo County Master Water Report, the future water supply will not meet the
projected demand of 2,034 to 2,260 acre-feet per year (AFY) in 2022. The Water System
Master Plan Update for TCSD indicates that additional supplies are needed for future water
supply, but the location, costs, and construction timeframe of the new wells are not identified.
The District would provide water, sewer and other services including fire protection, recreation,
and drainage to the SOI properties if annexed.
Present Capacity of Public Facilities and Adequacy of Public Services
The District’s current supply is estimated at 2,120 afy. The projected demand for the District at
build out and including Outside Service Agreements and the SOI areas is 2,512. The TCSD
does not appear to have access to an adequate water supply to serve future customers and has
established a waiting list. As of 2012, the District had allocated all of its supply and had a
CHAPTER 2 SPHERE OF INFLUENCE UPDATE
ADOPTED 2-10 NOVEMBER 2013
backlog of approximately 1,680 units from 70 requests for service. The TCSD estimates that its
existing supply and distribution system could provide water for 8,000 people. This number
includes existing residents plus the additional estimated population resulting from the
development of vacant lots within District boundaries.
Social and Economic Communities of Interest
The Sphere of Influence areas for the Templeton Community Services District are linked to the
District’s social and economic communities of interest. The Sphere areas would rely on the
District for customers and employees if commercial development occurs. Where residential
development is proposed, the District provides places for shopping and services for the people
living in those areas. Areas to recreate, schools, places of worship and cultural events would
also be available to the areas in the Sphere of Influence that include residential development.
Templeton is located between the Cities of Paso Robles and Atascadero which could provide
linkages for social and cultural community interests.
Present and Probable need for Public Facilities and Services of Disadvantaged Unincorporated Communities
Templeton has a variety of economic diversity that lives within the District’s service area and
surrounding area including within or adjacent to the Sphere of Influence. Disadvantaged
community means a community with an annual median household income that is less than 80
percent of the statewide annual median household income. Templeton’s Sphere of Influence
does not qualify under the definition of disadvantage community for the present and probable
need for public facilities and services.

CHAPTER 2 SPHERE OF INFLUENCE UPDATE
ADOPTED 2-11 NOVEMBER 2013
SAN MIGUEL COMMUNITY SERVICES DISTRICT
No changes are recommended to San Miguel’s Sphere of Influence because of the well-defined
area of land occupied by the District. Figure 2-5 show the recommended SOI, San Miguel
CSD’s existing Sphere of Influence and Service Area are co-terminus; identical to one another.
The District boundary takes in approximately 1,644 acres of land. About 674 acres are within
the Urban Reserve Line which is determined by the County. The balance of the area served by
the District is approximately 970 acres, and is zoned agriculture. The District is providing its
residents with adequate services and is striving to improve and increase the level of services.
The District is continuing to improve its service delivery system by reviewing how services are
provided and how the systems can be improved. The Municipal Service Review chapter
contains information related to the service capability of the District for existing residents.
Present and Planned Land Use Chapter Four of this document discusses present and planned land uses in detail under factor
number one, Growth and Population. The present and planned land uses are being considered
under a revised Community Plan for San Miguel and will guide development over the next 20-
years. The County is working on the Community Plan and is expected to complete the plan by
2015. The District is preparing to meet the challenges of future growth within their existing
boundaries. The District has not requested an increase to their Sphere of Influence and LAFCO
staff is not recommending an expansion. The Sphere is proposed to remain coterminous to the
existing service area.
Present and Probable Need for Public Services
The present and probable need for public services is described in detail in Chapter Four, the
Infrastructure Needs and Deficiencies section. Since no changes to the Sphere of Influence are
proposed, the current need for services will not change significantly.
The water analysis completed in Chapter Four identifies the need for development of
supplemental water supplies and increased conservation over the next 20 years. According to
the San Luis Obispo County Master Water Report, the existing water supply cannot meet future
demand of 466 to 582 acre-feet per year (AFY) in 2040. San Miguel CSD plans to build one
CHAPTER 2 SPHERE OF INFLUENCE UPDATE
ADOPTED 2-12 NOVEMBER 2013
additional well, according to the 2002 San Miguel CSD Water Master Plan, but the location and
timeframe of the new well have not been identified1.
Present Capacity of Public Facilities and Adequacy of Public Services
The present capacity of public facilities and adequacy of public services is described in detail in
Chapter Four, the Infrastructure Needs and Deficiencies section. Since no changes to the
Sphere of Influence are proposed, the current need for services will not change significantly.
Social and Economic Communities of Interest
There is no Sphere of Influence areas proposed for San Miguel CSD; therefore this factor does
not need to be addressed. However, he residents of the District could rely on either the
community of San Miguel or the City of Paso Robles for social and cultural linkages
Present and Probable need for Public Facilities and Services of Disadvantaged Unincorporated Communities
San Miguel has a variety of economic diversity that lives within the District and surrounding
area. A Disadvantaged community is defined as a community with an annual median
household income that is less than 80 percent of the statewide annual median household
income. In 2013, San Miguel qualifies under state law as a disadvantaged community, based
on its average per capita income. Few head-of-household jobs exist in the community, and
many residents commute to Paso Robles or beyond for employment. Although the community of
San Miguel qualifies as a disadvantage community, San Miguel does not have a Sphere of
Influence outside of its service area; therefore the necessity to evaluate the present and
probable need for public facilities and services adjacent or contiguous to the sphere of influence
is not called for.
1 The District’s water supply is stated as 235 afy; however, the District’s current water demand at the time this report
was written, was 235 afy. According to the 2002 WMP prepared by the District/Wallace Group in 2002, the District’s existing wells are capable of supplying future projected demands.
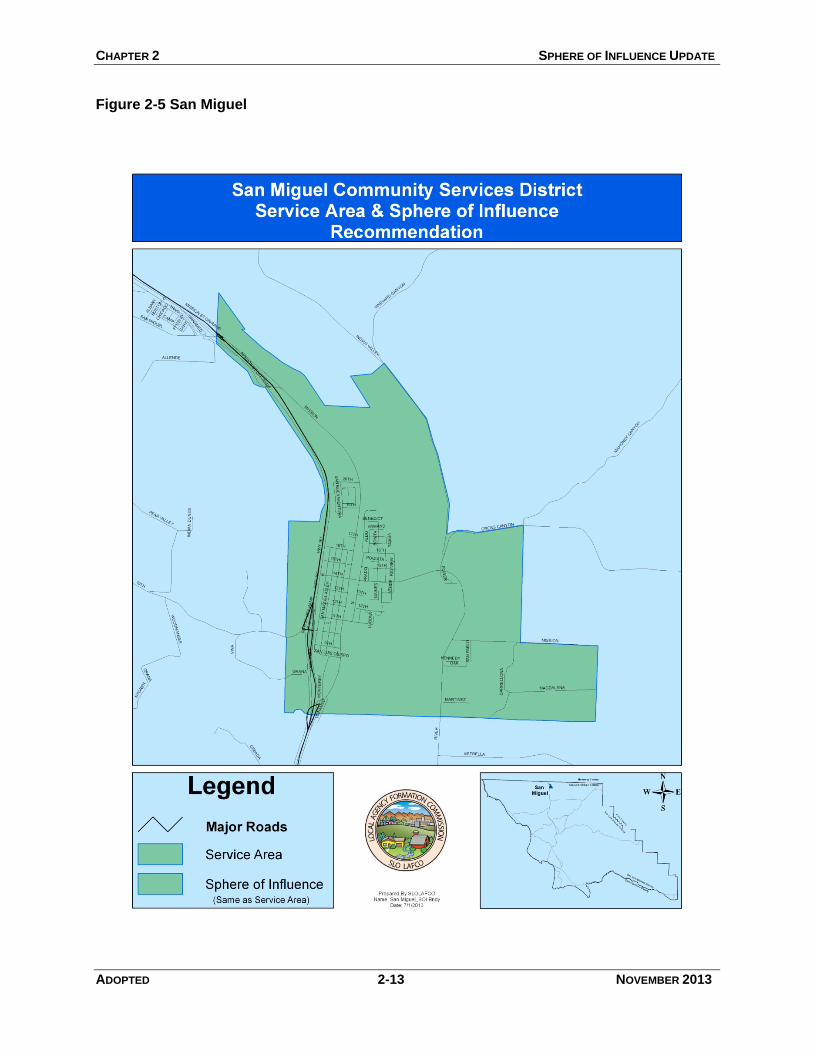
CHAPTER 2 SPHERE OF INFLUENCE UPDATE
ADOPTED 2-13 NOVEMBER 2013
Figure 2-5 San Miguel
CHAPTER 2 SPHERE OF INFLUENCE UPDATE
ADOPTED 2-14 NOVEMBER 2013
HERITAGE RANCH COMMUNITY SERVICES DISTRICT
No changes are recommended to Heritage Ranch’s Sphere of Influence because of the well-
defined area of land served by the District that follows an approved Master Plan. Figure 2-6
show the recommended SOI, Heritage Ranch CSD’s existing Sphere of Influence and Service
Area are co-terminus; identical to one another. The District’s service boundary encompasses
the area that is in the process of being built out under a master plan. Heritage Ranch is a
planned community with 14 subdivisions of various types and totaling more than 2,000
residential units. The Master Plan calls for up to 2,900 parcels. The District is providing its
residents with adequate services and is striving to improve and increase the level of services.
The District is continuing to improve its service delivery system by reviewing how services are
provided and how the systems can be improved. The Municipal Service Review chapter
contains information related to the service capability of the District for existing residents.
Present and Planned Land Use
In Chapter Five of this document factor number one, Growth and Population, present and
planned land uses are discussed in detail. The present and planned land uses are well defined
in the Heritage Ranch Specific Plan prepared by the County and adopted by the Board of
Supervisors in 1976. The Specific Plan establishes the vision and goals for the community and
prioritizes the key issues. The Plan also provides for public improvements through the adoption
of policies and programs designed to address certain issues in the community.
Present and Probable Need for Public Services
The present and probable need for public services is described in detail in Chapter Five, the
Infrastructure Needs and Deficiencies section, factor number three. Since no changes to the
Sphere of Influence are proposed, the current need for services will not change significantly.
The District is well prepared to provide services to existing and future residents.
Present Capacity of Public Facilities and Adequacy of Public Services
The present capacity of public facilities and adequacy of public services is described in detail in
Chapter Five, the Infrastructure Needs and Deficiencies section. Since no changes to the
Sphere of Influence are proposed, the current need for services will not change significantly.
CHAPTER 2 SPHERE OF INFLUENCE UPDATE
ADOPTED 2-15 NOVEMBER 2013
Social and Economic Communities of Interest
The residents of the District could rely on either the community of Heritage Ranch or the City of
Paso Robles for social and cultural linkages.
Present and Probable need for Public Facilities and Services of Disadvantaged Unincorporated Communities
The Community of Heritage Ranch has a variety of economic diversity that lives within the
districts service area and surrounding area. Disadvantaged community means a community
with an annual median household income that is less than 80 percent of the statewide annual
median household income. The Heritage Ranch CSD’s Sphere of Influence is coterminous with
its service area and therefore does not qualify under the definition of disadvantage community
for the present and probable need for public facilities and services.
Local Sphere of Influence Guidelines
The Cortese/Knox/Hertzberg Act (CKH Act) requires that each commission establish written
policies and procedures. The act also states that LAFCOs are to exercise their powers
consistent with those policies and procedures. The San Luis Obispo LAFCO’s policies
encourage and provide for well-ordered, efficient urban development patterns, balanced with
preserving open space and agriculture land while discouraging urban sprawl. This Sphere of
Influence Update and Municipal Service Review for the Templeton, San Miguel, and Heritage
Ranch Community Services Districts are consistent with those policies and the purposes of
LAFCO. The SOI discourages urban sprawl and encourages the preservation of open space
and agriculture land. Inclusion in the jurisdiction also provides for more efficient provision of
public services and is consistent with San Luis Obispo LAFCO policies.

CHAPTER 2 SPHERE OF INFLUENCE UPDATE
ADOPTED 2-16 NOVEMBER 2013
Figure 2-6 Heritage Ranch
ADOPTED 3-1 NOVEMBER 2013
CHAPTER 3 Templeton CSD – Municipal Service Review
The legislative authority for conducting Municipal
Service Reviews is provided in Section 56430 of the
Cortese-Knox-Hertzberg Act (CKH). The Act states
that, in order to update Spheres of Influence in
accordance with Government Code Section 56425,
LAFCOs are required to conduct a service review of
the services provided by the jurisdiction. The
Municipal Service Review factors that need to be addressed include:
1. Growth and Population projections for the affected area
2. Location and characteristics of any disadvantaged unincorporated communities
3. Present and planned capacity of public facilities and adequacy of public services,
including infrastructure needs or deficiencies
4. Financial ability of agencies to provide services
5. Status of, and opportunity for, shared facilities
6. Accountability for community service needs including governmental structure and
operational efficiencies
7. Any other matter related to effective or efficient service delivery, as required by
commission policy
The above-listed factors are addressed in this chapter and written determinations are included
for each factor as called for in the CKH Act. The Templeton CSD provides the following
services for the area residents:
Water and wastewater services;
Street lighting;
Refuse and Garbage Collection;
Fire protection and basic life support services;
Parks and recreation services; and
Stormwater and Drainage.
CHAPTER 3 MUNICIPAL SERVICE REVIEW
ADOPTED 3-2 NOVEMBER 2013
Other powers under the CSD law Government Code 61600 are considered “latent” and would
need to be activated through approval by LAFCO before the District could provide those
services.
The Templeton Community Services District (TCSD) was established in 1976 by a vote of the
electorate that dissolved the Templeton Fire Protection District, the Templeton Sanitary District,
the Templeton Lighting District, and County Waterworks #5 and formed the new TCSD. The
District currently serves an estimated 6,838 people and covers approximately 5.5 square miles.
Businesses currently in Templeton include real estate, tack shops, veterinarians and orthopedic
surgeons. Twin Cities Community Hospital is a 122-bed general medical/surgical acute care
facility, equipped with state-of-the-art technology. There are 115 active medical staffers and 64
on the courtesy staff. The hospital serves the North San Luis Obispo County. It offers advanced
capabilities for numerous services and specialties including Emergency Medicine, Orthopedics,
Obstetrics/Gynecology, Nuclear Medicine, Physical and Respiratory Therapy, Cardiology and
Radiology. The Wilshire Foundation, a not-for-profit organization, currently operates a 99-bed
convalescent center - skilled nursing facility licensed by the State of California. They also
operate Templeton Gardens, a forty-unit retirement apartment complex with emergency call,
transportation and optional meals. Cal Trans, Southern California Gas, SBC, the California
Highway Patrol and the San Luis Obispo County Sheriff have located their regional
headquarters in Templeton. The area is served by almost a dozen churches and numerous
service and community clubs.
Templeton is surrounded by agricultural land. The topography ranges from semi-flat to hilly with
clusters of oak trees. Heavy production of almonds, cherries, apples, grains and dairy products
now exist within the area. The most rapidly increasing agricultural crop is grapes. There are
many wineries to be found on the roads in the neighboring hills. There are several housing
tracts under various stages of construction. Several areas have subdivided into 1 to 10-acre lots
and have attracted a cross section of families to the area. The Templeton CSD Sphere of
Influence was most recently updated in 2006, and included the areas to the north and south.
Figure 3-1 shows the adopted service area and Sphere of Influence for the District. Figure 3-2
shows the Study Areas considered under this review. Please note that a study area is intended
to be studied for possible inclusion. The area may or may not be included in the SOI.
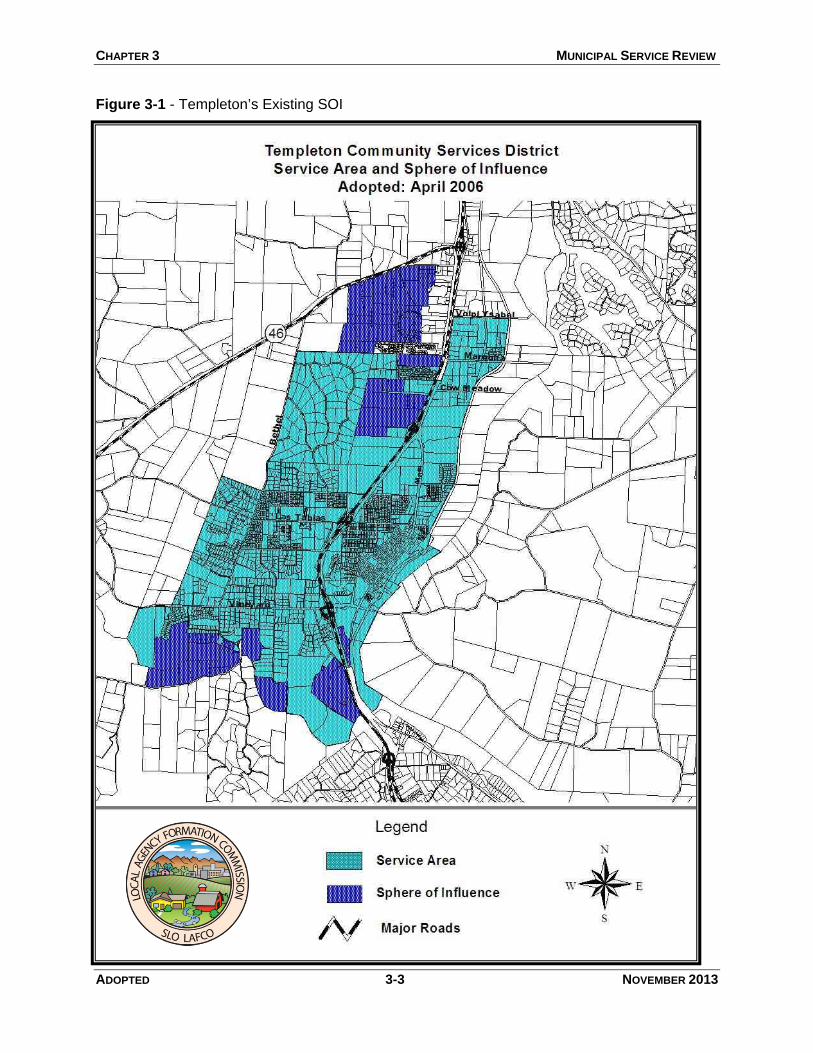
CHAPTER 3 MUNICIPAL SERVICE REVIEW
ADOPTED 3-3 NOVEMBER 2013
Figure 3-1 - Templeton’s Existing SOI
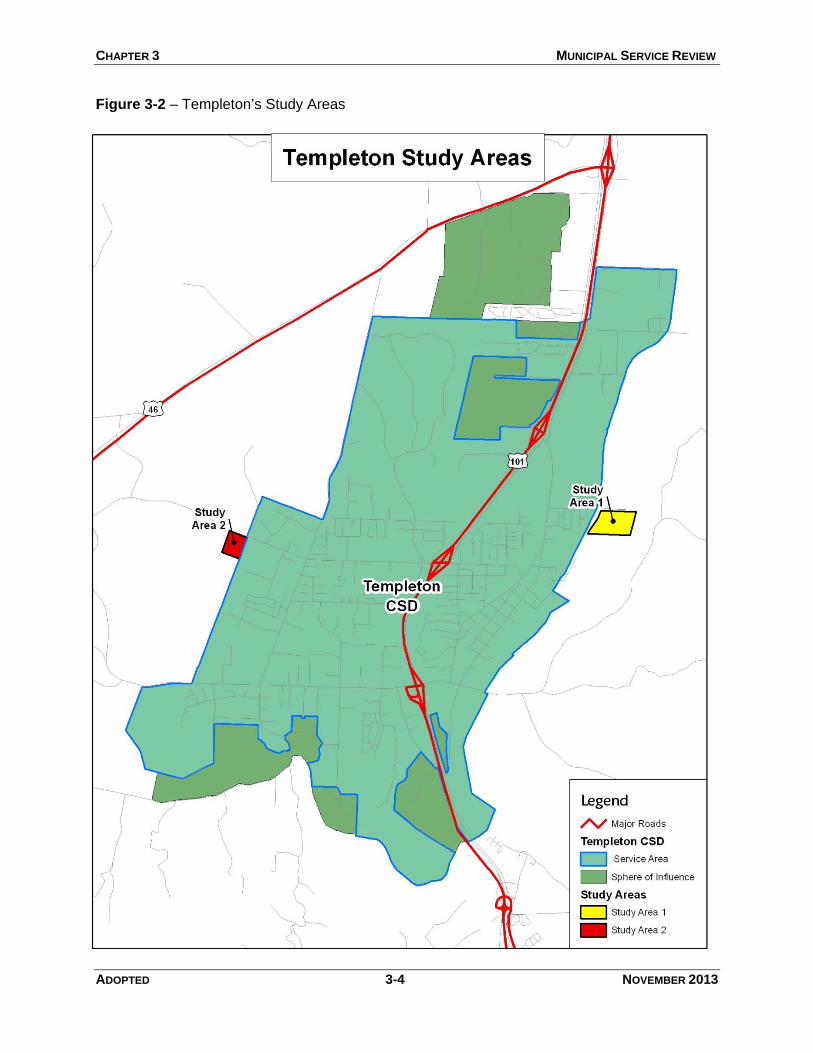
CHAPTER 3 MUNICIPAL SERVICE REVIEW
ADOPTED 3-4 NOVEMBER 2013
Figure 3-2 – Templeton’s Study Areas
ADOPTED 3-5 NOVEMBER 2013
3.1 Growth and Population Projections for the Affected Area
Purpose: To review future growth patterns and project population increases.
POPULATION
This factor is intended to identify growth and population projections for the affected area of a
jurisdiction. Various sources of information will be used to review future growth and population
for Templeton. The previous Sphere of Influence update and Municipal Service Review for
Templeton Community Services District provides background information, as does, the County
of San Luis Obispo’s Salinas River Area Plan. The table below summarizes proposals
considered by LAFCO since 2006 to the present.
Table 3-1 - Proposals Since 2006
Date
Action
Proposal
Acreage
Status
9/12/12 Outside User Outside User Agreement with TCSD (Los Robles MHP)
25 Emergency Water Service Agreement (Pending)
2/27/06 Activation Activation of Latent Power (Cemetery)
N/A Approved
Templeton is a rural community of approximately 6,838 people located midway between
Atascadero and Paso Robles in San Luis Obispo County. The community was founded in 1886
when the Southern Pacific Railroad was constructed through the area. Templeton has retained
much of its historical character with many of the old buildings having been restored and still in
use today. New buildings are being built using historically based design guidelines, which help
maintain the rural character of the town.
Templeton had been one of the fastest growing communities in the County. From 1990 to 2010
Templeton grew with a 2% average annual increase in the number of dwelling units constructed
in the unincorporated Community. The population of the community of Templeton was 2,887 in
1990, 4,687 in 2000 and is estimated to be 6,838 in 2013. The community’s population is
expected to increase by 31 percent in the next 25 years according to the County Planning and
Building Department; however Templeton’s population grew less than 1% per year from 2000 to
2010.
CHAPTER 3 MUNICIPAL SERVICE REVIEW
ADOPTED 3-6 NOVEMBER 2013
According to the 2010 US Census, Templeton had a population of 6,838. Total housing units
were estimated to be 2,580 units. The estimated build-out population within the current service
area is estimated to be 8,993 within the current District boundary and SOI. The Salinas River
Inland Area Plan estimates that the existing Templeton CSD boundary has enough land for
future residential, commercial, and industrial development. Due to its location in the center of
the urban corridor, it has a large capacity for regional commercial and industrial development.
Council of Governments Population Projections-2009
The Council of Governments recently had the consulting firm of Economics Research
Associates update population projections for San Luis Obispo County including Templeton. The
original study was completed in 2006 and was updated in 2009 to take into account the recent
economic downturn. These projections use a variety of data sources and assumptions to project
the future population of the cities and unincorporated areas of the County. These projections
incorporate information from the State of California about future population increases, past and
present County growth trends, and projected changes within the region. The consultants worked
with local planners to anticipate future growth in the various areas of the County to estimate the
potential for increases in population. The updated report presents low, medium, and high
population growth projections for areas in the County including Templeton. The table below
shows those results:
Table 3-2: Projected Population Growth Templeton
San Luis Obispo Council of Governments Projections
2008 2010 2015 2020 2025 2030 2035
LOW 5,464 5,683 6,177 6,434 6,687 6,820 6,913
MEDIUM 5,464 5,683 6,177 6,461 6,743 6,906 7,028
HIGH 5,464 5,683 6,177 6,485 6,787 6,979 7,125
Note: The County of San Luis Obispo Planning & Building Department has slightly revised population numbers for Templeton that was prepared by WSC in March 2013
The Templeton urban area is planned to form a self-contained community that may also
accommodate regional uses in recognition of the town's central location in the north county.
COUNTY’S GENERAL PLAN
The County’s Land Use Ordinance and the Salinas River Inland Planning Area of its General
Plan establish land use policy in the unincorporated area of Templeton and surrounding areas.
The County’s plans identify where and how the County anticipates development over the next
CHAPTER 3 MUNICIPAL SERVICE REVIEW
ADOPTED 3-7 NOVEMBER 2013
20-years for Templeton. The County’s Plans promote the preservation of prime agricultural
lands and open space corridors. It has a number of policies that call for guiding growth away
from agricultural areas and promoting infill or other non-prime agricultural use.
The County’s Conservation and Open Space Element (COSE) consolidated five previous
individual elements (conservation and open space, historic, esthetic, and energy elements). The
COSE is utilized as a tool to protect and preserve the unique community resources. The
element addresses many issues with regard to conservation, development, and utilization of
natural resources. The element includes policies and strategies that address reducing
greenhouse gas emissions, directing growth away from areas with constrained natural
resources, water and energy conservation, use of low impact development and green building
techniques, increased protection of community separators and scenic corridors.
The County recognizes that separation between communities provides each community with the
opportunity for developing its own distinctive identity. The physical difference between each
community is strengthened by intervening rural land, which can contribute to a unique sense
arrival or departure. The open areas between each town provide rural visual character where
densities in the Agriculture, Rural Lands and Residential Rural category are acceptable. Open
areas that separate communities should be retained through controls on the amount and
location of development. This distinct change in the amount of development at the edge of a
town in relation to other towns and the countryside establishes a border to the community.
The County has adopted Strategic Growth Principles that strengthens and directs development
towards existing communities within an Urban Reserve Line, provides for logical, attractive and
safe pedestrian circulation, and protects, preserves, and/or restores important open space,
scenic natural beauty and sensitive environmental areas. These policies allow the County to
work with communities to maintain distinct urban boundaries and community separators and
identify suitable development areas for affordable development, where supported by sustainable
resource capacities.
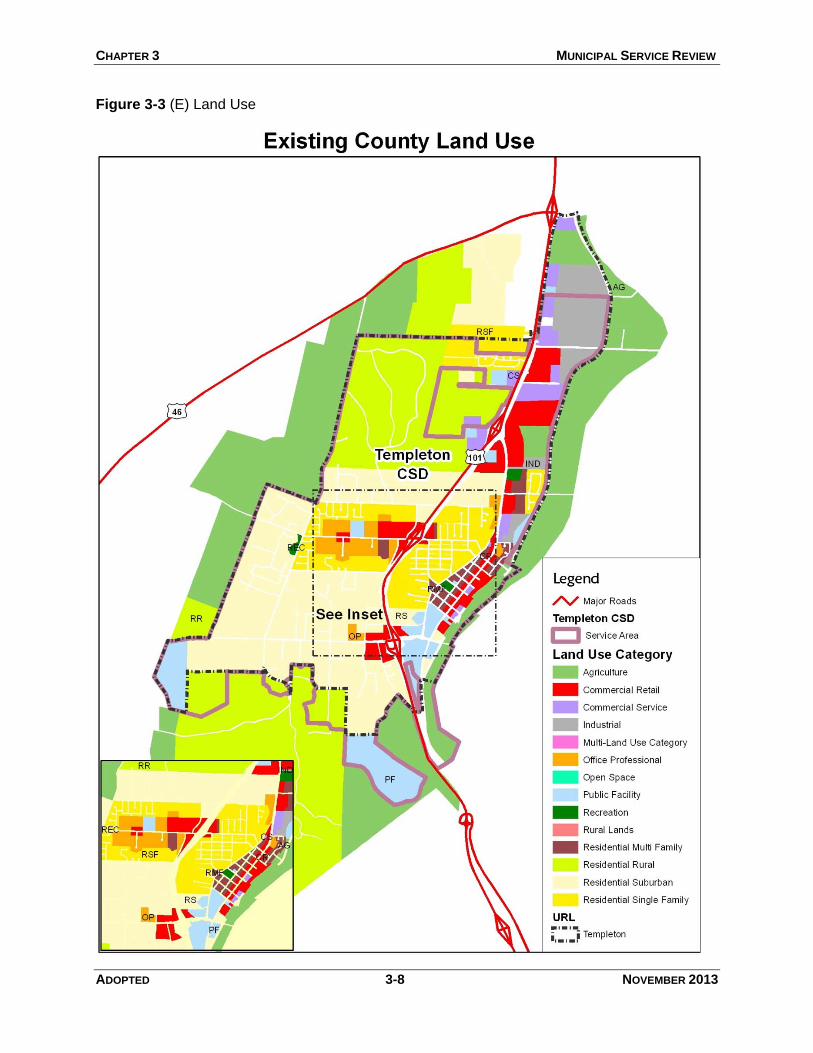
CHAPTER 3 MUNICIPAL SERVICE REVIEW
ADOPTED 3-8 NOVEMBER 2013
Figure 3-3 (E) Land Use
CHAPTER 3 MUNICIPAL SERVICE REVIEW
ADOPTED 3-9 NOVEMBER 2013
According to the Salinas River Inland Area Plan implementation of the Templeton Community
Design Plan will ensure high quality development that is integrated within the community's
historical character and its rural features. The design plan is important for the whole community
and all land uses, not just the downtown, since it contains guidelines that apply to residential as
well as non-residential development. The northeastern part of the Templeton urban reserve
area is designated Agriculture. The area between Highway 101 and the Salinas River may be
regarded as a long range industrial reserve area providing for potential expansion of industrial
lands designated to the south. Agricultural uses are encouraged to persist until the land is
clearly needed for urban expansion after build-out of other areas.
Development projects are approved contingent upon receiving water and sewer services from
community water and sewer systems such as those operated by the TCSD. The County’s
General Plan identifies the type and intensity of development allowed in each of several land
use categories (zoning) for County. The following table summarizes the existing zoning and
acreage for the study areas being reviewed:
Table 3-3: Existing Land Use
Study Areas Acreage Land Use/Zoning Existing Land Use Build-Out Potential
#1 Creekside Ranch 21 Agriculture Vacant 0 units
#2 Ramberg 9.9 Agriculture Residential 1 units
Source: SLO County Planning & Building Department, General Plan.
A Williamson Act contract preserves land that is used for agricultural purposes and provides the
owner with a decrease in property taxes. Williamson Act contracts exist that surround
Templeton CSD, however no contract exist in any of the Study Areas. The Cortese-Knox-
Hertzberg Act states that the Commission shall only include parcels under Williamson Act
contract in a Sphere of Influence if the SOI change meets the criteria found in GC 56426.6 of
the CKH Act. The Commission must find that the change in the SOI would facilitate planned,
orderly and efficient pattern of land use or provision of services and the public interest in the
change substantially outweighs the public interest to maintain the area in the contract.
RMS Biennial Report - 2010-2012
The Resource Management System (RMS) provides information to guide decisions about
balancing land development with the resources necessary to sustain such development. It
focuses on, 1) Collecting data, 2) Identifying resource problems and 3) Recommending
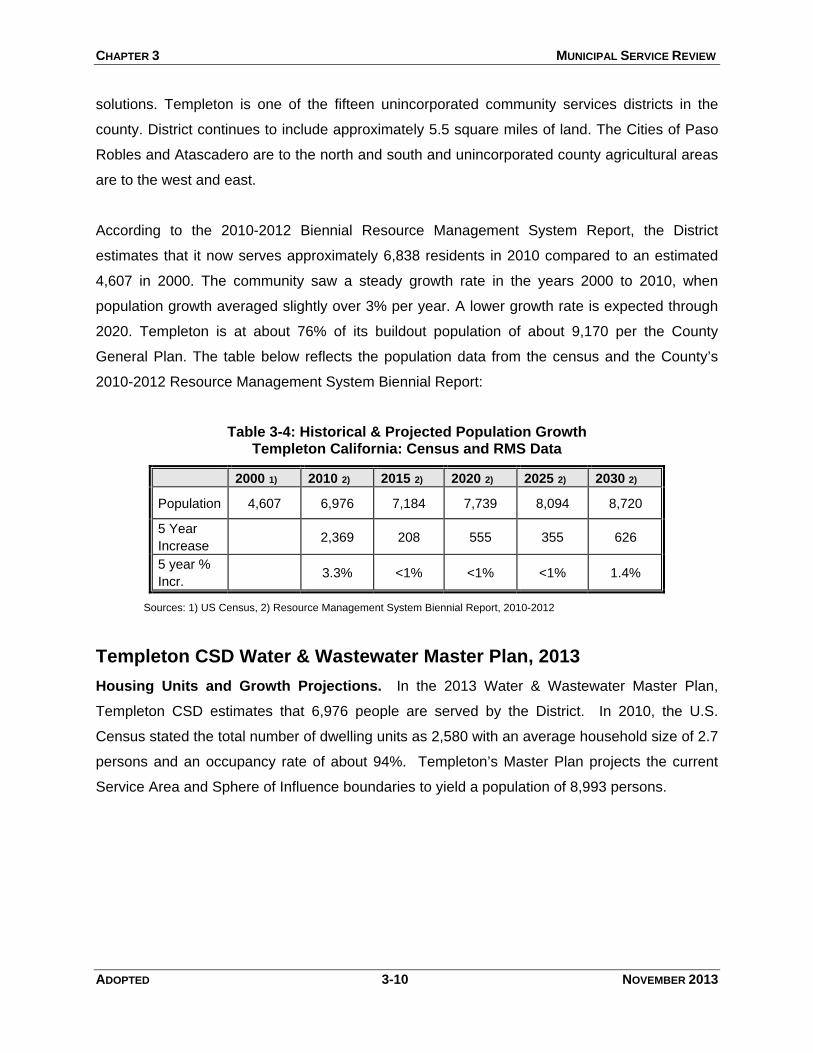
CHAPTER 3 MUNICIPAL SERVICE REVIEW
ADOPTED 3-10 NOVEMBER 2013
solutions. Templeton is one of the fifteen unincorporated community services districts in the
county. District continues to include approximately 5.5 square miles of land. The Cities of Paso
Robles and Atascadero are to the north and south and unincorporated county agricultural areas
are to the west and east.
According to the 2010-2012 Biennial Resource Management System Report, the District
estimates that it now serves approximately 6,838 residents in 2010 compared to an estimated
4,607 in 2000. The community saw a steady growth rate in the years 2000 to 2010, when
population growth averaged slightly over 3% per year. A lower growth rate is expected through
2020. Templeton is at about 76% of its buildout population of about 9,170 per the County
General Plan. The table below reflects the population data from the census and the County’s
2010-2012 Resource Management System Biennial Report:
Table 3-4: Historical & Projected Population Growth Templeton California: Census and RMS Data
2000 1) 2010 2) 2015 2) 2020 2) 2025 2) 2030 2)
Population 4,607 6,976 7,184 7,739 8,094 8,720
5 Year
Increase 2,369 208 555 355 626
5 year %
Incr. 3.3% <1% <1% <1% 1.4%
Sources: 1) US Census, 2) Resource Management System Biennial Report, 2010-2012
Templeton CSD Water & Wastewater Master Plan, 2013
Housing Units and Growth Projections. In the 2013 Water & Wastewater Master Plan,
Templeton CSD estimates that 6,976 people are served by the District. In 2010, the U.S.
Census stated the total number of dwelling units as 2,580 with an average household size of 2.7
persons and an occupancy rate of about 94%. Templeton’s Master Plan projects the current
Service Area and Sphere of Influence boundaries to yield a population of 8,993 persons.
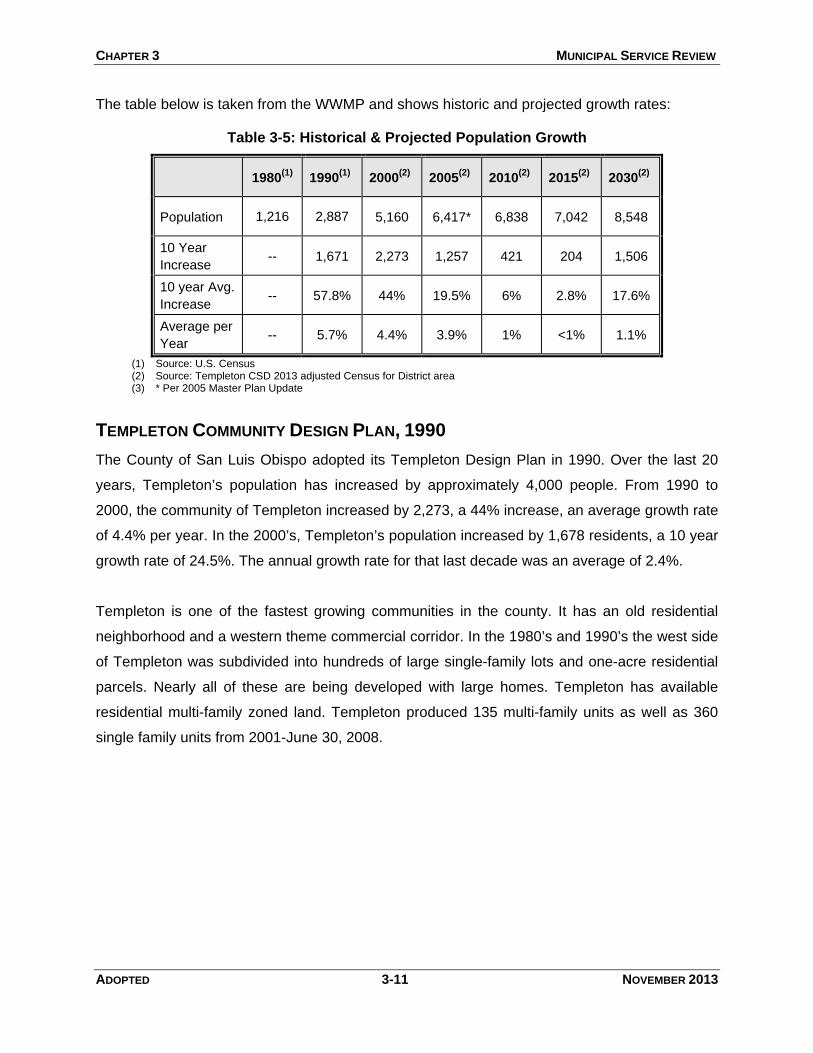
CHAPTER 3 MUNICIPAL SERVICE REVIEW
ADOPTED 3-11 NOVEMBER 2013
The table below is taken from the WWMP and shows historic and projected growth rates:
Table 3-5: Historical & Projected Population Growth
1980(1) 1990
(1) 2000(2) 2005
(2) 2010(2) 2015
(2) 2030(2)
Population 1,216 2,887 5,160 6,417* 6,838 7,042 8,548
10 Year
Increase -- 1,671 2,273 1,257 421 204 1,506
10 year Avg.
Increase -- 57.8% 44% 19.5% 6% 2.8% 17.6%
Average per
Year -- 5.7% 4.4% 3.9% 1% <1% 1.1%
(1) Source: U.S. Census (2) Source: Templeton CSD 2013 adjusted Census for District area (3) * Per 2005 Master Plan Update
TEMPLETON COMMUNITY DESIGN PLAN, 1990
The County of San Luis Obispo adopted its Templeton Design Plan in 1990. Over the last 20
years, Templeton’s population has increased by approximately 4,000 people. From 1990 to
2000, the community of Templeton increased by 2,273, a 44% increase, an average growth rate
of 4.4% per year. In the 2000’s, Templeton’s population increased by 1,678 residents, a 10 year
growth rate of 24.5%. The annual growth rate for that last decade was an average of 2.4%.
Templeton is one of the fastest growing communities in the county. It has an old residential
neighborhood and a western theme commercial corridor. In the 1980’s and 1990’s the west side
of Templeton was subdivided into hundreds of large single-family lots and one-acre residential
parcels. Nearly all of these are being developed with large homes. Templeton has available
residential multi-family zoned land. Templeton produced 135 multi-family units as well as 360
single family units from 2001-June 30, 2008.
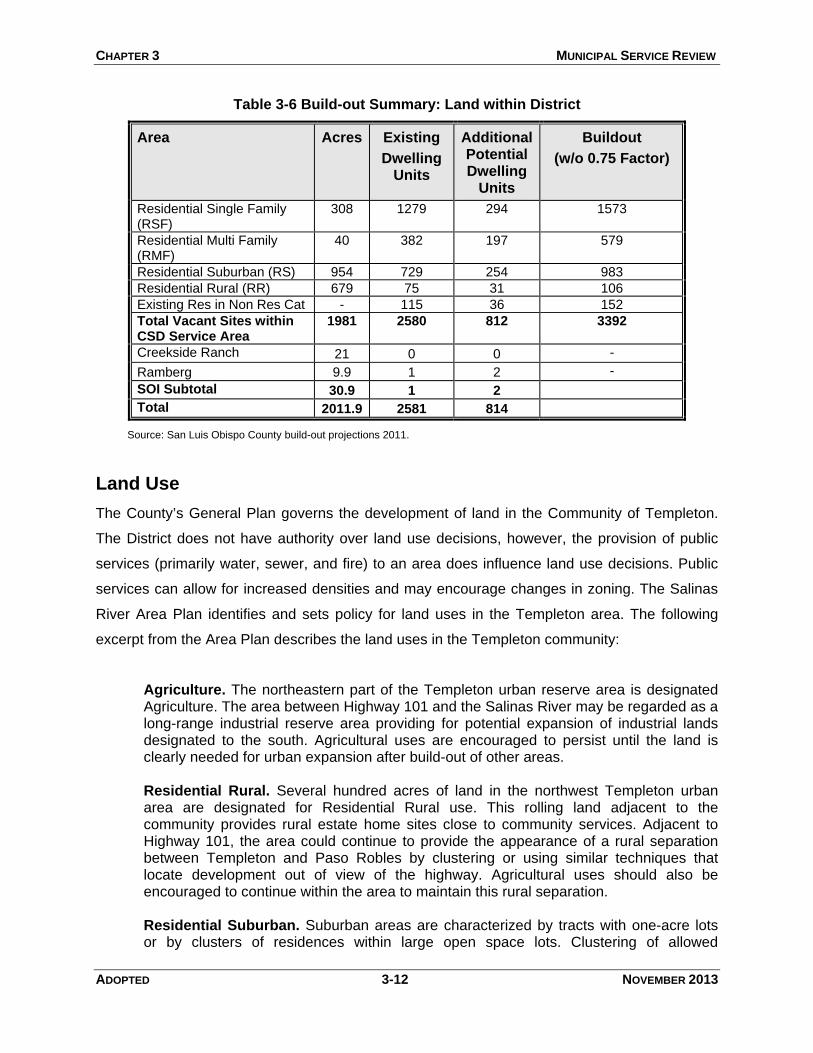
CHAPTER 3 MUNICIPAL SERVICE REVIEW
ADOPTED 3-12 NOVEMBER 2013
Table 3-6 Build-out Summary: Land within District
Area Acres Existing
Dwelling Units
Additional Potential Dwelling
Units
Buildout
(w/o 0.75 Factor)
Residential Single Family (RSF)
308 1279 294 1573
Residential Multi Family (RMF)
40 382 197 579
Residential Suburban (RS) 954 729 254 983
Residential Rural (RR) 679 75 31 106
Existing Res in Non Res Cat - 115 36 152
Total Vacant Sites within CSD Service Area
1981 2580 812 3392
Creekside Ranch 21 0 0 -
Ramberg 9.9 1 2 -
SOI Subtotal 30.9 1 2
Total 2011.9 2581 814
Source: San Luis Obispo County build-out projections 2011.
Land Use
The County’s General Plan governs the development of land in the Community of Templeton.
The District does not have authority over land use decisions, however, the provision of public
services (primarily water, sewer, and fire) to an area does influence land use decisions. Public
services can allow for increased densities and may encourage changes in zoning. The Salinas
River Area Plan identifies and sets policy for land uses in the Templeton area. The following
excerpt from the Area Plan describes the land uses in the Templeton community:
Agriculture. The northeastern part of the Templeton urban reserve area is designated Agriculture. The area between Highway 101 and the Salinas River may be regarded as a long-range industrial reserve area providing for potential expansion of industrial lands designated to the south. Agricultural uses are encouraged to persist until the land is clearly needed for urban expansion after build-out of other areas. Residential Rural. Several hundred acres of land in the northwest Templeton urban area are designated for Residential Rural use. This rolling land adjacent to the community provides rural estate home sites close to community services. Adjacent to Highway 101, the area could continue to provide the appearance of a rural separation between Templeton and Paso Robles by clustering or using similar techniques that locate development out of view of the highway. Agricultural uses should also be encouraged to continue within the area to maintain this rural separation. Residential Suburban. Suburban areas are characterized by tracts with one-acre lots or by clusters of residences within large open space lots. Clustering of allowed
CHAPTER 3 MUNICIPAL SERVICE REVIEW
ADOPTED 3-13 NOVEMBER 2013
development or other techniques that achieve the same purpose as clustering are encouraged when needed to preserve rural visual character, steep hillsides, oak woodlands and creek riparian habitats within this area. Properties along North Main Street are designated Residential Suburban to retain the existing rural landscape adjacent to Highway 101. Residential Single Family. Most existing residential lots in the original town site of Templeton are 7,500 square feet (50 x 150 feet), with a number of homes occupying double lots. Spacious yards with shade trees and outdoor living areas typify the area. Five single-family expansion areas are outside the original town site of Templeton. They are located west of Highway 101 surrounding higher intensity uses along Las Tablas Road; along Theater Drive; east of Highway 101 north of Las Tablas Avenue and east of Highway 101 between Cayucos Avenue and Vineyard Drive, and on Phillips Lane. Residential Multi-Family. Multi-Family development in the past has been interspersed within the single-family neighborhood in downtown, where it often was inconsistent with the single-family appearance of the older neighborhood. Density is limited to 12 units per acre in this area, which will allow the creation of rental units without disrupting the neighborhood's character. Outside of the central area, a density up to 26 units per acre is allowed on designated large properties located adjacent to convenience shopping areas on Las Tablas Road and on North Main Street. Recreation. Recreation facilities in Templeton will continue to be primarily resident- rather than tourist-oriented. Recreation facilities presently include Templeton Park with swimming pool, playground area, ball field, BBQ pits and picnic area, and community bandstand, all of which provide for active and group recreation needs; and Tom Jermin, Sr. Community Park which provides a play field, Evers Park and Skate Park. Office and Professional. Four separate Office and Professional areas are located in Templeton, in the downtown area, the northern end of the main business district, the Las Tablas Road area west of Highway 101, and Vineyard Drive west of Highway 101. The downtown area includes some single-family homes, which should be retained for office use rather than be moved or destroyed. Public and quasi-public offices and services and limited retail uses should be encouraged and attempts should be made to maintain the historic motif as established in many of the new uses and remodeled structures. The North Main Street area is an extension of the main business district along the strip of land between Toad Creek and Main Street. This area could attract a variety of office and service uses that might be unsuitable for the other two locations. The Las Tablas area designated as Office and Professional includes substantial development in the vicinity of Twin Cities Hospital. The easy access from Highway 101 and the large lot sizes provide opportunity for master-planned subdivisions and developments that relate to hospital or quasi-public facilities, such as offices, convalescent facilities, multi-family developments, schools or similar uses. Impacts on infrastructure, especially water and sewer, and on adjacent residential land should be considered as development occurs in this area. These office and professional uses together with adjacent Residential Single Family areas will provide a transition to surrounding lands designated for Residential Suburban development and will provide a logical termination of urban service extensions on the west side of Highway 101. Commercial Retail. The Commercial Retail category encourages different types of retail shopping areas depending on their location in the community. The traditional community
CHAPTER 3 MUNICIPAL SERVICE REVIEW
ADOPTED 3-14 NOVEMBER 2013
shopping area has been downtown on Main Street. The central business district can be expected to provide neighborhood and visitor shopping as the town and surrounding population grow. It should develop with commercial uses appropriate to the small-scale lot pattern in downtown. Main Street should be enhanced as an attractive two-lane business street. The Templeton Community Design Plan encourages retaining existing oak trees and using architectural harmony, signing and landscaping to create a desired community theme of historic design. These concepts should be reinforced with tree-lined sidewalks and parallel parking with possibly a landscaped median strip. A community shopping area was planned on North Main Street at the stockyard site to serve projected development, where large parcels could have accommodated larger stores (This area is now buildout as housing and not commercial as planned). Regional shopping districts were planned on Ramada Drive just north of the North Main and Highway 101 interchange and just south of Marquita Drive, with the purpose of serving the north county region with major commercial establishments and providing visitor theme destinations (This area was annexed into the City of Paso Robles). Visitor-serving commercial areas are located at the North Main, Las Tablas and Vineyard Drive/Highway 101 interchanges to provide for traveler needs. Sites on Las Tablas Road are located near the Highway 101 interchange to provide traveler services, lodging and entertainment. The North Main Street site is adjacent to a north county regional government center. Offices are intended to be a fundamental use at that site as well. The Vineyard Drive site west of Rossi Road is also intended to be neighborhood-serving for convenience shopping. Neighborhood sites are also located on Las Tablas Road on each side of the office area to provide for daily shopping needs of nearby residents and employees. All commercial sites are encouraged to include affordable incidental residential uses to provide housing opportunities as part of their benefit to the community. Commercial Service. Service or heavy commercial activities are appropriately located along the railroad tracks, the east side of Main Street and on Ramada Drive. Traditional downtown uses include the very prominent Templeton Feed and Grain building. North of downtown, service commercial areas are located along the North Main Street and Ramada Drive corridors in front of industrial areas that are next to the railroad. Another area designated for commercial service uses is located on Cow Meadow Lane south of Marquita Avenue. As service/commercial uses are established or restored, attention should be given to their visual impact from Main Street, Highway 101 and nearby residential and retail areas. The Templeton Design Plan and the Land Use Ordinance should be fully used for high quality screening, siting, architecture and unobtrusive signing. Industrial. The areas designated Industrial in Templeton include a larger area north of Marquita Drive. These areas are suited to industrial development because they are fairly level, adjacent to the railroad, have easy access from the freeway and have proximity to community services and facilities. Future industrial uses should not conflict with the residential qualities of Templeton or with adjacent commercial or agricultural uses. To prevent land use conflicts, industrial subdivisions should be oriented internally and provide substantial fencing and landscaped screening when located adjacent to other land use categories. Proposed industrial uses should be evaluated for possible off-site noxious effects when located in the proximity of other land use categories.
CHAPTER 3 MUNICIPAL SERVICE REVIEW
ADOPTED 3-15 NOVEMBER 2013
Public Facilities. Existing public facilities include the Templeton Community Services District office, district fire station, a north county regional center site at North Main/Highway 101, the Veterans Memorial Building at Main and Eighth Streets, and the post office on North Main Street. The Templeton Unified School District provides kindergarten through 12th grades at their present location north and south of Vineyard Drive on Main Street. An elementary school is located on Vineyard Drive. Additional public facilities include the California Highway Patrol Station at Highway 101 and Las Tablas Road and Twin Cities Hospital on Las Tablas Road. The north county regional center is located on a highly visible hill adjacent to Highway 101. Any development should serve as a landmark at the northern entrance to the community. Building architecture would be appropriate that is exemplary of civic functions within the historic context of Templeton. It should be complemented by landscaping, with special attention to setbacks from the highway to partially buffer views.
Study Areas
The areas being studied for possible inclusion in the District’s Sphere of Influence are in the
County’s Salinas River Area Plan. These areas are zoned Agricultural and are currently
undeveloped. These properties are not under Williamson Act contracts. These areas are
described below:
The Creekside Ranch Property (Located in SLO County; Not Within the SOI). The 21-acre
area just east of the District’s service area is owned by the District. This area was originally
approved for SOI amendment and annexation by LAFCO in 2007. The District intended to
apply for a General Plan Amendment (GPA) from the County to develop a park. LAFCO placed
a condition of approval that required approval of a (GPA) from the County before the annexation
would be finalized. The GPA was not completed and therefore the Certificate of Completion for
the annexation was not filed. At that time the District was proceeding with permitting of a
passive and active recreational park and the development of water wells on the site. The area
continues to be designated agriculture with class II prime soils. The area has not been used for
agricultural purposes for a number of years. The District has applied and was issued a
Conditional Use Permit to construct a fire training facility on the property. The County permit
was issued in August 2012 and is valid for one-year until 2013. As the owner of the property, the
TCSD must pay property taxes for property located outside the TCSD’s service area. Annexing
the property into the District’s service area would relieve the TCSD from paying property taxes
on this property. The District also has two municipal wells on this property.

CHAPTER 3 MUNICIPAL SERVICE REVIEW
ADOPTED 3-16 NOVEMBER 2013
The Ramberg Property (Located in SLO County; Not Within the SOI). The 9.9-acre area
just west of the District’s service area is owned by Ramberg Ventures LLC. The property
currently has a residential unit approved for vacation rental. The property owner has discussed
with the TCSD the possibility of annexing into the District to provide water and wastewater
services. The property owner also owns adjacent land that’s within the TCSD service boundary.
To date the property owner has not indicated if they have future plans to further develop the
property. The site is located in the County designated Agricultural with class II soils and planted
with a vineyard. The adjacent land within the District boundary is designated Residential
Suburban planted in rotational field corps with class IV soil.
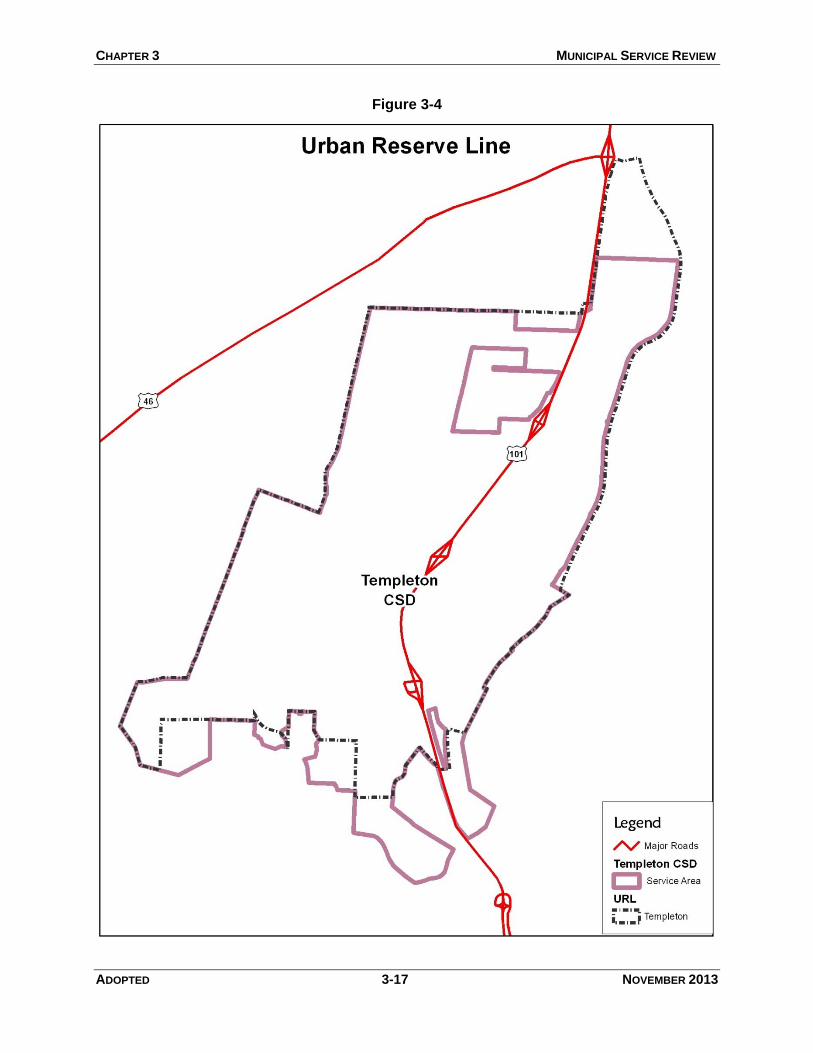
CHAPTER 3 MUNICIPAL SERVICE REVIEW
ADOPTED 3-17 NOVEMBER 2013
Figure 3-4
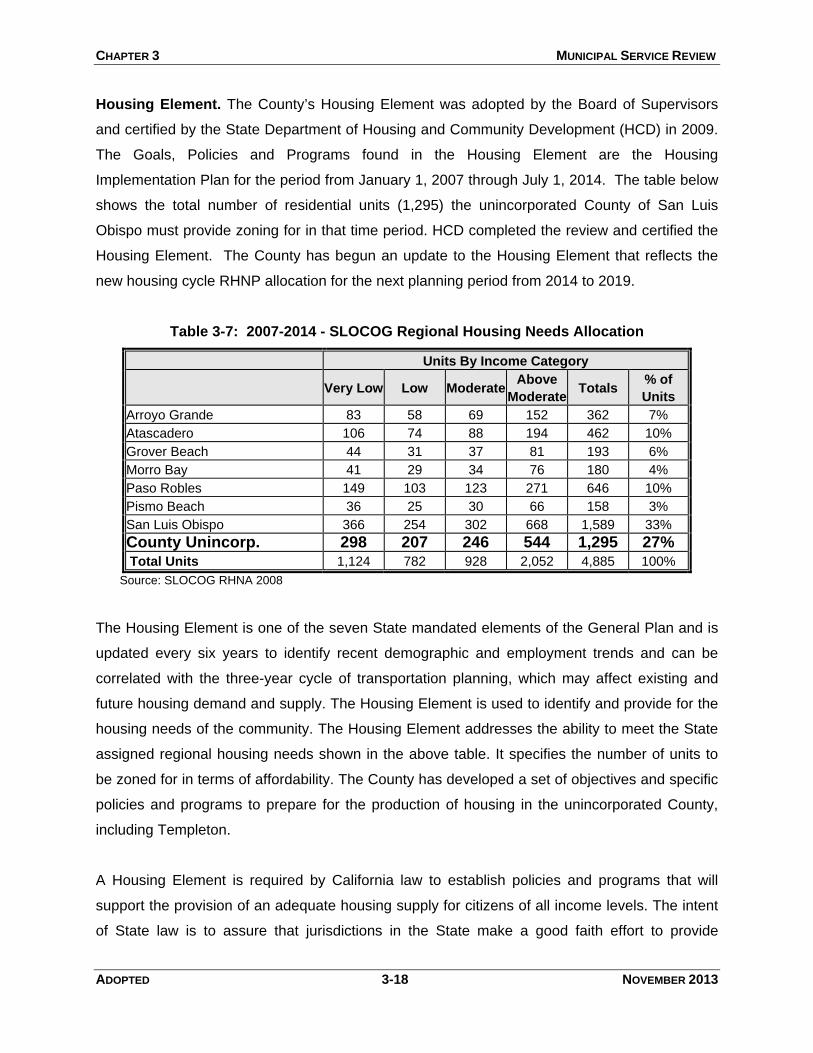
CHAPTER 3 MUNICIPAL SERVICE REVIEW
ADOPTED 3-18 NOVEMBER 2013
Housing Element. The County’s Housing Element was adopted by the Board of Supervisors
and certified by the State Department of Housing and Community Development (HCD) in 2009.
The Goals, Policies and Programs found in the Housing Element are the Housing
Implementation Plan for the period from January 1, 2007 through July 1, 2014. The table below
shows the total number of residential units (1,295) the unincorporated County of San Luis
Obispo must provide zoning for in that time period. HCD completed the review and certified the
Housing Element. The County has begun an update to the Housing Element that reflects the
new housing cycle RHNP allocation for the next planning period from 2014 to 2019.
Table 3-7: 2007-2014 - SLOCOG Regional Housing Needs Allocation
Units By Income Category
Very Low Low Moderate
Above
ModerateTotals
% of
Units
Arroyo Grande 83 58 69 152 362 7%
Atascadero 106 74 88 194 462 10%
Grover Beach 44 31 37 81 193 6%
Morro Bay 41 29 34 76 180 4%
Paso Robles 149 103 123 271 646 10%
Pismo Beach 36 25 30 66 158 3%
San Luis Obispo 366 254 302 668 1,589 33%
County Unincorp. 298 207 246 544 1,295 27% Total Units 1,124 782 928 2,052 4,885 100%
Source: SLOCOG RHNA 2008
The Housing Element is one of the seven State mandated elements of the General Plan and is
updated every six years to identify recent demographic and employment trends and can be
correlated with the three-year cycle of transportation planning, which may affect existing and
future housing demand and supply. The Housing Element is used to identify and provide for the
housing needs of the community. The Housing Element addresses the ability to meet the State
assigned regional housing needs shown in the above table. It specifies the number of units to
be zoned for in terms of affordability. The County has developed a set of objectives and specific
policies and programs to prepare for the production of housing in the unincorporated County,
including Templeton.
A Housing Element is required by California law to establish policies and programs that will
support the provision of an adequate housing supply for citizens of all income levels. The intent
of State law is to assure that jurisdictions in the State make a good faith effort to provide
CHAPTER 3 MUNICIPAL SERVICE REVIEW
ADOPTED 3-19 NOVEMBER 2013
adequate housing to all members of the community. While the State Department of Housing
and Community Development (HCD) reviews the Housing Element for compliance with housing
law, each jurisdiction must identify its particular issues to address its housing needs.
WRITTEN DETERMINATIONS
The following written determinations are based on the information contained in the above
section regarding Growth and Population:
1. The Salinas River Area Plan provides an information and policy base for the improvement
and future development of the Community of Templeton. The Plan provides detailed policies
and programs that were considered by the Community through public workshops and
hearings. The Plan is reflective of the Community’s concerns, values and vision for
Templeton.
2. The District does not have land use authority and does not control land use decisions which
are made by the County of San Luis Obispo.
3. The Templeton Design Guidelines together with the planning area standards for Templeton
and other standards in the Land Use Ordinance will govern the design of future projects in
the town of Templeton. The Guidelines has provisions for adding curbs, gutters, and
sidewalks and other drainage improvements. The Plan details transportation and circulation
system improvements that will enhance Templeton’s traffic flow and walkability
4. The growth and population increases have been anticipated by the District and are reflected
in their updated draft Master Plans for water and sewer. The District is prepared to manage
the impacts that future growth and development will bring.
5. The TCSD’s Water & Wastewater Master Plan includes population projections to plan for
future water service.
Figure 5-5
ADOPTED 3-20 NOVEMBER 2013
3.2 Location and Characteristics of any Disadvantaged Unincorporated Communities
Purpose: To identify any disadvantaged unincorporated communities.
LAFCO is required by the Cortese-Knox-Hertzberg Act to determine the location and
characteristics of any disadvantaged unincorporated communities within or contiguous to the
Sphere of Influence of a jurisdiction. If a jurisdiction is reasonably capable of providing needed
resources and basic infrastructure to disadvantaged unincorporated communities within the
sphere of influence or contiguous to the sphere of influence, it is important that such findings of
infrastructure and resource availability occur when revisions to the SOI and annexations are
proposed by the District or property owners.
The community of Templeton has a variety of economic diversity that reside within the CSD
boundary and surrounding area. A Disadvantaged community is defined as a community with
an annual median household income that is less than 80 percent of the statewide annual
median household income. Government Code section 56033.5 further defines it as inhabited
territory; an area with 12 or more registered voters. In the analysis completed by LAFCO staff,
Templeton CSD’s Sphere of Influence does not have any disadvantage unincorporated
communities within the proposed Sphere of Influence or in the areas contiguous to the Sphere
of Influence.
WRITTEN DETERMINATIONS
The following written determinations are based on the information contained in the above
section regarding disadvantaged unincorporated communities:
1. The Templeton Community Services District’s proposed Sphere of Influence does not have
disadvantaged unincorporated community located within or adjacent to its boundaries.
ADOPTED 3-21 NOVEMBER 2013
3.3 Present and Planned Capacity of Public Facilities and Adequacy of Public Services, including Infrastructure Needs or Deficiencies
Purpose: To identify the infrastructure and resource needs and deficiencies in terms of supply, capacity, condition of facilities, and ability to provide services.
LAFCO is responsible for determining that a jurisdiction is reasonably capable of providing
needed resources and basic infrastructure to serve areas already within the service area and in
the Sphere of Influence. It is important that such findings of infrastructure and resource
availability occur when revisions to the SOI and annexations are proposed by the District or
property owners.
The MSR analyzes present and long-term infrastructure demands and resource capabilities of
the Templeton Community Services District. LAFCO reviews and evaluates: 1) the resources
and services that are currently available, and 2) the ability of the CSD to expand such resources
and services in line with increasing demands.
The most basic infrastructure needs are the provision of water and wastewater services.
Beyond these services, police and fire protection, and circulation/road services are considered
high priority needs for future growth of the District.
This section evaluates the District’s resources and capabilities to provide services to existing
and future residents. The key topics addressed include water supply and demand, water
pipeline system, sewer system capacity and condition, fire and police protection, traffic and
roads, as well as, other services.
CHAPTER 3 MUNICIPAL SERVICE REVIEW
ADOPTED 3-22 NOVEMBER 2013
WATER
Templeton CSD completed its most recent Water & Wastewater Master Plan in 2013. The
previous water plans were Master Plans from 2005. These plans, and other documents, are the
basis for this section of the Municipal Service Review. A jurisdiction’s ability to provide water to
existing residents and the Sphere of Influence areas is a key consideration in updating an SOI.
Because a Sphere is the area that is envisioned for eventual annexation and service by a
jurisdiction, it is important that an adequate water supply be documented. Also to be considered
are a jurisdiction’s policies or specific policies identified for unincorporated areas with regard to
growth and the provision of water. In this area the County has the authority over land use.
Water Supply
The Templeton Community Services District (TCSD) provides water supply services in
Templeton. The District relies on several different water sources which, taken together, make up
the District’s water portfolio. Considering all of the water sources together as a whole will assist
the District in evaluating how well its current resources can meet current and projected
demands. This also provides a framework for evaluating future water supply needs based on
existing obligations and available water sources.
Templeton Subunit
The Templeton Subunit is an information designation of the portion of the Atascadero Basin
underlying District wells. The District wells are located within the Atascadero Basin which the
District considers to be distinctly different from the Paso Robles Groundwater Basin. The
Atascadero Basin aquifer contains two primary water-bearing geologic units; the Paso Robles
formation and the Salinas River alluvial gravels. For purposes of discussion the groundwater
basin supplies are considered separately: the deep, percolating groundwater wells referred to
as “deep” wells, and the underflow from the Salinas River alluvial gravels, referred to as the
“river” wells.
Percolating Ground Water Wells
The District extracts percolating groundwater from 10 active wells pumping from the Templeton
subunit. These wells are located throughout the District. FUGRO recently completed a study of
the District’s deep aquifer supply capability and concluded that a perennial yield of 1200 AF may
be used as an operational guide. This includes an annual average of approximately 160 AF per
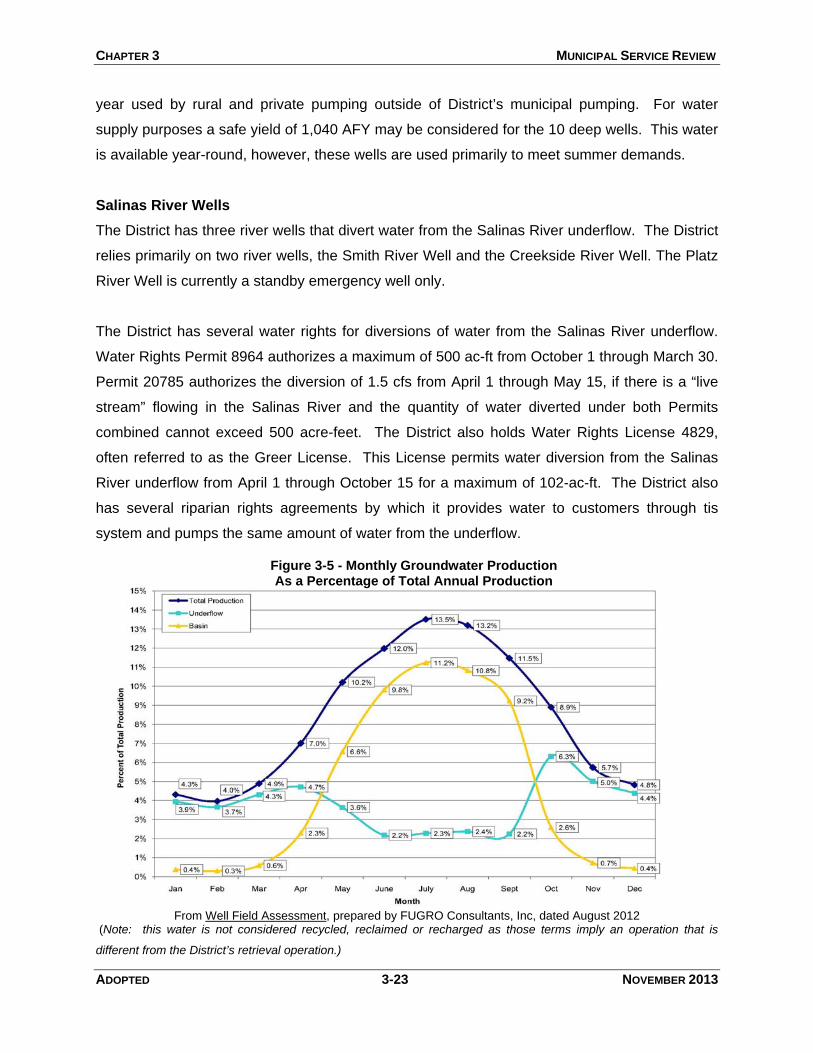
CHAPTER 3 MUNICIPAL SERVICE REVIEW
ADOPTED 3-23 NOVEMBER 2013
year used by rural and private pumping outside of District’s municipal pumping. For water
supply purposes a safe yield of 1,040 AFY may be considered for the 10 deep wells. This water
is available year-round, however, these wells are used primarily to meet summer demands.
Salinas River Wells
The District has three river wells that divert water from the Salinas River underflow. The District
relies primarily on two river wells, the Smith River Well and the Creekside River Well. The Platz
River Well is currently a standby emergency well only.
The District has several water rights for diversions of water from the Salinas River underflow.
Water Rights Permit 8964 authorizes a maximum of 500 ac-ft from October 1 through March 30.
Permit 20785 authorizes the diversion of 1.5 cfs from April 1 through May 15, if there is a “live
stream” flowing in the Salinas River and the quantity of water diverted under both Permits
combined cannot exceed 500 acre-feet. The District also holds Water Rights License 4829,
often referred to as the Greer License. This License permits water diversion from the Salinas
River underflow from April 1 through October 15 for a maximum of 102-ac-ft. The District also
has several riparian rights agreements by which it provides water to customers through tis
system and pumps the same amount of water from the underflow.
From Well Field Assessment, prepared by FUGRO Consultants, Inc, dated August 2012
(Note: this water is not considered recycled, reclaimed or recharged as those terms imply an operation that is
different from the District’s retrieval operation.)
Figure 3-5 - Monthly Groundwater Production As a Percentage of Total Annual Production

CHAPTER 3 MUNICIPAL SERVICE REVIEW
ADOPTED 3-24 NOVEMBER 2013
Treated wastewater percolated into the underflow of the Salinas River at the Selby percolation
ponds may be retrieved, less 2%, 28 months later at the Smith River Well, or 35 months later at
the Creekside River Well. At the current average discharge of 150,000 gpd, this provides an
additional 164 ac-ft of water available annually. Due to the locations of the two wells, all of the
water discharged at the Selby ponds can be retrieved during the summer pumping season from
April through October.
The District is in the process of final design and preparation of construction documents for the
East Side Force Main and Lift Station (ESFM) Project which will return all of the eastside area
wastewater flows to the Meadowbrook WWTP for treatment and disposal. Return of Eastside
wastewater flows may begin as early as 2015, bring an additional 220,000 gpd, or 241 ac-ft
annually, to the Meadowbrook WWTP and Selby ponds for percolation into the Salinas River
underflow and subsequent retrieval at the downstream wells.
The Addition of Nacimiento Water
The District receives an allocation of 250 acre-feet of Nacimiento water on an annual basis.
The Nacimiento raw water is discharged in the Selby ponds where is percolates into the
underflow and becomes available for retrieval downstream at the Smith River Well 28 months
later or at the Creekside River Well 35 months later. Retrieval of the water at the Smith Wells
and Creekside Well will net approximately 245 ac-ft annually. As long as the percolation ponds
have capacity to receive the discharges, percolation at the Selby site may continue until the
ESFM Project is completed. Preliminary studies for a water treatment facility are underway. It
is anticipated that additional studies and alternatives for a water treatment facility will be
investigated before a final decision on the best uses and treatment of the Nacimiento water is
made. In any case, the Nacimiento water will supplement the water supply during the peak
summer season and provide some additional source capacity for the District.
Current Supply
The District water supplies are distinctly grouped into two water seasons due to both demand
and water availability based on water rights. The summer season extends from April 1 through
September 30 and the winter season starts on October 1 and extends through March 30.
At this time the District is capable of meeting the seasonal average daily water demands of the
District. The District also is able to meet the maximum daily demand (MDD) requirements set
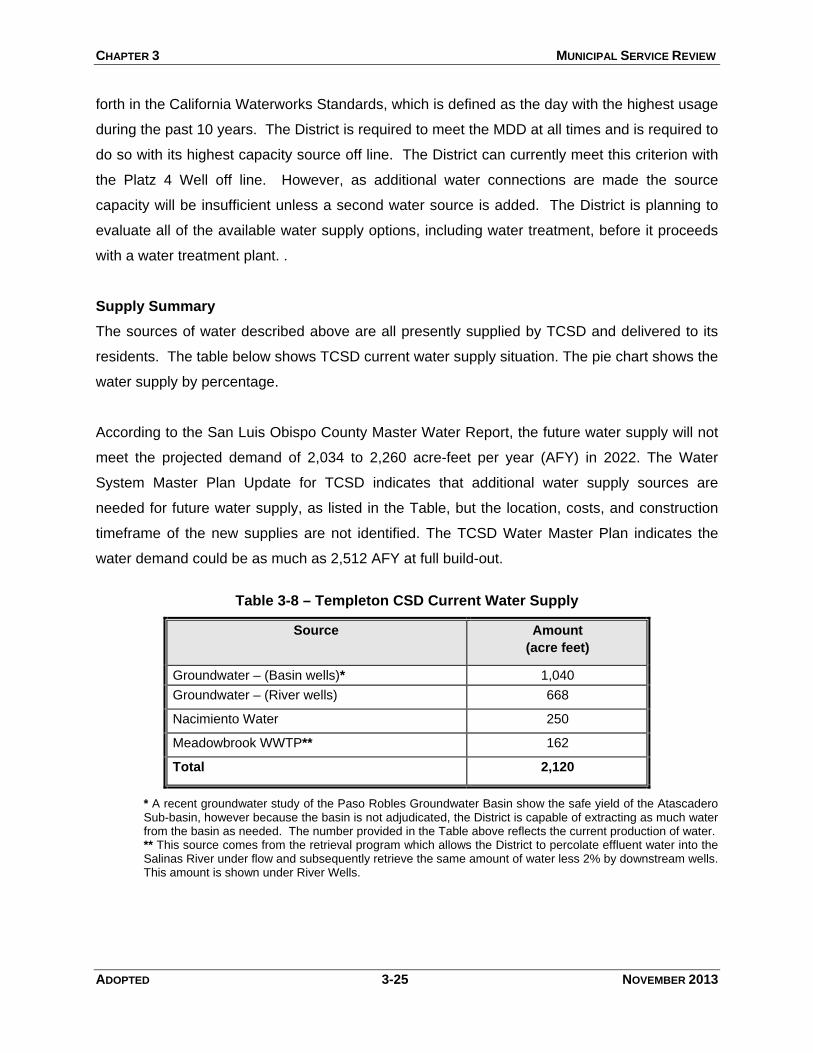
CHAPTER 3 MUNICIPAL SERVICE REVIEW
ADOPTED 3-25 NOVEMBER 2013
forth in the California Waterworks Standards, which is defined as the day with the highest usage
during the past 10 years. The District is required to meet the MDD at all times and is required to
do so with its highest capacity source off line. The District can currently meet this criterion with
the Platz 4 Well off line. However, as additional water connections are made the source
capacity will be insufficient unless a second water source is added. The District is planning to
evaluate all of the available water supply options, including water treatment, before it proceeds
with a water treatment plant. .
Supply Summary
The sources of water described above are all presently supplied by TCSD and delivered to its
residents. The table below shows TCSD current water supply situation. The pie chart shows the
water supply by percentage.
According to the San Luis Obispo County Master Water Report, the future water supply will not
meet the projected demand of 2,034 to 2,260 acre-feet per year (AFY) in 2022. The Water
System Master Plan Update for TCSD indicates that additional water supply sources are
needed for future water supply, as listed in the Table, but the location, costs, and construction
timeframe of the new supplies are not identified. The TCSD Water Master Plan indicates the
water demand could be as much as 2,512 AFY at full build-out.
Table 3-8 – Templeton CSD Current Water Supply
Source Amount
(acre feet)
Groundwater – (Basin wells)* 1,040
Groundwater – (River wells) 668
Nacimiento Water 250
Meadowbrook WWTP** 162
Total 2,120
* A recent groundwater study of the Paso Robles Groundwater Basin show the safe yield of the Atascadero Sub-basin, however because the basin is not adjudicated, the District is capable of extracting as much water from the basin as needed. The number provided in the Table above reflects the current production of water. ** This source comes from the retrieval program which allows the District to percolate effluent water into the Salinas River under flow and subsequently retrieve the same amount of water less 2% by downstream wells. This amount is shown under River Wells.

CHAPTER 3 MUNICIPAL SERVICE REVIEW
ADOPTED 3-26 NOVEMBER 2013
Figure 3-6 Templeton CSD Current Water Supply
Table 3-9 - Future Available Water Supply
Source
Allocation
AFY
Groundwater 0
Nacimiento Water 343
Retrieval Water 78
Total
421
Source: County of San Luis Obispo Master Water Report, 2012
The table below shows water production by Templeton CSD by source from 2002 to 2012. The
District projects that groundwater could be used as a source of water over the next 20 years. It
is estimated that by 2025 the current water supply will continue to supply the same safe yields
of groundwater 1,040 AFY, Nacimiento 250 AFY, and Retrieval Water 162 AFY. The District
may increase retrieval water, with East Side Force Main (ESFM) project to 240 AFY.
Basin Wells49%
River Wells32%
Nacimiento12%
WWTP7%
Water Supply
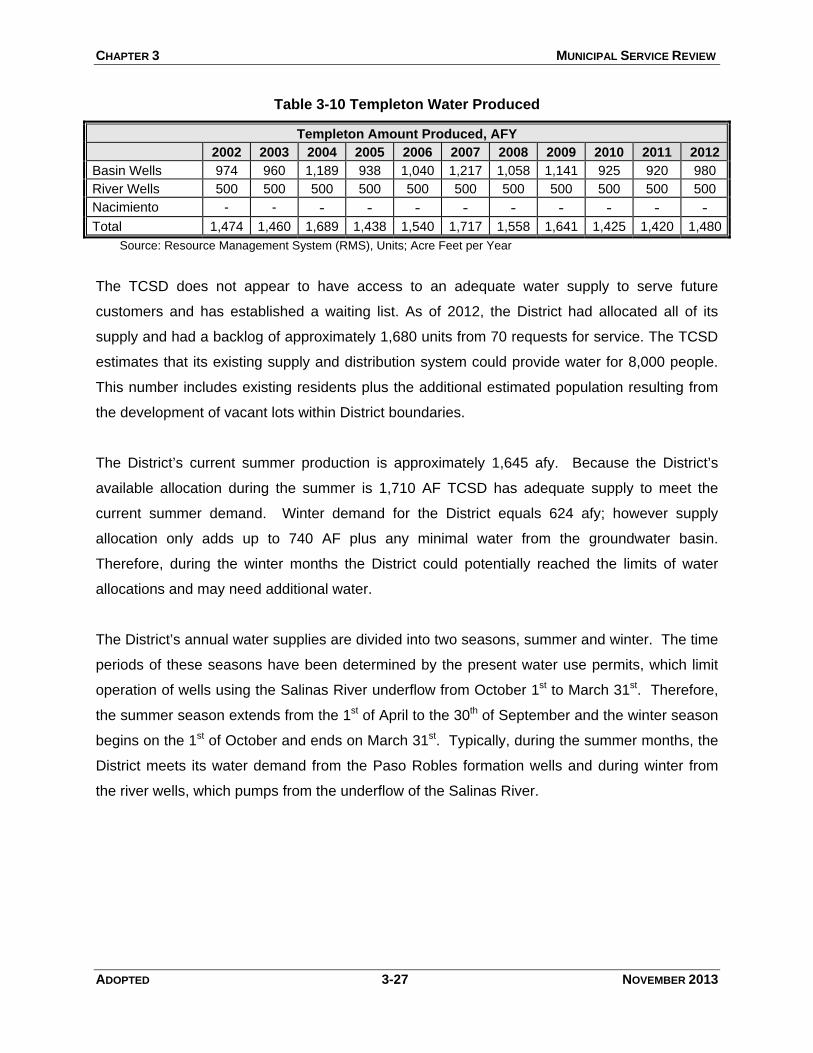
CHAPTER 3 MUNICIPAL SERVICE REVIEW
ADOPTED 3-27 NOVEMBER 2013
Table 3-10 Templeton Water Produced
Templeton Amount Produced, AFY
2002 2003 2004 2005 2006 2007 2008 2009 2010 2011 2012
Basin Wells 974 960 1,189 938 1,040 1,217 1,058 1,141 925 920 980
River Wells 500 500 500 500 500 500 500 500 500 500 500
Nacimiento - - - - - - - - - - - Total 1,474 1,460 1,689 1,438 1,540 1,717 1,558 1,641 1,425 1,420 1,480
Source: Resource Management System (RMS), Units; Acre Feet per Year
The TCSD does not appear to have access to an adequate water supply to serve future
customers and has established a waiting list. As of 2012, the District had allocated all of its
supply and had a backlog of approximately 1,680 units from 70 requests for service. The TCSD
estimates that its existing supply and distribution system could provide water for 8,000 people.
This number includes existing residents plus the additional estimated population resulting from
the development of vacant lots within District boundaries.
The District’s current summer production is approximately 1,645 afy. Because the District’s
available allocation during the summer is 1,710 AF TCSD has adequate supply to meet the
current summer demand. Winter demand for the District equals 624 afy; however supply
allocation only adds up to 740 AF plus any minimal water from the groundwater basin.
Therefore, during the winter months the District could potentially reached the limits of water
allocations and may need additional water.
The District’s annual water supplies are divided into two seasons, summer and winter. The time
periods of these seasons have been determined by the present water use permits, which limit
operation of wells using the Salinas River underflow from October 1st to March 31st. Therefore,
the summer season extends from the 1st of April to the 30th of September and the winter season
begins on the 1st of October and ends on March 31st. Typically, during the summer months, the
District meets its water demand from the Paso Robles formation wells and during winter from
the river wells, which pumps from the underflow of the Salinas River.
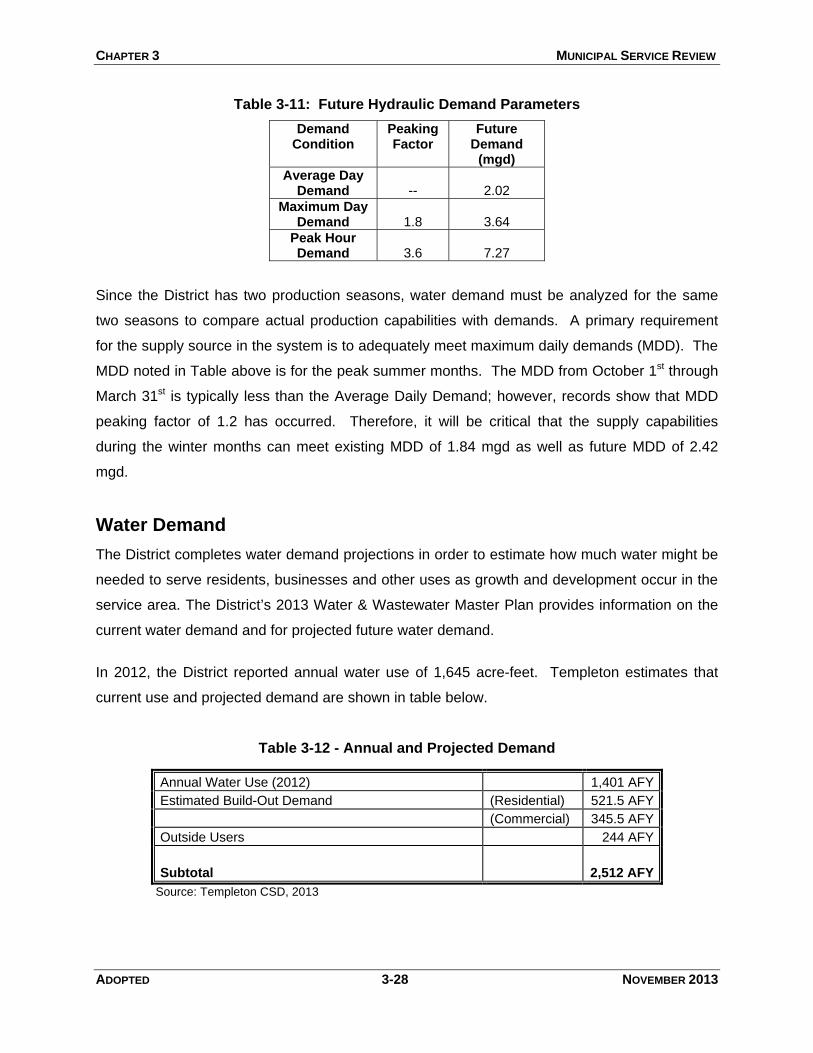
CHAPTER 3 MUNICIPAL SERVICE REVIEW
ADOPTED 3-28 NOVEMBER 2013
Table 3-11: Future Hydraulic Demand Parameters
Demand Condition
Peaking Factor
Future Demand
(mgd)
Average Day Demand
--
2.02
Maximum Day Demand
1.8
3.64
Peak Hour Demand
3.6
7.27
Since the District has two production seasons, water demand must be analyzed for the same
two seasons to compare actual production capabilities with demands. A primary requirement
for the supply source in the system is to adequately meet maximum daily demands (MDD). The
MDD noted in Table above is for the peak summer months. The MDD from October 1st through
March 31st is typically less than the Average Daily Demand; however, records show that MDD
peaking factor of 1.2 has occurred. Therefore, it will be critical that the supply capabilities
during the winter months can meet existing MDD of 1.84 mgd as well as future MDD of 2.42
mgd.
Water Demand
The District completes water demand projections in order to estimate how much water might be
needed to serve residents, businesses and other uses as growth and development occur in the
service area. The District’s 2013 Water & Wastewater Master Plan provides information on the
current water demand and for projected future water demand.
In 2012, the District reported annual water use of 1,645 acre-feet. Templeton estimates that
current use and projected demand are shown in table below.
Table 3-12 - Annual and Projected Demand
Annual Water Use (2012) 1,401 AFY
Estimated Build-Out Demand (Residential) 521.5 AFY
(Commercial) 345.5 AFY
Outside Users 244 AFY
Subtotal
2,512 AFY
Source: Templeton CSD, 2013
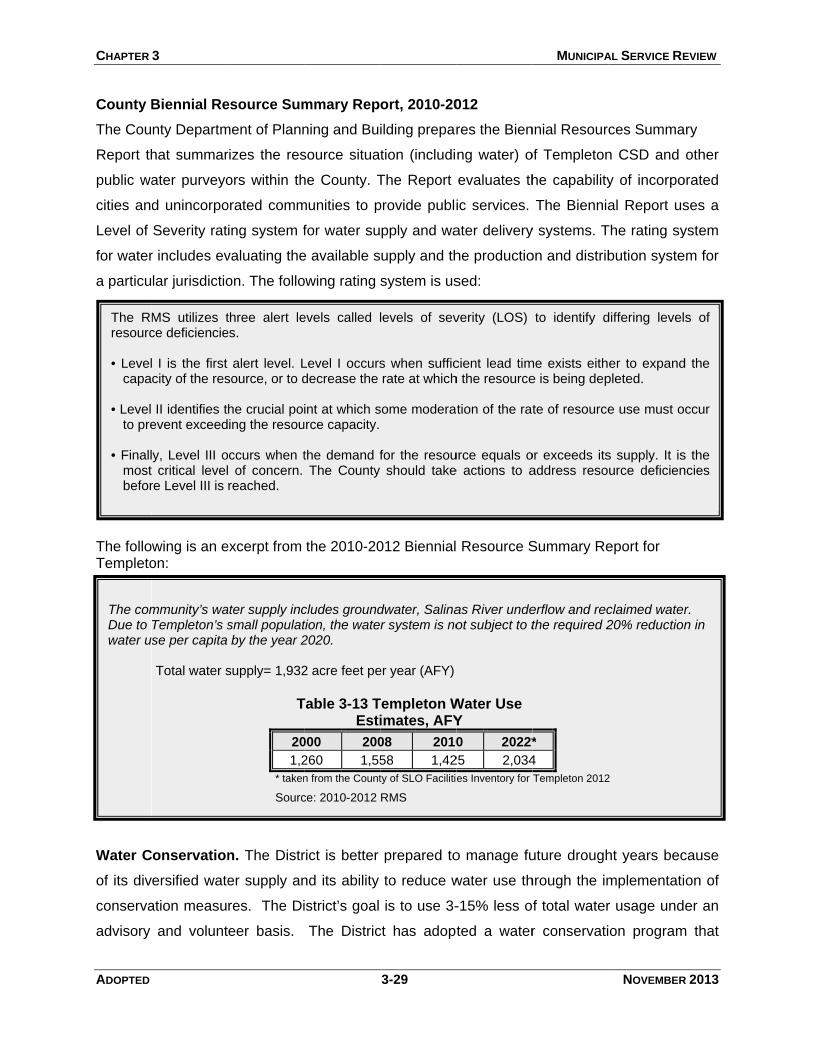
CHAPTER
ADOPTED
County B
The Cou
Report th
public wa
cities and
Level of
for water
a particu
The folloTempleto
Water C
of its div
conserva
advisory
The RMresourc • Level
capa • Level
to pre • Finall
most befor
The comDue to water u
3
Biennial Re
nty Departm
hat summar
ater purveyo
d unincorpo
Severity rat
r includes ev
lar jurisdictio
wing is an eon:
onservation
ersified wate
ation measu
and volunt
MS utilizes tce deficiencie
I is the first city of the res
II identifies tevent exceed
y, Level III ocritical level
re Level III is
mmunity’s waTempleton’s sse per capita Total water s
esource Sum
ment of Plann
rizes the res
ors within th
orated comm
ing system f
valuating the
on. The follo
excerpt from
n. The Distr
er supply an
res. The Di
eer basis.
three alert lees.
alert level. Lsource, or to d
he crucial poing the resou
ccurs when t of concern. reached.
ater supply incsmall populatby the year 2
supply= 1,932
T
20
1,2
* taken
Sourc
mmary Rep
ning and Bu
source situa
he County. T
munities to p
for water su
e available s
owing rating
the 2010-20
rict is better
nd its ability
istrict’s goal
The Distric
evels called l
Level I occursdecrease the
int at which surce capacity.
the demand fThe County
cludes groundtion, the wate2020.
2 acre feet pe
Table 3-13 TEsti
000 200
260 1,55
n from the Count
ce: 2010-2012
3-29
ort, 2010-20
ilding prepar
tion (includi
The Report
provide publi
pply and wa
upply and th
system is us
012 Biennial
prepared to
to reduce w
is to use 3-
ct has adop
levels of sev
s when sufficrate at which
some modera
for the resoushould take
dwater, Salinar system is no
er year (AFY)
Templeton Wimates, AFY
08 2010
58 1,42
ty of SLO Faciliti
RMS
012
res the Bien
ng water) o
evaluates th
ic services.
ater delivery
he productio
sed:
Resource S
o manage fu
water use th
-15% less o
ted a water
verity (LOS)
cient lead timh the resource
tion of the rat
urce equals oe actions to a
as River undeot subject to t
Water Use Y
0 2022*
25 2,034
es Inventory for
MUNICIPA
nnial Resour
of Templeton
he capability
The Biennia
y systems. T
on and distrib
Summary Re
uture drough
hrough the im
f total water
r conservati
to identify d
me exists eithe is being dep
te of resource
or exceeds itsaddress reso
erflow and recthe required 2
*
4
Templeton 2012
AL SERVICE RE
NOVEMBER
ces Summa
n CSD and
y of incorpo
al Report us
The rating sy
bution syste
eport for
ht years bec
mplementati
r usage und
on program
differing level
er to expandpleted.
e use must o
s supply. It isurce deficien
claimed water20% reduction
2
EVIEW
R 2013
ry
other
orated
ses a
ystem
em for
cause
on of
er an
m that
s of
d the
ccur
s the ncies
r. n in
CHAPTER 3 MUNICIPAL SERVICE REVIEW
ADOPTED 3-30 NOVEMBER 2013
allows them to implement tiered measures to adapt to the water conservation most appropriate
to the actual water supply at any time. The County also implemented that new development be
required to meet rigid standards for both inside and outside water use.
Water Management Policies. The District has established water management policies to
manage their supply:
• Maintains a will serve list that prioritizes future users based on the District’s ability to serve and the users’ ability to provide a water supply. Users that have access to a water supply are given priority over those who do not;
• Works with local developers and builders to gain access/rights to water wells as appropriate and legally possible. Trades hook-ups for access to a water supply such as a well;
• Does not over-extend the District’s water supply by serving customers in excess of the water supply.
Based on past management practices, the District is unlikely to over-extend its ability to provide
water services. The District takes a prudent approach to managing water supplies.
Water Distribution and Storage System
The District’s water distribution system delivers potable water through a transmission main from
various wells to customers and fire hydrants via pump stations, water tanks, and approximately
45 miles of water distribution pipelines. The District’s water is delivered through a system of
local distribution lines operating on a single pressure zone, receiving gravity flow from the four
above ground tanks.
Water Distribution. The Water Distribution system includes over 45 miles of various pipes, four
above ground steel water storage tanks, thirteen wells and 573 fire hydrants. The Water
System Master Plan indicates that the system is well-maintained and provides adequate water
pressures for most areas of the District. The District has completed a number of improvements
to the distribution system, including pipeline upgrades and meter replacements.
The Water Master Plan identifies areas of the distribution system that experience less than
desirable pressures during domestic demands and substandard pressures or flows under fire
flow conditions. The areas in which the pressures were found to be inadequate were caused by
the elevation of the storage tanks relative to the area being served. In other words the tanks

CHAPTER 3 MUNICIPAL SERVICE REVIEW
ADOPTED 3-31 NOVEMBER 2013
were not located at a high enough elevation to cause adequate pressure levels for certain
service areas. These low-pressure areas are few and relatively small in size. The situation has
been improved by private residences having installed booster pumps at key locations along the
pipeline system. Based on the existing studies the distribution system appears adequate to
serve the existing residents and can be expanded to meet the needs of future residents.
Water Storage. The Water Storage system in Templeton is described in the Water Master Plan.
Several upgrades have occurred to the system from 2005 to the present. The District stores
water in four above-ground steel water tanks located throughout the area. The storage system
provides water for emergency, fire and operational purposes. The storage tanks would help
responds to emergencies such as power outages, pipeline breaks, broken fire hydrants and
similar system related problems. Fire storage is the volume of water needed to control a
structure fire. The amount of water needed is established by the Uniform Fire Code as enforced
by the Templeton Fire Department.
The District has completed a number of improvements to the storage system and has 2.66
million gallons of storage capacity. Based on the existing studies, the storage system appears
adequate to serve the existing residents and can be expanded to meet the needs of future
residents.
Capital Improvement Plan-Water System. The District’s Capital Improvement Plan (CIP)
comprehensively schedules and finances all capital projects and equipment purchases. Planned
water system improvements are included in the District’s Capital Improvements Program that
was adopted by the Board of Directors. The Water Master Plan has prioritized the projects that
are most needed to improve the system. The District is planning several projects that will
increase water supply and reliability. These are:
Future Projects
Return Eastside area wastewater lows to Meadowbrook WWTP for treatment
and disposal to Selby percolation ponds for subsequent retrieval at District Smith and Creekside wells. Construction documents are underway, project target completion by late 2015 (this schedule may be extended out).
Water treatment facility for 250-ac-ft Naci [sic] water and blending with existing well supply. Preliminary analysis of water treatment options has been completed. (Prior to moving forward on this project the District anticipates that it will conduct an alternatives analysis exploring other options in receiving the
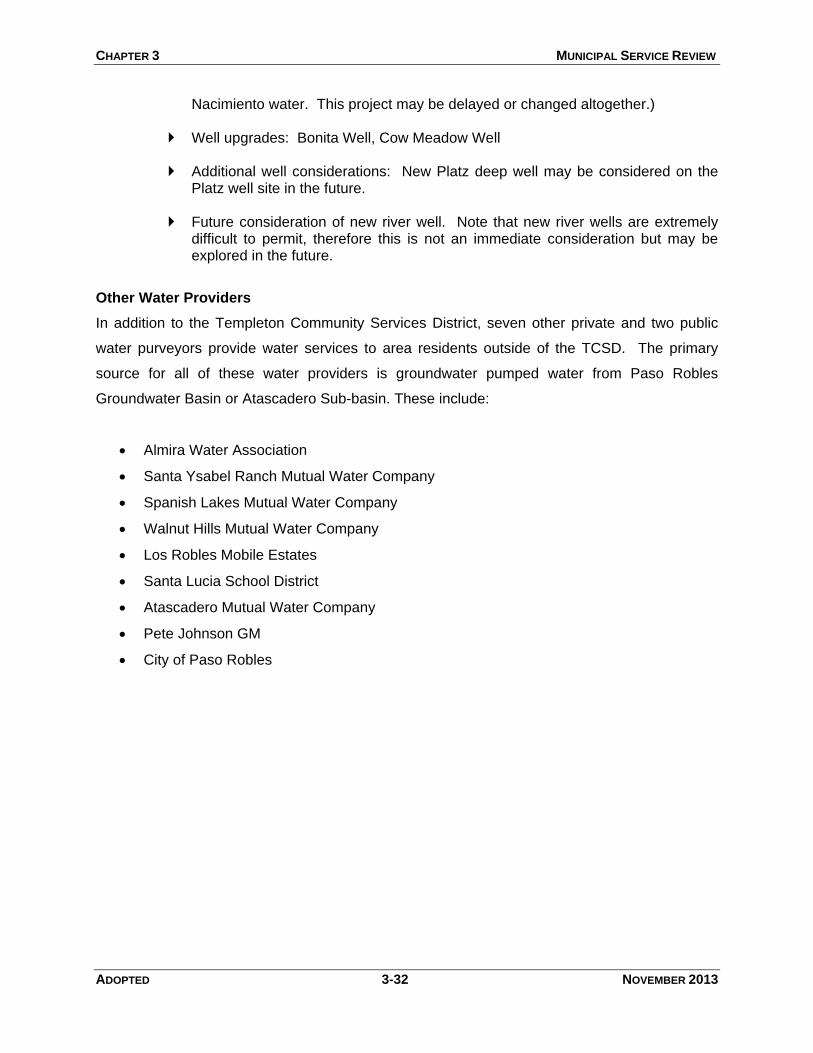
CHAPTER 3 MUNICIPAL SERVICE REVIEW
ADOPTED 3-32 NOVEMBER 2013
Nacimiento water. This project may be delayed or changed altogether.)
Well upgrades: Bonita Well, Cow Meadow Well
Additional well considerations: New Platz deep well may be considered on the Platz well site in the future.
Future consideration of new river well. Note that new river wells are extremely difficult to permit, therefore this is not an immediate consideration but may be explored in the future.
Other Water Providers
In addition to the Templeton Community Services District, seven other private and two public
water purveyors provide water services to area residents outside of the TCSD. The primary
source for all of these water providers is groundwater pumped water from Paso Robles
Groundwater Basin or Atascadero Sub-basin. These include:
• Almira Water Association
• Santa Ysabel Ranch Mutual Water Company
• Spanish Lakes Mutual Water Company
• Walnut Hills Mutual Water Company
• Los Robles Mobile Estates
• Santa Lucia School District
• Atascadero Mutual Water Company
• Pete Johnson GM
• City of Paso Robles
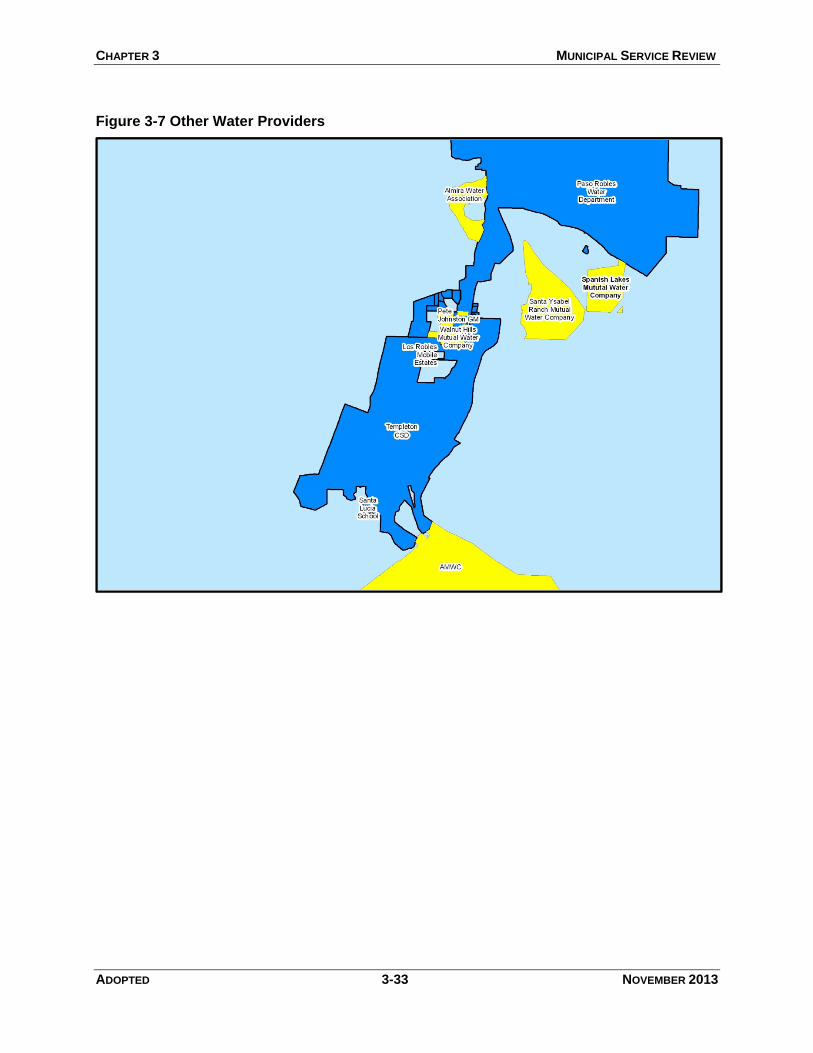
CHAPTER 3 MUNICIPAL SERVICE REVIEW
ADOPTED 3-33 NOVEMBER 2013
Figure 3-7 Other Water Providers

CHAPTER 3 MUNICIPAL SERVICE REVIEW
ADOPTED 3-34 NOVEMBER 2013
WASTEWATER COLLECTION & TREATMENT SYSTEM
Facility Description. The TCSD is responsible for collecting, transporting, and treating
wastewater from customers to its wastewater treatment facilities. The current capacity of the
Meadowbrook Wastewater Treatment Plant (WWTP) is 600,000 gallons per day (GPD), and the
average daily flow is 150,000 GPD. The Meadowbrook WWTP operates at 25% capacity at
peak flow. Plans are underway to redirect Eastside sewer area flows to the Meadowbrook
WWTP resulting in an additional flow of 220,000 gpd. There are two distinct wastewater
tributary areas: the Meadowbrook WWTP treats a majority of the wastewater flows from the
west side of Highway 101. All of the flows from the east side of Highway 101 plus a small
portion of the west side go to the City of Paso Robles for treatment. The TCSD has been
examining the feasibility of treating all or a portion of its east side wastewater flows at the
Meadowbrook WWTP. The District Board approved moving forward with treating all of the flows
at the Meadowbrook WWTP. To achieve this, the TCSD has to complete a number of projects,
including completing a California Environmental Quality Act determination, attaining permission
from the State Water Resources Control Board, constructing new lift stations and force mains,
and examining capacity of the Selby ponds and Salinas River impacts. Preparation of
construction plans and specifications are underway.
The Meadowbrook Wastewater Treatment Plant was constructed in 1987 to serve a 115 unit
mobile home park at the southernmost portion of Templeton, and consisted of a bar screen
headworks, three aerated facultative lagoons, wet weather storage and approximately five acres
of spray disposal fields. The original facility had a design capacity of 43,000 gpd. The District
purchased the Meadowbrook WWTP in the mid 1980’s with the intent to eventually expand the
plant using the 56 acres at the site for treatment and disposal, using spray irrigation. In 1996,
the District entered into an option agreement with a land owner to purchase the 41 acre Selby
Property for the purpose of utilizing the area for percolation ponds suitable for disposal of
secondary treated wastewater through rapid infiltration basins. In 2001, the Meadowbrook
WWTP was upgraded to 0.3 MGD using an advanced integrated pond system (AIPS) and
upgraded again in 2008 to 0.6 MGD with an additional 2 acres of percolation disposal ponds at
the Selby site.
Wastewater Collection. The TCSD is responsible for collecting, transporting and treating
wastewater from customers to its wastewater treatment facilities. The system includes 15 miles
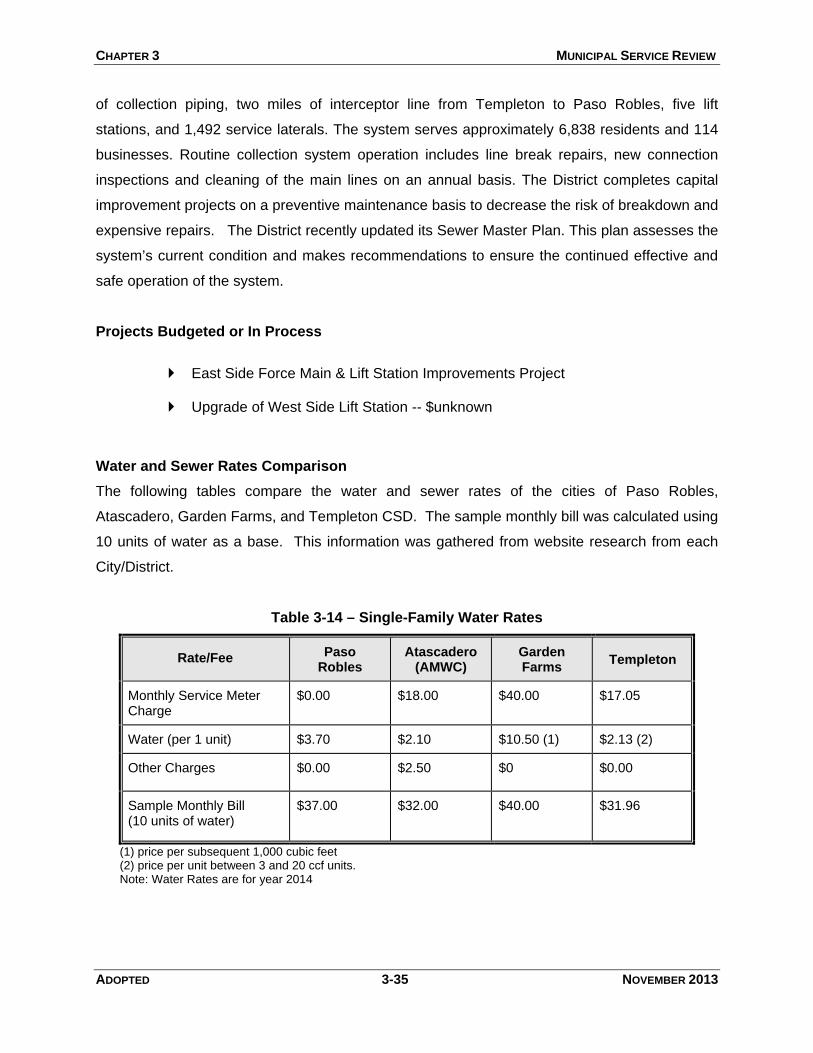
CHAPTER 3 MUNICIPAL SERVICE REVIEW
ADOPTED 3-35 NOVEMBER 2013
of collection piping, two miles of interceptor line from Templeton to Paso Robles, five lift
stations, and 1,492 service laterals. The system serves approximately 6,838 residents and 114
businesses. Routine collection system operation includes line break repairs, new connection
inspections and cleaning of the main lines on an annual basis. The District completes capital
improvement projects on a preventive maintenance basis to decrease the risk of breakdown and
expensive repairs. The District recently updated its Sewer Master Plan. This plan assesses the
system’s current condition and makes recommendations to ensure the continued effective and
safe operation of the system.
Projects Budgeted or In Process
East Side Force Main & Lift Station Improvements Project
Upgrade of West Side Lift Station -- $unknown
Water and Sewer Rates Comparison
The following tables compare the water and sewer rates of the cities of Paso Robles,
Atascadero, Garden Farms, and Templeton CSD. The sample monthly bill was calculated using
10 units of water as a base. This information was gathered from website research from each
City/District.
Table 3-14 – Single-Family Water Rates
Rate/Fee
Paso Robles
Atascadero (AMWC)
Garden Farms
Templeton
Monthly Service Meter Charge
$0.00
$18.00
$40.00
$17.05
Water (per 1 unit)
$3.70
$2.10
$10.50 (1)
$2.13 (2)
Other Charges
$0.00
$2.50
$0
$0.00
Sample Monthly Bill (10 units of water)
$37.00
$32.00
$40.00
$31.96
(1) price per subsequent 1,000 cubic feet (2) price per unit between 3 and 20 ccf units. Note: Water Rates are for year 2014
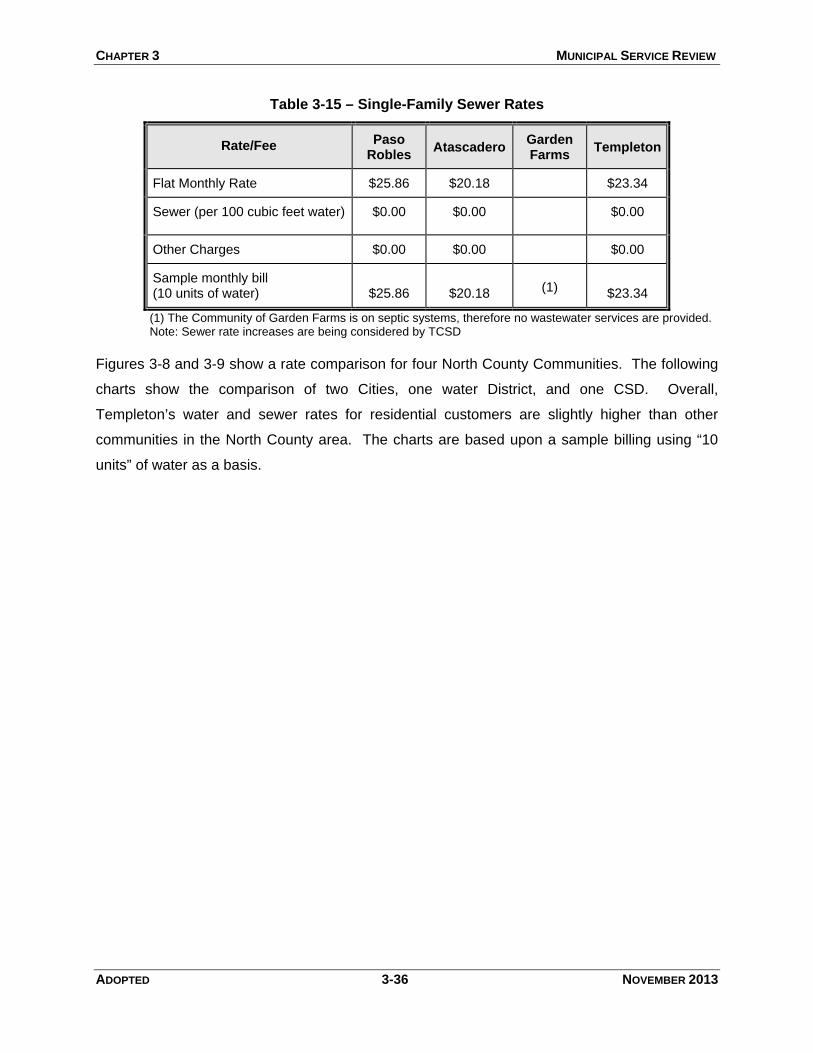
CHAPTER 3 MUNICIPAL SERVICE REVIEW
ADOPTED 3-36 NOVEMBER 2013
Table 3-15 – Single-Family Sewer Rates
Rate/Fee
Paso Robles
Atascadero
Garden Farms
Templeton
Flat Monthly Rate
$25.86
$20.18
$23.34
Sewer (per 100 cubic feet water)
$0.00
$0.00
$0.00
Other Charges
$0.00
$0.00
$0.00
Sample monthly bill (10 units of water)
$25.86
$20.18
(1)
$23.34
(1) The Community of Garden Farms is on septic systems, therefore no wastewater services are provided. Note: Sewer rate increases are being considered by TCSD
Figures 3-8 and 3-9 show a rate comparison for four North County Communities. The following
charts show the comparison of two Cities, one water District, and one CSD. Overall,
Templeton’s water and sewer rates for residential customers are slightly higher than other
communities in the North County area. The charts are based upon a sample billing using “10
units” of water as a basis.
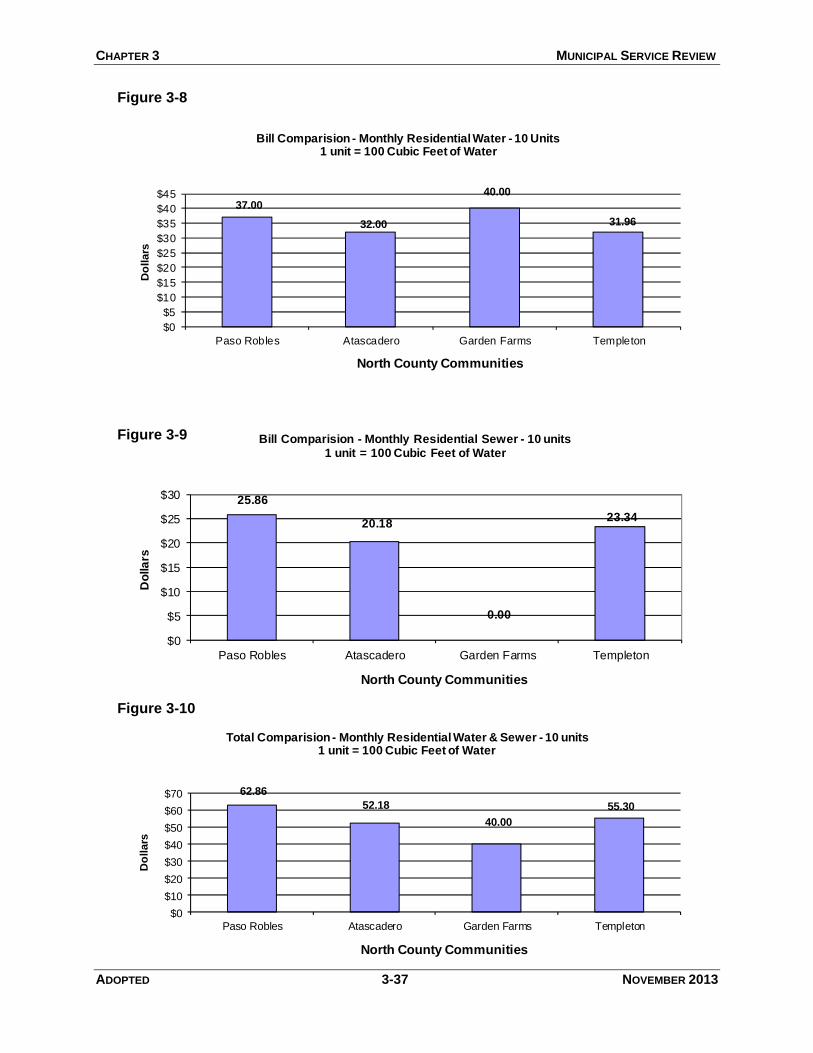
CHAPTER 3 MUNICIPAL SERVICE REVIEW
ADOPTED 3-37 NOVEMBER 2013
37.00
32.00
40.00
31.96
$0
$5
$10
$15
$20
$25
$30
$35
$40
$45
Paso Robles Atascadero Garden Farms Templeton
Do
llars
North County Communities
Bill Comparision - Monthly Residential Water - 10 Units1 unit = 100 Cubic Feet of Water
25.86
20.18
0.00
23.34
$0
$5
$10
$15
$20
$25
$30
Paso Robles Atascadero Garden Farms Templeton
Do
lla
rs
North County Communities
Bill Comparision - Monthly Residential Sewer - 10 units1 unit = 100 Cubic Feet of Water
62.86
52.18
40.00
55.30
$0
$10
$20
$30
$40
$50
$60
$70
Paso Robles Atascadero Garden Farms Templeton
Do
llars
North County Communities
Total Comparision - Monthly Residential Water & Sewer - 10 units1 unit = 100 Cubic Feet of Water
Figure 3-8
Figure 3-9
Figure 3-10
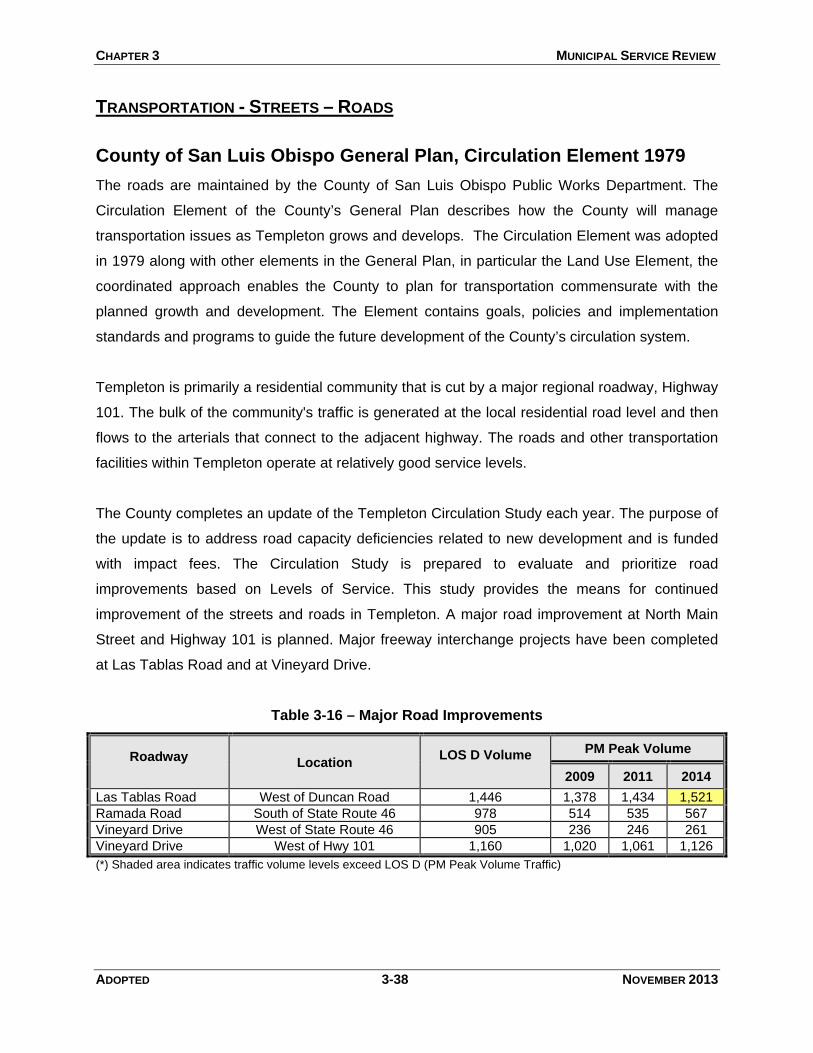
CHAPTER 3 MUNICIPAL SERVICE REVIEW
ADOPTED 3-38 NOVEMBER 2013
TRANSPORTATION - STREETS – ROADS
County of San Luis Obispo General Plan, Circulation Element 1979
The roads are maintained by the County of San Luis Obispo Public Works Department. The
Circulation Element of the County’s General Plan describes how the County will manage
transportation issues as Templeton grows and develops. The Circulation Element was adopted
in 1979 along with other elements in the General Plan, in particular the Land Use Element, the
coordinated approach enables the County to plan for transportation commensurate with the
planned growth and development. The Element contains goals, policies and implementation
standards and programs to guide the future development of the County’s circulation system.
Templeton is primarily a residential community that is cut by a major regional roadway, Highway
101. The bulk of the community's traffic is generated at the local residential road level and then
flows to the arterials that connect to the adjacent highway. The roads and other transportation
facilities within Templeton operate at relatively good service levels.
The County completes an update of the Templeton Circulation Study each year. The purpose of
the update is to address road capacity deficiencies related to new development and is funded
with impact fees. The Circulation Study is prepared to evaluate and prioritize road
improvements based on Levels of Service. This study provides the means for continued
improvement of the streets and roads in Templeton. A major road improvement at North Main
Street and Highway 101 is planned. Major freeway interchange projects have been completed
at Las Tablas Road and at Vineyard Drive.
Table 3-16 – Major Road Improvements
Roadway
Location
LOS D Volume
PM Peak Volume
2009 2011 2014
Las Tablas Road West of Duncan Road 1,446 1,378 1,434 1,521
Ramada Road South of State Route 46 978 514 535 567
Vineyard Drive West of State Route 46 905 236 246 261
Vineyard Drive West of Hwy 101 1,160 1,020 1,061 1,126
(*) Shaded area indicates traffic volume levels exceed LOS D (PM Peak Volume Traffic)

CHAPTER 3 MUNICIPAL SERVICE REVIEW
ADOPTED 3-39 NOVEMBER 2013
SLOCOG Regional Transportation Plan, 2010
The most recent RTP, Preliminary Sustainable Communities Strategy, acts as a blueprint for
a transportation system that addresses transportation projects that will meet access and mobility
needs. The 2010 Regional Transportation Plan (2010 RTP) is intended to be a comprehensive
Plan guiding transportation policy for the region and will make recommendations concerning
improvements to the existing transportation network of highways, transit, air and water, rail and
bicycling.
Regional Improvements. According to the San Luis Obispo Council of Government’s
(SLOCOG) 2010 Regional Transportation Plan the segment of Highway 101 from Templeton to
Highway 46W junction is projected from the 2008 number of 58,800 average daily trips to
79,000 average daily trips in 2035. This segment provides access to Main Street and the
commercial/community hospital district of Templeton. This increase is primarily due to Paso
Robles’ emergence as the primary North County job center and its successful downtown, the
intensified commercial development near the US101/SR46W interchange, and continued
residential development in Paso Robles and west Templeton.
Highway 101/SR 46E Corridor. The City is bisected by Highway 101 Freeway Corridor. In
2008, this highway carried Annual Average Daily Trips (AADT) of 22,700 (2008 Caltrans counts;
website). Volumes are continuing to increase from local and regional sources. Highway 101
segment carries heavy commuter traffic as well as interregional and local traffic. On these
critical interchanges and in other places such as the Hwy 46 corridor, PSCS recognizes the
need to begin project development and secure local development funds for interchange
improvements and even grade separation. Highway 46E interchange has been redesigned to
address capacity issues. SLOCOG and Caltrans have prepared and published the 2008
Comprehensive Corridor Study for State Route 46 East. The primary purpose of this Corridor
Study is to assist the four key partner agencies, Caltrans, SLOCOG, City of Paso Robles, and
San Luis Obispo County, in addressing mobility and safety concerns and develop a long term
vision for the State Route 46 East (SR 46E) corridor.
Transit. The Templeton Dial a Ride is operated by the RTA and available 2 days a week
(Tuesdays & Thursdays) with 24 hour reservation. The Templeton area is served by the RTA at
the Las Tablas Park and Ride lot where hourly transfers can be made to the North County
Shuttle, serving the Main Street area 5 days a week and limited connections on Saturdays.
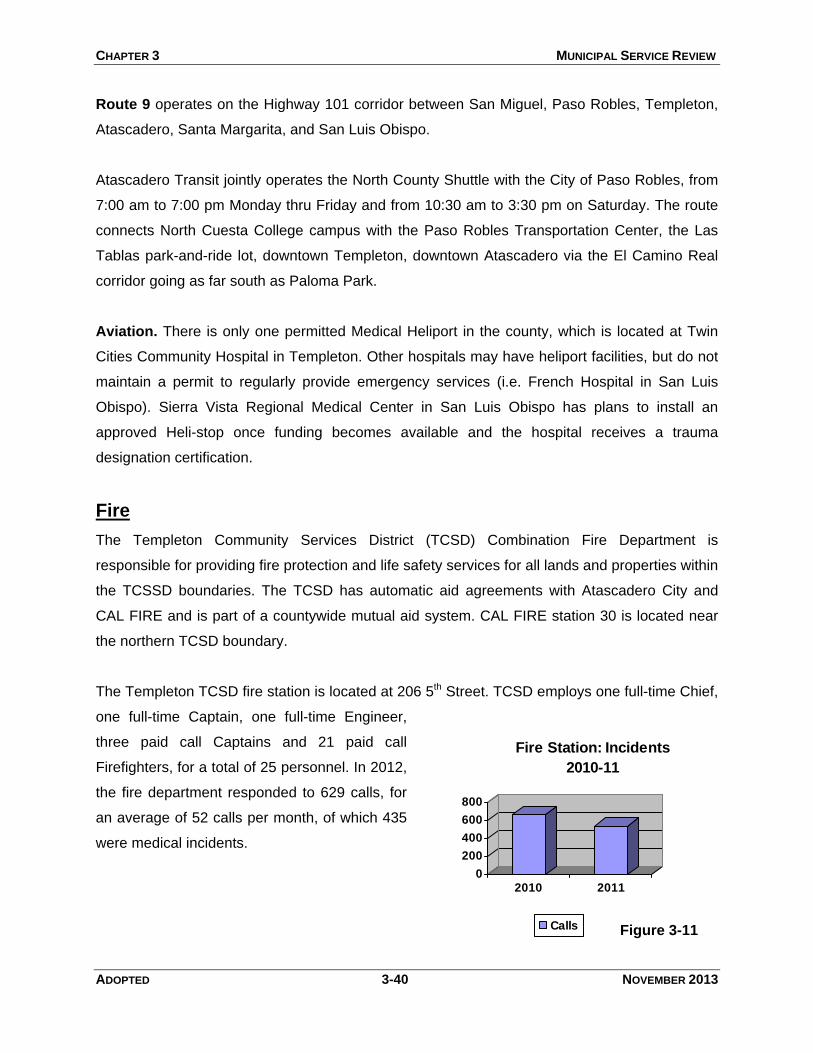
CHAPTER 3 MUNICIPAL SERVICE REVIEW
ADOPTED 3-40 NOVEMBER 2013
Route 9 operates on the Highway 101 corridor between San Miguel, Paso Robles, Templeton,
Atascadero, Santa Margarita, and San Luis Obispo.
Atascadero Transit jointly operates the North County Shuttle with the City of Paso Robles, from
7:00 am to 7:00 pm Monday thru Friday and from 10:30 am to 3:30 pm on Saturday. The route
connects North Cuesta College campus with the Paso Robles Transportation Center, the Las
Tablas park-and-ride lot, downtown Templeton, downtown Atascadero via the El Camino Real
corridor going as far south as Paloma Park.
Aviation. There is only one permitted Medical Heliport in the county, which is located at Twin
Cities Community Hospital in Templeton. Other hospitals may have heliport facilities, but do not
maintain a permit to regularly provide emergency services (i.e. French Hospital in San Luis
Obispo). Sierra Vista Regional Medical Center in San Luis Obispo has plans to install an
approved Heli-stop once funding becomes available and the hospital receives a trauma
designation certification.
Fire
The Templeton Community Services District (TCSD) Combination Fire Department is
responsible for providing fire protection and life safety services for all lands and properties within
the TCSSD boundaries. The TCSD has automatic aid agreements with Atascadero City and
CAL FIRE and is part of a countywide mutual aid system. CAL FIRE station 30 is located near
the northern TCSD boundary.
The Templeton TCSD fire station is located at 206 5th Street. TCSD employs one full-time Chief,
one full-time Captain, one full-time Engineer,
three paid call Captains and 21 paid call
Firefighters, for a total of 25 personnel. In 2012,
the fire department responded to 629 calls, for
an average of 52 calls per month, of which 435
were medical incidents.
0
200
400
600
800
2010 2011
Fire Station: Incidents
2010-11
Calls Figure 3-11
CHAPTER 3 MUNICIPAL SERVICE REVIEW
ADOPTED 3-41 NOVEMBER 2013
Police/Sheriff.
Police protection is provided by the San Luis Obispo County Sheriff’s Department through their
North County Station, located at 356 Main Street, in Templeton. The Sheriff’s Department goal
in the North County is to provide a 10-minute response time for high priority, life-threatening
calls.
Currently, the North Station has personnel shortages, but does not expect to expand or replace
the existing facilities in the near future. However, in the next 25 years, when the North County
Station is fully staffed, more space would be needed in the locker room, in the report writing
room, at the workstations, and in the parking area. The Sheriff’s Department expects this will
require a major remodeling of the existing facility or construction of an additional building, but no
specific plans have been developed.
The California Crime Rate for the unincorporated areas of the County is the lowest in the State
compared with other counties with a population of 100,000 or more. The statewide average for
serious crimes per 100,000 people is 1,270; the County’s crime rate was at 623/100,000 people.
Recreation.
Mission Statement:
The Templeton Recreation Department, with integrity and enthusiasm, is committed to providing
quality recreational services which are educational, fun and rewarding. Our goal is to enhance
the quality of life and well-being of the community we serve.
Scope and Importance of Recreation:
While most of the recreational activities, events and programs offered through the Templeton
Recreation Department are geared toward the youth in our community, we also believe the
adults of Templeton should not be left behind. The positive effects of recreation participation for
people of all ages are not only physical, but social and personal as well. From promoting health
and wellness to being a team player, from building self-esteem to enhancing community pride,
the role of recreation is as vast and varied as its components, and is incredibly important to all
members of our community. Templeton Recreation offers parks and programs throughout the
year that not only enhance the quality of life, but capture the spirit of our community.
CHAPTER 3 MUNICIPAL SERVICE REVIEW
ADOPTED 3-42 NOVEMBER 2013
TEMPLETON ACTIVE SENIOR CLUB:
The Templeton Active Senior Club has been revitalized due to increased interest of members in
our community. From ground zero to over 20 members this year, the club meets the second
Friday of each month to discuss topics of the day, plan future events and interact socially.
During these meetings, the club hears presentations from various local businesses regarding
issues specific to the aging population such as health and wellness, financial investments and
computer literacy. Past presentations include, but are not limited to:
• Brain Aerobics with Dr. Sonja Glassmeyer
• Introduction to Zumba Gold (Zumba specific for Seniors)
• Strategies for Taking Withdrawals from IRA’s and Other Retirement Accounts with Paul
Perotti of Rob Garcia Wealth Management
• Discussion on Trusts with Jennifer Langstaff
• Energetic Nutrition for those over 50 with Nancy Walker from the Wellness Kitchen
EVENTS/ACTIVITIES:
Templeton Recreation offers events throughout the year that highlight the spirit of Templeton
and provide positive, healthy alternatives. Aside from the staff time needed to plan, prepare and
run each event, there is a goal of fiscal responsibility and each event is intended to operate
financially independent of the budget of Templeton Recreation, utilizing volunteers from various
local civic and community organizations as well as donations and sponsorships from community
members and businesses.
Templeton Turkey Trot – With a consistent average participation rate of over 150 runners, the
Templeton Turkey Trot & Fun Run will be the 5th annual in 2012. This event is geared toward
runners of all ages and averages over 150 adult runners in the 5K and 10K. Prizes are offered
to random finishers in both the 5K and 10K, while participation medals are awarded to every
child participating in the Kid’s Loop.
Summer Concerts in the Park – The annual Summer Concert in the Park Series is Templeton
Recreation’s premier event. Held across ten or more Wednesday evenings during the summer
season in San Luis Obispo County’s Templeton Community Park, we typically see a range of
500-1,500 concert-goers, depending on the type of music, weather and other activities around
CHAPTER 3 MUNICIPAL SERVICE REVIEW
ADOPTED 3-43 NOVEMBER 2013
San Luis Obispo County (i.e. California Mid-State Fair). This free event is open to the public of
all ages and is family friendly.
Zumba Fitness – Zumba is one of the fastest growing dance-based fitness crazes in the
country, and Templeton is no exception. With easy-to-follow dance moves and motivating Latin
rhythms such as Merengue, Salsa, Cumbia, Reggaeton and even Hip-Hop, Zumba is the most
fun you’ve ever had working out. We currently have over 25 adult participants per week.
OTHER ADULT RECREATION OPPORTUNITIES:
The national trend for adult recreation is independent participation. While there are plenty of
adult sports leagues and organized lessons, data suggests adults primarily prefer to actively
participate in recreation in an independent manner, such as hiking, walking/jogging or picnicking
in a park. However, within Templeton there are still a variety of activities, events and organized
recreational opportunities outside of the Templeton Recreation Department for adults to
participate in that enhance community pride, reflect the spirit of our community and
simultaneously nurture local business. These opportunities include, but are not limited to:
• Annual Wine and Roses Bicycle Ride
• Main Street Christmas
• Earth Day Food and Wine Festival
• Founder’s Day Celebration
• Pinot Paella Festival
ACTIVITIES/CLASSES:
The Templeton Recreation Department has a variety of rental space available to offer activities
and classes for the youth of our community. What were once offered as “Community Classes”
are now considered “Facility Rentals”, wherein an instructor, group or organization can pay a
fee to host their class in one of the spaces in our facility. Typical activities and classes geared
toward the youth of our community include, but are not limited to:
• Money Management for Kids
• French Language Class
• SAT/ACT Success
• The Storybook Kitchen
• Passport to the World
• After-School Tutoring
CHAPTER 3 MUNICIPAL SERVICE REVIEW
ADOPTED 3-44 NOVEMBER 2013
• Great Adventures Preschool
• Zumba
Templeton Recreation also has an all concrete Skate Park. Open to skateboarders of all ages,
the Skate Park typically sees over 25 skaters per day, most under the age of 18. With 10,000
square feet of concrete and coping, the park is ideal for both street-style and vertical
skateboarding and roller-blading. The skate park is open for recreational use of skateboards,
bicycles, and scooters. Designed by world-renowned Wormhoudt, Inc., the park is open 7 days
a week and monitored on a part-time basis. The Templeton Skate Park is also a proud
participant in the annual Central Coast Monster Skate Park Series, a series of 6 skateboarding
contests held at skate parks throughout San Luis Obispo County each spring.
EVENTS:
Templeton Recreation offers events throughout the year that highlight the spirit of Templeton
and provide positive, healthy alternatives. Aside from the staff time needed to plan, prepare and
run each event, there is a goal of fiscal responsibility and each event is intended to operate
financially independent of the budget of Templeton Recreation, utilizing volunteers from various
local civic and community organizations as well as donations and sponsorships from community
members and businesses.
Easter Egg Hunt – The Easter Egg Hunt, held annually the Saturday before Easter at Evers
Sports Park, is a popular and family friendly event for children of all ages. An average year will
see more than 300 youngsters lined up to hunt for prizes ranging from stuffed eggs to toys. The
Easter Bunny is always present for fun pictures and the egg-hunters are separated by age
groups to encourage age appropriate hunting at all levels.
Summer Concerts in the Park – The annual Summer Concert in the Park Series is Templeton
Recreation’s premier event. Held across ten or more Wednesday evenings during the summer
season in San Luis Obispo County’s Templeton Community Park, we typically see a range of
500-1,500 concert-goers, depending on the type of music, weather and other activities around
San Luis Obispo County (i.e. California Mid-State Fair). This free event is open to the public of
all ages and is family friendly. There is never a lack of healthy youth activity at the event, from
listening to the band, playing games in the open field or circling the park on skateboards,
bicycles, scooters or foot.
CHAPTER 3 MUNICIPAL SERVICE REVIEW
ADOPTED 3-45 NOVEMBER 2013
Summer Movie Nights – There’s a certain excitement watching a movie outside on a giant
blow-up screen with the smell of popcorn wafting in the air. Templeton Summer Movie night,
held three Saturdays in September, is geared specifically to the younger audience members
with “G-rated” movies such as How to Train your Dragon and Kung Fu Panda. Average evening
attendance ranges from 50-150. Movie-goers are charged a small fee for parking in the lot,
receiving free popcorn, provided by a local business, in return.
Halloween Carnival – In homage to the carnivals of old, the Templeton Recreation Halloween
Carnival returned to its roots in 2011. Hosted in the Templeton Fire Department Truck Bay the
evening of Halloween, this free event is a fun alternative for children of all ages. Complete with
a cake walk, costume contest and games hosted by local businesses, there are plenty of smiles
to go around. Free hot dogs are provided to those in attendance, typically 100 costumed ghouls.
Templeton Turkey Trot – With a consistent average participation rate of over 150 runners, the
Templeton Turkey Trot & Fun Run will be the 5th annual in 2012. This event is geared toward
runners of all ages and averages anywhere from 30-80 participants under the age of 18 in the
5K, 10K or the 1-mile Kid’s Loop. Prizes are offered to random finishers in both the 5K and
10K, while participation medals are awarded to every child participating in the Kid’s Loop.
SPORTS:
The Templeton Recreation Department offers youth sports leagues for players ranging in age
from 4-18 years of age. The focus is on player development, learning the skills and rules of the
sport, player participation and fun. Aside from the staff time needed to plan and execute a
positive youth sports experience, it is our goal to keep all sports leagues operating in a fiscally
responsible manner. Player registration fees, donations and sponsorships from local
community members and businesses keep each league operating independently. Each league
has an advisory committee, an independent group of volunteers that assist in furthering the
opportunities of their sport, league operations, player development, post-season competitive
play and fundraising.
Soccer – Arguably the world’s most popular sport and Templeton is no exception. Run in the
fall, soccer is the largest program offered through Templeton Recreation with an average of
over 500 players each season.
CHAPTER 3 MUNICIPAL SERVICE REVIEW
ADOPTED 3-46 NOVEMBER 2013
Basketball – The Templeton Youth Basketball League likely would not exist without the
partnership of Templeton Unified School District (TUSD). Utilizing TUSD facilities for both
practices and games during the winter season, basketball is offered to players in 1st grade
through high school and has over 300 participants each season.
Girls Softball – The Templeton Girls Softball League is known throughout the State for
excellence and it is not uncommon to find a Templeton Eagles All-Star team competing in the
annual California State Games. With over 100 girls participating every spring the program is
open to players ages 4-16.
T-Ball – Arguably the most adorable sport Templeton Recreation has to offer, T-Ball is run in
the spring for players 4-6 years old. This coed league is designed to introduce the sport of
baseball to the youngest players.
YOUTH RECREATION EMPLOYMENT/VOLUNTEERISM:
The Templeton Recreation Department has many employment and volunteer opportunities
available for the youth of our community, with over 40 part-time/temporary/seasonal staff
members under the age of 18 on payroll. Given the fact that many of our youth employees have
grown up participating in our programs, or are currently participating in our programs, we take
great pride in the cycle of community service we have created. Opportunities for youth
recreation employment, volunteerism and community service include, but are not limited to:
• Youth Sports Official/Staff
• Youth Sports Assistant Coach
• Community Clean-up
• Special Event Staff
CHAPTER 3 MUNICIPAL SERVICE REVIEW
ADOPTED 3-47 NOVEMBER 2013
WRITTEN DETERMINATIONS
The following written determinations are based on the information contained in the above
section regarding Infrastructure Needs and Deficiencies:
Water Supply and Demand
1. The District is able to provide the services (water, sewer, and fire) to the existing residents
within the service area.
2. The District’s potentially available Water Supply is estimated to be 2,111 AFY in the Water
Master Plan which was updated in 2013. The estimated water demand within the service
area is estimated to be 2,512 AFY at full build-out.
3. The District may not have an adequate water supply to serve the anticipated build-out under
the current General Plan plus the sphere of influence areas.
4. The District maintains a wait list for future water hook-ups due to its current water supply
situation.
Wastewater
5. The District operates and regularly maintains the wastewater collection and treatment
system, which consists of sewer pipelines, manholes, pump stations, and transports
wastewater to the Meadowbrook treatment facility.
6. The treatment facility has the capacity to process 600,000 gallons per day of wastewater
and is currently processing an average of 150,000 GPD. The system is operating at 25% of
capacity.
Roads and Streets
7. The District is not responsible for the construction or maintenance of roads and streets in
Templeton. This responsibility lies with the County of San Luis Obispo, Public Works
Department.
CHAPTER 3 MUNICIPAL SERVICE REVIEW
ADOPTED 3-48 NOVEMBER 2013
8. The District continues to advocate for the upgrading and maintenance of the roads and
streets in Templeton via development proposals that pay their share for facilities and other
services as a condition of project development.
9. The County’s Circulation Element, in conjunction with the Land Use Element and Capital
Improvement Plan, prioritizes and manages the transportation and traffic network.
10. The County’s Resource Management System has identified Las Tablas roadways in need of
improvements. The County is planning road widening and operation improvements to
increase the level of service of these roads.
Infrastructure
11. The District continues to regularly upgrade and maintain its public facilities, including water
system, and wastewater collection system through its Capital Improvement Plan.
12. Based upon review of the available information, the District’s facilities comply with
environmental and safety standards.
13. Additional infrastructure to accommodate future development would likely include expanded
water supply lines, improved water storage and distribution facilities, upgraded wastewater
facilities, and road improvements.
14. The District should be able to provide the services while continuing to adequately serve
existing residents if it continues to resolve its water supply issues.
Police and Fire
15. The County of San Luis Obispo Sheriff’s Department provides adequate law enforcement
services.
16. The District maintains fire facilities and adequate staff as needed to serve the residents of
Templeton.
ADOPTED 3-49 NOVEMBER 2013
3.4 Financial Ability of Agencies to Provide Services
Purpose: To review the District’s existing financial documentation and identify any financial constraints or opportunities.
Budget
The budget document is well-organized, thorough, and clearly articulates the District’s future
financial performance plans. It also contains the purpose of each fund or budget unit, the
personnel dedicated to the function and any programs being implemented by the fund. Each
fund has a description of its purpose and programs, a where it comes from and where it goes
section, the actual budget, individual line item justifications and debt service information if
applicable. The document provides information that is divided into the following sections:
Introduction
Budget Summaries
Departmental Summaries
Capital Improvement Program
The District adopts the budget each year and it is used as the spending plan for the District. The
budget provides a framework for the District to address the following issues: reserves,
revenues, expenditures, fiscal management, investments, capital improvements and rates and
fees. The District has adopted fiscal policies that guide TCSD staff in preparing the budget and
other fiscal matters. The District is able to meet its financial obligations and responsibilities.
Annual audits confirm the sound fiscal status of the TCSD.
Fiscal Trend Analysis
The following charts show the fiscal trend analysis for the past five years for key fiscal indicators
that represent an early warning system for an agencies fiscal health. The key indicators are
overall operating budget, property tax revenues, long-term debt, and fund balance for each
year. The information was derived from the District’s comprehensive annual financial statement
for each year.
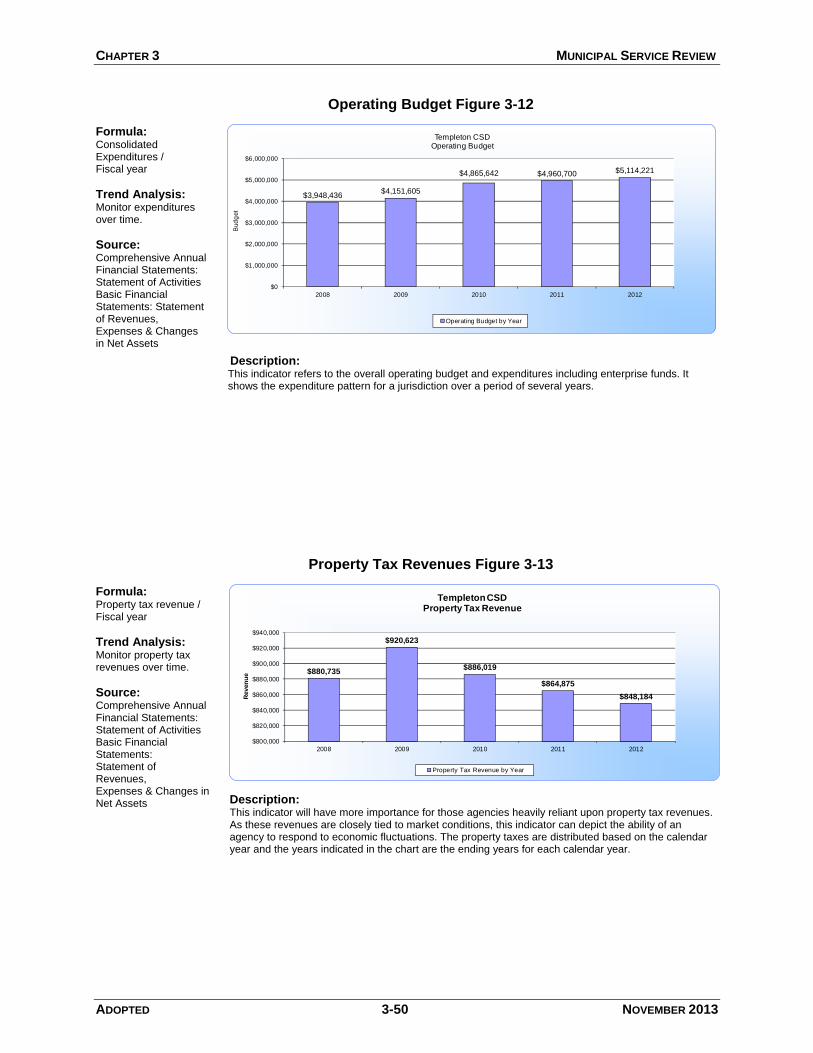
CHAPTER 3 MUNICIPAL SERVICE REVIEW
ADOPTED 3-50 NOVEMBER 2013
Operating Budget Figure 3-12
Formula: Consolidated Expenditures / Fiscal year
Trend Analysis: Monitor expenditures over time.
Source: Comprehensive Annual Financial Statements: Statement of Activities Basic Financial Statements: Statement of Revenues, Expenses & Changes in Net Assets
$3,948,436$4,151,605
$4,865,642 $4,960,700 $5,114,221
$0
$1,000,000
$2,000,000
$3,000,000
$4,000,000
$5,000,000
$6,000,000
2008 2009 2010 2011 2012
Bud
get
Templeton CSD Operating Budget
Operating Budget by Year
Description: This indicator refers to the overall operating budget and expenditures including enterprise funds. It shows the expenditure pattern for a jurisdiction over a period of several years.
Property Tax Revenues Figure 3-13
Formula: Property tax revenue / Fiscal year
Trend Analysis: Monitor property tax revenues over time.
Source: Comprehensive Annual Financial Statements: Statement of Activities Basic Financial Statements: Statement of Revenues, Expenses & Changes in Net Assets
$880,735
$920,623
$886,019
$864,875
$848,184
$800,000
$820,000
$840,000
$860,000
$880,000
$900,000
$920,000
$940,000
2008 2009 2010 2011 2012
Reven
ue
Templeton CSD Property Tax Revenue
Property Tax Revenue by Year
Description: This indicator will have more importance for those agencies heavily reliant upon property tax revenues. As these revenues are closely tied to market conditions, this indicator can depict the ability of an agency to respond to economic fluctuations. The property taxes are distributed based on the calendar year and the years indicated in the chart are the ending years for each calendar year.
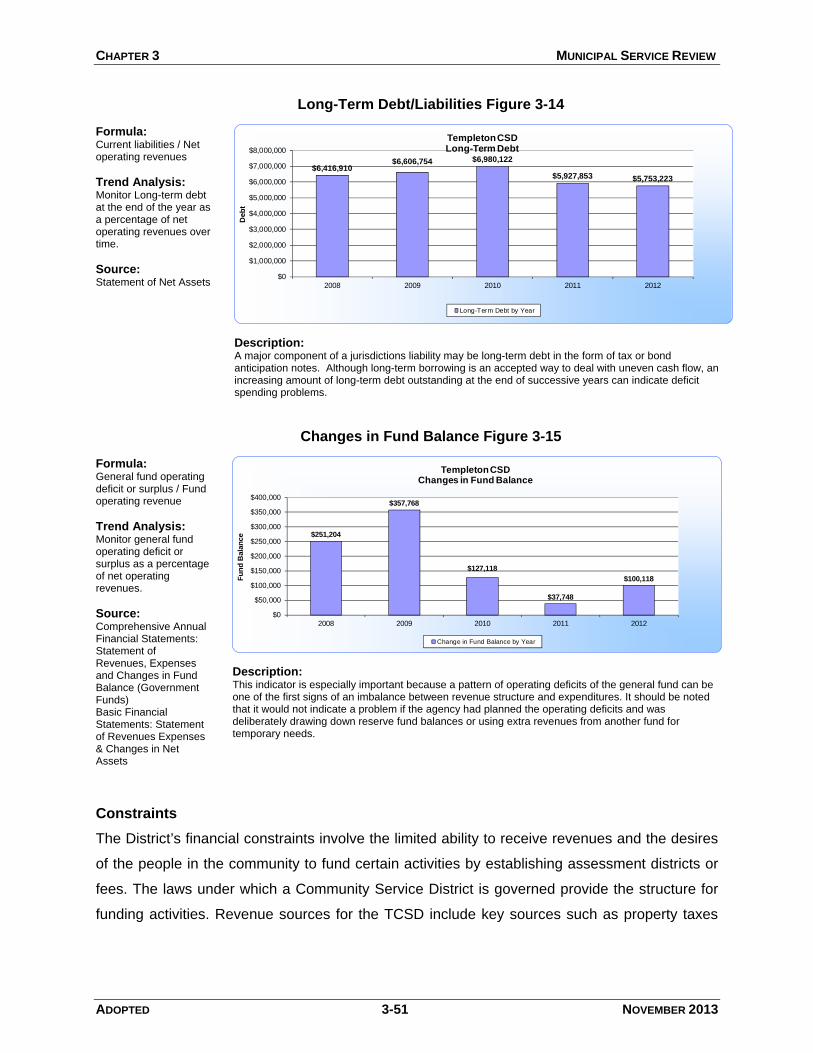
CHAPTER 3 MUNICIPAL SERVICE REVIEW
ADOPTED 3-51 NOVEMBER 2013
Long-Term Debt/Liabilities Figure 3-14
Formula: Current liabilities / Net operating revenues
Trend Analysis: Monitor Long-term debt at the end of the year as a percentage of net operating revenues over time.
Source: Statement of Net Assets
$6,416,910$6,606,754 $6,980,122
$5,927,853 $5,753,223
$0
$1,000,000
$2,000,000
$3,000,000
$4,000,000
$5,000,000
$6,000,000
$7,000,000
$8,000,000
2008 2009 2010 2011 2012
Deb
t
Templeton CSD Long-Term Debt
Long-Term Debt by Year
Description: A major component of a jurisdictions liability may be long-term debt in the form of tax or bond anticipation notes. Although long-term borrowing is an accepted way to deal with uneven cash flow, an increasing amount of long-term debt outstanding at the end of successive years can indicate deficit spending problems.
Changes in Fund Balance Figure 3-15
Formula: General fund operating deficit or surplus / Fund operating revenue
Trend Analysis: Monitor general fund operating deficit or surplus as a percentage of net operating revenues.
Source: Comprehensive Annual Financial Statements: Statement of Revenues, Expenses and Changes in Fund Balance (Government Funds) Basic Financial Statements: Statement of Revenues Expenses & Changes in Net Assets
$251,204
$357,768
$127,118
$37,748
$100,118
$0
$50,000
$100,000
$150,000
$200,000
$250,000
$300,000
$350,000
$400,000
2008 2009 2010 2011 2012
Fu
nd
Bala
nce
Templeton CSD Changes in Fund Balance
Change in Fund Balance by Year
Description: This indicator is especially important because a pattern of operating deficits of the general fund can be one of the first signs of an imbalance between revenue structure and expenditures. It should be noted that it would not indicate a problem if the agency had planned the operating deficits and was deliberately drawing down reserve fund balances or using extra revenues from another fund for temporary needs.
Constraints
The District’s financial constraints involve the limited ability to receive revenues and the desires
of the people in the community to fund certain activities by establishing assessment districts or
fees. The laws under which a Community Service District is governed provide the structure for
funding activities. Revenue sources for the TCSD include key sources such as property taxes
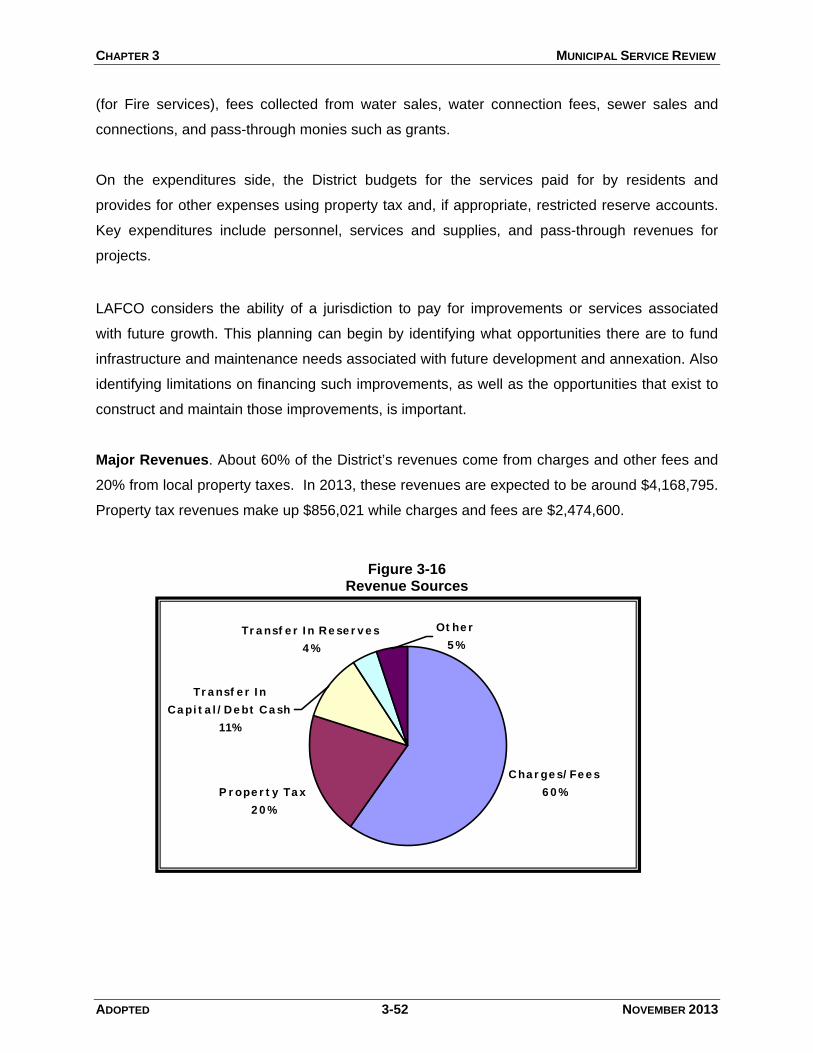
CHAPTER 3 MUNICIPAL SERVICE REVIEW
ADOPTED 3-52 NOVEMBER 2013
(for Fire services), fees collected from water sales, water connection fees, sewer sales and
connections, and pass-through monies such as grants.
On the expenditures side, the District budgets for the services paid for by residents and
provides for other expenses using property tax and, if appropriate, restricted reserve accounts.
Key expenditures include personnel, services and supplies, and pass-through revenues for
projects.
LAFCO considers the ability of a jurisdiction to pay for improvements or services associated
with future growth. This planning can begin by identifying what opportunities there are to fund
infrastructure and maintenance needs associated with future development and annexation. Also
identifying limitations on financing such improvements, as well as the opportunities that exist to
construct and maintain those improvements, is important.
Major Revenues. About 60% of the District’s revenues come from charges and other fees and
20% from local property taxes. In 2013, these revenues are expected to be around $4,168,795.
Property tax revenues make up $856,021 while charges and fees are $2,474,600.
Figure 3-16 Revenue Sources
P r ope r t y Ta x
2 0 %
Tr a nsf e r I n Re se r v e s
4 %
Ot he r
5 %
Cha r ge s/ Fe e s
6 0 %
Tr a nsf e r I n
Ca pi t a l / De bt Ca sh
11%
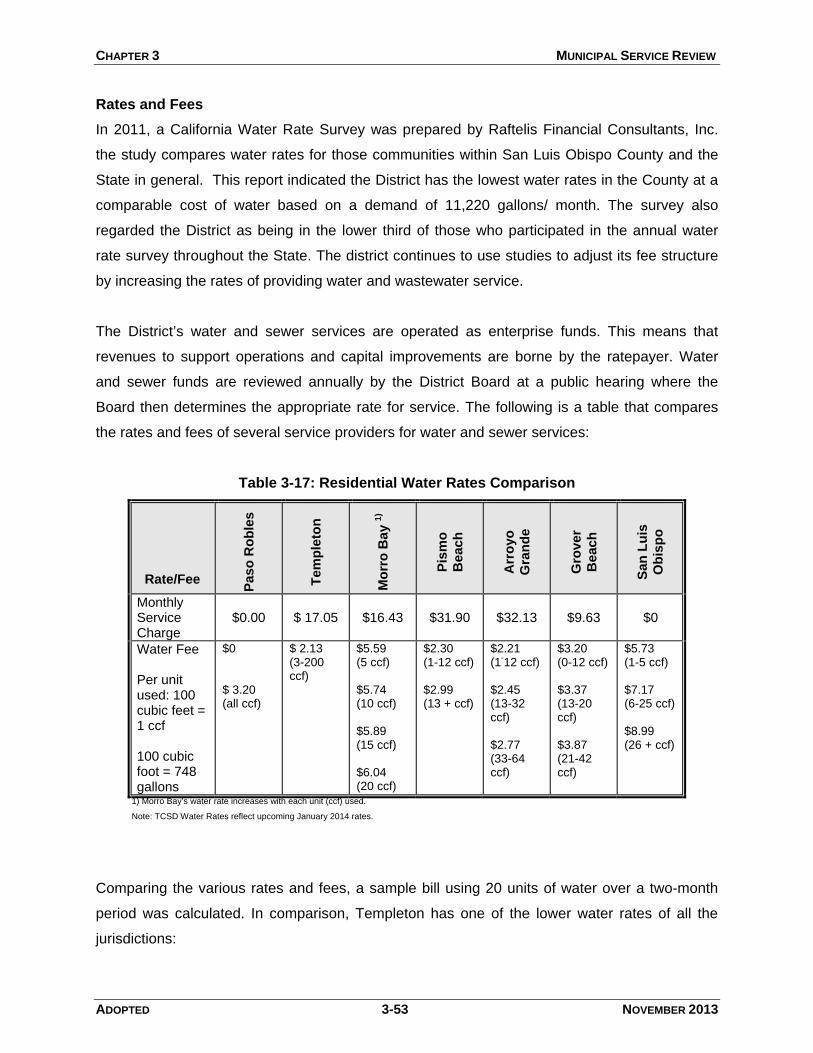
CHAPTER 3 MUNICIPAL SERVICE REVIEW
ADOPTED 3-53 NOVEMBER 2013
Rates and Fees
In 2011, a California Water Rate Survey was prepared by Raftelis Financial Consultants, Inc.
the study compares water rates for those communities within San Luis Obispo County and the
State in general. This report indicated the District has the lowest water rates in the County at a
comparable cost of water based on a demand of 11,220 gallons/ month. The survey also
regarded the District as being in the lower third of those who participated in the annual water
rate survey throughout the State. The district continues to use studies to adjust its fee structure
by increasing the rates of providing water and wastewater service.
The District’s water and sewer services are operated as enterprise funds. This means that
revenues to support operations and capital improvements are borne by the ratepayer. Water
and sewer funds are reviewed annually by the District Board at a public hearing where the
Board then determines the appropriate rate for service. The following is a table that compares
the rates and fees of several service providers for water and sewer services:
Table 3-17: Residential Water Rates Comparison
Rate/Fee
Paso
Ro
ble
s
Tem
ple
ton
Mo
rro
Bay 1
)
Pis
mo
Be
ac
h
Arr
oyo
Gra
nd
e
Gro
ve
r
Be
ac
h
San
Lu
is
Ob
isp
o
Monthly Service Charge
$0.00
$ 17.05
$16.43
$31.90
$32.13
$9.63
$0
Water Fee Per unit used: 100 cubic feet = 1 ccf 100 cubic foot = 748 gallons
$0 $ 3.20 (all ccf)
$ 2.13 (3-200 ccf)
$5.59 (5 ccf) $5.74 (10 ccf) $5.89 (15 ccf) $6.04 (20 ccf)
$2.30 (1-12 ccf) $2.99 (13 + ccf)
$2.21 (1
-12 ccf)
$2.45 (13-32 ccf) $2.77 (33-64 ccf)
$3.20 (0-12 ccf) $3.37 (13-20 ccf) $3.87 (21-42 ccf)
$5.73 (1-5 ccf) $7.17 (6-25 ccf) $8.99 (26 + ccf)
1) Morro Bay’s water rate increases with each unit (ccf) used.
Note: TCSD Water Rates reflect upcoming January 2014 rates.
Comparing the various rates and fees, a sample bill using 20 units of water over a two-month
period was calculated. In comparison, Templeton has one of the lower water rates of all the
jurisdictions:
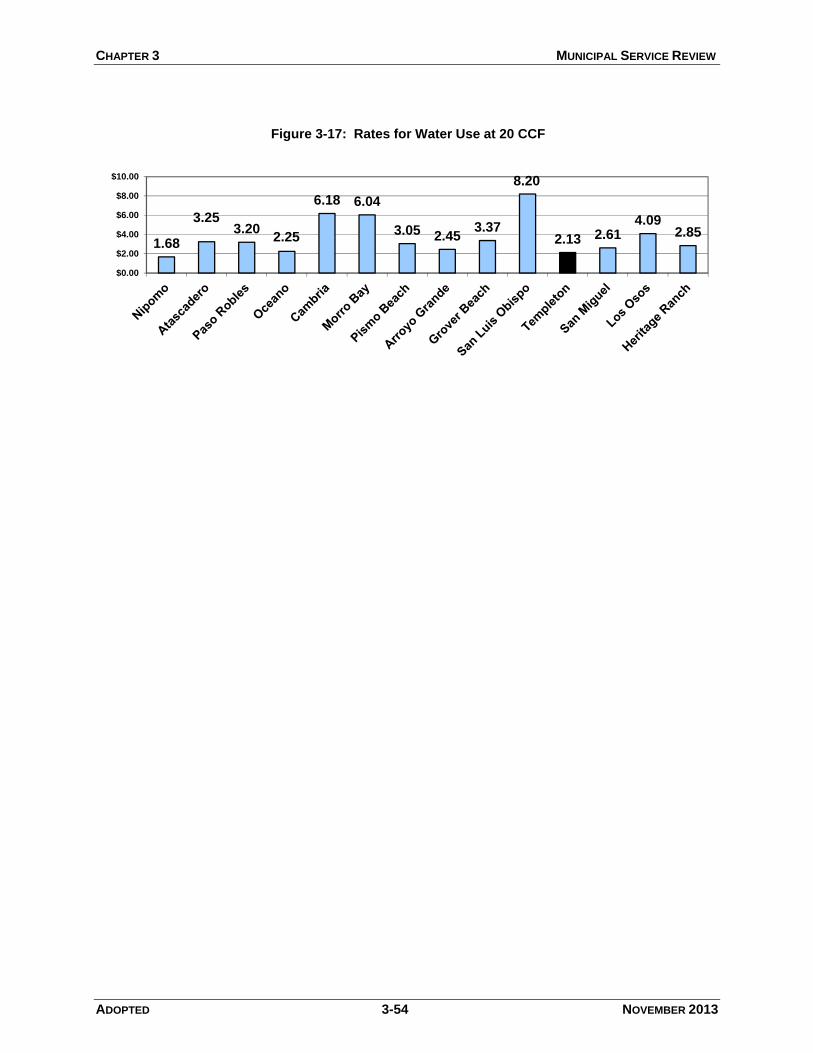
CHAPTER 3 MUNICIPAL SERVICE REVIEW
ADOPTED 3-54 NOVEMBER 2013
1.68
3.253.20
2.25
6.18 6.04
3.05 2.453.37
8.20
2.13 2.614.09
2.85
$0.00
$2.00
$4.00
$6.00
$8.00
$10.00
Figure 3-17: Rates for Water Use at 20 CCF
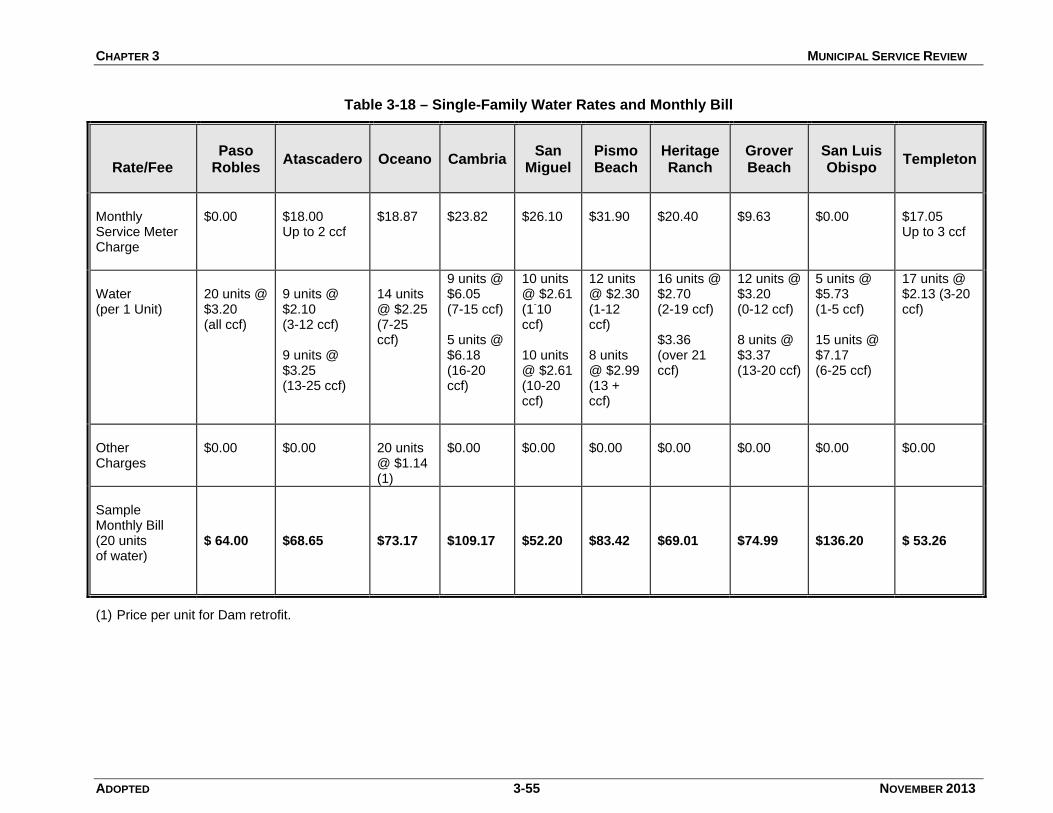
CHAPTER 3 MUNICIPAL SERVICE REVIEW
ADOPTED 3-55 NOVEMBER 2013
Table 3-18 – Single-Family Water Rates and Monthly Bill
Rate/Fee
Paso
Robles
Atascadero
Oceano
Cambria
San
Miguel
Pismo Beach
Heritage Ranch
Grover Beach
San Luis Obispo
Templeton
Monthly Service Meter Charge
$0.00
$18.00 Up to 2 ccf
$18.87
$23.82
$26.10
$31.90
$20.40
$9.63
$0.00
$17.05 Up to 3 ccf
Water (per 1 Unit)
20 units @ $3.20 (all ccf)
9 units @ $2.10 (3-12 ccf) 9 units @ $3.25 (13-25 ccf)
14 units @ $2.25 (7-25 ccf)
9 units @ $6.05 (7-15 ccf) 5 units @ $6.18 (16-20 ccf)
10 units @ $2.61 (1
-10
ccf) 10 units @ $2.61 (10-20 ccf)
12 units @ $2.30 (1-12 ccf) 8 units @ $2.99 (13 + ccf)
16 units @ $2.70 (2-19 ccf) $3.36 (over 21 ccf)
12 units @ $3.20 (0-12 ccf) 8 units @ $3.37 (13-20 ccf)
5 units @ $5.73 (1-5 ccf) 15 units @ $7.17 (6-25 ccf)
17 units @ $2.13 (3-20 ccf)
Other Charges
$0.00
$0.00
20 units @ $1.14 (1)
$0.00
$0.00
$0.00
$0.00
$0.00
$0.00
$0.00
Sample Monthly Bill (20 units of water)
$ 64.00
$68.65
$73.17
$109.17
$52.20
$83.42
$69.01
$74.99
$136.20
$ 53.26
(1) Price per unit for Dam retrofit.
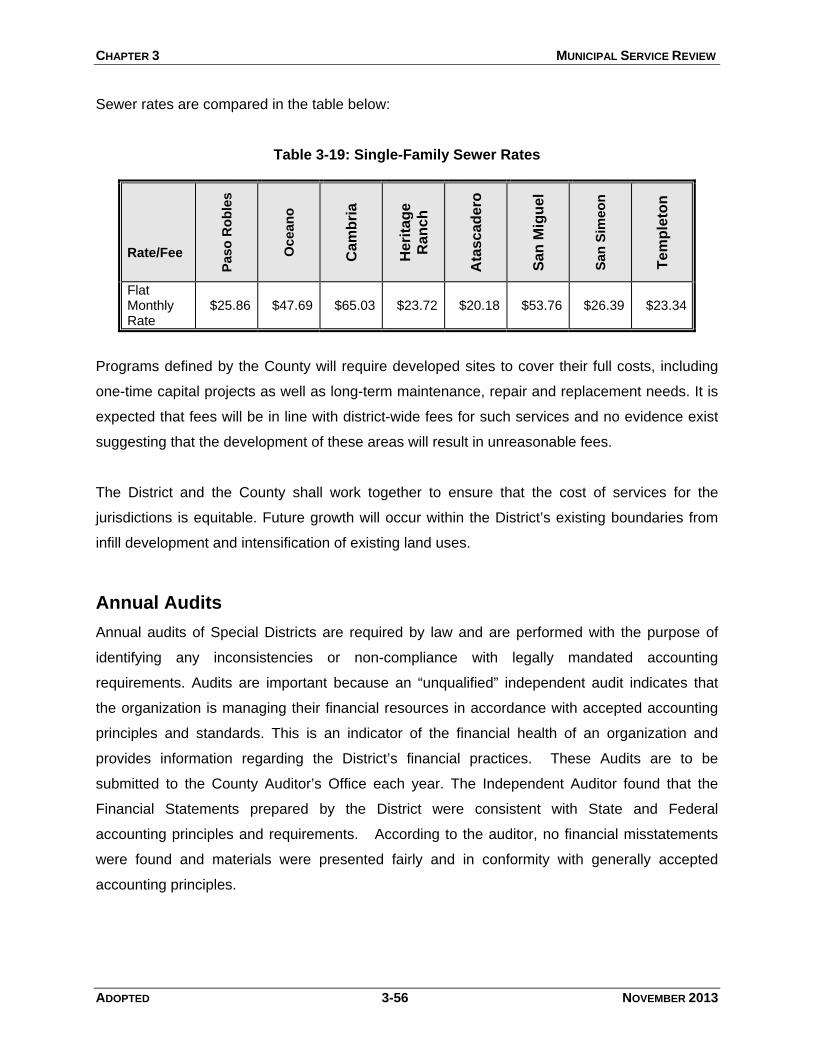
CHAPTER 3 MUNICIPAL SERVICE REVIEW
ADOPTED 3-56 NOVEMBER 2013
Sewer rates are compared in the table below:
Table 3-19: Single-Family Sewer Rates
Rate/Fee
Paso
Ro
ble
s
Oc
ea
no
Ca
mb
ria
He
rita
ge
Ra
nc
h
Ata
sc
ad
ero
Sa
n M
igu
el
San
Sim
eo
n
Te
mp
leto
n
Flat Monthly Rate
$25.86
$47.69
$65.03 $23.72 $20.18 $53.76
$26.39 $23.34
Programs defined by the County will require developed sites to cover their full costs, including
one-time capital projects as well as long-term maintenance, repair and replacement needs. It is
expected that fees will be in line with district-wide fees for such services and no evidence exist
suggesting that the development of these areas will result in unreasonable fees.
The District and the County shall work together to ensure that the cost of services for the
jurisdictions is equitable. Future growth will occur within the District’s existing boundaries from
infill development and intensification of existing land uses.
Annual Audits
Annual audits of Special Districts are required by law and are performed with the purpose of
identifying any inconsistencies or non-compliance with legally mandated accounting
requirements. Audits are important because an “unqualified” independent audit indicates that
the organization is managing their financial resources in accordance with accepted accounting
principles and standards. This is an indicator of the financial health of an organization and
provides information regarding the District’s financial practices. These Audits are to be
submitted to the County Auditor’s Office each year. The Independent Auditor found that the
Financial Statements prepared by the District were consistent with State and Federal
accounting principles and requirements. According to the auditor, no financial misstatements
were found and materials were presented fairly and in conformity with generally accepted
accounting principles.
CHAPTER 3 MUNICIPAL SERVICE REVIEW
ADOPTED 3-57 NOVEMBER 2013
WRITTEN DETERMINATIONS
The following written determinations are based on the information contained in the above
section regarding Financial Constraints and Opportunities:
1. The District prepares a comprehensive and thorough annual budget that clearly describes
the services provided to residents and the funds expended for those services.
2. The District requires new development to pay for infrastructure needed to serve new
development projects. It is reasonable to conclude that the County endeavors to avoid long-
term County obligations for the capital improvement or maintenance of new development
projects.
3. There are no apparent fiscal constraints limiting the ability of the District to serve existing
and future residents.
4. The District has in place financial regulations that are codified in its implementing
ordinances and resolutions.
5. Annual audits show that the District prepares financial statements consistent with
accounting principles generally accepted in the United States of America as well as
accounting systems prescribed by the State Controller’s Office and State regulations
governing Special Districts.
ADOPTED 3-58 NOVEMBER 2013
3.5 Status of, and Opportunity for, Shared Facilities
Purpose: To identify the opportunities for jurisdictions to share facilities and resources creating a more efficient service delivery system.
In the case of developing areas in the District, LAFCO can evaluate whether services or
facilities can be provided in a more efficient manner if both the District and County share them.
In some cases, it may be possible to establish a cooperative approach to facility planning by
encouraging the District, surrounding cities, and County to work cooperatively in such efforts.
The District has worked with the City of Paso Robles to use the City’s wastewater plant to treat
effluent collected by the District in the past. The intertie into the City’s wastewater system
allowed the District to discharge up to a maximum 443,000 gallons per day into the City’s
facility. The District has returned portions of that flow back to the Meadowbrook treatment plant,
but opportunities exist between the City and District if the need arises.
There are opportunities for continued shared relationships between agencies for services within
the TCSD boundary. The County and the District coordinate to provide services and avoid a
duplication of effort. The relationship between the District and the County could be enhanced by
continued improvement of the lines of communication.
Development in Templeton can lead to shared infrastructure between the County, the District,
and the Cities. At present, the distinction between District and County services in the area is
clear. The opportunities for more coordination may include:
• Roadway connections (this is a County function, not a District function)
• Coordinated open space preservation
• District and County parks and recreational facilities
• Preservation and enhancement of Agricultural Lands
CHAPTER 3 MUNICIPAL SERVICE REVIEW
ADOPTED 3-59 NOVEMBER 2013
WRITTEN DETERMINATIONS
The following written determinations are based on the information contained in the above
section regarding Opportunities for Shared Facilities:
1. The development of areas within the TCSD service boundary may lead to shared
infrastructure with the County; i.e. roads and streets a County function), Sheriff services,
parks and recreational facilities. The potential to create shared relationships for providing
some services is suggested and may be appropriate when providing certain services.
2. At present, the distinction between District and County services with the service boundary
is clear.
3. The District and Cities should continue to work together to provide services in an efficient
manner.
ADOPTED 3-60 NOVEMBER 2013
3.6 Accountability for Community Service Needs Including Governmental Structure and Operational Efficiencies
Purpose: To review the District’s operations and public participation efforts associated with the agency’s decision-making and management processes.
The governing body of Templeton is the Board of Directors that is elected in compliance with
California Election Laws. The District complies with the Brown Act Open-Meeting Law and
provides the public with opportunities to obtain information about community issues, including
website and phone access. The District‘s website contains information about the various
services it provides to residents. The District has legal counsel at each meeting to advise
them in regards to the Brown Act and other legal matters.
The Board of Directors holds regular meetings at 7:00 p.m. on the first and third Tuesdays of
each month in the TCSD Meeting Room, at 206 Fifth Street. Other meetings or study sessions
are held as needed. A public comment period is scheduled at the beginning of each meeting for
citizens to comment on District issues not on the agenda.
The following section briefly discusses various operational and service aspects of the District.
Much of the information was obtained from the District’s budgets and discussions with their
staff. The organizational chart shows the major divisions of the District; the Fire Department,
the Administrative and Finance Department, the Parks and Recreation Department, Engineering
and the Utility Operations Departments.
The Budget includes a purpose statement for each service department or budget unit, a
description of the activity or service, the personnel allocated to the tasks, and the programs
being implemented by the budget unit. The TCSD has an adopted Mission Statement as well as
goals that were re-affirmed in the 2013-14 budget.
Overall, the District is well equipped administratively to serve Templeton. The District
accomplishes many goals and implements a variety of initiatives. The District’s Budget process
is discussed in the Financial Constraints and Opportunities section of this report. The
organizational chart shows the structure of the District. Templeton does maintain various
customer-oriented programs, including regular in-house safety training and management, and
similar programs designed to enhance the experience for the district customer.
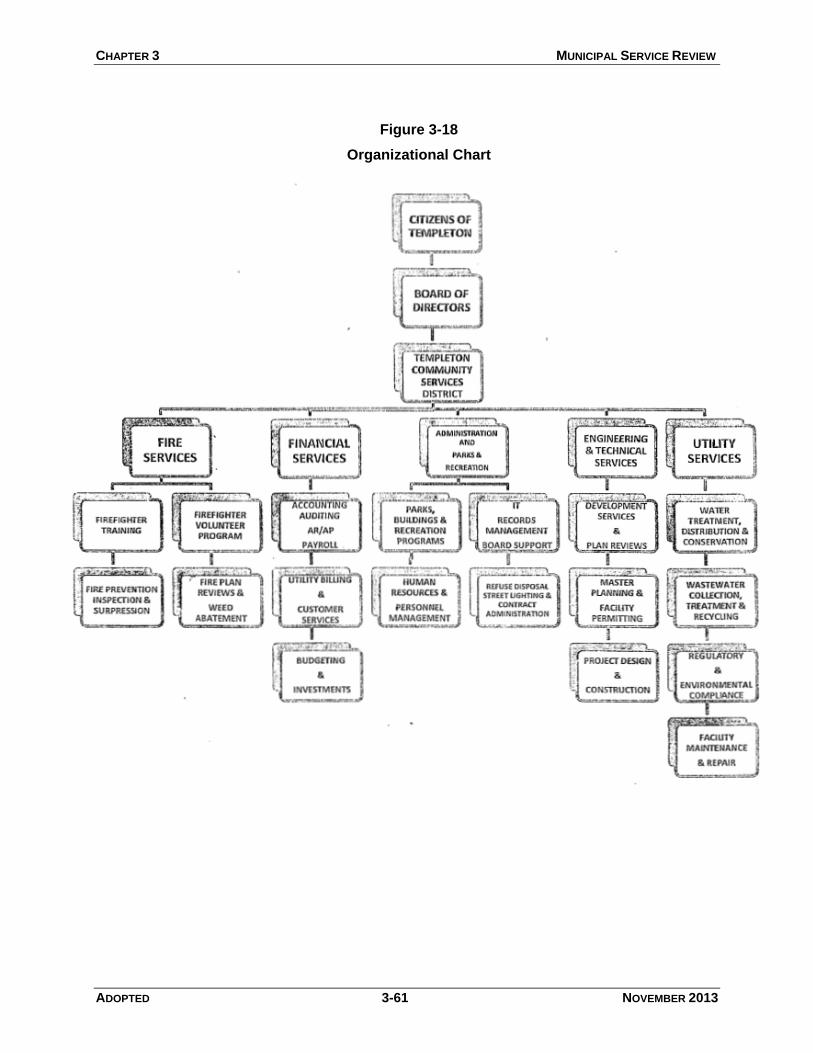
CHAPTER 3 MUNICIPAL SERVICE REVIEW
ADOPTED 3-61 NOVEMBER 2013
Figure 3-18
Organizational Chart

CHAPTER 3 MUNICIPAL SERVICE REVIEW
ADOPTED 3-62 NOVEMBER 2013
WRITTEN DETERMINATIONS
The following written determinations are based on the information contained in the above
section regarding Local Accountability and Governance:
1. The District has historically made reasonable efforts to maintain a public dialogue regarding
issues and projects of concern to the community. The District’s outreach program includes
providing information regarding current issues of significance to the community.
2. The District has maintained relationships with local news media, providing information
and/or interviews as requested.
3. The District evaluates the services provided to residents and services that may need to be
upgraded or started.
4. The District remains focused on providing quality water, fire, lighting, garbage and parks and
recreation services to its customers.
5. The District continues to improve its website by adding more information that is accessible to
the public.
ADOPTED 3-63 NOVEMBER 2013
3.7 OTHER MATTERS This factor allows LAFCO to discuss other issues and topics that may need to be addressed or
focused on in the MSR.
Cemetery Powers. In April 2006 the Commission authorized the Templeton Community
Services District (TCSD) to add cemetery services to its list of active powers.
The Templeton Cemetery District is comprised of 64,160 acres and was formed in
1938. Although cemetery districts are independent agencies, the board of directors are
appointed by the County Board of Supervisors rather than elected at large (H&S 9021). Over
the years, the Board of Supervisors has had difficulty finding 3 persons who are willing to serve
on the Cemetery District’s board of directors. Resignations from the board of directors have
also been frequent making it difficult to establish a quorum to conduct district business. The
County Auditor has found that the district’s financial affairs are irregular and audits have been
infrequent.
Simply activating the cemetery powers for the TCSD would mean that first the district must
annex the area served by the Cemetery District. That was not recommended by LAFCO staff or
requested by the TCSD because of the size difference in the two districts (64,160 acres
compared to 2,240 acres). It was determined by County Counsel, and TCSD legal counsel, that
there was an “incompatibility of office.” The Templeton Cemetery District contracted with the
TCSD to provide support services to the cemetery district instead.
The Plan for Services discussed the costs of service, the financing plan, and the alternatives to
having the District perform this service, the level and range of services. Also adopted between
the TSCD and Cemetery District was an agreement setting forth the terms of providing services,
compensation, rights of access, indemnification, etc. Until 2013, TCSD provided support
services to the cemetery district in accordance with the approved agreement. On December 18,
2012 the TCSD took action to terminate the management agreement between the two districts.
The termination was mutually agreed upon by both parties to be effective January 1, 2013. The
Cemetery District felt they were in a position to independently manage the cemetery operation
after six and a half years of assistance from TCSD. The Templeton Community Services
District no longer provides the cemetery power.
References
• Templeton CSD Water & Wastewater Master Plan, 2013
• Templeton CSD Budget FY 2010/11, 2011/12, 2012/13
• TCSD Staff Report – Termination of Management Agreement, December 18, 2012
• TCSD Staff Report – Sewer System Upgrade & Nacimiento Water Project, November
12, 2011
• California Department of Finance E-4 Report, 2010
• San Luis Obispo Council of Governments Regional Transportation Planning Agency,
Regional Transportation Plan, 2010.
• SLO County Resource Management System Annual Report, 2010
• Templeton CSD Stormwater Management Plan, 2009
• California Department of Finance E-4 Report, 2009
• SLOCOG ERA Population & Employment Forecast, 2009
• SLO County Salinas River Inland Area Plans, Revised 2009
• Engineer’s Report For Fire Suppression Assessment , 2009
• SLOCOG Regional Housing Needs Allocation, 2008
• San Luis Obispo Local Agency Formation Commission, Sphere of Influence Study,
2006.
• San Luis Obispo Council of Governments, Regional Profile, October 2004.
• Templeton Design Plan, 1990
• Templeton CSD, Official Website, www.Templetoncsd.org.
• County of San Luis Obispo, Official Website, www.slocounty.ca.gov.
• San Luis Obispo Council of Governments, Official Website, www.slocog.org.
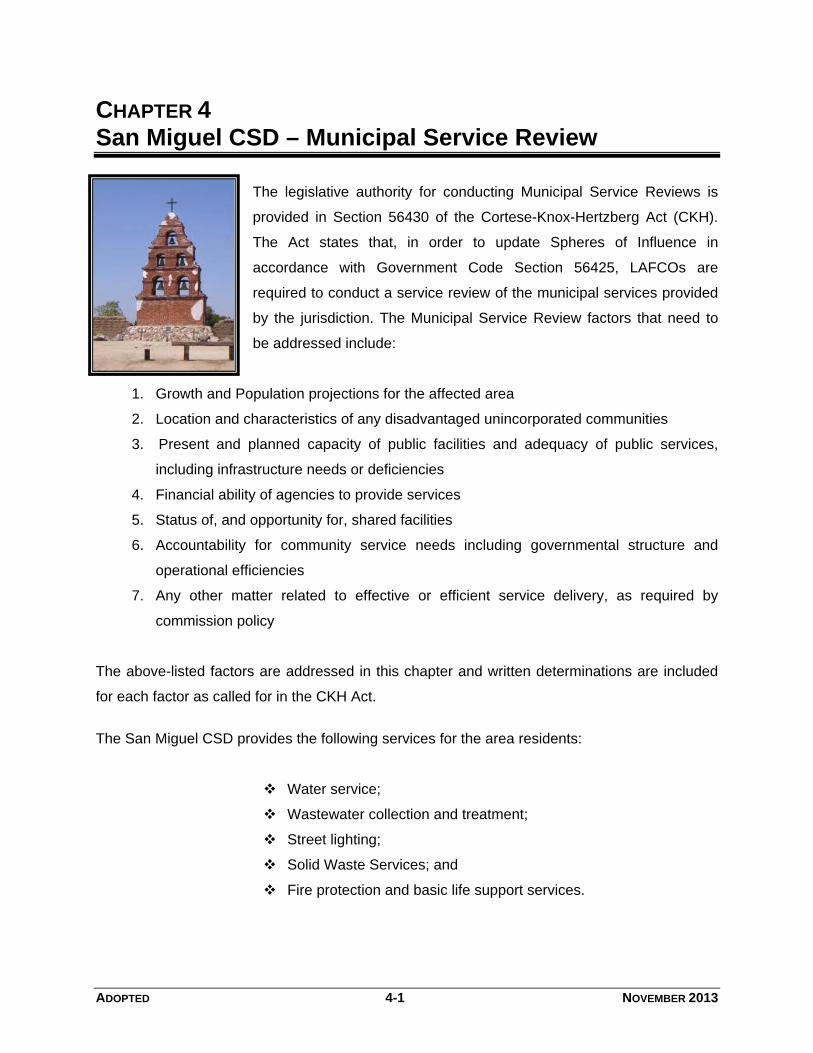
ADOPTED 4-1 NOVEMBER 2013
CHAPTER 4 San Miguel CSD – Municipal Service Review
The legislative authority for conducting Municipal Service Reviews is
provided in Section 56430 of the Cortese-Knox-Hertzberg Act (CKH).
The Act states that, in order to update Spheres of Influence in
accordance with Government Code Section 56425, LAFCOs are
required to conduct a service review of the municipal services provided
by the jurisdiction. The Municipal Service Review factors that need to
be addressed include:
1. Growth and Population projections for the affected area
2. Location and characteristics of any disadvantaged unincorporated communities
3. Present and planned capacity of public facilities and adequacy of public services,
including infrastructure needs or deficiencies
4. Financial ability of agencies to provide services
5. Status of, and opportunity for, shared facilities
6. Accountability for community service needs including governmental structure and
operational efficiencies
7. Any other matter related to effective or efficient service delivery, as required by
commission policy
The above-listed factors are addressed in this chapter and written determinations are included
for each factor as called for in the CKH Act.
The San Miguel CSD provides the following services for the area residents:
Water service;
Wastewater collection and treatment;
Street lighting;
Solid Waste Services; and
Fire protection and basic life support services.
CHAPTER 4 MUNICIPAL SERVICE REVIEW
ADOPTED 4-2 NOVEMBER 2013
The San Miguel CSD Sphere of Influence was most recently updated in 2006. Figure 4-1
shows the adopted service area and coterminous Sphere of Influence. Expansion of the
District’s Sphere of Influence is not envisioned at this time. In meeting with District officials, no
areas of potential expansion were identified at this point in time. The District’s service boundary
encompasses the area that is in the process of being update by the County Planning and
Building Department and the City and Regional Planning Department at California Polytechnic
State University to prepare a new San Miguel Community Plan.
The County has authority to make land use decisions in this unincorporated community. Future
development within the District’s boundaries is dependent on approvals from the County.
The District includes approximately 2.4 square miles or 1,530 acres of land. The City of Paso
Robles is located seven miles to the south. Unincorporated county agricultural areas surround
the town. The County’s Urban Reserve Line is within the District’s Boundary and contains
approximately 673 acres. Much of the land in the District is undeveloped, approximately 236
acres.
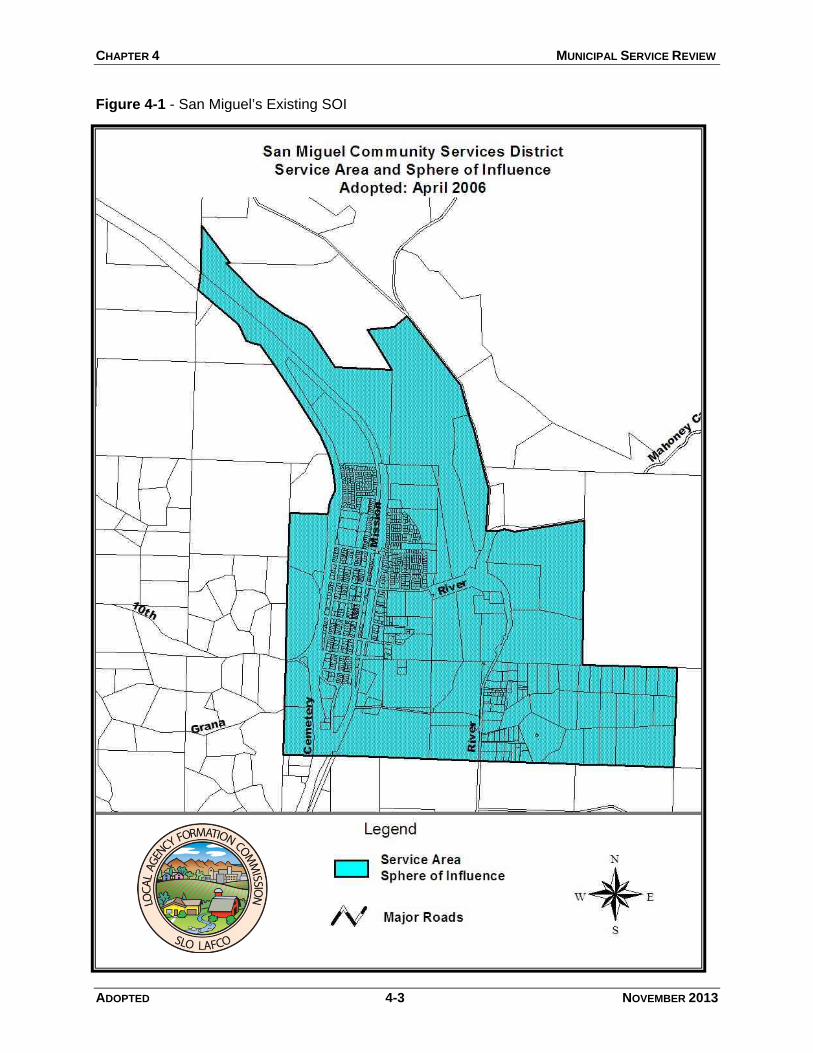
CHAPTER 4 MUNICIPAL SERVICE REVIEW
ADOPTED 4-3 NOVEMBER 2013
Figure 4-1 - San Miguel’s Existing SOI
ADOPTED 4-4 NOVEMBER 2013
4.1 Growth and Population Projections for the Affected Area
Purpose: To identify future growth patterns and project population increases.
POPULATION
This factor is intended to identify growth and population projections for the affected area of a
jurisdiction. This section will use various sources of information to project growth and population
for San Miguel. The previous Sphere of Influence update and Municipal Service Review for San
Miguel Community Services District provides background information, as well as, the County of
San Luis Obispo adopted San Miguel Design Plan. The County Planning and Building
Department and the City and Regional Planning Department at California Polytechnic State
University are teaming up to update the San Miguel Community Plan. The last comprehensive
update to the community plan was in 1981. When adopted by the County, the plan should help
shape new growth, enhance the quality of life, and help bring new vitality to San Miguel.
The Growth and Population factor includes a summary of population data and land use and
zoning in the area as well as growth trends.
According to the 2010 US Census, San Miguel had a population of 2,3371. Total housing units
were estimated to be 736 units. The estimated build-out population within the current service
area is estimated to be 3,338. This assumes an existing population of 2,337, plus 293 infill
residential units occupied at a rate 3.41 people per unit. San Miguel’s population is expected to
grow by 43% in the next 25 years.
Council of Governments Population Projections-2009
The Council of Governments recently had the consulting firm of Economics Research
Associates update population projections for San Luis Obispo County including San Miguel. The
original study was completed in 2006 and was updated in 2009 to take into account the recent
economic downturn. These projections use a variety of data sources and assumptions to project
the future population of the cities and unincorporated areas of the County. These projections
incorporate information from the State of California about future population increases, past and
1 The Census Data may have captured the entire San Miguel area which extends beyond the District service area
boundary. According to the District records in 2010 the District had approximately 700 water service connections and an estimated corresponding population of 1,700 to 1,800 residents within the service area boundary.
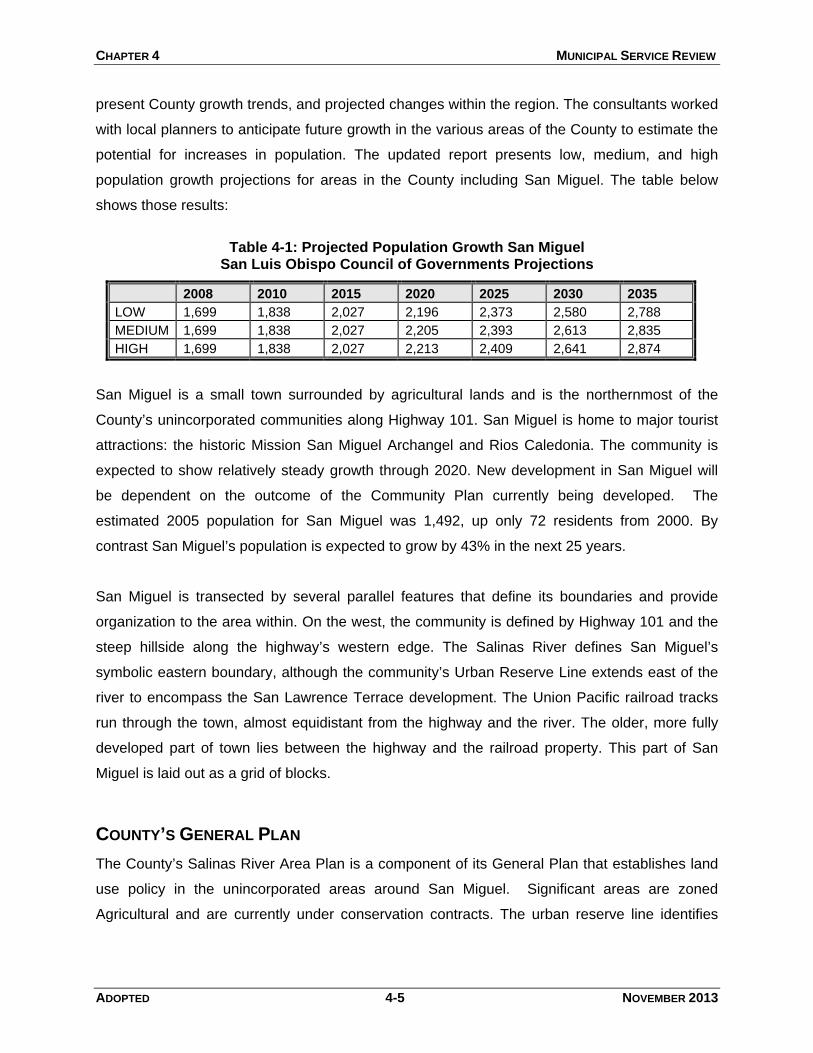
CHAPTER 4 MUNICIPAL SERVICE REVIEW
ADOPTED 4-5 NOVEMBER 2013
present County growth trends, and projected changes within the region. The consultants worked
with local planners to anticipate future growth in the various areas of the County to estimate the
potential for increases in population. The updated report presents low, medium, and high
population growth projections for areas in the County including San Miguel. The table below
shows those results:
Table 4-1: Projected Population Growth San Miguel
San Luis Obispo Council of Governments Projections
2008 2010 2015 2020 2025 2030 2035
LOW 1,699 1,838 2,027 2,196 2,373 2,580 2,788
MEDIUM 1,699 1,838 2,027 2,205 2,393 2,613 2,835
HIGH 1,699 1,838 2,027 2,213 2,409 2,641 2,874
San Miguel is a small town surrounded by agricultural lands and is the northernmost of the
County’s unincorporated communities along Highway 101. San Miguel is home to major tourist
attractions: the historic Mission San Miguel Archangel and Rios Caledonia. The community is
expected to show relatively steady growth through 2020. New development in San Miguel will
be dependent on the outcome of the Community Plan currently being developed. The
estimated 2005 population for San Miguel was 1,492, up only 72 residents from 2000. By
contrast San Miguel’s population is expected to grow by 43% in the next 25 years.
San Miguel is transected by several parallel features that define its boundaries and provide
organization to the area within. On the west, the community is defined by Highway 101 and the
steep hillside along the highway’s western edge. The Salinas River defines San Miguel’s
symbolic eastern boundary, although the community’s Urban Reserve Line extends east of the
river to encompass the San Lawrence Terrace development. The Union Pacific railroad tracks
run through the town, almost equidistant from the highway and the river. The older, more fully
developed part of town lies between the highway and the railroad property. This part of San
Miguel is laid out as a grid of blocks.
COUNTY’S GENERAL PLAN
The County’s Salinas River Area Plan is a component of its General Plan that establishes land
use policy in the unincorporated areas around San Miguel. Significant areas are zoned
Agricultural and are currently under conservation contracts. The urban reserve line identifies
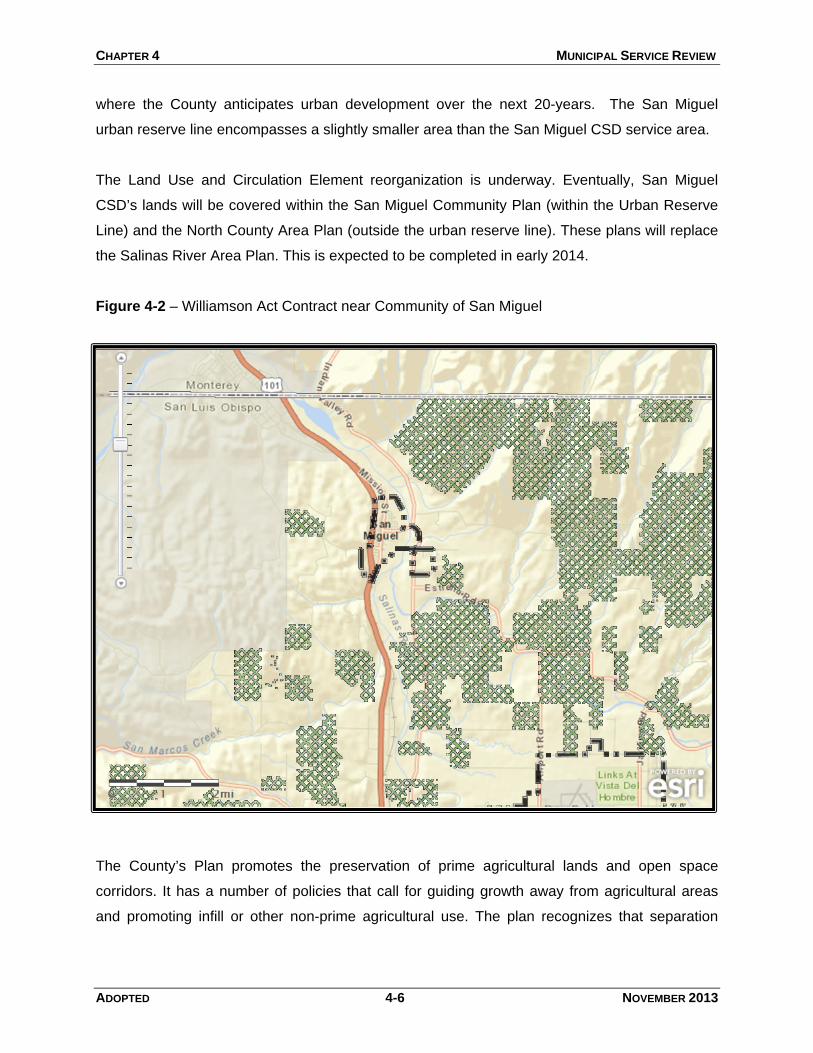
CHAPTER 4 MUNICIPAL SERVICE REVIEW
ADOPTED 4-6 NOVEMBER 2013
where the County anticipates urban development over the next 20-years. The San Miguel
urban reserve line encompasses a slightly smaller area than the San Miguel CSD service area.
The Land Use and Circulation Element reorganization is underway. Eventually, San Miguel
CSD’s lands will be covered within the San Miguel Community Plan (within the Urban Reserve
Line) and the North County Area Plan (outside the urban reserve line). These plans will replace
the Salinas River Area Plan. This is expected to be completed in early 2014.
Figure 4-2 – Williamson Act Contract near Community of San Miguel
The County’s Plan promotes the preservation of prime agricultural lands and open space
corridors. It has a number of policies that call for guiding growth away from agricultural areas
and promoting infill or other non-prime agricultural use. The plan recognizes that separation
CHAPTER 4 MUNICIPAL SERVICE REVIEW
ADOPTED 4-7 NOVEMBER 2013
between communities provides each community with the opportunity for developing its own
distinctive identity.
The County’s Conservation and Open Space Element (COSE) consolidated five previous
individual elements (conservation and open space, historic, esthetic, and energy elements). The
COSE is utilized as a tool to protect and preserve the unique community resources. The
element addresses many issues with regard to conservation, development, and utilization of
natural resources. The element includes policies and strategies that address reducing
greenhouse gas emissions, directing growth away from areas with constrained natural
resources, water and energy conservation, use of low impact development and green building
techniques, increased protection of community separators and scenic corridors. The County’s
Strategic Growth Principles intend to direct growth to occur in existing urban areas and in a
more sustainable manner.
RMS Biennial Report - 2010-2012
The Resource Management System (RMS) provides information to guide decisions about
balancing land development with the resources necessary to sustain such development. It
focuses on, 1) Collecting data, 2) Identifying resource problems and 3) Recommending
solutions. San Miguel is one of the fifteen unincorporated community services districts in the
county. The District includes approximately 2.4 square miles of land. The City of Paso Robles is
to the south, the Monterey County Line is to the north and unincorporated county agricultural
areas surround the URL.
According to the 2010-2012 Biennial Resource Management System Report, the District
estimates that it now serves approximately 2,383 residents in 2012 compared to an estimated
1,420 in 2000. Over the last 12 years, San Miguel’s population has increased by approximately
963 people. This equates to 3.3% per year rate of population increase over the period. The
table below reflects the population data from the census and the County’s 2010-2012 Resource
Management System Report:
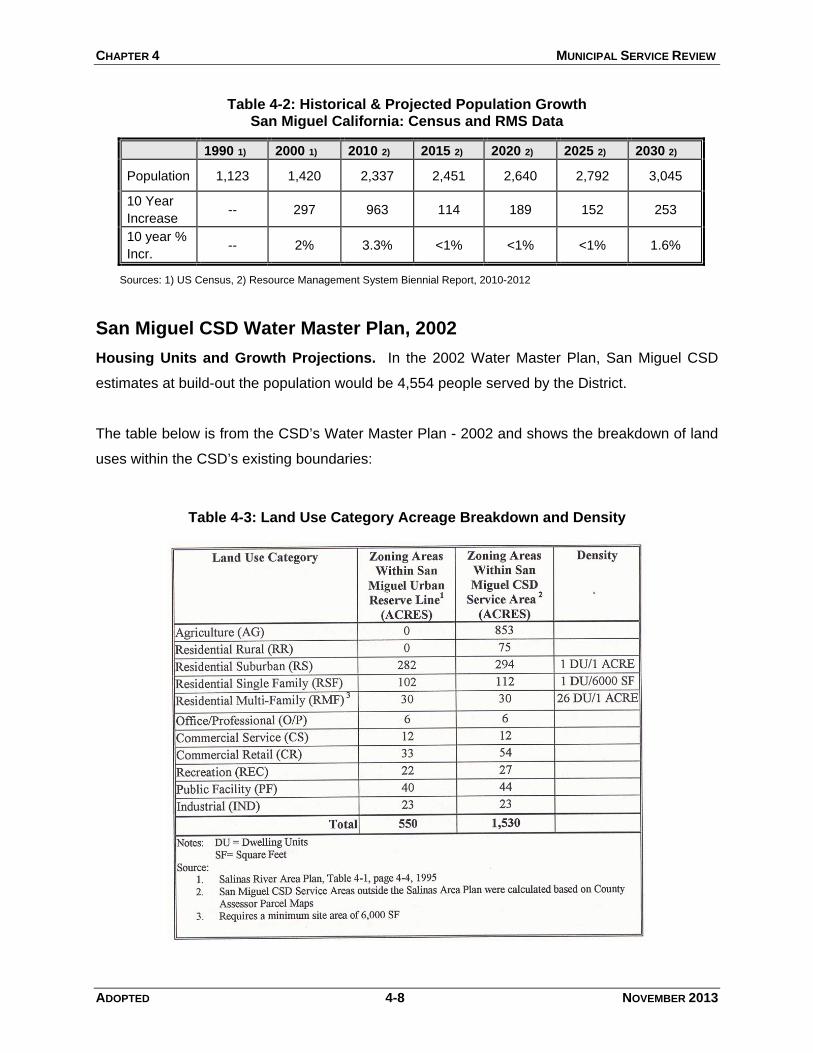
CHAPTER 4 MUNICIPAL SERVICE REVIEW
ADOPTED 4-8 NOVEMBER 2013
Table 4-2: Historical & Projected Population Growth San Miguel California: Census and RMS Data
1990 1) 2000 1) 2010 2) 2015 2) 2020 2) 2025 2) 2030 2)
Population 1,123 1,420 2,337 2,451 2,640 2,792 3,045
10 Year
Increase -- 297 963 114 189 152 253
10 year %
Incr. -- 2% 3.3% <1% <1% <1% 1.6%
Sources: 1) US Census, 2) Resource Management System Biennial Report, 2010-2012
San Miguel CSD Water Master Plan, 2002
Housing Units and Growth Projections. In the 2002 Water Master Plan, San Miguel CSD
estimates at build-out the population would be 4,554 people served by the District.
The table below is from the CSD’s Water Master Plan - 2002 and shows the breakdown of land
uses within the CSD’s existing boundaries:
Table 4-3: Land Use Category Acreage Breakdown and Density
CHAPTER 4 MUNICIPAL SERVICE REVIEW
ADOPTED 4-9 NOVEMBER 2013
SAN MIGUEL DESIGN PLAN, 2003
The County Board of Supervisors adopted the San Miguel Design Plan in 2003. It provided a
way to encourage development inside the community that is consistent with the residents’ vision
for the town. The following is an excerpt from the plan.
Purpose of the Plan. In opinion surveys and workshops, residents of San Miguel have expressed a desire for specific standards, guidelines and programs to address certain characteristics of the community that have frustrated the development of a wider range of housing opportunities and a vigorous local economy. The Community Design Plan is intended to provide a framework that will ensure that new development adds value to the community while preserving the positive features of San Miguel’s character.
How the plan will be used. This plan is intended to influence development in San Miguel so that the form, character and historical resources of the community are enhanced. The plan is available to prospective developers, who will be able to create development plans that are consistent with the community’s intent. The plan provides the community with a way to measure the value of individual proposals as they are presented for local review.
The design plan helps development conform to a community vision for the town and helps
streamline the permitting process for projects that comply with the plan.
Land Use
The County’s General Plan governs the development of land in the community of San Miguel.
The District can provide the County with comments regarding land use decisions but does not
have authority over land use entitlements (permits). The General Plan identifies the type and
intensity of development allowed in each of several land use categories for San Miguel. The
County Planning and Building Department and the City and Regional Planning Department at
California Polytechnic State University are underway with preparing a new San Miguel
Community Plan.
In 2007, the Cal Poly City and Regional Planning (CRP) class identified various Land Uses
during their preparation of that San Miguel Community Plan. The Table below shows the Land
Use categories developed in 2007. As stated above the County and CRP class will be
considering a new Community Plan and identify current land uses. Since the new Community
Plan has not been completed at this time this Municipal Service Review will provide land uses
identified in 2007. The following land use categories were identified:
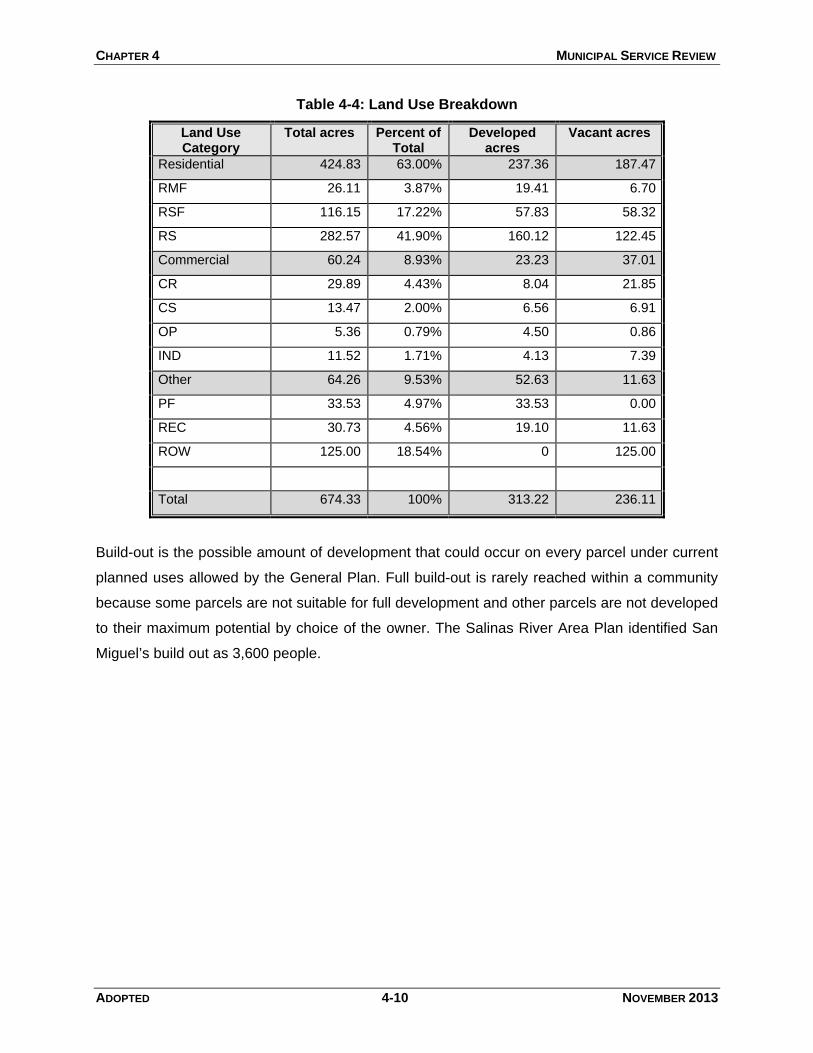
CHAPTER 4 MUNICIPAL SERVICE REVIEW
ADOPTED 4-10 NOVEMBER 2013
Table 4-4: Land Use Breakdown
Land Use Category
Total acres Percent of Total
Developed acres
Vacant acres
Residential 424.83 63.00% 237.36 187.47
RMF 26.11 3.87% 19.41 6.70
RSF 116.15 17.22% 57.83 58.32
RS 282.57 41.90% 160.12 122.45
Commercial 60.24 8.93% 23.23 37.01
CR 29.89 4.43% 8.04 21.85
CS 13.47 2.00% 6.56 6.91
OP 5.36 0.79% 4.50 0.86
IND 11.52 1.71% 4.13 7.39
Other 64.26 9.53% 52.63 11.63
PF 33.53 4.97% 33.53 0.00
REC 30.73 4.56% 19.10 11.63
ROW 125.00 18.54% 0 125.00
Total 674.33 100% 313.22 236.11
Build-out is the possible amount of development that could occur on every parcel under current
planned uses allowed by the General Plan. Full build-out is rarely reached within a community
because some parcels are not suitable for full development and other parcels are not developed
to their maximum potential by choice of the owner. The Salinas River Area Plan identified San
Miguel’s build out as 3,600 people.
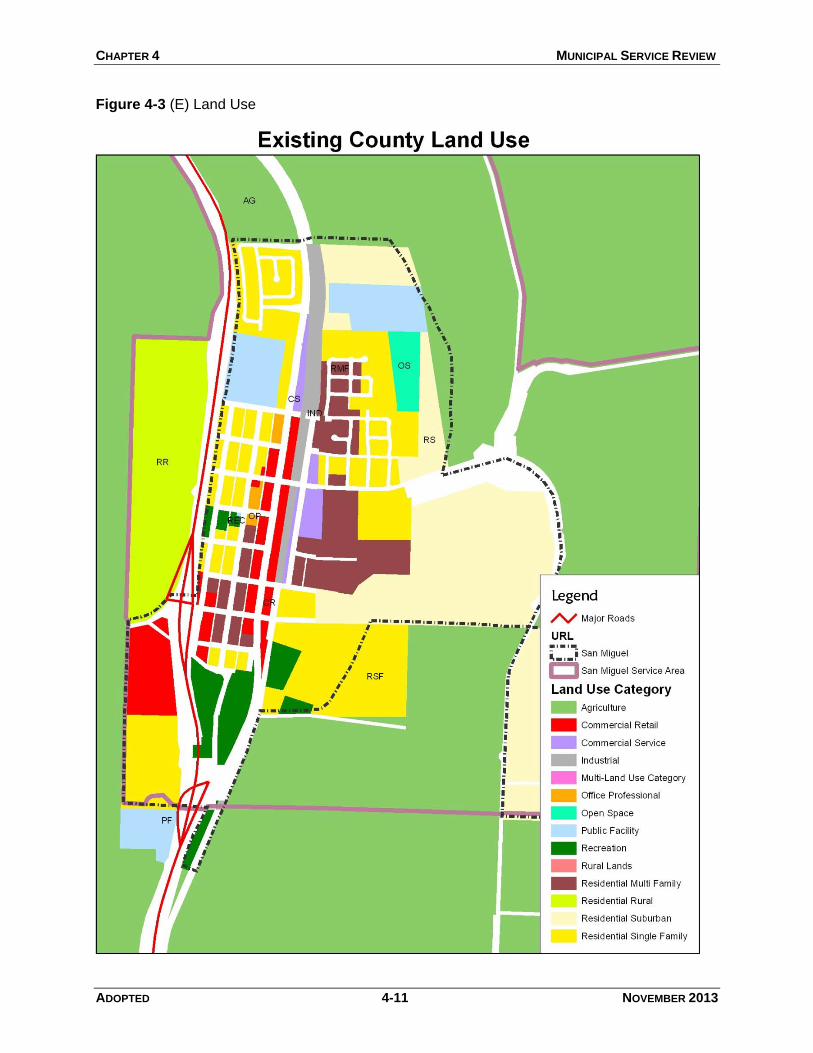
CHAPTER 4 MUNICIPAL SERVICE REVIEW
ADOPTED 4-11 NOVEMBER 2013
Figure 4-3 (E) Land Use
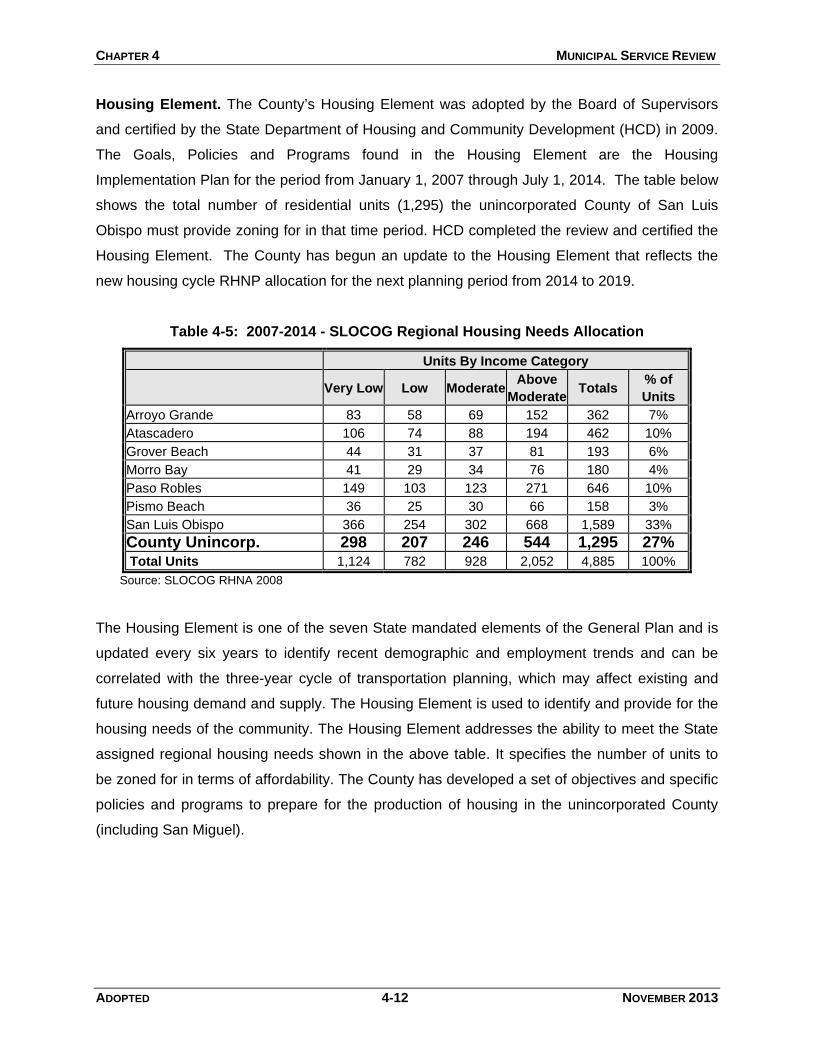
CHAPTER 4 MUNICIPAL SERVICE REVIEW
ADOPTED 4-12 NOVEMBER 2013
Housing Element. The County’s Housing Element was adopted by the Board of Supervisors
and certified by the State Department of Housing and Community Development (HCD) in 2009.
The Goals, Policies and Programs found in the Housing Element are the Housing
Implementation Plan for the period from January 1, 2007 through July 1, 2014. The table below
shows the total number of residential units (1,295) the unincorporated County of San Luis
Obispo must provide zoning for in that time period. HCD completed the review and certified the
Housing Element. The County has begun an update to the Housing Element that reflects the
new housing cycle RHNP allocation for the next planning period from 2014 to 2019.
Table 4-5: 2007-2014 - SLOCOG Regional Housing Needs Allocation
Units By Income Category
Very Low Low Moderate
Above
ModerateTotals
% of
Units
Arroyo Grande 83 58 69 152 362 7%
Atascadero 106 74 88 194 462 10%
Grover Beach 44 31 37 81 193 6%
Morro Bay 41 29 34 76 180 4%
Paso Robles 149 103 123 271 646 10%
Pismo Beach 36 25 30 66 158 3%
San Luis Obispo 366 254 302 668 1,589 33%
County Unincorp. 298 207 246 544 1,295 27% Total Units 1,124 782 928 2,052 4,885 100%
Source: SLOCOG RHNA 2008
The Housing Element is one of the seven State mandated elements of the General Plan and is
updated every six years to identify recent demographic and employment trends and can be
correlated with the three-year cycle of transportation planning, which may affect existing and
future housing demand and supply. The Housing Element is used to identify and provide for the
housing needs of the community. The Housing Element addresses the ability to meet the State
assigned regional housing needs shown in the above table. It specifies the number of units to
be zoned for in terms of affordability. The County has developed a set of objectives and specific
policies and programs to prepare for the production of housing in the unincorporated County
(including San Miguel).
CHAPTER 4 MUNICIPAL SERVICE REVIEW
ADOPTED 4-13 NOVEMBER 2013
WRITTEN DETERMINATIONS
The following written determinations are based on the information contained in the above
section regarding Growth and Population:
1. The Salinas River Area Plan provides an information and policy base for the improvement
and future development of the Community of San Miguel.
2. The San Miguel Design Plan was adopted by the County Board of Supervisors in 2003. The
Plan provides detailed standards and guidelines that were considered by the Community
through public workshops and hearings. The Plan is reflective of the Community’s concerns,
values and vision for San Miguel.
3. According to both the County’s Resource Management System and the Council of
Governments Population Projections San Miguel is projected to grow at a rate of less than
1% per year. Under the draft San Miguel Community Plan the County is projecting an
annual growth rate of roughly 1.4%.
4. The San Miguel Design Plan and New Community Plan will govern the design of future
projects in the town of San Miguel. The Guidelines and Standards have provisions for
adding curbs, gutters and sidewalks and other drainage improvements. The Plan details
transportation and circulation system improvements that will improve San Miguel’s traffic
flow and walkability. The Community Plan will also include a Public Facilities Financing Plan
component to guide funding for needed infrastructure.
5. The Community of San Miguel has an estimated 236 acres of vacant land that is zoned for
future development.
ADOPTED 4-14 NOVEMBER 2013
4.2 Location and Characteristics of any Disadvantaged
Unincorporated Communities
Purpose: To identify any disadvantaged unincorporated communities.
LAFCO is responsible for determining the location and characteristics of any disadvantaged
unincorporated communities within or contiguous to the sphere of influence of a jurisdiction. If a
jurisdiction is reasonably capable of providing needed resources and basic infrastructure to
disadvantaged unincorporated communities within the sphere of influence or contiguous to the
sphere of influence, it is important that such findings of infrastructure and resource availability
occur when revisions to the SOI and annexations are proposed by the District or property
owners.
The community of San Miguel has a variety of economic diversity that reside within the CSD
boundary and surrounding area. San Miguel does not currently have a Sphere of Influence. A
Disadvantaged community is defined as a community with an annual median household income
that is less than 80 percent of the statewide annual median household income. In 2013, San
Miguel qualifies under state law as a disadvantaged community, based on its average per capita
income. Few head-of-household jobs exist in the community, and many residents commute to
Paso Robles or beyond for employment. Although the community of San Miguel qualifies as a
disadvantage community, San Miguel does not have a Sphere of Influence outside of its service
area; therefore the necessity to evaluate the present and probable need for public facilities and
services adjacent or contiguous to the sphere of influence is not called for.
WRITTEN DETERMINATIONS
The following written determinations are based on the information contained in the above
section regarding disadvantaged unincorporated communities:
1. The San Miguel Community Services District’s Sphere of Influence does not have
disadvantaged unincorporated community located within or adjacent to its boundaries
because the SOI is coterminous to the service area.
ADOPTED 4-15 NOVEMBER 2013
4.3 Present and Planned Capacity of Public Facilities and Adequacy
of Public Services, including Infrastructure Needs or Deficiencies
Purpose: To identify the infrastructure needs and deficiencies in terms of supply, capacity, condition of facilities, and ability to provide services.
LAFCO is responsible for determining that a jurisdiction is reasonably capable of providing
needed resources and basic infrastructure to serve areas already within the service area and in
the Sphere of Influence. It is important that such findings of infrastructure and resource
availability occur when revisions to the SOI and annexations are proposed by the District or
property owners.
LAFCO analyzes present and long-term infrastructure demands and resource capabilities of the
San Miguel Community Services District. LAFCO evaluates 1) the resources and services that
are currently available, and 2) the ability of the CSD to expand such resources and services in
line with increasing demands.
The most basic infrastructure needs are the provision of water and wastewater services.
Beyond these services, police and fire protection, and circulation/road services are considered
high priority needs for future growth of the District.
This section evaluates the District’s resources and capabilities to provide services to existing
and future residents. The key topics addressed include water supply and demand, water
pipeline system, sewer system capacity and condition, fire and police protection, traffic and
roads, as well as, other services.
CHAPTER 4 MUNICIPAL SERVICE REVIEW
ADOPTED 4-16 NOVEMBER 2013
WATER
San Miguel CSD updated its Water Master Plan in 2002. The District will be updating their water
master plan in the near future. These plans, and other documents, are the basis for this section
of the Municipal Service Review. The County updated a Master Water Report in 2012. Urban
Water Management Plan are due every five years, in years ending in “5” and “0” for water
suppliers having more than 3,000 connections or selling at least 3,000 acre-feet of water per
year. A jurisdiction’s ability to provide water to existing residents and the Sphere of Influence
areas is a key consideration in updating an SOI. Because a Sphere is the area that is
envisioned for eventual annexation and service by a jurisdiction, it is important that an adequate
water supply be documented. Also to be considered are a jurisdiction’s policies with regard to
growth and the provision of water. The San Miguel CSD did not participate in the Nacimiento
water project.
Water Supply
The San Miguel Community Services District (CSD) provides water supply services in San
Miguel service area. The existing facilities include three wells; the San Lawrence well (well #5)
is currently being used, under approval/permission by the California Department of Public
Health (CDPH). The well’s arsenic level exceeds the MCL, but CDPH is allowing the use of this
well on an interim basis. Groundwater pumping from the Paso Robles Formation is the CSD’s
sole water source.
Groundwater. The District is an active participant in water resources management and
analysis, including the Paso Robles Groundwater Basin Agreement with San Luis Obispo
County and specific basin landowners. This agreement supports groundwater management to
avoid overdraft and promotes long-term groundwater supply reliability. The agreement also
supports cooperative participation in monitoring and management of groundwater resources.
Water levels in a majority of the Basin south of the town are in a state of decline.
Gross alpha emitters and uranium (radionuclides) are currently present in Wells 3 and 4.
Continued water quality testing is recommended to track the maximum contaminant levels for
radionuclides in Wells 3 and 4. There are several alternatives for treatment of radionuclides, but
they are costly and generate unwanted sludges and brine wastes. It has been recommended by
County Public Works Department that the San Miguel CSD completes a new well siting study
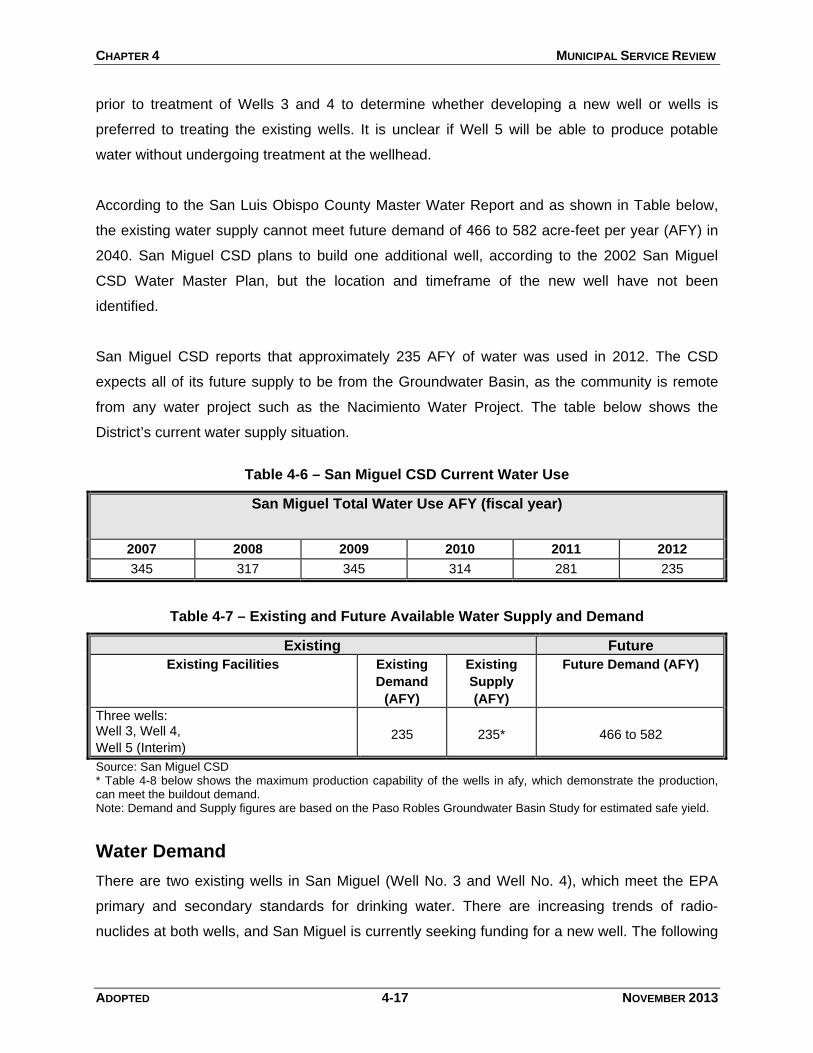
CHAPTER 4 MUNICIPAL SERVICE REVIEW
ADOPTED 4-17 NOVEMBER 2013
prior to treatment of Wells 3 and 4 to determine whether developing a new well or wells is
preferred to treating the existing wells. It is unclear if Well 5 will be able to produce potable
water without undergoing treatment at the wellhead.
According to the San Luis Obispo County Master Water Report and as shown in Table below,
the existing water supply cannot meet future demand of 466 to 582 acre-feet per year (AFY) in
2040. San Miguel CSD plans to build one additional well, according to the 2002 San Miguel
CSD Water Master Plan, but the location and timeframe of the new well have not been
identified.
San Miguel CSD reports that approximately 235 AFY of water was used in 2012. The CSD
expects all of its future supply to be from the Groundwater Basin, as the community is remote
from any water project such as the Nacimiento Water Project. The table below shows the
District’s current water supply situation.
Table 4-6 – San Miguel CSD Current Water Use
San Miguel Total Water Use AFY (fiscal year)
2007 2008 2009 2010 2011 2012
345 317 345 314 281 235
Table 4-7 – Existing and Future Available Water Supply and Demand
Existing Future
Existing Facilities Existing
Demand
(AFY)
Existing
Supply
(AFY)
Future Demand (AFY)
Three wells: Well 3, Well 4,
Well 5 (Interim)
235
235*
466 to 582
Source: San Miguel CSD * Table 4-8 below shows the maximum production capability of the wells in afy, which demonstrate the production, can meet the buildout demand. Note: Demand and Supply figures are based on the Paso Robles Groundwater Basin Study for estimated safe yield.
Water Demand
There are two existing wells in San Miguel (Well No. 3 and Well No. 4), which meet the EPA
primary and secondary standards for drinking water. There are increasing trends of radio-
nuclides at both wells, and San Miguel is currently seeking funding for a new well. The following

CHAPTER 4 MUNICIPAL SERVICE REVIEW
ADOPTED 4-18 NOVEMBER 2013
table is from the District’s Water Master Plan and shows the production capacity of the wells:
Table 4-8 – Summary of Well Capacity and Production
Well Capacity GPM 1)
Historical Production 2)
Maximum Production 3)
Well No. 3 400 110 323
Well No. 4 600 137 484
Total 1000 247 807
1) Well capacity refers to the maximum pumping rating of the well.
2) Historical production is the average amount of water the wells produced in 1999 and 2000.
3) Maximum production is the amount of water the wells could produce if run 12 hours per day 365 days per year.
According to the San Miguel water master plan, the wells could be potentially capable of
meeting future water demands, however, the wells may produce water that needs to be treated.
Water Distribution and Storage System
The San Miguel CSD provides water distribution services within the CSD boundaries. Currently,
the CSD water storage capacity is 700,000 gallons, within one 650,000-gallon tank located west
of U.S. Highway 101 and one 50,000- gallon tank in San Lawrence Terrace. When San Miguel
reaches build-out, storage requirements will increase to a total of 1,772,000 gallons (CSD
WMP).
Fire Flow. Fire storage is the volume of water needed to control an anticipated fire in a building
or group of buildings. Determining the amount of water needed is based upon a recommended
flow rate, its duration, and a minimum residual pressure as established by the District.
According to state law, San Miguel’s water storage capacity must increase to meet fire safety
standards. Capacity of water transmission lines must also increase to meet “fire flow” standards.
The San Miguel CSD Engineering Report provides alternative solutions to both of these
problems including exploration of environmental impacts of implementing such solutions. The
report recommends that two 650,000-gallon storage tanks, for a total of 1.3 million gallons of
storage, be constructed at the site of the existing 143,800-gallon reservoir. These tanks would
replace the existing tank. The report also recommends that a 16-inch diameter transmission
main be constructed to convey water from the new storage facility to the existing water
distribution system.
CHAPTER 4 MUNICIPAL SERVICE REVIEW
ADOPTED 4-19 NOVEMBER 2013
WASTEWATER COLLECTION & TREATMENT SYSTEM
Facility Description. The San Miguel CSD provides wastewater service to the community of
San Miguel service area. San Lawrence Terrace, located on the east side of the Salinas River,
is served by individual septic systems. San Miguel expanded the treatment facility in the year
2000 to support an approximate population of 2,847.
The San Miguel CSD provides wastewater collection and treatment services in San Miguel. The
current capacity of the San Miguel CSD Wastewater Treatment Plant (WWTP) is 200,000
gallons per day (GPD), with an average daily flow of 112,000 GPD. At capacity, it is estimated
that the existing treatment plant can support an approximate population of 2,847. However,
there are deficiencies in the collection system that will need improvement to handle the
population increase. Two wastewater tributary areas are located on the west side and east side
of the Union Pacific Railroad tracks.
Wastewater Collection. The District is responsible for collecting and transporting wastewater
from its 425 lateral connections. The collection system is generally in good condition and is
regularly maintained by the District. Sewage waste is collected from most of the homes and
businesses. Private septic systems are used for homes in San Lawrence Terrace Tracts.
Capital Improvement Projects
The Wastewater Master Plan estimates an increase in population of up to 4,554 at buildout
(2034) within the CSD boundaries. This is approximately 1,200 more residents than the
County’s projection for the San Miguel URL, which is 3,338 residents (2035), The Wastewater
Master Plan recommends a list of Capital Improvement Projects (CIPs) to serve the increasing
population. Since the Wastewater Master Plan does not include any timeframe for CIP
implementation, this report assumes that Replacement CIPs, which the Master Plan states are
required to meet existing demand/deficiencies, will adequately serve the estimated 2020
population and that Expansion CIPs, which the Master Plan states are required to meet future
demand/deficiencies, will adequately serve the estimated 2035 population.
Future Projects by 2020
Upgrading 8-inch sewer line to a 12- inch sewer line on 16th Street
Upgrading 8-inch gravity sewer to 12-inch on N Street
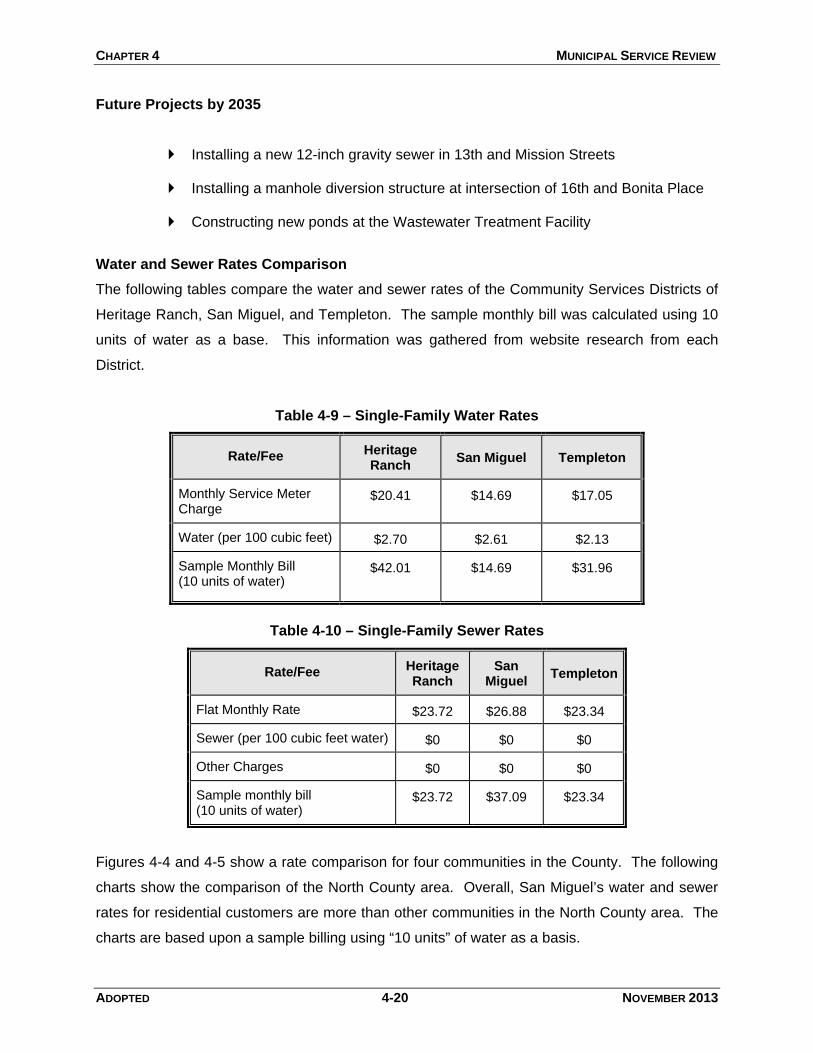
CHAPTER 4 MUNICIPAL SERVICE REVIEW
ADOPTED 4-20 NOVEMBER 2013
Future Projects by 2035
Installing a new 12-inch gravity sewer in 13th and Mission Streets
Installing a manhole diversion structure at intersection of 16th and Bonita Place
Constructing new ponds at the Wastewater Treatment Facility
Water and Sewer Rates Comparison
The following tables compare the water and sewer rates of the Community Services Districts of
Heritage Ranch, San Miguel, and Templeton. The sample monthly bill was calculated using 10
units of water as a base. This information was gathered from website research from each
District.
Table 4-9 – Single-Family Water Rates
Rate/Fee
Heritage Ranch
San Miguel
Templeton
Monthly Service Meter Charge
$20.41 $14.69 $17.05
Water (per 100 cubic feet)
$2.70 $2.61 $2.13
Sample Monthly Bill (10 units of water)
$42.01 $14.69 $31.96
Table 4-10 – Single-Family Sewer Rates
Rate/Fee
Heritage Ranch
San Miguel
Templeton
Flat Monthly Rate
$23.72 $26.88 $23.34
Sewer (per 100 cubic feet water)
$0 $0 $0
Other Charges
$0 $0 $0
Sample monthly bill (10 units of water)
$23.72 $37.09 $23.34
Figures 4-4 and 4-5 show a rate comparison for four communities in the County. The following
charts show the comparison of the North County area. Overall, San Miguel’s water and sewer
rates for residential customers are more than other communities in the North County area. The
charts are based upon a sample billing using “10 units” of water as a basis.
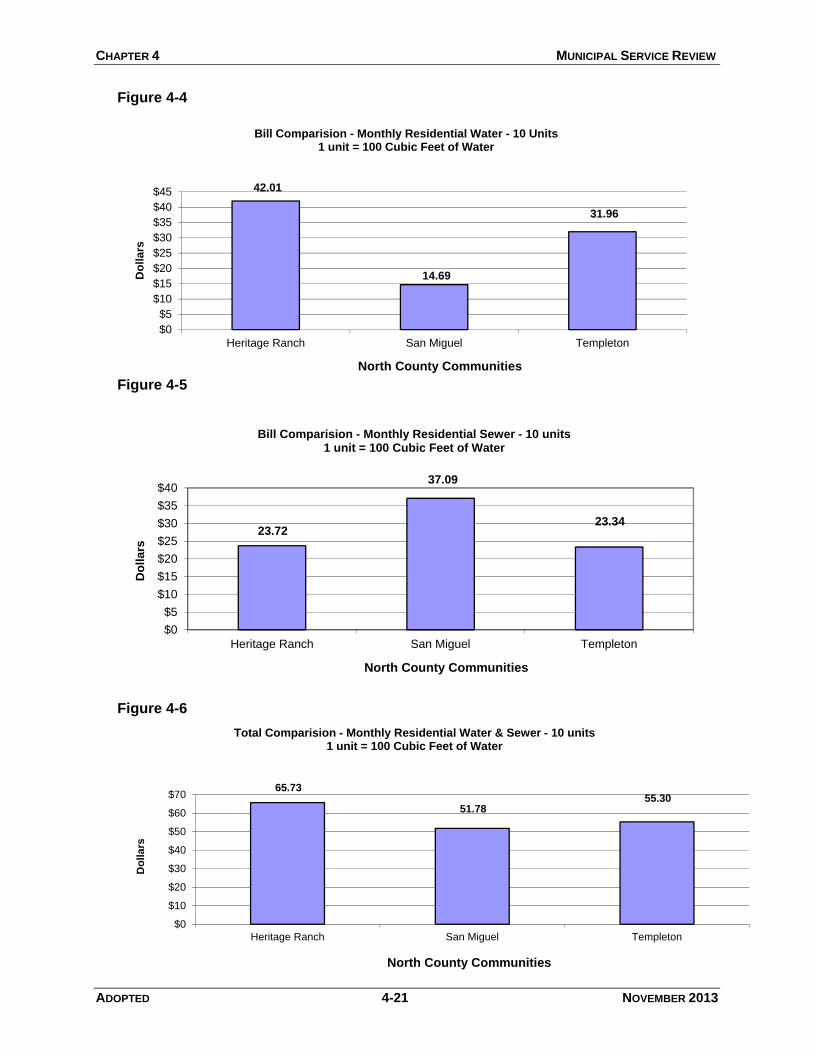
CHAPTER 4 MUNICIPAL SERVICE REVIEW
ADOPTED 4-21 NOVEMBER 2013
42.01
14.69
31.96
$0
$5
$10
$15
$20
$25
$30
$35
$40
$45
Heritage Ranch San Miguel Templeton
Do
llars
North County Communities
Bill Comparision - Monthly Residential Water - 10 Units1 unit = 100 Cubic Feet of Water
23.72
37.09
23.34
$0
$5
$10
$15
$20
$25
$30
$35
$40
Heritage Ranch San Miguel Templeton
Do
llars
North County Communities
Bill Comparision - Monthly Residential Sewer - 10 units1 unit = 100 Cubic Feet of Water
65.73
51.7855.30
$0
$10
$20
$30
$40
$50
$60
$70
Heritage Ranch San Miguel Templeton
Do
lla
rs
North County Communities
Total Comparision - Monthly Residential Water & Sewer - 10 units1 unit = 100 Cubic Feet of Water
Figure 4-4
Figure 4-5
Figure 4-6
CHAPTER 4 MUNICIPAL SERVICE REVIEW
ADOPTED 4-22 NOVEMBER 2013
STREETS AND ROADS
The County of San Luis Obispo Public Works Department is responsible for the maintenance
and repair of the streets and roads in San Miguel. The efficient transportation of goods,
services, and people is an important characteristic of a well-functioning community. A
description of the major transportation facilities, major roadway segments, current traffic
volumes, and other transportation modes are discussed below.
There is a total of 12.2 miles of roads in San Miguel. Based on the San Luis Obispo County
Pavement Management Plan (2009), pavement condition throughout San Miguel had an
average Pavement Condition Index (PCI) of 64 percent, which is within the “good roads”
category. The Plan indicates that $6.75 million per year of funding is required to maintain the
county-wide road system at the current quality level through 2018; and $8.86 million per year to
bring the road system back up to the desired average PCI of 70 by 2018. The estimated cost is
only provided at the county-wide level, not at the community level, because funding is shared
among the needs of all unincorporated communities.
The circulation system of San Miguel consists of State highways, arterials, collectors, local
streets, and alleys. U.S. Highway 101 borders the western edge of the community. The primary
on-off ramps accessing the highway are at 10th Street and the southern end of Mission Street.
The east-west routes are 10th Street, which connects U.S. Highway 101 with the primary north-
south arterial street, Mission Street. From Mission Street, connections can be made with the two
other arterial roads: 11th Street on the south end of town and 14th Street/River Road on the
north. These two streets are the only regulated, signalized crossings for the Union Pacific
Railroad tracks, which divide the central portion of the community in two.
River Road connects San Miguel to the surrounding developments on the east side of the
Salinas River, including San Lawrence Terrace. The San Miguel Bridge has been deemed
unsafe and is being replaced.
Transit System
The San Luis Obispo Regional Transit Authority (RTA) and Monterey-Salinas Transit (MST)
provide transit services in San Miguel. Route 9 connects San Miguel to California Polytechnic
State University, Santa Margarita, Atascadero, Templeton, and Paso Robles. MST Route 83
runs from the North County Transit Center in Paso Robles to Fort Hunter Liggett through San

CHAPTER 4 MUNICIPAL SERVICE REVIEW
ADOPTED 4-23 NOVEMBER 2013
Miguel and Lockwood. Runabout Americans with Disabilities (ADA) bus services are also
available.
Park-and-Ride Lots
The San Luis Obispo Council of Governments (SLOCOG) oversees park-and-ride lots in the
San Miguel urban area. Currently, one park and ride lot with ten parking spaces is located at the
intersection of K Street and 10th Street.
SOLID WASTE
Garbage Service. San Miguel Garbage is the local company that provides solid waste disposal
services to the community of San Miguel. San Miguel is located within the Paso Robles Landfill
District. It is not anticipated that the town will significantly impact the landfill when the community
reaches the projected build-out.
San Miguel Garbage Company Inc. provides solid waste collection services to the community of
San Miguel under a 15-year contract that expires in 2025. San Miguel Garbage Company has
recently expanded its facilities and indicated that no additional expansion would be necessary to
handle the projected growth within its current contracts.
The collected solid waste is taken to the Paso Robles Landfill and the Chicago Grade Landfill.
The Paso Robles Landfill, located on Highway 46 in Paso Robles, has an estimated site life of
approximately 40 years. Site life is expected to be extended through increased recycling, as well
as through the installation of a construction and demolition recycling facility in 2013. In 2011,
one third of the solid waste (approximately 12,860 tons) received at the Paso Robles Landfill
came from the unincorporated communities, including San Miguel and Templeton and
approximately 65 percent of the solid waste came from the City of Paso Robles. The Chicago
Grade Landfill, located on Homestead Road northeast of the City of Atascadero, also has
enough capacity to accommodate the forecasted growth of San Miguel and does not anticipate
any expansion.
CHAPTER 4 MUNICIPAL SERVICE REVIEW
ADOPTED 4-24 NOVEMBER 2013
Fire
The San Miguel Community Services District manages the San Miguel Fire Department, which
is responsible for providing fire protection and emergency response services for all lands and
properties within the District boundaries. The San Miguel CSD’s fire station is located on
Mission Street. The station is staffed by volunteers, and currently has one Fire Chief, an
Assistant Fire Chief, one Fire Captain, one Lieutenant, and ten firefighters.
The station is equipped with a 2007 Ferrara 1000 GPM Rescue pumper; a 2009 Ferrara 1500
GPM pumper; and a 1984 Pierce 1250 GPM pumper (Reserve engine). The Fire Department
responds to approximately 200 calls each year. The San Miguel CSD also has an aid
agreement with the City of Paso Robles and County of San Luis Obispo, and a Mutual Aid
Agreement with the California Department of Forestry and Camp Robert’s Fire Department. Of
these calls about 60% (150) are medical emergencies.
In the case of a major fire, the San Luis Obispo County Fire Department and the California
Department of Forestry would provide additional dispatch service. The major evacuation routes
for fire protection are U.S. Highway 101 and River Road. According to the fire chief, the goal is a
5-8 minute response time. Because the station is staffed by volunteers, there can be additional
delay in staff arriving at the station, donning safety gear, and then responding. This can
increase the response time to 15-20 minutes. The highest fire risk for the community comes
from the existing oak woodlands, grasslands, and chaparral communities.
Police/Sheriff
Police protection is provided by the San Luis Obispo County Sheriff’s Department through their
North County Station in Templeton, California. California Highway Patrol (CHP) also contributes
to the protection of San Miguel by patrolling all major county and state roads. The CHP is also
based out of Templeton. In the case of an emergency, the cities of Atascadero and Paso Robles
have an agreement to send aid to San Miguel. The average response time for the San Luis
Obispo County Sheriff’s Department to all areas of San Miguel is 30 minutes.
The North County Station’s goal is to provide a 10-minute response time for high priority, life-
threatening calls. Currently, the North County Station has a shortage of police personnel, and
expansion or replacement of the station is not expected in the near future. However, in the next
25 years, when the station is fully staffed, more space would be needed in the locker room, in
CHAPTER 4 MUNICIPAL SERVICE REVIEW
ADOPTED 4-25 NOVEMBER 2013
the report writing room, at the workstations, and in the parking area. The North County Station
expects that this additional staff could require a major remodeling of the existing facility or
construction of an additional building, but no specific plans have been determined.
The California Crime Rate for the unincorporated areas of the County is the third lowest in the
State compared with other counties with a population of 100,000 or more. The Sheriff’s
Department goal in the North County is to provide a 10-minute response time for high priority,
life-threatening calls for service.
Drainage/Flood Control
The responsibilities for drainage are administered through the San Luis Obispo County Flood
Control and Water Conservation District. In response to questions raised by several citizens
who experienced flood damage to their homes and businesses, the County Board of
Supervisors approved funding for drainage and flood control studies for the community. The
San Miguel CSD board of directors was identified to serve as the community representative for
the duration of the study. It was recommended that the CSD continue as the representative and
assume the role as lead agency for implementing any proposed drainage projects. The San
Miguel CSD does not provide drainage services. The first step in establishing the CSD as the
lead agency would be to activate drainage as a power.
The community of San Miguel lacks a formal drainage system. Local runoff generally follows the
gentle northeasterly slope of the community and either flows to the Salinas River or infiltrates
into the historic flood plain. Low spots or depressions cause frequent ponding and shallow
flooding at several locations. Localized flooding is particularly extensive along Mission Street
and N Street between 11th and 14th Streets, and north of 14th Street between Mission and N
Streets.
The primary cause of flooding in San Miguel is due to the absence of a continuous positive
slope and drainage conveyance path from L Street to the Salinas River. The railroad serves as
a barrier to storm runoff flowing from west of Mission Street to the Salinas River. Also, the
absence of continuous curb and gutter system has led to the concentration of street runoff in
areas that do not have curbs or gutters and generally represent local low spots within a
neighborhood block.
CHAPTER 4 MUNICIPAL SERVICE REVIEW
ADOPTED 4-26 NOVEMBER 2013
WRITTEN DETERMINATIONS
The following written determinations are based on the information contained in the above
section regarding Infrastructure Needs and Deficiencies:
Water Supply and Demand
1. Based on information from the Paso Robles Groundwater Basin Study, County Annual
Resource Summary Report and the District’s Water Master Plan, the District recognizes the
need for managing water resources to sustain growth within the District’s existing service
boundary over the next 20 years.
2. According to the County’s Master Water Report the District’s potentially available Water
Supply is estimated to be 235 AFY. According to the District, the potentially available Water
Supply is estimated to be 807 AFY. The estimated water demand within the service area is
estimated to be 466 to 582 at full build-out.
3. The District manages its water facilities in a professional, effective manner that complies
with state regulations and provides for the healthful provision of water to its residents and
customers.
Wastewater
4. The District operates and regularly maintains the wastewater collection and treatment
system, which consists of sewer pipelines, manholes, pump stations, and transports
wastewater to the treatment facility.
5. The treatment facility has the capacity to process 200,000 gallons per day. At capacity it is
estimated that the treatment plant can support an approximate population of 2,847. The
system is operating at 67.5% of capacity.
6. The District has plans to upgrade the Treatment Plant to process 500,000 gallons per day.
The CSD will be updating their wastewater master plan in the near future and the
recommendations could change depending on the update.
CHAPTER 4 MUNICIPAL SERVICE REVIEW
ADOPTED 4-27 NOVEMBER 2013
Roads and Streets
7. The District is not responsible for the construction or maintenance of roads and streets in
San Miguel. This responsibility lies with the County of San Luis Obispo, Public Works
Department.
8. The District continues to advocate for the upgrading and maintenance of the roads and
streets in San Miguel via development proposals that pay their share for facilities and other
services as a condition of project development.
Infrastructure
9. The District continues to upgrade and maintain public facilities, including the water
distribution pipelines and wastewater collection system.
Police and Fire
10. The County of San Luis Obispo Sheriff’s Department provides adequate law enforcement
services.
11. The District maintains fire facilities and adequate staff as needed to serve the residents of
San Miguel.

ADOPTED 4-28 NOVEMBER 2013
4.4 Financial Ability of Agencies to Provide Services
Purpose: To review the District’s existing financial documentation and identify any financial constraints or opportunities.
Budget
The budget consists of a series of line items that provide an overview of the revenues and
expenditures planned for the coming year. The District adopts the Budget each year and it is
used as the spending plan for the District. The Budget provides a framework for the District to
address the following issues: reserves, revenues, expenditures, transfer authority, fiscal
management, investments, capital improvements and rates and fees. The District’s financial
constraints involve the governmental structure and the desires of the people in the community to
fund certain activities by establishing assessment districts or fees. Revenue sources for the
SMCSD include key sources such as property taxes, fees collected from water sales, water
connection fees, and sewer fees and connections.
Fiscal Trend Analysis
The following charts show the fiscal trend analysis for the past five years for key fiscal indicators
that represent an early warning system for an agencies fiscal health. The key indicators are
overall operating budget, general fund expenditures, property tax revenues, elastic revenues
(which include transit occupancy tax, sales tax, and franchise fees), reserves, long-term debt,
and fund balance for each year. The information was derived from the District’s comprehensive
annual financial statement for each year.
Operating Budget Figure 4-7
Formula: Consolidated Expenditures / Fiscal year
Trend Analysis: Monitor expenditures over time.
Source: Comprehensive Annual Financial Statements: Statement of Activities Basic Financial Statements: Statement of Revenues, Expenses & Changes in Net Assets
$1,123,778
$1,450,227
$1,193,475$1,281,063
$1,445,000
$0
$200,000
$400,000
$600,000
$800,000
$1,000,000
$1,200,000
$1,400,000
$1,600,000
2008 2009 2010 2011 2012
Bu
dg
et
San Miguel CSD Operating Budget
Operating Budget by Year
Description: This indicator refers to the overall operating budget and expenditures including enterprise funds. It shows the expenditure pattern for a jurisdiction over a period of several years.
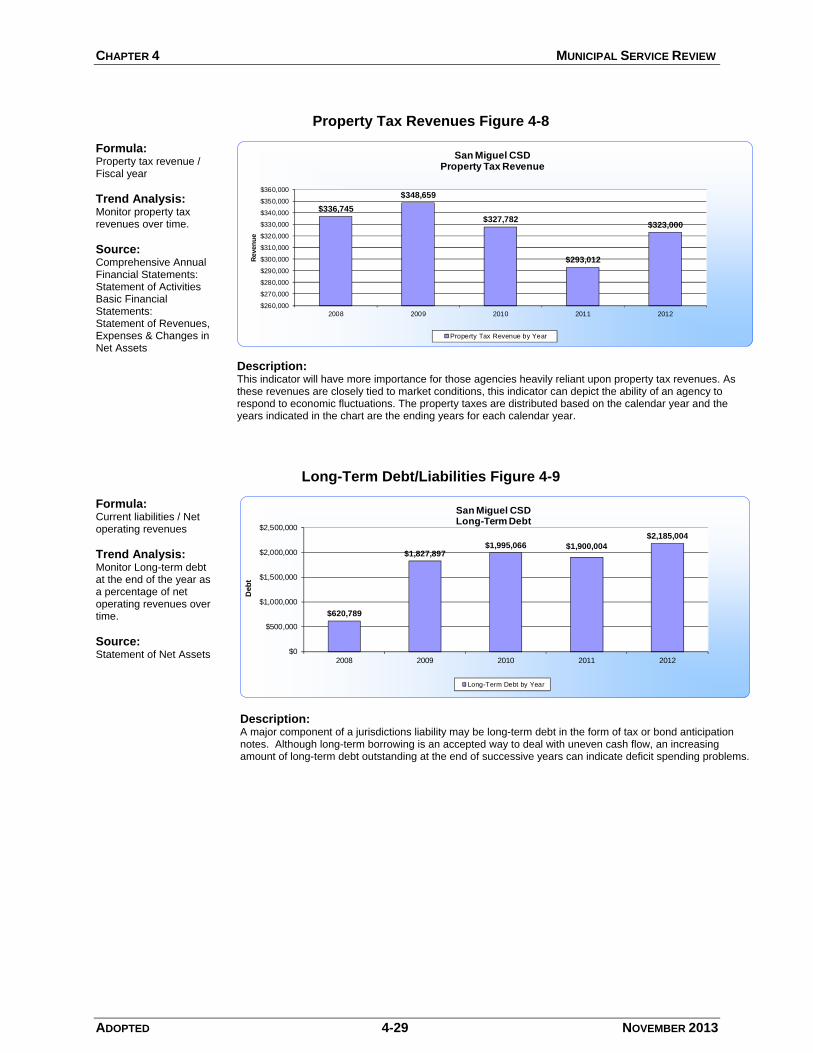
CHAPTER 4 MUNICIPAL SERVICE REVIEW
ADOPTED 4-29 NOVEMBER 2013
Property Tax Revenues Figure 4-8
Formula: Property tax revenue / Fiscal year
Trend Analysis: Monitor property tax revenues over time.
Source: Comprehensive Annual Financial Statements: Statement of Activities Basic Financial Statements: Statement of Revenues, Expenses & Changes in Net Assets
$336,745
$348,659
$327,782
$293,012
$323,000
$260,000
$270,000
$280,000
$290,000
$300,000
$310,000
$320,000
$330,000
$340,000
$350,000
$360,000
2008 2009 2010 2011 2012
Reven
ue
San Miguel CSD Property Tax Revenue
Property Tax Revenue by Year
Description: This indicator will have more importance for those agencies heavily reliant upon property tax revenues. As these revenues are closely tied to market conditions, this indicator can depict the ability of an agency to respond to economic fluctuations. The property taxes are distributed based on the calendar year and the years indicated in the chart are the ending years for each calendar year.
Long-Term Debt/Liabilities Figure 4-9
Formula: Current liabilities / Net operating revenues
Trend Analysis: Monitor Long-term debt at the end of the year as a percentage of net operating revenues over time.
Source: Statement of Net Assets
$620,789
$1,827,897$1,995,066 $1,900,004
$2,185,004
$0
$500,000
$1,000,000
$1,500,000
$2,000,000
$2,500,000
2008 2009 2010 2011 2012
Deb
t
San Miguel CSD Long-Term Debt
Long-Term Debt by Year
Description: A major component of a jurisdictions liability may be long-term debt in the form of tax or bond anticipation notes. Although long-term borrowing is an accepted way to deal with uneven cash flow, an increasing amount of long-term debt outstanding at the end of successive years can indicate deficit spending problems.
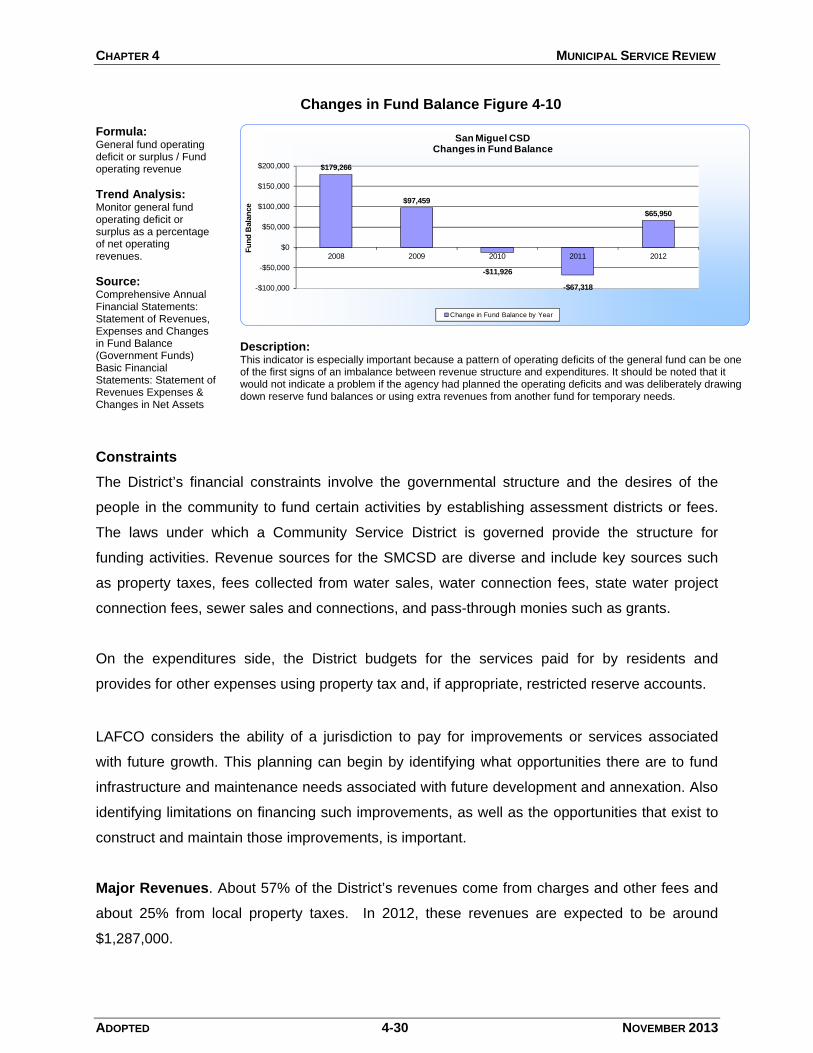
CHAPTER 4 MUNICIPAL SERVICE REVIEW
ADOPTED 4-30 NOVEMBER 2013
Changes in Fund Balance Figure 4-10
Formula: General fund operating deficit or surplus / Fund operating revenue
Trend Analysis: Monitor general fund operating deficit or surplus as a percentage of net operating revenues.
Source: Comprehensive Annual Financial Statements: Statement of Revenues, Expenses and Changes in Fund Balance (Government Funds) Basic Financial Statements: Statement of Revenues Expenses & Changes in Net Assets
$179,266
$97,459
-$11,926
-$67,318
$65,950
-$100,000
-$50,000
$0
$50,000
$100,000
$150,000
$200,000
2008 2009 2010 2011 2012F
un
d B
ala
nce
San Miguel CSD Changes in Fund Balance
Change in Fund Balance by Year
Description: This indicator is especially important because a pattern of operating deficits of the general fund can be one of the first signs of an imbalance between revenue structure and expenditures. It should be noted that it would not indicate a problem if the agency had planned the operating deficits and was deliberately drawing down reserve fund balances or using extra revenues from another fund for temporary needs.
Constraints
The District’s financial constraints involve the governmental structure and the desires of the
people in the community to fund certain activities by establishing assessment districts or fees.
The laws under which a Community Service District is governed provide the structure for
funding activities. Revenue sources for the SMCSD are diverse and include key sources such
as property taxes, fees collected from water sales, water connection fees, state water project
connection fees, sewer sales and connections, and pass-through monies such as grants.
On the expenditures side, the District budgets for the services paid for by residents and
provides for other expenses using property tax and, if appropriate, restricted reserve accounts.
LAFCO considers the ability of a jurisdiction to pay for improvements or services associated
with future growth. This planning can begin by identifying what opportunities there are to fund
infrastructure and maintenance needs associated with future development and annexation. Also
identifying limitations on financing such improvements, as well as the opportunities that exist to
construct and maintain those improvements, is important.
Major Revenues. About 57% of the District’s revenues come from charges and other fees and
about 25% from local property taxes. In 2012, these revenues are expected to be around
$1,287,000.
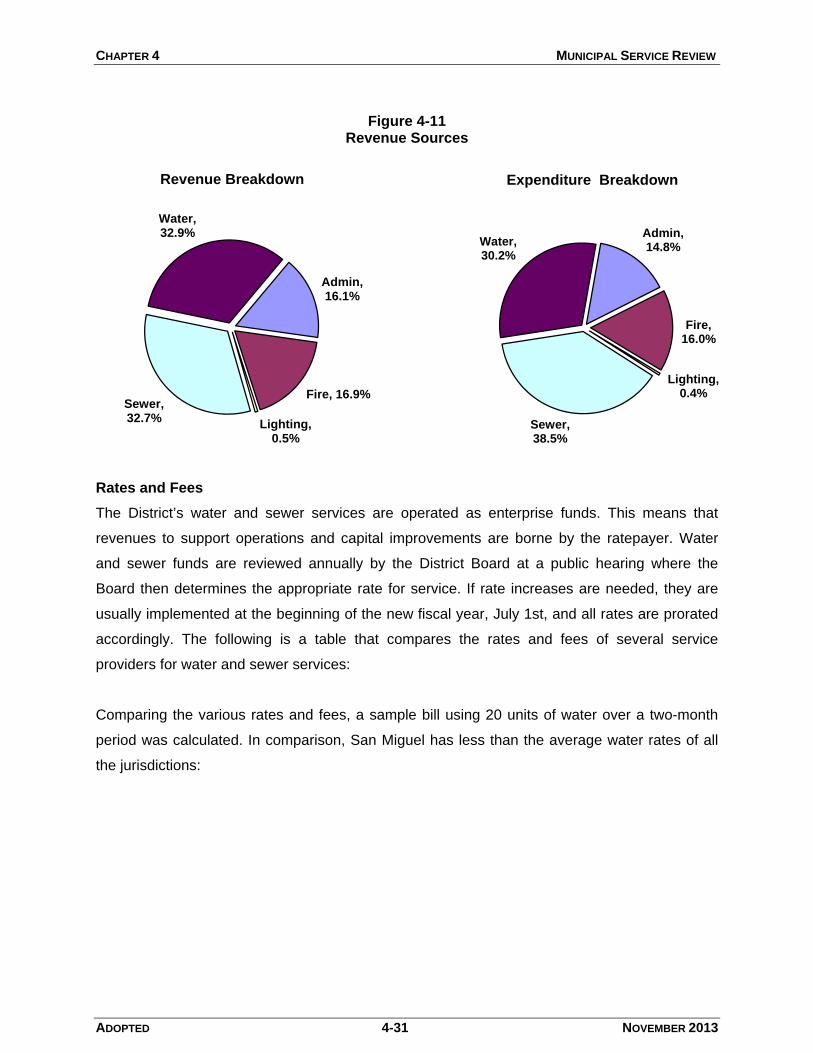
CHAPTER 4 MUNICIPAL SERVICE REVIEW
ADOPTED 4-31 NOVEMBER 2013
Figure 4-11
Revenue Sources
Rates and Fees
The District’s water and sewer services are operated as enterprise funds. This means that
revenues to support operations and capital improvements are borne by the ratepayer. Water
and sewer funds are reviewed annually by the District Board at a public hearing where the
Board then determines the appropriate rate for service. If rate increases are needed, they are
usually implemented at the beginning of the new fiscal year, July 1st, and all rates are prorated
accordingly. The following is a table that compares the rates and fees of several service
providers for water and sewer services:
Comparing the various rates and fees, a sample bill using 20 units of water over a two-month
period was calculated. In comparison, San Miguel has less than the average water rates of all
the jurisdictions:
Admin, 16.1%
Fire, 16.9%
Lighting, 0.5%
Sewer, 32.7%
Water, 32.9%
Revenue Breakdown
Admin, 14.8%
Fire, 16.0%
Lighting, 0.4%
Sewer, 38.5%
Water, 30.2%
Expenditure Breakdown
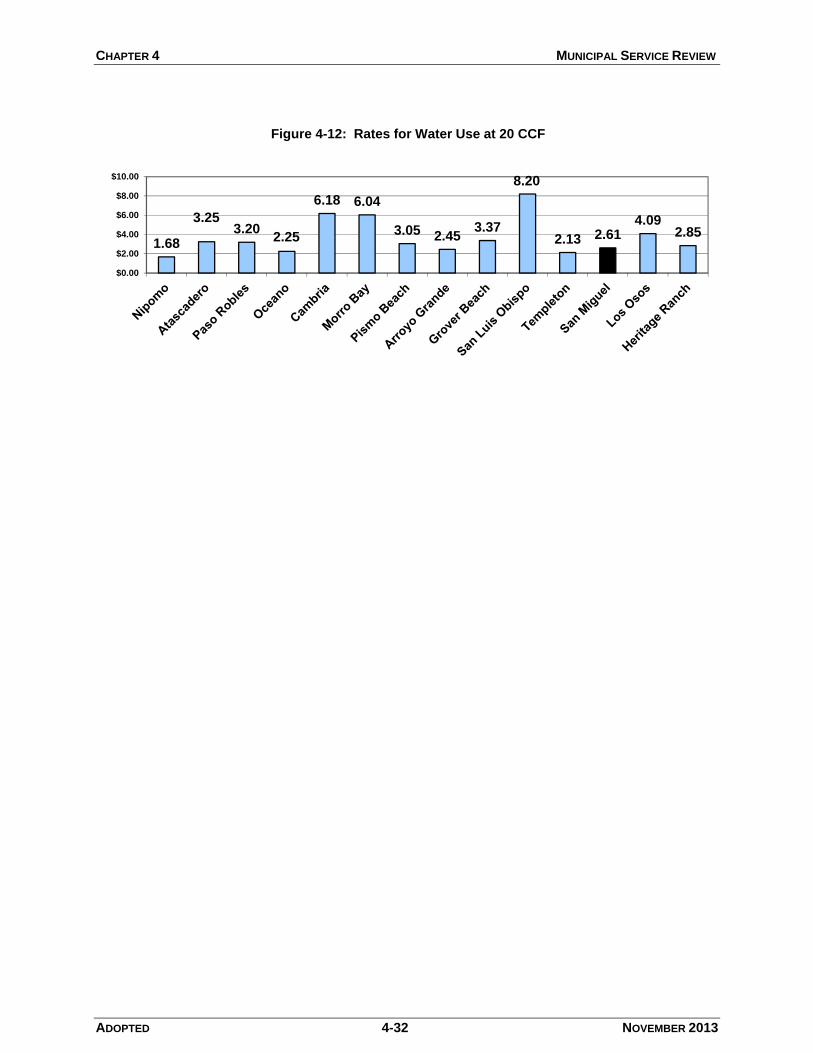
CHAPTER 4 MUNICIPAL SERVICE REVIEW
ADOPTED 4-32 NOVEMBER 2013
1.68
3.253.20
2.25
6.18 6.04
3.05 2.453.37
8.20
2.13 2.614.09
2.85
$0.00
$2.00
$4.00
$6.00
$8.00
$10.00
Figure 4-12: Rates for Water Use at 20 CCF
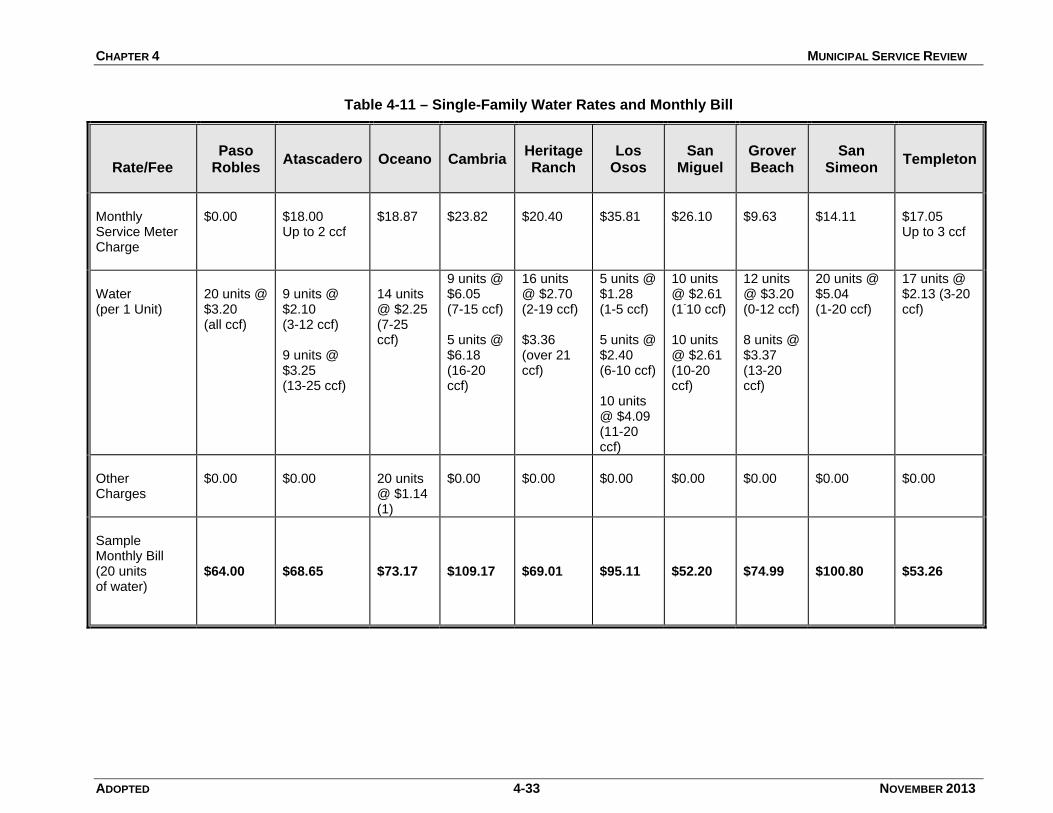
CHAPTER 4 MUNICIPAL SERVICE REVIEW
ADOPTED 4-33 NOVEMBER 2013
Table 4-11 – Single-Family Water Rates and Monthly Bill
Rate/Fee
Paso
Robles
Atascadero
Oceano
Cambria
Heritage Ranch
Los
Osos
San
Miguel
Grover Beach
San
Simeon
Templeton
Monthly Service Meter Charge
$0.00
$18.00 Up to 2 ccf
$18.87
$23.82
$20.40
$35.81
$26.10
$9.63
$14.11
$17.05 Up to 3 ccf
Water (per 1 Unit)
20 units @ $3.20 (all ccf)
9 units @ $2.10 (3-12 ccf) 9 units @ $3.25 (13-25 ccf)
14 units @ $2.25 (7-25 ccf)
9 units @ $6.05 (7-15 ccf) 5 units @ $6.18 (16-20 ccf)
16 units @ $2.70 (2-19 ccf) $3.36 (over 21 ccf)
5 units @ $1.28 (1-5 ccf) 5 units @ $2.40 (6-10 ccf) 10 units @ $4.09 (11-20 ccf)
10 units @ $2.61 (1
-10 ccf)
10 units @ $2.61 (10-20 ccf)
12 units @ $3.20 (0-12 ccf) 8 units @ $3.37 (13-20 ccf)
20 units @ $5.04 (1-20 ccf)
17 units @ $2.13 (3-20 ccf)
Other Charges
$0.00
$0.00
20 units @ $1.14 (1)
$0.00
$0.00
$0.00
$0.00
$0.00
$0.00
$0.00
Sample Monthly Bill (20 units of water)
$64.00
$68.65
$73.17
$109.17
$69.01
$95.11
$52.20
$74.99
$100.80
$53.26
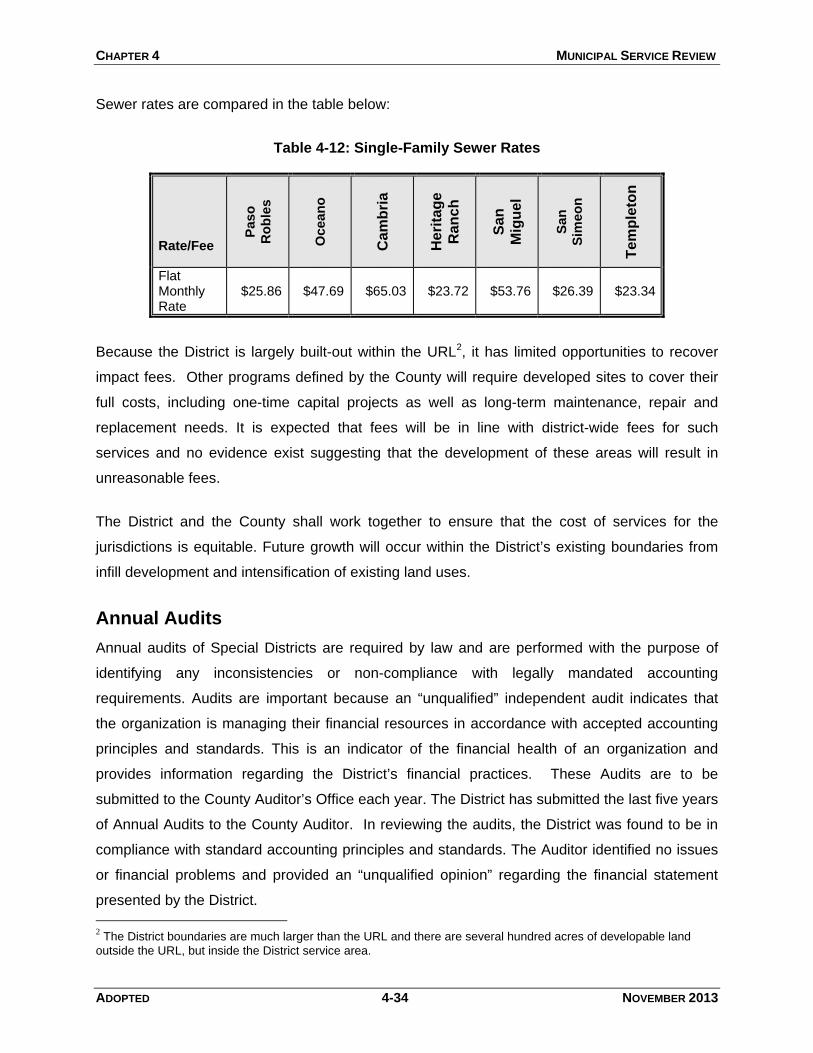
CHAPTER 4 MUNICIPAL SERVICE REVIEW
ADOPTED 4-34 NOVEMBER 2013
Sewer rates are compared in the table below:
Table 4-12: Single-Family Sewer Rates
Rate/Fee
Paso
Ro
ble
s
Oc
ea
no
Ca
mb
ria
He
rita
ge
Ra
nc
h
Sa
n
Mig
ue
l
San
Sim
eo
n
Te
mp
leto
n
Flat Monthly Rate
$25.86 $47.69 $65.03 $23.72 $53.76
$26.39 $23.34
Because the District is largely built-out within the URL2, it has limited opportunities to recover
impact fees. Other programs defined by the County will require developed sites to cover their
full costs, including one-time capital projects as well as long-term maintenance, repair and
replacement needs. It is expected that fees will be in line with district-wide fees for such
services and no evidence exist suggesting that the development of these areas will result in
unreasonable fees.
The District and the County shall work together to ensure that the cost of services for the
jurisdictions is equitable. Future growth will occur within the District’s existing boundaries from
infill development and intensification of existing land uses.
Annual Audits
Annual audits of Special Districts are required by law and are performed with the purpose of
identifying any inconsistencies or non-compliance with legally mandated accounting
requirements. Audits are important because an “unqualified” independent audit indicates that
the organization is managing their financial resources in accordance with accepted accounting
principles and standards. This is an indicator of the financial health of an organization and
provides information regarding the District’s financial practices. These Audits are to be
submitted to the County Auditor’s Office each year. The District has submitted the last five years
of Annual Audits to the County Auditor. In reviewing the audits, the District was found to be in
compliance with standard accounting principles and standards. The Auditor identified no issues
or financial problems and provided an “unqualified opinion” regarding the financial statement
presented by the District.
2 The District boundaries are much larger than the URL and there are several hundred acres of developable land
outside the URL, but inside the District service area.

CHAPTER 4 MUNICIPAL SERVICE REVIEW
ADOPTED 4-35 NOVEMBER 2013
WRITTEN DETERMINATIONS
The following written determinations are based on the information contained in the above
section regarding Financial Constraints and Opportunities:
1. The District prepares an annual budget that clearly shows the expenditures and revenues
for the services provided to residents.
2. The District does not pay for infrastructure needed to serve new development projects. It is
reasonable to conclude that the District endeavors to avoid long-term District obligations for
the capital improvement or maintenance of new development projects.
3. There are no apparent fiscal constraints limiting the ability of the District to serve existing
and future residents.
4. Rates and fees for services are established using the District’s budget process and special
studies as the need arises.
ADOPTED 4-36 NOVEMBER 2013
4.5 Status of, and Opportunity for, Shared Facilities
Purpose: To identify the opportunities for jurisdictions to share facilities and resources creating a more efficient service delivery system.
In the case of developing areas in the District, LAFCO evaluates whether services or facilities
can be provided in a more efficient manner if both the District and some other jurisdiction share
the construction, acquisition and maintenance of such facilities. In some cases, it may be
possible to establish a cooperative approach to facility planning by encouraging the District,
nearby cities, County and State to work cooperatively in such efforts. There are opportunities
for continued shared relationships between agencies for services within their boundaries.
Development in San Miguel can lead to shared infrastructure between the County and the
District. By working together the County and the District may be able to provide for services that
lead to the improvement of the downtown. At present, the distinction between District and
County services in the area is clear. The opportunities for increased coordination may include:
• Roadway connections and utilities
• Water supply projects
• Coordination of water and sewer issues regarding new development
Under the Camp Roberts Joint Land Use Study (JLUS) policy (Policy IE-2A) supports regional
coordination on infrastructure such as combining water and wastewater treatment facilities
between San Miguel, Heritage Ranch, and Camp Roberts.
Regional Coordination
Coordinate on a region-wide basis, the development of plans for infrastructure improvements to avoid overlap and duplication of services. Development of systems that can serve both community (including Heritage Ranch and San Miguel) and Camp Roberts’ needs should be evaluated when appropriate.
WRITTEN DETERMINATIONS
The following written determinations are based on the information contained in the above
section regarding Opportunities for Shared Facilities:
The development of areas within the SMCSD service boundary may lead to shared
infrastructure with the County. The potential to create shared relationships for providing some
services is suggested and may be appropriate when providing certain services.
ADOPTED 4-37 NOVEMBER 2013
4.6 Accountability for Community Service Needs Including
Governmental Structure and Operational Efficiencies
Purpose: To evaluate the accessibility and levels of public participation associated with the agency’s decision-making and management processes.
The governing body of San Miguel is the Board of Directors that is elected in compliance with
California Election Laws. The District complies with the Brown Act Open-Meeting Law and
provides the public with opportunities to obtain information about community issues, including
website and phone access. The District‘s website contains information about the various
services.
The Board of Directors holds regular meetings at 7:00 p.m. on the 4th Thursday of each month
at 1150 Mission (fire station). Other meetings or study sessions are held as needed on 2nd
Monday of the month. A public comment period is scheduled at the beginning of each meeting
for citizens to comment on District issues not on the agenda.
The following section briefly discusses various operational and service aspects of the District.
Much of the information was obtained from the District’s budgets and discussions with their
staff. The organizational chart shows the three major divisions of the District; the Fire
Department, the Administrative Department and the Utility Operations Department.
The Budget includes a purpose statement for each service department or budget unit, a
description of the activity or service, the personnel allocated to the tasks, and the programs
being implemented by the budget unit.
Overall, the District is equipped administratively to serve the residents of San Miguel. The
District accomplishes its goals and implements a variety of service programs. The District’s
Budget process is discussed in the Financial Constraints and Opportunities section of this
report. The organizational chart shows the structure of the District.
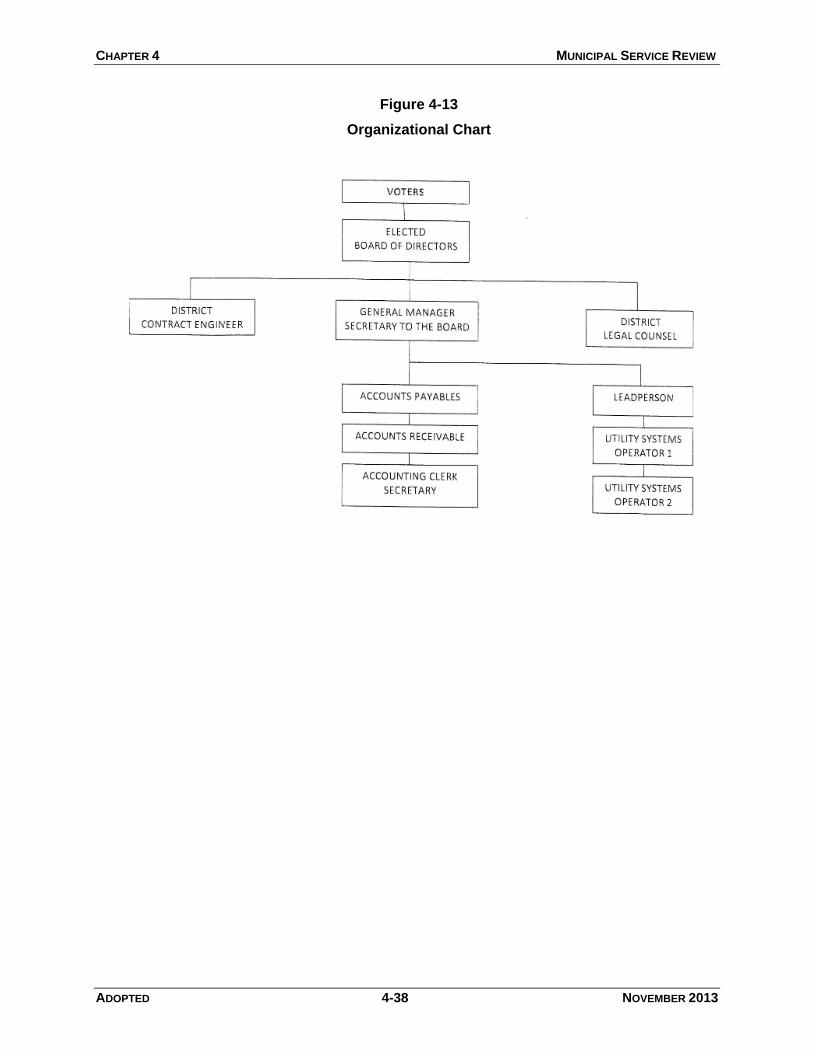
CHAPTER 4 MUNICIPAL SERVICE REVIEW
ADOPTED 4-38 NOVEMBER 2013
Figure 4-13
Organizational Chart
CHAPTER 4 MUNICIPAL SERVICE REVIEW
ADOPTED 4-39 NOVEMBER 2013
WRITTEN DETERMINATIONS
The following written determinations are based on the information contained in the above
section regarding Local Accountability and Governance:
1. The District has historically made reasonable efforts to maintain a public dialogue regarding
issues and projects of concern to the community.
2. The District has maintained relationships with local news media, providing information
and/or interviews as requested.
3. The District evaluates the services provided to residents and services that may need to be
upgraded or started.
4. The District remains focused on providing quality water, sewer, fire, lighting, and garbage
services to its customers.
5. The District continues to improve its website by adding more information that is accessible to
the public.
6. The District is developing a Strategic Plan which would provide goals and objectives for the
future of the District.

ADOPTED 4-40 NOVEMBER 2013
4.7 OTHER MATTERS
This factor allows LAFCO to discuss other issues and topics that may need to be addressed or
focused on in the MSR.
References
• San Miguel CSD Budget FY 2012/13
• SLO County Resource Management System Biennial Report, 2010-2012
• SLO County Master Water Report, 2012
• San Luis Obispo Council of Governments Regional Transportation Planning Agency,
Regional Transportation Plan, 2010.
• California Department of Finance E-4 Report, 2010
• Technical Memo regarding Wastewater System, 2009
• California Department of Finance E-4 Report, 2009
• SLOCOG ERA Population & Employment Forecast, 2009
• SLO County Salinas River Inland Area Plan, revised 2009
• SLOCOG Regional Housing Needs Allocation, 2008
• San Luis Obispo Local Agency Formation Commission, Sphere of Influence Study,
2006.
• San Miguel Wastewater Master Plan, 2005.
• San Luis Obispo Council of Governments, Regional Profile, October 2004.
• San Miguel Water Master Plan, 2002
• San Miguel Community Plan, 2002
• San Miguel CSD, Official Website, www.San Miguelcsd.org.
• County of San Luis Obispo, Official Website, www.slocounty.ca.gov.
• San Luis Obispo Council of Governments, Official Website, www.slocog.org.

ADOPTED 5-1 NOVEMBER 2013
CHAPTER 5 Heritage Ranch CSD – Municipal Service Review
The legislative authority for conducting Municipal Service
Reviews is provided in Section 56430 of the Cortese-Knox-
Hertzberg Act (CKH). The Act states that, in order to update
Spheres of Influence in accordance with Government Code
Section 56425, LAFCOs are required to conduct a service
review of the services provided by the jurisdiction. The
Municipal Service Review factors that need to be addressed
include:
1. Growth and Population projections for the affected area
2. Location and characteristics of any disadvantaged unincorporated communities
3. Present and planned capacity of public facilities and adequacy of public services,
including infrastructure needs or deficiencies
4. Financial ability of agencies to provide services
5. Status of, and opportunity for, shared facilities
6. Accountability for community service needs including governmental structure and
operational efficiencies
7. Any other matter related to effective or efficient service delivery, as required by
commission policy
The above-listed factors are addressed in this chapter and written determinations are included
for each factor as called for in the CKH Act.
The Heritage Ranch CSD provides the following services for the area residents:
Water service;
Sewage collection;
Refuse and Garbage Collection; and
Parks and recreation services.
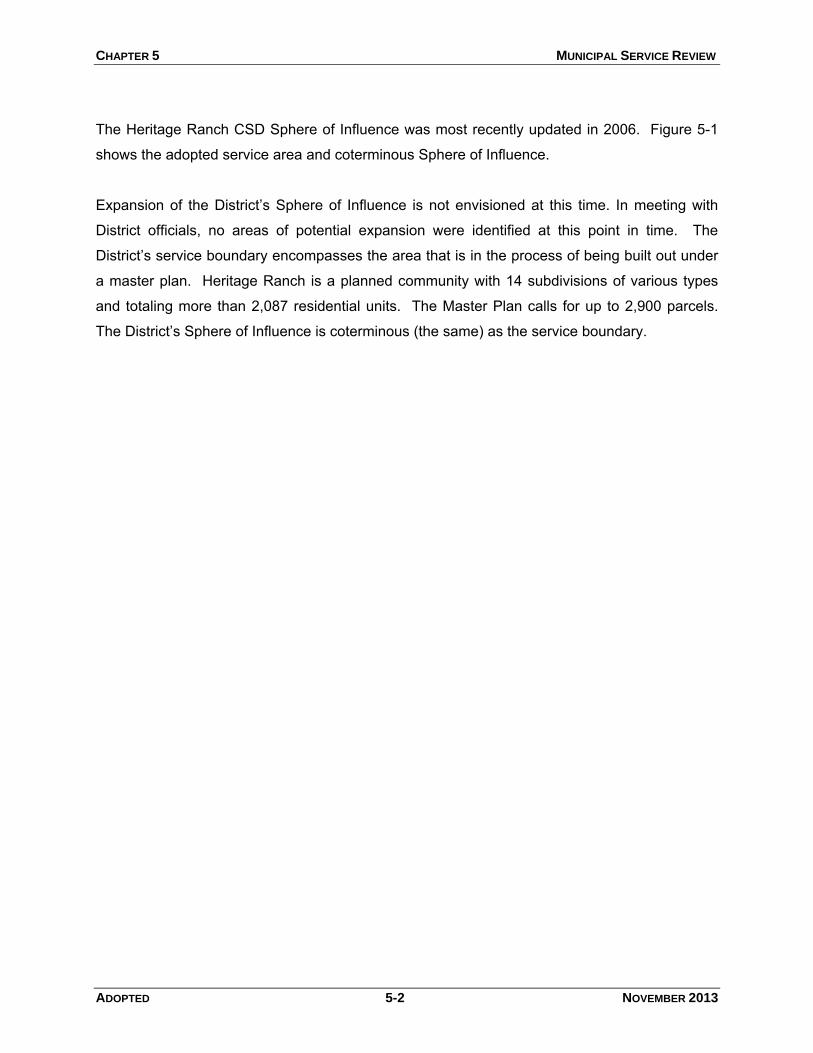
CHAPTER 5 MUNICIPAL SERVICE REVIEW
ADOPTED 5-2 NOVEMBER 2013
The Heritage Ranch CSD Sphere of Influence was most recently updated in 2006. Figure 5-1
shows the adopted service area and coterminous Sphere of Influence.
Expansion of the District’s Sphere of Influence is not envisioned at this time. In meeting with
District officials, no areas of potential expansion were identified at this point in time. The
District’s service boundary encompasses the area that is in the process of being built out under
a master plan. Heritage Ranch is a planned community with 14 subdivisions of various types
and totaling more than 2,087 residential units. The Master Plan calls for up to 2,900 parcels.
The District’s Sphere of Influence is coterminous (the same) as the service boundary.
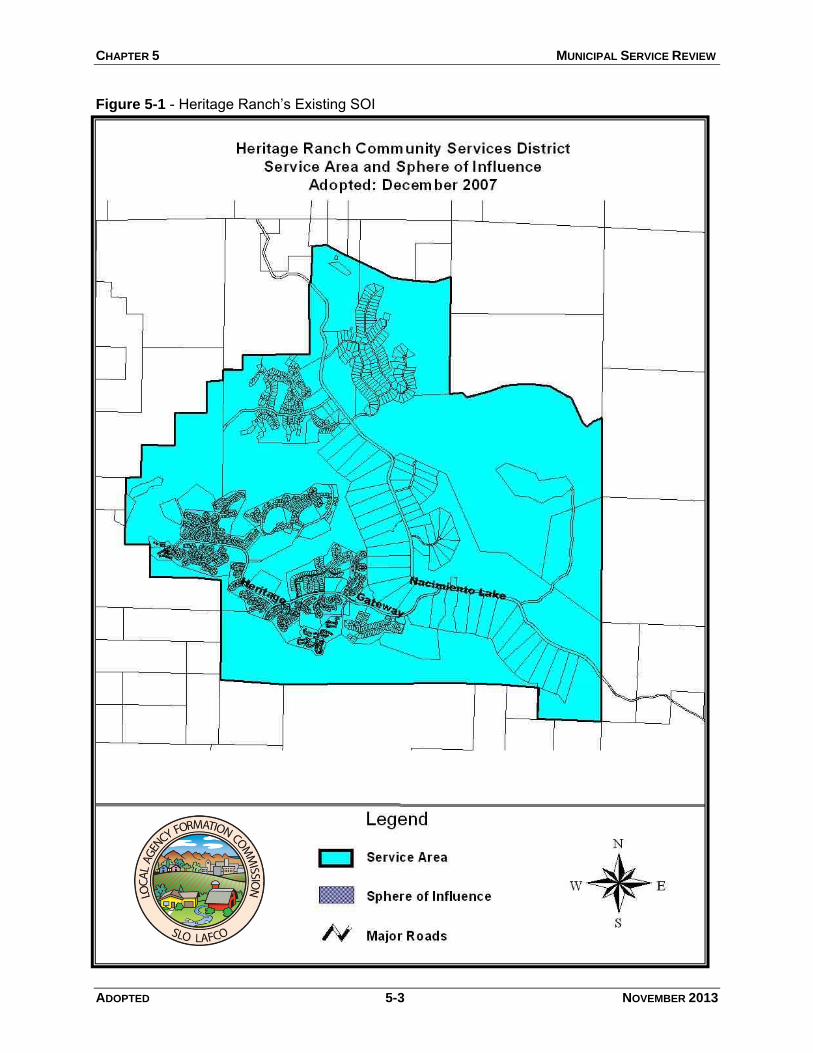
CHAPTER 5 MUNICIPAL SERVICE REVIEW
ADOPTED 5-3 NOVEMBER 2013
Figure 5-1 - Heritage Ranch’s Existing SOI
ADOPTED 5-4 NOVEMBER 2013
5.1 GROWTH AND POPULATION PROJECTIONS FOR THE AFFECTED AREA
Purpose: To review future growth patterns and project population increases.
POPULATION
This factor is intended to identify growth and population projections for the affected area of a
jurisdiction. This section will use various sources of information to project growth and population
for Heritage Ranch. The previous Sphere of Influence update and Municipal Service Review for
Heritage Ranch Community Services District provides background information, as well as, the
County of San Luis Obispo adopted Heritage Ranch Specific Plan.
The Growth and Population factor includes a summary of population data and land use and
zoning in the area as well as growth trends.
According to the 2000 US Census, Heritage Ranch had a population of 3,300. Total housing
units were estimated to be 1,780 units. The estimated build-out population within the current
service area is estimated to be 5,834. The demographics of the Heritage Ranch have changed
from a vacation area to a community with more permanent residents. Several factors have
influenced this dynamic including the County’s shortage of affordable housing and the
availability of various housing options in the Heritage Ranch community. The Heritage Ranch
CSD finds that this is no longer the case and estimates that only approximately 30% of the
water connections can be considered part-time. Most homes in the community are now
occupied by full-time residents.
Council of Governments Population Projections-2009
The Council of Governments recently had the consulting firm of Economics Research
Associates update population projections for San Luis Obispo County including Heritage Ranch.
The original study was completed in 2006 and was updated in 2009 to take into account the
recent economic downturn. These projections use a variety of data sources and assumptions to
project the future population of the cities and unincorporated areas of the County. These
projections incorporate information from the State of California about future population
increases, past and present County growth trends, and projected changes within the region.
The consultants worked with local planners to anticipate future growth in the various areas of

CHAPTER 5 MUNICIPAL SERVICE REVIEW
ADOPTED 5-5 NOVEMBER 2013
the County to estimate the potential for increases in population. The updated report presents
low, medium, and high population growth projections for areas in the County including
Nacimiento area. The table below shows those results:
Table 5-1: Projected Population Growth Nacimiento
San Luis Obispo Council of Governments Projections
2008 2010 2015 2020 2025 2030 2035
LOW 3,152 3,227 3,335 3,386 3,411 3,457 3,481 MEDIUM 3,152 3,227 3,335 3,400 3,440 3,500 3,539 HIGH 3,152 3,227 3,335 3,413 3,462 3,537 3,588
Heritage Village is at the eastern end of Lake Nacimiento, encompassing the Heritage Ranch
development and the portions of Lake Nacimiento Resort located on the south shore of the lake.
Area topography includes gently rolling terrain intermixed with moderate and steep slopes.
Natural vegetation varies from open grassland to oak woodland with areas of dense chaparral
and oak groves. The entire village boundary encompasses a land area of approximately 2,518
acres, which includes only the portions of the Heritage and Resort ownerships planned for
intensive development. New development in Heritage Ranch will continue to be chiefly build-out
of the Master Plan parcels.
COUNTY’S GENERAL PLAN
The County’s Nacimiento Area Plan identifies and sets policy for land uses in the Heritage
Ranch area. The County’s Master Plan for Heritage Ranch identifies where and how the
County anticipates development over the next 20-years for Heritage Ranch. The County’s
Plans promote the preservation of prime agricultural lands and open space corridors. It has a
number of policies that call for guiding growth away from agricultural areas and promoting infill
or other non-prime agricultural use.
The Land Use and Circulation Element reorganization is underway. Heritage Ranch CSD’s area
will be entirely covered by the Heritage Ranch Village Plan. This will replace the current
Nacimiento Area Plan for areas within the Village Reserve Line. The Heritage Ranch Village
Plan will also incorporate by reference the Lake Nacimiento Resort Specific Plan, which covers
the resort area owned by the Monterey County Water Agency.

CHAPTER 5 MUNICIPAL SERVICE REVIEW
ADOPTED 5-6 NOVEMBER 2013
The County’s Conservation and Open Space Element (COSE) consolidated five previous
individual elements (conservation and open space, historic, esthetic, and energy elements). The
COSE is utilized as a tool to protect and preserve the unique community resources. The
element addresses many issues with regard to conservation, development, and utilization of
natural resources. The element includes policies and strategies that address reducing
greenhouse gas emissions, directing growth away from areas with constrained natural
resources, water and energy conservation, use of low impact development and green building
techniques, increased protection of community separators and scenic corridors. The County’s
overarching land use planning framework Strategic Growth Principles guided the element to
direct growth to occur in a more sustainable manner.
The map on the next page shows the Land Use Categories (zoning) for the community of
Heritage Ranch as established in the Nacimiento Area Plan. The map shows the overall zoning
for the area.
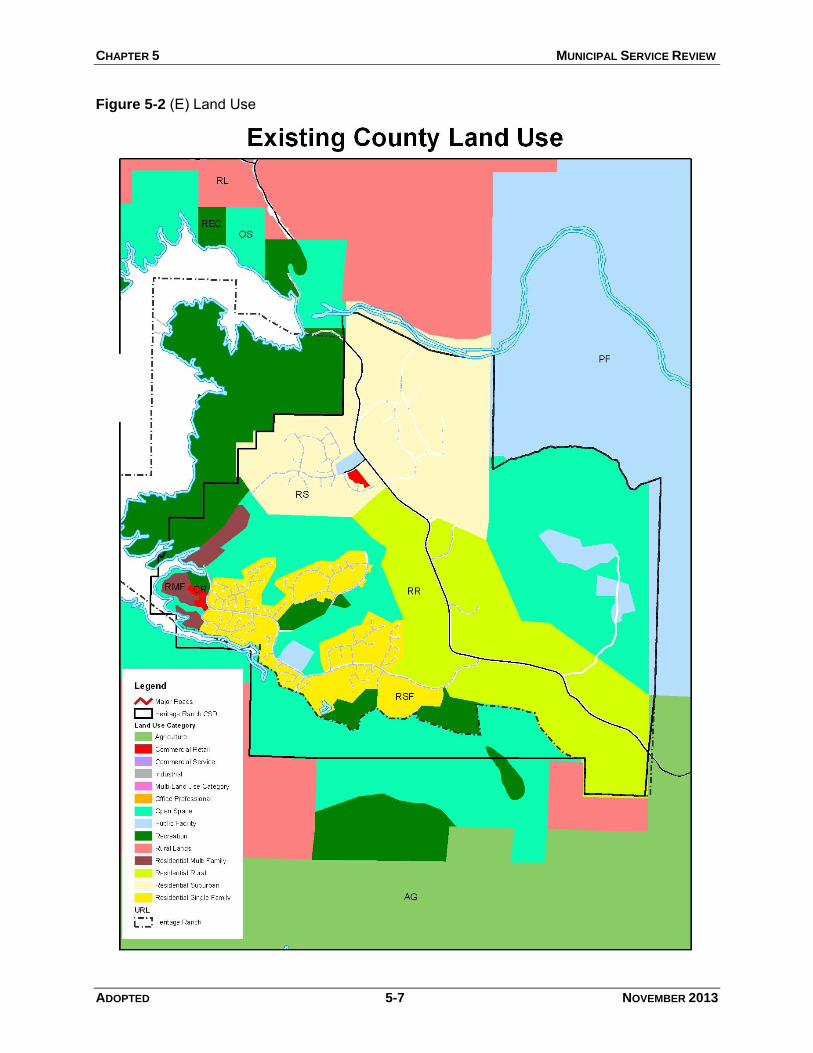
CHAPTER 5 MUNICIPAL SERVICE REVIEW
ADOPTED 5-7 NOVEMBER 2013
Figure 5-2 (E) Land Use
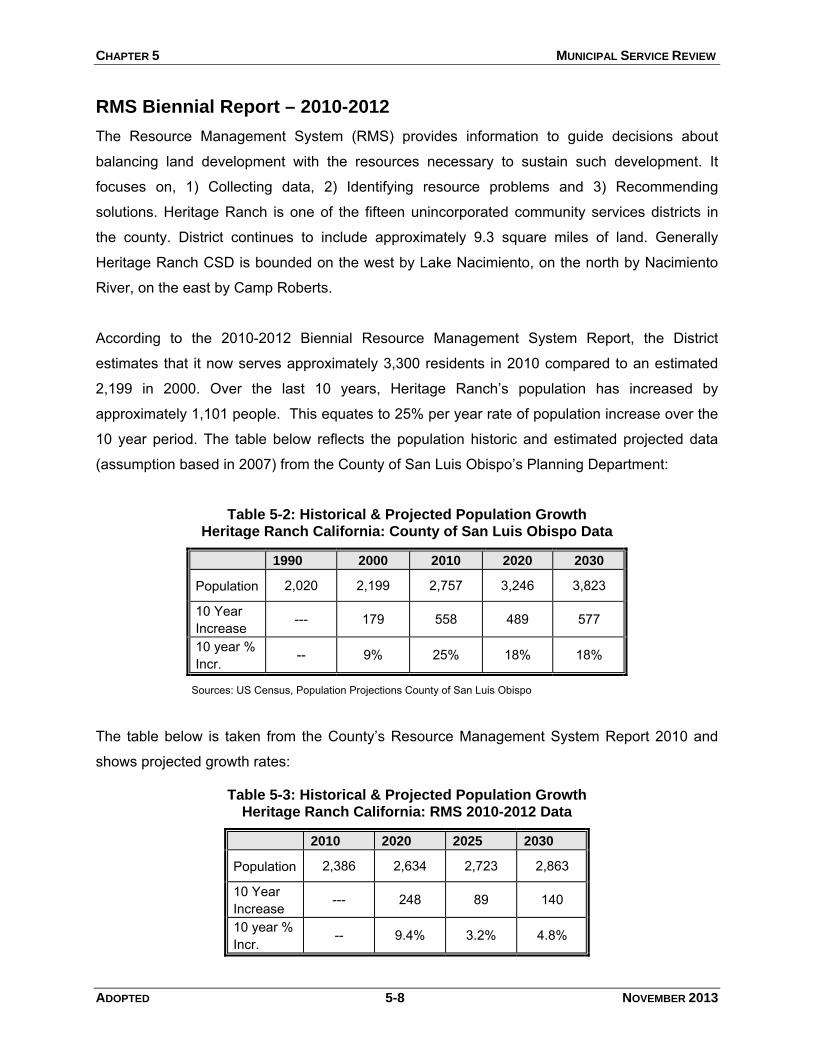
CHAPTER 5 MUNICIPAL SERVICE REVIEW
ADOPTED 5-8 NOVEMBER 2013
RMS Biennial Report – 2010-2012
The Resource Management System (RMS) provides information to guide decisions about
balancing land development with the resources necessary to sustain such development. It
focuses on, 1) Collecting data, 2) Identifying resource problems and 3) Recommending
solutions. Heritage Ranch is one of the fifteen unincorporated community services districts in
the county. District continues to include approximately 9.3 square miles of land. Generally
Heritage Ranch CSD is bounded on the west by Lake Nacimiento, on the north by Nacimiento
River, on the east by Camp Roberts.
According to the 2010-2012 Biennial Resource Management System Report, the District
estimates that it now serves approximately 3,300 residents in 2010 compared to an estimated
2,199 in 2000. Over the last 10 years, Heritage Ranch’s population has increased by
approximately 1,101 people. This equates to 25% per year rate of population increase over the
10 year period. The table below reflects the population historic and estimated projected data
(assumption based in 2007) from the County of San Luis Obispo’s Planning Department:
Table 5-2: Historical & Projected Population Growth Heritage Ranch California: County of San Luis Obispo Data
1990 2000 2010 2020 2030
Population 2,020 2,199 2,757 3,246 3,823
10 Year Increase
--- 179 558 489 577
10 year % Incr.
-- 9% 25% 18% 18%
Sources: US Census, Population Projections County of San Luis Obispo
The table below is taken from the County’s Resource Management System Report 2010 and
shows projected growth rates:
Table 5-3: Historical & Projected Population Growth Heritage Ranch California: RMS 2010-2012 Data
2010 2020 2025 2030
Population 2,386 2,634 2,723 2,863
10 Year Increase
--- 248 89 140
10 year % Incr.
-- 9.4% 3.2% 4.8%
CHAPTER 5 MUNICIPAL SERVICE REVIEW
ADOPTED 5-9 NOVEMBER 2013
Heritage Ranch CSD Water Treatment Plant Report, 2010
Housing Units and Growth Projections. Heritage Ranch is gated community outside of the
City of Paso Robles, California. The housing area is provided treated water from a two million
gallon per day treatment plant. The water treatment plant is operated by the Heritage Ranch
Community Services District (HRCSD). In addition to providing water to the Heritage Ranch
housing area, the HRCSD provides water to some residential, commercial, and public parcels
outside the housing area such as a public school and commercial center.
LAKE NACIMIENTO SPECIFIC PLAN, 1976
While the following discussion of land use issues for Heritage Village is divided into land use
categories, it should be recognized that a multitude of interrelationships exist between the
various use areas of the village, and that the organization of the discussion does not reflect
isolation of land use concerns within specific land use categories. The following excerpt from the
Area Plan describes the land uses in the Heritage Ranch community:
Recreation This designation has been applied to all portions of Lake Nacimiento Resort located within the village area, reflecting the overall recreational orientation of the resort, and the wide range of recreational facilities and related commercial services intended to serve the public. When considering conditions needing improvement, a high priority should be assigned to expanding the existing entrance facility to the resort, to minimize the severe traffic congestion experienced at times of peak use on the entry road and Lake Nacimiento Drive. The Recreation category is also applied to the recreational vehicle park and subdivisions, dude ranch, marina/launch ramp and campground areas, recreational vehicle storage area, the proposed organizational camps, the proposed tourist area and the various recreational facilities held in trust for operation by the Heritage Ranch Property Owner's Association. The latter include the equestrian center, three recreational centers, family and children's park, and ball park. Provision of proposed recreation areas are to be coordinated with the phasing of future development. Open Space Heritage Ranch developers have previously agreed with the county to retain approximately 5,100 acres in permanent open space. Recorded easements limit use of open space lands to grazing, agriculture, and passive recreation. The area within the village reserve line under the Open Space land use category is considerably less than the 5,100 acre total. The Open Space category is applied within the VRL to areas shown in the previous Heritage Ranch Specific Plan as open space or rangeland, as well as commonly-held lots in existing and planned subdivisions.
CHAPTER 5 MUNICIPAL SERVICE REVIEW
ADOPTED 5-10 NOVEMBER 2013
Residential Suburban An area of approximately 1,000 acres at the north portion of Heritage Ranch is designated for larger lot development of single-family residences. Using clustered land divisions, lot sizes may range as low as 10,000 square feet and high as to 2.5 acres, although an average parcel size of about 1 acre is intended. This area is designated to accommodate up to 400 dwelling units while retaining 60% of the acreage in open space use. (Amended 1986, Ord. 2270) Residential Rural Areas with a density of 20 acres have been designated as Residential Rural for larger acreage parcels. Residential Single Family This designation includes: the existing 750 single family residential lots created by Tracts 424, 446, 452, and 474; 693, 721, 1094, 1910, 1990, and the 188 mobile home lots in Tract 475. All future development of lots is to be in accordance with the original conditions of approval of the subdivisions and related Conditional Use Permits. Residential Multi-Family Existing Tract 466 and Tentative Tract 720 are condominium projects which have been designated Residential Multi-Family. Tract 466 and 720 contain 30 existing and 30 proposed units, respectively. Commercial Retail This designation is applied to two locations. The first location is a site near the intersection of Lake Nacimiento Drive and Heritage Loop Road. That center will serve both tourists and residents of the lake area, and it includes a restaurant, convenience stores, gas station, specialty shops, and offices. The center will use an early California architectural theme. In addition to these two areas designated as Commercial Retail, certain tourist-oriented commercial uses such as a retail store, restaurant, and motel are also planned in Lake Nacimiento Resort in the Recreation land use category (Amended 1983, Ord. 2133). Public Facilities Four sites within Heritage village are in the Public Facilities land use category: the Heritage Ranch sewage treatment plant; the sewage effluent disposal area for Heritage Ranch (east of Lake Nacimiento Drive); the Cappy Culver school site; and the Cal Fire Station 33 on Heritage Road. Future public facilities not yet assigned specific sites are noted on the combining designations map found in Chapter 7.
Land Use The County’s General Plan governs the development of land in the Community of Heritage
Ranch. The District provides the County with comments regarding land use decisions but does
not have authority over land use entitlements. The General Plan identifies the type and intensity
of development allowed in each of several land use categories for Heritage Ranch.

CHAPTER 5 MUNICIPAL SERVICE REVIEW
ADOPTED 5-11 NOVEMBER 2013
Development of Heritage Ranch was commenced in 1971 as a vacation and retirement home
community with recreational and commercial facilities provided for the residents. The Land Use
Element provides for substantial reduction in the extent of development originally authorized by
the specific plan. Re-evaluation of county water allocations for development around Lake
Nacimiento resulted in a maximum of 1,100 acre-feet a year being set aside for development of
Heritage Ranch. This allocation was expected to support the development of a maximum 4,000
residential units and other non-residential uses. (Amended 1986, Ord. 2270) In 1986, the
developer reduced the number of potential dwelling units further to 2,900 to reflect a more
realistic development capability within the intended semi-rural character of the ranch. As a
result, both the physical area within the entire Heritage Ranch Village reserve line (including
Lake Nacimiento Resort) and the densities proposed for specific locations have been revised.
The 1972 Heritage Ranch Specific Plan has been superseded by the adoption of the Land Use
Element.
This Land Use Element is now the specific plan for Heritage Ranch. (Amended 1986, Ord.
2270) To date, 1,780 lots for single-family residences, mobile homes, condominiums,
recreational vehicles, and twenty-acre lots have been created at Heritage Ranch. Also existing
are limited commercial facilities, marina/launch ramp area and campground, and dude ranch,
recreation and equestrian centers, water supply system, sewage treatment facilities, a
recreational vehicle storage area, a ball park, and Cal Fire Station 33. (Amended 1986, Ord.
2270)
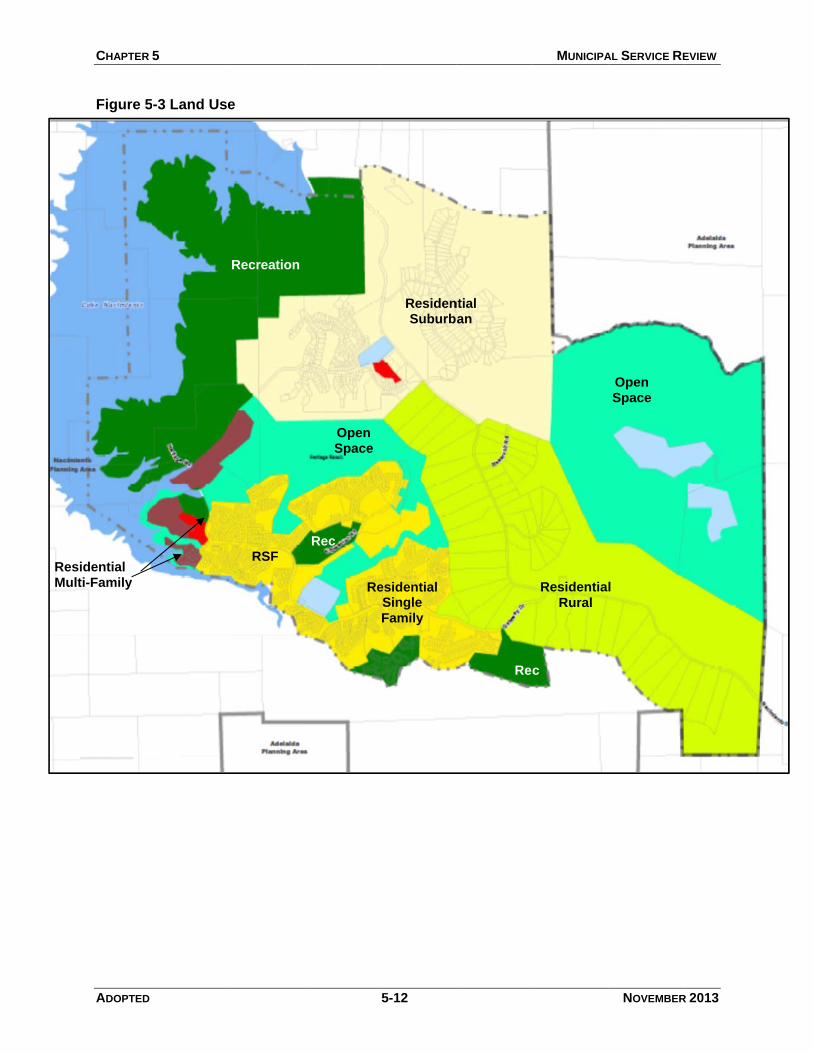
ResMul
CHAPTER
ADOPTED
Figure 5
sidential lti-Family
5
5-3 Land Use
e
Recreation
RSF
Open Space
Re
Rec
5-12
ResidenSuburb
esidential Single
Family
Rec
ntial an
Rec
MUNICIPA
Residentia
Rural
c
AL SERVICE RE
NOVEMBER
l
Open Space
EVIEW
R 2013
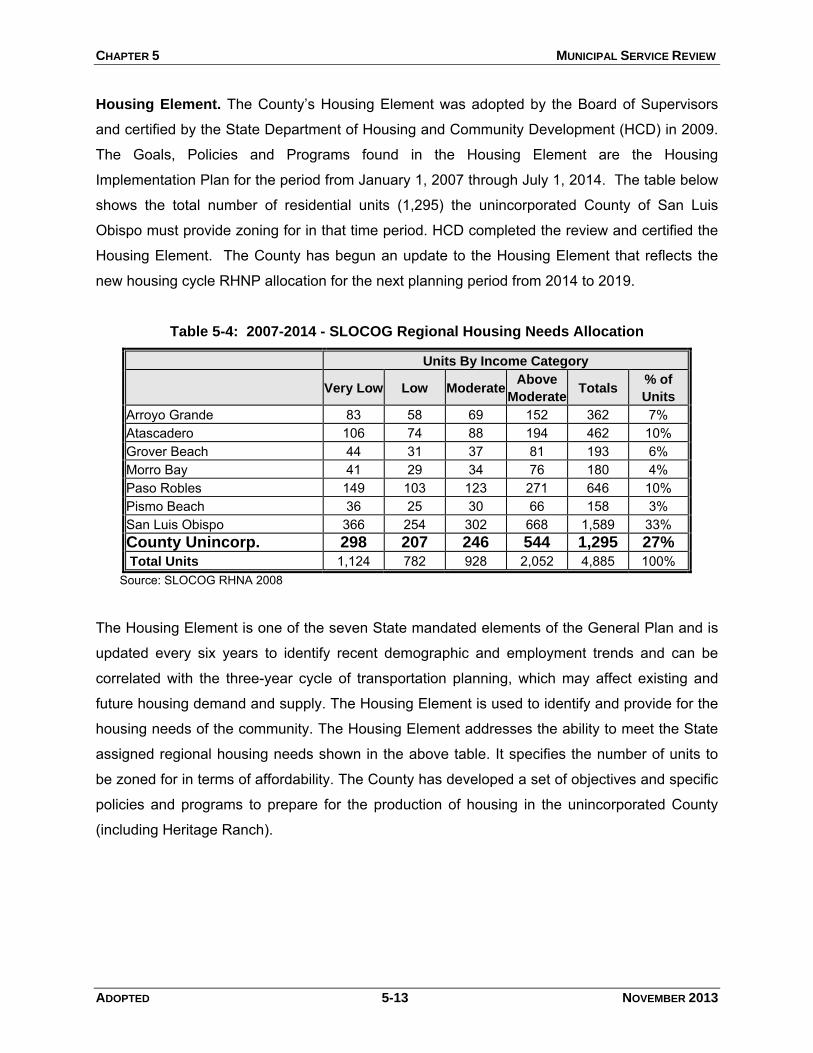
CHAPTER 5 MUNICIPAL SERVICE REVIEW
ADOPTED 5-13 NOVEMBER 2013
Housing Element. The County’s Housing Element was adopted by the Board of Supervisors
and certified by the State Department of Housing and Community Development (HCD) in 2009.
The Goals, Policies and Programs found in the Housing Element are the Housing
Implementation Plan for the period from January 1, 2007 through July 1, 2014. The table below
shows the total number of residential units (1,295) the unincorporated County of San Luis
Obispo must provide zoning for in that time period. HCD completed the review and certified the
Housing Element. The County has begun an update to the Housing Element that reflects the
new housing cycle RHNP allocation for the next planning period from 2014 to 2019.
Table 5-4: 2007-2014 - SLOCOG Regional Housing Needs Allocation
Units By Income Category
Very Low Low ModerateAbove
ModerateTotals
% of
Units
Arroyo Grande 83 58 69 152 362 7% Atascadero 106 74 88 194 462 10% Grover Beach 44 31 37 81 193 6% Morro Bay 41 29 34 76 180 4% Paso Robles 149 103 123 271 646 10% Pismo Beach 36 25 30 66 158 3% San Luis Obispo 366 254 302 668 1,589 33% County Unincorp. 298 207 246 544 1,295 27% Total Units 1,124 782 928 2,052 4,885 100%
Source: SLOCOG RHNA 2008
The Housing Element is one of the seven State mandated elements of the General Plan and is
updated every six years to identify recent demographic and employment trends and can be
correlated with the three-year cycle of transportation planning, which may affect existing and
future housing demand and supply. The Housing Element is used to identify and provide for the
housing needs of the community. The Housing Element addresses the ability to meet the State
assigned regional housing needs shown in the above table. It specifies the number of units to
be zoned for in terms of affordability. The County has developed a set of objectives and specific
policies and programs to prepare for the production of housing in the unincorporated County
(including Heritage Ranch).
CHAPTER 5 MUNICIPAL SERVICE REVIEW
ADOPTED 5-14 NOVEMBER 2013
WRITTEN DETERMINATIONS
The following written determinations are based on the information contained in the above
section regarding Growth and Population:
1. The Nacimiento Area Plan provides an information and policy base for the improvement and
future development of the Community of Heritage Ranch. The Plan provides detailed
policies and programs that were considered by the Community through public workshops
and hearings. The Plan is reflective of the Community’s concerns, values and vision for
Heritage Ranch.
2. The District does not have land use authority and does not control land use decisions which
are made by the County of San Luis Obispo.
3. According to both the County’s Resource Management System and the Council of
Governments Population Projections Heritage Ranch is projected to grow at a rate of 9.4%
in ten years.
4. The District has the administrative capability, water management expertise and sewer
capacity to serve the areas identified for growth in the area plan.
ADOPTED 5-15 NOVEMBER 2013
5.2 LOCATION AND CHARACTERISTICS OF ANY DISADVANTAGED
UNINCORPORATED COMMUNITIES
Purpose: To identify any disadvantaged unincorporated communities.
LAFCO is responsible for determining the location and characteristics of any disadvantaged
unincorporated communities within or contiguous to the sphere of influence of a jurisdiction. If a
jurisdiction is reasonably capable of providing needed resources and basic infrastructure to
disadvantaged unincorporated communities within the sphere of influence or contiguous to the
sphere of influence, it is important that such findings of infrastructure and resource availability
occur when revisions to the SOI and annexations are proposed by the District or property
owners.
The community of Heritage Ranch has a variety of economic diversity that reside within the
CSD boundary and surrounding area. Heritage Ranch’s currently has a coterminous Sphere of
Influence. A disadvantaged community is defined as a community with an annual median
household income that is less than 80 percent of the statewide annual median household
income. Because the community of Heritage Ranch CSD does not have a Sphere of Influence
disadvantage community for the present and probable need for public facilities and services nor
are the areas contiguous to the sphere of influence qualify.
WRITTEN DETERMINATIONS
The following written determinations are based on the information contained in the above
section regarding disadvantaged unincorporated communities:
1. The Heritage Ranch Community Services District’s Sphere of Influence does not have
disadvantaged unincorporated community located within or adjacent to its boundaries.
ADOPTED 5-16 NOVEMBER 2013
5.3 PRESENT AND PLANNED CAPACITY OF PUBLIC FACILITIES AND ADEQUACY
OF PUBLIC SERVICES, INCLUDING INFRASTRUCTURE NEEDS OR DEFICIENCIES
Purpose: To identify the infrastructure needs and deficiencies in terms of supply, capacity, condition of facilities, and ability to provide services.
LAFCO is responsible for determining that a jurisdiction is reasonably capable of providing
needed resources and basic infrastructure to serve areas already within the service area and in
the Sphere of Influence. It is important that such findings of infrastructure and resource
availability occur when revisions to the SOI and annexations are proposed by the District or
property owners.
The MSR analyzes present and long-term infrastructure demands and resource capabilities of
the Heritage Ranch Community Services District. LAFCO reviews and evaluates 1) the
resources and services that are currently available, and 2) the ability of the CSD to expand such
resources and services in line with increasing demands.
The most basic infrastructure needs are the provision of water and wastewater services.
Beyond these services, recreation/parks and fire protection, along with circulation/road services
are considered high priority needs for future growth of the District.
This section evaluates the District’s resources and capabilities to provide services to existing
and future residents. The key topics addressed include water supply and demand, water
pipeline system, sewer system capacity and condition, solid waste, parks and recreation
services. The District no longer provides for gas station services; however to deactivate this
power would require LAFCO approval of an application. The roads are maintained by the
Heritage Ranch Homeowner’s Association, and some portions by County of San Luis Obispo
Public Works Department and law enforcement services are provided by the County Sheriff.
CHAPTER 5 MUNICIPAL SERVICE REVIEW
ADOPTED 5-17 NOVEMBER 2013
WATER Heritage Ranch CSD considered a Water Treatment Plant Improvement Report in 2010. A
jurisdiction’s ability to provide water to existing residents and the Sphere of Influence areas is a
key consideration in updating an SOI. Because a Sphere is the area that is envisioned for
eventual annexation and service by a jurisdiction, it is important that an adequate water supply
be documented. Also to be considered are a jurisdiction’s policies with regard to growth and the
provision of water. In this area the SOI is expected to remain unchanged, with no expansions or
reductions.
Water Supply
The water treatment plant is operated by the Heritage Ranch Community Services District
(HRCSD). In addition to providing water to the Heritage Ranch housing area, the HRCSD
provides water to some residential, commercial, and public parcels outside the housing area
such as a public school and commercial center. The water treatment plant (WTP) currently pulls
water from the Nacimiento River through an infiltration gallery well. The river intake is one mile
downstream of the Nacimiento Reservoir Dam. The water is pumped from the river infiltration
gallery well to a 300,000 gallon raw water storage tank at the water treatment plant site. From
the raw water tank, the water flows by gravity to a series of four contact clarifier/filter units.
Potassium permanganate and powdered activated carbon are added to the raw water prior to
the raw water tank. Polymer and aluminum sulfate are added via an inline static mixer prior to
the clarifier/filter units. After passing through the clarifier and multimedia filters, sodium
hypochlorite and orthophosphate (corrosion control) is added. The treated water is then pumped
to a 300,000 gallon storage tank (clearwell) prior to pumping into a two million gallon water tank.
From the two million gallon tank, water is fed into the distribution system.
Entitlements. Water entitlements for Lake Nacimiento are shared between two entities:
Monterey County Water Resources Agency (MCWRA) and County of San Luis Obispo. Heritage
Ranch CSD’s and other lakeside users’ water entitlements are included within the water
entitlements held by the County of San Luis Obispo. The Nacimiento Water Supply Project will
allow the County to use their remaining water entitlements. The Nacimiento Water Project
consists of an intake and pump station in the Nacimiento Reservoir and approximately 45 miles
of transmission pipeline to serve several communities in San Luis Obispo County. Although the
County of San Luis Obispo’s water entitlements are significantly less than MCWRA, the
CHAPTER 5 MUNICIPAL SERVICE REVIEW
ADOPTED 5-18 NOVEMBER 2013
increased demand from the County will also play a contributing factor to the fluctuating lake
levels.
Allocation. The County of San Luis Obispo has allocated 1,100 acre-feet from Lake Nacimiento
to serve the Heritage Ranch community. The District has three contracts with the County that
allow the District an allocation of 889 acre-feet per year. The balance of the water, 211 acre-
feet, is contracted to a developer. The District is in the planning stages of constructing a
temporary/emergency pipeline to allow water to be supplied to the WTP directly from the
Nacimiento Water Project. This pipeline would be used as an alternative source of water during
dead pool levels in the reservoir (the period when water can no longer be released through the
dam). Since this pipeline would bypass the infiltration gallery, there may be increased turbidity,
iron/manganese, and disinfection byproduct precursors.
The District’s Water Fund receives revenues from user fees and service charges, connection
fees, and interest from cash flow accumulations and reserves. Routine water system operation
and maintenance includes repair of line breaks and installation of new services. It also includes
monitoring and/or recording of tank levels, line pressures, chlorine levels and quantities, and
water demand flows. The District is also responsible for maintaining and repairing engines and
electric motors for well pumps, 5 vehicles, 1 backhoe, and other assorted equipment and
machinery. The HRCSD also flushes lines, reads meters, responds to requests from the public,
and inspects new construction installations. The District allocates 3 full time equivalents to this
function.
Emergency Water Supply. Heritage Ranch Community Services District (HRCSD) provides
water, wastewater, and solid waste services to the community of Heritage Ranch. The
community consists of 1,760 residential home water services, a public school, and a small
commercial center. The population is approximately 3,500 people.
HRCSD’s only water source is the Nacimiento Reservoir via the Nacimiento River. HRCSD’s
raw water intake facility is a series of shallow infiltration gallery wells located under the
Nacimiento River approximately 3,000 feet downstream of the Nacimiento Dam. The existing
water intake facilities consist of three 60-foot long (16″ diameter) well screens laid horizontally
under the Nacimiento River bed, under approximately 10-foot of rock and engineered bedding
and native material. The water production/yield through the water intakes is dependent upon a
CHAPTER 5 MUNICIPAL SERVICE REVIEW
ADOPTED 5-19 NOVEMBER 2013
variety of factors including river flow rate and turbidity. This surface water is treated at the
HRCSD’s water treatment plant.
The flow of water to the river is controlled by Monterey County Water Resources Agency
(MCWRA) until the reservoir reaches the upper minimum pool boundary of 687.8 feet at which
time all reservoir releases may stop. Any release of water at the minimum pool requires the
authorization of San Luis Obispo County. This situation has never occurred and water has
always flowed in the river. However, the community has come very close in the past with
discussions in 2009 between MCWRA and San Luis Obispo County regarding reduced/no flow
in the river.
During dead pool conditions, reservoir elevation below 670 feet, water can no longer be gravity
fed to the lower outlet works of the dam. At this reservoir elevation the Nacimiento River is not
capable of receiving gravity fed water from the outlet works of the dam and the only water
supply for Heritage Ranch (gallery wells downstream of the dam) will be without a water supply.
Dead pool conditions have never existed since the reservoir was constructed in 1958. However,
it has come close during several multi-year drought periods. These include 1960 (671′) 1977
(674′). 1989/90 (672′) and the most recent in December 2009 when the reservoir lowered to 700
feet in elevation.
In addition to dead pool, MCWRA has the option to stop flow down the river whenever they
repair or maintain the lower outlet works of the dam. This situation occurred in the summer of
2013 when major work on the hydro-electric plant at the base of the dam required MCWRA to
close off the lower outlet works preventing any water from flowing into the river. Bypass
pumping of minimum flow water over the spillway occurred at the direction of NOAA Fisheries. If
this had not occurred, Heritage Ranch would not have been able to access its water entitlement.
The District’s water supply is totally dependent on a flow of water in the Nacimiento River
directly below the dam. There is no viable groundwater basin in or around Heritage Ranch. The
Nacimiento Reservoir and the flow of water in the river is our only water supply.
CHAPTER 5 MUNICIPAL SERVICE REVIEW
ADOPTED 5-20 NOVEMBER 2013
1,100 acre feet per year (afy) of Nacimiento water is reserved for Heritage Ranch. Currently the
HRCSD is under contract with the San Luis Obispo County Flood Control and Water
Conservation District for 889 afy of Nacimiento water. Actual water use for HRCSD for the 2012
year was 550 acre feet.
On September 22, 2009, the California Department of Public Health (CDPH) issued a letter
directing the HRCSD to identify options for a permanent backup/emergency water supply for
Heritage Ranch. The CDPH’s focus is for HRCSD to provide an emergency water supply to
maintain the health and safety of the community during dead pool conditions.
Imminent Threat to Life and Property. The HRCSD's water intake structure in the Nacimiento
River is the only source of water for the community. Any loss or major disruption to this water
source will equate to damage to an essential public service, and has a very real potential to
result in an unacceptable hazard to health, life and/or property. This threat to the health and
safety of the community of Heritage Ranch includes the lives and well-being of residents, a
public school, and commercial businesses. The HRCSD’s water intake structure must provide
for an emergency/temporary direct intake of its Nacimiento water entitlement in the event of no
water in the Nacimiento River to prevent a loss of the potable water system for the community.
The HRCSD’s Nacimiento water supply provides the only source of water for fire protection for
the entire community.
Proposed Project Components. The proposed project includes a temporary above ground
pipe between the Nacimiento Water Project (NWP) and the HRCSD’s water intake pump station
1 along the Nacimiento River. The HRCSD’s water pump station 1 is almost directly across the
Nacimiento River from the proposed connection point at an existing air vacuum valve on the
NWP. This temporary above ground water pipe would only be placed in service in the event
there is no water in the Nacimiento River. The project would consist of the following
components:
• Install connection and water meter to the existing air vacuum valve (NWP Station
40+92.94).
• Connect flexible piping from the air vacuum valve to HRCSD pump station 1.

CHAPTER 5 MUNICIPAL SERVICE REVIEW
ADOPTED 5-21 NOVEMBER 2013
• The temporary piping will be less than 1 mile in length and placed above ground in the
event the river is dry.
The project is only for a short term emergency use, only when there is no water flowing in the
Nacimiento River. This condition would likely be caused by a reservoir elevation below dead
pool elevation of 670 feet, a malfunction of the lower outlet works that did not permit MCWRA to
release water into the river. This event would be short term to allow other water pumping
systems to be established in the reservoir, repair of any broken structures on the dam, or until
the eventual rising of reservoir water levels from rainfall.
Water Conservation
The HRCSD’s use of the NWP would be temporary and only needed to supply water for fire
protection and the health and safety of the community. During these circumstances the HRCSD
would implement its water conservation ordinance that severely restricts water use throughout
the community. The use of the emergency turnout on the NWP is only for the HRCSD’s access
to its current Nacimiento water entitlement; the HRCSD is not requesting any addition allocation
of Nacimiento water.
Funding
Article 30(B) of the Water Delivery Entitlement Contracts discusses use of reserve capacity–
water wheeling. The HRCSD falls within the definition of a Wheeling Customer. The HRCSD’s
will fund its cost of water accessed through the NWP including operations, maintenance, debt
service and variable energy costs.
County Resource Management System Report. The County produces a Biennial Resources
Summary Report (RMS) that summarizes the resource situation (including water) of Heritage
Ranch and other unincorporated areas of the County. The County Resource Management
System indicates that the level of severity for the water supply and delivery system is “none”,
which means the system and supply are projected to be adequately meet the needs of current
and future residents. The 2010-2012 RMS report characterizes the District’s water supply. The
Heritage Ranch Community Services District provided updated water use as follows:
CHAPTER 5 MUNICIPAL SERVICE REVIEW
ADOPTED 5-22 NOVEMBER 2013
Water use in Heritage Ranch has ranged from a low of 479 AFY in 2002-03 to a high of 625
AFY in 2006-07, as shown in the following table.
Table 5-5 Heritage Ranch Water Produced
Heritage Ranch Amount Produced, AFY
2002 2003 2004 2005 2006 2007 2008 2009 2010 2011 2012
Total 493 479 507 550 585 625 616 592 563 548 536 Source: Heritage Ranch CSD. Units; Acre Feet per Year
The following table shows per capita water use, which is currently estimated at 150 gpcd. A
20% reduction in per capita use was provided by the Heritage Ranch CSD.
Table 5-6 Heritage Ranch Per Capita Water Use
Heritage Ranch Per Capita Water Use
Year Population Gallons Per Capita Per Day (GPCD)
Total Acre Feet Per Year
July 2009-June 2010 3,300 150 553 2020 4,335 120 581 2025 4,786 120 642 2035 5,834 120 782 Source: Heritage Ranch CSD.
Water Demand The District completes water demand projections in order to estimate how much water might be
needed to serve residents, businesses and other uses as growth and development occur in the
service area. The District’s Water Master Plan provides information and establishes policies for
meeting the current water demand and for projecting future water demand. This document is a
valuable water resource planning tool.
In 2012, the District reported annual water use of 536 acre-feet.
Water Supply and Demand. This section provides an analysis of the water supply and
demand situation for the HRCSD. The information that follows characterizes the future supply
and demand projections for Heritage Ranch. It provides a forecast of the District’s future water
situation using the water demand data from the above section, population projections from the
County and other studies. Please note that this analysis was prepared based on the District’s
existing boundaries and does not anticipate an expanded Sphere of Influence.
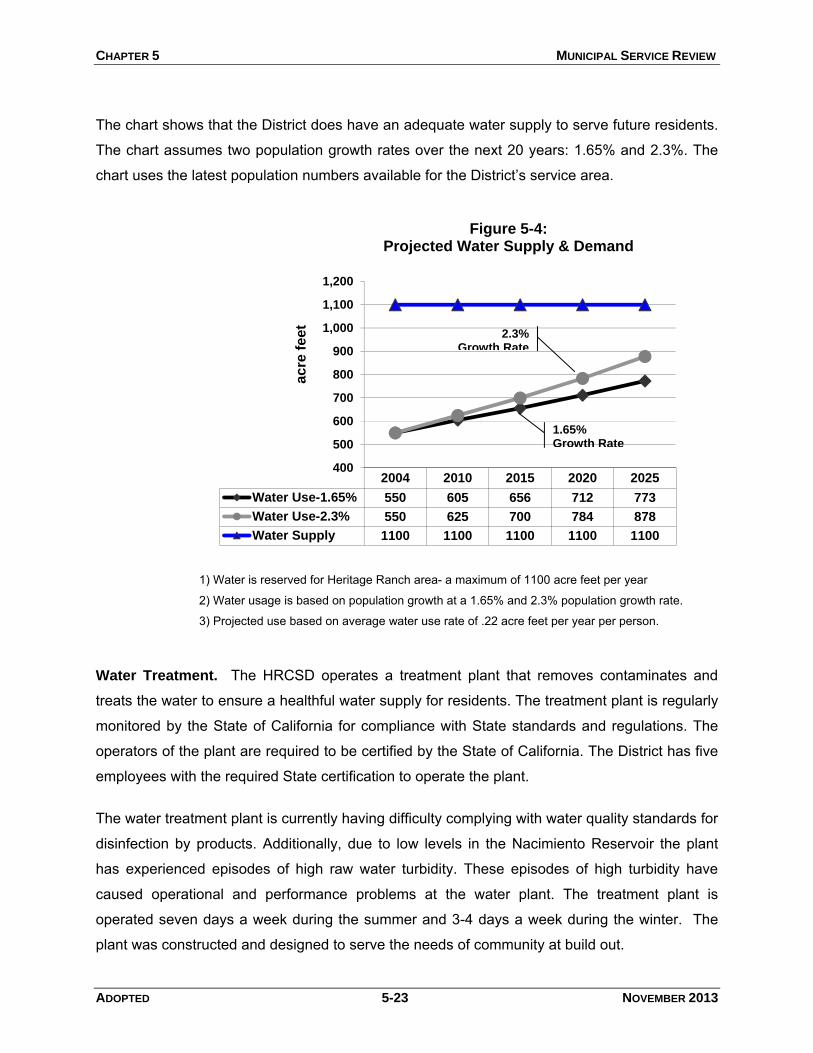
CHAPTER 5 MUNICIPAL SERVICE REVIEW
ADOPTED 5-23 NOVEMBER 2013
The chart shows that the District does have an adequate water supply to serve future residents.
The chart assumes two population growth rates over the next 20 years: 1.65% and 2.3%. The
chart uses the latest population numbers available for the District’s service area.
Water Treatment. The HRCSD operates a treatment plant that removes contaminates and
treats the water to ensure a healthful water supply for residents. The treatment plant is regularly
monitored by the State of California for compliance with State standards and regulations. The
operators of the plant are required to be certified by the State of California. The District has five
employees with the required State certification to operate the plant.
The water treatment plant is currently having difficulty complying with water quality standards for
disinfection by products. Additionally, due to low levels in the Nacimiento Reservoir the plant
has experienced episodes of high raw water turbidity. These episodes of high turbidity have
caused operational and performance problems at the water plant. The treatment plant is
operated seven days a week during the summer and 3-4 days a week during the winter. The
plant was constructed and designed to serve the needs of community at build out.
2004 2010 2015 2020 2025
Water Use-1.65% 550 605 656 712 773
Water Use-2.3% 550 625 700 784 878
Water Supply 1100 1100 1100 1100 1100
400
500
600
700
800
900
1,000
1,100
1,200
ac
re f
ee
t
Figure 5-4:Projected Water Supply & Demand
1.65% Growth Rate
2.3%Growth Rate
1) Water is reserved for Heritage Ranch area- a maximum of 1100 acre feet per year
2) Water usage is based on population growth at a 1.65% and 2.3% population growth rate.
3) Projected use based on average water use rate of .22 acre feet per year per person.
CHAPTER 5 MUNICIPAL SERVICE REVIEW
ADOPTED 5-24 NOVEMBER 2013
A review of existing WTP operational data, raw water analyses, and finished water analyses
was performed. Based on this information, a jar testing study was conducted and a treatment
basis of design to meet the set goals were developed. Based on an analysis of the potential
alternatives and their ability to meet the goals of the District, the recommended projects are to
construct a potassium permanganate and powdered activated carbon feed system at the water
treatment plant.
Water Storage. The Water Storage system in Heritage Ranch is comprised of four tanks:
300,000 gallon raw water tank-prior to treatment
300,000 gallon clearwell tank-after water treatment
2 million gallon tank that serves most of Heritage Ranch
40,000 gallon tank serving 8 lots 20 acres in size
The tanks are linked by a pipeline system that is used to transfer water from the river to the raw
water tank, then to the clearwell tank, and up to the two million gallon main storage tank. From
the main storage tank, the water is distributed to the residents of Heritage Ranch.
Water Distribution. The Water Distribution system includes pipelines of various sizes that
connect to residences in the area. In 2010 Heritage Ranch had 1,780 residential connections
and approximately 25 commercial/irrigation connections. The District completes regular
maintenance on the distribution system, including: pipeline upgrades, repairs and meter
replacements. The staff also responds to questions from residents. Based on the studies the
District is considering options to continue and adequate distribution system to serve the existing
residents and can be expanded to meet the needs of future residents.
Capital Improvement Plan-Water System. The District’s Capital Improvement Plan (CIP)
comprehensively schedules and finances the capital projects and equipment purchases needed
for the WTP improvements. Planned water system improvements are included in the District’s
Capital Improvements Program that was adopted by the Board of Directors. The improvements
to the system include:
CHAPTER 5 MUNICIPAL SERVICE REVIEW
ADOPTED 5-25 NOVEMBER 2013
Projects Budgeted or In Process
Phase I WTP DBP improvements: Potassium Permanganate and PAC Feed
System, tank mixing and pipeline work -- $650,000. Plate Settler-- $715,000
UV Spectrophotometer -- $30,000
Other Water Providers
In addition to the Heritage Ranch Community Services District, nine other private water
purveyors provide water services to area residents. The primary source for all of these water
providers is groundwater under the direct influence of surface water of Nacimiento Lake or
River. These include:
• South Shore Village Club
• Christmas Cove Company
• Cal Shasta Club
• Nacimiento Water Company
• Tri-Counties Club
• Laguna Vista Boat Club
• Northshore S&B Inc.
• Lake Nacimiento, and
• Babe Ruth Oak View Mobile Home Park

CHAPTER 5 MUNICIPAL SERVICE REVIEW
ADOPTED 5-26 NOVEMBER 2013
Figure 5-5 Private Water Purveyors
CHAPTER 5 MUNICIPAL SERVICE REVIEW
ADOPTED 5-27 NOVEMBER 2013
WASTEWATER COLLECTION & TREATMENT SYSTEM
Facility Description. The sewer treatment plant is located on Heritage Road next to the
District office. It has a capacity of 400,000 gallons per day. Actual flows are about half of
capacity. Heritage Ranch CSD wastewater treatment plant is an extended aeration facility.
Aeration treatment relies on aerobic bacteria to digest the sewage. To enhance the process,
HRCSD operate aerators; floating mixers that are composed of electric motors with “propellers”
that hang down in the water about a foot. The objective is to introduce more oxygen in order to
speed the digestion process. The treatment process is further enhanced with the use of two
ponds; aeration in the first and decanting (less turbid water from the upper layer) into the
second pond where it settles out.
The partially treated waste is then pumped from the second pond and with injection of chlorine,
which travels 3.5 mile to the final treatment parcel. This parcel is 220 acres in size is used for
final treatment and disposal. HRCSD can direct the flow from the treatment plant either directly
to sand filters, or pond #3 for storage and later, to the sand filters.
The effluent is then collected and piped to the adjacent ephemeral drainage way which courses
northeasterly to and across Camp Roberts Military Reservation. The point of discharge and the
entire service area of the District, overlays the “Paso Robles” geological formation. Among its
characteristics is low permeability. The discharge flows largely intact for about 1.5 miles
whereupon it percolates almost immediately upon meeting the “Monterey” formation,
characteristically a highly permeable formation. The discharge is down gradient of Lake
Nacimiento but can occasionally flow all the way to the Nacimiento River during significant
storm runoff. The discharge does not impact the water quality of Lake Nacimiento.
The California Regional Water Quality Control Board (RWQCB), Central Coast Region, issues a
Waste Discharge permit for discharge of the treated effluent. A NPDES (National Pollution
Discharge Elimination System) permit is also required for the discharge of treated water. A
NPDES permit is required because the ephemeral creek discharges to the Nacimiento River
during heavy rains and thus to a “water of the United States” that is under Federal authority.
Basic effluent limitations set by the RWQCB are that the discharge must be treated to a degree
that protects groundwater, streams and riparian habitat. The current five-year NPDES permit
expires in 2016. Daily, monthly and annual testing is required of HRCSD wastewater effluent.
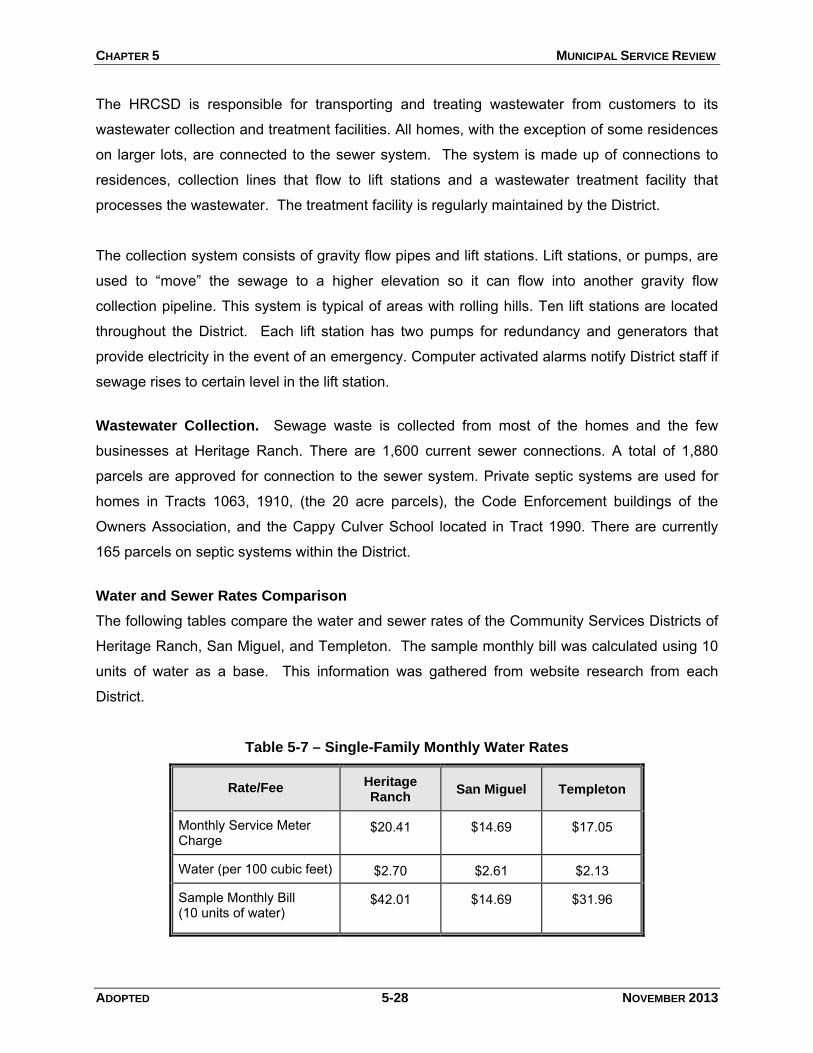
CHAPTER 5 MUNICIPAL SERVICE REVIEW
ADOPTED 5-28 NOVEMBER 2013
The HRCSD is responsible for transporting and treating wastewater from customers to its
wastewater collection and treatment facilities. All homes, with the exception of some residences
on larger lots, are connected to the sewer system. The system is made up of connections to
residences, collection lines that flow to lift stations and a wastewater treatment facility that
processes the wastewater. The treatment facility is regularly maintained by the District.
The collection system consists of gravity flow pipes and lift stations. Lift stations, or pumps, are
used to “move” the sewage to a higher elevation so it can flow into another gravity flow
collection pipeline. This system is typical of areas with rolling hills. Ten lift stations are located
throughout the District. Each lift station has two pumps for redundancy and generators that
provide electricity in the event of an emergency. Computer activated alarms notify District staff if
sewage rises to certain level in the lift station.
Wastewater Collection. Sewage waste is collected from most of the homes and the few
businesses at Heritage Ranch. There are 1,600 current sewer connections. A total of 1,880
parcels are approved for connection to the sewer system. Private septic systems are used for
homes in Tracts 1063, 1910, (the 20 acre parcels), the Code Enforcement buildings of the
Owners Association, and the Cappy Culver School located in Tract 1990. There are currently
165 parcels on septic systems within the District.
Water and Sewer Rates Comparison
The following tables compare the water and sewer rates of the Community Services Districts of
Heritage Ranch, San Miguel, and Templeton. The sample monthly bill was calculated using 10
units of water as a base. This information was gathered from website research from each
District.
Table 5-7 – Single-Family Monthly Water Rates
Rate/Fee
Heritage Ranch
San Miguel
Templeton
Monthly Service Meter Charge
$20.41 $14.69 $17.05
Water (per 100 cubic feet)
$2.70 $2.61 $2.13
Sample Monthly Bill (10 units of water)
$42.01 $14.69 $31.96
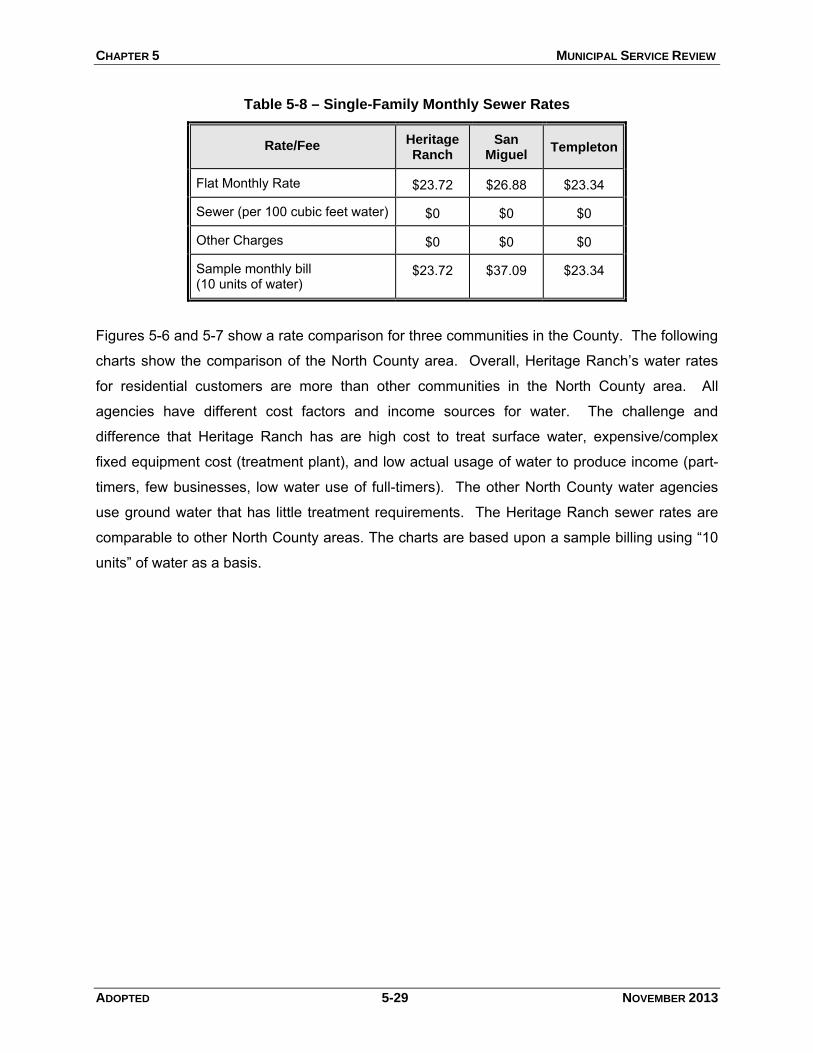
CHAPTER 5 MUNICIPAL SERVICE REVIEW
ADOPTED 5-29 NOVEMBER 2013
Table 5-8 – Single-Family Monthly Sewer Rates
Rate/Fee
Heritage Ranch
San Miguel
Templeton
Flat Monthly Rate
$23.72 $26.88 $23.34
Sewer (per 100 cubic feet water)
$0 $0 $0
Other Charges
$0 $0 $0
Sample monthly bill (10 units of water)
$23.72 $37.09 $23.34
Figures 5-6 and 5-7 show a rate comparison for three communities in the County. The following
charts show the comparison of the North County area. Overall, Heritage Ranch’s water rates
for residential customers are more than other communities in the North County area. All
agencies have different cost factors and income sources for water. The challenge and
difference that Heritage Ranch has are high cost to treat surface water, expensive/complex
fixed equipment cost (treatment plant), and low actual usage of water to produce income (part-
timers, few businesses, low water use of full-timers). The other North County water agencies
use ground water that has little treatment requirements. The Heritage Ranch sewer rates are
comparable to other North County areas. The charts are based upon a sample billing using “10
units” of water as a basis.
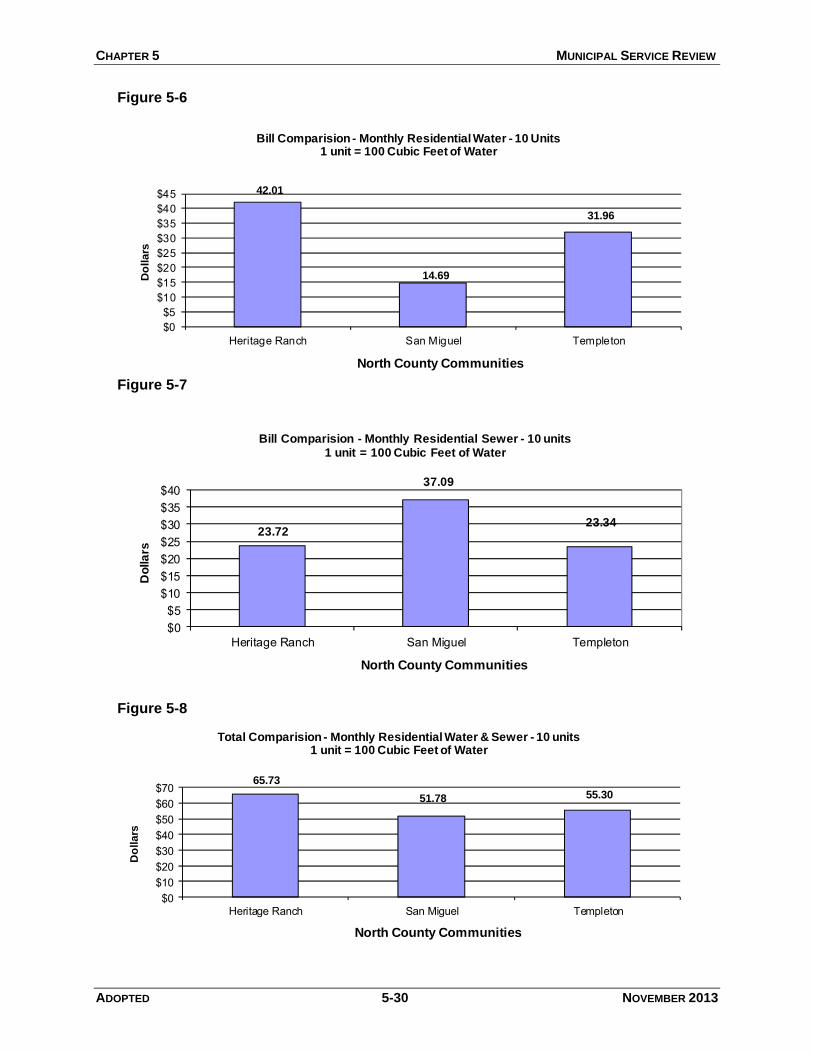
CHAPTER 5 MUNICIPAL SERVICE REVIEW
ADOPTED 5-30 NOVEMBER 2013
42.01
14.69
31.96
$0$5
$10$15$20$25$30$35$40$45
Heritage Ranch San Miguel Templeton
Do
llars
North County Communities
Bill Comparision - Monthly Residential Water - 10 Units1 unit = 100 Cubic Feet of Water
23.72
37.09
23.34
$0$5
$10$15$20$25$30$35$40
Heritage Ranch San Miguel Templeton
Do
lla
rs
North County Communities
Bill Comparision - Monthly Residential Sewer - 10 units1 unit = 100 Cubic Feet of Water
65.73
51.78 55.30
$0$10$20$30$40$50$60$70
Heritage Ranch San Miguel Templeton
Do
llars
North County Communities
Total Comparision - Monthly Residential Water & Sewer - 10 units1 unit = 100 Cubic Feet of Water
Figure 5-6
Figure 5-7
Figure 5-8
CHAPTER 5 MUNICIPAL SERVICE REVIEW
ADOPTED 5-31 NOVEMBER 2013
STREETS AND ROADS
The Heritage Ranch Homeowners Association is responsible for the maintenance and repair of
the streets and roads in Heritage Ranch. The HRCSD does not have responsibility for the
construction or maintenance of roads. Because this is a gated community the circulation and
traffic system is managed by the Homeowners Association. The County is responsible for
maintaining the main road up to Heritage Ranch, G14.
FIRE & POLICE SERVICES Fire. Fire protection and emergency medical response services are provided by the County
Fire Department through station number 33 which is located on the east side of the Heritage
Ranch area. This provides for a very swift response to emergency situations throughout the
Heritage Ranch community and the surrounding area. Two other CDF stations are in the
outlying areas of Oak Shores and Las Tablas and the City of Paso Robles can also respond if
needed.
The community has considered upgrading the response capability from an emergency medical
technician (EMT) to a paramedic level of service. Paramedics have an increased training that
allows them to intubate a victim among other services they can provide. Upgrading to a
paramedic from an EMT would not guarantee that a paramedic would respond in an emergency.
The paramedic might be stationed at another facility or could be out on another call in the area.
Also, the costs of upgrading would be borne by the residents through a special tax or fee. The
CSD would not provide this service as it would be an upgrade to the Cal Fire’s current area-
wide response system.
The District is only a part of the response area served by Cal Fire. Also, the District does not
have the authority to provide emergency response services. If the upgrade to service is to be
pursued, the District is not the agency in the best position to provide this service.
Sheriff. The County Sheriff’s Department provides law enforcement services for the community
of Heritage Ranch. The California Crime Rate for the unincorporated areas of the County is one
of the lowest in the State compared with other counties with a population of 100,000 or more.
The statewide average for serious crimes per 100,000 people is 3,187; the County’s crime rate
was 603/100,000 people. The Sheriff Department’s goal in the North County is to provide a 10-
minute response time for high priority, life-threatening calls for service.
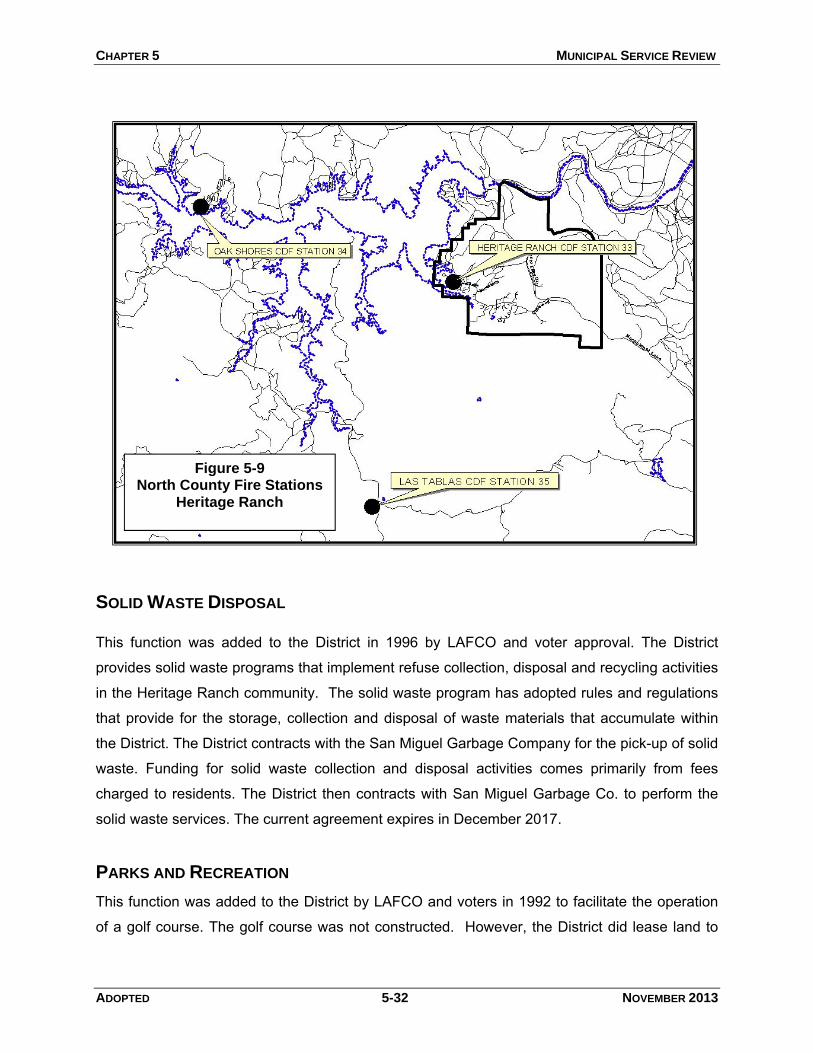
CHAPTER 5 MUNICIPAL SERVICE REVIEW
ADOPTED 5-32 NOVEMBER 2013
SOLID WASTE DISPOSAL This function was added to the District in 1996 by LAFCO and voter approval. The District
provides solid waste programs that implement refuse collection, disposal and recycling activities
in the Heritage Ranch community. The solid waste program has adopted rules and regulations
that provide for the storage, collection and disposal of waste materials that accumulate within
the District. The District contracts with the San Miguel Garbage Company for the pick-up of solid
waste. Funding for solid waste collection and disposal activities comes primarily from fees
charged to residents. The District then contracts with San Miguel Garbage Co. to perform the
solid waste services. The current agreement expires in December 2017.
PARKS AND RECREATION
This function was added to the District by LAFCO and voters in 1992 to facilitate the operation
of a golf course. The golf course was not constructed. However, the District did lease land to
Figure 5-9 North County Fire Stations
Heritage Ranch
CHAPTER 5 MUNICIPAL SERVICE REVIEW
ADOPTED 5-33 NOVEMBER 2013
enable construction of a Senior Center for the community. Currently, the District does not
operate the Senior Center but leases the Center to Heritage Village Seniors’ Association.
The District and the Homeowners Association worked together to construct two boat docks with
a total of 40 slips. The District financed and managed the construction of the project. The
Association administered the slip rentals and regular maintenance on the docks. The
Association collected fees and rents and transferred these to the District. The Association paid
off the financed portion of the project to the District in 2009 and the ownership of the slips was
transferred to the Homeowners Association.
CHAPTER 5 MUNICIPAL SERVICE REVIEW
ADOPTED 5-34 NOVEMBER 2013
WRITTEN DETERMINATIONS
The following written determinations are based on the information contained in the above
section regarding Infrastructure Needs and Deficiencies:
Water Supply and Demand
1. Based on information provided by the District and the County’s Resource Management
System, the District has an adequate water supply to serve the community of Heritage
Ranch.
2. The chart on page 5-20 shows that the District appears to have an adequate water supply to
serve future residents. The chart assumes two population growth rates over the next 20
years: 1.65% and 2.3% and uses per capita water use for the past four years to project
demand.
3. The District manages its water facilities in a professional and effective manner that complies
with state regulations and provides for the provision of healthful water to its residents and
customers. The District is in the process of undergoing improvements to the water
treatment plant to improve water quality for its residents.
4. The District has access to only one source of water; Lake Nacimiento. This limits the
District’s ability to provide water service to other areas.
Wastewater
5. The capacity of the District’s wastewater treatment plant is adequate to serve the growth
anticipated in the Heritage Ranch Community. The County Resource Management System
Annual Summary Report indicates that the District’s system is operating at 50% of capacity.
6. The treatment facility has the capacity to process 0.4 million gallons per day of wastewater
and is currently processing an average of 0.2 million gallons per day.
7. The District maintains the facility on a regular basis and is in compliance with regulatory
requirements
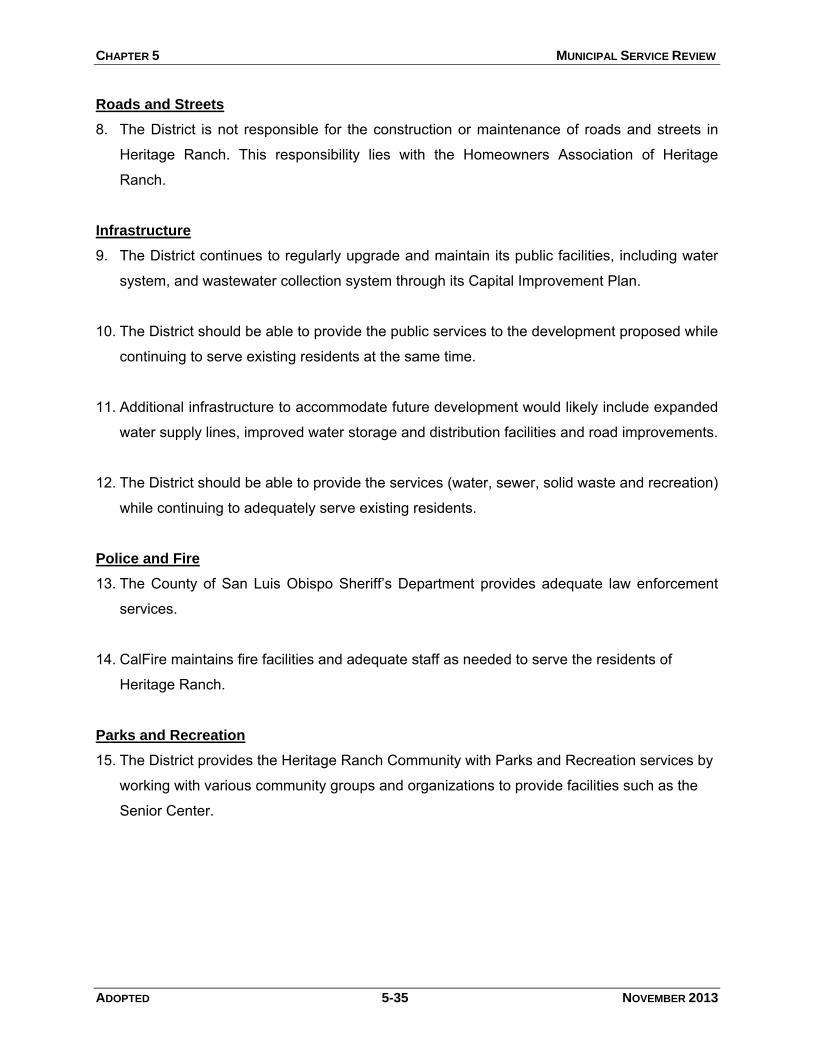
CHAPTER 5 MUNICIPAL SERVICE REVIEW
ADOPTED 5-35 NOVEMBER 2013
Roads and Streets
8. The District is not responsible for the construction or maintenance of roads and streets in
Heritage Ranch. This responsibility lies with the Homeowners Association of Heritage
Ranch.
Infrastructure
9. The District continues to regularly upgrade and maintain its public facilities, including water
system, and wastewater collection system through its Capital Improvement Plan.
10. The District should be able to provide the public services to the development proposed while
continuing to serve existing residents at the same time.
11. Additional infrastructure to accommodate future development would likely include expanded
water supply lines, improved water storage and distribution facilities and road improvements.
12. The District should be able to provide the services (water, sewer, solid waste and recreation)
while continuing to adequately serve existing residents.
Police and Fire
13. The County of San Luis Obispo Sheriff’s Department provides adequate law enforcement
services.
14. CalFire maintains fire facilities and adequate staff as needed to serve the residents of
Heritage Ranch.
Parks and Recreation
15. The District provides the Heritage Ranch Community with Parks and Recreation services by
working with various community groups and organizations to provide facilities such as the
Senior Center.
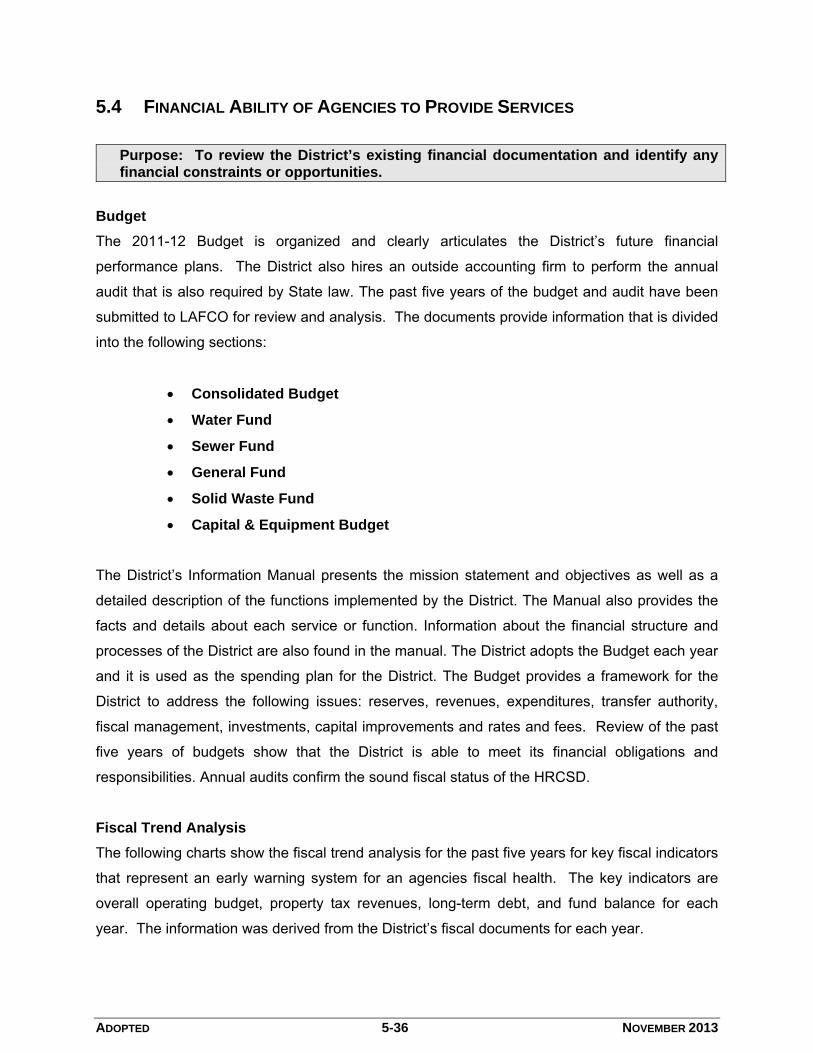
ADOPTED 5-36 NOVEMBER 2013
5.4 FINANCIAL ABILITY OF AGENCIES TO PROVIDE SERVICES
Purpose: To review the District’s existing financial documentation and identify any financial constraints or opportunities.
Budget
The 2011-12 Budget is organized and clearly articulates the District’s future financial
performance plans. The District also hires an outside accounting firm to perform the annual
audit that is also required by State law. The past five years of the budget and audit have been
submitted to LAFCO for review and analysis. The documents provide information that is divided
into the following sections:
• Consolidated Budget
• Water Fund
• Sewer Fund
• General Fund
• Solid Waste Fund
• Capital & Equipment Budget
The District’s Information Manual presents the mission statement and objectives as well as a
detailed description of the functions implemented by the District. The Manual also provides the
facts and details about each service or function. Information about the financial structure and
processes of the District are also found in the manual. The District adopts the Budget each year
and it is used as the spending plan for the District. The Budget provides a framework for the
District to address the following issues: reserves, revenues, expenditures, transfer authority,
fiscal management, investments, capital improvements and rates and fees. Review of the past
five years of budgets show that the District is able to meet its financial obligations and
responsibilities. Annual audits confirm the sound fiscal status of the HRCSD.
Fiscal Trend Analysis
The following charts show the fiscal trend analysis for the past five years for key fiscal indicators
that represent an early warning system for an agencies fiscal health. The key indicators are
overall operating budget, property tax revenues, long-term debt, and fund balance for each
year. The information was derived from the District’s fiscal documents for each year.
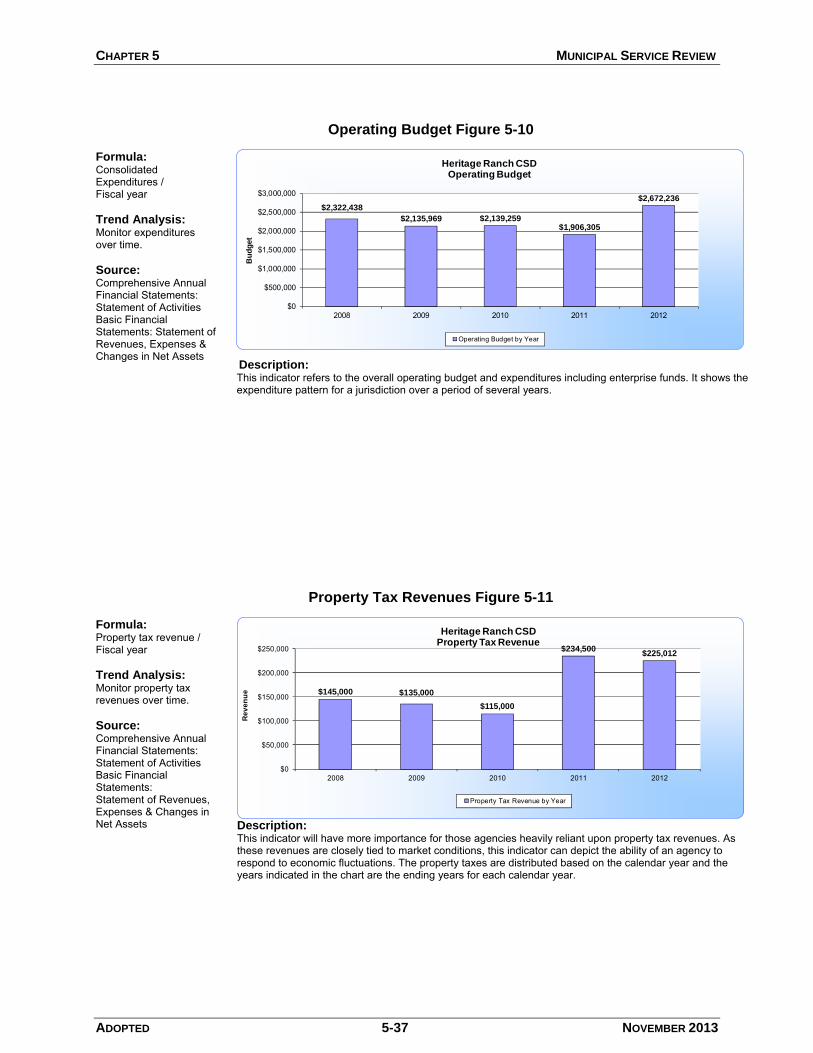
CHAPTER 5 MUNICIPAL SERVICE REVIEW
ADOPTED 5-37 NOVEMBER 2013
Operating Budget Figure 5-10
Formula: Consolidated Expenditures / Fiscal year
Trend Analysis: Monitor expenditures over time.
Source: Comprehensive Annual Financial Statements: Statement of Activities Basic Financial Statements: Statement of Revenues, Expenses & Changes in Net Assets
$2,322,438
$2,135,969 $2,139,259$1,906,305
$2,672,236
$0
$500,000
$1,000,000
$1,500,000
$2,000,000
$2,500,000
$3,000,000
2008 2009 2010 2011 2012
Bu
dg
et
Heritage Ranch CSD Operating Budget
Operating Budget by Year
Description: This indicator refers to the overall operating budget and expenditures including enterprise funds. It shows the expenditure pattern for a jurisdiction over a period of several years.
Property Tax Revenues Figure 5-11
Formula: Property tax revenue / Fiscal year
Trend Analysis: Monitor property tax revenues over time.
Source: Comprehensive Annual Financial Statements: Statement of Activities Basic Financial Statements: Statement of Revenues, Expenses & Changes in Net Assets
$145,000 $135,000
$115,000
$234,500$225,012
$0
$50,000
$100,000
$150,000
$200,000
$250,000
2008 2009 2010 2011 2012
Re
ve
nu
e
Heritage Ranch CSD Property Tax Revenue
Property Tax Revenue by Year
Description: This indicator will have more importance for those agencies heavily reliant upon property tax revenues. As these revenues are closely tied to market conditions, this indicator can depict the ability of an agency to respond to economic fluctuations. The property taxes are distributed based on the calendar year and the years indicated in the chart are the ending years for each calendar year.
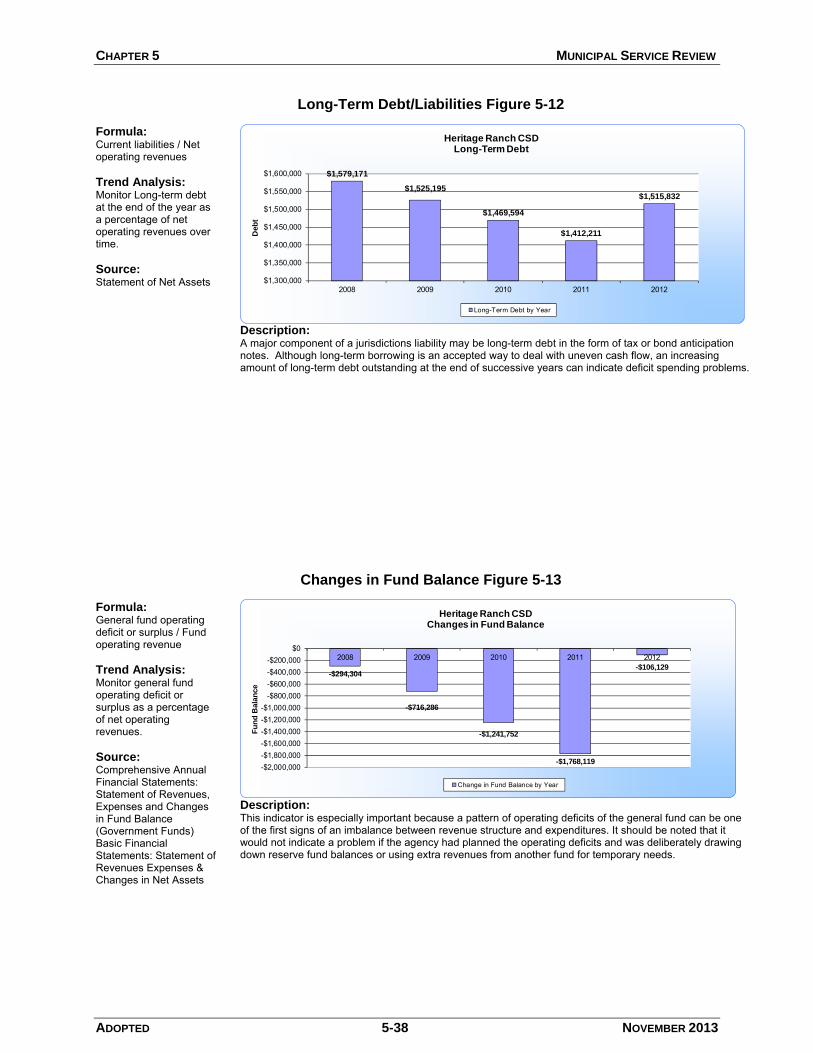
CHAPTER 5 MUNICIPAL SERVICE REVIEW
ADOPTED 5-38 NOVEMBER 2013
Long-Term Debt/Liabilities Figure 5-12
Formula: Current liabilities / Net operating revenues
Trend Analysis: Monitor Long-term debt at the end of the year as a percentage of net operating revenues over time.
Source: Statement of Net Assets
$1,579,171
$1,525,195
$1,469,594
$1,412,211
$1,515,832
$1,300,000
$1,350,000
$1,400,000
$1,450,000
$1,500,000
$1,550,000
$1,600,000
2008 2009 2010 2011 2012
Deb
t
Heritage Ranch CSD Long-Term Debt
Long-Term Debt by Year
Description: A major component of a jurisdictions liability may be long-term debt in the form of tax or bond anticipation notes. Although long-term borrowing is an accepted way to deal with uneven cash flow, an increasing amount of long-term debt outstanding at the end of successive years can indicate deficit spending problems.
Changes in Fund Balance Figure 5-13
Formula: General fund operating deficit or surplus / Fund operating revenue
Trend Analysis: Monitor general fund operating deficit or surplus as a percentage of net operating revenues.
Source: Comprehensive Annual Financial Statements: Statement of Revenues, Expenses and Changes in Fund Balance (Government Funds) Basic Financial Statements: Statement of Revenues Expenses & Changes in Net Assets
-$294,304
-$716,286
-$1,241,752
-$1,768,119
-$106,129
-$2,000,000-$1,800,000-$1,600,000-$1,400,000-$1,200,000-$1,000,000
-$800,000-$600,000-$400,000-$200,000
$02008 2009 2010 2011 2012
Fu
nd
Bala
nce
Heritage Ranch CSD Changes in Fund Balance
Change in Fund Balance by Year
Description: This indicator is especially important because a pattern of operating deficits of the general fund can be one of the first signs of an imbalance between revenue structure and expenditures. It should be noted that it would not indicate a problem if the agency had planned the operating deficits and was deliberately drawing down reserve fund balances or using extra revenues from another fund for temporary needs.
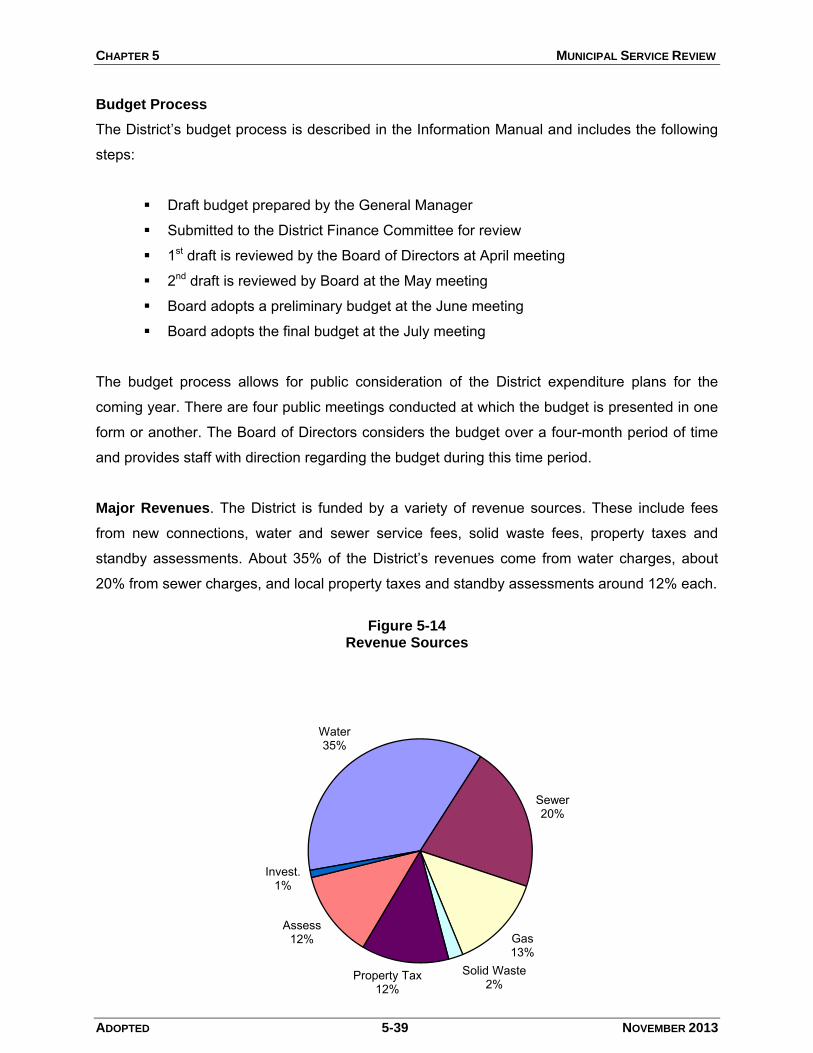
CHAPTER 5 MUNICIPAL SERVICE REVIEW
ADOPTED 5-39 NOVEMBER 2013
Budget Process
The District’s budget process is described in the Information Manual and includes the following
steps:
Draft budget prepared by the General Manager
Submitted to the District Finance Committee for review
1st draft is reviewed by the Board of Directors at April meeting
2nd draft is reviewed by Board at the May meeting
Board adopts a preliminary budget at the June meeting
Board adopts the final budget at the July meeting
The budget process allows for public consideration of the District expenditure plans for the
coming year. There are four public meetings conducted at which the budget is presented in one
form or another. The Board of Directors considers the budget over a four-month period of time
and provides staff with direction regarding the budget during this time period.
Major Revenues. The District is funded by a variety of revenue sources. These include fees
from new connections, water and sewer service fees, solid waste fees, property taxes and
standby assessments. About 35% of the District’s revenues come from water charges, about
20% from sewer charges, and local property taxes and standby assessments around 12% each.
Figure 5-14
Revenue Sources
Water35%
Sewer20%
Gas13%
Solid Waste2%
Property Tax12%
Assess12%
Invest.1%
CHAPTER 5 MUNICIPAL SERVICE REVIEW
ADOPTED 5-40 NOVEMBER 2013
Annual Audits. The Independent Auditor’s Reports for fiscal years 2008, 2009, 2010, 2011
and 2012 were submitted to the County Auditor as required by State Law. These audits provide
for a third party review of the District’s financial statements and status. The Independent Auditor
found that the Financial Statements prepared by the District were consistent with State and
Federal accounting principles and requirements. According to the auditor, no financial
misstatements were found and materials were presented fairly and in conformity with generally
accepted accounting principles.
The District has cash and equivalents of approximately $2 million. The District remains
dependent on both property taxes and standby assessments to fund their operations. The
District currently has $1,353,081 in long-term principal and interest payments due on the water
treatment plant loan. New regulatory requirements and/or continued condition in both water
treatment and wastewater discharge may require plant upgrades in the future.
Rates and Fees
In 2009, the District retained Tuckfield & Associates to provide rate studies and related reports
and recommendations for the District’s water and wastewater enterprise funds. This report
provided a list of capital improvements to maintain a reliable water and wastewater service. The
District is continuing to use this study to adjust its fee structure by increasing the rates of
providing water and wastewater service.
The District’s water and sewer services are operated as enterprise funds. This means that
revenues to support operations and capital improvements are borne by the ratepayer. Water
and sewer funds are reviewed annually by the District Board at a public hearing where the
Board then determines the appropriate rate for service. If rate increases are needed, they are
usually implemented at the beginning of the new fiscal year, July 1st, and all rates are prorated
accordingly. The following is a table that compares the rates and fees of several service
providers for water and sewer services:
Comparing the various rates and fees, a sample bill using 20 units of water over a two-month
period was calculated. In comparison, Heritage Ranch has less than the average water rates of
all the jurisdictions:
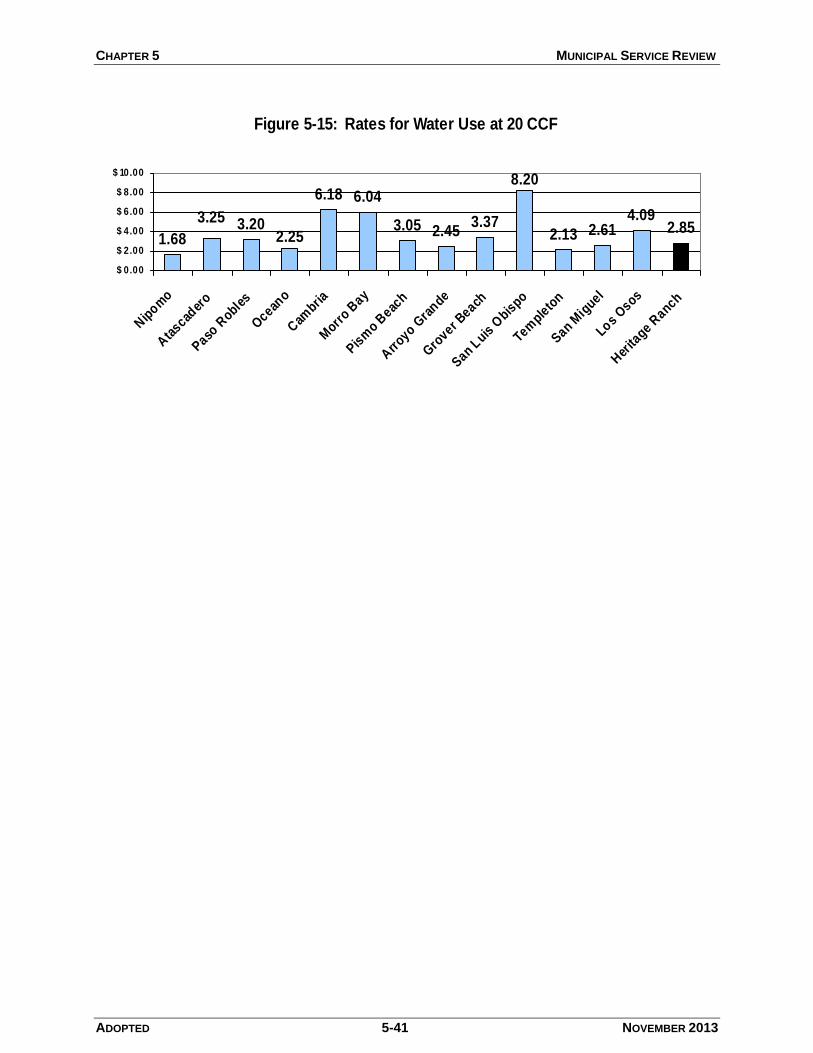
CHAPTER 5 MUNICIPAL SERVICE REVIEW
ADOPTED 5-41 NOVEMBER 2013
Figure 5-15: Rates for Water Use at 20 CCF
1.683.20
6.18 6.04
3.05 2.453.37
2.13 2.614.09
2.85
8.20
2.25
3.25
$ 0.00
$ 2.00
$ 4.00
$ 6.00
$ 8.00
$ 10.00
Nip
omo
Ata
scader
o
Paso R
obles
Ocean
o
Cam
bria
Morr
o Bay
Pism
o Beac
h
Arr
oyo Gra
nde
Gro
ver Beach
San Luis
Obis
po
Temple
ton
San Mig
uel
Los O
sos
Her
itage R
anch

CHAPTER 5 MUNICIPAL SERVICE REVIEW
ADOPTED 5-42 NOVEMBER 2013
Table 5-9 – Single-Family Water Rates and Monthly Bill
Rate/Fee
Paso
Robles
Atascadero
Oceano
Cambria
Heritage Ranch
Los
Osos
San
Miguel
Grover Beach
San
Simeon
Templeton
Monthly Service Meter Charge
$0.00
$18.00 Up to 2 ccf
$18.87
$23.82
$20.40
$35.81
$26.10
$9.63
$14.11
$17.05 Up to 3 ccf
Water (per 1 Unit)
20 units @ $3.20 (all ccf)
9 units @ $2.10 (3-12 ccf) 9 units @ $3.25 (13-25 ccf)
14 units @ $2.25 (7-25 ccf)
9 units @ $6.05 (7-15 ccf) 5 units @ $6.18 (16-20 ccf)
16 units @ $2.70 (2-19 ccf) $3.36 (over 21 ccf)
5 units @ $1.28 (1-5 ccf) 5 units @ $2.40 (6-10 ccf) 10 units @ $4.09 (11-20 ccf)
10 units @ $2.61 (1-10 ccf) 10 units @ $2.61 (10-20 ccf)
12 units @ $3.20 (0-12 ccf) 8 units @ $3.37 (13-20 ccf)
20 units @ $5.04 (1-20 ccf)
17 units @ $2.13 (3-20 ccf)
Other Charges
$0.00
$0.00
20 units @ $1.14 (1)
$0.00
$0.00
$0.00
$0.00
$0.00
$0.00
$0.00
Sample Monthly Bill (20 units of water)
$64.00
$68.65
$73.17
$109.17
$69.01
$95.11
$52.20
$74.99
$100.80
$53.26
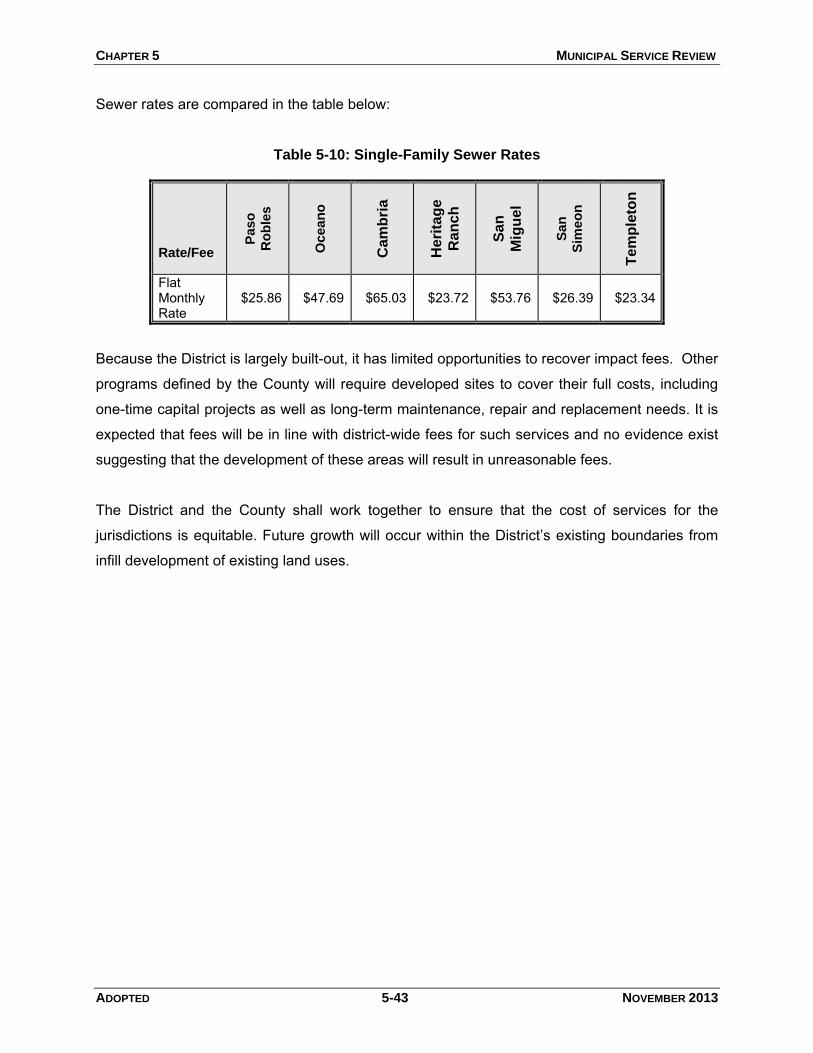
CHAPTER 5 MUNICIPAL SERVICE REVIEW
ADOPTED 5-43 NOVEMBER 2013
Sewer rates are compared in the table below:
Table 5-10: Single-Family Sewer Rates
Rate/Fee
Paso
Ro
ble
s
Oc
ea
no
Ca
mb
ria
He
rita
ge
Ra
nc
h
Sa
n
Mig
ue
l
San
Sim
eo
n
Te
mp
leto
n
Flat Monthly Rate
$25.86 $47.69 $65.03 $23.72 $53.76
$26.39 $23.34
Because the District is largely built-out, it has limited opportunities to recover impact fees. Other
programs defined by the County will require developed sites to cover their full costs, including
one-time capital projects as well as long-term maintenance, repair and replacement needs. It is
expected that fees will be in line with district-wide fees for such services and no evidence exist
suggesting that the development of these areas will result in unreasonable fees.
The District and the County shall work together to ensure that the cost of services for the
jurisdictions is equitable. Future growth will occur within the District’s existing boundaries from
infill development of existing land uses.
CHAPTER 5 MUNICIPAL SERVICE REVIEW
ADOPTED 5-44 NOVEMBER 2013
WRITTEN DETERMINATIONS
The following written determinations are based on the information contained in the above
section regarding Financial Constraints and Opportunities:
1. The District prepares a comprehensive and thorough annual budget that clearly describes
the services provided to residents and the funds expended for those services.
2. The District requires new developments to pay hook-up fees that pay for infrastructure
needed to serve new projects. The District has a rate and fee schedule to charge new hook-
ups. It is reasonable to conclude that the District endeavors to avoid long-term District
obligations for the capital improvements or maintenance of facilities that may be associated
with new development projects.
3. There are no apparent fiscal constraints limiting the ability of the District to serve existing
and future residents. The fiscal trend analysis indicates that the District is fiscally stable.
5. Rates and fees for services are established using the District’s budget process and special
studies as the need arises.
6. Annual audits show that the District prepares financial statements consistent with
accounting principles generally accepted in the United States of America as well as
accounting systems prescribed by the State Controller’s Office and State regulations
governing Special Districts.

ADOPTED 5-45 NOVEMBER 2013
5.5 STATUS OF, AND OPPORTUNITY FOR, SHARED FACILITIES
Purpose: To identify the opportunities for jurisdictions to share facilities and resources creating a more efficient service delivery system.
In the case of developing areas in the District, LAFCO can evaluate whether services or
facilities can be provided in a more efficient manner if both the District and County share them.
In some cases, it may be possible to establish a cooperative approach to facility planning by
encouraging the District, surrounding cities, and the County to work cooperatively in such
efforts.
There are opportunities for continued shared relationships between agencies for services within
the HRCSD boundary. The County, the Homeowners Association, and the District coordinate to
provide services and avoid a duplication of effort.
At present, the distinction between District and County services in the area is clear. The
opportunities for more coordination may include:
• Roadway connections (Homeowners Association/County function, not a District function)
• Coordinated open space preservation and development of trails
• District and County parks and recreational facilities
• Preservation and enhancement of Agricultural Lands
Opportunities exist at the time of annexation and development to introduce alternative methods
of construction and maintenance of public or semi-public infrastructure to serve the future
SOI/Annexation areas. Generally, the District requires development projects to pay for their own
infrastructure (water lines, sewer lines, fire protection and lighting) to serve their projects. This
helps to avoid unnecessary costs.
The District has the available staff resources and administrative capabilities to provide the
needed level of services to the residents within its boundaries. The majority of future
development in Heritage Ranch is likely to be new infill development within the current service
area of the District.
CHAPTER 5 MUNICIPAL SERVICE REVIEW
ADOPTED 5-46 NOVEMBER 2013
Services provided by the District and the County are well delineated. The County provides for
roads and streets maintenance, Sheriff Services, and general government. The District provides
water, sewer, and solid waste services, parks and recreation. In 2012 the District has stopped
operating the gas station. The gas station facilities and infrastructure has been removed.
Under the Camp Roberts Joint Land Use Study (JLUS) policy (Policy IE-2A) supports regional
coordination on infrastructure such as combining water and wastewater treatment facilities
between San Miguel, Heritage Ranch, and Camp Roberts.
Regional Coordination
Coordinate on a region-wide basis, the development of plans for infrastructure improvements to avoid overlap and duplication of services. Development of systems that can serve both community (including Heritage Ranch and San Miguel) and Camp Roberts’ needs should be evaluated when appropriate.
WRITTEN DETERMINATIONS
The following written determinations are based on the information contained in the above
section regarding Opportunities for Shared Facilities:
1. The District’s services do not require shared facilities to efficiently and effectively serve the
Heritage Ranch Community.
2. At present, the distinction between District and County services with the service boundary
is clear. At present, the County provides basic general government (Tax Collector,
Assessor, Fire Protection, etc.) Roads and Streets and Sheriff Services to the community
of Heritage Ranch. Draining and lighting are provided by the Homeowners Association.
3. The District works cooperatively with the Homeowners Association to implement projects
that better serve the residents of Heritage Ranch.
ADOPTED 5-47 NOVEMBER 2013
5.6 ACCOUNTABILITY FOR COMMUNITY SERVICE NEEDS INCLUDING
GOVERNMENTAL STRUCTURE AND OPERATIONAL EFFICIENCIES
Purpose: To evaluate the accessibility and levels of public participation associated with the agency’s decision-making and management processes.
The governing body of Heritage Ranch is the Board of Directors that is elected in compliance
with California Election Laws. The District complies with the Brown Act Open-Meeting Law and
provides the public with opportunities to obtain information about community issues, including
website and phone access. The District‘s website contains information about the various
services. Complaints have been noted from some members of the public regarding Brown Act
compliance.
The Board of Directors holds regular meetings at 4:00 p.m. on the third Thursdays of each
month at the District Office at 4870 Heritage Road, Village of Heritage Ranch. Other meetings
or study sessions are held as needed. A public comment period is scheduled at the beginning of
each meeting for citizens to comment on District issues not on the agenda.
The following section briefly discusses various operational and service aspects of the District.
Much of the information was obtained from the District’s budgets and discussions with their
staff. The Board of Directors and General Manager receive technical advice from a consulting
engineer (Wallace Group), legal counsel from Adamski, Moroski, & Green, and annual audits by
Bob Crosby, CPA. The General Manager supervises the Operations and Administrative
Departments. The Operations Department includes a Supervisor and four Water/Wastewater
Treatment Operators who are certified and a maintenance worker.
Overall, the District is well equipped administratively to serve Heritage Ranch. The District
accomplishes many goals and implements a variety of initiatives. The District’s Budget process
is discussed in the Financial Constraints and Opportunities section of this report. The
organization appears efficient in terms of staffing and the number of residents that are served by
the CSD. The organizational chart shows the structure of the District.
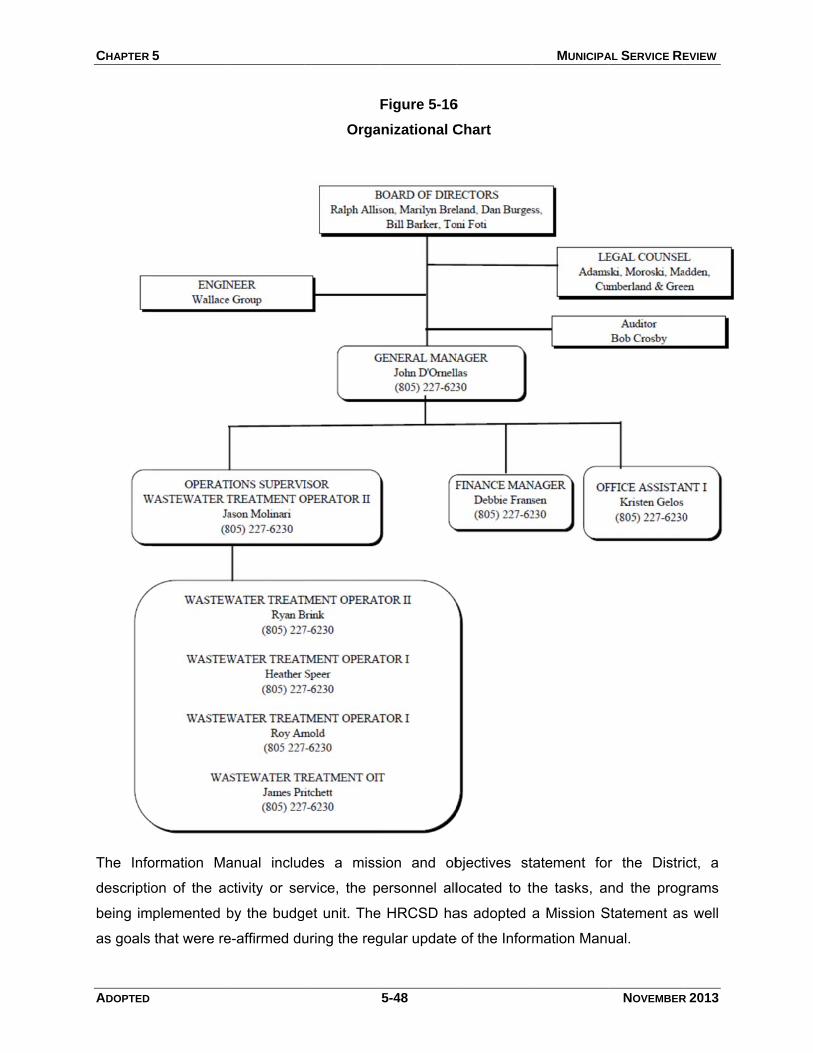
CHAPTER
ADOPTED
The Info
descriptio
being im
as goals
5
ormation Ma
on of the ac
plemented b
that were re
anual includ
ctivity or se
by the budg
e-affirmed du
Orga
des a miss
rvice, the p
et unit. The
uring the reg
5-48
Figure 5-16
nizational C
sion and ob
ersonnel all
e HRCSD ha
gular update
6
Chart
bjectives st
located to t
as adopted a
e of the Inform
MUNICIPA
tatement for
he tasks, a
a Mission S
mation Man
AL SERVICE RE
NOVEMBER
r the Distri
nd the prog
Statement as
ual.
EVIEW
R 2013
ict, a
grams
s well
CHAPTER 5 MUNICIPAL SERVICE REVIEW
ADOPTED 5-49 NOVEMBER 2013
WRITTEN DETERMINATIONS
The following written determinations are based on the information contained in the above
section regarding Local Accountability and Governance:
1. The District has historically made reasonable efforts to maintain a public dialogue regarding
issues and projects of concern to the community. The District’s outreach program includes
information regarding current issues of significance to the community.
2. The District appears to be efficiently organized and effectively provides services to its
customers.
3. The District evaluates the services provided to residents and services that may need to be
upgraded or started.
4. The District remains focused on providing quality water, wastewater collection, garbage and
parks and recreation services to its customers.
5. The District continues to improve its website by adding more information that is accessible to
the public.
ADOPTED 5-50 NOVEMBER 2013
5.7 OTHER MATTERS
This factor allows LAFCO to discuss other issues and topics that may need to be addressed or
focused on in the MSR.
Gas Station Services. The District no longer provides gas station services in the area. The
service station was closed and all facilities were properly removed including the underground
tanks. Because the power was established by legislation specific to Heritage Ranch Community
Services District possible revision for future Cortese Knox-Hertzberg Act may be appropriate.
Therefore the gas station powers will not revert back to a latent power, however the District will
no longer be providing that service.
REFERENCES
• Sewer System Management Plan, 2013
• Heritage Ranch Water Treatment Improvement Report, 2010
• San Luis Obispo Council of Governments Regional Transportation Planning Agency,
Regional Transportation Plan, 2010.
• Heritage Ranch CSD Budget FY 2007 to 2012
• California Department of Finance E-4 Report, 2010
• SLO County Resource Management System Annual Report, 2010
• Independent Auditor’s Report and Financial Statements, 2010
• Water and Wastewater Rate Study, 2009
• California Department of Finance E-4 Report, 2009
• SLOCOG ERA Population & Employment Forecast, 2009
• SLOCOG Regional Housing Needs Allocation, 2008
• San Luis Obispo Local Agency Formation Commission, Sphere of Influence Study,
2006.
• San Luis Obispo Council of Governments, Regional Profile, October 2004.
• SLO County Nacimiento Inland Area Plans, revised 2003
• Heritage Ranch Specific Plan, 1976
• Heritage Ranch CSD, Official Website, www.heritageranchcsd.com.
• County of San Luis Obispo, Official Website, www.slocounty.ca.gov.
• San Luis Obispo Council of Governments, Official Website, www.slocog.org.