A novel melanoma-targeting peptide screened by phage display exhibits antitumor activity
Upload
khangminh22Category
view
0download
0
Volume 27, Issue 3, pp. 595-906 , May-June 2007
RSNA Education Exhibits: CME ARTICLE Christina Mueller-Mang, Claudia Grosse, Katharina Schmid, Leopold Stiebellehner, and Alexander A. Bankier
What Every Radiologist Should Know about Idiopathic Interstitial Pneumonias The morphologic patterns of the idiopathic interstitial pneumonias, as defined in the American Thoracic Society-European Respiratory Society classification, are presented, and the clinical and radiologic hallmarks associated with these patterns are reviewed. RadioGraphics 2007 27: 595-615 (DOI: 10.1148/rg.273065130);
CME ARTICLE Yeon Joo Jeong, Kun-Il Kim, Im Jeong Seo, Chang Hun Lee, Ki Nam Lee, Ki Nam Kim, Jeung Sook Kim, and Woon Jung Kwon
Eosinophilic Lung Diseases: A Clinical, Radiologic, and Pathologic Overview The general diagnostic approach to and the characteristic clinical, histologic, and radiologic findings in the various eosinophilic lung diseases are discussed and illustrated. RadioGraphics 2007 27: 617-637 (DOI: 10.1148/rg.273065051);
Stephen K. Frankel, Steve D. Groshong, and David A. Lynch Invited Commentary RadioGraphics 2007 27: 637-639
CME ARTICLE Wayne Fang, Lacey Washington, and Nidhi Kumar
Imaging Manifestations of Blastomycosis: A Pulmonary Infection with Potential Dissemination The epidemiologic features, pathogenesis, clinical course, radiologic manifestations, and extrapulmonary manifestations of pulmonary blastomycosis are discussed and illustrated. RadioGraphics 2007 27: 641-655 (DOI: 10.1148/rg.273065122);
Camilla R. Whitten, Sameer Khan, Graham J. Munneke, and Sisa Grubnic A Diagnostic Approach to Mediastinal Abnormalities The normal appearance of mediastinal reflections and how the presence or distortion of these reflections reveals mediastinal disease are reviewed. RadioGraphics 2007 27: 657-671 (DOI: 10.1148/rg.273065136);
Markus Körner, Christof H. Weber, Stefan Wirth, Klaus-Jürgen Pfeifer, Maximilian F. Reiser, and Marcus Treitl
Advances in Digital Radiography: Physical Principles and System Overview The physical principles of digital radiography, the digital imaging systems that are currently available, and future technologies and perspectives in digital radiography are discussed and illustrated. RadioGraphics 2007 27: 675-686 (DOI: 10.1148/rg.273065075);
Dong Il Gwon, Gi-Young Ko, Hyun-Ki Yoon, Kyu-Bo Sung, Jae Moung Lee, Seok Jong Ryu, Myong Hee Seo, Jae-Chan Shim, Ghi Jai Lee, and Ho Kyun Kim
Inferior Phrenic Artery: Anatomy, Variations, Pathologic Conditions, and Interventional Management Careful evaluation of arterial phase CT scans of the IPA and careful interpretation of the angiographic findings are important, as a thorough knowledge of the normal and variant anatomy of the IPA is critical to effective interventional treatment of pathologic conditions related to the IPA, especially hepatocellular carcinoma. RadioGraphics 2007 27: 687-705 (DOI: 10.1148/rg.273065036);
CME ARTICLE Eunhye Yoo, Joo Hee Kim, Myeong-Jin Kim, Jeong-Sik Yu, Jae-Joon Chung, Hyung-Sik Yoo, and Ki Whang Kim
Greater and Lesser Omenta: Normal Anatomy and Pathologic Processes Knowledge of omental anatomy, the spectrum of diseases involving the greater and lesser omenta, and the characteristic appearances of some of these diseases at multidetector CT with multiplanar reformation is essential for accurate diagnosis and proper treatment of pathologic conditions of the omenta. RadioGraphics 2007 27: 707-720 (DOI: 10.1148/rg.273065085);
CME ARTICLE Ivan Pedrosa, Eric A. Zeikus, Deborah Levine, and Neil M. Rofsky
MR Imaging of Acute Right Lower Quadrant Pain in Pregnant and Nonpregnant Patients MR imaging is an excellent imaging modality for evaluation of patients with right lower quadrant pain and should be strongly considered in those patients in whom use of iodinated contrast media or radiation is not desirable. RadioGraphics 2007 27: 721-743 (DOI: 10.1148/rg.273065116);
Douglas S. Katz, Vladimir Merunka, John J. Hines, Evan M. Meiner, Ivan Pedrosa, Deborah Levine, and Neil M. Rofsky
Invited Commentary • Authors’ Response RadioGraphics 2007 27: 743-753
CME ARTICLE A. Bassem Elaini, Sanjay K. Shetty, Vernon M. Chapman, Dushyant V. Sahani, Giles W. Boland, Ann T. Sweeney, Michael M. Maher, James T. Slattery, Peter R. Mueller, and Michael A. Blake
Improved Detection and Characterization of Adrenal Disease with PET-CT The PET-CT appearances of a wide variety of conditions affecting the adrenal gland are discussed and illustrated, along with diagnostic pitfalls inherent in the use of PET or CT alone and the importance of using meticulous PET-CT technique in the setting of adrenal disease. RadioGraphics 2007 27: 755-767 (DOI: 10.1148/rg.273055031);
CME ARTICLE Phillip M. Young, Thomas H. Berquist, Laura W. Bancroft, and Jeffrey J. Peterson
Complications of Spinal Instrumentation By using various imaging modalities, radiologists can help accurately diagnose complications of spine surgery, including incomplete fusion, suboptimal positioning or failure of instrumentation, infection, and hematoma. RadioGraphics 2007 27: 775-789 (DOI: 10.1148/rg.273065055);
Mi-Jung Lee, Sungjun Kim, Sung-Ah Lee, Ho-Taek Song, Yong-Min Huh, Dae-Hong Kim, Seung Hwan Han, and Jin-Suck Suh
Overcoming Artifacts from Metallic Orthopedic Implants at High-Field-Strength MR Imaging and Multi-detector CT Metal-related artifacts at MR imaging and multidetector CT can be minimized by positioning the patient for optimal orientation of the metallic implants and by using optimal image acquisition and reconstruction parameters. RadioGraphics 2007 27: 791-803 (DOI: 10.1148/rg.273065087);
CME ARTICLE Gregory Scott Stacy and Larry B. Dixon
Pitfalls in MR Image Interpretation Prompting Referrals to an Orthopedic Oncology Clinic Information from nearly 400 cases at the authors' institution is reviewed to help radiologists recognize and confidently report the benignity of bone and soft-tissue lesions that mimic malignancies at MR imaging. RadioGraphics 2007 27: 805-826 (DOI: 10.1148/rg.273065031);
Laura W. Bancroft, Gregory Scott Stacy, and Larry B. Dixon Invited Commentary • Authors’ Response RadioGraphics 2007 27: 827-828

CME ARTICLE Sebastian Leschka, Erwin Oechslin, Lars Husmann, Lotus Desbiolles, Borut Marincek, Michele Genoni, René Prêtre, Rolf Jenni, Simon Wildermuth, and Hatem Alkadhi
Pre- and Postoperative Evaluation of Congenital Heart Disease in Children and Adults with 64-Section CT Although echocardiography is the diagnostic imaging method of choice for evaluating most congenital cardiac abnormalities, multidetector CT increasingly plays a complementary role because it provides accurate information about intracardiac anatomic structures and ventricular function as well as extracardiac conditions. RadioGraphics 2007 27: 829-846 (DOI: 10.1148/rg.273065713);
CME ARTICLE Jenny K. Hoang, Wai Kit Lee, Michael Lee, Daryl Johnson, and Stephen Farrell
US Features of Thyroid Malignancy: Pearls and Pitfalls US features that are helpful for diagnosing thyroid malignancy are described, with particular attention to common interpretative pitfalls that may lead to misdiagnosis. RadioGraphics 2007 27: 847-860 (DOI: 10.1148/rg.273065038);
Jill E. Langer, Jenny K. Hoang, Wai Kit Lee, and Stephen Farrell Invited Commentary • Authors’ Response RadioGraphics 2007 27: 861-865
AFIP Archives: CME ARTICLE Aletta Ann Frazier, Teri J. Franks, Tan-Lucien H. Mohammed, Irem H. Ozbudak, and Jeffrey R. Galvin
From the Archives of the AFIP: Pulmonary Veno-occlusive Disease and Pulmonary Capillary Hemangiomatosis Pulmonary veno-occlusive disease and pulmonary capillary hemangiomatosis are two rare disorders of the pulmonary circulation that manifest clinically as primary pulmonary arterial hypertension, and radiologic imaging may assist in the discernment of these capillary and postcapillary disease entities from pulmonary arterial hypertension. RadioGraphics 2007 27: 867-882 (DOI: 10.1148/rg.273065194);
David A. Altman, Denis S. Atkinson, Jr, and Daniel J. Brat Best Cases from the AFIP: Glioblastoma Multiforme RadioGraphics 2007 27: 883-888 (DOI: 10.1148/rg.273065138);
Continuing Education: CME Objectives and Tests RadioGraphics 2007 27: 899-906
Informatics: Tony C. Pan, Metin N. Gurcan, Stephen A. Langella, Scott W. Oster, Shannon L. Hastings, Ashish Sharma, Benjamin G. Rutt, David W. Ervin, Tahsin M. Kurc, Khan M. Siddiqui, Joel H. Saltz, and Eliot L. Siegel
Informatics in Radiology: GridCAD: Grid-based Computer-aided Detection System GridCAD is a grid-enabled software application for the management of radiologic imaging data and the execution of computer-aided detection algorithms across a geographically distributed set of computation and data storage systems. RadioGraphics 2007 27: 889-897 (DOI: 10.1148/rg.273065153);
Special Communications: Gary J. Becker and Hedvig Hricak
Herbert Y. Kressel, MD, Named Editor of Radiology RadioGraphics 2007 27: 673-674 (DOI: 10.1148/rg.273075913);
Special Reports: Janet L. Strife, Larry E. Kun, Gary J. Becker, N. Reed Dunnick, Jennifer Bosma, and Robert R. Hattery
American Board of Radiology Perspective on Maintenance of Certification: Part IV—Practice Quality Improvement for Diagnostic Radiology RadioGraphics 2007 27: 769-774 (DOI: 10.1148/rg.273075914);
Illuminations: Pulmonary Veno-occlusive Disease RadioGraphics 2007 27: 866
Departments: Call for Historical Anecdotes RadioGraphics 2007 27: Publication Information for Authors RadioGraphics 2007 27:
EDUCATION EXHIBIT 595
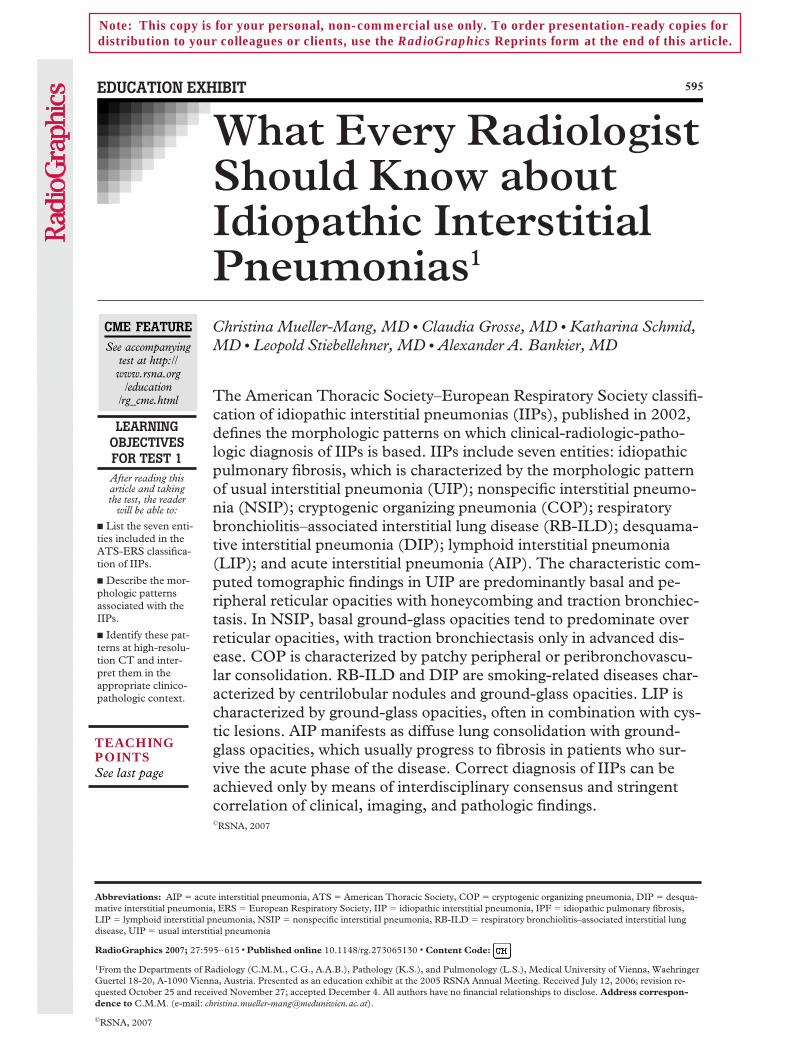
What Every RadiologistShould Know aboutIdiopathic InterstitialPneumonias1
LEARNINGOBJECTIVESFOR TEST 1After reading thisarticle and takingthe test, the reader
will be able to:
� List the seven enti-ties included in theATS-ERS classifica-tion of IIPs.
� Describe the mor-phologic patternsassociated with theIIPs.
� Identify these pat-terns at high-resolu-tion CT and inter-pret them in theappropriate clinico-pathologic context.
Christina Mueller-Mang, MD ● Claudia Grosse, MD ● Katharina Schmid,MD ● Leopold Stiebellehner, MD ● Alexander A. Bankier, MD
The American Thoracic Society–European Respiratory Society classifi-cation of idiopathic interstitial pneumonias (IIPs), published in 2002,defines the morphologic patterns on which clinical-radiologic-patho-logic diagnosis of IIPs is based. IIPs include seven entities: idiopathicpulmonary fibrosis, which is characterized by the morphologic patternof usual interstitial pneumonia (UIP); nonspecific interstitial pneumo-nia (NSIP); cryptogenic organizing pneumonia (COP); respiratorybronchiolitis–associated interstitial lung disease (RB-ILD); desquama-tive interstitial pneumonia (DIP); lymphoid interstitial pneumonia(LIP); and acute interstitial pneumonia (AIP). The characteristic com-puted tomographic findings in UIP are predominantly basal and pe-ripheral reticular opacities with honeycombing and traction bronchiec-tasis. In NSIP, basal ground-glass opacities tend to predominate overreticular opacities, with traction bronchiectasis only in advanced dis-ease. COP is characterized by patchy peripheral or peribronchovascu-lar consolidation. RB-ILD and DIP are smoking-related diseases char-acterized by centrilobular nodules and ground-glass opacities. LIP ischaracterized by ground-glass opacities, often in combination with cys-tic lesions. AIP manifests as diffuse lung consolidation with ground-glass opacities, which usually progress to fibrosis in patients who sur-vive the acute phase of the disease. Correct diagnosis of IIPs can beachieved only by means of interdisciplinary consensus and stringentcorrelation of clinical, imaging, and pathologic findings.©RSNA, 2007
Abbreviations: AIP � acute interstitial pneumonia, ATS � American Thoracic Society, COP � cryptogenic organizing pneumonia, DIP � desqua-mative interstitial pneumonia, ERS � European Respiratory Society, IIP � idiopathic interstitial pneumonia, IPF � idiopathic pulmonary fibrosis,LIP � lymphoid interstitial pneumonia, NSIP � nonspecific interstitial pneumonia, RB-ILD � respiratory bronchiolitis–associated interstitial lungdisease, UIP � usual interstitial pneumonia
RadioGraphics 2007; 27:595–615 ● Published online 10.1148/rg.273065130 ● Content Code:
1From the Departments of Radiology (C.M.M., C.G., A.A.B.), Pathology (K.S.), and Pulmonology (L.S.), Medical University of Vienna, WaehringerGuertel 18-20, A-1090 Vienna, Austria. Presented as an education exhibit at the 2005 RSNA Annual Meeting. Received July 12, 2006; revision re-quested October 25 and received November 27; accepted December 4. All authors have no financial relationships to disclose. Address correspon-dence to C.M.M. (e-mail: [email protected]).
©RSNA, 2007
CME FEATURESee accompanying
test at http://www.rsna.org
/education/rg_cme.html
Note: This copy is for your personal, non-commercial use only. To order presentation-ready copies for distribution to your colleagues or clients, use the RadioGraphics Reprints form at the end of this article.
See last page
TEACHING POINTS

IntroductionThe diagnostic approach to idiopathic interstitialpneumonias (IIPs) has long been confusing be-cause these disorders were categorized accordingto different clinical, radiologic, and histologicclassifications (1,2).
In 2001, the American Thoracic Society(ATS) and European Respiratory Society (ERS)standardized the terminology for IIPs (Fig 1) (3).This new ATS-ERS classification is the result of amultidisciplinary consensus and includes sevendisease entities: idiopathic pulmonary fibrosis(IPF), nonspecific interstitial pneumonia (NSIP),cryptogenic organizing pneumonia (COP), respi-ratory bronchiolitis–associated interstitial lung
Figure 1. Terminology for the IIPs withthe various subentities according to theATS-ERS classification. UIP � usual in-terstitial pneumonia.
Table 1Clinical Features of Patients with IIPs according to the ATS-ERS Consensus Statement
Type ofIIP
MeanAge atOnset
(y)Gender
Distribution
MostProminentSymptoms
Type ofOnset
Associationwith
Smoking PrognosisResponse to
Corticosteroids
IPF �50 More com-mon inmen
Dyspnea,cough
Gradual Currentlyunder dis-cussion
Poor (mediansurvival, 2.5–3.5 y)
Poor, if any
NSIP 40–50 Equal Dyspnea,cough,fatigue
Gradual orsubacute
None Variable, betterthan in UIP
Good
COP 55 Equal Cough, milddyspnea,fever
Subacute More com-mon innonsmok-ers
Complete recov-ery in mostpatients
Excellent
RB-ILD 30–40 More com-mon inmen
Mild dys-pnea,cough
Gradual Required fordiagnosis
Good after smok-ing cessation
Good
DIP 30–40 More com-mon inmen
Dyspnea,cough
Insidious In mostcases
Generally goodafter smokingcessation
Good
LIP 40–50 More com-mon inwomen
Cough, dys-pnea
Slow None Variable Variable
AIP 50 Equal Dyspnea Acute None High mortalityrate (�50%)
Not proved
Source.—Reference 3.
596 May-June 2007 RG f Volume 27 ● Number 3
disease (RB-ILD), desquamative interstitialpneumonia (DIP), lymphoid interstitial pneumo-nia (LIP), and acute interstitial pneumonia (AIP).
In their idiopathic form, IIPs are rare diseases.However, more frequent disorders such as sar-coidosis, vasculitis, and connective tissue diseasescan display identical morphologic patterns, andthe IIPs are considered “prototypes” for thesemorphologic alterations (3). Because imagingplays a crucial role in identifying both the idio-pathic and the secondary interstitial pneumonias,radiologists need to be familiar with the morpho-logic and clinical manifestations and the diagnos-tic approach to these conditions.
The main clinical symptoms of IIPs are non-specific and consist of cough and dyspnea; how-ever, other factors such as age, gender, risk fac-tors, and course of disease can be helpful in dis-tinguishing between the various entities (Table 1).
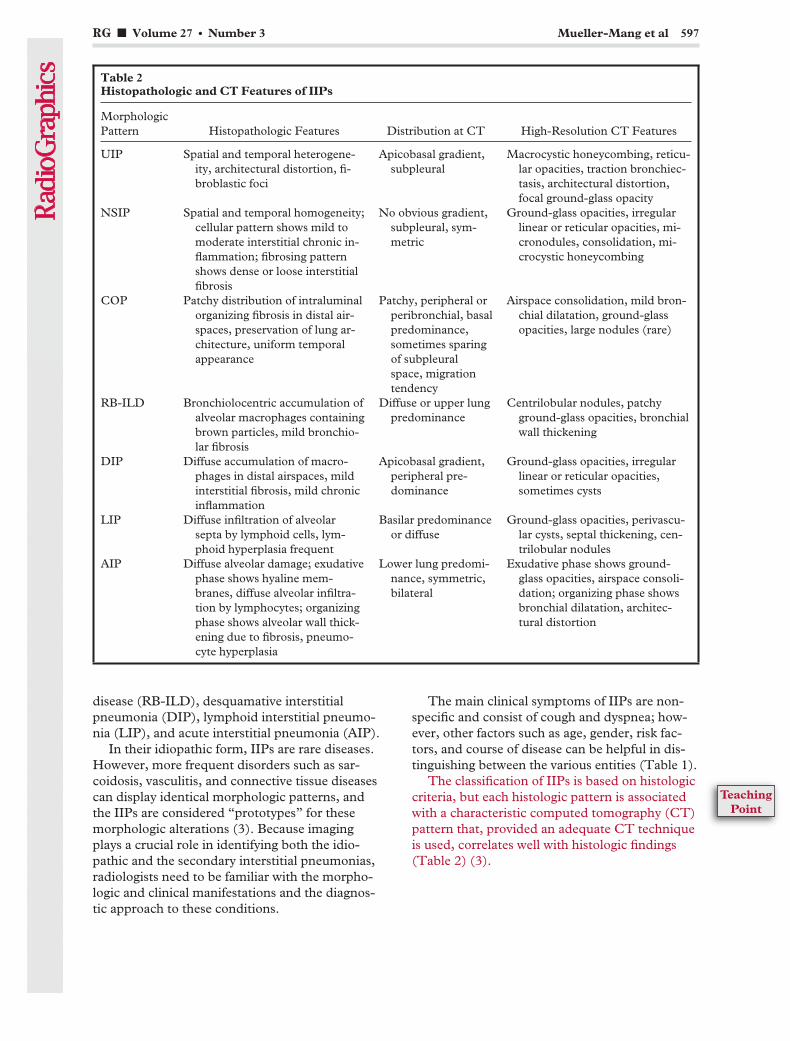
The classification of IIPs is based on histologiccriteria, but each histologic pattern is associatedwith a characteristic computed tomography (CT)pattern that, provided an adequate CT techniqueis used, correlates well with histologic findings(Table 2) (3).
Table 2Histopathologic and CT Features of IIPs
MorphologicPattern Histopathologic Features Distribution at CT High-Resolution CT Features
UIP Spatial and temporal heterogene-ity, architectural distortion, fi-broblastic foci
Apicobasal gradient,subpleural
Macrocystic honeycombing, reticu-lar opacities, traction bronchiec-tasis, architectural distortion,focal ground-glass opacity
NSIP Spatial and temporal homogeneity;cellular pattern shows mild tomoderate interstitial chronic in-flammation; fibrosing patternshows dense or loose interstitialfibrosis
No obvious gradient,subpleural, sym-metric
Ground-glass opacities, irregularlinear or reticular opacities, mi-cronodules, consolidation, mi-crocystic honeycombing
COP Patchy distribution of intraluminalorganizing fibrosis in distal air-spaces, preservation of lung ar-chitecture, uniform temporalappearance
Patchy, peripheral orperibronchial, basalpredominance,sometimes sparingof subpleuralspace, migrationtendency
Airspace consolidation, mild bron-chial dilatation, ground-glassopacities, large nodules (rare)
RB-ILD Bronchiolocentric accumulation ofalveolar macrophages containingbrown particles, mild bronchio-lar fibrosis
Diffuse or upper lungpredominance
Centrilobular nodules, patchyground-glass opacities, bronchialwall thickening
DIP Diffuse accumulation of macro-phages in distal airspaces, mildinterstitial fibrosis, mild chronicinflammation
Apicobasal gradient,peripheral pre-dominance
Ground-glass opacities, irregularlinear or reticular opacities,sometimes cysts
LIP Diffuse infiltration of alveolarsepta by lymphoid cells, lym-phoid hyperplasia frequent
Basilar predominanceor diffuse
Ground-glass opacities, perivascu-lar cysts, septal thickening, cen-trilobular nodules
AIP Diffuse alveolar damage; exudativephase shows hyaline mem-branes, diffuse alveolar infiltra-tion by lymphocytes; organizingphase shows alveolar wall thick-ening due to fibrosis, pneumo-cyte hyperplasia
Lower lung predomi-nance, symmetric,bilateral
Exudative phase shows ground-glass opacities, airspace consoli-dation; organizing phase showsbronchial dilatation, architec-tural distortion
RG f Volume 27 ● Number 3 Mueller-Mang et al 597
TeachingPoint
The key role that radiologists play in thework-up of IIPs necessitates a thorough knowl-edge of the patterns as described in the interna-tional classification and an increased awareness ofthe multidisciplinary challenges involved in theirinterpretation.
In this article, we illustrate the morphologiccharacteristics of the patterns included in theATS-ERS classification of IIPs and present anencyclopedic review of the clinical and radiologichallmarks associated with these patterns.
Idiopathic Pulmonary FibrosisIPF is the most common entity of the IIPs. Bydefinition, IPF is the term for the clinical syn-drome associated with the morphologic patternof UIP (3). With a median survival time rangingfrom 2 to 4 years, IPF has a substantially poorerprognosis than NSIP, COP, RB-ILD, DIP, andLIP (3,4).
Clinical FeaturesThe typical patient with IPF is 50 years old orolder. Patients present with progressively worsen-ing dyspnea and nonproductive cough (3). Manypatients also report that the subtle onset of theirsymptoms months or even years earlier was mis-taken for a less serious respiratory disease, whichdelayed referral to a specialized center (5). Al-though there are slightly more cases in men thanin women, there is no obvious gender predilection(3). A history of cigarette smoking seems to be arisk factor for the development of IPF; however, itdoes not appear to affect the course of the disease(4,6,7). Usually, patients do not respond to high-dose corticosteroid therapy; data suggest that,due to the considerable side effects of corticoste-roids, this therapy might even be contraindicated(8). However, a combination therapy of cyclo-sporin A and corticosteroids seems to be effica-cious for acute exacerbations of IPF (9). In addi-tion, patients should be considered candidates forlung transplantation early after diagnosis (10).
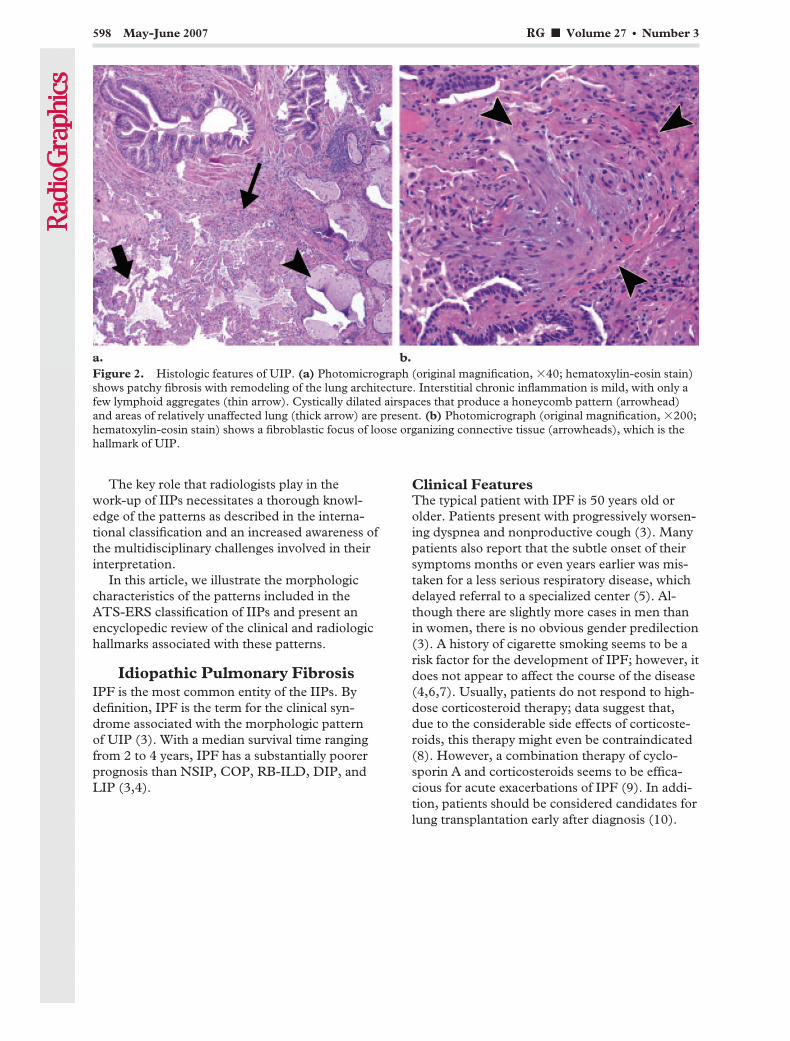
Figure 2. Histologic features of UIP. (a) Photomicrograph (original magnification, �40; hematoxylin-eosin stain)shows patchy fibrosis with remodeling of the lung architecture. Interstitial chronic inflammation is mild, with only afew lymphoid aggregates (thin arrow). Cystically dilated airspaces that produce a honeycomb pattern (arrowhead)and areas of relatively unaffected lung (thick arrow) are present. (b) Photomicrograph (original magnification, �200;hematoxylin-eosin stain) shows a fibroblastic focus of loose organizing connective tissue (arrowheads), which is thehallmark of UIP.
598 May-June 2007 RG f Volume 27 ● Number 3

Histologic FeaturesThe histologic hallmark of UIP is the presence ofscattered fibroblastic foci (Fig 2). Typically, thelung involvement is heterogeneous and areas ofnormal lung alternate with interstitial inflamma-tion and honeycombing (1). Owing to the patchylung involvement, histologic evaluation of mul-tiple biopsy specimens from one patient may re-veal discordant histologic patterns. Evidence ofthe UIP pattern in one biopsy specimen is associ-ated with a worse prognosis, independently ofother coexisting patterns (11,12). Therefore, bi-opsy samples from more than one lobe should beobtained in any patient with suspected IIP, andhigh-resolution CT should serve as a guiding toolfor determining the appropriate anatomic loca-tion of the biopsy site (12,13).
Imaging FeaturesThe chest radiograph is normal in most patientswith early disease. In advanced disease, the chestradiograph shows decreased lung volumes and
subpleural reticular opacities that increase fromthe apex to the bases of the lungs (14).
This apicobasal gradient is even better seen onhigh-resolution CT images. Together with sub-pleural reticular opacities and macrocystic honey-combing combined with traction bronchiectasis,the apicobasal gradient represents a trio of signsthat is highly suggestive of UIP (Fig 3) (15,16).Therefore, UIP should be considered in patientswho present with low lung volumes, subpleuralreticular opacities, macrocystic honeycombing,and traction bronchiectasis, the extent of whichincreases from the apex to the bases of the lungs(Fig 4). In the typical patient with UIP, the dis-ease is most extensive on the most basal section ofthe high-resolution CT examination. Ground-glass opacities are present in the majority of pa-tients with UIP but are usually limited in extent(17). Typically, imaging findings are heteroge-neous, with areas of fibrosis alternating with areasof normal lung (Fig 5).
Figure 3. Distribution (a), CT image (b), and CT pattern (c) of UIP. The distribution issubpleural with an apicobasal gradient (red area in a). CT shows honeycombing (green ar-eas in c), reticular opacities (blue areas in c), traction bronchiectasis (red area in c), and fo-cal ground-glass opacity (gray area in c).
RG f Volume 27 ● Number 3 Mueller-Mang et al 599
TeachingPoint
In patients who show the characteristic distri-bution and high-resolution CT pattern of UIPand the appropriate clinical features, the diagno-sis can be reliably made without biopsy (18,19).The ATS-ERS has defined eight major and minorcriteria for the diagnosis of IPF in the absence of asurgical lung biopsy, which are summarized inTable 3. However, histologic confirmation shouldbe obtained in all patients with atypical imagingfindings, such as extensive ground-glass opacities,nodules, consolidation, or a predominantly peri-bronchovascular distribution (3,20).
Nonspecific Interstitial PneumoniaNSIP is less common than UIP but is still one ofthe most common histologic findings in patientswith IIPs (21). NSIP is associated with a varietyof imaging and histologic findings, and the diag-nostic approach is highly challenging. However,the distinction of NSIP from UIP is more thanacademic, given the better response to corticoste-roids seen in a subgroup of patients with NSIP(22,23).
Owing to the clinical, radiologic, and patho-logic variability of NSIP, the term should be con-sidered a provisional diagnosis until further char-acterization of this entity has been established (3).
Clinical FeaturesThe typical patient with NSIP is between 40and 50 years old and is usually about a decadeyounger than the patient with IPF. Symptomsof NSIP are similar to those of IPF but usuallymilder (24). Patients present with gradually wors-ening dyspnea over several months, and they of-ten experience fatigue and weight loss. There isno gender predilection, and cigarette smoking isnot an obvious risk factor in the development ofNSIP. Treatment of patients with NSIP is based
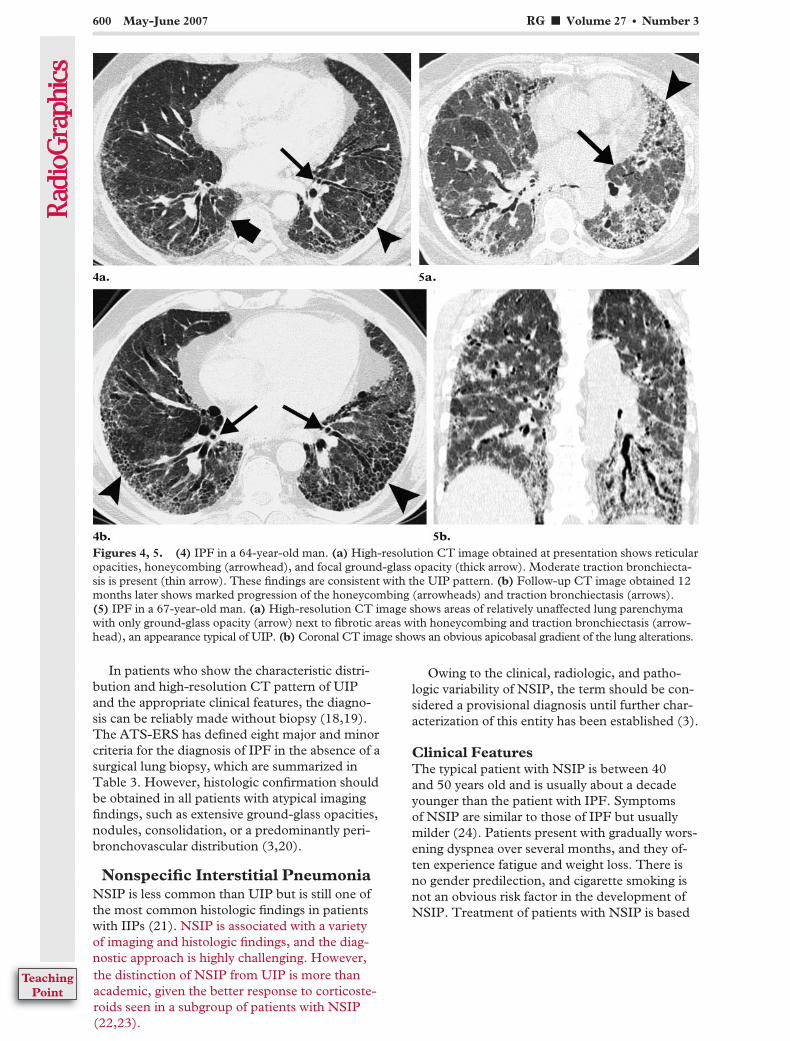
Figures 4, 5. (4) IPF in a 64-year-old man. (a) High-resolution CT image obtained at presentation shows reticularopacities, honeycombing (arrowhead), and focal ground-glass opacity (thick arrow). Moderate traction bronchiecta-sis is present (thin arrow). These findings are consistent with the UIP pattern. (b) Follow-up CT image obtained 12months later shows marked progression of the honeycombing (arrowheads) and traction bronchiectasis (arrows).(5) IPF in a 67-year-old man. (a) High-resolution CT image shows areas of relatively unaffected lung parenchymawith only ground-glass opacity (arrow) next to fibrotic areas with honeycombing and traction bronchiectasis (arrow-head), an appearance typical of UIP. (b) Coronal CT image shows an obvious apicobasal gradient of the lung alterations.
600 May-June 2007 RG f Volume 27 ● Number 3
TeachingPoint
on the use of systemic corticosteroids in combina-tion with cytotoxic drugs, such as cyclophospha-mide and cyclosporin, and the majority of pa-tients stabilize or improve with this therapy (25).
Although it is primarily defined as an idio-pathic disease, the morphologic pattern of NSIPis encountered in association with frequent disor-ders, such as connective tissue diseases, hypersen-sitivity pneumonitis, or drug exposure (26,27).Once the morphologic pattern of NSIP has beendetermined in a patient, these secondary forms ofNSIP must be ruled out by the clinician.
Histologic FeaturesThe histologic pattern of NSIP is characterized bytemporally and spatially homogeneous lung in-volvement (28). This homogeneity is a key featurein differentiating the NSIP pattern from the UIPpattern. On the basis of the varying proportions ofinflammation and fibrosis, NSIP is divided intocellular and fibrosing subtypes (Fig 6) (1). In cel-lular NSIP, the thickening of alveolar septa is pri-marily caused by inflammatory cells; in fibrosing
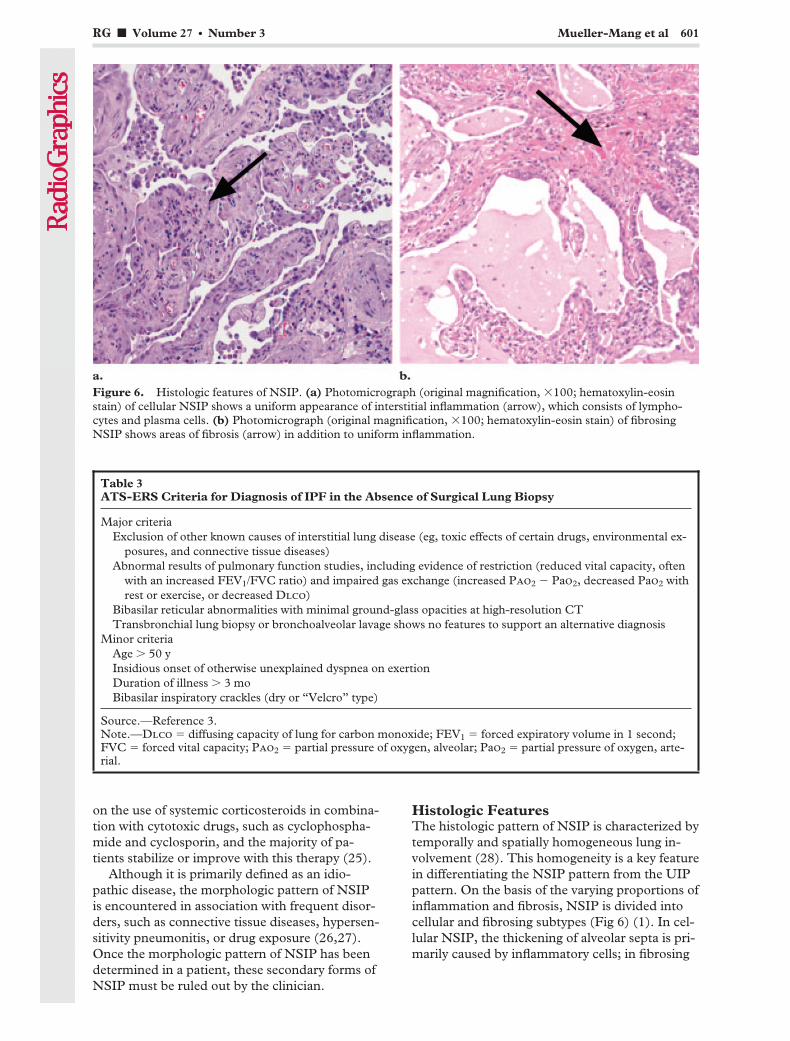
Figure 6. Histologic features of NSIP. (a) Photomicrograph (original magnification, �100; hematoxylin-eosinstain) of cellular NSIP shows a uniform appearance of interstitial inflammation (arrow), which consists of lympho-cytes and plasma cells. (b) Photomicrograph (original magnification, �100; hematoxylin-eosin stain) of fibrosingNSIP shows areas of fibrosis (arrow) in addition to uniform inflammation.
Table 3ATS-ERS Criteria for Diagnosis of IPF in the Absence of Surgical Lung Biopsy
Major criteriaExclusion of other known causes of interstitial lung disease (eg, toxic effects of certain drugs, environmental ex-
posures, and connective tissue diseases)Abnormal results of pulmonary function studies, including evidence of restriction (reduced vital capacity, often
with an increased FEV1/FVC ratio) and impaired gas exchange (increased Pao2 � Pao2, decreased Pao2 withrest or exercise, or decreased Dlco)
Bibasilar reticular abnormalities with minimal ground-glass opacities at high-resolution CTTransbronchial lung biopsy or bronchoalveolar lavage shows no features to support an alternative diagnosis
Minor criteriaAge � 50 yInsidious onset of otherwise unexplained dyspnea on exertionDuration of illness � 3 moBibasilar inspiratory crackles (dry or “Velcro” type)
Source.—Reference 3.Note.—Dlco � diffusing capacity of lung for carbon monoxide; FEV1 � forced expiratory volume in 1 second;FVC � forced vital capacity; Pao2 � partial pressure of oxygen, alveolar; Pao2 � partial pressure of oxygen, arte-rial.
RG f Volume 27 ● Number 3 Mueller-Mang et al 601
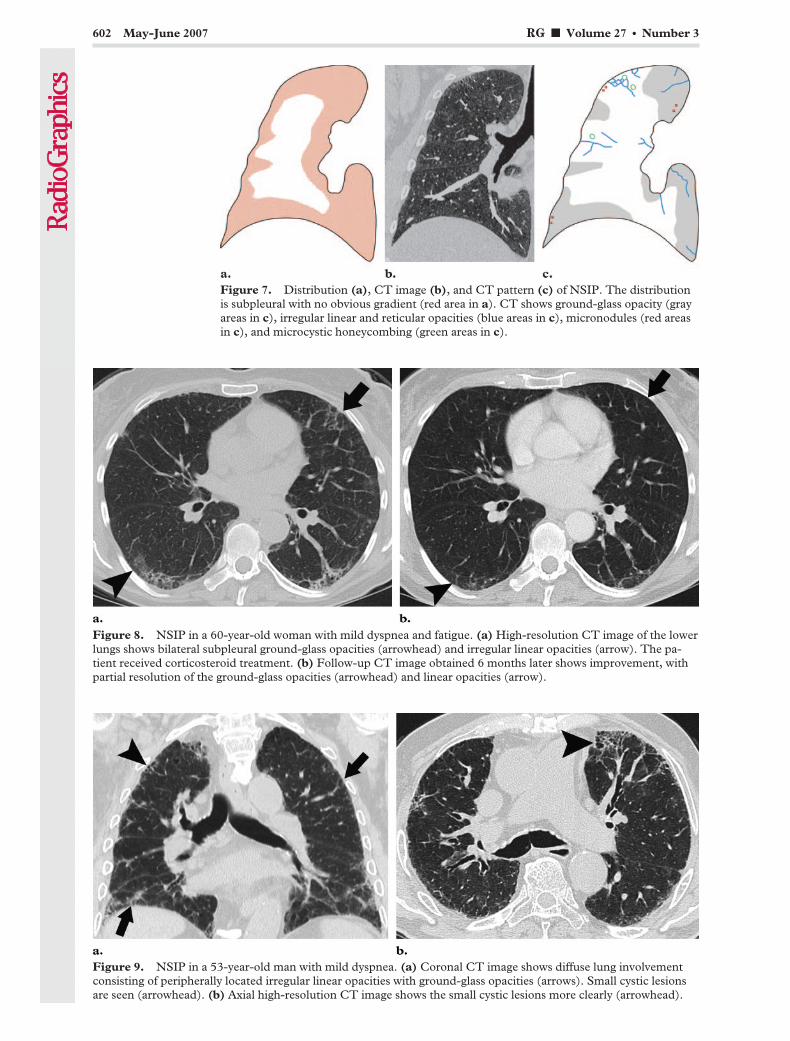
Figure 7. Distribution (a), CT image (b), and CT pattern (c) of NSIP. The distributionis subpleural with no obvious gradient (red area in a). CT shows ground-glass opacity (grayareas in c), irregular linear and reticular opacities (blue areas in c), micronodules (red areasin c), and microcystic honeycombing (green areas in c).
Figure 8. NSIP in a 60-year-old woman with mild dyspnea and fatigue. (a) High-resolution CT image of the lowerlungs shows bilateral subpleural ground-glass opacities (arrowhead) and irregular linear opacities (arrow). The pa-tient received corticosteroid treatment. (b) Follow-up CT image obtained 6 months later shows improvement, withpartial resolution of the ground-glass opacities (arrowhead) and linear opacities (arrow).
Figure 9. NSIP in a 53-year-old man with mild dyspnea. (a) Coronal CT image shows diffuse lung involvementconsisting of peripherally located irregular linear opacities with ground-glass opacities (arrows). Small cystic lesionsare seen (arrowhead). (b) Axial high-resolution CT image shows the small cystic lesions more clearly (arrowhead).
602 May-June 2007 RG f Volume 27 ● Number 3
NSIP, interstitial fibrosis is seen in addition tomild inflammation. Cellular NSIP is less commonthan fibrosing NSIP but shows a better responseto corticosteroids and carries a substantially bet-ter prognosis (21). Histologic distinction betweenfibrotic NSIP and UIP is difficult and is subject tosubstantial interobserver variation (20). In bor-derline cases, CT correlation may help by show-ing features more typical of either UIP or NSIP.
Imaging FeaturesIn patients with early NSIP, the chest radiographis normal. In advanced disease, bilateral pulmo-nary infiltrates are the most salient abnormality.The lower lung lobes are more frequently in-volved, but an obvious apicobasal gradient, asseen in UIP, is usually missing (3).
High-resolution CT typically reveals a sub-pleural and rather symmetric distribution of lungabnormalities (Fig 7). The most common mani-festation consists of patchy ground-glass opacitiescombined with irregular linear or reticular opaci-ties and scattered micronodules (Fig 8) (29–31).In advanced disease, traction bronchiectasis andconsolidation can be seen; however, ground-glassopacities remain the most obvious high-resolutionCT feature in the typical patient with NSIP andare related to the histologic finding of homoge-neous interstitial inflammation (29,30).
Other findings in advanced NSIP include sub-pleural cysts, but compared to those of UIP, thesecysts are smaller and limited in extent (Fig 9)(29). The term “microcystic honeycombing” isused for these cystic changes in NSIP, as opposedto the macrocystic honeycombing seen in UIP(32,33). Although the CT features of cellular andfibrotic NSIP overlap considerably, it has beenshown that honeycombing is seen almost exclu-sively in patients with fibrotic NSIP (17,29).Other CT findings that have been correlated withincreased likelihood of fibrosis in NSIP are theextent of traction bronchiectasis and intralobularreticular opacities (29).
Owing to the substantial overlap of high-reso-lution CT patterns, the major CT differential di-agnosis for NSIP is UIP. The key CT featuresthat favor the diagnosis of NSIP over UIP are ho-mogeneous lung involvement without an obviousapicobasal gradient, extensive ground-glass ab-normalities, a finer reticular pattern, and mi-cronodules (Figs 10, 11) (17,20,34). Follow-up
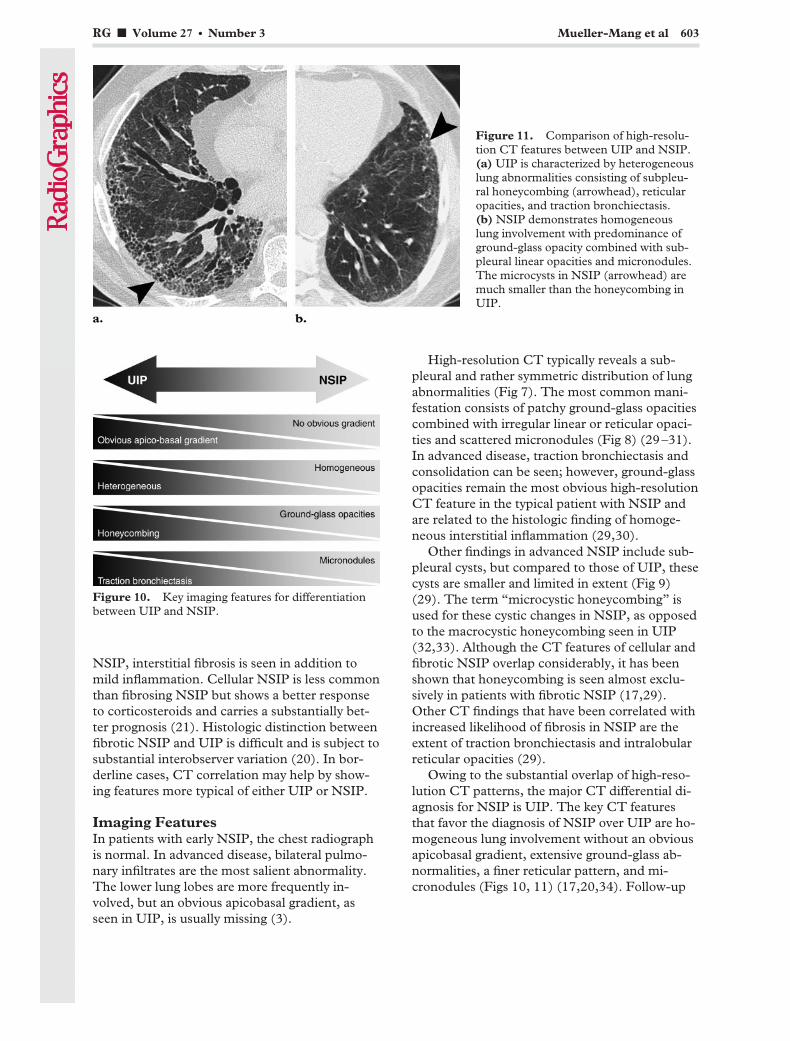
Figure 10. Key imaging features for differentiationbetween UIP and NSIP.
Figure 11. Comparison of high-resolu-tion CT features between UIP and NSIP.(a) UIP is characterized by heterogeneouslung abnormalities consisting of subpleu-ral honeycombing (arrowhead), reticularopacities, and traction bronchiectasis.(b) NSIP demonstrates homogeneouslung involvement with predominance ofground-glass opacity combined with sub-pleural linear opacities and micronodules.The microcysts in NSIP (arrowhead) aremuch smaller than the honeycombing inUIP.
RG f Volume 27 ● Number 3 Mueller-Mang et al 603
CT also demonstrates differences between pa-tients with NSIP and those with UIP. In patientswith NSIP, ground-glass opacities usually do notprogress to areas of honeycombing, even if thereis associated bronchiectasis (30). However, inpatients with UIP, progression of ground-glassattenuation to honeycombing is common andindicates irreversible fibrosis (35).
Despite differences in distribution and CT pat-tern, the differential diagnosis between UIP andNSIP remains challenging, and surgical lung bi-opsy is required in all patients who do not presentwith the typical clinical and CT features of UIP.
CryptogenicOrganizing Pneumonia
COP is an IIP with characteristic clinical and ra-diologic features. The histologic pattern of COPis organizing pneumonia, formerly referred to asbronchiolitis obliterans organizing pneumonia(BOOP). The term BOOP has been omitted toavoid confusion with airway diseases such as con-strictive bronchiolitis (3).
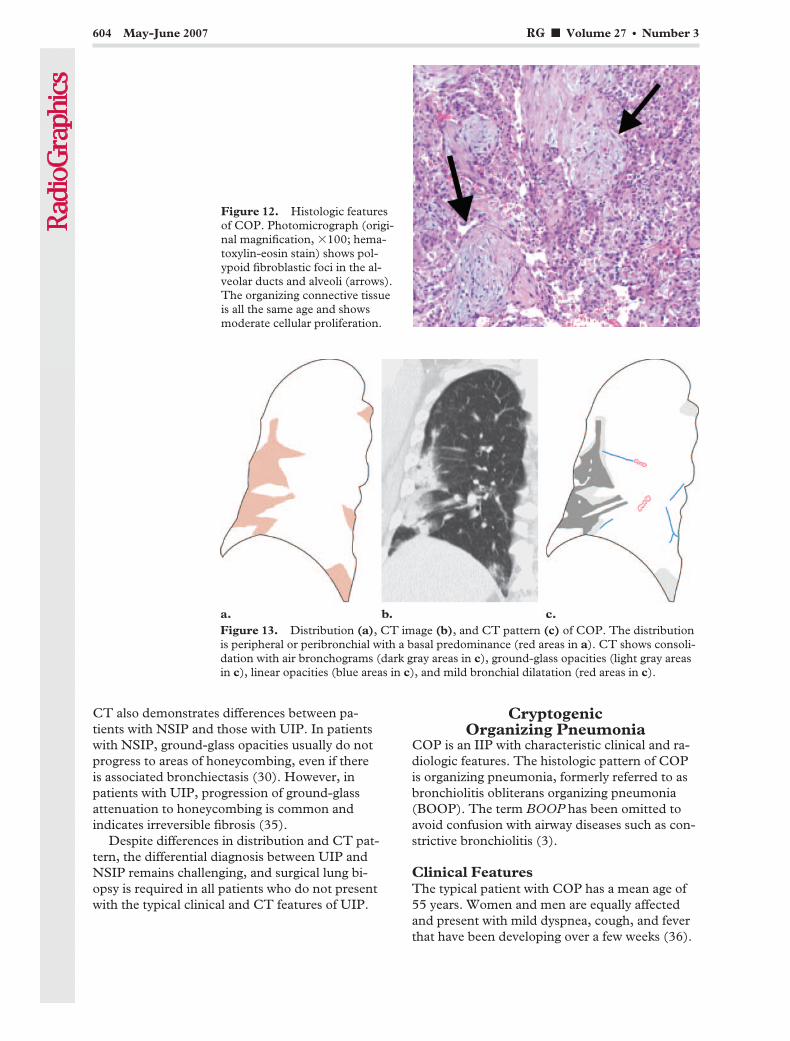
Clinical FeaturesThe typical patient with COP has a mean age of55 years. Women and men are equally affectedand present with mild dyspnea, cough, and feverthat have been developing over a few weeks (36).
Figure 12. Histologic featuresof COP. Photomicrograph (origi-nal magnification, �100; hema-toxylin-eosin stain) shows pol-ypoid fibroblastic foci in the al-veolar ducts and alveoli (arrows).The organizing connective tissueis all the same age and showsmoderate cellular proliferation.
Figure 13. Distribution (a), CT image (b), and CT pattern (c) of COP. The distributionis peripheral or peribronchial with a basal predominance (red areas in a). CT shows consoli-dation with air bronchograms (dark gray areas in c), ground-glass opacities (light gray areasin c), linear opacities (blue areas in c), and mild bronchial dilatation (red areas in c).
604 May-June 2007 RG f Volume 27 ● Number 3

Patients typically report a respiratory tract infec-tion preceding their symptoms, and antibioticswere commonly prescribed at a previous consul-tation (37). There is no association with cigarettesmoking; in fact, most patients are nonsmokers orex-smokers (3). The majority of patients recovercompletely after administration of corticosteroids,but relapses occur frequently within 3 monthsafter corticosteroid therapy is reduced or stopped(38). As with the other interstitial pneumonias,the pattern of organizing pneumonia may occurin a wide variety of entities, notably in collagenvascular diseases and in infectious and drug-in-duced lung diseases (26,27). Therefore, the final
diagnosis of COP should be rendered only afterexclusion of any other possible cause of organiz-ing pneumonia.
Histologic FeaturesThe histologic hallmark of organizing pneumoniais the presence of granulation tissue polyps in thealveolar ducts and alveoli (Fig 12) (39). Thesefibroblast proliferations result from organizationof inflammatory intraalveolar exudates (36).Typically, there is patchy lung involvement withpreservation of lung architecture. The granulationtissue is all the same age and contains few inflam-matory cells.
Imaging FeaturesThe chest radiograph in patients with COP usu-ally shows unilateral or bilateral patchy consolida-tions that resemble pneumonic infiltrates (40).However, the consolidations in COP do not rep-resent an active pneumonia but result from in-traalveolar fibroblast proliferations, which may beassociated with prior respiratory infection. Somepatients present with nodular opacities on thechest radiograph. Lung volumes are preserved inmost patients.
Frequently, the CT findings are far more ex-tensive than expected from a review of the plainchest radiograph. The lung abnormalities show acharacteristic peripheral or peribronchial distribu-tion, and the lower lung lobes are more frequentlyinvolved (Figs 13, 14) (41). In some cases, theoutermost subpleural area is spared (Fig 15) (42).
Figure 14. COP in a 54-year-old woman. (a) Coronal CT image shows extensive bilateral peribronchial consolida-tion and ground-glass opacities (arrows). An endotracheal tube is present (arrowhead), indicating the need for me-chanical ventilation. (b) CT image obtained after 3 weeks of corticosteroid and supportive treatment shows subtotalresolution of the lung abnormalities (arrows).
Figure 15. COP in a 69-year-old man. High-resolu-tion CT image shows peripherally located consolida-tion with air bronchograms and sparing of the subpleu-ral space (arrow).
RG f Volume 27 ● Number 3 Mueller-Mang et al 605
Typically, the appearance of the lung opacitiesvaries from ground glass to consolidation; in thelatter, air bronchograms and mild cylindricalbronchial dilatation are a common finding (41).These opacities have a tendency to migrate,changing location and size, even without treat-ment (42). They are of variable size, ranging froma few centimeters to an entire lobe.
In the appropriate clinical context, that is, con-solidation that increases over several weeks de-spite antibiotics, the CT features of COP are of-ten suggestive. However, apart from the typicalimaging pattern of COP, other less specific imag-ing patterns can be encountered. These atypicalimaging findings include irregular linear opacities,solitary focal lesions that resemble lung cancer, ormultiple nodules that may cavitate (Fig 16) (43–45). In either case, the diagnosis should be con-firmed with surgical lung biopsy. The role oftransbronchial lung biopsy for diagnosis of COPis currently under evaluation (3).
Respiratory Bronchiolitis–associated Interstitial Lung Disease
RB-ILD is a smoking-related interstitial lung dis-ease and is thought to represent an exaggeratedand symptomatic form of the histologically com-mon and incidental finding of respiratory bron-chiolitis. Because of the significant overlap inclinical, imaging, and histologic features betweenRB-ILD and DIP, these entities are considered apathomorphologic continuum, representing dif-ferent degrees of severity of the same disease pro-cess (46,47).
Clinical FeaturesPatients with RB-ILD are usually 30–40 yearsold and have an average smoking history of 30pack-years (47). Men are affected nearly twice asoften as women and present with mild dyspneaand cough. Smoking cessation is the most impor-tant component in the therapeutic managementof RB-ILD. However, the majority of patientsalso receive corticosteroid therapy (48).
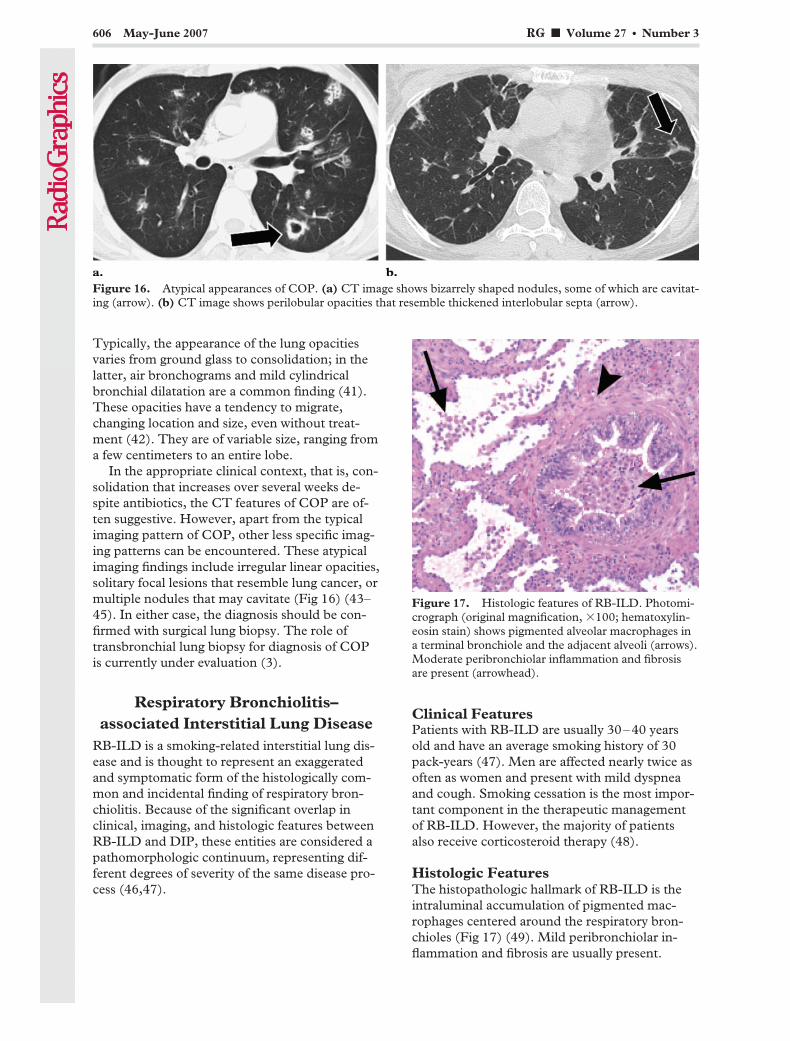
Histologic FeaturesThe histopathologic hallmark of RB-ILD is theintraluminal accumulation of pigmented mac-rophages centered around the respiratory bron-chioles (Fig 17) (49). Mild peribronchiolar in-flammation and fibrosis are usually present.
Figure 16. Atypical appearances of COP. (a) CT image shows bizarrely shaped nodules, some of which are cavitat-ing (arrow). (b) CT image shows perilobular opacities that resemble thickened interlobular septa (arrow).
Figure 17. Histologic features of RB-ILD. Photomi-crograph (original magnification, �100; hematoxylin-eosin stain) shows pigmented alveolar macrophages ina terminal bronchiole and the adjacent alveoli (arrows).Moderate peribronchiolar inflammation and fibrosisare present (arrowhead).
606 May-June 2007 RG f Volume 27 ● Number 3

Findings in patients with RB-ILD cannot be dif-ferentiated histologically from those seen inasymptomatic patients with respiratory bronchi-olitis.
Imaging FeaturesThe chest radiograph is insensitive for detectionof RB-ILD and is often normal. Sometimes,bronchial wall thickening or reticular opacitiescan be seen (3,50).
The distribution at high-resolution CT ismostly diffuse (Fig 18) (46). The key high-resolu-tion CT features of RB-ILD are centrilobularnodules in combination with ground-glass opaci-ties and bronchial wall thickening (Fig 19) (47).
The ground-glass opacities have been shown tocorrelate with macrophage accumulation in alveo-lar ducts and alveolar spaces (51). The centri-lobular nodules are presumably caused by theperibronchial distribution of the intraluminal in-filtrates (52). Coexisting moderate centrilobularemphysema is common, given that most patientshave a smoking history.
DesquamativeInterstitial Pneumonia
DIP is strongly associated with cigarette smokingand is considered to represent the end of a spec-trum of RB-ILD. However, DIP also occurs innonsmokers and has been related to a variety ofconditions, including lung infections and expo-sure to organic dust (53,54).
Clinical FeaturesFor the majority of patients with DIP, the onsetof symptoms is between 30 and 40 years of age.Men are affected about twice as often as women,and most patients are current or past smokers(average smoking history of 18 pack-years) (47).
With smoking cessation and corticosteroidtherapy, the prognosis is good. Nevertheless, pro-gressive disease with eventual death can occur,notably in patients with continued cigarettesmoking (48).
Histologic FeaturesThe major histopathologic feature of DIP is theaccumulation of pigmented macrophages and afew desquamated alveolar epithelial cells in the
Figure 18. Distribution (a), CT image (b), and CT pattern (c) of RB-ILD. RB-ILD hasan upper lung predominance (red area in a). CT shows ground-glass opacity (gray area in c)and centrilobular nodules (red areas in c).
Figure 19. RB-ILD in a 44-year-old woman with a20 pack-year smoking history. High-resolution CT im-age of the upper lung lobes shows centrilobular nod-ules (white arrows) and patchy ground-glass opacities(black arrow). Mild coexisting centrilobular emphy-sema is seen (arrowhead).
RG f Volume 27 ● Number 3 Mueller-Mang et al 607

alveoli (Fig 20). As opposed to the bronchiolo-centric distribution in RB-ILD, lung involvementin DIP is more diffuse and uniform (55). Usually,there is mild fibrosis in the interstitium. The morecommon DIP-like lung alterations seen in pa-tients secondary to exposure to organic dust or inassociation with other IIPs, such as UIP, cannotbe differentiated histologically from idiopathicDIP (56).
Imaging FeaturesChest radiographs of DIP are nonspecific andmay reveal hazy opacities (57).
At high-resolution CT, DIP is characterized bydiffuse ground-glass opacities, which correlate
histologically with the spatially homogeneous in-traalveolar accumulation of macrophages andthickening of alveolar septa (Fig 21) (58). Usu-ally, there is a peripheral and lower lung lobe pre-dominance (Fig 22) (59). Other frequent CTfindings include spatially limited irregular linearopacities and small cystic spaces, which are in-dicative of fibrotic changes (Fig 23) (3).
Despite differences in the CT appearance ofRB-ILD and DIP, imaging findings may overlapand may be indistinguishable from each other. Toimprove diagnostic accuracy, lung biopsy is re-quired in all cases of suspected RB-ILD or DIP(3).
Lymphoid Interstitial PneumoniaAs an idiopathic disease, LIP is exceedingly rare.It is far more common as a secondary disease inassociation with systemic disorders, most notably
Figure 20. Histologic featuresof DIP. Photomicrograph (origi-nal magnification, �200; hema-toxylin-eosin stain) shows diffusefilling of the alveolar spaces withalveolar macrophages and a fewdesquamated alveolar epithelialcells (arrow) (inset). Mild inter-stitial fibrosis is present (arrow-head).
Figure 21. Distribution (a), CT image (b), and CT pattern (c) of DIP. DIP has a periph-eral predominance (red areas in a). CT shows ground-glass opacity (gray area in c), irregularlinear opacities (blue areas in c), and cysts (green areas in c).
608 May-June 2007 RG f Volume 27 ● Number 3
Sjogren syndrome, human immunodeficiencyvirus infection, and variable immunodeficiencysyndromes (60).
Clinical FeaturesLIP is more common in women than in men, andpatients are usually in their fifth decade of life atpresentation. They present with slowly progres-sive dyspnea and cough over a period of 3 ormore years (3). Occasionally, patients report sys-temic symptoms, such as fever, night sweats, and
weight loss. In the past, LIP was considered apulmonary lymphoproliferative disorder, withsubsequent progression to malignant lymphoma(61). However, many of these cases were reclassi-fied as lymphoma from the outset, and only asmall number of definite LIP cases seem to actu-ally undergo malignant transformation (62). Cor-ticosteroids are used in the therapy of LIP, butresponse is unpredictable and no controlled ran-domized treatment trials have been reported todate (60).
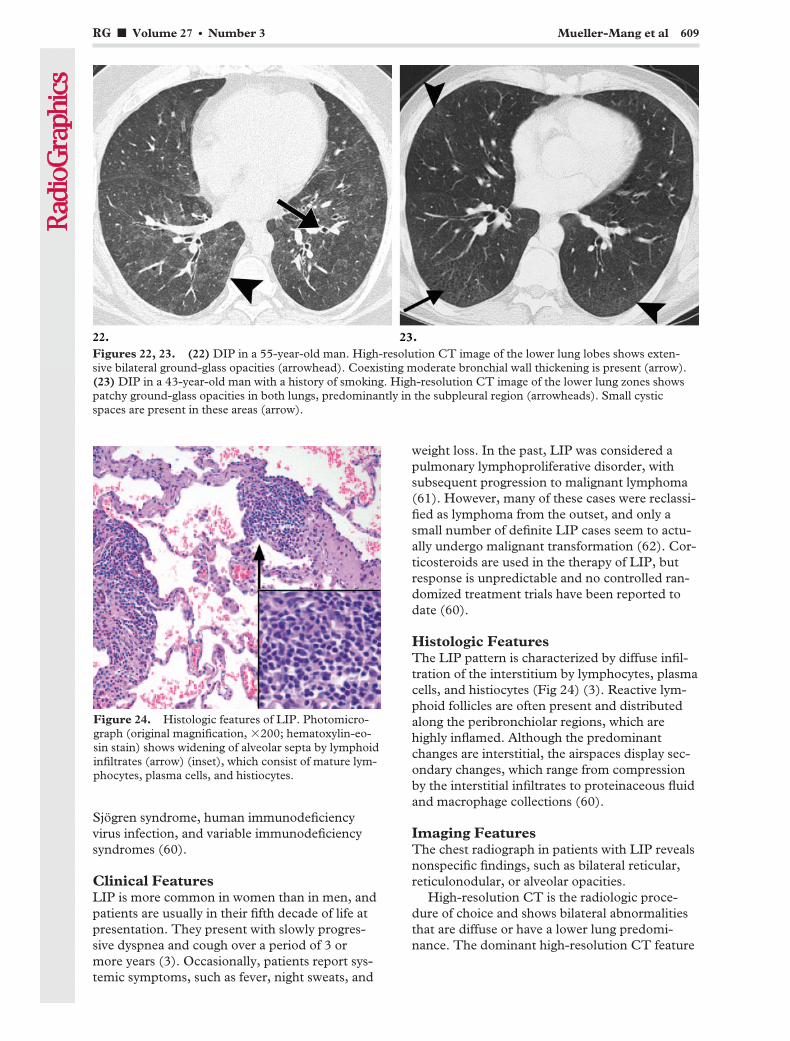
Histologic FeaturesThe LIP pattern is characterized by diffuse infil-tration of the interstitium by lymphocytes, plasmacells, and histiocytes (Fig 24) (3). Reactive lym-phoid follicles are often present and distributedalong the peribronchiolar regions, which arehighly inflamed. Although the predominantchanges are interstitial, the airspaces display sec-ondary changes, which range from compressionby the interstitial infiltrates to proteinaceous fluidand macrophage collections (60).
Imaging FeaturesThe chest radiograph in patients with LIP revealsnonspecific findings, such as bilateral reticular,reticulonodular, or alveolar opacities.
High-resolution CT is the radiologic proce-dure of choice and shows bilateral abnormalitiesthat are diffuse or have a lower lung predomi-nance. The dominant high-resolution CT feature
Figure 24. Histologic features of LIP. Photomicro-graph (original magnification, �200; hematoxylin-eo-sin stain) shows widening of alveolar septa by lymphoidinfiltrates (arrow) (inset), which consist of mature lym-phocytes, plasma cells, and histiocytes.
Figures 22, 23. (22) DIP in a 55-year-old man. High-resolution CT image of the lower lung lobes shows exten-sive bilateral ground-glass opacities (arrowhead). Coexisting moderate bronchial wall thickening is present (arrow).(23) DIP in a 43-year-old man with a history of smoking. High-resolution CT image of the lower lung zones showspatchy ground-glass opacities in both lungs, predominantly in the subpleural region (arrowheads). Small cysticspaces are present in these areas (arrow).
RG f Volume 27 ● Number 3 Mueller-Mang et al 609
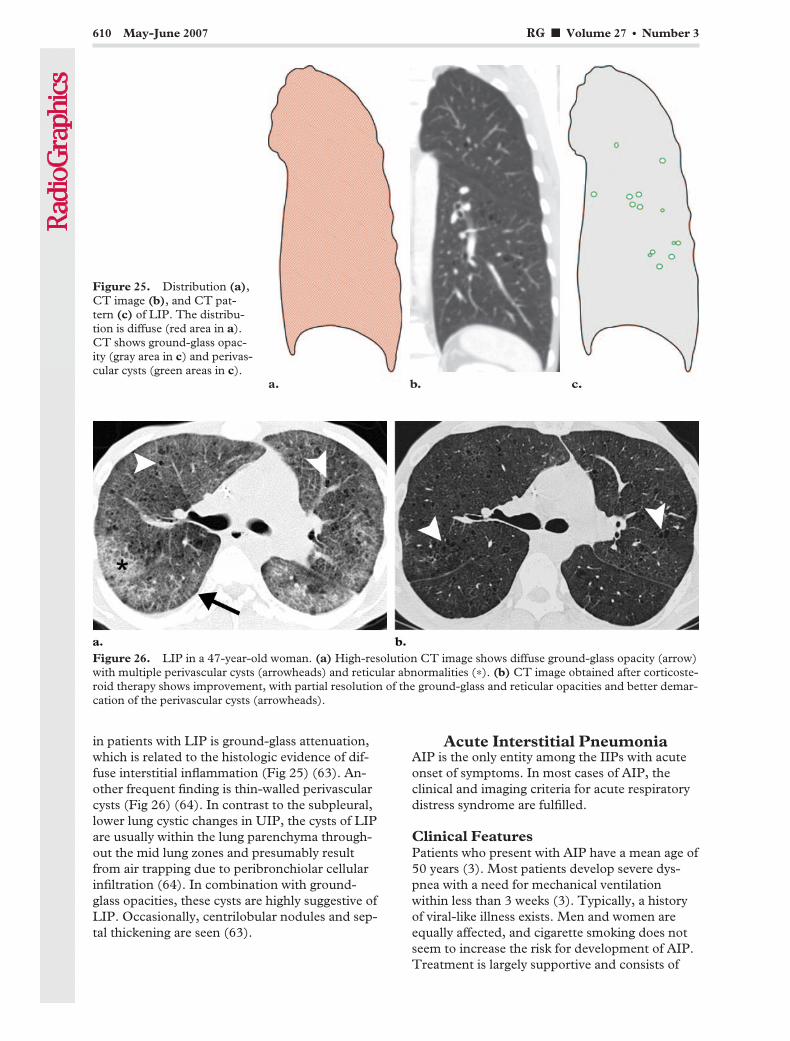
in patients with LIP is ground-glass attenuation,which is related to the histologic evidence of dif-fuse interstitial inflammation (Fig 25) (63). An-other frequent finding is thin-walled perivascularcysts (Fig 26) (64). In contrast to the subpleural,lower lung cystic changes in UIP, the cysts of LIPare usually within the lung parenchyma through-out the mid lung zones and presumably resultfrom air trapping due to peribronchiolar cellularinfiltration (64). In combination with ground-glass opacities, these cysts are highly suggestive ofLIP. Occasionally, centrilobular nodules and sep-tal thickening are seen (63).
Acute Interstitial PneumoniaAIP is the only entity among the IIPs with acuteonset of symptoms. In most cases of AIP, theclinical and imaging criteria for acute respiratorydistress syndrome are fulfilled.
Clinical FeaturesPatients who present with AIP have a mean age of50 years (3). Most patients develop severe dys-pnea with a need for mechanical ventilationwithin less than 3 weeks (3). Typically, a historyof viral-like illness exists. Men and women areequally affected, and cigarette smoking does notseem to increase the risk for development of AIP.Treatment is largely supportive and consists of
Figure 25. Distribution (a),CT image (b), and CT pat-tern (c) of LIP. The distribu-tion is diffuse (red area in a).CT shows ground-glass opac-ity (gray area in c) and perivas-cular cysts (green areas in c).
Figure 26. LIP in a 47-year-old woman. (a) High-resolution CT image shows diffuse ground-glass opacity (arrow)with multiple perivascular cysts (arrowheads) and reticular abnormalities (*). (b) CT image obtained after corticoste-roid therapy shows improvement, with partial resolution of the ground-glass and reticular opacities and better demar-cation of the perivascular cysts (arrowheads).
610 May-June 2007 RG f Volume 27 ● Number 3
oxygen supplementation. Corticosteroids seem tobe effective in the early phase of disease (65).Nevertheless, the prognosis remains poor, with amortality rate of 50% or more (3). Although re-currences of AIP have been described, most pa-tients who survive the acute phase of the diseaselater progress to lung fibrosis (66,67).
Histologic FeaturesThe histologic pattern of AIP includes diffusealveolar damage, which can be categorized into anearly exudative phase and a chronic organizingphase, depending on the timing of the biopsy inrelation to the lung insult (68). The exudativephase is characterized by interstitial and intraal-veolar edema, formation of hyaline membranes,and diffuse alveolar infiltration by inflammatorycells (Fig 27). The organizing phase usually be-gins at the end of the first week after lung injuryand is characterized by formation of granulation
tissue, which results in alveolar wall thickening.As opposed to the heterogeneous appearance ofUIP, fibrotic changes in AIP are uniform andcharacterized by numerous fibroblasts but rela-tively little collagen deposition (69).
Histopathologic investigation is necessary for adefinitive diagnosis of AIP. However, consideringthe fact that patients with AIP are often too ill totolerate surgical lung biopsy, transbronchial bi-opsy seems to be sufficient (65).
Imaging FeaturesThe radiographic and high-resolution CT fea-tures of AIP are similar to those of acute respira-tory distress syndrome; however, patients withAIP are more likely to have a symmetric, bilateraldistribution with a lower lobe predominance (Fig28) (70). The costophrenic angles are often
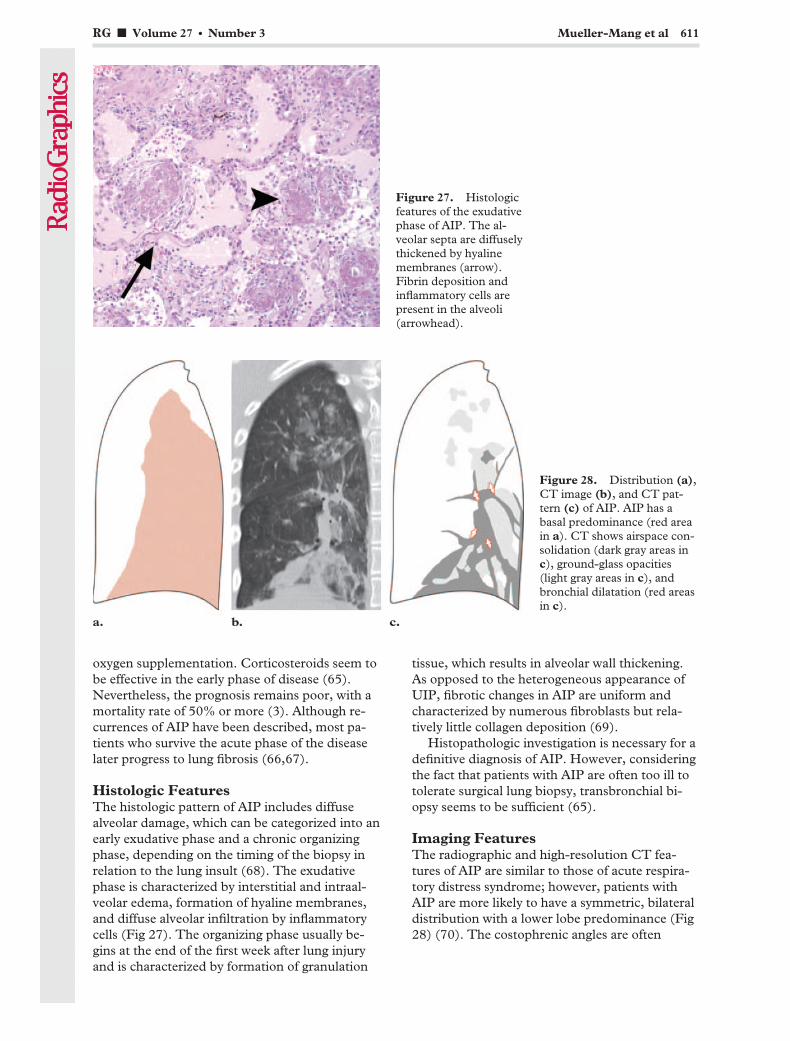
Figure 27. Histologicfeatures of the exudativephase of AIP. The al-veolar septa are diffuselythickened by hyalinemembranes (arrow).Fibrin deposition andinflammatory cells arepresent in the alveoli(arrowhead).
Figure 28. Distribution (a),CT image (b), and CT pat-tern (c) of AIP. AIP has abasal predominance (red areain a). CT shows airspace con-solidation (dark gray areas inc), ground-glass opacities(light gray areas in c), andbronchial dilatation (red areasin c).
RG f Volume 27 ● Number 3 Mueller-Mang et al 611
spared. In the early phase of AIP, ground-glassopacities are the dominant CT pattern and reflectthe presence of alveolar septal edema and hyalinemembranes (Fig 29) (69). Areas of consolidationare also present but are usually less extensive andlimited to the dependent area of the lung (71). Inthe early phase, airspace consolidation resultsfrom intraalveolar edema and hemorrhage.
However, consolidations are also present in thefibrotic phase and then result from intraalveolarfibrosis (72). In the late phase of AIP, architec-tural distortion, traction bronchiectasis, and hon-
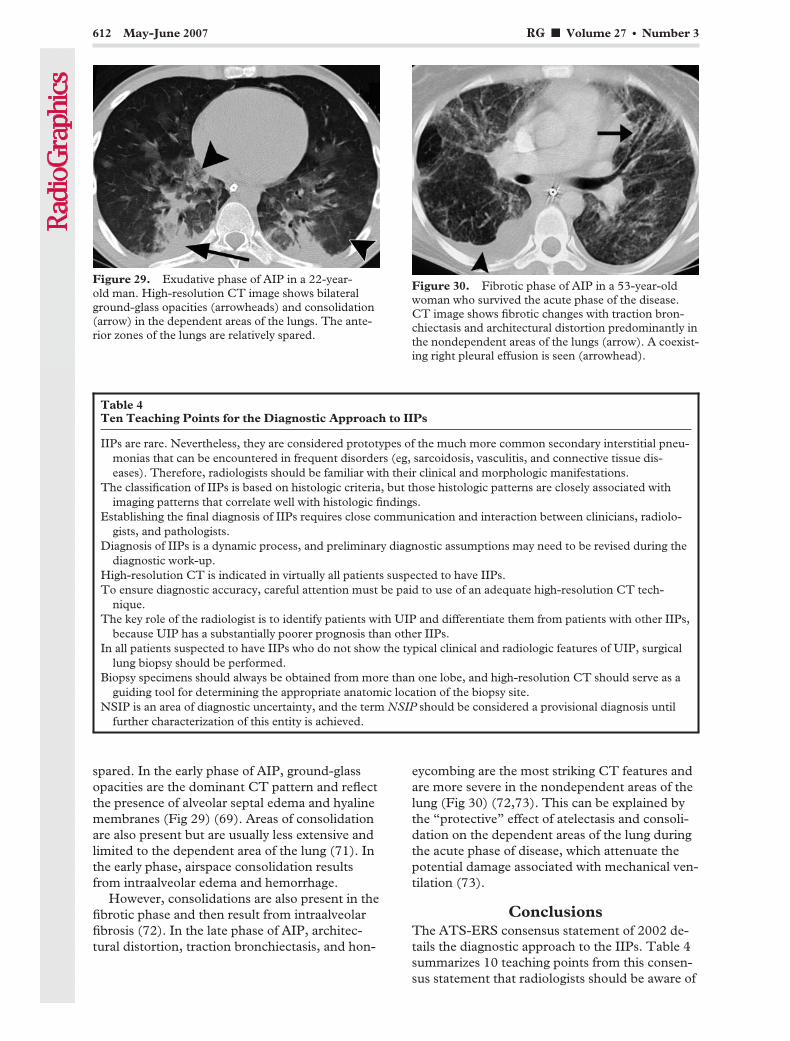
eycombing are the most striking CT features andare more severe in the nondependent areas of thelung (Fig 30) (72,73). This can be explained bythe “protective” effect of atelectasis and consoli-dation on the dependent areas of the lung duringthe acute phase of disease, which attenuate thepotential damage associated with mechanical ven-tilation (73).
ConclusionsThe ATS-ERS consensus statement of 2002 de-tails the diagnostic approach to the IIPs. Table 4summarizes 10 teaching points from this consen-sus statement that radiologists should be aware of
Figure 29. Exudative phase of AIP in a 22-year-old man. High-resolution CT image shows bilateralground-glass opacities (arrowheads) and consolidation(arrow) in the dependent areas of the lungs. The ante-rior zones of the lungs are relatively spared.
Figure 30. Fibrotic phase of AIP in a 53-year-oldwoman who survived the acute phase of the disease.CT image shows fibrotic changes with traction bron-chiectasis and architectural distortion predominantly inthe nondependent areas of the lungs (arrow). A coexist-ing right pleural effusion is seen (arrowhead).
Table 4Ten Teaching Points for the Diagnostic Approach to IIPs
IIPs are rare. Nevertheless, they are considered prototypes of the much more common secondary interstitial pneu-monias that can be encountered in frequent disorders (eg, sarcoidosis, vasculitis, and connective tissue dis-eases). Therefore, radiologists should be familiar with their clinical and morphologic manifestations.
The classification of IIPs is based on histologic criteria, but those histologic patterns are closely associated withimaging patterns that correlate well with histologic findings.
Establishing the final diagnosis of IIPs requires close communication and interaction between clinicians, radiolo-gists, and pathologists.
Diagnosis of IIPs is a dynamic process, and preliminary diagnostic assumptions may need to be revised during thediagnostic work-up.
High-resolution CT is indicated in virtually all patients suspected to have IIPs.To ensure diagnostic accuracy, careful attention must be paid to use of an adequate high-resolution CT tech-
nique.The key role of the radiologist is to identify patients with UIP and differentiate them from patients with other IIPs,
because UIP has a substantially poorer prognosis than other IIPs.In all patients suspected to have IIPs who do not show the typical clinical and radiologic features of UIP, surgical
lung biopsy should be performed.Biopsy specimens should always be obtained from more than one lobe, and high-resolution CT should serve as a
guiding tool for determining the appropriate anatomic location of the biopsy site.NSIP is an area of diagnostic uncertainty, and the term NSIP should be considered a provisional diagnosis until
further characterization of this entity is achieved.
612 May-June 2007 RG f Volume 27 ● Number 3
when dealing with these conditions. IIPs are asso-ciated with typical morphologic patterns. The CTappearances of UIP and COP may be diagnosticin the appropriate clinical context. However,there is substantial overlap in the CT appearancesof the other IIPs. Therefore, accurate diagnosis ofthese disorders requires a dynamic interdiscipli-nary approach that correlates clinical, radiologic,and pathologic features.
Acknowledgment: The authors gratefully thank InesFischer for her help in editing the illustrations.
References1. Katzenstein AL, Myers JL. Idiopathic pulmonary
fibrosis: clinical relevance of pathologic classifica-tion. Am J Respir Crit Care Med 1998;157:1301–1315.
2. Liebow A. New concepts and entities in pulmo-nary disease. Monogr Pathol 1968;8:322–365.
3. American Thoracic Society; European RespiratorySociety. American Thoracic Society/European Re-spiratory Society International MultidisciplinaryConsensus Classification of the Idiopathic Intersti-tial Pneumonias. This joint statement of theAmerican Thoracic Society (ATS), and the Euro-pean Respiratory Society (ERS) was adopted bythe ATS board of directors, June 2001 and by theERS Executive Committee, June 2001. Am J Re-spir Crit Care Med 2002;165:277–304. [Pub-lished correction appears in Am J Respir Crit CareMed 2002;166:426.]
4. King TE Jr, Schwarz MI, Brown K, et al. Idio-pathic pulmonary fibrosis: relationship betweenhistopathologic features and mortality. Am J Re-spir Crit Care Med 2001;164:1025–1032.
5. du Bois RM, Wells AU. Cryptogenic fibrosing al-veolitis/idiopathic pulmonary fibrosis. Eur Respir JSuppl 2001;32:43s–55s.
6. Hidalgo A, Franquet T, Gimenez A, Bordes R,Pineda R, Madrid M. Smoking-related interstitiallung diseases: radiologic-pathologic correlation.Eur Radiol 2006;16:2463–2470.
7. Taskar VS, Coultas DB. Is idiopathic pulmonaryfibrosis an environmental disease? Proc Am Tho-rac Soc 2006;3:293–298.
8. Michaelson JE, Aguayo SM, Roman J. Idiopathicpulmonary fibrosis: a practical approach for diag-nosis and management. Chest 2000;118:788–794.
9. Homma S, Sakamoto S, Kawabata M, et al. Cy-closporin treatment in steroid-resistant and acutelyexacerbated interstitial pneumonia. Intern Med2005;44:1144–1150.
10. Thabut G, Mal H, Castier Y, et al. Survival ben-efit of lung transplantation for patients with idio-pathic pulmonary fibrosis. J Thorac CardiovascSurg 2003;126:469–475.
11. Monaghan H, Wells AU, Colby TV, du Bois RM,Hansell DM, Nicholson AG. Prognostic implica-tions of histologic patterns in multiple surgicallung biopsies from patients with idiopathic inter-stitial pneumonias. Chest 2004;125:522–526.
12. Flaherty KR, Travis WD, Colby TV, et al. His-topathologic variability in usual and nonspecificinterstitial pneumonias. Am J Respir Crit CareMed 2001;164:1722–1727.
13. Muller NL, Miller RR, Webb WR, Evans KG,Ostrow DN. Fibrosing alveolitis: CT-pathologiccorrelation. Radiology 1986;160:585–588.
14. Chandler PW, Shin MS, Friedman SE, Myers JL,Katzenstein AL. Radiographic manifestations ofbronchiolitis obliterans with organizing pneumo-nia vs usual interstitial pneumonia. AJR Am JRoentgenol 1986;147:899–906.
15. Hunninghake GW, Lynch DA, Galvin JR, et al.Radiologic findings are strongly associated with apathologic diagnosis of usual interstitial pneumo-nia. Chest 2003;124:1215–1223.
16. Johkoh T, Muller NL, Cartier Y, et al. Idiopathicinterstitial pneumonias: diagnostic accuracy ofthin-section CT in 129 patients. Radiology 1999;211:555–560.
17. MacDonald SL, Rubens MB, Hansell DM, et al.Nonspecific interstitial pneumonia and usual in-terstitial pneumonia: comparative appearances atand diagnostic accuracy of thin-section CT. Radi-ology 2001;221:600–605.
18. Raghu G, Mageto YN, Lockhart D, Schmidt RA,Wood DE, Godwin JD. The accuracy of the clini-cal diagnosis of new-onset idiopathic pulmonaryfibrosis and other interstitial lung disease: a pro-spective study. Chest 1999;116:1168–1174.
19. Hunninghake GW, Zimmerman MB, SchwartzDA, et al. Utility of a lung biopsy for the diagnosisof idiopathic pulmonary fibrosis. Am J Respir CritCare Med 2001;164:193–196.
20. Flaherty KR, Thwaite EL, Kazerooni EA, et al.Radiological versus histological diagnosis in UIPand NSIP: survival implications. Thorax 2003;58:143–148.
21. Travis WD, Matsui K, Moss J, Ferrans VJ. Idio-pathic nonspecific interstitial pneumonia: prog-nostic significance of cellular and fibrosing pat-terns—survival comparison with usual interstitialpneumonia and desquamative interstitial pneumo-nia. Am J Surg Pathol 2000;24:19–33.
22. Riha RL, Duhig EE, Clarke BE, Steele RH,Slaughter RE, Zimmerman PV. Survival of pa-tients with biopsy-proven usual interstitial pneu-monia and nonspecific interstitial pneumonia. EurRespir J 2002;19:1114–1118.
23. Latsi PI, du Bois RM, Nicholson AG, et al. Fi-brotic idiopathic interstitial pneumonia: theprognostic value of longitudinal functionaltrends. Am J Respir Crit Care Med 2003;168:531–537.
24. Martinez FJ. Idiopathic interstitial pneumonias:usual interstitial pneumonia versus nonspecificinterstitial pneumonia. Proc Am Thorac Soc2006;3:81–95.
25. Daniil ZD, Gilchrist FC, Nicholson AG, et al. Ahistologic pattern of nonspecific interstitial pneu-monia is associated with a better prognosis thanusual interstitial pneumonia in patients with cryp-togenic fibrosing alveolitis. Am J Respir Crit CareMed 1999;160:899–905.
26. Kim EA, Lee KS, Johkoh T, et al. Interstitial lungdiseases associated with collagen vascular diseases:radiologic and histopathologic findings. Radio-Graphics 2002;22(spec no):S151–S165.
RG f Volume 27 ● Number 3 Mueller-Mang et al 613
TeachingPoint
TeachingPoint

27. Rossi SE, Erasmus JJ, McAdams HP, Sporn TA,Goodman PC. Pulmonary drug toxicity: radio-logic and pathologic manifestations. RadioGraph-ics 2000;20:1245–1259.
28. Katzenstein AL, Fiorelli RF. Nonspecific intersti-tial pneumonia/fibrosis: histologic features andclinical significance. Am J Surg Pathol 1994;18:136–147.
29. Johkoh T, Muller NL, Colby TV, et al. Nonspe-cific interstitial pneumonia: correlation betweenthin-section CT findings and pathologic sub-groups in 55 patients. Radiology 2002;225:199–204.
30. Akira M, Inoue G, Yamamoto S, Sakatani M.Non-specific interstitial pneumonia: findings onsequential CT scans of nine patients. Thorax2000;55:854–859.
31. Kim EY, Lee KS, Chung MP, Kwon OJ, Kim TS,Hwang JH. Nonspecific interstitial pneumoniawith fibrosis: serial high-resolution CT findingswith functional correlation. AJR Am J Roentgenol1999;173:949–953.
32. Wells AU, Desai SR, Rubens MB, et al. Idiopathicpulmonary fibrosis: a composite physiologic indexderived from disease extent observed by computedtomography. Am J Respir Crit Care Med 2003;167:962–969.
33. Desai SR, Veeraraghavan S, Hansell DM, et al.CT features of lung disease in patients with sys-temic sclerosis: comparison with idiopathic pul-monary fibrosis and nonspecific interstitial pneu-monia. Radiology 2004;232:560–567.
34. Do KH, Lee JS, Colby TV, Kitaichi M, Kim DS.Nonspecific interstitial pneumonia versus usualinterstitial pneumonia: differences in the densityhistogram of high-resolution CT. J Comput AssistTomogr 2005;29:544–548.
35. Remy-Jardin M, Giraud F, Remy J, Copin MC,Gosselin B, Duhamel A. Importance of ground-glass attenuation in chronic diffuse infiltrative lungdisease: pathologic-CT correlation. Radiology1993;189:693–698.
36. Cordier JF. Organising pneumonia. Thorax 2000;55:318–328.
37. Cordier JF, Loire R, Brune J. Idiopathic bronchi-olitis obliterans organizing pneumonia: definitionof characteristic clinical profiles in a series of 16patients. Chest 1989;96:999–1004.
38. Lazor R, Vandevenne A, Pelletier A, Leclerc P,Court-Fortune I, Cordier JF. Cryptogenic orga-nizing pneumonia: characteristics of relapses in aseries of 48 patients. The Groupe d’Etudes et deRecherche sur les Maladies “Orphelines” Pulmon-aires (GERM“O”P). Am J Respir Crit Care Med2000;162:571–577.
39. Myers JL, Colby TV. Pathologic manifestations ofbronchiolitis, constrictive bronchiolitis, crypto-genic organizing pneumonia, and diffuse panbron-chiolitis. Clin Chest Med 1993;14:611–622.
40. Muller NL, Guerry-Force ML, Staples CA, et al.Differential diagnosis of bronchiolitis obliteranswith organizing pneumonia and usual interstitialpneumonia: clinical, functional, and radiologicfindings. Radiology 1987;162:151–156.
41. Lee KS, Kullnig P, Hartman TE, Muller NL.Cryptogenic organizing pneumonia: CT findingsin 43 patients. AJR Am J Roentgenol 1994;162:543–546.
42. Izumi T, Kitaichi M, Nishimura K, Nagai S.Bronchiolitis obliterans organizing pneumonia:clinical features and differential diagnosis. Chest1992;102:715–719.
43. Akira M, Yamamoto S, Sakatani M. Bronchiolitisobliterans organizing pneumonia manifesting asmultiple large nodules or masses. AJR Am JRoentgenol 1998;170:291–295.
44. Bouchardy LM, Kuhlman JE, Ball WC Jr, HrubanRH, Askin FB, Siegelman SS. CT findings inbronchiolitis obliterans organizing pneumonia(BOOP) with radiographic, clinical, and histologiccorrelation. J Comput Assist Tomogr 1993;17:352–357.
45. Haro M, Vizcaya M, Texido A, Aguilar X, ArevaloM. Idiopathic bronchiolitis obliterans organizingpneumonia with multiple cavitary lung nodules.Eur Respir J 1995;8:1975–1977.
46. Moon J, du Bois RM, Colby TV, Hansell DM,Nicholson AG. Clinical significance of respiratorybronchiolitis on open lung biopsy and its relation-ship to smoking related interstitial lung disease.Thorax 1999;54:1009–1014.
47. Heyneman LE, Ward S, Lynch DA, Remy-JardinM, Johkoh T, Muller NL. Respiratory bronchioli-tis, respiratory bronchiolitis-associated interstitiallung disease, and desquamative interstitial pneu-monia: different entities or part of the spectrum ofthe same disease process? AJR Am J Roentgenol1999;173:1617–1622.
614 May-June 2007 RG f Volume 27 ● Number 3
48. Ryu JH, Myers JL, Capizzi SA, Douglas WW,Vassallo R, Decker PA. Desquamative interstitialpneumonia and respiratory bronchiolitis-associ-ated interstitial lung disease. Chest 2005;127:178–184.
49. Myers JL, Veal CF Jr, Shin MS, Katzenstein AL.Respiratory bronchiolitis causing interstitial lungdisease: a clinicopathologic study of six cases. AmRev Respir Dis 1987;135:880–884.
50. Ryu JH, Colby TV, Hartman TE, Vassallo R.Smoking-related interstitial lung diseases: a con-cise review. Eur Respir J 2001;17:122–132.
51. Remy-Jardin M, Remy J, Boulenguez C, SobaszekA, Edme JL, Furon D. Morphologic effects ofcigarette smoking on airways and pulmonary pa-renchyma in healthy adult volunteers: CT evalua-tion and correlation with pulmonary functiontests. Radiology 1993;186:107–115.
52. Howling SJ, Hansell DM, Wells AU, NicholsonAG, Flint JD, Muller NL. Follicular bronchiolitis:thin-section CT and histologic findings. Radiology1999;212:637–642.
53. Sung SA, Ko GJ, Kim JY, et al. Desquamativeinterstitial pneumonia associated with concurrentcytomegalovirus and Aspergillus pneumonia in arenal transplant recipient. Nephrol Dial Trans-plant 2005;20:635–638.
54. Kern DG, Kuhn C 3rd, Ely EW, et al. Flockworker’s lung: broadening the spectrum of clinico-pathology, narrowing the spectrum of suspectedetiologies. Chest 2000;117:251–259.
55. Yousem SA, Colby TV, Gaensler EA. Respiratorybronchiolitis-associated interstitial lung diseaseand its relationship to desquamative interstitialpneumonia. Mayo Clin Proc 1989;64:1373–1380.
56. Fraig M, Shreesha U, Savici D, Katzenstein AL.Respiratory bronchiolitis: a clinicopathologicstudy in current smokers, ex-smokers, and never-smokers. Am J Surg Pathol 2002;26:647–653.
57. Feigin DS, Friedman PJ. Chest radiography indesquamative interstitial pneumonitis: a review of37 patients. AJR Am J Roentgenol 1980;134:91–99.
58. Lynch DA, Travis WD, Muller NL, et al. Idio-pathic interstitial pneumonias: CT features. Radi-ology 2005;236:10–21.
59. Akira M, Yamamoto S, Hara H, Sakatani M,Ueda E. Serial computed tomographic evaluationin desquamative interstitial pneumonia. Thorax1997;52:333–337.
60. Swigris JJ, Berry GJ, Raffin TA, Kuschner WG.Lymphoid interstitial pneumonia: a narrative re-view. Chest 2002;122:2150–2164.
61. Banerjee D, Ahmad D. Malignant lymphomacomplicating lymphocytic interstitial pneumonia:a monoclonal B-cell neoplasm arising in a poly-clonal lymphoproliferative disorder. Hum Pathol1982;13:780–782.
62. Addis BJ, Hyjek E, Isaacson PG. Primary pulmo-nary lymphoma: a re-appraisal of its histogenesisand its relationship to pseudolymphoma and lym-phoid interstitial pneumonia. Histopathology1988;13:1–17.
63. Johkoh T, Muller NL, Pickford HA, et al. Lym-phocytic interstitial pneumonia: thin-section CTfindings in 22 patients. Radiology 1999;212:567–572.
64. Ichikawa Y, Kinoshita M, Koga T, Oizumi K, Fu-jimoto K, Hayabuchi N. Lung cyst formation inlymphocytic interstitial pneumonia: CT features.J Comput Assist Tomogr 1994;18:745–748.
65. Akira M, Hamada H, Sakatani M, Kobayashi C,Nishioka M, Yamamoto S. CT findings duringphase of accelerated deterioration in patients withidiopathic pulmonary fibrosis. AJR Am J Roentge-nol 1997;168:79–83.
66. Vourlekis JS, Brown KK, Cool CD, et al. Acuteinterstitial pneumonitis: case series and review ofthe literature. Medicine (Baltimore) 2000;79:369–378.
67. Olson J, Colby TV, Elliott CG. Hamman-Richsyndrome revisited. Mayo Clin Proc 1990;65:1538–1548.
68. Savici D, Katzenstein AL. Diffuse alveolar damageand recurrent respiratory failure: report of 6 cases.Hum Pathol 2001;32:1398–1402.
69. Johkoh T, Muller NL, Taniguchi H, et al. Acuteinterstitial pneumonia: thin-section CT findings in36 patients. Radiology 1999;211:859–863.
70. Bonaccorsi A, Cancellieri A, Chilosi M, et al.Acute interstitial pneumonia: report of a series.Eur Respir J 2003;21:187–191.
71. Akira M. Computed tomography and pathologicfindings in fulminant forms of idiopathic intersti-tial pneumonia. J Thorac Imaging 1999;14:76–84.
72. Ichikado K, Johkoh T, Ikezoe J, et al. Acute inter-stitial pneumonia: high-resolution CT findingscorrelated with pathology. AJR Am J Roentgenol1997;168:333–338.
73. Desai SR, Wells AU, Rubens MB, Evans TW,Hansell DM. Acute respiratory distress syndrome:CT abnormalities at long-term follow-up. Radiol-ogy 1999;210:29–35.
RG f Volume 27 ● Number 3 Mueller-Mang et al 615
This article meets the criteria for 1.0 credit hour in category 1 of the AMA Physician’s Recognition Award. To obtaincredit, see accompanying test at http://www.rsna.org/education/rg_cme.html.
EDUCATION EXHIBIT 617
Eosinophilic LungDiseases: A Clinical,Radiologic, and Patho-logic Overview1
LEARNINGOBJECTIVESFOR TEST 2After reading thisarticle and takingthe test, the reader
will be able to:
� Describe the diag-nostic criteria for andclassification of eo-sinophilic lung dis-eases.
� Identify the clini-cal, pathologic, andradiologic findings inthese diseases.
� Discuss the differ-ential diagnoses forthese diseases interms of the patternand distribution ofabnormalities seen atthin-section CT.
Yeon Joo Jeong, MD ● Kun-Il Kim, MD ● Im Jeong Seo, MD ● Chang HunLee, MD ● Ki Nam Lee, MD ● Ki Nam Kim, MD ● Jeung Sook Kim, MDWoon Jung Kwon, MD
Eosinophilic lung diseases are a diverse group of pulmonary disordersassociated with peripheral or tissue eosinophilia. They are classified aseosinophilic lung diseases of unknown cause (simple pulmonary eosino-philia [SPE], acute eosinophilic pneumonia [AEP], chronic eosinophilicpneumonia [CEP], idiopathic hypereosinophilic syndrome [IHS]), eosin-ophilic lung diseases of known cause (allergic bronchopulmonary aspergil-losis [ABPA], bronchocentric granulomatosis [BG], parasitic infections,drug reactions), and eosinophilic vasculitis (allergic angiitis, granulo-matosis [Churg-Strauss syndrome]). The percentages of eosinophils inperipheral blood and bronchoalveolar lavage fluid are essential parts of theevaluation. Chest computed tomography (CT) demonstrates a more char-acteristic pattern and distribution of parenchymal opacities than does con-ventional chest radiography. At CT, SPE and IHS are characterized bysingle or multiple nodules with a surrounding ground-glass-opacity halo,AEP mimics radiologically hydrostatic pulmonary edema, and CEP ischaracterized by nonsegmental airspace consolidations with peripheralpredominance. ABPA manifests with bilateral central bronchiectasis withor without mucoid impaction. The CT manifestations of BG are nonspe-cific and consist of a focal mass or lobar consolidation with atelectasis.The most common CT findings in Churg-Strauss syndrome include sub-pleural consolidation with lobular distribution, centrilobular nodules,bronchial wall thickening, and interlobular septal thickening. The integra-tion of clinical, radiologic, and pathologic findings facilitates the initial anddifferential diagnoses of various eosinophilic lung diseases.©RSNA, 2007
Abbreviations: ABPA � allergic bronchopulmonary aspergillosis, AEP � acute eosinophilic pneumonia, BAL � bronchoalveolar lavage, BG �bronchocentric granulomatosis, CEP � chronic eosinophilic pneumonia, DRESS � drug rash with eosinophilia and systemic symptoms, FDG �2-[fluorine-18]fluoro-2-deoxy-d-glucose, H-E � hematoxylin-eosin, IHS � idiopathic hypereosinophilic syndrome, PP � pleuropulmonary paragon-imiasis, SPE � simple pulmonary eosinophilia
RadioGraphics 2007; 27:617–639 ● Published online 10.1148/rg.273065051 ● Content Codes:
1From the Departments of Diagnostic Radiology (Y.J.J., K.-I.K., I.J.S.) and Pathology (C.H.L.), Pusan National University Hospital, Pusan NationalUniversity School of Medicine and Medical Research Institute, 1-10, Ami-Dong, Seo-gu, Pusan 602-739, Korea; the Department of Radiology, DongA University Hospital, Pusan, Korea (K.N.L., K.N.K.); the Department of Radiology, Dongguk University International Hospital, Gyeonggi-do, Ko-rea (J.S.K.); and the Department of Radiology, Ulsan University Hospital, Ulsan, Korea (W.J.K.). Recipient of a Certificate of Merit award for aneducation exhibit at the 2005 RSNA Annual Meeting. Received April 3, 2006; revision requested May 3; final revision received August 21; acceptedAugust 22. All authors have no financial relationships to disclose. Address correspondence to Y.J.J. (e-mail: [email protected]).
See the commentary by Frankel et al following this article.
©RSNA, 2007
CME FEATURESee accompanying
test at http://www.rsna.org
/education/rg_cme.html
Note: This copy is for your personal, non-commercial use only. To order presentation-ready copies for distribution to your colleagues or clients, use the RadioGraphics Reprints form at the end of this article.
See last page
TEACHING POINTS
IntroductionEosinophilic lung diseases are a diverse group ofdisorders characterized by pulmonary opacitiesassociated with tissue or peripheral eosinophilia.The diagnosis of eosinophilic lung disease can bemade if any of the following findings is present:(a) pulmonary opacities with peripheral eosino-philia, (b) tissue eosinophilia confirmed at eitheropen or transbronchial lung biopsy, or (c) in-creased eosinophils in bronchoalveolar lavage(BAL) fluid (1). A large variety of pulmonary dis-eases may be associated with occasional bloodeosinophilia of a minor degree. These diseasesinclude asthma; various pulmonary infectionssuch as coccidioidomycosis, Pneumocystis jiroveciiinfection, and mycobacteria; some types of tumor(eg, non–small cell lung carcinoma, lymphoma,lymphocytic leukemia); collagen vascular disor-ders such as rheumatoid disease and Wegenergranulomatosis; idiopathic pulmonary fibrosis;and Langerhans cell histiocytosis (2–6). How-ever, these conditions are not usually consideredto be eosinophilic lung diseases, in which a tissueeosinophilia is by definition pathogenically signifi-cant.
The eosinophil is a polymorphonuclear leuko-cyte containing several eosinophil-specific pro-teins in cytoplasmic granules (Fig 1). An eosino-phil can serve as an end-stage effector cell but canalso have specialized roles in the host defensemechanism. However, the eosinophil sometimesharms the host by releasing specific proteins thatare potentially cytotoxic to tissues, resulting inpathologic processes (7). One of these proteins isthe protein that forms Charcot-Leyden crystals,the bipyramidal crystals whose presence in spu-tum and tissues is a hallmark of eosinophil-relateddisease.
Eosinophilic lung diseases are generally classi-fied as those of unknown cause (simple pulmo-nary eosinophilia [SPE], acute eosinophilic pneu-monia [AEP], chronic eosinophilic pneumonia[CEP], idiopathic hypereosinophilic syndrome[IHS]) and those of known cause (allergic bron-chopulmonary aspergillosis [ABPA], bronchocen-tric granulomatosis [BG], parasitic infection,drug reaction), as well as eosinophilic vasculitis(allergic angiitis, granulomatosis) (Table 1).Some eosinophilic lung diseases are predomi-nantly airway based, whereas others are parenchy-mal or a mixture of both. A new disease entityknown as eosinophilic bronchiolitis, which ischaracterized by pathologic and radiologic find-ings that suggest eosinophilic bronchiolar involve-ment, has been reported (8).
In this article, we discuss and illustrate the gen-eral diagnostic approach to and the characteristicclinical, histologic, and radiologic findings in thevarious eosinophilic lung diseases.
Diagnostic MethodsThe most valuable clinical information is derivedfrom the patient’s history and from physical ex-amination. The duration and severity of symp-toms are also of critical importance. A history ofasthma may raise suspicion for Churg-Strausssyndrome, ABPA, or BG. Travel history may sug-gest parasitic infection. A careful history of theuse of prescription and illicit drugs should be ob-tained.
A white blood cell differential count is an es-sential part of the evaluation of eosinophilic lung
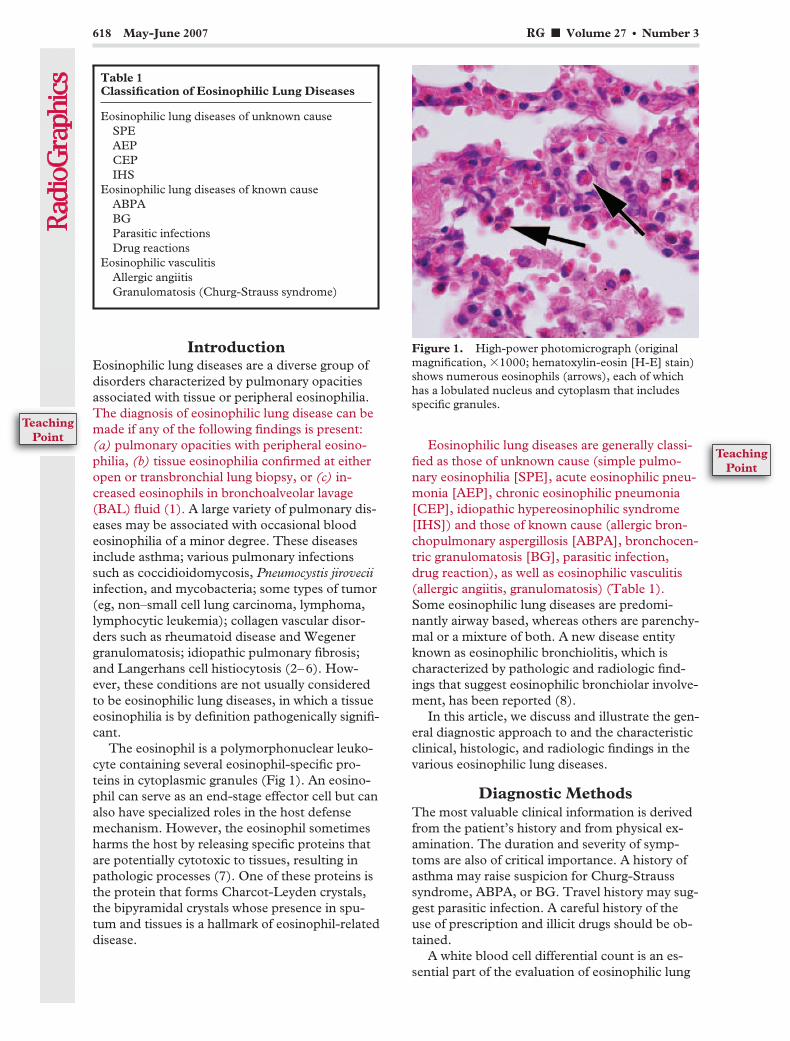
Figure 1. High-power photomicrograph (originalmagnification, �1000; hematoxylin-eosin [H-E] stain)shows numerous eosinophils (arrows), each of whichhas a lobulated nucleus and cytoplasm that includesspecific granules.
Table 1Classification of Eosinophilic Lung Diseases
Eosinophilic lung diseases of unknown causeSPEAEPCEPIHS
Eosinophilic lung diseases of known causeABPABGParasitic infectionsDrug reactions
Eosinophilic vasculitisAllergic angiitisGranulomatosis (Churg-Strauss syndrome)
618 May-June 2007 RG f Volume 27 ● Number 3
TeachingPoint
TeachingPoint

disease. Although several different normal valueshave been reported, normal blood generally con-tains 50–250 eosinophils per microliter (1). Mosteosinophilic lung diseases manifest with periph-eral eosinophilia, although AEP may not. Stoolexamination and serologic testing are helpful inevaluating patients with specific conditions suchas parasitic infection and ABPA.
Pulmonary function tests can occasionally beuseful in the evaluation of patients with unex-plained pulmonary eosinophilia. Some eosino-philic lung diseases (AEP, CEP, tropical pulmo-nary eosinophilia) are typically accompanied bymainly restrictive ventilatory defects, whereasothers (ABPA, Churg-Strauss syndrome) typi-cally cause mainly obstructive ventilatory defects.
BAL can also be very useful in the evaluationof patients with eosinophilic lung disease. NormalBAL fluid consists of less than 1% eosinophils.Because some disorders are not accompanied byperipheral eosinophilia, BAL may provide the first(and, perhaps, the only) indication of an eosino-philic lung disease.
Patients with eosinophilic lung disease maybe identified initially on the basis of pulmonarysymptoms or chest radiographic abnormalitiesaccompanied by blood or tissue eosinophilia. Di-verse and nonspecific findings may also be seen atconventional chest radiography. Chest computedtomography (CT) demonstrates a more charac-teristic pattern and distribution of parenchymalopacities than does chest radiography. Althoughthe characteristic CT findings are often helpful,there is still a considerable overlap of CT findingsamong the various eosinophilic lung diseases (9).
Open lung biopsy may be necessary to confirmdiseases such as Churg-Strauss syndrome andBG. Biopsy is generally not required for the diag-nosis of ABPA, IHS, drug reactions, or parasiticinfections.
Eosinophilic LungDiseases of Unknown Cause
Simple Pulmonary EosinophiliaSPE, or Loeffler syndrome, was originally re-ported as a benign AEP of unknown cause char-acterized by migrating pulmonary opacities, in-creased peripheral blood eosinophils, minimal orno pulmonary symptoms, and spontaneous reso-lution within 1 month. In some patients, theseclinical characteristics may prove to be secondaryto the presence of parasites, ABPA, or drugs(10,11). Pathologic specimens show edema andaccumulation of eosinophils in the alveolar septaand interstitium (1).
The radiographic manifestations of SPE con-sist of transient and migratory areas of consolida-tion that typically clear spontaneously within 1month (12). These consolidations are nonseg-mental, may be single or multiple, usually haveill-defined margins, and often have a predomi-nantly peripheral distribution (1,12). High-reso-lution CT findings consist of ground-glass opacityor airspace consolidation involving mainly theperipheral regions of the middle and upper lungzones (Fig 2) (9), as well as single or multiple air-space nodules with surrounding ground-glassopacity (Fig 3) (9,13). The differential diagnosis
Figures 2, 3. (2) SPE in a 25-year-old man with 13.5% peripheral eosinophilia. Transverse thin-section (1-mmcollimation) CT scan (lung windowing) shows consolidation and ground-glass opacity involving mainly the periph-eral regions of both lower lobes. At follow-up radiography performed 10 days later, the parenchymal opacities hadcleared spontaneously. (3) SPE in a 46-year-old woman with 30.1% peripheral eosinophilia. Transverse thin-section(1-mm collimation) CT scan (lung windowing) shows an airspace nodule with surrounding ground-glass opacity inthe right lower lobe (arrow). At follow-up chest radiography, the nodule had disappeared.
RG f Volume 27 ● Number 3 Jeong et al 619
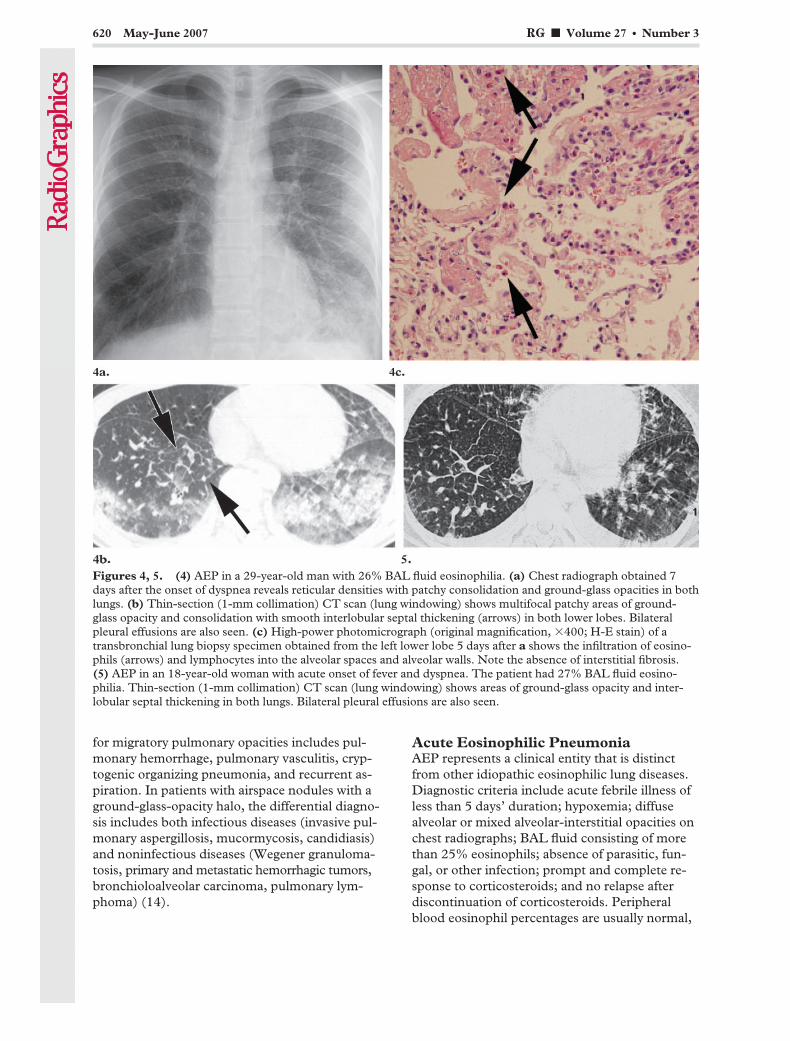
for migratory pulmonary opacities includes pul-monary hemorrhage, pulmonary vasculitis, cryp-togenic organizing pneumonia, and recurrent as-piration. In patients with airspace nodules with aground-glass-opacity halo, the differential diagno-sis includes both infectious diseases (invasive pul-monary aspergillosis, mucormycosis, candidiasis)and noninfectious diseases (Wegener granuloma-tosis, primary and metastatic hemorrhagic tumors,bronchioloalveolar carcinoma, pulmonary lym-phoma) (14).
Acute Eosinophilic PneumoniaAEP represents a clinical entity that is distinctfrom other idiopathic eosinophilic lung diseases.Diagnostic criteria include acute febrile illness ofless than 5 days’ duration; hypoxemia; diffusealveolar or mixed alveolar-interstitial opacities onchest radiographs; BAL fluid consisting of morethan 25% eosinophils; absence of parasitic, fun-gal, or other infection; prompt and complete re-sponse to corticosteroids; and no relapse afterdiscontinuation of corticosteroids. Peripheralblood eosinophil percentages are usually normal,
Figures 4, 5. (4) AEP in a 29-year-old man with 26% BAL fluid eosinophilia. (a) Chest radiograph obtained 7days after the onset of dyspnea reveals reticular densities with patchy consolidation and ground-glass opacities in bothlungs. (b) Thin-section (1-mm collimation) CT scan (lung windowing) shows multifocal patchy areas of ground-glass opacity and consolidation with smooth interlobular septal thickening (arrows) in both lower lobes. Bilateralpleural effusions are also seen. (c) High-power photomicrograph (original magnification, �400; H-E stain) of atransbronchial lung biopsy specimen obtained from the left lower lobe 5 days after a shows the infiltration of eosino-phils (arrows) and lymphocytes into the alveolar spaces and alveolar walls. Note the absence of interstitial fibrosis.(5) AEP in an 18-year-old woman with acute onset of fever and dyspnea. The patient had 27% BAL fluid eosino-philia. Thin-section (1-mm collimation) CT scan (lung windowing) shows areas of ground-glass opacity and inter-lobular septal thickening in both lungs. Bilateral pleural effusions are also seen.
620 May-June 2007 RG f Volume 27 ● Number 3

although they become elevated during the subse-quent clinical course (1). Unlike with blood eo-sinophils, a very high percentage of BAL eosino-phils is characteristic of AEP (15). Pulmonaryfunction testing in the acute phase shows a re-strictive pattern (16). Patients respond rapidlyto high doses of corticosteroids, usually within24–48 hours. Unlike patients with CEP, patientswith AEP do not experience relapse after discon-tinuation of corticosteroids (16,17).
The cause of AEP remains unknown; however,AEP-like signs and symptoms have been reportedafter cigarette smoking (18,19) or exposure todust (20) or smoke from fireworks (21).
The principal histologic finding in AEP is dif-fuse alveolar damage associated with interstitialand alveolar eosinophilia (Fig 4) (22).
The predominant radiographic findings inAEP are bilateral reticular densities (with or with-out areas of patchy consolidation) and pleuraleffusion (Fig 4) (23,24). The predominant pat-terns of parenchymal abnormality seen at CT arebilateral patchy areas of ground-glass opacity,frequently accompanied by interlobular septalthickening and sometimes by consolidation orpoorly defined nodules (Figs 4, 5) (23,24).
The radiologic differential diagnosis for AEPincludes hydrostatic pulmonary edema, adult re-spiratory distress syndrome or acute interstitialpneumonia, and atypical bacterial or viral pneu-monia (23). Because initial peripheral blood eo-sinophil counts are usually normal, however, de-veloping a clinicoradiologic differential diagnosisfor AEP is often difficult.
Chronic Eosinophilic PneumoniaCEP is an idiopathic condition characterized bychronic and progressive clinical features and spe-cific pathologic findings (25). The clinical mani-festation is usually insidious, and the patient ex-periences symptoms for an average of 7.7 monthsbefore the diagnosis is made (26). Most patientsare middle aged, and approximately 50% haveasthma (27). Women are more frequently af-fected than men (25). Pulmonary function testscan be normal in mild cases but usually show re-strictive defects (26).
Peripheral blood eosinophilia is usually mildor moderate but occasionally is severe (26). In-creased serum IgE levels are seen in two-thirds ofpatients (28). The erythrocyte sedimentation rateis usually elevated (26), and peripheral bloodthrombocytosis has also been reported (29). Thepercentage of eosinophils in the BAL fluid is veryhigh (30).
Histologic examination typically shows accu-mulation of eosinophils and lymphocytes in thealveoli and interstitium, with interstitial fibrosis(Fig 6) (25,26,31). An organizing pneumoniapattern or an eosinophilic abscess may also beseen (31). The essential histologic differences be-tween AEP and CEP are related to (a) the sever-ity of damage to the basal lamina, and (b) theamount of subsequent intraluminal fibrosis (31).
The typical chest radiographic finding in CEPis nonsegmental peripheral airspace consolidation(“photographic negative shadow of pulmonary
Figure 6. CEP in a 59-year-old man with a 3-week history of severe cough and fever. The patient had 25% BALfluid eosinophilia. (a) Thin-section (1-mm collimation) CT scan (lung windowing) shows ground-glass opacitieswith intralobular interstitial thickening in both lower lobes. (b) High-power photomicrograph (original magnifica-tion, �400; H-E stain) of a transbronchial lung biopsy specimen shows infiltration of eosinophils and polymorphousinflammatory cells into the alveolar lumen and interstitium and a varying degree of interstitial fibrosis (arrows).
RG f Volume 27 ● Number 3 Jeong et al 621
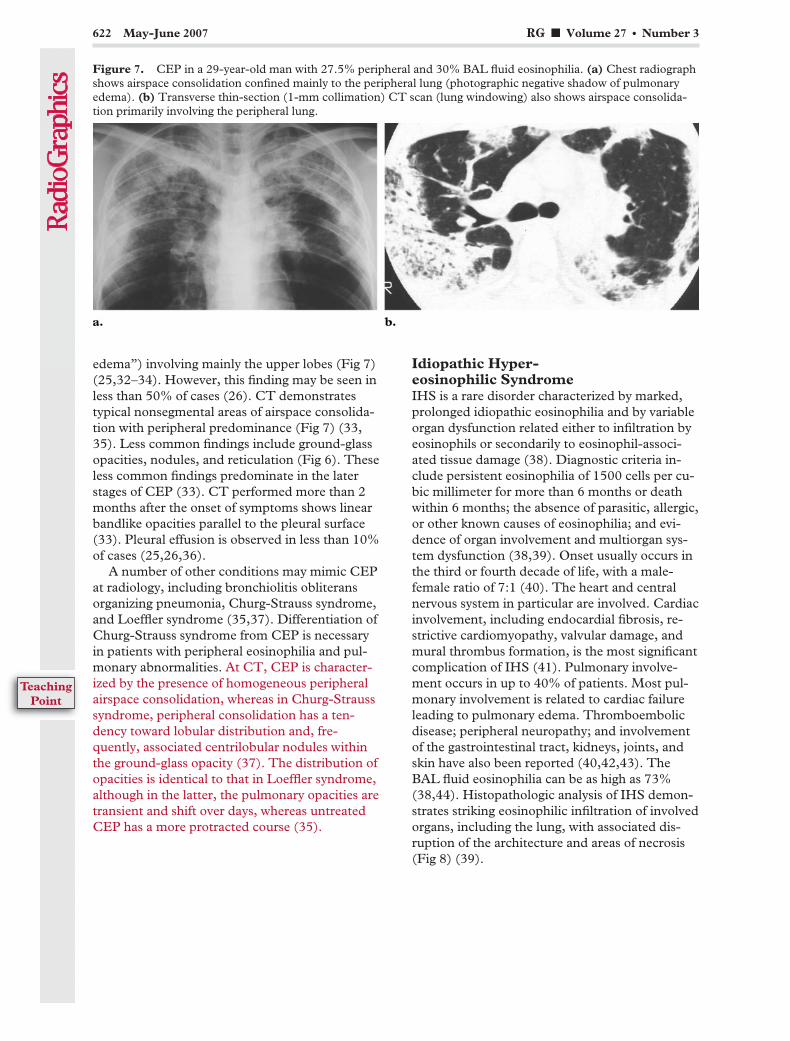
edema”) involving mainly the upper lobes (Fig 7)(25,32–34). However, this finding may be seen inless than 50% of cases (26). CT demonstratestypical nonsegmental areas of airspace consolida-tion with peripheral predominance (Fig 7) (33,35). Less common findings include ground-glassopacities, nodules, and reticulation (Fig 6). Theseless common findings predominate in the laterstages of CEP (33). CT performed more than 2months after the onset of symptoms shows linearbandlike opacities parallel to the pleural surface(33). Pleural effusion is observed in less than 10%of cases (25,26,36).
A number of other conditions may mimic CEPat radiology, including bronchiolitis obliteransorganizing pneumonia, Churg-Strauss syndrome,and Loeffler syndrome (35,37). Differentiation ofChurg-Strauss syndrome from CEP is necessaryin patients with peripheral eosinophilia and pul-monary abnormalities. At CT, CEP is character-ized by the presence of homogeneous peripheralairspace consolidation, whereas in Churg-Strausssyndrome, peripheral consolidation has a ten-dency toward lobular distribution and, fre-quently, associated centrilobular nodules withinthe ground-glass opacity (37). The distribution ofopacities is identical to that in Loeffler syndrome,although in the latter, the pulmonary opacities aretransient and shift over days, whereas untreatedCEP has a more protracted course (35).
Idiopathic Hyper-eosinophilic SyndromeIHS is a rare disorder characterized by marked,prolonged idiopathic eosinophilia and by variableorgan dysfunction related either to infiltration byeosinophils or secondarily to eosinophil-associ-ated tissue damage (38). Diagnostic criteria in-clude persistent eosinophilia of 1500 cells per cu-bic millimeter for more than 6 months or deathwithin 6 months; the absence of parasitic, allergic,or other known causes of eosinophilia; and evi-dence of organ involvement and multiorgan sys-tem dysfunction (38,39). Onset usually occurs inthe third or fourth decade of life, with a male-female ratio of 7:1 (40). The heart and centralnervous system in particular are involved. Cardiacinvolvement, including endocardial fibrosis, re-strictive cardiomyopathy, valvular damage, andmural thrombus formation, is the most significantcomplication of IHS (41). Pulmonary involve-ment occurs in up to 40% of patients. Most pul-monary involvement is related to cardiac failureleading to pulmonary edema. Thromboembolicdisease; peripheral neuropathy; and involvementof the gastrointestinal tract, kidneys, joints, andskin have also been reported (40,42,43). TheBAL fluid eosinophilia can be as high as 73%(38,44). Histopathologic analysis of IHS demon-strates striking eosinophilic infiltration of involvedorgans, including the lung, with associated dis-ruption of the architecture and areas of necrosis(Fig 8) (39).
Figure 7. CEP in a 29-year-old man with 27.5% peripheral and 30% BAL fluid eosinophilia. (a) Chest radiographshows airspace consolidation confined mainly to the peripheral lung (photographic negative shadow of pulmonaryedema). (b) Transverse thin-section (1-mm collimation) CT scan (lung windowing) also shows airspace consolida-tion primarily involving the peripheral lung.
622 May-June 2007 RG f Volume 27 ● Number 3
TeachingPoint
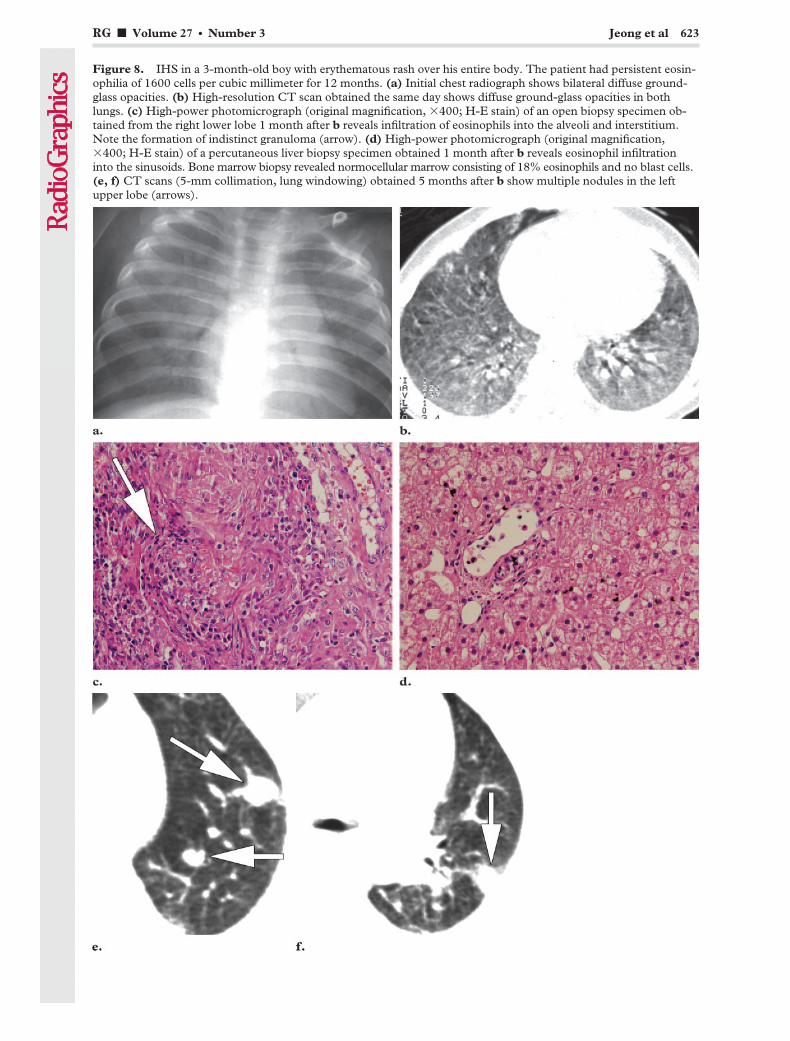
Figure 8. IHS in a 3-month-old boy with erythematous rash over his entire body. The patient had persistent eosin-ophilia of 1600 cells per cubic millimeter for 12 months. (a) Initial chest radiograph shows bilateral diffuse ground-glass opacities. (b) High-resolution CT scan obtained the same day shows diffuse ground-glass opacities in bothlungs. (c) High-power photomicrograph (original magnification, �400; H-E stain) of an open biopsy specimen ob-tained from the right lower lobe 1 month after b reveals infiltration of eosinophils into the alveoli and interstitium.Note the formation of indistinct granuloma (arrow). (d) High-power photomicrograph (original magnification,�400; H-E stain) of a percutaneous liver biopsy specimen obtained 1 month after b reveals eosinophil infiltrationinto the sinusoids. Bone marrow biopsy revealed normocellular marrow consisting of 18% eosinophils and no blast cells.(e, f) CT scans (5-mm collimation, lung windowing) obtained 5 months after b show multiple nodules in the leftupper lobe (arrows).
RG f Volume 27 ● Number 3 Jeong et al 623
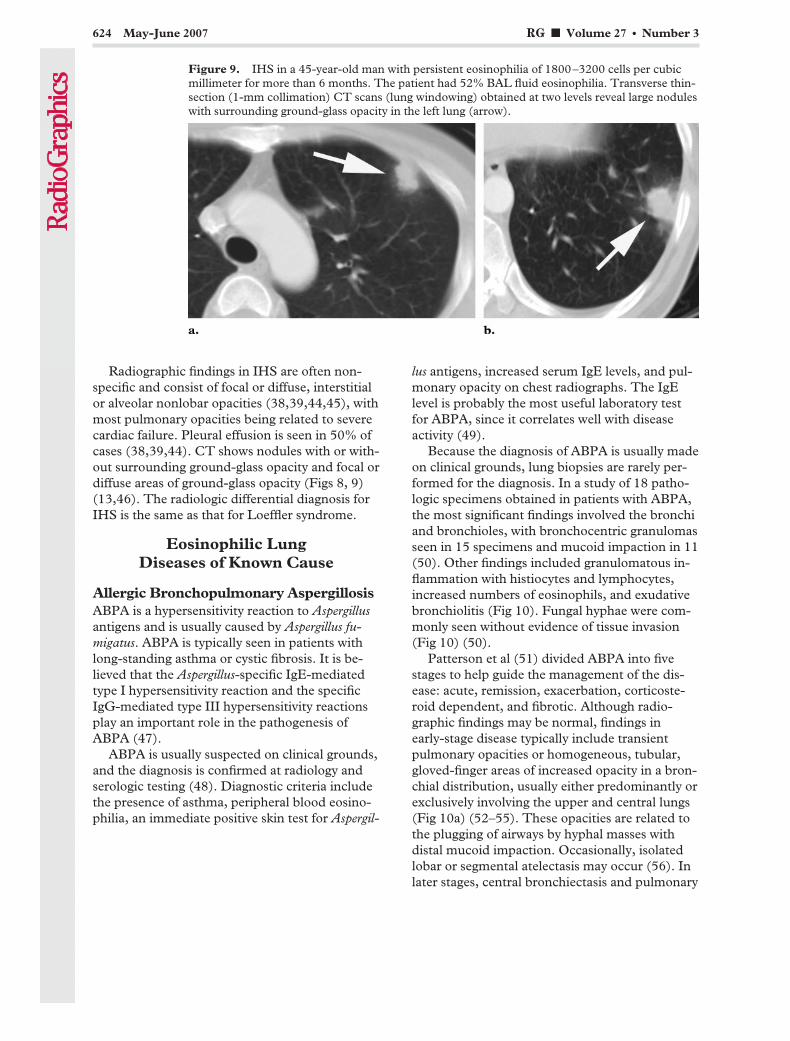
Radiographic findings in IHS are often non-specific and consist of focal or diffuse, interstitialor alveolar nonlobar opacities (38,39,44,45), withmost pulmonary opacities being related to severecardiac failure. Pleural effusion is seen in 50% ofcases (38,39,44). CT shows nodules with or with-out surrounding ground-glass opacity and focal ordiffuse areas of ground-glass opacity (Figs 8, 9)(13,46). The radiologic differential diagnosis forIHS is the same as that for Loeffler syndrome.
Eosinophilic LungDiseases of Known Cause
Allergic Bronchopulmonary AspergillosisABPA is a hypersensitivity reaction to Aspergillusantigens and is usually caused by Aspergillus fu-migatus. ABPA is typically seen in patients withlong-standing asthma or cystic fibrosis. It is be-lieved that the Aspergillus-specific IgE-mediatedtype I hypersensitivity reaction and the specificIgG-mediated type III hypersensitivity reactionsplay an important role in the pathogenesis ofABPA (47).
ABPA is usually suspected on clinical grounds,and the diagnosis is confirmed at radiology andserologic testing (48). Diagnostic criteria includethe presence of asthma, peripheral blood eosino-philia, an immediate positive skin test for Aspergil-
lus antigens, increased serum IgE levels, and pul-monary opacity on chest radiographs. The IgElevel is probably the most useful laboratory testfor ABPA, since it correlates well with diseaseactivity (49).
Because the diagnosis of ABPA is usually madeon clinical grounds, lung biopsies are rarely per-formed for the diagnosis. In a study of 18 patho-logic specimens obtained in patients with ABPA,the most significant findings involved the bronchiand bronchioles, with bronchocentric granulomasseen in 15 specimens and mucoid impaction in 11(50). Other findings included granulomatous in-flammation with histiocytes and lymphocytes,increased numbers of eosinophils, and exudativebronchiolitis (Fig 10). Fungal hyphae were com-monly seen without evidence of tissue invasion(Fig 10) (50).
Patterson et al (51) divided ABPA into fivestages to help guide the management of the dis-ease: acute, remission, exacerbation, corticoste-roid dependent, and fibrotic. Although radio-graphic findings may be normal, findings inearly-stage disease typically include transientpulmonary opacities or homogeneous, tubular,gloved-finger areas of increased opacity in a bron-chial distribution, usually either predominantly orexclusively involving the upper and central lungs(Fig 10a) (52–55). These opacities are related tothe plugging of airways by hyphal masses withdistal mucoid impaction. Occasionally, isolatedlobar or segmental atelectasis may occur (56). Inlater stages, central bronchiectasis and pulmonary
Figure 9. IHS in a 45-year-old man with persistent eosinophilia of 1800–3200 cells per cubicmillimeter for more than 6 months. The patient had 52% BAL fluid eosinophilia. Transverse thin-section (1-mm collimation) CT scans (lung windowing) obtained at two levels reveal large noduleswith surrounding ground-glass opacity in the left lung (arrow).
624 May-June 2007 RG f Volume 27 ● Number 3

fibrosis develop. CT findings in ABPA consistprimarily of mucoid impaction and bronchiectasisinvolving predominantly the segmental and sub-segmental bronchi of the upper lobes, along withcentrilobular nodules or branching linear struc-tures (Fig 10b) (54). In approximately 30% ofpatients, the impacted mucus is highly opaque ordemonstrates frank calcification at CT (56). Thedifferential diagnosis includes other causes of mu-coid impaction such as endobronchial lesions,bronchial atresia, bronchiectasis, and bronchialasthma. Mild central bronchiectasis can be seenin asthma subsequent to chronic inflammationand does not necessarily indicate the presence of
ABPA (54,57). However, in an asthmatic patient,ABPA is strongly suggested by the presence ofrandomly distributed, central, moderate to severebronchiectasis predominantly involving the upperlungs; bronchial wall thickening; and centrilobu-lar nodules (58).
Figure 10. ABPA in a 31-year-old asthmatic man with 15% peripheral eosinophilia. (a) Chest radiograph showstubular and cystic lesions in the central portions of both lungs. Note also the mucus plugging with a gloved-fingerappearance (arrows). (b) Thin-section (1-mm collimation) CT scan (lung windowing) demonstrates central bronchi-ectasis with mucus plugging (arrows), centrilobular nodules, and bronchial wall thickening involving predominantlythe segmental and subsegmental bronchi of the upper lobes. (c) Photomicrograph (original magnification, �100;H-E stain) of the impacted mucoid material from a bronchoscopic biopsy specimen reveals parallel rows of necroticeosinophils and cellular debris within a mucinous background. (d) High-power photomicrograph (original magnifi-cation, �400; Gomori methenamine silver stain) shows branching fungal hyphae within impacted mucus, a findingthat is suggestive of Aspergillus species.
RG f Volume 27 ● Number 3 Jeong et al 625
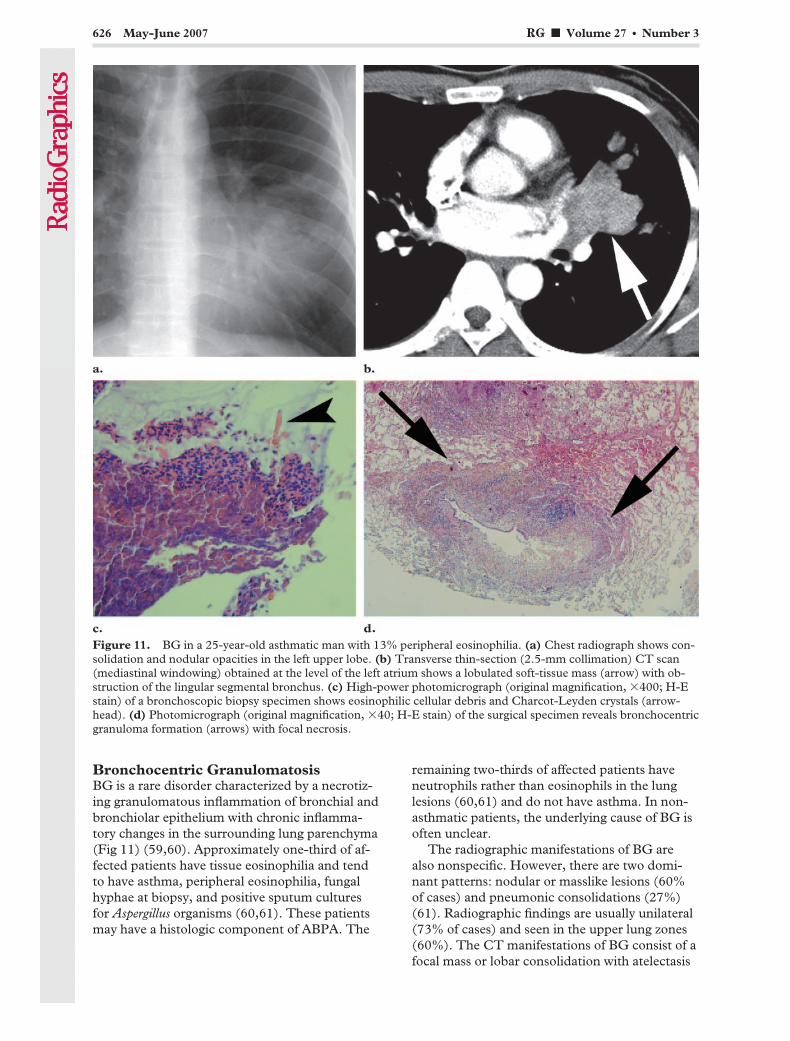
Bronchocentric GranulomatosisBG is a rare disorder characterized by a necrotiz-ing granulomatous inflammation of bronchial andbronchiolar epithelium with chronic inflamma-tory changes in the surrounding lung parenchyma(Fig 11) (59,60). Approximately one-third of af-fected patients have tissue eosinophilia and tendto have asthma, peripheral eosinophilia, fungalhyphae at biopsy, and positive sputum culturesfor Aspergillus organisms (60,61). These patientsmay have a histologic component of ABPA. The
remaining two-thirds of affected patients haveneutrophils rather than eosinophils in the lunglesions (60,61) and do not have asthma. In non-asthmatic patients, the underlying cause of BG isoften unclear.
The radiographic manifestations of BG arealso nonspecific. However, there are two domi-nant patterns: nodular or masslike lesions (60%of cases) and pneumonic consolidations (27%)(61). Radiographic findings are usually unilateral(73% of cases) and seen in the upper lung zones(60%). The CT manifestations of BG consist of afocal mass or lobar consolidation with atelectasis
Figure 11. BG in a 25-year-old asthmatic man with 13% peripheral eosinophilia. (a) Chest radiograph shows con-solidation and nodular opacities in the left upper lobe. (b) Transverse thin-section (2.5-mm collimation) CT scan(mediastinal windowing) obtained at the level of the left atrium shows a lobulated soft-tissue mass (arrow) with ob-struction of the lingular segmental bronchus. (c) High-power photomicrograph (original magnification, �400; H-Estain) of a bronchoscopic biopsy specimen shows eosinophilic cellular debris and Charcot-Leyden crystals (arrow-head). (d) Photomicrograph (original magnification, �40; H-E stain) of the surgical specimen reveals bronchocentricgranuloma formation (arrows) with focal necrosis.
626 May-June 2007 RG f Volume 27 ● Number 3

(Fig 11b) (62). However, the imaging features arenonspecific, and histologic confirmation is re-quired.
Parasitic InfectionsMany parasites can cause pulmonary opacitieswith blood or tissue eosinophilia. Because the
prevalence of individual parasitic infections variesfrom one geographic region to another, familiaritywith the common parasites in one’s geographicarea of practice is critical to arriving at a correctdiagnosis (Fig 12).
Strongyloides stercoralis infection can be accom-panied by peripheral blood eosinophilia, rash, andtransient pulmonary opacities (1). In patientswith defects of cell-mediated immunity, Strongy-loides hyperinfection syndrome can develop andis associated with diffuse pulmonary opacities,gram-negative sepsis, respiratory failure, and ahigh mortality rate (63).
In many developing countries, Ascaris lumbri-coides is the most common cause of peripheralblood eosinophilia with pulmonary opacities. Alumbricoides was responsible for the pulmonaryopacities in most of Loeffler’s patients (1). Twomechanisms of pulmonary eosinophilic infiltra-tion in parasitic infestations have been postulated:direct invasion (eg, Ascaris, Schistosoma, and Fi-laria species; Paragonimus westermani; Ancylostomaduodenale) and allergic reaction (Entamoeba histo-lytica, Toxocara canis, Clonorchis sinensis). In casesof Clonorchis infestation, immunologic stimulationfrom the life cycle of C sinensis in humans may causethe pulmonary opacities manifesting as single ormultiple migrating nodules (Fig 13) (64).
Figure 12. Maps illustrate thegeographic distributions of commonparasites. Strongyloides and Wuchere-ria infections are found in tropicaland subtropical areas. The main en-demic areas of paragonimiasis areEast Asia, Southeast Asia, LatinAmerica, and Africa. Clonorchiasisis endemic to Asia, including Korea,China, Taiwan, and Vietnam. Ancy-lostoma and Schistosoma infectionsare frequently seen in Africa, SouthAmerica, and Asia. Dirofilariasis hasbeen reported predominantly in thetemperate climate of the East Coastand South in the United States. En-tamoeba and Toxocara infections aredistributed worldwide.
Figure 13. C sinensis infestation in a 25-year-oldman. A skin test for C sinensis was strongly positive, andClonorchis-specific IgG antibody by enzyme-linked im-munosorbent assay was 0.27 (normal range, 0–0.25).Transverse thin-section (1-mm collimation) CT scan(lung windowing) shows multiple airspace nodules withsurrounding ground-glass opacity in both lungs (arrows).
RG f Volume 27 ● Number 3 Jeong et al 627
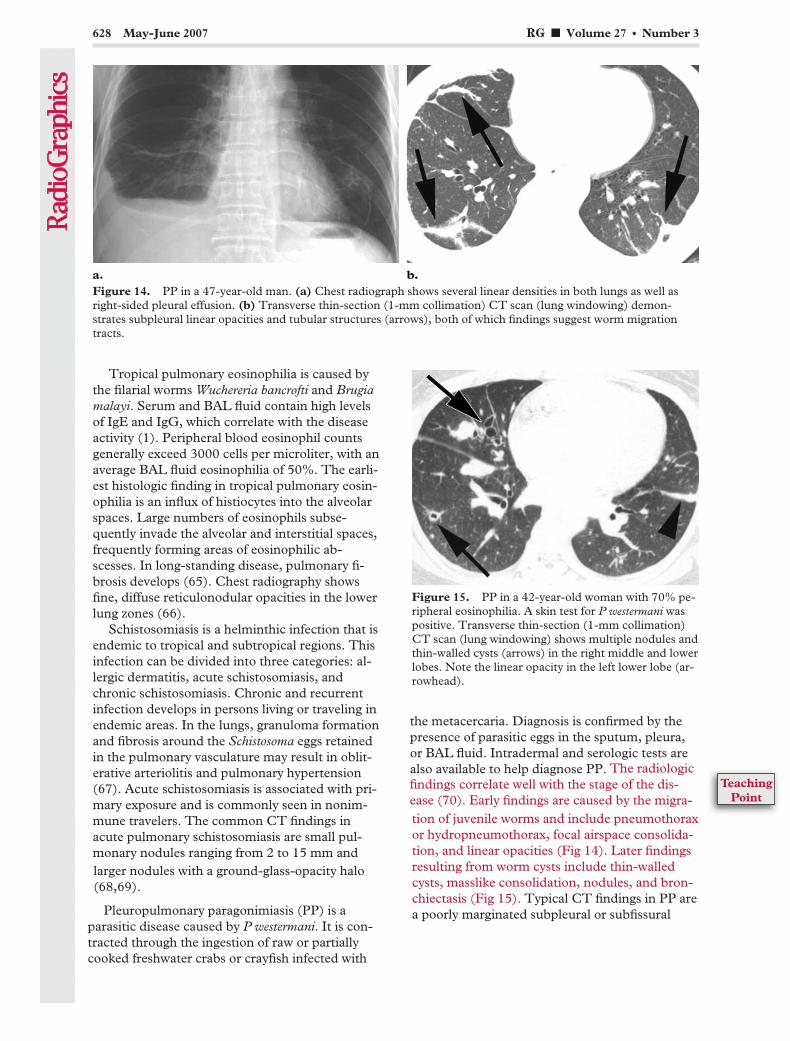
Tropical pulmonary eosinophilia is caused bythe filarial worms Wuchereria bancrofti and Brugiamalayi. Serum and BAL fluid contain high levelsof IgE and IgG, which correlate with the diseaseactivity (1). Peripheral blood eosinophil countsgenerally exceed 3000 cells per microliter, with anaverage BAL fluid eosinophilia of 50%. The earli-est histologic finding in tropical pulmonary eosin-ophilia is an influx of histiocytes into the alveolarspaces. Large numbers of eosinophils subse-quently invade the alveolar and interstitial spaces,frequently forming areas of eosinophilic ab-scesses. In long-standing disease, pulmonary fi-brosis develops (65). Chest radiography showsfine, diffuse reticulonodular opacities in the lowerlung zones (66).
Schistosomiasis is a helminthic infection that isendemic to tropical and subtropical regions. Thisinfection can be divided into three categories: al-lergic dermatitis, acute schistosomiasis, andchronic schistosomiasis. Chronic and recurrentinfection develops in persons living or traveling inendemic areas. In the lungs, granuloma formationand fibrosis around the Schistosoma eggs retainedin the pulmonary vasculature may result in oblit-erative arteriolitis and pulmonary hypertension(67). Acute schistosomiasis is associated with pri-mary exposure and is commonly seen in nonim-mune travelers. The common CT findings inacute pulmonary schistosomiasis are small pul-monary nodules ranging from 2 to 15 mm andlarger nodules with a ground-glass-opacity halo(68,69).
Pleuropulmonary paragonimiasis (PP) is aparasitic disease caused by P westermani. It is con-tracted through the ingestion of raw or partiallycooked freshwater crabs or crayfish infected with
the metacercaria. Diagnosis is confirmed by thepresence of parasitic eggs in the sputum, pleura,or BAL fluid. Intradermal and serologic tests arealso available to help diagnose PP.
Figure 14. PP in a 47-year-old man. (a) Chest radiograph shows several linear densities in both lungs as well asright-sided pleural effusion. (b) Transverse thin-section (1-mm collimation) CT scan (lung windowing) demon-strates subpleural linear opacities and tubular structures (arrows), both of which findings suggest worm migrationtracts.
Figure 15. PP in a 42-year-old woman with 70% pe-ripheral eosinophilia. A skin test for P westermani waspositive. Transverse thin-section (1-mm collimation)CT scan (lung windowing) shows multiple nodules andthin-walled cysts (arrows) in the right middle and lowerlobes. Note the linear opacity in the left lower lobe (ar-rowhead).
628 May-June 2007 RG f Volume 27 ● Number 3
tion of juvenile worms and include pneumothoraxor hydropneumothorax, focal airspace consolida-tion, and linear opacities (Fig 14). Later findingsresulting from worm cysts include thin-walledcysts, masslike consolidation, nodules, and bron-chiectasis (Fig 15). Typical CT findings in PP area poorly marginated subpleural or subfissural
The radiologicfindings correlate well with the stage of the dis-ease (70). Early findings are caused by the migra-
TeachingPoint
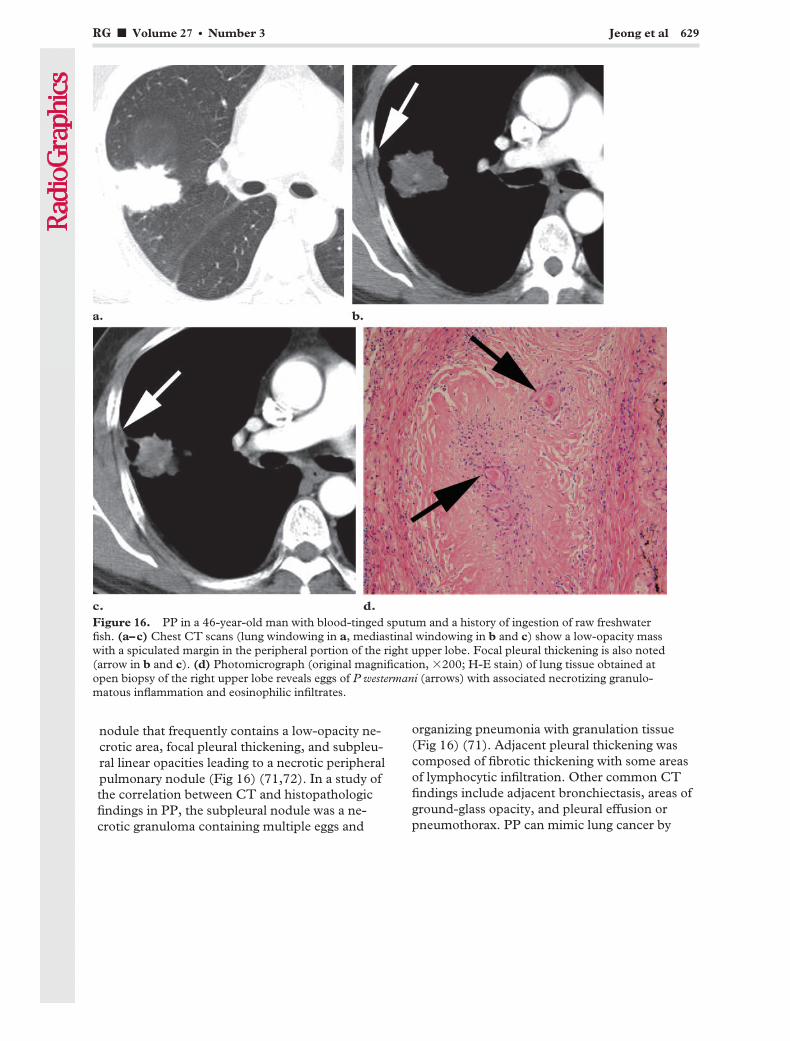
nodule that frequently contains a low-opacity ne-crotic area, focal pleural thickening, and subpleu-ral linear opacities leading to a necrotic peripheralpulmonary nodule (Fig 16) (71,72). In a study ofthe correlation between CT and histopathologicfindings in PP, the subpleural nodule was a ne-crotic granuloma containing multiple eggs and
organizing pneumonia with granulation tissue(Fig 16) (71). Adjacent pleural thickening wascomposed of fibrotic thickening with some areasof lymphocytic infiltration. Other common CTfindings include adjacent bronchiectasis, areas ofground-glass opacity, and pleural effusion orpneumothorax. PP can mimic lung cancer by
Figure 16. PP in a 46-year-old man with blood-tinged sputum and a history of ingestion of raw freshwaterfish. (a–c) Chest CT scans (lung windowing in a, mediastinal windowing in b and c) show a low-opacity masswith a spiculated margin in the peripheral portion of the right upper lobe. Focal pleural thickening is also noted(arrow in b and c). (d) Photomicrograph (original magnification, �200; H-E stain) of lung tissue obtained atopen biopsy of the right upper lobe reveals eggs of P westermani (arrows) with associated necrotizing granulo-matous inflammation and eosinophilic infiltrates.
RG f Volume 27 ● Number 3 Jeong et al 629

showing high radiotracer uptake at 2-[fluorine-18]fluoro-2-deoxy-d-glucose (FDG) positronemission tomography (PET) (Fig 17) (71,73).Pleural and pericardial paragonimiasis withoutparenchymal lesions has also been reported (Fig18) (74). The radiologic differential diagnosisincludes bacterial infections with abscess forma-tion, vasculitis, pulmonary tuberculosis, and cryp-tococcosis. However, a combination of typicalCT findings and a history of eating freshwatercrabs or wild boar meat in endemic areas maysuggest the diagnosis of PP.
Drug ReactionsA wide variety of drugs and toxic substances areimportant causes of pulmonary eosinophilic infil-trates. Patients with drug-induced eosinophiliclung disease can present with a variety of patho-logic conditions ranging from a mild, SPE-likesyndrome to a fulminant, AEP-like syndrome.There have been two significant outbreaks ofdrug-induced eosinophilic lung disease. The firstoutbreak was the toxic-oil syndrome associatedwith the oral ingestion of food-grade rapeseed oil
contaminated with aniline derivatives (75). Thesecond was the eosinophilia-myalgia syndromeassociated with the ingestion of L-tryptophan(76). Cutaneous adverse drug reactions such astoxic epidermal necrolysis and DRESS (drug rashwith eosinophilia and systemic symptoms) syn-drome can be life threatening. Pulmonary in-volvement by cutaneous adverse drug reactions israre (Fig 19) and is considered to be a severityfactor (77). Many patients with drug-inducedeosinophilic lung disease will improve by simplydiscontinuing the medication; in severe or persis-tent cases, however, short courses of corticoste-roids appear to hasten recovery. The diagnosis isusually made on the basis of clinical history andblood eosinophilia rather than imaging findings.
At histologic analysis, drug-induced eosino-philic pneumonia is characterized by the accumu-lation of eosinophils and macrophages in the al-veolar spaces (78). There is also usually an ac-companying infiltrate composed of eosinophils,lymphocytes, and plasma cells within the alveolarsepta and adjacent interstitium.
Figure 17. PP in a 44-year-old man. FDG PET scandemonstrates high glucose uptake (standardized uptakevalue � 5.6), a finding that suggests malignancy. Per-cutaneous aspiration biopsy revealed eosinophilicorganizing pneumonia containing multiple eggs ofP westermani.
Figure 18. Pleural and pericardial paragonimiasis ina 31-year-old man with 20% peripheral eosinophilia.Contrast material– enhanced chest CT scan (medias-tinal windowing) demonstrates pericardial and leftpleural effusion with homogeneous thickening andenhancement of the pericardium and pleura. Eggs ofP westermani were found in the pleural fluid.
630 May-June 2007 RG f Volume 27 ● Number 3

Chest radiography demonstrates variable andnonspecific findings that include consolidation,hilar adenopathy, pleural effusion, and reticu-lonodular densities. CT more clearly reveals the
pattern and extent of the variable findings, in-cluding areas of ground-glass opacity, consolida-tion, nodules, and irregular lines (Fig 20) (13). Inone series, airspace consolidation and ground-glass opacity in a predominantly peripheral distri-bution were the most common high-resolutionCT findings (79).
Eosinophilic VasculitisChurg-Strauss syndrome was first described in1951 by Churg and Strauss on the basis of thehistologic criteria of tissue infiltration by eosino-phils, necrotizing vasculitis, and extravasculargranulomas (80). The diagnosis of Churg-Strausssyndrome can be made if four or more of the fol-lowing six findings are present: asthma, eosino-philia greater than 10% of the white blood celldifferential count, neuropathy, migratory or tran-sient pulmonary opacities, paranasal sinus abnor-malities, and extravascular eosinophils revealedat biopsy (81). The etiology of Churg-Strauss
Figure 19. DRESS syndrome caused by the antituberculous medication rifampin in a 30-year-old woman.The patient had 20% BAL fluid eosinophilia. (a) Transverse thin-section CT scan (lung windowing) showsconsolidation with volume loss in the left lower lobe. (b) High-power photomicrograph (original magnification,�400; H-E stain) of a muscle biopsy specimen reveals infiltrates composed of eosinophils, lymphocytes, andplasma cells within the muscle fiber. Similar findings were seen in the periportal area, alveolar septa and adja-cent interstitium, and dermis at microscopic analysis of biopsy specimens obtained from the liver, lung, andskin, respectively.
Figure 20. Ampicillin-induced pneumonia in a 69-year-old man with 24.1% peripheral eosinophilia.Transverse thin-section (1-mm collimation) CT scan(lung windowing) demonstrates multifocal patchy areasof ground-glass opacity with thickening of the inter-lobular and intralobular interstitium.
RG f Volume 27 ● Number 3 Jeong et al 631
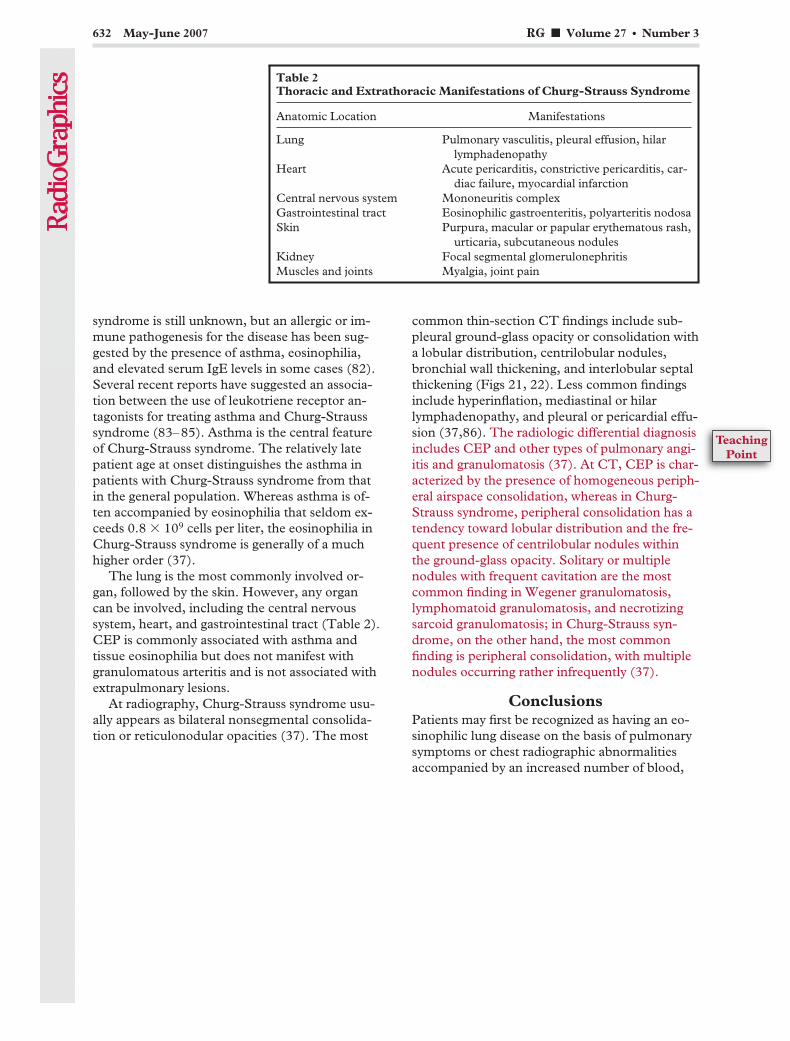
syndrome is still unknown, but an allergic or im-mune pathogenesis for the disease has been sug-gested by the presence of asthma, eosinophilia,and elevated serum IgE levels in some cases (82).Several recent reports have suggested an associa-tion between the use of leukotriene receptor an-tagonists for treating asthma and Churg-Strausssyndrome (83–85). Asthma is the central featureof Churg-Strauss syndrome. The relatively latepatient age at onset distinguishes the asthma inpatients with Churg-Strauss syndrome from thatin the general population. Whereas asthma is of-ten accompanied by eosinophilia that seldom ex-ceeds 0.8 � 109 cells per liter, the eosinophilia inChurg-Strauss syndrome is generally of a muchhigher order (37).
The lung is the most commonly involved or-gan, followed by the skin. However, any organcan be involved, including the central nervoussystem, heart, and gastrointestinal tract (Table 2).CEP is commonly associated with asthma andtissue eosinophilia but does not manifest withgranulomatous arteritis and is not associated withextrapulmonary lesions.
At radiography, Churg-Strauss syndrome usu-ally appears as bilateral nonsegmental consolida-tion or reticulonodular opacities (37). The most
common thin-section CT findings include sub-pleural ground-glass opacity or consolidation witha lobular distribution, centrilobular nodules,bronchial wall thickening, and interlobular septalthickening (Figs 21, 22). Less common findingsinclude hyperinflation, mediastinal or hilarlymphadenopathy, and pleural or pericardial effu-sion (37,86). The radiologic differential diagnosisincludes CEP and other types of pulmonary angi-itis and granulomatosis (37). At CT, CEP is char-acterized by the presence of homogeneous periph-eral airspace consolidation, whereas in Churg-Strauss syndrome, peripheral consolidation has atendency toward lobular distribution and the fre-quent presence of centrilobular nodules withinthe ground-glass opacity. Solitary or multiplenodules with frequent cavitation are the mostcommon finding in Wegener granulomatosis,lymphomatoid granulomatosis, and necrotizingsarcoid granulomatosis; in Churg-Strauss syn-drome, on the other hand, the most commonfinding is peripheral consolidation, with multiplenodules occurring rather infrequently (37).
ConclusionsPatients may first be recognized as having an eo-sinophilic lung disease on the basis of pulmonarysymptoms or chest radiographic abnormalitiesaccompanied by an increased number of blood,
Table 2Thoracic and Extrathoracic Manifestations of Churg-Strauss Syndrome
Anatomic Location Manifestations
Lung Pulmonary vasculitis, pleural effusion, hilarlymphadenopathy
Heart Acute pericarditis, constrictive pericarditis, car-diac failure, myocardial infarction
Central nervous system Mononeuritis complexGastrointestinal tract Eosinophilic gastroenteritis, polyarteritis nodosaSkin Purpura, macular or papular erythematous rash,
urticaria, subcutaneous nodulesKidney Focal segmental glomerulonephritisMuscles and joints Myalgia, joint pain
632 May-June 2007 RG f Volume 27 ● Number 3
TeachingPoint

BAL fluid, or tissue eosinophils. Although severalradiologic findings can help identify idiopathiceosinophilic lung disease, there is considerableoverlap of these findings in the various entities,which precludes a confident diagnosis in the ma-jority of cases. Correlation between CT findings
and the results of careful clinical evaluation maybe helpful in developing a differential diagnosisfor eosinophilic lung disease, although there arediagnostic pitfalls in the form of some overlappingfeatures (Table 3).
Figures 21, 22. (21) Churg-Strauss syndrome in a 30-year-old asthmatic man who presented with chronic cough,dyspnea, and skin rash. The patient had 17% peripheral and 32% BAL fluid eosinophilia. (a) Thin-section (1-mmcollimation) CT scan (lung windowing) demonstrates multiple small centrilobular nodules, bronchial wall thicken-ing, and ground-glass opacity in both lung bases. (b) Photomicrograph (original magnification, �200; H-E stain) ofan open biopsy specimen obtained from the right lower lobe 3 months after a shows eosinophilic organizing pneumo-nia. (22) Churg-Strauss syndrome in a 49-year-old asthmatic woman with quadriparesis and skin rash. The patienthad a leukocyte count of 15,640 leukocytes per microliter and 49% peripheral eosinophilia. (a) Thin-section CTscan (lung windowing) shows subpleural ground-glass opacity, focal lobular consolidation, centrilobular nodules, andbronchial wall thickening in both lung bases. (b) High-power photomicrograph (original magnification, �400; H-Estain) of a biopsy specimen obtained from the skin of the leg reveals necrotizing vasculitis (arrows) involving smalldermal vessels. Peripheral nerve biopsy revealed eosinophilic vasculitis.
RG f Volume 27 ● Number 3 Jeong et al 633

Tab
le3
Ove
rvie
wof
Eos
inop
hil
icL
un
gD
isea
ses
Clin
ical
Ent
ity
Clin
ical
,Pat
holo
gic,
and
Rad
iolo
gic
Fea
ture
s
Ast
hma
Init
ial
Per
iphe
ral
Eos
inop
hilia
BA
LF
luid
Eos
inop
hilia
Incr
ease
dIg
EL
evel
Ext
rath
orac
icM
anif
esta
tion
sP
atho
logi
cF
indi
ngs
CT
Fin
ding
s
SP
EN
oY
es�
20%
Yes
No
Infil
trat
ion
ofeo
sino
phils
into
the
alve
olar
sept
aan
din
ters
titi
um
Nod
ules
wit
ha
GG
Oha
lo,t
rans
ient
and
mi-
grat
ory
AE
PN
oN
o�
25%
Som
eN
oD
iffu
seal
veol
arda
mag
ew
ith
inte
rsti
tial
and
alve
olar
eosi
noph
ils
Bila
tera
lpat
chy
area
sof
GG
O,i
nter
lobu
lar
sep-
talt
hick
enin
gC
EP
Yes
(50%
)Y
es�
25%
Yes
(app
roxi
mat
ely
67%
)N
oIn
filtr
atio
nof
eosi
noph
ilsin
toth
eal
veol
iand
in-
ters
titi
umw
ith
inte
rsti
-ti
alfib
rosi
s
Hom
ogen
eous
peri
pher
alai
rspa
ceco
nsol
idat
ion
IHS
No
Yes
Hig
h(u
pto
73%
)Y
es(5
0%)
Yes
Eos
inop
hilic
infil
trat
ion
wit
hdi
srup
tion
ofar
-ch
itec
ture
Nod
ules
wit
ha
GG
Oha
lo
AB
PA
Yes
(100
%)
Yes
�20
%Y
esN
oB
ronc
hoce
ntri
cgr
anu-
lom
aw
ith
eosi
noph
ils,
fung
alhy
phae
Bro
nchi
ecta
sis
wit
hor
wit
hout
muc
oid
impa
c-ti
onin
volv
ing
the
cen-
tral
and
uppe
rlu
ngs
BG
Yes
(app
roxi
mat
ely
33%
)Y
es�
20%
Som
eN
oG
ranu
lom
atou
sin
flam
-m
atio
nof
bron
chia
lan
dbr
onch
iola
rep
ithe
-liu
m
Non
spec
ific:
foca
lmas
sor
lobu
lar
cons
olid
atio
nw
ith
atel
ecta
sis
Par
asit
icin
fect
ions
No
Yes
�20
%Y
esN
oV
aria
ble
depe
ndin
gon
type
ofpa
rasi
tic
infe
sta-
tion
Var
iabl
ede
pend
ing
onty
peof
para
siti
cin
fest
a-ti
onD
rug
reac
tion
sN
oY
es�
20%
Yes
No
Infil
trat
ion
ofeo
sino
phils
and
mac
roph
ages
into
the
alve
oli
Non
spec
ific:
peri
pher
alai
rspa
ceco
nsol
idat
ion
and
GG
OC
SS
Yes
(100
%)
Yes
�30
%Y
esY
esN
ecro
tizi
ngva
scul
itis
,ex
trav
ascu
lar
gran
ulo-
mas
,eos
inop
hilic
pneu
-m
onia
Sub
pleu
ralc
onso
lidat
ion
wit
ha
lobu
lar
dist
ribu
-ti
on,c
entr
ilobu
lar
nod-
ules
Not
e.—
CS
S�
Chu
rg-S
trau
sssy
ndro
me,
GG
O�
grou
nd-g
lass
opac
ity.
634 May-June 2007 RG f Volume 27 ● Number 3
References1. Allen JN, Davis WB. Eosinophilic lung diseases.
Am J Respir Crit Care Med 1994;150:1423–1438.2. Allen JN, Davis WB, Pacht ER. Diagnostic signifi-
cance of increased bronchoalveolar lavage fluideosinophils. Am Rev Respir Dis 1990;142:642–647.
3. Davis WB, Fells GA, Sun XH, Gadek JE, VenetA, Crystal RG. Eosinophil-mediated injury to lungparenchymal cells and interstitial matrix: a pos-sible role for eosinophils in chronic inflammatorydisorders of the lower respiratory tract. J Clin In-vest 1984;74:269–278.
4. Friedman PJ, Liebow AA, Sokoloff J. Eosinophilgranuloma of lung: clinical aspects of primary his-tiocytosis in the adult. Medicine 1981;60:385–396.
5. Lombard CM, Tazelaar HD, Krasne DL. Pulmo-nary eosinophilia in coccidioidal infections. Chest1987;91:734–736.
6. Fleury-Feith J, Van Nhieu JT, Picard C, EscudierE, Bernaudin JF. Bronchoalveolar lavage eosino-philia associated with Pneumocystis carinii pneu-monitis in AIDS patients: comparative study withnon-AIDS patients. Chest 1989;95:1198–1201.
7. Weller PF. The immunobiology of eosinophils.N Engl J Med 1991;324:1110–1118.
8. Takayanagi N, Kanazawa M, Kawabata Y, ColbyTV. Chronic bronchiolitis with associated eosino-philic lung disease (eosinophilic bronchiolitis).Respiration 2001;68:319–322.
9. Johkoh T, Muller NL, Akira M, et al. Eosinophiliclung diseases: diagnostic accuracy of thin-sectionCT in 111 patients. Radiology 2000;216:773–780.
10. Ford RM. Transient pulmonary eosinophilia andasthma: a review of 20 cases occurring in 5,702asthma sufferers. Am Rev Respir Dis 1966;93:797–803.
11. Cordier JF. Eosinophilic pneumonias. In: SchwarzM, King T, eds. Interstitial lung disease. 4th ed.Toronto, Canada: Decker, 2003; 657–700.
12. Bain GA, Flower CD. Pulmonary eosinophilia.Eur J Radiol 1996;23:3–8.
13. Kim Y, Lee KS, Choi DC, Primack SL, Im JG.The spectrum of eosinophilic lung disease: radio-logic findings. J Comput Assist Tomogr 1997;21:920–930.
14. Kim Y, Lee KS, Jung KJ, Han J, Kim JS, Suh JS.Halo sign on high resolution CT: findings in spec-trum of pulmonary diseases with pathologic corre-lation. J Comput Assist Tomogr 1999;23(4):622–626.
15. Allen JN, Pacht ER, Gadek JE, Davis WB. Acuteeosinophilic pneumonia as a reversible cause ofnoninfectious respiratory failure. N Engl J Med1989;321:569–574.
16. Ogawa H, Fujimura M, Matsuda T, Nakamura H,Kumabashiri I, Kitagawa S. Transient wheeze:eosinophilic bronchobronchiolitis in acute eosino-philic pneumonia. Chest 1993;104:493–496.
17. Philit F, Etienne-Mastroianni B, Parrot A, GuerinC, Robert D, Cordier JF. Idiopathic acute eosino-philic pneumonia: a study of 22 patients. Am JRespir Crit Care Med 2002;166(9):1235–1239.
18. Nakajima M, Manabe T, Niki Y, Matsushima T.Cigarette smoke–induced acute eosinophilic pneu-monia. Radiology 1998;207:829–831.
19. Shintani H, Fujimura M, Yasui M, et al. Acuteeosinophilic pneumonia caused by cigarette smok-ing. Intern Med 2000;39:66–68.
20. Rom WN, Weiden M, Garcia R, et al. Acute eo-sinophilic pneumonia in a New York City fire-fighter exposed to World Trade Center dust. Am JRespir Crit Care Med 2002;166(6):797–800.
21. Hirai K, Yamazaki Y, Okada K, Furuta S, KuboK. Acute eosinophilic pneumonia associated withsmoke from fireworks. Intern Med 2000;39:401–403.
22. Tazelaar HD, Linz LJ, Colby TV, Myers JL,Limper AH. Acute eosinophilic pneumonia: his-topathologic findings in nine patients. Am J RespirCrit Care Med 1997;155:296–302.
23. Cheon JE, Lee KS, Jung GS, Chung MH, ChoYD. Acute eosinophilic pneumonia: radiographicand CT findings in six patients. AJR Am J Roent-genol 1996;167:1195–1199.
24. King MA, Pope-Harman AL, Allen JN, Christofo-ridis GA, Christoforidis AJ. Acute eosinophilicpneumonia: radiologic and clinical features. Radi-ology 1997;203:715–719.
25. Carrington CB, Addington WW, Goff AM, et al.Chronic eosinophilic pneumonia. N Engl J Med1969;280:787–798.
26. Jederlinic PJ, Sicilian L, Gaensler EA. Chroniceosinophilic pneumonia: a report of 19 cases and areview of the literature. Medicine 1988;67:154–162.
27. Fox B, Seed WA. Chronic eosinophilic pneumo-nia. Thorax 1980;35:570–580.
28. Naughton M, Fahy J, FitzGerald MX. Chroniceosinophilic pneumonia: a long-term follow-up of12 patients. Chest 1993;103:162–165.
29. Brezis M, Lafair J. Thrombocytosis in chronic eo-sinophilic pneumonia. Chest 1979;76:231–232.
30. Dejaegher P, Demedts M. Bronchoalveolar lavagein eosinophilic pneumonia before and during cor-ticosteroid therapy. Am Rev Respir Dis 1984;129:631–632.
31. Mochimaru H, Kawamoto M, Fukuda Y, KudohS. Clinicopathological differences between acuteand chronic eosinophilic pneumonia. Respirology2005;10:76–85.
32. Gaensler EA, Carrington CB. Peripheral opacitiesin chronic eosinophilic pneumonia: the photo-graphic negative of pulmonary edema. AJR Am JRoentgenol 1977;128:1–13.
33. Ebara H, Ikezoe J, Johkoh T, et al. Chronic eosin-ophilic pneumonia: evolution of chest radiogramsand CT features. J Comput Assist Tomogr 1994;18:737–744.
34. McCarthy DS, Pepys J. Cryptogenic pulmonaryeosinophilias. Clin Allergy 1973;3:339–351.
35. Mayo JR, Muller NL, Road J, Sisler J, LillingtonG. Chronic eosinophilic pneumonia: CT findings insix cases. AJR Am J Roentgenol 1989;153:727–730.
36. Samman YS, Wali SO, Abdelaal MA, Gangi MT,Krayem AB. Chronic eosinophilic pneumonia pre-senting with recurrent massive bilateral pleuraleffusion. Chest 2001;119:968–970.
37. Choi YH, Im JG, Han BK, Kim JH, Lee KY,Myoung NH. Thoracic manifestation of Churg-Strauss syndrome: radiologic and clinical findings.Chest 2000;117:117–124.
38. Winn RE, Kollef MH, Meyer JI. Pulmonary in-volvement in the hypereosinophilic syndrome.Chest 1994;105:656–660.
RG f Volume 27 ● Number 3 Jeong et al 635
39. Chusid MJ, Dale DC, West BC, Wolff SM. Thehypereosinophilic syndrome: analysis of fourteencases with review of the literature. Medicine 1975;54:1–27.
40. Spry CJ, Davies J, Tai PC, Olsen EG, Oakley CM,Goodwin JF. Clinical features of fifteen patientswith the hypereosinophilic syndrome. Q J Med1983 Winter;52(205):1–22.
41. Parrillo JE, Borer JS, Henry WL, Wolff SM, FauciAS. The cardiovascular manifestations of the hy-pereosinophilic syndrome: prospective study of 26patients, with review of the literature. Am J Med1979;67:572–582.
42. Fauci AS, Harley JB, Roberts WC, Ferrans VJ,Gralnick HR, Bjornson BH. The idiopathic hy-pereosinophilic syndrome: clinical, pathophysi-ologic, and therapeutic considerations. Ann InternMed 1982;97:78–92.
43. Spry CJ. The hypereosinophilic syndrome: clinicalfeatures, laboratory findings and treatment. Al-lergy 1982;37:539–551.
44. Slabbynck H, Impens N, Naegels S, Dewaele M,Schandevyl W. Idiopathic hypereosinophilic syn-drome-related pulmonary involvement diagnosedby bronchoalveolar lavage. Chest 1992;101:1178–1180.
45. Epstein DM, Taormina V, Gefter WB, MillerWT. The hypereosinophilic syndrome. Radiology1981;140:59–62.
46. Kang EY, Shim JJ, Kim JS, Kim KI. Pulmonaryinvolvement of idiopathic hypereosinophilic syn-drome: CT findings in five patients. J Comput As-sist Tomogr 1997;21(4):612–615.
47. Wang JL, Patterson R, Rosenberg M, Roberts M,Cooper BJ. Serum IgE and IgG antibody activityagainst Aspergillus fumigatus as a diagnostic aid inallergic bronchopulmonary aspergillosis. Am RevRespir Dis 1978;117:917–927.
48. Rosenberg M, Patterson R, Mintzer R, Cooper BJ,Roberts M, Harris KE. Clinical and immunologiccriteria for the diagnosis of allergic bronchopulmo-nary aspergillosis. Ann Intern Med 1977;86:405–414.
49. Ricketti AJ, Greenberger PA, Patterson R. SerumIgE as an important aid in management of allergicbronchopulmonary aspergillosis. J Allergy ClinImmunol 1984;74:68–71.
50. Bosken CH, Myers JL, Greenberger PA, Katzen-stein AL. Pathologic features of allergic broncho-pulmonary aspergillosis. Am J Surg Pathol 1988;12:216–222.
51. Patterson R, Greenberger PA, Radin RC, RobertsM. Allergic bronchopulmonary aspergillosis: stag-ing as an aid to management. Ann Intern Med1982;96:286–291.
52. McCarthy DS, Simon G, Hargreave FE. The ra-diological appearances in allergic bronchopulmo-nary aspergillosis. Clin Radiol 1970;21:366–375.
53. Mendelson EB, Fisher MR, Mintzer RA, HalwigJM, Greenberger PA. Roentgenographic and clini-cal staging of allergic bronchopulmonary aspergil-losis. Chest 1985;87:334–339.
54. Neeld DA, Goodman LR, Gurney JW, Green-berger PA, Fink JN. Computerized tomography inthe evaluation of allergic bronchopulmonary as-
pergillosis. Am Rev Respir Dis 1990;142:1200–1205.
55. Mintzer RA, Rogers LF, Kruglik GD, RosenbergM, Neiman HL, Patterson R. The spectrum ofradiologic findings in allergic bronchopulmonaryaspergillosis. Radiology 1978;127:301–307.
56. Franquet T, Muller NL, Gimenez A, Guembe P,de La Torre J, Bague S. Spectrum of pulmonaryaspergillosis: histologic, clinical, and radiologicfindings. RadioGraphics 2001;21:825–837.
57. Angus RM, Davies ML, Cowan MD, McSharryC, Thomson NC. Computed tomographic scan-ning of the lung in patients with allergic broncho-pulmonary aspergillosis and in asthmatic patientswith a positive skin test to Aspergillus fumigatus.Thorax 1994;49:586–589.
58. Ward S, Heyneman L, Lee MJ, Leung AN, Han-sell DM, Muller NL. Accuracy of CT in the diag-nosis of allergic bronchopulmonary aspergillosis inasthmatic patients. AJR Am J Roentgenol 1999;173:937–942.
59. Liebow AA. The J. Burns Amberson lecture: pul-monary angiitis and granulomatosis. Am Rev Re-spir Dis 1973;108:1–18.
60. Katzenstein AL, Liebow AA, Friedman PJ. Bron-chocentric granulomatosis, mucoid impaction andhypersensitivity reaction to fungi. Am Rev RespirDis 1975;111:497–537.
61. Robinson RG, Wehunt WD, Tsou E, Koss MN,Hochholzer L. Bronchocentric granulomatosis:roentgenographic manifestations. Am Rev RespirDis 1982;125:751–756.
62. Ward S, Heyneman LE, Flint JD, Leung AN, Ka-zerooni EA, Muller NL. Bronchocentric granulo-matosis: computed tomographic findings in fivepatients. Clin Radiol 2000;55:296–300.
63. Jamil SA, Hilton E. The strongyloides hyperinfec-tion syndrome. N Y State J Med 1992;92:67–68.
64. Lee HK, Jin SL, Lee HP, Choi SJ, Yum HK. Loff-ler’s syndrome associated with Clonorchis sinensisinfestation. Korean J Intern Med 2003;18:255–259.
65. Udwadia FE. Tropical eosinophilia: a correlationof clinical, histopathologic and lung function stud-ies. Dis Chest 1967;52:531–538.
66. Khoo FY, Danaraj TJ. The roentgenographic ap-pearance of eosinophilic lung (tropical eosino-philia). Am J Roentgenol Radium Ther Nucl Med1960;83:251–259.
67. Gopinath R, Nutman TB. Parasitic diseases. In:Murray JF, Nadel JA, eds. Textbook of respiratorymedicine. 3rd ed. Philadelphia, Pa: Saunders,2000; 1143–1171.
68. Nguyen LQ, Estrella J, Jett EA, Grunvald EL, Ni-cholson L, Levin DL. Acute schistosomiasis innonimmune travelers: chest CT findings in 10patients. AJR Am J Roentgenol 2006;186:1300–1303.
69. Waldman AD, Day JH, Shaw P, Bryceson AD.Subacute pulmonary granulomatous schistosomia-sis: high resolution CT appearances—anothercause of the halo sign. Br J Radiol 2001;74:1052–1055.
70. Im JG, Kong Y, Shin YM, et al. Pulmonary para-gonimiasis: clinical and experimental studies. Ra-dioGraphics 1993;13:575–586.
71. Kim TS, Han J, Shim SS, et al. Pleuropulmonaryparagonimiasis: CT findings in 31 patients. AJRAm J Roentgenol 2005;185:616–621.
636 May-June 2007 RG f Volume 27 ● Number 3
72. Im JG, Whang HY, Kim WS, Han MC, Shim YS,Cho SY. Pleuropulmonary paragonimiasis: radio-logic findings in 71 patients. AJR Am J Roentgenol1992;159:39–43.
73. Watanabe S, Nakamura Y, Kariatsumari K, et al.Pulmonary paragonimiasis mimicking lung canceron FDG-PET imaging. Anticancer Res 2003;23:3437–3440.
74. Iwahashi N, Suzuki F, Tamura S, et al. A case ofparagonimiasis Miyazakii with bilateral pleural andpericardial effusion [in Japanese]. Nihon KyobuShikkan Gakkai Zasshi 1991;29:1047–1051.
75. Kilbourne EM, Rigau-Perez JG, Heath CW Jr, etal. Clinical epidemiology of toxic-oil syndrome:manifestations of a new illness. N Engl J Med1983;309:1408–1414.
76. Silver RM, Heyes MP, Maize JC, Quearry B, Vi-onnet-Fuasset M, Sternberg EM. Scleroderma,fasciitis, and eosinophilia associated with the in-gestion of tryptophan. N Engl J Med 1990;322:874–881.
77. Wolkenstein P, Chosidow O. Cutaneous adversedrug reaction with pulmonary involvement [inFrench]. Rev Mal Respir 2003;20(5 pt 1):719–726.
78. Pietra GG. Pathologic mechanisms of drug-in-duced lung disorders. J Thorac Imaging 1991;6:1–7.
79. Souza CA, Muller NL, Johkoh T, Akira M. Drug-induced eosinophilic pneumonia: high-resolutionCT findings in 14 patients. AJR Am J Roentgenol2006;186:368–373.
80. Churg J, Strauss L. Allergic granulomatosis, aller-gic angiitis, and periarteritis nodosa. Am J Pathol1951;27:277–301.
81. Masi AT, Hunder GG, Lie JT, et al. The Ameri-can College of Rheumatology 1990 criteria for theclassification of Churg-Strauss syndrome (allergicgranulomatosis angiitis). Arthritis Rheum 1990;33:1094–1100.
82. Chumbley LC, Harrison EG Jr, DeRemee RA.Allergic granulomatosis and angiitis (Churg-Strauss syndrome): report and analysis of 30 cases.Mayo Clin Proc 1977;52:477–484.
83. Shimbo J, Onodera O, Tanaka K, Tsuji S. Churg-Strauss syndrome and the leukotriene receptorantagonist pranlukast. Clin Rheumatol 2005;24:661–662.
84. Kinoshita M, Shiraishi T, Koga T, Ayabe M, Riki-maru T, Oizumi K. Churg-Strauss syndrome aftercorticosteroid withdrawal in an asthmatic patienttreated with pranlukast. J Allergy Clin Immunol1999;103:534–535.
85. Wechsler ME, Garpestad E, Flier SR, et al. Pul-monary infiltrates, eosinophilia, and cardiomyopa-thy following corticosteroid withdrawal in patientswith asthma receiving zafirlukast. JAMA 1998;279:455–457.
86. Worthy SA, Muller NL, Hansell DM, Flower CD.Churg-Strauss syndrome: the spectrum of pulmo-nary CT findings in 17 patients. AJR Am J Roent-genol 1998;170:297–300.
RG f Volume 27 ● Number 3 Jeong et al 637
This article meets the criteria for 1.0 credit hour in category 1 of the AMA Physician’s Recognition Award. To obtaincredit, see accompanying test at http://www.rsna.org/education/rg_cme.html.

Invited Commentary
From:Stephen K. Frankel, MD, Steve D. Groshong, MD, PhD, David A. Lynch, MDDepartment of Medicine and Division of Radiology, National Jewish Medical & Research CenterDenver, Colorado
In this issue of RadioGraphics, Jeong et al (1) re-view the clinical, radiologic, and pathologic fea-tures of the eosinophilic lung diseases. In so do-ing, they call attention to this heterogeneousgroup of pulmonary disorders, which have classi-cally been grouped together based on the pres-ence of pulmonary infiltrates in patients with pe-ripheral or tissue eosinophilia. Familiarity withthese relatively uncommon conditions is impor-tant for the radiologist because they often mani-fest initially as a radiographic abnormality, andbecause their clinical and imaging features oftenoverlap with those of more common disorderssuch as infection and malignancy. Eosinophiliclung disease often enters the differential diagnosis
only upon the identification of eosinophilia. Itremains unclear whether eosinophilic lung dis-eases are related to each other, or even whetherthe eosinophil is pathogenic (as opposed to a “by-stander”) in any or all of these diseases.
The priority for the clinician is to identify anddiagnose eosinophilic lung disease as quickly andefficiently as possible, and then to institute appro-priate treatment. Identification of the biomarkerof blood or tissue eosinophilia should prompt aninitial evaluation for “known causes,” includingparasitic and fungal infections, medications,asthma or atopy, allergic bronchopulmonary
RG f Volume 27 ● Number 3 Jeong et al 637
Note: This copy is for your personal, non-commercial use only. To order presentation-ready copies for distribution to your colleagues or clients, use the RadioGraphics Reprints form at the end of this article.

mycosis, systemic autoimmune disease, and ma-lignancy. Once these diseases have been ruledout, the next logical step is to proceed down the“unknown causes” pathway. As Jeong et al (1)indicate, the primary eosinophilic disorders maybe subdivided into eosinophilic vasculitis, hyper-eosinophilic syndromes, and organ-limitedeosinophilic disorders (idiopathic CEP, AEP,SPE). However, this classification, although valu-able to the clinician, may not correlate with thefeatures identified by the pathologist, radiologist,or basic scientist.
Lung biopsy is not necessary in patients withsimple or chronic pulmonary eosinophilia if theclinical and imaging features are characteristicand there is rapid response to treatment. In pa-tients with acute respiratory failure, biopsy maybe necessary to make the diagnosis of AEP. Bi-opsy can also be helpful in refractory and chroniccases of eosinophilia, in which the differential di-agnosis includes life-threatening entities such asChurg-Strauss vasculitis, hypereosinophilic syn-drome, and eosinophilic leukemia. There are sev-eral challenges in making a specific histologic di-agnosis in patients with these conditions. For ex-ample, previous partial treatment with steroidsmay significantly alter both the number of eosino-phils in a specimen and many of the associatedfindings. Also, some important findings in eosino-philic lung disease (such as vasculitis in Churg-Strauss syndrome) can be focal and may not bepresent in a small biopsy sample, leaving only themore general finding of increased tissue eosino-
phils. In such difficult or equivocal cases, the im-aging features may help in classification. Serologictests such as antineutrophil cytoplasmic antibody,proteinase 3, and myeloperoxidase would supportthe diagnosis of vasculitis, whereas the presenceof a fusion protein would support the diagnosis ofhypereosinophilic syndrome. It should also beremembered that not all cases of eosinophilic lungdisease can be neatly classified into one of theexisting categories. For example, we recentlyevaluated a patient with severe asthma, eosino-philic pneumonia, severe eosinophilic sinusitis,arthralgias, myalgias, and constitutional symp-toms in whom there was no evidence of vasculitisat surgical lung biopsy, serologic tests for vasculi-tis were negative, and there was neither evidenceof a fusion protein nor clonality at bone marrowbiopsy. Does this patient have Churg-Strauss syn-drome, a complex undefined hypereosinophilicsyndrome, or some condition that falls some-where between the two?
The importance of the eosinophil in the patho-genesis of the eosinophilic lung disorders remainsunclear. Numerous studies support a pathogenicrole for the eosinophil in asthma and parasiticinfections (2,3), although paradoxically, the eo-sinophilia in these disorders is generally classifiedas “secondary.” However, there is little objectiveinformation to support the clinical notion thateosinophilia is a dominant pathogenic feature insome of the primary eosinophilic diseases. In-deed, although Churg-Strauss vasculitis is classi-fied as a “primary” eosinophilic disorder, its clini-cal behavior is more like that of other small-ves-sel, antineutrophil cytoplasmic antibody–associatedvasculitides than that of the other eosinophilic lung
638 May-June 2007 RG f Volume 27 ● Number 3
diseases. Likewise, CEP may have more in commonwith other organ-limited eosinophilic disorders suchas eosinophil-associated gastrointestinal diseasethan with diseases such as ABPA.
Fortunately, as our understanding of these dis-eases grows, so does our ability to think clearlyabout them. Perhaps the most prominent ex-amples of this growing ability are recent refine-ments in the molecular analysis, the clinical clas-sification, and, ultimately, the treatment of hy-pereosinophilic syndrome. As indicated by Jeonget al (1), hypereosinophilic syndrome has previ-ously been defined as characterized by (a) persis-tent eosinophilia greater than 1500 cells per cubicmillimeter for more than 6 months, (b) multior-gan involvement and dysfunction, and (c) a nega-tive work-up for known causes of eosinophilia.However, the recent identification of the FIP1L1-PDGFR� fusion protein in up to 50% of patientswith hypereosinophilic syndrome has led to therecognition that this subgroup of patients typi-cally respond to the protein kinase inhibitor iman-tinib (4). The current classification scheme forhypereosinophilic syndrome incorporates a de-tailed analysis of cell surface markers and molecu-lar genetic features, thereby permitting more ac-curate classification of (5) and, potentially, moreeffective treatment for these disorders.
The advent of rational biologic therapiesmakes accurate classification and an improvedunderstanding of the pathophysiologic role of theeosinophil more than a simple academic matter.Anti-IgE antibodies have been approved for thetreatment of subsets of asthmatic patients (6),and anti-IL5 antibodies are already being intro-duced into clinical trials for the treatment of asthmaas well as hypereosinophilic syndrome (7–9). As
additional targeted therapeutics become available,we will need to define their role in each of the eo-sinophilic lung diseases. We thank Jeong et al (1)for their comprehensive and well-illustrated re-view of eosinophilic lung diseases, which shouldserve to increase awareness and understanding ofthese uncommon and complex disorders. We an-ticipate that the next decade of interdisciplinaryinteractions will lead to substantial further ad-vances in the classification of these disorders.
References1. Jeong YJ, Kim KI, Seo IJ, et al. Eosinophilic lung
diseases: a clinical, radiologic, and pathologic over-view. RadioGraphics 2007;27:617–639.
2. Weller PF. Human eosinophils. J Allergy Clin Im-munol 1997;100:283–287.
3. Bochner BS, Busse WW. Allergy and asthma. J Al-lergy Clin Immunol 2005;115:953–959.
4. Klion AD, Bochner BS, Gleich GJ, et al. Ap-proaches to the treatment of hypereosinophilic syn-dromes: a workshop summary report. J Allergy ClinImmunol 2006;117:1292–1302.
5. Gleich GJ, Leiferman KM. The hypereosinophilicsyndromes: still more heterogeneity. Curr Opin Im-munol 2005;17:679–684.
6. Strunk RC, Bloomberg GR. Omalizumab forasthma. N Engl J Med 2006;354:2689–2695.
7. Garrett JK, Jameson SC, Thomson B, et al. Anti-interleukin-5 (mepolizumab) therapy for hypereosi-nophilic syndromes. J Allergy Clin Immunol 2004;113:115–119.
8. Sutton SA, Assa’ad AH, Rothenberg ME. Anti-IL5and hypereosinophilic syndromes. Clin Immunol2005;115:51–60.
9. Klion AD, Law MA, Noel P, Kim YJ, Haverty TP,Nutman TB. Safety and efficacy of the monoclonalanti-interleukin-5 antibody SCH55700 in the treat-ment of patients with hypereosinophilic syndrome.Blood 2004;103:2939–2941.
RG f Volume 27 ● Number 3 Jeong et al 639
EDUCATION EXHIBIT 641
Imaging Manifestationsof Blastomycosis:A Pulmonary Infectionwith Potential Dissemi-nation1
ONLINE-ONLYCME
See www.rsna.org/education/rg_cme.html.
LEARNINGOBJECTIVESAfter reading thisarticle and takingthe test, the reader
will be able to:
� Describe the epide-miologic features,pathogenesis, andradiologic appear-ance of Blastomycesdermatitidis.
� Discuss the clini-cal settings in whichblastomycosis shouldbe considered.
� Identify commonand uncommon ra-diologic manifesta-tions of pulmonaryblastomycosis.
Wayne Fang, MD ● Lacey Washington, MD ● Nidhi Kumar, MD
Pulmonary blastomycosis is an uncommon pathologic condition that isendemic to Canada and the upper Midwest of the United States. Blas-tomycosis has a variety of radiologic manifestations, including airspaceconsolidation, focal masses, intermediate-sized nodules, interstitialdisease, miliary disease, and cavitary lesions. Affected patients may beasymptomatic or may present with clinical manifestations ranging frommild chronic cough to acute respiratory distress syndrome–like symp-toms. Patients with acute symptoms are more likely to have airspaceconsolidation, whereas chronic manifestations may be associated withmasslike lesions. Intermediate-sized nodules with accompanying air-space consolidation, particularly in the upper lobes, should raise suspi-cion for fungal disease. Lymphadenopathy and pleural effusions arequite uncommon, and calcification is not often seen. Blastomycosismay be aggressive and require treatment. Dissemination from the lungis not unusual and can involve any organ. Diagnosis is often delayedbecause blastomycosis can mimic many other disease processes, in-cluding bacterial pneumonia, malignancy, and tuberculosis. Radiolo-gists can best contribute to the care of patients who live or travel in en-demic areas by maintaining a high degree of suspicion for blastomyco-sis and being familiar with its myriad manifestations.©RSNA, 2007
Abbreviations: AIDS � acquired immunodeficiency syndrome, CNS � central nervous system
RadioGraphics 2007; 27:641–655 ● Published online 10.1148/rg.273065122 ● Content Code:
1From the Departments of Radiology (W.F.) and Pathology (N.K.), Medical College of Wisconsin, 9200 W Wisconsin Ave, Milwaukee, WI 53226;and the Department of Radiology, Duke University Medical Center, Durham, NC (L.W.). Presented as an education exhibit at the 2005 RSNA An-nual Meeting. Received June 21, 2006; revision requested August 9 and received September 22; accepted September 29. All authors have no financialrelationships to disclose. Address correspondence to W.F. (e-mail: [email protected]).
©RSNA, 2007
Note: This copy is for your personal, non-commercial use only. To order presentation-ready copies for distribution to your colleagues or clients, use the RadioGraphics Reprints form at the end of this article.
See last page
TEACHING POINTS
IntroductionBlastomyces dermatitidis (also called North Ameri-can blastomycosis) is endemic to Canada and theupper Midwest of the United States, particularlyin moist wooded areas near this region’s manylakes, rivers, and streams. Human exposures oc-cur during outdoor activities when fungal micro-habitats existing in soil with high organic contentare disturbed. Inhaled airborne spores result inprimary lung infection, which may then becomedisseminated. The clinical presentation of af-fected patients is extremely variable, and clinicalsymptoms of pulmonary infection may be absent,chronic, acute, or even fulminant.
In this article, we describe the B dermatitidisorganism and discuss blastomycosis in terms of itsepidemiologic features, pathogenesis, and clinicalcourse. In addition, we discuss and illustrate theradiologic manifestations of blastomycosis, in-cluding airspace consolidation, masses, interme-diate-sized nodules, interstitial disease, miliarydisease, and cavitary lesions. We also describevarious extrapulmonary manifestations of blasto-mycosis.
OrganismB dermatitidis is a thermally dimorphic fungus thatgrows in a mycelial form at room temperature andin culture at 25°C. After 2–4 weeks of incubation,mycelial colonies develop into white cottonymolds. At microscopy, the mycelia possessbranching hyphae with right-angled conidio-phores ending in single round conidia. Manyother fungal mycelial forms share this appearancewith B dermatitidis; thus, this appearance is notspecific.
B dermatitidis converts to a yeast form withintissues and in culture at 37°C. At gross examina-tion, yeast colonies appear cream or tan with but-tery wrinkled surfaces. At microscopic examina-tion, the yeast cells are 8–15 �m in diameter andpossess thick double refractile cell walls. Repro-ducing cells are characterized by single broad-based budding. The daughter cells grow nearly aslarge as the mother cells before detachment (Fig1). In the yeast form, B dermatitidis is far morelikely to have these features than are other fungi.Direct visualization of these cells in sputum ortissue samples at microscopy is the primarymethod with which a definitive diagnosis is made(1).
Making the diagnosis after growing the fun-gus in culture is also highly reliable but time con-suming, requiring weeks (2). Unlike Candida andAspergillus species, B dermatitidis is not associatedwith human colonization (3).
Epidemiologic FeaturesB dermatitidis is very difficult to isolate directlyfrom its native environment. Only a few reports ofsuccessful isolation have been published, and stillfewer reports are associated with outbreaks of dis-ease. In these reports, organisms were found insoil containing decayed vegetation and in decom-posing wood. Recent rainfall and proximity towater appear to be important in promoting thegrowth of the organism (1). B dermatitidis growsin a microclimate of warm, moist soil in woodedareas and flourishes briefly when the proper eco-logic conditions are met. When conditionschange, the microclimate disappears (1,3).
North American blastomycosis (as distin-guished from South American blastomycosis, adifferent fungus) is considered endemic to regionsof North America that have the highest preva-lence of disease outbreaks. The majority of casesoccur in (a) the states bordering the Mississippiand Ohio rivers, (b) the Midwest states, (c) theCanadian provinces bordering the Great Lakes,and (d) a narrow strip of New York and Canadabordering the St Lawrence River (Fig 2). Preva-lence is reported to be 1 in 100,000 persons inthese regions. Small hyperendemic areas havebeen documented within the endemic regions; inthese hyperendemic regions, the prevalence maybe as high as 40 in 100,000 persons, supportingthe hypothesis that specific environmental condi-tions are important (4,5). Outside of NorthAmerica, blastomycosis has been found in Africa,India, Israel, and Saudi Arabia, as well as in Cen-tral and South America. South American blasto-mycosis is caused by the fungus Paracoccidioidesbrasiliensis and is a similar but distinct disease.Notably, infection with P brasiliensis is consideredto be an acquired immunodeficiency syndrome(AIDS)–defining illness (6). North Americanblastomycosis is found infrequently in AIDS pa-tients or other immunocompromised patients,much less frequently than either histoplasmosis orcoccidioidomycosis (7).
642 May-June 2007 RG f Volume 27 ● Number 3
TeachingPoint
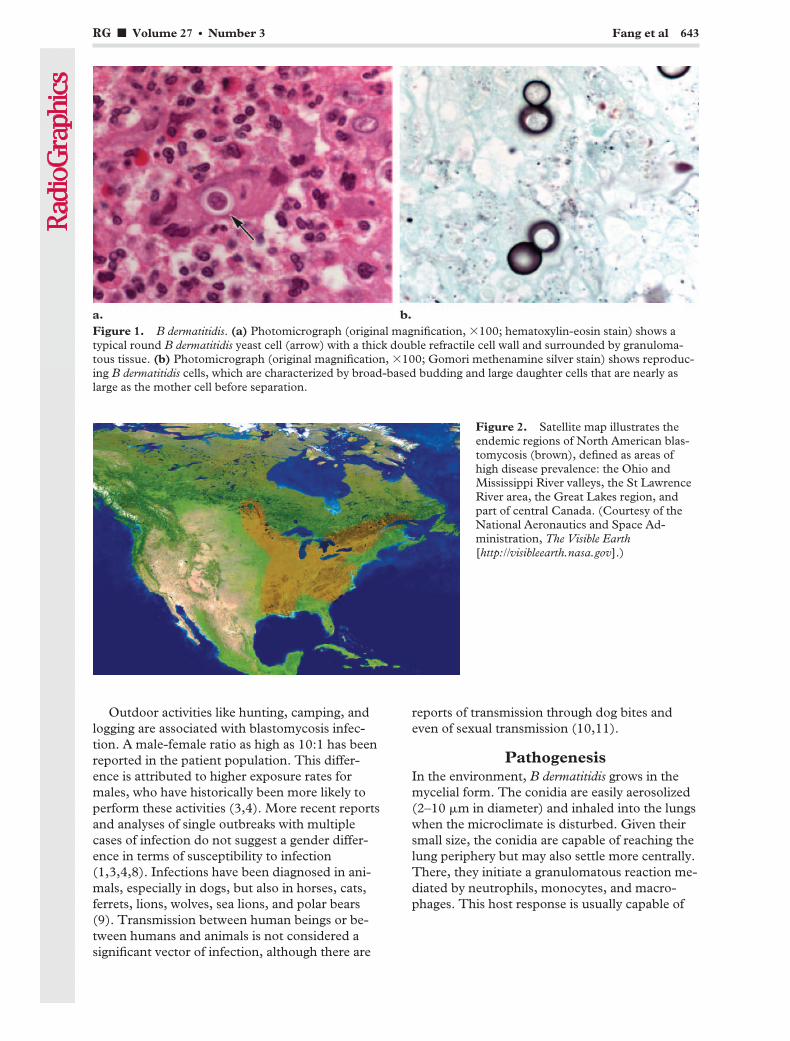
Outdoor activities like hunting, camping, andlogging are associated with blastomycosis infec-tion. A male-female ratio as high as 10:1 has beenreported in the patient population. This differ-ence is attributed to higher exposure rates formales, who have historically been more likely toperform these activities (3,4). More recent reportsand analyses of single outbreaks with multiplecases of infection do not suggest a gender differ-ence in terms of susceptibility to infection(1,3,4,8). Infections have been diagnosed in ani-mals, especially in dogs, but also in horses, cats,ferrets, lions, wolves, sea lions, and polar bears(9). Transmission between human beings or be-tween humans and animals is not considered asignificant vector of infection, although there are
reports of transmission through dog bites andeven of sexual transmission (10,11).
PathogenesisIn the environment, B dermatitidis grows in themycelial form. The conidia are easily aerosolized(2–10 �m in diameter) and inhaled into the lungswhen the microclimate is disturbed. Given theirsmall size, the conidia are capable of reaching thelung periphery but may also settle more centrally.There, they initiate a granulomatous reaction me-diated by neutrophils, monocytes, and macro-phages. This host response is usually capable of
Figure 1. B dermatitidis. (a) Photomicrograph (original magnification, �100; hematoxylin-eosin stain) shows atypical round B dermatitidis yeast cell (arrow) with a thick double refractile cell wall and surrounded by granuloma-tous tissue. (b) Photomicrograph (original magnification, �100; Gomori methenamine silver stain) shows reproduc-ing B dermatitidis cells, which are characterized by broad-based budding and large daughter cells that are nearly aslarge as the mother cell before separation.
Figure 2. Satellite map illustrates theendemic regions of North American blas-tomycosis (brown), defined as areas ofhigh disease prevalence: the Ohio andMississippi River valleys, the St LawrenceRiver area, the Great Lakes region, andpart of central Canada. (Courtesy of theNational Aeronautics and Space Ad-ministration, The Visible Earth[http://visibleearth.nasa.gov].)
RG f Volume 27 ● Number 3 Fang et al 643

destroying the conidia and inhibiting conversionof mycelia to yeast. However, conidia that over-whelm host defenses rapidly convert to the yeastform and become more resistant to destruction(1). Hematogenous dissemination reportedly oc-curs less often than in histoplasmosis but is morefrequently symptomatic (7). The most commonextrathoracic site is the skin, followed by bone,the male genitourinary system, and the centralnervous system (CNS). It is generally acceptedthat the primary site of infection is the lung, withsubsequent dissemination to other sites. Rare re-ported cases of cutaneous inoculation in labora-tory workers and veterinarians are thought to bethe exception to this rule. Skin findings are oftenreported on the face, although the etiology of thisphenomenon is not clear (1).
Clinical CourseThe clinical manifestations of blastomycosis mayrange from asymptomatic infection to a fulminantclinical course. The ability to mimic other dis-eases is a hallmark of blastomycosis and oftenleads to erroneous or delayed treatment. Inasymptomatic patients, blastomycosis has beenfound both incidentally and at screening of indi-viduals during epidemics. When blastomycosis issymptomatic, it can have either an acute or achronic clinical course.
Clinically acute blastomycosis manifests withfever, chills, and cough, similar to bacterial pneu-monia. Often, treatment is begun for presumedcommunity-acquired pneumonia, and sputum ortissue culture is obtained only after the patientfails to respond to therapy.
Chronic pulmonary symptoms occur more fre-quently than acute ones (7). Patients present withintermittent low-grade fevers, mild persistent pro-ductive cough, chest pain, and hemoptysis. Gen-eral symptoms of malaise, fatigue, and weight lossare also often present. These symptoms have beenmistakenly diagnosed as tuberculosis or atypicalpneumonia.
In a small percentage of cases, blastomycosishas a fulminant course, manifesting as fevers,chills, and shortness of breath. Rapid systemicdissemination and progression to acute respira-tory distress syndrome result within 1 week, oftenleading to death. Patients often require ventilatorassistance within a few days of admission. Thefulminant manifestation occurs in both immuno-competent and immunocompromised patients.Blastomycosis is not considered an opportunisticfungal infection, but immunocompromised pa-tients with AIDS or a history of either transplan-tation or steroid use more often have diffuse dis-ease and a higher mortality rate.
At tertiary referral centers, blastomycosis issometimes found in patients sent for evaluationof presumed malignancy. Most commonly, theevaluation is for suspected lung cancer, butbreast, skin, CNS, and laryngeal masses havebeen diagnosed as blastomycosis infection afterpathologic assessment (1). Although pulmonaryfindings are generally more common, patientsmay present initially with disseminated extratho-racic infections such as skin lesions, osteomyelitis,prostatitis, CNS abscesses, or meningitis, withfew or no pulmonary symptoms.
Disseminated disease should be treated withsystemic antifungal medications, but cliniciansmay choose to observe patients with isolated pul-monary disease, since mild clinical symptoms of-ten resolve without treatment. These untreatedpatients should be observed for several months todocument resolution. Previously treated or un-treated thoracic or extrathoracic infections mayreactivate, sometimes years after the initial infec-tion (7).
Radiologic Manifesta-tions of Pulmonary Infection
The imaging features of blastomycosis are highlyvariable. The major radiologic features of pulmo-nary involvement fall into the following catego-ries: airspace consolidation, masses, intermediate-sized nodules, interstitial disease, miliary disease,and cavitary lesions. Regardless of the category,the disease may be unilateral or bilateral and mul-tifocal or solitary. There is no characteristic lobarpredilection, although some reports suggest a ten-dency for blastomycosis to affect the upper lobesover a basal distribution (12). Multiple manifesta-tions may occur in the same patient.
Airspace ConsolidationAirspace consolidation is the most common ra-diologic manifestation of blastomycosis. Its re-ported prevalence varies between 26% and 76%,but the consensus is that the majority of cases ofblastomycosis manifest with consolidation (7,13).The usual findings consist of patchy, ill-definedopacities or densities. Although areas of conflu-ence can become quite large, lobar consolidationis considered uncommon. Frequently, air bron-chograms are found within these areas of consoli-dation (Figs 3–7). Several reports have noted a
644 May-June 2007 RG f Volume 27 ● Number 3
TeachingPoint
TeachingPoint
TeachingPoint

Figures 3, 4. (3) Airspace consolidation from blastomycosis in a young boy with acute fever and productive cough.Anteroposterior chest radiograph shows a large confluent left upper lobar–lingular consolidation obscuring the leftborder of the heart. Air bronchograms can be seen faintly. (4) Airspace consolidation from blastomycosis in a differ-ent patient. Computed tomographic (CT) scan shows a large confluent area of consolidation with prominent airbronchograms.
Figure 5. Airspace consolidation from blastomycosisin a 45-year-old woman with persistent chronic cough.(a) Chest radiograph shows patchy consolidation in theretrocardiac region. Patchy consolidation is the mostcommon finding in blastomycosis. (b) Magnified viewmore clearly shows the patchy infiltrate. (c) CT scanshows irregular consolidation in the left lower lobe.
RG f Volume 27 ● Number 3 Fang et al 645
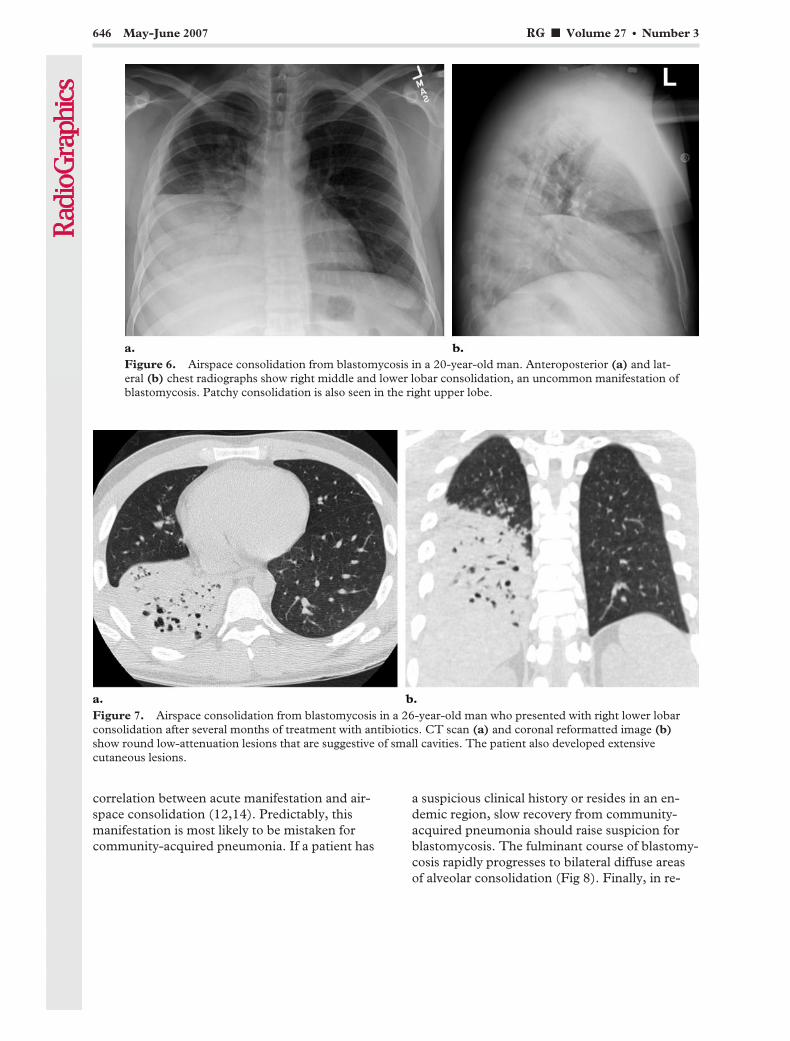
correlation between acute manifestation and air-space consolidation (12,14). Predictably, thismanifestation is most likely to be mistaken forcommunity-acquired pneumonia. If a patient has
a suspicious clinical history or resides in an en-demic region, slow recovery from community-acquired pneumonia should raise suspicion forblastomycosis. The fulminant course of blastomy-cosis rapidly progresses to bilateral diffuse areasof alveolar consolidation (Fig 8). Finally, in re-
Figure 6. Airspace consolidation from blastomycosis in a 20-year-old man. Anteroposterior (a) and lat-eral (b) chest radiographs show right middle and lower lobar consolidation, an uncommon manifestation ofblastomycosis. Patchy consolidation is also seen in the right upper lobe.
Figure 7. Airspace consolidation from blastomycosis in a 26-year-old man who presented with right lower lobarconsolidation after several months of treatment with antibiotics. CT scan (a) and coronal reformatted image (b)show round low-attenuation lesions that are suggestive of small cavities. The patient also developed extensivecutaneous lesions.
646 May-June 2007 RG f Volume 27 ● Number 3

ports of epidemic cases, airspace consolidationis seen at radiography in a large majority of pa-tients (1).
MassesMasses are the second most common radiologicfinding in blastomycosis. Their reported preva-lence varies, but they occur in up to 31% of cases
(13). Masses are usually well circumscribed andbetween 3 and 10 cm in diameter (Fig 9). Theyhave a tendency to be paramediastinal or perihilar(7). Some reports have found a correlation be-tween masses and more chronic manifestations of
Figure 8. Fulminant blastomycosis in a 48-year-old immunocompetent man with fever,cough, and dyspnea. Radiograph shows bilateraldiffuse areas of alveolar consolidation, which de-veloped rapidly and required intubation after 2days of hospitalization. The patient died 10 dayslater.
Figure 9. Blastomycotic mass in a 51-year-old male heavy smoker who was referred by a community clinic.(a) Chest radiograph shows a mass in the left upper lobe. (b) Corresponding CT scan shows the mass to be well cir-cumscribed and round with irregular borders. The results of CT-guided biopsy were inconclusive, and the patientunderwent left upper lobectomy and mediastinal lymph node dissection for suspected lung carcinoma. Blastomycosiswas diagnosed.
RG f Volume 27 ● Number 3 Fang et al 647
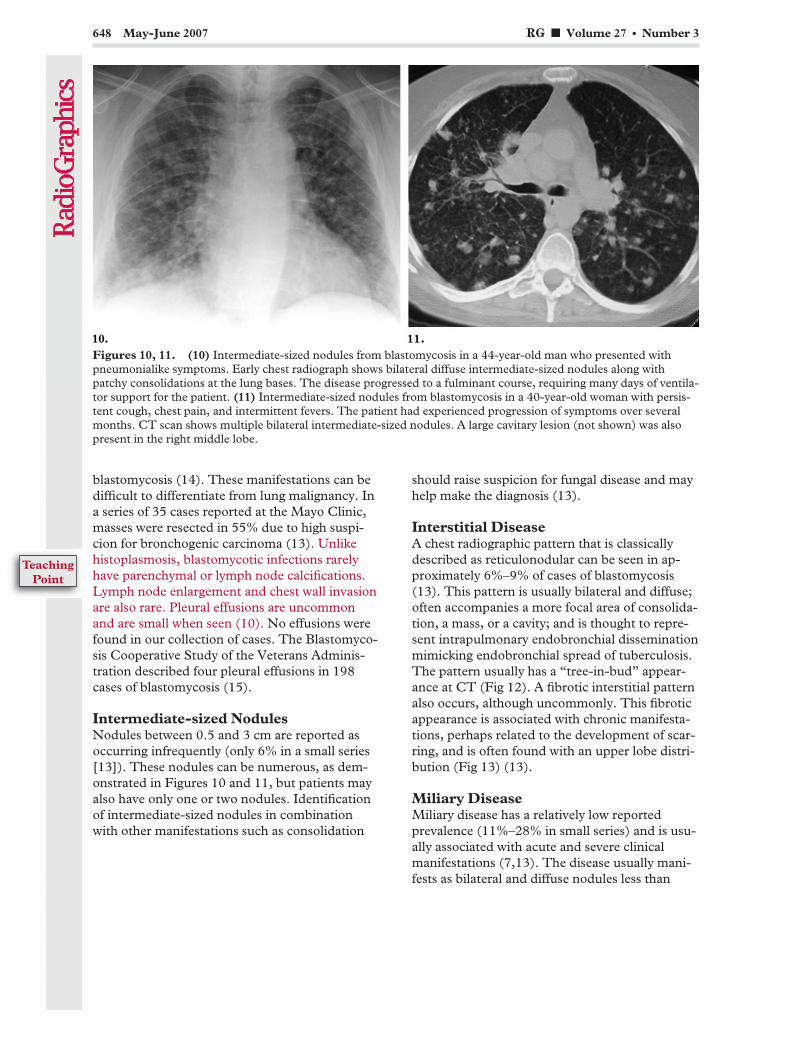
blastomycosis (14). These manifestations can bedifficult to differentiate from lung malignancy. Ina series of 35 cases reported at the Mayo Clinic,masses were resected in 55% due to high suspi-cion for bronchogenic carcinoma (13). Unlikehistoplasmosis, blastomycotic infections rarelyhave parenchymal or lymph node calcifications.Lymph node enlargement and chest wall invasionare also rare. Pleural effusions are uncommonand are small when seen (10). No effusions werefound in our collection of cases. The Blastomyco-sis Cooperative Study of the Veterans Adminis-tration described four pleural effusions in 198cases of blastomycosis (15).
Intermediate-sized NodulesNodules between 0.5 and 3 cm are reported asoccurring infrequently (only 6% in a small series[13]). These nodules can be numerous, as dem-onstrated in Figures 10 and 11, but patients mayalso have only one or two nodules. Identificationof intermediate-sized nodules in combinationwith other manifestations such as consolidation
should raise suspicion for fungal disease and mayhelp make the diagnosis (13).
Interstitial DiseaseA chest radiographic pattern that is classicallydescribed as reticulonodular can be seen in ap-proximately 6%–9% of cases of blastomycosis(13). This pattern is usually bilateral and diffuse;often accompanies a more focal area of consolida-tion, a mass, or a cavity; and is thought to repre-sent intrapulmonary endobronchial disseminationmimicking endobronchial spread of tuberculosis.The pattern usually has a “tree-in-bud” appear-ance at CT (Fig 12). A fibrotic interstitial patternalso occurs, although uncommonly. This fibroticappearance is associated with chronic manifesta-tions, perhaps related to the development of scar-ring, and is often found with an upper lobe distri-bution (Fig 13) (13).
Miliary DiseaseMiliary disease has a relatively low reportedprevalence (11%–28% in small series) and is usu-ally associated with acute and severe clinicalmanifestations (7,13). The disease usually mani-fests as bilateral and diffuse nodules less than
Figures 10, 11. (10) Intermediate-sized nodules from blastomycosis in a 44-year-old man who presented withpneumonialike symptoms. Early chest radiograph shows bilateral diffuse intermediate-sized nodules along withpatchy consolidations at the lung bases. The disease progressed to a fulminant course, requiring many days of ventila-tor support for the patient. (11) Intermediate-sized nodules from blastomycosis in a 40-year-old woman with persis-tent cough, chest pain, and intermittent fevers. The patient had experienced progression of symptoms over severalmonths. CT scan shows multiple bilateral intermediate-sized nodules. A large cavitary lesion (not shown) was alsopresent in the right middle lobe.
648 May-June 2007 RG f Volume 27 ● Number 3
TeachingPoint
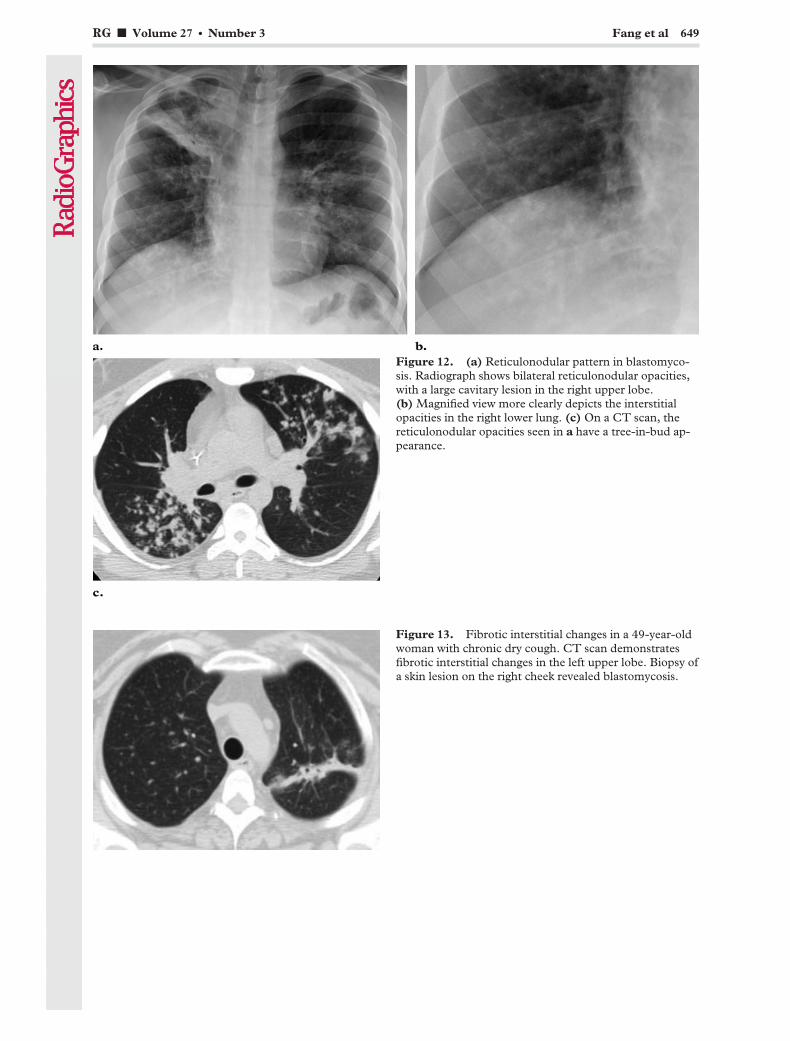
Figure 12. (a) Reticulonodular pattern in blastomyco-sis. Radiograph shows bilateral reticulonodular opacities,with a large cavitary lesion in the right upper lobe.(b) Magnified view more clearly depicts the interstitialopacities in the right lower lung. (c) On a CT scan, thereticulonodular opacities seen in a have a tree-in-bud ap-pearance.
Figure 13. Fibrotic interstitial changes in a 49-year-oldwoman with chronic dry cough. CT scan demonstratesfibrotic interstitial changes in the left upper lobe. Biopsy ofa skin lesion on the right cheek revealed blastomycosis.
RG f Volume 27 ● Number 3 Fang et al 649
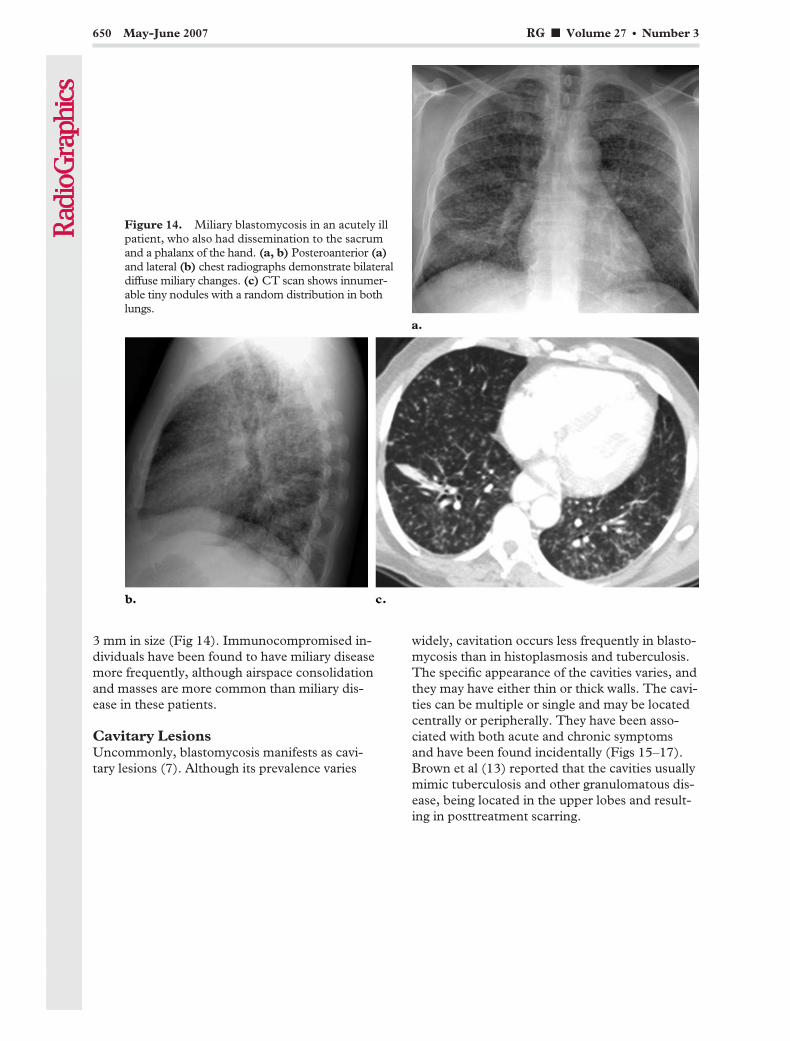
3 mm in size (Fig 14). Immunocompromised in-dividuals have been found to have miliary diseasemore frequently, although airspace consolidationand masses are more common than miliary dis-ease in these patients.
Cavitary LesionsUncommonly, blastomycosis manifests as cavi-tary lesions (7). Although its prevalence varies
widely, cavitation occurs less frequently in blasto-mycosis than in histoplasmosis and tuberculosis.The specific appearance of the cavities varies, andthey may have either thin or thick walls. The cavi-ties can be multiple or single and may be locatedcentrally or peripherally. They have been asso-ciated with both acute and chronic symptomsand have been found incidentally (Figs 15–17).Brown et al (13) reported that the cavities usuallymimic tuberculosis and other granulomatous dis-ease, being located in the upper lobes and result-ing in posttreatment scarring.
Figure 14. Miliary blastomycosis in an acutely illpatient, who also had dissemination to the sacrumand a phalanx of the hand. (a, b) Posteroanterior (a)and lateral (b) chest radiographs demonstrate bilateraldiffuse miliary changes. (c) CT scan shows innumer-able tiny nodules with a random distribution in bothlungs.
650 May-June 2007 RG f Volume 27 ● Number 3

Extrapulmonary ManifestationsMultiorgan involvement in North American blas-tomycosis is not uncommon, occurring in 17%–30% of cases in two reports (5,16). The mostcommon extrapulmonary site of dissemination of
blastomycosis is the skin, believed to occur in20%–40% of cases of disseminated disease (4).At clinical examination, cutaneous lesions mayappear verrucous (warty) or ulcerative. Both types
Figures 15–17. (15) Cavitary blastomycotic lesions. Posteroanterior (a) and lateral (b) chest radiographs demon-strate one large cavitary and multiple smaller cavitary lesions. (16) Cavitary lesion in an asymptomatic 37-year-oldwoman with breast cancer. Surveillance CT scan shows a new cavitary lesion. Resection led to a diagnosis of blasto-mycosis. (17) Cavitary blastomycotic lesion in a 29-year-old man with a 3–4-week history of fever, chills, dyspnea,and productive cough. CT scan shows a large, apical, thick-walled cavitary lesion. Cavitary lesions can be found inboth acutely ill and asymptomatic patients.
RG f Volume 27 ● Number 3 Fang et al 651
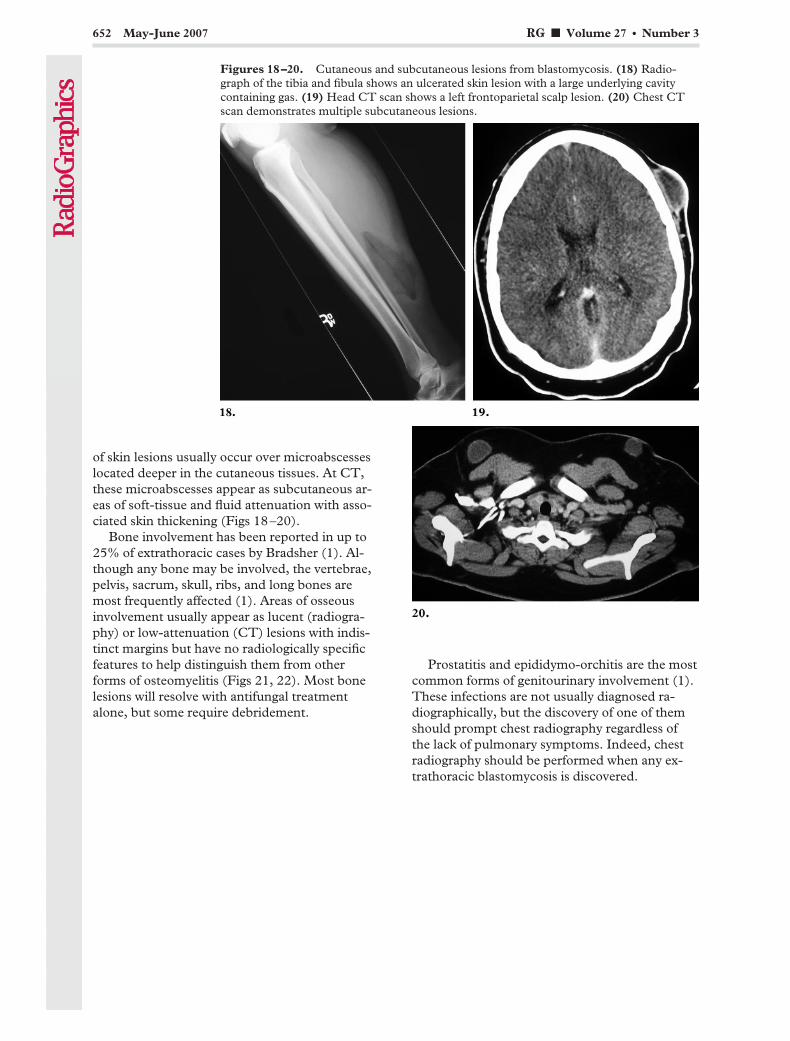
of skin lesions usually occur over microabscesseslocated deeper in the cutaneous tissues. At CT,these microabscesses appear as subcutaneous ar-eas of soft-tissue and fluid attenuation with asso-ciated skin thickening (Figs 18–20).
Bone involvement has been reported in up to25% of extrathoracic cases by Bradsher (1). Al-though any bone may be involved, the vertebrae,pelvis, sacrum, skull, ribs, and long bones aremost frequently affected (1). Areas of osseousinvolvement usually appear as lucent (radiogra-phy) or low-attenuation (CT) lesions with indis-tinct margins but have no radiologically specificfeatures to help distinguish them from otherforms of osteomyelitis (Figs 21, 22). Most bonelesions will resolve with antifungal treatmentalone, but some require debridement.
Prostatitis and epididymo-orchitis are the mostcommon forms of genitourinary involvement (1).These infections are not usually diagnosed ra-diographically, but the discovery of one of themshould prompt chest radiography regardless ofthe lack of pulmonary symptoms. Indeed, chestradiography should be performed when any ex-trathoracic blastomycosis is discovered.
Figures 18–20. Cutaneous and subcutaneous lesions from blastomycosis. (18) Radio-graph of the tibia and fibula shows an ulcerated skin lesion with a large underlying cavitycontaining gas. (19) Head CT scan shows a left frontoparietal scalp lesion. (20) Chest CTscan demonstrates multiple subcutaneous lesions.
652 May-June 2007 RG f Volume 27 ● Number 3
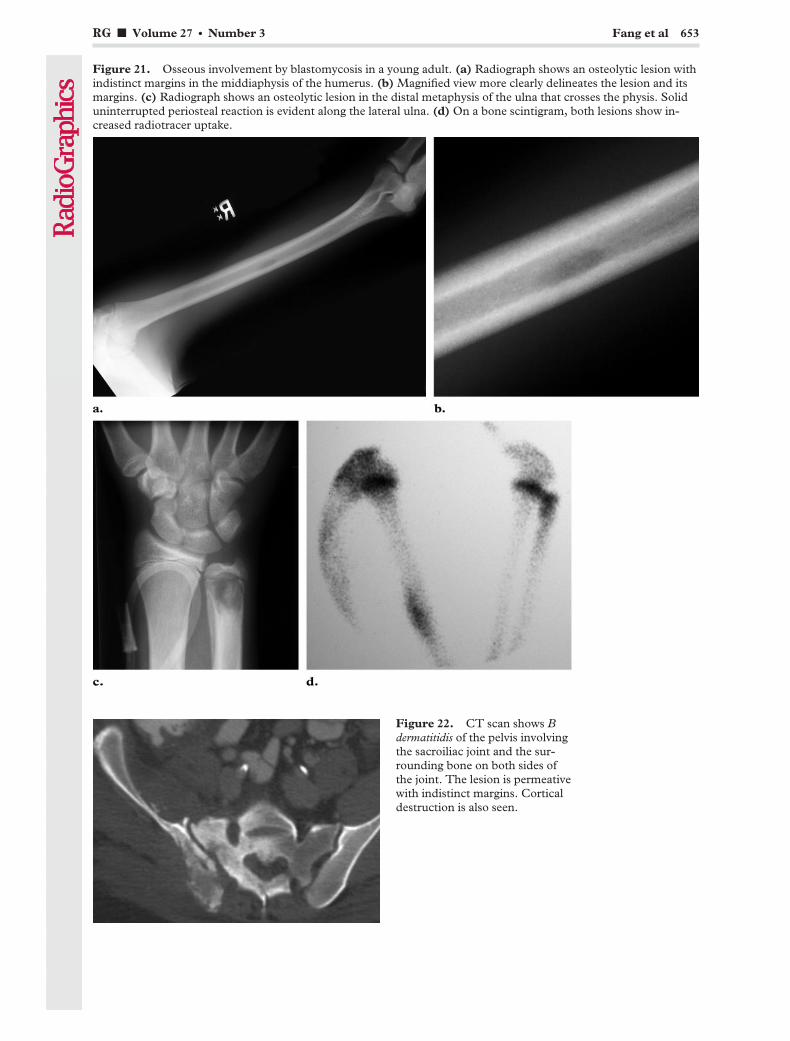
Figure 21. Osseous involvement by blastomycosis in a young adult. (a) Radiograph shows an osteolytic lesion withindistinct margins in the middiaphysis of the humerus. (b) Magnified view more clearly delineates the lesion and itsmargins. (c) Radiograph shows an osteolytic lesion in the distal metaphysis of the ulna that crosses the physis. Soliduninterrupted periosteal reaction is evident along the lateral ulna. (d) On a bone scintigram, both lesions show in-creased radiotracer uptake.
Figure 22. CT scan shows Bdermatitidis of the pelvis involvingthe sacroiliac joint and the sur-rounding bone on both sides ofthe joint. The lesion is permeativewith indistinct margins. Corticaldestruction is also seen.
RG f Volume 27 ● Number 3 Fang et al 653
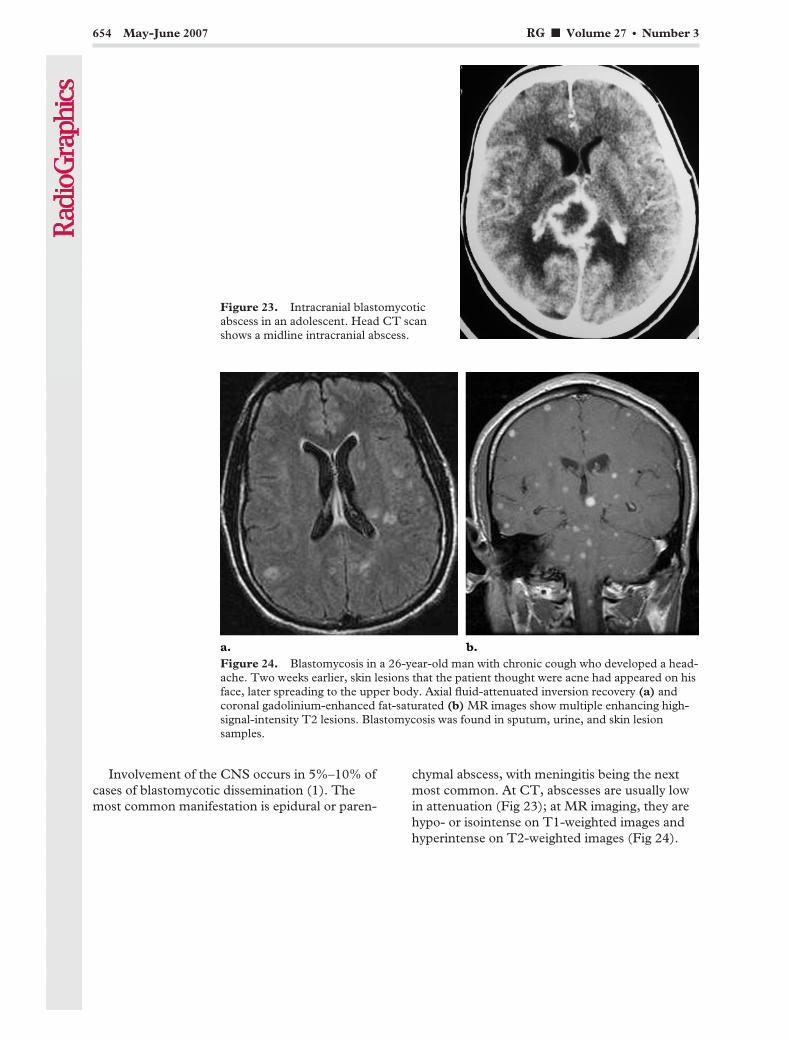
Involvement of the CNS occurs in 5%–10% ofcases of blastomycotic dissemination (1). Themost common manifestation is epidural or paren-
chymal abscess, with meningitis being the nextmost common. At CT, abscesses are usually lowin attenuation (Fig 23); at MR imaging, they arehypo- or isointense on T1-weighted images andhyperintense on T2-weighted images (Fig 24).
Figure 23. Intracranial blastomycoticabscess in an adolescent. Head CT scanshows a midline intracranial abscess.
Figure 24. Blastomycosis in a 26-year-old man with chronic cough who developed a head-ache. Two weeks earlier, skin lesions that the patient thought were acne had appeared on hisface, later spreading to the upper body. Axial fluid-attenuated inversion recovery (a) andcoronal gadolinium-enhanced fat-saturated (b) MR images show multiple enhancing high-signal-intensity T2 lesions. Blastomycosis was found in sputum, urine, and skin lesionsamples.
654 May-June 2007 RG f Volume 27 ● Number 3

Peripheral and dural enhancement is also charac-teristic, similar to other cerebral abscesses. Earlycases of meningitis usually have normal findings,whereas advanced cases show enlarged cerebro-spinal fluid spaces, generalized cerebral swelling,and diffuse meningeal enhancement. In a smallseries, ventricular fluid samples had a higher diag-nostic yield than lumbar puncture samples (1).
ConclusionsAlthough uncommon, blastomycosis may be ag-gressive and require treatment. It has a reputationfor mimicking many other disease processes, in-cluding bacterial pneumonia, malignancy, andtuberculosis. The majority of cases of blastomy-cosis will manifest radiologically as consolidationor a mass, although there are few specific rules orpatterns associated with this disease entity. Thediscovery of intermediate-sized nodules with ac-companying airspace consolidation should raisesuspicion for fungal disease. There may be a pre-dilection for the upper lobes. Patients with acutesymptoms are more likely to have airspace con-solidation, whereas chronic manifestations maybe associated with masslike lesions. Lymphad-enopathy and pleural effusions are notably un-common. Unlike with histoplasmosis, calcifica-tion is not often seen.
Radiologists may contribute to the care of pa-tients who live or travel in endemic areas by main-taining a high degree of suspicion for blastomyco-sis and an awareness of its myriad manifestations.
Acknowledgments: The authors wish to thank G.Carrera, MD, L. Goodman, MD, M. Laguna, MD,and M. Peng, MD, Medical College of Wisconsin, Mil-waukee, Wis.
References1. Bradsher RW. Blastomycosis. Infect Dis Clin
North Am 2003;17:21–40.
2. Martynowicz MA, Prakash UB. Pulmonary blasto-mycosis: an appraisal of diagnostic techniques.Chest 2002;121:768–773.
3. Morris SK, Nguyen CK. Blastomycosis. Univ To-ronto Med J 2004;81(3):172–175.
4. Varkey B, Raugi G. Blastomycosis. eMedicine.Available at: http://www.emedicine.com/med/topic231.htm. Accessed March 10, 2006.
5. Sriram PS, Knox KS, Busk MF, et al. A 19-year-old man with non-resolving pneumonia. Chest2004;125:330–333.
6. Dixon J, Levine N. South American blastomyco-sis. eMedicine. Available at: http://www.emedicine.com/derm/topic863.htm. Accessed March 10,2006.
7. Kuzo RS, Goodman LR. Blastomycosis. SeminRoentgenol 1996;31(1):45–51.
8. Crampton TL, Light RB, Berg GM, et al. Epide-miology and clinical spectrum of blastomycosisdiagnosed at Manitoba hospitals. Clin Infect Dis2002;34:1310–1316.
9. Stiles P. Final diagnosis: disseminated blastomy-cosis in a dog. Indiana Animal Disease DiagnosticLaboratory Newsletter 2003.
10. Failla PJ, Cerise FP. Blastomycosis: pulmonaryand pleural manifestations. South Med J 1995;88(4):405–410.
11. Craig MW, Davey WN, Green RA. Conjugal blas-tomycosis. Am Rev Respir Dis 1970;102:86–90.
12. Masood A, Bensadoun ES. A 62-year-old manwith multiple pulmonary nodular opacities. Chest2002;121(3):982–984.
13. Brown LR, Swensen SJ, Van Scoy RE, et al.Roentgenologic features of pulmonary blastomy-cosis. Mayo Clin Proc 1991;66:29–38.
14. Patel RG, Patel B, Petrini M, et al. Clinical pre-sentation, radiographic findings, and diagnosticmethods of pulmonary blastomycosis: a review of100 consecutive cases. South Med J 1999;92(3):289–295.
15. Kaplan W, Clifford MK. Blastomycosis. I. A re-view of 198 collected cases in Veterans Adminis-tration hospitals. Am Rev Respir Dis 1964;89:659–672.
16. Chapman SW, Lin AC, Hendricks KA, et al. En-demic blastomycosis in Mississippi: epidemiologi-cal and clinical studies. Semin Respir Infect 1997;12(3):219–228.
This article meets the criteria for 1.0 AMA PRA Category 1 Credit TM. To obtain credit, see www.rsna.org/education/rg_cme.html.
RG f Volume 27 ● Number 3 Fang et al 655
EDUCATION EXHIBIT 657
A Diagnostic Approachto Mediastinal Abnor-malities1
Camilla R. Whitten, MRCS, FRCR ● Sameer Khan, MRCP, FRCRGraham J. Munneke, MRCP, FRCR ● Sisa Grubnic, MRCP, FRCR
A number of mediastinal reflections are visible at conventional radiog-raphy that represent points of contact between the mediastinum andadjacent lung. The presence or distortion of these reflections is the keyto the detection and interpretation of mediastinal abnormalities. Ante-rior mediastinal masses can be identified when the hilum overlay sign ispresent and the posterior mediastinal lines are preserved. Widening ofthe right paratracheal stripe and convexity relative to the aortopulmo-nary window reflection indicate a middle mediastinal abnormality. Dis-ruption of the azygoesophageal recess can result from disease in eitherthe middle or posterior mediastinum. Paravertebral masses disruptthe paraspinal lines, and the location of masses above the level of theclavicles can be inferred by their lateral margins, which are sharp inposterior masses but not in anterior masses. The divisions of the medi-astinum are not absolute; however, referring to the local anatomy ofthe mediastinal reflections in an attempt to more accurately localize anabnormality may help narrow the differential diagnosis. Identificationof the involved mediastinal compartment helps determine which imag-ing modality might be appropriate for further study.©RSNA, 2007
Abbreviations: AP � aortopulmonary, IVC � inferior vena cava, SVC � superior vena cava
RadioGraphics 2007; 27:657–671 ● Published online 10.1148/rg.273065136 ● Content Code:
1From the Department of Radiology, St George’s Hospital, Blackshaw Rd, Tooting, London SW17 0QT, England. Presented as an education exhibitat the 2005 RSNA Annual Meeting. Received July 13, 2006; revision requested August 17 and received October 11; accepted October 18. All authorshave no financial relationships to disclose. Address correspondence to C.R.W. (e-mail: [email protected]).
©RSNA, 2007
Note: This copy is for your personal, non-commercial use only. To order presentation-ready copies for distribution to your colleagues or clients, use the RadioGraphics Reprints form at the end of this article.
See last page
TEACHING POINTS
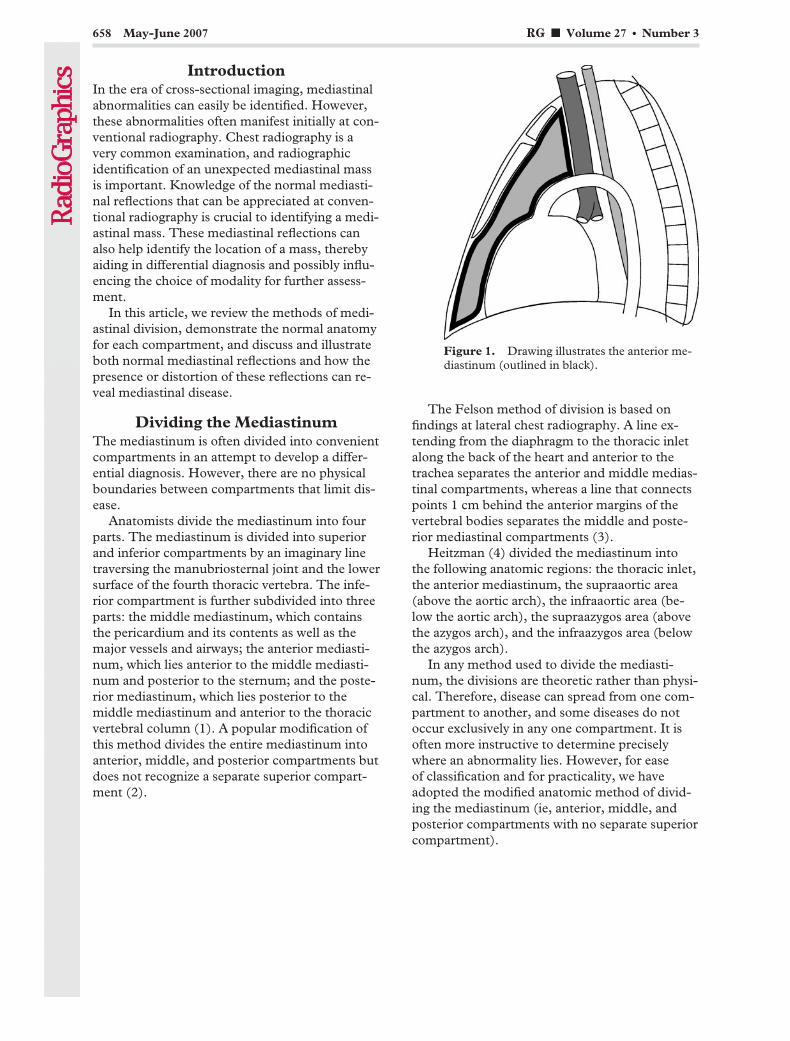
IntroductionIn the era of cross-sectional imaging, mediastinalabnormalities can easily be identified. However,these abnormalities often manifest initially at con-ventional radiography. Chest radiography is avery common examination, and radiographicidentification of an unexpected mediastinal massis important. Knowledge of the normal mediasti-nal reflections that can be appreciated at conven-tional radiography is crucial to identifying a medi-astinal mass. These mediastinal reflections canalso help identify the location of a mass, therebyaiding in differential diagnosis and possibly influ-encing the choice of modality for further assess-ment.
In this article, we review the methods of medi-astinal division, demonstrate the normal anatomyfor each compartment, and discuss and illustrateboth normal mediastinal reflections and how thepresence or distortion of these reflections can re-veal mediastinal disease.
Dividing the MediastinumThe mediastinum is often divided into convenientcompartments in an attempt to develop a differ-ential diagnosis. However, there are no physicalboundaries between compartments that limit dis-ease.
Anatomists divide the mediastinum into fourparts. The mediastinum is divided into superiorand inferior compartments by an imaginary linetraversing the manubriosternal joint and the lowersurface of the fourth thoracic vertebra. The infe-rior compartment is further subdivided into threeparts: the middle mediastinum, which containsthe pericardium and its contents as well as themajor vessels and airways; the anterior mediasti-num, which lies anterior to the middle mediasti-num and posterior to the sternum; and the poste-rior mediastinum, which lies posterior to themiddle mediastinum and anterior to the thoracicvertebral column (1). A popular modification ofthis method divides the entire mediastinum intoanterior, middle, and posterior compartments butdoes not recognize a separate superior compart-ment (2).
The Felson method of division is based onfindings at lateral chest radiography. A line ex-tending from the diaphragm to the thoracic inletalong the back of the heart and anterior to thetrachea separates the anterior and middle medias-tinal compartments, whereas a line that connectspoints 1 cm behind the anterior margins of thevertebral bodies separates the middle and poste-rior mediastinal compartments (3).
Heitzman (4) divided the mediastinum intothe following anatomic regions: the thoracic inlet,the anterior mediastinum, the supraaortic area(above the aortic arch), the infraaortic area (be-low the aortic arch), the supraazygos area (abovethe azygos arch), and the infraazygos area (belowthe azygos arch).
In any method used to divide the mediasti-num, the divisions are theoretic rather than physi-cal. Therefore, disease can spread from one com-partment to another, and some diseases do notoccur exclusively in any one compartment. It isoften more instructive to determine preciselywhere an abnormality lies. However, for easeof classification and for practicality, we haveadopted the modified anatomic method of divid-ing the mediastinum (ie, anterior, middle, andposterior compartments with no separate superiorcompartment).
Figure 1. Drawing illustrates the anterior me-diastinum (outlined in black).
658 May-June 2007 RG f Volume 27 ● Number 3

Anterior Mediastinum
AnatomyThe anterior mediastinum is bounded anteriorlyby the sternum; posteriorly by the pericardium,aorta, and brachiocephalic vessels; superiorly bythe thoracic inlet; and inferiorly by the diaphragm(Fig 1). Its contents include the thymus, lymph
nodes, adipose tissue, and internal mammary ves-sels (1,5,6). The thyroid gland (if it extends intothe mediastinum) is traditionally considered ananterior mediastinal compartment structure. Dis-ease of any of the contents of the anterior medias-tinum may result in a mass; thus, knowledge ofthe normal contents of the anterior mediastinumaids in developing a differential diagnosis once amass has been identified. Masses may be subdi-vided into (a) prevascular masses and (b) precar-diac masses that are in contact with the dia-phragm (Table 1).
Anterior Junction LineThe anterior junction line is seen at posteroante-rior chest radiography. The line is formed by theanterior apposition of the lungs and consists ofthe four layers of pleura separating the lungs be-hind the upper two-thirds of the sternum (Fig 2).There is a variable amount of fat between theselayers that can affect the thickness of the anteriorjunction line (5), which can be seen in approxi-mately 25% of examinations. The line runs ob-liquely from upper right to lower left and doesnot extend above the manubriosternal junction.These properties help differentiate the anteriorjunction line from the posterior junction line (dis-cussed later) (7).
Figure 2. Anterior junction line. (a) Posteroanterior chest radiograph demonstrates the anterior junction line(arrow). (b) Computed tomographic (CT) scan shows the four layers of pleura that constitute the anteriorjunction line (arrow). The interface between aerated lung and pleura allows the line to be appreciated at con-ventional radiography (cf a).
Table 1Anterior Mediastinal Masses
Prevascular massesLymphadenopathyRetrosternal goiterThymic lesions (thymoma, carcinoma, hyperpla-
sia, cysts, thymolipoma)Germ cell tumor
Precardiac masses in contact with the diaphragmEpicardial fat padDiaphragmatic humpMorgagni herniaPleuropericardial cysts*Lymph node enlargement
Rare lesionsLymphatic malformationsHemangiomas
*Some classification schemes place pleuropericar-dial cysts in the middle mediastinum.
RG f Volume 27 ● Number 3 Whitten et al 659

Anterior mediastinal masses in the prevascularregion can obliterate the anterior junction line,although it is usually the preservation of moreposterior lines at radiography that helps identifythe location of an anterior mediastinal mass. Thehilum overlay sign (3) is present when the normalhilar structures project through a mass, such thatthe mass can be understood as being either ante-rior or posterior to the hilum (Fig 3). Preservation
or disruption of posterior mediastinal lines canhelp further clarify the location of the mass.
The craniocaudal location and tissue density ofa mass may also help in developing a differentialdiagnosis. Anterior mediastinal masses that are incontact with the diaphragm include an epicardialfat pad, pleuropericardial cyst, and Morgagni her-nia (Table 1). Epicardial fat pads obliterate thecardiac silhouette and are of relatively low density(Fig 4). The presence of bowel gas within an an-terior mediastinal mass that is in contact with thediaphragm is diagnostic for a Morgagni hernia.
Figure 3. Hilum overlay sign in a patient with lymphoma. (a) Posteroanterior chest radiograph clearly de-picts the hila (white arrow), which indicates that the mass is either anterior or posterior to the hila. In addition,the descending aorta is clearly seen (black arrow), indicating that the mass is not within the posterior mediasti-num. (b) Chest CT scan demonstrates an anterior mediastinal mass. The anterior junction line is obliterated,whereas the lung interfaces with the hilar vessels (arrow) and aorta (arrowhead) are preserved.
Figure 4. Epicardial fat pad. (a) Posteroanterior chest radiograph shows loss of the cardiac silhouette at theborder of the right side of the heart and an epicardial fat pad with relatively low density (arrow). (b) CT scanshows the fat pad (arrow) as an area of homogeneous fat attenuation adjacent to the right border of the heart.
660 May-June 2007 RG f Volume 27 ● Number 3
TeachingPoint
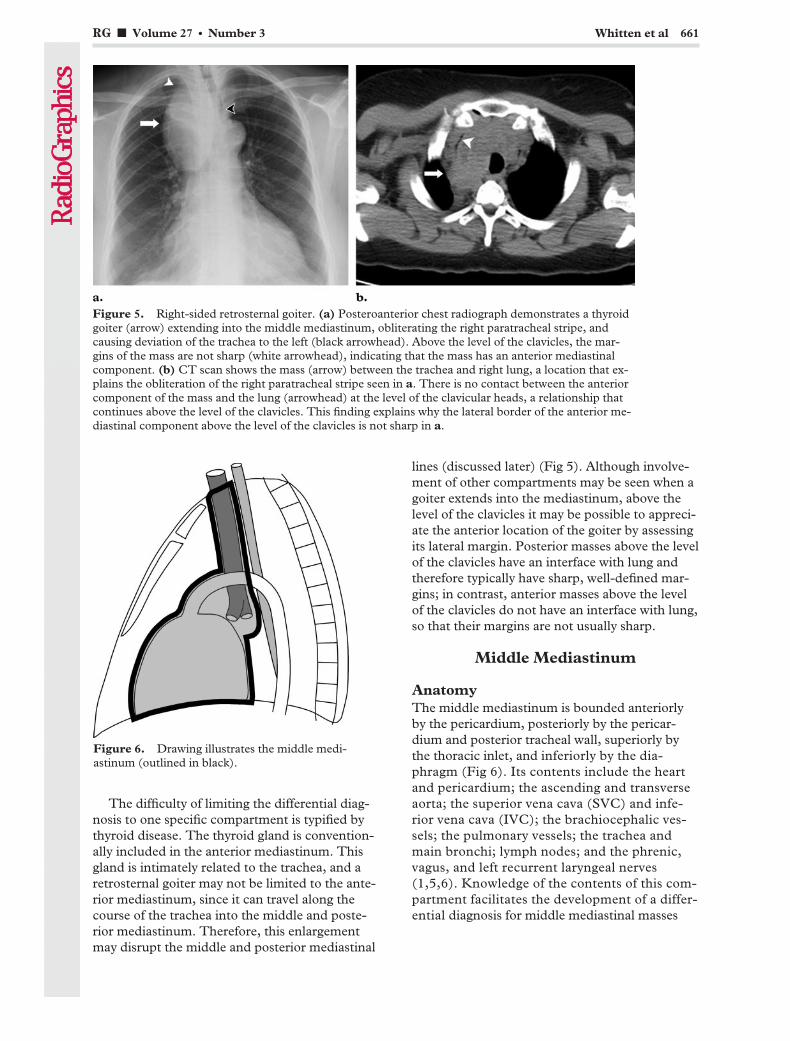
The difficulty of limiting the differential diag-nosis to one specific compartment is typified bythyroid disease. The thyroid gland is convention-ally included in the anterior mediastinum. Thisgland is intimately related to the trachea, and aretrosternal goiter may not be limited to the ante-rior mediastinum, since it can travel along thecourse of the trachea into the middle and poste-rior mediastinum. Therefore, this enlargementmay disrupt the middle and posterior mediastinal
lines (discussed later) (Fig 5). Although involve-ment of other compartments may be seen when agoiter extends into the mediastinum, above thelevel of the clavicles it may be possible to appreci-ate the anterior location of the goiter by assessingits lateral margin. Posterior masses above the levelof the clavicles have an interface with lung andtherefore typically have sharp, well-defined mar-gins; in contrast, anterior masses above the levelof the clavicles do not have an interface with lung,so that their margins are not usually sharp.
Middle Mediastinum
AnatomyThe middle mediastinum is bounded anteriorlyby the pericardium, posteriorly by the pericar-dium and posterior tracheal wall, superiorly bythe thoracic inlet, and inferiorly by the dia-phragm (Fig 6). Its contents include the heartand pericardium; the ascending and transverseaorta; the superior vena cava (SVC) and infe-rior vena cava (IVC); the brachiocephalic ves-sels; the pulmonary vessels; the trachea andmain bronchi; lymph nodes; and the phrenic,vagus, and left recurrent laryngeal nerves(1,5,6). Knowledge of the contents of this com-partment facilitates the development of a differ-ential diagnosis for middle mediastinal masses
Figure 5. Right-sided retrosternal goiter. (a) Posteroanterior chest radiograph demonstrates a thyroidgoiter (arrow) extending into the middle mediastinum, obliterating the right paratracheal stripe, andcausing deviation of the trachea to the left (black arrowhead). Above the level of the clavicles, the mar-gins of the mass are not sharp (white arrowhead), indicating that the mass has an anterior mediastinalcomponent. (b) CT scan shows the mass (arrow) between the trachea and right lung, a location that ex-plains the obliteration of the right paratracheal stripe seen in a. There is no contact between the anteriorcomponent of the mass and the lung (arrowhead) at the level of the clavicular heads, a relationship thatcontinues above the level of the clavicles. This finding explains why the lateral border of the anterior me-diastinal component above the level of the clavicles is not sharp in a.
Figure 6. Drawing illustrates the middle medi-astinum (outlined in black).
RG f Volume 27 ● Number 3 Whitten et al 661
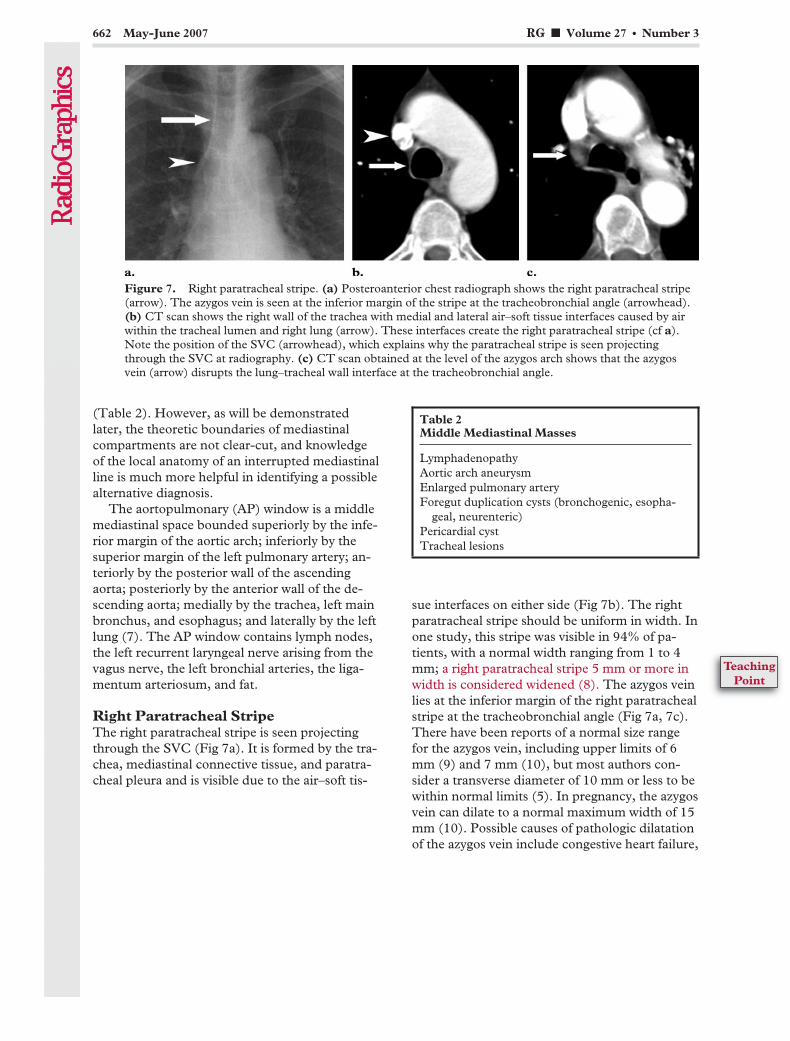
(Table 2). However, as will be demonstratedlater, the theoretic boundaries of mediastinalcompartments are not clear-cut, and knowledgeof the local anatomy of an interrupted mediastinalline is much more helpful in identifying a possiblealternative diagnosis.
The aortopulmonary (AP) window is a middlemediastinal space bounded superiorly by the infe-rior margin of the aortic arch; inferiorly by thesuperior margin of the left pulmonary artery; an-teriorly by the posterior wall of the ascendingaorta; posteriorly by the anterior wall of the de-scending aorta; medially by the trachea, left mainbronchus, and esophagus; and laterally by the leftlung (7). The AP window contains lymph nodes,the left recurrent laryngeal nerve arising from thevagus nerve, the left bronchial arteries, the liga-mentum arteriosum, and fat.
Right Paratracheal StripeThe right paratracheal stripe is seen projectingthrough the SVC (Fig 7a). It is formed by the tra-chea, mediastinal connective tissue, and paratra-cheal pleura and is visible due to the air–soft tis-
sue interfaces on either side (Fig 7b). The rightparatracheal stripe should be uniform in width. Inone study, this stripe was visible in 94% of pa-tients, with a normal width ranging from 1 to 4mm; a right paratracheal stripe 5 mm or more inwidth is considered widened (8). The azygos veinlies at the inferior margin of the right paratrachealstripe at the tracheobronchial angle (Fig 7a, 7c).There have been reports of a normal size rangefor the azygos vein, including upper limits of 6mm (9) and 7 mm (10), but most authors con-sider a transverse diameter of 10 mm or less to bewithin normal limits (5). In pregnancy, the azygosvein can dilate to a normal maximum width of 15mm (10). Possible causes of pathologic dilatationof the azygos vein include congestive heart failure,
Figure 7. Right paratracheal stripe. (a) Posteroanterior chest radiograph shows the right paratracheal stripe(arrow). The azygos vein is seen at the inferior margin of the stripe at the tracheobronchial angle (arrowhead).(b) CT scan shows the right wall of the trachea with medial and lateral air–soft tissue interfaces caused by airwithin the tracheal lumen and right lung (arrow). These interfaces create the right paratracheal stripe (cf a).Note the position of the SVC (arrowhead), which explains why the paratracheal stripe is seen projectingthrough the SVC at radiography. (c) CT scan obtained at the level of the azygos arch shows that the azygosvein (arrow) disrupts the lung–tracheal wall interface at the tracheobronchial angle.
Table 2Middle Mediastinal Masses
LymphadenopathyAortic arch aneurysmEnlarged pulmonary arteryForegut duplication cysts (bronchogenic, esopha-
geal, neurenteric)Pericardial cystTracheal lesions
662 May-June 2007 RG f Volume 27 ● Number 3
TeachingPoint
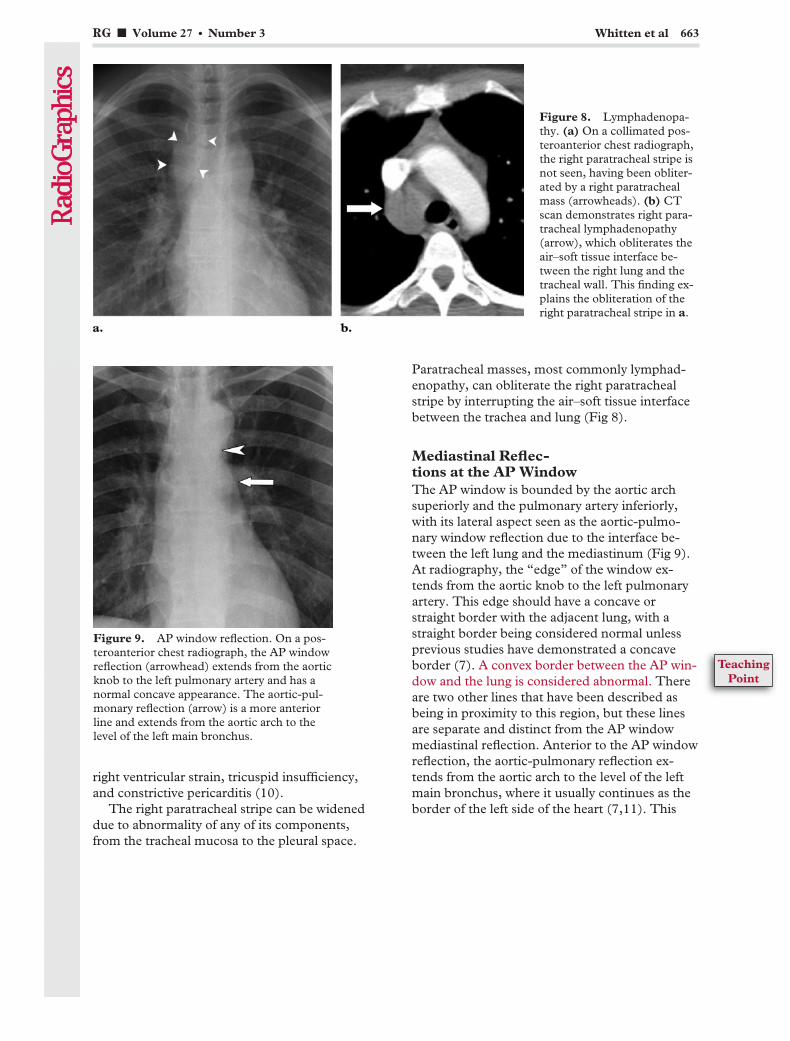
right ventricular strain, tricuspid insufficiency,and constrictive pericarditis (10).
The right paratracheal stripe can be wideneddue to abnormality of any of its components,from the tracheal mucosa to the pleural space.
Paratracheal masses, most commonly lymphad-enopathy, can obliterate the right paratrachealstripe by interrupting the air–soft tissue interfacebetween the trachea and lung (Fig 8).
Mediastinal Reflec-tions at the AP WindowThe AP window is bounded by the aortic archsuperiorly and the pulmonary artery inferiorly,with its lateral aspect seen as the aortic-pulmo-nary window reflection due to the interface be-tween the left lung and the mediastinum (Fig 9).At radiography, the “edge” of the window ex-tends from the aortic knob to the left pulmonaryartery. This edge should have a concave orstraight border with the adjacent lung, with astraight border being considered normal unlessprevious studies have demonstrated a concaveborder (7). A convex border between the AP win-dow and the lung is considered abnormal. Thereare two other lines that have been described asbeing in proximity to this region, but these linesare separate and distinct from the AP windowmediastinal reflection. Anterior to the AP windowreflection, the aortic-pulmonary reflection ex-tends from the aortic arch to the level of the leftmain bronchus, where it usually continues as theborder of the left side of the heart (7,11). This
Figure 8. Lymphadenopa-thy. (a) On a collimated pos-teroanterior chest radiograph,the right paratracheal stripe isnot seen, having been obliter-ated by a right paratrachealmass (arrowheads). (b) CTscan demonstrates right para-tracheal lymphadenopathy(arrow), which obliterates theair–soft tissue interface be-tween the right lung and thetracheal wall. This finding ex-plains the obliteration of theright paratracheal stripe in a.
Figure 9. AP window reflection. On a pos-teroanterior chest radiograph, the AP windowreflection (arrowhead) extends from the aorticknob to the left pulmonary artery and has anormal concave appearance. The aortic-pul-monary reflection (arrow) is a more anteriorline and extends from the aortic arch to thelevel of the left main bronchus.
RG f Volume 27 ● Number 3 Whitten et al 663
TeachingPoint
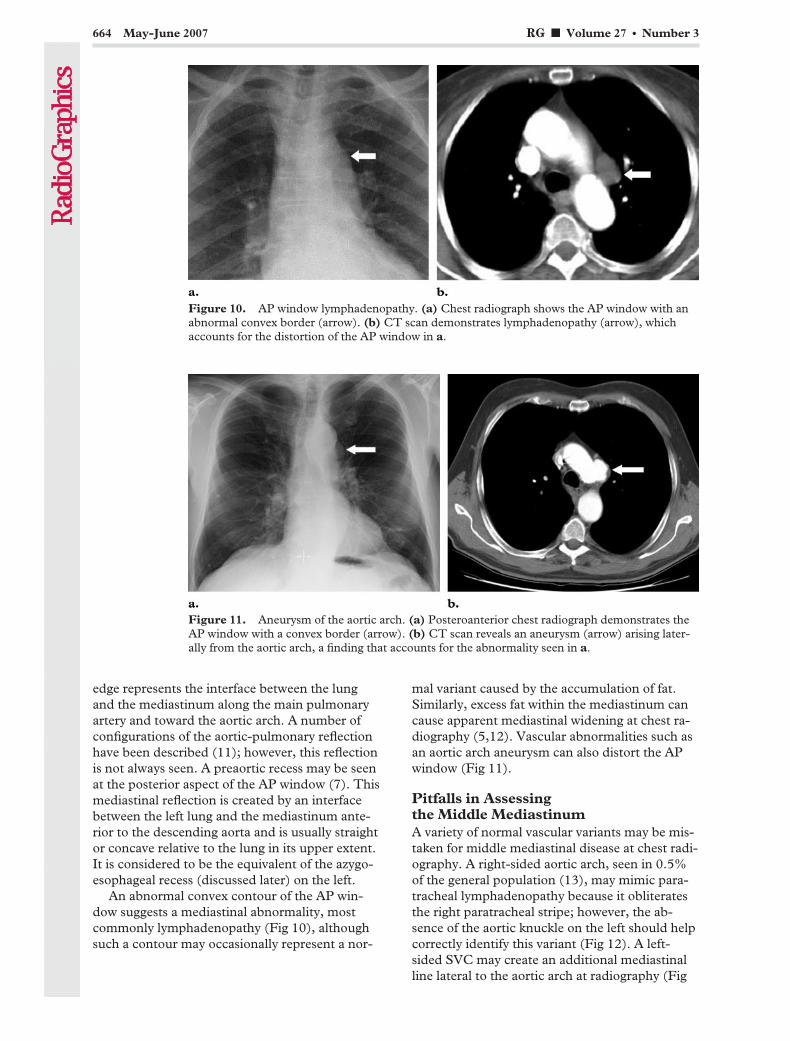
edge represents the interface between the lungand the mediastinum along the main pulmonaryartery and toward the aortic arch. A number ofconfigurations of the aortic-pulmonary reflectionhave been described (11); however, this reflectionis not always seen. A preaortic recess may be seenat the posterior aspect of the AP window (7). Thismediastinal reflection is created by an interfacebetween the left lung and the mediastinum ante-rior to the descending aorta and is usually straightor concave relative to the lung in its upper extent.It is considered to be the equivalent of the azygo-esophageal recess (discussed later) on the left.
An abnormal convex contour of the AP win-dow suggests a mediastinal abnormality, mostcommonly lymphadenopathy (Fig 10), althoughsuch a contour may occasionally represent a nor-
mal variant caused by the accumulation of fat.Similarly, excess fat within the mediastinum cancause apparent mediastinal widening at chest ra-diography (5,12). Vascular abnormalities such asan aortic arch aneurysm can also distort the APwindow (Fig 11).
Pitfalls in Assessingthe Middle MediastinumA variety of normal vascular variants may be mis-taken for middle mediastinal disease at chest radi-ography. A right-sided aortic arch, seen in 0.5%of the general population (13), may mimic para-tracheal lymphadenopathy because it obliteratesthe right paratracheal stripe; however, the ab-sence of the aortic knuckle on the left should helpcorrectly identify this variant (Fig 12). A left-sided SVC may create an additional mediastinalline lateral to the aortic arch at radiography (Fig
Figure 10. AP window lymphadenopathy. (a) Chest radiograph shows the AP window with anabnormal convex border (arrow). (b) CT scan demonstrates lymphadenopathy (arrow), whichaccounts for the distortion of the AP window in a.
Figure 11. Aneurysm of the aortic arch. (a) Posteroanterior chest radiograph demonstrates theAP window with a convex border (arrow). (b) CT scan reveals an aneurysm (arrow) arising later-ally from the aortic arch, a finding that accounts for the abnormality seen in a.
664 May-June 2007 RG f Volume 27 ● Number 3
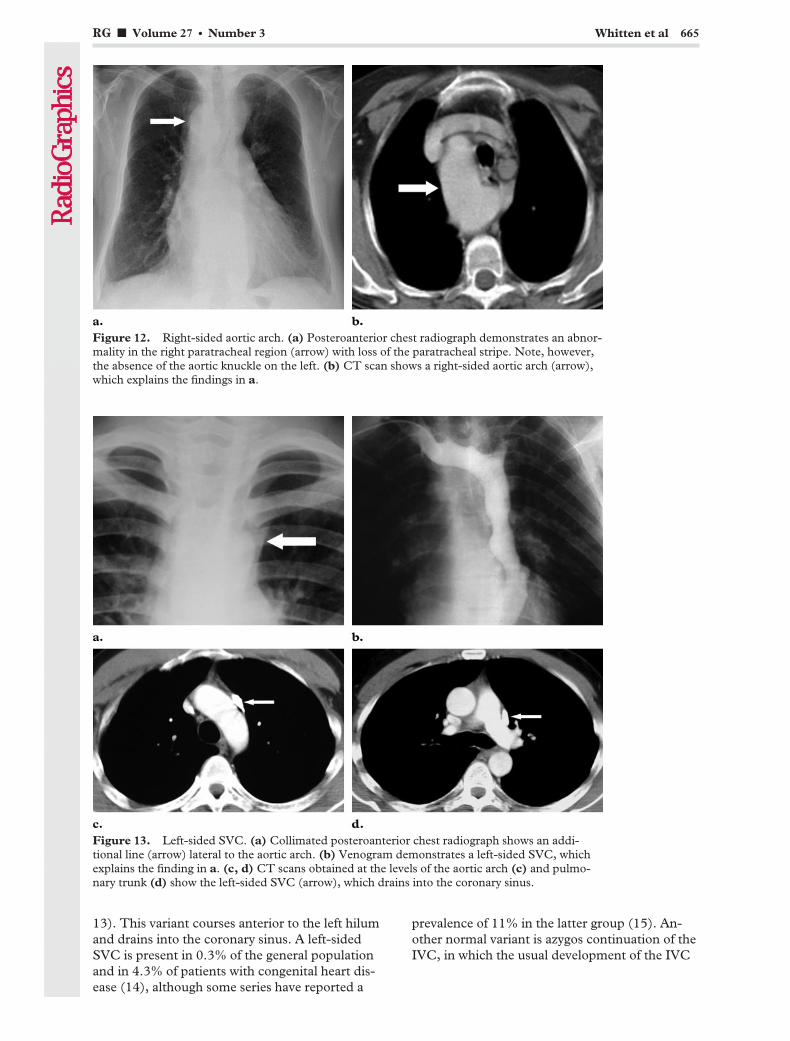
13). This variant courses anterior to the left hilumand drains into the coronary sinus. A left-sidedSVC is present in 0.3% of the general populationand in 4.3% of patients with congenital heart dis-ease (14), although some series have reported a
prevalence of 11% in the latter group (15). An-other normal variant is azygos continuation of theIVC, in which the usual development of the IVC
Figure 12. Right-sided aortic arch. (a) Posteroanterior chest radiograph demonstrates an abnor-mality in the right paratracheal region (arrow) with loss of the paratracheal stripe. Note, however,the absence of the aortic knuckle on the left. (b) CT scan shows a right-sided aortic arch (arrow),which explains the findings in a.
Figure 13. Left-sided SVC. (a) Collimated posteroanterior chest radiograph shows an addi-tional line (arrow) lateral to the aortic arch. (b) Venogram demonstrates a left-sided SVC, whichexplains the finding in a. (c, d) CT scans obtained at the levels of the aortic arch (c) and pulmo-nary trunk (d) show the left-sided SVC (arrow), which drains into the coronary sinus.
RG f Volume 27 ● Number 3 Whitten et al 665
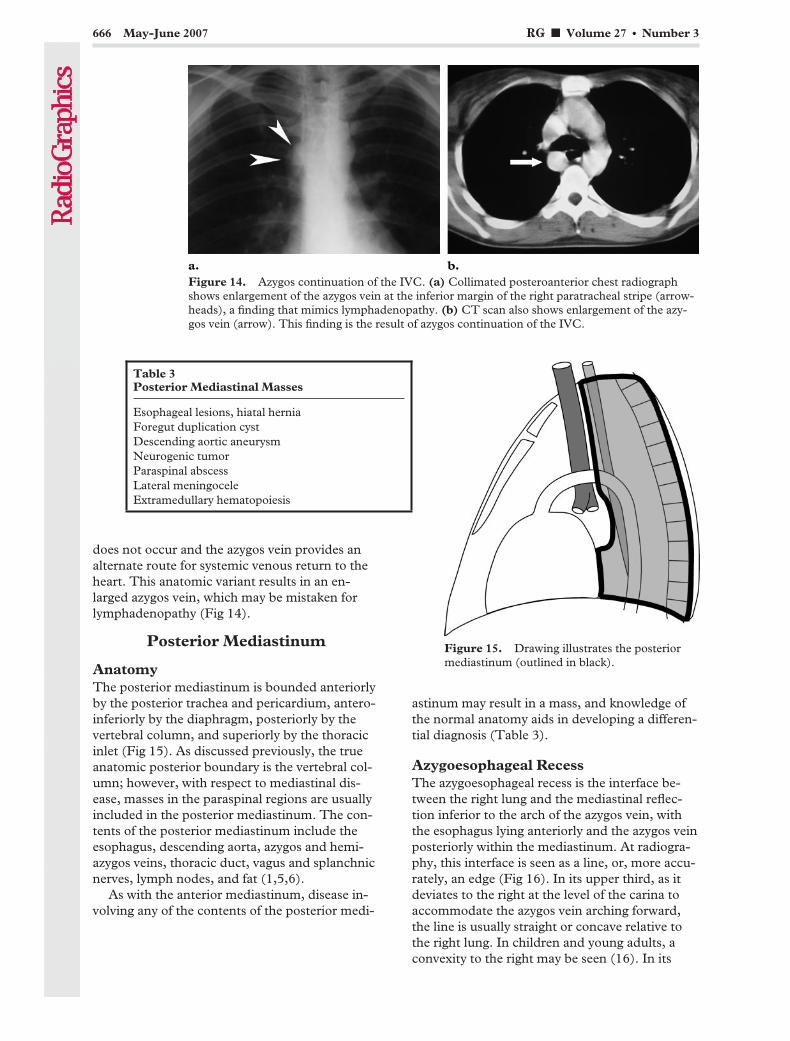
does not occur and the azygos vein provides analternate route for systemic venous return to theheart. This anatomic variant results in an en-larged azygos vein, which may be mistaken forlymphadenopathy (Fig 14).
Posterior Mediastinum
AnatomyThe posterior mediastinum is bounded anteriorlyby the posterior trachea and pericardium, antero-inferiorly by the diaphragm, posteriorly by thevertebral column, and superiorly by the thoracicinlet (Fig 15). As discussed previously, the trueanatomic posterior boundary is the vertebral col-umn; however, with respect to mediastinal dis-ease, masses in the paraspinal regions are usuallyincluded in the posterior mediastinum. The con-tents of the posterior mediastinum include theesophagus, descending aorta, azygos and hemi-azygos veins, thoracic duct, vagus and splanchnicnerves, lymph nodes, and fat (1,5,6).
As with the anterior mediastinum, disease in-volving any of the contents of the posterior medi-
astinum may result in a mass, and knowledge ofthe normal anatomy aids in developing a differen-tial diagnosis (Table 3).
Azygoesophageal RecessThe azygoesophageal recess is the interface be-tween the right lung and the mediastinal reflec-tion inferior to the arch of the azygos vein, withthe esophagus lying anteriorly and the azygos veinposteriorly within the mediastinum. At radiogra-phy, this interface is seen as a line, or, more accu-rately, an edge (Fig 16). In its upper third, as itdeviates to the right at the level of the carina toaccommodate the azygos vein arching forward,the line is usually straight or concave relative tothe right lung. In children and young adults, aconvexity to the right may be seen (16). In its
Figure 14. Azygos continuation of the IVC. (a) Collimated posteroanterior chest radiographshows enlargement of the azygos vein at the inferior margin of the right paratracheal stripe (arrow-heads), a finding that mimics lymphadenopathy. (b) CT scan also shows enlargement of the azy-gos vein (arrow). This finding is the result of azygos continuation of the IVC.
Figure 15. Drawing illustrates the posteriormediastinum (outlined in black).
Table 3Posterior Mediastinal Masses
Esophageal lesions, hiatal herniaForegut duplication cystDescending aortic aneurysmNeurogenic tumorParaspinal abscessLateral meningoceleExtramedullary hematopoiesis
666 May-June 2007 RG f Volume 27 ● Number 3
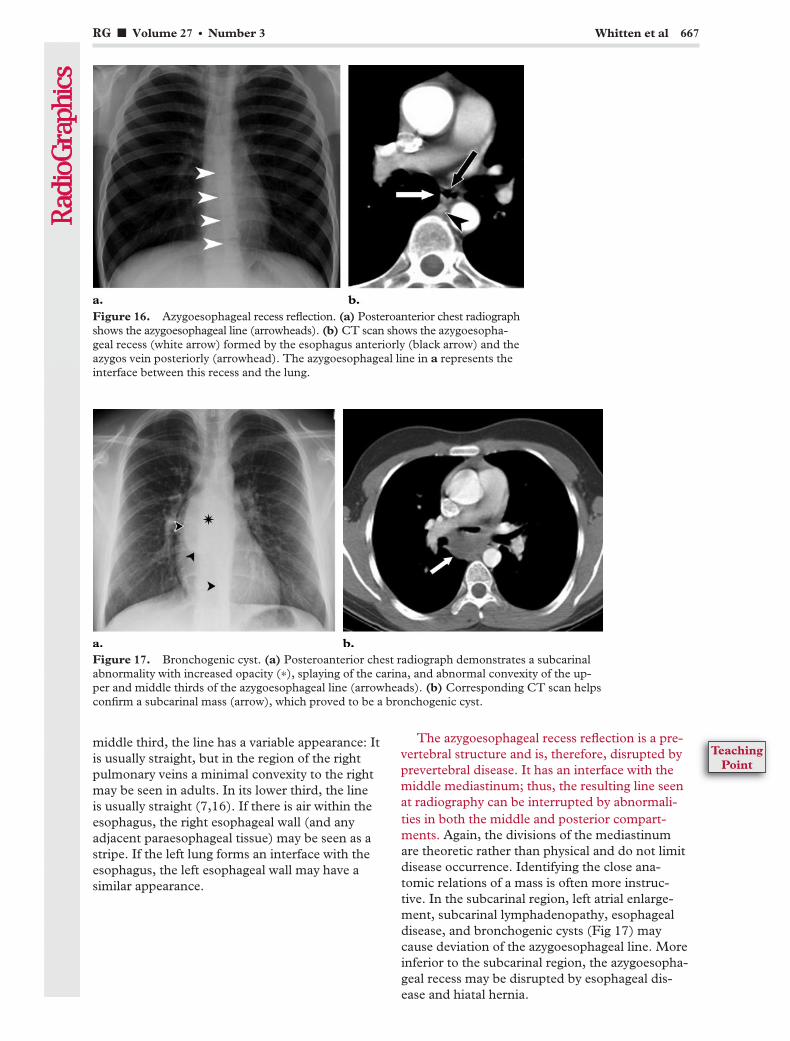
middle third, the line has a variable appearance: Itis usually straight, but in the region of the rightpulmonary veins a minimal convexity to the rightmay be seen in adults. In its lower third, the lineis usually straight (7,16). If there is air within theesophagus, the right esophageal wall (and anyadjacent paraesophageal tissue) may be seen as astripe. If the left lung forms an interface with theesophagus, the left esophageal wall may have asimilar appearance.
The azygoesophageal recess reflection is a pre-vertebral structure and is, therefore, disrupted byprevertebral disease. It has an interface with themiddle mediastinum; thus, the resulting line seenat radiography can be interrupted by abnormali-ties in both the middle and posterior compart-ments. Again, the divisions of the mediastinumare theoretic rather than physical and do not limitdisease occurrence. Identifying the close ana-tomic relations of a mass is often more instruc-tive. In the subcarinal region, left atrial enlarge-ment, subcarinal lymphadenopathy, esophagealdisease, and bronchogenic cysts (Fig 17) maycause deviation of the azygoesophageal line. Moreinferior to the subcarinal region, the azygoesopha-geal recess may be disrupted by esophageal dis-ease and hiatal hernia.
Figure 16. Azygoesophageal recess reflection. (a) Posteroanterior chest radiographshows the azygoesophageal line (arrowheads). (b) CT scan shows the azygoesopha-geal recess (white arrow) formed by the esophagus anteriorly (black arrow) and theazygos vein posteriorly (arrowhead). The azygoesophageal line in a represents theinterface between this recess and the lung.
Figure 17. Bronchogenic cyst. (a) Posteroanterior chest radiograph demonstrates a subcarinalabnormality with increased opacity (*), splaying of the carina, and abnormal convexity of the up-per and middle thirds of the azygoesophageal line (arrowheads). (b) Corresponding CT scan helpsconfirm a subcarinal mass (arrow), which proved to be a bronchogenic cyst.
RG f Volume 27 ● Number 3 Whitten et al 667
TeachingPoint

Posterior Junction LineThe posterior junction line is a posterior medias-tinal line that is seen above the level of the azygosvein and aorta and that is formed by the apposi-tion of the lungs posterior to the esophagus andanterior to the vertebral bodies, usually the thirdto fifth thoracic vertebrae (Fig 18). It can occa-sionally be seen more inferiorly if the lungs comein contact posterior to the esophagus in the lowerthorax. Like the anterior junction line, it consistsof four layers of pleura. Unlike its counterpart,however, the posterior junction line can be seenabove the suprasternal notch and lies almost ver-tical, whereas the anterior junction line deviatesto the left (7).
Prevertebral disease superior to the level ofthe aortic arch may obliterate the posteriorjunction line (Fig 19). Further clues to the loca-tion of a mass in this region can be inferredfrom the lateral margins of the line above thelevel of the clavicles (see “Anterior JunctionLine”).
Paraspinal LinesThe paraspinal lines are created by the interfacebetween lung and the pleural reflections over thevertebral bodies. The left paraspinal line is muchmore commonly seen than the right. The de-scending aorta holds the pleural reflection off thevertebral body, allowing the lung–soft tissue inter-face to be more tangential to the x-ray beam and,
Figure 18. (a) Collimated posteroanterior chest radiograph shows the posterior junction line(arrow) projecting through the tracheal air column. (b) CT scan shows the posterior junction line(arrow), which is formed by the interface between the lungs posterior to the mediastinum and con-sists of four pleural layers.
Figure 19. Bronchogenic cyst. (a) Posteroanterior chest radiograph shows a mass (arrow) oblit-erating the posterior junction line. Note that the mass extends above the level of the clavicle andhas a well-demarcated outline due to the interface with adjacent lung (arrowhead). (b) CT scanhelps confirm the posterior location of the mass (arrow), which proved to be a bronchogenic cyst.
668 May-June 2007 RG f Volume 27 ● Number 3

therefore, to be visualized as a line (Fig 20a, 20b).On the right, the pleural reflection is more oftenoblique to the x-ray beam and therefore less com-monly seen (Fig 20c). The amount of mediastinalfat also affects these lines. Superior to the aorticarch, there is a relatively symmetric distributionof fat lateral to the vertebral bodies. Inferior to theaortic arch, there is usually more fat on the leftside than on the right, with the aorta in a left para-spinal or prevertebral location. The left paraspinalline runs parallel to the lateral margin of the ver-tebral bodies and can lie anywhere medial to thelateral wall of the descending aorta (seen due tothe interface between the lateral aortic margin
and the lung). The right paraspinal line (whenseen) lies within a few millimeters of the vertebrae(5,7).
The paraspinal lines are disrupted by paraver-tebral disease—which commonly includes dis-eases originating in the intervertebral disks andvertebrae—and by neurogenic tumors. The leftparaspinal line and the lateral margin of the de-scending aorta should be clearly distinguishedfrom one another. This differentiation is demon-strated in Figure 21, which shows a paraspinalabscess effacing the left paraspinal line while the
Figure 20. (a) On a collimated posteroanterior chest radiograph, the left paraspinal line (arrow) is seen sepa-rate and distinct from the vertebral body (black arrowhead) and the descending thoracic aorta (white arrow-head). (b) CT scan shows the left paraspinal line. The descending aorta holds the pleural reflection (arrow)away from the vertebral body, which allows the lung–soft tissue interface to be more tangential to the x-raybeam and therefore visualized as a line. (c) Collimated posteroanterior radiograph shows the right paraspinalline (arrow).
Figure 21. Paraspinal abscess. (a) Posteroanterior chest radiograph shows a mass (arrow) effac-ing the left paraspinal line. The lateral wall of the descending aorta is seen as a separate entity (ar-rowhead). (b) CT scan shows a paraspinal abscess (arrow) effacing the paraspinal lines. The air–soft tissue interface between the lung and aorta remains intact (arrowhead), thereby preserving thenormal radiographic appearance of the lateral aortic wall (cf a).
RG f Volume 27 ● Number 3 Whitten et al 669
TeachingPoint

aorta maintains an air–soft tissue interface withlung and is, therefore, still visible. In contrast,Figure 22 shows a descending aortic aneurysmwith deviation of the lateral margin of the aorta. Itshould be remembered that the paraspinal linesalso project below the level of the diaphragm at
radiography, and disruption of the lines in thislocation can also be identified (Fig 23).
Further AssessmentOnce a mediastinal mass has been identified, itcan be assessed with cross-sectional imaging,which can help confirm its location and furthercharacterize the disease. CT is most often used in
Figure 22. Descending aortic aneurysm. (a) Posteroanterior chest radiograph shows lateral dis-placement of the lateral margin of the descending thoracic aorta due to an aortic aneurysm (arrow-heads). (b) CT scan also demonstrates the aneurysm (arrow).
Figure 23. Neurogenic tumor. (a) Posteroanterior chest radiograph shows a small mass (arrow)disrupting the left paraspinal line inferiorly. (b) Coronal T2-weighted magnetic resonance (MR)image helps confirm a left paraspinal mass (arrow).
670 May-June 2007 RG f Volume 27 ● Number 3

the assessment of mediastinal masses, with MRimaging usually being used as an adjunct to CT.MR imaging has high contrast resolution andmultiplanar capability, thereby providing addi-tional information as to the location and extent ofthe abnormality, and is the preferred modality inevaluating neurogenic tumors because it providesinformation regarding the nature and extent ofintraspinal involvement. In addition, MR imagingcan further characterize tissue, is useful in show-ing the cystic nature of mediastinal lesions thatappear solid at CT, and can help assess the medi-astinum in patients who have contraindications toiodinated contrast material (17). If a posteriormediastinal mass is suspected, MR imaging maybe the imaging modality of choice. However, thismodality does not demonstrate calcification aswell as CT and has poorer spatial resolution.
SummaryMany mediastinal reflections can be appreciatedat conventional radiography, and their presenceor distortion is the key to the interpretation ofmediastinal abnormalities. Anterior mediastinalmasses can be identified when both the hilumoverlay sign and preservation of the posterior me-diastinal lines are present. Widening of the rightparatracheal stripe and convexity relative to theAP window reflection both indicate abnormalityin the middle mediastinum. Disruption of theazygoesophageal recess can be caused by diseasein either the middle or posterior mediastinum.Paravertebral masses disrupt the paraspinal lines,and the location of masses above the level of theclavicles can be inferred by their lateral margins:Posterior masses have sharp margins due to theirinterface with lung, whereas anterior masses donot.
Although the divisions of the mediastinum arenot absolute, attempting to more accurately local-ize an abnormality with reference to the localanatomy of the mediastinal reflections may helpnarrow the differential diagnosis. Identification ofthe involved compartment helps determine ap-propriate further imaging.
References1. Williams PL, Warwick R, Dyson M, Bannister
LH. Splanchnology. In: Gray’s anatomy. 37th ed.New York, NY: Churchill Livingstone, 1989;1245–1475.
2. Zylak CJ, Pallie W, Jackson R. Correlative anat-omy and computed tomography: a module on themediastinum. RadioGraphics 1982;2(4):555–592.
3. Felson B. The mediastinum. Semin Roentgenol1969;4:41–58.
4. Heitzman ER. The mediastinum: radiologic corre-lations with anatomy and pathology. St Louis, Mo:Mosby, 1977; 216–334.
5. Fraser RS, Muller NL, Colman N, Pare PD. Diag-nosis and diseases of the chest. 4th ed. Philadel-phia, Pa: Saunders, 1999; 196–234.
6. Aquino SL, Duncan G, Taber KH, Sharma A,Hayman LA. Reconciliation of the anatomic, sur-gical, and radiographic classifications of the medi-astinum. J Comput Assist Tomogr 2001;25(3):489–492.
7. Proto AV. Mediastinal anatomy: emphasis on con-ventional images with anatomic and computedtomographic correlations. J Thorac Imaging 1987;2(1):1–48.
8. Savoca CJ, Austin JH, Goldberg HI. The rightparatracheal stripe. Radiology 1977;122:295–301.
9. Fleischner FG, Udis SW. Dilatation of the azygosvein; a roentgen sign of venous engorgement. Am JRoentgenol Radium Ther Nucl Med 1952;67:569–575.
10. Keats TE, Lipscombe GE, Betts CS 3rd. Mensu-ration of the arch of the azygos vein and its appli-cation to the study of cardiopulmonary disease.Radiology 1968;90(5):990–994.
11. Blank N, Castellino RA. Patterns of pleural reflec-tions of the left superior mediastinum: normalanatomy and distortions produced by adenopathy.Radiology 1972;102:585–589.
12. Homer MJ, Wechsler RJ, Carter BL. Mediastinallipomatosis: CT confirmation of a normal variant.Radiology 1978;128:657–661.
13. Predey TA, McDonald V, Demos TC, MoncadaR. CT of congenital anomalies of the aortic arch.Semin Roentgenol 1989;24(2):96–113.
14. Cha EM, Khoury GH. Persistent left superiorvena cava: radiologic and clinical significance. Ra-diology 1972;103(2):375–381.
15. Buirski G, Jordan SC, Joffe HS, Wilde P. Superiorvena caval abnormalities: their occurrence rate,associated cardiac abnormalities and angiographicclassification in a paediatric population with con-genital heart disease. Clin Radiol 1986;37(2):131–138.
16. Ravenel JG, Erasmus JJ. Azygoesophageal recess.J Thorac Imaging 2002;17(3):219–226.
17. Erasmus JJ, McAdams HP, Donnelly LF, SpritzerCE. MR imaging of mediastinal masses. MagnReson Imaging Clin N Am 2000;8(1):59–89.
RG f Volume 27 ● Number 3 Whitten et al 671
SPECIAL COMMUNICATION 673
Special Communication
Herbert Y. Kressel, MD, Named Editor of Radiology1
Gary J. Becker, MD, Chairman, RSNA Board of DirectorsHedvig Hricak, MD, PhD, Liaison for Publications and Communications, RSNA Board of Directors
More than a year after an extensive search beganto find a new editor for the premier research jour-nal in radiology, the Board of Directors of theRadiological Society of North America (RSNA)is pleased to announce that Herbert Y. Kressel,MD, will become Radiology editor in January2008. He succeeds Anthony V. Proto, MD, whohas admirably and tirelessly served the journal, aswell as the RSNA, since 1998. Dr Proto will retireas editor at the end of this year.
Dr Kressel, a prolific investigator and inventor,made his mark as a diagnostic radiologist in mag-netic resonance (MR) imaging of the abdomenand pelvis, with particular interest in imaging ofthe liver, pancreas, prostate, and rectum. He de-scribed the MR appearance of a variety of condi-
tions, from colorectal metastases and uterineanomalies to soft-tissue neoplasms. His researchhas also included evaluations of contrast agentsand comparisons of imaging technologies. He hascontributed greatly to the role of imaging in rectaland prostate tumor staging.
A graduate of Brandeis University in Waltham,Mass, Dr Kressel earned his MD degree from theUniversity of Southern California in Los Angeles.He completed a medical internship at the Univer-sity of Washington Hospital in Seattle and a radi-ology residency at the University of California,San Francisco (UCSF), where he also completeda National Institutes of Health diagnostic radiol-ogy fellowship. Dr Kressel then accepted a posi-tion as clinical instructor at UCSF. He moved toPhiladelphia, Pa, to become assistant professorof radiology at the University of Pennsylvania in1977 and was promoted to chief of the MR imag-ing section of the Department of Radiology at theHospital of the University of Pennsylvania in1982. He became professor of radiology in 1985.
Currently, Dr Kressel is the Miriam H. Stone-man Professor of Radiology at Harvard MedicalSchool in Boston, Mass, a position to which hewas appointed in 1993. He is radiologist-in-chiefof the Department of Radiology at Beth IsraelDeaconess Medical Center in Boston, where healso served as president and chief executive officerfrom 1998 to 2000. He is also chair of the Institu-tional Participants Committee of the AmericanCollege of Radiology Imaging Network.
Dr Kressel served as an editorial board mem-ber of Radiology for 6 years (1985–1991) and iscurrently on the editorial board of Magnetic Reso-nance in Medicine. He was also the editor of Mag-netic Resonance Annual and Magnetic ResonanceQuarterly. He is the author or coauthor of nearly200 peer-reviewed scientific reports, books, bookchapters, and invited papers and has publishedmore than 60 articles in Radiology over the past30 years.
RadioGraphics 2007; 27:673–674 ● Published online 10.1148/rg.273075913
1From the Radiological Society of North America, 820 Jorie Blvd, OakBrook, IL 60523. Address correspondence to Marian Strassner(e-mail: [email protected]).
©RSNA, 2007
Herbert Y. Kressel, MD
Note: This copy is for your personal, non-commercial use only. To order presentation-ready copies for distribution to your colleagues or clients, use the RadioGraphics Reprints form at the end of this article.

Dr Kressel is certified in diagnostic radiologyby the American Board of Radiology and is cur-rently licensed in Massachusetts. He holds a U.S.patent for the externally moveable intracavityprobe for MR imaging and spectroscopy.
The recipient of numerous awards and honors,Dr Kressel has been widely recognized for hisacademic achievements and MR research. He isthe recipient of a silver medal from the Interna-tional Society for Magnetic Resonance in Medi-cine, the Sylvia Sorkin Greenfield Award from theAmerican Association of Physicists in Medicine,and the Crues-Kressel Award from the Interna-tional Society for Magnetic Resonance in Medi-cine. A member of the Alpha Omega Alpha honorsociety for medical school students, Dr Kressel
received the Herron Award while at the Univer-sity of Southern California.
An RSNA member since 1977, Dr Kresselserved as a member of the Refresher CourseCommittee from 1990 to 1993. He has deliveredsix lectures at RSNA Scientific Sessions since1979. Dr Kressel also has served in many capaci-ties with the American College of Radiology, theAmerican Roentgen Ray Society, the Associationof University Radiologists, the Society of Com-puted Body Tomography, the Society of Gastro-intestinal Radiologists, and the International So-ciety for Magnetic Resonance in Medicine.
Well aware of the respect and stature Dr Kres-sel has earned in radiology as a researcher andleader, we were further impressed by his vision forthe journal and its relationship to scientific ad-vances in radiology. We have no doubt that hiseditorship will add luster to our premier journaland to his own prestigious career.
674 May-June 2007 RG f Volume 27 ● Number 3
EDUCATION EXHIBIT 675
Advances in DigitalRadiography: PhysicalPrinciples and SystemOverview1
Markus Korner, MD ● Christof H. Weber, MD ● Stefan Wirth, MDKlaus-Jurgen Pfeifer, MD ● Maximilian F. Reiser, MD ● Marcus Treitl,MD
During the past two decades, digital radiography has supplantedscreen-film radiography in many radiology departments. Today, manu-facturers provide a variety of digital imaging solutions based on variousdetector and readout technologies. Digital detectors allow implementa-tion of a fully digital picture archiving and communication system, inwhich images are stored digitally and are available anytime. Image dis-tribution in hospitals can now be achieved electronically by means ofweb-based technology with no risk of losing images. Other advantagesof digital radiography include higher patient throughput, increaseddose efficiency, and the greater dynamic range of digital detectors withpossible reduction of radiation exposure to the patient. The future ofradiography will be digital, and it behooves radiologists to be familiarwith the technical principles, image quality criteria, and radiation expo-sure issues associated with the various digital radiography systems thatare currently available.©RSNA, 2007
Abbreviations: CCD � charge-coupled device, CR � computed radiography, DQE � detective quantum efficiency, DR � direct radiography,MTF � modulation transfer function, TFT � thin-film transistor
RadioGraphics 2007; 27:675–686 ● Published online 10.1148/rg.273065075 ● Content Code:
1From the Department of Clinical Radiology, University Hospital Munich, Nussbaumstr 20, 80336 Munich, Germany. Presented as an education ex-hibit at the 2005 RSNA Annual Meeting. Received April 21, 2006; revision requested August 15 and received September 18; accepted September 18.All authors have no financial relationships to disclose. Address correspondence to M.K. (e-mail: [email protected]).
©RSNA, 2007
Note: This copy is for your personal, non-commercial use only. To order presentation-ready copies for distribution to your colleagues or clients, use the RadioGraphics Reprints form at the end of this article.
See last page
TEACHING POINTS
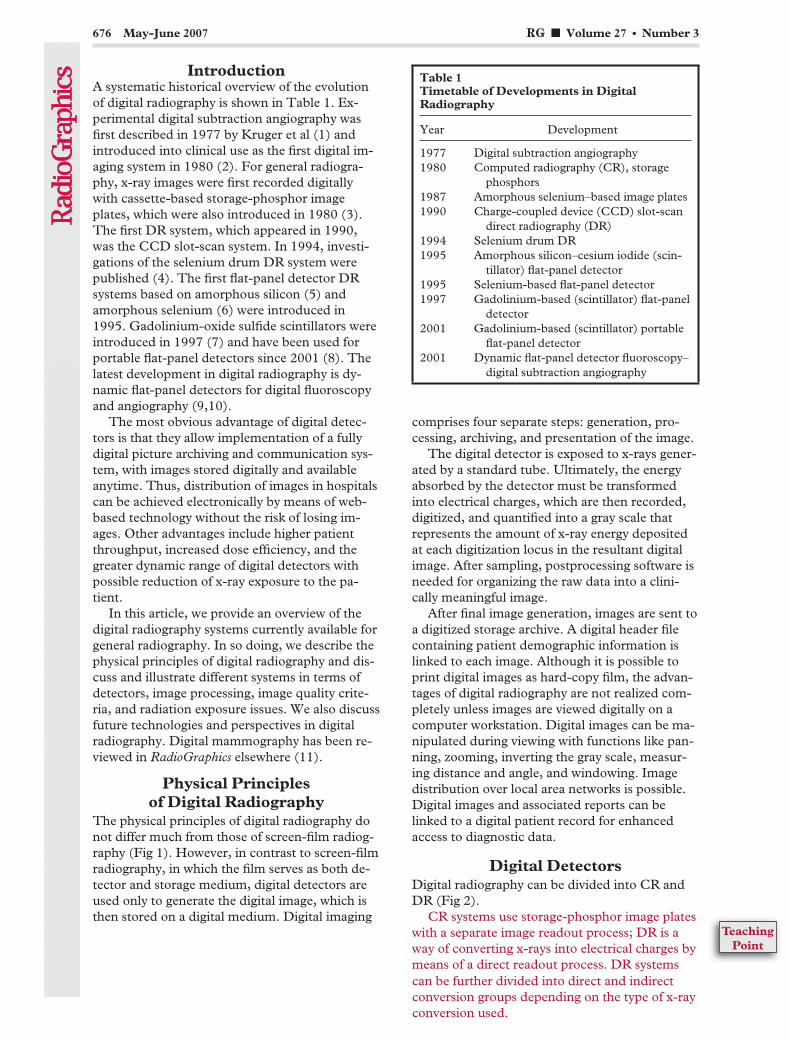
IntroductionA systematic historical overview of the evolutionof digital radiography is shown in Table 1. Ex-perimental digital subtraction angiography wasfirst described in 1977 by Kruger et al (1) andintroduced into clinical use as the first digital im-aging system in 1980 (2). For general radiogra-phy, x-ray images were first recorded digitallywith cassette-based storage-phosphor imageplates, which were also introduced in 1980 (3).The first DR system, which appeared in 1990,was the CCD slot-scan system. In 1994, investi-gations of the selenium drum DR system werepublished (4). The first flat-panel detector DRsystems based on amorphous silicon (5) andamorphous selenium (6) were introduced in1995. Gadolinium-oxide sulfide scintillators wereintroduced in 1997 (7) and have been used forportable flat-panel detectors since 2001 (8). Thelatest development in digital radiography is dy-namic flat-panel detectors for digital fluoroscopyand angiography (9,10).
The most obvious advantage of digital detec-tors is that they allow implementation of a fullydigital picture archiving and communication sys-tem, with images stored digitally and availableanytime. Thus, distribution of images in hospitalscan be achieved electronically by means of web-based technology without the risk of losing im-ages. Other advantages include higher patientthroughput, increased dose efficiency, and thegreater dynamic range of digital detectors withpossible reduction of x-ray exposure to the pa-tient.
In this article, we provide an overview of thedigital radiography systems currently available forgeneral radiography. In so doing, we describe thephysical principles of digital radiography and dis-cuss and illustrate different systems in terms ofdetectors, image processing, image quality crite-ria, and radiation exposure issues. We also discussfuture technologies and perspectives in digitalradiography. Digital mammography has been re-viewed in RadioGraphics elsewhere (11).
Physical Principlesof Digital Radiography
The physical principles of digital radiography donot differ much from those of screen-film radiog-raphy (Fig 1). However, in contrast to screen-filmradiography, in which the film serves as both de-tector and storage medium, digital detectors areused only to generate the digital image, which isthen stored on a digital medium. Digital imaging
comprises four separate steps: generation, pro-cessing, archiving, and presentation of the image.
The digital detector is exposed to x-rays gener-ated by a standard tube. Ultimately, the energyabsorbed by the detector must be transformedinto electrical charges, which are then recorded,digitized, and quantified into a gray scale thatrepresents the amount of x-ray energy depositedat each digitization locus in the resultant digitalimage. After sampling, postprocessing software isneeded for organizing the raw data into a clini-cally meaningful image.
After final image generation, images are sent toa digitized storage archive. A digital header filecontaining patient demographic information islinked to each image. Although it is possible toprint digital images as hard-copy film, the advan-tages of digital radiography are not realized com-pletely unless images are viewed digitally on acomputer workstation. Digital images can be ma-nipulated during viewing with functions like pan-ning, zooming, inverting the gray scale, measur-ing distance and angle, and windowing. Imagedistribution over local area networks is possible.Digital images and associated reports can belinked to a digital patient record for enhancedaccess to diagnostic data.
Digital DetectorsDigital radiography can be divided into CR andDR (Fig 2).
CR systems use storage-phosphor image plateswith a separate image readout process; DR is away of converting x-rays into electrical charges bymeans of a direct readout process. DR systems
Table 1Timetable of Developments in DigitalRadiography
Year Development
1977 Digital subtraction angiography1980 Computed radiography (CR), storage
phosphors1987 Amorphous selenium–based image plates1990 Charge-coupled device (CCD) slot-scan
direct radiography (DR)1994 Selenium drum DR1995 Amorphous silicon–cesium iodide (scin-
tillator) flat-panel detector1995 Selenium-based flat-panel detector1997 Gadolinium-based (scintillator) flat-panel
detector2001 Gadolinium-based (scintillator) portable
flat-panel detector2001 Dynamic flat-panel detector fluoroscopy–
digital subtraction angiography
676 May-June 2007 RG f Volume 27 ● Number 3
can be further divided into direct and indirectconversion groups depending on the type of x-rayconversion used.
TeachingPoint

Computed RadiographyCR systems make use of image plates having adetective layer of photostimulable crystals thatcontain different halogenides such as bromide,chlorine, or iodine (eg, BaFBr:Eu2�). The phos-phor crystals are usually cast into plates into resinmaterial in an unstructured way (unstructuredscintillators). Image plates replace the conven-tional films in the cassette.
The exposure process with storage-phosphorimage plates is illustrated in Figure 3. During ex-posure, x-ray energy is absorbed and temporarilystored by these crystals by bringing electrons tohigher energy levels. In this way, x-ray energy canbe stored for several hours, depending on the spe-cific physical properties of the phosphor crystals
used (12). However, the readout process shouldstart immediately after exposure because theamount of stored energy decreases over time.
The readout process is a separate step that fol-lows exposure of the image plate (Fig 3). Whenthe detective layer is scanned pixel by pixel with ahigh-energy laser beam of a specific wave length(flying-spot scanner), stored energy is set free asemitted light having a wave length different fromthat of the laser beam. This light is collected byphotodiodes and converted digitally into an image(12).
Figure 1. Chart illustrates a digital radi-ography system. After image exposure, theimaging data are digitally processed andstored in a digital archive. A centralizedimage management system is used for fur-ther distribution of the images to viewingstations, information systems, and elec-tronic patient records.
Figure 2. Chart provides a systematic overview ofvarious types of digital detectors. CCD � charge-coupled device, FPD � flat-panel detector, TFT �thin-film transistor.
Figure 3. Drawing illustrates a CR system based onstorage-phosphor image plates. Image generation isseparated into two steps. First, the image plate (IP) isexposed to x-ray energy, part of which is stored withinthe detective layer of the plate. Second, the image plateis scanned with a laser beam, so that the stored energyis set free and light is emitted. An array of photomulti-pliers collects the light, which is converted into electri-cal charges by an analog-to-digital (A/D) converter.
RG f Volume 27 ● Number 3 Korner et al 677
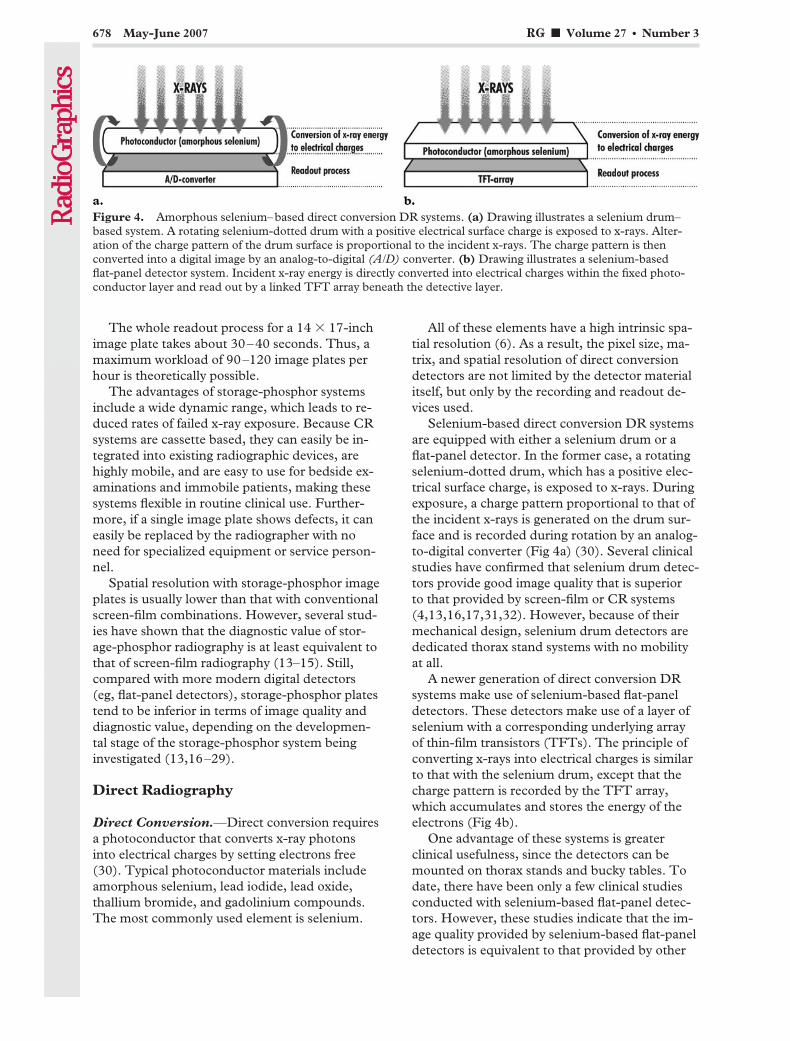
The whole readout process for a 14 � 17-inchimage plate takes about 30–40 seconds. Thus, amaximum workload of 90–120 image plates perhour is theoretically possible.
The advantages of storage-phosphor systemsinclude a wide dynamic range, which leads to re-duced rates of failed x-ray exposure. Because CRsystems are cassette based, they can easily be in-tegrated into existing radiographic devices, arehighly mobile, and are easy to use for bedside ex-aminations and immobile patients, making thesesystems flexible in routine clinical use. Further-more, if a single image plate shows defects, it caneasily be replaced by the radiographer with noneed for specialized equipment or service person-nel.
Spatial resolution with storage-phosphor imageplates is usually lower than that with conventionalscreen-film combinations. However, several stud-ies have shown that the diagnostic value of stor-age-phosphor radiography is at least equivalent tothat of screen-film radiography (13–15). Still,compared with more modern digital detectors(eg, flat-panel detectors), storage-phosphor platestend to be inferior in terms of image quality anddiagnostic value, depending on the developmen-tal stage of the storage-phosphor system beinginvestigated (13,16–29).
Direct Radiography
Direct Conversion.—Direct conversion requiresa photoconductor that converts x-ray photonsinto electrical charges by setting electrons free(30). Typical photoconductor materials includeamorphous selenium, lead iodide, lead oxide,thallium bromide, and gadolinium compounds.The most commonly used element is selenium.
All of these elements have a high intrinsic spa-tial resolution (6). As a result, the pixel size, ma-trix, and spatial resolution of direct conversiondetectors are not limited by the detector materialitself, but only by the recording and readout de-vices used.
Selenium-based direct conversion DR systemsare equipped with either a selenium drum or aflat-panel detector. In the former case, a rotatingselenium-dotted drum, which has a positive elec-trical surface charge, is exposed to x-rays. Duringexposure, a charge pattern proportional to that ofthe incident x-rays is generated on the drum sur-face and is recorded during rotation by an analog-to-digital converter (Fig 4a) (30). Several clinicalstudies have confirmed that selenium drum detec-tors provide good image quality that is superiorto that provided by screen-film or CR systems(4,13,16,17,31,32). However, because of theirmechanical design, selenium drum detectors arededicated thorax stand systems with no mobilityat all.
A newer generation of direct conversion DRsystems make use of selenium-based flat-paneldetectors. These detectors make use of a layer ofselenium with a corresponding underlying arrayof thin-film transistors (TFTs). The principle ofconverting x-rays into electrical charges is similarto that with the selenium drum, except that thecharge pattern is recorded by the TFT array,which accumulates and stores the energy of theelectrons (Fig 4b).
One advantage of these systems is greaterclinical usefulness, since the detectors can bemounted on thorax stands and bucky tables. Todate, there have been only a few clinical studiesconducted with selenium-based flat-panel detec-tors. However, these studies indicate that the im-age quality provided by selenium-based flat-paneldetectors is equivalent to that provided by other
Figure 4. Amorphous selenium–based direct conversion DR systems. (a) Drawing illustrates a selenium drum–based system. A rotating selenium-dotted drum with a positive electrical surface charge is exposed to x-rays. Alter-ation of the charge pattern of the drum surface is proportional to the incident x-rays. The charge pattern is thenconverted into a digital image by an analog-to-digital (A/D) converter. (b) Drawing illustrates a selenium-basedflat-panel detector system. Incident x-ray energy is directly converted into electrical charges within the fixed photo-conductor layer and read out by a linked TFT array beneath the detective layer.
678 May-June 2007 RG f Volume 27 ● Number 3

flat-panel detectors and selenium drum detectors(17,32). Another promising clinical application ofselenium-based flat-panel detectors is in the fieldof mammography (33).
Indirect Conversion with a CCD.—A CCD isa light-sensitive sensor for recording images thatconsists of an integrated circuit containing an ar-ray of linked or coupled capacitors. X-ray energyis converted into light by a scintillator such as Tl-doped cesium iodide. The amount of light emit-ted is then recorded by the CCD, and the light isconverted into electrical charges.
Because the detector area cannot be largerthan the CCD chip, it is necessary to combineseveral chips to create larger detector areas.
CCDs can be used for radiography as part ofeither a lens-coupled CCD system or a slot-scanCCD system. In lens-coupled CCD systems, an
array consisting of several CCD chips forms adetector area similar to that of a flat-panel detec-tor. Optical lenses are needed to reduce the areaof the projected light to fit the CCD array (Fig5a). One drawback of the lens system is a de-crease in the number of photons reaching theCCD, resulting in a lower signal-to-noise ratioand relatively low quantum efficiency (34).
Slot-scan CCD systems make use of a specialx-ray tube with a tungsten anode. The patient isscanned with a collimated fan-shaped beam,which is linked to a simultaneously moving CCDdetector array having a matching detector width(Fig 5b). The combination of a small collimatedbeam and a concordant detector reduces the im-pact of scattered radiation in the image, sincemuch of this radiation will escape without detec-tion. In addition, the relatively low quantum effi-ciency of slot-scan CCD systems, which is com-parable to that of CR systems, can be offset by theresulting lower image noise (35). The exposuretime to the patient is about 20 msec, and thereadout process takes about 1.3 seconds (36).Because of the need for fixed installation, slot-scan CCD systems are dedicated to chest radiog-raphy, mammography, or dental radiography.
Studies dealing with CCD-based digital gen-eral radiography are rare. Phantom studies havebeen conducted to investigate slot-scan CCD sys-tems and compare them with screen-film combi-nations (35,36) and various digital detectors(16,17,37). In all of these studies, CCD-basedsystems were comparable to flat-panel detectorsin terms of image quality and allowed slightly su-perior low-contrast visualization. Clinical studiesperformed with slot-scan detectors are mainlyconcentrating on applications in mammography(11,38) and digital dental radiography.
The performance of lens-coupled CCD sys-tems is somewhat inferior to that of slot-scan sys-tems because of their technical principle (16,17),substantially lower quantum efficiency, and lowersignal-to-noise ratio.
Indirect Conversion with a Flat-Panel De-tector.—Indirect conversion DR systems are“sandwich” constructions consisting of a scintilla-tor layer, an amorphous silicon photodiode cir-cuitry layer, and a TFT array. When x-ray pho-tons reach the scintillator, visible light propor-tional to the incident energy is emitted and thenrecorded by an array of photodiodes and con-verted to electrical charges. These charges are
Figure 5. CCD-based indirect conversion DR sys-tem. (a) Drawing illustrates a lens-coupled CCD-based system. The incident x-ray energy is convertedinto light by a scintillator. The emitted light has to bebundled by an optical lens to fit the size of the CCDchip, which subsequently converts the light energy intoelectrical charges. (b) Drawing illustrates a slot-scanCCD-based system. The patient is scanned with a fan-shaped beam of x-rays. A simultaneously moving CCDdetector of the same size collects the emitted light andconverts the light energy into electrical charges.
RG f Volume 27 ● Number 3 Korner et al 679
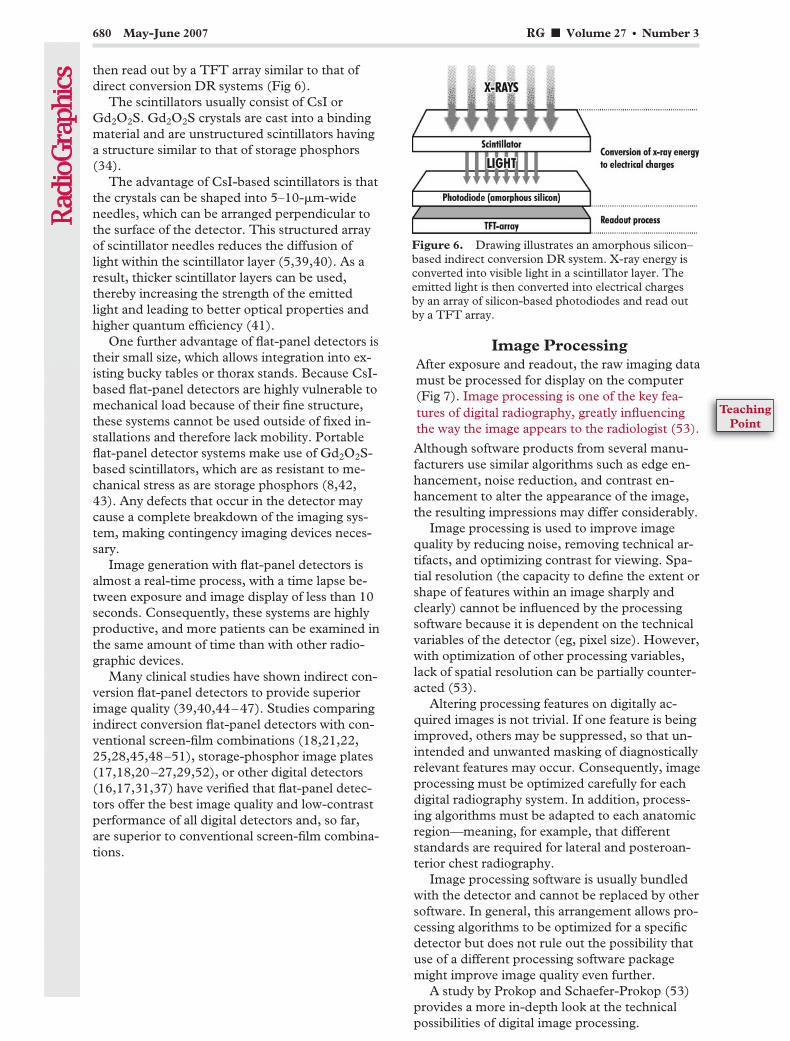
then read out by a TFT array similar to that ofdirect conversion DR systems (Fig 6).
The scintillators usually consist of CsI orGd2O2S. Gd2O2S crystals are cast into a bindingmaterial and are unstructured scintillators havinga structure similar to that of storage phosphors(34).
The advantage of CsI-based scintillators is thatthe crystals can be shaped into 5–10-�m-wideneedles, which can be arranged perpendicular tothe surface of the detector. This structured arrayof scintillator needles reduces the diffusion oflight within the scintillator layer (5,39,40). As aresult, thicker scintillator layers can be used,thereby increasing the strength of the emittedlight and leading to better optical properties andhigher quantum efficiency (41).
One further advantage of flat-panel detectors istheir small size, which allows integration into ex-isting bucky tables or thorax stands. Because CsI-based flat-panel detectors are highly vulnerable tomechanical load because of their fine structure,these systems cannot be used outside of fixed in-stallations and therefore lack mobility. Portableflat-panel detector systems make use of Gd2O2S-based scintillators, which are as resistant to me-chanical stress as are storage phosphors (8,42,43). Any defects that occur in the detector maycause a complete breakdown of the imaging sys-tem, making contingency imaging devices neces-sary.
Image generation with flat-panel detectors isalmost a real-time process, with a time lapse be-tween exposure and image display of less than 10seconds. Consequently, these systems are highlyproductive, and more patients can be examined inthe same amount of time than with other radio-graphic devices.
Many clinical studies have shown indirect con-version flat-panel detectors to provide superiorimage quality (39,40,44–47). Studies comparingindirect conversion flat-panel detectors with con-ventional screen-film combinations (18,21,22,25,28,45,48–51), storage-phosphor image plates(17,18,20–27,29,52), or other digital detectors(16,17,31,37) have verified that flat-panel detec-tors offer the best image quality and low-contrastperformance of all digital detectors and, so far,are superior to conventional screen-film combina-tions.
Image ProcessingAfter exposure and readout, the raw imaging datamust be processed for display on the computer(Fig 7). Image processing is one of the key fea-tures of digital radiography, greatly influencingthe way the image appears to the radiologist (53).
Although software products from several manu-facturers use similar algorithms such as edge en-hancement, noise reduction, and contrast en-hancement to alter the appearance of the image,the resulting impressions may differ considerably.
Image processing is used to improve imagequality by reducing noise, removing technical ar-tifacts, and optimizing contrast for viewing. Spa-tial resolution (the capacity to define the extent orshape of features within an image sharply andclearly) cannot be influenced by the processingsoftware because it is dependent on the technicalvariables of the detector (eg, pixel size). However,with optimization of other processing variables,lack of spatial resolution can be partially counter-acted (53).
Altering processing features on digitally ac-quired images is not trivial. If one feature is beingimproved, others may be suppressed, so that un-intended and unwanted masking of diagnosticallyrelevant features may occur. Consequently, imageprocessing must be optimized carefully for eachdigital radiography system. In addition, process-ing algorithms must be adapted to each anatomicregion—meaning, for example, that differentstandards are required for lateral and posteroan-terior chest radiography.
Image processing software is usually bundledwith the detector and cannot be replaced by othersoftware. In general, this arrangement allows pro-cessing algorithms to be optimized for a specificdetector but does not rule out the possibility thatuse of a different processing software packagemight improve image quality even further.
A study by Prokop and Schaefer-Prokop (53)provides a more in-depth look at the technicalpossibilities of digital image processing.
Figure 6. Drawing illustrates an amorphous silicon–based indirect conversion DR system. X-ray energy isconverted into visible light in a scintillator layer. Theemitted light is then converted into electrical chargesby an array of silicon-based photodiodes and read outby a TFT array.
680 May-June 2007 RG f Volume 27 ● Number 3
TeachingPoint
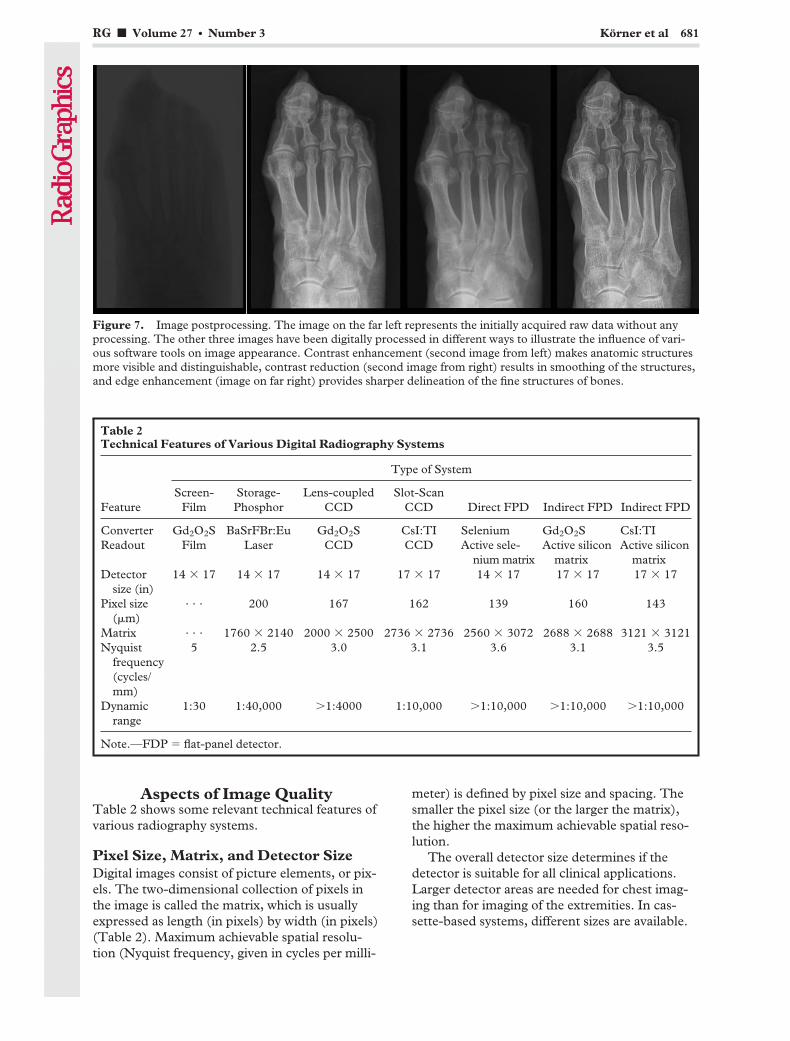
Aspects of Image QualityTable 2 shows some relevant technical features ofvarious radiography systems.
Pixel Size, Matrix, and Detector SizeDigital images consist of picture elements, or pix-els. The two-dimensional collection of pixels inthe image is called the matrix, which is usuallyexpressed as length (in pixels) by width (in pixels)(Table 2). Maximum achievable spatial resolu-tion (Nyquist frequency, given in cycles per milli-
meter) is defined by pixel size and spacing. Thesmaller the pixel size (or the larger the matrix),the higher the maximum achievable spatial reso-lution.
The overall detector size determines if thedetector is suitable for all clinical applications.Larger detector areas are needed for chest imag-ing than for imaging of the extremities. In cas-sette-based systems, different sizes are available.
Figure 7. Image postprocessing. The image on the far left represents the initially acquired raw data without anyprocessing. The other three images have been digitally processed in different ways to illustrate the influence of vari-ous software tools on image appearance. Contrast enhancement (second image from left) makes anatomic structuresmore visible and distinguishable, contrast reduction (second image from right) results in smoothing of the structures,and edge enhancement (image on far right) provides sharper delineation of the fine structures of bones.
Table 2Technical Features of Various Digital Radiography Systems
Type of System
FeatureScreen-
FilmStorage-Phosphor
Lens-coupledCCD
Slot-ScanCCD Direct FPD Indirect FPD Indirect FPD
Converter Gd2O2S BaSrFBr:Eu Gd2O2S CsI:TI Selenium Gd2O2S CsI:TIReadout Film Laser CCD CCD Active sele-
nium matrixActive silicon
matrixActive silicon
matrixDetector
size (in)14 � 17 14 � 17 14 � 17 17 � 17 14 � 17 17 � 17 17 � 17
Pixel size(�m)
. . . 200 167 162 139 160 143
Matrix . . . 1760 � 2140 2000 � 2500 2736 � 2736 2560 � 3072 2688 � 2688 3121 � 3121Nyquist
frequency(cycles/mm)
5 2.5 3.0 3.1 3.6 3.1 3.5
Dynamicrange
1:30 1:40,000 �1:4000 1:10,000 �1:10,000 �1:10,000 �1:10,000
Note.—FDP � flat-panel detector.
RG f Volume 27 ● Number 3 Korner et al 681
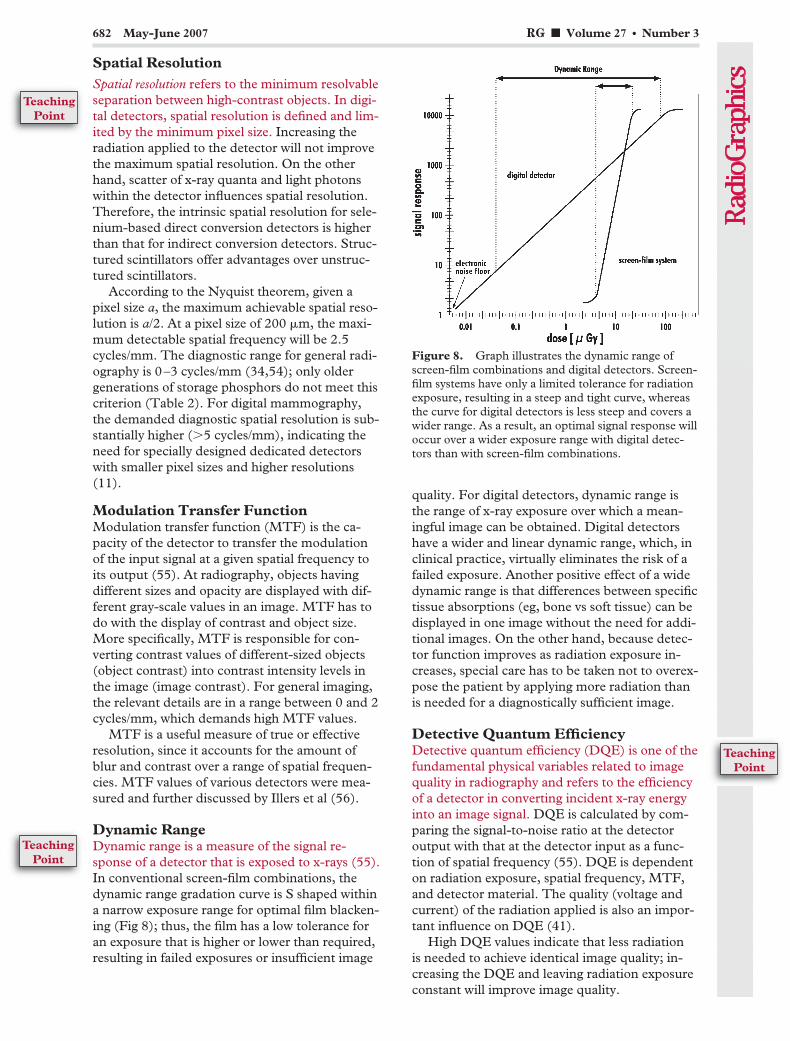
Spatial ResolutionSpatial resolution refers to the minimum resolvableseparation between high-contrast objects. In digi-tal detectors, spatial resolution is defined and lim-ited by the minimum pixel size. Increasing theradiation applied to the detector will not improvethe maximum spatial resolution. On the otherhand, scatter of x-ray quanta and light photonswithin the detector influences spatial resolution.Therefore, the intrinsic spatial resolution for sele-nium-based direct conversion detectors is higherthan that for indirect conversion detectors. Struc-tured scintillators offer advantages over unstruc-tured scintillators.
According to the Nyquist theorem, given apixel size a, the maximum achievable spatial reso-lution is a/2. At a pixel size of 200 �m, the maxi-mum detectable spatial frequency will be 2.5cycles/mm. The diagnostic range for general radi-ography is 0–3 cycles/mm (34,54); only oldergenerations of storage phosphors do not meet thiscriterion (Table 2). For digital mammography,the demanded diagnostic spatial resolution is sub-stantially higher (�5 cycles/mm), indicating theneed for specially designed dedicated detectorswith smaller pixel sizes and higher resolutions(11).
Modulation Transfer FunctionModulation transfer function (MTF) is the ca-pacity of the detector to transfer the modulationof the input signal at a given spatial frequency toits output (55). At radiography, objects havingdifferent sizes and opacity are displayed with dif-ferent gray-scale values in an image. MTF has todo with the display of contrast and object size.More specifically, MTF is responsible for con-verting contrast values of different-sized objects(object contrast) into contrast intensity levels inthe image (image contrast). For general imaging,the relevant details are in a range between 0 and 2cycles/mm, which demands high MTF values.
MTF is a useful measure of true or effectiveresolution, since it accounts for the amount ofblur and contrast over a range of spatial frequen-cies. MTF values of various detectors were mea-sured and further discussed by Illers et al (56).
Dynamic RangeDynamic range is a measure of the signal re-sponse of a detector that is exposed to x-rays (55).In conventional screen-film combinations, thedynamic range gradation curve is S shaped withina narrow exposure range for optimal film blacken-ing (Fig 8); thus, the film has a low tolerance foran exposure that is higher or lower than required,resulting in failed exposures or insufficient image
quality. For digital detectors, dynamic range isthe range of x-ray exposure over which a mean-ingful image can be obtained. Digital detectorshave a wider and linear dynamic range, which, inclinical practice, virtually eliminates the risk of afailed exposure. Another positive effect of a widedynamic range is that differences between specifictissue absorptions (eg, bone vs soft tissue) can bedisplayed in one image without the need for addi-tional images. On the other hand, because detec-tor function improves as radiation exposure in-creases, special care has to be taken not to overex-pose the patient by applying more radiation thanis needed for a diagnostically sufficient image.
Detective Quantum EfficiencyDetective quantum efficiency (DQE) is one of thefundamental physical variables related to imagequality in radiography and refers to the efficiencyof a detector in converting incident x-ray energyinto an image signal. DQE is calculated by com-paring the signal-to-noise ratio at the detectoroutput with that at the detector input as a func-tion of spatial frequency (55). DQE is dependenton radiation exposure, spatial frequency, MTF,and detector material. The quality (voltage andcurrent) of the radiation applied is also an impor-tant influence on DQE (41).
High DQE values indicate that less radiationis needed to achieve identical image quality; in-creasing the DQE and leaving radiation exposureconstant will improve image quality.
Figure 8. Graph illustrates the dynamic range ofscreen-film combinations and digital detectors. Screen-film systems have only a limited tolerance for radiationexposure, resulting in a steep and tight curve, whereasthe curve for digital detectors is less steep and covers awider range. As a result, an optimal signal response willoccur over a wider exposure range with digital detec-tors than with screen-film combinations.
682 May-June 2007 RG f Volume 27 ● Number 3
TeachingPoint
TeachingPoint
TeachingPoint

The ideal detector would have a DQE of 1,meaning that all the radiation energy is absorbedand converted into image information. In prac-tice, the DQE of digital detectors is limited toabout 0.45 at 0.5 cycles/mm (Fig 9). During thepast few years, various methods of measuringDQE have been established (41), making thecomparison of DQE values difficult if not impos-sible. In 2003, the IEC62220–1 standard wasintroduced to standardize DQE measurementsand make them comparable.
The DQE curves for four different digital de-tectors are shown in Figure 9. Screen-film sys-tems have a DQE comparable to that of detectorCR 2 in Figure 9.
Radiation ExposureIn general, the higher DQE values of most digitaldetectors compared with screen-film combina-tions suggest that, besides providing better imagequality, digital detectors have the potential forsubstantially lowering patient exposure without aloss of image quality. Efforts have been made tooptimize both image quality and exposure in digi-tal radiography.
The most obvious way to minimize patient ex-posure is to greatly reduce the number of failedexposures and requisite additional images. Thisreduction is made possible by the wider dynamicrange of digital detectors compared with conven-tional screen-film combinations. Yet, this widerdynamic range will contribute little to reducingexposure to the individual patient. By reducingthe amount of radiation exposure needed for asufficient image, unnecessary exposure can bedirectly eliminated.
Only a few studies have investigated the possi-bility of reducing the exposure with storage-phos-phor radiography. Heyne et al (57–59) published
three studies on exposure reduction in digital ra-diography of skull, hand, pelvis, and lumbar spinephantoms using a standard CR system. In allthree studies, the authors concluded that reduc-tion of exposure with storage-phosphor systems ispossible to a variable extent, depending on theclinical problem and the specific clinical question.These results were confirmed by another trial, inwhich specimens of fractured wrists were used(60). Busch et al (61) compared various storage-phosphor systems with a flat-panel detector sys-tem at different exposures in radiography of low-contrast, hand, abdomen, and chest phantoms.The authors found that exposure reduction withstorage-phosphor systems is limited to certainclinical indications and cannot be applied unre-strictedly in clinical practice because some inci-dental finding might be masked by increased im-age noise in low-exposure images (61). Reason-able exposure reduction requires settings in whichthe chance of underdiagnosis is minimized.
Unlike storage-phosphor systems, in which thepossibility of exposure reduction is limited, DRsystems offer a significantly higher potential forgeneral exposure reduction because of their farsuperior quantum efficiency. Several studies haveshown that a considerably lower exposure is re-quired for equivalent depiction of anatomic de-tails with flat-panel detectors than with storage-phosphor systems and screen-film combinationsfor different clinical fields, including radiographyof the extremities and chest (16,17,22–25,27,32,35,37,40,43,45,47,49,51,52,62–65). In mostof these studies, indirect conversion flat-paneldetectors showed the highest potential for reduc-ing exposure, regardless of the clinical setting.There have also been numerous studies compar-ing various digital detectors within the same ap-plication (16,17). The authors of these studiesalso concluded that flat-panel detectors achievedthe best results in low-exposure imaging, followedby other DR systems such as selenium drum– andCCD-based systems.
Although almost all of these studies agree as tothe ranking of the systems in terms of the degreeof exposure reduction, the total percentage ofsuggested reduction varies dramatically (64).Consequently, requirements for the optimizationof image quality may differ even within the de-partments that conducted the studies, and generalrecommendations for optimal imaging exposuresfor specific indications cannot be given. In sum-mary, reduction of exposure in flat-panel detectordigital radiography is possible, to some extentregardless of the clinical situation.
Figure 9. Graph illustrates the DQE curves for fourdigital detectors. CR 1 � needle-structured storagephosphor and line scanner (MD5.0/DX-S; Agfa-Ge-vaert, Mortsel, Belgium), CR 2 � unstructured storagephosphor and flying-spot scanner (MD40/ADC Com-pact, Agfa-Gevaert), Indirect FPD � CsI-based flat-panel detector (Pixium 4600; Trixell, Moirans, France),Direct FPD � selenium-based flat-panel detector (DR9000; Kodak, Rochester, NY).
RG f Volume 27 ● Number 3 Korner et al 683
Reports of an increase of exposure with digitalradiography are rare and concern only chest radi-ography with storage phosphors (66,67). Onereason for these apparently contradictory findingsis the effectively variable speed of CR systems andthe willingness of radiologists to accept morenoise in some of the images obtained with thesesystems (66). Another reason might be that bothstudies were published in 2000, having made useof somewhat older generations of storage phos-phors and scanners.
A study by Geijer et al (68) and one by Geijeralone (69) described an increase of exposure inthe imaging of scoliosis with a direct conversionflat-panel detector. However, this finding was putinto perspective by the fact that optimization ofthe DR systems yielded superior image quality atlower exposure (69).
Future Technol-ogies and Perspectives
New storage phosphors and scanning systems arebeing investigated for use in CR. These phos-phors are structured, since their crystals aregrown in a needle shape, and are coated on a glassor aluminum substrate without any binding mate-rial between the crystals (70,71). This techniqueoffers tighter phosphor packing and reduced pixelsize, resulting in DQE values that are as high asthose for indirect conversion flat-panel detectorsystems (Fig 9) (70,72,73). In addition, imagesare scanned line by line with this system, resultingin shorter scanning times. Line scanners couldalso read out each pixel of a line for a longer timeif scanning time is kept constant compared withthat of a flying-spot scanner, which results in ahigher signal being produced by the emitted light.Initial clinical studies in chest radiography withthis system have shown equal quality with a state-of-the-art unstructured CR system with the expo-sure lowered to 50% (72).
With the introduction of portable devices, flat-panel detector systems will be more flexible andmight even replace CR systems (8,42,43). How-ever, the image quality afforded by these portabledevices must be further investigated and com-pared with that afforded by storage-phosphor sys-tems.
Another promising application is the use ofdynamic flat-panel detectors in fluoroscopy(9,55). Studies using these systems have indicatedimproved image quality and reduced patient ex-posure (74,75), although there are also reportsthat do not indicate reduced exposure (76).
Improvement in the DQE and signal-to-noiseratio of detectors may lead to even further reduc-
tion of exposure or improvement in image qual-ity. The architecture of the readout arrays couldbe optimized by reducing the size of the circuitand pixels.
ConclusionsThe future of radiography will be digital. The ad-vantages of digital radiography with respect tovarious imaging systems have been extensivelydiscussed in the literature. The large number ofscientific papers dealing with digital radiographythat have been published over the last 25 yearsalso indicates the importance of this topic to theradiologist.
References1. Kruger RA, Mistretta CA, Crummy AB, et al.
Digital K-edge subtraction radiography. Radiology1977;125:243–245.
2. Ovitt TW, Christenson PC, Fisher HD 3rd, et al.Intravenous angiography using digital video sub-traction: x-ray imaging system. AJR Am J Roent-genol 1980;135:1141–1144.
3. Moore R. Computed radiography. Med Electron1980;11:78–79.
4. Neitzel U, Maack I, Gunther-Kohfahl S. Imagequality of a digital chest radiography system basedon a selenium detector. Med Phys 1994;21:509–516.
5. Antonuk LE, Yorkston J, Huang W, et al. A real-time, flat-panel, amorphous silicon, digital x-rayimager. RadioGraphics 1995;15:993–1000.
6. Zhao W, Rowlands JA. X-ray imaging using amor-phous selenium: feasibility of a flat panel self-scanned detector for digital radiology. Med Phys1995;22:1595–1604.
7. Kandarakis I, Cavouras D, Panayiotakis GS, etal. Evaluating x-ray detectors for radiographicapplications: a comparison of ZnSCdS:Ag withGd2O2S:Tb and Y2O2S:Tb screens. Phys MedBiol 1997;42:1351–1373.
8. Puig S. Digital radiography of the chest in pediat-ric patients [in German]. Radiologe 2003;43:1045–1050.
9. Choquette M, Demers Y, Shukri Z, et al. Perfor-mance of a real-time selenium-based x-ray detec-tor for fluoroscopy. Proc SPIE 2001;4320:501–508.
10. Colbeth R, Boyce S, Fong R, et al. 40 � 30 cmflat-panel imager for angiography, R&F, and cone-beam CT applications. Proc SPIE 2001;4320:94–102.
11. Mahesh M. AAPM/RSNA physics tutorial for resi-dents. Digital mammography: an overview. Radio-Graphics 2004;24:1747–1760.
12. Rowlands JA. The physics of computed radiogra-phy. Phys Med Biol 2002;47:R123–R166.
13. Bernhardt TM, Otto D, Reichel G, et al. Detec-tion of simulated interstitial lung disease and cath-eters with selenium, storage phosphor, and film-based radiography. Radiology 1999;213:445–454.
14. Kirchner J, Stueckle CA, Schilling EM, et al. Effi-cacy of daily bedside chest radiography as visual-ized by digital luminescence radiography. Aus-tralas Radiol 2001;45:444–447.
15. Schaefer-Prokop CM, Prokop M. Storage phos-phor radiography. Eur Radiol 1997;7:58–65.
684 May-June 2007 RG f Volume 27 ● Number 3
16. Veldkamp WJ, Kroft LJ, Boot MV, et al. Contrast-detail evaluation and dose assessment of eightdigital chest radiography systems in clinical prac-tice. Eur Radiol 2006;16:333–341.
17. Kroft LJ, Veldkamp WJ, Mertens BJ, et al. Com-parison of eight different digital chest radiographysystems: variation in detection of simulated chestdisease. AJR Am J Roentgenol 2005;185:339–346.
18. Ono K, Yoshitake T, Akahane K, et al. Compari-son of a digital flat-panel versus screen-film, pho-tofluorography and storage-phosphor systems bydetection of simulated lung adenocarcinoma le-sions using hard copy images. Br J Radiol 2005;78:922–927.
19. Uffmann M, Prokop M, Eisenhuber E, et al.Computed radiography and direct radiography:influence of acquisition dose on the detection ofsimulated lung lesions. Invest Radiol 2005;40:249–256.
20. Uffmann M, Schaefer-Prokop C, Neitzel U, et al.Skeletal applications for flat-panel versus storage-phosphor radiography: effect of exposure on de-tection of low-contrast details. Radiology 2004;231:506–514.
21. Ganten M, Radeleff B, Kampschulte A, et al.Comparing image quality of flat-panel chest radi-ography with storage phosphor radiography andfilm-screen radiography. AJR Am J Roentgenol2003;181:171–176.
22. Ludwig K, Henschel A, Bernhardt TM, et al. Per-formance of a flat-panel detector in the detectionof artificial erosive changes: comparison with con-ventional screen-film and storage-phosphor radi-ography. Eur Radiol 2003;13:1316–1323.
23. Fischbach F, Ricke J, Freund T, et al. Flat paneldigital radiography compared with storage phos-phor computed radiography: assessment of doseversus image quality in phantom studies. InvestRadiol 2002;37:609–614.
24. Herrmann A, Bonel H, Stabler A, et al. Chest im-aging with flat-panel detector at low and standarddoses: comparison with storage phosphor technol-ogy in normal patients. Eur Radiol 2002;12:385–390.
25. Ludwig K, Lenzen H, Kamm KF, et al. Perfor-mance of a flat-panel detector in detecting artifi-cial bone lesions: comparison with conventionalscreen-film and storage-phosphor radiography.Radiology 2002;222:453–459.
26. Goo JM, Im JG, Lee HJ, et al. Detection of simu-lated chest lesions by using soft-copy reading:comparison of an amorphous silicon flat-panel-detector system and a storage-phosphor system.Radiology 2002;224:242–246.
27. Kim TS, Im JG, Goo JM, et al. Detection of pul-monary edema in pigs: storage phosphor versusamorphous selenium-based flat-panel-detectorradiography. Radiology 2002;223:695–701.
28. Rong XJ, Shaw CC, Liu X, et al. Comparison ofan amorphous silicon/cesium iodide flat-paneldigital chest radiography system with screen/filmand computed radiography systems: a contrast-detail phantom study. Med Phys 2001;28:2328–2335.
29. Goo JM, Im JG, Kim JH, et al. Digital chest radi-ography with a selenium-based flat-panel detectorversus a storage phosphor system: comparison ofsoft-copy images. AJR Am J Roentgenol 2000;175:1013–1018.
30. Yaffe MJ, Rowlands JA. X-ray detectors for digitalradiography. Phys Med Biol 1997;42:1–39.
31. Fischbach F, Freund T, Pech M, et al. Compari-son of indirect CsI/a:Si and direct a:Se digital radi-ography: an assessment of contrast and detail visu-alization. Acta Radiol 2003;44:616–621.
32. Ramli K, Abdullah BJ, Ng KH, et al. Computedand conventional chest radiography: a comparisonof image quality and radiation dose. Australas Ra-diol 2005;49:460–466.
33. Zhao W, Ji WG, Debrie A, et al. Imaging perfor-mance of amorphous selenium based flat-paneldetectors for digital mammography: characteriza-tion of a small area prototype detector. Med Phys2003;30:254–263.
34. Chotas HG, Dobbins JT 3rd, Ravin CE. Prin-ciples of digital radiography with large-area, elec-tronically readable detectors: a review of the ba-sics. Radiology 1999;210:595–599.
35. Kroft LJ, Geleijns J, Mertens BJ, et al. Digital slot-scan charge-coupled device radiography versusAMBER and Bucky screen-film radiography fordetection of simulated nodules and interstitial dis-ease in a chest phantom. Radiology 2004;231:156–163.
36. Veldkamp WJ, Kroft LJ, Mertens BJ, et al. Digitalslot-scan charge-coupled device radiography ver-sus AMBER and Bucky screen-film radiography:comparison of image quality in a phantom study.Radiology 2005;235:857–866.
37. Pascoal A, Lawinski CP, Mackenzie A, et al.Chest radiography: a comparison of image qualityand effective dose using four digital systems. Ra-diat Prot Dosimetry 2005;114:273–277.
38. Noel A, Thibault F. Digital detectors for mam-mography: the technical challenges. Eur Radiol2004;14:1990–1998.
39. Kotter E, Langer M. Digital radiography withlarge-area flat-panel detectors. Eur Radiol 2002;12:2562–2570.
40. Strotzer M, Gmeinwieser J, Volk M, et al. Clinicalapplication of a flat-panel X-ray detector based onamorphous silicon technology: image quality andpotential for radiation dose reduction in skeletalradiography. AJR Am J Roentgenol 1998;171:23–27.
41. Illers H, Buhr E, Hoeschen C. Measurement ofthe detective quantum efficiency (DQE) of digitalX-ray detectors according to the novel standardIEC 62220–1. Radiat Prot Dosimetry 2005;114:39–44.
42. Rapp-Bernhardt U, Bernhardt TM, Lenzen H, etal. Experimental evaluation of a portable indirectflat-panel detector for the pediatric chest: com-parison with storage phosphor radiography at dif-ferent exposures by using a chest phantom. Radi-ology 2005;237:485–491.
43. Rapp-Bernhardt U, Roehl FW, Esseling R, et al.Portable flat-panel detector for low-dose imagingin a pediatric intensive care unit: comparison withan asymmetric film-screen system. Invest Radiol2005;40:736–741.
44. Chotas HG, Ravin CE. Digital chest radiographywith a solid-state flat-panel x-ray detector: con-trast-detail evaluation with processed imagesprinted on film hard copy. Radiology 2001;218:679–682.
RG f Volume 27 ● Number 3 Korner et al 685

45. Fink C, Hallscheidt PJ, Noeldge G, et al. Clinicalcomparative study with a large-area amorphoussilicon flat-panel detector: image quality and vis-ibility of anatomic structures on chest radiography.AJR Am J Roentgenol 2002;178:481–486.
46. Floyd CE Jr, Warp RJ, Dobbins JT 3rd, et al. Im-aging characteristics of an amorphous silicon flat-panel detector for digital chest radiography. Radi-ology 2001;218:683–688.
47. Geijer H, Beckman KW, Andersson T, et al. Im-age quality vs. radiation dose for a flat-panel amor-phous silicon detector: a phantom study. Eur Ra-diol 2001;11:1704–1709.
48. Okamura T, Tanaka S, Koyama K, et al. Clinicalevaluation of digital radiography based on a large-area cesium iodide-amorphous silicon flat-paneldetector compared with screen-film radiographyfor skeletal system and abdomen. Eur Radiol2002;12:1741–1747.
49. Strotzer M, Volk M, Reiser M, et al. Chest radiog-raphy with a large-area detector based on cesium-iodide/amorphous-silicon technology: image qual-ity and dose requirement in comparison with anasymmetric screen-film system. J Thorac Imaging2000;15:157–161.
50. Strotzer M, Volk M, Wild T, et al. Simulated boneerosions in a hand phantom: detection with con-ventional screen-film technology versus cesiumiodide-amorphous silicon flat-panel detector. Ra-diology 2000;215:512–515.
51. Volk M, Strotzer M, Holzknecht N, et al. Digitalradiography of the skeleton using a large-area de-tector based on amorphous silicon technology:image quality and potential for dose reduction incomparison with screen-film radiography. ClinRadiol 2000;55:615–621.
52. Bacher K, Smeets P, Bonnarens K, et al. Dosereduction in patients undergoing chest imaging:digital amorphous silicon flat-panel detector radi-ography versus conventional film-screen radiogra-phy and phosphor-based computed radiography.AJR Am J Roentgenol 2003;181:923–929.
53. Prokop M, Schaefer-Prokop CM. Digital imageprocessing. Eur Radiol 1997;7:73–82.
54. Neitzel U. Status and prospects of digital detectortechnology for CR and DR. Radiat Prot Dosim-etry 2005;114:32–38.
55. Spahn M. Flat detectors and their clinical applica-tions. Eur Radiol 2005;15:1934–1947.
56. Illers H, Buhr E, Gunther-Kohfahl S, et al. Mea-surement of the modulation transfer function ofdigital X-ray detectors with an opaque edge-testdevice. Radiat Prot Dosimetry 2005;114:214–219.
57. Heyne JP, Merbold H, Sehner J, et al. The reduc-tion of the radiation dosage by means of storagephosphor-film radiography compared to a conven-tional film-screen system with a grid cassette on askull phantom [in German]. Rofo 1999;171:54–59.
58. Heyne JP, Merbold H, Sehner J, et al. Reductionof radiation dosage by using digital luminescenceradiography on a hand phantom [in German].Rofo 2000;172:386–390.
59. Heyne JP, Sehner J, Neumann R, et al. Reductionof radiation exposure by using storage phosphorradiography on pelvis and lumbar spine [in Ger-man]. Rofo 2002;174:104–111.
60. Peer R, Lanser A, Giacomuzzi SM, et al. Storagephosphor radiography of wrist fractures: a subjec-tive comparison of image quality at varying expo-sure levels. Eur Radiol 2002;12:1354–1359.
61. Busch HP, Busch S, Decker C, et al. Image qual-ity and exposure dose in digital projection radiog-raphy. Rofo 2003;175:32–37.
62. Strotzer M, Volk M, Frund R, et al. Routine chestradiography using a flat-panel detector: image qual-ity at standard detector dose and 33% dose reduc-tion. AJR Am J Roentgenol 2002;178:169–171.
63. Hosch WP, Fink C, Radeleff B, et al. Radiationdose reduction in chest radiography using a flat-panel amorphous silicon detector. Clin Radiol2002;57:902–907.
64. Neofotistou V, Tsapaki V, Kottou S, Schreiner-Karoussou A, Vano E. Does digital imaging de-crease patient dose? a pilot study and review of theliterature. Radiat Prot Dosimetry 2005;117:204–210.
65. Volk M, Strotzer M, Gmeinwieser J, et al. Flat-panel x-ray detector using amorphous silicon tech-nology: reduced radiation dose for the detection offoreign bodies. Invest Radiol 1997;32:373–377.
66. Heggie JC, Wilkinson LE. Radiation doses fromcommon radiographic procedures: a ten year per-spective. Australas Phys Eng Sci Med 2000;23:124–134.
67. Weatherburn GC, Bryan S, Davies JG. Compari-son of doses for bedside examinations of the chestwith conventional screen-film and computed radi-ography: results of a randomized controlled trial.Radiology 2000;217:707–712.
68. Geijer H, Beckman K, Jonsson B, et al. Digitalradiography of scoliosis with a scanning method:initial evaluation. Radiology 2001;218:402–410.
69. Geijer H. Radiation dose and image quality in di-agnostic radiology: optimization of the dose-imagequality relationship with clinical experience fromscoliosis radiography, coronary intervention and aflat-panel digital detector. Acta Radiol Suppl2002;43:1–43.
70. Leblans P, Struye L, Willems P. A new needle-crystalline computed radiography detector. J DigitImaging 2000;13:117–120.
71. Schillinger B, Baumann J, Gebele H, et al. A newfast and large area neutron detector using a novelimage plate readout technique. Appl Radiat Isot2004;61:451–454.
72. Korner M, Wirth S, Treitl M, et al. Initial clinicalresults with a new needle screen storage phosphorsystem in chest radiograms. Rofo 2005;177:1491–1496.
73. Frankenberger J, Mair S, Herrmann C, Lamotte J,Fasbender R. Reflective and transmissive CRScanHead technology on needle image plates.Proc SPIE 2005;5745:499–510.
74. Suzuki S, Furui S, Kobayashi I, et al. Radiationdose to patients and radiologists during transcath-eter arterial embolization: comparison of a digitalflat-panel system and conventional unit. AJR Am JRoentgenol 2005;185:855–859.
75. Vano E, Geiger B, Schreiner A, et al. Dynamic flatpanel detector versus image intensifier in cardiacimaging: dose and image quality. Phys Med Biol2005;50:5731–5742.
76. Trianni A, Bernardi G, Padovani R. Are new tech-nologies always reducing patient doses in cardiacprocedures? Radiat Prot Dosimetry 2005;117:97–101.
686 May-June 2007 RG f Volume 27 ● Number 3
EDUCATION EXHIBIT 687
Inferior Phrenic Artery:Anatomy, Variations,Pathologic Conditions,and InterventionalManagement1
Dong Il Gwon, MD ● Gi-Young Ko, MD ● Hyun-Ki Yoon, MD ● Kyu-BoSung, MD ● Jae Moung Lee, MD ● Seok Jong Ryu, MD ● Myong Hee Seo,MD ● Jae-Chan Shim, MD ● Ghi Jai Lee, MD ● Ho Kyun Kim, MD
The inferior phrenic artery (IPA) is the most common source of extra-hepatic collateral blood supply for hepatocellular carcinoma (HCC)and frequently supplies HCCs located in the bare area of the liver.Other pathologic conditions including hemoptysis, diaphragmatic orhepatic bleeding due to trauma or surgery, and bleeding caused by gas-troesophageal problems (eg, Mallory-Weiss tear or gastroesophagealcancer) may be related to the IPA. Over a 4-year period, the authorsperformed 383 interventional procedures related to the IPA. The rightand left IPAs originate with almost equal frequency from the aorta andceliac axis and with lesser frequency from the renal arteries. Variousother sites of origin—such as the left gastric, hepatic, superior mesen-teric, spermatic, and adrenal arteries—are also seen. Radiologists mustbe familiar with the normal spectrum of IPA anatomy so that detectionand adequate interventional management can be achieved when patho-logic conditions related to the IPA are present.©RSNA, 2007
Abbreviations: CTAP � CT during arterial portography, CTHA � CT during hepatic arteriography, HCC � hepatocellular carcinoma, IPA � in-ferior phrenic artery, TACE � transcatheter arterial chemoembolization
RadioGraphics 2007; 27:687–705 ● Published online 10.1148/rg.273065036 ● Content Codes:
1From the Department of Radiology, Seoul Paik Hospital, University of Inje College of Medicine, Seoul, Korea (D.I.G., J.M.L., S.J.R., M.H.S.,J.C.S., G.J.L., H.K.K.); and the Department of Radiology, Asan Medical Center, University of Ulsan College of Medicine, 388-1 Poongnap-Dong,Songpa-Ku, Seoul 138-736, Korea (G.Y.K., H.K.Y., K.B.S.). Recipient of a Cum Laude award for an education exhibit at the 2005 RSNA AnnualMeeting. Received March 22, 2006; revision requested June 12; final revision received January 18, 2007; accepted January 26. All authors have no fi-nancial relationships to disclose. Address correspondence to G.Y.K. (e-mail: [email protected]).
©RSNA, 2007
Note: This copy is for your personal, non-commercial use only. To order presentation-ready copies for distribution to your colleagues or clients, use the RadioGraphics Reprints form at the end of this article.
See last page
TEACHING POINTS
IntroductionThere are many pathologic conditions related tothe inferior phrenic artery (IPA), the most com-mon of which is extrahepatic collateral supply ofhepatocellular carcinoma (HCC) (1–3). The de-velopment of extrahepatic collateral arteries thatsupply HCC interferes with effective control ofthe HCC by means of transcatheter arterial che-moembolization (TACE). To detect involvementof the IPA at an early stage, radiologists should befamiliar with the spectrum of possible extrahe-patic collateral supply by the IPA. The IPA cancontribute to hemoptysis, especially when thepulmonary abnormality involves the lung base(4,5). Other pathologic conditions, such as dia-phragmatic or hepatic bleeding due to trauma orsurgery and bleeding resulting from gastroesopha-geal problems (eg, Mallory-Weiss tear and gastro-esophageal cancer) may also be related to the IPA(6–9). In these cases, interventional managementof the IPA should be attempted to increase thera-peutic efficacy.
To effectively treat pathologic conditions re-lated to the IPA, radiologists should be familiarboth with the anatomy and variations of the nor-mal IPA and with its imaging appearance at com-puted tomographic (CT) and conventional an-giography. In this article, we discuss the anatomyand variations of the IPA, pathologic conditionsrelated to the IPA, and interventional manage-ment of those conditions.
Imaging Techniquesand Interventional Methods
From March 2001 to February 2005, 383 inter-ventional procedures related to the IPA were per-formed at Seoul Paik Hospital and Asan MedicalCenter. All triple-phase dynamic CT scans wereobtained with a multi–detector row helical CTunit (HiSpeed Advantage [GE Medical Systems,Milwaukee, Wis] or Somatom Plus [Siemens,Erlangen, Germany]). A 19–21-gauge intrave-nous catheter was placed in the patient’s ante-cubital vein, and 100 mL of nonionic contrastmaterial was injected intravenously at a rate of2.5 mL/sec by using a power injector. Triple-phase dynamic CT was performed at 30 secondsfor the arterial phase, 60 seconds for the portalvenous phase, and 180 seconds for the equilib-rium phase. The images were obtained in acraniocaudal direction during a single breath-holdacquisition of 20–30 seconds, depending on theliver size, by using the following settings: 7-mmcollimation, 10 mm/sec table speed, and 7–8-mmreconstruction interval.
CT during arterial portography (CTAP) andCT during hepatic arteriography (CTHA) wereused for preoperative evaluation of candidates forhepatic resection. For CTAP and CTHA, arterialvascular access was obtained through two sepa-rate punctures in the same femoral artery by usingthe Seldinger technique. Two 5-F Rosch hepaticcatheters (Cook, Bloomington, Ind) were selec-tively placed, one in the superior mesenteric ar-tery and the other in the common hepatic artery.Before CTAP and CTHA, celiac and superiormesenteric angiographic examinations were per-formed to evaluate tumor vascularity and the vas-cular anatomy. For CTAP, 80 mL of contrastmaterial was injected through the superior mesen-teric artery with a power injector at a rate of 2.5mL/sec, and CT was performed 35 seconds afterthe start of injection. For CTHA, 36 mL of con-trast material was injected through the commonhepatic artery at a rate of 1.8 mL/sec, and CT wasperformed 6 seconds after the start of injection.The images were obtained in a craniocaudal di-rection during a single breath-hold acquisition of20–30 seconds, depending on the liver size. Thescanning parameters were the same as for triple-phase dynamic CT.
For TACE in patients with a hepatic tumor,superior mesenteric arterial portography and ce-liac angiography were performed first, followedby selective angiography of the proper hepatic,right hepatic, and left hepatic arteries; a digitalsubtraction angiography unit was used (V-3000[Philips Medical Systems, Best, the Netherlands]or Multistar TOP [Siemens Medical Solutions,Forchheim, Germany]). IPA collateral supply of ahepatic tumor was suspected after analysis of thefindings demonstrated a hepatic tumor abuttingthe bare area of the liver at initial CT, visualiza-tion of a hypertrophied IPA, a peripheral defectof iodized oil retention within the tumor at fol-low-up CT that was indicated by the previousTACE, a local recurrence at the peripheral por-tion of the treated tumor during follow-up, nodefinitive tumor staining or occlusion of the celiacor hepatic artery at routine angiography, and in-jury to the hepatic artery after multiple previoussessions of TACE.
In most cases, the IPA angiograms were ob-tained through a 5-F Rosch hepatic catheter withmanual injection of 5–10 mL of contrast mate-rial. If adequate angiograms were not obtainedthrough the 5-F catheter due to IPA orifice steno-sis, superselective IPA angiograms were obtainedthrough a 3-F microcatheter (SP [Terumo, To-kyo, Japan] or Microferret-18 [Cook]); 4–8 mLof contrast material was injected with a powerinjector at a rate of 2 mL/sec. Because the IPA
688 May-June 2007 RG f Volume 27 ● Number 3

orifice was previously identified with arterialphase dynamic CT, abdominal aortography wasnot performed. Although the IPA orifice was un-clear at CT, the probable site of IPA origin can bededuced, so there was no need for abdominal aor-tography.
When an IPA angiogram showed tumor stain-ing, treatment by way of the IPA was performed.A 3-F microcatheter was selectively inserted intothe branches of the IPA supplying the liver tumor,and IPA embolization was performed. Becausetissue toxic effects due to chemotherapeuticagents have the potential to cause complications,only a single use of chemotherapeutic agents forTACE through the IPA was avoided. Approxi-mately 2–5 mL of iodized oil mixed with 4–10mL of cis-diaminedichloroplatinum (cisplatin;Dong A, Seoul, Korea) or 5–10 mg of doxorubi-cin hydrochloride (Adriamycin; Dong A) wascarefully injected until near stasis was observed,with careful observation for reflux into nontargetbranches. A small amount of gelatin sponge(Spongostan; Johnson & Johnson, Skipton, En-gland) was also used to achieve complete emboli-zation of the IPA.
For all patients with hemoptysis, contrast-en-hanced CT was performed because it is useful indiagnosing the underlying disease, localizing thebleeding site, and demonstrating the presence of
nonbronchial systemic collateral vessels, whichcan be a significant source of recurrent hemopty-sis after successful bronchial artery embolization.When treating patients with hemoptysis, thebronchial arteries were addressed first. In patientswith lower lung pathologic conditions related tohemoptysis, an IPA angiogram was obtained(a) when CT or thoracic aortography after bron-chial artery embolization revealed pleural thicken-ing and a hypertrophied IPA within hypertro-phied extrapleural fat or (b) when hemoptysisrecurred after the previous bronchial artery em-bolization. These angiograms were obtainedthrough a 5-F visceral catheter (Cobra; Cook).After the selective angiography, if the bronchialarteries and IPA were thought to be the source ofhemoptysis, they were superselectively catheter-ized by using a 3-F microcatheter and then care-fully embolized with 355–510-�m polyvinyl alco-hol particles (Contour; Boston Scientific, Cork,Ireland), gelatin sponge, or microcoils (Tornado;Cook).
Anatomy of the IPA and VariationsThe IPA usually originates between the middle ofthe 12th thoracic and second lumbar vertebrae(10). The right IPA and left IPA originate withalmost equal frequency from the aorta (Figs 1, 2)
Figure 1. Normal anatomy of a right IPA originating from the aorta in a 55-year-old man with a recurrentHCC in the right posterior superior hepatic lobe. (a) Arterial phase dynamic CT scan obtained after two ses-sions of TACE shows the right IPA (arrow) originating from the aorta. A recurrent HCC was seen in liver seg-ment 7. (b) Selective right inferior phrenic angiogram obtained for treatment of the recurrent HCC by meansof a 5-F Rosch hepatic catheter shows the normal anatomy of the right IPA, which originates from the aorta, aswell as no definitive tumor staining. There was no tumor staining on a hepatic angiogram, and the viable por-tion of the HCC was supplied by the right 10th and 11th intercostal arteries. 1 � ascending (anterior) branch,2 � descending (posterior) branch, 3 � inferior vena caval branch, 4 � superior adrenal branch, 5 � diaphrag-matic branch.
RG f Volume 27 ● Number 3 Gwon et al 689
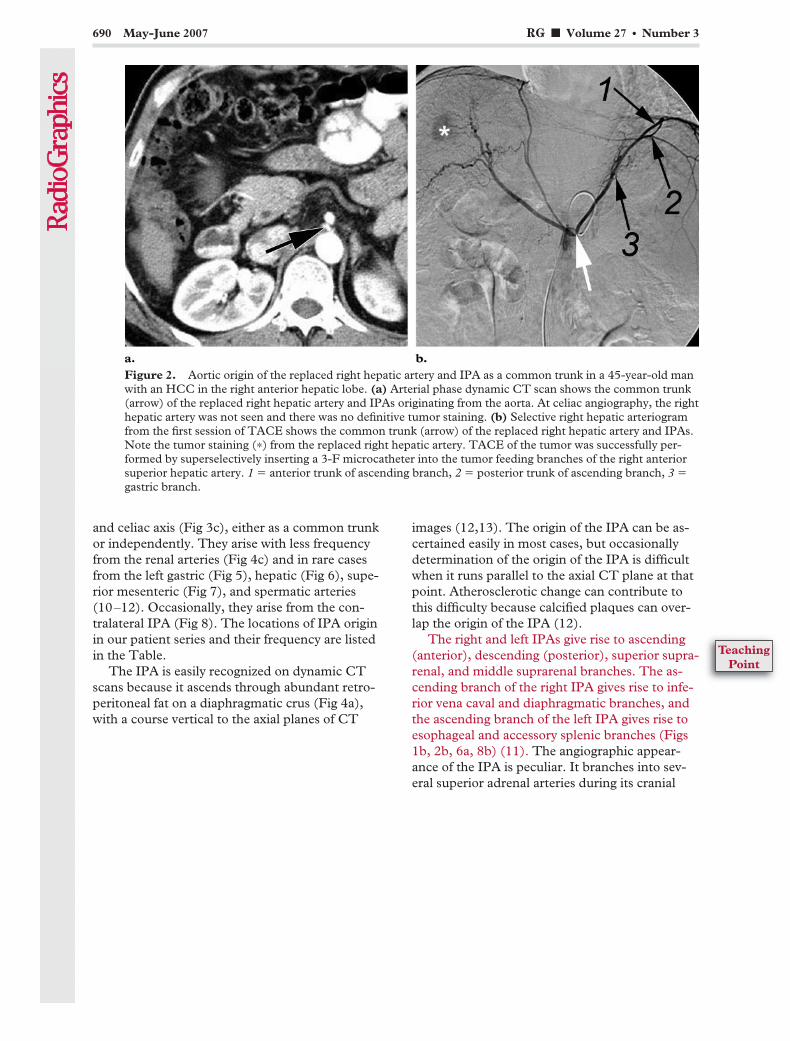
and celiac axis (Fig 3c), either as a common trunkor independently. They arise with less frequencyfrom the renal arteries (Fig 4c) and in rare casesfrom the left gastric (Fig 5), hepatic (Fig 6), supe-rior mesenteric (Fig 7), and spermatic arteries(10–12). Occasionally, they arise from the con-tralateral IPA (Fig 8). The locations of IPA originin our patient series and their frequency are listedin the Table.
The IPA is easily recognized on dynamic CTscans because it ascends through abundant retro-peritoneal fat on a diaphragmatic crus (Fig 4a),with a course vertical to the axial planes of CT
images (12,13). The origin of the IPA can be as-certained easily in most cases, but occasionallydetermination of the origin of the IPA is difficultwhen it runs parallel to the axial CT plane at thatpoint. Atherosclerotic change can contribute tothis difficulty because calcified plaques can over-lap the origin of the IPA (12).
The right and left IPAs give rise to ascending(anterior), descending (posterior), superior supra-renal, and middle suprarenal branches. The as-cending branch of the right IPA gives rise to infe-rior vena caval and diaphragmatic branches, andthe ascending branch of the left IPA gives rise toesophageal and accessory splenic branches (Figs1b, 2b, 6a, 8b) (11). The angiographic appear-ance of the IPA is peculiar. It branches into sev-eral superior adrenal arteries during its cranial
Figure 2. Aortic origin of the replaced right hepatic artery and IPA as a common trunk in a 45-year-old manwith an HCC in the right anterior hepatic lobe. (a) Arterial phase dynamic CT scan shows the common trunk(arrow) of the replaced right hepatic artery and IPAs originating from the aorta. At celiac angiography, the righthepatic artery was not seen and there was no definitive tumor staining. (b) Selective right hepatic arteriogramfrom the first session of TACE shows the common trunk (arrow) of the replaced right hepatic artery and IPAs.Note the tumor staining (*) from the replaced right hepatic artery. TACE of the tumor was successfully per-formed by superselectively inserting a 3-F microcatheter into the tumor feeding branches of the right anteriorsuperior hepatic artery. 1 � anterior trunk of ascending branch, 2 � posterior trunk of ascending branch, 3 �gastric branch.
690 May-June 2007 RG f Volume 27 ● Number 3
TeachingPoint
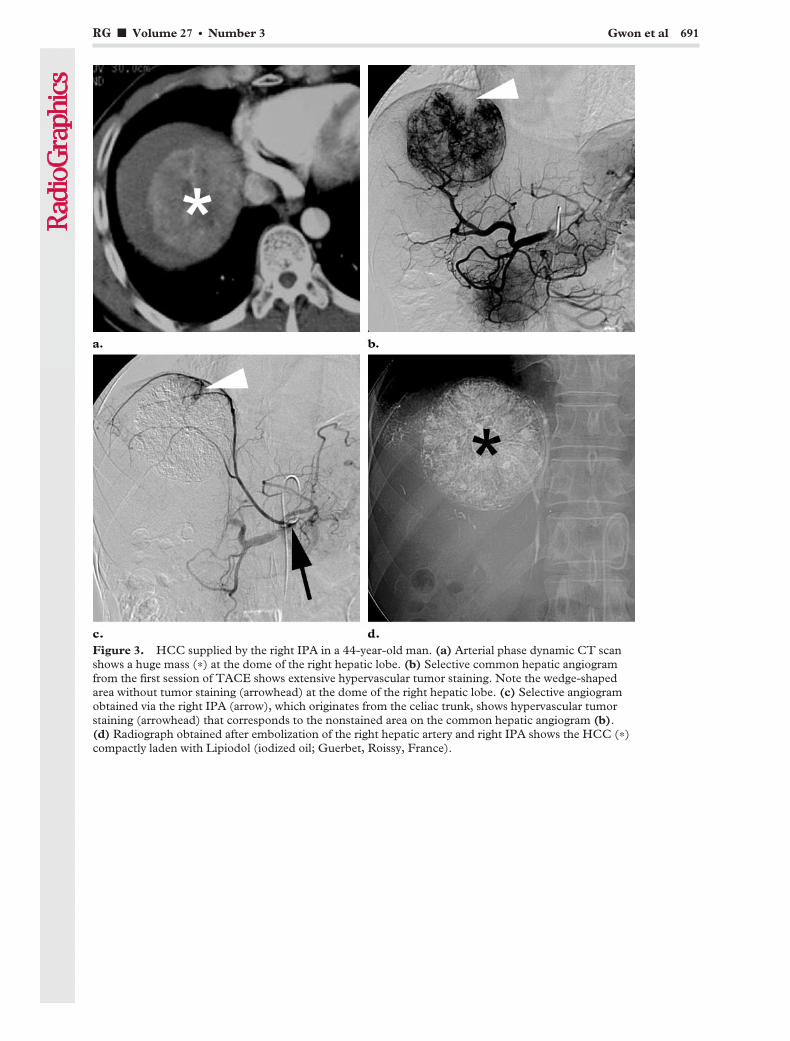
Figure 3. HCC supplied by the right IPA in a 44-year-old man. (a) Arterial phase dynamic CT scanshows a huge mass (*) at the dome of the right hepatic lobe. (b) Selective common hepatic angiogramfrom the first session of TACE shows extensive hypervascular tumor staining. Note the wedge-shapedarea without tumor staining (arrowhead) at the dome of the right hepatic lobe. (c) Selective angiogramobtained via the right IPA (arrow), which originates from the celiac trunk, shows hypervascular tumorstaining (arrowhead) that corresponds to the nonstained area on the common hepatic angiogram (b).(d) Radiograph obtained after embolization of the right hepatic artery and right IPA shows the HCC (*)compactly laden with Lipiodol (iodized oil; Guerbet, Roissy, France).
RG f Volume 27 ● Number 3 Gwon et al 691

Figure 4. HCC exclusively supplied by the right IPA in a 58-year-old man. (a) Arterial phase dynamic CTscan shows a hypervascular mass (*) in the posterior portion of the right hepatic lobe. Note the hypertrophiedascending portion of the right IPA (arrow). (b) Selective celiac angiogram from the first session of TACEshows no definitive tumor staining. We concluded that the feeding vessel might be the right IPA because of thetumor location directly adjacent to the posterior diaphragm, the hypertrophied right IPA, and the absence oftumor staining at celiac angiography. Dynamic CT showed that the right IPA originated from the right renalartery; therefore, aortography for detection of the right IPA was not performed. (c) Selective angiogram ob-tained via the right IPA (arrow), which originates from the right renal artery, shows hypervascular tumor stain-ing (*). The intercostal artery (arrowhead) arising from the right IPA is the feeding vessel for the HCC. (d) Ra-diograph obtained after embolization of the right IPA shows the compact HCC (*) laden with iodized oil.
692 May-June 2007 RG f Volume 27 ● Number 3
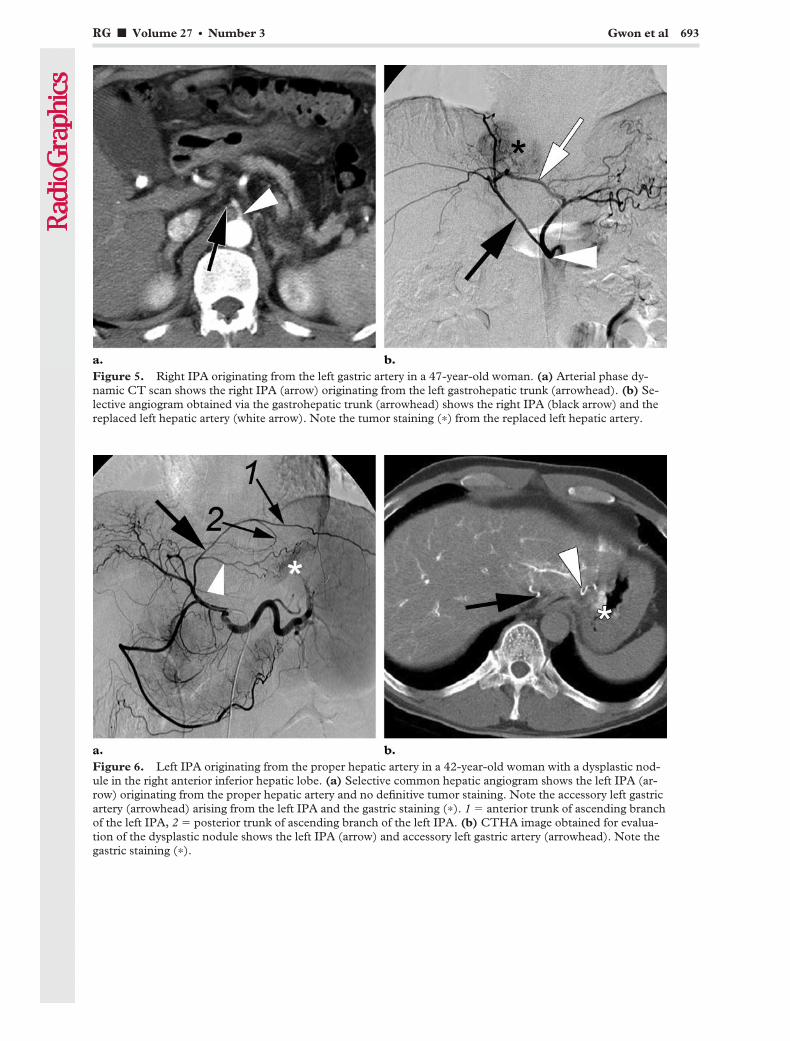
Figure 5. Right IPA originating from the left gastric artery in a 47-year-old woman. (a) Arterial phase dy-namic CT scan shows the right IPA (arrow) originating from the left gastrohepatic trunk (arrowhead). (b) Se-lective angiogram obtained via the gastrohepatic trunk (arrowhead) shows the right IPA (black arrow) and thereplaced left hepatic artery (white arrow). Note the tumor staining (*) from the replaced left hepatic artery.
Figure 6. Left IPA originating from the proper hepatic artery in a 42-year-old woman with a dysplastic nod-ule in the right anterior inferior hepatic lobe. (a) Selective common hepatic angiogram shows the left IPA (ar-row) originating from the proper hepatic artery and no definitive tumor staining. Note the accessory left gastricartery (arrowhead) arising from the left IPA and the gastric staining (*). 1 � anterior trunk of ascending branchof the left IPA, 2 � posterior trunk of ascending branch of the left IPA. (b) CTHA image obtained for evalua-tion of the dysplastic nodule shows the left IPA (arrow) and accessory left gastric artery (arrowhead). Note thegastric staining (*).
RG f Volume 27 ● Number 3 Gwon et al 693

Figure 7. Right IPA originating from the superiormesenteric artery and supplying a huge HCC in a49-year-old woman. (a) Arterial phase dynamic CTscan shows the right IPA (arrow) originating fromthe superior mesenteric artery (arrowhead). (b) Ar-terial phase dynamic CT scan obtained at a higherlevel shows a huge HCC (*) at the dome of the righthepatic lobe. Note the hypertrophied right IPA (ar-row). (c) Selective superior mesenteric angiogramfrom the first session of TACE shows hypervascu-lar tumor staining (*) from the right IPA (arrow),which originates from the superior mesenteric artery(arrowhead). Celiac angiography showed the hugehypervascular tumor with faint tumor staining,which corresponded to the hypervascular tumorstaining seen on the superior mesenteric angiogram,in the right superior portion of the liver.
694 May-June 2007 RG f Volume 27 ● Number 3

ascent along the spine, then divides into ascend-ing and descending branches under the dia-phragm (12,14,15).
The ascending branch is usually located crani-ally and contacts the bare area of the liver, whereno parietal peritoneum covers the diaphragm.Liver segments 1, 2, and 7 make up the bare area(1,2,12,14). As the ascending branch passes be-hind the inferior vena cava, it shoots off the infe-rior vena caval and diaphragmatic hiatal branches(Fig 1b) (11). Potentially, the IPA can communi-cate with the internal mammary artery, intercostalartery (Fig 4c), musculophrenic artery, pericar-diophrenic artery (Fig 9c), and other systemicvessels of the thorax (10,14). The descendingbranch courses toward the lateral crus and anas-tomoses with the lower posterior intercostal arter-ies and musculophrenic artery.
Figure 8. Left IPA originating from the right IPA in a 49-year-old woman who had undergone S6 segmen-tectomy. (a) Arterial phase dynamic CT scan obtained after the second session of postoperative TACE shows arecurrent tumor (*) at the resection margin. Note the right IPA (arrow), which originates from the celiac axis.(b) Selective angiogram obtained via the right IPA (black arrow) shows the left IPA (arrowhead) originatingfrom the right IPA. Note the esophageal branch (white arrow) of the left IPA and the tumor staining (*).
Sites of IPA Origin and Frequencies in 383Cases
Site of Origin No. of Cases
Celiac axis 152 (39.7)Aorta 148 (38.6)Renal artery 59 (15.4)Left gastric artery 14 (3.7)Hepatic artery 8 (2.1)Superior mesenteric artery 1 (0.3)Contralateral IPA 1 (0.3)
Total 383 (100)
Note.—Numbers in parentheses are percentages.
RG f Volume 27 ● Number 3 Gwon et al 695

Behind the esophagus, the ascending branch ofthe left IPA divides into a larger anterior trunkand smaller posterior trunk (Figs 2b, 6a). Theanterior trunk supplies the dome of the dia-phragm and the region of the esophagogastricjunction. The left IPA may give rise to a smallnumber of branches that serve to supply the supe-rior pole of the spleen and the proximal portion ofthe stomach (Figs 2b, 6a, 8b) (11).
The right IPA potentially communicates withthe intrahepatic arteries. Among the variouscollateral pathways, one of the most commonsources of extrahepatic blood supply to the liver isthe right IPA (15,16). All liver segments have thepotential for such communication, but it typicallyoccurs with the caudate lobe and posterior seg-ment, whereas the frequency of communicationwith the other segments is lower (16). In cases ofocclusion or severe stenosis of hepatic arteriesafter repeated TACE, the hepatic arteries are
mainly reconstituted through the right IPA(Fig 10).
The left IPA has the potential to communicatewith intrahepatic arteries of the lateral segment(15). When the IPA is occluded, it is likely to bereconstituted through retroperitoneal branchesderived from the dorsal pancreatic artery, adrenalarteries (Fig 11), left gastric artery, and patentcontralateral IPA (17). Possible collateral path-ways are sometimes missed in cases of occlusionor stenosis of the hepatic arteries or IPA. There-fore, potential collateral pathways of the IPA andhepatic artery should be kept in mind in order toaccomplish effective interventional management.
Figure 9. Hemoptysis due to right middle lobecollapse with bronchiectasis in a 66-year-oldwoman. (a) Contrast-enhanced chest CT scan ob-tained at the level of the celiac trunk shows the rightIPA (arrows) originating from the aorta. (b) Con-trast-enhanced chest CT scan obtained at a higherlevel shows collapse of the right middle lobe (*).Note the hypertrophied vascular structure (arrow)near the right atrium. (c) Selective right inferiorphrenic angiogram shows pulmonary arterial shunts(arrowheads) supplied by the hypertrophied pericar-diophrenic artery (white arrow), which originatesfrom the right IPA (black arrow).
696 May-June 2007 RG f Volume 27 ● Number 3
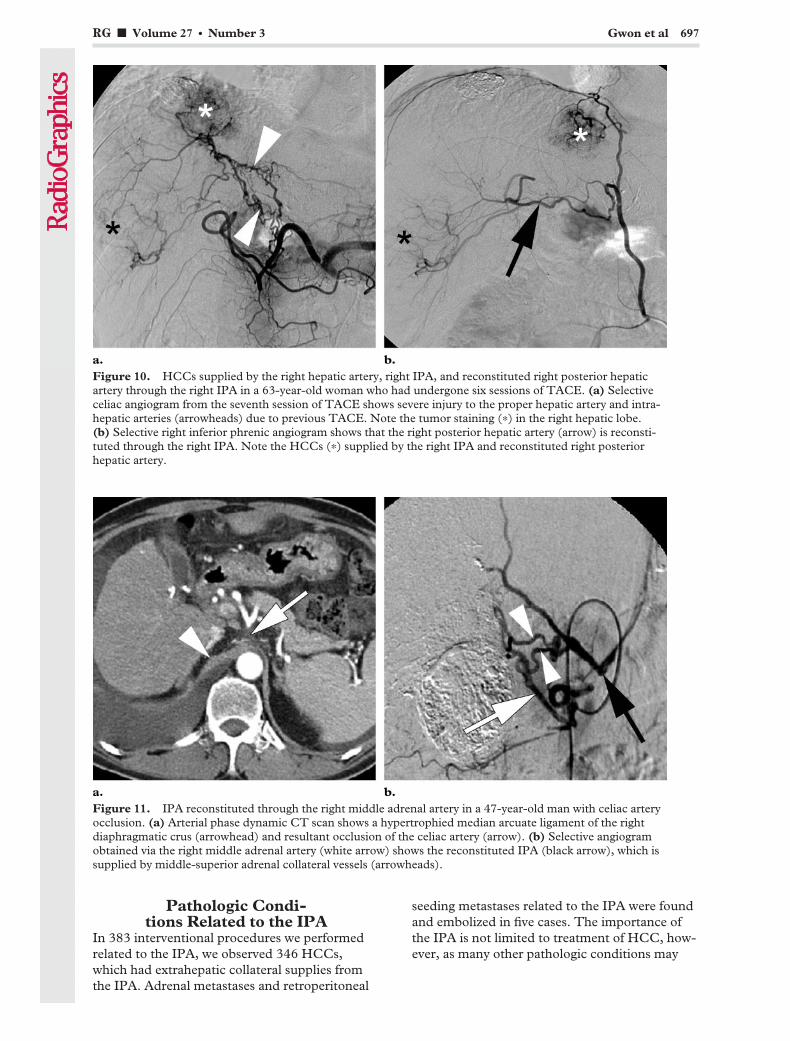
Pathologic Condi-tions Related to the IPA
In 383 interventional procedures we performedrelated to the IPA, we observed 346 HCCs,which had extrahepatic collateral supplies fromthe IPA. Adrenal metastases and retroperitoneal
seeding metastases related to the IPA were foundand embolized in five cases. The importance ofthe IPA is not limited to treatment of HCC, how-ever, as many other pathologic conditions may
Figure 10. HCCs supplied by the right hepatic artery, right IPA, and reconstituted right posterior hepaticartery through the right IPA in a 63-year-old woman who had undergone six sessions of TACE. (a) Selectiveceliac angiogram from the seventh session of TACE shows severe injury to the proper hepatic artery and intra-hepatic arteries (arrowheads) due to previous TACE. Note the tumor staining (*) in the right hepatic lobe.(b) Selective right inferior phrenic angiogram shows that the right posterior hepatic artery (arrow) is reconsti-tuted through the right IPA. Note the HCCs (*) supplied by the right IPA and reconstituted right posteriorhepatic artery.
Figure 11. IPA reconstituted through the right middle adrenal artery in a 47-year-old man with celiac arteryocclusion. (a) Arterial phase dynamic CT scan shows a hypertrophied median arcuate ligament of the rightdiaphragmatic crus (arrowhead) and resultant occlusion of the celiac artery (arrow). (b) Selective angiogramobtained via the right middle adrenal artery (white arrow) shows the reconstituted IPA (black arrow), which issupplied by middle-superior adrenal collateral vessels (arrowheads).
RG f Volume 27 ● Number 3 Gwon et al 697

involve blood supply from the IPA. Other patho-logic conditions related to the IPA that we treatedincluded 19 cases of hemoptysis, 12 of postopera-tive bleeding, and one of trauma. In addition,there have been reports of gastric hemorrhage andMallory-Weiss tear due to bleeding from the leftIPA (7).
Extrahepatic Collateral Supply of HCCTACE is an accepted method of treatment forpatients considered to have unresectable disease.Recognition of the presence of extrahepatic col-lateral arteries is crucial for effective TACE be-cause adequate embolization of both collateralarteries and the hepatic arteries is equally impor-tant. Among the collateral arteries, the IPA is the
Figure 12. HCC in liver segment 1 supplied by the right IPA in a 56-year-old man with multinodular HCCin the entire liver. (a) Arterial phase dynamic CT scan shows multiple HCCs in the entire liver. Note the largeHCC in liver segment 1 (*). (b) Arterial phase dynamic CT scan obtained after one session of TACE shows arecurrent tumor (arrowhead) in liver segment 1. Note the hypertrophied right IPA (arrow). (c) Selective angio-gram obtained via the right IPA (arrow) shows hypervascular tumor staining (arrowhead) that corresponds tothe recurrent tumor. (d) Precontrast CT scan obtained after two sessions of TACE shows the atrophied HCC(arrowhead) laden with iodized oil in liver segment 1.
698 May-June 2007 RG f Volume 27 ● Number 3
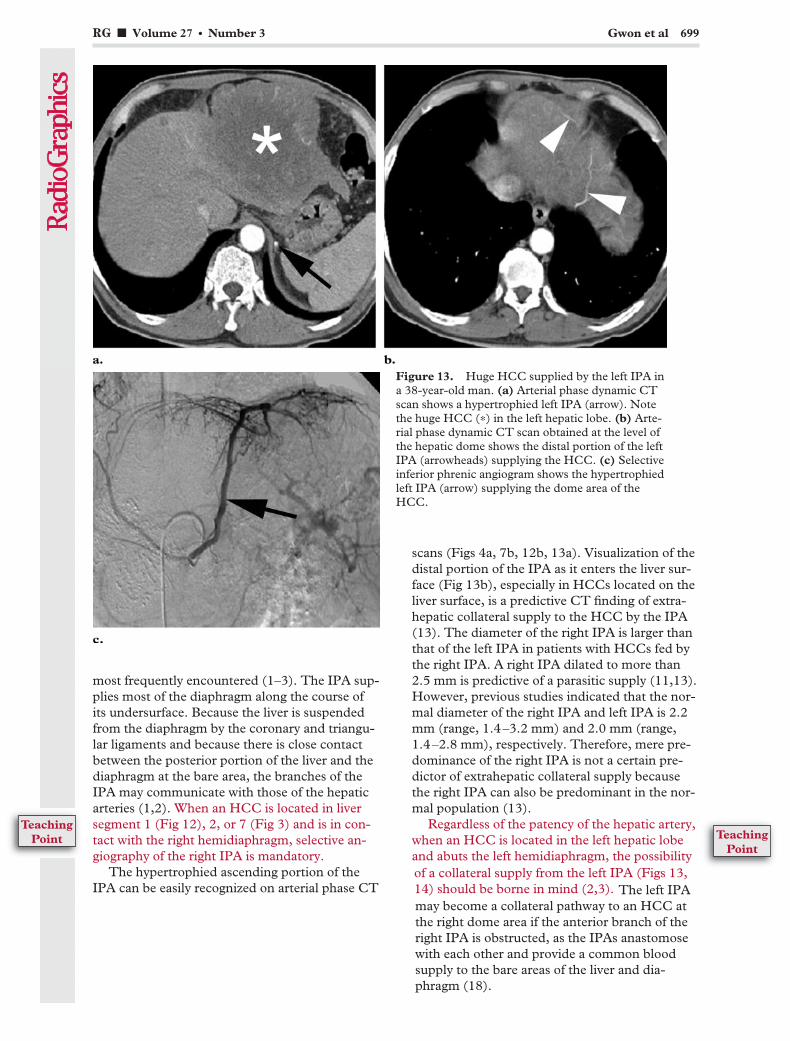
most frequently encountered (1–3). The IPA sup-plies most of the diaphragm along the course ofits undersurface. Because the liver is suspendedfrom the diaphragm by the coronary and triangu-lar ligaments and because there is close contactbetween the posterior portion of the liver and thediaphragm at the bare area, the branches of theIPA may communicate with those of the hepaticarteries (1,2). When an HCC is located in liversegment 1 (Fig 12), 2, or 7 (Fig 3) and is in con-tact with the right hemidiaphragm, selective an-giography of the right IPA is mandatory.
The hypertrophied ascending portion of theIPA can be easily recognized on arterial phase CT
scans (Figs 4a, 7b, 12b, 13a). Visualization of thedistal portion of the IPA as it enters the liver sur-face (Fig 13b), especially in HCCs located on theliver surface, is a predictive CT finding of extra-hepatic collateral supply to the HCC by the IPA(13). The diameter of the right IPA is larger thanthat of the left IPA in patients with HCCs fed bythe right IPA. A right IPA dilated to more than2.5 mm is predictive of a parasitic supply (11,13).However, previous studies indicated that the nor-mal diameter of the right IPA and left IPA is 2.2mm (range, 1.4–3.2 mm) and 2.0 mm (range,1.4–2.8 mm), respectively. Therefore, mere pre-dominance of the right IPA is not a certain pre-dictor of extrahepatic collateral supply becausethe right IPA can also be predominant in the nor-mal population (13).
Regardless of the patency of the hepatic artery,when an HCC is located in the left hepatic lobeand abuts the left hemidiaphragm, the possibility
Figure 13. Huge HCC supplied by the left IPA ina 38-year-old man. (a) Arterial phase dynamic CTscan shows a hypertrophied left IPA (arrow). Notethe huge HCC (*) in the left hepatic lobe. (b) Arte-rial phase dynamic CT scan obtained at the level ofthe hepatic dome shows the distal portion of the leftIPA (arrowheads) supplying the HCC. (c) Selectiveinferior phrenic angiogram shows the hypertrophiedleft IPA (arrow) supplying the dome area of theHCC.
RG f Volume 27 ● Number 3 Gwon et al 699
of a collateral supply from the left IPA (Figs 13,14) should be borne in mind (2,3).
TeachingPoint
TeachingPoint
The left IPAmay become a collateral pathway to an HCC atthe right dome area if the anterior branch of theright IPA is obstructed, as the IPAs anastomosewith each other and provide a common bloodsupply to the bare areas of the liver and dia-phragm (18).
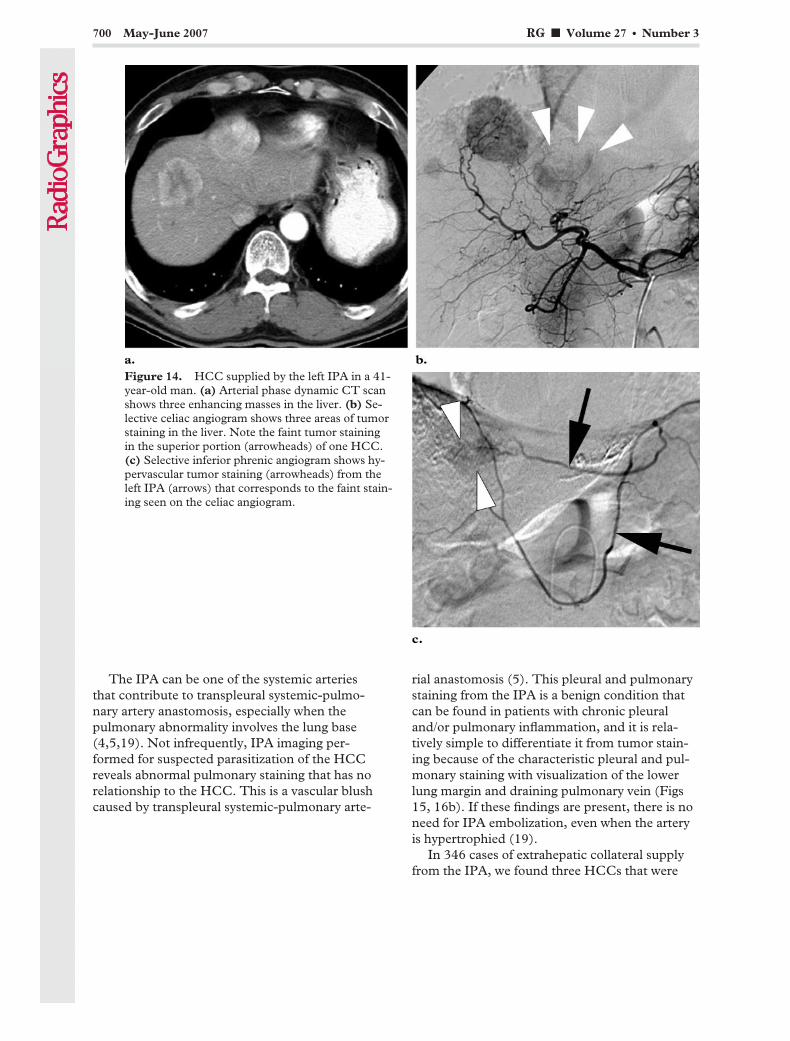
The IPA can be one of the systemic arteriesthat contribute to transpleural systemic-pulmo-nary artery anastomosis, especially when thepulmonary abnormality involves the lung base(4,5,19). Not infrequently, IPA imaging per-formed for suspected parasitization of the HCCreveals abnormal pulmonary staining that has norelationship to the HCC. This is a vascular blushcaused by transpleural systemic-pulmonary arte-
rial anastomosis (5). This pleural and pulmonarystaining from the IPA is a benign condition thatcan be found in patients with chronic pleuraland/or pulmonary inflammation, and it is rela-tively simple to differentiate it from tumor stain-ing because of the characteristic pleural and pul-monary staining with visualization of the lowerlung margin and draining pulmonary vein (Figs15, 16b). If these findings are present, there is noneed for IPA embolization, even when the arteryis hypertrophied (19).
In 346 cases of extrahepatic collateral supplyfrom the IPA, we found three HCCs that were
Figure 14. HCC supplied by the left IPA in a 41-year-old man. (a) Arterial phase dynamic CT scanshows three enhancing masses in the liver. (b) Se-lective celiac angiogram shows three areas of tumorstaining in the liver. Note the faint tumor stainingin the superior portion (arrowheads) of one HCC.(c) Selective inferior phrenic angiogram shows hy-pervascular tumor staining (arrowheads) from theleft IPA (arrows) that corresponds to the faint stain-ing seen on the celiac angiogram.
700 May-June 2007 RG f Volume 27 ● Number 3

exclusively supplied by the right IPA (Figs 4, 17).These HCCs were located in liver segments 6and 7, and two of them had not been previouslytreated. Recurrent HCCs previously treated withTACE may show delayed enhancement at dy-namic CT when the hepatic artery is occludedand when long narrow extrahepatic collateralsother than the right IPA feed the HCC (20).However, in one case we found an HCC exclu-sively supplied by the IPA that also showed de-
layed enhancement at dynamic CT (Fig 17a,17b). At CTHA and CTAP, these masses did notenhance at all (Fig 17c, 17d). Selective commonhepatic angiography showed no tumor staining, afinding indicative of extrahepatic collateral supply(Fig 17e). In this case, we suggest that the rightIPA had an accessory right hepatic artery thatacted as the feeder for the HCC (Fig 17e). Other
Figure 15. HCC supplied by the right IPA in a 65-year-old man. Pleural and pulmonary staining was notedat initial TACE. (a) Arterial phase image from right inferior phrenic angiography shows pleural and pulmonarystaining (arrowheads). (b) Image from the late arterial phase shows the draining pulmonary veins (arrows) run-ning along their courses into the left atrium. HCC staining (*) is also seen.
Figure 16. Retroperitoneal HCC seeding metastases supplied by the right IPA in a 46-year-old man who hadundergone left lobectomy. (a) Arterial phase dynamic CT scan shows multiple seeding metastatic nodules (ar-rowheads) in the right retroperitoneal area. A left adrenal metastasis is also seen. (b) Selective right inferiorphrenic angiogram shows hypervascular seeding metastases (arrowheads). Note the localized pleural and pul-monary staining (arrows) at the lateral aspect of the right lower lung base.
RG f Volume 27 ● Number 3 Gwon et al 701

Figure 17. HCC exclusively supplied by the rightIPA in a 40-year-old man. (a) Arterial phase dy-namic CT scan shows a mass (*) in the posteriorportion of the right hepatic lobe. The mass demon-strates peripheral nodular enhancement. (b) Portalphase dynamic CT scan shows gradual centripetalenhancement. (c, d) CTHA (c) and CTAP (d) im-ages show no tumor enhancement. (e) Selective an-giogram obtained via the right IPA shows hypervas-cular tumor staining (*). There was no tumor stain-ing at hepatic angiography. On the CT scans, avascular structure (arrowhead in a–d) is seen justposteromedial to the mass. The arrow in e indicatesthe vascular structure seen on the CT scans.
702 May-June 2007 RG f Volume 27 ● Number 3

HCC-related pathologic conditions such as retro-peritoneal seeding metastases (Fig 16) and adre-nal metastases can also receive a blood supplyfrom the IPA.
Other PathologicConditions Involving the IPAIn patients with hemoptysis, the bronchial arteriesare the primary source of bleeding. Reduced pul-monary circulation in the lesions of inflammatorylung disease leads to systemic-pulmonary arterialanastomosis accompanied by a compensatoryincrease in systemic circulation, resulting in rup-ture of systemic arteries. In addition to the bron-chial arteries, many systemic arteries—such as theinferior phrenic, intercostal, thyrocervical, inter-nal mammary, thoracodorsal, and lateral thoracicarteries—serve as nonbronchial systemic collater-als that also contribute to hemoptysis (4,5). Dis-eases associated with pleural fibrosis and de-creased pulmonary blood flow, such as bronchi-ectasis, cystic fibrosis, tuberculosis, sarcoidosis,chronic pneumonia, congenital pulmonary arterystenosis, and in some cases pulmonary embolism,
have a tendency to develop this kind of trans-pleural systemic-pulmonary artery anastomosis(4,19). The IPA and other nonbronchial systemiccollaterals are consequently assumed to reducethe therapeutic effect of embolization (5). There-fore, it is important to recognize the IPA duringtransarterial embolization in patients with hemop-tysis, especially when the pulmonary abnormalityinvolves the lung base (Fig 18).
Other pathologic conditions, such as diaphrag-matic or hepatic bleeding due to trauma or sur-gery (Fig 19), may be related to the IPA (6,9).During liver transplantation, ligation of the rightIPA is necessary for hepatectomy in the recipientand for right hepatic lobectomy in a living donor.If the ligation of this artery is not maintained ad-equately, bleeding from the IPA can occur afterliver transplantation. Right IPA bleeding fre-quently occurs within the first 2 weeks after livertransplantation, especially in recipients who un-dergo living donor transplantation because ofliver cirrhosis or HCC (9). In such cases, it is im-portant to keep in mind the possibility of IPAbleeding, and careful evaluation of CT scans maybe helpful in locating the origin of the IPA andactive bleeding foci.
Figure 18. Hemoptysis due to cystic bronchiecta-sis in a 62-year-old man. (a) High-resolution chestCT scan shows cystic bronchiectasis (arrowheads)in the basal segment of the left lower lobe. Ground-glass opacities (*) in the right lower lobe indicateaspirated blood. (b) Contrast-enhanced chest CTscan shows a hypertrophied left IPA (arrow). (c) Se-lective angiogram obtained via the left IPA (arrow),which originates from the celiac trunk, shows pul-monary staining and draining pulmonary veins (ar-rowheads). Successful embolization of the bronchialarteries and left IPA with polyvinyl alcohol particleswas performed. The patient had no further hemop-tysis.
RG f Volume 27 ● Number 3 Gwon et al 703
TeachingPoint
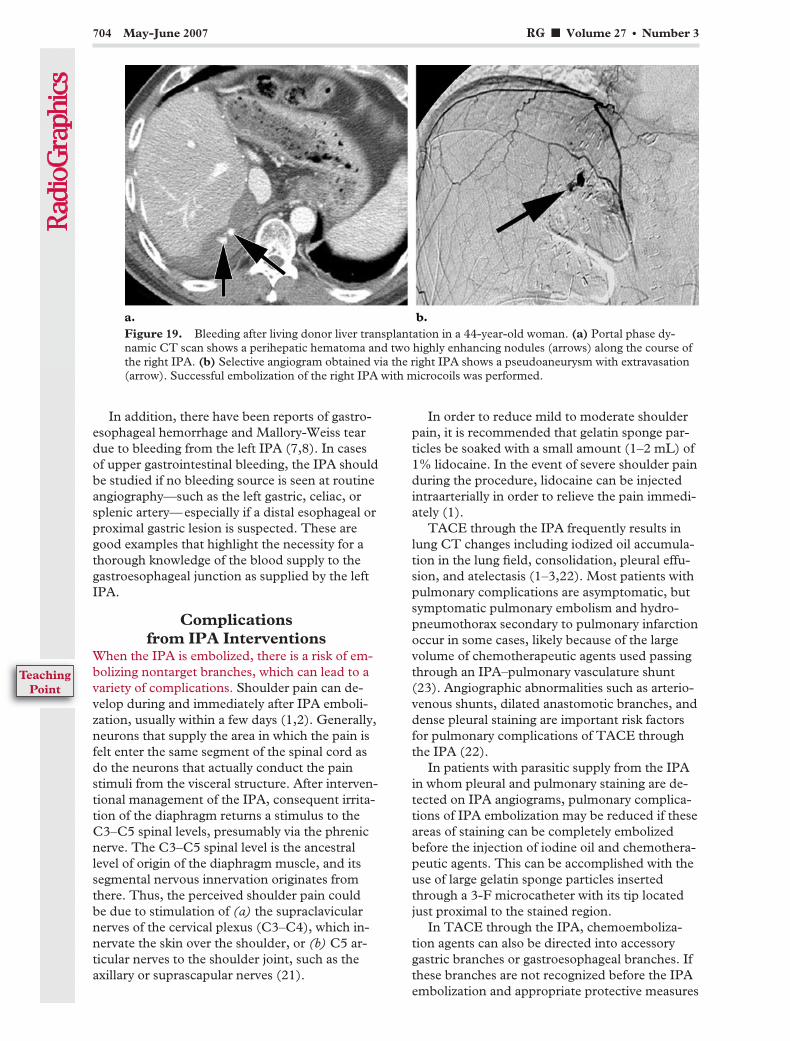
In addition, there have been reports of gastro-esophageal hemorrhage and Mallory-Weiss teardue to bleeding from the left IPA (7,8). In casesof upper gastrointestinal bleeding, the IPA shouldbe studied if no bleeding source is seen at routineangiography—such as the left gastric, celiac, orsplenic artery—especially if a distal esophageal orproximal gastric lesion is suspected. These aregood examples that highlight the necessity for athorough knowledge of the blood supply to thegastroesophageal junction as supplied by the leftIPA.
Complicationsfrom IPA Interventions
When the IPA is embolized, there is a risk of em-bolizing nontarget branches, which can lead to avariety of complications. Shoulder pain can de-velop during and immediately after IPA emboli-zation, usually within a few days (1,2). Generally,neurons that supply the area in which the pain isfelt enter the same segment of the spinal cord asdo the neurons that actually conduct the painstimuli from the visceral structure. After interven-tional management of the IPA, consequent irrita-tion of the diaphragm returns a stimulus to theC3–C5 spinal levels, presumably via the phrenicnerve. The C3–C5 spinal level is the ancestrallevel of origin of the diaphragm muscle, and itssegmental nervous innervation originates fromthere. Thus, the perceived shoulder pain couldbe due to stimulation of (a) the supraclavicularnerves of the cervical plexus (C3–C4), which in-nervate the skin over the shoulder, or (b) C5 ar-ticular nerves to the shoulder joint, such as theaxillary or suprascapular nerves (21).
In order to reduce mild to moderate shoulderpain, it is recommended that gelatin sponge par-ticles be soaked with a small amount (1–2 mL) of1% lidocaine. In the event of severe shoulder painduring the procedure, lidocaine can be injectedintraarterially in order to relieve the pain immedi-ately (1).
TACE through the IPA frequently results inlung CT changes including iodized oil accumula-tion in the lung field, consolidation, pleural effu-sion, and atelectasis (1–3,22). Most patients withpulmonary complications are asymptomatic, butsymptomatic pulmonary embolism and hydro-pneumothorax secondary to pulmonary infarctionoccur in some cases, likely because of the largevolume of chemotherapeutic agents used passingthrough an IPA–pulmonary vasculature shunt(23). Angiographic abnormalities such as arterio-venous shunts, dilated anastomotic branches, anddense pleural staining are important risk factorsfor pulmonary complications of TACE throughthe IPA (22).
In patients with parasitic supply from the IPAin whom pleural and pulmonary staining are de-tected on IPA angiograms, pulmonary complica-tions of IPA embolization may be reduced if theseareas of staining can be completely embolizedbefore the injection of iodine oil and chemothera-peutic agents. This can be accomplished with theuse of large gelatin sponge particles insertedthrough a 3-F microcatheter with its tip locatedjust proximal to the stained region.
In TACE through the IPA, chemoemboliza-tion agents can also be directed into accessorygastric branches or gastroesophageal branches. Ifthese branches are not recognized before the IPAembolization and appropriate protective measures
Figure 19. Bleeding after living donor liver transplantation in a 44-year-old woman. (a) Portal phase dy-namic CT scan shows a perihepatic hematoma and two highly enhancing nodules (arrows) along the course ofthe right IPA. (b) Selective angiogram obtained via the right IPA shows a pseudoaneurysm with extravasation(arrow). Successful embolization of the right IPA with microcoils was performed.
704 May-June 2007 RG f Volume 27 ● Number 3
TeachingPoint
are not taken, gastroesophageal complications—such as gastritis, esophagitis, or ulcer—are un-avoidable. Preventive measures that can be takenare superselective chemoembolization of tumor-feeding vessels and embolization of the accessorygastric branches with microcoils and/or n-butylcyanoacrylate (24,25).
ConclusionsThe IPA is the most frequently encountered ofthe extrahepatic collateral arteries that supplyHCCs. Regardless of the patency of the hepaticartery, angiographic study of the IPA may be rou-tinely recommended when HCCs are located inthe bare area of the liver. Moreover, other patho-logic conditions related to the IPA should beborne in mind. Because variation frequently existsin the origin of the IPA, it may at times be diffi-cult for the angiographer to thoroughly study theIPA. However, careful analysis of arterial phaseCT scans may be significantly helpful in evaluat-ing the IPA. Careful interpretation of the angio-graphic findings of the IPA is also important, as athorough knowledge of the vascular anatomy andvariations of the IPA is critical to effective inter-ventional treatment of the pathologic conditionsrelated to the IPA.
References1. Chung JW, Park JH, Choi BI, Kim TK, Han MC.
Transcatheter oily chemoembolization of the infe-rior phrenic artery in hepatocellular carcinoma: thesafety and potential therapeutic role. J Vasc IntervRadiol 1998;9:495–500.
2. Kim HC, Chung JW, Lee W, Jae HJ, Park JH.Recognizing extrahepatic collateral vessels thatsupply hepatocellular carcinoma to avoid compli-cations of transcatheter arterial chemoemboliza-tion. RadioGraphics 2005;25(suppl 1):S25–S39.
3. Miyayama S, Matsui O, Taki K, et al. Extrahe-patic blood supply to hepatocellular carcinoma:angiographic demonstration and transcatheter ar-terial chemoembolization. Cardiovasc InterventRadiol 2006;29(1):39–48.
4. Webb WR, Jacobs RP. Transpleural abdominalsystemic artery-pulmonary artery anastomosis inpatients with chronic pulmonary infection. AJRAm J Roentgenol 1977;129:233–236.
5. Chun HJ, Byun JY, Yoo SS, Choi BG. Addedbenefit of thoracic aortography after transarterialembolization in patients with hemoptysis. AJRAm J Roentgenol 2003;180:1577–1581.
6. Mizobata Y, Yokota J, Yajima Y, Sakashita K.Two cases of blunt hepatic injury with activebleeding from the right inferior phrenic artery.J Trauma 2000;48:1153–1155.
7. Carsen GM, Casarella WJ, Spiegel RM. Trans-catheter embolization for treatment of Mallory-Weiss tears of the esophagogastric junction. Radi-ology 1978;128(2):309–313.
8. Smith DC, Kitching GB. Angiographic demon-stration of esophagogastric bleeding from the infe-rior phrenic artery. Radiology 1977;125:613–614.
9. Hong SS, Kim AY, Kim HJ, et al. Inferior phrenicarterial bleeding after adult liver transplantation:
incidence, clinical manifestations, and predictiveCT features. AJR Am J Roentgenol 2006;187:W15–W19.
10. Pick JM, Anson BJ. The inferior phrenic artery:origin and suprarenal branches. Anat Rec 1940;78:413–427.
11. Loukas M, Hullett J, Wagner T. Clinical anatomyof the inferior phrenic artery. Clin Anat 2005;18(5):357–365.
12. Hiwatashi A, Yoshida K. The origin of right infe-rior phrenic artery on multidetector row helicalCT. Clin Imaging 2003;27(5):298–303.
13. Okino Y, Kiyosue H, Matsumoto S, Takaji R,Yamada Y, Mori H. Hepatocellular carcinoma:prediction of blood supply from right inferiorphrenic artery by multiphasic CT. J Comput As-sist Tomogr 2003;27(3):341–346.
14. Kahn PC. Selective angiography of the inferiorphrenic arteries. Radiology 1967;88:1–8.
15. Takeuchi Y, Arai Y, Inaba Y, Ohno K, Maeda T,Itai Y. Extrahepatic arterial supply to the liver: ob-servation with a unified CT and angiography systemduring temporary balloon occlusion of the properhepatic artery. Radiology 1998;209:121–128.
16. Yamagami T, Kato T, Tanaka O, Hirota T, Nishi-mura T. Influence of extrahepatic arterial inflowinto the posterior segment or caudate lobe of theliver on repeated hepatic arterial infusion chemo-therapy. J Vasc Interv Radiol 2005;16(4):457–463.
17. Miyayama S, Matsui O, Taki K, et al. Transcath-eter arterial chemoembolization for hepatocellu-lar carcinoma fed by the reconstructed inferiorphrenic artery: anatomical and technical analysis.J Vasc Interv Radiol 2004;15(8):815–823.
18. Suh SH, Won JY, Lee DY, Lee JT, Lee KH. Che-moembolization of the left inferior phrenic arteryin patients with hepatocellular carcinoma: radio-graphic findings and clinical outcome. J Vasc In-terv Radiol 2005;16:1741–1745.
19. Lee DH, Hwang JC, Lim SM, Yoon HK, SungKB, Song HY. Pleural and pulmonary staining atinferior phrenic angiography mimicking a tumorstaining of hepatocellular carcinoma. CardiovascIntervent Radiol 2000;23:109–113.
20. Katoh T, Mitani M, Noma K, et al. Delayed en-hancement of hepatocellular carcinoma on dy-namic CT: sign of extrahepatic collaterals aftertranscatheter arterial chemoembolization or trans-catheter arterial chemoinfusion. Abdom Imaging2002;27:34–39.
21. Tubbs RS, Wellons JC 3rd, Blount JP, Grabb PA,Oakes WJ. Referred shoulder pain from ventricu-loperitoneal shunts. J Neurosurg 2005;102(2suppl):218–220.
22. Tajima T, Honda H, Kuroiwa T, et al. Pulmonarycomplications after hepatic artery chemoemboliza-tion or infusion via the inferior phrenic artery forprimary liver cancer. J Vasc Interv Radiol 2002;13:893–900.
23. Sakamoto I, Aso N, Nagaoki K, et al. Complica-tions associated with transcatheter arterial emboli-zation for hepatic tumors. RadioGraphics 1998;18:605–619.
24. Chung JW, Park JH, Han JK, et al. Hepatic tu-mors: predisposing factors for complications oftranscatheter oily chemoembolization. Radiology1996;198:33–40.
25. Yamagami T, Kato T, Iida S, Tanaka O, Nishi-mura T. Value of transcatheter arterial emboliza-tion with coils and n-butyl cyanoacrylate for long-term hepatic arterial infusion chemotherapy. Radi-ology 2004;230:792–802.
RG f Volume 27 ● Number 3 Gwon et al 705

EDUCATION EXHIBIT 707
Greater and LesserOmenta: NormalAnatomy and Patho-logic Processes1
ONLINE-ONLYCME
See www.rsna.org/education/rg_cme.html.
LEARNINGOBJECTIVESAfter reading thisarticle and takingthe test, the reader
will be able to:
� Describe the nor-mal anatomy of theomenta as seen onCT scans.
� List the diseasesthat may manifest asdiffuse omental infil-tration at CT.
� Discuss the useful-ness of multidetectorCT with multiplanarreformation in evalu-ation of omental dis-eases.
Eunhye Yoo, MD ● Joo Hee Kim, MD ● Myeong-Jin Kim, MD ● Jeong-SikYu, MD ● Jae-Joon Chung, MD ● Hyung-Sik Yoo, MD ● Ki Whang Kim,MD
The peritoneum is the largest serous membrane in the body and theone with the most complex structure. The omentum is a double-lay-ered extension of the peritoneum that connects the stomach to adja-cent organs. The peritoneal reflections form the greater and lesseromenta, and the natural flow of peritoneal fluid determines the route ofspread of intraperitoneal fluid and consequently of disease processeswithin the abdominal cavity. The omenta serve both as boundaries fordisease processes and as conduits for disease spread. The omenta arefrequently involved by infectious, inflammatory, neoplastic, vascular,and traumatic processes. Computed tomography (CT) is a primarydiagnostic method for evaluation of omental diseases, most of whichmay manifest with nonspecific clinical features. Multidetector CT withmultiplanar reformation allows accurate examination of the complexanatomy of the peritoneal cavity, knowledge of which is the key to un-derstanding the pathologic processes affecting the greater and lesseromenta.©RSNA, 2007
RadioGraphics 2007; 27:707–720 ● Published online 10.1148/rg.273065085 ● Content Codes:
1From the Department of Diagnostic Radiology (E.Y., J.H.K., M.J.K., J.S.Y., J.J.C., H.S.Y., K.W.K.) and Institute of Gastroenterology (M.J.K.),Yonsei University College of Medicine, Seodaemun-ku, Shinchon-dong 134, Seoul 120-752, Republic of Korea. Presented as an education exhibit atthe 2005 RSNA Annual Meeting. Received May 2, 2006; revision requested July 24 and received September 11; accepted September 18. All authorshave no financial relationships to disclose. Address correspondence to J.H.K. (e-mail: [email protected]).
©RSNA, 2007
Note: This copy is for your personal, non-commercial use only. To order presentation-ready copies for distribution to your colleagues or clients, use the RadioGraphics Reprints form at the end of this article.
See last page
TEACHING POINTS
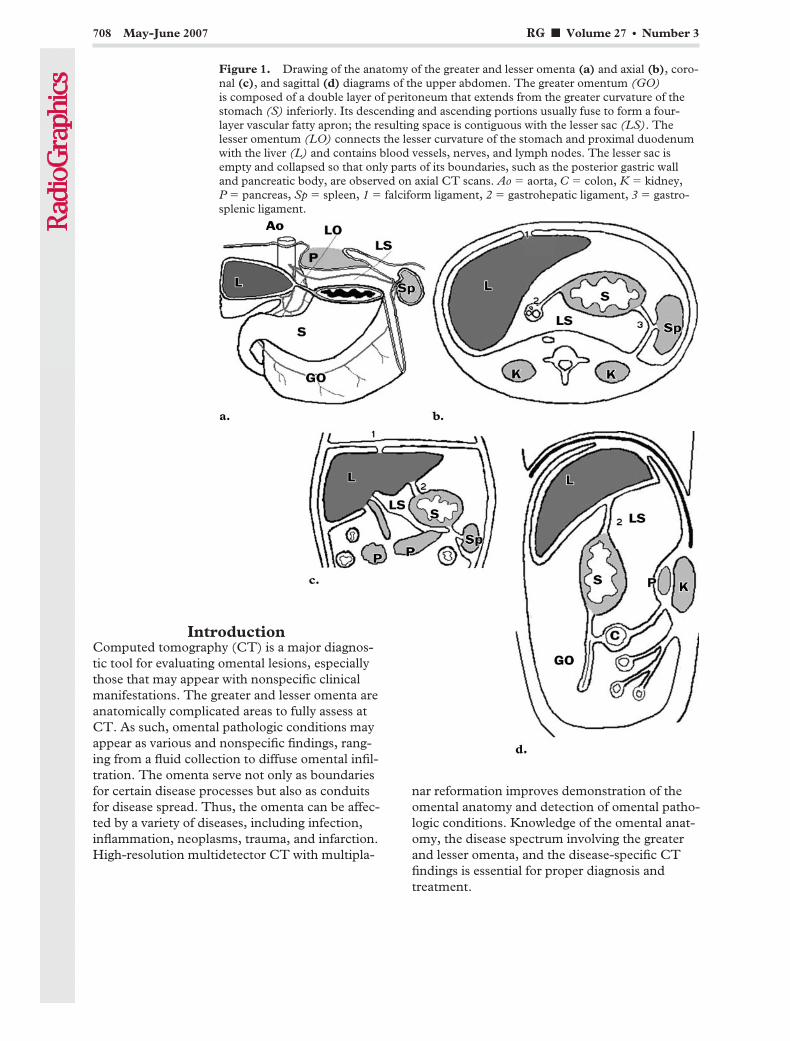
IntroductionComputed tomography (CT) is a major diagnos-tic tool for evaluating omental lesions, especiallythose that may appear with nonspecific clinicalmanifestations. The greater and lesser omenta areanatomically complicated areas to fully assess atCT. As such, omental pathologic conditions mayappear as various and nonspecific findings, rang-ing from a fluid collection to diffuse omental infil-tration. The omenta serve not only as boundariesfor certain disease processes but also as conduitsfor disease spread. Thus, the omenta can be affec-ted by a variety of diseases, including infection,inflammation, neoplasms, trauma, and infarction.High-resolution multidetector CT with multipla-
nar reformation improves demonstration of theomental anatomy and detection of omental patho-logic conditions. Knowledge of the omental anat-omy, the disease spectrum involving the greaterand lesser omenta, and the disease-specific CTfindings is essential for proper diagnosis andtreatment.
Figure 1. Drawing of the anatomy of the greater and lesser omenta (a) and axial (b), coro-nal (c), and sagittal (d) diagrams of the upper abdomen. The greater omentum (GO)is composed of a double layer of peritoneum that extends from the greater curvature of thestomach (S) inferiorly. Its descending and ascending portions usually fuse to form a four-layer vascular fatty apron; the resulting space is contiguous with the lesser sac (LS). Thelesser omentum (LO) connects the lesser curvature of the stomach and proximal duodenumwith the liver (L) and contains blood vessels, nerves, and lymph nodes. The lesser sac isempty and collapsed so that only parts of its boundaries, such as the posterior gastric walland pancreatic body, are observed on axial CT scans. Ao � aorta, C � colon, K � kidney,P � pancreas, Sp � spleen, 1 � falciform ligament, 2 � gastrohepatic ligament, 3 � gastro-splenic ligament.
708 May-June 2007 RG f Volume 27 ● Number 3
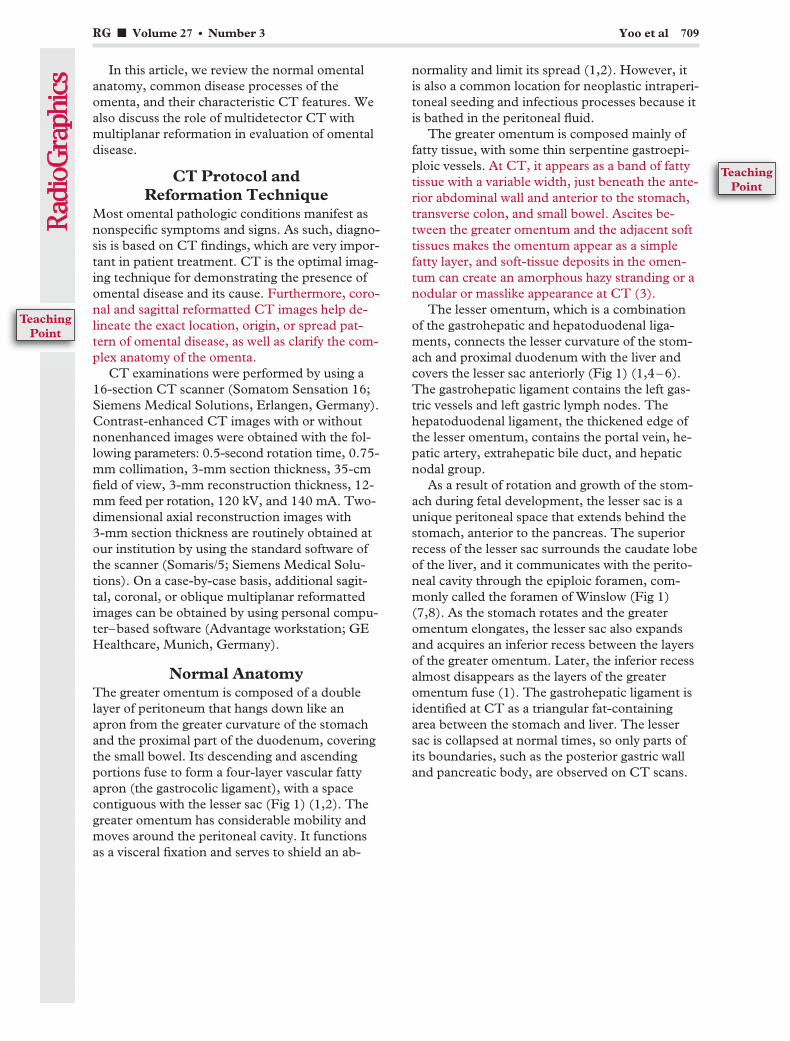
In this article, we review the normal omentalanatomy, common disease processes of theomenta, and their characteristic CT features. Wealso discuss the role of multidetector CT withmultiplanar reformation in evaluation of omentaldisease.
CT Protocol andReformation Technique
Most omental pathologic conditions manifest asnonspecific symptoms and signs. As such, diagno-sis is based on CT findings, which are very impor-tant in patient treatment. CT is the optimal imag-ing technique for demonstrating the presence ofomental disease and its cause. Furthermore, coro-nal and sagittal reformatted CT images help de-lineate the exact location, origin, or spread pat-tern of omental disease, as well as clarify the com-plex anatomy of the omenta.
CT examinations were performed by using a16-section CT scanner (Somatom Sensation 16;Siemens Medical Solutions, Erlangen, Germany).Contrast-enhanced CT images with or withoutnonenhanced images were obtained with the fol-lowing parameters: 0.5-second rotation time, 0.75-mm collimation, 3-mm section thickness, 35-cmfield of view, 3-mm reconstruction thickness, 12-mm feed per rotation, 120 kV, and 140 mA. Two-dimensional axial reconstruction images with3-mm section thickness are routinely obtained atour institution by using the standard software ofthe scanner (Somaris/5; Siemens Medical Solu-tions). On a case-by-case basis, additional sagit-tal, coronal, or oblique multiplanar reformattedimages can be obtained by using personal compu-ter–based software (Advantage workstation; GEHealthcare, Munich, Germany).
Normal AnatomyThe greater omentum is composed of a doublelayer of peritoneum that hangs down like anapron from the greater curvature of the stomachand the proximal part of the duodenum, coveringthe small bowel. Its descending and ascendingportions fuse to form a four-layer vascular fattyapron (the gastrocolic ligament), with a spacecontiguous with the lesser sac (Fig 1) (1,2). Thegreater omentum has considerable mobility andmoves around the peritoneal cavity. It functionsas a visceral fixation and serves to shield an ab-
normality and limit its spread (1,2). However, itis also a common location for neoplastic intraperi-toneal seeding and infectious processes because itis bathed in the peritoneal fluid.
The greater omentum is composed mainly offatty tissue, with some thin serpentine gastroepi-ploic vessels. At CT, it appears as a band of fattytissue with a variable width, just beneath the ante-rior abdominal wall and anterior to the stomach,transverse colon, and small bowel. Ascites be-tween the greater omentum and the adjacent softtissues makes the omentum appear as a simplefatty layer, and soft-tissue deposits in the omen-tum can create an amorphous hazy stranding or anodular or masslike appearance at CT (3).
The lesser omentum, which is a combinationof the gastrohepatic and hepatoduodenal liga-ments, connects the lesser curvature of the stom-ach and proximal duodenum with the liver andcovers the lesser sac anteriorly (Fig 1) (1,4–6).The gastrohepatic ligament contains the left gas-tric vessels and left gastric lymph nodes. Thehepatoduodenal ligament, the thickened edge ofthe lesser omentum, contains the portal vein, he-patic artery, extrahepatic bile duct, and hepaticnodal group.
As a result of rotation and growth of the stom-ach during fetal development, the lesser sac is aunique peritoneal space that extends behind thestomach, anterior to the pancreas. The superiorrecess of the lesser sac surrounds the caudate lobeof the liver, and it communicates with the perito-neal cavity through the epiploic foramen, com-monly called the foramen of Winslow (Fig 1)(7,8). As the stomach rotates and the greateromentum elongates, the lesser sac also expandsand acquires an inferior recess between the layersof the greater omentum. Later, the inferior recessalmost disappears as the layers of the greateromentum fuse (1). The gastrohepatic ligament isidentified at CT as a triangular fat-containingarea between the stomach and liver. The lessersac is collapsed at normal times, so only parts ofits boundaries, such as the posterior gastric walland pancreatic body, are observed on CT scans.
RG f Volume 27 ● Number 3 Yoo et al 709
TeachingPoint
TeachingPoint
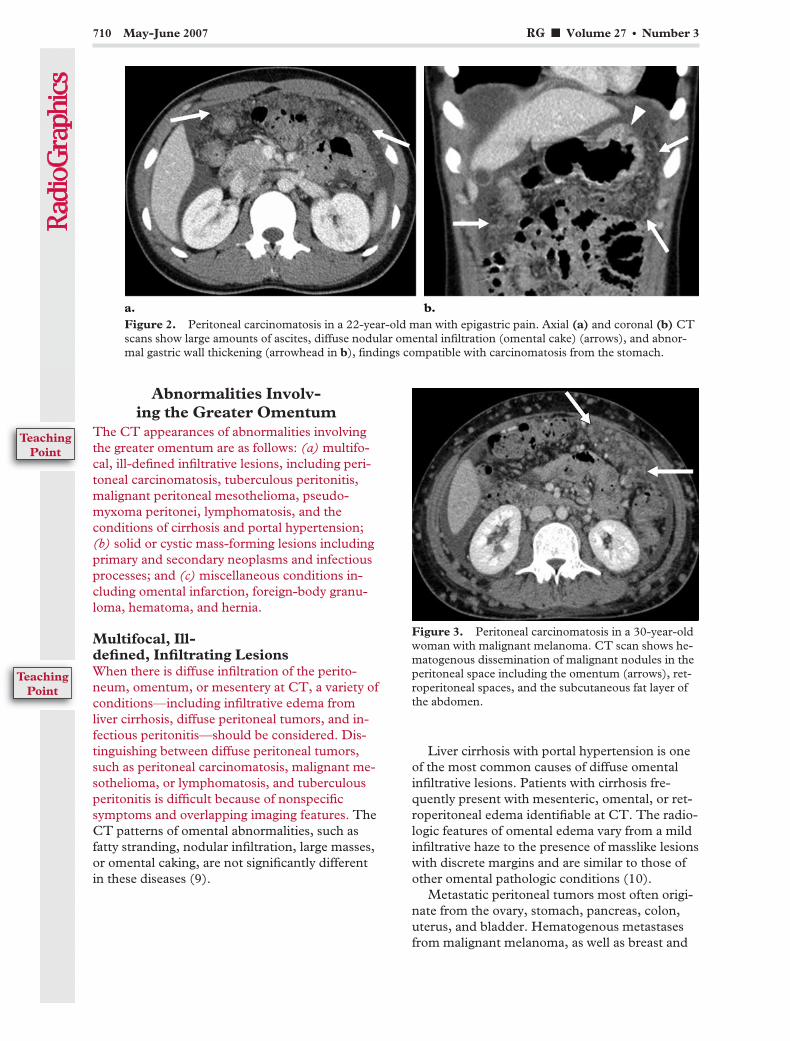
Abnormalities Involv-ing the Greater Omentum
The CT appearances of abnormalities involvingthe greater omentum are as follows: (a) multifo-cal, ill-defined infiltrative lesions, including peri-toneal carcinomatosis, tuberculous peritonitis,malignant peritoneal mesothelioma, pseudo-myxoma peritonei, lymphomatosis, and theconditions of cirrhosis and portal hypertension;(b) solid or cystic mass-forming lesions includingprimary and secondary neoplasms and infectiousprocesses; and (c) miscellaneous conditions in-cluding omental infarction, foreign-body granu-loma, hematoma, and hernia.
Multifocal, Ill-defined, Infiltrating LesionsWhen there is diffuse infiltration of the perito-neum, omentum, or mesentery at CT, a variety ofconditions—including infiltrative edema fromliver cirrhosis, diffuse peritoneal tumors, and in-fectious peritonitis—should be considered. Dis-tinguishing between diffuse peritoneal tumors,such as peritoneal carcinomatosis, malignant me-sothelioma, or lymphomatosis, and tuberculousperitonitis is difficult because of nonspecificsymptoms and overlapping imaging features. TheCT patterns of omental abnormalities, such asfatty stranding, nodular infiltration, large masses,or omental caking, are not significantly differentin these diseases (9).
Liver cirrhosis with portal hypertension is oneof the most common causes of diffuse omentalinfiltrative lesions. Patients with cirrhosis fre-quently present with mesenteric, omental, or ret-roperitoneal edema identifiable at CT. The radio-logic features of omental edema vary from a mildinfiltrative haze to the presence of masslike lesionswith discrete margins and are similar to those ofother omental pathologic conditions (10).
Metastatic peritoneal tumors most often origi-nate from the ovary, stomach, pancreas, colon,uterus, and bladder. Hematogenous metastasesfrom malignant melanoma, as well as breast and
Figure 2. Peritoneal carcinomatosis in a 22-year-old man with epigastric pain. Axial (a) and coronal (b) CTscans show large amounts of ascites, diffuse nodular omental infiltration (omental cake) (arrows), and abnor-mal gastric wall thickening (arrowhead in b), findings compatible with carcinomatosis from the stomach.
Figure 3. Peritoneal carcinomatosis in a 30-year-oldwoman with malignant melanoma. CT scan shows he-matogenous dissemination of malignant nodules in theperitoneal space including the omentum (arrows), ret-roperitoneal spaces, and the subcutaneous fat layer ofthe abdomen.
710 May-June 2007 RG f Volume 27 ● Number 3
TeachingPoint
TeachingPoint

lung carcinoma, are also common. Patients withperitoneal carcinomatosis may demonstrate as-cites, peritoneal thickening, seeding nodules, andomental infiltration (Figs 2, 3) (3,11). However,these findings are not specific for peritoneal carci-nomatosis and can be seen with other entities thatseed the peritoneum, including mesothelioma,tuberculosis, and lymphomatosis. Therefore, theradiologist should make an effort to look for aprimary tumor, especially in the gastrointestinaland genitourinary tracts. Although omental cak-ing is commonly seen in patients with peritonealcarcinomatosis, it is not diagnostic for this dis-ease. Irregular thickening of the outer contour ofthe infiltrated omentum favors the diagnosis ofperitoneal carcinomatosis (11).
Tuberculous peritonitis is caused by hematog-enous spread of pulmonary tuberculosis or byrupture of a mesenteric node. CT findings favor-ing a diagnosis of tuberculous peritonitis overother disease processes are as follows: smoothperitoneum with minimal thickening and pro-nounced enhancement, mesenteric involvementwith macronodules (5 mm in diameter), a thinomental line (fibrous wall covering the infiltratedomentum), mesenteric adenopathy with low-at-tenuation centers (caseous necrosis), and calcifi-cations (Fig 4) (11–13). The fibrotic type of tu-berculous peritonitis, although not common, is
characterized by loculated ascites, large omentalmasses, and separation or fixation of bowel loops.
Malignant peritoneal mesothelioma is a rarecondition and accounts for 12%–33% of all me-sotheliomas. Malignant peritoneal mesotheliomamay have a variable appearance at CT. It is com-monly associated with ascites, irregular or nodu-lar peritoneal thickening, a “stellate” pattern ofthe mesentery, bowel wall thickening, and omen-tal involvement ranging from finely infiltrated fatwith a “smudged” appearance to discrete omentalnodules or omental caking (Fig 5) (13). It some-times manifests as a large quantifiable mass in theupper abdomen with minimal ascites and discretenodules scattered over the peritoneum.
Pseudomyxoma peritonei is characterized bythe gradual accumulation of large volumes of mu-cinous ascites, which arise from a ruptured be-nign or malignant mucin-producing tumor of theappendix, ovary, pancreas, stomach, colorectum,or urachus. At CT, pseudomyxoma peritonei ap-pears as a low-attenuation, frequently loculatedfluid collection in the peritoneal cavity, omentum,and mesentery. Scalloping of visceral surfaces,especially the liver, is the diagnostic characteristicthat distinguishes mucinous from serous ascites atCT (Fig 6) (14). Curvilinear or punctate calcifi-cations in the mucinous materials are frequentlyidentified (15).
Figure 4. Tuberculous peritonitis in a 38-year-oldwoman with abdominal distention for 1 week. CT scanshows a large amount of ascites with even peritonealthickening (arrowhead) and diffuse omental infiltration(arrow) without associated lymphadenopathy. The ini-tial impression was carcinomatosis. When the primarymalignancy is unclear, the differential diagnosis shouldinclude tuberculous peritonitis, particularly in endemicareas. The final diagnosis was tuberculous peritonitis.
Figure 5. Malignant peritoneal mesothelioma in a47-year-old man with dyspnea for 1 month. CT scanshows a diffuse, platelike mass in the greater omentum(arrows), massive ascites, and peritoneal thickening.Malignant mesothelioma was confirmed with pleuralbiopsy and cytologic analysis of peritoneal fluid.
RG f Volume 27 ● Number 3 Yoo et al 711
Peritoneal lymphomatosis is curable withoutsurgery, unlike other peritoneal malignant dis-eases. Diagnosis of peritoneal lymphomatosiswith CT is difficult because it closely mimics peri-toneal carcinomatosis and tuberculous peritonitis.However, ascites without any loculation or septa-tions and a diffuse distribution of enlarged lymphnodes are promising prognosticators (16). Retro-peritoneal and mesenteric lymphadenopathy isdemonstrable, and the enlarged lymph nodes ap-pear as homogeneous attenuation or central lowattenuation with peripheral rim enhancement(Fig 7). CT findings of omental involvement in-clude omental “smudging” and omental cakingrather than a discrete nodular pattern.
Solid or Cystic Mass-forming LesionsSecondary neoplasms involving the greater omen-tum are far more common than primary tumors.Many neoplasms have been shown to involve thegreater omentum by direct spread, peritonealseeding, or hematologic spread (Fig 8). Meta-static peritoneal tumors most often originate fromcarcinomas of the ovary, stomach, pancreas, andcolon (Fig 9) (9).
Primary neoplasms of the omentum are un-common and include mesotheliomas, hemangio-pericytomas, stromal tumors, leiomyomas, lipo-mas, neurofibromas, fibromas, leiomyosarcomas,liposarcomas, and fibrosarcomas. Imaging find-ings of primary omental tumors are nonspecific.Benign tumors are usually well circumscribed and
localized in the omentum. Malignant tumors fre-quently have indistinct margins and invade intosurrounding structures. Both malignant and be-nign tumors can appear complex, with cystic andsolid elements. Some cystic lesions may involvethe greater omentum, including cystic lym-phangioma, enteric duplication cyst, enteric cyst,mesothelial cyst, and nonpancreatic pseudocyst(17). Abdominal lymphangioma is characterized
Figure 6. Pseudomyxoma peritonei in a 47-year-old man with abdominal discomfort. Axial (a) and coro-nal (b) CT scans show multiple low-attenuation nodules and masses in the omentum and peritoneal cavity.Curvilinear or punctate calcifications of the seeding nodules; scalloping of the liver, spleen, and stomach; andsmall bowel adhesions from mesenteric infiltration are noted. Pseudomyxoma peritonei was proved with peri-toneoscopic biopsy.
Figure 7. Peritoneal lymphomatosis in a 71-year-oldman with abdominal distention for 15 days. CT scanshows ascites in the pelvic cavity and innumerableseeding nodules in the peritoneal cavity and omentum(white arrow). Multiple enlarged lymph nodes withconglomeration (black arrows) are seen in the retro-peritoneal spaces. Endoscopic gastric biopsy showedB-cell lymphoma, thus confirming the diagnosis of lym-phomatosis.
712 May-June 2007 RG f Volume 27 ● Number 3
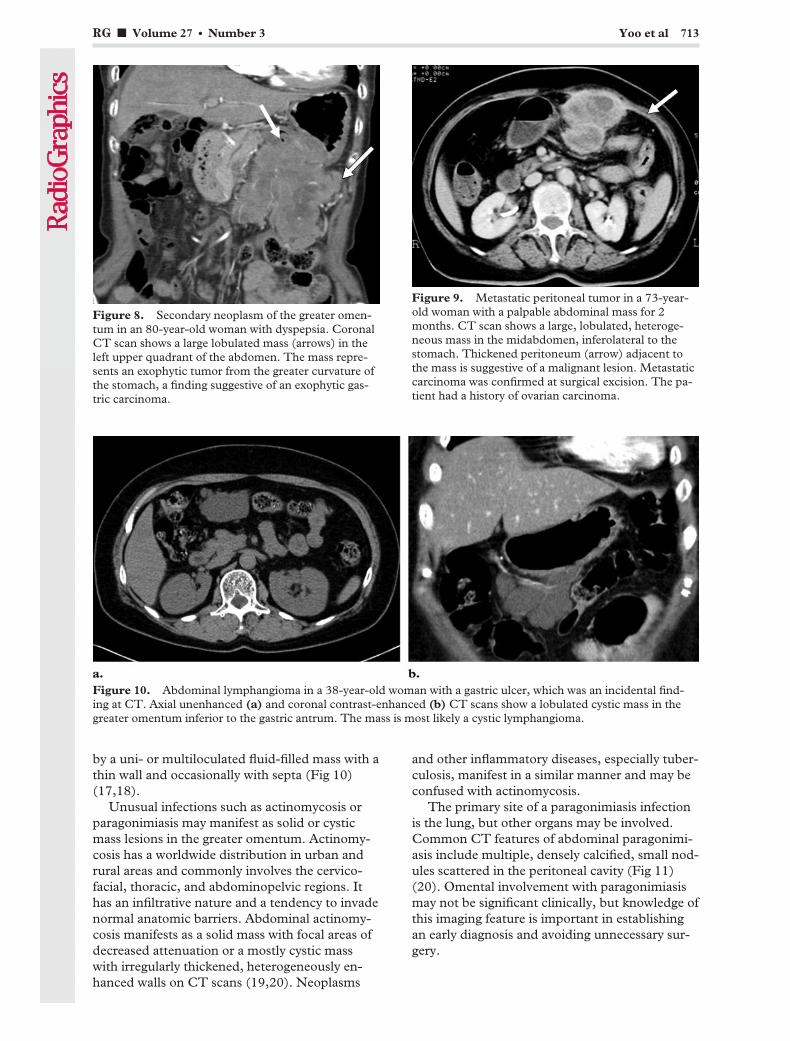
by a uni- or multiloculated fluid-filled mass with athin wall and occasionally with septa (Fig 10)(17,18).
Unusual infections such as actinomycosis orparagonimiasis may manifest as solid or cysticmass lesions in the greater omentum. Actinomy-cosis has a worldwide distribution in urban andrural areas and commonly involves the cervico-facial, thoracic, and abdominopelvic regions. Ithas an infiltrative nature and a tendency to invadenormal anatomic barriers. Abdominal actinomy-cosis manifests as a solid mass with focal areas ofdecreased attenuation or a mostly cystic masswith irregularly thickened, heterogeneously en-hanced walls on CT scans (19,20). Neoplasms
and other inflammatory diseases, especially tuber-culosis, manifest in a similar manner and may beconfused with actinomycosis.
The primary site of a paragonimiasis infectionis the lung, but other organs may be involved.Common CT features of abdominal paragonimi-asis include multiple, densely calcified, small nod-ules scattered in the peritoneal cavity (Fig 11)(20). Omental involvement with paragonimiasismay not be significant clinically, but knowledge ofthis imaging feature is important in establishingan early diagnosis and avoiding unnecessary sur-gery.
Figure 8. Secondary neoplasm of the greater omen-tum in an 80-year-old woman with dyspepsia. CoronalCT scan shows a large lobulated mass (arrows) in theleft upper quadrant of the abdomen. The mass repre-sents an exophytic tumor from the greater curvature ofthe stomach, a finding suggestive of an exophytic gas-tric carcinoma.
Figure 9. Metastatic peritoneal tumor in a 73-year-old woman with a palpable abdominal mass for 2months. CT scan shows a large, lobulated, heteroge-neous mass in the midabdomen, inferolateral to thestomach. Thickened peritoneum (arrow) adjacent tothe mass is suggestive of a malignant lesion. Metastaticcarcinoma was confirmed at surgical excision. The pa-tient had a history of ovarian carcinoma.
Figure 10. Abdominal lymphangioma in a 38-year-old woman with a gastric ulcer, which was an incidental find-ing at CT. Axial unenhanced (a) and coronal contrast-enhanced (b) CT scans show a lobulated cystic mass in thegreater omentum inferior to the gastric antrum. The mass is most likely a cystic lymphangioma.
RG f Volume 27 ● Number 3 Yoo et al 713

Miscellaneous LesionsSegmental omental infarctions are rare and cancause acute abdomen. Primary torsion has noknown cause. Secondary torsion is more com-mon, and the causes include a hernia, a focus ofinflammation, previous laparotomy, or a tumor.Preoperative diagnosis is difficult, as right omen-tal involvement is much more common and clini-
cal signs and symptoms are usually nonspecific;they may thus mimic acute appendicitis or chole-cystitis. CT findings range from subtle, focal,hazy soft-tissue infiltration of the omentum to amore extensive, masslike fullness that can re-semble pathologic infiltration from more ominouscauses. Whirling fatty tissue around a vascularstructure may be a specific finding for omentaltorsion (Fig 12) (21,22). The greater omentum is
Figure 11. Abdominal paragonimiasis in a 49-year-old man with hepatic lesions incidentally found during laparo-scopic cholecystectomy. (a) CT scan shows multilocular cystic lesions in the right lobe of the liver. (b) CT scanshows multifocal ill-defined cystic lesions and several nodules (arrow) in the omentum on the right side of the abdo-men. These appearances are suggestive of multilobulate parasitic abscesses in the liver with peritoneal seeding ofparasitic granulomas. Biopsy of the liver and omentum demonstrated paragonimiasis.
Figure 12. Omental infarction in a 47-year-old man with abdominal pain. Axial (a) and sagittal (b)CT scans show localized fatty infiltration and congestion with a secondary mass (arrow) in the rightlower aspect of the anterior abdomen. This appearance most likely indicates an omental infarction.
714 May-June 2007 RG f Volume 27 ● Number 3
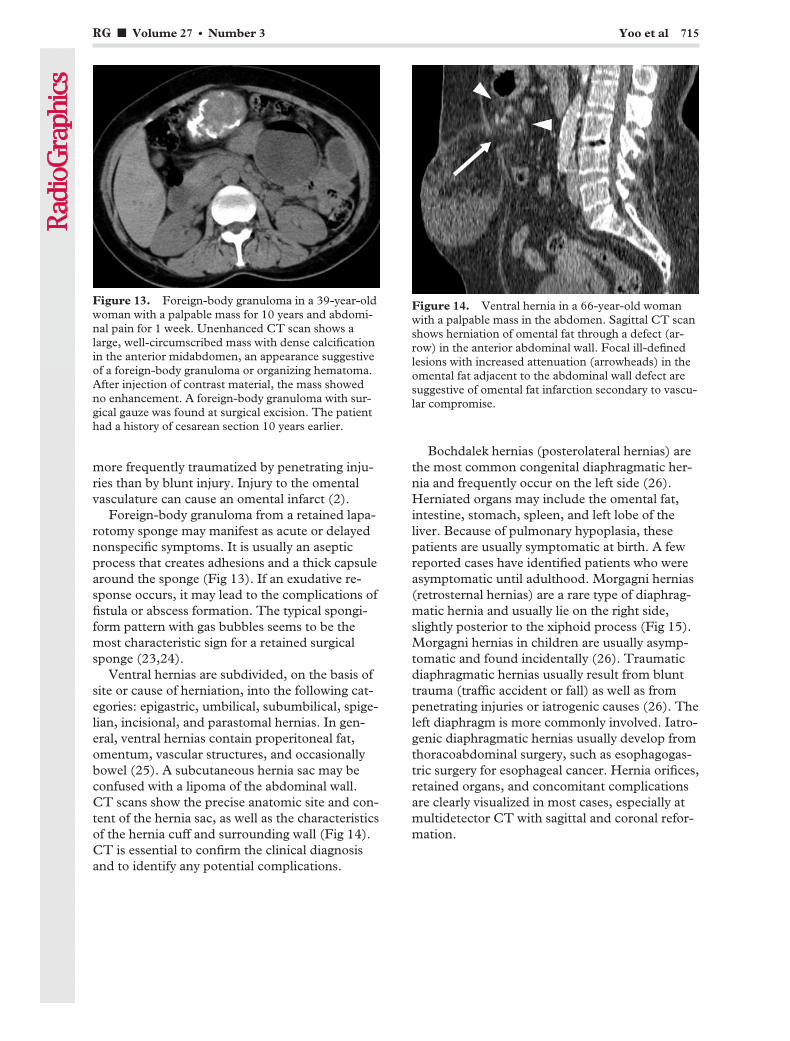
more frequently traumatized by penetrating inju-ries than by blunt injury. Injury to the omentalvasculature can cause an omental infarct (2).
Foreign-body granuloma from a retained lapa-rotomy sponge may manifest as acute or delayednonspecific symptoms. It is usually an asepticprocess that creates adhesions and a thick capsulearound the sponge (Fig 13). If an exudative re-sponse occurs, it may lead to the complications offistula or abscess formation. The typical spongi-form pattern with gas bubbles seems to be themost characteristic sign for a retained surgicalsponge (23,24).
Ventral hernias are subdivided, on the basis ofsite or cause of herniation, into the following cat-egories: epigastric, umbilical, subumbilical, spige-lian, incisional, and parastomal hernias. In gen-eral, ventral hernias contain properitoneal fat,omentum, vascular structures, and occasionallybowel (25). A subcutaneous hernia sac may beconfused with a lipoma of the abdominal wall.CT scans show the precise anatomic site and con-tent of the hernia sac, as well as the characteristicsof the hernia cuff and surrounding wall (Fig 14).CT is essential to confirm the clinical diagnosisand to identify any potential complications.
Bochdalek hernias (posterolateral hernias) arethe most common congenital diaphragmatic her-nia and frequently occur on the left side (26).Herniated organs may include the omental fat,intestine, stomach, spleen, and left lobe of theliver. Because of pulmonary hypoplasia, thesepatients are usually symptomatic at birth. A fewreported cases have identified patients who wereasymptomatic until adulthood. Morgagni hernias(retrosternal hernias) are a rare type of diaphrag-matic hernia and usually lie on the right side,slightly posterior to the xiphoid process (Fig 15).Morgagni hernias in children are usually asymp-tomatic and found incidentally (26). Traumaticdiaphragmatic hernias usually result from blunttrauma (traffic accident or fall) as well as frompenetrating injuries or iatrogenic causes (26). Theleft diaphragm is more commonly involved. Iatro-genic diaphragmatic hernias usually develop fromthoracoabdominal surgery, such as esophagogas-tric surgery for esophageal cancer. Hernia orifices,retained organs, and concomitant complicationsare clearly visualized in most cases, especially atmultidetector CT with sagittal and coronal refor-mation.
Figure 13. Foreign-body granuloma in a 39-year-oldwoman with a palpable mass for 10 years and abdomi-nal pain for 1 week. Unenhanced CT scan shows alarge, well-circumscribed mass with dense calcificationin the anterior midabdomen, an appearance suggestiveof a foreign-body granuloma or organizing hematoma.After injection of contrast material, the mass showedno enhancement. A foreign-body granuloma with sur-gical gauze was found at surgical excision. The patienthad a history of cesarean section 10 years earlier.
Figure 14. Ventral hernia in a 66-year-old womanwith a palpable mass in the abdomen. Sagittal CT scanshows herniation of omental fat through a defect (ar-row) in the anterior abdominal wall. Focal ill-definedlesions with increased attenuation (arrowheads) in theomental fat adjacent to the abdominal wall defect aresuggestive of omental fat infarction secondary to vascu-lar compromise.
RG f Volume 27 ● Number 3 Yoo et al 715
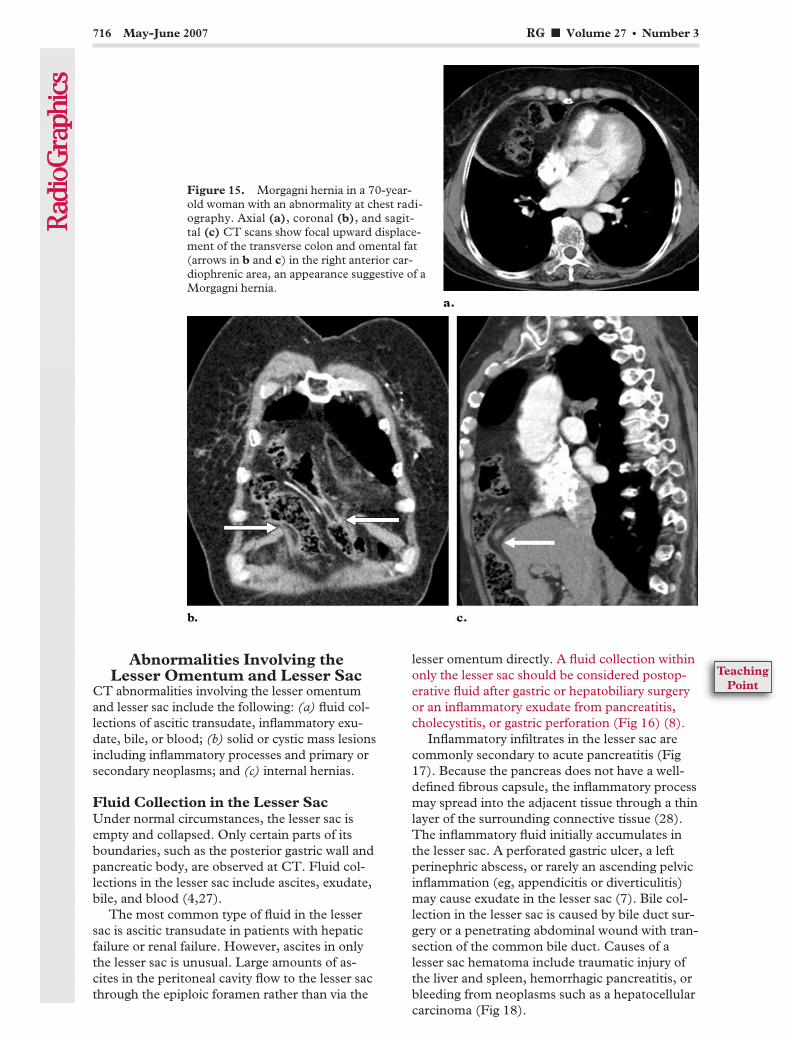
Abnormalities Involving theLesser Omentum and Lesser Sac
CT abnormalities involving the lesser omentumand lesser sac include the following: (a) fluid col-lections of ascitic transudate, inflammatory exu-date, bile, or blood; (b) solid or cystic mass lesionsincluding inflammatory processes and primary orsecondary neoplasms; and (c) internal hernias.
Fluid Collection in the Lesser SacUnder normal circumstances, the lesser sac isempty and collapsed. Only certain parts of itsboundaries, such as the posterior gastric wall andpancreatic body, are observed at CT. Fluid col-lections in the lesser sac include ascites, exudate,bile, and blood (4,27).
The most common type of fluid in the lessersac is ascitic transudate in patients with hepaticfailure or renal failure. However, ascites in onlythe lesser sac is unusual. Large amounts of as-cites in the peritoneal cavity flow to the lesser sacthrough the epiploic foramen rather than via the
lesser omentum directly. A fluid collection withinonly the lesser sac should be considered postop-erative fluid after gastric or hepatobiliary surgeryor an inflammatory exudate from pancreatitis,cholecystitis, or gastric perforation (Fig 16) (8).
Inflammatory infiltrates in the lesser sac arecommonly secondary to acute pancreatitis (Fig17). Because the pancreas does not have a well-defined fibrous capsule, the inflammatory processmay spread into the adjacent tissue through a thinlayer of the surrounding connective tissue (28).The inflammatory fluid initially accumulates inthe lesser sac. A perforated gastric ulcer, a leftperinephric abscess, or rarely an ascending pelvicinflammation (eg, appendicitis or diverticulitis)may cause exudate in the lesser sac (7). Bile col-lection in the lesser sac is caused by bile duct sur-gery or a penetrating abdominal wound with tran-section of the common bile duct. Causes of alesser sac hematoma include traumatic injury ofthe liver and spleen, hemorrhagic pancreatitis, orbleeding from neoplasms such as a hepatocellularcarcinoma (Fig 18).
Figure 15. Morgagni hernia in a 70-year-old woman with an abnormality at chest radi-ography. Axial (a), coronal (b), and sagit-tal (c) CT scans show focal upward displace-ment of the transverse colon and omental fat(arrows in b and c) in the right anterior car-diophrenic area, an appearance suggestive of aMorgagni hernia.
716 May-June 2007 RG f Volume 27 ● Number 3
TeachingPoint

Figure 16. Fluid collection in the lesser sac in a 36-year-old man 2 days after subtotal gastrectomy with gas-trojejunostomy for stomach cancer. Axial (a) and coronal (b) CT scans show a collection of meglumine dia-trizoate (Gastrografin; Bracco Diagnostics, Princeton, NJ) in the lesser sac (black arrow). This finding was sug-gestive of leakage (white arrow in b) from the anastomosis of the gastrojejunostomy; such leakage was visual-ized during an upper gastrointestinal study with meglumine diatrizoate 2 days later.
Figure 17. Inflammatory infiltrate in the lesser sac in a 68-year-old man with a history of heavy alcohol usewho had epigastric pain for 2 days. CT scans show infiltration of peripancreatic fat (a) and spread of an inflam-matory exudate to the lesser sac (arrow in b) and retroperitoneal space, findings suggestive of acute pancreati-tis.
Figure 18. Lesser sac hematoma 1 day after ab-dominal blunt trauma in a 40-year-old man withacute abdominal pain. Contrast-enhanced CT scanshows a large acute hematoma in the lesser sac be-tween the stomach and pancreas. Emergent lapa-rotomy with hematoma evacuation and “bleeder”ligation was performed.
RG f Volume 27 ● Number 3 Yoo et al 717
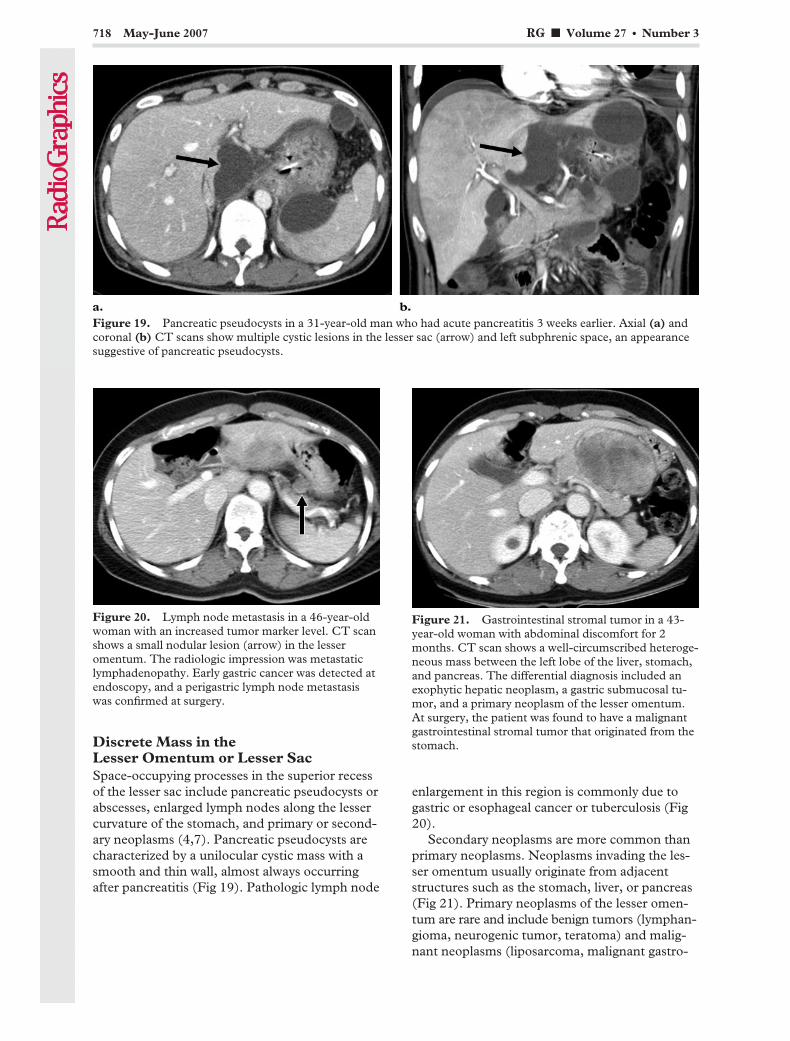
Discrete Mass in theLesser Omentum or Lesser SacSpace-occupying processes in the superior recessof the lesser sac include pancreatic pseudocysts orabscesses, enlarged lymph nodes along the lessercurvature of the stomach, and primary or second-ary neoplasms (4,7). Pancreatic pseudocysts arecharacterized by a unilocular cystic mass with asmooth and thin wall, almost always occurringafter pancreatitis (Fig 19). Pathologic lymph node
enlargement in this region is commonly due togastric or esophageal cancer or tuberculosis (Fig20).
Secondary neoplasms are more common thanprimary neoplasms. Neoplasms invading the les-ser omentum usually originate from adjacentstructures such as the stomach, liver, or pancreas(Fig 21). Primary neoplasms of the lesser omen-tum are rare and include benign tumors (lymphan-gioma, neurogenic tumor, teratoma) and malig-nant neoplasms (liposarcoma, malignant gastro-
Figure 19. Pancreatic pseudocysts in a 31-year-old man who had acute pancreatitis 3 weeks earlier. Axial (a) andcoronal (b) CT scans show multiple cystic lesions in the lesser sac (arrow) and left subphrenic space, an appearancesuggestive of pancreatic pseudocysts.
Figure 20. Lymph node metastasis in a 46-year-oldwoman with an increased tumor marker level. CT scanshows a small nodular lesion (arrow) in the lesseromentum. The radiologic impression was metastaticlymphadenopathy. Early gastric cancer was detected atendoscopy, and a perigastric lymph node metastasiswas confirmed at surgery.
Figure 21. Gastrointestinal stromal tumor in a 43-year-old woman with abdominal discomfort for 2months. CT scan shows a well-circumscribed heteroge-neous mass between the left lobe of the liver, stomach,and pancreas. The differential diagnosis included anexophytic hepatic neoplasm, a gastric submucosal tu-mor, and a primary neoplasm of the lesser omentum.At surgery, the patient was found to have a malignantgastrointestinal stromal tumor that originated from thestomach.
718 May-June 2007 RG f Volume 27 ● Number 3

intestinal stromal tumor) (29). Although almostall of these tumors have variable and nonspecificCT features, some manifest with characteristicappearances. For example, lymphangioma ap-pears as a multiloculated low-attenuation masswith a smooth thin wall on CT scans (Fig 22)(18).
Internal Hernia into the Lesser SacLesser sac hernias make up only about 1%–4% ofall internal hernias. The herniated organs includethe small intestine, cecum, proximal colon, trans-verse colon, omentum, and gallbladder. The en-trance of herniation into the lesser sac is usuallythrough the foramen of Winslow, and less com-monly, via the transverse mesocolon or trans-omental (often iatrogenic).
Lesser sac hernias manifest at CT as a clusterof gas-distended or fluid-filled bowel loops lo-cated between the liver, stomach, and pancreas.The stomach is usually displaced anteriorly andlaterally. Bowel caliber change and radiating vas-cular markings in the mesentery of protrudedbowel loops across the gastroduodenal or gastro-colic ligament is helpful in diagnosing lesser sachernias (30).
ConclusionsConditions involving the greater and lesseromenta include infectious, inflammatory, neo-plastic, vascular, and traumatic processes. Diag-nosis of omental pathologic conditions is difficultbecause of their nonspecific and overlapping clini-cal and imaging features. Correlation with the CT
pattern of omental involvement, associated CTfindings in the abdomen, and clinical informationare essential for proper diagnosis and treatment.Some diseases, such as omental fat infarction,omental herniation, or hemorrhage, can be accu-rately diagnosed only on the basis of characteristicCT features. Multidetector CT with coronal andsagittal reformation improves the resolution ofomental anatomy and the detection of omentalpathologic conditions. Knowledge of the omentalanatomy, the disease spectrum involving thegreater and lesser omenta, and the characteristicCT appearances of each disease is essential foraccurate diagnosis and proper treatment.
References1. Moore KL. The developing human: clinically ori-
ented embryology. 3rd ed. Philadelphia, Pa: Saun-ders, 1982; 227–229.
2. Sompayrac SW, Mindelzun RE, Silverman PM,Sze R. The greater omentum. AJR Am J Roentge-nol 1997;168:683–687.
3. Raptopoulos V, Gourtsoyiannis N. Peritoneal car-cinomatosis. Eur Radiol 2001;11:2195–2206.
4. Jeffrey RB, Federle MP, Goodman PC. Computedtomography of the lesser peritoneal sac. Radiology1981;141:117–122.
5. Healy JC, Reznek RH. The peritoneum, mesenter-ies and omenta: normal anatomy and pathologicalprocesses. Eur Radiol 1998;8:886–900.
6. Zhao Z, Liu S, Li Z, et al. Sectional anatomy ofthe peritoneal reflections of the upper abdomen inthe coronal plane. J Comput Assist Tomogr 2005;29:430–437.
Figure 22. Cystic lymphangioma in a 48-year-old woman with abdominal discomfort. Axial (a) and coro-nal (b) CT scans show a large multiloculated cystic mass in the lesser sac. The attenuation of the lesion wasabout 16 HU (range, �14 to 40 HU) on unenhanced scans. The diagnosis of cystic lymphangioma was con-firmed at surgical excision.
RG f Volume 27 ● Number 3 Yoo et al 719

7. Dodds WJ, Foley WD, Lawson TL, Stewart ET,Taylor A. Anatomy and imaging of the lesser peri-toneal sac. AJR Am J Roentgenol 1985;144:567–575.
8. DeMeo JH, Fulcher AS, Austin RF Jr. AnatomicCT demonstration of the peritoneal spaces, liga-ments, and mesenteries: normal and pathologicprocesses. RadioGraphics 1995;15:755–770.
9. Hamrick-Turner JE, Chiechi MV, Abbitt PL, RosPR. Neoplastic and inflammatory processes of theperitoneum, omentum, and mesentery: diagnosiswith CT. RadioGraphics 1992;12:1051–1068.
10. Chopra S, Dodd GD 3rd, Chintapalli KN, EsolaCC, Ghiatas AA. Mesenteric, omental, and retro-peritoneal edema in cirrhosis: frequency and spec-trum of CT findings. Radiology 1999;211:737–742.
11. Ha HK, Jung JI, Lee MS, et al. CT differentiationof tuberculous peritonitis and peritoneal carcino-matosis. AJR Am J Roentgenol 1996;167:743–748.
12. Jadvar H, Mindelzun RE, Olcott EW, Levitt DB.Still the great mimicker: abdominal tuberculosis.AJR Am J Roentgenol 1997;168:1455–1460.
13. Kebapci M, Vardareli E, Adapinar B, Acikalin M.CT findings and serum CA 125 levels in malig-nant peritoneal mesothelioma: report of 11 newcases and review of the literature. Eur Radiol2003;13:2620–2626.
14. Sulkin TV, O’Neill H, Amin AI, Moran B. CT inpseudomyxoma peritonei: a review of 17 cases.Clin Radiol 2002;57:608–613.
15. Walensky RP, Venbrux AC, Prescott CA, Oster-man FA Jr. Pseudomyxoma peritonei. AJR Am JRoentgenol 1996;167:471–474.
16. Kim Y, Cho O, Song S, Lee H, Rhim H, Koh B.Peritoneal lymphomatosis: CT findings. AbdomImaging 1998;23:87–90.
17. Ros PR, Olmsted WW, Moser RP Jr, DachmanAH, Hjermstad BH, Sobin LH. Mesenteric andomental cysts: histologic classification with imag-ing correlation. Radiology 1987;164:327–332.
18. Mar CR, Pushpanathan C, Price D, Cramer B.Omental lymphangioma with small-bowel volvu-lus. RadioGraphics 2003;23:847–851.
19. Ha HK, Lee HJ, Kim H, et al. Abdominal actino-mycosis: CT findings in 10 patients. AJR Am JRoentgenol 1993;161:791–794.
20. Jeong WK, Kim Y, Kim YS, et al. Heterotopicparagonimiasis in the omentum. J Comput AssistTomogr 2002;26:1019–1021.
21. Maeda T, Mori H, Cyujo M, Kikuchi N, Hori Y,Takaki H. CT and MR findings of torsion ofgreater omentum: a case report. Abdom Imaging1997;22:45–46.
22. Paroz A, Halkic N, Pezzetta E, Martinet O. Idio-pathic segmental infarction of the greater omen-tum: a rare cause of acute abdomen. J GastrointestSurg 2003;7:805–808.
23. Kopka L, Fischer U, Gross AJ, Funke M, Oest-mann JW, Grabbe E. CT of retained surgicalsponges (textilomas): pitfalls in detection andevaluation. J Comput Assist Tomogr 1996;20:919–923.
24. Rajput A, Loud PA, Gibbs JF, Kraybill WG.Diagnostic challenges in patients with tumors:case 1—gossypiboma (foreign body) manifesting30 years after laparotomy. J Clin Oncol 2003;21:3700–3701.
25. Ianora AA, Midiri M, Vinci R, Rotondo A, An-gelelli G. Abdominal wall hernias: imaging withspiral CT. Eur Radiol 2000;10:914–919.
26. Eren S, Ciris F. Diaphragmatic hernia: diagnosticapproaches with review of the literature. Eur J Ra-diol 2005;54:448–459.
27. Mueller PR, Ferrucci JT Jr, Simeone JF, et al.Lesser sac abscesses and fluid collections: drainageby transhepatic approach. Radiology 1985;155:615–618.
28. King LR, Siegel MJ, Balfe DM. Acute pancreatitisin children: CT findings of intra- and extrapancre-atic fluid collections. Radiology 1995;195:196–200.
29. Coulier B, Van Hoof M. Intraperitoneal fat focalinfarction of the lesser omentum: case report. Ab-dom Imaging 2004;29:498–501.
30. Inoue Y, Nakamura H, Mizumoto S, Akashi H.Lesser sac hernia through the gastrocolic ligament:CT diagnosis. Abdom Imaging 1996;21:145–147.
This article meets the criteria for 1.0 AMA PRA Category 1 Credit TM. To obtain credit, see www.rsna.org/education/rg_cme.html.
720 May-June 2007 RG f Volume 27 ● Number 3
EDUCATION EXHIBIT 721
MR Imaging of AcuteRight Lower QuadrantPain in Pregnant andNonpregnant Patients1
LEARNINGOBJECTIVESFOR TEST 3After reading thisarticle and takingthe test, the reader
will be able to:
� Discuss MR imag-ing protocols forevaluation of preg-nant and nonpreg-nant patients withacute RLQ pain.
� Describe the MRimaging appearancesof the normal andabnormal appendix.
� Identify variouscommon conditionsthat masquerade asacute appendicitis inboth pregnant andnonpregnant patientson MR images.
Ivan Pedrosa, MD ● Eric A. Zeikus, MD ● Deborah Levine, MDNeil M. Rofsky, MD
The use of magnetic resonance (MR) imaging in the evaluation ofacute abdominal pain is increasing, particularly in those circumstanceswhere computed tomography (CT) is not desirable (eg, pregnancy,allergy to iodinated contrast material). Although ultrasonography (US)is considered the imaging study of choice for evaluation of abdominalpain in pregnant patients, MR imaging is a valuable adjunct to US inevaluation of pregnant patients with acute right lower quadrant (RLQ)pain who have inconclusive US results. MR imaging is also frequentlyused in patients with renal failure, in whom the use of iodinated con-trast material is contraindicated, as well as in cases where CT resultsare inconclusive. In patients with acute RLQ pain, the breadth of ab-normalities visible at MR imaging is very broad, with pathologic condi-tions potentially originating from multiple organ systems, but mostcommonly from the gastrointestinal and genitourinary systems. MRimaging is an excellent imaging modality for evaluation of RLQ painand should be strongly considered in those patients in whom use ofiodinated contrast media or radiation is not desirable.©RSNA, 2007
Abbreviations: GRE � gradient echo, RLQ � right lower quadrant, SE � spin echo, 3D � three-dimensional, TOF � time of flight, 2D � two-dimensional
RadioGraphics 2007; 27:721–753 ● Published online 10.1148/rg.273065116 ● Content Codes:
1From the Department of Radiology, Beth Israel Deaconess Medical Center, Harvard Medical School, 330 Brookline Ave, Boston, MA 02215. Re-cipient of a Cum Laude award for an education exhibit at the 2005 RSNA Annual Meeting. Received June 7, 2006; revision requested July 19 and re-ceived September 13; accepted September 14. N.M.R. receives research support from GE Healthcare (Waukesha, Wis), is on the advisory board ofBerlex Laboratories (Wayne, NJ), and is a consultant to CAD Sciences (White Plains, NY); all other authors have no financial relationships to disclose.Address correspondence to I.P. (e-mail: [email protected]).
See the commentary by Katz et al following this article.
©RSNA, 2007
CME FEATURESee accompanying
test at http://www.rsna.org
/education/rg_cme.html
Note: This copy is for your personal, non-commercial use only. To order presentation-ready copies for distribution to your colleagues or clients, use the RadioGraphics Reprints form at the end of this article.
See last page
TEACHING POINTS
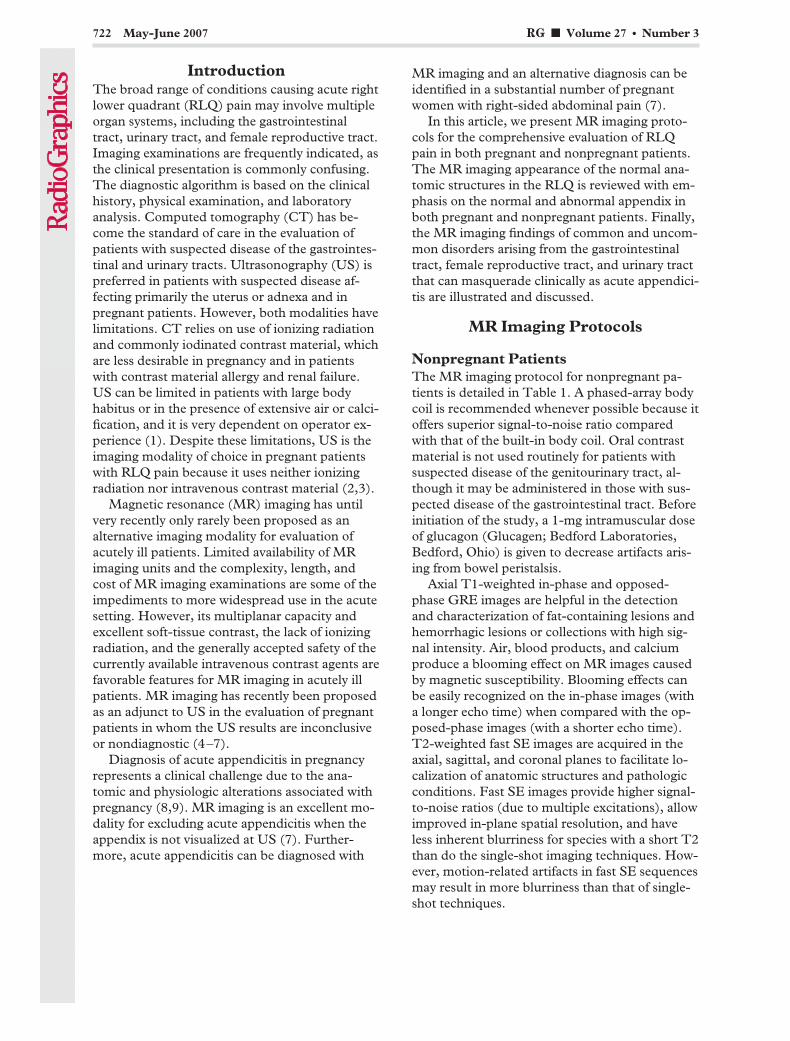
IntroductionThe broad range of conditions causing acute rightlower quadrant (RLQ) pain may involve multipleorgan systems, including the gastrointestinaltract, urinary tract, and female reproductive tract.Imaging examinations are frequently indicated, asthe clinical presentation is commonly confusing.The diagnostic algorithm is based on the clinicalhistory, physical examination, and laboratoryanalysis. Computed tomography (CT) has be-come the standard of care in the evaluation ofpatients with suspected disease of the gastrointes-tinal and urinary tracts. Ultrasonography (US) ispreferred in patients with suspected disease af-fecting primarily the uterus or adnexa and inpregnant patients. However, both modalities havelimitations. CT relies on use of ionizing radiationand commonly iodinated contrast material, whichare less desirable in pregnancy and in patientswith contrast material allergy and renal failure.US can be limited in patients with large bodyhabitus or in the presence of extensive air or calci-fication, and it is very dependent on operator ex-perience (1). Despite these limitations, US is theimaging modality of choice in pregnant patientswith RLQ pain because it uses neither ionizingradiation nor intravenous contrast material (2,3).
Magnetic resonance (MR) imaging has untilvery recently only rarely been proposed as analternative imaging modality for evaluation ofacutely ill patients. Limited availability of MRimaging units and the complexity, length, andcost of MR imaging examinations are some of theimpediments to more widespread use in the acutesetting. However, its multiplanar capacity andexcellent soft-tissue contrast, the lack of ionizingradiation, and the generally accepted safety of thecurrently available intravenous contrast agents arefavorable features for MR imaging in acutely illpatients. MR imaging has recently been proposedas an adjunct to US in the evaluation of pregnantpatients in whom the US results are inconclusiveor nondiagnostic (4–7).
Diagnosis of acute appendicitis in pregnancyrepresents a clinical challenge due to the ana-tomic and physiologic alterations associated withpregnancy (8,9). MR imaging is an excellent mo-dality for excluding acute appendicitis when theappendix is not visualized at US (7). Further-more, acute appendicitis can be diagnosed with
MR imaging and an alternative diagnosis can beidentified in a substantial number of pregnantwomen with right-sided abdominal pain (7).
In this article, we present MR imaging proto-cols for the comprehensive evaluation of RLQpain in both pregnant and nonpregnant patients.The MR imaging appearance of the normal ana-tomic structures in the RLQ is reviewed with em-phasis on the normal and abnormal appendix inboth pregnant and nonpregnant patients. Finally,the MR imaging findings of common and uncom-mon disorders arising from the gastrointestinaltract, female reproductive tract, and urinary tractthat can masquerade clinically as acute appendici-tis are illustrated and discussed.
MR Imaging Protocols
Nonpregnant PatientsThe MR imaging protocol for nonpregnant pa-tients is detailed in Table 1. A phased-array bodycoil is recommended whenever possible because itoffers superior signal-to-noise ratio comparedwith that of the built-in body coil. Oral contrastmaterial is not used routinely for patients withsuspected disease of the genitourinary tract, al-though it may be administered in those with sus-pected disease of the gastrointestinal tract. Beforeinitiation of the study, a 1-mg intramuscular doseof glucagon (Glucagen; Bedford Laboratories,Bedford, Ohio) is given to decrease artifacts aris-ing from bowel peristalsis.
Axial T1-weighted in-phase and opposed-phase GRE images are helpful in the detectionand characterization of fat-containing lesions andhemorrhagic lesions or collections with high sig-nal intensity. Air, blood products, and calciumproduce a blooming effect on MR images causedby magnetic susceptibility. Blooming effects canbe easily recognized on the in-phase images (witha longer echo time) when compared with the op-posed-phase images (with a shorter echo time).T2-weighted fast SE images are acquired in theaxial, sagittal, and coronal planes to facilitate lo-calization of anatomic structures and pathologicconditions. Fast SE images provide higher signal-to-noise ratios (due to multiple excitations), allowimproved in-plane spatial resolution, and haveless inherent blurriness for species with a short T2than do the single-shot imaging techniques. How-ever, motion-related artifacts in fast SE sequencesmay result in more blurriness than that of single-shot techniques.
722 May-June 2007 RG f Volume 27 ● Number 3
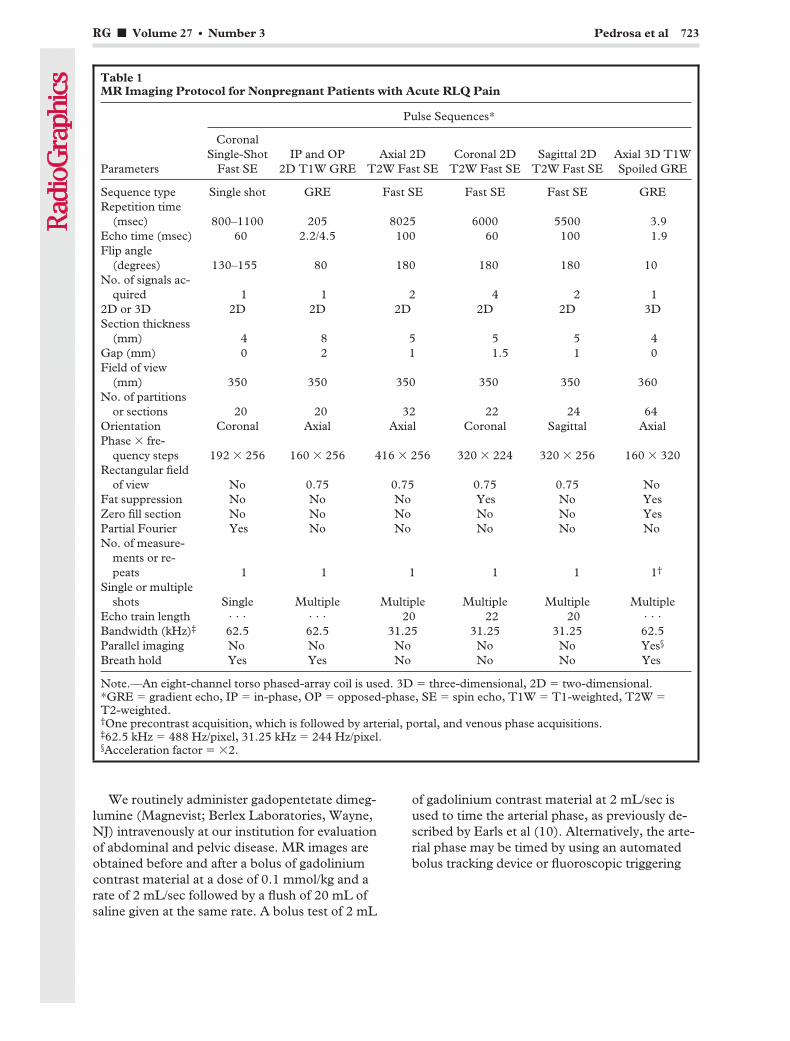
We routinely administer gadopentetate dimeg-lumine (Magnevist; Berlex Laboratories, Wayne,NJ) intravenously at our institution for evaluationof abdominal and pelvic disease. MR images areobtained before and after a bolus of gadoliniumcontrast material at a dose of 0.1 mmol/kg and arate of 2 mL/sec followed by a flush of 20 mL ofsaline given at the same rate. A bolus test of 2 mL
of gadolinium contrast material at 2 mL/sec isused to time the arterial phase, as previously de-scribed by Earls et al (10). Alternatively, the arte-rial phase may be timed by using an automatedbolus tracking device or fluoroscopic triggering
Table 1MR Imaging Protocol for Nonpregnant Patients with Acute RLQ Pain
Parameters
Pulse Sequences*
CoronalSingle-Shot
Fast SEIP and OP
2D T1W GREAxial 2D
T2W Fast SECoronal 2D
T2W Fast SESagittal 2D
T2W Fast SEAxial 3D T1WSpoiled GRE
Sequence type Single shot GRE Fast SE Fast SE Fast SE GRERepetition time
(msec) 800–1100 205 8025 6000 5500 3.9Echo time (msec) 60 2.2/4.5 100 60 100 1.9Flip angle
(degrees) 130–155 80 180 180 180 10No. of signals ac-
quired 1 1 2 4 2 12D or 3D 2D 2D 2D 2D 2D 3DSection thickness
(mm) 4 8 5 5 5 4Gap (mm) 0 2 1 1.5 1 0Field of view
(mm) 350 350 350 350 350 360No. of partitions
or sections 20 20 32 22 24 64Orientation Coronal Axial Axial Coronal Sagittal AxialPhase � fre-
quency steps 192 � 256 160 � 256 416 � 256 320 � 224 320 � 256 160 � 320Rectangular field
of view No 0.75 0.75 0.75 0.75 NoFat suppression No No No Yes No YesZero fill section No No No No No YesPartial Fourier Yes No No No No NoNo. of measure-
ments or re-peats 1 1 1 1 1 1†
Single or multipleshots Single Multiple Multiple Multiple Multiple Multiple
Echo train length . . . . . . 20 22 20 . . .
Bandwidth (kHz)‡ 62.5 62.5 31.25 31.25 31.25 62.5Parallel imaging No No No No No Yes§
Breath hold Yes Yes No No No Yes
Note.—An eight-channel torso phased-array coil is used. 3D � three-dimensional, 2D � two-dimensional.*GRE � gradient echo, IP � in-phase, OP � opposed-phase, SE � spin echo, T1W � T1-weighted, T2W �T2-weighted.†One precontrast acquisition, which is followed by arterial, portal, and venous phase acquisitions.‡62.5 kHz � 488 Hz/pixel, 31.25 kHz � 244 Hz/pixel.§Acceleration factor � �2.
RG f Volume 27 ● Number 3 Pedrosa et al 723

technique. MR images are then acquired duringthe properly timed arterial phase, portal phase (20seconds after the arterial phase), and delayed ve-nous phase (60 seconds after the arterial phase).
Pre- and dynamic postcontrast images areobtained with a 3D fat-saturated T1-weightedspoiled GRE sequence. These 3D data sets offersuperior signal-to-noise ratio and thinner sections
(without an intersection gap) than do 2D acquisi-tions. In addition, 3D acquisitions can be used forgenerating multiplanar reformations or MR an-giograms that allow a comprehensive evaluationof the abdomen or pelvis (11,12).
Pregnant PatientsWritten informed consent regarding use of MRimaging in pregnancy is obtained before perform-ing the examination.
Table 2MR Imaging Protocol for Pregnant Patients with Acute RLQ Pain
Parameters
Pulse Sequences*
CoronalSingle-Shot
Fast SEAxial Single-Shot
Fast SE
SagittalSingle-Shot
Fast SE
Axial 2D FSSingle-Shot
Fast SEIP and OP
2D T1W GRE 2D TOF
Sequence type Single shot Single shot Single shot Single shot GRE GRERepetition time
(msec) 800–1100 800–1100 800–1100 800–1100 205 5500Echo time (msec) 60 60 60 60 2.2/4.5 100Flip angle
(degrees) 130–155 130–155 130–155 130–155 80 45No. of signals ac-
quired 1 1 1 1 1 12D or 3D 2D 2D 2D 2D 2D 2DSection thickness
(mm) 4 4 4 4 5 3Gap (mm) 1 1 1 1 2 1Field of view
(mm) 350 350 350 350 350 350No. of partitions
or sections 20 20 20 20 32 24Orientation Coronal Axial Sagittal Axial Axial AxialPhase � fre-
quency steps 192 � 256 192 � 256 192 � 256 192 � 256 160 � 256 128 � 256Rectangular field
of view No 0.75 0.75 0.75 0.75 0.75Fat suppression No No No Yes No NoZero fill section No No No No No NoPartial Fourier Yes Yes Yes Yes No NoNo. of measure-
ments or re-peats 1 1 1 1 1 1
Single or multipleshots Single Single Single Single Multiple Multiple
Echo train length . . . . . . . . . . . . . . . . . .
Bandwidth (kHz)† 62.5 62.5 62.5 62.5 62.5 31.25Parallel imaging No No No No No NoBreath hold Yes Yes Yes Yes Yes Yes
Note.—An eight-channel torso phased-array coil is used.*FS � fat-saturated, IP � in-phase, OP � opposed-phase, TOF � time of flight, T1W � T1-weighted.†62.5 kHz � 488 Hz/pixel, 31.25 kHz � 244 Hz/pixel.
724 May-June 2007 RG f Volume 27 ● Number 3
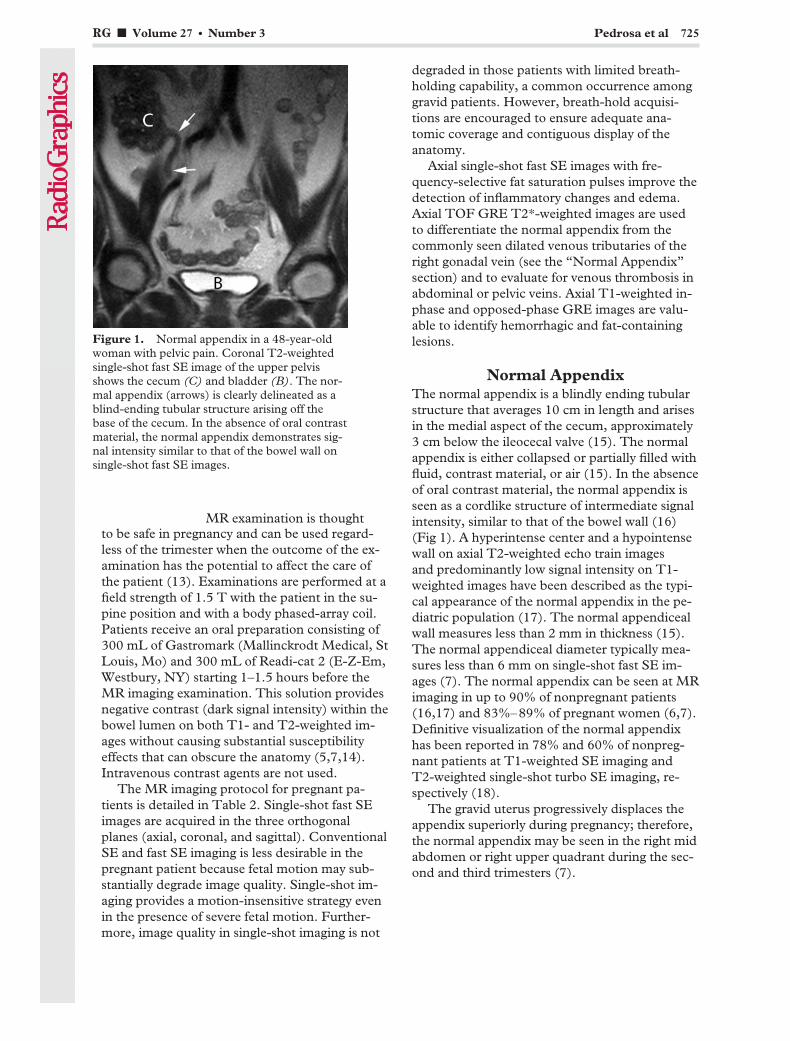
to be safe in pregnancy and can be used regard-less of the trimester when the outcome of the ex-amination has the potential to affect the care ofthe patient (13). Examinations are performed at afield strength of 1.5 T with the patient in the su-pine position and with a body phased-array coil.Patients receive an oral preparation consisting of300 mL of Gastromark (Mallinckrodt Medical, StLouis, Mo) and 300 mL of Readi-cat 2 (E-Z-Em,Westbury, NY) starting 1–1.5 hours before theMR imaging examination. This solution providesnegative contrast (dark signal intensity) within thebowel lumen on both T1- and T2-weighted im-ages without causing substantial susceptibilityeffects that can obscure the anatomy (5,7,14).Intravenous contrast agents are not used.
The MR imaging protocol for pregnant pa-tients is detailed in Table 2. Single-shot fast SEimages are acquired in the three orthogonalplanes (axial, coronal, and sagittal). ConventionalSE and fast SE imaging is less desirable in thepregnant patient because fetal motion may sub-stantially degrade image quality. Single-shot im-aging provides a motion-insensitive strategy evenin the presence of severe fetal motion. Further-more, image quality in single-shot imaging is not
degraded in those patients with limited breath-holding capability, a common occurrence amonggravid patients. However, breath-hold acquisi-tions are encouraged to ensure adequate ana-tomic coverage and contiguous display of theanatomy.
Axial single-shot fast SE images with fre-quency-selective fat saturation pulses improve thedetection of inflammatory changes and edema.Axial TOF GRE T2*-weighted images are usedto differentiate the normal appendix from thecommonly seen dilated venous tributaries of theright gonadal vein (see the “Normal Appendix”section) and to evaluate for venous thrombosis inabdominal or pelvic veins. Axial T1-weighted in-phase and opposed-phase GRE images are valu-able to identify hemorrhagic and fat-containinglesions.
Normal AppendixThe normal appendix is a blindly ending tubularstructure that averages 10 cm in length and arisesin the medial aspect of the cecum, approximately3 cm below the ileocecal valve (15). The normalappendix is either collapsed or partially filled withfluid, contrast material, or air (15). In the absenceof oral contrast material, the normal appendix isseen as a cordlike structure of intermediate signalintensity, similar to that of the bowel wall (16)(Fig 1). A hyperintense center and a hypointensewall on axial T2-weighted echo train imagesand predominantly low signal intensity on T1-weighted images have been described as the typi-cal appearance of the normal appendix in the pe-diatric population (17). The normal appendicealwall measures less than 2 mm in thickness (15).The normal appendiceal diameter typically mea-sures less than 6 mm on single-shot fast SE im-ages (7). The normal appendix can be seen at MRimaging in up to 90% of nonpregnant patients(16,17) and 83%–89% of pregnant women (6,7).Definitive visualization of the normal appendixhas been reported in 78% and 60% of nonpreg-nant patients at T1-weighted SE imaging andT2-weighted single-shot turbo SE imaging, re-spectively (18).
The gravid uterus progressively displaces theappendix superiorly during pregnancy; therefore,the normal appendix may be seen in the right midabdomen or right upper quadrant during the sec-ond and third trimesters (7).
Figure 1. Normal appendix in a 48-year-oldwoman with pelvic pain. Coronal T2-weightedsingle-shot fast SE image of the upper pelvisshows the cecum (C) and bladder (B). The nor-mal appendix (arrows) is clearly delineated as ablind-ending tubular structure arising off thebase of the cecum. In the absence of oral contrastmaterial, the normal appendix demonstrates sig-nal intensity similar to that of the bowel wall onsingle-shot fast SE images.
RG f Volume 27 ● Number 3 Pedrosa et al 725
MR examination is thought
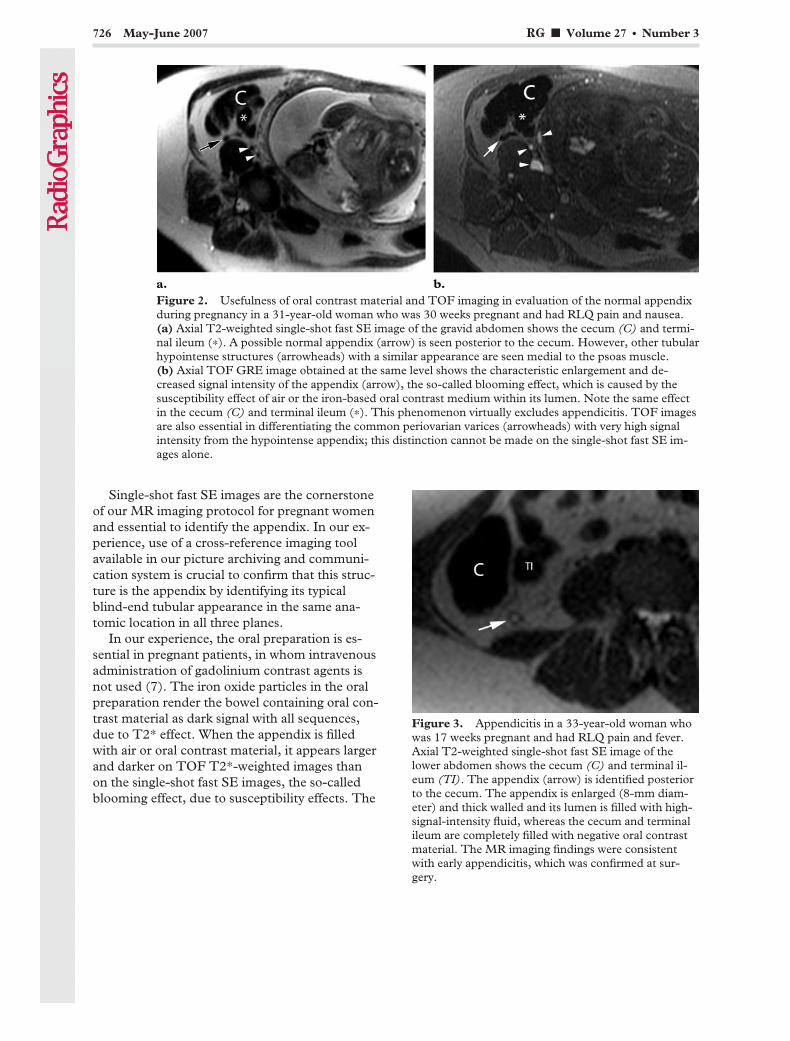
Single-shot fast SE images are the cornerstoneof our MR imaging protocol for pregnant womenand essential to identify the appendix. In our ex-perience, use of a cross-reference imaging toolavailable in our picture archiving and communi-cation system is crucial to confirm that this struc-ture is the appendix by identifying its typicalblind-end tubular appearance in the same ana-tomic location in all three planes.
In our experience, the oral preparation is es-sential in pregnant patients, in whom intravenousadministration of gadolinium contrast agents isnot used (7). The iron oxide particles in the oralpreparation render the bowel containing oral con-trast material as dark signal with all sequences,due to T2* effect. When the appendix is filledwith air or oral contrast material, it appears largerand darker on TOF T2*-weighted images thanon the single-shot fast SE images, the so-calledblooming effect, due to susceptibility effects. The
Figure 2. Usefulness of oral contrast material and TOF imaging in evaluation of the normal appendixduring pregnancy in a 31-year-old woman who was 30 weeks pregnant and had RLQ pain and nausea.(a) Axial T2-weighted single-shot fast SE image of the gravid abdomen shows the cecum (C) and termi-nal ileum (*). A possible normal appendix (arrow) is seen posterior to the cecum. However, other tubularhypointense structures (arrowheads) with a similar appearance are seen medial to the psoas muscle.(b) Axial TOF GRE image obtained at the same level shows the characteristic enlargement and de-creased signal intensity of the appendix (arrow), the so-called blooming effect, which is caused by thesusceptibility effect of air or the iron-based oral contrast medium within its lumen. Note the same effectin the cecum (C) and terminal ileum (*). This phenomenon virtually excludes appendicitis. TOF imagesare also essential in differentiating the common periovarian varices (arrowheads) with very high signalintensity from the hypointense appendix; this distinction cannot be made on the single-shot fast SE im-ages alone.
Figure 3. Appendicitis in a 33-year-old woman whowas 17 weeks pregnant and had RLQ pain and fever.Axial T2-weighted single-shot fast SE image of thelower abdomen shows the cecum (C) and terminal il-eum (TI). The appendix (arrow) is identified posteriorto the cecum. The appendix is enlarged (8-mm diam-eter) and thick walled and its lumen is filled with high-signal-intensity fluid, whereas the cecum and terminalileum are completely filled with negative oral contrastmaterial. The MR imaging findings were consistentwith early appendicitis, which was confirmed at sur-gery.
726 May-June 2007 RG f Volume 27 ● Number 3
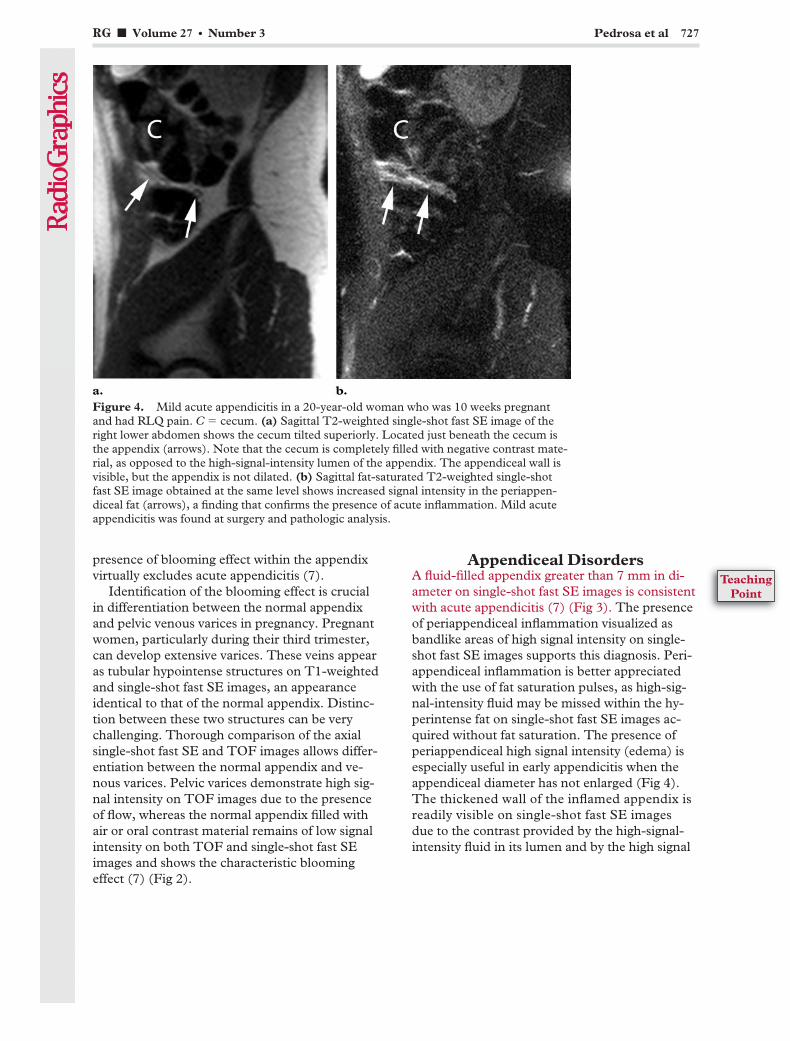
presence of blooming effect within the appendixvirtually excludes acute appendicitis (7).
Identification of the blooming effect is crucialin differentiation between the normal appendixand pelvic venous varices in pregnancy. Pregnantwomen, particularly during their third trimester,can develop extensive varices. These veins appearas tubular hypointense structures on T1-weightedand single-shot fast SE images, an appearanceidentical to that of the normal appendix. Distinc-tion between these two structures can be verychallenging. Thorough comparison of the axialsingle-shot fast SE and TOF images allows differ-entiation between the normal appendix and ve-nous varices. Pelvic varices demonstrate high sig-nal intensity on TOF images due to the presenceof flow, whereas the normal appendix filled withair or oral contrast material remains of low signalintensity on both TOF and single-shot fast SEimages and shows the characteristic bloomingeffect (7) (Fig 2).
Appendiceal DisordersA fluid-filled appendix greater than 7 mm in di-ameter on single-shot fast SE images is consistentwith acute appendicitis (7) (Fig 3). The presenceof periappendiceal inflammation visualized asbandlike areas of high signal intensity on single-shot fast SE images supports this diagnosis. Peri-appendiceal inflammation is better appreciatedwith the use of fat saturation pulses, as high-sig-nal-intensity fluid may be missed within the hy-perintense fat on single-shot fast SE images ac-quired without fat saturation. The presence ofperiappendiceal high signal intensity (edema) isespecially useful in early appendicitis when theappendiceal diameter has not enlarged (Fig 4).The thickened wall of the inflamed appendix isreadily visible on single-shot fast SE imagesdue to the contrast provided by the high-signal-intensity fluid in its lumen and by the high signal
Figure 4. Mild acute appendicitis in a 20-year-old woman who was 10 weeks pregnantand had RLQ pain. C � cecum. (a) Sagittal T2-weighted single-shot fast SE image of theright lower abdomen shows the cecum tilted superiorly. Located just beneath the cecum isthe appendix (arrows). Note that the cecum is completely filled with negative contrast mate-rial, as opposed to the high-signal-intensity lumen of the appendix. The appendiceal wall isvisible, but the appendix is not dilated. (b) Sagittal fat-saturated T2-weighted single-shotfast SE image obtained at the same level shows increased signal intensity in the periappen-diceal fat (arrows), a finding that confirms the presence of acute inflammation. Mild acuteappendicitis was found at surgery and pathologic analysis.
RG f Volume 27 ● Number 3 Pedrosa et al 727
TeachingPoint
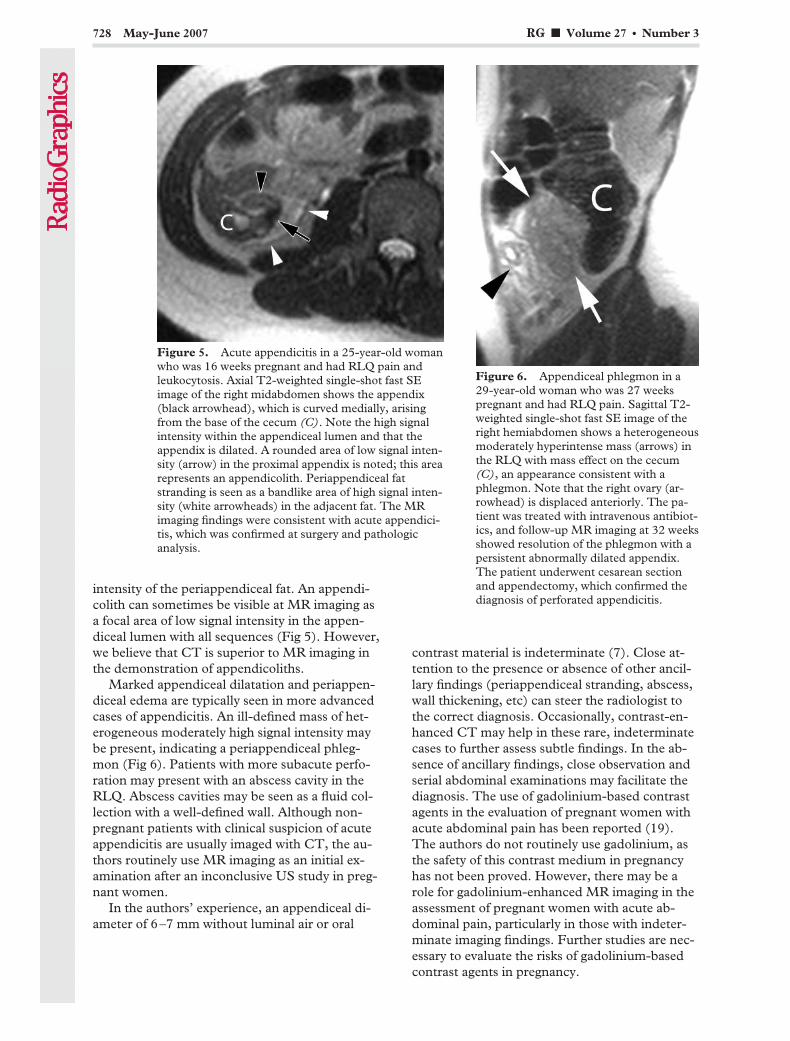
intensity of the periappendiceal fat. An appendi-colith can sometimes be visible at MR imaging asa focal area of low signal intensity in the appen-diceal lumen with all sequences (Fig 5). However,we believe that CT is superior to MR imaging inthe demonstration of appendicoliths.
Marked appendiceal dilatation and periappen-diceal edema are typically seen in more advancedcases of appendicitis. An ill-defined mass of het-erogeneous moderately high signal intensity maybe present, indicating a periappendiceal phleg-mon (Fig 6). Patients with more subacute perfo-ration may present with an abscess cavity in theRLQ. Abscess cavities may be seen as a fluid col-lection with a well-defined wall. Although non-pregnant patients with clinical suspicion of acuteappendicitis are usually imaged with CT, the au-thors routinely use MR imaging as an initial ex-amination after an inconclusive US study in preg-nant women.
In the authors’ experience, an appendiceal di-ameter of 6–7 mm without luminal air or oral
contrast material is indeterminate (7). Close at-tention to the presence or absence of other ancil-lary findings (periappendiceal stranding, abscess,wall thickening, etc) can steer the radiologist tothe correct diagnosis. Occasionally, contrast-en-hanced CT may help in these rare, indeterminatecases to further assess subtle findings. In the ab-sence of ancillary findings, close observation andserial abdominal examinations may facilitate thediagnosis. The use of gadolinium-based contrastagents in the evaluation of pregnant women withacute abdominal pain has been reported (19).The authors do not routinely use gadolinium, asthe safety of this contrast medium in pregnancyhas not been proved. However, there may be arole for gadolinium-enhanced MR imaging in theassessment of pregnant women with acute ab-dominal pain, particularly in those with indeter-minate imaging findings. Further studies are nec-essary to evaluate the risks of gadolinium-basedcontrast agents in pregnancy.
Figure 5. Acute appendicitis in a 25-year-old womanwho was 16 weeks pregnant and had RLQ pain andleukocytosis. Axial T2-weighted single-shot fast SEimage of the right midabdomen shows the appendix(black arrowhead), which is curved medially, arisingfrom the base of the cecum (C). Note the high signalintensity within the appendiceal lumen and that theappendix is dilated. A rounded area of low signal inten-sity (arrow) in the proximal appendix is noted; this arearepresents an appendicolith. Periappendiceal fatstranding is seen as a bandlike area of high signal inten-sity (white arrowheads) in the adjacent fat. The MRimaging findings were consistent with acute appendici-tis, which was confirmed at surgery and pathologicanalysis.
Figure 6. Appendiceal phlegmon in a29-year-old woman who was 27 weekspregnant and had RLQ pain. Sagittal T2-weighted single-shot fast SE image of theright hemiabdomen shows a heterogeneousmoderately hyperintense mass (arrows) inthe RLQ with mass effect on the cecum(C), an appearance consistent with aphlegmon. Note that the right ovary (ar-rowhead) is displaced anteriorly. The pa-tient was treated with intravenous antibiot-ics, and follow-up MR imaging at 32 weeksshowed resolution of the phlegmon with apersistent abnormally dilated appendix.The patient underwent cesarean sectionand appendectomy, which confirmed thediagnosis of perforated appendicitis.
728 May-June 2007 RG f Volume 27 ● Number 3
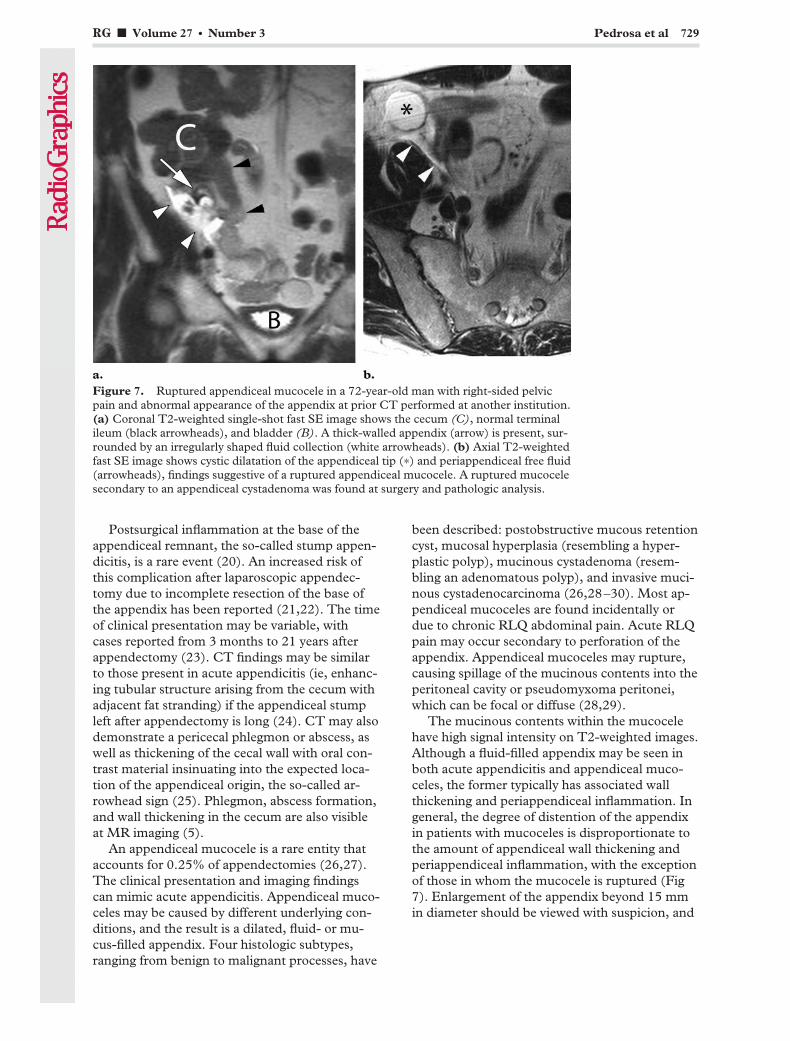
Postsurgical inflammation at the base of theappendiceal remnant, the so-called stump appen-dicitis, is a rare event (20). An increased risk ofthis complication after laparoscopic appendec-tomy due to incomplete resection of the base ofthe appendix has been reported (21,22). The timeof clinical presentation may be variable, withcases reported from 3 months to 21 years afterappendectomy (23). CT findings may be similarto those present in acute appendicitis (ie, enhanc-ing tubular structure arising from the cecum withadjacent fat stranding) if the appendiceal stumpleft after appendectomy is long (24). CT may alsodemonstrate a pericecal phlegmon or abscess, aswell as thickening of the cecal wall with oral con-trast material insinuating into the expected loca-tion of the appendiceal origin, the so-called ar-rowhead sign (25). Phlegmon, abscess formation,and wall thickening in the cecum are also visibleat MR imaging (5).
An appendiceal mucocele is a rare entity thataccounts for 0.25% of appendectomies (26,27).The clinical presentation and imaging findingscan mimic acute appendicitis. Appendiceal muco-celes may be caused by different underlying con-ditions, and the result is a dilated, fluid- or mu-cus-filled appendix. Four histologic subtypes,ranging from benign to malignant processes, have
been described: postobstructive mucous retentioncyst, mucosal hyperplasia (resembling a hyper-plastic polyp), mucinous cystadenoma (resem-bling an adenomatous polyp), and invasive muci-nous cystadenocarcinoma (26,28–30). Most ap-pendiceal mucoceles are found incidentally ordue to chronic RLQ abdominal pain. Acute RLQpain may occur secondary to perforation of theappendix. Appendiceal mucoceles may rupture,causing spillage of the mucinous contents into theperitoneal cavity or pseudomyxoma peritonei,which can be focal or diffuse (28,29).
The mucinous contents within the mucocelehave high signal intensity on T2-weighted images.Although a fluid-filled appendix may be seen inboth acute appendicitis and appendiceal muco-celes, the former typically has associated wallthickening and periappendiceal inflammation. Ingeneral, the degree of distention of the appendixin patients with mucoceles is disproportionate tothe amount of appendiceal wall thickening andperiappendiceal inflammation, with the exceptionof those in whom the mucocele is ruptured (Fig7). Enlargement of the appendix beyond 15 mmin diameter should be viewed with suspicion, and
Figure 7. Ruptured appendiceal mucocele in a 72-year-old man with right-sided pelvicpain and abnormal appearance of the appendix at prior CT performed at another institution.(a) Coronal T2-weighted single-shot fast SE image shows the cecum (C), normal terminalileum (black arrowheads), and bladder (B). A thick-walled appendix (arrow) is present, sur-rounded by an irregularly shaped fluid collection (white arrowheads). (b) Axial T2-weightedfast SE image shows cystic dilatation of the appendiceal tip (*) and periappendiceal free fluid(arrowheads), findings suggestive of a ruptured appendiceal mucocele. A ruptured mucocelesecondary to an appendiceal cystadenoma was found at surgery and pathologic analysis.
RG f Volume 27 ● Number 3 Pedrosa et al 729

careful attention should be paid to other findingsthat may indicate the presence of a neoplasm(31). In the presence of an appendiceal cystade-noma or cystadenocarcinoma, a focal mass maybe seen at cross-sectional imaging.
Other Disorders Arisingfrom the Gastrointestinal Tract
Pathologic processes involving the small and largebowel as well as the mesentery and omentum cangive rise to RLQ pain. Terminal ileitis, mesentericadenitis, diverticulitis (cecal, ascending colonic,Meckel, or ileal), typhlitis, primary epiploic ap-pendagitis, and omental infarction are among theprocesses involving the gastrointestinal tract andmesentery or omentum that may result in RLQpain.
MR imaging allows exquisite visualization ofthe small and large bowel. Patients with inflam-matory bowel disease (eg, Crohn disease and ul-cerative colitis) presenting with acute RLQ paincan be adequately evaluated with MR imaging.Bowel wall edema is readily appreciated on T2-weighted single-shot fast SE images as a band ofincreased signal intensity within the wall thick-ness. Superior sensitivity of MR imaging com-pared with that of CT has been reported for de-tection of early and mild forms of inflammatorybowel disease (32). The degree of wall enhance-ment on gadolinium-enhanced images and thedegree of high signal intensity on fat-saturatedT2-weighted images correlate with disease activ-ity (33,34).
Pelvic and perineal complications of Crohndisease including enteroenteric and enterovesicalfistulas or abscesses can be accurately seen at MRimaging (35). MR imaging findings in patientswith RLQ pain secondary to an acute flare ofCrohn disease are variable depending on the stageof the disease. Mild acute inflammation usuallymanifests as mild thickening of the small bowel(particularly the terminal ileum) or colon. Promi-nence, dilatation, and tortuosity of the vasa rectacoursing through proliferative mesenteric fat, theso-called comb sign, can be readily appreciated atMR imaging (Fig 8). However, similar findingscan be seen in patients with other forms of ileitis(eg, infectious). An inflammatory phlegmon canbe seen as a soft-tissue mass of intermediate sig-nal intensity on T1-weighted images and mildincreased signal intensity on T2-weighted images(better appreciated with fat saturation tech-niques). Frank increased signal intensity on T2-weighted images typically represents liquefactionwithin an abscess (Fig 9).
The multiplanar capability and inherent excel-lent soft-tissue contrast of MR imaging are usefulin the evaluation of patients with small bowel ob-struction. T2-weighted half-Fourier single-shotfast SE images can accurately demonstrate thedegree and level of small bowel obstruction with-out the need for intravenous or oral contrast ma-terial (36). The cause of the obstruction may berecognized on these images in one-half of patientswith small bowel obstruction (36) (Fig 10).
Detection of bowel wall pneumatosis may bevery challenging at MR imaging, as air is devoid
Figure 8. Crohn disease in a 26-year-old woman with RLQ pain and fever. (a) Axial T2-weighted fast SEimage of the lower abdomen shows marked mural thickening in the distal ileum (arrows) with a layer of in-creased signal intensity suggestive of submucosal edema. There is prominence, dilatation, and tortuosity of thevasa recta coursing through proliferative mesenteric fat, the comb sign (arrowheads). (b) Axial gadolinium-enhanced 3D fat-saturated T1-weighted GRE image obtained at the same level shows marked mural enhance-ment (arrows) in the abnormal loop of distal ileum. Linear areas of low signal intensity in the wall correspondto the edema in the bowel wall. The comb sign is better appreciated with gadolinium contrast material (arrow-heads). These findings are consistent with an acute flare of Crohn disease.
730 May-June 2007 RG f Volume 27 ● Number 3

Figure 9. Abscess in a 59-year-old man with a history of Crohn disease who presented with fever, chills, andlower abdominal pain. (a) Axial T2-weighted fast SE image shows a thick-walled fluid collection (arrows) inthe left hemipelvis, adjacent to the sigmoid colon (arrowheads). (b) Axial gadolinium-enhanced 3D fat-satu-rated T1-weighted GRE image obtained during the delayed venous phase shows peripheral rim and septal en-hancement of the fluid collection (arrows). The sigmoid colon is again visualized (arrowheads). The diagnosisof an abscess related to Crohn disease was confirmed with percutaneous drainage of the fluid collection.
Figure 10. Small bowel obstruction in a 34-year-old woman with a history of ulcerativecolitis and prior total colectomy who was 19 weeks pregnant and presented with nausea,vomiting, and abdominal pain. (a) Coronal T2-weighted single-shot fast SE image of theabdomen and pelvis shows the gravid uterus with the placenta (P). There is diffuse dilata-tion of fluid-filled loops of small bowel. Well-circumscribed areas of high signal intensity sur-round the bowel (arrows) and conform to the borders of the abdominal wall, a finding in-dicative of free fluid. (b) Sagittal T2-weighted single-shot fast SE image of the RLQ showsthe dilated, fluid-filled small bowel loops. The patient’s ostomy (large arrowhead) is col-lapsed, and the end ileal loop (arrow) tapers abruptly to the ostomy; these findings indicatethe transition point of the small bowel obstruction caused by stenosis at the level of the os-tomy. The free fluid is seen beneath the small bowel loops (small arrowhead). The smallbowel obstruction was relieved after placement of a catheter and dilation of the ostomy.
RG f Volume 27 ● Number 3 Pedrosa et al 731

of signal with all MR pulse sequences. In-phaseand opposed-phase GRE images may help dem-onstrate this finding because a characteristicblooming effect occurs on the in-phase images(acquired with a longer echo time) compared tothe opposed-phase images in the presence of airdue to susceptibility effects. Single-shot fast SEimages can help confirm this finding by demon-strating an area of very low signal intensity withinthe wall and showing the mucosa separating thisarea from the bowel lumen (Fig 11). Ancillaryfindings including bowel wall thickening, mesen-teric fat stranding, or air in the portomesentericvenous system provide further evidence that sup-ports the diagnosis of pneumatosis. However, CT
should be considered to confirm or exclude thisfinding when MR imaging features are equivocal.
Occasionally, RLQ pain may be secondary toherniation of a bowel loop through a defect in theanterior abdominal wall. MR imaging providesexquisite visualization of the fascia and muscles inthe anterior abdominal wall, allowing clear depic-tion of bowel herniating through an existing de-fect.
Obstetric andGynecologic Disorders
The female reproductive tract gives rise to a mul-titude of pathologic conditions that can manifestas acute RLQ pain. Most important, some ofthese entities may require surgical intervention,including ectopic pregnancy and ovarian torsion.
Figure 11. Cecal pneumatosis in a 47-year-old dia-betic woman with fever and abdominal pain 2 monthsafter pancreatic transplantation. She had undergonerenal transplantation 5 years before this admission.(a) Axial T2-weighted single-shot fast SE image of thelower abdomen shows an air-fluid level in the lumen ofthe cecum (black arrowhead). A curvilinear area of lowsignal intensity that conforms to the wall of the cecum(arrows) represents pneumatosis. Part of the cecal wallappears as a thin line of intermediate signal intensity(white arrowhead) that separates the luminal air from thepneumatosis. (b) Axial gadolinium-enhanced 3D fat-saturated T1-weighted GRE image of the upper abdo-men, obtained during the portal venous phase, showslack of signal within the left portal vein (arrow) due to airin the portal vein. (c) Unenhanced CT scan shows thececal pneumatosis (arrows) and cecal wall thickening(arrowhead); CT also showed the air in the left portalvein. At surgery, a perforated diverticulum was found inthe cecum.
732 May-June 2007 RG f Volume 27 ● Number 3

Ovarian DisordersHemorrhagic cysts are a very common cause ofRLQ pain, frequently resulting from rupture intothe peritoneal cavity. Hemorrhage may be seen inboth functional and corpus luteum cysts. Thesignal intensity of the cyst varies depending on theage of the hemorrhage. Subacute hemorrhage(deoxyhemoglobin) is of intermediate signal in-tensity on T1-weighted images and low signalintensity on T2-weighted images. Later, the pres-ence of intracellular methemoglobin causes in-creased signal intensity on T1-weighted imagesand decreased signal intensity on T2-weightedimages. Layering blood products within the de-pendent portion of the cyst, the so-called hemato-crit effect, can be seen on both T1- and T2-weighted images.
Pelvic endometriosis is another cause of RLQpain. Endometriosis is defined as the presenceof endometrial tissue outside the uterus. Themost common location of ectopic endometrialtissue is the ovaries (37). Hormonal stimulationof the endometrial tissue causes enlargementand hemorrhage with subsequent formation ofendometrial cysts (endometriomas) (37). MRimaging findings that suggest the diagnosis of en-dometrial cysts include homogeneous high signalintensity (equal to or greater than that of fat) onT1-weighted images; areas of decreased signalintensity or “shading” effect on T2-weighted im-ages (usually mixed with areas of high signal in-tensity) in cysts that exhibit high signal intensityon T1-weighted images; and multiplicity (morethan two cysts with increased signal intensity atT1-weighted imaging that adhere to each other)(37) (Fig 12). The shading effect is likely causedby the presence of high-viscosity contents, highprotein concentration, and/or high iron concen-tration within the fluid (37,38).
Ancillary findings that suggest endometriosisinclude a low-signal-intensity rim in the cysts,peritoneal implants, bowel tethering and angula-tion, and adhesions (39,40). Obliteration of theposterior cul-de-sac in the pelvis may also be seenin patients with endometriosis (41). However,these findings are considered insensitive for thediagnosis of endometriosis (39,42). Differentia-tion between endometriomas and hemorrhagiccysts is not always possible with a single imagingstudy. Comparison with study results at otherpoints in time can be helpful.
Figure 12. Endometriosis in a 37-year-old woman with RLQ pain and a right adnexal mass atUS. (a) Axial T1-weighted GRE image shows two lesions (arrows) with homogeneous high signalintensity in the pelvis. (b) Sagittal T2-weighted fast SE image shows heterogeneous decreased orlow signal intensity (shading) in the two lesions (arrows), which are located immediately superiorto the uterus (U). Gadolinium-enhanced MR imaging showed no enhancement within the lesions.Endometriomas were confirmed at surgery and pathologic analysis.
RG f Volume 27 ● Number 3 Pedrosa et al 733
TeachingPoint

neoplasm leading to torsion being a dermoid(43). Other conditions that may lead to ovariantorsion include ovarian hyperstimulation syn-drome, abscesses, and malignant neoplasms (44).Ovarian torsion is occasionally seen in pregnancy.
MR imaging findings in ovarian torsion varydepending on the stage of the disease. Initially,there is ovarian enlargement caused by stromaledema, which is appreciated as diffuse high signalintensity on T2-weighted images (45). Fat satura-tion techniques improve the detection of ovarianedema on T2-weighted images (Fig 13). In thepresence of a mass, detection of edema in theovarian stroma may be challenging (45). In-creased signal intensity of the ovarian stroma isan early sign, and a viable ovary is frequentlyfound at surgery in these patients (45). As torsionprogresses, the signal intensity in the ovary is vari-able due to the presence of hemorrhage and ne-crosis. Decreased signal intensity on T1- and T2-weighted images indicates hemorrhagic infarction(46).
Other findings that aid in recognition of ovar-ian torsion include tubal thickening, increasedsignal intensity (edema) within the tube on T2-weighted images (45), deviation of the uterus tothe side of the torsion, and a twisted vascularpedicle (47) (Fig 14). A hemorrhagic tube, hem-orrhage within the twisted adnexal mass, and he-moperitoneum can be seen, although these aretypically present only in torsion with hemorrhagicinfarction (43). Fat-saturated T1-weighted im-ages help identify high signal intensity associatedwith blood products (43).
Similar to Doppler US findings in incompleteor partial torsion, the presence of flow seen onTOF and contrast-enhanced MR images in theaffected ovary does not exclude torsion. In ourexperience, lack of enhancement is best appreci-ated on subtraction images and is typically seen inchronic stages.
Ovarian hyperstimulation syndrome occurs asa result of ovulation induction. Although up to65% of patients undergoing ovulation inductionhave a mild form of this condition, the rare severepresentations require hospitalization. Patients
Figure 13. Ovarian torsion in a 31-year-old woman who was 30 weeks pregnant and had RLQ pain and nau-sea. US showed a mildly enlarged right ovary with normal arterial and venous flow. (a) Axial T2-weightedsingle-shot fast SE image of the right pelvis shows a mildly enlarged right ovary with areas of increased signalintensity in its stroma (arrow), findings consistent with edema. (b) On an axial fat-saturated T2-weightedsingle-shot fast SE image obtained at the same level, the high signal intensity within the ovarian stroma (*)caused by edema is seen more clearly. Note the peripherally located follicles, which appear prominent due tothe stromal edema. A small amount of fluid is also present surrounding the ovary (arrowheads); this fluid wasnot appreciated without fat saturation. These MR imaging findings are characteristic of ovarian torsion, andthe diagnosis was confirmed at surgery.
734 May-June 2007 RG f Volume 27 ● Number 3
TeachingPoint
Ovarian torsion occurs as a result of twisting ofthe ovary around its vascular pedicle, leading toischemia. An ovarian lesion serves as the leadingpoint in the majority of cases. Ovarian or parao-varian cysts are the most common lesions en-countered in these patients. The ovarian cysts canbe physiologic or neoplastic, with the most common
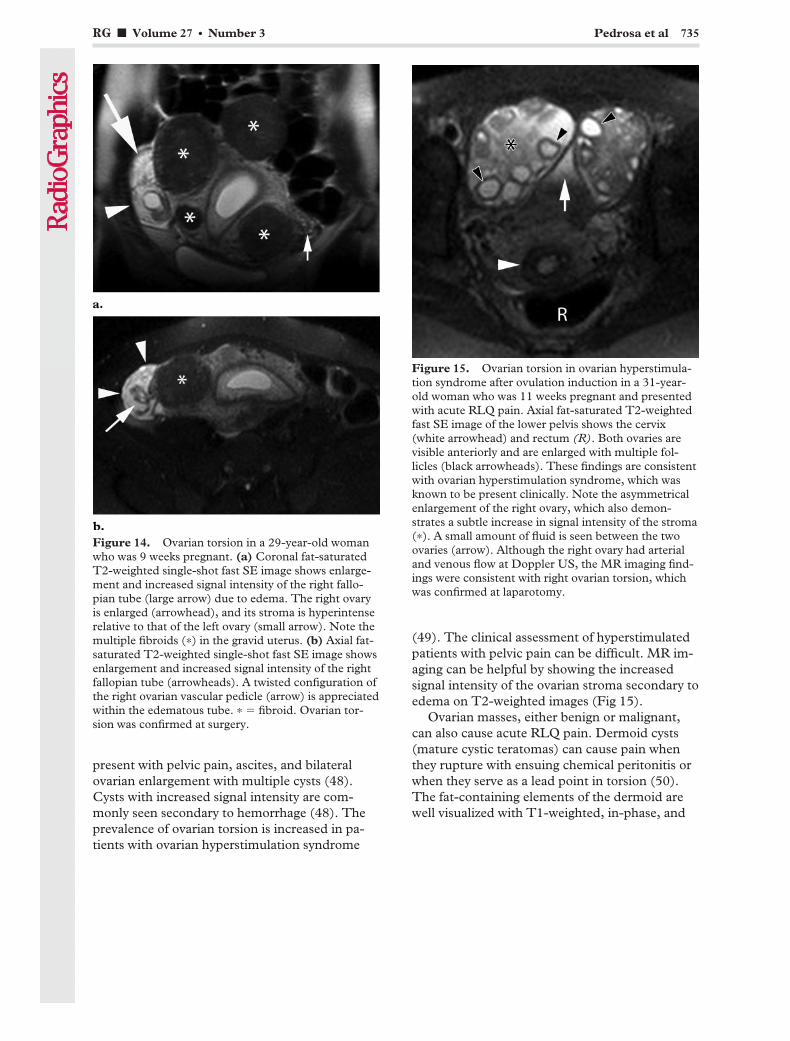
present with pelvic pain, ascites, and bilateralovarian enlargement with multiple cysts (48).Cysts with increased signal intensity are com-monly seen secondary to hemorrhage (48). Theprevalence of ovarian torsion is increased in pa-tients with ovarian hyperstimulation syndrome
(49). The clinical assessment of hyperstimulatedpatients with pelvic pain can be difficult. MR im-aging can be helpful by showing the increasedsignal intensity of the ovarian stroma secondary toedema on T2-weighted images (Fig 15).
Ovarian masses, either benign or malignant,can also cause acute RLQ pain. Dermoid cysts(mature cystic teratomas) can cause pain whenthey rupture with ensuing chemical peritonitis orwhen they serve as a lead point in torsion (50).The fat-containing elements of the dermoid arewell visualized with T1-weighted, in-phase, and
Figure 14. Ovarian torsion in a 29-year-old womanwho was 9 weeks pregnant. (a) Coronal fat-saturatedT2-weighted single-shot fast SE image shows enlarge-ment and increased signal intensity of the right fallo-pian tube (large arrow) due to edema. The right ovaryis enlarged (arrowhead), and its stroma is hyperintenserelative to that of the left ovary (small arrow). Note themultiple fibroids (*) in the gravid uterus. (b) Axial fat-saturated T2-weighted single-shot fast SE image showsenlargement and increased signal intensity of the rightfallopian tube (arrowheads). A twisted configuration ofthe right ovarian vascular pedicle (arrow) is appreciatedwithin the edematous tube. * � fibroid. Ovarian tor-sion was confirmed at surgery.
Figure 15. Ovarian torsion in ovarian hyperstimula-tion syndrome after ovulation induction in a 31-year-old woman who was 11 weeks pregnant and presentedwith acute RLQ pain. Axial fat-saturated T2-weightedfast SE image of the lower pelvis shows the cervix(white arrowhead) and rectum (R). Both ovaries arevisible anteriorly and are enlarged with multiple fol-licles (black arrowheads). These findings are consistentwith ovarian hyperstimulation syndrome, which wasknown to be present clinically. Note the asymmetricalenlargement of the right ovary, which also demon-strates a subtle increase in signal intensity of the stroma(*). A small amount of fluid is seen between the twoovaries (arrow). Although the right ovary had arterialand venous flow at Doppler US, the MR imaging find-ings were consistent with right ovarian torsion, whichwas confirmed at laparotomy.
RG f Volume 27 ● Number 3 Pedrosa et al 735
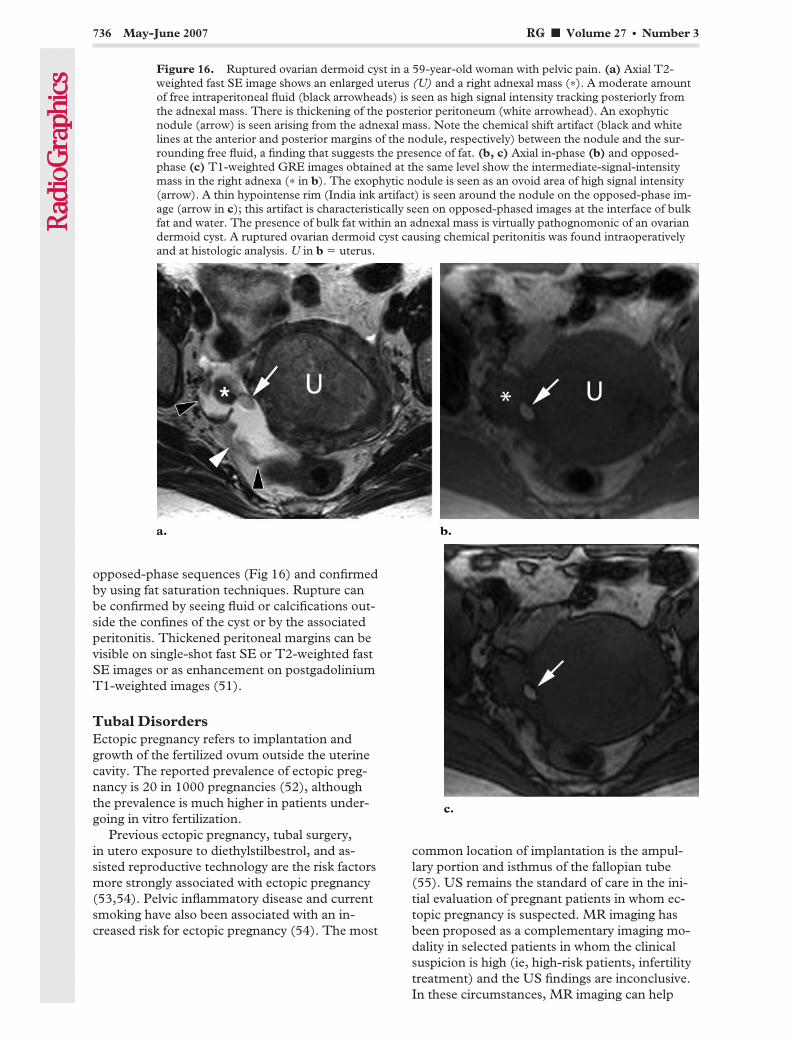
opposed-phase sequences (Fig 16) and confirmedby using fat saturation techniques. Rupture canbe confirmed by seeing fluid or calcifications out-side the confines of the cyst or by the associatedperitonitis. Thickened peritoneal margins can bevisible on single-shot fast SE or T2-weighted fastSE images or as enhancement on postgadoliniumT1-weighted images (51).
Tubal DisordersEctopic pregnancy refers to implantation andgrowth of the fertilized ovum outside the uterinecavity. The reported prevalence of ectopic preg-nancy is 20 in 1000 pregnancies (52), althoughthe prevalence is much higher in patients under-going in vitro fertilization.
Previous ectopic pregnancy, tubal surgery,in utero exposure to diethylstilbestrol, and as-sisted reproductive technology are the risk factorsmore strongly associated with ectopic pregnancy(53,54). Pelvic inflammatory disease and currentsmoking have also been associated with an in-creased risk for ectopic pregnancy (54). The most
common location of implantation is the ampul-lary portion and isthmus of the fallopian tube(55). US remains the standard of care in the ini-tial evaluation of pregnant patients in whom ec-topic pregnancy is suspected. MR imaging hasbeen proposed as a complementary imaging mo-dality in selected patients in whom the clinicalsuspicion is high (ie, high-risk patients, infertilitytreatment) and the US findings are inconclusive.In these circumstances, MR imaging can help
Figure 16. Ruptured ovarian dermoid cyst in a 59-year-old woman with pelvic pain. (a) Axial T2-weighted fast SE image shows an enlarged uterus (U) and a right adnexal mass (*). A moderate amountof free intraperitoneal fluid (black arrowheads) is seen as high signal intensity tracking posteriorly fromthe adnexal mass. There is thickening of the posterior peritoneum (white arrowhead). An exophyticnodule (arrow) is seen arising from the adnexal mass. Note the chemical shift artifact (black and whitelines at the anterior and posterior margins of the nodule, respectively) between the nodule and the sur-rounding free fluid, a finding that suggests the presence of fat. (b, c) Axial in-phase (b) and opposed-phase (c) T1-weighted GRE images obtained at the same level show the intermediate-signal-intensitymass in the right adnexa (* in b). The exophytic nodule is seen as an ovoid area of high signal intensity(arrow). A thin hypointense rim (India ink artifact) is seen around the nodule on the opposed-phase im-age (arrow in c); this artifact is characteristically seen on opposed-phased images at the interface of bulkfat and water. The presence of bulk fat within an adnexal mass is virtually pathognomonic of an ovariandermoid cyst. A ruptured ovarian dermoid cyst causing chemical peritonitis was found intraoperativelyand at histologic analysis. U in b � uterus.
736 May-June 2007 RG f Volume 27 ● Number 3
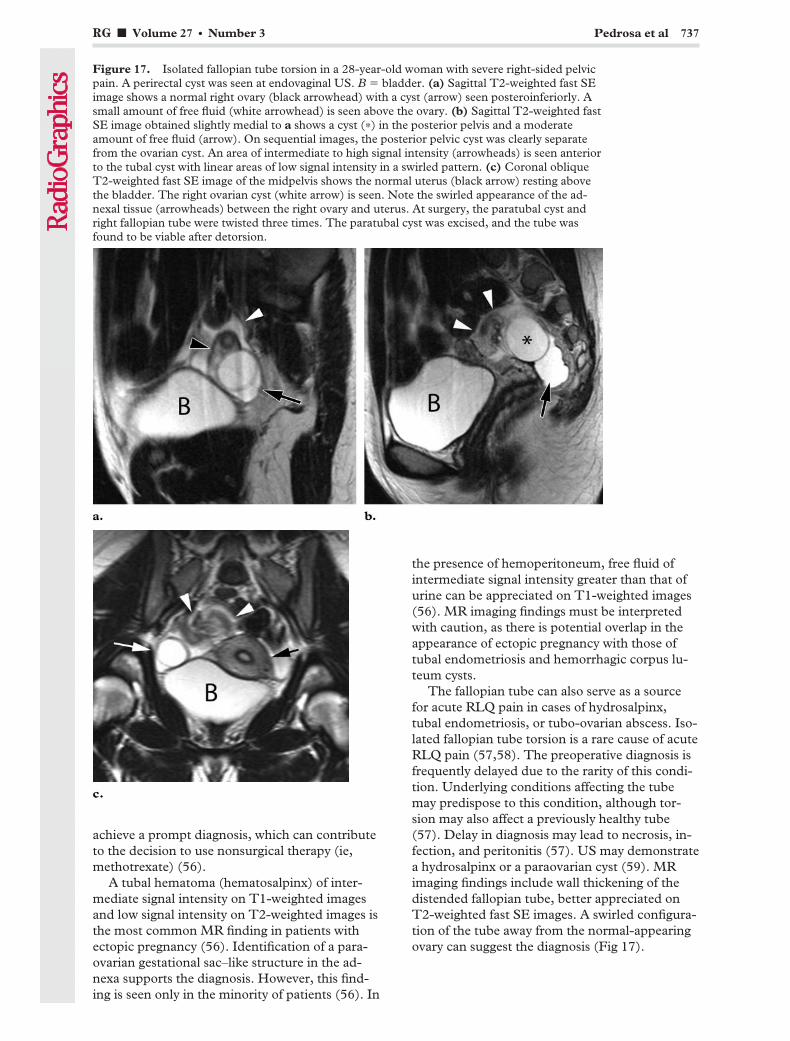
achieve a prompt diagnosis, which can contributeto the decision to use nonsurgical therapy (ie,methotrexate) (56).
A tubal hematoma (hematosalpinx) of inter-mediate signal intensity on T1-weighted imagesand low signal intensity on T2-weighted images isthe most common MR finding in patients withectopic pregnancy (56). Identification of a para-ovarian gestational sac–like structure in the ad-nexa supports the diagnosis. However, this find-ing is seen only in the minority of patients (56). In
the presence of hemoperitoneum, free fluid ofintermediate signal intensity greater than that ofurine can be appreciated on T1-weighted images(56). MR imaging findings must be interpretedwith caution, as there is potential overlap in theappearance of ectopic pregnancy with those oftubal endometriosis and hemorrhagic corpus lu-teum cysts.
The fallopian tube can also serve as a sourcefor acute RLQ pain in cases of hydrosalpinx,tubal endometriosis, or tubo-ovarian abscess. Iso-lated fallopian tube torsion is a rare cause of acuteRLQ pain (57,58). The preoperative diagnosis isfrequently delayed due to the rarity of this condi-tion. Underlying conditions affecting the tubemay predispose to this condition, although tor-sion may also affect a previously healthy tube(57). Delay in diagnosis may lead to necrosis, in-fection, and peritonitis (57). US may demonstratea hydrosalpinx or a paraovarian cyst (59). MRimaging findings include wall thickening of thedistended fallopian tube, better appreciated onT2-weighted fast SE images. A swirled configura-tion of the tube away from the normal-appearingovary can suggest the diagnosis (Fig 17).
Figure 17. Isolated fallopian tube torsion in a 28-year-old woman with severe right-sided pelvicpain. A perirectal cyst was seen at endovaginal US. B � bladder. (a) Sagittal T2-weighted fast SEimage shows a normal right ovary (black arrowhead) with a cyst (arrow) seen posteroinferiorly. Asmall amount of free fluid (white arrowhead) is seen above the ovary. (b) Sagittal T2-weighted fastSE image obtained slightly medial to a shows a cyst (*) in the posterior pelvis and a moderateamount of free fluid (arrow). On sequential images, the posterior pelvic cyst was clearly separatefrom the ovarian cyst. An area of intermediate to high signal intensity (arrowheads) is seen anteriorto the tubal cyst with linear areas of low signal intensity in a swirled pattern. (c) Coronal obliqueT2-weighted fast SE image of the midpelvis shows the normal uterus (black arrow) resting abovethe bladder. The right ovarian cyst (white arrow) is seen. Note the swirled appearance of the ad-nexal tissue (arrowheads) between the right ovary and uterus. At surgery, the paratubal cyst andright fallopian tube were twisted three times. The paratubal cyst was excised, and the tube wasfound to be viable after detorsion.
RG f Volume 27 ● Number 3 Pedrosa et al 737
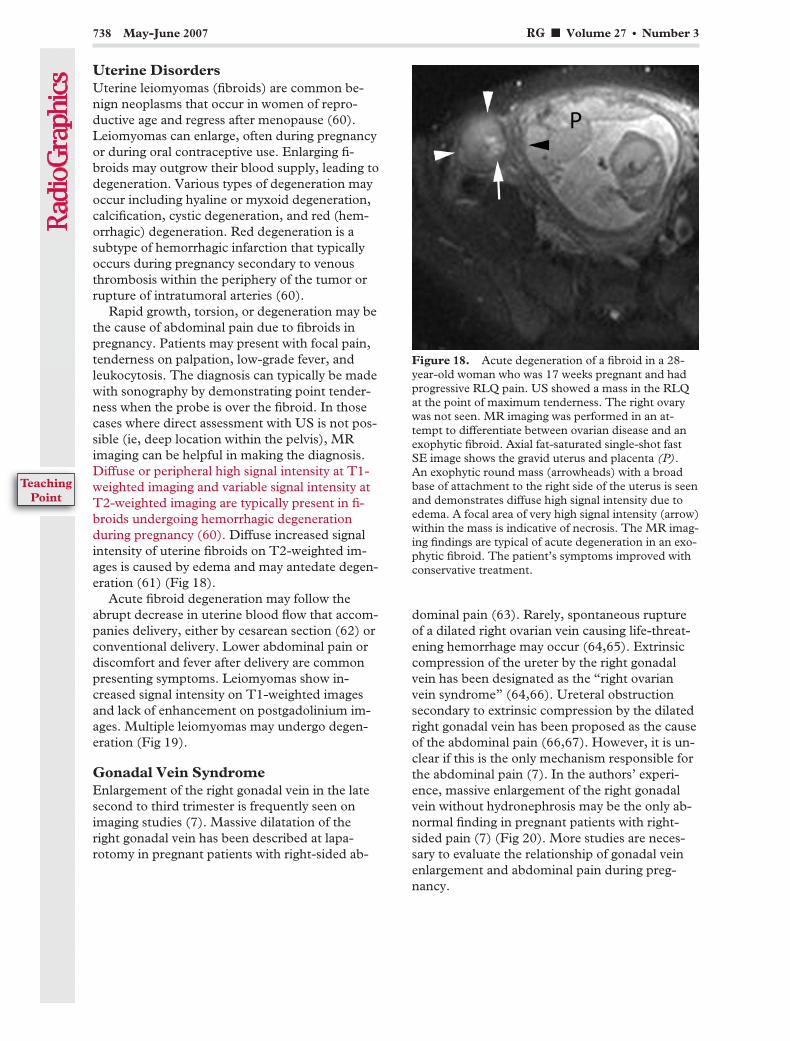
Uterine DisordersUterine leiomyomas (fibroids) are common be-nign neoplasms that occur in women of repro-ductive age and regress after menopause (60).Leiomyomas can enlarge, often during pregnancyor during oral contraceptive use. Enlarging fi-broids may outgrow their blood supply, leading todegeneration. Various types of degeneration mayoccur including hyaline or myxoid degeneration,calcification, cystic degeneration, and red (hem-orrhagic) degeneration. Red degeneration is asubtype of hemorrhagic infarction that typicallyoccurs during pregnancy secondary to venousthrombosis within the periphery of the tumor orrupture of intratumoral arteries (60).
Rapid growth, torsion, or degeneration may bethe cause of abdominal pain due to fibroids inpregnancy. Patients may present with focal pain,tenderness on palpation, low-grade fever, andleukocytosis. The diagnosis can typically be madewith sonography by demonstrating point tender-ness when the probe is over the fibroid. In thosecases where direct assessment with US is not pos-sible (ie, deep location within the pelvis), MRimaging can be helpful in making the diagnosis.Diffuse or peripheral high signal intensity at T1-weighted imaging and variable signal intensity atT2-weighted imaging are typically present in fi-broids undergoing hemorrhagic degenerationduring pregnancy (60). Diffuse increased signalintensity of uterine fibroids on T2-weighted im-ages is caused by edema and may antedate degen-eration (61) (Fig 18).
Acute fibroid degeneration may follow theabrupt decrease in uterine blood flow that accom-panies delivery, either by cesarean section (62) orconventional delivery. Lower abdominal pain ordiscomfort and fever after delivery are commonpresenting symptoms. Leiomyomas show in-creased signal intensity on T1-weighted imagesand lack of enhancement on postgadolinium im-ages. Multiple leiomyomas may undergo degen-eration (Fig 19).
Gonadal Vein SyndromeEnlargement of the right gonadal vein in the latesecond to third trimester is frequently seen onimaging studies (7). Massive dilatation of theright gonadal vein has been described at lapa-rotomy in pregnant patients with right-sided ab-
dominal pain (63). Rarely, spontaneous ruptureof a dilated right ovarian vein causing life-threat-ening hemorrhage may occur (64,65). Extrinsiccompression of the ureter by the right gonadalvein has been designated as the “right ovarianvein syndrome” (64,66). Ureteral obstructionsecondary to extrinsic compression by the dilatedright gonadal vein has been proposed as the causeof the abdominal pain (66,67). However, it is un-clear if this is the only mechanism responsible forthe abdominal pain (7). In the authors’ experi-ence, massive enlargement of the right gonadalvein without hydronephrosis may be the only ab-normal finding in pregnant patients with right-sided pain (7) (Fig 20). More studies are neces-sary to evaluate the relationship of gonadal veinenlargement and abdominal pain during preg-nancy.
Figure 18. Acute degeneration of a fibroid in a 28-year-old woman who was 17 weeks pregnant and hadprogressive RLQ pain. US showed a mass in the RLQat the point of maximum tenderness. The right ovarywas not seen. MR imaging was performed in an at-tempt to differentiate between ovarian disease and anexophytic fibroid. Axial fat-saturated single-shot fastSE image shows the gravid uterus and placenta (P).An exophytic round mass (arrowheads) with a broadbase of attachment to the right side of the uterus is seenand demonstrates diffuse high signal intensity due toedema. A focal area of very high signal intensity (arrow)within the mass is indicative of necrosis. The MR imag-ing findings are typical of acute degeneration in an exo-phytic fibroid. The patient’s symptoms improved withconservative treatment.
738 May-June 2007 RG f Volume 27 ● Number 3
TeachingPoint
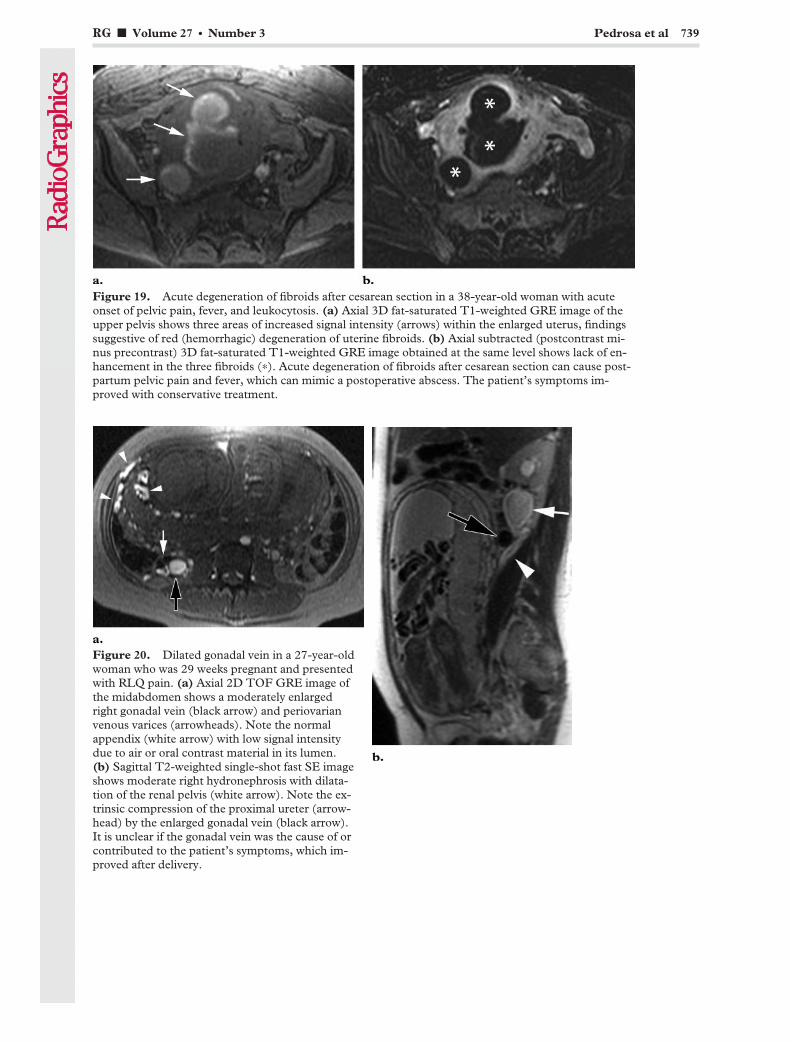
Figure 19. Acute degeneration of fibroids after cesarean section in a 38-year-old woman with acuteonset of pelvic pain, fever, and leukocytosis. (a) Axial 3D fat-saturated T1-weighted GRE image of theupper pelvis shows three areas of increased signal intensity (arrows) within the enlarged uterus, findingssuggestive of red (hemorrhagic) degeneration of uterine fibroids. (b) Axial subtracted (postcontrast mi-nus precontrast) 3D fat-saturated T1-weighted GRE image obtained at the same level shows lack of en-hancement in the three fibroids (*). Acute degeneration of fibroids after cesarean section can cause post-partum pelvic pain and fever, which can mimic a postoperative abscess. The patient’s symptoms im-proved with conservative treatment.
Figure 20. Dilated gonadal vein in a 27-year-oldwoman who was 29 weeks pregnant and presentedwith RLQ pain. (a) Axial 2D TOF GRE image ofthe midabdomen shows a moderately enlargedright gonadal vein (black arrow) and periovarianvenous varices (arrowheads). Note the normalappendix (white arrow) with low signal intensitydue to air or oral contrast material in its lumen.(b) Sagittal T2-weighted single-shot fast SE imageshows moderate right hydronephrosis with dilata-tion of the renal pelvis (white arrow). Note the ex-trinsic compression of the proximal ureter (arrow-head) by the enlarged gonadal vein (black arrow).It is unclear if the gonadal vein was the cause of orcontributed to the patient’s symptoms, which im-proved after delivery.
RG f Volume 27 ● Number 3 Pedrosa et al 739

Urinary Tract DisordersEvaluation of the urinary tract is typically per-formed with US and CT. Nephro- and ureteroli-thiasis represent the most common causes of ab-dominal pain of urologic origin. Visualizationof stones in the urinary tract is challenging withMR imaging, particularly intrarenal stones andthose at the ureterovesical junction. The utilityof MR imaging for assessment of the urinarytract in patients with suspected ureterolithiasishas been reported (68–71). MR imaging may beparticularly helpful when the use of contrast me-dia or radiation is undesirable (eg, pregnant pa-tients, children and young adults) (72). In thenonpregnant patient, a combination of heavilyT2-weighted images and gadolinium-enhancedT1-weighted images should be used. Evaluationof the urinary tract in the pregnant patient can beaccomplished with T2-weighted images (ie, half-Fourier single-shot fast SE).
Patients with acute obstruction demonstrateincreased perirenal fluid on T2-weighted images,most likely due to lymphatic congestion or forni-ceal rupture (73). Although this finding suggestsacute obstruction, perirenal fluid can be second-ary to any insult to the kidney and should be con-sidered a nonspecific sign (72,73).
Ureteral patency can be inferred by the pres-ence of a ureteral jet at Doppler US, although itdoes not exclude the presence of a nonobstructivestone. Transvaginal US is helpful in identificationof stones at the ureterovesical junction. MR imag-ing can help in determining the level of obstruc-tion. Hydronephrosis related to pregnancy can beeasily recognized at MR imaging, as the dilatedureter is extrinsically compressed between thegravid uterus and psoas muscle at the level of thesacral promontory. In our experience, as well asin others’ (74), dilatation distal to the sacralpromontory should raise suspicion for obstruction(ie, ureterovesical junction stone).
Care should be taken to not mistake flow arti-fact central in the ureter with a stone on T2-weighted single-shot fast SE images. This canbe done by reviewing images in multiple planeswhen a ureteral stone is suspected. Fast imagingwith a steady-state precession technique (eg, trueFISP [Siemens Medical Solutions, Malvern, Pa],FIESTA [GE Healthcare, Waukesha, Wis], bal-anced FFE [Philips Medical Systems, Andover,Mass]) may be used to identify stones in the distalureter. A 3D version of a steady-state precessionsequence allows improved signal-to-noise ratioand multiplanar reformation to facilitate recogni-tion of the stone (Fig 21).
The bladder can also be a source of pain due tocystitis. Attention must be paid to the bladdersize, the thickness of the bladder wall, and thepresence of air within the bladder. Air in the blad-der is an abnormal finding except in the setting ofrecent instrumentation or bladder catheter place-ment (5).
ConclusionsMR imaging is an excellent alternative to CT inthose patients in whom the use of iodinated con-trast media or radiation is not desirable. Further-more, MR imaging is an excellent adjunct to USin pregnant patients with RLQ pain in whom theresults of the US examination are inconclusive.Radiologists should become familiar with the MRimaging technique, advantages, and unique fea-tures of MR imaging for evaluating patients withacute RLQ pain.
References1. Puylaert JB. Ultrasonography of the acute abdo-
men: gastrointestinal conditions. Radiol ClinNorth Am 2003;41:1227–1242, vii.
2. Lim HK, Bae SH, Seo GS. Diagnosis of acute ap-pendicitis in pregnant women: value of sonogra-phy. AJR Am J Roentgenol 1992;159:539–542.
3. Puylaert JB. Acute appendicitis: US evaluationusing graded compression. Radiology 1986;158:355–360.
4. Cobben LP, Groot I, Haans L, Blickman JG, Puy-laert J. MRI for clinically suspected appendicitisduring pregnancy. AJR Am J Roentgenol 2004;183:671–675.
5. Eyvazzadeh AD, Pedrosa I, Rofsky NM, et al.MRI of right-sided abdominal pain in pregnancy.AJR Am J Roentgenol 2004;183:907–914.
6. Oto A, Ernst RD, Shah R, et al. Right-lower-quadrant pain and suspected appendicitis in preg-nant women: evaluation with MR imaging—initialexperience. Radiology 2005;234:445–451.
7. Pedrosa I, Levine D, Eyvazzadeh AD, Siewert B,Ngo L, Rofsky NM. MR imaging evaluation ofacute appendicitis in pregnancy. Radiology 2006;238:891–899.
8. Andersen B, Nielsen TF. Appendicitis in preg-nancy: diagnosis, management and complications.Acta Obstet Gynecol Scand 1999;78:758–762.
9. Mourad J, Elliott JP, Erickson L, Lisboa L. Ap-pendicitis in pregnancy: new information that con-tradicts long-held clinical beliefs. Am J Obstet Gy-necol 2000;182:1027–1029.
10. Earls JP, Rofsky NM, DeCorato DR, Krinsky GA,Weinreb JC. Hepatic arterial-phase dynamic gado-linium-enhanced MR imaging: optimization with atest examination and a power injector. Radiology1997;202:268–273.
11. Lavelle MT, Lee VS, Rofsky NM, Krinsky GA,Weinreb JC. Dynamic contrast-enhanced three-dimensional MR imaging of liver parenchyma:source images and angiographic reconstructions todefine hepatic arterial anatomy. Radiology 2001;218:389–394.
740 May-June 2007 RG f Volume 27 ● Number 3
TeachingPoint

12. Rofsky NM, Lee VS, Laub G, et al. AbdominalMR imaging with a volumetric interpolatedbreath-hold examination. Radiology 1999;212:876–884.
13. Shellock FG, Crues JV. MR procedures: biologiceffects, safety, and patient care. Radiology 2004;232:635–652.
14. Liebig T, Stoupis C, Ros PR, Ballinger JR, BriggsRW. A potentially artifact-free oral contrast agentfor gastrointestinal MRI. Magn Reson Med 1993;30:646–649.
15. Birnbaum BA, Wilson SR. Appendicitis at the mil-lennium. Radiology 2000;215:337–348.
16. Nitta N, Takahashi M, Furukawa A, Murata K,Mori M, Fukushima M. MR imaging of the nor-mal appendix and acute appendicitis. J Magn Re-son Imaging 2005;21:156–165.
17. Hormann M, Puig S, Prokesch SR, Partik B, Hel-bich TH. MR imaging of the normal appendix inchildren. Eur Radiol 2002;12:2313–2316.
18. Nikolaidis P, Hammond N, Marko J, Miller FH,Papanicolaou N, Yaghmai V. Incidence of visual-ization of the normal appendix on different MRIsequences. Emerg Radiol 2006;12:223–226.
19. Birchard KR, Brown MA, Hyslop WB, Firat Z,Semelka RC. MRI of acute abdominal and pelvicpain in pregnant patients. AJR Am J Roentgenol2005;184:452–458.
20. Mangi AA, Berger DL. Stump appendicitis. AmSurg 2000;66:739–741.
21. Greenberg JJ, Esposito TJ. Appendicitis after lapa-roscopic appendectomy: a warning. J Laparoen-dosc Surg 1996;6:185–187.
22. Walsh DC, Roediger WE. Stump appendicitis: apotential problem after laparoscopic appendicec-tomy. Surg Laparosc Endosc 1997;7:357–358.
23. Rao PM, Sagarin MJ, McCabe CJ. Stump appen-dicitis diagnosed preoperatively by computed to-mography. Am J Emerg Med 1998;16:309–311.
24. Shin LK, Halpern D, Weston SR, Meiner EM,Katz DS. Prospective CT diagnosis of stump ap-pendicitis. AJR Am J Roentgenol 2005;184(3suppl):S62–S64.
25. Rao PM, Wittenberg J, McDowell RK, Rhea JT,Novelline RA. Appendicitis: use of arrowhead signfor diagnosis at CT. Radiology 1997;202:363–366.
26. Higa E, Rosai J, Pizzimbono CA, Wise L. Mucosalhyperplasia, mucinous cystadenoma, and muci-nous cystadenocarcinoma of the appendix: a re-evaluation of appendiceal “mucocele”. Cancer1973;32:1525–1541.
27. Aho AJ, Heinonen R, Lauren P. Benign and ma-lignant mucocele of the appendix: histologicaltypes and prognosis. Acta Chir Scand 1973;139:392–400.
28. Landen S, Bertrand C, Maddern GJ, et al. Appen-diceal mucoceles and pseudomyxoma peritonei.Surg Gynecol Obstet 1992;175:401–404.
29. Qizilbash AH. Mucoceles of the appendix: theirrelationship to hyperplastic polyps, mucinouscystadenomas, and cystadenocarcinomas. ArchPathol 1975;99:548–555.
30. Isaacs KL, Warshauer DM. Mucocele of the ap-pendix: computed tomographic, endoscopic, andpathologic correlation. Am J Gastroenterol 1992;87:787–789.
Figure 21. Distal ureterolithiasis in a 39-year-old woman who was 11 weeks pregnant andhad right-sided abdominal pain. US showed right hydronephrosis and a calculus in the distalureter. MR imaging was performed due to worsening symptoms. (a) Sagittal fat-saturatedT2-weighted single-shot fast SE image shows hydronephrosis (arrow) and extensive retro-peritoneal fluid (arrowheads) around the right kidney, an appearance suggestive of fornicealrupture. (b) Coronal reformatted image from axial 3D fast imaging with steady-state acqui-sition shows a filling defect (arrow) in the distal right ureter (arrowheads), a finding consis-tent with a ureteral calculus. B � bladder. The patient’s symptoms resolved after ureteros-copy with basket extraction of the calculus followed by placement of a double-J stent.
RG f Volume 27 ● Number 3 Pedrosa et al 741
31. Pickhardt PJ, Levy AD, Rohrmann CA Jr, KendeAI. Primary neoplasms of the appendix manifest-ing as acute appendicitis: CT findings with patho-logic comparison. Radiology 2002;224:775–781.
32. Prassopoulos P, Papanikolaou N, GrammatikakisJ, Rousomoustakaki M, Maris T, GourtsoyiannisN. MR enteroclysis imaging of Crohn disease. Ra-dioGraphics 2001;21(Spec Issue):S161–S172.
33. Maccioni F, Bruni A, Viscido A, et al. MR imag-ing in patients with Crohn disease: value of T2-versus T1-weighted gadolinium-enhanced MRsequences with use of an oral superparamagneticcontrast agent. Radiology 2006;238:517–530.
34. Maccioni F, Viscido A, Broglia L, et al. Evaluationof Crohn disease activity with magnetic resonanceimaging. Abdom Imaging 2000;25:219–228.
35. Haggett PJ, Moore NR, Shearman JD, Travis SP,Jewell DP, Mortensen NJ. Pelvic and perinealcomplications of Crohn’s disease: assessment us-ing magnetic resonance imaging. Gut 1995;36:407–410.
36. Regan F, Beall DP, Bohlman ME, Khazan R, SufiA, Schaefer DC. Fast MR imaging and the detec-tion of small-bowel obstruction. AJR Am J Roent-genol 1998;170:1465–1469.
37. Togashi K, Nishimura K, Kimura I, et al. Endo-metrial cysts: diagnosis with MR imaging. Radiol-ogy 1991;180:73–78.
38. Takahashi K, Okada S, Okada M, Kitao M, KajiY, Sugimura K. Magnetic resonance relaxationtime in evaluating the cyst fluid characteristics ofendometrioma. Hum Reprod 1996;11:857–860.
39. Outwater E, Schiebler ML, Owen RS, SchnallMD. Characterization of hemorrhagic adnexallesions with MR imaging: blinded reader study.Radiology 1993;186:489–494.
40. Bazot M, Darai E, Hourani R, et al. Deep pelvicendometriosis: MR imaging for diagnosis and pre-diction of extension of disease. Radiology 2004;232:379–389.
41. Kataoka ML, Togashi K, Yamaoka T, et al. Poste-rior cul-de-sac obliteration associated with endo-metriosis: MR imaging evaluation. Radiology2005;234:815–823.
42. Outwater EK, Dunton CJ. Imaging of the ovaryand adnexa: clinical issues and applications of MRimaging. Radiology 1995;194:1–18.
43. Rha SE, Byun JY, Jung SE, et al. CT and MR im-aging features of adnexal torsion. RadioGraphics2002;22:283–294.
44. Sommerville M, Grimes DA, Koonings PP,Campbell K. Ovarian neoplasms and the risk ofadnexal torsion. Am J Obstet Gynecol 1991;164:577–578.
45. Ghossain MA, Hachem K, Buy JN, et al. Adnexaltorsion: magnetic resonance findings in the viableadnexa with emphasis on stromal ovarian appear-ance. J Magn Reson Imaging 2004;20:451–462.
46. Kawakami K, Murata K, Kawaguchi N, et al.Hemorrhagic infarction of the diseased ovary: acommon MR finding in two cases. Magn ResonImaging 1993;11:595–597.
47. Kimura I, Togashi K, Kawakami S, Takakura K,Mori T, Konishi J. Ovarian torsion: CT and MRimaging appearances. Radiology 1994;190:337–341.
48. Jung BG, Kim H. Severe spontaneous ovarianhyperstimulation syndrome with MR findings.J Comput Assist Tomogr 2001;25:215–217.
49. Gorkemli H, Camus M, Clasen K. Adnexal tor-sion after gonadotrophin ovulation induction forIVF or ICSI and its conservative treatment. ArchGynecol Obstet 2002;267:4–6.
50. Schaffer RM, Cataldi GA, Shih YH. Sonographicdemonstration of rupture of a cystic teratoma dur-ing pregnancy. J Ultrasound Med 1984;3:425–427.
51. Dohke M, Watanabe Y, Okumura A, et al. Com-prehensive MR imaging of acute gynecologic dis-eases. RadioGraphics 2000;20:1551–1566.
52. Centers for Disease Control and Prevention(CDC). Ectopic pregnancy—United States,1990–1992. MMWR Morb Mortal Wkly Rep1995;44:46–48.
53. Barnhart KT, Sammel MD, Gracia CR, ChittamsJ, Hummel AC, Shaunik A. Risk factors for ec-topic pregnancy in women with symptomatic first-trimester pregnancies. Fertil Steril 2006;86:36–43.
54. Lozeau AM, Potter B. Diagnosis and managementof ectopic pregnancy. Am Fam Physician 2005;72:1707–1714.
55. Bouyer J. Epidemiology of ectopic pregnancy: in-cidence, risk factors and outcomes [in French]. JGynecol Obstet Biol Reprod (Paris) 2003;32(7suppl):S8–S17.
56. Kataoka ML, Togashi K, Kobayashi H, Inoue T,Fujii S, Konishi J. Evaluation of ectopic pregnancyby magnetic resonance imaging. Hum Reprod1999;14:2644–2650.
57. Ferrera PC, Kass LE, Verdile VP. Torsion of thefallopian tube. Am J Emerg Med 1995;13:312–314.
58. Gross M, Blumstein SL, Chow LC. Isolated fallo-pian tube torsion: a rare twist on a commontheme. AJR Am J Roentgenol 2005;185:1590–1592.
59. Tapia-Vine M, Pedrosa I, Aranzabal A. Torsion ofthe fallopian tube in a pregnant patient simulatingappendicitis [in Spanish]. Radiologia 2000;42:569–571.
60. Murase E, Siegelman ES, Outwater EK, Perez-Jaffe LA, Tureck RW. Uterine leiomyomas: his-topathologic features, MR imaging findings, dif-ferential diagnosis, and treatment. RadioGraphics1999;19:1179–1197.
61. Ueda H, Togashi K, Konishi I, et al. Unusualappearances of uterine leiomyomas: MR imag-ing findings and their histopathologic back-grounds. RadioGraphics 1999;19(Spec Issue):S131–S145.
62. Lee WL, Chiu LM, Wang PH, Chao HT, YuanCC, Ng HT. Fever of unknown origin in the puer-perium: a case report. J Reprod Med 1998;43:149–152.
63. Ameur A, Lezrek M, Boumdin H, Jira H, Bed-douch A, Abbar M. Right ovarian vein syndrome:report of a case and review of the literature [inFrench]. Ann Urol (Paris) 2002;36:368–371.
64. Renuka T, Dhaliwal LK, Gupta I. Hemorrhagefrom ruptured utero-ovarian veins during preg-nancy. Int J Gynaecol Obstet 1998;60:167–168.
65. Foley MR, Sonek JD, Lavender LM, Zuspan FP.Spontaneous rupture of uteroovarian veins inpregnancy: two case reports. Am J Obstet Gynecol1987;156:962–964.
742 May-June 2007 RG f Volume 27 ● Number 3
66. Arvis G. Right ovarian vein syndrome [in French].Ann Urol (Paris) 1985;19:65–66.
67. Gettman MT, Lotan Y, Cadeddu J. Laparoscopictreatment of ovarian vein syndrome. JSLS 2003;7:257–260.
68. Nolte-Ernsting CC, Bucker A, Adam GB, et al.Gadolinium-enhanced excretory MR urographyafter low-dose diuretic injection: comparison withconventional excretory urography. Radiology1998;209:147–157.
69. Regan F, Bohlman ME, Khazan R, Rodriguez R,Schultze-Haakh H. MR urography using HASTEimaging in the assessment of ureteric obstruction.AJR Am J Roentgenol 1996;167:1115–1120.
70. Sudah M, Vanninen R, Partanen K, Heino A,Vainio P, Ala-Opas M. MR urography in evalua-tion of acute flank pain: T2-weighted sequencesand gadolinium-enhanced three-dimensionalFLASH compared with urography. AJR Am JRoentgenol 2001;176:105–112.
71. Tang Y, Yamashita Y, Namimoto T, et al. Thevalue of MR urography that uses HASTE se-quences to reveal urinary tract disorders. AJRAm J Roentgenol 1996;167:1497–1502.
72. Sudah M, Vanninen RL, Partanen K, et al. Pa-tients with acute flank pain: comparison of MRurography with unenhanced helical CT. Radiology2002;223:98–105.
73. Regan F, Petronis J, Bohlman M, Rodriguez R,Moore R. Perirenal MR high signal: a new andsensitive indicator of acute ureteric obstruction.Clin Radiol 1997;52:445–450.
74. Roy C, Saussine C, Jahn C, et al. Fast imagingMR assessment of ureterohydronephrosis duringpregnancy. Magn Reson Imaging 1995;13:767–772.
RG f Volume 27 ● Number 3 Pedrosa et al 743
This article meets the criteria for 1.0 credit hour in category 1 of the AMA Physician’s Recognition Award. To obtaincredit, see accompanying test at http://www.rsna.org/education/rg_cme.html.
Invited Commentary
From:Douglas S. Katz, MD, Vladimir Merunka, BSDepartment of Radiology, Winthrop-University Hospital, Mineola, New YorkDepartment of Radiology, School of Medicine, State University of New York at Stony BrookJohn J. Hines, MDDepartment of Radiology, Long Island Jewish Medical Center, New Hyde Park, New YorkEvan M. Meiner, MDDepartment of Emergency Medicine, North Shore University Hospital, Manhasset, New York
Editor’s Note.—Supplemental material available atradiographics.rsnajnls.org/cgi/content/full/27/3/743/DC1.
When I began practice, I was relatively safe in assum-ing that abdominal pain was appendicitis or greenapples.
—Dr Gunnar Gundersen, former President,American Medical Association, 1962
The purpose of medicine is to prevent significant dis-ease, to decrease pain and to postpone death when it ismeaningful to do so. Technology has to support thesegoals.
—Dr Joel Nobel, 1985
In the continuing evolution of the use of cross-sectional imaging for the assessment of patientswith acute abdominal pain, MR imaging is thelatest modality to be evaluated. In the past, MRimaging was not considered a routine alternativeor adjunct for imaging of patients with acute rightlower (or left lower) quadrant pain, for a varietyof reasons, including less accessibility and avail-ability, increased cost relative to other modalities,artifacts related to bowel motion and respiratory
motion, inferior evaluation of the bowel relativeto CT, increased length of the examination com-pared with CT, and less familiarity of radiologistswith the MR imaging findings that may causeacute abdominal and pelvic pain—as well as amind-set that MR was not a step in the algorithmfor the imaging work-up of such patients.
Pedrosa et al (1) demonstrate in their well-researched and thoroughly illustrated article pre-ceding this commentary their clinical experienceover the past several years with MR for imagingpatients with RLQ pain, building on a previousreview of their earlier experience (2). The authorsdemonstrate and explain that MR currently is aviable component of the imaging work-up of pa-tients with RLQ pain, and has overcome some ofthese obstacles and impediments to its use in thissetting (1). In general, we agree with the situa-tions where the authors advocate the use of MRimaging as an adjunct to initial sonography or as areplacement for CT, including patients where theexposure to ionizing radiation is less than idealcompared with alternative imaging modalitiesthat do not use such ionizing radiation, or when
RG f Volume 27 ● Number 3 Pedrosa et al 743
Note: This copy is for your personal, non-commercial use only. To order presentation-ready copies for distribution to your colleagues or clients, use the RadioGraphics Reprints form at the end of this article.
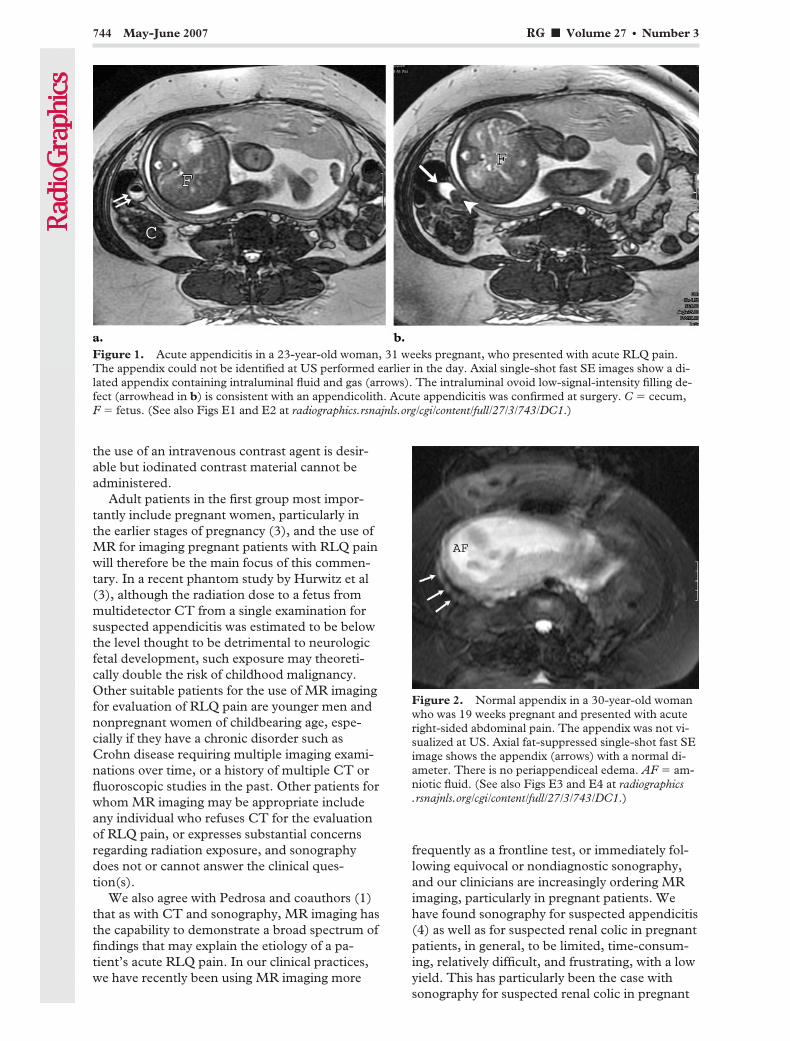
the use of an intravenous contrast agent is desir-able but iodinated contrast material cannot beadministered.
Adult patients in the first group most impor-tantly include pregnant women, particularly inthe earlier stages of pregnancy (3), and the use ofMR for imaging pregnant patients with RLQ painwill therefore be the main focus of this commen-tary. In a recent phantom study by Hurwitz et al(3), although the radiation dose to a fetus frommultidetector CT from a single examination forsuspected appendicitis was estimated to be belowthe level thought to be detrimental to neurologicfetal development, such exposure may theoreti-cally double the risk of childhood malignancy.Other suitable patients for the use of MR imagingfor evaluation of RLQ pain are younger men andnonpregnant women of childbearing age, espe-cially if they have a chronic disorder such asCrohn disease requiring multiple imaging exami-nations over time, or a history of multiple CT orfluoroscopic studies in the past. Other patients forwhom MR imaging may be appropriate includeany individual who refuses CT for the evaluationof RLQ pain, or expresses substantial concernsregarding radiation exposure, and sonographydoes not or cannot answer the clinical ques-tion(s).
We also agree with Pedrosa and coauthors (1)that as with CT and sonography, MR imaging hasthe capability to demonstrate a broad spectrum offindings that may explain the etiology of a pa-tient’s acute RLQ pain. In our clinical practices,we have recently been using MR imaging more
frequently as a frontline test, or immediately fol-lowing equivocal or nondiagnostic sonography,and our clinicians are increasingly ordering MRimaging, particularly in pregnant patients. Wehave found sonography for suspected appendicitis(4) as well as for suspected renal colic in pregnantpatients, in general, to be limited, time-consum-ing, relatively difficult, and frustrating, with a lowyield. This has particularly been the case withsonography for suspected renal colic in pregnant
Figure 1. Acute appendicitis in a 23-year-old woman, 31 weeks pregnant, who presented with acute RLQ pain.The appendix could not be identified at US performed earlier in the day. Axial single-shot fast SE images show a di-lated appendix containing intraluminal fluid and gas (arrows). The intraluminal ovoid low-signal-intensity filling de-fect (arrowhead in b) is consistent with an appendicolith. Acute appendicitis was confirmed at surgery. C � cecum,F � fetus. (See also Figs E1 and E2 at radiographics.rsnajnls.org/cgi/content/full/27/3/743/DC1.)
Figure 2. Normal appendix in a 30-year-old womanwho was 19 weeks pregnant and presented with acuteright-sided abdominal pain. The appendix was not vi-sualized at US. Axial fat-suppressed single-shot fast SEimage shows the appendix (arrows) with a normal di-ameter. There is no periappendiceal edema. AF � am-niotic fluid. (See also Figs E3 and E4 at radiographics.rsnajnls.org/cgi/content/full/27/3/743/DC1.)
744 May-June 2007 RG f Volume 27 ● Number 3
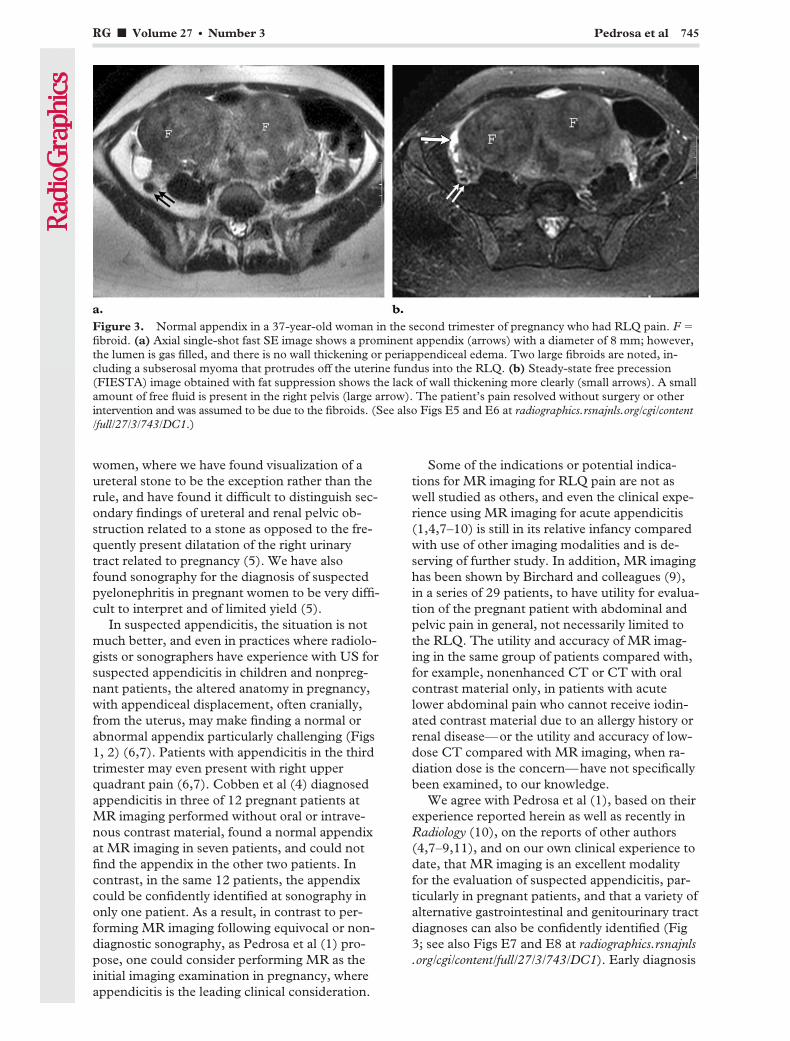
women, where we have found visualization of aureteral stone to be the exception rather than therule, and have found it difficult to distinguish sec-ondary findings of ureteral and renal pelvic ob-struction related to a stone as opposed to the fre-quently present dilatation of the right urinarytract related to pregnancy (5). We have alsofound sonography for the diagnosis of suspectedpyelonephritis in pregnant women to be very diffi-cult to interpret and of limited yield (5).
In suspected appendicitis, the situation is notmuch better, and even in practices where radiolo-gists or sonographers have experience with US forsuspected appendicitis in children and nonpreg-nant patients, the altered anatomy in pregnancy,with appendiceal displacement, often cranially,from the uterus, may make finding a normal orabnormal appendix particularly challenging (Figs1, 2) (6,7). Patients with appendicitis in the thirdtrimester may even present with right upperquadrant pain (6,7). Cobben et al (4) diagnosedappendicitis in three of 12 pregnant patients atMR imaging performed without oral or intrave-nous contrast material, found a normal appendixat MR imaging in seven patients, and could notfind the appendix in the other two patients. Incontrast, in the same 12 patients, the appendixcould be confidently identified at sonography inonly one patient. As a result, in contrast to per-forming MR imaging following equivocal or non-diagnostic sonography, as Pedrosa et al (1) pro-pose, one could consider performing MR as theinitial imaging examination in pregnancy, whereappendicitis is the leading clinical consideration.
Some of the indications or potential indica-tions for MR imaging for RLQ pain are not aswell studied as others, and even the clinical expe-rience using MR imaging for acute appendicitis(1,4,7–10) is still in its relative infancy comparedwith use of other imaging modalities and is de-serving of further study. In addition, MR imaginghas been shown by Birchard and colleagues (9),in a series of 29 patients, to have utility for evalua-tion of the pregnant patient with abdominal andpelvic pain in general, not necessarily limited tothe RLQ. The utility and accuracy of MR imag-ing in the same group of patients compared with,for example, nonenhanced CT or CT with oralcontrast material only, in patients with acutelower abdominal pain who cannot receive iodin-ated contrast material due to an allergy history orrenal disease—or the utility and accuracy of low-dose CT compared with MR imaging, when ra-diation dose is the concern—have not specificallybeen examined, to our knowledge.
We agree with Pedrosa et al (1), based on theirexperience reported herein as well as recently inRadiology (10), on the reports of other authors(4,7–9,11), and on our own clinical experience todate, that MR imaging is an excellent modalityfor the evaluation of suspected appendicitis, par-ticularly in pregnant patients, and that a variety ofalternative gastrointestinal and genitourinary tractdiagnoses can also be confidently identified (Fig3; see also Figs E7 and E8 at radiographics.rsnajnls.org/cgi/content/full/27/3/743/DC1). Early diagnosis
Figure 3. Normal appendix in a 37-year-old woman in the second trimester of pregnancy who had RLQ pain. F �fibroid. (a) Axial single-shot fast SE image shows a prominent appendix (arrows) with a diameter of 8 mm; however,the lumen is gas filled, and there is no wall thickening or periappendiceal edema. Two large fibroids are noted, in-cluding a subserosal myoma that protrudes off the uterine fundus into the RLQ. (b) Steady-state free precession(FIESTA) image obtained with fat suppression shows the lack of wall thickening more clearly (small arrows). A smallamount of free fluid is present in the right pelvis (large arrow). The patient’s pain resolved without surgery or otherintervention and was assumed to be due to the fibroids. (See also Figs E5 and E6 at radiographics.rsnajnls.org/cgi/content/full/27/3/743/DC1.)
RG f Volume 27 ● Number 3 Pedrosa et al 745
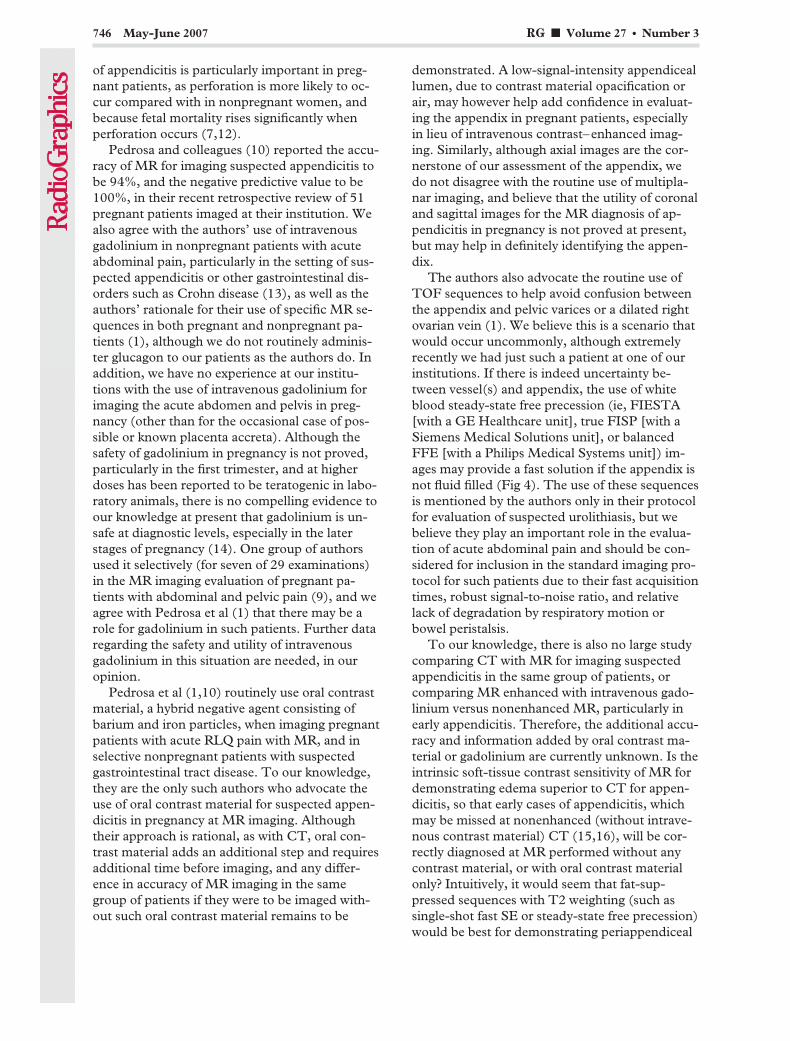
of appendicitis is particularly important in preg-nant patients, as perforation is more likely to oc-cur compared with in nonpregnant women, andbecause fetal mortality rises significantly whenperforation occurs (7,12).
Pedrosa and colleagues (10) reported the accu-racy of MR for imaging suspected appendicitis tobe 94%, and the negative predictive value to be100%, in their recent retrospective review of 51pregnant patients imaged at their institution. Wealso agree with the authors’ use of intravenousgadolinium in nonpregnant patients with acuteabdominal pain, particularly in the setting of sus-pected appendicitis or other gastrointestinal dis-orders such as Crohn disease (13), as well as theauthors’ rationale for their use of specific MR se-quences in both pregnant and nonpregnant pa-tients (1), although we do not routinely adminis-ter glucagon to our patients as the authors do. Inaddition, we have no experience at our institu-tions with the use of intravenous gadolinium forimaging the acute abdomen and pelvis in preg-nancy (other than for the occasional case of pos-sible or known placenta accreta). Although thesafety of gadolinium in pregnancy is not proved,particularly in the first trimester, and at higherdoses has been reported to be teratogenic in labo-ratory animals, there is no compelling evidence toour knowledge at present that gadolinium is un-safe at diagnostic levels, especially in the laterstages of pregnancy (14). One group of authorsused it selectively (for seven of 29 examinations)in the MR imaging evaluation of pregnant pa-tients with abdominal and pelvic pain (9), and weagree with Pedrosa et al (1) that there may be arole for gadolinium in such patients. Further dataregarding the safety and utility of intravenousgadolinium in this situation are needed, in ouropinion.
Pedrosa et al (1,10) routinely use oral contrastmaterial, a hybrid negative agent consisting ofbarium and iron particles, when imaging pregnantpatients with acute RLQ pain with MR, and inselective nonpregnant patients with suspectedgastrointestinal tract disease. To our knowledge,they are the only such authors who advocate theuse of oral contrast material for suspected appen-dicitis in pregnancy at MR imaging. Althoughtheir approach is rational, as with CT, oral con-trast material adds an additional step and requiresadditional time before imaging, and any differ-ence in accuracy of MR imaging in the samegroup of patients if they were to be imaged with-out such oral contrast material remains to be
demonstrated. A low-signal-intensity appendiceallumen, due to contrast material opacification orair, may however help add confidence in evaluat-ing the appendix in pregnant patients, especiallyin lieu of intravenous contrast–enhanced imag-ing. Similarly, although axial images are the cor-nerstone of our assessment of the appendix, wedo not disagree with the routine use of multipla-nar imaging, and believe that the utility of coronaland sagittal images for the MR diagnosis of ap-pendicitis in pregnancy is not proved at present,but may help in definitely identifying the appen-dix.
The authors also advocate the routine use ofTOF sequences to help avoid confusion betweenthe appendix and pelvic varices or a dilated rightovarian vein (1). We believe this is a scenario thatwould occur uncommonly, although extremelyrecently we had just such a patient at one of ourinstitutions. If there is indeed uncertainty be-tween vessel(s) and appendix, the use of whiteblood steady-state free precession (ie, FIESTA[with a GE Healthcare unit], true FISP [with aSiemens Medical Solutions unit], or balancedFFE [with a Philips Medical Systems unit]) im-ages may provide a fast solution if the appendix isnot fluid filled (Fig 4). The use of these sequencesis mentioned by the authors only in their protocolfor evaluation of suspected urolithiasis, but webelieve they play an important role in the evalua-tion of acute abdominal pain and should be con-sidered for inclusion in the standard imaging pro-tocol for such patients due to their fast acquisitiontimes, robust signal-to-noise ratio, and relativelack of degradation by respiratory motion orbowel peristalsis.
To our knowledge, there is also no large studycomparing CT with MR for imaging suspectedappendicitis in the same group of patients, orcomparing MR enhanced with intravenous gado-linium versus nonenhanced MR, particularly inearly appendicitis. Therefore, the additional accu-racy and information added by oral contrast ma-terial or gadolinium are currently unknown. Is theintrinsic soft-tissue contrast sensitivity of MR fordemonstrating edema superior to CT for appen-dicitis, so that early cases of appendicitis, whichmay be missed at nonenhanced (without intrave-nous contrast material) CT (15,16), will be cor-rectly diagnosed at MR performed without anycontrast material, or with oral contrast materialonly? Intuitively, it would seem that fat-sup-pressed sequences with T2 weighting (such assingle-shot fast SE or steady-state free precession)would be best for demonstrating periappendiceal
746 May-June 2007 RG f Volume 27 ● Number 3
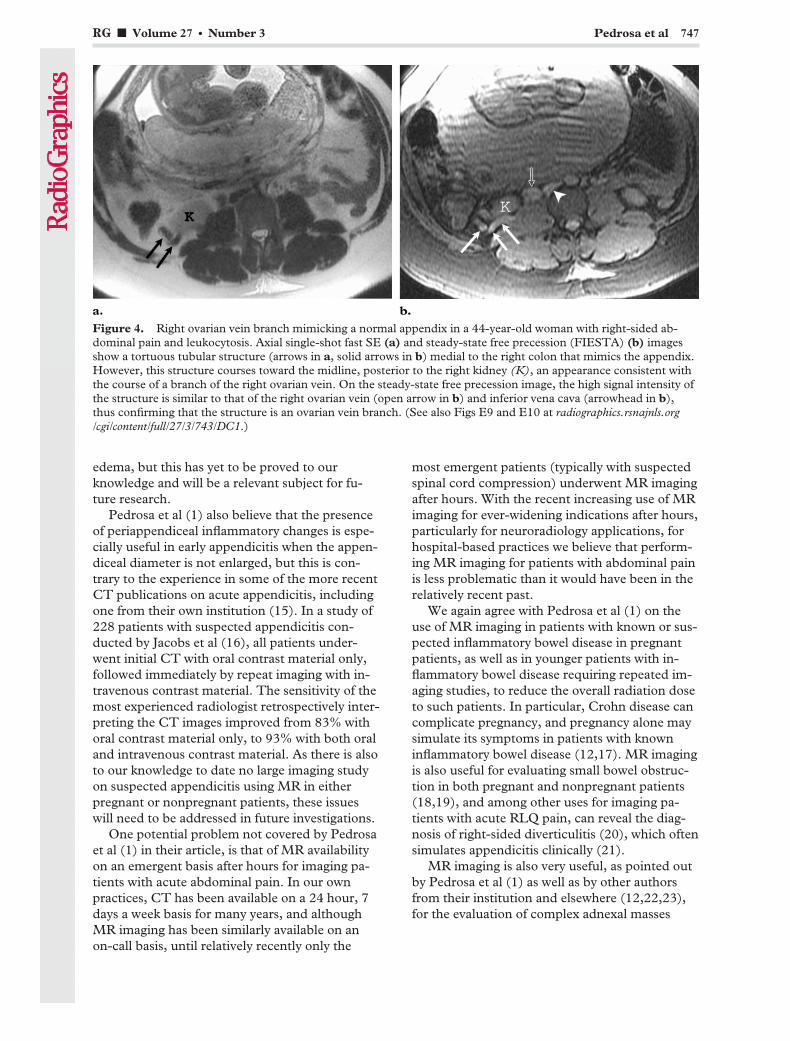
edema, but this has yet to be proved to ourknowledge and will be a relevant subject for fu-ture research.
Pedrosa et al (1) also believe that the presenceof periappendiceal inflammatory changes is espe-cially useful in early appendicitis when the appen-diceal diameter is not enlarged, but this is con-trary to the experience in some of the more recentCT publications on acute appendicitis, includingone from their own institution (15). In a study of228 patients with suspected appendicitis con-ducted by Jacobs et al (16), all patients under-went initial CT with oral contrast material only,followed immediately by repeat imaging with in-travenous contrast material. The sensitivity of themost experienced radiologist retrospectively inter-preting the CT images improved from 83% withoral contrast material only, to 93% with both oraland intravenous contrast material. As there is alsoto our knowledge to date no large imaging studyon suspected appendicitis using MR in eitherpregnant or nonpregnant patients, these issueswill need to be addressed in future investigations.
One potential problem not covered by Pedrosaet al (1) in their article, is that of MR availabilityon an emergent basis after hours for imaging pa-tients with acute abdominal pain. In our ownpractices, CT has been available on a 24 hour, 7days a week basis for many years, and althoughMR imaging has been similarly available on anon-call basis, until relatively recently only the
most emergent patients (typically with suspectedspinal cord compression) underwent MR imagingafter hours. With the recent increasing use of MRimaging for ever-widening indications after hours,particularly for neuroradiology applications, forhospital-based practices we believe that perform-ing MR imaging for patients with abdominal painis less problematic than it would have been in therelatively recent past.
We again agree with Pedrosa et al (1) on theuse of MR imaging in patients with known or sus-pected inflammatory bowel disease in pregnantpatients, as well as in younger patients with in-flammatory bowel disease requiring repeated im-aging studies, to reduce the overall radiation doseto such patients. In particular, Crohn disease cancomplicate pregnancy, and pregnancy alone maysimulate its symptoms in patients with knowninflammatory bowel disease (12,17). MR imagingis also useful for evaluating small bowel obstruc-tion in both pregnant and nonpregnant patients(18,19), and among other uses for imaging pa-tients with acute RLQ pain, can reveal the diag-nosis of right-sided diverticulitis (20), which oftensimulates appendicitis clinically (21).
MR imaging is also very useful, as pointed outby Pedrosa et al (1) as well as by other authorsfrom their institution and elsewhere (12,22,23),for the evaluation of complex adnexal masses
Figure 4. Right ovarian vein branch mimicking a normal appendix in a 44-year-old woman with right-sided ab-dominal pain and leukocytosis. Axial single-shot fast SE (a) and steady-state free precession (FIESTA) (b) imagesshow a tortuous tubular structure (arrows in a, solid arrows in b) medial to the right colon that mimics the appendix.However, this structure courses toward the midline, posterior to the right kidney (K), an appearance consistent withthe course of a branch of the right ovarian vein. On the steady-state free precession image, the high signal intensity ofthe structure is similar to that of the right ovarian vein (open arrow in b) and inferior vena cava (arrowhead in b),thus confirming that the structure is an ovarian vein branch. (See also Figs E9 and E10 at radiographics.rsnajnls.org/cgi/content/full/27/3/743/DC1.)
RG f Volume 27 ● Number 3 Pedrosa et al 747
identified at sonography, both in pregnant andnonpregnant patients, including in sonographi-cally equivocal cases of ovarian torsion. MR im-aging also has utility for the confirmation of fi-broid degeneration and for other complications ofuterine fibroid disease, both in pregnant and non-pregnant patients (12,22). However, the diagno-sis of ovarian dermoid rupture, which is pointedout by Pedrosa et al (1), is rarely made with cross-sectional imaging studies (24), and MR imaging,which is proposed for problem solving in selectedpatients with suspected ectopic pregnancy, is notusually in the imaging algorithm for this diagnosis(25).
Urinary tract stone disease complicates ap-proximately 1 in 1500 pregnancies and is a com-mon cause of abdominal and pelvic pain in preg-nancy, especially in the second and third trimes-ters (26–28). Urinary tract infection occurs inupward of 10%–15% of all pregnancies (26). MRimaging of the genitourinary tract, that is, MRurography, performed without gadolinium, hasbeen considered an alternative examination tosonography in pregnant patients (1,26,28–31).Sonography has traditionally been the first-lineimaging study, but as noted earlier it has substan-tial limitations for the diagnosis of urinary tractstone disease in pregnancy (5,26,28,30). In ouropinion, based on our clinical experiences to date,the literature has underestimated the problem ofdirect stone visualization at MR urography inpregnant patients.
We have found it difficult to differentiate be-tween pyelonephritis and an obstructing stone orrecently passed stone, when a filling defect consis-tent with a stone cannot be identified in the ure-ter, as both conditions may demonstrate hy-droureteronephrosis and perinephric edema atMR imaging. We appreciate the comments ofPedrosa and coauthors (1) regarding what theyconsider to be the best MR imaging sequences forureteral stone visualization, although we are notentirely convinced that the hydronephrosis andhydroureter of pregnancy can easily be distin-guished from those due to a ureteral stone, relyingon the presence (in the latter) or absence (in theformer) of dilatation of the distal ureter to makethe diagnosis (29). However, it is reassuring tosee secondary findings consistent with either diag-nosis at MR imaging or MR urography, as op-posed to other explanations for a pregnant wom-an’s right abdominal pain; the vast majority ofpatients with renal colic or pyelonephritis aremanaged conservatively (26–28), as opposed toother diagnoses such as appendicitis that requiresurgical intervention.
We concur completely with Pedrosa and col-leagues (1) that MR imaging is an excellent alter-native cross-sectional imaging examination in asubset of patients with acute lower quadrant pain,where the use of CT and/or iodinated contrastmedia is not desirable, particularly in pregnancy.We believe that MR imaging will likely play asomewhat larger role in the evaluation of patientswith acute abdominal and pelvic pain in generalin the near future, at least in a subset of patients,for a variety of reasons, including faster and im-proved MR imaging sequences, improved avail-ability after hours, and increased radiologist com-fort level with MR imaging. As noted earlier, avariety of issues remain as to the optimal tech-niques and sequences, and regarding the use ofcontrast media for MR imaging in such patients,but in general we agree with the authors’ ap-proach and anticipate future investigations bythem and by others on this important topic. Wecommend Dr Pedrosa and colleagues on theiraward-winning 2005 RSNA education exhibitfrom which this material originated, for their cur-rent article, and for familiarizing radiologists withthe MR imaging features of patients with RLQpain.
References1. Pedrosa I, Zeikus EA, Levine D, Rofsky NM. MR
imaging of acute right lower quadrant pain inpregnant and nonpregnant patients. RadioGraph-ics 2007;27:721–753.
2. Eyvazzadeh AD, Pedrosa I, Rofsky NM, et al.MRI of right-sided abdominal pain in pregnancy.AJR Am J Roentgenol 2004;183:907–914.
3. Hurwitz LM, Yoshizumi T, Reiman RE, et al. Ra-diation dose to the fetus from body MDCT duringearly gestation. AJR Am J Roentgenol 2006;186:871–876.
4. Cobben LP, Groot I, Haans L, Blickman JG, Puy-laert J. MRI for clinically suspected appendicitisduring pregnancy. AJR Am J Roentgenol 2004;183:671–675.
5. Hsu CT, Meiner EM, Katz DS. Utility of sonogra-phy for the evaluation of suspected urolithiasis inpregnancy. Scientific poster presented at the 2004annual meeting of the American College of Emer-gency Physicians, San Francisco, Calif, October2004.
6. Weiss CR, Macura KJ. Diagnosis of ruptured ap-pendicitis during pregnancy. J Womens Imaging2003;5:192–198.
7. Oto A, Srinivasan PN, Ernst RD, et al. RevisitingMRI for appendix location during pregnancy. AJRAm J Roentgenol 2006;186:883–887.
8. Oto A, Ernst RD, Shah R, et al. Right-lower-quadrant pain and suspected appendicitis in preg-nant women: evaluation with MR imaging—initialexperience. Radiology 2005;234:445–451.
9. Birchard KR, Brown MA, Hyslop WB, Firat Z,Semelka RC. MRI of acute abdominal and pelvicpain in pregnant patients. AJR Am J Roentgenol2005;184:452–458.
748 May-June 2007 RG f Volume 27 ● Number 3
10. Pedrosa I, Levine D, Eyvazzadeh AD, Siewert B,Ngo L, Rofsky NM. MR imaging evaluation ofacute appendicitis in pregnancy. Radiology 2006;238:891–899.
11. Nitta N, Takahashi M, Furukawa A, Murata K,Mori M, Fukushima M. MR imaging of the nor-mal appendix and acute appendicitis. J Magn Re-son Imaging 2005;21:156–165.
12. Levine D. Obstetric MRI. J Magn Reson Imaging2006;24:1–15.
13. Low RN, Francis IR, Politoske D, Bennett M.Crohn’s disease evaluation: comparison of con-trast-enhanced MR imaging and single-phase heli-cal CT scanning. J Magn Reson Imaging 2000;11:127–135.
14. Garcia-Bournissen F, Shrim A, Koren G. Mother-isk update: safety of gadolinium during pregnancy.Can Fam Physician 2006;52:309–311.
15. Raptopoulos V, Katsou G, Rosen MP, Siewert B,Goldberg SN, Kruskal JB. Acute appendicitis: ef-fect of increased use of CT on selecting patientsearlier. Radiology 2003;226:521–526.
16. Jacobs JE, Birnbaum BA, Macari M, et al. Acuteappendicitis: comparison of helical CT diagno-sis—focused technique with oral contrast materialversus nonfocused technique with oral and intra-venous contrast material. Radiology 2001;220:683–690.
17. Brown MA, Birchard KR, Semelka RC. Magneticresonance evaluation of pregnant patients withacute abdominal pain. Semin Ultrasound CT MR2005;26:206–211.
18. Beall DP, Fortman BJ, Lawler BC, Regan F. Im-aging bowel obstruction: a comparison betweenfast magnetic resonance imaging and helical com-puted tomography. Clin Radiol 2002;57:719–724.
19. Leyendecker JR, Gorengaut V, Brown JJ. MR im-aging of maternal diseases of the abdomen andpelvis during pregnancy and the immediate post-partum period. RadioGraphics 2004;24:1301–1316.
20. Cobben LP, Groot I, Blickman JG, Puylaert JB.Right colonic diverticulitis: MR appearance. Ab-dom Imaging 2003;28:794–798.
21. Katz DS, Lane MJ, Ross BA, Gold BM, JeffreyRB, Mindelzun RE. Diverticulitis of the right co-lon revisited. AJR Am J Roentgenol 1998;171:151–156.
22. Chiang G, Levine D. Imaging of adnexal massesin pregnancy. J Ultrasound Med 2004;23:805–819.
23. Adusumilli S, Hussain HK, Caoili EK, et al. MRIof sonographically indeterminate adnexal masses.AJR Am J Roentgenol 2006;187:732–740.
24. Fibus TF. Intraperitoneal rupture of a benign cys-tic ovarian teratoma: findings at CT and MR im-aging. AJR Am J Roentgenol 2000;174:261–262.
25. Yoshigi J, Yashiro N, Kinoshita T, O’uchi T, Kita-gaki H. Diagnosis of ectopic pregnancy with MRI:efficacy of T2-weighted imaging. Magn ResonMed Sci 2006;5:25–32.
26. Kennedy A. Assessment of acute abdominal painin the pregnant patient. Semin Ultrasound CTMR 2000;21:64–77.
27. Lewis DF, Robichaux AG, Jaekle RK, MarcumNG, Stedman CM. Urolithiasis in pregnancy: di-agnosis, management, and pregnancy outcome. JReprod Med 2003;48:28–32.
28. Loughlin KR, Kerr LA. The current managementof urolithiasis during pregnancy. Urol Clin NorthAm 2002;29:701–704.
29. Spencer JA, Chahal R, Kelly A, Taylor K, EardleyI, Lloyd SN. Evaluation of painful hydronephrosisin pregnancy: magnetic resonance urographic pat-terns in physiological dilatation versus calculousobstruction. J Urol 2004;171:256–260.
30. Nazarian GK, Platt JF, Rubin JM, Ellis JH. Renalduplex Doppler sonography in asymptomaticwomen during pregnancy. J Ultrasound Med1993;12:441–444.
31. Nagayama M, Watanabe Y, Okumura A, Amoh Y,Nakashita S, Dodo Y. Fast MR imaging in obstet-rics. RadioGraphics 2002;22:563–582.
Authors’ Response
From:Ivan Pedrosa, MD, Deborah Levine, MD, Neil M. Rofsky, MDDepartment of Radiology, Beth Israel Deaconess Medical Center, Harvard Medical School,
Boston, Massachusetts
The reasonable man adapts himself to the world; theunreasonable one persists in trying to adapt the worldto himself. Therefore all progress depends on the un-reasonable man.
—George Bernard Shaw (1856–1950)
We are grateful for the opportunity to respond tothe comments by Katz et al about our article. Weconcur with their opinion about the potentialbenefit of using MR imaging not only in pregnantpatients but also in young adults, particularly fe-
male patients in the reproductive age and patientsin whom repetitive cross-sectional imaging stud-ies are frequently needed (eg, Crohn disease).
The routine use of a fast MR imaging protocolwould reduce the number of individuals exposedto the risks of radiation and intravenous contrastmaterial, without causing substantial delay in pa-tient care. Should MR imaging prove to have adiagnostic accuracy at least similar (or superior)
RG f Volume 27 ● Number 3 Pedrosa et al 749

to that of CT in the evaluation of acute abdomi-nal pain, it would be our responsibility to imple-ment MR imaging protocols and offer the exami-nation to patients being considered for a CTstudy.
Herein we offer responses to some of the spe-cific comments by Katz et al. Some of these re-flect the authors’ opinions on specific issueswhere there is not sufficient scientific data to sup-port one argument or the other. We refer readersto the many cited references in the original article,in the editorial response, and in our comments tohelp guide their opinions on these issues.
We consider US to be a complementary test toMR imaging more than an alternative. We agreethat it may be appropriate to use MR imaging asthe initial imaging modality when the clinical di-agnosis is highly suggestive of appendicitis. How-ever, in our experience, it is rare that a pregnant
patient presents with such a clear clinical picture(which contributes to the high false-negative lapa-rotomy rate traditionally accepted in clinical prac-tice) (1). Uterine, ovarian, urinary, and gastroin-testinal causes (including appendicitis) may beresponsible for the clinical presentation. US offersan accurate and rapid diagnosis in some of theseclinical scenarios, as is the case with ectopic preg-nancy and ovarian torsion. In other settings, thereal-time, interactive nature of the US examina-
Early appendicitis in a 30-year-old woman with twins of 28 weeks gestational age who presented with right upperquadrant pain. She underwent an initial CT examination due to technical inability to perform an MR imaging exami-nation. CT was performed without intravenous contrast material and limited to the area of pain to reduce the amountof radiation to the fetuses. (a, b) Axial (a) and coronal reformatted (b) unenhanced CT images show a nondistendedappendix (arrows) next to the gravid uterus. The results were interpreted as negative for appendicitis because of thesize of the appendix (�6 mm) and lack of periappendiceal inflammation. After resolution of the technical issues, MRimaging was performed 2 hours after the initial CT because of continued clinical concern despite the negative CTresults. (c, d) Axial (c) and coronal (d) T2-weighted single-shot fast SE images obtained at the same level show afluid-filled thick-walled appendix (arrow) that is normal in size (�6 mm in diameter). Periappendiceal inflammationwas absent at fat-saturated imaging. The MR images were interpreted as consistent with early appendicitis, whichwas confirmed at laparotomy and pathologic analysis.
750 May-June 2007 RG f Volume 27 ● Number 3

tion offers advantages, as in the diagnosis of fi-broid degeneration when abdominal pain is re-produced by direct compression of the fibroidwith the US probe.
The administration of glucagon in nonpreg-nant patients mitigates the bowel peristalsis thatcan degrade image quality in relatively long, non–breath-hold, high-resolution acquisitions. How-ever, we agree with Katz et al in that glucagonmay not be needed when ultrafast (ie, single-shotsteady-state free precession) acquisitions areused.
As discussed by Katz et al, the contribution oforal contrast material to the accuracy of MR im-aging in diagnosis of acute appendicitis has notbeen established. In our recent report of 51 con-secutive patients (2), we found a trend toward asuperior visualization rate of the normal appendixwhen the oral contrast material reaches the cecumcompared to the rate in patients with poor oralpreparation. However, this difference was notstatistically significant. We believe oral contrastmaterial facilitates recognition of the normal ap-pendix and substantially increases the confidenceof radiologists in identification of the normal ap-pendix.
We also expect that, similar to the experiencereported in the CT literature, oral contrast mate-rial may help reduce the number of false-positivediagnoses (3). For example, oral contrast mate-rial, by clearly marking the bowel, helps avoidconfusion between fluid-filled terminal ileal loopsand distended, inflamed appendices (3).
The use of multiplanar imaging has, in ouropinion, several advantages. First, it helps identifythe anatomic variations caused by the graviduterus. For example, the horizontal orientation ofthe ascending colon and elevation of the cecum,which cause rotation of the terminal ileum andappendix, are usually better recognized on sagittalimages than on axial images. Review of sagittalimages facilitates the identification of the appen-dix by orienting the radiologist toward the areawhere the appendix is likely to be located, oncethe tip of the cecum and the terminal ileum areidentified.
In the authors’ experience, use of the cross-reference tool on the picture archiving and com-munication system workstation helps identify theappendix and increases the radiologist’s confi-dence when the tubular structure is confirmed inall three orthogonal planes. Also, depending onthe orientation of the appendix, it may be bettervisualized with coronal or sagittal images than inthe axial plane. Similarly, we have recently notedimproved visualization of the appendix on coronal
and sagittal reformatted images from our abdomi-nal 64–detector row CT examinations in selectedpatients.
Our experience differs from the comments byKatz et al regarding the presence of periovarianvarices in pregnancy. We found this issue to be avery common problem and one that makes recog-nition of the normal appendix very challenging,particularly in the second and third trimesters.We have virtually eliminated this problem by rou-tinely comparing the axial single-shot fast SE andTOF images, supplemented by using negativeoral contrast material. The appendix and peri-ovarian varices are frequently indistinguishable onsingle-shot fast SE images, while on TOF imagesthe normal appendix stands out as a black tubularstructure and the periovarian varices remainbright.
While steady-state free precession (SSFP) se-quences (ie, FIESTA, true FISP, balanced FFE)facilitate the evaluation of many bowel disorders,we believe these images have disadvantages whenevaluating acute appendicitis. The bright signal ofboth the blood pool and fluid that is inherent tothis sequence family can challenge the distinctionbetween an abnormal fluid-filled appendix andperiovarian veins. Also, the prominent suscepti-bility effects with SSFP sequences can distort orobscure structures in the vicinity of bowel loopsfilled with air or iron-based contrast material, in-cluding the appendix. Furthermore, off-reso-nance artifacts can be problematic. Single-shotfast SE minimizes or eliminates these disadvan-tages. Having stated these concerns, we appreci-ate the few examples provided by Katz et al thatdemonstrate the normal and abnormal appendixwith SSFP.
To the best of our knowledge, systematic stud-ies using SSFP techniques for the diagnosis ofappendicitis have not been reported. Thus, fur-ther research is needed to evaluate this sequenceand its role in the MR imaging protocol as well asthe suitability of this technique with the use ofiron-based oral preparation.
We also agree with Katz et al that the compara-tive accuracy of CT and MR imaging in the diag-nosis of acute appendicitis in pregnant patientshas not been systematically evaluated. However,as a pertinent anecdote, we have seen a case inwhich the correct diagnosis of acute appendicitiswas made at MR imaging after the initial nonen-hanced CT images were interpreted as negativefor appendicitis (Figure). Outcome studies will beuseful to compare the relative value of the twomodalities.
RG f Volume 27 ● Number 3 Pedrosa et al 751
As illustrated in figure 4 in our article, thepresence of periappendiceal inflammation canhelp in the diagnosis of acute appendicitis inthose cases where the appendix is not dilated, al-though absence of this finding does not excludethe diagnosis. Use of the fat saturation techniqueincreases the chances for detecting subtle degreesof periappendiceal inflammation; this may favor-ably affect the sensitivity of MR imaging for earlyacute appendicitis if one considers “early appen-dicitis” as nonperforated appendicitis. In fact, theCT experience extends the subtlety in diagnosiswith demonstration of a mildly enlarged appendixwithout periappendiceal inflammation, a findingmore commonly seen than in those circumstanceswhere CT is not widely used (4). Indeed, thewide use of CT in the emergency department hasled to an increased number of patients undergo-ing laparotomy at the early stage of the disease(4).
On this basis, we agree with Katz et al thatearly appendicitis can be diagnosed before periap-pendiceal inflammation is evident. In the pres-ence of a nonenlarged appendix, the diagnosisrelies on demonstration of appendiceal wall en-hancement. However, as discussed in our article,we do not administer intravenous contrast mate-rial in pregnancy; therefore, wall enhancementcannot be evaluated in this subset of patients withour MR imaging protocol.
In our experience, the diagnosis of early appen-dicitis on MR images is made before the appendixis dilated (�6 mm) when it is fluid-filled and thewall mildly thickened (better demonstrated onsingle-shot fast SE images); the degree of confi-dence in this diagnosis is higher when the cecumis filled with oral contrast material. Periappen-diceal inflammation is absent in some of thesecases. If present, periappendiceal inflammation isbetter appreciated on fat-saturated T2-weightedsingle-shot fast SE images and can help make thecorrect diagnosis before perforation occurs.
We acknowledge the differences that may existamong different practices regarding availability ofMR imaging units. At our institution, MR imag-ing is available 24 hours a day, 7 days a week andthe imaging units are located on the floor imme-diately below the emergency department. Thus,we are fortunate in that the only limitation to per-forming an immediate MR imaging examinationis a potential delay that may result from compet-ing use of the imaging unit. As MR imaging unitsproliferate in close proximity to or directly withinemergency departments, our practice patternswill likely become more widely applicable.
Another factor to take into account when con-sidering using MR imaging for RLQ pain is theradiologist’s expertise. While our current practicerelies on dedicated fellowship-trained body MRradiologists to interpret these cases, we are at theearly phase of an emerging practice. We fully ex-pect a broad adoption of these techniques andapplications into the mainstream of radiologypractice. It is essential to educate radiologists andreferring physicians regarding the use of MR im-aging for RLQ pain in order to export the oppor-tunity to the largest number of patients.
We also agree with the fact that MR imaging isnot the imaging examination of choice in theevaluation of ectopic pregnancy. This is one ofthe reasons why we elect to perform US as theinitial examination in all of our pregnant patientswith RLQ pain. However, with the increased useof MR imaging, it is likely that one may eventu-ally image a patient with an ectopic pregnancy,perhaps missed at US. An awareness of the MRimaging findings in this potentially life-threaten-ing abdominal emergency will assist the radiolo-gist in providing the very best care. For this rea-son, we included the description of the MR imag-ing findings of this as well as other rare clinicaland surgical conditions in our article.
Our experience is similar to that of Katz et al inthe differentiation between pyelonephritis andureteral stone, when a filling defect in the ureter isnot seen, or recently passed ureteral stone; dis-tinction between these three clinical scenarios
752 May-June 2007 RG f Volume 27 ● Number 3
may be virtually impossible based on MR imagesalone. MR imaging is superior to US in determin-ing the level of obstruction, as identification of themid and distal ureter with transabdominal US isfrequently impossible, even in the presence ofdilatation, during the second and third trimester.However, we disagree with avoiding the use of USfor preliminary assessment of patients with renalcolic. If the obstructing stone can be seen withUS, then further imaging is typically not needed.
In our experience, as well as that of others (5),hydronephrosis of pregnancy is caused by extrin-sic compression of the ureter by the gravid uterusagainst the sacral promontory. In these circum-stances, the distal ureter is typically collapsed;that collapse serves as an important negative pre-dictor for distal stones in our routine practice. Wehave seen no cases where a distal ureteral stonewas subsequently found in the absence of distalureteral dilatation. However, one could argue thata small, nonobstructing stone could be found in aureter with distal collapse. Regardless, the clinicalsignificance of missing a nonobstructing stonerequires further investigation, as it is unlikely thatthese patients would be managed differently.
We believe that a ureter dilated distal to thepromontory should be considered abnormal. Thisshould prompt strong consideration of a distalureteral stone, whether or not a stone is directlyvisualized, or a recently passed stone. DedicatedMR sequences with increased sensitivity to thepotential susceptibility effect caused by a calcifiedstone may help identify the filling defect (fig 21 inour article). However, even when a stone is notidentified, we find that evaluation of the distalureter with transvaginal US maximizes thechances for identification of the ureteral stone, ifpresent. Lack of filling defects in the distal dilatedureter at both MR imaging and transvaginal US isprobably an indication of a recently passed stone.
We have anecdotally experienced similar imag-ing findings in patients who reported passing a
stone prior to the MR examination (fig 5 in ref-erence 6). In our opinion, this clinical scenarioexemplifies a situation where MR and US arecomplementary imaging tests, and we agree thatthis issue needs to be addressed in future investi-gations.
We share the views of Katz et al in predictingincreased use of MR imaging for evaluation ofabdominal pain in pregnant and nonpregnantpatients and calling for expanded evaluations ofcurrently available and newly developed MR se-quences for this indication. We would like tothank Katz and collaborators for their thoroughanalysis and commentary and the Editor of thisjournal for giving us the opportunity to discussour opinions. We are pleased to see agreement onmost of the issues discussed and recognize thevaluable opportunities for discussion and futureresearch.
References1. Hee P, Viktrup L. The diagnosis of appendicitis
during pregnancy and maternal and fetal outcomeafter appendectomy. Int J Gynaecol Obstet 1999;65:129–135.
2. Pedrosa I, Levine D, Eyvazzadeh AD, Siewert B,Ngo L, Rofsky NM. MR imaging evaluation ofacute appendicitis in pregnancy. Radiology 2006;238:891–899.
3. Balthazar EJ, Megibow AJ, Siegel SE, BirnbaumBA. Appendicitis: prospective evaluation with high-resolution CT. Radiology 1991;180:21–24.
4. Raptopoulos V, Katsou G, Rosen MP, Siewert B,Goldberg SN, Kruskal JB. Acute appendicitis: ef-fect of increased use of CT on selecting patientsearlier. Radiology 2003;226:521–526.
5. Roy C, Saussine C, Jahn C, et al. Fast imaging MRassessment of ureterohydronephrosis during preg-nancy. Magn Reson Imaging 1995;13:767–772.
6. Eyvazzadeh AD, Pedrosa I, Rofsky NM, et al. MRIof right-sided abdominal pain in pregnancy. AJRAm J Roentgenol 2004;183:907–914.
RG f Volume 27 ● Number 3 Pedrosa et al 753

EDUCATION EXHIBIT 755
Improved Detectionand Characterizationof Adrenal Diseasewith PET-CT1
ONLINE-ONLYCME
See www.rsna.org/education/rg_cme.html.
LEARNINGOBJECTIVESAfter reading thisarticle and takingthe test, the reader
will be able to:
� Identify commonbenign adrenal le-sions at PET-CT.
� Describe poten-tial pitfalls in thePET-CT evaluationof the adrenal glands.
� Discuss the use ofPET-CT in the dif-ferentiation of benignfrom malignant adre-nal lesions and in theposttreatment fol-low-up of cancer pa-tients.
A. Bassem Elaini, MD ● Sanjay K. Shetty, MD ● Vernon M. Chapman,MD ● Dushyant V. Sahani, MD ● Giles W. Boland, MD ● Ann T.Sweeney, MD ● Michael M. Maher, MD ● James T. Slattery, MRCPI,FFR(RCSI) ● Peter R. Mueller, MD ● Michael A. Blake, MRCPI,FFR(RCSI), FRCR
Positron emission tomography (PET)–computed tomography (CT)combines complementary modalities, thereby providing useful struc-tural and functional information for the detection and characterizationof a variety of conditions affecting the adrenal gland. The coregisteredinformation provided by PET-CT is often superior to that provided byCT or PET owing to a variety of pitfalls inherent in the use of eithermodality alone. In addition, PET-CT can prove invaluable in the dif-ferentiation between benign and malignant adrenal disease. However,this combined modality also has certain limitations. Benign entitiessuch as lipid-poor adenomas may demonstrate increased uptake at2-[fluorine 18]fluoro-2-deoxy-d-glucose PET while being indetermi-nate at standard CT. Moreover, the combined information fromPET-CT will not always obviate additional studies or biopsy. Never-theless, radiologists and nuclear physicians should be familiar with thecommon as well as the atypical manifestations of adrenal disease atPET and CT. They should also be meticulous in the performance andinterpretation of PET-CT, which is crucial for optimal diagnosis andtreatment.©RSNA, 2007
Abbreviations: ACC � adrenocortical carcinoma, ACTH � adrenocorticotropic hormone, FDG � 2-[fluorine 18]fluoro-2-deoxy-d-glucose,MIBG � metaiodobenzylguanidine
RadioGraphics 2007; 27:755–767 ● Published online 10.1148/rg.273055031 ● Content Codes:
1From the Department of Radiology, Massachusetts General Hospital, FND 216, 55 Fruit St, Boston, MA 02114 (A.B.E., S.K.S., V.M.C., D.V.S.,G.W.B., M.M.M., J.T.S., P.R.M., M.A.B.); and the Department of Medicine, Division of Endocrinology, St Elizabeth’s Medical Center, Boston,Mass (A.T.S.). Recipient of a Certificate of Merit award for an education exhibit at the 2004 RSNA Annual Meeting. Received March 1, 2005; revi-sion requested April 4; final revision received June 20, 2006; accepted August 1. All authors have no financial relationships to disclose. Address cor-respondence to A.B.E. (email: [email protected]).
©RSNA, 2007
Note: This copy is for your personal, non-commercial use only. To order presentation-ready copies for distribution to your colleagues or clients, use the RadioGraphics Reprints form at the end of this article.
See last page
TEACHING POINTS
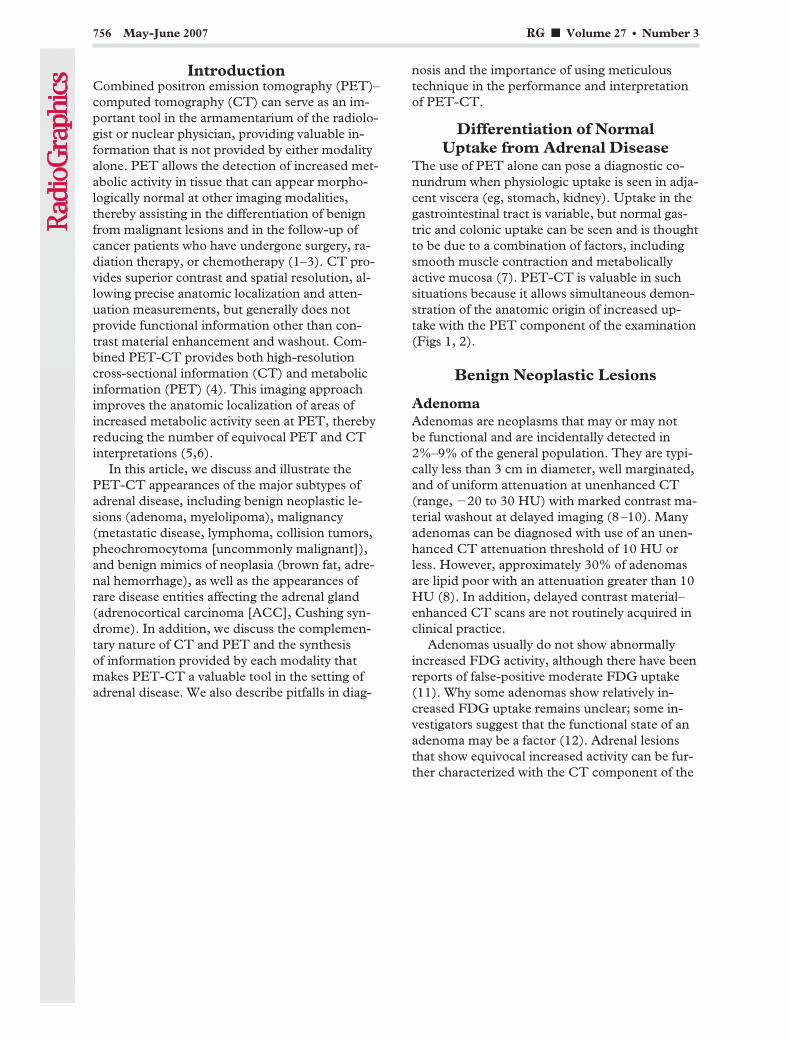
IntroductionCombined positron emission tomography (PET)–computed tomography (CT) can serve as an im-portant tool in the armamentarium of the radiolo-gist or nuclear physician, providing valuable in-formation that is not provided by either modalityalone. PET allows the detection of increased met-abolic activity in tissue that can appear morpho-logically normal at other imaging modalities,thereby assisting in the differentiation of benignfrom malignant lesions and in the follow-up ofcancer patients who have undergone surgery, ra-diation therapy, or chemotherapy (1–3). CT pro-vides superior contrast and spatial resolution, al-lowing precise anatomic localization and atten-uation measurements, but generally does notprovide functional information other than con-trast material enhancement and washout. Com-bined PET-CT provides both high-resolutioncross-sectional information (CT) and metabolicinformation (PET) (4). This imaging approachimproves the anatomic localization of areas ofincreased metabolic activity seen at PET, therebyreducing the number of equivocal PET and CTinterpretations (5,6).
In this article, we discuss and illustrate thePET-CT appearances of the major subtypes ofadrenal disease, including benign neoplastic le-sions (adenoma, myelolipoma), malignancy(metastatic disease, lymphoma, collision tumors,pheochromocytoma [uncommonly malignant]),and benign mimics of neoplasia (brown fat, adre-nal hemorrhage), as well as the appearances ofrare disease entities affecting the adrenal gland(adrenocortical carcinoma [ACC], Cushing syn-drome). In addition, we discuss the complemen-tary nature of CT and PET and the synthesisof information provided by each modality thatmakes PET-CT a valuable tool in the setting ofadrenal disease. We also describe pitfalls in diag-
nosis and the importance of using meticuloustechnique in the performance and interpretationof PET-CT.
Differentiation of NormalUptake from Adrenal Disease
The use of PET alone can pose a diagnostic co-nundrum when physiologic uptake is seen in adja-cent viscera (eg, stomach, kidney). Uptake in thegastrointestinal tract is variable, but normal gas-tric and colonic uptake can be seen and is thoughtto be due to a combination of factors, includingsmooth muscle contraction and metabolicallyactive mucosa (7). PET-CT is valuable in suchsituations because it allows simultaneous demon-stration of the anatomic origin of increased up-take with the PET component of the examination(Figs 1, 2).
Benign Neoplastic Lesions
AdenomaAdenomas are neoplasms that may or may notbe functional and are incidentally detected in2%–9% of the general population. They are typi-cally less than 3 cm in diameter, well marginated,and of uniform attenuation at unenhanced CT(range, �20 to 30 HU) with marked contrast ma-terial washout at delayed imaging (8–10). Manyadenomas can be diagnosed with use of an unen-hanced CT attenuation threshold of 10 HU orless. However, approximately 30% of adenomasare lipid poor with an attenuation greater than 10HU (8). In addition, delayed contrast material–enhanced CT scans are not routinely acquired inclinical practice.
Adenomas usually do not show abnormallyincreased FDG activity, although there have beenreports of false-positive moderate FDG uptake(11). Why some adenomas show relatively in-creased FDG uptake remains unclear; some in-vestigators suggest that the functional state of anadenoma may be a factor (12). Adrenal lesionsthat show equivocal increased activity can be fur-ther characterized with the CT component of the
756 May-June 2007 RG f Volume 27 ● Number 3

PET-CT examination (Fig 3); one author hassuggested incorporating delayed contrast-en-hanced CT for washout analysis as a useful ad-junct in characterizing lipid-poor lesions (13).Application of a specific standard uptake value
threshold on the PET portion of the examinationhas not proved foolproof in this situation and maylead to the misclassification of a benign adrenal
Figure 1. Normal gastric uptake as a potential pitfall in PET interpretation. The patientwas a 55-year-old woman with a history of non-Hodgkin lymphoma. Axial (a–c) and coro-nal (d–f) CT (a, d), PET (b, e), and fused PET-CT (c, f) images show the gastric fundus(arrow). The gastric fundus may normally be mildly FDG—2-[fluorine 18]fluoro-2-deoxy-d-glucose—avid and can be confused with adrenal disease in the absence of CT correlationwith adequate coregistration.
Figure 2. Normal renal uptake as a potential pitfall in PET interpretation. The patientwas a 57-year-old woman with a history of breast cancer. Axial CT (a), PET (b), and fusedPET-CT (c) images show urinary FDG excretion involving the upper renal pole (arrow), afinding that may be confused with adrenal disease in the absence of CT correlation with ad-equate coregistration.
RG f Volume 27 ● Number 3 Elaini et al 757

lesion as malignant (13). Because it makes useof the full capability of both modalities, fusionPET-CT can help characterize lesions as adrenaladenomas, particularly those that are deemed in-determinate with CT or PET alone.
MyelolipomaMyelolipoma is a nonfunctional tumor with char-acteristic CT findings of macroscopic fat inter-mixed with myeloid elements. It is a rare neo-plasm without malignant potential and is oftendiscovered incidentally, usually in the fifth to sev-enth decades of life. Larger tumors may hemor-rhage or displace adjacent viscera. Rare clinical
manifestations include a palpable mass or ab-dominal pain. Extraadrenal locations have beenreported but are uncommon. To our knowledge,malignant degeneration has not been reported.The primary complication (although it is uncom-mon) is retroperitoneal hemorrhage resultingfrom spontaneous or trauma-induced rupture.Symptomatic lesions and larger asymptomaticlesions are usually treated with adrenalectomy inan effort to prevent rupture (14). At CT, myeloli-pomas are typically well-defined lesions contain-ing macroscopic fat with an attenuation of �30 to�100 HU, calcify in 20% of cases, and usuallyshow variable contrast enhancement. Reportedsizes have ranged up to 30 cm. At PET, theseneoplasms typically do not demonstrate avidFDG uptake (Fig 4) (15). However, rare cases of
Figure 3. Adrenal adenoma in a 63-year-old woman with a history of mucosa-associ-ated lymphoid tissue lymphoma. Previous CT images had shown a 1.4-cm left adrenal nod-ule. Axial (a–c) and coronal (d–f) CT (a, d), PET (b, e), and fused PET-CT (c, f) imagesshow an area with minimally increased FDG uptake (arrow) relative to the liver, a findingthat corresponds to a left adrenal mass. The unenhanced CT attenuation value of the mass(0 HU) was consistent with an adenoma. The patient remains disease free in other anatomiclocations. A minimal degree of FDG uptake can be seen in adenomas, whose incidental de-tection is a relatively common occurrence. In patients with a history of known malignancyand equivocal CT findings (especially with lipid-poor adenomas), fusion PET-CT is valu-able in differentiating adenomas from other neoplasms given the usual lack of significantFDG avidity in adenomas.
758 May-June 2007 RG f Volume 27 ● Number 3
TeachingPoint
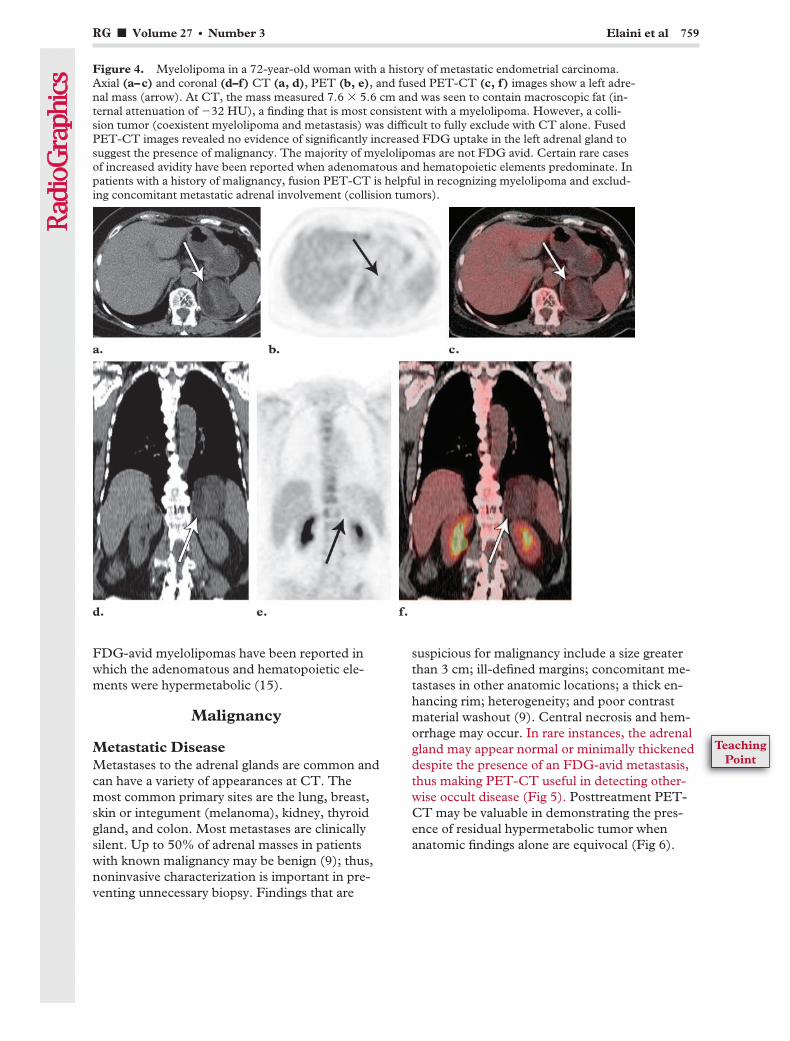
FDG-avid myelolipomas have been reported inwhich the adenomatous and hematopoietic ele-ments were hypermetabolic (15).
Malignancy
Metastatic DiseaseMetastases to the adrenal glands are common andcan have a variety of appearances at CT. Themost common primary sites are the lung, breast,skin or integument (melanoma), kidney, thyroidgland, and colon. Most metastases are clinicallysilent. Up to 50% of adrenal masses in patientswith known malignancy may be benign (9); thus,noninvasive characterization is important in pre-venting unnecessary biopsy. Findings that are
suspicious for malignancy include a size greaterthan 3 cm; ill-defined margins; concomitant me-tastases in other anatomic locations; a thick en-hancing rim; heterogeneity; and poor contrastmaterial washout (9). Central necrosis and hem-orrhage may occur. In rare instances, the adrenalgland may appear normal or minimally thickeneddespite the presence of an FDG-avid metastasis,thus making PET-CT useful in detecting other-wise occult disease (Fig 5). Posttreatment PET-CT may be valuable in demonstrating the pres-ence of residual hypermetabolic tumor whenanatomic findings alone are equivocal (Fig 6).
Figure 4. Myelolipoma in a 72-year-old woman with a history of metastatic endometrial carcinoma.Axial (a–c) and coronal (d–f) CT (a, d), PET (b, e), and fused PET-CT (c, f) images show a left adre-nal mass (arrow). At CT, the mass measured 7.6 � 5.6 cm and was seen to contain macroscopic fat (in-ternal attenuation of �32 HU), a finding that is most consistent with a myelolipoma. However, a colli-sion tumor (coexistent myelolipoma and metastasis) was difficult to fully exclude with CT alone. FusedPET-CT images revealed no evidence of significantly increased FDG uptake in the left adrenal gland tosuggest the presence of malignancy. The majority of myelolipomas are not FDG avid. Certain rare casesof increased avidity have been reported when adenomatous and hematopoietic elements predominate. Inpatients with a history of malignancy, fusion PET-CT is helpful in recognizing myelolipoma and exclud-ing concomitant metastatic adrenal involvement (collision tumors).
RG f Volume 27 ● Number 3 Elaini et al 759
TeachingPoint
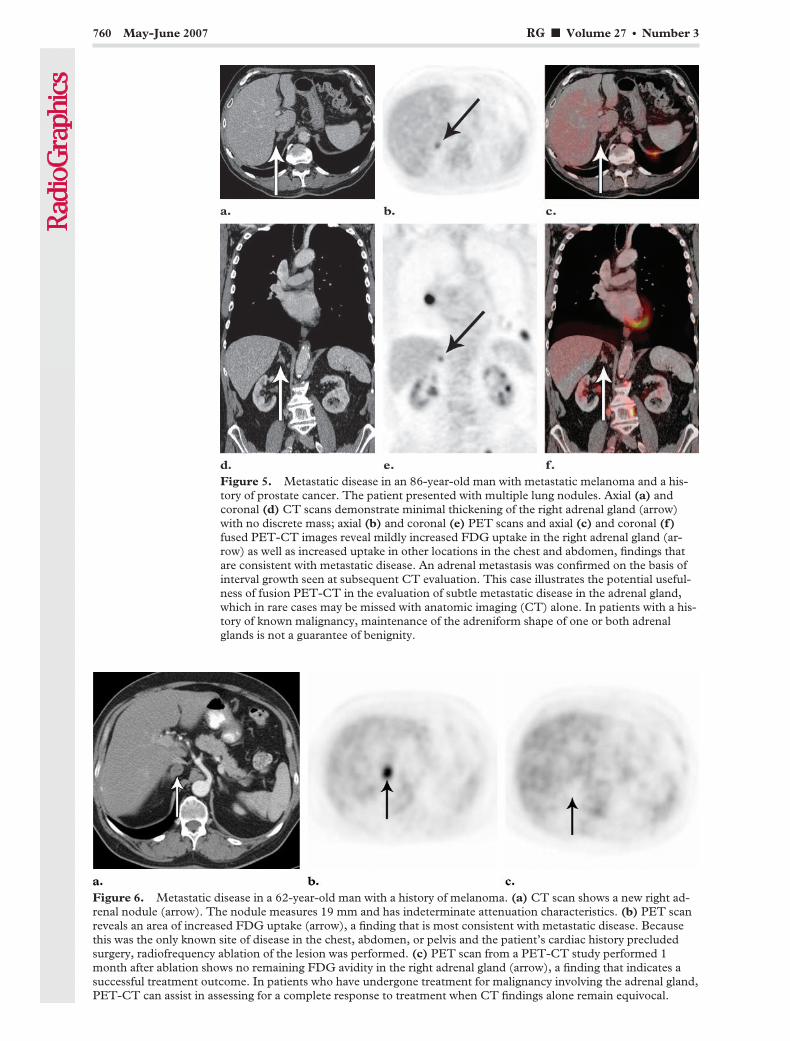
Figure 5. Metastatic disease in an 86-year-old man with metastatic melanoma and a his-tory of prostate cancer. The patient presented with multiple lung nodules. Axial (a) andcoronal (d) CT scans demonstrate minimal thickening of the right adrenal gland (arrow)with no discrete mass; axial (b) and coronal (e) PET scans and axial (c) and coronal (f)fused PET-CT images reveal mildly increased FDG uptake in the right adrenal gland (ar-row) as well as increased uptake in other locations in the chest and abdomen, findings thatare consistent with metastatic disease. An adrenal metastasis was confirmed on the basis ofinterval growth seen at subsequent CT evaluation. This case illustrates the potential useful-ness of fusion PET-CT in the evaluation of subtle metastatic disease in the adrenal gland,which in rare cases may be missed with anatomic imaging (CT) alone. In patients with a his-tory of known malignancy, maintenance of the adreniform shape of one or both adrenalglands is not a guarantee of benignity.
Figure 6. Metastatic disease in a 62-year-old man with a history of melanoma. (a) CT scan shows a new right ad-renal nodule (arrow). The nodule measures 19 mm and has indeterminate attenuation characteristics. (b) PET scanreveals an area of increased FDG uptake (arrow), a finding that is most consistent with metastatic disease. Becausethis was the only known site of disease in the chest, abdomen, or pelvis and the patient’s cardiac history precludedsurgery, radiofrequency ablation of the lesion was performed. (c) PET scan from a PET-CT study performed 1month after ablation shows no remaining FDG avidity in the right adrenal gland (arrow), a finding that indicates asuccessful treatment outcome. In patients who have undergone treatment for malignancy involving the adrenal gland,PET-CT can assist in assessing for a complete response to treatment when CT findings alone remain equivocal.
760 May-June 2007 RG f Volume 27 ● Number 3
LymphomaLymphomatous involvement of the adrenalglands in patients with other sites of involvementis rare, having been reported in only 1%–4% ofaffected patients (16). In fact, in an attempt tocharacterize the normal appearance of the adrenalglands at PET-CT, the authors of one clinicalstudy used scans from 20 patients with knownlymphoma owing to the low pretest likelihood ofadrenal involvement (16). Nevertheless, one mustbe cautious in the setting of an adrenal mass in apatient with a history of lymphoma. PET-CT isvaluable in distinguishing an incidental nonfunc-tioning adrenal neoplasm or hyperplasia fromlymphomatous involvement (Fig 7). Althoughlymphomatous involvement of the adrenal glandis rare, the degree of FDG avidity in adrenalglands that are involved by lymphoma tends toparallel that in other involved areas. Furthermore,the resolution of adrenal gland uptake often fol-lows that of uptake in other regions.
Collision TumorsCoexisting benign and malignant neoplasms inone adrenal gland (collision tumor), althoughrare, should always be considered a possibility inpatients with a history of known primary neo-plasm. With CT alone, differentiation of benignfrom malignant tissue in an adrenal gland is diffi-cult, so that collision tumors represent a pitfall in
Figure 7. Lymphomatous adrenal gland involvement in a 23-year-old woman with Burkitt lym-phoma of the left breast. Axial (a–c) and coronal (d–f) CT (a, d), PET (b, e), and fusedPET-CT (c, f) images show a 2 � 1-cm mass in the right adrenal gland (arrow) with an unen-hanced CT attenuation of 49 HU, an indeterminate finding that is nonetheless suspicious for ma-lignancy. Mild FDG uptake due to an early adrenal metastasis is also seen in the left adrenal gland.Follow-up PET-CT was performed at an outside institution 3 months after the initiation of che-motherapy and revealed subsequent resolution of these PET and CT findings, indicating success-fully treated lymphomatous adrenal gland involvement. Fusion PET-CT may be of value in lym-phoma patients with equivocal CT findings, either before or after treatment.
RG f Volume 27 ● Number 3 Elaini et al 761
TeachingPoint
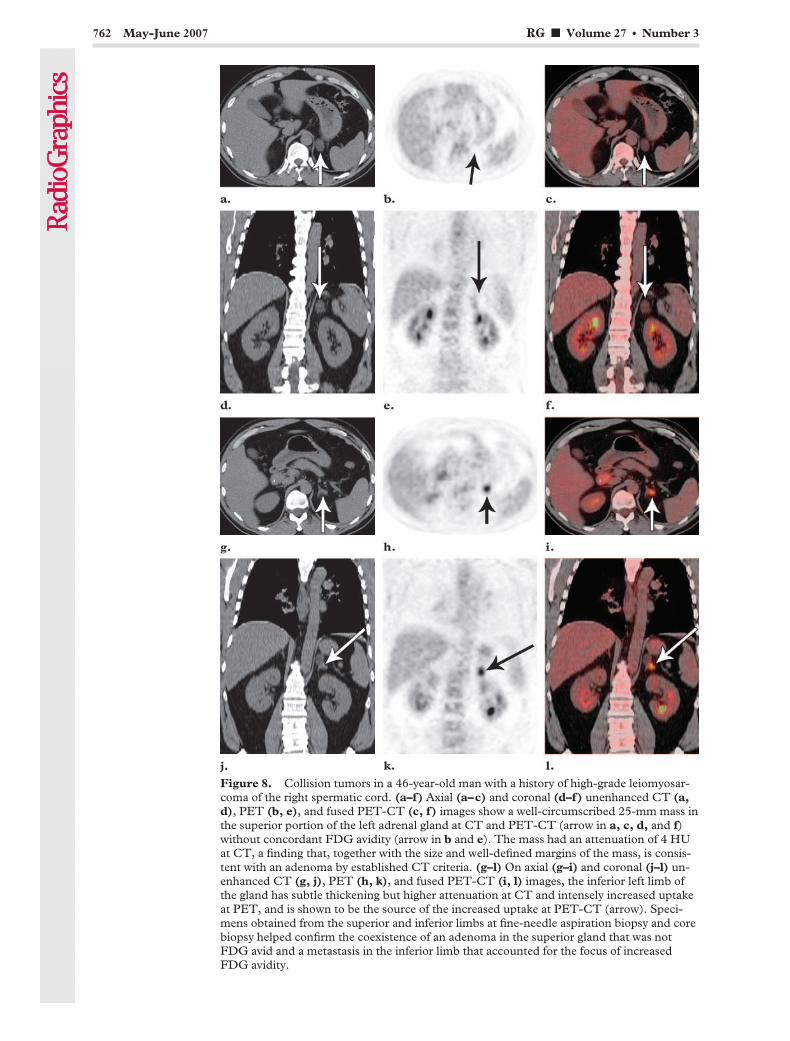
Figure 8. Collision tumors in a 46-year-old man with a history of high-grade leiomyosar-coma of the right spermatic cord. (a–f) Axial (a–c) and coronal (d–f) unenhanced CT (a,d), PET (b, e), and fused PET-CT (c, f) images show a well-circumscribed 25-mm mass inthe superior portion of the left adrenal gland at CT and PET-CT (arrow in a, c, d, and f)without concordant FDG avidity (arrow in b and e). The mass had an attenuation of 4 HUat CT, a finding that, together with the size and well-defined margins of the mass, is consis-tent with an adenoma by established CT criteria. (g–l) On axial (g–i) and coronal (j–l) un-enhanced CT (g, j), PET (h, k), and fused PET-CT (i, l) images, the inferior left limb ofthe gland has subtle thickening but higher attenuation at CT and intensely increased uptakeat PET, and is shown to be the source of the increased uptake at PET-CT (arrow). Speci-mens obtained from the superior and inferior limbs at fine-needle aspiration biopsy and corebiopsy helped confirm the coexistence of an adenoma in the superior gland that was notFDG avid and a metastasis in the inferior limb that accounted for the focus of increasedFDG avidity.
762 May-June 2007 RG f Volume 27 ● Number 3
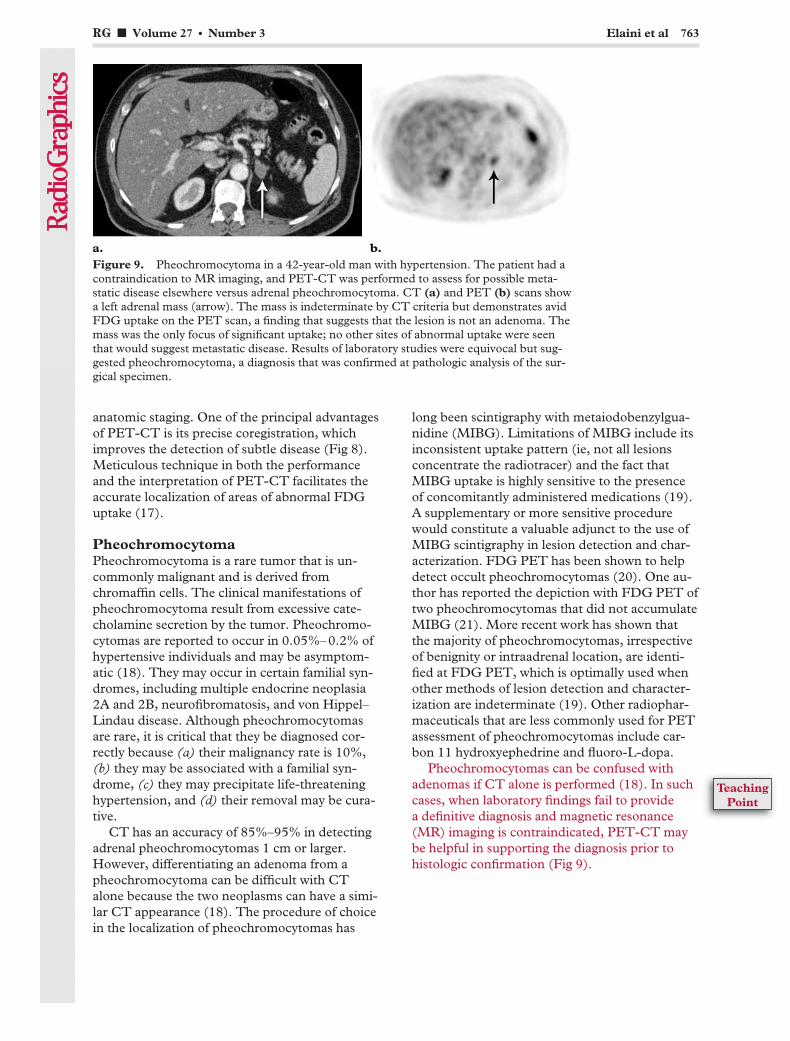
anatomic staging. One of the principal advantagesof PET-CT is its precise coregistration, whichimproves the detection of subtle disease (Fig 8).Meticulous technique in both the performanceand the interpretation of PET-CT facilitates theaccurate localization of areas of abnormal FDGuptake (17).
PheochromocytomaPheochromocytoma is a rare tumor that is un-commonly malignant and is derived fromchromaffin cells. The clinical manifestations ofpheochromocytoma result from excessive cate-cholamine secretion by the tumor. Pheochromo-cytomas are reported to occur in 0.05%–0.2% ofhypertensive individuals and may be asymptom-atic (18). They may occur in certain familial syn-dromes, including multiple endocrine neoplasia2A and 2B, neurofibromatosis, and von Hippel–Lindau disease. Although pheochromocytomasare rare, it is critical that they be diagnosed cor-rectly because (a) their malignancy rate is 10%,(b) they may be associated with a familial syn-drome, (c) they may precipitate life-threateninghypertension, and (d) their removal may be cura-tive.
CT has an accuracy of 85%–95% in detectingadrenal pheochromocytomas 1 cm or larger.However, differentiating an adenoma from apheochromocytoma can be difficult with CTalone because the two neoplasms can have a simi-lar CT appearance (18). The procedure of choicein the localization of pheochromocytomas has
long been scintigraphy with metaiodobenzylgua-nidine (MIBG). Limitations of MIBG include itsinconsistent uptake pattern (ie, not all lesionsconcentrate the radiotracer) and the fact thatMIBG uptake is highly sensitive to the presenceof concomitantly administered medications (19).A supplementary or more sensitive procedurewould constitute a valuable adjunct to the use ofMIBG scintigraphy in lesion detection and char-acterization. FDG PET has been shown to helpdetect occult pheochromocytomas (20). One au-thor has reported the depiction with FDG PET oftwo pheochromocytomas that did not accumulateMIBG (21). More recent work has shown thatthe majority of pheochromocytomas, irrespectiveof benignity or intraadrenal location, are identi-fied at FDG PET, which is optimally used whenother methods of lesion detection and character-ization are indeterminate (19). Other radiophar-maceuticals that are less commonly used for PETassessment of pheochromocytomas include car-bon 11 hydroxyephedrine and fluoro-L-dopa.
Pheochromocytomas can be confused withadenomas if CT alone is performed (18). In suchcases, when laboratory findings fail to providea definitive diagnosis and magnetic resonance(MR) imaging is contraindicated, PET-CT maybe helpful in supporting the diagnosis prior tohistologic confirmation (Fig 9).
Figure 9. Pheochromocytoma in a 42-year-old man with hypertension. The patient had acontraindication to MR imaging, and PET-CT was performed to assess for possible meta-static disease elsewhere versus adrenal pheochromocytoma. CT (a) and PET (b) scans showa left adrenal mass (arrow). The mass is indeterminate by CT criteria but demonstrates avidFDG uptake on the PET scan, a finding that suggests that the lesion is not an adenoma. Themass was the only focus of significant uptake; no other sites of abnormal uptake were seenthat would suggest metastatic disease. Results of laboratory studies were equivocal but sug-gested pheochromocytoma, a diagnosis that was confirmed at pathologic analysis of the sur-gical specimen.
RG f Volume 27 ● Number 3 Elaini et al 763
TeachingPoint
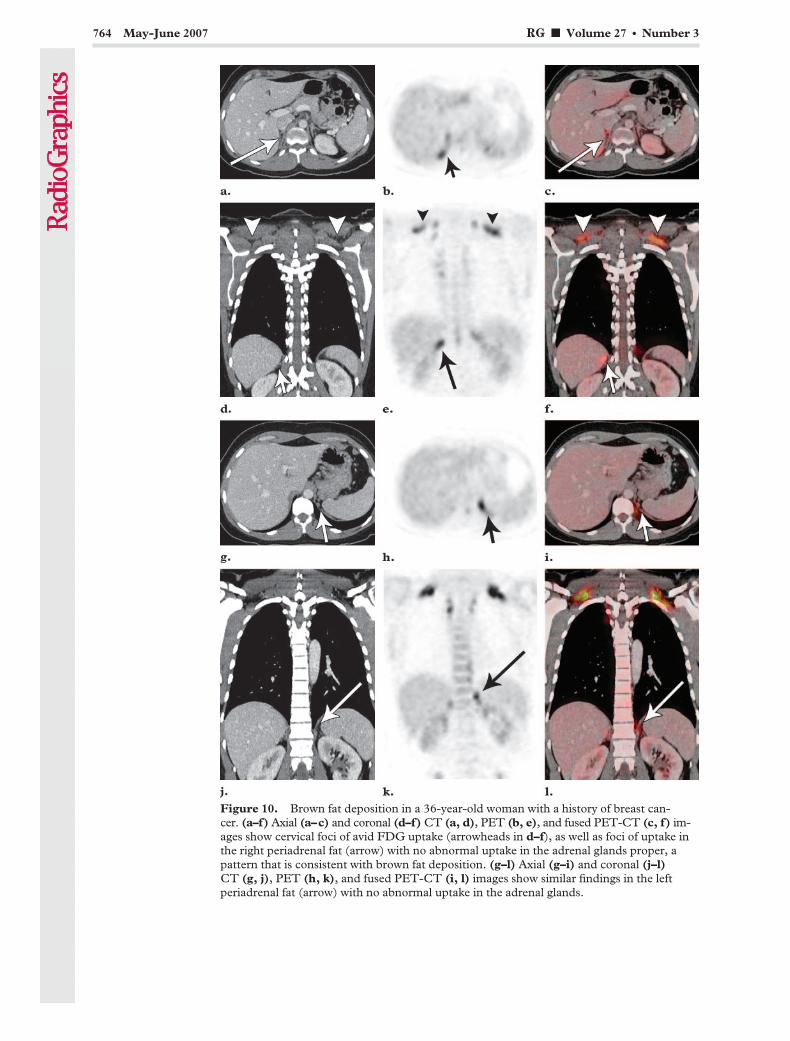
Figure 10. Brown fat deposition in a 36-year-old woman with a history of breast can-cer. (a–f) Axial (a–c) and coronal (d–f) CT (a, d), PET (b, e), and fused PET-CT (c, f) im-ages show cervical foci of avid FDG uptake (arrowheads in d–f), as well as foci of uptake inthe right periadrenal fat (arrow) with no abnormal uptake in the adrenal glands proper, apattern that is consistent with brown fat deposition. (g–l) Axial (g–i) and coronal (j–l)CT (g, j), PET (h, k), and fused PET-CT (i, l) images show similar findings in the leftperiadrenal fat (arrow) with no abnormal uptake in the adrenal glands.
764 May-June 2007 RG f Volume 27 ● Number 3
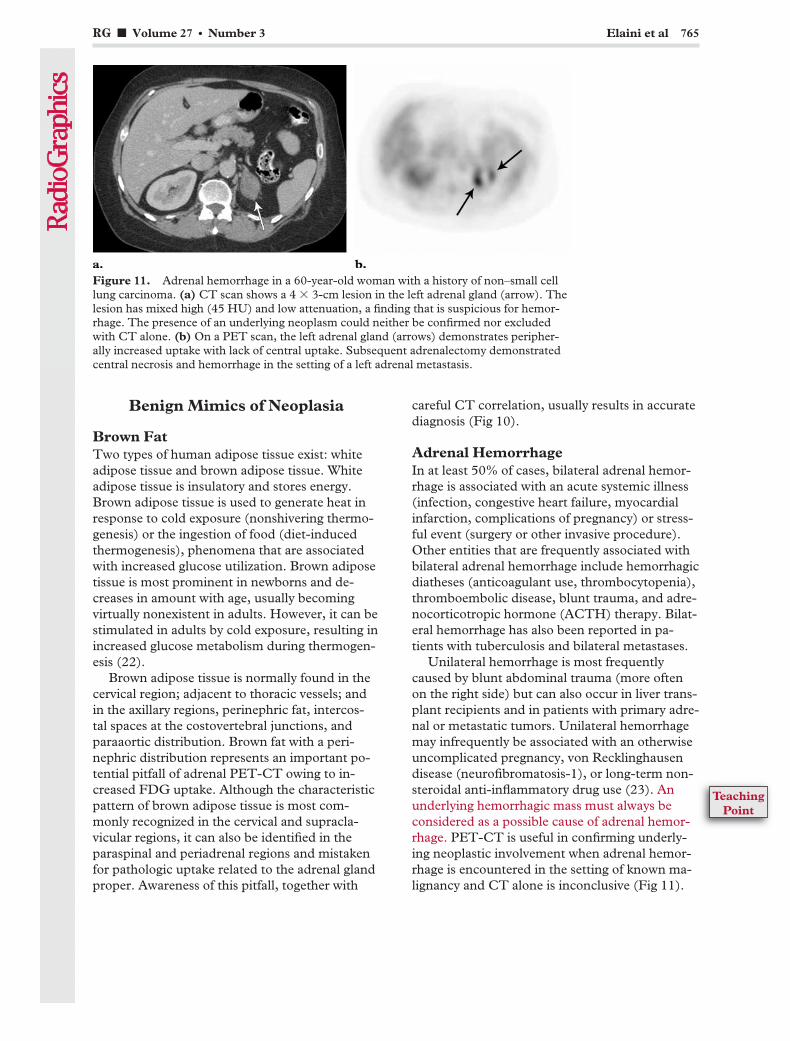
Benign Mimics of Neoplasia
Brown FatTwo types of human adipose tissue exist: whiteadipose tissue and brown adipose tissue. Whiteadipose tissue is insulatory and stores energy.Brown adipose tissue is used to generate heat inresponse to cold exposure (nonshivering thermo-genesis) or the ingestion of food (diet-inducedthermogenesis), phenomena that are associatedwith increased glucose utilization. Brown adiposetissue is most prominent in newborns and de-creases in amount with age, usually becomingvirtually nonexistent in adults. However, it can bestimulated in adults by cold exposure, resulting inincreased glucose metabolism during thermogen-esis (22).
Brown adipose tissue is normally found in thecervical region; adjacent to thoracic vessels; andin the axillary regions, perinephric fat, intercos-tal spaces at the costovertebral junctions, andparaaortic distribution. Brown fat with a peri-nephric distribution represents an important po-tential pitfall of adrenal PET-CT owing to in-creased FDG uptake. Although the characteristicpattern of brown adipose tissue is most com-monly recognized in the cervical and supracla-vicular regions, it can also be identified in theparaspinal and periadrenal regions and mistakenfor pathologic uptake related to the adrenal glandproper. Awareness of this pitfall, together with
careful CT correlation, usually results in accuratediagnosis (Fig 10).
Adrenal HemorrhageIn at least 50% of cases, bilateral adrenal hemor-rhage is associated with an acute systemic illness(infection, congestive heart failure, myocardialinfarction, complications of pregnancy) or stress-ful event (surgery or other invasive procedure).Other entities that are frequently associated withbilateral adrenal hemorrhage include hemorrhagicdiatheses (anticoagulant use, thrombocytopenia),thromboembolic disease, blunt trauma, and adre-nocorticotropic hormone (ACTH) therapy. Bilat-eral hemorrhage has also been reported in pa-tients with tuberculosis and bilateral metastases.
Unilateral hemorrhage is most frequentlycaused by blunt abdominal trauma (more oftenon the right side) but can also occur in liver trans-plant recipients and in patients with primary adre-nal or metastatic tumors. Unilateral hemorrhagemay infrequently be associated with an otherwiseuncomplicated pregnancy, von Recklinghausendisease (neurofibromatosis-1), or long-term non-steroidal anti-inflammatory drug use (23). Anunderlying hemorrhagic mass must always beconsidered as a possible cause of adrenal hemor-rhage. PET-CT is useful in confirming underly-ing neoplastic involvement when adrenal hemor-rhage is encountered in the setting of known ma-lignancy and CT alone is inconclusive (Fig 11).
Figure 11. Adrenal hemorrhage in a 60-year-old woman with a history of non–small celllung carcinoma. (a) CT scan shows a 4 � 3-cm lesion in the left adrenal gland (arrow). Thelesion has mixed high (45 HU) and low attenuation, a finding that is suspicious for hemor-rhage. The presence of an underlying neoplasm could neither be confirmed nor excludedwith CT alone. (b) On a PET scan, the left adrenal gland (arrows) demonstrates peripher-ally increased uptake with lack of central uptake. Subsequent adrenalectomy demonstratedcentral necrosis and hemorrhage in the setting of a left adrenal metastasis.
RG f Volume 27 ● Number 3 Elaini et al 765
TeachingPoint

Other ConditionsAffecting the Adrenal Gland
Other less common disease entities that maymanifest with anatomic and metabolic abnormali-ties of the adrenal gland include ACC and Cush-ing syndrome. These two entities and their ap-pearances at PET and CT deserve brief discus-sion.
Adrenocortical CarcinomaACC is a rare primary malignant neoplasm of theadrenal gland, accounting for only 0.02%–0.2%of all cancer-related deaths (24). It carries an ex-tremely poor prognosis and has protean clinicalmanifestations. The female-male ratio is approxi-mately 3:1, and two major age peaks are identi-fied: in the first decade of life and again in thefourth to fifth decades. Patients usually presentwith advanced-stage disease. The most commonassociated endocrine syndrome is Cushing syn-drome (24). Other potential clinical complica-tions of ACC are (a) local tumor invasion, in-cluding the potential for intravascular tumorthrombus formation; (b) paraneoplastic syn-dromes such as cachexia; and (c) focal pain re-lated to osseous metastatic disease. Radical sur-gery (when feasible) constitutes the only effectivetreatment for both local and distant disease, andthe 5-year survival rate is dismally low, with mostpatients succumbing within 12 months of diagno-sis of advanced-stage disease (24). Chemothera-peutic and radiation treatments are palliative atbest. One study evaluating the FDG imagingcharacteristics of ACC showed that (a) all knownsites of involvement by these tumors showedmarkedly increased FDG avidity, and (b) addi-tional lesions that went undetected at anatomicimaging alone were identified with the addition ofPET in 30% of patients (25). The addition ofPET modified management protocol in 20% ofpatients (25).
Cushing SyndromeCushing syndrome is caused by an excess of ei-ther endogenous or exogenous glucocorticoids.Clinical features include truncal obesity, facialplethora, hirsutism, and purple striae. Subjectivecomplaints include easy bruising, muscle weak-ness, and weight gain. In those cases in whichendogenous glucocorticoid overproduction is in-dependent of ACTH, Cushing syndrome usuallyresults from a primary adrenal neoplasm (mostcommonly adenoma; rarely, carcinoma). Mi-cronodular and macronodular hyperplasia arerarer causes of Cushing syndrome. ACTH-secret-ing neoplasms, usually pituitary in origin, causeACTH-dependent Cushing syndrome or classicCushing disease (26). The PET-CT manifesta-tions of ACTH-independent Cushing syndromearising from primary adrenal disease are concor-dant with the manifestations of adenoma and car-cinoma described earlier. In cases of bilateral ad-renal hyperplasia, symmetric bilateral adrenal up-take of FDG may be seen.
ConclusionsPET-CT combines complementary modalities,thereby allowing precise structural and functionalcharacterization of a variety of conditions affect-ing the adrenal gland, with subsequent significantimpact on clinical management. A variety of pit-falls are inherent in the use of either modalityalone, so that combined PET-CT provides addeddiagnostic value. However, PET-CT also has cer-tain limitations. Benign entities (eg, lipid-pooradenomas) may show increased uptake at FDGPET and may be indeterminate at standard CT.Moreover, the combined information from PET-CT, although often useful, will not always obviateadditional studies or biopsy. Radiologists andnuclear physicians should be aware of both thecommon and the atypical manifestations of adre-nal disease at PET and CT. Meticulous tech-nique in the performance and interpretation ofPET-CT is essential for optimal diagnosis andtreatment.
766 May-June 2007 RG f Volume 27 ● Number 3

References1. Rohren EM, Turkington TG, Coleman RE. Clini-
cal applications of PET in oncology. Radiology2004;231:305–332.
2. Kostakoglu L, Agress H Jr, Goldsmith SJ. Clinicalrole of FDG PET in evaluation of cancer patients.RadioGraphics 2003;23:315–340.
3. Kluetz PG, Meltzer CC, Villemagne VL, et al.Combined PET/CT imaging in oncology: impacton patient management. Clin Positron Imaging2000;3:223–230.
4. Beyer T, Townsend DW, Blodgett TM. Dual-modality PET/CT tomography for clinical oncol-ogy. Q J Nucl Med 2002;46:24–34.
5. Cohade C, Osman M, Leal J, Wahl RL. Directcomparison of (18)F-FDG PET and PET/CT inpatients with colorectal carcinoma. J Nucl Med2003;44:1797–1803.
6. Schoder H, Larson SM, Yeung HW. PET/CT inoncology: integration into clinical management oflymphoma, melanoma, and gastrointestinal malig-nancies. J Nucl Med 2004;45(suppl 1):72S–81S.
7. Kostakoglu L, Hardoff R, Mirtcheva R, GoldsmithSJ. PET-CT fusion imaging in differentiatingphysiologic from pathologic FDG uptake. Radio-Graphics 2004;24:1411–1431.
8. Boland GW, Lee MJ, Gazelle GS, Halpern EF,McNicholas MM, Mueller PR. Characterizationof adrenal masses using unenhanced CT: an analy-sis of the CT literature. AJR Am J Roentgenol1998;171:201–204.
9. Caoili EM, Korobkin M, Francis IR, et al. Adrenalmasses: characterization with combined unen-hanced and delayed enhanced CT. Radiology2002;222:629–633.
10. Yun M, Kim W, Alnafisi N, Lacorte L, Jang S,Alavi A. 18F-FDG PET in characterizing adrenallesions detected on CT or MRI. J Nucl Med 2001;42:1795–1799.
11. Rao SK, Caride VJ, Ponn R, Giakovis E, Lee SH.F-18 fluorodeoxyglucose positron emission to-mography-positive benign adrenal cortical ad-enoma: imaging features and pathologic correla-tion. Clin Nucl Med 2004;29:300–302.
12. Metser U, Miller E, Lerman H, Lievshitz G, Avi-tal S, Even-Sapir E. 18F-FDG PET/CT in theevaluation of adrenal masses. J Nucl Med 2006;47:32–37.
13. Blake MA, Slattery JM, Kalra MK, et al. Adrenallesions: characterization with fused PET/CT im-age in patients with proved or suspected malig-nancy—initial experience. Radiology 2006;238:970–977.
14. Adusumilli S, Ramchandani P. Adrenal myeloli-poma. Emedicine 2005. Available at: http://www.emedicine.com/radio/topic18.htm. Accessed May31, 2006.
15. Ludwig V, Rice MH, Martin WH, Kelley MC,Delbeke D. 2-deoxy-2-[18F]fluoro-d-glucosepositron emission tomography uptake in a giantadrenal myelolipoma. Mol Imaging Biol 2002;4:355–358.
16. Bagheri B, Maurer AH, Cone L, Doss M, Adler L.Characterization of the normal adrenal gland with18F-FDG PET/CT. J Nucl Med 2004;45:1340–1343.
17. Blake MA, Sweeney AT, Kalra MK, Maher MM.Collision adrenal tumors on PET/CT. AJR Am JRoentgenol 2004;183:864–865.
18. Blake MA, Krishnamoorthy SK, Boland GW, etal. Low-density pheochromocytoma on CT: amimicker of adrenal adenoma. AJR Am J Roent-genol 2003;181:1663–1668.
19. Shulkin BL, Thompson NW, Shapiro B, FrancisIR, Sisson JC. Pheochromocytomas: imaging with2-[fluorine-18]fluoro-2-deoxy-d-glucose PET.Radiology 1999;212:35–41.
20. Sweeney AT, Blake MA, Melby JC. Pheochromo-cytoma. Emedicine 2002. Available at: http://www.emedicine.com/med/topic1816.htm. AccessedMay 31, 2006.
21. Shulkin BL, Koeppe RA, Francis IR, Deeb GM,Lloyd RV, Thompson NW. Pheochromocytomasthat do not accumulate metaiodobenzylguanidine:localization with PET and administration of FDG.Radiology 1993;186:711–715.
22. Yeung HW, Grewal RK, Gonen M, Schoder H,Larson SM. Patterns of (18)F-FDG uptake in adi-pose tissue and muscle: a potential source of false-positives for PET. J Nucl Med 2003;44:1789–1796.
23. Tritos NA, Papanicolaou DA, Talavera F, et al.Adrenal hemorrhage. Emedicine 2003. Availableat: http://www.emedicine.com/med/topic3009.htm. Accessed May 31, 2006.
24. Uwaifo GI, Fojo AT. Adrenal carcinoma. Emedi-cine 2005. Available at: http://www.emedicine.com/med/topic63.htm. Accessed May 31, 2006.
25. Becherer A, Vierhapper H, Potzi C, et al. FDG-PET in adrenocortical carcinoma. Cancer BiotherRadiopharm 2001;16:289–295.
26. Adler G, Dipp SL. Cushing syndrome. Emedicine2006. Available at: http://www.emedicine.com/EMERG/topic117.htm. Accessed May 31, 2006.
This article meets the criteria for 1.0 AMA PRA Category 1 Credit TM. To obtain credit, see www.rsna.org/education/rg_cme.html.
RG f Volume 27 ● Number 3 Elaini et al 767
SPECIAL REPORT 769
American Board of Radi-ology Perspective on Main-tenance of Certification:Part IV—Practice QualityImprovement for Diag-nostic Radiology1
Janet L. Strife, MD ● Larry E. Kun, MD ● Gary J. Becker, MDN. Reed Dunnick, MD ● Jennifer Bosma, PhD ● Robert R. Hattery, MD
The American public expects safe, predictable,high-quality care and assumes that physicianswork to remain current and competent. TheAmerican Board of Radiology (ABR) encourageseach board-certified diagnostic radiologist to un-derstand his or her professional responsibilitiesand to participate in continuous quality improve-ment and lifelong learning.
In the United States health care system, qual-ity of care, medical error reduction, and patientsafety represent continuing themes that dominatepublic concern (1–3). Maintenance of Certifica-tion (MOC), the overarching program of theAmerican Board of Medical Specialties (ABMS)and its member boards, is the response of U.S.physicians to address these concerns (4–8). Al-though advances in medical science, technology,and biomedical research continue to accelerate,other barriers prevent rapid dissemination andadoption of evidence-based recommended care(9). A RAND Corporation study has estimatedthat only 50%–54% of the care Americans receiveis care that has been recommended on the basis ofevidence-based medical literature (3). Much ofwhat radiologists do is not evidence based (10).
Outcomes and costs to diagnose and treat specificdiseases vary widely among physicians, hospitals,health care providers, and regions of the country(10).
To address challenges in the medical systemand the public’s concerns, the ABMS, composedof 24 member boards representing all medicalspecialties in the United States, mandated inMarch 2000 that each board initiate specialty-specific MOC programs (4–8). Diplomates areno longer granted lifetime certification but rathermust demonstrate evidence of professionalism,continuing medical education, and knowledge, aswell as a commitment to practice improvement.The MOC program, including “Part IV: PracticeQuality Improvement,” for diagnostic radiology,radiation oncology, and radiologic physics hasbeen developed, approved by the ABMS, andinitiated in 2007.
The overriding objective of MOC is to improvethe quality of health care through diplomate-initi-ated learning and quality improvement. There arefour component parts to the MOC process: “PartI: Professional Standing,” “Part II: Life LongLearning and Periodic Self-assessment,” “PartIII: Cognitive Expertise,” and “Part IV: Evalua-tion of Practice Performance” (11–15). The ABRprogram for self-evaluation of practice perfor-mance is linked to a process of continuing qualityimprovement and is entitled “Practice QualityImprovement” (PQI).
PQI ProjectsThe key characteristics of PQI require each phy-sician to demonstrate commitment to practice
RadioGraphics 2007; 27:769–774 ● Published online 10.1148/rg.273075914
1From the American Board of Radiology, 5441 E Williams Blvd, Suite200, Tucson, AZ 85711. Received November 16, 2006; final versionaccepted November 17. All authors have no financial relationships todisclose. Address correspondence to J.L.S. (e-mail: [email protected]).
©RSNA, 2007
Editor’s Note.—This article is simultaneously being published inRadiology, RadioGraphics, Academic Radiology, the American Journal ofRoentgenology, and the Journal of the American College of Radiology.
Note: This copy is for your personal, non-commercial use only. To order presentation-ready copies for distribution to your colleagues or clients, use the RadioGraphics Reprints form at the end of this article.

quality improvement and competence in clinicalpractice. How do we measure competence whenpractices are diverse and roles are unique? Howcan we improve quality in the system in which weprovide care? The ABR guidelines state that everydiplomate must select a project or projects thatpotentially can improve the quality of the diplo-mate’s practice and enhance quality of care. Keyrequirements for the ABR’s PQI program are thateach project (a) be relevant to the diplomate’spractice, (b) be achievable in a practice setting,(c) produce measurable results that are suitablefor repeated measurement over the course of the10-year MOC cycle, and (d) be able to effectquality improvement. We anticipate that mostPQI projects will include the majority or all of thesix general competencies of medicine defined fortraining and practice: medical knowledge, patientcare, interpersonal and communication skills,professionalism, practice-based learning and im-provement, and systems-based practice.
A central element of PQI is to provide evidenceof critical evaluation of an individual’s perfor-mance in practice. Clearly, the ultimate goals ofeach individual diplomate, as well as all diplo-mates collectively, must be to achieve ongoingimprovement of practice and to demonstratecompetency as a physician (6,8,16).
Projects may be developed by the diplomatesindividually, by institutions or societies, or as apart of national registries. At this juncture, be-cause the ABR is just introducing part IV require-ments, only failure to participate in a project orfailure to comply with ABR’s reporting require-ments will be considered unsatisfactory perfor-mance. As diplomates become more familiar withquality improvement principles and their applica-tions to radiology practice, expectations for spe-cific outcomes in the PQI project will be devel-oped and articulated by the ABR.
This communication addresses how diplo-mates participating in the ABR MOC programwill use part IV (PQI) to demonstrate to patients,colleagues, and the broader health care commu-nity that they continue to maintain the competen-cies of medicine previously mentioned.
In developing its program of part IV topics, theABR faced the following major challenges: thediversity of radiology practices, including the fullspectrum from generalist to subspecialist, activepractitioner to administrator, and direct patientcaregiver to consultant; the full range of practicesettings, from hospital to office based to both; the
lack of a disease-specific focus in radiology; andthe need to address and incorporate nationalhealth care priorities.
In an effort to meet these challenges, the ABRhas created five categories from which an indi-vidual diplomate can select one required PQIproject: (a) patient safety, (b) accuracy of inter-pretation, (c) report turnaround time, (d) prac-tice guidelines and technical standards, and(e) referring physician surveys. The paragraphsthat follow describe the rationale underlying eachof these categories, concrete examples of PQIprojects that might be undertaken by an indi-vidual diplomate, and suggestions as to how na-tional or subspecialty societies could lend valu-able aid to project development. A potential sec-ondary gain is the production of national datarepositories, which would allow individual diplo-mates to compare their performance with that oftheir colleagues.
What is the timeline for participation? The 1styear of a cycle should provide radiologists the op-portunity to learn about the PQI process and ex-plore options for participating in an assessmentof their practices regarding improvement in thequality of care delivered. Each diagnostic radiolo-gist may select a project appropriate for an indi-vidual, participate in a project within a radiologydepartment, or choose a qualified national projectsponsored by a radiologic society. After selectinga project, the steps are (a) collect baseline datarelevant to the chosen project, (b) review and an-alyze the data and develop an improvement plan,(c) remeasure and track, and (d) report participa-tion to the ABR, using the template provided bythe ABR (Table). The reporting requirements aresatisfied by means of electronic entry into eachdiplomate’s password-protected ABR PersonalDatabase. The descriptions below include a briefrationale and specific examples of the five areastargeted to improve quality of care in diagnosticradiology. This is a work in progress, and the ex-amples here are provided to help the diplomateunderstand the process as it nears implementa-tion. Note that the minimum requirement is satis-factory completion of one PQI project per MOCcycle. If goals in a project are achieved readily,however, the diplomate will be encouraged to se-lect and participate in another quality improve-ment project.
Patient SafetyAll radiologists are concerned with the safety ofthe patients in their practices. Some examples ofsafety parameters that could be measured include
770 May-June 2007 RG f Volume 27 ● Number 3
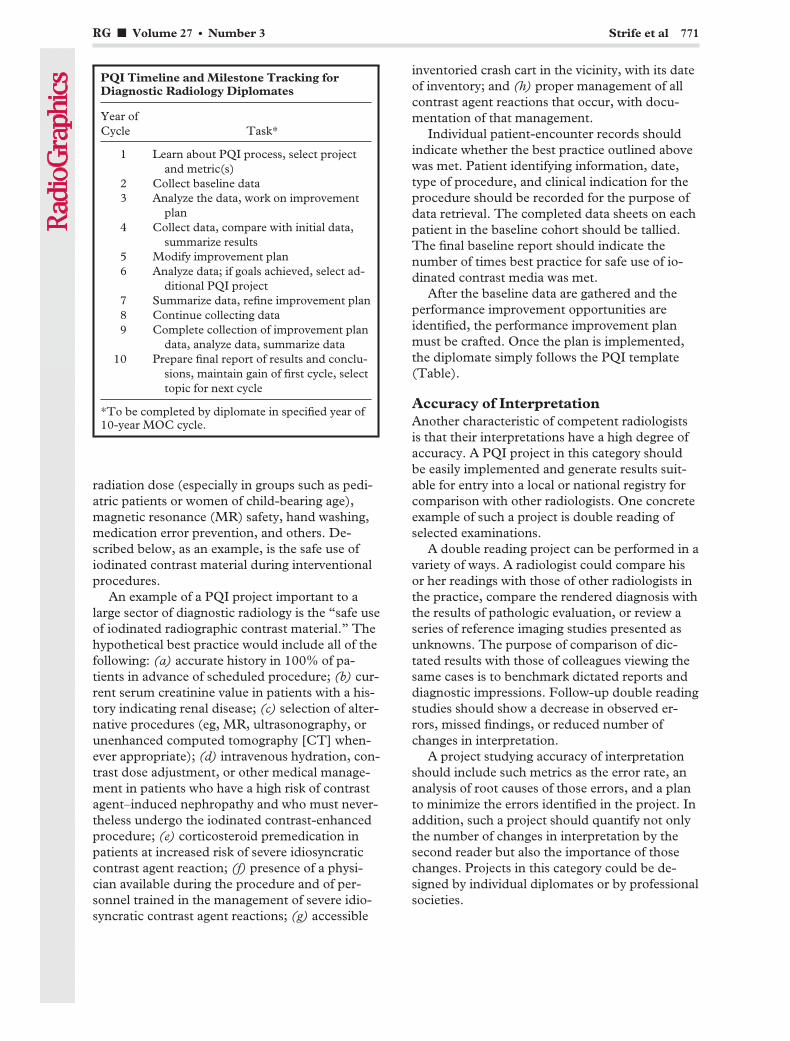
radiation dose (especially in groups such as pedi-atric patients or women of child-bearing age),magnetic resonance (MR) safety, hand washing,medication error prevention, and others. De-scribed below, as an example, is the safe use ofiodinated contrast material during interventionalprocedures.
An example of a PQI project important to alarge sector of diagnostic radiology is the “safe useof iodinated radiographic contrast material.” Thehypothetical best practice would include all of thefollowing: (a) accurate history in 100% of pa-tients in advance of scheduled procedure; (b) cur-rent serum creatinine value in patients with a his-tory indicating renal disease; (c) selection of alter-native procedures (eg, MR, ultrasonography, orunenhanced computed tomography [CT] when-ever appropriate); (d) intravenous hydration, con-trast dose adjustment, or other medical manage-ment in patients who have a high risk of contrastagent–induced nephropathy and who must never-theless undergo the iodinated contrast-enhancedprocedure; (e) corticosteroid premedication inpatients at increased risk of severe idiosyncraticcontrast agent reaction; (f) presence of a physi-cian available during the procedure and of per-sonnel trained in the management of severe idio-syncratic contrast agent reactions; (g) accessible
inventoried crash cart in the vicinity, with its dateof inventory; and (h) proper management of allcontrast agent reactions that occur, with docu-mentation of that management.
Individual patient-encounter records shouldindicate whether the best practice outlined abovewas met. Patient identifying information, date,type of procedure, and clinical indication for theprocedure should be recorded for the purpose ofdata retrieval. The completed data sheets on eachpatient in the baseline cohort should be tallied.The final baseline report should indicate thenumber of times best practice for safe use of io-dinated contrast media was met.
After the baseline data are gathered and theperformance improvement opportunities areidentified, the performance improvement planmust be crafted. Once the plan is implemented,the diplomate simply follows the PQI template(Table).
Accuracy of InterpretationAnother characteristic of competent radiologistsis that their interpretations have a high degree ofaccuracy. A PQI project in this category shouldbe easily implemented and generate results suit-able for entry into a local or national registry forcomparison with other radiologists. One concreteexample of such a project is double reading ofselected examinations.
A double reading project can be performed in avariety of ways. A radiologist could compare hisor her readings with those of other radiologists inthe practice, compare the rendered diagnosis withthe results of pathologic evaluation, or review aseries of reference imaging studies presented asunknowns. The purpose of comparison of dic-tated results with those of colleagues viewing thesame cases is to benchmark dictated reports anddiagnostic impressions. Follow-up double readingstudies should show a decrease in observed er-rors, missed findings, or reduced number ofchanges in interpretation.
A project studying accuracy of interpretationshould include such metrics as the error rate, ananalysis of root causes of those errors, and a planto minimize the errors identified in the project. Inaddition, such a project should quantify not onlythe number of changes in interpretation by thesecond reader but also the importance of thosechanges. Projects in this category could be de-signed by individual diplomates or by professionalsocieties.
PQI Timeline and Milestone Tracking forDiagnostic Radiology Diplomates
Year ofCycle Task*
1 Learn about PQI process, select projectand metric(s)
2 Collect baseline data3 Analyze the data, work on improvement
plan4 Collect data, compare with initial data,
summarize results5 Modify improvement plan6 Analyze data; if goals achieved, select ad-
ditional PQI project7 Summarize data, refine improvement plan8 Continue collecting data9 Complete collection of improvement plan
data, analyze data, summarize data10 Prepare final report of results and conclu-
sions, maintain gain of first cycle, selecttopic for next cycle
*To be completed by diplomate in specified year of10-year MOC cycle.
RG f Volume 27 ● Number 3 Strife et al 771
RADPEER is one example of a project tostudy the accuracy of interpretation. It was estab-lished by the American College of Radiology(ACR) and fulfills the standards listed above.This project allows a study of concurrence anderror rate by radiologist, facility, and modality.Error severity and impact can be analyzedthrough the peer review committee input, as sug-gested by the RADPEER project. This program ispart of the National Radiology Data Registry(NRDR).
Report Turnaround TimeReferring physicians act on interpretations, andthey utilize the final imaging report to help themcare for their patients. Thus, it is important toprovide diagnostic interpretation in a timely fash-ion. The turnaround times that are appropriatefor these radiology reports vary with the clinicalsetting. For example, different report times areappropriate for patients seen in the emergencyroom, for inpatients, for outpatients, and forthose undergoing screening examinations.
The report time is defined as the time betweencompletion of the examination and the time whenthe final report is made available to the referringphysician. Increasingly, examinations are elec-tronically reported, which makes collection ofsuch data practical.
A PQI project on report times would includecollection of baseline data for the individual radi-ologist. A plan to improve the report times shouldthen be prepared in written form and should de-scribe measures to improve the performance.Then, data should be collected a second time,approximately 3 years after the first data set. Asecond improvement plan should then be devel-oped on the basis of the results evident in the sec-ond data collection. This leads to a third data col-lection interval after another 2–3 years.
Practice Guidelinesand Technical StandardsChoosing this PQI category requires that the dip-lomate select two projects: One must involve theACR communication guideline; the other may bebased upon any of the 91 practice guidelines andsix technical standards available through ACRpublications or the ACR Web site (http://www.acr.org).
Communication Project.—Competent radiolo-gists are capable clinicians whose contribution topatient care includes communicating the results
of radiologic examinations to the appropriate in-dividuals in a timely manner. Accordingly, theACR practice guideline on communication states,“When a study discovers findings that reflect adiagnosis that seriously impacts the patient’shealth, a direct communication to the caring phy-sician is mandatory and should also be docu-mented in the final report.”
As a concrete example, the radiologist couldreview a consecutive series of recent reports todetermine how often unexpected results were de-tected and communicated to the appropriate phy-sician at the time of the examination and how of-ten communication was documented in the finalwritten report. On the basis of the analysis of theinitial study, an improvement plan could be de-veloped. Subsequently, in a different year, reviewof another consecutive series of reports could becompared with the initial study, and improve-ment in performance will hopefully be noted.
Practice Guideline and Technical StandardsProject.—Diplomates choosing this category ofPQI project must also select another project thatdeals with any of the other practice guidelines ortechnical standards. As an example, a radiologistwho performs CT of the abdomen and pelviscould review a series of consecutive examinationsfrom recent practice to determine how much(what percentage) of the small or large intestinewas adequately filled with oral contrast material.
For each practice guideline, after analysis ofthe results a plan is formulated for improvement.Subsequently, a second data collection periodhelps determine the effectiveness of this plan(Table).
Referring Physician SurveysPatient treatment is usually directed by the refer-ring physician. The radiologist contributes to careof the patient by helping the referring physicianrequest the most appropriate examination, pro-viding timely patient access to imaging, perform-ing the examination safely, interpreting the studyaccurately, and reporting the findings promptly.The experience of the referring physicians’ inter-actions with the radiologist can be assessedthrough surveys of those referring physicians.
Referring physician surveys must be qualifiedby the ABR. A few example surveys, either devel-oped by the ABR or modified from the CAHPS(Consumer Assessment of Healthcare Providersand Systems) survey, are available on the ABRWeb site. The survey must include the followingparameters: accessibility of the radiologist for ex-
772 May-June 2007 RG f Volume 27 ● Number 3
aminations or procedures, responsiveness for ur-gent examination consultation, professionalism,report turnaround time, and satisfaction of thereferring physician with his or her interaction. Aswith other projects, analysis of the responses mustlead to an improvement plan, which, after initia-tion, should be evaluated by using the same sur-vey instrument after a suitable time period.
The ABR and MOCDramatic change has occurred in the relationshipof the diplomate to the ABR. In the past, interac-tion occurred only in residency for the three ex-aminations: physics, clinical, and oral. Now, therelationship between a diagnostic radiologist andthe ABR will begin in residency and be continu-ous throughout his or her professional life. Thelifetime relationship will be maintained throughfrequent electronic communication of MOC up-dates, key milestones concerning the diplomate’sprogress through the MOC cycle, and remindersto increase activity whenever the diplomate is fall-ing behind.
Transformation ofthe ABR Infrastructure
The ABR is committed to providing a Web-basedsystem for diplomates to use both to access cur-rent information about MOC requirements andto record progress. The ABR Web site enablesdiplomates to access specialty-specific informa-tion and resources about MOC; the four compo-nents; the six competencies; and all requirements,examinations, and fees. The password-protectedABR Personal Database is each diplomate’s cen-ter for personalized information about MOC re-quirements and for tracking and documentingMOC progress. Within his or her personal data-base, an individual will be able to record parti-cipation in educational activities; attest to thefulfillment of various requirements, such as par-ticipation in PQI projects; update personal infor-mation; pay fees; and register for examinations.
Future plans call for linkages between the ABRand societies sponsoring continuing medical edu-cation credit, self-assessment modules (SAMs),and PQI projects. These linkages, undertakenwith permission of the society and the individualdiplomate, will allow the transmission of creditsand PQI participation directly into the individu-al’s ABR Personal Database. These entries will beregarded by the ABR as authenticated in the caseof an audit, and no further documentation will berequired.
The Role of Subspecialty SocietiesBoth the broad-based and the subspecialty radiol-ogy societies play a very important role, servingtheir members by advancing the science and prac-tice of their subspecialty and informing them onregional and national issues relevant to their prac-tice. The societies know the key components oftheir practices and stimulate the promotion ofquality in practice. Their multiple and potentiallyexpanded roles include, but are not limited to,educational courses or SAMs concerning PQI,workshops on subtopics of PQI, identification ofkey PQI focus areas and potential metrics, andthe development of tools or project templates forsociety members.
Development of national databases related topractice parameters in diagnostic radiology is animportant future goal in the collection of PQIdata, and professional societies may play an activerole in identifying key issues and providing tem-plates for data collection. National databases ofpractice parameters are a valuable tool in opti-mizing the practice of medicine for our patients,because they allow each radiologist to comparehis or her results with those collected in similarpractices throughout the country. The need forpooled, aggregate data on PQI results representsan opportunity for collaboration among the manyradiology societies to establish national databasesfor the benefit of our patients, our specialty, andall of medicine.
SummaryThere is a national imperative to improve thequality and safety of health care. For radiologists,participation in the ABR’s MOC PQI projects is avehicle through which this can happen. We mustmeasure what we do, provide comparative data,and encourage standardization of practice com-ponents to work toward improving the quality ofcare. Radiology has lagged behind some of theother specialties in measuring what we do and indocumenting our impact on clinical care. TheABR PQI program is a work in progress. Consid-erable progress has been made in understandingour charge and in identifying ways to use com-mon practice metrics to enhance the individual’spractice of radiology, yet change should be antici-pated. As our evidence base grows, our PQI ef-forts will be improved and refined. We encourageactive participation of all certified radiologists,both those with time-limited certificates and those
RG f Volume 27 ● Number 3 Strife et al 773
with lifetime certificates. We believe that mostradiologists want to engage in a personally andprofessionally rewarding, publicly visible processfor ongoing quality improvement.
References1. Kohn LT, Corrigan JM, Donaldson MS, eds. To
err is human: building a safer health system.Washington, DC: National Academy, 2000.
2. Institute of Medicine. Crossing the quality chasm:a new health system for the 21st century. Washing-ton, DC: National Academy, 2001.
3. McGlynn EA, Asch SM, Adams J, et al. The qual-ity of health care delivered to adults in the UnitedStates. N Engl J Med 2003;348:2635–2645.
4. Miller SH. ABMS’ Maintenance of certification:the challenge of continuing competence. Clin Or-thop Relat Res 2006;449:155–158.
5. Cassel CK, Holmboe ES. Credentialing and pub-lic accountability: a central role for board certifica-tion. JAMA 2006;295(8):939–940.
6. Brennan TA, Horwitz RI, Duffy FD, Cassel CK,Goode LD, Lipner RS. The role of physician spe-cialty board certification status in the qualitymovement. JAMA 2004;292:1038–1043.
7. American Board of Medical Specialties. Initiativesrecommended by the ABMS Task Force on Com-petence: description of the competent physician.Evanston, Ill: American Board of Medical Special-ties, 1999.
8. Steinbrook R. Renewing board certification.N Engl J Med 2005;353(19):1994–1997.
9. Rosenberg RN. Translating biomedical research tothe bedside: a national crisis and a call to action.JAMA 2003;289:1305–1306.
10. Swenson SJ, Johnson CD. Radiologic quality andsafety: mapping value into radiology. J Am CollRadiol 2005;2:992–1000.
11. Madewell JE, Hattery RR, Thomas SR, et al.Maintenance of certification. AJR Am J Roent-genol 2005;184(1):3–10.
12. Madewell JE, Hattery RR, Thomas SR, et al.American Board of Radiology: maintenance ofcertification. Radiology 2005;234(1):17–25.
13. Madewell JE, Hattery RR, Thomas SR, et al.American Board of Radiology: maintenance ofcertification. Acad Radiol 2005;12:104–115.
14. Madewell JE, Hattery RR, Thomas SR, et al.American Board of Radiology: maintenance ofcertification. RadioGraphics 2005;25:285–296.
15. Madewell JE, Hattery RR, Thomas SR, et al.Maintenance of certification. J Am Coll Radiol2005;2:22–32.
16. Baron RJ. Personal metrics for practice: how’m Idoing? N Engl J Med 2005;353:1992–1993.
774 May-June 2007 RG f Volume 27 ● Number 3

EDUCATION EXHIBIT 775
Complications ofSpinal Instrumen-tation1
ONLINE-ONLYCME
See www.rsna.org/education/rg_cme.html.
LEARNINGOBJECTIVESAfter reading thisarticle and takingthe test, the reader
will be able to:
� Explain the func-tional rationale be-hind spinal columnreconstruction.
� Describe a basicapproach for postop-erative radiographyafter spinal columnreconstruction.
� Recognize com-mon complications ofspine surgery thatcause persistent post-operative pain.
Phillip M. Young, MD ● Thomas H. Berquist, MD ● Laura W. Bancroft,MD ● Jeffrey J. Peterson, MD
Despite tremendous technical advances in spine surgery in recent de-cades, patients may experience residual or recurrent pain and othersymptoms after such surgery. The standard history and physical exami-nation have only limited utility for assessing the postoperative anat-omy, and radiologists can play an important role in diagnosing compli-cations and guiding postoperative care. To do so effectively, they mustbe familiar with the imaging features of successful and unsuccessfulfusion, instrumentation fracture and loosening, complications due tofaulty hardware placement, and postoperative infection. A basic knowl-edge of spinal biomechanics and common approaches to surgical in-strumentation also may help radiologists anticipate and identify com-plications.©RSNA, 2007
IntroductionSpinal fusion surgeries have increased markedly in frequency in recent decades. Sincethe first successful fusion procedures were described by Hibbs and Albee in 1911 forprevention of progressive deformity from Pott disease, an improved understanding ofspinal biomechanics and a burgeoning armamentarium of surgical fixation deviceshave allowed tremendous advances in surgical technique (1,2). Despite these devel-opments, the incidence of residual or recurrent postoperative back pain (so-calledfailed back syndrome) remains high because of the influence of a myriad of factors(3). Follow-up radiography is often performed to clarify the cause of postoperativepain. With the use of radiography and various other modalities, the radiologist canplay a crucial role in determining the origins of persistent or recurrent symptoms,which may be frustratingly nonspecific.
RadioGraphics 2007; 27:775–789 ● Published online 10.1148/rg.273065055 ● Content Code:
1From the Department of Radiology, Mayo Clinic, 2400 San Pablo Rd, Jacksonville, FL 32224. Recipient of a Certificate of Merit award for an educa-tion exhibit at the 2005 RSNA Annual Meeting. Received April 5, 2006; revision requested August 9; revision received September 29 and acceptedOctober 10. All authors have no financial relationships to disclose. Address correspondence to P.M.Y. (e-mail: [email protected]).
©RSNA, 2007
Note: This copy is for your personal, non-commercial use only. To order presentation-ready copies for distribution to your colleagues or clients, use the RadioGraphics Reprints form at the end of this article.
See last page
TEACHING POINTS
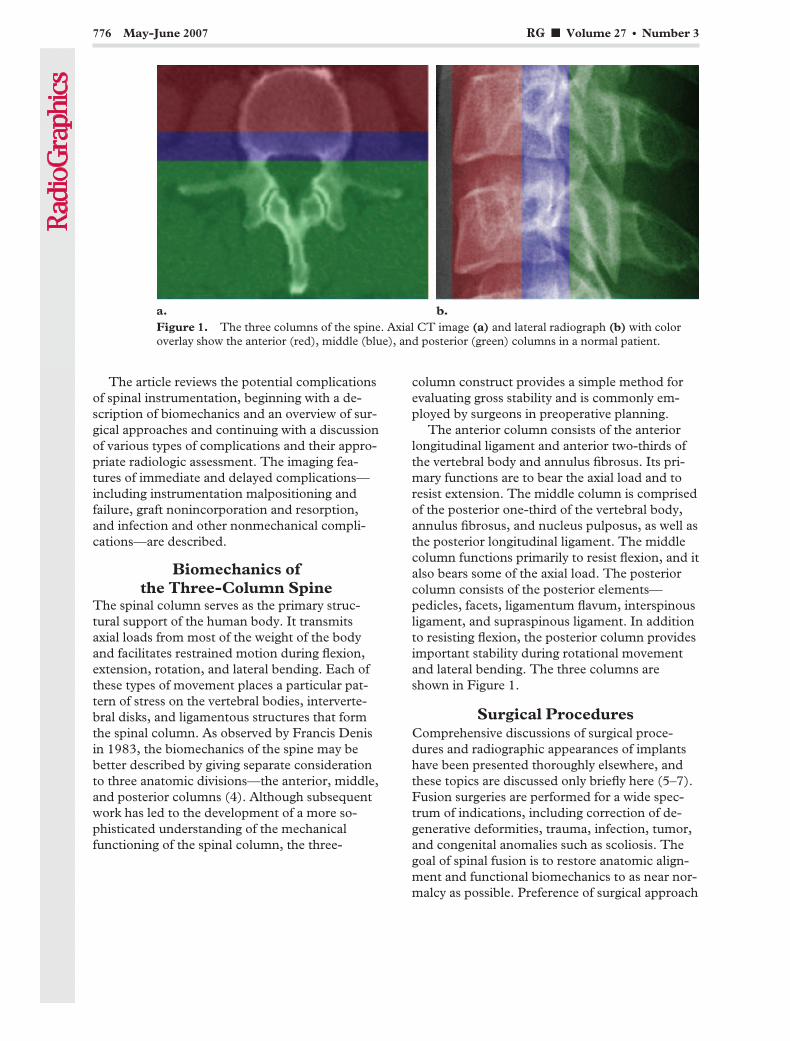
The article reviews the potential complicationsof spinal instrumentation, beginning with a de-scription of biomechanics and an overview of sur-gical approaches and continuing with a discussionof various types of complications and their appro-priate radiologic assessment. The imaging fea-tures of immediate and delayed complications—including instrumentation malpositioning andfailure, graft nonincorporation and resorption,and infection and other nonmechanical compli-cations—are described.
Biomechanics ofthe Three-Column Spine
The spinal column serves as the primary struc-tural support of the human body. It transmitsaxial loads from most of the weight of the bodyand facilitates restrained motion during flexion,extension, rotation, and lateral bending. Each ofthese types of movement places a particular pat-tern of stress on the vertebral bodies, interverte-bral disks, and ligamentous structures that formthe spinal column. As observed by Francis Denisin 1983, the biomechanics of the spine may bebetter described by giving separate considerationto three anatomic divisions—the anterior, middle,and posterior columns (4). Although subsequentwork has led to the development of a more so-phisticated understanding of the mechanicalfunctioning of the spinal column, the three-
column construct provides a simple method forevaluating gross stability and is commonly em-ployed by surgeons in preoperative planning.
The anterior column consists of the anteriorlongitudinal ligament and anterior two-thirds ofthe vertebral body and annulus fibrosus. Its pri-mary functions are to bear the axial load and toresist extension. The middle column is comprisedof the posterior one-third of the vertebral body,annulus fibrosus, and nucleus pulposus, as well asthe posterior longitudinal ligament. The middlecolumn functions primarily to resist flexion, and italso bears some of the axial load. The posteriorcolumn consists of the posterior elements—pedicles, facets, ligamentum flavum, interspinousligament, and supraspinous ligament. In additionto resisting flexion, the posterior column providesimportant stability during rotational movementand lateral bending. The three columns areshown in Figure 1.
Surgical ProceduresComprehensive discussions of surgical proce-dures and radiographic appearances of implantshave been presented thoroughly elsewhere, andthese topics are discussed only briefly here (5–7).Fusion surgeries are performed for a wide spec-trum of indications, including correction of de-generative deformities, trauma, infection, tumor,and congenital anomalies such as scoliosis. Thegoal of spinal fusion is to restore anatomic align-ment and functional biomechanics to as near nor-malcy as possible. Preference of surgical approach
Figure 1. The three columns of the spine. Axial CT image (a) and lateral radiograph (b) with coloroverlay show the anterior (red), middle (blue), and posterior (green) columns in a normal patient.
776 May-June 2007 RG f Volume 27 ● Number 3

and instrumentation vary and are dictated by theunderlying condition. Although a comprehensiveknowledge of instrumentation and surgical tech-nique is beyond the scope of most radiologists,familiarity with the favored procedures and im-plants used by the referring clinician will fosterimproved communication with the surgeon andmay lead to an increased awareness of potentialcomplications.
Whereas the early surgeries performed byHibbs and Albee required a significant convales-cence period and extended bracing, subsequentdevelopments in orthopedic hardware have dra-matically shortened the postoperative recoveryperiod. Internal fixation devices can preservealignment and prevent motion to optimize graftincorporation, while allowing early mobility.Generally, two of three columns must be ana-tomically intact for functional stability. Instru-mentation is therefore often necessary if morethan one column is disrupted by trauma, infec-tion, tumor, degenerative change, or surgical ap-proach. Complications may arise even years aftersingle-column surgery if subsequent trauma ordegenerative change affects the remaining col-umns (Fig 2).
Reconstruction of the posterior column hasbeen performed for decades and may be accom-plished with many types of instrumentation.Commonly used methods include long rodswith sublaminar hooks or wires, such as Cotrel-Dubousset or Luque rods. This type of instru-mentation is now used primarily for correction ofscoliosis. Pedicle screw and rod or plate con-structs have become the preferred method of in-strumentation when multiple-column reconstruc-tion is required.
The anterior and middle columns can be re-constructed from an anterior or posterior ap-proach. The anterior approach is generally pre-ferred in the cervical spine because of the risk ofcord manipulation, which would be required for aposterior approach at this level. Autograft or allo-graft bone blocks may be used for reconstructionafter diskectomy or corpectomy in the anteriorand middle columns. Allograft struts or bonegraft cages also may be employed if a corpectomyis performed. Posterior instrumentation, if re-quired, then can be placed through a separateincision (Fig 3).
Figure 2. Two-column instability. Anteropos-terior radiograph shows instability above the levelof successful fusion in a 61-year-old woman whounderwent laminectomies at L1 through L5 andposterior lumbar interbody fusion at L4 throughS1.
Figure 3. Combined anterior and posteriorfusion of the cervical spine. Lateral radiographdemonstrates an anterior column reconstructionwith a fibular allograft and an anterior plate andscrews after vertebral body resection (corpec-tomy) at multiple levels, as well as a posteriorcolumn reconstruction with articular pillarscrews and rods. The structural integrity of theanterior and posterior columns made reconstruc-tion of the middle column unnecessary.
RG f Volume 27 ● Number 3 Young et al 777
TeachingPoint

A posterior approach to anterior- and middle-column reconstruction is often preferred in thelumbar spine for two reasons. The first is that themorbidity associated with an anterior approach issignificant and delays recovery. The second isthat pedicle screws and rods or plates can beplaced before dural retraction and dissection ofthe intervertebral disk. This instrumentation maybe used to maximally distract the disk space, re-storing normal disk height and decompressing theneural foramina. The evacuated disk space is thenfilled with allograft bone blocks or fusion cagesthat contain morselized autograft bone. Theblocks and cages are preselected with specific di-mensions to restore anatomic alignment. Cagesmay be metallic or radiolucent, with radiopaquemarkers outlining the margins of the latter (Fig4). The posterior instrumentation is then lockedinto place to restore the normal lumbar lordosisand prevent posterior herniation of the graft ma-terial. Anterior interbody fusion is sometimes per-formed, frequently with the use of threaded cagesthat are “screwed” into the intervertebral diskspace. Because the sharp screw threads penetrate
Figure 4. Posterior interbody fusion of L3 toL4 in a 51-year-old man. Lateral radiographshows the pedicle screw and rod instrumentationused to reconstruct the posterior column. Ra-diopaque markers indicate the location of theradiolucent bone graft cage.
Figure 5. Fracture of sublaminar wires used incorrective surgery for scoliosis. Routine surveil-lance radiograph demonstrates the fracture ofmultiple wires (arrows) and recurrent kyphosis ofthe thoracic spine anterior to the instrumenta-tion.
Figure 6. Nonincorporated bone graft mate-rial. Lateral radiograph demonstrates anteriorplate and screw instrumentation at C4 throughC6, with intervertebral bone blocks used to re-construct the anterior column. The graft materialat C5–6 shows evidence of fusion, with blurringof graft margins and new bone formation in theinterspace. Visible at the C4–5 level are persis-tent graft margins, sclerosis of the adjacent end-plates, and absence of new bone formation, fea-tures indicative of a lack of graft incorporation.
778 May-June 2007 RG f Volume 27 ● Number 3
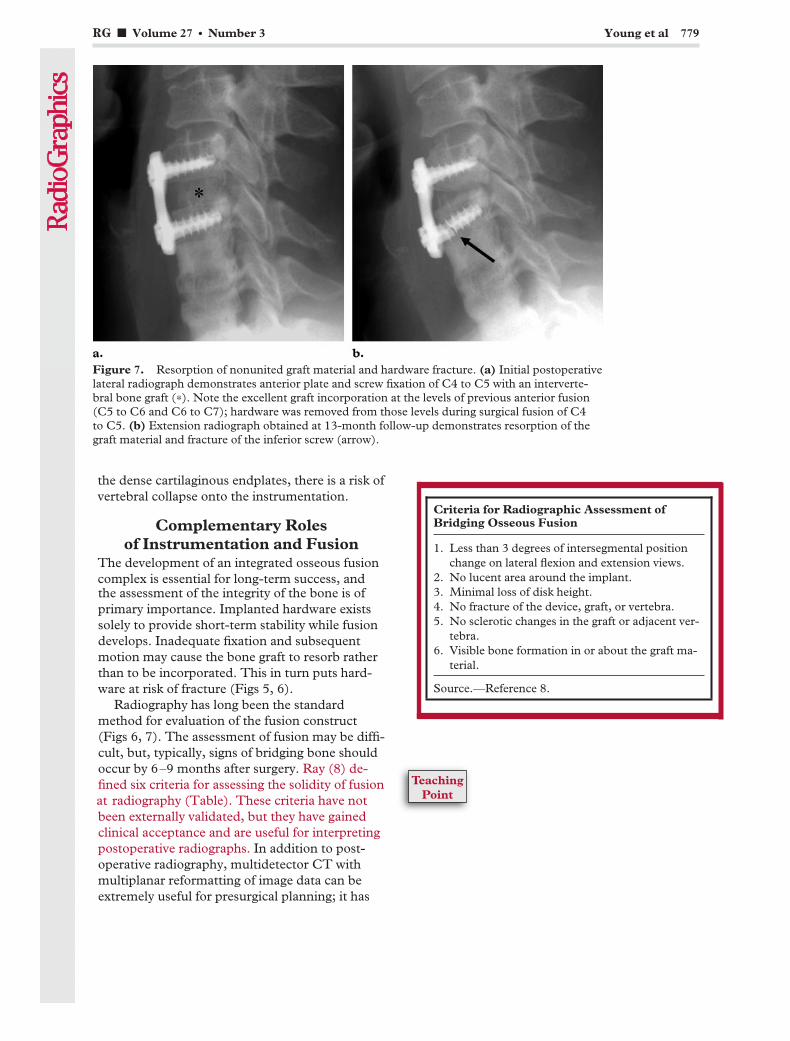
the dense cartilaginous endplates, there is a risk ofvertebral collapse onto the instrumentation.
Complementary Rolesof Instrumentation and Fusion
The development of an integrated osseous fusioncomplex is essential for long-term success, andthe assessment of the integrity of the bone is ofprimary importance. Implanted hardware existssolely to provide short-term stability while fusiondevelops. Inadequate fixation and subsequentmotion may cause the bone graft to resorb ratherthan to be incorporated. This in turn puts hard-ware at risk of fracture (Figs 5, 6).
Radiography has long been the standardmethod for evaluation of the fusion construct(Figs 6, 7). The assessment of fusion may be diffi-cult, but, typically, signs of bridging bone shouldoccur by 6–9 months after surgery. Ray (8) de-fined six criteria for assessing the solidity of fusionat radiography (Table). These criteria have notbeen externally validated, but they have gainedclinical acceptance and are useful for interpretingpostoperative radiographs. In addition to post-operative radiography, multidetector CT withmultiplanar reformatting of image data can beextremely useful for presurgical planning; it has
Figure 7. Resorption of nonunited graft material and hardware fracture. (a) Initial postoperativelateral radiograph demonstrates anterior plate and screw fixation of C4 to C5 with an interverte-bral bone graft (*). Note the excellent graft incorporation at the levels of previous anterior fusion(C5 to C6 and C6 to C7); hardware was removed from those levels during surgical fusion of C4to C5. (b) Extension radiograph obtained at 13-month follow-up demonstrates resorption of thegraft material and fracture of the inferior screw (arrow).
RG f Volume 27 ● Number 3 Young et al 779
Criteria for Radiographic Assessment ofBridging Osseous Fusion
1. Less than 3 degrees of intersegmental positionchange on lateral flexion and extension views.
2. No lucent area around the implant.3. Minimal loss of disk height.4. No fracture of the device, graft, or vertebra.5. No sclerotic changes in the graft or adjacent ver-
tebra.6. Visible bone formation in or about the graft ma-
terial.
Source.—Reference 8.
TeachingPoint

the capability to provide exquisitely detailed de-piction of hardware and graft materials (Fig 8).
In the presence of chronic low-grade instabilityand motion, pseudarthrosis may develop. Pseud-arthrosis represents fibrous rather than osseousunion of the fusion complex. Without solid osse-ous fusion, loosening or fracture of instrumenta-tion may occur. In addition, the pseudarthrosisitself may be a source of pain generation. Maturepseudarthrosis is typically seen as a clearly corti-cate linear lucency across the graft material (Fig9). Early-stage pseudarthrosis may have a subtleappearance, but radionuclide bone scanning orCT may help confirm the diagnosis (Fig 10). In-creased radiotracer uptake is expected at sites ofmotion, and CT may allow precise definition of
cortical margins and residual graft material. Mag-netic resonance (MR) imaging also is possiblewith most titanium and cobalt-chromium im-plants, and T2-weighted images may demonstratefocal high signal intensity in the region of pseudo-articulation. We have successfully performed di-agnostic and therapeutic injections of pseudar-throses for surgical planning and symptom relief,respectively, and further study is needed regard-ing the effectiveness of pseudarthrosis injection.
Figure 8. Utility of multidetector CT in evaluation of non-union. (a) Anteroposterior radiograph demonstrates multilevelpedicle screw and rod instrumentation with a corpectomy at L3and reconstruction with a humeral strut graft and lateral side-plate and screws. Areas of lucency around the inferior pediclescrews are indicative of loosening (arrowheads). (b) Coronal CTimage clearly shows areas of lucency around the inferior pediclescrews (arrows). (c) Coronal CT image in a more posteriorplane than b demonstrates the dense, granular appearance of thegraft material (arrows), a finding indicative of a lack of graft in-corporation into a solid fusion construct at this inferior level.(d) Coronal CT image in a more posterior plane than b and cshows adequate formation of a posterolateral osseous fusioncomplex at higher levels (arrows).
780 May-June 2007 RG f Volume 27 ● Number 3

Instrumentation-related Complications
Given the technical difficulties of placing instru-mentation in the spine, it is inevitable that com-plications sometimes arise from malpositioning ofhardware. The radiologist should systematicallyassess the integrity of neural and vascular struc-tures throughout the spine, including the neuralforamina, thecal sac, central cord and caudaequina, and foramen transversarium, as well asadjacent structures such as the major abdominalvessels, psoas musculature, posterior mediasti-num, and prevertebral soft tissues.
Pedicle screws, in particular, deserve attentionbecause of their frequent use and proximity tosensitive neural and vascular structures. Lonsteinet al (9) reported an overall complication rate of2.4% per screw in a retrospective review of clini-cal outcomes with placement of 4790 pediclescrews. The most common complication wasnerve root irritation from medial angulation of thescrew with resultant violation of the medial cortexof the pedicle.
Optimal screw placement is typically along themedial aspect of the pedicle. The instrumentationgains purchase from its proximity to cortical bonebut should not disrupt it; the tip of the pediclescrew should approach but not breach the ante-rior cortex of the vertebral body. Loosening ofpedicle screws often may be seen as a rim of lu-cency around the screw threads (Fig 8). Compli-cations may arise from medial or lateral deviationof a screw or from its penetration of the anteriorcortex of the vertebral body (Figs 11–13). Similarcomplications may arise from malpositioning of
Figure 9. Mature pseudarthrosis in a symp-tomatic 54-year-old man who had undergoneposterolateral fusion with Harrington rodsfrom L4 through S1. Anteroposterior radio-graph demonstrates a corticate linear defect inthe posterolateral fusion complex on the left(arrow), a feature indicative of pseudarthrosis.
Figure 10. Early pseudarthrosis in a 43-year-old man. (a) Anteroposterior radiograph demon-strates a linear lucency in the posterolateral bone graft material on the right (arrow), a finding in-dicative of early pseudarthrosis. (b) Technetium 99m methylene diphosphonate bone scan (re-versed to correspond to a) shows an area of markedly increased activity at this level (arrow), a fea-ture that helps confirm the diagnosis.
RG f Volume 27 ● Number 3 Young et al 781
TeachingPoint
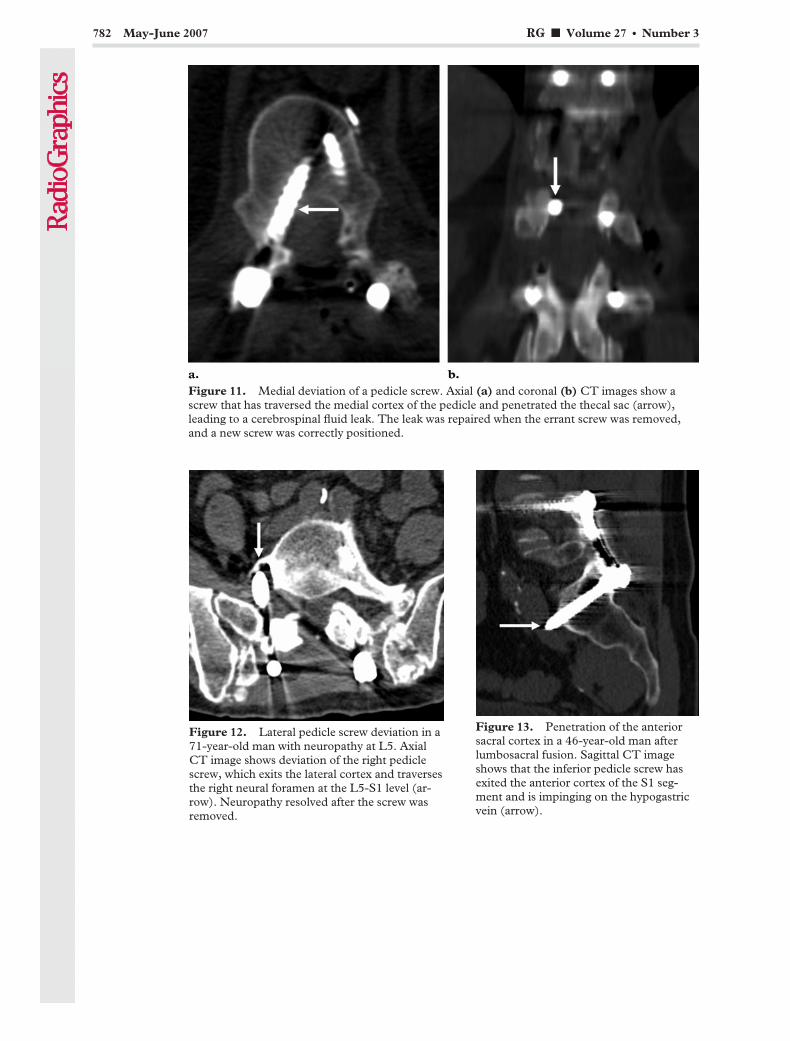
Figure 11. Medial deviation of a pedicle screw. Axial (a) and coronal (b) CT images show ascrew that has traversed the medial cortex of the pedicle and penetrated the thecal sac (arrow),leading to a cerebrospinal fluid leak. The leak was repaired when the errant screw was removed,and a new screw was correctly positioned.
Figure 12. Lateral pedicle screw deviation in a71-year-old man with neuropathy at L5. AxialCT image shows deviation of the right pediclescrew, which exits the lateral cortex and traversesthe right neural foramen at the L5-S1 level (ar-row). Neuropathy resolved after the screw wasremoved.
Figure 13. Penetration of the anteriorsacral cortex in a 46-year-old man afterlumbosacral fusion. Sagittal CT imageshows that the inferior pedicle screw hasexited the anterior cortex of the S1 seg-ment and is impinging on the hypogastricvein (arrow).
782 May-June 2007 RG f Volume 27 ● Number 3
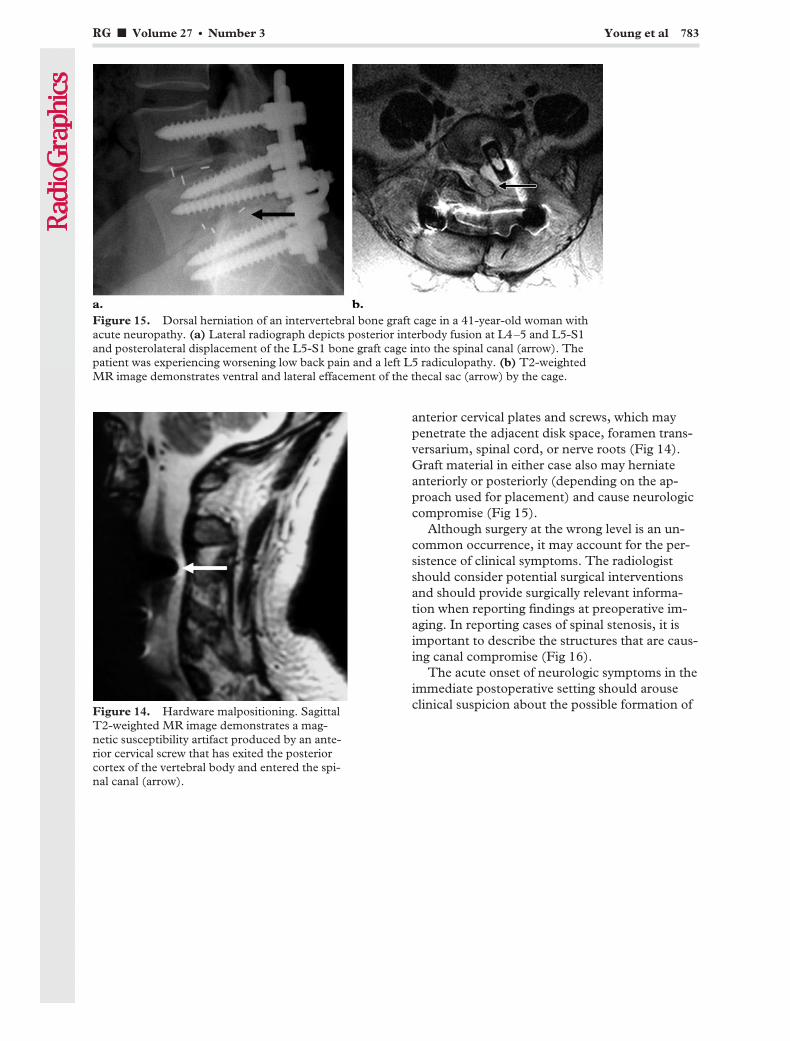
anterior cervical plates and screws, which maypenetrate the adjacent disk space, foramen trans-versarium, spinal cord, or nerve roots (Fig 14).Graft material in either case also may herniateanteriorly or posteriorly (depending on the ap-proach used for placement) and cause neurologiccompromise (Fig 15).
Although surgery at the wrong level is an un-common occurrence, it may account for the per-sistence of clinical symptoms. The radiologistshould consider potential surgical interventionsand should provide surgically relevant informa-tion when reporting findings at preoperative im-aging. In reporting cases of spinal stenosis, it isimportant to describe the structures that are caus-ing canal compromise (Fig 16).
The acute onset of neurologic symptoms in theimmediate postoperative setting should arouseclinical suspicion about the possible formation ofFigure 14. Hardware malpositioning. Sagittal
T2-weighted MR image demonstrates a mag-netic susceptibility artifact produced by an ante-rior cervical screw that has exited the posteriorcortex of the vertebral body and entered the spi-nal canal (arrow).
Figure 15. Dorsal herniation of an intervertebral bone graft cage in a 41-year-old woman withacute neuropathy. (a) Lateral radiograph depicts posterior interbody fusion at L4–5 and L5-S1and posterolateral displacement of the L5-S1 bone graft cage into the spinal canal (arrow). Thepatient was experiencing worsening low back pain and a left L5 radiculopathy. (b) T2-weightedMR image demonstrates ventral and lateral effacement of the thecal sac (arrow) by the cage.
RG f Volume 27 ● Number 3 Young et al 783

a hematoma. Such occurrences require urgentsurgical decompression (Fig 17).
Long-term Sequelae of FusionThe essential problem in fusion, despite its fre-quent success, is that the lost mobility of thefused segment places additional stresses on adja-cent levels of the vertebral column. The conse-quence is an increased likelihood of degenerativechanges, ligamentous instability, and even frac-ture at levels adjacent to a successful fusion con-struct (Figs 18–21). The long-term consequencesof altered spinal biomechanics are probablyunderrecognized.
Figures 16, 17. (16) Wrong level of surgery. Sagittal T2-weighted MR image of an 80-year-oldwoman demonstrates an acute burst fracture of the L4 vertebra. The interpretation of the preop-erative study (not shown) stated that posterior displacement of fracture fragments caused severecentral canal stenosis at this level. However, the narrowest segment is that between the L4 fracturefragments and the posterior elements of L3 (arrow), particularly the thickened ligamentum flavum.Laminectomies were performed at L4 and L5 (*), but central canal stenosis persists between theL4 fracture fragments and the posterior elements of L3. (17) Acute neurologic compromise (caudaequina syndrome) in an 80-year-old woman after laminectomies at levels L3 through L5 for de-compression. Sagittal T2-weighted MR image demonstrates a large hematoma (arrow) in the post-operative bed, with resultant compression of the thecal sac (arrowheads).
Figures 18, 19. (18) Accelerated ligamentous ossification secondary to placement of anteriorcervical plates within 5 mm of the adjacent intervertebral disk. Lateral radiograph demonstrateslarge osteophytes (arrows). (19) Ligamentous instability following multisegmental cervical fusion.Lateral flexion radiograph demonstrates cervical fusion at C4 through C6 with anterior and poste-rior instrumentation and marked ligamentous instability at C6–7.
784 May-June 2007 RG f Volume 27 ● Number 3
TeachingPoint
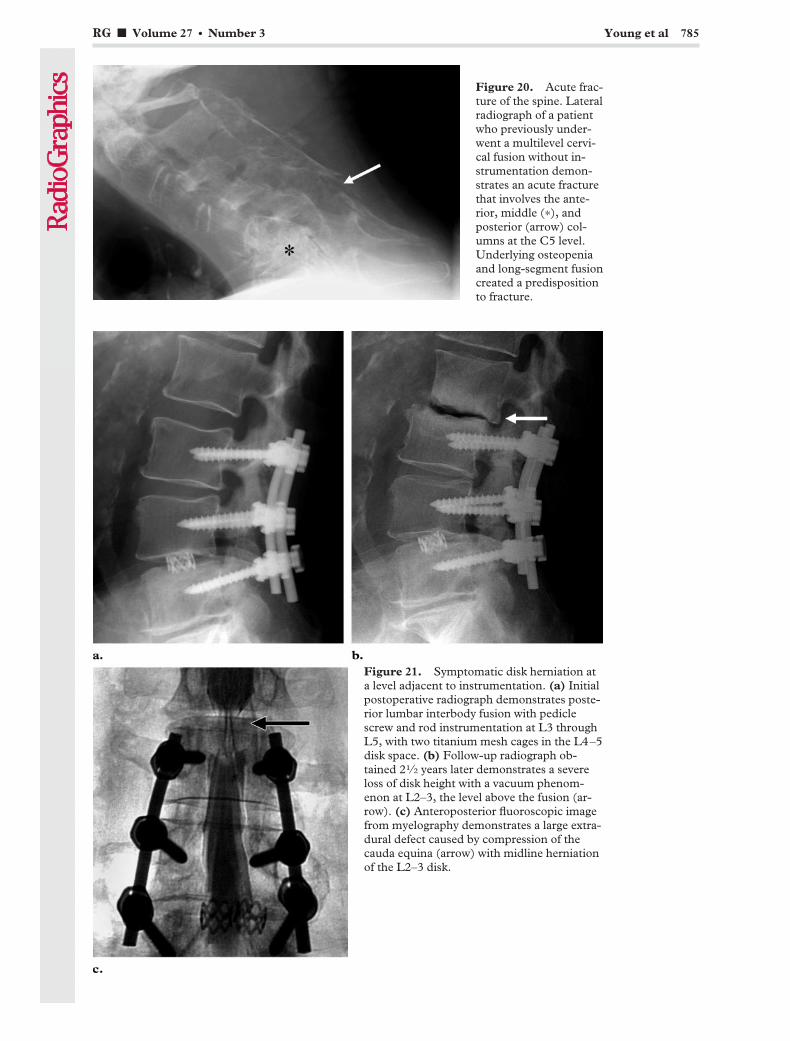
Figure 20. Acute frac-ture of the spine. Lateralradiograph of a patientwho previously under-went a multilevel cervi-cal fusion without in-strumentation demon-strates an acute fracturethat involves the ante-rior, middle (*), andposterior (arrow) col-umns at the C5 level.Underlying osteopeniaand long-segment fusioncreated a predispositionto fracture.
Figure 21. Symptomatic disk herniation ata level adjacent to instrumentation. (a) Initialpostoperative radiograph demonstrates poste-rior lumbar interbody fusion with pediclescrew and rod instrumentation at L3 throughL5, with two titanium mesh cages in the L4–5disk space. (b) Follow-up radiograph ob-tained 21⁄2 years later demonstrates a severeloss of disk height with a vacuum phenom-enon at L2–3, the level above the fusion (ar-row). (c) Anteroposterior fluoroscopic imagefrom myelography demonstrates a large extra-dural defect caused by compression of thecauda equina (arrow) with midline herniationof the L2–3 disk.
RG f Volume 27 ● Number 3 Young et al 785

Even seemingly minor differences in instru-mentation technique may affect outcome. Park etal (10) recently showed that placement of an an-terior cervical plate with its margin within 5 mmof the adjacent disk space increased the incidenceof osteophyte formation at that level (Fig 18).
Even in the absence of morphologic changes,increased stress from fusion may cause micro-trauma to the intervertebral disks at adjacent lev-els. The physiology of pain originating in a dam-aged disk is poorly understood, but it is well ac-cepted that a disk that is radiographically normalmay be the focus of extreme pain. Diskographymay be performed and the results used to guidetherapy. Frank herniation of a disk can be seen atmyelography or MR imaging (Fig 21).
As discussed previously, decompressive lami-nectomy without instrumentation or fusion alsomay have long-term functional consequences.Such procedures typically disrupt only the poste-rior column and have excellent initial results.However, if degenerative changes subsequentlyoccur in the anterior column, two-column insta-bility may develop, necessitating further surgery.
Patients also may be at risk for complicationsdue to underlying medical conditions. Patientswith osteoporosis, metabolic bone disease, Paget
Figure 22. Osteopenia-related insufficiencyfractures of the cartilaginous endplates adjacentto a humeral strut graft. Sagittal CT image afteran L1 corpectomy and reconstruction with a hu-meral allograft depicts the collapse of the carti-laginous endplates onto the dense graft material(arrows), which shows no signs of incorporation.Construct failure and a thoracic compressionfracture (*) are associated with underlying os-teopenia.
Figure 23. Facet fracture-dislocation and par-tially dislodged C5–6 anterior plate and screws.Sagittal CT image demonstrates a dislodged infe-rior screw (arrow) and interbody bone graft ma-terial. Bilateral locked facets and a facet fracturealso were found. The patient, who had dementia,had removed his cervical collar and attempted toambulate shortly after surgery.
Figure 24. Postoperative abscess and resultantdorsal effacement of the thecal sac. Sagittal T2-weighted fat-saturated MR image demonstrates alarge abscess in the postoperative bed, with ex-tensive abnormal T2 hyperintensity and masseffect on the thecal sac.
786 May-June 2007 RG f Volume 27 ● Number 3

disease, or a history of smoking may have poorunderlying bone quality and be more susceptibleto injury (Fig 22). Morbid obesity adds to thetechnical difficulty of spine surgery and exertsgreater stresses on instrumentation. Patients withdementia or a movement disorder are prone tofall and therefore have a higher risk for damage tothe construct (Fig 23). Parkinson disease, in par-ticular, may be a significant risk factor for compli-cations, as was recently suggested by Babat et al(11).
In summary, successful fusion permanentlyalters the mechanics of vertebral segments at ad-jacent levels. Such alterations may accelerate de-generative changes in the vertebrae, ligaments,and intervertebral disks. Awareness of this fact, aswell as of any cormorbid medical conditions, mayhelp the radiologist to anticipate complicationsand achieve an earlier diagnosis.
Nonmechanical Causesof Postoperative Symptoms
Infection is a complication that may not be mani-fested until much later in the postoperativecourse—even more than 2 years after surgery(12). Infection may involve any tissue in the post-operative bed. Generally, superficial infections aremanifested earlier than are deep-tissue and hard-ware-associated infections. Subcutaneous andsoft-tissue infections, which may be signaled byredness, pain, edema, or a draining sinus tract,typically are easy to diagnose clinically. MR imag-ing may depict fluid collections and intense en-hancement and often is useful for determining theextent of infection (Fig 24).
Deeper infections, including diskitis, may bedifficult to diagnose. Radiographs of patients withdiskitis classically show a collapse of the diskspace, destruction of the adjacent endplates, andevidence of osteomyelitis in the adjacent vertebralbodies (Figs 25, 26). In the early stages, when
Figure 25. Postoperative diskitis and osteo-myelitis. (a, b) Lateral radiographs in a pa-tient who underwent partial diskectomy, lami-nectomy, and lumbar fusion without instru-mentation. Initial postoperative image (a) and6-month follow-up image (b) show progres-sive endplate destruction, collapse of the diskspace, and osteopenia in the adjacent verte-bral bodies (arrow in b), findings indicative ofdiskitis and osteomyelitis. (c) Sagittal T1-weighted contrast-enhanced MR image dem-onstrates intense enhancement in the verte-bral bodies and remaining disk—a finding thathelped confirm the diagnosis—as well as ven-tral compression of the thecal sac (arrow).
RG f Volume 27 ● Number 3 Young et al 787
TeachingPoint

diagnosis may be especially difficult, scintigraphywith radionuclide-labeled white blood cells andMR imaging may be useful for confirming thediagnosis. A disk biopsy also may be performed;this method has a high sensitivity for the detectionof bacterial pathogens but a lower detection ratefor fungal infections (13).
Pain and neurologic symptoms that arise overthe long term may be due to arachnoiditis, an in-tradural scarring process that may manifest astraction with deformity of the nerve roots de-picted at myelography or MR imaging (Fig 27).
ConclusionsComplications of spine surgery may be difficult todiagnose and manage, and it is frequently difficultto identify the causes of persistent or recurrentsymptoms on clinical grounds alone. Radiographyis the standard follow-up imaging method, and itprovides a great deal of useful information. How-ever, assessment of the fusion construct and of
Figure 26. Postoperative diskitis after posterior instrumentation. (a) Scintigram obtained withindium 111–labeled autologous leukocytes demonstrates increased radiotracer activity and acuteangulation at the disk space (arrow), a finding suggestive of postoperative diskitis. (b) Anteropos-terior fluoroscopic spot image shows a needle inserted in the disk space for aspiration biopsy. Thepresence of bacterial diskitis was confirmed.
Figure 27. Arachnoiditis after L4 and L5 lami-nectomies. Sagittal T2-weighted MR imagedemonstrates an abnormal configuration of thelumbar nerve roots (arrow), a finding indicativeof arachnoiditis.
788 May-June 2007 RG f Volume 27 ● Number 3
accelerated degenerative changes may be per-formed with multiple imaging modalities. Postop-erative complications such as incomplete fusion,hardware failure, suboptimal positioning of in-strumentation, infection, hematoma, and othersmay be detected at imaging. An assessment withany modality is facilitated by an understanding ofspinal biomechanics. By accurately identifyingcomplications of spinal instrumentation, the radi-ologist can play an important role in the care ofpatients with persistent postoperative pain.
Acknowledgment: Special thanks to KathrynWaldeck for invaluable help in preparing the manu-script.
References1. Hibbs RA. An operation for progressive spinal de-
formities. N Y Med 1911;121:1013.2. Albee FH. Transplantation of a portion of the tibia
into the spine for Pott’s disease. JAMA 1911;57:855.
3. Long DM. Failed back surgery syndrome. Neuro-surg Clin N Am 1991;2(4):899–919.
4. Denis F. The three column spine and its signifi-cance in the classification of acute thoracolumbarspinal injuries. Spine 1983;8:817–831.
5. Slone RM, McEnery KW, Bridwell KH, Mont-gomery WJ. Fixation techniques and instrumenta-tion used in the cervical spine. Radiol Clin NorthAm 1995;33(2):213–232.
6. Slone RM, McEnery KW, Bridwell KH, Mont-gomery WJ. Fixation techniques and instrumenta-
tion used in the thoracic, lumbar and lumbosacralspine. Radiol Clin North Am 1995;33(2):233–266.
7. Berquist TH, Currier BL, Broderick DF. Thespine. In: Berquist TH, ed. Imaging atlas of ortho-pedic appliances and prostheses. New York, NY:Raven, 1995.
8. Ray CD. Threaded fusion cages for lumbar inter-body fusions: an economic comparison with 360degrees fusions. Spine 1997;22:681–685.
9. Lonstein JE, Denis F, Perra JH, Pinto MR, SmithMD, Winter RB. Complications associated withpedicle screws. J Bone Joint Surg Am 1999;81:1519–1528.
10. Park JB, Cho YS, Riew KD. Development of adja-cent-level ossification in patients with an anteriorcervical plate. J Bone Joint Surg Am 2005;87:558–563.
11. Babat LB, McLain RF, Bingaman W, Kalfas I,Young P, Rufo-Smith C. Spinal surgery in pa-tients with Parkinson’s disease: construct failureand progressive deformity. Spine 2004;29(18):2006–2012.
12. Richards BS. Delayed infections following poste-rior spinal instrumentation for the treatment ofidiopathic scoliosis. J Bone Joint Surg Am 1995;77:524–526.
13. Chew FS, Kline MJ. Diagnostic yield of CT-guided percutaneous aspiration procedures in sus-pected spontaneous infectious diskitis. Radiology2001;218(1):211–214.
This article meets the criteria for 1.0 AMA PRA Category 1 Credit TM. To obtain credit, see www.rsna.org/education/rg_cme.html.
RG f Volume 27 ● Number 3 Young et al 789
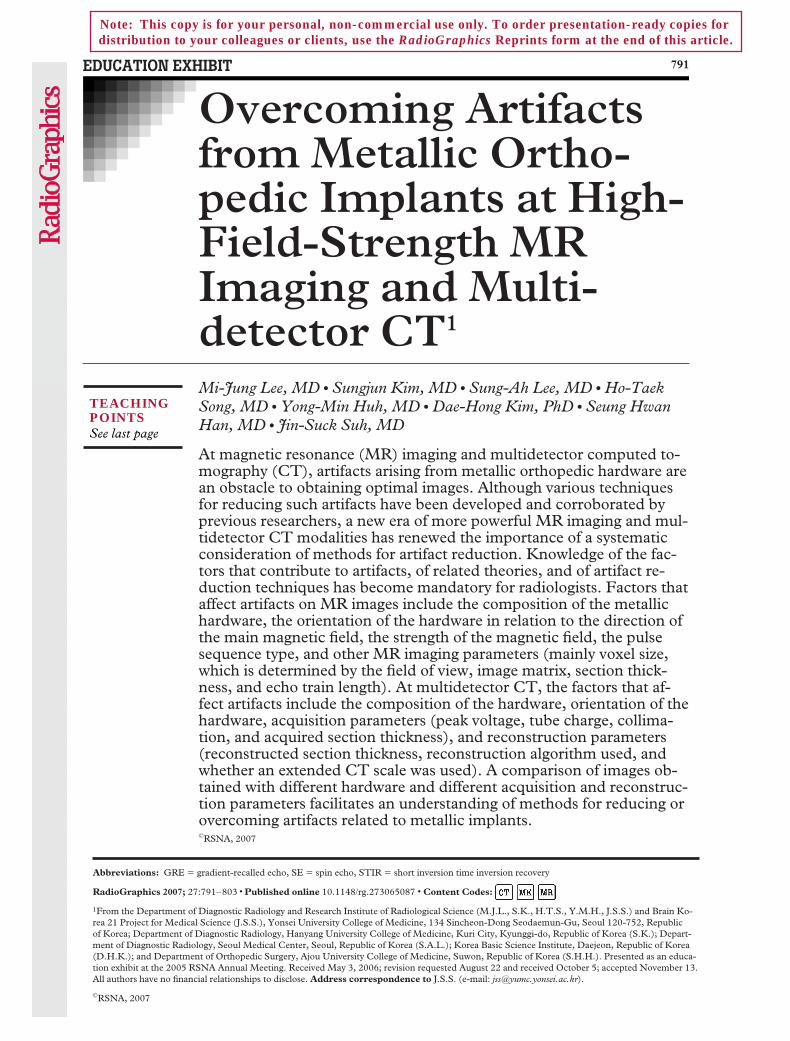
EDUCATION EXHIBIT 791
Overcoming Artifactsfrom Metallic Ortho-pedic Implants at High-Field-Strength MRImaging and Multi-detector CT1
Mi-Jung Lee, MD ● Sungjun Kim, MD ● Sung-Ah Lee, MD ● Ho-TaekSong, MD ● Yong-Min Huh, MD ● Dae-Hong Kim, PhD ● Seung HwanHan, MD ● Jin-Suck Suh, MD
At magnetic resonance (MR) imaging and multidetector computed to-mography (CT), artifacts arising from metallic orthopedic hardware arean obstacle to obtaining optimal images. Although various techniquesfor reducing such artifacts have been developed and corroborated byprevious researchers, a new era of more powerful MR imaging and mul-tidetector CT modalities has renewed the importance of a systematicconsideration of methods for artifact reduction. Knowledge of the fac-tors that contribute to artifacts, of related theories, and of artifact re-duction techniques has become mandatory for radiologists. Factors thataffect artifacts on MR images include the composition of the metallichardware, the orientation of the hardware in relation to the direction ofthe main magnetic field, the strength of the magnetic field, the pulsesequence type, and other MR imaging parameters (mainly voxel size,which is determined by the field of view, image matrix, section thick-ness, and echo train length). At multidetector CT, the factors that af-fect artifacts include the composition of the hardware, orientation of thehardware, acquisition parameters (peak voltage, tube charge, collima-tion, and acquired section thickness), and reconstruction parameters(reconstructed section thickness, reconstruction algorithm used, andwhether an extended CT scale was used). A comparison of images ob-tained with different hardware and different acquisition and reconstruc-tion parameters facilitates an understanding of methods for reducing orovercoming artifacts related to metallic implants.©RSNA, 2007
Abbreviations: GRE � gradient-recalled echo, SE � spin echo, STIR � short inversion time inversion recovery
RadioGraphics 2007; 27:791–803 ● Published online 10.1148/rg.273065087 ● Content Codes:
1From the Department of Diagnostic Radiology and Research Institute of Radiological Science (M.J.L., S.K., H.T.S., Y.M.H., J.S.S.) and Brain Ko-rea 21 Project for Medical Science (J.S.S.), Yonsei University College of Medicine, 134 Sincheon-Dong Seodaemun-Gu, Seoul 120-752, Republicof Korea; Department of Diagnostic Radiology, Hanyang University College of Medicine, Kuri City, Kyunggi-do, Republic of Korea (S.K.); Depart-ment of Diagnostic Radiology, Seoul Medical Center, Seoul, Republic of Korea (S.A.L.); Korea Basic Science Institute, Daejeon, Republic of Korea(D.H.K.); and Department of Orthopedic Surgery, Ajou University College of Medicine, Suwon, Republic of Korea (S.H.H.). Presented as an educa-tion exhibit at the 2005 RSNA Annual Meeting. Received May 3, 2006; revision requested August 22 and received October 5; accepted November 13.All authors have no financial relationships to disclose. Address correspondence to J.S.S. (e-mail: [email protected]).
©RSNA, 2007
Note: This copy is for your personal, non-commercial use only. To order presentation-ready copies for distribution to your colleagues or clients, use the RadioGraphics Reprints form at the end of this article.
See last page
TEACHING POINTS
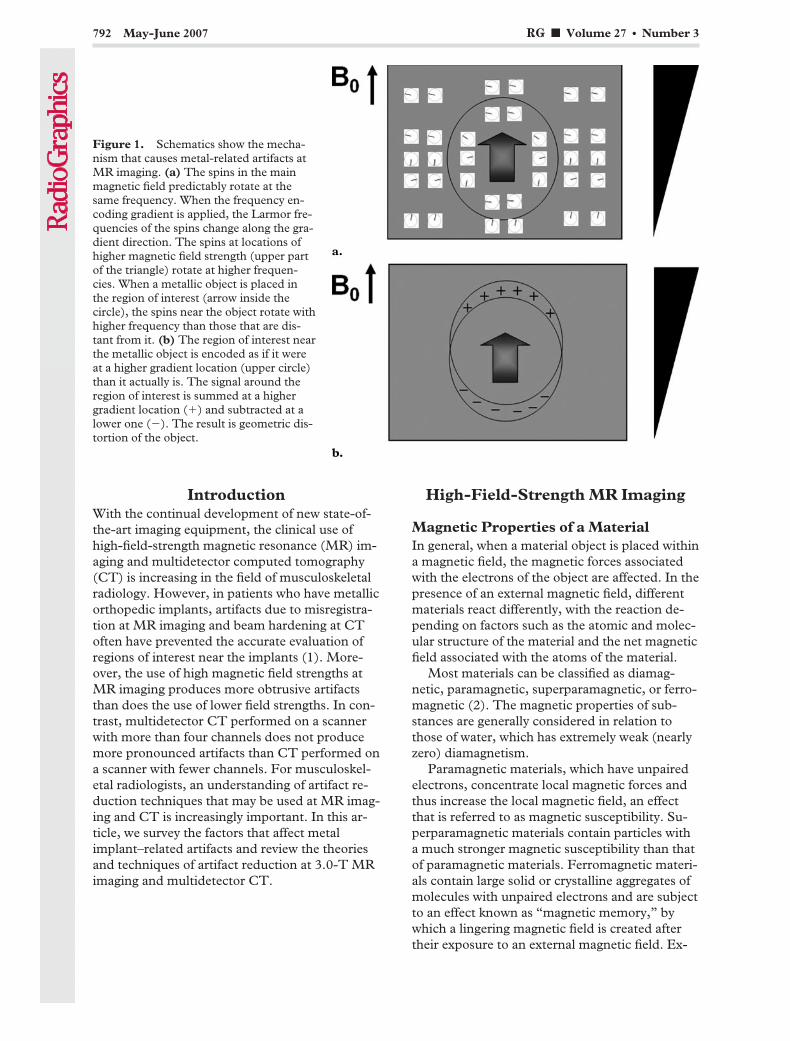
IntroductionWith the continual development of new state-of-the-art imaging equipment, the clinical use ofhigh-field-strength magnetic resonance (MR) im-aging and multidetector computed tomography(CT) is increasing in the field of musculoskeletalradiology. However, in patients who have metallicorthopedic implants, artifacts due to misregistra-tion at MR imaging and beam hardening at CToften have prevented the accurate evaluation ofregions of interest near the implants (1). More-over, the use of high magnetic field strengths atMR imaging produces more obtrusive artifactsthan does the use of lower field strengths. In con-trast, multidetector CT performed on a scannerwith more than four channels does not producemore pronounced artifacts than CT performed ona scanner with fewer channels. For musculoskel-etal radiologists, an understanding of artifact re-duction techniques that may be used at MR imag-ing and CT is increasingly important. In this ar-ticle, we survey the factors that affect metalimplant–related artifacts and review the theoriesand techniques of artifact reduction at 3.0-T MRimaging and multidetector CT.
High-Field-Strength MR Imaging
Magnetic Properties of a MaterialIn general, when a material object is placed withina magnetic field, the magnetic forces associatedwith the electrons of the object are affected. In thepresence of an external magnetic field, differentmaterials react differently, with the reaction de-pending on factors such as the atomic and molec-ular structure of the material and the net magneticfield associated with the atoms of the material.
Most materials can be classified as diamag-netic, paramagnetic, superparamagnetic, or ferro-magnetic (2). The magnetic properties of sub-stances are generally considered in relation tothose of water, which has extremely weak (nearlyzero) diamagnetism.
Paramagnetic materials, which have unpairedelectrons, concentrate local magnetic forces andthus increase the local magnetic field, an effectthat is referred to as magnetic susceptibility. Su-perparamagnetic materials contain particles witha much stronger magnetic susceptibility than thatof paramagnetic materials. Ferromagnetic materi-als contain large solid or crystalline aggregates ofmolecules with unpaired electrons and are subjectto an effect known as “magnetic memory,” bywhich a lingering magnetic field is created aftertheir exposure to an external magnetic field. Ex-
Figure 1. Schematics show the mecha-nism that causes metal-related artifacts atMR imaging. (a) The spins in the mainmagnetic field predictably rotate at thesame frequency. When the frequency en-coding gradient is applied, the Larmor fre-quencies of the spins change along the gra-dient direction. The spins at locations ofhigher magnetic field strength (upper partof the triangle) rotate at higher frequen-cies. When a metallic object is placed inthe region of interest (arrow inside thecircle), the spins near the object rotate withhigher frequency than those that are dis-tant from it. (b) The region of interest nearthe metallic object is encoded as if it wereat a higher gradient location (upper circle)than it actually is. The signal around theregion of interest is summed at a highergradient location (�) and subtracted at alower one (�). The result is geometric dis-tortion of the object.
792 May-June 2007 RG f Volume 27 ● Number 3

amples of ferromagnetic metals include iron,nickel, and cobalt, all of which distort magneticfields, thereby causing severe artifacts on MR im-ages (1).
Mechanism of Artifact GenerationMatter in a constant magnetic induction field(B0) induces a change in the magnetic flux den-sity. When an object is placed within a homoge-neous magnet, the object produces inhomogene-ities in the local magnetic field that interfere withthe imaging gradient field. The resultant imagingdistortions are called magnetic susceptibility ef-fects (3,4). Artifacts on MR images obtained inpatients with metallic implants are produced bythe large differences between the magnetic prop-erties of human tissues and those of the implantedmetals (5). The artifacts are more marked whenthe differences in magnetic susceptibilities be-
tween the metallic object and the surroundingmatter are substantial. In this regard, ferromag-netic materials, which have high magnetic suscep-tibilities, produce the largest artifacts (3). In con-trast, paramagnetic and diamagnetic substancesare far less likely to cause artifacts (4).
Differences in the magnetic susceptibilities ofadjacent tissues and implants create local mag-netic field inhomogeneities, altering the phase andfrequency of local spins. Thus, the spins are sub-sequently mapped to an erroneous location withinthe image. The results are distortion of the shapeof the metallic object along the axes of frequencyencoding and section selection, and loss of signalwithin the metallic object. A rim of high signalintensity appears around the metallic object as aresult of the mismapping of a disproportionatenumber of spins to that location (6) (Fig 1). Theresultant misregistration effect is especially exag-gerated in the direction of frequency encoding(7,8). Hence, at clinical MR imaging of a joint, ifthe frequency encoding direction is chosen opti-mally, away from the intraarticular structures ofinterest, those structures will be less obscured byartifacts (9). For example, to obtain sagittal im-ages for optimal evaluation of the posterior cruci-ate ligament in a patient with a metallic screwlocated at the middle of the posterior tibial cortex,near the tibial plateau, the frequency encodingdirection should be anterior to posterior.
Factors That Affect ArtifactsFactors that influence the production of metal-related artifacts at MR imaging include the com-position, size, and orientation of the metallic ob-ject with regard to the direction of the externalmagnetic field; the type of pulse sequences ap-plied; and the sequence parameters, includingmagnetic field strength, voxel size (determined bythe field of view, image matrix, and section thick-ness), and echo train length. To demonstratethese factors, we performed MR imaging in aphantom and a patient.
The phantom consisted of three orthopedicmetallic screws positioned inside a rectangularplastic container filled with 2% agarose gel. Onescrew was made of a titanium alloy (4.5-mm-diameter Cortical Bone Screws; Howmedica,Rutherford, NJ) and two were made of stainlesssteel (3.5- and 4.5-mm-diameter Cortical BoneScrews; A-O Synthes, Paoli, Pa). MR imaging ofthe phantom was performed with a 3.0-T scanner(Intera Achieva; Philips Medical Systems, Am-sterdam, the Netherlands) by using a coil pro-duced by the scanner manufacturer (SENSEFlex-S; Philips Medical Systems). Axial imageswere obtained with systematic variation of pulsesequences and screw orientations (Figs 2, 3).
Figure 2. Comparison of metal-related artifactsaccording to the physical composition and size of themetallic object and the MR pulse sequence used.(a) Schema shows the relative positions of a titanium-alloy screw (diameter, 4.5 mm) and two stainless steelscrews (diameters, 3.5 and 4.5 mm) within the phan-tom. (b, c) Axial MR images of the phantom, obtainedwith a gradient-recalled echo (GRE) sequence (rep-etition time msec/echo time msec, 500/14; flip angle,80°) (b) and a fast spin-echo (SE) sequence (500/14;echo train length, 16) (c), show that the titanium alloyscrews produced smaller artifacts than did the stainlesssteel screws, regardless of the sequence used. The arti-facts are smaller on c than on b. The arrow in b showsthe direction of the frequency encoding gradient.
RG f Volume 27 ● Number 3 Lee et al 793

One patient, who had a stainless steel screw inhis knee as a result of reconstructive surgery ofthe anterior cruciate ligament, participated as avolunteer in this study. MR imaging was per-formed mainly with the 3.0-T scanner describedearlier, but a 1.5-T scanner made by the samemanufacturer (Intera Achieva; Philips MedicalSystems) also was used to enable a comparison ofartifacts produced with the two different magnetstrengths (1.5-T and 3.0-T). A dedicated coil(SENSE knee coil; Philips Medical Systems) wasused. Sagittal images were obtained with system-atic variation of the parameters described earlieras factors that affect metal-related artifacts. Re-duction of an artifact was defined as a reductionof distortion due to misregistration.
Composition andSize of Orthopedic HardwareMetal-related artifacts vary according to the me-tallic composition of the orthopedic hardware.Implants made of titanium alloy are nonferro-magnetic and produce much less severe artifactsthan do ferromagnetic implants made of stainlesssteel (Fig 2) (4,9,10). In addition, the artifact sizeis affected by the implant size, with larger im-plants producing more obtrusive artifacts (9,10).
Orientation of Orthopedic HardwareThe angle between the long axis of a metallicscrew and the direction of the main magnetic fieldmay affect the severity of metal-related artifactson MR images: Placement of the screw parallel tothe axis of the main magnetic field (B0) helps re-duce the size of the susceptibility artifact (Fig 3)(3,8–14). The artifact size increases proportion-ally with an increase in the angle between the longaxis of the screw and the main magnetic field di-rection (9). In addition, the shape of susceptibilityartifacts changes with the angle of the long axis ofthe screw. For example, when the long axis of thescrew is perpendicular to the main magnetic field,the artifact has a cloverleaf shape (Fig 2), whereasit is round or oval when the long axis of the screwparallels the direction of the main magnetic field(9). On successive images acquired along the longaxis of a screw, the artifacts vary in shape andsize, and those variations are obviously exagger-ated with an increasing angle (Fig 3).
Imaging Parame-ters That Affect Artifacts
Pulse Sequence.—The severity of the imagedistortion produced by magnetic susceptibilityeffects depends also on the type of MR pulse se-
Figure 3. Effect of hardware orientation on metal-related artifacts at fast SE MR imaging. (a) Schematics demon-strate the orientation of a screw in the vertical position (0°) and at successive angles of 30°, 60°, and 90°. (b) CoronalT1-weighted fast SE images (500/17; echo train length, three), obtained in the phantom with sequential changes inthe angular orientation of the screw (as specified in a), show increases in artifact size that are proportional to the in-crease in the angle between the long axis of the screw and the direction of the main magnetic field.
794 May-June 2007 RG f Volume 27 ● Number 3

quence used. Magnetic susceptibility effects onspins near a metal object in a magnetic field resultin two main types of image distortion: (a) distor-tion of the spatial geometry and (b) loss of signalin the object. The first type of distortion, spatialmisregistration, is visible on both conventional SEand GRE images, whereas the second type (lossof signal intensity because of intravoxel dephas-ing, or the so-called T2* effect) appears only onGRE images (3,4). Unlike SE sequences, GREsequences include no 180° refocusing pulse. As aconsequence, GRE sequences allow no correctionfor large and fixed magnetic field inhomogeneitiesinduced by metallic implants. Such magnetic fieldinhomogeneities cause marked intravoxel dephas-ing (T2* effect) and result in local signal loss (Fig2). At MR imaging performed with SE sequences,a 180° refocusing pulse enables recovery of thetransverse signal lost because of static magneticfield inhomogeneities and bulk susceptibility dif-ferences (2,7–9).
Substantial magnetic field inhomogeneitiessuch as those caused by bulk ferromagnetic mate-rials result in additional local dephasing of thespins of hydrogen protons in randomly diffusingwater molecules, and this diffusion-relateddephasing is not recoverable with the applica-tion of a 180° refocusing pulse. This type ofdephasing, which is accentuated by imaging se-quences with long echo times (eg, T2-weightedsequences), contributes directly to the overall lo-
cal signal loss in the vicinity of metallic hardware(2,7–9). Fast SE sequences with short echo spac-ing (short time intervals between echoes) are lesssensitive to magnetic susceptibility effects thanare fast SE sequences with longer echo spacing orconventional SE sequences (3,8,9,15,16). How-ever, fast SE sequences that have long echo trainsmay still be vulnerable to magnetic susceptibilityeffects.
Frequency-selective fat saturation, also re-ferred to as spectral fat saturation, is commonlyused to suppress the signal from fat at musculo-skeletal imaging. Frequency-selective fat satura-tion relies on the different resonance frequenciesof hydrogen protons within water and fat. Fatsignal suppression is achieved with the applicationof a narrow-bandwidth radiofrequency pulse lim-ited to the spectral frequency of fat, and the mag-netic field must be homogeneous within the imag-ing volume in order to obtain uniform fat sup-pression within the field of view. Variation of theregional magnetic field surrounding metallic de-vices or debris creates an inhomogeneous mag-netic field, with resultant areas of suboptimal fatsaturation (2). Short inversion time inversion re-covery (STIR) imaging is an effective alternativemethod of fat signal suppression and is less de-pendent on the homogeneity of the main mag-netic field (Fig 4) (2,5).
Figure 4. Effect of fat signal suppression method on metal-related artifacts at MR imaging. A compari-son of images obtained with a frequency-selective fat saturation sequence (3000/62) (a) and with a STIRsequence (repetition time msec/echo time msec/inversion time msec, 3000/33/210) (b) shows a smallerartifact on the STIR image.
RG f Volume 27 ● Number 3 Lee et al 795
TeachingPoint
TeachingPoint
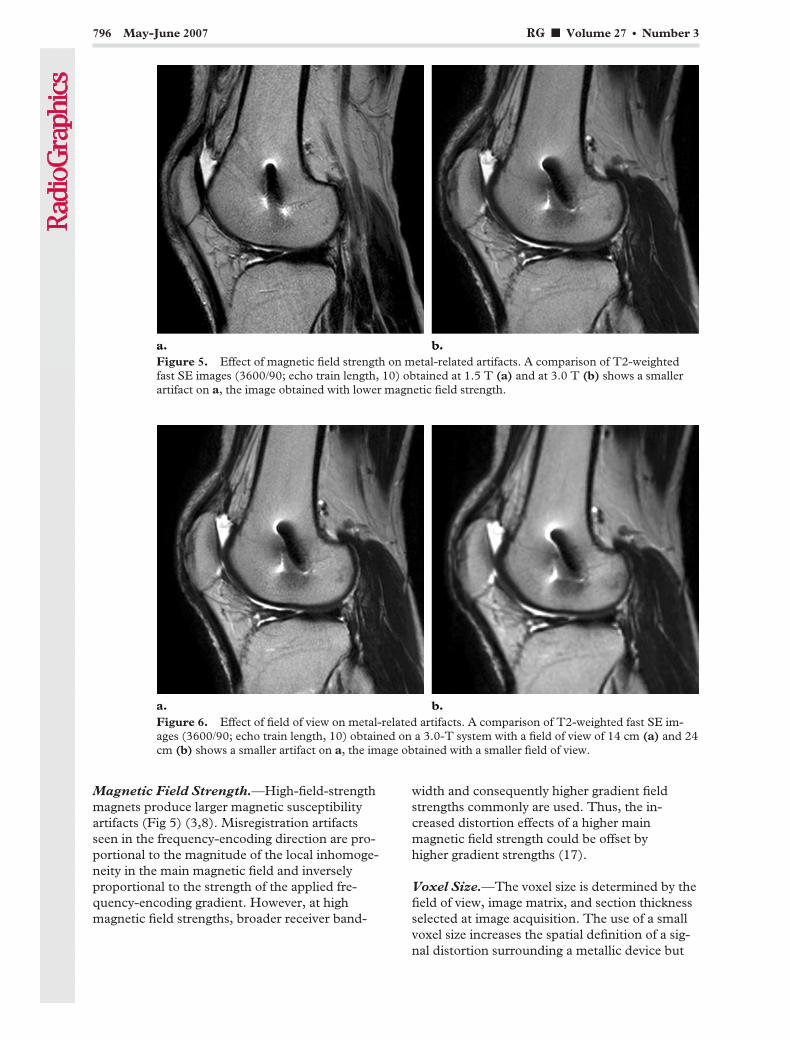
Magnetic Field Strength.—High-field-strengthmagnets produce larger magnetic susceptibilityartifacts (Fig 5) (3,8). Misregistration artifactsseen in the frequency-encoding direction are pro-portional to the magnitude of the local inhomoge-neity in the main magnetic field and inverselyproportional to the strength of the applied fre-quency-encoding gradient. However, at highmagnetic field strengths, broader receiver band-
width and consequently higher gradient fieldstrengths commonly are used. Thus, the in-creased distortion effects of a higher mainmagnetic field strength could be offset byhigher gradient strengths (17).
Voxel Size.—The voxel size is determined by thefield of view, image matrix, and section thicknessselected at image acquisition. The use of a smallvoxel size increases the spatial definition of a sig-nal distortion surrounding a metallic device but
Figure 5. Effect of magnetic field strength on metal-related artifacts. A comparison of T2-weightedfast SE images (3600/90; echo train length, 10) obtained at 1.5 T (a) and at 3.0 T (b) shows a smallerartifact on a, the image obtained with lower magnetic field strength.
Figure 6. Effect of field of view on metal-related artifacts. A comparison of T2-weighted fast SE im-ages (3600/90; echo train length, 10) obtained on a 3.0-T system with a field of view of 14 cm (a) and 24cm (b) shows a smaller artifact on a, the image obtained with a smaller field of view.
796 May-June 2007 RG f Volume 27 ● Number 3
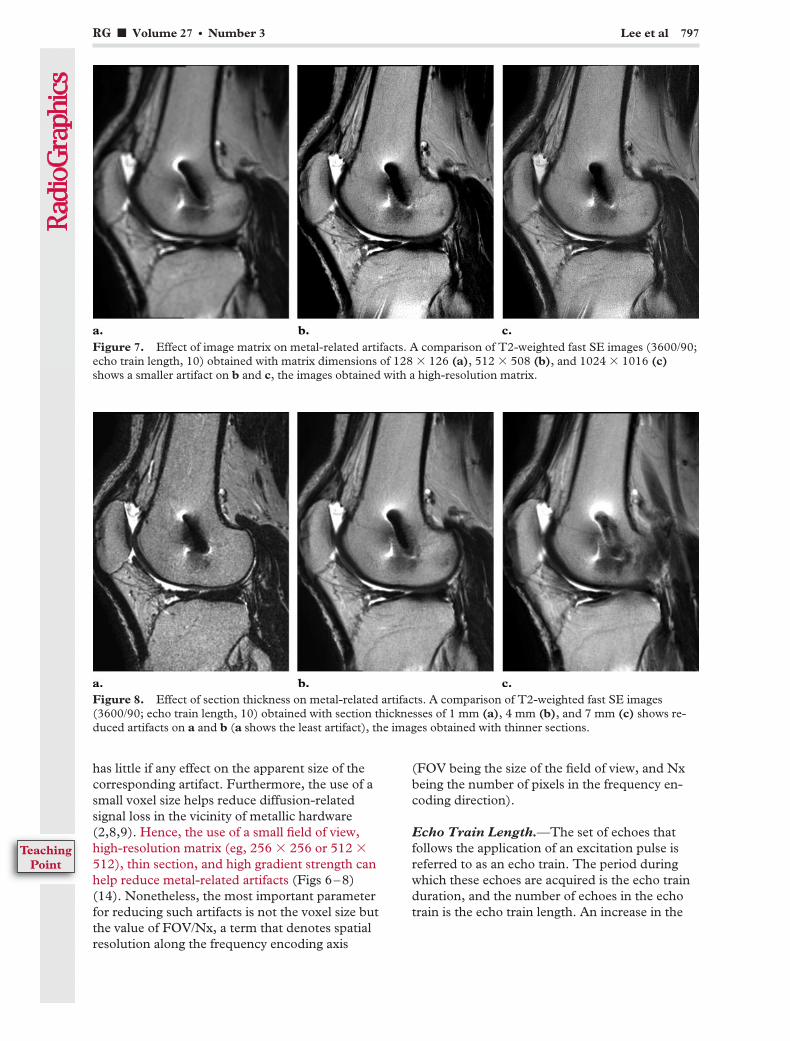
has little if any effect on the apparent size of thecorresponding artifact. Furthermore, the use of asmall voxel size helps reduce diffusion-relatedsignal loss in the vicinity of metallic hardware(2,8,9). Hence, the use of a small field of view,high-resolution matrix (eg, 256 � 256 or 512 �512), thin section, and high gradient strength canhelp reduce metal-related artifacts (Figs 6–8)(14). Nonetheless, the most important parameterfor reducing such artifacts is not the voxel size butthe value of FOV/Nx, a term that denotes spatialresolution along the frequency encoding axis
(FOV being the size of the field of view, and Nxbeing the number of pixels in the frequency en-coding direction).
Echo Train Length.—The set of echoes thatfollows the application of an excitation pulse isreferred to as an echo train. The period duringwhich these echoes are acquired is the echo trainduration, and the number of echoes in the echotrain is the echo train length. An increase in the
Figure 7. Effect of image matrix on metal-related artifacts. A comparison of T2-weighted fast SE images (3600/90;echo train length, 10) obtained with matrix dimensions of 128 � 126 (a), 512 � 508 (b), and 1024 � 1016 (c)shows a smaller artifact on b and c, the images obtained with a high-resolution matrix.
Figure 8. Effect of section thickness on metal-related artifacts. A comparison of T2-weighted fast SE images(3600/90; echo train length, 10) obtained with section thicknesses of 1 mm (a), 4 mm (b), and 7 mm (c) shows re-duced artifacts on a and b (a shows the least artifact), the images obtained with thinner sections.
RG f Volume 27 ● Number 3 Lee et al 797
TeachingPoint

echo train length, with a constant echo train dura-tion, leads to a reduction of metal-related artifacts(Fig 9) (1).
Multidetector CT
Mechanism of Artifact GenerationAn x-ray beam is composed of individual photonswith a range of energies. As the beam passesthrough an object, it becomes “harder”; that is, itsmean energy increases because lower-energy pho-tons are absorbed more rapidly than are higher-energy photons. A beam hardening artifact, whichappears as dark bands or streaks near a dense ob-ject, is the result (18).
Metallic hardware causes severe beam harden-ing and dramatically attenuates the x-ray beam.Thus, metallic hardware significantly degradesimage quality to the extent that the resultant im-age is either incomplete or is a faulty projection ofthe data with consequent reconstruction artifacts(18,19).
Factors That Affect ArtifactsThe factors that may contribute to or diminishthe production of artifacts at multidetector CTinclude metallic hardware composition and orien-tation, image acquisition parameters (peak volt-age, tube charge in milliampere-seconds, collima-tion, and section thickness), and image recon-struction parameters (reconstructed sectionthickness, reconstruction algorithm [kernel], and
extended CT scale). To demonstrate and evalu-ate these factors, we performed a study with twophantoms.
The first phantom was constructed from a 3.5-mm-diameter stainless steel orthopedic screw(Cortical Bone Screw; A-O Synthes, Paoli, Pa)and a rectangular plastic container filled with 2%agarose gel. A second phantom consisted of a 4.5-mm-diameter titanium alloy screw and two stain-less steel screws with diameters of 3.5 mm and4.5 mm that had been placed in a pig femur. Heli-cal CT was performed by using a 64-channelmultidetector scanner (Somatom Sensation 64;Siemens, Erlangen, Germany) with variation ofthe scanning parameters. The maximum windowwidth for reconstructions with the standard win-dow was 4000 HU, and that for reconstructionswith the extended CT scale was 40,000 HU. Afixed window level of 400 HU and fixed windowwidth of 2000 HU were used for reviewing im-ages. Decreased conspicuity and smoothing of abeam hardening artifact was considered reductionof the artifact.
Orthopedic Hardware CompositionThe specific metallic content of an implant mayaffect the severity of artifacts on CT images (20).Titanium alloy hardware causes the least obtru-sive artifact at CT imaging, whereas stainless steelimplants cause significant beam attenuation andartifact (Fig 10) (18,20). Knowledge of the com-position of the implanted material at the time ofthe CT examination may be helpful, as technicalparameters then may be adjusted to minimizeartifacts and to spare the patient excess radiation(18).
Figure 9. Effect of echo train length on metal-related artifacts. A comparison of T2-weighted fast SE images(3600/90) obtained with echo train lengths of four (a), 10 (b), and 20 (c) shows reduced artifacts on b and c, theimages obtained with increased echo train length.
798 May-June 2007 RG f Volume 27 ● Number 3

Orientation and Thick-ness of Orthopedic HardwareIn theory, the thickness of the hardware has a di-rect effect on the degree of x-ray beam attenua-tion. In other words, a smaller angle between thelong axis of the gantry and the metallic implantcan help reduce artifacts (18). The axis of a me-tallic implant in the human body cannot alwaysbe adjusted at imaging; however, to the extentthat adjustment is possible, the axis of the metal-lic implant should be aligned so that the x-raybeam traverses the smallest possible cross-sec-tional area of the implant.
Imaging Parame-ters That Affect ArtifactsWith the optimization of imaging and reconstruc-tion parameters, metal-related artifacts may be
reduced. However, artifact reduction that resultsfrom alteration of a particular imaging parameteris not always conspicuous; some parameters donot seem to affect artifacts as much as othersdo. We therefore performed an additional com-parative study of a phantom with a better and apoorer combination of parameters to identifythose that effect a significant difference (Fig 11).CT images were obtained through the short axisof the screw in an agarose gel phantom. It wasfound that artifacts were reliably minimized withthe better parameters. The optimal parametersfor minimizing artifacts are described in the fol-lowing sections.
Figure 10. Effect of metal composition on metal-related artifacts at multidetector CT. (a) Scout view of an ex vivomodel of a pig femur with a 4.5-mm titanium alloy screw (arrow) and a 4.5-mm stainless steel screw (arrowhead).(b) CT image obtained through the short axis of the screws, with 140 kVp, 120 mAs, 0.6-mm collimation, and1.0-mm reconstructed section thickness, shows more severe streak artifacts from the stainless steel screw than fromthe titanium alloy screw.
Figure 11. CT images obtained through the short axis of a stainless steel screw in an agarose gel phan-tom. Image obtained with optimal parameters (140 kVp, 300 mAs, 0.6-mm collimation, 3.0-mm recon-structed section thickness, a low kernel value [B30f], and the extended CT scale) (a) shows a less pro-nounced artifact than that in b, which was obtained with less advantageous parameters (80 kVp, 80 mAs,1.2-mm collimation, 1.5-mm acquired section thickness, 1.5-mm reconstructed section thickness, and ahigh kernel value [B70f], without the extended CT scale).
RG f Volume 27 ● Number 3 Lee et al 799

Peak Voltage.—Technical scanning factors af-fect the ability of the x-ray beam to penetratemetal, and therefore they influence the produc-tion of image artifacts. Increasing the peak voltageincreases the likelihood that x-rays will penetratethe metallic hardware (18); thus, artifacts are ex-pected to be diminished with higher peak voltage(Fig 12). However, higher peak voltage may onlymarginally improve the penetration of steel ortho-pedic devices by x-rays, and this remedy may notappreciably affect the imaging of large items suchas hip implants and metal plates. Moreover, someauthors assert that there is no additional value inusing exposure settings greater than 120 kVp at340 mAs when acquiring axial CT images with ascanner with four or fewer channels in patientswith orthopedic hardware (20). More investiga-tion of this question seems necessary with regardto multidetector CT scanners with a larger num-ber of channels.
Tube Charge.—A potential source of severestreak artifacts is photon starvation, which mayoccur in areas that cause high beam attenuation,such as the shoulders. When the x-ray beam istraveling through a dense object, the attenuationis greatest, and an insufficient number of photonsreaches the detector. The resultant projectionsare very noisy at these tube angulations, and thereconstruction process greatly magnifies thenoise, which results in horizontal streaks on theimage. If the tube charge (in milliampere-sec-onds) is increased for the duration of scanning,the problem of photon starvation is overcome andartifacts are reduced. However, the patient inevi-tably receives a higher radiation dose if the beampasses through a region with lower attenuation(18).
Although in theory the alteration of tubecharge should produce a diminished artifact, thedecrease is not always discernible (Fig 13). Theautomatic dose control option available on thenew generation of CT scanners provides an effi-cient approach to tube current modulation alongthe z-axis and at various projection angles follow-
Figure 12. Effect of peak voltage on metal-related artifacts. A comparison of CT images obtained through the shortaxis of the screws in the pig femur model, with 140 kVp (a) and 80 kVp (b) and with other parameters the same (120mAs, 0.6-mm collimation, and 1.0-mm reconstructed section thickness), shows a less obtrusive artifact on a, the im-age obtained with a higher peak voltage.
Figure 13. Effect of tube charge on metal-related artifacts. CT images obtained through the short axis of the screwsin the pig femur model, with tube charge of 80 mAs (a) and 120 mAs (b) and with other parameters the same (140kVp, 0.6-mm collimation, and 1.0-mm reconstructed section thickness), show similar streak artifacts.
800 May-June 2007 RG f Volume 27 ● Number 3
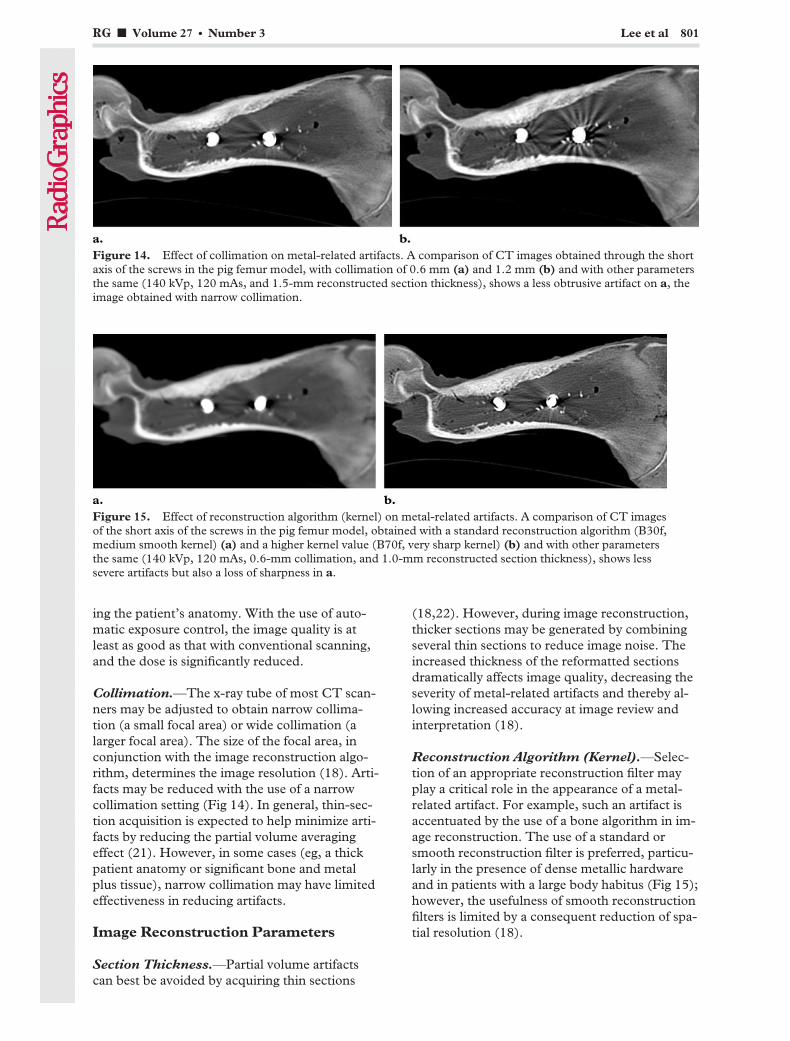
ing the patient’s anatomy. With the use of auto-matic exposure control, the image quality is atleast as good as that with conventional scanning,and the dose is significantly reduced.
Collimation.—The x-ray tube of most CT scan-ners may be adjusted to obtain narrow collima-tion (a small focal area) or wide collimation (alarger focal area). The size of the focal area, inconjunction with the image reconstruction algo-rithm, determines the image resolution (18). Arti-facts may be reduced with the use of a narrowcollimation setting (Fig 14). In general, thin-sec-tion acquisition is expected to help minimize arti-facts by reducing the partial volume averagingeffect (21). However, in some cases (eg, a thickpatient anatomy or significant bone and metalplus tissue), narrow collimation may have limitedeffectiveness in reducing artifacts.
Image Reconstruction Parameters
Section Thickness.—Partial volume artifactscan best be avoided by acquiring thin sections
(18,22). However, during image reconstruction,thicker sections may be generated by combiningseveral thin sections to reduce image noise. Theincreased thickness of the reformatted sectionsdramatically affects image quality, decreasing theseverity of metal-related artifacts and thereby al-lowing increased accuracy at image review andinterpretation (18).
Reconstruction Algorithm (Kernel).—Selec-tion of an appropriate reconstruction filter mayplay a critical role in the appearance of a metal-related artifact. For example, such an artifact isaccentuated by the use of a bone algorithm in im-age reconstruction. The use of a standard orsmooth reconstruction filter is preferred, particu-larly in the presence of dense metallic hardwareand in patients with a large body habitus (Fig 15);however, the usefulness of smooth reconstructionfilters is limited by a consequent reduction of spa-tial resolution (18).
Figure 14. Effect of collimation on metal-related artifacts. A comparison of CT images obtained through the shortaxis of the screws in the pig femur model, with collimation of 0.6 mm (a) and 1.2 mm (b) and with other parametersthe same (140 kVp, 120 mAs, and 1.5-mm reconstructed section thickness), shows a less obtrusive artifact on a, theimage obtained with narrow collimation.
Figure 15. Effect of reconstruction algorithm (kernel) on metal-related artifacts. A comparison of CT imagesof the short axis of the screws in the pig femur model, obtained with a standard reconstruction algorithm (B30f,medium smooth kernel) (a) and a higher kernel value (B70f, very sharp kernel) (b) and with other parametersthe same (140 kVp, 120 mAs, 0.6-mm collimation, and 1.0-mm reconstructed section thickness), shows lesssevere artifacts but also a loss of sharpness in a.
RG f Volume 27 ● Number 3 Lee et al 801
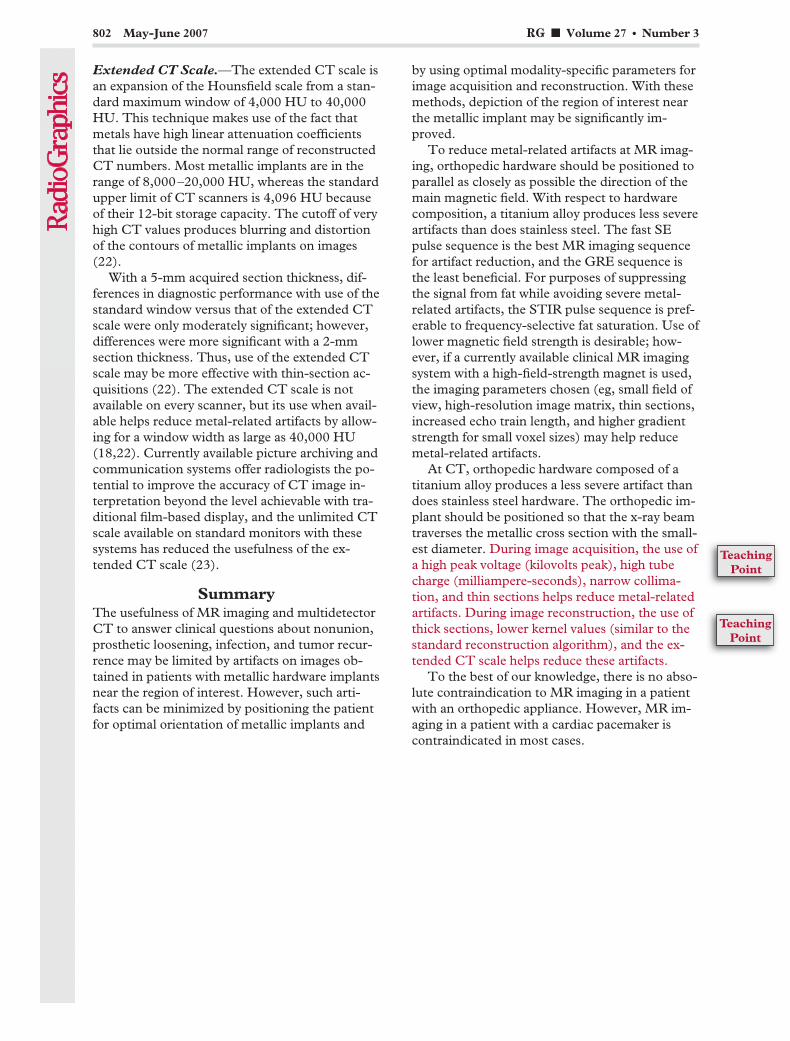
Extended CT Scale.—The extended CT scale isan expansion of the Hounsfield scale from a stan-dard maximum window of 4,000 HU to 40,000HU. This technique makes use of the fact thatmetals have high linear attenuation coefficientsthat lie outside the normal range of reconstructedCT numbers. Most metallic implants are in therange of 8,000–20,000 HU, whereas the standardupper limit of CT scanners is 4,096 HU becauseof their 12-bit storage capacity. The cutoff of veryhigh CT values produces blurring and distortionof the contours of metallic implants on images(22).
With a 5-mm acquired section thickness, dif-ferences in diagnostic performance with use of thestandard window versus that of the extended CTscale were only moderately significant; however,differences were more significant with a 2-mmsection thickness. Thus, use of the extended CTscale may be more effective with thin-section ac-quisitions (22). The extended CT scale is notavailable on every scanner, but its use when avail-able helps reduce metal-related artifacts by allow-ing for a window width as large as 40,000 HU(18,22). Currently available picture archiving andcommunication systems offer radiologists the po-tential to improve the accuracy of CT image in-terpretation beyond the level achievable with tra-ditional film-based display, and the unlimited CTscale available on standard monitors with thesesystems has reduced the usefulness of the ex-tended CT scale (23).
SummaryThe usefulness of MR imaging and multidetectorCT to answer clinical questions about nonunion,prosthetic loosening, infection, and tumor recur-rence may be limited by artifacts on images ob-tained in patients with metallic hardware implantsnear the region of interest. However, such arti-facts can be minimized by positioning the patientfor optimal orientation of metallic implants and
by using optimal modality-specific parameters forimage acquisition and reconstruction. With thesemethods, depiction of the region of interest nearthe metallic implant may be significantly im-proved.
To reduce metal-related artifacts at MR imag-ing, orthopedic hardware should be positioned toparallel as closely as possible the direction of themain magnetic field. With respect to hardwarecomposition, a titanium alloy produces less severeartifacts than does stainless steel. The fast SEpulse sequence is the best MR imaging sequencefor artifact reduction, and the GRE sequence isthe least beneficial. For purposes of suppressingthe signal from fat while avoiding severe metal-related artifacts, the STIR pulse sequence is pref-erable to frequency-selective fat saturation. Use oflower magnetic field strength is desirable; how-ever, if a currently available clinical MR imagingsystem with a high-field-strength magnet is used,the imaging parameters chosen (eg, small field ofview, high-resolution image matrix, thin sections,increased echo train length, and higher gradientstrength for small voxel sizes) may help reducemetal-related artifacts.
At CT, orthopedic hardware composed of atitanium alloy produces a less severe artifact thandoes stainless steel hardware. The orthopedic im-plant should be positioned so that the x-ray beamtraverses the metallic cross section with the small-est diameter. During image acquisition, the use ofa high peak voltage (kilovolts peak), high tubecharge (milliampere-seconds), narrow collima-tion, and thin sections helps reduce metal-relatedartifacts. During image reconstruction, the use ofthick sections, lower kernel values (similar to thestandard reconstruction algorithm), and the ex-tended CT scale helps reduce these artifacts.
To the best of our knowledge, there is no abso-lute contraindication to MR imaging in a patientwith an orthopedic appliance. However, MR im-aging in a patient with a cardiac pacemaker iscontraindicated in most cases.
802 May-June 2007 RG f Volume 27 ● Number 3
TeachingPoint
TeachingPoint
In the optimization of multidetector CT proto-cols for artifact reduction, another factor thatshould be addressed is the radiation hazard; in-creasing the tube charge may help reduce metal-related artifacts, but this modification inevitablyresults in an increased radiation dose to the pa-tient. Thus, radiologists also should take the ra-diation dose into account when optimizing arti-fact-reducing multidetector CT protocols.
References1. White LM, Buckwalter KA. Technical consider-
ations: CT and MR imaging in the postoperativeorthopedic patient. Semin Musculoskelet Radiol2002;6:5–17.
2. Mitchell DG, Cohen MS. Transverse magnetiza-tion and T2 contrast. In: Mitchell DG, CohenMS, eds. MRI principles. 2nd ed. New York, NY:Springer-Verlag, 2000; 35–47.
3. Guermazi A, Miaux Y, Zaim S, Peterfy CG, WhiteD, Genant HK. Metallic artefacts in MR imaging:effects of main field orientation and strength. ClinRadiol 2003;58:322–328.
4. Eggers G, Rieker M, Kress B, Fiebach J, DickhausH, Hassfeld S. Artefacts in magnetic resonanceimaging caused by dental material. MAGMA2005;18:103–111.
5. Viano AM, Gronemeyer SA, Haliloglu M, HofferFA. Improved MR imaging for patients with me-tallic implants. Magn Reson Imaging 2000;18:287–295.
6. Ludeke KM, Roschmann P, Tischler R. Suscepti-bility artefacts in NMR imaging. Magn Reson Im-aging 1985;3:329–343.
7. Cho ZH, Ro YM. Reduction of susceptibility arti-fact in gradient-echo imaging. Magn Reson Med1992;23:193–200.
8. White LM, Kim JK, Mehta M, et al. Complica-tions of total hip arthroplasty: MR imaging—initialexperience. Radiology 2000;215:254–262.
9. Suh JS, Jeong EK, Shin KH, et al. Minimizing ar-tifacts caused by metallic implants at MR imaging:experimental and clinical studies. AJR Am JRoentgenol 1998;171:1207–1213.
10. Ganapathi M, Joseph G, Savage R, Jones AR,Timms B, Lyons K. MRI susceptibility artefactsrelated to scaphoid screws: the effect of screwtype, screw orientation and imaging parameters.J Hand Surg [Br] 2002;27:165–170.
11. Williams DF. Titanium as a metal for implanta-tion. II. Biological properties and clinical applica-tions. J Med Eng Technol 1977;1:266–270.
12. Ladd ME, Erhart P, Debatin JF, Romanowski BJ,Boesiger P, McKinnon GC. Biopsy needle suscep-tibility artifacts. Magn Reson Med 1996;36:646–651.
13. Camacho CR, Plewes DB, Henkelman RM. Non-susceptibility artifacts due to metallic objects inMR imaging. J Magn Reson Imaging 1995;5:75–88.
14. Tormanen J, Tervonen O, Koivula A, Junila J,Suramo I. Image technique optimization in MRimaging of a titanium alloy joint prosthesis. JMagn Reson Imaging 1996;6:805–811.
15. Tartaglino LM, Flanders AE, Vinitski S, Fried-man DP. Metallic artifacts on MR images of thepostoperative spine: reduction with fast spin-echotechniques. Radiology 1994;190:565–569.
16. Petersilge CA, Lewin JS, Duerk JL, Yoo JU, Gha-neyem AJ. Optimizing imaging parameters for MRevaluation of the spine with titanium pediclescrews. AJR Am J Roentgenol 1996;166:1213–1218.
17. Alanen A, Bondestam S, Komu M. Artifacts inMR imaging caused by small quantities of pow-dered iron. Acta Radiol 1995;36:92–95.
18. Barrett JF, Keat N. Artifacts in CT: recognitionand avoidance. RadioGraphics 2004;24:1679–1691.
19. Yazdi M, Gingras L, Beaulieu L. An adaptive ap-proach to metal artifact reduction in helical com-puted tomography for radiation therapy treatmentplanning: experimental and clinical studies. Int JRadiat Oncol Biol Phys 2005;62:1224–1231.
20. Haramati N, Staron RB, Mazel-Sperling K, et al.CT scans through metal scanning technique ver-sus hardware composition. Comput Med ImagingGraph 1994;18:429–434.
21. Wang G, Frei T, Vannier MW. Fast iterative algo-rithm for metal artifact reduction in x-ray CT.Acad Radiol 2000;7:607–614.
22. Link TM, Berning W, Scherf S, et al. CT of metalimplants: reduction of artifacts using an extendedCT scale technique. J Comput Assist Tomogr2000;24:165–172.
23. Reiner BI, Siegel EL, Hooper FJ. Accuracy of in-terpretation of CT scans: comparing PACS moni-tor displays and hard-copy images. AJR Am JRoentgenol 2002;179:1407–1410.
RG f Volume 27 ● Number 3 Lee et al 803

EDUCATION EXHIBIT 805
Pitfalls in MR ImageInterpretationPrompting Referralsto an OrthopedicOncology Clinic1
LEARNINGOBJECTIVESFOR TEST 4After reading thisarticle and takingthe test, the reader
will be able to:
� Recognize the im-portance of accurateradiologic interpreta-tion of benign andnonneoplastic enti-ties to avoid unneces-sary referrals to anorthopedic oncolo-gist.
� Describe the MRimaging features ofnonneoplastic or be-nign marrow, articu-lar, and soft-tissueprocesses that maymimic malignancybut that do not re-quire referral to anorthopedic oncolo-gist.
� Identify the MRimaging features spe-cific to marrow, ar-ticular, and soft-tis-sues processes thatwarrant referral to anorthopedic oncolo-gist.
Gregory Scott Stacy, MD ● Larry B. Dixon, MD
Patients referred to the authors’ hospital for evaluation on suspicion ofa bone or soft-tissue malignancy frequently present to the OrthopaedicOncology Clinic with magnetic resonance (MR) images that show typi-cal features of nonmalignant or nonneoplastic entities. The purpose ofthis article is to review the benign entities that may be mistaken by theradiologist for a malignancy and thus lead to needless referral to anorthopedic oncologist. Normal hematopoietic marrow and marrowedema due to a stress reaction may mimic a neoplasm at MR imaging,but knowledge of the typical patterns and locations of these featuresallows an accurate radiologic interpretation. The MR imaging appear-ance of osteonecrosis, Paget disease, benign bone lesions, and rheuma-tologic conditions may be confusing; in such circumstances, radio-graphic findings may help formulate a correct diagnosis. Knowledge ofthe common locations and appearances of bursae and ganglia is neces-sary so that radiologists do not misinterpret these benign entities assoft-tissue sarcomas. Soft-tissue trauma and inflammation also maymimic tumors at MR imaging, but a familiarity with the imaging pat-terns of nonneoplastic change in muscle allows the avoidance of misin-terpretation. The clinical history, as always, is an important componentof proper diagnosis. The radiologist can be especially useful to both theclinician and the patient by recognizing entities that are highly unlikelyto represent malignancy and by confidently reporting those entities asbenign, thereby sparing the patient an unnecessary trip to the orthope-dic oncologist.©RSNA, 2007
RadioGraphics 2007; 27:805–828 ● Published online 10.1148/rg.273065031 ● Content Codes:
1From the Department of Radiology, University of Chicago Hospitals, 5841 S Maryland Ave, MC 2026, Chicago, IL 60637. Recipient of a Certificateof Merit award for an education exhibit at the 2005 RSNA Annual Meeting. Received March 17, 2006; revision requested August 14 and received Au-gust 25; accepted August 28. Authors have no financial relationships to disclose. Address correspondence to G.S.S. (e-mail: [email protected]).
See the commentary by Bancroft following this article.
©RSNA, 2007
Note: This copy is for your personal, non-commercial use only. To order presentation-ready copies for distribution to your colleagues or clients, use the RadioGraphics Reprints form at the end of this article.
CME FEATURESee accompanying
test at http://www.rsna.org
/education/rg_cme.html
See last page
TEACHING POINTS

IntroductionThe orthopedic oncology team at our hospitalincludes surgeons, oncologists, pathologists, andradiologists who specialize in the diagnosis andtreatment of tumors of bone and soft tissue. Asthe radiologists on this team, we are fortunate tobe able to attend the Orthopaedic OncologyClinic, where the surgeons see both new and re-turning patients. Most of the new patients arereferred to the clinic from another institution,and they are asked to provide all pertinent imag-ing studies performed at the referring institution.We review these images with the orthopedic sur-geons to decide whether the lesion truly repre-sents a neoplasm that requires further work-upand possibly treatment. New patients also areasked to provide for our review the reports of im-aging studies performed at the referring hospitalsand clinics. While reviewing these reports, we no-ticed that radiologists often misinterpreted certainimaging patterns and nonneoplastic disease enti-ties as representative of a possible malignancy(Table 1).
Over a 12-month period, 390 patients pre-sented to the Orthopaedic Oncology Clinic at ourinstitution with recently discovered imaging ab-normalities interpreted by radiologists at the re-ferring institutions as possibly representative of aneoplasm, findings that directly or indirectly re-sulted in the patient’s referral to our clinic. Thesepatients did not have a biopsy-based diagnosiswhen they presented to the clinic. Approximatelytwo-thirds of them had undergone imaging with
subsequent findings indicative of an entity thatrequired follow-up and possibly treatment (Table2). Each of these entities was initially interpretedby the radiologist at the referring institution as atumor or potential tumor; hence, these patientswere appropriately referred to the clinic, even ifthe initial diagnosis did not match the subsequentconsensus diagnosis by our orthopedic oncologyteam. The remaining one-third of the patientswho were referred to the clinic had images withfeatures that, in the opinion of the orthopedic on-cology team, were clearly characteristic either ofnonneoplastic entities or of benign tumors thatdid not require follow-up or treatment by an or-thopedic oncologist. The entities that most com-monly did not require follow-up by an orthopediconcologist are the focus of this article. We havelimited the detailed discussion to entities thatwere observed in at least five patients referred toour clinic during the 12-month period. We haveclassified these entities into three groups: marrowpitfalls, articular and juxta-articular pitfalls, andsoft-tissue pitfalls.
Marrow Pitfalls
Normal Hematopoietic MarrowThe marrow cavity of the skeleton contains bothfat cells and hematopoietic cells. When the hema-topoietic elements predominate, the marrow isdescribed as “red”; in “yellow” marrow, the fattyelement predominates. The appendicular skel-eton undergoes an orderly but variable conversionfrom predominantly red marrow at birth to yellowmarrow (1,2). Within an extremity, conversion
Table 1Common Entities That Did Not Require Further Evaluation or Treatment by anOrthopedic Oncologist
EntityNo. of Patients
Affected
Sequelae of soft-tissue trauma (eg, hematoma, myositis ossificans) 14Arthritis and rheumatologic disorders 12Fibroxanthoma (nonossifying fibroma) 11Muscle inflammation and infection 10Osteonecrosis 9Stress fracture and stress reaction 8Synovial recesses and bursae 8Cysts and ganglia 8Simple lipoma 8Normal hematopoietic marrow 6Paget disease of bone 5
Note.—Patients were referred to the Orthopaedic Oncology Clinic over a 12-month pe-riod for further evaluation and follow-up on the basis of initial imaging findings.
806 May-June 2007 RG f Volume 27 ● Number 3
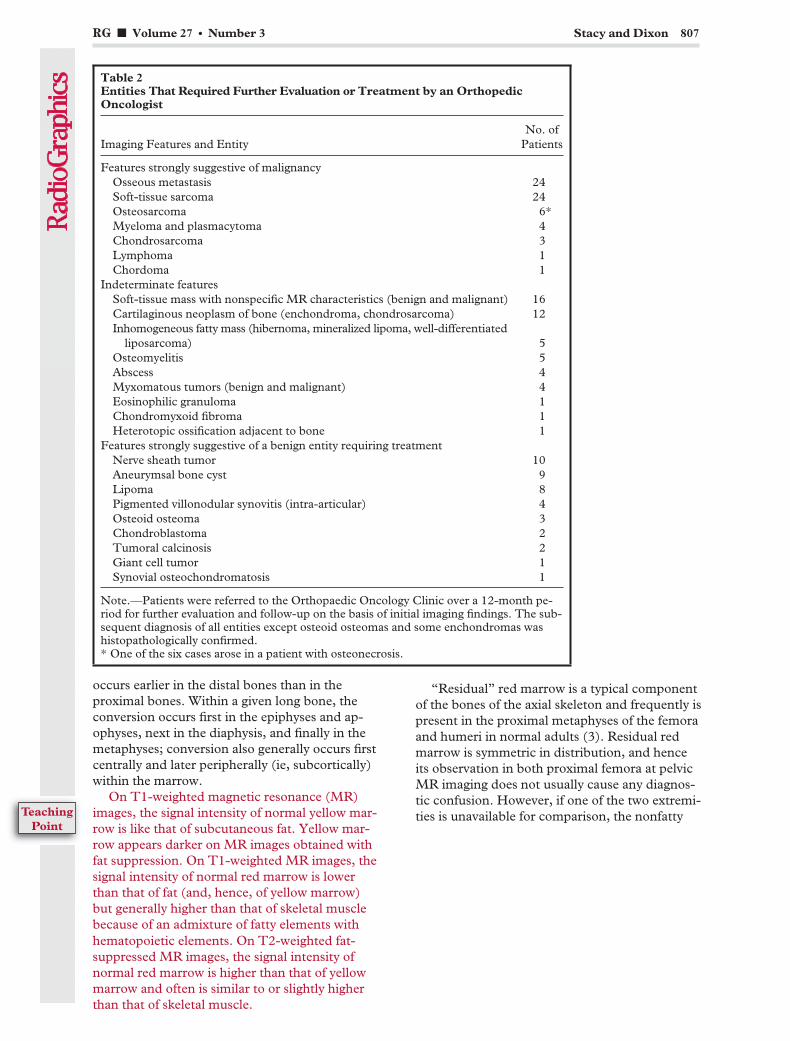
occurs earlier in the distal bones than in theproximal bones. Within a given long bone, theconversion occurs first in the epiphyses and ap-ophyses, next in the diaphysis, and finally in themetaphyses; conversion also generally occurs firstcentrally and later peripherally (ie, subcortically)within the marrow.
On T1-weighted magnetic resonance (MR)images, the signal intensity of normal yellow mar-row is like that of subcutaneous fat. Yellow mar-row appears darker on MR images obtained withfat suppression. On T1-weighted MR images, thesignal intensity of normal red marrow is lowerthan that of fat (and, hence, of yellow marrow)but generally higher than that of skeletal musclebecause of an admixture of fatty elements withhematopoietic elements. On T2-weighted fat-suppressed MR images, the signal intensity ofnormal red marrow is higher than that of yellowmarrow and often is similar to or slightly higherthan that of skeletal muscle.
“Residual” red marrow is a typical componentof the bones of the axial skeleton and frequently ispresent in the proximal metaphyses of the femoraand humeri in normal adults (3). Residual redmarrow is symmetric in distribution, and henceits observation in both proximal femora at pelvicMR imaging does not usually cause any diagnos-tic confusion. However, if one of the two extremi-ties is unavailable for comparison, the nonfatty
Table 2Entities That Required Further Evaluation or Treatment by an OrthopedicOncologist
Imaging Features and EntityNo. of
Patients
Features strongly suggestive of malignancyOsseous metastasis 24Soft-tissue sarcoma 24Osteosarcoma 6*Myeloma and plasmacytoma 4Chondrosarcoma 3Lymphoma 1Chordoma 1
Indeterminate featuresSoft-tissue mass with nonspecific MR characteristics (benign and malignant) 16Cartilaginous neoplasm of bone (enchondroma, chondrosarcoma) 12Inhomogeneous fatty mass (hibernoma, mineralized lipoma, well-differentiated
liposarcoma) 5Osteomyelitis 5Abscess 4Myxomatous tumors (benign and malignant) 4Eosinophilic granuloma 1Chondromyxoid fibroma 1Heterotopic ossification adjacent to bone 1
Features strongly suggestive of a benign entity requiring treatmentNerve sheath tumor 10Aneurymsal bone cyst 9Lipoma 8Pigmented villonodular synovitis (intra-articular) 4Osteoid osteoma 3Chondroblastoma 2Tumoral calcinosis 2Giant cell tumor 1Synovial osteochondromatosis 1
Note.—Patients were referred to the Orthopaedic Oncology Clinic over a 12-month pe-riod for further evaluation and follow-up on the basis of initial imaging findings. The sub-sequent diagnosis of all entities except osteoid osteomas and some enchondromas washistopathologically confirmed.* One of the six cases arose in a patient with osteonecrosis.
RG f Volume 27 ● Number 3 Stacy and Dixon 807
TeachingPoint
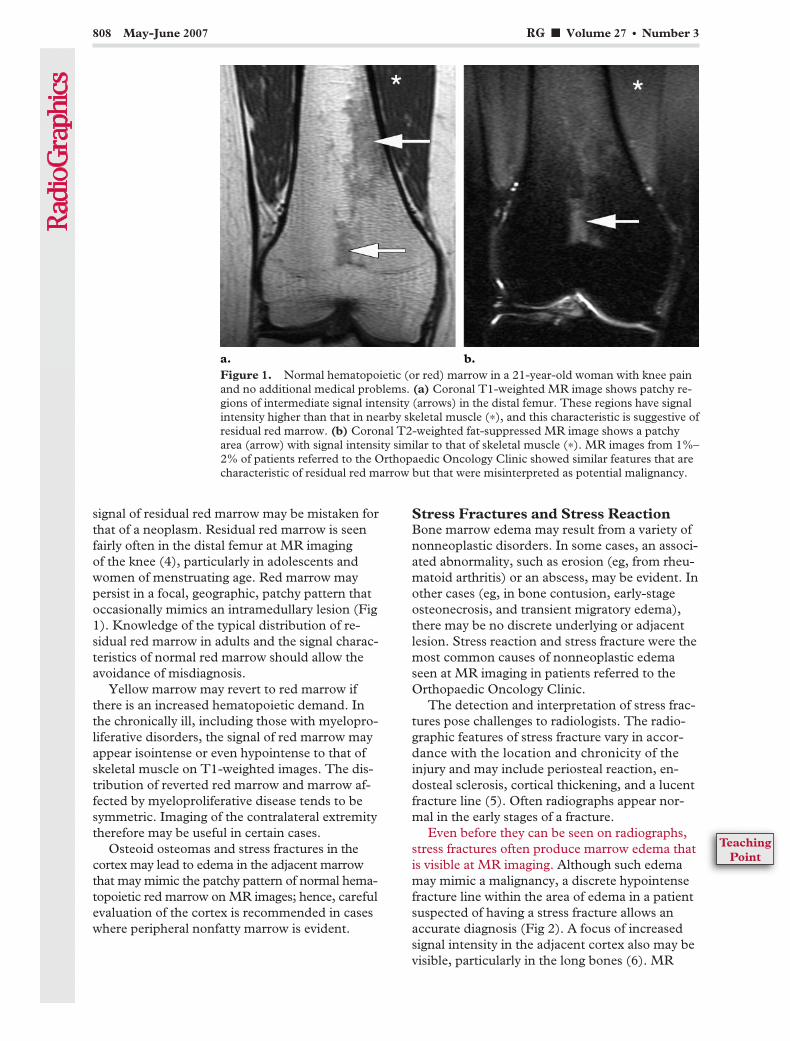
signal of residual red marrow may be mistaken forthat of a neoplasm. Residual red marrow is seenfairly often in the distal femur at MR imagingof the knee (4), particularly in adolescents andwomen of menstruating age. Red marrow maypersist in a focal, geographic, patchy pattern thatoccasionally mimics an intramedullary lesion (Fig1). Knowledge of the typical distribution of re-sidual red marrow in adults and the signal charac-teristics of normal red marrow should allow theavoidance of misdiagnosis.
Yellow marrow may revert to red marrow ifthere is an increased hematopoietic demand. Inthe chronically ill, including those with myelopro-liferative disorders, the signal of red marrow mayappear isointense or even hypointense to that ofskeletal muscle on T1-weighted images. The dis-tribution of reverted red marrow and marrow af-fected by myeloproliferative disease tends to besymmetric. Imaging of the contralateral extremitytherefore may be useful in certain cases.
Osteoid osteomas and stress fractures in thecortex may lead to edema in the adjacent marrowthat may mimic the patchy pattern of normal hema-topoietic red marrow on MR images; hence, carefulevaluation of the cortex is recommended in caseswhere peripheral nonfatty marrow is evident.
Stress Fractures and Stress ReactionBone marrow edema may result from a variety ofnonneoplastic disorders. In some cases, an associ-ated abnormality, such as erosion (eg, from rheu-matoid arthritis) or an abscess, may be evident. Inother cases (eg, in bone contusion, early-stageosteonecrosis, and transient migratory edema),there may be no discrete underlying or adjacentlesion. Stress reaction and stress fracture were themost common causes of nonneoplastic edemaseen at MR imaging in patients referred to theOrthopaedic Oncology Clinic.
The detection and interpretation of stress frac-tures pose challenges to radiologists. The radio-graphic features of stress fracture vary in accor-dance with the location and chronicity of theinjury and may include periosteal reaction, en-dosteal sclerosis, cortical thickening, and a lucentfracture line (5). Often radiographs appear nor-mal in the early stages of a fracture.
Even before they can be seen on radiographs,stress fractures often produce marrow edema thatis visible at MR imaging. Although such edemamay mimic a malignancy, a discrete hypointensefracture line within the area of edema in a patientsuspected of having a stress fracture allows anaccurate diagnosis (Fig 2). A focus of increasedsignal intensity in the adjacent cortex also may bevisible, particularly in the long bones (6). MR
Figure 1. Normal hematopoietic (or red) marrow in a 21-year-old woman with knee painand no additional medical problems. (a) Coronal T1-weighted MR image shows patchy re-gions of intermediate signal intensity (arrows) in the distal femur. These regions have signalintensity higher than that in nearby skeletal muscle (*), and this characteristic is suggestive ofresidual red marrow. (b) Coronal T2-weighted fat-suppressed MR image shows a patchyarea (arrow) with signal intensity similar to that of skeletal muscle (*). MR images from 1%–2% of patients referred to the Orthopaedic Oncology Clinic showed similar features that arecharacteristic of residual red marrow but that were misinterpreted as potential malignancy.
808 May-June 2007 RG f Volume 27 ● Number 3
TeachingPoint
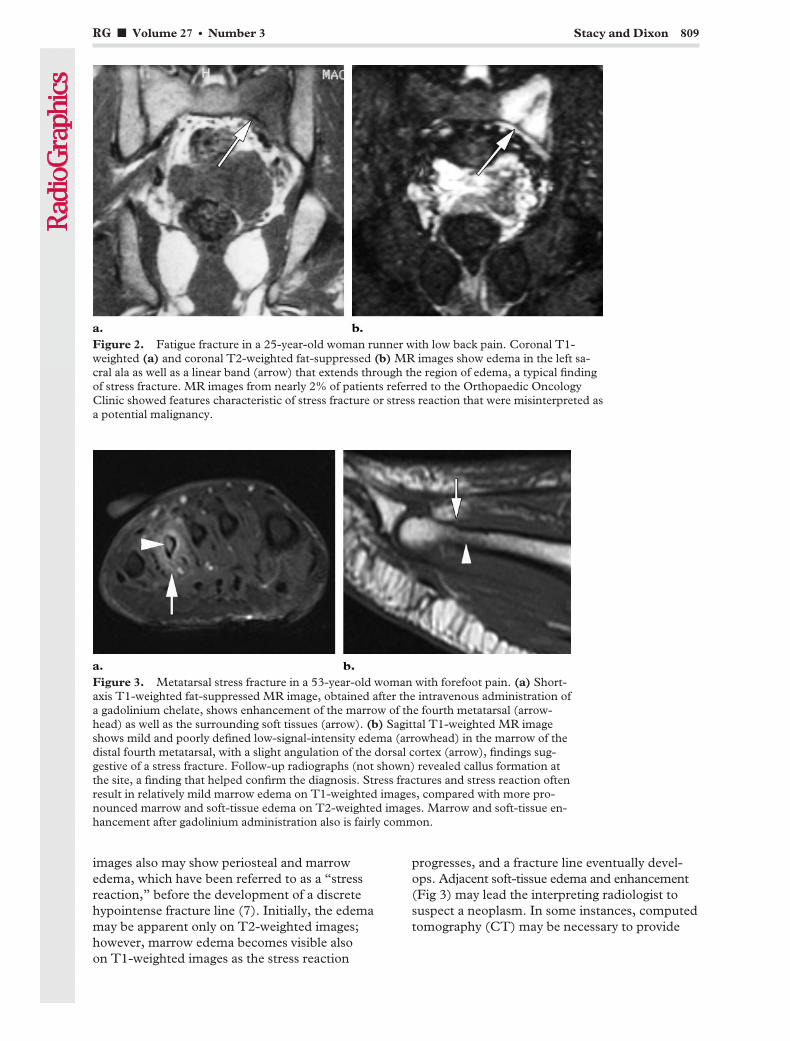
images also may show periosteal and marrowedema, which have been referred to as a “stressreaction,” before the development of a discretehypointense fracture line (7). Initially, the edemamay be apparent only on T2-weighted images;however, marrow edema becomes visible alsoon T1-weighted images as the stress reaction
progresses, and a fracture line eventually devel-ops. Adjacent soft-tissue edema and enhancement(Fig 3) may lead the interpreting radiologist tosuspect a neoplasm. In some instances, computedtomography (CT) may be necessary to provide
Figure 2. Fatigue fracture in a 25-year-old woman runner with low back pain. Coronal T1-weighted (a) and coronal T2-weighted fat-suppressed (b) MR images show edema in the left sa-cral ala as well as a linear band (arrow) that extends through the region of edema, a typical findingof stress fracture. MR images from nearly 2% of patients referred to the Orthopaedic OncologyClinic showed features characteristic of stress fracture or stress reaction that were misinterpreted asa potential malignancy.
Figure 3. Metatarsal stress fracture in a 53-year-old woman with forefoot pain. (a) Short-axis T1-weighted fat-suppressed MR image, obtained after the intravenous administration ofa gadolinium chelate, shows enhancement of the marrow of the fourth metatarsal (arrow-head) as well as the surrounding soft tissues (arrow). (b) Sagittal T1-weighted MR imageshows mild and poorly defined low-signal-intensity edema (arrowhead) in the marrow of thedistal fourth metatarsal, with a slight angulation of the dorsal cortex (arrow), findings sug-gestive of a stress fracture. Follow-up radiographs (not shown) revealed callus formation atthe site, a finding that helped confirm the diagnosis. Stress fractures and stress reaction oftenresult in relatively mild marrow edema on T1-weighted images, compared with more pro-nounced marrow and soft-tissue edema on T2-weighted images. Marrow and soft-tissue en-hancement after gadolinium administration also is fairly common.
RG f Volume 27 ● Number 3 Stacy and Dixon 809
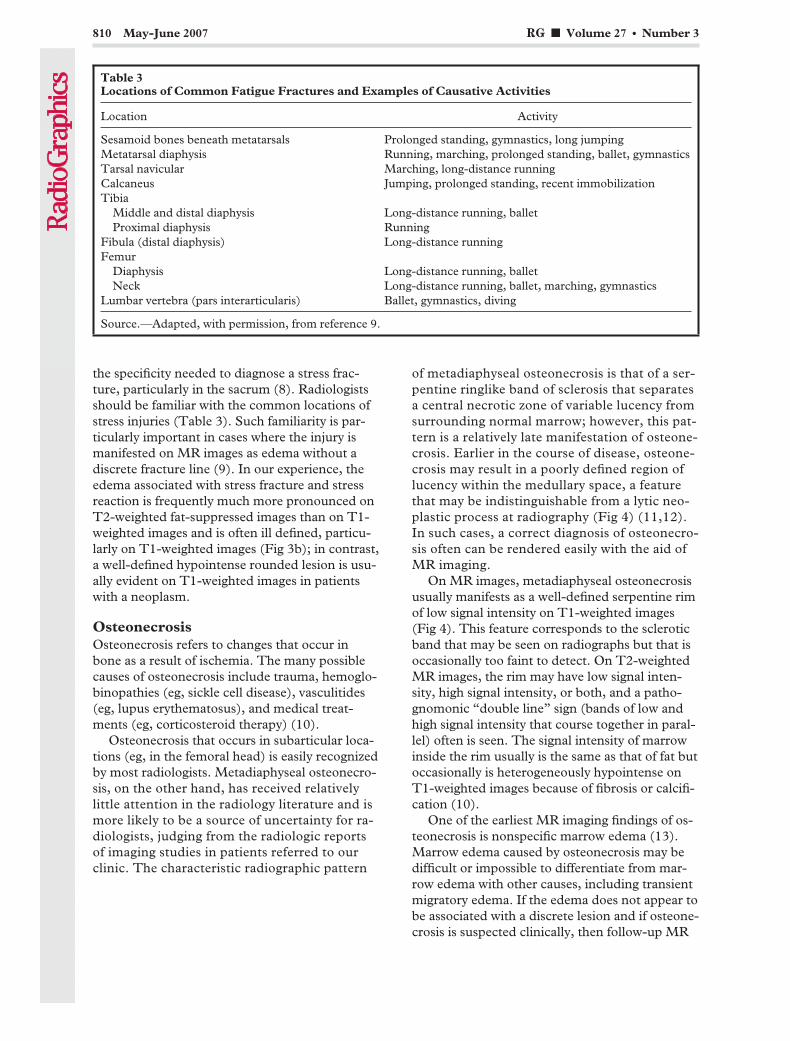
the specificity needed to diagnose a stress frac-ture, particularly in the sacrum (8). Radiologistsshould be familiar with the common locations ofstress injuries (Table 3). Such familiarity is par-ticularly important in cases where the injury ismanifested on MR images as edema without adiscrete fracture line (9). In our experience, theedema associated with stress fracture and stressreaction is frequently much more pronounced onT2-weighted fat-suppressed images than on T1-weighted images and is often ill defined, particu-larly on T1-weighted images (Fig 3b); in contrast,a well-defined hypointense rounded lesion is usu-ally evident on T1-weighted images in patientswith a neoplasm.
OsteonecrosisOsteonecrosis refers to changes that occur inbone as a result of ischemia. The many possiblecauses of osteonecrosis include trauma, hemoglo-binopathies (eg, sickle cell disease), vasculitides(eg, lupus erythematosus), and medical treat-ments (eg, corticosteroid therapy) (10).
Osteonecrosis that occurs in subarticular loca-tions (eg, in the femoral head) is easily recognizedby most radiologists. Metadiaphyseal osteonecro-sis, on the other hand, has received relativelylittle attention in the radiology literature and ismore likely to be a source of uncertainty for ra-diologists, judging from the radiologic reportsof imaging studies in patients referred to ourclinic. The characteristic radiographic pattern
of metadiaphyseal osteonecrosis is that of a ser-pentine ringlike band of sclerosis that separatesa central necrotic zone of variable lucency fromsurrounding normal marrow; however, this pat-tern is a relatively late manifestation of osteone-crosis. Earlier in the course of disease, osteone-crosis may result in a poorly defined region oflucency within the medullary space, a featurethat may be indistinguishable from a lytic neo-plastic process at radiography (Fig 4) (11,12).In such cases, a correct diagnosis of osteonecro-sis often can be rendered easily with the aid ofMR imaging.
On MR images, metadiaphyseal osteonecrosisusually manifests as a well-defined serpentine rimof low signal intensity on T1-weighted images(Fig 4). This feature corresponds to the scleroticband that may be seen on radiographs but that isoccasionally too faint to detect. On T2-weightedMR images, the rim may have low signal inten-sity, high signal intensity, or both, and a patho-gnomonic “double line” sign (bands of low andhigh signal intensity that course together in paral-lel) often is seen. The signal intensity of marrowinside the rim usually is the same as that of fat butoccasionally is heterogeneously hypointense onT1-weighted images because of fibrosis or calcifi-cation (10).
One of the earliest MR imaging findings of os-teonecrosis is nonspecific marrow edema (13).Marrow edema caused by osteonecrosis may bedifficult or impossible to differentiate from mar-row edema with other causes, including transientmigratory edema. If the edema does not appear tobe associated with a discrete lesion and if osteone-crosis is suspected clinically, then follow-up MR
Table 3Locations of Common Fatigue Fractures and Examples of Causative Activities
Location Activity
Sesamoid bones beneath metatarsals Prolonged standing, gymnastics, long jumpingMetatarsal diaphysis Running, marching, prolonged standing, ballet, gymnasticsTarsal navicular Marching, long-distance runningCalcaneus Jumping, prolonged standing, recent immobilizationTibia
Middle and distal diaphysis Long-distance running, balletProximal diaphysis Running
Fibula (distal diaphysis) Long-distance runningFemur
Diaphysis Long-distance running, balletNeck Long-distance running, ballet, marching, gymnastics
Lumbar vertebra (pars interarticularis) Ballet, gymnastics, diving
Source.—Adapted, with permission, from reference 9.
810 May-June 2007 RG f Volume 27 ● Number 3
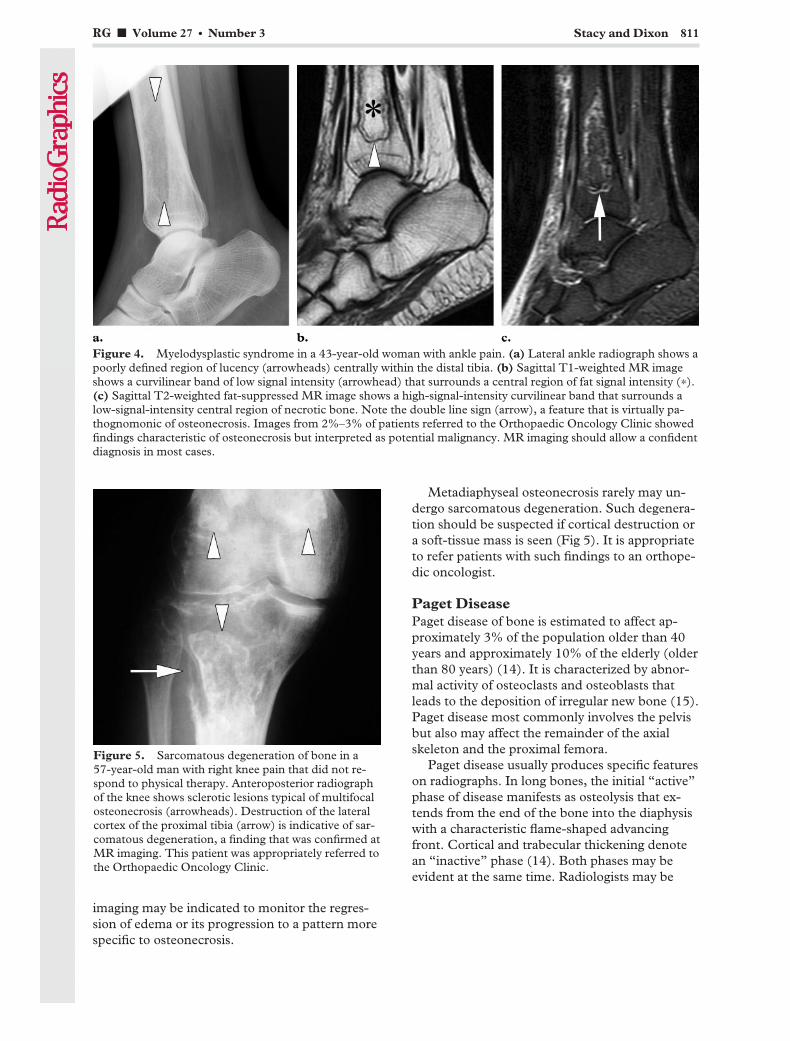
imaging may be indicated to monitor the regres-sion of edema or its progression to a pattern morespecific to osteonecrosis.
Metadiaphyseal osteonecrosis rarely may un-dergo sarcomatous degeneration. Such degenera-tion should be suspected if cortical destruction ora soft-tissue mass is seen (Fig 5). It is appropriateto refer patients with such findings to an orthope-dic oncologist.
Paget DiseasePaget disease of bone is estimated to affect ap-proximately 3% of the population older than 40years and approximately 10% of the elderly (olderthan 80 years) (14). It is characterized by abnor-mal activity of osteoclasts and osteoblasts thatleads to the deposition of irregular new bone (15).Paget disease most commonly involves the pelvisbut also may affect the remainder of the axialskeleton and the proximal femora.
Paget disease usually produces specific featureson radiographs. In long bones, the initial “active”phase of disease manifests as osteolysis that ex-tends from the end of the bone into the diaphysiswith a characteristic flame-shaped advancingfront. Cortical and trabecular thickening denotean “inactive” phase (14). Both phases may beevident at the same time. Radiologists may be
Figure 4. Myelodysplastic syndrome in a 43-year-old woman with ankle pain. (a) Lateral ankle radiograph shows apoorly defined region of lucency (arrowheads) centrally within the distal tibia. (b) Sagittal T1-weighted MR imageshows a curvilinear band of low signal intensity (arrowhead) that surrounds a central region of fat signal intensity (*).(c) Sagittal T2-weighted fat-suppressed MR image shows a high-signal-intensity curvilinear band that surrounds alow-signal-intensity central region of necrotic bone. Note the double line sign (arrow), a feature that is virtually pa-thognomonic of osteonecrosis. Images from 2%–3% of patients referred to the Orthopaedic Oncology Clinic showedfindings characteristic of osteonecrosis but interpreted as potential malignancy. MR imaging should allow a confidentdiagnosis in most cases.
Figure 5. Sarcomatous degeneration of bone in a57-year-old man with right knee pain that did not re-spond to physical therapy. Anteroposterior radiographof the knee shows sclerotic lesions typical of multifocalosteonecrosis (arrowheads). Destruction of the lateralcortex of the proximal tibia (arrow) is indicative of sar-comatous degeneration, a finding that was confirmed atMR imaging. This patient was appropriately referred tothe Orthopaedic Oncology Clinic.
RG f Volume 27 ● Number 3 Stacy and Dixon 811
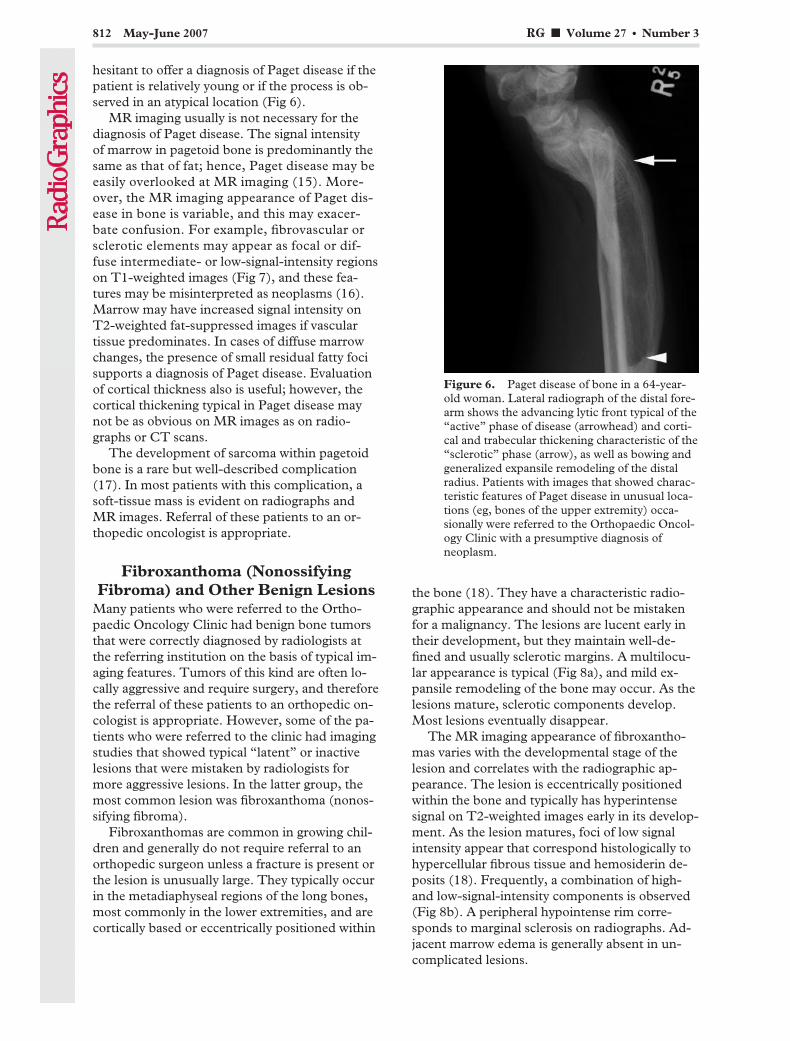
hesitant to offer a diagnosis of Paget disease if thepatient is relatively young or if the process is ob-served in an atypical location (Fig 6).
MR imaging usually is not necessary for thediagnosis of Paget disease. The signal intensityof marrow in pagetoid bone is predominantly thesame as that of fat; hence, Paget disease may beeasily overlooked at MR imaging (15). More-over, the MR imaging appearance of Paget dis-ease in bone is variable, and this may exacer-bate confusion. For example, fibrovascular orsclerotic elements may appear as focal or dif-fuse intermediate- or low-signal-intensity regionson T1-weighted images (Fig 7), and these fea-tures may be misinterpreted as neoplasms (16).Marrow may have increased signal intensity onT2-weighted fat-suppressed images if vasculartissue predominates. In cases of diffuse marrowchanges, the presence of small residual fatty focisupports a diagnosis of Paget disease. Evaluationof cortical thickness also is useful; however, thecortical thickening typical in Paget disease maynot be as obvious on MR images as on radio-graphs or CT scans.
The development of sarcoma within pagetoidbone is a rare but well-described complication(17). In most patients with this complication, asoft-tissue mass is evident on radiographs andMR images. Referral of these patients to an or-thopedic oncologist is appropriate.
Fibroxanthoma (NonossifyingFibroma) and Other Benign Lesions
Many patients who were referred to the Ortho-paedic Oncology Clinic had benign bone tumorsthat were correctly diagnosed by radiologists atthe referring institution on the basis of typical im-aging features. Tumors of this kind are often lo-cally aggressive and require surgery, and thereforethe referral of these patients to an orthopedic on-cologist is appropriate. However, some of the pa-tients who were referred to the clinic had imagingstudies that showed typical “latent” or inactivelesions that were mistaken by radiologists formore aggressive lesions. In the latter group, themost common lesion was fibroxanthoma (nonos-sifying fibroma).
Fibroxanthomas are common in growing chil-dren and generally do not require referral to anorthopedic surgeon unless a fracture is present orthe lesion is unusually large. They typically occurin the metadiaphyseal regions of the long bones,most commonly in the lower extremities, and arecortically based or eccentrically positioned within
the bone (18). They have a characteristic radio-graphic appearance and should not be mistakenfor a malignancy. The lesions are lucent early intheir development, but they maintain well-de-fined and usually sclerotic margins. A multilocu-lar appearance is typical (Fig 8a), and mild ex-pansile remodeling of the bone may occur. As thelesions mature, sclerotic components develop.Most lesions eventually disappear.
The MR imaging appearance of fibroxantho-mas varies with the developmental stage of thelesion and correlates with the radiographic ap-pearance. The lesion is eccentrically positionedwithin the bone and typically has hyperintensesignal on T2-weighted images early in its develop-ment. As the lesion matures, foci of low signalintensity appear that correspond histologically tohypercellular fibrous tissue and hemosiderin de-posits (18). Frequently, a combination of high-and low-signal-intensity components is observed(Fig 8b). A peripheral hypointense rim corre-sponds to marginal sclerosis on radiographs. Ad-jacent marrow edema is generally absent in un-complicated lesions.
Figure 6. Paget disease of bone in a 64-year-old woman. Lateral radiograph of the distal fore-arm shows the advancing lytic front typical of the“active” phase of disease (arrowhead) and corti-cal and trabecular thickening characteristic of the“sclerotic” phase (arrow), as well as bowing andgeneralized expansile remodeling of the distalradius. Patients with images that showed charac-teristic features of Paget disease in unusual loca-tions (eg, bones of the upper extremity) occa-sionally were referred to the Orthopaedic Oncol-ogy Clinic with a presumptive diagnosis ofneoplasm.
812 May-June 2007 RG f Volume 27 ● Number 3

Occasionally, a fibroxanthoma may be unusu-ally large and may cause so much expansile re-modeling that it becomes difficult to distinguishfrom lesions such as an aneurysmal bone cyst or achondromyxoid fibroma (19). Referral to an or-thopedic oncologist in such cases is reasonable.
Several of the patients referred to our clinichad bone lesions with imaging features charac-teristic of benign entities that did not requirefurther work-up or treatment. The images
Figure 7. Paget disease of bone in a 50-year-old woman. (a) Axial T1-weighted MR image of the pelvisshows abnormally low-signal-intensity marrow in the left ilium (arrowhead) and thickened cortex (arrow).(b) Axial CT image of the pelvis better illustrates the cortical thickening (arrow), a finding typical of Paget dis-ease. Approximately 1% of patients referred to the Orthopaedic Oncology Clinic had abnormalities at MR im-aging that could have been easily diagnosed as Paget disease at radiography or CT.
Figure 8. Fibroxanthoma (nonossifying fibroma) in a 16-year-old girl. (a) Lateral radiograph of theknee shows a mixed lucent and sclerotic intramedullary lesion (arrowheads) along the posterior cortexof the distal femur. The sclerotic margin and multilocular appearance are typical of a fibroxanthoma.(b) Sagittal T2-weighted MR image of the knee shows areas of heterogeneous signal intensity (arrow-heads) within the lesion. Images from 2%–3% of patients referred to the Orthopaedic Oncology Clinicshowed features characteristic of fibroxanthoma but interpreted as a potential malignancy. Several ofthese patients arrived with only MR images and probably would not have been referred if a radiographhad been obtained for correlation.
RG f Volume 27 ● Number 3 Stacy and Dixon 813
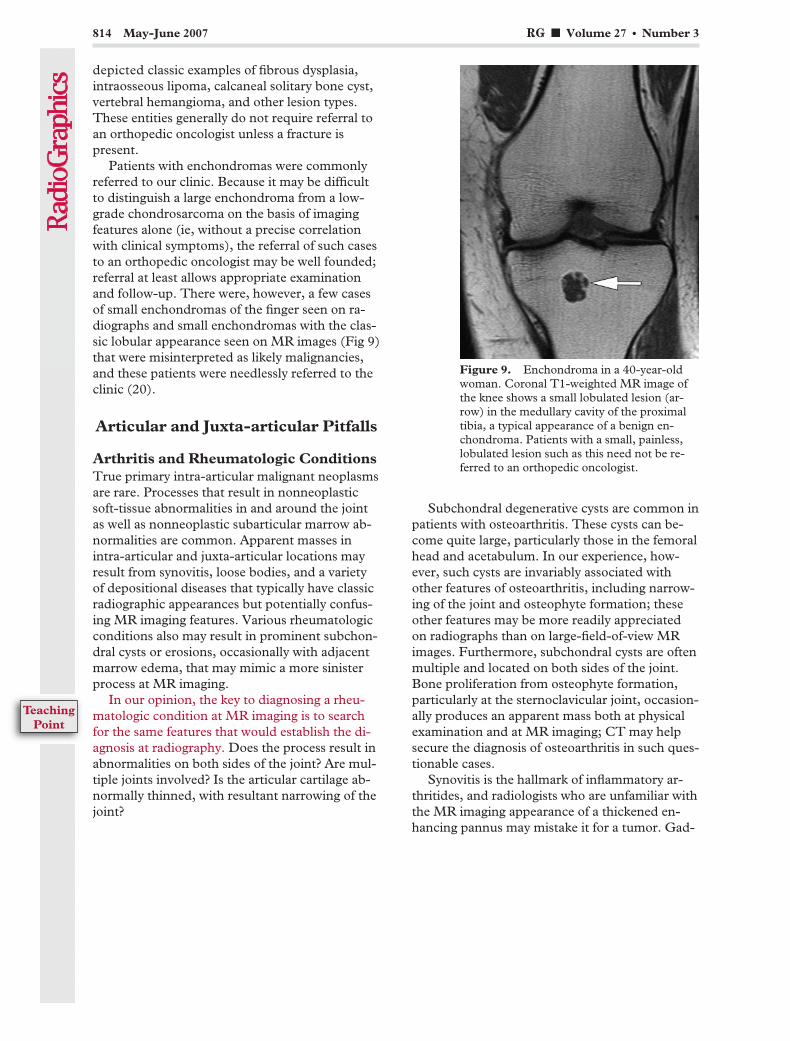
depicted classic examples of fibrous dysplasia,intraosseous lipoma, calcaneal solitary bone cyst,vertebral hemangioma, and other lesion types.These entities generally do not require referral toan orthopedic oncologist unless a fracture ispresent.
Patients with enchondromas were commonlyreferred to our clinic. Because it may be difficultto distinguish a large enchondroma from a low-grade chondrosarcoma on the basis of imagingfeatures alone (ie, without a precise correlationwith clinical symptoms), the referral of such casesto an orthopedic oncologist may be well founded;referral at least allows appropriate examinationand follow-up. There were, however, a few casesof small enchondromas of the finger seen on ra-diographs and small enchondromas with the clas-sic lobular appearance seen on MR images (Fig 9)that were misinterpreted as likely malignancies,and these patients were needlessly referred to theclinic (20).
Articular and Juxta-articular Pitfalls
Arthritis and Rheumatologic ConditionsTrue primary intra-articular malignant neoplasmsare rare. Processes that result in nonneoplasticsoft-tissue abnormalities in and around the jointas well as nonneoplastic subarticular marrow ab-normalities are common. Apparent masses inintra-articular and juxta-articular locations mayresult from synovitis, loose bodies, and a varietyof depositional diseases that typically have classicradiographic appearances but potentially confus-ing MR imaging features. Various rheumatologicconditions also may result in prominent subchon-dral cysts or erosions, occasionally with adjacentmarrow edema, that may mimic a more sinisterprocess at MR imaging.
In our opinion, the key to diagnosing a rheu-matologic condition at MR imaging is to searchfor the same features that would establish the di-agnosis at radiography. Does the process result inabnormalities on both sides of the joint? Are mul-tiple joints involved? Is the articular cartilage ab-normally thinned, with resultant narrowing of thejoint?
Subchondral degenerative cysts are common inpatients with osteoarthritis. These cysts can be-come quite large, particularly those in the femoralhead and acetabulum. In our experience, how-ever, such cysts are invariably associated withother features of osteoarthritis, including narrow-ing of the joint and osteophyte formation; theseother features may be more readily appreciatedon radiographs than on large-field-of-view MRimages. Furthermore, subchondral cysts are oftenmultiple and located on both sides of the joint.Bone proliferation from osteophyte formation,particularly at the sternoclavicular joint, occasion-ally produces an apparent mass both at physicalexamination and at MR imaging; CT may helpsecure the diagnosis of osteoarthritis in such ques-tionable cases.
Synovitis is the hallmark of inflammatory ar-thritides, and radiologists who are unfamiliar withthe MR imaging appearance of a thickened en-hancing pannus may mistake it for a tumor. Gad-
Figure 9. Enchondroma in a 40-year-oldwoman. Coronal T1-weighted MR image ofthe knee shows a small lobulated lesion (ar-row) in the medullary cavity of the proximaltibia, a typical appearance of a benign en-chondroma. Patients with a small, painless,lobulated lesion such as this need not be re-ferred to an orthopedic oncologist.
814 May-June 2007 RG f Volume 27 ● Number 3
TeachingPoint
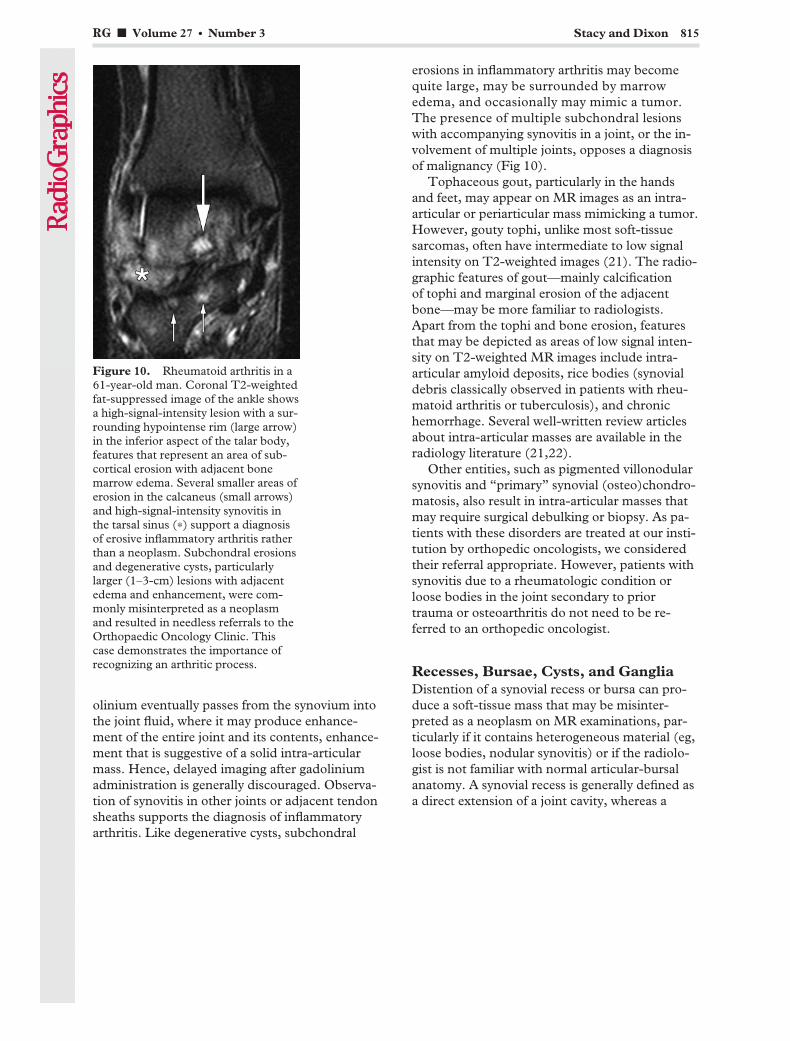
olinium eventually passes from the synovium intothe joint fluid, where it may produce enhance-ment of the entire joint and its contents, enhance-ment that is suggestive of a solid intra-articularmass. Hence, delayed imaging after gadoliniumadministration is generally discouraged. Observa-tion of synovitis in other joints or adjacent tendonsheaths supports the diagnosis of inflammatoryarthritis. Like degenerative cysts, subchondral
erosions in inflammatory arthritis may becomequite large, may be surrounded by marrowedema, and occasionally may mimic a tumor.The presence of multiple subchondral lesionswith accompanying synovitis in a joint, or the in-volvement of multiple joints, opposes a diagnosisof malignancy (Fig 10).
Tophaceous gout, particularly in the handsand feet, may appear on MR images as an intra-articular or periarticular mass mimicking a tumor.However, gouty tophi, unlike most soft-tissuesarcomas, often have intermediate to low signalintensity on T2-weighted images (21). The radio-graphic features of gout—mainly calcificationof tophi and marginal erosion of the adjacentbone—may be more familiar to radiologists.Apart from the tophi and bone erosion, featuresthat may be depicted as areas of low signal inten-sity on T2-weighted MR images include intra-articular amyloid deposits, rice bodies (synovialdebris classically observed in patients with rheu-matoid arthritis or tuberculosis), and chronichemorrhage. Several well-written review articlesabout intra-articular masses are available in theradiology literature (21,22).
Other entities, such as pigmented villonodularsynovitis and “primary” synovial (osteo)chondro-matosis, also result in intra-articular masses thatmay require surgical debulking or biopsy. As pa-tients with these disorders are treated at our insti-tution by orthopedic oncologists, we consideredtheir referral appropriate. However, patients withsynovitis due to a rheumatologic condition orloose bodies in the joint secondary to priortrauma or osteoarthritis do not need to be re-ferred to an orthopedic oncologist.
Recesses, Bursae, Cysts, and GangliaDistention of a synovial recess or bursa can pro-duce a soft-tissue mass that may be misinter-preted as a neoplasm on MR examinations, par-ticularly if it contains heterogeneous material (eg,loose bodies, nodular synovitis) or if the radiolo-gist is not familiar with normal articular-bursalanatomy. A synovial recess is generally defined asa direct extension of a joint cavity, whereas a
Figure 10. Rheumatoid arthritis in a61-year-old man. Coronal T2-weightedfat-suppressed image of the ankle showsa high-signal-intensity lesion with a sur-rounding hypointense rim (large arrow)in the inferior aspect of the talar body,features that represent an area of sub-cortical erosion with adjacent bonemarrow edema. Several smaller areas oferosion in the calcaneus (small arrows)and high-signal-intensity synovitis inthe tarsal sinus (*) support a diagnosisof erosive inflammatory arthritis ratherthan a neoplasm. Subchondral erosionsand degenerative cysts, particularlylarger (1–3-cm) lesions with adjacentedema and enhancement, were com-monly misinterpreted as a neoplasmand resulted in needless referrals to theOrthopaedic Oncology Clinic. Thiscase demonstrates the importance ofrecognizing an arthritic process.
RG f Volume 27 ● Number 3 Stacy and Dixon 815
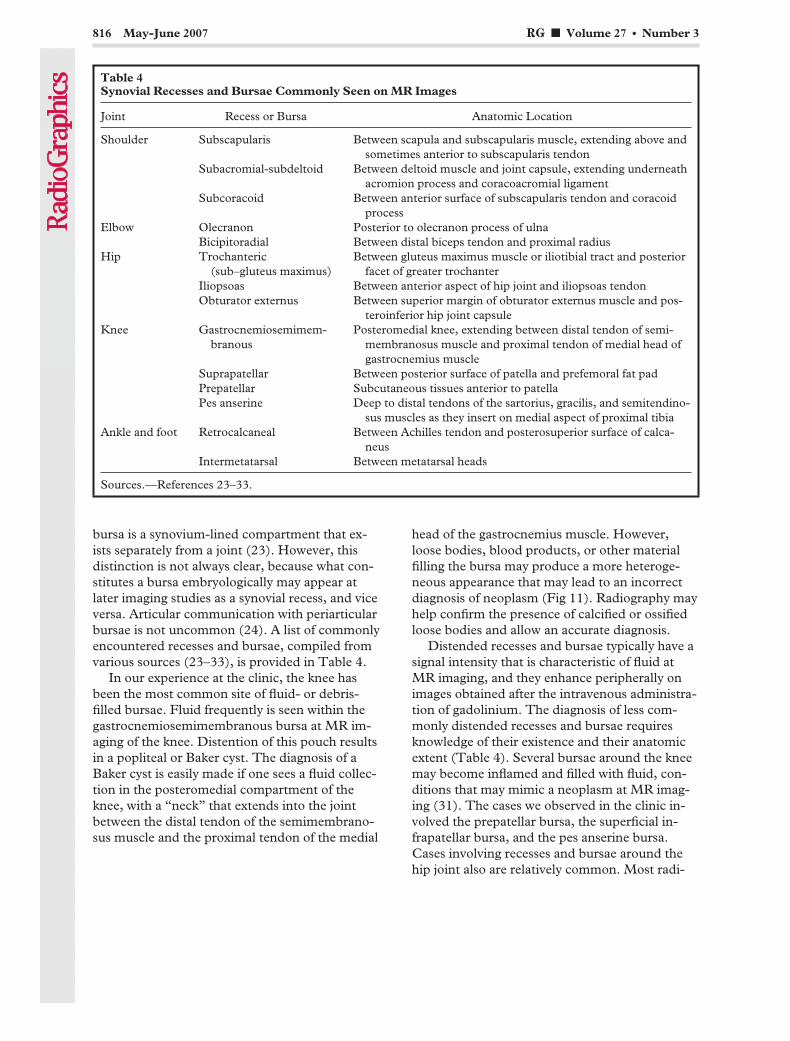
bursa is a synovium-lined compartment that ex-ists separately from a joint (23). However, thisdistinction is not always clear, because what con-stitutes a bursa embryologically may appear atlater imaging studies as a synovial recess, and viceversa. Articular communication with periarticularbursae is not uncommon (24). A list of commonlyencountered recesses and bursae, compiled fromvarious sources (23–33), is provided in Table 4.
In our experience at the clinic, the knee hasbeen the most common site of fluid- or debris-filled bursae. Fluid frequently is seen within thegastrocnemiosemimembranous bursa at MR im-aging of the knee. Distention of this pouch resultsin a popliteal or Baker cyst. The diagnosis of aBaker cyst is easily made if one sees a fluid collec-tion in the posteromedial compartment of theknee, with a “neck” that extends into the jointbetween the distal tendon of the semimembrano-sus muscle and the proximal tendon of the medial
head of the gastrocnemius muscle. However,loose bodies, blood products, or other materialfilling the bursa may produce a more heteroge-neous appearance that may lead to an incorrectdiagnosis of neoplasm (Fig 11). Radiography mayhelp confirm the presence of calcified or ossifiedloose bodies and allow an accurate diagnosis.
Distended recesses and bursae typically have asignal intensity that is characteristic of fluid atMR imaging, and they enhance peripherally onimages obtained after the intravenous administra-tion of gadolinium. The diagnosis of less com-monly distended recesses and bursae requiresknowledge of their existence and their anatomicextent (Table 4). Several bursae around the kneemay become inflamed and filled with fluid, con-ditions that may mimic a neoplasm at MR imag-ing (31). The cases we observed in the clinic in-volved the prepatellar bursa, the superficial in-frapatellar bursa, and the pes anserine bursa.Cases involving recesses and bursae around thehip joint also are relatively common. Most radi-
Table 4Synovial Recesses and Bursae Commonly Seen on MR Images
Joint Recess or Bursa Anatomic Location
Shoulder Subscapularis Between scapula and subscapularis muscle, extending above andsometimes anterior to subscapularis tendon
Subacromial-subdeltoid Between deltoid muscle and joint capsule, extending underneathacromion process and coracoacromial ligament
Subcoracoid Between anterior surface of subscapularis tendon and coracoidprocess
Elbow Olecranon Posterior to olecranon process of ulnaBicipitoradial Between distal biceps tendon and proximal radius
Hip Trochanteric(sub–gluteus maximus)
Between gluteus maximus muscle or iliotibial tract and posteriorfacet of greater trochanter
Iliopsoas Between anterior aspect of hip joint and iliopsoas tendonObturator externus Between superior margin of obturator externus muscle and pos-
teroinferior hip joint capsuleKnee Gastrocnemiosemimem-
branousPosteromedial knee, extending between distal tendon of semi-
membranosus muscle and proximal tendon of medial head ofgastrocnemius muscle
Suprapatellar Between posterior surface of patella and prefemoral fat padPrepatellar Subcutaneous tissues anterior to patellaPes anserine Deep to distal tendons of the sartorius, gracilis, and semitendino-
sus muscles as they insert on medial aspect of proximal tibiaAnkle and foot Retrocalcaneal Between Achilles tendon and posterosuperior surface of calca-
neusIntermetatarsal Between metatarsal heads
Sources.—References 23–33.
816 May-June 2007 RG f Volume 27 ● Number 3
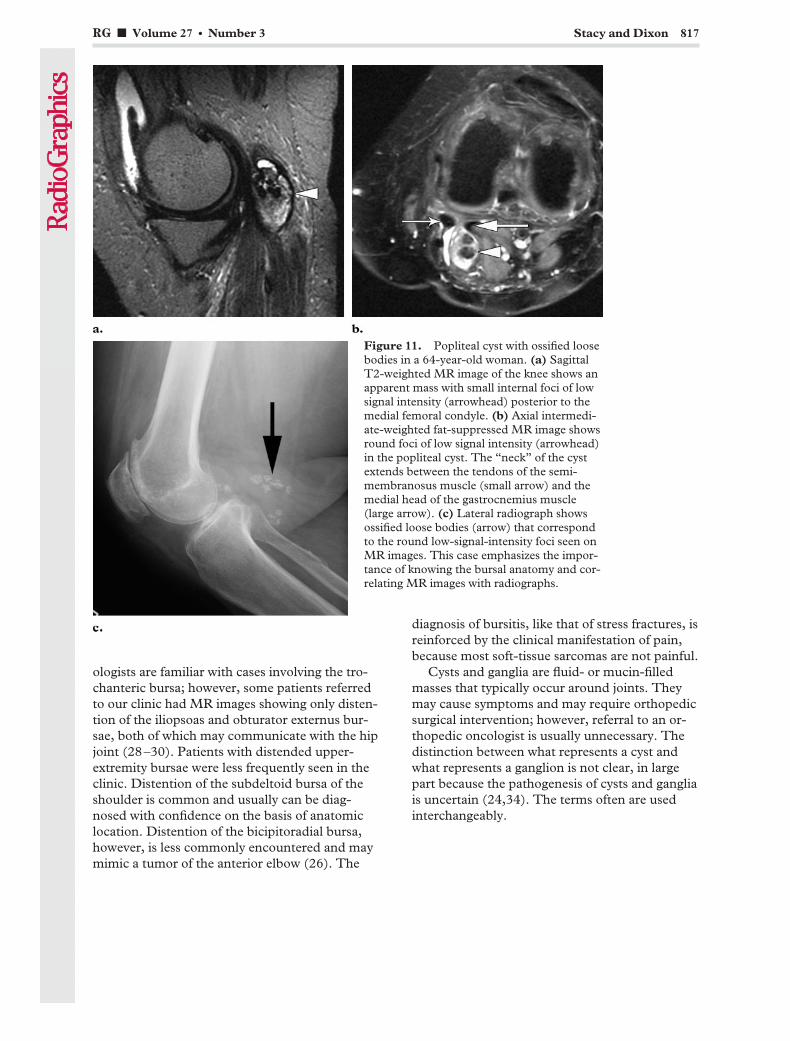
ologists are familiar with cases involving the tro-chanteric bursa; however, some patients referredto our clinic had MR images showing only disten-tion of the iliopsoas and obturator externus bur-sae, both of which may communicate with the hipjoint (28–30). Patients with distended upper-extremity bursae were less frequently seen in theclinic. Distention of the subdeltoid bursa of theshoulder is common and usually can be diag-nosed with confidence on the basis of anatomiclocation. Distention of the bicipitoradial bursa,however, is less commonly encountered and maymimic a tumor of the anterior elbow (26). The
diagnosis of bursitis, like that of stress fractures, isreinforced by the clinical manifestation of pain,because most soft-tissue sarcomas are not painful.
Cysts and ganglia are fluid- or mucin-filledmasses that typically occur around joints. Theymay cause symptoms and may require orthopedicsurgical intervention; however, referral to an or-thopedic oncologist is usually unnecessary. Thedistinction between what represents a cyst andwhat represents a ganglion is not clear, in largepart because the pathogenesis of cysts and gangliais uncertain (24,34). The terms often are usedinterchangeably.
Figure 11. Popliteal cyst with ossified loosebodies in a 64-year-old woman. (a) SagittalT2-weighted MR image of the knee shows anapparent mass with small internal foci of lowsignal intensity (arrowhead) posterior to themedial femoral condyle. (b) Axial intermedi-ate-weighted fat-suppressed MR image showsround foci of low signal intensity (arrowhead)in the popliteal cyst. The “neck” of the cystextends between the tendons of the semi-membranosus muscle (small arrow) and themedial head of the gastrocnemius muscle(large arrow). (c) Lateral radiograph showsossified loose bodies (arrow) that correspondto the round low-signal-intensity foci seen onMR images. This case emphasizes the impor-tance of knowing the bursal anatomy and cor-relating MR images with radiographs.
RG f Volume 27 ● Number 3 Stacy and Dixon 817
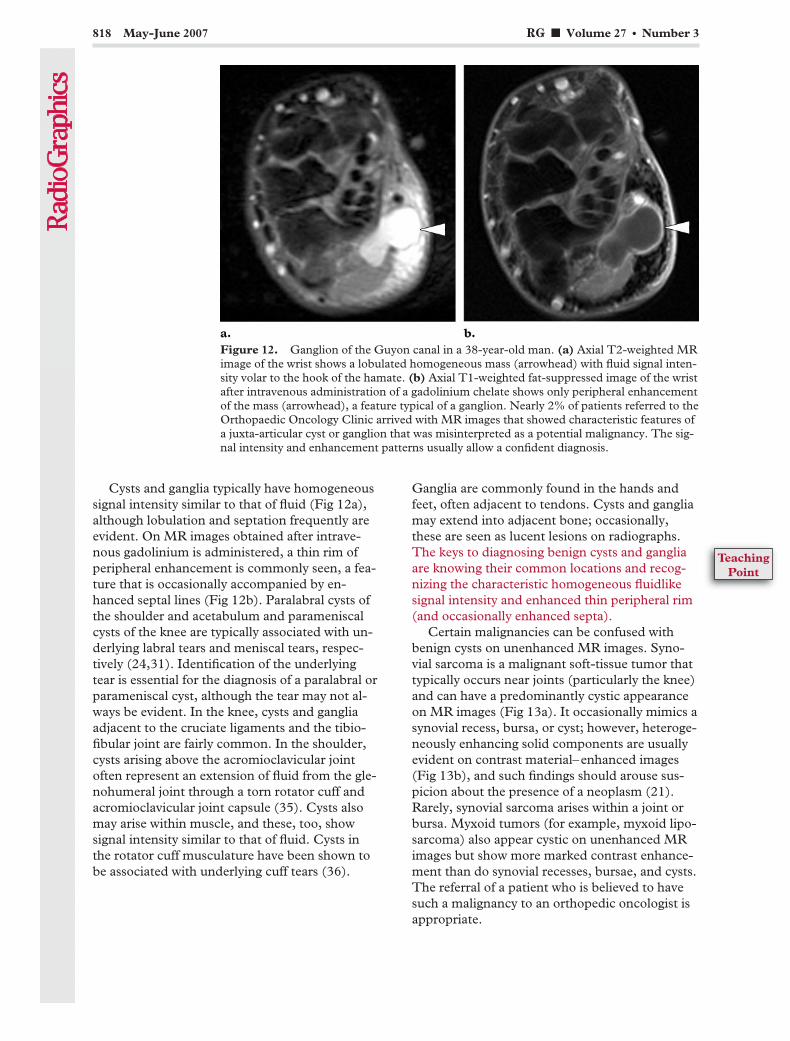
Cysts and ganglia typically have homogeneoussignal intensity similar to that of fluid (Fig 12a),although lobulation and septation frequently areevident. On MR images obtained after intrave-nous gadolinium is administered, a thin rim ofperipheral enhancement is commonly seen, a fea-ture that is occasionally accompanied by en-hanced septal lines (Fig 12b). Paralabral cysts ofthe shoulder and acetabulum and parameniscalcysts of the knee are typically associated with un-derlying labral tears and meniscal tears, respec-tively (24,31). Identification of the underlyingtear is essential for the diagnosis of a paralabral orparameniscal cyst, although the tear may not al-ways be evident. In the knee, cysts and gangliaadjacent to the cruciate ligaments and the tibio-fibular joint are fairly common. In the shoulder,cysts arising above the acromioclavicular jointoften represent an extension of fluid from the gle-nohumeral joint through a torn rotator cuff andacromioclavicular joint capsule (35). Cysts alsomay arise within muscle, and these, too, showsignal intensity similar to that of fluid. Cysts inthe rotator cuff musculature have been shown tobe associated with underlying cuff tears (36).
Ganglia are commonly found in the hands andfeet, often adjacent to tendons. Cysts and gangliamay extend into adjacent bone; occasionally,these are seen as lucent lesions on radiographs.The keys to diagnosing benign cysts and gangliaare knowing their common locations and recog-nizing the characteristic homogeneous fluidlikesignal intensity and enhanced thin peripheral rim(and occasionally enhanced septa).
Certain malignancies can be confused withbenign cysts on unenhanced MR images. Syno-vial sarcoma is a malignant soft-tissue tumor thattypically occurs near joints (particularly the knee)and can have a predominantly cystic appearanceon MR images (Fig 13a). It occasionally mimics asynovial recess, bursa, or cyst; however, heteroge-neously enhancing solid components are usuallyevident on contrast material–enhanced images(Fig 13b), and such findings should arouse sus-picion about the presence of a neoplasm (21).Rarely, synovial sarcoma arises within a joint orbursa. Myxoid tumors (for example, myxoid lipo-sarcoma) also appear cystic on unenhanced MRimages but show more marked contrast enhance-ment than do synovial recesses, bursae, and cysts.The referral of a patient who is believed to havesuch a malignancy to an orthopedic oncologist isappropriate.
Figure 12. Ganglion of the Guyon canal in a 38-year-old man. (a) Axial T2-weighted MRimage of the wrist shows a lobulated homogeneous mass (arrowhead) with fluid signal inten-sity volar to the hook of the hamate. (b) Axial T1-weighted fat-suppressed image of the wristafter intravenous administration of a gadolinium chelate shows only peripheral enhancementof the mass (arrowhead), a feature typical of a ganglion. Nearly 2% of patients referred to theOrthopaedic Oncology Clinic arrived with MR images that showed characteristic features ofa juxta-articular cyst or ganglion that was misinterpreted as a potential malignancy. The sig-nal intensity and enhancement patterns usually allow a confident diagnosis.
818 May-June 2007 RG f Volume 27 ● Number 3
TeachingPoint
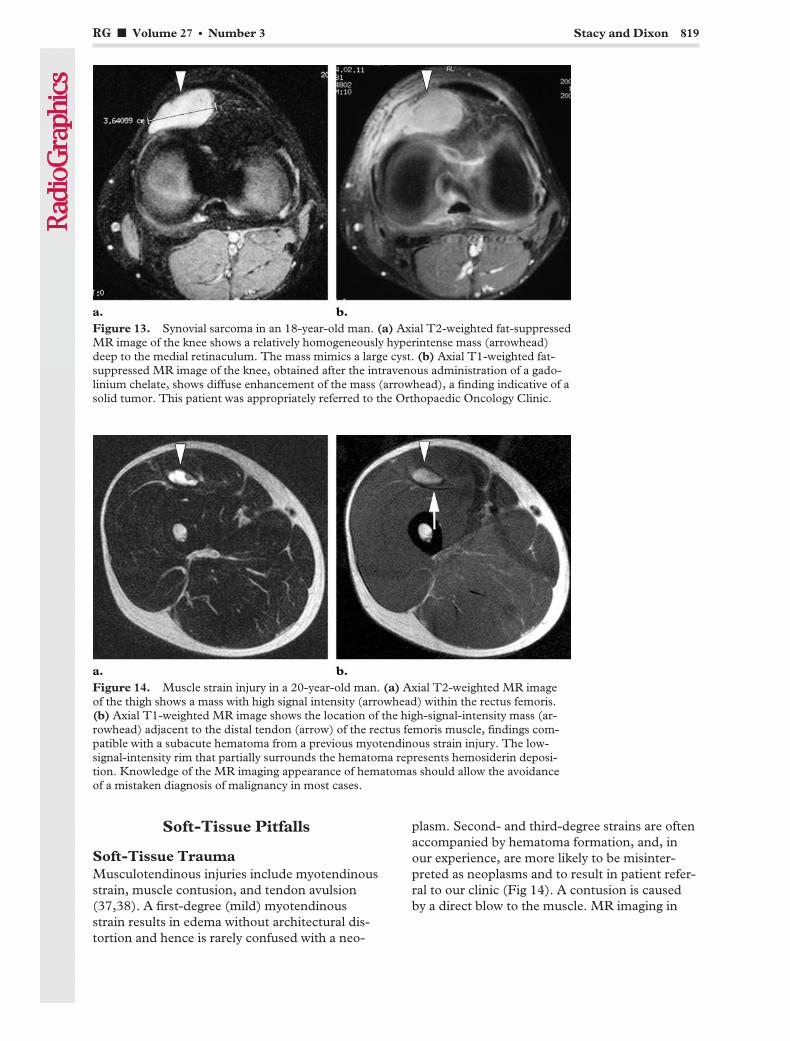
Soft-Tissue Pitfalls
Soft-Tissue TraumaMusculotendinous injuries include myotendinousstrain, muscle contusion, and tendon avulsion(37,38). A first-degree (mild) myotendinousstrain results in edema without architectural dis-tortion and hence is rarely confused with a neo-
plasm. Second- and third-degree strains are oftenaccompanied by hematoma formation, and, inour experience, are more likely to be misinter-preted as neoplasms and to result in patient refer-ral to our clinic (Fig 14). A contusion is causedby a direct blow to the muscle. MR imaging in
Figure 13. Synovial sarcoma in an 18-year-old man. (a) Axial T2-weighted fat-suppressedMR image of the knee shows a relatively homogeneously hyperintense mass (arrowhead)deep to the medial retinaculum. The mass mimics a large cyst. (b) Axial T1-weighted fat-suppressed MR image of the knee, obtained after the intravenous administration of a gado-linium chelate, shows diffuse enhancement of the mass (arrowhead), a finding indicative of asolid tumor. This patient was appropriately referred to the Orthopaedic Oncology Clinic.
Figure 14. Muscle strain injury in a 20-year-old man. (a) Axial T2-weighted MR imageof the thigh shows a mass with high signal intensity (arrowhead) within the rectus femoris.(b) Axial T1-weighted MR image shows the location of the high-signal-intensity mass (ar-rowhead) adjacent to the distal tendon (arrow) of the rectus femoris muscle, findings com-patible with a subacute hematoma from a previous myotendinous strain injury. The low-signal-intensity rim that partially surrounds the hematoma represents hemosiderin deposi-tion. Knowledge of the MR imaging appearance of hematomas should allow the avoidanceof a mistaken diagnosis of malignancy in most cases.
RG f Volume 27 ● Number 3 Stacy and Dixon 819
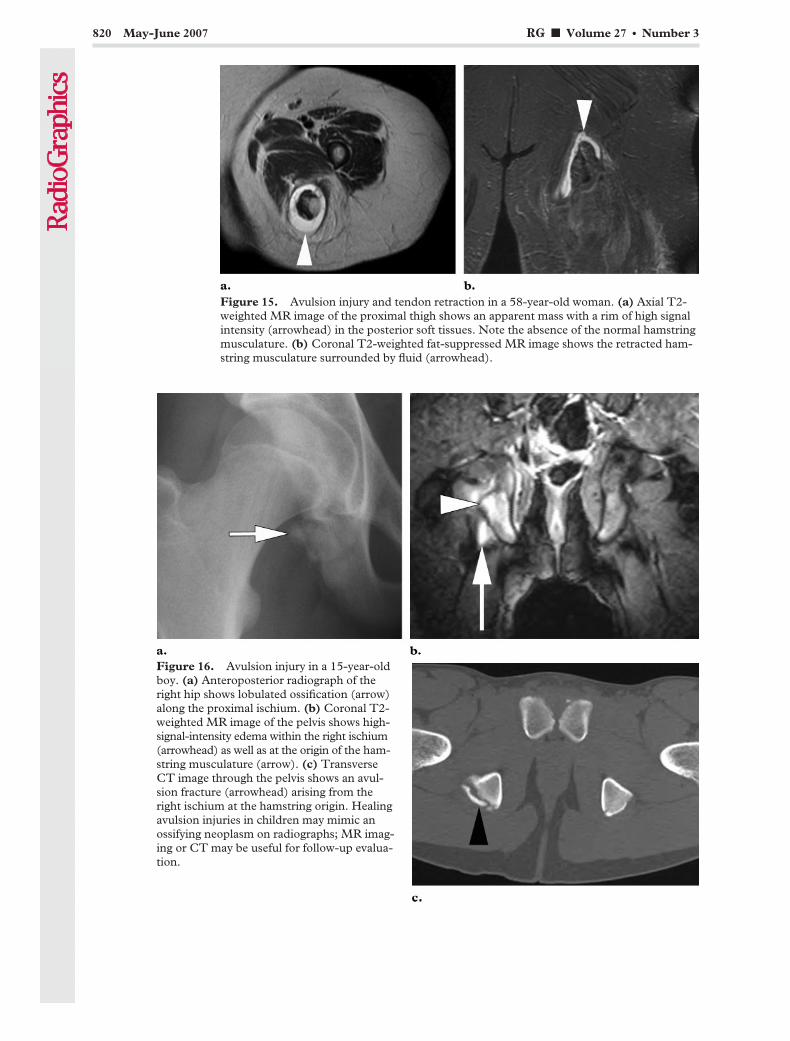
Figure 15. Avulsion injury and tendon retraction in a 58-year-old woman. (a) Axial T2-weighted MR image of the proximal thigh shows an apparent mass with a rim of high signalintensity (arrowhead) in the posterior soft tissues. Note the absence of the normal hamstringmusculature. (b) Coronal T2-weighted fat-suppressed MR image shows the retracted ham-string musculature surrounded by fluid (arrowhead).
Figure 16. Avulsion injury in a 15-year-oldboy. (a) Anteroposterior radiograph of theright hip shows lobulated ossification (arrow)along the proximal ischium. (b) Coronal T2-weighted MR image of the pelvis shows high-signal-intensity edema within the right ischium(arrowhead) as well as at the origin of the ham-string musculature (arrow). (c) TransverseCT image through the pelvis shows an avul-sion fracture (arrowhead) arising from theright ischium at the hamstring origin. Healingavulsion injuries in children may mimic anossifying neoplasm on radiographs; MR imag-ing or CT may be useful for follow-up evalua-tion.
820 May-June 2007 RG f Volume 27 ● Number 3
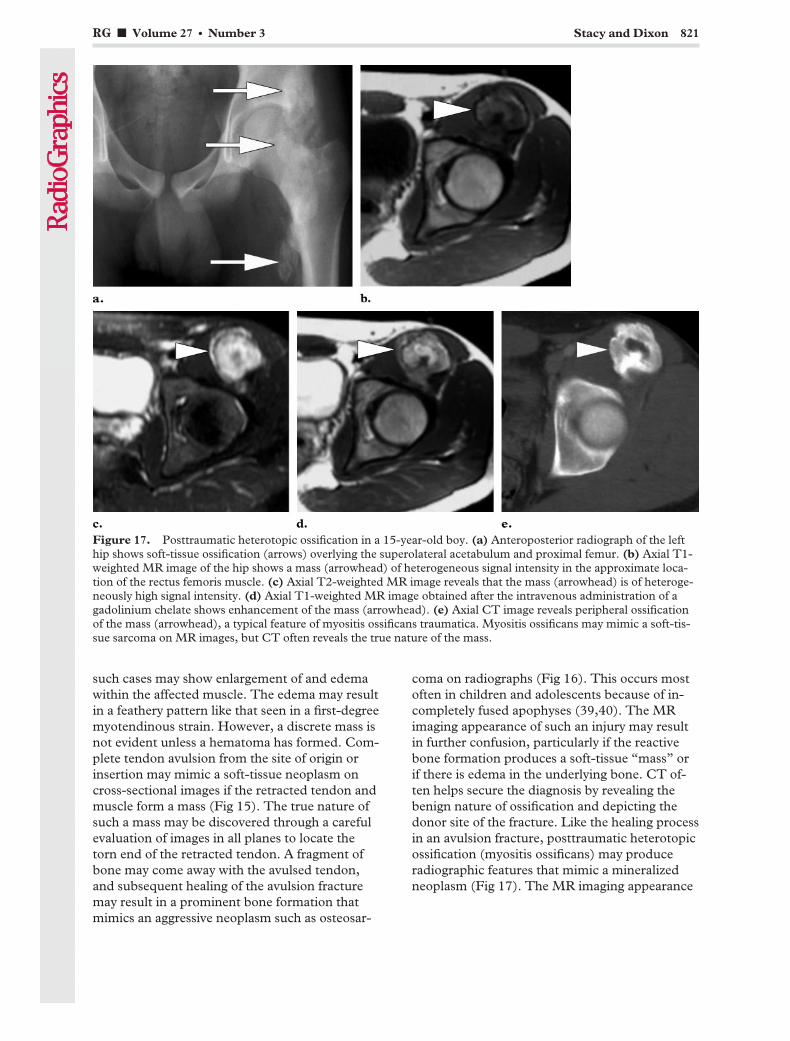
such cases may show enlargement of and edemawithin the affected muscle. The edema may resultin a feathery pattern like that seen in a first-degreemyotendinous strain. However, a discrete mass isnot evident unless a hematoma has formed. Com-plete tendon avulsion from the site of origin orinsertion may mimic a soft-tissue neoplasm oncross-sectional images if the retracted tendon andmuscle form a mass (Fig 15). The true nature ofsuch a mass may be discovered through a carefulevaluation of images in all planes to locate thetorn end of the retracted tendon. A fragment ofbone may come away with the avulsed tendon,and subsequent healing of the avulsion fracturemay result in a prominent bone formation thatmimics an aggressive neoplasm such as osteosar-
coma on radiographs (Fig 16). This occurs mostoften in children and adolescents because of in-completely fused apophyses (39,40). The MRimaging appearance of such an injury may resultin further confusion, particularly if the reactivebone formation produces a soft-tissue “mass” orif there is edema in the underlying bone. CT of-ten helps secure the diagnosis by revealing thebenign nature of ossification and depicting thedonor site of the fracture. Like the healing processin an avulsion fracture, posttraumatic heterotopicossification (myositis ossificans) may produceradiographic features that mimic a mineralizedneoplasm (Fig 17). The MR imaging appearance
Figure 17. Posttraumatic heterotopic ossification in a 15-year-old boy. (a) Anteroposterior radiograph of the lefthip shows soft-tissue ossification (arrows) overlying the superolateral acetabulum and proximal femur. (b) Axial T1-weighted MR image of the hip shows a mass (arrowhead) of heterogeneous signal intensity in the approximate loca-tion of the rectus femoris muscle. (c) Axial T2-weighted MR image reveals that the mass (arrowhead) is of heteroge-neously high signal intensity. (d) Axial T1-weighted MR image obtained after the intravenous administration of agadolinium chelate shows enhancement of the mass (arrowhead). (e) Axial CT image reveals peripheral ossificationof the mass (arrowhead), a typical feature of myositis ossificans traumatica. Myositis ossificans may mimic a soft-tis-sue sarcoma on MR images, but CT often reveals the true nature of the mass.
RG f Volume 27 ● Number 3 Stacy and Dixon 821
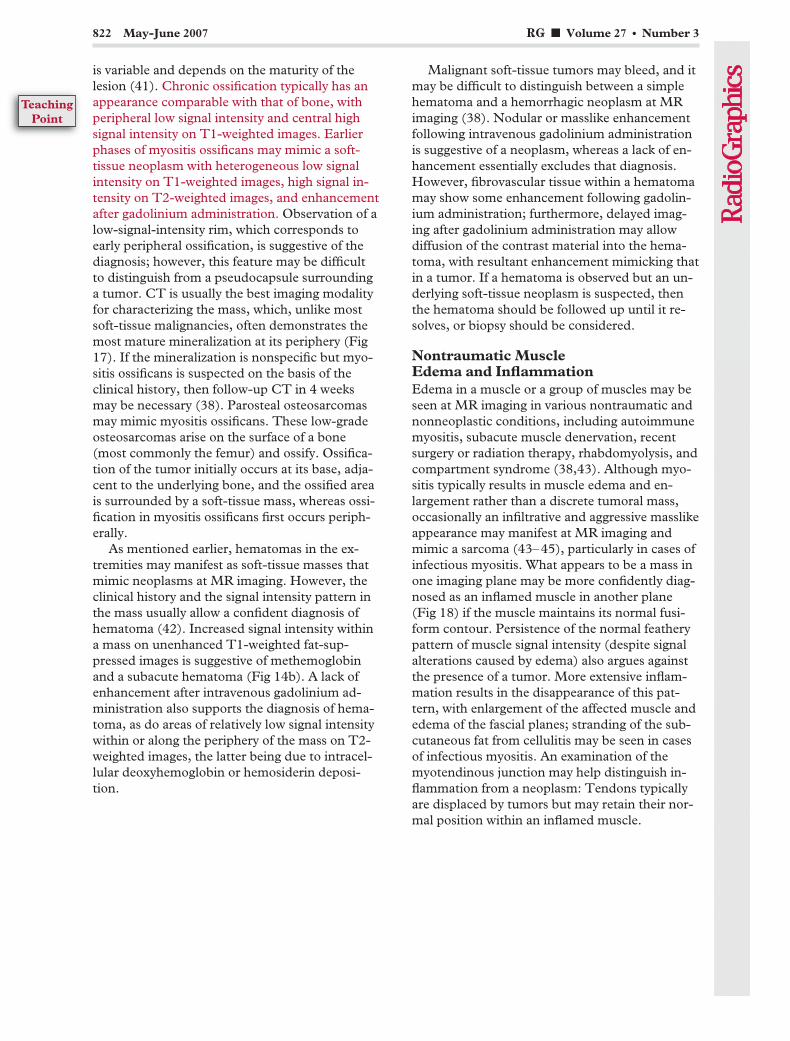
is variable and depends on the maturity of thelesion (41). Chronic ossification typically has anappearance comparable with that of bone, withperipheral low signal intensity and central highsignal intensity on T1-weighted images. Earlierphases of myositis ossificans may mimic a soft-tissue neoplasm with heterogeneous low signalintensity on T1-weighted images, high signal in-tensity on T2-weighted images, and enhancementafter gadolinium administration. Observation of alow-signal-intensity rim, which corresponds toearly peripheral ossification, is suggestive of thediagnosis; however, this feature may be difficultto distinguish from a pseudocapsule surroundinga tumor. CT is usually the best imaging modalityfor characterizing the mass, which, unlike mostsoft-tissue malignancies, often demonstrates themost mature mineralization at its periphery (Fig17). If the mineralization is nonspecific but myo-sitis ossificans is suspected on the basis of theclinical history, then follow-up CT in 4 weeksmay be necessary (38). Parosteal osteosarcomasmay mimic myositis ossificans. These low-gradeosteosarcomas arise on the surface of a bone(most commonly the femur) and ossify. Ossifica-tion of the tumor initially occurs at its base, adja-cent to the underlying bone, and the ossified areais surrounded by a soft-tissue mass, whereas ossi-fication in myositis ossificans first occurs periph-erally.
As mentioned earlier, hematomas in the ex-tremities may manifest as soft-tissue masses thatmimic neoplasms at MR imaging. However, theclinical history and the signal intensity pattern inthe mass usually allow a confident diagnosis ofhematoma (42). Increased signal intensity withina mass on unenhanced T1-weighted fat-sup-pressed images is suggestive of methemoglobinand a subacute hematoma (Fig 14b). A lack ofenhancement after intravenous gadolinium ad-ministration also supports the diagnosis of hema-toma, as do areas of relatively low signal intensitywithin or along the periphery of the mass on T2-weighted images, the latter being due to intracel-lular deoxyhemoglobin or hemosiderin deposi-tion.
Malignant soft-tissue tumors may bleed, and itmay be difficult to distinguish between a simplehematoma and a hemorrhagic neoplasm at MRimaging (38). Nodular or masslike enhancementfollowing intravenous gadolinium administrationis suggestive of a neoplasm, whereas a lack of en-hancement essentially excludes that diagnosis.However, fibrovascular tissue within a hematomamay show some enhancement following gadolin-ium administration; furthermore, delayed imag-ing after gadolinium administration may allowdiffusion of the contrast material into the hema-toma, with resultant enhancement mimicking thatin a tumor. If a hematoma is observed but an un-derlying soft-tissue neoplasm is suspected, thenthe hematoma should be followed up until it re-solves, or biopsy should be considered.
Nontraumatic MuscleEdema and InflammationEdema in a muscle or a group of muscles may beseen at MR imaging in various nontraumatic andnonneoplastic conditions, including autoimmunemyositis, subacute muscle denervation, recentsurgery or radiation therapy, rhabdomyolysis, andcompartment syndrome (38,43). Although myo-sitis typically results in muscle edema and en-largement rather than a discrete tumoral mass,occasionally an infiltrative and aggressive masslikeappearance may manifest at MR imaging andmimic a sarcoma (43–45), particularly in cases ofinfectious myositis. What appears to be a mass inone imaging plane may be more confidently diag-nosed as an inflamed muscle in another plane(Fig 18) if the muscle maintains its normal fusi-form contour. Persistence of the normal featherypattern of muscle signal intensity (despite signalalterations caused by edema) also argues againstthe presence of a tumor. More extensive inflam-mation results in the disappearance of this pat-tern, with enlargement of the affected muscle andedema of the fascial planes; stranding of the sub-cutaneous fat from cellulitis may be seen in casesof infectious myositis. An examination of themyotendinous junction may help distinguish in-flammation from a neoplasm: Tendons typicallyare displaced by tumors but may retain their nor-mal position within an inflamed muscle.
822 May-June 2007 RG f Volume 27 ● Number 3
TeachingPoint
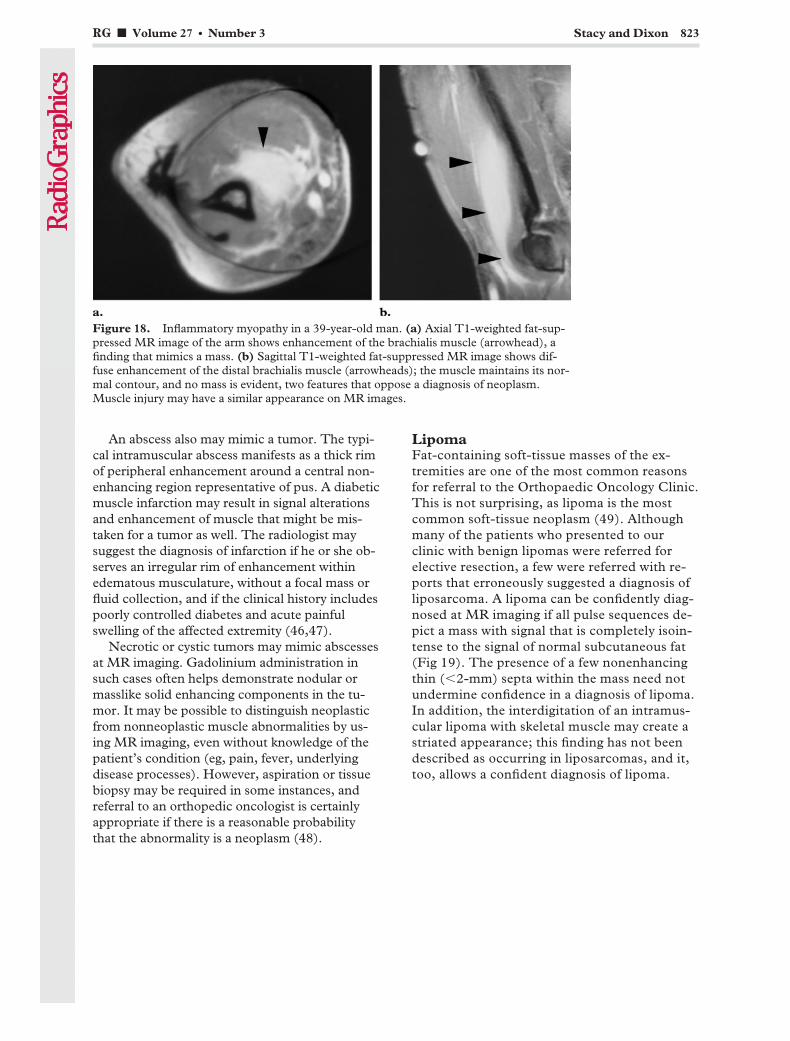
An abscess also may mimic a tumor. The typi-cal intramuscular abscess manifests as a thick rimof peripheral enhancement around a central non-enhancing region representative of pus. A diabeticmuscle infarction may result in signal alterationsand enhancement of muscle that might be mis-taken for a tumor as well. The radiologist maysuggest the diagnosis of infarction if he or she ob-serves an irregular rim of enhancement withinedematous musculature, without a focal mass orfluid collection, and if the clinical history includespoorly controlled diabetes and acute painfulswelling of the affected extremity (46,47).
Necrotic or cystic tumors may mimic abscessesat MR imaging. Gadolinium administration insuch cases often helps demonstrate nodular ormasslike solid enhancing components in the tu-mor. It may be possible to distinguish neoplasticfrom nonneoplastic muscle abnormalities by us-ing MR imaging, even without knowledge of thepatient’s condition (eg, pain, fever, underlyingdisease processes). However, aspiration or tissuebiopsy may be required in some instances, andreferral to an orthopedic oncologist is certainlyappropriate if there is a reasonable probabilitythat the abnormality is a neoplasm (48).
LipomaFat-containing soft-tissue masses of the ex-tremities are one of the most common reasonsfor referral to the Orthopaedic Oncology Clinic.This is not surprising, as lipoma is the mostcommon soft-tissue neoplasm (49). Althoughmany of the patients who presented to ourclinic with benign lipomas were referred forelective resection, a few were referred with re-ports that erroneously suggested a diagnosis ofliposarcoma. A lipoma can be confidently diag-nosed at MR imaging if all pulse sequences de-pict a mass with signal that is completely isoin-tense to the signal of normal subcutaneous fat(Fig 19). The presence of a few nonenhancingthin (�2-mm) septa within the mass need notundermine confidence in a diagnosis of lipoma.In addition, the interdigitation of an intramus-cular lipoma with skeletal muscle may create astriated appearance; this finding has not beendescribed as occurring in liposarcomas, and it,too, allows a confident diagnosis of lipoma.
Figure 18. Inflammatory myopathy in a 39-year-old man. (a) Axial T1-weighted fat-sup-pressed MR image of the arm shows enhancement of the brachialis muscle (arrowhead), afinding that mimics a mass. (b) Sagittal T1-weighted fat-suppressed MR image shows dif-fuse enhancement of the distal brachialis muscle (arrowheads); the muscle maintains its nor-mal contour, and no mass is evident, two features that oppose a diagnosis of neoplasm.Muscle injury may have a similar appearance on MR images.
RG f Volume 27 ● Number 3 Stacy and Dixon 823
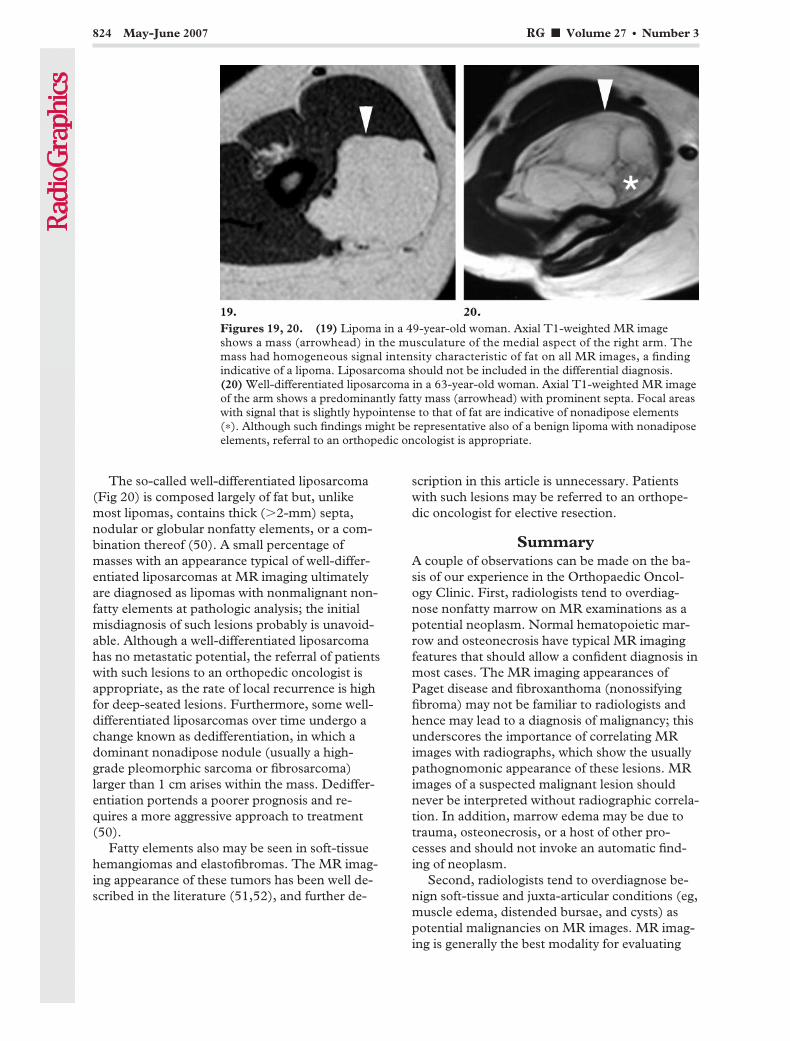
The so-called well-differentiated liposarcoma(Fig 20) is composed largely of fat but, unlikemost lipomas, contains thick (�2-mm) septa,nodular or globular nonfatty elements, or a com-bination thereof (50). A small percentage ofmasses with an appearance typical of well-differ-entiated liposarcomas at MR imaging ultimatelyare diagnosed as lipomas with nonmalignant non-fatty elements at pathologic analysis; the initialmisdiagnosis of such lesions probably is unavoid-able. Although a well-differentiated liposarcomahas no metastatic potential, the referral of patientswith such lesions to an orthopedic oncologist isappropriate, as the rate of local recurrence is highfor deep-seated lesions. Furthermore, some well-differentiated liposarcomas over time undergo achange known as dedifferentiation, in which adominant nonadipose nodule (usually a high-grade pleomorphic sarcoma or fibrosarcoma)larger than 1 cm arises within the mass. Dediffer-entiation portends a poorer prognosis and re-quires a more aggressive approach to treatment(50).
Fatty elements also may be seen in soft-tissuehemangiomas and elastofibromas. The MR imag-ing appearance of these tumors has been well de-scribed in the literature (51,52), and further de-
scription in this article is unnecessary. Patientswith such lesions may be referred to an orthope-dic oncologist for elective resection.
SummaryA couple of observations can be made on the ba-sis of our experience in the Orthopaedic Oncol-ogy Clinic. First, radiologists tend to overdiag-nose nonfatty marrow on MR examinations as apotential neoplasm. Normal hematopoietic mar-row and osteonecrosis have typical MR imagingfeatures that should allow a confident diagnosis inmost cases. The MR imaging appearances ofPaget disease and fibroxanthoma (nonossifyingfibroma) may not be familiar to radiologists andhence may lead to a diagnosis of malignancy; thisunderscores the importance of correlating MRimages with radiographs, which show the usuallypathognomonic appearance of these lesions. MRimages of a suspected malignant lesion shouldnever be interpreted without radiographic correla-tion. In addition, marrow edema may be due totrauma, osteonecrosis, or a host of other pro-cesses and should not invoke an automatic find-ing of neoplasm.
Second, radiologists tend to overdiagnose be-nign soft-tissue and juxta-articular conditions (eg,muscle edema, distended bursae, and cysts) aspotential malignancies on MR images. MR imag-ing is generally the best modality for evaluating
Figures 19, 20. (19) Lipoma in a 49-year-old woman. Axial T1-weighted MR imageshows a mass (arrowhead) in the musculature of the medial aspect of the right arm. Themass had homogeneous signal intensity characteristic of fat on all MR images, a findingindicative of a lipoma. Liposarcoma should not be included in the differential diagnosis.(20) Well-differentiated liposarcoma in a 63-year-old woman. Axial T1-weighted MR imageof the arm shows a predominantly fatty mass (arrowhead) with prominent septa. Focal areaswith signal that is slightly hypointense to that of fat are indicative of nonadipose elements(*). Although such findings might be representative also of a benign lipoma with nonadiposeelements, referral to an orthopedic oncologist is appropriate.
824 May-June 2007 RG f Volume 27 ● Number 3

soft-tissue abnormalities; however, knowledge ofthe anatomy of joints and bursae and an apprecia-tion of signal intensity and enhancement patternsthat may be seen in nonneoplastic disease pro-cesses are essential for accurate diagnosis.
Our consideration of the entities described inthis article was no doubt aided by the fact thatwhen we reviewed the imaging studies, we weresituated in the Orthopaedic Oncology Clinic,where we almost certainly had greater access topertinent clinical data than did the radiologists atthe referring institutions. Furthermore, other fac-tors unrelated to the radiologist’s interpretation(eg, cosmetic deformity) may lead to referral to anorthopedic oncologist. Finally, very few of theseentities undergo biopsy, and hence histologic con-firmation of the consensus diagnoses made by theorthopedic oncology team is not usually available.Nevertheless, a radiologist’s report stating that amalignant neoplasm cannot be excluded but de-scribing an entity with classically benign imagingfeatures may leave the clinician with little choicebut to refer the patient to a tumor specialist. Theevaluation of solitary lesions in bone or soft tissuemay be a daunting task, particularly for radiolo-gists who do not see many bone and soft-tissuetumors. In many cases, the lesion clearly appearsaggressive, and a confident diagnosis of malig-nancy can be rendered. In other cases, the lesionmay be described as indeterminate despite evalu-ation with multiple modalities, and referral of thepatient to an orthopedic oncologist is appropriate.The radiologist can be most useful by recognizingentities that are highly unlikely to represent malig-nancy and by confidently reporting them as be-nign, thereby sparing the patient an unnecessarytrip to the tumor specialist.
References1. Vande Berg BC, Malghem J, Lecouvet FE, Malda-
gue B. Magnetic resonance imaging of the normalbone marrow. Skeletal Radiol 1998;27:471–483.
2. Kricun ME. Parameters of diagnosis. In: KricunME, ed. Imaging of bone tumors. Philadelphia,Pa: Saunders, 1993; 2–45.
3. Richardson ML, Patten RM. Age-related changesin marrow distribution in the shoulder: MR imag-ing findings. Radiology 1994;192:209–215.
4. Lang P, Fritz R, Majumdar S, Vahlensieck M, Pe-terfy C, Genant HK. Hematopoietic bone marrowin the adult knee: spin-echo and opposed-phasegradient-echo MR imaging. Skeletal Radiol 1993;22:95–103.
5. Fayad LM, Kamel IR, Kawamoto S, BluemkeDA, Frassica FJ, Fishman EK. Distinguishingstress fractures from pathologic fractures: a multi-modality approach. Skeletal Radiol 2005;34:245–259.
6. Gaeta M, Minutoli F, Scribano E, et al. CT andMR imaging findings in athletes with early tibialstress injuries: comparison with bone scintigraphyfindings and emphasis on cortical abnormalities.Radiology 2005;235:553–561.
7. Fredericson M, Bergman AG, Hoffman KL,Dillingham MS. Tibial stress reaction in runners:correlation of clinical symptoms and scintigraphywith a new magnetic resonance grading system.Am J Sports Med 1995;23:472–481.
8. Brahme SK, Cervilla V, Vint V, Cooper K, Kort-man K, Resnick D. Magnetic resonance appear-ance of sacral insufficiency fractures. Skeletal Ra-diol 1990;19:489–493.
9. Daffner RH, Pavlov H. Stress fractures: currentconcepts. AJR Am J Roentgenol 1992;159:245–252.
10. Saini A, Saifuddin A. MRI of osteonecrosis. ClinRadiol 2004;59:1079–1093.
11. Resnick D, Sweet DE, Madewell JE. Osteonecro-sis: pathogenesis, diagnostic techniques, specificsituations, and complications. In: Resnick D, ed.Diagnosis of bone and joint disorders. 4th ed.Philadelphia, Pa: Saunders, 2002; 3599–3685.
12. Munk PL, Helms CA, Holt RG. Immature boneinfarcts: findings on plain radiographs and MRscans. AJR Am J Roentgenol 1989;152:547–549.
13. Barr MS, Anderson MW. The knee: bone marrowabnormalities. Radiol Clin North Am 2002;40:1109–1120.
14. Resnick D. Paget’s disease. In: Resnick D, ed. Di-agnosis of bone and joint disorders. 4th ed. Phila-delphia, Pa: Saunders, 2002; 1947–2000.
15. Whitehouse RW. Paget’s disease of bone. SeminMusculoskelet Radiol 2002;6:313–322.
16. Roberts MC, Kressel HY, Fallon MD, ZlatkinMB, Dalinka MK. Paget disease: MR imagingfindings. Radiology 1989;173:341–345.
17. Sundaram M, Khanna G, El-Khoury GY. T1-weighted MR imaging for distinguishing large os-teolysis of Paget’s disease from sarcomatous de-generation. Skeletal Radiol 2001;30:378–383.
18. Jee WH, Choe BY, Kang HS, et al. Nonossifyingfibroma: characteristics at MR imaging withpathologic correlation. Radiology 1998;209:197–202.
19. Levine SM, Lambiase RE, Petchprapa CN. Corti-cal lesions of the tibia: characteristic appearancesat conventional radiography. RadioGraphics 2003;23:157–177.
20. Resnick D, Kyriakos M, Greenway GD. Tumorsand tumor-like lesions of bone: imaging and pa-thology of specific lesions. In: Resnick D, ed. Di-agnosis of bone and joint disorders. 4th ed. Phila-delphia, Pa: Saunders, 2002; 3763–4128.
21. Sheldon PJ, Forrester DM, Learch TJ. Imaging ofintra-articular masses. RadioGraphics 2005;25:105–119.
22. Narvaez JA, Narvaez J, Aguilera C, De Lama E,Portabella F. MR imaging of synovial tumors andtumor-like lesions. Eur Radiol 2001;11:2549–2560.
RG f Volume 27 ● Number 3 Stacy and Dixon 825

23. Morrison JL, Kaplan PA. Water on the knee:cysts, bursae, and recesses. Magn Reson ImagingClin N Am 2000;8:349–370.
24. Mellado JM, Salvado E, Camins A, et al. Fluidcollections and juxta-articular cystic lesions of theshoulder: spectrum of MRI findings. Eur Radiol2002;12:650–659.
25. Steinbach LS, Anderson S, Panicek D. MR imag-ing of musculoskeletal tumors in the elbow region.Magn Reson Imaging Clin N Am 1997;5:619–653.
26. Skaf AY, Boutin RD, Dantas RWM, et al. Bicipi-toradial bursitis: MR imaging findings in eight pa-tients and anatomic data from contrast opacifica-tion of bursae followed by routine radiography andMR imaging in cadavers. Radiology 1999;212:111–116.
27. Dwek J, Pfirrmann C, Stanley A, Pathria M,Chung CB. MR imaging of the hip abductors:normal anatomy and commonly encountered pa-thology at the greater trochanter. Magn Reson Im-aging Clin N Am 2005;13:691–704.
28. Bianchi S, Martinoli C, Keller A, Bianchi-Zamo-rani M. Giant iliopsoas bursitis: sonographic find-ings with magnetic resonance correlations. J ClinUltrasound 2002;30:437–441.
29. Wunderbaldinger P, Bremer C, Schellenberger E,Cejna M, Turetschek K, Kainberger F. Imagingfeatures of iliopsoas bursitis. Eur Radiol 2002;12:409–415.
30. Robinson P, White LM, Agur A, Wunder J, BellRS. Obturator externus bursa: anatomic originand MR imaging features of pathologic involve-ment. Radiology 2003;228:230–234.
31. McCarthy CL, McNally EG. The MRI appear-ance of cystic lesions around the knee. SkeletalRadiol 2004;33:187–209.
32. Resnick D. Anatomy of individual joints. In:Resnick D, ed. Diagnosis of bone and joint disor-ders. 4th ed. Philadelphia, Pa: Saunders, 2002;708–792.
33. Theumann NH, Pfirrmann CW, Chung CB, et al.Intermetatarsal spaces: analysis with MR bursog-raphy, anatomic correlation, and histopathology incadavers. Radiology 2001;221:478–484.
34. Kilpatrick SE, Renner JB. Cysts of bone and softtissue. In: Kilpatrick SE, Renner JB. Diagnosticmusculoskeletal surgical pathology: clinicoradio-logic and cytologic correlations. Philadelphia, Pa:Saunders, 2004; 337–343.
35. Tshering Vogel DW, Steinbach LS, Hertel R,Bernhard J, Stauffer E, Anderson SE. Acromiocla-vicular joint cyst: nine cases of a pseudotumor ofthe shoulder. Skeletal Radiol 2005;34:260–265.
36. Kassarjian A, Torriani M, Ouellette H, PalmerWE. Intramuscular rotator cuff cysts: associationwith tendon tears on MRI and arthroscopy. AJRAm J Roentgenol 2005;185:160–165.
37. Bencardino JT, Rosenberg ZS, Brown RR, Has-sankhani A, Lustrin ES, Beltran J. Traumaticmusculotendinous injuries of the knee: diagnosiswith MR imaging. RadioGraphics 2000;20(SpecIssue):S103–S120.
38. Boutin RD, Fritz RC, Steinbach LS. Imaging ofsports-related muscle injuries. Radiol Clin NorthAm 2002;40:333–362.
39. Resnick JM, Carrasco CH, Edeiken J, Yasko AW,Ro JY, Ayala AG. Avulsion fracture of the anteriorinferior iliac spine with abundant reactive ossifica-tion in the soft tissue. Skeletal Radiol 1996;25:580–584.
40. Stevens MA, El-Khoury GY, Kathol MH, Brand-ser EA, Chow S. Imaging features of avulsion inju-ries. RadioGraphics 1999;19:655–672.
41. Parikh J, Hyare H, Saifuddin A. The imaging fea-tures of post-traumatic myositis ossificans, withemphasis on MRI. Clin Radiol 2002;57:1058–1066.
42. Bush CH. The magnetic resonance imaging ofmusculoskeletal hemorrhage. Skeletal Radiol2000;29:1–9.
43. May DA, Disler DG, Jones EA, Balkissoon AA,Manaster BJ. Abnormal signal intensity in skeletalmuscle at MR imaging: patterns, pearls, and pit-falls. RadioGraphics 2000;20(Spec Issue):S295–S315.
44. Soler R, Rodriguez E, Aguilera C, Fernandez R.Magnetic resonance imaging of pyomyositis in 43cases. Eur J Radiol 2000;35:59–64.
45. Trusen A, Beissert M, Schultz G, Chittka B,Darge K. Ultrasound and MRI features of pyo-myositis in children. Eur Radiol 2003;13:1050–1055.
46. Kattapuram TM, Suri R, Rosol MS, RosenbergAE, Kattapuram SV. Idiopathic and diabetic skel-etal muscle infarction: evaluation by magneticresonance imaging. Skeletal Radiol 2005;34:203–209.
47. Delaney-Sathy LO, Fessell DP, Jacobson JA,Hayes CW. Sonography of diabetic muscle infarc-tion with MR imaging, CT, and pathologic corre-lation. AJR Am J Roentgenol 2000;174:165–169.
48. Dion E, Forest M, Brasseur J, Amoura Z, GrenierP. Epithelioid sarcoma mimicking abscess: reviewof the MRI appearances. Skeletal Radiol 2001;30:173–177.
49. Murphey MD, Carroll JF, Flemming DJ, PopeTL, Gannon FH, Kransdorf MJ. Benign musculo-skeletal lipomatous lesions. RadioGraphics 2004;24:1433–1466.
50. Murphey MD, Arcara LK, Fanburg-Smith J.From the archives of the AFIP: imaging of muscu-loskeletal liposarcoma with radiologic-pathologiccorrelation. RadioGraphics 2005;25:1371–1395.
51. Murphey MD, Fairbairn KJ, Parman LM, Kirk-man GB, Parsa MB, Smith WS. Musculoskeletalangiomatous lesions: radiologic-pathologic corre-lation. RadioGraphics 1995;15:893–917.
52. Soler R, Requejo I, Pombo F, Saez A. Elastofi-broma dorsi: MR and CT findings. Eur J Radiol1998;27:264–267.
826 May-June 2007 RG f Volume 27 ● Number 3
This article meets the criteria for 1.0 credit hour in category 1 of the AMA Physician’s Recognition Award. To obtaincredit, see accompanying test at http://www.rsna.org/education/rg_cme.html.
Invited Commentary
From:Laura W. Bancroft, MDDepartment of Radiology, Mayo ClinicJacksonville, Florida
I am pleased to have the opportunity to commenton the article by Stacy and Dixon in this issue ofRadioGraphics (1). Since soft-tissue musculoskel-etal malignancies are uncommon and osseousmalignancies are even rarer, it is helpful for radi-ologists to be aware of commonly misinterpretedprocesses that may result in evaluation at a ter-tiary care center.
At our institution, we have a similar rate of re-ferrals to our orthopedic oncology surgeon forconditions that are ultimately deemed nonmalig-nant. Various marrow, articular, and juxta-articu-lar abnormalities are nicely outlined in the articleby Stacy and Dixon, and they are probably repre-sentative of those encountered in others’ practicesas well. Radiologists may be conscientious, mayparticipate in continuing medical education, andmay use appropriate reference materials, and yetmay be inconclusive in offering a diagnosis. Or-thopedic oncology referrals at our institution maybe due to uncertainty about the malignancy orbenignity of a lesion found by the referring radi-ologist or orthopedic surgeon or to a patient’sdesire for a second opinion about a lesion thatwas interpreted as benign. Early phases of benigndiseases may be confusing, and sometimes fol-low-up imaging at our institution helps provide aspecific diagnosis in such processes as developingmyositis ossificans, osteonecrosis, and Paget dis-ease.
A complete imaging work-up, full staging stud-ies, and consultation with an orthopedic onco-
logic surgeon are desirable before performing apercutaneous needle biopsy. It was reassuringthat the nearly 400 patients in this study did nothave a tissue biopsy-based diagnosis from theirreferring medical facilities. I believe that a biopsycould easily have been performed in a portion ofthese cases but was not performed because of thereferring physician’s awareness of potential com-plications related to erroneously performed biop-sies (2). Contamination of uninvolved compart-ments may convert intracompartmental lesionsinto extracompartmental lesions (3), result inhigher tumor staging, and possibly preclude limbsalvage surgery. Since tertiary care centers see adisproportionate amount of musculoskeletal tu-mors and may have more expertise in diagnosingsuch rare entities, referrals are always welcome,and false-positive examinations are expected. Pa-tient care is always the primary concern.
References1. Stacy GS, Dixon LB. Pitfalls in interpretation of
MR examinations prompting referrals to the ortho-paedic oncology clinic. RadioGraphics 2007;27:805–828.
2. Mankin HJ, Lange T, Spanier SS. The hazards inpatients with malignant primary bone and soft-tis-sue tumors. J Bone Joint Surg Am 1982;64:1121–1127.
3. Anderson MW, Temple TH, Dussaly RG, KaplanPA. Compartmental anatomy: relevance to stagingand biopsy of musculoskeletal tumors. AJR Am JRoentgenol 1999;173:1663–1671.
Authors’ Response
From:Gregory Scott Stacy, MD, Larry B. Dixon, MDDepartment of Radiology, University of ChicagoChicago, Illinois
We are grateful for Dr Bancroft’s commentaryand words of wisdom regarding the referral andwork-up of patients with bone and soft-tissue tu-mors. Her statements that warn of the conse-quences of erroneously performed biopsies of
aggressive lesions are particularly important.Our opinion is that the radiologist should notagree to perform a biopsy of any potential bone
RG f Volume 27 ● Number 3 Stacy and Dixon 827
Note: This copy is for your personal, non-commercial use only. To order presentation-ready copies for distribution to your colleagues or clients, use the RadioGraphics Reprints form at the end of this article.
or soft-tissue sarcoma without first consultingwith the surgeon who will ultimately be respon-sible for removal of the tumor—preferably, anorthopedic oncologist who specializes in thework-up and treatment of such neoplasms. Whenwe encounter a suspicious lesion in our own prac-tice, our impressions in the dictated report willinclude a statement such as “We recommend re-ferral to an orthopedic oncologist” rather than“We recommend biopsy.”
As a point of clarification, the nearly 400 pa-tients alluded to in our article that were referredto the Orthopaedic Oncology Clinic without atissue biopsy-based diagnosis did not constitutethe entire population of new patient referrals dur-ing the year: More than 800 new patients werereferred to the clinic during that 12-month pe-riod. For the purposes of our article, we excluded(a) any patient referred with a diagnosis based onhistologic specimens obtained at the referring in-stitution, including patients who were inappropri-ately treated at the referring institution; (b) anypatient with a potential recurrence of a knowntreated tumor; (c) any patient with a pathologicfracture through a known benign or malignant
tumor who was presenting for fixation; (d) anypatient seen by the orthopedic surgeon for adocumented reason other than a potential tumor(eg, for a nonpathologic fracture); (e) any patientwho brought images that we were unable to re-view (eg, because of an inability to load a CD-ROM disk); and (f) any patient who did not bringimages or for whom we could not reasonably de-termine the reason for referral. With regard tocriterion (c), we wish to emphasize that a patho-logic fracture through an underlying bone lesionoften may result in an incredibly confusing ap-pearance on radiographs and magnetic resonanceimages. An otherwise benign-appearing lesionmay seem more aggressive after a fracture, be-cause of adjacent periosteal reaction and soft-tissue edema. Referral of such patients to an or-thopedic oncologist for follow-up or fixation, inour opinion, may be appropriate.
Finally, we do not wish to imply that all boneand soft-tissue lesions should be confidently diag-nosed as either benign or malignant; frequently,they cannot be so diagnosed. As Dr Bancroft hasaffirmed, patient care is always the primary con-cern. As radiologists at a tertiary care center, wereadily offer our expertise so that patients maybe comforted and cared for in the appropriatemanner.
828 May-June 2007 RG f Volume 27 ● Number 3
EDUCATION EXHIBIT 829
Pre- and PostoperativeEvaluation of Con-genital Heart Disease inChildren and Adultswith 64-Section CT1
LEARNINGOBJECTIVESFOR TEST 5After reading thisarticle and takingthe test, the reader
will be able to:� Identify the ana-tomic and morpho-logic features of con-genital heart disease.
� Describe a sequen-tial segmental ap-proach that may beused in interpretingCT images of con-genital heart disease.
� Determine appro-priate CT protocolsfor evaluating con-genital heart diseaseaccording to the ana-tomic, pathologic,and hemodynamiccharacteristics of thedefect; type of previ-ous surgical repair;and patient’s age andability to cooperate.
Sebastian Leschka, MD ● Erwin Oechslin, MD ● Lars Husmann, MDLotus Desbiolles, MD ● Borut Marincek, MD ● Michele Genoni, MDRene Pretre, MD ● Rolf Jenni, MD ● Simon Wildermuth, MD ● HatemAlkadhi, MD
Although echocardiography is the imaging method of choice for diag-nostic, preoperative, and postoperative evaluation of congenital heartdisease, computed tomography (CT) is a helpful complementary imag-ing modality, particularly for postoperative evaluation. A thorough un-derstanding of the normal anatomy and the morphologic features ofcongenital heart diseases is a prerequisite for choosing the optimal CTtechnique and achieving an accurate diagnosis. Furthermore, a closecollaboration with a cardiologist with special training and expertise incongenital heart diseases is required. A sequential segmental approachshould be used in evaluating morphologic features, especially duringthe review of CT images obtained in patients with rare congenital car-diac defects and in postoperative adult patients. To accurately docu-ment and interpret the altered flow conditions in patients with congeni-tal heart disease, knowledge of the wide spectrum of surgical proce-dures and familiarity with the dedicated protocols for performing 64-section CT are needed.©RSNA, 2007
Abbreviations: ECG � electrocardiography, MIP � maximum intensity projection
RadioGraphics 2007; 27:829–846 ● Published online 10.1148/rg.273065713 ● Content Codes:
1From the Institute of Diagnostic Radiology (S.L., L.H., L.D., B.M., S.W., H.A.), Cardiovascular Center (E.O., R.J.), and Clinic for CardiovascularSurgery (M.G., R.P.), University Hospital Zurich, Raemistrasse 100, 8091 Zurich, Switzerland; and Congenital Cardiac Centre for Adults, TorontoGeneral Hospital/University Health Network, Toronto, Ontario, Canada (E.O.). Received April 21, 2006; revision requested July 6 and received Au-gust 21; accepted December 6. Supported by the National Center of Competence in Research, Computer Aided and Image Guided Medical Interven-tions (NCCR-CO ME), of the Swiss National Science Foundation; and by the Georg und Bertha Schwyzer-Winiker Stiftung, Zurich, Switzerland. Allauthors have no financial relationships to disclose. Address correspondence to H.A. (e-mail: [email protected]).
©RSNA, 2007
Note: This copy is for your personal, non-commercial use only. To order presentation-ready copies for distribution to your colleagues or clients, use the RadioGraphics Reprints form at the end of this article.
CME FEATURESee accompanying
test at http://www.rsna.org
/education/rg_cme.html
See last page
TEACHING POINTS
IntroductionAdvances in medicine have increased the life ex-pectancy of patients with congenital heart disease.Thus, the population of individuals who may ben-efit from long-term follow-up with cross-sectionalimaging is steadily increasing (1). Cross-sectionalimaging with magnetic resonance (MR) or com-puted tomography (CT) may help overcome thelimitations of echocardiography, including a pooracoustic window and poor depiction of extracar-diac vascular structures (2), as well as limitationsof conventional angiography such as overlap ofadjacent cardiovascular structures, difficulties insimultaneously depicting the systemic and thepulmonary vascular systems, and catheter-relatedcomplications (2,3). Despite the great capabilitiesof MR imaging for anatomic and functional as-sessment of the heart, an examination with thismodality is time-consuming and may require alengthy period of patient sedation; therefore, theuse of MR imaging in seriously ill or uncoopera-tive patients is often limited (3). In addition, theuse of MR imaging is contraindicated in patientswith a pacemaker or an internal cardioverter-defi-brillator (4).
CT has the advantages of widespread availabil-ity and short acquisition times. The developmentof 64-section CT, with increased scanning speed,higher spatial resolution, and enhanced capabili-ties for simultaneous evaluation of cardiovascularstructures and lung parenchyma, has increasedthe clinical application of CT for the evaluation ofpatients with congenital heart diseases (5). Whencoupled with electrocardiographic (ECG) data,CT images accurately delineate rapidly movingcardiac and paracardiac structures and allow anassessment of coronary artery disease (6–10) andassociated coronary artery anomalies (11). In ad-dition, 64-section CT may be used to obtainfunctional data about motion of the ventricularwall (12) or cardiac valves (13,14). The modalityshould play a particularly substantial role in theevaluation of patients after surgical interventionfor congenital heart disease. Its drawbacks in-clude exposure of the patient to ionizing radiationand the risks inherent in iodinated contrast mate-rial. These disadvantages must be kept in mindwhen considering the use of CT, particularly inpediatric patients.
The purpose of this article is to underscore theimportance of knowledge about the anatomy,morphology, and terminology of congenital heartdisease and to describe a sequential segmentalapproach for the accurate and comprehensive
assessment of pediatric and adult patients withsuch disease. In addition, the article providesguidelines for designing a CT protocol based onthe anatomic, pathologic, and hemodynamiccharacteristics of the cardiac defect; the type ofprevious surgical repair; and the patient’s age andability to cooperate. The CT findings of variouscommon and rare congenital cardiac defects be-fore and after surgery are described and ex-plained.
Scanning TechniqueCareful preparation is a prerequisite for CT inboth pediatric and adult patients. In our experi-ence, short-term sedation often is necessary, par-ticularly in young children (�5 years old). Weprefer the administration of midazolam hydro-chloride 0.1 mg/kg body weight (Dormicum0.5% solution; Hoffmann-La Roche, Grenzach-Wyhlen, Germany) via the intranasal route.
Optimal contrast agent administration and CTscanning techniques vary, depending on the ana-tomic, pathologic, and hemodynamic characteris-tics of the cardiac defect, the type of previous sur-gical repair, and the patient’s age and level of co-operation. Consequently, the CT protocol shouldbe selected on a case-by-case basis. The Tablesummarizes the preferred scanning protocols forpatients with a suspected cardiac disorder. Weroutinely use a 64-section CT scanner (Sensation64; Siemens Medical Solutions, Forchheim, Ger-many) with a detector collimation of 64 � 0.6mm (64 sections, each with a thickness of 0.6mm), pitch of 1.4, gantry rotation time of 330msec, tube voltage of 120 kV, and fully auto-mated real-time anatomy-based dose regulation(CARE Dose 4D) to reduce radiation exposure(15). For image acquisitions in adult patients, thetube current is set to 220 mA, whereas in pediat-ric patients a body weight–based low-dose proto-col (120 kV, 30–80 mA, pitch of 2.0) is used tofurther reduce radiation exposure. The size ofpediatric patients varies from that of a prematureinfant to that of an adult, and the tube currentshould be increased if the patient’s body weightexceeds approximately 50 kg, to improve the sig-nal-to-noise ratio. Lowering of the tube voltage to80 kV in pediatric patients was recently recom-mended to further reduce their radiation expo-sure without impairing the image quality (3).These protocols are used in patients with extra-cardiac abnormalities and abnormal connections.Scanning of the entire thorax is performed withinone breath hold of approximately 5 seconds.
830 May-June 2007 RG f Volume 27 ● Number 3
TeachingPoint

Pro
toco
lsfo
rE
valu
atin
gC
onge
nit
alH
eart
Dis
ease
sw
ith
64-S
ecti
onC
T
Dis
ease
Typ
eS
cann
ing
Ran
ge*
EC
GG
atin
g
Con
tras
tA
gent
Dos
e(m
L/k
gbo
dyw
eigh
t)
Sal
ine
Cha
sing
Bol
us
Sec
tion
Thi
ckne
ss,
Incr
emen
t(m
m)
Com
men
ts
Ext
raca
rdia
cab
norm
alit
ies
Aor
tic
coar
ctat
ion
Aor
tic
arch
todi
aphr
agm
No
1.0
Yes
1.0,
0.8
Thi
n-se
ctio
nre
cons
truc
tion
isre
com
men
ded
for
iden
tific
a-ti
onof
colla
tera
lpat
hway
sA
nom
alou
spu
lmon
ary
veno
usre
turn
Aor
tic
arch
toki
dney
sN
o1.
5N
o2.
0,1.
5Sc
anni
ngra
nge
shou
ldbe
exte
nded
toin
clud
eth
ean
omal
ousp
ul-
mon
ary
veno
usre
turn
toth
eup
perp
arto
fthe
infe
riorv
ena
cava
Pat
ent
duct
usar
teri
osus
Aor
tic
arch
todi
aphr
agm
No
1.0
Yes
1.0,
0.8
Thi
n-se
ctio
nre
cons
truc
tion
isre
com
men
ded
for
iden
tifica
tion
ofth
epa
tent
duct
usar
teri
osus
,whi
chis
usua
llysm
all
Per
sist
entl
efts
uper
iorv
ena
cava
Aor
tic
arch
todi
aphr
agm
No
1.5
No
2.0,
1.5
Intr
acar
diac
com
mun
icat
ions
Atr
ials
epta
ldef
ect,
vent
ricu
lar
sept
alde
fect
Tra
chea
lbif
urca
tion
todi
a-ph
ragm
Yes
†1.
0Y
es1.
0,0.
8
Con
otru
ncal
defe
cts
Tet
ralo
gyof
Fal
lot
Abo
veth
epu
lmon
ary
bi-
furc
atio
nto
diap
hrag
mN
o1.
0N
o2.
0,1.
5N
osa
line
chas
ing
bolu
ssh
ould
beap
plie
d,to
avoi
dw
asho
ut;
tore
duce
cont
rast
-rel
ated
arti
fact
s,th
eco
ntra
stm
ediu
mam
ount
shou
ldbe
min
imiz
edC
omm
onao
rtic
-pul
mon
ary
trun
kA
bove
the
pulm
onar
ybi
-fu
rcat
ion
todi
aphr
agm
No
1.0
Yes
2.0,
1.5
Abn
orm
alco
nnec
tion
sT
rans
posi
tion
ofth
egr
eata
rter
ies,
cong
enita
llyco
rrec
ted
tran
spo-
sitio
nof
the
grea
tart
erie
s
Abo
veth
epu
lmon
ary
bi-
furc
atio
nto
diap
hrag
mN
o1.
0Y
es2.
0,1.
5
Uni
vent
ricu
lar
hear
tT
rach
ealb
ifur
cati
onto
dia-
phra
gmN
o1.
0N
o2.
0,1.
5N
osa
line
chas
ing
bolu
ssh
ould
beap
plie
d,to
avoi
dw
asho
ut;
tore
duce
cont
rast
-rel
ated
arti
fact
s,th
eco
ntra
stm
ediu
mam
ount
shou
ldbe
min
imiz
edD
oubl
eou
tlet
vent
ricl
eA
bove
the
pulm
onar
ybi
-fu
rcat
ion
todi
aphr
agm
No
1.0
No
2.0,
1.5
No
salin
ech
asin
gbo
lus
shou
ldbe
appl
ied,
toav
oid
was
hout
;to
redu
ceco
ntra
st-r
elat
edar
tifa
cts,
the
cont
rast
med
ium
amou
ntsh
ould
bem
inim
ized
Isom
eris
mC
ardi
acT
rach
ealb
ifur
cati
onto
dia-
phra
gmY
es1.
5N
o1.
0,0.
8F
orm
orph
olog
icid
entifi
catio
nof
the
atria
lapp
enda
ges,
thin
-sec
-tio
nre
cons
truc
tion
and
EC
Gga
ting
are
reco
mm
ende
dE
xtra
card
iac
Upp
erth
orac
icap
ertu
reto
belo
wth
eki
dney
sN
o1.
5N
o2.
0,1.
5F
orid
enti
ficat
ion
ofex
trac
ardi
acab
norm
alit
ies,
scan
ning
mus
tin
clud
eth
eth
orax
and
sple
enA
nom
alou
sco
rona
ryar
teri
esT
rach
ealb
ifur
cati
onto
dia-
phra
gmY
es1.
0Y
es0.
75,
0.5
Thi
n-se
ctio
nre
cons
truc
tion
and
EC
Gga
ting
are
man
dato
ry;a
salin
ech
asin
gbo
luss
houl
dbe
appl
ied
toav
oid
high
cont
rast
inth
erig
htve
ntric
le,w
hich
coul
dob
scur
eth
erig
htco
rona
ryar
tery
Not
e.—
Pit
chfo
rno
ngat
edth
orac
ican
dab
dom
inal
CT
is1.
4;pi
tch
for
EC
G-g
ated
CT
is0.
2.*I
fthe
type
ofca
rdia
cab
norm
alit
yis
uncl
ear
befo
reC
T,s
cann
ing
ofth
een
tire
thor
axm
ust
bepe
rfor
med
toid
enti
fyth
epa
thol
ogic
feat
ures
and
toav
oid
mis
diag
nosi
s.† E
CG
gati
ngm
aybe
bene
ficia
lfor
the
dete
ctio
nof
smal
lcar
diac
defe
cts.
RG f Volume 27 ● Number 3 Leschka et al 831

Data acquisition isperformed in a craniocaudal direction from thelevel of the tracheal bifurcation to the diaphragm.Scanning parameters include a detector collima-tion of 32 � 0.6 mm, section collimation of 64 �0.6 mm by means of a z-flying focal spot, gantryrotation time of 330 msec, pitch of 0.2, and tubepotential of 120 kVp. ECG-controlled tube cur-rent modulation (ECG pulsing) is applied with anominal tube current during diastole (600 mAs)and a reduced tube current during systole (120mAs). The use of this technique leads to a consid-erable reduction in radiation dose (16). However,the ability to perform ECG-gated CT is limitedby the temporal resolution of the scanner, andimaging with this technique may not be feasible inpatients with high heart rates (eg, young children,who may have a heart rate as high as 200 beatsper minute). Thus, ECG-gated CT in childrenshould be performed only in the presence of spe-cific indications that outweigh the potential risk ofradiation exposure. In contrast to nongated scan-ning, ECG-gated CT scanning of the entire tho-rax requires an increase in scanning time to ap-proximately 20 seconds, with a resultant increasein radiation dose. Image quality is usually re-duced in patients with elevated heart rates but isstill sufficient to evaluate intracardiac abnormali-ties or the course of anomalous coronary arteries.We do not consider the administration of a�-blocker before CT mandatory for the evalua-tion of patients with congenital heart disease.
For vascular and cardiac opacification, a non-ionic contrast agent (Visipaque 320; GE Health-care, Little Chalfont, England) that contains 320mg of iodine per milliliter is injected via an ante-cubital vein at a dose of 1–1.5 mL/kg body weightand a rate of 3–4 mL/sec. To reduce artifactsfrom undiluted contrast material and to reducethe total amount of contrast material, a saline bo-lus chasing technique should be applied. In neo-nates and infants, the injection access route usu-ally necessitates a lower flow rate; thus, the injec-tion rate should be reduced to 2 mL/sec or less.The scanning delay is determined with an auto-matic bolus tracking technique. In the pediatricpatient, a region of interest is placed in the leftventricle, and a threshold attenuation of 200 HUis set. In adults, the region of interest is placed inthe ascending aorta, and the attenuation thresh-old is set at 140 HU (17). In children and unco-operative adults, scanning is performed duringquiet breathing, usually without serious impair-ment of depiction of intracardiac structures and
the course of anomalous coronary arteries. Sec-tions with a thickness of 2.0 mm (increment of1.5 mm) and a medium (soft-tissue) reconstruc-tion kernel (B30f) are used for image interpreta-tion at nongated CT. For assessing ventricularwall motion, cardiac valves, and coronary arteries,CT image data sets are reconstructed at a sectionwidth of 1.0 mm (increment of 0.8 mm) and syn-chronized to the ECG data in 10% steps of theR-R interval throughout the cardiac cycle. Foroptimal adaptation of the scanning technique andcontrast agent protocol to the individual patient’scondition, the radiologist should have experiencewith the use of multidetector CT in patients withcongenital heart disease.
Depending on the targeted structure and thepurpose of the examination, various image datapostprocessing techniques, including multiplanarreformation, maximum intensity projection(MIP), and volume rendering, are performed at aworkstation equipped with dedicated software(Syngo InSpace4D; Siemens). Multiplanar refor-mation is a rapid and easy way to obtain images ofstructures that follow a course oblique to the axialplane. The plane of the reformatted image can beindividually adjusted to the long axis of the struc-ture of interest and to obtain accurate measure-ments (diameters or area of the dedicated struc-ture). MIP images are obtained by projectingonto an image plane the highest-attenuation vox-els encountered throughout a volume, a tech-nique that facilitates the evaluation of structuresthat are not lying in a single plane. MIP is usedmainly for the evaluation of vascular structuresbut has the disadvantage that vessels adjacent tobones may be obscured. Although volume render-ing is the most time-consuming postprocessingtechnique, it is helpful for the three-dimensionalvisualization of complex anatomy, particularly forreferring cardiologists and cardiovascular sur-geons. In general, the combined use of variouspostprocessing techniques improves overall un-derstanding of the cardiovascular situation andreduces the time needed for CT-based diagnosis(18), although the greatest amount of structuralinformation about the cardiovascular anatomyusually is obtained with multiplanar reformation.
Radiation ExposureParticular emphasis must be placed on radiationexposure issues, because the initial CT examina-tion in patients with congenital heart disease oftentakes place in childhood or in early adulthood,and repeated scanning sometimes is necessary. IfECG-gated CT is to be used, the benefits of as-sessing ventricular function, cardiac valves, smallintracardiac abnormalities, and coronary arteriesmust outweigh the higher risk of radiation expo-sure that is inherent in the technique. The effec-
832 May-June 2007 RG f Volume 27 ● Number 3
In patients with a complex cardiac abnormalityor with a minor intracardiac abnormality and anabnormal communication, synchronization of theCT data acquisition with the ECG tracing isrecommended to reduce motion artifacts, whichmay obscure abnormalities.
TeachingPoint

tive radiation dose from ECG-gated CT of theheart is estimated to be approximately 15 mSv(19). For comparison, the effective radiation dosefrom nongated CT of the chest is approximately 5mSv (20).
In general, three different algorithms may beused to reduce the radiation dose: First, weight-and size-based adjustments of tube current usu-ally are performed according to the patient’s bodyhabitus (eg, at thoracic CT, tube current is in-creased for the lateral projection and reduced inthe anteroposterior projection) so that equalnumbers of photons are received by the detectorarray (15,20). Second, an ECG-controlled tubecurrent modulation algorithm known as ECGpulsing may be used to reduce radiation exposureby modulating the x-ray tube output according tothe patient’s ECG tracing (16,21,22). During auser-defined phase of the cardiac cycle (usuallybetween mid- and end-diastole), the output iskept at a nominal value; in the remainder of thecardiac cycle, the tube output is reduced by 80%.The quality of low-dose images obtained duringsystole is sufficient for the evaluation of ventricu-lar functional parameters or the origin and courseof coronary artery anomalies; however, it is usu-ally inadequate for the assessment of stenoses orother abnormalities in more distal parts of thecoronary artery tree. Mean dose reduction ratesof 29% (21) and 37% (19) with the use of ECGpulsing in CT coronary angiography protocolshave been reported. The effective dose for ECG-gated CT scanning with ECG pulsing has beenestimated as 9 mSv (19). Third, the radiationdose may be lowered by reducing the tube volt-age. In a comparison of cardiac CT protocols inwhich tube voltages of 120 kV and 100 kV wereused, a dose savings of 57% was found (19). De-creased tube voltage also leads to increased opaci-fication of contrast-enhanced structures becauseof an increase in the photoelectric effect and de-creased Compton scattering (23). However, re-duction of the tube voltage may result in in-creased image noise and decreased image quality.For noncardiac CT studies with decreased tubevoltage, an increase of the tube current has beenrecommended to decrease image noise (24).
Although the radiation burden incurred byECG-gated CT may be substantially reducedwith dose-saving algorithms, a trade-off betweena higher radiation dose and additional informa-tion provided by ECG gating must be made on apatient-by-patient basis.
Sequential Segmental ApproachCongenital heart defects may occur in many dif-ferent combinations and be very complex, andtheir accurate diagnosis requires profound knowl-edge. Several approaches to classifying congenital
heart diseases have been suggested, but no con-sensus has been reached about nomenclature.Nomenclature systems based on embryology werecommon in the past; other, more physiologic clas-sification systems rely on clinical manifestations(eg, cyanosis) and the presence of an increase ordecrease in pulmonary vascularity. In the lattersystem, congenital heart diseases may be classi-fied as acyanotic with increased pulmonary vascu-larity (with a left-to-right shunt), acyanotic withnormal pulmonary vascularity (with either out-flow obstruction or valvular insufficiency), cya-notic with decreased pulmonary vascularity (withan intracardiac defect that shunts blood awayfrom the lung), or cyanotic with increased pulmo-nary vascularity (with bidirectional systemic andpulmonary venous shunts).
A simpler descriptive system derived from thesequential segmental approach was introduced inthe 1980s. Based on the visualization of bloodflow into, through, and out of the heart, the se-quential segmental approach for interpreting ana-tomic images obtained in patients with congenitalheart disease consists of the following steps:(a) determining cardiac sidedness (arrangementof atrial chambers), (b) locating the three seg-ments (the atrial chambers, ventricular chambers,and the great arteries), (c) identifying the cardiacconnections (venoatrial, atrioventricular, andventriculoarterial), (d) assessing associated mal-formations, and (e) determining the cardiac posi-tion (position of the heart within the chest, orien-tation of the apex) (25–29).
The cardiac chambers are defined according totheir morphologic characteristics and need not bein the expected locations. Each chamber has in-trinsic morphologic features. Thus, the reader ofimages must be familiar with normal and abnor-mal morphologic features. The assessment of sid-edness (situs) includes cardiac, pulmonary, andabdominal sidedness, which usually are concor-dant. Cardiac sidedness is determined by the po-sition of the morphologic right atrium and is inde-pendent from cardiac position, cardiac orienta-tion, and the positions of the ventricles or greatarteries. In situs solitus (the normal configura-tion), the morphologic right atrium lies to theright of the morphologic left atrium. In situs in-versus, the morphologic right atrium lies to theleft of the morphologic left atrium.
The features of congenital heart disease inadults resemble those in pediatric patients but aremore likely to include complications that resultfrom hemodynamic alterations (eg, pulmonaryhypertension, ventricular hypertrophy). Therefore,
RG f Volume 27 ● Number 3 Leschka et al 833
TeachingPoint

changes in cardiac chamber size and morphologicfeatures should be thoroughly investigated withfollow-up imaging studies (30).
Normal AnatomyKnowledge of the normal cardiac morphology is aprerequisite for the evaluation of congenital heartdisease (3,31). The heart consists of atrial, ven-tricular, and arterial segments (25–29). Thesemain cardiac segments and their connections(venoatrial, atrioventricular, and ventriculoarte-rial) must be completely identified.
AtriaThe appendages are landmarks for morphologicright-sidedness or left-sidedness of the atria. Theright atrial appendage is characterized by a trian-gular shape with a broad base and a terminalcrest; the left atrial appendage has a fingerlikeshape with a narrow entrance (Fig 1a).
VentriclesNormal ventricles consist of three components:inlet, apex, and outlet. The cornerstone for mor-phologic identification of the two ventricles istheir inlet component, which includes the inlet(atrioventricular valve) and its tension apparatus.The latter consists of the chordae tendinae, whichprevent the valve from inverting, and the papillarymuscles, which are attached to the chordae tendi-nae and cause tension that prevents the valve
from prolapsing into the atrium when the valve isclosed. The inlet portion of the morphologic rightventricle is completely different from that of themorphologic left ventricle. Because the atrioven-tricular valve is connected to the correspondingventricle, identification of the tricuspid and mitralvalves is key for determining the ventricular struc-ture. First, the hingepoint of the tricuspid valve ismore apically positioned than that of the mitralvalve; second, the septal leaflet of the tricuspidvalve is extensive, and its tethering to the septumis an anatomic landmark of the valve.
The second landmark for determining mor-phologic right- or left-sidedness of ventricles istheir outlet portion. The outlet of the morpho-logic right ventricle is a saddle-shaped supraven-tricular muscular crest that is located between thepulmonary valve and the tricuspid valve. There isno conical musculature between the aortic andmitral valves; instead, complete continuity of thefibrous tissue is seen (Fig 1b).
The ventricular wall thickness and the appear-ance of trabeculae are not useful for defining themorphologic left- versus right-sidedness of ven-tricles in the clinical setting. The left ventricle isdemarcated by fine trabeculae and by two largepapillary muscles that arise from the free wall andthat are situated in the anterolateral and postero-medial positions, respectively. In the right ven-tricle, the muscular trabeculae are coarse andtend to parallel the right ventricular inflow andoutflow tracts. The papillary muscles are rela-tively small and arise from both the septal andfree wall surfaces. Papillary muscles that arisefrom the septal surface are unique to the morpho-
‹Figure 1. Normal anatomy of the heart, mediastinal vessels, and main bronchi at multidetector CT. (a) Thin-sec-tion axial image at the level of the ascending aorta (Ao) and pulmonary valve (PV) demonstrates normal anatomy ofthe left atrium (LA) and right atrium. The right atrial appendage (RAA) typically has a triangular shape, with a wideropening and larger pectinate muscles (arrows) than those of the left atrial appendage (LAA), which has a fingerlikeshape. (b) Thin-section double-oblique image through the left ventricular inflow and outflow tract shows normalanatomy of the morphologic left ventricle with fine trabeculae, the anterolateral and posteromedial papillary muscles,and fibrous continuity (arrowhead) between the aortic valve (AV) and the mitral valve (MV). (c) Thin-sectionoblique sagittal image depicts the morphologic right ventricle (RV), which is characterized by coarse trabeculae and amuscular crest, the crista supraventricularis (arrowhead), between the tricuspid valve (TV) and the pulmonary valve(PV). (d) Thin-section oblique sagittal image shows the normal anatomy of the ascending aorta (aA), the aortic arch(AoA), the aortic isthmus (Isth), and the descending aorta (dA). The ascending aorta originates from the aortic valve(AV), between the left atrium (LA) and right atrium (RA). (e) Thin-section axial image demonstrates the pulmo-nary trunk (PT), the left pulmonary artery (lPA), and the right pulmonary artery (rPA). The left pulmonary artery isshorter than the right, and it courses in a more posterior direction. The right pulmonary artery passes behind the as-cending aorta and the superior vena cava and in front of the descending aorta (dA). (f) Thin-section coronal imageobtained with lung window settings shows a normal bronchial branching pattern. The right upper lobe bronchus(RULB) is superior to the right pulmonary artery (rPA), whereas the left pulmonary artery (lPA) courses over the leftupper lobe bronchus (LULB). (g) Thick-section oblique coronal image obtained with a slab thickness of 5 mm dem-onstrates normal connections of the three systemic veins—the superior vena cava (SVC), inferior vena cava (IVC),and coronary sinus (CS)—to the right atrium (RA). The mixture of highly contrast-enhanced venous blood from thesuperior vena cava with nonenhanced venous blood from the inferior vena cava is visible in the atrium. LA � leftatrium. (h) Volume-rendered image, obtained with reconstruction in an oblique right-posterior plane by using thecut-plane mode, demonstrates the relationship of the superior (SVC) and inferior (IVC) venae cavae to other ana-tomic structures adjacent to the site of venous connection to the right atrium (RA).
834 May-June 2007 RG f Volume 27 ● Number 3
TeachingPoint

logic right ventricle. Another characteristic fea-ture of the right ventricle is the moderator band, aprominent muscle bundle that crosses from theseptomarginal trabecula to the anterior papillarymuscle and then to the parietal wall (Fig 1c).
Great ArteriesThe great arteries are distinguished by their branch-ing pattern rather than by the arterial valve, which isindistinguishable. Connection to the morphologicright or left ventricle cannot be used to define thegreat arteries. In most patients, the aortic sinusesgive rise to the coronary arteries. Normally, the as-cending aorta arises from the left ventricle and ex-tends to the aortic arch, which is usually on the leftside and gives rise to the brachiocephalic trunk, theleft common carotid artery, and the left subclavian
artery. The distal part of the aortic arch, which iscalled the aortic isthmus and which continues as thedescending aorta, gives rise to the intercostal arter-ies and bronchial arteries (Fig 1d).
The main pulmonary artery passes from ananterior position toward the left posterior aspectof the aorta and subdivides into the left and rightpulmonary arteries. The left pulmonary arterycourses in a more posterior direction, while theright pulmonary artery passes behind the ascend-ing aorta and superior vena cava (Fig 1e).
The bronchial branching pattern is helpful fordefining the right- or left-sidedness of pulmonary
RG f Volume 27 ● Number 3 Leschka et al 835

structures. However, the anatomic relationshipbetween the upper lobe bronchus and the branchpulmonary artery is the only characteristic featuredefining the morphologic left- or right-sidednessof pulmonary structures (Fig 1f ). When the pul-monary structures are in the normal position (si-tus solitus), the right upper lobe bronchus is su-perior and posterior to the descending branch ofthe right pulmonary artery (epiarterial bronchus),while the left upper pulmonary artery coursesposterior to the left upper bronchus and over theleft upper lobe bronchus (hyparterial bronchus).
Great VeinsThe great veins are identified by the organs thatthey drain. Three systemic veins are connected tothe heart: the superior and inferior venae cavaeand the coronary sinus (Fig 1g, 1h). In mostpeople, these three veins join the right atriumwithin the confines of the sinus venosus, which isbounded by the atrial septum and the crista ter-minalis.
The four pulmonary veins normally are con-nected to the left atrium in a different corner ofthe posterior atrial wall. The right upper- andmiddle-lobe veins join to form the right superiorpulmonary vein, while the left superior pulmo-nary vein receives blood from the left upper lobe.The left and right inferior lobes drain blood intothe left and right inferior pulmonary veins, re-spectively.
Normal ConnectionsThree types of connections—venoatrial, atrioven-tricular, and ventriculoarterial—must be de-scribed. In the setting of concordant (normal)atrioventricular connection, the morphologicright atrium is connected to the morphologic rightventricle via the tricuspid valve, and the morpho-logic left atrium is connected to the morphologicleft ventricle via the mitral valve. In the setting ofconcordant (normal) ventriculoarterial connec-tion, the morphologic right ventricle is connectedto the pulmonary artery, and the morphologic leftventricle is connected to the aorta.
In the presence of discordant connection, theatria and ventricles or the ventricles and arteriesare not connected to the corresponding cham-bers. Atrioventricular concordance and ventricu-
loarterial discordance occur together in completetransposition of the great arteries. Atrioventricu-lar and ventriculoarterial discordance, or doublediscordance, occurs in congenitally correctedtransposition of the great arteries.
Extracardiac Abnormalities
Aortic CoarctationCoarctation of the aorta typically consists of adiaphragmlike ridge that extends into the aorticlumen just distal to the left subclavian artery. Thecondition results in upper-body arterial hyperten-sion and often is associated with a bicuspid aorticvalve (familial aortic ectasia syndrome). Mostadults with aortic coarctation are asymptomaticbecause chronic luminal narrowing of the aortaprovokes the development of collateral vessels(eg, collateral epigastric, intercostal, thoracoacro-mial, vertebral, and anterior spinal arteries) toallow blood to flow from high-pressure to low-pressure areas (Fig 2) (32). CT is an effective andrapid imaging modality for the morphologic as-sessment of vessels, determination of the degreeof stenosis, and visualization of collateral vessels(32). In addition, CT is a valuable tool when con-sidering different therapeutic strategies (ballooncatheterization and stent implantation vs surgery)in patients with severe aortic coarctation. How-ever, CT is less useful than MR imaging in pa-tients with mild stenosis, because of the lack ofhemodynamic information provided by CT (33).On the other hand, CT is superior to MR imagingfor postinterventional or postsurgical follow-up,because of the magnetic susceptibility artifactsproduced by metallic stents and metallic clips atMR imaging.
Anomalous Pulmo-nary Venous ConnectionTotal anomalous pulmonary venous connection ischaracterized by the connection of all the pulmo-nary veins to the right atrium either directly orindirectly via the superior or the inferior venacava; the pulmonary veins may form a confluencebehind the left atrium (34). Depending on the siteof connection with the right atrium or systemicveins, total anomalous pulmonary venous con-nection is described as supracardiac, cardiac, in-fracardiac, or mixed (3,17). In partial anomalouspulmonary venous connection, one or more (but
836 May-June 2007 RG f Volume 27 ● Number 3

not all) pulmonary veins are connected to thevena cava or right atrium. The anatomic varia-tions of partial anomalous pulmonary venousconnection are manifold. Anomalous connectionof the right pulmonary vein or veins to the inferiorvena cava, often seen in association with hypopla-sia of the right lung and anomalous systemic arte-rial supply through aortopulmonary collateralvessels, is called scimitar syndrome (Fig 3)
(35,36). Abnormal connection of the right upperpulmonary vein to the superior vena cava occursfrequently in the presence of a sinus venosus de-fect (37); in such cases, the anomalous connec-tion occurs at a slightly higher level than it does in
Figure 2. Coarctation of the aorta at nongated CT in a 25-year-old man with atypicalchest pain. (a) Thick-section oblique sagittal MIP image shows a high-grade aortic coarcta-tion (arrow). AoA � aortic arch, dA � descending aorta, PT � pulmonary trunk. (b) Thin-section volume-rendered image, obtained with reconstruction in an oblique left-posteriorplane by using the cut-plane mode, demonstrates narrowing of the aortic isthmus (small ar-row) and extensive collateral intercostal and nuchal arteries (large arrow).
Figure 3. Scimitar syndrome at nongated CT performed for preoperative evaluation of pul-monary structures and lung parenchyma in a 16-year-old girl. Thick-section coronal MIPimage (a) and thick-section axial MIP image (b) with a slab thickness of 10 mm show an anoma-lous connection of the right lower pulmonary vein (*) to the inferior vena cava (IVC). Hypoplasiaof the right lung also is depicted. lPA � left pulmonary artery, rPA � right pulmonary artery.
RG f Volume 27 ● Number 3 Leschka et al 837
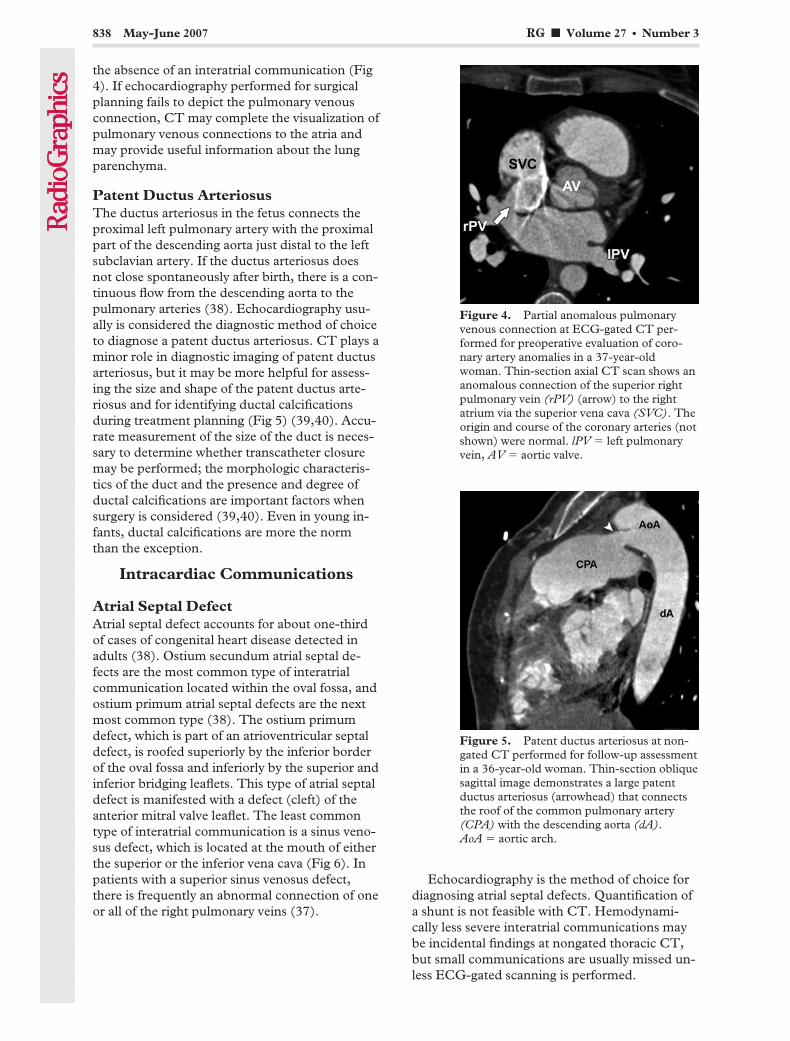
the absence of an interatrial communication (Fig4). If echocardiography performed for surgicalplanning fails to depict the pulmonary venousconnection, CT may complete the visualization ofpulmonary venous connections to the atria andmay provide useful information about the lungparenchyma.
Patent Ductus ArteriosusThe ductus arteriosus in the fetus connects theproximal left pulmonary artery with the proximalpart of the descending aorta just distal to the leftsubclavian artery. If the ductus arteriosus doesnot close spontaneously after birth, there is a con-tinuous flow from the descending aorta to thepulmonary arteries (38). Echocardiography usu-ally is considered the diagnostic method of choiceto diagnose a patent ductus arteriosus. CT plays aminor role in diagnostic imaging of patent ductusarteriosus, but it may be more helpful for assess-ing the size and shape of the patent ductus arte-riosus and for identifying ductal calcificationsduring treatment planning (Fig 5) (39,40). Accu-rate measurement of the size of the duct is neces-sary to determine whether transcatheter closuremay be performed; the morphologic characteris-tics of the duct and the presence and degree ofductal calcifications are important factors whensurgery is considered (39,40). Even in young in-fants, ductal calcifications are more the normthan the exception.
Intracardiac Communications
Atrial Septal DefectAtrial septal defect accounts for about one-thirdof cases of congenital heart disease detected inadults (38). Ostium secundum atrial septal de-fects are the most common type of interatrialcommunication located within the oval fossa, andostium primum atrial septal defects are the nextmost common type (38). The ostium primumdefect, which is part of an atrioventricular septaldefect, is roofed superiorly by the inferior borderof the oval fossa and inferiorly by the superior andinferior bridging leaflets. This type of atrial septaldefect is manifested with a defect (cleft) of theanterior mitral valve leaflet. The least commontype of interatrial communication is a sinus veno-sus defect, which is located at the mouth of eitherthe superior or the inferior vena cava (Fig 6). Inpatients with a superior sinus venosus defect,there is frequently an abnormal connection of oneor all of the right pulmonary veins (37).
Echocardiography is the method of choice fordiagnosing atrial septal defects. Quantification ofa shunt is not feasible with CT. Hemodynami-cally less severe interatrial communications maybe incidental findings at nongated thoracic CT,but small communications are usually missed un-less ECG-gated scanning is performed.
Figure 4. Partial anomalous pulmonaryvenous connection at ECG-gated CT per-formed for preoperative evaluation of coro-nary artery anomalies in a 37-year-oldwoman. Thin-section axial CT scan shows ananomalous connection of the superior rightpulmonary vein (rPV) (arrow) to the rightatrium via the superior vena cava (SVC). Theorigin and course of the coronary arteries (notshown) were normal. lPV � left pulmonaryvein, AV � aortic valve.
Figure 5. Patent ductus arteriosus at non-gated CT performed for follow-up assessmentin a 36-year-old woman. Thin-section obliquesagittal image demonstrates a large patentductus arteriosus (arrowhead) that connectsthe roof of the common pulmonary artery(CPA) with the descending aorta (dA).AoA � aortic arch.
838 May-June 2007 RG f Volume 27 ● Number 3
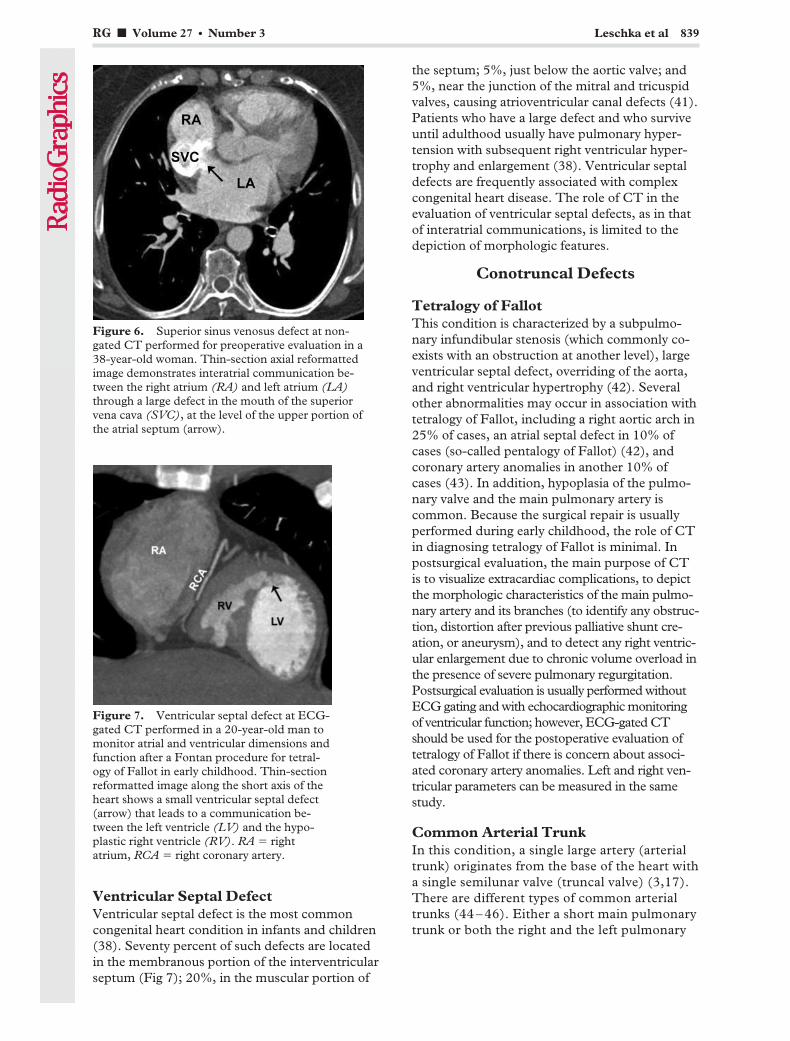
Ventricular Septal DefectVentricular septal defect is the most commoncongenital heart condition in infants and children(38). Seventy percent of such defects are locatedin the membranous portion of the interventricularseptum (Fig 7); 20%, in the muscular portion of
the septum; 5%, just below the aortic valve; and5%, near the junction of the mitral and tricuspidvalves, causing atrioventricular canal defects (41).Patients who have a large defect and who surviveuntil adulthood usually have pulmonary hyper-tension with subsequent right ventricular hyper-trophy and enlargement (38). Ventricular septaldefects are frequently associated with complexcongenital heart disease. The role of CT in theevaluation of ventricular septal defects, as in thatof interatrial communications, is limited to thedepiction of morphologic features.
Conotruncal Defects
Tetralogy of FallotThis condition is characterized by a subpulmo-nary infundibular stenosis (which commonly co-exists with an obstruction at another level), largeventricular septal defect, overriding of the aorta,and right ventricular hypertrophy (42). Severalother abnormalities may occur in association withtetralogy of Fallot, including a right aortic arch in25% of cases, an atrial septal defect in 10% ofcases (so-called pentalogy of Fallot) (42), andcoronary artery anomalies in another 10% ofcases (43). In addition, hypoplasia of the pulmo-nary valve and the main pulmonary artery iscommon. Because the surgical repair is usuallyperformed during early childhood, the role of CTin diagnosing tetralogy of Fallot is minimal. Inpostsurgical evaluation, the main purpose of CTis to visualize extracardiac complications, to depictthe morphologic characteristics of the main pulmo-nary artery and its branches (to identify any obstruc-tion, distortion after previous palliative shunt cre-ation, or aneurysm), and to detect any right ventric-ular enlargement due to chronic volume overload inthe presence of severe pulmonary regurgitation.Postsurgical evaluation is usually performed withoutECG gating and with echocardiographic monitoringof ventricular function; however, ECG-gated CTshould be used for the postoperative evaluation oftetralogy of Fallot if there is concern about associ-ated coronary artery anomalies. Left and right ven-tricular parameters can be measured in the samestudy.
Common Arterial TrunkIn this condition, a single large artery (arterialtrunk) originates from the base of the heart witha single semilunar valve (truncal valve) (3,17).There are different types of common arterialtrunks (44 – 46). Either a short main pulmonarytrunk or both the right and the left pulmonary
Figure 6. Superior sinus venosus defect at non-gated CT performed for preoperative evaluation in a38-year-old woman. Thin-section axial reformattedimage demonstrates interatrial communication be-tween the right atrium (RA) and left atrium (LA)through a large defect in the mouth of the superiorvena cava (SVC), at the level of the upper portion ofthe atrial septum (arrow).
Figure 7. Ventricular septal defect at ECG-gated CT performed in a 20-year-old man tomonitor atrial and ventricular dimensions andfunction after a Fontan procedure for tetral-ogy of Fallot in early childhood. Thin-sectionreformatted image along the short axis of theheart shows a small ventricular septal defect(arrow) that leads to a communication be-tween the left ventricle (LV) and the hypo-plastic right ventricle (RV). RA � rightatrium, RCA � right coronary artery.
RG f Volume 27 ● Number 3 Leschka et al 839

arteries may arise from the arterial trunk. Asubtruncal ventricular septal defect is alwayspresent. About one-third of patients with acommon arterial trunk also have a right-sided
aortic arch. Surgical repair consists of (a) dis-connection of the pulmonary trunk from theascending aorta with patch closure and (b) res-toration of continuity between the right ven-tricle and pulmonary vascular bed with graftimplantation (Fig 8).
Figure 8. Childhood surgical repair of a common arterial trunk at ECG-gated CT performed in a 32-year-oldwoman because of suspicion of a coronary artery anomaly. (a) Thin-section axial CT scan shows a patch (arrow) be-tween the common arterial trunk (CAT) and the right ventricle (RV). RA � right atrium. (b) Thin-section axial CTscan demonstrates a graft implanted from the right ventricle to the pulmonary trunk. The connection to the ascend-ing aorta (aA) was closed with a patch (arrow). The origin and course of the coronary arteries (not shown) were nor-mal. dA � descending aorta, rPA � right pulmonary artery.
Figure 9. Double inlet left ventricle with d-transposition of the great arteries, observed at ECG-gated CT performed to supplement postoperative echocardiography in a 30-year-old man aftersurgical banding of the common pulmonary artery. (a) Thin-section reformatted image along thelong axis of the heart shows connection of the left atrium (LA) and right atrium (RA) through aleft-sided valve (LSV) and a right-sided valve (RSV), respectively, to a dominant ventricle (DV,morphologic left ventricle). (b) Thin-section oblique sagittal image demonstrates a subaortic out-let chamber (SOC) connected via a bulboventricular foramen (*) to the subpulmonary ventricle(the dominant ventricle in a). There is no atrioventricular connection to the subaortic outlet cham-ber. Banding of the common pulmonary artery was performed to protect the lung from high sys-temic blood flow and pressure. The great arteries are in parallel position (d-transposition): Thepulmonary artery arises from the morphologic left single ventricle, and the aorta arises from thesubaortic outlet chamber. AV � aortic valve, PV � pulmonary valve.
840 May-June 2007 RG f Volume 27 ● Number 3
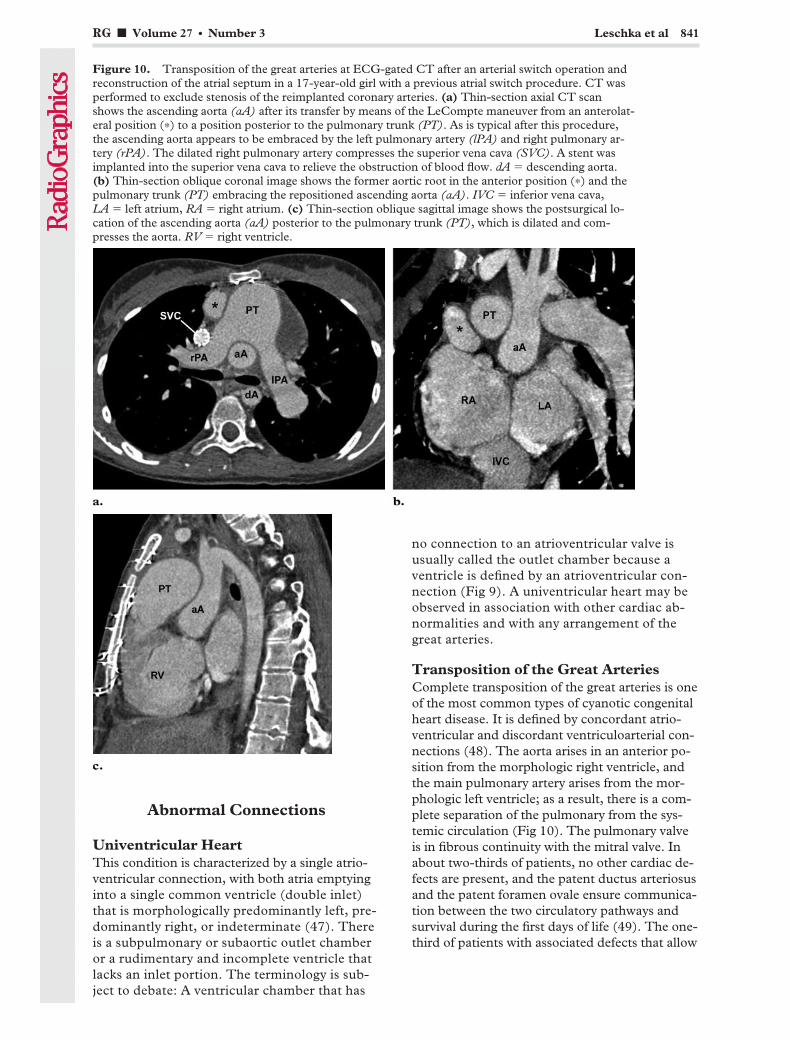
Abnormal Connections
Univentricular HeartThis condition is characterized by a single atrio-ventricular connection, with both atria emptyinginto a single common ventricle (double inlet)that is morphologically predominantly left, pre-dominantly right, or indeterminate (47). Thereis a subpulmonary or subaortic outlet chamberor a rudimentary and incomplete ventricle thatlacks an inlet portion. The terminology is sub-ject to debate: A ventricular chamber that has
no connection to an atrioventricular valve isusually called the outlet chamber because aventricle is defined by an atrioventricular con-nection (Fig 9). A univentricular heart may beobserved in association with other cardiac ab-normalities and with any arrangement of thegreat arteries.
Transposition of the Great ArteriesComplete transposition of the great arteries is oneof the most common types of cyanotic congenitalheart disease. It is defined by concordant atrio-ventricular and discordant ventriculoarterial con-nections (48). The aorta arises in an anterior po-sition from the morphologic right ventricle, andthe main pulmonary artery arises from the mor-phologic left ventricle; as a result, there is a com-plete separation of the pulmonary from the sys-temic circulation (Fig 10). The pulmonary valveis in fibrous continuity with the mitral valve. Inabout two-thirds of patients, no other cardiac de-fects are present, and the patent ductus arteriosusand the patent foramen ovale ensure communica-tion between the two circulatory pathways andsurvival during the first days of life (49). The one-third of patients with associated defects that allow
Figure 10. Transposition of the great arteries at ECG-gated CT after an arterial switch operation andreconstruction of the atrial septum in a 17-year-old girl with a previous atrial switch procedure. CT wasperformed to exclude stenosis of the reimplanted coronary arteries. (a) Thin-section axial CT scanshows the ascending aorta (aA) after its transfer by means of the LeCompte maneuver from an anterolat-eral position (*) to a position posterior to the pulmonary trunk (PT). As is typical after this procedure,the ascending aorta appears to be embraced by the left pulmonary artery (lPA) and right pulmonary ar-tery (rPA). The dilated right pulmonary artery compresses the superior vena cava (SVC). A stent wasimplanted into the superior vena cava to relieve the obstruction of blood flow. dA � descending aorta.(b) Thin-section oblique coronal image shows the former aortic root in the anterior position (*) and thepulmonary trunk (PT) embracing the repositioned ascending aorta (aA). IVC � inferior vena cava,LA � left atrium, RA � right atrium. (c) Thin-section oblique sagittal image shows the postsurgical lo-cation of the ascending aorta (aA) posterior to the pulmonary trunk (PT), which is dilated and com-presses the aorta. RV � right ventricle.
RG f Volume 27 ● Number 3 Leschka et al 841
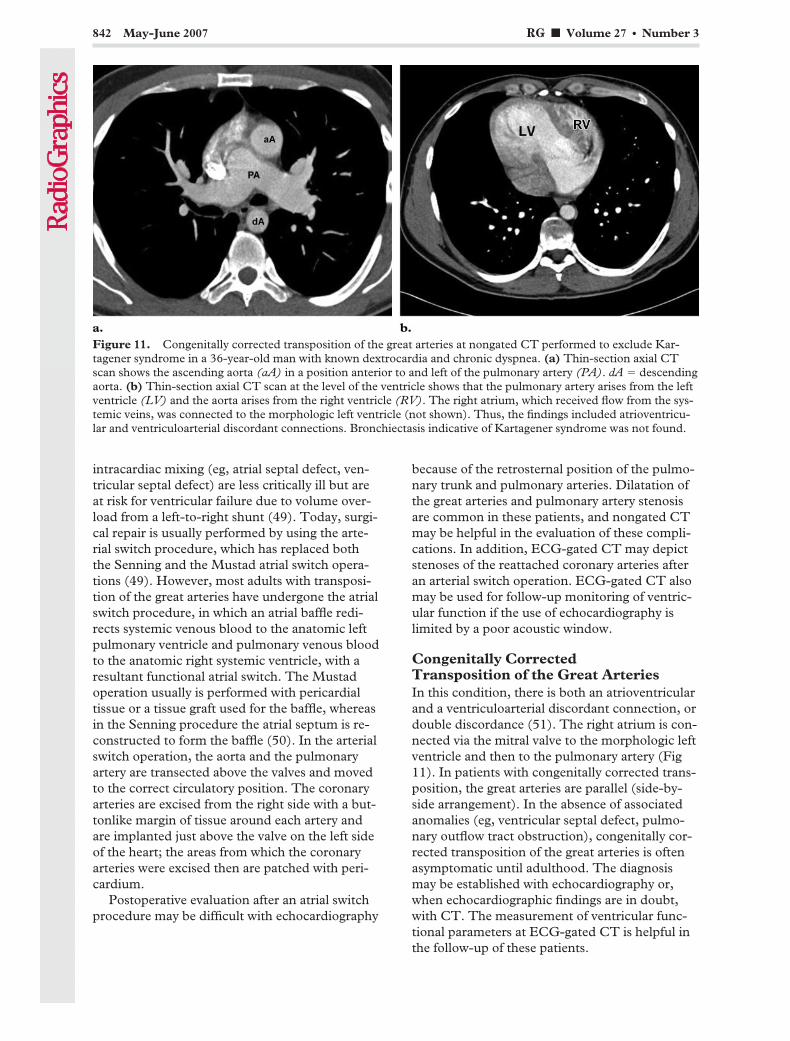
intracardiac mixing (eg, atrial septal defect, ven-tricular septal defect) are less critically ill but areat risk for ventricular failure due to volume over-load from a left-to-right shunt (49). Today, surgi-cal repair is usually performed by using the arte-rial switch procedure, which has replaced boththe Senning and the Mustad atrial switch opera-tions (49). However, most adults with transposi-tion of the great arteries have undergone the atrialswitch procedure, in which an atrial baffle redi-rects systemic venous blood to the anatomic leftpulmonary ventricle and pulmonary venous bloodto the anatomic right systemic ventricle, with aresultant functional atrial switch. The Mustadoperation usually is performed with pericardialtissue or a tissue graft used for the baffle, whereasin the Senning procedure the atrial septum is re-constructed to form the baffle (50). In the arterialswitch operation, the aorta and the pulmonaryartery are transected above the valves and movedto the correct circulatory position. The coronaryarteries are excised from the right side with a but-tonlike margin of tissue around each artery andare implanted just above the valve on the left sideof the heart; the areas from which the coronaryarteries were excised then are patched with peri-cardium.
Postoperative evaluation after an atrial switchprocedure may be difficult with echocardiography
because of the retrosternal position of the pulmo-nary trunk and pulmonary arteries. Dilatation ofthe great arteries and pulmonary artery stenosisare common in these patients, and nongated CTmay be helpful in the evaluation of these compli-cations. In addition, ECG-gated CT may depictstenoses of the reattached coronary arteries afteran arterial switch operation. ECG-gated CT alsomay be used for follow-up monitoring of ventric-ular function if the use of echocardiography islimited by a poor acoustic window.
Congenitally CorrectedTransposition of the Great ArteriesIn this condition, there is both an atrioventricularand a ventriculoarterial discordant connection, ordouble discordance (51). The right atrium is con-nected via the mitral valve to the morphologic leftventricle and then to the pulmonary artery (Fig11). In patients with congenitally corrected trans-position, the great arteries are parallel (side-by-side arrangement). In the absence of associatedanomalies (eg, ventricular septal defect, pulmo-nary outflow tract obstruction), congenitally cor-rected transposition of the great arteries is oftenasymptomatic until adulthood. The diagnosismay be established with echocardiography or,when echocardiographic findings are in doubt,with CT. The measurement of ventricular func-tional parameters at ECG-gated CT is helpful inthe follow-up of these patients.
Figure 11. Congenitally corrected transposition of the great arteries at nongated CT performed to exclude Kar-tagener syndrome in a 36-year-old man with known dextrocardia and chronic dyspnea. (a) Thin-section axial CTscan shows the ascending aorta (aA) in a position anterior to and left of the pulmonary artery (PA). dA � descendingaorta. (b) Thin-section axial CT scan at the level of the ventricle shows that the pulmonary artery arises from the leftventricle (LV) and the aorta arises from the right ventricle (RV). The right atrium, which received flow from the sys-temic veins, was connected to the morphologic left ventricle (not shown). Thus, the findings included atrioventricu-lar and ventriculoarterial discordant connections. Bronchiectasis indicative of Kartagener syndrome was not found.
842 May-June 2007 RG f Volume 27 ● Number 3

Double Outlet VentricleDouble outlet ventricle encompasses a wide spec-trum of congenital heart abnormalities in whichboth great arteries arise predominantly from ei-ther the morphologic right or the morphologic leftventricle (Fig 12) (52). The “50% rule” usually isapplied in determining a ventriculoarterial con-nection, and an artery is considered to be con-nected to a ventricle when more than half of itssemilunar valve is connected to that ventricle. Inmore than 50% of patients with a double outletventricle, both the ascending aorta and the pul-monary trunk arise from the morphologic rightventricle, a condition denoted by the term doubleoutlet right ventricle (53). In patients with doubleoutlet right ventricle, numerous anatomic andphysiologic variations may occur with regard tothe location of the ventricular septal defect (sub-aortic, subpulmonary) and the presence or ab-sence of right ventricular outflow tract obstruc-tion. The identification of anatomic and physi-ologic variations has an important influence onthe surgical strategy (54). ECG-gated CT mightbe performed for the initial evaluation of thesepatients, to better define the position of the ven-tricular septal defect. However, follow-up evalua-tion usually is performed with nongated CT.
IsomerismThe term isomerism (ie, bilateral symmetry) de-scribes paired, mirror-image sets of normallysingle or nonidentical organ systems. Althoughatrial arrangement is characterized by the left orright morphologic characteristics of the atrial ap-pendages, accurate identification of morphologicleft- or right-sidedness may be difficult (55). Inpatients with right isomerism, there is bilateralright-sidedness; hence, the anomalies include bi-lateral morphologic right atrial appendages, bilat-eral bronchi (trilobed right-sided lungs), aspleniasyndrome, and bilateral superior venae cavae.Conversely, left atrial isomerism describes bilat-eral left-sidedness and includes bilateral morpho-logic left atrial appendages, bilateral left bronchi(bilateral bilobed lungs with hyparterial bronchuson both sides), polysplenia, and an interruptedinferior vena cava with azygos continuation (Fig13). Although these criteria are helpful for deter-mining sidedness, there is considerable variationwithin each syndrome, and features of one syn-drome also may be found in another (56).
Figure 12. Double outlet right ventricle with d-transposition of the great arteries at ECG-gated CT performed forfollow-up evaluation of complex anatomy in a 17-year-old girl after a Damus-Kaye-Stansel procedure, patch closureof an atrial septal defect and tricuspid valve, and a Fontan-Kreutzer procedure. (a) Thin-section oblique coronal im-age shows the connections of the systemic veins to the dilated right atrium (RA), which was surgically anastomosedto the left pulmonary artery (lPA) and right pulmonary artery (rPA). The tricuspid valve was closed with a patch. Inthe postsurgical circulation, blood flows directly from the systemic veins to the pulmonary arteries, without a subpul-monary ventricle (Fontan-Kreutzer procedure). The pulmonary veins are connected to the left atrium, which is con-nected to the hypoplastic left ventricle. The morphologic left ventricle is connected to the morphologic right ventricle(RV) via a ventricular septal defect. (b) Thin-section oblique sagittal image demonstrates connection of the rightventricle (RV) to the left ventricle (LV) via a ventricular septal defect (*). (c) Thin-section oblique sagittal imageshows a hypoplastic morphologic left ventricle (LV) and a normal-sized right ventricle (RV). Both the ascendingaorta (aA) and the pulmonary trunk (PT) arise from the morphologic right ventricle, with the pulmonary trunk over-riding the ventricular septal defect. The pulmonary trunk was surgically connected to the ascending aorta with theDamus-Kaye-Stansel procedure. LA � left atrium.
RG f Volume 27 ● Number 3 Leschka et al 843

ConclusionsThe high spatial and temporal resolution pro-vided by multidetector CT, combined with the
short scanning times, enable the use of no seda-tion or only short-term sedation while evaluatingpatients with congenital heart disease. Conse-quently, CT has become a useful imaging modal-ity for the pre- and postsurgical evaluation of a
Figure 13. Left pulmonary isomerism at ECG-gated cardiac CT and nongated chest and abdominalCT performed for suspicion of situs inversus in a 38-year-old man after unknown surgical procedures inearly childhood. (a) Thin-section reformatted image along the long axis of the heart reveals morphologicleft atria on both sides, with ventricular inversion: a morphologic left atrium with right-sided pulmonaryvenous atrium (LA*); a morphologic left atrium with right-sided atrial appendage (LAA*); a morpho-logic left atrium and left-sided systemic venous atrium (LA); a morphologic left atrium and right-sidedleft ventricle (LV); and a morphologic right atrium and left-sided right ventricle (RV). The left-sidedsystemic venous atrium is connected via the tricuspid valve to the left-sided right ventricle and the pul-monary artery; the right-sided pulmonary venous atrium is connected via the mitral valve to the right-sided left ventricle and the aorta. (b) Thick-section oblique coronal MIP image with a slab thickness of10 mm shows direct connection of the hepatic veins (arrows) to the left-sided systemic venous atrium(LA). LA* � morphologic left atrium with right-sided pulmonary venous atrium, LV � left ventricle,RV � right ventricle. (c) Thin-section coronal reformatted image demonstrates an abnormal bronchialbranching pattern, with the left pulmonary artery (lPA) and right pulmonary artery (rPA) coursing overthe upper lobe bronchus on the left and right sides, respectively (hyparterial bronchus). AoA � aorticarch, AV � azygos vein, dA � descending aorta, LB � left-sided (morphologic left) bronchus, RB � right-sided (morphologic left) bronchus, SVC � left-sided superior vena cava. (d) Thin-section axial CT scanthrough the upper abdomen shows a large, predominantly midline liver and right-sided polysplenia (*).
844 May-June 2007 RG f Volume 27 ● Number 3
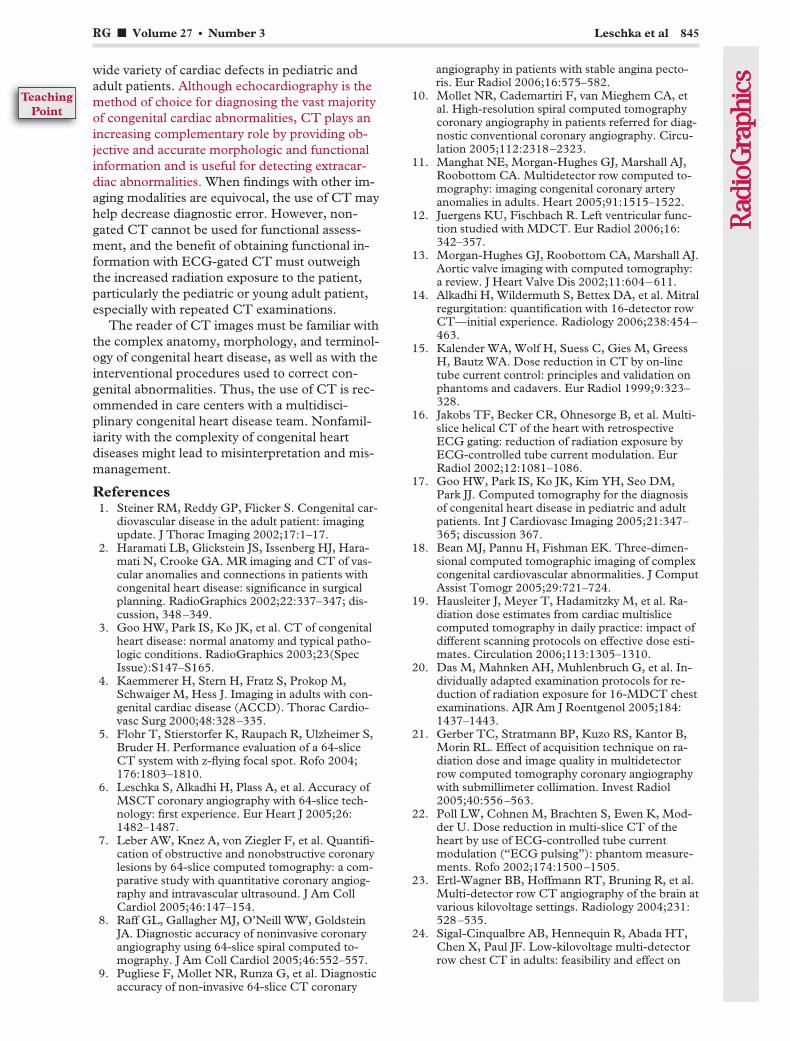
wide variety of cardiac defects in pediatric andadult patients. Although echocardiography is themethod of choice for diagnosing the vast majorityof congenital cardiac abnormalities, CT plays anincreasing complementary role by providing ob-jective and accurate morphologic and functionalinformation and is useful for detecting extracar-diac abnormalities. When findings with other im-aging modalities are equivocal, the use of CT mayhelp decrease diagnostic error. However, non-gated CT cannot be used for functional assess-ment, and the benefit of obtaining functional in-formation with ECG-gated CT must outweighthe increased radiation exposure to the patient,particularly the pediatric or young adult patient,especially with repeated CT examinations.
The reader of CT images must be familiar withthe complex anatomy, morphology, and terminol-ogy of congenital heart disease, as well as with theinterventional procedures used to correct con-genital abnormalities. Thus, the use of CT is rec-ommended in care centers with a multidisci-plinary congenital heart disease team. Nonfamil-iarity with the complexity of congenital heartdiseases might lead to misinterpretation and mis-management.
References1. Steiner RM, Reddy GP, Flicker S. Congenital car-
diovascular disease in the adult patient: imagingupdate. J Thorac Imaging 2002;17:1–17.
2. Haramati LB, Glickstein JS, Issenberg HJ, Hara-mati N, Crooke GA. MR imaging and CT of vas-cular anomalies and connections in patients withcongenital heart disease: significance in surgicalplanning. RadioGraphics 2002;22:337–347; dis-cussion, 348–349.
3. Goo HW, Park IS, Ko JK, et al. CT of congenitalheart disease: normal anatomy and typical patho-logic conditions. RadioGraphics 2003;23(SpecIssue):S147–S165.
4. Kaemmerer H, Stern H, Fratz S, Prokop M,Schwaiger M, Hess J. Imaging in adults with con-genital cardiac disease (ACCD). Thorac Cardio-vasc Surg 2000;48:328–335.
5. Flohr T, Stierstorfer K, Raupach R, Ulzheimer S,Bruder H. Performance evaluation of a 64-sliceCT system with z-flying focal spot. Rofo 2004;176:1803–1810.
6. Leschka S, Alkadhi H, Plass A, et al. Accuracy ofMSCT coronary angiography with 64-slice tech-nology: first experience. Eur Heart J 2005;26:1482–1487.
7. Leber AW, Knez A, von Ziegler F, et al. Quantifi-cation of obstructive and nonobstructive coronarylesions by 64-slice computed tomography: a com-parative study with quantitative coronary angiog-raphy and intravascular ultrasound. J Am CollCardiol 2005;46:147–154.
8. Raff GL, Gallagher MJ, O’Neill WW, GoldsteinJA. Diagnostic accuracy of noninvasive coronaryangiography using 64-slice spiral computed to-mography. J Am Coll Cardiol 2005;46:552–557.
9. Pugliese F, Mollet NR, Runza G, et al. Diagnosticaccuracy of non-invasive 64-slice CT coronary
angiography in patients with stable angina pecto-ris. Eur Radiol 2006;16:575–582.
10. Mollet NR, Cademartiri F, van Mieghem CA, etal. High-resolution spiral computed tomographycoronary angiography in patients referred for diag-nostic conventional coronary angiography. Circu-lation 2005;112:2318–2323.
11. Manghat NE, Morgan-Hughes GJ, Marshall AJ,Roobottom CA. Multidetector row computed to-mography: imaging congenital coronary arteryanomalies in adults. Heart 2005;91:1515–1522.
12. Juergens KU, Fischbach R. Left ventricular func-tion studied with MDCT. Eur Radiol 2006;16:342–357.
13. Morgan-Hughes GJ, Roobottom CA, Marshall AJ.Aortic valve imaging with computed tomography:a review. J Heart Valve Dis 2002;11:604–611.
14. Alkadhi H, Wildermuth S, Bettex DA, et al. Mitralregurgitation: quantification with 16-detector rowCT—initial experience. Radiology 2006;238:454–463.
15. Kalender WA, Wolf H, Suess C, Gies M, GreessH, Bautz WA. Dose reduction in CT by on-linetube current control: principles and validation onphantoms and cadavers. Eur Radiol 1999;9:323–328.
16. Jakobs TF, Becker CR, Ohnesorge B, et al. Multi-slice helical CT of the heart with retrospectiveECG gating: reduction of radiation exposure byECG-controlled tube current modulation. EurRadiol 2002;12:1081–1086.
17. Goo HW, Park IS, Ko JK, Kim YH, Seo DM,Park JJ. Computed tomography for the diagnosisof congenital heart disease in pediatric and adultpatients. Int J Cardiovasc Imaging 2005;21:347–365; discussion 367.
18. Bean MJ, Pannu H, Fishman EK. Three-dimen-sional computed tomographic imaging of complexcongenital cardiovascular abnormalities. J ComputAssist Tomogr 2005;29:721–724.
19. Hausleiter J, Meyer T, Hadamitzky M, et al. Ra-diation dose estimates from cardiac multislicecomputed tomography in daily practice: impact ofdifferent scanning protocols on effective dose esti-mates. Circulation 2006;113:1305–1310.
20. Das M, Mahnken AH, Muhlenbruch G, et al. In-dividually adapted examination protocols for re-duction of radiation exposure for 16-MDCT chestexaminations. AJR Am J Roentgenol 2005;184:1437–1443.
21. Gerber TC, Stratmann BP, Kuzo RS, Kantor B,Morin RL. Effect of acquisition technique on ra-diation dose and image quality in multidetectorrow computed tomography coronary angiographywith submillimeter collimation. Invest Radiol2005;40:556–563.
22. Poll LW, Cohnen M, Brachten S, Ewen K, Mod-der U. Dose reduction in multi-slice CT of theheart by use of ECG-controlled tube currentmodulation (“ECG pulsing”): phantom measure-ments. Rofo 2002;174:1500–1505.
23. Ertl-Wagner BB, Hoffmann RT, Bruning R, et al.Multi-detector row CT angiography of the brain atvarious kilovoltage settings. Radiology 2004;231:528–535.
24. Sigal-Cinqualbre AB, Hennequin R, Abada HT,Chen X, Paul JF. Low-kilovoltage multi-detectorrow chest CT in adults: feasibility and effect on
RG f Volume 27 ● Number 3 Leschka et al 845
TeachingPoint
image quality and iodine dose. Radiology 2004;231:169–174.
25. Ho SY. Cardiac morphology and nomenclature.In: Gatzoulis MA, Webb GD, Daubeny PEF, eds.Diagnosis and management of adult congenitalheart disease. London, England: Churchill Living-stone, 2003; 7–18.
26. Van Praagh R. The segmental approach to diagno-sis in congenital heart disease. In: Bergsama D, ed.Birth defects. National Foundation–March ofDimes Original Articles series, vol VIII, no. 5. Bal-timore, Md: Williams & Wilkins, 1972; 4–23.
27. de la Cruz MV, Berrazueta JR, Arteaga M, AttieF, Soni J. Rules for diagnosis of arterioventriculardiscordances and spatial identification of ven-tricles: crossed great arteries and transposition ofthe great arteries. Br Heart J 1976;38:341–354.
28. Anderson RH, Becker AE, Freedom RM, et al.Sequential segmental analysis of congenital heartdisease. Pediatr Cardiol 1984;5:281–287.
29. Shinebourne EA, Macartney FJ, Anderson RH.Sequential chamber localization—logical approachto diagnosis in congenital heart disease. Br Heart J1976;38:327–340.
30. Boxt LM. Magnetic resonance and computed to-mographic evaluation of congenital heart disease. JMagn Reson Imaging 2004;19:827–847.
31. St. John Sutton MG, Rutherford JD. Clinical car-diovascular imaging: a comparison to Braunwald’sheart disease. Philadelphia, Pa: Elsevier Saunders,2004.
32. Sebastia C, Quiroga S, Boye R, Perez-LafuenteM, Castella E, Alvarez-Castells A. Aortic stenosis:spectrum of diseases depicted at multisection CT.RadioGraphics 2003;23(Spec Issue):S79–S91.
33. Gutberlet M, Hosten N, Vogel M, et al. Quantifi-cation of morphologic and hemodynamic severityof coarctation of the aorta by magnetic resonanceimaging. Cardiol Young 2001;11:512–520.
34. Ryerson L, Harder J. Totally anomalous pulmonaryvenous return. Cardiol Young 2005;15:304–305.
35. Kerkhoff G, Albes G, Montag M, Kamler M, Ja-kob H, Budde T. A “late” scimitar syndrome: di-agnostic contribution of cardiac computed tomog-raphy [in German]. Z Kardiol 2003;92:595–600.
36. Sehgal A, Loughran-Fowlds A. Scimitar syn-drome. Indian J Pediatr 2005;72:249–251.
37. Otsuka M, Itoh A, Haze K. Sinus venosus type ofatrial septal defect with partial anomalous pulmo-nary venous return evaluated by multislice CT.Heart 2004;90:901.
38. Brickner ME, Hillis LD, Lange RA. Congenitalheart disease in adults. First of two parts. N EnglJ Med 2000;342:256–263.
39. Goitein O, Fuhrman CR, Lacomis JM. Incidentalfinding on MDCT of patent ductus arteriosus: useof CT and MRI to assess clinical importance. AJRAm J Roentgenol 2005;184:1924–1931.
40. Morgan-Hughes GJ, Marshall AJ, Roobottom C.Morphologic assessment of patent ductus arterio-sus in adults using retrospectively ECG-gatedmultidetector CT. AJR Am J Roentgenol 2003;181:749–754.
41. Graham TP Jr, Gutgesell HP. Ventricular septaldefects. In: Emmanouilides GC, RiemenschneiderTA, Allen HD, Gutgesell HP, eds. Moss and Ad-ams heart disease in infants, children, and adoles-cents. Baltimore, Md: Williams & Wilkins, 1995;724–746.
42. Rao BN, Anderson RC, Edwards JE. Anatomicvariations in the tetralogy of Fallot. Am Heart J1971;81:361–371.
43. Dabizzi RP, Teodori G, Barletta GA, Caprioli G,Baldrighi G, Baldrighi V. Associated coronary andcardiac anomalies in the tetralogy of Fallot: an an-giographic study. Eur Heart J 1990;11:692–704.
44. Van Praagh R, Van Praagh S. The anatomy ofcommon aorticopulmonary trunk (truncus arterio-sus communis) and its embryologic implications: astudy of 57 necropsy cases. Am J Cardiol 1965;16:406–425.
45. Collet RW, Edwards JE. Persistent truncus arte-riosus: a classification according to anatomictypes. Surg Clin North Am 1949;29:1245–1270.
46. Jacobs ML. Congenital Heart Surgery Nomencla-ture and Database Project: truncus arteriosus. AnnThorac Surg 2000;69(4 suppl):S50–S55.
47. Ritter DG, Seward JB, Moodie D, Danielson GK.Univentricular heart (common ventricle): preop-erative diagnosis—hemodynamic, angiocardio-graphic and echocardiographic features. Herz1979;4:198–205.
48. Kawano T, Ishii M, Takagi J, et al. Three-dimen-sional helical computed tomographic angiographyin neonates and infants with complex congenitalheart disease. Am Heart J 2000;139:654–660.
49. Brickner ME, Hillis LD, Lange RA. Congenitalheart disease in adults. Second of two parts.N Engl J Med 2000;342:334–342.
50. Siegel MJ, Bhalla S, Gutierrez FR, Billadello JB.MDCT of postoperative anatomy and complica-tions in adults with cyanotic heart disease. AJRAm J Roentgenol 2005;184:241–247.
51. Chen SJ, Li YW, Wang JK, et al. Three-dimen-sional reconstruction of abnormal ventriculoarte-rial relationship by electron beam CT. J ComputAssist Tomogr 1998;22:560–568.
52. Niezen RA, Beekman RP, Helbing WA, van derWall EE, de Roos A. Double outlet right ventricleassessed with magnetic resonance imaging. IntJ Card Imaging 1999;15:323–329.
53. Ueda M, Becker AE. Classification of hearts withoverriding aortic and pulmonary valves. Int J Car-diol 1985;9:357–369.
54. de la Cruz MV, Cayre R, Arista-Salado MartinezO, Sadowinski S, Serrano A. The infundibularinterrelationships and the ventriculoarterial con-nection in double outlet right ventricle: clinicaland surgical implications. Int J Cardiol 1992;35:153–164.
55. Chen SJ, Li YW, Wang JK, et al. Usefulness ofelectron beam computed tomography in childrenwith heterotaxy syndrome. Am J Cardiol 1998;81:188–194.
56. Winer-Muram HT, Tonkin IL. The spectrum ofheterotaxic syndromes. Radiol Clin North Am1989;27:1147–1170.
846 May-June 2007 RG f Volume 27 ● Number 3
This article meets the criteria for 1.0 credit hour in category 1 of the AMA Physician’s Recognition Award. To obtaincredit, see accompanying test at http://www.rsna.org/education/rg_cme.html.
EDUCATION EXHIBIT 847
US Features of ThyroidMalignancy: Pearlsand Pitfalls1
ONLINE-ONLYCME
See www.rsna.org/education/rg_cme.html.
LEARNINGOBJECTIVESAfter reading thisarticle and takingthe test, the reader
will be able to:
� Describe commonUS features of thy-roid malignancy andthe value and limita-tions of each.
� Correlate US fea-tures with the patho-logic appearance andbehavior of differenthistologic types ofthyroid malignancy.
� Recognize atypicalfeatures of thyroidmalignancy and otherpotential diagnosticpitfalls.
Jenny K. Hoang, MBBS, FRANZCR ● Wai Kit Lee, MBBS, FRANZCRMichael Lee, MBBS ● Daryl Johnson, MBBS ● Stephen Farrell, MBBS,FRACS
Thyroid nodules are common and occur in up to 50% of the adultpopulation; however, less than 7% of thyroid nodules are malignant.High-resolution ultrasonography (US) is commonly used to evaluatethe thyroid gland, but US is frequently misperceived as unhelpful foridentifying features that distinguish benign from malignant nodules.Microcalcifications are one of the most specific US findings of a thy-roid malignancy. Other useful US features include a marked hypoecho-genicity, irregular margins, and the absence of a hypoechoic haloaround the nodule. Lymphadenopathy and local invasion of adjacentstructures are highly specific features of thyroid malignancy but are lesscommonly seen. The number, size, and interval growth of nodules arenonspecific characteristics. Suspicious US features may be useful forselecting patients for fine-needle aspiration biopsy when incidentalnodules are discovered and when multiple nodules are present. Com-mon interpretative pitfalls that may lead to failure to recognize a malig-nancy include mistaking cystic or calcified nodal metastases for nod-ules in a multinodular thyroid, mistaking diffusely infiltrative thyroidcarcinomas and multifocal carcinomas for benign disease, and failingto recognize microcalcifications in papillary thyroid cancer.©RSNA, 2007
IntroductionThyroid nodules are very common and may be observed at ultrasonography (US) in50% of the adult population. Thyroid malignancy is relatively rare and is diagnosedin approximately 25,000 patients per year in the United States (1). The most com-mon cause of benign thyroid nodules is nodular hyperplasia (2). Although less than7% of thyroid nodules are malignant (2), it is critical that they be accurately identi-fied. The imaging modality of choice for the investigation of thyroid nodules is high-resolution US. US is commonly misperceived as unhelpful in distinguishing betweenbenign and malignant thyroid nodules. Although individual US features may be of
Abbreviation: FNA � fine-needle aspiration
RadioGraphics 2007; 27:847–865 ● Published online 10.1148/rg.273065038 ● Content Codes:
1From the Departments of Medical Imaging (J.K.H., W.K.L., M.L.), Pathology (D.J.), and Surgery (S.F.), St Vincent’s Hospital Melbourne, Univer-sity of Melbourne, 41 Victoria Parade, Fitzroy 3065, Victoria, Australia. Recipient of a Certificate of Merit award for an education exhibit at the 2005RSNA Annual Meeting. Received March 22, 2006; revision requested July 7 and received August 7; accepted August 14. All authors have no financialrelationships to disclose. Address correspondence to J.K.H. (e-mail: [email protected]).
See the commentary by Langer following this article.
©RSNA, 2007
Note: This copy is for your personal, non-commercial use only. To order presentation-ready copies for distribution to your colleagues or clients, use the RadioGraphics Reprints form at the end of this article.
See last page
TEACHING POINTS

limited value, when multiple signs of thyroid ma-lignancy appear in combination it is possible tomake an accurate prediction. The nodule thenmay be further assessed with fine-needle aspira-tion (FNA).
Scintigraphy is not used routinely to assess thy-roid nodules. It is primarily of use in patients witha suppressed thyroid-stimulating hormone level,in whom it allows assessment of the functionalactivity of a thyroid nodule and of the wholegland. A functioning, or “hot,” thyroid nodule israrely malignant, with only a few reported cases ofsuch malignancy (3–10). Although a nonfunc-tioning, or “cold,” nodule at scintigraphy is com-monly thought to indicate an increased risk ofthyroid malignancy, as many as 77% of cold thy-roid nodules may be benign (4,11). Thyroid scin-tigraphy therefore is unhelpful for differentiatinga benign nodule from a malignant one, and itsutility for the routine evaluation of thyroid nod-ules is limited.
Pathologic Typesof Thyroid Malignancy
The main pathologic types of thyroid carcinomaare papillary, follicular, medullary, and anaplastic(Fig 1). Papillary and follicular thyroid carcino-mas both have an excellent prognosis, with a 20-year survival of 90%–95% and 75%, respectively(12–14). Medullary thyroid carcinoma is moreaggressive, with a 10-year survival of 42%–90%(13,14). Anaplastic thyroid carcinoma has an ex-tremely poor prognosis, with a 5-year survival of5% (13,14). Risk factors for thyroid carcinomainclude age of less than 20 years or more than 60years, a history of neck irradiation, and a familyhistory of thyroid cancer (14).
Thyroid lymphoma, usually of the non-Hodg-kin type, is uncommon. It may occur as part ofgeneralized lymphoma or as a primary tumor,usually in the setting of Hashimoto thyroiditis.Metastases to the thyroid are rare and usuallyoriginate from primary lung, breast, and renal cellcarcinomas. Metastatic disease should be sus-pected when a solid thyroid nodule is found in apatient with a known nonthyroid malignancy.
US FeaturesSuggestive of Malignancy
CalcificationsThyroid calcifications may occur in both benignand malignant disease. Thyroid calcifications canbe classified as microcalcification, coarse calcifi-cation, or peripheral calcification. Thyroid micro-calcifications are psammoma bodies, which are10–100-�m round laminar crystalline calcific de-posits (Fig 2a). They are one of the most specificfeatures of thyroid malignancy, with a specificityof 85.8%–95% (2,15–17) and a positive predic-tive value of 41.8%–94.2% (1). Microcalcifica-tions are found in 29%–59% of all primary thy-roid carcinomas (2,16,18,19), most commonly inpapillary thyroid carcinoma. Their occurrence hasbeen described in follicular and anaplastic thyroidcarcinomas as well as in benign conditions suchas follicular adenoma and Hashimoto thyroiditis(20). At US, microcalcifications appear as punc-tate hyperechoic foci without acoustic shadowing(Fig 2b).
Large irregularly shaped dystrophic calcifica-tions also may occur and are secondary to tissuenecrosis. They may appear as spicules, frag-mented plates, or granular deposits within fibroussepta in the thyroid gland. They are commonlypresent in multinodular goiters; however, whenfound in solitary nodules, they may be associatedwith a malignancy rate of nearly 75% (21).Coarse calcifications may coexist with micro-calcifications in papillary cancers, and they arethe most common type of calcification in medul-lary thyroid carcinomas (14,10,22). At US, densecoarse calcifications cause posterior acousticshadowing (Fig 3). Inspissated colloid calcifica-tions in benign thyroid lesions may mimic micro-calcifications in thyroid malignancies, but theformer can be distinguished from malignant cal-cifications by the observation of ring-down or re-verberation artifact (Fig 4) (23). Peripheral calci-fication is one of the patterns most commonlyseen in a multinodular thyroid but also may beseen in malignancy (22).
Figure 1. Drawing shows the thyroid gland and thefrequency of occurrence of the different pathologictypes of thyroid malignancy.
848 May-June 2007 RG f Volume 27 ● Number 3
TeachingPoint
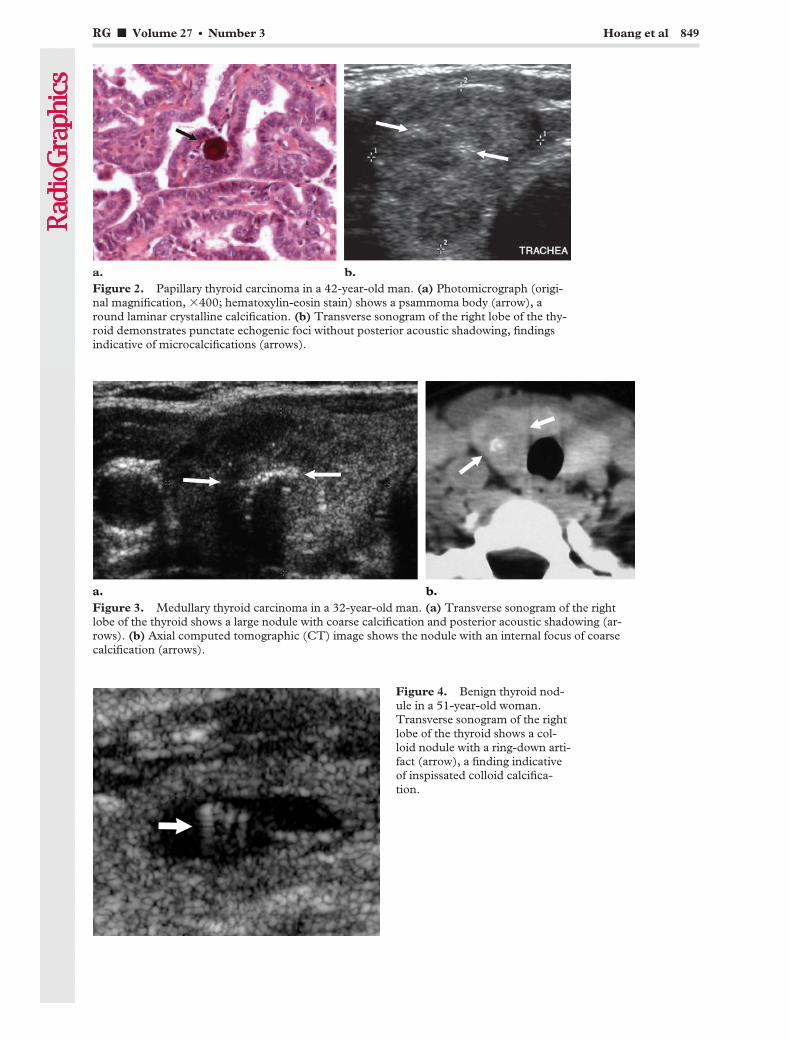
Figure 2. Papillary thyroid carcinoma in a 42-year-old man. (a) Photomicrograph (origi-nal magnification, �400; hematoxylin-eosin stain) shows a psammoma body (arrow), around laminar crystalline calcification. (b) Transverse sonogram of the right lobe of the thy-roid demonstrates punctate echogenic foci without posterior acoustic shadowing, findingsindicative of microcalcifications (arrows).
Figure 3. Medullary thyroid carcinoma in a 32-year-old man. (a) Transverse sonogram of the rightlobe of the thyroid shows a large nodule with coarse calcification and posterior acoustic shadowing (ar-rows). (b) Axial computed tomographic (CT) image shows the nodule with an internal focus of coarsecalcification (arrows).
Figure 4. Benign thyroid nod-ule in a 51-year-old woman.Transverse sonogram of the rightlobe of the thyroid shows a col-loid nodule with a ring-down arti-fact (arrow), a finding indicativeof inspissated colloid calcifica-tion.
RG f Volume 27 ● Number 3 Hoang et al 849
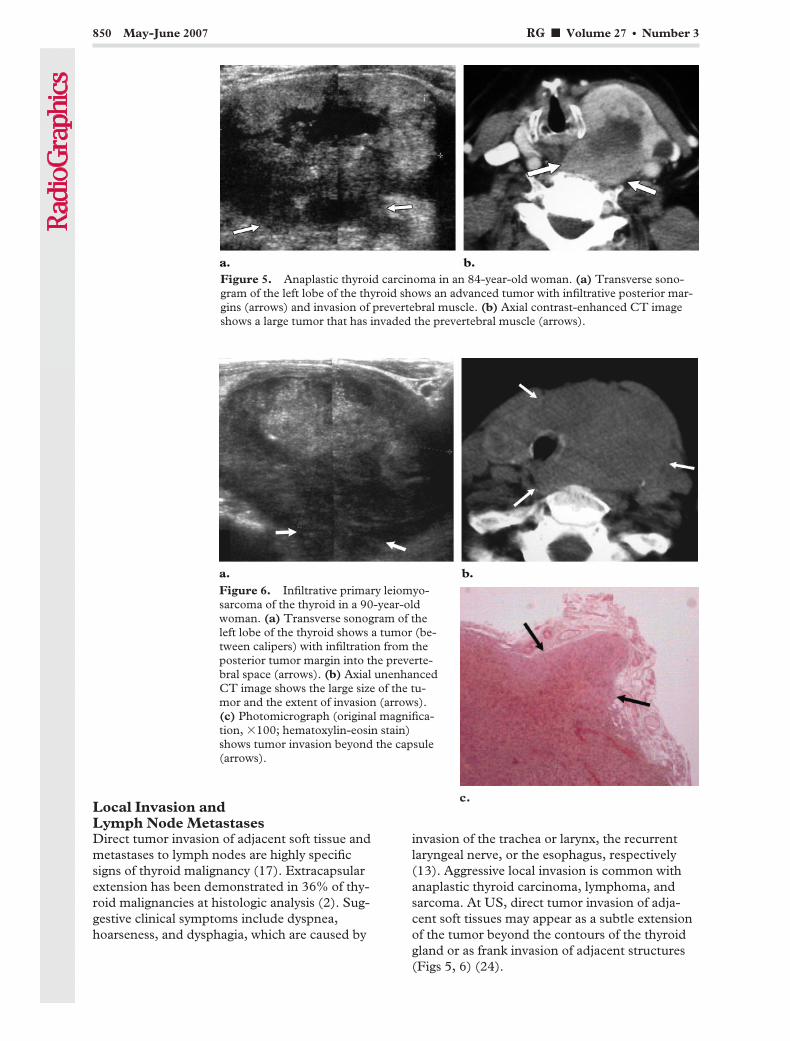
Local Invasion andLymph Node MetastasesDirect tumor invasion of adjacent soft tissue andmetastases to lymph nodes are highly specificsigns of thyroid malignancy (17). Extracapsularextension has been demonstrated in 36% of thy-roid malignancies at histologic analysis (2). Sug-gestive clinical symptoms include dyspnea,hoarseness, and dysphagia, which are caused by
invasion of the trachea or larynx, the recurrentlaryngeal nerve, or the esophagus, respectively(13). Aggressive local invasion is common withanaplastic thyroid carcinoma, lymphoma, andsarcoma. At US, direct tumor invasion of adja-cent soft tissues may appear as a subtle extensionof the tumor beyond the contours of the thyroidgland or as frank invasion of adjacent structures(Figs 5, 6) (24).
Figure 5. Anaplastic thyroid carcinoma in an 84-year-old woman. (a) Transverse sono-gram of the left lobe of the thyroid shows an advanced tumor with infiltrative posterior mar-gins (arrows) and invasion of prevertebral muscle. (b) Axial contrast-enhanced CT imageshows a large tumor that has invaded the prevertebral muscle (arrows).
Figure 6. Infiltrative primary leiomyo-sarcoma of the thyroid in a 90-year-oldwoman. (a) Transverse sonogram of theleft lobe of the thyroid shows a tumor (be-tween calipers) with infiltration from theposterior tumor margin into the preverte-bral space (arrows). (b) Axial unenhancedCT image shows the large size of the tu-mor and the extent of invasion (arrows).(c) Photomicrograph (original magnifica-tion, �100; hematoxylin-eosin stain)shows tumor invasion beyond the capsule(arrows).
850 May-June 2007 RG f Volume 27 ● Number 3
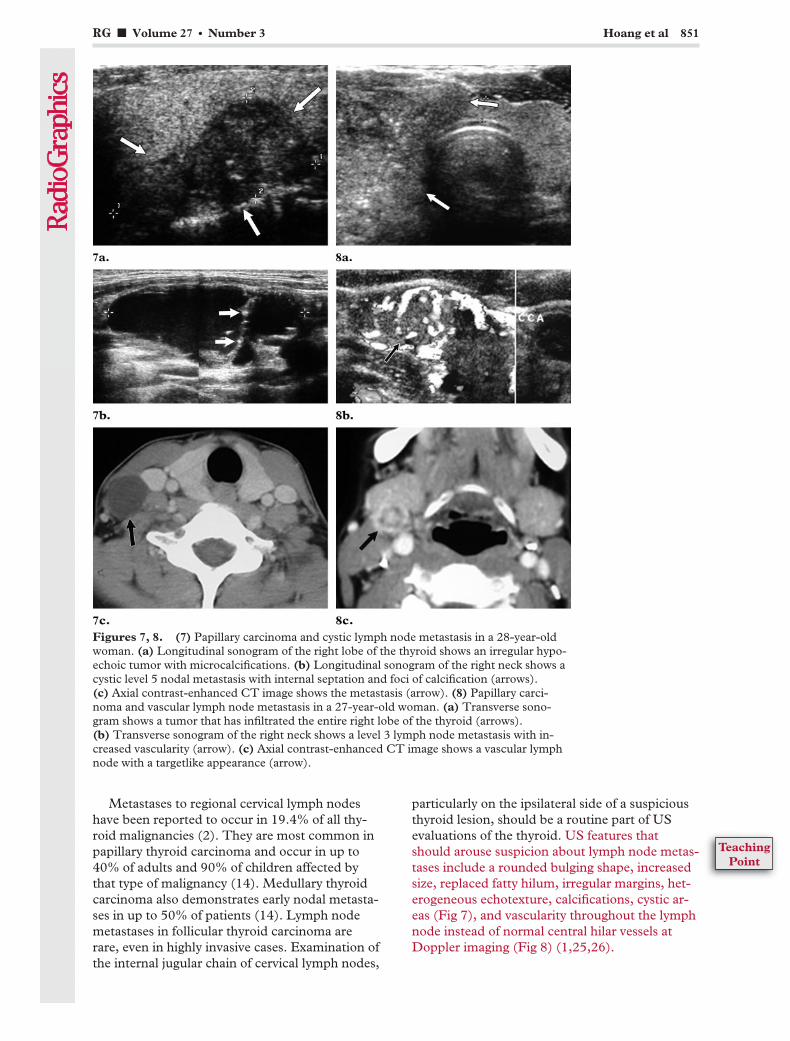
Metastases to regional cervical lymph nodeshave been reported to occur in 19.4% of all thy-roid malignancies (2). They are most common inpapillary thyroid carcinoma and occur in up to40% of adults and 90% of children affected bythat type of malignancy (14). Medullary thyroidcarcinoma also demonstrates early nodal metasta-ses in up to 50% of patients (14). Lymph nodemetastases in follicular thyroid carcinoma arerare, even in highly invasive cases. Examination ofthe internal jugular chain of cervical lymph nodes,
particularly on the ipsilateral side of a suspiciousthyroid lesion, should be a routine part of USevaluations of the thyroid. US features thatshould arouse suspicion about lymph node metas-tases include a rounded bulging shape, increasedsize, replaced fatty hilum, irregular margins, het-erogeneous echotexture, calcifications, cystic ar-eas (Fig 7), and vascularity throughout the lymphnode instead of normal central hilar vessels atDoppler imaging (Fig 8) (1,25,26).
Figures 7, 8. (7) Papillary carcinoma and cystic lymph node metastasis in a 28-year-oldwoman. (a) Longitudinal sonogram of the right lobe of the thyroid shows an irregular hypo-echoic tumor with microcalcifications. (b) Longitudinal sonogram of the right neck shows acystic level 5 nodal metastasis with internal septation and foci of calcification (arrows).(c) Axial contrast-enhanced CT image shows the metastasis (arrow). (8) Papillary carci-noma and vascular lymph node metastasis in a 27-year-old woman. (a) Transverse sono-gram shows a tumor that has infiltrated the entire right lobe of the thyroid (arrows).(b) Transverse sonogram of the right neck shows a level 3 lymph node metastasis with in-creased vascularity (arrow). (c) Axial contrast-enhanced CT image shows a vascular lymphnode with a targetlike appearance (arrow).
RG f Volume 27 ● Number 3 Hoang et al 851
TeachingPoint

Lymph node metastasis is a US feature thatmay be prognostic of thyroid carcinoma recur-rence. Ito et al (27,28) showed a higher rate oflocal recurrence with metastases to lateral com-partment lymph nodes than with only centralcompartment metastases identified at preopera-tive US in patients with microcarcinomas (6.0%vs 1.1%). The lateral compartment includes theinternal jugular, spinal accessory (posterior tri-angle), and transverse cervical (supraclavicular)lymph node groups (nodal levels 2–5). The cen-tral compartment lies between the right and leftcarotid arteries and comprises the delphian orpretracheal nodes, the paratracheal nodes (lyingalongside the recurrent laryngeal nerve), and thethymic and perithymic nodes located in the fattytissue in the lower anterior part of the neck.
Margins, Contour, and ShapeThe halo or hypoechoic rim around a thyroidnodule is produced by a pseudocapsule of fibrousconnective tissue, a compressed thyroid paren-chyma, and chronic inflammatory infiltrates (29)(Fig 9). A completely uniform halo around a nod-ule is highly suggestive of benignity, with a speci-ficity of 95% (30). However, a halo is absent atUS in more than half of all benign thyroid nod-ules (29,31). Moreover, 10%–24% of papillarythyroid carcinomas have either a complete or anincomplete halo (18,30–32).
A thyroid nodule is considered ill defined whenmore than 50% of its border is not clearly demar-cated. Furthermore, nodules can be classified ac-cording to their contours as smooth and roundedor irregular with jagged edges. An ill-defined andirregular margin in a thyroid tumor suggests ma-lignant infiltration of adjacent thyroid paren-chyma with no pseudocapsule formation (Fig 10).The reported sensitivity of ill-defined margins andirregular margins, however, ranges widely (53%–89% and 7%–97%, respectively) (17,18,30).Some papillary thyroid carcinomas may have amisleadingly well-demarcated margin at US andmay be found to be encapsulated at histologicreview (18). The US appearance of minimallyinvasive follicular carcinoma may have some fea-tures in common with that of follicular adenoma(12). The specificity of ill-defined margins is vari-able, with 15%–59% of benign nodules havingpoorly defined margins with macro- or mi-crolobulations (2,33). Therefore, unless frankinvasion beyond the capsule is demonstrated, theUS appearance of the nodule margins alone is anunreliable basis for determining malignancy orbenignity.
The shape of a thyroid nodule is a potentiallyuseful US feature that has not been extensivelydescribed in the literature. Kim et al (16) foundthat a solid thyroid nodule that is taller than it iswide (ie, greater in its anteroposterior dimensionthan its transverse dimension) has a 93% specific-ity for malignancy. This appearance is thought tobe due to a centrifugal tendency in tumor growth,
Figure 9. Follicular adenoma in a 30-year-oldwoman. Transverse sonogram of the left lobe of thethyroid shows a follicular adenoma with a hypoechoichalo (arrows).
Figure 10. Papillary carcinoma in an 87-year-oldman. Transverse sonogram of the thyroid isthmusshows a poorly defined tumor with marked hypoecho-genicity and irregular margins (arrows) and without ahypoechoic halo.
852 May-June 2007 RG f Volume 27 ● Number 3
TeachingPoint
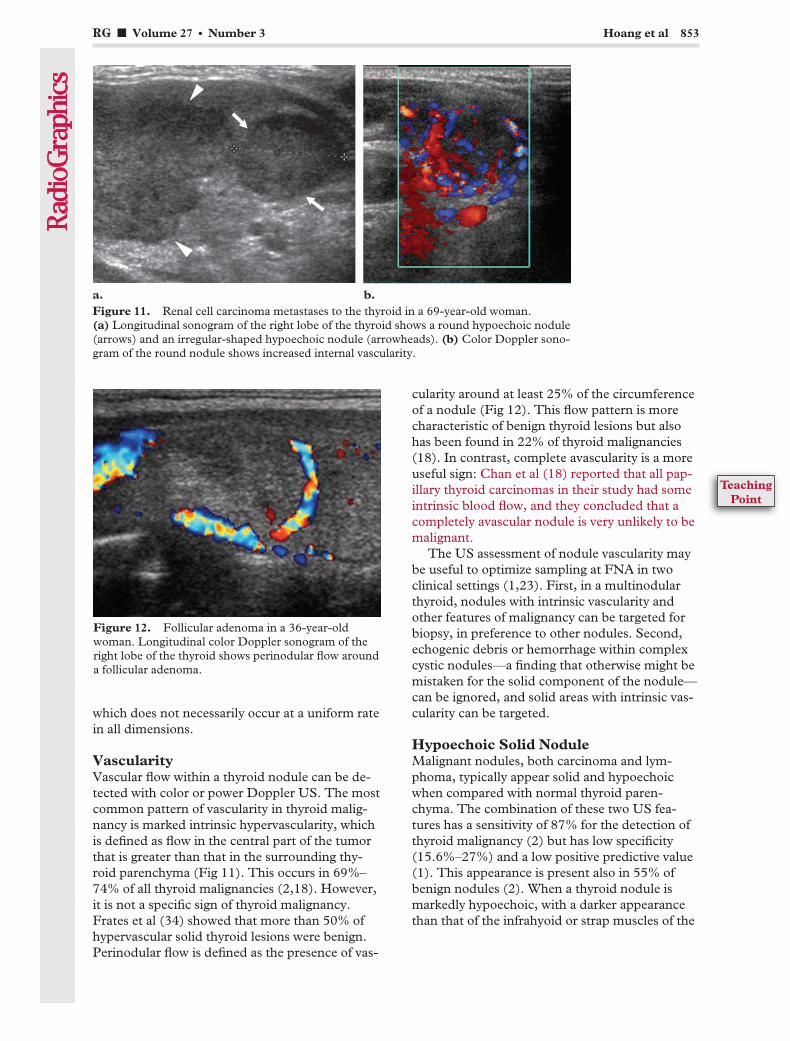
which does not necessarily occur at a uniform ratein all dimensions.
VascularityVascular flow within a thyroid nodule can be de-tected with color or power Doppler US. The mostcommon pattern of vascularity in thyroid malig-nancy is marked intrinsic hypervascularity, whichis defined as flow in the central part of the tumorthat is greater than that in the surrounding thy-roid parenchyma (Fig 11). This occurs in 69%–74% of all thyroid malignancies (2,18). However,it is not a specific sign of thyroid malignancy.Frates et al (34) showed that more than 50% ofhypervascular solid thyroid lesions were benign.Perinodular flow is defined as the presence of vas-
cularity around at least 25% of the circumferenceof a nodule (Fig 12). This flow pattern is morecharacteristic of benign thyroid lesions but alsohas been found in 22% of thyroid malignancies(18). In contrast, complete avascularity is a moreuseful sign: Chan et al (18) reported that all pap-illary thyroid carcinomas in their study had someintrinsic blood flow, and they concluded that acompletely avascular nodule is very unlikely to bemalignant.
The US assessment of nodule vascularity maybe useful to optimize sampling at FNA in twoclinical settings (1,23). First, in a multinodularthyroid, nodules with intrinsic vascularity andother features of malignancy can be targeted forbiopsy, in preference to other nodules. Second,echogenic debris or hemorrhage within complexcystic nodules—a finding that otherwise might bemistaken for the solid component of the nodule—can be ignored, and solid areas with intrinsic vas-cularity can be targeted.
Hypoechoic Solid NoduleMalignant nodules, both carcinoma and lym-phoma, typically appear solid and hypoechoicwhen compared with normal thyroid paren-chyma. The combination of these two US fea-tures has a sensitivity of 87% for the detection ofthyroid malignancy (2) but has low specificity(15.6%–27%) and a low positive predictive value(1). This appearance is present also in 55% ofbenign nodules (2). When a thyroid nodule ismarkedly hypoechoic, with a darker appearancethan that of the infrahyoid or strap muscles of the
Figure 11. Renal cell carcinoma metastases to the thyroid in a 69-year-old woman.(a) Longitudinal sonogram of the right lobe of the thyroid shows a round hypoechoic nodule(arrows) and an irregular-shaped hypoechoic nodule (arrowheads). (b) Color Doppler sono-gram of the round nodule shows increased internal vascularity.
Figure 12. Follicular adenoma in a 36-year-oldwoman. Longitudinal color Doppler sonogram of theright lobe of the thyroid shows perinodular flow arounda follicular adenoma.
RG f Volume 27 ● Number 3 Hoang et al 853
TeachingPoint
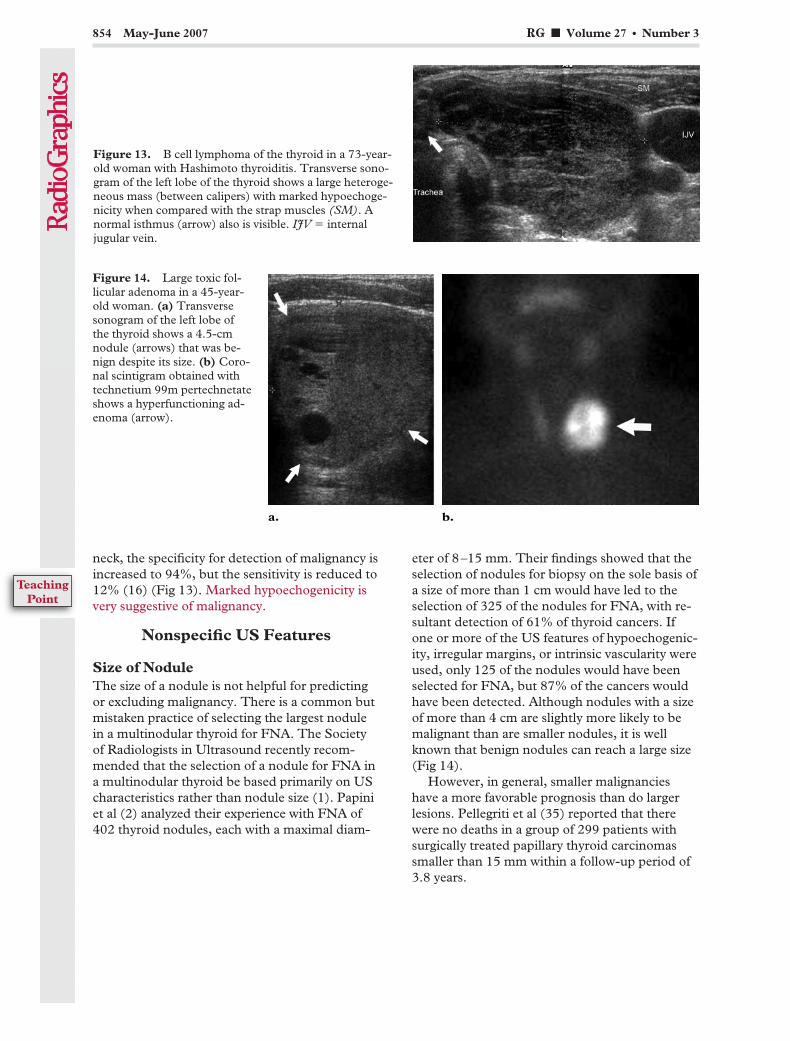
neck, the specificity for detection of malignancy isincreased to 94%, but the sensitivity is reduced to12% (16) (Fig 13). Marked hypoechogenicity isvery suggestive of malignancy.
Nonspecific US Features
Size of NoduleThe size of a nodule is not helpful for predictingor excluding malignancy. There is a common butmistaken practice of selecting the largest nodulein a multinodular thyroid for FNA. The Societyof Radiologists in Ultrasound recently recom-mended that the selection of a nodule for FNA ina multinodular thyroid be based primarily on UScharacteristics rather than nodule size (1). Papiniet al (2) analyzed their experience with FNA of402 thyroid nodules, each with a maximal diam-
eter of 8–15 mm. Their findings showed that theselection of nodules for biopsy on the sole basis ofa size of more than 1 cm would have led to theselection of 325 of the nodules for FNA, with re-sultant detection of 61% of thyroid cancers. Ifone or more of the US features of hypoechogenic-ity, irregular margins, or intrinsic vascularity wereused, only 125 of the nodules would have beenselected for FNA, but 87% of the cancers wouldhave been detected. Although nodules with a sizeof more than 4 cm are slightly more likely to bemalignant than are smaller nodules, it is wellknown that benign nodules can reach a large size(Fig 14).
However, in general, smaller malignancieshave a more favorable prognosis than do largerlesions. Pellegriti et al (35) reported that therewere no deaths in a group of 299 patients withsurgically treated papillary thyroid carcinomassmaller than 15 mm within a follow-up period of3.8 years.
Figure 13. B cell lymphoma of the thyroid in a 73-year-old woman with Hashimoto thyroiditis. Transverse sono-gram of the left lobe of the thyroid shows a large heteroge-neous mass (between calipers) with marked hypoechoge-nicity when compared with the strap muscles (SM). Anormal isthmus (arrow) also is visible. IJV � internaljugular vein.
Figure 14. Large toxic fol-licular adenoma in a 45-year-old woman. (a) Transversesonogram of the left lobe ofthe thyroid shows a 4.5-cmnodule (arrows) that was be-nign despite its size. (b) Coro-nal scintigram obtained withtechnetium 99m pertechnetateshows a hyperfunctioning ad-enoma (arrow).
854 May-June 2007 RG f Volume 27 ● Number 3
TeachingPoint
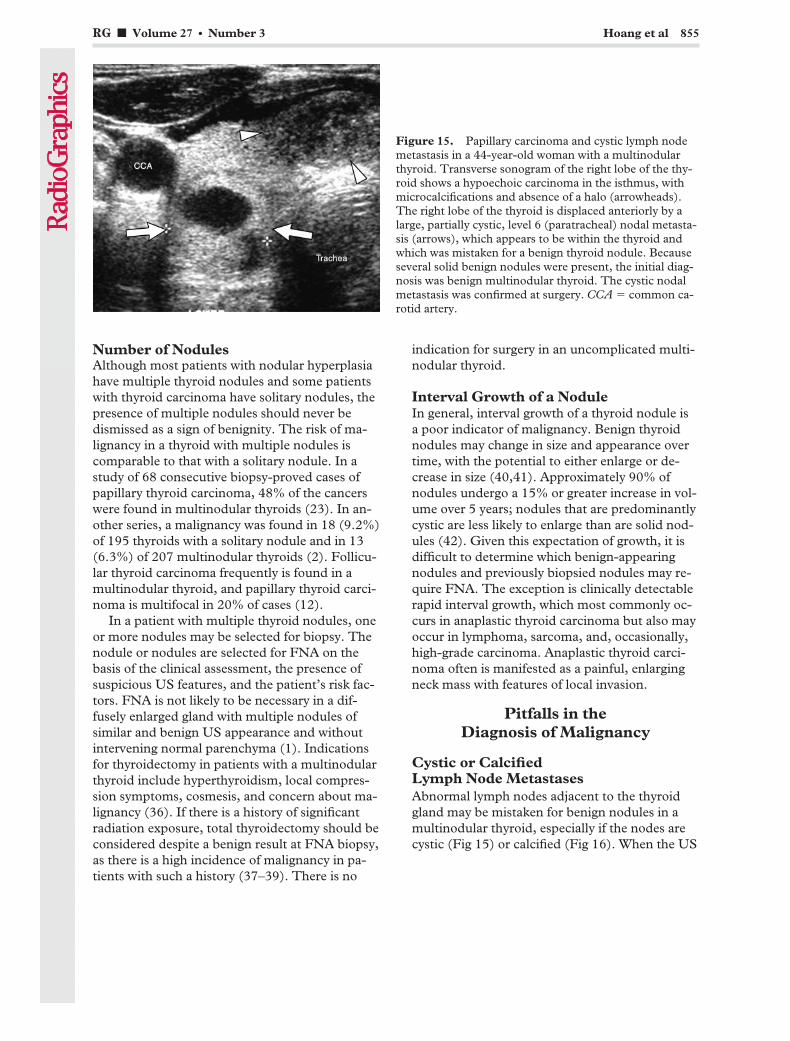
Number of NodulesAlthough most patients with nodular hyperplasiahave multiple thyroid nodules and some patientswith thyroid carcinoma have solitary nodules, thepresence of multiple nodules should never bedismissed as a sign of benignity. The risk of ma-lignancy in a thyroid with multiple nodules iscomparable to that with a solitary nodule. In astudy of 68 consecutive biopsy-proved cases ofpapillary thyroid carcinoma, 48% of the cancerswere found in multinodular thyroids (23). In an-other series, a malignancy was found in 18 (9.2%)of 195 thyroids with a solitary nodule and in 13(6.3%) of 207 multinodular thyroids (2). Follicu-lar thyroid carcinoma frequently is found in amultinodular thyroid, and papillary thyroid carci-noma is multifocal in 20% of cases (12).
In a patient with multiple thyroid nodules, oneor more nodules may be selected for biopsy. Thenodule or nodules are selected for FNA on thebasis of the clinical assessment, the presence ofsuspicious US features, and the patient’s risk fac-tors. FNA is not likely to be necessary in a dif-fusely enlarged gland with multiple nodules ofsimilar and benign US appearance and withoutintervening normal parenchyma (1). Indicationsfor thyroidectomy in patients with a multinodularthyroid include hyperthyroidism, local compres-sion symptoms, cosmesis, and concern about ma-lignancy (36). If there is a history of significantradiation exposure, total thyroidectomy should beconsidered despite a benign result at FNA biopsy,as there is a high incidence of malignancy in pa-tients with such a history (37–39). There is no
indication for surgery in an uncomplicated multi-nodular thyroid.
Interval Growth of a NoduleIn general, interval growth of a thyroid nodule isa poor indicator of malignancy. Benign thyroidnodules may change in size and appearance overtime, with the potential to either enlarge or de-crease in size (40,41). Approximately 90% ofnodules undergo a 15% or greater increase in vol-ume over 5 years; nodules that are predominantlycystic are less likely to enlarge than are solid nod-ules (42). Given this expectation of growth, it isdifficult to determine which benign-appearingnodules and previously biopsied nodules may re-quire FNA. The exception is clinically detectablerapid interval growth, which most commonly oc-curs in anaplastic thyroid carcinoma but also mayoccur in lymphoma, sarcoma, and, occasionally,high-grade carcinoma. Anaplastic thyroid carci-noma often is manifested as a painful, enlargingneck mass with features of local invasion.
Pitfalls in theDiagnosis of Malignancy
Cystic or CalcifiedLymph Node MetastasesAbnormal lymph nodes adjacent to the thyroidgland may be mistaken for benign nodules in amultinodular thyroid, especially if the nodes arecystic (Fig 15) or calcified (Fig 16). When the US
Figure 15. Papillary carcinoma and cystic lymph nodemetastasis in a 44-year-old woman with a multinodularthyroid. Transverse sonogram of the right lobe of the thy-roid shows a hypoechoic carcinoma in the isthmus, withmicrocalcifications and absence of a halo (arrowheads).The right lobe of the thyroid is displaced anteriorly by alarge, partially cystic, level 6 (paratracheal) nodal metasta-sis (arrows), which appears to be within the thyroid andwhich was mistaken for a benign thyroid nodule. Becauseseveral solid benign nodules were present, the initial diag-nosis was benign multinodular thyroid. The cystic nodalmetastasis was confirmed at surgery. CCA � common ca-rotid artery.
RG f Volume 27 ● Number 3 Hoang et al 855

appearance of the metastatic lymph node differsfrom that of the primary thyroid tumor, that dif-ference may increase the likelihood of misinter-pretation (Figs 7, 15). Kessler et al (43) showedthat 70% of metastatic nodes from papillary thy-roid carcinoma had a cystic component, whilemost of the primary tumors were solid. Cysticmetastatic nodes are more common in youngerpatients. Helpful US features suggestive of anextrathyroidal location of a lymph node mass arean incomplete rim of thyroid parenchyma aroundthe mass, and lack of movement of the mass withthe thyroid gland during swallowing. Cysticlymph node metastases may be differentiatedfrom benign cystic thyroid nodules by carefullyassessing sonograms for the presence of a thick-ened outer wall, internal echoes, internal nodular-ity, and septation.
Cystic Variant of Papillary CarcinomaA cystic component occurs in 13%–26% of allthyroid malignancies (18,31), but a predominantcystic appearance is uncommon. Chan et al (18)showed that three of 50 papillary thyroid carcino-mas had this predominant cystic appearance,which may be mistaken for cystic change in a hy-perplastic nodule. However, a careful US assess-ment will demonstrate solid components withvascularity (18), solid excrescences protrudinginto the cyst, or microcalcifications (44), whichwill help differentiate a papillary carcinoma froma benign cystic hyperplastic nodule (Figs 17, 18).
Figure 16. Medullary thyroid carcinoma and calcified nodal metastases ina 57-year-old man. (a) Transverse sonogram shows a lymph node metastasiswith coarse calcifications (arrows) immediately inferior to the left lobe of thethyroid. The metastasis was mistaken for a benign calcified hyperplastic thy-roid nodule. Several truly benign thyroid nodules also were found at US, andthese findings led to an incorrect diagnosis of multinodular thyroid. CCA �common carotid artery. (b) Sagittal sonogram obtained at follow-up USshows two other calcified lymph node metastases (arrows) on the left side, atlevel 2. (c) Coronal unenhanced CT image shows the calcified nodal metas-tases in both locations (arrows).
856 May-June 2007 RG f Volume 27 ● Number 3

Figure 18. Rare cystic papillary thyroidcarcinoma in a 55-year-old woman.(a) Transverse sonogram of the right lobeof the thyroid shows a complex cystic le-sion with thick walls and solid components(arrows). (b) Color Doppler sonogramshows vascularity in a small part of the le-sion margin (arrow). (c) Axial contrast-enhanced CT image shows the tumor (ar-rows) but does not clearly depict itscomplexity.
Figure 17. Hurthle cell (follicular)carcinoma in a 60-year-old woman.(a) Transverse sonogram of the leftlobe of the thyroid shows a partiallycystic tumor with solid internal pro-jections (arrows) and thick walls.(b) Color Doppler sonogram(shown in black and white) depictsincreased vascularity in the solidparts of the tumor (arrow).
RG f Volume 27 ● Number 3 Hoang et al 857

Diffusely InfiltrativeHypervascular TumorUS characteristics of autoimmune diseases suchas Graves disease or chronic lymphocytic (Hashi-moto) thyroiditis include enlargement of the thy-roid with reduced echogenicity, heterogeneity,and hypervascularity, particularly in Graves dis-ease (14). Diffusely infiltrative papillary or follicu-lar thyroid carcinoma may have all these featuresand therefore may be mistaken for autoimmunethyroid disease (Fig 19). Patients may evenpresent with misleading thyrotoxicosis. Coexist-ing autoimmune thyroid disease and thyroid can-cer also may present a trap at image interpreta-tion. The frequency of such occurrences may in-dicate that autoimmune thyroid disease is a riskfactor for thyroid malignancy (13,45–48). USfeatures that are suggestive of malignancy includeirregular or nodular enlargement of the thyroid
gland, sparing from the infiltrative process inparts of the gland, and nodal metastases.
Biopsy of Inciden-tal Thyroid Nodules
Palpable thyroid nodules should be investigatedwith FNA on the basis of thyroid function testresults, clinical presentation, US features, andrisk factors. The management of asymptomaticthyroid nodules detected at US is controversial.There is a dilemma between the needs to avoidburdening health care providers with overinvesti-gation of benign nodules and, at the same time, to
Figure 19. Diffuse follicular variant of papillary thyroid carcinoma in a 37-year-oldwoman with thyrotoxicosis mistaken for Graves disease. (a) Transverse sonogram of the leftlobe of the thyroid shows a heterogeneously hypoechoic enlarged thyroid (arrows) with noresidual normal thyroid tissue. (b) Color Doppler image shows diffuse increased parenchy-mal vascularity. (c) Transverse sonogram of the right neck shows a lymph node metastasisinferior to the right lobe of the thyroid (arrow) with coarse calcification. This finding arousedsuspicion about the possible presence of a primary thyroid carcinoma. Histopathologic anal-ysis of the surgical specimen showed replacement of the thyroid gland by a diffuse follicularvariant of papillary thyroid carcinoma. CCA � common carotid artery.
858 May-June 2007 RG f Volume 27 ● Number 3
avoid adversely affecting the survival of patientswith carcinoma by delaying the diagnosis. Thework-up of incidental thyroid nodules must beconsidered against the high prevalence of benignthyroid nodules, the low incidence of thyroid car-cinoma, and the low rate of mortality from smallthyroid carcinomas. Consensus guidelines set bythe Society of Radiologists in Ultrasound (1) arebased on the size of the nodule and suspicious UScharacteristics. FNA is recommended for the fol-lowing: microcalcifications in a nodule with a di-ameter of 1 cm or greater; coarse calcification or asolid nodule with a size of 1.5 cm or greater; anda mixed cystic and solid nodule with a size of 2cm or greater. These size limitations for each cat-egory are based on consideration of the excessivenumber of biopsies of small nodules and the like-lihood that treatment of microcarcinomas (�1cm) does not improve life expectancy (35). Thepresence of abnormal lymph nodes suggestive ofmetastatic disease overrides these recommenda-tions.
ConclusionsUS is valuable for identifying many malignant orpotentially malignant thyroid nodules. Althoughthere is some overlap between the US appearanceof benign nodules and that of malignant nodules,certain US features are helpful in differentiatingbetween the two. These features include micro-calcifications, local invasion, lymph node metas-tases, a nodule that is taller than it is wide, andmarkedly reduced echogenicity. Other features,such as the absence of a halo, ill-defined irregularmargins, solid composition, and vascularity, areless specific but may be useful ancillary signs.Apart from local extrathyroidal invasion, none ofthese features is individually pathognomonic ofmalignancy. However, in combination, these fea-tures may lead to a diagnosis of malignancy andmay direct attention to other suspicious nodulesin need of further investigation. Potential diag-nostic pitfalls include routinely dismissing smallnodules, assuming that multiple nodules are mostlikely benign, mistaking carcinomas for cystic hy-perplastic nodules and Graves disease, and mis-taking adjacent nodal metastases for benign thy-roid nodules.
Acknowledgments: The authors acknowledge LukeF. Chen, MBBS, FRACP, Oliver F. Hennessy, FRCR,FRANZCR, and Christopher T. Holden, MBBS,FRANZCR, for their assistance with preparation of theeducation exhibit and manuscript.
References1. Frates MC, Benson CB, Charboneau JW, et al.
Management of thyroid nodules detected at US:Society of Radiologists in Ultrasound consensusconference statement. Radiology 2005;237(3):794–800.
2. Papini E, Guglielmi R, Bianchini A, et al. Risk ofmalignancy in nonpalpable thyroid nodules: pre-dictive value of ultrasound and color-Doppler fea-tures. J Clin Endocrinol Metab 2002;87(5):1941–1946.
3. Abdel-Razzak M, Christie JH. Thyroid carcinomain an autonomously functioning nodule. J NuclMed 1979;20(9):1001–1002.
4. Kountakis SE, Skoulas IG, Maillard AA. The ra-diologic work-up in thyroid surgery: fine-needlebiopsy versus scintigraphy and ultrasound. EarNose Throat J 2002;81(3):151–154.
5. Bitterman A, Uri O, Levanon A, Baron E, Lefel O,Cohen O. Thyroid carcinoma presenting as a hotnodule. Otolaryngol Head Neck Surg 2006;134(5):888–889.
6. De Rosa G, Testa A, Maurizi M, et al. Thyroidcarcinoma mimicking a toxic adenoma. Eur J NuclMed 1990;17(3–4):179–184.
7. Hoving J, Piers DA, Vermey A, Oosterhuis JW.Carcinoma in hyperfunctioning thyroid nodule inrecurrent hyperthyroidism. Eur J Nucl Med 1981;6(3):131–132.
8. Majima T, Doi K, Komatsu Y, et al. Papillary thy-roid carcinoma without metastases manifesting asan autonomously functioning thyroid nodule. En-docr J 2005;52(3):309–316.
9. Iwata M, Kasagi K, Misaki T, Iida Y, Konishi J. Apatient with two thyroid papillary carcinomasdemonstrating hot and cold lesions on 113I thy-roid scintigraphy. Ann Nucl Med 2002;16(5):355–358.
10. Rubenfeld S, Wheeler TM. Thyroid cancer pre-senting as a hot thyroid nodule: report of a caseand review of the literature. Thyroidology 1988;1:63–68.
11. Rago T, Vitti P, Chiovato L, et al. Role of conven-tional ultrasonography and color flow-dopplersonography in predicting malignancy in ‘cold’ thy-roid nodules. Eur J Endocrinol 1998;138(1):41–46.
12. Middleton WD, Kurtz AB, Hertzberg BS. Ultra-sound: the requisites. 2nd ed. St Louis, Mo:Mosby, 2004; 244–252.
13. Harnsberger H. Diagnostic imaging: head andneck. Salt Lake City, Utah: Amirsys, 2004; 24–43.
14. Dahnert W. Radiology review manual. 5th ed.Philadelphia, Pa: Lippincott Williams & Wilkins,2003; 394–396.
15. Iannuccilli JD, Cronan JJ, Monchik JM. Risk formalignancy of thyroid nodules as assessed bysonographic criteria: the need for biopsy. J Ultra-sound Med 2004;23(11):1455–1464.
16. Kim EK, Park CS, Chung WY, et al. New sono-graphic criteria for recommending fine-needle aspira-tion biopsy of nonpalpable solid nodules of the thy-roid. AJR Am J Roentgenol 2002;178(3):687–691.
RG f Volume 27 ● Number 3 Hoang et al 859

17. Koike E, Noguchi S, Yamashita H, et al. Ultra-sonographic characteristics of thyroid nodules:prediction of malignancy. Arch Surg 2001;136(3):334–337.
18. Chan BK, Desser TS, McDougall IR, Weigel RJ,Jeffrey RB Jr. Common and uncommon sono-graphic features of papillary thyroid carcinoma. JUltrasound Med 2003;22(10):1083–1090.
19. Klinck GH, Winship T. Psammoma bodies andthyroid cancer. Cancer 1959;12(4):656–662.
20. Taki S, Terahata S, Yamashita R, et al. Thyroidcalcifications: sonographic patterns and incidenceof cancer. Clin Imaging 2004;28(5):368–371.
21. Khoo ML, Freeman JL, Witterick IJ, et al. Under-expression of p27/Kip in thyroid papillary microcar-cinomas with gross metastatic disease. Arch Otolar-yngol Head Neck Surg 2002;128(3):253–257.
22. Takashima S, Fukuda H, Nomura N, KishimotoH, Kim T, Kobayashi T. Thyroid nodules: re-evaluation with ultrasound. J Clin Ultrasound1995;23(3):179–184.
23. Jun P, Chow LC, Jeffrey RB. The sonographicfeatures of papillary thyroid carcinomas: pictorialessay. Ultrasound Q 2005;21(1):39–45.
24. Shah JP, Loree TR, Dharker D, Strong EW, BeggC, Vlamis V. Prognostic factors in differentiatedcarcinoma of the thyroid gland. Am J Surg 1992;164(6):658–661.
25. Ahuja AT, Chow L, Chick W, King W, MetreweliC. Metastatic cervical nodes in papillary carci-noma of the thyroid: ultrasound and histologicalcorrelation. Clin Radiol 1995;50(4):229–231.
26. Shirakawa T, Miyamoto Y, Yamagishi J, FukudaK, Tada S. Color/power Doppler sonographic dif-ferential diagnosis of superficial lymphadenopathy:metastasis, malignant lymphoma, and benign pro-cess. J Ultrasound Med 2001;20(5):525–532.
27. Ito Y, Tomoda C, Uruno T, et al. Preoperativeultrasonographic examination for lymph node me-tastasis: usefulness when designing lymph nodedissection for papillary microcarcinoma of the thy-roid. World J Surg 2004;28(5):498–501.
28. Ito Y, Tomoda C, Uruno T, et al. Clinical signifi-cance of metastasis to the central compartmentfrom papillary microcarcinoma of the thyroid.World J Surg 2006;30(1):91–99.
29. Propper RA, Skolnick ML, Weinstein BJ, DekkerA. The nonspecificity of the thyroid halo sign.J Clin Ultrasound 1980;8(2):129–132.
30. Lu C, Chang TC, Hsiao YL, Kuo MS. Ultrasono-graphic findings of papillary thyroid carcinomaand their relation to pathologic changes. J FormosMed Assoc 1994;93(11–12):933–938.
31. Watters DA, Ahuja AT, Evans RM, et al. Role ofultrasound in the management of thyroid nodules.Am J Surg 1992;164(6):654–657.
32. Hayashi N, Tamaki N, Yamamoto K, et al. Real-time ultrasonography of thyroid nodules. Acta Ra-diol Diagn (Stockh) 1986;27(4):403–408.
33. Wienke JR, Chong WK, Fielding JR, Zou KH,Mittelstaedt CA. Sonographic features of benignthyroid nodules: interobserver reliability and over-
lap with malignancy. J Ultrasound Med 2003;22(10):1027–1031.
34. Frates MC, Benson CB, Doubilet PM, Cibas ES,Marqusee E. Can color Doppler sonography aid inthe prediction of malignancy of thyroid nodules? JUltrasound Med 2003;22(2):127–131.
35. Pellegriti G, Scollo C, Lumera G, Regalbuto C,Vigneri R, Belfiore A. Clinical behavior and out-come of papillary thyroid cancers smaller than 1.5cm in diameter: study of 299 cases. J Clin Endo-crinol Metab 2004;89(8):3713–3720.
36. Hurley DL, Gharib H. Evaluation and manage-ment of multinodular goiter. Otolaryngol ClinNorth Am 1996;29(4):527–540.
37. Imaizumi M, Usa T, Tominaga T, et al. Radiationdose-response relationships for thyroid nodulesand autoimmune thyroid diseases in Hiroshimaand Nagasaki atomic bomb survivors 55–58 yearsafter radiation exposure. JAMA 2006;295(9):1011–1022.
38. Imaizumi M, Usa T, Tominaga T, et al. Long-term prognosis of thyroid nodule cases comparedwith nodule-free controls in atomic bomb survi-vors. J Clin Endocrinol Metab 2005;90(9):5009–5014.
39. Sklar C, Whitton J, Mertens A, et al. Abnormali-ties of the thyroid in survivors of Hodgkin’s dis-ease: data from the Childhood Cancer SurvivorStudy. J Clin Endocrinol Metab 2000;85(9):3227–3232.
40. Brander AE, Viikinkoski VP, Nickels JI, KivisaariLM. Importance of thyroid abnormalities detectedat US screening: a 5-year follow-up. Radiology2000;215(3):801–806.
41. Kuma K, Matsuzuka F, Yokozawa T, Miyauchi A,Sugawara M. Fate of untreated benign thyroidnodules: results of long-term follow-up. WorldJ Surg 1994;18(4):495–498; discussion 499.
42. Alexander EK, Hurwitz S, Heering JP, et al. Natu-ral history of benign solid and cystic thyroid nod-ules. Ann Intern Med 2003;138(4):315–318.
43. Kessler A, Rappaport Y, Blank A, Marmor S,Weiss J, Graif M. Cystic appearance of cervicallymph nodes is characteristic of metastatic papil-lary thyroid carcinoma. J Clin Ultrasound 2003;31(1):21–25.
44. Hatabu H, Kasagi K, Yamamoto K, et al. Cysticpapillary carcinoma of the thyroid gland: a newsonographic sign. Clin Radiol 1991;43(2):121–124.
45. Aozasa K. Hashimoto’s thyroiditis as a risk factorof thyroid lymphoma. Acta Pathol Jpn 1990;40(7):459–468.
46. Ciric J, Beleslin-Nedeljkovic B. Differentiated thy-roid carcinoma in previously manifested autoim-mune thyroid disease [in Serbian]. Srp Arh CelokLek 2005;133(suppl 1):74–76.
47. Pino Rivero V, Guerra Camacho M, Marcos Gar-cia M, et al. The incidence of thyroid carcinoma inHashimoto’s thyroiditis: our experience and litera-ture review [in Spanish]. An OtorrinolaringolIbero Am 2004;31(3):223–230.
48. Stocker DJ, Burch HB. Thyroid cancer yield inpatients with Graves’ disease. Minerva Endocrinol2003;28(3):205–212.
This article meets the criteria for 1.0 AMA PRA Category 1 Credit TM. To obtain credit, see www.rsna.org/education/rg_cme.html.
860 May-June 2007 RG f Volume 27 ● Number 3

Invited Commentary
From:Jill E. Langer, MDDepartment of Radiology, University of Pennsylvania Medical CenterPhiladelphia, Pennsylvania
I am pleased to have the opportunity to commenton the excellent article by Hoang et al in this issueof RadioGraphics (1). Over the past several years,there has been a dramatic increase in the numberof thyroid nodules that have come to clinical at-tention because of the widespread use of high-resolution ultrasonography (US) to evaluate thethyroid gland (2). It is now recognized that thesonographic features of thyroid nodules are morepredictive of thyroid cancer than is nodule size.Certain sonographic features play a key role indeciding which nodules should undergo fine-needle aspiration (FNA), and they have been in-corporated into biopsy recommendations pub-lished by the Society of Radiologists in Ultra-sound (SRU) (2) and the American ThyroidAssociation (ATA) (3). It is therefore incumbenton the sonologist to be able recognize these fea-tures so as to select appropriate nodules for bi-opsy. The authors review the sonographic fea-tures that carry a high predictive value for thyroidmalignancy and discuss interpretative pitfalls,particularly those that make the detection of amalignancy more difficult.
FNA was introduced into this country approxi-mately 2 decades ago and has been widely ac-cepted as a safe and accurate procedure for thediagnosis of thyroid cancer. Prior to the incorpo-ration of FNA into the management algorithm ofpalpable thyroid abnormalities, surgical excisionwas commonly performed to both diagnose andtreat nodular thyroid disease. The use of FNAprior to surgical resection has led to an overalldecrease in the number of thyroid surgeries, witha twofold increase in the diagnosis of carcinoma(4,5). The recommended first diagnostic test for aeuthyroid patient with a palpable thyroid nodulemore than 1.0–1.5 cm in diameter is palpation-guided FNA (6). This nodule size threshold wasestablished on the basis of the knowledge that thesize of a thyroid cancer is a predictor of outcome;the propensity of papillary cancers to cause ad-verse events increases above 1 cm, compared with4 cm for follicular cancers (7). Although theprevalence of palpable nodules in the adult popu-lation in the United States is estimated to be4%–6% (2), US of the thyroid gland allowsdetection of nonpalpable nodules in 17%–67%of asymptomatic adults (8,9). Even in patientswith palpable nodules, the detection of unsus-
pected additional nodules at US approaches 50%(10,11). Nonpalpable nodules may come to clini-cal attention also as a result of other imaging ex-aminations of the neck, such as carotid US, com-puted tomography (CT), and magnetic resonance(MR) imaging.
The clinical dilemma is how to manage thelarge number of nonpalpable nodules that aredetected with US. Although nonpalpable nodulesare as likely to be cancerous as are palpable nod-ules, most nodules detected with US are benign(5,10). The rationale behind avoiding biopsy ofsome nodules is not only that resources are lim-ited but also that a nondiagnostic or an indeter-minate biopsy results in indirect morbidity. Ap-proximately 60%–70% of nodules biopsied withFNA are benign, and 10%–13% are malignant;however, approximately 15%–30% are character-ized as indeterminate, a follicular lesion, or “sus-picious” (2). Roughly 80% of the latter group ofnodules are benign, including follicular adeno-mas, hyperplastic nodules, and foci of thyroiditis;the other 20% are malignant, representing mixedfollicular and papillary cancer or pure follicularcancer (2,5). The current recommendation is torefer all patients with an indeterminate FNA re-sult or persistent nondiagnostic FNA result (dueto insufficient cellular material) for surgical ex-cision (3,12). Therefore, the decision aboutwhether to pursue FNA of a sonographically de-tected nonpalpable nodule involves balancing theneed to identify clinically relevant cancers againstthe need to avoid unnecessary surgical excision toprove benignity in a large asymptomatic popula-tion of patients with inconclusive FNA results.
In a small percentage of patients, FNA of anonpalpable sonographically detected nodulemay be desirable regardless of the sonographiccharacteristics. The decision may be based onclinical factors, including an increased risk forthyroid cancer because of family history or a his-tory of prior radiation exposure (3). For most pa-tients who are at low risk for thyroid cancer, thegoals of assessing the sonographic characteristicsof detected nonpalpable nodules are (a) to deter-mine the likelihood of malignancy so that patientswith thyroid cancer can be diagnosed and treated
RG f Volume 27 ● Number 3 Hoang et al 861
Note: This copy is for your personal, non-commercial use only. To order presentation-ready copies for distribution to your colleagues or clients, use the RadioGraphics Reprints form at the end of this article.
at an earlier stage, possibly with a resultant reduc-tion of morbidity and mortality, and (b) to recog-nize sonographic features that have a high correla-tion with benign disease, so as to avoid unneces-sary tests and surgery (2,12). As reviewed by theauthors (1), the sonographic feature with thehighest positive predictive value of cancer is thepresence of calcifications within a nodule, par-ticularly microcalcifications (2). Calcifications,including peripheral calcifications that occur insolitary nodules, hypoechoic nodules, and pre-dominantly solid nodules, arouse concern aboutpossible malignancy (13–15). For example, mi-crocalcifications within a solid or predominantlysolid nodule are associated with a risk of cancerthat is three times that for a solid noncalcifiednodule, and coarse calcifications are associatedwith twice the risk (2). It is important for the so-nologist to be able to distinguish between micro-calcifications and colloid reverberation artifact.Microcalcifications within a nodule signify a veryhigh risk of malignancy (and therefore, the SRUstrongly recommends FNA at a 1.0-cm sizethreshold), whereas colloid reverberation artifactis considered a strong predictor of benign disease(2,12). Lower-frequency transducers, slight angleadjustments in the scanning plane, and real-timeexamination often may make the comet-tail arti-fact of colloid within a nodule more apparent(16). The SRU guidelines recommend FNA of acolloid-containing nodule without suspicious fea-tures only if the nodule has a diameter of at least2.0 cm, and they do not necessarily require it,given the very low likelihood of malignancy insuch nodules (2). The ATA recommendationsdiffer significantly in this regard: They recom-mend biopsy at the 1.0–1.5-cm size for all de-tected solitary nodules (3).
As described by the authors, other sonographicfeatures with a relatively high predictive value formalignancy include a solid composition andmarked hypoechogenicity of a nodule (1). Somefeatures that are relatively nonspecific individuallyare more predictive of malignancy when they ap-pear in combination (eg, the combination of in-tranodular flow and hypoechogenicity) (17,18).The presence of a thick or irregular halo in asso-ciation with a solid consistency and iso- or hy-perechogenicity often is correlated with a follicu-lar tumor (12). At the opposite end of the spec-trum, the sonographic features that are highlypredictive of benign disease include entirely ornearly entirely cystic consistency without a calci-fied or vascular soft-tissue component; a honey-comblike or spongiform consistency; and a com-plete, thin, and regular halo. Many would argue
that a biopsy could be avoided when these fea-tures are clearly apparent (12).
An analysis of the sonographic characteristicsis particularly important in the evaluation of pa-tients with multiple thyroid nodules. Based on theuse of imaging to define nodularity, several re-ports have determined that an individual’s risk ofthyroid cancer is the same whether one nodule ormultiple nodules are present (19). Both the SRUand the ATA recommend analyzing the sono-graphic features of a multinodular gland to deter-mine which nodule or nodules should be biop-sied, instead of relying on the practice of selectingthe largest nodule. When multiple nodules withdifferent sonographic appearances are observed,each nodule can be evaluated by using the criteriaestablished for solitary nodules (2). Our lab con-siders nodules that are sonographically similar tobe histologically similar. For example, if a patienthad one solid hypoechoic noncalcified 18-mmnodule and several partially cystic noncalcifiedsonographically similar nodules in the 10–25-mmsize range, we would biopsy the solid nodule first.If the nodule was found benign at FNA, wewould choose to biopsy the largest mixed cysticand solid nodule (25 mm), considering it repre-sentative of the remaining nodules. At present,there are many approaches to the patient withmultiple nonsuspicious thyroid nodules. The ap-proaches vary from no biopsy in a case whereglandular tissue has been diffusely replaced bymultiple nonsuspicious nodules (2), to biopsy ofonly the largest nodule (3), to the selection of asmany as four different nodules for FNA (13). Thenodules that are not biopsied may be followedwith annual US examinations and reevaluated forfuture FNA if they demonstrate rapid growth orother features that cause concern (2,3).
Perhaps one of the greatest controversies con-cerning thyroid US is the decision about whetherto biopsy nodules with a diameter of less than1.0–1.5 cm that are detected in a patient withoutrisk factors for thyroid cancer—“thyroid inciden-talomas” (20,21). It is well known that there is ahigh prevalence of occult thyroid cancer, which isdefined as a papillary cancer focus with a diam-eter of less than 1.0 cm. These occult cancers aredetected at autopsy with frequencies ranging from2.7% to 28.4% (7). In general, most of these arepapillary thyroid microcarcinomas, small foci ofcancer that are thought to pursue an indolentcourse. However, a small percentage of microcar-cinomas are or become invasive or metastatic,with resultant morbidity (7). Others have arguedthat earlier detection of these lesions does little toaffect mortality (22,23). The current recommen-dation of the ATA is to biopsy 8- and 9-mm nod-ules that are detected incidentally and that haveone or more suspicious sonographic features, in-
862 May-June 2007 RG f Volume 27 ● Number 3

cluding microcalcifications, hypoechogenicity,intranodular flow, and indistinct margins (3).
I fully concur with the authors that the resultsof scintigraphy generally are not useful for deter-mining which nodules are more likely to be malig-nant in most euthyroid patients, since most be-nign nodules, like malignancies, do not demon-strate iodine uptake (5). However, iodine 123scintigraphy is a worthwhile test in patients withindeterminate FNA results, since the demonstra-tion of iodine uptake in a thyroid nodule virtuallyexcludes a malignancy. Approximately 5% ofnodules described at cytologic analysis as “follicu-lar” show iodine uptake, which obviates surgicalexcision to determine their benignity. Patientswith a cytologic result of “suspicious for papillarycancer” or “Hurthle cell lesion” should be re-ferred for surgical excision (3).
As described in the article, one of the mostspecific findings in thyroid malignancy is the pres-ence of metastatic lymphadenopathy or evidenceof direct invasion of adjacent soft-tissue struc-tures. I agree with the authors’ assertion that allpatients should undergo an evaluation of the cer-vical lymph nodes as part of a routine thyroid USexamination. This practice is particularly helpfulwhen abnormal lymph nodes are identified ipsi-lateral to a suspicious thyroid nodule. FNA withcytopathologic analysis of an abnormal lymphnode can be performed as the initial diagnosticprocedure. If the results confirm the presence ofmetastatic thyroid carcinoma in the lymph node,the patient can be referred for thyroidectomy withresection of the affected lymph node chains. Thy-roid cancer most commonly metastasizes to theipsilateral cervical lymph nodes, but contralateralcervical metastases have been noted in as many as20% of patients; for this reason, both lateral com-partments of the neck should be examined withUS (24,25). After a diagnosis of metastatic thy-roid cancer is established, the identification ofcentral compartment metastases is less importantbecause the central compartment is typically ex-plored at the time of thyroidectomy. In my opin-ion, the size of the lymph node is a less importantfeature than its morphologic characteristics atUS. I commonly encounter metastatic lymphnodes that are normal in size or minimally en-larged but that show calcifications, cystic change,diffuse or focal increased vascularity, heteroge-neous echotexture, and rounded shape, and I tar-get these nodes rather than larger but otherwisenormal-appearing lymph nodes for FNA (26,27).It is very common to see enlarged yet otherwisesonographically normal cervical lymph nodes be-cause of benign inflammatory conditions of thenasopharynx, particularly in the upper portions ofthe cervical chains (levels 2 and 3) (27). Manypatients with chronic lymphocytic thyroiditis
(Hashimoto thyroiditis) have multiple enlargedbut otherwise sonographically normal nodes inthe central and lateral compartments.
The authors also draw attention to the poten-tial misinterpretation of metastatic lymphad-enopathy as benign thyroid disease. Cystic metas-tases to central compartment nodes, which arecommon with papillary cancers, are more likely tobe mistaken for benign cystic thyroid nodulesthan correctly interpreted as abnormal lateralnodes. Misinterpretation is more likely to occurwith cystic anterior prelaryngeal nodes, which arelocated just anterior to the isthmus, and less likelywith paratracheal nodes, which lie just behind thethyroid; however, careful scanning usually dem-onstrates the extrathyroidal location of these cys-tic nodes. Fortunately, the coexisting cancerousthyroid lesion is often easily identifiable at USand can be targeted for FNA to establish the pres-ence of thyroid cancer, even if central compart-ment metastases are overlooked (Fig 15). Thepresence of microcalcifications or coarse calcifica-tions anywhere within the central compartment ofthe neck should prompt FNA even if the sonolo-gist is uncertain about whether the lesion is a cal-cified thyroid nodule or a metastatic central com-partment lymph node (Fig 16).
Palpable lymphadenopathy may be found insome patients in whom the primary thyroid can-cer is clinically occult or (rarely) undetectableeven with US (2). Consideration should be givento the possibility of metastatic thyroid cancerwhen a solitary cystic lesion is observed in thelateral part of the neck in either a child or anadult. Often the lymph node has been nearly en-tirely replaced by the cystic metastasis. An abnor-mal lymph node may be differentiated from acongenital cyst, exophytic thyroid cystic nodule,and parathyroid cyst by accurately identifying itslocation within either the anterior or the posteriorcervical lymph node chain, and the diagnosis maybe confirmed with FNA. When it is difficult toobtain cellular material from a predominantlycystic lymph node, a portion of the aspirate canbe sent for thyroglobulin analysis. If thyroglobu-lin, a protein unique to follicular thyroid cells, ispresent in a cystic lesion in a lateral compartment,a diagnosis of metastatic thyroid cancer can bemade (28).
Although many of the figures in the article con-sist of cross-sectional images of thyroid malignan-cies, I do not recommend cross-sectional imagingof the neck in most patients with a new diagnosisof differentiated thyroid cancer, since the vastmajority will have only regional cervical metasta-ses. US has the capacity to depict invasion of the
RG f Volume 27 ● Number 3 Hoang et al 863
thyroid capsule and extension into the adjacentsoft tissues by some of the more aggressive differ-entiated thyroid cancers; however, it is of limiteduse in identifying the extent of invasion into theadjacent trachea and esophagus and detectinglymphadenopathy that extends into the uppermediastinum and retropharyngeal space. There-fore, I do recommend CT or MR imaging of theneck to help plan surgical resection in patientswith undifferentiated thyroid cancer and for large,rapidly growing or invasive tumors (3,24).
The greatest departure of my views from thoseof the authors concerns their comments aboutdiffuse thyroid disease and the coexistence of ma-lignancy. It has been well established that chroniclymphocytic thyroiditis is a risk factor for the de-velopment of primary thyroid lymphoma, but,fortunately, that is a relatively rare occurrence(29). Although there are many reports of an in-creased occurrence of papillary cancers in thyroidglands affected by chronic lymphocytic thyroid-itis, the degree to which the “increase” is relatedto an increased frequency of detection with USand surgical removal of the thyroid in these pa-tients is not fully delineated. The diagnosis of co-existent malignancy with diffuse thyroid disease isoften complicated by the heterogeneous back-ground echotexture in affected glands, which hasthe effect of both masking true malignancies andcreating a false impression of focal nodular dis-ease. When confronted with a diffusely heteroge-neous gland, I rely heavily on real-time examina-tion to determine whether “true” nodules arepresent, rather than geographic, patchy areas oflymphocytic infiltration, and then I apply theSRU guidelines to target appropriate nodules forFNA. I also try to target focal clusters of calcifica-tions, particularly microcalcifications, knowingthat the delineation of a hypoechoic papillary can-cer is difficult in a gland with overall decreasedechogenicity. In addition, I consider it exceed-ingly rare for a thyroid cancer to produce thyro-toxicosis.
Although US of the thyroid has created “anepidemic of thyroid nodules” (22), it offers a par-tial solution, allowing targeted biopsy on the basisof an ability to recognize US findings that carry ahigh likelihood of malignancy. Yet even with thisstrategy, cancers without apparent suspicioussonographic features may remain undiagnosed(3,13). Thus, we are left with several uncertain-ties regarding the optimal management of thyroidnodules detected at US: Is it clinically relevant to
diagnose all thyroid cancer, especially papillarycancers smaller than 1.0 cm? Does an early diag-nosis of thyroid cancer truly affect the prognosis?What is the optimal biopsy strategy for a multi-nodular gland? Are there sonographic featuresindicative of such a low risk for malignancy thatthey obviate the need for FNA to exclude malig-nancy? Is it more cost effective to biopsy a nodulewhen it is first detected or to monitor it forgrowth with serial US examinations? Several ofthese questions are the focus of active research,and we can look forward to the formulation offuture recommendations concerning the manage-ment of sonographically detected thyroid nod-ules.
References1. Hoang JK, Lee WK, Lee M, Johnson D, Farrell S.
Sonographic features of thyroid malignancy: pearlsand pitfalls. RadioGraphics 2007;27:847–865.
2. Frates MC, Benson CB, Charboneau JW, et al.Management of thyroid nodules detected at US:Society of Radiologists in US consensus confer-ence statement. Radiology 2005;237:794–800.
3. Cooper DS, Doherty GM, Haugen BR, et al.Management guidelines for patients with thyroidnodules and differentiated thyroid cancer. Thyroid2006;16:109–142.
4. Belfiore A, La Rosa GL. Fine-needle aspirationbiopsy of the thyroid. Endocrinol Metab ClinNorth Am 2001;30:361–400.
5. Mandel SJ. A 64-year-old-woman with a thyroidnodule. JAMA 2004;292:2632–2642.
6. Mazzaferri EL. Management of a solitary thyroidnodule. N Engl J Med 1993;328:553–559.
7. Mazzaferri EL. Managing small thyroid cancers.JAMA 2006;295:2179–2182.
8. Brander A, Viikinkoski P, Nickels J, Kivisaari L.Thyroid gland: US screening in a random adultpopulation. Radiology 1991;181:683–687.
9. Tan GH, Gharib H. Thyroid incidentalomas:management approaches to nonpalpable nodulesdiscovered incidentally on thyroid imaging. AnnIntern Med 1997;126:226–231.
10. Tan GH, Gharib H, Reading CC. Solitary thyroidnodule: comparison between palpation and ultra-sonography. Arch Intern Med 1995;155:2418–2423.
11. Marqusee E, Benson CB, Frates MC, et al. Use-fulness of ultrasonography in the management ofnodular thyroid disease. Ann Intern Med 2000;133:696–700.
12. Reading CC, Charboneau LW, Hay ID, Sebo TJ.Sonography of thyroid nodules: a “classic pattern”diagnostic approach. Ultrasound Q 2005;21:157–165.
13. Frates MC, Benson CB, Doubilet PM, et al.Prevalence and distribution of carcinoma in pa-tients with solitary and multiple thyroid noduleson sonography. J Clin Endocrinol Metab 2006;91:3411–3417.
14. Khoo ML, Asa SL, Witterick IJ, Freeman JL.Thyroid calcification and its association with thy-roid carcinoma. Head Neck 2002;24:651–655.
864 May-June 2007 RG f Volume 27 ● Number 3
15. Kakkos SK, Scopa CD, Chalmoukis AK, et al.Relative risk of cancer in sonographically detectedthyroid nodules with calcifications. J Clin Ultra-sound 2000;28:347–352.
16. Ahuja A, Chick W, King W, Metreweli C. Clinicalsignificance of the comet-tail artifact in thyroidultrasound. J Clin Ultrasound 1996;24:129–133.
17. Papini E, Guglielmi R, Bianchini A, et al. Risk ofmalignancy in nonpalpable thyroid nodules: pre-dictive value of ultrasound and color-Doppler fea-tures. J Clin Endocrinol Metab 2002;87:1941–1946.
18. Frates MC, Benson CB, Doubilet PM, Cibas ES,Marqusee E. Can color Doppler sonography aid inthe prediction of malignancy of thyroid nodules? JUltrasound Med 2003;22:127–131.
19. Belfiore A, La Rosa GL, La Porta GA, et al. Can-cer risk in patients with cold thyroid nodules: rel-evance of iodine intake, sex, age, and multinodu-larity. Am J Med 1992;93:363–369.
20. Topliss D. Thyroid incidentaloma: the ignorant inpursuit of the impalpable. Clin Endocrinol (Oxf)2004;60:18–20.
21. Kang HW, No JH, Chung JH, et al. Prevalence,clinical and ultrasonographic characteristics ofthyroid incidentalomas. Thyroid 2004;14:29–33.
22. Ross DS. Nonpalpable thyroid nodules: managingan epidemic [editorial]. J Clin Endocrinol Metab2002;87:1938–1940.
23. Davies L, Welch HG. Increasing incidence of thy-roid cancer in the United States, 1973–2002.JAMA 2006;295:2164–2167.
24. Shimamoto K, Satake H, Sawaki A, Ishigaki T,Funahashi H, Imai T. Preoperative staging of thy-roid papillary cancer with ultrasonography. Eur JRadiol 1998;29:4–10.
25. Kouvaraki MA, Shapiro SE, Fornage BD, et al.Role of pre-operative ultrasonography in the surgi-cal management of patients with thyroid cancer.Surgery 2003;134:946–955.
26. Ying M, Ahuja A, Metreweli C. Diagnostic accu-racy of sonographic criteria for evaluation of cervi-cal lymphadenopathy. J Ultrasound Med 1998;17:437–445.
27. Bruneton JN, Balu-Maestro C, Marcy P, Melia P,Mourou MY. Very high frequency (13 MHz) ul-trasonographic examination of the normal neck:detection of normal lymph nodes and thyroid nod-ules. J Ultrasound Med 1994;13:87–90.
28. Frasoldati A, Toschi E, Zini M, et al. Role of thy-roglobulin measurement in fine-needle aspirationbiopsies of cervical lymph nodes in patients withdifferentiated thyroid cancer. Thyroid 1999;9:105–111.
29. Takashima S, Matsuzuka F, Nagareda T, To-miyama N, Kozuka T. Thyroid nodules associatedwith Hashimoto thyroiditis: assessment with ultra-sound. Radiology 1992;185:125–130.
Authors’ Response
From:Jenny K. Hoang, MBBS, FRANZCRWai Kit Lee, MBBS, FRANZCR
Department of Medical ImagingStephen Farrell, MBBS, FRACS
Department of SurgerySt Vincent’s Hospital MelbourneFitzroy, Australia
We thank Dr Langer for her comments.We agree with Dr Langer’s observation that a
thyroid carcinoma manifesting with diffuse infil-tration and with thyrotoxicosis is very rare, andthyrotoxic carcinoma has been described in onlyisolated case reports (1–3). We have seen bothsituations, which became clear only after appre-ciation of lymph node metastasis.
Concerning diffuse autoimmune thyroid dis-ease, we also agree that malignancy developing inlong-standing disease is uncommon; nevertheless,thyroiditis is probably an independent risk factorfor differentiated thyroid cancer as well as lym-phoma. Thyroid nodules against a background ofthyroiditis should be assessed just as an isolated
thyroid nodule would be assessed, for the samesonographic features suggestive of malignancy.
References1. Li WY, Tomlinson MA, Bryson JM, Hopkins NF.
Medullary thyroid carcinoma: a rare presentation asa hypervascular tumour. J Laryngol Otol 2002;116:647–649.
2. Heymann RS, Brent GA, Hershman JM. Anaplasticthyroid carcinoma with thyrotoxicosis and hypo-parathyroidism. Endocr Pract 2005;11:281–284.
3. Villa ML, Mukherjee JJ, Tran NQ, Cheah WK,Howe HS, Lee KO. Anaplastic thyroid carcinomawith destructive thyrotoxicosis in a patient with pre-existing multinodular goiter. Thyroid 2004;14:227–230.
RG f Volume 27 ● Number 3 Hoang et al 865
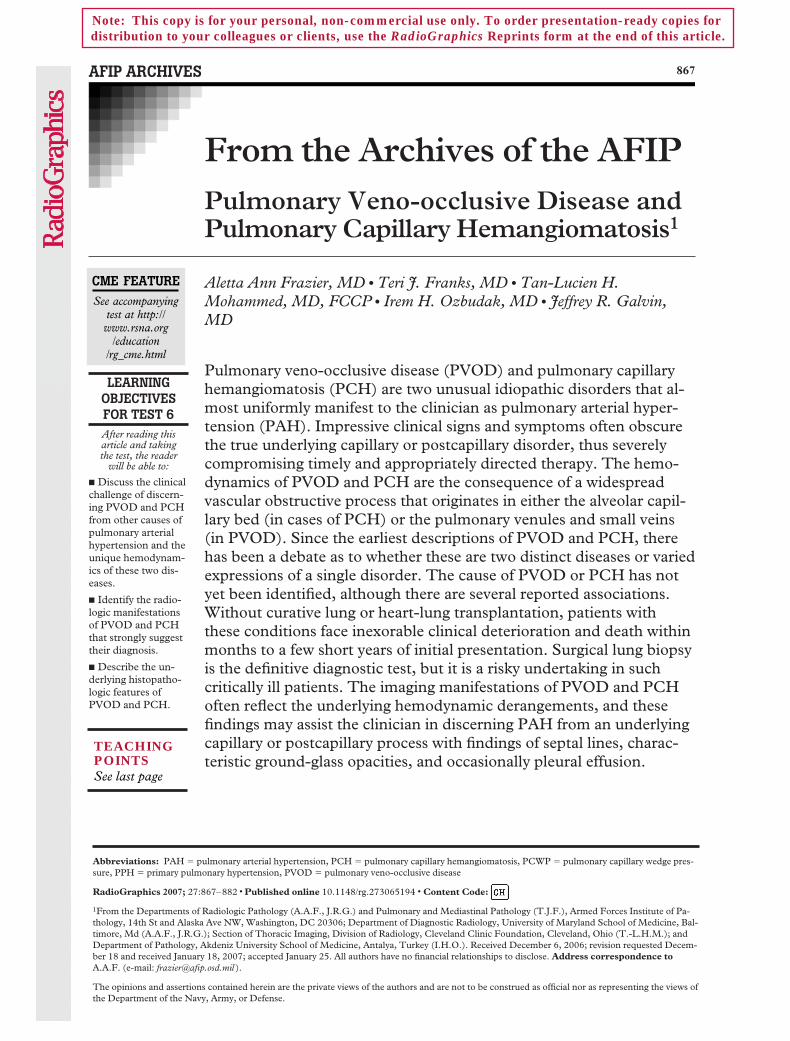
AFIP ARCHIVES 867
From the Archives of the AFIPPulmonary Veno-occlusive Disease andPulmonary Capillary Hemangiomatosis1
LEARNINGOBJECTIVESFOR TEST 6After reading thisarticle and takingthe test, the reader
will be able to:
� Discuss the clinicalchallenge of discern-ing PVOD and PCHfrom other causes ofpulmonary arterialhypertension and theunique hemodynam-ics of these two dis-eases.
� Identify the radio-logic manifestationsof PVOD and PCHthat strongly suggesttheir diagnosis.
� Describe the un-derlying histopatho-logic features ofPVOD and PCH.
Aletta Ann Frazier, MD ● Teri J. Franks, MD ● Tan-Lucien H.Mohammed, MD, FCCP ● Irem H. Ozbudak, MD ● Jeffrey R. Galvin,MD
Pulmonary veno-occlusive disease (PVOD) and pulmonary capillaryhemangiomatosis (PCH) are two unusual idiopathic disorders that al-most uniformly manifest to the clinician as pulmonary arterial hyper-tension (PAH). Impressive clinical signs and symptoms often obscurethe true underlying capillary or postcapillary disorder, thus severelycompromising timely and appropriately directed therapy. The hemo-dynamics of PVOD and PCH are the consequence of a widespreadvascular obstructive process that originates in either the alveolar capil-lary bed (in cases of PCH) or the pulmonary venules and small veins(in PVOD). Since the earliest descriptions of PVOD and PCH, therehas been a debate as to whether these are two distinct diseases or variedexpressions of a single disorder. The cause of PVOD or PCH has notyet been identified, although there are several reported associations.Without curative lung or heart-lung transplantation, patients withthese conditions face inexorable clinical deterioration and death withinmonths to a few short years of initial presentation. Surgical lung biopsyis the definitive diagnostic test, but it is a risky undertaking in suchcritically ill patients. The imaging manifestations of PVOD and PCHoften reflect the underlying hemodynamic derangements, and thesefindings may assist the clinician in discerning PAH from an underlyingcapillary or postcapillary process with findings of septal lines, charac-teristic ground-glass opacities, and occasionally pleural effusion.
Abbreviations: PAH � pulmonary arterial hypertension, PCH � pulmonary capillary hemangiomatosis, PCWP � pulmonary capillary wedge pres-sure, PPH � primary pulmonary hypertension, PVOD � pulmonary veno-occlusive disease
RadioGraphics 2007; 27:867–882 ● Published online 10.1148/rg.273065194 ● Content Code:
1From the Departments of Radiologic Pathology (A.A.F., J.R.G.) and Pulmonary and Mediastinal Pathology (T.J.F.), Armed Forces Institute of Pa-thology, 14th St and Alaska Ave NW, Washington, DC 20306; Department of Diagnostic Radiology, University of Maryland School of Medicine, Bal-timore, Md (A.A.F., J.R.G.); Section of Thoracic Imaging, Division of Radiology, Cleveland Clinic Foundation, Cleveland, Ohio (T.-L.H.M.); andDepartment of Pathology, Akdeniz University School of Medicine, Antalya, Turkey (I.H.O.). Received December 6, 2006; revision requested Decem-ber 18 and received January 18, 2007; accepted January 25. All authors have no financial relationships to disclose. Address correspondence toA.A.F. (e-mail: [email protected] ).
The opinions and assertions contained herein are the private views of the authors and are not to be construed as official nor as representing the views ofthe Department of the Navy, Army, or Defense.
CME FEATURESee accompanying
test at http://www.rsna.org
/education/rg_cme.html
Note: This copy is for your personal, non-commercial use only. To order presentation-ready copies for distribution to your colleagues or clients, use the RadioGraphics Reprints form at the end of this article.
See last page
TEACHING POINTS

IntroductionVeno-occlusive histopathologic changes were firstdescribed in 1934 as the cause of death in a 48-year-old German baker with progressive dyspnea,cyanosis, and pulmonary edema (1). In 1966,British pathologist Donald Heath and associates(2) were the first to assert that pulmonary veno-occlusive disease (PVOD) is a distinct entityrather than an incidental autopsy finding. Heath’sexhaustive dissections revealed occlusive changesin up to 95% of the pulmonary veins and venulesin a 37-year-old female patient and led him topropose that, “Whatever the etiology of this con-dition proves to be, there is no doubt that itshould be separated from cases of classical pri-mary pulmonary hypertension on the grounds ofits histopathology with pronounced involvementof the pulmonary veins and alveolar walls” (3). Adecade later, Dutch pathologist C. A. Wagen-voort (4) and his colleagues (5) proposed thatPVOD is an acquired syndrome of devastatingvenous thrombosis induced by a wide spectrum ofinsults to the venous endothelium. Today, thereis an estimated annual incidence of 0.1–0.2 casesof PVOD per million persons (1). PVOD affectspatients with a wide range of ages, from 9 days to60–70 years old, but it is chiefly reported in chil-dren and young adults (1,6). In the 30%–50% ofpatients who are less than 20 years of age, there isno sexual predilection, but among adult patients,men are affected twice as frequently as women(5,7–9). The duration of illness before death isusually 2 years from initial presentation; pediatricpatients tend to experience a more rapid, relent-less progression of disease, which leads to right-sided heart failure and death in only a few shortmonths (7–11).
Pulmonary capillary hemangiomatosis (PCH)is reported much less frequently in the medicalliterature than PVOD. It was first recognized in1978 by Wagenvoort and colleagues (12) in a 71-year-old woman with progressive dyspnea, he-moptysis, and hemorrhagic pleural effusions.They observed a distinctive “atypical proliferationof capillary-like channels” in the lung tissue thatappeared to be an “angiomatous growth” (12). InPCH, the age range of affected patients is broad(2–71 years), with a mean age of 30 years, which
is comparable to the age range of patients withPVOD. In contrast to PVOD, however, PCH oc-curs with equal frequency in both sexes in pa-tients of any age (13–15). Median survival is 3years from initial presentation, and, as in PVOD,death may occur only a few months after the on-set of symptoms (13,15).
Both PVOD and PCH are considered idio-pathic diseases, although a myriad of associatedconditions is reported in the medical literature.An immune-mediated cause is suggested by thesporadic occurrence of PVOD in patients withunderlying systemic lupus erythematosus, sclero-derma, systemic sclerosis, human immunodefi-ciency virus infection, rheumatoid arthritis,Raynaud phenomenon, Hashimoto thyroiditis,Langerhans cell histiocytosis, or granulomatousvenulitis (10,16–25). Similarly, PCH has devel-oped in patients with systemic lupus erythemato-sus, scleroderma, Takayasu arteritis, Kartagenersyndrome, or hypertrophic cardiomyopathy(15,19). A viral etiology has been proposed inseveral patients with PVOD who recounted a re-cent viral illness (1,10). Three pairs of siblingshave died of PVOD, and an autosomal recessivehereditary form of PCH has been proposed, bothinstances prompting theories of a familial associa-tion (10,14,26). PVOD also occurs in cancer pa-tients following radiation therapy, chemotherapy(including treatment with bleomycin, cisplatin,vincristine, carmustine, and mitomycin), periph-eral blood stem cell transplantation, and autolo-gous or allogeneic bone marrow transplantation(10,27–35). Antecedent malignancies in pa-tients with PVOD have included neuroblastoma,lung cancer, multiple myeloma, leukemia, andHodgkin lymphoma; there is one report of PCHin a patient with preexisting colon cancer (30,31,33,36–39). Authors debate whether PVOD orPCH developed in these patients as a response toa toxic insult from their cancer treatment or as acomplication of malignancy. Many of these ques-tions remain unanswered.
Deceptive Clinical PresentationProgressive dyspnea and fatigue characterize theclinical manifestations of both PVOD and PCH,which are thus typically misdiagnosed as pulmo-nary arterial hypertension (PAH) (1,10,13–15).Patients may also have chronic cough (dry or pro-
868 May-June 2007 RG f Volume 27 ● Number 3

ductive), chest pain, syncope, or digital clubbing(1,6,15). The only clinical features that may dis-tinguish PCH from PVOD are the presence ofhemoptysis (evident in 30% of patients with PCHbut not reported in PVOD) and hemorrhagicpleural effusions (absent in PVOD but reportedin up to 25% of patients with PCH) (12–15,40).As either PVOD or PCH progresses, right-sidedheart failure may produce hypoxia, cyanosis, hy-potension, peripheral edema, ascites, hepato-megaly, hepatojugular reflex, and right paraster-nal heave. Electrocardiography typically demon-strates right axis deviation and right ventricularhypertrophy. Echocardiography (M-mode,Doppler, and two-dimensional) reveals PAH andhelps to exclude an underlying left-sided cardiacstructural lesion (such as mitral stenosis or myx-oma) or left ventricular dysfunction (7–10,16,41,42). It is estimated that in 5%–25% of patientswith PVOD, their condition is misdiagnosed asidiopathic pulmonary hypertension or pulmonarythromboembolic disease (1,7,8,10,11,41,43). Inthe great majority of patients with PCH, the con-dition is misdiagnosed before transplantation ordeath as primary pulmonary hypertension (PPH),PVOD, pulmonary fibrosis, sarcoidosis, pulmo-nary thromboembolism, or pulmonary hemo-siderosis (15).
Distinctive HemodynamicsTwo hemodynamic features characterize bothPVOD and PCH: elevated pulmonary arterialpressures and normal or low pulmonary capillarywedge pressures (PCWP). Virtually all patientswith PVOD and PCH have elevated pulmonaryarterial pressures at right-sided heart catheteriza-tion, a finding that confirms the presence of PAHand potentially misleads clinicians in their diag-nostic work-up (1,6–9,15,16,28,42,44–46). ThisPAH—which is further evidenced by medial hy-pertrophy of the pulmonary arterioles, dilatationof the main pulmonary artery, and right ventricu-lar hypertrophy—is explained by the sustainedreflection of pressure elevation in the pulmonaryveins (as in PVOD) or capillary bed (as in PCH)(47).
The second characteristic hemodynamic find-ing is that of normal or low PCWP. The termPCWP is actually a misnomer since the pressurein the capillary bed is not assessed. The actualpressure being measured is distal to the wedged
catheter tip and reaches beyond the venules andsmall veins to the largest pulmonary veins and leftatrium; these structures are unaffected in bothPVOD and PCH (1,6–8,16,46,48–51). Themeasurement of PCWP in most cases underesti-mates the pressure within the capillary bed itself(51). It is theorized that PVOD variably affectsthe venules and small veins, which allows somefraction of collateral bronchial veins and sparedpatent venous tributaries to provide perceivednormal venous outflow into the larger veins andleft atrium during PCWP measurement. The nor-mal or even low values of PCWP observed inPVOD or PCH are helpful in the clinical differen-tial diagnosis because they are in direct contrastto the elevated PCWPs obtained in patients withobstructed or stenotic larger pulmonary veins, leftatrial myxoma, mitral stenosis, or left ventricularfailure (52).
The hemodynamics of PVOD in particularmay also lead the capillary hydrostatic pressure toexceed the osmotic pressure of blood. This stateleads to transudation of fluid into the interstitium(ie, pulmonary edema) with consequent engorge-ment and dilatation of the subpleural and inter-lobular septal lymphatic channels. The clinicaltriad of findings—PAH, normal to low PCWP,and prominent radiologic septal lines—is welldocumented in PVOD, although in reality, manypatients present with only one physical or radio-logic finding suggestive of the diagnosis (1,6,53).
Radiologic Manifes-tations of PVOD and PCH
The chest radiographic appearance of PVODtypically includes features of both PAH and ofpostcapillary congestion: Main pulmonary arterialenlargement and prominent septal (Kerley B)lines together reveal that the primary disorder liesbeyond the pulmonary arterial circulation (Figs 1,2a). Localization to the pulmonary veins is furthersuggested by evidence of normal-caliber pulmo-nary veins and normal left atrial and left ventricu-lar contours. Pleural effusions may be present.Multifocal airspace consolidation occurs uncom-monly and variably corresponds to parenchymalhemorrhage, pulmonary edema, or pulmonaryinfarction (6–9,11,16,28,41,43,44,48,52,54,55).
RG f Volume 27 ● Number 3 Frazier et al 869
TeachingPoint
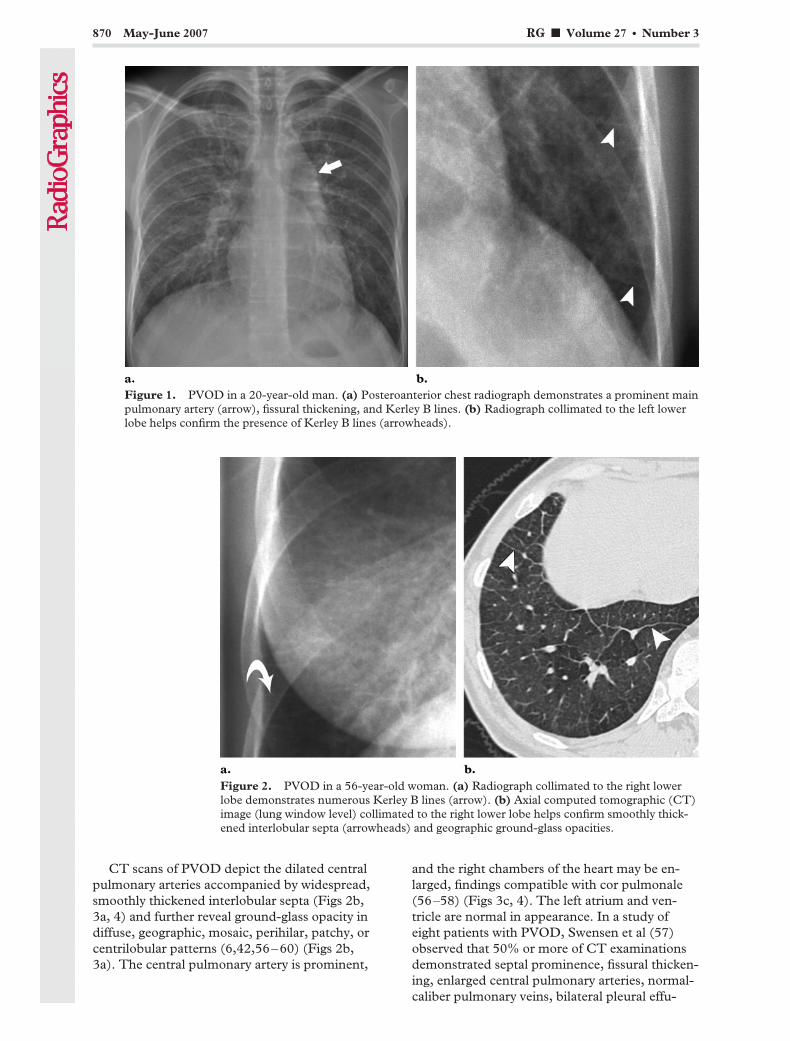
CT scans of PVOD depict the dilated centralpulmonary arteries accompanied by widespread,smoothly thickened interlobular septa (Figs 2b,3a, 4) and further reveal ground-glass opacity indiffuse, geographic, mosaic, perihilar, patchy, orcentrilobular patterns (6,42,56–60) (Figs 2b,3a). The central pulmonary artery is prominent,
and the right chambers of the heart may be en-larged, findings compatible with cor pulmonale(56–58) (Figs 3c, 4). The left atrium and ven-tricle are normal in appearance. In a study ofeight patients with PVOD, Swensen et al (57)observed that 50% or more of CT examinationsdemonstrated septal prominence, fissural thicken-ing, enlarged central pulmonary arteries, normal-caliber pulmonary veins, bilateral pleural effu-
Figure 1. PVOD in a 20-year-old man. (a) Posteroanterior chest radiograph demonstrates a prominent mainpulmonary artery (arrow), fissural thickening, and Kerley B lines. (b) Radiograph collimated to the left lowerlobe helps confirm the presence of Kerley B lines (arrowheads).
Figure 2. PVOD in a 56-year-old woman. (a) Radiograph collimated to the right lowerlobe demonstrates numerous Kerley B lines (arrow). (b) Axial computed tomographic (CT)image (lung window level) collimated to the right lower lobe helps confirm smoothly thick-ened interlobular septa (arrowheads) and geographic ground-glass opacities.
870 May-June 2007 RG f Volume 27 ● Number 3
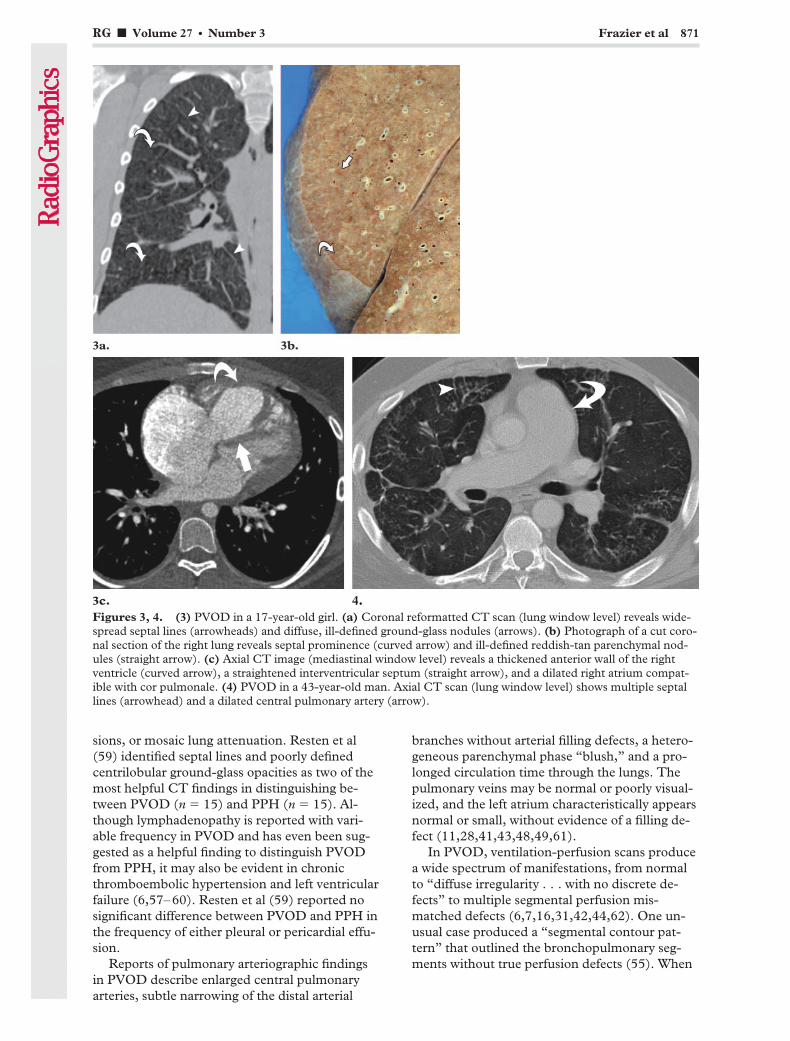
sions, or mosaic lung attenuation. Resten et al(59) identified septal lines and poorly definedcentrilobular ground-glass opacities as two of themost helpful CT findings in distinguishing be-tween PVOD (n � 15) and PPH (n � 15). Al-though lymphadenopathy is reported with vari-able frequency in PVOD and has even been sug-gested as a helpful finding to distinguish PVODfrom PPH, it may also be evident in chronicthromboembolic hypertension and left ventricularfailure (6,57–60). Resten et al (59) reported nosignificant difference between PVOD and PPH inthe frequency of either pleural or pericardial effu-sion.
Reports of pulmonary arteriographic findingsin PVOD describe enlarged central pulmonaryarteries, subtle narrowing of the distal arterial
branches without arterial filling defects, a hetero-geneous parenchymal phase “blush,” and a pro-longed circulation time through the lungs. Thepulmonary veins may be normal or poorly visual-ized, and the left atrium characteristically appearsnormal or small, without evidence of a filling de-fect (11,28,41,43,48,49,61).
In PVOD, ventilation-perfusion scans producea wide spectrum of manifestations, from normalto “diffuse irregularity . . . with no discrete de-fects” to multiple segmental perfusion mis-matched defects (6,7,16,31,42,44,62). One un-usual case produced a “segmental contour pat-tern” that outlined the bronchopulmonary seg-ments without true perfusion defects (55). When
Figures 3, 4. (3) PVOD in a 17-year-old girl. (a) Coronal reformatted CT scan (lung window level) reveals wide-spread septal lines (arrowheads) and diffuse, ill-defined ground-glass nodules (arrows). (b) Photograph of a cut coro-nal section of the right lung reveals septal prominence (curved arrow) and ill-defined reddish-tan parenchymal nod-ules (straight arrow). (c) Axial CT image (mediastinal window level) reveals a thickened anterior wall of the rightventricle (curved arrow), a straightened interventricular septum (straight arrow), and a dilated right atrium compat-ible with cor pulmonale. (4) PVOD in a 43-year-old man. Axial CT scan (lung window level) shows multiple septallines (arrowhead) and a dilated central pulmonary artery (arrow).
RG f Volume 27 ● Number 3 Frazier et al 871
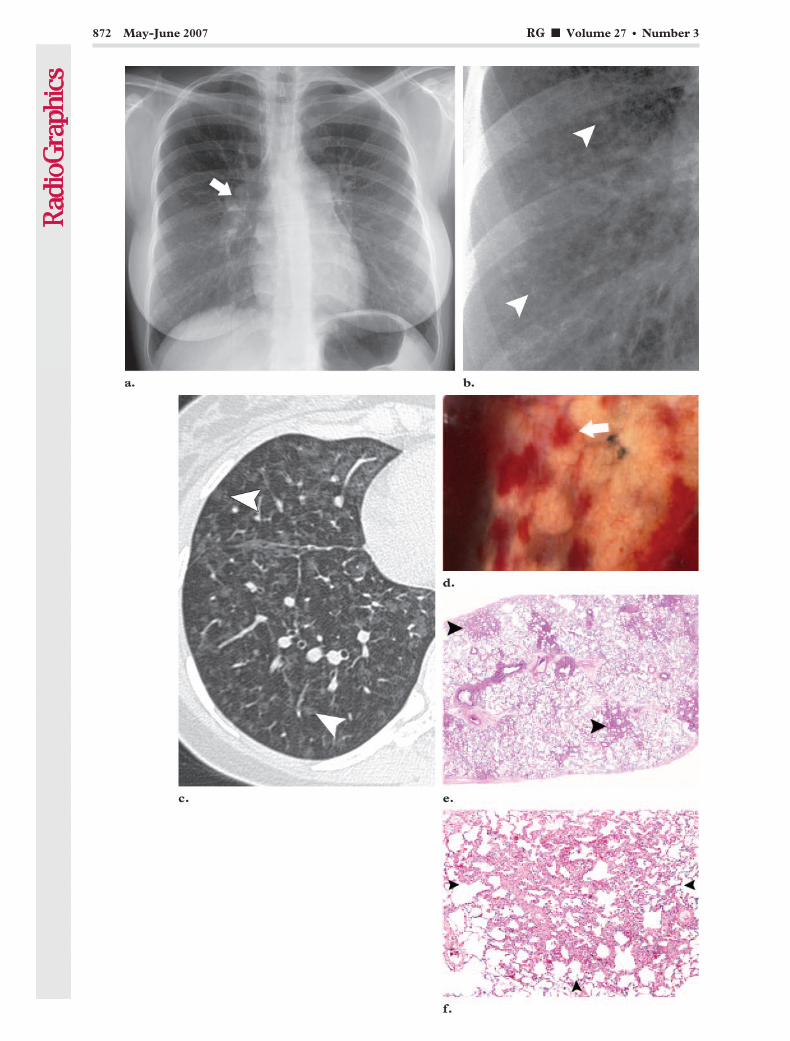
872 May-June 2007 RG f Volume 27 ● Number 3

a ventilation-perfusion scan obtained in a patientwith PVOD is understandably interpreted as“high probability,” this interpretation may lead toa misdiagnosis of chronic thromboembolic dis-ease; therefore, ventilation-perfusion scans areregarded as nonspecific for PVOD (1,6,7,28,49).
In PCH, chest radiography demonstrates PAH(enlarged central pulmonary arteries and right-sided prominence of the heart), accompanied bydiffuse or bibasilar reticulonodular or micronodu-lar areas of opacity uncharacteristic of PVOD(Fig 5a, 5b). In further contrast to PVOD, septallines or pleural effusions are unusual (13–15,40,45,61,63–66) (Figs 5c, 6a). Mediastinal lymph-adenopathy is reported occasionally at chest radi-ography (14,64).
At CT, main pulmonary arterial enlargementand widespread ill-defined centrilobular nodulesof ground-glass opacity are consistently describedin PCH, often mixed with lobular ground-glass
opacities (13,15,58,65–67) (Figs 5c, 6a). The leftatrium is normal or small in outline. Sporadicallyreported findings include septal thickening,lymphadenopathy, pleural effusion, enlargementof the right chambers of the heart, and pericardialeffusion (15,58,67).
Pulmonary arteriograms usually appear normalin PCH, although there are isolated interpreta-tions of pulmonary embolism or “nonspecific vas-cular abnormalities” (15).
As in PVOD, a ventilation-perfusion examina-tion is not helpful for confirming the diagnosis ofPCH. There is a wide spectrum of reported mani-festations, including normal results, small perfu-sion mismatch defects (considered “low probabil-ity”), perfusion mismatch defects large enough tobe considered “high probability,” multiplematched defects, and diffusely increased bibasilarperfusion (13–15,19,63,65).
Figure 6. PCH in a 27-year-old woman. (a) Coronal reformatted CT scan (lung window level) shows dif-fuse, ill-defined, ground-glass nodules (arrowhead) and no evidence of interlobular septal thickening. (b) Pho-tograph of a cut coronal section of the lung reveals multiple parenchymal nodules that appear hemorrhagic(arrow).
Š Figure 5. PCH in a 22-year-old woman. (a) Posteroanterior chest radiograph shows a prominent central pulmo-nary artery (arrow) and faint nodular opacities, best seen in the lung bases. (b) Radiograph collimated to the rightlower lobe reveals widespread, poorly circumscribed nodular opacities (arrowheads). (c) Axial CT image (lung win-dow level) collimated to the right lower lobe shows well-circumscribed ground-glass nodules (arrowheads) and noseptal lines. (d) Photograph of the visceral pleural surface reveals multiple petechial-appearing nodules (arrow), justvisible beneath the pleura, that actually represent the angiomatous lesions of PCH. (e) Low-power photomicrograph(original magnification, �1; hematoxylin-eosin [H-E] stain) shows multiple discrete parenchymal nodules (arrow-heads). (f) Low-power photomicrograph (original magnification, �4; H-E stain) shows a discrete parenchymal nod-ule (arrowheads) abutting the visceral pleura.
RG f Volume 27 ● Number 3 Frazier et al 873
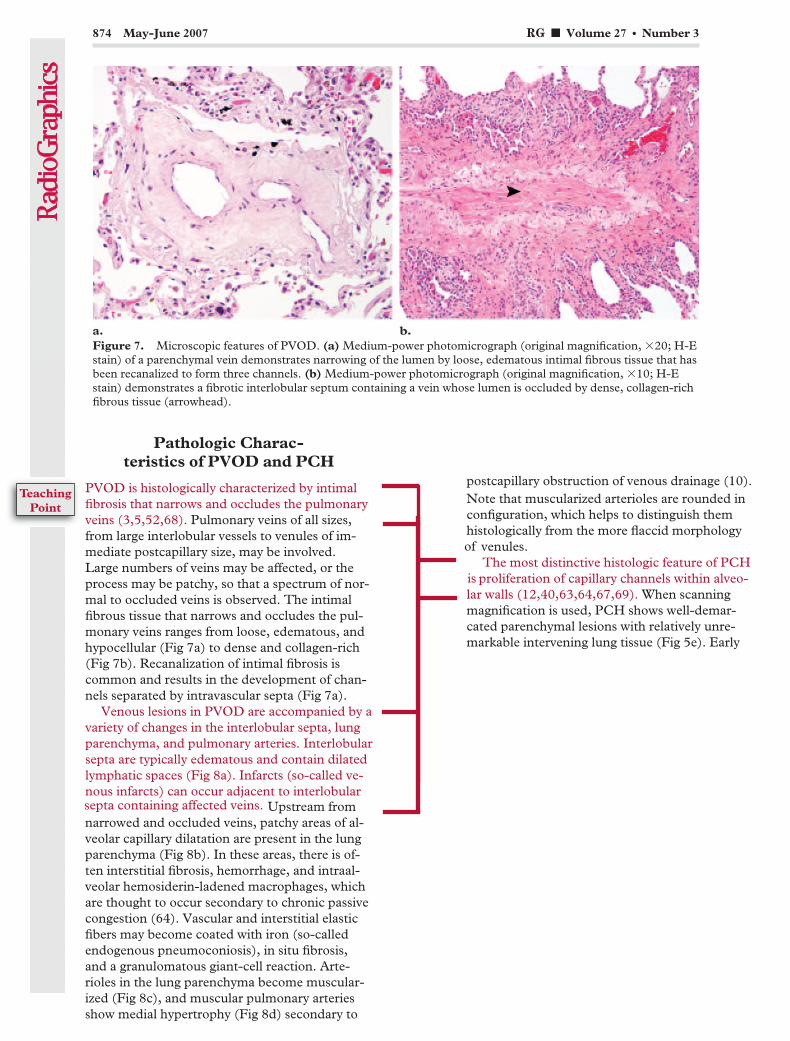
Pathologic Charac-teristics of PVOD and PCH
PVOD is histologically characterized by intimalfibrosis that narrows and occludes the pulmonaryveins (3,5,52,68). Pulmonary veins of all sizes,from large interlobular vessels to venules of im-mediate postcapillary size, may be involved.Large numbers of veins may be affected, or theprocess may be patchy, so that a spectrum of nor-mal to occluded veins is observed. The intimalfibrous tissue that narrows and occludes the pul-monary veins ranges from loose, edematous, andhypocellular (Fig 7a) to dense and collagen-rich(Fig 7b). Recanalization of intimal fibrosis iscommon and results in the development of chan-nels separated by intravascular septa (Fig 7a).
Venous lesions in PVOD are accompanied by avariety of changes in the interlobular septa, lungparenchyma, and pulmonary arteries. Interlobularsepta are typically edematous and contain dilatedlymphatic spaces (Fig 8a). Infarcts (so-called ve-nous infarcts) can occur adjacent to interlobularsepta containing affected veins. Upstream fromnarrowed and occluded veins, patchy areas of al-veolar capillary dilatation are present in the lungparenchyma (Fig 8b). In these areas, there is of-ten interstitial fibrosis, hemorrhage, and intraal-veolar hemosiderin-ladened macrophages, whichare thought to occur secondary to chronic passivecongestion (64). Vascular and interstitial elasticfibers may become coated with iron (so-calledendogenous pneumoconiosis), in situ fibrosis,and a granulomatous giant-cell reaction. Arte-rioles in the lung parenchyma become muscular-ized (Fig 8c), and muscular pulmonary arteriesshow medial hypertrophy (Fig 8d) secondary to
postcapillary obstruction of venous drainage (10).Note that muscularized arterioles are rounded inconfiguration, which helps to distinguish themhistologically from the more flaccid morphologyof venules.
The most distinctive histologic feature of PCHis proliferation of capillary channels within alveo-lar walls (12,40,63,64,67,69). When scanningmagnification is used, PCH shows well-demar-cated parenchymal lesions with relatively unre-markable intervening lung tissue (Fig 5e). Early
Figure 7. Microscopic features of PVOD. (a) Medium-power photomicrograph (original magnification, �20; H-Estain) of a parenchymal vein demonstrates narrowing of the lumen by loose, edematous intimal fibrous tissue that hasbeen recanalized to form three channels. (b) Medium-power photomicrograph (original magnification, �10; H-Estain) demonstrates a fibrotic interlobular septum containing a vein whose lumen is occluded by dense, collagen-richfibrous tissue (arrowhead).
874 May-June 2007 RG f Volume 27 ● Number 3
TeachingPoint

lesions demonstrate several rows of capillariesalong alveolar walls; this feature progresses tonodules and sheets of back-to-back capillariesin advanced lesions (64). These proliferative
changes lead to the histologic appearance ofdensely cellular alveolar walls, which are in con-trast to the distended capillary loops seen in
Figure 8. Microscopic features of PVOD. (a) Medium-power photomicrograph (original magnification, �10; H-Estain) demonstrates an edematous interlobular septum (*) that contains a dilated lymphatic, the latter of which isidentified by the presence of valves (arrowhead). (b) Medium-power photomicrograph (original magnification,�10; H-E stain) shows loop-like alveolar capillary dilatation (arrow) upstream from a narrowed vein (arrowhead).(c) High-power photomicrograph (original magnification, �40; H-E stain) demonstrates a muscularized arteriolecomposed of concentric layers of spindle-shaped smooth muscle cells that give the vessel a distinctly rounded con-figuration; typically, arterioles lack smooth muscle. (d) Medium-power photomicrograph (original magnification,�20; H-E stain) of a muscular pulmonary artery reveals medial hypertrophy (arrowhead) and, in this case, also inti-mal thickening (arrow).
RG f Volume 27 ● Number 3 Frazier et al 875

PVOD (Fig 9). Cytologic atypia and mitoses areabsent. Proliferating capillaries surround andcompress walls of pulmonary venules and veins,causing intimal fibrosis and secondary veno-oc-clusion (64). As in PVOD, these characteristicsresult in compensatory muscularization of arte-rioles and medial hypertrophy of muscular pul-monary arteries (67).
In the setting of unexplained PAH, the clinicaland radiologic diagnosis of PVOD and PCH canbe very difficult, and histologic examination isregarded as the most reliable means to establishthe diagnosis. Typically, PVOD manifests withobstructive venous lesions within edematous in-terlobular septa, accompanied by loop-like dilata-tion of the capillary bed and secondary arterialchanges (Fig 10a, 10b). Classic PCH manifestswith well-circumscribed, proliferative capillarylesions that also produce secondary arterialchanges (Fig 10c). However, PCH is easily misdi-agnosed pathologically as PVOD—and, less com-monly, PVOD as PCH—because of their histo-logic similarities. For example, it may be difficultto distinguish loop-like capillary engorgementfrom capillary proliferation. Special histologicstudies to highlight reticular and elastic fibers
(such as those in which reticulin, Movat penta-chrome, or Verhoeff–van Gieson stains are used)demonstrate the difference between loop lesionsin PVOD, which are composed of single dilatedcapillaries between the alveolar epithelial layers,and the proliferative rows of capillaries that ex-pand the alveolar walls in PCH. A second histo-logic pitfall is that the pulmonary arterial changesmay be so striking in PVOD that the case is mis-diagnosed as PAH or PCH. Finally, inadequatebiopsy material, particularly specimens withoutinterlobular septa, may also lead to missed diag-nosis of either PVOD or PCH. It has been recom-mended that a minimum of five blocks from asurgical lung biopsy is required for adequateevaluation of pulmonary vasculopathies (70).
Therapeutic Agentsand the Importance of Radiology
No randomized clinical trials have been devel-oped to examine the safety and efficacy of phar-macologic agents in treating patients with eitherPVOD or PCH; most of the data concerningtreatment is available only in case reports (1,6,71,72). Lung or heart-lung transplantation is theonly curative therapeutic option; consequently,
Figure 9. Microscopic features of PCH. (a) Medium-power photomicrograph (original magnification, �20; H-Estain) demonstrates thickened and cellular alveolar walls due to capillary proliferation in PCH. (b) In contrast, thismedium-power photomicrograph (original magnification, �20; H-E stain) shows the loop-like dilatation of capillar-ies in PVOD.
876 May-June 2007 RG f Volume 27 ● Number 3
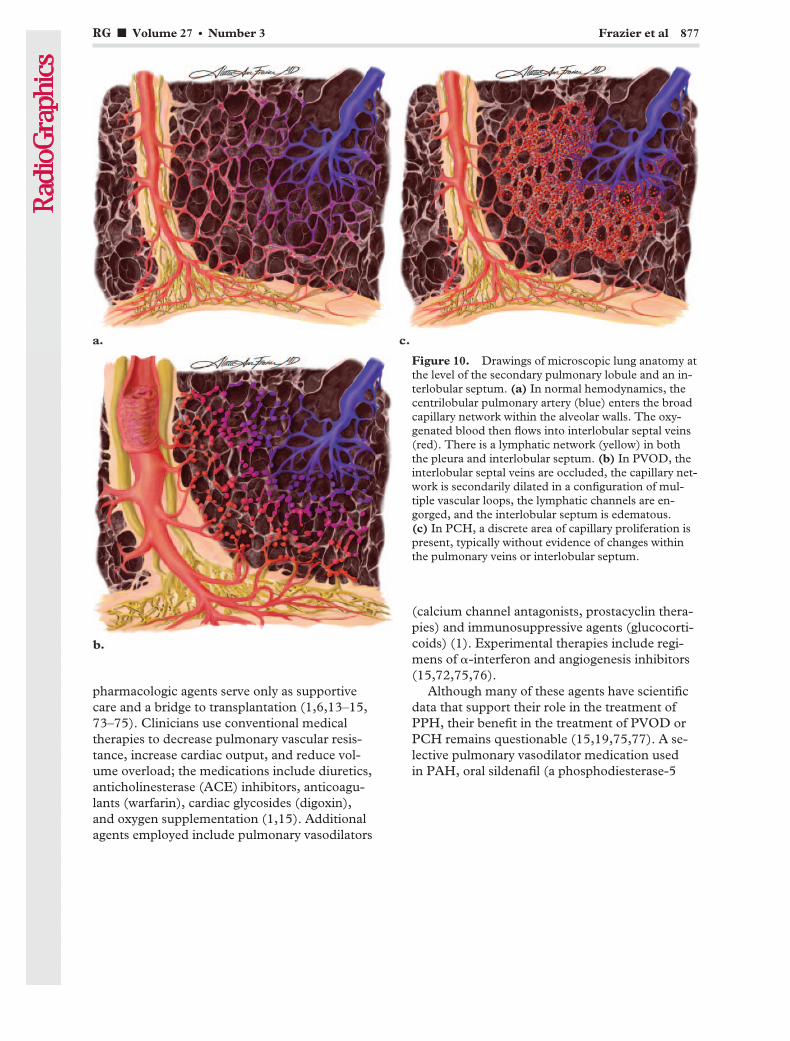
pharmacologic agents serve only as supportivecare and a bridge to transplantation (1,6,13–15,73–75). Clinicians use conventional medicaltherapies to decrease pulmonary vascular resis-tance, increase cardiac output, and reduce vol-ume overload; the medications include diuretics,anticholinesterase (ACE) inhibitors, anticoagu-lants (warfarin), cardiac glycosides (digoxin),and oxygen supplementation (1,15). Additionalagents employed include pulmonary vasodilators
(calcium channel antagonists, prostacyclin thera-pies) and immunosuppressive agents (glucocorti-coids) (1). Experimental therapies include regi-mens of �-interferon and angiogenesis inhibitors(15,72,75,76).
Although many of these agents have scientificdata that support their role in the treatment ofPPH, their benefit in the treatment of PVOD orPCH remains questionable (15,19,75,77). A se-lective pulmonary vasodilator medication usedin PAH, oral sildenafil (a phosphodiesterase-5
Figure 10. Drawings of microscopic lung anatomy atthe level of the secondary pulmonary lobule and an in-terlobular septum. (a) In normal hemodynamics, thecentrilobular pulmonary artery (blue) enters the broadcapillary network within the alveolar walls. The oxy-genated blood then flows into interlobular septal veins(red). There is a lymphatic network (yellow) in boththe pleura and interlobular septum. (b) In PVOD, theinterlobular septal veins are occluded, the capillary net-work is secondarily dilated in a configuration of mul-tiple vascular loops, the lymphatic channels are en-gorged, and the interlobular septum is edematous.(c) In PCH, a discrete area of capillary proliferation ispresent, typically without evidence of changes withinthe pulmonary veins or interlobular septum.
RG f Volume 27 ● Number 3 Frazier et al 877
inhibitor), has been shown to improve hemody-namics and the clinical course in some patientswith PVOD (78,79). In many cases, however,clinical experience has shown that potent vasodi-lators (including continuous intravenous prosta-cyclin and calcium channel blockers) induceflorid and even fatal pulmonary edema in patientswith either PVOD or PCH. This deleterious out-come is explained as follows: If the pulmonarymuscular arteries and arterioles are dilated andyet the pulmonary vein resistance remains fixed,the increased transcapillary hydrostatic pressureleads to massive transudation of fluid into thelung parenchyma (15,19,58,75,80). Radiologistsplay an important role in this situation: To ex-clude unsuspected radiologic evidence of PVODor PCH, it is currently recommended that pa-tients with presumed PPH should undergo ahigh-resolution CT examination before initiationof vasodilator therapy (75,81).
Unfortunately, the average time frame to re-ceive an organ transplant often exceeds the lifeexpectancy of both PVOD and PCH patients (1).In one patient who underwent single-lung trans-plantation for PVOD, high-resolution CT per-formed 3 months after the surgery demonstratednormalization of the previously dilated rightchambers of the heart as well as nearly completeresolution of ground-glass opacities and septallines in the native lung (56). The ventilation-per-fusion scan showed 80% perfusion to the trans-planted lung, a finding that suggests that the ra-diologic changes of PVOD are at least partiallyrelated to hemodynamic factors rather than fixedanatomic changes (56). Another case reportdescribed PVOD that recurred in a patient 3months after heart-lung transplantation, althoughthe diagnosis in this case was based on clinicaland radiologic features without lung biopsy con-firmation (82).
Cases at the AFIPEleven cases of PVOD (n � 7) and PCH (n � 4)at the AFIP were reviewed by two radiologists(A.A.F., J.R.G.) and two pathologists (T.J.F.,I.H.O.) (Table). The age of patients with PVODranged from 17 to 56 years (mean, 38 years) witha male-to-female ratio of 2:5. The age range ofpatients with PCH was 12–52 years (mean, 28years) with a male-to-female ratio of 1:3. Chestradiographs were available only in three cases of
PVOD; all three cases had central pulmonary ar-tery prominence, two had Kerley B lines, and thethird showed pleural effusion. In the single case ofPCH for which chest radiographs were available,the images demonstrated main pulmonary arteryprominence and widespread, small, subcentime-ter pulmonary nodules. The majority of PVODpatients (six of seven) and half of the PCH pa-tients (two of four) demonstrated impressive CTfindings compatible with PAH, including a di-lated main pulmonary artery (�3 cm in diam-eter), enlarged right-sided heart chambers, refluxof intravenous contrast material into the inferiorvena cava, or pericardial effusion. On CT scans(with lung window levels), all seven cases ofPVOD manifested with smoothly thickened inter-lobular septa, which ranged from a few septa inthree cases to numerous septa in four cases. CTscans of all four PCH cases also demonstratedsmoothly thickened interlobular septa, but in ev-ery case, the septa were uniformly sparse and fewin number. Ground-glass opacities, either geo-graphic or nodular, were evident in all cases ofPVOD and PCH and were predominantly diffusein distribution. The nodules of ground-glassopacity appeared either ill defined (two of fourPCH cases; three of seven PVOD cases) or welldefined (two of four PCH cases; no PVODcases). Geographic ground-glass opacities wereevident in four of seven cases of PVOD but werenot seen in the PCH cases. Pleural effusions wereidentified in three of seven PVOD cases, andlymphadenopathy was present in only one case ofPVOD. In two cases, a radiologic diagnosis ofPCH based on the appearance of ground-glassnodules was incorrect, and the diagnosis was ulti-mately confirmed as PVOD at histopathologicexamination.
SummaryPVOD and PCH are clinically indistinguishablefrom a primary PAH disorder such as PPH orchronic thromboembolic pulmonary hyperten-sion. This distinction, however, is essential forappropriate pharmacologic intervention as well asfor timely evaluation for lung transplantation.Indeed, if a patient with PVOD or PCH is treatedpresumptively for PPH with standard vasodilatorssuch as continuous intravenous prostacyclin orcalcium channel blockers, the treatment may re-sult in a critical and potentially fatal pulmonaryedema. The radiologist may be the first to discernan unsuspected capillary or postcapillary disorderthat is otherwise obscured by impressive clinical
878 May-June 2007 RG f Volume 27 ● Number 3
TeachingPoint
TeachingPoint
TeachingPoint
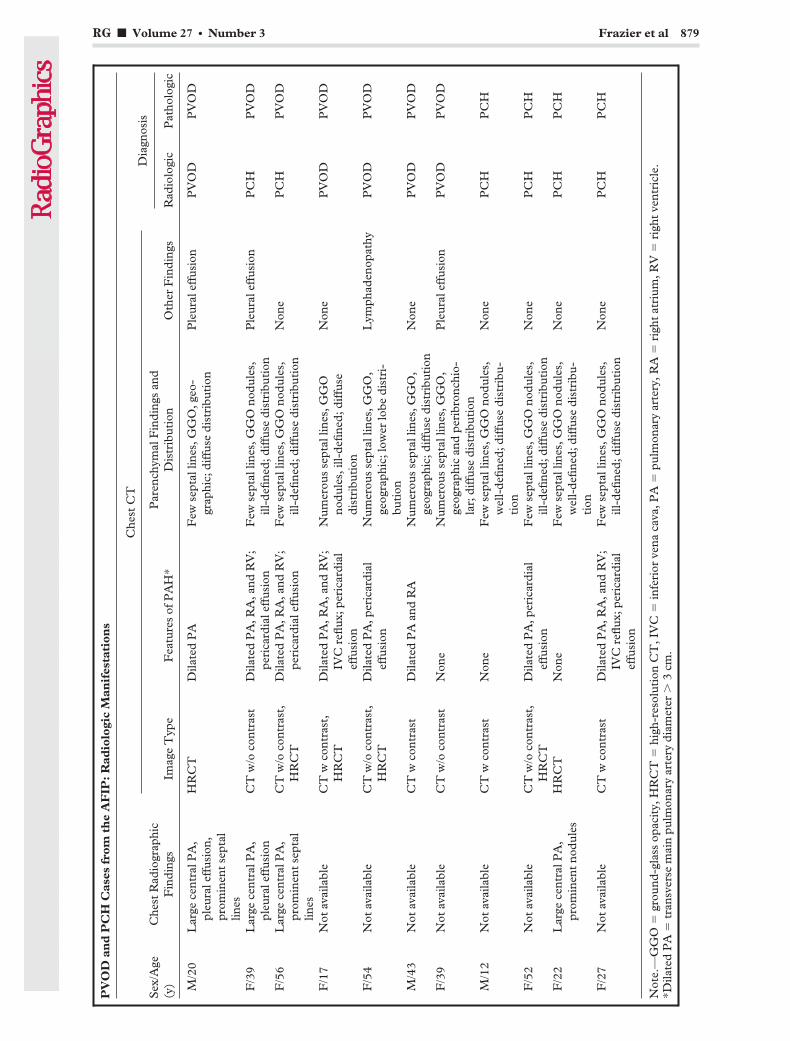
PV
OD
and
PC
HC
ases
from
the
AF
IP:
Rad
iolo
gic
Man
ifes
tati
ons
Sex
/Age
(y)
Che
stR
adio
grap
hic
Fin
ding
s
Che
stC
TD
iagn
osis
Imag
eT
ype
Fea
ture
sof
PA
H*
Par
ench
ymal
Fin
ding
san
dD
istr
ibut
ion
Oth
erF
indi
ngs
Rad
iolo
gic
Pat
holo
gic
M/2
0L
arge
cent
ralP
A,
pleu
rale
ffus
ion,
prom
inen
tse
ptal
lines
HR
CT
Dila
ted
PA
Few
sept
allin
es,G
GO
,geo
-gr
aphi
c;di
ffus
edi
stri
buti
onP
leur
alef
fusi
onP
VO
DP
VO
D
F/3
9L
arge
cent
ralP
A,
pleu
rale
ffus
ion
CT
w/o
cont
rast
Dila
ted
PA
,RA
,and
RV
;pe
rica
rdia
leff
usio
nF
ewse
ptal
lines
,GG
Ono
dule
s,ill
-defi
ned;
diff
use
dist
ribu
tion
Ple
ural
effu
sion
PC
HP
VO
D
F/5
6L
arge
cent
ralP
A,
prom
inen
tse
ptal
lines
CT
w/o
cont
rast
,H
RC
TD
ilate
dP
A,R
A,a
ndR
V;
peri
card
iale
ffus
ion
Few
sept
allin
es,G
GO
nodu
les,
ill-d
efine
d;di
ffus
edi
stri
buti
onN
one
PC
HP
VO
D
F/1
7N
otav
aila
ble
CT
wco
ntra
st,
HR
CT
Dila
ted
PA
,RA
,and
RV
;IV
Cre
flux;
peri
card
ial
effu
sion
Num
erou
sse
ptal
lines
,GG
Ono
dule
s,ill
-defi
ned;
diff
use
dist
ribu
tion
Non
eP
VO
DP
VO
D
F/5
4N
otav
aila
ble
CT
w/o
cont
rast
,H
RC
TD
ilate
dP
A,p
eric
ardi
alef
fusi
onN
umer
ous
sept
allin
es,G
GO
,ge
ogra
phic
;low
erlo
bedi
stri
-bu
tion
Lym
phad
enop
athy
PV
OD
PV
OD
M/4
3N
otav
aila
ble
CT
wco
ntra
stD
ilate
dP
Aan
dR
AN
umer
ous
sept
allin
es,G
GO
,ge
ogra
phic
;dif
fuse
dist
ribu
tion
Non
eP
VO
DP
VO
D
F/3
9N
otav
aila
ble
CT
w/o
cont
rast
Non
eN
umer
ous
sept
allin
es,G
GO
,ge
ogra
phic
and
peri
bron
chio
-la
r;di
ffus
edi
stri
buti
on
Ple
ural
effu
sion
PV
OD
PV
OD
M/1
2N
otav
aila
ble
CT
wco
ntra
stN
one
Few
sept
allin
es,G
GO
nodu
les,
wel
l-de
fined
;dif
fuse
dist
ribu
-ti
on
Non
eP
CH
PC
H
F/5
2N
otav
aila
ble
CT
w/o
cont
rast
,H
RC
TD
ilate
dP
A,p
eric
ardi
alef
fusi
onF
ewse
ptal
lines
,GG
Ono
dule
s,ill
-defi
ned;
diff
use
dist
ribu
tion
Non
eP
CH
PC
H
F/2
2L
arge
cent
ralP
A,
prom
inen
tno
dule
sH
RC
TN
one
Few
sept
allin
es,G
GO
nodu
les,
wel
l-de
fined
;dif
fuse
dist
ribu
-ti
on
Non
eP
CH
PC
H
F/2
7N
otav
aila
ble
CT
wco
ntra
stD
ilate
dP
A,R
A,a
ndR
V;
IVC
reflu
x;pe
rica
rdia
lef
fusi
on
Few
sept
allin
es,G
GO
nodu
les,
ill-d
efine
d;di
ffus
edi
stri
buti
onN
one
PC
HP
CH
Not
e.—
GG
O�
grou
nd-g
lass
opac
ity,
HR
CT
�hi
gh-r
esol
utio
nC
T,I
VC
�in
feri
orve
naca
va,P
A�
pulm
onar
yar
tery
,RA
�ri
ght
atri
um,R
V�
righ
tve
ntri
cle.
*Dila
ted
PA
�tr
ansv
erse
mai
npu
lmon
ary
arte
rydi
amet
er�
3cm
.
RG f Volume 27 ● Number 3 Frazier et al 879
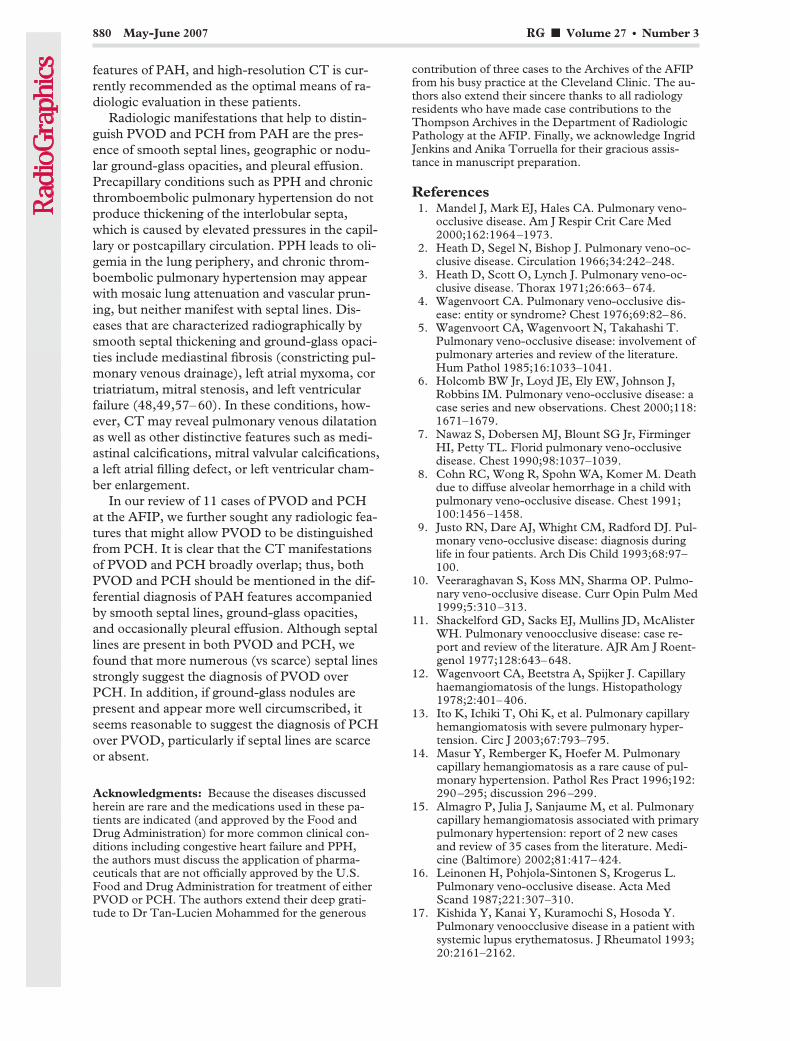
features of PAH, and high-resolution CT is cur-rently recommended as the optimal means of ra-diologic evaluation in these patients.
Radiologic manifestations that help to distin-guish PVOD and PCH from PAH are the pres-ence of smooth septal lines, geographic or nodu-lar ground-glass opacities, and pleural effusion.Precapillary conditions such as PPH and chronicthromboembolic pulmonary hypertension do notproduce thickening of the interlobular septa,which is caused by elevated pressures in the capil-lary or postcapillary circulation. PPH leads to oli-gemia in the lung periphery, and chronic throm-boembolic pulmonary hypertension may appearwith mosaic lung attenuation and vascular prun-ing, but neither manifest with septal lines. Dis-eases that are characterized radiographically bysmooth septal thickening and ground-glass opaci-ties include mediastinal fibrosis (constricting pul-monary venous drainage), left atrial myxoma, cortriatriatum, mitral stenosis, and left ventricularfailure (48,49,57–60). In these conditions, how-ever, CT may reveal pulmonary venous dilatationas well as other distinctive features such as medi-astinal calcifications, mitral valvular calcifications,a left atrial filling defect, or left ventricular cham-ber enlargement.
In our review of 11 cases of PVOD and PCHat the AFIP, we further sought any radiologic fea-tures that might allow PVOD to be distinguishedfrom PCH. It is clear that the CT manifestationsof PVOD and PCH broadly overlap; thus, bothPVOD and PCH should be mentioned in the dif-ferential diagnosis of PAH features accompaniedby smooth septal lines, ground-glass opacities,and occasionally pleural effusion. Although septallines are present in both PVOD and PCH, wefound that more numerous (vs scarce) septal linesstrongly suggest the diagnosis of PVOD overPCH. In addition, if ground-glass nodules arepresent and appear more well circumscribed, itseems reasonable to suggest the diagnosis of PCHover PVOD, particularly if septal lines are scarceor absent.
Acknowledgments: Because the diseases discussedherein are rare and the medications used in these pa-tients are indicated (and approved by the Food andDrug Administration) for more common clinical con-ditions including congestive heart failure and PPH,the authors must discuss the application of pharma-ceuticals that are not officially approved by the U.S.Food and Drug Administration for treatment of eitherPVOD or PCH. The authors extend their deep grati-tude to Dr Tan-Lucien Mohammed for the generous
contribution of three cases to the Archives of the AFIPfrom his busy practice at the Cleveland Clinic. The au-thors also extend their sincere thanks to all radiologyresidents who have made case contributions to theThompson Archives in the Department of RadiologicPathology at the AFIP. Finally, we acknowledge IngridJenkins and Anika Torruella for their gracious assis-tance in manuscript preparation.
References1. Mandel J, Mark EJ, Hales CA. Pulmonary veno-
occlusive disease. Am J Respir Crit Care Med2000;162:1964–1973.
2. Heath D, Segel N, Bishop J. Pulmonary veno-oc-clusive disease. Circulation 1966;34:242–248.
3. Heath D, Scott O, Lynch J. Pulmonary veno-oc-clusive disease. Thorax 1971;26:663–674.
4. Wagenvoort CA. Pulmonary veno-occlusive dis-ease: entity or syndrome? Chest 1976;69:82–86.
5. Wagenvoort CA, Wagenvoort N, Takahashi T.Pulmonary veno-occlusive disease: involvement ofpulmonary arteries and review of the literature.Hum Pathol 1985;16:1033–1041.
6. Holcomb BW Jr, Loyd JE, Ely EW, Johnson J,Robbins IM. Pulmonary veno-occlusive disease: acase series and new observations. Chest 2000;118:1671–1679.
7. Nawaz S, Dobersen MJ, Blount SG Jr, FirmingerHI, Petty TL. Florid pulmonary veno-occlusivedisease. Chest 1990;98:1037–1039.
8. Cohn RC, Wong R, Spohn WA, Komer M. Deathdue to diffuse alveolar hemorrhage in a child withpulmonary veno-occlusive disease. Chest 1991;100:1456–1458.
9. Justo RN, Dare AJ, Whight CM, Radford DJ. Pul-monary veno-occlusive disease: diagnosis duringlife in four patients. Arch Dis Child 1993;68:97–100.
10. Veeraraghavan S, Koss MN, Sharma OP. Pulmo-nary veno-occlusive disease. Curr Opin Pulm Med1999;5:310–313.
11. Shackelford GD, Sacks EJ, Mullins JD, McAlisterWH. Pulmonary venoocclusive disease: case re-port and review of the literature. AJR Am J Roent-genol 1977;128:643–648.
12. Wagenvoort CA, Beetstra A, Spijker J. Capillaryhaemangiomatosis of the lungs. Histopathology1978;2:401–406.
13. Ito K, Ichiki T, Ohi K, et al. Pulmonary capillaryhemangiomatosis with severe pulmonary hyper-tension. Circ J 2003;67:793–795.
14. Masur Y, Remberger K, Hoefer M. Pulmonarycapillary hemangiomatosis as a rare cause of pul-monary hypertension. Pathol Res Pract 1996;192:290–295; discussion 296–299.
15. Almagro P, Julia J, Sanjaume M, et al. Pulmonarycapillary hemangiomatosis associated with primarypulmonary hypertension: report of 2 new casesand review of 35 cases from the literature. Medi-cine (Baltimore) 2002;81:417–424.
16. Leinonen H, Pohjola-Sintonen S, Krogerus L.Pulmonary veno-occlusive disease. Acta MedScand 1987;221:307–310.
17. Kishida Y, Kanai Y, Kuramochi S, Hosoda Y.Pulmonary venoocclusive disease in a patient withsystemic lupus erythematosus. J Rheumatol 1993;20:2161–2162.
880 May-June 2007 RG f Volume 27 ● Number 3

18. Morassut PA, Walley VM, Smith CD. Pulmonaryveno-occlusive disease and the CREST variant ofscleroderma. Can J Cardiol 1992;8:1055–1058.
19. Gugnani MK, Pierson C, Vanderheide R, GirgisRE. Pulmonary edema complicating prostacyclintherapy in pulmonary hypertension associatedwith scleroderma: a case of pulmonary capillaryhemangiomatosis. Arthritis Rheum 2000;43:699–703.
20. Kokturk N, Demir N, Demircan S, et al. Pulmo-nary veno-occlusive disease in a patient with a his-tory of Hashimoto’s thyroiditis. Indian J Chest DisAllied Sci 2005;47:289–292.
21. Hourseau M, Capron F, Nunes H, Godmer P,Martin A, Kambouchner M. Pulmonary veno-occlusive disease in a patient with HIV infection: acase report with autopsy findings [in French]. AnnPathol 2002;22:472–475.
22. Escamilla R, Hermant C, Berjaud J, Mazerolles C,Daussy X. Pulmonary veno-occlusive disease in aHIV-infected intravenous drug abuser. Eur RespirJ 1995;8:1982–1984.
23. Hamada K, Teramoto S, Narita N, Yamada E,Teramoto K, Kobzik L. Pulmonary veno-occlu-sive disease in pulmonary Langerhans’ cell granu-lomatosis. Eur Respir J 2000;15:421–423.
24. Saito A, Takizawa H, Ito K, Yamamoto K, Oka T.A case of pulmonary veno-occlusive disease associ-ated with systemic sclerosis. Respirology 2003;8:383–385.
25. Johnson SR, Patsios D, Hwang DM, Granton JT.Pulmonary veno-occlusive disease and sclero-derma associated pulmonary hypertension.J Rheumatol 2006;33:2347–2350.
26. Langleben D, Heneghan JM, Batten AP, et al. Fa-milial pulmonary capillary hemangiomatosis re-sulting in primary pulmonary hypertension. AnnIntern Med 1988;109:106–109.
27. Salzman D, Adkins DR, Craig F, Freytes C, Le-Maistre CF. Malignancy-associated pulmonaryveno-occlusive disease: report of a case followingautologous bone marrow transplantation and re-view. Bone Marrow Transplant 1996;18:755–760.
28. Capewell SJ, Wright AJ, Ellis DA. Pulmonaryveno-occlusive disease in association withHodgkin’s disease. Thorax 1984;39:554–555.
29. Or R, Nagler A, Elad S, Naparstek E, SchechterD. Noncardiogenic pulmonary congestion follow-ing bone marrow transplantation. Respiration1997;64:170–172.
30. Mukai M, Kondo M, Bohgaki T, Notoya A,Kohno M. Pulmonary veno-occlusive disease fol-lowing allogeneic peripheral blood stem cell trans-plantation for chronic myeloid leukaemia. Br JHaematol 2003;123:1.
31. Malhotra P, Varma S, Varma N, et al. Pulmonaryveno-occlusive disease as a cause for reversiblepulmonary hypertension in a patient with multiplemyeloma undergoing peripheral blood stem celltransplantation. Am J Hematol 2005;80:164–165.
32. Kramer MR, Estenne M, Berkman N, et al. Ra-diation-induced pulmonary veno-occlusive dis-ease. Chest 1993;104:1282–1284.
33. Trobaugh-Lotrario AD, Greffe B, Deterding R,Deutsch G, Quinones R. Pulmonary veno-occlu-sive disease after autologous bone marrow trans-plant in a child with stage IV neuroblastoma: casereport and literature review. J Pediatr HematolOncol 2003;25:405–409.
34. Williams LM, Fussell S, Veith RW, Nelson S, Ma-son CM. Pulmonary veno-occlusive disease in anadult following bone marrow transplantation: casereport and review of the literature. Chest 1996;109:1388–1391.
35. Lombard CM, Churg A, Winokur S. Pulmonaryveno-occlusive disease following therapy for malig-nant neoplasms. Chest 1987;92:871–876.
36. Swift GL, Gibbs A, Campbell IA, WagenvoortCA, Tuthill D. Pulmonary veno-occlusive diseaseand Hodgkin’s lymphoma. Eur Respir J 1993;6:596–598.
37. Ibrahim NB, Burnley H, Gaber KA, et al. Seg-mental pulmonary veno-occlusive disease second-ary to lung cancer. J Clin Pathol 2005;58:434–436.
38. Gagnadoux F, Capron F, Lebeau B. Pulmonaryveno-occlusive disease after neoadjuvant mitomy-cin chemotherapy and surgery for lung carcinoma.Lung Cancer 2002;36:213–215.
39. Moritani S, Ichihara S, Seki Y, Kataoka M, YokoiT. Pulmonary capillary hemangiomatosis inciden-tally detected in a lobectomy specimen for a meta-static colon cancer. Pathol Int 2006;56:350–357.
40. Whittaker JS, Pickering CA, Heath D, Smith P.Pulmonary capillary haemangiomatosis. DiagnHistopathol 1983;6:77–84.
41. Brown CH, Harrison CV. Pulmonary veno-occlu-sive disease. Lancet 1966;2:61–65.
42. Valdes L, Gonzalez-Juanatey JR, Alvarez D, et al.Diagnosis of pulmonary veno-occlusive disease:new criteria for biopsy. Respir Med 1998;92:979–983.
43. Glassroth J, Woodford DW, Carrington CB,Gaensler EA. Pulmonary veno-occlusive disease inthe middle-aged. Respiration 1985;47:309–321.
44. Chawla SK, Kittle CF, Faber LP, Jensik RJ. Pul-monary venoocclusive disease. Ann Thorac Surg1976;22:249–253.
45. Domingo C, Encabo B, Roig J, Lopez D, MoreraJ. Pulmonary capillary hemangiomatosis: report ofa case and review of the literature. Respiration1992;59:178–180.
46. Townend JN, Roberts DH, Jones EL, Davies MK.Fatal pulmonary venoocclusive disease after use oforal contraceptives. Am Heart J 1992;124:1643–1644.
47. Lucas RV Jr. Congenital causes of pulmonary ve-nous obstruction. Cardiovasc Clin 1972;4:19–51.
48. Scheibel RL, Dedeker KL, Gleason DF, Pliego M,Kieffer SA. Radiographic and angiographic char-acteristics of pulmonary veno-occlusive disease.Radiology 1972;103:47–51.
49. Thadani U, Burrow C, Whitaker W, Heath D.Pulmonary veno-occlusive disease. Q J Med 1975;44:133–159.
50. Weed HG. Pulmonary “capillary” wedge pressurenot the pressure in the pulmonary capillaries.Chest 1991;100:1138–1140.
51. Wiedemann HP. Wedge pressure in pulmonaryveno-occlusive disease. N Engl J Med 1986;315:1233.
52. Carrington CB, Liebow AA. Pulmonary veno-occlusive disease. Hum Pathol 1970;1:322–324.
53. Rambihar VS, Fallen EL, Cairns JA. Pulmonaryveno-occlusive disease: antemortem diagnosisfrom roentgenographic and hemodynamic find-ings. Can Med Assoc J 1979;120:1519–1522.
RG f Volume 27 ● Number 3 Frazier et al 881
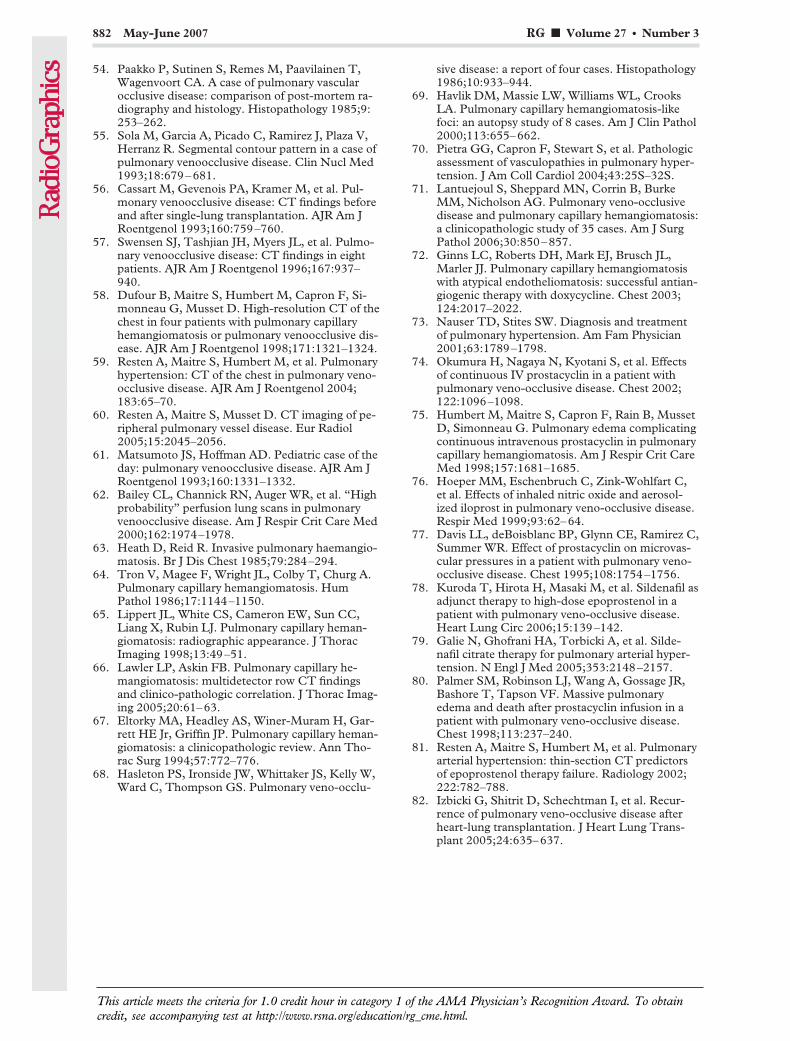
54. Paakko P, Sutinen S, Remes M, Paavilainen T,Wagenvoort CA. A case of pulmonary vascularocclusive disease: comparison of post-mortem ra-diography and histology. Histopathology 1985;9:253–262.
55. Sola M, Garcia A, Picado C, Ramirez J, Plaza V,Herranz R. Segmental contour pattern in a case ofpulmonary venoocclusive disease. Clin Nucl Med1993;18:679–681.
56. Cassart M, Gevenois PA, Kramer M, et al. Pul-monary venoocclusive disease: CT findings beforeand after single-lung transplantation. AJR Am JRoentgenol 1993;160:759–760.
57. Swensen SJ, Tashjian JH, Myers JL, et al. Pulmo-nary venoocclusive disease: CT findings in eightpatients. AJR Am J Roentgenol 1996;167:937–940.
58. Dufour B, Maitre S, Humbert M, Capron F, Si-monneau G, Musset D. High-resolution CT of thechest in four patients with pulmonary capillaryhemangiomatosis or pulmonary venoocclusive dis-ease. AJR Am J Roentgenol 1998;171:1321–1324.
59. Resten A, Maitre S, Humbert M, et al. Pulmonaryhypertension: CT of the chest in pulmonary veno-occlusive disease. AJR Am J Roentgenol 2004;183:65–70.
60. Resten A, Maitre S, Musset D. CT imaging of pe-ripheral pulmonary vessel disease. Eur Radiol2005;15:2045–2056.
61. Matsumoto JS, Hoffman AD. Pediatric case of theday: pulmonary venoocclusive disease. AJR Am JRoentgenol 1993;160:1331–1332.
62. Bailey CL, Channick RN, Auger WR, et al. “Highprobability” perfusion lung scans in pulmonaryvenoocclusive disease. Am J Respir Crit Care Med2000;162:1974–1978.
63. Heath D, Reid R. Invasive pulmonary haemangio-matosis. Br J Dis Chest 1985;79:284–294.
64. Tron V, Magee F, Wright JL, Colby T, Churg A.Pulmonary capillary hemangiomatosis. HumPathol 1986;17:1144–1150.
65. Lippert JL, White CS, Cameron EW, Sun CC,Liang X, Rubin LJ. Pulmonary capillary heman-giomatosis: radiographic appearance. J ThoracImaging 1998;13:49–51.
66. Lawler LP, Askin FB. Pulmonary capillary he-mangiomatosis: multidetector row CT findingsand clinico-pathologic correlation. J Thorac Imag-ing 2005;20:61–63.
67. Eltorky MA, Headley AS, Winer-Muram H, Gar-rett HE Jr, Griffin JP. Pulmonary capillary heman-giomatosis: a clinicopathologic review. Ann Tho-rac Surg 1994;57:772–776.
68. Hasleton PS, Ironside JW, Whittaker JS, Kelly W,Ward C, Thompson GS. Pulmonary veno-occlu-
sive disease: a report of four cases. Histopathology1986;10:933–944.
69. Havlik DM, Massie LW, Williams WL, CrooksLA. Pulmonary capillary hemangiomatosis-likefoci: an autopsy study of 8 cases. Am J Clin Pathol2000;113:655–662.
70. Pietra GG, Capron F, Stewart S, et al. Pathologicassessment of vasculopathies in pulmonary hyper-tension. J Am Coll Cardiol 2004;43:25S–32S.
71. Lantuejoul S, Sheppard MN, Corrin B, BurkeMM, Nicholson AG. Pulmonary veno-occlusivedisease and pulmonary capillary hemangiomatosis:a clinicopathologic study of 35 cases. Am J SurgPathol 2006;30:850–857.
72. Ginns LC, Roberts DH, Mark EJ, Brusch JL,Marler JJ. Pulmonary capillary hemangiomatosiswith atypical endotheliomatosis: successful antian-giogenic therapy with doxycycline. Chest 2003;124:2017–2022.
73. Nauser TD, Stites SW. Diagnosis and treatmentof pulmonary hypertension. Am Fam Physician2001;63:1789–1798.
74. Okumura H, Nagaya N, Kyotani S, et al. Effectsof continuous IV prostacyclin in a patient withpulmonary veno-occlusive disease. Chest 2002;122:1096–1098.
75. Humbert M, Maitre S, Capron F, Rain B, MussetD, Simonneau G. Pulmonary edema complicatingcontinuous intravenous prostacyclin in pulmonarycapillary hemangiomatosis. Am J Respir Crit CareMed 1998;157:1681–1685.
76. Hoeper MM, Eschenbruch C, Zink-Wohlfart C,et al. Effects of inhaled nitric oxide and aerosol-ized iloprost in pulmonary veno-occlusive disease.Respir Med 1999;93:62–64.
77. Davis LL, deBoisblanc BP, Glynn CE, Ramirez C,Summer WR. Effect of prostacyclin on microvas-cular pressures in a patient with pulmonary veno-occlusive disease. Chest 1995;108:1754–1756.
78. Kuroda T, Hirota H, Masaki M, et al. Sildenafil asadjunct therapy to high-dose epoprostenol in apatient with pulmonary veno-occlusive disease.Heart Lung Circ 2006;15:139–142.
79. Galie N, Ghofrani HA, Torbicki A, et al. Silde-nafil citrate therapy for pulmonary arterial hyper-tension. N Engl J Med 2005;353:2148–2157.
80. Palmer SM, Robinson LJ, Wang A, Gossage JR,Bashore T, Tapson VF. Massive pulmonaryedema and death after prostacyclin infusion in apatient with pulmonary veno-occlusive disease.Chest 1998;113:237–240.
81. Resten A, Maitre S, Humbert M, et al. Pulmonaryarterial hypertension: thin-section CT predictorsof epoprostenol therapy failure. Radiology 2002;222:782–788.
82. Izbicki G, Shitrit D, Schechtman I, et al. Recur-rence of pulmonary veno-occlusive disease afterheart-lung transplantation. J Heart Lung Trans-plant 2005;24:635–637.
882 May-June 2007 RG f Volume 27 ● Number 3
This article meets the criteria for 1.0 credit hour in category 1 of the AMA Physician’s Recognition Award. To obtaincredit, see accompanying test at http://www.rsna.org/education/rg_cme.html.

AFIP ARCHIVES 883
Best Cases from the AFIPGlioblastoma Multiforme1
Editor’s Note.—Every-one who has taken thecourse in radiologic pa-thology at the ArmedForces Institute of Pa-thology (AFIP) remem-bers bringing beautifullyillustrated cases for ac-cession to the Institute.In recent years, the staffof the Department ofRadiologic Pathologyhas judged the ‘‘bestcases’’ by organ system,and recognition is givento the winners on the lastday of the class. With eachissue of RadioGraphics,one or more of thesecases are published,written by the winningresident. Radiologic-pathologic correlation isemphasized, and thecauses of the imagingsigns of various diseasesare illustrated.
David A. Altman, MD ● Denis S. Atkinson, Jr, MD ● Daniel J. Brat,MD, PhD
HistoryAn 80-year-old man with a remote history of prostate cancer fell and struck theleft side of his head. He did not recall the details of the fall and had to be awak-ened afterward. The patient exhibited persistent difficulty with balance andmemory, and he was taken to the emergency department, where computed to-mography (CT) of the head yielded abnormal findings. Results of magneticresonance (MR) imaging of the brain confirmed the presence of a heteroge-neously enhancing lesion in the posterior left temporal lobe. CT of the chest,abdomen, and pelvis was negative for metastatic disease. On being questioned,the patient reported occasional bilateral temporal headaches; right-sided weak-ness; and escalating impairment of hearing, speech, concentration, andmemory.
Upon admission, the patient was started on decadron, resulting in significantimprovement in speech impairment and weakness. On the fifth day after admis-sion, he underwent a single radiation treatment. In the early morning of the11th day after admission, he was found dead. Autopsy was performed.
Abbreviations: NAA � N-acetylaspartate, WHO � World Health Organization
RadioGraphics 2007; 27:883–888 ● Published online 10.1148/rg.273065138 ● Content Codes:
1From the Departments of Radiology (D.A.A., D.S.A.) and Pathology (D.J.B.), Emory University School of Medicine, 1364 Clifton Rd NE, Atlanta,GA 30322. Received July 19, 2006; revision requested August 17 and received September 20; accepted September 22. All authors have no financialrelationships to disclose. Address correspondence to D.A.A. (e-mail: [email protected]).
©RSNA, 2007
Note: This copy is for your personal, non-commercial use only. To order presentation-ready copies for distribution to your colleagues or clients, use the RadioGraphics Reprints form at the end of this article.
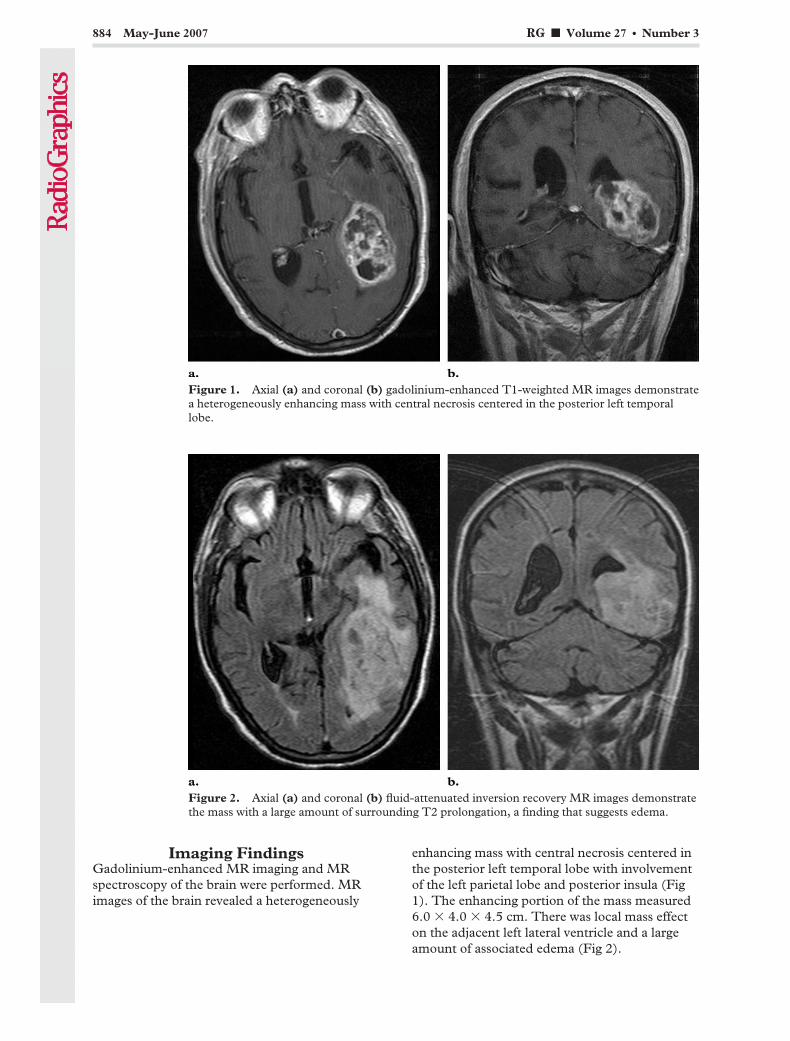
Imaging FindingsGadolinium-enhanced MR imaging and MRspectroscopy of the brain were performed. MRimages of the brain revealed a heterogeneously
enhancing mass with central necrosis centered inthe posterior left temporal lobe with involvementof the left parietal lobe and posterior insula (Fig1). The enhancing portion of the mass measured6.0 � 4.0 � 4.5 cm. There was local mass effecton the adjacent left lateral ventricle and a largeamount of associated edema (Fig 2).
Figure 1. Axial (a) and coronal (b) gadolinium-enhanced T1-weighted MR images demonstratea heterogeneously enhancing mass with central necrosis centered in the posterior left temporallobe.
Figure 2. Axial (a) and coronal (b) fluid-attenuated inversion recovery MR images demonstratethe mass with a large amount of surrounding T2 prolongation, a finding that suggests edema.
884 May-June 2007 RG f Volume 27 ● Number 3
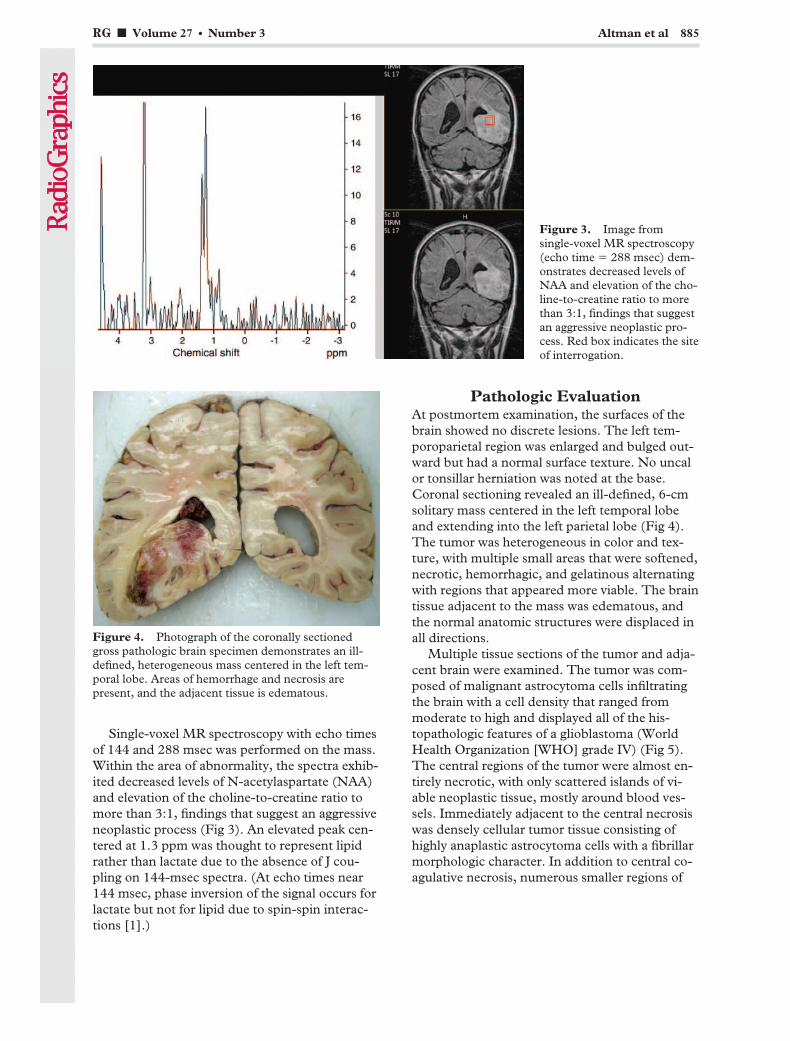
Single-voxel MR spectroscopy with echo timesof 144 and 288 msec was performed on the mass.Within the area of abnormality, the spectra exhib-ited decreased levels of N-acetylaspartate (NAA)and elevation of the choline-to-creatine ratio tomore than 3:1, findings that suggest an aggressiveneoplastic process (Fig 3). An elevated peak cen-tered at 1.3 ppm was thought to represent lipidrather than lactate due to the absence of J cou-pling on 144-msec spectra. (At echo times near144 msec, phase inversion of the signal occurs forlactate but not for lipid due to spin-spin interac-tions [1].)
Pathologic EvaluationAt postmortem examination, the surfaces of thebrain showed no discrete lesions. The left tem-poroparietal region was enlarged and bulged out-ward but had a normal surface texture. No uncalor tonsillar herniation was noted at the base.Coronal sectioning revealed an ill-defined, 6-cmsolitary mass centered in the left temporal lobeand extending into the left parietal lobe (Fig 4).The tumor was heterogeneous in color and tex-ture, with multiple small areas that were softened,necrotic, hemorrhagic, and gelatinous alternatingwith regions that appeared more viable. The braintissue adjacent to the mass was edematous, andthe normal anatomic structures were displaced inall directions.
Multiple tissue sections of the tumor and adja-cent brain were examined. The tumor was com-posed of malignant astrocytoma cells infiltratingthe brain with a cell density that ranged frommoderate to high and displayed all of the his-topathologic features of a glioblastoma (WorldHealth Organization [WHO] grade IV) (Fig 5).The central regions of the tumor were almost en-tirely necrotic, with only scattered islands of vi-able neoplastic tissue, mostly around blood ves-sels. Immediately adjacent to the central necrosiswas densely cellular tumor tissue consisting ofhighly anaplastic astrocytoma cells with a fibrillarmorphologic character. In addition to central co-agulative necrosis, numerous smaller regions of
Figure 3. Image fromsingle-voxel MR spectroscopy(echo time � 288 msec) dem-onstrates decreased levels ofNAA and elevation of the cho-line-to-creatine ratio to morethan 3:1, findings that suggestan aggressive neoplastic pro-cess. Red box indicates the siteof interrogation.
Figure 4. Photograph of the coronally sectionedgross pathologic brain specimen demonstrates an ill-defined, heterogeneous mass centered in the left tem-poral lobe. Areas of hemorrhage and necrosis arepresent, and the adjacent tissue is edematous.
RG f Volume 27 ● Number 3 Altman et al 885
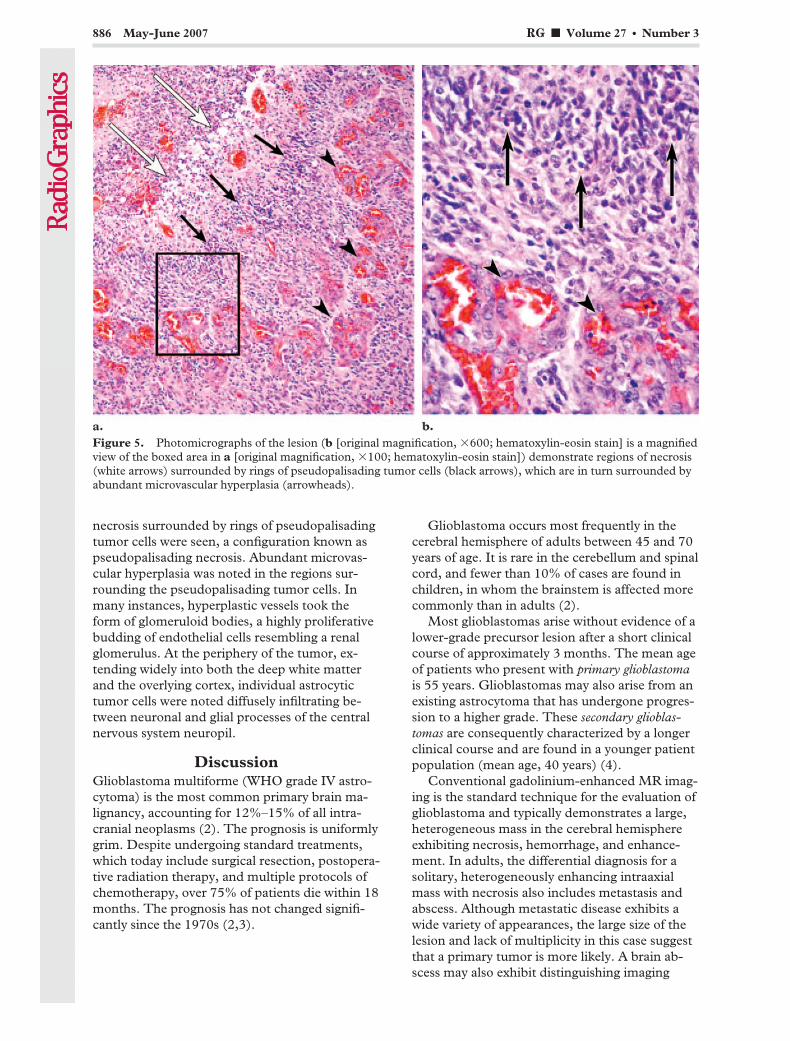
necrosis surrounded by rings of pseudopalisadingtumor cells were seen, a configuration known aspseudopalisading necrosis. Abundant microvas-cular hyperplasia was noted in the regions sur-rounding the pseudopalisading tumor cells. Inmany instances, hyperplastic vessels took theform of glomeruloid bodies, a highly proliferativebudding of endothelial cells resembling a renalglomerulus. At the periphery of the tumor, ex-tending widely into both the deep white matterand the overlying cortex, individual astrocytictumor cells were noted diffusely infiltrating be-tween neuronal and glial processes of the centralnervous system neuropil.
DiscussionGlioblastoma multiforme (WHO grade IV astro-cytoma) is the most common primary brain ma-lignancy, accounting for 12%–15% of all intra-cranial neoplasms (2). The prognosis is uniformlygrim. Despite undergoing standard treatments,which today include surgical resection, postopera-tive radiation therapy, and multiple protocols ofchemotherapy, over 75% of patients die within 18months. The prognosis has not changed signifi-cantly since the 1970s (2,3).
Glioblastoma occurs most frequently in thecerebral hemisphere of adults between 45 and 70years of age. It is rare in the cerebellum and spinalcord, and fewer than 10% of cases are found inchildren, in whom the brainstem is affected morecommonly than in adults (2).
Most glioblastomas arise without evidence of alower-grade precursor lesion after a short clinicalcourse of approximately 3 months. The mean ageof patients who present with primary glioblastomais 55 years. Glioblastomas may also arise from anexisting astrocytoma that has undergone progres-sion to a higher grade. These secondary glioblas-tomas are consequently characterized by a longerclinical course and are found in a younger patientpopulation (mean age, 40 years) (4).
Conventional gadolinium-enhanced MR imag-ing is the standard technique for the evaluation ofglioblastoma and typically demonstrates a large,heterogeneous mass in the cerebral hemisphereexhibiting necrosis, hemorrhage, and enhance-ment. In adults, the differential diagnosis for asolitary, heterogeneously enhancing intraaxialmass with necrosis also includes metastasis andabscess. Although metastatic disease exhibits awide variety of appearances, the large size of thelesion and lack of multiplicity in this case suggestthat a primary tumor is more likely. A brain ab-scess may also exhibit distinguishing imaging
Figure 5. Photomicrographs of the lesion (b [original magnification, �600; hematoxylin-eosin stain] is a magnifiedview of the boxed area in a [original magnification, �100; hematoxylin-eosin stain]) demonstrate regions of necrosis(white arrows) surrounded by rings of pseudopalisading tumor cells (black arrows), which are in turn surrounded byabundant microvascular hyperplasia (arrowheads).
886 May-June 2007 RG f Volume 27 ● Number 3

findings. For example, an abscess will not typi-cally exhibit an elevated choline-creatine ratio atMR spectroscopy.
Multiple advanced MR imaging techniqueshave been shown to improve both tumor detec-tion and the prospective evaluation of tumorgrade. In a study of grade II and grade III astrocy-tomas, peripheral disarrangement of fiber tracts atdiffusion-tensor MR imaging was shown to corre-late with higher grade (5). Both MR spectroscopyand perfusion MR imaging have been shown tobe useful in prospective determination of tumorgrade. At spectroscopy, elevation of choline anddepression of NAA suggest tumor; metaboliteratios (choline-creatine, choline-NAA, NAA-creatine, myoinositol-creatine) exhibit relation-ships to tumor grade. At perfusion MR imaging,relative cerebral blood volume is increased inhigher-grade astrocytomas (6,7). A recent studyalso suggests a direct relationship between thecontrast transfer coefficient (Ktrans, a reflection ofboth blood flow and endothelial permeability)and length of survival in high-grade gliomas (8).MR imaging is also widely used in the posttreat-ment evaluation of tumor. Combinations of ab-normal enhancement patterns at conventionalMR imaging, such as the presence of multiplelesions and corpus callosum involvement, havebeen shown to be more likely than individualfindings to help distinguish necrosis from tumorprogression (9). It is the rule at initial diagnosisthat glioblastoma exhibits necrosis at both radio-logic and pathologic examination. Indeed, necro-sis is one of the imaging findings that helps distin-guish glioblastoma multiforme from a lower-grade astrocytoma.
Why do tumors become necrotic? We aretaught that large tumors outgrow their blood sup-ply due to unrestricted proliferation, and that inspite of increased angiogenesis, there is centralvascular insufficiency. This model may not beaccurate in glioblastoma. Recent pathology litera-ture suggests that the characteristic pathologicfeatures of glioblastoma—necrosis with surround-ing pseudopalisades and microvascular hyperpla-sia—may reflect an intrinsic prothrombotic orvaso-occlusive event within the tumor rather thaninsufficient blood supply. Effects of both vascularendothelial growth factor and increased neoplas-tic production of tissue factor may cause an in-trinsic prothrombotic state (10–13).
Rather than being a consequence of rapidgrowth, the distinctive neuroimaging features ofglioblastoma—emergence of enhancement andrapid peripheral expansion of the mass—may be
secondary to an intrinsic vascular event mediatedby factors overexpressed by the glioblastoma it-self. A cascade of events is triggered by inherentprothrombotic–vaso-occlusive mechanisms: Mi-crovascular occlusion is followed by local hypoxiaand consequent outward migration of tumor cellsin a peripheral wave. The characteristic waves ofpseudopalisading cells are thought to representactively migrating hypoxic tumor cells. Pathologicanalysis supports this hypothesis: The wave ofpseudopalisading cells is less proliferative than theadjacent astrocytoma cells. These pseudopalisad-ing cells are not rapidly dividing cells that have“outgrown their blood supply” (10); they are oxy-gen-starved cells desperately seeking sustenance.This pathologic model provides a better explana-tion for the findings at radiologic and gross patho-logic examination: swift peripheral expansion ofan enhancing tumor with extensive central necro-sis, unfailingly leading to a poor prognosis.
Nevertheless, progress is being made in thediagnosis and treatment of glioblastoma, andmuch of the work involves an understanding ofthe mutations and differential expression of genesthat have been associated with both primary andsecondary glioblastomas. Primary glioblastomasare associated with amplification and overexpres-sion of the cell surface receptor EGFR, mutationsin PTEN, and abnormalities in chromosome 10,among other factors. Secondary glioblastomasoften exhibit mutations in TP53, as well as abnor-malities in chromosomes 19q and 10q (4,14,15).These variations are increasingly being exploitedas molecular targets for diagnosis and therapy(16). Many kinds of biomarkers are being investi-gated. A study in an animal model demonstratedthat MR imaging could help detect the incorpora-tion of magnetically labeled stem cells into theneovascularization accompanying glioma. Notonly can such techniques be used directly to iden-tify disease, but they also can facilitate therapy aspotential vectors of treatment (17).
Systemic delivery of chemotherapeutic agentsto a glioblastoma has only limited efficiency, andside effects can be severe. One alternative is deliv-ery of therapy directly to the tumor bed. Smallwafers containing chemotherapeutic agents canbe implanted into the surgical bed during resec-tion. More recently, directed therapies using mul-tiple specific molecular targets have been devel-oped. One such area of current research is the useof antibodies directed against the overexpressed
RG f Volume 27 ● Number 3 Altman et al 887

EGFR found in some glioblastomas (16). Thegoal of such research is not merely to generatemore drugs for the treatment of glioblastoma; it isalso to generate tools to assault specific types ofglioblastomas. Ideally, an individualized geneticprofile could be determined for each patient’stumor and a corresponding treatment plan de-signed.
References1. Chang KH, Song IC, Kim SH, et al. In vivo single-
voxel proton MR spectroscopy in intracranial cysticmasses. AJNR Am J Neuroradiol 1998;19(3):401–405.
2. Kleihues P, Burger PC, Collins VP, NewcombEW, Ohgaki H, Cavenee WK. Glioblastoma. In:Kleihues P, Cavenee WK, eds. Pathology and ge-netics of tumors of the nervous system. Lyon,France: IARC, 2000; 29–39.
3. Stark AM, Nabavi A, Mehdorn HM, Blomer U.Glioblastoma multiforme: report of 267 casestreated at a single institution. Surg Neurol 2005;63:162–169.
4. Kleihues P, Louis DN, Scheithauer BW, et al. TheWHO classification of tumors of the nervous sys-tem. J Neuropathol Exp Neurol 2002;61(3):215–225.
5. Goebell E, Paustenbach S, Vaeterlein O, et al.Low-grade and anaplastic gliomas: differences inarchitecture evaluated with diffusion-tensor MRimaging. Radiology 2006;239(1):217–222.
6. Law M, Yang S, Wang H, et al. Glioma grading:sensitivity, specificity, and predictive values ofperfusion MR imaging and proton MR spectro-scopic imaging compared with conventional MRimaging. AJNR Am J Neuroradiol 2003;24:1989–1998.
7. Stadlbauer A, Gruber S, Nimsky C, et al. Preop-erative grading of gliomas by using metabolitequantification with high-spatial-resolution proton
MR spectroscopic imaging. Radiology 2006;238(3):958–969.
8. Mills SJ, Patankar TA, Haroon HA, Baleriaux D,Swindell R, Jackson A. Do cerebral blood volumeand contrast transfer coefficient predict prognosisin human glioma? AJNR Am J Neuroradiol 2006;27:853–858.
9. Mullins ME, Barest GD, Schaefer PW, HochbergFH, Gonzalez RG, Lev MH. Radiation necrosisversus glioma recurrence: conventional MR imag-ing clues to diagnosis. AJNR Am J Neuroradiol2005;26:1967–1972.
10. Brat DJ, Van Meir EG. Vaso-occlusive and pro-thrombotic mechanisms of tumor hypoxia, necro-sis, and accelerated growth in glioblastoma. LabInvest 2004;84:397–405.
11. Hunter SB, Brat DJ, Olson JJ, von Deimling A,Zhou W, Van Meir EG. Alterations in molecularpathways of diffusely infiltrating glial neoplasms:application to tumor classification and anti-tumortherapy. Int J Oncol 2003;23:857–869.
12. Burger PC, Nelson JS, Boyko OB. Diagnostic syn-ergy in radiology and surgical neuropathology:neuroimaging techniques and general interpretiveguidelines. Arch Pathol Lab Med 1998;122(7):609–619.
13. Rong Y, Durden DL, Van Meir EG, Brat DJ.“Pseudopalisading” necrosis in glioblastoma: afamiliar morphologic feature that links vascularpathology, hypoxia, and angiogenesis. J Neuro-pathol Exp Neurol 2006;65(6):529–539.
14. Wang SI, Puc J, Li J, et al. Somatic mutations ofPTEN in glioblastoma multiforme. Cancer Res1997;57:4183–4186.
15. Rasheed BK, Stenzel TT, McLendon RE, et al.PTEN gene mutations are seen in high-grade butnot in low-grade gliomas. Cancer Res 1997;57:4187–4190.
16. Phuphanich S, Brat DJ, Olson JJ. Delivery systemsand molecular targets of mechanism-based thera-pies for GBM. Expert Rev Neurother 2004;4(4):649–663.
17. Anderson SA, Glod J, Arbab AS, et al. Noninva-sive MR imaging of magnetically labeled stem cellsto directly identify neovasculature in a gliomamodel. Blood 2005;105:420–425.
888 May-June 2007 RG f Volume 27 ● Number 3

INFORMATICS 889
Informatics in RadiologyGridCAD: Grid-based Computer-aidedDetection System1
Tony C. Pan, MS ● Metin N. Gurcan, PhD ● Stephen A. Langella, MSScott W. Oster, MS ● Shannon L. Hastings, MS ● Ashish Sharma, PhDBenjamin G. Rutt, MS ● David W. Ervin, BA ● Tahsin M. Kurc, PhDKhan M. Siddiqui, MD ● Joel H. Saltz, MD, PhD ● Eliot L. Siegel, MD
Grid computing—the use of a distributed network of electronic re-sources to cooperatively perform subsets of computationally intensivetasks—may help improve the speed and accuracy of radiologic imageinterpretation by enabling collaborative computer-based and humanreadings. GridCAD, a software application developed by using the Na-tional Cancer Institute Cancer Biomedical Informatics Grid architec-ture, implements the fundamental elements of grid computing anddemonstrates the potential benefits of grid technology for medical im-aging. It allows users to query local and remote image databases, viewimages, and simultaneously run multiple computer-assisted detection(CAD) algorithms on the images selected. The prototype CAD sys-tems that are incorporated in the software application are designed forthe detection of lung nodules on thoracic computed tomographic im-ages. GridCAD displays the original full-resolution images with anoverlay of nodule candidates detected by the CAD algorithms, by hu-man observers, or by a combination of both types of readers. With anunderlying framework that is computer platform independent and scal-able to the task, the software application can support local and long-distance collaboration in both research and clinical practice throughthe efficient, secure, and reliable sharing of resources for image datamining, analysis, and archiving.©RSNA, 2007
Abbreviations: CAD � computer-aided detection, HIPAA � Health Insurance Portability and Accountability Act, NCI � National Cancer Insti-tute, PACS � picture archiving and communication system, RIDER � Reference Image Database to Evaluate Response, XML � extensible markuplanguage
RadioGraphics 2007; 27:889–897 ● Published online 10.1148/rg.273065153 ● Content Code:
1From the Department of Biomedical Informatics, Ohio State University, 3190 Graves Hall, 333 W 10th Ave, Columbus, OH 43210 (T.C.P.,M.N.G., S.A.L., S.W.O., S.L.H., A.S., B.G.R., D.W.E., T.M.K., J.H.S.); VA Maryland Health Care System, Baltimore, Md (K.M.S., E.L.S.); andUniversity of Maryland School of Medicine, Baltimore, Md (E.L.S.). Presented as an infoRAD exhibit at the 2005 RSNA Annual Meeting. ReceivedAugust 17, 2006; revision requested September 22 and received November 8; accepted December 20. Supported in part by the National CancerInstitute, the National Science Foundation (CNS-0509326, CNS-0403342, ANI-0330612), the National Institutes of Health (NIBIB BISTIP20EB000591), and the Ohio Board of Regents (BRTTC BRTT02– 0003, ODOD-AGMT-TECH-04 – 049). M.N.G. is a stockholder iniCAD. K.M.S. is a speaker for TeraRecon, San Mateo, Calif; cofounder of iVirtuoso, Baltimore, Md; and a member of the advisory board ofGE Healthcare IT, Barrington, Ill. E.L.S. received research funding from GE Healthcare. All other authors have no financial relationships todisclose. Address correspondence to T.C.P. (e-mail: [email protected]).
©RSNA, 2007
Note: This copy is for your personal, non-commercial use only. To order presentation-ready copies for distribution to your colleagues or clients, use the RadioGraphics Reprints form at the end of this article.

IntroductionThe Internet originally was developed to meetrequirements for communication among multiplefederally funded computing centers. Require-ments for resource sharing and communicationamong these groups underscored the necessity tostandardize the protocols needed to exchangeinformation. The continuing development ofthese protocols evolved into what we now think ofas the Internet, which has transformed the way inwhich information is shared by hundreds of mil-lions of users around the world. Grid computingis an emerging technology that offers an infra-structure for sharing not only information butalso geographically dispersed computational andstorage resources. The grid has been defined inthe computer literature as an environment thatfacilitates “flexible, secure, coordinated resourcesharing among dynamic collections of individuals,institutions, and resources” (1). It can be thoughtof as an extension of the framework of the Inter-net to create an even more generic and powerfulresource-sharing environment.
Grid computing grew out of the work of manycomputer scientists in the 1980s and 1990s. To-day, the most widely accepted grid software sys-
tem is the Globus toolkit, which was developed byIan Foster, Carl Kesselman, and Steve Tuecke.The Globus toolkit is an open-source frameworkfor computer processing and storage manage-ment, security, data movement, and monitoring.Unlike traditional computer clusters or distrib-uted computing, grid computing provides supportfor computation across multiple disparate admin-istrative domains. Grid computing makes it pos-sible to unite resources from different computerplatforms, with different architectures, using dif-ferent computer languages, and in multiple loca-tions, over a single network by using open stan-dards. This enables what has been referred to asvirtualization of computing resources. It providesefficient and secure ways to share resources, in-cluding data, software applications, computa-tional capabilities, and storage capacity, by usingopen protocols and standardized service inter-faces. It creates unprecedented possibilities fornew forms of collaborative investigation as well asmore powerful clinical and research applications.The Globus toolkit has been used to support awide variety of applications in the physical sci-ences, engineering, and biomedicine.
Perhaps the best-known application of gridcomputing is the project SETI@home (http://setiweb.ssl.berkeley.edu), in which hundreds ofthousands of personal computers with many dif-ferent software platforms (including MicrosoftWindows, Linux, and Macintosh operating sys-tems) are connected via the Internet in a coopera-tive and coordinated search for radio signals withnonnatural patterns that might indicate extrater-restrial intelligence. The application uses datacollected by the Arecibo radio telescope in PuertoRico and employs the Berkeley Open Infrastruc-ture for Network Computing grid toolkit. Theapplication coordinates the processing of thecomplex radio telescope signals by dividing theminto multiple small segments that can be analyzedindividually on personal computers using theSETI@home screen saver programs.
Grid computing is particularly well suited tocomplex and computationally demanding appli-cations in medical imaging, such as computer-aided detection (CAD). Especially intriguing isthe possibility of using CAD software programsfrom different vendors in a cooperative manner toenhance the performance and accuracy of lungnodule detection in a single image data set. Thenodule candidates selected in a composite auto-mated reading then could be combined or com-pared with those identified by one or more humanobservers for research purposes or for clinical im-age interpretation.
TAKE-HOME POINTS
� Grid computing allows efficient and secure sharing ofdata, software applications, computational resources,and storage capacity by using open protocols andstandardized service interfaces.
� A generic grid may be composed of several services (eg,data, analysis, computation, and middleware support)and one or more user interfaces or applications thatconnect and interact with the grid components.
� GridCAD is a software application that makes innovativeuse of grid computing to increase the speed and accuracyof radiologic image interpretation through the sharing ofdata and analysis resources.
� GridCAD may be used to obtain a consensus interpreta-tion by multiple CAD systems and human readers in oneor more geographic locations.
� GridCAD is built on the NCI Cancer Biomedical InformaticsGrid (caBIG) architecture and is semantically and syntac-tically interoperable with services and applications incaBIG.
890 May-June 2007 RG f Volume 27 ● Number 3
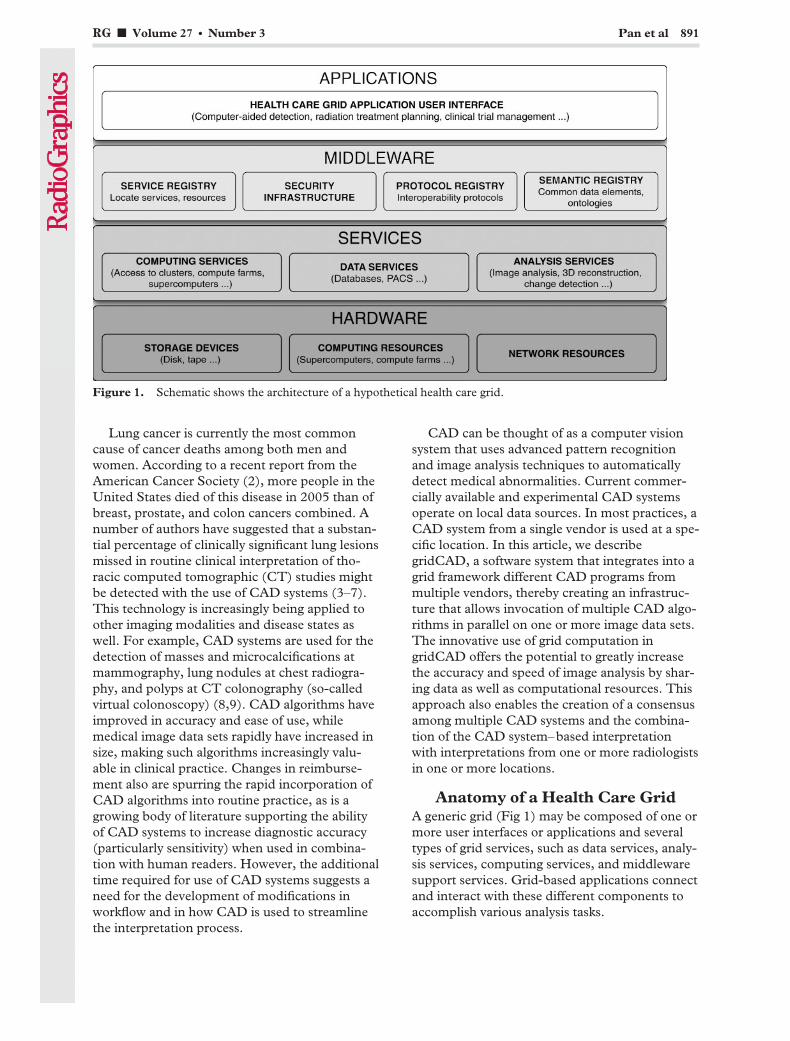
Lung cancer is currently the most commoncause of cancer deaths among both men andwomen. According to a recent report from theAmerican Cancer Society (2), more people in theUnited States died of this disease in 2005 than ofbreast, prostate, and colon cancers combined. Anumber of authors have suggested that a substan-tial percentage of clinically significant lung lesionsmissed in routine clinical interpretation of tho-racic computed tomographic (CT) studies mightbe detected with the use of CAD systems (3–7).This technology is increasingly being applied toother imaging modalities and disease states aswell. For example, CAD systems are used for thedetection of masses and microcalcifications atmammography, lung nodules at chest radiogra-phy, and polyps at CT colonography (so-calledvirtual colonoscopy) (8,9). CAD algorithms haveimproved in accuracy and ease of use, whilemedical image data sets rapidly have increased insize, making such algorithms increasingly valu-able in clinical practice. Changes in reimburse-ment also are spurring the rapid incorporation ofCAD algorithms into routine practice, as is agrowing body of literature supporting the abilityof CAD systems to increase diagnostic accuracy(particularly sensitivity) when used in combina-tion with human readers. However, the additionaltime required for use of CAD systems suggests aneed for the development of modifications inworkflow and in how CAD is used to streamlinethe interpretation process.
CAD can be thought of as a computer visionsystem that uses advanced pattern recognitionand image analysis techniques to automaticallydetect medical abnormalities. Current commer-cially available and experimental CAD systemsoperate on local data sources. In most practices, aCAD system from a single vendor is used at a spe-cific location. In this article, we describegridCAD, a software system that integrates into agrid framework different CAD programs frommultiple vendors, thereby creating an infrastruc-ture that allows invocation of multiple CAD algo-rithms in parallel on one or more image data sets.The innovative use of grid computation ingridCAD offers the potential to greatly increasethe accuracy and speed of image analysis by shar-ing data as well as computational resources. Thisapproach also enables the creation of a consensusamong multiple CAD systems and the combina-tion of the CAD system–based interpretationwith interpretations from one or more radiologistsin one or more locations.
Anatomy of a Health Care GridA generic grid (Fig 1) may be composed of one ormore user interfaces or applications and severaltypes of grid services, such as data services, analy-sis services, computing services, and middlewaresupport services. Grid-based applications connectand interact with these different components toaccomplish various analysis tasks.
Figure 1. Schematic shows the architecture of a hypothetical health care grid.
RG f Volume 27 ● Number 3 Pan et al 891
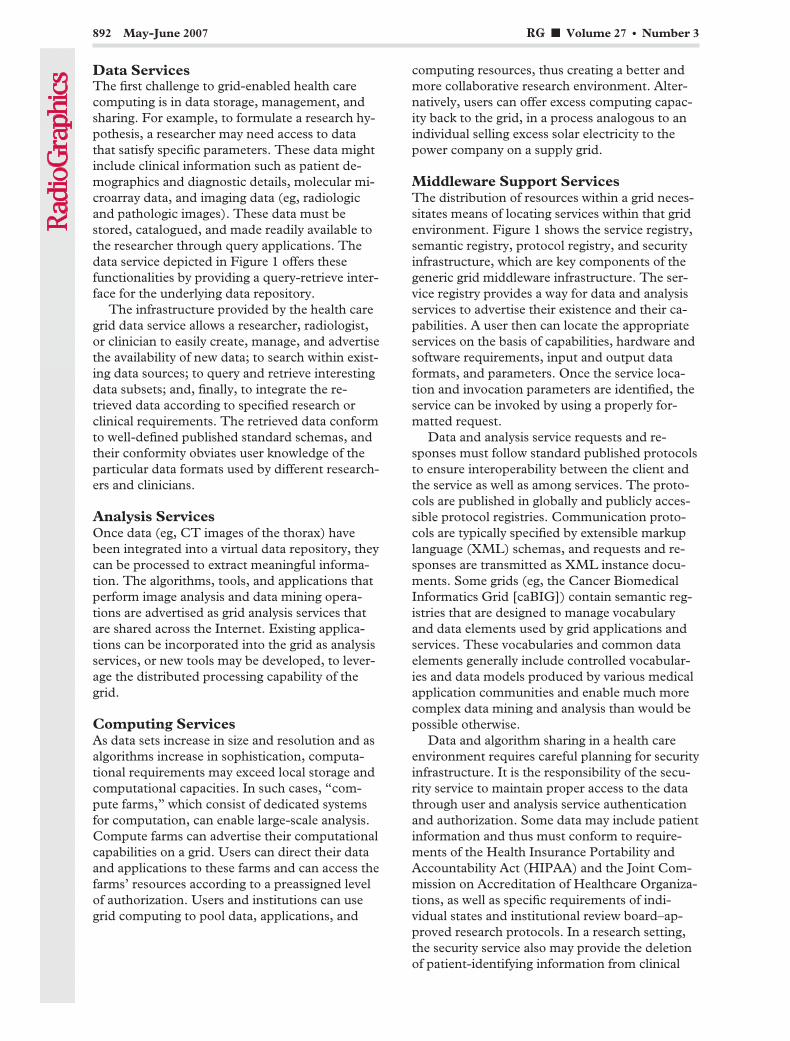
Data ServicesThe first challenge to grid-enabled health carecomputing is in data storage, management, andsharing. For example, to formulate a research hy-pothesis, a researcher may need access to datathat satisfy specific parameters. These data mightinclude clinical information such as patient de-mographics and diagnostic details, molecular mi-croarray data, and imaging data (eg, radiologicand pathologic images). These data must bestored, catalogued, and made readily available tothe researcher through query applications. Thedata service depicted in Figure 1 offers thesefunctionalities by providing a query-retrieve inter-face for the underlying data repository.
The infrastructure provided by the health caregrid data service allows a researcher, radiologist,or clinician to easily create, manage, and advertisethe availability of new data; to search within exist-ing data sources; to query and retrieve interestingdata subsets; and, finally, to integrate the re-trieved data according to specified research orclinical requirements. The retrieved data conformto well-defined published standard schemas, andtheir conformity obviates user knowledge of theparticular data formats used by different research-ers and clinicians.
Analysis ServicesOnce data (eg, CT images of the thorax) havebeen integrated into a virtual data repository, theycan be processed to extract meaningful informa-tion. The algorithms, tools, and applications thatperform image analysis and data mining opera-tions are advertised as grid analysis services thatare shared across the Internet. Existing applica-tions can be incorporated into the grid as analysisservices, or new tools may be developed, to lever-age the distributed processing capability of thegrid.
Computing ServicesAs data sets increase in size and resolution and asalgorithms increase in sophistication, computa-tional requirements may exceed local storage andcomputational capacities. In such cases, “com-pute farms,” which consist of dedicated systemsfor computation, can enable large-scale analysis.Compute farms can advertise their computationalcapabilities on a grid. Users can direct their dataand applications to these farms and can access thefarms’ resources according to a preassigned levelof authorization. Users and institutions can usegrid computing to pool data, applications, and
computing resources, thus creating a better andmore collaborative research environment. Alter-natively, users can offer excess computing capac-ity back to the grid, in a process analogous to anindividual selling excess solar electricity to thepower company on a supply grid.
Middleware Support ServicesThe distribution of resources within a grid neces-sitates means of locating services within that gridenvironment. Figure 1 shows the service registry,semantic registry, protocol registry, and securityinfrastructure, which are key components of thegeneric grid middleware infrastructure. The ser-vice registry provides a way for data and analysisservices to advertise their existence and their ca-pabilities. A user then can locate the appropriateservices on the basis of capabilities, hardware andsoftware requirements, input and output dataformats, and parameters. Once the service loca-tion and invocation parameters are identified, theservice can be invoked by using a properly for-matted request.
Data and analysis service requests and re-sponses must follow standard published protocolsto ensure interoperability between the client andthe service as well as among services. The proto-cols are published in globally and publicly acces-sible protocol registries. Communication proto-cols are typically specified by extensible markuplanguage (XML) schemas, and requests and re-sponses are transmitted as XML instance docu-ments. Some grids (eg, the Cancer BiomedicalInformatics Grid [caBIG]) contain semantic reg-istries that are designed to manage vocabularyand data elements used by grid applications andservices. These vocabularies and common dataelements generally include controlled vocabular-ies and data models produced by various medicalapplication communities and enable much morecomplex data mining and analysis than would bepossible otherwise.
Data and algorithm sharing in a health careenvironment requires careful planning for securityinfrastructure. It is the responsibility of the secu-rity service to maintain proper access to the datathrough user and analysis service authenticationand authorization. Some data may include patientinformation and thus must conform to require-ments of the Health Insurance Portability andAccountability Act (HIPAA) and the Joint Com-mission on Accreditation of Healthcare Organiza-tions, as well as specific requirements of indi-vidual states and institutional review board–ap-proved research protocols. In a research setting,the security service also may provide the deletionof patient-identifying information from clinical
892 May-June 2007 RG f Volume 27 ● Number 3

data. The security service can be used to restrictaccess to proprietary analysis services to specifiedpersonnel.
Health Care GridApplication User InterfacesThe components of the grid are linked via an ap-plication-specific user interface (Fig 2). The userinterface defines workflow and, consequently, theflow of data among different components in thegrid environment. The user interface also pro-vides mechanisms for retrieving and reviewingdata and analysis results.
The data storage services, analysis services,computing services, and support services togetherform the grid (Fig 1).
Data Sharing and AggregationGrid infrastructure provides a unified way to ac-cess remote data. In the health care setting, thiscan simplify data sharing among institutions andfacilitate remote review of cases by multiple users.In addition, a clinical case or research study mayinvolve subjects from multiple sites. For example,a researcher may want to analyze the prevalenceof a given finding (eg, ground-glass opacities inpatients less than 50 years old) for one or morespecified geographic locations. Analyses can bedirected at multi-institutional data sets withoutexplicitly copying and aggregating the images.Each site also can stage analysis services that op-erate on local data and can transmit to the re-questing researcher only aggregated results thatmaintain patient anonymity and confidentiality,thereby simplifying compliance with HIPAA andinstitutional review board requirements.
Cancer Biomed-ical Informatics Grid
One of the most prominent and promising recentefforts in health care grid computing was thelaunch of caBIG, a community initiative spon-sored by the National Cancer Institute (NCI)Center for Bioinformatics to create an informaticsinfrastructure among clinical cancer centers thatwould facilitate research through the sharing ofdata, software, and expertise. The NCI-fundedcaBIG program aims to improve cancer researchand patient care through effective collaborationacross institutions and disciplines in an open,standards-based environment. This includescommon standards and data sets, grid infrastruc-ture (caGrid) that extends grid middleware tosupport semantic and syntactic interoperability,and interoperable grid application for the partici-pants. In April 2005, the In Vivo Imaging Work-space, a community within the caBIG program,was created to foster the development of projectsthat are designed to advance medical imaging in-formatics, especially in cancer care.
GridCAD, the software application describedin this article and demonstrated at the 2005RSNA Scientific Assembly and Annual Meeting,was constructed by using caGrid, which was de-veloped as part of the caBIG initiative (Fig 2).CaGrid is a middleware infrastructure that pro-vides a communications layer for applications tointeract across different hardware and networkenvironments. It is also a toolkit that supports thedevelopment of grid-enabled, caBIG-compliant
Figure 2. Schematic shows the gridCAD framework and the flow of information among the components.
RG f Volume 27 ● Number 3 Pan et al 893

applications. The caGrid toolkit leverages theGlobus toolkit, NCI Cancer Data Standards Re-pository, Global Model Exchange (an XMLschema management system produced by theMobius project), and Open Grid Services Archi-tecture–Data Access Integration. The Globustoolkit provides the following set of core compo-nents for the development of grid applications(10): security, including authentication, authori-zation, and credential management; data manage-ment, including data transfer and associated opti-mizations; execution management and resourceallocation; information services for monitoringand discovery; and a common runtime library forapplication development support.
GridCAD ImplementationTo demonstrate the benefits of grid computingfor CAD, we implemented gridCAD for the de-tection of lung cancer. GridCAD differs fromother grid services (see “Summary and FutureProspects”) in its use of community standardtoolkits, caGrid, and community-accepted datacommunications standards, as well as in its goalof providing a common and open framework forrapidly creating and deploying grid-based imageanalysis applications.
As discussed previously, a grid computing en-vironment has several components, includingdata services, analysis services, middleware sup-port services, computing infrastructure, and userinterfaces. Each of these is implemented and uti-lized in gridCAD for the lung cancer application.The objectives of the gridCAD framework areachieved by exposing a CAD algorithm as a grid-aware service and by facilitating the easy and se-cure exchange of images and CAD results. Oneapproach for exposing an application or a datasource as a grid service is to wrap it inside a layerthat facilitates interaction and communicationwith other grid components while leaving theoriginal unmodified. The wrappers that we usedcome from the caGrid toolkit. In gridCAD (Fig2), the following grid components are imple-mented: CAD analysis services, which invokeCAD systems and manage the flow of data; imagedata services, which provide interfaces to the datarepositories (eg, a picture archiving and commu-nication system [PACS] server); middleware sup-port services, which provide operational supportsuch as storage and communication schemas,data security, application invocation, and CADresult storage (in repositories such as the MakoXML database, a product of the open-source
Mobius project); and user interfaces, which allowquery, original image preview, and CAD systemmarking review.
Reference Implementa-tion in Lung Cancer Detection
In our implementation of gridCAD for lung can-cer detection, we used CT image data sets fromthe Reference Image Database to Evaluate Re-sponse (RIDER), an archive of time-series imagesof lung cancer. We also included a thoracic CTdatabase of 100 patients at the Baltimore Veter-ans Affairs Medical Center. The RIDER datasets, which contain image data that were acquiredwith various imaging modalities and protocols atvarious institutions and from which patient-iden-tifying information has been deleted, are availablefor free public use from the NCI National CancerImaging Archive Web site (http://ncia.nci.nih.gov).Information that might allow patient identifica-tion also was removed from the image data setsthat we received from the Baltimore Veterans Af-fairs Medical Center, and we received an institu-tional review board exemption for our use ofthese data. The images from the Baltimore Veter-ans Affairs Medical Center were acquired andreconstructed at a section thickness of 0.75 mm.Image data were stored on five different DigitalImaging and Communications in Medicine(DICOM)-compliant PACS servers that wereexposed to the grid as image data services that aregeographically distributed across the UnitedStates. The locations of the gridCAD image dataservices included the infoRAD booth at the 2005RSNA annual meeting, the Collaboratory for Ad-vanced Computing and Simulations at the Uni-versity of Southern California (Los Angeles,Calif), and the Multiscale Computing Laboratoryat Ohio State University (Columbus, Ohio). TheDICOM-compliant server software that was usedto host and manage the images was the open-source PACS server software in the PixelMedJava toolkit library (http://www.dclunie.com/pixelmed/software). More than 800 image serieswere used for the gridCAD implementation.
CAD analysis services were implemented aswrappers for lung nodule CAD algorithms fromSiemens Medical Solutions (Malvern, Pa) andiCAD (Nashua, NH). Each of these algorithmswas treated as a black box with a well-definedcommand-line interface. A separate analysis ser-vice wrapper was developed for each CAD algo-rithm because the algorithms were not developedfor a grid computing environment and have dif-ferent interfaces for invocation and different for-mat requirements for data input and output.
894 May-June 2007 RG f Volume 27 ● Number 3
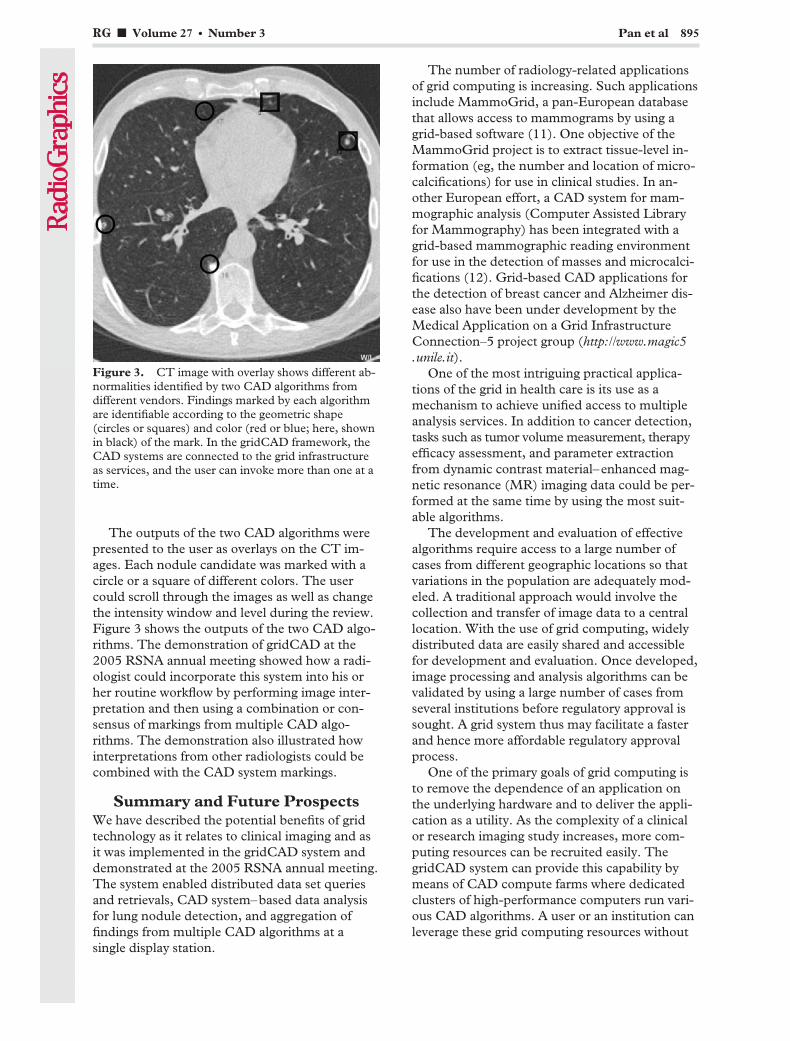
The outputs of the two CAD algorithms werepresented to the user as overlays on the CT im-ages. Each nodule candidate was marked with acircle or a square of different colors. The usercould scroll through the images as well as changethe intensity window and level during the review.Figure 3 shows the outputs of the two CAD algo-rithms. The demonstration of gridCAD at the2005 RSNA annual meeting showed how a radi-ologist could incorporate this system into his orher routine workflow by performing image inter-pretation and then using a combination or con-sensus of markings from multiple CAD algo-rithms. The demonstration also illustrated howinterpretations from other radiologists could becombined with the CAD system markings.
Summary and Future ProspectsWe have described the potential benefits of gridtechnology as it relates to clinical imaging and asit was implemented in the gridCAD system anddemonstrated at the 2005 RSNA annual meeting.The system enabled distributed data set queriesand retrievals, CAD system–based data analysisfor lung nodule detection, and aggregation offindings from multiple CAD algorithms at asingle display station.
The number of radiology-related applicationsof grid computing is increasing. Such applicationsinclude MammoGrid, a pan-European databasethat allows access to mammograms by using agrid-based software (11). One objective of theMammoGrid project is to extract tissue-level in-formation (eg, the number and location of micro-calcifications) for use in clinical studies. In an-other European effort, a CAD system for mam-mographic analysis (Computer Assisted Libraryfor Mammography) has been integrated with agrid-based mammographic reading environmentfor use in the detection of masses and microcalci-fications (12). Grid-based CAD applications forthe detection of breast cancer and Alzheimer dis-ease also have been under development by theMedical Application on a Grid InfrastructureConnection–5 project group (http://www.magic5.unile.it).
One of the most intriguing practical applica-tions of the grid in health care is its use as amechanism to achieve unified access to multipleanalysis services. In addition to cancer detection,tasks such as tumor volume measurement, therapyefficacy assessment, and parameter extractionfrom dynamic contrast material–enhanced mag-netic resonance (MR) imaging data could be per-formed at the same time by using the most suit-able algorithms.
The development and evaluation of effectivealgorithms require access to a large number ofcases from different geographic locations so thatvariations in the population are adequately mod-eled. A traditional approach would involve thecollection and transfer of image data to a centrallocation. With the use of grid computing, widelydistributed data are easily shared and accessiblefor development and evaluation. Once developed,image processing and analysis algorithms can bevalidated by using a large number of cases fromseveral institutions before regulatory approval issought. A grid system thus may facilitate a fasterand hence more affordable regulatory approvalprocess.
One of the primary goals of grid computing isto remove the dependence of an application onthe underlying hardware and to deliver the appli-cation as a utility. As the complexity of a clinicalor research imaging study increases, more com-puting resources can be recruited easily. ThegridCAD system can provide this capability bymeans of CAD compute farms where dedicatedclusters of high-performance computers run vari-ous CAD algorithms. A user or an institution canleverage these grid computing resources without
Figure 3. CT image with overlay shows different ab-normalities identified by two CAD algorithms fromdifferent vendors. Findings marked by each algorithmare identifiable according to the geometric shape(circles or squares) and color (red or blue; here, shownin black) of the mark. In the gridCAD framework, theCAD systems are connected to the grid infrastructureas services, and the user can invoke more than one at atime.
RG f Volume 27 ● Number 3 Pan et al 895
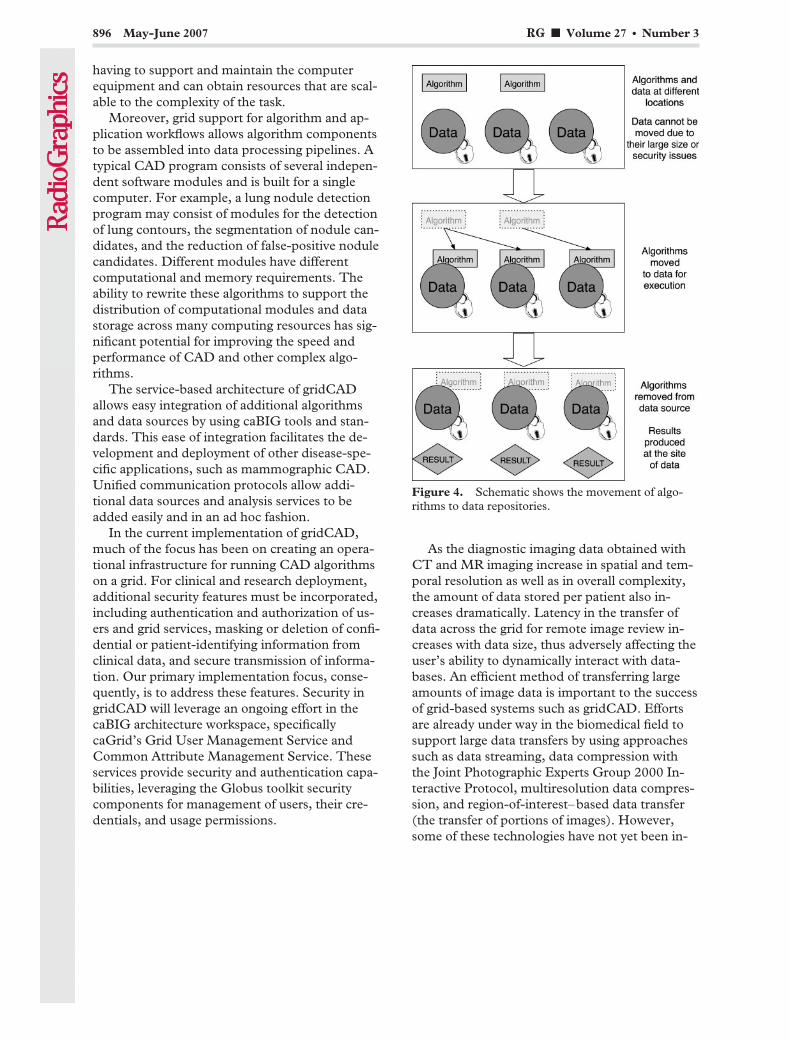
having to support and maintain the computerequipment and can obtain resources that are scal-able to the complexity of the task.
Moreover, grid support for algorithm and ap-plication workflows allows algorithm componentsto be assembled into data processing pipelines. Atypical CAD program consists of several indepen-dent software modules and is built for a singlecomputer. For example, a lung nodule detectionprogram may consist of modules for the detectionof lung contours, the segmentation of nodule can-didates, and the reduction of false-positive nodulecandidates. Different modules have differentcomputational and memory requirements. Theability to rewrite these algorithms to support thedistribution of computational modules and datastorage across many computing resources has sig-nificant potential for improving the speed andperformance of CAD and other complex algo-rithms.
The service-based architecture of gridCADallows easy integration of additional algorithmsand data sources by using caBIG tools and stan-dards. This ease of integration facilitates the de-velopment and deployment of other disease-spe-cific applications, such as mammographic CAD.Unified communication protocols allow addi-tional data sources and analysis services to beadded easily and in an ad hoc fashion.
In the current implementation of gridCAD,much of the focus has been on creating an opera-tional infrastructure for running CAD algorithmson a grid. For clinical and research deployment,additional security features must be incorporated,including authentication and authorization of us-ers and grid services, masking or deletion of confi-dential or patient-identifying information fromclinical data, and secure transmission of informa-tion. Our primary implementation focus, conse-quently, is to address these features. Security ingridCAD will leverage an ongoing effort in thecaBIG architecture workspace, specificallycaGrid’s Grid User Management Service andCommon Attribute Management Service. Theseservices provide security and authentication capa-bilities, leveraging the Globus toolkit securitycomponents for management of users, their cre-dentials, and usage permissions.
As the diagnostic imaging data obtained withCT and MR imaging increase in spatial and tem-poral resolution as well as in overall complexity,the amount of data stored per patient also in-creases dramatically. Latency in the transfer ofdata across the grid for remote image review in-creases with data size, thus adversely affecting theuser’s ability to dynamically interact with data-bases. An efficient method of transferring largeamounts of image data is important to the successof grid-based systems such as gridCAD. Effortsare already under way in the biomedical field tosupport large data transfers by using approachessuch as data streaming, data compression withthe Joint Photographic Experts Group 2000 In-teractive Protocol, multiresolution data compres-sion, and region-of-interest–based data transfer(the transfer of portions of images). However,some of these technologies have not yet been in-
Figure 4. Schematic shows the movement of algo-rithms to data repositories.
896 May-June 2007 RG f Volume 27 ● Number 3

corporated as use cases for caGrid’s communica-tion protocols. High-performance data transferremains an area of future work for gridCAD aswell as caGrid.
Although high-performance data transfer mayimprove the transfer latency for an individual dataset, large numbers of image data sets still presentchallenges for efficient data movement. Clinicaltrials that involve multiple sites, each with largenumbers of image data sets, may further com-pound the problem. The resulting data transfertime on the grid can become a bottleneck forCAD system performance.
Moving algorithms to data repositories insteadof moving data to analysis services reduces theamount of data transfer and may enhance overallsystem performance in certain scenarios (Fig 4).This requires a significant amount of middlewaresupport for runtime transmission of algorithmsand installation at remote grid services. We planto implement this capability in future gridCADversions, with the support of the caGrid toolkitand CAD system vendors.
Transmitting CAD algorithms to remote datasites also provides an additional benefit. Analysescarried out at individual data sites help avoid thetransmittal of image data containing protectedhealth information; aggregated CAD results maybe sent back to the grid user without such infor-mation, thus reducing the risk of problems withinstitutional review board and HIPAA compli-ance.
Grid computing has tremendous potential tocreate health care benefits; the medical imagingcommunity has only begun to explore the possi-bilities. Promising grid computing applicationsinclude teleradiology services, distributed andremote image processing and analysis, qualityassurance and research, and clinical data mining.
Acknowledgments: The authors thank DennisO’Dell, Marcos Salganicoff, Toshiro Kubota, andRajesh Amara of Siemens Medical Solutions and Eu-vondia Friedmann, Tom Fister, Maha Sallam, andTim Carter of iCAD for their assistance. The authorsalso thank the Collaboratory for Advanced Computingand Simulations at the University of Southern Califor-nia for contributing storage resources.
References1. Foster I, Kesselman C, Tuecke S. The anatomy of
the grid: enabling scalable virtual organizations.Int J Supercomput Appl 2001;15:200–222.
2. American Cancer Society. Cancer facts and figures2005. American Cancer Society Web site. http://www.cancer.org/docroot/STT/content/STT_1x_Cancer_Facts__Figures_2005.asp. Published2005. Accessed July 1, 2006.
3. Peldschus K, Herzog P, Wood SA, Cheema JI,Costello P, Schoepf UJ. Computer-aided diagnosisas a second reader: spectrum of findings in CTstudies of the chest interpreted as normal. Chest2005;128:1517–1523.
4. Brown MS, Goldin JG, Rogers S, et al. Computer-aided lung nodule detection in CT: results oflarge-scale observer test. Acad Radiol 2005;12:681–686.
5. Farag AA, El-Baz A, Gimelfarb G, El-Ghar MA,Eldiasty T. Quantitative nodule detection in lowdose chest CT scans: new template modeling andevaluation for CAD system design. Med ImageComput Assist Interv 2005;8(pt 1):720–728.
6. Gurcan MN, Sahiner B, Petrick N, et al. Lungnodule detection on thoracic computed tomogra-phy images: preliminary evaluation of a computer-aided diagnosis system. Med Phys 2002;29:2552–2558.
7. Giger ML, Doi K, MacMahon H, Metz CE, YinFF. Pulmonary nodules: computer-aided detec-tion in digital chest images. RadioGraphics 1990;10:41–51.
8. Summers RM, Jerebko AK, Franaszek M, MalleyJD, Johnson CD. Colonic polyps: complementaryrole of computer-aided detection in CT colonog-raphy. Radiology 2002;225:391–399.
9. Chan HP, Doi K, Vyborny CJ, et al. Improvementin radiologists’ detection of clustered microcalcifi-cations on mammograms: the potential of com-puter-aided diagnosis. Invest Radiol 1990;25:1102–1110.
10. About the Globus toolkit. Globus Toolkit Website. http://globus.org/toolkit/about.html. AccessedJune 10, 2006.
11. Amendolia SR, Brady M, McClatchey R, Mulet-Parada M, Odeh M, Solomonides T. Mammo-Grid: large-scale distributed mammogram analy-sis. Stud Health Technol Inform 2003;95:194–199.
12. Bottigli U, Cerello P, Delogu P, et al. A computeraided detection system for mammographic imagesimplemented on a GRID infrastructure. Proceed-ings of the 13th IEEE-NPSS Real Time Confer-ence 2003, Montreal, Canada, May 18–23, 2003.
RG f Volume 27 ● Number 3 Pan et al 897
CONTINUING EDUCATION 899
Accreditation and Designation StatementsThe Radiological Society of North America is accredited by the Accreditation Council for Continuing Medical Edu-cation to provide continuing medical education for physicians.
The Radiological Society of North America designates each test of this educational activity for a maximum of 1.0AMA PRA Category 1 Credit TM. Physicians should claim only those credits commensurate with the extent of their par-ticipation in the activity.
This event is an Accredited Self-Assessment Program (Section 3) as defined by the Maintenance of Certificationprogram of the Royal College of Physicians and Surgeons of Canada.
DisclosureAs an ACCME-accredited provider of continuing medical education, the RSNA must ensure that all decisions abouteducational content were made free of the control of a commercial interest. Furthermore, the RSNA must be able toshow that all individuals in a position to control educational content have disclosed all relevant financial relationshipswith any commercial interest. The RSNA must then resolve all identified conflicts of interest prior to education beingdelivered to learners.
In accordance with ACCME policy, William W. Olmsted, MD, Editor, RadioGraphics, and Education Editor,RSNA, discloses the following financial relationship: Stockholder, General Electric Company.
Goals and ObjectivesGoalsThe goal of the articles designated as CME features and their accompanying tests is to increase awareness about theradiologic characteristics of a variety of pathologic conditions and basic physics principles.
Educational ObjectivesThe overall objectives for the RadioGraphics CME activity are included here. In addition, each article designated as aCME feature is accompanied by specific learning objectives for that article.After reading the CME feature articles, physicians will be able to:● Identify and describe the basic physics principles for a variety of imaging modalities.● Identify and describe a variety of pathologic conditions.● Understand and synthesize physical principles underlying diagnostic and therapeutic techniques.● Analyze and correlate anatomic, pathologic, and radiologic findings for a variety of pathologic conditions.
EvaluationParticipants must answer correctly a minimum of 80% of the questions on each test accompanying a designated ar-ticle to earn the 1.0 credit. Participants will receive notification of credit earned for each test. In addition, participantsare asked to evaluate the quality of the CME feature articles.
Instructions● Turn to page 754A for the answer form and complete all registration information or see www.rsna.org/education
/rg_cme.html to complete the following tests online as well as to access additional online-only CME tests.● Answer each question by darkening the appropriate space on the form. Each question has only one answer.● Send the form or a photocopy to RadioGraphics CME, Radiological Society of North America, 820 Jorie Blvd,
Oak Brook, IL 60523 or fax number 630-571-7837.● Tests are valid for credit for 3 years from the date of publication. Credit is awarded on the date that an answer
form is received (ie, answers for a 2006 test received in 2007 are valid for credit in 2007, not 2006).● We recommend that participants keep photocopies of the following items: (a) both sides of the answer form and
(b) the first pages of the articles on which the tests are based. Occasionally, mailed or even faxed answer formsare not received. With a photocopy, a participant can resend his or her answers if needed.The first page of eacharticle contains the title, abstract, and learning objectives for that article. If these pages are filed with the post-cards that notify participants of credit earned, this information can be used as documentation about the natureof RadioGraphics CME credits if requested by an accrediting agency.
Note: This copy is for your personal, non-commercial use only. To order presentation-ready copies for distribution to your colleagues or clients, use the RadioGraphics Reprints form at the end of this article.

Test 1: What Every Radiologist Should Know about Idiopathic InterstitialPneumonias (pp 595–615)
1. A previous respiratory tract infection is typi-cally reported in which of the following enti-ties?a. UIP.b. COP.c. NSIP.d. LIP.
2. In combination with ground-glass opacity,which of the following imaging findings ismost likely associated with RB-ILD?a. Cysts.b. Honeycombing.c. Airspace consolidation.d. Centrilobular nodules.
3. Which of the following statements about NSIPis true?a. High-resolution CT shows areas of ground-
glass opacity in a subpleural distribution.b. There is a strong association with cigarette
smoking.c. The histologic pattern is characterized by tem-
poral and spatial heterogeneity.d. Patients are usually older than patients with
UIP.
4. The histologic finding of granulation tissuepolyps in the alveolar ducts and alveoli ischaracteristic of which of the following enti-ties?a. COP.b. DIP.c. LIP.d. AIP.
5. The high-resolution CT appearance of peri-bronchial consolidation with air broncho-grams and bronchial dilatation is characteris-tic of which of the following entities?a. DIP.b. LIP.c. NSIP.d. COP.
6. Which of the following entities is associatedwith a history of cigarette smoking?a. DIP.b. LIP.c. NSIP.d. COP.
7. Which of the following statements about UIPis true?a. The histologic hallmark is the formation of hya-
line membranes.b. Most patients improve with corticosteroid treat-
ment; however, relapses are common.c. Surgical lung biopsy is not required in patients
with typical clinical and radiologic findings.d. CT shows a basoapical gradient.
8. As seen in Figure 29, what are the predomi-nant imaging findings in the exudative phaseof AIP?a. Consolidation with bronchial dilatation in the
dependent areas of the lungs.b. Architectural distortion and honeycombing.c. Ground-glass opacity and consolidation in the
dependent areas of the lungs.d. Diffuse ground-glass opacity and centrilobular
nodules.
9. Which of the following combinations of imag-ing findings best describes the appearance ofUIP?a. Consolidation, ground-glass opacity, honey-
combing.b. Honeycombing, reticular opacities, traction
bronchiectasis.c. Perivascular cysts, traction bronchiectasis,
ground-glass opacity.d. Consolidation, reticular opacities, ground-glass
opacity.
10. As seen in Figure 9a, what are the key imagingfeatures of NSIP?a. Heterogeneous lung involvement with airspace
consolidation.b. Heterogeneous lung involvement with architec-
tural distortion.c. Homogeneous lung involvement with centri-
lobular nodules.d. Homogeneous lung involvement without an
obvious apicobasal gradient.
900 f May-June 2007 RG f Volume 27 ● Number 3
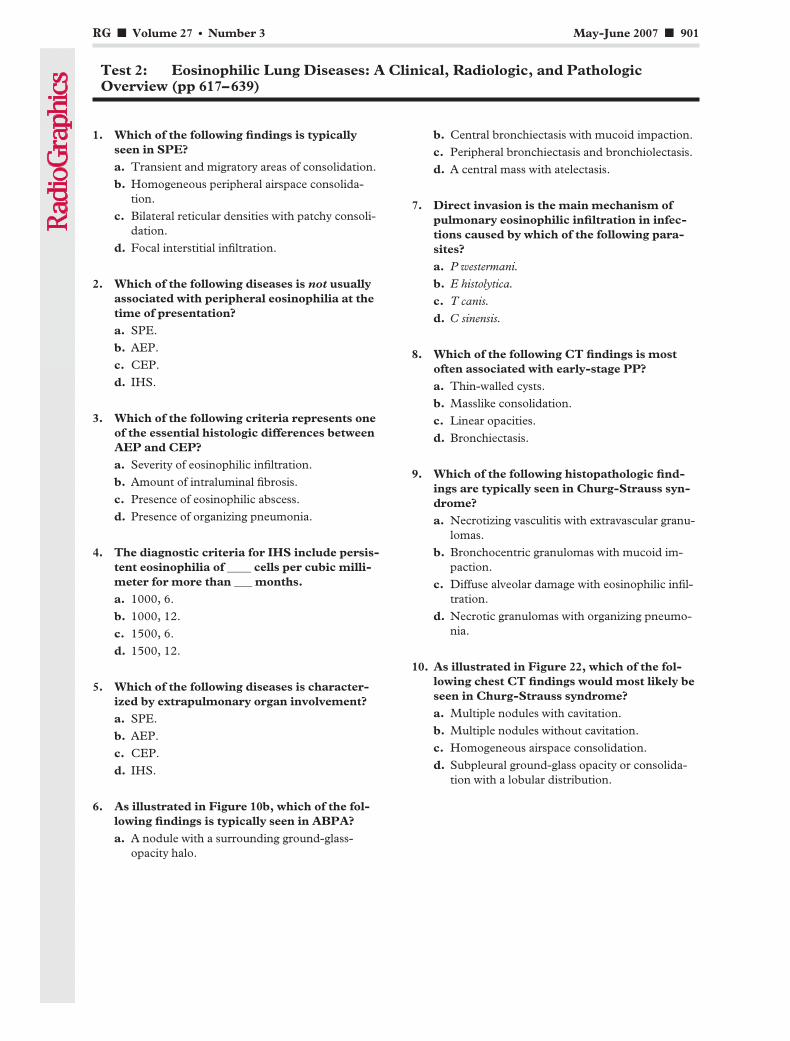
Test 2: Eosinophilic Lung Diseases: A Clinical, Radiologic, and PathologicOverview (pp 617–639)
1. Which of the following findings is typicallyseen in SPE?a. Transient and migratory areas of consolidation.b. Homogeneous peripheral airspace consolida-
tion.c. Bilateral reticular densities with patchy consoli-
dation.d. Focal interstitial infiltration.
2. Which of the following diseases is not usuallyassociated with peripheral eosinophilia at thetime of presentation?a. SPE.b. AEP.c. CEP.d. IHS.
3. Which of the following criteria represents oneof the essential histologic differences betweenAEP and CEP?a. Severity of eosinophilic infiltration.b. Amount of intraluminal fibrosis.c. Presence of eosinophilic abscess.d. Presence of organizing pneumonia.
4. The diagnostic criteria for IHS include persis-tent eosinophilia of ____ cells per cubic milli-meter for more than ___ months.a. 1000, 6.b. 1000, 12.c. 1500, 6.d. 1500, 12.
5. Which of the following diseases is character-ized by extrapulmonary organ involvement?a. SPE.b. AEP.c. CEP.d. IHS.
6. As illustrated in Figure 10b, which of the fol-lowing findings is typically seen in ABPA?a. A nodule with a surrounding ground-glass-
opacity halo.
b. Central bronchiectasis with mucoid impaction.c. Peripheral bronchiectasis and bronchiolectasis.d. A central mass with atelectasis.
7. Direct invasion is the main mechanism ofpulmonary eosinophilic infiltration in infec-tions caused by which of the following para-sites?a. P westermani.b. E histolytica.c. T canis.d. C sinensis.
8. Which of the following CT findings is mostoften associated with early-stage PP?a. Thin-walled cysts.b. Masslike consolidation.c. Linear opacities.d. Bronchiectasis.
9. Which of the following histopathologic find-ings are typically seen in Churg-Strauss syn-drome?a. Necrotizing vasculitis with extravascular granu-
lomas.b. Bronchocentric granulomas with mucoid im-
paction.c. Diffuse alveolar damage with eosinophilic infil-
tration.d. Necrotic granulomas with organizing pneumo-
nia.
10. As illustrated in Figure 22, which of the fol-lowing chest CT findings would most likely beseen in Churg-Strauss syndrome?a. Multiple nodules with cavitation.b. Multiple nodules without cavitation.c. Homogeneous airspace consolidation.d. Subpleural ground-glass opacity or consolida-
tion with a lobular distribution.
RG f Volume 27 ● Number 3 May-June 2007 f 901

Test 3: MR Imaging of Acute Right Lower Quadrant Pain in Pregnant andNonpregnant Patients (pp 721–753)
1. Which of the following statements about diag-nosis of acute appendicitis in pregnancy istrue?a. CT is always the examination of choice, as there
is no associated risk with ionizing radiation tothe fetus.
b. The diagnosis can be reliably made on the basisof the clinical features and laboratory results.
c. Anatomic differences in the location of the ap-pendix make the diagnosis challenging.
d. US is not a useful diagnostic test.
2. Which of the following statements about useof MR imaging in evaluation of pregnantwomen with acute abdominal pain is true?a. It should always be delayed until the second
trimester.b. It is contraindicated during the first trimester
regardless of the potential benefit for the pa-tient.
c. It should be performed regardless of the trimes-ter when the outcome of the examination hasthe potential to affect the care of the patient.
d. None of the above.
3. What pulse sequence is the cornerstone of theauthors’ MR imaging protocol for pregnantpatients and is essential for identifying thenormal appendix?a. Axial in-phase and opposed-phase T1-weighted
GRE.b. Axial TOF.c. Axial single-shot fast SE.d. Axial fat-saturated single-shot fast SE.
4. Which of the following MR imaging findingsvirtually rules out the diagnosis of appendici-tis?a. A distended fluid-filled appendix.b. Blooming artifact along most of the appendix
on T2*-weighted TOF images due to air or oralcontrast material filling the lumen.
c. Lack of periappendiceal inflammation.d. A 7-mm-diameter appendix.
5. Which of the following MR imaging findings ismore commonly demonstrated in patientswith mild acute appendicitis?a. A 7-mm-diameter air-filled appendix.
b. A 6-mm-diameter fluid-filled appendix withperiappendiceal edema.
c. An abscess in the RLQ.d. All of the above.
6. Which of the following statements about ap-pendiceal mucoceles is true?a. Periappendiceal fluid and edema are common
in nonruptured mucoceles.b. Minimal distention of the appendiceal lumen is
the most common finding.c. They are frequently associated with underlying
benign or malignant neoplasms.d. Rupture of an appendiceal mucocele is typically
indolent.
7. In a patient with Crohn disease and acuteRLQ pain, MR imaging may show which ofthe following findings?a. Thickening of the small bowel wall.b. Prominence, dilatation, and tortuosity of the
vasa recta coursing through proliferative mesen-teric fat.
c. A phlegmon.d. All of the above.
8. Which of the following conditions is mostcommonly a complication of ovarian hyper-stimulation syndrome?a. Endometriosis.b. Ovarian carcinoma.c. Ovarian torsion.d. All of the above.
9. Which of the following MR imaging findingsseen in Figure 14 is suggestive of ovarian tor-sion?a. Edematous ovarian stroma.b. An edematous fallopian tube.c. Twisted configuration of the ovarian vascular
pedicle.d. All of the above.
10. The presence of India ink artifact in partof the right adnexal mass shown in Figure 16is suggestive of which of the following enti-ties?a. Endometrioid carcinoma.b. Ovarian dermoid cyst.c. Tubo-ovarian abscess.d. Ovarian torsion.
902 f May-June 2007 RG f Volume 27 ● Number 3
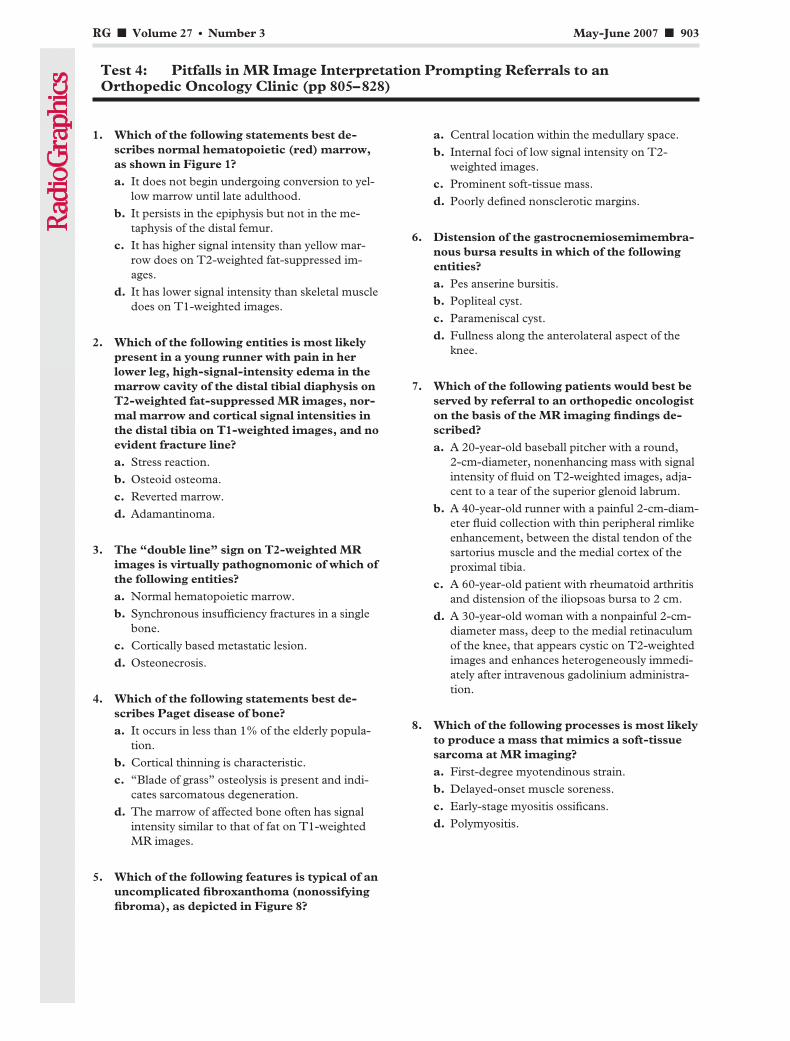
Test 4: Pitfalls in MR Image Interpretation Prompting Referrals to anOrthopedic Oncology Clinic (pp 805–828)
1. Which of the following statements best de-scribes normal hematopoietic (red) marrow,as shown in Figure 1?a. It does not begin undergoing conversion to yel-
low marrow until late adulthood.b. It persists in the epiphysis but not in the me-
taphysis of the distal femur.c. It has higher signal intensity than yellow mar-
row does on T2-weighted fat-suppressed im-ages.
d. It has lower signal intensity than skeletal muscledoes on T1-weighted images.
2. Which of the following entities is most likelypresent in a young runner with pain in herlower leg, high-signal-intensity edema in themarrow cavity of the distal tibial diaphysis onT2-weighted fat-suppressed MR images, nor-mal marrow and cortical signal intensities inthe distal tibia on T1-weighted images, and noevident fracture line?a. Stress reaction.b. Osteoid osteoma.c. Reverted marrow.d. Adamantinoma.
3. The “double line” sign on T2-weighted MRimages is virtually pathognomonic of which ofthe following entities?a. Normal hematopoietic marrow.b. Synchronous insufficiency fractures in a single
bone.c. Cortically based metastatic lesion.d. Osteonecrosis.
4. Which of the following statements best de-scribes Paget disease of bone?a. It occurs in less than 1% of the elderly popula-
tion.b. Cortical thinning is characteristic.c. “Blade of grass” osteolysis is present and indi-
cates sarcomatous degeneration.d. The marrow of affected bone often has signal
intensity similar to that of fat on T1-weightedMR images.
5. Which of the following features is typical of anuncomplicated fibroxanthoma (nonossifyingfibroma), as depicted in Figure 8?
a. Central location within the medullary space.b. Internal foci of low signal intensity on T2-
weighted images.c. Prominent soft-tissue mass.d. Poorly defined nonsclerotic margins.
6. Distension of the gastrocnemiosemimembra-nous bursa results in which of the followingentities?a. Pes anserine bursitis.b. Popliteal cyst.c. Parameniscal cyst.d. Fullness along the anterolateral aspect of the
knee.
7. Which of the following patients would best beserved by referral to an orthopedic oncologiston the basis of the MR imaging findings de-scribed?a. A 20-year-old baseball pitcher with a round,
2-cm-diameter, nonenhancing mass with signalintensity of fluid on T2-weighted images, adja-cent to a tear of the superior glenoid labrum.
b. A 40-year-old runner with a painful 2-cm-diam-eter fluid collection with thin peripheral rimlikeenhancement, between the distal tendon of thesartorius muscle and the medial cortex of theproximal tibia.
c. A 60-year-old patient with rheumatoid arthritisand distension of the iliopsoas bursa to 2 cm.
d. A 30-year-old woman with a nonpainful 2-cm-diameter mass, deep to the medial retinaculumof the knee, that appears cystic on T2-weightedimages and enhances heterogeneously immedi-ately after intravenous gadolinium administra-tion.
8. Which of the following processes is most likelyto produce a mass that mimics a soft-tissuesarcoma at MR imaging?a. First-degree myotendinous strain.b. Delayed-onset muscle soreness.c. Early-stage myositis ossificans.d. Polymyositis.
RG f Volume 27 ● Number 3 May-June 2007 f 903
9. A nonenhancing intramuscular mass with sig-nal intensity higher than that of skeletal muscleon T1-weighted fat-suppressed MR imagesand a peripheral rim of low signal intensity onT1- and T2-weighted images most likely rep-resents which of the following entities?a. A hematoma.b. A fluid-filled bursa.c. A ganglion.d. A parosteal osteosarcoma.
10. A 1-cm-diameter mass on the dorsum of thewrist, that appears predominantly cystic onT2-weighted MR images and shows only athin rim of peripheral enhancement, mostlikely represents which of the following enti-ties?a. Synovial sarcoma.b. Myxoid liposarcoma.c. Ganglion.d. Abscess.
Test 5: Pre- and Postoperative Evaluation of Congenital Heart Disease inChildren and Adults with 64-Section CT (pp 829–846)
1. Which of the following statements about CTfor the evaluation of congenital heart diseaseis correct?a. Short-term sedation is necessary in all children
and adults.b. Lowering tube voltage to 80 kV in pediatric pa-
tients was recently recommended to further re-duce the radiation exposure without impairingimage quality.
c. ECG-gated CT should be used for postopera-tive follow-up of ventricular function.
d. In neonates and infants, the injection accessroute usually allows an injection rate of 5 mL/sec or more.
2. Which of the following features is not assessedwhen the sequential segmental approach isused to interpret CT scans obtained for evalu-ation of congenital heart disease?a. Cardiac sidedness.b. Coronary arteries.c. Cardiac connections.d. Arrangement of the great arteries.
3. Which of the following characteristics deter-mines cardiac sidedness?a. Cardiac position.b. Cardiac orientation.c. Position of the ventricles.d. Position of the morphologic right atrium.
4. Which of the following statements best de-scribes the normal cardiac anatomy?a. The venoatrial and atrioventricular connections
are landmarks for morphologic right-sidednessor left-sidedness of the atria.
b. The inlet portion of the morphologic right ven-tricle is similar to that of the morphologic leftventricle.
c. The continuity between the aortic and the mi-tral valves is characterized by the presence ofconical musculature.
d. The right atrial appendage is characterized by atriangular shape with a broad base and terminalcrest.
5. Which of the following statements about im-aging of extracardiac abnormalities is false?a. Aortic coarctation often is associated with a bi-
cuspid aortic valve.b. Most adults with aortic coarctation are asymp-
tomatic because of the development of collat-eral vessels.
c. Accurate measurement of a patent ductus arte-riosus is necessary to decide whether the duct issuitable for transcatheter closure.
d. Abnormal connection of the right upper pulmo-nary vein to the superior vena cava is rarely as-sociated with the presence of a sinus venosusdefect.
6. The structure marked with an asterisk (*) inFigure 3a represents ______.a. Sinus venosus defect.b. Anomalous connection of the right pulmonary
vein.c. Collateral pathway in aortic coarctation via in-
tercostal arteries.d. Total anomalous pulmonary venous connec-
tion.
904 f May-June 2007 RG f Volume 27 ● Number 3

7. Which of the following statements aboutpathologic intracardiac communications isfalse?a. The sinus venosus defect is the most common
interatrial communication.b. Hemodynamically less severe interatrial com-
munications may be incidental findings on non-gated thoracic CT scans, but small communica-tions are usually missed unless ECG-gatedscanning is performed.
c. Ventricular septal defects are most commonlylocated in the membranous portion of the ven-tricular septum.
d. Adult patients with large ventricular septal de-fects usually have pulmonary hypertension withsubsequent right ventricular hypertrophy andenlargement.
8. Which of the following congenital abnormali-ties is characterized by complete separation ofthe pulmonary from the systemic circulation,with no associated malformations?a. Transposition of the great arteries.b. Congenitally corrected transposition of the
great arteries.c. Univentricular heart.d. Tetralogy of Fallot.
9. Which of the following statements about ab-normal cardiac connections is correct?a. Complete transposition of the great arteries is
defined as a discordant atrioventricular and aconcordant ventriculoarterial connection.
b. Surgical repair usually is performed with theatrial switch procedure, which has replaced thearterial switch operation.
c. Identification of anatomic and physiologicvariations in double outlet right ventricle has animportant effect on the surgical strategy.
d. A ventricular chamber that is connected to anatrioventricular valve is usually called an outletchamber.
10. In normal anatomy, the structure markedwith an arrowhead in Figure 1b representsthe ______.a. Fibrous continuity between the aortic and mi-
tral valves.b. Chordae tendinae of the mitral valve.c. Conical musculature between the aortic and
mitral valves.d. Moderator band.
Test 6: Pulmonary Veno-occlusive Disease and Pulmonary CapillaryHemangiomatosis (pp 867–882)
1. Which of the following statements best de-scribes the clinical presentation of PVOD andPCH?a. These conditions are abrupt in onset.b. Patients with PVOD and PCH present with
dyspnea, cough, and chest pain.c. The clinical features of PVOD and PCH help
distinguish these conditions from primary PAH.d. These conditions are typically seen in elderly
patients.
2. Hemodynamic features of PVOD include allof the following features except ______.a. Low PCWP.b. Elevated mean pulmonary arterial pressure.c. Normal PCWP.d. Low pulmonary vascular resistance.
3. Which of the following statements best de-scribes PCH?a. In most patients with PCH, the disorder is cor-
rectly diagnosed before transplantation.b. Median survival for patients with PCH is 3
years from clinical onset.
c. The ideal imaging examination for diagnosis ofPCH is a ventilation-perfusion scan.
d. PCH occurs in male patients three times morefrequently than female patients.
4. In Figure 3, which of the following CT find-ings most strongly suggests the diagnosis ofPVOD?a. Dilatation of the right chambers of the heart.b. Mosaic attenuation.c. Septal thickening.d. Centrilobular nodules.
5. In Figure 5c, which of the following CT find-ings most strongly suggests the diagnosis ofPCH?a. Enlarged pulmonary arteries.b. Centrilobular nodules.c. Geographic ground-glass opacities.d. Septal thickening.
RG f Volume 27 ● Number 3 May-June 2007 f 905
6. All of the following histologic features arecharacteristic of PVOD except ______.a. Narrowing and occlusion of septal veins and
venules.b. Loop-like dilatation of capillaries.c. Medial hypertrophy of muscular pulmonary
arteries.d. Capillary proliferation.
7. All of the following histologic features arecharacteristic of PCH except ______.a. Thickening of alveolar walls by capillary prolif-
eration.b. Narrowing and obliteration of veins and
venules.c. Loop-like dilatation of capillaries.d. Medial hypertrophy of muscular pulmonary
arteries.
8. Which of the following statements best de-scribes treatment of PVOD and PCH?a. All medical therapies are considered palliative.b. Continuous intravenous prostacyclin is the
treatment of choice.
c. Use of anticoagulants is contraindicated.d. Thromboendarterectomy improves clinical
prognosis.
9. Which of the following statements best de-scribes the imaging of PVOD?a. The presence of ground-glass opacities helps
distinguish PVOD from PCH.b. In PVOD, the pulmonary veins and the left
atrium appear normal at pulmonary angiogra-phy.
c. CT features of cor pulmonale help distinguishPVOD from PPH.
d. Ventilation-perfusion scans are consistently in-terpreted as “high probability” in PVOD.
10. Which of the following statements best de-scribes the imaging of PCH?a. Nodular and geographic ground-glass opacities
are typical CT features of PCH.b. Ventilation-perfusion scans are highly sensitive
and specific for the diagnosis of PCH.c. Pulmonary angiography demonstrates multiple
small arteriovenous malformations.d. Vascular pruning and peripheral oligemia char-
acterize PCH on chest radiographs.
906 f May-June 2007 RG f Volume 27 ● Number 3
Copyright © 2022 FDOKUMEN