Shopping centres and selected aspects of shopping behaviour (Brno, the Czech republic)
Upload
khangminh22Category
view
0download
0
1
Ronny Kohavi, Microsoft
Slides available at http://exp-platform.com
2
Add an item to your shopping cart at a websiteMost sites show the cart
At Amazon, Greg Linden had the idea of showing recommendations based on cart items
EvaluationPro: cross-sell more items (increase average basket size)
Con: distract people from checking out (reduce conversion)
HiPPO (Highest Paid Person’s Opinion) was: stop the project
Simple experiment was run, wildly successful
From Greg Linden’s Blog: http://glinden.blogspot.com/2006/04/early-amazon-shopping-cart.html
Whenever you feel stressed that a decision is made without data, squeeze the Stress-HiPPO
Put one in your office to show others you believe in data-driven decisions based on experiments
Hippos kill more humans than anyother (non-human) mammal (really)
Don’t let HiPPOs in your orgkill innovative ideas. ExPeriment!
3
The less data, the stronger the opinions

2
Controlled Experiments in one slide
Examples: you’re the decision maker
Cultural evolution: hubris, insight through measurement, Semmelweis reflex, fundamental understanding
Controlled Experiments: deeper dive
Two key messages to rememberIt is hard to assess the value of ideas.Get the data by experimenting because data trumps intuition
Make sure the org agrees what you are optimizing
4
Concept is trivialRandomly split traffic betweentwo (or more) versions
A/Control
B/Treatment
Collect metrics of interest
Analyze
5
Must run statistical tests to confirm differences are not due to chance
Best scientific way to prove causality, i.e., the changes in metrics are caused by changes introduced in the treatment(s)
Three experiments that ran at Microsoft recently
All had enough users for statistical validity
Game: see how many you get right Everyone please stand up
Three choices are:A wins (the difference is statistically significant)
A and B are approximately the same (no stat sig diff)
B wins
If you guess randomly1/3 left standing after first question
1/9 after the second question
6

3
“Find a house” widget variations
Overall Evaluation Criterion: Revenue to Microsoft generated every time a user clicks search/find button
7
• Raise your right hand if you think A Wins• Raise your left hand if you think B Wins• Don’t raise your hand if you think they’re about the same
A B
8
If you did not raise a hand, please sit down
If you raised your left hand, please sit down
A was 8.5% better
Since this is the #1 monetization, it effectively raised revenues significantly.
Actual experiment had 6 variants. There was a “throwdown” (vote for the winning variant) and nobody
from MSN Real Estate or Zaaz (the company that did the creative) voted for the winning widget
OEC: Clickthrough rate for Search box and popular searches
A
B
Differences: A has taller search box (overall size is the same), has magnifying glass icon, “popular searches”
B has big search button
• Raise your right hand if you think A Wins• Raise your left hand if you think B Wins• Don’t raise your hand if they are the about the same

4
If you raised any hand, please sit down
InsightStop debating, it’s easier to get the data
10
11
A later test showed that changing the magnifying glass to an actionable word (search, go, explore) was highly beneficial.
This:
is better than
OEC: Clicks on revenue generating links (red below)
A B
• Raise your right hand if you think A Wins• Raise your left hand if you think B Wins• Don’t raise your hand if they are the about the same

5
If you did not raise a hand, please sit down
If you raised your left hand, please sit down
B was 64% worse
What % of the audience is still standing?
Humbling!
13
14
Any figure that looks interesting or different is usually wrong
� If something is “amazing,” find the flaw!
� Examples
� If you have a mandatory birth date field and people think it’s unnecessary, you’ll find lots of 11/11/11 or 01/01/01
� If you have an optional drop down, do not default to the first alphabetical entry, or you’ll have lots jobs = Astronaut
� Traffic to web sites doubled between 1-2AM November 6, 2011 for many sites, relative to the same hour a week prior. Why?
� The previous Office example assumes click maps to revenue.Seemed reasonable, but when the results look so extreme, find the flaw
Features are built because teams believe they are useful.But most experiments show that features fail to move the metrics they were designed to improve
We joke that our job is to tell clients that their new baby is ugly
In the recently published book Uncontrolled, Jim Manzi writesGoogle ran approximately 12,000 randomized experiments in 2009, with [only] about 10 percent of these leading to business changes.
In an Experimentation and Testing Primer by Avinash Kaushik, authors of Web Analytics: An Hour a Day, he wrote
80% of the time you/we are wrong about what a customer wants
15

6
QualPro tested 150,000 ideas over 22 years75 percent of important business decisions andbusiness improvement ideas either have no impact onperformance or actually hurt performance…
Based on experiments at Microsoft (paper)1/3 of ideas were positive ideas and statistically significant
1/3 of ideas were flat: no statistically significant difference
1/3 of ideas were negative and statistically significant
Our intuition is poor: 60-90% of ideas do not improve themetric(s) they were designed to improve (domain dependent).Humbling!
16
One page article by Stefan Thomke, May 2006
Mistakes refer to the wrong actions that result from poor judgments or inattention; they should be avoided because they produce little new or useful information.
A poorly planned or badly conducted experiment that results in ambiguous data, forcing researchers to repeat the experiment, is a mistake.
Another common mistake is repeating a prior failure or learning nothing from the experience
17
Story about Tom Watson Sr., IBM's founder A promising young executive involved in a risky new venture, managed to lose more than $10 million while trying to make the venture work
When the nervous man was called into Watson's office, he offered to accept the logical consequence of losing the company such a large amount of money: "I guess you want my resignation, Mr. Watson.“
Much to his surprise, Watson countered: 'You can't be serious! We've just spent 10 million [dollars] educating you."
18

7
Avoid the temptation to try and build optimal features through extensive planning without early testing of ideas
Experiment oftenTo have a great idea, have a lot of them -- Thomas Edison
If you have to kiss a lot of frogs to find a prince, find more frogs and kiss them faster and faster
-- Mike Moran, Do it Wrong Quickly
Try radical ideas. You may be surprisedDoubly true if it’s cheap to implement (e.g., shopping cart recommendations and Behavior-Based search at Amazon)
If you're not prepared to be wrong, you'll never come upwith anything original – Sir Ken Robinson, TED 2006
If you remember one thing from this talk, remember this point
OEC = Overall Evaluation CriterionAgree early on what you are optimizing
Getting agreement on the OEC in the org is a huge step forward
Suggestion: optimize for customer lifetime value, not immediate short-term revenue
Criterion could be weighted sum of factors, such asTime on site (per time period, say week or month)
Visit frequency
Report many other metrics for diagnostics, i.e., to understand why the OEC changed and raise new hypotheses
20
Controlled Experiments in one slide
Examples: you’re the decision maker
Cultural evolution: hubris, insight through measurement, Semmelweis reflex, fundamental understanding
Controlled Experiments: deeper dive
Two key messages to rememberIt is hard to assess the value of ideas.Get the data by experimenting because data trumps intuition
Make sure the org agrees what you are optimizing
21

8
Why people/orgs avoid controlled experimentsSome believe it threatens their job as decision makers
At Microsoft, program managers select the next set of features to develop. Proposing several alternatives and admitting you don’t know which is best is hard
Editors and designers get paid to select a great design
Failures of ideas may hurt image and professional standing.It’s easier to declare success when the feature launches
We’ve heard: “we know what to do. It’s in our DNA,” and“why don’t we just do the right thing?”
22
It is difficult to get a man to understand something when his
salary depends upon his not understanding it.
-- Upton Sinclair
The org goes through stages in its cultural evolution
Stage 1: we know what to do and we’re sure of itTrue story from 1849
John Snow claimed that Cholera was caused by polluted water
A landlord dismissed his tenants’ complaints that their water stankEven when Cholera was frequent among the tenants
One day he drank a glass of his tenants’ water to show there was nothing wrong with it
He died three days later
That’s hubris. Even if we’re sure of our ideas, evaluate them
Controlled experiments are a powerful tool to evaluate ideas
Measurement• Semmelweis worked at Vienna’s General Hospital, an
important teaching/research hospital, in the 1830s-40s
• In 19th-century Europe, childbed fever killed more than a million women
• Measurement: the mortality rate for women giving birth was• 15% in his ward, staffed by doctors and students
• 2% in the ward at the hospital, attended by midwives

9
InsightControl
• He tries to control all differences• Birthing positions, ventilation, diet, even the way laundry was done
• He was away for 4 months and death rate fell significantly when he was away. Could it be related to him?
• Insight:• Doctors were performing autopsies each morning on cadavers
• Conjecture: particles (called germs today) were being transmitted to healthy patients on the hands of the physicians
He experiments with cleansing agents• Chlorine and lime was effective: death rate fell from 18% to 1%
Success? No! Disbelief. Where/what are these particles?Semmelweis was dropped from his post at the hospital
He goes to Hungary and reduced mortality rate in obstetrics to 0.85%
His student published a paper about the success. The editor wrote
We believe that this chlorine-washing theory has long outlived its usefulness… It is time we are no longer to be deceived by this theory
In 1865, he suffered a nervous breakdown and was beaten at a mental hospital, where he died
Semmelweis Reflex is a reflex-like rejection of new knowledge because it contradicts entrenched norms, beliefs or paradigms
Only in 1800s? No! A 2005 study: inadequate hand washing is one of the prime contributors to the 2 million health-care-associated infections and 90,000 related deaths annually in the United States
In 1879, Louis Pasteur showed the presence of Streptococcus in the blood of women with child fever
2008, 143 years after he died, there is a 50 Euro coin commemorating Semmelweis

10
HubrisMeasure and
Control
Accept Results avoid
Semmelweis Reflex
Fundamental Understanding
In many areas we’re in the 1800s in terms of our understanding, so controlled experiments can help
First in doing the right thing, even if we don’t understand the fundamentals
Then developing the underlying fundamental theories
Controlled Experiments in one slide
Examples: you’re the decision maker
Cultural evolution: hubris, insight through measurement, Semmelweis reflex, fundamental understanding
Controlled Experiments: deeper dive
Two key messages to rememberIt is hard to assess the value of ideas.Get the data by experimenting because data trumps intuition
Make sure the org agrees what you are optimizing
29
With data mining, we find patterns, but most are correlational, providing hypotheses for possible causes
Here is one a real example of two highly correlatedvariables
30

11
31
• Data for the city of Oldenburg, Germany
• X-axis: stork population • Y-axis: human population
What your mother told you about babies and storks when you were three is still not right, despite the strong correlational “evidence”
Ornitholigische Monatsberichte 1936;44(2)
True statement (but not well known):
Palm size correlates with your life expectancy
The larger your palm, the less you will live, on average.
Try it out - look at your neighbors and you’ll see who is expected to live longer
Women have smaller palms and live 6 years longeron average
But…don’t try to bandage your hands
Controlled experiments test for causal relationships, not simply correlations
When the variants run concurrently, only two things could explain a change in metrics:1. The “feature(s)” (A vs. B)
2. Random chance
Everything else happening affects both the variants
For #2, we conduct statistical tests for significance
The gold standard in science and the only way to prove efficacy of drugs in FDA drug tests
33

12
Scope: Experimentation is not applicable everywhereNecessary ingredients for experimentation to be useful detailed in separate paper (see http://exp-platform.com/expMicrosoft.aspx)
Sweet spot: websites and services that practice agile development (Scrum, XP, etc)
Org has to agree on OEC (Overall Evaluation Criterion).This is hard, but it provides a clear direction and alignment
Quantitative metrics, not always explanations of “why”A treatment may lose because page-load time is slower.At Amazon, we slowed pages by 100-250msec and lost 1% of revenue
A treatment may have JavaScript that fails on certain browsers, causing users to abandon.
34
If you don't know where you are going, any road will take you there
—Lewis Carroll
Primacy/novelty effectPrimacy: Changing navigation in a website may degrade the customer experience (temporarily), even if the new navigation is betterNovelty: new flashing icon catches the eye and everyone clicks onceEvaluation may need to focus on new users, or run for a long period
Multiple experimentsEven though the methodology shields an experiment from other changes, statistical variance increases making it harder to get significant results.There can also be strong interactions (rarer than most people think)
Consistency/contaminationOn the web, assignment is usually cookie-based, but people may use multiple computers, erase cookies, etc. Typically a small issue
Launch events / media announcements sometimes preclude controlled experiments
The journalists need to be shown the “new” version
35
Run A/A tests Run an experiment where the Treatment and Control variants are coded identically and validate the following:1. Are users split according to the planned percentages?
2. Is the data collected matching the system of record?
3. Are the results showing non-significant results 95% of the time?
This is a powerful technique for finding bugs and other integration issues before teams try to make data-driven decisions
Generating some numbers is easy
Getting correct numbers you trust is much harder!

13
A very common mistake is to declare a winner when the difference could be due to random variations
Compute 95% confidence intervals on the metrics to determine if the difference is due to chance or whether it is statistically significant
Increase percentage if you do multiple tests(e.g., use 99%)
Idea: run an A/A test in concurrent to your A/B test to make sure the overall system doesn’t declare it as significant more than 5% of the time (great QA)
37
Ramp-upStart an experiment at 0.1%
Do some simple analyses to make sure no egregious problems can be detected
Ramp-up to a larger percentage, and repeat until 50%
Big differences are easy to detect because the min sample size is quadratic in the effect we want to detect
Detecting 10% difference requires a small sample and serious problems can be detected during ramp-up
Detecting 0.1% requires a population 100^2 = 10,000 times bigger
Abort the experiment if treatment is significantly worse on OEC or other key metrics (e.g., time to generate page)
38
Unless you’re running an experiment on one of the top 10 sites in the world, run experiments at 50/50%
Novice experimenters run 1% experiments
To detect an effect, you need to expose a certain number of users to the treatment (based on power calculations)
Fastest way to achieve that exposure is to run equal-probability variants (e.g., 50/50% for A/B)
If you perceive risk, don’t start an experiment at 50/50% from the beginning: Ramp-up over a short period
39

14
Good randomization is critical.It’s unbelievable what mistakes developers will make in favor of efficiency
Properties of user assignmentConsistent assignment. User should see the same variant on successive visits
Independent assignment. Assignment to one experiment should have no effect on assignment to others (e.g., Eric Peterson’s code in his book gets this wrong)
Monotonic ramp-up. As experiments are ramped-up to larger percentages, users who were exposed to treatments must stay in those treatments (population from control shifts)
40
Run concurrent univariate experimentsVendors make you think that MVTs and Fractional Factorial designs are critical---they are not. The same claim can be made that polynomial models are better than linear models: true in theory, less useful in practice
Let teams launch multiple experiments when they are ready, and do the analysis to detect and model interactions when relevant (less often than you think)
Backend integration (server-side) is a better long-term approach to integrate experimentation than Javascipt
Javascript suffers from performance delays, especially when running multiple experiments
Javascript is easy to kickoff, but harder to integrate with dynamic systems
Hard to experiment with backend algorithms (e.g., recommendations)
41
1. It is hard to assess the value of ideasListen to your customers
Get the data by experimenting because data trumps intuition
Examples are humbling. More at http://exp-platform.com
2.Empower the HiPPO with data-driven decisionsOEC: make sure the org agrees what you are optimizing (long term lifetime value)
3.Compute the statistics carefullyPower, 95% confidence, ramp-up
Stats/details described in DMKD journal paper: http://exp-platform.com/hippo_long.aspx
4.Experiment oftenTriple your experiment rate and you triple your success (and failure) rate.Fail fast & often in order to succeed
Accelerate innovation by lowering the cost of experimenting
42
The less data, the stronger the opinions

15
43
Support.microsoft.com shows “top issues”
OEC = click-through rate
A shows top issues
B filters top issues toOS & Browser used tovisit site (useragent)
44
Personalization rarely hurts, but does it help?• Raise your right hand if you think B Wins by over 30%• Raise your left hand if you think B Wins by under 30%• Don’t raise your hand if you think they’re about the same
If you did not raise a hand, please sit down
If you raised your left hand, please sit down
B was >50% better
Personalization helps more than people think!
45

16
A: When user clicks on email
hotmail opens in same window
B: Open hotmail in separate window
Trigger: only users that click in themodule are in experiment (no diff otherwise)
OEC: clicks on home page (after trigger)
• Raise your right hand if you think A Wins• Raise your left hand if you think B Wins• Don’t raise your hand if they are the about the same
If you didn’t raise a hand, please sit down
If you raised your right hand, please sit down
For those in the experiment, clicks on MSN Home Page increased +8.9%
<0.001% of users in B wrote negative feedback about the new window
48

17
� The experiment report was sent by the BI/CI team to all multiple teams across the world
� Someone who saw the report wroteThis report came along at a really good time and was VERY useful.
I argued this point to my team (open Live services in new window from HP) just some days ago. They all turned me down.
Funny, now they have all changed their minds.
49
“Find a house” widget variations
Overall Evaluation Criterion: Revenue to Microsoft generated every time a user clicks
50
Think which one should win…
the simplest
� Revenue increase over control: +9.7%
� Interesting note: nobody from MSN Real Estate or Zaaz (the company that did the creative) thought this widget would win
51
The widget that performed the best was…

18
Proposal: New Offers module below Shopping
Treatment
Control
Value propositionThe Offers module appears below the fold
Sales estimated the three ads would sell for several millions of dollars a year
ConcernDo more ads degrade the user experience?
How do we trade the two off?
Experiment!
Ran experiment for 12 days on 5% of traffic
Clickthrough rate per user (CTR) decreased 0.31%
(p-value =0.044). This result is statistically significant
Clicks per user decreased 0.72% (p-value=0.015)
Value of click from home page: talk to finance and the SEM team (how much are you paying to drive traffic from search engines)
The net result: losing idea

19
Determine impact of 2 factors for video ads.
1) Factor A: pre-roll vs. post-roll ads
2) Factor B: time between ads (90, 120, 180, 300, 900 seconds)
OEC: revenue from ad starts
Eliminating the initial pre-roll adIncreased repeat visits by 1-3%, but
Reduced overall ad views by 50-60%
The amount of time between ad plays had no statistically significant impact on repeat visits
Decreasing the length of time between ad streams increased the total ad streams without impacting loyalty(as measured by return visits)
Reducing the time to 90 seconds would improve annual revenue by millions
Client wroteThere is a preponderance of opinion driven design…The results of the experiment were in some respect counterintuitive.They completely changed our feature prioritization. It dispelled long held assumptions about
video advertising. Very, very useful.
56
B: Poker gamein hero position
A: Solitaire gamein hero position
This experiment ran in Windows Marketplace / Game DownloadsWhich image has the higher clickthrough? By how much?
A is 61% better

20
For many years, the prevailing conception of illness was that the sickwere contaminated by some toxin
Opening a vein and letting the sickness run out – bloodletting.
One British medical text recommended bloodletting foracne, asthma, cancer, cholera, coma, convulsions, diabetes, epilepsy, gangrene, gout, herpes, indigestion, insanity, jaundice, leprosy, ophthalmia, plague, pneumonia, scurvy, smallpox, stroke, tetanus, tuberculosis, and for some one hundred other diseases
Physicians often reported the simultaneous use of fifty or more leeches on a given patient. Through the 1830s the French imported about forty million leeches a year for medical purposes
President George Washington had a sore throat anddoctors extracted 82 ounces of blood over 10 hours (35% of his total blood), causing anemia and hypotension. He died that night.
Pierre Louis did an experiment in 1836 that is now recognized as one of the first clinical trials, or randomized controlled experiment. He treated people with pneumonia either with
early, aggressive bloodletting, or
less aggressive measures
At the end of the experiment, Dr. Louis counted the bodies. They were stacked higher over by the bloodletting sink.
Lancet
Tight integration with other systems (e.g., content management) allowing “codeless experiments”Accurate results in near real-time
Trust is importantQuickly detect and abort poorly performing experimentsHigh-performance data pipeline with built-in data loss detection
Minimal risk for experimenting applicationsEncourage bold innovations with reduced QA cyclesAuto-abort catches bugs in experimental codeClient library insulates app from platform bugs
Experimentation should be easyClient library exposes simple interfaceWeb UI enables self-serviceService layer enables platform integration
60

21
Ronny Kohavi
61
Searches for “24” are underspecified, yet most humans are probably searching for the TV program
Prior to Behavior-based search, here is what you would get (you can get this today by adding an advanced modifier like –foo to exclude foo)
Mostly irrelevant stuff:• 24 Italian songs• Toddler clothing suitable for 24 month olds• 24” towel bar• Opus 24 by Strauss• 24- lb stuff, cases of 24, etc
Amazon/P13N had an engine for X to YPeople who bought item X bought Y
Feed searches, i.e.,People who searched for X bought Y
Prototype looked great
Integration with Search would take a long time: different team in A9 in the Bay Area
They also highlighted a flaw:The results don’t always have the search terms.Example: search for “duracell charger” and you will see a best selling Sony charger, which does not have the word Duracell.But people choose to buy it after searching with this phrase!
62
(*) Based on UW iEdge Seminar talk by Amazon, 4/2006
Ran experiment with very thin integration
Strong correlations shown at the top of the page, pushing search results down
Implemented simple de-duping of results
Result : +3% increase to revenue.
3% of $12B is $360M Ronny Kohavi
63

22
Ronny Kohavi, Microsoft Confidential
64
I’m a Netflix user since 1/2000Great example of a company tweaking things
(*) TIMITI acronym by Jim Sterne
Ronny Kohavi, Microsoft Confidential
65
Ronny Kohavi, Microsoft Confidential
66
Details in Business 2.0 Apr 21, 2006.The evolution of the NetFlix envelope

23
Article in Organization Science Management can support experimentation and highlight it as a value (normative influence)
However, inconsistent reward systems that punish failure lead to aversion
Especially in organizations that are under constant evaluation for perfect execution
67
Tiger Woods comes to you for advice on how to spend his time: improving golf, or improving ad revenue (most revenue comes from ads)
68
Short term, he could improve his ad revenueby focusing on ads…
But to optimize lifetime financial value(and immortality as a great golf player),he needs to focus on the game
While the example seems obvious,organizations commonly make the mistakeof focusing on the short term
HBR article by Stefan Thomke (Feb, 2001)
Experimentation lies at the heart of every company's ability to innovate
In the past, testing was relatively expensive, so companies had to be parsimonious with the number of experimental iterations
The electric light bulb, required more than 1,000 complex experiments with filament materials and shapes, electromechanical regulators, and vacuum technologies
69

24
Essentials for enlightened experimentation1. Organize for rapid experimentation
a) Encourage rapid experimentation
b) Use small development groups with key people to iterate rapidly
c) Perform experiments in parallel
2. Fail early and often, but avoid mistakesa) Embrace failure to advance knowledge
b) Failure can expose important gaps in knowledge
c) Don't forget the basics: well designed tests with clear objectives
d) IDEO's “fail often to succeed sooner”
e) Don't develop expensive sleek prototypes, as you become committed to them before you know if they work.
70
Essentials (CONT)3. Anticipate and exploit early information
a) Front-load to identify problems and provide guidance when it's cheap
b) Acknowledge trade-off between cost and fidelity. Low-fidelity experiments (costing less) are suited in early exploratory stages
4. Combine new and traditional technologiesa. Today's new technology might eventually replace its traditional counterpart,
but it could then be challenged by tomorrow's new technology
71
Beware of measuring what is easy instead of what’s important. For example:
Clicks to the beginning of the purchase pipeline rather than actual purchases (you may change the probability of purchase given someone enters the pipeline).
McNamara’s Fallacy:The first step is to measure what can easily be measured. This is OK as far as it goes.
The second step is to disregard that which can't easily be measured or give it an arbitrary quantitative value.This is artificial and misleading.
The third step is to presume that which can't be measured easily really isn't important.This is blindness.
The fourth step is to say that what can't be easily measured really does not exist.This is suicide.

1
Roger Longbotham, Principal Statistician, Microsoft
What to measure
How to compare Treatment to Control
How long to run test
Start up options
Good test design
Data validation and cleansing
Before your first experiment
Common errors
MultiVariable Tests
Advanced Topics
Start with objectiveOf the site (content, ecommerce, marketing, help/support,…)
Of the experiment
What can you measure to tell you if you met your objective?Content site: clicks/user, pageviews/user, time on site
Ecommerce: rev/visitor, units purchased/visitor, cart-adds/visitor
Marketing: referrals/visitor, time on site
Help/support: Pct of users engaged, Pct of users who print, email or download content, time on site

2
Measures of user behaviorNumber of events (clicks, pageviews, visits, downloads, etc)
Time (minutes per session, total time on site, time to load page)
Value (revenue, units purchased, ads clicked)
Analysis unitsPer user (e.g. clicks per user)
Per session (e.g. minutes per session)
Per user-day (e.g. pageviews per day)
Per experiment (e.g. clicks per pageview)
It is very helpful to have a single metric that summarizes whether the Treatment is successful or not – the Overall Evaluation Criterion, or OEC
Examples:Content site: OEC could be clicks/user or time on site
Ecommerce: rev/user or lifetime value
Help/support site: Survey responses
OEC could also capture monetary value of the site, aka ROI (return on investment)
Experimentation Principle: all non-test factors should have the same effect on the Treatment as on the Control
Online experiments don’t have stationarityWe would expect some metrics to vary by hour and day – such as number of visitors and any metric related to that (number of pageviews, clicks, etc.)
However, even those metrics that we think could be relatively constant (stationary) are not

3
Metric plotted is number of clicks in an hour divided by the number of pageviews
Experimentation Principle: all non-test factors should have the same effect on the Treatment as on the Control
Online experiments don’t have stationarityMust run Treatment and Control concurrentlyDays: 1 2 3 4 5 6 7 8
NOT C C C C T T T T
and
NOT C T C T C T C T
Randomly assign one set of users to T and other to C and keep them in those groups throughout the experiment (ideal)
Took a valid experiment that ran for two weeks (50% in T, 50% in C)
Treatment effect in week 1: +1.93%
Treatment effect in week 2: +2.09%
For same experimentCompare Treatment week 2 to Control week 1: +11.38% Difference was due to uncontrolled differences between weeks 1 and 2

4
Single TreatmentTwo-sample t test works well
Large samples sizes => Normal distribution for means
Calculate 95% Confidence Interval (CI) for difference in two means
if zero not in the interval conclude Treatment mean different from Control
May have many tests, OEC critical
Multiple TreatmentsMultiple applications of two-sample t test
Analysis of Variance
(��� − ���) ± 1.96 ∗ ���� −���
Included:
Averages for
both variants
P-values
Percent change
Significance
Confidence
Intervals
103 metrics
P-value is the probability of getting a difference farther from zero than observed under assumption of no difference
CI for percent effect must use special formula (Fieller’stheorem)
Care must be taken in calculating standard deviationsWhen randomization is by user, any metric that is not per user must take into account non-independence in calculating standard deviation
We routinely use bootstrap or delta method to estimate standard deviations for metrics that are not by user

5
May need to consider
Sample size needed for normality of means
Sample size needed for sufficient power
Sample size needed for representative sample
By metric
Sample size needed to assume normality holds for confidence interval of the mean
This table uses the |skewness| of the distribution (sample)
The criterion used: that the probability of being in the left or right tail of the CI (LHS, RHS) is no more than 20% different from nominal (.025), i.e. no larger than .03 and no smaller than .02.
Most online metrics need 1000s for each group
|Skewness| Min sample size
0.05 8
0.1 12
0.2 18
0.4 60
0.7 175
1.0 350
1.5 800
2.0 1400
3.0 3200
5.0 9000
Normality of mean (criterion:
max(LHS,RHS)<20%)
The power of a test is the probability of detecting a difference (∆) of a given size i.e., it is 1-Prob(Type II error)
Power depends on• The size of effect you want to be able to detect, ∆
• Variability of the metric
• Number of users in each group (T/C)
It is typical to determine the sample size needed to achieve 80% power
2
2**16
∆=
σrn

6
Example: Number of users needed for each variant (group) to achieve 80% power, with equal number of users in Treatment and Control and with standard deviation s is
2
2*32
∆=
sN
2
2*32
∆=
sN
Often good practice is to start with small percent in Treatment and increase when you have confidence Treatment is bug-free
Sample ramp up schedule:1% in Treatment for 4 hours
5% in Treatment for 4 hours
20% in Treatment for 4 hours
50 % in Treatment for 14 days
In an online experiment that ran for 35 days, the Treatment had a click-through rate (CTR) of 29.6% and the Control had a CTR of 30.9% for a -4.3% drop (Control did better)When CTR effect is calculated by day => Treatment better
What’s going on?
-2.00%
-1.00%
0.00%
1.00%
2.00%
3.00%
4.00%
1 2 3 4 5 6 7 8 9 10 11 12 13 14 15 16 17 18 19 20 21 22 23 24 25 26 27 28 29 30 31 32 33 34 35
Perc
en
t D
iffe
ren
ce in
Click
Th
rou
gh
Rate
s (
T-C
)/C
Treatment % Effect by Day
Which is correct?

7
Can happen when numerators and denominators are accumulated over groups of unequal sizes
Famous example: UC Berkeley gender bias lawsuit. The graduate school was sued in 1973. Admission rates:
But for two large departments:
So, a larger percentageof men admitted than
women
Applicants Admitted
Men 8442 44%
Women 4321 35%
In these two departments, admission rates did not seem to favor men, but when
combined, the admission rate for men was 55% and for women it was 41%
A C
MenApplicants/
Admitted825 / 62% 325 / 37%
WomenApplicants/
Admitted108 / 82% 593 / 34%
Two Departments
Why did the overall comparison show Treatment was 4.3% worse than Control when 34 of 35 days Treatment was better?
0%
10%
20%
30%
40%
50%
1 3 5 7 9 11 13 15 17 19 21 23 25 27 29 31 33 35
Treatment and Control means and % in Treatment
Control Treatment % in Tmt
Example: Real Estate widget designTest five alternatives to the current design
OEC: clicks to links weighted by revenue per click
Control T1
T3 T4
T2
T5

8
The widget that performed the best was the simplest
Revenue increase over control: +9.7%
Note Ronny’s example earlier compared the best Treatment to another Treatment, not the Control
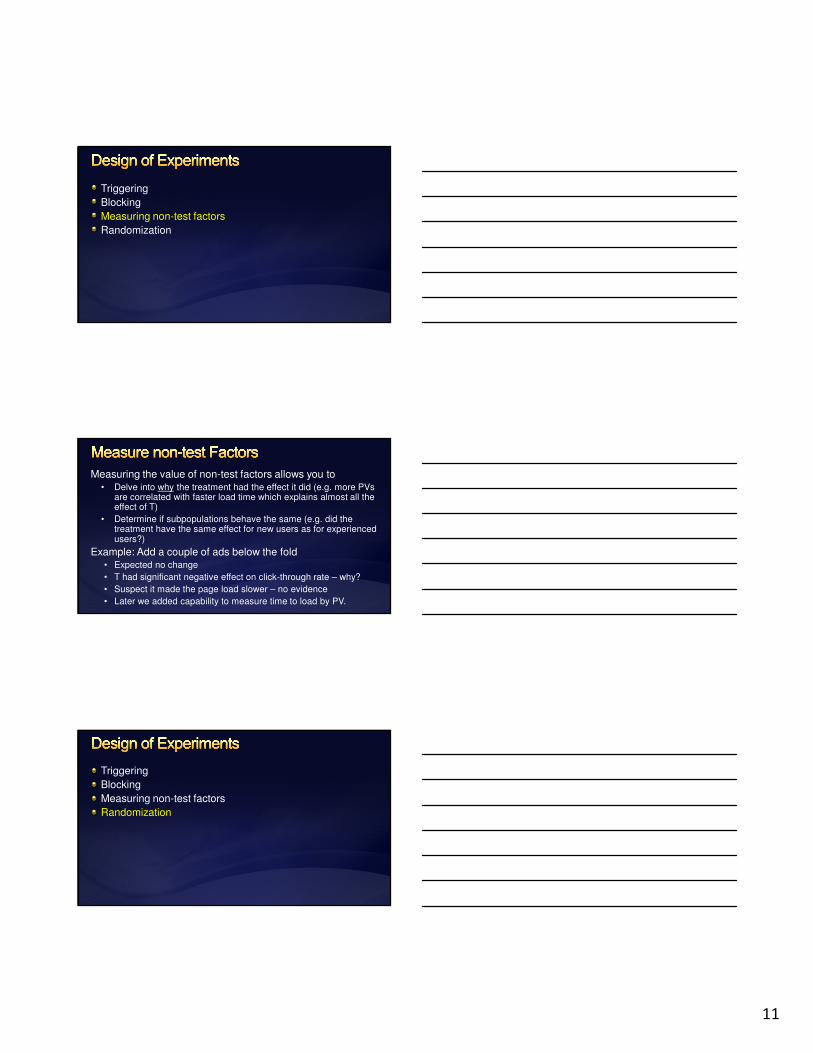
Triggering
Blocking
Measuring non-test factors
Randomization
Only allow users into your experiment if they “trigger” the experiment. i.e. a user’s data should only be used in the analysis of the experiment if they saw one of the variants
Example: MSN Hotmail experiment Control: When user clicks on email
hotmail opens in same window
Treatment: Open hotmail in
separate window
Business Question: Will this increase user
engagement on MSN homepage?
Which users do you want to track as part of your
experiment?

9
Triggering
Blocking
Measuring non-test factors
Randomization
Factor is controlled such that it affects both treatment and control equally, hence not affecting the estimate of the effect
Blocking on a factor is more common than keeping it fixed (keeping it constant throughout the experiment)
Advantages to blockingCan estimate the effect of the different levels of the factor, e.g. what is the effect on weekends/weekdays
Can make inference to a broader population
Time (time of day, day of week, etc.)Always run treatment and control concurrently in online
experiments to block on all factors that vary with time
ContentEx: If content of a site changes during the experiment it must be the
same for both Treatment and Control at all times
UserMay use before/after for users or a cohort group
Updates to site

10
The Treatment and Control groups should be as alike as possible except for application of the treatment
Who is in the experiment
What is done during the experiment
etc.
Example: One partner was conducting an A/A test (same as an A/B test but no real change is made) What would you expect?
Results: T very significant (much more than it should be) Why?
Found out another group was using their Treatment group to test something so there really was a difference between T and C
Ex: A site was testing a change to the layout of their page Content to T and C was not the same for a 7 hour period
0.0%
0.2%
0.4%
0.6%
0.8%
1.0%
1.2%
10
/15/0
7 1
4:0
0
10
/15/0
7 1
8:0
0
10
/15/0
7 2
2:0
0
10
/16/0
7 2
:00
10
/16/0
7 6
:00
10
/16/0
7 1
0:0
0
10
/16/0
7 1
4:0
0
10
/16/0
7 1
8:0
0
10
/16/0
7 2
2:0
0
10
/17/0
7 2
:00
10
/17/0
7 6
:00
10
/17/0
7 1
0:0
0
10
/17/0
7 1
4:0
0
10
/17/0
7 1
8:0
0
10
/17/0
7 2
2:0
0
10
/18/0
7 2
:00
10
/18/0
7 6
:00
10
/18/0
7 1
0:0
0
10
/18/0
7 1
4:0
0
10
/18/0
7 1
8:0
0
10
/18/0
7 2
2:0
0
10
/19/0
7 2
:00
10
/19/0
7 6
:00
10
/19/0
7 1
0:0
0
10
/19/0
7 1
4:0
0
Clickth
rou
gh
Rate
Hourly Clickthrough Rate for Treatment and Control for Module
CTR_Control
CTR_Tmt
11
Triggering
Blocking
Measuring non-test factors
Randomization
Measuring the value of non-test factors allows you to• Delve into why the treatment had the effect it did (e.g. more PVs
are correlated with faster load time which explains almost all the effect of T)
• Determine if subpopulations behave the same (e.g. did the treatment have the same effect for new users as for experienced users?)
Example: Add a couple of ads below the fold• Expected no change
• T had significant negative effect on click-through rate – why?
• Suspect it made the page load slower – no evidence
• Later we added capability to measure time to load by PV.
Triggering
Blocking
Measuring non-test factors
Randomization

12
Why randomize?
So that those factors you can’t control (or don’t know about) don’t bias your results
“Randomization is too important to be left to chance” Robert Coveyou, ORNL
UnknownUnknownUnknownUnknown
FactorsFactorsFactorsFactors
How to randomize? (online tests)
Randomly assign T or C to user (alternately could use user-session, search query, page view or product/SKU)
Usually best by user (store UserID in cookie)
How persistent is the UID?
Ideally user always gets same treatment group
Limitations:
Clearing cookies => can change treatment
Different browser => may get different treatment
Can’t allow opt-in or opt-out
Make sure users and conditions are as representative of launch environment as possible
Time period: not holiday (unless holiday factor), pre-holiday, complete cycle (day, week)
Users: all users who would see T in the future,
not robots, not internal testers, outliers(?)
Not during special events

13
Remove robots (web crawlers, spiders, etc.) from analysisThey can generate many pageviews or clicks in Treatment or Control skewing the results
Remove robots with known identifiers (found in the user agent)
Develop heuristics to identify robots with many clicks or pageviews in short period of time
Other patterns may be used to identify robots as well, such as very regular activity
Carry out checks to make sure data is not affected by some unknown factor
Check that percentage of users in each variant is not different from planned (statistical test)
Check that number of users in the experiment is approximately what was expected (and doesn’t change too much during experiment)
Check that the Treatment effect does not change too much during experiment
Check that means for primary metrics do not change unexpectedly
Conduct logging auditCompare data collected for experiment to system of record
Should have approximately same number of users, clicks, pageviews, orders, etc.
Conduct A/A testSplit users into two groups that get same experience
Should have about 5% of tests significant
p-values should have U(0,1) distribution
No p-values should be extremely small (say <.001)

14
Not conducting logging or A/A testsFind caching issues, UID reassignment
Not keeping all factors constant or blockingContent changes to site
Redirect for Treatment but not for Control
Sample size too small
Caution with using surrogates for OEC!Measure clicks to buy button (instead of revenue)
Clicks to download button (instead of completed downloads)
Several factors/variables, each of which has two or more levels (C/T1/T2/…)
Main effects: Comparison of Treatments to Control for each variable (i.e. compare means for T and C same as before)
Interactions: Determine if combinations of variables have different effect than adding main effects
(This is for illustration purposes only, it does not reflect any previous or planned test on MSN HP)
F3
F3: Sports/Money placement
C = Sports above Money
T = Money above Sports
Factors/variables
F1: Size of Right col ad
C = current size
T1 = 10% larger
T2 = 10% smaller
F2: MSNBC news stories
C = Top international
T = Specific to country ID’d
OEC: Clicks per User
Other metrics: PVs, CTR
F2
F1

15
Advantages:– Can test many things at once, accelerating innovation
– Can estimate interactions between factors
Disadvantages– Some combinations of factors may give negative customer
experience
– Analysis and interpretation is more difficult
– May take longer to set up test
Off-line experimental designs use specific subsets of all combinations (fractional factorials, Plackett-Burman,…)*
Example: Test 7 factors each at 2 levels
27 = 128 combinations (full factorial)
27-4 fractional factorial has 8 combinations
can estimate main effects, but in order to
estimate two-factor interactions need
27-1 fractional factorial with 64 combinations
*sometimes known as Taguchi designs
On-line experiments can simply run overlapping, concurrent, independently randomized experiments
Example: Test 7 factors each at 2 levels
Set up 7 separate experiments to run at the same time with the same users. Get all 128 combinations in the results.
Advantages: – Easier to implement
– Can turn off one experiment if negative
– Get all interactions

16
Procedure for analyzing an MVT for interactions1. Since there are potentially a vary large number of interactions
among the variables being tested, restrict the ones you will look at to a few you suspect may be present. (If 7 factors, 21 two-factor interactions, 35 three-factor interactions, etc.)
2. Conduct the test to determine if the interaction between two factors is present or not
3. If interaction is not significant, stop!
If the interaction IS significant, look at the graphical output to interpret.
Example: Factors from MSN HP illustration
Hypothesis tests for interactions similar to main effects (details omitted)
F3 Sports/Money placement
C = same order every day
T = Sports higher on wkends
and Money higher wkdays
F2: MSNBC news stories
C = Top international
T = Specific to country ID’d
(This is for illustration purposes only, it does not reflect any previous or planned test on MSN HP)
F3
F3: Sports/Money placement
C = Sports above Money
T = Money above Sports
Factors/variables
F2: MSNBC news stories
C = Top international
T = Specific to country ID’d
OEC: Clicks per User
Other metrics: PVs, CTR
F2

17
If hypothesis test for interaction is not significantAssume no interaction present
Interaction graph would show lines approximately parallel
If interaction is statistically significantPlot interaction to interpret
Case 1: No Interaction (parallel lines)Data Table Main Effects Results
F2 - C F2 - T
F3 - C 4.06 4.10
F3 - T 4.08 4.12
Pct Effect p-value
Effect(F2) 0.98% <.001
Effect(F3) 0.49% 0.032
4.05
4.06
4.07
4.08
4.09
4.10
4.11
4.12
4.13
F2 - C F2 - T
Av
era
ge C
lick
s p
er
Us
er
F2xF3 Interaction
F3 - C
F3 - T
No Interaction
When interaction is statistically significant
Two types of interactions:
Synergistic – when the presence of both is more than the sum of the individual treatments
Antagonistic – when the presence of both is less than the sum of the individuals

18
Case 2: Synergistic InteractionData Table Main Effects Results
Microsoft Confidential
F2 - C F2 - T
F3 - C 4.08 4.09
F3 - T 4.08 4.13
Pct Effect p-value
Effect(F2) 0.74% 0.008
Effect(F3) 0.49% 0.032
4.07
4.08
4.09
4.10
4.11
4.12
4.13
4.14
F2 - C F2 - T
Nu
mb
er
Da
ys
Vis
it M
SN
HP
F2xF3 Interaction
F3 - C
Synergistic Interaction
4.07
4.08
4.09
4.10
4.11
4.12
4.13
4.14
F2 - C F2 - T
Av
era
ge C
lick
s p
er
Us
er
F2xF3 Interaction
F3 - C
F3 - T
Synergistic Interaction
Case 3: Antagonistic InteractionData Table Main Effects Results
Microsoft Confidential
4.07
4.08
4.09
4.10
4.11
4.12
4.13
4.14
F2 - C F2 - T
Nu
mb
er
Da
ys
Vis
it M
SN
HP
F2xF3 Interaction
F3 - C
Antagonistic Interaction
4.07
4.08
4.09
4.10
4.11
4.12
4.13
4.14
F2 - C F2 - T
Av
era
ge C
lick
s p
er
Us
er
F2xF3 Interaction
F3 - C
F3 - T
Antagonistic Interaction
Pct Effect p-value
Effect(F2) 0.18% 0.396
Effect(F3) 0.55% 0.028
F2 - C F2 - T
F3 - C 4.08 4.11
F3 - T 4.12 4.11
Variance calculations for metrics
Non-parametric alternatives to t-test, ANOVA
Robot detection
Automatic detection of interesting population segments
Experimentation with exploration/exploitation schemes

19
For metrics that are not “per user” (i.e. not the same as the randomization unit) – cannot use usual standard devformula
Can use bootstrap or delta method to estimate varianceDelta method uses a formula to take into account correlation of experimental units
Example: Clickthrough rate (CTR) per experiment
True variance is much larger than that from Binomial distribution
Permutation or Mann-Whitney tests are natural
Pros Can get a p-value
May have better power for some metrics
Works better for small sample sizes
Cons Understandability by business managers
Not a test of a shift of a change in the mean
Confidence intervals for effect not straight-forward
What is “best” way to develop heuristics to detect robots?
What is “best” way to assess how well heuristics are doing?
How to adjust robot detection parameters based on the specific site in the test?
For example
Sites with low traffic may need more aggressive robot filtering
Sites that have more robot traffic may need more aggressive robot filtering
Sites that expect active users (e.g. many clicks per hour) need less aggressive robot filtering
Sites that require users to sign-in should have fewer robots so less aggressive robot filtering required
20
A population segment is interesting if their response to the Treatment is different from the overall response
Segments can be defined by a number of variablesBrowser or operating system
Referrer (e.g. from search engine, etc.)
Signed-in status
Loyalty
Demographics
Location – country, state, size of city (use IP lookup)
Bandwidth
Want to automatically display best content based on exploration/exploitation strategy
Is this strategy better than editor-placed content?
What are the optimal parameter values?Percent in exploration group?
How long to test content in exploration group?
What level of significance is needed?
BREAK

1
Ronny Kohavi, Microsoft
Slides available at http://exp-platform.com
2
Wrap-up section based on KDD 2012 paper, co-authored by Ronny Kohavi, Alex Deng, Brian Frasca, Roger Longbotham, Toby Walker, and Ya Xu
How does one determine the OEC for a search engine?
What are some of the most surprising results we faced, and how did we resolve them
3
An OEC is the Overall Evaluation Criterion
It is a metric (or set of metrics) that guides the org as to whether A is better than B in an A/B test
In prior work, we emphasized long-term focus and thinking about customer lifetime value, but operationalizing it is hard
Search engines (Bing, Google) are evaluated on query share (distinct queries) and revenue as long-term goals
PuzzleA ranking bug in an experiment resulted in very poor search results
Distinct queries went up over 10%, and revenue went up over 30%
What metrics should be in the OEC for a search engine?
2
4
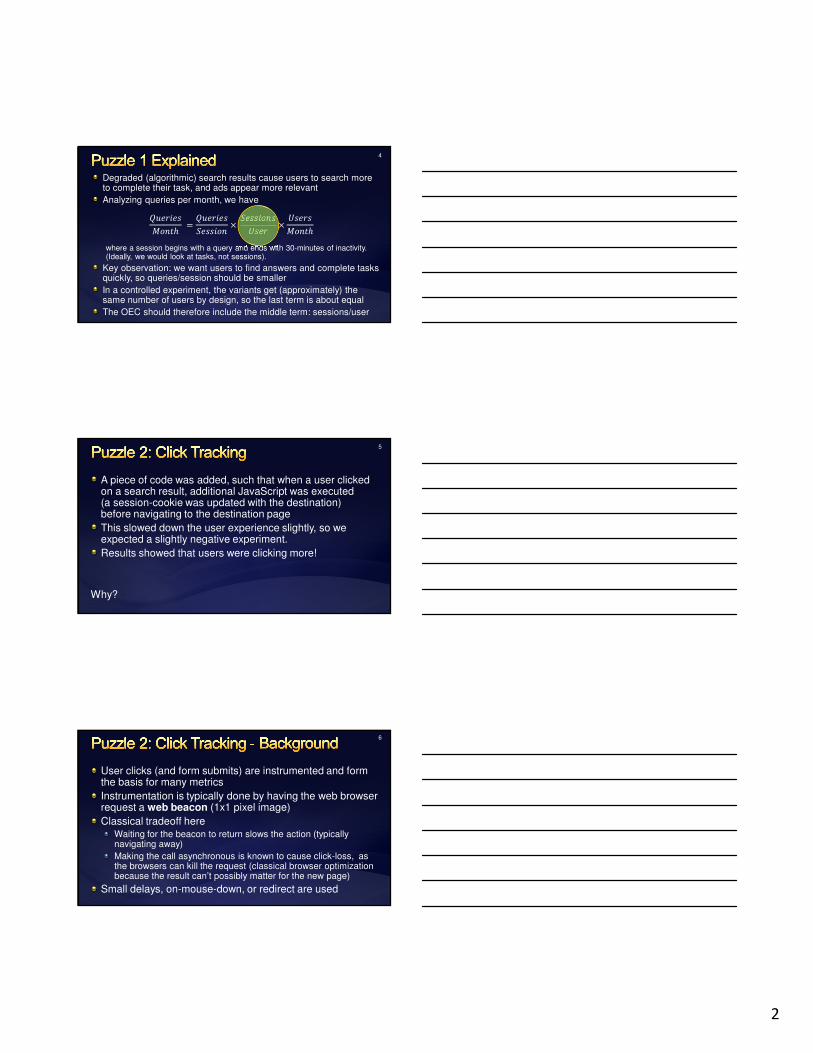
Degraded (algorithmic) search results cause users to search more to complete their task, and ads appear more relevant
Analyzing queries per month, we have
�������
���
�������
������� �������
����������
���
where a session begins with a query and ends with 30-minutes of inactivity. (Ideally, we would look at tasks, not sessions).
Key observation: we want users to find answers and complete tasks quickly, so queries/session should be smaller
In a controlled experiment, the variants get (approximately) the same number of users by design, so the last term is about equal
The OEC should therefore include the middle term: sessions/user
5
A piece of code was added, such that when a user clicked on a search result, additional JavaScript was executed(a session-cookie was updated with the destination)before navigating to the destination page
This slowed down the user experience slightly, so we expected a slightly negative experiment.
Results showed that users were clicking more!
Why?
6
User clicks (and form submits) are instrumented and form the basis for many metrics
Instrumentation is typically done by having the web browser request a web beacon (1x1 pixel image)
Classical tradeoff hereWaiting for the beacon to return slows the action (typically navigating away)
Making the call asynchronous is known to cause click-loss, as the browsers can kill the request (classical browser optimization because the result can’t possibly matter for the new page)
Small delays, on-mouse-down, or redirect are used

3
7
Click-loss varies dramatically by browser
Chrome, Firefox, Safari are aggressive at terminating such reqeuests. Safari’s click loss > 50%.
IE respects image requests for backward compatibility reasons
White paper available on this issue here
Other cases where this impacts experimentsOpening link in new tab/window will overestimate the click deltaBecause the main window remains open, browsers can’t optimize and kill the beacon request, so there is less click-loss
Using HTML5 to update components of the page instead of refreshing the whole page has the overestimation problem
8
Primacy effect occurs when you change the navigation on a web site
Experienced users may be less efficient until they get used to the new navigation
Control has a short-term advantage
Novelty effect happens when a new design is introducedUsers investigate the new feature, click everywhere, and introduce a “novelty” bias that dies quickly if the feature is not truly useful
Treatments have a short-term advantage
9
Given the high failure rate of ideas, new experiments are followed closely to determine if new idea is a winner
Multiple graphs of effect look like thisNegative on day 1: -0.55%
Less negative on day 2: -0.38%
Less negative on day 3: -0.21%
Less negative on day 4: -0.13%
The experimenter extrapolates linearlyand says: primacy effect. This will be positive in a couple of days, right?
Wrong! This is expected
-1.20%
-0.80%
-0.40%
0.00%
0.40%
8/3
0/2
01
1
8/3
1/2
01
1
9/1
/201
1
9/2
/201
1
9/3
/201
1
9/4
/201
1
Cumulative Effect

4
10
For many metrics, the standard deviation of the mean is proportional to 1 ⁄ √, where is the number of users
As we run an experiment longer, more users are admitted into the experiment, so grows and the conf interval shrinks
The first days are highly variable
The first day has a 67% chanceof falling outside the 95% CIat the end of the experiment
The second day has a 55% chanceof falling outside this bound.
-0.80%
-0.60%
-0.40%
-0.20%
0.00%
0.20%
0.40%
0.60%
0.80%
0 5 10 15 20Eff
ec
t
Experiment Days
95% bound 21-day bound
11
The longer graph
This was an A/A test, so the true effect is 0
-1.40%
-1.00%
-0.60%
-0.20%
0.20%
0.60%
Cumulative Effect
12
We expect the standard deviation of the mean (and thus the confidence interval) to be proportional to 1 ⁄ √, where is the number of users
So as the experiment runs longer and more users are admitted, the confidence interval should shrink
Here is the graph for sessions/user X-axis: Treatment size
Y-axis: conf interval
Three lines: 1,2,3 weeks
Overlapping lines?That’s the problem!
0
1
2
1 2 3 4 5 6 7 8 9 10 11 12 13 14 15 16 17 18 19 20
Co
nfi
den
ce In
erv
al
Wid
th (
perc
en
t)
Size of Treatment (relative factor)
1 week 2 weeks 3 weeks

5
13
The distribution changesUsers churn, so they contribute zero visits
New users join with fresh count of one
We have a mixture
Empirically, the coefficient of variation (ratio of the standard deviation to the mean) grows at the same rate as √
Running an experiment longer does not increase statistical power for some metrics; you must increase the variant size
14
Experiment is run, results are surprising.(This by itself is fine, as our intuition is poor.)
Rerun the experiment, and the effects disappear
Reason: bucket system recycles users, and the prior experiment had carryover effects
These can last for months!
Must run A/A tests, or re-randomize
15
OEC: evaluate long-term goals through short-term metrics
The difference between theory and practice is greater in practice than in theory
Instrumentation issues (e.g., click-tracking) must be understood
Carryover effects impact “bucket systems” used by Bing, Google, and Yahoo require rehashing and A/A tests
Experimentation insight:Effect trends are expected
Longer experiments do not increase power for some metrics. Fortunately, we have a lot of users
Copyright © 2022 FDOKUMEN