Roll-Out von intelligenter und öffentlicher Ladeinfrastruktur
65
Roll-Out von intelligenter und öffentlicher Ladeinfrastruktur Digitalen Inspirationsreise Elektromobilität und Ladeinfrastruktur Image: ANP
-
Upload
khangminh22 -
Category
Documents
-
view
0 -
download
0
Transcript of Roll-Out von intelligenter und öffentlicher Ladeinfrastruktur

Afbeelding wijzigen? appm lint > achtergrondfoto wijzigen
Roll-Out von intelligenter und öffentlicher Ladeinfrastruktur
Digitalen Inspirationsreise Elektromobilität und Ladeinfrastruktur
Image: ANP

Technische Aspekte
• Schalten Sie Ihr Mikrofon und Video aus.
• Nutzen Sie den Chat für Fragen und
Ergänzungen.
• Fragen nach dem Webtalk gerne an
Kolja Schwenson via

Elektromobilität in den Niederlanden und Deutschland
Deutschland Die Niederlande
Anzahl der Personenkraftwagen 47,1 Millionen 8,5 Millionen
Position Ende 2019
Zahl der vollelektrischen Autos 193.902 (0,4%) 107.536 (1,3%)
Öffentlich zugängliche Ladestellen 23.840 49.520
Ziele bis 2030
Zahl der vollelektrischen Autos 10 Millionen (21,2%) 1,9 Millionen (22,4%)
Öffentlich zugängliche Ladestellen 1 Million (1 pro 10 BEVs) 957.780 (1 von 2 BEVs)
Gesamtzahl der Ladestellen 10 Millionen (1 pro BEV) 1,7 Millionen (0,9 pro BEV)

Elektromobilität in
den Niederlanden
Zero-Emission in Städten
(Stadtlogistik)
Roll-Out von intelligenter und
öffentlicher Ladeinfrastruktur
Los geht‘s: Konkrete Schritte
für Elektromobilität
29. September
10:00 – 11:00
1. Oktober
14:00 – 15:30
6. Oktober
10:00 – 11:30
8. Oktober
10:00 – 11:30
Vier Webtalks über Elektromobilität in den Niederlanden

Unsere Sprecher
Onoph Caron
Nationale Agenda Laadinfrastructuur
Matthijs Kok
Gemeinde Utrecht
Baerte de Brey
ElaadNL

Unsere Sprecher
Onoph Caron
Nationale Agenda Laadinfrastructuur
Matthijs Kok
Gemeinde Utrecht
Baerte de Brey
ElaadNL

E-mobility in The
Netherlands
Onoph Caron
Member Steering Committee
National Agenda Charging Infrastructure

Dutch approach to electric mobility
➢ Government leadership
▪ strong ambitions
▪ e-mobility action plans since 2011
➢ Fiscal incentives: PHEV vs BEV focus
➢ Attention to charging infrastructure
▪ local & regional participation
▪ interoperability from the start
▪ open protocols
➢ Public private cooperation

Key figures EV in the Netherlands
➢ 232,000 EVs, 57% BEVs
➢ In 2020: 20% EVs new registrations passenger cars
➢ 2.7% EVs in total fleet passenger cars
➢ Densest charging network worldwide:
– 9% of global public charging infrastructure
– 28% of European public charging infrastructure
➢ Almost 60,000 (semi)public charging points
➢ 1463 Fast chargers
➢ More than 2,000 electric taxis (majority BEV)
➢ Almost 800 electric buses

Political road to 2030 ambitions
Coalition agreement in 2017:
➢ 49% GHG emissions by 2030
➢ 100% zero emission sales
passenger cars by 2030
National Climate Agreement in 2019:
➢ 48.7 Mton CO2 reduction
➢ 5 sectoral agreements
➢ Mobility one of them
➢ Electric mobility as part of mobility

Dutch zero emission transport ambitions
➢ 100% zero emission new sales consumer cars by 2030
➢ 100% zero emission public transport by 2030
➢ 100% zero emission city logistics by 2030
➢ 100% zero emission dedicated transport by 2025 in 32 municipalities
➢ Zero emission zones for commercial vehicles by 2025 in 30-40 largest
municipalities

2030 calculations: 1.9 million EVs and 1.7 million chargepoints
Measures:
• Fiscal and financial instruments
• National Agenda on Charging Infrastructure
• Accompanying measures (e.g. communication)
E-mobility in national climate agreement

➢ Fiscal incentives (ZEVs):
– No purchase tax
– No circulation tax
– Benefit in company car tax
– Fiscal advantage company investments
➢ Purchase subsidy 2020 (big success)
➢ Decreased energy tax for charging
EV support

Public private cooperation

Complete approach:
• Charging on street, at home and at work
• Fast charging on the road and in the city
• Hand in hand with the energy transition task
• All means of transportation
National Agenda on Charging Infrastructure: NAL
Charging infrastructure may not be an impediment to the
transition of zero emission mobility

Upscaling smart charging & V2G
NAL: focus
Logistics & transport
Open markets & open protocolsAccelerating rollout process
Safety

➢ 6 regions
➢ Supporting municipalities
➢ Active collaboration with utilities responsible for electricity network
NAL: regional approach
Fast chargers
Number of charging points NL
(semi-)public charging

Learnings
• Start early
• Public Private partnerships help
• National/general topics vs Regional or Local topics
• Organise support (NKL, ElaadNL)
• Public tender vs licensing system
• Involve EV community
• Accept different approach/pace per municipality
• Collaborate closely with your DSO
• Businesscase is important for succes
• Mobility is part of a larger demand; integrality

Unsere Sprecher
Onoph Caron
Nationale Agenda Laadinfrastructuur
Matthijs Kok
Gemeinde Utrecht
Baerte de Brey
ElaadNL

Utrecht charges for 2030!
Utrecht.nl/elektrisch
6 april 2020Matthijs Kok

Groei elektrische auto’s

Market share

2025: 25.000 EV’s 21%2030: 55.000 EV’s 44%
0
10.000
20.000
30.000
40.000
50.000
60.000
2016 2020 2025 2030 2035
Electric cars Utrecht
EV's Utrecht

Growth = 150% per year

City of Utrecht
• 350.000 inhabitants
• 140.000 cars
• 70% parking in public space
• Healthy Urban Living
• Ambition: zero emission zone in 2030
• 2025: 1:5 cars electric


All e-drivers must be able to charge within a balancedurban charging network.
Strategisch Plan Laadinfrastructuur

1. Demand driven→Data driven roleout

Innovations

Prognoses 2025
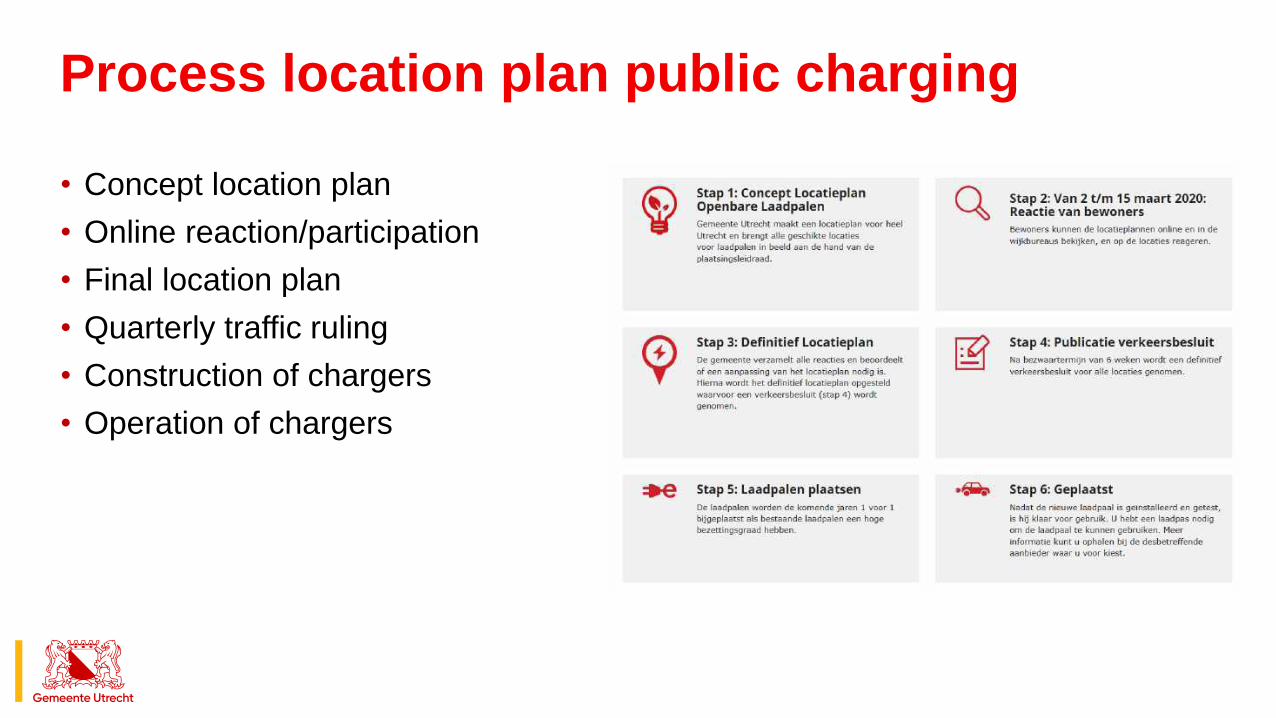
Process location plan public charging
• Concept location plan
• Online reaction/participation
• Final location plan
• Quarterly traffic ruling
• Construction of chargers
• Operation of chargers

Design frameworks for different chargingsolutions
Link naar plaatsingsleidraad en inrichtingskaders

Link naar plaatsingsleidraad en inrichtingskaders

Quality levels public space

Charge Point Operators

KPI’s concession public charging
1. Occupation rate
→ 50 to 95 % per neighbourhood in at highest occupation in the month
2. Charging outside public space
→ 50% rebate on kWh price in that neighbourhood
3. Uptime and malfunction of infrastructure
→ 98% uptime

Occupation rate per neighbourhood

Concession Fast Charging Shoppingmallsand sport facilities

What’s next?
2020
• Start new concession public charging
• Data driven roleout
• 1600 chargepoints
2021
• Concession Fast Charging
• Smart Charging & V2G pilots
• 2000 charge points
2020
2024
• New concession (BVP)
• Data driven role-out & BVP
• 5000 – 10.000 charge points

Unsere Sprecher
Onoph Caron
Nationale Agenda Laadinfrastructuur
Matthijs Kok
Gemeinde Utrecht
Baerte de Brey
ElaadNL

Grid management via Smart Charging
Baerte De Brey

High penetration of electric vehicles & infrastructure
• + 200.000 EV’s
• 75.000 (semi)public chargers
• 87.500 private chargers
• ~1400 fast chargers


The effect of Smart Charging
Unbalanced grid

Innovative solutionsData analytics
Number of EV’s (mid scenario) per municipality in 2035 Percentage of home
chargers per municipality in 2035

Innovative solutionsData analytics


Test centre
Innovative solutionsTest centre
InteroperabilitySmart chargingPower quality

Strategisch plan ElaadNL 2019 - 2023
Power quality


Paris March 2016: deal Utrecht Region & Renault

Technocentre Paris


Smart ChargingInteroperabilityPower Quility & V2G!

Thank you very much!Feel free to contact me:[email protected]

Abschluss
• Sie erhalten die Präsentationen
• Fragen an Kolja Schwenson:

Elektromobilität in
den Niederlanden
Zero-Emission in Städten
(Stadtlogistik)
Roll-Out von intelligenter und
öffentlicher Ladeinfrastruktur
Los geht‘s: Konkrete Schritte
für Elektromobilität
29. September
10:00 – 11:00
1. Oktober
14:00 – 15:30
6. Oktober
10:00 – 11:30
8. Oktober
10:00 – 11:30
Vier Webtalks über Elektromobilität in den Niederlanden

Vielen Dank!