Role of good health care in holistic development: A comparative study of two States in India .
18
1 | Page Role of good health care in holistic development: A comparative study of two States in India Moutrisha Ganguly 1 , Koustab Majumdar 2 Abstract Rural India is the real face of our country as it represents 68.84 per cent of population. We need continuous efforts to accelerate the development trajectory to maintain the rural landscape of India. Health is an important indicator of quality of life and various health indicators, like – crude birth rate, crude death rate, infant mortality rate, maternal mortality rate etc. are intimately related with holistic development of an area. The concept of holistic development works at multiple levels which are deeply enmeshed with each other. A high quality healthcare system can support economic and development initiatives. Health care is essential for holistic development and this calls for greater investment. In recent trends health investment is a great factor intended for direct implications for health outcomes. Kerala is supposed to be a socialist paradise with the best social and gender indicators, glowering on health issues, economic growth and globalisation and ranked in 1 st position in the Human Development Index (0.790) in India while West Bengal ranked in 13 th position (0.492). Kerala's mortality level has been lower than West Bengal's at least since the early 20th century. The difference became sharper in the 1970s. The empirical evidence from various surveys shows that the differences between the states in nutritional standard, per capita income, distribution of income and assets, industrialisation and urbanisation. The wider distribution of health facilities in the rural areas of Kerala and their greater utilisation are found to be significant factors. Two important reasons why the health facilities are used more in Kerala have been identified. First, the proportion of literates, particularly among females, is much higher in Kerala. Historically there has always been greater emphasis in Kerala on education and public health. Secondly, the rural poor in Kerala are more aware of their rights to use health and other public facilities than those in West Bengal. The decadal population growth of Kerala presents a conducive scenario for development. As per the market price of 2009-10 Rs.499/- has been spent as per capita health 1 Masters in Rural Development and Management, Department of Rural Development Management, University of Kalyani, Kalyani, Nadia, West Bengal, email: moutrisha.ganguly @gamil.com, Mobile no: +91-9836239038 2 Masters in Rural Development and Management, Department of Rural Development Management, University of Kalyani, Kalyani, Nadia, West Bengal, email: [email protected], Mobile no: +91-9647274605
-
Upload
visvabharati -
Category
Documents
-
view
5 -
download
0
Transcript of Role of good health care in holistic development: A comparative study of two States in India .
1 | P a g e
Role of good health care in holistic development: A comparative study of
two States in India
Moutrisha Ganguly1, Koustab Majumdar2
Abstract
Rural India is the real face of our country as it represents 68.84 per cent of population. We need
continuous efforts to accelerate the development trajectory to maintain the rural landscape of
India. Health is an important indicator of quality of life and various health indicators, like –
crude birth rate, crude death rate, infant mortality rate, maternal mortality rate etc. are
intimately related with holistic development of an area. The concept of holistic development
works at multiple levels which are deeply enmeshed with each other. A high quality healthcare
system can support economic and development initiatives. Health care is essential for holistic
development and this calls for greater investment. In recent trends health investment is a great
factor intended for direct implications for health outcomes. Kerala is supposed to be a socialist
paradise with the best social and gender indicators, glowering on health issues, economic
growth and globalisation and ranked in 1st position in the Human Development Index (0.790)
in India while West Bengal ranked in 13th position (0.492). Kerala's mortality level has been
lower than West Bengal's at least since the early 20th century. The difference became sharper
in the 1970s. The empirical evidence from various surveys shows that the differences between
the states in nutritional standard, per capita income, distribution of income and assets,
industrialisation and urbanisation. The wider distribution of health facilities in the rural areas
of Kerala and their greater utilisation are found to be significant factors. Two important reasons
why the health facilities are used more in Kerala have been identified. First, the proportion of
literates, particularly among females, is much higher in Kerala. Historically there has always
been greater emphasis in Kerala on education and public health. Secondly, the rural poor in
Kerala are more aware of their rights to use health and other public facilities than those in West
Bengal. The decadal population growth of Kerala presents a conducive scenario for
development. As per the market price of 2009-10 Rs.499/- has been spent as per capita health
1 Masters in Rural Development and Management, Department of Rural Development Management, University of Kalyani, Kalyani, Nadia, West Bengal, email: moutrisha.ganguly @gamil.com, Mobile no: +91-9836239038 2 Masters in Rural Development and Management, Department of Rural Development Management, University of Kalyani, Kalyani, Nadia, West Bengal, email: [email protected], Mobile no: +91-9647274605

2 | P a g e
investment in Kerala which was Rs.330/- only in West Bengal. In general, West Bengal has
always been characterised by a higher level of economic development and Kerala by a higher
level of social development. The lower mortality level in Kerala can be attributed mostly to its
higher social development and social mobilization.
This paper seeks to find out a comparative analysis between the two State i.e. Kerala and West
Bengal specially focus on health related issues and basically based on different sources of
secondary sources of data related with health.
Keywords: Good Health Care, Health Care System, Holistic Development, Kerala, West
Bengal.
3 | P a g e
Introduction
The nations of the world have agreed that enjoying the highest attainable standard of health is
one of the fundamental rights of every human being without distinction of race, religion,
political belief and economic or social condition. Beyond its intrinsic value for individuals,
improving and protecting health is also central to overall human development and to the
reduction of poverty.
The twentieth century has seen remarkable gains in health. Average life expectancy in
developing countries was only 40 years in 1950 but had increased to 63 years by 1990 (World
Bank, 1993). Factors such as improved nutrition, better sanitation, innovations in medical
technologies, and public health infrastructure have gradually increased the human life span.
The relative contribution of these factors depends on the level of economic development; there
are synergisms between the underlying factors operating in complex ways. More generally,
economic development depends on the level of skills acquired by the population and on capital
formation. The former is influenced by child nutrition, educational infrastructure, and
households’ resources, including parents’ physical health and cognitive attainment (e.g. Fogel,
1994, Scrimshaw, 1996, Bhargava, 1998a, 1999a). Capital accumulation depends on the
savings rate that is also influenced by adult health.
India is far away from achieving the Millennium Development Goals (MDGs) of UN and the
situation in West Bengal, though generally better than the Indian average, but worse than
Kerala, also requires substantial improvement.
Methodology
The health status of a population depends on nutrition, access to safe drinking water and
sanitation facilities, environment, type of shelter, awareness about health and health care. We
choose West Bengal as it is our home state and Kerala which represents the “shining India”.
Along with this in West Bengal and Kerala 68.13% and 52.30% of total population respectively
still lives in rural area according to 2011 Census. This study provides an assessment on the
health and health care situation in West Bengal in comparison with Kerala and all-India. The
major focus is on providing exhaustive and comprehensive accounts of different aspects of
health status and health care scenario than providing analytical insights on select issues. This
study is primarily based on the data from National Sample Surveys, National Family Health
Surveys, World Health Survey (for West Bengal), Sample Registration System, Census, State
Bureau of Health Intelligence (Government of West Bengal), Central Bureau of Health
Intelligence and Reserve Bank of India.
4 | P a g e
Health Status
The health status of a population is usually measured in terms of indicators of mortality and
morbidity. The commonly used mortality indicators are crude death rate, infant mortality rate,
child mortality rate and maternal mortality rate. The last three indicators are important as they
reflect crucial aspects of health of a society, that is, the health status of mothers and children.
Also life expectancy at birth depends largely on infant mortality rate (IMR). The recent Sample
Registration System estimates of IMR show that West Bengal is in the fourth position (38),
after Kerala (14), Maharashtra (36) and Tamil Nadu (37).
Although India accounts for 16.5% of the global population, the country contributes to a fifth
of the world's share of diseases; a third of the diarrhoeal diseases, TB, respiratory, and other
infections and parasitic infestations, peri-natal conditions; a quarter of maternal ill health; a
fifth of nutritional deficiencies, diabetes, Cardio Vascular Diseases, and second largest number
of HIV/AIDS cases after South Africa.
Improvement of health requires more public spending. Yet, India is one of the five countries in
the world where public spending is lesser than 0.9% of GDP and one of the fifteen where
households account for more than 80% of total health spending. The need to increase spending
on health is well recognized. The Common Minimum Programme of the UPA Government had
committed itself to raise public health spending to 2%-3% of GDP. Such an increase would be
required for strengthening the regulatory aspects of governance, expanding the scope and
institutional capacity for intensive health education and dissemination of public information,
disease surveillance and research. In addition, there is need to strengthen delivery of health
services, decentralize systems for monitoring and oversight by involving local governments
and establishing systems for ensuring accountability and providing financial risk protection.
Poor public health outcome in the country can be appreciated from the table below, which
shows a few important health indicators for India as well as some other countries.
Health and Development
Investment in health is increasingly recognised as an important – and previously under-
estimated – means of economic development. As the Commission on Macroeconomics and
Health (CMH) of the World Health Organization (WHO) has shown, substantially improved
health outcomes are a prerequisite if developing countries are to break out of the cycle of
poverty. Good health contributes to development through a number of pathways, which partly
overlap but in each case add to the total impact as mentioned below:

5 | P a g e
● Improved human capital - Healthy children have better cognitive potential. As health
improves, rates of absenteeism and early school drop-outs fall, and children learn better,
leading to growth in the human capital base.
● Higher labour productivity - Healthier workers are more productive, earn higher wages,
and miss fewer days of work than those who are ill. This increases output, reduces turnover in
the workforce, and increases enterprise profitability and agricultural production.
● Higher rates of national savings - Healthy people have more resources to devote to savings,
and people who live longer save for retirement. These savings in turn provide funds for capital
investment.
● Demographic changes - Improvements in both health and education contribute to lower
rates of fertility and mortality. After a delay, fertility falls faster than mortality, slowing
population growth and reducing the “dependency ratio” (the ratio of active workers to
dependants). This “demographic dividend” has been shown to be an important source of growth
in per capita income for many low-income countries.
Table 1: Changing Rural Population from 2001 Census to 2011 Census
State % of Rural Population 2001
Census
% of Rural Population 2011
Census
Kerala 74 52.3
West Bengal 72 68.1
All-India 72.2 68.8
Source3
Fig: 1 Changing Rural Population among overall India, Kerala and West Bengal
3 Report on Rural Health Statistics, April 2013, Statistics Division, Ministry of Health and Family Welfare, GOI,
New Delhi
74 72 72.2
52.3
68.1 68.8
0
20
40
60
80
Kerala West Bengal All-India
Per
cen
tag
e of
Ru
ral
Pop
ula
tion
Decrease in Percentage of Rural Population from 2001 Census to 2011
Census
% of Rural Population 2001 Census % of Rural Population 2011 Census
6 | P a g e
This table 1 shows the changing rural population in the overall India, Kerala and West Bengal.
It reveals that rural population is decreasing with shifting of trends of year. Major changes is
recorded in rural population (In, 2001 74% and 52.3% in 2011) in Kerala while the rural
population is recorded in West Bengal (In, 2001 72% and 68.1% in 2011), more or less same
at the national average (In, 2001 72.2% and 68.8% in 2011)
Important Health Indicators
Public health outcome is measured by certain key indicators such as Infant Mortality Rate or
IMR (no of children dying within one year after birth out of 1,000 live birth); Child Mortality
Rate or CMR (no of children dying within five years after birth out of 1,000 live birth);
Neonatal Mortality Rate or NMR (no of children dying within four weeks after birth out of
1,000 live birth); Maternal Mortality Rate or MMR (no of death of women while pregnant or
within 42 days of termination of pregnancy out of one lakh live birth); Birth Rate (no of child
birth per 1,000 population per year), Death Rate (deaths per 1000 population per year); Total
Fertility Rate or TFR (average number of children that would be born to a woman over her
lifetime if (1) she were to experience the exact current age-specific fertility rates through her
lifetime, and (2) she were to survive from birth through the end of her reproductive life), Life
expectancy at birth (which is the statistically expected number of years of life remaining at
birth) etc.
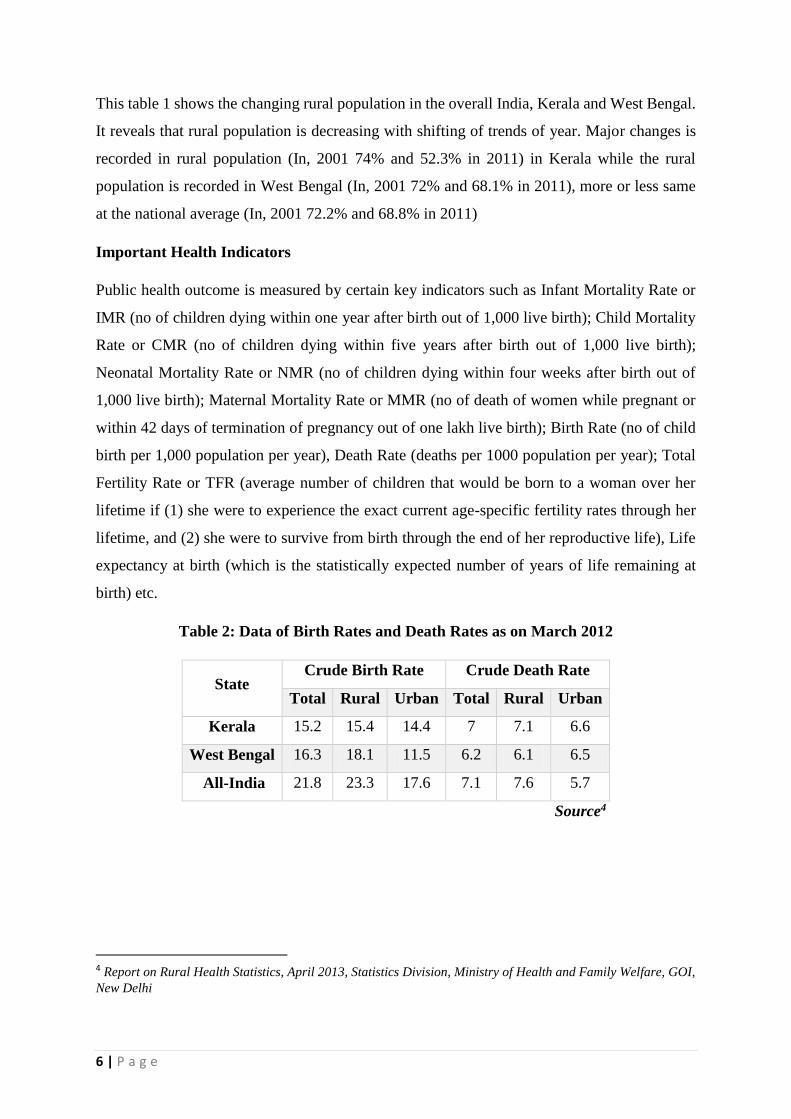
Table 2: Data of Birth Rates and Death Rates as on March 2012
State Crude Birth Rate Crude Death Rate
Total Rural Urban Total Rural Urban
Kerala 15.2 15.4 14.4 7 7.1 6.6
West Bengal 16.3 18.1 11.5 6.2 6.1 6.5
All-India 21.8 23.3 17.6 7.1 7.6 5.7
Source4
4 Report on Rural Health Statistics, April 2013, Statistics Division, Ministry of Health and Family Welfare, GOI,
New Delhi
7 | P a g e
Fig: 2 Crude Birth Rates and Crude death Rates in between Rural and Urban areas among
overall India, Kerala and West Bengal
The following table: 2 shows the CBR and CDR in between rural and urban areas of overall
India, Kerala and West Bengal. It shows that there are a substantial difference in the CBR as
well as CDR in between the rural and urban areas and it is prominent due to service of health
treatment, per capita income, nutritional status and awareness about good health practice. The
difference is more-high in West Bengal as compared to Kerala but significantly less as
compared to national average.
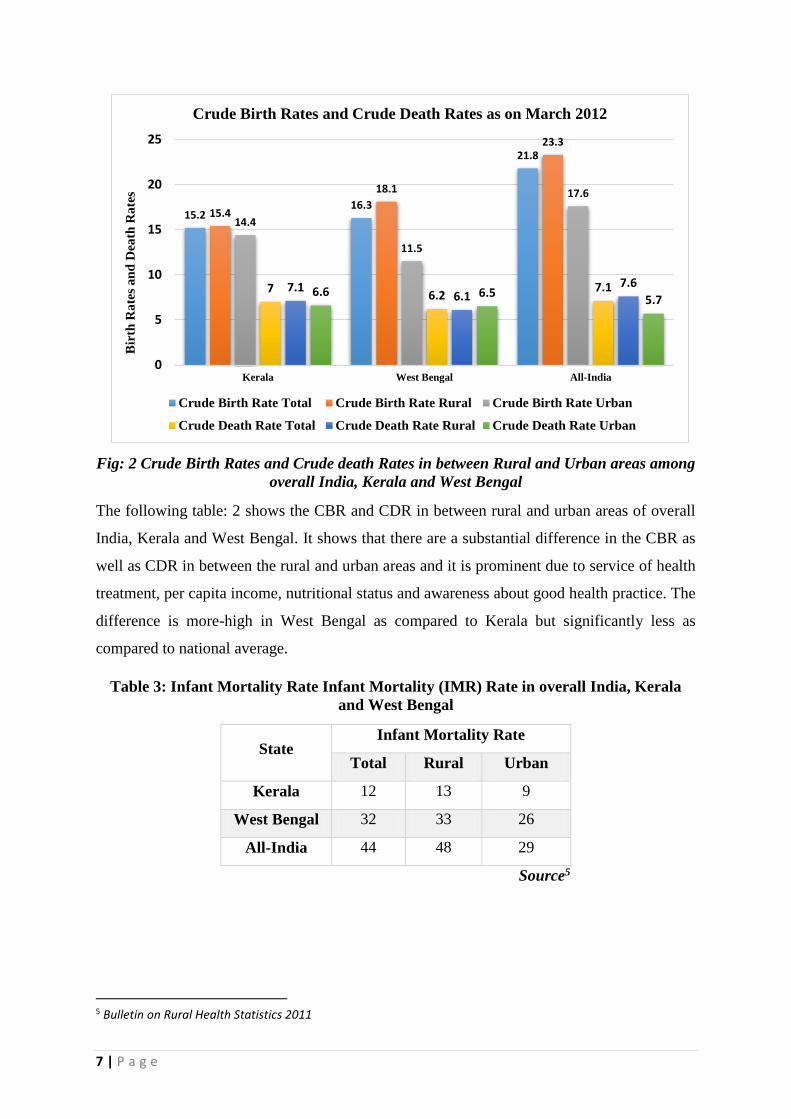
Table 3: Infant Mortality Rate Infant Mortality (IMR) Rate in overall India, Kerala
and West Bengal
State Infant Mortality Rate
Total Rural Urban
Kerala 12 13 9
West Bengal 32 33 26
All-India 44 48 29
Source5
5 Bulletin on Rural Health Statistics 2011
15.216.3
21.8
15.4
18.1
23.3
14.4
11.5
17.6
76.2
7.17.16.1
7.66.6 6.5
5.7
0
5
10
15
20
25
Kerala West Bengal All-India
Bir
th R
ate
s a
nd
Dea
th R
ate
s Crude Birth Rates and Crude Death Rates as on March 2012
Crude Birth Rate Total Crude Birth Rate Rural Crude Birth Rate Urban
Crude Death Rate Total Crude Death Rate Rural Crude Death Rate Urban
8 | P a g e
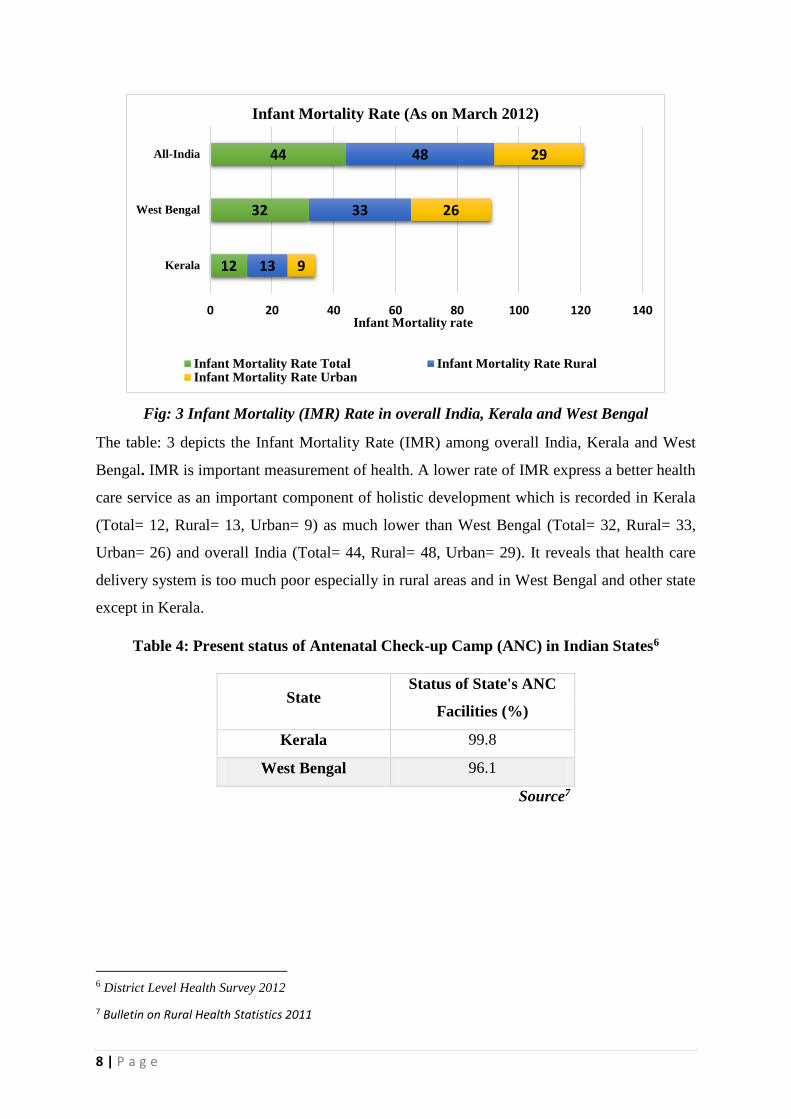
Fig: 3 Infant Mortality (IMR) Rate in overall India, Kerala and West Bengal
The table: 3 depicts the Infant Mortality Rate (IMR) among overall India, Kerala and West
Bengal. IMR is important measurement of health. A lower rate of IMR express a better health
care service as an important component of holistic development which is recorded in Kerala
(Total= 12, Rural= 13, Urban= 9) as much lower than West Bengal (Total= 32, Rural= 33,
Urban= 26) and overall India (Total= 44, Rural= 48, Urban= 29). It reveals that health care
delivery system is too much poor especially in rural areas and in West Bengal and other state
except in Kerala.
Table 4: Present status of Antenatal Check-up Camp (ANC) in Indian States6
State Status of State's ANC
Facilities (%)
Kerala 99.8
West Bengal 96.1
Source7
6 District Level Health Survey 2012
7 Bulletin on Rural Health Statistics 2011
12
32
44
13
33
48
9
26
29
0 20 40 60 80 100 120 140
Kerala
West Bengal
All-India
Infant Mortality rate
Infant Mortality Rate (As on March 2012)
Infant Mortality Rate Total Infant Mortality Rate RuralInfant Mortality Rate Urban
9 | P a g e
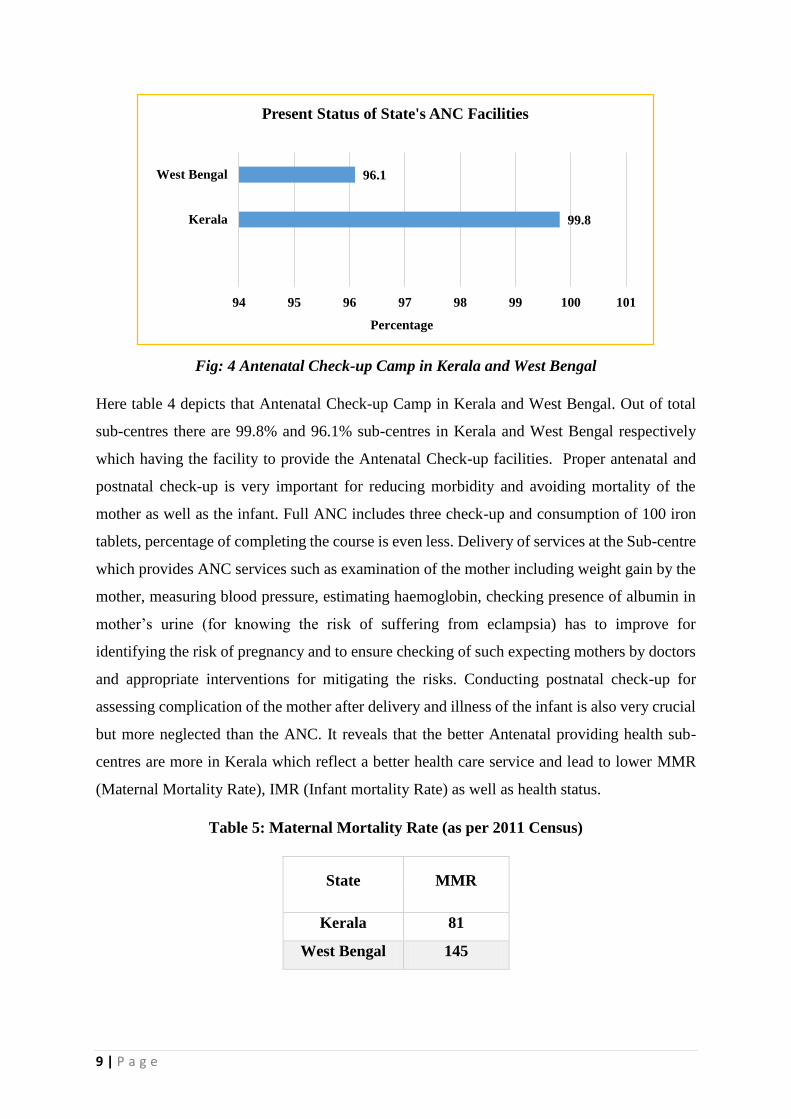
Fig: 4 Antenatal Check-up Camp in Kerala and West Bengal
Here table 4 depicts that Antenatal Check-up Camp in Kerala and West Bengal. Out of total
sub-centres there are 99.8% and 96.1% sub-centres in Kerala and West Bengal respectively
which having the facility to provide the Antenatal Check-up facilities. Proper antenatal and
postnatal check-up is very important for reducing morbidity and avoiding mortality of the
mother as well as the infant. Full ANC includes three check-up and consumption of 100 iron
tablets, percentage of completing the course is even less. Delivery of services at the Sub-centre
which provides ANC services such as examination of the mother including weight gain by the
mother, measuring blood pressure, estimating haemoglobin, checking presence of albumin in
mother’s urine (for knowing the risk of suffering from eclampsia) has to improve for
identifying the risk of pregnancy and to ensure checking of such expecting mothers by doctors
and appropriate interventions for mitigating the risks. Conducting postnatal check-up for
assessing complication of the mother after delivery and illness of the infant is also very crucial
but more neglected than the ANC. It reveals that the better Antenatal providing health sub-
centres are more in Kerala which reflect a better health care service and lead to lower MMR
(Maternal Mortality Rate), IMR (Infant mortality Rate) as well as health status.
Table 5: Maternal Mortality Rate (as per 2011 Census)
State MMR
Kerala 81
West Bengal 145
99.8
96.1
94 95 96 97 98 99 100 101
Kerala
West Bengal
Percentage
Present Status of State's ANC Facilities

10 | P a g e
Fig: 4 Present status of Maternal Mortality Rate (MMR) in Kerala and West Bengal
Source8
MMR is an important component to measuring the current status of health. Here, the following
table: 4 shows a significant difference in MMR in Kerala and West Bengal. MMR is recorded
81 while it is 145 in West Bengal. Thus it reveals a strong health care system is exist in Kerala
while it is too poor in West Bengal.
Table 5: Average Monthly Per Capita Expenditure of overall India, Kerala and West
Bengal
State Average MPCE (Rs.)
Rural Urban
Kerala 1383 1941
West Bengal 702 1452
All-India 772 1472
Source9
8 Registrar General, India, Ministry of Home Affairs, Govt. of India, Census and Vital Statistics, January
2011http://www.censusindia.gov.in
9 Report on Rural Health Statistics, April 2013, Statistics Division, Ministry of Health and Family Welfare, GOI,
New Delhi
Kerala, 81
West Bengal, 145
0
20
40
60
80
100
120
140
160
KERALA WEST BENGAL
Present status of MMR
11 | P a g e
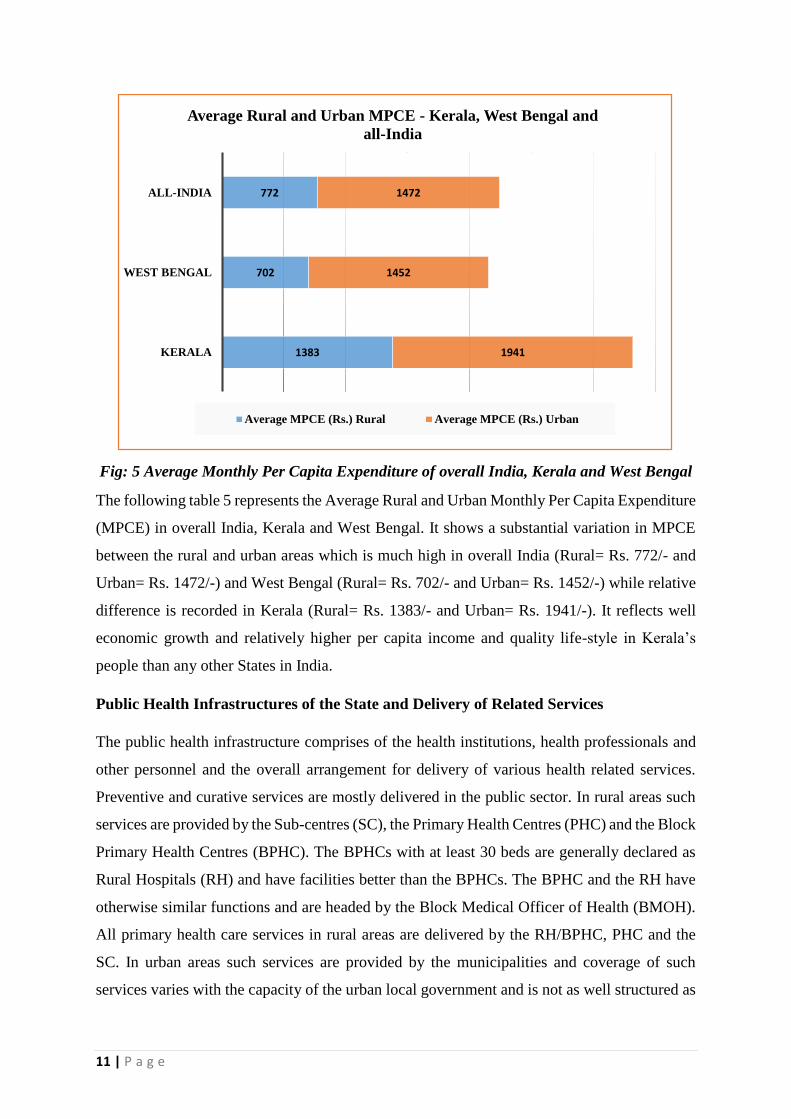
Fig: 5 Average Monthly Per Capita Expenditure of overall India, Kerala and West Bengal
The following table 5 represents the Average Rural and Urban Monthly Per Capita Expenditure
(MPCE) in overall India, Kerala and West Bengal. It shows a substantial variation in MPCE
between the rural and urban areas which is much high in overall India (Rural= Rs. 772/- and
Urban= Rs. 1472/-) and West Bengal (Rural= Rs. 702/- and Urban= Rs. 1452/-) while relative
difference is recorded in Kerala (Rural= Rs. 1383/- and Urban= Rs. 1941/-). It reflects well
economic growth and relatively higher per capita income and quality life-style in Kerala’s
people than any other States in India.
Public Health Infrastructures of the State and Delivery of Related Services
The public health infrastructure comprises of the health institutions, health professionals and
other personnel and the overall arrangement for delivery of various health related services.
Preventive and curative services are mostly delivered in the public sector. In rural areas such
services are provided by the Sub-centres (SC), the Primary Health Centres (PHC) and the Block
Primary Health Centres (BPHC). The BPHCs with at least 30 beds are generally declared as
Rural Hospitals (RH) and have facilities better than the BPHCs. The BPHC and the RH have
otherwise similar functions and are headed by the Block Medical Officer of Health (BMOH).
All primary health care services in rural areas are delivered by the RH/BPHC, PHC and the
SC. In urban areas such services are provided by the municipalities and coverage of such
services varies with the capacity of the urban local government and is not as well structured as
1383
702
772
1941
1452
1472
KERALA
WEST BENGAL
ALL-INDIA
Average Rural and Urban MPCE - Kerala, West Bengal and
all-India
Average MPCE (Rs.) Rural Average MPCE (Rs.) Urban

12 | P a g e
it exists in the rural areas. RH/BPHC or even higher level hospitals located within
municipalities provide some of those services to the urban population. There should be one
Auxiliary Nurse-cum-Midwives (ANMs) and one male Health Workers (known as Multi-
Purpose Worker (Male) or simply MPW) for looking after preventive healthcare other than
those related to Reproductive & Child Health (RCH).
Table 6: Number of Sub Centres, PHCs & CHCs functioning in India, West Bengal and
Kerala
State 2005 2012
Sub-centers PHCs CHCs Sub-centers PHCs CHCs
Kerala 5094 911 106 4575 809 217
West Bengal 10356 1173 1173 1056 909 348
All-India 146026 23236 3346 148366 24049 4833
Source10
Fig: 6 Number of Sub Centres, PHCs & CHCs Functioning in India, West Bengal and
Kerala
The table 6 depicts number of Sub Centres, PHCs & CHCs functioning in India, West Bengal
and Kerala. It shows there is a reduction in number of Sub Centres and PHCs in Kerala due to
Standardization of Health Institutions during 2009 (as reported by the State Government) but
number of functioning Community Health Centre (CHC) become increase. While in West
10 Bulletin on rural health statistics in India 2012
0
20000
40000
60000
80000
100000
120000
140000
160000
Kerala West Bengal All-India
Table 6: Number of Sub Centres, PHCs & CHCs functioning in
India, West Bengal and Kerala
2005 Sub-centres 2005 PHCs 2005 CHCs 2012 Sub-centres 2012 PHCs 2012 CHCs

13 | P a g e
Bengal PHCs upgraded to CHCs in 2005 and 2012 in West Bengal and in India the functioning
number of SC, PHC and CHC frequently increase in 2012.
Table 7: Distribution of Sub-centers on the basis of facilities not available at Sub-
centers (As on March 2012)
State
Number of
Sub-centres
Functioning
Without
Regular
Water Supply
Without
Electric Supply
Kerala 4575 607 (13.2%) 108 (2.30%)
West
Bengal 10356 7046 (68%) 3524 (34%)
All-India 148366 37855 (25.5%) 35845 (24.1%)
Source11
Fig: 7 Facilities not available at Sub-centers (As on March 2012)
Here the table represents Distribution of Sub-centers on the basis of facilities not available at
Sub-centers in overall India, Kerala and West Bengal. It shows that the number of functioning
sub-centers is much low in Kerala (4575) than West Bengal (607) but in those sub-centers there
are only 13.2 % of functioning sub-centers having no water supply facilities while it is recorded
as 68% in West Bengal and 25.5% in overall India. There are only 23% of SC functioning
without electric supply which is recorded in West Bengal and over all India is 34% and 24.1%
respectively.
11 Bulletin on rural health statistics in India 2012
0
20000
40000
60000
80000
100000
120000
140000
160000
Number of Sub-centres
Functioning
Without Regular Water
Supply
Without Electric Supply
Facilities not available at Sub-centers
Kerala West Bengal All-India
14 | P a g e
Table 8: Changes in Public Expenditure in Health by State Government of Kerala &
West Bengal (in percentage)
States 2009-10 2010-11 2011-12
Kerala 3.71 % 3.83 % 4.13 %
West
Bengal 7.19 % 7.14 % 5.96 %
Source12
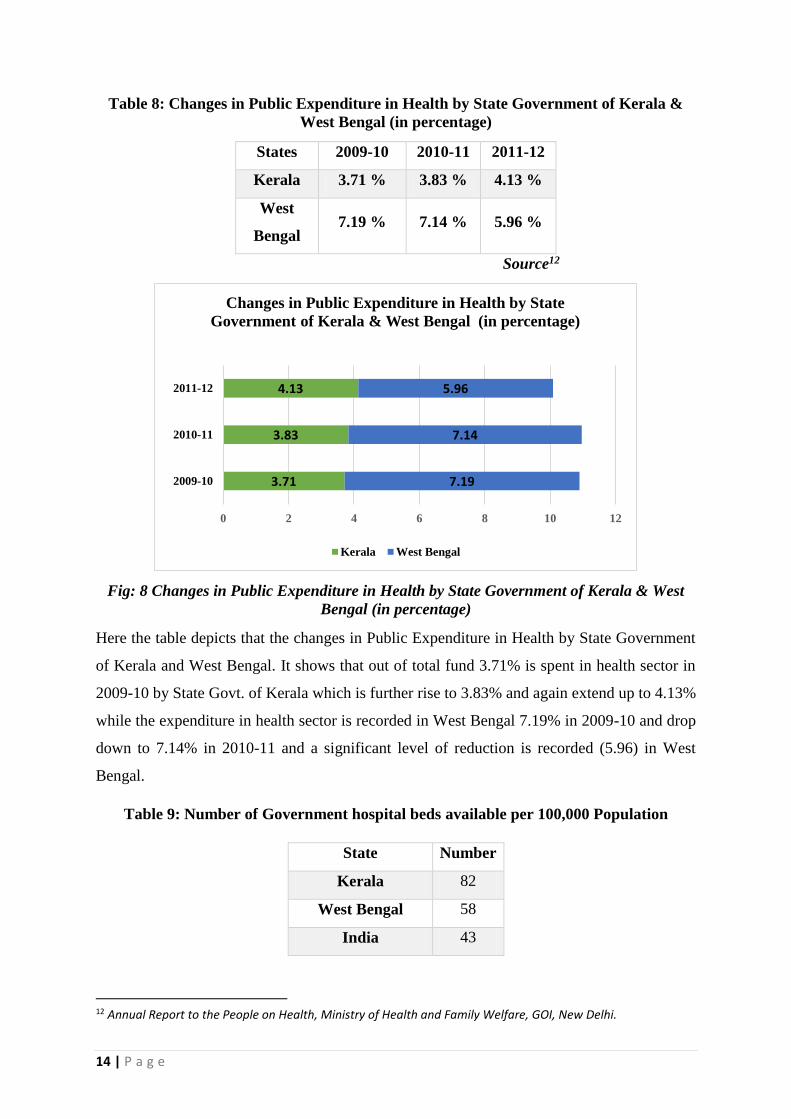
Fig: 8 Changes in Public Expenditure in Health by State Government of Kerala & West
Bengal (in percentage)
Here the table depicts that the changes in Public Expenditure in Health by State Government
of Kerala and West Bengal. It shows that out of total fund 3.71% is spent in health sector in
2009-10 by State Govt. of Kerala which is further rise to 3.83% and again extend up to 4.13%
while the expenditure in health sector is recorded in West Bengal 7.19% in 2009-10 and drop
down to 7.14% in 2010-11 and a significant level of reduction is recorded (5.96) in West
Bengal.
Table 9: Number of Government hospital beds available per 100,000 Population
State Number
Kerala 82
West Bengal 58
India 43
12 Annual Report to the People on Health, Ministry of Health and Family Welfare, GOI, New Delhi.
3.71
3.83
4.13
7.19
7.14
5.96
0 2 4 6 8 10 12
2009-10
2010-11
2011-12
Changes in Public Expenditure in Health by State
Government of Kerala & West Bengal (in percentage)
Kerala West Bengal
15 | P a g e
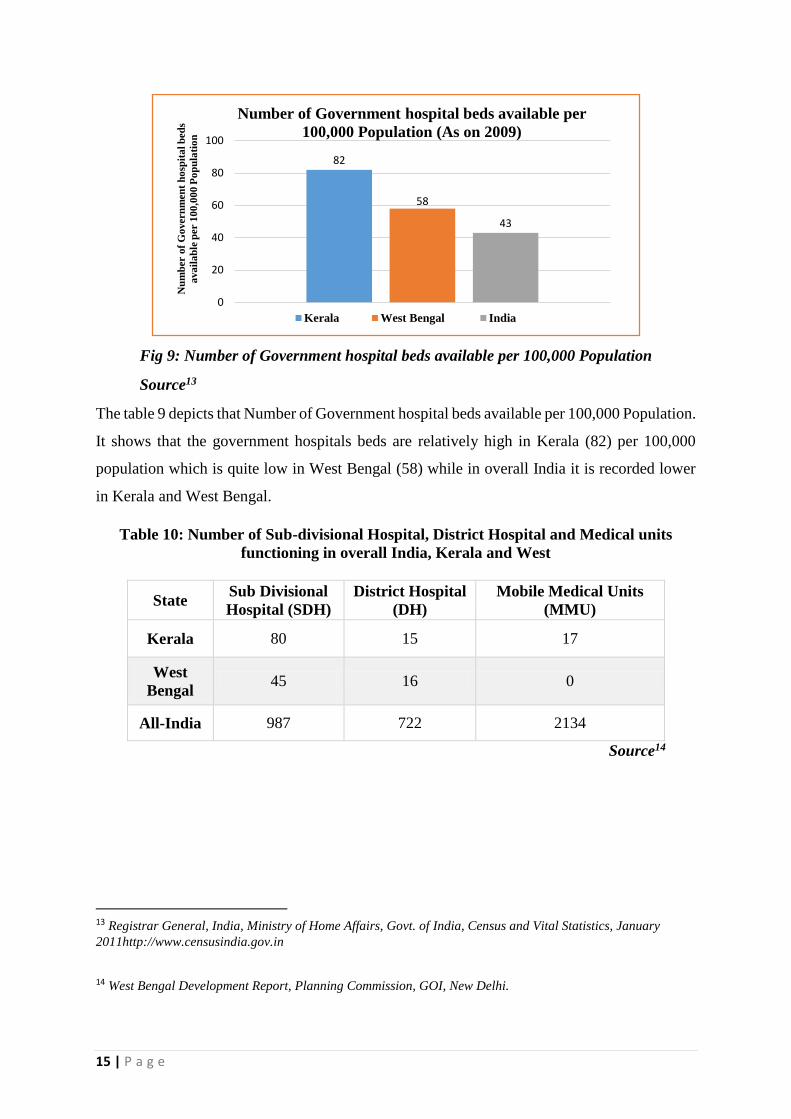
Fig 9: Number of Government hospital beds available per 100,000 Population
Source13
The table 9 depicts that Number of Government hospital beds available per 100,000 Population.
It shows that the government hospitals beds are relatively high in Kerala (82) per 100,000
population which is quite low in West Bengal (58) while in overall India it is recorded lower
in Kerala and West Bengal.
Table 10: Number of Sub-divisional Hospital, District Hospital and Medical units
functioning in overall India, Kerala and West
State Sub Divisional
Hospital (SDH)
District Hospital
(DH)
Mobile Medical Units
(MMU)
Kerala 80 15 17
West
Bengal 45 16 0
All-India 987 722 2134
Source14
13 Registrar General, India, Ministry of Home Affairs, Govt. of India, Census and Vital Statistics, January
2011http://www.censusindia.gov.in
14 West Bengal Development Report, Planning Commission, GOI, New Delhi.
82
58
43
0
20
40
60
80
100
Nu
mb
er o
f G
overn
men
t h
osp
ita
l b
ed
s
ava
ila
ble
per 1
00
,00
0 P
op
ula
tio
n
Number of Government hospital beds available per
100,000 Population (As on 2009)
Kerala West Bengal India
16 | P a g e
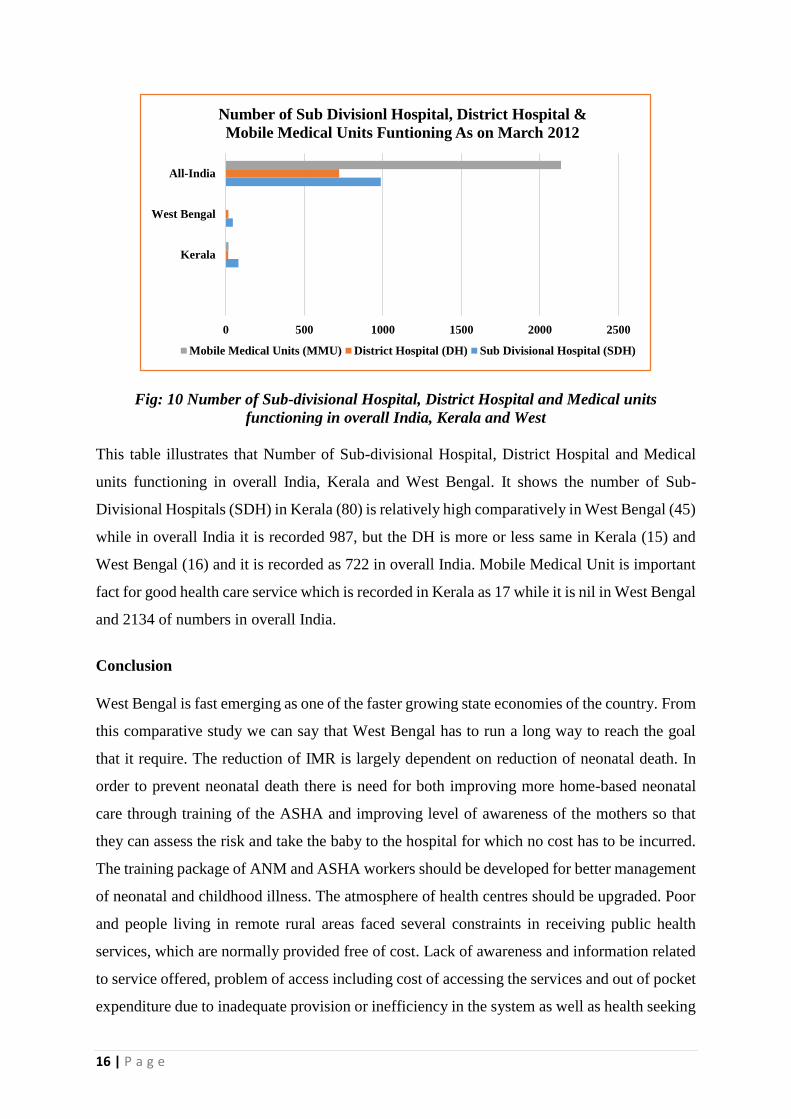
Fig: 10 Number of Sub-divisional Hospital, District Hospital and Medical units
functioning in overall India, Kerala and West
This table illustrates that Number of Sub-divisional Hospital, District Hospital and Medical
units functioning in overall India, Kerala and West Bengal. It shows the number of Sub-
Divisional Hospitals (SDH) in Kerala (80) is relatively high comparatively in West Bengal (45)
while in overall India it is recorded 987, but the DH is more or less same in Kerala (15) and
West Bengal (16) and it is recorded as 722 in overall India. Mobile Medical Unit is important
fact for good health care service which is recorded in Kerala as 17 while it is nil in West Bengal
and 2134 of numbers in overall India.
Conclusion
West Bengal is fast emerging as one of the faster growing state economies of the country. From
this comparative study we can say that West Bengal has to run a long way to reach the goal
that it require. The reduction of IMR is largely dependent on reduction of neonatal death. In
order to prevent neonatal death there is need for both improving more home-based neonatal
care through training of the ASHA and improving level of awareness of the mothers so that
they can assess the risk and take the baby to the hospital for which no cost has to be incurred.
The training package of ANM and ASHA workers should be developed for better management
of neonatal and childhood illness. The atmosphere of health centres should be upgraded. Poor
and people living in remote rural areas faced several constraints in receiving public health
services, which are normally provided free of cost. Lack of awareness and information related
to service offered, problem of access including cost of accessing the services and out of pocket
expenditure due to inadequate provision or inefficiency in the system as well as health seeking
0 500 1000 1500 2000 2500
Kerala
West Bengal
All-India
Number of Sub Divisionl Hospital, District Hospital &
Mobile Medical Units Funtioning As on March 2012
Mobile Medical Units (MMU) District Hospital (DH) Sub Divisional Hospital (SDH)
17 | P a g e
behaviour etc. are the important causes behind failure of services reaching the poor and those
living in remote areas. Health cannot be seen as a state at all but must be seen as a process of
continuous adjustment to the changing demand of living and of the changing meaning we give
to the life. The holistic perspective of health not only takes into account existing technologies
and their organisation, it also underlines the importance of social determinants such as food
availability and nutritional status of populations, drinking water supply, housing, transport,
education, employment that contribute to people’s well-being and, last but not the least, the
status of women. The health status of the people in the country is an important flag-post to
evaluate the success of the policies of government. Despite several growth-orientated policies
adopted by the government, the widening economic, regional, and gender disparities are posing
challenges for the health sector.
References
Annual Report to the People on Health, 2010-11, 2012-13, Ministry of Women and Child
Development, Government of India.
Bhandari L. and Dutta S. (2010), Health Infrastructure in Rural India, Chapter 11, pp. 265-
285.
Bulletin on Rural Health Statistics (2011), http: // www.mohfw.nic.in, accessed on Saturday,
August 16, 2014
District Level Health Survey 2012, http: //www.dlhswb.nic.in, accessed on Saturday, August
16, 2014
Indian Human Development Report 2011, institute of Applied Manpower research, Planning
Commission, GOI
Kadekodi G. & Kulkarni K., Status of Health and Medical Care in India: A Macro Perspective,
IIPA, 2006, UNDP
MHFW (2005). Rural Health Care System in India, Ministry of Health and Family Welfare,
Government of India, New Delhi.
National Health Profile (2010), www.cbhidghs.nic.in, accessed on Saturday, August 16, 2014
NSSO (2004). Morbidity, Health Care and the Condition of the Aged, NSSO 60th Round,
Report No. 507 (60/25.01/1)

18 | P a g e
Report on Public Health in West Bengal –Current Status and Ongoing Interventions (2011)
Report on NSS Socio-Economic Survey 64th Round, accessed on 16.08.2014
NSSO Report of Sample Survey Organisation, Ministry of Statistics and Programme
Implementation, New Delhi, www.nsso.org, accessed on Tuesday, August 19, 2014
State Update: Government of West Bengal by Economics Division of Credit Analysis &
Research Limited [CARE] (2012)
West Bengal Development Report, Planning Commission, GOI, New Delhi.
World Bank (2006)—India: Inclusive Growth & Service Delivery: Building on India’s
Success, World Bank, Washington D.C.
http://www.expresshealthcaremgmt.com/200601/focus01.shtml, accessed on 16.08.2014
http://www.mohfw.nic.in, accessed on Saturday, August 16, 2014
http://www.corecentre.org/nrhm, accessed on Saturday, August 16, 2014
http://www.censusindia.gov.in, accessed on Saturday, August 16, 2014
www.hsprodindia.nic.in, accessed on Tuesday, August 19, 2014
www.cbhidghs.nic.in, accessed on Wednesday, August 20, 2014
www.cbhighf.nic.in, accessed on Friday, August 22, 2014