Risk management with a duration gap approach
44
Risk management with a duration gap approach Empirical evidence from a cross-country study of dual banking systems Jamshaid Anwar Chattha Islamic Financial Services Board, Kuala Lumpur, Malaysia, and International Islamic University Malaysia, Kuala Lumpur, Malaysia Syed Musa Alhabshi IIUM Institute of Islamic Banking and Finance (IIiBF), International Islamic University Malaysia, Kuala Lumpur, Malaysia, and Ahamed Kameel Mydin Meera Department of Finance, International Islamic University Malaysia, Kuala Lumpur, Malaysia Abstract Purpose – In line with the IFSB and BCBS methodology, the purpose of this study is to undertake a comparative analysis of dual banking systems for asset-liability management (ALM) practices with the duration gap, in Islamic Commercial Banks (ICBs) and Conventional Commercial Banks (CCBs). Based on the research objective, two research questions are developed: How do the duration gaps of ICBs compare with those of similar sized CCBs? Are there any country-specific and regional differences among ICBs in terms of managing their duration gaps? Design/methodology/approach – The research methodology comprises two-stages: stage one uses a duration gap model to calculate the duration gaps of ICBs and CCBs; stage two applies parametric tests. In terms of the duration gap model, the study determines the duration gap with a four-step process. The study selected a sample of 100 banks (50 ICBs and 50 CCBs) from 13 countries for the period 2009-2015. Findings – The paper provides empirical insights into the duration gap and ALM of ICBs and CCBs. The ICBs have more variations in their mean duration gap compared to the CCBs, and they have a tendency for a higher (more) mean duration gap (28.37 years) in comparison to the CCBs (11.79 years). The study found ICBs as having 2.41 times more duration gap compared to the CCBs, and they are exposed to increasing rate of return (ROR) risk due to their larger duration gaps and severe liquidity mismatches. There are significant regional differences in terms of the duration gap and asset-liability management. Research limitations/implications – Future studies also consider “Off-Balance Sheet” activities of the ICBs, with multi-term duration measures. A larger sample size of 100 ICBs with 10 years’ data after the GFC would be more beneficial to the industry. In addition, the impact of an increasing benchmark rate (e.g. 100, 200 and 300 bps) on the ICBs as per the IFSB 20 per cent threshold can also be established with the duration gap approach to identify the vulnerabilities of the ICBs. Practical implications – The study makes profound contributions to the literature and suggests various policy recommendations for Islamic banks, regulators, and standard setters of the ICBs, for identifying and measuring the significance of the duration gaps; and management of the ROR risk under Pillar 2 of the BCBS and IFSB, for financial soundness and stability purposes. Originality/value – To the best of the authors’ knowledge, this is a pioneer study in Islamic banking involving a sample of 100 banks (50 ICBs and 50 CCBs) from 13 countries. The results of the study provide Study of dual banking systems 1257 Received 23 October 2017 Revised 29 May 2018 23 July 2018 15 August 2018 Accepted 16 September 2018 Journal of Islamic Accounting and Business Research Vol. 11 No. 6, 2020 pp. 1257-1300 © Emerald Publishing Limited 1759-0817 DOI 10.1108/JIABR-10-2017-0152 The current issue and full text archive of this journal is available on Emerald Insight at: https://www.emerald.com/insight/1759-0817.htm
-
Upload
khangminh22 -
Category
Documents
-
view
2 -
download
0
Transcript of Risk management with a duration gap approach

Risk management with a durationgap approach
Empirical evidence from a cross-country studyof dual banking systems
Jamshaid Anwar ChatthaIslamic Financial Services Board, Kuala Lumpur, Malaysia, and
International Islamic University Malaysia, Kuala Lumpur, Malaysia
Syed Musa AlhabshiIIUM Institute of Islamic Banking and Finance (IIiBF),
International Islamic University Malaysia, Kuala Lumpur, Malaysia, and
Ahamed Kameel Mydin MeeraDepartment of Finance, International Islamic University Malaysia,
Kuala Lumpur, Malaysia
AbstractPurpose – In line with the IFSB and BCBS methodology, the purpose of this study is to undertake acomparative analysis of dual banking systems for asset-liability management (ALM) practices with theduration gap, in Islamic Commercial Banks (ICBs) and Conventional Commercial Banks (CCBs). Based on theresearch objective, two research questions are developed: How do the duration gaps of ICBs compare withthose of similar sized CCBs? Are there any country-specific and regional differences among ICBs in terms ofmanaging their duration gaps?
Design/methodology/approach – The research methodology comprises two-stages: stage one usesa duration gap model to calculate the duration gaps of ICBs and CCBs; stage two applies parametrictests. In terms of the duration gap model, the study determines the duration gap with a four-stepprocess. The study selected a sample of 100 banks (50 ICBs and 50 CCBs) from 13 countries for theperiod 2009-2015.
Findings – The paper provides empirical insights into the duration gap and ALM of ICBs and CCBs.The ICBs have more variations in their mean duration gap compared to the CCBs, and they have atendency for a higher (more) mean duration gap (28.37 years) in comparison to the CCBs (11.79 years).The study found ICBs as having 2.41 times more duration gap compared to the CCBs, and they areexposed to increasing rate of return (ROR) risk due to their larger duration gaps and severe liquiditymismatches. There are significant regional differences in terms of the duration gap and asset-liabilitymanagement.
Research limitations/implications – Future studies also consider “Off-Balance Sheet” activities of theICBs, with multi-term duration measures. A larger sample size of 100 ICBs with 10 years’ data after the GFCwould be more beneficial to the industry. In addition, the impact of an increasing benchmark rate (e.g. 100, 200and 300 bps) on the ICBs as per the IFSB 20 per cent threshold can also be established with the duration gapapproach to identify the vulnerabilities of the ICBs.
Practical implications – The study makes profound contributions to the literature and suggests variouspolicy recommendations for Islamic banks, regulators, and standard setters of the ICBs, for identifying andmeasuring the significance of the duration gaps; and management of the ROR risk under Pillar 2 of the BCBSand IFSB, for financial soundness and stability purposes.
Originality/value – To the best of the authors’ knowledge, this is a pioneer study in Islamic bankinginvolving a sample of 100 banks (50 ICBs and 50 CCBs) from 13 countries. The results of the study provide
Study of dualbankingsystems
1257
Received 23 October 2017Revised 29May 2018
23 July 201815 August 2018
Accepted 16 September 2018
Journal of Islamic Accounting andBusiness ResearchVol. 11 No. 6, 2020
pp. 1257-1300© EmeraldPublishingLimited
1759-0817DOI 10.1108/JIABR-10-2017-0152
The current issue and full text archive of this journal is available on Emerald Insight at:https://www.emerald.com/insight/1759-0817.htm

original empirical evidence regarding the estimation of duration gap, and variations across jurisdictions interms of vulnerability of ICBs and CCBs in dual banking systems.
Keywords ALM, Risk management, Pillar 2, ROR risk, Duration gap, ICBs, CCBs
Paper type Technical paper
1. IntroductionOne of the aspects, which has received significant prominence after the Global FinancialCrisis (GFC) of 2007/2008 is the strengthening risk management of financial institutionsincluding banks, reflecting improved risk management tools, techniques and regulatorystandards. As a result, the global financial system has been undergoing unprecedentedsupervisory structural transformations and improvements in securing the financial stabilityof the financial intermediation function and rebuilding the trust of various stakeholders. Tothis end, the emergence of the Islamic financial services industry (IFSI)[1], anchored by keypeculiar specificities and various inbuilt stabilisers (such as unbridled leverage, lack ofsynthetic and exotic products, stable funding base, etc.), has now become an integral part ofglobal finance. This certainly indicates the viability of Islamic financial institutions (IFIs)[2],including Islamic Commercial Banks’ (ICBs) operations. There is growing appreciation inthe international financial community of the inbuilt strengths of the IFSI[3]. This recognitionhas been established because international institutions (e.g. the IMF and the World Bank)and international standard-setting organisations (e.g. BCBS, IOSCO and IAIS) have beenworking closely with the Kuala Lumpur-based IFSB[4].
Although the growth of the IFSI in the past decades has been extraordinary, thecomposition of the IFSI, however, remains highly bank-centric and deeply geographicallyfocused in a few jurisdictions. The IFSI has proven to be relatively resilient compared to itsconventional counterpart during the early waves of the financial tsunami, as IFIs wererelatively less impacted by the GFC. However, it is also recognised that when the GFCturned into an economic crisis, certain IFIs (e.g. Arcapita Bank, IDG, Gulf Finance House,Kuwait Finance House, Dubai Islamic Bank) were exposed to spillover effects (a.k.a. secondround effects). This is because ICBs operate in the same financial and economic environmentof dual banking systems (Chattha and Bacha, 2010; Chattha and Alhabshi, 2017). With theexception of Sudan and Iran (which have fully Sharī’ah-compliant banking systems), dualbanking (where conventional financial institutions operate parallel to the IFIs) is the realityin almost every country where ICBs operate, which implies shared risks, returns and cashflows between ICBs and Conventional Commercial Banks (CCBs). Hence, there is acompelling need to address the source and impacts of these vulnerabilities and risks from anIslamic financial stability perspective, to keep ICBs resilient and less vulnerable.
The stylised balance sheet of an ICB indicates structural differences, which are differentcompared to its conventional counterpart, thus outlining different effects on riskmanagement and risk implications (Section 2.2). From the business model of an ICB, itsactivities are exposed to a variety of financial risks such as credit risk/counterparty risk,liquidity risk, equity investment risk, market risk, rate of return (ROR) risk and operationalrisk (Chattha, 2013; IFSB, 2005). As stated earlier, the economic and financial environment indual banking systems inevitably exposes ICBs to the same problems encountered by CCBs,especially benchmark rate risk (Bacha, 2004; Chattha and Bacha, 2010; Chattha andAlhabshi, 2017). Therefore, one of the risks is the potential squeeze of Net worth (NW) oreconomic value of equity (EVE) as benchmark[5] rate risk changes due to wider liquidityand duration gaps (Bierwag et al., 2000; Bierwag and Kaufman, 1992; and Chattha andBacha, 2010; Chattha and Alhabshi, 2017). This reflects the relevance of studying ICBs’
JIABR11,6
1258

profitability and vulnerabilities under volatile (or changing)[6] benchmark rates riskconditions. Therefore, identifying, quantifying and regulating these vulnerabilities as perthe IFSB is a very important consideration for the ICBs in a dual banking environment, andforms the subject of our study.
In particular, in the case of the ROR risk in the banking book of an ICB, it is an analogueof interest rate risk (IRR) in the banking book of CCBs as defined by the BCBS, and it is dealtwith in Pillar 2 instead of Pillar 1 (IFSB, 2014) under the BCBS and the IFSB[7]. Therefore,“benchmark rate risk”, if not properly managed, has the potential to pose a substantialdanger to an ICB’s earnings and capital base, and it can also affect the underlying value ofan ICB’s assets, impact its funding costs and make it more vulnerable to contingent risksfrom off-balance sheet exposures. This is particularly relevant because benchmark rates inmany countries are at historically low levels and there is the risk that IRR could increasesignificantly once rates “normalize”. Consequently, an effective risk management process –addressing the “economic value perspective through duration gap model (i.e. weightedaverage maturity in which the weights are stated in present value terms)” – is essential tothe safety and financial soundness of an ICB. The IFSB, under Pillar 2, has outlined theimportance of the assessment of ROR in the banking book through the duration gapapproach.
A critical review of existing recent literature on ICBs mainly categorises the riskmanagement studies into:
� general risk management practices (Khan and Ahmad, 2001; Romzie and AbdulRahim, 2015);
� risk reporting and disclosure (Mohd. Ariffin et al., 2009; Romzie, 2009); and� risk management tools and practices (Alam and Masukujjaman, 2011; Chattha and
Bacha, 2010; Fauziah et al., 2011; Hassan, 2009; Khalid and Amjad, 2012; Ben SelmaMokni et al., 2014; Sundararajan and Errico, 2002; Zainol, 2015).
However, no specific study has been conducted to explain the times-series and cross-sectionvariation of the ICBs’ duration gaps for a longer period. In addition, the existing work alsodoes not provide enough evidence on:
� whether ICBs have more gaps on a long-term basis compared to CCBs;� the main reasons explaining the duration gaps practices for ROR risk;� whether there are any cross-country specific and regional differences in terms of
managing duration gaps and liquidity gaps of ICBs and CCBs; and� the implications of higher duration gaps for ICBs and their supervisors under Basel
or IFSB Pillar 2.
Taking into account the above background, our study attempts to bridge this gap froman Islamic finance perspective. The main objective of the study is to undertake acomparative analysis of dual banking systems for asset-liability managementpractices with the duration gap, in ICBs and CCBs. For our research objective, tworesearch questions are developed, whereas hypotheses development is provided inSection 5:
RQ1. How do the duration gaps of ICBs compare with those of similar sized CCBs?
RQ2. Are there any country-specific and regional differences among ICBs in terms ofmanaging their duration gaps?
Study of dualbankingsystems
1259

With the above considerations, to the best of the authors’ knowledge, this is a pioneer studyin Islamic banking involving a sample of 100 banks (50 ICBs and 50 CCBs) from 13 countriesfor the period 2009-2015. The results of the study provide empirical evidence regarding theestimation of duration gap and variations across jurisdictions in terms of vulnerability ofICBs and CCBs. In our results, the study found that the ICBs have 2.41 times more durationgap compared to the CCBs, and they are exposed to increasing ROR risk due to their largerduration gaps and severe liquidity mismatches. The study also found significant regionaldifferences in terms of duration gap and asset-liability management. In this respect, ourstudy offers deeper insight into the issue and gives guidance to ICBs on managing theirduration gaps while factoring in country-specific differences of ICBs’ business models[8],and provides direction to the ICBs to reflect upon the importance of liquidity risk, ALM, theimpact of benchmark rate risk (ROR risk) under Pillar 2 of the BCBS and IFSB, and financialstability. Moreover, our results highlight the involvement of, and implication for,supervisors and international standard-setting bodies (e.g. IFSB).
The rest of the paper is structured as follows: Section 2 explains Islamic finance withits key specificities, and theoretical considerations for ROR risk for ICBs; Section 3covers the detailed literature review on the measurement of the ROR risk with aduration gap approach; Section 4 presents the description of the data and themethodology including the application of Duration Gap model, and Cumulative Short-term Liquidity Mismatch Gap (CLGAP); in Section 5, we discuss the empirical results ofthe study and the practical implications; and finally, Section 6 concludes the entirestudy, followed by appendix.
2. Islamic finance: structural differences and risk implications2.1 Islamic banking sector growthIn terms of accurate statistics, according to the IFSB (2017) Islamic Financial Services IndustryFinancial Stability Report, the IFSI’s total worth across its three main sectors (banking, capitalmarkets and Takaful [Islamic insurance]) is estimated at US$1.89tn in 2016[9]. Islamicbanking remains the most dominant form of asset-based intermediation system withapproximately 80 per cent of Islamic financial assets held within the banking sector indifferent asset classes, products and services[10].
2.2 An Islamic commercial banks’ stylised balance sheet: structural differences andimplicationsAs alluded to earlier, one of the key elements of an ICB’s specificities is the structuraldifferences in its balance sheet composition compared to a CCB, which consequently hasdifferent effects on risk management and risk implications (Table I). At first glance, thestylised or the schematic balance sheet of an ICB appears to be similar to a one-stopshopping mall concept, reflecting a universal banking model where all the traditionalintermediation functions such as retail and core banking, and investment banking functionsare being undertaken for a variety of customers (Chattha, 2013). Both sides of the ICBs’balance sheet have peculiar features, which fundamentally differentiate the ICBs from theirconventional counterparts, the CCBs. These specificities indicate various risk implicationsfor ICBs, and play an important role in the development of financial regulation bysupervisors.
Referring to Table I, it is obvious that the asset side of an ICB is involved in buyingphysical assets before selling, direct equity investment and investment in Sukūk[11].Further, an ICB is also involved in leasing and trading in real estate properties, and fundmanagement services, which are traditionally not offered by the CCBs, rather by their
JIABR11,6
1260

separate subsidiaries. Various types of contracts defining contractual rights and obligationsof counterparties underlie each category of asset. Sales, lease and equity financing assets arebased on different forms of financing contracts. Therefore, on the asset side, an ICB mayassume the role of, among others, a trader (under Mur�abahah), a lessor (under Ij�arah), aninvestor (under Mud�arabah and/or Mush�arakah) or a developer or manufacturer (underIstisn�a’).
On the liability side, “demand deposits such as current accounts, which are guaranteedby owner’s equity and, in most cases, represent non-Mud�arabah funds, are considered asliabilities” (IFSB Compilation Guide, IFSB, 2011, p. 30). In addition to a current account or asavings account, an ICB offers Profit Sharing Investment Accounts (PSIA), which is aspecific feature of Islamic finance and one of the key distinctions in terms of its risk-rewardmechanism[12]. Further, with respect to the PSIA on the funding side, the contracts mostfrequently used are forms of fund management contracts, which are mostly based onMud�arabah, whereby the ICB acts as the entrepreneur (“mudarib”), and the provider offunds as (“rab-alma”), the so-called unrestricted PSIA[13]. This arrangement is based on anagreed upon formula (i.e. profit sharing ratio, say, 70:30). Moreover, with respect to thePSIA, to manage displaced commercial risk (DCR)[14], an ICB sets aside reserves such as theProfit Equalisation Reserve (PER) and the Investment Risk Reserve (InRR). The former isset aside to smooth the returns paid to unrestricted PSIA, and the latter is set aside to bufferany potential loss exposure of unrestricted PSIA.
In light of the above, the following risk implications are derived from the balance sheetstructure of an ICB:
Table I.Stylised balance
sheet of an ICB andrisk implications
Assets Liabilities and capital
Cash and cash equivalents Current account/Demand Deposits [Non-Mud�arabah(Wadī`ah or Qar �d)]
Central bank placements Savings account [Mud�arabah or Non-Mud�arabah(Wadī`ah or Qar �d)]
Interbank placements CommodityMur�abahah account (Tawarruq/Mur�abahah)
Financing/Sales receivables Interbank deposits (Mur�abahah/Mud�arabah)Asset-based Financing “based onMur�abahah, Bay`Muajjal, Salam or Istisn�a`contracts”
Unrestricted PSIA (Mud�arabah)
Equity financing or investments “based onMud�arabah andMush�arakah contracts”
Profit Equalisation Reserve (PER)
Lease financing assets based on “Ij�arah andIj�arah Muntahia Bittamlīk (IMB) contracts”
Investment Risk Reserve (InRR)
Investment in securities Other depositsInvestment in leased assets Salam/ Istisn�a` payable for financingInvestment in real estate Tier�2 Sukūk/InstrumentEquity investment in joint ventures Other liabilitiesEquity investment in capital ventures Capital and ReservesInventoriesOther assetsFixed assetsOff-Balance sheet – Restricted Investment Account
Source:Authors
Study of dualbankingsystems
1261

� no re-pricing of sale contracts (e.g.Mur�abahah);� asset-backed nature of structures;� risk transformation[15];� key risks and risk management controls;� role of risk weights and PSIA in Capital Adequacy Ratio (CAR)[16]; and� corporate and Sharī’ah governance.
Besides, in essence, the above description of the stylised balance sheet raises key concernsfor an ICB given that the presence of a majority of sales-based contracts (from short-term tolong-term) are funded by the short-term PSIA funds. This highlights an acute inherent asset-liability maturity mismatch, which is studied in this research.
2.3 Risks in the Islamic banking industry – key gaps and considerationsIt is important to note that while the risks are an integral part of the banking industry,regardless of ICBs or CCBs, robust risk management differentiates and outlines the intensityof these risks and vulnerabilities to ensure financial stability and other unintended economicconsequences. However, the need for risk management in ICBs requires more attention dueto the unique structure of their assets and liabilities. For instance, according to the IFSB:
The different business models of the ICBs, new emerging products and risk mitigants employedby the ICBs have created new levels of complexities that may lead to financial instability andother unintended economic consequences (IFSB, 2014, p. 24).
This necessitates the undertaking of certain studies, which may explain the implications ofthese models with particular reference to ICBs as not many studies offer useful insight onthis issue[17].
To address some of the key risks and distinctive risk features of Islamic financialtransactions and contracts offered by the ICB, IFSB (2005) provides comprehensiveregulation on risk management controls through guiding principles. These controls are forboth the ICBs and their supervisors. These 15 principles, which complement Pillar II of theBasel II, are grouped together under six types according to risk. ICBs are also exposed toother specific risks such as “Sharī’ah non-compliance risk, fiduciary risk, ROR risk andDCR”, in addition to the customary banking risks (e.g. credit, market and operational risks).
Following the GFC, the role of the regulators and supervisors to place prominence on theadequacy and capability of an ICB’s management of risks during their normal supervisoryreview process has been intensified. Both the BCBS and the IFSB lay out clear guidelines onrisk management from supervisory perspectives, in particular for ROR risk. IFSB (2014) hasindicated that it is essential for ICBs to have benchmark rate risk measurement systemsincluding a number of generally accepted techniques (such as gap analysis and duration gapanalysis) for measuring the benchmark rates risk exposure of both earnings and economicvalue. The IFSB’s most recent work on ROR risk is in IFSB (2015), also known as CPIFR(Core Principles for Islamic Finance Regulation), in which CPIFR 26 on ROR risk advocatesthat the supervisory authorities should require ICBs (through policies and regulations) tohave an appropriate ROR risk strategy and ROR management framework that provides acomprehensive ICB-wide view of ROR risk[18].
In addition to the above reflections, the existing literature on risk management practicesand tools from ICBs’ perspective shows a lot of variations but seems to focus on general riskmanagement practices without combining institutional and regulatory perspectives. Thereare a wide range of studies on risk management practices for ICBs in different countries, for
JIABR11,6
1262

dealing with different types of risk (Al-Janabi, 2008; Alam and Masukujjaman, 2011; Al-Ajmi and Hameeda, 2012; Al-Tamimi and Al-Mazrooei, 2007; Ben Selma Mokni et al., 2014;Fauziah et al., 2011; How et al., 2005; Hassan, 2009; Hussain and Naysary, 2014; Mohd.Ariffin et al., 2009; Romzie and Abdul Rahim, 2015; Usman et al., 2011). Of these studies,three of them (Ben Selma Mokni et al., 2014; Romzie and Abdul Rahim, 2015; How et al.,2005) are worth citing here in the context of this study.
First, Ben Selma Mokni et al. (2014) investigate in detail the way each risk is measuredandmanaged by ICBs in theMENA region.While the study discusses and analyses:
[. . .] the current practices employed in the risk management of ICBs, and identifies the tools andmethods used in managing credit risk, market risk, liquidity risk and operational risk by ICBs.
It leaves some important gaps in terms of how the ROR risk could be captured through theduration gap, and other quantitative techniques. Second, Romzie and Abdul Rahim (2015)examine the risk management practices of ICBs internationally by explaining the uniquerisks as recommended by the IFSB. While exploring the differences in risk managementpractices based on various parameters (such as the country, size, type and age of the bank),Romzie and Abdul Rahim find “a lack of effective risk management practices in relation toliquidity risk, DCR and equity investment risk by ICBs”, but they do not provide evidence onhow the DCR and ROR risk are measured by ICBs across the jurisdictions. Finally, Howet al. (2005, p. 76) provide evidence for Malaysia by showing that “banks engaging in Islamicfinancing have lower credit and liquidity risks, but significantly higher IRR than banks thatdo not offer such facilities.” Nevertheless, the study does not show the effect of higher IRRthrough the duration gap on the ALM. Furthermore, one of the reasons for such lowerliquidity risks could be that these ICBs have access to the SLOLR mechanism in Malaysia(Chattha and Halim, 2014).
After a careful review of the above studies, we establish the following:� the studies have merely focused on general risk management practices (with
qualitative focus on perception and practices), and therefore, they did not look into aspecific risk from an institutional perspective (a quantitative measurement ofcertain risks);
� they were country-specific rather than having a comparative focus; and� there was no regulatory perspective (e.g. compliance with Pillar 2) in the light of
ongoing developments pertaining to the GFC. In this study, we combine theseperspectives.
3. Literature review3.1 What is duration gap? Duration gap for measuring rate of return riskIt is important to define the concept of duration gap to provide context for discussing therelevant past studies on the issue. Gup et al. (2007), citing Bierwag (1987), define duration as“the weighted average time (measured in years) to receive all cash flows from a financialinstrument”, and the duration gap is the difference between the duration of a bank’s assetsand liabilities. In simple terms, it is defined as the “weighted average maturity in which theweights are stated in present value terms” (Chattha and Bacha, 2010, p. 16). On the otherhand, similar to the BCBS, the IFSB provides an identical definition of duration measure.
Based on the above definition, we can conjecture that when the duration gap is positive,any increase (decrease) in benchmark rates, will result in a decrease (increase) in the NW of abank. On the other hand, when the duration gap is negative, any increase (decrease) in
Study of dualbankingsystems
1263

benchmark rates, will result in an increase (decrease) in the NW of a bank. However, whenthe duration gap is zero, any increase or decrease in benchmark rates, will bring no changeto the NW of a bank. This relationship emphasises the need for having in place appropriatestrategies for managing the duration gap. In this context, there are two strategies whenmanaging duration gaps – aggressive and defensive (Chattha and Bacha, 2010). The formerwould alter the duration gap in anticipation of changes in interest rates[19]. The latterstrategy within this context would seek to keep the duration of assets (DA) equal to theduration of liabilities (DL), thereby maintaining a duration gap of zero.
3.2 Duration gap perspective and relevant empirical studiesThe issues of duration and duration gaps (DGAP) have been studied comprehensively in thepast decades, due to its significance for CCBs, but very little research is available, whichstudies the application of such a measure for ICBs. The academic literature on the durationgap can be classified into three main categories:
(1) classical studies explaining the concept of duration gap;(2) empirical studies used to reflect the importance of duration gap to the banking
system to measure the benchmark rate risk; and(3) contemporary studies showing the determinants of the duration gap as a proxy for
measuring the impact of benchmark rate risk for banks.
Among the notable classical studies are Alden (1983), Bierwag (1987), Bierwag andKaufman (1992), Bierwag et al. (2000), Fooladi and Roberts (2000) and Macaulay (1938). Allof these studies have established that gaps, which are computed as functions of the DA andDL, are a more meaningful measure of IRR exposure for depository institutions, than are thesimpler and more commonly used maturity gaps. To understand the classical work on themajor highlights, development and use of DGAP theories and concepts, Bierwag andFooladi (2006) provide a comprehensive historical perspective in the context of durationanalysis. In fact, they note that the concept of duration is among a few major innovationsdevised by economists, however, they also argue that “the concept of duration still remainssomething of a mystery and a curiosity[20]”.
Macaulay (1938), the father of the duration concept, has provided in the literatureextensive basis for the modern development of duration gap analysis. In his work, hedescribed the “duration as the weighted average number of years until the cash flows (CF) ofan asset or liability occur”. This demonstrates that the CF’s duration should be multiplied bythe present values (PV) of each CF with the respective maturity, and finally, those resultsmust be added and the sum then divided by the PV of the CF. In this context, the DA or DLwill always be # to the term-to-maturity[21]. While Alden (1983) authored one of theclassical works on gap management with respect to managing IRR in banks. His work isclassified as one of the pioneers in terms of intellectual contribution to ALM and IRRmanagement. For IRR management and ALM, he described three techniques: maturity gapapproach[22], simulation approaches[23] and duration gap approach. In particular, heprovided technical calculations on the duration model in his work and reflected thatduration analysis can be used for many purposes by the banks, including hedgingMVE.
Moreover, Dembiec et al. (1989) also contribute a distinguished work on the application ofALM and duration gap to the industry. In their study, after determining the assets andliabilities, they used modified duration measurement and incorporated estimates of the DAand the DL. David (1995) using the duration-based approach explains that a negativeduration gap means that the DA is greater than the DL. Koch and MacDonald (2009) also
JIABR11,6
1264

hold a similar view that IRR is measured by comparing the weighted average DA with theweighted average DL. They identify four steps in the duration gap analysis:
(1) developing an interest rate forecast;(2) estimating the market value of bank assets, liabilities and stockholders’ equity;(3) estimating the weighted DA and weighted DL[24]; and(4) forecasting the changes in the market value of stockholders’ equity across different
interest rate environments.
BCBS (2004) provides a detailed framework, which formalised IRRmanagement through theduration gap and other techniques for banks under the supervisory authority. Theframework discusses, among others:
� modalities of maturity gap calculations;� the standardised rates shock;� duration-based weights and calculation of the precise duration of assets and
liabilities; and� and the impact of changing market rates on banks.
In addition, while acknowledging that banks have access to a wide array of financial toolsfor managing their IRR, such as standard ALM procedures, Lopez (2004) specificallysuggested that to cope with the IRR banks commonly use two approaches, the traditionalearnings approach and the more challenging economic value approach. The latter approachuses a duration gap analysis.
Entrop et al. (2009) specifically evaluate the robustness of the standardisedframework proposed by the BCBS (2004) to quantify the IRR of banks. This workprovides an empirical application of the BCBS framework on IRR for CCBs. In theirempirical methodology and analysis, they use and calculate the duration gap andmodified duration gap for assets and liabilities of the sample banks. On the other hand,Ballester et al. (2009) provide empirical evidence through the estimation of the empiricalduration coefficients. In their study, estimated empirical durations were found with“both positive and negative signs”, as it could be expected. They argue that a higherduration, regardless of its sign, implies a higher IRR for the bank (greater variation inthe value of the firm for a given change in interest rates). Moreover, using supervisorydata and the information on volumes and maturities of different lender and borrowertypes, Entrop et al. (2012) calculated modified duration gaps to proxy for on-balanceinterest rate risk. The results indicated that duration gaps show positive effects, andalmost all banking samples show a positive relationship with regard to duration gaps.In the context of duration gaps, their results also demonstrate that savings andcooperative banks have substantially larger duration gaps.
With respect to ICBs, Khan and Ahmed (2001) conducted a study (through a survey of 17IFIs) about the perception of risks in the Islamic banking industry. They highlighted thatthe ROR risk or benchmark risk is considered the most serious risk faced by ICBs, as ICBsstill use the same benchmark. From the ICBs’ perspective, their work was one of the pioneerstudies, which suggested the use of the duration gap approach for ICBs to manage theirasset-liability mismatch, although they did not provide empirical evidence on the use of sucha duration gap approach. Besides Khan and Ahmed, Salman (2006) uses the duration gapapproach to identify factors responsible for the collapse of an IFI in Turkey. Using theduration approach, he shows that the maturity mismatches of assets and liabilities were
Study of dualbankingsystems
1265

high at Ihlas Finans[25], compared to other IFIs. The study also points out the higherduration gap in IFIs.
In addition, using the duration gap approach Chattha and Bacha (2010) provide empiricalinsight into ICBs’ vulnerability to rate of risk exposure, in their preliminary cross-countrystudy of nine countries with a sample of 60 commercial banks (30 CCBs and 30 ICBs) for theyear 2006. The study concluded that, among others, ICBs for the year 2006 are: “more proneto duration gaps compared with their conventional counterparts”. Although the results ofChattha and Bacha provide a preliminary clue about the vulnerability of ICBs, there seemsto be, however, a lot of gaps in the study, which are addressed in this study. From aregulatory perspective, IFSB (2014) has indicated that it is essential for ICBs to havebenchmark rate risk measurement systems including a number of generally acceptedtechniques (such as duration gap analysis) for measuring the benchmark rates risk exposureof both earnings and economic value. In this respect, there is a dearth of studies, whichprovide a comparative perspective under the duration gap for ICBs and CCBs.
Ariffin and Kassim (2014) provide a qualitative perspective on risk managementpractices of major Islamic banks in Malaysia with the objective of having a deeperunderstanding of the practices and identifying ways for further improvements. Theirfindings, through a survey, show that Islamic banks are perceived to use less technicallyadvanced risk measurement techniques of which the most commonly used are creditratings, gap analysis, duration analysis, maturity matching and earnings at risk.Similarly, Rahman et al. (2015) examine the risk management practices of Islamic andconventional banks in Bangladesh and reveal that conventional banks rely mostly onadvanced techniques of risk management. In particular, with respect to the use of variousrisk management techniques, 71 per cent of the Islamic banks have used durationanalysis. Both studies by Ariffin and Kassim (2014) and Rahman et al. (2015) do notprovide any empirical explanation on the estimation and implication of the duration gapmeasure by the Islamic banks. these studies even do not discuss how the duration gaptechnique works in practice and can assist the ICBs in managing the rate of return risk inthe banking book under Pillar 2.
Moreover, taking into account the specific features of ICBs, Chattha and Alhabshi (2017)provide a theoretically and empirically review of the possible prudential implications oflowly and increasing benchmark rates risk using duration gap methodology with a sampleof 50 ICBs from 13 countries, for the period 2009-2015, and provide a sturdy riskmanagement and regulatory perspective for Islamic banks and supervisors. Their resultsindicate that 80 per cent of the ICBs have positive and higher duration gap and only 20 percent (10 ICBs) tend to have a negative duration gap. However, the study only took ICBs, andtherefore, did not compare the results with the conventional counterpart, the CCBs, asauthors suggested future studies can consider such analysis. This paper addresses this gapwith a larger sample size of 100 banks (50 ICBs paired with 50 conventional banks).
Khaliq et al. (2017) use the duration gap analysis to measure the Islamic bank’ssensitivity of bank assets and liabilities towards the rate of return risk due to theconventional interest rate volatility. Their empirical data and analyses covered a five-yearperiod using annually based data (2008-2012) for Malaysian Islamic banks only. Though thequantitative results reveal that the majority of the Islamic banks are exposed to the interestrate risk but the study does not provide how the duration gap is estimated includingestimating the weighted duration of assets and liabilities and process of estimation. Morerecently, Hassan and Aliyu (2018) provide a contemporary survey of Islamic bankingliterature and review empirical studies on Islamic banking. They find that the growing trendof the empirical literature on Islamic banking research is conducted using a range of diverse
JIABR11,6
1266

methodologies including duration analysis. On one hand, this confirms the usage of theduration gap methodology; on the other hand, no explanation is provided how thismethodology is used by the ICBs in their risk management andwhat are the implications.
The previous studies reveal significant gaps, for instance:� no specific studies on duration gap management for long-term data are found
reflecting the peculiar features of ICBs;� trends of the duration gaps over a period of several years, which is key to determine
whether the gaps have been increasing over the period of time or vice versa;� country-specific and regional differences among ICBs in terms of managing their
duration gaps and ALM; and� main causes influencing the duration gaps of ICBs.
Keeping these considerations in mind, in this study we offer deeper insight into the issueand give guidance to ICBs onmanaging their duration gaps.
4. Data and methodology4.1 Overview of sample – key considerationsWe selected a sample of 100 banks (50 ICBs and 50 CCBs) from 13 countries, namely,Bahrain, Bangladesh, Indonesia, Jordan, Kuwait, Malaysia, Pakistan, Qatar, Saudi Arabia,Turkey, UAE and Yemen, for the period 2009-2015. It is worth mentioning that the samplecountries hosting these 50 ICBs are leading Islamic finance jurisdictions, where almost 90per cent of the total Islamic banking assets reside, within the dual banking systems. The sizeof these 50 ICBs amounted to US$558bn in 2015 including the top 5 systemically importantICBs in terms of asset size, holding more than 70 per cent shares of Global Islamic BankingAssets.
Themain reasons and criteria for choosing this sample and period are:� balanced panel;� latest data[26] of full-fledged ICBs (instead of including Islamic windows[27] or
Islamic units or branches of the CCBs) globally; and� full-fledged ICBs operating in dual banking systems (thus excluding Sudan and
Iran, which are not considered to have a dual banking system)[28].
The details of the list of banks is shown in Appendix 2. It is pertinent to note that theaccessibility to long-horizon data for the ICBs covering 2007-2015, with relevant informationon the undiscounted contractual maturity breakdown of the assets and liabilities, was acritical concern and posed a serious challenge[29]. In some cases, the desired data on theundiscounted maturity breakdown of the assets and liabilities was not provided by the ICBsin their published annual reports (or financial statements). For this reason, the study had toexclude many ICBs from the sample. It is also important to mention that some ICBs hadreported only the data on the maturity of financial liabilities instead of disclosing fullcomparative information on the maturity breakdown of both the assets and the liabilities.This made the estimation of the duration gap impossible for these ICBs.
Due to the fact that this sample of 100 banks came from 13 jurisdictions, which haddifferent reporting currencies, converting all the local currency of the respective banks intoUS$, with a credible and consistent exchange rate was an important consideration. For this,the study used yearly data from the IMF International Financial Statistics (IFS) to ensureconsistency in the data and comparison. Moreover, to extract the right information and data,
Study of dualbankingsystems
1267
the study also translated all the data in Arabic, Indonesian, Malay and Turkish into English,where applicable, as some of the selected banks had reported data in their local language.
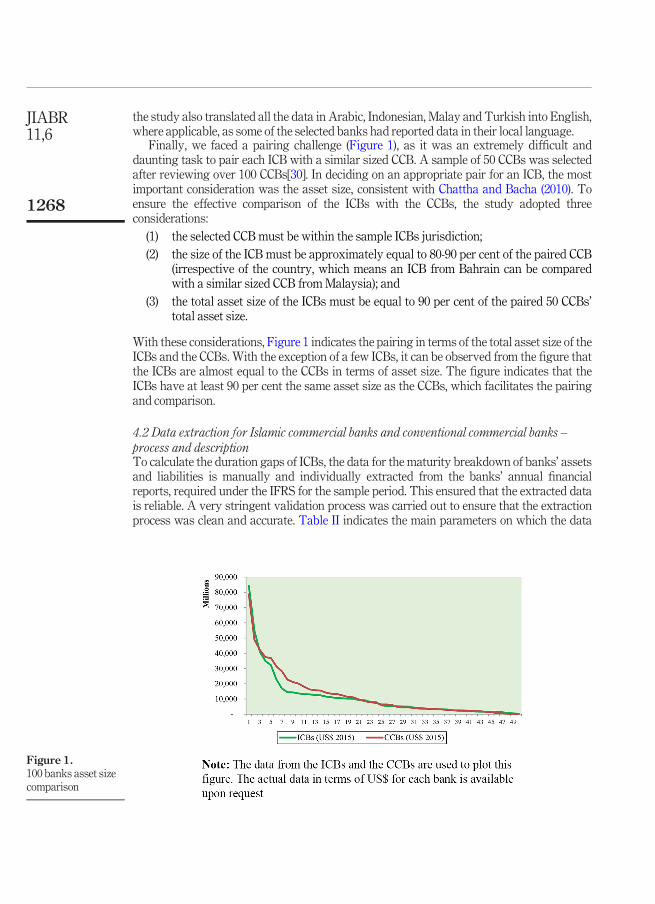
Finally, we faced a pairing challenge (Figure 1), as it was an extremely difficult anddaunting task to pair each ICB with a similar sized CCB. A sample of 50 CCBs was selectedafter reviewing over 100 CCBs[30]. In deciding on an appropriate pair for an ICB, the mostimportant consideration was the asset size, consistent with Chattha and Bacha (2010). Toensure the effective comparison of the ICBs with the CCBs, the study adopted threeconsiderations:
(1) the selected CCB must be within the sample ICBs jurisdiction;(2) the size of the ICB must be approximately equal to 80-90 per cent of the paired CCB
(irrespective of the country, which means an ICB from Bahrain can be comparedwith a similar sized CCB from Malaysia); and
(3) the total asset size of the ICBs must be equal to 90 per cent of the paired 50 CCBs’total asset size.
With these considerations, Figure 1 indicates the pairing in terms of the total asset size of theICBs and the CCBs. With the exception of a few ICBs, it can be observed from the figure thatthe ICBs are almost equal to the CCBs in terms of asset size. The figure indicates that theICBs have at least 90 per cent the same asset size as the CCBs, which facilitates the pairingand comparison.
4.2 Data extraction for Islamic commercial banks and conventional commercial banks –process and descriptionTo calculate the duration gaps of ICBs, the data for the maturity breakdown of banks’ assetsand liabilities is manually and individually extracted from the banks’ annual financialreports, required under the IFRS for the sample period. This ensured that the extracted datais reliable. A very stringent validation process was carried out to ensure that the extractionprocess was clean and accurate. Table II indicates the main parameters on which the data
Figure 1.100 banks asset sizecomparison
JIABR11,6
1268

was extracted for both the ICBs and the CCBs. For the duration gap, on the assets side, todetermine the amount of loan or financing[31], the study uses total loans/financing oradvances (Chattha and Bacha, 2010; Ruprecht et al., 2013) as the case may be, from one-month to long-term financing (all maturity buckets). Unlike the CCBs, the data for the ICBsis complex due to the nature of the ICBs’ balance sheet, as Islamic banks can participate orprovide financing for their customers’ projects or assets acquisition in numerous ways asper the principles of Sharī’ah. Thus, financing, from the ICBs’ perspective, is taken from fivecommon debt-based contracts used by the ICBs across the countries[32]:
(1) Mur�abahah (or similar contracts such as Bai’ Bithaman Ajil or Bai Muajjal) (inthese contracts, an ICB sells a specific asset, which is under the ownership of thebank, using a cost plus profit mechanism);
(2) CommodityMur�abahah or Tawarruq;(3) Salam (in this contract, the price is paid in advance to the customer, and the
specified goods are supplied on a future date by the customer)[33];(4) Istisn�a’ (it is a kind of contract that is used in manufacturing of an asset according
to the customer’s specifications. The delivery of the asset is on a specified futuredate while the payment of the price is upfront); and
(5) Ij�arah (it is a rental or lease contract for a specified asset).
It should also be noted that financing extended by ICBs through equity-based contracts suchasMush�arakah (joint venture – based on profit and loss sharing) andMud�arabah (based onprofit sharing and loss bearing) is excluded from the analysis and estimation, as theirpricing mechanism is ex-post and the study is addressing only ex ante pricing contracts,which are equivalent to their conventional counterparts in terms of risk and categorisation.On the liabilities side, similarly, in the case of deposits (including PSIA), the study includesdeposits from customers (from one-month to long-term deposits maturity), deposits andplacements of banks and other financial institutions and any funding/borrowing through
Table II.Data used for the
estimation ofDuration Gap
Assets side Liabilities sideICBs CCBs ICBs CCBs
Financing, netFinancing (or financingassets or salesreceivables) using anydebt-based contract suchasMur�abahah, CMT,Ij�arah, Istisn�a, Salam, etc
Loans/advances,net
DepositsAll kinds of deposits backed byvarious Sharī’ah-compliantcontracts, for savings account,current account, fixed maturity
DepositsAll kinds of depositslike savings account,current account orfixed with timematurity
Due from banks andfinancial institutions
Due fromfinancialinstitutions
PSIA or unrestricted investmentaccount
Due to financialinstitutions
CMT-based deposits (also knownasMur�abahah payables orWak�alah payables)Due to banks and financialinstitutions
Note: For comparison, in the case of PSIA, we considered it as a deposit instead of its legal status withrespect to its contract
Study of dualbankingsystems
1269

CMT. For the purpose of clarity and to ensure appropriate comparison, the study onlyincludes “On-Balance Sheet” items listed as financing[34] (short-term to long-term) on theasset side and customer’s deposit[35] (short-term to long-term) on the liability side[36].
4.3 Data analysisThe research methodology comprises two-stages: stage one uses duration gap model tocalculate the duration gaps of the ICBs and the CCBs; stage two applies parametric tests.
4.3.1 Stage 1: Determination of duration gaps of the Islamic commercial banks and con-ventional commercial banks. The conceptual understanding of the duration gap has beenelucidated in Section 3 thoroughly. Building on the same theory, the duration gap of a bank isdemonstrated by comparing the weighted average duration of bank assets (DA) [Equation (1)]with the weighted average duration of bank liabilities (DL) [Equation (2)]. In terms of a model,the study determines the duration gap with a four-step process, consistent with Koch andMacDonald (2009), Chattha and Bacha (2010) and Chattha and Alhabshi (2017):
(1) Determining the DA and DL for each asset and liability item of the balance sheet (inthis study, financing and deposit).
(2) Finding the weight (proportion) of each item within its category.(3) Calculating the weighted duration of DA and DL using (a) and (b).(4) Calculating the DGAP through deducting DA from DL[37].
Weighted average duration of bank assets (DA):
DA ¼Xn
i
wiDai (1)
where:wi=Market value of asset i divided by the market value of all bank assets;
Dai=Macaulay’s duration of asset i [Equation (3)]; andn= number of different bank assets.
Weighted average duration of bank liabilities (DL):
DL ¼Xm
j
zjDlj (2)
where:nj=Market value of liability j divided by themarket value of all bank liabilities;Dlj=Macaulay’s duration of liability j; andjm= number of different bank liabilities.
The traditional Macaulay’s duration (D) calculation:
D ¼Xk
t¼1CFt tð Þ= 1þ yð Þt
Xk
t¼1CFt= 1þ yð Þt
¼Xn
t¼1CFt tð Þ= 1þ yð Þt
PV of the Security(3)
JIABR11,6
1270

where:D=Duration;
CFt= Cash Flow at t time;Y=Yield to maturity or rate of discount;T=Time at which cash flow is received;
PV= Present value of the security; andn=Number of years to maturity.
4.3.2 Key assumptions for the estimation of duration gap. For the estimation of DGAP forICBs and CCBs, it is also important to underline some important assumptions. The studyassumes that “there is a flat term structure for all On-Balance-Sheet accounts at all times sothat the profit rates are yields to maturity”. We also assumed that duration can besummarised as a single-factor model and “the profit rates are equal for each asset accountand for each liability account” (Bierwag and Kaufman, 1992, p. 218). In addition, thefollowing additional parameters are taken into consideration, which is consistent with BCBS(2004, 2006), Chattha and Bacha (2010), Chattha and Alhabshi (2017), Drechsler et al. (2018),Esposito et al. (2013) and IFSB (2014).
First, the study does not include the Off-Balance Sheet (OBS) items as the majority of theICBs cannot avail the OBS for transaction purposes due to certain Sharī’ah regulations,which are apparent in conventional banks. Second, the study does not include in itscalculation any proportion or item of less than one-month maturity, where no duration isconsidered. However, up to 3months is included with mid-point maturity. Third, to calculateaverage maturity for each asset and liability class, the average (or mid-point) is obtainedbetween the class’s lower boundary and upper boundary. Fourth, in most cases, each bankhas one maturity bucket where no upper boundary is available when financing/loans areclassified without a specific upper limit. In this case, the study extends each end maturitybucket to 50 per cent, as the average maturity of the asset. Similarly, we apply the same rulefor customers’ deposits on the liability side in the sample of 100 banks[38].
Finally, with respect to using a standard approach of a scale factor, it has been empiricallytested in finance that the duration of the asset is always less than the maturity of the asset. Wehold the estimated duration as 0.80 (80 per cent) of the average maturity for sample banks. Thischoice of a 0.80 factor is reflective of the non-availability of, and access to, information about thetotal sample size. This means that if the average maturity of an item is 5years, then the durationwould be 4.0 years (5 � 0.8). While the use of this factor is consistent with the literature ofBierwag and Kaufman (1992), Chattha and Bacha (2010) and Ruprecht et al. (2013), we providefurther reasons after simulation of durationwith equation (3)[39][40].
In addition to DGAP, the study also complements the findings with an estimation of thecumulative short-term liquidity mismatch gap (CLGAP) up to one-year. This is also knownas a one-year repricing gap (Zainol, 2015) over various repricingmaturity buckets, which areavailable in the respective banks’ balance sheet under liquidity risk. The CLGAP isestimated using the following equation (4) for 100 banks (50 ICBs and 50 CCBs):
CLGAPi,t= (Risk Sensitive Assets one-year) – (Risk Sensitive Liabilities one-year)
CLGAPi;t ¼ Total RSAi;t � Total RSLi;t (4)
where: i (banks) = 1,. . .,N; and t (time in year) = 1, . . .,Ti4.3.3 Stage 2: Statistical tests. In the end, after calculating the duration gaps, the study
also undertakes statistical techniques, which consist of relevant parametric tests (e.g.F-tests, t-tests) to compare the sample means of the ICBs and the CCBs.
Study of dualbankingsystems
1271

5. Empirical results, discussion and policy implications5.1 Stage 1: Determination of duration gaps of the Islamic commercial banks and theconventional commercial banksDGAP is the main pillar of this study. Before explaining the results of the duration gap ofthe 100 banks, it is important to explicate the estimation process using the methodology andassumptions presented in the last chapter. In this context, to disclose the calculation processfor the 100 banks, while Table AI (in Appendix 1) explains the DGAP for one of the ICBs,Table AII (in Appendix 1) covers one of the CCBs to illustrate DA and DL calculations.Therefore, in line with the research objectives, the results in this section explain the trendandmagnitude of the duration gap of the ICBs and the CCBs (RQ1), followed by a discussionon country-specific and regional differences of duration gap (RQ2), and a discussion of thekey reasons behind the larger duration gaps in the banking industry.
5.1.1 Comparison trend of duration gap in Islamic commercial banks and conventionalcommercial banks. Pairing the ICBs and the CCBs based on the asset size ($), theconsolidated results of the mean duration gap are exhibited in Figure 2. Among the 50paired samples used, the results reveal two important findings:
(1) ICBs have more cross-sectional and time-series variations in their mean durationgap compared to their counterpart CCBs; and
(2) ICBs have a tendency to have a higher (more) mean duration gap (28.37 years) incomparison to CCBs (11.79 years).
This shows that the ICBs have 2.41 times more mean duration gap compared to the CCBs.When the results are plotted (Figure 3) in ascending order (i.e. smaller to larger meanduration gap), the difference between the 50 ICBs and the 50 CCBs is enormous andalarming, reflecting serious implications for risk management and risk culture among thesample banks.
Figure 2.Variation of meanDGAP of banks(2009-2015)
JIABR11,6
1272

As is evident from Figure 2, which plots the duration gaps for both ICBs and CCBs, the varianceis much larger for the ICBs than the CCBs for the sample period 2009-2015 (see also Tables AIIIand AIV in Appendix 2). With the exception of two banks, which have a mean duration gap of1.90 and 1.31years, respectively, the remaining 48 CCBs have mean duration gaps of less than1.0 year. Within these 48 CCBs, almost seven CCBs have mean duration gaps close to 0, and 15CCBs have mean duration gaps less than zero (negative) reflecting positively on ALM. Thissuggests that if these banks are expecting an increase in the benchmark rate they will not beaffected negatively with respect to NW risk (Chattha and Alhabshi, 2018). For the ICBs on theother hand, at least 15 ICBs or 30 per cent of the study sample, have mean duration gaps greaterthan 1.0year. Only two ICBs have mean duration gaps close to zero. Eight ICBs account for 50per cent of the total duration gap of the study’s sample observation. The highest duration gapestimated is at Sharjah Islamic Bank, 15.96years (or a mean of 2.28) for 2009-2015, whereas thelowest duration gap is estimated to be�14.32years at KFHBahrain.
In total, seven ICBs have duration gaps in double-digit figures in terms of years. Thissignificantly higher duration gap can be attributed to the inspiration and business model ofthese ICBs, which have more long-term financing with short-term deposits, demonstratingthe inability to raise long-term deposits, consequently creating a severe mismatch in theassets and liabilities. Finance theory and academic literature suggest that when the durationgap is positive and higher, an increase in the benchmark rates, from the central bank, by anynumber of basis points would inflict severe consequences on the NW risk (or EVE) and thecapital base of the banks. In this way, our duration gap results are consistent with Khaliqet al. (2017), Chattha and Bacha (2010) and Chattha andAlhabshi (2017).
Despite higher duration gaps among the majority of the ICBs, there is little evidencesignifying that nine ICBs also have mean duration gaps less than zero (negative). We can seefrom Tables AIII in Appendix 2 that the highest negative mean duration gap is found atKuwait Finance House, followed by Al Salam Bank from Bahrain, with �14.32 and�6.21 years, respectively. This negative duration gap is an indication that some ICBs havebeen managing the ALM more effectively. The secret to maintaining the negative durationgap in the above mentioned banks, simply put, is their competence – they have beenefficacious in raising deposits from the customers on a long-term basis, and extending
Figure 3.Variance of meanDGAP of Banks
(2009-2015)
Study of dualbankingsystems
1273

financing into medium-term maturities. This mechanism appears to be the best naturalhedge against the risks associated with asset liability mismatch. The highest negativeduration gap is attributed to the fact that KFH Bahrain, Al Salam Bank and Bank IslamiPakistan, over the years, have an excess of long-term liabilities compared to financingstructure. This also means that if any of their central banks raise the benchmark rates byany number of bps, these ICBs would not be negatively affected in their jurisdictions.
5.1.2 Magnitude and countries’ trend of the total duration gap. Banking institutions,including ICBs and CCBs, are in the business of maturity transformation. Thus, it is notsurprising to the academic world that some degree of maturity mismatch is inevitable andan essential part of financial intermediation. However, what is important is to determine theseverity of the mismatch and whether the duration gap is increasing or decreasing overtime, which in the case of this study is the sample period 2009-2015, for both the ICBs andthe CCBs.
In aggregate, the study results show a general excess of short-term liabilities and long-term financing (Appendix 2). From the results, the study establishes that overall, theduration gap of all banks under observation increased during the seven years under review.For the ICBs, the duration gap remained in the range of 25-34 years, compared to the CCBs’range of 9-13 years. This indicates that the ICBs have a general tendency of maintaining ahigher duration gap compared to their conventional counterparts, the CCBs. In particular, itis noted that the duration gap difference between the ICBs and the CCBs has been increasingthroughout the seven years of research, except for 2014 and 2015, where it decreasedmarginally. Nonetheless, the difference between ICBs and CCBs remained a double-digitfigure, posing a genuine and serious concern for the ICBs and their supervisors (Figure 4).
5.1.3 Country and region specific duration gap of Islamic commercial banks. Based onthe results of RQ1, it appears that regional differences in terms of duration gap practices doexist for ICBs. Therefore, to explain the regional specific duration gap differences of theICBs, the study divided the sample of 50 ICBs into three regions: Gulf Cooperation Council(GCC), South Asia and South East Asia (SASEA) and MENA and West (MENAW). Thetotal number of ICBs from the GCC stood at 22: Bahrain (7), Kuwait (4), Qatar (4), SaudiArabia (3) and UAE (4); the SASEA region had 20 ICBs: Bangladesh (3), Indonesia (2),Malaysia (11), and Pakistan (4); and the MENAW region had 8 ICBs: Jordan (2), South Africa
Figure 4.Trend andmagnitudeof DGAP of banks(2009-2015)
JIABR11,6
1274

(1), Turkey (4) and Yemen (1)[41]. This grouping is done for the purpose of comparing theresults of duration gaps of ICBs across countries, rather than to make any geographicalclassification of the sample countries.
Based on the above classification of regions, Figure 5 highlights that the SASEAaccounts for the largest duration gaps, with 107 years (54 per cent), followed by the GCC,with 65 years (32 per cent), and finally, the MENAW with only 27 years (14 per cent). Thisdemonstrates the SASEA is the host of more duration gap and indicates the vulnerability ofthe ICBs operating in this region. Within SASEA, Malaysia is the dominant jurisdictionindicating significantly higher duration gaps. On the other hand, the GCC, which is almostthe same size of SASEA, has almost 50 per cent lesser duration gaps compared to SASEA.Thus, regional distribution is skewed towards SASEA. For this reason, this study examinedthis region in detail and carried out empirical tests.
On the other hand, despite higher duration gaps for ICBs, it has been established by thestudy that all three regions tend to converge to the lowest duration gap in recent years. Thiscould be attributed to the implementation of Basel III LCR and NSFR ratios for liquiditymanagement, which started being implemented in 2014. On one hand, the recent trendindicates positive change in the risk profile of ICBs, but on the other hand, it also indicatesthat the difference in the duration gaps of these regions is significant and demands attentionby the ICBs in their internal risk management culture, and by their respective supervisoryauthorities in their Pillar II supervisory review process.
In terms of countrywide findings, the results revealed two important observations for thesimple observation:
(1) there are nine countries, which have positive duration gaps; and(2) four countries have a negative duration gap.
It is interesting to note that ICBs in these four jurisdictions (Bahrain, Jordan, Pakistan andYemen) tend to have close to zero or negative duration gaps (Table AV). A closeexamination of these four jurisdictions’ ICB’s balance sheets reflects that they are managingtheir duration of assets and duration of liabilities more effectively through long-termliabilities and reduced concentration of financing for longer-term maturities. This suggestsand implies that these ICBs would not be affected should the benchmark rate be increased
Figure 5.Regional Distributionof the ICBs’DGAPs
(Yrs.)
107
65
27
0
20
40
60
80
100
120
SASEA GCC MENAW
Study of dualbankingsystems
1275

by their respective supervisory authorities. However, the problem is far more serious in themajority of the other jurisdictions, which have positive duration gaps, suggesting the needfor crucial reviews of their business models.
It is essential to mention that among the 13 jurisdictions, Malaysia (38 per cent), UAE (20per cent), Indonesia (13 per cent) and Turkey (10 per cent) constitute almost 80 per cent of thetotal duration gap of the 50 ICBs. Not surprisingly, Malaysian ICBs have significantlyhigher mean duration gaps; which is interesting not only because of Malaysia’s pioneeringrole in Islamic banking (Chattha and Bacha, 2010) but also because Malaysia has probablythe most well-developed and competitive banking sector among the study’s 13 samplecountries. This highlights the rationale for closely examining the business model of theseICBs within Malaysia to identify what is causing these ICBs to have higher duration gaps,which can expose them to benchmark rate risk.
To add more significance to the existing literature and to investigate other on-balancesheet motivations of such a difference in the duration gap management practices among theICBs across the 13 jurisdictions, we examined the business models of these ICBs thoroughly –by investigating their respective financial reports. This led to an appraisal of the key balancesheet indicators that could possibly explain the reasons. These indicators included: averagefinancing to total assets ratio (FINA), average financing to total deposits ratio (FDR), averageliquid assets to total assets ratio (LIQR) and average cumulative liquidity gap to total assets(LIQG). The balance sheets of the ICBs suggest that Mur�abahah financing is the mostdominant form of financing extended by the ICBs to the customers to meet their differentneeds. The results of the FINA, FDR, LIQR and LIQG are discussed below and are presentedin Figure A1 in Appendix 2.
In terms of FINA, ICBs also tend to have higher ratios compared to their counterparts,the CCBs (Figure A1). In particular, almost 15 or 30 per cent of ICBs have an average FINAabove 70 per cent for the period under observation, compared to only 8 CCBs that stand atabove 70 per cent. This demonstrates that the ICBs have not been successful in diversifyingtheir portfolios. The study establishes that higher duration gaps in ICBs are explained bythe higher FINA, as most ICBs channel their financing into long-term maturity buckets, as isevident in the duration gaps of the ICBs. The use of longer maturity buckets for financingpresents a danger to ICBs with respect to the ALM. Similar to the FINA, the FDR alsoappeared higher for the sample ICBs compared to their conventional counterparts, the CCBs(Figure A1). In particular, to understand whether an ICB’s aggressiveness in undertakingcustomer financing can explain their larger gaps, the study compared ICBs’ FINA to theduration gaps and found some evidence of correlation, although not a strong one. This isunderstandable because for the FINA to influence the duration gap it must becomplemented with longer maturity. For instance, if an ICB has 70 per cent FINA, but it isfinancing to customer utilisation is within the short-term maturity buckets (say less than5 years), then it will not have a direct impact on the duration gap. The second controllingsituation is that if the duration of liabilities is longer, irrespective of the financing maturities,the duration gap is also going to be affected. In short, there is some evidence for a few banksthat have higher FINA to have higher duration gaps[42]. This correlation between the FINAand the duration gap needs to be empirically tested to ascertain whether this factor or anyother factor, significantly influences the duration gap with a larger sample size over a longerperiod of time.
With respect to the LIQR, the results indicated that the ICBs have a higher average LIQRcompared to their counterparts, the CCBs (Figure A1), which can easily be attributed toexcess liquidity and the unavailability of a number of instruments, on both the asset andliability side, in ICBs. More than 70 per cent of the ICBs have significantly higher LIQR
JIABR11,6
1276

compared to the CCBs. The lowest average LIQR for one of the ICBs stands at 6.19 per centand the highest average LIQR stands at 34 per cent. 22 ICBs have an average LIQR of morethan 20 per cent, whereas 28 CCBs’ average LIQR stands below 15 per cent. While thisindicates a good trend for the ICBs, in terms of being liquid, it also highlights the deepliquidity problems faced by ICBs on the asset side. In the absence of HQLA and lack ofopportunities, ICBs tend to hold more liquid assets (or cash) which, in turn, exposes theseICBs to risk-return trade-offs.
Moreover, the results of the 50 ICBs indicate that a majority of the ICBs have a negativeLIQG (or CLGAP) compared to the CCBs. An important observation noted in Figure AIII isthat both, the ICBs and the CCBs, have negative liquidity gaps, however, the magnitude ofthe ICBs’ CLGAP is significantly higher when compared with the CLGAP of CCBs as apercentage of total assets. In this respect, it is important to note that a bank is considered tohave positioned itself adequately in terms of assets and liabilities as long as short-termnegative gap does not exceed 10 per cent of the total assets. While this threshold may be anindustry norm, it would be judicious to note that different central banks can have differentmaturity mismatch limits.
5.2 Stage 2: Statistical tests5.2.1 Empirical tests for duration gap of Islamic commercial banks and similar sized conven-tional commercial banks. Given the small population size, in comparing the sample means ofICBs and CCBs to test our hypothesis, student’s t-test is used as the parametric test. The t-test will confirm that the hypothesis for RQ1 is statistically significant:How do the durationgaps of ICBs compare with those of similar sized CCBs? Hence, our first hypothesis is asfollows:
H1. There is a significant difference in the duration gaps of ICBs compared with thoseof similar sized CCBs.
Running the parametric t-test for paired samples, the results for one tail and two-tail testsare presented in Table III. As can be noted from Table III, the sample statistics (2.659) fulfilthe critical value of 5 per cent confidence level (2.010) to reject the null hypothesis, with theprobability of the one-tail test (0.005) and two-tail test (0.01), which are significant.
Table III.t-test – paired twosample for means
Mean duration (ICBs) Mean duration (CCBs)
Mean 0.5674 0.2359Variance 0.6251 0.1449Observations 50 50Pearson correlation �0.0126Hypothesised mean difference 0Df 49t Stat 2.659P(T# t) one-tail 0.005t critical one-tail 1.677P(T# t) two-tail 0.011t critical two-tail 2.010
Notes: The descriptive statistics of the test are available upon request; the following rules are applied forthe hypothesis: (a) If the absolute t Stat value> 2 or the t Stat value is larger than the t-critical value, thenthe ratio is significant, and; (b) If the p-value is less than alpha (level of significance), then it is significant
Study of dualbankingsystems
1277

Therefore, the study rejects the null hypothesis and confirms that there is a significantdifference in the duration gaps of ICBs compared to CCBs.
5.2.2 Empirical statistical tests between groups. To claim that the group’s mean durationgaps are statistically different from each other, we would need to run empirical statisticaltests for RQ2: Are there any country-specific and regional differences among ICBs in terms ofmanaging their duration gaps? Thus, our second hypothesis is as follows:’
H2: There is a significant difference in the country-specific and regional differencesamong ICBs in terms of managing their duration gaps.
As our quantitative results highlighted Malaysian ICBs’ duration gap concentration,therefore, to determine whether Malaysian ICBs are indeed statistically significantlydifferent from the other ICBs from different countries and whether the findings of the study,that ICBs have higher duration gaps than CCBs, may have been skewed by this, we carriedout a series of eight F-tests similar to Chattha and Bacha (2010). The results of these F-testsare presented in Table IV. Except for one test (which compares GCC ICBs and SASEA ICBs),all the remaining tests are conducted with respect to the duration gap of Malaysian ICBswith other ICBs. The reason behind exclusively studying Malaysian ICBs is theirsignificantly larger gaps, as pointed out in the previous subsection.
Overall, the results reveal that there is sufficient evidence available to reject the nullhypothesis. We found a substantial country-specific difference in risk profile and MalaysianICBs have significantly higher duration gaps. The first five of the eight tests examinewhether the group of 11 Malaysian ICBs are statistically different from the other ICBswithin the sample. In this respect, four out of five hypotheses, that the average duration gapof Malaysian ICBs equals that of the other ICBs, are strongly rejected and have a probabilityof less than 2 per cent of being true. This essentially confirms that Malaysian ICBs areindeed different from ICBs from our other sample countries. Interestingly, the last test ofMalaysian ICBs vs. Pakistani CCBs is also rejected, confirming the existence of significantdifferences across the ICBs and CCBs. The rationale behind running this test was the factthat both the ICBs in Malaysia (11 ICBs) and the CCBs in Pakistan (10 CCBs) had the largestgaps within their respective categories. However, Table IV also specifies that there isinsufficient evidence available to reject the fifth test (Malaysia ICBs vs MENAW ICBs),
Table IV.Comparison of meanduration betweengroups (F-test)
p-Value
Variable F-Statistic F-Critical P(F# f) one-tailNo. ofobservations
Malaysia ICBs vs Bahrain ICBs 6.01 3.21 0.0068 11 vs 7Malaysia ICBs vs Other ICBs 3.78 2.66 0.0146 11 vs 39Malaysia ICBs vs GCC ICBs 4.37 2.76 0.0100 11 vs 22Malaysia ICBs vs SASEA ICBs 4.10 3.07 0.0204 11 vs 9Malaysia ICBs vs MENAW ICBs 2.68* 3.13 0.0769 11 vs 8GCC ICBs vs SASEA ICBs 1.71* 2.14 0.1231 22 vs 20Malaysia ICBs vs Turkey CCBs 3.56* 3.63 0.0524 11 vs 8Malaysia ICBs vs Pakistan CCBs 5.76 3.13 0.0072 11 vs 10
Notes: * No significant difference as the value of F-statistic is < F-critical, suggesting group variances areequal; before applying the statistical test for country-specific differences, the study computed the meanduration gaps of ICBs by country. Tables AV and AVI in Appendix 2 show the results of the computationfor each country and region for the period 2009-2015
JIABR11,6
1278

suggesting that there is no significant difference between these two groups. Similarly, forthe sixth (GCC ICBs vs. SASEA ICBs) and seventh tests (Malaysia ICBs vs Turkey CCBs),there is insufficient evidence available to reject these two tests. In fact, these two tests wereundertaken to indicate whether there are any differences across the two regions, the GCC (22ICBs) and SASEA (20 ICBs), which host almost 84 per cent of the sample ICBs.
5.3 Prudential policy implicationsThe study has significant prudential policy implications on the institutional level (banklevel) and supervisory level. Although the scope and proportionality of these implications isdependent upon the ICBs’ size, business model, complexity and cross-border operations, therelevance of these implications, however, is broadly applicable, irrespective of thejurisdiction where the ICBs operate.
First, the tendency to have a higher duration gap in ICBs does not explain the reasons forthe same. This necessitates identifying the reasons why ICBs find themselves plagued byrelatively higher duration gaps. Having examined the business models of the ICBs from 13jurisdictions, we establish that due to the specificities of Islamic finance, ICBs would tend tohave higher duration gaps, as they can not avail of certain risk management tools andtechniques, due to certain Sharī’ah limitations. These techniques include:
� lack of Sharī’ah-compliant hedging instruments (e.g. swaps and options);� lack of financing or assets’ tradability (i.e. factoring of financing);� lack of Sharī’ah-compliant securitisation;� lack of adjusting the price of assets due to sale contracts; and� lack of floating rate assets and fixed rate liabilities.
These tools are easily available to the CCBs. Although the use of Sharī’ah-complianthedging instruments (such as profit rate swaps) is still not a common practice among ICBs,we are of the view that Shariah Supervisory Board of the respective ICBs should pay dueconsideration to the use of Sharī’ah-compliant hedging instruments and resolve the mattersfrom a financial stability perspective. In this respect, the International Islamic FinancialMarket (IIFM) has issued several documents including Mubadalatul Arbaah (Profit RateSwap), which can be effectively explored and used by the ICBs.
Second, we also determined that the variation of duration gaps is also attributed:� to the different reporting standards, in particular, the disclosure of the maturity of
assets and liabilities into different maturity buckets. We did not find the consistencyof maturity buckets across the ICBs as there was little evidence available for theICBs to have implemented the AAOIFI accounting standards; and
� to the severe mismatch between their assets and liabilities, particularly on theliability side, due to the unavailability of financial instruments for different maturitybuckets.
To this end, funding long-term deposits or borrowing, either through the Sharī’ah-compliantinter-bank market or through the Islamic capital market is considered a major issue. Theinability to raise long-term deposits or funding is due to many reasons, including, theinability of the ICBs to price the long-term deposits, lack of active Islamic capital market,and inadequate regulatory framework on issuing Sukūk as source of long-term funding.While long-term deposits can certainly bring the duration gap down to a low level, an
Study of dualbankingsystems
1279

important consideration remains, however, that the ICBs will have to compensate the PSIAor depositors with competitive returns to entice long-term deposits.
Third, the ICBs should continuously monitor and control the gaps between maturingassets and liabilities in various time buckets. Control over maturity gaps should receiveparticular attention from the ICBs. A maturity ladder is a useful device to compare cashinflows and outflows for different time periods. There should be proper management of theduration gap of the assets and liabilities. In this respect, the ICBs should have in placethe approved limits, set by their respective BOD, for maximum CLGAP and DGAP. Theselimits should be implemented by the ALCO. Furthermore, for ICBs, a review of the businessmodel (both financing and funding options) is important to determine, which segment iscausing higher duration gaps.
The next implication comes from examining the structure of the duration gaps of theICBs, where banks with the largest duration gaps tend to have the largest DA with low DL.This suggests that the size of the duration gap is correlated with lengthy asset duration butnot with short (not long) liability duration (Chattha and Bacha, 2010; Chattha and Alhabshi,2017). As an example, the bank with the highest duration gap (Sharjah Islamic Bank) has thelargest asset duration compared to duration of liabilities. For instance, for the year 2015,Sharjah Islamic Bank’s total duration gap is 2.26 years (2.41� 0.14), in which the total DA isfound to be 2.41 years and DL is found to be only 0.14 years. This indicates that almost 27per cent of its total financing is in the “12months to 60 months”maturity bucket, and 30 percent of its total financing is from the “over 60 months” maturity bucket. On the other hand,64 per cent of the total liabilities (or deposits) are in the less than 3months maturity bucket,and 12 per cent is in the “3months to 12 months” maturity bucket. The business model ofthis bank indicates a high concentration of short-term funding to finance long-term assets,thus explaining why the duration gap is higher. Similar observations have been made atMalaysian banks and banks in the GCC. It is quite surprising, particularly in Malaysia, thatthe ICBs tend to have higher duration gaps especially considering the fact that Malaysia hasone of the finest Islamic finance architecture, including Islamic inter-bank, Islamic depositinsurance, Islamic commodity house, etc. This shows that an examination of the asset side isimportant to explain the larger gaps of ICBs across the jurisdictions.
Moreover, on the liability side, it is noticeable from the sample that ICBs have fewerinstruments for long-term deposits, compared to the CCBs. This seems to restrict the abilityof ICBs to increase the DL, which can help manage the duration gap of the bank. In somejurisdictions, the utilisation of CMT-based deposits has helped some ICBs to increase theirDL. For instance, in Kuwait and Bahrain, the ICBs raise funding through CMT into longer-term maturities, which are being rolled over. This helps them in managing DL. Additionally,there is also some evidence of the same at a few ICBs, which have issued Sukūk to raise long-term funding. While this has not been a common phenomenon due to the underlyingSharī’ah and regulatory requirements, it can help to manage the duration gaps of ICBs in thefuture.
It is also important to highlight that as a result of the higher duration gap, the ICBs arevulnerable to a significant loss of EVE or NW risk under an increasing benchmark rateregime (Chattha and Alhabshi, 2017; Khaliq et al., 2017). This in return, can cause problemsof early settlement for financing, leading to higher non-performing financing (NPF), whichcan ultimately impact the capital base of the ICBs. On the other hand, the emergence of DCRis also inevitable, causing early withdrawals by the customers due to higher expectations ofPSIA, and their switch to CCBs in a dual banking system. This would be a concern for theirsupervisors indicating the need for strengthening risk management tools (such as stress
JIABR11,6
1280

testing), and applying innovative new techniques including PLS, to reduce the asset-liabilitymismatches.
Referring to LIQG (CLGAP) in Figure A1 the existing business model of ICBs presents adanger of asset/liability mismatches, highlighting the need for innovation to effectivelymanage the duration gap with appropriate risk management tools. This innovation musttake into consideration the close examination and review of the Sharī’ah-compliant hedgingtools approved and endorsed by the SSBs, and potential delinking efforts resulting inshifting from debt-based financing to equity sharing instruments such asMush�arakah (jointventure – based on profit and loss sharing) and Mud�arabah (based on profit sharing andloss bearing). This study reveals that asset-based financing is the core element in ICBs,dominated byMur�abahah, Ij�arah, Istisn�a and CMT instruments. These instruments, due totheir Sharī’ah rules and principles, serve to lengthen the duration and liquidity gaps of ICBsbecause exits from these transactions cannot be agreed upon in advance.
Next, taking into account the negative CLGAP of ICBs, it is quite obvious and reasonableto argue that until ICBs diversify their funding base, including the use of short-term fundingmarkets offering liquidity at a variety of tenors in a Sharī’ah-compliant way, they willcontinue to be exposed to a bank-run scenario. Without a stable and long-term funding baseand HQLA, this makes ICBs less resilient to exogenous liquidity shocks. With a negativemismatch, ICBs may face funding risk, call risk, and event risk (i.e. the risk of ratingdowngrades). This indicates a need to:
� identify the profit rate sensitive products and activities in which the ICB is involved;� establish a limit structure to monitor and control its profit rate risk;� measure profit rate risk through establishing a maturity/re-pricing schedule that
distributes profit rate RSA and RSL in pre-defined time maturity buckets (or timebands); and
� estimate the EVE under different stress shock scenarios (e.g. 200 bps) on a regularbasis under Pillar II.
Finally, it is important for supervisory authorities to provide comprehensive guidance onthe duration gap approach tailored for ICBs. The guidance should include surplus orshortfall of liquidity of ICBs or more specifically, the mismatch between inflows arisingfrom financing activities on a contractual or behavioural basis and outflows arising fromfunding activities in various maturity buckets. The mismatches reported by the ICBs shouldbe studied in detail, and supervisory actions should be taken against the ICBs that have asevere negative CLGAP. Moreover, supervisors should require single maturity buckets (e.g.up to 1month, 1-3months, 3-6months, 6months to 1 year, 1-3 years, 3-5 years, 5-10 years,etc.) in their jurisdiction for all banks including ICBs, and enforcement of the consistentusage of buckets should be part of the supervisory approach. Any change in the bucket bythe ICBs, for any year, has to be made known to their supervisors, along with the rationaleand reasons for the same. Supervisors are to improve the disclosure regime by implementingBasel Pillar III or the equivalent of the IFSB. Particularly, on-site department to makeinspections and off-site department to monitor data and initiate dialogue on negativeliquidity mismatches within ICBs, and this should be followed by remedial actions.
6. ConclusionPrevious research has shown inconclusive results in dual banking systems for time-seriesand cross-sectional characteristics, in terms of duration gaps for the ICBs and CCBs. Anovelty of this research is that it provides empirical evidence regarding the estimation of the
Study of dualbankingsystems
1281

duration gap for ICBs and CCBs from 13 countries. The analysis offered deeper insight intothe issue and gave ICBs guidance on managing the duration gaps within their uniqueintegrated regulatory system. By using the duration gap approach, the study establishedthat among the 100 banks, the ICBs showed more cross-sectional and time-series variationsin the duration gap. In particular, we found that ICBs had more variations in their meanduration gap compared to the CCBs, and they have a tendency for a higher (more) meanduration gap in comparison to the CCBs. This shows the ICBs as having 2.41 timesmore duration gap compared to the CCBs, and they are exposed to increasing ROR risk dueto their larger duration gaps and severe liquidity mismatches. We established that thehigher the duration gap, the higher would be the profit rate sensitivity of a financialinstrument, and vice-versa.
Moreover, the study also found that the duration gap difference between the ICBs and theCCBs, throughout the seven years of research observation, remained significant at16.50 years. It was also evident that the majority of the ICBs having a negative CLGAPcompared to the CCBs, and the magnitude of the ICBs’ CLGAP is significantly wider whencompared with the CCBs. With respect to regional differences, in terms of duration gap, theresults showed that the SASEA accounts for the largest duration gaps, followed by the GCCand the MENAW. This demonstrates that the SASEA is the host of more duration gaps, andindicates the vulnerability of the ICBs operating in this region. Out of the 13 jurisdictions,there are six jurisdictions (Indonesia, Malaysia, Qatar, Saudi Arabia, Turkey and UAE)where ICBs are more vulnerable in terms of duration gap and EVE risk.
Our study has significant policy implications on the institutional level and regulatory.Given that global benchmark rates are currently at a low, having fallen steadily over thepast several years after the GFC, the study cautions that larger duration gaps will pose aserious challenge to ICBs as the benchmark rate cycle turns. One should bear in mind that asa result of higher duration gap, the ICBs are vulnerable to a significant loss of EVE or NWrisk under an increasing benchmark rate regime. This should be empirically tested. For theICBs to fully deflect this risk, while being part of a dual banking system, would require themto undertake significant improvements in their risk management tools (such as stresstesting), and applying innovative new techniques.
We also argue that ICBs’ business model of having more long-term financing with short-term deposits demonstrates their inability to raise long-term deposits, consequently creatinga severe mismatch in the assets and liabilities. In our policy implications, a number of policyactions are recommended for the ICBs to address the duration gap. To reduce the durationgap, on the asset side, ICBs should engage in the diversification of their financing intomedium-term maturities and into liquid assets (e.g. HQLA). The ICBs should alsocontinuously monitor and control the gaps between maturing assets and liabilities invarious time buckets. The use of Sharī’ah-compliant hedging instruments (such as profitrate swaps) by the IIFM should be studied and implemented by the ICBs. A shift from debt-based financing to equity sharing instruments such as Mush�arakah and Mud�arabah isdesired for ICBs and supervisors should provide clear guidance on the operationalisation ofthis shift. Moreover, we also suggest that the ICBs should have in place the approved limits,set by their respective BOD, for maximum duration gap, and these limits should beimplemented by the ALCO, and supervisors to enforce the implementation under Pillar 2.Other than supervisors, the role of international regulatory standard-setting bodies ofIslamic finance (e.g. IFSB) to develop a regulatory framework tailored for ICBs is alsoessential. The implementation of IFSB relevant standards by the ICBs will improve theoverall financial soundness and stability of the ICBs.
JIABR11,6
1282

6.1 Limitations and future directionOur study, similar to other studies, has some limitations due to the scope as we specificallyfocussed on a specific tool of risk management (which is the duration gap for benchmarkrate risk under ALM). We make the following suggestions for further study. Future studiesought to be undertaken, perhaps, in the year 2019, to see the full effect of the IFSB LCR andNSFR standards on the liquidity management practices of the ICBs. A larger sample size of100 ICBs with 10 years’ data after the GFC would be more beneficial to the industry.Moreover, other than mismatch as a percentage of total assets, different measures ofliquidity mismatch can be adopted, such as mismatch as a percentage of unrestricted PSIA.Cross-sectoral perspective with a duration gap can also be captured. The impact of anincreasing benchmark rate (e.g. 100 bps, 200 bps and 300 bps) on the ICBs as per the IFSB 20per cent threshold can also be established with the duration gap approach. Finally, thedeterminants of the duration gap for ICBs can be studied through Panel GMM estimation orRandom effect or Fixed effect approach.
Notes
1. It is common understanding in the literature that Islamic banking involves the provision offinancial services by IFIs based on contracts that, apart from social and moralconsiderations, adhere to Sharī`ah rules and principles with precepts such as profit-and-loss sharing, asset-backed and/or sales-based forms of financing/fund raising, etc.(Section 2)
2. The term “IFIs” is used broadly to refer to any institution offering Islamic financial products and/or services; whereas the term “ICBs” is used specifically to refer to Islamic Commercial Banks.The Islamic Financial Services Board (IFSB) uses the term “IIFS” for ICBs instead of IFIs as usedby the AAOIFI.
3. For instance, in addition to Muslim dominant jurisdictions, non-Muslim jurisdictions (e.g. China,Singapore, Hong Kong, UK, Luxemburg, Japan, Korea, Mauritius, South Africa and Zambia)have not only indicated their interest in Islamic finance but also have shown some developmentsin the promotion of Islamic finance (Chattha, 2017a).
4. The IFSB was established in 2002 by central banks as a multilateral organisation to setprudential standards for the IFSI. It deals with issues common to the banking, securities andinsurance sectors and complements the work of the BCBS, the IOSCO and the IAIS,respectively.
5. Interest rate risk (IRR) or “profit rate risk” or “benchmark risk” or “ROR” is used interchangeablyin the study. Khan and Ahmed (2001) uses “benchmark risk” or “ROR” terminology instead of“IRR” so as to avoid unnecessary confusion since ICBs do not deal directly with interest rate.Subsequently, this term was used by the IFSB (2005, 2007), and other academicians andresearchers (Cihak and Hesse, 2008; Chattha and Bacha, 2010). As a matter of practice and forcertain reasons, ICBs use benchmark rate (e.g. the LIBOR) to price different financial instruments,therefore, changes in the market rates introduce some risk in the earnings and values of assets ofICBs.
6. The term changing benchmark rates does not imply that the benchmark rates used by the ICBsare floating rates, rather it indicates the direction of the rate, that is, an upward or downwardincrease in the benchmark rate. The term “changing benchmark rates” has been used by theBCBS (2004, p. 29). Moreover, for discussion on the Sharī`ah perspective for benchmarking,Omar et al. (2010).
7. Basel II has three Pillars (BCBS, 2006). Pillar 1 is about minimum capital requirements, whereasPillar 2 presents the supervisory review process of CCBs, while Pillar 3 covers the disclosure
Study of dualbankingsystems
1283

requirements. Similarly, the IFSB has outlined its equivalent standards, such as IFSB (2013, 2014,2007) corresponding to Pillar 1, Pillar 2 and Pillar 3, respectively.
8. Given that some ICBs have tweaked their modus operandi, changing their business models (e.g. a shift from PSIA to CMT-based funding) to address the issue of higher duration gaps,analysing the impacts of changing business models of ICBs on liquidity and duration gaps isimportant. This will establish: whether CMT in the ICBs in terms of liquidity and durationgaps has been effective or not; whether the duration gaps have increased (or decreased)during the last 10 years; and what the major causes for the increasing (decreasing) gapsamong the ICBs are?
9. At present, according to some studies and estimates, Islamic financial products and services arebeing offered by more than 300 IFIs in more than 75 countries, and the IFSI’s assets are projectedto be worth over USD 3 trillion by 2020, a substantial increase from a mere USD150 billion(1990s).
10. The Islamic banking sector in some jurisdictions (e.g. Brunei, Kuwait, Malaysia, Qatar, SaudiArabia, and the UAE) is gradually becoming substantial. These jurisdictions seem to haveaccomplished at least 15% market share for their ICBs compared to total banking assets.
11. For instance, under sales financing, the Mur�abahah contract requires having a specific asset,which is under complete ownership of the ICB, on which there is an agreement on cost and profit.
12. While unrestricted PSIA are reflected on-balance sheet as they are comingled with the funds ofshareholders, restricted PSIA are normally considered as off-balance sheet assets and they are“managed by an ICB as an investment manager based on either a Mud�arabah contract or anagency-basedWak�alah contract” (IFSB Compilation Guide, 2011, p. 32).
13. The client alone bears the risk of loss unless this is due to misconduct and negligence on the partof the ICB. In effect, the ICB asmudarib has no funds in theMud�arabah exposed to losses.
14. DCR is the “consequence of the rate of return risk. It refers to the magnitude of risks that aretransferred to shareholders to cushion the IAH from bearing some or all of the risks to which theyare contractually exposed in Mud�arabah funding contracts” (Islamic Financial Services Board(IFSB), 2005, p. 23).
15. For instance, in aMur�abahah transaction, “the market risk transforms into the credit risk, that is,market risk is applicable before selling the Sharī’ah-compliant commodities to the counterpartyand after selling to counterparty market risk converts into credit risk when the payment is ondeferred terms” (Chattha, 2013, p. 89).
16. The CAR also requires special attention to be paid to the PSIA, as suitable credit and market riskexposures arising from assets are proportionately borne by unrestricted PSIA as per theMud�arabah contract (IFSB, 2013). This is known as Alpha (a).
17. Due to various considerations, quite recently, some ICBs have tweaked their modus operandi –changing their business models to address the issue of higher duration gaps, but thesedevelopments have resulted in increased risks (Chattha, 2010; IFSB, 2015). The implications ofthis, and other different models within the ICBs, are relevant subjects of study within the contextof dual banking systems.
18. Prior to issuing IFSB-17, Chattha et al. (2014) identified the need for assessment of ROR riskunder the study entitled “Evaluation by the IFSB of Core Principles Relevant to Islamic FinanceRegulation”.
19. For example, if interest rates were expected to increase, management would want to shift from apositive to a negative gap position; it could do this by reducing the DA and/or increasing the DL.
20. Bierwag and Fooladi (2006) further explain that it was not until the 1980s that there waswidespread use of the duration concept in financial markets, in particular, how it could be used tominimise IRR. In late 1979 and early 1980, the volatility of IRR increased remarkably, and
JIABR11,6
1284

practitioners became very interested in the duration concept. As the 1980s proceeded, anenormous number of applications of duration were found and it became a concept havingcommon use in the financial markets.
21. However, it is important to note that Fisher and Weil (1971) provided evidence of the impact of anon-flat term structure on duration (DA or DL). By combining first-order derivative (or first-orderapproximation) and second- and higher-order (second-order approximation), both Macaulay andFisher–Weil duration measures can be enhanced.
22. This approach matches the rate-sensitive assets (RSA) and rate-sensitive liabilities (RSL) to bematured within a specified range of maturity dates (i.e. 0-3 months, 3-6 months, 6-9 months, 1year, etc.). In fact, according to Alden (1983) the gap model derives its name from the dollar gap(Gap $) that is the difference between the dollar amounts of RSA and RSL. Gap $ = RSA $- RSL $.RSA are those that can experience contractual changes in interest rates during the gappingperiod. All financial assets that mature within the gapping period are rate-sensitive. RSL aresimilarly defined.
23. These are defined as computer designed modeling techniques with varying levels ofsophistication, which provide results in a dynamic context. Regarding simulation models, it isdebated that these models are often criticised as being “black boxes”, having unknown internalstructures, and their inability to reflect the actual environment of the institution or bank beingmodelled.
24. In these steps, it is important to mention that on-balance sheet and off-balance sheet effects areincluded when calculating the duration gap. These estimates are used to calculate duration gap.However, this study will not incorporate the OBS items (as explained in Section 4).
25. Ihlas Finans House from Turkey closed in 2001 due to liquidity problems and financial distress.
26. The accessibility to long-horizon data posed a serious challenge. This was due to the factthat most of the ICBs started operations globally after 2007 and 2008. In addition, thoseICBs which started operations before 2005 did not provide archive data on their websiteand other sources (such as stock exchange), which limited the scope of their inclusion intothe sample.
27. We wanted to be very clear about the selection of the sample, and not to confuse the Islamicwindows with ICBs for comparison purposes. This process ensured that the selection of the ICBswould be purely based on them being full-fledged ICBs in any jurisdiction.
28. Countries such as Brunei, Egypt, Lebanon, Tunisia, Algeria, Syria and UK with dual bankingsystems, where ICBs are allowed to operate, were not included in the sample of the selected 13countries due to the unavailability of data and relevant information on the maturity breakdownof the assets and liabilities of the ICBs in these countries.
29. Taking into account the data challenges, we removed many ICBs from being part of the samplefor the study, although initially the study included a sample of more than 100 ICBs.
30. In the process of pairing the ICBs with the CCBs, it was found that the asset size of most of theICBs is smaller than that of the CCBs. To pair them with respect to the above conditions, we hadto access more than 100 CCBs. It is also interesting to note that once a pair was formulated basedon asset size, we found that the paired CCB does not always have long-horizon data, and at times,the relevant information on the maturity breakdown of the assets and liabilities was notavailable. This led to perusing more than 1,000 (100 � 9; 100 banks’ annual reports across 9years) annual reports of the CCBs. Finally, after considering the above challenges, and applyingthe conditions of pairing, the final 50 CCBs which are similar to the ICBs were selected fromacross 12 countries.
31. Term loans or advances apply to the CCBs, and financing (or Islamic financing) applies to theICBs.
Study of dualbankingsystems
1285

32. According to IFSB (2017), the data on “financing by type of the Shariah-compliant contracts”reveals that these five major financing contracts used by the ICBs as of 2017Q1 cover almost 85 percent of total financing extended by the ICBs. www.ifsb.org/preess_full.php?id=400&submit=more
33. From the Sharī`ah perspective, both Salam and Istisn�a’ represent an exception to the sale rule (i.e.existence of assets at the time of sale).
34. Financing or loans/advances are the terms used by different banks. Financing covers short termfinancing, medium term financing and long term financing, for both ICBs and CCBs. However,the contracts used by both ICBs and CCBs are different.
35. Customer deposit, investor capital, participating capital, unrestricted equity of PSIA or depositsare the terms used on the liability side.
36. In addition, on the asset side, the study excludes any other assets such as fixed assets, deferredtax assets, investment in associates/real estate, etc. On the liability side, the study excludes otherliabilities such as bills payable, deferred tax liabilities, etc.
37. Where the total amount of interest bearing assets and liabilities are not equal, then the DGAP is;
D GAP ¼ DA � LA � DL
� �
38. This is because some banks have 15 years financing and others 20 years. There could be severalmaturity buckets providing different years of maturity in the banks which vary from onejurisdiction to another. Instead of assuming one constant estimated maturity [any year], thestudy considers the 50 per cent extension of the last bucket to calculate the duration gap. This isconsistent with Chattha and Bacha (2010) and Chattha and Alhabshi (2017).
39. To be able to gauge the enormity of the problem, we elucidate with the help of the following example.For instance, if there are seven maturity buckets covering financing on the assets side of an ICB, andsimilarly assuming the same for deposits on the liability side, if we combine these buckets togetherwe would need the duration of 14 buckets corresponding to the assets and liabilities. In this case, 14items for one ICB require the estimation of duration for DGAP, given the information on eachaccount’s profit rate, repricing schedule, early withdrawal potential and default probability. The totaldifferent durations for 9 years will work out to be 12,600 durations (14 � 9 = 126 � 100 banks) withdifferent numbers. To estimate these 12,600 durations across a sample of 100 banks, we would needaround 6,300 excel work sheets for each maturity and profit rate.
40. Therefore, keeping in mind the simple finance rule that duration will be lower than the actualmaturity of the asset/liability item, and with the available information on each type/category offinancing along with its maturity and profit rate, various simulations were undertaken to find outthe appropriate and reasonable single measure of duration. For instance, given the availableinformation, and by applying some assumptions on the asset side, using equation 3, we estimatedthe DA of some banks, which indicated DA varied from 0.70 to 0.85 of the estimated maturity,although the results were indifferent in terms of estimation of DGAP when using any pointbetween this range. As such, the duration measure of 0.80 was deemed more appropriate andreasonable to be assumed as the duration estimation of various components of assets and liabilities.
41. Similarly, the total number of CCBs from the GCC stood at 13: Bahrain (2), Kuwait (4), Qatar (1),Saudi Arabia (1) and UAE (5); the SASEA region had 20 CCBs: Bangladesh (2), Indonesia (3),Malaysia (5) and Pakistan (10). Finally, the MENAW region had 17 CCBs: Jordan (4), SouthAfrica (5) and Turkey (8). See Table AVI in Appendix 2.
42. For instance, Al Rajhi, being one of the largest ICBs in the study sample, has an average FINA ofaround 65 per cent, but its mean duration gap for the period under observation is around 1.15years; whereas KFH Kuwait, being the second largest ICB in the sample, has a 58 per cent FINA,but its mean duration gap is negative. On the other hand, Abu Dhabi Islamic Bank, being thefifth largest, has a FINA of 72 per cent, but its mean duration gap of 1.70 years is higher than thatof Al Rajhi (1.15) and KFH Kuwait (�0.064).
JIABR11,6
1286

ReferencesAl-Ajmi, J. and Hameeda, A.H. (2012), “Risk management practices of conventional and Islamic banks
in Bahrain”,The Journal of Risk Finance, Vol. 13 No. 3, pp. 215-239.Al-Janabi, M.A.M. (2008), “Proactive risk management in emerging and Islamic financial markets:
evidence from theMoroccan financial markets”,Humanomics, Vol. 24 No. 2, pp. 74-94.Al-Tamimi, H. and Al-Mazrooei (2007), “Banks’ risk management: a comparison study of UAE national
and foreign banks”,The Journal of Risk Finance, Vol. 8 No. 4, pp. 394-409.Alden, L.T. (1983), “Gap management: managing interest rate in banks and thrifts”, Federal Reserve
Bank of San Francisco, Economic Review, pp. 20-35.Alam, M.Z. and Masukujjaman, M. (2011), “Risk management practices: a critical diagnosis of some selected
commercial banks in Bangladesh”, Journal of Business andTechnology (Dhaka), Vol. 6 No. 1, pp. 15-35.Ariffin, N.M. and Kassim, S. (2014), “Risk management practices of selected Islamic banks in
Malaysia”,Aceh International Journal of Social Science, Vol. 3 No. 1, pp. 26-36.Bacha, O.I. (2004), “Dual banking systems and interest rate risk for Islamic banks”, International
Islamic University Malaysia, Retrieved 2014, fromMunich Personal RePEc Archive, available at:http://mpra.ub.uni-muenchen.de/12763/
Ballester, L., Ferrer, R., González, C. and Soto, G.M. (2009), “Determinants of interest rate exposure ofSpanish banking industry”, Working Paper, Department of Economics and Finance,Universidad de Castilla-LaMancha, Spain.
Basel Committee on Banking Supervision (BCBS) (2004), Principles for the Management andSupervision of Interest Rate Risk, Bank for International Settlements, Basel.
BCBS (2006), International Convergence of Capital Measurement and Capital Standards, Bank forInternational Settlements, Basel.
Ben Selma Mokni, R., Echchabi, A., Azouzi, D. and Rachdi, H. (2014), “Risk management tools practicedin Islamic banks: evidence in MENA region”, Journal of Islamic Accounting and BusinessResearch, Vol. 5 No. 1, pp. 77-97.
Bierwag, G.O. (1987),Duration Analysis: Managing Interest Rate Risk, Ballinger, Cambridge, MA.Bierwag, G.O. and Fooladi, I.J. (2006), “Duration analysis: an historical perspective”, Journal of Applied
Finance, Vol. 16 No. 2, pp. 144-160.Bierwag, G.O., Fooladi, I.J. and Roberts, G.S. (2000), “Risk management with duration: potential and
limitations”, Canadian Journal of Administrative Sciences/Revue Canadienne Des Sciences deL’administration, Vol. 17 No. 2, pp. 126-142.
Bierwag, G.O. and Kaufman, G.G. (1992), “Duration gaps with futures and swaps for managing interestrate risk at depository institutions”, Journal of Financial Services Research, Vol. 5 No. 3, pp. 217-234.
Chattha, J.A. (2010), “Decoupling Sharī’ah and prudential considerations: a case of commodityMur�abahah”,Association of Chartered Islamic Finance Professionals - Newsletter, July- Dec 2010,Malaysia Vol. 1 No. 1.
Chattha, J.A. (2013), “Significance and key challenges in conducting stress testing for Islamic commercialbanks”,Global Review of Islamic Economics and Business, Vol. 1 No. 2, pp. 85-98.
Chattha, J.A. and Alhabshi, S.M. (2017), “Risk management in changing benchmark rates regime:prudential implications for Islamic banks and supervisors”, Journal of Islamic Finance, Vol. 6,pp. 205-230, ISSN 2289-2117.
Chattha, J.A. and Bacha, O.I. (2010), “Duration gaps and net worth risk for Islamic and conventional banks:a comparative cross-country analysis”,Review of Islamic Economics, Vol. 13 No. 2, pp. 5-33.
Chattha, J.A. and Alhabshi, S.M. (2018), “Lowly or negative benchmark rates bandwagon: any riskimplications for Islamic banks?”,Al-Iqtishad Journal of Islamic Economics, Vol. 10 No. 1, pp. 115-134.
Study of dualbankingsystems
1287

Chattha, J.A. and Halim,W.N. (2014), “Strengthening the financial safety net: the role of sharī`ah-compliantlender-of-last-resort (SLOLR) facilities as an emergency financing mechanism”, The IFSBWorkingPaper SeriesWP/01/3/2014, Islamic Financial Services Board, Kuala Lumpur.
Chattha, J.A. (2017a), “Islamic finance and UN sustainable development goals: a regulatoryperspective”, Islamic Finance News, Vol. 14 No. 1, pp. 21-23.
Chattha, J.A., Kartina, A., Dong, C. and Abozer, M. (2014), “Evaluation by the IFSB of core principlesrelevant to Islamic finance regulation”, The IFSB Working Paper Series, WP-02/11, IslamicFinancial Services Board, Kuala Lumpur.
Cihak, M. and Hesse, H. (2008), “The Islamic banks and financial stability: an empirical analysis”,Working Paper No.WP/08/16, International Monetary Fund,Washington, DC.
David, C. (1995), “Irish loan-deposit interest rate margins: a duration-based approach”, AppliedFinancial Economics, Vol. 5 No. 1, pp. 27-32.
Dembiec, L.A., Pogozelski, J.D. and Rowland, V.T. (1989), The Measurement and Management ofInterest Rate Risk, Casualty Actuarial Society.
Drechsler, I., Savov, A. and Schnabl, P. (2018), “Banking on deposits: maturity transformation withoutinterest rate risk (No. w24582)”,National Bureau of Economic Research.
Entrop, O., Wilkens, M. and Zeisler, A. (2009), “Quantifying the interest rate risk of banks: assumptionsdomatter”, European Financial Management, Vol. 15 No. 5, pp. 1001-1018.
Entrop, O., Memmel, C., Ruprecht, B. and Wilkens, M. (2012), “Determinants of bank interest margins:impact of maturity transformation (no. 17/2012)”, Discussion Paper, Deutsche Bundesbank.
Esposito, L., Nobili, A. and Ropele, T. (2013), “The management of interest rate risk during the crisis:evidence from Italian banks”, Bank of Italy Temi di Discussione (Working Paper) No, 933.
Fauziah, H.T., Abdul Rahman, R. and Omar, N. (2011), “Empirical evidence on the risk managementtools practiced in Islamic and conventional banks”, Qualitative Research in Financial Markets,Vol. 3 No. 2, pp. 86-104.
Fisher, L. and Weil, R.L. (1971), “Coping with the risk of interest-rate fluctuations: returns to bondholdersfrom naive and optimal strategies”,The Journal of Business, Vol. 44 No. 4, pp. 408-431.
Fooladi, I.J. and Roberts, G.S. (2000), “Risk management with duration analysis”, Managerial Finance,Vol. 26 No. 3, pp. 18-28.
Gup, B.E., Lambert, R., Avram, K.J., Kolari, J.W. and Diana, B. (2007), Commercial Banking: TheManagement of Risk, JonWiley and Sons.
Hassan, A. (2009), “Risk management practices of Islamic banks of Brunei Darussalam”,The Journal ofRisk Finance, Vol. 10 No. 1, pp. 23-37.
Hassan, M.K. and Aliyu, S. (2018), “A contemporary survey of Islamic banking literature”, Journal ofFinancial Stability, Vol. 34, pp. 12-43, doi: 10.1016/j.jfs.2017.11.006.
How, J., Abdul Karim, M. and Verhoeven, P. (2005), “The Islamic financing and bank risks: the case ofMalaysia”,Thunderbird International Business Review, Vol. 47 No. 1, pp. 75-94.
Hussain, A.A. and Naysary, B. (2014), “Risk management practices in Islamic banks in Kuwait”,Journal of Islamic Banking and Finance, Vol. 2 No. 1, pp. 123-148.
IFSB (2007), IFSB-4: Disclosures to Promote Transparency andMarket Discipline for IIFS, Kuala Lumpur.IFSB (2011), Revised Compilation Guide on Prudential and Structural Islamic Financial Indicators,
Kuala Lumpur.IFSB (2013), IFSB-15: Revised Capital Adequacy Standard for IIFS, Kuala Lumpur, Malaysia.
IFSB (2014), IFSB-16: Revised Guidance on Key Elements in the Supervisory Review Process for IIFS,Kuala Lumpur.
IFSB (2015), IFSB-17: Core Principles for Islamic Finance Regulation (Banking Segment); KualaLumpur.
JIABR11,6
1288

IFSB (2017), Islamic Financial Services Industry Stability Report, Kuala Lumpur.Islamic Financial Services Board (IFSB) (2005), IFSB-1: Guiding Principles on Risk Management for
IIFS, Kuala Lumpur.Khalid, S. and Amjad, S. (2012), “Risk management practices in Islamic banks of Pakistan”,The Journal
of Risk Finance, Vol. 13 No. 2, pp. 148-159.Khaliq, A., Mohd, H., Pitchary, A. and Thaker, T. (2017), “Interest rate risk management and Islamic
banking: evidence fromMalaysia”, Journal of Islamic Finance, Vol. 6 No. 1, pp. 16-30.Khan, T. and Ahmed, H. (2001), Risk Management: An Analysis of Issues in Islamic Financial Industry
(Occasional Papers), The Islamic Research and Teaching Institute (IRTI), No. 91.
Koch, T.W. andMacDonald, S.S. (2009), BankManagement, 7th ed., Cengage Learning.Lopez, J. (2004), “Supervising interest rate risk management”, FRBSFEconomic Letter, Vol. 26, pp. 1-2.Macaulay, F.R. (1938), The Movements of Interest Rates, Bond Yields and Stock Prices in the United
States since 1856,National Bureau of Economic Research, NewYork, NY.
Mohd. Ariffin, N., Archer, S. and Abdel Karim, R.A. (2009), “Risks in Islamic banks: evidence fromempirical research”, Journal of Banking Regulation, Vol. 10 No. 2, pp. 153-163.
Omar, M., Mohd Noor, A., Meera, A.K.M., Abdul Manap, T.A., Majid, M.S.A. and Sarif, M.A. (2010),“Islamic pricing benchmarking”, ISRA Research Paper, Vol. 17.
Rahman, M.M., Rahman, M.A. and Azad, M.A.K. (2015), “Risk management practices in Islamic andconventional banks of Bangladesh: a comparative analysis”, Asian Social Science, Vol. 11 No. 18,pp. 153-163.
Romzie, R. (2009), “Risk management practices and risk management processes of Islamic banks: aproposed framework”, International Review of Business Research Papers, Vol. 5 No. 1,pp. 242-254.
Romzie, R. and Abdul Rahim, A.R. (2015), “The practice of IFSB guiding principles of risk managementby Islamic banks: international evidence”, Journal of Islamic Accounting and Business Research,Vol. 6 No. 2, pp. 150-172.
Ruprecht, B., Entrop, O., Kick, T. and Wilkens, M. (2013), “Market timing, maturity mismatch, and riskmanagement: evidence from the banking industry”, Discussion Paper No 56/2013. DeutscheBundesbank.
Salman, S.A. (2006), “Financial distress and bank failure: lessons from closure of Ihlas Finans inTurkey”, Islamic Economic Studies, Vol. 14 Nos 1/2.
Sundararajan, V. and Errico, L. (2002), “Islamic financial institutions and products in the globalfinancial system: key issues in risk management and challenges ahead”, Working PaperNo.WP/02/192, International Monetary Fund, Washington, DC.
Usman, M., Akhtar, M. and Ahmed, N. (2011), “Risk management practices and Islamic banks: anempirical investigation from Pakistan”, Interdisciplinary Journal of Research in Business, Vol. 1No. 6, pp. 50-57.
Zainol, Z. (2015), “Rate of return risk of Islamic bank: empirical evidence in Malaysia”, PhD dissertation(Unpublished), International Islamic University Malaysia. Malaysia.
Further readingChattha, J.A. (2017b), “On becoming an Islamic financial Centre: Realism and challenges”, Wahed
Islamic Finance Journal, available at: http://journal.wahedinvest.com/on-becoming-an-islamic-financial-centre-realism-and-challenges/
International Monetary Fund (2017), Ensuring Financial Stability in Countries with Islamic Banking,International Monetary Fund, Washington, DC.
Study of dualbankingsystems
1289

Appendix 1. Explanation of the estimation of duration gap for Islamic commercialbanks and Conventional commercial banksThis appendix explicates the estimation process using the methodology and assumptions presentedin Section 4. Table AI explains the DGAP for one of the ICBs to disclose the calculation process forthe 100 banks (Table AII covers one of the CCBs). Qatar International Islamic Bank (QIIB) serves asthe sample ICB for the year 2015 (the most recent year), to illustrate DA and DL calculations.
The column titled “amount” shows the sum of the total financing and deposits spread intomainly five maturity repricing buckets: “upto 1 month”, “over 1 month to 3 months”, “over 3 monthsto 12 months”, “over 12 months to 60 months” and “over 60 months”, for the QIIB. The amountsdenote the undiscounted values of the total financing for the given maturity buckets for the QIIB.These amounts are specified in local currency for duration gap calculation purposes, however, for theestimation of the impact of ROR risk they are converted to US$, as explained in Section 4.
The column entitled “proportion” indicates the proportion of the respective asset class (oramount) compared to total asset value. For this reason, the sum is not essentially 1.00 (or 100 percent), as the study is only concerned with the total financing, as explained earlier, and not with theentire assets class on the balance sheet, such as financial assets, fixed assets or other assets,intangible assets, etc. In addition, we can see that the ratio of QIIB’s total financing to total assets onits balance sheet is around 73 per cent, which is spread into five maturity repricing buckets asindicated above. Of this 73 per cent, the QIIB has 15 per cent of its financing assets maturing in the“upto one-month” bucket, which is the amount of assets (financing) maturing within the respectiveperiod, 5,971,140.00 QR, divided by the total yield rate asset, 40,540,045.00 QR. Applying the samecalculation, it is 6 per cent, 22 per cent, 25 per cent and 5 per cent for assets maturing in “over 1monthto 3 months”, “over 3 to 12 months”, “over 12 to 60 months” and “over 60 months”, respectively.
The next column represents average maturity for each asset class. It is the average (reflected inmonths) between the lower boundary and upper boundary of the maturity bucket. The followingcolumn denotes the estimated maturity for each asset class in a year. The column “estimatedduration” gives an estimation of each asset class’s duration, by assuming that the duration of anasset is lower than its maturity, and a single assumption of 0.80 is taken for all assets in all observedbanks (Section 4.3.2). In the same column, the average of 2months (or 0.17 years) for assets includedin the “over 1 to 3 months” class is estimated; however, the duration gap for “upto one-month” isestimated as zero (0), as estimated maturity is considered zero, and for the maturity class “over 60months”, an assumption of 7.5 years average maturity is taken, as outlined earlier under assumptionspresented in Section 4.
The last column shows the weighted duration, which is obtained by multiplying the“proportion” by “estimated duration”. For assets maturing “over 1 to 3 months”, the weightedduration is 0.01 years, a product of asset weight, 0.06, times estimated duration, 0.13 years, (=0.80� 0.17) for the QIIB. Assets maturing in less than 1month do not have duration, and the rest ofthe weighted durations are 0.11, 0.59 and 0.33, for the respective asset classes. The maturity bucket of“over 12months to 60 months” indicates the highest duration for financing. By totalling all theweighted duration of assets, the average duration for yield rate assets (DA) of QIIB is estimated as1.04 year. Similarly, on the liability side, DL is also calculated using this method. Table AI shows thecalculation format for QIIB’s liabilities. As can be seen in the bottom-right corner of the table,duration for its liabilities (DL) is calculated to be 0.30 year.
Having calculated the DA and DL, DGAP can be calculated as a function of difference betweenDA and DL. The DGAP for the QIIB stands at 0.73 (1.04 – 0.30) years for the year 2015. Similarly, theDGAP for the remaining years is calculated for the QIIB, which stands at 0.34 (2009), 0.43 (2010), 1.17
JIABR11,6
1290

Qatar
InternationalIslam
icBank(QIIB)2015
12
33x0.80
=4
1x4=5
Assets
Amount
Proportio
nEstim
ated
avg.
maturity
Estim
ated
maturity
Estim
ated
duratio
nDurationof
assets
Maturities
Break
Dow
nQR(000)
(months)
(Yrs.)
(Yrs.)
(Yrs.)
Upto1month
5,971,140.00
0.15
––
–Over1
month
to3months
2,502,335.00
0.06
2.00
0.17
0.13
0.01
Over3
monthsto
12months
8,930,186.00
0.22
7.50
0.63
0.50
0.11
Over1
2monthsto
60months
9,962,757.00
0.25
36.00
3.00
2.40
0.59
Over6
0months
2,223,911.00
0.05
90.00
7.50
6.00
0.33
Totalyieldrateassets
40,540,045.00
Totaldu
ratio
noftheassets
1.04
Liabilities
Upto1month
16,988,158.00
0.49
––
–Over1
month
to3months
5,186,301.00
0.15
2.00
0.17
0.13
0.02
Over3
monthsto
12months
6,717,943.00
0.19
7.50
0.63
0.50
0.10
Over1
2monthsto
60months
2,758,070.00
0.08
36.00
3.00
2.40
0.19
Over6
0months
––
90.00
7.50
6.00
–Totalyieldrateliabilities
35,010,933.00
Totaldu
ratio
noftheliabilities
0.30
DurationgapoftheQIIB=
TotalDurationoftheAssets
1.04
Yrs
TotalDurationof
theLiabilities
0.30
Yrs
QIIBDGAP
0.73
Yrs
Table AI.Sample of duration ofassets and liabilitiescalculation (financing
vs deposit)
Study of dualbankingsystems
1291

Alliance
Bank2015
12
33x0.80
=4
1x4=5
Assets
Amount
Proportio
nEstim
ated
avg.
maturity
Estim
ated
maturity
Estim
ated
duratio
nDurationof
assets
Maturities
breakDow
nRM
(000)
(months)
(Yrs.)
(Yrs.)
(Yrs.)
Upto1month
29,497,781.00
0.56
––
––
Over1
month
to3months
1,281,202.00
0.02
2.00
0.17
0.13
0.00
Over3
monthsto6months
702,623.00
0.01
4.50
0.38
0.30
0.00
Over6
monthsto12
months
823,136.00
0.02
9.00
0.75
0.60
0.01
Over1
2monthsto60
months
2,366,784.00
0.04
36.00
3.00
2.40
0.11
Over6
0months
2,202,385.00
0.04
90.00
7.50
6.00
0.25
..................
..................
TotalYield
rateAssets
53,134,837.00
Totaldu
ratio
noftheassets
0.37
Liabilities
Upto1month
22,516,171.00
0.46
––
––
Over1
month
to3months
6,242,311.00
0.13
2.00
0.17
0.13
0.017
Over3
monthsto6months
5,514,399.00
0.11
4.50
0.38
0.30
0.0339
Over6
monthsto12
months
5,206,645.00
0.11
9.00
0.75
0.60
0.06
Over1
2monthsto60
months
575,012.00
0.01
36.00
3.00
2.40
0.03
Over6
0months
70,171.00
0.00
90.00
7.50
6.00
0.01
..................
..................
Totalyieldrateliabilities
48,761,668.00
Totaldu
ratio
noftheliabilities
0.15
Durationgapof
bank
=Totaldu
ratio
noftheassets
0.37
Yrs
Totaldu
ratio
noftheliabilities
0.15
Yrs
Alliance
BankDGAP
0.22
Yrs
Table AII.Sample of duration ofassets and liabilitiescalculation (loans vsdeposit)
JIABR11,6
1292

(2011), 1.24 (2012), 0.83 (2013) and 0.86 (2014). The total sum of duration gap for the period 2009-2015for the QIIB is estimated to be 5.6 years, and the mean duration of 0.80 years, for the same period,respectively (Appendix 2).
With the above calculation process for the QIIB, Table AII presents the results of one of theCCBs, Alliance Bank, for the purpose of understanding. The remaining 98 banks follow the sameprocess for the years 2009-2015, in terms of estimation of the DGAP. It is important to remark herethat similar to Table AI, eight similar tables were computed to calculate only the DGAP for the QIIBfor the period 2009-2015. Using the same estimation for all the 100 banks (50 ICBs and 50 CCBs), thetotal number of tables generated for the study sample period exceeded 800. Tables AIII-AVI inAppendix 2 present the consolidated results of the duration gap for each bank and country.
Study of dualbankingsystems
1293

Appendix 2. Duration gaps of ICBs and CCBs
FigureA1.Key balance sheetindicators forduration gaps –results of the FINA,FDR, LIQR and LIQG
0%
5%
10%
15%
20%
25%
30%
35%
40%
1 4 7 10 13 16 19 22 25 28 31 34 37 40 43 46 49
ICBs - Average LIQR for 2009-2015
CCBs - Average LIQR for 2009-2015
0%
20%
40%
60%
80%
100%
120%
140%
1 4 7 1013161922252831343740434649
ICBs - Average FDR for 2009-2015
CCBs - Average FDR for 2009-2015
0%
10%
20%
30%
40%
50%
60%
70%
80%
90%
100%
1 4 7 10 13 16 19 22 25 28 31 34 37 40 43 46 49
ICBs - Average FINA for 2009-2015
CCBs - Average FINA for 2009-2015
-70%-60%-50%-40%-30%-20%-10%
0%10%20%30%40%
1 4 7 1013161922252831343740434649
ICBs - Average LIQG for 2009-2015
CCBs - Average LIQG for 2009-2015
Note: The LIQR is measured as a per cent of Total Assets for the year 2009-2015; The FDR ismeasured as a per cent of Total Assets for the year 2009-2015; The LIQR is measured as a percent of Total Assets for the year 2009-2015; The LIQG is measured as a per cent of Total Assetsfor the year 2009-2015
JIABR11,6
1294

#ICBbank
name
2009
2010
2011
2012
2013
2014
2015
Grand
total
Mean
1ABCIslamicBank
1.21
0.99
1.14
1.09
1.10
0.90
0.94
7.37
1.05
22
Abu
DhabiIslamicBank
1.60
1.67
1.68
1.67
1.60
1.79
1.89
11.90
1.70
03
AffinIslamicBankBerhad
0.60
0.55
0.38
0.38
0.37
0.41
0.57
3.25
0.46
54
AhliU
nitedBank
0.21
0.16
�0.08
0.11
0.10
0.10
0.11
0.71
0.10
15
AlB
arakah
Turkish
FinanceHouse
0.88
0.82
0.67
0.68
0.87
0.99
1.04
5.95
0.85
16
AlB
arakah
BankPa
kistan
0.16
0.00
�0.28
�0.37
�0.32
0.23
0.22
�0.36
�0.051
7AlB
arakah
BankBahrain
�0.05
�0.02
�0.09
0.28
0.24
0.37
0.35
1.07
0.15
38
AlB
arakah
SouthAfrica
1.55
1.66
1.85
1.92
1.84
1.27
2.15
12.24
1.74
99
AlR
ajhi
0.81
1.22
1.28
1.25
1.13
1.12
1.24
8.06
1.15
210
AlSalam
Bank
�1.21
�0.79
�1.17
�0.85
�0.98
�0.79
�0.41
�6.21
�0.887
11AlR
ajhiMalaysiaBerhad
0.31
1.61
1.26
0.97
0.94
0.83
1.22
7.13
1.01
912
AmIslamicBankBerhad
3.01
2.69
1.78
2.07
1.78
1.67
1.10
14.10
2.01
513
Asian
FinanceBankBerhad
0.62
0.87
0.56
0.44
0.36
0.15
0.09
3.08
0.44
014
BahrainIslamicBank
0.44
0.75
0.21
0.94
0.69
1.29
�0.11
4.20
0.60
015
BankAlB
ilad
0.74
0.66
0.70
0.75
0.68
0.59
0.59
4.72
0.67
416
BankAlJazira
0.30
0.47
0.57
0.63
0.37
0.42
0.45
3.22
0.46
017
BankAsya
0.69
0.89
0.90
0.76
0.01
0.90
0.90
5.04
0.72
018
BankIslam
MalaysiaBerhad
1.08
1.47
0.78
0.15
2.76
0.70
0.59
7.54
1.07
719
BankIslamiP
akistan
�0.19
�0.41
�0.98
�1.33
�0.51
�0.73
0.22
�3.93
�0.561
20BankMuamlaat
MalaysiaBerhad
1.25
0.91
0.95
1.18
2.25
0.81
0.67
8.02
1.14
621
BankSy
ariahMandiri
1.31
1.15
1.25
3.08
1.99
1.89
2.06
12.73
1.81
922
BankSy
ariahMuamalat
Indonesia
2.01
2.05
1.95
2.16
4.31
0.75
0.72
13.96
1.99
423
BarwaBank
�1.81
�0.27
�0.24
0.73
0.55
�0.10
�0.04
�1.18
�0.169
24Bouby
anIslamicBank
0.02
0.00
0.04
0.14
0.17
0.21
0.27
0.84
0.12
025
CIMBIslamicBankBerhad
2.03
0.62
0.72
0.70
0.91
1.15
0.86
7.00
1.00
026
Dub
aiIslamicBank
0.15
0.15
0.18
0.20
0.29
0.17
0.12
1.25
0.17
927
Dub
aiIslamicBankPa
kistan
0.48
0.42
0.30
0.22
0.22
0.20
0.23
2.08
0.29
728
Emirates
IslamicBank
1.19
0.91
1.41
1.56
2.19
1.46
1.43
10.14
1.44
829
EximBankLtd
0.54
0.61
1.01
0.65
0.63
0.74
0.81
4.99
0.71
330
FirstS
ecurity
IslamicBank
0.65
0.78
0.73
0.71
�0.34
�0.20
�0.25
2.07
0.29
631
HongLeongIslamicBankBerhad
1.14
0.80
0.68
0.80
0.85
1.54
0.67
6.48
0.92
532
IslamicBankBangladeshLtd
�0.09
�0.04
�0.09
�0.16
�0.18
�0.33
�0.02
�0.92
�0.131
33IslamicInternationalA
rabBank
0.07
0.09
0.06
0.23
0.19
0.02
�0.22
0.44
0.06
3
(contin
ued)
Table AIII.Details of ICBs’
duration gap (yrs.)
Study of dualbankingsystems
1295

#ICBbank
name
2009
2010
2011
2012
2013
2014
2015
Grand
total
Mean
34Ithm
aarB
ank
0.30
0.31
0.28
0.34
0.50
0.72
0.60
3.04
0.43
535
Jordan
IslamicBank
�0.29
�0.31
�0.27
�0.13
�0.17
�0.18
�0.11
�1.47
�0.210
36KFH
Bahrain
�2.24
�2.04
�1.75
�2.02
�1.59
�2.13
�2.55
�14.32
�2.045
37KFH
Kuw
ait
�0.17
�0.17
�0.10
0.00
�0.02
�0.01
0.02
�0.45
�0.064
38KFH
MalaysiaBerhad
0.15
0.09
0.66
0.79
0.88
0.75
0.68
4.00
0.57
139
KhaleejiC
ommercialBank
0.03
�1.64
0.62
0.39
0.29
�0.76
�1.85
�2.92
�0.417
40Kuv
etTurkPa
rticipationBank
0.00
0.09
0.49
0.41
0.31
0.57
0.61
2.48
0.35
441
Kuw
aitInternatio
nalB
ank
0.33
0.30
0.31
0.33
0.28
0.25
0.19
1.98
0.28
342
MasrafA
lRayan
0.81
0.58
0.38
0.32
0.59
1.66
1.37
5.71
0.81
643
MeezanIslamicBank
�0.01
0.53
0.10
0.11
0.08
0.17
0.21
1.20
0.17
144
PublicIslamicBankBerhad
1.48
1.29
1.26
1.16
0.92
0.56
0.61
7.28
1.04
045
Qatar
InternationalIslam
icBank
0.33
0.43
1.17
1.24
0.83
0.87
0.73
5.60
0.80
046
Qatar
IslamicBank
0.75
0.85
0.65
0.51
0.36
0.34
0.64
4.09
0.58
447
RHBIslamicBankBerhad
1.79
1.32
1.31
0.99
0.66
0.33
0.71
7.10
1.01
548
SharjahIslamicBank
2.49
2.15
2.40
2.36
2.62
1.66
2.26
15.94
2.27
849
Tadhamon
InternationalIslam
icBank
�0.46
�0.39
�0.39
�0.35
�0.47
�0.58
�0.57
�3.22
�0.460
50Turkiye
Finans
ParticipationBank
0.66
0.79
0.77
0.74
0.81
0.84
0.92
5.53
0.79
0Grand
Total
27.66
27.62
27.98
30.95
33.93
25.55
24.91
198.60
28.371
Note:
DurationGap
asperthe
alph
abeticalordero
fthe
ICBs’names
Table AIII.
JIABR11,6
1296

#CC
Bbank
name
2009
2010
2011
2012
2013
2014
2015
Grand
total
Mean
1ABCBank
0.643
0.301
0.684
�0.200
0.296
0.099
�0.036
1.78
80.25
542
AffinBank
0.452
0.704
0.473
0.490
0.481
0.425
0.462
3.48
60.49
813
AktifYatırım
BankasıA.S�
�0.113
0.216
0.608
0.349
0.554
0.392
0.475
2.48
10.35
454
AlK
haleejiC
ommercialBank
0.247
0.012
0.255
0.424
0.674
0.326
0.166
2.10
50.30
065
Alliance
Bank
0.142
0.170
0.139
0.225
0.242
0.206
0.220
1.34
30.19
186
AmBank
1.509
1.475
2.037
2.148
2.149
1.970
1.992
13.280
1.89
727
Anadolubank
A.S�
0.658
0.690
0.565
0.513
0.411
0.510
0.420
3.76
70.53
818
ArapTürkBankasıA.S�
0.007
0.046
0.041
0.052
0.179
0.006
�0.076
0.25
50.03
649
BankAlE
tihad
�0.032
�0.048
�0.084
�0.021
0.058
0.026
0.047
�0.055
�0.007
810
BankAlF
alah
0.554
0.536
�0.123
�0.037
�0.026
0.412
0.108
1.42
40.20
3411
BankAlHabib
0.221
�0.033
�0.124
�0.063
�0.012
�0.176
�0.004
�0.191
�0.027
312
BankBJB
2.263
�0.113
0.106
0.316
�0.098
0.190
0.118
2.78
10.39
7313
BankBNI
0.394
�0.102
0.013
�0.142
�0.053
�0.143
�0.052
�0.084
�0.012
014
Bankof
Athens
�0.080
�0.197
�0.129
�0.129
�0.078
�0.106
�0.099
�0.818
�0.116
815
Bankof
Jordan
0.543
0.478
0.523
�0.190
�0.098
0.055
0.560
1.87
00.26
7116
Bankof
Punjab
�0.096
�0.146
�0.148
�0.117
�0.110
�0.124
�0.115
�0.856
�0.122
317
Bankof
Sharjah
�0.041
�0.051
�0.090
�0.085
�0.086
�0.092
�0.098
�0.545
�0.077
818
BankPa
nin
0.073
0.088
0.572
0.077
�0.119
0.016
0.054
0.76
00.10
8619
BankPo
zitif
Kredi
veKalkınm
aBankası
0.109
�0.395
0.051
0.170
�0.114
0.088
0.029
�0.062
�0.008
820
BurganBank
0.197
0.168
0.111
0.146
0.173
0.197
0.184
1.17
60.16
8021
BurganBankA.S�
0.064
0.089
0.329
0.323
0.144
0.226
0.292
1.46
70.20
9622
CairoAmman
Bank
0.031
�0.003
0.016
0.023
0.004
0.002
�0.010
0.06
40.00
9123
CapitalB
ankofJordan
0.259
0.175
0.285
0.423
0.437
0.302
0.653
2.53
30.36
1824
Capitecbank
�0.178
�0.223
0.089
0.164
0.163
0.156
0.224
0.39
40.05
6325
CBKBank
�0.131
�0.198
�0.073
�0.009
�0.068
0.210
0.275
0.00
60.00
0826
CommercialBankof
Dub
ai0.043
�0.004
�0.005
0.000
�0.134
�0.044
0.107
�0.036
�0.005
227
FaysalBank
0.073
0.099
�0.811
0.069
0.045
0.268
0.105
�0.152
�0.021
828
GulfB
ank
0.828
0.985
0.797
1.034
0.952
0.914
1.011
6.52
00.93
1529
HabibMetro
Bank
0.042
0.020
�0.131
�0.115
�0.100
�0.147
�0.099
�0.530
�0.075
830
HabibOverseasBank
�0.005
0.026
�0.336
0.001
0.034
�0.077
0.093
�0.264
�0.037
731
HBLBank
�0.661
�0.617
�0.912
�0.036
�0.005
�0.066
�0.048
�2.345
�0.335
032
HongLeongBank
0.178
0.099
0.486
0.328
0.370
0.333
0.330
2.12
40.30
3433
ICBCTurkeyBankA.S�
0.398
0.610
0.486
0.594
0.719
0.606
0.791
4.20
40.60
05
(contin
ued)
Table AIV.Details of CCBs’
duration gap (yrs.)
Study of dualbankingsystems
1297

#CC
Bbank
name
2009
2010
2011
2012
2013
2014
2015
Grand
total
Mean
34IFIC
Bank
0.285
0.123
0.057
0.077
�0.314
�0.226
�0.671
�0.670
�0.095
735
Mashreq
Bank
0.230
0.545
0.326
0.853
0.503
0.079
0.174
2.71
10.38
7236
MCB
Bank
�0.059
�0.018
�0.012
�0.005
0.028
0.059
0.130
0.12
40.01
7737
Mercantile
Bank
�0.007
�0.025
�0.033
�0.039
�0.053
�0.061
�0.039
�0.257
�0.036
738
NationalB
ankofBahrain
0.518
0.475
0.482
0.461
0.319
0.280
0.336
2.87
10.41
0239
NBKBank
0.245
0.254
�0.486
0.187
0.240
0.239
0.237
0.91
70.13
1040
NBPBank
0.699
0.231
0.231
0.248
0.281
0.288
0.274
2.25
20.32
1741
NIB
Bank
0.130
0.051
0.117
0.074
0.002
0.242
0.016
0.63
10.09
0242
One
BankLtd
0.165
�0.123
�0.681
0.322
0.314
0.005
�0.157
�0.154
�0.022
043
RAKBank
1.239
1.307
1.385
1.360
1.296
1.091
1.517
9.19
51.31
3644
RHBBank
0.476
0.538
0.533
0.417
0.382
0.266
0.279
2.89
00.41
2945
Saud
iFranceBank
0.175
0.219
0.323
0.240
0.287
0.270
0.486
2.00
10.28
5846
T-Bank
0.121
0.133
0.142
0.134
0.342
0.358
0.230
1.45
90.20
8447
Türkiye
Kalkınm
aBankasıA.S�
0.530
0.491
0.428
0.343
0.249
0.295
0.976
3.31
20.47
3148
Ubank
�0.083
0.050
0.287
0.374
0.382
0.294
0.183
1.48
60.21
2349
UBLBank
�0.045
�0.123
0.202
0.045
�0.027
�0.031
�0.038
�0.017
�0.002
450
UAB
0.493
0.389
0.937
0.841
1.346
1.014
0.888
5.90
90.84
42Grand
Total
13.701
9.37
39.93
612
.659
12.558
11.423
12.900
82.549
11.792
Note:
DurationGap
asperthe
alph
abeticalordero
fthe
CCBs’names
Table AIV.
JIABR11,6
1298

About the authorsDr Jamshaid Anwar Chattha, CPIF, Dr Jamshaid is an ex-regulator, standard-setter and qualifiedchartered Islamic finance professional with 13þ years of direct Islamic financial sector experience indifferent countries that range from commercial banking to regulatory policy development andimplementation. As Banking Supervision and Stress Testing Advisor to the IMF, he has providedpolicy advice to various central banks through nine IMF TA missions for Kuwait, Kyrgyz, Libya,Nigeria and Yemen and one for World Bank for Saudi Arabia. He is well travelled and has conducted100þ technical workshops on Islamic finance for the IFSB, IMF, World Bank, IDB, Toronto Centre,AMF, Cambridge IFA and 20þ central banks in Middle East, South Asia, Central Asia and North andCentral Africa and Europe. He regularly writes on risk management and regulatory issues pertainingto Islamic finance and his work has been published in international Scopus and ISI journals.
He has served the IFSB as Project Manager for various technical projects, as well as AssistantSecretary-General, Technical and Research, where he oversaw and provided immediate leadershipand supervision to Technical and Research Division, responsible for standard development in Islamicbanking, capital markets, and Takaful sectors; research; technical publications; annual flagshipStability Report; and PSIFIs project. He has also served Central Bank of Kuwait as Chief Banking
Table AVI.Details of CCBs’duration gap atcountry level
CCBs sum of DGAP (yrs.)2009 2010 2011 2012 2013 2014 2015 Grand total
Bahrain 1.161 0.776 1.166 0.261 0.615 0.379 0.301 4.659Bangladesh 0.450 0.000 �0.624 0.400 0.000 �0.222 �0.828 �0.824Indonesia 2.730 �0.126 0.690 0.251 �0.270 0.062 0.121 3.457Jordan 0.800 0.602 0.740 0.235 0.400 0.385 1.250 4.411Kuwait 1.139 1.208 0.349 1.358 1.297 1.560 1.708 8.619Malaysia 2.757 2.986 3.668 3.607 3.623 3.199 3.283 23.123Pakistan 0.858 0.000 �1.711 0.064 0.074 0.725 0.329 0.339Qatar 0.247 0.012 0.255 0.424 0.674 0.326 0.166 2.105Saudi Arabia 0.175 0.219 0.323 0.240 0.287 0.270 0.486 2.001South Africa �0.354 �0.370 �0.123 0.371 0.448 0.206 0.362 0.542Turkey 1.773 1.880 2.649 2.477 2.484 2.482 3.136 16.882UAE 1.964 2.187 2.553 2.969 2.924 2.048 2.588 17.234Grand Total 13.701 9.373 9.936 12.659 12.558 11.423 12.900 82.549
Table AV.Details of ICBs’duration gap atcountry level
ICBs Sum of DGAP (yrs.)2009 2010 2011 2012 2013 2014 2015 Grand total
Bahrain �1.534 �2.439 �0.763 0.171 0.247 �0.411 �3.026 �7.756Bangladesh 1.095 1.347 1.645 1.209 0.115 0.197 0.541 6.150Indonesia 3.327 3.202 3.201 5.244 6.304 2.637 2.782 26.696Jordan �0.218 �0.221 �0.218 0.104 0.028 �0.166 �0.339 �1.031Kuwait 0.383 0.295 0.164 0.571 0.526 0.544 0.597 3.081Malaysia 13.470 12.225 10.343 9.625 12.669 8.902 7.760 74.994Pakistan 0.453 0.539 �0.854 �1.362 �0.538 �0.127 0.878 �1.013Qatar 0.077 1.590 1.958 2.800 2.324 2.770 2.701 14.220Saudi Arabia 1.852 2.350 2.556 2.639 2.181 2.133 2.284 15.996South Africa 1.554 1.665 1.847 1.917 1.838 1.274 2.147 12.242Turkey 2.227 2.584 2.827 2.595 2.006 3.301 3.463 19.003UAE 5.434 4.878 5.672 5.780 6.699 5.075 5.698 39.237Yemen �0.462 �0.389 �0.395 �0.347 �0.469 �0.582 �0.574 �3.218Grand Total 27.657 27.625 27.983 30.947 33.931 25.545 24.913 198.600
Study of dualbankingsystems
1299

Researcher, Chief Financial Analyst and Islamic Finance Expert in the Off-Site SupervisionDepartment. He has hands-on experience in central bank pertaining to Basel II, 2.5, III, IFRS 9implementation and its equivalent IFSB/AAOIFI framework. He also worked in Singapore andPakistan.
Dr Jamshaid Anwar Chattha received his PhD in Islamic Banking and Finance from InternationalIslamic University Malaysia (IIUM) with outstanding award. He graduated with a BSc (Mathematicsand Economics). He holds an MBA–Finance (NUML), an MSc–Islamic Finance (IIUM) and a CIFP(INCEIF), all with distinctions and outstanding awards. He is also a fellow member of CharteredInstitute of Islamic Finance Professionals (CIIF), Malaysia. He has Executive Education fromColumbia Business School, New York, USA and Cambridge IFA, UK. Jamshaid Anwar Chattha is thecorresponding author and can be contacted at: [email protected]
Dr Syed Musa Alhabshi is an Associate Professor in Institute of Islamic Banking and Finance,IIUM and Dean of Institute of Islamic Banking and Finance, IIUM and Dean of Graduate School ofBusiness, University Tun Abdul Razak (2012-2013). He was also engaged as a Fellow Consultantwith Amanie Business Solutions and International Institute of Islamic Finance Inc in providingadvisory, research and training services to the Islamic financial services industry. Previously he wasa technical consultant with Centennial Group International in developing Islamic Financial ServicesBoard (IFSB) Prudential Standards.
He had served as a member of Accounting, Auditing and Governance Standards Board ofAccounting Auditing Organization for Islamic Financial Institutions (AAOIFI). In Malaysia, he iscurrently a member of Malaysian Accounting Standards Board (MASB) Working Committee ofIslamic Financial Reporting Standards. He has presented papers in both local and InternationalConferences, as well as published papers in academic journals and related academic literature.
Dr Syed Musa has a Diploma in Business Studies (1984) from Ngee Ann Polytechnic, a Bachelor inBusiness Administration (1989) from the International Islamic University of Malaysia and aDoctorate in Business Administration (1994) majoring in Accounting and Finance from University ofStrathclyde, UK.
His areas of interest and expertise include Financial Markets, Investment Analysis, Macro-Economics, Economics of Social Issues and Quantitative Methods. He has wide experience inteaching, training, consultancy and research in the above areas. His works have been published inlocal and international journals.
His current research interest is in money systems that include the gold dinar. He is the author ofthe books The Islamic Gold Dinar, The Theft of Nations (both published by Pelanduk Publications)and Real Money – Money and Payment Systems from an Islamic Perspective published by IIUMPress.
Prof. Dato’ Dr Ahamed Kameel Mydin Meera is currently the Managing Director of the ZConsulting Group. He was a Professor in the Faculty of Economics and Management Sciences,International Islamic University Malaysia and the Dean of the Institute of Islamic Banking andFinance, International Islamic University Malaysia. He holds a PhD degree in Finance from theUniversity of North Texas, Denton, Texas, USA. His undergraduate and Masters Degrees were in thearea of Economics from the International Islamic University Malaysia.
For instructions on how to order reprints of this article, please visit our website:www.emeraldgrouppublishing.com/licensing/reprints.htmOr contact us for further details: [email protected]
JIABR11,6
1300


![GuideStone Funds Medium-Duration Bond Fund [GMDZX]](https://static.fdokumen.com/doc/165x107/631a32e45d5809cabd0f4dd3/guidestone-funds-medium-duration-bond-fund-gmdzx.jpg)