Review of Two-Phase Steam-Water Critical Flow Models w
72
. . . . . . . _ _ _ _ . . _ _ _ _ _ NUREG/CR-0417 BNL-NUREG-50907 A REVIEW 0F TWO-PHASE STEAM-WATER CRITICAL FLOW MODELS WITH EMPHASIS OR THERMAL NONEQUlllBRIUM PRADIP SAHA Date Published: September 1978 .. THERMAL HYDRAULIC DEVELOPMENT DIVISION DEPARTMENT OF tiUCLEAR ENERGY, BROOKHAVEN NATIONAL LABORATORY UPTON, NEW YORK 11973 1843 502 . ~ ~ ~ . Division of R oc o S ty Research 9 United States Nuclear Regulatory Commission Of0ce of Nuclear Regulatory Research - Contract No. EY-76-C42-0016 . [ k M W_ g- 4' % j ,[ r 4 j 912200[h _ _ _ _
-
Upload
khangminh22 -
Category
Documents
-
view
1 -
download
0
Transcript of Review of Two-Phase Steam-Water Critical Flow Models w

. . . . . . . _ _ _ _ . . _ _ _ _ _
NUREG/CR-0417
BNL-NUREG-50907
A REVIEW 0F TWO-PHASE STEAM-WATER
CRITICAL FLOW MODELS WITH EMPHASIS
OR THERMAL NONEQUlllBRIUM
PRADIP SAHA
Date Published: September 1978
..
THERMAL HYDRAULIC DEVELOPMENT DIVISION
DEPARTMENT OF tiUCLEAR ENERGY, BROOKHAVEN NATIONAL LABORATORY
UPTON, NEW YORK 11973
1843 502
. ~ ~ ~ . Division of R oc o S ty Research9 United States Nuclear Regulatory Commission
Of0ce of Nuclear Regulatory Research- Contract No. EY-76-C42-0016
.
[ k M W_ g- 4' % j ,[ r 4 _
j 912200[h_ _ _ _ .

NUREG/CR-0417
BNL-NUREG-50907
R-4
A REVIEW 0F TWO-PHASE STEAM-WATER
CRITICAL FLOW MODELS WITH EMPHASIS
ON THERMAL NONEQUILIBRIUM
PRADIP SAHA
Manuscript Submitted: December 1977
Date Published: September 1978
THERMAL HYDRAULIC DEVELOPMENT DIVISION
DEPARTMENT OF NUCLEAR ENERGY, BROOKHAVEN NATIONAL LABORATORY
UPTON, NEW YORK 11973
843 503
Prepared for
0FFICE OF NUCLtR, P,EGULATORY RESEARCH
UNITED STATES NUCLEAR REGULATORY COMMISSION
WASHINGTON, D.C. 20555
NRC FIN NO. A3014
'>. ; . ..

.
NOTICE
'Ihis rep >rt was prepared as an account of work sponsored by an agency of theUnited States Government. Neither the United States Government nor any agencythereof, or any of their employees, makes any warranty, expressed or implied, orassumes any legal liability or responsibility for any third party's use, or the results ofsuch use, of any information, apparatu=, product or pr<ress diwhved in this report, orrepresents that its use by such third party would not infringe privately owned rights.
The views exprewd in this report are not necessarily those of the U.S. Nuc learRegulatory Commission.
Available fromU.S. Nuclear Regulatory Commission
Washington, I).C. 20555
Available fromNational Technical Information Senice
Springfield, Virginia 22161
1849 n

ABSTRACT
A review of the two-phase critical flow models has been presented with
particular attention to the light water reactor (LWR) safety application.
Pertinent experimental results have also been reviewed. No experiment has
yet been performed in reactor-size pipe diameters (N 300 mm) with relatively
short pipe lengths (m 1000 mm).* From the small scale tests, it has been found
that the critical flow rate increases rapidly as the pipe length is shortened
to zero. This is particularly true if the upstream fluid condition is near
saturation or subcooled, as is the case during the early stages of a hypo-
thetical LOCA in a LWR system. In this case, both the homogeneous-equilibrium
model (HEM) and the Moody model(10) underpredict the critical flow rate data
considerably. The effect of thermal nonequilibrium is believed to be the
reason for this discrepancy.
Models which include the effect of thermal nonequilibrium have been re-
viewed in detail. Although a large number of lumped as well as distributed
models have been proposed, there is no general correlation for any of these
models. In view of the complexity of the problem, the relaxation-type models
for the actual rate of vapor generation seem to be the most logical approach
at this time.
Large-scale transient critical flow experiments have begun in Marviken test*
apparatus in Sweden. However, no detailed analyses of the tests are avail-able yet.
1843 505
-
- 111 -

TABLE OF CONTENTS
Page
ABSTRACT ........................................... ................... iij
LIST OF FIGURES ........................................................ Vi
LIST OF TABLES ......................................................... vi
ACKNOWLEDGMENTS ........................ ............................... vii
NOMENCLATURE ........................................................... viii
1. INTRODUCTION ...................................................... I
2. HOMOGENE0US-EQUILIBRIUM MODEL ..................................... 2
2.1 Analytical Studies ........................................... 2
2.2 Experimental Studies in Long Tubes andComparison With Analysis ..................................... 5
3. NONHOMOGENE0US, EQUILIBRIUM MODELS ................................ 10
4. EXPERIMENTAL STUDIES IN SHORT TUBES AND N0ZZLES ................... 15
5. NONEQUILIBRIUM MODELS ............................................. 27
5.1 Lumped Models ................................................ 27
5.2 Distributed Models ........ ............. .................... 34
6. DISCUSSION ...................... ................................. 49
7. CONCLUSIONS AND RECOMMENDATIONS ................................... 53
8. REFERENCES ........................................................ 55
1843 5061
*t ,
. **t)
-V -

LIST OF FIGURES
Figure Page
1 Steam-water critical mass-flux according to the homogeneous-equilibrium model (in terms of upstream conditions). ....... 5
2 Steam-water critical mass-flux according to the HEM (interms of critical conditions). ............................ 6
3 Maximum discharge rate of saturated water through a 6.35 mmI.D. tube. ...... ......................................... 18
4 Comparison of experimental flow rates with the homogeneous-equilibrium and homogeneous-frozen models. ................ 20
Sa Comparison of critical pressure ratios with the predictionof Henry and Fauske. ...................................... 33
5b Comparisen of critical flow rates with the prediction ofH e n ry a n d Fa u s k e . . . . . . . . . . . . . . . . . . . . . . . . . . . . . . . . . . . . . . . . . . 33
Sc Comparison of critical flow rates with the prediction ofHenry and Fauske. ......................................... 33
6 Comparison of the prediction of Wolfert with the data ofFriz, et al. 43.............................................
LIST OF TABLES
Table Page
1 Summary of Steam-Water Critical Flow Data in ConstantArea Pipes 24................................................
1843 507
- vi -

ACKNOWLEDGMENTS
The author thanks Dr. Owen C. Jones, Jr., /or many helpful suggestions
and discussions on this work, performed under the auspices of the U. S. Nuclear
Regulatory Commission.
-.
1843 308
- vii -

NOMENCLATURE
A interfacial area density function defined by (59)
B decay constant in (28) and (32)
C contraction coefficient at pipe entrance
c vapor mass concentration, ap /py m
c specific heat at constant pressurep
D pipe inside diameter
F function defined by (54)
G mixture mass-flux
G critical mass-fluxcrg acceleration due to gravity
HN heterogeneous nucleation site density in liquid volume
h specific enthalpy
h latent heat of vaporizationfg
h heat transfer coefficient at vapor-liquid interfaceg
K Boltzmann constant
k thermal conductivity
k slip ratio, u /uy g
L pipe length
m molecular weight
N system characteristic parameter defined l'y (23)
N bubble or droplet number density in mixtire volume
N number of bubbles per unit volume of licuidg
Nr flashing relaxation numberf
1843 309..-.
*
- viii -

fiOMEtlCLATURE
(Cont.)
flu flusselt number
n coefficient of polytropic expansion
P pressure
Pe Peclet number
r bubble radius
i initial bubble radiusg
r* critical pressure ratio
R universal gas constantu
S specific entropy
T temperature
T saturation temperaturesat
t time
u velocity
v specific volume
x actual vapor flow quality
x equilibrium vapor flow qualityeq
z axial distance
Greek Symbols
a vapor void fraction
6 function defined by (40)
F actual mass rate of vapor generation per unit volumey
r equilibrium vapor generation rate per unit volumeeq
: .;
1843 310- ix -

NOMENCLATURE
(Cont.)
y ratio of specific heats
O contact angle
A arbitrary constant in (58)e
p density
a surface tension
T time constant
t* nondimensional time constant in (65)
t contact angle function defined by (56)
Subscripts
e exit
eq equilibrium
f liquid (saturated)
g vapor (saturated)
HEM homogeneous-equilibrium model
LT long tube
A liquid (general)
m two-phase mixture
o upstream or inlet
t throat
v vapor (general)
1843 311
x*e

1. INTRODUCTION
Fluid discharge rate through a pipe break is a key parameter in the anal-
ysis of hypothetical loss-of-coolant accident in nuclear reactor systems. It
is expected that during most of the blowdown transient, the flow will be choked
at the break. Consequently, the flow rate is expected not to depend on the
downstream (containment) conditions, but on the upstream fluid- and thermody-
namic conditions, piping size and system geometry. Therefore, to predict the
discharge rate accurately for a LOCA situation, one must use a critical flow
model which is applicable to large diameter pipes (D s 300 m) of relatively
short lengths, a wide range of upstream vapor qualities including subcooled
liquid, and a wide range of upstream pressures.
The main purpose of this report is to review the presently available crit-
ical flow models, and try to identify a model which is best suited for the LOCA
application of water reactors. First, the well-known homogeneous-equilibrium
model is reviewed and its success / failure to predict the test data is discussed.
Secondly, the models which attempted to incorporate the effect of relative ve-
locity between the phases, but excluded the effect of thermal nonequilibrium,
are discussed. This is followed by a brief review of experimental studies in
short tubes and nozzles where the effect of thermal nonequilibrium is prominent.
Finally, a detailed discussion of the models including the effects of thermal
nonequilibrium is presented.
1843 512
.
-1-

2. Il0M0 GENE 0VS-EQUILIBRIUM MODEL
2.1 Analytical Studies
Analytical and experimental work on two-phase critical flow has been in
progress for the last three decades. Although early researchers (1,2,3) noted
the role of a metastable liquid state, the isentropic Homogeneous-Equilibrium
Model (HEM) is still one of the more popular critical flow models. As the
name implies, the model is based on the following assumptions:
a. the flow is adiabatic and frictionles',, hence,
isentropic
b. the liquid and vapor velocities are equal at
any given point
c. the flow is in thermodynamic equilibrium at every
point.
Assuming a stagnant upstream condition, and utilizing assumption (a), one can
exoress the mass velocity at any section as
G = p "m * D [2g (h - h)] U (1).m m g
For homogeneous flow,
1 _ 1-x ,L (2)P P Pm R v
and
h = (1 - x) n *xh. (3)g y
- 1843 3i3-
-2-
On the other hand, for flow in thermal equilibrium,
T =T =Tsat ( )g y
so that
= pf (P), g (P)o p =pg y
(4)b; = hf(P), b =h g (P) .y
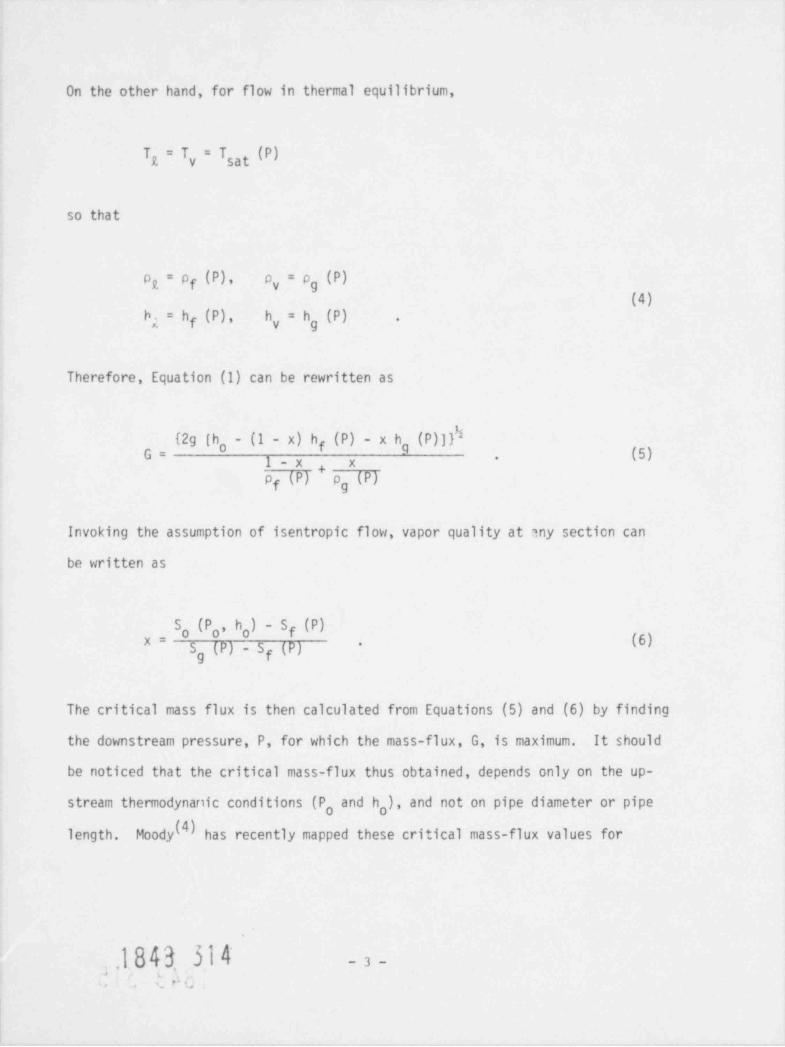
Therefore, Equation (1) can be rewritten as
{29 [h - (1 - x) hf (P) - x h9 (P)]}bG= (5).1-x x
of (P) , pg (P)
Invoking the assumption of isentropic flow, vapor quality at any secticn can
be written as
S (P , h ) - Sf(P)g g g** (0)
g (P) - Sf (P)S*
The critical mass flux is then calculated from Equations (5) and (6) by finding
the downstream pressure, P, for which the mass-flux, G, is maximum. It should
be noticed that the critical mass-flux thus obtained, depends only on the up-
stream thermodynanic conditions (P and h ), and not on pipe diameter or pipeg g
length. Moody (4) has recently mapped these critical mass-flux values for
.1843. 314 -3-4
, P**

steam-water system over a wide range of stagnation pressures and enthalpies
including subcooled water. The map is reproduced here (Fig. 1) for complete-
ness. This method provides a simple and direct method specially suited for
hand calculations.
Some previous researchers (5-6) referred to express the critical mass-flux
in terms of the fluid properties at the location of choking which usually occurs
at the exit of a constant diameter pipe or at the throat of a converging-diverg-
ing nozzle. With the choking criterion
=0 (7)
one can show that for isentropic flow
DP
(8)G =-.
3x gv
For homogeneous, equilibrium flow
V (9)v = (1-xe,eq) Vf + *e,eq ge .
Therefore, Equation (8) becomes
(10)Gnax " - ( av i / dx ) /av ) .
*e,eq [s+(9-v ) | + (1 e,eq) lf 0
( s ls
A graphical representation of the above equation for steam-water system is
'
-4-
1843 315

100.0 .
~
-
_
- ---_.
- - s
- ==_=w~
10.0 -
: 30.0
m~
g-
20.0_
$ - 1 0
- - / 10 08.03 /6.0
1.0b / 104
2 - - 3.0
9-
/ lW-
2.0
t - 1
0 - in
0.1 - Oh0; I~. 100 lbfhn.2.
PREF * 689.5 kN/m- 2 ST AGN ATION. REF * M-
100 Bru/Ihm- hREF 5(2.326) 10 jjkg ,,
REF.j1 0 h/wcM [~ G214882 kg m/me<n )
4 01 ' ' ' ' ' '
O 2.0 4.0 6.0 0.0 10.0 12.0
STAGNATION ENTHALPY,hAgg p
Figure 1. Steam-water critical mass-flux accordingto the homogeneous-equilibrium model (Ir; terms ofupstream conditions). (Moody 0) (BNL 5-1230-78)
taken from Reference 8 and reproduced in Figure 2. It should be noted that the
pressure and the equilibrium vapor quality (or total energy) at the critical
(choking) point must be known to be able to determine the maximum (critical)
mass-flux at that point. This is a major disadvantage for "a priori" hand cal-
culation, but does not seem to be an obstacle to marching technique solutions
generally typical of computational methods.
2.2 Experimental Studies in Long Tubes and Comparison With HEM
Systematic experimental studies on two-phase, steam-water critical flows
.
P
1843 316- 5-

7%M - ^1200 - gno w-
- - %"-" -.
90 s ~S q,
'1000 - 80 -' ~'5-j i i ., p
#p 3206.270 4
2 's@ 800 - 3000x 60
*
2000
600 - '
$ 40 4000
d~
S0
$ 30 s00> 400 -
ago
20 00g
-
100
200 -
20UOR 10 CRITICAL PRESSURE psia_,3
|,,,, |,,,,| | ..|' ", . .U
io 100 1000 10,000CRITICAL MASS VELOCITY, G ,1b/sec/f t'e
ligure 2. Steam-water crit ical mass-f lux accortling
to the IW.M (ii. terms of critical contlitions).(Za lou.le k8) (ItNL 5-1.11-78)
over a wide range of equilibrium qualities were apparently started by Isbin,
May and Da Cruz(5) in University of Minnesota. Critical flow rates were measured
in constant diameter pipes of 0.3743" to 1.0425" (9.5 to 26.5 mm) in inside di-
ameter and 2 ft. (610 mm) in length. Pressures at the exit of the test pipes
ranged from 4 to 43 psia (0.28 to 2.96 bar), whereas the exit equilibrium quality
ranged from 0.01 to 1.0. In general, the experimental values of the critical
flow rates were much higher than those calculated by the homogeneous-equilibrium
model based on the exit fluid properties. The discrepancy between the experimental
1843 317
..- . .#k y J
-6-

values and the predicted values was maximum as the exit equilibrium quality
approached zero and it was minimum (almost zero) as the exit equilibrium quality
approached unity. No explanation for this discrepancy was offered. Also, no
specific effect of tube diameter could be seen from the data.
Fauske(6,7) extended the work of Isbin, en al.,(5) at higher critical pres-
sures (2.76 to 24.8 bar). Smaller tube diameters (3.18, 6.83, and 12.25 cm),
but longer tube lengths (1429 and 2794 mm) were employed. The exit equilibrium
qualities ranged from 0.01 to 0.7. The data on the critical ..v., rate showed
the same behavior with respect to exit qualities as the earlier data taken by
Isbin, et al.,(5) and the homogeneous-equilibrium model underpredicted the data
considerably.
Zaloudek(8) performed similar experiments in 0.520" and 0.625" (13.2 and
15.9 mm) diameter tubes of 24" to 48" (610 to 1219 mm) in length. Exit pres-
sures were measured more accurately than the previous workers by locating a
pressure tap only 1/32" (0.8 mm) from the exit. Critical pressures ranged from
40 to 110 psia (2.76 to 7.58 bar), whereas the exit equilibrium quality ranged
from 0.004 to 0.99. The critical flow data fell slightly above the data of
Isbin, et al.,(5) but showed the same general trend as the other data. No effect
of tube diameter and/or tube length could be detected.
Faletti and MoultonI9) measured the exit pressure most accurately by insert-
ing a concentric pressure probe of 0.187" (4.75 mm) or 0.375" (9.53 m) outside
diameter into a tube of 0.574" (13.58 mm) inside diameter. Thus the test sec-
tion had a hydraulic diameter of 0.387" (9.83 nn) or 0.199" (5.05 mm). The
length of the test section was varied from 9" to 35.14" (229 to 893 mm). A
short test section of 0.531" (13.5 mm) in length and 0.199" (5.05 mm) in hydrau-
lic diameter was also used. Critical pressures ranged from 25 to 80 psia
.:' - t
i.
1843 518-7-
.

(1.72 to 5.52 bar), and the exit equilibrium qualities ranged from 0.001 to 0.96.
The data showed very gc.:d agreement with Zaloudek's data (8) and they fell above
the data of Isbin, et al.(5) This showed the sensitivity of the critical flow
rate on the critical pressure, and the importance of measuring the latter accu-
rately. The general behavior of the data was the same as other previous data
and no length or diameter effect for test sections above 9" (229 m) in length
was noticed. On the other hand, the short test section of 0.5313" (13.5 mm) in
length exhibited critical flow rates ten times those predicted by the homogeneous-
equilibrium model. However, it was not clear whether those high flow rates were
caused by the short tube length or by the low vapor qua'ity (s 0.001) or by both.
James (45) conducted steam-water critical flow experiments in pipes of di-
ameter 3", 6", and 8" (76,152, and 203 m). The length of the discharge pipes
was 12 ft. (3658 mm) and the exit pressure tap was located at 0.25" (6.4 mm) from
the end of the pipe. The stagnation enthalpies ranged from 230 to 1200 Btu /lbm5 5(5.35 x 10 to 27.91 x 10 J/Kg) and the critical, i.e., exit, pressures ranged
from 14 to 54 psia (0.97 to 4.4 bar). A geothemal bore in New Zeland was used
as the source of steam-water mixture. The experimental critical mass-fluxes were
approximately 10% larger than those obtained by Isbin, Moy and Da Cruz.(5) There-
fore, the experimental values were also larger than the predictions of the homog-
encous-equilibrium model. James was able to correlate the mass-flux data in terms
of critical pressure and stagnation enthalpy only, and no effect of pipe diameter
was found.
From the above discussion of the experimentai studies it is evident that one
cannot rely on the homogeneous-equilibrium model for an accurate prediction of
the critical flow rate. Therefore, a fresh look to the issumptiors of the HEM
1843 519L
-8-

was needed. It was found that except for high length-to-diameter ratios, the
pressure drop across a tube was caused mainly by the acceleration of the fluid
and not so much by the friction. Therefore, the assumption of isentropic ex-
pansion of fluid could be retained for adiabatic systems. It was also argued
that unless the tube was short, the assumption of thermodynamic equilibrium be-
tween the two phases would hold good. Therefore, attention was focused to re-
lax the assumption of homogeneous flow and try to accommodate the effect of
relative velocity between the phases in a theoretical model.
b!3 520t
-9-

3. fl0f1HOMOGEflE0VS, EQUILIBRIUM MODELS
'NFauske led the field in developing a new model. He assumed that in
addition to the usual choking criterion of (BG/3P ) equal to zero, the press ae
gradient attained a finite, maximum value at the location of choking. Consider-
ing the momentum equation, Fauske found it necessary to define the specific
volume of two-phase mixture as
2 (1 - x)2x v y9 fvr + (11)" (1 - a)
where a was the vapor void fraction. It should be noted that the above defini-
tion of specific volume for a mixture is not correct, and is known as the
" momentum" specific volume in literature. By introducing a slip ratio, k, i.e.,
the ratio of average vapor velocity to average liquid velocity, the " momentum"
specific volume (11) can be written as
v=f (1 - x) v k+xv 1 + x (k - 1) (12)f g.
Finally, the assumption of maximum pressure gradient at the critical condition
led to
h = x (1 - x) !v =0 (13)fk( j
so that for critical flow, the slip ratio at the critical location became
vk= 3 (14).
vf
,eu,,
- 10 -
1843 521

Equations (12) and (14) were then used to calculate the critical flow rate from
(BPe)2(15)G ,,
.gy
The above derivative was evaluated by following isentropic as well as isenthalpic
processes, and the difference was found to be minor. Fauske's model predicted
larger critical flow rates than the homogeneous-equilibrium model predictions
previously discussed, and showed good agreement with the data of Isbin, et al.,
Fauske, Zaloudek, and Faletti and Moulton, described earlier. It also showed
good agreement (46) with the large diameter pipe data of James.( )
Starting from continuity and energy equations, and by assuming an isentropic
process, Moody (10) was able to express the local mass-flux in terms of stagna-
tion properties (entropy and enthalpy), local slip ratio, k, and local pressure,
P. Assuming the slip ratio, k, and pressure, P, as independent variables,
Moody defined the critical condition as
(y p = 03G(16)
and
' 3G |i k"0(17)
'87 *
Equation (16) led to the following slip ratio for critical condition:
r-k=3 (18).
1843 522)
- 11 -

Applying the above equation in the expression for local mass-flux and by search-
ing the critical pressure P which would satisfy condition (17), Moody was able
to map the maximum steam-water flow rate in terms of stagnation properties. Maxi-
mum flow rates in tenns of local (critical) static pressures and equilibrium
vapor qualities were also mapped. Like Fauske's model, this model also predicted
flow rates which were higher than the predictions of the homogeneous-equilibrium
model. However, when compared to the data of Isbin, et al.,(5) Fauske,(0' }
Zaloudek,IO) and Faletti,(9) the model slightly overpredicted the measured flow
rates for exit equilibrium qualities between 0.01 and 0.5, and underpredicted the
data slightly for qualities between 0.5 and 1.0.
The discrepancy between the models of Fauske(0' } and Moody (10) becomes
obvious from Equations (14) and (18). Both claimed to maximize the mass-flux
by using two different values of slip ratios at the critical section. A closer
look towards the models revealed that the Fauske model minimized the so-called
momentum specific volume, whereas the Mcady model minimized the so-called kinetic
energy specific volume. That is to say that the Fauske model maximized the mo-
mentum flow rate, whereas the Moody model maximized the kinetic energy flow rate.
Moreover, Cruver and Moulton(II) pointed out that Fauske's critical slip ratio
did not necessarily maximize the pressure gradient dP/dZ at the critical location.
They concluded that the pressure gradient in the two-phase critical flow would
not attain a finite maximum because of a variation in slip ratio.
Levy (I2} used continuity and two momentum equations, one for each phase,
to derive a relationship between the vapor quality and the vapor void fraction.
Assuming an isentropic process, he then expressed the critical mass-flux as
1843 523
- 12 -

2 , [DP (19)Gmax (ayg,
where v is identical to Fauske's so-called momentum specific volume defined byg
Equation (11). It is interesting to note that at low pressure, Levy's slip ratio
can be approximated by(13)
vk= Q2a (20).
Because of the similarity between Equation (14) and (20), Levy's prediction for
critical mass-flux matched closely with that of Fauske, and agreed reasonably well
with the data of Isbin, et al.,(6) Fauske,(6,7) Zaloudek,(8) and Faletti.(9) Al-
though the models of Fauske, Moody, Levy were successful in predicting critical
flow rate data at low pressures (< 25 bar) and high length-to-diameter ratios
(> 20), it must be kept in mind that none of the above models was completely
correct in its theoretical treatment of the problem. Some of the defects of
Fauske's and Moody's models have been pointed out earlier. It should be noted
that analysis of Levy was in error due to a wrong definition of mixture entropy.
Moody also used the same definition for mixture entropy which is valid only for
the homogeneous, equilibrium flow. However, the variation in slip ratios changes
the resultant critical flows slightly, as evidenced by the Fauske,(6,7) Moody,(10)
and Levy (I2) model predictions.
The preceding sections have all dealt with long tubes and pipes relative
to the diameter (L/D>20). The net conclusion is that nonhomogeneous slip mod-
els based on equilibrium assumptions do a reasonably good job for pipes with
184-3 524
- 13 -

large length-to-diameter ratios (L/D>20). In the following section the experi-
ments conducted in test sections of small length-to-diameter ratios will be de-
scribed. This will reveal the inadequacy of the equilibrium models and show
the importance of incorporating the effect of 'hermal nonequilibrium in critical
flow models.
1843 525.
.. . .
- 14 -

4. EXPERIMENTAL STUDIES IN SHORT TUBES AND N0ZZLES
It was well known for a long time that flow rates of two-phase mixture or
saturated liquid through orifices and short nozzles were much higher than the
HEM predictions.(1-3) Hewever, Zaloudek(I4) apparently started a systerutic
investigation of critical flow of initially subcooled water through short tubes
of length 0.03" to 5" (0.8 to 127 mm) and with sharp entrance edges. The tube
diameters were 0.25", 0.50" and 0.625" (6.35, 12.7 and 15.9 roi), and the upstream
pressure ranged from 100 to 350 psig (7.9 to 25.1 bar). Two types of choking
phenomena were observed by Zaloudek. The first type occurred near the vena-
contracta at the inlet of the test piece when localized flashing occurred as the
pressure dropped below the corresponding saturation pressure. The receiver (back)
pressure was still higher than the saturation pressure. As the back pressure was
decreased, a free discharge-type flow pattern appeared, arid the flow rate in-
creased. When the back pressure fell well below saturation, a second type of
choking occurred at the exit of the test piece. It is the second type of choking
which is more important from the practical point of view and will be discussed
here.
Critical mass-fluxes corresponding to the second t'/pe of choking were con-
siderably higher than the predictions of the homogeneous-equilibrium model, but
were in agreement with Burnell's surface tension model(2) and Bailey's surface
evaporation model.(3) Visual observation in a 12.7 mm diameter and 31 an long
glass tube revealed that at the critical condition a vapor annulus surrounded a
liquid core with some vaporization near the exit. The liquid core was believed
to be metastable although no temperature measurement was taken. Variation of
tube diameter and the tube length showed only a very slight effect on the criti-
cal mass flux, and no conclusion could be drawn because of the scatter of the
1843 326* '
- 15 -

data. The dissolved gas in water was partially blamed for the scatter, but no
systematic observations of this parameter were reported. It was observed that
a reduction in the amount of dissolved gas, by heating the water to 90 C in an
open tank, could increase the critical mass flux by 5 to 8%
Zaloudek(15) extended the above investigation to higher pressures in a tube
of diameter 0.505" (12.8 mm) and a length of 10" (254 mm). Thus the length-to-
diameter ratio of the test section was approximately twenty. There was also a020 conical approach section. Upstream pressures ranged from 400 to 1800 psia
(27.6 to 124 bar), whereas upstream enthalpies varied from 420 to 533 Btu /lbm
(9.76 x 10 to 12.39 x 10 J/kg). It was found that Fauske's model(O' ) pre-5
dicted the critical flow rate data quite well when two-phase mixture entered the
test section. However, when subcooled water entered the test section, the crit-
ical flow ratcs were much higher than those predicted by the Fauske model.(6,7)
This discrepancy was indeed attributed to the thermal nonequilibrium phenomenon
which retarded the vapor generation in the tube and produced lower vapor qualities
at the exit.
Fauske(16) studied the effect of test section length-to-diameter ratios for
saturated water discharging from high pressure sources (6.9 to 124 bar). The
test section inside diameter was 0.25" (6.35 mm) u the length was varied from
0 to 254 mm (i .e. , 0 < h < 40) . All the tubes had sharp-edged entrances. Forh
ratios higher than 12, the critical flow rates agreed well with the Fauske
model,(6,7) On the other hand, for b values less than 3, the data were highlyD
underpredicted by the Fauske model, but could be well predicted by the following
incompressible flow equation for the orifice:
G = 0.61 /2 o g{{-Pl (21)-
g c
.
- 16 -

where P was the pressure at the exit which yielded maximum flows. Therefore,
Fauskeconcludedthatforsmallh(<3),thefluidbrokeimmediatelyfromthewall and remained as a metastable liquid core jet with some evaporation from the
jet surface. For the intermediate range of h ratios (3 to 12), however, the
measured flow rates fell between Equation (21) and the Fauske model. Therefore,
it appeared that a breakup of metastable liquid jet took place in that interme-
diate range. The experimental results of this study are shown in Figure 3.
Uchida and Nariai(17) perfomed similar tests at low pressures (1.96 to
7.85 bar) in copper, brass and glass tubes of 4 nm inside diameter. The tube
lengthwasvariedfrom0to2500mm,(i.e.,0<h<625). The tube had a sharp-
edged entrance through which initially saturated or subcooled water flowed to
the atmosphere. The flow rates were found to decrease with increasing tube
length and showed only fair agreement with Levy, Fauske, or Moody's model for
long tubes. Flow rates for subcooled water were always higher than those for
saturated water at the same upstream pressure. However, the data from this test
were in qualitative agreement with Fauske's test,( 0} and visual observation (in
a glass tube) showed that even for saturated upstream condition and long tube
(1410 nm), phase change started at the middle of the tube. Therefore, the liq-
uid did become superheated in the glass tube which might have had less nucleation
sites than a metallic pipe.
Starkman, et al.(18) used two convergent-divergent nozzles of throat di-
ameters 0.438" (11.1 mm) and 0.252" (6.4 mm) to measure critical flow rates of
steam-water mixtures at upstream pressures of 100 to 1000 psia (6.9 to 69 bar)
and upstream vapor qualities of zero (no subcooling) to 20%. The flow rates were
found to increase rapidly as the upstream quality approached zero. Over the
entire range of the experiment, the flow rates were higher than the predictions
1843 328
- 17 -

_ 20- ' -
of the homogeneous-equilibrium model,0"
|a and the deviation between the data and'
' iu
j is -, 7 3~ the prediction reduced to 10% as the
i I 4
upstream quality was raised above 10%.-
, ,o
- _ _ _ _ ___io ,
42 No systematic effect of throat diameterg 1-g i|/// ss:
/p A vo.4o. was noticed., _j
u _ . . _
3 ,- -- - Starkman, et al., compared their
d ~~T~~ I-~ ~I I data also with a " Homogeneous Frozen"
2 o 5 to 15 20
sTAcNATioN PRESSURE,10 psig model (HFM). This is a limiting model
rirari 3. Maximum aischarge rate of based on the following assumptier.s:s.it u r.it ed wa t er t hrough .i 6. 35 mm I.D.
tube. (rauaeU>> om s-122 7- 78) a. The velocities of both phases
are equal, i.e., homogeneous
flow.
a. No heat or mass transfer takes place between the phases; thus, the vapor
quality remains constant throughout the channel.
c. The vapor expands isentropically; i.e., PyY = constant,g
d. The kinetic energy of the stream evolves entirely from the vapor expan-
sion due to pressure drop and area change.
e. The critical flow rate occurs when the vapor Mach number reaches unity
at the throat.
The final expression for the critical mass-flux at the throat becomes(18,20)
~1
G . xcrit (r*)-1/y + (1-x ) vx v g f,g
.
'y-1 _3.
| Y fY (p*) (22)29x v Po g,o o y-1 |}_ }
.
.
* .g
- 18 -
1843 529

,
where the pressure ratio, r*, is given by:
p - _L.
r* = - Y~l
The abiabatic coefficient of expansion, y, for steam is usually taken as
1.3.
It was found that for upstream qualities greater than approximately 2%,
the critical flow rate data of Starkman, et al.,(IO) could be bounded by the
homogeneous-equilibrium and the homogeneous-frozen models. This is shown in Fig.
4. At very low qualities the frozen model predicts much lower flow rates which
do not agree with the trend of the data. The reason for this anomaly is that the
kinetic energy of the liquid phase was ignored completely.
Schrock, et al.,(19) extended the above study to initially subcooled water.
They also employed a third nozzle of throat diameter 0.156" (3.96 mm). The stag-
nation pressure ranged from 100 to 1300 psia (6.9 to 89.6 bar), and the subcooling
ranged from 0 to 60 C. The critical flow rate data always fell between the
homogeneous-equilibrium model and the all liquid, i.e., Bernoulli, flow model.
Existence of metastable state of water was recognized, and a two-step frozen
model was advanced. According to this model, the flow remains all liquid until
the pressure drops below the corresponding saturation pressure by a certain
amount. At this point, the flow suddenly attains the equilibrium condition. How-
ever, beyond that point the two-phase mixture is again assumed to flow according
to the homogeneous-frozen model. This two-step model showed only limited success,
and no correlation for the point of discontinuity was proposed.
1843 330
- 19 -.,
( . .* i

~' *'
SERNOULLt Ftow. 0% CUAUTY80F lbha8 set
cal flow rate at low pressure (1.22 bar),-so e, . 300 n;.'u e WOzzlE No.8
5 I but higher upstream qualities (20 to. e.azztc w..:
2 40 1
[ $ 100%) in a convergent-divergent nozzleF s
3Ua % of throat diameter 32.55 mm. Their ex-
h pot b ',.7"* rio, g perimental data on flow rates were al-.
h' -.O =ar-- ways higher than those predicted by both
10'* ' '5 2 the homogeneous-equilibrium and theCHAMBER OV ALITY. %
9 *Figure 4. Comparison of experimentalf low rates wit h t he homogeneous-
equilibrium and homogeneous-frozen for this apparent contradiction withnodels. (Starl< man, et al.18) (BNL 5-
the data of Starkman, et al.,(18) was1224-78)
not given.
Recently, Sozzi and Sutherland(21)
reported critical flow rate data in a variety of nozzles. Most of the data were
taken in (1) a convergent-divergent nozzle with well-rounded entrance and 0.5"
(12.7 mm) diameter throat, (2) a convergent nozzle with well-rounded entrance and
0.5" (12.7 mmi diameter exit section, i.e., the same configuration as Nozzle No.1
without the divergent section, (3) a sharp-edged orifice of diameter 0.5" (12.7 mm),
and (4) a convergent nozzle, the same as Nozzle No. 2, but with 0.75" (19 mm) exit
diameter. Limited amount of data were also taken in convergent-divergent nozzles
of throat diameters 2.125" (54 mm), 3.0" (76.2 mm) and 1.1" (28 nm). In addition,
constant diameter (12.7 mm) pipes of various length were attached to Nozzle No. 2
and 3 to study the effect of pipe length on critical flow. Stagnation pressure
was varied from 600 to 1000 psia (41.4 to 69 bar) and the stagnation temperature
ranged from 450 to 550 F (232 to 288 C).
- 20 -
1843 331

Several interesting observations were made. Like other investigations,
the critical flow rate in this study was also found to decrease with increasing
upstream quality.* As expected, a well-rounded convergent nozzle (No. 2) allowed
more flow than a sharp-edged orifice of the same diameter. However, when a di-
vergent section was added to a convergent nozzle, the critical flow rate decreased
cons itiora bly. The finw rate was found to decrease further when the divergent sec-
tion was replaced with a constant diameter pipe of the same length. The pipe dia-
meter, of course, was equal to the throat diameter. Therefore, it could be con-
cluded that the geometry (or, the choking location) played an important role in
critical flow phenomenon, particularly for short flow lengths.
Sozzi and Sutherland(21) also found that the critical mass flux decreased
with increasing throat diameter. This was clearly shown for convergent nozzles
of two different throat diameters (12.7 and 19 mm). The same trend was shown for
convergent-divergent nozzles with various throat diameters (12.7, 28, 54 and
76.2 nm) . These findings were in contradiction with earlier investigations of
Starkman, et al. ,(IO) but in agreement with the studies of Bryers and Hsieh. 7)
The effect of pipe length was similar to that found by Fauske(16) and
lichida and Nariai.(19 The critical flow rate decreased sharply as the pipe
length was increased. However, above a pipe length of 5" (127 nm), only a small
decrease in critical flow rate was observed, and the flow rates in these longer
pipes seemed to agree well with the homogeneous-equilibrium nodel prediction.
Sozzi and Sutherland, therefore, concluded that the effect of thermal non-
equilibrium could be neglected if the flow lengths were larger than 5" (127 mm).
This seems to be quite arbitrary, and may not be valid for larger pipe diameters.
* Quality in this study was based on mixture density, not on mixture enthalpy.Therefore, this quality, when positive, is the same as the static quality, orthe vapor mass concentration, jg
- 21 -

MorrisonI22) provided further data in support of the above conclusian of
Sozzi and Sutherland. He took critical flow data in a well-rounded, convergent
nozzle of 1.1" (28 cm) exit diameter with a 5.25" (133 nm) long constant diar ater
(28 nm) section attached to it. The data seemed to agree well with the HEM pre-
diction except for zero upstream quality. Morrison also showed that the critical
flow rate for the above test section was smaller than that for a convergent-
divergent nozzle of the same throat diameter and same ovarall length. He attrib-
uted this difference to the nonequilibrium effects associated with the convergent-
divergent nozzle, or in other words, to the different locations of choking. More-
over, no diameter effect was found when constant diameter (12.7 or 28 nm) pipes
of at least 127 mm lengths were attached to convergent nozzles of 12.7 or 28 nr1
This was partially in agreement with other investigations.(5,8,9)exit diameter.
Hutcherson(23) ran transient blowdown tests from a vessel with internal
skirt. The discharge pipe was 4.257" (108 nm) in inside diameter and 12.755"
(324 nm) in lengtn. Thus, the length-to-diameter ratio of the discharge pipe was
approximately three. The pipe was connected to the vessel through a short conical
convergent section. Initially saturated water at 290 and 402 psia (20 and 27.7
bar) was discharged through the pipe, and conditions (pressure and quality) at
the entrance of the pipe were calculated as a function of time. Based on these
upstream conditions, critical discharge flow rates were calculated assuming the
HEM and a nonequilibrium model developed by Henry and Fauske,(28) discussed later.
The nonequilibrium model, which predicted higher flow rate than the HEM, showed
better agreement with the measured flow rate during the early part of the tran-
sient when the flow was believed to be choked. Therefore, it is not certain that
the nonequilibrium effect is negligible for large diameter pipes (> 100 mm) if
the pipe length exceeds 127 nm as suggested by Sozzi and Sutherland.(21)
) f 0,b b
- 22 -

In summary, it can be said that the critical ma. s-flux is a strong func-
tion of pipe length, particularly for short pipes anr. low upstream qualities in-
cluding the subcooled liquid. Under these circumstances, the measured critical
flow rates, which also depend on the entrance geometry, have been found to be
much higher than the predictions of the homogeneous-equilibrium model. In some
cases,(15,16,17) the flow rates were even higher than the equilibrium, slip-
flow models of Fauske,(6,7) Levy (IU or Moody.(10) Thermal nonequilibrium be-
tween the phases has been cited as the possible reason for this discrepancy.
However, it has not yet been establisheo whether the pipe length, L, or the
length-to-diameterratio,h,orbothshouldbethegcverningparameter(s)in
relation to the nonequilibrium effects. In Table 1, the experimental studies
reviewed in this report are presented and the conditions where thermal non-
equilibrium is important have been indicated. In the following section, the
models which have attempted to take into account the effect of thennal non-
equilibrium are discussed in detail.
1843 M4
- 23 -,
,

Table 1: Summary of Steam-Water Critical Flow Data in Constant Area Pipes
h pe Geoinetry Mode! CrcrarisnnResearc hers Sy stem Entrance D L Equilibrium
(Ref.) Conditions Geome try (mm) (mm) L/D HFN slio (6,7,10,12) Remarks
Isbin, et al. P = 0.28 to conical 9.5 to 610 23 to 64 poor good Exit pressuree(5) 3 bar 26.5 except measurements
* = 0.01 X e .eq :1 may be in error.:e eq
to 1.0
Fauske P = 3 to 25 conical and 3.2 to 1429 and 116 to -do- -do- -do-e(6,7) bar sharp-edged 12.3 2794 873
X .eq = 0.P1e to 0.7
Zaloudek P*= 2.76 to conical 13.2 and 610 to 38 to -do- -do- Setter exit(8) 7.58 15.9 1219 92 pressure mea-
I X = 0.004 su remen t .e.eqw to* 0.99
Faletti P = 1.72 to conical 5 and 229 to 23 to poor good Annular testeand 5.52 bar 9.8 893 178 except section. Hy-
Moul ton X = 0.001 X ::1 draulic diame-e.eq e.eq(9) to ters indicated.
0.96
-do- conical 5 13.5 2.7 poor poor Nonegailioriumeffects are im-portant.
James P = 1 to no t /6 to 3658 18 to 48 poor good Upstream pres-~ee, (45) 4.4 bar reported 203 sures not re-
A ported,h = 5.35 xg, g
510 to
Y' 27.9 x 10W J/kgLJ1

Table 1: Summary cf Steam-Water Critical Flow Data in Constant Area Pipes (Cont.)P1pe Geome try Mottel Comparison
Researchers System Entrance D L Equilibrium(Ref.) Conditions Geometry (m) (mm) L/D HEM slip (6,7,10,12) Remarks
Zaloudek P = 8 to 25 sharp-edged 6.35 to 0. 8 to 0.05 poor poor Nonequil ibrium(14) bar 15.9 127 to 20 e f f ec ts are i m-
subcooled portant. Ef-liquid fects of dis-
solve gases arealso important.
Zalc>dek P = 27.6 to 20 conical 12.8 254 20 poor poor, Nonequilibriumo(151 124 bar except 2-phase effects im-5
h = 9.76 x 10 entrance portant forgt 12.39 x | subcooled lig-510 J/kg uid entrance.'
,
y Fauske P = 7 to sharp-edged 6.35 0 to 254 0 to 40 poor, poor, None quil ibri umg(16) 124 bar
,
except effects im-!except'h =h L/D > 12 L/0 > 12 portant forU I' L/D < 12.
Uchida and P = 2 to sharp-edged 4 0 to 2500 0 to 625 poor, poor, Significant0Narlai (17) 8 bar except except nonequilibrium
h <h L > 1000 mm L > 1000 m e f fec ts.7,g
Sozzi and |P = 41 to well-rounded 12.7 0 to 1775 0 to 140 poor, comparison Signiricant0Su therl and | 69 bar and except not nonequilibrium" (21) T = 232 sharp-edged L > 12 7 mm shown ef fects forU6) to 288 C L < 127 rn.:>
w Morrison P = 69 bar wel l-rou nded 28 133 4.75 good, -do- None quil ibri um(22) v-v (P ) except effects .ref g
X X :: O claimed to be= ,fg(p )u g go insignificanty
= - 0.0027 because L >to 0.005 127 m.

: ._
f
.
t.
Table 1: Summar/ of Stean-Water Critical Flow Data in Constant Area Pipes (Cont.)
h oe beometry unan1 rn-nariennResearchers System Entrance U L Equilibrium
(Ref.) Condi ti ons Geometry (mm) (mm) L/D HEM sli p (6,7,1u,12 ) Remarks_
'Hutchenson Initial con- conical 108 324 3 poor poor Significant
$ (23) ditions: nonequilibrium.(Transient P = 20 and'Blowdown) 27.7 bar
h =hg g
a
bLL;
64'N

5. fl0NEQUILIBRIUM MODELS
5.1 Lumped Models
Henry, et al .,(24) recognized the fact that the effect of thermal non-
equilibrium was to maintain the value of the actual vapor quality, x, below
the corresponging equilibrium quality, x They defined a system character-eq.
istic parameter, N, such that
N5 ( }keq
where k is the slip ratio. Because x<xeq, Nk must be less than unity. Henry,
et al., also recognized, from their experimental studies in long tubes g>40(5)and studies of Klingebiel and Moulton,( 0} that the actual slip ratios at the
chokingplaneweremuchlowerthanthevaluestakeninFauske's(,]F)orf
Moody's(pv/vf ) models. Therefore, they were able to derive the followingg
expression for the critical mass-flux for low exit equilibrium qualities
(0 < x <0.02):eq
6 (24)*r N dN
-V X
Gg eq W2
, cr, HEM ,e
where G represents the critical mass-flux value under the homogeneous-cr, HEM
equilibrium model and the right-hand side of Equation (24) is to be evaluated
at the exit (or throat) conditions.
For low vapor qualities one can write
g _"g [vx=k Nkx (25)=
eq9
1843 M8' '
's
.
27 _

Henry, et al. ,(24) calculated the values of N from their experimental studies, 25)
and assuming N to be a function of equilibrium quality only, they developed the
following correlation:
N = 20 x (0 < x < 0.05)eq eq(26)
N=1 (X > 0.05)eq
The above correlation implicitly assumes that equilibrium is reached at 5%
equilibrium-quality for a slip-ratio value of unity. This seems to have no
dNphysical basis. It was also found that at the choking plane gg- could be taken
to be zero. Therefore, Equation (24) reduces to:
Gcr, HEM
(27)G =cr y
e
Henry, et al. , applied Equation (27) to their data at moderate exit pressures
(2.76 to 10.3 bar) and low exit equilibrium qualities (< 0.02) taken in long
tubes (h2 40), and showed good agreement. Scatter at very low qualities was
attributed to the dissolved gas in water used for the experiment. Notice that
one has to know the exit pressure, wnich is usually not known, to be able to
calculate the critical flow from the above model.
Henry ( } also proposed a model for initially subcooled or saturated water
discharging from a long tube having a sharp-edged entrance. He assumed that theL
vapor generation in pipes of g ratio less than 12 could be neglected, and the
actual vapor quality for pipes of h greater than 12 approached the correspond-
ing long tube value, x T, in an exponential manner:
- 28 -

- B ( h - 12)} (28)* *LT 1 - expx
e
The actual vapor quality at the exit of a long tube was given by
x =Nx (29)LT eq
where N was taken from Equation (26).
By assuming the liquid to be incompressible, and the flow to be friction-
less and homogeneous, Henry was able to write the following expression for
pressure ratio:
2~ -
P G vcr __R- +xr* = pS=1 p e (V - *bo) (30)g,e
o o 2C- _
where C is the contraction coefficient at the pipe eni.rance.
By assuming the vapor compressibility to follow an isothermal process,
Henry expressed the critical mass flux as
2
G r " xv dx ~ ( I}~
e3d - (v t,o) N dP _e-vP gt
Given a value for B, one can now iterate on Equations (28) through (31) to cal-
culate the exit pressure and the critical mass-flux. From the data of Uchida
and Nariai,(17) Henry recommended a value of 0.0523 for the decay constant B.
The advantage of this model is that only the test section geometry and the up-
stream stagnation conditions have to be known. However, no specific recommenda-
tionhasbeengivenforhlessthan12.
1843 340- 29 -

lor smooth inlet configurations, Henry suggested a value of unity for the
contraction coefficient, C, and vapor generation to start from the beginning of
the constant area portion. Therefore, Equation (28) was modified as:
* *LT 1 - exp - B (h) (32)xe
where x was given by Equation (29) and the same value of B as before wasT
used.
The model showed good agreement with the critical mass-flux data of
Fauske,(16) Uchida and Nariai,(17) and Zaloudek.(15) The critical pressure-
ratio data were somewhat overpredicted by the model. However, Henry argued that
because of the two-dimensional effect near the exit of an abrupt expansion, the
pressure taps at the wall recorded lower-than-actual exit (critical) pressures.
He also compared the model with Freon-11 and Freon-12 data to justify the use
of ( -) as a nonequilibrium scaling parameter.
Henry and Fauske( ) extended their nonequilibrium modeling efforts to
nozzles, orifices and short tubes. They argued that in a normal nozzle con-
figuration there would be little time for heat and mass transfer in the con-
verging section. Therefore, they assumed that
x** (33)t o
and
Tt ,t = T (34)g,g
They also assumed the flow to be homogeneous and the expansion up to the throat
1843 341
g. x
- 30 -

to be isentropic. The vapor compressibility at the throat was, however,
assumed to follow a polytropic process such that
dv v-E 9. (35)=-dP nP
t
where the polytropic exponent, n, was calculated from:
(1 - x) C / C +1g P'9 (36)n = [1 - x) C;/ C + 1h
p,9
The liquid was assumed to be incompressible, and the derivative of slip ratio
with respect to pressure at the throat was taken to be zero. The previous de-
finition of nonequilibrium system parameter, N, was invoked and the final ex-
pression for critical mass-flux at the throat was written as:
2 1Gcr "[x v (1 - x ) N dS *C (1[n - 1/yl -g g t eq _o
nP g t,o S -b dP P -S g) _t_g,eq 4eq g
(37)
From the data of Starkman, et al.,(18) Henry and Fauske recommended the follow-
ing expressions for N for nozzles:
N=x /0.14, (0 < xeq,t < 0.14)eq,t
(38)
N=1, (xeq,t > 0.14)
From momentum equation, and utilizina Ecuation (37), they expressed the critical
1843 342..
.
- 31 -- ', ,
-, t .,

pressure ratio as:Y'' 1. a
Y Y-1(1 - r*) +P1= |c Y -1{
r* = p (39)'
o 1 y,2
28a y-1t
,
where
g t te,
p,g (1/n - 1/y)1, fy _ Vt,o [(1 - x ) NPdS C
6_-St,eq)t dP (S -Sg,g)g,t/ Yo (bg,eq" V
\ g,g- -(40)
*V_
o g,o (41)"o ~ ( 1 - x ) v +xvg g,g g g,g
o g,t(42)=a
t (1 - x ) v +xvg g,g g
and
g,o (r*) - 1/Y (43)v =vg,t
For given stagnation conditions of P and x , the transcendental Equation (39)g g
can be solved to determine the throat pressure. The critical mass-flux can
then be calculated from Equation (37).
The model showed fair agreement with critical mass-flux data as well as
critical pressure ratio data. Comparisons with Starkman et al.'s data (18) are
shown in Figures 5a through Sc.
For saturated or subcooled watar stagnation condition, i.e., x = 0, theg
expression for critical mass-flux [Equat. ion (37)] was written as:
2 1
d5- (44)G ,
t,o S~-N t,eq
( g,eq -,
l -b dP_
g,eq Geq
4>- 32 - jg43 343

The additional assumption was that the
vapor at the throat was saturated at
171.0 .iii.iii.ii;ig.gigig,
9 PROPOSED MODEL~
the local pressure. The critical pres-
li ', -W2tN ff3',
- ---HOMOGENEOUS FROZEN _ j .o,
*Jflg -
g 0. 7-
'
-->,2= 0. 6 - -
r*=[ph0.s f '''
y gcr1- (45)- =
g o,. /1,I, .I I,!,t,I,l,I,I o ou O 2 4 6 & 10 12 I4 16 le 20 22
STAGNATION QUALITY, X)
Figure Sa. Comparison of critical An iteration on Equations (44) and (45)pressure ratios (18) with the pre-diction of ilenry and Fauske.(28) resulted in the desired critical pres-(BNL 5-1225-78)
sure and critical mass flux. Predic-
tions from this model agreed well with
the data of Zaloudek(14) and others.
' '' ' 1''''''''I_ 7000 i e ia: aisg i3sasg ps i s s
PRESSURE P pslo, MODEL OATA f7000 o P R ES S U R E, P, psic MODEL DATAa|, 6000 N 200 - - - - O g 300 ---e
e 400 m = 500 BN * 6000 -
21 5000 - -
: =
* 4000 >- s - g 5000 5% -
s
Jg % ss
\( -$ 3000 - 's - O
3 N Ng \oo e oo o2000 - N 3000 N -
{ 1000 - O' o t ~ 2000-* L. 5%'"s 55 *
0 AN
$ $ N t*' ' ' ' ' ' ' ' ' ' ' ''''' ' ' ' ' ' ' ' ' ' ' ' ' ' ' ' ' 'O 1000
0 . 0 01 0.01 0.10 0. 0 01 0.01 0,10
S TAGNATION QUALITY, X, STAGN ATION QUALITY, X,
Figure 5b. Comparison of critical Figure 5c. Comparison of criticalflow rates (18) with the prediction of flow rates (18) with the prediction oflienry and Fauske.(28) (BNL 5-1226- lienry and Fauske.(28) (BNL 5-1228-78) 78)
1843 344
- 33 -

for sharp-edged orifices and short tubes with two-phase entrance condi-
tion, Henry and Fauske suggested a discharge coefficient of 0.84. This would
only modify the expression for critical pressure ratio [ Equation (39)] as
Y1-a i
Y Y-1U ( 1 - r*) +I Y-Ila
(46)r* = / +
Il1 y,
,2 (0.84)2 y-12
Equation (37) can then be used to calculate the critical mass-flux.
The above three models of Henry and co-workers (24,27,28) are useful cal-
culational tools for taking into account the overall effect of thermal non-
equilibrium in the prediction of critical mass-fluxes. However, none of these
models attempted to describe the mechanism of vapor formation during rapid de-
pressurization or flashing. Moreover, no specific recommendation has been
made for pipe lengths less than twelve diameters where a strong length effect
can be expected (see Figure 3). Thus, the models could be of 1imited useful-
ness in the analyses of a hypothetical LOCA in LWR systems.
5.2 Distributed Models
A large number of distributed models have been developed in recent years.
These models have attempted to calculate the actual local rate of vapor genera-
tion, and then determine the actual vapor quality at the critical location. We
shall discuss these models in detail.
Edwards (29) attempted to formulate the problem from a mechanistic view-
point. The major assumptions of his model were:
(a) homogeneous ficw
(b) the vapor phase was always at saturation
(c) all bubble nuclei:were formed simultaneously following an arbitraryr ~ _t e
1843 545
- 34 -

time delay corresponding to a certain degree of liquid superheating
(d) for sharp-edged entries, causing initial flow separation, downstream
flow expansion took place at constant pressure
(e) results of Plesset and Zwick(30) for bubble growth at constant pres-
sures could be applied during the initial phase of bubble growth
(f) at the later stage, when the pressure was falling, the vapor genera-
tion could be calculated from a one-dimensional composite slab heat
conduction model
(g) the surface area of vapor-liquid interface per unit mass of liquid
could be approximated by:
A * (UN) ! 3x (1 - x) d [v -2/3v
(47)b_ _
where N is the number of bubble nuclei per unit mass of liquid, x is
the actual vapor quality and v is the specific volume of the mixture.
Based on the above assumptions, a set of one-dimensional conservation equa-
tions was solved to calculate the pressure, velocity and the specific volume a-
long the length of a pipe. The flow was taken to be choked when the pressure
gradient at the exit of the pipe became infinite. However, this choking cri-
terion does not agree with the finite experimental pressure gradient obtained by
Reocreux.(43,44)
There were two arbitrary constants in the above model. These were:
(1) the time-delay for bubble nucleation which was on the order of 1
millisecond,
(2) the number of bubble nuclei per pound of liquid which ranged from
I toiIdlI~101843 346
- 33 -

Utilizing the data of FauskeO 6) taken in 6.35 mm diameter tubes.
Edwards suggested the following correlations for those two items:
(P - F)(i) Time delay: At = C Exp - B sat
(48)E p j
sat
3) (49)where C = F (c) = 2.85 x 10- exp (7.2 x 10⁷ c
and B = 4.605 (50)
1
-190[p " _ p- f (51)Il(ii) Bubble nuclei: N = 3.0 x 10 exp
( sat j(per pound of water).
Pressures and surface tensions are expressed in psi and Ibf/ft, respectively,
Forshorttubelengths(h<5),anarbitraryradialin the above correlations.
pressure gradient near the exit was needed to match the data. This was nec-
essary because of the abrupt expansion at the exit.
Applicability of the above model to a large diameter p'pe was checked by
Edwards and O'Brien.( I) Several transient depressurization tests were carried
out in a steel pipe, 2.88" (73 mm) in inside diameter and 13.44 ft. (4097 mm)
in length. The pipe was filled with subcooled water at high pressures (34.5 to
172.a bar). Transients were initiated by rupturing a disc at one end of the
pipe. During the transient, pressures at the wall were recorded along the length
of the pipe. These pressure traces including a dip during the early part of the
transient could be well predicted by Edwards' model by choosing a suitable value
for the number of bubble nuclei.* However, the prediction did not agree well
with the long term pressure traces. An error in the computer program was
The tima delay had only a small effect. kh4i
- 36 -

blamed for the discrepancy. In spite of this, it is clear that although the
model showed some promise yet the correlations for the time delay and the number
ofbubblenuclei[ Equations (48)and(51)]cannotbeconsideredasgeneral.
Malnes(32) emphasized the importance of dissolved gas in water by taking
its effect into account in his critical flow model. By assuraing a homogeneous
flow model and 1 - a (1 - py/pg)= 1, he expressed the mass rate of vapor genera-
tion per unit volume as:
p $2)T =y y
whereh-h+uh
Like Edwards, Malnes used the conduction-controlled bubble growth la i
applicable to a liquid of constant pressure and constant superheat. He a'so
assumed that the number of bubbles per unit volume was constant, and wou'd
be a function of (go /c). Finally, by combining the vaporization due to bubble
growth and flashing from droplets, Malnes expressed the vapor generation rate
as:
{ a (1 - a)}1/3 (T -TP E(R F+R)F =
y g 3 g sate ah
yg
where R and R are two dimensionless empirical constants, andg
F = 1 - 2a (a < 0.5)(54)
F=0 (a > 0.5)1843 348
- 37 -

A set of conservatior. equations were solved along with Equation (53) a-
long the length of a pipe, and inlet mass-flux was increased until critical
velocity was obtained at the exit of the constant diameter pipe. Values of7 57 x 10 and 2 x 10 for the constants R and R , respectively, were obtainedg 3
from the best fit of Henry's data,( 5) where exit void fractions were measured.
3 3Gas content of the order of 0.01 to 0.06 m /m at 1 bar and 25 C was assumed.
This large gas conter,t was necessary to explain the observed void fractions
before the pressure reached saturation. Finally, good agreement with Henry's
critical mass flux data was shown by assuming an average gas content of3 30.04 m /m at 1 bar and 25 C. Ma'.nes pointed out that nitrogen gas was used to
pres urize the water tank in Henry's experiment, and therefore, a large amount of
dissolvcd gas in water could be expected.
To match Zaloudek's data,(15) fialnes needed a relatively small (0.5 x 10⁻³
3 3m /m at 1 bar and 25 C, typical for BWR) amount of gas. The predictions with
the same amount of dissolved gas also agreed well with Fauske's critical flow
rate data (IO) for tube lengths greater than 5 cm (i.e. , LD>8). However, for-
shorter tube lengths the predictions were much lower than the data. Malnes
attributed this discrepancy to the phenomenon of delayed flashing which was not
included in his model. Similar discrepancy was found even with respect to the
long tube length data of Uchida and flariai,(I } and the same explanation was
offered.
Rohatgi and Reshotko( ) made an attempt to relax the assumption of a
constant number of bubble nuclei per unit mass of liquid as employed by
Edwards.(29) Following the kinetic theory of bubble nucleation in a super-
heated liquid, they wrote the following expression for the rate of production.
1843 349
- 38 -

of bubble nuclei per unit volume of liquid:
dN 3-
exp -16g=(HN) (55)
- v c -
where HN is the number of heterogeneous nucleation sites per unit volume of
liquid, m is the mass of a molecule, K is the Boltzmann constant and 4 is a
contact angle function given by
4 = (2 - Coso) (1 + Coso)2 (56)4
Plesset and Zwick's formulation (30) for the bubble growth was assumed, and the
bubbles were tracked downstream from their location of nucleation. Finally, the
vapor void fraction at any location, Z, was given by
7- Z 3
+[ dZ 1 - a(Z ) dZ (57)a= rd 1_ 1g
Z-
Zg 3
where Z represents the saturation location, and r is the initial bubble radiusg g
at nucleation site Z .1
Rohatgi and Reshotko used Simoneau's data (34) taken in a converging-diverg-
ing nozzle with liquid nitrogen as the operating fluid to recommend values for
4 and HN. A very small value (5 x 10⁻⁶) for t, which corresponds to a value ofUapproximately 176 for contact angle 0, was required to match the data. The
3value of HN ranged from 1 to 2 per cm . This w'as a very small value compared
to thr. bubble nuclei number proposed by Edwards.(29) However, no comparison
was made with any steam-water data, and the model did not include the effect
of delayed flashing.
1843 350.
- 39 -

As seen from Equation (53), a conduction-controlled bubble growth law at
constant pressure, although not realistic during a flashing flow, results in
a vapor generation rate which is proportional to the square of the liquid
superheating. In a different type of formulation, Rivard and Torrey( 5) assumed
the vapor generation rate to be proportional to the liquid superheating, and
wrote the following expression:
r =A A(1 - a)ap (T (t - sat)I saty e 7 sat u
where l is an arbitrary constant, l'u is the universal gas constant and A ise
proportional to the vapor-liquid interfacial area per unit mixture volume. For
N equal sized spherical bubbles (or droplets) per unit volume, A is given by:
A = a /3 [ )1/3 (a < 0.5)2
(59)
A = (1 - a)2/3 [ N)1/3 (a > 0.5)_
Two-phase flow equations corresponding to the two-fluid model, i.e., six con-
servation equations, were solved by the computer code called KACHINA.("")
Edwards and O'Brien's transient data (31) ,aere used or model comparison. Values
3of 0.1 for A and 10 bubbles per cm for N seemed to predict the 1000 psig (70g
bar) data with limited success. Rivard and Torrey Liso reported that the
values for A nd N had some effect during early period of the transient, but noe
significant effect at a later stage. This indicates the importance of non-
equilibrium effects when initially subcooled liquid is depressurized rapidly.
1843 351
- 40 -

Wolfert(37) calculated the rate of vapor generation by allowing a relative
velocity between the vapor bubbles and the liquid. He started from the follow-
ing expression for heat transfer coefficient, h , between the bubbles and the7
liquid:
h 2rb _ 2 | 2rb ,c' P'',u
2 (Pe )'2 (61)Nu - 7 r-
l = -
bb k g( k j g7 g
where u is the relative velocity.p
Wolfert finally expressed the rate of vapor generation per unit volume
for the case of bubbles with relative velocity as:
r ( ""r ) (k p q p,1) (T -Tsat)/h7gc (61)av,u /o g 7r
where N is the number of bubbles per unit mixture volume. Notice that the
vapor generation rate in this case is proportional to the liquid superheating,
and in this respect, somewhat similar to the formulation of Rivard and Torrey,
i.e., Equation (58).
Wolfert also considered the case with no relative velocity, and starting
from the bubble growth law of Plesset and Zwick,(30) he finally obtained:
2/3 1/3 (k p p,7) (T -Tsat)/3 \1/3 c7r _ 24 N " - (62)v,u =0 - 2
r v h fg
Thei ! fore, the functional relationship between the vapor generation rate and
the liquid superheating clearly depends on whether the relative velocity is
considered or not. A comparison between Equations (61) and (62) showed that
at small vapor void fraction, particularly at high liquid superheating,
1843 22- 41 -

r dominates, whereas at higher void fraction the vapor generation ratev,u =0
r
would be determined primarily by r W Ifert just added the two termsv,u /0
r
without justification and expressed the vapor generation rate per unit volume
as
(63)r =rv,u =0 + rv,u /0vr r
Wolfert applied the model to predict Edwards and O'Brien's 1000 psig (70 bar)
test data.(31) A value of 0.15 m/sec was used for the relative velocity of the9 3bubbles, and a value of 5 x 10 per m for number of bubbles gave reasonable
agreement with the test data. It should be noticed that Rivard and Torrey(35)7 3used a bubble density of only 10 per m to match the same data, whereas
Edwards (29) recommended bubble densities in the range of 2 x 10 ll to 2 x 10"3
per m .
Wolfert also compared the above model with the data of Friz, et al .( 8)
In that experiment, a fixed volume of subcooled water at high pressure was
suddenly expanded to a slightly larger volume and the pressure-time history was
recorded. After a number of trials and errors, Wolfert recommended the com-
bined form of the vapor generation rate, i.e., Equation (63), with a bubble9 3density of 10 per m . The comparison of the data with various values of bubble
densities is shown in Figure 6. It should be noticed that the pressure dip be-
low the saturation pressure was a marked manifestation of the thermal non-
equilibrium effects during a sudden expansion.
Friz, et al.,( ) themselves made an attempt to predict their experimental
They used the Plesset and Zwick bubble growth law at constant pressure (30)data.
and derived an expression for vapor generation rate, very similar to Equation (62).
,
''
^
1843 553- 42 -

p(bel They found the bubble density to be a95 -
strone. function of water temperature,
and recommended bubble density values90 - ** A
H -- ' P '.' ; =" in the range of 108 to 2 x 10¹⁰ per m 3,
85 - I '// - EXPEMENT 0
f for water temperatures of 250 C to 325 C.ig// CALCULATIONS
80 - U,/ --- N i x io' m-3
However, they recognized that the bubble- N = 5xio' m-3
density, which might be influenced by75 - --- N = 5x lO' m-3
r, r ,,, , , + r,,,, , , impurities, gas content and wall eifects,'
5 ' '5 was the most uncertain factor in their(msec)
theoretical model.Figure 6. Comparison of the predictionof Wolfert(37) with the data of Friz, In Contrast to the rather "adet al.(38) (BSL 5-1229-78)
hoc" forms of the vapor generation rate
described until now, Boure, et al.,(39) suggested that a general constitutive equa-
tion for mass transfer rate between the phases should include derivatives of the
dependent variables. The reason for this suggestion was that under some circum-
stances imaginary characteristics were encountered and only the terms containing
the derivatives would enter the system determinant (which must vanish at the
critical section). Therefore, only the differential terms of the constitutive
equation could possibly have the effect of rendering real enaracteristics under
all conditions, and have an effect on the critical flow. Liles(40) has attempted
to follow the above suggestion to formulate the constitutive equation for vapor
generation, but no correlation has been proposed.
In an attempt to compare various forms of the constitutive equation,
Kroeger( I) studies three different expressions. The fitst expression was the
same as the vapor generation rate corresponding to the homogeneous equilibrium
i 1843 354....
- 43 -

model:
~
dh dh ~ |
= f |Ih _(1 - c) dP +cy h Mp
r =ry ggg
fg m _j
where c ( = an /pm) is the mass concentration of vapor, and the substantial de-y
,rivative is taken with respect to the mixture velocity, um ( = G/pm). The se-
cond expression was a delayed relaxation model for nonequilibrium, nonhomogeneous
flashing flow:
0 (c <c)eq A1r;=< _ _
(65)g
| c -cT + (c >c)eq zHEM *
,
_ _
where c w s a threshold value of the equilibrium vapor mass concentration, ceq'A
up to which no vapor generation was assumed. Vapor generation was assumed to
start at c =c at a rate larger than r nd finally relaxed to the equil-eq A HEM,
ibrium state, controlled by the non-dimensional time constant T*. This ex-
> c , r ; must always be greater than THEMpression also implies that for c A yeq
which may not be realized in practice.
The tnird expression was an alternate relaxation type model similar to that
of a first-order chemical reaction (40)
c -c (1 - c) (i - i )eg g fr =p "P (66)yyy m t m T h fg
wheret was the time constant. Notice that the vapor generation rate according.
to the above equation is approximately proportional to the liquid superheating,
and therefore, similar to those used by Rivard and Torrey [ Equation (58)], and
1843 555- 44 -

Wolfert [ Equation (61)] . Also notice that the first two expressions used by
Kroeger, i.e., Equations (64) and (65), contain derivatives of dependent vari-
ables, as suggested by Boure, et al . , whereas the third expression, i.e. ,
Equation (66), contains no such derivative. Equation (65) also contains a nu-
cleation delay as suggested by Edwards.(20
All of the above three expressions for the vapor generation rate were used
in a drif t-flux formulation of the transient tests of Edwards and O'Brien.(31)
Method of characteristics was used as the solution procedure and the condition
of no backward characteristic (similar to the vanishing condition of the system
determinant) was employed as the choking criterion, Unfortunately, the re- *
sultant pressure-time histories were found to be quite insensitive of the chosen
constitutive relations, and all the predictions agreed reasonably well with the
test data. Kroeger, therefore, concluded that the tests of Edwards and O'Brien(31)
were not suitable experiments for determining the effects of thermal nonequil-
ibrium during a flashing flow.
Bauer, et al.,(42) incorporated the effect of thermal nonequilibrium by
implying the following equation for the actual vapor quality:
uh= = - (67)-+m
where u is the homogeneous flow velocity and 1 is a time constant. The follow-
}:ing correlation for this time constant was evaluated from MOBY DICK tests '
-0.505 -1.89 -0.9541 = 660 P u (68)
2where r is in secor.ds, P is in N/m and u is in m/sec. The range of conditions
1843 556-
- 45 -

covered was:
1.2 < P < 8 bars
5 < u < 54 m/sec
0.01 < a < 0.96
0.001 < r < 1 sec
However, no theoretical basis for the correlation for r, i.e., Equation (68),
was given. Therefore, one should be cautious in extrapolating the correlation
beyond the range of its data base.
Jones ( 9) has shown that Bauer, et al's formulation was indeed correct for
steady, one-dimensional flow. In addition, he showed that the constitutive law
for the rate of vapor generation may be given as
x -x*4r =p, =r Nrf (x - x) (69)y eq eq
which shows that the relaxation time constant, t, may be expressed in terms of
a flashing relaxation number, Nr , osf
D
(70)T = r req f
where r is the equilib .um rate of vapor generation. The flashing relaxationeq
number, Nr , may be expressed in terms of the net interfacial heat flux andf
interfacial area density, and must be correlated against actual measurements.
This has not yet been accomplished. It may be noted that the nonequilibrium
1843 3571 . <J t. , t's, ,
- 46 -

evaporation rates may be either smaller or larger thar the equilibrium values,
the fomer in the early stages and the latter as equilibrium is being approached
along the pipe.
In summary, there are basically four types of models to take into account
the effects of thermal nonequilibrium. In the first type of models, namely
those of Henry and co-workers,( 4,27,28) direct assumptions regarding the actual
vapor quality and various derivatives at the critical location are employed. Al-
though these models are useful calculational tools, their applicability to tran-
sient blowdown situations has yet to be proved. The second type of models, i.e.,
those of Edwards,(29) Malnes,(32) and others, takes a more mechanistic approach
towards the problem. Some of the models have attempted to consider the nucleation
delay, the nucleation rate, the bubble growth law, the bubble population, and even
the effect of dissolved gas. However, at present, there is no general correlation
for any of these items, and further work is necessary in this area. In particular,
the present models use the bubble growth law at constant pressure, which could be
in error if the bubble transit time through the pipe is not extremely small.(50)
The third class of models, suggested by Boure, et al.,(39) incorporates terms con-
taining derivates of dependent variables in the expression for vapor generation.
However, no widely accepted functional form of such an expression is available yet.
Finally, the relaxation-type models as suggested by Bauer, et al.,(42) and Jones (49)
seem to show promise in describing the nonequilibrium vapor generation rate in a
simple, and yet phenomenological way. Further work is still needed in representing
these models with the interfacial heat transfer rate and the interfacial area
characteristics of the flow field.
1843 M8.
'
s , , e
- 47 -

As for the choking criterion, the vanishing condition of the system deter-
minant is a necessary one. However, it is not a sufficient condition. Several
compatible conditions must also be satisfied for the flow to be " critical."
These have been discussed in a recent paper by Boure.(50 Interested readers
are urged to read the paper.
1843 359
- 48 -

6. DISCUSSION
With the exception of James'( ) study, all the other steady-state critical
flow experiments have been conducted in small diameter ( < 30 mm) pipes and
nozzles. Although some transient tests have been carried oct in intermediate
pipe diameters (~100 mm), there is no data (transient or steady-state) in
reactor-size pipe diameters (~ 300 nin) with relatively short flow lengths.* In
small diameter pipes, however, experimental data are available in various pipe
lengths (short as well as long) with a wide range of vapor qualities and pres-
sures.
A comparison of various experimental data (as shown in Table 1) reveals
that there are disagreements regarding the effect of pipe diameters on the
critical flow rates. Although most of the experiments do not show any signifi-
} which suggests that thecant effect of pipe diameters, there is evidence '
critical mass-flux decreases with increasing pipe diameters. The reason for
this anomaly is not understood at this time. However, there is no discrepancy
regarding the effect of pipe length. All experiments show that the critical
flow rate increases significantly as the pipe length is shortened, and brought
near zero. Critical flow rate also increases with decreasing upstream enthalpy,
particularly for near-saturation and subcooled liquid conditions. Both of these
effects, have been attributed to the thermal nonequilibrium phenomena associated
with a bubble nucleation delay and a limited, heat transfer controlled, rate of
vapor generation. The amount of dissolved gas in liquid, nucleation character-
istics of the wall and the entrance geometry for a short pipe are also believed
to have an effect on the degree of thermal nonequilibrium, and thus affect the
critical flow rate.
*Large-scale (pipe diameter s 500 mm) transient critical flow experiments haverecently begun in Marviken test apparatus in Sweden.
1843 5604.
- 49 -

Although the pipe length has a strong effect on the critical flow rate
for short pipes, it is not yet establiaed whether the nine length, L, or the
pipe length-to-diameter ratio, L/D, or both should be the governing parameter (s).
It has been suggested ( I' } that the nonequilibrium effect is primarily due to
the length of the pipe, and becomes insignificant if the pipe length exceeds
127 mm. On the other hand, some researchers (27) have used the pipe length-to-
diameter ratio, L/D, as the governing parameter for thermal nonequilibiium.
However, there are experimental findings (23,47) which disagree with both of the
above viewpoints. Therefore, it is possible that both the length and the diameter,
along with the upstream fluid conditions, are important in determining the critical
flow rates.
The simplest analytical model, namely the isentropic Homogeneous-Equilibrium
Model (HEM), underpredicts the critical flow rate data considerably for short
pipe lengths and low upstream quali-ties, including the subcooled liquid condi-
tion. The reason for this discrepancy is mainly due to the model's inability
to account for the therTnal nonequilibrium effects. The model also underpre-
dicts the critical flow rate data, particularly at low system pressures, mainly
because of the homogeneous flow assumption of the model. Therefore, this model
can serve as the lower bound of the actual critical flow rates, and is acceptable
only for high pressures, relatively long pipes and relatively high upstream vapor
qualities.
The effect of relative velocity has been considered in a number of models,
namely those of Fauske,(6,7) Moody (10) and Levy.(12) Theoretical treatments of
these models are not completely correct, and t':e experimental data on relative
velocities show much lower values than those taken in these models. L?ke the
homogeneous-equilibrium model, these models also underpredict the critical flow
rate data for short pipes and low upstream qualities. Therefore, the Moody
1843 361'
- 50 -

M> #i$
w er j %o aKg<AyaNNN\ y/c vp
%+q /g% 's+4jVv
V IMAGE EVALUATIONTEST TARGET (MT-3)
1.0 |# B Ba-|#|;?DE
I.| ([ WMl.8
I.25 1.4 ' l.6|
|4 6" *
MICROCOPY RESOLUTION TEST CHART
4% + '4Ab,f!*/?' - #D+%%fb
O l <% <P-
.ip
i . _ _ . . _ .

&& $9't'% //// #
R&()h
%;|$e,*
\ IMAGE EVALUATION NNN
TEST TARGET (MT-3)
1.0 |; a", m!! ";4 Lu
l.| [/2 He| 1.8
1.25 1.4 1.6
= s.? =
MICROCOPY RESOLUTION TEST CHART
si +iefb ;D 4%+ s//s* gtw & p f
< > + , , a f 4ff ,.
w, 7/. -
ypo4p
,. - _ . .

M
$+ds>q$ro
/////#;w+
?/ > g'
$/< +---
TEST TARGET (MT-3)
'
|I 039 B"4 L2al.0r
t|| 2.2L==gg|,| ["2 EM
[ 1.8
1.25 1.4 1.6---
MICROCOPY RESOLUTION TEST CHART
.f|b$7/
''#82 3,# 2 %1 4( ,& e ,
- _
o
-a4L,A O

model(10) which is approved for LWR licensing calculations, may underpredict
the break flow rate during the early stages of a hypothetical LOCA. Uncertain-
ties in the break flow rate can then alter the transient core thermal-hydraulic
calculations.
It is generally agreed upon that the effect of thermd; nonequilibrium
must be taken into account for critical flow rates in a short pipe with low up-
stream qualities including the subcooled liquid m ndition. Such is tne case
during the early stages of a hypothetical LOCA in a LWR system. Therefore, a
number of models have been proposed in recent years to include the effect of
thermal nonequilibrium. These can be categorized as (i) lumped models, andv
(ii) distributed models. The lumped models, as developed by Henry and co-
workers,(24,27,28) do not include the length effect for pipe lengths less than
twelve diameters where a strong length effect has been found experimentally.
Moreover, because of the nonmechanistic nature of these lumped models, it is
questionable whether they can be applied to transient situations with confidence.
On the other hand, the distributed models(29,32,33,37,42) have attempted to form-
ulate the problem from a mechanistic viewpoint. Some great efforts have been
made in quantifying the bubble nucleation delay,( 9) the rate of bubble nu-
cleation(33) and the bubble population density. However, no general correlation
for any of these items is available yet. In view of the complexity of the prob-
lem, it seems that the relaxation-type models, as proposed by Eauer, et al . ,(42)
and Jones,(49) are the logical approaches to take at this time. However further
work is needed to develop phenomenological correlations for this type of models.
Because of the influence of the entrance geometry and the sharp pressure
gradient at the critical section (exit section for a constant diameter pipe) ita |
!
1849 001
- 51 -

is expected that a distributed formulation will be superior to a lumped ap-
proach. At the critical section, the system determinant must vanish. However,
for the flow to be " critical" several compatible conditions must also be satis-
fied. These have been discussed by Bcure( ) in detail.
Finally, a two-phase critical flow model which is applicable to the entire
range of expected conditions during a hypothetical LOCA in a LWR system, is not
available yet. Such a model must include the effects of thermal nonequilibrium
as well as relative velocity between the phases. The effect of dissolved gases
and other parameters which significantly affect the vapor-liquid interfacial
area densities and the rate of heat transfer to the interfaces, must be included.
The model should be able ts predict the all liquid Bernoulli flow at one end
(subcooled liquid discharging through an orifice), and approach the homogeneous-
equilibrium model at the other end (l.igh quality two-phase mixture discharging
through a long pipe). Such an effort, combined with controlled experiments to
measure the actual rate of vapor generation, is currently under way at Brook-
haven National Laboratory.
$
- 52 -

7. CO*!CLUSIONS AND RECOMMENDATIONS
Based on the previous discussion, the following conclusions can be
drawn:
1. The Homogene: Js-Equilibrium Model (HEM) underpredicts the critical flow
rates for short pipes and near saturation or subcooled upstream condi-
tions.
Moody (10) and Levy,(12)2. The equilibrium slip models of Fauske, '
although successful for long tubes, underpredict the critical flow rates
for short pipes. This is particularly true if the upstream condition
is subcooled or near saturation.
3. Effects of thermal nonequilibrium must be taken into account for short
pipes. However, it is not clear whether the pipe length, L, or the
pipe length-to-diameter ratio, L/D, or both are important in determining
the effects of thermal nonequilibrium.
4. At present, there is no general model or correlatio.. for critical flow
which is valid for a wide range of pipe lengths, pipe diameters, and
upstream conditions including subcooled liquid.
Based on the above conclusions, the following recommendations seem to be
appropriate:
1. A general model for critical flow, which considers both the thermal non-
equilibrium and the relative velocity between the phases, must be
developed.
2. In view of the complexity of two-phase flashing flow, a relaxation-
type nonequilibrium model seems to be the logical approach at this time.
3. The general model must include the effects of dissolved gases, t!.e
heterogeneous nucleation characteristics of the wall, and other
1849 003
-53-

parameters which affect the interfacial area densities, and thus
affect the rate of vapor generation (or the degree of thermal non-
equilibrium).
4. The general model must be able to predict the all liquid Bernoulli flow
at one end and the homogeneous-equilibrium flow at the other end.
5. Controlled ex.perimental data must be obtained in various pipe diam-
eters (including reactor sizes, if possible), pipe lengths and op-
erating conditions so that the general model can be verified for all
possible conditions.
_r, - ,
1849 004- 54 -

8 REFERENCES
1. Benjamin, M. W. and Miller, J. G. , "The Flow of Saturated Water ThroughThrottling Orifices," Trans. ASME, Vol. 63, 1941, pp. 419-429.
2. Burnell, J. G., " Flow of Boiling Water Through Nozzles, Orifices and Pipes,"Engineering, Vol. 164, 1947, p. 572.
3. Bailey, J. F. , "Metastable Flow of Saturated Water," Trans. ASME, Vol. 73,1951, pp. 1109-1116.
4. Moody, F. J., " Maximum Discharge Rate of Liquid-Vapor Mixtures from Vessels,"ASME Symposium Vol. Non-Equilibrium Two-Phase Flows, 1975, pp. 2, 36.
5. Isbin, H. S., Moy, J. E. and DaCruz, J. R., "Two-Phase, Steam-Water CriticalFlow," AIChE Journal, Vol. 3, 1957, pp. 361-365.
6. Fauske, H., " Critical Two-Phase, Steam-Water Flows," Proceedings of HeatTransfer and Fluid Mechanics Institute, Stanford Univ. Press, 1961, pp. 79-89.
7. Fauske, H., " Contribution to the Theory of Two-Phase, One-Component CriticalFlow," ANL-6633, 1962
8. Zaloudek, F. R., "The Low Pressure Critical Discharge of Steam-Water Mix-tures from Pipes," Hanford Atomic Products Operation Report, HW-68934 Rev.,1961.
9. Faletti, D. W. and Moulton, R. W., "Two-Phase Critical Flow of Steam-WaterMixtures, AIChE Journ11, Vol. 9, 1963, pp. 247-253.
10. Moody, F. J., " Maximum Flow Rate of a Single Component, Two-Phase Mixture,"Journal of Heat Transfer, Trans. ASME, Series C, Vol. 8_7, 1965, pp. 134-142.
11. Cruver, J. E. and Moulton R. W., " Critical Flow of Liquid-Vapor Mixtures,"AIChE Journal, Vol. 13_, 1967, pp. 52-60.
12. Levy, S., " Prediction of Two-Phase Critical Flow Rate," Journal of Heat
Transfer, Trans. ASME, Series C, Vol. 87, 1965, pp. 53-58.
13. Levy, S., " Steam Slip - Theoretical Prediction from Momentum Model," Journalof Heat Transfer, Trans. ASME, Series C, Vol. 82, 1960, pp. 113-124.
14. Zaloudek, F. R., "The Critical Flow of Hot Water Through Short Tubes," Han-ford Atomics Products Operation Report, HW-77594, 1963.
15. Zaloudek, F. R. , " Steam-Water Critical Flow from High Pressure Systems,"Hanford Atomic Products Operation Interim Report, HW-80535, 1964.
16. Fauske, H. K., "The Discharge of Saturated Water Through Tubes," ChemicalEngineering Progress Symposium Series, Vol. 61, No. 59, 1965, pp. 210-216.
1849 005..~
' *. g, _ 55 --

17. Uchida, H and Nariai, H., " Discharge of Saturated Water Through Pipes andOrifices," Proceedings of the Third International Heat Transfer Conference,Vol. V, 1966, pp. 1-12.
18. Starkman, E. S., Schrock, V. E., Neusen, K. F. and Maneely, J. D., " Expansionof a Very Ouality Two-Phase Fluid Through a Convergent-Divergent Nozzle,"Journal ic Engineering, Trans. ASME, Series D, Vol. 86, 1964, pp. 247-,
256.
19. Schrock, V. E., Starkman, E. S. and Brown, R. A., " Flashing Flow of InitiallySubcooled Water in Convergent-Divergent Nozzles," ASME Paper No. 76-HT-12,1976.
20. Deich, M. E., Danilin, V. S., Tsiklauri, G. V. and Shanin, V. K., "Inves-tigation of the Flow of Wet Steam in Axisymmetric Laval Nozzles over aWide Range of Moisture Content," High Temperature, Vol. 7, 1969, pp. 294-299.
21. Sozzi, G. L. and Sutherland, W. A. , " Critical Flow of Saturated and Sub-cooled Water at High Pressure," ASME Symposium Vol. Non-Equilibrium Two_.Phase Flows, 1975, pp. 19-25. Also, General Electric Company Report NEDO-13418, 19E.
22. Morrison, A. F. , " Blowdown Flow in the BWR BDHT Test Apparatus',' GeneralElectric Company Report NEDG-21468, 1976.
23. Hutcherson, M. N., " Contribution to the Theory of the Two-Phase BlowdownPhenomenon," ANL-75-82, 1975.
24. Henry, R. E., Fauske, H. K. and McComas, S. T., "Two-Phase Critical Flow atLow Qualities, Part II: Analysis," Nuclear Sci. and Eng., Vol. 41, 1970,pp. 92-98.
25. Henry, R. E. , Fauske, H. K. and McComas, S. T. , "Two-phase Criticai Flow atLow Qualities, Part I: Experimental," Nuclear Sci. and Eng., Vol. 41., 1970,np. 79-91.
26. Klingebiel, W. J. and Moulton, R. W., " Analysis of Flow Choking of Two-Phase,One-Component Mixtures," AIChE Journal, Vol. 17, 1971, pp. 383-390.
27. Henry, R. E., "The Two-Phase Critical Discharge of Initially Saturated orSubcooled Liquid," Nuclear Sci. and Eng., Vol. 41, 1970, pp. 336-342.
28. Henry, R. E. and Fauske, H. K. , "The Two-Phase Critical Flow of One-ComponentMixtures in Nozzles, Orifices, and Short Tubes," Journal of Heat Transfer,Trans. ASME, Seri.3 u, Vol. 93, 1971, pp. 179-187.
29. Edwards, A. R., " Conduction Controlled Flashing of a Fluid, and the Predic-tion of Critical Flow Rates in a One-Dimensional System," United KingdomAtomic Energy Authority Report, AHSB (S) R 147, 1968.
30. Plesset, M. S. and Zwick, S. A., "The Growth of Vapor Bubbles in SuperheatedLiquids," Journal of Applied Physics, Vol. 25, 1954, pp. 493-500.
/~
}849 V O- 56 -

31. Edwards, A. R. and O'Brien, T.P., " Studies of Phenomena Connected with theDepressurization of Water Reactors," Journal of the British Nuclear EnergySociety, Vol. 9, 1970, pp. 125-135.
32. Malnes, D., " Critical Two-Phase Flow Based on Non-Equilibrium Effects,"ASME Symposium Vol. Non-Equilibrium Two-Phase Flows, R. T. Lahey, and G. B.Wallis, ed., 1975, pp. 11-17.
33. Rohatgi, U. S. and Reshotko, E., "Non-Equilibrium One-Dimensional Two-PhaseFlow in Variable Area Channels," ASME Symposium Vol. Non-Equilibrium Two-Phase Flows, R. T. Lahey and G. B. Wallis, ed., 1975, pp. 47-54.
34. Simoneau, R. J., " Pressure Distribution in a Converging-Diverging Nozzleduring Two-Phase Choked Flow of Subcooled Nitrogen," ASME Symposium Vol.Non-Equilibrium Two-Phase Flow, R. T. Lahey and G. B. Wallis, ed. ,1975,pp. 37-45.
35. Rivard, W. C. and Torrey, M. D., " Numerical Calculation of Flashing from LongPipes Using a Two-Field Model," Los Alamcs Scientific Laboratory Report,LAMS-NUREG-6330, 1976, also, LA-6104-MS, 1975.
36. Amsden, A. A. and Harlow, F. H., " KACHINA: An Eulerian Computer Program forMultifield Fluid Flows," Los Alamos Scientific Laboratory Report, LA-5680,1974.
37. Wolfert, K., "The Simulation of Blowdown Processes with Consideration ofThermodynamic Non-Equilibrium Phenomena," Paper presented at the OECD/NEASpecialists' Meeting on Transient Two-Phase Flow, Toronto, Canada, August1976.
38. Friz, G., Riebold, d. and Schulze, W., " Studies on Thermodynamic Non-Equilibrium in Flashing Water," Papec presented at the OECD/NEA Spscialists'Meeting on Transient Two-Phase Flow, Toronto, Canada, August 1976.
39. Boure, J., Fritte, A., Giot, M. and Reocreux, M., " Choking Flows and Propaga-tion of Small Disturbances," Paper No. F-1, European Two-Phase Flow GroupMeeting, Brussels, June 1973.
40. Liles, D. R., " Wave Propagation and Choking in Two-Phase Two-Component Flow,"Ph.D. Thesis, School of Mechanical Engineering, Georgia Institute of Tech-nology, Atlanta, Georgia, December 1974, pp. 77-86.
41. Kroeger, P. G. , " Application of a Non-Equilibrium Drif t Flux Model to Two-Phase Blowdown Experiments," Paper presented at the OECD/NEA Specialists'Meeting on Transient Two-Phase Flow, Toronto, Canada, August 1976. Also,Brookhaven National Laboratory Report BNL-NUREG-21506-R, 1976.
42. Bauer, E. G., Houdayer, G. R. and Sureau, H. M., "A Non-Equilibrium AxialFlow Model and Application to Loss-of-Coolant Accident Analysis: T..a CLYSTERESystem Code," Paper presented at the OECD/NEA Specialist's Meeting onTransient Two-Phase Flow, Toronto, Canada, August 1976.
1849 007
- 57 -

43. Reocreux, M., " Experimental Study of Steam-Water Choked Flow," Paper pre-sented at the OECD/NEA Specialists' Meeting on Transient Two-Phase Flow,Toronto, Canada, August 1976.
44. Reocreux, M., " Contribution a L' Etude des debits critiques en ecoulementdiphasique eat.-vapeur ," Ph.D. Thesis, Universite Scientifique etMedicale de Grenoble, 1974.
45. James, R., " Steam-Water Critical Flow through Pipes," Proceedings of theInstitution of Mechanical Engineers, Thermodynamics and Fluid MechanicsGroup, Vol. 176. No. 26, 1962, pp. 741-748.
46. Fauske, H. K., "Twc-Phase Critical Flow with Application to Liquid-MetalSystems," ANL-6779, 1963.
47. Bryers, R. W., and Hsieh, S. C., "Metastable Two-Phase Flow of SaturatedWater through Short Tubes," Paper presented at the 60th AIChE NationalMeeting, Atlantic City, N.J. ,1966.
48. Wegener, P. P. , "Non-Equilibriu .i Flows ," Marcel Decker, New York, 1969.
49. Jones, 0. C., " Light Water Reactor Thermal / Hydraulic Development Program,"Reactor Safety Research Program, Quarterly Proaress Report (January-March,1977), BNL -NUREG-50661,1977, pp.141-158.
50. Jones, 0. C., and Saha, P., "Non-Equilibrium Vapor Generation," Paper pre-sented at the 5th Water Reactor Safety Information Meeting, Gaithersburg,Maryland, Nov. 7-11, 1977.
bl. Boure, J. A., "The Critical Flow Phenomena with Reference to Two-PhaseFlow and Nuclear Reactor Systems," in Thermal and Hydraulic Aspects ofNuclear Reactor Safety, Vol. 1: Light Water Reactors, O. C. Jones, and$. G. Bankoff, ed., ASf1E, New York, 1977, pp. 195-216.
1849 008,
N %g
-58-

DISTRIBUTION
BNL
H. J. C. KoutsW. Y. KatoRSP Division HeadsRSP Group LeadersTHDD PersonnelLibrary (2)
NRC
S. FabicY. Y. HsuL. S. longN. Zuber
1849 009
- 59 -