
poetry lesson plans - Instructional Coaching:Resources for ...

Research on Scaling Up Evidence-Based Instructional Practice:Developing a Sensitive Measure ofthe Rate of Implementation
Jay Buzhardt, Charles R. Greenwood, Mary Abbott,and Yolanda Tapia
Few evidence-based instructional practices achieve large-scale use, oftenremaining only in the schools directly involved in their development.Research on scaling up effective educational practice often lacks sensitivemeasures of the practice’s implementation and the required researchprotocol. This article describes how we used rate of implementation as asensitive measure to help identify barriers to implementation ofclass-wide peer tutoring (CWPT). Using communication technologiesand a learning management system, we monitored the rate of CWPTimplementation and its research protocol across nine schools in fivestates. Rate of implementation was defined as the number of weeks inwhich a school successfully completed the 12 implementation tasksrequired to reach full implementation. We discuss factors related to thevariation in implementation rate (30-50 weeks) between schools, andimplications of this measurement strategy for research on instructionalpractices and the technology used to facilitate scalability research.
Keywords: Large-scale implementation, rate of implementation, researchfrom a distance, scaling up
The No Child Left Behind Act calls for elementary and secondary educationprograms to use evidence-based teaching practices (Department of Education,2003). The Department of Education (2004) defined evidence-based teaching aseducational practices supported by data from randomized trials with controlor experimental groups. The need for the federal government to legislate theuse of evidenced-based instruction underscores the historical gap between
ETR&D, Vol. 54, No. 5, pp. 467–492, 2006
© 2006 Association for Educational Communications and Technology. 467
AAH GRAPHICS, INC. / (540) 933-6210 / FAX 933-6523 / 08-02-2006 / 21:22

what works in education and actual classroom practice, a gap that researchershave lamented for decades (e.g., Carnine, 1997; Clark, 1989; Elmore, 1996;Greenwood & Abbott, 2001; King-Sears, 2001; Kozma, 2000). Efforts are under-way to bridge this gap. For example, the Interagency Education Research Ini-tiative, which has invested more than $250,000,000 in educational researchfrom 1999 to 2003, funds research that “investigates the effectiveness of educa-tion interventions . . . when applied on a large scale” (Institute of EducationalSciences, 2004, p. 9). However, there are no rigorous strategies for measuringlarge-scale implementation of instructional practice. A critical piece to under-standing an educational intervention’s scalability is knowledge of the tasksrequired to move from no implementation to complete implementation, howlong it takes to get to that point, and the factors affecting the rate of achievingthose tasks. Without the appropriate strategies and tools to evaluate aninstructional practice’s scalability, designers and developers are left to do littlemore than speculate or rely on sporadic anecdotal reports about the fate oftheir programs after completing the research and development effort.
Fuchs and Fuchs (1998) describe scalability research in education as an“effort to reproduce an effective practice in a considerably greater number ofclassrooms and schools” (p. 132). Add to this effort the necessity of demon-strating superior student outcomes and the potentially high costs of doing soacross multiple geographically distant sites, and it is clear that research onscale adds significant new challenges and costs to research. One suchchallenge is the use of measures that are sensitive to variations in the speedand quality of an intervention’s implementation, and measures that research-ers can reliably obtain from a distance at a reasonable cost. Additionally,Kozma (2000) stressed that scalability research should address the “unneces-sary noise” and “messy intrusions” experienced in real classrooms. One wayto assess these naturally occurring variables is to measure the rate of imple-mentation of the research protocol’s key elements in addition to the implemen-tation of the instructional intervention under natural conditions (Fullan, 2001).Measuring the rate that participants implement the intervention and researchprotocol provides a measure that identifies barriers to both the interventionimplementation and the research protocol in schools away from the watchfuleye of research staff.
Using Technology to Facilitate the Conduct of Scalability Research
The use of instructional and communications technologies can help research-ers conduct scalability research while maintaining reasonable costs (Kozma,2000; Mayben, Nichols, & Wright, 2003). In traditional educational research,implementation of the intervention typically occurs within close proximity to
AAH GRAPHICS, INC. / (540) 933-6210 / FAX 933-6523 / 08-02-2006 / 21:22
468 BUZHARDT, GREENWOOD, ABBOTT, AND TAPIA

the research team. This allows for face-to-face observations of the interventionand detailed analyses of implementation fidelity. However, scalabilityresearch requires researchers to remain somewhat removed from the experi-mental settings. Not only is it cost prohibitive for most developers to maintainresearch teams across geographically distant sites, but the mere presence of anonsite research team may compromise the validity of the research becauseonsite researchers rarely participate in the implementation of the instructionalprogram under natural conditions. In order to remain removed from schoolsand maintain costs, scalability researchers often rely on participants’ self-reported accounts of implementation through surveys and interviews(Berends, Kirby, Naftal, & McKelvey, 2001; Klingner, Ahwee, Pilonieta, &Menendez, 2003). Although self-report data are critical to scalability research,instructional science benefits from the more objective implementation data.For instance, the use of instructional technology (particularly online technol-ogy) often leaves evidence of its use, such as log files, completed forms, testscores, and so on. Thus, instructional interventions that use technology enableresearchers to confirm self-reports through verification by permanent prod-ucts—the results of specific implementation tasks.
Another challenge for studies that involve geographically distant partici-pants is maintaining effective and fluid two-way communication betweenresearchers and site participants using technology that is available and usableby all (Mayben et al., 2003; Pauleen & Yoong, 2001). In a preliminary evalua-tion of the scalability of class-wide peer tutoring and its learning managementsystem (CWPT-LMS), Abbott, Greenwood, Buzhardt, and Tapia (in press)reported that teachers and administrators communicated with researchersmost frequently via e-mail and phone. They also reported that inconsistent orlack of timely communication contributed to incomplete or no implementationof CWPT-LMS in the school. Further evaluation is needed to identify moreclearly the impact of researcher-participant communication on implementa-tion from a distance.
In the current study, we measured the rate of implementation of CWPT-LMS, an evidence-based instructional intervention targeted to K–12 class-rooms (Greenwood, 1991; Greenwood, & Delquadri, 1995; Greenwood, Terry,Utley, Montagna, & Walker, 1993), across nine schools in five states over thecourse of a year. Measuring the rate of implementation allowed us to monitorimplementation progress, and discriminate between fast versus slowimplementers, rather than simply full versus partial implementers. Implemen-tation measurement was primarily based on the permanent products resultingfrom each school’s completion of 12 implementation tasks (e.g., receivingtutoring data via the LMS integrated file transfer protocol [FTP] system).Additionally, we tracked communication between the researchers and the
AAH GRAPHICS, INC. / (540) 933-6210 / FAX 933-6523 / 08-02-2006 / 21:22
RESEARCH ON EVIDENCE-BASED PRACTICE 469

schools (e.g., e-mail and phone contacts) throughout the year-long implemen-tation period to identify relationships between implementation and communi-cation. Issues addressed in this report include the variability in schools’ rate ofimplementation progress, barriers that contributed to this variability, andproblem-solving communications used to remove or dampen the effects ofimplementation barriers. Our goal was not to report the entire set of findingsfor this project (e.g., student outcomes), nor was it to undertake a discourseanalysis of communications between researchers and participants; rather, wereport the utility of using implementation rate and communication frequencyto assess the scalability of CWPT-LMS from a distance across diverse educa-tional settings. We addressed the following research questions:
1. What was the rate and variation in each school’s implementationprogress?
2. What was the relationship between implementation progress andcommunications with researchers?
3. What barriers emerged that prevented or slowed fullimplementation and/or its rate?
METHOD
Background
The current study was part of a three-year project focused on developing,refining, and testing a blueprint for scaling up CWPT-LMS, an evidence-basedinstructional intervention (e.g., Greenwood, 1997; Greenwood, Maheady, &Delquadri, 2002). This blueprint consisted of four components for reachingscale with CWPT (see Figure 1, and http://www.lsi.ku.edu/jgproj ects/cwptlms/html2002/ProjectInfo/blueprint.htm) combining educational, behavioral,and computer technologies. We use the term blueprint to refer to a plan for rep-licating and scaling up a practice. It is a framework of principles, strategicsteps, learned experiences, and tools (traditional and technology-based)directed toward changing teacher practice to improve student learning(Greenwood & Hou, 2001; Greenwood, Hou, Delquadri, Terry, & Arreaga-Mayer, 2001). The blueprint is hard-edged in that it is based on past successesand failures, and soft-edged in that it contains choices for tailoring it to fit localcontexts (e.g., Schorr, 1988).
The blueprint is organized by components (see Figure 1): Core, Support,Replication, and Information Technology (IT). Core components are proceduresfocused on designing and integrating CWPT classroom applications (e.g., 2nd
AAH GRAPHICS, INC. / (540) 933-6210 / FAX 933-6523 / 08-02-2006 / 21:22
470 BUZHARDT, GREENWOOD, ABBOTT, AND TAPIA

grade spelling) to yield a comprehensive literacy curriculum. This componentcontains information on skills to teach, and the unique peer-mediated aspectsof CWPT that complement conventional teacher-led instruction (e.g., Elmore,1996; Utley, Mortweet, & Greenwood, 1997). Support components make CWPTusable by supporting and guiding weekly planning, daily implementation,and instructional decision-making to improve individual and group learningin CWPT (e.g., Carnine, 1997). Replication components support migrating CWPTto various and diverse new local school programs. These components involveelements of marketing and public awareness combined with leadership train-ing and professional development (e.g., annual CWPT training institutes). ITcomponents support telecommunications and immediate access to CWPT (e.g.,media assets, procedures, e-mail, and central databases). IT components makeCWPT readily accessible to teachers and administrators without leaving localprograms (Carnine, 1997). Central databases receive and store data about indi-vidual student progress and other valuable indicators (e.g., fidelity of imple-mentation measures) of interest to program evaluation and research on scalingup.
The first support component in the blueprint, the administrative-adoptionmodel (Figure 2), required research staff to recruit national consultants, whorecruited schools and school-based site coordinators (usually principals). Thesite coordinators trained local staff and managed local implementation anddata collection.
Research staff provided a three-day summer training institute in KansasCity for the national consultants and site coordinators. After training thesetrainers, research staff monitored CWPT-LMS implementation, engaged inproblem-solving communications with site coordinators, and monitored datacollection, all from a distance, throughout the following school year. Overall,the blueprint provides a framework for scaling up intended to guide localadoption, local training, implementation, support, and evaluation of largenumbers of CWPT classrooms.
Participants. Fifty-five general education teachers and their students in nineschools across five states (Maryland, Mississippi, Nebraska, Kansas, and Flor-ida) participated. Schools reflected a purposive sampling of schools to reflect arange of rural, urban, and suburban communities, and a mix of parochial, pub-lic, and reservation schools, and culturally and linguistically diverse studentbodies. Eighty-seven percent of teachers were female; 95% taught Grades 1 to6, 5% taught Grades 7 and 8; 75% had a bachelor’s degree, 24% a master’s, and1 a doctorate; 46% worked in an urban setting, 40% suburban, and 14% rural;93% taught in a regular education classroom; 66% had 1 to 6 years of teaching
AAH GRAPHICS, INC. / (540) 933-6210 / FAX 933-6523 / 08-02-2006 / 21:22
RESEARCH ON EVIDENCE-BASED PRACTICE 471

CWPT-LMS Scaling Up Blueprint
Core
Components
Support
Components
•CWPT Process•Teacher Manual•CurriculumProcedures•Student ProgressMonitoring•Weekly Advice
•AdoptionProcess•Staffing Process•Software/ Multimedia/Materials•Trainer of Trainers
•Public AwarenessCampaign•Site Recruitment•Leadership Training•Published Materials/Media
Replication
Components
Information
Technology
Components
•E-mail•Web Downloads•Web Services•Online Documents•CentralizedWeb Database
Figure 1 Components of the blueprint for scaling up class-wide peertutoring and its learning management system (CWPT-LMS).
National Consultant
Site Coordinator
Teachers
Students
Parents
-Recruits Local Schools & Site Coordinators
- Trains local staff, manages local implementation & data collection
-Implements CWPT-LMS
-Engage in CWPT
-Participate in Plans & Evaluation
Figure 2 The administrative-adoption model for implementing class-widepeer tutoring and its learning management system (CWPT-LMS).
AAH GRAPHICS, INC. / (540) 933-6210 / FAX 933-6523 / 08-02-2006 / 21:22
472 BUZHARDT, GREENWOOD, ABBOTT, AND TAPIA

experience, 34% had 7+ years; 60% were European American, 13% AfricanAmerican, 13% Hispanic-Latino, 4% Native American, and 5% of multiracialbackground. To participate, teachers in each classroom were required to havea computer with Internet and e-mail access, and at least one student with a dis-ability.
A pair of schools willing to participate and submit to random assignment toconditions was recruited within localities by five national consultants (see Fig-ure 2). National consultants were university faculty with significant experi-ence using CWPT and in the professional development of teachers. Eachnational consultant recruited one or two local site coordinators responsible forproject operations, including teacher recruitment, informed consent, CWPTtraining, implementation, progress monitoring, research measures, and com-munication with the research staff. In all, 12 principals and teachers served assite coordinators. Each site coordinator received $750 contingent upon com-pletion of the tasks (described below).
Design
For the overall research design, we used a “wait-list” randomized trial (Shad-ish, Cook, & Campbell, 2002), randomly assigning half the schools to useCWPT-LMS in Year 1, while the other half continued conventional, nonpeertutoring instructional methods. All schools used CWPT in Year 2. In thisdesign, an experimental-control group comparison to assess the efficacy of theintervention was available only in Year 1 and eventually all schools receivedthe CWPT intervention. This article involves Year 2 only.
The Evidence-Based Practice: CWPT-LMS
Twenty years and more than 35 studies support the instructional effectivenessof CWPT with a wide range of student populations (e.g., students with milddevelopmental disabilities, students who are poor, and/or those with varyingcultural backgrounds; Greenwood, Arreaga-Mayer, Utley, Gavin, & Terry,2001; Greenwood et al., 2002). The keys to the success of CWPT include (a)maintaining active student responding and motivation, (b) parsing the curric-ulum into weekly units, and (c) providing teachers with continuous studentprogress data. In a CWPT classroom, the teacher creates weekly tutoring pairsof students; each pair completes a daily activity that requires overt respondingfrom one student (the tutee), while the other (the tutor) provides immediate,corrective feedback. After the tutee completes the activity, the students reverseroles and repeat the activity. To help teachers determine student growth inweekly mastery-fluency and the effectiveness of their CWPT implementation,
AAH GRAPHICS, INC. / (540) 933-6210 / FAX 933-6523 / 08-02-2006 / 21:22
RESEARCH ON EVIDENCE-BASED PRACTICE 473

students take brief pre- and posttests before and after weekly tutoring ses-sions.
The CWPT-LMS, a Windows®-based application, reduces the work associ-ated with CWPT (e.g., planning, development of CWPT materials, progressmonitoring, etc.), improves implementation fidelity, and helps teachers inter-pret and use progress data to make decisions for improving future CWPT les-sons (Greenwood, Arreaga-Mayer et al., 2001; Greenwood, Hou et al., 2001).Teachers use the LMS for three primary purposes: (a) data entry, (b) progressmonitoring, and (c) data management. The data entry feature allows teachersto create a class roster, enter student scores, create tutoring pairs, and so forth.Using the progress monitoring component, teachers can view graphs of indi-vidual student scores (e.g., pre- and posttest comparisons, weekly gains, etc.)and/or mean performances of entire classes. Also within progress monitoring,teachers can review advice generated by the LMS. Based on student data, thisadvice suggests ways that teachers can modify CWPT procedures to increasestudent progress. Finally, the data management feature allows teachers tobackup data, restore data from another drive, and/or send data over the Inter-net using FTP. Prior research implies that using the LMS improves implemen-tation fidelity of CWPT procedures, which leads to increased studentachievement (Greenwood, et al, 2001). Throughout the project reported here,all schools used the same version of the CWPT-LMS.
Measurement
We used three measures to address the research questions: (a) the weekly rateof each school’s implementation progress, (b) the weekly rate of e-mail andphone communications between research staff and school staff regardingimplementation, and (c) barriers to implementation that emerged.
Schools’ rate of implementation progress. We designed a measurement tool totrack the number of weeks it took schools to complete the 12 tasks required toimplement CWPT-LMS and the research protocol. For this study, the measurewas sensitive to completion of the first occurrence of each unique task; it didnot measure second or third occurrences of some repeating tasks.
To determine the specific tasks necessary to implement the CWPT-LMS andresearch protocol, we conducted a task analysis of steps. Because lack of expertinput on implementation measurement can limit the validity of scalability-implementation research (Berends et al., 2001), CWPT experts, including oneoriginal developer, participated in this process. The task analysis resulted in12 implementation tasks. The absence of any one of these tasks at a school indi-cated less than complete implementation.
AAH GRAPHICS, INC. / (540) 933-6210 / FAX 933-6523 / 08-02-2006 / 21:22
474 BUZHARDT, GREENWOOD, ABBOTT, AND TAPIA

Each implementation task is described below, including the evidence used toverify completion. Evidence of completion for 7 of the 12 tasks involved thereceipt of CWPT data either from the LMS’s integrated FTP functionality, or fromWeb forms that teachers and site coordinators completed. Only Tasks 6 and 7relied purely on the site coordinator’s self-report as evidence of completion.
1. Annual training institute attended. (Evidence of completion: record ofattendance of a site coordinator at the meeting.) The intended sitecoordinators for each school traveled to Kansas City, Missouri, fora three-day training institute conducted by the researchers duringthe June prior to the start of the upcoming school year. At thistraining event, participants learned how to implement CWPT, usethe CWPT-LMS, train their teachers to do the same, and completethe required research tasks. In one case, the site coordinator whoattended the training institute permanently passed these duties toanother administrator, who, in turn, learned the protocol at homeby reading the training materials. Because the institute was thelogical beginning point for tracking progress in the project, and fullCWPT-LMS implementation typically occurred 8–14 weeks later inthe new school year, we used a 52-week time frame to track eachschool’s progress, rather than the typical 38-week school year.
2. Site coordinators’ estimate received of the number of teachers intending toconduct CWPT-LMS. (Evidence of completion: the record of thenumber of CD installation packages sent to each school.) After thetraining institute, site coordinators from each school sentresearchers an estimate of the number of teachers who planned toconduct CWPT. This dictated the number of CWPT-LMS softwareinstallation packages (one per teacher) that researchers sent to theschool. The installation package consisted of an installation CD anda multimedia training CD that contained a teacher’s manual, videoof actual CWPT sessions, interviews with CWPT teachers, and soforth. Site coordinators could use these training resources duringtheir training sessions, and teachers subsequently could accessthem anytime on their own computers.
3. Site coordinator registered on CWPT-LMS Website. (Evidence ofcompletion: completed registration data in the online database.)Prior to beginning CWPT, site coordinators registered on theWebsite. Here, they completed a Web form that provideddescriptive information about themselves and their classrooms(e.g., their highest level of education, name of the school, e-mail
AAH GRAPHICS, INC. / (540) 933-6210 / FAX 933-6523 / 08-02-2006 / 21:22
RESEARCH ON EVIDENCE-BASED PRACTICE 475

address, etc.). They also established a password-protected accountthat they used to access other forms for subsequent data reports.
4. Teacher registered on the CWPT-LMS Website. (Evidence ofcompletion: registration data in the online database.) Like the sitecoordinators, teachers also registered on the Website. Teachersprovided the same descriptive information as the site coordinators.
5. CWPT-LMS software installed on teachers’ computers. (Evidence ofcompletion: (a) site coordinators’ self-reports and (b) subsequentstudent progress data generated by CWPT sessions, and sent viaFTP to the online database.) Site coordinators installed the softwareon their teachers’ computers. Although site coordinator’sself-reported the specific date of this task, successful completion ofthe task was verified by the receipt of CWPT data using the LMSintegrated FTP component. These data, entered by teachers or anassistant, included teachers’ student rosters, students’ dailytutoring points, and weekly pre- and posttest scores.
6. Teacher CWPT-LMS training attended. (Evidence of completion: sitecoordinator’s self-report.) Using the materials provided at thetraining institute, site coordinators trained teachers to implementCWPT, enter weekly progress data, use the support tools in theCWPT-LMS, and carry out research tasks associated with theproject. Examples of research tasks include acquiring informedconsent from parents, identifying target students for evaluation,and administering student outcome measures to these targetstudents.
7. Target students selected by teachers for purposes of a summativeevaluation of achievement in reading and spelling. (Evidence ofcompletion: teachers’ self-report.) Site coordinators asked teachersto select a maximum of eight target students from the pool ofstudents in each of their classrooms. Based on their knowledge ofthese students, each teacher selected two low-, two middle-, andtwo high-achieving students, and two students who had individualeducation plans. Teachers administered achievement assessmentsto these students three times per year to measure the instructionaleffectiveness of CWPT-LMS (see Task 12 for more details).Although all students in each class participated in CWPT, targetingeight students in each of the 55 classes for achievement assessmentreduced the burden on teachers while maintaining an adequate
AAH GRAPHICS, INC. / (540) 933-6210 / FAX 933-6523 / 08-02-2006 / 21:22
476 BUZHARDT, GREENWOOD, ABBOTT, AND TAPIA

sample size for subsequent statistical analyses of instructionaleffectiveness.
8. Signed parental consent forms received by researchers. (Evidence ofcompletion: receipt of signed consent forms.) Teachers obtainedparental consent for student participation. After collecting allsigned informed consent forms, teachers mailed them to theresearchers.
9. Daily CWPT instructional sessions conducted in the classroom.(Evidence of completion: (a) teacher self-report, (b) subsequentonline receipt of CWPT data). The conduct of CWPT results in twoforms of data: (a) daily tutoring points for each student, and (b)weekly scores on a pretest at the beginning of each tutoring weekand a subsequent posttest at the end of the week. These data areentered into the LMS and reside locally on teachers’ computers.Using the LMS, teachers sent quarterly updates of their CWPT datato researchers (see Task 10).
10. Students’ CWPT weekly progress data sent to researchers online usingthe LMS FTP technology. (Evidence of completion: first receipt ofCWPT data in the online database.) Using the FTP technologyintegrated into the CWPT-LMS, teachers sent student progress datato researchers on a quarterly basis. To complete this task, theteacher opened the LMS in data management mode, selected a classor classes for which to send data, and clicked a button labeled FTP.One week’s worth of data varied between 2 and 3 Kb; thus,transmission time rarely exceeded a few seconds via dial-upInternet connections.
11. Fidelity of implementation data collected and sent. (Evidence ofcompletion: receipt of fidelity of implementation data in the onlinedatabase.) During the first three months of implementation at aschool, site coordinators observed at least one full CWPT sessionfor each teacher. Using a researcher-developed fidelity ofimplementation checklist, the site coordinator assessed fidelity ofeach teacher’s CWPT program. These data were shared with theteachers and sent to the researchers using Web forms that sitecoordinators completed on the CWPT-LMS Website.
12. Student achievement data collected and sent three times per year (fall,winter, spring) for eight target students. (Evidence of completion:receipt of data from the first assessment in the online database.)
AAH GRAPHICS, INC. / (540) 933-6210 / FAX 933-6523 / 08-02-2006 / 21:22
RESEARCH ON EVIDENCE-BASED PRACTICE 477

Each teacher administered a researcher-developed achievementassessment that measured reading fluency, readingcomprehension, and spelling throughout the school year. Afteradministering the assessment for their eight target students,teachers entered these data in the CWPT-LMS Website’s Webforms.
The order of the 12 tasks presented above was the sequence in which theylogically needed to occur at each school. However, although the completion ofsome tasks required prior completion of other tasks (e.g., CWPT-LMS softwarecould not be installed if it had not been sent out), other tasks did not have suchprerequisites. For example, the site coordinator could register after conductingteacher training without affecting implementation quality.
Hypothesized barriers to implementation. Weekly records of these tasks and com-munications with school site coordinators allowed continuous monitoring ofimplementation rate. Prior to implementation, we used previous research byour group (Abbott et al., in press; Abbott, Buzhardt, & Greenwood, 2003) andothers (Klingner et al., 2003) to guide us to a consensus on the categories ofbarriers that we expected schools to experience. This resulted in four catego-ries of hypothesized barriers: (a) computer technology, (b) communications,(c) site coordination, and (d) local administrative support. At weekly researchmeetings, we discussed each school’s progress and specific barriers that mightbe affecting each school’s implementation rate. Contextual barriers such aslimited administrative support and technology problems were identifiedbased on self-reports from school site coordinators; we identified other bar-riers such as late communication start and change in site coordinator using ourown records.
Communications. To answer questions, facilitate solving implementation prob-lems, and identify barriers quickly, researchers sought to maintain an openline of communication with site coordinators. Based on past experiences inCWPT-LMS implementation (Abbott et al, in press), we hypothesized that fre-quent communication between site coordinators and research staff would be acritical factor in successful implementation. To test this hypothesis werecorded and monitored the frequency of e-mail and phone communicationsbetween research and school staff over time. This allowed us to map the rateof communication against the rate of implementation to determine if a rela-tionship existed.
In order to track communications, research staff saved all e-mails sent andreceived between research participants and maintained a phone log to track
AAH GRAPHICS, INC. / (540) 933-6210 / FAX 933-6523 / 08-02-2006 / 21:22
478 BUZHARDT, GREENWOOD, ABBOTT, AND TAPIA

phone calls. Every month, a designated member of the research team compiledall e-mails and phone logs from the research team, gave each communicationa unique alphanumeric identification number, and entered the numbers into aspreadsheet. The spreadsheet generated a cumulative record of communica-tion for each school, which was mapped onto the cumulative record of imple-mentation tasks achieved (see Figures 3 and 4). The identification numberidentified the school, and whether it was sent by research staff or receivedfrom the school. The research team member involved in each phone callrecorded the following information into the phone log: time, date, who wasinvolved in the call, and general content of the call. E-mails contained thisinformation in the header.
Communications were categorized as either sent or received. Sent commu-nications were defined as those sent by research staff (i.e., an e-mail sent byresearch staff, or a phone call made by research staff to a participant). Receivedcommunications were those received by research staff from participants (i.e.,an e-mail received from site coordinators or teachers, or a phone call receivedfrom a participant). Using these records, we calculated the rate of weekly com-munications sent and received.
An independent observer conducted a reliability check of all 403 communi-cations to ensure accurate data collection. Five communications were enteredinto the spreadsheet under the wrong date, and one communication wasrecorded twice. These errors were corrected.
Analytic Strategies
To assess rate of implementation and communication, we used simpledescriptive statistics and graphic analysis of each school’s rate of weekly prog-ress over time during the school year. This provides an analysis that extendsbeyond a binary yes or no measure of implementation by providing a way toqualify full and partial implementers (e.g., slow full implementers, fast partialimplementers, etc.) Cumulative records generated with Excel® spreadsheetsprovided graphic displays (Figures 3 and 4) of implementation wherein thetotal number of events occurring in the current week was added to that of theprior week, with slope an indicator of rate over time.
To allow standard comparisons between schools in the project, the x axes(time in weeks) represented the same 52-week calendar period to accommod-ate the fact that schools started and stopped their school years at differenttimes. All x axes (time) began on the week of the training institute (June 16).The year ended on the week of the following June 14, when the last schoolclosed for summer vacation. Combining the implementation and communica-tions measures in one graph for each school provided a visual analysis of the
AAH GRAPHICS, INC. / (540) 933-6210 / FAX 933-6523 / 08-02-2006 / 21:22
RESEARCH ON EVIDENCE-BASED PRACTICE 479

temporal covariation between implementation and communication. Note thatalthough we chose to plot communications along the secondary axis for thisstudy, any continuous variable believed to affect rate of implementation couldbe plotted on this axis.
RESULTS
What Was the Rate and Variation of Implementation ProgressBetween Schools?
Implementation progress varied between the nine schools (see Table 1), fromthe fastest full implementer (School 1), to School 9, which finished 7 of the 12tasks by year’s end. Six schools (67%) fully implemented the 12 tasks, whilethree partially implemented (range = 7 to 11 tasks completed, Schools 7–9).The time required to reach full implementation ranged from 30 weeks (School1) to 50 consecutive weeks (School 6). The average time to complete each taskranged from 2.5 weeks (School 1) to 7.4 weeks (School 4). Using a simplebinary measure of implementation (e.g., full or partial implementation) wouldhave combined these schools into two categories, (a) full implementers and (b)partial implementers, making the following analyses difficult at best.
What Was the Relationship Between Implementation Progress and Communications?
A Pearson’s product-moment correlation revealed statistically significant cor-relations between both the number of tasks completed and sent communica-tions (r = .72; p < .05), and the number of tasks completed and receivedcommunications (r = .69; p < .05). There was no statistically significant correla-tion between communications and the number of weeks to reach full imple-mentation. The most striking difference between full and partial implementerswas total number of communications (see Table 1). Full implementers rangedfrom 30–86 communications, compared to 8–29 for partial implementers. Themean number of sent, received, and total communications for the fullimplementers was 35, 21, and 56, respectively; the same values for partialimplementers were much lower at 17, 4, and 21.
Figure 3 displays the rate of implementation progress and communicationpatterns for two schools that reached full implementation. The 12 initial imple-mentation tasks are plotted along the primary y axis (left), and communica-tions between the research staff and the site coordinators are plotted along thesecondary y axis (right). We selected these graphs because they represent thetwo most divergent rates of implementation progress for the full imple-
AAH GRAPHICS, INC. / (540) 933-6210 / FAX 933-6523 / 08-02-2006 / 21:22
480 BUZHARDT, GREENWOOD, ABBOTT, AND TAPIA

Tab
le 1
Sum
ma
ry o
f im
ple
me
nta
tion
pro
gre
ss a
nd
co
mm
un
ica
tion
s fo
r all
nin
e s
ch
oo
ls (s
ort
ed
on
We
eks
to
Co
mp
letio
n).
Impl
emen
tati
onC
omm
unic
atio
nsT
asks
Wee
ks to
Wee
ks-
Freq
uenc
yC
omm
unic
atio
ns-T
ask
Scho
olSt
ate
Com
plet
edC
ompl
ete
Tas
kSe
ntR
ecei
ved
Tot
alSe
ntR
ecei
ved
Tot
al
1M
D12
302.
525
1439
2.1
1.2
3.3
2M
D12
363.
041
2768
3.4
2.3
5.7
3N
E12
403.
319
1130
1.6
0.9
2.5
4N
E12
433.
640
1959
3.3
1.6
4.9
5M
D12
494.
150
3686
4.2
3.0
7.2
6K
S12
504.
236
2258
3.0
1.8
4.8
7FL
1152
4.7
236
292.
10.
52.
6
8M
S10
525.
220
626
2.0
0.6
2.6
9FL
752
7.4
80
81.
10.
01.
1
Mea
n11
.144
.94.
229
.115
.744
.82.
51.
33.
9
Ran
ge7–
1230
–52
2.5–
7.4
8-50
0–36
8–86
1.1–
4.2
0-3
1.1–
7.2
AAH GRAPHICS, INC. / (540) 933-6210 / FAX 933-6523 / 08-02-2006 / 21:22
RESEARCH ON EVIDENCE-BASED PRACTICE 481

menters. School 1 reached full implementation 20 weeks sooner than School 6(see Figure 3). School 1 communications (sent and received) totaled 39 (3.3 pertask completed), whereas School 6 totaled 58 (4.8 per task completed).
In both schools, the research staff sent more communications to schools thanwere returned to the researchers, reflecting the fact that a majority of these com-munications were prompting or requesting feedback on the completion of thenext task. The increasing separation between sent and received communica-tions in both schools was linked temporally to plateaus in implementation after10 or more tasks had been completed (i.e., researchers reminding, schools notreplying immediately). For School 6 in particular, the number of communica-tions sent to the school began accelerating at Week 42 when it became apparentthat the school might not reach full implementation by the end of the year.Despite being the fastest school to complete 10 tasks, the School 6 site coordina-tor took maternity leave in late October, passing her duties to another person inthe school who completed Task 11. She returned in April, and after gettinganswers to questions after Week 42, she completed the final task.
School 1
0
2
4
6
8
10
12
1
July
3 5
Aug
7 9
Sept
11 13
Oct 1
5 17 19
Nov
21 23
Dec
25 27
Jan
29 31
Feb
33 35
March
37 39
Apr
41 43
May
45 47 49
June
51
Month/Week
Tas
ks C
om
ple
ted
0
10
20
30
40
50
60
Co
mm
un
icat
ion
s
Number of Tasks Completed
Communications Sent
Communications Rcv'd
SummerInstitute
School 6
0
2
4
6
8
10
12
1
July
3 5
Aug
7 9
Sept
11 13
Oct 1
5 17 19
Nov
21 23
Dec
25 27
Jan
29 31
Feb
33 35
March
37 39
Apr
41 43
May
45 47 49
June
51
Month/Week
Tas
ks C
om
ple
ted
0
10
20
30
40
50
60
Co
mm
un
icat
ion
s
TrainingInstitute
Figure 3 The implementation progress and communications sent andreceived between two schools that reached full implementation.
AAH GRAPHICS, INC. / (540) 933-6210 / FAX 933-6523 / 08-02-2006 / 21:22
482 BUZHARDT, GREENWOOD, ABBOTT, AND TAPIA
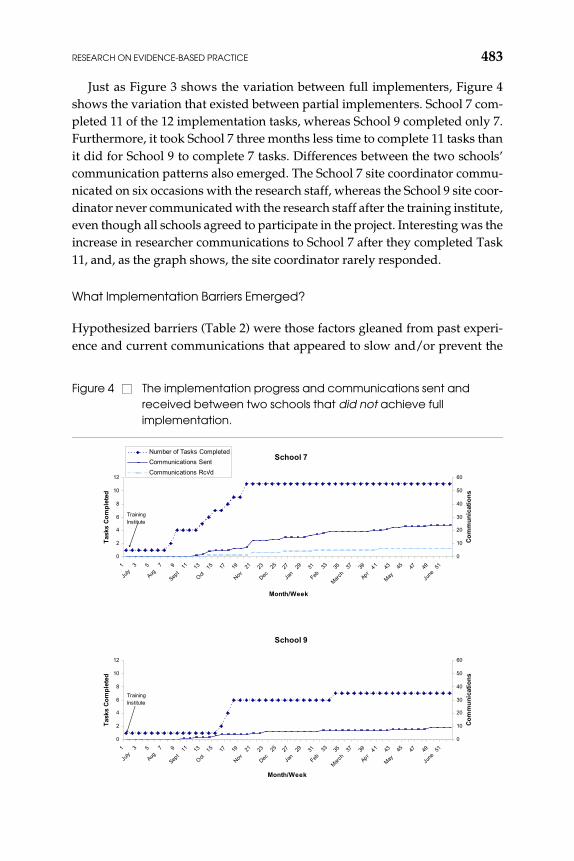
Just as Figure 3 shows the variation between full implementers, Figure 4shows the variation that existed between partial implementers. School 7 com-pleted 11 of the 12 implementation tasks, whereas School 9 completed only 7.Furthermore, it took School 7 three months less time to complete 11 tasks thanit did for School 9 to complete 7 tasks. Differences between the two schools’communication patterns also emerged. The School 7 site coordinator commu-nicated on six occasions with the research staff, whereas the School 9 site coor-dinator never communicated with the research staff after the training institute,even though all schools agreed to participate in the project. Interesting was theincrease in researcher communications to School 7 after they completed Task11, and, as the graph shows, the site coordinator rarely responded.
What Implementation Barriers Emerged?
Hypothesized barriers (Table 2) were those factors gleaned from past experi-ence and current communications that appeared to slow and/or prevent the
School 7
0
2
4
6
8
10
12
1
July
3 5
Aug
7 9
Sept
11 13
Oct 1
5 17 19
Nov
21 23
Dec
25 27
Jan
29 31
Feb
33 35
March
37 39
Apr
41 43
May
45 47 49
June
51
Month/Week
Tas
ks C
om
ple
ted
0
10
20
30
40
50
60
Co
mm
un
icat
ion
s
Number of Tasks Completed
Communications Sent
Communications Rcv'd
TrainingInstitute
School 9
0
2
4
6
8
10
12
1
July
3 5
Aug
7 9
Sept
11 13
Oct 1
5 17 19
Nov
21 23
Dec
25 27
Jan
29 31
Feb
33 35
March
37 39
Apr
41 43
May
45 47 49
June
51
Month/Week
Tas
ks C
om
ple
ted
0
10
20
30
40
50
60
Co
mm
un
icat
ion
s
TrainingInstitute
Figure 4 The implementation progress and communications sent andreceived between two schools that did not achieve fullimplementation.
AAH GRAPHICS, INC. / (540) 933-6210 / FAX 933-6523 / 08-02-2006 / 21:22
RESEARCH ON EVIDENCE-BASED PRACTICE 483
implementation of CWPT-LMS and the associated research protocol. Hypoth-esized Barriers 1, 4, 6, 8, and 9 were identified for each school based on self-reports of site coordinators. A school experienced Hypothesized Barrier 1(computer IT problem) if the site coordinator reported problems sending data,running the LMS software, and so forth. Barrier 4 (limited tech support) wasbased on site coordinator responses to an e-mail asking them if they had a full-time, onsite tech support staff person. Schools were required to report achange in site coordinator (Barrier 6) because this was our primary contact atthe school, and we needed to know to whom to send the site coordinator sti-pends. A school experienced Barrier 8 (limited administrative support) if thesite coordinator reported implementation delays due to limited administrativecooperation (e.g., not allowing time needed to conduct training during theweek, or a lack of encouragement for the project). Barrier 9 (overburdened sitecoordinator) was reserved for schools in which unanticipated administrativerestructuring occurred (e.g., School 7 lost its principal in the middle of theyear, meaning that the site coordinator served the dual role of vice-principaland principal of a large urban public school).
Irrespective of the barrier labels, an analysis of Table 2 reveals the degree towhich hypothesized barriers functioned as actual barriers in the current evalua-tion. Strong barriers in this evaluation were experienced exclusively by partialand slow implementers (e.g., schools farther to the right in the table). Weak bar-riers were experienced by slow full implementers (schools in the middle). Finally,nonbarriers were experienced only by fast implementers (schools farther to theleft). Although few of the hypothesized barriers fell precisely into these categories,patterns did emerge. Hypothesized Barriers 3, 7, 8, and 9 are clear candidates forstrong implementation barriers because any school that experienced them failedto reach full implementation. To a lesser degree, Barriers 2 and 4 could also fallinto this category, but in each case, one school eventually reached full implemen-tation despite the barrier. Weak barriers included Barriers 5 and 6 because theywere experienced by slower implementers but only one partial implementer.Because all full implementers experienced Hypothesized Barrier 1, it did notappear to function as a barrier in this evaluation.
Strong barriers (2, 3, 4, 7, 8, and 9). Perhaps the strongest of these barriers (expe-rienced by all partial implementers, but only one full implementer) were thoserelated to communication. Failure to communicate with researchers at thebeginning of the school year (Barrier 2) indicated potential implementationproblems, which subsequently led to limited communication overall (Barrier3). Barrier 4, limited onsite tech support, prevented schools from easily solvingtechnical problems. Further indication of the strength of Barrier 4 is the factthat those schools with full-time onsite tech support clearly took advantage of
AAH GRAPHICS, INC. / (540) 933-6210 / FAX 933-6523 / 08-02-2006 / 21:22
484 BUZHARDT, GREENWOOD, ABBOTT, AND TAPIA

Tab
le 2
Barr
iers
aff
ec
ting
imp
lem
en
tatio
n b
y sc
ho
ol.
Scho
olsa
Per
cent
of
Hyp
othe
size
dFu
ll Im
plem
enta
tion
Par
tial
Impl
emen
tati
onSc
hool
s w
ith
Bar
rier
s1b
23
4b5
67b
89
Bar
rier
1×
××
××
××
×89
2×
××
×44
3×
××
33
4×
××
33
5×
××
33
6×
××
33
7×
×22
8×
×22
9×
11
Tot
al1
22
31
34
76
Not
es: a
= F
ast t
o sl
ow in
ran
k or
der
left
to r
ight
; b =
Sch
ools
that
impl
emen
ted
cla
ss-w
ide
peer
tuto
ring
and
its
lear
ning
man
agem
ent s
yste
m(C
WPT
-LM
S) in
the
prio
r ye
ar. B
arri
ers
wer
e d
efin
ed a
s fo
llow
s: 1
= te
chno
logy
pro
blem
; 2 =
late
com
mun
icat
ion
star
t (fi
rst r
ecei
ved
com
mun
icat
ion
afte
r Se
ptem
ber
1); 3
= li
mit
ed c
omm
unic
atio
n (f
ewer
than
10
rece
ived
); 4
= li
mit
ed o
nsit
e te
ch s
uppo
rt; 5
= te
ache
r as
sit
e co
ord
inat
or; 6
= c
hang
e in
site
coo
rdin
ator
; 7 =
late
impl
emen
tati
on s
tart
up
(com
plet
ed 2
nd ta
sk a
fter
Sep
tem
ber
1); 8
= li
mit
ed a
dm
inis
trat
ive
supp
ort;
9 =
ove
rbur
den
ed s
ite
coor
din
ator
.
AAH GRAPHICS, INC. / (540) 933-6210 / FAX 933-6523 / 08-02-2006 / 21:22
RESEARCH ON EVIDENCE-BASED PRACTICE 485

these services because almost all experienced technical problems (Hypothe-sized Barrier 1). Based on this evaluation and past experience, beginningimplementation after the school year is well underway (Barrier 7) impedesimplementation because by this time teachers have already established theirroutines and schedules, making them less likely to begin a new program. Lim-ited administrative support (Barrier 8) often meant little or no time to getCWPT-LMS off the ground, much less conduct the required research protocol.As with Barrier 8, an overburdened site coordinator (Barrier 9) did not havetime to complete the tasks necessary for successful implementation.
Weak barriers (5 and 6). Barrier 5 (teacher as site coordinator) was the most sur-prising barrier to fall into this category because of the overwhelming difficultypast teacher–site coordinators have encountered. This may be explained by thefact that the schools that overcame this barrier were small private schools(School 2: Catholic; School 3: Native-American tribal), whereas School 9 was alarge urban public school. Because of the availability of training materials(manuals, CD-ROM, online, etc.), two of three schools overcame difficultiesassociated with site coordinator turnover (Barrier 6).
Nonbarrier (1). Hypothesized Barrier 1 (reported technology problem) was theonly factor that did not appear to affect implementation. As noted earlier,onsite technical support played a significant role in dampening the effects ofthis barrier. School 6 countered this pattern by achieving full implementationdespite technical problems without onsite tech support; however, it requiredthe most time to reach full implementation.
Other factors. Finally, these data allow two additional observations. First, aschool’s prior year’s experience implementing CWPT-LMS (Schools 1, 4, and7) did not appear to explain successful implementation, because School 7 onlypartially implemented. Second, all three partial implementers were publicschools, whereas all successful implementers were parochial or tribal schools,suggesting that smaller, self-contained administrative infrastructures mayhave facilitated implementation.
DISCUSSION
The purpose of this research was to examine the technical and practical valueof using rate of implementation to help identify barriers to scaling up an evi-dence-based educational intervention. Specifically, this study informs futureresearch and development of scalable evidence-based instructional interven-tions in which support staff makes no site visits to participating schools, mon-
AAH GRAPHICS, INC. / (540) 933-6210 / FAX 933-6523 / 08-02-2006 / 21:22
486 BUZHARDT, GREENWOOD, ABBOTT, AND TAPIA

itoring progress and conducting all technical support communications from adistance. We tracked each school’s implementation progress over time(Research Question 1), examined the role of communications betweenresearchers and local site coordinators (Research Question 2), and generatedhypotheses about the strength of implementation barriers (Research Question3). Furthermore, rather than relying on participant self-reports of implementa-tion (Rogers, 2003), this study primarily used objective documentation ofimplementation tasks based on the permanent products generated by the tech-nology used in CWPT-LMS procedures and the research protocol.
Results indicated considerable variability in the number of weeks needed toachieve full implementation as well as the mean time needed to complete eachtask (see Table 1). Six of the nine schools reached full implementation, eventhough four of these successful schools (Schools 3–6) took 40–50 weeks to com-plete tasks that the fastest school finished in only 30 weeks (School 1). Themost difficult tasks for schools to complete involved collecting research data(e.g., curriculum-based measures, fidelity of implementation data, etc.). Howto reliably achieve these tasks in future research within reasonable costsremains a critical question.
One limitation of this investigation was the small number of schools thatparticipated. Because our investigation involved only nine schools, we wereable to monitor progress for each school and provide personalized guidance insolving implementation problems. A large-scale evaluation would helpunderstand the practical limitations of such a measure when the investigationinvolves hundreds of schools. Although methods will vary depending on theintervention, large-scale evaluations might investigate innovative methods ofcollecting data, monitoring implementation, and providing effective feedbackto a large number of schools more efficiently. For example, an automated pro-cess might track schools’ successful completion of implementation activitieson a Website, which could, in turn, provide intelligent feedback and problem-solving advice to administrators and/or researchers.
An anecdotal observation limited by the small sample of schools was thatall the parochial and tribal schools in the project achieved full implementation,but none of the public schools fully implemented. We had not experienced“typology of schools” as a barrier in the past, thus, we did not include it as ahypothesized barrier. However, future research may prove otherwise. Forinstance, it may be that public schools are relatively more resistant to the intro-duction of new innovations than other schools. Additionally, evidenced-basedpractices such as CWPT may be more volatile in public schools where localand federal accountability standards may differ, making them more suscepti-ble to other barriers. For instance, when the site coordinator at School 7became burdened with the duties of both vice-principal and principal after the
AAH GRAPHICS, INC. / (540) 933-6210 / FAX 933-6523 / 08-02-2006 / 21:22
RESEARCH ON EVIDENCE-BASED PRACTICE 487

principal was promoted to a district-level position, the administrative struc-ture within this public school was not flexible enough for her to pass the sitecoordinator duties on to someone else as the School 4 site coordinator did.
Relationship Between Communication and Implementation
A clear relationship emerged between communication and rate of implemen-tation: Fast implementers began communication earlier and maintained com-munication more frequently than slower and partial implementers. None ofthe schools that experienced both Barriers 2 and 3 (late communication startand limited communication) achieved full implementation; conversely, noneof the schools that achieved full implementation experienced both of these bar-riers. In this project, where all nine schools had formally agreed to participateprior to the start of the school year, starting on time and communicating withresearch staff functioned as leading indicators of success. Conversely, the fail-ure to communicate with research staff suggested early problems and a possi-ble drift in commitment to project implementation.
Based on these data, further research is needed to make definitive conclu-sions regarding the nature and direction of this relationship. For example,slow implementation may lead to poor communication rather than vice versa.Site coordinators who had difficulty completing implementation tasks at theirschools may have simply avoided communicating with research staff to avoidunpleasant interactions. Also, our conclusions are limited without a qualita-tive analysis of the content of communications. A discourse analysis of thecommunications would allow a more detailed investigation of the impact ofthis variable on implementation. For example, how did researchers’ verbalpraise of task completion affect implementation rate? How did remindersaffect task completion? Is there a relationship between the number of trouble-shooting questions asked by site coordinators and implementation rate?
Implications for Researchers and Developers of Instructional Systems
Kozma (2000) and others recognized the need for more research and develop-ment efforts to investigate the scalability of evidence-based instructional inter-ventions, and the need for more sensitive tools and methods to improve therigor and feasibility of such investigations. Future research on scale will needto take full advantage of the knowledge of variables that hinder and promotethe rate of implementation of both intervention and research components inlocal schools under natural conditions. Measuring implementation rate andcommunications provided information in a standard framework to monitorprogress, facilitate the individual progress of schools, and compare the prog-
AAH GRAPHICS, INC. / (540) 933-6210 / FAX 933-6523 / 08-02-2006 / 21:22
488 BUZHARDT, GREENWOOD, ABBOTT, AND TAPIA

ress of schools. It enabled a quantitative comparison of differences in full ver-sus partial implementers, as well as slow versus fast full implementers. In eachcase, it provided an indicator that focused both research and local staffs on thenext steps toward full implementation. We envision using the measures infuture studies to test the effects of experimentally varying strategies for reach-ing full implementation and to measure school maintenance of these strate-gies. The wisdom of obtaining this knowledge seems well founded whencoupled with traditional measures of implementation fidelity and student out-comes prior to or along with conducting expensive efforts to promote wide-scale use.
Compared to annual summative methods of measuring scale, formativemeasures of implementation progress in individual schools provide develop-ers with important, sensitive data that monitor implementation rate, aid prob-lem solving, help identify barriers, and inform strategies to overcome them.Similar to the often described advantages of formative measurement of stu-dent academic progress (e.g., Fuchs & Fuchs, 1986), similar advantages areprovided to personnel responsible for adoption and promotion of implemen-tation progress. Just one of these advantages is the hypothesis that using mea-sures sensitive to short-term changes will accelerate implementation ratebecause such measures are leading indicators of progress or lack of same, andbecause they prompt actions that remove barriers and solve problems.
In addition to measuring the speed at which schools implement a practice,rate of implementation also provides important data for measuring the dosageand/or intensity of an educational practice that students receive. Logically,students received the greatest educational benefit from the evidence-basedCWPT program in schools and classrooms that reached full implementationsooner and continued the longest over the year. Knowledge of the specific datein which each task occurred for each school allows developers to compareachievement across schools with varying implementation patterns. For exam-ple, how do achievement gains differ between schools that achieved fullimplementation in 30 weeks versus those that required 50 weeks? Also, similarto a component analysis, this allows investigation of the relative contributionof specific tasks to achievement gains, including various combinations oftasks. For example, how do achievement gains differ between schools thatconducted their first fidelity of implementation in Week 10 versus those thatbegan in Week 22? Different from experimentally controlled component anal-yses, this type of study allows natural variation to occur based on the uniquecontext and circumstances at each school—the “unnecessary noise” and“messy intrusions” described by Kozma (2000).
The likelihood that a new practice will spread is not determined only bywhether people commit to its implementation, but also by the amount of time
AAH GRAPHICS, INC. / (540) 933-6210 / FAX 933-6523 / 08-02-2006 / 21:22
RESEARCH ON EVIDENCE-BASED PRACTICE 489

and effort it takes to implement. All other variables being equal, a practice thattakes less time to implement has a higher probability of reaching scale thanone that takes more time. It also has a greater opportunity of having an educa-tional benefit because it is in place faster and used longer to the benefit ofweekly content coverage in the curriculum, increased student engagement,unit mastery, fluency, and comprehension, and so forth. The current approachprovided a means of determining precisely when the practice (and theresearch protocol to study it) was fully implemented. Thus, implications forthe rigor of the research design implementation (and control for) are also ofgreat significance.
Because the approach was practically related to the sequence of tasks com-pleted in each school, in all likelihood it generalizes to other interventions inthe same way. We argue that measures such as this will provide more sophis-ticated and definitive information about an intervention’s scalability, forexample, the range of time and factors that schools need to fully implement, inadvance of large and expensive efforts to reach scale (e.g., Berends et al., 2001).A rate of implementation measure combined with fidelity of implementationand an annual measure of uptake rate (new adopters) in a population ofschools seems critical to teasing out a complete analysis of the efficacy of alter-native methods of promoting wide scale use of education interventions.
Jay Buzhardt [[email protected]], Charles R. Greenwood, Mary Abbott, & Yolanda Tapia arewith the Juniper Gardens Children’s Project at the University of Kansas.
Acknowledgements
This work was supported by a Steppingstones Technology Innovation Project(No. H327A00038) from the Office of Special Education Programs (OSEP), U.S.Department of Education. Additional support was provided by grant No.H029D60040, a Leadership Personnel Preparation Project, and the KansasMental Retardation and Developmental Disabilities Research Center(HD02538). Opinions expressed herein are those of the authors and do not rep-resent the position of the U.S. Department of Education. We would like toacknowledge the significant technological contributions of Shye Hou and Dar-win Eakins. Special thanks are in order for the students, teachers, and admin-istrators who participated in this study.
AAH GRAPHICS, INC. / (540) 933-6210 / FAX 933-6523 / 08-02-2006 / 21:22
490 BUZHARDT, GREENWOOD, ABBOTT, AND TAPIA

REFERENCES
Abbott, M., Greenwood, C., Buzhardt, J., Tapia, Y. (2006). Using technology-basedteacher support tools to scale up the classwide peer tutoring program. Reading andWriting Quarterly, 22(1), 47–64.
Abbott, M., Buzhardt, J., & Greenwood, C. R. (2003). Scaling up classwide peer tutoring:Effects of a blueprint on use, implementation, and student learning. Paper presented at thePacific Coast Research Conference, LaJolla, CA.
Berends, M., Kirby, S., Naftal, S., & McKelvey, C. (2001). Implementation and performancein new American schools: Three years into scale-up. Arlington, VA: Rand Education.
Carnine, D. (1997). Bridging the research-to-practice gap. Exceptional Children, 63(4),513–521.
Clark, R. E. (1989). Current progress and future directions for research in instructionaltechnology. Educational Technology Research and Development, 37(1), 57–66.
Department of Education. (2003). Identifying and implementing educational practices sup-ported by rigorous evidence. Washington, DC: Author. Retrieved February 27, 2005 fromhttp://www.excelgov.org/usermedia/images/uploads/PDFs/User-Friendly_Guide_12.2.03.pdf.
Department of Education. (2004). Proven methods: Questions and answers on No Child LeftBehind. Retrieved November 3, 2004 from http://www.ed.gov/nclb/meth-ods/whatworks/doing.html
Elmore, R. F. (1996). Getting to scale with good educational practice. Harvard EducationalReview, 66(1), 1–26.
Fuchs, D., & Fuchs, L. (1998). Researchers and teachers working together to adaptinstruction for diverse learners. Learning Disabilities Research and Practice, 13(3), 162–170.
Fuchs, L. S., & Fuchs, D. (1986). Linking assessment to instructional intervention: Anoverview. School Psychology Review, 15, 318–323.
Fullan, M. (2001). The new meaning of educational change (2nd ed.). New York: TeachersCollege Press.
Greenwood, C. R. (1991). Longitudinal analysis of time engagement and academicachievement in at-risk and non-risk students. Exceptional Children, 57, 521–535.
Greenwood, C. R. (1997). Classwide peer tutoring. Behavior and Social Issues, 7, 11–18.Greenwood, C. R., & Abbott, M. (2001). The research to practice gap in special educa-
tion. Teacher Education and Special Education, 24(4), 276–289.Greenwood, C. R., Arreaga-Mayer, C., Utley, C. A., Gavin, K., & Terry, B. J. (2001).
Classwide peer tutoring learning management system: Applications with elemen-tary-level English language learners. Remedial and Special Education, 22(1), 34–47.
Greenwood, C. R., & Delquadri, J. (1995). Classwide peer tutoring and the prevention ofschool failure. Preventing School Failure, 39(4), 21–25.
Greenwood, C. R., & Hou, S. (2001). The classwide peer tutoring learning management sys-tem (CWPT-LMS): Manual for teachers. Kansas City, KS: Juniper Gardens Children’sProject, University of Kansas.
Greenwood, C. R., Hou, L. S., Delquadri, J., Terry, B. J., & Arreaga-Mayer, C. (2001).Classwide peer tutoring program: A learning management system. In J. Woodward &L. Cuban (Eds.), Technology, curriculum, and professional development: Adapting schools tomeet the needs of students with disabilities (pp. 61–86). Thousand Oaks, CA: Corwin.
Greenwood, C. R., Maheady, L., & Delquadri, J. (2002). Classwide peer tutoring. In M.R. Shinn, H. M. Walker & G. Stoner (Eds.), Interventions for achievement and behavior
AAH GRAPHICS, INC. / (540) 933-6210 / FAX 933-6523 / 08-02-2006 / 21:22
RESEARCH ON EVIDENCE-BASED PRACTICE 491

problems (2nd ed., pp. 611–649). Washington, DC: National Association for SchoolPsychologists (NASP).
Greenwood, C. R., Terry, B., Utley, C. A., Montagna, D., & Walker, D. (1993). Achieve-ment placement and services: Middle school benefits of classwide peer tutoring usedat the elementary school. School Psychology Review, 22(3), 497–516.
Institute of Educational Sciences. (2004). Reading comprehension and reading scale-upresearch CFDA 84.305G. Washington, DC: Department of Education.
King-Sears, M. (2001). Institutionalizing peer-mediated instruction and interventions inschools, Remedial and Special Education, 2(22) 89–101.
Klingner, J. K., Ahwee, S., Pilonieta, P., & Menendez, R. (2003). Barriers and facilitatorsin scaling up research-based practice. Exceptional Children, 69(4), 411–429.
Kozma, R. (2000). Reflections on the state of educational technology research and devel-opment. Educational Technology Research and Development, 48(1), 5–15.
Mayben, R., Nichols, S., Wright, V. (2003). Distance technologies in collaborativeresearch: Analyzing the successes and barriers. The Journal of Interactive Online Learn-ing, 2(2), 1–21.
Pauleen, D., & Yoong, P. (2001). Facilitating virtual team relationships via Internet andconventional communication channels. Internet Research: Electronic Networking Appli-cations and Policies, 11(3), 190–202.
Rogers, E. (2003). Diffusion of innovations (5th ed.). New York: The Free Press.Schorr, L. B. (1988). Common purpose: Strengthening families and neighborhoods to rebuild
America. New York: Anchor.Shadish, W. R., Cook, T. D., & Campbell, D. T. (2002). Experimental and quasi-experimen-
tal designs for generalized causal inference. Boston: Houghton Mifflin.Utley, C. A., Mortweet, S. L., & Greenwood, C. R. (1997). Peer-mediated instruction and
interventions. Focus on Exceptional Children, 29(5), 1–23.
AAH GRAPHICS, INC. / (540) 933-6210 / FAX 933-6523 / 08-02-2006 / 21:22
492 BUZHARDT, GREENWOOD, ABBOTT, AND TAPIA
Copyright © 2022 FDOKUMEN