
Representation in Images and Text of Children's Books
94
5757 S. University Ave. Chicago, IL 60637 Main: 773.702.5599 bfi.uchicago.edu WORKING PAPER · NO. 2021-44 What We Teach About Race and Gender: Representation in Images and Text of Children’s Books Anjali Adukia, Alex Eble, Emileigh Harrison, Hakizumwami Birali Runesha, and Teodora Szasz JULY 2021
-
Upload
khangminh22 -
Category
Documents
-
view
0 -
download
0
Transcript of Representation in Images and Text of Children's Books

5757 S. University Ave.
Chicago, IL 60637
Main: 773.702.5599
bfi.uchicago.edu
WORKING PAPER · NO. 2021-44
What We Teach About Race and Gender:Representation in Images and Text of Children’s BooksAnjali Adukia, Alex Eble, Emileigh Harrison, Hakizumwami Birali Runesha, and Teodora SzaszJULY 2021
What we teach about race and gender:Representation in images and text of children’s books∗
Anjali AdukiaUniversity of Chicago
and NBER
Alex EbleColumbia University
Emileigh HarrisonUniversity of Chicago
Hakizumwami Birali RuneshaUniversity of Chicago
Teodora SzaszUniversity of Chicago
July 29, 2021
Abstract
Books shape how children learn about society and social norms, in part through therepresentation of different characters. To better understand the messages children en-counter in books, we introduce new artificial intelligence methods for systematicallyconverting images into data. We apply these image tools, along with established textanalysis methods, to measure the representation of race, gender, and age in children’sbooks commonly found in US schools and homes over the last century. We find thatmore characters with darker skin color appear over time, but “mainstream” award-winning books, which are twice as likely to be checked out from libraries, persistentlydepict more lighter-skinned characters even after conditioning on perceived race. Acrossall books, children are depicted with lighter skin than adults. Over time, females areincreasingly present but are more represented in images than in text, suggesting greatersymbolic inclusion in pictures than substantive inclusion in stories. Relative to theirgrowing share of the US population, Black and Latinx people are underrepresented inthe mainstream collection; males, particularly White males, are persistently overrepre-sented. Our data provide a view into the “black box” of education through children’sbooks in US schools and homes, highlighting what has changed and what has endured.
∗Contact: [email protected], (adukia, harrisone, runesha, tszasz)@uchicago.edu, [email protected] helpful feedback, we thank Barbara Atkin, Karen Baicker, Anna Brailovsky, Tom Brock, Steven Durlauf,Alice Eagly, Allyson Ettinger, James Evans, Adam Gamoran, Jon Guryan, Andrew Ho, Rick Hornbeck,Caroline Hoxby, Susanna Loeb, Jens Ludwig, Jonathan Meer, Martha Minow, Sendhil Mullainathan, DerekNeal, Anna Neumann, Aaron Pallas, Steve Raudenbush, Cybele Raver, Heather Sarsons, Fred Stafford,Chenhao Tan, David Uminsky, Miguel Urquiola, Alessandra Voena, Amy Stuart Wells, and others includingseminar participants at AEFP, CGD, EPC, Harvard Measurement Lab, NAEd/Spencer, NBER, W.T. GrantFdn., UChicago, UVA, and UW-Madison. For financial support, we thank UChicago BFI, UChicago CDAC,NAEd/Spencer, and UChicago Career Advancement. The research reported here was also supported bythe Institute of Education Sciences, U.S. Department of Education, through Grant R305A200478 to theUniversity of Chicago. The opinions expressed are those of the authors and do not represent views of theInstitute or the U.S. Department of Education. For excellent research assistance, we thank Fabiola Alba-Vivar, Celia Anderson, Ryan Atkinson, Callista Christ, Marliese Dalton, Anjali Das, Maya Escueta, SaloniGupta, Amara Haider, Shavonna Hinton, Camilo Ibáñez, Juan Miguel Jimenez, Jalnidh Kaur, ZipporahKlain, Jarvis Lam, Erica Lin, Ping-Chang Lin, Ping-Jung Liu, Simon Mahns, Noah McLean, Karla Monteiro,Ifeatu Oliobi, Raj Shukla, Bhargavi Thakur, Jeffrey Tharsen, Qurat ul ain, and Charlie Wang. We also thankAshiyana and Kairav Adukia-Hornbeck for manual coding assistance. For access to important resources, wethank UChicago RCC, LaShanda Howard-Curry, Bridget Madden, and Kalli Mathios.

Education teaches children about the world, its people, and their place in it. Muchof this happens through the curricular materials society presents to children, particularly inthe books they read in school and at home (Giroux, 1981; Apple and Christian-Smith, 1991;Jansen, 1997; Van Kleeck, Stahl and Bauer, 2003; Steele, 2010). These lessons are conveyed,in part, through the inclusion or exclusion of characters of different identities in the imagesand text of books. The presence or absence of these characters contributes to how childrensee themselves and others, their strengths, and their possible futures. Given persistent racialand gender inequality in society (Darity and Mason, 1998; O’Flaherty, 2015; Blau and Kahn,2017; Quillian et al., 2017), and the potential importance of identity and representation incontributing to beliefs, aspirations, academic effort, and outcomes (Dee, 2005; Riley, 2017;Gershenson et al., 2018; Porter and Serra, 2020), these representations offer means throughwhich society can either address, perpetuate, or entrench structural inequalities.
In this paper, we use new image tools and established text tools to measure therepresentation of racial constructs, gender identity, and age in the images and text containedin influential collections of children’s books. First, we develop and showcase new tools for thesystematic analysis of images, highlighting their potential use in a wide range of applicationsin policy, education practice, and social science research. Second, we apply these image tools,alongside established text analysis methods, to systematically characterize representationin ways that computers could not have previously done for children’s books, particularlyrelated to measuring the skin color, racial identity, gender presentation, and age of picturedcharacters.
Our main data set is a series of books targeted to children and likely to appear inhomes, classrooms, and school libraries over the past century. Specifically, we use booksthat have won awards from the Association for Library Service to Children, a division ofthe American Library Association, starting in 1922. These and other children’s books areoften filled with images that transmit implicit and explicit messages to readers. Historically,content analysis to measure these messages has been done “by hand” using human coders(Bell, 2001; Neuendorf, 2016; Krippendorff, 2018). Such analysis provides deep understand-ing but can generally only be done on a small set of content and necessarily reflects humanbehavior and biases. We apply and develop computer vision tools that use convolutionalneural networks to identify and classify components of images; in our case, the tools detectcharacters in photos and illustrations and classify their skin color, race, gender, and age.1
While artificial intelligence tools also reflect bias in their training data and algorithms, they1Convolutional neural networks, or CNNs, are programs trained to model the way the human brain
functions by being given examples and then learning to perform tasks (such as detecting faces or classifyingfeatures on these faces) by analyzing these examples without explicit instructions.
1
can be standardized, are more replicable, and can be applied to a much larger sample thanmanual content analysis permits. These books also represent an ideal setting for demonstrat-ing both the challenges of analyzing heterogeneous types of images and our tools’ ability toprocess them into usable data.2
Analyzing images involves three primary components: (1) training the computer todetect faces, (2) classifying skin color, and (3) predicting the race, gender, and age of thefaces. We build on existing face analysis software tools, making some key improvements.First, because most established face detection models are trained on photographs, and be-cause the books in our sample contain a large number of illustrations, we trained our ownmodel using illustrated faces to improve accuracy. Second, we developed a model to classifyskin color of faces.3 This process involves isolating the skin of the detected face using con-volutional neural networks, identifying the predominant colors in that segmented skin usingk -means clustering, and then using a weighted average of those colors to classify the skincolor of a character. Third, we train a new model with higher precision in its classificationof race, gender, and age than in previously available models.
The second contribution of this paper is to use these image tools, in conjunction withexisting text analysis tools, to understand the representations of race, gender, and age seenby the generations of children exposed to these books, and how this has changed over time.We divide the award-winning corpora into two primary groups: (i) “Mainstream” booksconsidered to be of high literary value but written without explicit intention to highlight anidentity group (i.e., the Newbery and Caldecott Awards) and (ii) “Diversity” books selectedbecause they highlight experiences of specific identity groups (e.g., the Coretta Scott Kingand Rise Feminist Awards). We first show evidence that suggests these awards matterfor readership. Using data from a major public library system, we find that receipt ofMainstream awards is followed by a sustained increase of approximately 100 percent in thelikelihood of a book being checked out, relative to other children’s books. This corroboratesqualitative accounts of how award receipt establishes a book’s membership in the “canon” ofchildren’s literature (Smith, 2013; Koss, Johnson and Martinez, 2018) and recorded increasesin the sales of children’s books after receipt of an award (Cockcroft, 2018). This highlights the
2Images in children’s books, for example, vary widely with respect to several important characteristics.These books can include illustrations or photographs. Images can be polychromatic or monochromatic (e.g.,black and white); and even when characters are polychromatic, their skin is sometimes shown in seeminglynon-typical colors, such as green or blue. Characters can take human or non-human forms, and images oftenhave shadows or highlights that add to the complexity of measurement of the representation in these images.
3Skin color is an important dimension of human categorization for which there exists societal discrim-ination related to, but distinct from “putative” race, that is, the race that society assigns to people. Forexample, Hersch (2008) finds that, among legal immigrants to the US, darker skin color is associated withlower wages, even after controlling for demographic and occupational characteristics.
2
particular influence these books may have and underscores the importance of understandingthe messages they may transmit.
We present a series of descriptive analyses documenting patterns of representation inthese books over time. Additionally, we explore the efficacy of explicit efforts to highlightdiversity and their likelihood to account for intersectional experiences.
We find that books have included more characters with dark skin over time, but thosein the Mainstream collection are more likely to depict lighter-skinned characters than thosein the Diversity collection, even among characters classified by our model as belonging to agiven race. Black and Latinx people are underrepresented in the images and text, relative totheir share of the US population. Across all collections, children are more likely than adultsto be shown with lighter skin, despite there not being a definitive biological foundation forthis systematic difference in skin colors across ages in society.4 Regardless of the reasonswhy these differences exist, our estimates show that lighter-skinned children see themselvesrepresented more often in these books than do darker-skinned children.
We also use established text analysis methods to measure the representation of gender,racial constructs, and age in text, complementing our image analysis results. We comparethe incidence of female appearances in images to female mentions in text, and we see thatfemales have consistently been more likely to be visualized (seen) in images than mentioned(heard) in the text, except in the collection of books specifically selected to highlight females.This suggests there may be symbolic inclusion of females in pictures without their substantiveinclusion in the actual story. Despite being half of the US population, and despite substantialchanges in female societal roles over time, females are persistently less likely than males to berepresented in both images and text. This finding is consistent across all of the measures weuse: predicted gender of the pictured character, pronoun counts, specific gendered tokens,5
gender of famous characters, character first names, and geographic origin. Another surprisingresult is that, even though these books are targeted to children, adults are depicted morethan children both in images and text.
The Diversity collection has broader geographic representation of famous figures bornoutside of the United States or Europe than the Mainstream collection. However, wheneither collection presents a character outside of these two regions, that character is more
4Differences in skin color between children and adults could present in many possible configurations:adults could be darker than children (perhaps due to greater exposure to the sun due to outside labor ordue to children of mixed race couples being lighter than the average combined skin tone of their parents),children could be darker than adults (given evidence of the breakdown of melanin over the life course (Sarnaet al., 2003), or the skin tone of adults and children could be similar, on average.
5A “token” refers to a single word such as “queen” or “nephew.” We explain this further in Section IV.A.
3
likely to be male. This suggests that while the Diversity collection may represent a broaderrange of nationalities, it is still unequal in its representation of identity at the intersection ofgender and nationality. Moreover, White males comprise the majority of famous figures inall collections. Famous people from racial groups other than Black people or White people(e.g., Asian, Latinx) are less likely to be represented in any collection, comprising zero toeight percent of all famous people, on average, per collection. Even then, males are generallymore likely to be represented than females within each racial group.
Our paper makes two key contributions. First, we develop and hone a series of toolsfrom the field of computer vision for rapidly processing images into analyzable data, andshowcase how they can be used to process large amounts of images to study importantsocial phenomena. These tools allow the systematic measurement of characteristics in visualdata that were previously beyond the reach of empirical researchers. This contribution isin the spirit of other recent work introducing new sources of data to the economic studyof social phenomena, such as text (Gentzkow and Shapiro, 2010; Gentzkow, Shapiro andTaddy, 2019) and geospatial imagery (Burchfield et al., 2006; Henderson, Storeygard andWeil, 2012). Practically, we aim to instigate the use of these tools by scholars in a widerange of fields. This may include, for example, analysis of representation in the historicalrecord, the impacts of visual media such as television programming (Jensen and Oster, 2009;La Ferrara, Chong and Duryea, 2012; Kearney and Levine, 2019), advertising (Bertrandet al., 2010; Lewis and Rao, 2015), and textbooks (Fuchs-Schündeln and Masella, 2016;Cantoni et al., 2017), or linking exposure to different levels of representation with formationof beliefs, preferences, and educational outcomes. This also demonstrates how our tools canbe used by another key set of stakeholders: the practitioners, policymakers, and parentslooking for information to guide their choice of which books or other curricular materials toinclude in their classrooms, libraries, and homes.
Second, we show how race, gender, and age have been represented to children in theimages and text within influential book collections. This analysis yields three main findings.One, we find multiple sites of “hidden” messages, such as the depiction of children withlighter skin than adults and a greater presence of females being visualized in images thanmentioned in the text. Two, we find some evidence that representation is trending towardsmore parity in both race and gender over time. Three, we find that males and White peopleare overrepresented in both images and text relative to their shares in the US population.In summary, we find that while some inequality in representation has ameliorated over time,multiple other sites of this inequality persist. These patterns provide a view into the “blackbox” of education through children’s books in US schools and homes, highlighting what has
4

changed and what has endured.
It is important to note that AI is a product of human biases and therefore necessarilyreflects such biases (Das, Dantcheva and Bremond, 2018). Preliminary uses of these modelsshowed that AI classification models can perpetuate inequality caused by these biases (Fu,He and Hou, 2014; Nagpal et al., 2019; Krishnan, Almadan and Rattani, 2020). More recentwork has shown how careful application of these models with appropriate reporting can makethese biases visible and, in so doing, suggest paths forward – such as deliberate samplingfocused on achieving better representation – for minimizing their harms (Buolamwini andGebru, 2018; Mitchell et al., 2019). Use of our tools, and subsequent improvements uponthem, must adhere to these practices in order to prevent retrenchment of such biases.
This paper proceeds as follows. We present background information in Section I.Section II describes the books in our data. Section III explains how we convert imagesto data on skin color, race, gender, and age. Section IV discusses the text analysis tools.Section V synthesizes our final measures. Section VI presents our main results, showing ourestimates of inequality and inclusion of race and gender in the images and text of differentbook collections, and how these estimates change or persist over time. Section VII discussesthe potential benefits and concerns to using AI models. Section VIII discusses the cost-effectiveness of machine-led approaches to analyzing content relative to traditional manualapproaches. Section IX concludes.
I The Importance of Representation and the Challenge of Measurement
In this section, we briefly discuss research on the representation of race and genderand follow with a short description of the empirical challenges involved in measuring theserepresentations.
I.A The Importance of Equity in Representation
Our institutional practices, public policies, and cultural representations reflect thevalue that society assigns to specific groups. Inequality in representation, therefore, con-stitutes an explicit statement of inequality in value. If our records of history, culture, andsociety are disproportionately associated with whiteness and maleness, then the human po-tential of females, males of color, and non-binary individuals is devalued relative to theprivileged group. In a broad range of cultural products, from news media and history booksto children’s books, people who do not belong to the culturally dominant group are typicallyabsent or portrayed through negative stereotypes (O’Kelly, 1974; Stewig and Knipfel, 1975;Dobrow and Gidney, 1998; Balter, 1999; Witt, 2000; Brooks and Hébert, 2006; Martin, 2008;Paceley and Flynn, 2012; Daniels, Layh and Porzelius, 2016).
5

While there exist myriad structural barriers to racial and gender equality woventhroughout the organizations, laws, and customs of our society (Darity and Mason, 1998;O’Flaherty, 2015; Blau and Kahn, 2017; Muhammad, 2019; Chetty et al., 2020), inequalityof representation is a key contributor to inequality in outcomes if it instills the belief thatmembers of the underrepresented group are inherently deficient. Research from differentdisciplines supports the notion that representation gaps may be linked to socioeconomicinequality. For example, the experience of cultural subjugation may reduce the “capacityto aspire” (Appadurai, 2004). The absence of identity-specific positive examples of successcan lead to a distorted view of the path from present action to future outcomes (Wilson,2012; Genicot and Ray, 2017; Eble and Hu, 2020). This potential recursive loop from theself-image formed by the educational experience to socioeconomic success underscores theimportance of addressing inequality in representation within educational materials.
Inequality in representation in the context of schools is particularly pernicious be-cause educational materials are explicitly intended to shape students’ views of the worldaround them, and schools make important contributions to the formation of children’s socialpreferences (Cappelen et al., 2020). Importantly, the messages in these materials shape howchildren view others of different identities. When children do or do not see others represented,their conscious or unconscious perceptions of their own potential and that of unrepresentedgroups can be molded in detrimental ways and can erroneously shape subconscious defaults.
Empirical evidence suggests that the reverse also may be true: improving represen-tation may improve outcomes. Closing the representation gap by revealing previously in-visible opportunities may influence beliefs, actions, and educational outcomes for femalesand, separately, people of underrepresented racial and ethnic identities (of all genders) (Dee,2004; Stout et al., 2011; Beaman et al., 2012; Riley, 2017). While not a panacea, such“subject-object identity match” (e.g., teacher-student identity match, or content-reader iden-tity match) can help reduce academic performance gaps among multiple marginalized groupsvia a wide range of potential channels.6
I.B The Need for Better Measurement Tools
Systematically addressing these issues requires a systematic method for assessing therepresentations contained in the content used to instruct children. Educators and curriculumdevelopers have worked to address this representation gap by, for instance, expanding the
6These include, but are not limited to: by reducing stereotype threat (Steele and Aronson, 1995); bypotentially increasing the perceived likelihood of different possible futures for the individual (Wilson, 2012);and by expanding the perceptions and assumptions of those in majority-represented groups who therebymay be less likely to limit access to opportunities.
6
curriculum to include individual books that elevate the presence of an identity group. Theseefforts, however, are inherently piecemeal. Furthermore, the incidence, levels, and impacts ofsuch efforts are likely to vary dramatically across teachers and schools, and the sheer quantityof content that they have to review or create is too large for any individual to manually trackand assess. As a result, educators, administrators, and policymakers currently lack feasibleways to systematically identify such inclusive materials.
Children’s books represent a prime opportunity to “fix the institution” by increasingequity in representation, particularly in books that highlight the diverse roles that people canperform in an equal society. Identifying such books has been done through content analysis,which historically has been conducted primarily by humans reading carefully through text,images, or other media while coding the presence of certain words, themes, or concepts byhand (Neuendorf, 2016; Krippendorff, 2018). Because this manual process is time-consumingand therefore costly, resource constraints have limited the scope of such work.
In this paper, we demonstrate how tools from computer vision and natural languageprocessing can be used to systematically analyze content. We expand and develop tools forimage analysis, pairing them with tools from text analysis used in recent work by Caliskan,Bryson and Narayanan (2017), Garg et al. (2018), and Kozlowski, Taddy and Evans (2019).These tools can facilitate broader and more cost-effective measurements of racial constructs,gender identity, and age in images and text in a larger set of content than could be analyzedby any one individual or institution.
There are challenges to this type of numeric measurement of representation, how-ever. For example, racial constructs are multi-faceted and often ill-defined. To address thischallenge, we measure different facets of the broad concept of race in various ways: skincolor, putative race (that is, assigned by society), and birthplace.7 It is important to focuson these racial constructs, because each of these concepts has been used in systems thatperpetrate oppression and inequality by asserting a system of intrinsic hierarchy. In systemsof explicit and implicit racism, European facial features are privileged over non-Europeanfeatures, such as those seen as African, Asian, or Indigenous peoples (MacMaster, 2001). Incolorism, lighter skin tones are similarly either more desired or more associated with desir-able traits, relative to darker skin tones (Hunter, 2007; Ghavami, Katsiaficas and Rogers,2016). Separately, current methods measure gender identity in a binary way and neglect
7A wide range of research studies highlight the importance of both place of birth (Jencks and Mayer,1990; Brooks-Gunn et al., 1993; Cutler and Glaeser, 1997; Leventhal and Brooks-Gunn, 2000; Sampson,Morenoff and Gannon-Rowley, 2002; Chetty, Hendren and Katz, 2016) and the color of one’s skin (Banks,1999; Hunter, 2007; Burton et al., 2010; Ghavami, Katsiaficas and Rogers, 2016; Keith and Monroe, 2016;Dixon and Telles, 2017) in determining one’s chances of economic and social mobility
7

non-binary and gender fluid identities. While the methods we use are unable to address thisshortcoming, it is an important venue for future work.
Furthermore, even numeric characterization of the representation of race and gendercan be difficult and, if executed improperly, a tool for the perpetuation of bias. Because AItools are designed by humans, they contain human biases (Das, Dantcheva and Bremond,2018), and, if used improperly, their use can even perpetuate inequality (Fu, He and Hou,2014; Nagpal et al., 2019; Krishnan, Almadan and Rattani, 2020). New scholarship shows,however, that careful attention to identifying and addressing these biases allows scholars andpractitioners to overcome them while preserving the advantages of this type of computermeasurement (Buolamwini and Gebru, 2018; Mitchell et al., 2019).
An important contribution of this paper is to explore how and whether intersection-ality is addressed over time in books that are intentionally selected to highlight specificmarginalized groups compared to books not selected to highlight any particular identity.Different aspects of identity, such as race, gender identity, class, sexual orientation, and dis-ability, do not exist separately from each other, but rather are inextricably linked (Crenshaw,1989, 1990; Ghavami, Katsiaficas and Rogers, 2016). The notion of “intersectionality” refersto the unique experiences of people whose identities lie at one or multiple intersections ofthese identities. It highlights the fact that such identities cannot simply be characterizedby the sum of their parts; for example, the experiences of Black women cannot merely besummarized by a description of the experiences of all women and, separately, the experiencesof all Black people.
Inattention to intersectionality can lead to the omission of groups with intersectionalexperiences. An effort by publishers to diversify by gender, for example, is likely to over-represent the experiences of White women relative to women of color, given the relativeabundance of White women in popular media. Even those who select content with an eyetowards increasing representation of particular groups are themselves often products of aneducation system that reflects the structural racism, sexism, and other drivers of systematicinequality. Thus, even deliberate efforts to address inequality in representation may inad-vertently perpetuate other inequalities, thereby contributing to the underrepresentation – orexclusion – of intersectional experiences.
II Data
School libraries serve as major purveyors of sanctioned visual content for children.The books they offer are accompanied by an implicit state-sanctioned stamp-of-approval.These books are generally targeted towards specific age groups, ranging from picture books
8
to print-only books. They are deliberately chosen and curated by librarians and school ad-ministrators, and are often selected because they transmit clear narratives about appropriateconduct, an account of important historical moments, or other, often identity-specific mes-sages. For the purposes of our analysis, children’s books also serve as a useful test case forimage analysis tool development because they contain both illustrations and photographs.By drawing from a set of materials that has a broad range of image types, we are able todevelop more flexible face detection and feature classification models that can recognize adiverse set of images.
II.A Award-winning Children’s Books
Our data come from a set of children’s books considered to be of high literary valueand likely to be found in US schools and libraries. We use books that received awards ad-ministered or featured by the Association for Library Service to Children (ALSC), a divisionof the American Library Association (ALA). Our sample comprises 1,130 books, and eachbook in this sample is associated with one of 19 different awards.8
We divide these award-winning corpora into two primary “collections” of books, whichwe call the “Mainstream” and “Diversity” collections. Figure 1a presents the full list of awardsin our sample and the collection(s) into which we categorized them. Figure 1b and Table 1show the sample size of each collection by decade.
Mainstream Collection. The Mainstream collection comprises books that have receivedeither Newbery Honors or Caldecott Honors, the two oldest children’s book awards in theUnited States. The Newbery Medal, which was first awarded in 1922, is given to authors ofbooks that are considered to be the “most distinguished contribution to American literaturefor children.” The Caldecott Medal, which was first awarded in 1938, is given to illustratorsof “the most distinguished American picture books for children.” These books are explicitlychosen for their literary quality and not their popular appeal per se. Books receiving theseawards are considered to be of general interest to all children and are quickly incorporatedinto mainstream outlets for children, such as school libraries (ALSC, 2007; Koss, Johnsonand Martinez, 2018). The covers of these books are often marked by a conspicuous pictureof the award. The primary goal for studying these books is to understand the representationof race, gender, and age in a set of books to which a large proportion of American childrenare exposed.
8The 19 award corpora are comprised of 3,447 total books which either won an award or received anhonorable mention; we obtained and digitized 1,130 of these books using both library and online resources.
9
Diversity Collection. The Diversity collection is a set of books featured by the ALSCthat purposefully highlight the representation of excluded or marginalized identities.9 Thesebooks are also likely to be placed on “diversity lists” during events such as Black HistoryMonth or Women’s History Month. Two goals of studying representation in these books areone, to measure the efficacy of these books in highlighting the identity on which they focus,and two, to measure the levels of representation of identities beyond the identity on which agiven award focuses, particularly to assess the extent to which they account for intersectionalexperiences.
This collection includes books that have received the following awards: AmericanIndian Youth Literature Award, Américas Award, Arab American Book Award, Asian/PacificAmerican Award for Literature, Carter G. Woodson Book Award, Coretta Scott King BookAward, Dolly Gray Award, Ezra Jack Keats Book Award, Middle East Book Award, NotableBooks for a Global Society, Pura Belpré Award, Rise Feminist Award,10 Schneider FamilyBook Award, Skipping Stones Honor Award, South Asia Book Award, Stonewall Book Award,and Tomás Rivera Mexican American Award. The first of these awards was the Coretta ScottKing Award created in 1970 specifically to highlight African American writers, partly becauseno such writer had received either the Newbery or Caldecott Medals as of that point. Otherawards were created more recently, such as the South Asia Book Awards in 2012.
We also create smaller collections of these awards that highlight the following specificidentity areas: people of color, African American people, females, people with disabilities,and lesbian, gay, bisexual, transgender, and queer (LGBTQ) people.
While different awards begin in different years, we do not limit the analysis to yearsin which all awards have books in the sample. The use of books persists over time, and itmay be just as likely, if not more likely, for someone to select a book considered to be a“classic” (typically an older book) rather than to select a book more recently published.
We present summary statistics of the books in our sample, by collection, in Table 1.This shows key information about each collection, such as the number of years each awardwithin a given collection has been in existence, as well as aggregate information about eachcollection, including the average length of the books (number of pages, number of wordscontained) and summaries of the measurements we describe in the following sections.
9We selected children’s book awards featured on the ALSC website, many of which are administered bydifferent organizations.
10The Rise Feminist Award was formerly known as the Amelia Bloomer Award.
10

II.B Why Focus on Award-winning Books?
Scholars of children’s literature assert that receiving an award from the ALSC, andparticularly one of the Mainstream awards, places the book into the “canon” of children’sliterature and makes it a common feature in homes and school libraries (Smith, 2013; Kossand Paciga, 2020). Furthermore, the winners of the broader set of awards are commonlyfeatured in numerous venues that are part of children’s learning experience, from book fairsand catalogues to school curricula and summer reading lists (Knowles, Knowles and Smith,1997).11
We use publicly available, book-level, daily checkout data from the Seattle PublicLibrary system from 2004 to 2017 to show empirical evidence of the relationship betweenreceipt of these awards and book popularity. Most of these awards are presented annually,and many award recipients are announced at the ALA’s Midwinter Meeting, which typicallyoccurs near the end of January. To be eligible for these awards, a book must be publishedin January of that year or any time in the prior year. In Figure 2, we present an eventstudy that shows the average number of daily checkouts per book by collection, centeredaround the time when awards are announced.12 We plot checkout rates for three sets ofbooks in the library’s collections: (1) all books winning Mainstream awards in that year; (2)all books winning Diversity awards in that year; and (3) a random sample of 10 percent ofthe children’s books that did not win one of the awards in our sample that were publishedeither in the year prior to the award or in the same year as the award, prior to February 1stin that year.13
We see that checkout rates of books selected for Mainstream awards increase aroundthe time of the announcement of awards, surpassing the average daily checkouts of otherbooks.14 This persists for at least two years after the award announcement, during whichaverage daily checkouts of the Mainstream collection plateau at a rate roughly twice thatof the comparator groups – books from the Diversity collection and books that did not winan award from our sample. Checkout rates of books in the Diversity collection group do
11Our time window for the inclusion of books in our sample ranges from the inception of the award to thepresent. We do not limit the time frame to the same set of years for all awards, because the use of theseaward-winning books often persists for decades after their receipt of the award. For example, picture bookssuch as The Snowy Day by Ezra Jack Keats (1962) and novels such as Charlotte’s Web by E.B. White (1952)came into the collection before 1970, when the first Diversity collection book entered the sample, yet theyremain an important part of children’s literature options even today.
12We describe the empirical specification and data cleaning details in the Data Appendix.13These are books that did not receive one of the awards in our study, but they may have received
recognition from a different source. For brevity, we refer to this third set of books as “non-winners” or“non-award winners.”
14The three series exhibit parallel trends during the year prior to the award announcements.
11
not increase similarly to those of books in the Mainstream collection, though their averagedaily checkout rates trend upwards over the threshold, while those of the non-winners trenddownwards. Overall, this suggests that Newbery and Caldecott award winners have greaterinfluence than other children’s books, and children may be more likely to be exposed to themessages in books recognized by Newbery and Caldecott than other books, consistent withprevious qualitative assessments of these books’ central role in children’s literature (Smith,2013; Koss and Paciga, 2020). This is also reflected in analysis of book sales data frompublishers, who see large gains in sales – of similar or even larger magnitudes – after a bookreceives an award (Cockcroft, 2018).
II.C The Need for Computer-driven Content Analysis
Analysis of these features in books has historically been the domain of the field ofcontent analysis. Conventional content analysis is performed by human coders, or “by hand”(Neuendorf, 2016; Krippendorff, 2018). The 1,130 books in the sample contain 162,872 pagesof content and 54,043 detected faces. It would be cost-prohibitive to analyze this muchcontent through manual content analysis techniques, let alone to analyze the much largerbodies of potential content that practitioners or policymakers regularly consider for inclusionin curricula. As outlined in Section VIII, a back-of-the-envelope calculation suggests thatit would cost between $245,000 and $325,000 to analyze all the pages in our sample usingtraditional content analysis methods.15
To mitigate these costs and to more systematically analyze representation in the largevolume of images and text these book pages contain, we extract measures of representationusing automated methods, which we describe in Sections III and IV.
III Images as Data
In this section, we describe our development and application of software tools tomeasure the content of images. The maxim “a picture is worth a thousand words” speaksto the fact that an image often contains a wide range of messages. Perhaps the most directform of representation is what a child sees in the visual portrayals of people in the imagesshown in a book, particularly before a child becomes textually literate. Despite this, imagesare not widely used as a source of data in the social sciences. This is in stark contrast to theuse of text as data, which has seen substantial attention in the past decade (Gentzkow andShapiro, 2010; Gentzkow, Shapiro and Taddy, 2019; Kozlowski, Taddy and Evans, 2019).A main contribution of this paper is to address this gap by introducing, applying, and
15The marginal cost of analyzing each additional page using traditional content analysis methods is a linearfunction of the per-page cost; whereas the marginal cost of analyzing each additional page using developedartificial intelligence tools is relatively trivial.
12

developing tools for the computer-led analysis of the content of images.
Perhaps the first message people take from an image is that of representation: namely,who is contained in an image. The tools that we develop and apply in this paper identifyfaces of characters contained in images – both photographs and illustrations – and classifytheir skin color, race, gender, and age. In this section, we will describe the componentprocesses: identifying characters’ faces, then identifying the color of the skin, and, separately,classifying their race, gender, and age. We depict this process in Figure 3a and refer to it asour “Image-to-Data Pipeline.”
III.A Face Detection
Our first step in converting images to data is to use computer vision tools to identifythe faces of characters in each image.16 Specifically, we trained a custom transfer learningmodel to detect and classify images on a scanned book page, using Google’s AutoML Vision(Zoph and Le, 2017).17 Transfer learning is a process which facilitates the use of a pre-trained model as a “shortcut” to learn patterns from data on which it was not originallytrained. AutoML is an artificial-intelligence-based technology for conducting “automatedmachine learning.” Using a series of labeled data sets, we train models that recognize andidentify patterns in images to detect faces and classify features of interest. The AutoMLtool algorithmically optimizes its performance of classifying features via fine-tuning its neuralnetworks.18
Classifying the identity of people represented in images is a complex problem becauseof the wide variance in the way people can be represented. This problem is further compli-cated in the context of children’s books by the substantial variation in the characteristics ofthe images in these books. First, the images in these books consist of both illustrations andphotographs. This is notable, in particular, because most existing models were trained ex-clusively on photographs, leading these models to undercount illustrations.19 Second, theseimages are also likely to show both human and non-human characters. These characterscould have human skin colors (e.g., different shades of beige and brown), non-typical skin
16Computer vision involves teaching a computer to view and interpret images as a human would. Facedetection is a subset of computer vision, in addition to identifying features such as colors, objects, andemotions.
17A neural network is a program designed to model the way the human brain functions, wherein thecomputing system is given examples and learns to perform tasks by analyzing them, usually without beinggiven explicit instructions.
18More specifically, AutoML seeks the optimal network architecture and hyper-parameter configurationwhich minimizes the loss function of a model. Google’s AutoML Vision is based on neural architecture searchand transfer learning technologies.
19This concern is amplified by the large proportion of illustrations in our data: in a random sample ofmanually labeled images, we found that over 80 percent were illustrated, as opposed to photographic.
13

colors (e.g., blue or green), or monochromatic skin colors (e.g., greyscale or sepia). Finally,characters could be shown in different poses, such as facing the viewer, shown in profile, orfacing away from the viewer.
To address the potential undercounting of characters in illustrations, we trained atransfer learning face detection model (FDAI) using a manually-labeled data set of 5,403illustrated faces drawn from two sets of books that contain a wide variety of illustratedcharacters.20 To train the model, we split the data set into training (80 percent of the data),validation (10 percent of the data, used for hyper-parameter tuning), and test (10 percentof the data, used for evaluating the model).21
The test data are manually labeled data that are kept separate from the training andhyper-parameter tuning algorithms.22 The models compare results from the algorithms tothe manual labels in the test data to evaluate the accuracy of the algorithms. This processprovides two specific parameters that are commonly used to evaluate the performance ofthis class of model: “precision” and “recall.”23 Precision is the proportion of items whichare correctly assigned a label out of all items that are assigned that label. For example,precision for detected faces is the number of actual faces out of all regions in an image thatour model classifies as a face (that might not always be a face). Recall, on the other hand,tells us the percentage of items that are correctly assigned a label out of all items that shouldbe assigned that label. In the case of recall for faces, recall is the proportion of the numberof correctly detected faces out of the actual number of faces in the book.24 Formally:
precision =true positives
true positives+ false positives
20We used books in the Newbery and Caldecott corpora. A face was manually labeled if it could be easilyobserved. If a face was not detectable by a human, then we assumed it would not be easily detected by amachine. There were on average three detectable faces in each labeled image. We refer to our face detectionmodel as FDAI (face detection using AutoML trained on illustrations).
21The validation data are used for hyper-parameter tuning to optimize the model architecture. Hyper-parameter tuning involves “searching” for the optimal values of the hyper-parameters. Examples of hyper-parameters include learning rate, number of epochs (number of times the model goes through the wholedataset), and different activation functions of the model that can be tuned to improve the accuracy of themodel. FDAI is using Google Cloud infrastructure and functions to test different hyperparameter configu-rations and chooses the set of hyperparameters that maximize the model’s accuracy.
22The manually labeled data for the face detection model came from data labeled by our research team.The manually labeled data for the feature classification model came from the UTKFace dataset.
23AutoML has its own functions to calculate the precision and recall of the model. For our purposes, weuse the precision and recall that were calculated on the test data. In other words, the model is run on thetest data, and then the results generated by the trained model are compared to the results from the manuallylabeled test data.
24Sometimes “recall” is also referred to as “sensitivity.”
14

recall =true positives
true positives+ false negatives
The higher the precision, the fewer false positives the model produces. In other words,precision tells us from all the test examples that were predicted with a certain label, whichones are truly of that label? On the other hand, the higher the recall, the fewer falsenegatives the model produces. In other words, recall tells us, from all the test examples thatshould have had the label assigned, how many were actually assigned the label (Sokolovaand Lapalme, 2009).
Our face detection model has 93.4 percent precision 76.8 percent recall. In otherwords, 6.6 percent of the faces we identify may not, in truth, be faces (a false positive), whilethe model may neglect to identify one in 4.5 “true” faces (a false negative).
III.B Image Feature Classification: Skin Color
Skin color is an important and distinct dimension of how humans categorize eachother. Skin color is likely to be an immediate feature of an image that a viewer is likelyto process. Distinct from putative race, skin color is itself a site of historical and ongoingdiscrimination with clear impacts on health and in the labor market (Hersch, 2008; Monk Jr,2015). From a measurement perspective, it is a parameter for which we can more clearlyobserve the “ground truth,” as the color detected by the computer is a value purely based offof each pixel value, as compared with the categorization of putative race, which may vary byobserver. In this subsection, we introduce and describe our method for measuring the skincolor of the character faces our model detects.
We develop a novel method to classify the skin color of these characters. Our skincolor classification method involves a three-step process: (1) “segmenting” the skin on the face(isolating the parts of the face which contain skin from other facial features), (2) extractingthe dominant colors in the identified skin, and (3) constructing measures of the skin color ofeach face using the dominant colors identified. Figure 3a illustrates this process.
III.B.1 Skin Segmentation: Fully-Convolutional Conditional Random Field
We first isolate skin components of the character’s face using convolutional neuralnetworks (CNN).25 Traditional skin segmentation methods assign a skin or non-skin labelfor every pixel of the cropped face image in which skin features are extracted. These labelsare assigned using traditional image processing methods such as thresholding, level tracing,or watershed. These methods, however, face a number of challenges such as the need to take
25A convolutional neural network (CNN) is a multilayer, fully connected neural network, often used formachine-led image analysis.
15

into account skin color (in)consistency across variations in illumination, acquisition types,ethnicity, geometric transformations, and partial occlusions (Lumini and Nanni, 2020). Todeal with these issues, we isolate skin from non-skin parts of the detected face using adeep learning approach called Fully-Connected Convolutional Neural Network ContinuousConditional Random Field (FC-CNN CRF).26
This skin segmentation method (FC-CNN CRF) comprises three steps. First, we applya fully-convolutional neural network (FC-CNN),27 which is a type of convolutional neuralnetwork (CNN) where the last fully-connected layer is substituted with a convolutional layerthat can capture locations of the predicted labels. This allows us to predict peripherylandmarks such as the edges of the facial skin area, eyes, nose, and mouth. Second, we thenuse these predicted landmarks to extract a “mask” for the targeted facial region using theconvex hull function in SciPy’s Python library. Third, we refine this mask by applying acontinuous conditional random field (CRF) module, which predicts the labels of neighboringpixels (i.e., whether they are predicted to be skin or not skin) to produce a more fine-grainedsegmentation result.28 The resulting mask provides the segmented skin that we can then useto classify skin color. In Figure 3a, we illustrate the process of detecting a face and thenisolating the facial area of interest through skin segmentation.
III.B.2 Skin Color Classification: k-means clustering
We then identify the predominant colors in the pixels of the face mask created inSection III.B.1 using k -means clustering. k -means clustering is a traditional unsupervisedmachine learning algorithm whose goal is to group data containing similar features into kclusters.29 Specifically, k -means clustering partitions all the pixels in the “segmented” skininto k clusters, each pixel being assigned to the cluster with the nearest mean.30 For ouranalysis, we partition the pixels into five clusters (i.e., where k takes a value of five) and wedrop the pixels in the smallest two clusters as they tend to represent to shadows, highlights,or non-skin portions of the detected face.
26Specifically, we use a Convolutional Neural Network (CNN) cascade which parses the skin from thedetected face via a fully-convolutional continuous Conditional Random Field (CRF) neural network (Zhou,Liu and He, 2017). To do so, we used the trained model proposed in Jackson, Valstar and Tzimiropoulos(2016) to automatically conduct semantic segmentation of the facial skin in which we adapt code from Lu(2018) for parsing skin and from Beyer (2018) for CRF post-processing.
27An equivalent term for this is Fully-Convolutional Continuous Conditional Random Field. “Fully-Convolutional” implies fully-connected CNN in this case.
28Conditional random field (CRF) is a class of statistical modeling using a probabilistic graphical model.29Clustering entails partitioning data points into a small group of clusters.30We used the k -means clustering function implemented in the the scikit-learn Python library Sculley
(2010). Originally from the field of signal processing, k -means clustering is a tool used in various applicationsthat require the grouping of fields of data into disparate clusters.
16
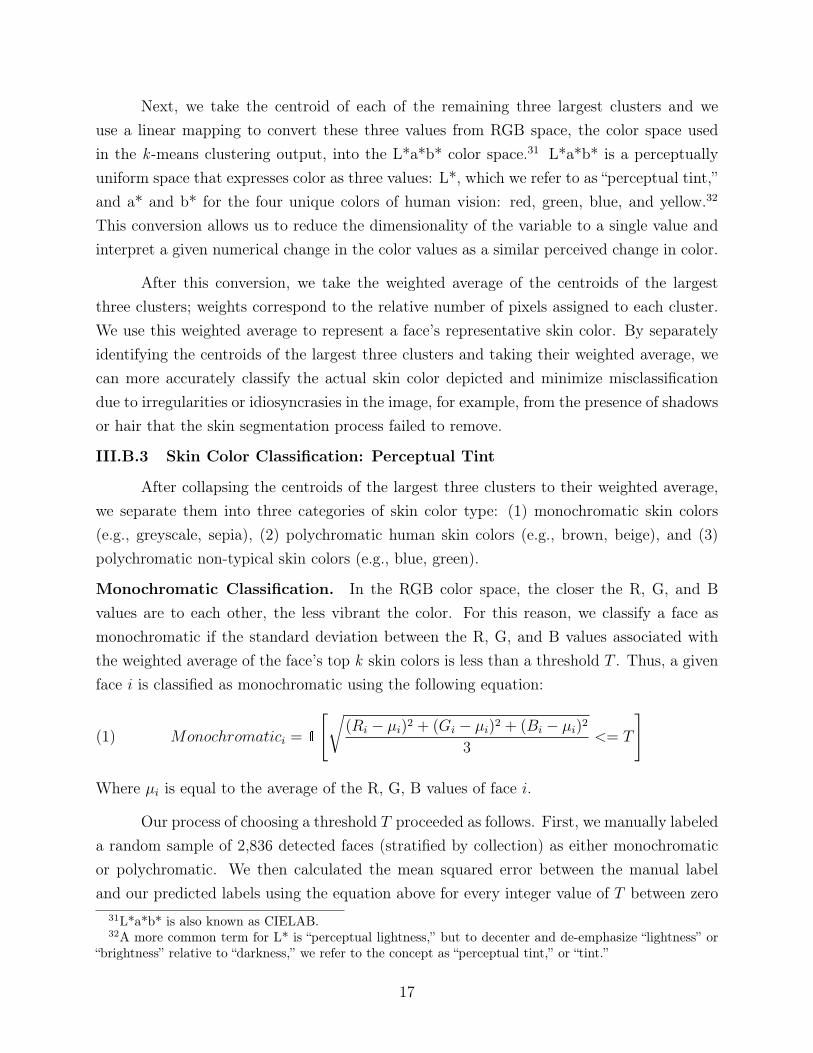
Next, we take the centroid of each of the remaining three largest clusters and weuse a linear mapping to convert these three values from RGB space, the color space usedin the k -means clustering output, into the L*a*b* color space.31 L*a*b* is a perceptuallyuniform space that expresses color as three values: L*, which we refer to as “perceptual tint,”and a* and b* for the four unique colors of human vision: red, green, blue, and yellow.32
This conversion allows us to reduce the dimensionality of the variable to a single value andinterpret a given numerical change in the color values as a similar perceived change in color.
After this conversion, we take the weighted average of the centroids of the largestthree clusters; weights correspond to the relative number of pixels assigned to each cluster.We use this weighted average to represent a face’s representative skin color. By separatelyidentifying the centroids of the largest three clusters and taking their weighted average, wecan more accurately classify the actual skin color depicted and minimize misclassificationdue to irregularities or idiosyncrasies in the image, for example, from the presence of shadowsor hair that the skin segmentation process failed to remove.
III.B.3 Skin Color Classification: Perceptual Tint
After collapsing the centroids of the largest three clusters to their weighted average,we separate them into three categories of skin color type: (1) monochromatic skin colors(e.g., greyscale, sepia), (2) polychromatic human skin colors (e.g., brown, beige), and (3)polychromatic non-typical skin colors (e.g., blue, green).
Monochromatic Classification. In the RGB color space, the closer the R, G, and Bvalues are to each other, the less vibrant the color. For this reason, we classify a face asmonochromatic if the standard deviation between the R, G, and B values associated withthe weighted average of the face’s top k skin colors is less than a threshold T . Thus, a givenface i is classified as monochromatic using the following equation:
(1) Monochromatici = 1
[√(Ri − µi)2 + (Gi − µi)2 + (Bi − µi)2
3<= T
]
Where µi is equal to the average of the R, G, B values of face i.
Our process of choosing a threshold T proceeded as follows. First, we manually labeleda random sample of 2,836 detected faces (stratified by collection) as either monochromaticor polychromatic. We then calculated the mean squared error between the manual labeland our predicted labels using the equation above for every integer value of T between zero
31L*a*b* is also known as CIELAB.32A more common term for L* is “perceptual lightness,” but to decenter and de-emphasize “lightness” or
“brightness” relative to “darkness,” we refer to the concept as “perceptual tint,” or “tint.”
17

and 100. We calculated the average of these mean squared errors using 1,000 bootstrappedsamples. The threshold that minimized the mean squared error on average is given byT = 13; this provides a classification of images as being monochromatic or not that is 82.9percent accurate, on average.
Polychromatic Classification. Once we have identified the monochromatic faces, wethen separate the remaining faces into two polychromatic color types using the R, G, andB values associated with the weighted average of a face’s top k skin colors: (1) human skincolors and (2) polychromatic non-typical skin colors. This allows us to distinguish betweenhumans and non-human characters who may have colorful skin tones (e.g., aliens, monsters,or characters found in Dr. Seuss books). Specifically, we classify the skin color of the faceas a typical human skin color if R ≥ G ≥ B.33 Otherwise, it is classified as a polychromaticnon-typical skin color.
(2) Humani = [1−Monochromatici]× 1 [R ≥ G ≥ B]
(3) NonTypicali = [1−Monochromatici]× [1−Humani]
We find this method of classifying the skin color of a face as human or non-typical tobe 82.1 percent accurate using our set of 2,836 manually labeled faces.
To classify the darkness or lightness of pictured skin colors, we use the perceptualtint, or L* value, associated with the average of the k colors in L*a*b* space. This valueranges from zero to 100 where a value of zero represents the color black and a value of 100represents the color white, and there is a range of colors in between. We use this continuousmeasure of perceptual tint along with the skin color tercile classifications (darker, medium,or lighter) as our measures for skin color.
III.C Image Feature Classification: Race, Gender, and Age
In this section, we discuss how we classify putative race, gender, and age of detectedfaces in images. We build a method for the analysis of race, gender, and age by training amulti-label classification model using Google’s AutoML Vision platform. Due to the largeamount of manually labeled data necessary to train these deep learning models and due to
33The boundaries of skin color regions in RGB space from an established pixel-based method of skinclassification are defined as R > 95 and G > 40 and B > 20 and max{R,G,B} −min{R,G,B} > 15 and|R − G| > 15 and R > G and R > B (Vezhnevets, Sazonov and Andreeva, 2003). However, these rulesfor defining skin color regions are only focused on classifying skin color from photographs. We expand thisregion in RGB space to account for illustrated skin colors (such as pure white and yellow).
18

the fact that there are no public data sets using illustrations, we use transfer learning topredict gender and age for both photographs and illustrations in our children’s books usinga model trained on photographs. Therefore, to train this model, we used the UTKFacepublic data set (Zhang and Qi, 2017), which contains over 20,000 photographs of faces withmanually verified race, gender, and age labels.34 We split the data set into three parts:training (80 percent of the data), validation (10 percent of the data), and test (10 percent ofthe data). The resulting model has 90.6 percent precision and 88.98 percent recall. In otherwords, 9.4 percent of the images assigned a given race, gender, or age label will, in truth, notpossess that trait (a false positive), while 11 percent of the images not assigned the label forthat trait would, in truth, possess it (a false negative). The main drawback of this model isthat it was trained on photographs while the majority of the faces in our children’s booksare illustrations.35
Race Classification (Images). The model assigns the probability that a detected faceis of a given race category: Asian, Black, Latinx + Others, White.36 Each identified faceis assigned to the race category to which the model assigns the highest predicted probabil-ity.37,38
Gender Classification (Images). For each face detected, we predict the probabilitythat the face is female- (or male-) presenting. We also label a face as female if the predictedprobability that the face is female-presenting is greater than 50 percent; otherwise, we labelthe face as male.39
We recognize that these classifications are imperfect and focus only on the performa-34The labels in the data set include: Gender (male or female), Age (infant (0-3), child (4-11), teenager
(12-19), adult (20-64), senior (65+)), Race (Asian (a combination of Asian and Indian), Black, White, andothers (e.g., Latinx, Middle Eastern).
35In a random sample, 84.2 percent of the detected faces were illustrations. Future work would include thecreation and usage of a manually labeled dataset of illustrated faces to use as training data to more preciselypredict the race, gender, and age of faces detected in illustrations.
36The race labels in the original model were defined in the UTKFace dataset and include: Asian, Black,Indian, Others (where “Others” includes Latinx and Middle Eastern) and White. We combine Asian andIndian predictions into a broader Asian category.
37Previously, many existing artificial intelligence models that classified putative race had a high error rate,both misclassifying the putative race of identified people and, in “one-shot” models that identify existence ofpeople and their putative race simultaneously, misclassifying people as non-human (Fu, He and Hou, 2014;Nagpal et al., 2019; Krishnan, Almadan and Rattani, 2020). Much work has been done to acknowledge andaddress these disparities (Buolamwini and Gebru, 2018; Mitchell et al., 2019)
38Classifying race is an imperfect exercise that will yield imperfect algorithms with imperfect categories.Our analysis by race looks across collections within race, so any error within a race would be consistentacross collections (i.e., Both the Mainstream and Diversity collections would classify people of the same racesimilarly.)
39We compare these predictions to a manually labeled random sample of 2,836 detected faces and presentthe results in the Data Appendix.
19

tive aspect of gender presentation, as they are trained based on how humans classify images.Future work should incorporate the classification of fluid and nonbinary gender identities.
Age Classification (Images). The model assigns the probability that a detected face isof a given age category (infant, child, teenager, adult, senior). We aggregate these categoriesinto two bins: child and adult. We collapse the probabilities for infant and child into asingle “child” bin and those for teenager, adult, and senior into a single “adult” bin. A faceis classified as child if the probability assigned to the age categories comprising the largerchild bin is larger than 50 percent, and as adult otherwise.40
IV Text as Data
In this section, we describe the tools we use to measure representation in the text ofbooks. Social scientists have manually analyzed the messages contained in text of printedmaterial for centuries, which is labor- and time-intensive (Neuendorf, 2016; Krippendorff,2018). Recent work by economists and sociologists showcases how the computational speedand power of (super)computers can be harnessed to conduct automated text analysis, greatlyaccelerating work traditionally done by hand (Gentzkow, Kelly and Taddy, 2019; Kozlowski,Taddy and Evans, 2019). We draw from this work and, in particular, a series of naturallanguage processing tools that take bodies of text – e.g., from a book – and extract variousfeatures of interest. In Figure 3b, we show our process of extracting text from digitizedbooks and then analyzing it; we refer to this as our “Text-to-Data Pipeline.”
The first step in conducting this analysis is to extract text from digital scans ofbooks by using Google Vision Optical Character Recognition (GVOCR). We input the rawfiles into GVOCR, which then separately identifies text and images (e.g., illustrations andphotographs) in each file. It then applies its own OCR software to the text sections of thescans, converting the text into ASCII which then encodes each character to be recognizedby the computer. This generates the text data we analyze.41
40We compare these predictions to the same manually labeled random sample of 2,836 detected faces usedfor comparison in the gender classification exercise and present the results in the Data Appendix.
41There are other commonly used OCR interfaces. However, over the past five years, researchers haveconsistently identified Google Cloud Vision OCR as the best technology for converting images to text. Inone study, Tafti et al. (2016) compare the accuracy of Google Docs (now Google Vision), Tesseract, ABBYYFineReader, and Transym OCR methods for over 1,000 images and 15 image categories, and found thatGoogle Vision generally outperformed other methods. In particular, Google Vision’s accuracy with digitalimages was 4 percent better than any other method. Additionally, the standard deviation of accuracy forGoogle Vision was quite low, suggesting that the quality of OCR does not drastically change from one imageto the next. A test of OCR tools by programmers compared the performance of seven different OCR tools(Han and Hickman, 2019). This analysis also found Google Vision to be superior, specifically when extractingresults from low resolution images. In another study that focused on comparing results from multiple imageformats (including .jpg, .png, and .tif), Vijayarani and Sakila (2015) found that Google surpassed all otherOCR tools. We also tested OCR using ABBYY FineReader and Google Tesseract. Our comparison of their
20

We clean these raw text data to remove erroneous characters and other noise generatedby the OCR process, increasing the precision of our measurement of features in the text.The cleaning process removes numerical digits and line breaks but maintains capitalization,punctuation, and special characters. It also standardizes the various permutations of famousnames (e.g., all variations of reference to Dr. Martin Luther King Jr. – for example, “MLK”– become “Martin Luther King Junior”).
From these text data, we then derive several features. These features include: token(single word) counts, the presence of famous people, and the first names of characters. Inthe rest of this section, we describe how we use these features to construct measures of therepresentation of gender, race, and age in the text of each book.
IV.A Text Analysis: Token Counts
One branch of traditional content analysis consists of enumerating words that repre-sent a particular attribute (Krippendorff, 2018). This process generates counts of different“tokens,” which comprise a maximal sequence of non-delimiting consecutive characters. Inour context, a token is an individual word. We generated a set of tokens associated withidentities related to gender, race, or age. The vocabulary used for each of these lists isavailable in the Data Appendix.42 We aggregate counts of these words by their respectiveidentity category (such as female or male) by book, generating our “token count” measuresof the representation of each identity in each book (Neuendorf, 2016).
Gender (Token Counts). To calculate gender representation in token counts, we cal-culate the proportion of words with a gendered meaning that refers to females. For ourmain analysis, we combine specific gendered tokens (e.g., queen, husband, daughter) withgendered pronouns (e.g., her, he, she).43,44,45
We show how gender representation varies on three additional dimensions: one,whether the gendered identity is represented by individuals (singular) or groups (plural);two, whether the character is placed as the subject or object of a sentence; and three, by the
performance relative to manual coding also showed GVOCR performed the best.42We use the spaCy library to generate these counts, but we see similar patterns in our findings when we
use NLTK instead.43Traditional content analysis often restricts gendered words to pronoun counts. We show the sensitivity
of our findings related to this construct by restricting the analysis to gendered pronouns only in AppendixFigure A12. Our results are robust to this alternate specification.
44We calculate the total number of words in a book by removing all punctuation from the text and thendividing the text into a list of words using either the “nlp” package in the spaCy library or the “word_tokenize”package in the NLTK library. The length of this list provides the total number of words in a given text.
45In some cases, characters have a gendered title such as “Señora Cuervo,” “Uncle Robin,” or “Queen Swan.”We count these gendered titles in the specific gendered token counts.
21
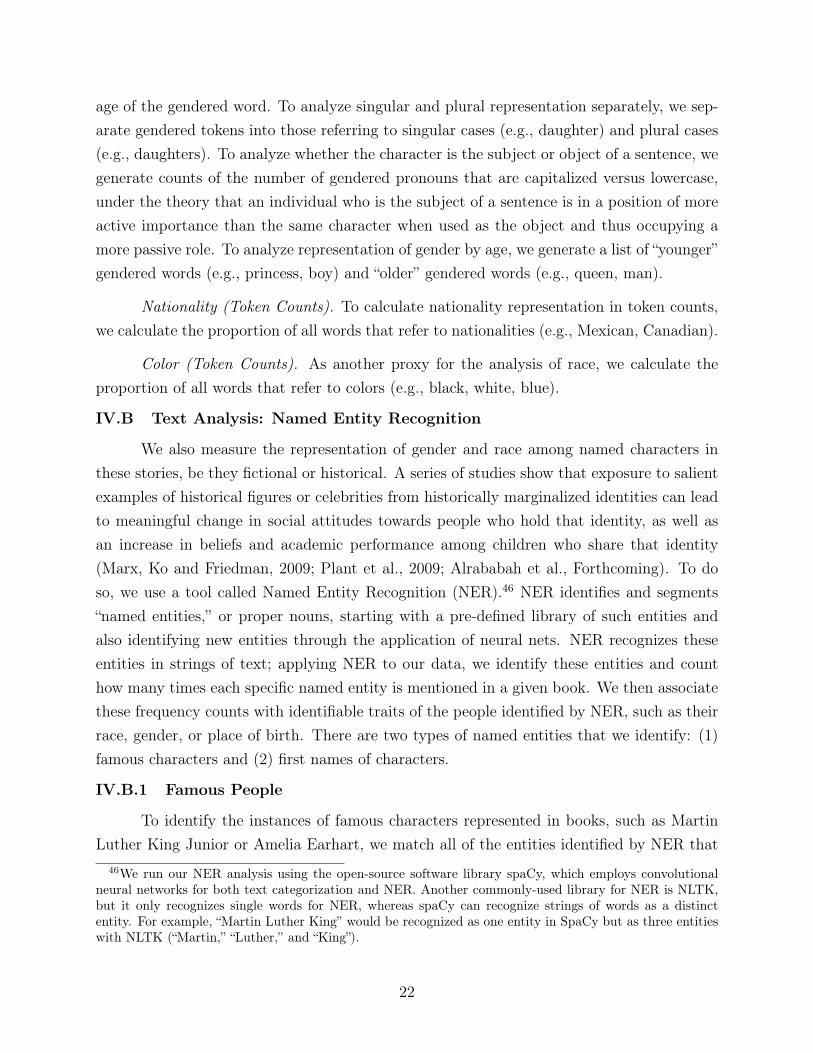
age of the gendered word. To analyze singular and plural representation separately, we sep-arate gendered tokens into those referring to singular cases (e.g., daughter) and plural cases(e.g., daughters). To analyze whether the character is the subject or object of a sentence, wegenerate counts of the number of gendered pronouns that are capitalized versus lowercase,under the theory that an individual who is the subject of a sentence is in a position of moreactive importance than the same character when used as the object and thus occupying amore passive role. To analyze representation of gender by age, we generate a list of “younger”gendered words (e.g., princess, boy) and “older” gendered words (e.g., queen, man).
Nationality (Token Counts). To calculate nationality representation in token counts,we calculate the proportion of all words that refer to nationalities (e.g., Mexican, Canadian).
Color (Token Counts). As another proxy for the analysis of race, we calculate theproportion of all words that refer to colors (e.g., black, white, blue).
IV.B Text Analysis: Named Entity Recognition
We also measure the representation of gender and race among named characters inthese stories, be they fictional or historical. A series of studies show that exposure to salientexamples of historical figures or celebrities from historically marginalized identities can leadto meaningful change in social attitudes towards people who hold that identity, as well asan increase in beliefs and academic performance among children who share that identity(Marx, Ko and Friedman, 2009; Plant et al., 2009; Alrababah et al., Forthcoming). To doso, we use a tool called Named Entity Recognition (NER).46 NER identifies and segments“named entities,” or proper nouns, starting with a pre-defined library of such entities andalso identifying new entities through the application of neural nets. NER recognizes theseentities in strings of text; applying NER to our data, we identify these entities and counthow many times each specific named entity is mentioned in a given book. We then associatethese frequency counts with identifiable traits of the people identified by NER, such as theirrace, gender, or place of birth. There are two types of named entities that we identify: (1)famous characters and (2) first names of characters.
IV.B.1 Famous People
To identify the instances of famous characters represented in books, such as MartinLuther King Junior or Amelia Earhart, we match all of the entities identified by NER that
46We run our NER analysis using the open-source software library spaCy, which employs convolutionalneural networks for both text categorization and NER. Another commonly-used library for NER is NLTK,but it only recognizes single words for NER, whereas spaCy can recognize strings of words as a distinctentity. For example, “Martin Luther King” would be recognized as one entity in SpaCy but as three entitieswith NLTK (“Martin,” “Luther,” and “King”).
22

have at least two names (for example, a first and last name) with a pre-existing data set,Pantheon 2.0, that contains data from over 70,000 Wikipedia biographies which have apresence in more than 15 language editions of Wikipedia (Yu et al., 2016). This generates adata set of 2,697 famous people. We count the number of unique books in which each famousperson is mentioned as well as the number of times they are mentioned in each book.47
Gender and Birthplace (Famous People). The Pantheon 2.0 data set contains infor-mation on the gender and birthplace of these famous people. We match these data to eachfamous figure identified from the NER in our data.48
Race (Famous People). We then manually code race for each identified person. Thiswas conducted based on a manual internet search for each person, starting with Wikipedia.49
We collapse the following identities: East Asian, Middle Eastern, and South Asian intothe Asian category; North American Indigenous peoples and South American Indigenouspeoples into the Indigenous category; and African American and Black African into theBlack category. If an individual was coded as having more than one race, they were thenclassified as multiracial.
IV.B.2 Character First Names
We also study the representation of gender among people who are named but notidentified as “famous” using the methods described above. Using the named entities identifiedby the spaCy NER engine, we limit the sample to those entities categorized as a person andremove the famous characters we found by applying the process described in Section IV.B.1.50
We then categorize the remaining named entities and construct a data set containing thename of each unique character and the number of times that character is mentioned in agiven book.
Gender (Character First Names). To identify the gender of characters not identifiedas famous, we extract the first name of each remaining named entity and estimate the
47Since NER tools are not perfect, the longer an entity’s name the more likely it is that only part of thename is identified. It is important to note that we have observed several instances where Martin Luther KingJunior was mentioned in our text but only the first part of his name was recognized and saved as “MartinLuther.” As a result, we under count the number of times Martin Luther King Jr. is mentioned and overcount the number of times Martin Luther is mentioned. This is a limitation of our method.
48The Pantheon 2.0 curators run a classifier over the English text of the Wikipedia biographies to extractinformation such as place of birth and gender from each biography. Their classifier was trained on a dataset called Pantheon 1.0 (Yu et al., 2016) which contains a subset of manually curated biographies.
49Note that coding of putative race is subject to the individual biases and perceptions of each humancoder and may be classified with error.
50NER tags each entity with a different category: people, locations, currency, and more. This entitycategorization (e.g., person, location) is not always correct, so there may be entities misclassified or missedoverall. We do not use this categorization when identifying famous characters.
23
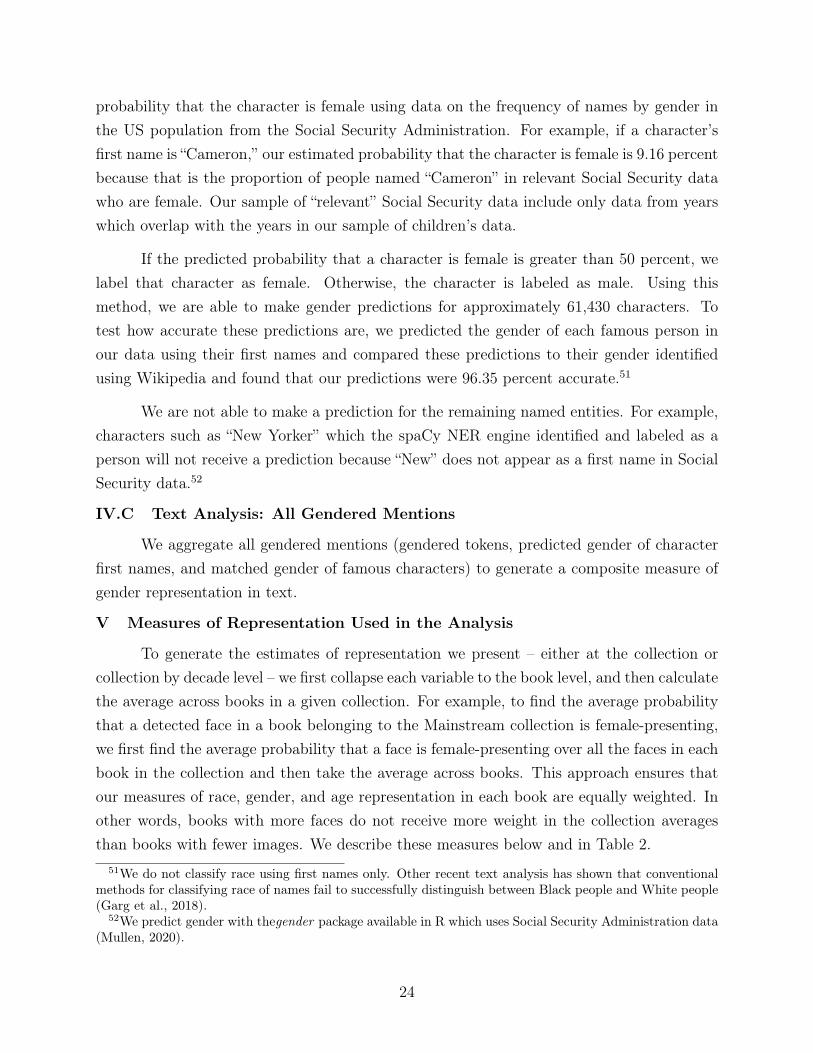
probability that the character is female using data on the frequency of names by gender inthe US population from the Social Security Administration. For example, if a character’sfirst name is “Cameron,” our estimated probability that the character is female is 9.16 percentbecause that is the proportion of people named “Cameron” in relevant Social Security datawho are female. Our sample of “relevant” Social Security data include only data from yearswhich overlap with the years in our sample of children’s data.
If the predicted probability that a character is female is greater than 50 percent, welabel that character as female. Otherwise, the character is labeled as male. Using thismethod, we are able to make gender predictions for approximately 61,430 characters. Totest how accurate these predictions are, we predicted the gender of each famous person inour data using their first names and compared these predictions to their gender identifiedusing Wikipedia and found that our predictions were 96.35 percent accurate.51
We are not able to make a prediction for the remaining named entities. For example,characters such as “New Yorker” which the spaCy NER engine identified and labeled as aperson will not receive a prediction because “New” does not appear as a first name in SocialSecurity data.52
IV.C Text Analysis: All Gendered Mentions
We aggregate all gendered mentions (gendered tokens, predicted gender of characterfirst names, and matched gender of famous characters) to generate a composite measure ofgender representation in text.
V Measures of Representation Used in the Analysis
To generate the estimates of representation we present – either at the collection orcollection by decade level – we first collapse each variable to the book level, and then calculatethe average across books in a given collection. For example, to find the average probabilitythat a detected face in a book belonging to the Mainstream collection is female-presenting,we first find the average probability that a face is female-presenting over all the faces in eachbook in the collection and then take the average across books. This approach ensures thatour measures of race, gender, and age representation in each book are equally weighted. Inother words, books with more faces do not receive more weight in the collection averagesthan books with fewer images. We describe these measures below and in Table 2.
51We do not classify race using first names only. Other recent text analysis has shown that conventionalmethods for classifying race of names fail to successfully distinguish between Black people and White people(Garg et al., 2018).
52We predict gender with thegender package available in R which uses Social Security Administration data(Mullen, 2020).
24
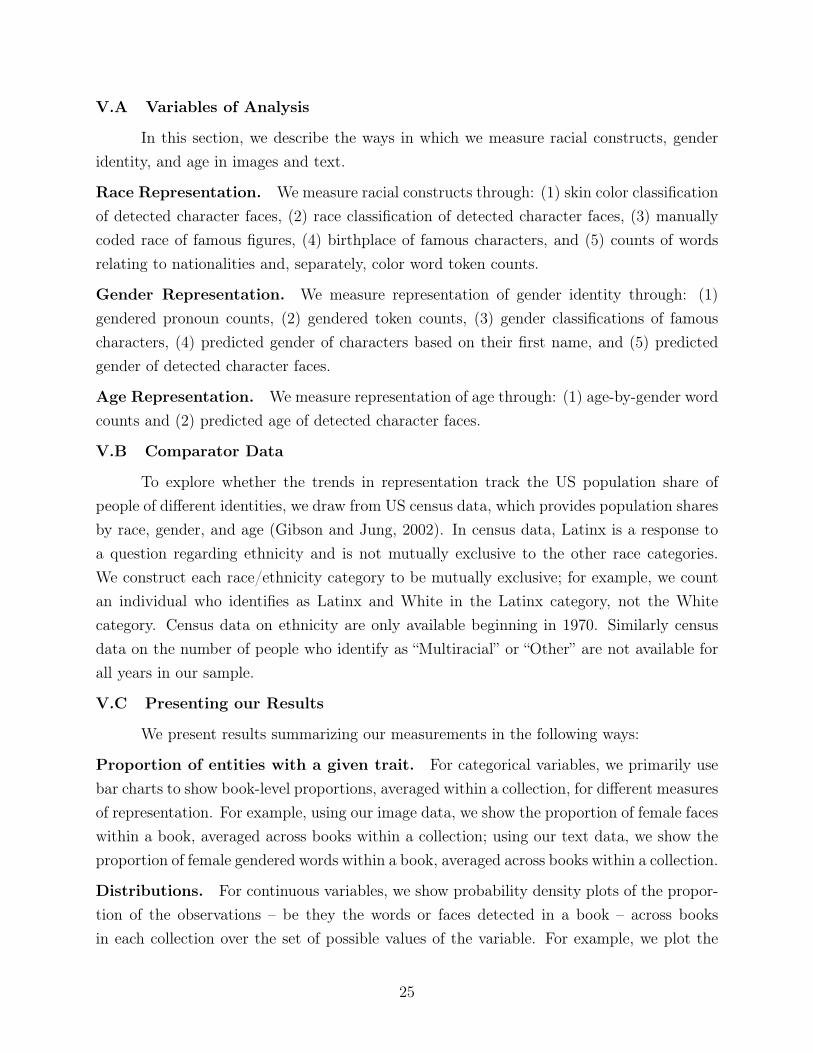
V.A Variables of Analysis
In this section, we describe the ways in which we measure racial constructs, genderidentity, and age in images and text.
Race Representation. We measure racial constructs through: (1) skin color classificationof detected character faces, (2) race classification of detected character faces, (3) manuallycoded race of famous figures, (4) birthplace of famous characters, and (5) counts of wordsrelating to nationalities and, separately, color word token counts.
Gender Representation. We measure representation of gender identity through: (1)gendered pronoun counts, (2) gendered token counts, (3) gender classifications of famouscharacters, (4) predicted gender of characters based on their first name, and (5) predictedgender of detected character faces.
Age Representation. We measure representation of age through: (1) age-by-gender wordcounts and (2) predicted age of detected character faces.
V.B Comparator Data
To explore whether the trends in representation track the US population share ofpeople of different identities, we draw from US census data, which provides population sharesby race, gender, and age (Gibson and Jung, 2002). In census data, Latinx is a response toa question regarding ethnicity and is not mutually exclusive to the other race categories.We construct each race/ethnicity category to be mutually exclusive; for example, we countan individual who identifies as Latinx and White in the Latinx category, not the Whitecategory. Census data on ethnicity are only available beginning in 1970. Similarly censusdata on the number of people who identify as “Multiracial” or “Other” are not available forall years in our sample.
V.C Presenting our Results
We present results summarizing our measurements in the following ways:
Proportion of entities with a given trait. For categorical variables, we primarily usebar charts to show book-level proportions, averaged within a collection, for different measuresof representation. For example, using our image data, we show the proportion of female faceswithin a book, averaged across books within a collection; using our text data, we show theproportion of female gendered words within a book, averaged across books within a collection.
Distributions. For continuous variables, we show probability density plots of the propor-tion of the observations – be they the words or faces detected in a book – across booksin each collection over the set of possible values of the variable. For example, we plot the
25

distribution of books which have a given proportion of gendered words that are female acrossthe range of possible values (0%-100%). It is important to note that these are estimateddensities and that the density plots do not convey information on sample size.
Patterns over time. We also plot how collection averages change over time, using linegraphs to show the evolution of decade-specific estimates for these variables.
Comparing measures within collections over time. When we want to compare twodifferent measures within the same collection in a given decade we use scatter plots. In theseplots, each point represents the average over all books in a single collection within a givendecade. The size of the point corresponds to the number of books in a given collection for agiven decade and the color of the point corresponds to a given collection. This means thatthe Mainstream collection has ten data points because it spans ten decades, but the Femalecollection only has one data point because that collection begins in the 2010s and only spansone decade.
VI Results
In this section, we present our results characterizing the representation of race, gender,and age in the images and text of the books in our collections. First, we present patternsof the representation of racial constructs (skin color, race, and place of origin) across col-lections and time. We then present patterns of the representation of gender identity acrosscollections and time. We conclude the section with a discussion of our results summarizingthe representation of race, gender, and age in these books.
VI.A Representation of the Construct of Race
In this section, we show results for traits which characterize the latent, human-perceived construct of race in images and in text – skin color, putative race, and placeof origin – as discussed in Sections I, III, and IV. Our measures include: (1) the represen-tative skin color of detected character faces in images, (2) the predicted race of detectedcharacter faces in images, (3) classification of the putative race of famous figures named inthe text, (4) the birthplace, or place of origin, of famous figures named in the text, and (5)token counts of color words.
Skin color of faces. We first report our estimates of the representation of race inimages, focusing on the representative skin color of a character’s face. In Figure 4, weshow the representative skin colors of all the individual faces we detect in the images in thebooks in each collection. We show these by the three color “types” present in these images:polychromatic human skin colors,53 monochromatic skin colors (e.g., black and white, sepia),
53Skin color is classified as “human” where the segmented skin’s color is R ≥ G ≥ B, conditional on the
26
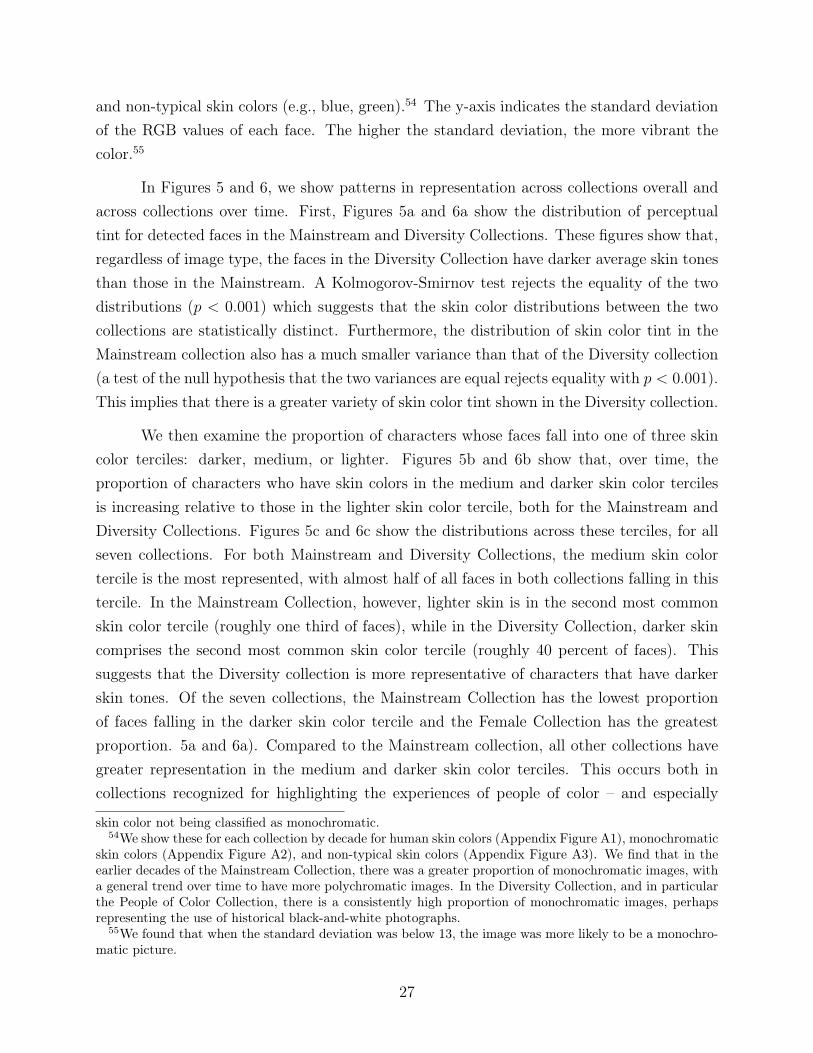
and non-typical skin colors (e.g., blue, green).54 The y-axis indicates the standard deviationof the RGB values of each face. The higher the standard deviation, the more vibrant thecolor.55
In Figures 5 and 6, we show patterns in representation across collections overall andacross collections over time. First, Figures 5a and 6a show the distribution of perceptualtint for detected faces in the Mainstream and Diversity Collections. These figures show that,regardless of image type, the faces in the Diversity Collection have darker average skin tonesthan those in the Mainstream. A Kolmogorov-Smirnov test rejects the equality of the twodistributions (p < 0.001) which suggests that the skin color distributions between the twocollections are statistically distinct. Furthermore, the distribution of skin color tint in theMainstream collection also has a much smaller variance than that of the Diversity collection(a test of the null hypothesis that the two variances are equal rejects equality with p < 0.001).This implies that there is a greater variety of skin color tint shown in the Diversity collection.
We then examine the proportion of characters whose faces fall into one of three skincolor terciles: darker, medium, or lighter. Figures 5b and 6b show that, over time, theproportion of characters who have skin colors in the medium and darker skin color tercilesis increasing relative to those in the lighter skin color tercile, both for the Mainstream andDiversity Collections. Figures 5c and 6c show the distributions across these terciles, for allseven collections. For both Mainstream and Diversity Collections, the medium skin colortercile is the most represented, with almost half of all faces in both collections falling in thistercile. In the Mainstream Collection, however, lighter skin is in the second most commonskin color tercile (roughly one third of faces), while in the Diversity Collection, darker skincomprises the second most common skin color tercile (roughly 40 percent of faces). Thissuggests that the Diversity collection is more representative of characters that have darkerskin tones. Of the seven collections, the Mainstream Collection has the lowest proportionof faces falling in the darker skin color tercile and the Female Collection has the greatestproportion. 5a and 6a). Compared to the Mainstream collection, all other collections havegreater representation in the medium and darker skin color terciles. This occurs both incollections recognized for highlighting the experiences of people of color – and especially
skin color not being classified as monochromatic.54We show these for each collection by decade for human skin colors (Appendix Figure A1), monochromatic
skin colors (Appendix Figure A2), and non-typical skin colors (Appendix Figure A3). We find that in theearlier decades of the Mainstream Collection, there was a greater proportion of monochromatic images, witha general trend over time to have more polychromatic images. In the Diversity Collection, and in particularthe People of Color Collection, there is a consistently high proportion of monochromatic images, perhapsrepresenting the use of historical black-and-white photographs.
55We found that when the standard deviation was below 13, the image was more likely to be a monochro-matic picture.
27

those that highlight the experiences of Black people – as well as in those in the Femalecollection.56
Race of detected characters. We then examine the predicted race of characters inimages. Figure 7 shows that the Mainstream collection is likely to show characters within agiven race as lighter than their counterparts in the Diversity collection. We see in Figure 8that detected character faces are overwhelmingly classified as being White males or females.57
Race of famous figures. To examine the race of the famous figures mentioned in thetext, we count the number of famous people mentioned at least once in a book and sum overall books in a collection. We then show the percentage breakdown of these famous peopleby race. For example, if Aretha Franklin was mentioned at least once in two separate bookswithin the Diversity collection, we would count her twice for that collection. In AppendixFigure A9, we show the proportion of famous figures in each collection identified as Asian,Black, Indigenous, Latinx, Multiracial, or White. We find that, in all collections, the famousfigures mentioned are predominantly White. In the Mainstream Collection, over 90 percentof famous figures are White.58 The African American Collection is the only collection to havea majority identity other than White represented. Other groups appear far less frequently.Black people are the next-most represented, comprising 50 percent of the famous people inthe African American collection, and 7 to 29 percent in the other collections. Famous peopleof Asian, Latinx, Indigenous and Multiracial identities account for between 3 and 10 percentof famous people combined, a high level of inequality in representation relative even to USpopulation averages.59
We also examine how representation of race in famous figures varies by gender inFigure 9, which shows the proportion of famous figures in each race-by-gender category.We find that the majority of famous characters in almost all collections are White males.In the African American collection, there are more Black male famous characters by 0.6
56As we see in Appendix Figure A3, which shows these estimates for polychromatic “non-typical” skincolors, the method of classifying “human” vs. “non-typical” skin colors may underestimate the number ofdarker-skinned faces if the browns that are used do not follow the polychromatic R ≥ G ≥ B rule. However,Appendix Figure A4 shows that this does not change the patterns in skin color representation by collectionover time.
57Appendix Figure A5 shows that most pictured characters are classified as being White. AppendixFigure A6 shows a substantial portion of pictured characters predicted to be female-presenting, and Figure 8suggests that most of these pictured characters are White females. We map these shares on their respectiveshares of the US population in Appendix Figures A7a and A7b
58Recent work reporting conventional content analysis of the race of main characters in the Caldecott and,separately, Newbery award-winning books finds qualitatively similar results (Koss, Johnson and Martinez,2018; Koss and Paciga, 2020).
59For example, the US Census Bureau estimates that only 60 percent of the US population is non-LatinxWhite (US Census, 2019).
28

percentage points. 37.4 percent of the famous characters are Black males, and 36.8 percentof the famous characters are White males. In all other collections, White males are 49.8percent or more of all famous people mentioned. The next most represented groups areWhite females (9-25 percent of famous people) and Black males (5-37 percent of famouspeople). The representation of Black females (between 2 and 8 percent of famous people,except in the African American collection, where they comprise 13 percent) is consistentlyless than that of Black males, despite their roughly equal shares in the population. Thishighlights that even within collections of books curated to highlight a given racial identity,race and gender are often treated as mutually exclusive categories of experience, overlookingthe representation of groups such as Black females whose identities lay at the intersection ofmultiple experiences of exclusion.
In Appendix Table A1, we list the five most frequently mentioned famous people over-all, including their race and gender. The most uniquely mentioned person in the Mainstreamcollection is George Washington; in the Diversity collection, it is Martin Luther King Junior.For the Mainstream collection, all five of the most commonly mentioned people are Whitemales. For the Diversity collection, all five are males, two of whom are White (AbrahamLincoln, George Washington) and three of whom are Black (Martin Luther King Junior,Frederick Douglass, and Langston Hughes). Even in the Female collection, the three mostuniquely mentioned people are males (Martin Luther King Junior, John F. Kennedy, andJimmy Carter) and the fourth is a female (Betty Friedan).60
We then explore whether these trends in racial representation of famous people trackthe US population share of different races in Figure 10.61 In the Mainstream collection,White people – particularly White males – have been consistently overrepresented, andBlack people and Latinx people underrepresented, relative to their US population share.
Birthplace of famous figures. We next examine representation of famous figures interms of their place of origin. Learning about real people from different parts of the world canexpand a child’s understanding of experiences beyond their own, and is another importantdimension of diversity in educational content. We show the spatial distribution of birthplacesof famous figures mentioned in the Mainstream and Diversity collections in Figure 11, whichpresents a map of the world with a dot for each birthplace. This captures the representation ofnational and subnational identities presented to children. This figure shows that Mainstream
60Appendix Tables A2 and A3 show this for the top five females and top five males, respectively, uniquelymentioned in each collection. Appendix Table A4 shows the most uniquely mentioned famous figure bycollection for each decade. Out of all collections and decades, only two females are the most uniquelymentioned famous figures.
61These data come from the US census, which we explain in Section V.B.
29
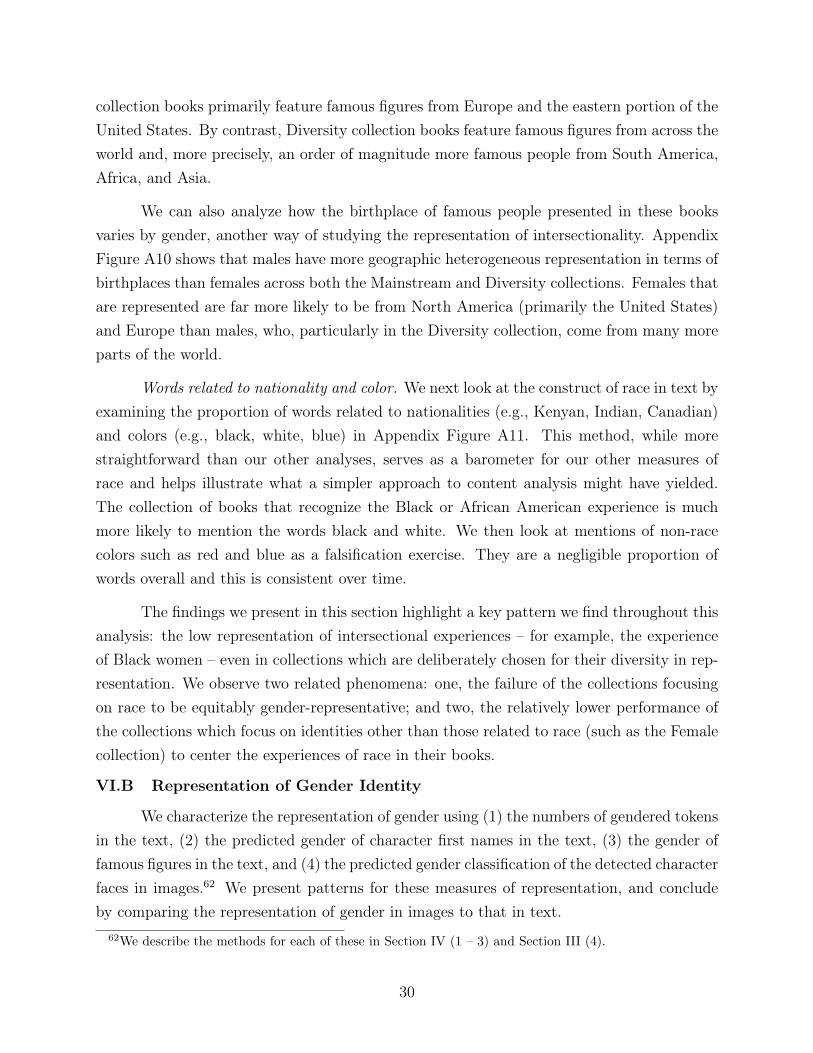
collection books primarily feature famous figures from Europe and the eastern portion of theUnited States. By contrast, Diversity collection books feature famous figures from across theworld and, more precisely, an order of magnitude more famous people from South America,Africa, and Asia.
We can also analyze how the birthplace of famous people presented in these booksvaries by gender, another way of studying the representation of intersectionality. AppendixFigure A10 shows that males have more geographic heterogeneous representation in terms ofbirthplaces than females across both the Mainstream and Diversity collections. Females thatare represented are far more likely to be from North America (primarily the United States)and Europe than males, who, particularly in the Diversity collection, come from many moreparts of the world.
Words related to nationality and color. We next look at the construct of race in text byexamining the proportion of words related to nationalities (e.g., Kenyan, Indian, Canadian)and colors (e.g., black, white, blue) in Appendix Figure A11. This method, while morestraightforward than our other analyses, serves as a barometer for our other measures ofrace and helps illustrate what a simpler approach to content analysis might have yielded.The collection of books that recognize the Black or African American experience is muchmore likely to mention the words black and white. We then look at mentions of non-racecolors such as red and blue as a falsification exercise. They are a negligible proportion ofwords overall and this is consistent over time.
The findings we present in this section highlight a key pattern we find throughout thisanalysis: the low representation of intersectional experiences – for example, the experienceof Black women – even in collections which are deliberately chosen for their diversity in rep-resentation. We observe two related phenomena: one, the failure of the collections focusingon race to be equitably gender-representative; and two, the relatively lower performance ofthe collections which focus on identities other than those related to race (such as the Femalecollection) to center the experiences of race in their books.
VI.B Representation of Gender Identity
We characterize the representation of gender using (1) the numbers of gendered tokensin the text, (2) the predicted gender of character first names in the text, (3) the gender offamous figures in the text, and (4) the predicted gender classification of the detected characterfaces in images.62 We present patterns for these measures of representation, and concludeby comparing the representation of gender in images to that in text.
62We describe the methods for each of these in Section IV (1 – 3) and Section III (4).
30

All gendered words. We first report the patterns for an aggregated measure of thetextual representation of gender, which includes all counts of gendered tokens, the gender ofthe famous characters in the text, and the gender classifications for character first names.In Figure 12, we present estimates of the book-level proportion of the gendered words andcharacters which are female. In Figure 12a, we show the distribution of these estimatesfor the Mainstream and Diversity collections.63 In Figure 12b, we show this distributionfor each of the collections, including the smaller collections that highlight specific identities.We observe that the Mainstream collection is the most male-skewed of all the collections.The patterns show that in all collections except the Female collection, the central tendencyof each distribution is skewed towards more male representation. However, we see that theFemale collection – which we would expect to be more female-centered – is less female-skewedthan the Mainstream collection is male-skewed.
In Figures 13a, 13b, and 13c, we present a numerical accounting of the proportion offemale words relative to all gendered words. The main pattern we observe is that, for allcollections except those books specifically recognized for highlighting females, fewer femalewords are present than male words. Figure 13a shows that the proportion of female wordsin these collections is between 35 and 45 percent, as opposed to 56 percent in the Femalecollection. Figure 13b presents the ratio of male words to female words as opposed to justthe proportion and documents that this pattern of greater male representation is consistentacross time for collection and decade book averages. Figure 13c shows that this proportionis gradually increasing over time but remains below the US population share of females forall collections in every decade, except for the Female collection.
One possible dimension on which the representation of gender might vary is by typeof gendered word. For example, until recently, grammar rules dictated that male pronounswould be used as “gender-neutral” pronouns, which would then lead us to overstate the malerepresentation in these books. However, the pattern holds when the analysis is restrictedto each type of gendered word: pronouns, specific gendered tokens such as “princess” and“prince,” gendered first names of characters, or gender of famous people mentioned (AppendixFigure A12).
These patterns of discrepancy in the representation of gender in text are consistentacross other measures of gender representation, such as whether they are represented asindividuals or groups of females vs. males (Appendix Figure A13) or if they are representedas the subject (as opposed to the object) of a sentence (Appendix Figure A14).
63Recall that the Diversity collection is the aggregate of multiple smaller collections which focus on cen-tering different diverse identities. The classification is shown in Figure 1a.
31
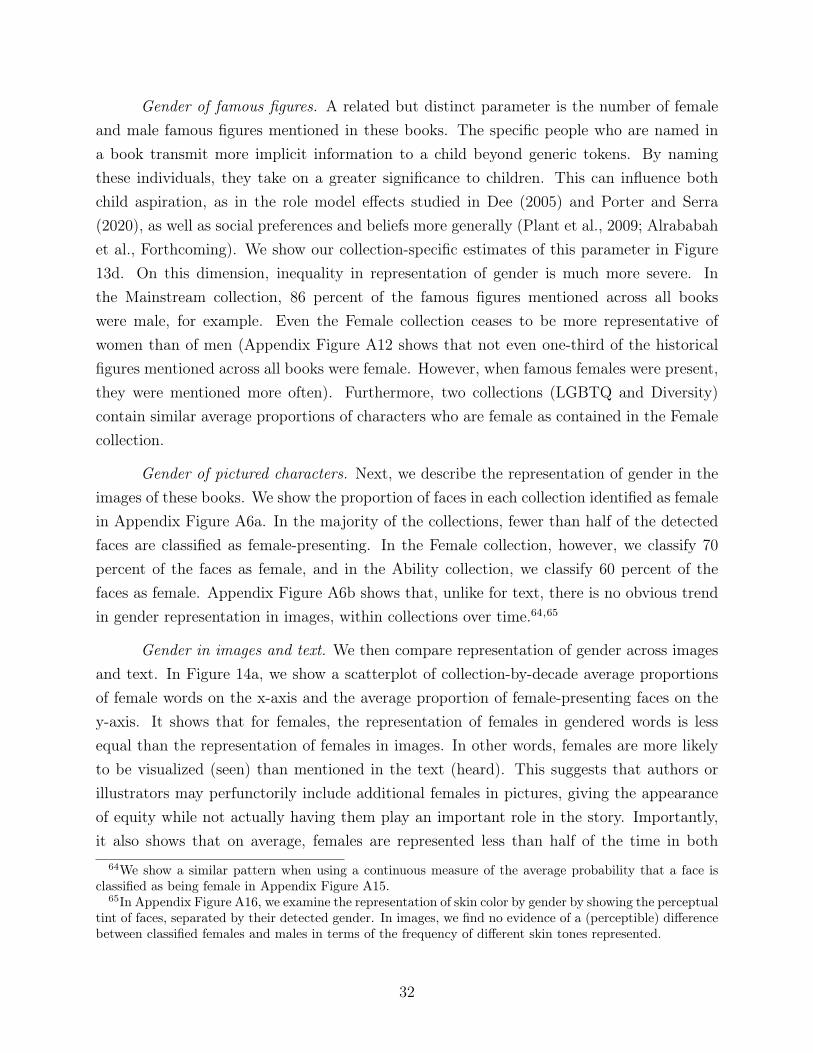
Gender of famous figures. A related but distinct parameter is the number of femaleand male famous figures mentioned in these books. The specific people who are named ina book transmit more implicit information to a child beyond generic tokens. By namingthese individuals, they take on a greater significance to children. This can influence bothchild aspiration, as in the role model effects studied in Dee (2005) and Porter and Serra(2020), as well as social preferences and beliefs more generally (Plant et al., 2009; Alrababahet al., Forthcoming). We show our collection-specific estimates of this parameter in Figure13d. On this dimension, inequality in representation of gender is much more severe. Inthe Mainstream collection, 86 percent of the famous figures mentioned across all bookswere male, for example. Even the Female collection ceases to be more representative ofwomen than of men (Appendix Figure A12 shows that not even one-third of the historicalfigures mentioned across all books were female. However, when famous females were present,they were mentioned more often). Furthermore, two collections (LGBTQ and Diversity)contain similar average proportions of characters who are female as contained in the Femalecollection.
Gender of pictured characters. Next, we describe the representation of gender in theimages of these books. We show the proportion of faces in each collection identified as femalein Appendix Figure A6a. In the majority of the collections, fewer than half of the detectedfaces are classified as female-presenting. In the Female collection, however, we classify 70percent of the faces as female, and in the Ability collection, we classify 60 percent of thefaces as female. Appendix Figure A6b shows that, unlike for text, there is no obvious trendin gender representation in images, within collections over time.64,65
Gender in images and text. We then compare representation of gender across imagesand text. In Figure 14a, we show a scatterplot of collection-by-decade average proportionsof female words on the x-axis and the average proportion of female-presenting faces on they-axis. It shows that for females, the representation of females in gendered words is lessequal than the representation of females in images. In other words, females are more likelyto be visualized (seen) than mentioned in the text (heard). This suggests that authors orillustrators may perfunctorily include additional females in pictures, giving the appearanceof equity while not actually having them play an important role in the story. Importantly,it also shows that on average, females are represented less than half of the time in both
64We show a similar pattern when using a continuous measure of the average probability that a face isclassified as being female in Appendix Figure A15.
65In Appendix Figure A16, we examine the representation of skin color by gender by showing the perceptualtint of faces, separated by their detected gender. In images, we find no evidence of a (perceptible) differencebetween classified females and males in terms of the frequency of different skin tones represented.
32

images and text.66 Figure 14b shows the converse of this for males, underscoring that theyare represented more than half of the time in both images and text.
VI.C Representation of Age
Finally, we briefly discuss the representation of people by age in the images and textof our books. In Figure 15a, we show detected character faces by age and gender. We findthat images of males dominate in most collections, though in no case is the discrepancy asextreme as it is in gendered adults in text. In the Female and Ability collections, there aremore females than males. Regardless of gender, in both images and text, we show that thereare more adults than children depicted in the books in each collection.67 We also see inAppendix Figure A7c that adults are overrepresented relative to their share in the census.This raises a question as to why adult experiences or depictions are privileged in bookstargeted to children.
In Figure 15b, we show the age classifications of gendered words (e.g., girl vs. womanand boy vs. man). Similar to images, this shows that, in most books, the distribution ofyoung people by gender is roughly similar, though in the Female collection, girls are roughlytwice as likely to appear than boys. For words specific to gendered adults, however, menare always more likely to appear. This discrepancy is largest in the Mainstream and AfricanAmerican collections, where adult men are roughly 60 percent of adult gendered mentionsand adult women only 40 percent.
We also study how the representation of skin color varies by age. Figures 16a and 16bpresent plots of the distribution and percentage of skin color tints which show that whenchildren are depicted in images, they are more likely to be shown with lighter skin tone thanadults, regardless of collection.68 We are aware of no definitive biological justification for thissystematic difference in the representation of skin colors by age. There are many possibledeterminants of potential differences, for example, greater exposure to the sun from moreoutside labor could cause adults to be darker. Mixed race couples may generate childrenwho are lighter, on average, than the mean of the parent’s skin tone. On the other hand,evidence of the breakdown of melanin over the life course (Sarna et al., 2003) suggests thatthere may be reason to expect the skin tone of adults to be lighter than that of children.
66In Appendix Figure A17, we show these results for females by race in which we see Black and Latinxfemales less represented.
67One concern may be that the age classification algorithms are primarily trained on adult faces, andtherefore overclassify adults; however, we see consistent ratios of adult presence to children presence in textand in images.
68One concern could be that the algorithms are trained to classify faces as being more likely to be a childif the skin color of the detected face is lighter, which then would attenuate the number of children detected.
33

Nonetheless, the pattern we find of children being represented with lighter skin than adults isconsistent across collections. While there are many potential interpretations of this pattern,a particularly concerning one is that brightness may be used to connote innocence (e.g.,of childhood), supernatural features (e.g., of angels), or another type of emphasis whichseparates the character from the rest of the context.
VII AI is Only Human
Our paper brings a set of artificial intelligence tools to bear on the field of contentanalysis. These tools are powerful, computer-driven methods. They are designed by humansand, in many cases, trained with initial human input. We use them because they offer afew key advantages. The first is scale: because algorithms are automated, they allow foranalysis of a much larger set of content than would be possible using conventional, “by hand”methods. The second is adaptability: we can rapidly change one dimension of measurementand re-run the analysis at low cost. Were we to do this via hand-coding, the cost wouldincrease linearly with each addition or adjustment (see Section VIII); with AI-based analysis,the marginal cost of such additions or adjustments is much lower.
Measuring representation in content via any means will generate some errors in mea-surement. In traditional content analysis, analysts may misclassify some images or text.If this occurs at random, this can be treated as standard measurement error, which wouldbe captured via estimating inter-rater reliability (Neuendorf, 2016; Krippendorff, 2018). If,however, traits of the analyst systematically influence their coding, then error from misclas-sification may be non-classical, leading to a bias in expectation (Krippendorff, 1980). Thiscan arise, for example, if an analyst’s identity (e.g., one’s race and/or gender) causes them toclassify content differently than analysts of different identities (Boer, Hanke and He, 2018).
These same biases appear in AI models. Many AI models, including those we use,are trained using a set of data which are first labeled by humans. Furthermore, nearlyall models are either fine-tuned, evaluated, or both, based on their performance relative tohuman classification. As a result, the bias in classical content analysis is “baked into the pie”for computer-driven content analysis (Das, Dantcheva and Bremond, 2018).
Most face detection models are trained using photographs of humans - particularlyWhite humans, which could lead us to undercount people of color and illustrated charactersif the model were less able to identify characters on which it was not trained. To addressthis, we trained our own face detection model using 5,403 illustrated faces from the Caldecottand Newbery corpora (discussed in Section III.A). A similar problem with under-detectionof certain types of faces could also appear in the skin segmentation process, as we relied upon
34

a series of convolutional neural networks to identify skin, rather than on human-performedidentification of the skin region of faces.
These issues persist when classifying features. In the case of gender, for example,all public data sets with labels for gender that we encountered have a binary structure,limiting classification to “female” or “male,” and neglecting to account for gender fluidity ornonbinary identities. Furthermore, intrinsic to these models is the general assumption thatwe can predict someone’s gender identity using an image of their faces (Leslie, 2020). Similarproblems beset the task of classifying putative race (Fu, He and Hou, 2014; Nagpal et al.,2019; Krishnan, Almadan and Rattani, 2020). Resolving these problems is an active field ofinquiry, and recent scholarship has suggested several promising paths forward for doing so(Buolamwini and Gebru, 2018; Mitchell et al., 2019).
While AI is a product of and therefore reflects human biases, this problem is also in-trinsic to traditional “by-hand” content analysis. Manual coding necessarily can only reflectthe biases of the individual coders. We observed that the identities of the manual labelerson our team led to non-classical error, particularly in the classification of race of the pic-tured characters in images. We therefore use multiple measures for each identity to try tounderstand the extent of this potential measurement error. For example, in addition to themanually coded putative race of famous figures, we examine two other constructs of race –birthplace of famous figures and skin color of detected characters.
While we primarily use AI tools to study representation, we end this section by em-phasizing that AI and manual coding provide complementary understanding of content. Thetools we use are meant to rapidly estimate how a human might categorize these phenom-ena. They are motivated by human perception and, ultimately, their performance is alsoevaluated based on how accurately they can determine how a human might perceive therepresentations in images and text. Our use of these tools depends on human input at eachstage, from the conception of tools and the labelling of training data, to the evaluation ofthe tools’ accuracy and the way that we interpret their results. We see our efforts addingthe strengths of recent advances in computational science to content analysis as a naturalextension of the rich history of human-driven analysis in this field.
VIII Cost-Effectiveness
Drawing from validation theory, we conducted traditional manual content analysis tovalidate our measures (Kane, 2013; Neuendorf, 2016). To do so, we hand-coded represen-tations in 30 short stories and poems for children written and illustrated by a variety ofauthors and illustrators from a third grade reading textbook published in 1987. This helped
35
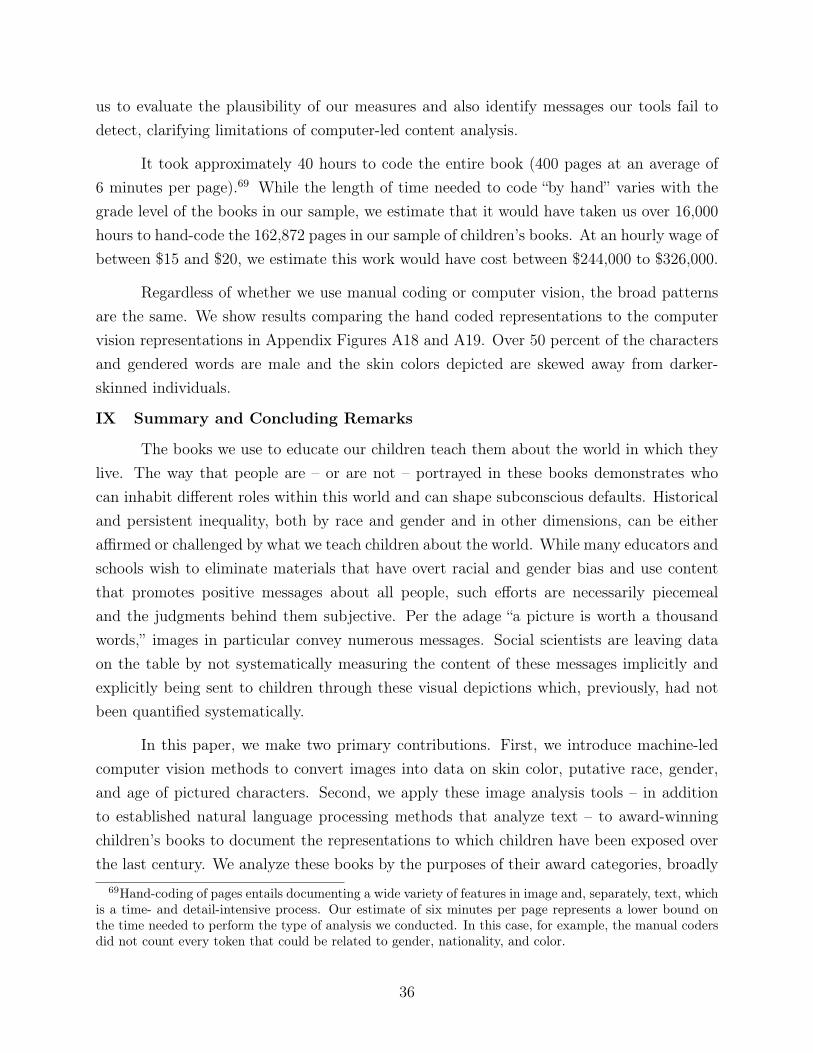
us to evaluate the plausibility of our measures and also identify messages our tools fail todetect, clarifying limitations of computer-led content analysis.
It took approximately 40 hours to code the entire book (400 pages at an average of6 minutes per page).69 While the length of time needed to code “by hand” varies with thegrade level of the books in our sample, we estimate that it would have taken us over 16,000hours to hand-code the 162,872 pages in our sample of children’s books. At an hourly wage ofbetween $15 and $20, we estimate this work would have cost between $244,000 to $326,000.
Regardless of whether we use manual coding or computer vision, the broad patternsare the same. We show results comparing the hand coded representations to the computervision representations in Appendix Figures A18 and A19. Over 50 percent of the charactersand gendered words are male and the skin colors depicted are skewed away from darker-skinned individuals.
IX Summary and Concluding Remarks
The books we use to educate our children teach them about the world in which theylive. The way that people are – or are not – portrayed in these books demonstrates whocan inhabit different roles within this world and can shape subconscious defaults. Historicaland persistent inequality, both by race and gender and in other dimensions, can be eitheraffirmed or challenged by what we teach children about the world. While many educators andschools wish to eliminate materials that have overt racial and gender bias and use contentthat promotes positive messages about all people, such efforts are necessarily piecemealand the judgments behind them subjective. Per the adage “a picture is worth a thousandwords,” images in particular convey numerous messages. Social scientists are leaving dataon the table by not systematically measuring the content of these messages implicitly andexplicitly being sent to children through these visual depictions which, previously, had notbeen quantified systematically.
In this paper, we make two primary contributions. First, we introduce machine-ledcomputer vision methods to convert images into data on skin color, putative race, gender,and age of pictured characters. Second, we apply these image analysis tools – in additionto established natural language processing methods that analyze text – to award-winningchildren’s books to document the representations to which children have been exposed overthe last century. We analyze these books by the purposes of their award categories, broadly
69Hand-coding of pages entails documenting a wide variety of features in image and, separately, text, whichis a time- and detail-intensive process. Our estimate of six minutes per page represents a lower bound onthe time needed to perform the type of analysis we conducted. In this case, for example, the manual codersdid not count every token that could be related to gender, nationality, and color.
36

categorizing them as Mainstream collections if they were selected without explicit intentionto highlight a specific identity and as Diversity collections if they were deliberately chosenfor a given award because of their focus on underrepresented groups. We then further createsmaller collections that highlight specific identities.
We show suggestive evidence from public library checkout data that children may betwice as likely to be exposed to books from the Mainstream collection relative to other books.This illustrates the outsized influence that Newbery and Caldecott honorees may have andhighlights the importance of understanding what messages children may be encountering inthese books.
These image analysis tools show that books selected to highlight people of color orfemales increasingly depict characters with darker skin tones over time. Books in the Main-stream collection, however, primarily depict characters with lighter skin tones compared tobooks in the other collections, despite increased rhetoric about the importance of represen-tation. Moreover, we see that children consistently have been more likely than adults to bedepicted with light skin. Regardless of the reason, these findings show that lighter-skinnedchildren see themselves represented more often in these books than do darker-skinned chil-dren.
We compare the patterns we find in images to those we find in text. We see thatfemales are more likely to be represented in images than in text over time, consistent withthe maxim that women should “be seen but not heard.” This suggests there may be symbolicinclusion in pictures without substantive inclusion in the actual story. Across all measuresin our study, males, especially White males, are persistently more likely to be represented;this overrepresentation relative to their share in the US population is surprising, particularlygiven substantial changes in female societal participation over time.
Our approach has a few key limitations. First, artificial intelligence tools reflect thebiases of the human coders that trained the models, in ways distinct from but consistentwith traditional content analysis conducted entirely manually. Second, the measures of rep-resentation that we use are imperfect. Our measures of gender identity neglect measurementof non-binary and gender-fluid identities. Because race is a multifaceted construct of hu-man categorization that is ill-defined, efforts to measure it are inherently difficult. Third,the algorithms we use do not perfectly detect faces or isolate the skin from faces, generat-ing measurement error. Fourth, our analysis consists of a numerical accounting of differentcharacters through simple representational statistics, i.e., whether characters are included.However, this is not a holistic measure of representation. If a character is depicted in a
37
reductive or stereotypical manner, then their representation may send messages which in-advertently reinforce existing inequality in representation. An important avenue for futurework will be to further develop tools that can measure how people are represented and thuscapture the messages sent by the manner of their portrayal as well as its incidence.
The “optimal” level of representation is a normative question beyond the scope of thispaper, but the actual representation in books is something that can be measured and, givensome reasonable set of goals, improved upon. To achieve any progress toward such goals,practitioners and publishers require mechanisms to systematically measure and compare theamount and type of representation in the content they consider for inclusion in curriculumor even for prospective consideration for publication.
Inequality in representation, particularly in the materials we use to teach children, isa systemic problem which requires a systemic solution. Our tools will directly contribute tolasting improvement of the practice of education, both by helping guide curriculum choicesand by assisting publishers and content creators to prospectively assess representation in thecreation of new content. Separately, these tools can help catalyze a wide range of scholarshipto systematically use printed content – images, as well as text – as primary source data. Thiswork could, for example, describe patterns of representation in other bodies of content and,subsequently, study how variation in representation shapes human beliefs, behavior, andoutcomes. Finally, these methods can be applied to the study of other text and visualmedia, from print-based and online news to television and film. By providing research thatexpands our understanding about the diversity in content, we can help to contribute to workthat aims to overcome the structural inequality that pervades society and our daily lives.
38
References
Alrababah, Ala, William Marble, Salma Mousa, and Alexandra Siegel. Forth-coming. “Can exposure to celebrities reduce prejudice? The effect of Mohamed Salah onIslamophobic behaviors and attitudes.” American Political Science Review.
ALSC. 2007. “The Newbery and Caldecott Awards: A guide to the Medal and Honor books.”Association for Library Service to Children, American Library Association.
Appadurai, Arjun. 2004. “The capacity to aspire: Culture and the terms of recognition.”Culture and public action, 59: 62–63.
Apple, Michael, and Linda Christian-Smith. 1991. The politics of the textbook. Rout-ledge.
Balter, Rochelle. 1999. “From stigmatization to patronization: The media’s distorted por-trayal of physical disability.” American Psychological Association.
Banks, Taunya Lovell. 1999. “Colorism: A darker shade of pale.” UCLA L. Rev., 47: 1705.
Beaman, Lori, Esther Duflo, Rohini Pande, and Petia Topalova. 2012. “Femaleleadership raises aspirations and educational attainment for girls: A policy experiment inIndia.” Science, 335(6068).
Bell, Philip. 2001. “Content analysis of visual images.” In The Handbook of Visual Analysis.Chapter 2, 11–34. Thousand Oaks, CA:Sage.
Bertrand, Marianne, Dean Karlan, Sendhil Mullainathan, Eldar Shafir, andJonathan Zinman. 2010. “What’s advertising content worth? Evidence from a consumercredit marketing field experiment.” The Quarterly Journal of Economics, 125(1): 263–306.
Beyer, Lucas. 2018. “Github: PyDenseCRF.”
Blau, Francine D, and Lawrence M Kahn. 2017. “The gender wage gap: Extent, trends,and explanations.” Journal of Economic Literature, 55(3): 789–865.
Boer, Diana, Katja Hanke, and Jia He. 2018. “On detecting systematic measurementerror in cross-cultural research: A review and critical reflection on equivalence and invari-ance tests.” Journal of Cross-Cultural Psychology, 49(5): 713–734.
Brooks, Dwight E, and Lisa P Hébert. 2006. “Gender, race, and media representation.”Handbook of Gender and Communication, 16.
39

Brooks-Gunn, Jeanne, Greg J Duncan, Pamela Kato Klebanov, and NaomiSealand. 1993. “Do neighborhoods influence child and adolescent development?”American Journal of Sociology, 99(2): 353–395.
Buolamwini, Joy, and Timnit Gebru. 2018. “Gender shades: Intersectional accuracydisparities in commercial gender classification.” Conference on Fairness, Accountabilityand Transparency, 77–91.
Burchfield, Marcy, Henry G Overman, Diego Puga, and Matthew A Turner.2006. “Causes of sprawl: A portrait from space.” The Quarterly Journal of Economics,121(2): 587–633.
Burton, Linda M, Eduardo Bonilla-Silva, Victor Ray, Rose Buckelew, and Eliza-beth Hordge Freeman. 2010. “Critical race theories, colorism, and the decade’s researchon families of color.” Journal of Marriage and Family, 72(3): 440–459.
Caliskan, Aylin, Joanna J Bryson, and Arvind Narayanan. 2017. “Semantics derivedautomatically from language corpora contain human-like biases.” Science, 356(6334).
Cantoni, Davide, Yuyu Chen, David Y Yang, Noam Yuchtman, and Y JaneZhang. 2017. “Curriculum and ideology.” Journal of Political Economy, 125(2): 338–392.
Cappelen, Alexander, John List, Anya Samek, and Bertil Tungodden. 2020. “Theeffect of early-childhood education on social preferences.” Journal of Political Economy,128(7): 2739–2758.
Chetty, Raj, Nathaniel Hendren, and Lawrence F Katz. 2016. “The effects of expo-sure to better neighborhoods on children: New evidence from the Moving to Opportunityexperiment.” American Economic Review, 106(4): 855–902.
Chetty, Raj, Nathaniel Hendren, Maggie R Jones, and Sonya R Porter. 2020.“Race and economic opportunity in the United States: An intergenerational perspective.”The Quarterly Journal of Economics, 135(2): 711–783.
Cockcroft, Marlaina. 2018. “Caldecott and Newbery Medal wins bring instant boost tobook sales.” School Library Journal, 64(2).
Crenshaw, Kimberlé. 1989. “Demarginalizing the intersection of race and sex: A blackfeminist critique of antidiscrimination doctrine, feminist theory and antiracist politics.”University of Chicago Legal Forum, 1989(8).
Crenshaw, Kimberlé. 1990. “Mapping the margins: Intersectionality, identity politics, andviolence against women of color.” Stanford Law Review, 43: 1241.
40

Cutler, David M, and Edward L Glaeser. 1997. “Are ghettos good or bad?” TheQuarterly Journal of Economics, 112(3): 827–872.
Daniels, Elizabeth A, Marlee C Layh, and Linda K Porzelius. 2016. “Grooming ten-year-olds with gender stereotypes? A content analysis of preteen and teen girl magazines.”Body Image, 19.
Darity, William A, and Patrick L Mason. 1998. “Evidence on discrimination in employ-ment: Codes of color, codes of gender.” Journal of Economic Perspectives, 12(2): 63–90.
Das, Abhijit, Antitza Dantcheva, and Francois Bremond. 2018. “Mitigating biasin gender, age and ethnicity classification: a multi-task convolution neural networkapproach.” Proceedings of the European Conference on Computer Vision (ECCV)Workshops.
Dee, Thomas S. 2004. “Teachers, race, and student achievement in a randomized experi-ment.” Review of Economics and Statistics, 86(1): 195–210.
Dee, Thomas S. 2005. “A teacher like me: Does race, ethnicity, or gender matter?”American Economic Review, 95(2): 158–165.
Dixon, Angela R, and Edward E Telles. 2017. “Skin color and colorism: Global research,concepts, and measurement.” Annual Review of Sociology, 43: 405–424.
Dobrow, Julia R, and Calvin L Gidney. 1998. “The good, the bad, and the foreign: Theuse of dialect in children’s animated television.” The Annals of the American Academy ofPolitical and Social Science, 557(1).
Eble, Alex, and Feng Hu. 2020. “Child beliefs, societal beliefs, and teacher-student iden-tity match.” Economics of Education Review, 77: 101994.
Fuchs-Schündeln, Nicola, and Paolo Masella. 2016. “Long-lasting effects of socialisteducation.” Review of Economics and Statistics, 98(3): 428–441.
Fu, Siyao, Haibo He, and Zeng-Guang Hou. 2014. “Learning race from face: A survey.”IEEE Transactions on Pattern Analysis and Machine Intelligence, 36(12): 2483–2509.
Garg, Nikhil, Londa Schiebinger, Dan Jurafsky, and James Zou. 2018. “Word em-beddings quantify 100 years of gender and ethnic stereotypes.” Proceedings of the NationalAcademy of Sciences, 115(16): E3635–E3644.
Genicot, Garance, and Debraj Ray. 2017. “Aspirations and inequality.” Econometrica,85(2): 489–519.
41
Gentzkow, Matthew, and Jesse M Shapiro. 2010. “What drives media slant? Evidencefrom US daily newspapers.” Econometrica, 78(1).
Gentzkow, Matthew, Bryan T. Kelly, and Matt Taddy. 2019. “Text as data.” Journalof Economic Literature, 57(3): 535–74.
Gentzkow, Matthew, Jesse M Shapiro, and Matt Taddy. 2019. “Measuring groupdifferences in high-dimensional choices: Method and application to Congressional speech.”Econometrica, 87(4): 1307–1340.
Gershenson, Seth, Cassandra Hart, Joshua Hyman, Constance Lindsay, andNicholas W Papageorge. 2018. “The long-run impacts of same-race teachers.” NationalBureau of Economic Research.
Ghavami, Negin, Dalal Katsiaficas, and Leoandra Onnie Rogers. 2016. “Towardan intersectional approach in developmental science: The role of race, gender, sexualorientation, and immigrant status.” In Advances in Child Development and Behavior.Vol. 50, 31–73. Elsevier.
Gibson, Campbell, and Kay Jung. 2002. “Historical census statistics on populationtotals by race, 1790 to 1990, and by Hispanic origin, 1790 to 1990, for the United States,regions, divisions, and states.”
Giroux, Henry A. 1981. Ideology, culture, and the process of schooling. Temple UniversityPress.
Han, Ted, and Amanda Hickman. 2019. “Our search for the best OCR tool, and whatwe found.”
Henderson, J Vernon, Adam Storeygard, and David N Weil. 2012. “Measuringeconomic growth from outer space.” American Economic Review, 102(2): 994–1028.
Hersch, Joni. 2008. “Profiling the new immigrant worker: The effects of skin color andheight.” Journal of Labor Economics, 26(2): 345–386.
Hunter, Margaret. 2007. “The persistent problem of colorism: Skin tone, status, andinequality.” Sociology Compass, 1(1): 237–254.
Jackson, Aaron S, Michel Valstar, and Georgios Tzimiropoulos. 2016. “A CNN cas-cade for landmark guided semantic part segmentation.” European Conference on ComputerVision, 143–155.
42

Jansen, JD. 1997. “Critical theory and the school curriculum.” Metatheories in EducationalTheory and Practice.
Jencks, Christopher, and Susan E Mayer. 1990. “The social consequences of growingup in a poor neighborhood.” Inner-city Poverty in the United States, 111: 186.
Jensen, Robert, and Emily Oster. 2009. “The power of TV: Cable television and women’sstatus in India.” The Quarterly Journal of Economics, 124(3).
Kane, Michael T. 2013. “Validating the interpretations and uses of test scores.” Journalof Educational Measurement, 50(1).
Kearney, Melissa S, and Phillip B Levine. 2019. “Early childhood education by tele-vision: Lessons from Sesame Street.” American Economic Journal: Applied Economics,11(1): 318–50.
Keith, Verna M, and Carla R Monroe. 2016. “Histories of colorism and implicationsfor education.” Theory Into Practice, 55(1): 4–10.
Knowles, Elizabeth, Liz Knowles, and Martha Smith. 1997. The reading connection:Bringing parents, teachers, and librarians together. Libraries Unlimited.
Koss, Melanie D, and Kathleen A Paciga. 2020. “Diversity in Newbery Medal-winningtitles: A content analysis.” Journal of Language and Literacy Education, 16(2): n2.
Koss, Melanie D, Nancy J Johnson, and Miriam Martinez. 2018. “Mapping thediversity in Caldecott books from 1938 to 2017: The changing topography.” Journal ofChildren’s Literature, 44(1): 4–20.
Kozlowski, Austin C, Matt Taddy, and James A Evans. 2019. “The geometry of cul-ture: Analyzing the meanings of class through word embeddings.” American SociologicalReview, 84(5).
Krippendorff, Klaus. 1980. “Validity in content analysis.” In Computerstrategien fÃr diekommunikationsanalyse. 69–112. Frankfurt, Germany:Campus Verlag.
Krippendorff, Klaus. 2018. Content Analysis: An Introduction to its Methodology. Sagepublications.
Krishnan, Anoop, Ali Almadan, and Ajita Rattani. 2020. “Understanding fairness ofgender classification algorithms across gender-race groups.” arXiv.
43
La Ferrara, Eliana, Alberto Chong, and Suzanne Duryea. 2012. “Soap operas andfertility: Evidence from Brazil.” American Economic Journal: Applied Economics, 4(4): 1–31.
Leslie, David. 2020. “Understanding bias in facial recognition technologies: An explainer.”The Alan Turing Institute.
Leventhal, Tama, and Jeanne Brooks-Gunn. 2000. “The neighborhoods they live in:The effects of neighborhood residence on child and adolescent outcomes.” PsychologicalBulletin, 126(2): 309.
Lewis, Randall A, and Justin M Rao. 2015. “The unfavorable economics of measuringthe returns to advertising.” The Quarterly Journal of Economics, 130(4): 1941–1973.
Lu, Conny. 2018. “Github: Face segmentation with CNN and CRF.”
Lumini, Alessandra, and Loris Nanni. 2020. “Fair comparison of skin detection ap-proaches on publicly available datasets.” Expert Systems with Applications, 160: 113677.
MacMaster, Neil. 2001. Racism in Europe: 1870-2000. New York, NY:Palgrave.
Martin, Ardis C. 2008. “Television media as a potential negative factor in the racial identitydevelopment of African American youth.” Academic Psychiatry.
Marx, David M, Sei Jin Ko, and Ray A Friedman. 2009. “The “Obama effect”: Howa salient role model reduces race-based performance differences.” Journal of ExperimentalSocial Psychology, 45(4): 953–956.
Mitchell, Margaret, Simone Wu, Andrew Zaldivar, Parker Barnes, Lucy Vasser-man, Ben Hutchinson, Elena Spitzer, Inioluwa Deborah Raji, and Timnit Ge-bru. 2019. “Model cards for model reporting.” Proceedings of the Conference on Fairness,Accountability, and Transparency, 220–229.
Monk Jr, Ellis P. 2015. “The cost of color: Skin color, discrimination, and health amongAfrican-Americans.” American Journal of Sociology, 121(2): 396–444.
Muhammad, Khalil Gibran. 2019. The condemnation of Blackness: Race, crime, and themaking of modern urban America, with a new preface. Cambridge, MA:Harvard UniversityPress.
Mullen, Lincoln. 2020. “gender: Predict gender from names using historical data.” Rpackage version 0.5.4.
44

Nagpal, Shruti, Maneet Singh, Richa Singh, and Mayank Vatsa. 2019. “Deep learn-ing for face recognition: Pride or prejudiced?” arXiv.
Neuendorf, Kimberly A. 2016. The Content Analysis Guidebook. Sage.
O’Flaherty, Brendan. 2015. The Economics of Race in the United States. Cambridge,MA:Harvard University Press.
O’Kelly, Charlotte G. 1974. “Sexism in children’s television.” Journalism Quarterly, 51(4).
Paceley, Megan S, and Karen Flynn. 2012. “Media representations of bullying towardqueer youth: Gender, race, and age discrepancies.” Journal of LGBT Youth, 9(4).
Pathak, Madhu A, Kowichi Jimbow, George Szabo, and Thomas B Fitzpatrick.1976. “Sunlight and melanin pigmentation.” Photochemical and Photobiological Reviews,211–239.
Plant, E Ashby, Patricia G Devine, William TL Cox, Corey Columb, Saul LMiller, Joanna Goplen, and B Michelle Peruche. 2009. “The Obama effect: De-creasing implicit prejudice and stereotyping.” Journal of Experimental Social Psychology,45(4): 961–964.
Porter, Catherine, and Danila Serra. 2020. “Gender differences in the choice of major:The importance of female role models.” American Economic Journal: Applied Economics,12(3): 226–54.
Quillian, Lincoln, Devah Pager, Ole Hexel, and Arnfinn H Midtbøen. 2017. “Meta-analysis of field experiments shows no change in racial discrimination in hiring over time.”Proceedings of the National Academy of Sciences, 114(41): 10870–10875.
Riley, Emma. 2017. “Increasing students’ aspirations: The impact of Queen of Katwe onstudents’ educational attainment.” In CSAE Working Paper WPS/2017-13.
Sampson, Robert J, Jeffrey D Morenoff, and Thomas Gannon-Rowley. 2002. “As-sessing “neighborhood effects”: Social processes and new directions in research.” AnnualReview of Sociology, 28(1): 443–478.
Sarna, Tadeusz, Janice M Burke, Witold Korytowski, Małgorzata Różanowska,Christine MB Skumatz, Agnieszka Zaręba, and Mariusz Zaręba. 2003. “Lossof melanin from human RPE with aging: Possible role of melanin photooxidation.”Experimental Eye Research, 76(1): 89–98.
45

Sculley, David. 2010. “Web-scale k-means clustering.” Proceedings of the 19th InternationalWorld Wide Web Conference, 1177–1178.
Smith, Vicky. 2013. “The ‘Caldecott effect’.” Children and Libraries: The Journal of theAssociation for Library Service to Children, 1(1): 9–13.
Sokolova, Marina, and Guy Lapalme. 2009. “A systematic analysis of performancemeasures for classification tasks.” Information Processing & Management, 45(4): 427–437.
Steele, Claude M. 2010. Whistling Vivaldi: And Other Clues to How Stereotypes AffectUs (Issues of our Time). WW Norton & Company.
Steele, Claude M, and Joshua Aronson. 1995. “Stereotype threat and the intellectualtest performance of African Americans.” Journal of Personality and Social Psychology,69(5): 797–811.
Stewig, John Warren, and Mary Lynn Knipfel. 1975. “Sexism in picture books: Whatprogress?” The Elementary School Journal, 76(3).
Stout, Jane G, Nilanjana Dasgupta, Matthew Hunsinger, and Melissa A Mc-Manus. 2011. “STEMing the tide: Using ingroup experts to inoculate women’s self-concept in science, technology, engineering, and mathematics (STEM).” Journal ofPersonality and Social Psychology, 100(2): 255.
Tafti, Ahmad P, Ahmadreza Baghaie, Mehdi Assefi, Hamid R Arabnia, ZeyunYu, and Peggy Peissig. 2016. “OCR as a service: An experimental evaluation of GoogleDocs OCR, Tesseract, ABBYY FineReader, and Transym.” International Symposium onVisual Computing, 735–746.
US Census. 2019. “Census QuickFacts.” Accessed March 13, 2021.
Van Kleeck, Anne, Steven A Stahl, and Eurydice B Bauer. 2003. On Reading Booksto Children: Parents and Teachers. Routledge.
Vezhnevets, Vladimir, Vassili Sazonov, and Alla Andreeva. 2003. “A survey onpixel-based skin color detection techniques.” Moscow, Russia.
Vijayarani, S, and A Sakila. 2015. “Performance comparison of OCR tools.” InternationalJournal of UbiComp (IJU), 6(3): 19–30.
Wilson, William J. 2012. The Truly Disadvantaged: The Inner City, the Underclass, andPublic Policy. University of Chicago Press.
46

Witt, Susan D. 2000. “Review of research: The influence of television on children’s genderrole socialization.” Childhood Education, 76(5): 322–324.
Yu, Amy Zhao, Shahar Ronen, Kevin Hu, Tiffany Lu, and César A Hidalgo. 2016.“Pantheon 1.0, a manually verified dataset of globally famous biographies.” Scientific Data,3(1): 1–16.
Zhang, Zhifei, Song Yang, and Hairong Qi. 2017. “Age progression/regression byconditional adversarial autoencoder.” IEEE Conference on Computer Vision and PatternRecognition (CVPR).
Zhou, Lei, Zhi Liu, and Xiangjian He. 2017. “Face parsing via a fully-convolutionalcontinuous CRF neural network.” CoRR, abs/1708.03736.
Zoph, Barret, and Quoc V Le. 2017. “Neural architecture search with reinforcementlearning.” arXiv.
47

X Tables
Table 1. Summary Statistics
Mainstream Diversity People of Color African American Ability Female LGBTQCollection TotalsTotal Number of Books 495 635 577 130 29 14 15Range of Years in our Sample 1923-2019 1971-2019 1971-2019 1971-2017 2000-2014 2013-2017 2010-2017
Book-Level AveragesNumber of Pages 139 148 137 147 213 314 268Number of Words 24362 26497 23816 26328 35273 87411 55792Number of Faces 44 58 60 41 30 30 73% Faces - Human Skin Color 42% 46% 47% 43% 50% 45% 38%% Faces - Monochromatic Skin Color 54% 48% 48% 52% 45% 54% 52%% Faces - Non-Typical Skin Color 4% 6% 6% 6% 5% 1% 10%Number of Famous People 2 8 7 2 0 1 0Tint of All Faces 53 43 43 40 45 34 45% Famous People Born in Africa 0% 2% 2% 2% 0% 16% 1%% Famous People Born in Americas 56% 69% 70% 86% 69% 53% 71%% Famous People Born in Asia 5% 7% 7% 2% 4% 8% 4%% Famous People Born in Europe 38% 21% 21% 11% 26% 23% 24%% Famous People Born in Oceania 1% 0% 0% 0% 0% 1% 0%
Note: In this table, we present summary statistics (described in the row titles) for each collection of books we analyze (named in thecolumn titles).
48
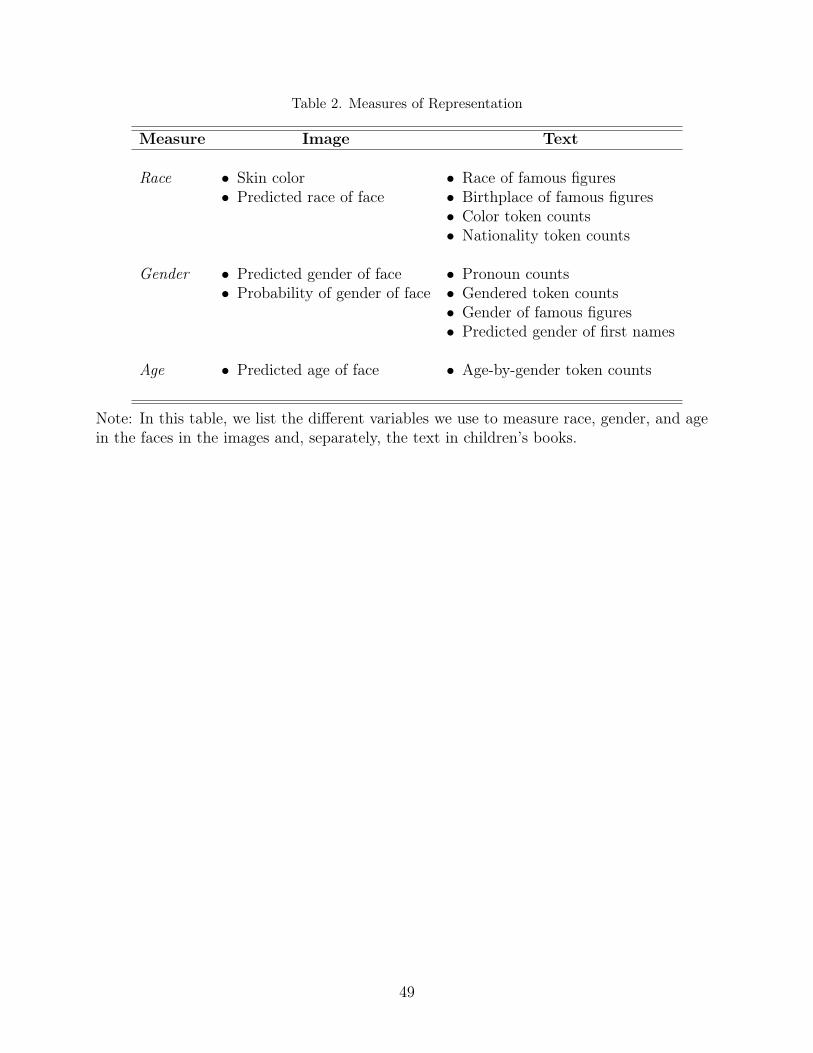
Table 2. Measures of Representation
Measure Image Text
Race • Skin color • Race of famous figures• Predicted race of face • Birthplace of famous figures
• Color token counts• Nationality token counts
Gender • Predicted gender of face • Pronoun counts• Probability of gender of face • Gendered token counts
• Gender of famous figures• Predicted gender of first names
Age • Predicted age of face • Age-by-gender token counts
Note: In this table, we list the different variables we use to measure race, gender, and agein the faces in the images and, separately, the text in children’s books.
49

XI Figures
Figure 1. Books in the Sample
(a) Corpora in Sample, by Collection
(b) Collection Sample Size, by Decade
Note: This figure shows the main sources of data we use for our analysis. In Panel A, we list the book awardswhose books we collected and digitized, along with the collections into which we group them in our analysis.In Panel B, we show the sample size, in terms of the number of books we have in each collection, over time.
50

Figure 2. Children’s Book Checkouts, by Collection
Note: In this figure, we show an event study of the average daily checkouts of children’s library booksbetween 2004 to 2017 from the Seattle Public Library, disaggregated by whether the book was recognizedby a Mainstream award, a Diversity award, or whether it was a non-award winner. We use a smoothed localpolynomial to generate each of the three series. See the data appendix for further discussion of our processfor cleaning and aggregation of these data.
51
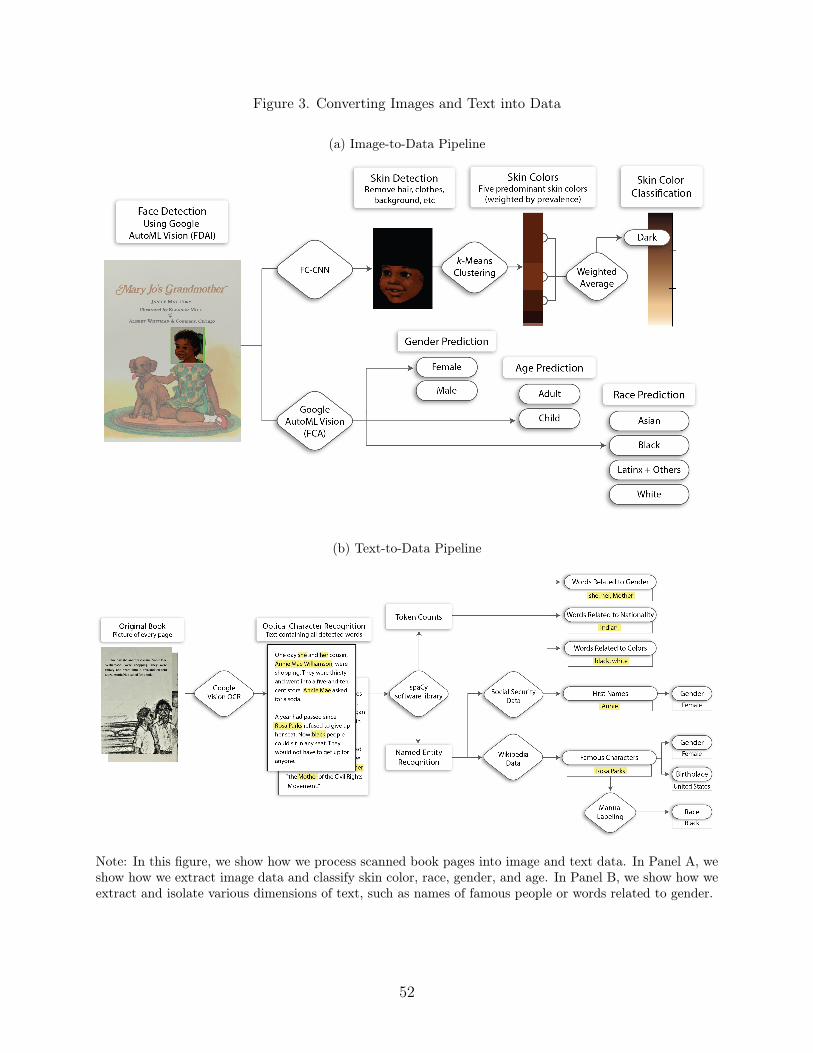
Figure 3. Converting Images and Text into Data
(a) Image-to-Data Pipeline
(b) Text-to-Data Pipeline
Note: In this figure, we show how we process scanned book pages into image and text data. In Panel A, weshow how we extract image data and classify skin color, race, gender, and age. In Panel B, we show how weextract and isolate various dimensions of text, such as names of famous people or words related to gender.
52

Figure 4. Skin Color Data, by Color Type
(a) Human Skin Colors (b) Monochromatic (c) Non-Typical Skin Colors
Note: This figure shows the representative skin colors of the individual faces we detect in the images found in the books from each collection. Weshow these by the three color “types” present in these images: human skin colors (polychromatic skin colors where R ≥ G ≥ B), monochromatic skincolors (e.g., black and white, sepia), and non-typical polychromatic skin colors (e.g., blue, green). The y-axis indicates the standard deviation of theRGB values of each face. The higher the standard deviation, the more vibrant the color.
53

Figure 5. Skin Colors in Faces, by Collection: Human Skin Colors
(a) Distribution of Skin Colors (b) Mean Proportion in Each Tercile, Over Time
(c) Mean Proportion in Each Tercile, All Collections
Note: This figure shows our analysis of the representative skin colors of the individual faces we detect in theimages found in the books we analyze, focusing on faces considered to be human skin colors (polychromaticskin colors where R ≥ G ≥ B). Panel A shows the distribution of skin color tint for faces detected in booksfrom the Mainstream and Diversity collections. The mean for each distribution is denoted with a dashed line.In Panel B, we show the average proportion of faces in each tercile, over time, for faces in the Mainstreamand Diversity collections. Panel C shows the overall collection-specific average proportion of faces in eachskin color tercile for each of the seven collections. Skin classification methods are described in Section III.
54

Figure 6. Skin Colors in Faces, by Collection: Monochromatic Skin Colors
(a) Distribution of Skin Colors (b) Mean Proportion in Each Tercile, Over Time
(c) Mean Proportion in Each Tercile, All Collections
Note: This figure shows our analysis of the representative skin colors of the individual faces we detect in theimages found in the books we analyze, focusing on monochromatic faces. Panel A shows the distributionof skin color tint for faces detected in books from the Mainstream and Diversity collections. The mean foreach distribution is denoted with a dashed line. In Panel B, we show the average proportion of faces ineach tercile, over time, for faces in the Mainstream and Diversity collections. Panel C shows the overallcollection-specific average proportion of faces in each skin color tercile for each of the seven collections. Skinclassification methods are described in Section III.
55

Figure 7. Skin Color by Predicted Race of Pictured Characters
(a) Human Skin Colors (b) Monochromatic Skin Colors
Note: This figure shows the distribution of skin color tint by predicted race of the detected faces in the Mainstream and Diversity collections. Skintint is determined by the L* value of a face’s representative skin color in L*a*b* space. We extract a face’s representative skin color using methodsdescribed in Section III.B.2. Skin color tint distribution for non-typical skin colors not shown. Race was classified by our trained AutoML model asdescribed in Section III.C.
56

Figure 8. Race and Gender Predictions of Pictured Characters
Note: In this figure, we show the proportion of detected faces in all collections by race and gender predictions.Race and gender were classified by our trained AutoML model as described in Section III.C.
57
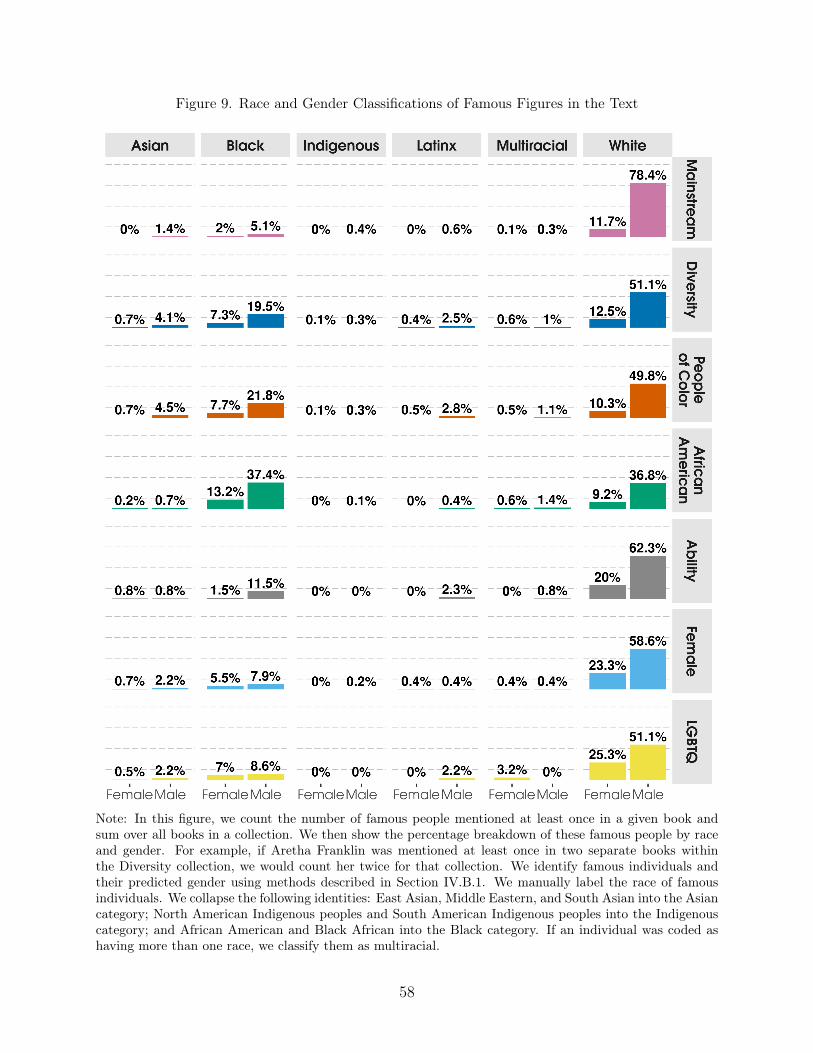
Figure 9. Race and Gender Classifications of Famous Figures in the Text
Note: In this figure, we count the number of famous people mentioned at least once in a given book andsum over all books in a collection. We then show the percentage breakdown of these famous people by raceand gender. For example, if Aretha Franklin was mentioned at least once in two separate books withinthe Diversity collection, we would count her twice for that collection. We identify famous individuals andtheir predicted gender using methods described in Section IV.B.1. We manually label the race of famousindividuals. We collapse the following identities: East Asian, Middle Eastern, and South Asian into the Asiancategory; North American Indigenous peoples and South American Indigenous peoples into the Indigenouscategory; and African American and Black African into the Black category. If an individual was coded ashaving more than one race, we classify them as multiracial.
58
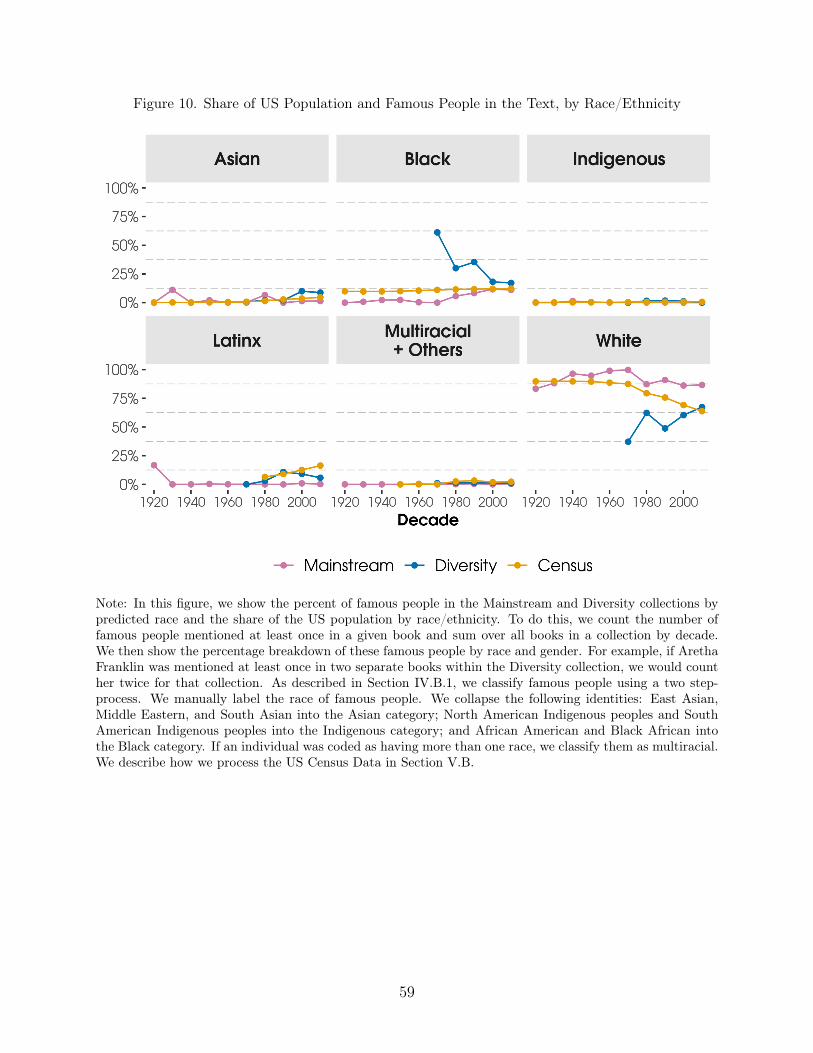
Figure 10. Share of US Population and Famous People in the Text, by Race/Ethnicity
Note: In this figure, we show the percent of famous people in the Mainstream and Diversity collections bypredicted race and the share of the US population by race/ethnicity. To do this, we count the number offamous people mentioned at least once in a given book and sum over all books in a collection by decade.We then show the percentage breakdown of these famous people by race and gender. For example, if ArethaFranklin was mentioned at least once in two separate books within the Diversity collection, we would counther twice for that collection. As described in Section IV.B.1, we classify famous people using a two step-process. We manually label the race of famous people. We collapse the following identities: East Asian,Middle Eastern, and South Asian into the Asian category; North American Indigenous peoples and SouthAmerican Indigenous peoples into the Indigenous category; and African American and Black African intothe Black category. If an individual was coded as having more than one race, we classify them as multiracial.We describe how we process the US Census Data in Section V.B.
59

Figure 11. Birthplace of Famous Figures
Note: In this figure, we show two maps in which we plot the distribution of the place of birth of the famouspeople in our books: one for the Mainstream collection and one for the Diversity collection. We identifybirthplace using a model trained on text from Wikipedia biographies collected by Pantheon (Yu et al., 2016).If the city/town they were born in was unavailable, we use birth country. Size of dots correspond to thenumber of famous characters born in a given location that are mentioned at least once in a given book andthen aggregated across all books in a collection. For example, if Aretha Franklin was mentioned at leastonce in two separate books within the Diversity collection, we would count her twice for that collection.
60
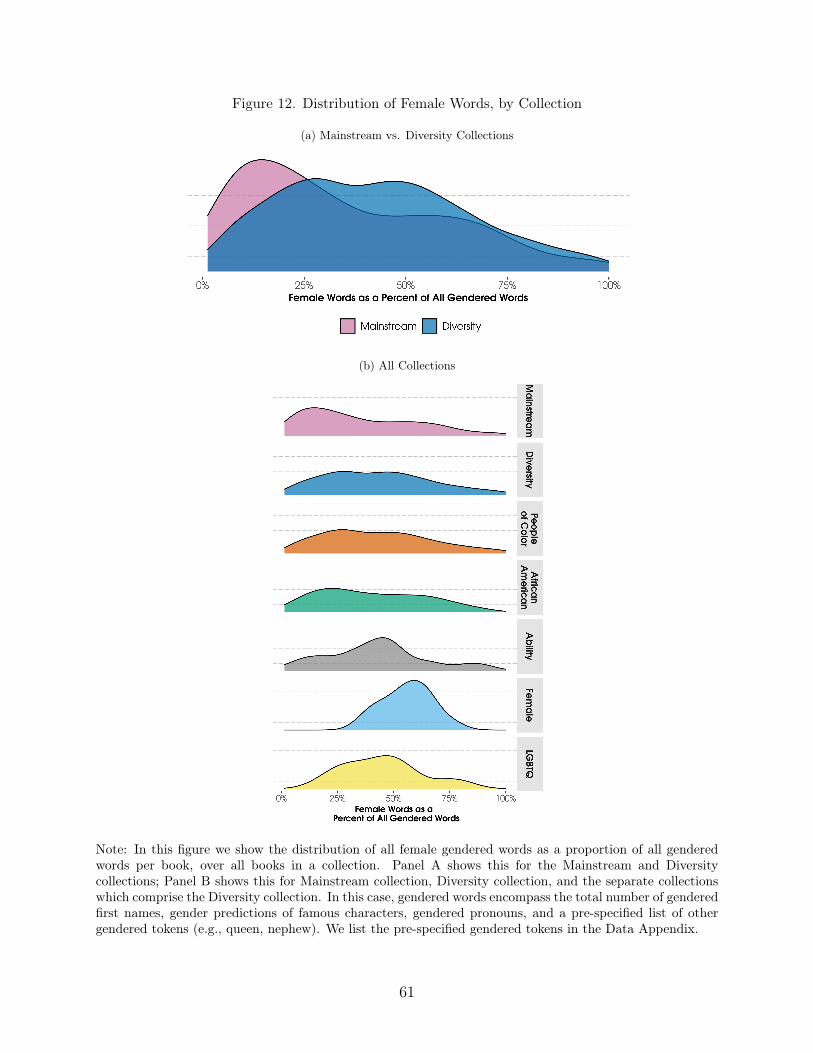
Figure 12. Distribution of Female Words, by Collection
(a) Mainstream vs. Diversity Collections
(b) All Collections
Note: In this figure we show the distribution of all female gendered words as a proportion of all genderedwords per book, over all books in a collection. Panel A shows this for the Mainstream and Diversitycollections; Panel B shows this for Mainstream collection, Diversity collection, and the separate collectionswhich comprise the Diversity collection. In this case, gendered words encompass the total number of genderedfirst names, gender predictions of famous characters, gendered pronouns, and a pre-specified list of othergendered tokens (e.g., queen, nephew). We list the pre-specified gendered tokens in the Data Appendix.
61
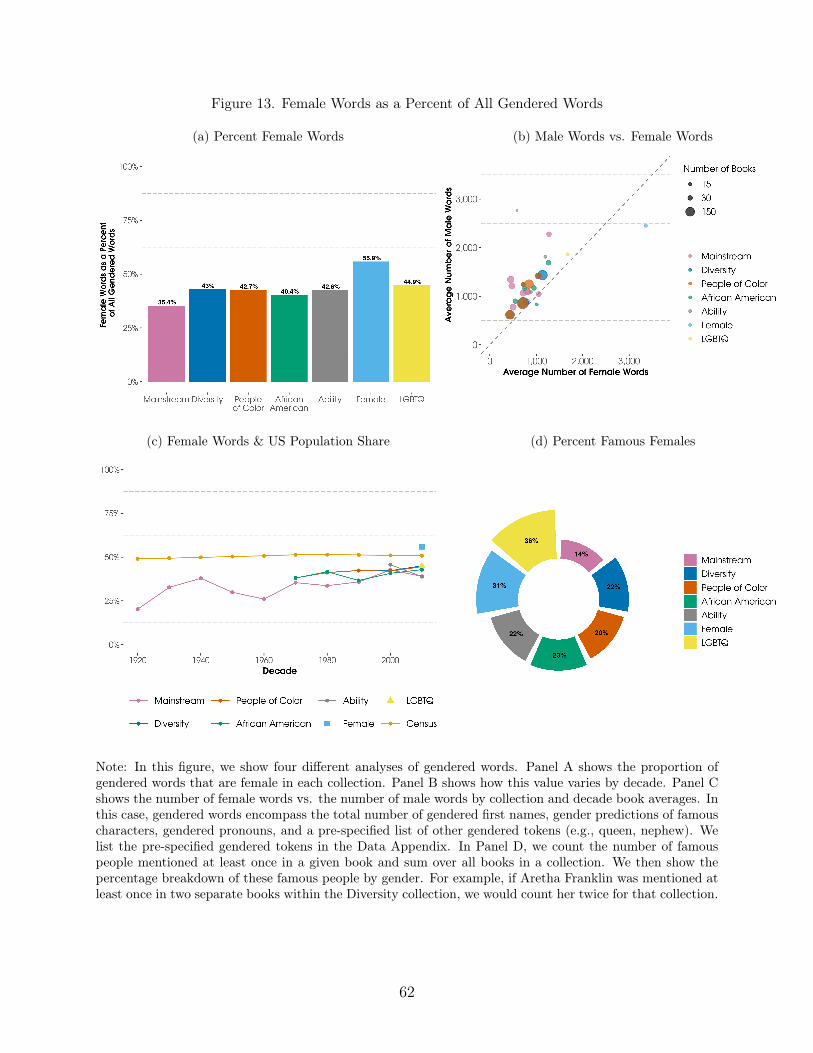
Figure 13. Female Words as a Percent of All Gendered Words
(a) Percent Female Words (b) Male Words vs. Female Words
(c) Female Words & US Population Share (d) Percent Famous Females
Note: In this figure, we show four different analyses of gendered words. Panel A shows the proportion ofgendered words that are female in each collection. Panel B shows how this value varies by decade. Panel Cshows the number of female words vs. the number of male words by collection and decade book averages. Inthis case, gendered words encompass the total number of gendered first names, gender predictions of famouscharacters, gendered pronouns, and a pre-specified list of other gendered tokens (e.g., queen, nephew). Welist the pre-specified gendered tokens in the Data Appendix. In Panel D, we count the number of famouspeople mentioned at least once in a given book and sum over all books in a collection. We then show thepercentage breakdown of these famous people by gender. For example, if Aretha Franklin was mentioned atleast once in two separate books within the Diversity collection, we would count her twice for that collection.
62

Figure 14. Women Should be Seen More Than Heard?
(a) Percent Female Faces vs. Words
(b) Percent Male Faces vs. Words
Note: In this figure, we contrast the proportion of females (and males) represented in the text with theproportion of of females (and males) represented in the images of the books in our data. In Panel A, we plotcollection-by-decade averages of female representation in images (on the y-axis) and female representationin text (on the x-axis). In Panel B, for illustrative purposes, we plot the analogous collection-by-decadeaverages of male representation, which are the converse of the patterns shown in Panel A.
63

Figure 15. More Adults than Children in Images and Text
(a) Percent of Faces by Predicted Age Group and Gender
(b) Percent of Gendered Words by Age Group
Note: In this figure, we show analysis of the representation of age and gender. In Panel A, we show analysisof predicted age and gender in the faces in images. Specifically, we plot the proportion of identified facesclassified in each age (adult vs. child) and gender (female vs. male) category. In Panel B, we show analysisof age and gender in text. Specifically, we plot the proportion of words that refer to specific gender-agecombinations (e.g., female adults or male children) as a percent of all gendered words in the book. Genderedwords encompass the total number of gendered first names, gender predictions of famous characters, genderedpronouns, and a pre-specified list of other gendered tokens (e.g., queen, nephew). We list the pre-specifiedgendered tokens in the Data Appendix.
64

Figure 16. Children Are Consistently Depicted with Lighter Skin than Adults
(a) Skin Color Distribution by Age (b) Proportion of Faces in Skin Color Terciles, by Age
Note: In this figure, we show analysis of how the representation of skin color varies with the predicted age of the person being represented. In Panel A,we show the distribution of skin tint values of representative skin color of detected faces in the Mainstream and Diversity collections by the classifiedage (adult vs. child) of the face. In Panel B, we show the proportion of faces in each tercile of the perceptual tint distribution by the classified age(adult vs. child) of the face. We detect faces using our face detection model (FDAI) described in Section III.A. Within these faces, we classify age andgender using an AutoML algorithm we trained using the UTKFace public data set. Skin tint is determined by the L* value of a face’s representativeskin color in L*a*b* space. We extract a face’s representative skin color using methods described in Section III.B.2. These figures show the resultsfor images that have identified human skin colors (polychromatic skin colors where R ≥ G ≥ B).
65
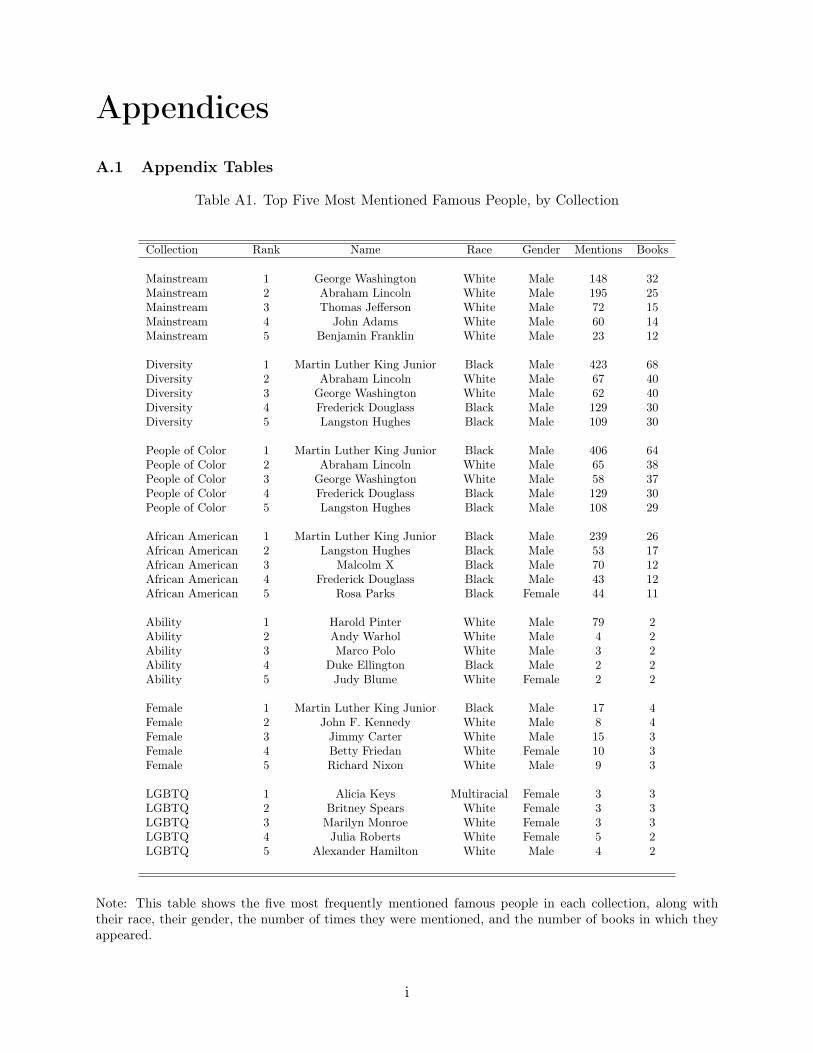
Appendices
A.1 Appendix Tables
Table A1. Top Five Most Mentioned Famous People, by Collection
Collection Rank Name Race Gender Mentions Books
Mainstream 1 George Washington White Male 148 32Mainstream 2 Abraham Lincoln White Male 195 25Mainstream 3 Thomas Jefferson White Male 72 15Mainstream 4 John Adams White Male 60 14Mainstream 5 Benjamin Franklin White Male 23 12
Diversity 1 Martin Luther King Junior Black Male 423 68Diversity 2 Abraham Lincoln White Male 67 40Diversity 3 George Washington White Male 62 40Diversity 4 Frederick Douglass Black Male 129 30Diversity 5 Langston Hughes Black Male 109 30
People of Color 1 Martin Luther King Junior Black Male 406 64People of Color 2 Abraham Lincoln White Male 65 38People of Color 3 George Washington White Male 58 37People of Color 4 Frederick Douglass Black Male 129 30People of Color 5 Langston Hughes Black Male 108 29
African American 1 Martin Luther King Junior Black Male 239 26African American 2 Langston Hughes Black Male 53 17African American 3 Malcolm X Black Male 70 12African American 4 Frederick Douglass Black Male 43 12African American 5 Rosa Parks Black Female 44 11
Ability 1 Harold Pinter White Male 79 2Ability 2 Andy Warhol White Male 4 2Ability 3 Marco Polo White Male 3 2Ability 4 Duke Ellington Black Male 2 2Ability 5 Judy Blume White Female 2 2
Female 1 Martin Luther King Junior Black Male 17 4Female 2 John F. Kennedy White Male 8 4Female 3 Jimmy Carter White Male 15 3Female 4 Betty Friedan White Female 10 3Female 5 Richard Nixon White Male 9 3
LGBTQ 1 Alicia Keys Multiracial Female 3 3LGBTQ 2 Britney Spears White Female 3 3LGBTQ 3 Marilyn Monroe White Female 3 3LGBTQ 4 Julia Roberts White Female 5 2LGBTQ 5 Alexander Hamilton White Male 4 2
Note: This table shows the five most frequently mentioned famous people in each collection, along withtheir race, their gender, the number of times they were mentioned, and the number of books in which theyappeared.
i
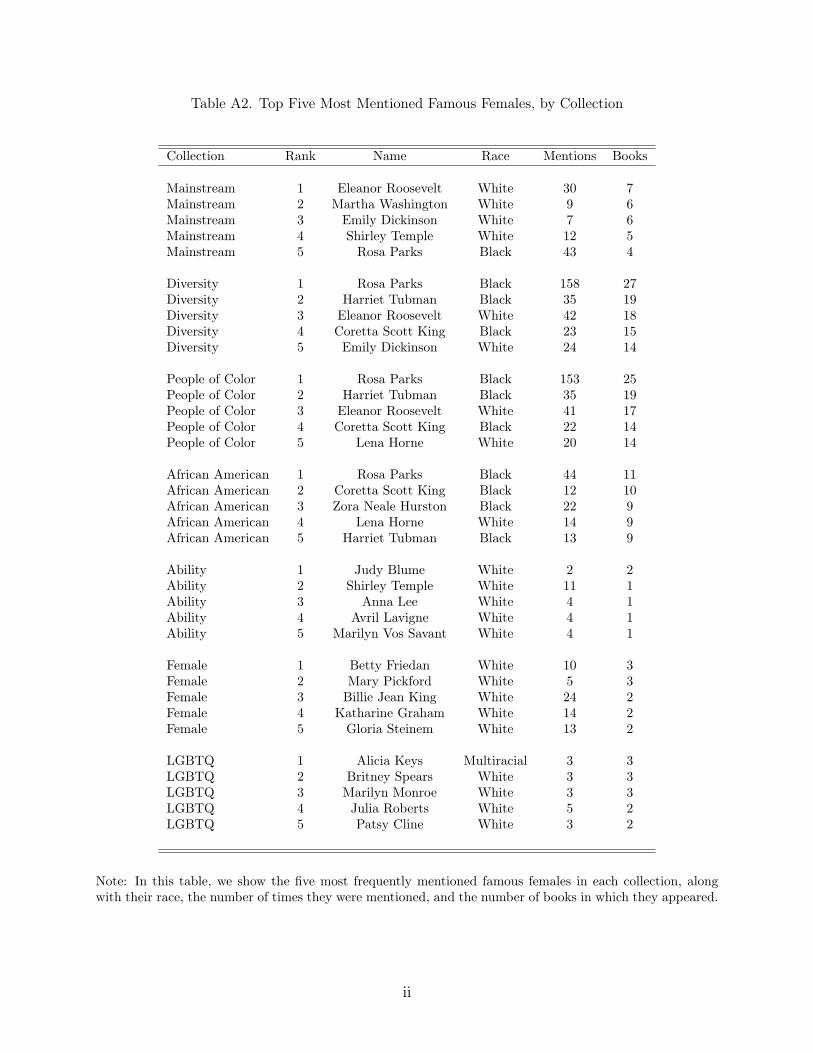
Table A2. Top Five Most Mentioned Famous Females, by Collection
Collection Rank Name Race Mentions Books
Mainstream 1 Eleanor Roosevelt White 30 7Mainstream 2 Martha Washington White 9 6Mainstream 3 Emily Dickinson White 7 6Mainstream 4 Shirley Temple White 12 5Mainstream 5 Rosa Parks Black 43 4
Diversity 1 Rosa Parks Black 158 27Diversity 2 Harriet Tubman Black 35 19Diversity 3 Eleanor Roosevelt White 42 18Diversity 4 Coretta Scott King Black 23 15Diversity 5 Emily Dickinson White 24 14
People of Color 1 Rosa Parks Black 153 25People of Color 2 Harriet Tubman Black 35 19People of Color 3 Eleanor Roosevelt White 41 17People of Color 4 Coretta Scott King Black 22 14People of Color 5 Lena Horne White 20 14
African American 1 Rosa Parks Black 44 11African American 2 Coretta Scott King Black 12 10African American 3 Zora Neale Hurston Black 22 9African American 4 Lena Horne White 14 9African American 5 Harriet Tubman Black 13 9
Ability 1 Judy Blume White 2 2Ability 2 Shirley Temple White 11 1Ability 3 Anna Lee White 4 1Ability 4 Avril Lavigne White 4 1Ability 5 Marilyn Vos Savant White 4 1
Female 1 Betty Friedan White 10 3Female 2 Mary Pickford White 5 3Female 3 Billie Jean King White 24 2Female 4 Katharine Graham White 14 2Female 5 Gloria Steinem White 13 2
LGBTQ 1 Alicia Keys Multiracial 3 3LGBTQ 2 Britney Spears White 3 3LGBTQ 3 Marilyn Monroe White 3 3LGBTQ 4 Julia Roberts White 5 2LGBTQ 5 Patsy Cline White 3 2
Note: In this table, we show the five most frequently mentioned famous females in each collection, alongwith their race, the number of times they were mentioned, and the number of books in which they appeared.
ii
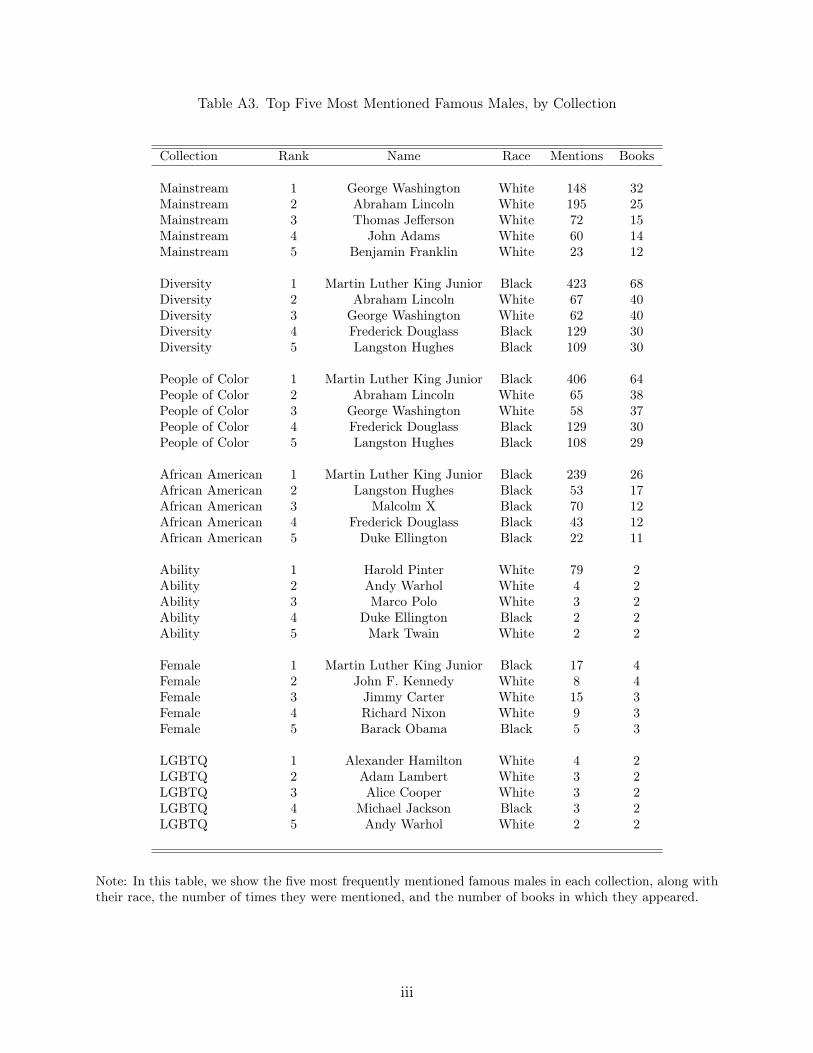
Table A3. Top Five Most Mentioned Famous Males, by Collection
Collection Rank Name Race Mentions Books
Mainstream 1 George Washington White 148 32Mainstream 2 Abraham Lincoln White 195 25Mainstream 3 Thomas Jefferson White 72 15Mainstream 4 John Adams White 60 14Mainstream 5 Benjamin Franklin White 23 12
Diversity 1 Martin Luther King Junior Black 423 68Diversity 2 Abraham Lincoln White 67 40Diversity 3 George Washington White 62 40Diversity 4 Frederick Douglass Black 129 30Diversity 5 Langston Hughes Black 109 30
People of Color 1 Martin Luther King Junior Black 406 64People of Color 2 Abraham Lincoln White 65 38People of Color 3 George Washington White 58 37People of Color 4 Frederick Douglass Black 129 30People of Color 5 Langston Hughes Black 108 29
African American 1 Martin Luther King Junior Black 239 26African American 2 Langston Hughes Black 53 17African American 3 Malcolm X Black 70 12African American 4 Frederick Douglass Black 43 12African American 5 Duke Ellington Black 22 11
Ability 1 Harold Pinter White 79 2Ability 2 Andy Warhol White 4 2Ability 3 Marco Polo White 3 2Ability 4 Duke Ellington Black 2 2Ability 5 Mark Twain White 2 2
Female 1 Martin Luther King Junior Black 17 4Female 2 John F. Kennedy White 8 4Female 3 Jimmy Carter White 15 3Female 4 Richard Nixon White 9 3Female 5 Barack Obama Black 5 3
LGBTQ 1 Alexander Hamilton White 4 2LGBTQ 2 Adam Lambert White 3 2LGBTQ 3 Alice Cooper White 3 2LGBTQ 4 Michael Jackson Black 3 2LGBTQ 5 Andy Warhol White 2 2
Note: In this table, we show the five most frequently mentioned famous males in each collection, along withtheir race, the number of times they were mentioned, and the number of books in which they appeared.
iii

Table A4. Top Mentioned Famous Person, by Collection and Decade
Decade Mainstream Diversity People of Color African American Ability Female LGBTQ1920 James Fenimore Cooper
White MaleCharles Darwin
White MaleMark TwainWhite Male
1930 Abraham LincolnWhite Male
1940 Benjamin FranklinWhite Male
1950 George WashingtonWhite Male
1960 George WashingtonWhite Male
1970 Claude Lorrain Martin Luther King Jr. Martin Luther King Jr. Martin Luther King Jr.White Male Black Male Black Male Black Male
Leonardo da VinciWhite Male
1980 George Washington Franklin D. Roosevelt Franklin D. Roosevelt Paul RobesonWhite Male White Male White Male Black Male
1990 William Shakespeare Martin Luther King Jr. Martin Luther King Jr. Martin Luther King Jr.White Male Black Male Black Male Black Male
2000 Martin Luther King Jr. Martin Luther King Jr. Martin Luther King Jr. Langston Hughes Judy BlumeBlack Male White Male Black Male Black Male White Female
2010 George Washington Martin Luther King Jr. Martin Luther King Jr. Martin Luther King Jr. Andy Warhol Martin Luther King Jr. Alicia KeysWhite Male Black Male Black Male Black Male White Male White Male Multiracial Female
Marilyn MonroeWhite FemaleBritney SpearsWhite Female
Note: In this table, we show the top most uniquely mentioned famous figure in each collection by decade. When multiple names are listed for acollection within the same decade, it indicates that each of those people were tied for the most mentioned famous person in that collection-by-decade.
iv

B.2 Appendix Figures
Figure A1. Skin Color Data Over Time, Human Skin Colors
Note: In this figure, we show the representative skin colors for all detected faces with human skin colors (polychromatic skin colors where R ≥ G≥ B) in each collection-by-decade. As described in Section III, we use our face detection model (FDAI) trained on illustrations to classify faces inimages. We determine a face’s representative skin color using methods described in Section III.B.2.
v
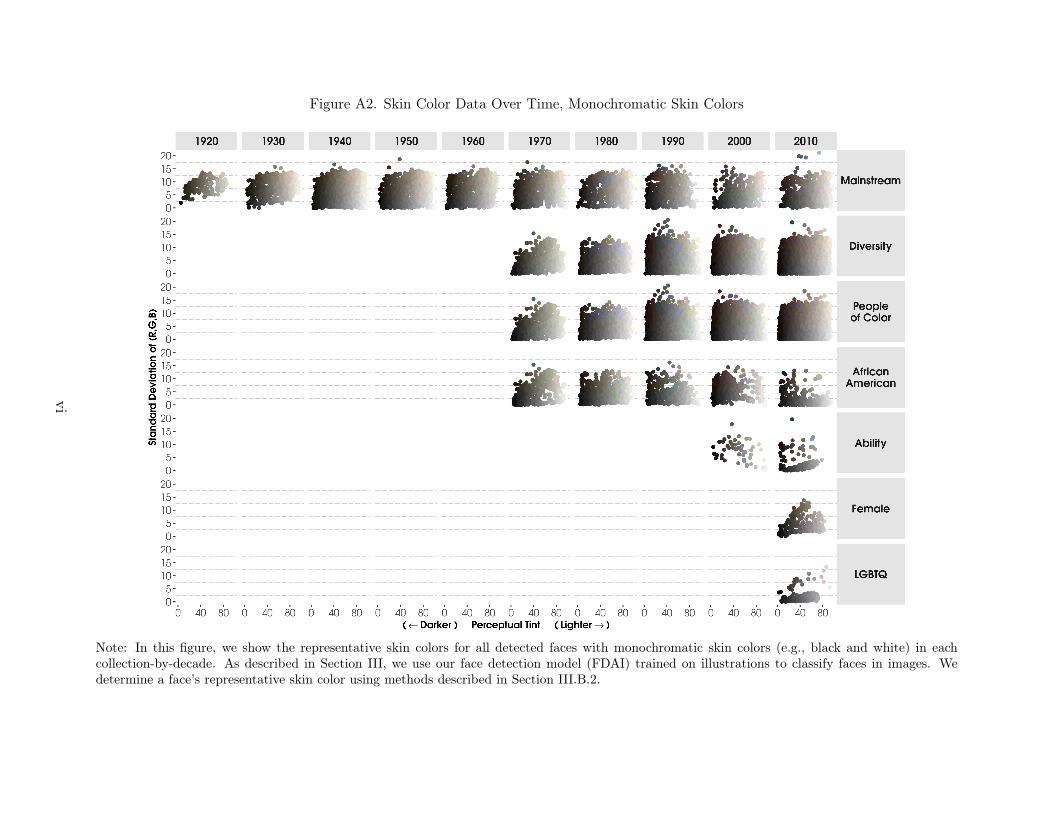
Figure A2. Skin Color Data Over Time, Monochromatic Skin Colors
Note: In this figure, we show the representative skin colors for all detected faces with monochromatic skin colors (e.g., black and white) in eachcollection-by-decade. As described in Section III, we use our face detection model (FDAI) trained on illustrations to classify faces in images. Wedetermine a face’s representative skin color using methods described in Section III.B.2.
vi
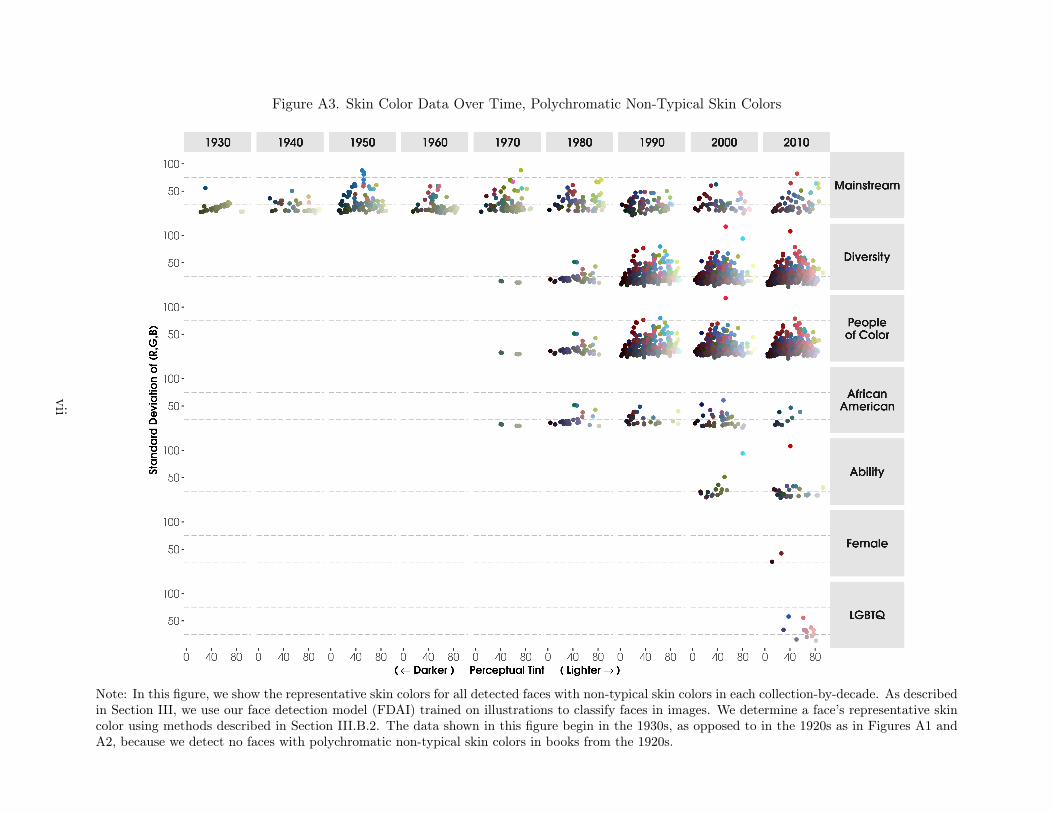
Figure A3. Skin Color Data Over Time, Polychromatic Non-Typical Skin Colors
Note: In this figure, we show the representative skin colors for all detected faces with non-typical skin colors in each collection-by-decade. As describedin Section III, we use our face detection model (FDAI) trained on illustrations to classify faces in images. We determine a face’s representative skincolor using methods described in Section III.B.2. The data shown in this figure begin in the 1930s, as opposed to in the 1920s as in Figures A1 andA2, because we detect no faces with polychromatic non-typical skin colors in books from the 1920s.
vii
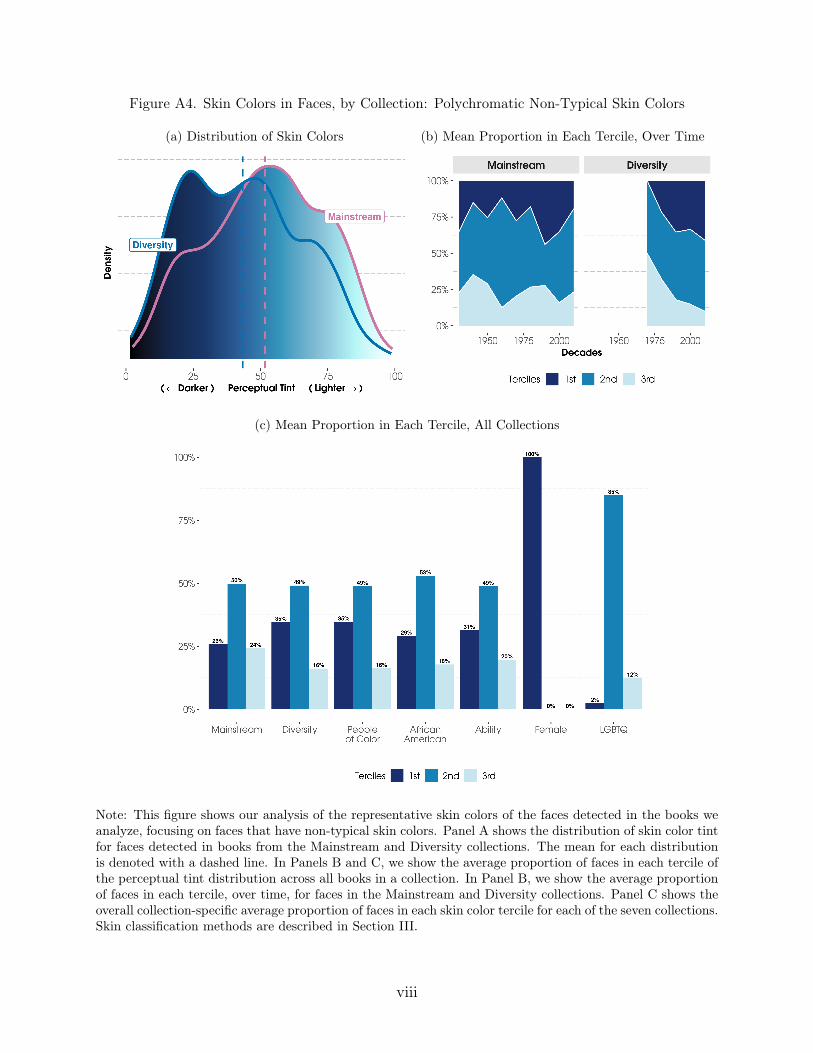
Figure A4. Skin Colors in Faces, by Collection: Polychromatic Non-Typical Skin Colors
(a) Distribution of Skin Colors (b) Mean Proportion in Each Tercile, Over Time
(c) Mean Proportion in Each Tercile, All Collections
Note: This figure shows our analysis of the representative skin colors of the faces detected in the books weanalyze, focusing on faces that have non-typical skin colors. Panel A shows the distribution of skin color tintfor faces detected in books from the Mainstream and Diversity collections. The mean for each distributionis denoted with a dashed line. In Panels B and C, we show the average proportion of faces in each tercile ofthe perceptual tint distribution across all books in a collection. In Panel B, we show the average proportionof faces in each tercile, over time, for faces in the Mainstream and Diversity collections. Panel C shows theoverall collection-specific average proportion of faces in each skin color tercile for each of the seven collections.Skin classification methods are described in Section III.
viii
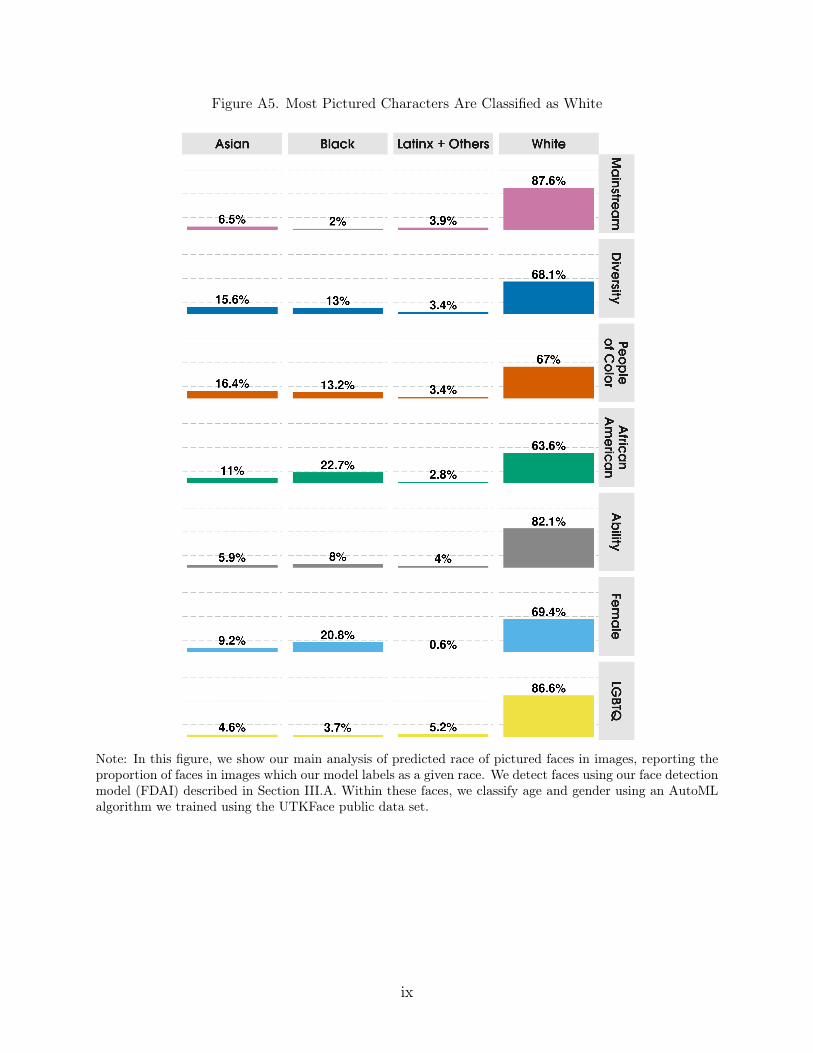
Figure A5. Most Pictured Characters Are Classified as White
Note: In this figure, we show our main analysis of predicted race of pictured faces in images, reporting theproportion of faces in images which our model labels as a given race. We detect faces using our face detectionmodel (FDAI) described in Section III.A. Within these faces, we classify age and gender using an AutoMLalgorithm we trained using the UTKFace public data set.
ix

Figure A6. Proportion of Detected Faces Which Are Female-Presenting
(a) Percent of Female-Presenting Faces Detected, Overall
(b) Percent of Female-Presenting Faces Detected, Over Time
Note: In this figure, we show our main analysis of gender in images, reporting the proportion of faces inimages which our model labels as female. In Panel A, we show collection-level estimates of the percent ofdetected faces classified as female. In Panel B, we show these values over time.
x

Figure A7. Share of US Population and Pictured Characters, by Identity
(a) Race/Ethnicity
(b) Gender
(c) Age
Note: We show the share of the US population of specific identities mapped on the share of the picturedcharacters classified as a given identity over time. In Panel A, we show this by race/ethnicity. Eachrace/ethnicity category is constructed to be mutually exclusive as defined in Section V.B. In Panel B, weshow this by gender. In Panel C, we show this by age group.
xi

Figure A8. Proportion of Characters in Images and Text, by Race and Gender
(a) Detected Faces (Images)
(b) Famous Figures (Text)
Note: In this figure, we show the share of the characters by race and gender over time. In Panel A, we showthis for detected faces in images. In Panel B, we show this for famous figures mentioned in the text.
xii

Figure A9. Race of Famous People in the Text
Note: In this figure, we show a separate measure of the representation of race in text: the proportion offamous people of different racial identities. To do this, we count the number of famous people mentioned atleast once in a given book and sum over all books in a collection. We then show the percentage breakdownof these famous people by race and gender. For example, if Aretha Franklin was mentioned at least once intwo separate books within the Diversity collection, we would count her twice for that collection. We showthese proportions for each collection, classified into six racial categories defined on the x-axis. We identifyfamous individuals using methods described in Section IV.B.1. We manually label the race of famous people.We collapse the following identities: East Asian, Middle Eastern, and South Asian into the Asian category;North American Indigenous peoples and South American Indigenous peoples into the Indigenous category;and African American and Black African into the Black category. If an individual was coded as having morethan one race, we classify them as multiracial.
xiii

Figure A10. Birthplace of Famous Figures, by Gender
Note: In this figure, we show collection-specific measures of the birthplace of famous figures, separately for females and males. We identify famousindividuals as well as their gender and birthplace using methods described in Section IV.B.1. If the city/town they were born in was unavailable, weuse birth country. Size of dots correspond to the number of famous characters born in a given location that are mentioned at least once in a givenbook and then aggregated across all books in a collection. For example, if Aretha Franklin was mentioned at least once in two separate books withinthe Diversity collection, we would count her twice for that collection.
xiv

Figure A11. Token-Based Proxies for Race: Nationality and Color
(a) Words Related to Nationality
(b) Color Words
Note: In this figure, we show two measures of the representation of race in text: words related to nationalitiesand words related to color. In Panel A, we show collection-specific averages of the proportion of words in abook that relate to nationalities. In Panel B, we show collection-by-time averages of mentions of three colorwords: black, white, and blue – as a proportion of all words in our data. We generated the estimates usinga pre-specified list of words (also known as “tokens,” as described in Section IV.A). We provide this list inthe Data Appendix.
xv

Figure A12. Female Representation in Text, by Type of Word
(a) Pronouns (b) Specific Tokens
(c) Character First Names (d) Famous Figures
Note: In this figure, we show the proportion of female words out of all gendered words, across collections,separately by category of word. In Panel A, we show the percentage of gendered pronouns which are female.In Panel B, we show the percentage of words from a pre-specified list of female gendered words (tokens) suchas queen or niece (full list provided in Data Appendix). In Panel C, we show the percentage of character firstnames that are predicted to be female based on Social Security Administration data. In Panel D, we counteach time a famous person is mentioned across all books in a collection and show the percentage breakdownof these famous people by gender. For example, if Aretha Franklin was mentioned 5 times in one book and10 times in another book within the Diversity collection, we would count her as appearing 15 times for thatcollection.
xvi
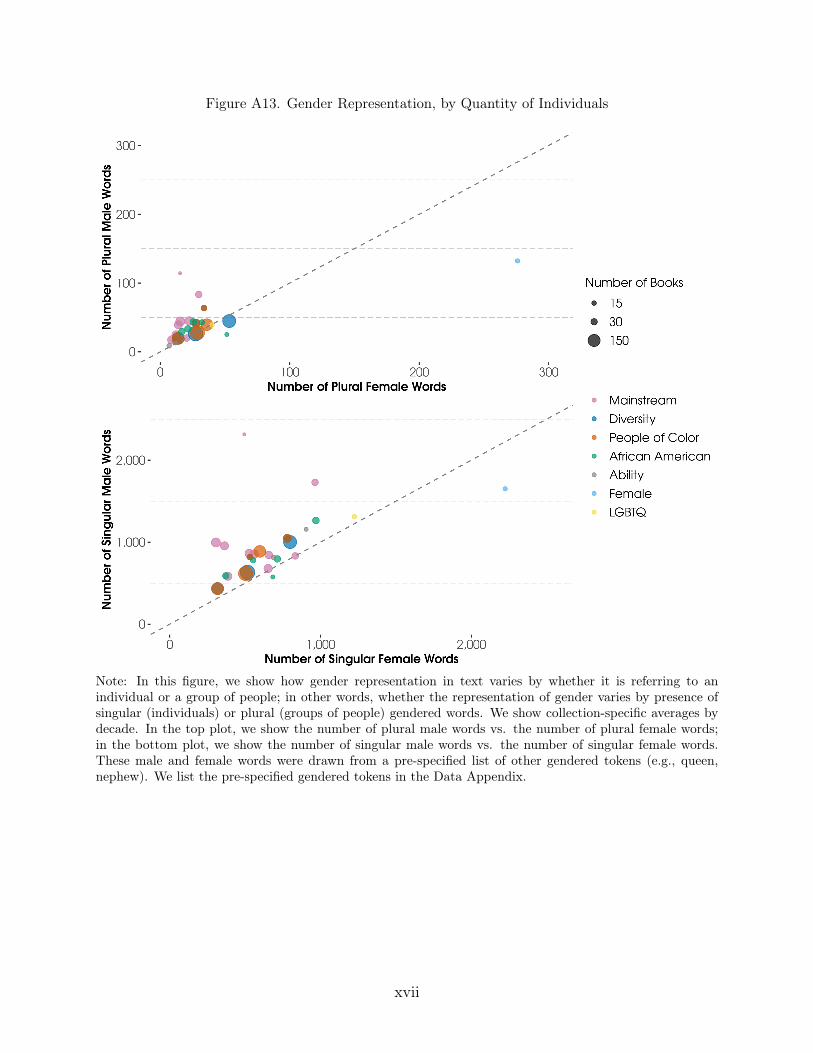
Figure A13. Gender Representation, by Quantity of Individuals
Note: In this figure, we show how gender representation in text varies by whether it is referring to anindividual or a group of people; in other words, whether the representation of gender varies by presence ofsingular (individuals) or plural (groups of people) gendered words. We show collection-specific averages bydecade. In the top plot, we show the number of plural male words vs. the number of plural female words;in the bottom plot, we show the number of singular male words vs. the number of singular female words.These male and female words were drawn from a pre-specified list of other gendered tokens (e.g., queen,nephew). We list the pre-specified gendered tokens in the Data Appendix.
xvii

Figure A14. Proportion of Females and Males Serving as Subjects and Objects of Sentences
Note: In this figure, we plot the representation of gender by its location in sentences. The top two plots show the average proportion of all genderedpronouns in a book that are uppercase, and the bottom two plots show those that are lowercase. The left plots show the female-related pronouns, andthe right plots show the male-related pronouns. We present these separately because an uppercase pronoun is more likely than a lowercase pronounto be the subject, as opposed to the object, of the sentence in which it appears.
xviii
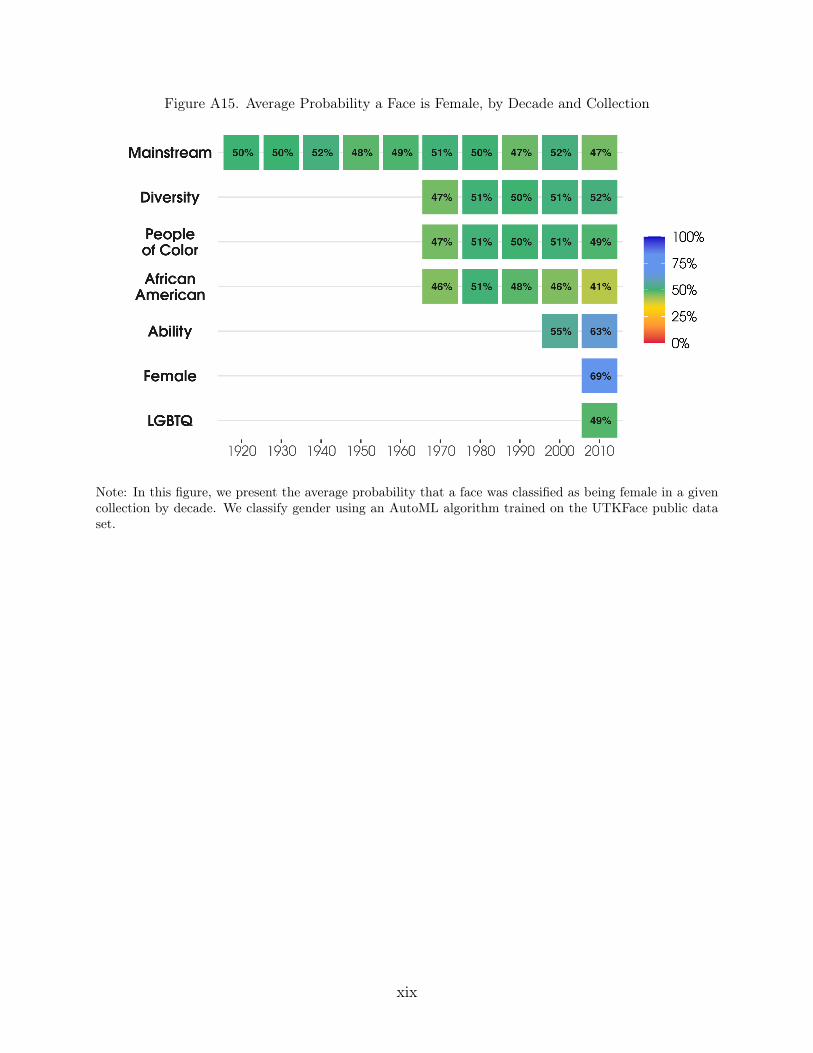
Figure A15. Average Probability a Face is Female, by Decade and Collection
Note: In this figure, we present the average probability that a face was classified as being female in a givencollection by decade. We classify gender using an AutoML algorithm trained on the UTKFace public dataset.
xix

Figure A16. Distribution of Skin Color, by Gender and Collection
Note: In this figure, we show the distribution of skin tint by gender in detected faces with human skin color(polychromatic skin colors where R ≥ G ≥ B) for each collection of books. Skin tint is determined by theL* value of a face’s representative skin color in L*a*b* space. We extract a face’s representative skin colorusing methods described in Section III.B.2.
xx
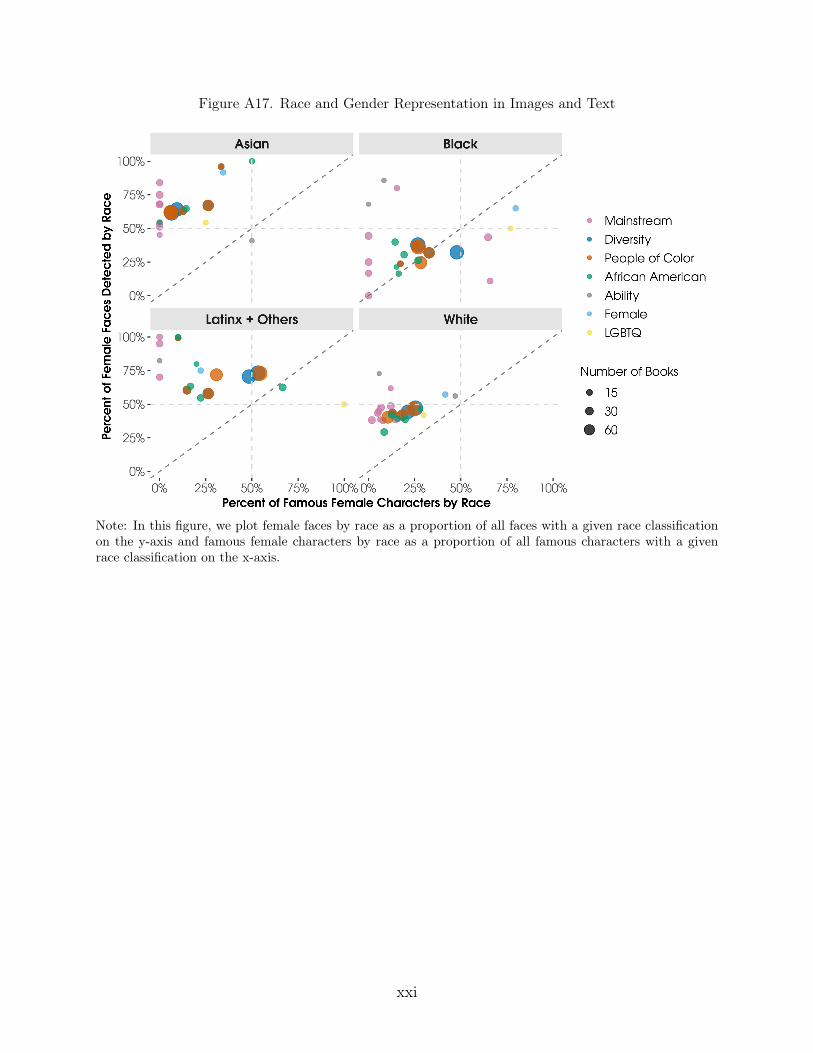
Figure A17. Race and Gender Representation in Images and Text
Note: In this figure, we plot female faces by race as a proportion of all faces with a given race classificationon the y-axis and famous female characters by race as a proportion of all famous characters with a givenrace classification on the x-axis.
xxi
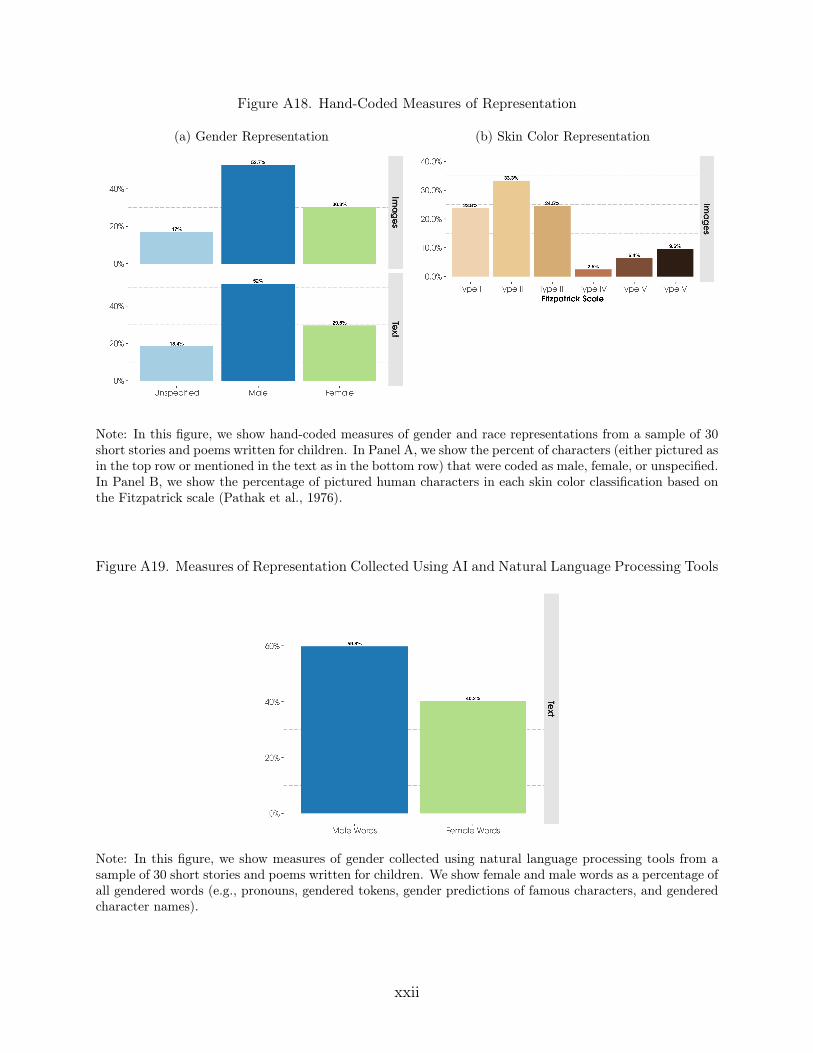
Figure A18. Hand-Coded Measures of Representation
(a) Gender Representation (b) Skin Color Representation
Note: In this figure, we show hand-coded measures of gender and race representations from a sample of 30short stories and poems written for children. In Panel A, we show the percent of characters (either pictured asin the top row or mentioned in the text as in the bottom row) that were coded as male, female, or unspecified.In Panel B, we show the percentage of pictured human characters in each skin color classification based onthe Fitzpatrick scale (Pathak et al., 1976).
Figure A19. Measures of Representation Collected Using AI and Natural Language Processing Tools
Note: In this figure, we show measures of gender collected using natural language processing tools from asample of 30 short stories and poems written for children. We show female and male words as a percentage ofall gendered words (e.g., pronouns, gendered tokens, gender predictions of famous characters, and genderedcharacter names).
xxii
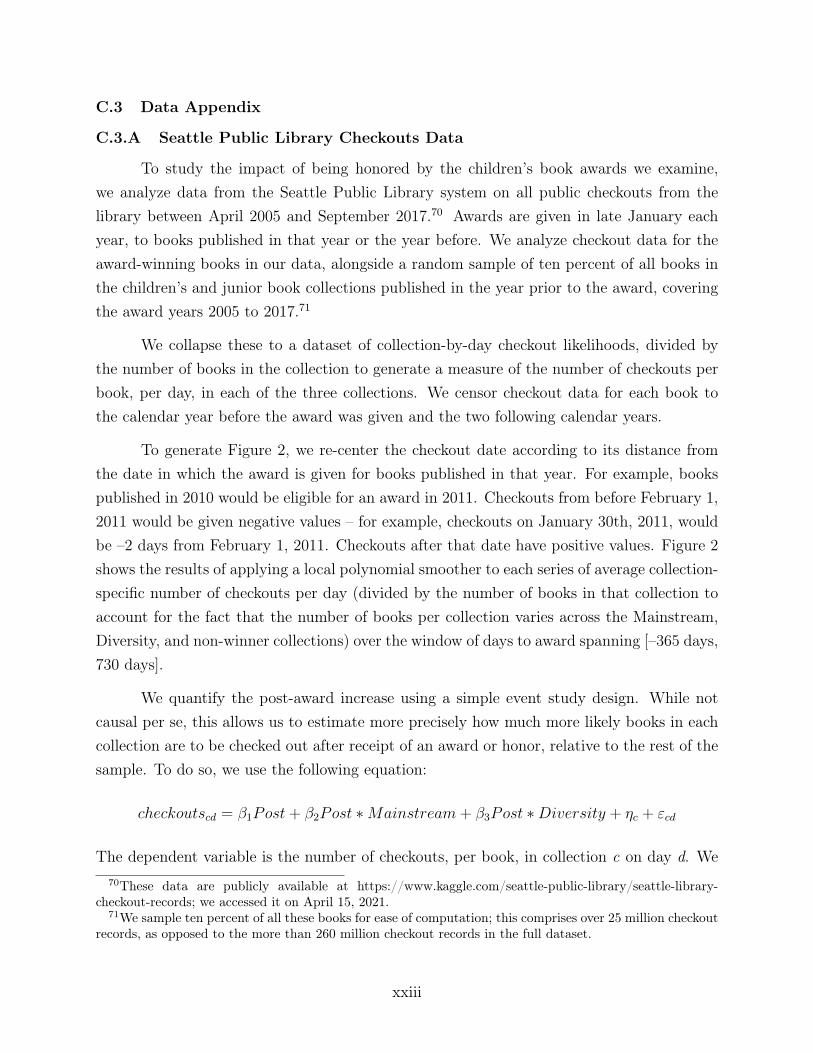
C.3 Data Appendix
C.3.A Seattle Public Library Checkouts Data
To study the impact of being honored by the children’s book awards we examine,we analyze data from the Seattle Public Library system on all public checkouts from thelibrary between April 2005 and September 2017.70 Awards are given in late January eachyear, to books published in that year or the year before. We analyze checkout data for theaward-winning books in our data, alongside a random sample of ten percent of all books inthe children’s and junior book collections published in the year prior to the award, coveringthe award years 2005 to 2017.71
We collapse these to a dataset of collection-by-day checkout likelihoods, divided bythe number of books in the collection to generate a measure of the number of checkouts perbook, per day, in each of the three collections. We censor checkout data for each book tothe calendar year before the award was given and the two following calendar years.
To generate Figure 2, we re-center the checkout date according to its distance fromthe date in which the award is given for books published in that year. For example, bookspublished in 2010 would be eligible for an award in 2011. Checkouts from before February 1,2011 would be given negative values – for example, checkouts on January 30th, 2011, wouldbe –2 days from February 1, 2011. Checkouts after that date have positive values. Figure 2shows the results of applying a local polynomial smoother to each series of average collection-specific number of checkouts per day (divided by the number of books in that collection toaccount for the fact that the number of books per collection varies across the Mainstream,Diversity, and non-winner collections) over the window of days to award spanning [–365 days,730 days].
We quantify the post-award increase using a simple event study design. While notcausal per se, this allows us to estimate more precisely how much more likely books in eachcollection are to be checked out after receipt of an award or honor, relative to the rest of thesample. To do so, we use the following equation:
checkoutscd = β1Post+ β2Post ∗Mainstream+ β3Post ∗Diversity + ηc + εcd
The dependent variable is the number of checkouts, per book, in collection c on day d. We70These data are publicly available at https://www.kaggle.com/seattle-public-library/seattle-library-
checkout-records; we accessed it on April 15, 2021.71We sample ten percent of all these books for ease of computation; this comprises over 25 million checkout
records, as opposed to the more than 260 million checkout records in the full dataset.
xxiii
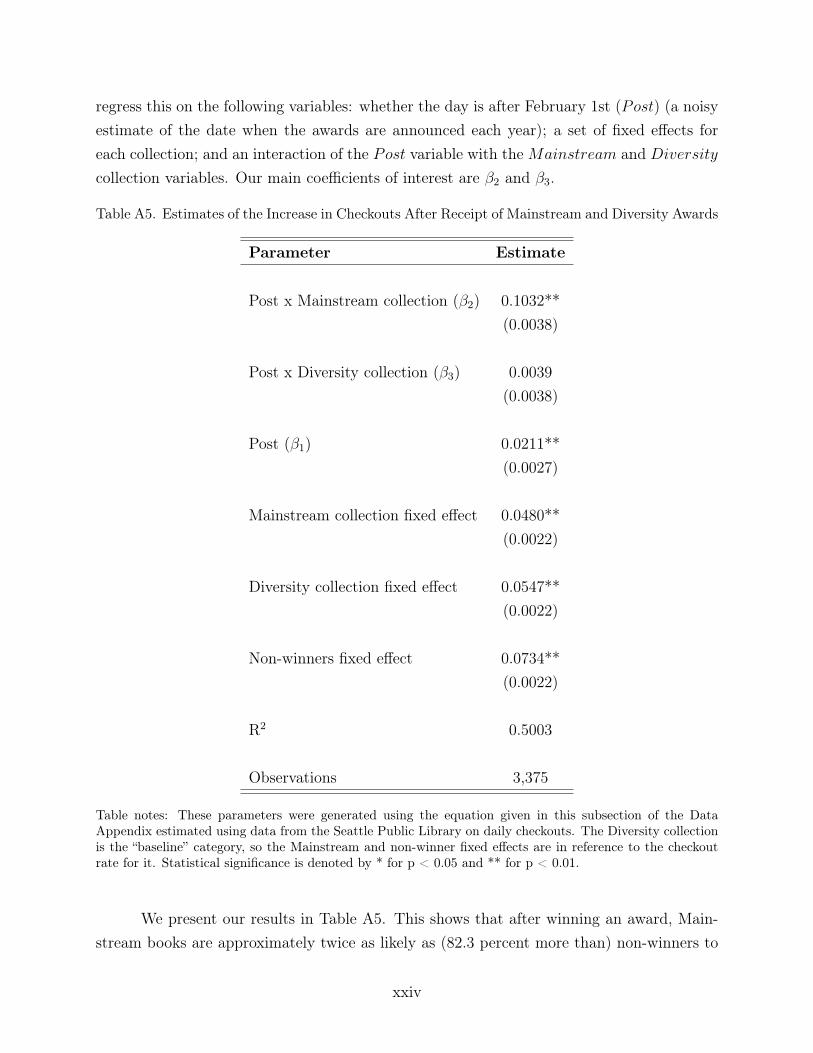
regress this on the following variables: whether the day is after February 1st (Post) (a noisyestimate of the date when the awards are announced each year); a set of fixed effects foreach collection; and an interaction of the Post variable with theMainstream and Diversitycollection variables. Our main coefficients of interest are β2 and β3.
Table A5. Estimates of the Increase in Checkouts After Receipt of Mainstream and Diversity Awards
Parameter Estimate
Post x Mainstream collection (β2) 0.1032**(0.0038)
Post x Diversity collection (β3) 0.0039(0.0038)
Post (β1) 0.0211**(0.0027)
Mainstream collection fixed effect 0.0480**(0.0022)
Diversity collection fixed effect 0.0547**(0.0022)
Non-winners fixed effect 0.0734**(0.0022)
R2 0.5003
Observations 3,375
Table notes: These parameters were generated using the equation given in this subsection of the DataAppendix estimated using data from the Seattle Public Library on daily checkouts. The Diversity collectionis the “baseline” category, so the Mainstream and non-winner fixed effects are in reference to the checkoutrate for it. Statistical significance is denoted by * for p < 0.05 and ** for p < 0.01.
We present our results in Table A5. This shows that after winning an award, Main-stream books are approximately twice as likely as (82.3 percent more than) non-winners to
xxiv

be checked out on any given day. We derive this from calculating the ratio of the post-awardcheckout rate for the Mainstream collection to that of the non-winners. For the Mainstreambooks, this is the sum of the constant, the Mainstream fixed effect, the coefficient on the“post-award” variable (Post), and the coefficient on the interaction term between Post andthe Mainstream collection, which sums to approximately 0.1723. The post-award checkoutrate for non-winners is the sum of the Non-winners fixed effect and the coefficient on Post,which sums to approximately 0.0945. Prior to receiving an award, on the other hand, theMainstream collection books were approximately 35 percent less likely to be checked outthan non-winners.
An alternate interpretation is that after winning the award, the Mainstream collectionbooks are approximately 2.6 times more likely to be checked out than they were before. Thisis derived by dividing the sum of coefficients on Post (0.0211), the interaction ofMainstream
and Post (0.1032), and theMainstream fixed effect (0.0480) by theMainstream fixed effect.We note that these should be interpreted as suggestive estimates; we define “pre-” and “post-”award using February 1st, an estimate of when news of the award announcements is likelyto reach readers, parents, and librarians. Its precise date varies from year to year.
For the Diversity awards, we see no significant change in checkout behavior afterFebruary 1st. This can be seen in our estimate of the interaction term between Diversityand Post, which is small in magnitude and not statistically distinguishable from zero. Seenthrough the lens of the calculations above, after receiving an award, Diversity collection booksare more than 15 percent less likely to be checked out than non-winners; this can be derivedanalogously, comparing the post-award checkout rate for the Diversity collection – the sumof the Diversity fixed effect, the coefficient on Post, and the coefficient on the interactionterm between Post and the Diversity collection, which sums to approximately 0.0797. Thepost-award checkout rate for non-winners is the sum of the Non-winners fixed effect andthe coefficient on Post, which is approximately 0.0945. Prior to receipt of the award, theywere approximately 25 percent less likely to be checked out, but the statistical insignificanceof the interaction between the Post and Diversity (Post x Diversity) variables means thatwe cannot reject the null hypothesis that the pre-award and post-award differential checkoutrates between Diversity collection books and non-winners is zero.
C.3.B Text Cleaning
The current data cleaning process standardizes the following names, which may havevariants in how they are written: abraham lincoln, martin luther king junior, rosa parks,eleanor roosevelt, harriet tubman, george washington.
xxv

Our current data cleaning process also removes alpha consecutive lines with no morethan beta words. Currently, we use a value of four for alpha and three for beta. This ismeant to serve as a way to remove copyright pages or indices.
This process generates a list of words, also known as tokens, which we aggregate togenerate “token counts,” or measures of frequency of the mention of specific words.72
C.3.C All Gendered Mentions
The total number of female words in book i is calculated as follows:
(female words)i = (total number of female-specific tokens)i+ (total number of mentions of famous female characters)i+ (total number of characters with female first names)i
C.3.D Specific Token Counts
The list of specific tokens (words) that we use in our text analysis are listed below.
Gendered Tokens. The gendered tokens we enumerate are as follows. Subset lists areused for the specific gendered token counts, gendered pronouns, singular/plural genderedtoken counts, younger/older gendered token counts and uppercase/lowercase pronouns.
Female. abuela, abuelita, actress, aunt, auntie, aunties, aunts, aunty, czarina,damsel, damsels, daughter, daughters, emperess, emperesses, empress, empresses, fairies,fairy, female, females, girl, girls, grandma, grandmas, grandmom, grandmother, grandmoth-ers, her, hers, herself, housekeeper, housekeepers, ladies, lady, ma’am, madame, mademoi-selle, mademoiselles, maid, maiden, maidens, maids, mama, mamas, mermaid, mermaids,miss, mlle, mme, mom, mommies, mommy, moms, mother, mothers, mrs, ms, nana, nanas,princess, princesses, queen, queens, she, sissie, sissy, sister, sisters, stepmother, stepmothers,titi, tsarevna, tsarina, tsaritsa, tzaritza, waitress, wife, witch, witches, wives, woman, women
Male. abuelito, abuelo, actor, boy, boys, bro, brother, brothers, butler, butlers, chap,chaps, czar, dad, daddies, daddy, dads, einstein, emperor, emperors, father, fathers, fellow,fellows, gentleman, gentlemen, granddad, granddads, grandfather, grandfathers, grandpa,grandpas, he, him, himself, his, hisself, husband, husbands, king, kings, knight, lad, lads,lord, lords, male, males, man, master, masters, men, merman, mermen, mr, paige, paiges,
72This differs slightly from the notion of “lemmas,” which are measures of the count of word stems. Tounderstand the difference, take the words “father,” “fatherly,” and “fathered.” If each word appeared once ina book, it would generate a token count of one for each word, but a lemma count of three for the lemma“father.”
xxvi

papa, papas, prince, princes, sir, sirs, son, sons, squire, squires, stepfather, stepfathers, tio,tsar, uncle, uncles, waiter, wizard, wizards
Racial Proxy Tokens. The tokens we use as proxies for race are as follows.
Colors. The color word tokens used as proxies for race and falsification words are thefollowing: black, blue, brown, gold, golden, green, orange, pink, purple, red, silver, violet,white, yellow. For parsimony, in the paper we only show the words black, blacks, white,whites, blue, and blues.
Nationalities. Afghan, African, Albanian, Algerian, American, Andorran, Angolan,Antiguans, Apache, Argentinean, Armenian, Asian, Australian, Austrian, Azerbaijani, Ba-hamian, Bahraini, Bangladeshi, Barbadian, Barbudans, Batswana, Belarusian, Belgian, Be-lizean, Beninese, Bhutanese, Bolivian, Bosnian, Brazilian, British, Bruneian, Bulgarian,Burkinabe, Burmese, Burundian, Cambodian, Cameroonian, Canadian, Cape Verdean, Cha-dian, Cherokee, Chicana, Chicano, Chicanx, Chilean, Chinese, Choctaw, Colombian, Co-moran, Congolese, Croatian, Cuban, Cypriot, Czech, Danish, Djibouti, Dominican, Dutch,Dutchman, Dutchwoman, Ecuadorean, Egyptian, Emirian, English, Eritrean, Estonian,Ethiopian, Fijian, Filipino, Finnish, French, Gabonese, Gambian, Georgian, German, Ghana-ian, Greek, Grenadian, Guatemalan, Guinea-Bissauan, Guinean, Guinean, Guyanese, Haitian,Herzegovinian, Hispanic, Honduran, Hungarian, Icelander, I-Kiribati, Indian, Indonesian,Iranian, Iraqi, Irish, Irish, Iroquois, Israeli, Italian, Ivorian, Jamaican, Japanese, Jordanian,Kazakhstani, Kenyan, Kittian, Korean, Kuwaiti, Kyrgyz, Laotian, Latina, Latino, Latinx,Latvian, Lebanese, Leonean, Liberian, Libyan, Liechtensteiner, Lithuanian, Lucian, Luxem-bourger, Macedonian, Malagasy, Malawian, Malaysian, Maldivan, Malian, Maltese, Mari-nese, Marshallese, Mauritanian, Mauritian, Mexican, Micronesian, Moldovan, Monacan,Mongolian, Mongols, Moroccan, Mosotho, Motswana, Mozambican, Namibian, Nauruan,Navajo, Nepalese, Netherlander, Nevisian, Nicaraguan, Nigerian, Nigerien, Ni-Vanuatu, Nor-wegian, Ojibwe, Omani, Pakistani, Palauan, Panamanian, Paraguayan, Persian, Peruvian,Polish, Portuguese, Qatari, Rican, Romanian, Russian, Rwandan, Salvadoran, Samoan,Saudi, Scottish, Senegalese, Serbian, Seychellois, Singaporean, Sioux, Slovakian, Slovenian,Somali, Spanish, Sri-Lankan, Sudanese, Surinamer, Swazi, Swedish, Swiss, Syrian, Tai-wanese, Tajik, Tanzanian, Thai, Timorese, Tobagonian, Togolese, Tomean, Tongan, Trinida-dian, Tunisian, Turkish, Tuvaluan, Ugandan, Ukrainian, Uruguayan, Uzbekistani, Venezue-lan, Vietnamese, Welsh, Yemenite, Zambian, Zealander, Zimbabwean
xxvii