Reports and Policy Papers - University of East Anglia
190
Reports and Policy Papers Gender Caste and Growth Assessment – India International Development UEA & School of International Development, University of East Anglia , Norwich, NR4 7TJ, United Kingdom 2010 Nitya Rao, Arjan Verschoor, Ashwini Deshpande, Amaresh Dubey Report to Department for International Development
-
Upload
khangminh22 -
Category
Documents
-
view
1 -
download
0
Transcript of Reports and Policy Papers - University of East Anglia

Reports and Policy Papers
Gender Caste and Growth Assessment – India
International Development UEA & School of International Development, University of East Anglia , Norwich, NR4 7TJ, United Kingdom
2010
Nitya Rao, Arjan Verschoor,
Ashwini Deshpande, Amaresh Dubey
Report to Department for International Development
DEV Reports and Policy Papers
Gender Caste and Growth Assessment – India Report to Department for International Development Nitya Rao, Arjan Verschoor, Ashwini Deshpande, Amaresh Dubey First published by the School of International Development in November, 2010. This publication may be reproduced by any method without fee for teaching or nonprofit purposes, but not for resale. The papers should be cited with due acknowledgment. This publication may be cited as: Rao, N., Verschoor, A., Deshpande, A., Dubey, A., 2010, ‘Gender Caste and Growth Assessment – India, Report to Department for International Development’, DEV Reports and Policy Paper Series, The School of International Development, University of East Anglia, UK. About the Authors Nitya Rao is a Senior Lecturer in the School of International Development at the University of East Anglia, Norwich, UK. Arjan Verschoor is a Reader in Economics in the School of International Development at the University of East Anglia, Norwich, UK. Ashwini Deshpande is a Professor at the Department of Economics, Delhi School of Economics, University of Delhi, Delhi. Amaresh Dubey is Professor of Social Sciences at the Centre for the Study of Regional Development, Jawaharlal Nehru University, New Delhi. Contact: Email: [email protected] School of International Development University of East Anglia Norwich, NR4 7TJ United Kingdom Tel: +44 (0) 1603 592333 Fax: +44 (0) 1603 451999

About the DEV Reports and Policy Papers These are reports and policy papers that reproduce consultancy, applied research findings and policy work conducted by the School of International Development or International Development UEA (formerly Overseas Development Group). Launched in 2007, they provide an opportunity for staff, associated researchers and fellows to disseminate studies and findings on a wide range of subjects. Recent past work, provided it meets the standards required and has contemporary significance is also welcome. About the School of International Development The School of International Development (DEV) applies economic, social and natural science disciplines to the study of international development, with special emphasis on social and environmental change and poverty alleviation. DEV has a strong commitment to an interdisciplinary research and teaching approach to Development Studies and the study of poverty. This has been developed over a forty year period, bringing together researchers and students from different disciplines (economists, social scientists, natural resource scientists) into research areas and teaching teams. The International Development UEA (formerly Overseas Development Group) Founded in 1967, International Development UEA is a charitable company wholly owned by the University of East Anglia, which handles the consultancy, research, and training undertaken by the faculty members in DEV and approximately 200 external consultants. Since its foundation it has provided training for professionals from more than 70 countries and completed over 1,000 consultancy and research assignments. International Development UEA provides DEV staff with opportunities to participate in on-going development work, practical and policy related engagement which add a unique and valuable element to the School's teaching programmes. For further information on DEV and the International Development UEA, please contact: School of International Development University of East Anglia, Norwich NR4 7TJ, United Kingdom Tel: +44 (0)1603 592329 Fax: +44 (0)1603 451999 Email: [email protected] Web: www.uea.ac.uk/dev

Acknowledgements There are several people who have contributed to this GCGA, donor partners, researchers and NGO workers, giving generously of their time, both in Delhi and in the field sites, and while we are not able to name all of them, a few need mention. The sub-national studies in Uttar Pradesh and West Bengal were led by Nishi Mehrotra and Amit Mitra respectively. Despite very difficult conditions, they and their team of researchers have done a remarkable job, in terms of data collection and analysis. We would like to thank all of them for their inputs and insights. Adriaan Kalwij, Paul Clist and Veronica Pal have collaborated on the analysis of the data, and we are very grateful for their highly qualified support. Research Assistance was provided by Nivedita Ghosh, Bidisha Barooah, Uma Sarmistha and Yashodhan Ghorpade. We thank them for responding to our repeated demands, and facilitating the review of literature as well as analysis of the data used in this report. Nitya Rao Arjan Verschoor Ashwini Deshpande Amaresh Dubey
5
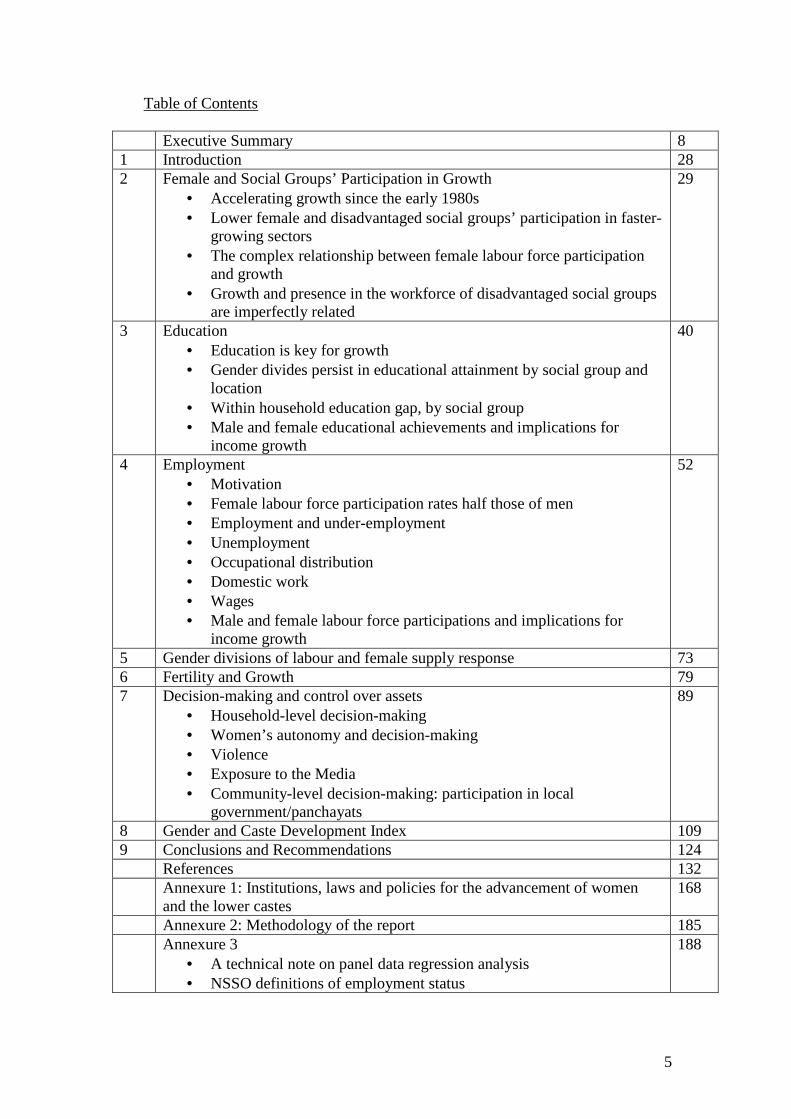
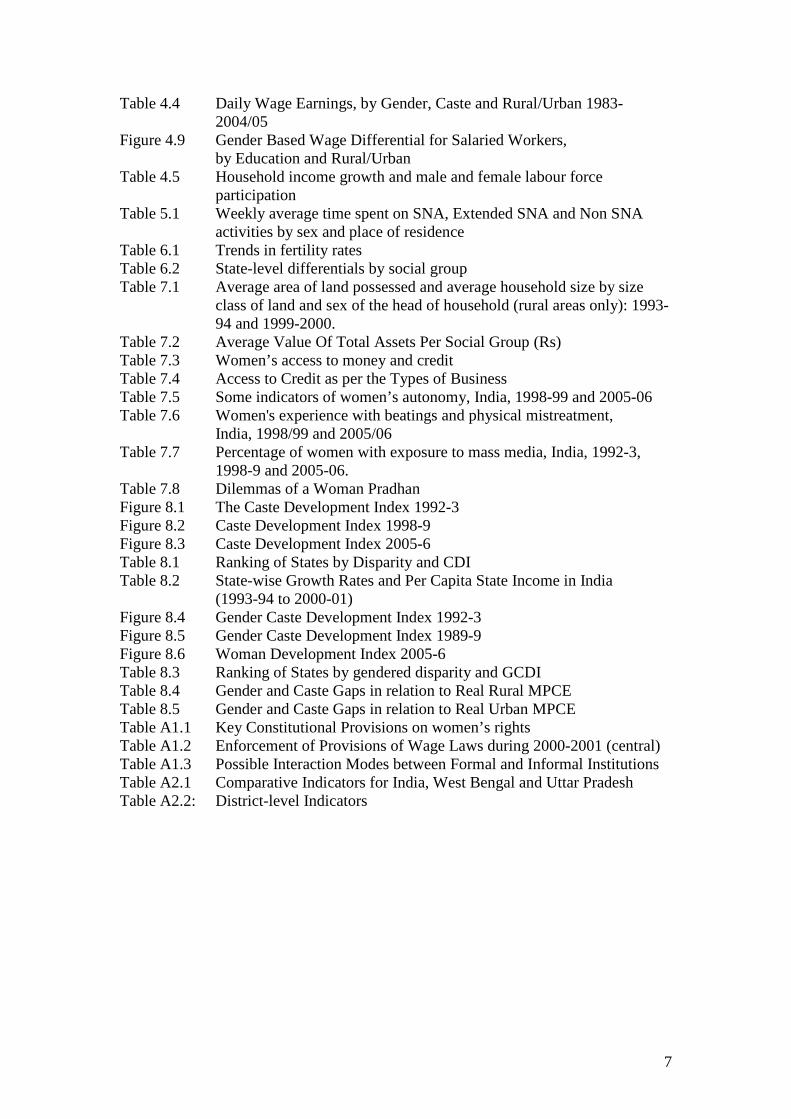
Table of Contents
Executive Summary 8 1 Introduction 28 2 Female and Social Groups’ Participation in Growth
· Accelerating growth since the early 1980s · Lower female and disadvantaged social groups’ participation in faster-
growing sectors · The complex relationship between female labour force participation
and growth · Growth and presence in the workforce of disadvantaged social groups
are imperfectly related
29
3 Education · Education is key for growth · Gender divides persist in educational attainment by social group and
location · Within household education gap, by social group · Male and female educational achievements and implications for
income growth
40
4 Employment · Motivation · Female labour force participation rates half those of men · Employment and under-employment · Unemployment · Occupational distribution · Domestic work · Wages · Male and female labour force participations and implications for
income growth
52
5 Gender divisions of labour and female supply response 73 6 Fertility and Growth 79 7 Decision-making and control over assets
· Household-level decision-making · Women’s autonomy and decision-making · Violence · Exposure to the Media · Community-level decision-making: participation in local
government/panchayats
89
8 Gender and Caste Development Index 109 9 Conclusions and Recommendations 124 References 132 Annexure 1: Institutions, laws and policies for the advancement of women
and the lower castes 168
Annexure 2: Methodology of the report 185 Annexure 3
· A technical note on panel data regression analysis · NSSO definitions of employment status
188
6
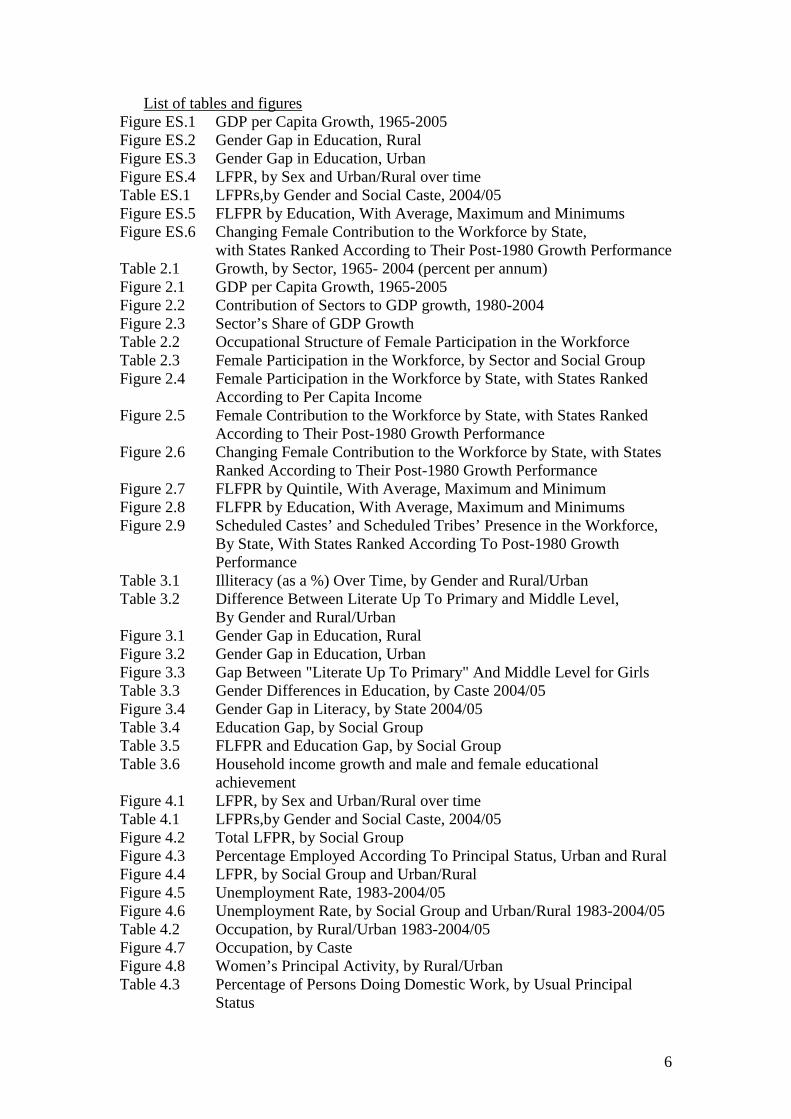
List of tables and figures Figure ES.1 GDP per Capita Growth, 1965-2005 Figure ES.2 Gender Gap in Education, Rural Figure ES.3 Gender Gap in Education, Urban Figure ES.4 LFPR, by Sex and Urban/Rural over time Table ES.1 LFPRs,by Gender and Social Caste, 2004/05 Figure ES.5 FLFPR by Education, With Average, Maximum and Minimums Figure ES.6 Changing Female Contribution to the Workforce by State,
with States Ranked According to Their Post-1980 Growth Performance Table 2.1 Growth, by Sector, 1965- 2004 (percent per annum) Figure 2.1 GDP per Capita Growth, 1965-2005 Figure 2.2 Contribution of Sectors to GDP growth, 1980-2004 Figure 2.3 Sector’s Share of GDP Growth Table 2.2 Occupational Structure of Female Participation in the Workforce Table 2.3 Female Participation in the Workforce, by Sector and Social Group Figure 2.4 Female Participation in the Workforce by State, with States Ranked
According to Per Capita Income Figure 2.5 Female Contribution to the Workforce by State, with States Ranked
According to Their Post-1980 Growth Performance Figure 2.6 Changing Female Contribution to the Workforce by State, with States
Ranked According to Their Post-1980 Growth Performance Figure 2.7 FLFPR by Quintile, With Average, Maximum and Minimum Figure 2.8 FLFPR by Education, With Average, Maximum and Minimums Figure 2.9 Scheduled Castes’ and Scheduled Tribes’ Presence in the Workforce,
By State, With States Ranked According To Post-1980 Growth Performance
Table 3.1 Illiteracy (as a %) Over Time, by Gender and Rural/Urban Table 3.2 Difference Between Literate Up To Primary and Middle Level,
By Gender and Rural/Urban Figure 3.1 Gender Gap in Education, Rural Figure 3.2 Gender Gap in Education, Urban Figure 3.3 Gap Between "Literate Up To Primary" And Middle Level for Girls Table 3.3 Gender Differences in Education, by Caste 2004/05 Figure 3.4 Gender Gap in Literacy, by State 2004/05 Table 3.4 Education Gap, by Social Group Table 3.5 FLFPR and Education Gap, by Social Group Table 3.6 Household income growth and male and female educational
achievement Figure 4.1 LFPR, by Sex and Urban/Rural over time Table 4.1 LFPRs,by Gender and Social Caste, 2004/05 Figure 4.2 Total LFPR, by Social Group Figure 4.3 Percentage Employed According To Principal Status, Urban and Rural Figure 4.4 LFPR, by Social Group and Urban/Rural Figure 4.5 Unemployment Rate, 1983-2004/05 Figure 4.6 Unemployment Rate, by Social Group and Urban/Rural 1983-2004/05 Table 4.2 Occupation, by Rural/Urban 1983-2004/05 Figure 4.7 Occupation, by Caste Figure 4.8 Women’s Principal Activity, by Rural/Urban Table 4.3 Percentage of Persons Doing Domestic Work, by Usual Principal
Status
7
Table 4.4 Daily Wage Earnings, by Gender, Caste and Rural/Urban 1983-2004/05
Figure 4.9 Gender Based Wage Differential for Salaried Workers, by Education and Rural/Urban
Table 4.5 Household income growth and male and female labour force participation
Table 5.1 Weekly average time spent on SNA, Extended SNA and Non SNA activities by sex and place of residence
Table 6.1 Trends in fertility rates Table 6.2 State-level differentials by social group Table 7.1 Average area of land possessed and average household size by size
class of land and sex of the head of household (rural areas only): 1993-94 and 1999-2000.
Table 7.2 Average Value Of Total Assets Per Social Group (Rs) Table 7.3 Women’s access to money and credit Table 7.4 Access to Credit as per the Types of Business Table 7.5 Some indicators of women’s autonomy, India, 1998-99 and 2005-06 Table 7.6 Women's experience with beatings and physical mistreatment,
India, 1998/99 and 2005/06 Table 7.7 Percentage of women with exposure to mass media, India, 1992-3,
1998-9 and 2005-06. Table 7.8 Dilemmas of a Woman Pradhan Figure 8.1 The Caste Development Index 1992-3 Figure 8.2 Caste Development Index 1998-9 Figure 8.3 Caste Development Index 2005-6 Table 8.1 Ranking of States by Disparity and CDI Table 8.2 State-wise Growth Rates and Per Capita State Income in India
(1993-94 to 2000-01) Figure 8.4 Gender Caste Development Index 1992-3 Figure 8.5 Gender Caste Development Index 1989-9 Figure 8.6 Woman Development Index 2005-6 Table 8.3 Ranking of States by gendered disparity and GCDI Table 8.4 Gender and Caste Gaps in relation to Real Rural MPCE Table 8.5 Gender and Caste Gaps in relation to Real Urban MPCE Table A1.1 Key Constitutional Provisions on women’s rights Table A1.2 Enforcement of Provisions of Wage Laws during 2000-2001 (central) Table A1.3 Possible Interaction Modes between Formal and Informal Institutions Table A2.1 Comparative Indicators for India, West Bengal and Uttar Pradesh Table A2.2: District-level Indicators

8
Executive Summary Gender, Caste and Growth Assessment India
High rates of growth have characterised developments in the Indian economy over the
last few years, with a growth rate of over 9 per cent in 2005-6 and 2006-7 surpassing
all expectations (Economic Survey, 2006-7). This has however also led to some
genuine concerns about the inclusiveness of the growth process, especially on account
of the near stagnation of the agricultural sector. Reports of farmer suicides from
different parts of the country have raised questions about the neglect of the rural
sector, still home to over 60 per cent of the Indian population, and its exclusion from
growth. The Approach Paper to the 11th Plan highlights this concern, drawing
attention to both the rural-urban divide and the gender divide as critical barriers to
growth (2006: 3).
Research is slowly pointing out how women neither share in nor are able to contribute
to growth equally (Seguino 2000). This has led to a “new equity agenda” which
shows that inequalities based on a number of background variables such as parental
education, ethnicity, caste and gender are major obstacles to long-term equitable
development (World Bank 2006, UNDP 2005b, UN 2005). Further, it is also believed
that these inequalities (across the spectrum of women’s lives in economic, political,
social and cultural spheres) must be addressed if poverty is to be eliminated (DFID
2000). There is hence growing recognition that gender inequality not only hampers
pro-poor growth but hinders economic growth in general both in the short and long-
term (Birdsall and Londono 1997; Deininger & Olinto 2000).
This in fact has made the MDG Task Force on Gender Equality identify three key
domains requiring urgent attention: a) the ‘capabilities’ domain referring to basic
human abilities as measured through education, health and nutrition; b) the ‘access to
resources and opportunities’ domain that includes access to economic assets (land,
property, infrastructure) and resources (income and employment) as well as political
opportunity; and c) the ‘security’ domain that seeks to reduce vulnerability to
violence and conflict (Birdsall et al. 2004).

9
In India, while disadvantage is multi-faceted, caste and gender are recognised as two
key indicators of social stratification. Women and members of lower caste groups
experience a range of inequalities: in health and nutrition, education, wages,
occupation and ownership, control and access to assets and resources. Low
entitlements, social barriers and discrimination combine to dampen capabilities and
hinder market possibilities. As a result, these groups suffer disproportionate rates of
poverty - a situation that is passed on from generation to generation despite gender
and caste-based affirmative action by formal institutions (Mehta & Shah 2003). In
this Gender Caste and Growth Assessment, we have attempted to analyse the links
between gender inequality and growth; and caste and growth in India; but also
examine how the membership of different social groupings interlock to deepen
disadvantage and reinforce the detrimental impact on shared economic outcomes.
People are seen to participate in the growth process mainly through engagement in
the labour force – an analysis of labour force participation by gender, social grouping
and location has therefore been at the core of this assessment. Interestingly, in India,
labour force participation rates have been virtually stagnant over the last two decades
– a case of ‘jobless growth’. Other pathways for shared growth are thus also explored,
principal among them being education, followed by the distribution of assets and
access to physical and social infrastructure, fertility decline, female work burdens that
restrict their supply response and female autonomy and decision-making.
In the next sections, key findings of the GCGA are summarised and broad directions
for policy suggested.
Key Research Findings in a Nutshell
This GCGA for India is primarily based on new research, carried out for its purpose,
using a variety of all-India large-scale datasets and in-depth primary research for two
states, West Bengal and Uttar Pradesh. Key research findings are listed here first and
then expounded in the sections that follow, which also spell out policy implications.
10
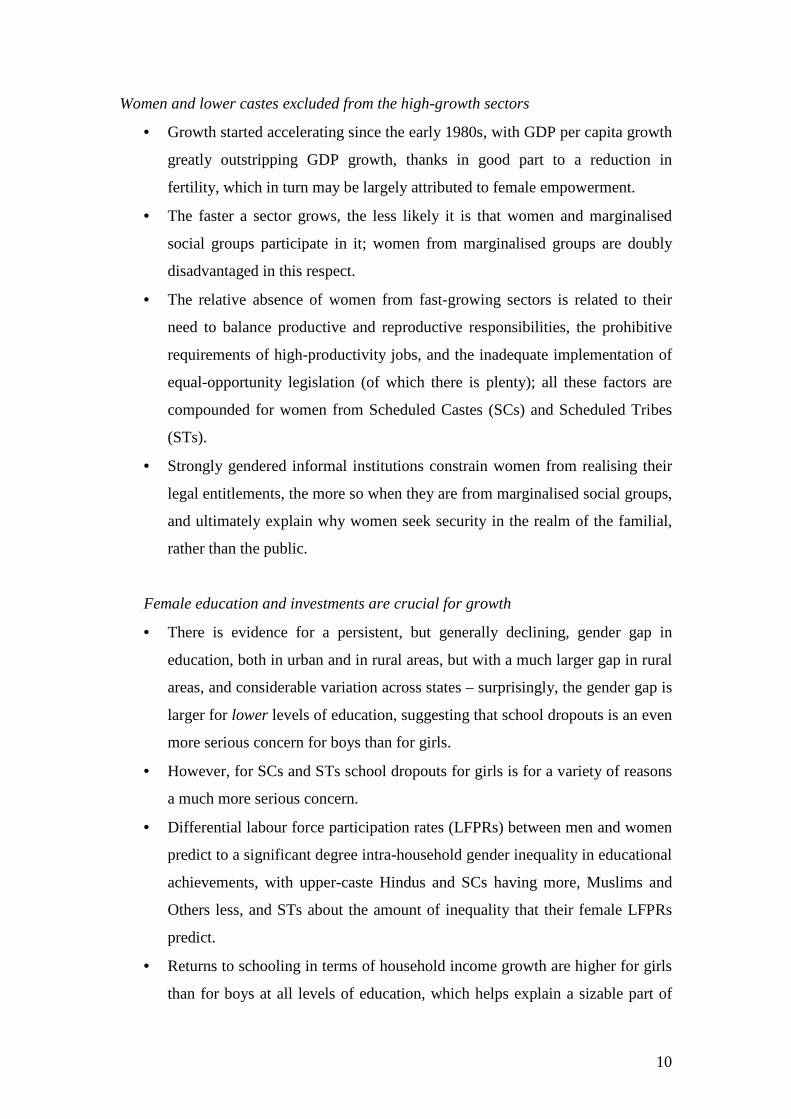
Women and lower castes excluded from the high-growth sectors
· Growth started accelerating since the early 1980s, with GDP per capita growth
greatly outstripping GDP growth, thanks in good part to a reduction in
fertility, which in turn may be largely attributed to female empowerment.
· The faster a sector grows, the less likely it is that women and marginalised
social groups participate in it; women from marginalised groups are doubly
disadvantaged in this respect.
· The relative absence of women from fast-growing sectors is related to their
need to balance productive and reproductive responsibilities, the prohibitive
requirements of high-productivity jobs, and the inadequate implementation of
equal-opportunity legislation (of which there is plenty); all these factors are
compounded for women from Scheduled Castes (SCs) and Scheduled Tribes
(STs).
· Strongly gendered informal institutions constrain women from realising their
legal entitlements, the more so when they are from marginalised social groups,
and ultimately explain why women seek security in the realm of the familial,
rather than the public.
Female education and investments are crucial for growth
· There is evidence for a persistent, but generally declining, gender gap in
education, both in urban and in rural areas, but with a much larger gap in rural
areas, and considerable variation across states – surprisingly, the gender gap is
larger for lower levels of education, suggesting that school dropouts is an even
more serious concern for boys than for girls.
· However, for SCs and STs school dropouts for girls is for a variety of reasons
a much more serious concern.
· Differential labour force participation rates (LFPRs) between men and women
predict to a significant degree intra-household gender inequality in educational
achievements, with upper-caste Hindus and SCs having more, Muslims and
Others less, and STs about the amount of inequality that their female LFPRs
predict.
· Returns to schooling in terms of household income growth are higher for girls
than for boys at all levels of education, which helps explain a sizable part of

11
the growth difference between North and South India, although not that
between social groups.
Promoting female employment can be good for growth but requires complementary
policy
· There are stark differences between urban and rural, male and female, and (for
women only) social groups’ LFPRs, which have not changed during India’s
modern growth period – female LFPRs remain extremely low by international
standards.
· Contrary to earlier literature, we do not find evidence for a U-shaped
relationship between female LFPRs and income; we do find one for education.
· Female unemployment has risen during India’s modern growth period, the
more so for urban women; when they are employed, they are much more
likely to be salaried employees than rural women.
· There is a substantial gender wage gap in urban and even more in rural areas.
In rural areas this gap has been stagnant, in urban areas it has declined, which
is largely due to rising female wages at the bottom rungs of the labour market.
· Consistent with the wage gap evidence, we find that male employment
contributes more to household income growth than female employment. Only
if barriers to female labour force participation (including labour market
discrimination) are removed will promoting female employment have the
disproportionately large growth effects that have been associated with it in the
literature.
Rigidifying gender division of labour adversely affects growth
· A broader shift in labour relations, reinforced by the poor work environment
for women, is responsible for a rigidifying gender division of labour, which
mutes the female supply response and thereby adversely affects growth.
· Women’s reproductive work, in particular, continues to account for the time
constraint faced by women, as well as affecting their labour productivity
directly through a number of channels.

12
Fertility decline enhances per capita growth
· Fertility declined at the national level and faster in urban areas, for the upper
castes (classes), for those with higher education and in the Southern states,
mainly because of an increase in female literacy and improved access to health
services. SCs and STs continue to be at a disadvantage.
Access to assets and finances supports growth
· Substantial productivity gains derive from the control over landed assets and
money, which continues to elude women, SC/ST women in particular.
· Indicators of female autonomy have worsened for SC women and improved
for other women, with OBC (other backward castes) women continuing to do
worst.
· Participation of women in local government has increased, with interesting
pro-growth implications for the nature of local government public investment.
Links between caste, gender and growth are not linear
· Gender and caste disparities have improved during India’s modern growth
period but are tapering off as growth is accelerating. Combined with inter-state
variability this clearly shows that growth is not sufficient for ensuring equality
outcomes.
Women and Lower Castes Excluded from the High Growth Sectors
Growth in India is not new, it started accelerating since the early 1980s. GDP per
capita growth has however been more pronounced in the last decade, 4.3 per cent per
year between 1995 and 2004 (Figure ES.1), a threefold increase in the annual rate of
growth India was accustomed to. This compares to an increase in annual GDP growth
from 4 to about 6 per cent, an increase by 1.5 times. The favourable difference
between the increase in GDP per capita growth and the increase in GDP growth is due
to a slowing down of population growth. This suggests that female empowerment
may have contributed to growth in recent years through reducing fertility.

13
Figure ES.1 GDP per Capita Growth, 1965-2005
0
1
2
3
4
5
1965-1969 1970-1974 1975-1979 1980-1984 1985-1989 1990-1994 1995-1999 2000-2004
Years
%
Source: authors’ calculations using data from Development Data Group, World Bank, World Development Indicators, Various Issues. Note: Figures are in real terms based on local constant price data. Since 1990, the services sector has contributed more to GDP growth than industry.
For 1980-2004, agriculture contributed 18%, industry 36% and services 46% to
overall GDP growth. The data suggests however that the faster a sector grows, the
lower is female participation in that sector (women make up about 35% of the
workforce in agriculture, 25% in industry, and less than 20% in services); the lower is
the participation of SCs and STs; and within SCs and STs, women are less likely to
participate in faster-growing sectors.
The lack of a definite relationship between growth and women’s participation, indeed
even an exclusion, raises the need to better understand the gender implications of the
growth process – the nature of jobs available to women, the conditions of work, as
well as the need to balance productive and reproductive responsibilities. Over 95% of
women workers are engaged in informal employment characterised by low wages,
absence of secure contracts, worker benefits or any form of social protection. High
productivity often demands long hours of work, as well as irregular hours of work.
Despite the prevalence of a plethora of Acts and Policies to ensure minimum
remuneration as well as equal benefits, these are hardly implemented. Women then
are confronted with major trade-offs in terms of participation in growth and the

14
potential benefits from this and investment in the maintenance and social reproduction
of their households. A similar situation is faced by SCs and STs.
A whole host of social norms, rules and routines appear to constrain women, and the
lower caste groups, from realising their legal entitlements, pervading as they do not
just community and local processes, but also state and economic ones. These informal
institutions, strongly gendered, cover a gamut of human interaction from the most
private sphere of sexuality to the public arenas of economic and political life, whether
in terms of access to property and other productive resources, divisions of labour or
political participation. They are however not fixed and do change in response to the
external context, as visible in the regional variations across India itself. Finally, they
are not always negative, but do offer women opportunities to exercise their agency
and gain social status. Faced with insecure employment opportunities and declining
real wages, it should be no surprise that women seek security in the realm of the
familial, rather than the public.
Policy Implications
· Develop a better understanding of the working conditions and requirements
of the high growth sectors of the economy to enable the provision of
additional support to women and lower caste groups to overcome the
barriers and participate in these sectors. These include the provision of child
care, minimum wages and other employment benefits that can ensure
women an asset base for fall-back in the future.
· Understanding the interactions between the formal and informal institutions
in order to build on complementary and accommodating institutions and
support those that can substitute for a lack of formal provision.
15
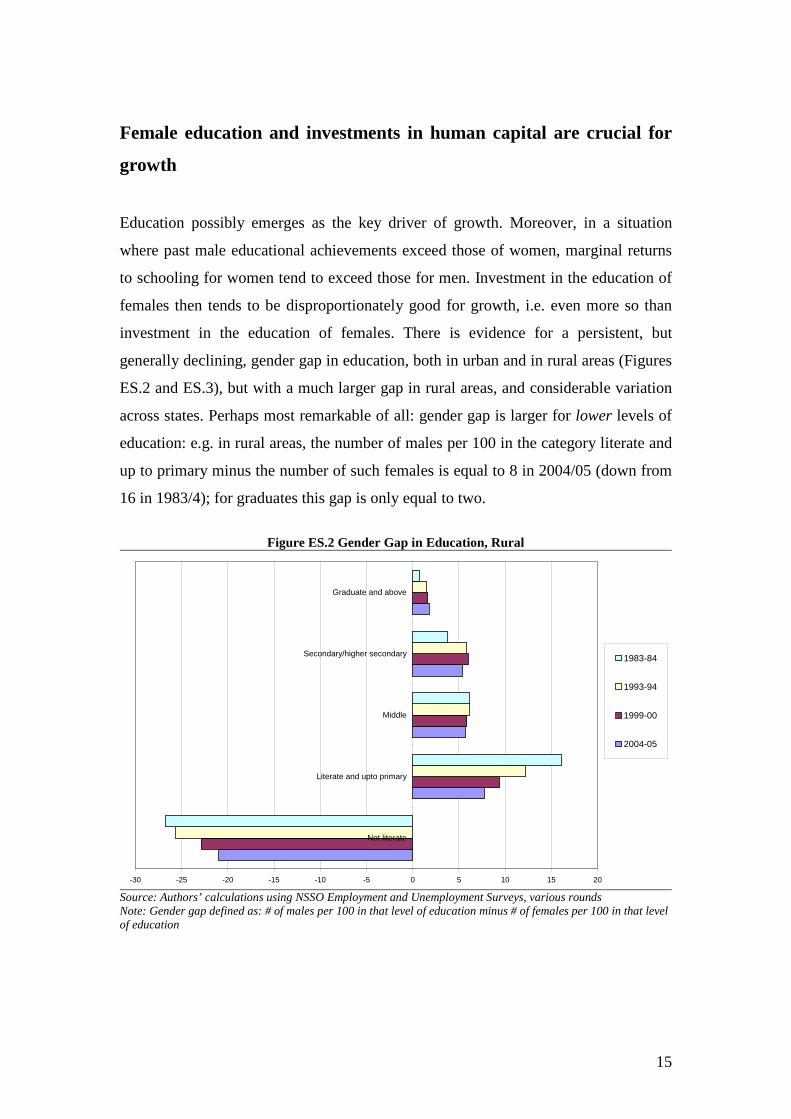
Female education and investments in human capital are crucial for
growth
Education possibly emerges as the key driver of growth. Moreover, in a situation
where past male educational achievements exceed those of women, marginal returns
to schooling for women tend to exceed those for men. Investment in the education of
females then tends to be disproportionately good for growth, i.e. even more so than
investment in the education of females. There is evidence for a persistent, but
generally declining, gender gap in education, both in urban and in rural areas (Figures
ES.2 and ES.3), but with a much larger gap in rural areas, and considerable variation
across states. Perhaps most remarkable of all: gender gap is larger for lower levels of
education: e.g. in rural areas, the number of males per 100 in the category literate and
up to primary minus the number of such females is equal to 8 in 2004/05 (down from
16 in 1983/4); for graduates this gap is only equal to two.
Figure ES.2 Gender Gap in Education, Rural
-30 -25 -20 -15 -10 -5 0 5 10 15 20
Not literate
Literate and upto primary
Middle
Secondary/higher secondary
Graduate and above
1983-84
1993-94
1999-00
2004-05
Source: Authors’ calculations using NSSO Employment and Unemployment Surveys, various rounds Note: Gender gap defined as: # of males per 100 in that level of education minus # of females per 100 in that level of education

16
Figure ES.3 Gender Gap in Education, Urban
-30 -25 -20 -15 -10 -5 0 5 10 15 20
Not literate
Literate and upto primary
Middle
Secondary/higher secondary
Graduate and above
1983-84
1993-94
1999-00
2004-05
Source: Authors’ calculations using NSSO Employment and Unemployment Surveys, various rounds Note: Gender gap defined as: # of males per 100 in that level of education minus # of females per 100 in that level of education However, school dropouts for girls is a much more serious concern for SCs and STs
than for other groups, especially at the post-primary level, resulting for example in a
negligible 0.52% of rural SCs that are in the category “graduates and above”. This
could be a result of the need to support household incomes directly or indirectly
(through performing domestic chores), lack of attractive employment opportunities,
lack of easily accessible secondary schools (especially for STs) and the poor quality
of provision. With growing privatisation and the increasing costs of obtaining what is
seen as ‘quality’ education, girls, especially of the SC/ST category, remain the most
disadvantaged. The gender and caste interaction is clearly visible in the case of access
to post-primary education.
However, differences between gender inequality in educational achievements across
social groups reflect to a degree differences in female and male labour force
participation rates. In particular, when a social group has relatively low levels of
female labour force participation rates (FLFPRs), returns to schooling of girls are
relatively low. Intra-household gender inequality in educational achievements is worst
for upper-caste Hindus, followed by SCs, Muslims, STs and Others, in that order.
Upper-caste Hindus and SCs have more, Muslims and Others less, and STs about the

17
amount of gender inequality in educational achievements that their FLFPRs would
predict.
We use panel data regression analysis to estimate returns to male and female
education in terms of household income growth, and use the estimated coefficients to
compute the contribution of differences between male and female educational
achievements to regional and social group differences in growth. Female education
has larger effects on household income growth than male education at all levels of
education. 86% of the growth difference between North and South India that is due to
education is due to differences in female educational achievements; the remaining
14% is due to differences in male educational achievements. By contrast, the effects
on the growth difference between social groups that is due to differences in gender
inequality in education are not found to be large. Returns however vary with
educational level, with secondary and higher education essential for productivity and
income growth.
Policy Implications
Despite a massive expansion in educational investments in order to ensure access to
primary education to all children, this continues to be of poor quality, and gender and
caste disparities in outcomes persist. These early disadvantages get carried forward in
their lives. Furthermore, such disparities both reduce economic growth potential of
the country as a whole and the potential of women and disadvantaged social groups to
participate in growth.
· Improving quality of basic education and educational outcomes should be a
priority. This would include ensuring manageable teacher-student ratios,
classroom infrastructure and good quality curriculum and teaching-
learning material.
· Financial and material incentives for girls and lower caste groups to be
continued.
· Additionally, incentives (could be non-tangible such as extending public
appreciation) also need to be provided to schools and teachers to ensure that
equitable and relevant learning takes place within the school.

18
· Affirmative action should take account of multiple sources of disadvantage,
not just caste or gender per se, but additionally parental occupation,
rural/urban residence and region.
· Apart from continuing with incentives to the student, the household and the
school, there is need to also ensure reliable, safe and affordable transport to
the village/town that has a middle school. Increasing proportion of women
teachers as well as the provision of toilets for women (both teachers and
students) is likely to improve attendance.
· In the medium term, the focus should be on establishing a middle/secondary
school in every village.
Promoting female employment can be good for growth but requires
complementary policy
Barriers to the economic participation of women and disadvantaged groups, apart
from of obvious concern for reasons of equity, restrict the potential for economic
growth, since the “pool of talent” from which economic opportunities originate and
from which employees are drawn is artificially limited. This has implications for
human capital investment (both for men and women) and technology choice, which in
turn affect growth prospects (e.g. Esteve-Volart 2004). An obvious starting point for
the analysis is thus the documentation of labour force participation rates.
For each social group, for rural and urban, for males and females, LFPRs did not
change much during India’s modern growth period (Figure ES.4). Remarkable
differences between groups have thus persisted: males continue to have much higher
LFPRs than females and rural women much higher than urban women. Thus, LFPR is
about 85% for rural males, 80% for urban males, slightly less than 40% for rural
females, and about 20% for urban females. For social groups, differences between
male LFPR are not large, but they are stark between female LFPR (Table ES.1): In
rural areas, FLFPR for STs is almost 60%, for SCs and OBCs it is close to 40%
(separately computed; it happens to be similar), and for all others (so includes upper-
caste Hindus) it is close to 25%. In urban areas, female LFPR is about 30% for STs,

19
close to 25% for SCs and OBCs (as before); and only about 15% for “others” (again:
includes upper-caste Hindus). Figure ES.4 LFPR, by Sex and Urban/Rural over time
Rural Male
Rural Female
Urban Male
Urban Female
0
10
20
30
40
50
60
70
80
90
100
1983 1993-94 1999-00 2004-05Year
%
Source: Authors’ calculations using NSSO Employment and Unemployment Surveys, various rounds
Table ES.1 LFPRs,by Gender and Social Caste, 2004/05 Rural Urban Gender and FLFPR Types
ST SC OBC Others ST SC OBC Others
Wom
en Principal 58.49 38.20 38.12 26.67 30.69 25.66 23.05 16.18
Subsidiary 69.77 52.19 50.09 38.52 35.67 30.17 27.66 19.56
Weekly 59.95 44.44 43.32 33.54 30.73 28.70 25.73 18.69
Daily 50.84 36.56 36.00 26.98 28.33 25.70 23.00 16.85
Men
Principal 88.78 86.00 84.66 82.76 77.20 80.99 80.71 76.42
Subsidiary 89.68 87.05 85.77 83.95 77.69 81.38 81.47 76.96
Weekly 87.63 85.49 84.37 82.72 75.63 80.79 80.82 76.63
Daily 84.85 82.91 82.39 80.91 74.43 79.50 80.00 76.10 Source: Authors’ calculations using NSSO Employment and Unemployment Surveys, 61st round Note: ‘FLFPR types’ refers to whether participation is measured on a daily or weekly level and so forth; for precise definitions see Annexure 3B. A U-shaped relationship between female labour force participation rates (FLFPR) and
income is suggested in the literature as arising from women needing to do manual
labour when poor and choosing to do white-collar work when rich. In the case of
India, this neither exists across states nor within states. It does however exist (within
states) for levels of education (Figure ES.5): average FLFPR is about 30, for illiterate
women it is about 50 and for graduates it is about 40: a (kind of) U-shaped
relationship between FLFPR and education. During India’s modern growth period,

20
higher FLFPRs neither particularly characterise faster-growing nor slow-growing
states; and rises and falls in FLFPRs occur about as frequently, and across the growth
spectrum (Figure ES.6). Figure ES.5 FLFPR by Education, With Average, Maximum and Minimums
0
10
20
30
40
50
60
70
80
90
Illiterate Primary Middle and Secondary Graduates and Above
Education
FLFP
R (%
)
Source: authors’ calculations using the National Sample Survey Organisation (NSSO), Employment and Unemployment Survey, 61st round (2004/05) Note: “average”, “maximum” and “minimum” all refer to within-state figures
Figure ES.6 Changing Female Contribution to the Workforce by State, with States Ranked According to Their Post-1980 Growth Performance
Rajasthan
Haryana
Kerala
Punjab
Madhya Pradesh
Karnataka
Andhra Pradesh
Gujarat Tamil Nadu
Himachal Pradesh
Jharkhand
West Bengal
Jammu & Kashmir Uttar Pradesh
Orissa
BiharAssam
0
5
10
15
20
25
30
35
40
45
50
States, Ranked From High to Low Growth Performance
FLFP
R
Source: authors’ calculations using data from Government of India Central Statistical Organisation (http://mospi.nic.in/), and the National Sample Survey Organisation (NSSO), Employment and Unemployment Survey. The 38th and 60th rounds are chosen (1983 and 2004/05, respectively), with the right-hand data point being the more recent. Note: States are excluded for which partial or only aggregate data is available. Growth is in real terms (constant prices) from 1981-2003, using Gross State Domestic Product.

21
Female unemployment rates have been increasing over the last two decades, more so
for urban women. Although they are thus employed far less often, when they are
employed, urban women are about four times more likely to be salaried employees
than rural women (40% of employed urban women versus 10% of rural), who
continue to dominate the agricultural sector, or engage in forms of petty production,
jobs in rural services not having been created. Despite being in regular, salaried
employment, the jobs available to them however tend to be clustered at the lower ends
of the labour markets, as service providers in hospitals, schools and domestic homes.
Both in rural and in urban areas, wages (averaged across all workers) are higher for
men than for women: about 40% higher in 2004/05 for urban areas, and about 85%
for rural areas. In percentage terms, the gender wage gap in rural areas is about now
what it was in 1983/84; however, in urban areas it declined from 71% in 1983/84 to
the 40% mentioned in 2004/05. This declining wage gap in urban areas is interesting.
Taking a closer look, it transpires that wages of both rural and urban women have
risen (in real terms) by about 90%. Wages of rural men grew by a similar percentage.
However, wages of urban men “only” grew by 55%, which explains the declining
wage gap in urban areas. Taking an even closer look than that, it is nonetheless the
case that the gender wage gap has widened most (more than for other category, be it
in rural or in urban areas) for higher-educated women in urban areas. The declining
overall gap in urban areas is thus due to the expansion of employment for women
with relatively little education at the bottom rungs of the labour market.
We use panel data regression analysis to estimate the effects on household income
growth of male and female employment, disaggregated by employment type.
Unsurprisingly, male employment (of all types) has much larger effects on household
income growth than female employment (a direct result of higher hourly earnings).
The very large growth effects that the literature attributes to (hypothetical) increases
in FLFP in India will only come about if wages and human capital are equalised
across men and women. This in turn requires the removal of barriers to female
economic participation: their “time poverty” that arises from their domestic duties,
social norms, employers’ preferences reflected in lower wages, parental
discrimination in investing in the human capital of boys more than in girls, barriers of
all sorts in accessing and continuing schooling, and so forth. It is then imperative that

22
these issues are tackled simultaneously, at least in so far as the growth implications of
the promotion of female employment are concerned.
Policy Implications
Labour force participation is an important sphere of life, which enhances control over
income and consequently autonomy for women. Women lack property rights and have
few benefits from lifelong work which is either unpaid or lacking benefits in the
informal sector. Widow destitution in old age is then only to be expected.
· As a majority of women are in informal employment, there is urgent need to
pay attention to the payment of remunerative wages, worker benefits
including child-care and old age security as well as safety, in short, the
need to ensure ‘decent work’.
· Quick redressal mechanisms to deal with sexual harassment at the
workplace need to be operationalised (The Sexual Harassment Bill is yet to
be passed by Parliament, see Annexure 1).
· There is need to focus on skill training and vocational education alongside
basic education in order to provide women, in particular from the lower
caste groups, employable skills, in the high growth sectors.
· Expansion of non-farm employment and self-employment in rural areas
through the provision of adequate credit and other resources to women and
the lower castes can enhance the productivity of rural female labour.
· Provision of basic services to address women’s time poverty to be in place.
Rigidifying gender divisions of labour adversely affect growth
Low female supply response can be explained by both the expansion in domestic
work burdens, especially in urban areas and the increasingly rigid gender divisions of
labour. If the extended SNA activities (household maintenance and care functions as
per the System of National Accounts) are included as economic activities, then
women’s contribution is in fact higher than that of men (the problem then lies in
accounting for women’s work). Educational status does not seem to affect the time

23
spent on domestic activities. Rigidifying gender divisions of labour appear to be a
consequence of the broader shift in labour relations, in particular, higher male hourly
earnings across occupational and educational categories. This is reinforced by the
poor work environment for women – the lack of child-care, worker benefits, and the
growing exposure to abuse and harassment at the workplace.
Women’s reproductive work can have several economic implications. It reduces
educational achievements and places restrictions on time which decreases market value
and opportunities, it is physically demanding thus affecting health, productivity and
maintenance of the future labour force and it is work that is neither paid for nor
included in official accounting. Policies are therefore essential for addressing the time
constraint faced by women.
Policy Implications
· Improvement in basic services and infrastructure provision such as the
provision of drinking water, electricity, grain mills and transport services,
· Improved access to education and health services and markets for essential
commodities.
· Functional child-care facilities of good quality need to be prioritised, both in
rural and urban contexts.
Fertility Declines enhances per capita growth
As mentioned at the start, the accelerated growth per capita in the recent decade is as
much a result of growth in GDP as a decline in population growth due to reducing
fertility. While the TFRs declined from 3.39 to 2.68 over the decade at the national
level, the decline was faster in urban areas, for the upper castes (classes), for those
with higher education and in the southern states. While changes in wage structures
and employment opportunities for women could potentially lead to a decline in
fertility by shifting women’s time allocation, the major determinants of fertility
decline in the Indian context appear to be increase in female literacy and improved
access to health services. In both cases, SCs and STs continue to be at a disadvantage.
Public policies could here be influential not just through reproductive policies, but

24
through general health, welfare and social security policies on the one hand and
improvement in infrastructure and non-discriminatory service provision on the other.
Coercive action to reduce fertility can however have negative implications for
women. With continued son preference and male desire for more children, sex-
selective abortion is a stark example of female disadvantage.
Policy Implications
· Priority to provision of adequate public health services, as fertility control is
crucially dependent on this. States such as Kerala with near-total coverage
of public health services have attained stable fertility rates across caste
categories, while those witnessing a privatisation of health services, have
ended up excluding the poorest, especially SCs and STs.
· Removal of wage gaps and improved employment opportunities to women
and lower caste groups.
· Provision of state services and infrastructure that can support women’s
autonomy and decision-making.
· Educational curriculum to help shift attitudes and behaviours towards son
preference as the desire to have adequate number of sons as part of a small
family has led to gross violations of the PNDT Act (Annexure 1).
Access to assets and finances supports growth
Substantial productivity gains derive from the control over landed assets and money
by women. Yet, women in general, but SC/ST women in particular, are excluded from
resource access and control, whether land, technology or credit, reflecting perhaps a
lack of bargaining power. While there is a general decline in per capita operational
landholdings (confirming the declining trend in self-employment in agriculture), SCs
and STs have on average a third in value of assets in relation to Others. Micro-credit
interventions have expanded over the last decade, seeking to give women access to
credit, but have not made a substantial impact in addressing livelihood concerns.
Access to loans continues to be low. Entrepreneurship, as a consequence, is lower
amongst the SCs and STs; a result of lack of resources alongside social stigma.

25
In terms of women’s autonomy, SC women seem to have lost any advantage they may
have had in the past. Apart from material deprivation, they are prone to more violence
and lack substantial decision-making power. Interestingly, Other women seem to be
improving their relative indicators of autonomy, perhaps a result of education. OBC
women appear to do the worst.
Finally, participation by women in local government and community-level decision-
making has improved on account of the Constitutional 73rd and 74th amendment Acts,
with considerable impacts on the nature of local investments. Their performance
however appears to be linked to both caste and educational levels.
Policy Implications
· To achieve productivity gains, need to reform inheritance laws to give
women control over landed property.
· Ensure access to a package of inputs and services that include credit,
technology, information on agricultural methods, irrespective ofand
delinked from ownership of land.
· Credit through Self help Groups needs to respond to women’s livelihood
needs, rather than focusing on micro-finance for small-scale, secondary and
often marginal activities.
· Support self-employment and non-farm employment for women through
provision of market opportunities, as well as addressing issues of time
poverty and requisite skills (see previous sections) alongside credit.
· Provide support to women to participate in public decision-making processes
in the form of training, honorariums, adequate equipment etc that can build
upon their existing knowledge and experience.
Links between caste, gender and growth are not linear
Growth appears to have no direct link with either inter-caste disparity or the level of
development of SCs in relation to Others. Further, gender disparities persist within
each caste group. A positive development is the improvement in the Gender Caste
Development Index over the last decade across social groups. The possible
26
explanation lies in enhanced female education during this period. A state like UP,
which has failed to address gender-specific barriers to education then does much
worse in terms of gendered caste disparity than caste disparity alone. The benefits of
lower caste mobilisation have not here been shared equally by lower caste women.
What emerges quite clearly is that growth alone cannot deliver equality outcomes.
While gender and caste gaps have been improving over the last decade, the
improvement is but marginal in the last five years, which coincides with exceptionally
high rates of growth in both rural and urban areas. Growth therefore needs to go
alongside continuing policy commitments to make investments in human capital, in
particular, good quality education and health services, ensuring decent work
conditions including appropriate worker benefits and vocational and other skills, as
well as specific, targeted policies for SC/ST and women within these groups. The last
would include a host of affirmative action measures and incentives to help overcome
barriers posed by poverty, remoteness and social expectations.
While the above measures have been discussed, there is also need for regular
monitoring and reviews to identify what works, for whom and in which context. This
is particularly important as in a diverse country such as India, wide regional variations
are visible in both growth and equality, related substantially to the nature of policies
pursued and the very direction of development. Some specific fiscal and policy
measures are therefore also suggested.
Policy Implications
Budget analyses have pointed to a decline in development expenditures over the last
decade, with cuts in economic services (covering functions that promote growth such
as infrastructure, but also rural development and poverty alleviation schemes) more
pronounced than in social services, though this too has declined. While education has
rightly remained a priority, specific, targeted policies and programmes, focused on
women, or SCs and STs, have declined.
Women-specific programmes include relief policies (widow benefits), gender-
reinforcing assistance (to support reproductive functions such as anganwadi workers)
and empowering schemes. The latter includes those that promote equity (such as

27
universal primary education) and those that promote equality (such as child-care
facilities, support to women teachers etc). An analysis of the West Bengal budget
shows that over 90% of the outlay on women-oriented programmes goes to equity
promoting schemes, in particular education, and very marginal amounts to equality
promoting and relief schemes (Banerjee and Roy, 2003).
· Need to support gender budgeting exercises across priority sectors as
identified above.
· Need to ensure budgetary allocations to relief policies (e.g widow benefits)
and equality-promoting policies (e.g child care).

28
Section 1 Introduction
Key themes Based on a wealth of new statistical analysis, carried out for the purpose of this GCGA, using a comprehensive range of large-scale all-India datasets, an extensive review of existing analysis, and new primary research in Uttar Pradesh and West Bengal, we empirically explore linkages between gender, caste and growth. The focus is on growth implications of the myriad of gender inequities that are found in India, and caste is treated as a mediating variable: gender and caste interact, so that not only do gender inequities differ between social groups, but also do caste-based practices themselves co-determine growth implications of gender inequities. This report summarises the analysis. The presentation of our findings broadly follows the main pathways recognised in the literature through which gender inequality impacts on growth1. First and foremost among these are the growth opportunities that are missed because of gender discrimination in education (Section 3). Second, growth is known to be potentially substantially lower than a country’s human resources would permit because of gendered access to employment (including self-employment) opportunities (Section 4). Third, the gendered division of labour frequently mutes the female supply response, so that market signals are not as much acted on as would be optimal for the sake of economic growth (Section 5). Fourth, female empowerment is known to be crucial for reducing fertility levels, which facilitates sustained per capita income growth (Section 6). Fifth, equal gender relations in household-level decision-making processes (regarding investment, savings, borrowing and the education and health care of children) and community-level decision-making processes are known to affect both the efficiency of these processes and the decisions reached, with potentially major implications for growth (Section 7). The presentation of the main findings is preceded by a descriptive analysis of gender and caste inequality in participation in growth (in Section 2). A background of the institutional and policy context that relates to gender and caste (in)equality is presented in Annexure 1. Suffice to say at this point that post-Independence, in its efforts to shape a gender-just society and a society free of caste discrimination, India has created a strong legal and policy framework to achieve these ends. Yet the constitutional guarantee of equality has remained an unrealized dream, pointing to the need to take into account not just social and cultural norms, but also the host of informal institutions that support or hinder the achievement of equality, irrespective of the levels of growth. A brief summary of the methodology of the report is in Annexure 2. A technical note on the panel data econometric analysis, and the unemployment and employment definitions, used in the report are in Annexure 3. 1 See Verschoor et al. (2006), Blackden et al. (2006) and Klasen (2005) for recent reviews of the large literature

29
Section 2
Female and social groups’ participation in growth
Accelerating growth since the early 1980s India’s growth spurt since the early 1980s has been much analysed and commented on2. Although claimed by some as evidence for success of a pro-market strategy, Kohli (2006a, 2006b) argues persuasively that it should primarily be seen as evidence for the State’s intensifying commitment to the existing business sector, in which price distortions were used as often as “getting the prices right”. Whereas GDP growth amounted to less than four percent per year during 1965-74, it has been close to six percent per year since 1985, an increase in the growth rate by one-and-a-half times (Table 2.1). However, it is sometimes overlooked that the increase in the annual rate of GDP per capita growth is considerably more pronounced than that in GDP: from 1.4 percent during 1965-74 to 4.3 percent during 1995-2004, a threefold increase (Table 2.1 and Figure 2.1). An annual growth rate of 1.4 percent implies that GDP per capita doubles every 50 years; a rate of 4.3 percent that it doubles every 16 years. This is very fast – and fast accelerating – growth indeed.
Table 2.1 Growth, by Sector, 1965 – 2004 (percent per annum) 1965-
1974 1975-1984
1985-1994
1995-2004
1991-2004
1980-2004
GDP 3.75 4.30 5.74 5.99 5.74 5.77 Population 2.26 2.10 2.00 1.65 1.74 1.88 GDP per capita 1.39 2.02 3.66 4.29 3.95 3.81 Services 4.90 5.14 6.52 8.20 7.53 7.31 Industry 5.42 5.94 6.30 5.75 5.67 6.25 Agriculture 3.30 2.29 3.77 2.93 2.92 3.14
Source: Sector, GDP and GDP per capita growth figures are based on authors’ calculations using data from World Development Indicators, Development Data Group, World Bank, Various Issues. Population Statistics are from the Population Division of the Department of Economic and Social Affairs of the United Nations Secretariat. Note: Figures are in real terms based on local constant price data. Sector growth rates are calculated using ISIC sector definitions.
2 For analytic accounts see De Long (2003), Rodrik and Subramanian (2004), Virmani (2004) and Kohli (2006a, 2006b)

30
Figure 2.1 GDP per Capita Growth, 1965 - 2005
0
1
2
3
4
5
1965-1969 1970-1974 1975-1979 1980-1984 1985-1989 1990-1994 1995-1999 2000-2004
Years
%
Source: authors’ calculations using data from Development Data Group, World Bank, World Development Indicators, Various Issues. Note: Figures are in real terms based on local constant price data. What matters for economic wellbeing is GDP per capita growth, not GDP growth as such. The favourable difference between the increase in GDP and GDP per capita growth is due to the fact that India’s population growth has slowed down in recent years (Table 2.1). This suggests immediately that one of the primary ways in which female empowerment has contributed to growth in recent years is through helping bring about a reduction in the level of fertility3. Lower female and disadvantaged social groups’ participation in faster-growing sectors The services sector has overtaken industry as the main contributor to GDP growth. Agricultural growth has remained relatively sluggish and more or less constant, hovering around three percent per year (Table 2.1). Until 1985, industry was the fastest-growing sector, growing at an annual rate of between five and six percent. Whereas industrial growth only marginally improved on its pre-1985 levels, growth of the services sector accelerated: its annual growth rate was less than five percent during 1965-74 and increased every subsequent ten-year period until it became over eight percent for the period 1995-2004. Reflecting the relative size of sectors, Figures 2.2 and 2.3 show that since 1990 services has contributed more to GDP growth than industry; for India’s modern growth period, 1980-2004, agriculture, despite being by far the largest employer, has contributed only 18 percent to overall GDP growth, industry 36 percent, and services 46 percent.
3 There is no suggestion here that fertility reduction can be achieved without this affecting the rate of growth of GDP; population and growth dynamics are complex and interrelated.

31
Figure 2.2 Contribution of Sectors to GDP growth, 1980 - 2004
Services46%
Industry36%
Agriculture18%
Source: authors’ calculations using data from Development Data Group, World Bank, World Development Indicators, Various Issues. Note: Figures are the difference between each sector’s contribution to GDP in 1980 and 2004 expressed as a percentage of the increase in GDP over that period. The ISIC definition is used for defining sectors.
Figure 2.3 Sector’s Share of GDP Growth
0
1
2
3
4
5
6
7
8
9
1965-1969 1970-1974 1975-1979 1980-1984 1985-1989 1990-1994 1995-1999 2000-2004
Years
% G
row
th ServicesIndustryAgriculture
Source: authors’ calculations using data from Development Data Group, World Bank, World Development Indicators, Various Issues. Note: Figures are the difference between each sector’s contribution to GDP in 1980 and 2004 expressed as a percentage of the increase in GDP over that period. The ISIC definition is used for defining sectors.

32
The larger is a sector’s contribution to GDP growth during 1980-2004, India’s period of exceptionally fast growth, the lower is female participation in that sector: it is about 35 percent in agriculture, 25 percent in industry, and less than 20 percent in services (Table 2.2). This is doubly unfortunate, since if women are employed in services, they are more likely (although still only in about a quarter of cases) to be regular salaried employees than when they are employed in industry or agriculture. Female casual labourers and helpers in household enterprises combined make up about 85 percent of the female workforce in agriculture, about 65 percent in industry, and about 45 percent in services. Female participation is thus lowest in the sectors that grew fastest and where most job security can be found. Understanding the barriers to such participation is clearly important.
Table 2.2 Occupational Structure of Female Participation in the Workforce Growth FLFPR Self employed
HH enterprise Helper in a HH enterprise
Regular Salaried Employment
Casual Labourer
Agriculture 17.72 35.61 13.32 43.79 1.41 41.48 Industry 36.13 25.83 23.69 32.13 11.34 32.84 Services 46.15 18.20 28.81 26.75 24.16 20.28 Total 29.64 17.05 39.66 6.20 37.09
Source: authors’ calculations using data from Government of India Central Statistical Organisation (http://mospi.nic.in/), and the National Sample Survey Organisation (NSSO), Employment and Unemployment Survey, 61st round (2004/05). Note: Growth is a sector’s percentage contribution to overall GDP growth in India 1980-2004. Likewise, it is without exception the case that the faster a sector grows, the less likely it is that disadvantaged social groups participate in that sector (Table 2.3). For example, whereas 11.2 percent of the workforce in agriculture consists of members of Scheduled Tribes (ST), only 3.6 percent of the workforce in services consists of these (the corresponding figures for Scheduled Castes (SC) are 20.5 and 14.0 percent, respectively). And then within these disadvantaged groups, it is again without exception the case that female labour force participation in a sector is lower the faster that sector grows. So, whereas about 50 percent of the ST members that work in agriculture are female, only about 30 percent of them that work in services are (about 40 and 20 percent, respectively, for SC members).
Table 2.3 Female Participation in the Workforce, by Sector and Social Group
Growth Scheduled Castes
Of which Female
Scheduled Tribes
Of which Female
Others Of which Female
Agriculture 17.7 20.5 38.2 11.2 49.8 68.4 32.5 Industry 36.1 18.6 29.2 6.5 42.7 74.9 23.4 Services 46.1 14.0 22.2 3.6 29.4 82.4 17.0 Total 18.5 33.7 8.5 46.8 73.0 26.6
Source: authors’ calculations using data from Government of India Central Statistical Organisation (http://mospi.nic.in/), and the National Sample Survey Organisation (NSSO), Employment and Unemployment Survey, 50th round (1993/94). Note: Growth is the contribution (%) of that sector to overall economic growth 1980-2004. ‘Of which Female’ is the percentage of the previous column which is female. The NSSO 50th Round (1993/4) is used, as it is in the middle of the time period. The overall pattern is thus that the faster a sector grows, the less likely it is that women participate, and the less likely it is that disadvantaged social groups participate. Women from disadvantaged social groups are doubly disadvantaged.
33
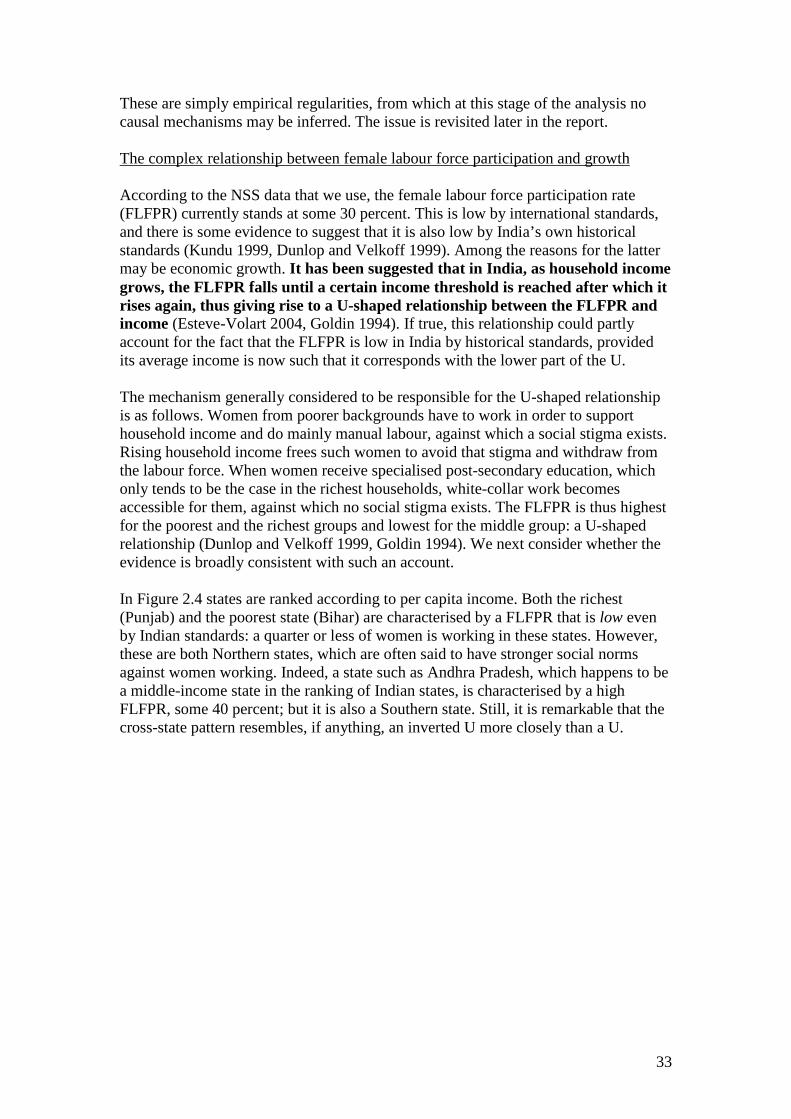
These are simply empirical regularities, from which at this stage of the analysis no causal mechanisms may be inferred. The issue is revisited later in the report. The complex relationship between female labour force participation and growth According to the NSS data that we use, the female labour force participation rate (FLFPR) currently stands at some 30 percent. This is low by international standards, and there is some evidence to suggest that it is also low by India’s own historical standards (Kundu 1999, Dunlop and Velkoff 1999). Among the reasons for the latter may be economic growth. It has been suggested that in India, as household income grows, the FLFPR falls until a certain income threshold is reached after which it rises again, thus giving rise to a U-shaped relationship between the FLFPR and income (Esteve-Volart 2004, Goldin 1994). If true, this relationship could partly account for the fact that the FLFPR is low in India by historical standards, provided its average income is now such that it corresponds with the lower part of the U. The mechanism generally considered to be responsible for the U-shaped relationship is as follows. Women from poorer backgrounds have to work in order to support household income and do mainly manual labour, against which a social stigma exists. Rising household income frees such women to avoid that stigma and withdraw from the labour force. When women receive specialised post-secondary education, which only tends to be the case in the richest households, white-collar work becomes accessible for them, against which no social stigma exists. The FLFPR is thus highest for the poorest and the richest groups and lowest for the middle group: a U-shaped relationship (Dunlop and Velkoff 1999, Goldin 1994). We next consider whether the evidence is broadly consistent with such an account. In Figure 2.4 states are ranked according to per capita income. Both the richest (Punjab) and the poorest state (Bihar) are characterised by a FLFPR that is low even by Indian standards: a quarter or less of women is working in these states. However, these are both Northern states, which are often said to have stronger social norms against women working. Indeed, a state such as Andhra Pradesh, which happens to be a middle-income state in the ranking of Indian states, is characterised by a high FLFPR, some 40 percent; but it is also a Southern state. Still, it is remarkable that the cross-state pattern resembles, if anything, an inverted U more closely than a U.

34
Figure 2.4 Female Participation in the Workforce by State,
with States Ranked According to Per Capita Income
0
5
10
15
20
25
30
35
40
45
50
Punjab
Haryan
a
Gujarat
Tamil N
adu
Karnata
kaKera
la
West B
enga
l
Andhra
Prad
esh
Himac
hal P
rades
h
Madhy
a Prad
esh
Jammu &
Kas
hmir
Jhark
hand
Uttar P
rades
h
Assam
Orissa
Bihar
States
%
Source: Development Data Group, World Bank, World Development Indicators, and authors’ calculations using data from Government of India Central Statistical Organisation (http://mospi.nic.in/), and the National Sample Survey Organisation (NSSO), Employment and Unemployment Survey, 61st round (2004/05) Note: States are excluded where partial or only aggregate data is available Figure 2.5 ranks states according to recent growth performance instead of per capita income (which measures cumulated growth performance). Here, there is a hint that faster-growing states tend to be characterised by a higher FLFPR, but there are plenty of exceptions. Indeed, in Figure 2.6, where changes in the FLFPR concurrent with growth are presented, the safest conclusion to be drawn is that there is no overall pattern. Among the six fastest-growing states, more often than not the FLFPR rises, but then again the two fastest-growing states, Rajasthan and Gujarat, experienced a drop in the FLFPR. Among the states with medium-to-poor recent growth performance, rises and falls in the FLFPR are seen about equally frequently. The point is neatly illustrated by the two poorest performers: Bihar saw a sharp drop in its FLFPR and Assam experienced the largest rise of all states.

35
Figure 2.5 Female Contribution to the Workforce by State, with States Ranked According to Their Post-1980 Growth Performance
0
5
10
15
20
25
30
35
40
45
50
Rajasth
an
Gujarat
Haryan
a
Andhra
Prad
esh
Karnata
ka
Tamil N
adu
Jhark
hand
Himac
hal P
rades
h
West B
enga
l
Kerala
Jammu &
Kas
hmir
Punjab
Uttar P
rades
h
Madhy
a Prad
esh
Orissa
Bihar
Assam
Fastest-Growing States Slowest-Growing States
%
Source: authors’ calculations using data from Government of India Central Statistical Organisation (http://mospi.nic.in/), and the National Sample Survey Organisation (NSSO), Employment and Unemployment Survey, 50th round (1993/94) Note: States are excluded for which partial or only aggregate data is available. Growth is in real terms (constant prices) from 1981-2003, using Gross State Domestic Product. The NSSO 50th round is chosen, as it represents the middle of the time period.
Figure 2.6 Changing Female Contribution to the Workforce by State, with States Ranked According to Their Post-1980 Growth Performance
Rajasthan
Haryana
Kerala
Punjab
Madhya Pradesh
Karnataka
Andhra Pradesh
Gujarat Tamil Nadu
Himachal Pradesh
Jharkhand
West Bengal
Jammu & Kashmir Uttar Pradesh
Orissa
BiharAssam
0
5
10
15
20
25
30
35
40
45
50
States, Ranked From High to Low Growth Performance
FLFP
R
Source: authors’ calculations using data from Government of India Central Statistical Organisation (http://mospi.nic.in/), and the National Sample Survey Organisation (NSSO), Employment and Unemployment Survey. The 38th and 60th rounds are chosen (1983 and 2004/05, respectively), with the right-hand data point being the more recent. Note: States are excluded for which partial or only aggregate data is available. Growth is in real terms (constant prices) from 1981-2003, using Gross State Domestic Product.
36
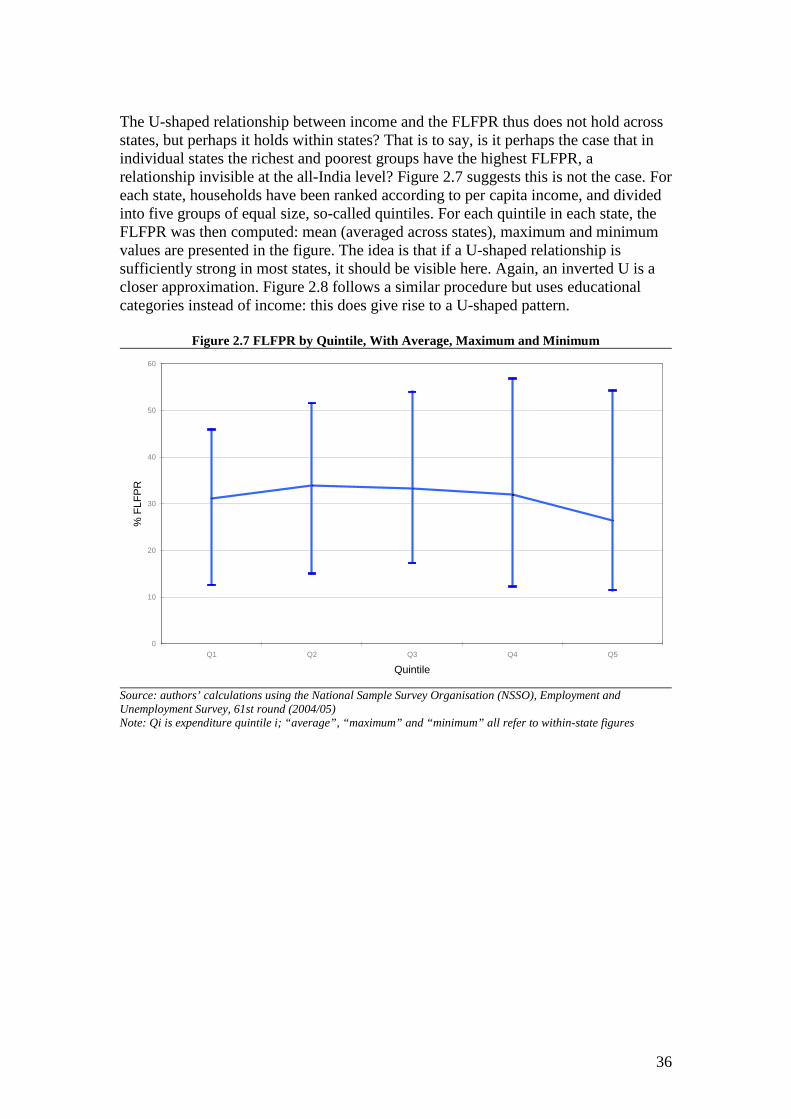
The U-shaped relationship between income and the FLFPR thus does not hold across states, but perhaps it holds within states? That is to say, is it perhaps the case that in individual states the richest and poorest groups have the highest FLFPR, a relationship invisible at the all-India level? Figure 2.7 suggests this is not the case. For each state, households have been ranked according to per capita income, and divided into five groups of equal size, so-called quintiles. For each quintile in each state, the FLFPR was then computed: mean (averaged across states), maximum and minimum values are presented in the figure. The idea is that if a U-shaped relationship is sufficiently strong in most states, it should be visible here. Again, an inverted U is a closer approximation. Figure 2.8 follows a similar procedure but uses educational categories instead of income: this does give rise to a U-shaped pattern.
Figure 2.7 FLFPR by Quintile, With Average, Maximum and Minimum
0
10
20
30
40
50
60
Q1 Q2 Q3 Q4 Q5
Quintile
% F
LFP
R
Source: authors’ calculations using the National Sample Survey Organisation (NSSO), Employment and Unemployment Survey, 61st round (2004/05) Note: Qi is expenditure quintile i; “average”, “maximum” and “minimum” all refer to within-state figures
37
Figure 2.8 FLFPR by Education, With Average, Maximum and Minimums
0
10
20
30
40
50
60
70
80
90
Illiterate Primary Middle and Secondary Graduates and Above
Education
FLFP
R (%
)
Source: authors’ calculations using the National Sample Survey Organisation (NSSO), Employment and Unemployment Survey, 61st round (2004/05) Note: “average”, “maximum” and “minimum” all refer to within-state figures The broad patterns suggested here are thus not consistent with a U-shaped relationship between household income and female labour force participation, despite the plausible mechanism that has been suggested for it by other analysts. However, it is the case that illiterate women and those with post-secondary education are both more likely to be employed than those with intermediate levels of education, which is consistent with a suggestion that the former work out of necessity and the latter out of choice. Even so, the FLFPR in the latter group is still only 40 percent. Growth and presence in the workforce of disadvantaged social groups are imperfectly related Finally, the point should be made that having a sizable proportion of disadvantaged groups does not seem to be a major obstacle for states’ overall growth performance (Figure 2.9). Although some of the poorest and most poorly growing states have among the highest proportion of SCs and STs in their workforce (Orissa and Madhya Pradesh both have about 40 percent), on the whole there is not much of a pattern when states’ growth performance and proportion of disadvantaged groups are plotted against each other. It is undoubtedly the case that, despite a general shift in attitudes towards caste-based social rankings, severe limits to economic mobility for the lower castes persist (Jayaraman and Lanjouw 1999). Nonetheless, per capita income growth of SCs and STs during the period 1993-2005 has been reported to be higher than that for other groups (Dubey and Verschoor 2007). It is somewhat of an empirical puzzle how this relates to the phenomenon, reported above, that they are disproportionately absent from the fastest-growing sectors.

38
Figure 2.9 Scheduled Castes’ and Scheduled Tribes’ Presence in the Workforce, By State, With States Ranked According To Post-1980 Growth Performance
0
10
20
30
40
50
60
70
80
90
100
Rajasth
an
Gujarat
Haryan
a
Andhra
Prad
esh
Karnata
ka
Tamil N
adu
Jhark
hand
Himac
hal P
rades
h
Wes
t Ben
gal
Kerala
Jammu &
Kas
hmir
Punjab
Uttar P
rades
h
Madhy
a Prad
esh
Orissa
Bihar
Assam
State
%
OtherScheduled TribesScheduled Castes
Source: authors’ calculations using data from Government of India Central Statistical Organisation (http://mospi.nic.in/), and the National Sample Survey Organisation (NSSO), Employment and Unemployment Survey, 50th round (1993/94) Note: States are excluded for which partial or only aggregate data is available. Growth is in real terms (constant prices) from 1981-2003, using Gross State Domestic Product. The NSSO 50th round is chosen, as it represents the middle of the time period. Conclusions and Policy Implications
This section simply sets the scene for the analysis that follows. Nonetheless, the broad patterns sketched here clearly outline the challenge that faces policymakers:
· Growth has been accelerating rapidly since the early 1980s · Women and disadvantaged social groups are disproportionately absent from
the faster-growing sectors; women from disadvantaged social groups are doubly disadvantaged in this respect
· Female labour force participation is extremely low by international standards · Contrary to earlier suggestions, there is no convincing evidence that the
poorest and richest groups have relatively high, groups in the middle relatively low female labour force participation rates (the U-shaped relationship)
· However, illiterate women have the highest labour force participation rates, followed by those with primary education, followed by graduates and above, followed by those with middle and secondary education. There is a suggestion here that poorly educated women by and large work out of necessity; highly educated women out of choice
The need for special provisions to include women and those of the marginalised social groups into the high growth sectors thus remains critical. One finds evidence of some large companies in the IT sector, such as Infosys and Tatas, setting up special training programmes to provide adequate skills to the marginalised to participate in this sector, which the education system appears unable to deliver. At the same time, the underlying causes of the relative exclusion

39
of women and disadvantaged groups from high-growth sectors are complex and multi-faceted, rooted as they are in the social and economic structure. Comprehensively dealing with these causes is bound to be enormously challenging. The analysis in subsequent sections begins to unravel this complexity.
40
Section 3 Education
Education is key for Growth Schultz (2002) posits three growth-motivated arguments for increasing public expenditures on girls’ schooling. First, the marginal returns to schooling for women tend to exceed those for men, the more so the larger the initial gap between male and female education. Second, the human capital formation of children is more closely related to their mother’s education than it is to their father’s. Third, more educated women work more hours in the labour force, broadening the tax base and reducing tax distortions. If Schultz’s line of reasoning is correct, closing the gender gap in education would be associated with higher economic growth. Studies that make use of cross-country regressions of economic growth on the gender gap in education (and a host of appropriate control variables) broadly support Schultz’s conjectures. Dollar and Gatti (1999), Forbes (2000), Klasen (2002), Klasen and Francesca (2003), Knowles et al. (2002), and Abu-Ghaida and Klasen (2004) are the main such cross-country studies. All find that growth is negatively affected by the gender gap in education, a finding that is robust to differing definitions of the dependent and independent variables, varying estimation methodologies, and extensions of the dataset. In India too several studies have sought to examine the returns to education for women. Bhandari and Bordoloi (2006) find the income returns to female education to be higher than for males. The explanation however lies in the fact that the “base” incomes for females is about 36 per cent lower than for males, making for higher returns in percentage terms, rather than higher incomes per se. While greater levels of education is likely to increase both the likelihood of being employed and the income earned for work, they also find that the returns from elementary (primary and middle) education are quite low (see also Tilak, 2007), and ceteris paribus, women, lower social groups, rural residents and non-English speakers have both significantly lower incomes and a lower likelihood of being employed. Individuals from SC and ST households are likely to have about 10 per cent lower incomes than those from non-SC/ST households and women’s incomes are likely to be about a third lower than males having the same household and educational characteristics. Ramaswamy (2007), in his analysis of interstate variations in educational attainments finds that the five bottom states in terms of growth had only 12% with secondary or higher secondary against a national average of 16%, with higher income states at a clear advantage. He finds a relationship between states with higher GER (gross enrolment ratio) for secondary education and labour productivity growth (see also Kingdon and Unni, 1997). Gender divides persist in educational attainment by social group and location Table 3.1 shows that literacy has been rising consistently in the period, across male and females, both urban and rural, the primary reason being the enhanced access to basic education at the village level (including the Sarva Shiksha Abhiyan, or
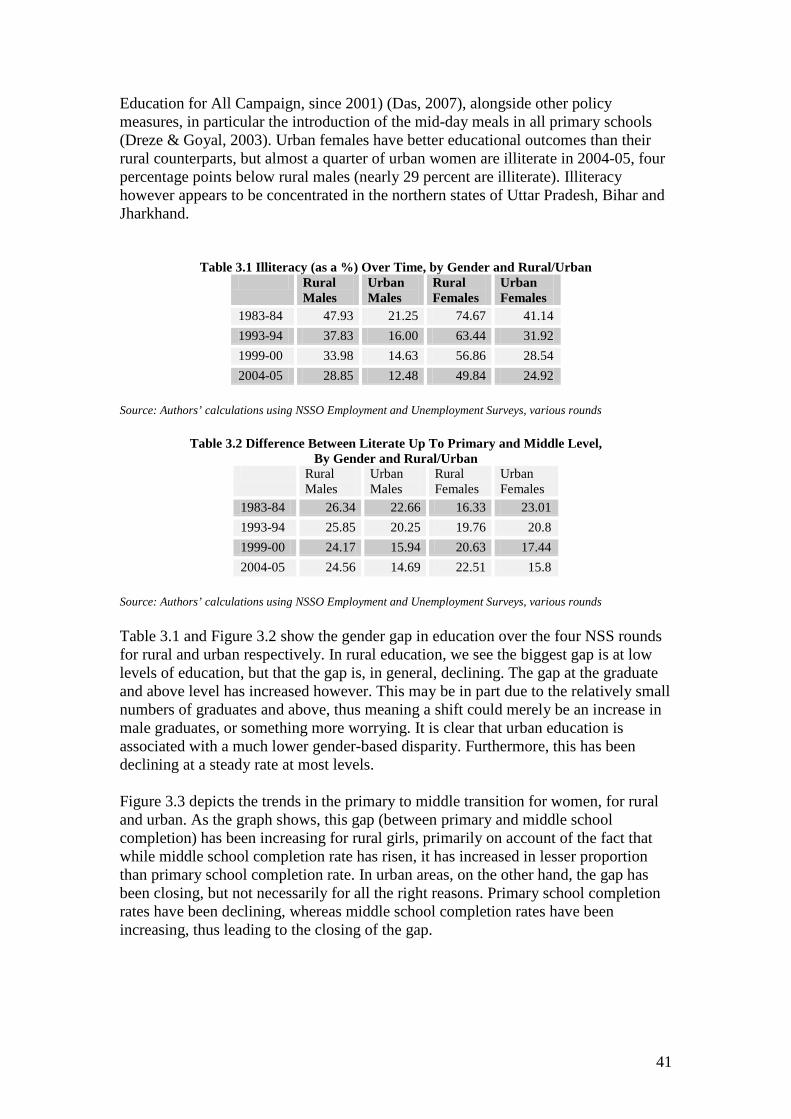
41
Education for All Campaign, since 2001) (Das, 2007), alongside other policy measures, in particular the introduction of the mid-day meals in all primary schools (Dreze & Goyal, 2003). Urban females have better educational outcomes than their rural counterparts, but almost a quarter of urban women are illiterate in 2004-05, four percentage points below rural males (nearly 29 percent are illiterate). Illiteracy however appears to be concentrated in the northern states of Uttar Pradesh, Bihar and Jharkhand.
Table 3.1 Illiteracy (as a %) Over Time, by Gender and Rural/Urban Rural
Males Urban Males
Rural Females
Urban Females
1983-84 47.93 21.25 74.67 41.14 1993-94 37.83 16.00 63.44 31.92 1999-00 33.98 14.63 56.86 28.54 2004-05 28.85 12.48 49.84 24.92
Source: Authors’ calculations using NSSO Employment and Unemployment Surveys, various rounds
Table 3.2 Difference Between Literate Up To Primary and Middle Level, By Gender and Rural/Urban
Rural Males
Urban Males
Rural Females
Urban Females
1983-84 26.34 22.66 16.33 23.01 1993-94 25.85 20.25 19.76 20.8 1999-00 24.17 15.94 20.63 17.44 2004-05 24.56 14.69 22.51 15.8
Source: Authors’ calculations using NSSO Employment and Unemployment Surveys, various rounds Table 3.1 and Figure 3.2 show the gender gap in education over the four NSS rounds for rural and urban respectively. In rural education, we see the biggest gap is at low levels of education, but that the gap is, in general, declining. The gap at the graduate and above level has increased however. This may be in part due to the relatively small numbers of graduates and above, thus meaning a shift could merely be an increase in male graduates, or something more worrying. It is clear that urban education is associated with a much lower gender-based disparity. Furthermore, this has been declining at a steady rate at most levels. Figure 3.3 depicts the trends in the primary to middle transition for women, for rural and urban. As the graph shows, this gap (between primary and middle school completion) has been increasing for rural girls, primarily on account of the fact that while middle school completion rate has risen, it has increased in lesser proportion than primary school completion rate. In urban areas, on the other hand, the gap has been closing, but not necessarily for all the right reasons. Primary school completion rates have been declining, whereas middle school completion rates have been increasing, thus leading to the closing of the gap.

42
Figure 3.1 Gender Gap in Education, Rural
-30 -25 -20 -15 -10 -5 0 5 10 15 20
Not literate
Literate and upto primary
Middle
Secondary/higher secondary
Graduate and above
1983-84
1993-94
1999-00
2004-05
Source: Authors’ calculations using NSSO Employment and Unemployment Surveys, various rounds Note: Gender gap defined as: # of males per 100 in that level of education minus # of females per 100 in that level of education
Figure 3.2 Gender Gap in Education, Urban
-30 -25 -20 -15 -10 -5 0 5 10 15 20
Not literate
Literate and upto primary
Middle
Secondary/higher secondary
Graduate and above
1983-84
1993-94
1999-00
2004-05
Source: Authors’ calculations using NSSO Employment and Unemployment Surveys, various rounds Note: Gender gap defined as: # of males per 100 in that level of education minus # of females per 100 in that level of education This is particularly worrying from a perspective of growth. As Jeffrey et al indicate in the case of northern India, ‘rural people usually regard an “educated” person as someone with at least an eighth class pass and someone with just a Grade V pass as “uneducated” (Jeffrey, Jeffery et al. 2005: 2089). While this reflects the social

43
perception of the value of different levels of education, Vasudeva-Dutta (2004) demonstrates through several regression equations the significant jump in wage earnings between secondary and higher education, suggesting that secondary education may be a threshold level for education to influence earnings. After correcting for household and individual characteristics and state effects, Bhandari and Bordoloi (2006) too find that compared to illiterates those who have completed primary have 31 per cent greater incomes, those who have completed middle school by 45 per cent, those who have completed schooling by 89 per cent, graduates by 136 per cent and professionals by 171 per cent. Table 3.3 shows the breakdown of these educational achievements and disparities by social group, gender and rural/urban. It reveals a very clear gender divide within each caste category. So, for instance, the proportion of rural SC women who were graduates and above was a virtually non-existent 0.52 percent in 2004-05. Given the high drop out rates at the middle school level, this is perhaps only to be expected, but the final outcome is a cause of concern. Also, this explanation is not complete because while middle school drop-outs can be seen across all caste groups, we still find a disparity by gender. This seems to imply that social and familial attitudes as well as objective factors prevent the education of the girl child relatively independent of the caste hierarchy. Educating girls beyond a point is considered futile (given the imperatives of marriage); middle school age girls are needed at home to help mothers with house work and also take care of the younger siblings; middle schools do not exist in all villages, so attending middle school would mean travelling some distance that is both costly and unsafe for girls who have just attained puberty.
Figure 3.3 Gap Between "Literate Up To Primary" And Middle Level for Girls
0
5
10
15
20
25
Rural Urban1983-84 1993-94 1999-00 2004-05
Source: Authors’ calculations using NSSO Employment and Unemployment Surveys, various rounds Note: Gap between levels of education defined as: # of girls per 100 at "literate up to primary level" minus # of girls at middle level
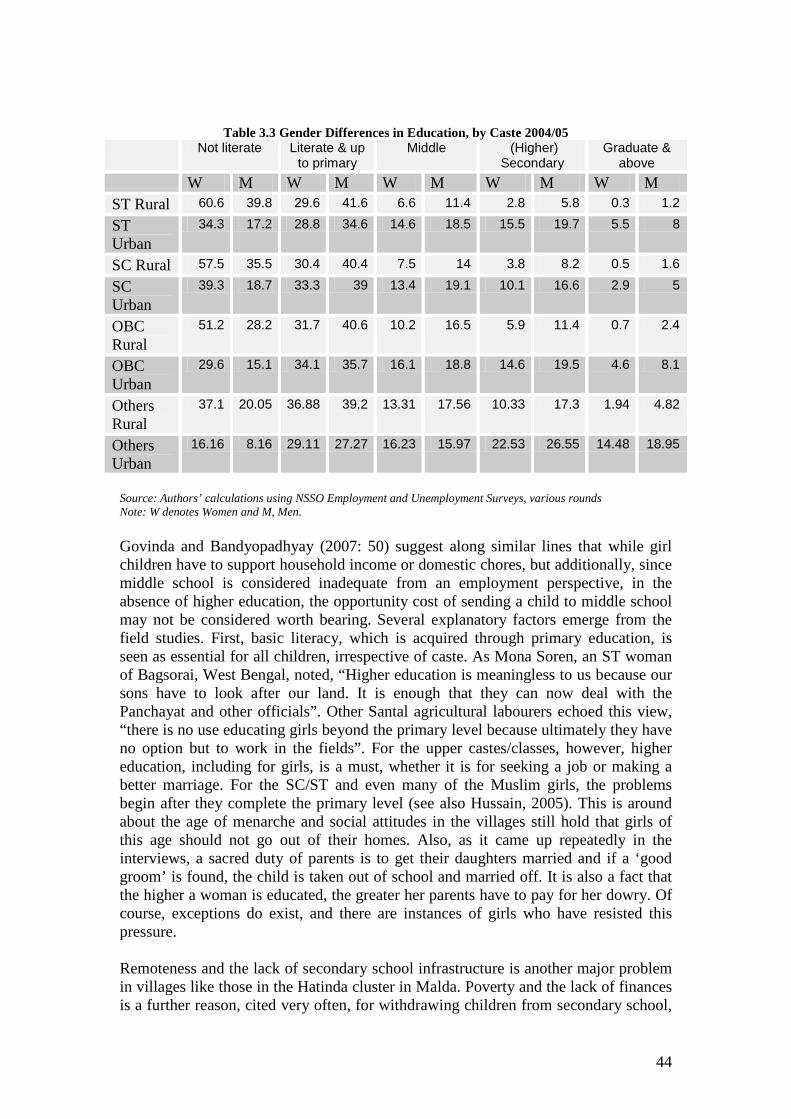
44
Table 3.3 Gender Differences in Education, by Caste 2004/05 Not literate Literate & up
to primary Middle (Higher)
Secondary Graduate &
above W M W M W M W M W M ST Rural 60.6 39.8 29.6 41.6 6.6 11.4 2.8 5.8 0.3 1.2
ST Urban
34.3 17.2 28.8 34.6 14.6 18.5 15.5 19.7 5.5 8
SC Rural 57.5 35.5 30.4 40.4 7.5 14 3.8 8.2 0.5 1.6
SC Urban
39.3 18.7 33.3 39 13.4 19.1 10.1 16.6 2.9 5
OBC Rural
51.2 28.2 31.7 40.6 10.2 16.5 5.9 11.4 0.7 2.4
OBC Urban
29.6 15.1 34.1 35.7 16.1 18.8 14.6 19.5 4.6 8.1
Others Rural
37.1 20.05 36.88 39.2 13.31 17.56 10.33 17.3 1.94 4.82
Others Urban
16.16 8.16 29.11 27.27 16.23 15.97 22.53 26.55 14.48 18.95
Source: Authors’ calculations using NSSO Employment and Unemployment Surveys, various rounds Note: W denotes Women and M, Men. Govinda and Bandyopadhyay (2007: 50) suggest along similar lines that while girl children have to support household income or domestic chores, but additionally, since middle school is considered inadequate from an employment perspective, in the absence of higher education, the opportunity cost of sending a child to middle school may not be considered worth bearing. Several explanatory factors emerge from the field studies. First, basic literacy, which is acquired through primary education, is seen as essential for all children, irrespective of caste. As Mona Soren, an ST woman of Bagsorai, West Bengal, noted, “Higher education is meaningless to us because our sons have to look after our land. It is enough that they can now deal with the Panchayat and other officials”. Other Santal agricultural labourers echoed this view, “there is no use educating girls beyond the primary level because ultimately they have no option but to work in the fields”. For the upper castes/classes, however, higher education, including for girls, is a must, whether it is for seeking a job or making a better marriage. For the SC/ST and even many of the Muslim girls, the problems begin after they complete the primary level (see also Hussain, 2005). This is around about the age of menarche and social attitudes in the villages still hold that girls of this age should not go out of their homes. Also, as it came up repeatedly in the interviews, a sacred duty of parents is to get their daughters married and if a ‘good groom’ is found, the child is taken out of school and married off. It is also a fact that the higher a woman is educated, the greater her parents have to pay for her dowry. Of course, exceptions do exist, and there are instances of girls who have resisted this pressure. Remoteness and the lack of secondary school infrastructure is another major problem in villages like those in the Hatinda cluster in Malda. Poverty and the lack of finances is a further reason, cited very often, for withdrawing children from secondary school,

45
including boys. However, when it comes to making a choice between sons’ and daughters’ continuity, the axe usually falls on the latter. This also emerges from Chandrasekhar and Mukhopadhyay (2006) who notes that girls belonging to the poorest households have a 16% lower chance of attending primary schools than boys. In the Bahraich villages financial constraints were highlighted as a major reason for not sending children to school. The families were large, so out of 6 children, 2-3 may be educated. Here, very few SC or poor OBC children proceeded beyond the primary level. For Muslim girls, it was not even this, just a few years in the local madrasa. Finally, there is a major issue of quality, related also to the financial burdens. Secondary or post secondary education is linked to the notion of getting jobs, more so in the government sector. But these are hard to come by in the current context. In order to even be able to compete, the school education is seen as sorely lacking, private tutors have to be appointed and they are expensive (see also Pratichi Trust, 2002, Rana et al, 2005, Majumdar, 2006). In the UP villages, private schools and coaching centres have mushroomed and apart from the upper castes, many OBC boys and girls too are joining these schools. Private education, though more expensive, appears more promising in terms of its quality, and consequently returns. Parents and children additionally complained of discrimination, including physical and verbal use. SC girls probably bear the double stigma on account of their gender and caste. Finally, with the anganwadi centres hardly operational, older SC girls here end up either working for a wage or taking care of the domestic work burdens rather than going to middle school. Interestingly it is a very similar pattern for the OBCs, but additionally OBC girls are also married off early. These girls were however not without aspirations. They wanted a secondary school at the panchayat level, easily accessible to them as well as opportunities for vocational training that could help them find jobs in the future. Another noteworthy difference between the SC and Other women is that for the latter, the outcomes for urban women are sharply better than their rural counterparts, especially for “graduates and above”. The proportion of urban Other girls who are literate up to primary has been declining over the period. That could be due to the fact that a larger number is proceeding on to the next stage, as indeed the graph indicates. It may be worth mentioning a few key developments in the education sector in the last few years that suggest a much worse scenario for girls and women in the future. With the push to meet international commitments and universalise education, the government has adopted various short-term measures such as the recruitment of local para-teachers to support teaching in remote areas and thus ensure universal coverage. This in itself is not a bad move. However, it gets problematic when there is no simultaneous move to recruit and appoint trained teachers in these schools. There are a large number of vacancies in teaching positions, especially in remote areas, and not sufficient response to fill these vacancies. While the para-teachers are often highly committed, lacking both qualifications as well as training, there is a limit to their capacity to deliver high quality education.
Realising this and fully aware of the importance of education for economic mobility, the middle classes have completely moved away from public education. There is a trend even amongst the poor to where possible send their children to private schools. Private schools however cost money and hence parents often have to choose which

46
child should go, and here, girls tend to lose out to their brothers. As the Probe Report notes, “parents are not generally opposed to female education, but they are reluctant to pay for it” (1999:97). Ramachandran and Sahjee (2002) argue that soon one will find a new segregation in basic education – with Scheduled Castes, Scheduled Tribes and girls going to poorly-run and ill-equipped government schools and all the others attending private schools. With an increasing privatisation of education, there is evidence of growing gaps – those with resources are likely to benefit, and those without will get even further marginalised in relative terms. Figure 3.4 shows the great disparity in gender gaps in literacy across states, that the other graphs, using aggregate data, tend to hide. Thus the biggest gap is almost 20% between states. This underlines the importance of regional factors as well as gender and social group when considering education. Most of the contemporary states in India were formed at the time of independence in 1947 via a linguistic reorganisation of the erstwhile princely states. Some contemporary states such as Chhatisgarh, Jharkhand, Uttaranchal are a result of a recent re-organisation of some of the other bigger states; some others such as Goa and Delhi were granted statehood at different times after independence. Thus, the states of India represent very diverse histories and ethnic/community compositions. Some regions have had a more vigorous social reform within Hinduism and it is not unlikely that this specific history might influence access to primary education for SCs and women: groups that have traditionally been denied access to basic education. However, the current data sets do not allow us to test for a set of influences that have operated through centuries.
Figure 3.4 Gender Gap in Literacy, by State 2004/05
0 5 10 15 20 25
Andhra Pradesh
Assam
Bihar
Goa
Gujarat
Haryana
Himachal Pradesh
Jammu & Kashmir
Karnataka
Kerala
Madhya Pradesh
Maharastra
Orissa
Punjab
Rajasthan
Tamil Nadu
Uttar Pradesh
West Bengal
Total
Source: Authors’ calculations using NSSO Employment and Unemployment Surveys, various rounds The Annual Status of Education Review (ASER, 2006) found that it was not parental demands that kept children out of school; these related to inadequate infrastructure, insensitive teachers and uninteresting curricula. As Ramachandran (2004: 86) notes, ‘hierarchies of access’ are discernible at all levels of the education system. The

47
presence of a good quality government school, which functions regularly, can help overcome many problems, especially for the deprived sub-groups of SCs and STs and girls amongst them. This will however require enhanced investments rather than low-cost options, which include incentives, making the curricula both relevant and interesting, introducing flexible school timings with crèche facilities, but most important, addressing the issue of recruitment and training of teachers (Tilak, 2005).
Within-household education gap, by social group The analysis so far has focussed on aggregate levels of the gender gap in education, but it is of some interest to take a closer look at what this implies at the household level, since it is likely that higher intra-household inequality in educational achievements translates into lower bargaining power for the disadvantaged party, which, as will be explained in a subsequent section, has implications for growth. Table 3.4 and Table 3.5 show in some detail that intra-household gender inequality in educational achievements is greatest (i.e. worst) for upper-caste Hindus, followed by SCs, Muslims, STs and Others, in that order. One plausible hypothesis is that intra-household gender inequality in educational achievements is ceteris paribus higher if the female labour force participation rate is lower. “If women don’t work, they don’t need to be educated,” so the reasoning could go. The prima facie evidence, presented in Table 3.5, is mixed. Applying the simple test of a correspondence between rank order in a high education gap and low FLFPR, it may be seen that upper-caste Hindus and Scheduled Castes have more, Muslims and Others less, and Scheduled Tribes about the amount of gender inequality in education that their FLFPRs would suggest. Other factors must be at work.
Table 3.4 Education Gap, by Social Group Education Gap Upper-Caste
Hindus Scheduled Castes
Scheduled Tribes
Muslims Others Total
-5 0.95 0.70 0.48 0.70 0.18 0.78 -4 2.77 2.15 1.33 1.56 0.87 2.28 -3 6.64 4.70 2.87 4.03 4.91 5.56 -2 15.08 11.12 8.57 10.43 12.95 13.12 -1 26.21 21.88 21.86 22.75 21.07 24.29 0 41.16 54.84 61.50 53.56 46.83 47.31 1 5.13 3.37 2.44 5.39 9.17 4.80 2 1.69 1.04 0.80 1.36 3.17 1.53 3 0.33 0.16 0.13 0.12 0.66 0.28 4 0.03 0.02 0.00 0.10 0.15 0.04 5 0.02 0.01 0.03 0.00 0.04 0.02
Source: Dubey et al. (2007) [Background paper to the report] Note: The Education Gap is calculated as Female Educational Attainment minus Male Educational Attainment. It is at the household level, thus the two prominent members of the household are chosen. The numbers refer to educational levels as follows: 1 = illiterate; 2 = up to primary; 3 = middle; 4 = matriculation; 5 = higher secondary; and 6 = graduate and above. Therefore positive numbers refer to females achieving a higher level of education than men and vice versa.

48
Table 3.5 FLFPR and Education Gap, by Social Group
Upper-Caste Hindus
Scheduled Castes
Scheduled Tribes
Muslims Others Total
Weighted Education Gap
-82.4 -64.26 -50.75 -56.57 -47.79 -71.27
FLFPR 46.05 50.69 59.4 36.21 44.15 47 Source: Dubey et al. (2007) [Background paper to the report] Note: The Weighted Education Gap is calculated by multiplying the education gap (defined in the note to the previous table) with the proportion of instances of this particular gap occurring, and then summing across. Thus a larger minus shows a larger gap. Male and female educational achievements and implications for income growth In this section we obtain evidence that the effects of female education on income growth are larger than those of male education. Regional differences in the gender gap between male and female educational achievements account for a substantial part of the implied growth difference. We do not find similar strong implications for growth of differences in gender equality in education of social groups. We use recent panel data in order to compute implications for household income growth of differential educational achievements of men and women. The results of a random effects panel data regression are reported in Table 3.6. Only coefficients of interest here are reported, but included in the regression are a large number of mainly standard controls that are not reported on here. The dependent variable is the natural logarithm of equivalised (i.e. equivalence-scale adjusted per capita) household income. As will be seen in the next section, coefficients on male labour force participation are higher than those on female labour force participation (which is understandable, since male wages are higher). But remarkably, coefficients on female education, always significant, are higher than those on male education, which are in addition not significant at lower levels of education. The interpretation of the coefficients is that they are the effect of a particular educational achievement on income growth compared to that of illiteracy, which is the omitted category. The estimation technique filters out reverse causation, i.e. the effect of income growth on educational achievements. That the effects of female education on household income growth are higher for all levels than those of male education is a strong result. It is consistent with the conjecture discussed at the beginning of this section that where historically one group has been discriminated against in access to education, marginal returns on investing in that group’s education are relatively high. On the other hand, it is not immediately obvious what the pathways are through which female education outperforms male education in its effects on income growth. Through labour market participation is unlikely, as female labour market participation and wages are much lower than those for men, as will be seen in the next section. Alternative possibilities are that female education influences women’s influence in their households, reduces fertility, and increases female supply response disproportionately – these, and their implications for growth, are examined in subsequent sections.

49
Table 3.6 Household income growth and male and female educational achievement
(Dependent variable: log-equivalised household income) Variable Coefficient Standard Error
Intercept 8.095 0.113 *
Round 0.445 0.029 *
Household social group Scheduled Castes -0.035 0.017
Scheduled Tribes -0.067 0.024 *
Muslims -0.009 0.025
Others -0.164 0.038 *
Education variables Male up to primary -0.005 0.012
Male middle 0.030 0.013
Male matriculation & higher secondary 0.102 0.014 *
Male graduate & above 0.264 0.022 *
Female up to primary 0.048 0.013 *
Female middle 0.092 0.014 *
Female matriculation & higher secondary 0.169 0.019 *
Female graduate & above 0.368 0.037 *
Log of household landholdings 0.169 0.012 *
Ditto cropped land 0.090 0.008 *
Ditto irrigated land 0.102 0.006 *
N 45,468
R-squared (within) 0.287
R-squared (between) 0.4162
R-squared (overall) 0.406
Wald Chi-Squared 25694.58 Source: Dubey et al (2007) [Background paper to the report] Notes: Random effects panel data regressions (GLS is used as the estimator) – see Annexure 3A for details; included but not reported in the table are state dummies, a set of employment controls, a set of controls for household composition, a set of village controls, and a set of interaction terms of educational achievements for men and women by social group. We next computed implications of gender inequality in educational achievements for observed income growth, using the following procedure. We used all coefficients on education terms in the regression to compute the component of income growth differences between social groups or regions of interest that is due to differences in all educational achievements between these groups or regions, and then computed the part of that component that is due to differences in female education. If regions or groups differ in both male and female educational achievements, then the model allows one to compute their separate contributions to income growth differences. India’s South has better overall educational achievements than the North, especially for women (i.e. the difference between South and North in women’s levels of education is much higher than that in men’s); 86% of the implied growth difference is due to differences in female education, according to the model. Upper-caste Hindus

50
have higher levels of education than the population as a whole, but slightly more gender inequality; as a result, the contribution of female education to its higher growth (insofar as due to education) is slightly lower than half, 47%. The corresponding figures for SCs, STs and Muslims are 56%, 56% and 39%, respectively. When comparing upper-caste Hindus with Scheduled Castes, we find that 52% of the implied growth difference is due to different levels of female education. (Again, the closer these figures are to 50%, the less of the growth difference is due to differences in gender inequality in educational achievements.) We thus find that regional differences in gender inequality in education have much starker implications for growth (with less inequality being better for growth) than differences between social groups. Conclusions and Policy Implications This section has documented the persistence of gender divides in educational achievements, by social group and location, and computed implications for growth. The difference between social groups in gender inequality in education does not account for much of the growth difference between them. In economic terms, this means that each social group is guided roughly to the same extent by labour market prospects when deciding on investing in the education of boys and girls. It remains true, of course, that SCs and STs are as a group (both males and females) significantly less educated than other groups. The difference between North and South India in gender divides in educational achievements, by contrast, accounts for a substantial part of the implied growth difference. Both in South India and in North India, but much more so in the latter region, females relative educational status is sub-optimal, even from a narrow economic efficiency point of view alone. What should be done? Chakrabarti and Joglekar (2006) analysing the patterns and changes in the allocation of government funds for education before and after the introduction of new economic policies in 15 major Indian states, find that while a growth in state real per capita income is seen to enhance educational expenditures, most states have witnessed a decline in the post-reform era. They found that states with a higher proportion of scheduled caste population had a significantly lower expenditure on education at aggregate, elementary and higher level. This is particularly discouraging in view of the fact that these social groups already lag behind others in terms of their educational status and need enhanced investments in order to catch up with other groups. Similar results were also obtained for the scheduled tribes. The coefficient of sex ratio enters with a negative significant coefficient in majority of the cases, clearly highlighting the need for government to put sustained effort in designing policies and allocating resources targeted towards female population. Finally, the coefficient of “rural” is in general positive and significant at aggregate and elementary level. Financial burdens, the long distance to school, lack of reliable transport have all been cited as major reasons for dropout at the middle school level, in addition to the risks and norms associated with puberty for girls. Dearth of private providers in rural areas implies that the government has to assume a significant role in terms of provision of educational facilities in rural areas. However, government commitment is more apparent at the elementary stage than at higher levels (Tilak, 2006). What seems apparent is the continued need for state intervention and affirmative action in education. However, in order to have an impact, this education needs to be
51
of high quality, to ensure learning (see also Mehta, 2006, Educational Initiatives and Wipro, 2006, on this point) such that it can eliminate sources of disadvantage, rather than maintaining quotas purely on grounds of caste identity. In the case of higher education in particular, Deshpande and Yadav (2006) propose an alternative model of affirmative action which is evidence-based, and addresses the multiple sources of group and individual disadvantage (caste, region, gender and rural/urban residence) as well as its interaction effects with different dimensions and degrees of disadvantage (parental occupation and type of school attended as proxies for class and quality) rather than a uniform caste-based quota. Incentives for education have existed in India since 1921, when the Indian national leadership strongly felt the need for provision of not only ‘free education’, but also a liberal provision of other forms of positive student support such as free supplies of educational equipment or clothing, provision of free school meals and other health services, hostels and scholarships (Naik, 1975). An incentive is a reward for a specific behaviour, hence designed to encourage and motivate that behaviour, be it in terms of enrolment, retention, or completion. These incentives may be tangible (as in being financial or material) or non-tangible (as in extending appreciation). All stakeholders (school authorities, donors, programme planners and the community) value incentive programmes, but the continuing disparities suggest the need to change strategy somewhat to ensure the desired outcomes in terms of participation in schools, but also attitudinal and behavioural changes of all parties concerned in relation to learning (Educational Resource Unit, 2006). While financial, infrastructural and other incentives related to mid-day meals and health matters are indeed valuable, these have not succeeded in improving learning outcomes, especially for the disadvantaged. Perhaps there is need to think of additional incentives to reward schools and teachers who work towards elimination of educational disadvantage and enhanced learning in their own contexts. Apart from continuing with incentives to the student, the household and the school, there is need to also ensure reliable, safe and affordable transport to the village/town that has a middle school. In the medium term, the focus should be on establishing a middle/secondary school in every village. Increasing proportion of women teachers as well as the provision of toilets for women (both teachers and students) is likely to improve attendance.

52
Section 4 Employment Motivation Country case studies routinely report the presence of barriers to female employment in both the public and the private formal sector. Klasen and Francesca (2003) use cross-country regressions in order to examine the extent to which gender gaps in education and employment reduce growth. The effects are considerably larger than when education alone is considered (discussed in Section 3). Depending on the specification, between 0.9 and 1.7 percentage points of the current growth difference between East Asia and the Pacific on the one hand, and the Middle East and North Africa on the other are accounted for by differences in the gender gaps in education and employment between the regions. For India, there is systematically obtained evidence that labour market discrimination suppresses growth not only significantly but also substantially. Esteve-Volart (2004) uses a panel of sixteen Indian states for estimating the impact on growth of low female-to-male ratios, first, in the labour force and second, in managerial positions. The estimated coefficients are not only statistically significant but also large. For example, a hypothetical increase by one standard deviation of the ratio of female-to-male workers would increase output per capita by 37 percent, according to the model. A similar exercise, using the estimated coefficients, suggests that if all Indian states were characterised by Karnataka’s female-to-male ratio in managerial positions, total output would increase by 35 percent. Although one should be wary of extrapolating regression results, they do suggest that India’s massive underutilisation of female potential for measured economic activity comes at a high price in terms of measured growth forgone. Female Labour Force Participation Rates (FLFPRs) half those of men We first present the trend in LFPRs (number of persons in the labour force per 100 persons) by gender and caste (for all persons over 15) for rural and urban over the four NSS rounds. The rural female LFPR (by usual principal status, see the appendix to this section for definitions) declined slightly from 1983 to 1994-95, to rise to the initial level by 2004-05 (Figure 4.1). Thus, over the two decades, it has virtually remained the same with negligible fluctuations. The same is true for male LFPRs, thus the overall picture is that of very little change in the LFPRs in rural India over the two decades. Urban LFPRs show a similar trend, with the difference that urban female LFPRs are roughly half that of their rural counterparts. There is some discussion about the causes of the rural urban disparity in the literature (Sundaram, 2004, Papola and Sharma, 1999, Hirway, 2002, Swaminathan, 2004, Unni and Raveendran, 2007, Ghose, 1999). While urban areas seem to afford more opportunities, the nuclear/small family setting means greater burden for the working women in terms of handling the double demand of domestic as well as employment related work. Often that might mean that women drop out of the labour force altogether. Table 4.1 reveals that LFPR by subsidiary status is higher by at least four percentage points than by principal status especially in the urban context. This

53
suggests that a lot of women enter the labour force for short periods during the year, balancing constraints of domestic work such that they are out in the labour force when conditions at home are more favourable.
Figure 4.1 LFPR, by Sex and Urban/Rural over time
Rural Male
Rural Female
Urban Male
Urban Female
0
10
20
30
40
50
60
70
80
90
100
1983 1993-94 1999-00 2004-05Year
%
Source: Authors’ calculations using NSSO Employment and Unemployment Surveys, various rounds
Table 4.1 LFPRs,by Gender and Social Caste, 2004/05 Rural Urban Gender and FLFPR Types
ST SC OBC Others ST SC OBC Others
Wom
en Principal 58.49 38.20 38.12 26.67 30.69 25.66 23.05 16.18
Subsidiary 69.77 52.19 50.09 38.52 35.67 30.17 27.66 19.56
Weekly 59.95 44.44 43.32 33.54 30.73 28.70 25.73 18.69
Daily 50.84 36.56 36.00 26.98 28.33 25.70 23.00 16.85
Men
Principal 88.78 86.00 84.66 82.76 77.20 80.99 80.71 76.42
Subsidiary 89.68 87.05 85.77 83.95 77.69 81.38 81.47 76.96
Weekly 87.63 85.49 84.37 82.72 75.63 80.79 80.82 76.63
Daily 84.85 82.91 82.39 80.91 74.43 79.50 80.00 76.10 Source: Authors’ calculations using NSSO Employment and Unemployment Surveys, 61st round Note: ‘FLFPR types’ refers to whether participation is measured on a daily or weekly level and so forth; for precise definitions see Annexure 3B. A similar picture of virtually stagnant LFPRs reveals itself when we look at LFPRs by social groups (Figure 4.2). LFPRs are highest for STs (slightly over 60 percent), followed by SCs (slightly under 60 percent), followed by OBCs (slightly over 55%), followed by others (about 50 percent). The figures over time need to be interpreted with care. The 38th and the 50th rounds did not have an OBC category, so the “Others” category included everyone other than SC or ST. The last two rounds of the NSS do have the OBC category, so the erstwhile Others is now split into OBC and the non-

54
SC-ST-OBC residual. So what appears as a “decline” in the Others LFPR is in fact due to a redefinition of categories.
Figure 4.2 Total LFPR, by Social Group
0
10
20
30
40
50
60
70
80
ST SC OBC Others
19831993-941999-002004-05
Source: Authors’ calculations using NSSO Employment and Unemployment Surveys, various rounds Note: The OBC category is not available for the first two rounds, and while there is a ‘non ST/SC’ category, the categories are kept ‘consistent’ so as to facilitate comparison. When we examine LFPRs by social groups and gender (Table 4.1), it turns out that whereas overall, SC LFPRs are greater than that for Others for all definitions of LFPRs (based on principal, subsidiary, weekly and daily status), it is the difference in female LFPRs that contribute to this. For males only, Others have a higher LFPR, but the picture is completely reversed for women, where SC women have substantially higher LFPRs than “Other” women: respectively 40 percent versus 25 percent in rural areas, and 25 versus 15 in urban areas. This is due to the fact that there are far greater taboos on the public visibility of upper caste women and working for wages is seen as a mark of low status. Dalit women, apart from facing fewer taboos, do not have the luxury of remaining outside the labour force as compelling poverty pushes them out to seek work (Liddle and Joshi, 1986, Deshpande, 2001b). In the rural context, the scheduled caste and scheduled tribes, both men and women dominate agricultural work. For the SCs, much of this is likely to be agricultural wage work as they are either landless or marginal land-holders (please see section on assets). The STs do own land and a large number of them are cultivators, yet due to poor quality of land, their own poverty and lack of public investment, they additionally join the agricultural labour force. Upper caste women continue to report agricultural work, but this is more likely to involve supportive activities and post-harvest work, rather than working on the fields (Gupta, 2002, Kumari, 1998, Nakkeeran, 2003, Kapadia, 2002).

55
On the whole, the picture is one of stagnant LFPRs over the two decades. During India’s modern growth period, the LFPR for rural males stayed close to 85 percent, that of urban males to 80 percent, of rural females slightly under 40 percent, and that of urban females stayed close to 20 percent. The contrast between these groups is remarkable, as well as that their LFPRs stayed more or less constant. Males continue to have much higher LFPRs than females; and rural females much higher rates than urban females. Employment and under-employment Figure 4.3 shows the employed percentages by principal status for male, female and all over the four rounds. For rural India, the overall proportion of people employed by principal status remained virtually stagnant over 1983-1993, dropped between 1993-1999 and then increased to the 1983 level by 2004-05. So, overall, over the entire period the proportion has remained stagnant. Urban India shows a more or less similar picture. Thus, the latter half of the nineties was characterized simultaneously by a high growth rate of output and by stagnation in employment -- the “jobless growth” phenomenon that has been extensively written about (Bhattacharya and Sakthivel, 2003, Sundaram, 2001, Chaddha and Sahu, 2002, Hirway, 2002, Bhalotra, 1998, GOI, 2001).
Figure 4.3 Percentage Employed According To Principal Status, Urban and Rural
0
10
20
30
40
50
60
1983 1993-94 1999-00 2004-05 1983 1993-94 1999-00 2004-05
Rural Urban
MaleFemaleAll
Source: Authors’ calculations using NSSO Employment and Unemployment Surveys, various rounds Disaggregated by gender, we see that both groups show a similar trend over time, but the disparity in employment rates between men and women is striking. The proportion of rural women employed is less than half that of men. This disparity is even sharper for urban areas, where the proportion of men employed is around 54 while that of women is around 12-13 percent. Also, the proportion of urban men over the two decades has risen by two percentage points, while that of rural men has risen by one percentage point.

56
While women’s labour force participation rates remained stubbornly flat in urban India from 1983 to 2000, there is an increase in 2004-5, especially for women with below primary levels of education4, concentrated in the self-employed sector, mainly in low paid jobs in the service sector, either in schools and hospitals or as domestic help in households (Unni & Raveendran, 2007, Himanshu, 2007). In the rural sector, while men have been diversifying from agriculture to the services sector, women’s involvement in agriculture has remained stable. This has disadvantaged women who have lost out on the higher wages in the non-farm sector while bearing the brunt of the stagnation in the agricultural sector (Papola, 1999). The insights from the field are very interesting in this regard and offer some explanation into the processes of employment creation or the lack of it for women. Much of the agricultural land of Kazakpur village in Gorakhpur has been sold to urban land developers in the last decade. While men have taken to petty trade, brokering, rickshaw pulling or a range of private jobs in the city, no similar opportunity is available to the women, increasingly confined to their homes. In the interior village Sanaha, a large number of men now migrate to Mumbai, Gujarat, Goa and even the middle east (especially Muslim) for a range of labour tasks. A similar situation prevails in Bahraich. The women generally stay at home, perhaps maintaining a few milch animals. Muslim women may take up stitching or embroidery work at home, a similar pattern in West Bengal, and indeed across India were Muslim women are seen to dominate in different categories of home-based work (Sachar, 2007). But only the poorest of the Muslim women do this work: its laborious, has to be done on time despite all the domestic work for a contractor. It is highly exploitative too: for embroidering a sari, a worker is paid about Rs 800-1000 and it takes almost a month to finish one. The same sari sells in Kolkata for about Rs 4500. However, as Jaheda Begum, a kantha worker herself who also sub-contracts, puts it, “Where do we have the contacts and the resources do what the contractor does? We know its exploitative but something is better than nothing.” It is only the SC and poorer OBC women who engage in agricultural and other forms of labour, when available. Combine harvesters have deprived women of additional days of work in agriculture. While some non-farm opportunities have indeed become available in the local areas, employers are not keen to employ women workers. This is perhaps best reflected in the response to the question as to what he thinks of employing women of a petrol pump owner in Gajol (the block headquarters) in Malda: “Tell me how many petrol pumps in Kolkata employ women?” In Gajol, a brick kiln owner employs some women but says that he does so on humanitarian grounds and that men work better. A jute businessman (buying jute, sorting and packing into bales and loading them for transportation looks very puzzled when asked about the prospects of employing women: “Look this is not a bank. It’s a jute araat (wholesale depot). It is hard work. Even the Bengalis can’t do it. I get labour from the Bihar border as those men can work harder.” Several rice mills have come up in the Galsi-Khetura area. They all employ women, but not the locals, preferring again migrant workers from Jharkhand. In Bahraich, a similar response was obtained from the owner of a dal (lentils) mill – men were better able to perform both labour and managerial jobs. A brick-kiln owner
4 More than 40% have no education and less than 6% have tertiary education (Mohanty, 2006).

57
here did employ women too, as part of family groups, but similar to Gupta’s (2003) study of brick-kilns in Haryana and Uttar Pradesh, only men were on the muster rolls as workers, women included as part of ‘family labour’. While all these employers seemed aware of the labour laws, they were practiced minimally. While some non-farm opportunities have indeed become available in the local areas, employers are not keen to employ women workers. This is perhaps best reflected in the response to the question as to what he thinks of employing women of a petrol pump owner in Gajol (the block headquarters) in Malda: “Tell me how many petrol pumps in Kolkata employ women?” In Gajol, a brick kiln owner employs some women but says that he does so on humanitarian grounds and that men work better. A jute businessman (buying jute, sorting and packing into bales and loading them for transportation looks very puzzled when asked about the prospects of employing women: “Look this is not a bank. It’s a jute araat (wholesale depot). It is hard work. Even the Bengalis can’t do it. I get labour from the Bihar border as those men can work harder.” Several rice mills have come up in the Galsi-Khetura area. They all employ women, but not the locals, preferring again migrant workers from Jharkhand. In Bahraich, a similar response was obtained from the owner of a dal (lentils) mill – men were better able to perform both labour and managerial jobs. A brick-kiln owner here did employ women too, as part of family groups, but similar to Gupta’s (2003) study of brick-kilns in Haryana and Uttar Pradesh, only men were on the muster rolls as workers, women included as part of ‘family labour’. While all these employers seemed aware of the labour laws, they were practiced minimally. Such insights are confirmed by long-term village studies. Ramachandran et al (2001) found in their Tamil Nadu study that the days of overall work of women in hired labour households (mostly SC) amounted to 147 on average, a figure that has remained remarkably stable since 1976, but the agricultural component of the total has dropped from 65 per cent in 1976-77 to 37 per cent in 1998-9. This mirrors the position for India as a whole, where the total days of employment available to a woman in a rural labour household has risen from 233 days in 1983 to 265 days in 1993-4, but days in agriculture have fallen steadily. Women have moved from agriculture into two types of work – the first is that which pays more than daily rated agricultural work (such as plantation work, construction, brick-kilns, road construction and other public works), but is bodily more taxing5, and the second is worse paid, piece-rate work, in this case mainly tamarind processing. By social group, in rural India, the percentage employed is highest for STs, followed by SCs and then Others (Figure 4.4). This ordering remains intact over the period, even though the gap between SC and Others has narrowed over the last five years, and for each group, the trend is similar to the overall trend. The differences among groups are much less significant in urban areas, and in 1999-2000, SCs overtake the other two groups slightly.
5 Quite a lot of the better paid work is for activities which make great physical demands on women’s bodies, and the character of these jobs therefore may make women who are nutritionally challenged unwilling to engage in them (Jackson and Palmer-Jones 1999).

58
Figure 4.4 LFPR, by Social Group and Urban/Rural
ST rural
SC rural
Others+ OBC rural
ST urban
SC urban
Others+ OBC urban
30
32
34
36
38
40
42
44
46
48
50
1983 1993-94 1999-00 2004-05
Source: Authors’ calculations using NSSO Employment and Unemployment Surveys, various rounds Unemployment Figure 4.5 shows the trend in the all-India unemployment rates. Annexure 3B contains and discusses the definition of unemployment (number of persons unemployed per 1000 in the labour force) and the four measures of unemployment and what they indicate. Comparing male and female usual principal status unemployment rates, (a measure indicating chronic unemployment), we see a sharp contrast between rural and urban trends6. In rural India, for both men and women, the unemployment rates declined from 1983-1993-4 to rise by 1999-2000 with a sharper rise by 2004-05. The unemployment rates for men were higher than those for women in all years except in 2004-05, when the rates for women overshot the rates for men. As mentioned in the last section, data from the field points towards male efforts to diversify into a range of self-employment activities as own account workers or small employers, a majority in trade and repair activities, with women mainly assisting as unpaid family workers. The Arjun Sengupta Report on Conditions of Work and Promotion of Livelihoods in the Unorganised Sector, categorises “77 per cent, totalling 836 million people, with an income roughly below $2 in PPP terms, as the poor and vulnerable segment of the Indian population” (NCEUS, 2007: 6). The insecurity of work and low returns have been well documented (see Ghosh and Chandrasekhar, 2006), creating the push for protective legislation discussed in section 3.
6 If we look at the daily and weekly status unemployment rates, these are much higher than the usual status ones and with lower rural-urban differentials than those for usual status. The analysis is not presented here but is available on request.

59
Figure 4.5 Unemployment Rate, 1983-2004/05
0
2
4
6
8
10
1983 1993-94 1999-00 2004-05
Rural Male Rural Female Urban Male Urban Female
Source: Authors’ calculations using NSSO Employment and Unemployment Surveys, various rounds Note: Unemployment rate is defined as the percentage of persons unemployed in the labour force The urban unemployment rates show a different pattern. First, for both men and women, the urban rates are far greater than the rural rates, with the rates for urban women over 3 percentage points higher than those for rural women. Second, for men, the rates show a steady downward trend over the two decades, whereas for women, it is almost a steady upward trend, with a blip in 1999-00 from the previous round, but still higher than the first round. But overall urban rates show a downward trend because of the downward trends in the male rates. This can possibly be explained by the increase in male migration to urban areas for low-paid contractual jobs in the private sector – hospitals, schools, hotels, franchises, and so on (Deshingkar and Start, 2003). Hotel and dhaba owners in both Bahraich and Bardhaman, also employed a large number of local workers, but no women, primarily due to the long working hours required. There is however no job security and high job mobility. As Jeffrey et al (2005) show, based on their longitudinal study in Bijnor, UP, a lot of educated youth prefer to take such jobs in the towns and cities, albeit for short periods of time, instead of remaining unemployed, as a pathway to a better future. It is seen as white-collar and status-giving, preferable to engaging in manual work. Third, for all the years, the female rates are higher than the male rates. Thus, overall, we see much higher unemployment rates for urban India compared to rural India. However, the trend in the former is that of a decline, sharply differentiated by gender, whereas the latter shows an increasing trend, with a smaller gender differential and not always in the same direction as the urban.
By social group, Figure 4.6 shows that rural SCs have the same trend as rural women, but rural STs who have significantly lower rates than SCs (and Others) show a steady upward trend. Urban SCs show a decline over the first three data points but then increase for 2004-05. With a growing number of educated SCs, reservations in jobs are clearly not sufficient for ensuring employment to all those seeking it, while social disadvantages including lack of access to resources and credit, makes it difficult for them to set up successful enterprises (see also section 8).
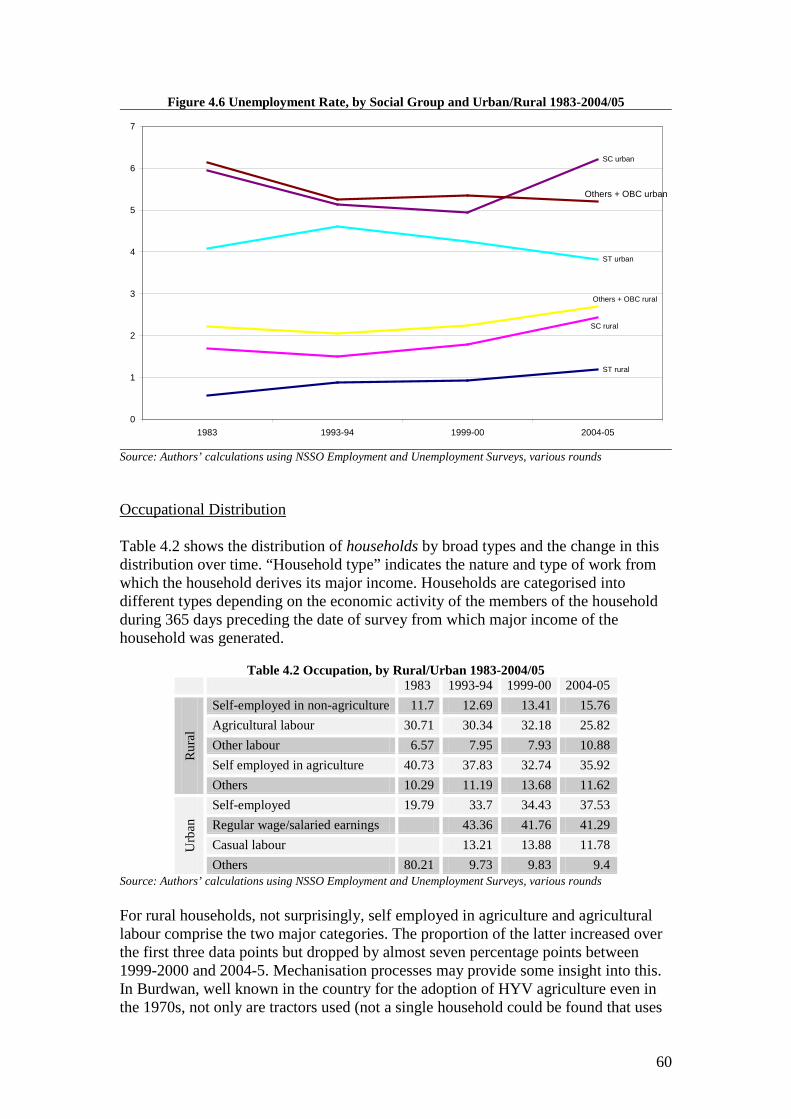
60
Figure 4.6 Unemployment Rate, by Social Group and Urban/Rural 1983-2004/05
ST rural
ST urban
SC urban
SC rural
Others + OBC rural
Others + OBC urban
0
1
2
3
4
5
6
7
1983 1993-94 1999-00 2004-05
Source: Authors’ calculations using NSSO Employment and Unemployment Surveys, various rounds Occupational Distribution Table 4.2 shows the distribution of households by broad types and the change in this distribution over time. “Household type” indicates the nature and type of work from which the household derives its major income. Households are categorised into different types depending on the economic activity of the members of the household during 365 days preceding the date of survey from which major income of the household was generated.
Table 4.2 Occupation, by Rural/Urban 1983-2004/05 1983 1993-94 1999-00 2004-05
Rur
al
Self-employed in non-agriculture 11.7 12.69 13.41 15.76 Agricultural labour 30.71 30.34 32.18 25.82 Other labour 6.57 7.95 7.93 10.88 Self employed in agriculture 40.73 37.83 32.74 35.92 Others 10.29 11.19 13.68 11.62
Urb
an
Self-employed 19.79 33.7 34.43 37.53 Regular wage/salaried earnings 43.36 41.76 41.29 Casual labour 13.21 13.88 11.78 Others 80.21 9.73 9.83 9.4
Source: Authors’ calculations using NSSO Employment and Unemployment Surveys, various rounds For rural households, not surprisingly, self employed in agriculture and agricultural labour comprise the two major categories. The proportion of the latter increased over the first three data points but dropped by almost seven percentage points between 1999-2000 and 2004-5. Mechanisation processes may provide some insight into this. In Burdwan, well known in the country for the adoption of HYV agriculture even in the 1970s, not only are tractors used (not a single household could be found that uses
61
a plough) irrigation pumpsets have become common. The traditional dugout is no longer in vogue. Of course, no women, unlike in Punjab, drive tractors. Even weeding and threshing, that generated substantial employment for women of the lower castes and the adivasis, is under threat as mechanical threshers have come in and also weedicides are increasingly being used. Substantial employment is generated in paddy cultivation in transplanting, threshing and for a few days in weeding still. The bigger and even the middle farmers prefer to employ migrant labour from Santal Parganas in Jharkhand, leaving the local labour to migrate to other villages, foraging for the scant labour that is available. The proportion of the self-employed in agriculture followed exactly the opposite trend: dropped over the first three rounds and then rose over the third and the fourth data point. It is not clear if these two are causally related. Indicative either of a structural shift or of stagnation in employment possibilities in agriculture, we see that proportion of households involved in self employment in non-agriculture in rural areas is steadily increasing, even though proportions are much smaller (16 percent in 2004-05) than those in agricultural activities (roughly 62 percent). In urban India, regular salaried and self employed together comprise the two biggest categories. In 1983, NSS classified households by only two types: self employed and others. In subsequent rounds, more classificatory categories were added. We see in Table 4.2 that between 1993/4 and 2004/5, the proportion of regular salaried households decreased slightly (by roughly two percentage points). The proportion of self employed households increased over the period, again the largest increase corresponding to the last five years. The proportion of casual labour households declined slightly over the last five years. Disaggregating by caste, in rural India, there is a sharp distinction between SC and other households (Figure 4.7). Agricultural labour comprises the single largest category for rural SCs, however, the proportion has decreased from 54 percent in 1983 to 41 percent in 2004-05. The corresponding proportions of “Others” are 23 and 25, so there has been a slight increase in Other households in this category. For Others, there is a clear indication of a move away from agriculture, as the proportion of self employed in agriculture has also declined from 46 to 32 percent and those of self employed in non-agriculture have increased from 13 to 22 over the entire period. While the macro-data on migration by groups is not available to us (it would have given a clearer picture of occupational shifts), the field studies, especially in Bahraich, one of the poorest districts in Uttar Pradesh, did provide a picture. Daily labourers in construction or the mills (dal), mainly SC, only go as far as Bahraich, some to Punjab for short spells. Men from upper class families, both Brahmins and Muslims, have started small businesses like hardware stores, mobile repair, rice polishing, outside the village. Young Muslim men generally move to Mumbai, though some go to Lucknow or Punjab. From Sanaha, the Gorakhpur village, the migration patterns are somewhat different, though again totally male. The educated Yadav (OBC) men from here have developed many contacts and networks in other states, so often end up in large cities or metros, seeking private jobs through their networks.

62
Figure 4.7 Occupation, by Caste
other labourother labour other labour
casual labourcasual labour
casual labour
Others Others Others OthersOthers
Others
self-employed (non-agriculture)
self-employed (non-agriculture)
self-employed (non-agriculture)self-employed
(non-agriculture)self-employed (non-agriculture)self-employed
(non-agriculture)
self employedin agriculture
self employed in agriculture
self employed in agriculture
agricultural labour
agricultural labour
agricultural labour
regularwage/salary earnings
regularwage/salary earningsregularwage/
salary earnings
0
10
20
30
40
50
60
70
80
90
100
RURAL ST RURAL SC RURAL OBC+Others URBAN ST URBAN SC URBAN OBC+Others
Source: Authors’ calculations using NSSO Employment and Unemployment Surveys, 61st round (2004/05) Note: A problem with the data accounts for the disparity in the last column. In urban India, the two single largest categories for SCs are casual labour and regular salaried employment, the latter reflecting the working of the affirmative action policy. Over the period, we see an increase in the self employed category from 25 to 29 percent. For the Others, there is a decline in regular salaried from 44 to 30 percent over the entire period, a slight decline in self employed from 35 to 30 percent over the entire period, and a corresponding increase in “other” jobs, from 10 to 20 percent. Since the bulk of new jobs in the wake of globalization are getting created in urban areas, it is possible that the “other” jobs are reflecting this trend. One of the major growth areas since the early 1990s has been the field of Information and Communication Technologies (ICTs). The Task Force on Information Technology emphasised the role of education, especially at the tertiary levels for making India a knowledge superpower. It is precisely this last point that has made IT a symbol of upper class/caste, male, and anglicized Hindu control, raising questions about whether technology can really lead to a socially just life. This is because as discussed in the section on education, women, the lower castes and Muslims lag far behind the rest in terms of their educational attainments.7 Although IT is a new field, a “gendered” division of labour is already visible with women concentrated in end-user, lower skilled IT jobs related to word processing or data entry, comprising only small percentages of managerial, maintenance, and design personnel in networks, operating systems, or software development (Hafkin and Nancy, 2001, Mitter, 2000, Mazumdar 2004, Babu and Neetha 2004). 7 According to the Sachar Committee report, of all those attending post-graduate courses, only 8.9 per cent belong to the SC/ST category and 6.4 per cent to Muslims, the number of girls within these groups being marginal (Table 4.5 and Figure 4.14/4.15).

63
Figure 4.8 shows the occupational distribution at the personal level for all women older than 18 years by the principal activity status. For both rural and urban women, “attended domestic duties” forms the single largest category. Hirway (ibid) links greater involvement of women in domestic activities to the decline of female work participation rates at a steeper rate than their male counterparts, revealed in the subsequent NSS data set of 1999-2000. She argues that the concepts and methods used by the NSSO to net work and workers, are not able to capture the work of the poor, and particularly of women, satisfactorily. This is because a large part of the workforce is employed in the ‘difficult to measure’ sectors (such as, subsistence work, home based work or informal work) of the economy. This is followed by casual labour and helper in domestic enterprise for rural women, and by regular wage earner, self-employed and casual labour for urban women. The differences between urban and rural women are large. Whereas it is about equally likely, if they are employed, for the two categories to be self-employed, it is three times more likely for rural women to be helpers in household enterprises or casual labourers, and about four times more likely for urban women to be salaried employees. This also emerges from Gupta’s (1993) study in two districts of West Bengal, where she found that even though upper caste and Muslim women were not allowed to work in the fields, they took on major responsibility for the agricultural operations at home. Similarly, Ranjana Kumari’s (1998) study in Haryana finds that nearly 29 per cent of the women provide family labour which implies that their work remains unpaid. Another 41 per cent are doing domestic work which is not considered ‘work’. Eight per cent are wage workers, 3 per cent self-employed, besides a good number of them employed in household production exclusively (see also Rawal, 2003, Chowdhry, 2007).
Figure 4.8 Women’s Principal Activity, by Rural/Urban
0
5
10
15
20
25
30
35
self-employed helper in hhenterprise
regular wage casual labour did not workbut was
available
attendededucational
institute
attendeddomestic duty
others
ruralurban
Source: Authors’ calculations using NSSO Employment and Unemployment Survey, 61st round (2004/05)
64
Domestic work Changes to domestic work burdens and gender divisions of labour may follow not only from changing resource availability, but also as an effect of broader social changes, elsewhere in labour relations. Agarwal’s (1982) study of women’s work burdens in the Green Revolution villages of the Punjab suggested that while women of the rich peasant class did not work in the fields anymore, their work burdens had increased due to the need to prepare food for hired-in labour, enhanced post-harvest work as well as the need to entertain guests more frequently to demonstrate their economic position (see also Sharma 1980, Rawal, 2003). In their Palanpur study it was found that the occupational structure changed, with a decline in village based industries due to competition from urban areas and changing consumer preferences. The rise in real wages for hired labour led some formerly non-labouring groups like Thakurs to both engage in such work attracted by better wages, and to avoid using service providers like washers and water carriers and do it themselves. The latter might imply an increase in women’s unpaid domestic work in farming households (Dreze 2002). This also emerges from the sub-national study in West Bengal. Even in the early 1990s, in the Burdwan cluster, there were several non-farm work avenues for women especially of the lower castes. The work included providing services to the clients. These were caste specific and also depended on the caste standing of the service provider to the client. Thus Kamar women (Karmakar now, ironsmiths) whose water was accepted by the upper castes, would have their fixed clients where they would go at regular intervals or on demand to make muri (puffed rice), chire (beaten paddy) or khoi (popped paddy). Typically, they would be remunerated in rice or paddy and also get some of the products made. Sometimes, when needed, these women would also parboil paddy and de-husk the same. Napit (barber) women would have their fixed clients for applying alta (red paint) on the feet of upper caste women or cut their nails. The kumhar (potter) women would supply pots. Of course, all these services were between the Hindus. The Muslims were excluded from such services. The Bagdi and Bauri women often worked in others homes as domestic help. Today in multi-caste villages like Khetura or Galsi, muri-making has virtually stopped. Only in a few Muslim households is it made during festivities. With the coming of rice mills and muri mills, virtually no one makes it at home. In fact, eating muri as a snack too is on the decline, with the entry of “chowmein” and “maggi noodles.” When needed, it is bought from the bazaar. The Napit women do not provide their traditional services nor do the Kamar women. Beauty parlours have come up and alta is no longer in fashion. The survey did not come across a single traditional birth attendant in the Burdwan cluster as people prefer to go to nursing homes and hospitals. Examining the performance of domestic work by gender and caste as emerges from the NSSO data presented in the Table 4.3 below is instructive. First, male performance of domestic work across social categories in both rural and urban India has steadily declined over the last two decades, indicating a growing rigidification in the gender division of labour. It is slightly higher among ST men, as at least seasonally, when women are busy with cultivation (e.g paddy transplanting), there is no option but for them to help with domestic tasks (Rao, 2002).
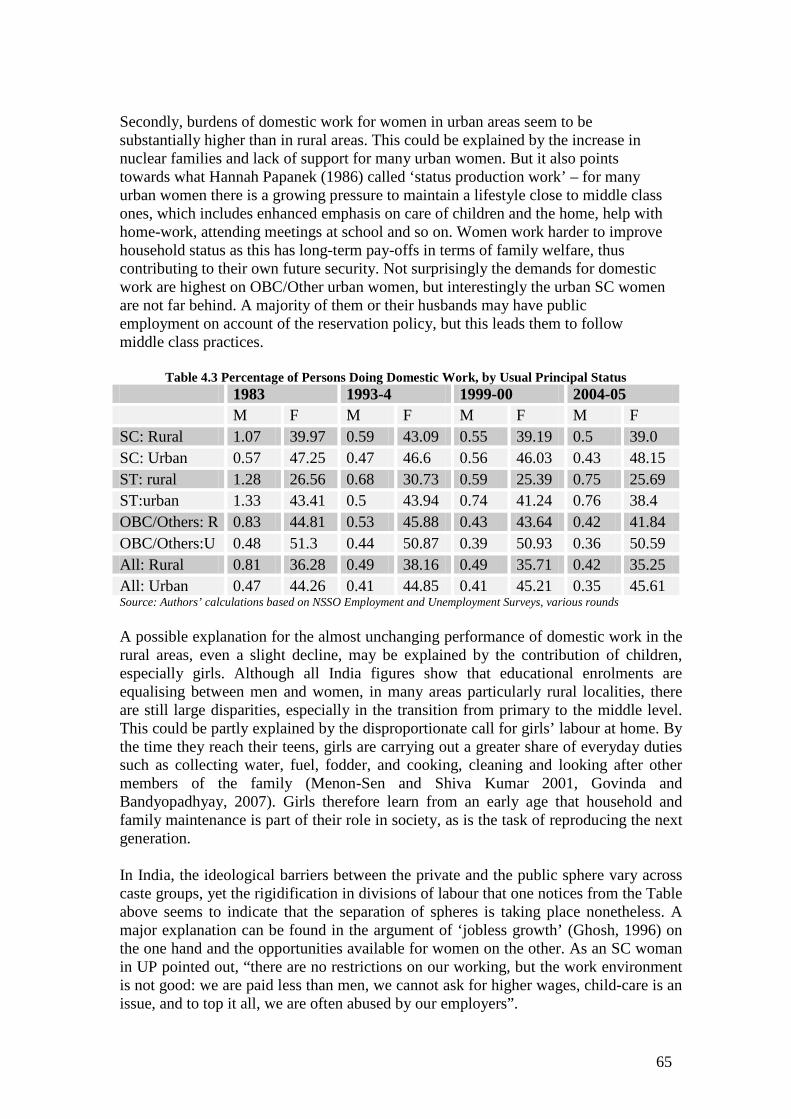
65
Secondly, burdens of domestic work for women in urban areas seem to be substantially higher than in rural areas. This could be explained by the increase in nuclear families and lack of support for many urban women. But it also points towards what Hannah Papanek (1986) called ‘status production work’ – for many urban women there is a growing pressure to maintain a lifestyle close to middle class ones, which includes enhanced emphasis on care of children and the home, help with home-work, attending meetings at school and so on. Women work harder to improve household status as this has long-term pay-offs in terms of family welfare, thus contributing to their own future security. Not surprisingly the demands for domestic work are highest on OBC/Other urban women, but interestingly the urban SC women are not far behind. A majority of them or their husbands may have public employment on account of the reservation policy, but this leads them to follow middle class practices.
Table 4.3 Percentage of Persons Doing Domestic Work, by Usual Principal Status 1983 1993-4 1999-00 2004-05 M F M F M F M F SC: Rural 1.07 39.97 0.59 43.09 0.55 39.19 0.5 39.0 SC: Urban 0.57 47.25 0.47 46.6 0.56 46.03 0.43 48.15 ST: rural 1.28 26.56 0.68 30.73 0.59 25.39 0.75 25.69 ST:urban 1.33 43.41 0.5 43.94 0.74 41.24 0.76 38.4 OBC/Others: R 0.83 44.81 0.53 45.88 0.43 43.64 0.42 41.84 OBC/Others:U 0.48 51.3 0.44 50.87 0.39 50.93 0.36 50.59 All: Rural 0.81 36.28 0.49 38.16 0.49 35.71 0.42 35.25 All: Urban 0.47 44.26 0.41 44.85 0.41 45.21 0.35 45.61 Source: Authors’ calculations based on NSSO Employment and Unemployment Surveys, various rounds A possible explanation for the almost unchanging performance of domestic work in the rural areas, even a slight decline, may be explained by the contribution of children, especially girls. Although all India figures show that educational enrolments are equalising between men and women, in many areas particularly rural localities, there are still large disparities, especially in the transition from primary to the middle level. This could be partly explained by the disproportionate call for girls’ labour at home. By the time they reach their teens, girls are carrying out a greater share of everyday duties such as collecting water, fuel, fodder, and cooking, cleaning and looking after other members of the family (Menon-Sen and Shiva Kumar 2001, Govinda and Bandyopadhyay, 2007). Girls therefore learn from an early age that household and family maintenance is part of their role in society, as is the task of reproducing the next generation. In India, the ideological barriers between the private and the public sphere vary across caste groups, yet the rigidification in divisions of labour that one notices from the Table above seems to indicate that the separation of spheres is taking place nonetheless. A major explanation can be found in the argument of ‘jobless growth’ (Ghosh, 1996) on the one hand and the opportunities available for women on the other. As an SC woman in UP pointed out, “there are no restrictions on our working, but the work environment is not good: we are paid less than men, we cannot ask for higher wages, child-care is an issue, and to top it all, we are often abused by our employers”.

66
Those with some resources therefore seek to shift from wage employment to self-employment. This has also been the direction of state support, setting up SHGs (Self help Groups) of women that provides them with some credit for undertaking a range of petty production or petty trade activities. Most women in the study sites who have accessed such credit through SHGs have invested it in traditional activities such as poultry, goat-rearing, dairy cattle or sewing/tailoring, the numbers however are few (4 out of 20 women interviewed in West Bengal and 3 in UP). In West Bengal, a few ‘quasi-modern’ initiatives have also been taken through the SHGs – provision of midday meals to government primary schools, or then the establishment of mini-rice mills. Thus in Darbarpur village, between Galsi and Khetura, the panchayat has started three mini-rice mills, where the women are supposed to buy paddy, parboil it, de-husk it and sell the rice. The land has been acquired on lease from the owners and the paddy floor cemented at considerable cost. The women however don’t use the space: the drying yards are inconveniently located and the boiling chambers are too high and don’t even have steps. In UP, especially in the rural context, it is only women with a minimum of education who have been able to undertake some form of micro-enterprise, whether tailoring or petty vending. Those with a little more education have taken to providing private tuitions or working as teachers in private schools. Those close to urban areas have found jobs in the private sector – beauty and health care, internet/mobile services and computer education. The latter however prefer men, who can work longer hours. Self employment, entrepreneurship in particular, appears to offer fewer options to women to earn decent incomes compared to men, constrained as they are by the ability to secure loans as well as manage procurement of materials on the one hand and management of their domestic tasks on the other. Wages Table 4.4 shows the trends in daily wage earnings (real wages, base 1983) for regular salaried and casual workers. For rural India, both men and women show a steady upward trend in daily real wages. However, two features are noteworthy. One, male wages are consistently higher than female wages. Two, the gap between male and female wages has been steadily rising from roughly 4.6 in 1983 to over 10 in 2004-05. As the Table shows, for rural, the rate of growth for all has been declining over the period (from 31 percent over 1993-1999/00 to 25 percent over 1999/00 to 2004/5), however the gender divide is sharp, in that the rate of growth of male wages is higher than that of female wages. An analysis of Agricultural Wages in India (AWI) data from 1964-70 to 1990-97 for male and female agricultural labourers, confirms this trend. (Chavan & Bedamatta, 2006: 4045), alongside a widening gap in male-female earnings through the 1990s, especially in the southern states of Andhra Pradesh, Kerala, Karnataka and Tamil Nadu. The restricted access for women in non-agricultural employment as well as the higher degrees of mechanisation leading to an overall decline in labour requirements in agriculture in these states, could be contributory factors.

67
Table 4.4 Daily Wage Earnings, by Gender, Caste and Rural/Urban 1983-2004/05 Male Female ST SC Others
& OBC Total Average
Rural 1983 9.91 5.42 6.91 7.13 9.67 8.55 1993-94 13.64 7.4 9.32 10.12 13.25 11.79 1999-00 17.55 10.27 11.8 12.82 18.66 15.42 2004-05 22.12 11.98 14.44 16.36 21.88 19.26
Urban 1983 20.65 12.04 14.52 13.77 20.33 19.15 1993-94 27.73 18.43 22.19 18.48 27.62 26.05 1999-00 36.71 27.18 29.96 25.92 41.45 35.05 2004-05 32.16 23.03 26.82 20.95 32.72 30.36
Source: Authors’ calculations using NSSO Employment and Unemployment Surveys, various rounds Note: Real wages are calculated using base 1983. The Central Government and State Governments have fixed minimum wages under the Minimum Wages Act. In the year 1997-98, the wages of agricultural workers in the States ranged from Rs. 20 per day to Rs. 60 per day. Chavan and Bedamatta’s (2006) analysis further points out that the earnings of female labourers were below minimum wages for all states in 2001, with the exception of Himachal Pradesh, Assam, Gujarat and Kerala, while this was not the case for men. Except for West Bengal and Madhya Pradesh, most other states seemed to pay men over the minimum wages. The enforcement of minimum wages in agriculture is a real problem because inspectors are generally reluctant to visit farms and fields, and employers are reluctant to cooperate with them whenever such visits are undertaken. The ordinary farm labourer is not aware of the law or the machinery for enforcing minimum wages or just accepts what he/she is given. In urban India too, male wages are greater than female wages. However, the upward trend in both wages can be seen over 1983 to 1999-00. There is a decline for both men and women over 1999-00 and 2004-05. Ghosh and Chandrasekhar (2006) in their paper “working for less”, point out that a striking feature of this scenario (falling real wages along with relatively less regular employment) is the generally low expectation level of most workers in terms of income from such work. A large number of workers (10 per cent rural male and 25 per cent rural female) would apparently be satisfied with monthly incomes well below the minimum wages in the country (less than Rs 1000).8 If the bar is raised to Rs 1500, then a fourth of men and half of women would consider the amount remunerative. In urban areas, the expectations in general are higher, though urban women workers appearing to have the lowest expectations of all – 56 per cent satisfied with less than Rs 1500 per month. Despite these low expectations, the 61st Round of the NSS suggests that in reality even these are not achieved. The absolute gap between male and female wages rises over the first three data points (from 8.6 to 10.6) and declines to 9 in 2004-05. For urban workers, the last five years have seen a sharp decline in the rate of growth of real wages, with the decline being greater for women than for men, despite regulations to the contrary such as the Equal
8 Legal minimum wages vary across states, from a low of around Rs 45 per day in rural areas to Rs 120 a day in some urban areas. Assuming 24 days of work per month, this would mean a range of Rs 1080 to Rs 2880 per month.

68
Remuneration Act. Hirway (2006), based on an analysis of the occupational wage survey, Labour Bureau, Government of India, concludes that the gender wage differentials were highest in the apparel industry. This wage discrimination is largely due to women’s engagement in unskilled and semi-skilled work, lowest grades of management work and other related productive work. A similar conclusion was derived by Unni (2001) in a study of textile workers in Surat. By social group, we can see (Table 4.4) that the wages for rural SCs increase steadily over the entire period, a feature shared by all groups. For urban India, real wages for SCs (and all groups) increase over the three data points but decline over 1999-00 and 2004-05. Thus, the trends by social group mirror those for gender. Figure 4.9 shows gender-based wage differentials (in real terms, base 1983) for salaried workers by education categories by gender and caste. It provides prima facie evidence for gender discrimination: similarly educated men and women earn significantly different real wages. For rural workers, the wage gap between men and women has been rising over time for all educational categories, with a sharp rise in the wage gap between 1999-00 and 2004-05.

69
Figure 4.9 Gender Based Wage Differential for Salaried Workers,
by Education and Rural/Urban
0
20
40
60
80
100
120
140
1983 1993-94 1999-00 2004-05
Graduate andabove urban
Secondary andhigher secondaryurbanMiddle urban
Literate and belowprimary urban
Not literate urban
Graduate andabove rural
Secondary andhigher secondaryruralMiddle rural
Literate and belowprimary rural
Not literate rural
Source: Authors’ calculations using NSSO Employment and Unemployment Surveys, various rounds For urban workers, the picture is not as sharp. Illiterate workers see a continuous increase in the gender wage gap over the period. Literate, up to primary, see an increase and then a decline such that in 2004-05 the gap is almost the same as in 1983. For workers who have studied up to middle school, the gap increases over the first three data points and then declines but is still higher than in 1983. Secondary and higher secondary pass workers have the smallest absolute gap (across all categories of workers), but the trend is increasing over the period, with the gap remaining more or less constant over 1999-2000 and 2004-05 (see also Unni and Raveendran, 2007). The difference in human capital can be one explanation for the wage gaps between gender and caste groups. The low level of education among women and lower caste groups lead to lower wages and low end jobs for them. But as Bordia and Desai (2002) point out, the clustering at the low end can also be a result of the structure of the labour market itself, with not enough jobs available for women with higher levels of education, making many such educated women withdraw from the labour force. What could be possible reasons for such discrimination? A major one is the ‘invisibility’ and ‘taken for granted’ nature of much of women’s work. A second is the almost exclusive responsibility of women for reproductive and household maintenance tasks. A third is the ideological valuation of women as home-makers rather than productive workers, hence allowing them at best to be seen as ‘secondary earners’ (Chen et al, 1999, Bajaj, 1999, Mehrotra and Biggeri, 2007). Rao and Hussain, in their case study of a garment industry in Delhi, note how women had internalized the view that their work was only marginal. In talking about their work identity and rights, women said “Yeh bhi koi kaam hai? Kamate to woh hain – main to sirf pakati hoon (Is this work? He earns the living – I only do the cooking.)” (1987:62). A majority of these women did not even know about the minimum wages

70
act or other relevant laws. In her case study of the beedi shops in Keelapavoor district, Gopal (1999) notes the shop-owners’ perception of women’s beedi work, when 28 of the 42 shop-owners interviewed responded by saying that beedi work was spare time work for women. All this contributes not just to the lower proportion of women in the labour market, but more important, to wage differentials, lack of security and independence of work, unpaid work and lower upward mobility in jobs. While the work of the Scheduled Castes, both men and women, is not invisibilised in the same way as women’s work, they too remain at the bottom end of the job market, due to continued notions of untouchability and the segregation this creates in spheres of work. Agricultural labour and manual scavenging are two sectors, both low paid, where Scheduled castes, especially SC women, dominate. Over the years several laws have been enacted and millions of rupees have been spent to eradicate the practice of manual scavenging, a target for achieving the national goal of complete eradication of manual scavenging being the end of Tenth Plan (2007). The Employment of Manual Scavengers and Construction of Dry Latrines (Prohibition) Act was passed in 1993. In 2002-03, the Union Ministry for Social Justice and Empowerment admitted the existence of 6.76 lakh people who lift human excreta for a living and the presence of 92 lakh dry latrines, spread across 21 States and Union Territories. Civil society estimates are higher, almost 8 million (Zaidi, 2006, Mander, 2001, Narula, 2001, Thorat et al, 2006). The Safai Karamchari Andolan's sample survey in 30 districts across India, confirmed the existence of both private and community-run dry latrines serviced by manual scavengers in many urban areas. Nearly 80 per cent of the scavengers, employed by the government, local bodies, contractors or private homes are women (Viswanathan, 2006). The evidence of discrimination is more persuasive when we look at highly educated workers, since these workers would apply for jobs where “merit” should matter the most and presumably, their own merit should be the most obvious owing to their high levels of education. For the category “graduate and above”, rural wages have been rising steadily for men and women and the rise of urban wages from 1983 is arrested by a decline over 1999-00- 2004/05 for both men and women. Even though both groups have experienced a rise in real wages, the gender gap in wages for this highly educated category of workers has consistently widened for rural workers over time. As a Muslim woman in Khetura, West Bengal commented, “Look at Rahima. She has done two MAs yet finding a job was such a problem. Now she has just managed to get a para-teachers job, paying barely Ra 1000 per month”, pointing both to the lack of respectable jobs for women within the teaching profession and the increasingly low paying nature of these jobs. For urban workers, the rise is even sharper, as real wages for urban men first, are much higher than for women and have shown a lower decline, so the wage gap for highly educated urban workers shows a sharply rising trend, even during the period when the real wages themselves were declining. Male and female labour force participation and implications for income growth We use recent panel data in order to compute implications for household income growth of differential rates of labour force participation of men and women (Table 4.5 presents a selection of the results). Coefficients on female employment variables are lower than on corresponding male ones, and are in one case, self-employed women
71
(including own account informal workers, and owners of business both in the formal and informal sector), even statistically insignificant. An insignificant coefficient does of course not mean (it cannot mean) that women’s earnings do not contribute to household income. Rather, it suggests hat women work out of necessity, responding to a drop in household income and making up for the shortfall. The coefficient on female salaried employment is considerably higher than that on the other female employment variables, but still less than 40 percent of the coefficient on male salaried employment. For reasons discussed in this section and in Section 2, this is more likely to represent a category of women that work out of choice. However, it is quite wrong to suggest that promoting extra female labour force participation of this type will on its own bring about extra growth, either at the micro level or at the macro level. The precise argument is complex, but can be loosely paraphrased as follows. At the micro level, given constraints on labour supply because domestic duties have to be taken care of, and given that female wages are lower than male wages, it must be optimal for a typical household to supply more male than female labour. Observed lower female than male LFPRs are thus consistent with households maximising income growth. At the macro level, supposing for argument’s sake that labour demand is exogenously given, promoting extra female employment will reduce male employment. This is only good for growth if the average productivity of the female workers that replace the male workers is higher than that of those they replace. Productivity reflects human capital. Current levels of female and male human capital reflect labour market conditions: in the light of employer preferences and social norms in favour of male labour, gender inequality in human capital is optimal. It is thus not a priori obvious that female workers will be more productive than the male workers they replace; and it is thus not necessarily the case that promoting female labour force participation will lead to extra GDP growth. What to make then of Esteve-Volart’s findings, cited above, that promoting female labour force participation will lead to massive extra growth in India? The model used for these calculations implicitly assumes the removal of all barriers to female participation: their “time poverty” that arises from their domestic duties, social norms, employers’ preferences reflected in lower wages, parental discrimination in investing in the human capital of boys more than in girls, barriers of all sorts in accessing and continuing schooling, and so forth. If all these barriers were to be removed, then over time the distortion in the allocation of talent that is implied by lower female than male labour force participation would be removed as well – and that has large effects on economic growth. However, until that time, maximising income growth at the household level, and the growth of GDP per capita of the country as a whole, would require a degree of gender inequality both in employment and in education (and health care…). Whether that degree is higher than, lower than, or equal to the degree that actually prevails is not something we have been able to investigate. In practice this means that promoting female employment on its own cannot be guaranteed to lead to extra growth. The barriers to female participation mentioned need to be removed as well.
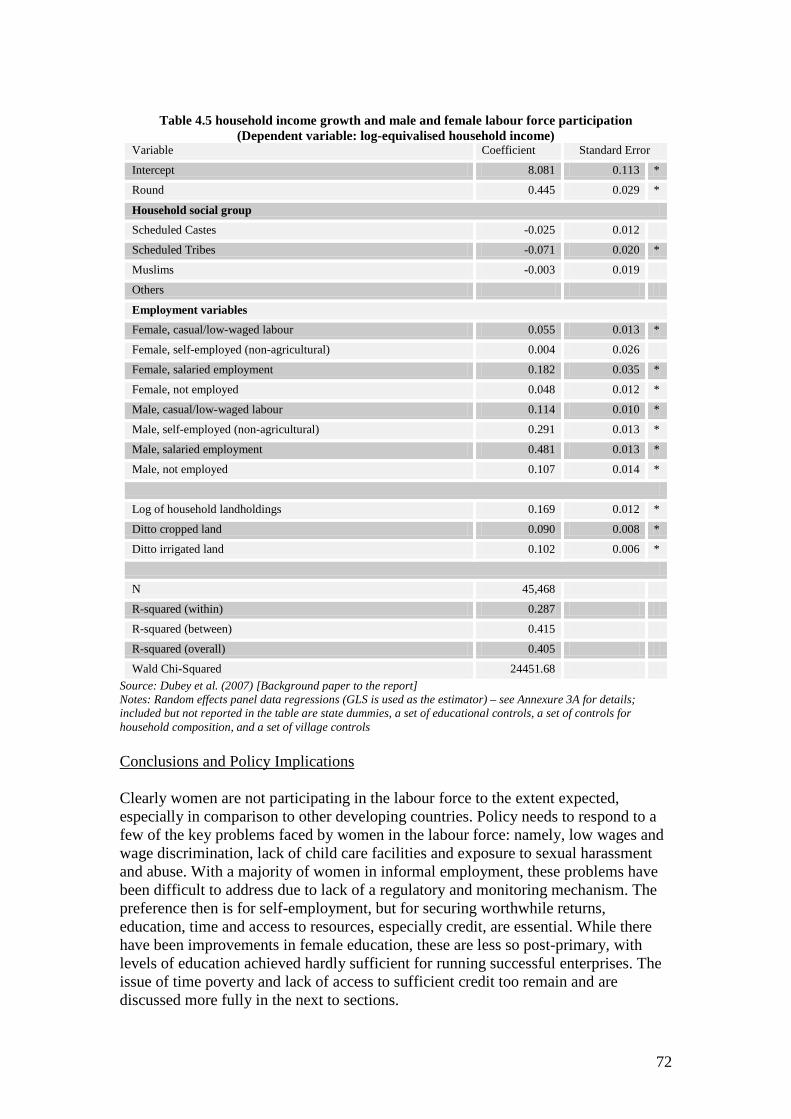
72
Table 4.5 household income growth and male and female labour force participation
(Dependent variable: log-equivalised household income) Variable Coefficient Standard Error
Intercept 8.081 0.113 *
Round 0.445 0.029 *
Household social group Scheduled Castes -0.025 0.012
Scheduled Tribes -0.071 0.020 *
Muslims -0.003 0.019
Others
Employment variables Female, casual/low-waged labour 0.055 0.013 *
Female, self-employed (non-agricultural) 0.004 0.026
Female, salaried employment 0.182 0.035 *
Female, not employed 0.048 0.012 *
Male, casual/low-waged labour 0.114 0.010 *
Male, self-employed (non-agricultural) 0.291 0.013 *
Male, salaried employment 0.481 0.013 *
Male, not employed 0.107 0.014 *
Log of household landholdings 0.169 0.012 *
Ditto cropped land 0.090 0.008 *
Ditto irrigated land 0.102 0.006 *
N 45,468
R-squared (within) 0.287
R-squared (between) 0.415
R-squared (overall) 0.405
Wald Chi-Squared 24451.68 Source: Dubey et al. (2007) [Background paper to the report] Notes: Random effects panel data regressions (GLS is used as the estimator) – see Annexure 3A for details; included but not reported in the table are state dummies, a set of educational controls, a set of controls for household composition, and a set of village controls Conclusions and Policy Implications Clearly women are not participating in the labour force to the extent expected, especially in comparison to other developing countries. Policy needs to respond to a few of the key problems faced by women in the labour force: namely, low wages and wage discrimination, lack of child care facilities and exposure to sexual harassment and abuse. With a majority of women in informal employment, these problems have been difficult to address due to lack of a regulatory and monitoring mechanism. The preference then is for self-employment, but for securing worthwhile returns, education, time and access to resources, especially credit, are essential. While there have been improvements in female education, these are less so post-primary, with levels of education achieved hardly sufficient for running successful enterprises. The issue of time poverty and lack of access to sufficient credit too remain and are discussed more fully in the next to sections.
73
Section 5 Gender Divisions of Labour and Female supply Response Policies that promote growth through incentives for more lucrative economic activities may fail to reach women when the gendered division of labour is static, in particular when women are “time poor” because of the burden of their domestic activities. In Uganda, female supply response to the promotion of non-traditional agricultural exports is highly inelastic (Whitehead et al. 2000), and regulatory barriers to formalisation of a business have a disproportionate effect on female entrepreneurs (Ellis et al. 2006), precisely for that reason. Supplementary policies are therefore called for that address this time constraint.
“Poverty has pushed us to join the labour force. The only time we take a break from working in the fields is during the late stages of pregnancy,” says a female Santal agricultural labourer staying in Bompur, an impoverished adivasi hamlet adjacent to Khetura and Galsi in Burdwan. She adds, “I have to wake up at 3 in the morning to do the domestic work otherwise I can’t cope with it. I can’t afford to sleep late.” “I got married when I was 17”, says a Brahmin and graduate (BA) of Khetura village. Before I got married, I wanted to become a nurse, but my father said that girls from respectable families do not become nurses. After my marriage, my in-laws did not want me to work perhaps because my husband earns enough to maintain the household and also because of our high status: we are bhadroloks. We can’t do manual work; we can’t work in the fields like the Bagdis and the Bauri women. These will lower our social status. Then there is the domestic work burden too: homemaking, bringing up children takes a lot of time. And then where is the respectable work available for women like me? So many women and men too who are highly educated do not get jobs.”
The two accounts above come from women of two different social categories, the first a poor Scheduled Tribe woman and the second an upper caste Brahmin woman. While there are several points of difference, there is a key similarity: the high premium to domestic work. Indeed, irrespective of whether the family is rich or poor, Brahmin or Bauri (SC, considered a very low caste in South Bengal), Hindu, Christian or Muslim, the woman educated or illiterate is that homemaking and all that goes with it is the exclusive responsibility of the women. This emerged clearly in the numerous focus group interviews with the men and women across the two states; a woman’s primary duty is to raise a family, look after the needs of the husband, children and in-laws. Only then should she take up work outside the home, no matter what it maybe. The women too articulate this sentiment. Men, in their own opinions as well as those of the women, are not supposed to cook, clean or wash. “I don’t mind helping my wife with such things (meaning domestic work) once in a while, when she is sick, but I can’t do it regularly. What will my friends say? And why should I have got married then?” asked a Bagsorai youth in West Bengal. Women who are perceived to “neglect” their “household duties” for work are looked on disdainfully by both men
74
and women across all castes and regions. Some of the younger women did mention that men too should lend a hand in the domestic responsibilities, but then they quickly pointed out that in their samaj (community) such things would not be possible. The second common perception, across the districts and states is that women should work for remuneration outside the home only if the economic situation of the household so demands it. There are a few exceptions to this of course, but those are in situations where the educational and economic status of the household is higher than the average of the social group in a particular village. It must be pointed out that helping in the family farm is not considered work as it does not bring in additional money. As another Santal woman of Saharpur in Maldah put it, “Although every man wants his wife to stay inside the house, do household chores and not step out, sheer poverty has led them to change their attitudes towards women working outside their homes.” Her household has 10 kathas (half an acre) of land so both she and her husband have to work as agricultural labourers. The perception is that economic provisioning is the domain of the men, so women should not work. “Women don’t join the labour force out of pleasure or for amusement. They have to work only when there is a severe monetary crisis. A woman like me has to work to keep the family together. We have about 2 bighas of unirrigated land that is cultivated by my husband but the earnings are not enough. It was worse when my daughters were unmarried. But now that they are married, I don’t have to go out for work as an agricultural labourer as frequently. I manage with whatever my husband earns,” says a Rajbanshi (SC) woman of Bhashakandar village in Maldah district. They are certainly not rich but better off than some of the other women in the village, one of the declared ‘backward villages’ of the block. It is a similar story in the UP villages. Irrespective of caste and religion, women have to do all the domestic work. As one OBC woman said, “women work outside the home only when their circumstances are constrained. She takes up a livelihood in the case of poverty, when the man of the house is unable to earn, he is sick or has died, or the brother or father do not support her. No one protests as she has no option, otherwise her work is confined to the four walls of the house”. The rules of purdah (seclusion) are strongest for the Brahmin women, who must stay at home and look after their families. Amongst the Muslims too, it is a status symbol for women to stay at home, and those who go out are seen as desperately poor. The poor among the OBC and most SC women in Kazakpur and Sanaha had no option but to work. The conditions are difficult: they are paid less and have to work harder than men, they face problems in commuting, they carry their children to work, and often get beaten by their alcoholic husbands. There are situations when the woman is forced to work, but as soon as the economic condition of the household improves, say with a male, either a husband or a son, getting a job, the woman is made to withdraw from the labour force. Thus Mira Murmu (Santal, ST, 28) of Khetura says that when she got married 15 years ago she had to work often outside the home as an agricultural labourer. Then her husband got a job first as a temporary night guard in Burdwan, earning Rs 800 a month, and then in the General Post Office in Kolkata. He became permanent four years ago and now draws Rs 6000-8000 per month including overtime. She says she feels lucky that her husband earns enough so that she does not have to work outside the home. Similar is the story of an SC woman, who worked as an agricultural labour seasonally apart

75
from their own plot. But they educated their children and the eldest, Kalyan, finished his higher secondary and got a job as an agent with the Life Insurance Corporation of India. He earns Rs 3000-4000 per month. She says now “her son does not want that his mother work hard outside the home.” A final and related issue is one of respectability of work. In both states, the job considered most respectable in the eyes of both men and women is that of a government school teacher. But that requires a high level of education and nowadays, candidates are required to clear a competitive written test and an interview at the state level. That alone is not enough because the jobs are given only when vacancies arise. Connections with political leaders also matter. The second most preferred job is that of a para teacher, who gets about Rs 1000 per month. Apart from qualifications, party connections too are important in this. Take the case of Rahima in Khetura. She has done two MAs. After trying several years for a job (and she continued with her studies meanwhile) she has got a job as a para teacher. She rues that it’s only for three years but says something is better than nothing. And for those who have some basic education (upto primary level) the most preferred job is that of an ICDS worker (Anganwadi worker) at Rs 1000 per month. This is an issue raised by Das and Desai (2003) in pointing to the low work participation of educated women – the lack of suitable and respectable jobs. The issue of women’s unpaid work, the visibility of women’s work and the problems for accounting and measurement were raised in the global arena in the early 1980s (Beneria, 1982, Goldschmidt-Clermont, 1987, Oppong and Abu, 1987, Beneria, 1988, White, 1984). In focusing on women’s invisible work, there was also a greater emphasis on the non-recognition of their work and under-enumeration as workers (Feldman 1998, Papola and Sharma 1999). There was a concern about women’s presence in the labour market, and the focus of research and analysis shifted from women’s employment per se to the nature of women’s work, their livelihood and poverty situation, access to and ownership of productive resources and human development in terms of health and education and disparity in all these areas. While these remain issues not fully addressed or understood by state policies, Elson (1995, 1999) has pointed out that processes of economic growth in fact end up levying what she calls a “reproductive tax” on women, due to enhanced and unsupported burdens of domestic work. This introduces the concept of the “Care Sector”, which refers to a range of domestic work, both in terms of care and in terms of maintaining the household. Women’s role in this care or reproductive sector falls out of the national accounting system. Many of these tasks in which “non-working” women are involved would be considered ‘work’ if performed by a person hired for the purpose or unrelated to the household (Visaria, 1998). The time use surveys (Government of India, 1999) reveal the significance of time spent by women in unpaid care activities (Bhatia, 2002, Hirway, 2002). The first of its kind Time Use Survey (from more than one location) was conducted (and indeed among developing countries) between July 1998 and June 19999. The study was commissioned by the Government of India and conducted by the Central
9 Results made available by Ministry of Statistics and Programme Implementation, Government of India at mospi.nic.in/stat_act_t5_2.htm
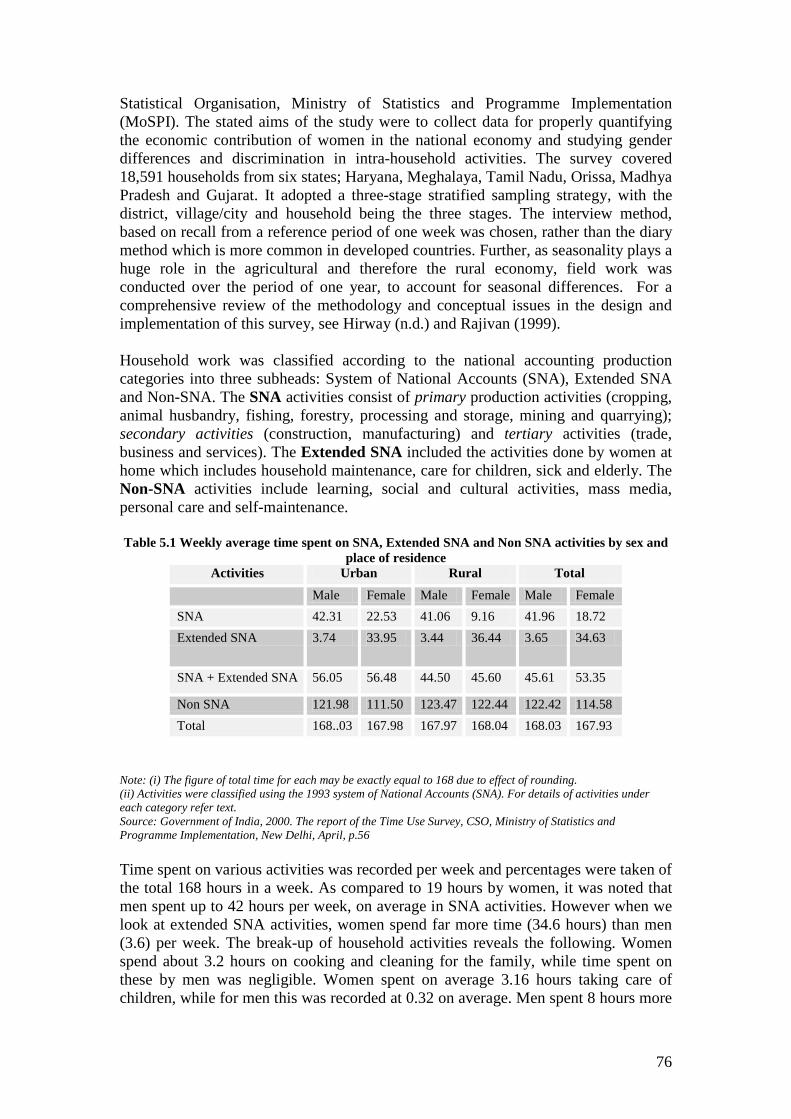
76
Statistical Organisation, Ministry of Statistics and Programme Implementation (MoSPI). The stated aims of the study were to collect data for properly quantifying the economic contribution of women in the national economy and studying gender differences and discrimination in intra-household activities. The survey covered 18,591 households from six states; Haryana, Meghalaya, Tamil Nadu, Orissa, Madhya Pradesh and Gujarat. It adopted a three-stage stratified sampling strategy, with the district, village/city and household being the three stages. The interview method, based on recall from a reference period of one week was chosen, rather than the diary method which is more common in developed countries. Further, as seasonality plays a huge role in the agricultural and therefore the rural economy, field work was conducted over the period of one year, to account for seasonal differences. For a comprehensive review of the methodology and conceptual issues in the design and implementation of this survey, see Hirway (n.d.) and Rajivan (1999). Household work was classified according to the national accounting production categories into three subheads: System of National Accounts (SNA), Extended SNA and Non-SNA. The SNA activities consist of primary production activities (cropping, animal husbandry, fishing, forestry, processing and storage, mining and quarrying); secondary activities (construction, manufacturing) and tertiary activities (trade, business and services). The Extended SNA included the activities done by women at home which includes household maintenance, care for children, sick and elderly. The Non-SNA activities include learning, social and cultural activities, mass media, personal care and self-maintenance. Table 5.1 Weekly average time spent on SNA, Extended SNA and Non SNA activities by sex and
place of residence Activities Urban Rural Total
Male Female Male Female Male Female SNA 42.31 22.53 41.06 9.16 41.96 18.72 Extended SNA 3.74 33.95 3.44 36.44 3.65 34.63
SNA + Extended SNA 56.05 56.48 44.50 45.60 45.61 53.35
Non SNA 121.98 111.50 123.47 122.44 122.42 114.58 Total 168..03 167.98 167.97 168.04 168.03 167.93
Note: (i) The figure of total time for each may be exactly equal to 168 due to effect of rounding. (ii) Activities were classified using the 1993 system of National Accounts (SNA). For details of activities under each category refer text. Source: Government of India, 2000. The report of the Time Use Survey, CSO, Ministry of Statistics and Programme Implementation, New Delhi, April, p.56 Time spent on various activities was recorded per week and percentages were taken of the total 168 hours in a week. As compared to 19 hours by women, it was noted that men spent up to 42 hours per week, on average in SNA activities. However when we look at extended SNA activities, women spend far more time (34.6 hours) than men (3.6) per week. The break-up of household activities reveals the following. Women spend about 3.2 hours on cooking and cleaning for the family, while time spent on these by men was negligible. Women spent on average 3.16 hours taking care of children, while for men this was recorded at 0.32 on average. Men spent 8 hours more

77
on average on non-SNA activities (including learning, leisure and personal care) than did women. Women slept, on average, 2 hours lesser than men in Haryana, MP and Orissa, though no significant differences were observed in other states. It was also recorded that men spent much more time on newspaper-reading, music, smoking, drinking and exercise than women. On the other hand, women spent marginally more time than men on recreational reading. Women’s participation in SNA activities varied across states and urban and rural areas. Meghalaya and Gujarat recorded a high time input by rural women in SNA activities, while Tamil Nadu and Orissa registered the highest shares for urban women. Using a definition of women’s work which combines SNA and extended-SNA activities, women’s work accounts for about 55% of the total of men’s and women’s work. As quoted from the report, “If we take SNA and extended SNA activities together… women were found to be working for longer hours than men. If we work out the average of women’s work to the total work of male and female, it works out to 55%, which compares quite well with the figure of 53% quoted in the UNDP Human Development Report for 1995. Therefore if extended SNA activities are included in economic activities, the contribution of women will be higher when compared to men” (Government of India, 2000:81). Non-paid activities accounted for about 38% of the total time spent by household members. Women’s share in this was as high as 51% while for men this stood at 33%. The highest share of time spent by women on unpaid activities was recorded in Haryana (86%) and Meghalaya (76%), while the lowest was in Tami Nadu (32%). Interestingly, the NFHS-3 reports that about one in four women did not receive any payment for the work they did, while this was only 5% for men. Revathi’s (1998) study in Andhra Pradesh shows how most of the unwaged activity is of an expenditure-saving type, such as collection of wood, fetching water, childcare, and dairying and allied activities. These get excluded from the calculation of work. Women spend on average about twice as much time on taking care of family members as their men, yet their individual educational status does not make a difference to their time spent on family care-giving activities as revealed by the case studies at the beginning of this section. Giving a good overview of time-use studies, across the world, and the specific adaptation to the Indian context, Indira Hirway (2002) highlights certain difficulties/ shortcomings of this first survey. First, time use per se does not reflect efforts or efficiency of people. The amount of energy and involvement is not accurately gauged by time-use alone. For instance, time spent on cooking may be the same for two households, but the drudgery involved may be very different if one uses a modern stove as against a traditional smoky stove. Getting the right response from respondents was also noted to be somewhat problematic at times. Apart from illiteracy of many respondents and them not keeping proper record of time, work is often organized in a complex manner and delineation of specific activities often was challenging. Yet, this is a very useful study which sheds much light on intra-household time-use patterns and is relevant to policy decisions in India.
78
Conclusions and Policy Implications Women’s reproductive work therefore can have many economic implications. It reduces educational achievements and places restrictions on time, decreasing both market value and opportunities. It is physically demanding thus affecting health, productivity and maintenance of the future labour force and it is work that is neither paid for nor included in official accounting. Yet it is work that is essential. Policies are therefore essential for addressing the time constraint faced by women. Simple labour market integration may not hit the mark as revealed in the previous sections. Instead policies should seek to improve basic services and infrastructure such as the provision of drinking water, electricity, cooking gas, grain mills and transport services. By changing the character of domestic work and reducing the drudgery therein, it may be possible to gradually change the ideologies and attitudes towards its performance, with men sharing in tasks that are anyway less burdensome. This would help improve female supply response. Functional child-care facilities of good quality too need to be prioritised, both in rural and urban contexts.

79
Section 6 Fertility and Growth
Fertility decline enhances per capita growth An escape from Malthusian stagnation, into the final stage of the Demographic Transition, characterised by low mortality and fertility rates, and the potential for sustained per capita income growth, requires that the initial drop in mortality rates, usually brought about by improving overall health conditions, is followed by a similar drop in fertility rates. In theory, female education is among the factors that may help bring about decreased fertility, because of its effect on the opportunity costs to women’s time of raising children and investment in their schooling (Foster and Rosenzweig, 1996). Schultz (1994) verifies this theoretical proposition in a sample of 68 low-income countries. His regression results imply that an increase in the average number of years of schooling that women have received in a country by a year is associated with a 12 percent reduction in total fertility10. His analysis shows that, alongside increasing employment outside of agriculture, narrowing the gap between male and female human capital is the best available predictor of a decline in fertility and population in low-income countries. Female education, both directly and indirectly, through lowering fertility, is thus important for long-run growth. India has been witnessing a decline in fertility rates over the past few decades, with the total fertility rate (TFR) for the 15-49 age group declining from 3.39 (1990-92) to 2.68 (2003-5) (Table 6.1). These averages however vary by caste, education and region, with the upper castes, educated and urban people showing much lower levels of fertility. Again TFRs are lowest for the wealthy and highest for the poorest people. Muslims show a higher TFR of 3.09 in relation to other groups.
Table 6.1 Trends in fertility rates State NFHS-1 (1993-4) NFHS-2 (1998-99) NFHS-3 (2005-6) Uttar Pradesh n.a 4.06 3.82 West Bengal 2.92 2.29 2.27 All India 3.39 2.85 2.68 India: Urban 2.70 2.27 2.06 India: Rural 3.67 3.07 2.98 Schedule Caste 3.92 3.15 2.92 Scheduled Tribe 3.55 3.06 3.12 OBC n.a 2.83 2.75 Others 3.30 2.66 2.35 No education 4.03 3.47 3.55 5-7 years complete 3.01 2.64 2.51 12 or more years 2.15 1.99 1.80 Source: NFHS Reports.
10 This effect is evaluated at mean levels of female education in low-income countries only; one should be wary of extrapolating this to countries with much higher levels of average female education.
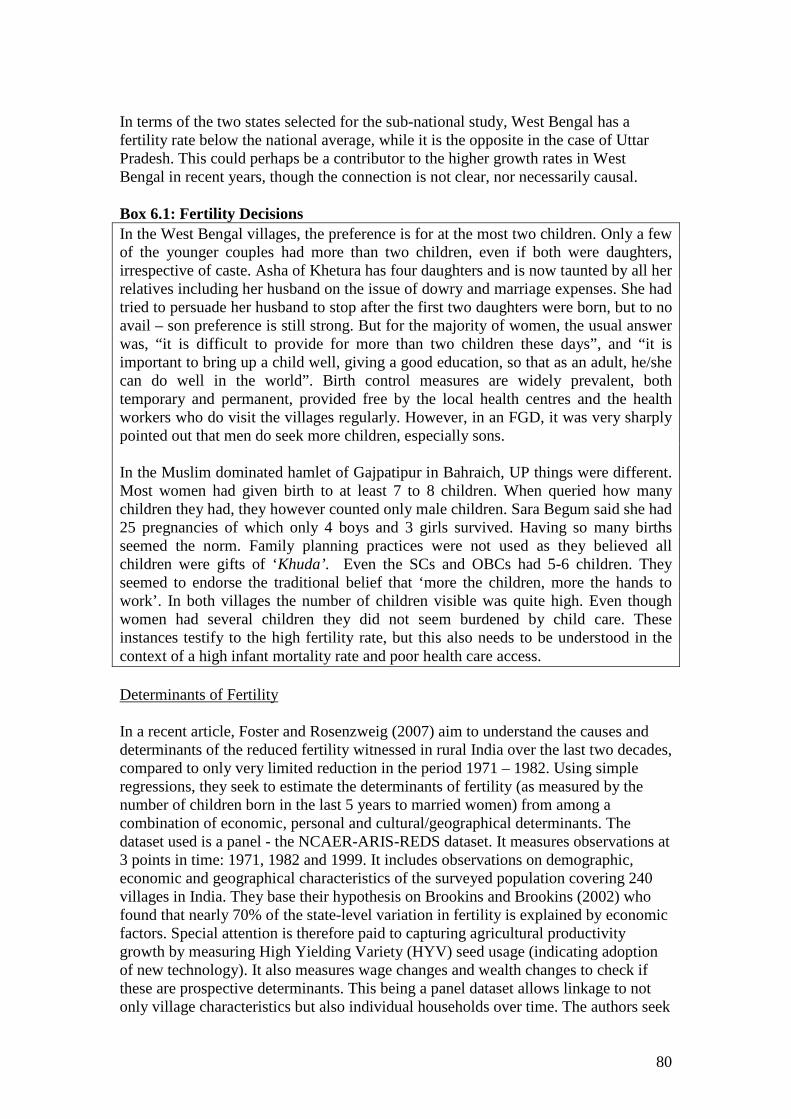
80
In terms of the two states selected for the sub-national study, West Bengal has a fertility rate below the national average, while it is the opposite in the case of Uttar Pradesh. This could perhaps be a contributor to the higher growth rates in West Bengal in recent years, though the connection is not clear, nor necessarily causal. Box 6.1: Fertility Decisions In the West Bengal villages, the preference is for at the most two children. Only a few of the younger couples had more than two children, even if both were daughters, irrespective of caste. Asha of Khetura has four daughters and is now taunted by all her relatives including her husband on the issue of dowry and marriage expenses. She had tried to persuade her husband to stop after the first two daughters were born, but to no avail – son preference is still strong. But for the majority of women, the usual answer was, “it is difficult to provide for more than two children these days”, and “it is important to bring up a child well, giving a good education, so that as an adult, he/she can do well in the world”. Birth control measures are widely prevalent, both temporary and permanent, provided free by the local health centres and the health workers who do visit the villages regularly. However, in an FGD, it was very sharply pointed out that men do seek more children, especially sons. In the Muslim dominated hamlet of Gajpatipur in Bahraich, UP things were different. Most women had given birth to at least 7 to 8 children. When queried how many children they had, they however counted only male children. Sara Begum said she had 25 pregnancies of which only 4 boys and 3 girls survived. Having so many births seemed the norm. Family planning practices were not used as they believed all children were gifts of ‘Khuda’. Even the SCs and OBCs had 5-6 children. They seemed to endorse the traditional belief that ‘more the children, more the hands to work’. In both villages the number of children visible was quite high. Even though women had several children they did not seem burdened by child care. These instances testify to the high fertility rate, but this also needs to be understood in the context of a high infant mortality rate and poor health care access. Determinants of Fertility In a recent article, Foster and Rosenzweig (2007) aim to understand the causes and determinants of the reduced fertility witnessed in rural India over the last two decades, compared to only very limited reduction in the period 1971 – 1982. Using simple regressions, they seek to estimate the determinants of fertility (as measured by the number of children born in the last 5 years to married women) from among a combination of economic, personal and cultural/geographical determinants. The dataset used is a panel - the NCAER-ARIS-REDS dataset. It measures observations at 3 points in time: 1971, 1982 and 1999. It includes observations on demographic, economic and geographical characteristics of the surveyed population covering 240 villages in India. They base their hypothesis on Brookins and Brookins (2002) who found that nearly 70% of the state-level variation in fertility is explained by economic factors. Special attention is therefore paid to capturing agricultural productivity growth by measuring High Yielding Variety (HYV) seed usage (indicating adoption of new technology). It also measures wage changes and wealth changes to check if these are prospective determinants. This being a panel dataset allows linkage to not only village characteristics but also individual households over time. The authors seek

81
to estimate a dynamic model of fertility choice, and capture features such as the (opportunity) costs of time, quantity/quality (of children) trade-off and access to health and family planning services. The regression results show the following:
a) Aggregate wage changes explain 23% of the total observed changes in fertility. Of these female wages alone explain 15% of the variation (which implies a shift in women’s time allocation).
b) Changes in agricultural productivity and agricultural wages (together) explain about 61% of the decline in fertility in the latter time period under consideration.
c) The presence of health centres has a significant effect on fertility but the aggregate diffusion of health centres explains only 3.4% of the fall. In other words, while the presence of a health centre is important for fertility reduction, the number of health centres did not vary greatly over the period.
d) Interestingly, although female literacy rose by about 81% over the last two decades, there is no evidence of this having any impact on fertility.
Economic Growth An interesting discussion with regard to the impact of changes in agricultural productivity on fertility is provided. Changes in agricultural productivity as measured and observed through HYV-seeds adoption is expressed either through an induced wage increase, or through greater investments in schooling. This is explained as follows: greater adoption of technology increases the returns to skills, which in turn encourages schooling. Greater schooling implies lower fertility and also allows greater employment opportunities to children/young adults outside of agriculture. This further reinforces the propensity to limit family size. It is due to the operation of such effects, the authors argue, that they observe that increased adoption of HYV varieties accounts for 39.2% of the fall in rural fertility, and of this 92% is through the direct effect discussed above, net of the effect of agricultural wage increases. The authors believe that in light of greater technological improvements in agriculture and increasing returns to education, this trend of decreasing fertility will continue in rural India in the years to come. Yet they do also point out that it is not economic growth per se, rather the incentives available to the household through changes in the nature of production, that influence fertility decisions, such as a rise in female wages and expansion of opportunities for female employment. Despite high growth rates, the analysis in section 4 however demonstrates that female employment has stagnated and there is a growing gender gap in wages, so how far their predictions will hold true is not clear. Access to health services and nutrition Desai and Wu (2006) point to the importance of access to health services in particular, as women often do not access maternal health services as they do not place enough value on their own health. Yet Kerala with the highest proportion of public health care services has close to 99% of women receiving at least one pre-natal check-up, while UP with the lowest, had only 35% women accessing this service. As Mahadevia (2000) noted for Gujarat, increasing privatisation of health services and declining state provision makes it difficult for women, at least poorer women, from accessing such services, with negative effects on fertility.

82
Despite the low impact of health centres in their model, the field studies point to a definite relationship between lack of access to health services, high mortality and consequently high fertility rates. It was found that the focus of the health department seems mainly on children’s health especially administering of polio drops as a preventive measure. RCH and women’s general health remain poor. In Sanaha, Gorakhpur, the ANM, who lived in the city, hardly came and when she did, confined herself to the main village at the Anganwadi Centre. This was accessed to an extent by women and children for the nutritional supplement when it was available. But in the village women were hardly aware of the Janani Suraksha Yojana that provides financial incentives to women for regular health checkups during pregnancy and post natal care for encouraging institutional deliveries. Even ASHA, the Community Health Worker, who was a relative of the Pradhan, was not very active among the poor SC/OBC hamlets, nor did she distribute contraceptive pills. People who had the financial means accessed private doctors and nursing homes situated close by in Gorakhpur. In Bahraich, the status of health services was worse. Similar complaints of ANMs restricting themselves to administering polio drops to children and not extending support for RCH were reported. The SC women seemed more aware of health facilities rendered by the government, as financial constraints inhibited them from going for treatment to the private hospitals and doctors, who charged high fees. But even at the Civil Hospital, several people noted that government doctors promised better treatment if they went to their private clinics. Here they were charged a fee of Rs 100 and in the event of a patient needing hospitalization the charges were Rs 300 per bed per day, at a private nursing home, an exorbitant sum for the poor. This is quite different from the West Bengal villages, where the health workers did visit the women regularly including in the SC/ST hamlets, distributed contraceptive pills and encouraged them to go for institutional deliveries. While the better off did go to private practitioners, this was more out of choice than necessity as in the UP case. Clearly, if one looks at the state of health provision and the fertility rates, there can be no doubt of a strong correlation. This emerges also from NFHS data. STs are at a disadvantage due to their physical isolation and distance from health facilities, while SCs, integrated across settlements, do not face a physical barrier, rather they suffer from social discrimination in access to public facilities including health services (Baraik and Kulkarni, 2006, Thorat et al, 2006). A look at Infant and Child Mortality Rates, pointing to much higher mortality rates amongst STs and SCs in relation to Others, points to a lower access to health services, and insights into why fertility rates for these groups remain high (Table 6.2). While a large number of primary health centres and sub-centres have been created as part of the government’s ‘Health for All’ programme, NFHS surveys reveal that health services either do not reach disadvantaged sections or are not accessed by them.

83
Table 6.2 State-level differentials by social group
NFHS-1(1992-93) NFHS-2 (1998-9) NFHS-3 (2004-5) SC ST Non-
Sc/ST SC ST Non-
Sc/ST SC ST Non-
Sc/ST* India: IMR 107 91 82 83 84 68 66.4 62.1 56.6 CMR 47 49 32 40 46 25 23.2 35.8 17.3 Uttar Pradesh: IMR 138 168 110 110 83 91 n.a n.a 72.7 CMR 74 67 46 54 45 36 n.a n.a 25.6 West Bengal IMR 97 107 77 55 85 45 n.a n.a 48 CMR 44 30 27 28 16 19 n.a n.a 12.2 Source: NFHS Reports, calculations from NFHS-1 and 2 from Baraik & Kularni (2006) * Non-SC/ST for 2004-5, figures used are for OBCs and not Others, which are even lower. Note: UP has a very low proportion of STs, hence the figures are not significant. Roy et al. (2004) in their paper examine health and nutrition inequalities between four broad caste/tribe groups in India. They assess the extent of inequalities in health care and nutritional status across states examining how far these inequalities are a result of caste/tribe per se or whether they can be attributed to differential economic and educational conditions of individuals belonging to different caste/tribe categories. Inequality is examined with regard to the following deprivation indicators: (1) Four socio-economic indicators:
· Low standard of living (SLI); · Illiteracy; · No exposure to media; · No health facility within locality
(2) Two programme indicators of utilisation of health services: · Non-utilisation of ANC services; · Unsafe delivery (delivery not assisted by a health professional).
(3) Two nutritional status indicators · Low body mass index (BMI < 18.5 kg/m2), · Prevalence of any anaemia.

84
What they find is that virtually for all indicators, the ST and SC lag behind other groups; the OBCs have a middle position, but are clearly attempting to catch up with the Others. In terms of the nutritional indicators, the regional variation is wide and in fact inequality between the four social groups in terms of low BMI is highest in Gujarat, one of the fastest growing states in India today, followed by West Bengal and Orissa. Interestingly, the least disparity nutritionally is found in Karnataka, Andhra Pradesh and Uttar Pradesh. As revealed also in our analysis in section 8, the link between growth and inequality is far from clear. In her study on food insecurity among India’s poor, Rajuladevi (2001) measures the food intake of landless agricultural labour households, to find variations between slack and peak seasons. She examines, within and between wet and dry villages the ‘caste’ differences in food intake between backward castes (BCs) and scheduled castes (SCs). Her findings show that the majority of sample households survive on cereals, and have only one main meal per day, a stark indicator of food insecurity. Female-headed households are the most adversely affected ‘poverty group’ in the study villages irrespective of caste. The landless peoples’ lack of basic needs (clothing, shelter, household equipment, and health care) reveals much more of their utter destitution than conventional food intake. Seasonality in nutritional deficits is another important factor, though often overlooked. Role of female autonomy A look at the varied state-level performance clearly points to the fact that apart from economic development, social sector attainments have played a key role in achieving stable fertility rates in Kerala and Tamil Nadu. Apart from agricultural productivity and wages (Foster and Rosenzweig, 2007), access to health care and education, better infrastructure and women’s autonomy and role in decision-making are seen to have a major influence on fertility outcomes. In fact, the NFHS-3 empowerment index, based on women’s participation in household decisions (own health care, major household purchases, daily purchases and visits to family and relatives – please see section 7, Table 7.5) is positively connected to contraceptive use and fertility control. 62% of

85
women participating in 3-4 of the above decisions used contraception as against 44% who didn’t participate in decision-making. In a classic study on female autonomy and demographic behaviour, Dyson and Moore (1983) had argued that the North-South differences in fertility outcomes is largely due to the higher levels of autonomy enjoyed by women in the South compared to the North. Recent studies however suggest that the North-South differences in female autonomy and gender outcomes may not be as clear-cut as previously thought. For example, there has been a sharp increase in dowry payments in the South with a transition from bride-price to groom-price. Work on violence against women has shown that it is a severe problem in the Southern states of Karnataka (Rao, 1997) and Tamil Nadu (Jejeebhoy, 1998), not just in the northern States. Rajan et. al (2000) suggest that gender bias, as indicated by differential infant mortality and sex ratios at birth, may be worsening in Kerala and parts of Tamil Nadu, with evidence of female infanticide being particularly widespread is some districts of Tamil Nadu.
Rahman and Rao (2002) sought to revisit the north-south dichotomy in their study on the impact of culture, economics and public action on women’s agency in household decision-making. They focus on the North Indian State of Uttar Pradesh (UP) and the South Indian state of Karnataka and take off from the observation that the 2001 female-male sex ratio for Karnataka was 964 compared to 898 for UP. Rural Karnataka also had lower female-male infant mortality, 0.99 compared to 1.20 in rural UP; higher female-male enrolment rates, 0.68 compared to UP’s 0.50 for the 11-14 age group; and higher female literacy rates, 49 per cent compared to 38 per cent in UP. The authors offer three explanatory sources for this persistent divergence in gender outcomes:
(1) The first, emphasized by anthropologists and many demographers, focuses on cultural norms and kinship differences between the Northern and Southern regions. Village exogamy and distance from the natal home are seen to disadvantage women in terms of their influence in the husband’s family (Dyson and Moore, 1983, Dyson, 2002). Desai and Wu (2006) further argue that this shapes women’s access (or lack of it) to prenatal, delivery and postnatal care.
(2) The second, stressed by economists attributes the differences to regional variations in climate and ecology and the resulting cropping patterns that tend to favour female labour markets more in the South than in the North. Lower female agency could here arise from lower female productivity in highly valued tasks or lower returns to female labour in these jobs (Foster and Rosenzweig, 1996, 2007, Narasimhan et al. 1997).
(3) The third gives an important role to state intervention in promoting policies that lead to women’s equality and argues that the Southern states have been more proactive in this respect thereby resulting in engendered welfare outcomes. These include improved infrastructure and service provision such as roads, electricity, drinking water, schools, health centres and so on (Rahman and Rao, 2002).
Clearly certain aspects of decision-making influence fertility much more strongly than others and from their data they conclude that rather than kinship or labour force variables, public action seems to play a critical role in enhancing women’s mobility
86
and in turn fertility decisions. What is also clear is that culturally, across many rural areas, girls are expected to marry and bear children quite young, often when they are neither psychologically nor physically prepared for having a family. In 2005-6, the mean age at marriage for women was 16.8 years. Most SC, ST and OBC girls were married before the legal minimum age of 18 (NFHS-3). Statistics show that 51.8 per cent of women suffer from anaemia, a deficiency in iron caused or exacerbated by poor nutrition. Anaemia puts women and girls at particular risk during pregnancy and childbirth. Maternal mortality rates are high, 407 per 100,000 births in 2001 for India (UNDP 2000), 517 in the case of UP. Factors contributing to this are a lack of control over fertility, a lack of basic amenities such as clean water and sanitation and a lack of access to health facilities. Women’s voice and decision-making agency seems to increase with age, especially once they have borne sons, and as emerged in the field interviews, even though they were keen for small families, they often give in to male desire for more children. Policy Directions and Challenges Policy interventions can follow different pathways, but nevertheless continue to play an important role in influencing fertility. Dixon-Mueller (1993) groups population policies into four categories: reproductive policies whose objective is to lower the birth rates; health policies which aim to reduce mortality and morbidity; migration and urbanisation policies that seek to rationalise spatial distribution of the population; and family and welfare policies that seek to enhance the wellbeing of individuals and households through a range of protective mechanisms such as maternity benefits, child care, old age security and so on. Some may be directly targeted at influencing the demographic process by raising the age at marriage, creating a package of incentives to reward couples with small families (or penalise those with large ones), targeting birth control information in certain states and locations and so on. Alternatively, a policy may try to alter the economic, political, or socio-cultural environment in which people make demographic decisions in order to affect these behaviours indirectly. Policy measures of this type include family allowances, subsidized child care or paid maternity leaves, the expansion of primary or secondary education, and increases in female employment, among other possibilities. It is important to remember that although a population policy may set specific demographic targets, its implementation almost always depends on an interlocking set of sectoral programs relating to employment, education, health, housing, family welfare, urban planning, and agricultural and industrial growth, with different aspects driving the process in different contexts. While female education seems to have played an important role in West Bengal, it has one of the lowest rates of female labour force participation in the country. The National Human Development Report 2001 notes that though there is a visible reduction in the population growth rate, the future pace of deceleration in fertility and mortality is by no means certain. Much of this uncertainty comes from the fact that there are considerable differences in fertility across States and while there are States that have already attained replacement level of fertility or are close to attaining it, five States namely, Bihar, Uttar Pradesh, Madhya Pradesh, Rajasthan and Orissa, accounting for nearly 40 per cent of country’s population in 2001, will contribute well over 50 per cent of the population growth in the next decade, as they have:

87
- a large segment of the population in the reproductive age group (estimated contribution 60 per cent);
- high fertility due to considerable unmet need for contraception (estimated contribution 20 per cent); and
- high desired level of fertility due to prevailing high IMRs (estimated contribution about 20 per cent).
Taking forward the discussion of state policy, Rosenzweig and Zhang (2006) show that the reductions in fertility due to the one-child policy in China increased human capital investments in children. While this may be the case, the negative implications in terms of overt son preference and sex-selective abortions, increasingly rampant in both China and India, are rarely mentioned. In fact, in India the national population policy and the promulgation of a two-child norm for elected representatives, was hotly contested in the early 1990s, as it was introduced at almost the same time as reservations for women in the panchayats. Buch (2005) in a field study across five states of India (Rajasthan, Andhra Pradesh, Haryana, Himachal Pradesh and Madhya Pradesh), where the two-child qualification norm had been implemented in local bodies, found a clear dichotomy is perceptions: at higher policy-making levels this measure was seen as conducive in view of the need to raise small families and freeing up women’s time, at the grassroots levels the perception of the norm being coercive was widespread. But more important some of the assumptions underlying the law on birth control were flawed:
(i) choice of number of children is independent of the sex of the children11; (ii) health services are adequately available, affordable and accessible to give
confidence for survival of children among all sections, and (iii) contraceptive services are universally available and equally accessible.
These assumptions do not necessarily hold true, in fact it is quite the opposite, with the two-child norm having a serious negative impact on the status of women. While decision-making on reproduction is not often in women’s hands, they have to bear the consequences of implementation of the norm directly (as candidates) or indirectly (as spouse of those disqualified). A number of disquieting trends were visible in practices used to meet the conditionality of the law without changing decisions about family size and without moving away from strong son preference. These included:
(i) the desertion and divorce of women; (ii) hospital admission for delivery under wrong name, neglect and death of
female infant; (iii) cases of bigamy; (iv) cases of pre-natal sex determination and induced abortion of female foetus
(despite the existence of the PNDT Act, 1994) whereas having a son was seen as far outweighing the benefits of being a panchayat representative;
11 Dabral and Malik’s study (2004) of the fertility preferences of Gujjar women in revealed that the average number of children considered ideal is lower than the average actual number of children. Given a strong preference for sons, they stop childbearing only after they have given birth to the desired number of sons. The percent of women using contraception tends to increase with number of living sons.

88
(v) children given away for adoption; (vi) allegations of infidelity, denial of paternity of the third child; (vii) women exposed to violence from their opponents.
So while the intentions of the population policy may have been good, it became a tool to further subordinate women as there was no simultaneous shift in son preference across class and caste categories. At the All-India level, the male-female sex ratio at birth is 1.12, moving to 1.061 for the 15-64 age group and then 0.908 in the over 65 age group. The skewed nature of sex ratios at both ends is worrying. While the figures at birth are a clear indication of the rapid expansion of sex-selective abortions, the larger number of women over the age of 65 also points to a possible reason why they might desire sons with whom they can live in their old age, given their predominance in the informal sector which provides for no social security benefits post-retirement, and the social taboo on staying with married daughters. For the PNDT Act to be followed, a more gender equitable environment needs to be created in the larger society, facilitating shifts in attitudes and behaviours. There is also an urgent need for social security and social support for the elderly, including property rights, for women. Conclusions and Policy Implications While declining fertility is no doubt good for growth, in India, the demographic transition has been accompanied by adverse male to female sex ratios. As Buch (2005) shows, the uniform application of a two-child norm has the potential of adversely affecting the democratic rights and reproductive choices of individuals, especially women. Policy-makers seem to have inadequate appreciation of the distinction between informed responsible choice for a small family and the state’s responsibility to facilitate such choice by social development and access to quality services, on the one hand, and the coercion inherent in a norm applied through a law, its limitations and negative impacts, on the other.
Several factors influence the decline in fertility rates. Rather than economic growth per se, incentives available to the household through changes in the nature of production can influence fertility decisions, such as a rise in female wages and expansion of opportunities for female employment. Despite high growth rates, the analysis in section 4 however demonstrates that female employment has stagnated and there is a growing gender gap in wages. On the employment front, better working conditions, wages and benefits are essential to motivate women to join the labour force, and for significant fertility impacts. Alongside employment promotion and support, the provision of health care and education appear critical in terms of their influence on fertility decisions and control. Finally, the provision of state services and infrastructure that enhance broader social development can support women’s autonomy and decision-making and hence appear crucial. This last can also be influenced by control over assets, which is discussed in the next section.

89
Section 7 Decision-making and Control over assets
The exclusion of women from access to and control over assets, whether land, property, technology or credit is seen to lower growth as it implies constraints in channelling resources to where returns could be highest (Schultz 2002, Evers and Walters 2000, Klasen 2002, Agarwal 1994). In the case of India, it is not just gender, but an interplay of caste and gender that seem to influence resource control and use. There is sufficient evidence to suggest that the SCs own a very small proportion of the total agricultural land and also constitute a very small proportion of the business community due to lack of access to adequate capital, facing disadvantages similar to women in many ways. In this section, we discuss first, the constraints and disparities that remain in terms of asset control (especially land, livestock and savings) across the gender-caste interface. This is followed by a discussion on women’s role in decision-making at both the household and community levels, including the implications of their involvement in panchayati raj institutions. This section draws on an analysis of data on decision-making and asset control from the National Family Health Survey, but also includes insights from recent research on asset control and development effectiveness, and from the sub-national studies carried out as part of this project.
A. Household-level decision-making (a) Ownership of land/livestock
Despite the national and international advocacy around the need for gender equality in resource access and control (UN, 1980), the implications of this for growth and development remains relatively under-researched. Udry (1996) in an influential study on the impact of gender inequality on farm productivity found for Burkina Faso that plots controlled by women have significantly lower yields than those controlled by men within the same household. The effect is large: a female cultivator achieves on average a 30 percent lower yield than a male cultivator on plots that are in every other respect identical. The reason is that household resources – in this case primarily labour and fertilizer – are not used efficiently, in that total household output could be raised by simply reallocating resources from male to female-controlled plots. The efficiency loss in terms of total household output is approximately 6 percent on average. Put conversely, gender equality in access to farm inputs would raise farm productivity by 6 percent. Investigating the impact of female bargaining power12 on household production in 15 villages in Ethiopia, Seebens and Sauer (2006) concluded that when bargaining power is highly asymmetrical in terms of the value of assets brought into the marriage by the husband and wife, relative efficiency is about 55% and when it is highly symmetrical
12 The idea of the ‘bargaining problem’ was first formulated by Nash (1950, 1953). It essentially implies that the division of resources and benefits amongst different members of a household depends on their ability to negotiate, which in turn depends on their relative fallback positions, that is, the power or resources they would have if the bargain failed.

90
relative efficiency is about 95% (where relative efficiency is the proportion of actual efficiency achieved in farm production to the maximum possible (or frontier) efficiency). Quisumbing and Maluccio (2003), based on evidence from four countries (Bangladesh, Ethiopia, Indonesia and South Africa), conclude that control over economic resources and education are two key determinants of bargaining power at the household level. Based on household survey data from 47 villages across three sites in Bangladesh (where programmes for dissemination of new agricultural technologies in relation to vegetable cultivation and fishpond cultivation were in place), Quisumbing and Briere (2000) note that for both husband and wife, parents’ landholdings are a consistent determinant of both assets at marriage and current assets. For the woman it reflects a continuous source of support for her lifetime, financial or otherwise, rather than an immediate gain. While wives owned only 3-4 per cent of the land, they owned between 30-50 per cent of livestock (including poultry, sheep, goats and cattle) across the three sites. More than land, livestock appears to have the potential to be a key asset for rural women (Bouis, 2003: 77) While these examples attempt to link gender relations with allocative efficiency in the household, two provisos should be made. First, allocative efficiency in household production (unlike the distribution of household resources) is not in the first place a matter of relative female bargaining power: (lack of) cooperation between the spouses is key here. It is of course possible that the two are linked in that higher female bargaining power leads to males contributing more to females’ activities, which females possibly reciprocate; all of which raises agricultural productivity (Evers and Walters 2000). Second, lack of allocative efficiency in agricultural production extends beyond a waste of resources within the household to a waste of resources within groups of households. This emerges in particular from Kazakpur, a peri-urban village in Gorakhpur, UP where urbanisation and the growth of a land market has led to the sale of agricultural land for construction and urban development. The money accrued from the sale of land has been invested in pucca houses; some men have bought motorcycles or set up small shops. The rest of the money has been used to repay loans and arrange marriages. While men have taken up property dealing, brokering, or work in private jobs in the city, without agriculture, women have lost their source of employment and earnings. With improved status, better off OBC and even SC women are being restricted to their homes. Implications for bargaining are not clear. Most surveys present data for land and livestock as household resources, and do not really consider the issue of intra-household allocation and control. The only exception is in the case of female-headed households, but through a detailed analysis of three villages in Tamil Nadu, Harriss-White and Janakarajan (2004) bring out the definitional problems surrounding female headship. They find that while landlessness amongst female-headed households varies from 47 per cent to 82 per cent, it ranges between 71 per cent and 90 per cent for female only households. Women’s vulnerability is sharply enhanced due to absence of an adult male in the household, providing some insight into why women may indeed invest in marriage as a resource (Jackson, 2007) and buy into the patriarchal bargain (Kandiyoti, 1988) for the material security this can potentially provide. Several village studies have found that women own approximately 10-12 per cent of land, though this may include both recorded and unrecorded holdings.

91
The following table, drawn from the NSSO 50th and 55th round data, presents data on land ownership for male and female headed households through the 1990s13. Several interesting conclusions emerge from the table. First, for both male and female headed households there is a decline in average area of land possessed, revealing in a sense that with growth of population and a larger number of people demanding land, the average size of holding is declining. The persistence of this trend is confirmed by the land-holding survey of 2003 which found the average holding in 2002-3 to be 1.06 hectares as against 1.34 ha in 1991-2, 1.67 ha in 1981-82 and 2.63 ha in 1961-61, with marginal holdings now constituting 70% of all operational holdings. Amongst the SCs, however, 75% are marginal holders, while it is 55% for others, yet in both West Bengal and Uttar Pradesh, the states selected for the sub-national study, one finds a decrease in the degree of concentration (Table 2R, NSS Report 491: Household Ownership Holdings in India, 2003). Simultaneously there has been a decline in the total area operated from 133.5 million hectares in 1960-61 to 125 million hectares in 1991-2 and 107.65 million hectares in 2002-3. Table 7.1 Average area of land possessed and average household size by size class of land and sex
of the head of household (rural areas only): 1993-94 and 1999-2000.
Male Female Per 1000
distribution of hh 93-94 99-00
Average area of land possessed (ha) 93-4 99-00
Average hh size (0.0)
93-4 99-0
Per 000 distribution of hh 93-4 99-00
Average area of land possessed
(ha)
Average hh size (0.0)
93-4 99-0 0.00 122 70 0.00 0.00 4.1 4.1 190 83 0.00 0.00 2.4 2.5 0.01-0.40 391 492 0.11 0.09 4.6 4.8 527 668 0.09 0.07 3.1 3.3 0.41-1.00 192 197 0.69 0.67 5.1 5.3 143 137 0.66 0.63 3.8 4.0 1.01-2.00 146 121 1.43 1.39 5.6 5.7 81 62 1.41 1.4 4.0 4.1 2.01-4.00 94 77 2.72 2.64 6.0 6.2 36 34 2.68 2.64 4.2 4.4 Above 4.01 55 42 7.49 7.23 6.8 7.0 21 16 6.92 6.78 4.7 4.8 Total 1000 1000 1.05 0.85 5.0 5.2 1000 1000 0.50 0.42 3.2 3.5 Estimated hhs 1078893 1227336 - - - - 116403 143461 - - - -
Source: Report no. 409: Employment and Unemployment situation in India, NSSO 50th round, 1993-94; Report no. 458: Employment and Unemployment situation in India- 1999-2000 (Part I), NSSO 55th round, 1999- 2000 The above trends point towards the growing wage dependence of small and marginal farmers and while raising questions about how much land can actually contribute to household livelihoods (Krishnaji, 2001) in a context of limited public investment14, also provide justification for stagnation in growth rates of agricultural wages, with more people seeking jobs on limited land. Secondly, while 94.3 per cent of female-headed households were small/marginal landowners (less than 2 hectares) in 1993-94, this increased to 95 per cent by the 1999-00 (the number of marginal farmers increased from 88.5 per cent to 91 per cent during this period). In the case of male-headed households, there was in fact a sharper decline from 14.9 per cent being medium/large farmers to only 11.9 per cent. Thus, average size of landholding has declined for both male and female-headed households, though the quantum of land 13 60th Round NSS data by sex of head of household is not yet published. 14 Several studies point towards the steady decline in public investment in agriculture in successive Plans since 1951 to the Ninth Plan (1997-2002), and this is also noted with concern by the Report of the Steering Committee on Agriculture and Allied Sectors for the Tenth Five Year Plan, especially in a context where about 70 per cent of the population has remained dependent on agriculture (GOI, 2002).

92
owned by women is about half that of men.15 A third interesting point, is the much more rapid growth in the number of female-headed households over the period, 23 per cent as against 13.5 per cent for male-headed households, and an increase in the proportion of female headed households to total households from 10.7 to 11.7 percent. Perhaps one explanation for this trend is the growing out-migration of men from rural areas to earn a living, thus reflecting in a sense the ‘feminisation’ of agriculture and the rural economy. Over the 1990s, however, the proportion of female-headed households, particularly those in the marginal farmer category (less than one ha of land), engaged in own account agriculture, has declined (Rao, 2006). This could be a result of lack of access to inputs, technical services and credit due both to the male bias of development institutions (Elson, 1992) and discrimination of women in markets (financial, labour etc), and also perhaps reflects a growing dependence on remittances from men. There is evidence to show that even where women do own land, they are unable to control its use (Arun, 1999, Rao, 2002, Gupta, 2002). At the same time, even amongst all small landowners, it was only those with non-farm employment who were able to enhance productivity and in turn invest in more land, and here women in general are at a disadvantage (Harriss-White and Janakarajan, 2003). While the gains for women emerging from growth may seem technically possible, in the face of structural constraints, it appears difficult to achieve. The question of what women investing more of their time and resources into a low-growth, increasingly feminised and low-status agricultural sector, means in terms of gender equality gains, also remains (Rao, 2006b). So while landed property does have value for women, from a growth perspective, the overall efficiency of investment in agriculture could be raised not just by titling women who are household heads, but also influencing cultural norms that currently limit their access to lucrative livelihood strategies, credit, technology, information on agricultural methods and labour (Dolan 2004, Agarwal 1994). While not many studies have attempted to quantify this process, based on the Udry study mentioned at the start of this chapter, the World Bank has estimated a 6-20 per cent increase in productivity through a more equitable allocation of resources to male and female farmers (World Bank, 2001, p 119). Increasing effective land rights16 and access to productive resources through altering social norms regarding what constitute proper female economic activities apply as much to female influence within their households as they do to increasing female influence in the broader community. While the NSSO data on livestock ownership is not gender disaggregated, it is interesting to note that the possession of both milch and draught animals increases with size of land-holding, the critical point determining the ownership decision appears to be in the size class of 0.41-1 hectare. If one looks at the Table above, 75 per cent of female headed and 56 per cent of male-headed households have less than 0.40 ha of land and hence are unlikely to own either milch or draught animals. This is partly related to the need to provide fodder to such animals, a large part of it being the 15 See also field study in Gujarat by Vasavada (2004). 16 The case is often made that granting formal land rights to women tends to be overruled by customary law when the latter remains unchanged (Ellis et al. 2006, World Bank 2006a, Evers and Walters 2000). See Whitehead and Kabeer (2001) for an account for rural Sub-Saharan Africa of women’s poor access to resources that relies far more on women’s access to labour and credit rather than land rights.

93
stalks and hay from foodgrain cultivation. What then seems clear is that there is a minimal level of land ownership required to encourage both cultivation and the maintenance of larger livestock. Smaller livestock on the other hand are much more manageable for the landless or near-landless and are often assets controlled by women (Rao, 2002, White, 1992). The gap in the ownership and control over land and livestock is then gendered, but there is also a stark division by caste. Household assets in Table 7.2 include land, livestock/poultry, buildings, machinery/equipment, household durables and financial assets. What is very clear is that the assets of both SCs and STs are only about 30% that of Others. Heyer (2007) through detailed village surveys in Coimbatore district of Tamil Nadu demonstrates that the agricultural land-holders were all caste Hindus, while a majority of the labour were dalits (SCs). During her first survey in 1981-82, the labourers accepted an oppressive regime due to lack of support from state services on the one hand and lack of alternatives on the other. The situation had somewhat improved in 1996 due to the industrial expansion and availability of mill jobs, but interestingly, the low caste agricultural labourer households have been less successful in moving into either urban or rural non-agricultural occupations than caste Hindu labourer households. Table 7.2: Average Value Of Total Assets Per Social Group (Rs)
(b) Savings and Credit
Growth requires investment, and investment requires savings. If women save more out of disposable income than men, then an increase in the overall share of income that is at women’s disposal would tend to raise aggregate savings and thereby, potentially, investment and growth. Sagrario Floro and Seguino (2003) attempted to estimate the gender effects on aggregate savings for a sample of middle-income countries. Their regression results suggest that a one percentage point increase in women’s share of the total wage bill tends to increase aggregate savings by approximately one quarter of a percentage point. The factors that determine women’s differential propensity to save are not identified in the paper (although they are speculated about), and the study is plagued, to the authors’ own admission, by a lack of appropriate data. The authors point out that, in developing countries, the gendered determinants of savings at the household level are ill-understood, among the reasons for which is a paucity of reliable household-level savings data. They also point out that household savings data disaggregated by gender are required at the macro level.
All Social Groups Scheduled Castes Scheduled Tribes Other Backward Classes*
Others
1991 2002 1991 2002 1991 2002 1991 2002 1991 2002 Rural 1,07,007 2,65,606 49,189 1,25,954 52,662 1,36,640 - 2,66,033 1,34,500 4,29,513 Urban 1,44,330 4,17,158 57,908 1,82,351 68,763 2,40,295 - 3,34,161 1,59,745 5,60,362 § http://mospi.nic.in/mospi_nsso_rept_pubn.htm National Sample Survey House Hold Assets and
Indebtedness Report 432 Part 1 and Report 503 *OBCs are included in Others category in 1991

94
The Tenth Plan, recognising that women are in reality often left behind in the rural areas to manage their farms, along with ensuring land rights to women, also laid emphasis on credit access, in order to ensure productivity enhancement. Given that a majority of the Indian population live in rural areas and depend on agriculture for their livelihood, provision of adequate and timely credit, at reasonable rates of interest, has been a stated objective of public policy in post-Independence India. This objective was translated in terms of the expansion of the institutional structure of formal-sector lending institutions, directed lending (mainly through the Integrated Rural Development Programme or IRDP)17 and concessional or subsidised credit to the poor and socially disadvantaged groups. The bureaucratic problems as well as the lack of sensitivity of banks to the social and economic context in which they functioned led to a period of banking sector reforms in 1991. This had several implications for access to credit in rural areas. Firstly, while the share of rural bank offices had jumped from 17.6 per cent in 1969 to 58.2 per cent in 1990, there was a gradual slowdown in this process thereafter, with the share falling to 47.8 per cent in 2002. Secondly, while the bank credit given to rural areas increased from 10 per cent to 15 per cent during the 1980s (1980-91), it once again declined to 10 per cent in 2001-02 (Ramachandran and Swaminathan, 2002). The figures for agriculture reveal a decline from 17.1 per cent in 1985 to 10.7 per cent in 2001. A further disaggregation of agricultural advances to cultivators by size classes of holdings reveals that the share of agricultural credit to marginal farmers that accounted for 30 per cent of total agricultural credit from commercial banks in 1990 declined to 23.8 per cent in 1999-2000. During the same period, the number of beneficiaries receiving credit through the IRDP also declined from 2.9 million to 1.3 million persons (Chavan, 2005, Tables 9 and 10: 121-2). While gender disaggregated data is not available, it is likely that only a small proportion of this went to women due to the need for land as collateral for agricultural credit and the lack of land titles with most women.18 The government has sought to fill this gap through a rapid expansion in micro-credit through the formation of Self Help Groups (SHG), especially of women. These are meant to overcome the problems of inaccessibility, high transaction costs and poor repayments that were encountered by the formal credit institutions. The SHG-linkage programme has grown from support to 500 SHGs in 1992 to 2.9 million in 2006-07, covering over 40 million poor households, 90 per cent of the actual SHG members being women. A major criticism of the SHG linkage programme has been its uneven regional spread, with a focus on the southern states. The cumulative share of non-southern states has however improved to 48% in March 2007 as against 29% in 2001. (http://www.nabard.org/fileupload/DataBank/AnnualReports/ContentEnglish/Development%20Initiatives.pdf, Annual Report 2006-7, accessed on 6/12/07). There is however evidence to show that micro-credit cannot adequately address the problems of the poorest. First of all, while only 9 per cent of the micro-finance programme is implemented through NGOs, in over 70 per cent of the cases the SHG-
17 IRDP loans were mainly targeted at men, and it was only with the introduction of a special scheme, namely, Development of Women and Children in Rural Areas or DWCRA within the IRDP ambit, that some of the resources were directed to women. 18 Gender-disaggregated data on crop loans for Dumka district, Jharkhand, revealed that 3.9 per cent of all crop loans were disbursed to women in 2000-01, doubling from 2 per cent the previous year (Rao, 2002:282).

95
linkage is facilitated by NGOs. This implies that distribution and reach is governed by the existence of micro-finance NGOs, and these continue to be spread unevenly. Secondly while the NABARD Task Force estimated the credit requirement per family as Rs 6000 in rural areas and Rs 9000 in urban areas, the average loan recommended for and given to members of SHGs is around Rs 1000 (NABARD, 2000). This is clearly insufficient and once again leads to the trap of small income generation projects for women that are bound to fail (Buvinic, 1986)19. Mahajan (2005) has therefore argued for a shift in approach from microfinance to livelihood finance. One further point about use of credit is relevant here. Women across the country are more engaged with livestock keeping (milch animals, goats, pigs and poultry) than crop production. They often also have more control over livestock than crops due to the lack of direct rights over land. Yet the share of animal husbandry and dairying was only 5.7 per cent of the total ground level credit offered by NABARD for agriculture and allied activities during 1999-2000 (GOI, 2002: 65-6). A lot of SHG activity is focused on petty trade rather than production. Without sufficient finances and infrastructure support, while SHGs can contribute towards survival, it is unlikely that they could facilitate a shift to a higher quality of life. The Nirantar Survey of 2750 SHGs in three states of India, Andhra Pradesh, Gujarat and Uttar Pradesh, covering 1650 SHGs formed under government schemes and 1100 through NGOs, found at least 35% of the groups to be inactive. 40% of the women members belonged to landless and wage labour households, and perhaps it was both the inability to save regularly and the lack of timely credit that could respond to their needs, that led to a collapse of these groups. This is confirmed by the data from the NFHS 3 survey. Close to 60% of the groups had been saving for two years, but not received any loans (2007: 29). Further, more than half the groups did not engage in any social issues; 15% had taken up the issue of domestic violence and less than 6% of caste related violence, nor did they provide any credit-plus support to the members.
Table 7.3 Women’s access to money and credit Percentage
who have a bank account
Percentage who know of a micro-credit scheme
Percentage who have taken a loan from a micro-credit scheme
SC 11.6 38.1 4.7 ST 9.0 30.1 3.1 OBC 13.3 38.5 4.8 Other 20.5 41.0 3.0 West Bengal 14.1 41.4 2.7 Uttar Pradesh 13.2 14.1 0.4 India 15.0 38.6 4.0
Source: NFHS-3 Report In the study villages in Bahraich and Gorakhpur districts, 7 SHGs were formed, but in the absence of any further capacity-building inputs, group activities could not be 19 Working with women’s groups in Andhra Pradesh between 1996-98, Rao observed farming women in a village in Nellore district carefully analysing their needs, identifying irrigation as the investment required to improve their lives and estimating the cost of such a project to be Rs 50-60,000. This was however way beyond what was acceptable to the mediating agency, the district government in this case and what was finally sanctioned was Rs 10,000 at the rate of Rs 1000 per member of the group.

96
sustained. Five women are engaged in individual activities – sewing, goat-keeping and dairying in Sanaha. Here a majority of the OBC (Yadav) families maintain milch cattle, the work entirely done by the women in terms of feeding, cleaning, fetching the fodder etc. Yet in the absence of an organised system for selling the milk, they depend on their men to negotiate the sales in the town, losing all control over the income from this activity. In the West Bengal villages too, out of 20 women, only four were members of SHGs. The reasons are many: no one has tried to organise them, their husbands/in-laws did not approve, and there were no benefits for the poorest. A poor general caste woman from Malda noted, “the group dissolved as I could not give enough time for the meetings. My husband did not approve, he would get very angry and even beat me if I was late. Finally I withdrew and the group too disbanded”. There are a few success stories, but these are few and far between. Finally, transaction costs for such interventions are not necessarily lower. High rates of repayment require careful monitoring, supervision and support to the groups. What however happens is that transaction costs are borne by the NGOs, they in turn passing them on either to the donors or to the borrowers, as interest rates on such credit are generally higher than bank interest rates (Hulme and Mosley, 1998). The pressure to start repaying soon after the loans have been taken further leads to a bias in favour of those with some starting resources. It would be worthwhile to briefly comment on the impact of such micro-credit interventions on gender relations, as the data presented above reveals that 90 per cent of micro-finance was going to women’s Self Help Groups. Evidence from Bangladesh is contradictory. While Hashemi et al. (1996) note that the control over income and assets by women do strengthen women’s bargaining position within households, Goetz and Sengupta (1995) suggest that access to credit has not always served to strengthen women’s bargaining position in the household, but has often led to increased stress due to the pressure to repay as well as enhanced violence. Yet interestingly in analysing different dimensions of empowerment of Grameen and BRAC members and non-members, Hashemi et al. found that while control over decisions on purchases, and political and legal awareness was much higher amongst members, on the variable they called ‘freedom from domination’ which included taking of money and jewellery against her will, being prevented from visiting the natal home or from working outside the home, responses from both members and non-members were at par with each other (1996: 40). Kabeer (1998), reviewing both the negative and positive evaluations of credit programmes in Bangladesh notes that while they may indeed increase work burdens in some instances and violence in others, the perception of women as contributing to the household and sharing in the burden of provision does mitigate their sense of dependency and enhances their sense of self-worth, interdependence in familial relationships and voice in household decision-making. While no intervention may have a uniform set of outcomes and these are likely to vary with household structure, resources and status, yet the very fact of having access to a resource does expand women’s choices. In the Indian context, a study of women’s Self Help Groups in Andhra Pradesh points out that while the organisation of women into groups is indeed a strategy in the right direction, advocated for long by women’s organisations20, and does have significant 20 Collective action was a key strategy for the empowerment of third world women emphasised by the DAWN collective (Sen and Grown, 1987), reiterated in later documents such as Shramshakti, 1988. But even earlier in

97
gains for women at the individual level, it does not automatically contribute to changing social norms and achieving gender equity. There is in fact evidence to the contrary. When women’s incomes increases, as does their influence in the public sphere, women’s work burdens at home are likely to increase, there are more frequent instances of domestic violence and tensions in general tend to get accentuated within households (Deshmukh-Ranadive, 2003). Kabeer (2005) too agrees that credit per se may not have empowering effects for women and there is need for specific organisations to advance women’s rights in the wider social arena (see also Nirantar, 2007). Credit access may then well have both positive and negative effects simultaneously and generalisations simply in favour or against credit for women would be mistaken; what matters is not to have unrealistic expectations of changed gender relations, to accept that evaluation requires a longer time perspective than is commonly the case, and to ensure careful critical scrutiny in programme monitoring. A final point can be made about caste disadvantage in setting up enterprises. A study of 90 dalit business people across six Indian states revealed a range of problems faced by them in accessing credit to set up their business, despite the fact that a majority chose to stick with caste-related businesses or general enterprises. 80-85% of the sample applied for credit from the government or nationalized banks, but over 60% of them were denied it. For those who were successful, this was because they had a member of the family in the institution, their application was facilitated by an NGO, or they paid large bribes. While credit was a major barrier, other barriers existed too, such as the difficulty of getting workers or procuring initial order, due to the lack of trust and stigma attached to the dalits, as well as stereotypical images of them as only fit for labouring. The Economist (October 4th, 2007) noted that low caste Indians struggle in schools and very few emerge with competitive abilities, despite the fact that they do graduate on account of the reservation policy, and this adds to the notion that they lack the capacity to become successful businessmen. At best, they end up as petty traders, relying on caste for their clientele and business networks.
India, soon after independence, the strategy of mahila mandals was adopted, though the language used was one of welfare rather than empowerment.

98
Table 7.4 Access to Credit as per the Types of Business
Categories No. of Business People
Banks Govt. Social Network
Ow
n C
aste
Diff.
Caste
Interest Paid
Requested
Accepted
Declined
Requested
Accepted
Denied
Pvt cap mkt
Ow
n Caste
Diff. C
aste
Caste Related
26 20 5 15 24 13 11 26 3 22 NA
Earlier Restricted and Considered Taboo
12 9 3 6 9 3 6 10 4 9 Na
General 36 31 13 18 34 18 16 35 12 34 Na Varying rates of Soft Int.
Liberalised market
11 7 3 4 8 2 6 11 4 9 Na
Specialised 5 3 1 2 3 2 1 5 4 5 Na Source: Aseem Prakash, presentation at UEA on 12/10/07. It is no surprise then that SC women rarely join SHGs or are able to sustain their participation therein. Even if they were to get credit, making it operational remains a substantial task.
(c) Women’s autonomy and decision making An important historical-sociological issue related to the overlap between caste and gender (not applicable to men) is the following. It has historically been the case that the subordination of women was crucial to the development of the caste hierarchy, with constraints on women rising with the status of the caste in the hierarchy (Liddle and Joshi, 1986). Thus, upper caste women were typically subjected to greater immurement and taboos on mobility and visibility, which included an undervaluation of their role in the family and workplace (such as disinheritance from land, exclusion from the productive economy, removal from public life and seclusion) and dalit households were characterised by more egalitarian spousal relations as well as by fewer taboos. Thus, there was presumed to be a trade-off: while Dalit women were worse-off in terms of material standard of living, they were better-off in terms of lower taboos and better relationships with their husbands/partners. Deshpande (2002) has argued that this trade-off might be vanishing such that Dalit women now face the double brunt of both material deprivation as well as higher taboos than they might have traditionally faced. Of course, historical taboos cannot be established with data but there are anthropological accounts to substantiate claims of relative immurement.

99
Thus, the relative freedom of Dalit women may now be more illusory than real. While actual material improvements among the Dalit castes are not substantial, there is evidence to suggest that the phenomenon of Sanskritisation (lower castes’ emulating upper-caste practices as symbolic of a betterment in their position) (Srinivas, 1976) may be spreading widely. To the extent that Sanskritisation extends to an emulation of immuring women, the distinction between the two rungs of women, based on the relative freedom quotients, becomes largely redundant. The second round of NFHS collected data on a set of variables related to women’s autonomy and decision making allowing for a direct comparison between the broad caste groups on a range of questions. The third round of NFHS continued with that practice; however, with addition, deletion and modifications of questions from the earlier round. Despite these comparability issues, the two rounds do offer some interesting insights into issues related to women’s autonomy and decision making and changes therein.
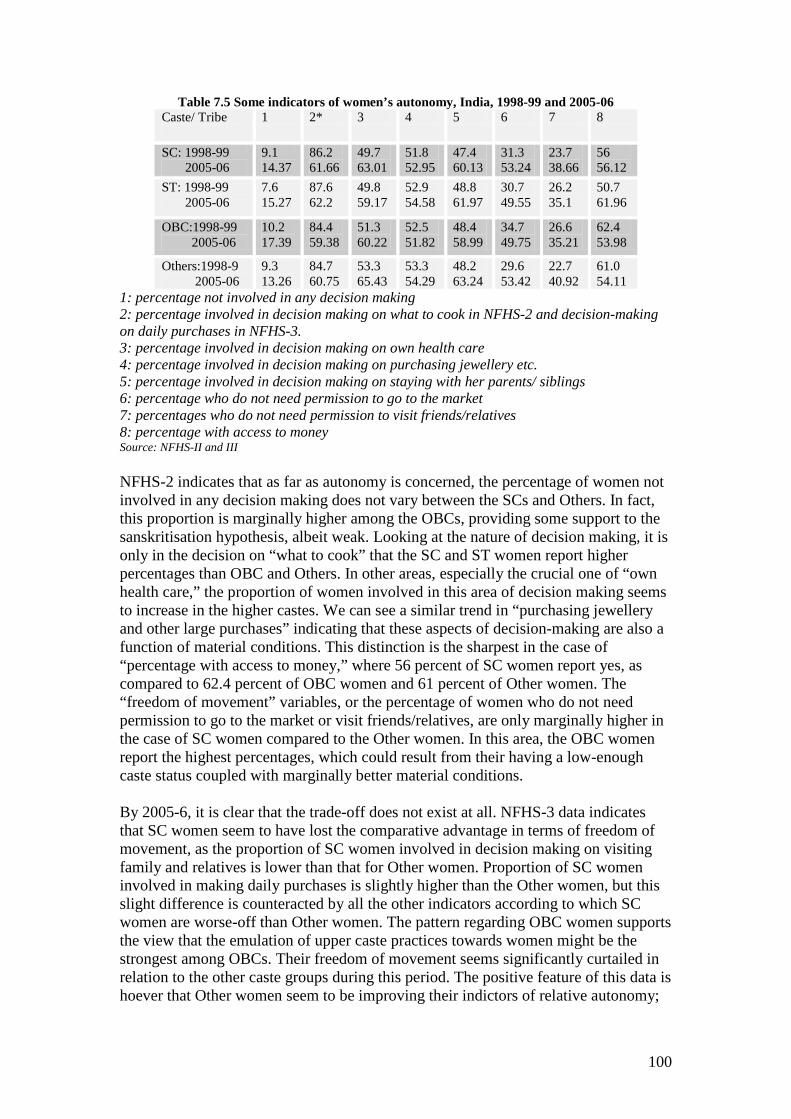
100
Table 7.5 Some indicators of women’s autonomy, India, 1998-99 and 2005-06 Caste/ Tribe
1 2* 3 4 5 6 7 8
SC: 1998-99 2005-06
9.1 14.37
86.2 61.66
49.7 63.01
51.8 52.95
47.4 60.13
31.3 53.24
23.7 38.66
56 56.12
ST: 1998-99 2005-06
7.6 15.27
87.6 62.2
49.8 59.17
52.9 54.58
48.8 61.97
30.7 49.55
26.2 35.1
50.7 61.96
OBC:1998-99 2005-06
10.2 17.39
84.4 59.38
51.3 60.22
52.5 51.82
48.4 58.99
34.7 49.75
26.6 35.21
62.4 53.98
Others:1998-9 2005-06
9.3 13.26
84.7 60.75
53.3 65.43
53.3 54.29
48.2 63.24
29.6 53.42
22.7 40.92
61.0 54.11
1: percentage not involved in any decision making 2: percentage involved in decision making on what to cook in NFHS-2 and decision-making on daily purchases in NFHS-3. 3: percentage involved in decision making on own health care 4: percentage involved in decision making on purchasing jewellery etc. 5: percentage involved in decision making on staying with her parents/ siblings 6: percentage who do not need permission to go to the market 7: percentages who do not need permission to visit friends/relatives 8: percentage with access to money Source: NFHS-II and III NFHS-2 indicates that as far as autonomy is concerned, the percentage of women not involved in any decision making does not vary between the SCs and Others. In fact, this proportion is marginally higher among the OBCs, providing some support to the sanskritisation hypothesis, albeit weak. Looking at the nature of decision making, it is only in the decision on “what to cook” that the SC and ST women report higher percentages than OBC and Others. In other areas, especially the crucial one of “own health care,” the proportion of women involved in this area of decision making seems to increase in the higher castes. We can see a similar trend in “purchasing jewellery and other large purchases” indicating that these aspects of decision-making are also a function of material conditions. This distinction is the sharpest in the case of “percentage with access to money,” where 56 percent of SC women report yes, as compared to 62.4 percent of OBC women and 61 percent of Other women. The “freedom of movement” variables, or the percentage of women who do not need permission to go to the market or visit friends/relatives, are only marginally higher in the case of SC women compared to the Other women. In this area, the OBC women report the highest percentages, which could result from their having a low-enough caste status coupled with marginally better material conditions. By 2005-6, it is clear that the trade-off does not exist at all. NFHS-3 data indicates that SC women seem to have lost the comparative advantage in terms of freedom of movement, as the proportion of SC women involved in decision making on visiting family and relatives is lower than that for Other women. Proportion of SC women involved in making daily purchases is slightly higher than the Other women, but this slight difference is counteracted by all the other indicators according to which SC women are worse-off than Other women. The pattern regarding OBC women supports the view that the emulation of upper caste practices towards women might be the strongest among OBCs. Their freedom of movement seems significantly curtailed in relation to the other caste groups during this period. The positive feature of this data is hoever that Other women seem to be improving their indictors of relative autonomy;

101
whether that is due to higher levels of education among their families or some other influences, it is difficult to say, the worse indicators of autonomy now lying with the OBC women. What the above tables suggest is that while the material gap persists between dalit and upper caste women, any autonomy they may have enjoyed to compensate for their poverty appears to be disappearing. The caste-gender overlap unambiguously suggests that dalit women are worse off than upper caste women in contemporary India. This also emerges from ethnographic studies such as by Nakkeeran (2003), who in studying the complex mediation between caste, economic status and gender within a small village in Coimbatore district of Tamil Nadu, shows that low caste women who enjoy a higher work participation rate and make a significant contribution to the family economy, do not necessarily enjoy higher levels of literacy, food security, health, leisure or even decision-making. The upper caste households predominantly hire in outside labour and/or in which men are usually salaried employees, women seldom take up any paid employment, yet they may have a better quality of life in terms of leisure, food, health and command over the labour of poorer women. A study conducted by Tamil Nadu Women’s Forum on the unheard voices of dalit women (2007) found that dalit women work more than bullocks or men. On an average, bullocks and men work for 1064 and 1202 hours respectively on a hectare of land in a year. A dalit woman however works for more than 3485 hours. Ramachandran et al. (2001: 12) too found that landless dalit women were employed for three weeks a year more than landless non-dalit women. This might signal a greater commitment by dalit women to agricultural wage work, or less aversion by dalit husbands to wives doing such work. Yet, this could also suggest that some of the decline in agricultural wage labour by landed and/or upper caste women is related not to limited opportunities but to ‘choice’ (related to education, the availability of better jobs, or indeed the wishes of husbands to limit wives’ agricultural wage work). What seems to emerge is the need for an enabling institutional framework to enable women to make full use of their capacities and live and work with dignity. As part of the sub-national study for this project, 80 women were interviewed in the two UP sites: 22 SC, 29 OBC, 17 Muslim and 12 Brahmin. The responses of OBC women were split by their class position. So the SC and poorer OBC women who worked as wage labour could decide on their work and use of wages for small purchases. This was not the case for better off OBC women, who managed their own farms or milch animals. As one woman in Sanaha, Gorakhpur, reported, “they are sending the money, so they have to be asked about usage and accounts for the expenditure given to them”. Her husband, along with many other men from the village, is a migrant to Mumbai, he has a mobile phone and gives advice regularly. She, like the poorer women, cannot decide about larger issues such as the marriage or education of the children, even though she manages the day-to-day activities. While 19% of these women do contribute to household earnings, their role in decision-making is unclear. In the West Bengal study, while decisions of purchase of household assets were finally taken by men, as well as decisions on marriage of children, especially the age of marriage, though perhaps after some consultation, it was in the area of education, especially girl’s education, that women definitely had a say. Upper caste women in particular fought for higher education for their daughters, albeit geared to ultimately
102
finding a good groom. Out of 39 women interviewed, only three had exercised some choice in terms of marriage partner and two are still unmarried. 15 of them had interrupted their studies for marriage. In Sen’s (1990) terms, the perception of contributions is as important as actual contributions in influencing intra-household bargaining and resource allocation. One reason for unchanging perceptions despite women’s contributions may relate to the nature of work available to women, largely informal and low-paid. With rising costs, this makes it difficult for them to make ends meet. In the rural areas, work is irregular and continues to be poorly paid. While the national average for female participation in NREGA is 45%, UP has a particularly poor record of less than 15% (and West Bengal 16%). But more, work is not available and over half the sanctioned budget has not been utilised (www.nrega.nic.in, accessed on 7/12/07). In such a context, it is not surprising that women may choose not to work, if their husbands are able to earn enough to support them. Violence But coming back to the issue of autonomy and decision-making, the possible link with asset ownership has already been mentioned. SCs in general and SC women in particular have much lower access to assets, especially land, and hence are also likely to face greater structural constraints in terms of engaging with processes of growth. But for women in particular, research in two states of India – West Bengal and Kerala, and Sri Lanka, conducted by the International Centre for Research of Women reveals that irrespective of productivity effects, asset ownership enhances a degree of social protection apart from substantially lowering the risk of violence. Non-propertied women are much more likely to experience violence than propertied women (who account for roughly 30% of the study sample), both physical (38.5% against 15%) and psychological (50% against 28%). Interestingly, much more significant than land is the ownership of a house in this context (Panda and Agarwal, 2005, ICRW, 2006). As against 61% of women with land, only 13% of women with a house faced any form of violence (ICRW, 2006: 79). Despite the contribution of SC and ST women to household income, they seem to suffer more regular violence than women of other categories, linked also to their lack of asset ownership, a blow to the presumption of more egalitarian gender relations amongst the lower castes. Table 7.6 shows self-reported figures for percentages of ever-married women beaten or physically mistreated since age 15, indicating that 27.4 percent of SC women reported physical mistreatment as compared to 15.7 percent of “Other” women (and 23 percent of OBC women) in 1998-9. The question always arises on whether the incidence of physical violence is actually lower among upper castes or whether the SC women are more candid about their condition. NFHS-II however reports that “the prevalence of domestic violence decreases substantially as the standard of living increases” (p.76). Given the association between caste and standard of living, there is reason to believe that the incidence of domestic violence might be greater among the SCs than for upper-caste women. Interestingly, the NFHS-3 data indicates that the incidence of violence of all types with the exception of mistreatment by in-laws appears to have increased across all categories of women, or perhaps the reporting is higher due to enhanced awareness, nevertheless the pattern of violence remains the

103
same, with SC women, despite being perhaps the most economically active, getting the brunt of it. In the field studies, women across the board spoke of violence in the family and eve-teasing in public. Adolescent Muslim girls from Sanaha in fact complained that their mobility was severely restricted on account of eve-teasing; they were no longer being sent to schools. But it is the SC and ST women who face greater violence from individuals outside their families. Incidents of dominant caste men raping, beating and terrorising dalit women are known to be a regular feature. All these factors contribute to a situation where dalit women are quite decidedly at the bottom of the economic ladder and in addition, face constraints and violence in greater measure than the upper caste women.
Table 7.6 Women's experience with beatings and physical mistreatment, India, 1998/99 and 2005/06
1 2 3 4 1998-9 2005/6 1998-9 2005/6 1998-9 2005/6 1998-9 2005/6 1.SC 25.2 35.37 2.2 1.32 3.3 8.61 27.4 35.33 2.ST 20.8 33.83 1.8 0.84 3.0 8.13 23.0 33.82 3.OBC 20.7 28.85 1.7 0.99 3.6 7.37 23.0 28.84 4.Others 13.6 21.23 1.6 0.72 2.6 6.58 15.7 21.21 1: % ever physically mistreated by husband 2. % ever physically mistreated by in-laws 3. % ever physically mistreated by other family members/person 4. % ever faced any violence
Source: NFHS Reports
On June 23, 2005, the cabinet approved the Protection of Women from Domestic Violence Bill, 2005. As noted by Kothari (2005) this amendment provided immediate emergency remedies for women facing violence such as protection orders, non-molestation orders, the right to reside in the shared household, etc. This was in view of the fact that the experience of women's organisations working with battered and harassed women increasingly showed that it was the fear of being thrown out of the matrimonial home or any shared household that often compelled these women to put up with violence. As Rajalakshmi (2005) points out, the Act covers all those women who were or had been in a relationship with the abuser, where both parties lived together in a shared household and were related by consanguinity, marriage or adoption. Accordingly, in this definition domestic violence included not only inter-spousal violence, but also violence perpetrated by other family members. This is significant because generally, an important part of the power relationship between spouses and their families relates to dowry and its ramifications (Karlekar, 1995).
The demand for the criminalisation of dowry death and domestic violence had in fact much earlier culminated successfully in the enactment of Sec 498A in the IPC in 1983, Sec 304B in 1986 and corresponding provisions in the Indian Evidence Act, 1872. These criminal law reforms held great promise at the time of their enactment and sought for the first time to bring the issue of domestic or family violence out of the protected private realm of the family and into the public domain in India. But despite these legal reforms, societal responses to domestic violence still largely exclude legal intervention. As argued by Kothari (2005), women who face violence within the home claim that male batterers are rarely arrested, prosecuted, or sentenced as severely as other violent offenders. In many police stations, policies for domestic

104
“disputes” actively discourage arrest focusing instead on responses such as calling the abuser to the police station for “conciliation” among other measures. Sentences in general tend to be less serious for those convicted of domestic violence. Agnes (1998) notes how the general perception for women who muster up the courage to approach a police station is that of a deviant. Instead of registering her complaint the police would counsel her about her role in the house. This perhaps explains the increase in violence against women across all categories in NFHS-3.
Exposure to the media Exposure to the media can potentially complement the impact of education in terms of enabling women to attain a position of equality. There is a steady decline across all caste groups of women not exposed to any media, with only the STs much worse off, even more than the SCs, perhaps because of the remote locations in which they live. While there is a decline in the proportion listening to the radio or visiting the cinema, there has been a rapid increase in exposure to TV. Except for newspaper reading and the STs for all sorts of media, inter-caste disparities seem to have declined, with implications for access to information and opportunities. In the context of general growth, without specific interventions, people need to be able to access information and opportunities in order to gain benefits from the process of growth, while also contributing to it. Table 7.7 Percentage of women with exposure to mass media, India, 1992-3, 1998-9 and 2005-06.
NFHS-I 1 2 3 4
SC 22.7 34.8 13.8 56 ST 12 25.3 6.3 70.2 OBC Not applicable Others 35.4 46.8 16.2 43.4
NFHS-II 1 2 3 4 5
SC 11.0 36.9 31.1 10.3 48.3 ST 8.5 22.7 25.1 5.4 61.8 OBC 18.8 45.1 36.3 12.5 40.7 Others 30.2 56.1 42 10.5 31.0
NFHS-III 1 2 3 4 5 1.SC 15.6 50.6 26.5 5.1 38.9 2.ST 10.0 30.3 20.9 3.6 57.4 3.OBC 19.9 53.1 28.1 5.3 36.8 4.Others 33.9 66.0 32.8 6.9 24.1
for NFHS-I for NFHS-II and III 1=watches TV at least once a week 1=reads a newspaper or a magazine at least once a
week 2=listens to the radio at least once a week 2=watches TV at least once a week 3=visits a cinema/theatre at least once a month
3=listens to the radio at least once a week
4=not regularly exposed to any media. 4=visits a cinema/theatre at least once a month 5=not regularly exposed to any media.

105
Community-level decision-making As mentioned in the first section, a part of allocative efficiency includes not just the utilisation or non-utilisation of resources at the level of the individual household, but also at the level of the community or a group of households. There has been much written about the importance of community participation in the effective functioning and management of schools, for instance, and in particular, the role of mother’s involvement in securing the best outcomes for their children. Yet in the selected villages in UP one found an absence of such initiatives. Participation in local government/panchayats The 73rd and 74th Constitutional Amendments were path-breaking in ensuring women a role in local government, with the usual reservations for SCs and STs within each category, including women (Strulik, 2004). The hope was that such decentralisation would contribute to an improvement in the delivery of services and respond to the needs of the people, including the oppressed. Assessments of the constitutional amendment have presented both sides of the story: that elected women representatives continue to depend on their husbands or other male relatives for all decisions made on the one hand; to the exercise of agency and taking of initiatives by women to fulfil urgent local, often gendered needs, on the other (Mathew 1994, Kaushik 1998, Buch, 2001, Kurien, 1999, Mathew and Buch, 2000, Mohanty, 1996). Taking advantage of the fact that one third of the positions of panchayat heads (pradhans) were randomly allocated to women in India, Chattopadhyay and Duflo (2004) have been able to establish for West Bengal and Rajasthan that: a) women in villages with reserved pradhans were twice as likely to have addressed a request or complaint than in villages with male pradhans; b) investments in the provision of public goods are significantly affected by the gender of the pradhan, with drinking water, education and roads being the priority for women; and c) in the case of an SC/ST pradhan, the public goods were more likely to be located in their hamlets than in other instances. As noted in the previous sections of this report, the provision of infrastructure and services have significant effects on women’s autonomy, fertility decisions, supply response as well as educational attainments, all having significant growth impacts. In short, female participation in local government is good for growth. What seems clear from the literature on inclusion and exclusion in community institutions (Alsop, 2000, Alsop et al 2002) is that education, information and gender are all significant variables in terms of participation and decision-making, and these cannot be taken for granted. The experience of the panchayats re-emphasises the fact that affirmative action is essential to ensure enhanced political participation as there is no guarantee that women’s economic independence will necessarily lead to a shift in the gender balance in the political arena. Economic engagement may often be driven by material deprivation, leaving women little time or resources for active engagement with decision-making processes. In fact, male insecurities in the realm of production could lead to a further emphasis on controlling women in the private sphere. Interestingly, all four of the villages selected for the UP study had women pradhans, the two in Gorakhpur were Yadavs (OBCs) and the two in Bahraich were Muslims. One of them, the 33 year old sarpanch of Kazakpur, Geeta Yadav, is attempting to play an active role in village affairs (see box below), in the other three cases, the

106
sarpanches belong to families which have been dominant in the villages for a long time, and when the seat was reserved, put up one of their women, so as not to lose control. In Sanaha, the woman sarpanch is totally subordinate to her husband, the pradhan for the last 17 years, who has retained complete control over the office. They have land and money and people in the other hamlets feel totally marginalised, yet there is no recorded history of caste violence. In Bahraich, both the women pradhans were in purdah, did not go out of the home, and were hardly accessible. Though they are Muslims, the perception amongst Muslims is that no special favours were being done for them in terms of housing, rations or pensions. Table 7.8: Dilemmas of a Woman Pradhan Geeta Yadav, 33 years old, is the young Pradhan of Kazakpur village. She is married to a functionary in the Commissioner’s Office and has two children – a boy and a girl who study in classes 5 and 3 respectively. The boy attends a private school while the girl goes to the government primary school. She had wanted to study further but was married off before she could complete high school. We found her rushing off to the primary school with the checklist for the children’s scholarships, which had to be submitted to the NPRC. The second thing on her mind was that the cook for the mid-day meal was absent so she had to arrange for another woman to do the cooking. She apprehended that if no one was available she herself would take up the task as it was her responsibility to ensure the meal for the children. The young pradhan is proud of her status and her work. She meets everyone in the village, moves across all the hamlets and is recognised by all. She makes it a point to attend all the meetings at the block level. She is paid Rs 700 per month for travel to participate in the meetings. When discussion about ration cards and PDS supply took place in the village she was quite rattled as there were several anomalies and people were upset. She has yet not come to grips with the nexus of the powerful PDS supplier and the officials who bungle rations meant for the poor. At home Geeta faces questions from her husband about her decisions, her movements and the domestic chores left undone when she is away fulfilling her duties as pradhan. He even questions her if she spends his money to help someone. Her husband feels threatened by her position, her growing self independence and her image. Geeta is struggling between two roles – that of political leader as pradhan and that of a wife as seen by her husband. She has to play it cautiously before she can move on to the next rung of the political ladder. Field notes: Deepali Verma, Sept. 2007 Most of the dominant communities are against the process of reservation for women and marginalised groups as they hold predominantly patriarchal values. Several writers argue (Strulik, 2004, Beteille, 2002) that it is unrealistic to expect that government programmes or legislation imposed from above will be easily accepted on the ground, especially in this instance, where society constructs women as unfit, ignorant or too naïve to engage with politics on the one hand, or associated with issues of family honour that support women’s role in reproduction and at the home more than in the public space. Even in the West Bengal villages, the common refrain from the women was that they did not know about the meetings, they didn’t have the
107
time, their husbands attended, they were not interested, but even if they were, the samaj would object. Based on her case study from Uttar Pradesh, Strulik (2004) however argues that even in a context of extreme gender segregation, new female political spaces are indeed being created and gender relations subtly altered, illustrated by the example of Geeta Yadav above. The dalits similarly face a difficult social situation. Sudarsen (2005) examines the working of the constitutionally guaranteed panchayat system in Pappapatti village in Madurai district of Tamil Nadu where a dalit elected as panchayat president was not allowed to function. She illustrates the implementation or non-implementation of the process of transfer of the local governance to the local dalit community by the thevars, claiming that since they constituted over 60% of the village population, they had a right to control its governance, the dalits constituting little over 30%. Social norms, which have made democratic deliberation on the ground difficult, have simultaneously, in several parts of the country, in particular northern India, led to the rise of caste panchayats (Lele, 2001). The gram panchayats are seen as ineffective, and existing powerful groups seek to take over control. Prem Chawdhry (2005) argues that Khap (caste) panchayats are so powerful because of their ability to mobilise a large number of people. They appear to be democratic from outside, but they exclude women, the youth as well as the groups lower down in the caste hierarchy. She believes that the expansion of new technologies, globalisation and consumerism has led to greater aggression and violence, worsened gender equations, encouraged a greater exploitation of other subordinate categories, consolidated repressive social forces and strengthened casteism. She relates the phenomenon to the complexity of masculinities in present Haryana, generated by increasing number of unemployed and unmarried youth and the relation this bears to power. Such insecure masculinities also afford an unprecedented role to illegal and unconstitutional bodies like caste panchayats and thereby strengthen highly regressive trends in society. Pallavi (2005) however notes in the case of Maharashtra’s Gadchiroli district, that women have in fact started negotiating with the caste panchayats on a range of issues. While caste panchayats may not be able to render women entirely powerless, yet insecurities, both economic and social, often resulting from processes of growth and the consumerist aspirations they support, increasingly push these institutions into regression. Through the efforts of SHGs, some areas have witnessed women’s participation in the political sphere of caste panchayats. Yet the vision of making women and lower caste groups more visible in mainstream local governance institutions should continue to be promoted and strengthened. Conclusion and Recommendations: Control over assets by women: land, livestock and financial resources, appears to have considerable benefits in terms of enhancing production potentials. This is related to the shifts in employment patterns, with men increasingly seeking higher paid, non-agricultural work, and women confined to managing their fields, albeit with few resources. But to achieve these productivity gains, what is required is not just control over landed property, though this in itself has value for women in terms of enhancing their bargaining power, but access to a package of inputs and services that include credit, technology, information on agricultural methods and labour. Alongside increasing effective land rights, it is crucial to ensure access to productive resources

108
through also altering social norms regarding what constitute proper female economic activities. Bank credit for instance can be delinked from ownership of land. This equally applies to caste disadvantage, with the lower castes performing poorly in terms of material resources, which in turn keeps them in a vicious circle of poverty. In terms of autonomy, an encouraging trend is visible in terms of women of the Other categories, previously subjected to a host of restrictions, especially on their mobility. However, with a growth in consumerism that has accompanied the recent growth process, the SC women seem to have lost their relative advantage in terms of autonomy and the OBC women face growing restrictions, in their move towards higher social status. While higher education accessed by the Other women may be a contributing factor, as well as exposure to the media, especially TV, the data on violence against women is disturbing across social categories. Perhaps it is a reaction to women’s enhanced autonomy (Kabeer, 1999). The only way to achieve a reduction in domestic violence is perhaps by more sensitive laws and quick convictions. If laws are basically insensitive to the issue of domestic or other violence against women, they will actually act as a deterrent for women - women are not going to feel encouraged to use the legal route to raise their grievances. Also, if the laws are framed well, but the legal system is slow, costly and unresponsive, and convictions are few and far between, then it is unlikely to provide redressal and justice. While there are no simple and enforceable policies for enhancing women’s autonomy, better educational and occupational outcomes are found to be positively related to women’s status within the home. This is however by no means a linear relationship; often middle castes and classes are more conservative in attitudes to women than those at the two ends of the distribution. Participation by women and lower caste groups in community-level decision-making has important growth implications in terms of setting the agenda for local development. While a majority of the elected women may indeed be ‘proxies’ for their husbands, additional support in the form of training, honorariums, adequate equipment etc can indeed help to change the situation. It is important here to emphasise that rather than taking a “deficiency approach”, namely stressing women’s lack of education, lack of information, lack of economic resources, lack of time, lack of experience, lack of integration into political networks and lack in toughness, women’s existing knowledge and strength need to be encouraged.

109
Section 8 Gender and Caste Development Index
Using the three rounds of the National Family and Health Survey (NFHS) data, this section discusses the trends in the Caste Development Index, following Deshpande (2001). It seeks to identify any possible links between caste deprivation and growth, or between gender disadvantage and growth within different caste groups. The three rounds were conducted in 1992-93; 1998-99 and 2005-06. While the NFHS does not have information on consumption or income, essential for looking at material deprivation/advantage, it has other indicators (such as land ownership, consumer durables ownership, livestock, occupation and education) that have been combined to construct the CDI.21 For the household, occupation and education of the head of household have been used. The first round of the NFHS data, in line with all the other national data sets, divides the population into SC, ST and Others. The subsequent two rounds further divide the erstwhile Others into OBC and Others. Thus, the NFHS data shares the limitation of other data sets inasmuch as it does not allow us to isolate the upper castes. Thus, it needs to be stressed again that this three- or four-fold division, while allowing for computational ease, underestimates the disparity between the top and bottom of the caste hierarchy. The CDI, by construction, takes a value between zero and one; the higher the bar, the better-off the group. As the figures indicate, all the three CDIs show a substantial regional variation, not surprising in view of the diverse socio-political regional histories. What is interesting to note is that in all the states over this 15 year period, the gap between SCs and Others remains persistent. The data for the last two rounds also has the OBC category. It is interesting that despite an increase in the number and proportion of OBC legislators (indicated by the media) and the overall feeling about the OBCs being the dominant castes or the new elite, the disparity between OBCs and Others is a persistent feature of this period. One of the problems with the data is that the definitions of some variables and some questions have been changing over the three rounds, so strict comparison of the CDI values over the three rounds leaves certain ambiguities. However, the trends are indicative enough to suggest the persistence of caste disparities across all states of India.
21 Following the HDI methodology, the caste deprivation index is calculated thus: Ic
ij is the deprivation indicator for the jth state with respect to the ith indicator for group c ( c can take three values: SC, ST, others) and is given by the following: Ic
ij = [max Xij - Xcij ]/ [max Xij - min Xij ], where the maximum (minimum) values are those that the given
indicator takes from the all India data. Thus in the entire country if 12 is the maximum number of assets that an individual owns, then the max value for assets is 12, that will be used for calculation of the index in all states. Xc
ij is the mean value of the ith indicator for the cth caste group in the jth state. The caste deprivation index is an average of the five deprivation indicators, calculated as above. Thus, Ic
j = summation over i [ Icij ]/ 5, for the cth caste group in the jth state.
The CDI = (1 - Caste Deprivation Index).
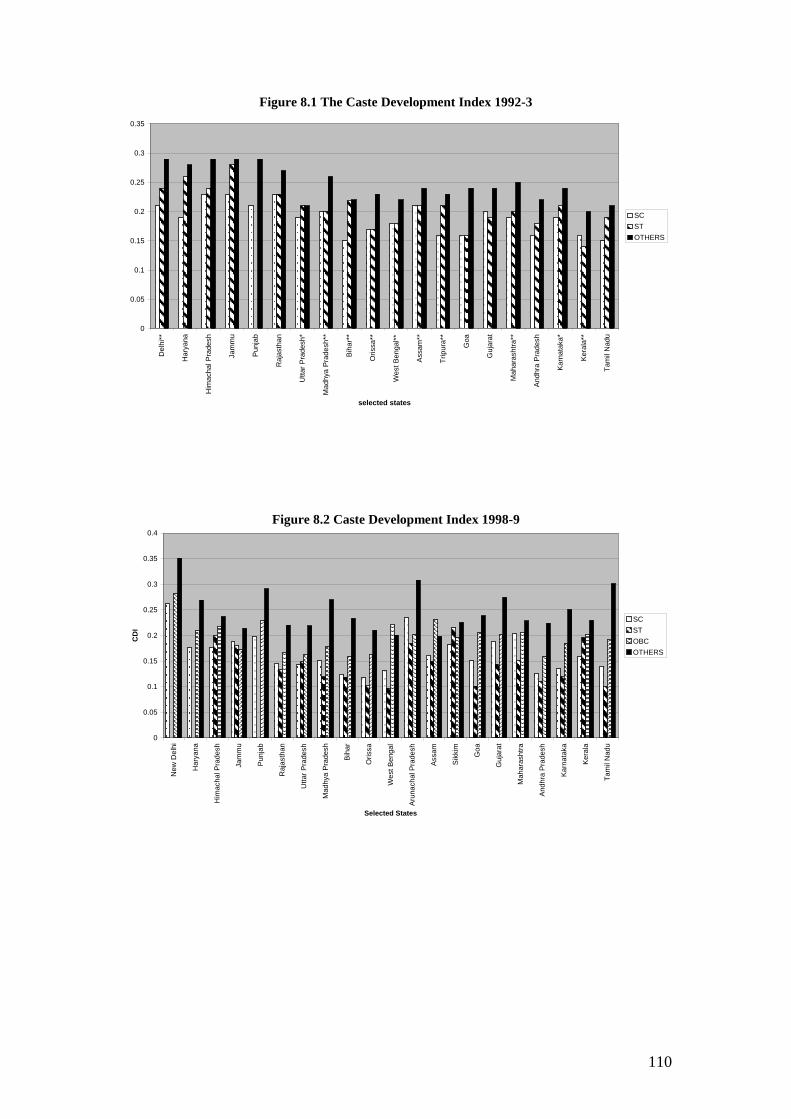
110
Figure 8.1 The Caste Development Index 1992-3
0
0.05
0.1
0.15
0.2
0.25
0.3
0.35
Del
hi**
Har
yana
Him
acha
l Pra
desh
Jam
mu
Pun
jab
Raj
asth
an
Utta
r Pra
desh
*
Mad
hya
Pra
desh
**
Bih
ar**
Oris
sa**
Wes
t Ben
gal**
Ass
am**
Trip
ura*
*
Goa
Guj
arat
Mah
aras
htra
**
And
hra
Pra
desh
Kar
nata
ka*
Ker
ala*
*
Tam
il N
adu
selected states
SCSTOTHERS
Figure 8.2 Caste Development Index 1998-9
0
0.05
0.1
0.15
0.2
0.25
0.3
0.35
0.4
New
Del
hi
Har
yana
Him
acha
l Pra
desh
Jam
mu
Pun
jab
Raj
asth
an
Utta
r Pra
desh
Mad
hya
Pra
desh
Bih
ar
Oris
sa
Wes
t Ben
gal
Aru
nach
al P
rade
sh
Ass
am
Sik
kim
Goa
Guj
arat
Mah
aras
htra
And
hra
Pra
desh
Kar
nata
ka
Ker
ala
Tam
il N
adu
Selected States
CD
I
SCSTOBCOTHERS

111
Figure 8.3 Caste Development Index 2005-6
0
0.05
0.1
0.15
0.2
0.25
0.3
0.35
0.4
0.45
Jam
mu
kash
mir
Him
acha
l pra
desh
Pun
jab
Utta
ranc
hal
Har
yana
Del
hi
Raj
asth
an
Utta
r pra
desh
Cha
ttisg
arh
Mad
hya
Pra
desh
**
Bih
ar**
Wes
t Ben
gal**
Jhar
khan
d
Oris
sa
Trip
ura
Ass
am
Guj
arat
Mah
aras
htra
**
And
hra
Pra
desh
Kar
nata
ka*
Ker
ala*
*
Tam
il N
adu
Selected States
CD
I
SCSTOBCOthers
Using the apparatus of the CDI, we can define caste disparity as the difference between the CDI value for Others and the CDI value for SC. We can then further rank the different states by their levels of disparity as well as by the absolute value of CDI for SCs, the latter being a measure of the absolute level of development of the SCs. The idea behind using both these rankings is that a desirable outcome will involve a low disparity as well as a high CDI for SC.

112
Table 8.1: Ranking of States by Disparity and CDI PC Real SDP Disparity CDI SC Ranks 1993-94 1998-99 2002-03 1992-93 1998-99 2004-05 1992-93 1998-99 2004-05
1 Delhi Delhi Delhi Haryana Tamil Nadu Tamil Nadu Himachal Pradesh Delhi Delhi 2 Punjab Punjab Maharashtra Delhi Madhya Pradesh Rajasthan Jammu Maharashtra Gujarat 3 Maharashtra Maharashtra Punjab Punjab Karnataka Madhya Pradesh Rajasthan Punjab Maharashtra 4 Haryana Gujarat Haryana Bihar Bihar Bihar Delhi Gujarat Assam 5 Gujarat Haryana Gujarat Himachal Pradesh Andhra Pradesh Delhi Punjab Jammu Himachal pradesh 6 Tamil Nadu Tamil Nadu Tamil Nadu Jammu Haryana Gujarat Assam Haryana Jammu kashmir 7 Kerala Karnataka Himachal Pradesh Madhya Pradesh Orissa Uttar pradesh Madhya Pradesh Himachal Pradesh Haryana 8 Himachal Pradesh Himachal Pradesh Karnataka Maharashtra Punjab Punjab Gujarat Assam Punjab 9 Karnataka Kerala Kerala Orissa New Delhi Andhra Pradesh Haryana Kerala Rajasthan
10 Andhra Pradesh Andhra Pradesh West Bengal Andhra Pradesh Gujarat Orissa Uttar Pradesh Madhya Pradesh Madhya Pradesh 11 West Bengal West Bengal Andhra Pradesh Tamil Nadu Uttar Pradesh Haryana Maharashtra Rajasthan Uttar pradesh 12 Madhya Pradesh Rajasthan Rajasthan Karnataka Rajasthan Kerala Karnataka Uttar Pradesh Kerala 13 Jammu & Kashmir Madhya Pradesh Madhya Pradesh Rajasthan Kerala Himachal pradesh West Bengal Tamil Nadu Tamil Nadu 14 Rajasthan Jammu & Kashmir Assam Gujarat West Bengal Jammu kashmir Orissa Karnataka West Bengal 15 Assam Assam Orissa West Benga Himachal Pradesh Maharashtra Andhra Pradesh West Bengal Andhra Pradesh 16 Uttar Pradesh Orissa Uttar Pradesh Keral Assam Karnataka Kerala Andhra Pradesh Karnataka 17 Orissa Uttar Pradesh Bihar Assam Jammu West Bengal Bihar Bihar Orissa 18 Bihar Bihar N/A Uttar Pradesh Maharashtra Assam Tamil Nadu Orissa Bihar
Source of PC real SDP: www.indiastat.com: table 51676
Disparity and CDI are author’s own calculations from NFHS I, II and III
Only those states that are common to all 3 rounds have been retained in this table

113
A comparison of the three rounds on both these counts indicates the following:
1. The states with high CDI for SCs are not necessarily those with low disparity. For example, for 2005-06, Tamil Nadu, Rajasthan and Madhya Pradesh top the disparity list. The rankings of these states by CDI for SCs are 13, 9 and 10 respectively. At the other end of the spectrum, we have states like Karnataka and West Bengal that have low disparity but have low CDI for SCs as well. We can see similar patterns for the earlier two rounds, suggesting that states that do well on one count, viz, high CDI for SCs, need not necessarily do as well on the other count, viz, low disparity.
2. The three rounds of NFHS have seen several ups and downs in the rankings of states on both these counts. Thus, round 1 saw Haryana, Delhi and Punjab top the disparity list, round 2 had Tamil Nadu, Madhya Pradesh and Karnataka and round 3 has Tamil Nadu, Rajasthan and Madhya Pradesh at the top. Similarly, in terms of CDI for SCs, round 1 had Himachal Pradesh, Jammu and Rajasthan, on top, round 2 had Delhi, Maharashtra and Punjab and round 3 had Delhi, Gujarat and Maharashtra. .
3. A part of these swings could be attributable to data inconsistencies: the changing definitions of variables, inclusion, exclusion and modifications in data questions, as well as, for instance, the creation of three new states between the second and the third rounds. In addition to these, what these suggest is that the variety of factors affecting the variables that go into the construction of the CDI are producing a complexity of influences, leading to eventual outcomes that fluctuate a lot. Of the five variables that have gone into the construction of the CDI, the two that have displayed the most variation are occupation and education.
4. Across the three rounds, there is no clear-cut relationship between the real per capita SDP (State Domestic Product) or the rate of growth of SDP and either the CDI for SCs or disparity. Thus, we see all kinds of patterns in all the three rounds. For instance, for 2004-05, we see poorer states with high disparity (Madhya Pradesh and Bihar); richer states with high disparity (Tamil Nadu, Delhi, Gujarat), poor states with high ranks on CDI for SCs (Assam and Jammu & Kashmir), rich states with high ranks on CDI for SCs (Delhi, Gujarat, Maharashtra).
5. A similar confounding of patterns exists with respect to rates of growth of states (table below). So, for example, we can see faster growing states with high disparity (Tamil Nadu and Rajasthan), faster growing states with low disparity (West Bengal and Maharashtra), faster growing states with high CDI for SCs (Gujarat and Maharashtra ) and faster growing states with low CDI for SCs (West Bengal and Andhra Pradesh).
This suggests that the issues of inter-caste disparity and higher CDI do not have a simple solution in the form of either greater material prosperity of states or greater rates of growth. The implication is that rather than relying growth to deliver equality outcomes, specific, targeted policies might be needed for this purpose. The case of Maharashtra could be instructive, as it has managed to achieve relatively low disparity and high CDI for SCs over the last decade. A strong dalit movement that has constantly pushed for entitlements, alongside policy interventions such as the EGS have clearly played a role in this process.

114
Table 8.2 State-wise Growth Rates and Per Capita State Income in India (1993-94 to 2000-01)
States Annual Growth Rates* (%)
Per Capita State Income at Current Prices 2000-01 (Rs.)
State Per Capita Income State Income
Andhra Pradesh
5.5 4.1 16373
Assam 2.4 0.8 10198 Bihar 4 1.3 5108 Gujarat 5.3 3.6 19228 Haryana 5.6 3.6 23742 Himachal Pradesh
6.5 4.7 18920
Karnataka 8.1 6.5 18041 Kerala 5.1 3.9 21046 Madhya Pradesh
4.3 2.3 10803
Maharashtra 5 2.9 22179 Orissa 2.5 1.3 8547 Punjab 4.9 2.9 25048 Rajasthan 6.5 3.8 11978 Tamil Nadu 6.1 5 19889 Uttar Pradesh 4 1.8 9721 West Bengal 7.2 5.5 16072 India 6.3 4.3 16707
Notes : * : At Constant (1993-94) Prices 1993-94 to 2000-01. Source : Economic Survey of Maharashtra 2002-03, Directorate of Economics & Statistics, Planning Department, Govt. of Maharashtra. The Gender Caste Development Index Roughly 90 percent of all household heads in the NFHS-1 and -2 data were male, but in the third round this proportion is 86 percent. Thus, the CDI, while highly instructive from the point of view of caste disparities, does not offer insights into the gendered patterns of caste disparity. The NFHS dataset has a separate survey with only women as respondents. Deshpande (2001b and 2007) extended the CDI framework to the women’s survey to calculate and analyse the gender-caste development index (GCDI) (disparities between different caste groups among women). Three out of the five indicators that go into the making of the CDI are household specific (consumer durables, land and livestock) and hence are common both to the CDI and the GCDI. The other two variables, namely education and occupation, are individual specific and contribute to the differences between the CDI and the GCDI. There are important and valid questions related to the intra-household distribution of resources and it is a moot point whether and to what extent, women have claims over the household resources. However, the existing information does not allow us to assess the nature and extent of these claims and thus, we assume that these household resources are indicators of material prosperity or deprivation of households and therefore, also of the women in the households.

115
The GCDI over the three data points reveals that the SC women remain very much at the bottom of the rankings, much like their male counterparts. However, one noteworthy feature of this data is the improvement in the values of the GCDI for all categories of women across the three rounds, issues of strict comparability notwithstanding. However, the inter-caste disparity remains persistent. The patterns of GCDI and per capita real SDP as well as rates of growth of states are as unclear as in the case of CDI.
Figure 8.4 Gender Caste Development Index 1992-3
0
0.05
0.1
0.15
0.2
0.25
0.3
0.35
Delhi**
Haryan
a
Himac
hal P
rades
h
Jammu
Punjab
Rajasth
an
Uttar P
rades
h*
Madhy
a Prad
esh*
*
Bihar**
Orissa
**
Wes
t Ben
gal**
Assam
**
Tripura
**
Gujarat
Mahara
shtra
**
Andhra
Prad
esh
Karnata
ka*
Kerala*
*
Tamil N
adu
selected states
CDI for SC womenCDI for OTHER womenCDI for SC hhCDI for OTHER hh

116
Figure 8.5 Gender Caste Development Index 1989-9
0
0.05
0.1
0.15
0.2
0.25
0.3
0.35
0.4
New Delhi HimachalPradesh
Punjab UttarPradesh
Bihar WestBengal
Gujarat AndhraPradesh
Kerala
Selected States
GC
DI
SCSTOBCOthers
Figure 8.6 Woman Development Index 2005-6
0
0.1
0.2
0.3
0.4
0.5
0.6
0.7
0.8
Jam
mu
kash
mir
Him
acha
l pra
desh
Pun
jab
Utta
ranc
hal
Har
yana
Del
hi
Raj
asth
an
Utta
r pra
desh
Cha
ttisg
arh
Mad
hya
Pra
desh
**
Bih
ar**
Wes
t Ben
gal**
Jhar
khan
d
Oris
sa
Trip
ura
Ass
am
Guj
arat
Mah
aras
htra
**
Goa
And
hra
Pra
desh
Kar
nata
ka*
Ker
ala*
*
Tam
il N
adu
Selected States
CD
I
SCSTOBCOTHERS

117
Table 8.3: Ranking of States by gendered disparity and GCDI
PC Real SDP Disparity CDI SC Ranks 1993-94 1998-99 2002-03 1992-93 1998-99 2003-04 1992-93 1998-99 2003-04
1 Delhi Delhi Delhi Rajasthan Tamil Nadu Tamil Nadu Himachal Pradesh Kerala Kerala 2 Punjab Punjab Maharashtra Haryana Madhya Pradesh Rajasthan Jammu Maharashtra Maharashtra 3 Maharashtra Maharashtra Punjab Punjab Karnataka Delhi Gujarat Delhi Gujarat 4 Haryana Gujarat Haryana Delhi Bihar Uttar pradesh Kerala Gujarat Punjab 5 Gujarat Haryana Gujarat Jammu Andhra Pradesh Bihar Delhi Tamil Nadu Delhi 6 Tamil Nadu Tamil Nadu Tamil Nadu Tamil Nadu Haryana Punjab Rajasthan West Bengal Tamil Nadu 7 Kerala Karnataka Himachal Pradesh Uttar Pradesh Orissa Gujarat Assam Andhra Pradesh Himachal pradesh 8 Himachal Pradesh Himachal Pradesh Karnataka Orissa Punjab Madhya Pradesh Maharashtra Karnataka Haryana 9 Karnataka Kerala Kerala Maharashtra Delhi Haryana Punjab Madhya Pradesh Jammu kashmir 10 Andhra Pradesh Andhra Pradesh West Bengal Himachal Pradesh Gujarat Orissa Madhya Pradesh Punjab Andhra Pradesh 11 West Bengal West Bengal Andhra Pradesh Madhya Pradesh Uttar Pradesh Himachal pradesh Karnataka Himachal Pradesh Madhya Pradesh 12 Madhya Pradesh Rajasthan Rajasthan Bihar Rajasthan Andhra Pradesh Haryana Assam Assam 13 Jammu & Kashmir Madhya Pradesh Madhya Pradesh Gujarat Kerala Karnataka West Bengal Jammu Karnataka 14 Rajasthan Jammu & Kashmir Assam Karnataka West Bengal Maharashtra Andhra Pradesh Rajasthan Rajasthan 15 Assam Assam Orissa Assam Himachal Pradesh Jammu kashmir Uttar Pradesh* Haryana West Bengal 16 Uttar Pradesh Orissa Uttar Pradesh Andhra Pradesh Assam West Bengal Tamil Nadu Orissa Orissa 17 Orissa Uttar Pradesh Bihar Kerala Jammu Kerala Orissa Uttar Pradesh Uttar pradesh 18 Bihar Bihar N/A West Bengal Maharashtra Assam Bihar Bihar Bihar

118
Table 8.4: Gender and Caste Gaps in relation to Real Rural MPCE Real Rural Median MPCE Gender Gap Caste gap state_cd 1983 1993-94 1999-00 2004-2005 1983 1993-94 1999-00 2004-2005 1983 1993-94 1999-00 2004-2005 01.Andhra Pradesh 101.2 107.1 92.6 180.8 37.09 20.52 17.43 16.66 -16.07 13.18 10.53 9.58 03.Assam 108.8 101.7 86.1 140.6 53.12 15.02 14.7 11.60 17.68 1.16 -1.55 -4.32 04.Bihar 85.2 90.0 83.4 121.4 42.14 26.3 21.76 21.13 -3.02 17.64 16.01 18.86 05.Goa 155.4 178.7 145.4 209.6 51.32 19.37 15.69 11.53 73.14 5.51 8.3 10.00 06.Gujarat 107.9 114.2 99.0 167.2 48.16 24.31 22.37 22.34 -23.73 10.04 10.87 7.55 07.Haryana 125.9 117.1 117.2 178.4 14.06 24.65 21.73 20.73 5.02 12.78 11.29 12.09 08.Himachal Pradesh 139.8 109.7 108.2 183.6 24.35 16.59 14.34 15.01 31.09 6.27 2.97 7.29 09.Jammu & Kashmir 118.7 125.2 3.37 20.6 22.95 20.43 29.94 10.17 24.2 -2.58 10.Karnataka 104.5 92.6 75.9 79.7 48.26 19.55 17.81 15.51 13 17.35 15.69 12.97 11.Kerala 123.1 148.5 124.6 142.7 27.95 3.76 6.1 4.36 -5.42 9.81 7.03 9.36 12.Madhya Pradesh 88.0 83.8 72.2 73.9 42.46 25.36 23.47 23.11 13.7 17.37 17.01 16.94 13.Maharastra 96.7 87.8 75.2 77.2 51.2 23.16 19.18 16.70 -30.14 14 16.12 15.21 18.Orissa 89.9 83.0 71.5 68.2 48.43 21.76 19.52 16.55 33.98 24.94 21.75 23.72 19.Punjab 148.4 144.9 124.4 160.6 24.3 12.59 9.68 8.58 23.64 20.9 17.23 10.98 20.Rajasthan 105.0 116.9 101.4 98.5 50.32 32.33 31.23 27.48 13.59 14.32 13.09 11.11 22.Tamil Nadu 97.5 99.1 81.4 96.3 26 22.24 17.54 17.86 9.26 15.75 11.36 7.68 24.Uttar Pradesh 90.8 99.5 87.4 98.8 33.94 26.62 24.57 22.00 19.87 15.17 11.99 8.87 25.West Bengal 91.7 102.2 81.7 110.4 56.1 17.89 17.48 13.98 -3.41 11.67 7.32 9.87 Total 97.9 99.0 84.2 93.4 34.81 22.37 20.24 18.6 1.17 15.89 13.23 11.41
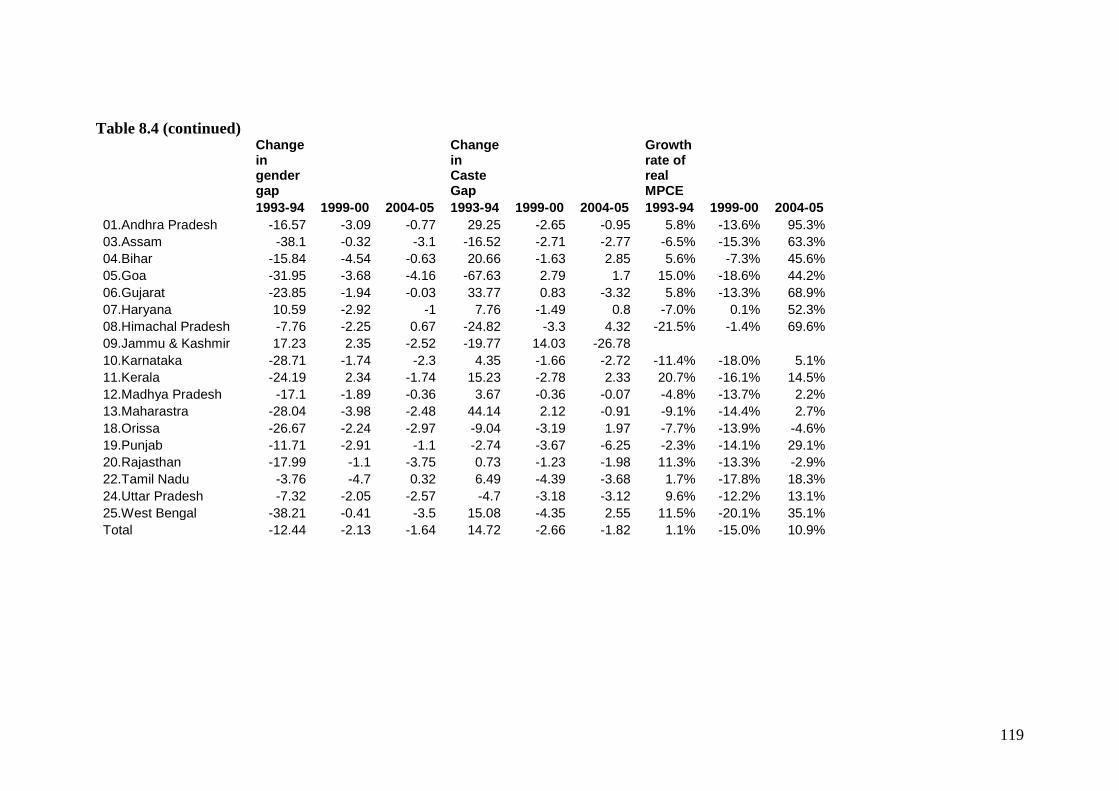
119
Table 8.4 (continued)
Change in gender gap
Change in Caste Gap
Growth rate of real MPCE
1993-94 1999-00 2004-05 1993-94 1999-00 2004-05 1993-94 1999-00 2004-05 01.Andhra Pradesh -16.57 -3.09 -0.77 29.25 -2.65 -0.95 5.8% -13.6% 95.3% 03.Assam -38.1 -0.32 -3.1 -16.52 -2.71 -2.77 -6.5% -15.3% 63.3% 04.Bihar -15.84 -4.54 -0.63 20.66 -1.63 2.85 5.6% -7.3% 45.6% 05.Goa -31.95 -3.68 -4.16 -67.63 2.79 1.7 15.0% -18.6% 44.2% 06.Gujarat -23.85 -1.94 -0.03 33.77 0.83 -3.32 5.8% -13.3% 68.9% 07.Haryana 10.59 -2.92 -1 7.76 -1.49 0.8 -7.0% 0.1% 52.3% 08.Himachal Pradesh -7.76 -2.25 0.67 -24.82 -3.3 4.32 -21.5% -1.4% 69.6% 09.Jammu & Kashmir 17.23 2.35 -2.52 -19.77 14.03 -26.78 10.Karnataka -28.71 -1.74 -2.3 4.35 -1.66 -2.72 -11.4% -18.0% 5.1% 11.Kerala -24.19 2.34 -1.74 15.23 -2.78 2.33 20.7% -16.1% 14.5% 12.Madhya Pradesh -17.1 -1.89 -0.36 3.67 -0.36 -0.07 -4.8% -13.7% 2.2% 13.Maharastra -28.04 -3.98 -2.48 44.14 2.12 -0.91 -9.1% -14.4% 2.7% 18.Orissa -26.67 -2.24 -2.97 -9.04 -3.19 1.97 -7.7% -13.9% -4.6% 19.Punjab -11.71 -2.91 -1.1 -2.74 -3.67 -6.25 -2.3% -14.1% 29.1% 20.Rajasthan -17.99 -1.1 -3.75 0.73 -1.23 -1.98 11.3% -13.3% -2.9% 22.Tamil Nadu -3.76 -4.7 0.32 6.49 -4.39 -3.68 1.7% -17.8% 18.3% 24.Uttar Pradesh -7.32 -2.05 -2.57 -4.7 -3.18 -3.12 9.6% -12.2% 13.1% 25.West Bengal -38.21 -0.41 -3.5 15.08 -4.35 2.55 11.5% -20.1% 35.1% Total -12.44 -2.13 -1.64 14.72 -2.66 -1.82 1.1% -15.0% 10.9%
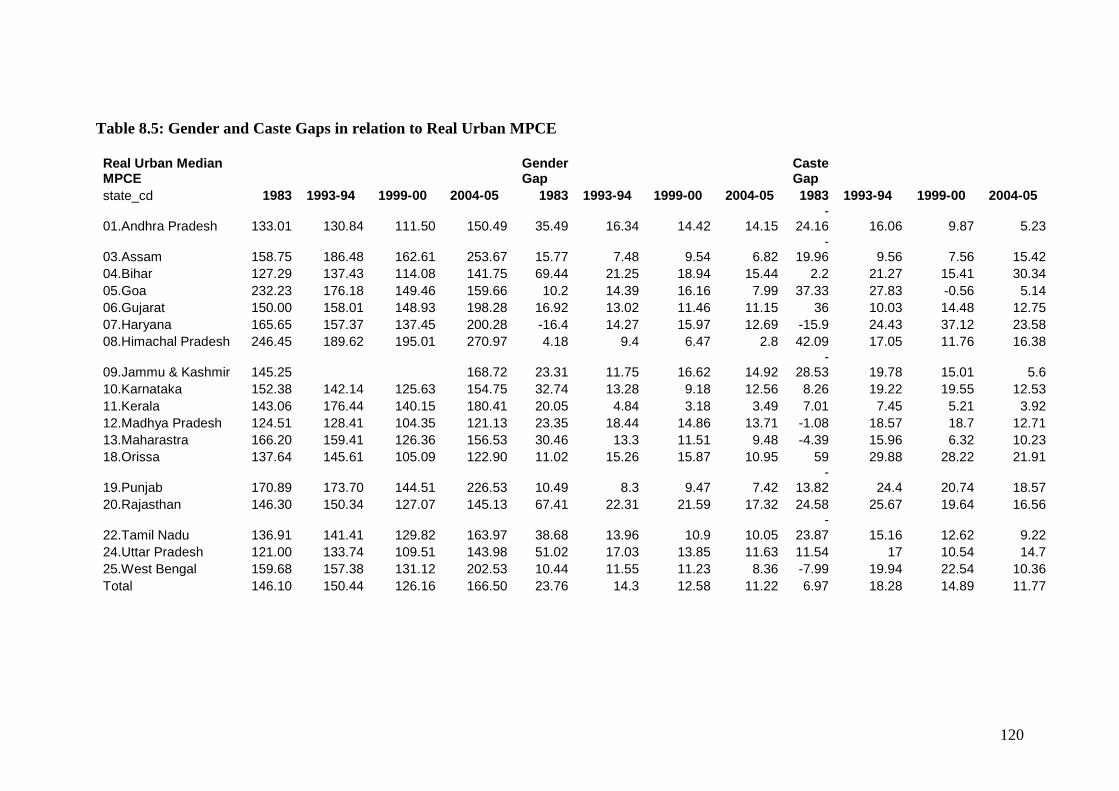
120
Table 8.5: Gender and Caste Gaps in relation to Real Urban MPCE Real Urban Median MPCE
Gender Gap
Caste Gap
state_cd 1983 1993-94 1999-00 2004-05 1983 1993-94 1999-00 2004-05 1983 1993-94 1999-00 2004-05
01.Andhra Pradesh 133.01 130.84 111.50 150.49 35.49 16.34 14.42 14.15 -
24.16 16.06 9.87 5.23
03.Assam 158.75 186.48 162.61 253.67 15.77 7.48 9.54 6.82 -
19.96 9.56 7.56 15.42 04.Bihar 127.29 137.43 114.08 141.75 69.44 21.25 18.94 15.44 2.2 21.27 15.41 30.34 05.Goa 232.23 176.18 149.46 159.66 10.2 14.39 16.16 7.99 37.33 27.83 -0.56 5.14 06.Gujarat 150.00 158.01 148.93 198.28 16.92 13.02 11.46 11.15 36 10.03 14.48 12.75 07.Haryana 165.65 157.37 137.45 200.28 -16.4 14.27 15.97 12.69 -15.9 24.43 37.12 23.58 08.Himachal Pradesh 246.45 189.62 195.01 270.97 4.18 9.4 6.47 2.8 42.09 17.05 11.76 16.38
09.Jammu & Kashmir 145.25 168.72 23.31 11.75 16.62 14.92 -
28.53 19.78 15.01 5.6 10.Karnataka 152.38 142.14 125.63 154.75 32.74 13.28 9.18 12.56 8.26 19.22 19.55 12.53 11.Kerala 143.06 176.44 140.15 180.41 20.05 4.84 3.18 3.49 7.01 7.45 5.21 3.92 12.Madhya Pradesh 124.51 128.41 104.35 121.13 23.35 18.44 14.86 13.71 -1.08 18.57 18.7 12.71 13.Maharastra 166.20 159.41 126.36 156.53 30.46 13.3 11.51 9.48 -4.39 15.96 6.32 10.23 18.Orissa 137.64 145.61 105.09 122.90 11.02 15.26 15.87 10.95 59 29.88 28.22 21.91
19.Punjab 170.89 173.70 144.51 226.53 10.49 8.3 9.47 7.42 -
13.82 24.4 20.74 18.57 20.Rajasthan 146.30 150.34 127.07 145.13 67.41 22.31 21.59 17.32 24.58 25.67 19.64 16.56
22.Tamil Nadu 136.91 141.41 129.82 163.97 38.68 13.96 10.9 10.05 -
23.87 15.16 12.62 9.22 24.Uttar Pradesh 121.00 133.74 109.51 143.98 51.02 17.03 13.85 11.63 11.54 17 10.54 14.7 25.West Bengal 159.68 157.38 131.12 202.53 10.44 11.55 11.23 8.36 -7.99 19.94 22.54 10.36 Total 146.10 150.44 126.16 166.50 23.76 14.3 12.58 11.22 6.97 18.28 14.89 11.77
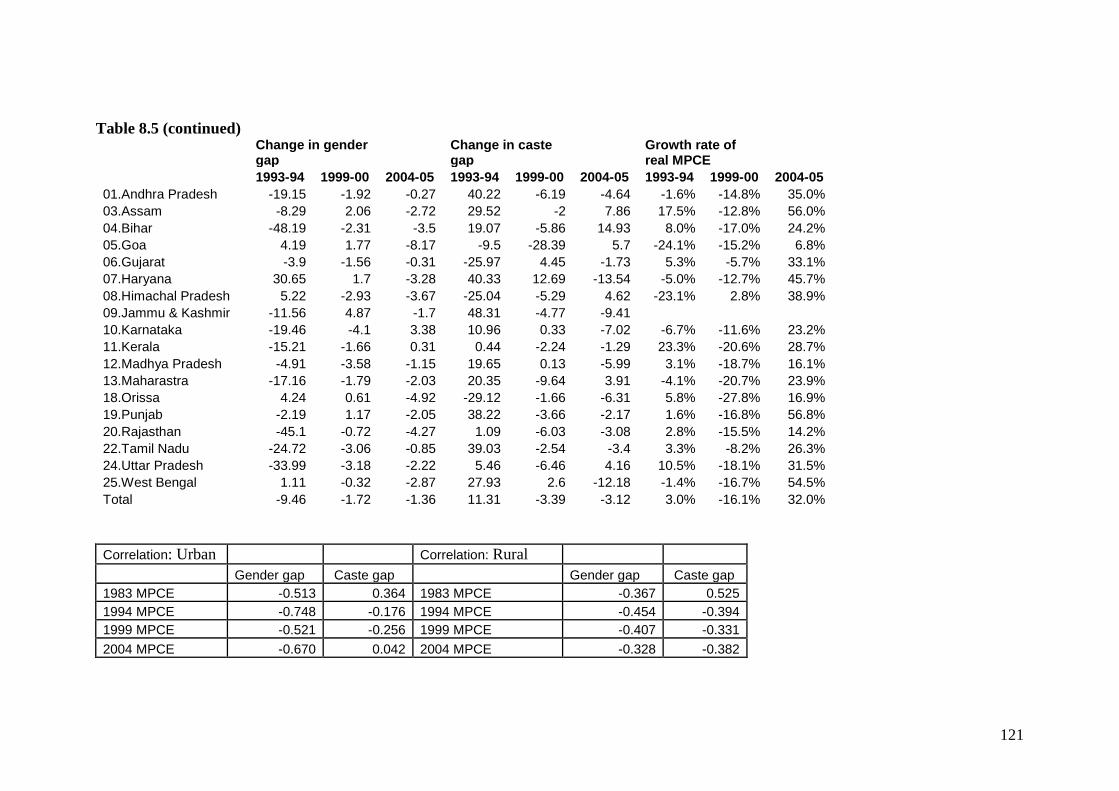
121
Table 8.5 (continued)
Change in gender gap
Change in caste gap
Growth rate of real MPCE
1993-94 1999-00 2004-05 1993-94 1999-00 2004-05 1993-94 1999-00 2004-05 01.Andhra Pradesh -19.15 -1.92 -0.27 40.22 -6.19 -4.64 -1.6% -14.8% 35.0% 03.Assam -8.29 2.06 -2.72 29.52 -2 7.86 17.5% -12.8% 56.0% 04.Bihar -48.19 -2.31 -3.5 19.07 -5.86 14.93 8.0% -17.0% 24.2% 05.Goa 4.19 1.77 -8.17 -9.5 -28.39 5.7 -24.1% -15.2% 6.8% 06.Gujarat -3.9 -1.56 -0.31 -25.97 4.45 -1.73 5.3% -5.7% 33.1% 07.Haryana 30.65 1.7 -3.28 40.33 12.69 -13.54 -5.0% -12.7% 45.7% 08.Himachal Pradesh 5.22 -2.93 -3.67 -25.04 -5.29 4.62 -23.1% 2.8% 38.9% 09.Jammu & Kashmir -11.56 4.87 -1.7 48.31 -4.77 -9.41 10.Karnataka -19.46 -4.1 3.38 10.96 0.33 -7.02 -6.7% -11.6% 23.2% 11.Kerala -15.21 -1.66 0.31 0.44 -2.24 -1.29 23.3% -20.6% 28.7% 12.Madhya Pradesh -4.91 -3.58 -1.15 19.65 0.13 -5.99 3.1% -18.7% 16.1% 13.Maharastra -17.16 -1.79 -2.03 20.35 -9.64 3.91 -4.1% -20.7% 23.9% 18.Orissa 4.24 0.61 -4.92 -29.12 -1.66 -6.31 5.8% -27.8% 16.9% 19.Punjab -2.19 1.17 -2.05 38.22 -3.66 -2.17 1.6% -16.8% 56.8% 20.Rajasthan -45.1 -0.72 -4.27 1.09 -6.03 -3.08 2.8% -15.5% 14.2% 22.Tamil Nadu -24.72 -3.06 -0.85 39.03 -2.54 -3.4 3.3% -8.2% 26.3% 24.Uttar Pradesh -33.99 -3.18 -2.22 5.46 -6.46 4.16 10.5% -18.1% 31.5% 25.West Bengal 1.11 -0.32 -2.87 27.93 2.6 -12.18 -1.4% -16.7% 54.5% Total -9.46 -1.72 -1.36 11.31 -3.39 -3.12 3.0% -16.1% 32.0%
Correlation: Urban Correlation: Rural Gender gap Caste gap Gender gap Caste gap 1983 MPCE -0.513 0.364 1983 MPCE -0.367 0.525 1994 MPCE -0.748 -0.176 1994 MPCE -0.454 -0.394 1999 MPCE -0.521 -0.256 1999 MPCE -0.407 -0.331 2004 MPCE -0.670 0.042 2004 MPCE -0.328 -0.382

122
As already mentioned the gender-caste disparity index uses the household ownership of resources as an indicator of material deprivation, along with individual characteristics in terms of occupation and education. It hence does not capture the impact of ownership of assets on gender equality or indeed enhancement of productivity. But it is interesting to note that a state such as UP ranks much higher in terms of disparity and much lower in terms of CDI when gender is taken into account, pointing to the fact that while lower caste mobilisation may have helped reduce caste disparity in general, its benefits have not been equally shared by lower caste women.. What is also interesting to note from Tables 8.4 and 8.5 is that while gender and caste gaps have been improving over the last two decades, the improvement is but marginal in the most recent period, which coincides with exceptionally high rates of growth. This is true for both rural and urban areas. For example, both rural Andhra Pradesh and Haryana have seen a similar improvement in MPCE between 1983-4 and 2004-5, yet caste gaps have worsened in both states and while gender gaps have improved in Andhra Pradesh, they have worsened in Haryana. Part of this could perhaps be attributed to the rapid expansion in self help groups and livelihood promotion activities for women in Andhra Pradesh.
Conclusions and Recommendations: What emerges from this analysis is that there is no clear association with either high/low growth or high/low SDP and the CDI or GCDI. Similarly, there is a lack of a clear pattern if we compare CDI/GCDI for SCs and disparity between SCs and Others. In other words, the two issues, one, raising the material standard of living for SCs, and two, lowering disparities have to be tackled independently (one will not necessarily lead to another) through a host of measures suggested in the previous sections. Secondly the regional variation is substantial as is the change in rankings of states – suggesting that political motivation and policy change do indeed have a role to play. So in terms of policies, a continuous monitoring and review (say, every 5 years) and readjustments of targets might lead to better outcomes. Part of the problem appears to be the lack of appropriate mechanisms to monitor the implementation of formal laws and policies directed to ensuring equality. While there is a Ministry of Women and Child Development at the central and state levels and a gender focal point in each Ministry, the latter continue to be marginalized. They lack the teeth to demand accountability from their counterparts in other Ministries. Thirdly, one conclusion we can draw from the GCDI, is that for women, the point of focus should be education and occupation. Land ownership by women should be targeted more indirectly via focusing on inheritance laws, on the one hand, but also legal awareness on the other. Alongside this, as mentioned in the last chapter, access to other resources needs to be delinked from ownership of land. Intra-household access to assets is not easily controllable by state policies, except, say via policies focusing on improving nutritional outcomes for women. Finally, it needs to be pointed out that substantial changes have been made in terms of gender and caste equality within the legal framework in India post-Independence.

123
Some might even argue that matters have reached a stage where women are at no substantial disadvantage compared to their male counterparts. This is especially so when one is looking at laws related to women across sectors. However, Acts such as the Equal Remuneration 1976 and Minimum Wages Act 1948, are rendered less effective when the many social practices seen as ‘normal’ from a cultural point of view, are taken into account. Even within Government Schemes it has been found that women are paid less than men. Shifting patterns and structures of employment have aggravated the problem of invisibility, but also insecurity, and this is further reinforced by social norms and attitudes relating to the gender divisions of work, especially the notion of ‘family labour’ and the differential valuations of productive and reproductive work. While formal institutions focus on the individual; rather than being free-floating bodies, these individuals are embedded within a social structure that in many ways shapes the extent to which they can exercise their individuality and claim their legitimate rights. In the present context of insecure employment and declining real wages, security for women is increasingly seen to lie in the realm of the familial and social, rather than public and political, leading to the ineffectiveness of a growing number of laws and policies. What is important then is to recognise that not all formal institutions are beneficial and not all informal ones are harmful. Once we acknowledge that informal institutions (like formal ones) can have both positive and negative elements when viewed from the standpoint of gender equality and women’s rights, we can better understand how women themselves attempt to adapt them to their needs wherever possible. Sen (2006) has therefore proposed that in relation to formal institutions, informal institutions may be complementary, accommodating, substitutive, competing, or dominant (see Annexure 1 for detailed examples). Such a framework that explores the terms of interaction between formal and informal institutions can be helpful for developing more nuanced policies favouring gender equality in different contexts, with starting points often lying within accepted social practice.

124
Section 9 Conclusions and Recommendations
High rates of growth have characterised developments in the Indian economy over the last few years, with a growth rate of over 9 per cent in 2005-6 and 2006-7 surpassing all expectations (Economic Survey, 2006-7). This has however also led to some genuine concerns about the inclusiveness of the growth process, especially on account of the near stagnation of the agricultural sector. Reports of farmer suicides from different parts of the country have raised questions about the neglect of the rural sector, still home to over 60 per cent of the Indian population, and its exclusion from growth. The Approach Paper to the 11th Plan highlights this concern, drawing attention to both the rural-urban divide and the gender divide as critical barriers to growth (2006: 3). Economists are showing increased interest in feminist perspectives which reveal gender inequality as a determinant of economic outcomes. Research is slowly pointing out how women neither share in nor are able to contribute to growth equally (Seguino 2000). This has led to a “new equity agenda” which shows that inequalities based on a number of background variables such as parental education, ethnicity, caste and gender are major obstacles to long-term equitable development (World Bank 2006, UNDP 2005b, UN 2005). Further, it is also believed that these inequalities (across the spectrum of women’s lives in economic, political, social and cultural spheres) must be addressed if poverty is to be eliminated (DFID 2000). There is hence growing recognition that gender inequality not only hampers pro-poor growth but hinders economic growth in general both in the short and long-term (Birdsall and Londono 1997; Deininger & Olinto 2000). This in fact has made the MDG Task Force on Gender Equality identify three key domains requiring urgent attention: a) the ‘capabilities’ domain referring to basic human abilities as measured through education, health and nutrition; b) the ‘access to resources and opportunities’ domain that includes access to economic assets (land, property, infrastructure) and resources (income and employment) as well as political opportunity; and c) the ‘security’ domain that seeks to reduce vulnerability to violence and conflict (Birdsall et al. 2004). In India, while disadvantage is multi-faceted, caste and gender are recognised as two key indicators of social stratification. Women and members of lower caste groups experience a range of inequalities: in health and nutrition, education, wages, occupation and ownership, control and access to assets and resources. Low entitlements, social barriers and discrimination combine to dampen capabilities and hinder market possibilities. As a result, these groups suffer disproportionate rates of poverty - a situation that is passed on from generation to generation despite gender and caste-based affirmative action by formal institutions (Mehta & Shah 2003).In this Gender Caste and Growth Assessment, we have attempted to analyse the links between gender inequality and growth; and caste and growth in India; but also examine how the membership of different social groupings interlock to deepen disadvantage and reinforce the detrimental impact on shared economic outcomes.

125
People are seen to participate in the growth process mainly through engagement in the labour force – an analysis of labour force participation by gender, social grouping and location has therefore been at the core of this assessment. Interestingly, in India, labour force participation rates have been virtually stagnant over the last two decades – a case of ‘jobless growth’. Other pathways for shared growth are thus also explored, principal among them being education, followed by the distribution of assets and access to physical and social infrastructure, fertility decline and female work burdens that restrict their supply response.. In the next section, key findings of the GCGA are summarised and broad directions for action suggested. Women and Lower Castes Excluded from the High Growth Sectors Growth in India is not new, it started accelerating since the early 1980s. GDP per capita growth has however been more pronounced in the last decade, 4.3 per cent per year between 1995 and 2004, a threefold increase in the annual rate of growth India was accustomed to. This compares to an increase in annual GDP growth from 4 to about 6 per cent, an increase by 1.5 times. The favourable difference between the increase in GDP per capita growth and the increase in GDP growth is due to a slowing down of population growth. This suggests that female empowerment may have contributed to growth in recent years through reducing fertility. Since 1990, the services sector has contributed more to GDP growth than industry. For 1980-2004, agriculture contributed 18%, industry 36% and services 46% to overall GDP growth. The data suggests however that faster a sector grows, the lower is female participation in that sector (women make up about 35% of the workforce in agriculture, 25% in industry, and less than 20% in services); the lower is the participation of SCs and STs; and within SCs and STs, women are less likely to participate in faster-growing sectors. A U-shaped relationship between female labour force participation rates (FLFPR) and income is suggested in the literature as arising from women needing to do manual labour when poor and choosing to do white-collar work when rich. In the case of India, this neither exists across states nor within states. It does however exist (within states) for levels of education: average FLFPR is about 30, for illiterate women it is about 50 and for graduates it is about 40: a (kind of) U-shaped relationship between FLFPR and education. During India’s modern growth period, higher FLFPRs neither particularly characterise faster-growing nor slow-growing states; and rises and falls in FLFPRs occur about as frequently, and across the growth spectrum. This lack of a definite relationship between growth and women’s work raises the need to better understand the gender implications of the growth process – the nature of jobs available to women, the conditions of work, as well as the need to balance productive and reproductive responsibilities. Over 95% of women workers are engaged in informal employment characterised by low wages, absence of secure contracts, worker benefits or any form of social protection. High productivity often demands long hours of work, as well as irregular hours of work. Despite the prevalence of a plethora of Acts and Policies to ensure minimum remuneration as well as equal benefits, these are not implemented, not even in government programmes. Women

126
then are confronted with major trade-offs in terms of participation in growth and the potential benefits from this and investment in the maintenance and social reproduction of their households A similar situation is faced by SCs and STs. A whole host of social norms, rules and routines appear to constrain women, and the lower caste groups, from realising their legal entitlements, pervading as they do not just community and local processes, but also state and economic ones. These informal institutions, strongly gendered, cover a gamut of human interaction from the most private sphere of sexuality to the public arenas of economic and political life, whether in terms of access to property and other productive resources, divisions of labour or political participation. They are however not fixed and do change in response to the external context, as visible in the regional variations across India itself. Finally, they are not always negative, but do offer women opportunities to exercise their agency and gain social status. Faced with insecure employment opportunities and declining real wages, it should be no surprise that women seek security in the realm of the familial, rather than the public. Policy Implications
· Develop a better understanding of the working conditions and requirements of the high growth sectors of the economy to enable the provision of additional support to women and lower caste groups to overcome the barriers and participate in these sectors. These include the provision of child care, minimum wages and other employment benefits that can ensure women an asset base for fall-back in the future.
· Understanding the interactions between the formal and informal institutions in order to build on complementary and accommodating institutions and support those that can substitute for a lack of formal provision.
Female education and investments in human capital are crucial for growth Education possibly emerges as the key driver of growth. There is evidence for a persistent, but generally declining, gender gap in education, both in urban and in rural areas, but with a much larger gap in rural areas, and considerable variation across states. Perhaps most remarkable of all: gender gap is larger for lower levels of education: e.g. in rural areas, the number of males per 100 in the category literate and up to primary minus the number of such females is equal to 8 in 2004/05 (down from 16 in 1983/4); for graduates this gap is only equal to two. However, school dropouts for girls is a much more serious concern for SCs and STs than for other groups, especially at the post-primary level, resulting for example in a negligible 0.52% of rural SCs that are in the category “graduates and above”. This could be a result of the need to support household incomes directly or indirectly (through performing domestic chores), lack of attractive employment opportunities, lack of easily accessible secondary schools (especially for STs) and the poor quality of provision. With growing privatisation and the increasing costs of obtaining what is seen as ‘quality’ education, girls, especially of the SC/ST category, remain the most disadvantaged. The gender and caste interact interaction is clearly visible in the case of access to post-primary education.

127
Intra-household gender inequality in educational achievements is however worst for upper-caste Hindus, followed by SCs, Muslims, STs and Others, in that order. Upper-caste Hindus and SCs have more, Muslims and Others less, and STs about the amount of gender inequality in educational achievements that their FLFPRs would predict. Female education has larger effects on household income growth than male education at all levels of education. 86% of the growth difference between North and South India that is due to education is due to differences in female educational achievements; the remaining 14% is due to differences in male educational achievements. By contrast, the effects on the growth difference between social groups that is due to differences in gender inequality in education are not found to be large. Returns however vary with educational level, with secondary and higher education essential for productivity and income growth. Policy Implications
· Investments in human capital continue to be a priority. Despite a massive expansion in educational investments in order to ensure access to primary education to all children, this continues to be of poor quality, and gender and caste disparities in outcomes persist. Improving quality of basic education should hence be a priority. This would include ensuring manageable teacher-student ratios, classroom infrastructure and good quality curriculum and teaching-learning material.
· In addition to financial and material incentives for girls and lower caste groups, incentives (could be non-tangible such as extending public appreciation) also need to be provided to schools and teachers to ensure that equitable and relevant learning takes place within the school.
· Affirmative action should take account of multiple sources of disadvantage, not just caste or gender per se, but additionally parental occupation, rural/urban residence and region.
· Apart from continuing with incentives to the student, the household and the school, there is need to also ensure reliable, safe and affordable transport to the village/town that has a middle school. Increasing proportion of women teachers as well as the provision of toilets for women (both teachers and students) is likely to improve attendance.
· In the medium term, the focus should be on establishing a middle/secondary school in every village.
Promoting female employment can be good for growth but requires complementary policy Employment is often considered the major pathway for growth. For each social group, for rural and urban, for males and females, LFPRs however did not change much during India’s modern growth period. Remarkable differences between groups have thus persisted: males continue to have much higher LFPRs than females and rural women much higher than urban women. Thus, LFPR is about 85% for rural males, 80% for urban males, slightly less than 40% for rural females, and about 20% for urban females. For social groups, differences between male LFPR are not large, but they are stark between female LFPR: In rural areas, FLFPR for STs is almost 60%, for SCs and OBCs it is close to 40% (separately computed; it happens to be similar), and for all others (so includes upper-caste Hindus) it is close to 25%. In urban areas,

128
female LFPR is about 30% for STs, close to 25% for SCs and OBCs (as before); and only about 15% for “others” (again: includes upper-caste Hindus). Female unemployment rates have been increasing over the last two decades, more so for urban women. Although they are thus employed far less often, when they are employed, urban women are about four times more likely to be salaried employees than rural women (40% of employed urban women versus 10% of rural), who continue to dominate the agricultural sector, or engage in forms of petty production, jobs in rural services not having been created. Despite being in regular, salaried employment, the jobs available to them however tend to be clustered at the lower ends of the labour markets, as service providers in hospitals, schools and domestic homes. Both in rural and in urban areas, wages (averaged across all workers) are higher for men than for women: about 40% higher in 2004/05 for urban areas, and about 85% for rural areas. In percentage terms, the gender wage gap in rural areas is about now what it was in 1983/84; however, in urban areas it declined from 71% in 1983/84 to the 40% mentioned in 2004/05. This declining wage gap in urban areas is interesting. Taking a closer look, it transpires that wages of both rural and urban women have risen (in real terms) by about 90% both in urban and in rural areas. Wages of rural men grew by a similar percentage. However, wages of urban men “only” grew by 55%, which explains the declining wage gap in urban areas. Taking an even closer look than that, it is nonetheless the case that the gender wage gap has widened most (more than for other category, be it in rural or in urban areas) for higher-educated women in urban areas. The declining overall gap in urban areas is thus due to the expansion of employment for women with relatively little education. Male employment (of all types) has much larger effects on household income growth than female employment (a direct result of higher hourly earnings). The very large growth effects that the literature attributes to (hypothetical) increases in FLFP in India will only come about if wages and human capital are equalised across men and women. It is then imperative that these issues are tackled simultaneously. Policy Implications
· Labour force participation is an important sphere of life, which enhances control over income and consequently autonomy for women. Women lack property rights and have few benefits from lifelong work which is either unpaid or lacking benefits in the informal sector. Widow destitution in old age is then only to be expected. As a majority of women are in informal employment, there is urgent need to pay attention to the payment of remunerative wages, worker benefits including child-care and old age security as well as safety, in short, the need to ensure ‘decent work’.
· Need to ensure quick and easy redress in instances of sexual harassment at the workplace.
· Need to focus on skill training and vocational education alongside basic education in order to provide women, in particular from the lower caste groups, employable skills, in the high growth sectors.
· Expansion of non-farm employment including self-employment in rural areas through the provision of adequate credit and other resources to women and the lower castes to enable an enhancement in the productivity of rural female labour.

129
· Provision of infrastructure and service support to address women’s time poverty.
Rigidifying gender divisions of labour adversely affect growth Low female supply response can be explained by both the expansion in domestic work burdens, especially in urban areas and the increasingly rigid gender divisions of labour. If the extended SNA activities (household maintenance and care functions as per the System of National Accounts) are included as economic activities, then women’s contribution is in fact higher than that of men (the problem then lies in accounting for women’s work). Educational status does not seem to affect the time spent on domestic activities. Rigidifying gender divisions of labour appear to be a consequence of the broader shift in labour relations, in particular, higher male hourly earnings across occupational and educational categories. This is reinforced by the poor work environment for women – the lack of child-care, worker benefits, and the growing exposure to abuse and harassment at the workplace. Women’s reproductive work can have several economic implications. It reduces educational achievements, decreasing market value and children’s potential; it places restrictions on time which reduces market opportunities, it is physically demanding thus affecting health, productivity and maintenance of the future labour force and it is work that is neither paid for nor included in official accounting. Policies are therefore essential for addressing the time constraint faced by women. Policy Implications
· Improvement in basic services and infrastructure provision such as the provision of drinking water, electricity, grain mills and transport services,
· Improved access to education and health services and markets for essential commodities.
· Functional child-care facilities of good quality too need to be prioritised, both in rural and urban contexts.
Fertility Declines enhances per capita growth As mentioned at the start, the accelerated growth per capita in the recent decade is as much a result of growth in GDP as a decline in population growth due to reducing fertility. While the TFRs declined from 3.39 to 2.68 over the decade at the national level, the decline was faster in urban areas, for the upper castes (classes), for those with higher education and in the southern states. While changes in wage structures and employment opportunities for women could potentially lead to a decline in fertility by shifting women’s time allocation, the major determinants of fertility decline in the Indian context appear to be increase in female literacy and improved access to health services. In both cases, SCs and STs continue to be at a disadvantage. Public policies could here be influential not just through reproductive policies, but through general health, welfare and social security policies on the one hand and improvement in infrastructure and non-discriminatory service provision on the other. Coercive action can however have negative implications for women, sex-selective abortions is a critical one.
130
Policy Implications · Priority to provision of adequate public health services, as fertility control is
crucially dependent on this. States such as Kerala with near-total coverage of public health services have attained stable fertility rates across caste categories, while those witnessing a privatisation of health services, have ended up excluding the poorest, especially SCs and STs.
· Removal of wage gaps and improved employment opportunities to women and lower caste groups.
· Provision of state services and infrastructure that can support women’s autonomy and decision-making appear crucial in terms of their impact on fertility.
Access to assets and finances supports growth Substantial productivity gains derive from the control over landed assets and money by women. Yet, women in general, but SC/ST women in particular, are excluded from resource access and control, whether land, technology or credit, reflecting perhaps a lack of bargaining power. While there is a general decline in per capita operational landholdings (confirming the declining trend in self-employment in agriculture), SCs and STs have on average a third in value of assets in relation to Others. Micro-credit interventions have expanded over the last decade, seeking to give women access to credit, but have not made a substantial impact in addressing livelihood concerns. Access to loans continues to be low. Entrepreneurship, as a consequence, is lower amongst the SCs and STs; a result of lack of resources alongside social stigma. In terms of women’s autonomy, SC women seem to have lost any advantage they may have had in the past. Apart from material deprivation, they are prone to more violence and lack substantial decision-making power. Interestingly, Other women seem to be improving their relative indicators of autonomy, perhaps a result of education. OBC women appear to do the worst. Finally, participation by women in local government and community-level decision-making has improved on account of the Constitutional 73rd and 74th amendment Acts. Their performance however appears to be linked to both caste and educational levels. Policy Implications
· To achieve productivity gains, need to reform inheritance laws to give women control over landed property.
· Ensure access to a package of inputs and services that include credit, technology, information on agricultural methods, irrespective of ownership of land.
· Credit through Self help Groups needs to respond to women’s livelihood needs, rather than focusing on micro-finance for small-scale, secondary and often marginal activities.
· Improve women’s educational and occupational outcomes as identified in the previous sections.
· Provide support to women to participate in public decision-making processes in the form of training, honorariums, adequate equipment etc that can build upon their existing knowledge and experience.
131
Links between caste, gender and growth are not linear Growth appears to have no direct link with either inter-caste disparity or the level of development of SCs in relation to Others. Further, gender disparities persist within each caste group. A positive development is the improvement in the Gender Caste Development Index over the last decade across social groups. The possible explanation lies in enhanced female education during this period. A state like UP, which has failed to address gender-specific barriers to education then does much worse in terms of gendered caste disparity than caste disparity alone. The benefits of lower caste mobilisation have not here been shared equally by lower caste women. What emerges quite clearly is that growth alone cannot deliver equality outcomes. While gender and caste gaps have been improving over the last decade, the improvement is but marginal in the last five years, which coincides with exceptionally high rates of growth in both rural and urban areas. Growth therefore needs to go alongside continuing policy commitments to make investments in human capital, in particular, good quality education and health services, ensuring decent work conditions including appropriate worker benefits and vocational and other skills, as well as specific, targeted policies for SC/ST and women within these groups. The last would include a host of affirmative action measures and incentives to help overcome barriers posed by poverty, remoteness and social expectations. While the above measures have been discussed, there is also need for regular monitoring and reviews to identify what works, for whom and in which context. This is particularly important as in a diverse country such as India, wide regional variations are visible in both growth and equality, related substantially to the nature of policies pursued and the very direction of development. Some specific fiscal and policy measures are therefore also suggested. Policy Implications
· Budget analyses have pointed to a decline in development expenditures over the last decade, with cuts in economic services (covering functions that promote growth such as infrastructure, but also rural development and poverty alleviation schemes) more pronounced than in social services, though this too has declined. While education has rightly remained a priority, specific, targeted policies and programmes, focused on women, or SCs and STs, have declined.
Women-specific programmes include relief policies (widow benefits), gender-reinforcing assistance (to support reproductive functions such as anganwadi workers) and empowering schemes. The latter includes those that promote equity (such as universal primary education) and those that promote equality (such as child-care facilities, support to women teachers etc). An analysis of the West Bengal budget shows that over 90% of the outlay on women-oriented programmes goes to equity promoting schemes, in particular education, and very marginal amounts to equality promoting and relief schemes (Banerjee and Roy, 2003). This latter needs to be a priority.

132
References Abu-Ghaida, D., and S. Klasen (2004). ‘The Costs of Missing the Millennium Development Goals on Gender Equity’, World Development 32: 1075-1107. Acharya, Akash , Kent Ranson (2005) Health Care Financing for the Poor Community-based Health Insurance Schemes in Gujarat. Economic and Political Weekly September 17, 2005 4141- 4150. Ackerly, B.A., 1995. "Testing the tools of development: credit programmes, loan involvement and women's empowerment", in "Getting Institutions Right for Women in Development", IDS Bulletin, Vol.26, No.3. Agarwal, Bina. (1985). “Work Force Participation of Rural Women in Third World – Some Data and Conceptual Biases”, Economic and Political Weekly, 20(51-52). Agarwal, B. (1994). A field of one's own: Gender and Land Rights in South Asia. Cambridge University Press, Cambridge. Agarwal, B. (1998). "Disinherited peasants, disadvantaged workers: A gender perspective on land and livelihood." Economic and Political Weekly, .33(13): A2-14. Agarwal, B. (2002) ‘Are We Not Peasants Too? Land Rights and Women’s Claims in India’. Seeds, 21: 29. Available at: www.popcouncil.org/publications/seeds/seds21.pdf . Agnes, Flavia (1998) Violence against women: Review of recent enactments in In the Name of Justice, Women and Law in Society (ed) Swapna Mukhopadhyay Agnes, Flavia (2002) “Law, Ideology and Female Sexuality, Gender Neutrality in Rape Law” EPW Perspectives March 02 Agnes, Flavia (2005) “Sexual Harassment at the Workplace, Emerging Problems and Debates” Economic and Political Weekly April 30 Agnihotri, S. 1997. “Workforce participation, kinship and sex ratio variations in India” in Gender, Technology, and Development, Vol. 1 (1), Alsop, Ruth J., Anirudh Krishna, Disa Sjoblom (2000) Are Gram Panchayats Inclusive? Report of a study conducted in Rajasthan and Madhya Pradesh South Asia - Social Development Unit Draft – March. Ananth Pur, Kripa (2002) Selection by Custom and Election by Statute – Interfaces in Local Governance Paper presented at the Workshop on Local Governance, Centre for the Study of Law & Governance, JNU, New Delhi. 11-12, April ASER (2006). Annual Status of Education Review. MHRD. New Delhi.

133
Babu, Ramesh P, (2004). “Cyber Coolies in BPO: Insecurities and Vulnerabilities of Non Standard Work”. Economic and Political Weekly, Vol. 39, No. 5, January 31- February 6. Babu, Ramesh P and N. Neetha (2004) “Women workers in the new economy: Call centre work in NOIDA”, paper presented at National Seminar on Globalisation and Women’s Work, VV Giri National Labour Institute, NOIDA, India, March 25-26. Bajaj, M (1999). 'Invisible Workers, Visible Contributions: A study of home-based women workers in Five Sectors Across South Asia'. WIEGO, Cambridge, MA Bajpai,G.S (2002) Towards Restorative Justice http://www.forensic.to/webhome/drgsbajpai/towards%20restorative%20justice.pdf Bajwa, G.S., (2003). “ICT policy in India in the era of liberalization: Its impact and consequences.” in Global Built Environment Review 3, 49-61. Balakrishnan, Revathi, (2005) “ICTs And Women’s Livelihoods – How Real Or Tenuous Is The Connection?” Gender Perspectives on the Information Society South Asia Pre-WSIS Seminar Baltagi, B. H. (1995), Econometric Analysis of Panel Data, Chichester &c.: John Wiley & Sons. Banerjee, B. (1983), ‘The Role of the Informal Sector in the Migration Process: A Test of Probabilistic Migration Models and Labour Market Segmentation for India’, Oxford Economic Papers, 35, pp. 399-422. Banerjee, B. (1984), ‘Information flow, expectations and job search: Rural-to-urban migration in India’, Journal of Development Economics, 15, pp. 239-257. Banerjee, B and J. B. Knight. (1985). ‘Caste discrimination in the Indian urban labour market’. Journal of Development Economics. 17(1): 277-307. Banerjee, B. (1998), ‘Migration Motivation, Family links, and Job Search Methods of Rural-to-Urban Migration in India’, In: R. Bilsborrow (Ed.), Migration, Urbanization and Development: New Directions and Issues, New York: United Nations Population Fund and Kluwer Academic Publishers, pp. 187-219. Banerjee, Nirmala (1999). Something Old, Something New, Something Borrowed: the electronics industry in Calcutta in Swasti Mitter and Sheila Rowbothom ed. Women Encounter Technology Changing Patterns of Employment in Third World Banerjee, N. and Devaki Jain, (2001). “Indian Sex Ratio through Time and Space: development from Women’s Perspective”. In Vina Mazumdar and N. Krishnaji (eds.), Enduring Conundrum: India’s Sex Ratio, pp. 73-119. New Delhi: Rainbow Publishers. Banerjee, N and P. Roy (2003). Gender in fiscal policies: the case of West Bengal. Sachetana. Kolkata.

134
Bardhan, K (1985): ‘Women’s Work, Welfare, and Status: Forces of Tradition and Change in India’, Economic and Political Weekly, 20(50): 2261-69. Barnhardt, S (2003) Atrocities against Scheduled Caste Women: Notes from the Field [email protected]://www.princeton.edu/~gender/Field/BarnhardtFieldNotes.html Basu, Alaka. 1992. Culture, the status ofwomen, anddemographic behaviouu. Oxford, UK: Clarendon. Basu, A M. 1990 "Cultural Influences on Health Care Use: Two Regional Groups in India." Studies in Family Planning. 21(5):275-86. Basu, Amrita. 2000. Globalization of the localllocalization of the global: Mapping transnational women's movements. Meridians 1 (1): 68-84. Basant R and Uma Rani, (2004) “Labour Market Deepening in India’s IT An Exploratory Analysis” Economic and Political Weekly December 11 , 5317- 5326 Baud, I.(1993) Institutional support for women in the footwear industry: recent experiences in India. Mimeo: Seminar on ‘Women’s Employment in Industry: the Case of Indian Footwear’, CLRI, Madras Baud, I.S.A. & Gender, Small-Scale Industry de Bruijne, G.A. (eds) (1993) and Development Policy. London: IT Publications Baumeyer, Alexandra (2003) New Toilets for Indian Slums Nutrients Mass Balance of a Co-Composting Plant in Bangalore, India Baxi, Pratiksha (2000) Rape, Retribution, State - On Whose Bodies? Economic and Political Weekly April 1 Baxi, Pratiksha, Shirin M Rai & Shaheen Sardar Ali (2006) Legacies of Common Law: ‘crimes of honour’ in India and Pakistan Third World Quarterly, Vol. 27, No. 7, pp 1239 – 1253, Baxi, U (1982): The Crisis of the Indian Legal System, Vikas Publishing House, New Delhi. Baxi, Upendra (1986) Participatory Justice: A Critique of Nyaya Panchayats in Karnataka, in George Mathew (ed) Panchayati Raj in Karnataka Today : Its National Dimensions, Institute of Social Sciences and Concept Publishing Co. New Delhi, PP 76-87. Beneria, L. 1982. ‘Accounting for Women’s Work’ in L. Beneria (ed.), Women and Development: The Sexual Division of Labor in Rural Societies. New York: Praeger: 119-147.

135
Beneria, L. 1988. “Conceptualizing the labour force: the underestimation of women’s economic activities”, in Pahl, R (ed). On Work: historical, comparative and theoretical approaches. Oxford. Basil Blackwell. Beteille, Andre (1990) Race, Caste and Gender Man, New Series, Vol. 25, No. 3. (Sep., 1990), pp. 489-504. Beteille, Andre (1992) ‘Caste, Class and Power’ in Gupta (ed), Social Stratification. Béteille, André (2002). Equality and Universality: Essays in Social and Political Theory. New Delhi: Oxford University Press. Betis As Bombs (2007) Exploding The Borders Of Caste And Community, 12 April. Countercurrents.org http://www.countercurrents.org/kavita120407.htm Bhalotra, S.R (1998). The puzzle of jobless growth in Indian manufacturing. Oxford Bulleting of Economics and Statistics. 60(1): 5-32. Bhan Gautam, (2001). “India Gender Profile: Report Commissioned for Sida”. Bridge Development- Gender Report No 62, Institute of Development Studies, University of Sussex, UK. Bhandari, L and M. Bordoloi (2006). ‘Income differentials and returns to education’. Economic and Political Weekly, 41(36), 9 September. Bhatia, B and J. Dreze. (2006) ‘Employment guarantee in Jharkhand: Ground results’. Economic and Political Weekly. 41(29), July 22. Bhatia, Jagdish C. 1993 "Levels and Causes of Maternal Mortality in Southern India." Studies in Family Planning 24(5):310-318. Bhatia, Rajesh, 2002. “Measuring Gender Disparities Using Time-Use Statistics”, Economic and Political Weekly, Vol. 37 Bhatt Ela (1987) “The Invisibility of Home-Based work: The case of piece Rate Workers” in India in Invisible Hands: Women in Home-based production. Eds Andrea Menefee Singh and Anita Kelles Viitanen Sage Publications New Delhi/London Bhatt, Ela (2006). We are poor but many. Oxford University Press. New Delhi. Bhattacharya, P.C. (1996), ‘The role of the informal sector in structural transformation: some Indian evidence’, Journal of International Development, 8(1), pp. 83-94. Bhattacharya, Prabir (1998), ‘The Informal Sector and Rural to Urban Migration: Some Indian Evidence’, Economic and Political Weekly 33(21), 23-29 May, 1255-62. Bhattacharya, P.C. (1998), ‘Migration, employment and development: a three-sector analysis’, Journal of International Development, 10(7), pp. 899-922.

136
Bhattacharya, P.C. (2002), ‘Rural-to-urban migration in LDCS: a test of two rival models’, Journal of International Development, 14, pp. 951-972. Bhattacharya, B.B and Sakthivel, S. (2003), Regional Growth and Disparity in India: A Comparison of Pre and Post-Reform Decades, Discussion Paper Series No. 74/2003, Institute of Economic Growth, Delhi. Bhatty, Zarina (1987) Economic Contribution of Women to the Household Budget: A case study of the Beedi Industry in Invisible Hands: Women in Home-based production. in Eds AndreaMenefee Singh and Anita Kelles Viitanen Sage Publications New Delhi/London Blackden, M. , S. Canagarajah, S. Klasen and D. Lawson (2006). ‘Gender and Growth in Sub-Saharan Africa: Issues and Evidence’, UNU-WIDER Research Paper no. 2006/37, UNU-WIDER: Helsinki. Blackden, M. and Q. Woden (eds.) (2006). ‘Gender, Time Use and Poverty in Sub-Saharan Africa’, World Bank Working Paper No.73, World Bank: Washington DC Bloom, Shelah S., David Wypij and Monica Das Gupta. (2001). "Dimensions of Women's Autonomy and the Influence on Maternal Health Care Utilization in a North Indian City." Demography 38(1):67-78. Boserup, E. (1970) Women’s Role in Economic Development, London: Allen and Unwin Breman, J. (1996). Footloose Labour. Cambridge University Press, Cambridge. Brookins, M. L. and Brookins, O.T. (2002) An Explanatory Analysis of Fertility Differentials in India. The Journal of Development Studies. 39 (2): 54 – 72. Bryld, Erik (2001) “Decentralization in Rural India” in Democratization; pp. 149-172; Vol. 8; No. 3; autumn 2001 Buch, N (2000)
The 73rd Amendment and the Experience of Women in the New
Panchayati Raj Institutions: A Critical Evaluation. In: Ambrose Pinto and Helmut Reifeld, eds. Women in Panchayati Raj. New Delhi: Indian Social Institute. Buch, N (2005) Law of Two-Child Norm in Panchayats Implications, Consequences and Experiences Economic and Political Weekly June 11, 2005 2421-2429 Budlender, D. and Hewitt, G. (eds) (2002) Gender Budgets Make More Cents, Commonwealth Secretariat: London Budlender, D., R. Sharp, and K. Allen (1998). How to do a gender-sensitive budget analysis: contemporary research and practice. Australian Agency for International Development, Canberra and the Commonwealth Secretariat, London. Butalia, Urvashi. (1993). Community, state, and gender: On women's agency during partition. Economic and Political Weekly 28 (17): WS12-24.

137
Caldwell John C., P.H. Reddy and Pat Caldwell (1988) "The Causes of Marriage Change," Chapter 4, The Causes of Demographic Change: Experimental Research in South India, Pp: 80-107 , The University of Wisconsin Press, Madison Centre for Budget and Governance Accountability (2006). Draft report on implementation of NREGA in andhra Pradesh, Chhatisgarh, Jharkhand and Madhya Pradesh in May and June 2006. New Delhi. Centre for Women’s Development Studies (n.d) Human Rights and Human Development: India. New Delhi. Chadha, G. K. (1992). ‘Non-Farm Sector in India’s Rural Economy: Policy, Performance and Growth Prospects’. Delhi: Center for Regional Development, Jawaharlal Nehru University. Mimeo. Chadha, G.K. and P.P. Sahu (2002), “Post-Reform Setbacks in Rural Employment – Issues That Need Further Scrutiny”, Economic and Political Weekly, May 25, pp. 1998-2026. Chaitanya, K. (1991) Government discrimination against women teachers [Bihar], EPW 21 December 1991: 2925 [G] Chakrabarti, A and R. Joglekar (2006). “Determinants of expenditure on education”. Economic and Political Weekly. 41(15): April 15. Chakraborty, Pinaki (2007) Implementation of Employment Guarantee: A Preliminary Appraisal Economic and Political Weekly February 17 548- 551 Chakravarti, Uma (2003), Gendering Caste: Through a Feminist Lens Calcutta : Stree - XVI, 183 S. : 22 cm. Chakravarti, Uma. 1990. Whatever happened to the Vedic Dasi? Orientalism, nationalism and a script for the past. In Recasting women: Essays in Indian colonial histo?, edited by Kumkum Sangari and Chaudhry, D.R. Chandra, Ramesh (1999) Rehabilitation of Scavengers. EPW Commentary. September 11 Chandra, S.K. (1991) Development of Women Entrepreneurship in India. A Study of Public Policies and Programmes. New Delhi: Mittal Chandrasekhar, C.P and J. Ghosh (2007). Self employment as opportunity or challenge. www.macroscan.org Chandrasekhar, S and A.Mukhopadhyay (2006) “Primary education as a fundamental right”. Economic and Political Weekly. 41(35): September 2. Charlesworth, Hilary. 1994. What Are “Women’s International Human Rights”? In Cook 1994d, 58–84.

138
Charmes, J. (1998), ‘Informal Sector, Poverty and Gender: A Review of Empirical Evidence’, Washington D.C.: The World Bank. Charsley, Simon(1996) `Untouchable': What is in a Name? The Journal of the Royal Anthropological Institute, Vol. 2, No. 1. (Mar., 1996), pp. 1-23. http://www.jstor.org
Chatterjee, Mirai (2006) The SEWA Experience. Economic and Political Weekly. August 26: 3660- 3664. Chattopadhyay, R. and E. Duflo. 2004. “Women as Policy Makers: Evidence from a Randomized Policy Experiment in India.” Econometrica, Vol. 72, No. 5 (September), pp. 1409-1443. Chaudhury, Ray &, Kumar Das (2007) Internal Displacement in South Samir Asia. New Delhi: Sage. Chavan, P and R Bedamatta (2006) Trends in agricultural wages in India: 1964-65 to 1999-2000. Economic and Political Weekly. 41(38): 4041-51. Chavan, P (2005). “Banking sector liberalisation, and the growth and regional distribution of rural banking”. In Ramachandran, V.K and M. Swaminathan (eds) Financial liberalisation and rural credit in India”. Tulika Books. New Delhi. Chen, M. (1989) A sectoral approach to promoting women’s work: lessons from India, World Development 17,: 1007-16 Chen, M.A., (1996). Beyond credit: a subsector approach to promoting women's enterprises, Aga Khan Foundation, Ottawa. Chen, M. A, (ed.) (1998). Widows in India: Social Neglect and Public Action. New Delhi, Sage. Chen, M, J. Sebstad and L. O’Connell (1999). Counting the Invisible Worforce: the cae of homebased workers. World Development, 27(3): 603-610. Chen, M. (2000). Perpetual Mourning: Widowhood in Rural India. Philadelphia: University of Pennsylvania Press. Chen, M., R. Jhabvala and F. Lund (2001), ‘Supporting workers in the Informal economy: A Policy Framework’, Background Paper for the ILO Task Force on the InformalEconomy, ILO, Geneva. Chopra, Anuj. (2006). India’s latest move to stop child labour. http://www.csmonitor.com/2006/1010/p07s02-wosc.html accessed on 13/4/07. Chopra, Radhika (2004) ‘Encountering Masculinity: An Ethnographer’s Dilemma’ in Radhika Chopra, Caroline Osella and Filippo Osella (eds), South Asian Masculinities: Context of Change, Sites of Continuity, Women Unlimited, New Delhi, pp 36-59.

139
Corbridge, S. and J. Harriss. (2000). Reinventing India. Polity Press, Cambridge. Chowdhry, Prem (2005) Crisis of Masculinity in Haryana The Unmarried, the Unemployed and the Aged Economic and Political Weekly December 3, 2005 5189- 5198. Chowdhry, P (2007). Contentious marriages, eloping couples: Gender, caste and patriarchy in Northern India. Oxford University Press. New Delhi. Collier, Paul, 1994. “Gender Aspects of Labour Allocation during structural Adjustment: Theoritical Framework and the Africa Experiences”, in labour Markets In an Era of Adjustments, Vol.1 ed. By Susan Horton, R. Hanbur and D. Mazumdar (Washington: World Bank) Coonrod, C. S. (1998). ‘Chronic Hunger and the Status of Women in India’. Available at: www.thp.org/reports/indiawom.htm. Dabral, Shweta and S.L. Malik Demographic Study of Gujjars of Delhi: Fertility Preferences J. Hum. Ecol., 16(3): 151-154 (2004) Dak, T.M. (ed.) Women and Work in Indian Society. Delhi: Discovery 1988 [G] Das, A (2007) “How far have we come in Sarva Shiksha Abhiyan?”. Economic and Political Weekly. January 6: 21-23. Das, M.B (2006). Do traditional axes of exclusion affect labour market outcomes in India?. Social Development papers South Asia Series. Paper No. 97. June. The World Bank. Washington D.C Das, M.B and Desai, S (2003). “Why are educated women less likely to be employed in India? Testing competing hypothesis”. Social Protection Discussion Paper No. 0313. The World Bank. Das S.K. (2001) “A Better Deal for Beedi Workers”, New Delhi, ILO. Das, Samir Kumar, Sanam Roohi & Ranabir Samaddar (2007) Dialogues on Justice:A Report By Calcutta Research Group. Kolkata Datt, G. and M. Ravallion, (2002), ‘Is India’s Economic Growth Leaving the Poor Behind?’, Journal of Economic Perspectives, 16(3), pp. 89-108 Deaton, Angus and Jean Dreze (2002): ‘Poverty and Inequality in India: A Re-examination’, Economic and Political Weekly, 37 (36): 3729-48. De Haan, A. and Lipton, M. (1998), Poverty in Emerging Asia: Progress, Setbacks and Logjams, Asian Development Review, Vol.16, No.2. Deininger, K. and P. Olinto 2000. ‘Asset Distribution, Inequality and Growth,’ World Bank Policy Research Working Paper Series 2375.

140
De Long, Bradford (2003), ‘India since Independence: An Analytic Growth Narrative,’ in Dani Rodrik (ed.), In Search of Prosperity: Analytic Narratives on Economic Growth, New Jersey, Princeton: Princeton University Press. Deliege, Robert (1993) The Myths of Origin of the Indian Untouchables Man, New Series, Vol. 28, No. 3 (Sep., 1993), pp. 533-549. Desai Sonalde and Lijuan Wu (2006) Marriage Patterns, Kinship Structure and the Utilization of Maternal Health Care Services in India Dixon-Mueller, Ruth Population Policy & Women’s Rights: Transforming Reproductive Choice Praeger Publishers, Westport, Connecticut, London, 1993 Deshingkar, P. and D. Start (2003), ‘Seasonal Migration for Livelihoods in India: Coping, Accumulation and Exclusion’, Working Paper 220, Overseas Development Institute, London. Deshingkar, P. (2004), ‘Rural-Urban Links in India: New Policy Challenges for Increasingly Mobile Populations’, Presentation at the World Bank Rural Week, Washington, 4-5 March. Deshingkar, P. (2004), ‘Understanding the Implications of Migration for Pro-poor Agricultural Growth’, paper prepared for the DAC POVNET Agriculture Task Group Meeting, Helsinki, 17–18 June. Deshmukh-Ranadive, J (2003) Deshphande, A. (2007) Overlapping identities under liberalisation: gender and caste in India, Economic Development and Cultural Change. 55 (4):735-760, July. Deshpande, A. (2001). Caste at Birth? Redefining Disparity in India. Review of Development Economics, 5 (1), 130-144. Deshpande, Ashwini (2001b) “Casting off servitude: assessing caste and gender disparity in India”, in Feminism and Anti racism: International Struggles for Justice, edited by Kathleen Blee and France Winddance Twine, New York University Press, New York and London, pp. 328-348. Deshpande, A. (2000). Recasting Economic Inequality”, Review of Social Economy, Vol. 58, No. 3, October 2000, pp. 381-399. Deshpande, S and Yadav, Y (2006) “Redesigning affirmative action: castes and benefits in higher education”. Economic and Political Weekly. 41(24): 2419-23, June 17. Deshpande, Sudha, and Deshpande, Lalitha K (1999) “Gender-Based Discrimination in Urban labour Market” In Gender and Employment in India, Ed. T.S. Papola, Alakh N. Sharma, New Delhi: Vikas Publishing House.

141
Development Gateway (2004). ‘News on Food Security, Intra Household Gender Disparities and Access to Food’. www//topics.developmentgateway.org/gender . Dhagamwar, V (2003) Invasion of Criminal Law by Religion, Custom and Family Law Economic and Political Weekly April 12, 1483- 1492 Dhillon, P.K. (1993) Women Entrepreneurs: Problems and Prospects. New Delhi: Blaze. Dixon-Mueller, R. (1989). Women’s Work in Third World Agriculture, Geneva: ILO. Djankov, S., R.L. Porta, F.L.D. Silanes and A. Shleifer (2002) ‘The Regulation of Entry’, The Quarterly Journal of Economics, 117(1), pp 1-37. Dolan, C (2004) Dollar, D., and R. Gatti (1999), ‘Gender Inequality, Income and Growth: Are Good Times Good for Women?’, World Bank Policy Research Report Working Papers 1, Washington DC: World Bank. Doyal, L. (1995) What Makes Women Sick: Gender and the Political Economy of Health, p. 231. Macmillan, London. Dreze, J. (2002). "Palanpur 1957-93: Occupational change, land ownership and social inequality." In Madan, V., The village in India. Oxford University Press, New Delhi, pp.203-21. Dreze, J. and A. Goyal. (2003). "Future of Mid-day Meals." Economic and Political Weekly, Vol.38, No. 44, pp.4673-83. Drèze, J. and M. Murthi. (2001). Fertility, Education, and Development: Evidence from India. Population and Development Review 27: 33-63. Dreze, J and A Sen (1995) India Economic Development and Social Oppurtunity, Oxford University Press, Delhi. Drèze, J & A, Sen (2002) India: Development and Participation, Oxford University Press, New Delhi and Oxford. Dube, L. & Palriwala, R. (ed.) (1990) Structures and Strategies. Women, Work and Family. New Delhi: Sage Dubey, Amaresh, and Arjan Verschoor (2007), ‘Income Mobility and Poverty Dynamics across Social Groups in India,’ paper presented at the International Seminar on Revisiting the Poverty Issue – Measurement, Identification and Eradication Strategies, Patna, India, 20-22 July. Dubey, Amaresh, Adriaan Kalwij and Arjan Verschoor (2007), ‘Gender Inequality by Social Group and Income Growth – Evidence from a Panel Data Set for India,’ New Delhi: NCAER.

142
Dunlop, John E. and Victoria A. Velkoff (1999), ‘Women and the Economy in India,’ U.S. Census Bureau, Official Statistics, December 3. Dyson, Tim and Mick Moore (1983) ‘On Kinship Structure, Female Autonomy, and Demographic Behavior in India’ Population and Development Review Vol.9, No. 1, pp 35-60. Eapen, Mridul (1994) ‘Rural Non-agricultural Employment in Kerala: Some Emerging Tendencies’, Economic and Political Weekly. Vol. 29 (21) Eapen, Mridul (2000) Rural Industrialisation in Kerala: Its Dynamics and Local Linkages, (forthcoming as a publication of Manohar Books, New Delhi). Eapen, Mridul. (2001) Women in Informal Sector in Kerala, Need for Re-examination Economic and Political Weekly June 30, 2001 2390- 2392 Ellis, F. (2006) 'Agrarian Change and Rising Vulnerability in Rural Sub-Saharan Africa', New Political Economy, Vol.11, No.3, pp.387-397 Elson, D (1991). Male bias in the development process. Manchester University Press. Manchester. Elson, D, 1999, “Labor markets as gendered institutions: Equality, efficiency and empowerment issues”, World Development, 27(3):611-27. EPW Editorial (2006) Women And Work After the Law. Economic and Political Weekly October 14 4304-4305 Esteve-Volart, Berta (2004), ‘Gender Discrimination and Growth: Theory and Evidence from India,’ Development Economics Discussion Paper No. 42, STICERD, LSE: London. Everett, Jana & Mira Savara (1987) Institutional Credit as a StrategyToward Self Reliance for Petty Commodity Producers in India: A Critical Evaluation in Home-based production. Eds Andrea Menefee Singh and Anita Kelles Viitanen Sage Publications Evers, B. and Walters B. (2000). ‘Extra-Household Factors and Women Farmers’ Supply Response in Sub-Saharan Africa,’ World Development 28: 1341-1345. Fafchamps, M. and A. R. Quisumbing. (1998) 'Human Capital, Productivity, and Labor Allocation in Rural Pakistan', Washington D.C. International Food Policy Research Institute. Fafchamps, Marcel and Quisumbing, Agnes R. (2003). ‘Social roles, human capital, and the intra-household division of labor: evidence from Pakistan.’ Oxford Economic Papers 55, Oxford University Press.

143
Feldman, Shelley, 1998. “Conceptualizing Change and Equality in the third World context”, in Nelly P. Stromquist (ed.), Women in the third world - An Encyclopedia of Contemporary Issue, pp. 24- 26 . New York Garland Publishing. Forbes, K. (2000), ‘A Reassessment of the Relationship Between Inequality and Growth,’ American Economic Review 86: 347-87. Forsythe, N., and R.P. Korzeniewicz (2000), ‘Gender Inequalities and Economic Growth: A Longitudinal Evaluation,’ Economic Development and Cultural Change 48(3): 573-617. Foster, A. D and M. Rosenzweig (2007) “Does economic growth reduce fertility? Rural India 1971-99”. India Policy forum 2006/07. Sage. New Delhi. Foster, A. D and M. Rosenzweig (1996) “Technical change and human capital returns and investments: Evidence from the Green Revolution”. American Economic Review. 86(4): 931-53. Freitas, Kripa (2006) The Indian Caste System as a Means of Contract Enforcement Northwestern University November 9 Gandhi, N, Shah, N and N. Rao (1999) Formal and informal sectors: a conceptual and statistical overview in Women workers’ rights in India: Issues and Strategies – a reference guide. Ed. A. Kapur. ILO, New Delhi. pp 3-60. Gangrade, K.D. & Gathia, J.A. (1983) Women and Child Workers in Unorganised Sector. NGOs Perspectives. New Delhi: Concept Galanter, Marc and Jayanth Krishnan (2002) Debased Informalism: Lok Adalats and Legal Rights in Modern India University of Wisconsin William Mitchell Law School College of Law First South Asian Regional Judicial Colloquium on Access to Justice ‘Gender and Development Issues, in Policy on Gender and in the Asia and Pacific Region’ Development: Policies and Strategies. Available at: www.adb.org/documents/policies/gender/gender0200.asp . Gender & Governance Reviewing the Women’s Agenda in the National Common Minimum Programme WADA NA TODO ABHIYAN March 2007 http://www.wadanatodo.net/images/220307/Gender&NCMP_Eng.pdf Ghose, A.K. 1999. “Current Issues of Employment Policy in India”, Economic and Political Weekly, Vol. 34, No. 36, September 4-10, 2592-2608. Ghosh, J and C.P Chandrasekhar (2006). Working for less. www.macroscan.org Gilardone, Muriel, Isabelle Guerin & Jane Palier (2002). The weight of institutions on women’s capabilities How far can microfinance help? Promoting Women’s Capabilities: Examining Nussbaum’s Capabilites Approach http://www.st-edmunds.cam.ac.uk/vhi/nussbaum/papers/gilardon.pdf

144
Goetz, A-M. and R. Sen Gupta. 1996. ‘Who takes the Credit? Gender, Power and Control over Loan Use in Rural Credit Programmes in Bangladesh’. World Development, 24(1): 45-63. Goldin, Claudia (1994), ‘The U-Shaped Female Labor Force Function in Economic Development and Economic History,’ Working Paper No. 4707, National Bureau of Economic Research. Gopal, Meena (1999) “Disempowered despite Wage Work Women Workers in Beedi Industry” EPW Review of Women Studies April 17-24 Gothoskar, Sujata,(1995) “Computerisation and Women’s Employment” In India’s Banking Sector in Swasti Mitter and Sheila Rowbothom ed. Women Encounter Technology Changing Patterns of Employment in Third World Gothoskar, Sujata (2000) “Teleworking and Gender” Economic and Political Weekly June 24, 2293- 2298 Government of India. (1974). Towards Equality: Report of the Committee on the Status of Women in India. New Delhi, Ministry of Education and Social Welfare. Government of India. (2000). Report of the Time Use Survey, Central Statistical organization, Ministry of Statistics and Programme Implementation, New Delhi. Government of India. (2001).Report of the Task Force on Employment Opportunities, Planning Commission, New Delhi, July. Government of India. (2002). Special Group on Targeting Ten Million Employment Opportunities Per Year, Planning Commission, New Delhi, May. Government of India.(2002) Report of the Steering Committee on Agriculture and Allied Sectors for the Tenth Five Year Plan. Planning Commission. New Delhi. Govinda, R and M. Bandyopadhyay (2007). Access to elementary education in India: Country Analytical Review. New Delhi. Govindasamy, P and Sonalde Desai. (1999) "Who Will Invest in Reproductive Health? Gender Inequality and Prenatal Care in India." Gupta, Jayoti (1993) Land, Dowry, Labour: Women in the Changing Economy of Midnapur Social Scientist, Vol. 21, No. 9/11 (Sep. - Oct., 1993), pp. 74-90. Gupta, Jayoti (2002), Women Second in the Land Agenda EPW Special Article Gupta, Jayoti (2003) “Informal Labour in Brick Kilns: Need for Regulation” 3282-3292 Economic and Political Weekly August 2 Gupta, M. (1993), ‘Rural-urban Migration, Informal sector and Development Policies: A Theoretical Analysis’, Journal of Development Economics, 41(1), pp. 137-151.

145
Gurumurthy A., (2004) “Overview Report, Gender and ICTs” Cutting Edge Pack, Brighton: BRIDGE/Institute of Development Studies Haan, A.D. (1997), ‘Migration as family strategy: rural-urban labor migration in India during the twentieth century’, The History of the Family, 2(4), pp. 481-505 Haan, A.D. (1999), ‘Livelihoods and Poverty: The Role of Migration - A CHritical Review of the Migration Literature’, Journal of Development Studies, 36(2), pp 1-47. Hafkin, Nancy & Nancy Taggart (2001). “Gender, Information Technology, and developing countries: An Analytic Study” Washington, USAID. Hafkin, Nancy (2002) “Gender Issues in ICT Policy in Developing Countries: An Overview”, United Nations Division for the Advancement of Women (DAW) http://www.un.org/womenwatch/daw/egm/ict2002/reports/Paper-NHafkin.PDF Hallman, Kelly (2000). ‘Mother-father resource control, marriage payments, and girl-boy health in rural Bangladesh.’ FCND Discussion Paper 93. International Food Policy Research Institute (IFPRI) Hamid, Areeba (2006) “Domestic Workers: Harsh, Everyday Realities” EPW Commentary April 1, 2006 Harriss- White, B., S. Subramanian (1999) Essays on India’s social sector, in honour of S. Guhan, New Delhi: Sage Publications Harriss-White, B. and S. Janakarajan. (2004). Rural India facing the 21st Century: Essays on long term village change and recent development policy. Anthem Press, London. Hasan, Zoya (2005) Diversity and Democracy in India Paper presented at the 9th Round Table EU-India, 18-20 September 2005, Hyderabad http://www.eesc.europa.eu/sections/rex/asia/india/rt/9/Zoya_Hasan_Paper_en.doc Hashemi, S. M., S.R.Schuler and A. P. Riley. 1996. "Rural Credit Programs and Women's Empowerment in Bangladesh." World Development, Vol.24, No. 4, pp.635-53. Hayashi, F. (2000), Econometrics, Princeton: Princeton University Press. Heller, Kevin Jon (1996). Power, Subjectification and Resistance in Foucault SubStance, Vol. 25, No. 1, Issue 79. (1996), pp. 78-110. Heyer, J. (1992). "The role of dowries and daughters' marriages in the accumulation and distribution of capital in a south Indian community." Journal of International Development, Vol.4, No. 4, pp.419-36. Heyer, J. (2007) “Rural dalits in the industrializing countryside in Coimbatore” Draft paper presented at Seminar on Dalits in Koljata, February 22-23.

146
Hilhorst, Th., and H. Oppenoorth, (1992). Financing women's enterprise: Beyond barriers and bias, Amsterdam. Himanshu, (2007). “Recent Trends in Poverty and Inequality: Some Preliminary Results” Special Article, Economic and Political Weekly, February 10. Hirway, I (n.d.) Time Use Studies: Conceptual and Methodological Issues with Reference to the Indian Time Use Survey. United Nations Development Programme. available at: data.undp.org.in/hdrc/thematicResource/gndr/Indira_metho_issues.pdf Hirway, Indira (2002), “Access to Employment for Ensuring Employment Security: Some Issues”, in National Seminar on Social Security, Social Welfare Department, Rajasthan, Jaipur. Hirway, Indra, (2002). “Employment and Unemployment Situation in the Nineties: How Good are the NSSO Data?”, Indian Journal of Labour Economics, 45 (1): 69-87. Hirway, I (2006) Hortib, Susan, (1996). “Women and Industrialization in Asia” Rutledge, London Hulme, D. and P. Mosley, 1996: Finance against poverty, London. Hussain, N. (2003) The Jurisprudence of Emergency, Colonialism and the Rule of law University if Michigan Press, 2003 Hussain, Z (2005). “Analysing demand for primary education: Muslim slum dwellers of Kolkata.” Economic and Political Weekly. January 8: 137-47. International Labour Organisation. (2002). Women and Men in the Informal Economy: A Statistical Picture, Employment Sector, ILO, Geneva ILO, 1995. Gender poverty and employment: Turning capabilities into entitlements, Geneva. ILO,1996. Action to assist rural women: Gender analysis study, Geneva. ILO, 1996. Collateral, collateral law and collateral substitutes, a paper for the Donors' Working Group on Financial Sector Development, Social Finance Unit, Geneva. ILO (1972), ‘Employment, Income and Equality: a strategy for increasing productive employment in Kenya’, Geneva: International Labour Organization Imayam (2001) Beasts of Burden. East West Books. Madras. International Labour Organisation and Institute of Social Studies Trust (2006). Women and the NREGA. ILO and ISST. New Delhi.
147
Institute of Social Studies Trust and Home Net South Asia (2006). Social protection for informal home-based women workers in South Asia (2004-2006). New Delhi. Jackson, C. and R. Palmer-Jones. (1999). "Rethinking gendered poverty and work." Development and Change, Vol.30, No. 1, pp.557-583. Jackson, C. (2007). "Resolving Risk? Marriage and Creative Conjugality." Development and Change 38(1): 107-29. Jacob, A and R. Varghese. (2006). ‘NREGA Implementation: Reasonable beginning in Palakkad, Kerala’. Economic and Political Weekly. 41(48): 4943-45. Jayaraman, Rajshri and Peter Lanjouw (1999), ‘The Evolution of Poverty and Inequality in Indian Villages,’ The World Bank Research Observer, Vol. 14, No 1 (February), pp. 1-30. Jeffrey, C., P. Jeffery, et al. (2005). "Reproducing Difference? Schooling, Jobs and Empowerment in Uttar Pradesh, India." World Development 33(12): 2085-2101. Jeffrey, C., R. Jeffery, et al. (2004). "Degrees without freedom: The impact of formal education on dalit young men in North India." Development and Change 35(5): 963-986. Jejeebhoy, Shireen J (1998), “Wife Beating in Rural India: A Husband’s Right?”, Economic and Political Weekly, 33(15), Pp:855-62 Jejeebhoy, J S. and A Z. Sathar. (2001) "Women's Autonomy in India and Pakistan: The Influence of Religion and Region." Population and Development Review 27(4):687. Jena, Manipadma (2004) ‘Orissa’s Child Domestic Workers: The ‘Nowhere’ Children’, InfoChange News and Features, July. Jha, R. (2002), ‘Rural Poverty in India: structure, determinants and suggestions for policy reform’, in: R Jha (ed.), Indian Economic Reforms, London: Palgrave Macmillan, pp. 390-416. Jha R.(2004), ‘Reducing poverty and inequality in India: Has liberalization helped?’, in: Cornia G. A. (2004), Inequality, growth and poverty in an era of liberalization and globalization, world institute for development economic research, Oxford: Oxford University press. Jhabvala, R. (1992) Women’s struggles in the informal Sector: two case studies from SEWA. In S. Gothoskar (ed.) Struggles of Women at Work. New Delhi: Vikas Jhabvala, R. (1994). Self Employed Women’s Association: Organising women by struggle and development in Dignity and Daily bread eds. Rowbotham, S and S. Mitter. Routledge, London and New York, pp 114-38.
148
Jhabvala, Renana, Neelam Gupta & Nita Mishra (2000) “Losing Work: A Study of Beedi Workers in India.” New Delhi: ILO Jhabvala R, Shalini Sinha (2002) Liberalisation and the Woman Worker Copyright ©Self Employed Women's Association (SEWA), www.sewa.org Ahmedabad, India. Jose, A.V. (ed.) (1989) Limited Options: Women Workers in Rural India. New Delhi: ILO - ARTEP Joshi, Barbara R. (1980) "Ex-Untouchable": Problems, Progress, and Policies in Indian Social Change Pacific Affairs, Vol. 53, No. 2. (Summer, 1980), pp. 193-222. Jumani, U. (1991) Dealing with Poverty. Self-employment for Poor, Rural Women. London: Sage Jütting, J. and C. Morrisson (2005), ‘Culture, Gender and Growth,’ OECD Development Centre, Policy Insights No. 15. Kabeer, Naila (1999) Resources, Agency, Achievements: Reflections on the Measurement of Women’s Empowerment,” Development and Change, Vol. 30, Pp: 435-464 Kabeer, N. (2003). ‘Safety Nets and Safety Ropes: Addressing Vulnerability and Enhancing Productivity in South Asia’, in S. Cook, N. Kabeer and G. Suwannarat (eds), Social Protection in Asia. New York and New Delhi: The Ford Foundation, Har Anand Publications Pvt. Ltd. Kabeer, N. (2003), Gender Mainstreaming in Poverty Eradication and the Millennium Development Goals - A Handbook for Policy-makers and Other Stakeholders, London: Commonwealth Secretariat. Kabeer, N. (2005). "Is Microfinance a 'Magic Bullet' for Women's Empowerment? Analysis of findings from South Asia". Economic and Political Weekly October 29. Kalpagam, U. (1994) Labour and Gender. Survival in Urban India. New Delhi: Sage Kalpagam, Uma, (1999). “Women Work and Domestic Duties: Income Planning for Housewives”, Indian Journal of Labour Economics, 42 (4) : 567-80. Kandiyoti D (1988) ‘Bargaining with patriarchy’ Gender and Society 2(3) 274-90. Kannan, K (2004) `Bring caste panchayats under legal framework' http://www.hinduonnet.com/2004/10/28/stories/2004102806460500.htm Kapadia, K. (1995). Siva and her Sisters: Gender, Caste and Class in Rural South India. Boulder, Colorado, Westview Press. Kapadia, K. ed. (2002)
The Violence of Development: The Politics of Identity,
Gender and Social Inequalities in India. New Delhi: Kali for Women.
149
Karlekar, M (1995) ‘Silences and Choosing to Hear: Perceptions of Violence Against Women’ in Malavika Karlekar, Anuja Agrawal and Maithili Ganjoo (eds), No Safe Spaces: Report of a Workshop on Violence against Women, Centre for Women’s Development Studies, New Delhi, pp 3-7. Kaur, R. 2004. The state and social equality: deconstructing reservations in Institutes of Technology. MS. New Delhi. Kaushik, S. 1998. Participation of Women in Panchayati Raj in India. A Stock Taking. A Study of Six States. New Delhi: National Commission for Women. Kavarana, Aditi (2001) Equal Remuneration Act Research Internship Papers 2001 17 Centre for Civil Society Kelkar, Govind et al (2005) Women’s Agency and the IT industry in India in Gender and the Digital Economy Perspectives from the Developing World Sage Publications India Pvt Ltd. Kijima, Y. (2006) Caste and Tribe Inequality. Evidence from India 1983-1999. Economic Development and Cultural Change Vol. 54. No.2. January. Kingdon, G and J. Unni (1997). How much does education affect women’s labour market outcomes in India? An analysis using household data. Working Paper No. 92. Gujarat Institute of Development Research. Ahmedabad. Kishor, S, 1993. ‘‘May God Give Sons to All: Gender and Child Mortality in India”, American Sociological Review, 58(2):247-65. Kishor, S (1995): ‘Gender Differentials in Child Mortality in India: A Review of Evidence from Rural India’ in M Das Gupta, T N Krishnan and L Chen (eds), Women’s Health in India: Risk and Vulnerability, Oxford University Press, Bombay. Klasen, S. (1999). ‘Does gender inequality reduce growth and development?’, World Bank Policy Research Department Working Paper 7, World Bank: Washington DC. Klasen, S. (2002), ‘Low Schooling for Girls, Slower Growth for All?’, World Bank Economic Review 16: 345-73. Klasen, S. (2005). ‘Pro-Poor Growth and Gender: What Can we Learn from the Literature and the OPPG Case Studies,’ Discussion Paper to the Operationalizing Pro-Poor Growth (OPPG) Working Group of AFD, DFID, BMZ (GTZ/KfW) and the World Bank, mimeo. Klasen, Stephan and Lamanna Francesca (2003), ‘The Impact of Gender Inequality in Education and Employment on Economic Growth in the Middle East and North Africa,’ background paper for World Bank Study: Women in the Public Sphere, Washington, DC: The World Bank.

150
Knowles, S., P. K. Lorgelly, and P. D. Owen (2002), ‘Are Educational Gender Gaps a Break on Economic Development? Some Cross Country Empirical Evidence,’ Oxford Economic Papers 54: 118-24. Kodoth Praveena, (2005) Fostering Insecure Livelihoods: Dowry and Female Seclusion in Left Developmental Contexts in West Bengal and Kerala Economic and Political Weekly June 18 Kohli, Atul (2006a), ‘Politics of Economic Growth in India, 1980-2005: Part I: The 1980s,’ Economic and Political Weekly, April 1. Kohli, Atul (2006b), ‘Politics of Economic Growth in India, 1980-2005: Part II: The 1990s and Beyond,’ Economic and Political Weekly, April 8. Kolenda, P. (1964) Religious anxiety and Hindu fate. In Religion in South Asia (ed.)E. Harper. Berkeley: Univ. of Califomia Press. Kopparty, S N M (1994) Social Inequality and Health Care, Northern Book Centre, New Delhi. Kothari, Jayna (2005) Criminal Law on Domestic Violence: Promises and Limits EPW Special Articles Kozel, V. and B. Parker. (2003). "A Profile and Diagnostic of Poverty in Uttar Pradesh." Economic and Political Weekly, Vol.38, No. 4, pp.385-403. Krishnaji, N (2001) ‘Land and labour in India: the demographic factor’ in Thorner, A (ed.) land, labour and rights. London: Anthem Press, p 70-87. Kucera, David, 2002. “The effects of wealth and gender inequality on economic growth: A survey of recent empirical studies”. Decent Work Programme Discussion Paper series no 136 Kumari, Ranjana (1998) Gender, Work and Power Relations: A Case Study of Haryana ; Har-Anand Publications, New Delhi. Kundu, Amitabh (1999), ‘Trends and Pattern of Female Employment: A Case of Organised Informalisation,’ in Alakh N. Sharma and T. S. Papola (eds.), Gender and Employment in India, New Delhi: Indian Society of Labour Economics. Kurien (1999)
“Empowering Conditions in the Decentralization Process: An Analysis
of Dynamics, Factors and Actors in Panchayati Raj Institutions From West Bengal and Karnataka, India.” Working Paper Series No. 228. The Hague, Netherlands: Institute of Social Studies. Lagerlof, N.-P. (2003). ‘Gender Equality and Long Run Growth,’ Journal of Economic Growth 8: 403-426. Lal, Deepak (1999) Culture, Democracy and Development: The Impact of Formal and Informal Institutions on Development September 20

151
Lavin, Abigail (2006) Dowry Disgrace: India's "kitchen accident" epidemic The Weekly Standard Source Publication Date: 28-NOV-06 Lele, M.K (2001). Local Government: Conflict of Interests and Issues of Legitimisation Economic and Political Weekly December 22, 2001 4702- 4704 Lewis, A. (1954), ‘Economic development with unlimited supplies of labour’, Manchester School of Economic and Social Studies, May. Li, H. and H. Zhou (1998). ‘Income Inequality is not Harmful for Growth: Theory and Evidence,’ Review of Development Economics 2: 318-34. Liddle, J and R. Joshi (1986). Daughters of independence: gender, caste and class in India. Kali for Women. New Delhi. Lim, L.L., 1996. More and better jobs for women, an action guide, ILO, Geneva. Loskin, M. and T. Mroz (2003). ‘Gender and poverty: a life cycle approach to the analysis of the differences in gender outcomes’, World Bank Policy Research Working paper S3153, World Bank: Washington DC. Louis, P (2006). ‘NREGA Implementation: Birth pangs in Bihar’. Economic and Political Weekly. 41(48): 4946-47. Luschinsky, Mildred Stroop (1963) The Impact of Some Recent Indian Government Legislation on the Women of an Indian Village Asian Survey, Vol. 3, No. 12. (Dec., 1963), pp. 573-583. http://www.jstor.org Thu Apr 12 04:34:05 2007 Mahajan, V. 2005. ‘From microcredit to livelihood finance’ Economic and Political Weekly. October 8: 4416-19. Mandelbaum, D G (1970) Society in India, 2 vols, University of California Press, Berkeley. Majumdar, M (2006). “Primary Education: A Commentary”. Economic and Political Weekly. 41(9): March 4. Majumdar, S., A. Mani, S.W. Mukand (2004), ‘Politics, information and the urban bias’, Journal of Development Economics,75, pp. 137-165 Mander, H (2001) Marrewijk, C. V. (2002), International trade & the world economy, Oxford: Oxford University Press. Mason, Karen Oppenheim (1984) The Status of Women: A Review of Its Relationships to Fertility and Mortality, New York, Rockefeller Foundation

152
Mason, Karen O. 1986. "The Status of Women: Conceptual and Methodological Issues in Demographic Studies." Sociological Forum 1(1):284-300. Mathew, George 1994 Panchayati Raj: From Legislation to Movement. New Delhi: Concept. Mathew, George and Nirmala Buch, eds. 2000 Status of Panchayati Raj in the States and Union Territories of India. New Delhi: Concept. Mayaram, Shail. (2002) The New Modes of Violence: The Backlash Against Women in the Panchayat System in The violence of Development: The politics of identity, gender and social inequality in India ed Karin Kapadia Kali for Women Mayoux, L. (1989) Income generation for women in India: problems and prospects, Development Policy Review, March: 5-27 [G] Mayoux, L., 1995. From vicious to virtuous circles? Gender and micro-enterprise development, Occasional Paper No.3, UNRISD, Geneva. Mazumdar, Indrani [2000] “Workers of the NOIDA Export Processing Zone”, mimeo, Centre for Women’s Development Studies, New Delhi. McKay, A. (2002), ‘Defining and Measuring Inequality’, Inequality Briefing No 1., London: Overseas Development Institute, March. Mehra, Rekha and S. Gammage, 1999. ‘Trends, Countertrends and Gaps in Women’s Employment’, World Development, 27(3): 533-50. Mehrotra, Santosh (2006) The economics of elementary education in India: the Challenge of public finance, private provision and household costs. Sage. New Delhi. Mehrotra SK and Biggeri M (2007). Asian informal workers: global risk, local protection. London, Routledge. Mehta, Aasha Kapur and Amita Shah (2006). “Chronic Poverty in India: Overview Study”. CPRC Working Paper 7 Chronic Poverty Research Centre Mehta, P.B (2006). “Democracy, disagreement and merit”. Economic and Political Weekly. 41(24): 2425-27, June 17. Meier, G. M., J.E. Rauch (2000) Leading issues in economic development. Seventh edition, Oxford: Oxford University press. Mencher, Joan P and K Saradamoni (1982) ‘Muddy Feet, Dirty Hands: Rice Production and Female Agricultural Labour’, Economic and Political Weekly (Review of Agriculture) 17, 52: A149–A167. Menefee Singh, & Kelles-Viitanen, A. (eds) 1987 Invisible Hands. Women in Home-based Production. New Delhi: Sage [G]
153
Menon, Nivedita (1998) “Rights, Law and Feminist Politics: Rethinking our Practice” In the Name of Justice, Women and Law in Society ed Swapna Mukhopadhyay Institute of Social Studies Trust Mies, Maria. 1986. Patriarchy and Accumulation: Women in the International Division of Labor. London: Zed Books. Ministry of Social Justice and Empowerment (2003) http://cag.nic.in/reports/reports/civil/2003_3/chapter1.htm Mitra, A. (2002), ‘Training and skill formation for decent work in the informal sector: Case studies from South India’, IFP/SKILLS Working Paper No. 8, International Labour Organization, http://www.ilo.org/public/ english/employment/skills/core/publ/ Mitter, S. 1994. On organizing women in casualised work: A global overview, in Dignity and Daily bread eds. Rowbotham, S and S. Mitter. Routledge, London and New York, pp 14-52. Mitter S & Rowbotham S (eds), 1995 "Women encounter Technology: Changing Patterns of Employment in the Third World", Routledge, London and New York, downloaded from www.unu.edu Mitter, Swasti (1995) “Beyond the Politics of Difference” in Swasti Mitter and Sheila Rowbothom ed. Women Encounter Technology Changing Patterns of Employment in Third World Mitter, S. (2000) “Teleworking and teletrade in India: diverse perspectives and visions.” Economic and Political Weekly 35(26): 2241 - 2252. Mitter, S. (2003) “Globalisation and ICT: Employment Opportunities for Women” Paper prepared for the Gender Advisory Board. United Nations Commission on Science and Technology for Development. http://gab.wigsat.org/partIII.pdf Mitter, S & Sophia Huyer (2003), “ICTs, Globalisation and Poverty Reduction: Gender Dimensions of the Knowledge Society” Gender Advisory Board, UN Commission on Science and Technology for Development (UNCSTD) Article Donated by The International Development Research Centre (IDRC) Mitter, Swasti; Fernandez, Grace & Varghese, Shaiby, (2004) 'On the Threshold of Informalization: Women Call Centre Workers in India, p. 164-183 in of Fortune: Linking Women Producers Workers with Global Markets, edited by Marilyn Carr, London: Commonwealth Secretariat. Morris, Anne E. & Susan M. Nott (1991) Working Women and the Law: Equality and Discrimination in Theory and Practice Routledge/Sweet & Maxwell London and New York Mohanty, Bidyut (1996) Women's Empowerment and Panchayats. In: Bidyut Mohanty, ed. Women and Political Empowerment: Proceedings of the Women's

154
Political Empowerment Day Celebrations 1995. New Delhi: Institute of Social Sciences. Mohanty, (2006). “Social inequality, labour market dynamics and the need for expanding reservation – some issues for consideration”. Economic and Political Weekly. 41(35): September 2nd. Morrisson, C. and J. Jütting (2005). ‘Women’s Discrimination in Developing Countries: A New Data Set for Better Policies,’ World Development 33(7): 1065-1081. Mosse, D., S. Gupta, M. Mehta, V. Shah, J. Rees and KRIBP Team (2002), ‘Brokered livelihoods: and Debt, labour migration development in tribal western India’, Journal of Development Studies, 38(5), pp. 59-88. Mukherjee, M. 1999. ‘Women and Work in India: A Collage from Five Decades of Independence’, in B. Ray and A. Basu (eds.) From Independence Towards Freedom. New Delhi, Oxford University Press: 56-79. Mukherji, S. (2001), ‘Low Quality Migration In India: The Phenomena Of Distressed Migration And Acute Urban Decay’, paper presented at the 24th Iussp Conference, Salvador, Brazil, August. Munyua, Alice W.(2005) “Positioning for Impact: Women and ICT Policy Making” IDRC Publications http://www.idrc.ca/en/ev-93062-201-1-DO_TOPIC.html Murti, M, Anne-Catherine Guio and J Dreaze, 1995. ‘Mortality, Fertility and Gender Bias in India: A District Level Analysis’, PDR, 21/4:745-82. Nagaraj, K. (1999), ‘Labour market characteristics and employment generation programs in India’, in: Harriss - White, B., S. Subramanian (1999) (eds.), Essays on India’s social sector, in honour of S. Guhan, new Delhi: Sage Publications. Nagaraj, R (2004) Fall in Organised Manufacturing Employment A Brief Note Economic and Political Weekly July 24, 2004 Naik, J. P. 1975. Equality, Quality and Quantity: The Elusive Triangle in Indian Education. New Delhi: Allied Publishers. Nakkeeran, N (2003) Women’s Work, Status and Fertility Land, Caste and Gender in a South Indian Village Economic and Political Weekly September 13, 2003 3931- 3939 Narayanan, Pradeep (2003). ‘Empowerment through Participation’, EPW, Vol XXXVIII, pp 2484-86. Narula, Smita (2001) ‘Untouchability’: The Economic Exclusion Of The Dalits In India The International Council On Human Rights Policy Seminar on the Economics of Racism Geneva, January 24-25 http://www.ichrp.org/paper_files/113_w_07.pdf
155
Nath, Vikas (2001) “Empowerment and Governance through Information and Communication Technologies: Women's Perspective” The International Information and Library Review, Volume 33, Number 4, December 2001, pp 317-339(23) Academic Press National Policy for the Empowerment of Women (2001) http://wcd.nic.in/empwomen.htm NCEUS (2007). Report on conditions of work and promotion of livelihoods in the unorganized sector. National Commission for Enterprises in the Unorganised Sector. New Delhi. NCEUS (2007) Draft Unorganised Agricultural Sector Workers (Conditions of Work and Livelihood Promotion) Bill, 2007, dated 22.02.2007. NCEUS (2007) Draft Unorganised Sector Workers (Conditions of Work and Livelihood Promotion) Bill, 2007, dated 22.02.2007. NCEUS (2007) Draft Unorganised Sector Workers (Social Security) Bill, 2007, dated 22.02.2007. Ng, Cecilia, Swasti Mitter (2005) Gender and the Digital Economy Perspectives from the developing world. Sage Publications India Pvt Ltd. North, Douglass, C (1994). ‘Economic Performance through Time’, American Economic Review, Vol 84, No 3, June, pp 359-68. Nussbaum Martha C. (1993) “Non-relative Virtues: An Aristotelian Approach“, in Nussbaum, M and A. Sen. The Quality of life, Clarendon Press, Oxford.1993. Nussbaum Martha C. [2000], “Women and Work – The capability approach”, The Little Magazine, Oldenburg, Veena (1993). Dowry Murders in India: A Preliminary Examination of the Historical Evidence In Women's lives and public policy: the international experience. (Ed) Meredeth Turshen and Briavel Holcomb Westport, Conn. Omvedt, G. (1982). ‘Women do Double Work’, in H. Johnson and H. Bernstein (eds.), Third World Lives of Struggle, Open University. Omvedt, G. (1993) Reinventing revolution: New Social Movements and the Socialist Tradition in India. New York: M.E. Sharpe. Oppong, C and K. Abu (1987) Seven roles of women: Impact of education, migration and employment on Ghanaian mothers. ILO. Geneva. Osmani, S. R. (1997). ‘Poverty and Nutrition in South Asia’. The First Dr Abraham Horwitz Lecture, United Nations Standing Committee on Nutrition. Available at: www.unsystem.org/scn/publications/horwitzlecture/lectureno1.htm .

156
Oxford policy management (2004), ‘DFID rural and urban development case study- India’, Working Paper, Oxford policy management. Pal, Mahi (2004) ‘Panchayat Raj and Rural Governance’, EPW, Vol XXXIX, pp 137-42. Pallavi, Aparna (2005) Women in the audience. 02 Sep. http://www.indiatogether.org/2005/sep/wom-attend.htm Palmer., I. (1991). Gender and Population in the Adjustment of African Economies. Geneva: ILO. PANOS (1999). ‘Globalization and Employment: New Opportunities and Real Threats’. Briefing No. 33. London: PANOS. Available at: www.panos.org.uk/global /reportdetails.asp?id=1023&reportid=1015 . Papanek, H. (1989). Family Status-Production Work: Women's contribution to social mobility and class differentiation. Gender and the Household Domain: Social and cultural dimensions. M. Krishnaraj and K. Chanana (eds.) New Delhi, Sage Publications: 97-116. Papola T. and Sharma A. (eds), (1999). Gender and Employment in India, New Delhi: Vikas Publishing. Patel, Reena (2005) “The Persistence of Traditional Gender Roles in the Information Technology Sector: A Study of Female Engineers in India” The Massachusetts Institute of Technology Information Technologies and International Development Volume 2, Number 3, Spring 2005, 29–46 Patel, Reena (2006) Working the Night Shift: Gender and the Global Economy Department of Geography and the Environment, University of Texas at Austin, Campus Mail Code A3100, Austin, TX 78712, USA http://www.acme-journal.org/vol5/Patel.pdf Patel, Vibhuti (1994) “Women and Structural Adjustment in India” Social Scientist, Vol. 22, No. 3/4. (Mar. - Apr., 1994), pp. 16-34. http://www.jstor.org Thu Apr 12 04:35:32 2007 Pearce, G. and D. Hulme, (1994). ‘Microenterprise and children - what are the intra-household impacts of income generating programs?’ Small Enterprise Development, Vol. 5, No. 1. Petchesky R. P. (1984) "Abortion and Woman's Choice" Northeasterm University Press. Pinto, Sarah (2006), Globalizing Untouchability, Grief And The Politics Of Depressing Speech. Social Text http://socialtext.dukejournals.org/cgi/reprint/24/1_86/81?rss=1

157
Planning Commission (2002). 'National Human Development Report. Government of India. New Delhi. http://planningcommission.nic.in/reports/genrep/nhdrep/nhdreportf.htm Prakash, A (2004) Workers' Right to Strike EPW Commentary Prachar, Uma (2006) Khap Panchayats: Out of Tune with the Times Resource Letter on Panchayat Raj Vol. 13 No. 1 Private Circulation Pratichi Trust (2002). The Pratichi Education Report 1. TLM Books. New Delhi. PROBE Team. (1999). Public Report on Basic Education. Oxford University Press, Oxford. Purkayastha, Bandana (2003) Mangala Subramaniam; Manisha Desai; Sunita Bose The Study of Gender in India: A Partial Review Gender and Society, Vol. 17, No. 4. (Aug., 2003), pp. 503-524.JSTOR Quisumbing, Agnes R.; de la Brière, Bénédicte (2000). ‘Women's assets and intrahousehold allocation in rural Bangladesh: Testing measures of bargaining power.’ FCND Discussion Paper 86. International Food Policy Research Institute. Quisumbing, Agnes R. and Maluccio, John A. (2000) ‘Intra-household allocation and gender relations: New empirical evidence from four developing countries’, FCND Discussion Paper 84. International Food Policy Research Institute (IFPRI). Radhakrishna et al (1998) (eds). Empowering Rural Labour In India: Market State and Mobilisation’, Institute for Human Development. Rahman, A. (2002). ‘On Measuring Intrahousehold Inequality in Food Distribution – Is the Conventional Calorie Intake Enough to Understand Individual Wellbeing within the Household?’. London: Department of Economics, University College. Mimeo. Rahman, Lupin and Vijayendra Rao (2002). The Relative Impact of Culture, Economics and Public Action on Women’s Agency: A Comparative Analysis of North and South India September 30 Rahman, Lupin and Vijayendra Rao. (2004). "The Determinants of Gender Equity in India: Examining Dyson and Moore's Thesis With New Data." Population & Development Review 30(2):239-68. Rajivan, A. K. (1999) Policy Implications for Gender Equity: The Indian Time Use Survey, 1998 – 99. International Seminar on Time Use Surveys. Made available by United Nations Economic and Social Commission for Asia and the Pacific at www.unescap.org/Stat/meet/timeuse/policy_india_ses5.pdf Raju, R..S. (1989), Urban unorganised sector in India, Delhi: Mittal publications. Raju, S. (2001). ‘Sustainable Livelihood, Gender and Food Security’, in M. D. Asthana

158
and P. Medrano (eds), Towards Hunger Free India: Agenda and Imperatives. New Delhi: Manohar Publishers. Rajuladevi, A K. (2001). Food Poverty and Consumption among Landless Labour Households Economic and Political Weekly July 14, 2656- 2664. Ramachandran, N. (2003). ‘The Paradox of Gender Food Security’. Paper presented at the Gender Poverty Summit, Women’s Political Watch and National Council for Applied Economic Research, 9-11 November. New Delhi. Ramachandran, N. (2004). ‘Seasonal Hunger: Implications for Food and Nutritional Security, in M. S. Swaminathan and P. Medrano (eds), Towards Hunger Free India: From Vision to Action. Madras: East West Books Pvt. Ltd. Ramachandran, N. (2005). ‘Why Women Must be a Central Concern in Food and Nutrition Policy’. Indian Social Science Review, 7. Ramachandran, V. and A. Saihjee. 2002. "The New Segregation: Reflections on Gender and Equity in Primary Education." Economic and Political Weekly, Vol.37, No. 17, pp.1600-1613. Ramachandran, V (ed.) (2004). Gender and social equity in primary education: hierarchies of access. Sage. New Delhi. Ramachandran, V.K, Swaminathan, M. & Rawal, V. 2001. "How have hired workers fared? A case study of women workers from an Indian village, 1977-1999." Centre for Development Studies. Trivandrum, Kerala. Ramachandran, V. K., & M. Swaminathan. 2002. "Rural Banking and Landless Labour Households: Institutional Reform and Rural Credit Markets in India." Journal of Agrarian Change, Vol.2, No. 4, pp.502-544. Ramaswamy, Justice Dr. K., (2001) Casteism, Intolerance and Instruments of Law PUCL Bulletin, December Erode: TN & Pondy PUCL Ramaswamy, K.V (2007). “Regional dimensions of growth and employment”. Economic and Political Weekly. December 8th. Rana, K, Santra, S, Mukherjee, A, Banerjee, T, Kundu, M (2005). “Public-private interface in primary education”. Economic and Political Weekly, 40(15): April 9. Rao, Brinda (1991) Dominant Constructions of Women and Nature in Social Science Literature. Pamphlet 2. Santa Cruz, CA: CES/CNS Rao, N. (2006). Women’s rights to land and other productive assets: its impact on gender relations and increased productivity. Working Paper 4, Unifem, New Delhi. Rao, N (2006b). ‘Land Rights, Gender Equity and Household Food Security: Exploring the Conceptual Links in the Case of India’. Food Policy 31:180-193.

159
Rao, N. (2005) Social Justice and Empowerment of the Weaker Sections and Gender Rights, in Adeney, K and L.Saez (eds.) Coalition Politics and Hindu Nationalism. Routledge, London. Rao, N. (2002). Standing One's Ground: Gender, Land and Livelihoods in the Santal Parganas, Jharkhand, India. PhD thesis. University of East Anglia, Norwich. Rao, Rukmini & S. Hussain (1987) “Women in Home-based production in the Garment Export industry in Delhi” in Invisible Hands (Eds) Andrea Menefee Singh and Anita Kelles Viitanen. Sage Publications New Delhi/London Rao, Rukmini (2006) Bonded by Caste and Gender: The Feminization of Poverty in Rural India http://www.cwpe.org/node/84 Rao, Vijayendra (1997), "Wife Beating in Rural South India: A Qualitative and Econometric Analysis," Social Science and Medicine , Vol. 44, # 8, Pp. 1169-1180, April Ravallion, M. (1997). ‘Can High-Inequality Countries Escape Absolute Poverty?’ Economics Letters 56: 51-57. Ravallion, M. (2001). ‘Growth, Inequality and Poverty: Looking Beyond Averages,’ World Development 29: 1803-1815. Ravallion M. and G. Datt (2002), ‘Why Has Economic Growth Been More Pro-Poor in Some States of India Than Others?’, Journal of Development Economics, 68, pp. 381-400. Rawal, V. 2003. "Labour Process in Rural Haryana: A Field Report from Two Villages". December 17 to 20. Bardhaman, West Bengal. Reddy K., Kranthi Kumar and Reddy P., Vijaya Lakshmi 2001 “Globalisation, Agriculture, and Women” in Social Action; pp. 378-392; Vol. 51; No. 4; October -December 2001 Revathi, E (1998) Women Work and Technology Spellbound Publications, Rohtak Rajalakshmi, T.K. (2005). A law for the domestic domain Frontline Volume 22 - Issue 16, Jul 30- Aug 12 Rodrik, Dani and Arvind Subramanian (2004), ‘From ‘Hindu Growth’ to Productivity Surge: The Mystery of the Indian Growth Transition,’ unpublished manuscript. Rosenzweig, M and J. Zhang (2006) “Do population control policies induce more human capital investment? Twins, birthweight and China’s one-child policy”. Manuscript. Roy, T K, Sumati and Kulkarni, Y Vaidehi (2004) Social Inequalities in Health Nutrition in Selected States Economic and Political Weekly. February 14, 677- 683

160
RoyChowdhury, S (2003) Old Classes and New Spaces: Urban Poverty, Unorganised Labour and New Unions EPW Special Articles December 13 Rustagi, Preet, 2003. “Gender Biases and Discrimination against women: What do different indicator says?” UNIFEM Publication. Rustagi, Preet, 2004. “Significance of Gender-related Development Indicators: An Analysis of Indian States”. Indian Journal of Gender Studies, Sage Publication. Sachar, Rajendra (2006). Social, Economic and Educational Status of the Muslim Community of India Report. New Delhi. Sankaran, P.N. (2003) Participatory justice and human rights protection in little democracies: a pilot study project report. Center for Development Studies Thiruvananthapuram, Kerala Santhya and S. Jejeebhoy (2003) Saradamoni, K.(1994).Women, Kerala and some development issues. Economic and Political Weekly 29: 501-509. Savara, M. (1993) Women’s organizations and subcontracting - a case study from India, In I. Baud & G.A. de Bruijne (eds) Gender, Small-Scale Industry and Development Policy. London: IT Publications Schultz T.P. (2001). ‘Human Capital, Family Planning, and their Effects on Population Growth,’ American Economic Review 84: 255-260. Schultz, T. P. (2002), ‘Why Governments Should Invest More to Educate Girls,’ World Development 30(2): 207-225. Sebstad, J. and G. Chen, (1996). Overview of studies on the impact of microenterprise credit, AIMS, USAID, Washington. Second National Commission on Labour Report http://labour.nic.in/lcomm2/nlc_report.html Seebens, H. and J. Sauer (2006). ‘Bargaining power and efficiency – the case of rural Ethiopian Households’ submitted to the “26th Conference of the International Association of Agricultural Economists 2006”, August 12-18 2006, Queensland, accessed at http://www.pasad.uni-bonn.de/seebens.htm, 2nd October 2006. Seguino, S. (2000). ‘Gender Inequality and Economic Growth: A Cross-Country Analysis,’ World Development 28: 1211-1230. Seguino, S., and C. Grown (2006), ‘Gender Equity and Globalization: Macroeconomic Policy for Developing Countries,’ Journal of International Development 18: 1081-1104.

161
Seguino, S. and M. Sagrario Floro (2003). ‘Does Gender Have any Effect on Aggregate Saving? An Empirical Analysis,’ International Review of Applied Economics 17: 147-166. Sen, Amartya, (1984). “Poverty and Famines”. Oxford: Oxford University Press. Sen, A. (1990). “Gender and Cooperative Conflicts”. Persistent Inequalities: Women and World Development. I. Tinker (ed.) New York, Oxford University Press: 123-149. Sen, A (2001): ‘Many Faces of Gender Inequality’, Frontline, October 27, 2001. Sen, Gita (2006) Informal Institutions and Gender Equality International Seminar on Informal Institutions and Development– What do we know and what can we do? http://www.oecd.org/dataoecd/29/53/37738408.pdf Selliah, S. (1989) The Self-Employed Women’s Association, Ahmedabad. Geneva: ILO Setalvad, Teesta Compilation of Law Backgrounder Prepared for Sabrang & Publishing Private Limited http://www.sabrang.com/leaction/complaw.pdf Sethuraman, S.V. (1997), 'Urban Poverty and the informal sector, a critical assessment of current strategies', International Labour organization, http://www.ilo.org/public/english/ employment/recon/ eiip/publ/1998/urbpover.htm Sharma, U. (1990) Public employment and private relations: women and work in India. In S. Stichter & J.L. Parpart (eds) Women, Employment and the Family in the International Division of Labour. London: Macmillan Shramshakti, Report of the National Commission on Self employed Women and Women in the Informal Sector, June, 1988. Singh, Kirti. 1994. Obstacles to Women’s Rights in India. In Cook 1994d, 375–96. Singh, Preeti (2002). “Women in the Corporate World in India – Balancing Work and Family Life.” Paper presented at Alva Myrdal's Questions to Our Time March 6-8, at Uppsala University, Sweden. http://www.pcr.uu.se/conferenses/myrdal/alvapapers.html Singh Preeti and Anu Pandey(2005) “Women in Call Centres” Economic and Political Weekly February 12 684- 688 Singh, Seema, (1993), “New Economic Policy in India: Some implications for Employment and Labour Market” in Indian Journal of Industrial Relation Volume 28 No 4 pp. 311-326. Smith, L., U. Ramakrishnan, A. Ndiaye, L. Haddad & R. Martorell (2003). ‘The Importance of Women’s Status for Child Nutrition in Developing Countries’. IFPRI

162
Research Report 13. Washington, DC: IFPRI. Available at: http://www.ifpri.org/pubs/abstract/131/rr131ch08.pdf . Sonalkar, Wandana (1999) An agenda for gender politics, EPW 34, 1+2, 1999: 24-29 Souza, A. de (ed.) (1975) Women in Contemporary India. New Delhi: Manohar Srinivas, M.N (1962).
Caste in Modern India and Other Essays. Bombay: Asia
Printing House. Srinivasan, K. & Kumar, S. (1999) Economic and Caste Criteria in definition of Backwardness. EPW Special Article. Oct 16-23. Srivastava, R. and S.K. Sasikumar (2003), ‘An Overview of Migration in India: Its Impacts and Key Issues’, Refugee and Migratory Movements Research Unit, Bangladesh and DFID, UK. Statement of the Asia Pacific Adopted on 12th January 2003 Gender Forum For Wsis Using Ict To Advance Women's Empowerment And Gender Equality In The Asia Pacific Region http://www.apcwomen.org/wsis/ap_gender_forum.doc Stiglitz, J.E. (2000), Economics of the Public Sector, New York, London: W. W. Norton & Company. Strulik, Stefanie (2004) Paper for the 18th European Conference on Modern South Asian Studies at Lund University, Sweden Panel on: “Gender and the Local State in South Asia” Women-Panchayat-Electives At The Interface Of State And Village Politics: Gendered Constructions of the Political Space http://www.sasnet.lu.se/EASASpapers/16StefanieStrulik.pdf Sudarsen, V And Sumathi (2005) What Does the New Panchayat System Guarantee? A Case Study of Pappapatti Economic and Political Weekly August 20, 2005 3751- 3758 Sugunar M. (1990) “The Relationship of Conflicts to Psycho-Social Distress: A Study to Predict Dowry-Psychological Violence on Working Women”, In Violence against Women, Ed. Sushma Sood. Jaipur: Arihant Publication. Sundaram, K. (2001), “Employment-Unemployment Situation in the Nineties – Some Results from NSS 55th Round Survey”, Economic and Political Weekly, March 17, pp. 931-940. Sundaram, K. (2004). “Growth of Work Opportunities in India: 1983-1999-2000” Working paper No 131, Centre for Development Economics, Department of Economics, Delhi School of Economics. Sundari, T K (1980) ‘Caste and the Rural Economy’, Working Paper, No 130, mimeo, Centre for Development Studies, Trivandrum.
163
Swaminathan, P. (2005) Trapped into Living: Women’s Work, Environment and their Perceptions of Health, pp.15-36. Centre for Enquiry into Health and Allied Themes, Mumbai Swaminathan Padmini, (2004). “The Trauma of ‘Wage Employment’ and the ‘Burden of Work’ for Women in India: Evidences and Experiences”. Working Paper No. 186, MIDS, Chennai. Taylor, L. (1995). ‘Environmental and gender feedbacks in macroeconomics’, World Development: Special Issue on Gender, Adjustment and Macro-economics 23(11) Tejani, Sheba (2004) Sexual Harassment at the Workplace Emerging Problems and Debates EPW Commentary October 9 The Constitution (Seventy-Third Amendment) Act, 1992 http://indiacode.nic.in/coiweb/amend/amend73.htm Thomas, Duncan. (2002) ‘Health, Nutrition and Prosperity: A Microeconomic perspective.’ Bulletin of the World Health Organization 80(2), World Health Organization. Thomas, Duncan and Chen, Chien-Liang. (1994) ‘Income Shares and Shares of Income: Empirical Tests of Models of Household Resource Allocation.’ Labor and Population Working Paper 94-08. RAND Corporation, Santa Monica, Calif. U.S.A. Thorat, Sukhdeo, Ghanshyam Shah, Harsh Mander, Satish Deshpande and Amita Baviskar (2006) Untouchability in Rural India. Sage Publications. Tilak, J. B. G. (2007). "Post-elementary education, poverty and development in India." International Journal of Educational Development 27: 435-445. Tilak, J.B.G (2006). “On allocating 6 per cent GDP to education”. Economic and Political Weekly. 41(7): 613-618. February 18. Todd, H., 1996. Women at the center. Grameen Bank borrowers after one decade, Westview Press, Oxford. Trenchard, R., & B. Shreshta (2002). ‘The Value of Resource Access Learning from Poor Rural Women in Nepal’. Paper presented at the WB Regional Workshop on Land Issues in Asia, 4-6 June. Phnom Penh. Udry, C. (1996). ‘Gender, Agricultural Production, and the Theory of the Household,’ The Journal of Political Economy 104: 1010-1046. United Nations. General Assembly. (1994) Declaration on Violence against Women. GA resolution 48/104. UN document no. A/48/49. UN (2005). The Inequality Predicament: Report on the World Social Situation, New York: Department of Economic and Social Affairs, UN.

164
UNDP (2005). Human Development Report 2005: International Cooperation at a Crossroads: Aid, Trade and Security in an Unequal World, New York: UNDP. UNIFEM (2005). Progress of the World’s Women: Overview: Women, Work and Poverty, UNIFEM: New York. Unheard Voices- Dalit Women, (2007). An Alternative Reports by Tamil Nadu Women’s Forum for the 15th – 19th periodic report on India submitted by the Government of Republic India for the 70th session of Committee on the Elimination of Racial Discrimination, Geneva. Unni, Jeemol and Raveendran, G.(2007), “Growth of Employment (1993-94 to 2004-05): Illusion of Inclusiveness?” Commentary, Economic and Political Weekly, January 20. Unni Jeemol and Uma Rani, (2004), Impact of Recent Policies on Home Based Work in India, Human Development Resource Centre, UNDP, New Delhi Unni, Jeemol and Uma Rani (2003) “Gender, Informality and Poverty” The Gujarat Institute of Development Research, Ahmedabad FOOTLOOSE LABOUR - a symposium on livelihood struggles of the informal workforce http://www.india-seminar.com/2003/531.htm Unni, J. (2001). "Gender and Informality in the labour market in South Asia". Economic and Political Weekly. 36(26): 2360-77. Unni, J., (1999) ‘Women workers in Agriculture: some recent trends in gender and employment in India’, in T. Papola and A. Sharma (eds), Gender and Employment in India, New Delhi: Vikas Publishing, 1999 Unni, J (1999) Property Rights for Women Case for Joint Titles to Agricultural Land and Urban Housing EPW Special Articles. May 22-28, 1999 Upadhyay, Ushma D. (2000) “India’s New Economic Policy of 1991 and its Impact on Women’s Poverty and AIDS” in Feminist Economics; pp.105-123; Vol. 6; No. 3; 2000 Vanamala, M. (2001) Informalisation and Feminisation of a Formal Sector Industry A Case Study Economic and Political Weekly June 30, 2001 Van Fleet D.D & Saurage J.G (1984) “Recent Research on Women in Management Apron” in Business and Economics review 1984, 15(2) pp. 15-24. Vasudeva-Dutta, P. (2004). The structure of wages in India, 1983-1999. Sussex, Department of Economics, University of Sussex. Vecchio, Nerina and Roy, Kartik C. (1998) Poverty, Female-Headed Households, and Sustainable Economic Development; Westport, CT: Greenwood Press; 1998

165
Vengroff, R. and L. Creevey, 1994. Evaluation of project impact: ACEP component of the community enterprise development project, report to USAID/Dakar, University of Connecticut, Storrs Verschoor, Arjan, Arlette Covarrubias and Catherine Locke (2006), ‘Women’s Economic Empowerment: Gender and Growth. Literature Review and Synthesis,’ Report to DFID. Vaidyanathan. A. (1994) “Employment Situation: Some Emerging Perspectives”, Economic and Political Weekly, 29 (50). Vijay, G. (2003). Changing Policy Regime and Labour: A Case Study Economic and Political Weekly. August 2 Virmani, Arvind (2005) Institutions, Governance and Policy Reform A Framework for Analysis Economic and Political Weekly May 28-June 4, 2005 2341-2350 Virmani, Arvind (2004), ‘India’s Economic Growth: From Socialist Rate of Growth to Bharataya Rate of Growth,’ Working Paper No 122, New Delhi: Indian Council for Research on International Economic Relations. Visaria, Leela (2000) Violence against Women: A Field Study Economic and Political Weekly May 13. Visaria, Pravin. T. S. Papola, Alakh N. Sharma (eds.) (1999) “Level and Pattern of Female Employment in India”, New Delhi: Vikas Publishing House. Viswanathan, Shiv (2006), Exposing An Abhorrent Practice 15 February, Frontline Vivek, P.S. (2000) Scavengers: Mumbai's Neglected Workers EPW Commentary October 14-20 Voitchovsky, S. (2004). ‘The Effect of Inequality on Growth: A Review of Recent Literature,’ mimeo, Oxford University. Vyas, A. & Singh, S. (1993) Women’s Studies in India. Information Sources, Services and Programmes. New Delhi: Sage Walters, B. (1995). ‘Engendering Macroeconomics: A Reconsideration of Growth Theory’ World Development :Special Issue on Gender, Adjustment and Macro-economics 23(11):1869-1880. Warner, J. and A. Campbell (2000). ‘Supply response in an Agrarian economy with non-symmetric gender relations’, World Development: Special Issue on Growth, Trade, Finance and Gender Inequality 28(7): 1327-1340. Weber, M. (1958) The religion of lndia: the sociology of Hinduism and Buddhism. New York: The Free Press. Webster, Juliet (2005) “Women in IT Professions: Corporate Structures, Masculine Cultures Work and Equality” Research, London.

166
http://ict.open.ac.uk/gender/papers/webster.doc Whitehead, A and N. Kabeer (2001). Living with uncertainty: Gender, livelihoods and pro-poor growth in rural sub-Saharan Africa” IDS Working paper 134. Brighton. Whitehead, A et al (2006) WIEGO (2001), 'A policy response to the informal economy', Women in Informal Employment: Globalizing and Organizing, http://www.wiego.org/main/publi.shtml Wiser, W and C. Wiser (2000). Behind mud walls: Seventy-five years in a North Indian Village. University of California Press. Berkeley. Wood, P., (2000), ‘Putting Beijing online: women working in information and communication technologies: experiences from the APC Women’s Networking Support Programme’, Philippines: APC Women’s Networking Support Programme,http://www.apcwomen.org/netsupport/sync/toolkit1.pdf World Bank (1991). Gender and Poverty in India. Washington, D.C, The World Bank. World Bank (2004). Attaining the Millennium Development Goals in India: Role of Public Policy and Service Delivery, Human Development Unit. Washington, DC: World Bank. World Bank (2005), ‘Doing business in 2005, removing obstacles to growth’, World Bank rapport, Washington DC: World Bank World Bank (2006). World Development Report 2006: Equity and Development, New York: Oxford University Press for the World Bank. World Development, Growth, trade, finance & gender inequality: Special Issue. (2000) New York. Zachariah, Mathew (1972) Positive Discrimination in Education for India's Scheduled Castes: A Review of the Problems, 1950-1970 Comparative Education Review, Vol. 16, No. 1. (Feb., 1972), pp. 16-29. http://www.jstor.org Zaidi (2006), Cover Story SEPTEMBER 22, 2006 India’s shame Manual scavenging is still a disgusting reality in most States despite an Act of Parliament banning it. REPORTS Shramshakti, Report of the National Commission on Self employed Women and Women in the Informal Sector, June, 1988. Second National Commission on Labour Report http://labour.nic.in/lcomm2/nlc_report.html National Human Rights Commission Report: Rights of Home-Based Workers By Shalini Sinha http://nhrc.nic.in/Publications/Home-based.pdf.

167
Gender & Governance: Reviewing the Women’s Agenda in the National Common Minimum Programme - WADA NA TODO ABHIYAN. March 2007 http://www.wadanatodo.net/images/220307/Gender&NCMP_Eng.pdf

168
Annexure 1 Institutions, Laws and Policies for the Advancement of Women and the Lower Castes India, a country of considerable diversity – ethnic, caste, linguistic, religious and locational - has a comprehensive legal and policy framework to promote gender and caste equality. Yet this is far from achieved in the sixty years since Independence. Since legal reforms have been at the centre of the agenda for approaching gender justice in India, the existing framework will be set out briefly, with reflections on the possible explanations for the limitations of law in practice, enabling one to then move on to an exploration of informal institutions. Background In the post-independence era, shaping a gender-just society was perceived as central to the task of nation building and the role of law key in this respect. The Preamble to the Constitution of India is both liberal, in terms of its emphasis on individual rights and liberty, but is also redistributive, in terms of freeing large groups of citizens, women but also the Scheduled Castes and Tribes, from the distortions of the past. The imperative for women’s equality is rooted in Part III (Fundamental Rights) of the Constitution, in particular Articles 14, 15 and 16. These rights were however introduced within a social structure, which is itself based on an unequal distribution of power and resources. Part IV of the Constitution therefore focused on the Directive Principles of State Policy that essentially presented the vision or direction as to what the country’s economic ideal or social order ought to be. Article 37, for instance, includes the right to an adequate means of livelihood for men and women, equal pay for equal work, protection from abuse, just and humane conditions of work, raising the level of nutrition, free and compulsory education for children up to the age of 14, maternity relief and conditions of work ensuring a decent standard of life (CWDS, n.d). Many of these provisions find place in Articles 11 and 12 of CEDAW (Convention on Elimination of all forms of discrimination against women), of which India is a signatory. A review by the CSWI (Committee on Status of Women in India) in the mid-1970s found that for the majority of Indian women, the Constitutional guarantee of equality of legal status and opportunity ‘had remained an unrealized dream’ (GOI, 1974). The question that naturally arose was why this was the case? Was the absence of a matching policy and institutional framework responsible for the large gap between policy and practice? As the report pointed out, neither the norms nor the institutions were in place which would enable women to fulfill their multiple roles in society.
Table A1.1 Key Constitutional Provisions on women’s rights Article 14. Equality before law guarantees that:
the State shall not deny to any person equality before the law or the equal protection of the laws within the territory of India.
Article 15. Prohibition of discrimination on grounds of religion, race, caste, sex or place of birth No citizen, on grounds of religion, race, caste, sex, place of birth or any of them, be subject to any disability, liability or restriction with regard to (a) access to shops, public restaurants, hotels and places of public entertainment; or (b) the use of wells, tanks, bathing ghats, roads etc.
Article 16. Equality of opportunity in matters of public employment

169
There shall be equality of opportunity for all citizens in matters relating to employment or appointment to any office under the State. No citizen shall, on grounds only of religion, race, caste, sex, descent, place of birth, residence or any of them, be ineligible for, or discriminated against in respect of, any employment or office under the State. Nothing in this article shall prevent the State from making any provision for the reservation of appointments or posts in favour of any backward class of citizens which, in the opinion of the State, is not adequately represented in the services under the State.
Article 17. Abolition of Untouchability Article 19. Protection of certain rights regarding freedom of speech, etc. guarantees that all citizens shall have the right -
to freedom of speech and expression; to form associations or unions; to practice any profession, or to carry on any occupation, trade or business.
Article 23. Prohibition of traffic in human beings and forced labour guarantees that - Traffic in human beings and other similar forms of forced labour are prohibited and any contravention of this provision shall be an offence punishable in accordance with law.
Article 29. Protection of interests of minorities. Article 39. Certain principles of policy to be followed by the State guarantees that –
The State shall, in particular, direct its policy towards securing that the citizens, men and women equally, have the right to an adequate means of livelihood;
Article 42. Provision for just and humane conditions of work and maternity relief. Article 43. Living wage, etc., for workers guarantees that -
The State shall endeavour to secure, by suitable legislation or economic organisation or in any other way, to all workers, agricultural, industrial or otherwise, work, a living wage, conditions of work ensuring a decent standard of life and full enjoyment of leisure and social and cultural opportunities and, in particular, the State shall endeavour to promote cottage industries on an individual or co-operative basis in rural areas.
Article 45. Provision of free and compulsory education for children. Article 46. Promotion of educational and economic interests of Scheduled Castes, Scheduled Tribes and other weaker sections. Laws and Rights: A theoretical distinction In the late-1970s, with the growth of the women’s movement in India following the first world women’s conference in Mexico, 1975, and the announcement of the International Women’s Decade, alongside political mobilization for the enforcement of Constitutional rights, there was renewed activity in the domain of legislative form. It might be useful at this point to distinguish between what are understood as laws and rights. As pointed out by Nivedita Menon (1998) any legal discourse is necessarily animated by the weighing of existing rights. Indeed, a social movement is also constrained to use the language of ‘individual rights’, which are then protected by the regulatory mechanism of law. The emphasis on the language of individualism becomes crucial because it is at this level that the burden of law enforcement, its successful implementation and failure can be most evidently recognized. It is here that the gaps between the theoretical possibilities of legislature and the practical limitations produced by a society collapse. The experience of the Scheduled Castes in India is a test case for understanding the problem of equality before law and inequality in practice. Just a brief clarification on the caste system itself. There is considerable debate over the nature of the caste system in India and the hierarchy between castes, yet it is generally used to define mutually exclusive, endogamous, hereditary and occupation specific groups: Brahmins – the priests and teachers – were followed by the kshatriyas (warriors), vaisyas (traders and merchants) and with sudras (all manual jobs, including degrading

170
occupations such as scavenging) at the bottom. The system of caste however extends beyond this occupational division to setting out rules of social interaction, food patterns and rites of living. The sudras at the bottom were subject to exploitation, humiliation and deprivation, as well as the practice of untouchability (Omvedt, 1993, Thorat et al, 2006). Of course, there are divisions and hierarchies even within the untouchable castes, and these vary across regions (Deliege, 1993, Imayam, 1986). The adivasis or tribal communities face a somewhat different situation, as they lie outside the Hindu caste system, yet they too are often discriminated against on account of their different culture, language and religion. As noted by Joshi (1980) the Indian policy makers have constantly faced the rising aspirations of traditionally depressed groups, with their equally rising frustrations. These have been accompanied by the ever persisting importance of ascriptive status; the emergence of Untouchable organizations aimed at increasing mobility; and the rapidly escalating opposition of fellow-citizens determined that change shall not occur. Indeed, it is within this scenario that the affirmative action policies that guarantee proportional legislative representation and encourage remedial benefits in education and government employment for the SCs can be understood. The result of these has been a certain level of political representation and government assistance for low-status minorities who face both poverty and prejudice. These policies are however deeply resented by many and are often blamed for rising violence against the SC population. It is not unusual for individuals to be unaware of their rights and more specifically the intricacies of the laws, but even if this is not the case, the process of enforcement may fail due to lack of resources or realistic remedies (especially true for marriage and property related laws). Barnhardt (2003) in her study of the Scheduled Castes and Scheduled Tribes (Prevention of Atrocities) Act, 1995 in relation to atrocities against SC women found that despite the establishment of Special Courts and Special Prosecutors, the rights of SC women continue to be violated because the government (and society more broadly) fails to enforce the existing laws. In 2004, out of 141, 881 cases in the court, filed under the SC and ST (Prevention of Atrocities) Act, 1989, less than 15% were disposed off by the courts. Women may not know their rights in some instances, but more often this is a result of their weak social position and inability to stand up to the upper caste rapists who had the support of the police and judges, often of the same castes. Several writers (Liddle and Joshi, 1986, Chakravarti, 2003, Beteille, 1990) have pointed out, the subordination of women was central to the caste system, hence upward mobility in the caste hierarchy meant that women had to strictly conform to caste codes in terms of restricted mobility, work participation and so on, what Srinivas (1962:9) termed ‘sanskritisation’. It is this ideology of guardianship (tied closely to control of female sexuality, reproduction and labour) that makes women the repositories of honour or ‘izzat’. In recent years this has led to honour killings decreed by caste panchayats for women and men who transgress codes of caste and community. The lower, dalit castes on the other hand, perhaps on account of their poverty and deprivation, were historically seen to practice more egalitarian gender norms. How far this trade off between material wellbeing and constraints on public mobility and visibility persists is no longer clear, as fewer restrictions on working outside their homes could be due to compelling poverty rather than a belief in women’s right to work (Deshpande, 2001), as demonstrated also by the sub-national studies. Secondly, while the lower castes continue to be materially deprived, they

171
have attempted to emulate upper caste traditions including the undervaluation of women’s role in the family and workplace, in addition to adopting the now ubiquitous practice of dowry (Kapadia, 1995). So while gender disadvantage and the undervaluation of women’s work and roles now seems to be widespread across castes, the factor of caste enhances the vulnerability of women of lower castes. Following up on the Constitutional guarantees, specific laws and policies have been framed across a realm of fields: work, property inheritance, marriage, dowry and violence, health and education. Given changes in the development context and access to new technologies, the need has arisen for new legislation and forms of protection, whether in terms of the Prenatal Diagnostic Techniques Act, 1994, that has sought to control the practice of sex-selective abortion resulting in increasingly adverse female to male sex ratios, or the Domestic Violence Act of 2005, a recognition of the growing occurrence of domestic violence across castes, classes and contexts. Given the continuing disparities in educational access and attainments between genders and between different caste groups, the 93rd Constitutional Amendment Act was passed in 2005 to make free and compulsory education for all children a fundamental right (not just a Directive Principle). In the realm of politics and governance, the Constitution 73rd Amendment Act, 1992, has made panchayats instruments of local-governance with potential space for women and marginalised groups in the federal set-up. In terms of assets and resource control, two recent pieces of legislation deserve mention: the Amendment to the Hindu Succession Act, 2005, which gave women equal rights to inherit property including agricultural land, and the Scheduled Tribes (Recognition of Rights) Act 2006, that has sought to ensure the STs control over their local livelihood resources. Given the changing nature of the economy in the 1990s with increased mobilization around women’s work and its concentration in the informal, unorganized sector, the realm of productive work has received serious attention, especially on account of its direct implications for economic growth. The Second National Commission on Labour was set up with two-fold objectives: a) to review the existing labour legislation and make suggestions for change; and b) to review the scope and spread of the informal sector and suggest suitable laws and policies for the protection and promotion of labour in this sector. The Second Labour Commission’s Report (2000) has sought to redefine the concept of the ‘right to work’ which figures in the Directive Principles of State Policy (Article 41) and invest it with the status and sanctity of a fundamental right. It summarizes the commitments of the Government with reference to the inalienable rights of workers under any system of labour laws and labour policy as:
(a) Right to work of one’s choice; (b) Right against discrimination; (c) Prohibition of child labour; (d) Just and humane conditions of work; (e) Right to social security; (f) Protection of wages including right to guaranteed wages; (g) Right to redress at of grievances; (h) Right to organise and form trade unions and right to collective bargaining, and (i) Right to participation in management.

172
Rights thus tell us how individual workers are constituted within the legal framework. These are then converted into/notified as laws, which as argued by Morris and Nott (1991), are closely related to the idea of justice. No law will be observed by all the people for all time. Accordingly, any legislation can be reviewed from two very distinct perspectives. One involves analyzing the theoretical limits of a law by looking for inconsistencies within the law or in relation to other laws. A second approach is to explore the practical limitations of law, as presented by the problem of enforcement. It would then be important to develop a clear understanding of the circumstances giving rise to the problem of non-implementation, but also a grasp of how the law itself is a response to a particular predicament or situation of social inequality and exploitation. It is for this purpose that relevant case studies and experiences of law enforcement become crucial in understanding both the practical and theoretical limitations of legislation, and thereafter finding a way forward. Some of the most important laws in favour of gender and caste equality that form the particular focus of this review are: A) Work-Related
· The Workmen’s Compensation Act, 1923; · Payment of Wages Act, 1936. · Minimum Wages Act, 1948 · Industrial Disputes Act, 1947 · Maternity Benefit Act, 1961 · Inter-State Migrant Workmen (R.E.C.S.) Act, 1979 · Beedi and Cigar Workers (Conditions of Employment) Act, 1966 · Building and Other Construction Workers (Regulation of Employment and
conditions of Service) Act, 1996 · Contract Labour (Regulation and Abolition) Act, 1970 · Factories Act, 1948 · Plantation Workers Act 1951 · The Mines Act, 1952 · Equal Remuneration Act, 1976 · The Personal Injuries (Compensation Insurance) Act, 1973; · The Bonded Labour System (Abolition) Act, 1976; · Unprotected Manual Workers (Regulation of Employment and Welfare) Act,
1979. · Employees State Insurance and Provident Fund Act · The Child Labour (Prohibition and Regulation) Act, 1986, Amendment in
2006. · National Rural Employment Guarantee Act, 2005 · The Sexual Harassment of women at workplace (prevention, prohibition and
redressal) Bill, 2006 · The Sex Workers’ Empowerment Bill, 2006 · The Unorganised Sector Workers Bill 2007 · The Unorganised Agricultural Sector Workers Bill, 2007 · The Unorganised Sector Social Security Bill 2007 B) Control over Resources and Assets · Muslim Women’s (Protection of Rights on Divorce) Act, 1986

173
· Hindu Succession Act, 1956 and Hindu Succession (Amendment) Act, 2005 · The Dowry Prohibition (Maintenance of Lists of Presents to the Bride and
Bridegroom) Rules, 1985 · Dowry Prohibition Act 1961 and Amendment Act 1986 · The Scheduled Tribes (Right to Recognition) Act, 2006 C) Health and Education · Preconception and Prenatal Diagnostic Techniques Act, 1994. · 93rd Constitutional Amendment Act, 2005 (Education as a fundamental right) · The Women Welfare Bill, 2006 D) Decision-making, Governance and Empowerment · Untouchability (Offences) Amendment Act, 1976 · The Scheduled Castes and Scheduled Tribes (Prevention of Atrocities) Act,
1989 · The National Commission for Women Act, 1990 · 73rd and 74th Constitutional Amendment Acts (providing women
representation in local government), 1992 · Prevention of Domestic Violence Act 2005 · The Right to Information Act, 2005
In addition to the Acts, there have been a range of policies too such as the National Policy for the Empowerment of Women (2001), National Health Policy (2002) and so on, each of which then get translated into a range of programmes and support structures. Law and rights however are contested, and it is important to recognize law itself as a social process. Legislating for the protection of workers in the unorganized sector in fact has been on the anvil for the last five years, yet this has not happened. Conflicts of interest are rampant, but it is important to recognize that these are both gendered and socially embedded. After briefly discussing this debate, we set out a framework for analyzing the interplay with informal institutions that seem to be posing barriers to the easy passage and implementation of laws. Informal Employment and Decent Work: The need for protection It has been consistently argued that the present laws and statutes cater mainly, if not solely, to the organised sector that accounts for less than 10% of the workforce and the remaining 90% in the informal sector are outside the purview of social security systems (Second NCLR). In recent years, with a globalizing economy and the adoption of a range of flexible labour arrangements, self-employment or informal employment appears to be the major engine of growth (Chandrasekhar and Ghosh, 2007). SC and ST households tend to be less dependent on self-employment than other social groups, possibly because the petty production of goods and services requires some control over assets, and access to credit, which they typically lack. But what is striking is the very low wages in this sector, often below the legal minimum wages in India. The ILO has conceptualised the informal economy, in view of both the nature of enterprise and of employment conditions as comprising of ‘informal employment (without secure contract, worker benefits, or social protection) both inside and outside

174
informal enterprises’. Informal employment refers to both self employment and wage employment – that is not recognised, nor regulated nor protected by legal or regulatory framework and non-remunerative work taken in income producing enterprises (ILO, 2002) The distinguishing feature of the informal economy is that most workers whether self employed or wage workers are deprived of social protection safeguards including work security, health care, retirement benefits and even representation (HNSA & ISST, 2006). It is evident that informal employment now extends to the casual and contract workers in the organised sector, who, for one reason or another, have failed to get the benefits of protective legislation and social security. In this sense, all workers, who are not covered by the existing Social Security Laws like Employees State Insurance Act, Employees Provident Fund and Miscellaneous Provisions Act, Payment of Gratuity Act and Maternity Benefit Act, can be considered as part of the unorganised sector. They do not have adequate bargaining power and are thus open to exploitation by entrepreneurs. Moreover, as the workers, particularly women, have not been able to organise themselves, they suffer further discrimination. The National Human Rights Commission Report (2006) broadly categorizes the work within informal sector as “small, unregistered, uncertain and unprotected”. The report further notes that 118 million women workers are engaged in the unorganized sector, constituting 97% of the total women workers in India, with clearly little security of work or income. Policies of liberalization post-1991, such as abolition of all industrial licensing policies, reduction in public expenditure, disinvestment in the public sector, ‘Exit’ provisions like the ‘Golden Handshake Policy’ (both in private and public sectors), have contributed to the enlargement of the informal sector. Global competition has had the effect of encouraging formal firms to hire workers at low wages, on loose contracts, with few social security benefits or to sub-contract (or out-source) the production of goods and services. Work is pushed out of the factories and formal work situations into small workshops (sweatshops), homes and informal situations. Such sub-contracting can be both domestic and international (Unni, 2001). Keeping this fluidity in mind and recognizing the continuum between formal and informal employment, it is useful to explore the practice of law across the range of employment opportunities in order to gain a comprehensive picture of the obstacles faced by working women in India along with their experiences of employment. The Equal Remuneration Act, 1976 provides for the payment of equal wages to men and women workers in order to prevent discrimination on grounds of sex. Eapen (2000) notes how in small manufacturing units of the Palghat industrial belt, Kerala, fresh female recruits were paid Rs 350 per month while their male counterparts with the same level of education got Rs 500. This was on the ground that women were only supplementary earners. This was a socially accepted norm that persisted despite the acknowledgement of the fact that in poorer households the contribution of women to family income was higher or often the only source of earning. Joan Mencher’s (1992) work on household budgets in two villages of South India reveals that while women earn less than men, they contribute almost the same amount as men to household budgets. They prioritise this over their personal expenses. Yet social norms are called into play to stop the implementation of the Act, by justifying differences in wage payments on the basis of the different tasks performed. This holds true for individual states and the country as a whole as seen in the table below.

175
Table A1.2 Enforcement of Provisions of Wage Laws during 2000-2001 (central) S.No Name of Act No. of Inspections Prosecutions launched Convictions obtained Claims filed
1 Payment of Wages Act, 1936 i) Mines 4951 1533 1336 - ii) Railways 1393 - - - iii) Air Transport 171 13 12
2 Minimum Wages Act, 1940 13222 9549 3541 2872 3 Contract Labour (R&A) Act, 1970 5268 3903 2019 138 4 Equal Remuneration Act, 1976 4112 903 - -
Uttar Pradesh 3405 380 496 6 5 Payment of Bonus Act, 1965 1003 45 26 - 6 Child Labour (P&R)) Act, 1986 1302 15 15 1
Uttar Pradesh 3843 418 Source: Office of the Chief Labour Commissioner (Central). A sectoral analysis can reveal the particular problems faced in each sector of work, and the difficulties of applying particular laws. Here we just provide one further example of the Minimum Wages Act and its lack of uniform implementation even within the government regulated National Rural Employment Guarantee Programme. Other examples can be drawn from home-based work, construction and brick-kilns and agriculture more widely. The Government implements several schemes and programmes for the welfare of rural workers including agricultural workers such as the Employment Assurance Scheme, Jawahar Gram Samridhi Yojana, Swarnajayanti Gram Swarojgar Yojana, etc. However, given the scale of the sector, implementation has always been a problem. Considering the inadequacy of the existing legislation, attempts have been made to enact a separate comprehensive legislation for agricultural workers. A draft Bill, ‘The Agricultural Workers (Employment, Conditions of Service and Welfare Measures) Bill, 1997’ was prepared by the Central Government. The proposed Bill incorporated provisions relating to registration of land-owners and agricultural workers, working conditions, creation of a welfare fund, implementation of welfare schemes, setting up a dispute resolution mechanism, etc. However, the efforts of the Central Government have not succeeded so far because of opposition from some States, representing the interests of the landed (Corbridge and Harriss, 2000). A revised bill entitled the ‘Unorganised Agricultural Sector Workers (Conditions of Work and Livelihood Promotion) Bill, 2007, has now been prepared for tabling in Parliament. A similar bill has been prepared for Unorganised Workers in general and to ensure them basic social security. Given a crisis of employment for the poor, both rural and urban, Parliament passed in 2005 the National Rural Employment Guarantee Act. A quick assessment brings out some of the specific problems of implementation which relate to both social and community norms as well as mainstream mindsets about women’s work.
176
National Rural Employment Guarantee Programme The NREGA was the result of long-standing mobilisation by workers organisations, women’s organizations and youth and student organizations, as part of the Government’s commitment to the Right to Work. “Har Haath Ko Kaam Do, Kaam Ko Poora Daam Do” Work for Every Hand, Full Wages for Every Work! was the slogan that led the collective struggle of more than two hundred organizations who campaigned for the enactment of the Employment Guarantee Act. The draft of the Act was based on the Maharashtra Employment Guarantee Scheme, but with some important changes like stronger provisions for transparency and the active involvement of Panchayati Raj Institutions. The objective of the Act is to provide for the enhancement of the livelihood security of the households in the rural areas of the country by providing at least 100 days of guaranteed wage employment in a financial year to every household whose adult members volunteer to do unskilled manual work. NREGA was brought into force from 2nd February 2006 in 200 most backward districts in 27 States selected for the first phase. With the notification on 2nd February 2006, the rural households in these districts have got the right to register themselves with the local Gram Panchayat, the principal implementation agency, as persons interested in getting employment under the Act. Once registered, a Job card is issued to the household by the Gram Panchayat. Work is to be given within 15 days of the date of demand. Employment is to be provided within a radius of 5 kilometers of residence. If not, extra-wages at the rate of 10% of the wage would be provided towards transport and living expenses. However, if employment is not provided within 15 days from the date from which the applicant demands employment, a daily unemployment allowance in cash has to be paid. The workers are entitled for the statutory minimum wages applicable to agricultural workers in the State. Work-site facilities like safe drinking water, shade for children, first-aid box etc are also to be made available to workers. The Act focuses on works relating to water conservation, drought proofing (including afforestation), land development, flood control/protection (including drainage in waterlogged areas) and rural connectivity in terms of all-weather roads. Each district has to prepare a perspective plan for 5 years with a bottom-up approach deriving from the needs of the local community. As noted by Chakraborty (2007), the NREGA provides for a multi-tier structure of authority for implementation and monitoring of the scheme with specified functions and duties for each authority. The agencies involved are central employment guarantee council, state employment guarantee council, district programme coordinator, the programme officer appointed by the state government and the gram panchayat. The responsibility of the gram panchayat is the identification, execution and supervision of projects as per the recommendations of the gram sabha (village assembly). For accountability and transparency purposes, the gram sabhas are given the power to conduct a regular social audit of individual schemes. The authority entrusted with the implementation as laid down indicates that a coordinated approach of different tiers of governments or vertical coordination is critical for successful implementation of the scheme. In its absence, the effectiveness is reduced as evident especially from the performance of the poorer states. Data provided in the latest report on NREGA published by the Ministry of Rural Development indicates that the fund utilisation ratio remains as low as 51 per cent even after the completion of one full

177
year of operation, and lower in the poorer States due to problems of both implementation and funding. A study on the implementation of NREGA in four states, namely, Andhra Pradesh, Madhya Pradesh, Chhatisgarh and Jharkhand in May-June 2006, found a series of issues in relation to implementation: non-issue of job cards, lack of awareness about the wages, improper maintenance of muster rolls, under-payment and delayed payments, lack of facilities at the worksite. The survey team reported surprise at the response of supervisors who justified underpayment of wages with excuses such as the tribals being inefficient as they often came to work in drunken state and hence were not able to complete the task assigned to them. Systematic gender discrimination in wages was also found, which mainly took two forms. Firstly, women were assigned tasks which were supposedly less demanding, which in other words also meant that they were given tasks which resulted in lower wage entitlements. For example, women were discouraged from cutting hard soil and instead preferred for carrying soil. Secondly, women were also found to take assistance of their children more often than men and hence the ‘invisible worker’ symptom was more common for women. (CBGA, 2006: 58).22 Another study in Rajasthan, Orissa, Madhya Pradesh and Karnataka had similar findings in terms of more than 35% reporting corruption (highest in Orissa), non-payment of stipulated minimum wages, manipulation in wage distribution, poor quality of construction materials and false muster rolls, except for Karnataka. Additionally, they found that often more than 50% of the workers on the sites were women, in Rajasthan 70-80%, yet child care facilities were sorely inadequate if not totally lacking. They also found systematic gender wage gaps (e.g Rs 38-40 per day instead of the Rs 73 minimum wage in Rajasthan) and the near total exclusion of women from participation in decision-making in the gram sabhas (ILO and ISST, 2006). These Reports made several recommendations to improve implementation: the translation of the Guidelines and its dissemination also through radio and other media to enhance awareness about the provisions of the Act, workers entitlements to be listed on the job cards and women to be made eligible to apply (not just widows), consultation of the works to be undertaken should be localized and more widespread (women for instance preferred water development activities), work-site facilities to be provided especially for child care and penalties imposed for their absence, payments to be made on time, and where these are very low, piece rates to be replaced by daily rates, muster rolls should be displayed and social audits encouraged. The NREGA is still in its early days, and being a flagship programme of the UPA government, the stakes are high to get it right. It is perhaps too early to evaluate the programme, yet warning signals need to be taken serious note of, if any change is to be made. Apart from women, the programme is also significant for the Scheduled Castes and Scheduled Tribes, who are likely to dominate as its participants, hence there is need for close monitoring to ensure that discrimination is not further
22 See also Bhatia and Dreze (2006), Jacob and Varghese (2006), Louis (2006) on implementation of NREGA in different states.

178
perpetrated. If the NREGA works, it could form an example for bridging the gaps between theory and practice in relation to other laws and policies as well. Informal Institutions By “informal institutions”, Martha Nussbaum and Amartya Sen (1993) mean the set of rules of conduct, norms, routines, traditions which are deeply settled down in every society and implicitly command its organization. One could also call it “social institutions”. The literature on institutions and development has generally dealt with questions of grand design such as the Constitution, the rule of law, property rights etc, frequently overlooking the importance of informal rules embodied in culture. Even when women formally have the same rights and liberty as men (which are still not effective everywhere), mentalities are strongly rooted in traditions and existing social norms, which constrain them from realizing these claims. Legal opportunities are essential but not sufficient, it is indispensable to act on informal institutions to reinforce women’s capabilities. In fact, the degree of success/failure of any specific policy reform or a set of policy reform measures may depend on institutional developments and complementary institutional reforms. The National Policy for the Empowerment of Women (2001) also recognizes the impact of informal institutions on the lives of the women.
· 1.9 The underlying causes of gender inequality are related to social and economic structure, which is based on informal and formal norms, and practices.
· 1.10 Consequently, the access of women particularly those belonging to weaker sections including Scheduled Castes/Scheduled Tribes/Other backward Classes and minorities, majority of whom are in the rural areas and in the informal, unorganized sector – to education, health and productive resources, among others, is inadequate. Therefore, they remain largely marginalized, poor and socially excluded.
Anthropological and other research has detailed the range of women-unfriendly norms, practices and customs in different communities and societies. Ever since the work of Ester Boserup (1970) over three decades ago, research and policy evidence has accumulated that both informal and formal institutions may sometimes be supportive of, but can often be inimical to gender equality. According to Gita Sen (2006), while there is considerable variation across different regions, countries and communities, the norms that underpin practices cover a range that includes unequal access to and control over property, economic assets and inheritance; strongly defined gender-based divisions of labour within and outside the home; unequal participation in political institutions from village to international levels; unequal restrictions on physical mobility, reproduction and sexuality; sanctioned violation of women’s and girls’ bodily integrity; and accepted codes of social conduct that condone and even reward violence against women. Further Sen (ibid) notes that these norms reflect and reproduce underlying gendered relations of power, and this is fundamentally what makes them difficult to alter or transform. Gendered informal institutions cover the entire gamut of human interaction, from the most private sphere of sexuality to the public arenas of economic and political life. Consequently, they form a web of beliefs and practices whose

179
different strands mutually reinforce each other. Cutting through these strands or replacing them with norms that are more gender equal can therefore be time-consuming and often frustrating. Policy change is more than a matter of rational choice and “good information – education – communication” (IEC), as changes may be opposed or subverted by power-holders, or women themselves, in subtle and creative ways. However, it is important to remember that not all formal institutions are beneficial and not all informal ones are harmful. Once we acknowledge that informal institutions (like formal ones) can have both positive and negative elements when viewed from the standpoint of gender equality and women’s rights, we can better understand how women themselves attempt to adapt them to their needs wherever possible This is noteworthy because women often have greater presence in spaces where informal institutions abound and they may be able to use and even shape some of them to meet those needs. This can mean that women may themselves have a stake in the continuance of certain institutions and therefore be unwilling to give them up. Sen (ibid.) therefore proposes that in relation to formal institutions, informal institutions may be complementary, accommodating, substitutive, competing, or dominant. Such a framework that explores the terms of interaction between formal and informal institutions can be helpful for developing more nuanced policies favouring gender equality in different contexts.
Table A1.3 Possible Interaction Modes between Formal and Informal Institutions FI favouring gender equality exist FI favouring GE
do not exist Strong FIs Weak FIs IIs favour GE 1. Complementary:
Knowledge networks and use of ICTs, Maternal health
3. Substitutive: Women’s SHGs (SEWA/NCL gaining recognition for informal employment), women’s courts, (ICDS)/child-care cooperatives
5. Dominant: Micro-finance (mutual lending); mutual help with care, sharing labour and assets, community based health insurance, age plays a role in enhancing d-m
IIs oppose GE 2. Accommodating: Reproduction and the gender division of work: Political representation in panchayats, equal remuneration and minimum wages (host of labour laws), ILGIs in Karnataka (all male) arbitrate disputes, engage in peer education, support people in distress.
4. Competing: Marriage the path to social security: Dowry, early marriage, unequal wages, son preference, sex determination and foeticide, unequal educational access, difference in health care services and nutrition
6. Dominant: Aspirations to higher status in the wake of material welfare: Caste panchayats, unequal work burdens, customary inheritance laws, treatment of widows/FHH, control mobility and sexuality, seclusion

180
Note 1: FI – formal institutions; II – Informal institutions. Note 2: The examples do not inherently belong in a particular cell, but represent cases selected for the GCGA. It is worth clarifying and expanding on some of these categories with specific reference to the laws and policies mentioned above. This would help understand why some laws may work better than others, in particular, the near-total failure of labour and property laws to ensure gender equality. Dominant (negative) institutions – cell 6: Where formal institutions favouring gender equality have not even been created, informal institutions will be dominant, whether or not they favour gender equality. Often they involve practices that control women’s physical mobility and autonomy, and limit their rights to bodily integrity especially in matters related to sexuality and reproduction, as well as inheritance and property rights and enforce rigid divisions of labour by sex. The Protection of Women from Domestic Violence Act was approved and passed by Parliament in 2005. While the impact is not yet clear, societal responses to domestic violence still largely exclude legal intervention. Karlekar (1995) argues that there is indeed a societal tolerance for wife-abuse, which is very often even considered justifiable under certain circumstance: disputes over dowries, a wife’s sexual infidelities, her neglect of household duties, and her disobedience of her husband’s dictates are all considered legitimate causes for wife-beating. It is only when the torture becomes unbearable or death appeared imminent that most women appeared willing to speak out. In a study on domestic violence in the marital relationship in a rural setting of Gujarat, Visaria (2000) found that contrary to the prevalent belief there was no significant relationship between beating and the educational qualification of the couple. Educated women are beaten as much by their husbands as those who are illiterate or less educated. The study also points out that family income, husband’s occupation and employment of women are not co-related with wife battering. A couple of women also hinted that men know that their wives cannot report such punishment even to their own parents or seek medical treatment due to a sense of shame. Kothari (2005) and Agnes (1998) note that in many police stations, even when complaints are filed, there is a focus on ‘conciliation’ rather than ‘punishment’. One cannot assume however that conviction of the husband is necessarily the best solution to their problems, as women are still left with the problem of survival and rebuilding their lives. Marriage seems to offer better security and resource claims than the alternatives facing women (Kandiyoti, 1988, Jackson, 2007). Competing informal institutions – cell 4: When formal institutions exist but are weakly enforced, informal institutions that oppose gender equality compete with them for influence. Examples include norms of civil codes around marriage, the abolition of dowry, child marriage, sex selection biased against females, equal access to education, nutrition, or health care, unequal wage-rates to name a few. An example is the anti-dowry Act in India which has never been effectively enforced; in the meanwhile, the phenomenon of dowry has been expanding even into communities where it did not exist previously. Kodoth (2005) in the contexts of West Bengal and Kerala notes how agrarian reform itself has reproduced female disadvantage in property rights. With a reduction in landlessness and poverty, ‘status-ascribing’ practices, such as female seclusion and withdrawal from outside work, have been consolidated. But further, alienation of land on account of dowry is pronounced among agricultural labour, small peasant and working class

181
households of the lower castes, who received land through the land reform process. In the case of Bengal, the shift to dowry is embedded in processes of aspiration to higher ritual status, decline of female industrial labour in the early 20th century, devaluation of women’s labour in agriculture and a continued disproportionate emphasis on the marriage of girls. The rising demands for dowry have had other negative consequences: encouraging low age of marriage (16.8 at All India level according to the NFHS-3)23, blocking prospects for education and skill accumulation, and curtailing women’s inheritance rights, but worst perhaps is the enhancement of sex-selection abortions. Legislation has been formulated or amended to tackle each of these growing problems within the last decade, and with the exception of education, there has been little visible impact. Interestingly, an investment in education is pursued as a means of negotiating a better marriage rather than with a view to a career. Similarly, the 73rd Amendment to the Indian Constitution reserves a third of the seats in panchayats (village councils) for women. However, subversion of these processes has occurred in some instances where the Act has been weakly enforced. From the beginning, cases were documented where husbands or other male kin blatantly substituted for elected women in the functioning of some of the councils. Elected women have also been forced in some instances to resign and make way for the appointment of male representatives. More recently, stories have begun to emerge about creative forms of subversion in which the entire village plays a role. Reports from the state of Gujarat affirm that the state government has been giving monetary incentives to villages that agreed unanimously to single candidates for the president’s seat, thereby doing away with elections altogether! This is justified on grounds of saving funds which can be used for village development. Accommodating informal institutions – cell 2: Informal institutions that oppose gender equality may be forced to accommodate to formal institutions when the latter are strong. One example is the success of peer education programmes as well as empowerment and sensitisation programmes in dealing with adolescent sexuality in the context of HIV/Aids. Many such programmes are part of new formal institutions that challenge the traditional beliefs and practices around sexuality and norms of femininity and masculinity. Another example from Karnataka is of the co-existence of informal, local governance institutions (ILGI) with the elected Gram Panchayats. These bodies are rooted in traditional practices, values and power relations, yet in the face of strong panchayati raj institutions (PRIs), they have turned to acting as support structures at the village level: arbitrating disputes, providing assistance to people in distress including destitute women, organizing social and religious activities (including mass marriages), mobilizing resources for development projects and so on (Ananth Pur, 2002). While the leadership of the ILGIs is largely drawn from the elite, here they co-exist and don’t necessarily influence the elected panchayats only in a negative way, unlike the caste (khap) panchayats in large parts of northern India.
23 Child Marriage Restraint Act was passed in 1978. Santhya and Jejeebhoy (2003) note that in 1998-9 one in three adolescent girls between the ages of 15 and 19 was already married. Regional variations exist: 25% of women aged 20-24 were married before 18 years in Tamil Nadu, while this was 60% in the case of Uttar Pradesh.

182
Dominant (positive) institutions – cell 5: While many informal institutions may be harmful, not all are. In the absence of formal support women have to make do with their own resources. The best examples are institutions for mutual lending in the absence of formal credit institutions, which can increase women’s access to and control over economic resources. Less well known are other informal pooling mechanisms among women that involve sharing of labour resources, mutual help with child-care and care of the sick and old, and mutual help with such essential activities as water and fuel collection. Such support is usually cemented through informal ties of reciprocity and mutual obligations. One successful intervention documented and analysed by Acharya and Ranson (2005) relates to Community based health insurance (CBHI) – a mechanism for pooling local resources to cover the costs of future, unpredictable health-related events, a major burden on the poor. Contribution to the Navsarjan health insurance fund in Gujarat is made by the members and enhanced by a contribution from a donor agency (Hivos) and a discount from the New India Assurance Company.
Substitutive informal institutions – cell 3: There are also positive examples of informal institutions that substitute for weak formal institutions in economic and legal areas. Tontines operate on the basis of well-known informal norms to ensure access to credit and savings for women who are excluded by gender-blind or biased formal credit norms. A different example is the case of women in the state of Gujarat who, when they found themselves treated as second-class citizens by the textile trade unions, formed their own cooperative, the Self Employed Women’s Association (SEWA) (Jhabvala, 1994). Starting with credit and legal services, in response to the demand for childcare, SEWA promoted childcare cooperatives, to provide services to working class women. As noted by Chatterjee (2006) the SEWA experience demonstrates that adequate childcare encourages school-going among children and helps tackle social barriers such as caste. Many women can also find employment as crèche teachers and this helps them forge bonds with other women. But most important, when childcare is available for the children of poor women workers, and according to their hours of work, they are able to work and earn more. From their studies in Kheda and Surendranagar districts, they learnt that all mothers reported income raise of 50 per cent and more. One of the members stated, “Since these centres started, I can work and earn in peace. I am no longer tense and worried about my child. And when I come home tired, I’m glad to see my child well-fed and happy.” Yet another example is the nari adalats or women’s courts in different states in India. When they found that they could not get justice from the male-dominated village panchayats (councils), village women created these courts with their own rules, procedures for investigation and evidence in order to provide justice to women in cases of domestic violence, land disputes, dowry, rape and murder. These have become a respected and powerful way by which poor rural women are able to obtain recourse to justice which was otherwise out of their reach. Complementary informal institutions – cell 1: Women’s role as mothers is one that is supported by both formal and informal institutions. A recent example is the use made of a traditional norm by a gender and health equity programme to improve maternal health in the state of Karnataka in India. The traditional norm requires that a special social ceremony be performed for
183
pregnant women at the start of the third trimester. Generally viewed as a positive cultural practice, it neatly complements formal maternal health programmes that attempt to raise families’ and the communities’ concern for the health of pregnant women. In the programme, moreover, the traditional ceremony, usually viewed as a women’s ceremony, has been modified so that men are included and take part in honouring their pregnant wives. This has become a way by which men publicly acknowledge their responsibility for the health of the pregnant woman. Another example comes from the field of knowledge, where women are seen to possess traditional knowledge relating to seed preservation and storage, food processing, indigenous health practices etc. Such forms of knowledge are contextual, rooted in experience and often not codified. Nath (2001) argues that the new knowledge networks need to value the contextual knowledge of women and recognize their capacity to act on the basis of a given knowledge set. They can help women articulate and share their experiences, hence alternative mechanisms and channels need to be developed for this purpose, which can influence decision-making and also strengthen democratic processes. The setting up of 72 Village Knowledge Centers in Tamil Nadu, Pondicherry, Maharashtra, Orissa and Rajasthan under Mission 2007 – Every Village a Knowledge Centre, with the support of several international and national agencies could be a step in such a process (www.mssrf-nva.org accessed on 10/12/07). While it is easy to understand why women may be strongly supportive of informal institutions that actually meet some of their needs, especially when formal institutions fail to do so, or do so weakly, it is important to ask why do women sometimes support informal norms that appear to work against them - limit their mobility, reduce their life chances, stigmatise and violate them, and subordinate them within power relations? Clearly they do exercise some agency in making these choices.
Sen (2006) offers a number of reasons, several of them confirmed by the sub-national studies:
· Women may give in because sanctions are too strong, and submission may buy peace or even survival. This may be especially true in areas involving physical mobility, sexuality or reproduction.
· Women may themselves reproduce informal institutions because this gives them status (presently or with age) despite being painful or dangerous (the case of dowry and violence).
· Women may tolerate loss of control and agency because they trade this off against economic support especially if their ‘fallback position’ (Sen 1990) is weak (and this is increasingly the case in a context of stagnating and low-paid work opportunities).
· Women submit to negative norms because it assures their integration into social networks that may be crucial to their own survival and that of their children.
· Some informal institutions, such as segregation during menstruation or post-partum, may actually give them much needed rest, although to outside observers they may appear to be stigmatising.

184
Conclusions The changes that can be witnessed in terms of gender and caste equality within the legal framework in India suggest how a policy of equality is increasingly pursued and some might even argue that matters have reached a stage where women are at no substantial disadvantage compared to their male counterparts. This is especially so when one is looking at laws related to women across sectors. However, Acts such as the Equal Remuneration 1976 and Minimum Wages Act 1948, are rendered less effective when the many social practices seen as ‘normal’ from a cultural point of view, are taken into account. Even within Government Schemes it has been found that women are paid less than men. Shifting patterns and structures of employment have aggravated the problem of invisibility, but also insecurity, and this is further reinforced by social norms and attitudes relating to the gender divisions of work, especially the notion of ‘family labour’ and the differential valuations of productive and reproductive work. While formal institutions focus on the individual; rather than being free-floating bodies, these individuals are embedded within a social structure that in many ways shapes the extent to which they can exercise their individuality and claim their legitimate rights. In the present context on insecure employment and declining real wages, security for women is increasingly seen to lie in the realm of the familial and social, rather than public and political, leading to the ineffectiveness of a growing number of laws and policies. A final word needs to be said about the mechanisms for implementation of formal laws directed to ensuring equality. While there is a Ministry of Women and Child Development at the central and state levels and a gender focal point in each Ministry, the latter continue to be marginalized. They lack the teeth to demand accountability from their counterparts in other Ministries. While laws relating to inheritance and dowry are derailed on account of the strength of local institutions, labour laws are increasingly difficult to implement on account of the informalisation and dispersed nature of work on the one hand and the social embeddedness of the implementers on the other. Perhaps the way forward is to support and enhance gender equal practices in areas which are not directly opposed by informal institutions in the first instance, followed by a strong package of formal support that can help women themselves make choices that tackle the barriers imposed by the dominant (negative) and competing informal institutions.

185
Annexure 2 Methodology of the report As per the TOR, a mixed methods approach has been used for this GCGA combining a review of the literature with a statistical analysis based on existing datasets, and complementing this with in-depth sub-national studies in two states, namely, West Bengal and Uttar Pradesh. The latter provides some insights into the processes and mechanisms through which growth occurs or fails to occur. Female education, for instance, is seen in the literature to have many benefits: to improve the skills and productivity of labour, to exercise a downward pressure on fertility and enhance the investment in children’s education. In the case of West Bengal, while the latter two processes are visible as a result of female education, female participation in the labour force has not improved. In fact, upward social mobility has created pressures in favour of female seclusion and lack of mobility, even amongst the lower caste groups. The review of literature has drawn on both economic research on inequality and its relationship to growth as well as anthropological understandings of inequality and change. It has focused particularly in the area of employment and notions of work. Apart from the general literature, data and background material for the states of Uttar Pradesh and West Bengal have been collected and analysed, including the State Human Development Reports. The two states present a contrast in terms of disparity, levels of female autonomy and effectiveness of state social policy. A major part of the review has included an institutional analysis that clearly identifies policies and laws in existence and how they interact with social institutions that continue to hamper shared growth, in order to suggest ways forward. All analysis of gender has included social, ethnic and religious group. The statistical analysis is based on three major datasets. Four rounds of the National Sample Survey Employment and Unemployment Surveys have been used to establish trends in labour force participation, wages and education over the last two decades. Shifts over the last two time periods namely 1998-9 and 2004-05 helps capture the impacts of growth, which has reached a high of 8-9% over the last few years, following a rapid expansion especially in the services sector. Three rounds of the National Family Health Survey have been analysed mainly for the purposes of calculating a Gender Caste Development Index as well as a disparity index based on five variables: land, livestock, consumer durables, occupation and education. The NFHS data has also been used to provide some insight into decision-making and violence issues. Two rounds of the Human Development Profile for India (HDPI) surveys have been analysed in order to quantify implications of gender inequality by caste group for income growth, using panel data regression analysis24. The second phase of work has involved undertaking sub-national studies in the states of Uttar Pradesh and West Bengal. The purpose of the sub-national study was to provide deeper insight into some of the growth pathways emerging from the statistical analysis. What is it within the household and community environment that facilitates
24 The first round of surveys took place in 1992/93, and the second round, in which the same households and individuals, insofar as possible, were resurveyed, in 2004/5. A technical note on the panel data econometric analysis is in Annexure 3A.
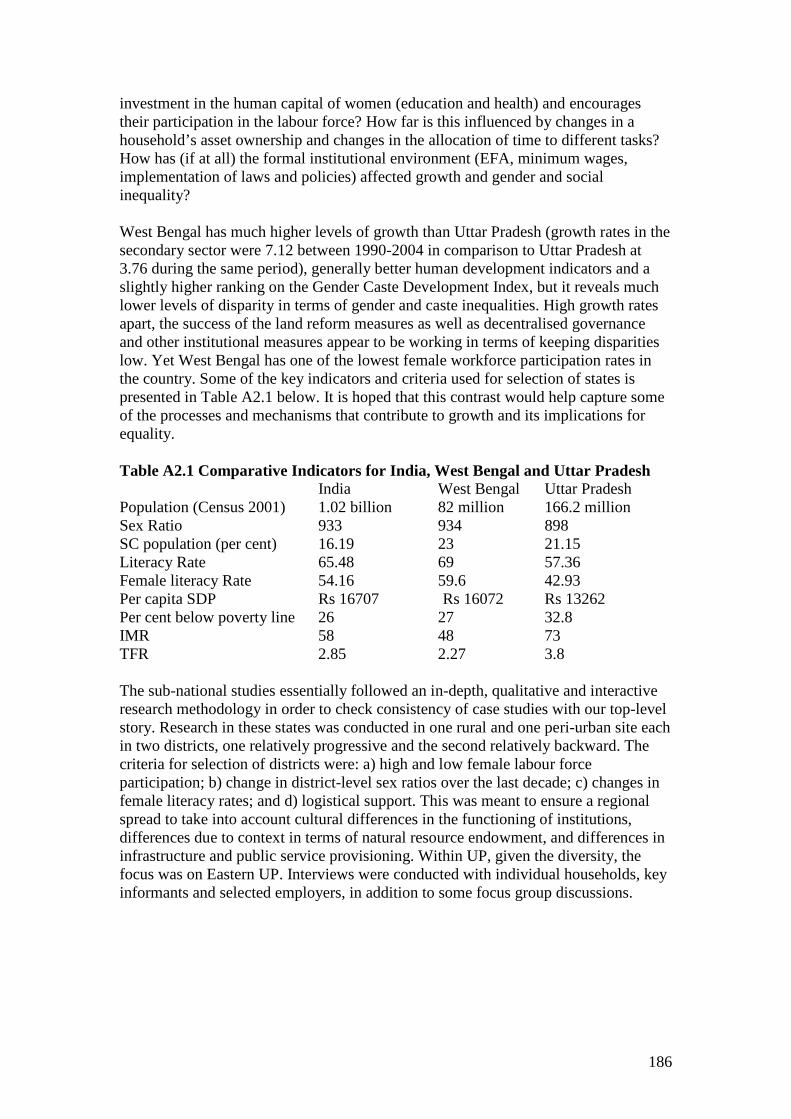
186
investment in the human capital of women (education and health) and encourages their participation in the labour force? How far is this influenced by changes in a household’s asset ownership and changes in the allocation of time to different tasks? How has (if at all) the formal institutional environment (EFA, minimum wages, implementation of laws and policies) affected growth and gender and social inequality? West Bengal has much higher levels of growth than Uttar Pradesh (growth rates in the secondary sector were 7.12 between 1990-2004 in comparison to Uttar Pradesh at 3.76 during the same period), generally better human development indicators and a slightly higher ranking on the Gender Caste Development Index, but it reveals much lower levels of disparity in terms of gender and caste inequalities. High growth rates apart, the success of the land reform measures as well as decentralised governance and other institutional measures appear to be working in terms of keeping disparities low. Yet West Bengal has one of the lowest female workforce participation rates in the country. Some of the key indicators and criteria used for selection of states is presented in Table A2.1 below. It is hoped that this contrast would help capture some of the processes and mechanisms that contribute to growth and its implications for equality. Table A2.1 Comparative Indicators for India, West Bengal and Uttar Pradesh India West Bengal Uttar Pradesh Population (Census 2001) 1.02 billion 82 million 166.2 million Sex Ratio 933 934 898 SC population (per cent) 16.19 23 21.15 Literacy Rate 65.48 69 57.36 Female literacy Rate 54.16 59.6 42.93 Per capita SDP Rs 16707 Rs 16072 Rs 13262 Per cent below poverty line 26 27 32.8 IMR 58 48 73 TFR 2.85 2.27 3.8 The sub-national studies essentially followed an in-depth, qualitative and interactive research methodology in order to check consistency of case studies with our top-level story. Research in these states was conducted in one rural and one peri-urban site each in two districts, one relatively progressive and the second relatively backward. The criteria for selection of districts were: a) high and low female labour force participation; b) change in district-level sex ratios over the last decade; c) changes in female literacy rates; and d) logistical support. This was meant to ensure a regional spread to take into account cultural differences in the functioning of institutions, differences due to context in terms of natural resource endowment, and differences in infrastructure and public service provisioning. Within UP, given the diversity, the focus was on Eastern UP. Interviews were conducted with individual households, key informants and selected employers, in addition to some focus group discussions.
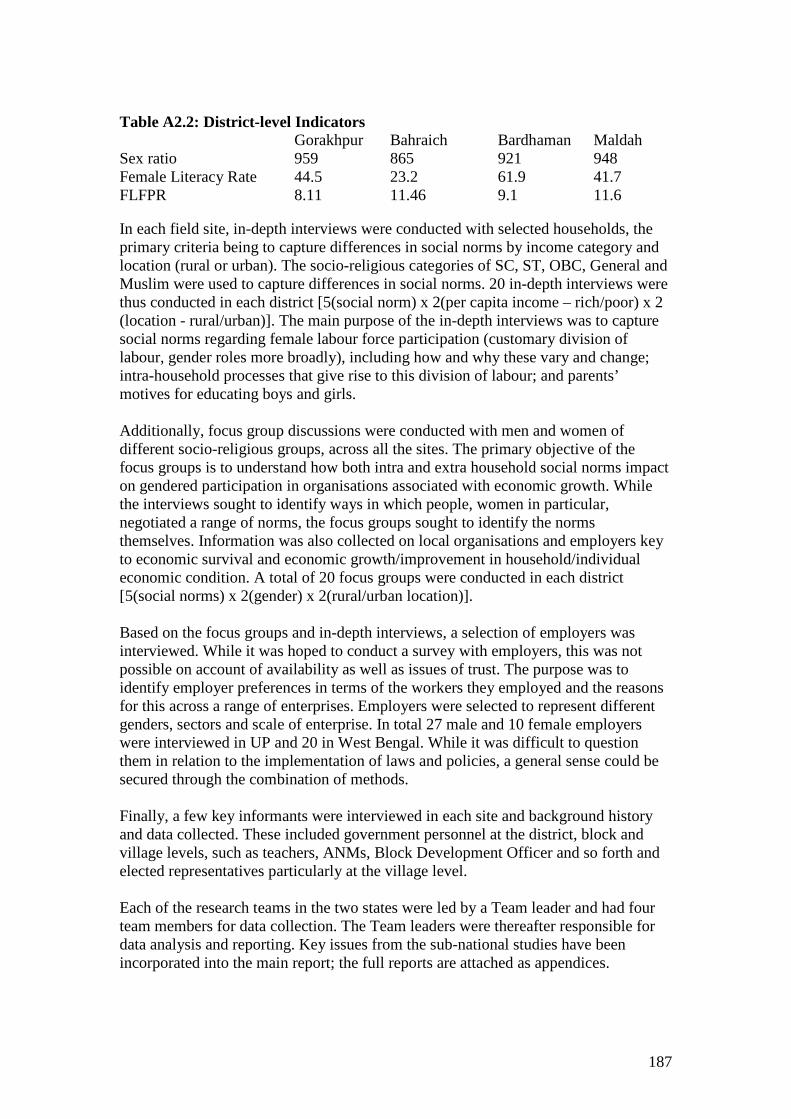
187
Table A2.2: District-level Indicators Gorakhpur Bahraich Bardhaman Maldah Sex ratio 959 865 921 948 Female Literacy Rate 44.5 23.2 61.9 41.7 FLFPR 8.11 11.46 9.1 11.6 In each field site, in-depth interviews were conducted with selected households, the primary criteria being to capture differences in social norms by income category and location (rural or urban). The socio-religious categories of SC, ST, OBC, General and Muslim were used to capture differences in social norms. 20 in-depth interviews were thus conducted in each district [5(social norm) x 2(per capita income – rich/poor) x 2 (location - rural/urban)]. The main purpose of the in-depth interviews was to capture social norms regarding female labour force participation (customary division of labour, gender roles more broadly), including how and why these vary and change; intra-household processes that give rise to this division of labour; and parents’ motives for educating boys and girls. Additionally, focus group discussions were conducted with men and women of different socio-religious groups, across all the sites. The primary objective of the focus groups is to understand how both intra and extra household social norms impact on gendered participation in organisations associated with economic growth. While the interviews sought to identify ways in which people, women in particular, negotiated a range of norms, the focus groups sought to identify the norms themselves. Information was also collected on local organisations and employers key to economic survival and economic growth/improvement in household/individual economic condition. A total of 20 focus groups were conducted in each district [5(social norms) x 2(gender) x 2(rural/urban location)]. Based on the focus groups and in-depth interviews, a selection of employers was interviewed. While it was hoped to conduct a survey with employers, this was not possible on account of availability as well as issues of trust. The purpose was to identify employer preferences in terms of the workers they employed and the reasons for this across a range of enterprises. Employers were selected to represent different genders, sectors and scale of enterprise. In total 27 male and 10 female employers were interviewed in UP and 20 in West Bengal. While it was difficult to question them in relation to the implementation of laws and policies, a general sense could be secured through the combination of methods. Finally, a few key informants were interviewed in each site and background history and data collected. These included government personnel at the district, block and village levels, such as teachers, ANMs, Block Development Officer and so forth and elected representatives particularly at the village level. Each of the research teams in the two states were led by a Team leader and had four team members for data collection. The Team leaders were thereafter responsible for data analysis and reporting. Key issues from the sub-national studies have been incorporated into the main report; the full reports are attached as appendices.

188
Annexure 3 A. A technical note on panel data regression analysis Tables 3.6 and 4.5 report the results of a panel data regression analysis (see Annexure 2 for a description of the dataset), that relates income of household i at time t ( ity ) to
a set of household characteristics ( 'itX ):
2,1,,...,1' ==++= tNiuXy ititit ba
This note justifies the choice of model (random effects) and estimators (generalised least squares). Panel data regressions combine a time-series element (t = 1,…, T) with a cross-sectional element (i = 1, … , N), which has implications for the structure of the error component itu . One-way error component models are most commonly used in panel data regression analysis:
itiitu um += where im is an unobservable, time-invariant individual specific effect, and itu the
remainder disturbance. In so-called fixed effects models, the im are considered to be parameters to be estimated. In the present context, the resulting loss in degrees of freedom would be unacceptably large. If the im can be assumed to be random, and the
additional assumptions are imposed that ),0(),,0( 22um susm IIDIID iti »» , the im are
independent of the itu , and the 'itX are independent of the im and itu for all i and t, a
so-called random effects model is obtained, which does not suffer from the large loss in degrees of freedom that the fixed effects model suffers from. The random effects model is generally considered to be appropriate for large-scale household panel studies (e.g. Baltagi 1995). Nonetheless, it may be shown that in random effects models the error terms of the cross-sectional units (i.e. households) are serially correlated; which means that OLS estimators will be inefficient. To obtain efficient estimators, the generalised least squares (GLS) method is appropriate (for mathematics and proof, see e.g. Hayashi 2000). B.NSSO definitions of employment status Usual principal activity status: The usual activity status relates to the activity status of a person during the reference period of 365 days preceding the date of survey. The activity status on which a person spent relatively longer time (i.e. major time criterion) during the 365 days preceding the date of survey is considered as the usual principal activity status of the person. Usual subsidiary economic activity status: A person whose usual principal status was determined on the basis of the major time criterion could have pursued some economic activity for a shorter time throughout the reference year of 365 days

189
preceding the date of survey or for a minor period, which is not less than 30 days, during the reference year. The status in which such economic activity was pursued was the subsidiary economic activity status of that person. Usual activity status considering principal and subsidiary status taken together: The usual status, determined on the basis of the usual principal activity and usual subsidiary economic activity of a person taken together, is considered as the usual activity status of the person and is written as usual status (ps+ss). According to the usual status (ps+ss), workers are those who perform some work activity either in the principal status or in the subsidiary status. Thus, a person who is not a worker in the usual principal status is considered as worker according to the usual status (ps+ss), if the person pursues some subsidiary economic activity for 30 days or more during 365 days preceding the date of survey. Current weekly activity status: The current weekly activity status of a person is the activity status obtaining for a person during a reference period of 7 days preceding the date of survey. It is decided on the basis of a certain priority cum major time criterion. According to the priority criterion, the status of ‘working’ gets priority over the status of ‘not working but seeking or available for work’ that, in turn, gets priority over the status of ‘neither working nor available for work’. A person was considered working (or employed) if he/she, while pursuing any economic activity, had worked for at least one hour on at least one day during the 7 days preceding the date of survey. A person was considered ‘seeking or available for work (or unemployed)’ if, during the reference week, no economic activity was pursued by the person but he/she made efforts to get work or had been available for work any time during the reference week though not active ly seeking work in the belief that no work was available. A person who had neither worked nor was available for work any time during the reference week was considered as engaged in non-economic activities (or not in labour force). After deciding the broad current weekly activity status of a person on the basis of 'priority' criterion, the detailed current activity status was then decided on the basis of 'major time' criterion if that person pursued multiple economic activities. Current daily activity status The current daily activity status for a person was determined on the basis of his/her activity status on each day of the reference week using a priority-cum-major time criterion (day to day labour time disposition). Underemployment is commonly defined as the under- utilisation of labour time of the workers. Some of the persons categorised as usually employed, do not have work throughout the year due to seasonality in work or otherwise and their labour time is not fully utilised - they are, therefore, underemployed. Their underemployment is termed visible underemployment if they report themselves to be not working with respect to a shorter reference period. The NSS measures the visible underemployment by cross classifying persons by (a) their usual and current weekly statuses (b) their usual and current daily statuses and (c) their current weekly and current daily statuses. Measures of unemployment Unemployment rate= number of persons unemployed per thousand persons in the labour force (which includes both employed and unemployed)
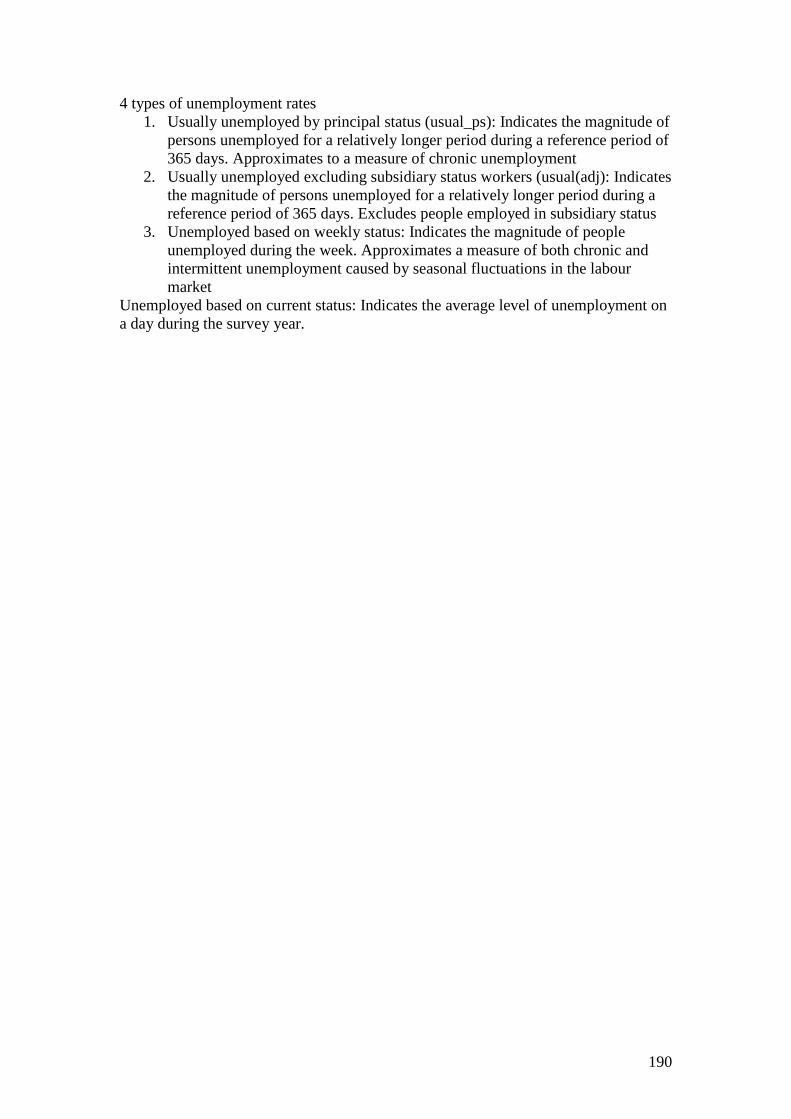
190
4 types of unemployment rates 1. Usually unemployed by principal status (usual_ps): Indicates the magnitude of
persons unemployed for a relatively longer period during a reference period of 365 days. Approximates to a measure of chronic unemployment
2. Usually unemployed excluding subsidiary status workers (usual(adj): Indicates the magnitude of persons unemployed for a relatively longer period during a reference period of 365 days. Excludes people employed in subsidiary status
3. Unemployed based on weekly status: Indicates the magnitude of people unemployed during the week. Approximates a measure of both chronic and intermittent unemployment caused by seasonal fluctuations in the labour market
Unemployed based on current status: Indicates the average level of unemployment on a day during the survey year.