Report on Status of Law and Order and Crime in Mumbai (2014)
44
State of Policing and Law & Order in Mumbai 1 WHITE PAPER STATE OF POLICING AND LAW & ORDER IN MUMBAI November 2014 Supported by FORD FOUNDATION
-
Upload
independent -
Category
Documents
-
view
1 -
download
0
Transcript of Report on Status of Law and Order and Crime in Mumbai (2014)

State of Policing and Law & Order in Mumbai
1
WHITE PAPER
STATE OF POLICING AND LAW & ORDER IN MUMBAI
November 2014
Supported by
FORD FOUNDATION

State of Policing and Law & Order in Mumbai
2
Table of Contents
Sr. No. Title Page No.
I Foreword 5
II Part A – Citizen Survey Data 6
Section I. Survey Statistics as per Areas of Mumbai as per Member of Parliament
Constituencies 6
Section II. A) Survey Statistics for Respondents who have witnessed crime (Table 3, 4
& 5) 7
Section II. B) Survey Statistics for Respondents who have faced crime (Table 6,7& 8) 10
Section II. Survey Statistics as per SEC (Socio-Economic Classification) 13
III Part B – Overall RTI Data for the City 15
Section I. Investigation Arm 15
Section II. Deliberations 28
IV Part C - Area-wise Status of Mumbai 29
Section I. North Mumbai Region Data 29
Section II. North West Mumbai Region Data 31
Section III. North East Mumbai Region Data 33
Section VI. North Central Mumbai Region Data 35
Section V. South Central Mumbai Region Data 37
Section VI. South Mumbai Region Data 39
Section VII. Mumbai Railway Crime Data Police Station-wise 41
V Part D - What needs to be done 42
Annexure 1 – Survey Methodology 43
Annexure 2 – Socio Economic Classification (SEC) Note 44
Tables
1 Table 1: Percentage of people who feel unsafe in Mumbai? 6
2 Table 2: Percentage of respondents who have witnessed or faced crime 6
3 Table 3: Respondents who witnessed crime and have informed police and their
satisfaction 7

State of Policing and Law & Order in Mumbai
3
4 Table 4: Medium of Informing Police by respondents who have witnessed crime 8
5 Table 5: Reason for not informing Police by respondents who have witnessed crime 9
6 Table 6: Respondents who faced crime and have informed police and their
satisfaction 10
7 Table 7: Medium of Informing Police by respondents who have faced crime 11
8 Table 8: Reason for not informing police by respondents who have faced crime 12
9 Table 9: Percentage of people who feel unsafe in Mumbai of different socio-
economic classes 13
10 Table 10: Respondents who witnessed crime or faced crime who have informed
police and their satisfaction 13
11 Table 11: Medium of Informing Police by respondents 14
12 Table 12: Reason for not informing police of different socio-economic classes 14
13 Table 13: Designation wise number of Police Personnel sanctioned and working (as
of July 2014) 15
14 Table 14: Designation wise number of police personnel different between working
forces in year 2014 to 2013 16
15 Table 15: Police Personnel details based on Areas of Mumbai (92 Police Station) 17
16 Table 16: Police Personnel details based on Department 18
17 Table 17: Police Personnel details based on Supervisory level officer (as on 31st July
2014) 18
18 Table 18: Occurrence of Crime in Mumbai City 19
19 Table 19: Quarter wise occurrence of Rape and Molestation cases 20
20 Table 20: Specific Crime’s highest occurrences area wise 21
21 Table 21: Cases Investigated for the Year 2012 to 2013 22
22 Table 22: Trial Cases from Annual Administrative Report for the Year 2012 to 2013 24
23 Table 23: Mumbai Railway Crime Statistics 26
24 Table 24: Mumbai Railway Accidental Death and Injured for the year 2009 to 2013 26
25 Table 25: Railway Police Personnel within Mumbai Corporation limits in the Railway
Police Stations 27
26 Table 26: Questions asked by MLAs on Crime issues area-wise 28
27 Table 27: Specific Crime highest occurrences (North Mumbai) 29

State of Policing and Law & Order in Mumbai
4
28 Table 28: Rank wise strength of Police personnel (North Mumbai) 29
29 Table 29: Questions asked by MLAs on Crime issues (North Mumbai) 30
30 Table 30: Specific Crime highest occurrences (North West Mumbai) 31
31 Table 31: Rank wise strength of Police personnel (North West Mumbai) 31
32 Table 32: Questions asked by MLAs on Crime issues (North West Mumbai) 32
33 Table 33: Specific Crime highest occurrences (North East Mumbai) 33
34 Table 34: Rank wise strength of Police personnel (North East Mumbai) 33
35 Table 35: Questions asked by MLAs on Crime issues (North East Mumbai) 34
36 Table 36: Specific Crime highest occurrences (North Central Mumbai) 35
37 Table 37: Rank wise strength of Police personnel (North Central Mumbai) 35
38 Table 38: Questions asked by MLAs on Crime issues (North Central Mumbai) 36
39 Table 39: Specific Crime highest occurrences (South Central Mumbai) 37
40 Table 40: Rank wise strength of Police personnel (South Central Mumbai) 37
41 Table 41: Questions asked by MLAs on Crime issues (South Central Mumbai) 38
42 Table 42: Specific Crime highest occurrences (South Mumbai) 39
43 Table 43: Rank wise strength of Police personnel (South Mumbai) 39
44 Table 44: Questions asked by MLAs on Crime issues (South Mumbai) 40
45 Table 45: Mumbai Railway Crime Statistics 41

State of Policing and Law & Order in Mumbai
5
I. Foreword
The 1993 serial blasts; 2006 train bombings and 2008 terror attacks will always remain as some of the darkest pages in the history books of Mumbai. They are also a reminder of the valour of those who defended the city; both, Mumbai Police and citizens. But, what routinely affect the feeling of security and the psyche of the Mumbaikar are daily crimes such as chain snatching, housebreaking.
As compared to last year (FY 2012-13), chain snatching went up by 66% (2110 cases); theft, by 19% (6644 cases); rioting, by 8% (387 cases); housebreaking, by 17% (3012 cases).
In the last four years, Praja has consistently tracked and brought out annual reports on policing and law and order in Mumbai. During research and interactions with experts on our reports, we came to a conclusion that, in the long run, to contain crime, conviction rates play a major role. Although conviction rates in Class II serious offences (cases involving bodily harm, murder, rape, grievous hurt, kidnapping, abduction etc.) improved slightly from 7% in 2012 to 8% in 2013, they are still very less - 92% of those charge sheeted have got away scot-free. Overall, the conviction rate remains at 22%.
One of the urgent steps required to correct this has been laid out by the Supreme Court directives on Police Reform in the Prakash Singh case of 2006, i.e. the separation of investigation from law and order. Praja has been consistently taking up this issue. We have been demanding that, as the first step, the gap between sanctioned and available IOs (Investigating Officers) needs to be bridged (a total of 4,301 IOs are sanctioned, but only 2,904 are working, a gap of 32%). Although this gap has reduced from 50% in 2013; total of 1,397 officers are still needed to bridge the gap completely.
A cursory study of acquitted cases shows that ‘lack of evidence’ has been the primary reason for acquittal. This directly correlates to the performance of the IO, to the role of public prosecutors, and the coordination between the two. If they have the will or the vision to provide Mumbaikars with a safe and secure city, the Home Department, which is under Devendra Fadnavis, needs to take immediate action.
Praja’s annual citizens’ survey 2014(of 22,580 households) of Mumbai reveals that 32% of the population do not feel secure in the city and 37% do not feel secure while travelling by train within Mumbai. On the whole, we have found that 50% of the respondents who have witnessed or been a faced of crime reported it to the police. However, the satisfaction level with the response of the police to complaints registered by both is depressingly low, at a figure of 41%. Of those who witnessed or were faced of crime, 46% called helpline numbers such as 100/103 etc. to report the crime, but their satisfaction level was only 37%. Dissatisfaction with the police response might be explained by the fact that the Control Room, where these calls are manned, is woefully understaffed (there is a shortage of personnel by 47%).
Parties across the spectrum, in the October 2014 Assembly elections, have ‘promised’ Mumbaikars a safe, secure and crime free city. To keep their promises, they will need to tackle the problem in a methodical and effective manner, by focussing on proper policing and investigation. They will have to ensure a citizen friendly (criminal) justice system.
Are our MLAs up to the challenge? And are they willing to provide a road map and a timeline to achieve their promises?
Nitai Mehta, Founder Trustee, Praja Foundation

State of Policing and Law & Order in Mumbai
6
Part A – Citizen Survey Data
Section I. Survey Statistics as per Areas of Mumbai as per Member of Parliament Constituencies
Table 1: Percentage of people who feel unsafe in Mumbai?
Percentage of Respondents1 who feel unsafe in Mumbai
Area of Mumbai2
North Mumbai
North West
Mumbai
North East
Mumbai
North Central
Mumbai
South Central
Mumbai
South Mumbai
Entire City
Percentage of people not feeling secure in Mumbai
44% 28% 28% 32% 32% 26% 32%
Percentage of people not feeling secure for women, children and senior citizens are in one's locality
45% 35% 28% 35% 38% 36% 36%
Percentage of people not feeling secure while travelling from one place to another within the city
43% 35% 29% 38% 38% 33% 36%
Percentage of people not feeling secure while travelling in a train within the city
46% 35% 30% 40% 37% 32% 37%
Inferences:
On an average one-third of Mumbai’s citizen feel unsafe.
Amongst the areas, North Mumbai is considered to be most unsafe as almost half the citizens feel unsafe.
Table 2: Percentage of respondents who have witnessed or faced crime
6% respondents have witnessed crime of the nature of accident, theft, murder, rape, etc. Amongst those who witnessed, 44% of the Respondents have faced crime of the nature of accident, theft, murder, rape, etc.
1Data based on a household survey of 22,580 respondents across the city of Mumbai. Kindly refer to Appendix 1 for more
details on the survey methodology. 2North Mumbai includes: Borivali, Dahisar, Malad West; North West Mumbai includes: Jogeshwari, Goregaon, Andheri;
North East Mumbai includes: Mulund, Ghatkopar, Shivaji Nagar; North Central Mumbai includes: Vileparle, Kurla, Bandra; South Central Mumbai includes: Chembur, SionKoliwada, Mahim; and South Mumbai includes: Worli, Byculla, Colaba, Malabar Hill.

State of Policing and Law & Order in Mumbai
7
Section II. A) Survey Statistics for Respondents who have witnessed crime (Table 3, 4 & 5)
Table 3: Respondents who witnessed crime and have informed police and their satisfaction
North Mumbai
North West
Mumbai
North East
Mumbai
North Central
Mumbai
South Central Mumbai
South Mumbai
Entire City
Percentage of respondents who witnessed crime
6% 8% 5% 8% 4% 6% 6%
Percentage of respondents who have witnessed crime and have informed police
58% 50% 45% 52% 47% 46% 50%
Percentage of respondents who had witnessed crime and informed police and were satisfied with their response
28% 29% 60% 54% 47% 36% 41%
Inferences:
Cases of crime are higher in North West and North Central parts of Mumbai where 8% of the respondents
have witnessed a crime
Amongst those who have witnessed, 50% of them have informed the police and only about 40% of them
were satisfied with the response
o A higher percentage of North Mumbai residents (58%) informed the police about crime and only
28% of them got a satisfactory response
o Response from Police from North East Mumbai was the most satisfactory at 60%

State of Policing and Law & Order in Mumbai
8
Table 4: Medium of Informing Police by respondents who have witnessed crime
North
Mumbai
North West
Mumbai
North East
Mumbai
North Central
Mumbai
South Central
Mumbai
South Mumbai
Entire City
Called the helpline numbers like 100/103 etc.
65% 34% 42% 40% 48% 42% 46%
Called on the local telephone number of the police station
8% 5% 18% 11% 13% 10% 10%
Personally visited the nearest police station and complained
18% 42% 31% 27% 27% 39% 31%
Personally visited the nearest police station and registered an FIR
7% 14% 3% 18% 8% 10% 10%
Others 2% 4% 6% 3% 3% 0% 3%
Inferences:
Common helpline numbers (46%) and Personal visits (31%) are the prominent modes of informing the
police officials about the Crime.
Residents in North Mumbai prefer to call the common helpline (65%) while residents in North West
Mumbai prefer to visit the police station personally (42%).
Residents in North Central Mumbai prefer to go a step ahead and register an FIR for the crime (18%).

State of Policing and Law & Order in Mumbai
9
Table 5: Reason for not informing Police by respondents who have witnessed crime
North
Mumbai
North West
Mumbai
North East
Mumbai
North Central
Mumbai
South Central
Mumbai
South Mumbai
Entire City
I don’t have the time for all this 35% 39% 30% 30% 35% 33% 34%
I don’t have any faith in the police / legal system
15% 9% 25% 10% 15% 7% 13%
Speaking to the police officials is a painful task
2% 5% 13% 6% 13% 4% 7%
I don’t think it’s my duty to inform them
5% 2% 3% 4% 2% 1% 3%
I don’t want to get involved in any trouble
36% 36% 15% 35% 21% 22% 28%
Others 7% 9% 14% 16% 13% 32% 16%
Inferences:
On an average 34% of citizens across all wards stated lack of time as a major reason for non-reportage of
crimes witnessed by them.
Overall 13% respondents who witnessed crime did not report because they do not have faith in the police,
while 28% did not report as they don’t want to get involved in any trouble.
25% of people from North East Mumbai don’t have faith in the police/legal system and hence they don’t
report to police when they witness incidences of crime in their locality.
36% people from North and North West Mumbai feel that by informing about crime incidences to police,
they will invite trouble for themselves.

State of Policing and Law & Order in Mumbai
10
Section II. B) Survey Statistics for Respondents who have faced crime (Table 6, 7& 8)
Table 6: Respondents who faced crime and have informed police and their satisfaction
North
Mumbai
North West
Mumbai
North East
Mumbai
North Central
Mumbai
South Central
Mumbai South
Mumbai Entire City
Percentage of respondents who faced crime
48% 51% 42% 38% 46% 39% 44%
Percentage of respondents who have faced crime and have informed police
81% 74% 69% 74% 70% 68% 50%
Percentage of respondents who had faced crime and informed police and were satisfied with their response
31% 30% 61% 56% 44% 27% 41%
Inferences:
A higher percentage of residents (51%) in North west Mumbai and (48%) in North Mumbai have
personally faced a crime and nearly 81% in North Mumbai and 74% in North West Mumbai have informed
the police.
Even after informing the police in North West or North Mumbai, only 30% of residents have got a
satisfactory response while the other 70% are still not convinced with the law and order situation.

State of Policing and Law & Order in Mumbai
11
Table 7: Medium of Informing Police by respondents who have faced crime
North
Mumbai
North West
Mumbai
North East
Mumbai
North Central
Mumbai
South Central
Mumbai South
Mumbai Entire City
Called the helpline numbers like 100/103 etc.
59% 36% 37% 45% 51% 33% 46%
Called on the local telephone number of the police station
9% 7% 16% 10% 12% 13% 10%
Personally visited the nearest police station and complained
22% 46% 36% 27% 24% 42% 31%
Personally visited the nearest police station and registered an FIR
10% 6% 1% 15% 8% 12% 10%
Others 0% 6% 9% 3% 5% 1% 3%
Inferences:
Even amongst those who faced the crime personally, North Mumbai residents preferred to call the
common helpline numbers (59%) while North West Mumbai preferred to visit the police station personally
(46%).
Although the cases of facing crime in North Central Mumbai are lower, they are much more active in filing
an FIR as 15% of those who faced the crime have registered an FIR.

State of Policing and Law & Order in Mumbai
12
Table 8: Reason for not informing police by respondents who have faced crime
North
Mumbai
North West
Mumbai
North East
Mumbai
North Central
Mumbai
South Central
Mumbai
South Mumbai
Entire City
I don’t have the time for all this 23% 34% 18% 59% 12% 9% 34%
I don’t have any faith in the police / legal system
0% 1% 31% 16% 22% 12% 13%
Speaking to the police officials is a painful task
0% 2% 18% 0% 15% 2% 6%
I don’t think it’s my duty to inform them
7% 3% 8% 0% 5% 0% 3%
I don’t want to get involved in any trouble
68% 45% 23% 17% 37% 35% 28%
Others 2% 15% 2% 8% 9% 41% 16%
Inferences:
On an average 34% of citizens who faced crime stated lack of time as a major reason for not reporting it
and this response was highest in North Central Mumbai (59%).
Overall 13% citizens who faced crime did not report because they do not have faith in the police, while
28% did not report as they don’t want to get involved in any trouble.
68% of citizens in North Mumbai did not report crimes to avoid any further trouble due to police
involvement.
31% of people from North East Mumbai cited lack of faith as a cause for non-engagement with police.

State of Policing and Law & Order in Mumbai
13
Section II. Survey Statistics as per SEC (Socio-Economic Classification)3
Table 9: Percentage of people who feel unsafe in Mumbai of different socio-economic classes
SEC A SEC B&C SEC D&E
Percentage of people not feeling secure in Mumbai 31% 32% 31%
Percentage of people not feeling secure about women, children and senior citizens are in one's locality
42% 39% 32%
Percentage of people not feeling secure while travelling from one place to another within the city
40% 38% 33%
Percentage of people not feeling secure while travelling in a train within the city
37% 38% 35%
Inference:
People belonging to the lower SEC (skilled or unskilled worker class) feel more secure than middle to higher
SEC individuals (petty traders, businessman, supervisor etc).
Table 10: Respondents who witnessed crime or faced crime who have informed police and their satisfaction
SEC A SEC B&C SEC D&E
Respondents who witnessed crime & have informed 59% 50% 44%
Respondents who faced crime & have informed 82% 73% 67%
Respondents who had informed police and were satisfied with their response
42% 39% 42%
Inferences:
SEC A respondents (42%) were most satisfied with the response that they received and they are the ones who
are actually informing police the most in both scenarios whether they witness (59%) or face crime (82%).
While, SEC D & E respondents have the lowest tendency to inform police when they witness (44%) or face
crime (67%), but their satisfaction level with the response on informing is similar to SEC A i.e. 42%.
3Data based on a household survey of 22,580respondents across the city of Mumbai.Kindly refer to Annexure 2 note on
the Socio Economic Classification (SEC).

State of Policing and Law & Order in Mumbai
14
Table 11: Medium of Informing Police by respondents
SEC A SEC B&C SEC D&E
Called the helpline numbers like 100/103 etc. 41% 47% 48%
Called on the local telephone number of the police station 12% 10% 8%
Personally visited the nearest police station and complained 37% 28% 29%
Personally visited the nearest police station and registered an FIR 9% 12% 9%
Others 1% 2% 6%
Inferences:
48% respondents from SEC D&E called up help lines (100/103) numbers to inform police; whereas only 9% of
them personally visited the nearest police station to register an FIR.
37% of the respondents from SEC A prefer to personally visit the police stations and complain if they witness
or face any crime and 12% call on the local telephone number of the police station.
Table 12: Reason for not informing police of different socio-economic classes
SEC A SEC B&C SEC D&E
I don't have the time for all this 39% 33% 33%
I don't have any faith in the police/legal system 12% 14% 12%
Speaking to the police officials is a painful task 7% 6% 7%
I don't think it's my duty to inform them 2% 4% 2%
I don't want to get involved in any trouble 26% 25% 33%
Others 14% 19% 12%
Inferences:
Amongst respondents who did not inform the police, 14% of respondents from SEC B&C don’t have faith in the
police/legal system, whereas 7% of respondents from SEC A, D&E feel that speaking to police is a painful task.
39% respondents from SEC A, which faced and witnessed the highest percentage of crime in Mumbai said that
they don’t have the time to report crime incidences to the police and hence they ignored them.
33% of the respondents from SEC D&E didn’t inform the police because they don’t want to get involved in any
trouble. It should be noted that, from Table 9, respondents from SEC B&C are the ones who feel least secured
in the city.

State of Policing and Law & Order in Mumbai
15
Part B – Overall RTI Data for the City
Section I. Investigation Arm
Table 13: Designation wise number of Police Personnel sanctioned and working (as of July 2014)
Sr. No. Designation Sanctioned
Working in
July’14
Difference between
Sanctioned and Working
(July’14)
% Difference between
Sanctioned and
Working
1 Commissioner of Police (C.P.) 1 1 0 0%
2 Joint Commissioner of Police (Jt. C.P.) 4 4 0 0%
3 Additional Commissioner of Police (Addl. C.P.) 12 11 -1 -8%
4 Deputy Commissioner of Police (D.C.P.) 40 37 -3 -8%
5 Assistant Commissioner of Police (A.C.P.) 130 104 -26 -20%
6 Police Inspector (P.I.) 1018 953 -65 -6%
7 Assistant Police Inspector (A.P.I.) 1047 880 -167 -16%
8 Police Sub - Inspector (P.S.I.) 3254 2024 -1230 -38%
9 Assistant Police Sub-Inspector (A.S.I) 3003 2922 -81 -3%
10 Head Constable (H.C.) 7071 7085 14 <1%
11 Police Naik (P.N.) 6817 7017 200 3%
12 Police Constable (P.C.) 19246 16121 -3125 -16%
Total Police Force 41643 37159 -4484 -11%
Inferences:
The above data represents designation-wise number of police personnel sanctioned, (actually) working and
the difference between them. What is most alarming is the gap in the number of sanctioned and working
Police Sub - Inspector (PSI) and Assistant Police Inspector (API), who are the Investigating Officers in cases of
crime.
Overall, the current police force has an 11% shortfall of personnel in Mumbai.

State of Policing and Law & Order in Mumbai
16
Table 14: Designation wise number of police personnel different between working forces in year 2014 to 2013
Sr. No. Designation Sanctioned4 Working in 2014
Working in 2013
Difference between working forces in 2014 &
2013
1 Commissioner of Police (C.P.) 1 1 1 0
2 Joint Commissioner of Police (Jt. C.P.) 4 4 4 0
3 Additional Commissioner of Police (Addl. C.P.) 12 11 11 0
4 Deputy Commissioner of Police (D.C.P.) 40 37 35 2
5 Assistant Commissioner of Police (A.C.P.) 130 104 95 9
6 Police Inspector (P.I.) 1018 953 872 81
7 Assistant Police Inspector (A.P.I.) 1047 880 732 148
8 Police Sub - Inspector (P.S.I.) 3254 2024 1319 705
9 Assistant Police Sub-Inspector (A.S.I) 3003 2922 2881 41
10 Head Constable (H.C.) 7071 7085 6833 252
11 Police Naik (P.N.) 6817 7017 6794 223
12 Police Constable (P.C.) 19246 16121 16184 -63
Total Police Force 41643 37159 35761 1398
Inferences:
In 2014, there has been a slight increase in the police personnel deployed at various ranks.
The data shows that currently Mumbai has sanctioned 41,643 police personnel however only 37,159 police
personnel are working (difference of 4,484), a gap of 10.76%. The number of APIs available in 2014 has
increased from 732 (2013) to 880 in 2014, an increase of 148 officers; also the Head Constable count has
increased by 252 officers; while at the ASI level there is an increase of 41 officers; at the constabulary level,
the number of police constables has decreased by 63 officers. Overall there is an increase in the police force of
1398 officers.
The increases or decreases internally at the designation level suggest that promotions which may have been
not given earlier were approved and given in the above period (in 2014). However the overall gap of 4,484
officers currently is still very significant and the state government should come with a clear and timely plan to
fill this gap, failing which could continue to impact the efficiency of policing in Mumbai.
4 Sanctioned strength of Mumbai police was increased in 2014 (41643 officers) from 2013 (41398 officers) by 245 of
officers.

State of Policing and Law & Order in Mumbai
17
Table 15: Police Personnel details based on Areas of Mumbai (92 Police Station)
Sr. No.
Area of Mumbai
No. of Police
Station
Police Personnel
Sanctioned (July’14)
Police Personn
el Working (July’13)
Difference between Sanctione
d and Working (July’13)
5
% difference between Sanctione
d and Working (July’13)
Police Personnel Working (July’14)
Difference between Sanctione
d and Working (July’14)
% Difference between Sanctione
d and Working
1 North
Mumbai 13 2799 2487 -306 -11% 2540 -259 -9%
2
North West
Mumbai 14 3010 2528 -460 -15% 2616 -394 -13%
3
North East
Mumbai 11 2431 2334 -97 -4% 2516 85 3%
4
North Central
Mumbai 13 2910 2543 -362 -12% 2618 -292 -10%
5
South Central
Mumbai 15 3262 3071 -178 -5% 3166 -96 -3%
6 South
Mumbai 26 7053 5490 -1534 -22% 5566 -1487 -21%
Total 92 21465 18453 -2937 -14% 19022 -2443 -11%
Inferences:
South Mumbai has the highest percentage of difference between sanctioned and working personnel in
2013 (22%) as well as 2014 (21%). Overall, there has been a decline in the shortfall.
The most unsafe part of Mumbai, as per total occurrence of crime (Refer Table No. 20), currently has a
shortage of 292 police personnel. The highest drop in the shortfall percentage is in North East Mumbai,
where the number of personnel deployed now is 85 more than the sanctioned number.
5 Sanctioned strength of police in the 92 police station was increased in 2014 (21465 officers) from 2013 (21390 officers)
by 75 of officers.

State of Policing and Law & Order in Mumbai
18
Table 16: Police Personnel details based on Department
Sr. No. Department
Police Personnel
Sanctioned
Police Personnel Working (July’14)
Police Personnel Working (July’13)
Difference between
Sanctioned and
Working (July’13)
6
% difference between
Sanctioned and
Working (July’13)
Difference between
Sanctioned and
Working (July’14)
% Difference between
Sanctioned and
Working (July’14)
1 Special Branch
(I - CID) 1006 823 838 -114 -12% -183 -18%
2 Special Branch (II - Passport) 356 292 306 -14 -4% -64 -18%
3 Crime Branch 1550 1552 1361 -164 -11% 2 <1%
4 Protection and
Security 1483 1501 1489 11 1% 18 1%
5 Armed Police 11346 9744 9221 -2087 -18% -1602 -14%
6 Anti-Terrorist
Squad 171 236 194 23 13% 65 38%
7 Wireless Section 447 334 324 -123 -28% -113 -25%
8 Traffic 3363 3357 3302 -51 -2% -6 <1%
9 Control Room 267 141 127 -140 -52% -126 -47%
10 Motor
Transport 2 0 0 0 0% -2 -100%
Total 19991 17980 17162 -2659 -13% -2011 -10%
Table 17: Police Personnel details based on Supervisory level officer (as on 31st July 2014)
Supervisory level officer
Police Personnel
Sanctioned
Police Personnel Working (July'13)
Difference between
Sanctioned and
Working (July’13)
% Difference between
Sanctioned and
Working (July’13)
Police Personnel Working (July’14)
Difference between
Sanctioned and
Working (July’14)
% Difference between
Sanctioned and
Working (July’14)
C.P., Jt. C.P., Addl. C.P., D.C.P. and A.C.P. 187 146 -41 -22% 157 -30 -16%
Inferences:
The above data represent details of Police personnel within different areas of Mumbai in the police stations
situated over there, at various Departments of Police and composition of the Supervisory Level Officers. The
data includes number of police personnel sanctioned, (actually) working and the difference between
sanctioned and working. Control room is short by 126 officers (a gap of 47%).
6Sanctioned strength of police (Department) was increased in 2014 (19991 officers) from 2013 (19821 officers) by 170 of officers.

State of Policing and Law & Order in Mumbai
19
Table 18: Occurrence of Crime in Mumbai City
Specific Crime
2009-10
2010-11
% Increase 2009-10 to 2010-
11 2011-
12
% Increase 2010-11 to 2011-
12 2012-
13
% Increase 2011-12 to 2012-
13 2013-
14
% Increase 2012-13 to 2013-
14
Murder 219 213 -3% 199 -7% 202 2% 171 -15%
Rape 158 165 4% 187 13% 294 57% 432 47%
Molestation 384 483 26% 554 15% 793 43% 1209 52%
Riot 333 334 <1% 329 -1% 360 9% 387 8%
House Breaking (Day/Night) 2788 3035 9% 2565 -15% 2578 1% 3012 17%
Chain Snatching 1541 1938 26% 1618 -17% 1269 -22% 2110 66%
Thefts7 6100 5892 -3% 5763 -2% 5578 -3% 6644 19%
Vehicles Stolen 4059 3909 -4% 4384 12% 4016 -8% 3796 -5%
Inferences:
The above data represent occurrence of crime in Mumbai from April 2009 to March 2014.
There has been a sharp increase in crime against women. Rape has increased by 47% and molestation by
52% in the year 2012-13. This is also reflected in the survey data where 36% of the citizens said they do
not feel secure for women, children and senior citizens of their locality (Refer Table No. 1). The
percentage of steady increase in occurrences of crimes against women can be attributed to a rise in
reporting of these cases, which is conducive towards ‘improving’ the status of crime against women.
Kindly refer to the following table for more.
7 Theft including - Theft by Servant/Locked Place/Theft at open Place/Theft from motor vehicle/Vehicle Parts/Mobile

State of Policing and Law & Order in Mumbai
20
Table 19: Quarter wise occurrence of Rape and Molestation cases
Apr11 to
Jun11
Jul11 to
Sep11
Oct11 to
Dec11
Jan12 to
Mar12
Apr12 to
Jun12
Jul12 to
Sep12
Oct12 to
Dec12
Jan13 to
Mar13
Apr13 to
Jun13
Jul13 to
Sep13
Oct13 to
Dec13
Jan14
to
Mar14
Rape
No. 52 50 52 33 59 64 76 95 107 82 105 138
(%) from
earlier Quarter
-4% 4% -37% 79% 8% 19% 25% 13% -23% 28% 31%
Molestation
No. 119 144 145 146 129 136 204 324 220 241 350 398
(%) from
earlier Quarter
21% 1% 1% -12% 5% 50% 59% -32% 10% 45% 14%
Inferences:
From January to March 2014, there has been a sharp 31% increase in the number of rapes. These statistics
suggest not only an increase in violence against women but also a rise in the reporting of such crimes.
Awareness of the possible course of law to deal with such crimes has possibly improved after the Nirbhaya
case in December 2012, Shakti Mill case in August 2013 and can also be attributed to the Mumbai Police
efforts in removing burking (not registering) of cases.

State of Policing and Law & Order in Mumbai
21
Table 20: Specific Crime’s highest occurrences area wise
Crime 2009-10 2010-11 2011-12 2012-13 2013-14
Area of Mumbai
Occurrence
Area of Mumbai
Occurrence
Area of Mumbai
Occurrence
Area of Mumbai
Occurrence
Area of Mumbai
Occurrence
Murder SM 47 SCM 60 SCM 45 NM 51 SCM 52
Rape SCM 33 SM 40 NCM 41 SCM 66 SCM 105
Riot NCM 77 NCM 85 SCM, SM 73 NCM 74 SM 86
House Breaking (Day/Night) NCM 618 NCM 694 NCM 565 NCM 612 NCM 734
Chain Snatching NCM 387 NCM 526 SCM 399 NCM 277 NM 487
Thefts SM 1441 NWM 1359 SM 1398 SM 1405 NCM 1598
Vehicles Stolen NCM 944 NCM 900 NCM 991 NCM 863 NCM 819
Overall NCM 7437 NCM 7473 NCM 6736 NCM 7446 NCM 8279
Inferences:
The above data represents year-wise highest occurrences of specific crime in a particular area of Mumbai from
April 2009 to March 2014.
The registered cases of House Breaking, Theft and Vehicles Stolen have been the highest in North Central
Mumbai region in the year 2013-14. It can be observed that across the years and across the specific crimes
mentioned in the above table, North Central Mumbai has had the highest number of registered crime, which
has a shortfall of 10% police personnel (Refer Table No. 15).
North Central Mumbai has the highest number of crime registered over past five years (37371 cases).

State of Policing and Law & Order in Mumbai
22
Table 21: Cases Investigated for the Year 2012 to 2013
Cases Investigated for the year -20128 to 2013
Year
Pending investigation
from early year
Cases Reported
in the current
year
Not investigated/
Refused
Classified final as
(Statement B/C9)
Final reports sent
(Statement A)
Cases sent-up
from current
year (Charge sheet)
Pending investigati
on as of December
of the current
year
Part I - I.PC. Act.
CLASS - I SERIOUS OFFENCES (Cases including rioting, unlawful assembly, offences relating to coin, stamps, currency etc.)
2012 1133 952 0 11 126 837 1111
2013 1137 983 1 5 84 776 1254
CLASS - II SERIOUS OFFENCES (Cases including murder, rape, grievous hurt, kidnapping, abduction etc.)
2012 6356 6993 0 72 580 6546 6151
2013 7167 7679 1 96 527 7048 7174
CLASS - III SERIOUS OFFENCES (Cases including robbery, killing poisoning or maiming any animal, extortion, dacoity etc.)
2012 3881 3883 0 179 1550 1575 4460
2013 4363 6021 1 162 2022 2648 5551
CLASS - IV (Cases including hurt or endangering life, criminal intimidation, wrongful restraint and confinement)
2012 1362 1412 0 13 152 1128 1481
2013 1375 1259 0 9 86 863 1676
CLASS-V MINOR OFFENCES (Cases including criminal breach of trust, stolen property, cheating, breaking closed receptacle etc.)
2012 18342 12841 1 1005 9176 4935 16066
2013 16047 13130 4 524 7227 5070 16352
CLASS - VI OTHER OFFENCES (Cases including public nuisance, Insult the modesty of a woman etc.)
2012 412 458 0 0 51 275 544
2013 353 1138 0 0 79 788 624
OTHER I.P.C.
2012 5233 3625 4 121 1014 3065 4654
2013 5690 4618 2 32 1027 4136 5111
8 Annual Administrative Reports pertain to calendar year for the period from January to December.
9 After an FIR is registered and investigation completed either in the case a charge sheet is filed and the case is sent to the
courts for trials (Cases Sent-up) or the case is classified as Statement A (mentioned above as ‘Final Reports Sent’ meaning cases in which charge sheet was not filed but investigation completed. In colloquial police vocabulary Statement A is also known as ‘Case True but not Detected’) or the case is classified as B/C (meaning cases declared false or mistake of fact or law).

State of Policing and Law & Order in Mumbai
23
Year
Pending investigation
from early year
Cases Reported
in the current
year
Not investigated/
Refused
Classified final as
(Statement B/C)
Final reports sent
(Statement A)
Cases sent-up
from current
year (Charge sheet)
Pending investigati
on as of December
of the current
year
304-B and 498-A (Cases including dowry deaths, Harassments to married women etc.)
2012 362 423 0 5 17 357 406
2013 411 604 2 1 12 379 621
PART - II Cognizable offences under local & special laws (Arms Act, Indian Railway Act, Gambling Act, Prevention of Corruption Act etc.)
2012 5548 5177 9 6 124 4653 5933
2013 5700 5740 1 4 36 5161 6238
Total
2012 42629 35764 14 1412 12790 23371 40806
2013 42243 41172 12 833 11100 26869 44601
Inference:
A total of 78,39310 cases were investigated in the year 2012 and 83,41511cases in the year 2013. Of which
investigation was completed in 37,58712 cases in the year 2012 and 38,81413 cases in 2013. Compared to 2012,
investigation of 1227 additional was completed in the year 2013.
Of this 38,814 cases, 29% of the (a total of 11,100) cases were found to be true but were not detected; and
69% (a total 26,869) cases were sent up for trials. While, investigation in 53% of the (a total of 44,601) cases
registered in 2013 or that may have been registered prior to 2013 is yet pending completion of investigation.
Of the total (78,393) cases, 17% (a total of 13,34914) in 2012 and the total (83,415) cases, 19% (a total of
14,84615) in 2013 cases are related to Class II (Serious Offences). Of the above classification of crime, Class II
(Serious Offences) is the most crucial:
A total of 14,846 cases (Class II serious offences) were investigated in the calendar year 2013. Of which
investigation was completed on 7,67216 cases in 2013. Of this 7,672 cases, 7% of the (a total of 527) cases
were found to be true but were not detected; and 92% (a total 7,048) cases were sent up for trials. While,
investigation in 48% of the (a total of 14,846) cases registered in 2013 or that may have been registered prior
to 2013 is yet pending completion of investigation i.e. in 7,174 cases.
10
Sum of pending investigation from early year (42629) and cases reported in the current year (35764). 11
Sum of pending investigation from early year (42243) and cases reported in the current year (41172). 12
Sum of not investigated/refused (14), classified final (1412), final reports sent (12790) and cases sent-up from current year (23371). 13
Sum of not investigated/refused (12), classified final (833), final reports sent (11100) and cases sent-up from current year (26869). 14
Sum of pending investigation from early year (6356) and cases reported in the current year (6993) of Class – II Serious offences. 15
Sum of pending investigation from early year (7167) and cases reported in the current year (7679) of Class – II Serious offences. 16
Sum of not investigated/refused (1), classified final (96), final reports sent (527) and cases sent-up from current year (7048) of Class – II Serious offences..

State of Policing and Law & Order in Mumbai
24
Table 22: Trial Cases from Annual Administrative Report for the Year 2012 to 2013
Trial Cases for the year – 2012 to 2013
Year
Pending Trial from early year
Cases sent-up in the current
year Compounded Withdrawn Acquitted
Convicted
Pending Trial as of
December of the current
year In no. In %
Part I - I.PC. Act.
CLASS - I SERIOUS OFFENCES en (Cases including rioting unlawful assembly, offences relating to coin, stamps, currency etc.)
2012 6281 837 6 6 242 19 7% 6845
2013 6879 776 57 3 240 33 10% 7322
CLASS - II SERIOUS OFFENCES (Cases including murder, rape, grievous hurt, kidnapping, abduction etc.)
2012 45896 6546 1100 156 3324 352 7% 47510
2013 47115 7048 669 400 3390 403 8% 49301
CLASS - III SERIOUS OFFENCES (Cases including robbery, killing poisoning or maiming any animal, extortion, dacoity etc.)
2012 12274 1575 2 7 473 303 39% 13064
2013 12873 2648 21 47 597 454 41% 14402
CLASS - IV (Cases including hurt or endangering life, criminal Intimidation, wrongful restraint and confinement)
2012 6479 1128 158 74 397 38 6% 6940
2013 6846 863 8 9 289 116 27% 7287
CLASS-V MINOR OFFENCES (Cases including criminal breach of trust, stolen property, cheating, breaking closed receptacle etc.)
2012 37750 4935 212 93 1889 887 29% 39604
2013 38571 5070 174 481 2127 844 23% 40015
CLASS - VI OTHER OFFENCES (Public nuisance, Insult the modesty of a woman etc.)
2012 1776 275 15 19 111 11 7% 1895
2013 1933 788 20 5 166 100 34% 2430
OTHER I.P.C.
2012 27716 4158 408 580 1974 326 10% 28584
2013 28737 4136 382 126 1866 569 19% 29930
304-B and 498-A (Cases including dowry deaths, harassments to married women etc.)
2012 2328 357 35 1 234 13 5% 2402
2013 2382 379 52 9 247 14 4% 2439
PART - II Cognizable offences under local & special Laws (Arms Act, Indian Railway Act, Gambling Act, Prevention of Corruption Act etc.)
2012 29620 4657 241 823 1583 1146 30% 30484
2013 29462 5161 401 114 1440 1161 37% 31507
Total
2012 170120 24468 2177 1759 10227 3095 18% 177328
2013 174798 26869 1784 1194 10362 3694 22% 184633

State of Policing and Law & Order in Mumbai
25
Inferences:
A total of 194,58817 cases in were tried in the courts in year 2012 and a total of 201,66718 cases in 2013. Of which trial was completed in 9% (a total of 17,25819) cases in year 2012 and in the year 2013 trial was completed in 8% (17,03420) cases and judgement was given.
In the year 2012, of the 17,258 cases in which judgement was given, 18% of the (a total of 3,095) cases were convicted. Similarly, in the year 2013, of the 17,034 cases in which judgement was given, 22% of the (a total of 3,694) cases were convicted. It should be noted that here the judgement for the case is considered and not for individual persons who are accused e.g. if there are three accused in the particular case and only one gets convicted then the entire case is treated as convicted, only when all three are acquitted then only the case is considered as acquitted for the above statistics.
While in the year 2012, 91% of the (a total of 1,77,328) cases and in the year 2013; 92% of the (a total of 18,46,33) cases were sent for trials are yet pending judgements.
Of the total (194,588) cases, 27% (a total of 52,44221) in year 2012 and the total (201,667) cases, 28% (a total
of 54,16322) in year 2013 are related to Class II (Serious Offences). Of the above classification of crime, Class II
(Serious Offences) is the most crucial:
A total of 54,163 cases (Class II serious offences) were tried in the courts in the calendar year 2013. Of which
trial was completed in 9% (a total of 4,86223) cases and judgement was given. Of this 4,862 cases in which
judgement was given, only 8% of the (a total of 403) cases were convicted; while the 70% cases were
acquitted, 14% cases were compounded and 8% cases withdrawn. While, 91% of the (a total of 49,301) cases
sent for trials in 2013 or prior to 2013 are yet pending judgements.
17
Sum of Pending trial from early year (170120) and Cases sent-up in the current year (24468). 18
Sum of Pending trial from early year (174798) and Cases sent-up in the current year (26869). 19
Sum of Compounded (2177), Withdrawn (1759), Acquitted (10227) and Convicted (3095). 20
Sum of Compounded (1784), Withdrawn (1194), Acquitted (10362) and Convicted (3694). 21
Sum of Pending Trial from early year (45896) and Cases sent-up in the current year (6546) of Class – II Serious offences. 22
Sum of Pending Trial from early year (47115) and Cases sent-up in the current year (7048) of Class – II Serious offences. 23
Sum of Compounded (669), Withdrawn (400), Acquitted (3390) and Convicted (403) of Class – II Serious offences.

State of Policing and Law & Order in Mumbai
26
Table 23: Mumbai Railway Crime Statistics
Head 2009 2010
% Increase 2009 to
2010 2011
% Increase 2010 to
2011 2012
% Increase 2011 to
2012 2013
% Increase 2012 to
2013
Murder 4 4 0% 9 125% 2 -78% 2 0%
Dacoity/Robbery 22 26 18% 32 23% 230 619% 282 23%
All Thefts 1468 1403 -4% 1444 3% 1015 -30% 1116 10%
Rape 3 1 -67% 3 200% 1 -67% 5 400%
Molestation 9 10 11% 4 -60% 12 200% 22 83%
Other IPC 108 113 5% 145 28% 128 -12% 162 27%
Total 1614 1557 -4% 1637 5% 1388 -15% 1589 14%
Inferences:
The above data represents the Mumbai Railway Crime Statistics. From the statistics, we can see that crimes such as rape and molestation have increased sharply from 2012 to 2013 by 400% and 83% respectively.
Incidences of other crimes like robbery (23%) have also increased in 2013. The percentage of steady increase in occurrences of crimes against women can be attributed to a rise in reporting of these cases, which is conducive towards ‘improving’ the status of crime against women.
Table 24: Mumbai Railway Accidental Death and Injured for the year 2009 to 2013
Name of Police Station24
Accidental Death Injured
2009 2010 2011 2012 2013 2009 2010 2011 2012 2013
C.S.T. 201 191 182 160 200 193 281 283 271 258
Dadar 187 174 156 187 156 186 236 202 186 141
Kurla 434 488 475 459 444 467 560 481 439 348
Wadala 210 227 200 207 215 316 259 317 240 206
Churchgate 70 80 59 39 48 104 120 99 101 116
M.C.T. 203 200 179 177 181 328 325 274 262 195
Bandra 184 169 152 111 115 278 193 154 88 82
Andheri 178 169 154 146 150 311 270 256 226 239
Borivali 398 342 349 339 345 476 435 283 453 290
Grand Total 2065 2040 1906 1825 1854 2659 2679 2349 2266 1875
Inferences: The above data shows the Mumbai Railway Accidental Death and Injured statistics for the year 2009 to 2013.
Out of the total 1854 cases of accidental deaths in the year 2013, 24% cases (444) were from Kurla. The case
of injuries in the year 2013 was 1875 with Kurla (348) again having the highest number of such cases.
24
Jurisdiction of CST police station is from CST station to Parel station, similarly for Churchgate it is from Churchgate to Grant Road station, and so on both the Central and Western railway lines upto Mulund (under Kurla) on the Central and Dahisar (under Borivali) .

State of Policing and Law & Order in Mumbai
27
Table 25: Railway Police Personnel25within Mumbai Corporation limits in the Railway Police Stations26
Sanctioned Working Actual
Difference
% Difference between
Sanctioned and Working
Police Inspector (P.I.) 27 26 -1 -4%
Asstt. Police Inspector (A.P.I.) 19 16 -3 -16%
Police Sub - Inspector (P.S.I.) 79 71 -8 -10%
Assistant Police Sub-inspector 198 158 -40 -20%
Constable 1844 1652 -192 -10%
Total 2167 1923 -242 -11%
Inferences:
The above table represents the Railway Police Personnel details based on Department. The shortage of personnel’s at the higher level of hierarchy is low as compared to the shortage at lower levels. The PSI’s (10%) have the highest difference between the sanctioned and working percentage. Overall, there is a difference of 11% between sanctioned and working Railway Police Personnel, which is almost the half. Again, the Investigation Officers (A.P.I. and P.S.I.) are short by 11% in Railway Police Personnel.
25
Government Railway Police (GRP) 26
Includes C.S.T., Dadar, Kurla, Wadala, Churchgate, M.C.T., Bandra, Andheri and Borivali

State of Policing and Law & Order in Mumbai
28
Section II. Deliberations
Table 26: Questions asked by MLAs on Crime issues area-wise
Sr. No.
Area of Mumbai
No. of Police
Stations MLAs
Total questions asked in Crime
2009-2014
Total occurrence of
crime from 2009-14
1 North Mumbai 13
Gopal Shetty, Vinod Ghosalkar, Pravin Darekar, Ramesh Thakur, Yogesh Sagar, Aslam Shaikh 1375 24357
2 North West Mumbai 14
Ravindra Waikar, Rajhans Singh, Subhash Desai, Baldev Khosa, Ashok Jadhav 954 30147
3 North East Mumbai 11
Sardar Tara Singh, Mangesh Sangle, Shishir Shinde, Ramchandra Kadam, Prakash Maheta, Abu Azmi 1461 22133
4 North Central Mumbai 13
Krishnakumar Hegde, Milind Kamble, Prakash Sawant, Baba Sidikki, Kripashankar Singh 341 37371
5 South Central Mumbai 15
Nawab Malik, Chandrakant Handore, Jagannath Shetty, Kalidas Kolambkar, Nitin Sardesai 387 30820
6 South Mumbai 26
Bala Nandgaonkar, Madhukar Chavan, Mangal Prabhat Lodha, Amin Patel, Annie Shekhar 1329 31834
Note: 1) Questions Asked by MLAs only during the following sessions have been included: Budget 2009 to Monsoon 2014
2) Sachin Ahir, Varsha Gaikwad, Arif Naseem Khan and Suresh Shetty are ministers hence there are no questions asked by them
Inferences:
The above data represents questions asked by MLAs on crime and police personnel/infrastructure. For the
period 2009-14, North Central Mumbai has highest occurrences of crime (37371); while the MLAs
representing this area have asked the second lowest number of (341) questions on crime.
Overall, Chandrakant Handore (4), Baldev Khosa (7) and Kripashankar Singh (12) have asked the least
questions, while Bala Nandgaonkar (830), Mangesh Sangle (672) and Subhash Desai (444) have asked the
maximum questions.

State of Policing and Law & Order in Mumbai
29
Part C - Area-wise Status of Mumbai
Section I. North Mumbai Region Data
1. North Mumbai27
Table 27: Specific Crime highest occurrences (North Mumbai)
Specific Crime 2009-10 2010-11 2011-12 2012-13 2013-14
Murder 38 31 39 51 32
Rape 26 27 37 52 85
Riot 43 40 38 61 64
House Breaking (Day/Night) 414 446 406 393 503
Chain Snatching 299 316 282 265 487
Thefts 722 752 794 744 894
Vehicles Stolen 657 553 777 776 661
Table 28: Rank wise strength of Police personnel (North Mumbai)
Sr. No. Rank Sanctioned Working Actual
Difference Difference
in %
1 Police Inspector (P.I.) 66 69 3 5%
2 Assistant Police Inspector (A.P.I.) 87 73 -14 -16%
3 Police Sub - Inspector (P.S.I.) 255 241 -14 -5%
4 Assistant Police Sub-Inspector (A.S.I) 237 203 -34 -14%
5 Head Constable (H.C.) 520 608 88 17%
6 Police Naik (P.N.) 569 579 10 2%
7 Police Constable (P.C.) 1065 767 -298 -28%
Total 2799 2540 -259 -9%
Inferences:
The data shows that Assistant Police Sub - Inspector (ASI) strength is short by 34 officers (gap of 14%) and the
police force in the Police Constable (PC) is short staffed by 298 officers (gap of 28%).
27
North Mumbai includes: Borivali, Dahisar, Malad West

State of Policing and Law & Order in Mumbai
30
Table 29: Questions asked by MLAs on Crime issues (North Mumbai)
Sr. No.
Question asked on crime issues
GopalShetty
Vinod Ghosalkar
Pravin Darekar
Ramesh Thakur
Yogesh Sagar
Aslam Shaikh Total
1 Murder 1 28 21 7 5 4 66
2 Rape 1 9 9 3 5 11 38
3 Rioting 0 12 5 1 3 1 22
4 House Breaking 0 1 2 1 0 0 4
5 Chain Snatching 0 1 1 3 1 1 7
6 Theft 1 3 1 0 2 1 8
7 Accident/Fatal Accident 17 25 25 15 12 16 110
8 Crime Against Child 7 12 18 5 12 9 63
9 Crime Against Women 15 16 26 6 11 9 83
10 Scams/Corruption 11 15 15 4 7 5 57
11 Terrorism related 7 31 28 2 13 5 86
12 Drugs 3 3 13 4 4 7 34
13 Extortion/Kidnapping/Threat 4 3 1 3 4 1 16
14 Human Rights 1 0 0 0 0 1 2
15 Convicted 1 2 1 0 1 0 5
16 Wrong Conduct/Action by Police 9 34 23 3 6 7 82
17 Other Crime related 50 117 125 35 55 52 434
18 Police and Establishment 35 68 64 15 44 28 254
19 Shortage of manpower 1 0 1 1 0 1 4
Total 164 380 379 108 185 159 1375
Inferences:
The above table shows that total question asked in North Mumbai region by the 6 MLAs on the issues of Crime
was 1375 in the sessions from Budget 2009 to Monsoon 2014. The maximum questions asked were by Vinod
Ghosalkar that is 380.The issue raised most was ‘Police and Establishment’ with 254 questions being raised on
it. We can see that Accident, Terrorism and Crime against Women related are few major concern of the North
Mumbai region MLAs.

State of Policing and Law & Order in Mumbai
31
Section II. North West Mumbai Region Data
2. North West Mumbai28
Table 30: Specific Crime highest occurrences (North West Mumbai)
Specific Crime 2009-10 2010-11 2011-12 2012-13 2013-14
Murder 35 30 28 32 28
Rape 32 35 31 48 88
Riot 49 82 43 64 66
House Breaking (Day/Night) 499 553 447 465 597
Chain Snatching 295 283 211 202 372
Thefts 1255 1359 1047 927 1336
Vehicles Stolen 743 734 736 757 710
Table 31: Rank wise strength of police personnel (North West Mumbai)
Sr. No. Rank Sanctioned Working Actual
Difference Difference
in %
1 Police Inspector (P.I.) 75 75 0 0%
2 Assistant Police Inspector (A.P.I.) 91 76 -15 -16%
3 Police Sub - Inspector (P.S.I.) 273 237 -36 -13%
4 Assistant Police Sub-Inspector (A.S.I) 254 188 -66 -26%
5 Head Constable (H.C.) 557 669 112 20%
6 Police Naik (P.N.) 608 534 -74 -12%
7 Police Constable (P.C.) 1152 837 -315 -27%
Total 3010 2616 -394 -13%
Inferences:
The data shows that Assistant Police Sub - Inspector (ASI) strength is short by 66 officers (gap of 26%) and the
police force in the Police Constable (PC) is short staffed by 315 officers (gap of 27%).
28
North West Mumbai includes: Jogeshwari, Goregaon, Andheri
State of Policing and Law & Order in Mumbai
32
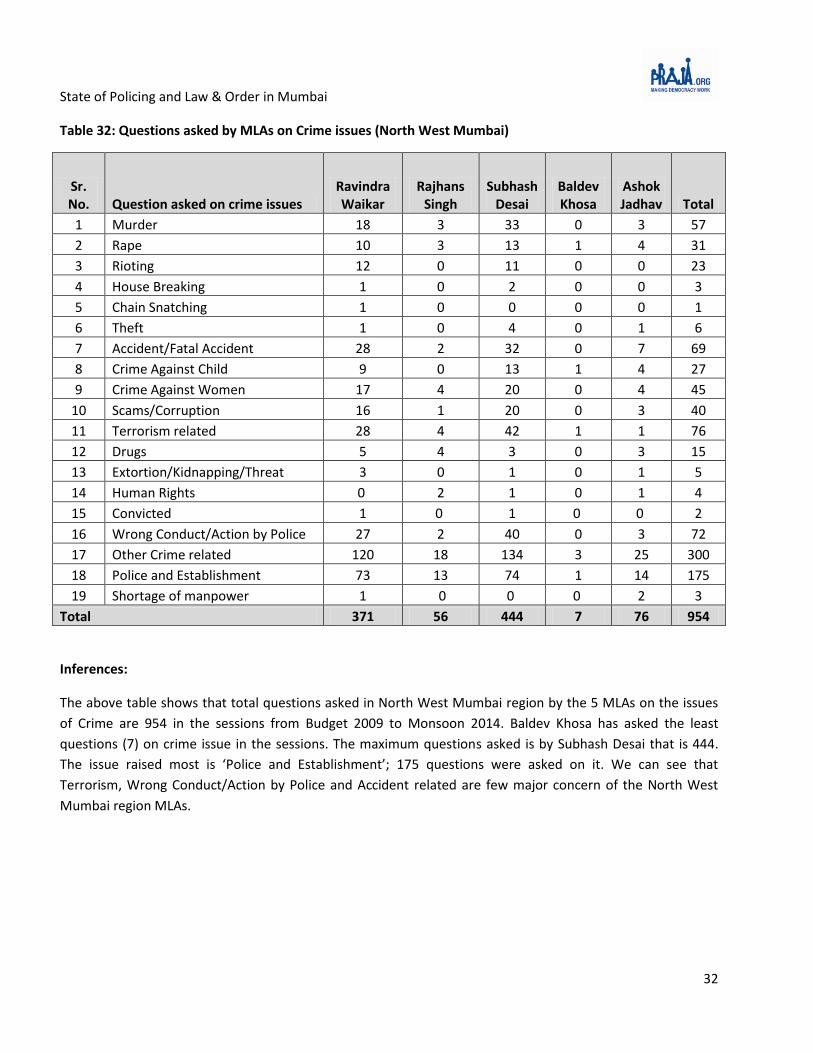
Table 32: Questions asked by MLAs on Crime issues (North West Mumbai)
Sr. No. Question asked on crime issues
RavindraWaikar
Rajhans Singh
Subhash Desai
Baldev Khosa
Ashok Jadhav Total
1 Murder 18 3 33 0 3 57
2 Rape 10 3 13 1 4 31
3 Rioting 12 0 11 0 0 23
4 House Breaking 1 0 2 0 0 3
5 Chain Snatching 1 0 0 0 0 1
6 Theft 1 0 4 0 1 6
7 Accident/Fatal Accident 28 2 32 0 7 69
8 Crime Against Child 9 0 13 1 4 27
9 Crime Against Women 17 4 20 0 4 45
10 Scams/Corruption 16 1 20 0 3 40
11 Terrorism related 28 4 42 1 1 76
12 Drugs 5 4 3 0 3 15
13 Extortion/Kidnapping/Threat 3 0 1 0 1 5
14 Human Rights 0 2 1 0 1 4
15 Convicted 1 0 1 0 0 2
16 Wrong Conduct/Action by Police 27 2 40 0 3 72
17 Other Crime related 120 18 134 3 25 300
18 Police and Establishment 73 13 74 1 14 175
19 Shortage of manpower 1 0 0 0 2 3
Total 371 56 444 7 76 954
Inferences:
The above table shows that total questions asked in North West Mumbai region by the 5 MLAs on the issues
of Crime are 954 in the sessions from Budget 2009 to Monsoon 2014. Baldev Khosa has asked the least
questions (7) on crime issue in the sessions. The maximum questions asked is by Subhash Desai that is 444.
The issue raised most is ‘Police and Establishment’; 175 questions were asked on it. We can see that
Terrorism, Wrong Conduct/Action by Police and Accident related are few major concern of the North West
Mumbai region MLAs.

State of Policing and Law & Order in Mumbai
33
Section III. North East Mumbai Region Data
3. North East Mumbai29
Table 33: Specific Crime highest occurrences (North East Mumbai)
Specific Crime 2009-10 2010-11 2011-12 2012-13 2013-14
Murder 36 43 29 31 36
Rape 20 25 22 46 56
Riot 76 67 69 63 64
House Breaking (Day/Night) 370 467 379 389 337
Chain Snatching 214 301 216 146 295
Thefts 759 730 773 754 837
Vehicles Stolen 523 561 588 628 623
Table 34: Rank wise strength of Police personnel (North East Mumbai)
Sr. No. Rank Sanctioned Working Actual
Difference Difference
in %
1 Police Inspector (P.I.) 55 55 0 0%
2 Assistant Police Inspector (A.P.I.) 70 70 0 0%
3 Police Sub - Inspector (P.S.I.) 216 202 -14 -6%
4 Assistant Police Sub-Inspector (A.S.I) 212 259 47 22%
5 Head Constable (H.C.) 456 514 58 13%
6 Police Naik (P.N.) 490 543 53 11%
7 Police Constable (P.C.) 932 873 -59 -6%
Total 2431 2516 85 3%
Inference:
The data shows that Police Sub - Inspector (PSI) strength is short by 14 officers (gap of 6%).
29
North East Mumbai includes: Mulund, Ghatkopar, Shivaji Nagar

State of Policing and Law & Order in Mumbai
34
Table 35: Questions asked by MLAs on Crime issues (North East Mumbai)
Sr. No.
Question asked on crime issues
Sardar Tara Singh
MangeshSangle
Shishir Shinde
Ramchandra Kadam
Prakas Maheta
Abu Azmi Total
1 Murder 6 41 17 11 2 4 81
2 Rape 9 10 2 1 2 3 27
3 Rioting 2 9 9 4 1 5 30
4 House Breaking (Day/Night) 0 2 0 1 0 0 3
5 Chain Snatching 0 1 1 1 0 0 3
6 Theft 4 7 3 0 0 0 14
7 Accident/Fatal Accident 20 41 21 10 7 5 104
8 Crime Against Child 10 32 11 10 5 2 70
9 Crime Against Women 17 44 15 18 3 1 98
10 Scams/Corruption 9 54 10 6 5 0 84
11 Terrorism related 20 28 6 8 2 12 76
12 Drugs 7 17 5 2 2 0 33
13 Extortion/Kidnapping/Threat 7 4 4 2 1 0 18
14 Human Rights 1 2 0 0 2 0 5
15 Convicted 0 2 0 0 0 0 2
16
Wrong Conduct/Action by Police 6 27 10 12 1 8 64
17 Other Crime related 63 216 79 72 28 19 477
18 Police and Establishment 37 135 51 27 6 15 271
19 Shortage of manpower 0 0 1 0 0 0 1
Total 218 672 245 185 67 74 1461
Inferences:
The above table shows that total questions asked in North East Mumbai region by the 6 MLAs on the issues of
Crime are 1461 in the sessions from Budget 2009 to Monsoon 2014. The maximum question asked is by
Mangesh Sangle (672). The issue raised most was of ‘Police and Establishment’ as 271 questions were asked
on it. We can see that Accident, Crime against Women, Scams/Corruption and Murder are few major concerns
of the North East Region MLAs.
State of Policing and Law & Order in Mumbai
35
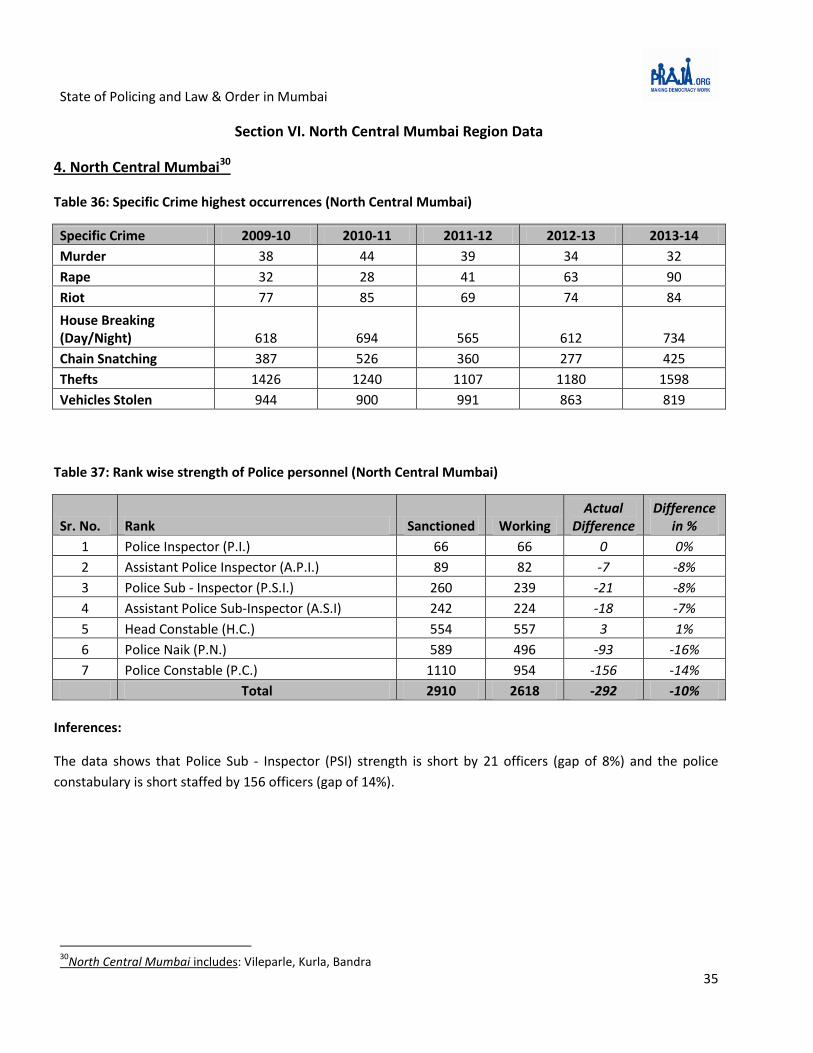
Section VI. North Central Mumbai Region Data
4. North Central Mumbai30
Table 36: Specific Crime highest occurrences (North Central Mumbai)
Specific Crime 2009-10 2010-11 2011-12 2012-13 2013-14
Murder 38 44 39 34 32
Rape 32 28 41 63 90
Riot 77 85 69 74 84
House Breaking (Day/Night) 618 694 565 612 734
Chain Snatching 387 526 360 277 425
Thefts 1426 1240 1107 1180 1598
Vehicles Stolen 944 900 991 863 819
Table 37: Rank wise strength of Police personnel (North Central Mumbai)
Sr. No. Rank Sanctioned Working Actual
Difference Difference
in %
1 Police Inspector (P.I.) 66 66 0 0%
2 Assistant Police Inspector (A.P.I.) 89 82 -7 -8%
3 Police Sub - Inspector (P.S.I.) 260 239 -21 -8%
4 Assistant Police Sub-Inspector (A.S.I) 242 224 -18 -7%
5 Head Constable (H.C.) 554 557 3 1%
6 Police Naik (P.N.) 589 496 -93 -16%
7 Police Constable (P.C.) 1110 954 -156 -14%
Total 2910 2618 -292 -10%
Inferences:
The data shows that Police Sub - Inspector (PSI) strength is short by 21 officers (gap of 8%) and the police
constabulary is short staffed by 156 officers (gap of 14%).
30
North Central Mumbai includes: Vileparle, Kurla, Bandra

State of Policing and Law & Order in Mumbai
36
Table 38: Questions asked by MLAs on Crime issues (North Central Mumbai)
Sr. No. Question asked on crime issues
Krishnakumar Hegde
Milind Kamble
Prakash Sawant
Baba Sidikki
Kripashankar Singh Total
1 Murder 0 3 15 1 0 19
2 Rape 4 2 6 1 0 13
3 Rioting 0 0 8 0 0 8
4 House Breaking (Day/Night) 0 0 3 0 0 3
5 Chain Snatching 2 0 0 0 0 2
6 Theft 1 0 4 0 0 5
7 Accident/Fatal Accident 7 0 21 0 1 29
8 Crime Against Child 1 1 8 0 0 10
9 Crime Against Women 4 1 10 0 0 15
10 Scams/Corruption 2 1 14 0 2 19
11 Terrorism related 0 1 17 0 0 18
12 Drugs 2 0 3 2 0 7
13 Extortion/Kidnapping/Threat 0 0 0 0 1 1
14 Human Rights 0 1 0 0 0 1
15 Convicted 0 0 1 0 0 1
16 Wrong Conduct/Action by Police 0 1 15 0 1 17
17 Other Crime related 8 3 79 8 4 102
18 Police and Establishment 3 3 51 10 3 70
19 Shortage of manpower 0 0 0 1 0 1
Total 34 17 255 23 12 341
Inferences:
The above table shows that total question asked in North Central Mumbai region by the 5 MLAs on the issues
of Crime is 341 in the sessions from Budget 2009 to Monsoon 2014. The maximum question asked is by Prakash
Sawant (255). The issue raised most was of ‘Police and Establishment’ as 70 questions were asked on it. By far it
can be said with even a cursory look at the crime data, that North Central Mumbai is the hotbed of criminal
activities with the maximum cases of crime in the year 2009-14 (37371) and MLAs of this region have asked the
least questions on crime.

State of Policing and Law & Order in Mumbai
37
Section V. South Central Mumbai Region Data
5. South Central Mumbai31
Table 39: Specific Crime highest occurrences (South Central Mumbai)
Specific Crime 2009-10 2010-11 2011-12 2012-13 2013-14
Murder 46 60 45 41 52
Rape 33 25 37 66 105
Riot 65 58 73 64 61
House Breaking (Day/Night) 576 640 478 547 669
Chain Snatching 337 474 399 269 443
Thefts 1094 1147 1152 1073 1243
Vehicles Stolen 715 707 791 734 724
Table 40: Rank wise strength of Police personnel (South Central Mumbai)
Sr. No. Rank Sanctioned Working Actual
Difference Difference
in %
1 Police Inspector (P.I.) 77 78 1 1%
2 Assistant Police Inspector (A.P.I.) 110 92 -18 -16%
3 Police Sub - Inspector (P.S.I.) 288 278 -10 -3%
4 Assistant Police Sub-Inspector (A.S.I) 265 237 -28 -11%
5 Head Constable (H.C.) 559 625 66 12%
6 Police Naik (P.N.) 707 647 -60 -8%
7 Police Constable (P.C.) 1256 1209 -47 -4%
Total 3262 3166 -96 -3%
Inferences:
The data shows that Assistant Police Sub - Inspector (ASI) strength is short by 28 officers (gap of 11%) and the
police force in the constabulary is short staffed by 47 officers (gap of 4%).
31
South Central Mumbai includes: Chembur, SionKoliwada, Mahim

State of Policing and Law & Order in Mumbai
38
Table 41: Questions asked by MLAs on Crime issues (South Central Mumbai)
Sr. no. Question asked on crime issues
Nawab Malik
Chandrakant Handore
Jagannath Shetty
Kalidas Kolambkar
Nitin Sardesai Total
1 Murder 9 0 1 2 12 24
2 Rape 3 1 2 3 5 14
3 Rioting 0 0 0 1 3 4
4 House Breaking (Day/Night) 0 0 0 3 1 4
5 Chain Snatching 0 0 0 3 1 4
6 Theft 0 0 2 1 0 3
7 Accident/Fatal Accident 9 0 10 11 17 47
8 Crime Against Child 2 2 4 4 9 21
9 Crime Against Women 1 0 2 4 9 16
10 Scams/Corruption 1 0 1 1 6 9
11 Terrorism related 1 0 2 0 11 14
12 Drugs 0 0 5 2 1 8
13 Extortion/Kidnapping/Threat 0 0 1 2 1 4
14 Human Rights 1 0 1 1 0 3
15 Convicted 0 0 0 0 1 1
16 Wrong Conduct/Action by Police 3 0 6 3 9 21
17 Other Crime related 8 0 29 13 57 107
18 Police and Establishment 16 1 13 17 32 79
19 Shortage of manpower 1 0 2 0 1 4
Total 55 4 81 71 176 387
Inferences: The above table shows that total questions asked in South Central Mumbai region by the 5 MLAs on the issues of Crime are 387 in the sessions from Budget 2009 to Monsoon 2014. Chandrakant Handore has asked only 4 questions on crime issue in the sessions. The maximum questions asked are by Nitin Sardesai that is 176. The issues raised most were of ‘Police and Establishment’ (79) and ‘Accident/Fatal Accident’ (47) with maximum questions being asked on them. While there has been highest number of rape cases (105) registered in this region during 2013-14 only 14 questions related to it were raised. .

State of Policing and Law & Order in Mumbai
39
Section VI. South Mumbai Region Data
6. South Mumbai32
Table 42: Specific Crime highest occurrences (South Mumbai)
Specific Crime 2009-10 2010-11 2011-12 2012-13 2013-14
Murder 47 32 40 34 19
Rape 28 40 39 47 66
Riot 74 53 73 65 86
House Breaking (Day/Night) 570 586 538 478 500
Chain Snatching 180 234 307 218 302
Thefts 1441 1267 1398 1405 1440
Vehicles Stolen 854 884 950 723 699
Table 43: Rank wise strength of Police personnel (South Mumbai)
Sr. No. Rank Sanctioned Working Actual
Difference Difference
in %
1 Police Inspector (P.I.) 130 127 -3 -2%
2 Assistant Police Inspector (A.P.I.) 175 142 -33 -19%
3 Police Sub - Inspector (P.S.I.) 596 424 -172 -29%
4 Assistant Police Sub-Inspector (A.S.I) 547 478 -69 -13%
5 Head Constable (H.C.) 1303 1056 -247 -19%
6 Police Naik (P.N.) 1507 1134 -373 -25%
7 Police Constable (P.C.) 2795 2205 -590 -21%
Total 7053 5566 -1487 -21%
Inferences: The data shows that Police Sub - Inspector (PSI) strength is short by 172 officers (gap of 29%). Police force in the Assistant Police Inspector (API) is short staffed by 33 officers (gap of 19%) and police in the Police Constable (PC) is short staffed by 590 officers (gap of 21%).
32
South Mumbai includes: Worli, Byculla, Colaba, Malabar Hill

State of Policing and Law & Order in Mumbai
40
Table 44: Questions asked by MLAs on Crime issues (South Mumbai)
Sr. no. Question asked on crime issues
Bala Nandgaonkar
Madhukar Chavan
Mangal Prabhat Lodha
Amin Patel
Annie Shekhar Total
1 Murder 47 2 5 4 0 58
2 Rape 7 7 2 8 0 24
3 Rioting 16 1 1 2 0 20
4 House Breaking (Day/Night) 1 1 0 1 0 3
5 Chain Snatching 1 2 0 2 0 5
6 Theft 10 0 2 5 0 17
7 Accident/Fatal Accident 49 15 9 19 1 93
8 Crime Against Child 37 5 6 16 1 65
9 Crime Against Women 49 6 10 12 5 82
10 Scams/Corruption 65 4 6 8 0 83
11 Terrorism related 39 1 15 3 0 58
12 Drugs 21 5 8 10 0 44
13 Extortion/Kidnapping/Threat 3 1 2 3 0 9
14 Human Rights 3 0 2 0 0 5
15 Convicted 5 0 0 0 0 5
16 Wrong Conduct/Action by Police 46 6 2 12 1 67
17 Other Crime related 263 30 39 69 6 407
18 Police and Establishment 167 19 41 50 1 278
19 Shortage of manpower 1 1 0 4 0 6
Total 830 106 150 228 15 1329
Inferences:
The above table shows that total questions asked in South Mumbai region by the 5 MLAs on the issues of
Crime was 1329 in the sessions from Budget 2009 to Monsoon 2014. The maximum question asked is by Bala
Nandgaonkar that is 830. The issue raised most is ‘Police and Establishment’, 278 questions were asked on it.
We can see that Accident/Fatal Accident, Scams/Corruption and Crime against women are few major concerns
of the South Mumbai Region MLAs.

State of Policing and Law & Order in Mumbai
41
Section VII. Mumbai Railway Crime Data Police Station-wise
Table 45: Mumbai Railway Crime Statistics
Head
C.S.T. Dadar Kurla
2009 2010 2011 2012 2013 2009 2010 2011 2012 2013 2009 2010 2011 2012 2013
Murder 2 0 1 0 0 0 0 0 0 0 0 2 5 0 0
Dacoity/ Robbery 0 2 5 30 21 1 0 2 43 33 5 8 13 43 57
All Thefts 143 159 153 91 103 181 170 186 151 168 239 212 251 227 281
Rape 1 0 0 0 2 0 0 1 0 0 1 0 2 1 1
Molestation 2 3 1 3 4 1 1 0 0 5 2 3 0 2 5
Other IPC 21 31 28 26 22 5 9 14 19 26 29 14 29 40 56
Head
Wadala Churchgate M.C.T.
2009 2010 2011 2012 2013 2009 2010 2011 2012 2013 2009 2010 2011 2012 2013
Murder 0 0 2 0 0 0 0 0 0 0 0 0 1 1 1
Dacoity/
Robbery 6 6 7 39 62 1 1 2 2 5 3 6 0 4 18
All Thefts 131 150 184 95 114 50 57 55 46 46 151 152 124 67 71
Rape 0 0 0 0 0 0 0 0 0 0 0 0 0 0 0
Molestation 1 0 0 0 1 0 0 0 2 0 1 0 2 0 2
Other IPC 6 16 14 6 13 0 3 5 6 0 10 11 8 6 15
Head
Bandra Andheri Borivali
2009 2010 2011 2012 2013 2009 2010 2011 2012 2013 2009 2010 2011 2012 2013
Murder 1 0 0 0 1 0 0 0 0 0 1 2 0 1 0
Dacoity/ Robbery 1 0 1 18 31 2 0 0 12 12 3 3 2 39 43
All Thefts 189 109 89 79 70 103 94 110 76 96 281 300 292 183 167
Rape 0 1 0 0 2 1 0 0 0 0 0 0 0 0 0
Molestation 1 2 0 3 3 1 0 0 0 0 0 1 1 2 2
Other IPC 7 9 15 9 9 12 8 11 4 7 18 12 21 12 14
Inferences:
The above data shows the Railway Crime statistics from 2009 to 2013. The highest incidences of
Dacoity/Robbery in the year 2013 were in Wadala area (62). Kurla ranks highest in the Number of theft cases
(281) in the year 2013. Overall, Churchgate area has the lowest Railway Crime cases reported in the year 2013.

State of Policing and Law & Order in Mumbai
42
Part D - What needs to be done
• Fill up gaps in the sanctioned and available strengths of the police force at the level of the
Investigating Officers and in the Police Control Room (100/103 helpline).
• Separate Investigation from Law and Order.
• Home department needs to improve coordination between Investigating officers and public
prosecutors.
• Police should take steps to reach out to SEC B & C classes to address any apprehensions about
police, law & order. Using regional language mediums, local cable channels can be helpful.
• Strengthen and where necessary create infrastructure for continuous training, forensic labs,
crime mapping and crime forecasting.

State of Policing and Law & Order in Mumbai
43
Annexure 1 – Survey Methodology
Praja Foundation had commissioned the household survey to Hansa Research and the survey methodology
followed is as below:
In order to meet the desired objectives of the study, we represented the city by covering a sample from
each of its 227 wards. Target Group for the study was :
Both Males & Females
18 years and above
Belonging to that particular ward.
Sample quotas were set for representing gender and age groups on the basis of their split available
through Indian Readership Study (Large scale baseline study conducted nationally by Media Research
Users Council (MRUC) &Hansa Research group) for Mumbai Municipal Corporation Region.
The required information was collected through face to face interviews with the help of structured
questionnaire.
In order to meet the respondent within a ward, following sampling process was followed:
5 prominent areas in the ward were identified as the starting point
In each starting point about 20 individuals were selected randomly and the questionnaire was
administered with them.
Once the survey was completed, sample composition of age & gender was corrected to match the
population profile using the baseline data from IRS. This helped us to make the survey findings more
representatives in nature and ensured complete coverage.
The total study sample was 22580.

State of Policing and Law & Order in Mumbai
44
Annexure 2 – Socio Economic Classification (SEC) Note
SEC is used to measure the affluence level of the sample, and to differentiate people on this basis and study their
behaviour / attitude on other variables.
While income (either monthly household or personal income) appears to be an obvious choice for such a purpose, it
comes with some limitations:
Respondents are not always comfortable revealing sensitive information such as income.
The response to the income question can be either over-claimed (when posturing for an interview) or
under-claimed (to avoid attention). Since there is no way to know which of these it is and the extent of over-
claim or under-claim, income has a poor ability to discriminate people within a sample.
Moreover, affluence may well be a function of the attitude a person has towards consumption rather than
his (or his household’s) absolute income level.
Attitude to consumption is empirically proven to be well defined by the education level of the Chief Wage Earner (CWE*)
of the household as well as his occupation. The more educated the CWE, the higher is the likely affluence level of the
household. Similarly, depending on the occupation that the CWE is engaged in, the affluence level of the household is
likely to differ – so a skilled worker will be lower down on the affluence hierarchy as compared to a CWE who is
businessman.
Socio Economic Classification or SEC is thus a way of classifying households into groups’ basis the education and
occupation of the CWE. The classification runs from A1 on the uppermost end thru E2 at the lower most end of the
affluence hierarchy. The SEC grid used for classification in market research studies is given below:
EDUCATION
OCCUPATION Illiterate
literate but no
formal schooling /
School up to 4th
School
5th
– 9th
SSC/
HSC
Some College
but not Grad
Grad/ Post-
Grad Gen.
Grad/ Post-
Grad Prof.
Unskilled Workers E2 E2 E1 D D D D
Skilled Workers E2 E1 D C C B2 B2
Petty Traders E2 D D C C B2 B2
Shop Owners D D C B2 B1 A2 A2
Businessmen/
Industrialists with
no. of employees
None D C B2 B1 A2 A2 A1
1 – 9 C B2 B2 B1 A2 A1 A1
10 + B1 B1 A2 A2 A1 A1 A1
Self-employed Professional D D D B2 B1 A2 A1
Clerical / Salesman D D D C B2 B1 B1
Supervisory level D D C C B2 B1 A2
Officers/ Executives Junior C C C B2 B1 A2 A2
Officers/ExecutivesMiddle/ Senior B1 B1 B1 B1 A2 A1 A1
*CWE is defined as the person who takes the main responsibility of the household expenses