Report of the Thirteenth Meeting of the Standing Committee ...
137
REPORT OF THE THIRTEENTH MEETING OF THE STANDING COMMITTEE ON TUNA AND BILLFISH 5–12 July 2000 Nouméa New Calédonia November 2000 ISSN 0377-452X
-
Upload
khangminh22 -
Category
Documents
-
view
4 -
download
0
Transcript of Report of the Thirteenth Meeting of the Standing Committee ...
REPORT OF THE THIRTEENTH MEETING OF THE
STANDING COMMITTEE ON TUNA AND BILLFISH
5–12 July 2000
Nouméa
New Calédonia
November 2000
ISSN 0377-452X

Secretariat of the Pacific Community Cataloguing-in-publication data
Meeting of the Standing Committee on Tuna and Billfish (13th : 2000 : Noumea) Report
(Report of Meeting (Technical) / Secretariat of the Pacific Community)
1. Tuna – Oceania – Congresses2. Billfishes – Oceania – CongressesI. TitleII. Secretariat of the Pacific CommunityIII. Series
639.27783 AACR2
ISSN 0377-452X
ISBN 982-203-759-7
Prepared for publication and printed by theSecretariat of the Pacific Community
Noumea, New Caledonia
iii
TABLE OF CONTENTS
SUMMARY OF DISCUSSIONS ................................................................................................................. 1
1. PRELIMINARIES........................................................................................................................... 11.1 Opening Ceremony................................................................................................................. 11.2 Confirmation of Chairman and Appointment of Rapporteurs ................................................... 11.3 Adoption of the Agenda .......................................................................................................... 21.4 Adoption of the Report of the Twelfth Meeting of the SCTB ................................................... 2
2. OVERVIEW OF WESTERN AND CENTRAL PACIFIC OCEAN TUNA FISHERIES.................. 32.1 Regional Overview ................................................................................................................. 32.2 National Tuna Fishery Reports ............................................................................................... 52.3 Economic Condition of the Fishery........................................................................................ 18
3. REPORTS BY ORGANISATIONS............................................................................................... 20
4. STATISTICS WORKING GROUP (SWG) ................................................................................... 264.1 Statistics Working Group Session on Data Collection Forms................................................. 264.2 Coordinator’s Report on Data Collection, Compilation and Dissemination............................. 264.3 Review of SCTB12 Directives to the Statistics Working Group............................................. 30
5. SKIPJACK RESEARCH GROUP (SRG) ...................................................................................... 335.1 Regional fishery developments .............................................................................................. 335.2 Biological and ecological research......................................................................................... 345.3 Stock assessment .................................................................................................................. 365.4 Research coordination and planning ...................................................................................... 375.5 Summary statement .............................................................................................................. 38
6. BIGEYE RESEARCH GROUP (BRG).......................................................................................... 396.1 Regional fishery developments .............................................................................................. 396.2 Biological and ecological research......................................................................................... 396.3 Stock assessment .................................................................................................................. 436.4 Research coordination and planning ...................................................................................... 476.5 Summary statement .............................................................................................................. 47
7. YELLOWFIN RESEARCH GROUP (YRG) ................................................................................. 497.1 Regional fishery developments .............................................................................................. 497.2 Biological and ecological research......................................................................................... 517.3 Stock assessment .................................................................................................................. 527.4 Research co-ordination and planning..................................................................................... 557.5 Summary statement .............................................................................................................. 56
8. ALBACORE RESEARCH GROUP (ARG) ................................................................................... 588.1 Regional fishery developments .............................................................................................. 588.2 Biological and ecological research......................................................................................... 598.3 Stock assessment .................................................................................................................. 608.4 Research co-ordination and planning..................................................................................... 628.5 Summary statement .............................................................................................................. 63
9. BILLFISH AND BYCATCH RESEARCH GROUP (BBRG) ........................................................ 649.1 Activities of other groups studying billfish and bycatch ......................................................... 649.2 Billfish data considerations ................................................................................................... 669.3. Fisheries taking swordfish..................................................................................................... 709.4 Biological research on swordfish........................................................................................... 72
iv
9.5 Assessment of swordfish and associated bycatch ................................................................... 749.6 Swordfish and billfish research plan...................................................................................... 799.7 Other business...................................................................................................................... 799.8 Summary statement .............................................................................................................. 80
10. DISCUSSION ON MHLC ISSUES ............................................................................................... 8210.1 Current status of the MHLC process and implications for SCTB............................................. 82
11. OTHER BUSINESS.................................................................................................................... 8211.1 Directives to the Statistics Working Group.............................................................................. 8211.2 Consideration of summary statements from the Species Research Groups ................................ 8411.3 Other matters.......................................................................................................................... 84
12. CLOSE ........................................................................................................................................ 85
TABLES OF ANNUAL CATCH ESTIMATES ......................................................................................... 86
APPENDIX 1. AGENDA ........................................................................................................................ 95
APPENDIX 2. LIST OF WORKING PAPERS........................................................................................ 97
APPENDIX 3. LIST OF PARTICIPANTS ............................................................................................ 103
APPENDIX 4. OPENING ADDRESS BY THE DIRECTOR-GENERAL OF THESECRETARIAT OF THE PACIFIC COMMUNITY.................................................. 113
APPENDIX 5. REVIEW OF CATCH AND EFFORT LOGSHEETS OF THE SPC/FFA TUNAFISHERY DATA COLLECTION FORMS COMMITTEE ........................................ 115
APPENDIX 6. REPORT OF THE OCEANOGRAPHIC DATABASE USERS GROUPMEETING.................................................................................................................. 119
APPENDIX 7. PROPOSED TEMPLATE FOR SCTB WORKING GROUP REPORTS ....................... 121
APPENDIX 8. SCIENTIFIC NAMES OF SPECIES ............................................................................. 122
APPENDIX 9. ACRONYMS AND ABBREVIATIONS ........................................................................ 123

v
Thirteenth Meeting of the
STANDING COMMITTEE ON TUNA AND BILLFISH
Noumea, New Caledonia
5 – 12 July 2000
EXECUTIVE SUMMARY
The thirteenth meeting of the Standing Committee on Tuna and Billfish (SCTB13) was held fromWednesday 5th July to Wednesday 12th July in Noumea, New Caledonia, at the invitation of the Secretariatof the Pacific Community. SCTB 13 was attended by participants from American Samoa, Australia, Canada,Cook Islands, Federated States of Micronesia, Fiji, France, French Polynesia, Guam, Japan, Kiribati, Korea,Marshall Islands, New Caledonia, New Zealand, Niue, Northern Marianas, Palau, Papua New Guinea,Samoa, Solomon Islands, Taiwan, Tonga, United States of America, Vanuatu, and Wallis and Futuna.Participants from the Food and Agricultural Organisation of the United Nations (FAO), the Forum FisheriesAgency (FFA), the Indian Ocean Tuna Commission (IOTC) and the Inter-American Tropical TunaCommission (IATTC) also attended.
The meeting agenda, working papers presented at the meeting, and list of participants are provided inAppendices 1, 2 and 3, respectively. The meeting convenes as six working groups – the Statistics WorkingGroup (SWG), the Skipjack Research Group (SRG), the Albacore Research Group (ARG), the YellowfinResearch Group (YRG), the Bigeye Research Group (BRG), and the Billfish and Bycatch Research Group(BBRG). The Bigeye RG and Billfish and Bycatch RG were accorded priority with time allocated fordeliberations, given existing resource uncertainties.
The initial overview of Western and Central Pacific Ocean (WCPO) tuna fisheries noted that the estimatedtotal catch for 1999 for the four main tuna species was 1,718,776 mt, the second highest total catch onrecord after 1998 (1,900,290 mt). The 1999 catch of skipjack (1,101,617 mt) was slightly down on the recordlevel of the previous year (1,244,349 mt) and as usual dominated the total catch (64%). The yellowfin(396,747 mt) and South Pacific albacore (37,080 mt) catches were also slightly down on the 1998 levels, butthe bigeye catch (105,365 mt) was a record high, just eclipsing the previous record catch in 1997 (103,886mt). National fishery reports provide further details of these catches.
Reports on relevant activities of other organisations were received from the Bureau of Resource Sciences(BRS–Australia), Commonwealth Scientific & Industrial Research Organisation (CSIRO–Australia), IATTC,Institut de recherche pour le dévelopment (IRD–France), FAO and the Interim Scientific Committee forTuna and Tuna-like Species in the North Pacific Ocean (ISC).
The objectives of the SCTB Statistics Working Group (SWG) are to co-ordinate the collection, compilationand dissemination of tuna fisheries data. In regard to the co-ordination of data collection, the SWG held asession prior to the main SCTB meeting to review the catch and effort logsheets developed by the SPC/FFATuna Fishery Data Collection Forms Committee, which are widely used in the region. In the future, theSWG will review other logsheets, including those of the Japanese fleets, through a small group ofparticipants that will report their findings to future meetings of the SCTB.
During the main SCTB meeting, the SWG Co-ordinator reported on the status of data collection, compilationand dissemination. Data that are compiled by the OFP on behalf of the SCTB include annual catchestimates, catch and effort data, length data, and other types of data. Progress in data compilation wasachieved, although estimates of the annual catches in recent years in Indonesia and the Philippines havenot been provided and problems remain with the longline and purse-seine catch and effort data provided byJapan and Korea. It was reported that revised catch and effort data covering the Taiwanese distant-waterlongline fleet would be provided in the near future.
vi
It was reported that the level of coverage of longline catches in the WCPO during 1991–1999 by observerdata held by the OFP is only 0.15 percent. It was noted that observer coverage must be increased in orderto better estimate the catches of non-target species, including sharks and rays, marine reptiles, marinemammals and birds.
Other subjects discussed by the SWG included the evaluation of observer and port sampling programmes;factors for converting processed weights to whole weights; predation of longline-caught fish by marinemammals and sharks; the compilation of annual catch estimates for small-scale fisheries (whethercommercial, artisanal, subsistence or recreational); the availability of information on illegal, unreported andunregulated (IUU) fishing; the availability of VMS data; definitions of GRT; the placement of SPC observersaboard Australian longliners; the application of regression trees to estimates of purse-seine catches ofbigeye and yellowfin; and the compilation of information on longline gear attributes and operations.
The five Research Groups considered regional fishery developments, advances in research, stockassessment and research co-ordination and planning for those species or species groups, with the BBRGconcentrating efforts this year on swordfish. Summary statements on these matters are provided for eachresearch group. The BRG held an informal workshop prior to SCTB plenary, to review the application of theMULTIFAN–CL model to Pacific-wide bigeye. Also, a meeting to consider the use of oceanographic data inpelagic fisheries research was held prior to the SCTB plenary.
The meeting was also provided with an update of the ongoing MHLC process to develop an arrangement forthe conservation and management of highly migratory fish stocks in the WCPO, which is scheduled forcompletion in August 2000 (Convention and Commission). The implications for SCTB in terms of theprovision of scientific advice to the proposed Commission were also discussed. It was decided that a smallgroup, under the direction of the SCTB Chairman, would consider how SCTB might make the transition to aScientific Committee in the new MHLC Interim Conference.
The SCTB13 was presented with, for the first time, applications of the MULTIFAN–CL length-basedassessment model to all four target tuna species in the WCPO and to North Pacific blue shark. In responseto a need for SCTB to receive technical advice regarding the application of this and similar methods, themeeting decided to establish a Methods Working Group. The terms of reference for this Working Groupwere agreed and are listed in a section following the Species Research Group summary statements.
Recognising tagging as a key source of information for stock assessment work, the meeting decided toexplore convening a tagging workshop in early 2001, the dates and venue to be decided. The objectives ofthe workshop will be to scope tagging objectives, prioritise methodology and logistics for mounting large-scale tagging projects for the four target tuna species, as well as integrating existing electronic andconventional tagging projects.
The meeting thanked outgoing Chairman Dr. Ziro Suzuki for his sterling service over the past two years andDr. Tony Lewis for his role as interim Skipjack Research Group Co-ordinator for the past three years. Thenew SCTB Chairman and Working Group and Research Group Co-ordinators for the next two years are asfollows:
SCTB Chairman: Mr Bernard ThoulagStatistics WG Co-ordinator: Mr Tim LawsonMethods WG Co-ordinator: Dr John SibertSkipjack RG Co-ordinator: Dr Gary SakagawaYellowfin RG Co-ordinator: Dr Robert CampbellBigeye RG Co-ordinator: Mr Naozumi MiyabeAlbacore RG Co-ordinator: Dr Talbot MurrayBillfish and By-Catch RG Co-ordinator: Mr Peter Ward
The venue for 14th SCTB meeting to be held during the period June-July 2001 was not confirmed, butwould be communicated to participants at a later date. The meeting closed on Wednesday 12 June at 1730hrs.
vii
SKIPJACK RESEARCH GROUP (SRG) – SUMMARY STATEMENT
Skipjack contribute two thirds of the WCPO catch of the four main tuna species. The best availableestimates indicate that the 1999 skipjack catch in the WCPO was approximately 1.1 million mt (slightly lessthan the record 1998 catch), with purse-seine fleets providing the majority of this catch (71%). Availableindicators (purse seine, pole-and-line) show variable catch rates over time in the fishery. A new analysis ofpurse-seine CPUE for Japanese vessels has shown a declining trend in standardised CPUE forunassociated school sets since the 1980s but an increasing trend for log and FAD-associated sets. In thelatter case, the recent switch away from natural log sets to mainly drifting FAD sets make associated-setCPUE difficult to interpret as an index of abundance at this time.
Ongoing fisheries oceanography studies have continued to provide a better understanding of environmentalinfluences on fluctuations seen in skipjack availability and productivity in the WCPO. These studies suggestpositive impact of El Niño conditions on skipjack recruitment, particularly when followed rapidly by La Niñaconditions, as occurred in 1998.
Tag-based assessments from the early 1990s found regional exploitation levels of skipjack to be low tomoderate at catch levels similar to those in recent years. The preliminary results of a MULTIFAN–CLanalysis for skipjack were consistent with the tag-based assessment, but in addition indicated that fishingmortality may have increased significantly since the early 1990s, particularly in the tropical region west of165°E. Nevertheless, the overall estimates of fishing mortality-at-age were still considerably smaller thanthe corresponding estimates of natural mortality-at-age. It is stressed that these are preliminary results froman analysis still under development. The analysis will be refined in the coming year by the inclusion ofadditional tagging and fisheries data from the North Pacific.
Given the importance of skipjack to the fisheries in this region, there is an urgent need (i) to improve thestatistical coverage of the fisheries, which remains poor in some areas (e.g. Indonesia, Philippines); (ii) todevelop fishery indicators, such as standardised CPUE, for use in stock assessments; (iii) to betterdocument and understand the use and impacts (ecological and biological) of new technology (such asremotely monitored FADs) in the purse-seine fishery; (iv) to continue the development of the MULTIFAN–CL-based assessment (and in particular to extend the geographical scope of the analysis to include thenorthern portion of the stock); and (v) to continue to develop an understanding of processes affecting stockproductivity and recruitment. Given the likely continued reliance on tagging data as a quasi-fishery-independent source of information on skipjack (and other tuna) stock dynamics, consideration now needs tobe given to a new large-scale tuna tagging programme in the WCPO.
BIGEYE RESEARCH GROUP (BRG) – SUMMARY STATEMENT
Although the catch of bigeye for the Pacific Ocean accounts for a relatively small portion (8%) of the totaltuna catch, its economic value is substantial (approximately US$1 billion annually). The 1999 total Pacificcatch was 184,546 mt, with 105,365 mt and 79,181 mt in the WCPO and EPO, respectively. Both regionsrecorded increases in bigeye catch (around 13,000 mt and 8,000 mt respectively) in 1999 due to increasesin purse-seine catches. This increased catch in the WCPO appears to be associated with the extensive useof drifting FADs, while the increase in the EPO was due to the improvement in bigeye catch monitoring forthe purse-seine fishery. It should also noted that the size of bigeye caught by drifting FADs sets in the EPOwas much larger in 1999 than previous years. The overall catch trend in the WCPO has been increasing inrecent years, reflecting either higher longline or purse-seine catches depending on year. In the EPO, thesurface fishery catch increased markedly to 29,000 mt in 1994 and has been more than 35,000 mt per yearsince then. At the same time, the longline catch has declined from its maximum of about 100,000 mt in themid-1980s to about 35,000 mt in 1998. Overall, EPO catches of bigeye have varied from 60,000–80,000 mtin recent years.
The environmental effects on availability and productivity have been investigated through fisheriesoceanographic studies. As with yellowfin, El Niño events may increase bigeye catchability in the west byraising the lower limit of its swimming habitat. At the same time, recruitment could be higher in the east dueto the warmer and more suitable environment for spawning and larval survival. Incorporating suchinformation into the stock assessment process may enhance the reliability of population models for thisspecies, and therefore this study should be further pursued.

viii
During the past year, collaborative research involving several institutions has been undertaken in order tobetter assess the status of the bigeye stock. The work has involved the application of an integratedstatistical model (MULTIFAN–CL) to Pacific-wide bigeye data for the first time. The preliminary results fromthe model are promising and are consistent in several respects with the results obtained by the IATTC forthe EPO using an independently derived model, although the absolute values of F from the collaborativestudy were considerably lower. Further work is required before the MULTIFAN–CL results can beinterpreted in a management context. The IATTC analysis for the EPO indicated relatively stable stockbiomass in recent years, but the outlook for the stock is uncertain because the most recent recruitment isnot precisely estimated.
The Group examined several nominal and standardised CPUE series for the longline fishery. Despite somedifferences among the standardised CPUE series, they tended to indicate a similar declining trend in recentyears. Although these estimates require further refinement, these results raise a concern of possibleoverfishing and decline in adult biomass, particularly in combination with the record purse-seine catch in theWCPO in 1999 and continuing high catches in the EPO.
The Group therefore strongly recommends that current research regarding appropriate stock assessment becontinued as a priority. Other research and data collection priorities include (i) acquisition of more detailedcatch statistics and size composition data for the fisheries of Philippines and Indonesia; (ii) if possible, refinethe methods for estimating bigeye catches in the purse-seine fishery; (iii) better document and understandthe use and impacts (ecological and biological) of new technology (such as drifting FADs) in the purse-seinefishery; and (iv) refine the estimates of bigeye vertical distribution in relation to temperature and othervariables (for use in habitat models) using the most recent archival and sonic tagging data. In addition tothese short-term research items, the Group foreshadowed a longer term need for additional large-scaletagging to provide information on bigeye movement, natural mortality and exploitation rates to supportfuture stock assessment analyses.
YELLOWFIN RESEARCH GROUP (YRG) – SUMMARY STATEMENT
The yellowfin tuna catch for the western and central Pacific Ocean (WCPO) has increased since the 1980s,when the purse-seine fishery began its significant expansion in the WCPO. Since 1990, the catch rangedfrom 320,000 mt (1996) to 458,000 mt (1997). The majority (55%) of this catch is produced by purseseiners.
In 1999, poor market conditions for purse-seine caught fish resulted in reduced purse-seine fishing effortand catch. In addition, the longline yellowfin catch for 1999 of 52,580 mt was the lowest for nearly 30 years.The overall catch for 1999 fell from 440,000 mt in 1998 to about 397,000 mt, well below the peak of 458,000mt in 1997.
Catch rates for purse-seine fleets continue to be variable and show no clear trend in the available timeseries of data. However, catch rates for some fleets since about 1997 may have benefited from theincreased use of drifting FADs. This fishing innovation is rapidly becoming the preferred technique for mostfleets.
Catch rates for longline fleets continue to remain near their historical lows. The trend in the recent data ismixed, with some fleets showing a flat trend and others showing a slightly downward trend since 1988. It isnoted that these trends may have been affected by changing fishing practices.
Tag-based assessments from the early 1990s found regional exploitation levels of yellowfin tuna to be lowto moderate at catch levels at that time slightly below those in recent years. The updated results of aMULTIFAN–CL analysis for yellowfin tuna continue to be consistent with the tag-based assessment, but inaddition indicate that fishing mortality may have increased significantly since the mid 1990s. However, theoverall estimates of fishing mortality-at-age remain considerably smaller than the corresponding estimatesof natural mortality-at-age. The analysis also indicates that recent recruitment may have declined, which inturn is producing a decline in overall stock biomass. Additional research with the MULTIFAN–CL model willbe undertaken to determine the significance of these results in terms of future stock productivity. Assumingthat major changes in yellowfin stock productivity have not occurred, it is likely that the WCPO yellowfintuna stock can sustain the current catch level.
ix
The research priorities for yellowfin include (i) continued improvement in the quality and coverage of catchand effort data and size composition sampling, with particular emphasis on the Philippines and Indonesiandomestic fisheries; (ii) continued development and evaluation of the MULTIFAN–CL model for yellowfintuna; and (iii) continued collection of information on a range of biological information, including age andgrowth, sex-specific natural mortality and trophic/ecosystem dynamics. As noted in the skipjack summarystatement, it is likely that there will be continued reliance on tagging data as a quasi-fishery-independentsource of information on yellowfin stock dynamics. Therefore, consideration now needs to be given to a newlarge-scale tuna tagging programme in the WCPO.
ALBACORE RESEARCH GROUP (ARG) – SUMMARY STATEMENT
Albacore caught in the South Pacific constitute a single stock. Longline, primarily catching adults, accountsfor the majority of albacore catches (89%) in the South Pacific with trolling catching the remainder (11%).The albacore catch, estimated at 37,080 mt in 1999, was less than in 1998 when catches reached the 10-year peak of over 42,000 mt. In 1999 longline catches were 33,353 mt and troll catches 3,641 mt. Longlinecatches of several South Pacific island States and territories exceed 2,000 mt, contributing substantially tothe total albacore catch. The combined albacore longline catch in 1999 by Fiji, French Polynesia andSamoa was slightly lower than 1998 in all three areas. This catch, more than 11,000 mt, constitutes 29% ofall longline catches of albacore in the South Pacific. Catches in Samoa have rapidly increased from 560 mtin 1994 to over 4,000 mt in 1998, but declined in 1999 to 3,400 mt. Longline albacore catches also declinedfor vessels in American Samoa over the same time period. Slight declines in catches were also reported forCanadian and USA troll vessels fishing the STCZ in the 1998/99 season relative to 1997/98. Troll caughtalbacore in the New Zealand EEZ declined by about half over the same period, in this latter case low pricesbeing given as an explanation by the fishing industry, rather than low availability.
There has not been any dedicated field research on albacore since the OFP research programme in1991/92. Biological data on albacore is regularly collected, however, via observer and port samplingprogrammes in the region, although some of these data have not been compiled. Length frequency datafrom port sampling is a critical input to the length-based age-structured stock assessment model(MULTIFAN–CL). This model has been extended to cover the period 1961–1998, to incorporate tagrecovery information, and include the Samoan longline fishery. Results from this model are stronglyinfluenced by a small number of tags recovered (135 recoveries) and hence are highly uncertain. Results,however, suggest a decline in biomass from 1961 to 1989/90 (about 50%) followed by an increase whichcontinues to 1998. These results are regarded as highly uncertain due to the influence of the tagging dataand the lack of information on tag reporting rates. An alternative stock production model examined stocksustainability from a theoretical perspective. The results of this model were also considered to be highlyuncertain as several key parameter estimates were unrealistic and there was no basis for confirming results,including reference to similar species. A new attempt to incorporate environmental factors (with appropriatetime lags) in modelling biomass suggests a possible link between recruitment and ENSO events. Thisapproach requires further work to confirm this interpretation.
A number of areas requiring further work before the next SCTB meeting were identified, these tasks include:incorporating data from additional fleets; reviewing the adequacy of observer coverage; conducting aneconomic analysis in relation to changes in effort; analysing longline data to determine if retention practiseshave changed in some fleets; analysing depth of longline sets in relation to albacore size; developing furtherextensions to the MULTIFAN–CL model; developing procedures for standardising CPUE; evaluating theneed for a further tagging programme; and evaluating the use of reference points in assessing stock status.
No information was presented to suggest a change in interpretation of stock status of South Pacificalbacore. Although model results are considered highly uncertain, exploitation rates appear to be moderateand current catches are likely to be sustainable.
x
BILLFISH AND BYCATCH RESEARCH GROUP (BBRG) – SUMMARY STATEMENT
Unlike the species-specific research groups, the BBRG reviewed information on a diverse range of speciesand issues. While research on catch and effort statistics, biology, population dynamics and assessments ofthe main billfish species was reviewed, the impacts of commercial fishing on bycatch species such asturtles, sharks and seabirds were also considered. The BBRG also reviewed the activities on billfish andbycatch issues of both the IATTC and the ISC.
Following on from the information on billfish species presented at SCTB12, new data on the catch of thesespecies in the WCPO was reviewed. This was assisted by the catch of these species now being included inthe National Fishery Reports presented to the SCTB. During 1999, the total commercial catch of billfish wasestimated to be around 32,600 mt (consisting of 16,700 t of swordfish, 10,500 t of blue marlin, 4,200 t ofstriped marlin and 1,200 t of black marlin). Nearly all of this catch is taken by longliners. Catch statistics onbillfish caught (and released) by recreational fisheries throughout the WCPO were also compiled andreviewed for the first time. The catch of billfish in these fisheries is estimated to be around 3-5 percent ofthe commercial catch of these species, with black marlin and blue marlin being the largest catchcomponent. Assessment of the status of blue marlin in the Pacific indicates that present catches are belowmaximum sustainable yield. However, this work is preliminary and many gaps in the information required forthe development of quantitative stock assessments on all billfish species still persist. Major gaps includeinformation on age and growth, mixing rates and natural mortality, together with an understanding of theinfluence of targeting practices and changes in oceanographic conditions on catch rates. Consequently, thestatus of billfish stocks in the WCPO remains uncertain.
A comprehensive review of the fisheries catching swordfish in the WCPO was undertaken. There has beena 50 percent increase in the catch of swordfish in the WCPO during the 1990s, a rapid increase in the catchin the south-west Pacific in recent years (mainly due to developments in the Australian fishery), and thereexists potential for further developments in other countries. Overfishing of this species in other oceans hasalso been acknowledged. New research on stock structure postulates three stocks in the Pacific (one in thenorthwest, one in the southeast and another in the southwest) and will necessitate a sub-regionalmanagement approach. Quantitative stock assessments have yet to be completed, and the present status ofswordfish stocks in the WCPO remains uncertain. However, a number of research projects are presentlyunderway to increase understanding of the biology and population dynamics of swordfish. Indicators ofpossible overfishing, based on information gathered from similar fisheries in other oceans, should beidentified and monitored.
The BBRG also reviewed information relating to the status of the blue shark stock in the northern Pacific.The results indicate that the stock is increasing after a large decline during the 1980s, though this workremains preliminary as many uncertainties remain both in the data and biology of this species.
Research on the incidental catch of turtles and seabirds in the Hawaiian longline fishery was also reviewed.The BBRG took particular note of the recent U.S. court-related actions in this fishery on the issue of turtlebycatch. The BBRG expressed concern that fisheries are being singled out and possibly closed when thethreat from fisheries to sea turtle populations are relatively small in comparison with those from otherhuman activities, especially those that result in the degradation and loss of eggs and nesting sites. TheBBRG highlighted the complexity of fishery interactions where highly migratory species, protected species,and a range of impacting activities are involved. Fishery bycatch species often have a wide distribution.Furthermore, seabird and turtle populations, because of their land associations, are often impacted by awide range of non-fishing activities. As management decisions applied to a fishery can generate largeeconomic and social impacts it is important to ensure that they achieve the desired resource sustainabilityoutcome. The BBRG noted that the full impact of all human activities should be taken into account inassessing the effect of fishing on these populations. Consideration should span the range of scientificinformation available, including species population parameters, the range of the fishery and non-fisheryimpacts, and bycatch mitigation measures in place.
Finally, the BBRG reviewed the research relating to billfish and bycatch. While noting the range of ongoingresearch, the collection of data needed in support of stock assessment, particularly observer data for whichcoverage in recent years has been less than one percent for almost all fleets, was seen as a priority. To thisend, a better understanding of catch (both present and historical and for all commercial, artisanal andrecreational fisheries) was seen as a high priority issue, particularly for bycatch species. Research onunderstanding the biology of these species (age and growth, reproduction and movement) is also required.

xi
The need for collaborative international research on many of these issues was identified and stronglyencouraged.
METHODS WORKING GROUP – DRAFT TERMS OF REFERENCE
The Methods Working Group will co-ordinate research and make recommendations to the SCTB plenary ontechnical questions related to stock assessment methodology that may arise from time to time. The initialterms of reference for the Working Group include the following:
1. Develop criteria for evaluating the performance of stock assessment methods applicable to the tunafisheries of the western and central Pacific Ocean.
2. Investigate the statistical properties and performance of selected stock assessment methods usingsimulation analysis and other appropriate methods and, on the basis of studies undertaken, makerecommendations to SCTB regarding the most appropriate methods to be used for the assessment of targettuna stocks and important by-catch species of the western and central Pacific Ocean tuna fishery.
3. Provide ongoing review of the application of stock assessment models to the various species of interestand, where necessary, make recommendations to SCTB regarding enhancements to the models to improvetheir performance or to address deficiencies with respect to specific applications.
4. Co-ordinate research to determine appropriate biological reference points for target tuna stocks andimportant by-catch species of the western and central Pacific Ocean tuna fishery and makerecommendations to SCTB on the basis of this research.
5. Advise SCTB on appropriate methods of formulating scientific advice for management.
6. Advise SCTB on methods that might be used to monitor and assess the ecosystem impacts of tunafishing in the western and central Pacific Ocean.

xii

1
SUMMARY OF DISCUSSIONS
1. PRELIMINARIES
1. The Thirteenth Meeting of the Standing Committee on Tuna and Billfish (SCTB13) was heldfrom 5–12 July 2000, in Noumea, New Caledonia. The Oceanic Fisheries Programme (OFP) of theSecretariat of the Pacific Community (SPC), New Caledonia, served as Secretariat for the meeting.
2. SCTB13 was attended by participants from American Samoa, Australia, Canada, Cook Islands,Federated States of Micronesia, Fiji, French Polynesia, Guam, Japan, Kiribati, Korea, MarshallIslands, New Caledonia, New Zealand, Niue, Northern Marianas, Papua New Guinea, Samoa,Solomon Islands, Taiwan, Tonga, USA and Vanuatu. Participants from the regional and internationalorganisations of the Food and Agriculture Organisation (FAO) of the United Nations (UN), IndianOcean Tuna Commission (IOTC), Inter–American Tropical Tuna Commission (IATTC), ForumFisheries Agency (FFA) and SPC also attended.
3. The agenda is presented in Appendix 1. The working papers presented at the meeting are listedin Appendix 2. The list of participants is presented in Appendix 3.
1.1 Opening Ceremony
4. The meeting opened with an address by the Director General of the Secretariat of the PacificCommunity Ms Lourdes Pangelinan (Appendix 4). Ms Pangelinan outlined the importance of thisgroup in providing scientific advice on the tuna fisheries of the western and central Pacific Ocean.She thanked the Korean and New Zealand governments, and the Western Pacific Regional FisheriesManagement Council (WPRFMC) for their generous support in funding Pacific Islands participationto this meeting, and also acknowledged the continuing support of the European Union and thegovernments of Australia, France and Taiwan as the major funding contributors of the OceanicFisheries Programme. The SCTB13 chairman, Dr Ziro Suzuki, National Research Institute of FarSeas Fisheries (NRIFSF), Japan, serving in his second term, welcomed the group and provided abrief overview of the expected work and outcomes of the meeting. He noted that, for the first time,an attempt would be made to develop a template for compiling information and presenting asummary report for the each species research group.
1.2 Confirmation of Chairman and Appointment of Rapporteurs
5. Dr Suzuki was confirmed as Chairman of SCTB13.
6. The appointment of coordinators for each SCTB working group was confirmed: Mr TimLawson for the Statistics Working Group, Dr Talbot Murray for the Albacore Research Group, MrNaozumi Miyabe for the Bigeye Research Group, Dr Gary Sakagawa for the Yellowfin ResearchGroup and Mr Peter Ward for the Billfish and Bycatch Research Group. Dr Antony Lewis was onceagain nominated and confirmed as interim coordinator for the Skipjack Research Group.Unfortunately, Mr Ward took ill during the meeting and was unable to serve as co-ordinator of theBillfish and Bycatch Research Group; Dr Rob Campbell was elected to take his place.
7. The SCTB13 Secretariat (OFP) assumed responsibility for coordinating the rapporteuringprocess and compiling the report of the meeting, with the assistance of participant rapporteurs. MrPeter Williams and Mr Wade Whitelaw were appointed as coordinating rapporteurs. The SCTB13Secretariat provided rapporteurs for agenda items 1–3 (Mr Keith Bigelow, Ms Deirdre Brogan, Mr

2
Colin Millar, Mr Whitelaw and Mr Williams), agenda item 10 (Mr Williams) and agenda items 11–12(Mr Whitelaw). Rapporteurs for each SCTB working group were appointed as follows:
• Agenda item 4 – Statistics Working Group: Mr Arsène Stein & Mr Lawson;• Agenda item 5 – Skipjack Research Group: Mr Peter Sharples, Mr Tim Park & Mr Dave Itano;• Agenda item 6 – Bigeye Research Group: Mr Sharples, Dr Rob Campbell, Mr Ray Conser & Mr Bigelow;• Agenda item 7 – Yellowfin Research Group: Dr Lewis, Dr Murray, Dr Bob Skillman and Dr Sakagawa;• Agenda item 8 – Albacore Research Group: Dr Murray, Mr Karl Staisch, Dr Chris O’Brien & Dr Conser;• Agenda item 9 – Billfish and Bycatch Research Group: Mr Campbell, Ms Brogan, Mr Sandy Argue, Mr
Whitelaw & Dr O’Brien.
1.3 Adoption of the Agenda
8. The agenda was adopted without modifications.
1.4 Adoption of the Report of the Twelfth Meeting of the SCTB
9. The report of the Twelfth Meeting of the SCTB, held in Papeete, Tahiti, from 16-23 June1999, was adopted.

3
2. OVERVIEW OF WESTERN AND CENTRAL PACIFIC OCEAN TUNA FISHERIES
2.1 Regional Overview
10. Dr Lewis provided a brief overview of the Western and Central Pacific Ocean (WCPO) tunafisheries, referring the meeting to Working Papers (WP) GEN–1 and SWG–2. The presentationdescribed each of the fisheries by gear and fleet, with emphasis on 1999 catches relative to those ofrecent years.
11. The total WCPO catch of tunas during 1999 was estimated at 1,718,776 mt (Figure 1), thesecond highest annual catch recorded after 1998 (1,900,290 mt). The purse-seine fishery accountedfor an estimated 1,033,967 mt (60% of the total catch), with pole-and-line taking an estimated285,747 mt (17%), the longline fishery an estimated 185,077 mt (11%), with the remainder (12%)taken by troll gear and a variety of artisanal gears, mostly in eastern Indonesia and the Philippines.The WCPO tuna catch represented 72% of the total estimated Pacific Ocean catch of 2,380,271 mtin 1999, and 48% of the provisional estimate of world tuna catch (3,571,114 mt) of the four species.The EPO catch in 1999 (661,495mt) was the highest on record, and the global catch, after two veryproductive years in the Pacific Ocean, may have been the highest ever.
0
200,000
400,000
600,000
800,000
1,000,000
1,200,000
1,400,000
1,600,000
1,800,000
2,000,000
1972 1974 1976 1978 1980 1982 1984 1986 1988 1990 1992 1994 1996 1998
Cat
ch(m
t)
Other
Purse seine
Pole-and-line
Longline
Figure 1. Catch (mt) of albacore, bigeye, skipjack and yellowfin in the WCPO, by longline,pole-and-line, purse seine and other gear types
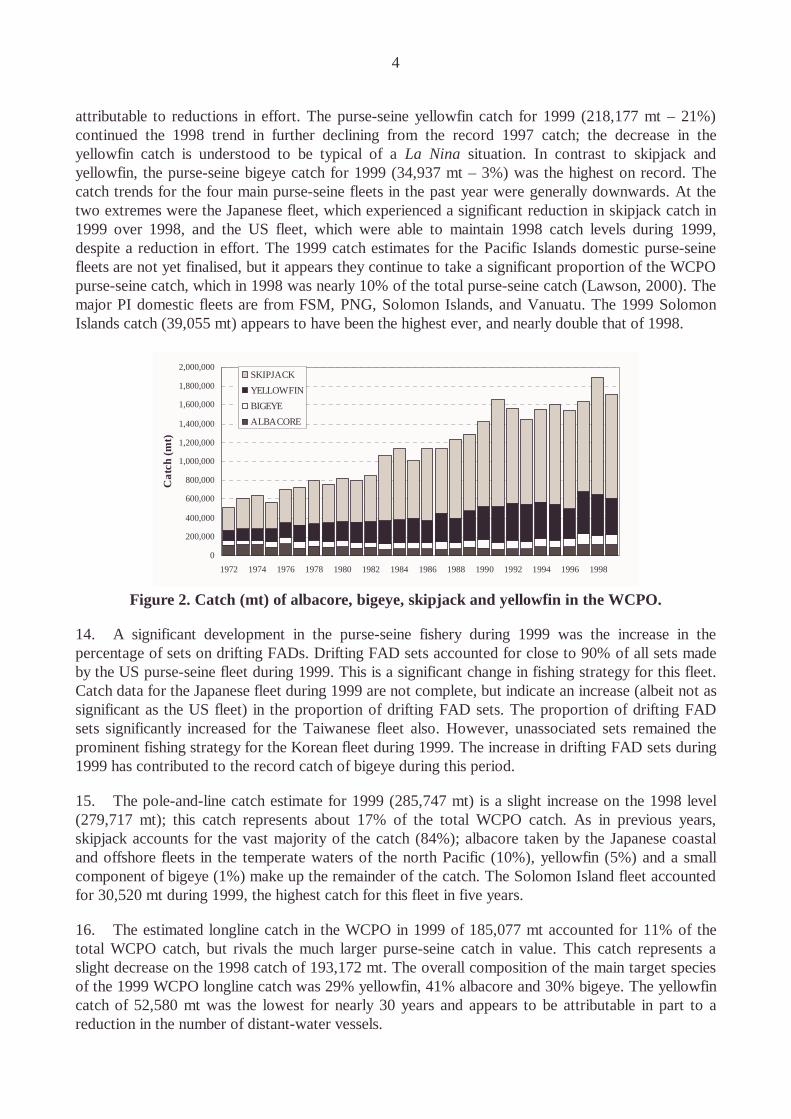
12. The 1999 catch by species (Figure 2) included skipjack (1,101,617 mt) which was slightlydown on the record level of the previous year (1,244,349 mt), but as usual dominated the totalspecies catch (64%). Yellowfin (396,747 mt; 23%) and albacore1 (115,047 mt; 7%) catches werealso slightly down on the 1998 levels, but the bigeye catch (105,365 mt; 6%) was a record high,eclipsing the previous record catch taken in 1997 (103,886 mt).
13. The purse-seine catches in recent years have been the highest ever - the WCPO record wasestablished in 1998 (1,206,267 mt), with the second highest taken in 1999 (1,033,967 mt), thisdespite the prevailing unfavourable economic conditions in the fishery, with historically low pricesfor part of the year, and some voluntary effort reduction. The purse-seine skipjack catch for 1999(780,853 mt – 76%) was nearly 150,000 mt less than the 1998 (record) catch (929,492 mt), andappears to have returned to pre-1998 levels, although it is unclear how much of this reduction is
1 includes catches of North and South Pacific albacore west of 1500 W, which comprised 89% of the totalPacific Ocean albacore catch of 131,163 mt in 1999; the subsequent section, “Tuna Fishery Catch by Species -Albacore” is concerned only with catches of South Pacific albacore, which make up less than 40% of the WCPO catch.
4
attributable to reductions in effort. The purse-seine yellowfin catch for 1999 (218,177 mt – 21%)continued the 1998 trend in further declining from the record 1997 catch; the decrease in theyellowfin catch is understood to be typical of a La Nina situation. In contrast to skipjack andyellowfin, the purse-seine bigeye catch for 1999 (34,937 mt – 3%) was the highest on record. Thecatch trends for the four main purse-seine fleets in the past year were generally downwards. At thetwo extremes were the Japanese fleet, which experienced a significant reduction in skipjack catch in1999 over 1998, and the US fleet, which were able to maintain 1998 catch levels during 1999,despite a reduction in effort. The 1999 catch estimates for the Pacific Islands domestic purse-seinefleets are not yet finalised, but it appears they continue to take a significant proportion of the WCPOpurse-seine catch, which in 1998 was nearly 10% of the total purse-seine catch (Lawson, 2000). Themajor PI domestic fleets are from FSM, PNG, Solomon Islands, and Vanuatu. The 1999 SolomonIslands catch (39,055 mt) appears to have been the highest ever, and nearly double that of 1998.
0
200,000
400,000
600,000
800,000
1,000,000
1,200,000
1,400,000
1,600,000
1,800,000
2,000,000
1972 1974 1976 1978 1980 1982 1984 1986 1988 1990 1992 1994 1996 1998
Cat
ch(m
t)
SKIPJACK
YELLOWFIN
BIGEYE
ALBACORE
Figure 2. Catch (mt) of albacore, bigeye, skipjack and yellowfin in the WCPO.
14. A significant development in the purse-seine fishery during 1999 was the increase in thepercentage of sets on drifting FADs. Drifting FAD sets accounted for close to 90% of all sets madeby the US purse-seine fleet during 1999. This is a significant change in fishing strategy for this fleet.Catch data for the Japanese fleet during 1999 are not complete, but indicate an increase (albeit not assignificant as the US fleet) in the proportion of drifting FAD sets. The proportion of drifting FADsets significantly increased for the Taiwanese fleet also. However, unassociated sets remained theprominent fishing strategy for the Korean fleet during 1999. The increase in drifting FAD sets during1999 has contributed to the record catch of bigeye during this period.
15. The pole-and-line catch estimate for 1999 (285,747 mt) is a slight increase on the 1998 level(279,717 mt); this catch represents about 17% of the total WCPO catch. As in previous years,skipjack accounts for the vast majority of the catch (84%); albacore taken by the Japanese coastaland offshore fleets in the temperate waters of the north Pacific (10%), yellowfin (5%) and a smallcomponent of bigeye (1%) make up the remainder of the catch. The Solomon Island fleet accountedfor 30,520 mt during 1999, the highest catch for this fleet in five years.
16. The estimated longline catch in the WCPO in 1999 of 185,077 mt accounted for 11% of thetotal WCPO catch, but rivals the much larger purse-seine catch in value. This catch represents aslight decrease on the 1998 catch of 193,172 mt. The overall composition of the main target speciesof the 1999 WCPO longline catch was 29% yellowfin, 41% albacore and 30% bigeye. The yellowfincatch of 52,580 mt was the lowest for nearly 30 years and appears to be attributable in part to areduction in the number of distant-water vessels.
5
17. The 1999 troll albacore catch has not been finalised but is expected to be similar to (but slightlyless than) the catches of recent years (1997 and 1998). As in previous years, the fleets of NewZealand (operating in their own waters) and the United States (operating in the Sub-tropicalConvergence Zone–STCZ) accounted for nearly all of the catch, which in turn consists almostexclusively of albacore tuna.
2.2 National Tuna Fishery Reports
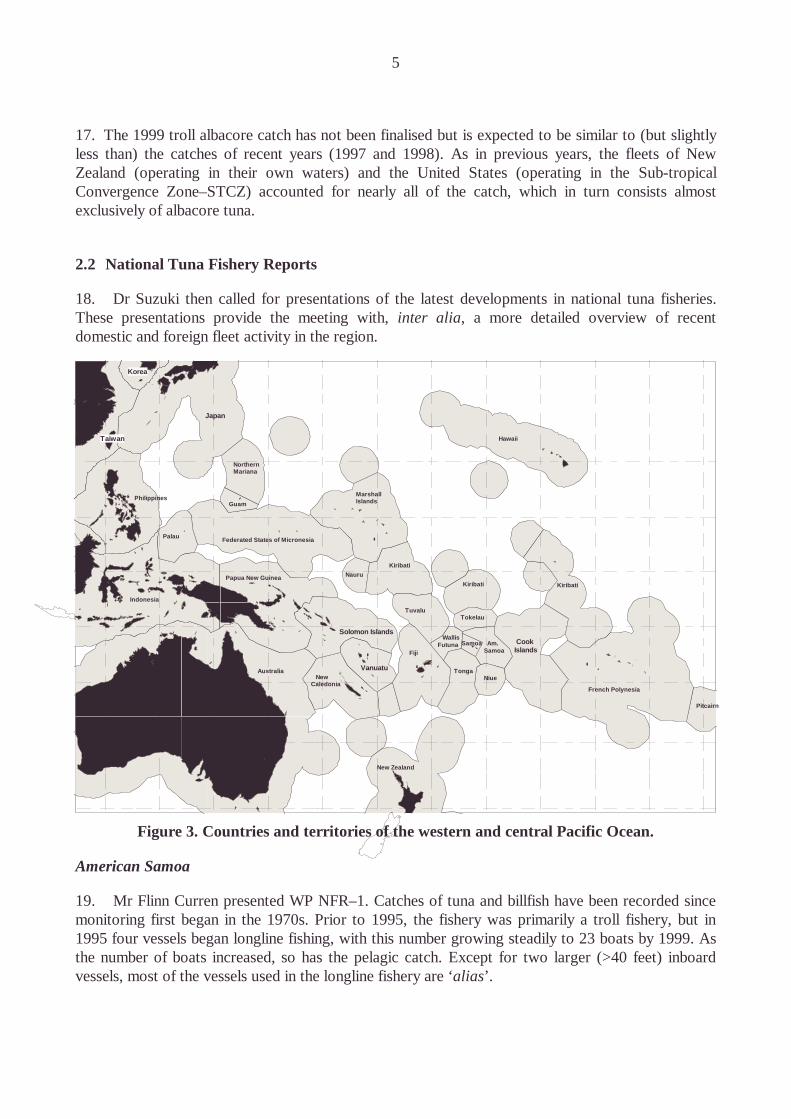
18. Dr Suzuki then called for presentations of the latest developments in national tuna fisheries.These presentations provide the meeting with, inter alia, a more detailed overview of recentdomestic and foreign fleet activity in the region.
Philippines
NorthernMariana
Guam
Papua New Guinea
Palau
Indonesia
Hawaii
Japan
Taiwan
Korea
Kiribati
MarshallIslands
Federated States of Micronesia
AustraliaNew
Caledonia
Vanuatu
Nauru
Solomon Islands
NiueTonga
New Zealand
Kiribati
Tokelau
Am.Samoa
Tuvalu
Fiji
SamoaWallis
Futuna
French Polynesia
CookIslands
Kiribati
Pitcairn
Figure 3. Countries and territories of the western and central Pacific Ocean.
American Samoa
19. Mr Flinn Curren presented WP NFR–1. Catches of tuna and billfish have been recorded sincemonitoring first began in the 1970s. Prior to 1995, the fishery was primarily a troll fishery, but in1995 four vessels began longline fishing, with this number growing steadily to 23 boats by 1999. Asthe number of boats increased, so has the pelagic catch. Except for two larger (>40 feet) inboardvessels, most of the vessels used in the longline fishery are ‘alias’.
6
20. Total landings in 1998 increased 51% over the 1997 catch but decreased by 16% in 1999,despite an increase in effort for both longlining and trolling. CPUE has decreased since 1997 (30fish/1,000 hooks), down to 15 fish/1000 hooks in 1999 – possibly related to ENSO events.
21. The alia fishery has been growing rapidly. Fishermen are ‘staking out’ their territory with asubmission to the government to restrict larger vessels outside 100nm, although this remainsunresolved. A new proposal will place a 50 nm closure around all the islands for vessels larger than50 feet, as well as establish a limited-entry programme (control date July 15, 2000) for vesselsfishing within 50–200nm around American Samoa.
22. Albacore is the major species caught in the longline fishery with a rapid increase in catch from1994 to 1998 peaking at around 460 mt. There was a subsequent decrease in 1999 to around 320 mt.Skipjack has been mainly caught by troll vessels, with the total catch fluctuating from 10 mt in 1993to around 80 mt in 1995; the catch in 1999 was around 40 mt. Yellowfin is caught mainly by longlineand is presently around 80 mt. The blue marlin, mahi mahi, sailfish and wahoo catches have alsoincreased significantly since 1997, corresponding to the increase in longlining effort.
Australia
23. Mr Peter Ward presented WP NFR–2. Historically, bilaterally-licensed longliners from Japanhad taken most of the tuna catch in the north–eastern Australian fishing zone (AFZ). Bilateral accessceased in November 1997 and Australia's longline fishery expanded to equal or exceed Japan’sfishery.
24. Activity by Australia’s longliners increased substantially during the late 1990s, with manyoperators purchasing larger vessels, thereby extending the range of longline activities furtheroffshore. In addition to the new vessels joining the fleet, longliners were more active. Fishing effort,for example, doubled from 4 million hooks in 1996 to 9 million in 1998. This included 0.55 millionhooks set in international waters, outside the eastern AFZ.
25. Expansion of Australia's longline fishery slowed in 1999. Fishing effort increased slightly toover 10 million hooks. However, landings of yellowfin (1,573 mt) and bigeye tuna (789 mt) weredown on the previous year’s peak catch. In the late 1990s many longliners had relocated from NewSouth Wales to southern Queensland where they used night–set squid baits to target broadbillswordfish and bigeye. Landings of swordfish in 1999 (1,877 mt) increased by only 100 mt on 1998landings. Noteworthy was an increase in striped marlin catches to 484 mt.
26. Australians also use pole-and-line and purse seine to take skipjack tuna off southern NewSouth Wales. This is a seasonal fishery, characterised by high inter-annual variability in catches andfishing activity. Skipjack catch peaked at 6000 mt in 1992 then fell below 1500 mt a year. Almost5000 mt of skipjack was landed in the 1999 season. The Eden cannery closed in mid 1999, resultingin significant reductions in the skipjack fishery (the cannery took all of the pole-and-line catch andseveral thousand metric tonnes of the purse-seine catch). The closure is also having ramifications forthe sale of longline bycatch, such as albacore, and low-grade catches of yellowfin and bigeye.
27. The fishery has been managed as a limited entry fishery since 1989, with a range of secondarycontrols, such as boat replacement regulations and area restrictions. Over the past two yearsmanagement closely examined arrangements based on input controls, such as gear units. However,individual transferable quotas (ITQs) are now being considered as the main fishery management toolfor both the longline and surface sectors of the fishery.
7
28. In the ensuing discussion, Mr Ward noted recent initiatives for monitoring the recreationalcharter fishery at the national level.
Canada
29. Mr Sandy Argue presented WP NFR–3. Commercial fishing for tunas, principally trolling foralbacore, is an important and growing fishery by vessels based on Canada’s west coast. TheDepartment of Fisheries and Ocean (DFO) has recently embarked on a program to document andcontrol the west coast albacore fishery to ensure its long-term sustainability. Based on a variety ofinformation sources (sales slips, logbooks, phone-in records and interviews of vessels masters), DFOhas revised recent albacore catch and effort statistics. Logbooks and sales slips continue to besubmitted from the 1998 & 1999 seasons.
30. The preliminary catch estimate for north Pacific albacore in 1999 is 2,703 mt, taken by a fleetin excess of 219 offshore and coastal vessels. This compares with a revised preliminary estimate of4,325 mt caught in 1998 by a fleet in excess of 172 vessels. Offshore vessels found fishing for northPacific albacore in 1999 was less successful from the date line east to approximately 130°Wlongitude compared to 1998. As a result, a higher proportion of the catch was taken in coastalwaters in 1999 than in 1998. For southern albacore, Canadian vessels caught 117 mt during the1998/99 season, compared to 167 mt during the 1997/98 season. Canadian vessels (2 to 5) haveparticipated in this fishery since the late 1980s, catching 130 to 330 mt of southern albacore per yearprior to 1997/98. Four of the large (>80 ft) Canadian albacore vessels have acquired licences tolongline tuna and billfish in 2000.
Cook Islands
31. Mr Josh Mitchell presented WP NFR–4. There were four foreign vessels licensed to fish in theCook Islands EEZ during the 1998/99 licensing period. These vessels were mainly targeting albacorefor American Samoan canneries. The total catch from 1998 to the end of 1999 was 980 mt. La Ninawas shown to have detrimental effect on catch rates, with CPUE in 1999 half that of the previousyear. These vessels have not, as yet, applied for licences in 2000. In addition, there are two smallerlongliners, which service the local market.
32. Onshore developments comprised a new coldstore, freezer facilities, a local fish market and anice making plant. An ambitious FAD deployment program is underway off twelve islands. Theseservices will enhance the ability of the eighty or so smaller ‘poti maroro’ to catch and supply tunafish to the local market. Fisheries legislation is also under review, with changes to be made withreference to the UNCLOS agreement. This work will be completed before the signing of the MHLCconvention.
Federated States of Micronesia (FSM)
33. Mr Tim Park presented paper WP NFR–5. The current tuna catch estimate for 1999 in theFSM EEZ (according to logsheets) is 128,040 mt. The catch by gear-type is: purse seine 117,829 mt(93%); longline 8,918 mt (7%); and pole-and-line 280 mt (0.22%).
34. The 1999 tuna catch was 56% higher than 1998, but was still only 63% of the record catch ofthe 1995, La Niña year.
8
35. The increase in purse-seine activity during 1999 showed a corresponding increase in the levelof transhipment. The total volume of transhipments at FSM ports in 1999 was 135,850 mt. This wasa three-fold increase on the 1998 total volume of 46,155 mt. Chuuk had 71 vessels making 177transhipments during the year, with transhipments made by Taiwanese, Korean and other foreign anddomestic vessels. 1999 was also a record for Pohnpei with 24 vessels making 63 transhipments (53Korean). Kosrae and Yap also received more purse-seine transhipments than in 1998, predominantlyby Korean vessels.
36. Chinese longline vessels made the most transhipments at FSM ports in 1999. These vesselswere based in Pohnpei and Kosrae at different times of the year.
37. The smaller Japanese vessels that had been based at FSM ports in previous years moved toGuam during 1999. Most of the Taiwanese longliners operating in FSM waters were also based inGuam, which created a problem, as there appears to be poor transhipment reporting by these vessels.Presently less than two-thirds of the transhipments in Guam are reported, and this problem iscurrently being reviewed.
38. In 1999 the Micronesian Maritime Authority (MMA) Fisheries Observer Programme (FOP)made 47 trips–29 purse seine, 16 longline and 2 pole and line. This constituted around 2.0%coverage of fishing activities during 1999. It is imperative that this be increased. The highestcoverage was for purse seine at 5.2%, while the poorest coverage was 0.9% of the longline trips.Despite the Japanese longliners being the most numerous and contributing the largest proportion ofthe total effort and catch in the FSM, coverage of these vessels remains poor. Unfortunately,Japanese associations have not acted on MMA requests for placements on their larger freezervessels. The movement of the smaller vessels to Guam has led to a poor response by the fishingassociation to observer placements.
39. It was noted that the bill presented before the FSM Congress last year, proposing changes tothe FSM Fisheries Law (reported at SCTB12), has not yet been passed. The July 1999 referendumproposing that the state governments, rather than the national government, have sovereignty of theFSM EEZ was also reported at SCTB12. This bill has since been defeated.
40. To prevent the loss of valuable fisheries and biological information from the longline vesselsoffloading in Guam, a pilot port sampling project was initiated. This was supported by a generousgrant from SPC, NMFS and the Guam Department of Commerce.
41. The current FSM Fisheries Policy and Fisheries Management Act, as well as the operations ofthe MMA, are currently being reviewed under an Asian Development Bank sponsored technicalconsultation. The consultation is to be undertaken for the duration of 2000.
Fiji
42. Mr Illiapi Tuwai presented WP NFR–6. The Fiji tuna fisheries consist mainly of longlinevessels (44 active in 1999) with only one pole-and-line vessel. There were two licensed (to fish in theEEZ) and 16 foreign longliners unloading in Suva during 1999.
43. The domestic catch in 1999 was over 5,000 mt, being mainly albacore, bycatch, yellowfin andbigeye tuna in descending order. The majority was taken by longliners with only 507 mt caught bypole-and-liners (solely skipjack). This is a decrease from the previous year, and is lower than theaverage for the last five years.
9
44. Foreign-licensed longliners landed 1,650 mt of albacore tuna, other species were not landed;this is a significant decrease from previous years. Troll fishers targeting around FADs sell theircatches in the local market for canning and the ‘tataki’ market in Japan.
45. Fiji’s main export market is Japan and the US, with billfish exported to the US and Japan inequal amounts. More than 50% of the fresh tuna is exported to the US.
46. Transhipments are carried out in Suva with over 10,000mt of tuna and billfish transhipped in1998 and 1999. Observers and port samplers monitor transhipments, and sample tuna and billfish forthe SPC.
French Polynesia
47. Mr Arsene Stein presented WP NFR–7. Until 1990, the French Polynesia tuna fisherycomprised two domestic fleets, being the 'bonitier' (~12 m long) catching surface tuna (mainlyskipjack) with pole-and-line and trolling, and the polyvalent 'poti marara' (5–7 m long) using manydifferent techniques to target pelagic or non-pelagic fishes. The Japanese DWFN longline fleet beganoperating in the French Polynesian EEZ more than 30 years ago, but only the Korean DWFN fleethas had an agreement to fish in the EEZ since 1992. A maximum of 70 Korean longliners isauthorised to fish in the EEZ.
48. Since the beginning of the 1990s, the fishery has evolved with the development of a domesticlongline fleet using monofilament gear. In 1999 there were 57 active vessels, of which 14 wereconverted bonitiers. The prediction for the year 2000 is around 65 vessels. The annual catch hasmore than doubled from 2,455 mt in 1995 to 5,304 mt in 1999. Despite increased fishing effort, theKorean longline fleet catch has only increased slightly to 2,688 mt in 1999. Bonitiers and poti-mararaprovided about 2,000 mt, as was the case in 1998.
49. The number of smaller coastal boats ('poti marara') is continuing to increase, mainly due to thedeployment of FADs and fishing development programs which are facilitating the acquisition of newboats.
50. In 1999, the total catch was 10,024 mt. Albacore was again the main catch of the domesticfleets comprising 36% of the total catch. This was mainly due to the international market demand forfrozen albacore loins and good fishing in the areas close to Tahiti. However, there was a largedecrease in CPUE in 1999 (a drop of 46% compared to 1998) which is likely to be related to the LaNiña situation. Conversely, the CPUE and catch of yellowfin has increased for all fleets (both forsurface and deep fisheries). Bigeye catch decreased during the past two years for the domestic fleets,but not for the Korean fleet, which target this species.
51. The local market remains important for tunas, with a growing demand and good prices. Theexports were stable in 1999. However, the proportion of loins was twice that of round fish. Portfacilities are still developing with the aim of facilitating commercial operations and achievinginternational quality standards.
52. As the initial objective of 11,000 mt caught by domestic longliners by 2003/2004 is beingapproached, a more ambitious objective of 22,000 mt by 2005/2006 is being aided by the plannedaddition of 20 small fresh units and 60 freezer vessels for that period.

10
53. The opportunity to place observers on Korean longliners operating in the EEZ has not yetoccurred, but it was noted that, if it is to occur, then observers should have French nationality.
Guam
54. Mr Tom Flores presented WP NFR–8. Trolling is the main fishing method used to capturepelagic species in Guam. There is an extensive FAD program on Guam with 15 FADs currentlydeployed. There is no longline fishery in the Guam EEZ, but the port is a major transhipment centrein Micronesia. Presently, two major concerns for the troll fishery are a decrease in catch and areduction in fish size.
55. The troll fishery is documented by an expanded offshore creel survey. The number of trollingboats increased from 276 in 1985 to 466 in 1996. Trolling boats are typically 10 meters and less inlength. There are about 20 charter vessels that comprise about 5-10% of the trolling fleet. Thoughcharter-boats represent a small percentage of the fleet, during the past five years charter-trolling tripsproduced about half of the marlin landings. Trolling trips peaked in 1996 but have declined recentlydue to economic reasons. Tunas dominated the catch in the early 1980s, but the catch of non-tunashas surpassed the tuna component since 1985. Mahi mahi is an important component of the catch,but landings have steadily decreased since 1996. Blue marlin are important to the charter-boat sectorand CPUE increased after 1985, peaked in 1990 and has declined since. There are large year-to-yearfluctuations in landings, presumably due to species availability. Similarly there is also high variabilityin CPUE, but some of the variability may be related to the difficulty in assigning species specificeffort in the fishery.
56. Transhipment of Taiwanese and Japanese longliners is an important industry in Guam.Transhipment volume peaked at 15,278 mt in 1990, declined from 1995 to 1997 due to climaticreasons, but rebounded to 10,000 mt in 1999. Some of the transhipped fish is not exported but entersthe local market through value-adding or further processing.
Japan
57. Mr Miyabe presented WP NFR–9. The recent trend in fleet size of the three major Japanesetuna fisheries continued in 1998 and 1999. While the number of purse seine vessels was stable, thenumber of longline and pole-and-line boats in the WCPO continued to decline, except for thesmallest size class of longline and the 100–199 GRT class of pole-and-line vessels. Japan reduced thedistant water longliner fleet (>200 GRT) by 20% (132 boats) in accordance with FAO’s internationalplan of action regarding fishing capacity.
58. The total longline effort has decreased steadily since the early 1980s when it was about 235million hooks. The 1998 total effort was 111 million hooks, which is down 10% from 1997.Although there were no significant changes in the seasonal and spatial distribution of effort, most ofthe decline has been observed in the western equatorial waters.
59. Total catch of tuna and billfish by the longline fishery has decreased from a high of nearly130,000 mt in 1980 to 57,000 mt in 1998. This is a decrease of 15% from 1997. This was mainly dueto the decline in yellowfin and, to a lesser extent, the albacore catch.
60. The pole-and-line and purse-seine fisheries are essentially skipjack fisheries, this speciesrepresenting 75% and 70% of total catch, respectively. Similar skipjack catch was observed for 1997and 1998 for the pole-and-line fishery while the 1998 catch was the highest on record for the purse-
11
seine fishery (230,000 mt). This catch was due to good fishing conditions, both in the equatorialwaters and waters around Japan with more than 100,000 mt caught in the waters around Japan. Portsampling data indicated that the 1999 bigeye catch by purse seiners was the second highest (5,600mt) since 1997 (13,000 mt). The pole-and-line and purse-seine fleets generally operated in a similarmanner during 1999 as in 1998.
61. In the ensuing discussion, it was noted that the reduction in the number of distant-water vesselsduring 1999 mostly represented the 60–70 vessels that normally fished in and around Australian andNew Zealand waters. Mr Miyabe indicated that there have been recent attempts to introduce alogbook system to monitor part (i.e. vessels of 10–20 GRT) of the coastal longline fleet operating inthe Japanese waters. However, he added that it would be too difficult to cover vessels less than 10GRT.
Kiribati
62. Mr Rimeta Tinga presented WP NFR–10. Kiribati does not have a well-developed domestictuna fleet, with one joint-venture (with Japan) purse seiner in operation. A government-ownedfishing company established initially for pole-and-line operation has existed for a number of years,though there has been recent interest in tuna longlining, with 2 pole-and-line vessels converted forthat purpose.
63. The joint-venture Kiribati purse-seine vessel caught an estimated 6,183 mt during 1999. This isa slight decrease on the estimated catch for 1998. This vessel operates under the FSM Arrangementand the main areas fished during 1999 were in and around FSM and PNG waters.
64. The Fisheries Division has conducted artisanal surveys on 14 islands of Kiribati. The resultsshow that tuna accounts for about 25% of the catch. The annual tuna catch for the individual islandsis estimated to be from 24 metric tonnes to a few hundred metric tons.
65. Between 1995 and 1998, a trial on vertical longlining was carried out in Kiribati. These trialswere carried out during the day in the vicinity of outer reef slopes using milkfish as bait, but withoutthe use of FADs. From 30 trips, 53 tuna were landed which were between 58–115cm in length. Theaverage catch rates were low.
66. A small-scale monofilament longlining trial is in progress with 6 trips undertaken before gearfailure temporarily halted the trials. A prototype catamaran vessel of 5.4 tons with a 39hp diesel wasused with appropriate electronics, monofilament longline gear and machinery. Catch rates have beenencouraging and the trials will continue when the gear has been repaired.
Korea
67. Dr Jin Yeong Kim presented paper WP NFR–11 on the Korean tuna fisheries in the westernPacific Ocean. During 1999, a total of 197 vessels were active (171 longline and 26 purse seine) withthe number of longliners increasing by two and purse seiners staying the same from the previousyear. The total catch of tuna and tuna-like species was estimated at around 173,539 mt, a decrease of26.3% from the previous year. The total catch was 77.6% and 22.4% respectively by purse seine andlongline.
68. The longline catch composition was 50.1%, 22.4%, 2.5% and 25% for bigeye, yellowfin,albacore and other species (including billfish) respectively. There were considerable decreases in the
12
catch of bigeye, yellowfin and albacore. The longline CPUE decreased by 46.7% from 1998 with noapparent shift in fishing area.
69. The number of purse seiners has decreased with a corresponding 29.3% decrease in total catchfrom 1998. Skipjack was the main species caught (77.2%) followed by yellowfin (22.5%). There wasa 23.5% and 44.2% decrease in the catch of skipjack and yellowfin tuna respectively.
70. Biological sampling of purse-seine catch has been carried out at a domestic landing site once amonth to obtain size data for skipjack, yellowfin and bigeye tuna. Occasional information onreproductive biology of yellowfin and skipjack is also collected.
Marshall Islands
71. Mr Glen Joseph presented WP NFR–12. The Marshall Islands has experienced a markedincrease in the number of licensed vessels since 1998. There are now 149 purse-seine vesselslicensed to fish in the zone. This number is made up of Japanese, Korean, Taiwanese, and US vesselsalong with others, fishing under the Palau and FSM arrangements.
72. Majuro transhipments are estimated to have exceeded 25 percent of the region's totaltranshipments (excluding Pago Pago) during 1998 and 1999. The Korean fleet transhipped 32,265mt of tuna in 1998 and 19,245 mt in 1999. Taiwan has 42 purse seiners licensed to fish in the zone.These vessels transhipped 38,774 mt of tuna in 1998 and another 42,581 mt in 1999. The Taiwaneseare now discussing plans to establish on-shore facilities at Majuro. The Japanese fleet, which waspursuing an experimental fishery until 1998, took up full licences for their 32 vessels in 1998 and 33vessels in 1999; this fleet unloads exclusively in Japan and their catch landings within the zone, from1998 through to October 1999 were 36,685 mt. The US fleet has access to the Marshall Island zonethrough the multilateral treaty administered by FFA. US interests have recently established a loiningplant in Majuro.
73. The Japanese freezer vessels dominate the longline fishery. These vessels off-load in Japan.There are no licences issued to foreign longline vessels wishing to exploit sashimi grade fish at themoment. There is some indication that the Taiwanese and Chinese fleets would like to re-enter thisfishery at some point in the future.
New Caledonia
74. Mr Régis Etaix-Bonnin presented WP NFR–13. In the waters around New Caledonia, asidefrom catches by a few small artisanal boats, large pelagic fish like tuna, billfish and associatedspecies, are caught by longliners of two different types: freezer vessels capable of staying at sea formore than one month which send their catch to regional canneries, and smaller longliners targetingbigeye and yellowfin tuna which are exported to the fresh Japanese sashimi market. These smalllongline vessels have used monofilament gear since 1994.
75. Although two more boats were registered in the fleet last year, the 1999 estimated catch oftuna and associated species was around 1,750 mt, similar to 1998. This is mainly due to theremaining New Caledonian freezer boat being less active during 1999. The proportion of bigeyecompared to yellowfin tuna has increased with the use of monofilament longline gear. Albacore isstill the major species caught, and is sold on different markets (local, export fresh or frozen). 1999appears to have been an uncommon year for striped marlin since this species contributed to less than25% of the total billfish catch (weight), compared to at least 45% in previous years. The increasingcatch of sailfish and spearfish in 1999 was noted.
13
76. Following the results of ECOTAP presented at SCTB12 by French Polynesia, New Caledonialast year carried out a study, funded under the program ZoNéCo, to validate these results in its ownwaters, mainly on the following issues: fishing depths and CPUE.
77. From the limited data collected, it was noted that: ● the deeper the hook, the higher thedifference between predicted and observed depths. This may be due to difficulties in using thetachometer and the line-shooter as well as bad weather conditions not facilitating a constant shipspeed; ● sea surface drift has a real impact on hooks depth. The reason for this is presently unknown(wind or surface currents on the buoys, deep currents); ● the fish hooked do not appear to interferewith the natural shape of the main line.
78. Bigeye CPUE was lower than that of ECOTAP, however better than reported by the NewCaledonia longliners. This result needs to be confirmed by more fishing tests which are to be carriedout during 2000.
New Zealand
79. Dr Talbot Murray presented WP NFR–14. There are four tuna target fisheries that operate inor adjacent to the New Zealand EEZ; an albacore troll fishery, a skipjack purse-seine fishery, andlongline fisheries for bigeye and southern bluefin tuna. Over 200 vessels target albacore by trollingin the summer months (January–April). This number reflects a large decline since the peak of nearly500 vessels in 1993/94. The purse-seine fleet has been at 5–6 vessels for many years; these aremostly small vessels (averaging 290 GRT) fishing for skipjack during the summer months(December-May) and other small pelagic species for the rest of the year. During 2000, a NewZealand-flagged super seiner entered the fleet with the intent of fishing both the New Zealandskipjack season and elsewhere in the WCPO for the rest of the year. About 50 vessels targetsouthern bluefin tuna in the winter months (April-August) each year.
80. The increasing trend in vessel numbers in the longline fleet targeting bigeye tuna is the mostmarked development in tuna fisheries in the EEZ. The bigeye fleet operates year round and in thepast two years has increased to nearly 80 vessels.
81. Over the past five years the annual catches of target species in each of these fisheries haveaveraged 4,550 mt in the albacore troll fishery, 4,904 mt in the skipjack purse-seine fishery, 193 mtin the bigeye longline fishery, and 340 mt in the southern bluefin tuna fishery. Swordfish can notlegally be targeted in the EEZ but is a major bycatch species in both the bigeye and southern bluefintuna longline fisheries. Annual catches of swordfish have increased markedly in the past several yearswith an average annual catch of 414 mt.
82. Over the past two years (1997/98 and 1998/99) catches in NZ fisheries have been 5,321 mtand 2,396 mt for albacore by trolling, 7,307 mt and 5,261 mt for skipjack by purse seine, 340 mt and391 mt for bigeye (longline), and 332 mt and 458 mt for southern bluefin tuna (longline). Swordfishbycatch in the two longline fisheries has been 534 mt and 965 mt in the past two years. In additionto these main target fisheries, a small amount of fishing is reported as targeting yellowfin andskipjack by trolling and pole-and-line, and southern bluefin by handline and trolling.
Niue
83. Mr Sione Leolahi presented WP NFR-15. Presently there are no foreign vessels licensed to fishwithin the Niue EEZ. Negotiations for fishing access are underway, though there has been some

14
delay due to revised provisions in the terms and conditions of the agreement. The Niue Governmentis also investigating joint-venture possibilities. Local market prices are $NZ6 per kilo for albacore,yellowfin and bigeye, $NZ3 to $NZ5 for billfish and $NZ8 to $NZ12 for wahoo. Pelagic species arealso harvested at a subsistence level, but catches are largely undocumented. In recent years, there hasbeen a dramatic increase in part-time or semi-commercial artisanal fisheries that supply the localmarket. For the first time since the USMLT started in 1988, there was a purse-seine catch (27.2 mt)reported in the Niue EEZ (during the 11th licensing period).
Northern Marianas (CNMI)
84. Mr Floyd Masga presented WP NFR–16. The fishing industry in the Northern Marianas isslowly growing. There are three categories making up the industry: Artisanal, which is small-scalecommercial production with fish sold locally; Subsistence for which landed fish are for selfconsumption with occasional sale of surplus catch; and Part-time commercial, professionally fishingon a part-time basis and sell the catch locally. The charter boat fishery has gained huge popularityamong local boat owners and has seen tremendous growth through visitors to the country.
85. In 1999, there were over 700 registered vessels, of which 25% were engaged in full or part-time commercial fishing with fish sold locally at fish markets, and to numerous hotels andrestaurants. Pelagic fish exports have not been established yet, though there has been a small-scalebottomfish exporter operating. The CNMI is hoping to develop a larger scale commercial fishery inthe future, with inquiries already received from Japan, Thailand, Korea and Taiwan.
86. Landings data are collected and compiled through a Commercial Landings monitoring systemthat operates a “trip ticket” invoicing system for all fisheries landing fish. Invoice receipt forms areprovided to and collected from all businesses buying fish directly from fisherman. Total fish landingsduring 1999 were an estimated 65 mt, of which skipjack was around 40 mt.
Papua New Guinea
87. Mr Ludwig Kumoru presented WP NFR–17. Commercial fishing operations commencedduring the 1950s with foreign fleets exploiting the fishery in its early stages. In 1995, adomestication policy reserved the longline fishery for PNG citizens and opened the archipelagicwaters to PNG-based purse seiners. The total catch by all vessels dropped to 72,647 mt in 1999,down from the 1998 figure of 128,765 mt. The total catch of domestic vessels has also decreased.The number of domestic longline vessels has risen to 38. The number of domestic purse seiners isalso higher at 12 vessels. This is expected to rise to 17 vessels in the near future.
88. The purse-seine landings for the domestic fleet were lower in 1999 at 25,800 mt. The CPUEfor both yellowfin (19.26 mt/set) and skipjack (7.46 mt/set) was nearly half that of the 1995 levels.Total landings for the domestic longliners increased to 650 mt in 1999, but the tuna component ofthis catch has decreased considerably. The decrease in tuna landings is directly attributed to activeshark targeting by longliners. The longline CPUE for yellowfin at 15.17 (kgs/1,000 hooks) was wellbelow the 1995 level of 30.09 kgs/1,000 hooks.
89. Four different tuna products are produced in PNG. These are canned tuna, fishmeal, chilledtuna (sashimi grade) and frozen tuna. Seven different markets were identified for these products.
90. The future of PNG fisheries is very promising. Both the government and commercial sectorare pursuing a number of projects. It is envisaged that two new fishery wharves will be built.
15
Complementing these will be new fish storage and processing facilities as well as two new loiningand canning factories.
91. The National Fisheries Authority, which manages the country’s fisheries resource, is presentlyundergoing a restructuring exercise, while the National Fisheries College will also change directions,offering more modular courses, directed at both the capture and processing sectors.
Samoa
92. Mr Antonio Mulipola presented WP NFR–18. Samoa’s longline tuna fishery is based on thetraditional nine to twelve meter alia fleet, with a number of larger (>15m) boats, and contributesaround 61% of all export commodities. Vessel numbers have increased from 25 in 1994 to more than200 in 1999. This large increase in vessel numbers has, at times, caused gear conflicts and has forcedthe fishery further offshore. Ten larger, double-hulled catamarans and six mono-hull vessels, alldomestically owned or in partnership, are also licensed.
93. The total estimated longline catch, which had shown a significant increase between 1996 and1997, has now recorded a decline, falling from 6,072 mt in 1998 down to 5,156 mt in 1999.Albacore is the main target catch. The CPUE for albacore has also fallen from 113 kgs/100 hooks in1996 to 41 kgs/100 hooks in 1999. It is felt that, although there may be some oceanographic factorsinvolved, the likelihood is that the large number of vessels is contributing to this decrease. Gearsaturation, caused by too many boats fishing in the 30-50-nm zone, is also a problem.
3. A management strategy is now being implemented to limit the number of licences to 200. Ofthese, 85 % will be reserved for vessels less than 15 meters. This measure will support the localfishers and maximise their participation. The Commercial Fishery Management Advisory Committee(CFMAC) along with the government, has now addressed their concerns on the safety, viability andcatch handling capabilities of smaller vessels, thus ensuring the sustainability and profitability ofSamoa’s domestic longline fishery.
Solomon Islands
94. Mr Sylvester Diake unfortunately could not present paper WP NFR–20 due to delayed arrivalin Noumea. A summary of the paper is presented here. The Solomon Islands have an EEZ ofapproximately 1.3 million km2 with a Tuna Management Plan implemented in 1999. The domestictuna industry began in 1972 with the establishment of Solomon Taiyo Ltd (STL). A second domesticcompany (NFD) was established in 1978. STL and NFD both initially operated mainly pole-and-linevessels but later introduced group seining and single seining.
95. A number of joint venture purse-seiners and longliners were established between 1993 and1998 as well as some bilateral purse-seiners. During and after 1998, almost all joint-venturecompanies, which did not have genuine local investors, were forced to close down. At the end of1999, only four domestic companies remained (STL, NFD, Mendana Fishing Company andSolgreen). The number of pole-and-line vessels has decreased while purse-seiners have increased.
96. Under the new Tuna Management Plan, individual licences will be issued rather than theissuance of tuna quotas. There has also been an introduction of a 30–nm zone around the mainarchipelago exclusively for domestic fishing companies. The permitted fishing area under theMultilateral Fisheries Treaty with the US has been increased to include all waters east of 163°W(except archipelagic and territorial waters).
16
97. Taiwanese longline vessels were the only fleet that continued to operate in the EEZ during1999. Numbers have decreased, probably due to the requirement of on-board VMS. These vesselsmainly target albacore for canneries in Fiji and American Samoa. The bilateral access agreement withKorea ceased in the early 1980s but since this time a number of Korean purse-seiners were charteredby local joint venture companies – this has continued during 1998 and early 1999.
98. The annual summary catch data shows that the highest overall tuna catch was obtained in1998, mostly from single seiners. There were also high catches during 1999 by the domestic groupseine operations (skipjack and yellowfin tuna), and pole-and-line (mainly skipjack with small amountsof yellowfin), while the longline catch (mainly yellowfin and bigeye tuna) was lower than previousyears, probably due to the low number of vessels able to meet the VMS requirements.
99. There was little transhipment during 1998–99, while the domestic observer programme isaiming for a 20% coverage. Port sampling at Noro and Honiara continued for the domestic fleetduring 1998–99.
Taiwan
100. Dr Shyh-Bin Wang presented WP NFR–19. The number of Taiwanese distant-water longlinevessels operating in the Pacific Ocean in 1999 was about 65, most of which target albacore tuna forcanning. The average annual catch in the Pacific region in recent years (1995–1999) was about18,847 mt for albacore, 1,030 mt for bigeye, and 1,176 mt for yellowfin tuna. The total number ofpurse-seine vessels operating in the WCPO during 1999 was 42. The average annual catches duringthe 1996–1999 period were 156,000 mt for skipjack, 42,000 mt for yellowfin and 1,000 mt forbigeye. Most of the catches came from free-swimming and log-associated schools.
101. The number of registered offshore longline vessels (<10–100 GRT) was stable during theperiod 1997–1999, and estimated to be about 1,700 (including vessels operating in both the Pacificand the Indian Oceans). The total catch of tuna and tuna-like species by this fleet was stable with theaverage annual catch being about 46,000 mt per year for the 1996–1999 period. The dominantspecies taken in this fleet were: yellowfin, bigeye, billfishes, skipjack and other tuna species. Theestimated annual catches of bigeye and yellowfin tunas unloaded in foreign bases (including Pacificand Indian Oceans) were estimated to be in the range of 12,000–15,000 mt, and 14,000–19,000 mtrespectively during the 1996–1999 period. The catch of the distant-water longline vessels generallygoes to canneries in American Samoa and Fiji, or is transhipped to Thailand for canning. The catchof the Taiwanese purse-seine fleet also goes to various canneries. Tuna caught in the offshore fisherymostly goes to the fresh fish market in Taiwan or is transhipped to the Japanese sashimi market,depending on price.
102. In the ensuing discussion, it was noted that the percentages of log sets undertaken by theTaiwanese purse-seine fleet, presented in Table 4 of WP NFR–19, includes sets on drifting FADs.The difference in catch estimates of billfish by the offshore longline fleet presented in the paper withstatistics available elsewhere was noted. Dr Wang indicated that the estimates presented in the paperincluded an unknown component of Indian Ocean catches, and hence were larger than estimatesavailable elsewhere.
United States of America
103. Dr Sakagawa presented WP NFR–21. Vessels making up the US distant-water purse seine,longline and troll fisheries, and several small-scale longline, handline, troll and pole-and-line fisheries

17
operate in the WCPO. Distant-water fisheries operate throughout the WCPO and small-scalefisheries operate within various EEZs.
104. Thirty-six U.S. distant water purse seiners operated in the WCPO between 10°N and 10°Slatitude and 130°E and 150°W longitude in 1999, a decrease from 39 vessels in 1998. Catchincreased from 174,600 mt in 1998 to 182,600 mt in 1999. Catches should have been even higher ifa large portion of the fleet had not stayed in port to protest low prices and long unloading timesduring the second half of the 1999 season. While the 1999 skipjack and yellowfin tuna catchdeceased slightly from those recorded in 1998, bigeye tuna catch increased 200%. Whereas 55% ofthe fleet’s sets were on floating objects in 1998, 96% were on floating objects in 1999 (90% FADsand 6% logs). Fishing on floating objects in 1999 resulted in a 25% drop in the number of sets pertrip, a 9 % drop in the number of days per trip and a record high catch per unit effort of 34 mt perday fished. Seventy-nine percent of the 1999 catch was landed in American Samoa, 13% in thePhilippines, 4% in the Solomon Islands, 2% in FSM and 2% in the U.S. Skipjack and bigeye tunaslanded in 1999 tended to be larger than those landed in 1998. In 1999, 933 mt of tuna and 220 mt ofby-catch species were discarded at sea.
105. In 1999, a distant-water Hawaii-based longline fleet operated in the WCPO between 5°N and35°N latitude and 140°W and 180° longitude. The Hawaii-based fleet increased from 114 vessels in1998 to 119 vessels in 1999. However, the catch decreased from 4,802 mt in 1998 to 4,020 mt in1999 (catches do not include swordfish and north Pacific albacore). Bigeye tuna accounted for 68%of the catch. All fish were landed and sold at the local fish auction. The average sizes of yellowfinand bigeye tuna, and striped marlin and blue marlin landed in 1999 were slightly less than thoselanded in 1999. In 1999, 1,978 mt of the longline catch was discarded at sea. Sixty-eight percent ofthe discarded catch was sharks.
106. In 1999, two other longline fisheries operated in the EEZs of American Samoa, FSM and theMarshall Islands. Approximately 19 vessels operated in 1999 in the American Samoa fishery; theycaught 401 mt of mainly albacore and landed their catch at local canneries and markets. Two vesselsoperated in 1999 in the FSM – Marshall Islands fishery and caught 73 mt of mainly yellowfin andbigeye tuna.
107. A distant-water troll fishery of 24 vessels operated in the WCPO in the 1998–99 season. Thefleet caught 1,200 mt of albacore in 1999, compared to 1,721 mt in 1998. Most of the catch waslanded in American Samoa. The average size of albacore landed increased from 67 cm in the 1997-98 season to 70 cm in the 1998–99 season. Three other small-scale troll/handline fisheries operatedin the EEZs of Hawaii, Guam, American Samoa and the Northern Marianas in 1999. Eighty-sevenpercent of the catch is from the Hawaii fishery and is mostly yellowfin and skipjack tunas. Catchdecreased from 1,741 mt in 1998 to 1,592 mt in 1999. A small-scale pole-and-line fishery of 6vessels operated in the Hawaiian EEZ and caught mainly skipjack tuna in 1999. Catch increased from384 mt in 1998 to 595 mt in 1999.
Vanuatu
108. Mr William Naviti presented WP NFR–22. Vanuatu is not well endowed with tuna fisheries.There are several foreign fleets operating in the EEZ outside the 12-mile zone. There are currently35 vessels licensed, mostly from Taiwan, but also include six vessels based in Fiji, which fish in theeastern portion of the EEZ.

18
109. The local fleet consists of artisanal, sports charter vessels and six multi-purpose vesselsoriginally proposed for tuna longlining but currently undertaking vertical longlining. A newlyestablished company proposes to fish with two 20–GRT vessels targeting tuna for the export market.
110. Ten percent of the production from Vanuatu’s fisheries came from domestic trollers during1999, and half of this catch is typically yellowfin. The charter fishery took 10 mt during 1997, acatch which comprised 30% tuna and 50% billfish (mostly blue marlin). The estimated catch of theTaiwanese longline fleet in Vanuatu waters during 1998 was 800–1,600 mt.
2.3 Economic Condition of the Fishery
111. Mr Karl Staisch presented WP GEN–2. In the purse-seine fishery, considerable interestcontinues to be shown in the establishment of loining plants in the region. Three projects arecurrently in operation or at advanced stages. A loining plant in the Marshall Islands was completedby the end of 1999; this project is based on surplus refrigerated cargo space on vessels sailing fromMajuro to American Samoa and is a joint venture between Starkist and PM and O shipping. ThePAFCO cannery in Fiji has continued an agreement with the US company Bumblebee for theproduction of tuna loins supplied by Taiwanese vessels and has substantially reduced its output ofcanned tuna. Plans to establish a large (50,000 mt per annum) loining plant in Papua New Guineahave also now been finalised.
112. There was a substantial fall in the price of tuna for canning during late 1999 to about US$ 400per tonne. As an indication of the severity of the fall in price, the average price for 1999 was US$600per tonne, the lowest for 15 years (the average price was US$671 per tonne in 1984). The majorreason for the substantial drop in prices was oversupply due to the continuing good catches in allmajor fishing grounds partly related to technological advances with the use of drifting FADsresulting in increased catch rates. The poor price resulted in lay-offs by vessels in several fleets; forexample, the US fleet was reduced to 26 vessels for the current licensing period (compared with 35vessels in the previous period).
113. There are several new projects for investment in the domestic industry for the fresh longlinefishery throughout the region. The longline fishery in Samoa continued to develop with over 220vessels active in 1999; a preliminary estimate of catch for the year is 5,516 mt. The South PacificProject Facility Interest continues to be active financing tuna related projects throughout the region.
114. Prices in the fresh sashimi market were similar in 1999 to 1998 levels. By contrast, supplies ofimported frozen bigeye and yellowfin decreased and resulted in prices, particularly for bigeye (367yen/kg), increasing. The major reason for the reduction in supply, and hence price increase, was thereduction in the Japanese distant-water longline fleet. The prices in the fresh sashimi marketdecreased for bigeye and were mostly unchanged for yellowfin. The level of fresh tuna exports inPacific Islands countries declined during 1999; this was attributable in part to the decline in thenumber of Chinese vessels. It was noted that the recent problems in the Hawaiian longline fisherymay present opportunities for the Pacific Islands.
115. Albacore cannery prices remained stable during 1999 (US$2,200) and the general outlook ispositive. Albacore catches from “higashi-oki” fishing grounds in the pole-and-line fishery werealmost double the usual catch in 1999 (39,600 mt), and prices were stable at around 309 yen per kg.

19
116. Mr Staisch then provided a brief overview of the US Multilateral Treaty observer programmefor which the most recent licensing period was completed on June 15. Observer coverage during thisperiod was 36 trips (approximately 20%), representing 1,350 sea days. The average sea days per tripin 1999 was about 36–38 days, a noted drop on pre–1999 levels of 52–54 days, probably due toincreased catch rates from drifting FAD sets. The average number of trips per boat increased from 5trips, for periods prior to 1999, to 7 trips for 1999.

20
3. REPORTS BY ORGANISATIONS
Commonwealth Scientific and Industrial Research Organisation (CSIRO)
117. Dr Campbell gave a brief presentation on behalf of the Commonwealth Scientific and IndustrialResearch Organisation. The CSIRO Division of Marine Research, employing around 300 people,undertakes a diverse range of research on fisheries and oceanography. The Pelagic Ecosystems sub-program currently consists of around 20 people, with 4 new staff joining over the last year. About 25percent of the research undertaken within the pelagic sub-program is directed at tropical tunas andbillfish with the remainder largely directed at research on southern bluefin tuna. Most of the researchon tropical tuna and billfish is focused on the domestic fisheries off eastern Australia, though aspectsof this work also have input into the larger regional assessments. Research is also being directed atthe longline fishery developing off Western Australia.
118. Eight projects are presently ongoing on tropical tunas and billfish. A brief description of eachproject is given in WP RG–5. Two of these projects – the genetic study on the population structureof swordfish and the assessment of the utility of ocean colour information in tuna fisheries, haverecently been completed. Other projects currently underway include: i) a reproductive study ofswordfish occurring off eastern Australia, ii) a study of swordfish movement and migration throughan industry based tagging program, iii) the development of an operating model for the swordfishfishery off eastern Australia, iv) a tagging study of the seasonal and long-term migration patterns andhabitat preferences of bigeye tuna, v) determination of the age and growth of bigeye tuna occurringoff eastern and western Australia, and vi) the archiving of hard parts for the routine ageing of tunaand billfish.
Institut de Recherche pour le Developpement (IRD)
119. Dr Francis Marsac reported on the recent work of the IRD. A four-year tuna researchprogram, THETIS, is being implemented during the second half of 2000. Although this programdoes not cover the Pacific Ocean, the main issues addressed in both the Atlantic and Indian Oceanshave a general concern that could allow possible co-operation with the OFP.
120. The THETIS project focuses primarily on the meso-scale, bio-physical processes that arecontrolling the dynamics of pelagic ecosystem, with emphasis on tuna populations and theirrelationships with other apex predators and their forage. The responses of tuna populations will bestudied in three categories of ecosystems found in both oceans (floating object retention areas,yellowfin spawning grounds, large mammal seasonal congregations) and one oligotrophic subtropicalecosystem in the Indian Ocean. In addition to biological interactions, the dynamics of tuna will alsobe analysed with regards to fishing strategies of purse seiners. The interactions within naturalsystems (from physics to biology) and between natural systems and human activities (fishingpatterns) will be integrated in a spatial dynamics model to understand the movements of tunapopulations under different types of climate variability (seasonal, inter-annual, decadal) andexploitation patterns.
121. A significant part of the work will be the collection of biological samples (stomach contents,otoliths, tissues and condition factors). The main platforms to be used are commercial vessels (purseseiners and longliners) and some research vessels cruises. Some sampling at landing sites willcomplement this data collection.

21
122. This project involves 13 staff in partnership with other French and foreign research bodies.Other co-operative links are sought, especially with the OFP.
123. In recent years, IRD has conducted a research program (ECOTAP) in the EEZ of FrenchPolynesia. Significant results were obtained in the combined use of acoustics and hydrology todefining a habitat index that can explain the distribution of yellowfin, bigeye and albacore.Behavioural studies were also carried out using ultrasonic tagging: it was demonstrated thatestimating the abundance and distribution of the tuna forage (by acoustics) while tracking the fishwas necessary for a better understanding of the fish movements. New research operations on tunabehaviour around drifting FADs should be undertaken in the Eastern Pacific (in conjunction withIATTC, Mexico and the University of Hawaii) during the period 2001-2004.
Inter–American Tropical Tuna Commission (IATTC)
124. Dr Mark Maunder reported on the recent work of the IATTC. The IATTC collectsinformation and conducts research on catches of tunas, other pelagic species, and bycatch species inthe eastern Pacific Ocean (EPO). The IATTC membership is open to states whose nationalsparticipate in fisheries that capture tuna or tuna like species in the EPO. A major development in1999 was that Mexico rejoined the IATTC. This was an important development because Mexicotakes a large proportion of the total tuna caught in the EPO.
125. Purse-seine and longline vessels harvest the majority of tuna caught in the EPO. Purse-seinesets can be divided into three set types: sets associated with dolphins, which mainly catch yellowfin,sets associated with floating objects, which mainly catch skipjack and bigeye, and sets associatedwith free swimming schools, which mainly catch yellowfin and skipjack.
126. Catch of yellowfin and skipjack were higher in 1999 than in any previous year. Initial estimatesindicate 298,000 mt of yellowfin, 269,000 mt of skipjack, and 35,000 mt of bigeye were caught inthe EPO during 1999. The size distribution of yellowfin and bigeye, caught in association withfloating objects, was larger than in previous years.
127. A number of management actions were implemented during 1999. A two-phase plan toconserve yellowfin was implemented. In the first phase, the surface catch in the Commission'sYellowfin Regulatory Area (CYRA) was restricted in two areas when a quota of 240,000 mt in theCYRA was estimated to have been reached on October 14 1999. The areas included one area offthe northern coast of Mexico and another area off northern South America. In the second phase, thesurface catch in the CYRA was restricted when a quota of 265,000 mt in the CYRA was estimatedto have been reached on November 23 1999. Fishing for tuna associated with floating objects wasprohibited when a quota of 40,000 mt of bigeye was estimated to have been reached on November 91999. The restrictions on tender vessels and transhipment of tuna on the high seas by purse-seinevessels in the EPO were continued in 1999. Limits on capacities of purse-seine fleets of individualnations were also continued in 1999.
128. A number of new research studies were implemented during 1999-2000. Some of these aredescribed below.
129. A new stock assessment model was developed to assess the tuna stocks in the EPO. The newmethod is an age-structured statistical catch-at-length analysis (A-SCALA) based on theMULTIFAN–CL method used by SPC. This method was used to asses the yellowfin (WP YFT–3)

22
and bigeye (WP BET–4) stocks. Assessments using other methods were also produced for bluemarlin (WP BBRG–4) and swordfish for 1999.
130. An ecosystem model of the EPO was produced using the ECOPATH/ECOSIM software. Thismodel was used to investigate the relationships between species, the effects of fishing on theecosystem, and the effect of the environment on the ecosystem.
131. A 90-day tagging experiment was carried out in the equatorial Pacific during March-May2000. A total of 197 bigeye tuna were tagged and released. Ninety-six of these fish were also taggedwith archival tags with four returns recorded to date. All the bigeye tuna were injected withtetracycline for otolith analysis. A total of 1,235 skipjack and 73 yellowfin were also tagged. A tagseeding experiment was carried out in conjunction with the tagging experiment to estimate reportingrates.
132. A sorting grid experiment was carried out using captive tuna to determine if a sorting gridcould be used to release small tuna. All yellowfin in the experiment swam through the sorting grid,however there was a mortality rate of ~25%. The IATTC proposes to do more experiments at seausing a video camera to determine escapement rates in combination with a net pen to determinemortality rates.
133. Port sampling was redesigned to improve estimates of species composition and length-frequency distributions.
134. Resolutions from the 66th meeting of the IATTC held in June 2000 are reported in WP GEN–3.
The Food and Agriculture Organisation (FAO) of the United Nations (UN)
135. Dr Jacek Majkowski reported on recent activities of the FAO Fisheries Department. Hementioned that Mr Ichiro Nomura has been recently appointed as the Head of that Department.
136. He summarised the outcome of the Expert Consultation on the Implications of thePrecautionary Approach on Tuna Biological and Technological Research which was held in Phuket,Thailand in March 7–15, 2000. He described plans to update & significantly extend FAO’s Atlas oftuna and billfish catches, which is accessible from the FAO Fisheries’ Home Page. He mentionedplans to supplement the Atlas by a multi-media synopsis on tuna and related subjects on the globalscale. He pointed out that a global review of fishery resources routinely prepared by FAO’s FisheryResources Division is being completed. This review includes chapters on (i) tuna and tuna likespecies on the global scale and (ii) all fishery resources of small developing island states (SIDS) inthe Pacific. Separately, a study has been initiated by FAO’s Marine Resources Service to determineand assess the global tuna fishing capacity in respect to the available tuna resources. Dr Majkowskithanked SPC, all tuna fishery bodies & national institutions of major tuna fishing countries for theirinput, other help and collaboration with carrying these activities.
137. Dr Majkowski also indicated that the FAO Fisheries Department is examining the suitability ofthe CITES in criteria for listing commercially-exploited species in CITES’ Appendixes. Thisexamination involved a technical consultation on that subject, which was held in Rome in June 28–302000. He referred also to the Expert Consultation on Illegal, Unreported and Unregulated Fishingand a related International Plan of Action.

23
Fisheries Global Information System (FIGIS)
138. Mr Marc Taconet provided an overview of the FIGIS project, and referred the meeting to WPGEN–4. Information and knowledge, and access to them through information technology have a keyrole to play in the pursuit of sustainable fisheries. Since the adoption of Agenda 21 of UNCED in1992, it has become well recognised that effective and efficient application and utilisation ofinformation are essential to achieving sustainable development. There are increasing demands forobjective, unbiased, peer reviewed and transparent information on the status and trends of fisheriesand fishery resources as a basis for policy making and fisheries management.
139. At the global level, FAO is promoting the sustainable development of capture fisheries andaquaculture through implementation of the Code of Conduct for Responsible Fisheries using amultifaceted approach comprising a wide range of information flows and technologies, with anemphasis on two-way exchange rather than dissemination. In an attempt to respond to the demand, amajor effort is being directed towards the development of a global information system for fisheries(FIGIS) which will facilitate the exchange of fishery information. Geographical Information System(GIS) functionality is being incorporated and data will be spatially referenced as much as possible.FIGIS is being developed using leading edge technology including XML/XSL, Java and Oracle.Some modules will provide for Internet open content directories using a Community DirectoryServer platform.
140. FIGIS will be a means for partners to contribute information. The information will beexchanged according to arrangements specified in partnership agreements involving FAO, regionalfishery organisations and national centres of excellence, and using agreed protocols. This easilyaccessible information repository will be used for producing information products such as a FisheriesAtlas. Another main focus of this approach will be the synthesis on the global state of marine fisheryresources.
141. FAO has a major responsibility to support capacity building in developing countries to allowusers to access, utilise and contribute to fisheries information and knowledge systems includingFIGIS. Communication between FIGIS and the FAO regional information systems like those forMediterranean capture fisheries and aquaculture, the regional tuna organisations like SPC, or a GIS(Geographic Information System) project for the West African coast, will be given precedenceduring the early phases of the FIGIS initiative. Likewise, software for the collection and processingof fishery statistics has been implemented in many developing countries to improve the quality ofnational statistics and facilitate exchange at regional and global levels. FAO also provides training inthe use of library and documentation systems such as CDS-ISIS.
Bureau of Rural Sciences
142. Mr Caton of Australia’s Bureau of Rural Sciences (BRS), a scientific bureau of Australia’sCommonwealth Department of Agriculture, Fisheries and Forestry, advised the meeting that foreight years BRS has produced annual reviews of the status of fisheries managed by a CommonwealthStatutory Authority, the Australian Fisheries Management Authority. The Authority is controlled byan expertise-based board that includes government and industry members.
143. The annual BRS reviews provide an independent audit of the Authority’s managementperformance, as reflected by the status of the stocks on which the fisheries depend. The reportsclassify stocks as underfished, fully fished, overfished or uncertain. Trends in classifications will
24
provide a means of monitoring whether management strategies are succeeding in sustaining theresources on which each fishery is based.
144. The BRS has been reviewing the format and approach of the status reports, so is keen tocompare them with other approaches to national and regional fishery status and ESD reporting.Standing Committee’s national fishery reviews, stock reviews, and regional fishery reviews, provideone such example. Another is the annual United States report to Congress on the status of UnitedStates fisheries. The format and approach adopted for such reporting have relevance in relation toStanding Committee’s discussions about the need for adopting a more standard template for itsreporting. The BRS would be keen to participate in such considerations. A pdf file of the mostrecent BRS fishery status reports publication is available from the BRS web page(http://www.brs.gov.au/fish/status99/1999 fishery status.pdf).
National Marine Fisheries Service
145. Dr Mike Laurs presented some recent information on the status of court actions related to theHawaii longline fishery where environmental groups initiated court action in regard to the taking ofturtles by longliners (WP BBRG–16). The initial lawsuit contended that the fishery was operating inviolation of two laws, being; 1. National Environmental Policy Act (NEPA), which requires anEnvironmental Impact Statement (EIS) for each Fishery Management Plan and 2. the EndangeredSpecies Act (ESA) which allows the incidental ‘take’ and kill of protected species by fisheries. Thisact also requires a special consultation process to establish allowable ‘take’ and kill levels that arespecified in Biological Opinion (BO).
146. The initial court findings (November 1999) upheld the biological opinion but found that theexisting EIS was outdated and a new one was required. Until the new EIS is prepared the judgetemporarily closed part of the fishery and ordered a scientific study to be completed by April 27 todetermine a closure that would reduce leatherback turtle mortality as well to consider the economicimpacts on the fishery. The judge also stipulated that fishermen must have line cutters and otherequipment to safely release any sea turtles that were caught.
147. A recent court ruling (June 26, 2000) stipulated that the EIS must be completed by April 2001and in the meantime (effective December 26, 2000), until the EIS is completed, a large area is closedto fishing with limited sets and 100% observer coverage. The amount of rest (soak) time is also to bereduced. Subsequent to this court ruling a request for clarification was made in regard to the size ofthe area closure, the permitted number of sets, the observer coverage and the definition of ‘resttime’. It is also likely that appeals will probably to be made to the higher court. It appears, at least inthe short term, that funding will probably be made available for the observer coverage.
148. A complicating factor is that recent estimates, using data collected in 1999, show that ‘takes’and ‘kills’ of olive ridley sea turtles have exceeded the levels allowed in the Biological Opinion. Thisnow requires initiation of new consultation processes and development of new Biological Opinion inorder for the fishery to operate. It is thought that there will be a number of probable lawsuits, inregard to; potential longline fishery interactions with short tail albatross, low observer coverage, newBiological Opinion and the EIS.
149. The overall conclusion is that it appears as if some conservation groups are intent on usingcourt actions to close the Hawaii longline fishery and in the long run to pressure U.S. Congress topass laws to ban longline fishing in the U.S. While there are these threats, there are alsoopportunities to enhance international cooperation and collaboration in studies to reduce sea turtle
25
mortality resulting from longline fishing interactions. There is also a need for research on gear,fishing strategies, and fishing tactics to avoid catching turtles as well as a need to determine the bestway to safely release turtles. There is a need for International collaboration on research on sea turtlebiology and oceanic habitats as well as international cooperation on development of sea turtlepopulation assessment models.
150. Dr Laurs also suggested that the SCTB Billfish and Bycatch Research Group give specialemphasis to international cooperative and collaborative research on longline fishing interactions withsea turtles.
Pelagic Fisheries Research Program (PFRP)
151. Mr Itano reported on the activities of the PFRP. The PFRP was established in 1992 to providescientific information on pelagic fisheries of the central and western Pacific for use in development offisheries management policies. The area encompassed by PFRP research includes the entirejurisdiction of the Western Pacific Regional Management Council (American Samoa, Guam, Hawaii,Commonwealth of the Northern Mariana Islands, and other U.S. Pacific Island territories). However,due to the highly migratory nature of pelagic species in this broad region, adjacent oceanic areas areoften included in the scope of PFRP research. The PFRP exists as a federally funded program of theUniversity of Hawaii, co-ordinated through the university’s Joint Institute for Marine andAtmospheric Research. The program is multi-disciplinary in concept, funding applied research inseveral disciplines, e.g., biology, fisheries oceanography, statistics, genetics, fisheries economics,modelling and socio-cultural studies. Projects are selected on a competitive granting basis and areopen to all legitimate researchers, although most principal investigators are affiliated with national orregional research institutes.
152. The PFRP has funded approximately 50 projects and produces a newsletter and a number ofreports and project documents. A detailed and highly informative website is maintained at:http://www.soest.hawaii.edu/PFRP/pfrp1.html, that includes descriptions of all funded projects with links toproject documents, many of which can be downloaded in PDF format. Alternately, hard copies ofPFRP reports can be requested through the website.
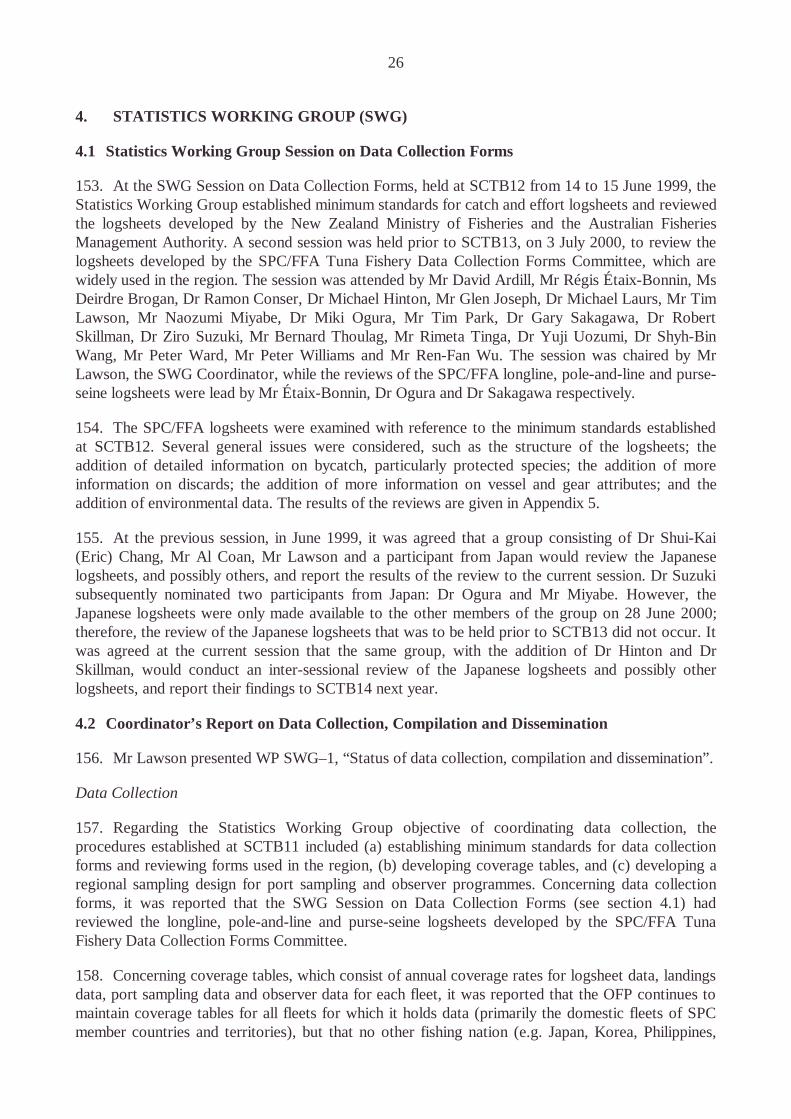
26
4. STATISTICS WORKING GROUP (SWG)
4.1 Statistics Working Group Session on Data Collection Forms
153. At the SWG Session on Data Collection Forms, held at SCTB12 from 14 to 15 June 1999, theStatistics Working Group established minimum standards for catch and effort logsheets and reviewedthe logsheets developed by the New Zealand Ministry of Fisheries and the Australian FisheriesManagement Authority. A second session was held prior to SCTB13, on 3 July 2000, to review thelogsheets developed by the SPC/FFA Tuna Fishery Data Collection Forms Committee, which arewidely used in the region. The session was attended by Mr David Ardill, Mr Régis Étaix-Bonnin, MsDeirdre Brogan, Dr Ramon Conser, Dr Michael Hinton, Mr Glen Joseph, Dr Michael Laurs, Mr TimLawson, Mr Naozumi Miyabe, Dr Miki Ogura, Mr Tim Park, Dr Gary Sakagawa, Dr RobertSkillman, Dr Ziro Suzuki, Mr Bernard Thoulag, Mr Rimeta Tinga, Dr Yuji Uozumi, Dr Shyh-BinWang, Mr Peter Ward, Mr Peter Williams and Mr Ren-Fan Wu. The session was chaired by MrLawson, the SWG Coordinator, while the reviews of the SPC/FFA longline, pole-and-line and purse-seine logsheets were lead by Mr Étaix-Bonnin, Dr Ogura and Dr Sakagawa respectively.
154. The SPC/FFA logsheets were examined with reference to the minimum standards establishedat SCTB12. Several general issues were considered, such as the structure of the logsheets; theaddition of detailed information on bycatch, particularly protected species; the addition of moreinformation on discards; the addition of more information on vessel and gear attributes; and theaddition of environmental data. The results of the reviews are given in Appendix 5.
155. At the previous session, in June 1999, it was agreed that a group consisting of Dr Shui-Kai(Eric) Chang, Mr Al Coan, Mr Lawson and a participant from Japan would review the Japaneselogsheets, and possibly others, and report the results of the review to the current session. Dr Suzukisubsequently nominated two participants from Japan: Dr Ogura and Mr Miyabe. However, theJapanese logsheets were only made available to the other members of the group on 28 June 2000;therefore, the review of the Japanese logsheets that was to be held prior to SCTB13 did not occur. Itwas agreed at the current session that the same group, with the addition of Dr Hinton and DrSkillman, would conduct an inter-sessional review of the Japanese logsheets and possibly otherlogsheets, and report their findings to SCTB14 next year.
4.2 Coordinator’s Report on Data Collection, Compilation and Dissemination
156. Mr Lawson presented WP SWG–1, “Status of data collection, compilation and dissemination”.
Data Collection
157. Regarding the Statistics Working Group objective of coordinating data collection, theprocedures established at SCTB11 included (a) establishing minimum standards for data collectionforms and reviewing forms used in the region, (b) developing coverage tables, and (c) developing aregional sampling design for port sampling and observer programmes. Concerning data collectionforms, it was reported that the SWG Session on Data Collection Forms (see section 4.1) hadreviewed the longline, pole-and-line and purse-seine logsheets developed by the SPC/FFA TunaFishery Data Collection Forms Committee.
158. Concerning coverage tables, which consist of annual coverage rates for logsheet data, landingsdata, port sampling data and observer data for each fleet, it was reported that the OFP continues tomaintain coverage tables for all fleets for which it holds data (primarily the domestic fleets of SPCmember countries and territories), but that no other fishing nation (e.g. Japan, Korea, Philippines,
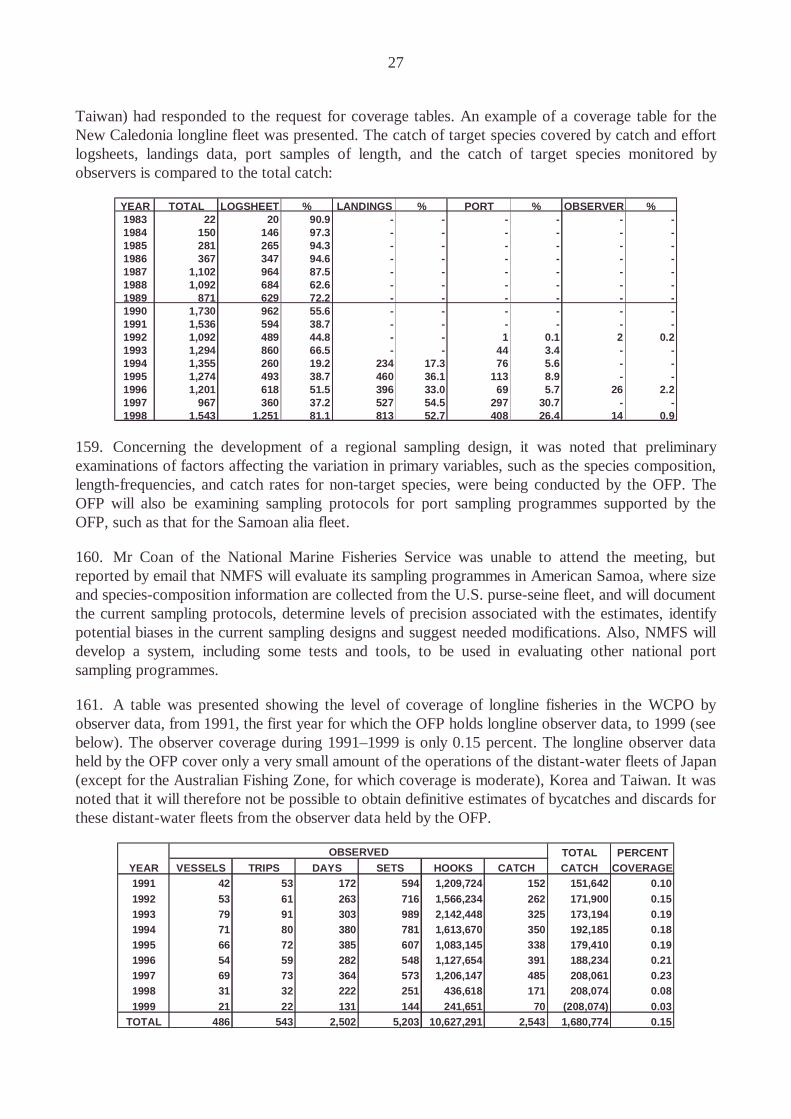
27
Taiwan) had responded to the request for coverage tables. An example of a coverage table for theNew Caledonia longline fleet was presented. The catch of target species covered by catch and effortlogsheets, landings data, port samples of length, and the catch of target species monitored byobservers is compared to the total catch:
YEAR TOTAL LOGSHEET % LANDINGS % PORT % OBSERVER %1983 22 20 90.9 - - - - - -1984 150 146 97.3 - - - - - -1985 281 265 94.3 - - - - - -1986 367 347 94.6 - - - - - -1987 1,102 964 87.5 - - - - - -1988 1,092 684 62.6 - - - - - -1989 871 629 72.2 - - - - - -1990 1,730 962 55.6 - - - - - -1991 1,536 594 38.7 - - - - - -1992 1,092 489 44.8 - - 1 0.1 2 0.21993 1,294 860 66.5 - - 44 3.4 - -1994 1,355 260 19.2 234 17.3 76 5.6 - -1995 1,274 493 38.7 460 36.1 113 8.9 - -1996 1,201 618 51.5 396 33.0 69 5.7 26 2.21997 967 360 37.2 527 54.5 297 30.7 - -1998 1,543 1,251 81.1 813 52.7 408 26.4 14 0.9
159. Concerning the development of a regional sampling design, it was noted that preliminaryexaminations of factors affecting the variation in primary variables, such as the species composition,length-frequencies, and catch rates for non-target species, were being conducted by the OFP. TheOFP will also be examining sampling protocols for port sampling programmes supported by theOFP, such as that for the Samoan alia fleet.
160. Mr Coan of the National Marine Fisheries Service was unable to attend the meeting, butreported by email that NMFS will evaluate its sampling programmes in American Samoa, where sizeand species-composition information are collected from the U.S. purse-seine fleet, and will documentthe current sampling protocols, determine levels of precision associated with the estimates, identifypotential biases in the current sampling designs and suggest needed modifications. Also, NMFS willdevelop a system, including some tests and tools, to be used in evaluating other national portsampling programmes.
161. A table was presented showing the level of coverage of longline fisheries in the WCPO byobserver data, from 1991, the first year for which the OFP holds longline observer data, to 1999 (seebelow). The observer coverage during 1991–1999 is only 0.15 percent. The longline observer dataheld by the OFP cover only a very small amount of the operations of the distant-water fleets of Japan(except for the Australian Fishing Zone, for which coverage is moderate), Korea and Taiwan. It wasnoted that it will therefore not be possible to obtain definitive estimates of bycatches and discards forthese distant-water fleets from the observer data held by the OFP.
TOTAL PERCENTYEAR VESSELS TRIPS DAYS SETS HOOKS CATCH CATCH COVERAGE1991 42 53 172 594 1,209,724 152 151,642 0.101992 53 61 263 716 1,566,234 262 171,900 0.151993 79 91 303 989 2,142,448 325 173,194 0.191994 71 80 380 781 1,613,670 350 192,185 0.181995 66 72 385 607 1,083,145 338 179,410 0.191996 54 59 282 548 1,127,654 391 188,234 0.211997 69 73 364 573 1,206,147 485 208,061 0.231998 31 32 222 251 436,618 171 208,074 0.081999 21 22 131 144 241,651 70 (208,074) 0.03
TOTAL 486 543 2,502 5,203 10,627,291 2,543 1,680,774 0.15
OBSERVED

28
162. In this regard, it was noted that certain distant-water longline fleets have been covered byobserver and port sampling programmes conducted by those fishing nations. These data are not heldby the OFP; hence, it would be useful to document the level of coverage and the sampling protocols,for presentation to SCTB.
163. During the discussion, Dr Hinton explained that the IATTC had revised its port samplingdesign during 1999 and that the new sampling design would become operational during 2000.Further information is available from Mr Patrick Tomlinson of IATTC.
164. Mr Ward noted that according to WP NFR–9, the Japanese were revising the factors used toconvert longline catches in units of processed weights to units of whole weight and he asked whetherthe conversion factors used by longline fishing nations were available. Mr Lawson explained that thefactors used by the OFP were available and that conversion factors have been documented in FAOFisheries Circular No. 847, Conversion factors – Landed Weight to Live Weight (originally publishedin March 1992 and soon to be updated), but that the factors used by the fishing nations that providelongline catch estimates in whole weight were unknown. The meeting agreed to the suggestion thatthe SWG attempt to compile the conversion factors that were currently in use.
Data Compilation
165. The procedures for coordinating data compilation include reviewing the compilation of annualcatch estimates, historical annual catch estimates, information on the use of processed weights orwhole weights for estimates of annual longline catches, the number of vessels by size category, catchand effort data, and length data. Detailed information on the compilation of data is given for eachfishing nation in WP SWG–1.
166. In regards to the compilation of annual catch estimates, in March 2000 estimates of catchesduring 1999 were requested from the major fishing nations (Indonesia, Japan, Korea, Philippines,Taiwan, and United States). Four of the major fishing nations (Japan, Korea, Taiwan, and UnitedStates) provided annual catch estimates prior to SCTB13, while there was no response to requestssent to Indonesia and the Philippines.
167. It was reported that for certain fleets for which annual catches are estimated by the OFP,including most offshore longline fleets, annual catches would be estimated when sufficient data areavailable. Estimates for certain Pacific island fleets will be taken from documents presented atSCTB13.
168. In regards to the compilation of historical annual catch estimates, the meeting was remindedthat in 1998, the tables of annual catch estimates compiled for SCTB (see WP SWG–2) wereextended from 1970 back to 1950. In 1999, prior to SCTB12, many historical estimates wereprovided. However, the time series for total bigeye and yellowfin catches in the WCPO area, andhence estimates of the total catch of the four target species in the WCPO area, as well as estimates ofglobal catches, will not be complete until estimates for Japanese longliners for 1950–1961 have beendetermined by the National Research Institute of Far Seas Fisheries. These estimates were requestedin March 1998, March 1999 and again in March 2000.
169. In regards to the compilation of information on the use of processed weights or whole weightsfor annual catch estimates for longline, several fishing nations responded to requests for informationsent in March 1999 and March 2000, and some estimates were revised to represent the catch inwhole weight. However, there have been no responses from Korea and Taiwan.

29
170. In regards to the compilation of statistics on the number of vessels by size category,information was provided prior to SCTB by three countries (French Polynesia, New Caledonia andNew Zealand) and information was also presented in several SCTB12 national fishery reports.Information is also available for several fleets from data held by the OFP.
171. In regards to the compilation of catch and effort data, logsheet data covering the fleets of SPCmember countries and territories are provided on a regular basis, although coverage varies. Logsheetdata for the United States purse-seine fleet, with full coverage, are provided to the OFP by theNMFS through the FFA.
172. Logsheet data covering the fleets of Japan, Korea and Taiwan are also provided by SPCmembers. However, these data are compiled under access agreements and coverage of the Japanesefleets and the longline fleets of Korea and Taiwan is incomplete. Catch and effort data grouped bytime-area strata are requested from Japan, Korea and Taiwan. In September and October 1999,NRIFSF provided data covering Japanese pole-and-line vessels for the period 1993–1997 and in May2000 provided data covering Japanese longliners for the period 1997–1998 and purse seiners for theperiod 1998–1999. No data have been received from OFDC since March 1999, when data coveringthe Taiwanese distant-water longline fleet during 1996 were provided. No data have been providedby OFDC for offshore longliners or purse seiners. In February 2000, NFRDI provided data coveringKorean longline fisheries during 1994–1997. NFRDI has not provided data for purse seiners sinceJune 1997, when data covering 1980–1997 were provided.
173. There continue to be significant problems with catch and effort data provided by Japan andKorea. For Japanese longline data, catches are reported in units of numbers of fish, but not in weight.Japanese purse-seine data have not been stratified by school association. Korean purse-seine datahave been provided with effort in units of “days on which a set was made”, rather than “days fishedor searched”. The usefulness of these data for stock assessment would be greatly enhanced if theseproblems were resolved.
174. In regards to the compilation of length data, data covering many fleets are available from portsampling programmes and observer programmes in SPC member countries and territories, butcoverage is low. Length data covering the United States purse-seine fleet are collected by portsamplers of the NMFS and provided through the FFA on a regular basis. Length data, known toexist but which have not been compiled, are held by Japan, Korea and Taiwan. There may also belength data that have been collected by the Landed Catch and Effort Monitoring (LCEM)programme in the Philippines during 1996–1999. The OFP may investigate the existence of thesedata through a visit to the Philippines later in 2000.
175. During the discussion, the problem of predation of longline-caught fish by marine mammalsarose. For example, in the offshore longline fishery of Réunion, in the Indian Ocean, the problem canbe severe, sometimes with a complete loss of the catch from predation by false killer whales. MsDeirdre Brogan, an SPC observer, noted that predation by mammals was common in the Pacific. Inparticular, Mr Iliapi Tuwai noted that complaints about predation were common in Fiji. Mr Steincommented that predation had been a problem in French Polynesia, but only for a period of two tothree months. He also noted that there had been predation of longline bait by dolphins in FrenchPolynesia. Dr Campbell recalled a Japanese study in about 1970 in which predation rates of 10–15percent were estimated for Japanese longliners. Dr Suzuki noted that the IOTC was conducting asurvey on predation. Mr Lawson suggested that the SWG attempt to document information onpredation of longline-caught fish in the WCPO and the meeting agreed.

30
176. The issue concerning the compilation of annual catch estimates for minor fisheries that are notcurrently covered by the estimates in the SCTB tables was discussed. These minor fisheries arevariously referred to as recreational, artisanal, small-scale industrial or subsistence fisheries. Thecatches are small relative to the total, but it was suggested that, for the sake of completeness,estimates of these catches be compiled if they are available, and the meeting agreed. Statistics areknown to exist for the American territories and French Polynesia. It was noted that FAO intends tohold a workshop on fishery statistics in Pacific island countries in conjunction with the SPC Heads ofFisheries meeting that is tentatively scheduled for July 2001, and that information concerning minorfisheries for tuna may come to light during the workshop.
177. The availability of information on illegal, unreported and unregulated (IUU) fishing in theWCPO was discussed. In a recent report published by FAO1, IUU catches in the Indian Ocean areestimated to be 100,000 mt, or 10 percent of all reported landings of tuna and tuna-like species,while in the Atlantic Ocean, IUU catches of bluefin, swordfish and bigeye are also estimated to beabout 10 percent of the total. However, the extent of IUU fishing in the WCPO is uncertain. Themeeting agreed to the suggestion that the SWG compile information that may be available regardingIUU catches.
178. The availability of VMS data was discussed. Mr Staisch reported that the FFA providestechnical support for the implementation of VMS in its member countries. However, the data areconsidered confidential and can only be released with authorisation from the member countries. Thedata currently include vessel positions, but not catches; however, catch data will be included at alater date. Mr Etaix-Bonnin explained that VMS data have been collected from Japanese longlinersthat have operated in the waters of New Caledonia in the past, but that the use of these data wascomplicated because of problems related to the ownership of the data.
Data Dissemination
179. The procedures for co-ordinating the dissemination of data by the Statistics Working Groupinclude reviewing instances of dissemination on an annual basis. It was reported that 17 releases ofdata occurred between January 1999 and June 2000. Details of each of the releases are presented inWP SWG–2. It was also reported that catch and effort data for driftnet, longline, pole-and-line andpurse seine, grouped by 5° latitude, 5° longitude and month, for all fishing nations combined, areavailable on the SPC website. The data are available in FoxPro DBF files, together with text filescontaining database formats and notes on the sources of data.
4.3 Review of SCTB12 Directives to the Statistics Working Group
Definitions of GRT in the United States (Bob Skillman) and Japan (Naozumi Miyabe)
180. Dr Skillman provided the following information: At a University of Rhode Island website, hefound a concise general definition, such that a “registered ton” is a measured volume in which oneregistered ton = 100 ft3. Gross Registered Tonnage (GRT) is the total enclosed volume of the vessel,minus certain exempted spaces (non-cargo carrying spaces). Hence, GRT is not a direct weightmeasurement; the term for an actual weight measurement is “displacement ton”, and for the United
1 Bray, K. 2000. A global review of illegal, unreported and unregulated (IUU) fishing. DocumentAUS:IUU/2000/6. Fisheries Department, Food and Agriculture Organization of the United Nations, Rome, Italy. 61pp.
31
States this is a long ton (2,240 lbs.). The precise definition of tonnage measurements can be found ata website for the Law Department of Cornell University. This site provides the Code of FederalRegulations Title 46 (i.e. the law as passed by Congress and signed by the President). The section ofinterest is Part 69 and Subpart 107. Details are provided regarding how to measure various parts ofvessels and what to do if they are odd shaped; when such measurements must be made; etc. Thespaces exempted from GRT are spaces for the anchor (including capstan, windlass, and chainlocker), companion and booby-hatches protecting stairways or ladderways, the galley, spacesproviding light or air to propelling machinery, skylights, non-propelling machinery, steering gear,water closets, the wheelhouse, passengers, open structures and open spaces, and water ballast. All ofthese amount to space not used for carrying commercial cargo. Net Registered Tons results whenadditional deductible space is subtracted.
181. Mr Miyabe reported that until the International Convention on Tonnage Measurement ofShips, 1969, was established by the International Maritime Organization of the United Nations(IMO), there was no standard for the gross tonnage. Japan deposited its instrument of ratification in1980, which went into effect in July 1982. The previous system that was used to calculate grosstonnage was to express its tonnage by multiplying its volume (1 GRT = 1000/353 cubic meter)excluding some parts of the vessel (e.g. bridge, kitchen, engine room on an upper deck). This wasmodified by the domestic law established in 1982 and applied to all vessels, not only those coveredunder the international law (i.e. those that make overseas cruises and that are larger than 24 m inoverall length). However, the difference between the new and old GRT was so large, a newconversion factor was used for vessels smaller than 4,000 GRT in order to avoid unnecessaryconfusion. Therefore, the new definition is not completely equivalent to the international standard forthis size of vessel. Generally speaking, the GRT of the same size of the international standard islarger by 50–60 percent than that used for the Japanese fishing vessel.
182. The following information on the IMO Convention was taken from the IMO website(www.imo.org): The International Convention on Tonnage Measurement of Ships, 1969, wasadopted on 23 June 1969 and entered into force on 18 July 1982. The Convention was the firstsuccessful attempt to introduce a universal tonnage measurement system. Previously, varioussystems were used to calculate the tonnage of merchant ships. Although all went back to the methoddevised by George Moorsom of the British Board of Trade in 1854, there were considerabledifferences between them and it was recognised that there was a great need for one singleinternational system. The 1969 Tonnage Measurement Convention provides for gross and nettonnages, both of which are calculated independently. The gross tonnage is a function of themoulded volume of all enclosed spaces of the ship. The net tonnage is produced by a formula whichis a function of the moulded volume of all cargo spaces of the ship. The net tonnage shall not betaken as less than 30 per cent of the gross tonnage. There is only one net tonnage and its change isallowed only once a year. The rules applied to all ships built on or after 18 July 1982 – the date ofentry into force – while existing ships were enabled to retain their existing tonnage for 12 years afterentry into force, or until 18 July 1994. This was intended to ensure that ships were given reasonablesafeguards in the interests of the economic welfare of the shipping industry. As far as possible, theConvention was drafted to ensure that gross and net tonnages calculated under the new system didnot differ too greatly from those calculated under previous methods.
Placement of OFP observers onboard Australian domestic longliners (Tim Lawson, Peter Sharples,Peter Ward)
183. In consultation with Mr Ward, Mr Lawson sent a request for assistance with the placement ofOFP observers on Australian longliners to Mr Ian Freeman, Executive Officer of the East Coast
32
Tuna Management Advisory Committee (ECTMAC). In his email of 11 October 1999, Mr Freemanadvised that at its meeting of 5 October 1999, the ECTMAC considered the request and that theECTMAC supported the request and agreed that operators should be given the opportunity toparticipate in the OFP observer programme on a voluntary basis. Subsequently, the OFP contacted alongline operator in Cairns to request the placement of an observer, but the operator explained thatbecause of ongoing negotiations with the Australian government to establish an observerprogramme, he was unable to agree to the OFP request. In this regard, CSIRO has advised that itholds observer data for Australian longliners and that these data could be made available.
Provision of annual catch estimates by Indonesia (Tim Lawson)
184. At the time of SCTB12, in June 1999, Indonesia had not provided annual catch estimates for1995–1997. Mr Lawson’s previous contacts at the Directorate General of Fisheries had notresponded to requests; however, he was advised that fishery statistics in Indonesia were now theresponsibility of the new Chief, Data and Statistics Division of the Directorate, Mr LasmaTambunan. Mr Lawson contacted Mr Tambunan in July 1999 and annual catch estimates for 1995–1997 were provided in August 1999. Subsequently, in March 2000, Mr Lawson tried to contact MrTambunan to request annual catch estimates for 1998; however, there was no response.
Provision of revised Taiwanese distant-water longline catch and effort data (Eric Chang)
185. Dr Shyh-Bin Wang reported that the revision of the Taiwanese distant-water longline catchand effort data was nearing completion and that the data may be available later in 2000.
Further examination of the application of regression trees for improving estimates of annualcatches of bigeye by purse seine (Keith Bigelow)
186. There was no progress with this directive during the past year because few port sampling datawere obtained from non-United States purse seiners (e.g. Japan, Korea and Taiwan). The analysiswill continue when port sampling data (i.e. the species composition of bigeye and yellowfin, stratifiedby school association, time and area) become available. Similarly, the analysis may be updated withobserver data if coverage of the non-United States fleets is sufficient.
Compilation of information on longline fishing operations; longline gear configuration; the use ofFADs; and the use of electronic equipment (Peter Williams)
187. Mr Peter Sharples presented information compiled by Mr Williams concerning the data that arecollected by SPC observers, and observers of the programmes of SPC-member countries, concerningvessel and gear attributes, and operational details. These details were compiled from the regionalobserver forms.
Compilation of estimates of annual catches of striped marlin, blue marlin, black marlin andswordfish and preparation of tables of annual catches for presentation at SCTB13 (Tim Lawson,Peter Williams, Wade Whitelaw)
188. Mr Lawson advised that a request for annual catch estimates for striped marlin, blue marlin,black marlin and swordfish was sent to several fishing nations in March 2000 and information wasprovided for catches by longliners. These estimates and estimates for other longline fleets and purseseiners, which were determined by the OFP from catch and effort data and observer data, werepresented in Working Paper BBRG–3.
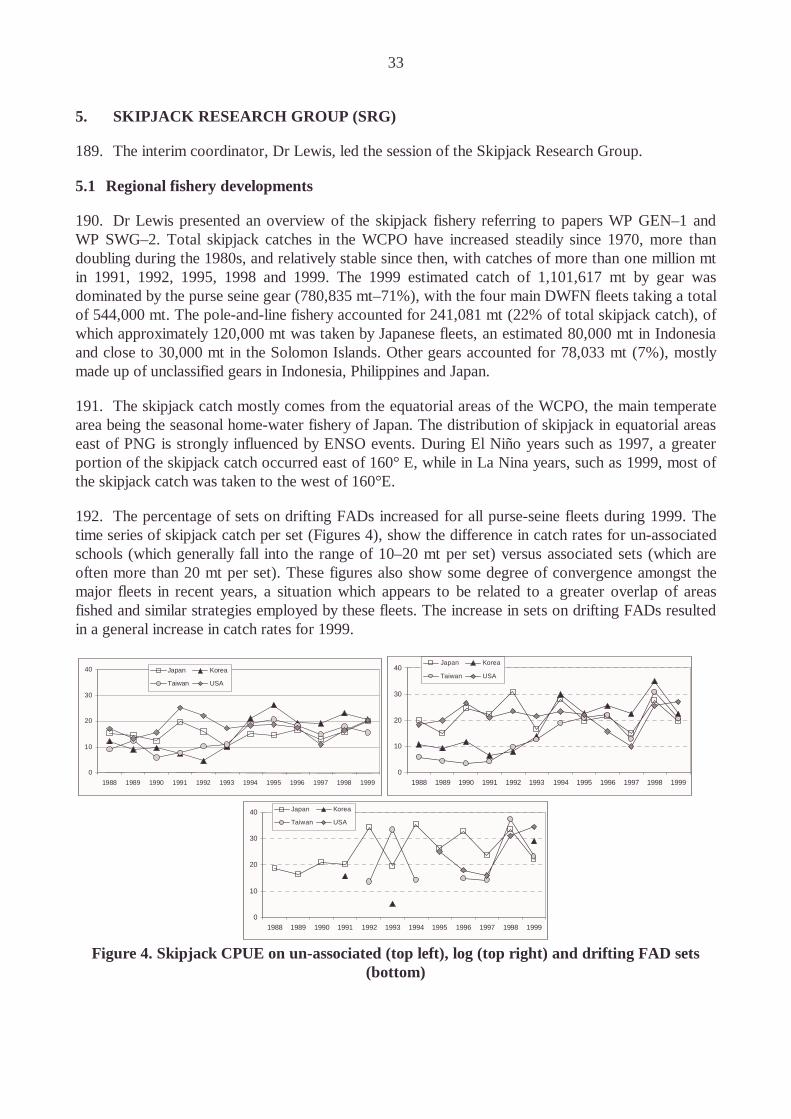
33
5. SKIPJACK RESEARCH GROUP (SRG)
189. The interim coordinator, Dr Lewis, led the session of the Skipjack Research Group.
5.1 Regional fishery developments
190. Dr Lewis presented an overview of the skipjack fishery referring to papers WP GEN–1 andWP SWG–2. Total skipjack catches in the WCPO have increased steadily since 1970, more thandoubling during the 1980s, and relatively stable since then, with catches of more than one million mtin 1991, 1992, 1995, 1998 and 1999. The 1999 estimated catch of 1,101,617 mt by gear wasdominated by the purse seine gear (780,835 mt–71%), with the four main DWFN fleets taking a totalof 544,000 mt. The pole-and-line fishery accounted for 241,081 mt (22% of total skipjack catch), ofwhich approximately 120,000 mt was taken by Japanese fleets, an estimated 80,000 mt in Indonesiaand close to 30,000 mt in the Solomon Islands. Other gears accounted for 78,033 mt (7%), mostlymade up of unclassified gears in Indonesia, Philippines and Japan.
191. The skipjack catch mostly comes from the equatorial areas of the WCPO, the main temperatearea being the seasonal home-water fishery of Japan. The distribution of skipjack in equatorial areaseast of PNG is strongly influenced by ENSO events. During El Niño years such as 1997, a greaterportion of the skipjack catch occurred east of 160° E, while in La Nina years, such as 1999, most ofthe skipjack catch was taken to the west of 160°E.
192. The percentage of sets on drifting FADs increased for all purse-seine fleets during 1999. Thetime series of skipjack catch per set (Figures 4), show the difference in catch rates for un-associatedschools (which generally fall into the range of 10–20 mt per set) versus associated sets (which areoften more than 20 mt per set). These figures also show some degree of convergence amongst themajor fleets in recent years, a situation which appears to be related to a greater overlap of areasfished and similar strategies employed by these fleets. The increase in sets on drifting FADs resultedin a general increase in catch rates for 1999.
0
10
20
30
40
1988 1989 1990 1991 1992 1993 1994 1995 1996 1997 1998 1999
Japan Korea
Taiwan USA
0
10
20
30
40
1988 1989 1990 1991 1992 1993 1994 1995 1996 1997 1998 1999
Japan Korea
Taiwan USA
0
10
20
30
40
1988 1989 1990 1991 1992 1993 1994 1995 1996 1997 1998 1999
Japan Korea
Taiwan USA
Figure 4. Skipjack CPUE on un-associated (top left), log (top right) and drifting FAD sets(bottom)

34
193. Skipjack CPUE by the Japanese pole-and-line fleet shows the continued increasing trend ofrecent years. This increase in CPUE has coincided with substantial effort reduction and the continueddeparture of less competitive boats from the fishery, as well as the acquisition of improvedtechnology. By contrast, skipjack CPUE by the Solomon Islands pole-and-line fleet (the othersignificant pole-and-line fleet in the region) shows some inter-annual variation, but no long-termtrend. Fluctuations in annual CPUE seem to be consistent across fleets suggesting stock-widevariations in abundance/catchability may be involved.
5.2 Biological and ecological research
Age and growth
194. Mr Bruno Leroy presented WP SKJ–1, preliminary results on skipjack growth. Previousmicrostructural examination of skipjack otoliths found that increments were deposited at a non-dailyrate for this species. However, these results have been demonstrated only for mature fish and thepresent study was focused on the possibility that growth rate may change after sexual maturity. Theexamination of 72 skipjack otoliths from PNG found that the manner in which layers are deposited inthe otolith clearly change in the size range relative to sexual maturity. Comparison with bigeye andyellowfin growth showed that the number of deposited layers are the same in the otoliths of the threespecies until a size of 50 cm FL (Figure 4). Comparison with growth rates estimated from taggingdata have been made and a composite growth model has been tested.
0
20
40
60
80
100
120
140
160
180
0 4 8
12
16
20
24
28
32
36
40
44
Age (quarter)
For
kle
ngth
(cm
)
Bigeye
Yellowfin
Skipjack (Hampton)
Skipjack (Leroy)
0
10
20
30
40
50
60
70
80
0 4 8
12
Age (quarter)
Fo
rkle
ng
th(c
m)
Bigeye
Yellow fin
Skipjack (Hampton)Skipjack (Leroy)
Figure 5. Comparison of skipjack growth curve estimates with estimated growth curves ofbigeye and yellowfin.
195. These observations suggests that otolith increment deposition rate may be daily for skipjackprior to sexual maturity, which would be attained at 5 to 6 months of age according to this sample.
196. It was noted that there were some differences with Japanese studies of ageing and there maytherefore be some relation to environmental effects, although no validation has yet been done. Thepoor correspondence with tagging data may be due to the common problems of length measurementerror in the recapture data from tagging exercises and/or the effects of tagging on growth. Mr Leroynoted that sexual dimorphism in growth had not yet been investigated. It was confirmed that thesamples came from more than one school and all were taken from drifting FAD sets.
Factors affecting skipjack availability and production
197. Dr Lehodey described the impacts of the El Niño Southern Oscillation (ENSO) on skipjack,referring to a review of recent findings in oceanography of the equatorial WCPO, an analysis of
35
CPUE time series (WP RG–1) and an application of a Spatial Environmental Population DynamicsModel (SEPODYM) that he is developing (WP SKJ–3). Recent updates to the spatial model includethe coupling between tuna forage and tuna population sub-models (WP RG–2) and the use ofenvironmental real time series instead of the previous used climatology data. It is encouraging to seethat the spatial model (WP SKJ–3) reproduces most of the main features of the skipjack populationand skipjack fisheries. The results indicate that large fluctuations in the catch and catch rates ofskipjack tuna would be driven by changes in stock size, and to a lesser extent by horizontal spatialextension (El Niño) or contraction (La Niña) of the habitat. ENSO would affect the recruitment ofskipjack with a positive El Niño effect in the western Pacific. The effect would be delayed by 6 to 12months, at which time skipjack are recruited to the fishery. The mechanism proposed to explain thepositive effect on the recruitment during El Niño events would be linked to the increase in biologicalproductivity (primary production and zooplankton) observed in the western Pacific during this phase.Spatial extension of the skipjack habitat during El Niño events would have a negative effect on thecatchability in the west, but would increase it in the warm pool – the cold tongue convergence zoneduring the eastward displacement associated to the development of El Niño. If change in the verticalthermal structure has some local effect on the catchability, the source of variability will apparently benegligible at the scale of the fishery and in regard to the other effects.
198. In the ensuing discussion, it was suggested that the spatial model be adapted to includeenvironmental factors in a north–south vector also. The model can be developed further from itscurrent state to include other environmental parameters such as wind stress. Also the model nowassumes constant mortality but needs to view age-specific parameters of mortality. Time dynamics,that is the effects of time lag, could also be examined. The basic forage model developed by DrLehodey had assumed the tuna forage to be a population of different species with similar biologicalcharacteristics in terms of development. These biological characteristics are described by a mean ageof population of 4 months and a minimum age of recruitment in the forage population of 2 months,which was in line with that of oceanic anchovy. Dr Marsac noted that a mean age of 4 months wassimilar to that used in the Atlantic (5-6 months) and hence the similarity between the simulated andobserved figures.
199. Mr Miyabe briefly presented WP RG–7 which describes a database created to identify variousfactors (e.g. vessel characteristics, gear and electronic equipment) affecting CPUE of the Japaneseequatorial purse-seine fishery. The source of information was a questionnaire distributed to vessels inan attempt to build a time series of information on specific vessel characteristics, gear and electronicequipment. Some of the survey data were presented with its main use planned to be forstandardising CPUE.
200. Mr Hiroshi Shono presented WP RG–3, a preliminary analysis of the effect of selected fishinggear and equipment on catch rates in the Japanese purse-seine fishery, which uses some of the datadescribed in the previous presentation. The main finding of this study was that there were no majordifferences between nominal and standardised CPUE and no apparent constant yearly increase offishing efficiency based on the equipment/gear tested for. While the ability of the fishing master wasrecognised as probably one of the major factors effecting fishing efficiency, it was noted that this isdifficult to categorise. Further, in order to understand the effect of devices used on purse-seinevessels, it will be necessary to identify how and when these devices are used. The purse-seine winch,power block, mesh size and area of the net were factors found to have some affect on the fishingefficiency and total operation time on vessels.
201. In the ensuing discussion, several participants commended this work stating that thestandardisation of catch rates for the introduction of new technologies had been identified as a

36
priority issue. However, it was suggested that as skipjack catch rates show a strong area response tochanges associated with El Nino/La Nina events, it may be useful to include a year-area effect in anyupdate of this analysis of the skipjack fishery. In response, Mr Shono acknowledged that recognisingyear-area and gear relationships are very important but that these effects had not been includedbecause of a lack of data and because each area was very large.
202. A useful way of considering the influence of environmental effects on catchability was toinclude a factor in the model associated with the changes observed in the environment (such as sea-surface temperature). It was also noted that only two categories had been used for categorisingmost technologies, and this may limit the ability of the model to discern the influence of the changesintroduced. An alternative approach of using continuous variables was suggested.
203. Further comments suggested that due to the difficulty in defining an adequate unit of effort forassociated sets, the index for unassociated sets might be more meaningful. As such, the forty percent decline in catch on unassociated schools was noteworthy.
204. In recent years there have been major changes to the fishery involving the deployment of FADsand more recently the introduction of electronic gear to remotely monitor FADs for presence andbehaviour of aggregating fish. As such, it would be useful to consider these developments in futureanalyses.
205. It was noted that the results might not show significant gear effects on associated schoolsbecause only two categories were used. There was significant variability with associated schools anda lack of variability in free-swimming schools suggesting gear effects might not be found to beimportant in the analysis due to the learning process incurred as the fishery moved more to targetingfloating objects. It was also speculated that the decline in CPUE for unassociated/free-swimmingschools might reflect a lack of effort on these schools as the fleet moves towards drifting FADs.
5.3 Stock assessment
206. Dr Hampton presented the results of a preliminary analysis of skipjack tuna data using theMULTIFAN–CL model, referring the meeting to WP SKJ–2. The data cover the period 1972–1998using a quarterly time stratification. The spatial coverage of the model is the tropical WCPO (15°N–20°S, 120°E–150°W), within which a two-region spatial stratification (boundary along 165°E) wasadopted. Catch, effort and size data for 14 fisheries (6 pole-and-line, Philippines and Indonesiadomestic, and 6 purse-seine fisheries) were used in the analysis, with the purse-seine fisheriesclassified by set type (log, FAD and unassociated sets) in each region. Tagging data from both theSkipjack Survey and Assessment Programme (SSAP) and Regional Tuna Tagging Project (RTTP)were incorporated into the analysis. One problem with the analysis to date is the estimation ofunrealistically high recruitments at the beginning of the time series. The reasons for this are currentlyunder investigation. Apart from this, the analysis provided results that are reasonably consistent withprevious studies. In particular, the model was able to derive realistic growth estimates from thelength-frequency data and provided a good fit to the tagging data sets. The preliminary resultssuggest that fishing mortality has increased strongly since 1993, particularly in the western regionwhere the fishery is concentrated. Nevertheless, the fishing mortality estimates are still considerablyless than the respective natural mortality estimates. Future model development could include anexpansion of the spatial area to 40°N (i.e. including the Japanese distant-water and coastal pole-and-line and purse-seine fleets north of 15°N). Such an expansion may provide important newinformation on the dynamics of the total stock in the WCPO.

37
207. In response to questions from the meeting, Dr Hampton indicated that growth data in themodel comes directly from the length-frequency data analysed by the model. In respect to the sizeresolution of the length-frequency data, he felt that 2cm partitioning was sufficient, which results in aclearly discernible modal signal in the data. However, he suggested that temporal analysis by monthinstead of quarter may be better and that sufficient data exists to run the model at monthlystratification. This, however, would be more computationally intensive and may not be feasible.
208. The meeting supported the utility of continuous tagging data in this region as a means ofobtaining better predictive results taking into account changing oceanographic conditions, andproviding improved estimates of movement, recruitment and mortality.
209. On the important subject of stock status, Dr. Hampton felt that it may be premature at thisstage to use this analysis to estimate stock status and that additional time and data was requiredbefore such attempts could be made with any confidence. However, he felt that inclusion of the northPacific region in subsequent analyses was a positive step, particularly as strong modal structure isevident in some skipjack length data from the temperate waters off Japan. In this respect, hesupported continued and increased collaboration with the Japanese researchers.
5.4 Research coordination and planning
210. The research needs identified by the SRG include items prioritised during SCTB12 and forwhich work is already underway. The following was work identified during SCTB13 that shouldcontinue and expand:
• apply MULTIFAN–CL assessment model to examine stock status and develop appropriatereference points;
• critically examine data inputs to the MULTIFAN–CL model;• examine skipjack abundance, movement and stocks in relation to environmental influences, in
particular El Nino and La Nina conditions;• continue to refine CPUE analyses, especially for purse-seine fisheries;• examine age, growth and mortality through the entire life history;• validate daily growth in skipjack during early life history stages.
211. New work suggested or given increased priority was as follows:• collect and examine more detailed information on use of moored and drifting FADs and other
technological improvements in regional purse-seine fisheries;• examine subsequent influences on purse-seine CPUE analyses and effort indices ;• support increased observer coverage to
improve knowledge base and available data relevant to moored and drifting FADtechnology;supply better length frequency data for inclusion in MULTIFAN–CL based assessments;
examine possible means to implement large-scale, ongoing tagging work to improve regionalassessment of stock.
212. Those specific items where there was limited progress and hence greater effort is requiredinclude:
• obtain more detailed catch statistics for significant fisheries where information is lacking, e.g.Philippines, Indonesia;
• study schooling and aggregation behaviour as this may have strong implications in assessingfishing effort;
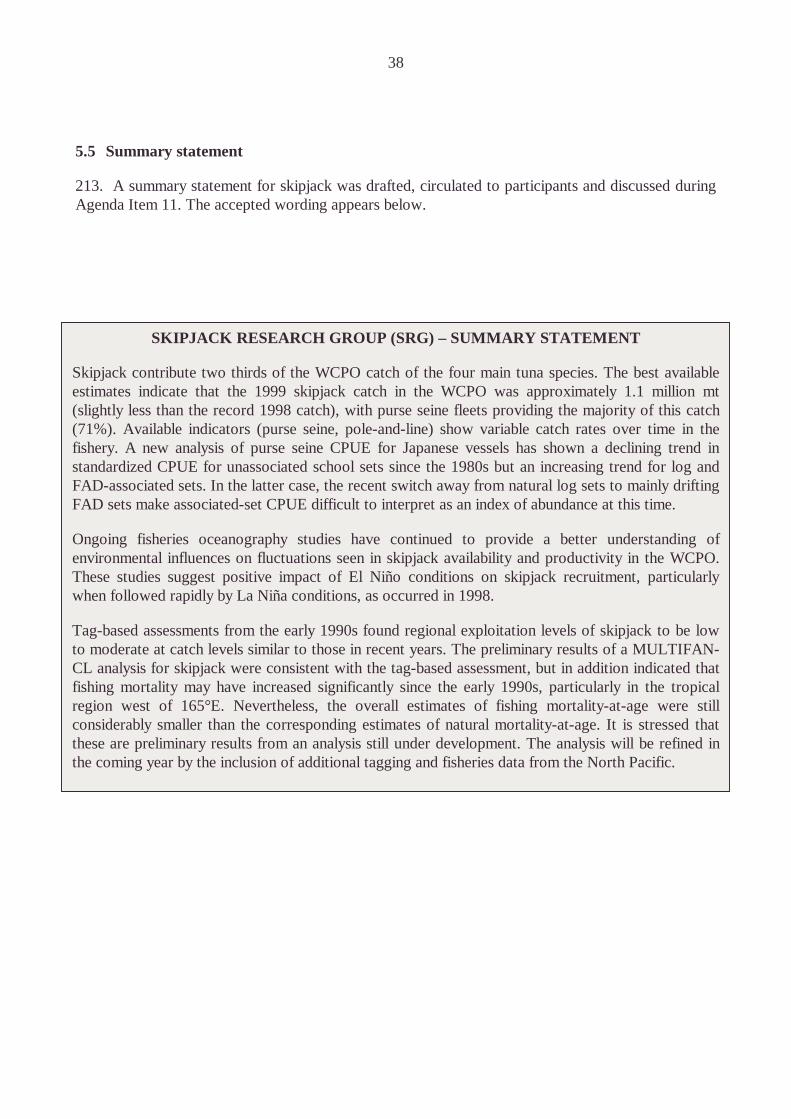
38
5.5 Summary statement
213. A summary statement for skipjack was drafted, circulated to participants and discussed duringAgenda Item 11. The accepted wording appears below.
SKIPJACK RESEARCH GROUP (SRG) – SUMMARY STATEMENT
Skipjack contribute two thirds of the WCPO catch of the four main tuna species. The best availableestimates indicate that the 1999 skipjack catch in the WCPO was approximately 1.1 million mt(slightly less than the record 1998 catch), with purse seine fleets providing the majority of this catch(71%). Available indicators (purse seine, pole-and-line) show variable catch rates over time in thefishery. A new analysis of purse seine CPUE for Japanese vessels has shown a declining trend instandardized CPUE for unassociated school sets since the 1980s but an increasing trend for log andFAD-associated sets. In the latter case, the recent switch away from natural log sets to mainly driftingFAD sets make associated-set CPUE difficult to interpret as an index of abundance at this time.
Ongoing fisheries oceanography studies have continued to provide a better understanding ofenvironmental influences on fluctuations seen in skipjack availability and productivity in the WCPO.These studies suggest positive impact of El Niño conditions on skipjack recruitment, particularlywhen followed rapidly by La Niña conditions, as occurred in 1998.
Tag-based assessments from the early 1990s found regional exploitation levels of skipjack to be lowto moderate at catch levels similar to those in recent years. The preliminary results of a MULTIFAN-CL analysis for skipjack were consistent with the tag-based assessment, but in addition indicated thatfishing mortality may have increased significantly since the early 1990s, particularly in the tropicalregion west of 165°E. Nevertheless, the overall estimates of fishing mortality-at-age were stillconsiderably smaller than the corresponding estimates of natural mortality-at-age. It is stressed thatthese are preliminary results from an analysis still under development. The analysis will be refined inthe coming year by the inclusion of additional tagging and fisheries data from the North Pacific.
39
6. BIGEYE RESEARCH GROUP (BRG)
214. The BRG Coordinator, Mr Miyabe, led the session of the Bigeye Research Group.
6.1 Regional fishery developments
215. Mr Miyabe presented an overview of bigeye fisheries, referring to information available in WPGEN–1. Bigeye tuna are an important component of tuna fisheries throughout the Pacific Ocean, andit is thought that Pacific bigeye may comprise a single basin-wide stock. The total 1999 WCPObigeye catch was an estimated 105,365 mt, a record high catch which eclipsed the previous recordcatch taken in 1997 (104,000 mt). The total Pacific catch was an estimated 184,546 mt, some 10,000mt below the record 1997 catch, largely due to the drop in the longline catch of bigeye in recentyears.
216. The estimated WCPO purse-seine catch for 1999 reached a record level of 34,937 mt, mainlyas a result of increased fishing on drifting FADs. The purse-seine bigeye catch for 1999 in the EPOwas an estimated 42,574 mt. Longline catch in the EPO, historically the primary bigeye longlinefishing area, has fallen to below 40,000 mt in recent years, and is understood to be due primarily tothe reduction in the number of Japanese distant-water vessels. In contrast, the longline catch in theWCPO has remained stable in recent years at around 40,000–66,000 mt.
217. Trends in nominal bigeye longline CPUE for most fleets have been relatively stable in theWCPO, despite increased targetting of that species. In the EPO, nominal CPUE for the main fleet(Japan) declined throughout the early-mid 1990s, but has increased in recent years, and still remainshigher than those for the WCPO.
218. The size distribution of bigeye sampled from associated sets by the US purse-seine fleet in theWCPO comprised one size mode in 1998, two size modes in 1997 and possibly three size modes bylate 1999. Bigeye sampled in the WCPO longline fishery are predominantly adult fish with a meansize of ~130 cm FL (range 100–160 cm FL). The progression of length modes of purse-seine caughtfish is clearly evident throughout 1997–1999, as is the recruitment of medium-sized fish into thelongline fishery in late 1997 and again in late 1999. Bigeye in the 50–70 cm range were found withyellowfin of a similar size range and perhaps reflected the effect that increasing use of FADs has onattracting species with similar ecological and physiological requirements.
219. Dr Maunder presented the recent trends in the bigeye fisheries in the EPO. EPO bigeye tunahave historically been taken by longline gear or by surface fisheries on floating objects, but in recentyears the longline catch has been decreasing. Notably, since 1993, there has been a rapid expansionof purse-seine effort on FADs with a large increase in bigeye catch in recent years.
6.2 Biological and ecological research
Tagging
220. Mr Itano presented WP RG–8 describing the current status of the Hawaii Tuna TaggingProject (HTTP), an initiative for tagging bigeye and yellowfin tuna throughout the Hawaii EEZ. Thesetting for the project lies within the Hawaii zone, composed of high volcanic islands, isolated atolls,banks and seamounts that provide attractive habitat for tuna and highly productive fishing groundsfor local fisheries. In addition, juvenile bigeye and yellowfin aggregate strongly to: (a) four offshoreweather monitoring buoys that act like FADs; (b) the Cross Seamount, an offshore shallow seamountthat aggregates large schools of tuna; (c) an extensive inshore array of moored FADs and (d)
40
nearshore tuna aggregation areas, or ahi koas, close to the high islands where larger tuna arevulnerable to handline gear. A wide range of fisheries target tuna at these locations, providing anideal setting to examine movement patterns, exchange rates, residence times and vulnerability tofishing of both species.
221. A release data set of roughly equal numbers of both species totalling 14,797 (7552 bigeye,7427 yellowfin) was presented, ranging in size from 29–133 cm fork length (FL) and 26–143 cm FLrespectively (average length–59.8 cm and 58.4 cm, respectively). As at April 30 2000, the overallrecapture rates were 15.57 %, with slightly higher rates for bigeye than yellowfin. The majority ofrecaptures are short-term, taken at point of release. However, movements of tagged tuna recoveredsignificant distances from their point of release support the influence of aggregation on thevulnerability of tuna, particularly for juveniles. To date, there have been a few long distancemovements documented for yellowfin, but most recaptures of both species have remained within orslightly beyond the Hawaii EEZ. As longer term and longer range recaptures continue to be received,increasingly detailed data will become available, tracking the vulnerability of bigeye and yellowfin asthey move, aggregate, grow and recruit to different fisheries. Special thanks were expressed to themany organisations and individuals attending the meeting that have offered support to the HTTP andassisted with the collection of tags and recapture data.
222. The observation was made that the different residence time behaviour between yellowfin andbigeye tunas in the Hawaiian study was similar to that observed based on tagging undertaken in theCoral Sea. These differences were hypothesised to be due to differences in both natural mortality andmovement rates. In regards to a question on likely reporting rates, Mr Itano responded that due tothe small scale of the fishery and the many contacts with the fishermen he felt that the reporting ratewas probably very high. However, reporting rates for the high seas fleets remain unknown. Inresponse to a question on time-at-liberty, he stated that most were very short-term recaptures and todate the longest time at liberty had been 730 days. It was also explained that most fish were taggedfrom offshore handline vessels using barbless hooks–there were no releases from longline vessels.Only fish that were considered to be in good condition were released to ensure the best survivalpossible.
223. No work had been attempted to use the results of the study to infer an optimum number ofFADs for the region. Some seasonality had been seen in the movement of fish, especially foryellowfin tuna, which was likely to be associated with spawning.
224. Dr Miyabe provided a summary for the Japanese bigeye tagging project. This project began in1999 as a 5-year project. The main objectives of the project were outlined in a research prospectusfor bigeye presented last year (SCTB12 WP BET–5); this work will provide information onmovements, growth, interactions among different gears used in the Northwest Pacific around Japan.The goal with the tagging component is to release 5,000 bigeye with conventional tags and 50–100bigeye with archival tags. The Fishery Agency of Japan (JFA) contracted two local prefecturalinstitutions, and they will each tag 500 bigeye annually. The Japanese Marine Fishery ResourcesResearch Centre (JAMARC) will co-operate and attempt to tag bigeye through its pole-and-lineproject. All tagging activities are conducted near anchored FADs using pole-and-line and handlinetechniques in the Amami Islands, Kagoshima prefecture and various locations in Okinawa prefecture(both prefectures are located in the south-west of Japan). There have been a few hundred bigeye andyellowfin released to date, with a lesser amount of skipjack tuna; already several short-termrecoveries have been received.

41
225. At this stage there is no monetary reward for recoveries (it is not allowed by law) and this wasacknowledged as a problem, especially for archival tags. It was pointed out that US$1,000 was paidfor the return of archival tags in the Atlantic Ocean. The SCTB Chair requested that information onthe rewards paid for the return of archival tags in other programs be forwarded to Japan. It was alsopointed out that there could be some problems with species mis-identification, though fisheriesinspectors could assist in this task. Japanese scientists were also attempting to reduce theproliferation of tagging posters at markets by producing a poster, which would cover all taggingprojects. Information on rewards for recovered archival tags was given to this group: US$500(NMFS Honolulu Lab.); US$500 (IATTC); A$250 (CSIRO–SPC). For the conventional tagrecovery, the New South Wales Game-fish Tagging provides no special rewards but provide acertificate showing the detail of tagged fish. Occasionally, CSIRO provide a financial reward (A$10or A$20) for conventional tags.
226. Dr Hampton presented a brief summary of the results to date from the SPC–CSIROcollaborative bigeye tuna archival tagging programme off the east coast of Australia. Archival tagswere applied to 98 bigeye in the Coral Sea off North Queensland last October, with one recaptureobtained after about 6 weeks at liberty. A small number of additional tags have been recently appliedto longline-caught bigeye off southern Queensland. The single recovery to date has yieldedinteresting results, with the fish showing periods of classical bigeye diving behaviour (shallow atnight, deep during the day) and other periods where it remained close to the surface for several days.The deepest dives went to about 700 m while the range of ambient temperature experienced was 7–26°C. During deep daytime mode, the fish undertook regular upward excursions into warmer watersfor thermoregulatory purposes, although on one occasion spent the entire day in water around 13°C.
227. Further recaptures of the Coral Sea releases are expected this winter when longline catch ratesof bigeye typically increase in the Coral Sea. Further tagging is planned for the Coral Sea in October-November this year.
228. Dr Maunder briefly described the IATTC bigeye tagging studies. The IATTC carried out a 90–day tagging cruise from March–May 2000 in the equatorial EPO. The total number of tuna taggedincluded 197 bigeye, 1,235 skipjack, and 73 yellowfin. Ninety-six of the bigeye were also taggedwith archival tags. To date, four bigeye with archival have been recovered. The bigeye tuna werealso injected with oxytetracycline to allow for ageing studies using otolith daily ring counts. A tagseeding experiment was also carried out to determine reporting rates.
229. Dr Laurs gave a brief presentation on the archival tagging project in the Hawaiian fishery. Atotal of 77 bigeye tuna have been tagged with archival tags and released, mostly off the west coast ofthe island of Hawaii. There have been 12 recoveries, with data available from nine of the tags. Onetagged fish was recovered soon after release and was re-released by the fishermen. There was onetag failure and one had only the ‘light’ stalk returned.
230. The recovery data generally show: 1) no long range movement, with all recoveries made in thevicinity of the Hawaiian Islands, 2) larger fish have apparent greater vertical mobility andtemperature tolerances, 3) minimum temperature and oxygen levels were about 6° C and 1 ml/l,respectively, and 4) swimming depth at night varied consistently with moon phase, which issupportive of the well-known moon-phase effects on CPUE.
42
231. The inability to obtain a precise location of an archival tag at any one time (location is usuallywithin 1-degree) has hindered any understanding of possible associations between tagged fish andFADs.
Impact of FADs on biology of tuna
232. Dr Marsac presented WP BET–5, 'Potential Biological Effects of Drifting FADs on TunaPopulations: the Ecological Trap Hypothesis'. The paper discusses the hypothesis that small tunasand the various species found in association with drifting FADs (such as mahi mahi, rainbow runner,wahoo, etc.) may be biologically trapped by such a strong association. Massive seeding of driftingartificial FADs was observed world-wide during recent years. In this hypothesis, it is suggested thatFADs may alter some biological characteristics of epipelagic populations associated with them:migration, growth, condition factors, predation and natural mortality. As FADs are most often usedin the equatorial currents, they tend to exhibit zonal drift. Therefore, the associated populationswould be artificially transferred from one part of the ocean to another, when they would showdifferent movement patterns in the absence of FADs. Natural logs were probably beneficial in term ofecology and evolution, because they tend to accumulate in convergence areas, most often consideredas rich forage areas. Now, FADs are seeded in offshore areas, which are not necessarily favourablefor tuna feeding. This apparently strong association between fishes and drifting FADs may thenproduce an unexpected biological impact on tuna populations and their associated fauna. The plan isto test this hypothesis in the Atlantic, developing an ad hoc research program based on tagging,biological and physiological studies, in association to an analysis of high resolution fishery databefore and after the development of the FAD fishery.
233. A number of questions were raised concerning the interesting hypotheses posed by Dr Marsac.An alternative conjecture was posed that instead of decreasing productivity, FADs may in factenhance productivity of larger tunas by providing a ready source of feed. In reply, Dr Marsacexplained that observations of the stomach contents of large tunas caught near FADs indicated thatthey preyed on small tunas, which in turn would increase the natural mortality of small tunas. Hesuggested that it was important to identify areas where many FADs were deployed and study theecosystem effects. It was also postulated that if one knew the number of FADs in the WCPO then itmay be possible to estimate a standing biomass of tuna around these devices. While the number ofFADs in the WCPO was not known, it was pointed out that many large purse-seiners in the IndianOcean deployed between 20–30 FADs, with Spanish vessels sometimes using up to 200. With up to200 purse-seiners operating in the WCPO then the total number of FADs could be many thousands.Also, there were also 1,000 anchored FADs off Papua New Guinea and an unknown number ofdrifting FADs.
234. A view was expressed that if the hypothesis raised by Dr Marsac was true then the introductionof large-scale fishing on FADs had the potential of inducing a large impact on the ecosystem. It wasacknowledged that research on exploring the hypothesis needed to be encouraged. At present, verylittle was known about the behaviour and distribution of small tunas near FADs (archival taggingwould be useful) and the fact that FADs retrieved by vessels may reduce any impact of such devices.
235. A final question was asked on whether the area closures in the Atlantic were only on FADs oralso on free-swimming schools. It was explained that such closures had on been on FADs only, andhad been in effect for the last three years.
43
Maturity and reproductive study
236. Dr Miyabe reported on a joint study that had just started between the IATTC and the NRIFSF.The objectives relate to better defining bigeye maturity and reproductive activities in the EPO, whichwill become more important as management needs arise. Gonad sampling will be undertaken byexperimental research and training crew on longliners active in the central and eastern Pacific Ocean.Sampling will be stratified by area and season in the EPO fishing grounds with the scope forestimating spawning (frequency and amount) by size of fish.
6.3 Stock assessment
CPUE standardisation
237. Mr Miyabe summarised newly available gear information from Japanese longline vessels andpresented preliminary results from a CPUE standardisation analysis. A new logbook form had beenintroduced that captures far more detailed information on gear configuration (for example, length ofbranch line, length of float line and distance between two branch lines). These new data shouldprovide better estimates of the depth of individual hooks – a factor that has become increasinglyimportant as habitat models are incorporated into CPUE standardisation studies. He stressed thatboth the data and analysis should be considered as preliminary but thought this brief review wasnecessary due to current interest in habitat-based CPUE standardisation studies.
238. The newly available data were summarised by the size of the longline vessel. Smaller vessels(less than 120 GRT) exhibit more homogeneous gear setting practices among vessels, using 25–30m,15–20m and 40–50m for the length of the branch line, length of the float line, and distance betweenbranch lines, respectively. On the other hand, larger vessels exhibit more variable setting practices(20–55m, 10–45m, and 35–55 m, respectively). Among the larger vessels, operations in theequatorial waters, targeting on mostly bigeye tuna, tended to employ larger length of branch andfloat lines with the greatest distances between branch lines. The number of hooks between floats(hooks per basket) is also an important factor that affects the fishing depth. These data were alsosummarised for the WCPO and EPO since 1975. During the beginning of the period, 10 hooksbetween floats were occasionally observed but the majority of sets employed the traditional 5 or 6hooks between floats. This number continued to increase over time and by the mid–1980’s, most setsemployed more than 10 hooks between floats. This trend has continued with more than 15 hooksbetween floats established in set configurations by the mid–1990s. This is especially true for theEPO, where nearly all Japanese longline vessels target bigeye tuna.
239. Nominal CPUE trends for both the WCPO and the EPO (equatorial waters only) for the period1952–1998, were presented (Figure 6). The nominal CPUE has been rather constant in the WCPObut indicates a slight declining trend during the 1990s in the EPO. The standardised CPUE – using aGLM, and accounting for fishing season, area, and number of hooks between floats, showed apattern similar to that of the nominal CPUE, although standardised CPUE in the EPO indicated arelatively greater decline than the nominal CPUE.
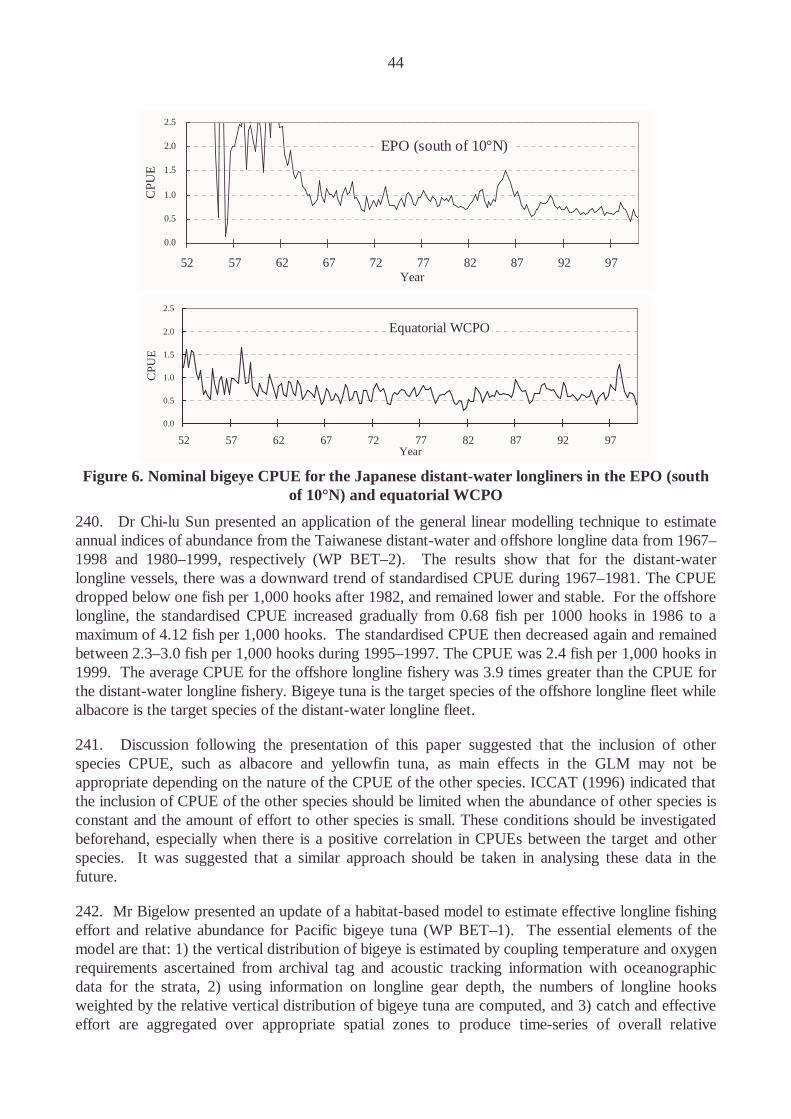
44
EPO (south of 10°N)
0.0
0.5
1.0
1.5
2.0
2.5
52 57 62 67 72 77 82 87 92 97Year
CPU
E
Equatorial WCPO
0.0
0.5
1.0
1.5
2.0
2.5
52 57 62 67 72 77 82 87 92 97Year
CP
UE
Figure 6. Nominal bigeye CPUE for the Japanese distant-water longliners in the EPO (southof 10°N) and equatorial WCPO
240. Dr Chi-lu Sun presented an application of the general linear modelling technique to estimateannual indices of abundance from the Taiwanese distant-water and offshore longline data from 1967–1998 and 1980–1999, respectively (WP BET–2). The results show that for the distant-waterlongline vessels, there was a downward trend of standardised CPUE during 1967–1981. The CPUEdropped below one fish per 1,000 hooks after 1982, and remained lower and stable. For the offshorelongline, the standardised CPUE increased gradually from 0.68 fish per 1000 hooks in 1986 to amaximum of 4.12 fish per 1,000 hooks. The standardised CPUE then decreased again and remainedbetween 2.3–3.0 fish per 1,000 hooks during 1995–1997. The CPUE was 2.4 fish per 1,000 hooks in1999. The average CPUE for the offshore longline fishery was 3.9 times greater than the CPUE forthe distant-water longline fishery. Bigeye tuna is the target species of the offshore longline fleet whilealbacore is the target species of the distant-water longline fleet.
241. Discussion following the presentation of this paper suggested that the inclusion of otherspecies CPUE, such as albacore and yellowfin tuna, as main effects in the GLM may not beappropriate depending on the nature of the CPUE of the other species. ICCAT (1996) indicated thatthe inclusion of CPUE of the other species should be limited when the abundance of other species isconstant and the amount of effort to other species is small. These conditions should be investigatedbeforehand, especially when there is a positive correlation in CPUEs between the target and otherspecies. It was suggested that a similar approach should be taken in analysing these data in thefuture.
242. Mr Bigelow presented an update of a habitat-based model to estimate effective longline fishingeffort and relative abundance for Pacific bigeye tuna (WP BET–1). The essential elements of themodel are that: 1) the vertical distribution of bigeye is estimated by coupling temperature and oxygenrequirements ascertained from archival tag and acoustic tracking information with oceanographicdata for the strata, 2) using information on longline gear depth, the numbers of longline hooksweighted by the relative vertical distribution of bigeye tuna are computed, and 3) catch and effectiveeffort are aggregated over appropriate spatial zones to produce time-series of overall relative
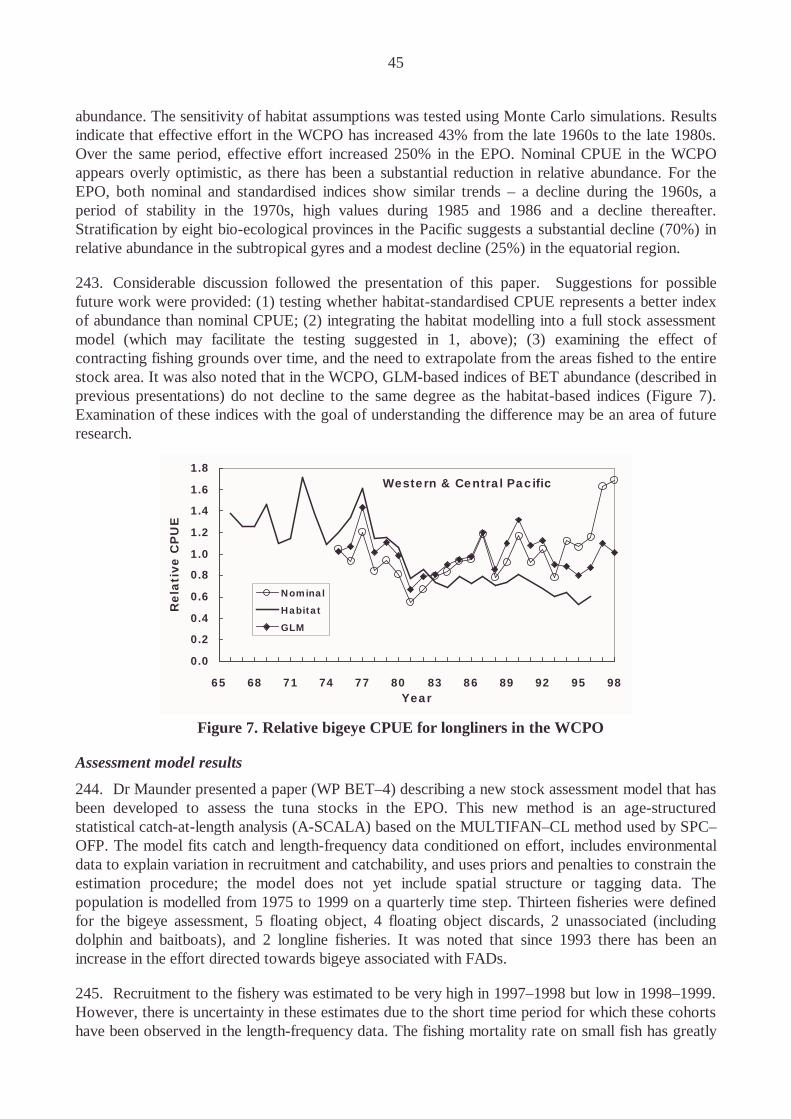
45
abundance. The sensitivity of habitat assumptions was tested using Monte Carlo simulations. Resultsindicate that effective effort in the WCPO has increased 43% from the late 1960s to the late 1980s.Over the same period, effective effort increased 250% in the EPO. Nominal CPUE in the WCPOappears overly optimistic, as there has been a substantial reduction in relative abundance. For theEPO, both nominal and standardised indices show similar trends – a decline during the 1960s, aperiod of stability in the 1970s, high values during 1985 and 1986 and a decline thereafter.Stratification by eight bio-ecological provinces in the Pacific suggests a substantial decline (70%) inrelative abundance in the subtropical gyres and a modest decline (25%) in the equatorial region.
243. Considerable discussion followed the presentation of this paper. Suggestions for possiblefuture work were provided: (1) testing whether habitat-standardised CPUE represents a better indexof abundance than nominal CPUE; (2) integrating the habitat modelling into a full stock assessmentmodel (which may facilitate the testing suggested in 1, above); (3) examining the effect ofcontracting fishing grounds over time, and the need to extrapolate from the areas fished to the entirestock area. It was also noted that in the WCPO, GLM-based indices of BET abundance (described inprevious presentations) do not decline to the same degree as the habitat-based indices (Figure 7).Examination of these indices with the goal of understanding the difference may be an area of futureresearch.
Western & Central Pacific
0.0
0.2
0.4
0.6
0.8
1.0
1.2
1.4
1.6
1.8
65 68 71 74 77 80 83 86 89 92 95 98Year
Rel
ativ
e C
PU
E
Nominal
Habitat
GLM
Figure 7. Relative bigeye CPUE for longliners in the WCPO
Assessment model results
244. Dr Maunder presented a paper (WP BET–4) describing a new stock assessment model that hasbeen developed to assess the tuna stocks in the EPO. This new method is an age-structuredstatistical catch-at-length analysis (A-SCALA) based on the MULTIFAN–CL method used by SPC–OFP. The model fits catch and length-frequency data conditioned on effort, includes environmentaldata to explain variation in recruitment and catchability, and uses priors and penalties to constrain theestimation procedure; the model does not yet include spatial structure or tagging data. Thepopulation is modelled from 1975 to 1999 on a quarterly time step. Thirteen fisheries were definedfor the bigeye assessment, 5 floating object, 4 floating object discards, 2 unassociated (includingdolphin and baitboats), and 2 longline fisheries. It was noted that since 1993 there has been anincrease in the effort directed towards bigeye associated with FADs.
245. Recruitment to the fishery was estimated to be very high in 1997–1998 but low in 1998–1999.However, there is uncertainty in these estimates due to the short time period for which these cohortshave been observed in the length-frequency data. The fishing mortality rate on small fish has greatly

46
increased since 1993. This increase corresponds to the increase in fishing effort on drifting FADswhere small bigeye are caught. Average weight of fish caught has decreased to below the criticalweight and also corresponds to the increase in effort on drifting FADs. Bigeye caught in associationwith drifting FADs are smaller than bigeye caught by the longline fishery. Spawning biomass isestimated to be above the level that would support MSY. Current effort is estimated to be below thelevel that would support MSY under the current effort distribution between fisheries and theestimated selectivities. However, due to the flat topped yield curve, the yield levels at current effortlevels are only slightly lower than MSY and are achieved at a higher biomass.
246. Dr Hampton presented the results of a preliminary analysis of Pacific-wide bigeye tuna datausing the MULTIFAN–CL model, noting that this topic was discussed in an informal workshop heldprior to the SCTB plenary. The data cover the period 1962–1998 using a quarterly timestratification. The spatial coverage of the model is the entire Pacific Ocean (40°N–40°S, 120°E–thecoast of the Americas), within which a four-region spatial stratification (boundaries along 20°N and160°W) was adopted. Catch, effort and size data for 15 fisheries (4 longline, Philippines andIndonesian domestic, 5 eastern Pacific purse seine and 3 western Pacific purse-seine fisheries) wereused in the analysis. A limited amount of tagging data from the RTTP was incorporated into theanalysis. The model structure adopted thus far includes: quarterly recruitment, 28 quarterly ageclasses, independent mean lengths for the first 8 age classes with von Bertalanffy growth constrainingthe mean lengths for the remaining age classes, structural time-series variation in catchability for allfisheries except three of the longline fisheries, age-specific natural mortality and age-specificmovement among the model regions.
247. The model obtained growth estimates from the length-frequency data that are very consistentwith independent estimates from otolith daily increments and tagging data. Overall, the model fittedthe length data, which appear to be very informative regarding growth, very well. The catchabilitytrends appeared to be mainly increasing for the purse-seine fisheries, and particularly in recent yearsfor drifting FAD-associated sets. The natural mortality estimates were fairly consistent withexpectation, with a basal level of around 0.55 per year for sub-adults with somewhat higher valuesfor both smaller and adult bigeye. Estimated movement was predominantly west to east, reflectingthe nature of the available tagging data. The lack of estimated movement from the eastern tropicalregion may simply reflect a lack of information on movement from this region (no tagging dataavailable). Recruitment estimates showed strong intra- and inter-annual variation, with the moststriking overall features being a decline in the western tropical region since the early 1990s and astrong increase in the eastern tropical region over the same period. The estimated trends inabundance were largely consistent with trends in CPUE standardised using the habitat model (fairlystable in the eastern Pacific, declining in the western Pacific, particularly since 1990). Overall fishingmortality is estimated to have increased but is not at a level that could be regarded as overfishing.These estimates are consistent with bigeye tag-recapture rates for the western Pacific.
248. Independent analyses of the same fisheries data (excluding tagging data) using the A-SCALAmodel of IATTC were consistent in many respects with the results of the MULTIFAN–CL analysis,although the A-SCALA estimates of fishing mortality tended to be higher and estimates of absolutepopulation size lower. This may simply reflect the impact of the tagging data on the MULTIFAN–CL analysis, however further collaborative work with IATTC is required to better understand thisdivergence in results.
249. Considerable discussion followed the presentation of this paper. Suggestions for future workincluded: 1) examination of the assumption that selectivity of the Japanese longline fishery is identicalin all regions of the WCPO; 2) comparison of model results with east-west movement turned off; 3)
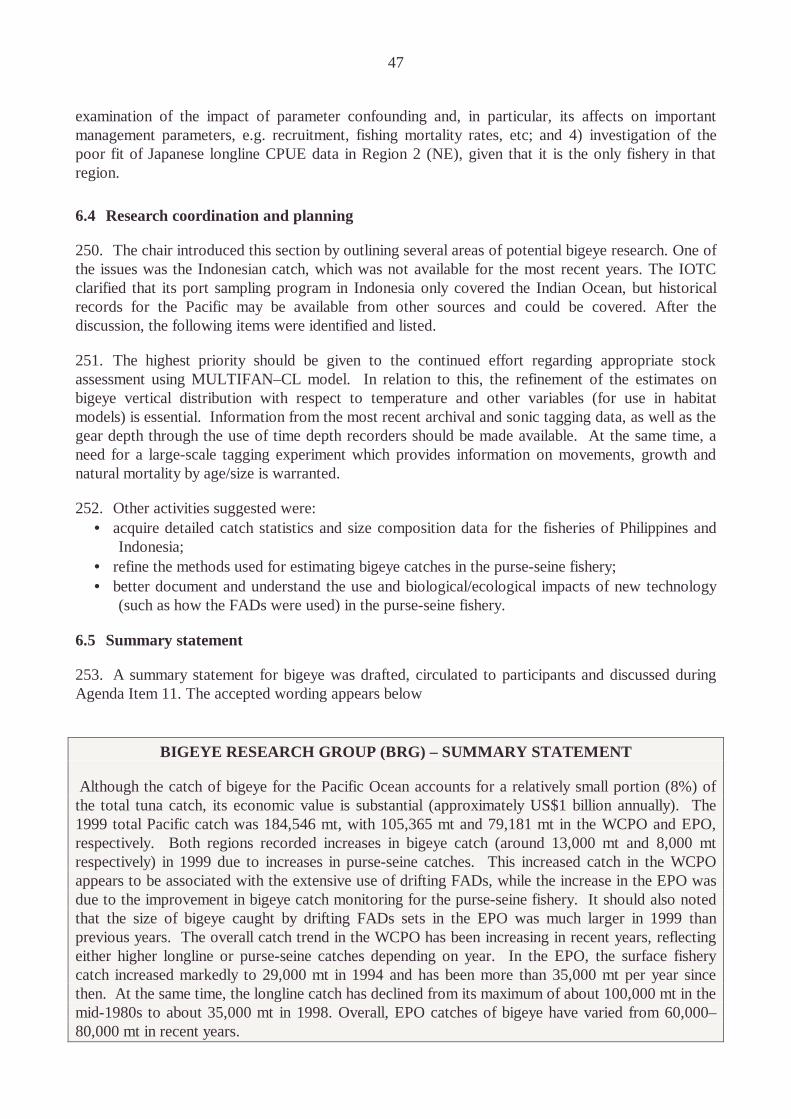
47
examination of the impact of parameter confounding and, in particular, its affects on importantmanagement parameters, e.g. recruitment, fishing mortality rates, etc; and 4) investigation of thepoor fit of Japanese longline CPUE data in Region 2 (NE), given that it is the only fishery in thatregion.
6.4 Research coordination and planning
250. The chair introduced this section by outlining several areas of potential bigeye research. One ofthe issues was the Indonesian catch, which was not available for the most recent years. The IOTCclarified that its port sampling program in Indonesia only covered the Indian Ocean, but historicalrecords for the Pacific may be available from other sources and could be covered. After thediscussion, the following items were identified and listed.
251. The highest priority should be given to the continued effort regarding appropriate stockassessment using MULTIFAN–CL model. In relation to this, the refinement of the estimates onbigeye vertical distribution with respect to temperature and other variables (for use in habitatmodels) is essential. Information from the most recent archival and sonic tagging data, as well as thegear depth through the use of time depth recorders should be made available. At the same time, aneed for a large-scale tagging experiment which provides information on movements, growth andnatural mortality by age/size is warranted.
252. Other activities suggested were:• acquire detailed catch statistics and size composition data for the fisheries of Philippines and
Indonesia;• refine the methods used for estimating bigeye catches in the purse-seine fishery;• better document and understand the use and biological/ecological impacts of new technology
(such as how the FADs were used) in the purse-seine fishery.
6.5 Summary statement
253. A summary statement for bigeye was drafted, circulated to participants and discussed duringAgenda Item 11. The accepted wording appears below
BIGEYE RESEARCH GROUP (BRG) – SUMMARY STATEMENT
Although the catch of bigeye for the Pacific Ocean accounts for a relatively small portion (8%) ofthe total tuna catch, its economic value is substantial (approximately US$1 billion annually). The1999 total Pacific catch was 184,546 mt, with 105,365 mt and 79,181 mt in the WCPO and EPO,respectively. Both regions recorded increases in bigeye catch (around 13,000 mt and 8,000 mtrespectively) in 1999 due to increases in purse-seine catches. This increased catch in the WCPOappears to be associated with the extensive use of drifting FADs, while the increase in the EPO wasdue to the improvement in bigeye catch monitoring for the purse-seine fishery. It should also notedthat the size of bigeye caught by drifting FADs sets in the EPO was much larger in 1999 thanprevious years. The overall catch trend in the WCPO has been increasing in recent years, reflectingeither higher longline or purse-seine catches depending on year. In the EPO, the surface fisherycatch increased markedly to 29,000 mt in 1994 and has been more than 35,000 mt per year sincethen. At the same time, the longline catch has declined from its maximum of about 100,000 mt in themid-1980s to about 35,000 mt in 1998. Overall, EPO catches of bigeye have varied from 60,000–80,000 mt in recent years.

48
The environmental effects on availability and productivity have been investigated through fisheriesoceanographic studies. As with yellowfin, El Niño events may increase bigeye catchability in thewest by raising the lower limit of its swimming habitat. At the same time, recruitment could behigher in the east due to the warmer and more suitable environment for spawning and larval survival.Incorporating such information into the stock assessment process may enhance the reliability ofpopulation models for this species, and therefore this study should be further pursued.
During the past year, collaborative research involving several institutions has been undertaken inorder to better assess the status of the bigeye stock. The work has involved the application of anintegrated statistical model (MULTIFAN–CL) to Pacific-wide bigeye data for the first time. Thepreliminary results from the model are promising and are consistent in several respects with theresults obtained by the IATTC for the EPO using an independently derived model, although theabsolute values of F from the collaborative study were considerably lower. Further work is requiredbefore the MULTIFAN–CL results can be interpreted in a management context. The IATTC analysisfor the EPO indicated relatively stable stock biomass in recent years, but the outlook for the stock isuncertain because the most recent recruitment is not precisely estimated.
The Group examined several nominal and standardised CPUE series for the longline fishery. Despitesome differences among the standardised CPUE series, they tended to indicate a similar decliningtrend in recent years. Although these estimates require further refinements, these results raise aconcern of possible overfishing and decline in adult biomass, particularly in combination with therecord purse-seine catch in the WCPO in 1999 and continuing high catches in the EPO.
The Group therefore strongly recommends that current research regarding appropriate stockassessment be continued as a priority. Other research and data collection priorities include (i)acquisition of more detailed catch statistics and size composition data for the fisheries of Philippinesand Indonesia; (ii) if possible, refine the methods for estimating bigeye catches in the purse-seinefishery; (iii) better document and understand the use and impacts (ecological and biological) of newtechnology (such as drifting FADs) in the purse-seine fishery; and (iv) refine the estimates of bigeyevertical distribution in relation to temperature and other variables (for use in habitat models) usingthe most recent archival and sonic tagging data. In addition to these short-term research items, theGroup foreshadowed a longer term need for additional large-scale tagging to provide information onbigeye movement, natural mortality and exploitation rates to support future stock assessmentanalyses.
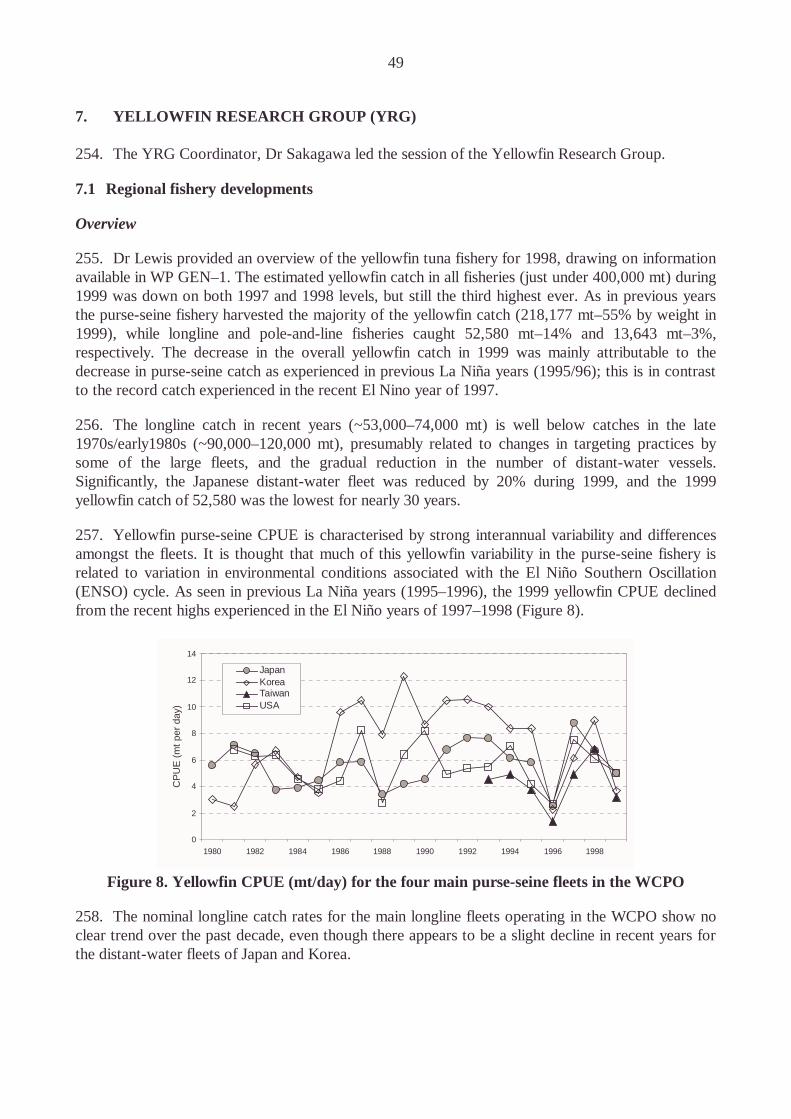
49
7. YELLOWFIN RESEARCH GROUP (YRG)
254. The YRG Coordinator, Dr Sakagawa led the session of the Yellowfin Research Group.
7.1 Regional fishery developments
Overview
255. Dr Lewis provided an overview of the yellowfin tuna fishery for 1998, drawing on informationavailable in WP GEN–1. The estimated yellowfin catch in all fisheries (just under 400,000 mt) during1999 was down on both 1997 and 1998 levels, but still the third highest ever. As in previous yearsthe purse-seine fishery harvested the majority of the yellowfin catch (218,177 mt–55% by weight in1999), while longline and pole-and-line fisheries caught 52,580 mt–14% and 13,643 mt–3%,respectively. The decrease in the overall yellowfin catch in 1999 was mainly attributable to thedecrease in purse-seine catch as experienced in previous La Niña years (1995/96); this is in contrastto the record catch experienced in the recent El Nino year of 1997.
256. The longline catch in recent years (~53,000–74,000 mt) is well below catches in the late1970s/early1980s (~90,000–120,000 mt), presumably related to changes in targeting practices bysome of the large fleets, and the gradual reduction in the number of distant-water vessels.Significantly, the Japanese distant-water fleet was reduced by 20% during 1999, and the 1999yellowfin catch of 52,580 was the lowest for nearly 30 years.
257. Yellowfin purse-seine CPUE is characterised by strong interannual variability and differencesamongst the fleets. It is thought that much of this yellowfin variability in the purse-seine fishery isrelated to variation in environmental conditions associated with the El Niño Southern Oscillation(ENSO) cycle. As seen in previous La Niña years (1995–1996), the 1999 yellowfin CPUE declinedfrom the recent highs experienced in the El Niño years of 1997–1998 (Figure 8).
0
2
4
6
8
10
12
14
1980 1982 1984 1986 1988 1990 1992 1994 1996 1998
CP
UE
(mt
per
day)
JapanKoreaTaiwanUSA
Figure 8. Yellowfin CPUE (mt/day) for the four main purse-seine fleets in the WCPO
258. The nominal longline catch rates for the main longline fleets operating in the WCPO show noclear trend over the past decade, even though there appears to be a slight decline in recent years forthe distant-water fleets of Japan and Korea.
50
Purse-seine vessel efficiency
259. Mr Itano presented information on the current status of purse-seine technology and recentdevelopments in the fishery with particular relevance to fisheries management (WP RG–9). Newdevelopments in fishing gear and technology, such as the recent shift to operations on drifting FADscan significantly influence catch and effort analyses, biological sampling programs, size compositionof catches and other management related factors. It was suggested that a small working group beformed to report to SCTB14 on recent developments in gear technology and the WCPO fishery andthe status of large-scale moored FAD arrays used by regional purse seiners.
260. One of the most notable developments in the yellowfin tuna fishery relates to a range oftechnological changes (some only suspected) in the purse-seine fishery. Discussion identified theimportance of documenting these changes, which included ongoing improvements in electronicequipment (for locating FADs and fish); fast brailling techniques, changes in catch handling andprocessing, chumming, use of FADs, and support vessels. Of these, the widespread use of driftingFADs by some fleets was known to be changing the nature of the catch composition (species andsize) and reducing the time spent locating fish. It was reported that the use of support vessels, whichcan quickly visit and check the fish concentration under FADs, had increased the catching power ofpurse seiners in the Indian Ocean by about 50%. The practice of processing catch on board alsocontributed to the increased catching power of vessels by increasing their efficiency throughmaximising the time spent on the fishing grounds.
261. Taken together, these changes in fishing operations affect how purse-seine catch and effort areinterpreted relative to earlier periods in the history of the fishery. In the absence of data on theseoperational details and fishing strategies, it is not possible to standardise CPUE. It was proposed thatthe current practices in the purse-seine fishery be documented and regularly updated. It wasconsidered essential that the data collected be readily obtainable and of direct use to scientistsanalysing purse-seine fishery data and towards this end discussions should be held with observers andvessel operators to identify potentially useful data that can realistically be obtained. It was also notedthat while US MLT observers were a useful starting point, practices differed amongst fleets, hencethere was an urgent need to expand observer coverage. It was also noted that the technologicalchanges and increasing sophistication of purse-seine vessels meant that there may also beopportunities to conduct some studies using these vessels as quasi-research platforms (for examplefor some oceanographic and biological studies) in support of studies of tuna ecology.
262. A brief presentation was given on fishery data supplied by the Spanish organisation operating 6large super seiners in the Kiribati EEZ. A map showing the distribution of effort on a scale of 5°latitude by 5° longitude indicated that most effort was in the region 5°N–15°S, 170°W–150°W.
263. A task for the group last year was to derive better estimates of the species composition ofpurse-seine catches by comparing estimates of the proportion of yellowfin and bigeye tunas fromobserver and port sampling data. Up to 400 fish were sampled per set by observers and up to 300 byport samplers. Despite careful sampling and reasonable sample sizes, significant differences weredetected in the ratio of yellowfin to bigeye in purse-seine samples when comparisons at the set levelwere conducted. Each data source has advantages and drawbacks and the reasons for differentestimates from each remain to be resolved as a work priority this year.

51
7.2 Biological and ecological research
Age and Growth
264. There has been little or no progress in studies of age and growth in the past year. To date,tagged yellowfin tuna in the Hawaiian tagging study have been at liberty for too short a time foruseful information on growth rates. In addition the otolith study by Mr John Gunn has beeninterrupted by other work commitments and no results are yet available.
Stock structure
265. It was reported that Dr Gunn is continuing his study of yellowfin tuna stock structure. Hispreliminary results from otolith micro-chemistry suggest some degree of sub-stock structure inyellowfin tuna. Final results from his study are expected later in the year.
Reproductive Biology
266. Mr Itano reported that he had completed his work on the reproductive biology of yellowfintuna and the report was available from JIMAR and via the PFRP website.
Environmental effects on yellowfin availability
267. Modelling results of yellowfin tuna are similar to those for skipjack tuna and indicate a strongcorrelation with ENSO events. Model results suggest that shallow mixed layer depths, and henceyellowfin habitat, during El Niño years are associated with higher yellowfin tuna catches by purseseine. There also appears to be a beneficial impact of El Niño on yellowfin tuna recruitment. In factif one assumes a relationship between recruitment and El Niño, then the predicted fluctuations inyellowfin tuna abundance seen in both the MULTIFAN–CL and A-SCALA models in the WCPOand EPO respectively show relatively good correlation with El Niño events.
Habitat models
268. It was noted that the habitat modelling done so far used simple assumptions about theunderlying environmental factors involved. For example, some concern was expressed that sinceseveral gear types and fishing strategies were used in the yellowfin tuna fishery that more complextemperature models may be required. Concern was also raised about defining yellowfin tuna habitatsolely with respect to temperature rather than incorporating other factors, like oxygen concentration,as had been done with similar models of bigeye tuna. It was pointed out that there was an importantdifference between the two species, with yellowfin tuna more critically dependent on the depth of themixed layer than bigeye tuna. The discussion raised the issue of the ongoing need for data on thephysiology and ecology of tunas. Hope was raised that the increasing use of archival tags willprovide critical insights into the vertical distribution of these species.
269. The importance of natural floating objects, especially logs, was briefly discussed. It waspointed out that the distribution of these objects, which act as FADs, should vary with ENSO eventsand should be examined. It was noted that while this was probably so, the primary driving force inthe distribution of purse-seine effort was most likely distance to ports for landing catch relative toareas where FADs were effective. It was also noted that sufficient data now exist to contrast thedistribution of log sets in El Niño and La Niña years. This type of study would also lend itself tosimulation modelling using lagrangian drift in a global circulation model.

52
270. Dr Lehodey presented results concerning ENSO impacts on yellowfin based on a time seriesanalysis (WP RG–1). Rising and vertical extension of the yellowfin temperature habitat in the westduring El Niño would increase the catchability by the surface fishing gears. There is also potentiallyan ENSO effect on recruitment, either linked to a similar mechanism described for skipjack (higherproductivity, lower juvenile mortality, higher recruitment) or to the extension of the spawning areaduring El Niño events since there is a relationship between sea temperature and tuna reproduction.Further studies are needed to confirm these preliminary results.
271. A question was raised about the hypothesis that catch rates increase when the verticaldistribution of habitat increase, as it was often conjectured that catch rates increase with thecontraction of the vertical habitat resulting in a higher density of fish. The change in volume ofhabitat versus the density of hooks and whether fishing behaviour changes in response to changes inthe prevailing oceanographic conditions were also seen as areas requiring further research
7.3 Stock assessment
MULTIFAN–CL Workshop
272. Dr Hampton presented WP YFT–2, the report of the MULTIFAN–CL Workshop, held from1–3 February 2000 in Hawaii. The purpose of the workshop was threefold:
• to provide an opportunity for stock assessment scientists, not actively involved in the use ofthe model, to gain an understanding of the methodology and technical issues involved;
• to compare the model with other models, and• to review the methodologies used in the model.
273. The three main conclusions from the workshop were a need:• for further testing of MULTIFAN–CL using simulated data;• for further work to determine the best method of estimating uncertainty;• to continue development of the model and diagnostics.
274. Workshop participants indicated that the working environment and the small number ofparticipants made it possible to conduct detailed analyses and produced excellent results. Followingthe workshop, it was suggested that a SCTB Methods Working Group be established to carry on thistype of work. Participants pointed out that the IOTC had approached FAO regarding theestablishment of such a working group and that ICES has had such a group for 20 years. Thus whilethe YRG participants favoured the formation of a modelling working group, a more general venuethan SCTB should be explored and such a working group might have sub-groups for specificmodelling work, for example habitat-based modelling to standardise CPUE data. A request wasmade to PFRP, which hosted the workshop, to make both the report of the workshop and thesimulation analysis report by Dr Jim Ianelli more widely available.
CPUE analyses
275. Dr Sun presented a paper entitled updated CPUE of central and western Pacific yellowfin tunafrom Taiwanese tuna fisheries (WP YFT–4).
276. Nominal yellowfin CPUE data were standardised using a GLM similar to analyses presentedearlier for other species. For the distant-water longline fishery, standardised CPUE declined in stagesfrom 1964–1998 while the trend for the offshore longline fishery was upward. For the distant–water
53
purse-seine fishery, standardised CPUE estimates are higher but more variable in the 1990s. It wasnoted that the CPUE for the distant–water purse-seine fleet presented in this paper (and in WPGEN–1) for early years was low. The CPUE values were sourced from statistics where catches, butnot effort, were understood to be under-reported prior to 1992, hence the lower than expectedCPUE. To avoid confusion, it was suggested that in future years OFP and Taiwan should use thesame catch statistics.
277. Mr Shono presented WP RG–3, a preliminary analysis of effect fishing gear on catch rate forthe Japanese purse-seine fishery.This preliminary review of the data used gear, boat, time and areafactor to standardise CPUE using GLM. No attempt was made to account for subtypes of associatedfishing, size of fish, or species mixture. The relative CPUE based on use of purse winch, mesh size,power block, net size, tele-sounder and GPS were presented, as were trends in nominal andstandardised CPUE for associated and free swimming schools. Larger estimates of standardisedCPUE for associated sets at the end of the time series are probably attributable to the use of FADs inareas where logs are uncommon, while smaller values occurred with reduced use of FADs.However, disentangling the effects of FADs and areas fished is problematic with the data currentlyavailable. Future modelling efforts will include environmental (SST) effects, use of continuous ratherthan discrete variables and better measures of FAD effects.
278. A general discussion ensued on the importance of fishing effort statistics for stock assessmentmodels and the importance of standardising CPUE measures. A proposal has been put forward touse either standardised purse-seine free-swimming school set CPUE, or even CPUE involvingcaptains with a long, continuous history in the fishery, as an index of stock abundance. It waspointed out that some boats set on associated schools in the morning and then search for freeschools, therefore standardisation would still be an issue. A process-oriented model was suggested asa measure of standardisation using detailed operational data collected by observers. Anothercomplication noted was that yellowfin is often bycatch in skipjack dominated sets. How to deal withthis in standardisation modelling is unclear.
279. Participants were unsure whether appropriate data were being collected for the standardisationprocess and a suggestion was made to ask captains what they consider important in catchingyellowfin. The point was made that our attempts to quantify changes occurring in the purse-seinefishery is from the perspective of short-term needs and some thought needs to be given to obtainingreliable indications from a long-term perspective.
280. Previous mention of the use of tagging studies as a source of quasi-fishery independent datawas revisited. The quantification of FAD monitoring by purse-seine vessels as an new unit of fishingeffort, and the use of FADs as scientific instruments, were two possible initiatives suggested to themeeting.
MULTIFAN–CL
281. Dr John Hampton presented the updated results of the analysis of WCPO yellowfin tuna datausing the MULTIFAN-CL model (WP YFT–1). The present analysis now covers the period 1962–1998, compared to the period 1970–1997 used in last year's analysis. The temporal stratification(quarterly) and spatial structure (seven regions within the overall model area of 40°N-35°S, 120°E-150°W), was the same as that used in previous analyses. Catch, effort and size data for 16 fisheries(7 longline, Philippines and Indonesia domestic, and purse seine fisheries classified by set type) wereused in the analysis. Tagging data from the RTTP were also incorporated into the analysis. Themodel structure adopted was the same as that used in previous analyses, and included: quarterly
54
recruitment, 20 quarterly age classes, independent mean lengths for the first 8 age classes with vonBertalanffy growth constraining the mean lengths for the remaining age classes, structural time-seriesvariation in catchability for all non-longline fisheries, age-specific natural mortality and age-specificmovement among the model regions.
282. The model obtained growth estimates from the length-frequency data that are reasonablyconsistent with independent estimates from otolith daily increments. However, for reasons not yetknown, the growth rates of tagged yellowfin (growth data for tagged fish were not included in themodel) were significantly less than those indicated by either the otolith or model estimates.Nevertheless, the model was able to fit the length data, which appear to be very informativeregarding growth, very well. The catchability trends appeared to be mainly increasing for the purseseine fisheries, and particularly in recent years for FAD-associated sets. The natural mortalityestimates were fairly consistent with expectation, with a basal level of around 0.6 per year for sub-adults, somewhat higher for smaller yellowfin and significantly higher for adult yellowfin. Estimatedmovement was predominantly west to east, reflecting the nature of the available tagging data.Recruitment estimates showed strong intra- and inter-annual variation, with the most striking overallfeature being a decline in the final 2-3 years of the analysis. This results in a decline in total and adultbiomass. Further research is required to determine the significance of the estimated recruitmentdecline, and its relationship to the other model parameters (e.g. the increasing purse seinecatchability over the same period). Overall fishing mortality is estimated to have increased but is notat a level for the WCPO stock as a whole that could be regarded as overfishing.
283. The suggested reduction in recruitment raised several issues. Since the estimate of recruitmentin the surface fisheries of the ETP has increased in the last few years of the time series, an east–westoscillation in productivity associated with ENSO events may be occurring. It was noted that theestimates of purse-seine catchability were higher in recent years, which might be confounded withthe estimates of lower recruitment. The importance of obtaining better coverage and representativesize samples was stressed. Since statistical models, in general, result in estimates with widerconfidence intervals at the end of the input time series, the estimated decline in recruitment should beinterpreted cautiously. This in turn led to a discussion of appropriate measures of uncertainty. It wassuggested that dividing the data into training and testing subsets could be used to measureuncertainty. However, it was pointed out that the amount of data is too limited for this approach tobe useful but that a resampling procedure might be implied. Possible impacts of model mis-specification came up in the discussion and it was pointed out that the model does not use explicitfunctional relationships (except for Von Bertalanffy growth) as in most other assessment models. Itwas observed that the estimate of natural mortality (and other factors) are more precise whencompared to estimates from other assessment methods. It was noted, however, that the use oftagging data in this model effectively narrows the confidence intervals by providing additionalinformation on mortality rates. It is possible that the assumed Poisson distribution may not accuratelyreflect actual variability of tag return data, and it is therefore planned to explore the use of a moreflexible statistical model for the tagging data.
A–Scala
284. Dr Maunder presented a new stock assessment model developed by IATTC to assess the tunastocks in the EPO. This new method is an age-structured statistical catch-at-length analysis (A–SCALA) based on the MULTIFAN–CL method used by SPC. The model fits to catch and length-frequency data conditioned on effort, includes environmental data to explain variation in recruitmentand catchability, and uses priors and penalties to constrain the estimation procedure. The populationis modelled from 1975–1999 on a quarterly time step. Sixteen fisheries were defined for the
55
yellowfin assessment, 4 floating object, 4 floating object discards, 3 dolphin, 2 unassociated, 1baitboat, and 2 longline.
285. The results indicate that there have been two productivity regimes, low productivity before1984 and high productivity after 1984. There is also a positive relationship between recruitment andsea surface temperature. Recruitment to the fishery was estimated to be very high in 1998 but low in1999. The recent observations of low sea surface temperatures give additional support to the lowrecruitment levels. However, there is uncertainty in these estimates due to the short time period forwhich these cohorts have subsequently been observed in the length-frequency data. The fishingmortality rate on small fish is estimated to be low. Average weight of fish caught is much lower thanthe critical weight, and has been since the start of the modelling period, indicating that the stock isbeing growth overfished. It should be noted that floating object and school sets catch smalleryellowfin than longline and dolphin sets. Spawning biomass is estimated to be above the level thatwould support Maximum Sustainable Yield (MSY). Current effort is estimated to be close to thelevel that would support MSY under the current effort distribution between fisheries and theestimated selectivities. Due to the flat topped yield curve, a reduction in effort would produce yieldlevels close to MSY while increasing the biomass level. However, different MSY levels couldpotentially be achieved by the different fisheries. Dolphin and longline fisheries have higher levels forboth MSY and biomass at MSY (BMSY).
286. Most of the discussion involved use of reference points. The use of critical size, derived fromyield per recruit analysis, as a knife-edge indicator of growth overfishing was questioned. Since it isimpossible to expend all fishing effort at the theoretical critical point, one would expect the averagesize of fish in the fishing to be below the critical size. Reference points need to be evaluated in termsof the management objectives for the fishery. A simulation study could be conducted to determinemaximum yield. The BMSY was estimated from the results of the model and reflect the conditions inthe fishery. If a stock recruitment relationship were assumed in the model, the estimate of BMSY couldbe higher depending on density dependence. From the perspective of MSY, the fishery is close tooptimum–current biomass is above BMSY.
7.4 Research co-ordination and planning
287. The YRG identified the following specific tasks (assigned individuals in parentheses) to beaddressed prior to SCTB14. These tasks are summarised under headings of Statistics, Researchstudies and General.
Statistics.
288. Statistical tasks for YRG are:
1. Obtain full slate of fishery statistics (catch, logbook, and length frequency) to the extentpossible for:
• the new distant-water purse-seine fleet that is largely operated by Spanish interests (SPC)• the Philippine fisheries (SPC)• the Indonesian fisheries (SPC)
2. Continue studies to evaluate yellowfin / bigeye species composition sampling by observer andport samplers, including development of experiments for “ground-truthing” the data for :
• U.S. purse-seine fishery (A. Coan)• Japan purse-seine fishery (N. Miyabe)
56
3. Develop options for improving timeliness of longline catch statistics:• Japan longline data (N. Miyabe)• Taiwan longline data ( S-B Wang)• Korean longline data (J-Y Kim)• Other fleets (SPC)
4. Organise working group to document current status and recent developments in purse seinetechnology with particular emphasis on those developments with significant potential to impactsampling programs, catch and effort analyses, and other data sources necessary for managementrelated research. The Working Group will also monitor developments in the use of moored anddrifting FADs and work in collaboration with appropriate members of the Skipjack and BigeyeWorking Groups through email correspondence and meet one day prior to the next SCTBmeeting. (D. Itano convenor)
Research Studies.
289. Research tasks to be undertaken for YRG are:1. Conduct studies on age and growth to more accurately determine ages in the catch. Report
on the use of otoliths for ageing (J. Gunn).2. Conduct studies on changing sex ratio with length / age for input into the understanding of
sex- specific natural mortality.3. Conduct studies on food habitats in order to understand trophic and ecosystem dynamics.4. Conduct studies on stock identification. Report on use of otolith micro-chemistry for stock
identification (J. Gunn)5. Conduct studies on process mechanisms (physiology, behaviour, etc.) related to:
temperature, depth and oxygen preferences by sex and by age for development of habitatmodels.
6. Continue studies designed to evaluate, validate and improve capabilities of emerging stockassessment models, such as MULTIFAN–CL, A-SCALA, habitat-based, SEPODYM, etc;
• Build stock projection capability in MULTIFAN – CL (J. Hampton)• Conduct cross analyses with differential models and simulations to evaluate model
behaviour (J. Hampton).
General.
290. General tasks related to the YRG are:
1. Develop research ideas and plans for obtaining fishery-independent or semi-independent datafor indexing stock abundance and /or for critical parameters of the new assessment models
7.5 Summary statement
291. A summary statement for yellowfin was drafted, circulated to participants and discussed duringAgenda Item 11. The accepted wording appears below.
YELLOWFIN RESEARCH GROUP (YRG) – SUMMARY STATEMENT
The yellowfin tuna catch for the western and central Pacific Ocean (WCPO) has increased since the1980s, when the purse-seine fishery began its significant expansion in the WCPO. Since 1990, the
57
catch ranged from 320,000 mt (1996) to 458,000 mt (1997). The majority (55%) of this catch isproduced by purse seiners.
In 1999, poor market conditions for purse-seine caught fish resulted in reduced purse-seine fishingeffort and catch. In addition, the longline yellowfin catch for 1999 of 52,580 mt was the lowest fornearly 30 years. The overall catch for 1999 fell from 440,000 mt in 1998 to about 397,000 mt, wellbelow the peak of 458,000 mt in 1997.
Catch rates for purse-seine fleets continue to be variable and without a clear trend in the availabletime series of data. However, catch rates for some fleets since about 1997 may have benefited fromthe increased use of drifting FADs. This fishing innovation is rapidly becoming the preferredtechnique for most fleets.
Catch rates for longline fleets continue to remain near their historical lows. The trend in the recentdata is mixed, with some fleets showing a flat trend and others showing a slightly downward trendsince 1988. It is noted that these trends may have been affected by changing fishing practices.
Tag-based assessments from the early 1990s found regional exploitation levels of yellowfin tuna tobe low to moderate at catch levels at that time slightly below those in recent years. The updatedresults of a MULTIFAN–CL analysis for yellowfin tuna continue to be consistent with the tag-basedassessment, but in addition indicate that fishing mortality may have increased significantly since themid 1990s. However, the overall estimates of fishing mortality-at-age remain considerably smallerthan the corresponding estimates of natural mortality-at-age. The analysis also indicates that recentrecruitment may have declined, which in turn is producing a decline in overall stock biomass.Additional research with the MULTIFAN–CL model will be undertaken to determine thesignificance of these results in terms of future stock productivity. Assuming that major changes inyellowfin stock productivity have not occurred, it is likely that the WCPO yellowfin tuna stock cansustain the current catch level.
The research priorities for yellowfin include (i) continued improvement in the quality and coverage ofcatch and effort data and size composition sampling, with particular emphasis on the Philippines andIndonesian domestic fisheries; (ii) continued development and evaluation of the MULTIFAN–CLmodel for yellowfin tuna; and (iii) continued collection of information on a range of biologicalinformation, including age and growth, sex-specific natural mortality and trophic/ecosystemdynamics. As noted in the skipjack summary statement, it is likely that there will be continuedreliance on tagging data as a quasi-fishery-independent source of information on yellowfin stockdynamics. Therefore, consideration now needs to be given to a new large-scale tuna taggingprogramme in the WCPO.
58
8. ALBACORE RESEARCH GROUP (ARG)
292. The ARG Co-ordinator, Dr Talbot Murray, led the session of the Albacore Research Group.
8.1 Regional fishery developments
293. The ARG Co-ordinator provided an overview of the albacore fisheries. While there are twostocks of albacore in the WCPO, discussion was limited to the South Pacific albacore stock. Catch,effort and CPUE trends for albacore fisheries in the South Pacific Ocean were reviewed based ontrends identified in WP GEN–1. The bulk of catches (30,000–40,000 mt; Figure 10) continue to bemade by the longline gear with catches increasing slightly over the past three years. Longline catchesare significant (exceeding 2,000 mt) for several Pacific islands, e.g., American Samoa, Fiji, FrenchPolynesia and Samoa. New Caledonian albacore catches are also likely to increase to this level nextyear with the transfer of 10 longliners from the French Polynesian EEZ later in the year. It waspointed out that appreciable declines in catches in 1999 occurred in the Samoan longline fishery andin the New Zealand and USA troll fisheries. The reason for the decline in Samoan catches is unclearwhile declines in troll catches are likely to be due to the low price offered at canneries. It was alsonoted that recent longline CPUE in temperate waters had slightly declined while there had been aslight increase in albacore longline CPUE in tropical waters. Troll fishery CPUE for New Zealandand USA fleets continued to be variable.
294. The most notable developments in the South Pacific albacore fisheries were the dramaticincrease in the Samoan and French Polynesian longline fisheries over the past four years and theprojected increase in longline vessels for New Caledonia. As mentioned in the national fisheryreports from American Samoa, French Polynesia, New Caledonia and Samoa, albacore were anincreasingly important component of tuna catches made by small domestic longline vessels.
295. Samoa has increased its longline fleet with most vessels targeting albacore (about 85% of alltuna landed were albacore). It was also noted that while effort increased during 1999, the overallcatch decreased. Although the reason for this decline was unclear, Samoa highlighted the concernthat a management strategy be developed for this species to ensure catches will be sustained atreasonable levels. It was also pointed out that the Samoan catches contained larger albacore thanwas seen in other longline fisheries. It was suggested that this might be due to hooks being set veryshallow. It was proposed that a study be undertaken to determine if the depth of setting couldexplain the differences in size composition in this fishery.
296. Experience in French Polynesia had also suggested that climatic factors might play a role in thelongline tuna catch composition with catches possibly related to La Niña and El Niño events. NewCaledonia reported that the planned increase in their longline fleet later this year would be fromvessels currently longlining in French Polynesia–the main species targeted being bigeye and yellowfintuna. It was noted that albacore would be a major catch component and could also be targeted whenbigeye and yellowfin catches diminish seasonally. It was pointed out that although the economics offleets targeting albacore had changed over the past few decades, even new Taiwanese vesselstargeting bigeye for the sashimi market are reported to target albacore when preferred species arenot abundant.
297. It had been suggested at SCTB12 that analysis of the economics of longline fishing mightexplain some of the variation in catch and effort in the South Pacific albacore fishery, as was nowreported for the New Zealand troll fishery. An economic appraisal of this fishery was still relevantand was suggested for inter-sessional work.

59
298. It was also noted that the recent court decision affecting the Hawaiian swordfish fishery mayalso have implications with respect to longline effort levels in the South Pacific as vessels excludedfrom the Hawaiian fishery are expected to fish elsewhere in the Pacific. Dr Laurs from the HonoluluNMFS laboratory indicated that further court action may result in all longliners being barred fromfishing Hawaiian and mainland US waters. He expected this fleet of >100 longliners would likelyrelocate in the Atlantic and the Pacific Oceans. It was also pointed out that Hawaiian vessels arecurrently able to fish in American Samoa if they wish but that the current swordfish market is forfresh chilled fish in the USA.
8.2 Biological and ecological research
Port Sampling Data
299. Port sampling of longline catches of South Pacific albacore has ranged from 5,000 to 75,000fish per year since 1992, primarily for length frequencies. Most sampling is done in Samoa and NewCaledonia. Port sampling of the troll fishery for length frequency data is done for New Zealand andUS vessels. NMFS has provided SPC with the US troll sampling data from Pago Pago through to1998. Sampling of the troll and longline fleets was noted as a secondary priority for port samplers inPago Pago who were busy with the purse seiners unloading. The priority given to purse-seinesampling had prompted SPC and NMFS to cooperate in providing for additional sampling of longlinecatches in Pago Pago. This had recently been funded through an SPC project but port sampling maydecline unless additional funds can be identified. At present there are no major gaps in the historicallength frequency sampling data according to SPC.
Observer data
300. Most observer coverage has been conducted since 1995, although Australian, Japanese andNew Zealand coverage dates from the mid-late 1980s for longline vessels in temperate waters. Atpresent there are no observer programs directed at fleets that target albacore. It was noted thatdistant-water longliners operating in temperate waters are likely to have high non-target catches ofalbacore but placing observers on these vessels, with trips lasting 2–3 months, could be difficult. Aswas mentioned for other species, increased observer coverage was considered a priority forestimating size composition. The lack of observer coverage of distant-water longline fleets,especially for Taiwanese vessels, was considered an ongoing issue of concern since this fleet morethan any other targets albacore and hence may be the most relevant for CPUE analyses.
301. It was reported that the Australian observer programme has discard records by the Japaneselongline vessels, with indications that retention practices for albacore have changed over time. It wassuggested from Australian experience that discarding of albacore might be more common whenvessels had limited space or were unable to transship lower valued species. Such practices couldaffect the interpretation of catch data and was considered an important area requiring clarification. Itwas noted that a direct comparison of catch records from specific vessels from Japanese logbookdata with observer data would provide valuable information on the extent to which this happened. Itwas agreed that Australian and Japanese scientists would analyse logbook and observer data fromthe AFZ for the next SCTB meeting.
60
8.3 Stock assessment
CPUE
302. It was noted that while CPUE is a fundamental part of stock assessment and there appears tobe ongoing difficulties in providing catch and effort data. In some cases catch is reported only inweight, necessitating information on size composition to estimate the number of fish caught. In somecases, catch and effort data are only available in certain units resulting in CPUE estimates that cannot be readily compared amongst fleets. In addition, there may be difficulty in comparing albacoreCPUE among fleets or areas because the target species is not specified and it is not clear whetherCPUE is related to abundance or to retention practices.
303. In the ensuing discussion it was considered desirable to reduce the lag time (1 to 2 yearscurrently) in reporting catch and effort data from all fisheries. This may be difficult for distant waterfleets because of the duration of trips (often 200–300 days) and because logbooks are only availableto authorities when vessels return home to port. Co-operative efforts with industry may be requiredto reduce the lag time for distant water vessels.
304. Vessel Monitoring Systems (VMS), incorporating catch and effort data, may be availablewithin the next few years. These data could be quite valuable for CPUE standardization studies, andplanning efforts to integrate these data sources into established databases should be considered.
305. A wider range of CPUE standardization studies for developing indices of abundance foralbacore would also be quite helpful for stock assessment work
Model Results
306. Dr Chien-Hsiung Wang presented an updated analysis using surplus production modelling toassess the South Pacific albacore stock (WP ALB–2). Based on Taiwanese longline catch and effortdata, the revised surplus production method was used to estimate carrying capacity (K), intrinsicgrowth rate (r), and catchability (q). These were estimated to be 149,733 mt (K), 2.2018 (r) and4.24098E-09 (q). During 1974–1998, the harvest rates varied between 0.14 and 0.23 with a mean of0.19. A unique “equivalent” point in catch (the point where the theoretical catch equals the surplusproduction) was estimated to be where F = 0.7339, biomass = 49,911 mt and catch = 36,631 mt.The model results indicated that the South Pacific albacore stock is close to this point andfluctuations in stock size were deemed to be stable. It was proposed that the production modelresults would be incorporated into a management decision table designed to evaluate the risk ofstock collapse under various management policies.
307. Considerable discussion followed the presentation of this paper. Much of the discussionfocused on the details of the method, its appropriateness for assessing the albacore stock, andinterpretation of the model’s results. As with previous discussions of this model (SCTB11 &SCTB12), some issues were clarified but others were unresolved. The key issues that remaininclude: 1) annual production and stock biomass levels appear to be approximately the same – anunusual situation for medium to long-lived fish stocks; 2) the fitting procedure needs clarification(e.g. equilibrium assumed or non-equilibrium time series fitting); 3) the rationale for excluding earlyyears in the model fit needs to be more fully developed; and 4) the need for a full description ofmodel equations and assumptions is critical for understanding the model’s dynamics and interpretingthe results.

61
308. In general, the meeting found it difficult to fully understand the details and the nuances inherentin new models, such as Dr. Wang’s. It was suggested that in the future, models and methods beexamined in detail by the Methods Working Group before submission to the SCTB.
309. Dr Hampton presented the results of an updated analysis of South Pacific albacore tuna datausing the MULTIFAN–CL model (WP ALB–1). The data cover the period 1962–1998 usingquarterly time stratification. The spatial coverage of the model is the entire Pacific Ocean south ofthe equator, within which a three-region spatial stratification (boundaries along 10°S and 30°S) wasadopted. Catch, effort and size data for 14 fisheries (11 longline, 2 troll, 1 driftnet) were used in theanalysis. Tagging data from the SPC's Albacore Tuna Tagging Project (1991–1992) wereincorporated in the analysis. The major updates from the previous albacore analysis were the additionof 1994–1998 data for all fisheries, the disaggregation of DWFN longline fisheries in each regionaccording to vessel nationality (Japan, Korea, Taiwan), the addition of the Samoan longline fisheryand the inclusion of tagging data in the analysis.
310. The model produced a consistent interpretation of the length-frequency data that is coherentwith previous estimates of age and growth from analysis of vertebral rings. Estimates of naturalmortality rates are consistent with those obtained from analyses using tagging data. The pattern ofage and size-specific variation in natural mortality is strongly related to changes in sex ratio withsize, which may suggest an effect of reproductive activity on female natural mortality. Therecruitment pattern is similar to previous analyses with a marked downwards shift in the mid- to late1970s. The recent increase in recruitment is a new feature in the present analysis. The absolutevalues of recruitment, and population size in general, are much higher than previously estimatedwhen tagging data were not included in the analysis. Biomass trends are largely driven byrecruitment, showing a decline through the late 1980s, followed by an increase (Figure 9). A similarbiomass pattern was derived using a simple model in which recruitment was assumed to be positivelyrelated to the Southern Oscillation Index (i.e. recruitment is La Niña positive). The low estimates offishing mortality for both adult and juvenile age classes are probably a reflection of the low recoveryrates of tagged albacore. While the appropriateness of using the tagging data in this analysis requiresfurther study, it seems unlikely that fishing mortality is underestimated to such an extent thatoverfishing is currently occurring.
Central
0.0
0.5
1.0
1.5
2.0
2.5
3.0
3.5
1961 1965 1969 1973 1977 1981 1985 1989 1993 1997
Bio
mas
s
North
0.00
0.01
0.02
0.03
0.04
0.05
1961 1965 1969 1973 1977 1981 1985 1989 1993 1997
Bio
mas
s
Total
0.0
0.2
0.4
0.6
0.8
1.0
1.2
1.4
1.6
1961 1965 1969 1973 1977 1981 1985 1989 1993 1997
Bio
mas
s
South
0.0
0.5
1.0
1.5
2.0
2.5
3.0
3.5
1961 1965 1969 1973 1977 1981 1985 1989 1993 1997
Bio
mas
s
Figure 9. Trends in relative south Pacific albacore biomass, with approximate 95% confidenceintervals.
62
311. In the ensuing discussion, it was suggested that perhaps not all of the albacore landings datahad been used in the assessment, and that the model should be rerun with complete landings data.Tag reporting rates for ten different fisheries were estimated by the model. There are few or no dataavailable to constrain these estimates and they may be confounded with other model parameters. Yetimportant model results (e.g. absolute recruitment estimates and fishing mortality rates) are highlydependent upon the estimated reporting rates. Future analyses should explore the uncertainty in theresults due to model estimates of tag-reporting rates.
312. Suggestions for future work included: 1) sensitivity analysis with respect to the tag reportingrates; 2) standardization of the longline CPUE data using GLM and/or habitat-based methods; 3)further examination of the SOI as a possible predictor of recruitment; 4) consideration of othermodels, such as ASPIC or other surplus production models, to compare and contrast withMULTIFAN–CL results; and 5) exploration of possible biological reference points for south Pacificalbacore.
8.4 Research co-ordination and planning
313. The following research needs were identified:
1. Incorporate data from the longline fleet in American Samoa and Canadian troll vesselsoperating in the SCTZ (OFP).
2. Compile summary tables of catch and effort by gear types similar to those in the “TunaYearbook” for the South Pacific stock (OFP).
3. Compare Australian observer data to vessel logsheets to clarify reported changes in theretention of albacore on Japanese longline vessels (BRS, NRIFSF).
4. With the termination of the SPRTRAMP programme there is a need to find ways toenhance observer coverage and improve transshipment information, especially on distantwater longliners from Taiwan (OFP, OFDC, FFA, others?).
5. Provide an update on the economics of albacore longline and troll fisheries in relation totrends in catch and effort (FFA).
6. Improve estimates of effective effort for use as model inputs (OFP, others?).
7. Explore ways in which historical Taiwanese longline data could be improved bydistinguishing albacore target and non-target sets, especially during the period of increasedtargeting of bigeye and yellowfin (OFDC, OFP, others?).
8. Continue the development of the MULTIFAN–CL model, especially through extensionsincorporating environmental information and further tests of the sensitivity of outputs toexisting model inputs derived from tagging in the early 1990s (OFP).
9. Determine whether the depth of longline fishing gear is related to the size composition ofthe catch (OFP, Samoa, NRIFSF, others?).
10. Identify the benefits of conducting a further albacore tagging programme, especially withrespect to providing corroboration of existing views of stock status (OFP, others?).
11. Consider a mechanism for monitoring long-term variation in biological parameters (eg,spawning activity, recruitment strength, etc) (NFRDI, others?).
12. Explore the utility of reference points derived from the MULTIFAN–CL and other modelsof stock trends for summarising information about current stock status (OFP, others?).

63
8.5 Summary statement
314. A summary statement for albacore was drafted, circulated to participants and discussed duringAgenda Item 11. The accepted wording appears below.
ALBACORE RESEARCH GROUP (ARG) – SUMMARY STATEMENT
Albacore caught in the South Pacific constitute a single stock. Longline, primarily catching adults,accounts for the majority of albacore catches (89%) in the South Pacific with trolling catching theremainder (11%). The albacore catch, estimated at 37,080 mt in 1999, was less than in 1998 whencatches reached the 10-year peak of over 42,000 mt. In 1999 longline catches were 33,353 mt andtroll catches 3,641 mt. Longline catches of several South Pacific island States and territories exceed2,000 mt, contributing substantially to the total albacore catch. The combined albacore longlinecatch in 1999 by Fiji, French Polynesia and Samoa was slightly lower than 1998 in all three areas.This catch, more than 11,000 mt, constitutes 29% of all longline catches of albacore in the SouthPacific. Catches in Samoa have rapidly increased from 560 mt in 1994 to over 4,000 mt in 1998, butdeclined in 1999 to 3,400 mt. Longline albacore catches also declined for vessels in AmericanSamoa over the same time period. Slight declines in catches were also reported for Canadian andUSA troll vessels fishing the STCZ in the 1998/99 season relative to 1997/98. Troll caught albacorein the New Zealand EEZ declined by about half over the same period, in this latter case low pricesbeing given as an explanation by the fishing industry, rather than low availability.
There has not been any dedicated field research on albacore since the OFP research programme in1991/92. Biological data on albacore are regularly collected, however, via observer and portsampling programmes in the region, although some of these data have not been compiled. Lengthfrequency data from port sampling is a critical input to the length-based age-structured stockassessment model (MULTIFAN–CL). This model has been extended to cover the period 1961–1998, to incorporate tag recovery information, and include the Samoan longline fishery. Results fromthis model are strongly influenced by a small number of tags recovered (135 recoveries) and henceare highly uncertain. Results, however, suggest a decline in biomass from 1961 to 1989/90 (about50%) followed by an increase which continues to 1998. These results are regarded as highlyuncertain due to the influence of the tagging data and the lack of information on tag reporting rates.An alternative stock production model examined stock sustainability from a theoretical perspective.The results of this model were also considered to be highly uncertain as several key parameterestimates were unrealistic and there was no basis for confirming results, including reference to similarspecies. A new attempt to incorporate environmental factors (with appropriate time lags) inmodelling biomass suggests a possible link between recruitment and ENSO events. This approachrequires further work to confirm this interpretation.
A number of areas requiring further work before the next SCTB meeting were identified, these tasksinclude: incorporating data from additional fleets; reviewing the adequacy of observer coverage;conducting an economic analysis in relation to changes in effort; analysing longline data to determineif retention practises have changed in some fleets; analysing depth of longline sets in relation toalbacore size; developing further extensions to the MULTIFAN–CL model; developing proceduresfor standardising CPUE; evaluating the need for a further tagging programme; and evaluating the useof reference points in assessing stock status.
No information was presented to suggest a change in interpretation of stock status of South Pacificalbacore. Although model results are considered highly uncertain, exploitation rates appear to bemoderate and current catches are likely to be sustainable.
64
9. BILLFISH AND BYCATCH RESEARCH GROUP (BBRG)
315. In the absence of Mr Peter Ward due to illness, Dr Robert Campbell led the session of theBillfish and Bycatch Research Group (BBRG).
316. Dr Campbell reminded the meeting of the importance of bycatch issues in commercial fisheriesas witnessed by the court actions recently instigated against the Hawaiian-based longline fleet overthe issue of turtle bycatch. As demonstrated by this case, bycatch issues can substantially influencethe economic viability of some fisheries and have large social consequences. For some fleets in theWCPO, the need to consider and manage bycatch issues is likely to increase in the years to come.Marlin species, whilst also often seen as a bycatch species in the main commercial fisheries in theWCPO, also support a diverse range of recreational fisheries in the region. As such, issues ofresource allocation between the different fishing sectors, as well as sustainability of the resources, arealso important.
317. A review of information pertaining to marlin fisheries, data collection and the biology of billfishspecies had been undertaken during SCTB12. This review had also initiated several important actionitems for review at SCTB13. The present meeting was also requested to undertake a review ofswordfish fisheries in the WCPO. The need for such a review was based on increases in the catch ofswordfish in the WCPO during the past decade (a 50 percent increase since 1990), the rapiddevelopment of the Australian fishery targeting this species in recent years, and the potential forfurther developments in the region. Experiences from other oceans suggest that swordfish might notbe able to support intensive harvesting. Finally, several other issues had been added to the agenda fordiscussion, particularly the incidental bycatch of sharks, turtles and seabirds in the Hawaiian longlinefishery.
9.1 Activities of other groups studying billfish and bycatch
318. The following summarises information on billfish and bycatch issues from other organisations.Acronyms are shown in Appendix 9.
Bycatch activities of IATTC
319 A presentation on the bycatch activities of IATTC was provided by Dr Maunder. On the 4–6April 2000 the IATTC had its 2nd Meeting of the Bycatch Working Group. Three main topics werediscussed at this meeting; ●ecosystem modelling, ●technology and fishing techniques, and●management options.
320 An ecosystem model was developed for the EPO using Ecopath/Ecosim/Ecospace. The modelincluded tuna fisheries, life histories, species interactions, energetics, and population dynamics. Themodel was used to investigate changes in fishing effort, time/area closures, the effects of sortinggrids, and environment forcing.
321 Investigations have been carried out to evaluate the usefulness of sorting grids to release smalltunas. An experiment was carried out using captive yellowfin tuna to determine if tuna would swimthrough the sorting grid. All the tuna in the experiment swam through the sorting grid, howeverthere was a high mortality rate. The IATTC proposes to carry out on-vessel experiments using avideo camera to determine the size and species of tuna that will swim through the sorting grid. Anadditional experiment, using net pens, is also proposed to determine mortality rates.
65
322 Management options to reduce the bycatch of small tuna and other species were considered.These management options included combinations of restricting fisheries on spatial and temporalscales and restricting fishing methods or set types.
323 The IATTC assessment model (A-SCALA) was used to determine the effect of discards on theyellowfin and bigeye populations. The results suggest that there is no impact on the yellowfinpopulation. Preventing the catch of small tuna in the bigeye fisheries increases biomass levels, yieldper recruit, catch taken by the surface fisheries, and catch taken by the longline fisheries.
324 The IATTC has produced assessments for blue marlin and swordfish. The IATTC is organisinga workshop sometime during February to April 2001 to discuss and co-ordinate research, funding,and the management of sharks and rays.
ISC overview
325 Dr Laurs presented WP BBRG–17, a report of the swordfish working group meeting (SFWG)of the ISC, held in January 1999. The meeting reviewed information concerning swordfish resourcesin the ISC region, including fishery statistics, swordfish stock status and progress in biological andoceanographic research.
326 Provisional stock assessments presented by SFWG were inconclusive with the degree ofexploitation, and condition of the resource remaining unknown. The SFWG identified several criticalneeds in fishery monitoring and biological and oceanographic research to improve models ofswordfish population dynamics and reduce uncertanities in stock assessments. One critical need is todevelop stock production models that account for spatial heterogeneity in stock dynamics.Supporting research includes: basin-wide tagging (conventional and archival), delineation of stockstructure and the continued development of dynamic production models.
327 A second area of critical research was concerns in modelling the relationship between CPUEand swordfish abundance including the effects of large-scale oceanographic phenomena. A thirdidentified need was to be able to develop models that account for effects of age-structure and sex-structure on stock production and responses to fishing. There is a need to validate age and growthmodels as well as a need to improve the collection of size and sex composition statistics. A fourthneed is to continue the development of the basin-scale simulation model and to continue compilingfishery statistics, particularly swordfish catch data from all countries exploiting swordfish stocks ofISC interest.
Billfish symposium 2001
328. Dr Julian Pepperell notified the meeting of the forthcoming billfish symposium to be held inCairns from the 19–23 August 2001.
329. This third International billfish symposium, entitled ‘Global sustainability of billfish – research,assessment and management in the 21st Century’, will provide the opportunity for the latestinformation on billfish to be presented, and will hopefully stimulate research in developing reliablestock assessments of billfishes in the three major oceans of the world. Many new developments aretaking place that will be discussed such as electronic tag technology and improved assessmenttechniques, as well as providing a forum for the discussion of the latest biological information forthese species.
66
330. There are six major sub-themes in the symposium: •stock structure, •stock assessment,•biological studies, •management, •socio-economics and the •status of broadbill swordfish aroundthe globe. Further information can be obtained from web-site http://www.flamingobay.com.au/billfish2001.
9.2 Billfish data considerations
Overview of Korean longline fishery in the Pacific
331. Dr Kim presented WP BBRG–8, reviewing the trend in billfish catches by Korean longlinersoperating in the Pacific during the 1990s and provided re-estimates of the nominal catch of billfishbased on the sampled catch statistics from fishing vessels.
332. The proportion of billfish to the total longline catch showed annual variations fluctuatingbetween 7% and 16%, averaging about 12%. Species composition by the Ministry of MaritimeAffairs and Fisheries (MOMAF) indicated that a large portion of the billfish was unidentified andthus classified into ‘other billfish’ categories. To re-estimate the nominal catch of the billfish species,these 'other billfish' catches were reassigned to each billfish species according to the percentage ofeach billfish species catch, as shown in the sampled catch data, which were based on the logbooksunder the responsibility of NFRDI.
333. Re-estimated nominal catch of billfish species consisted of 27.8% blue marlin, 24.4% stripedmarlin, 21.9% sailfish, 14.1% swordfish and 11.7% black marlin. From CPUE distribution, it wasspeculated that blue marlin, swordfish and striped marlin occurred over wide tropical regionsthroughout the Pacific, whereas sailfish and black marlin have somewhat limited or rare distribution.Most of the sailfish catches are from the eastern waters off Mexico and Central America. Theirdistribution in the western and central Pacific where the Korean fleet operates is rare.
Billfish annual catch estimates
334. Mr Williams presented a paper on the annual estimates of billfish catch in WCPO fisheries,referring the meeting to WP BBRG–3. The task of preparing this document originated from adirective of SCTB12–BBRG and enhanced papers presented at the two previous SCTB meetings.The sources of information used to compile the annual estimates for the commercial longline andpurse-seine fisheries, and the recreational fishery were briefly described. He mentioned that thisdocument would become a permanent contribution to future SCTB meetings and that furthercontributions by SCTB members will gradually improve these estimates in the years to come.
335. For the WCPO longline fishery, billfish estimates for most fleets were obtained directly fromlogbook or landings data. Where logbook or landings data were lacking or there were acknowledgedproblems with these sources, billfish estimates were derived from observer data by applying theobserver-reported species composition to annual catch estimates of target tuna. The provisionalWCPO longline catch estimates for 1999 were blue marlin–10,285 mt, black marlin–1,037 mt,striped marlin–4,237 mt and swordfish–16,658 mt.
336. The logbook reporting of billfish catch in the WCPO purse-seine fishery is very poor, eventhough observers regularly report incidences of blue and black marlin catch. An attempt was made toestimate the billfish purse-seine catch of blue and black marlin using observer data. The premise forcalculating billfish catch was the application of billfish catch rates (kg/set) derived from observer data
67
to the estimated number of sets, both stratified by fleet and school type. The provisional WCPOpurse-seine catch estimates for 1998 according to this method were blue marlin–239 mt and blackmarlin–135 mt.
337. In the past two years, a concerted effort has been made to compile information on recreationalfisheries in the region, with an emphasis on billfish catch. An attempt was made to compile anddescribe the annual estimates of the billfish recreational catches in each country–at this stage, onlyestimates for 1998 for all countries have been provided, but it was noted that some countries havereliable historical catches from this fishery. The importance of tag-and-release programmes in thisfishery, and the need to report this separately to landed catch, was highlighted. The provisionalWCPO recreational catch estimates for 1998 were blue marlin–604 mt, black marlin–198 mt andstriped marlin–246 mt.
338. In the ensuing discussion, it was noted that separate categories for estimates of mandatory-released billfish catch in commercial longline fishery should be included in the future. Thediscrepancies in estimates presented in this paper with Korean and Taiwan billfish estimatespresented in separate papers were explained by different areas of interest. That is, the Koreaestimates represented the entire Pacific Ocean and the Taiwanese catches included some IndianOcean catch, while the estimates presented in this paper were for the WCPO only.
339. It was a suggested that inter-annual variability could be incorporated in the estimation ofpurse-seine billfish catches in the future, provided there is sufficient observer data to do this.
Identification, discarding and life status of billfish
340. Mr Sharples presented WP BBRG-15, ‘A summary of species identification problems,discarding practices and life status of billfish taken in longline fisheries in the western and centralPacific’.
341. It noted that instances of billfish misidentification are generally found through three basicprocesses – species reported from waters where they are not usually prevalent; observer reports ofvessel mis-recording on logsheets; and difficulties identifying processed fish. Examples werepresented to characterise each of these processes. Most unresolved identification issues are beingaddressed or can be addressed by producing field guides, producing posters, and better training ofcrew, observers and port samplers. It is proposed that a poster be produced for vessels and anotherfor use at ports. These should be high quality, widely distributed and suitable size to readily findtheir way to visible locations on vessels and in ports.
342. In addressing discard issues it was noted that a large percentage of observed vessels have zerodiscarding of marlins. It was surprising to note a high discard of swordfish but this was probably dueto a high incidence of smaller swordfish caught in equatorial waters, which will need to be looked atmore closely. In looking at discard behaviour by fleet, there are differences between foreign anddomestic fleets. The former fleets are sometimes likely to discard due to licensing restrictions thatprevent landing fish to local markets and the high cost of freight being an incentive to high-grade thecatch. Billfish are also often discarded because they have received shark or whale damage.
343. Observers in the WCPO collect information on the life-status of all fish landed on observedlongliners. Billfish are categorised as ‘dead’, ‘alive but dying’, the somewhat subjective ‘alive butdamaged’ and ‘alive and vigorous’. Preliminary analysis of these data shows that striped marlin isthe most resilient billfish, with more than sixty per cent alive on landing, whereas sailfish and shortbill
68
spearfish are the least resilient. The data suggested that swordfish may be less resilient when caughtas smaller fish but further work needs to be done on spatial variability in regards to size, area and lifestatus of these fish
Life status and retention of billfish off eastern Australia
344. Dr Campbell presented WP BBRG–7, ‘The life-status and retention of billfish caught bylongline within the AFZ’.
345. Data on the life-status at the time of line retrieval and retention of billfish have been collectedby observers on board both Australian and Japanese longliners fishing within the Australian FishingZone. Of the 216 black marlin observed caught by Australian longliners fishing in the Coral Sea inOctober-December 1995, 98 were classified as alive and vigorous, 46 were alive and sluggish, 9were alive and injured and 55 were dead upon retrieval. One blue marlin and three swordfish werealso observed, with all classified as alive and sluggish. During a survey in the winter of 1996,swordfish were the predominant billfish caught, and of the 37 swordfish observed, 9 were retainedand 27 classified as dead upon retrieval. Two striped marlin (alive and vigorous) and two spearfish(one alive and injured, one dead) were also observed.
346. For the 6,301 billfish observed caught by Japanese longliners, retention was above 50 percentfor all species (highest of 69 percent for spearfish) except blue marlin (33 percent). The percentageclassified as dead was at least 50 percent for all species (highest was 81 percent for sailfish) exceptfor striped marlin (45 percent).
347. Data collected using hook-timers on Australian longliners indicated that life-status wascorrelated with the duration of being hooked. Life-status is also likely to be related to ambient watertemperatures and dissolved oxygen levels.
Billfish weight estimation from Japanese longliners
348. Mr Miyabe presented information to the meeting on weight estimation for billfish caught onJapanese longliners.
349. Prior to 1994, Japanese logbooks did not contain information on individual catch weights so itwas necessary to convert numbers to weights. This was accomplished by utilising the size (lengthand weight) data collected by NRIFSF. For each species of billfish, these data were aggregated to10 degrees of latitude and 20 degrees of longitude, and then the average weight was calculated usinga length-weight relationship.
350. Catch weight information has been included in the logbook since 1994. The conversionprocedure was modified at this stage. The current procedure is to calculate average weight for eachspecies from data which accompanies the logbook weight data. The average weight tables arecreated for three different levels; one is by two-month interval and a rectangle of 5 degrees latitudeand 10 degrees longitude (level 1), the second is annual for a rectangle of 10 degrees latitude and 20degrees longitude (level 2), and the last one is annual and ocean-wide average (level 3).
351. Then, using these tables, catch data without weight information (only number) are converted toweight according to the following substitution scheme: 1) Use average weight (level 1) of the samestrata. If there are no data in the same strata, then 2) Search neighbouring strata of the same latitudein the same two months interval, 3) Use average between neighbouring strata which are north andsouth to the original stratum in the same two months interval, 4) Use annual average weight (level 2)
69
of the area that the original strata is included, 5)-6) Repeat the same procedures as above for steps(3) and (4) using the level 2 average weight table, 7) Use annual ocean-wide average weight (level 3average weight table).
352. Weight data recorded on logsheets are processed weights. The current conversion from aprocessed to whole weight uses a conversion factor for each species. These have been obtained froma research boat, training boats and observers. As data are accumulated, conversion factors should berevised if they are variable among area and season.
Present knowledge of game-fisheries in western and central Pacific
353. Mr Whitelaw presented WP BBRG–2, ‘Knowledge of game-fisheries in the western andcentral Pacific’. He stressed that this was a preliminary paper trying to quantify information ontargeting, fishing gear and practices in game-fisheries around the Pacific. The paper described what ispresently known about the game-fishing facilities of member countries and some information, whereavailable, on the seasonality of the game fish species. He stressed that it was important to know theextent of the game-fishery in the Pacific and how it is developing.
354. Mr Whitelaw stressed that this was an initial attempt at trying to put this type of informationtogether and it was hoped that member countries would contribute their own knowledge andinformation to help update this document. It is intended to produce an informative ‘booklet’ on gamefishing in the Pacific, as well as to provide the information to the web site in the interim.
Recreational data collection forms and tagging programmes.
355. Mr Whitelaw presented WP BBRG–10 reporting on the availability of tags and game-fish datacollection forms.
356. He noted that there were three main tagging programmes operating in the Pacific and providedinformation on how to contact them and obtain tags. He stressed that SPC was amenable to assistingcountries set up game-fish tagging programmes in conjunction with existing tagging programmes.Tagging is important in helping to provide information on billfish movement, stock structure, growthand various other biological parameters as well as providing information on the interaction of thetwo main fisheries, being the commercial and recreational.
357. Mr Whitelaw also reported on the development of the SPC recreational database as well as thedevelopment of ‘tournament’ and ‘individual vessel’ data sheets. The intent is to initiate thecollection of game-fish data from member countries as well as to try and obtain any historic data thatis available. This has begun with data obtained from a number of member countries, which has nowbeen entered onto the database. Mr Whitelaw noted that, as with commercial data, this information isconfidential and cannot be accessed by others without the permission of the contributing country.There is a need for continued liaison between relevant research, game fish and country fisheryorganisations.
358. Game fishing is a developing industry in the Pacific and, as is the case in any fishery, there is aneed for historic and current data to properly manage the industry. Game-fishing data is diverse in itsnature, which is why SPC is trying to bring it together in one place for future analysis.
70
9.3. Fisheries taking swordfish
A review of world fisheries for swordfish
359. Mr Caton, in the absence of Mr Ward, provided a review of world swordfish fisheries from acurrent publication of BRS. Swordfish are large, highly fecund, migratory apex predators that growquickly in their early years. As well as a wide geographical distribution (50ºN–50ºS) they routinelymove between surface waters and great depths where they tolerate extreme cold (~5ºC). Recentresearch suggests several semi-independent Pacific Ocean swordfish stocks—a northern stock, asouth-western stock and two or three east Pacific stocks. Males and females have differentdistributions depending on size. Females grow faster and live longer, reaching their maximum size(~500 kg) at about 25 years of age.
360. Swordfish harpooning has existed for centuries, targeting large females basking at the seasurface. The fisheries changed dramatically with the introduction of longline fishing gear anddriftnets. Swordfish now represent an increasingly important source of revenue for many coastalnations in the south Pacific and Indian oceans, for example Australia and La Réunion. Boats canundertake long fishing trips for fresh-chilled swordfish because it has good storage characteristicsand the price is less sensitive to product quality. Future expansion or contraction in global demand,or health restrictions will directly influence the commercial viability of many swordfish fisheries. Asignificant decline in the value of the US dollar, for instance, might suddenly make some swordfishfisheries unprofitable.
361. Several swordfish fisheries have shown initial, rapid expansion of catches then a decline despitea steady increase in area fished. Such experiences have prompted concern over the species’ ability tosupport intensive harvesting. Even so, there is no clear evidence of swordfish stocks or their fisheriescollapsing from overfishing. Their broad distribution, combined with prolonged spawning periodsand rapid early growth might contribute to resilience to intensive harvesting. Nonetheless, inadequateresearch information and fishery management are failing to realise the considerable economic benefitsthat would be derived from optimum use of the swordfish resources.
362. Three fisheries, the Mediterranean, south Atlantic and north Atlantic, have been fished at levelsabove the estimated maximum sustainable yield (MSY). Initial parental harvest by harpoon andsubsequent juvenile longline catches both contributed to the decline in the parent stock. Swordfishabundance in the north Atlantic has shown a continuous decline since about 1980 with the stockeventually falling below the estimated optimum level. The most recent (1999) assessment suggestedthat the decline in abundance has slowed, with strong recruitment of juveniles in 1997 and 1998. Thestatus of swordfish in the south Atlantic is more uncertain. There, catches are believed to have beenabove the maximum sustainable yield in most years since 1989. In the Mediterranean, the number ofnew recruits produced in 1994 was estimated to be 10–20% of that for the unfished stock. Thefishery’s reliance on small swordfish and the fluctuations in recruitment reflect significant reductionsin the size of the parent stock.
363. Compared with longlining for tuna, swordfish longlining is more likely to interact with marinewildlife, such as seabirds, seals and turtles, because it usually involves late afternoon shallow sets, athigh latitudes where those species are often active. In addition to robust assessments of swordfishstatus, the fisheries need multi-species assessments and ecosystem approaches to their management.

71
Review of Japanese swordfish catch in the Pacific
364. Dr Uozumi presented WP BBRG–5 on the Japanese swordfish catch in the Pacific Ocean from1971 to 1998. The historical trend of the Japanese swordfish catch in the Pacific Ocean wasreviewed. The major swordfish fisheries in the Pacific Ocean are longline, driftnet and harpoon. Thelongline fishery has caught 90% of the Japanese swordfish catch in the Pacific. The total catch forthe whole Pacific has been stable at around 10,000 metric tons during the last 30 years. In the SouthPacific Ocean, the catch has gradually increased from 2,000 metric tons to 3,000 metric tons duringthe last 20 years. The main areas of higher CPUE are located in the Tasman Sea (SW Pacific), theNW Pacific off Japan and in the Eastern Pacific off South America (Figure 10).
Figure 10. Distribution of the Japanese offshore and distantwater longline CPUEs (No./1000 hooks) for swordfish in Pacific
Ocean during 1998
Status report on the Australian longline fishery off eastern Australia.
365. Dr Campbell presented a paper entitled ‘A Status report on the Australian Longline Fishery offeastern Australia’ (WP RG–5). While Japanese longliners began fishing off eastern Australia in the1950s, an Australian longline fishery did not become established until the late 1980s. Swordfishremained a small bycatch species until the mid-1990s when Australian longliners began targeting thisspecies off southern Queensland. The fishery for swordfish developed rapidly with the catchincreasing from 47 t in 1995 to 1,956 t in 1999. The spatial extent of the fishery also expandedconsiderably during this time. The present annual catch is considerably greater than the historicalcatches taken by Japanese longliners fishing in the eastern Australian Fishing Zone, and is similar tothe average annual catch taken by all longline fleets fishing in the south-west Pacific (0-50oS, 140-170oE) during the 1990s. The bulk of the Australian catch is taken in the region known as theBrisbane Grounds (24-32oS and 152-162oE), though catch rates indicate a southerly movement ofswordfish to higher latitudes over the summer months, possibly with the strengthening of the EastAustralia Current.
366. The Australian fishery generally targets swordfish over the full moon period and has highassociated catches of bigeye tuna. However, while the catch rates of bigeye show a strong seasonalcycle, varying by a factor of 3 between the second and fourth quarters, the seasonal cycle inswordfish catch rates is much smaller (approx. 25 percent). Average trunked weights of swordfish
72
average around 45 kg during the first six months of the year, increasing to around 50 kg during thesecond six months. Nominal catch rates of swordfish on the Brisbane Grounds peaked at around 10fish per 1,000 hooks in 1996 and since then have declined around 30-40 percent. The spatial patternof catch rates indicates a sequential decline in areas fished since the start of the fishery with catchrates being maintained on the periphery as the fishery expands into new areas.
Relationship between swordfish catches and oceanography in Australia.
367. Dr Young presented WP BBRG–14, which showed the relationship between oceanographicand environmental variables and catches of broadbill swordfish off the east coast of Australiabetween 25°S–36°S. The use of an underway sampler on two longliners which recorded surfacetemperature, salinity and fluorescence enabled the examination of the association between thesevariables with the point of capture of individual fish as well as more commonly used variables such asmoon phase and time of year. By using a combination of generalised linear and generalised additivemodels they examined two separate models – one incorporating the entire study area (Model 1) andone restricted to the northern area of the fishery (Model 2). In Model 1, the factors; area,fluorescence, nearness to front, year and moon were significantly correlated to broadbill swordfishcatch rates. In Model 2, salinity, nearness to front, moon and (month: year) were the main correlatesof catch rate. The results indicated that inclusion of these factors in CPUE models of the easternAustralian swordfish fishery may help in explaining some of the observed variations in catch rates.
9.4 Biological research on swordfish
Genetic evidence of swordfish population subdivision in the Pacific
368. Dr Carol Reeb presented WP BBRG–13 on structure and migrations corridors of swordfishusing mitochondrial DNA. The swordfish, Xiphias gladius, is a migratory oceanic species distributedin sub-tropical and temperate waters worldwide. Previous studies utilising mitochondrial DNA(mtDNA) have demonstrated genetic subdivision between ocean basins, as well as within the Atlanticbasin. However, there has been no support of population subdivision within the Pacific. A total of629 base pairs of the control region were sequenced for 281 swordfish collected in the Pacific.Eleven microsatellite loci were developed and analysed for these same fish. Hierarchical analysis ofmolecular variance (AMOVA) using mtDNA supports significant genetic structuring among Pacificpopulations. Northern and southern populations in the western Pacific were significantly divergentwhile populations in the eastern Pacific appeared to be genetically continuous. It is striking to notethat historically, migration of Pacific swordfish appear to follow the edges of major oceanographiccurrents.
369. Microsatellite data resolves the overlap in the eastern Pacific and uncovers a third geneticallyrecognisable group along the coasts of Chile and Ecuador. The waters of California and Mexicoappear to contain a mixture of north-western and south-eastern populations thus explaining theeastern overlap observed in mtDNA. Interestingly, the microsatellite data does not supportstatistically significant divergence between northern and southern populations in the western Pacific.There are several reasons for this discrepancy between nuclear and mitochondrial data sets includinga different pattern of male-mediated gene flow, a larger effective population size for nuclear allelescompared to mitochondrial haplotypes, and a potentially high level of reversion mutation inmicrosatellite loci. Nonetheless, both mitochondrial and microsatellite data reject the null hypothesisthat Pacific populations of swordfish are unstructured and comprise only a single homogeneousstock. These patterns of genetic structure and corridors of gene flow should now be tested furtherwith tagging studies. This would allow us to determine whether populations that are not significantly

73
different genetically are connected via contemporary gene flow or whether they are actually behavingas separate populations but are genetically similar because they share a very recent co-ancestry.
Biological research on swordfish at NMFS Honolulu laboratory
370. Dr Laurs presented WP BBRG–18, an overview of swordfish biological research being carriedout at NMFS. The NMFS Honolulu Laboratory has a multidisciplinary research program onswordfish which is guided by a comprehensive research plan developed by the Laboratory SwordfishResearch Team and by the Swordfish Working Group of the Interim Scientific Committee for Tunaand Tuna-like Species. Present research is grouped into four categories: ●biological research insupport of stock assessment, ● stock assessment, ● fishery oceanography to define swordfish habitatand the affects of oceanography on CPUE, and ● ECOPATH/ECOSIM modelling.
371. The emphasis on biological research is to obtain information required for swordfish stockassessment. Specific research topics include: 1) size-age relationships (Figure 12), 2) growth rates,3) size and age at sexual maturity, 4) sex, size, and age composition of catch, and 5) stock structure.
AGE in years
0 1 2 3 4 5 6 7 8 9 10 11
Eye
-to-
fork
leng
th(c
m)
0
25
50
75
100
125
150
175
200
225
250
275
Male age-lengthFemale age-lengthAge by DGI counts-lengthvon Bertalanffy growth curveRecaptured fish #1Recaptured fish #2Recaptured fish #3
Figure 11. Swordfish size-at-agerelationships (sexes pooled) according to
otolith-age and tagging data
372. Work was recently completed on the development of a basin-scale, stochastic computersimulation model of swordfish population dynamics and exploitation that will be used to generatesets of observations to test stock assessment procedures. Two types of production models have beenused for assessments with combined Hawaiian and Japanese longline catch and effort data.
373. The goals of the Laboratory’s fishery oceanography research are to define the habitat of theswordfish in the North Pacific and to develop methods to improve CPUE estimates by taking intoaccount ocean conditions. Research is conducted using fisheries research vessels, satellite remotesensing, ocean circulation models and swordfish fishery statistics.

74
374. Research on the central North Pacific pelagic ecosystem is currently underway at theLaboratory with ECOPATH and ECOSIM being the major tools used. One of the goals of thisresearch is to understand the linkages and relationships among swordfish and other large pelagicpredators and the pelagic ecosystem of the central North Pacific.
Note on Taiwan’s swordfish spawning as indicated by gonad indices
375. Dr Sun presented WP BBRG–9, which describes swordfish spawning in Taiwanese waters asindicated by gonad indices. Female gonad samples were obtained from the offshore longline andharpoon fisheries around Taiwan. Based on gonad indices, the swordfish were found to spawnmonthly with peaks from February to September. It was assumed that the Kume and Joseph (1969)gonad index value of 3.0 and above corresponded with swordfish spawning.
Reproductive biology of swordfish in SW Pacific
376. Dr Young presented WP BBRG–12, which provided preliminary results on the reproductivestatus of ~950 swordfish collected from the eastern Australian longline fishery from May 1999 toMay 2000. Spawning activity in females was found from October to April in eastern Australianwaters using gonad-somatic index, with spawning females identified using histology from February,March and December. A minimum size at first maturity for females of 156 cm was found. An overallsex ratio ~1 males : 2.25 females was recorded with a decline in the proportion of males to femalesin fish greater than 170 cm eye-fork length. Batch fecundity estimates ranged from 1.2 to 1.8 millionhydrated oocytes in fish ranging in size from 173 to 190 cm OFL.
377. The extended spawning season over the Australian spring and summer follows a similar patternto that found for northern hemisphere-temperate and subtropical populations, although at theopposite months of the year. The decrease in size of fish sampled over the winter months suggeststhat larger females may be coming into the region to spawn, although further examination of thelength frequency distributions of swordfish caught during the period is necessary.
Preliminary review of billfish hooking depth measured by small bathythermographs
378. Dr Uozumi presented WP BBRG–6, ‘A preliminary review of billfish hooking depth measuredby small bathythermograph system attached to longline gear’.
379. Hooking depths of five billfish species were analysed based on small bathythermographsystems used in experimental longline operations in the Pacific and Indian Ocean. Catch by branchline number was also recorded and analysed. A total of 22 individuals were observed. Striped marlin,shortbill spearfish and blue marlin were hooked mainly at depths less than 120m, which waspredominantly in the thermocline zone. On the other hand, swordfish were hooked at more diversedepths (43–212m). Catch by branch line, which may reflect vertical distribution of species, did notcoincide with the results by bathythermograph systems. The main cause of this discrepancy isprobably due to the variation of hook depth due to current.
9.5 Assessment of swordfish and associated bycatch
Stock status of swordfish in the north Pacific
380. Dr Pierre Kleiber presented a swordfish simulation model developed by Dr Marc Labelle. Themodel can be configured to be very simple, as in the typical “production model” type of stock

75
assessment. It can also be made to have many features that bring it much closer to the complexrealities of the swordfish population and fisheries in the North Pacific, including, for example,multiple fishing fleets, age-specific movement of fish in a spatially diverse environment, and sexspecific growth rates.
381. The simulation model was used to test the performance of a production model used for aswordfish stock assessment that was presented last year at SCTB12. With a simple configuration ofthe simulation model, the production model performed well, but failed badly with the simulationmodel configured to its full complexity. Experimentation with intermediate levels of complexityrevealed that the production model was particularly sensitive to large-scale expansion of fishing bythe Japanese longline fleet during the 1950s.
382. Parameterisation of the complex form of the simulation model was achieved by way ofliterature values for various population dynamic parameters and consideration of current flow andswimming speed to get movement parameters, with some adjustment particularly of movementparameters to get close to the observed spatial and temporal distribution of catches in the Japaneseand Hawaiian longline fleets. Under the initial parameterisation, the swordfish population was verylightly exploited throughout the history of the fisheries from 1950 to present. Hundred yearprojections into the future were made with effort in the model artificially boosted to a wide range oflevels. MSY was obtained at an effort level 80 times that of the initial parameterisation. Beyondabout seven (7) times the initial observed effort, the simulation model fails to reproduce the historicalpattern of catches, indicating that the true exploitation rate is probably not more than 7 times theinitial rate. That effort level is still an order of magnitude less than the effort at MSY.
383. In response to a question about the ability of this complex model to make statements about theyield, Dr Kleiber commented that the model would be sensitive to different parameter values,however it would take large departures from the current parameter values to change the yield curveso current effort levels are close to those that produce MSY. In a response to a question regardinghow the spatial expansion of the fishery, as seen in the sword fish fishery, would influence the resultsof MULTIFAN–CL, Dr Klieber commented that eliminating the early data when the fisheryexpanded caused the surplus production model to perform better. He also mentioned thatMULTIFAN–CL could be used with a finer spatial structure to allow for the incorporation of thefishery expansion.
Hawaii longline – interactions with sharks, sea turtles and sea-birds. Fishery management andcourt-related mitigation actions.
384. Dr Laurs presented WP BBRG–16, which described recent fishery interactions off Hawaii andresultant legal implications. The annual numbers of sharks caught incidentally in the Hawaii longlinefishery in recent years has been approximately 85,000–90,000 of which blue sharks comprise about95%. The percentage of the annual total catch of sharks finned has shown a 20-fold increase fromless that 3% in 1991 to about 67% in 1999.
385. Recent management actions adopted by the Western Regional Fishery Management Councilrelated to sharks include: 1) annual quotas of 50,000 blue sharks, 2) one non-blue shark that can belanded whole, and 3) prohibition of shark fishing with demersal longline fishing gear in the EEZaround Hawaii. A new Hawaii State law bans landing of shark fins and a new Federal law banningshark finning has been passed by the House of Representatives and is under consideration by theSenate.
76
386. The Hawaii longline fishery also has interactions with black-footed and Laysan albatrosses.The estimated number of black-footed albatross killed has ranged from nearly 1,600 to almost 2,000(plus or minus 500) during the years 1994 through 1998. The estimated number of Laysan albatrosskilled has ranged from a little over 1,000 to about 1,800 (plus or minus 400–600).
387. Research on methods to reduce fishery/bird interactions demonstrated that blue-dyed baitsuccessfully reduced interactions with albatrosses by over 90%, the use of weighted hooks by 90%,and the use of ‘tori’ poles a little over 70%. As a result of these findings, regulations have beenadopted to reduce longline fishing interactions. Fishermen must use any two of six actions thatinclude: 1) night fishing, 2) blue-dyed bait, 3) line-shooters with weighted branch lines, 4) ‘tori’poles, 5) offal discharge on the opposite side of setting or hauling, and 6) weights near hooks.
388. NMFS has operated a sea turtle observer program in the Hawaii longline fishery since 1994with about 5 per cent coverage. The estimates of ‘take’ and kill are difficult to determine as 1)fishery interactions with sea turtles are rare, 2) interaction events have a ‘clumped’ distribution, and3) observer coverage is relatively low. Four species of turtles are involved: 1) loggerhead, 2) Oliveridley, 3) leatherback, and 4) green.
389. Honolulu Laboratory research and activities include: 1) development of statistical models toestimate ‘takes’ and kills by longline fishing, 2) investigation of sea turtle post-hooking mortality andoceanic habitat, 3) analysis of factors associated with longline fishery interactions with turtles, 4)development of sea turtle population simulation models, and 5) genetic studies to determine thepopulation origin. Additional research was initiated including: 1) investigation of seasonal movementdynamics of leatherback sea turtles, 2) evaluation of artificial bait to reduce the incidence of longlinehooking of sea turtles, 3) refinement and application of a sea turtle simulation model to the longlinefishery interaction issue, and 4) further analysis of factors associated with longline fisheryinteractions with sea turtles.
390. Lawsuits filed against the NMFS have resulted in court findings that the agency must preparean updated Environmental Impact Statement (EIS) for the Hawaii longline fishery, including theimpacts of the fishery on sea turtles and other protected species. In the meantime until the EIS iscompleted, the court has ordered that 1) huge areas of the fishery be closed to fishing, 2) 100%observer coverage, 3) and a reduction in the number of sets. Earlier, the court ordered fishermen tocarry line cutters and other devices for releasing sea turtles that may be accidentally hooked ortangled during longline fishing. A new lawsuit filed on July 6, 2000 seeks to halt longline fishing byvessels operating out of California because of interactions with protected species and impacts onrecreational fishing.
391. In a response to a enquiry about which countries were monitoring bycatch and researching thisissue, Dr Campbell commented that seabirds have been a major issue in Australia and they aretrialing methods that set the longline gear deeper in the water. He also noted that there is not enoughinformation on sharks or turtles to determine the impact of the fisheries. Mr Sharples commentedthat the observers in the Pacific Island nations have observed very little bycatch of turtles or seabirds.Taiwan has an observer program for turtles for the coastal trawl fishery, they place some observerson temperate longline vessels, and encourage the installation of 'tori' poles. Japan stipulates themandatory use of 'tori' poles on southern bluefin tuna vessels and observers record bycatch. Japan’smanagement of sharks and seabirds is a national plan of action.
77
392. In response to a question about how the new quota and ban on finning of sharks will influencethe stock, Dr Laurs commented that it would probably not have much influence because the sharkswould still be caught and transhipment at sea may occur. There was no mention of mitigation ofshark catch in the presentation and in response to a suggestion, Dr Laurs agreed that it is probablyfeasible to develop mitigation techniques. For example, an increasing number of fishers usemonofilament leaders (rather than steel) which reduces shark catch. The production of a blue sharkassessment for federal Government advice is a priority before any action is taken. The limit of onenon-blue shark is a precautionary approach to the management of sharks in coastal areas.
North Pacific blue shark stock assessment
393. Dr Kleiber presented WP BBRG–11 where he reported on a collaborative project betweenNMFS and NRIFSF to assess blue sharks in the North Pacific. A MULTIFAN–CL model was usedwith two sub-areas of the North Pacific divided at 25°N and the major fishing fleets divided into tensectors. The model was run with a range of constraints on catchability deviations. With littleconstraint, the model predicted a scenario of increasing catchability in most fishery sectors during the1990s with some increase in abundance, whereas with greater constraint the model predictedscenarios with smaller changes in catchability with greater increases in abundance. There was thus atrade-off between increasing catchability and increasing abundance to explain increasing CPUE inmany of the fishery sectors during the 1990s.
394. Common to all scenarios was a marked drop in abundance during the 1980s. It was unclearwhether that drop is attributable to the large catches of blue shark by small mesh drift nets during the1980s or to another factor, such as an environmental shift. Even the worst case scenario showedsigns of recovery during the late 1990s, and other scenarios showed complete recovery to pre–1980slevels. The conclusion is that blue shark population in the North Pacific appears able to sustain thecurrent levels of fishing effort in the region.
395. Due to the unreliability of catch records for blue sharks and other incidental and by-catchspecies, various assumptions were made to assemble the catch and effort data used in the analysis.Future work will try alternatives to these assumptions to test the robustness of the optimisticconclusion above. In addition, evidence will be sought to try to resolve the trade-off betweenchanges in catchability and changes in abundance.
396. In response to an inquiry of how the reconstruction of historical catch influences the results, DrKleiber suggested that a number of sensitivity tests are required to investigate the early catchestimates. He also noted that it is unknown if the sharks recorded are released alive or not and whatthe survival rate is.
397. In response to a question of the stock structure, Dr Kleiber explained that the population wasdivided into northern and southern areas. There is also some evidence based on the difference in thecharacteristics of the fisheries around Japan compared to Hawaii that there should be a east-westdivision.
398. In response to an inquiry about other fleets catching blue shark in the Pacific, Dr Kleiberexplained that there were some on the California coast, but these are minor and therefore notincluded in the model.
399. The use of tagging data was discussed and it was noted that there is a large amount of taggingdata for the Atlantic that has not been completely analysed and there has been no evidence of a stock
78
decline in the Atlantic. It was also commented that the need for an assessment was urgent and wecan not wait for a tagging study. Age-specific natural mortality was not estimated in the modelbecause there was no tagging data. A single age-independent natural mortality was estimated. It wasnoted that the driftnet data included Japan, Korea, and Taiwanese.
400. There appears to be no stock recruitment relationship apparent in the data, and blue shark havesome biological characteristics that may increase its ability to increase recruitment per individual atlow population sizes.
FAO action plan on sharks
401. Dr Majkowski provided information on the International Plan of Action for the Conservationand Management of Sharks. He mentioned that the Plan originates from a proposal made during the22nd session of FAO’s Committee on Fisheries in Rome, Italy in March 1997. The formulation ofthe Plan involved; 1) The Meeting of Technical Working Group on the Conservation andManagement of Sharks (Tokyo, Japan, April 23–27, 1998), and 2) The Consultation on Managementof Fishing Capacity, Shark Fisheries and Incidental Catches of Seabird in Longline Fisheries (Rome,Italy July to 22–24, 1998).
402. The Plan is based on the Code of Conduct for Responsible Fisheries. It determines the role ofstates, regional organisations and FAO in the conservation and management of sharks, including therequirements for the preparation of national plans by the next session of FAO’s Committee onFisheries in 2001.
403. There are references to improving data collection and species identification which should bepart of the Action Plan. Taiwan and Korea indicated that they collect data on sharks but not at thespecies level. Korea may have information on species for some inshore fisheries.
Status of blue marlin in the Pacific ocean
404. Dr Maunder presented WP BBRG–4, a paper by Dr Hinton on the status of blue marlin in thePacific Ocean.
405. The blue marlin population was modelled from 1955–1997 using the Deriso-Schnute delaydifference model using Japanese longline catch and standardised effort. The effort data arestandardised based on the habitat approach, which relates the distribution of the longline gear to thepreferred habitat of blue marlin. Confidence intervals were calculated for the management parametersusing the likelihood profile approach. The standardised effort was tested to show a significantimprovement at estimating the observed catch data compared to the nominal effort. The method ofstandardisation of effort using habitat preference was improved by combining the method with aGLM to explain additional variation. The results show that the population size has been increasingand is above the level that would support MSY. The increase in biomass is consistent between all thesub-areas and with an increase in the average size.
406. Dr Hinton is planning to incorporate length frequency data into the assessment and that it ispossible that A–SCALA could be used, but a sex-structured model may be more appropriate.
79
9.6 Swordfish and billfish research plan
Billfish: knowledge, current and future research; priorities
407. Mr Whitelaw presented WP BBRG–1, ‘An update for the year 2000: Present knowledge,Current and Future Research’, which reviewed current billfish research and monitoring in the Pacific,identified information gaps and problems and suggested future work. This paper is an ‘evolving’document and is to be updated each year as more information becomes available. The paper wasmade available on the OFP web site two months prior to the SCTB so that all participants couldcontribute and update the information.
408. The content of the paper was not discussed in detail as all participants had ample opportunityprior to the meeting to contribute to the paper, and Mr Whitelaw merely discussed what he saw asthe main research priorities for the billfish species. These were; ● validated sex-specific catch andeffort data from both commercial and recreational fisheries, including historic game-fish and charterdata, ● quantification of fishing practices i.e. longline hook depths, searching techniques etc, ●validated size-at-age key, ● improved knowledge on movements via conventional and electronictagging programmes (possibly a review of existing tagging programmes and data bases), ● betterdelineation of spawning areas and early life history, ● validated age at maturity, ● game-fish andlongline mortality estimates, ● tag mortality and tag shedding estimates, ● improved ecologicalstudies and ● verification of genetic stock discrimination studies (possibly in conjunction withtagging programmes). Much of the required information is dependant upon comprehensive observerprogrammes and the utilisation of new pop-up tag technology.
409. The meeting noted that there was a need to better define the term ‘recreational’ compared tocommercial and artisanal fishing. It was noted that this is a grey area and does need clarification,especially in regard to country legislation and data gathering protocols.
410. There was general agreement that there was still a lot of unknown information anduncertainties regarding the biology of billfish species, and that there were minimal resources availableto carry out the required studies. There is a need to work together to improve our knowledge toassist in more accurate stock assessments for these species. A specific example mentioned was fromthe delegate from French Polynesia who noted that there were a lot of small (<1kg) broadbillswordfish caught in their waters that would be an ideal project for a joint tagging study.
Research plan for swordfish in the western and central Pacific
411. Dr Chris O’Brien informed the meeting that Australia and New Zealand intend to collaborateon a preliminary stock assessment for broadbill swordfish in the south-west Pacific Ocean. Othercountries and organisations were encouraged to participate and assist in this work. A progress reporton this work is expected to be presented to the next meeting of SCTB.
9.7 Other business
412. The BBRG Chair provided the following assignments for the next BBRG meeting. Theresearch needs identified by the BBRG are listed below. This list includes items previously identifiedduring SCTB12 that should be continued and expanded.
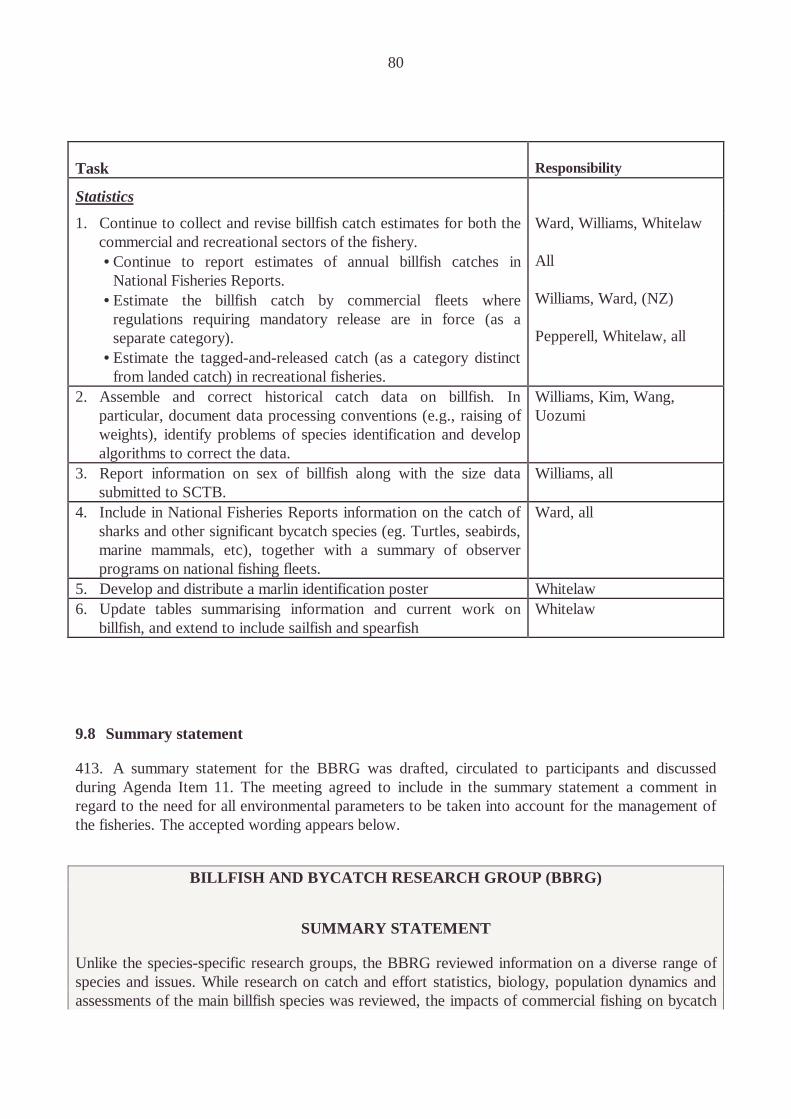
80
Task Responsibility
Statistics
1. Continue to collect and revise billfish catch estimates for both thecommercial and recreational sectors of the fishery.• Continue to report estimates of annual billfish catches in
National Fisheries Reports.• Estimate the billfish catch by commercial fleets where
regulations requiring mandatory release are in force (as aseparate category).
• Estimate the tagged-and-released catch (as a category distinctfrom landed catch) in recreational fisheries.
Ward, Williams, Whitelaw
All
Williams, Ward, (NZ)
Pepperell, Whitelaw, all
2. Assemble and correct historical catch data on billfish. Inparticular, document data processing conventions (e.g., raising ofweights), identify problems of species identification and developalgorithms to correct the data.
Williams, Kim, Wang,Uozumi
3. Report information on sex of billfish along with the size datasubmitted to SCTB.
Williams, all
4. Include in National Fisheries Reports information on the catch ofsharks and other significant bycatch species (eg. Turtles, seabirds,marine mammals, etc), together with a summary of observerprograms on national fishing fleets.
Ward, all
5. Develop and distribute a marlin identification poster Whitelaw6. Update tables summarising information and current work on
billfish, and extend to include sailfish and spearfishWhitelaw
9.8 Summary statement
413. A summary statement for the BBRG was drafted, circulated to participants and discussedduring Agenda Item 11. The meeting agreed to include in the summary statement a comment inregard to the need for all environmental parameters to be taken into account for the management ofthe fisheries. The accepted wording appears below.
BILLFISH AND BYCATCH RESEARCH GROUP (BBRG)
SUMMARY STATEMENT
Unlike the species-specific research groups, the BBRG reviewed information on a diverse range ofspecies and issues. While research on catch and effort statistics, biology, population dynamics andassessments of the main billfish species was reviewed, the impacts of commercial fishing on bycatch
81
species such as turtles, sharks and seabirds were also considered. The BBRG also reviewed theactivities on billfish and bycatch issues of both the IATTC and the ISC.
Following on from the information on billfish species presented at SCTB12, new data on the catch ofthese species in the WCPO was reviewed. This was assisted by the catch of these species now beingincluded in the National Fishery Reports presented to the SCTB. During 1999, the total commercialcatch of billfish was estimated to be around 32,600 mt (consisting of 16,700 t of swordfish, 10,500 tof blue marlin, 4,200 t of striped marlin and 1,200 t of black marlin). Nearly all of this catch is takenby longliners. Catch statistics on billfish caught (and released) by recreational fisheries throughoutthe WCPO were also compiled and reviewed for the first time. The catch of billfish in these fisheriesis estimated to be around 3-5 percent of the commercial catch of these species, with black marlin andblue marlin being the largest catch component. Assessment of the status of blue marlin in the Pacificindicates that present catches are below maximum sustainable yield. However, this work ispreliminary and many gaps in the information required for the development of quantitative stockassessments on all billfish species still persist. Major gaps include information on age and growth,mixing rates and natural mortality, together with an understanding of the influence of targetingpractices and changes in oceanographic conditions on catch rates. Consequently, the status of billfishstocks in the WCPO remains uncertain.
A comprehensive review of the fisheries catching swordfish in the WCPO was undertaken. There hasbeen a 50 percent increase in the catch of swordfish in the WCPO during the 1990s, a rapid increasein the catch in the south-west Pacific in recent years (mainly due to developments in the Australianfishery), and there exists potential for further developments in other countries. Overfishing of thisspecies in other oceans has also been acknowledged. New research on stock structure postulatesthree stocks in the Pacific (one in the north-west, one in the south-east and another in the south-west) and will necessitate a sub-regional management approach. Quantitative stock assessments haveyet to be completed, and the present status of swordfish stocks in the WCPO remains uncertain.However, a number of research projects are presently underway to increase understanding of thebiology and population dynamics of swordfish. Indicators of possible overfishing, based oninformation gathered from similar fisheries in other oceans, should be identified and monitored.
The BBRG also reviewed information relating to the status of the blue shark stock in the northernPacific. The results indicate that the stock is increasing after a large decline during the 1980s, thoughthis work remains preliminary as many uncertainties remain both in the data and biology of thisspecies.
Research on the incidental catch of turtles and seabirds in the Hawaiian longline fishery was alsoreviewed. The BBRG took particular note of the recent U.S. court-related actions in this fishery onthe issue of turtle bycatch. The BBRG expressed concern that fisheries are being singled out andpossibly closed when the threat from fisheries to sea turtle populations are relatively small incomparison with those from other human activities, especially those that result in the degradationand loss of eggs and nesting sites. The BBRG highlighted the complexity of fishery interactionswhere highly migratory species, protected species, and a range of impacting activities are involved.Fishery bycatch species often have a wide distribution. Furthermore, seabird and turtle populations,because of their land associations, are often impacted by a wide range of non-fishing activities. Asmanagement decisions applied to a fishery can generate large economic and social impacts it isimportant to ensure that they achieve the desired resource sustainability outcome. The BBRG notedthat the full impact of all human activities should be taken into account in assessing the effect offishing on these populations. Consideration should span the range of scientific information available,

82
including species population parameters, the range of the fishery and non-fishery impacts, andbycatch mitigation measures in place.
Finally, the BBRG reviewed the research relating to billfish and bycatch. While noting the range ofongoing research, the collection of data needed in support of stock assessment, particularly observerdata for which coverage in recent years has been less than one percent for almost all fleets, was seenas a priority. To this end, a better understanding of catch (both present and historical and for allcommercial, artisanal and recreational fisheries) was seen as a high priority issue, particularly forbycatch species. Research on understanding the biology of these species (age and growth,reproduction and movement) is also required. The need for collaborative international research onmany of these issues was identified and strongly encouraged.
10. DISCUSSION ON MHLC ISSUES
10.1 Current status of the MHLC process and implications for SCTB
414. Dr Lewis introduced this session by giving a brief outline of the current status of the MHLCprocess and referring the meeting to WP MHLC–1 which provides background and excerpts ofdocuments from the latest MHLC meeting.
415. Dr O’Brien gave a brief presentation on the outcomes, issues and events related to theMultilateral High-level Conference and the Convention on the Conservation and Management ofHighly Migratory Fish Stocks in the Western and Central Pacific Ocean (MHLC). In particular hefocused on the proposed scientific arrangements given that SCTB has been recognised in the DraftResolution Establishing a Preparatory Conference, and as having a role as the Scientific Committee(SC) in the interim arrangements (Preparatory Conference) of the Convention. His presentationbriefly outlined the expected relationships, roles and flow of information between the ScientificCommittee, the Scientific Services, the Commission and the Commission secretariat. He describedthe proposed role and functions of the SC and concluded that the SCTB was well placed to assumethe role of the SC for the interim Arrangement.
416. The SCTB noted that constituting the SC would be one of the first tasks for the Commissionto undertake according to its processes when it is established. The meeting recommended that aworking group be formed to plan how the SCTB might meet the requirements of the PreparatoryConference and report back to the SCTB14. This working group is to comprise the new Chair ofSCTB, Mr Bernard Thoulag, and Drs Suzuki, Laurs and Lewis. However, all SCTB members wereencouraged to monitor progress of this working group and contribute via the SCTB email list.
11. OTHER BUSINESS
11.1 Directives to the Statistics Working Group
417. The SWG Co-ordinator noted that the following directives include those formulated duringResearch Group sessions which are relevant to the work of the Statistics Working Group.
General
Compile estimates of annual catches of tuna and billfish in small-scale fisheries (commercial,artisanal, subsistence, recreational) (OFP)
83
Compile annual catch estimates for tuna, billfish and tuna-like species in the South China Sea, forconsideration by MHLC (OFP)
Investigate the availability of annual catch estimates, catch and effort data, and sampling data inIndonesia and the Philippines (OFP)
Review Japanese longline, pole-and-line and purse-seine logsheets, and possibly other logsheets(Chang, Coan, Hinton, Lawson, Miyabe, Ogura, Skillman)
Develop a strategy for improving the timeliness of longline catch and effort data (NFRDI,NRIFSF, OFDC, with all other fleets to be covered by the OFP)
Review the availability of data on sex ratios and length data by gender, for tuna and billfish, fromport sampling and observer data (OFP)
Compile information on factors for converting processed weights to whole weights (OFP)
Compile information on illegal, unreported and unregulated (IUU) fishing in the WCPO (OFP)
Compile information concerning predation of longline-caught fish by marine mammals (OFP)
Vessel and Gear Attributes
Review data on the FFA Regional Register concerning vessel and gear attributes (OFP, FFA)
Compile information on purse-seine vessel and gear attributes and fishing operations, includingmoored and drifting FADs (Itano)
Examine the classification of purse-seine effort by school association (OFP)
Bigeye and Yellowfin
Evaluate sampling of yellowfin and bigeye species composition for purse-seine (NMFS, NRIFSF,OFDC)
Improve estimation of bigeye catches by purse seiners (NFRDI, NMFS, NRIFSF, OFDC, OFP).
Albacore
Compile catch and effort data for the American Samoa longline fleet and the Canadian troll fleet(OFP, NMFS, DFO).
Examine discarding of albacore by Japanese longliners (BRS, NRIFSF)
Compile revised Taiwanese distant-water longline catch and effort data, and examine thefeasibility of stratifying the catch and effort data by target species (OFDC, OFP)
Examine longline operations in Samoa (e.g. use of shallow sets) in order to explain catches oflarge albacore (Mulipola)
Billfish and Bycatch
• Estimate the billfish catch by commercial fleets for species under mandatory release (CSIRO,MOF, NIWA, OFP)
• Estimate the tagged-and-released catch in recreational fisheries (Pepperell, OFP)
84
• Review and revise billfish catch data; document data processing, e.g. conversion of processedweights to whole weights; correct catch data for species mis-identification and species grouping(NFRDI, NRIFSF, OFDC, OFP)
• Compile gender-specific size data for billfish (NFRDI, NRIFSF, OFDC, OFP)
• Compile annual catch estimates for sharks and rays, marine reptiles, marine mammals and birds(OFP)
• Document the data that are available to estimate bycatches, by type of data (logbooks, portsampling, observers), species groups covered, and annual levels of coverage (NFRDI, NMFS,NRIFSF, OFDC, with other fleets to be covered by the OFP)
• Develop a strategy for increasing observer coverage of longline fleets in order to improve thereporting of bycatches (NFRDI, NRIFSF, OFDC, with other fleets to be covered by the OFP)
11.2 Consideration of summary statements from the Species Research Groups
418. The meeting reviewed draft summary statements prepared by the chairs of each SpeciesResearch Group. The revised and accepted versions of each summary statement appear in theExecutive Summary, and at the end of each Species Research Group section in this report.
11.3 Other matters
419. Mr Bernard Thoulag was appointed as the new chairman of the SCTB, replacing Dr Suzukiwho finishes a productive two-meeting term. In a summary statement, Mr Thoulag noted that therewas a great deal of challenging work ahead for the SCTB, especially in light of the MHLC outcomes.
420. The co-ordinators for the SCTB research (RG) and working groups (WG) were alsoconfirmed – these are:
Statistics WG Mr Timothy LawsonMethods WG Dr John SibertSkipjack RG Dr Gary SakagawaBigeye RG Mr Naozumi MiyabeYellowfin RG Dr Robert CampbellAlbacore RG Dr Talbot MurrayBillfish and Bycatch RG Mr Peter Ward
421. Dr Lewis referred the meeting to the proposed template for SCTB working groups (appendix7) and suggested that working group co-ordinators be prepared to work with the template before thenext SCTB meeting. He reminded participants that electronic mailing lists for each of the workinggroups could be established to facilitate communication and co-operation.
422. Dr Lewis opened the floor for offers to host the next SCTB. There were no offers forthcomingat this stage.
423. Dr Lewis noted that there had been repeated reference to the need to undertake large-scaletagging experiments. It was therefore suggested that a workshop be convened to look at a number ofissues related to tagging. The purpose of the workshop was to review issues of funding, existing and
85
proposed work, methodology and other research-related matters, for example genetic datacollection, tag seeding and recreational tagging. The OFP was tasked to investigate the feasibility ofconvening the workshop.
424. Dr Lewis announced to the meeting that there is to be a workshop on ‘Inter-annual ClimateVariability and Pelagic Fisheries’ to be held in Noumea from the 6–24 November 2000.
12. CLOSE
425. In closing the meeting, the SCTB13 chair, Dr Suzuki, thanked the working group co-ordinators and participants for their efforts in making SCTB13 a very successful meeting. Dr Suzukialso thanked Dr Lewis, the OFP staff and others involved in organising the meeting.
426. Dr Lewis also thanked the participants, and especially the outgoing chair, Dr Suzuki, for hisconsiderable efforts in chairing the last two SCTB meetings. The meeting was closed with aspontaneous round of applause.

86
TABLES OF ANNUAL CATCH ESTIMATES
Table 1. Total catches of albacore in the Pacific Ocean. Symbols: ‘…’ = missing data; ‘–’ = noeffort, hence no catch; ‘0’ = effort, but no catch; estimates in parentheses have been carried over fromprevious years
SOUTH PACIFIC NORTH PACIFIC
YEAR LONGLINE POLE-AND- TROLL OTHER SUB-TOTAL LONGLINE POLE-AND- TROLL OTHER SUB-TOTAL TOTALLINE LINE
1950 - ... - - - ... ... 32,746 ... ... ...
1951 - ... - - - ... ... 15,629 ... ... ...
1952 154 ... - - 154 26,733 41,787 23,914 1,764 94,198 94,352
1953 803 ... - - 803 27,800 32,921 15,745 341 76,807 77,610
1954 9,578 ... - - 9,578 20,971 28,069 12,246 208 61,494 71,072
1955 8,625 ... - - 8,625 16,286 24,236 13,264 721 54,507 63,132
1956 7,281 ... - - 7,281 14,347 42,810 18,768 539 76,464 83,745
1957 8,757 ... - - 8,757 21,057 49,500 21,173 538 92,268 101,025
1958 18,636 ... - - 18,636 18,439 22,175 14,929 180 55,723 74,359
1959 17,841 ... - - 17,841 15,807 14,252 21,202 72 51,333 69,174
1960 22,248 45 - - 22,293 17,373 25,156 20,105 773 63,407 85,700
1961 23,742 0 - - 23,742 17,442 21,476 12,059 1,636 52,613 76,355
1962 35,219 0 - - 35,219 15,771 9,814 19,753 1,933 47,271 82,490
1963 31,095 16 - - 31,111 13,471 28,852 25,145 1,445 68,913 100,024
1964 22,930 0 - - 22,930 15,488 27,269 18,391 1,275 62,423 85,353
1965 25,838 0 - - 25,838 13,965 41,908 16,557 866 73,296 99,134
1966 39,113 0 - - 39,113 25,329 24,430 15,377 1,293 66,429 105,542
1967 40,318 0 5 - 40,323 29,516 34,594 17,975 1,328 83,413 123,736
1968 29,051 0 14 - 29,065 24,670 21,503 21,462 2,337 69,972 99,037
1969 24,360 0 0 - 24,360 18,654 34,908 20,192 1,826 75,580 99,940
1970 32,590 100 50 - 32,740 16,897 28,679 21,422 1,604 68,602 101,342
1971 34,708 100 0 - 34,808 12,805 55,028 22,272 2,396 92,501 127,309
1972 33,842 122 268 - 34,232 15,748 64,341 27,521 1,646 109,256 143,488
1973 37,649 141 484 - 38,274 16,201 71,044 17,053 1,985 106,283 144,557
1974 30,985 809 898 - 32,692 13,632 78,353 21,509 1,368 114,862 147,554
1975 26,131 100 646 - 26,877 14,050 55,400 19,043 1,237 89,730 116,607
1976 24,106 100 25 - 24,231 18,029 88,036 16,183 3,227 125,475 149,706
1977 34,849 100 621 - 35,570 17,439 33,431 10,022 2,285 63,177 98,747
1978 34,858 100 1,686 - 36,644 13,627 60,827 16,636 8,102 99,192 135,836
1979 28,739 100 814 - 29,653 14,695 44,965 7,302 4,213 71,175 100,828
1980 31,027 101 1,468 - 32,596 15,658 47,125 7,768 4,723 75,274 107,870
1981 32,632 0 2,085 5 34,722 18,843 28,174 12,837 11,542 71,396 106,118
1982 28,339 1 2,434 6 30,780 17,802 30,040 6,713 13,973 68,528 99,308
1983 24,303 0 744 39 25,086 16,083 21,705 9,584 7,886 55,258 80,344
1984 20,340 2 2,773 1,589 24,704 15,720 27,045 9,354 18,801 70,920 95,624
1985 27,138 0 3,253 1,937 32,328 14,720 22,212 6,471 14,928 58,331 90,659
1986 32,641 0 2,003 1,946 36,590 13,186 16,528 4,738 11,015 45,467 82,057
1987 26,877 9 2,136 930 29,952 14,973 19,249 2,870 11,611 48,703 78,655
1988 31,530 0 4,026 4,283 39,839 14,360 6,814 4,367 19,233 44,774 84,613
1989 22,237 0 8,914 13,449 44,600 14,069 8,683 2,000 20,162 44,914 89,514
1990 22,532 3 7,150 5,635 35,320 16,403 8,647 2,905 26,332 54,287 89,607
1991 24,741 5 7,930 80 32,756 17,712 7,103 1,984 11,104 37,903 70,659
1992 30,088 5 6,373 58 36,524 19,824 13,888 4,935 16,909 55,556 92,080
1993 29,886 14 4,193 59 34,152 30,593 12,809 6,748 4,410 54,560 88,712
1994 33,000 5 5,549 78 38,632 30,787 26,391 11,814 3,950 72,942 111,574
1995 25,453 3 8,134 94 33,684 32,507 20,981 9,898 3,639 67,025 100,709
1996 24,388 4 8,147 105 32,644 37,313 20,272 16,948 1,751 76,284 108,928
1997 32,250 21 4,793 94 37,158 46,595 32,250 15,196 3,972 98,013 135,171
1998 35,178 35 7,078 55 42,346 46,682 28,518 17,059 4,212 96,471 138,817
1999 33,353 38 3,641 48 37,080 47,077 28,563 14,203 5,031 94,874 131,954

87
Table 2. Total catches of bigeye in the Pacific Ocean. Symbols: ‘…’ = missing data; ‘–’ = noeffort, hence no catch; estimates in parentheses have been carried over from previous years. Refer to WP SWG–2 formore information on purse seine bigeye/yellowfin estimates.
WCPO EPO
YEAR LONGLINE POLE-AND- PURSE OTHER SUB-TOTAL LONGLINE POLE-AND- PURSE TROLL OTHER SUB-TOTAL TOTAL
LINE SEINE LINE SEINE
1950 ... ... 0 ... ... ... ... ... ... ... ... ...
1951 ... ... 1,095 ... ... ... ... ... ... ... ... ...
1952 ... ... 1,039 ... ... ... ... ... ... ... ... ...
1953 ... ... 619 ... ... ... ... ... ... ... ... ...
1954 ... ... 360 ... ... ... ... ... ... ... ... ...
1955 ... ... 285 ... ... ... ... ... ... ... ... ...
1956 ... ... 908 ... ... ... ... ... ... ... ... ...
1957 ... ... 49 ... ... ... ... ... ... ... ... ...
1958 ... ... 48 ... ... ... ... ... ... ... ... ...
1959 ... ... 36 ... ... ... ... ... ... ... ... ...
1960 ... ... 58 ... ... ... ... ... ... ... ... ...
1961 ... ... 63 ... ... ... 57 156 - - ... ...
1962 34,206 ... 173 ... 34,379 44,200 168 160 - - 44,528 78,907
1963 40,727 ... 6 ... 40,733 65,300 75 - - - 65,375 106,108
1964 29,316 ... 231 ... 29,547 45,400 68 - - - 45,468 75,015
1965 28,318 ... 201 ... 28,519 28,600 117 - - - 28,717 57,236
1966 30,761 ... 9 ... 30,770 34,100 157 109 - - 34,366 65,136
1967 30,353 ... 60 ... 30,413 35,035 748 916 - - 36,699 67,112
1968 23,528 ... 183 ... 23,711 34,216 63 2,496 - - 36,775 60,486
1969 28,904 4 48 ... 28,956 50,938 - 576 - - 51,514 80,470
1970 33,987 10 726 2,820 37,543 31,800 - 1,332 - - 33,132 70,675
1971 34,659 47 877 3,060 38,643 29,900 58 2,494 - 14 32,466 71,109
1972 45,329 1,762 865 3,498 51,454 36,400 66 2,172 - - 38,638 90,092
1973 35,478 1,258 1,078 4,218 42,032 53,400 131 1,848 - - 55,379 97,411
1974 39,029 1,039 1,389 4,719 46,176 36,500 - 890 - - 37,390 83,566
1975 52,779 1,334 1,328 4,943 60,384 42,700 28 3,695 - - 46,423 106,807
1976 64,513 3,423 1,312 4,138 73,386 51,100 45 10,136 1 4 61,286 134,672
1977 62,934 3,325 1,587 5,637 73,483 71,100 2 7,053 - - 78,155 151,638
1978 49,394 3,337 1,146 4,243 58,120 70,600 - 11,714 - - 82,314 140,434
1979 56,748 2,419 2,033 4,674 65,874 56,100 - 7,531 - 1 63,632 129,506
1980 54,045 2,243 2,162 4,149 62,599 58,400 - 15,318 - 103 73,821 136,420
1981 41,239 2,596 4,315 4,929 53,079 48,500 - 10,090 - 1 58,591 111,670
1982 44,739 4,108 5,150 4,742 58,739 43,800 23 4,079 - - 47,902 106,641
1983 41,144 4,055 9,388 5,024 59,611 78,500 21 3,144 - 95 81,760 141,371
1984 46,156 3,465 8,556 5,189 63,366 66,800 1 5,919 - 16 72,736 136,102
1985 51,064 4,326 7,311 6,125 68,826 70,800 17 4,497 - 18 75,332 144,158
1986 46,486 2,865 7,509 6,481 63,341 107,400 - 1,939 - - 109,339 172,680
1987 60,647 3,134 11,395 5,566 80,742 102,300 - 771 - 5 103,076 183,818
1988 50,166 4,112 7,305 6,453 68,036 64,100 2 1,051 - - 65,153 133,189
1989 51,182 4,272 12,651 7,146 75,251 66,000 - 1,470 - - 67,470 142,721
1990 66,801 3,868 12,143 8,895 91,707 89,600 - 4,701 - 11 94,312 186,019
1991 51,251 1,909 13,406 10,289 76,855 95,400 25 3,702 - 13 99,140 175,995
1992 63,177 1,631 19,384 7,357 91,549 69,700 - 5,488 - 9 75,197 166,746
1993 57,042 2,360 14,286 7,392 81,080 62,200 - 8,043 - 26 70,269 151,349
1994 64,879 2,805 11,178 8,724 87,586 60,300 - 28,683 692 - 89,675 177,261
1995 53,426 3,807 14,222 10,408 81,863 47,800 - 36,155 1,154 - 85,109 166,972
1996 48,242 3,861 18,244 11,601 81,948 37,900 - 50,728 - 625 89,253 171,201
1997 56,883 3,706 31,637 11,660 103,886 38,600 - 51,617 - 2 90,219 194,105
1998 60,139 2,473 18,342 11,639 92,593 36,000 - 35,036 - 12 71,048 163,641
1999 56,402 (2,473) 34,937 11,553 105,365 (36,000) - 42,574 - 607 79,181 184,546
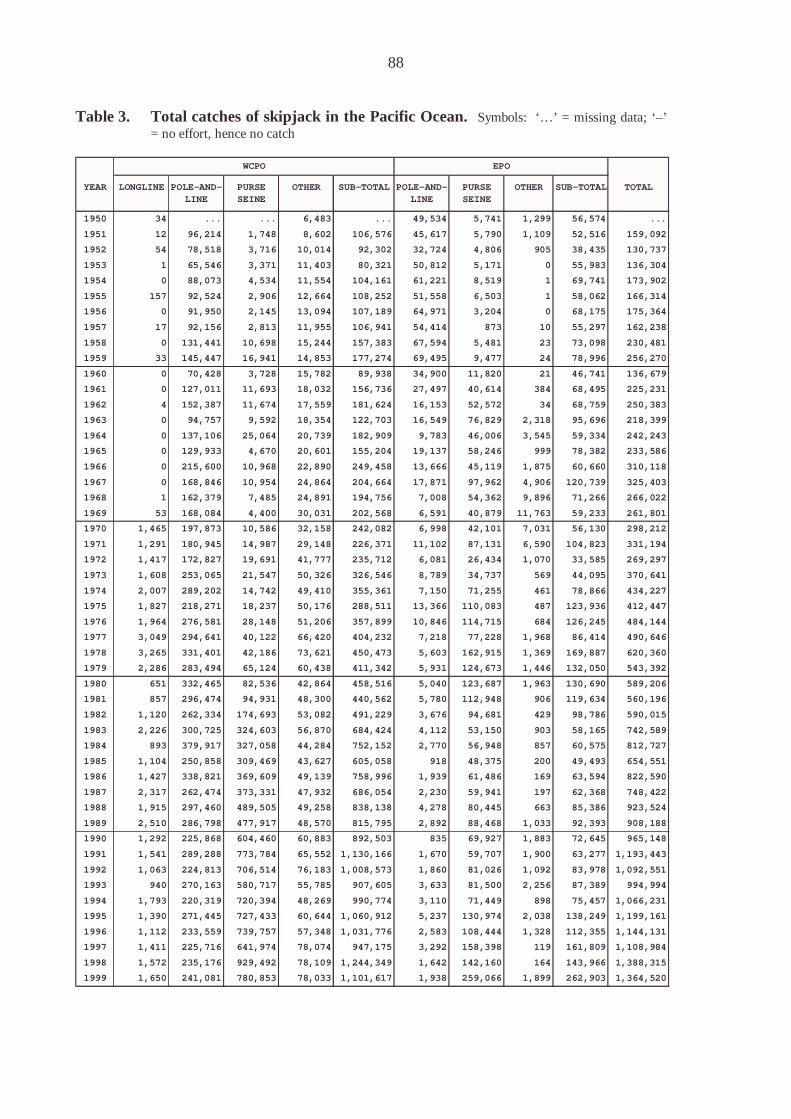
88
Table 3. Total catches of skipjack in the Pacific Ocean. Symbols: ‘…’ = missing data; ‘–’= no effort, hence no catch
WCPO EPO
YEAR LONGLINE POLE-AND- PURSE OTHER SUB-TOTAL POLE-AND- PURSE OTHER SUB-TOTAL TOTALLINE SEINE LINE SEINE
1950 34 ... ... 6,483 ... 49,534 5,741 1,299 56,574 ...
1951 12 96,214 1,748 8,602 106,576 45,617 5,790 1,109 52,516 159,092
1952 54 78,518 3,716 10,014 92,302 32,724 4,806 905 38,435 130,737
1953 1 65,546 3,371 11,403 80,321 50,812 5,171 0 55,983 136,304
1954 0 88,073 4,534 11,554 104,161 61,221 8,519 1 69,741 173,902
1955 157 92,524 2,906 12,664 108,252 51,558 6,503 1 58,062 166,314
1956 0 91,950 2,145 13,094 107,189 64,971 3,204 0 68,175 175,364
1957 17 92,156 2,813 11,955 106,941 54,414 873 10 55,297 162,238
1958 0 131,441 10,698 15,244 157,383 67,594 5,481 23 73,098 230,481
1959 33 145,447 16,941 14,853 177,274 69,495 9,477 24 78,996 256,270
1960 0 70,428 3,728 15,782 89,938 34,900 11,820 21 46,741 136,679
1961 0 127,011 11,693 18,032 156,736 27,497 40,614 384 68,495 225,231
1962 4 152,387 11,674 17,559 181,624 16,153 52,572 34 68,759 250,383
1963 0 94,757 9,592 18,354 122,703 16,549 76,829 2,318 95,696 218,399
1964 0 137,106 25,064 20,739 182,909 9,783 46,006 3,545 59,334 242,243
1965 0 129,933 4,670 20,601 155,204 19,137 58,246 999 78,382 233,586
1966 0 215,600 10,968 22,890 249,458 13,666 45,119 1,875 60,660 310,118
1967 0 168,846 10,954 24,864 204,664 17,871 97,962 4,906 120,739 325,403
1968 1 162,379 7,485 24,891 194,756 7,008 54,362 9,896 71,266 266,022
1969 53 168,084 4,400 30,031 202,568 6,591 40,879 11,763 59,233 261,801
1970 1,465 197,873 10,586 32,158 242,082 6,998 42,101 7,031 56,130 298,212
1971 1,291 180,945 14,987 29,148 226,371 11,102 87,131 6,590 104,823 331,194
1972 1,417 172,827 19,691 41,777 235,712 6,081 26,434 1,070 33,585 269,297
1973 1,608 253,065 21,547 50,326 326,546 8,789 34,737 569 44,095 370,641
1974 2,007 289,202 14,742 49,410 355,361 7,150 71,255 461 78,866 434,227
1975 1,827 218,271 18,237 50,176 288,511 13,366 110,083 487 123,936 412,447
1976 1,964 276,581 28,148 51,206 357,899 10,846 114,715 684 126,245 484,144
1977 3,049 294,641 40,122 66,420 404,232 7,218 77,228 1,968 86,414 490,646
1978 3,265 331,401 42,186 73,621 450,473 5,603 162,915 1,369 169,887 620,360
1979 2,286 283,494 65,124 60,438 411,342 5,931 124,673 1,446 132,050 543,392
1980 651 332,465 82,536 42,864 458,516 5,040 123,687 1,963 130,690 589,206
1981 857 296,474 94,931 48,300 440,562 5,780 112,948 906 119,634 560,196
1982 1,120 262,334 174,693 53,082 491,229 3,676 94,681 429 98,786 590,015
1983 2,226 300,725 324,603 56,870 684,424 4,112 53,150 903 58,165 742,589
1984 893 379,917 327,058 44,284 752,152 2,770 56,948 857 60,575 812,727
1985 1,104 250,858 309,469 43,627 605,058 918 48,375 200 49,493 654,551
1986 1,427 338,821 369,609 49,139 758,996 1,939 61,486 169 63,594 822,590
1987 2,317 262,474 373,331 47,932 686,054 2,230 59,941 197 62,368 748,422
1988 1,915 297,460 489,505 49,258 838,138 4,278 80,445 663 85,386 923,524
1989 2,510 286,798 477,917 48,570 815,795 2,892 88,468 1,033 92,393 908,188
1990 1,292 225,868 604,460 60,883 892,503 835 69,927 1,883 72,645 965,148
1991 1,541 289,288 773,784 65,552 1,130,166 1,670 59,707 1,900 63,277 1,193,443
1992 1,063 224,813 706,514 76,183 1,008,573 1,860 81,026 1,092 83,978 1,092,551
1993 940 270,163 580,717 55,785 907,605 3,633 81,500 2,256 87,389 994,994
1994 1,793 220,319 720,394 48,269 990,774 3,110 71,449 898 75,457 1,066,231
1995 1,390 271,445 727,433 60,644 1,060,912 5,237 130,974 2,038 138,249 1,199,161
1996 1,112 233,559 739,757 57,348 1,031,776 2,583 108,444 1,328 112,355 1,144,131
1997 1,411 225,716 641,974 78,074 947,175 3,292 158,398 119 161,809 1,108,984
1998 1,572 235,176 929,492 78,109 1,244,349 1,642 142,160 164 143,966 1,388,315
1999 1,650 241,081 780,853 78,033 1,101,617 1,938 259,066 1,899 262,903 1,364,520
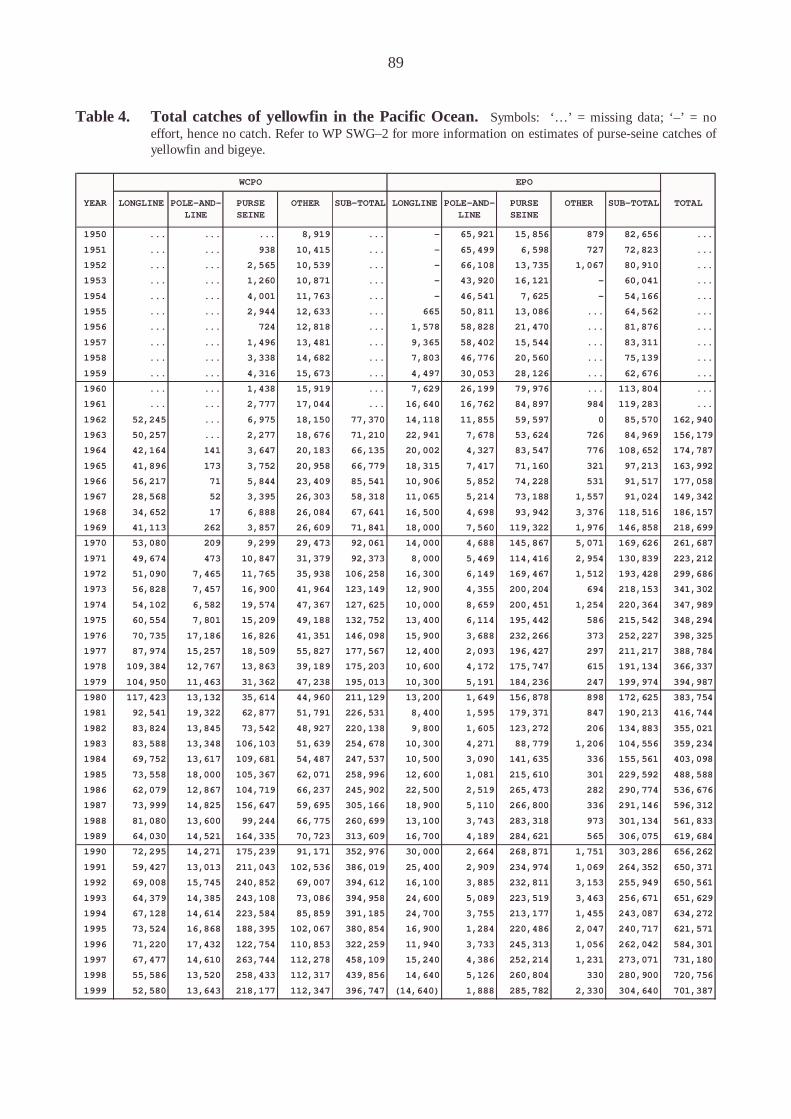
89
Table 4. Total catches of yellowfin in the Pacific Ocean. Symbols: ‘…’ = missing data; ‘–’ = noeffort, hence no catch. Refer to WP SWG–2 for more information on estimates of purse-seine catches ofyellowfin and bigeye.
WCPO EPO
YEAR LONGLINE POLE-AND- PURSE OTHER SUB-TOTAL LONGLINE POLE-AND- PURSE OTHER SUB-TOTAL TOTALLINE SEINE LINE SEINE
1950 ... ... ... 8,919 ... - 65,921 15,856 879 82,656 ...
1951 ... ... 938 10,415 ... - 65,499 6,598 727 72,823 ...
1952 ... ... 2,565 10,539 ... - 66,108 13,735 1,067 80,910 ...
1953 ... ... 1,260 10,871 ... - 43,920 16,121 - 60,041 ...
1954 ... ... 4,001 11,763 ... - 46,541 7,625 - 54,166 ...
1955 ... ... 2,944 12,633 ... 665 50,811 13,086 ... 64,562 ...
1956 ... ... 724 12,818 ... 1,578 58,828 21,470 ... 81,876 ...
1957 ... ... 1,496 13,481 ... 9,365 58,402 15,544 ... 83,311 ...
1958 ... ... 3,338 14,682 ... 7,803 46,776 20,560 ... 75,139 ...
1959 ... ... 4,316 15,673 ... 4,497 30,053 28,126 ... 62,676 ...
1960 ... ... 1,438 15,919 ... 7,629 26,199 79,976 ... 113,804 ...
1961 ... ... 2,777 17,044 ... 16,640 16,762 84,897 984 119,283 ...
1962 52,245 ... 6,975 18,150 77,370 14,118 11,855 59,597 0 85,570 162,940
1963 50,257 ... 2,277 18,676 71,210 22,941 7,678 53,624 726 84,969 156,179
1964 42,164 141 3,647 20,183 66,135 20,002 4,327 83,547 776 108,652 174,787
1965 41,896 173 3,752 20,958 66,779 18,315 7,417 71,160 321 97,213 163,992
1966 56,217 71 5,844 23,409 85,541 10,906 5,852 74,228 531 91,517 177,058
1967 28,568 52 3,395 26,303 58,318 11,065 5,214 73,188 1,557 91,024 149,342
1968 34,652 17 6,888 26,084 67,641 16,500 4,698 93,942 3,376 118,516 186,157
1969 41,113 262 3,857 26,609 71,841 18,000 7,560 119,322 1,976 146,858 218,699
1970 53,080 209 9,299 29,473 92,061 14,000 4,688 145,867 5,071 169,626 261,687
1971 49,674 473 10,847 31,379 92,373 8,000 5,469 114,416 2,954 130,839 223,212
1972 51,090 7,465 11,765 35,938 106,258 16,300 6,149 169,467 1,512 193,428 299,686
1973 56,828 7,457 16,900 41,964 123,149 12,900 4,355 200,204 694 218,153 341,302
1974 54,102 6,582 19,574 47,367 127,625 10,000 8,659 200,451 1,254 220,364 347,989
1975 60,554 7,801 15,209 49,188 132,752 13,400 6,114 195,442 586 215,542 348,294
1976 70,735 17,186 16,826 41,351 146,098 15,900 3,688 232,266 373 252,227 398,325
1977 87,974 15,257 18,509 55,827 177,567 12,400 2,093 196,427 297 211,217 388,784
1978 109,384 12,767 13,863 39,189 175,203 10,600 4,172 175,747 615 191,134 366,337
1979 104,950 11,463 31,362 47,238 195,013 10,300 5,191 184,236 247 199,974 394,987
1980 117,423 13,132 35,614 44,960 211,129 13,200 1,649 156,878 898 172,625 383,754
1981 92,541 19,322 62,877 51,791 226,531 8,400 1,595 179,371 847 190,213 416,744
1982 83,824 13,845 73,542 48,927 220,138 9,800 1,605 123,272 206 134,883 355,021
1983 83,588 13,348 106,103 51,639 254,678 10,300 4,271 88,779 1,206 104,556 359,234
1984 69,752 13,617 109,681 54,487 247,537 10,500 3,090 141,635 336 155,561 403,098
1985 73,558 18,000 105,367 62,071 258,996 12,600 1,081 215,610 301 229,592 488,588
1986 62,079 12,867 104,719 66,237 245,902 22,500 2,519 265,473 282 290,774 536,676
1987 73,999 14,825 156,647 59,695 305,166 18,900 5,110 266,800 336 291,146 596,312
1988 81,080 13,600 99,244 66,775 260,699 13,100 3,743 283,318 973 301,134 561,833
1989 64,030 14,521 164,335 70,723 313,609 16,700 4,189 284,621 565 306,075 619,684
1990 72,295 14,271 175,239 91,171 352,976 30,000 2,664 268,871 1,751 303,286 656,262
1991 59,427 13,013 211,043 102,536 386,019 25,400 2,909 234,974 1,069 264,352 650,371
1992 69,008 15,745 240,852 69,007 394,612 16,100 3,885 232,811 3,153 255,949 650,561
1993 64,379 14,385 243,108 73,086 394,958 24,600 5,089 223,519 3,463 256,671 651,629
1994 67,128 14,614 223,584 85,859 391,185 24,700 3,755 213,177 1,455 243,087 634,272
1995 73,524 16,868 188,395 102,067 380,854 16,900 1,284 220,486 2,047 240,717 621,571
1996 71,220 17,432 122,754 110,853 322,259 11,940 3,733 245,313 1,056 262,042 584,301
1997 67,477 14,610 263,744 112,278 458,109 15,240 4,386 252,214 1,231 273,071 731,180
1998 55,586 13,520 258,433 112,317 439,856 14,640 5,126 260,804 330 280,900 720,756
1999 52,580 13,643 218,177 112,347 396,747 (14,640) 1,888 285,782 2,330 304,640 701,387
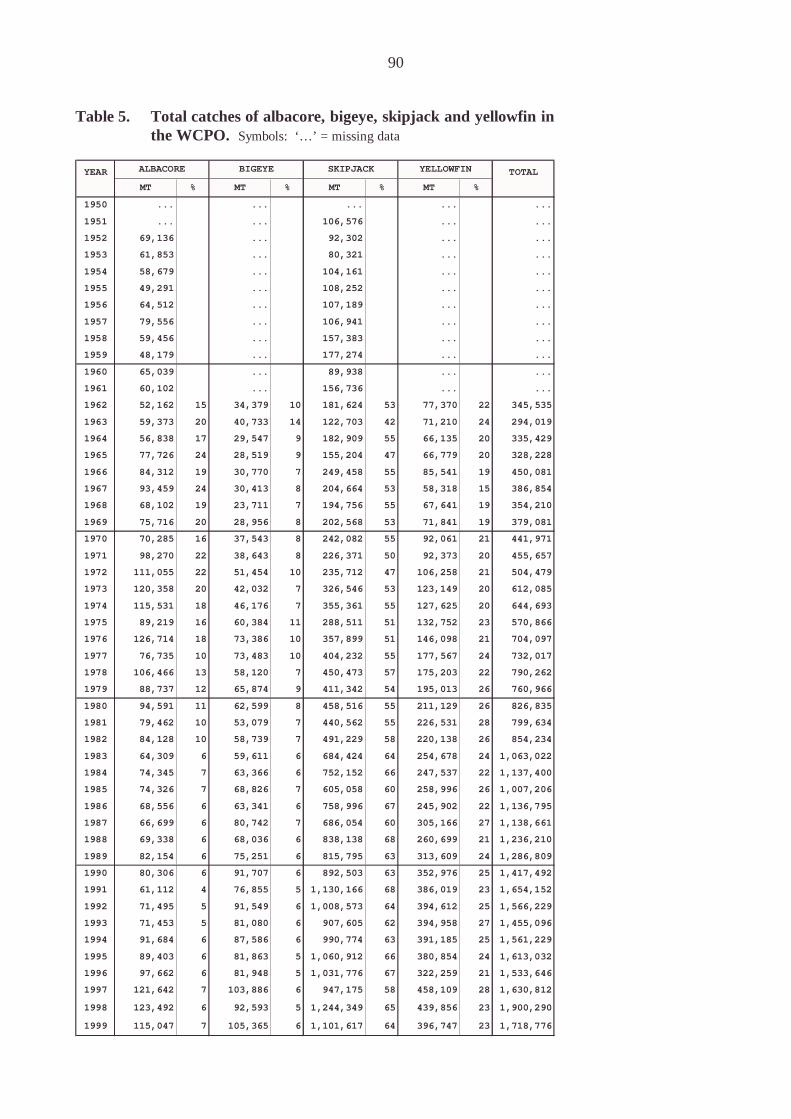
90
Table 5. Total catches of albacore, bigeye, skipjack and yellowfin inthe WCPO. Symbols: ‘…’ = missing data
YEAR ALBACORE BIGEYE SKIPJACK YELLOWFIN TOTAL
MT % MT % MT % MT %
1950 ... ... ... ... ...
1951 ... ... 106,576 ... ...
1952 69,136 ... 92,302 ... ...
1953 61,853 ... 80,321 ... ...
1954 58,679 ... 104,161 ... ...
1955 49,291 ... 108,252 ... ...
1956 64,512 ... 107,189 ... ...
1957 79,556 ... 106,941 ... ...
1958 59,456 ... 157,383 ... ...
1959 48,179 ... 177,274 ... ...
1960 65,039 ... 89,938 ... ...
1961 60,102 ... 156,736 ... ...
1962 52,162 15 34,379 10 181,624 53 77,370 22 345,535
1963 59,373 20 40,733 14 122,703 42 71,210 24 294,019
1964 56,838 17 29,547 9 182,909 55 66,135 20 335,429
1965 77,726 24 28,519 9 155,204 47 66,779 20 328,228
1966 84,312 19 30,770 7 249,458 55 85,541 19 450,081
1967 93,459 24 30,413 8 204,664 53 58,318 15 386,854
1968 68,102 19 23,711 7 194,756 55 67,641 19 354,210
1969 75,716 20 28,956 8 202,568 53 71,841 19 379,081
1970 70,285 16 37,543 8 242,082 55 92,061 21 441,971
1971 98,270 22 38,643 8 226,371 50 92,373 20 455,657
1972 111,055 22 51,454 10 235,712 47 106,258 21 504,479
1973 120,358 20 42,032 7 326,546 53 123,149 20 612,085
1974 115,531 18 46,176 7 355,361 55 127,625 20 644,693
1975 89,219 16 60,384 11 288,511 51 132,752 23 570,866
1976 126,714 18 73,386 10 357,899 51 146,098 21 704,097
1977 76,735 10 73,483 10 404,232 55 177,567 24 732,017
1978 106,466 13 58,120 7 450,473 57 175,203 22 790,262
1979 88,737 12 65,874 9 411,342 54 195,013 26 760,966
1980 94,591 11 62,599 8 458,516 55 211,129 26 826,835
1981 79,462 10 53,079 7 440,562 55 226,531 28 799,634
1982 84,128 10 58,739 7 491,229 58 220,138 26 854,234
1983 64,309 6 59,611 6 684,424 64 254,678 24 1,063,022
1984 74,345 7 63,366 6 752,152 66 247,537 22 1,137,400
1985 74,326 7 68,826 7 605,058 60 258,996 26 1,007,206
1986 68,556 6 63,341 6 758,996 67 245,902 22 1,136,795
1987 66,699 6 80,742 7 686,054 60 305,166 27 1,138,661
1988 69,338 6 68,036 6 838,138 68 260,699 21 1,236,210
1989 82,154 6 75,251 6 815,795 63 313,609 24 1,286,809
1990 80,306 6 91,707 6 892,503 63 352,976 25 1,417,492
1991 61,112 4 76,855 5 1,130,166 68 386,019 23 1,654,152
1992 71,495 5 91,549 6 1,008,573 64 394,612 25 1,566,229
1993 71,453 5 81,080 6 907,605 62 394,958 27 1,455,096
1994 91,684 6 87,586 6 990,774 63 391,185 25 1,561,229
1995 89,403 6 81,863 5 1,060,912 66 380,854 24 1,613,032
1996 97,662 6 81,948 5 1,031,776 67 322,259 21 1,533,646
1997 121,642 7 103,886 6 947,175 58 458,109 28 1,630,812
1998 123,492 6 92,593 5 1,244,349 65 439,856 23 1,900,290
1999 115,047 7 105,365 6 1,101,617 64 396,747 23 1,718,776

91
Table 6. Total catches of albacore, bigeye, skipjack and yellowfin inthe WCPO, by gear type. Symbols: ‘…’ = missing data
YEAR LONGLINE POLE-AND-LINE PURSE SEINE OTHER TOTAL
MT % MT % MT % MT %
1950 ... ... ... 15,402 ...
1951 ... 96,214 3,780 19,017 ...
1952 ... 120,305 7,320 21,014 ...
1953 ... 98,467 5,250 22,603 ...
1954 ... 116,142 8,895 23,378 ...
1955 ... 116,760 6,135 25,441 ...
1956 ... 134,760 3,776 25,985 ...
1957 ... 141,656 4,358 25,678 ...
1958 ... 153,616 14,084 30,132 ...
1959 ... 159,699 21,293 30,805 ...
1960 ... 95,629 5,224 31,918 ...
1961 ... 145,650 14,533 35,355 ...
1962 129,643 38 161,116 47 18,822 5 35,954 10 345,535
1963 123,639 42 121,193 41 11,875 4 37,312 13 294,019
1964 104,010 31 161,105 48 28,942 9 41,372 12 335,429
1965 106,302 32 171,597 52 8,623 3 41,706 13 328,228
1966 147,720 33 238,501 53 16,821 4 47,039 10 450,081
1967 121,124 31 199,379 52 14,409 4 51,942 13 386,854
1968 107,268 30 178,993 51 14,556 4 53,393 15 354,210
1969 111,053 29 200,262 53 8,305 2 59,461 16 379,081
1970 133,241 30 222,455 50 20,611 5 65,664 15 441,971
1971 127,881 28 234,522 51 26,711 6 66,543 15 455,657
1972 142,988 28 242,767 48 32,321 6 86,403 17 504,479
1973 141,552 23 330,729 54 39,525 6 100,279 16 612,085
1974 132,790 21 371,208 58 35,705 6 104,990 16 644,693
1975 150,057 26 279,663 49 34,774 6 106,372 19 570,866
1976 175,700 25 382,626 54 46,286 7 99,485 14 704,097
1977 196,272 27 345,257 47 60,218 8 130,270 18 732,017
1978 199,600 25 407,482 52 57,195 7 125,985 16 790,262
1979 200,268 26 342,441 45 98,519 13 119,738 16 760,966
1980 211,104 26 395,066 48 120,312 15 100,353 12 826,835
1981 171,459 21 346,566 43 162,123 20 119,486 15 799,634
1982 163,850 19 310,328 36 253,385 30 126,671 15 854,234
1983 158,649 15 339,833 32 440,094 41 124,446 12 1,063,022
1984 143,831 13 424,046 37 445,295 39 124,228 11 1,137,400
1985 156,566 16 295,396 29 422,147 42 133,097 13 1,007,206
1986 146,597 13 371,081 33 481,837 42 137,280 12 1,136,795
1987 169,324 15 299,691 26 541,373 48 128,273 11 1,138,661
1988 169,254 14 321,986 26 596,054 48 148,917 12 1,236,210
1989 149,054 12 314,274 24 654,903 51 168,578 13 1,286,809
1990 173,758 12 252,657 18 791,842 56 199,235 14 1,417,492
1991 147,745 9 311,318 19 998,233 60 196,855 12 1,654,152
1992 168,287 11 256,082 16 966,750 62 175,110 11 1,566,229
1993 170,083 12 299,731 21 838,111 58 147,171 10 1,455,096
1994 187,306 12 264,134 17 955,156 61 154,634 10 1,561,229
1995 180,662 11 313,104 19 930,050 58 189,216 12 1,613,032
1996 176,356 11 275,128 18 880,755 57 201,407 13 1,533,646
1997 196,782 12 276,303 17 937,355 57 220,372 14 1,630,812
1998 193,172 10 279,717 15 1,206,267 63 221,135 12 1,900,290
1999 185,077 11 285,747 17 1,033,967 60 213,985 12 1,718,776
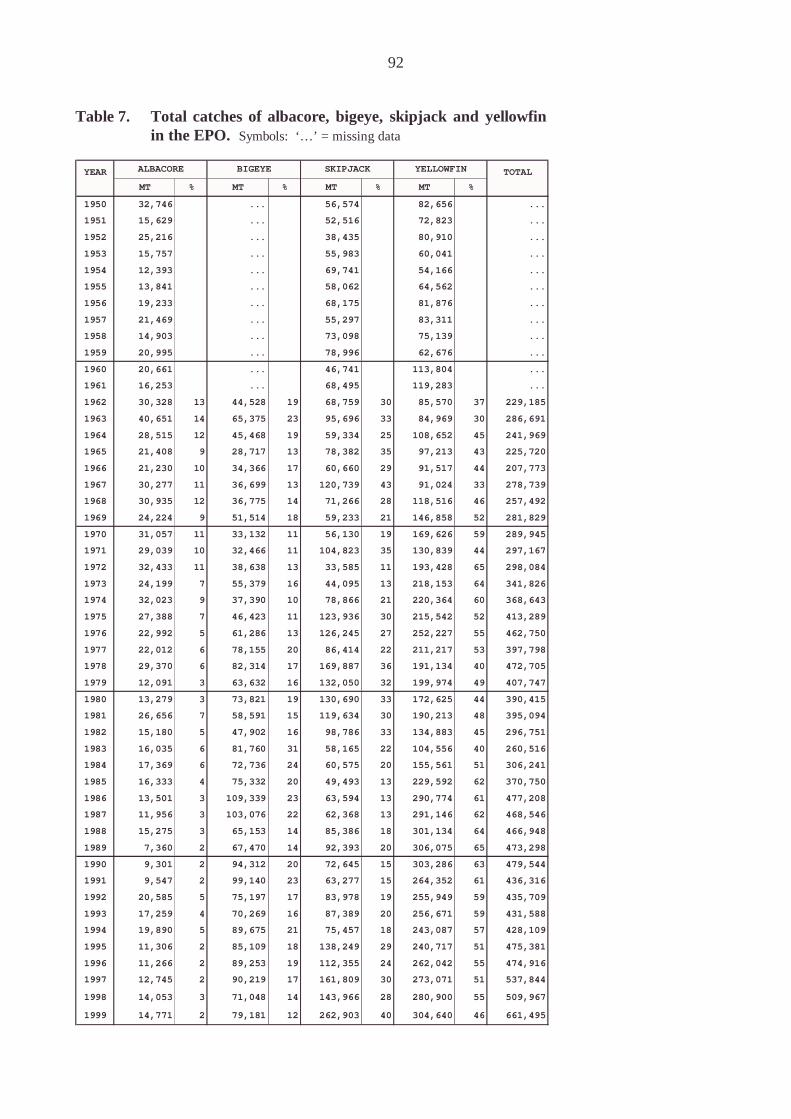
92
Table 7. Total catches of albacore, bigeye, skipjack and yellowfinin the EPO. Symbols: ‘…’ = missing data
YEAR ALBACORE BIGEYE SKIPJACK YELLOWFIN TOTAL
MT % MT % MT % MT %
1950 32,746 ... 56,574 82,656 ...
1951 15,629 ... 52,516 72,823 ...
1952 25,216 ... 38,435 80,910 ...
1953 15,757 ... 55,983 60,041 ...
1954 12,393 ... 69,741 54,166 ...
1955 13,841 ... 58,062 64,562 ...
1956 19,233 ... 68,175 81,876 ...
1957 21,469 ... 55,297 83,311 ...
1958 14,903 ... 73,098 75,139 ...
1959 20,995 ... 78,996 62,676 ...
1960 20,661 ... 46,741 113,804 ...
1961 16,253 ... 68,495 119,283 ...
1962 30,328 13 44,528 19 68,759 30 85,570 37 229,185
1963 40,651 14 65,375 23 95,696 33 84,969 30 286,691
1964 28,515 12 45,468 19 59,334 25 108,652 45 241,969
1965 21,408 9 28,717 13 78,382 35 97,213 43 225,720
1966 21,230 10 34,366 17 60,660 29 91,517 44 207,773
1967 30,277 11 36,699 13 120,739 43 91,024 33 278,739
1968 30,935 12 36,775 14 71,266 28 118,516 46 257,492
1969 24,224 9 51,514 18 59,233 21 146,858 52 281,829
1970 31,057 11 33,132 11 56,130 19 169,626 59 289,945
1971 29,039 10 32,466 11 104,823 35 130,839 44 297,167
1972 32,433 11 38,638 13 33,585 11 193,428 65 298,084
1973 24,199 7 55,379 16 44,095 13 218,153 64 341,826
1974 32,023 9 37,390 10 78,866 21 220,364 60 368,643
1975 27,388 7 46,423 11 123,936 30 215,542 52 413,289
1976 22,992 5 61,286 13 126,245 27 252,227 55 462,750
1977 22,012 6 78,155 20 86,414 22 211,217 53 397,798
1978 29,370 6 82,314 17 169,887 36 191,134 40 472,705
1979 12,091 3 63,632 16 132,050 32 199,974 49 407,747
1980 13,279 3 73,821 19 130,690 33 172,625 44 390,415
1981 26,656 7 58,591 15 119,634 30 190,213 48 395,094
1982 15,180 5 47,902 16 98,786 33 134,883 45 296,751
1983 16,035 6 81,760 31 58,165 22 104,556 40 260,516
1984 17,369 6 72,736 24 60,575 20 155,561 51 306,241
1985 16,333 4 75,332 20 49,493 13 229,592 62 370,750
1986 13,501 3 109,339 23 63,594 13 290,774 61 477,208
1987 11,956 3 103,076 22 62,368 13 291,146 62 468,546
1988 15,275 3 65,153 14 85,386 18 301,134 64 466,948
1989 7,360 2 67,470 14 92,393 20 306,075 65 473,298
1990 9,301 2 94,312 20 72,645 15 303,286 63 479,544
1991 9,547 2 99,140 23 63,277 15 264,352 61 436,316
1992 20,585 5 75,197 17 83,978 19 255,949 59 435,709
1993 17,259 4 70,269 16 87,389 20 256,671 59 431,588
1994 19,890 5 89,675 21 75,457 18 243,087 57 428,109
1995 11,306 2 85,109 18 138,249 29 240,717 51 475,381
1996 11,266 2 89,253 19 112,355 24 262,042 55 474,916
1997 12,745 2 90,219 17 161,809 30 273,071 51 537,844
1998 14,053 3 71,048 14 143,966 28 280,900 55 509,967
1999 14,771 2 79,181 12 262,903 40 304,640 46 661,495

93
Table 8. Total catches of albacore, bigeye, skipjack and yellowfin inthe Pacific Ocean. Symbols: ‘…’ = missing data
YEAR ALBACORE BIGEYE SKIPJACK YELLOWFIN TOTAL
MT % MT % MT % MT %
1950 ... ... ... ... ...
1951 ... ... 159,092 ... ...
1952 94,352 ... 130,737 ... ...
1953 77,610 ... 136,304 ... ...
1954 71,072 ... 173,902 ... ...
1955 63,132 ... 166,314 ... ...
1956 83,745 ... 175,364 ... ...
1957 101,025 ... 162,238 ... ...
1958 74,359 ... 230,481 ... ...
1959 69,174 ... 256,270 ... ...
1960 85,700 ... 136,679 ... ...
1961 76,355 ... 225,231 ... ...
1962 82,490 14 78,907 14 250,383 44 162,940 28 574,720
1963 100,024 17 106,108 18 218,399 38 156,179 27 580,710
1964 85,353 15 75,015 13 242,243 42 174,787 30 577,398
1965 99,134 18 57,236 10 233,586 42 163,992 30 553,948
1966 105,542 16 65,136 10 310,118 47 177,058 27 657,854
1967 123,736 19 67,112 10 325,403 49 149,342 22 665,593
1968 99,037 16 60,486 10 266,022 43 186,157 30 611,702
1969 99,940 15 80,470 12 261,801 40 218,699 33 660,910
1970 101,342 14 70,675 10 298,212 41 261,687 36 731,916
1971 127,309 17 71,109 9 331,194 44 223,212 30 752,824
1972 143,488 18 90,092 11 269,297 34 299,686 37 802,563
1973 144,557 15 97,411 10 370,641 39 341,302 36 953,911
1974 147,554 15 83,566 8 434,227 43 347,989 34 1,013,336
1975 116,607 12 106,807 11 412,447 42 348,294 35 984,155
1976 149,706 13 134,672 12 484,144 41 398,325 34 1,166,847
1977 98,747 9 151,638 13 490,646 43 388,784 34 1,129,815
1978 135,836 11 140,434 11 620,360 49 366,337 29 1,262,967
1979 100,828 9 129,506 11 543,392 46 394,987 34 1,168,713
1980 107,870 9 136,420 11 589,206 48 383,754 32 1,217,250
1981 106,118 9 111,670 9 560,196 47 416,744 35 1,194,728
1982 99,308 9 106,641 9 590,015 51 355,021 31 1,150,985
1983 80,344 6 141,371 11 742,589 56 359,234 27 1,323,538
1984 91,714 6 136,102 9 812,727 56 403,098 28 1,443,641
1985 90,659 7 144,158 10 654,551 48 488,588 35 1,377,956
1986 82,057 5 172,680 11 822,590 51 536,676 33 1,614,003
1987 78,655 5 183,818 11 748,422 47 596,312 37 1,607,207
1988 84,613 5 133,189 8 923,524 54 561,833 33 1,703,158
1989 89,514 5 142,721 8 908,188 52 619,684 35 1,760,107
1990 89,607 5 186,019 10 965,148 51 656,262 35 1,897,036
1991 70,659 3 175,995 8 1,193,443 57 650,371 31 2,090,468
1992 92,080 5 166,746 8 1,092,551 55 650,561 32 2,001,938
1993 88,712 5 151,349 8 994,994 53 651,629 35 1,886,684
1994 111,574 6 177,261 9 1,066,231 54 634,272 32 1,989,338
1995 100,709 5 166,972 8 1,199,161 57 621,571 30 2,088,413
1996 108,928 5 171,201 9 1,144,131 57 584,301 29 2,008,562
1997 134,387 6 194,105 9 1,108,984 51 731,180 34 2,168,656
1998 137,545 6 163,641 7 1,388,315 58 720,756 30 2,410,257
1999 129,818 5 184,546 8 1,364,520 57 701,387 29 2,380,271
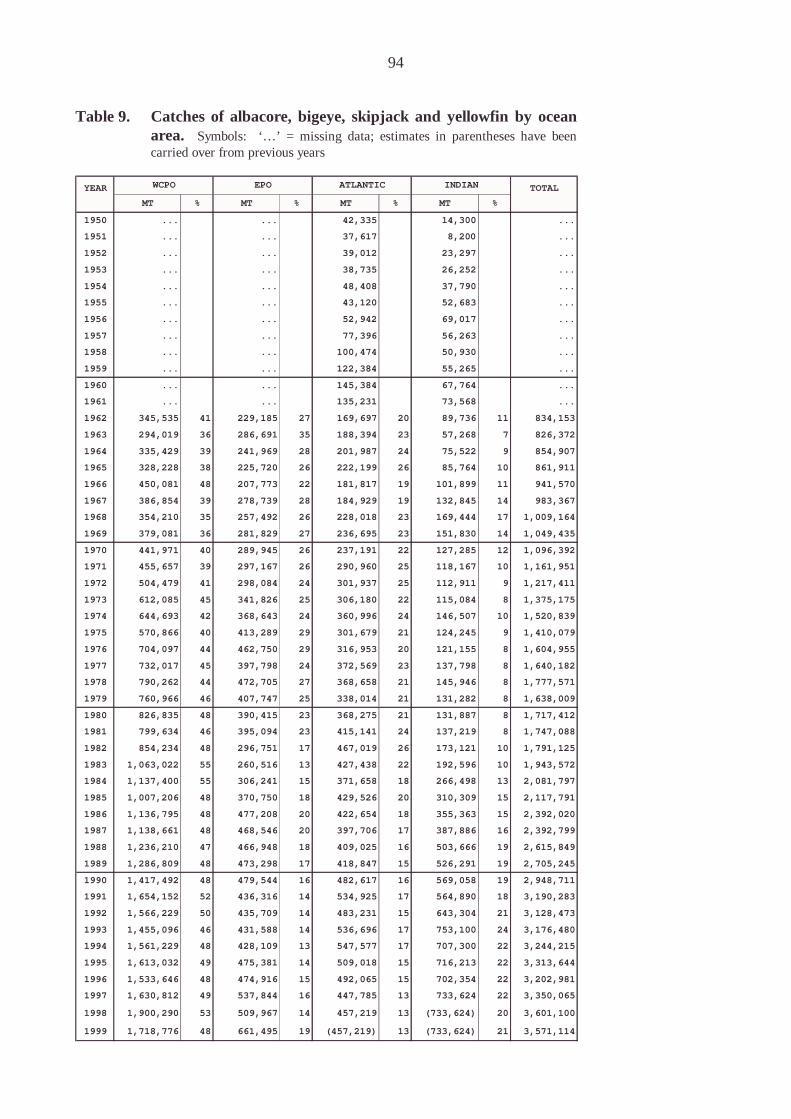
94
Table 9. Catches of albacore, bigeye, skipjack and yellowfin by oceanarea. Symbols: ‘…’ = missing data; estimates in parentheses have beencarried over from previous years
YEAR WCPO EPO ATLANTIC INDIAN TOTAL
MT % MT % MT % MT %
1950 ... ... 42,335 14,300 ...
1951 ... ... 37,617 8,200 ...
1952 ... ... 39,012 23,297 ...
1953 ... ... 38,735 26,252 ...
1954 ... ... 48,408 37,790 ...
1955 ... ... 43,120 52,683 ...
1956 ... ... 52,942 69,017 ...
1957 ... ... 77,396 56,263 ...
1958 ... ... 100,474 50,930 ...
1959 ... ... 122,384 55,265 ...
1960 ... ... 145,384 67,764 ...
1961 ... ... 135,231 73,568 ...
1962 345,535 41 229,185 27 169,697 20 89,736 11 834,153
1963 294,019 36 286,691 35 188,394 23 57,268 7 826,372
1964 335,429 39 241,969 28 201,987 24 75,522 9 854,907
1965 328,228 38 225,720 26 222,199 26 85,764 10 861,911
1966 450,081 48 207,773 22 181,817 19 101,899 11 941,570
1967 386,854 39 278,739 28 184,929 19 132,845 14 983,367
1968 354,210 35 257,492 26 228,018 23 169,444 17 1,009,164
1969 379,081 36 281,829 27 236,695 23 151,830 14 1,049,435
1970 441,971 40 289,945 26 237,191 22 127,285 12 1,096,392
1971 455,657 39 297,167 26 290,960 25 118,167 10 1,161,951
1972 504,479 41 298,084 24 301,937 25 112,911 9 1,217,411
1973 612,085 45 341,826 25 306,180 22 115,084 8 1,375,175
1974 644,693 42 368,643 24 360,996 24 146,507 10 1,520,839
1975 570,866 40 413,289 29 301,679 21 124,245 9 1,410,079
1976 704,097 44 462,750 29 316,953 20 121,155 8 1,604,955
1977 732,017 45 397,798 24 372,569 23 137,798 8 1,640,182
1978 790,262 44 472,705 27 368,658 21 145,946 8 1,777,571
1979 760,966 46 407,747 25 338,014 21 131,282 8 1,638,009
1980 826,835 48 390,415 23 368,275 21 131,887 8 1,717,412
1981 799,634 46 395,094 23 415,141 24 137,219 8 1,747,088
1982 854,234 48 296,751 17 467,019 26 173,121 10 1,791,125
1983 1,063,022 55 260,516 13 427,438 22 192,596 10 1,943,572
1984 1,137,400 55 306,241 15 371,658 18 266,498 13 2,081,797
1985 1,007,206 48 370,750 18 429,526 20 310,309 15 2,117,791
1986 1,136,795 48 477,208 20 422,654 18 355,363 15 2,392,020
1987 1,138,661 48 468,546 20 397,706 17 387,886 16 2,392,799
1988 1,236,210 47 466,948 18 409,025 16 503,666 19 2,615,849
1989 1,286,809 48 473,298 17 418,847 15 526,291 19 2,705,245
1990 1,417,492 48 479,544 16 482,617 16 569,058 19 2,948,711
1991 1,654,152 52 436,316 14 534,925 17 564,890 18 3,190,283
1992 1,566,229 50 435,709 14 483,231 15 643,304 21 3,128,473
1993 1,455,096 46 431,588 14 536,696 17 753,100 24 3,176,480
1994 1,561,229 48 428,109 13 547,577 17 707,300 22 3,244,215
1995 1,613,032 49 475,381 14 509,018 15 716,213 22 3,313,644
1996 1,533,646 48 474,916 15 492,065 15 702,354 22 3,202,981
1997 1,630,812 49 537,844 16 447,785 13 733,624 22 3,350,065
1998 1,900,290 53 509,967 14 457,219 13 (733,624) 20 3,601,100
1999 1,718,776 48 661,495 19 (457,219) 13 (733,624) 21 3,571,114

95
APPENDIX 1. AGENDA
1. Preliminaries1.1 Opening Address1.2 Confirmation of Chairman and Appointment of Rapporteurs1.3 Adoption of the Agenda1.4 Adoption of the Report of the Twelfth Meeting of the SCTB
2. Overview of Western and Central Pacific Ocean Tuna Fisheries2.1 Regional Overview2.2 National Tuna Fishery Reports2.3 Economic Condition of the Fishery
3. Reports by Organisations
4. Statistics Working Group4.1 Statistics Working Group Session on Data Collection Forms4.2 Coordinator’s Report on Data Collection, Compilation and Dissemination4.3 Review of SCTB12 Directives to the Statistics Working Group
5. Skipjack Research Group5.1 Regional Fishery Developments5.2 Biological and Ecological Research, and ENSO Update5.3 Stock Assessment5.4 Research Coordination and Planning
6. Bigeye Research Group6.1 Regional Fishery Developments6.2 Biological and Ecological Research6.3 Stock Assessment6.4 Research Coordination and Planning
7. Yellowfin Research Group7.1 Regional Fishery Developments7.2 Biological and Ecological Research7.3 Stock Assessment7.4 Research Coordination and Planning
8. Albacore Research Group8.1 Regional Fishery Developments8.2 Biological and Ecological Research8.3 Stock Assessment8.4 Research Coordination and Planning
9. Billfish and Bycatch Research Group9.1 Activities of other groups studying billfish and bycatch

96
9.2 Billfish data considerations9.3 Fisheries taking swordfish9.4 Biological research on swordfish9.5 Assessment of swordfish and associated bycatch9.5 Research Coordination and Planning
10. MHLC Issues
11. Other Business
12. Close
97
APPENDIX 2. LIST OF WORKING PAPERS
Information Reports
Anonymous. Report of the Twelfth Meeting of the Standing Committee on Tuna and Billfish(SCTB12), 16–23 June 1999, Papeete, Tahiti, French Polynesia. Oceanic Fisheries Programme,Secretariat of the Pacific Community, Noumea, New Caledonia. 125 pp.
Overview of Western and Central Pacific Ocean Tuna Fisheries
GEN–1 Lewis A.D. & P.G. Williams. Overview of the western and central Pacific Ocean tuna fisheries –1999. Oceanic Fisheries Programme, Secretariat of the Pacific Community, Noumea, NewCaledonia.
GEN–2 Forum Fisheries Agency. Economic overview of the tuna fishery, 1999. Forum Fisheries Agency.Honiara. Solomon Islands.
GEN-3 IATTC. Resolutions adopted at the 66th meeting of the IATTC. IATTC, La Jolla CA, USA
GEN-4 Garcia S., R. Grainger & M. Taconet. International Plan of Action on Fishery Status and TrendsReporting Partnership agreements for data exchange and the Fisheries Global InformationSystem (FIGIS). Food and Agriculture Organisation (FAO). United Nations.
Statistics Working Group
SWG–1 Lawson, T. Status of data collection, compilation and dissemination. Oceanic Fisheries Programme,Secretariat of the Pacific Community, Noumea, New Caledonia.
SWG–2 Lawson, T. Estimates of annual catches of target species in tuna fisheries of the western and centralPacific Ocean. Oceanic Fisheries Programme, Secretariat of the Pacific Community, Noumea,New Caledonia.
Research Groups
General
RG–1 Lehodey, P. Impacts on the El Niño Southern Oscillation on tuna populations and fisheries in thetropical Pacific Ocean. Oceanic Fisheries Programme, Secretariat of the Pacific Community,Noumea, New Caledonia
RG–2 Lehodey, P. Update on the spatial environmental population dynamics model: SEPODYUM. OceanicFisheries Programme, Secretariat of the Pacific Community, Noumea, New Caledonia
RG–3 Shono H., T. Matsumoto, M. Ogura & N. Miyabe. Preliminary analysis of effect of fishing gears oncatch rate for the Japanese purse seine fishery. National Research Institute of Far SeasFisheries. Japan.
RG–4 Inagake, D. Oceanographic Data in the National Research Institute of Far Seas Fisheries. NationalResearch Institute of Far Seas Fisheries. Japan.
RG–5 Campbell, R. Status Report on the Australian longline fishery off eastern Australia. CSIRO. Divisionof Marine Research, Hobart, Australia.
98
RG–6 An, D-H and Kim, J.Y. Scientific Observations for Korean tuna purse seine fishery in the westernand central Pacific Ocean in 1999. National Fisheries Research and Development Institute(NFRDI). Republic of Korea.
RG–7 Matsumoto, T., M. Ogura, N. Miyabe & H. Shono. Creation of a database to identify factors affectingCPUE of the Japanese equatorial purse seine fishery. National Research Institute of Far SeasFisheries. Japan.
RG–8 Itano, D.G. & K. M. Holland. Hawaii Tuna Tagging Project. Pelagic Fisheries Research Program,University of Hawaii and Hawaii Institute of Marine Biology, University of Hawaii.
RG–9 Itano, D.G. Current status and recent developments in the WCPO purseseine fishery. PelagicFisheires Research Program, University of Hawaii.
Skipjack
SKJ–1 Leroy B. Preliminary results on skipjack (Katsuwonus pelamis) growth. Oceanic Fisheries Programme,Secretariat of the Pacific Community, Noumea, New Caledonia.
SKJ–2 Bigelow, K., J. Hampton & D. Fournier. Preliminary application of the MULTIFAN–CL model toskipjack tuna in the tropical WCPO. Oceanic Fisheries Programme, Secretariat of the PacificCommunity, Noumea, New Caledonia.
SKJ– 3 Lehodey, P. An application of a Spatial Environment Population Dynamics Model (SEPODYM) toskipjack. Oceanic Fisheries Programme, Secretariat of the Pacific Community, Noumea, NewCaledonia.
Yellowfin
YFT– 1 Hampton, J. & D. Fournier. Updated MULTIFAN–CL based assessment of yellowfin tuna. OceanicFisheries Programme, Secretariat of the Pacific Community, Noumea, New Caledonia.
YFT– 2 Sibert, J. Report of the MULTIFAN–CL Workshop, 1–3 February, East-West Center, University ofHawaii, Honolulu.
YFT– 3 IATTC. Status of yellowfin tuna in the eastern Pacific Ocean (EPO). Inter-American Tropical TunaCommission.
YFT– 4 Sun, C-L. & S-Z. Yeh. Updated CPUE of Central and Western Pacific Yellowfin Tuna fromTaiwanese Tuna Fisheries. Institute of Oceanography, National Taiwan University, Taipei,Taiwan, R.O.C.
Bigeye
BET– 1 Bigelow, K. A., J. Hampton, & N. Miyabe. Application of a habitat-based model to estimate effectivelongline fishing effort and relative abundance of Pacific bigeye tuna (Thunnus obesus).Oceanic Fisheries Programme, Secretariat of the Pacific Community, Noumea, New Caledonia andNational Research Institute of Far Seas Fisheries, Japan.

99
BET– 2 Sun, C-L. & S-Z. Yeh. Updated CPUE of Central and Western Pacific Bigeye Tuna from TaiwaneseTuna Longline Fisheries. Institute of Oceanography, National Taiwan University, Taipei,Taiwan, R.O.C.
BET– 3 (NOT PROVIDED) Gunn, J. & J. Hampton. Preliminary results from archival tagging of bigeye tunaoff north-eastern Australia. Commonwealth Scientific & Industrial Research Organisation,Australia and Oceanic Fisheries Programme, Secretariat of the Pacific Community, Noumea, NewCaledonia.
BET– 4 IATTC. Status of bigeye tuna in the eastern Pacific Ocean (EPO). Inter-American Tropical TunaCommission.
BET– 5 Marsac, F., A. Fonteneau & F. Ménard. Potential Biological Effects of Drifting FADs on TunaPopulations: the Ecological Trap Hypothesis. Institut de Recherche pour le Développement(IRD), Montpellier, France.
Albacore
ALB– 1 Hampton, J. & D. Fournier. Update of MULTIFAN–CL based assessment of South Pacific albacoretuna. Oceanic Fisheries Programme, Secretariat of the Pacific Community, Noumea, NewCaledonia.
ALB–2 Wang, C-H. Applied the improved surplus production method to assess the South Pacific AlbacoreStocks (Thunnus alalunga), 1967-1998. Institute of Oceanography, National Taiwan University,Taipei, Taiwan, ROC
Billfish and Bycatch
BBRG–1 Whitelaw, A.W. Interactive session on billfish: Present knowledge, current and future research. Anupdate for the year 2000. Oceanic Fisheries Programme, Secretariat of the Pacific Community,Noumea, New Caledonia.
BBRG–2 Whitelaw, A.W. & J. Pepperell. Present knowledge on Game Fisheries in the Western and CentralPacific. Oceanic Fisheries Programme, Secretariat of the Pacific Community, Noumea, NewCaledonia .
BBRG–3 Williams, P.G & A.W. Whitelaw. Estimates of annual catches for billfish species taken in commercialand recreational fisheries of the western and central Pacific Ocean. Oceanic FisheriesProgramme, Secretariat of the Pacific Community, Noumea, New Caledonia.
BBRG–4 IATTC. Status of blue marlin in the Pacific Ocean. Inter-American Tropical Tuna Commission.
BBRG–5 Saito, H., & K. Yokawa. Brief Review of the Japanese Swordfish Catch in the Pacific Ocean from1971 to 1998. National Research Institue of Far Seas Fisheries. Japan.
BBRG–6 Matsumoto, T., Y. Uozumi, K. Uosaki, & M.Okazaki. Preliminary review of billfish hooking depthmeasured by small bathythermograph systems attached to longline gear. National ResearchInstitue of Far Seas Fisheries. Japan.
100
BBRG–7 Campbell, R. Life-Status and retention of billfish caught by longline within the Australian fishingzone. CSIRO. Division of Marine Research, Hobart, Australia.
BBRG–8 Moon, D-Y, An, D-H, Kim, J.B. & Kim, J-Y Overview of billfish catch by the Korean tuna longlinefishery in the Pacific Ocean. National Fisheries Research and Development Institute (NFRDI).Republic of Korea.
BBRG–9 Sun, C-L., S-P. Wang & S-Z. Yeh. Note on Taiwan water’s swordfish spawning as indicated bygonad indices. Institute of Oceanography, National Taiwan University, Taipei, Taiwan, R.O.C.
BBRG-10 Whitelaw, A.W. Report on availability of tags and data collection forms for developing gamefisheries. Oceanic Fisheries Programme, Secretariat of the Pacific Community, Noumea, NewCaledonia.
BBRG-11 Kleiber, P. North Pacific Blue Shark Stock Assessment. National Marine Fisheries Service HonoluluLaboratory, USA.
BBRG-12 Young, J., A. Drake, T. Carter & J. Farley. Reproductive dynamics of broadbill swordfish (Xiphiasgladius) in the eastern Australian AFZ – preliminary results. CSIRO Marine Research HobartTasmania, Australia.
BBRG-13 Reeb, C.A., Arcangeli, L. & Block, B.A. Structure and migration corridors in pacific populations ofthe swordfish, Xiphias gladius, as inferred through analysis of Mitochondrial DNA. HopkinsMarine Station, Stanford University, California, USA.
BBRG-14 Young, J., A. Cowling & C. Stanley. A two boat study of the relationship between swordfish catchrates and fine - and broad-scale physical and environmental variables off eastern Australia.CSIRO Marine Research Hobart Tasmania, Australia.
BBRG-15 Sharples, P., D. Brogan and P. Williams. A preliminary summary of (i) species identificationproblems, (ii) discarding practices and (iii) the life status of billfish taken in longline fisheriesof the western and central Pacific Ocean, according to information collected by observers andlogbook data. Oceanic Fisheries Programme, Secretariat of the Pacific Community, Noumea, NewCaledonia.
BBRG-16 Laurs, M. Hawaii Longline Fishery Incidental Catches of Sharks, Interactions with Sea Turtles andSeabirds, and Fishery Management and Court Actions. NMFA, Honolulu, Hawaii.
BBRG-17 ISC. Report of the swordfish working group meeting. Interim Scientific Committee for Tuna and tuna-like species in the North Pacific Ocean.
BBRG-18 Laurs, M. Biological Research on Swordfish at the NMFS Honolulu Laboratory. NMFS, Honolulu,Hawaii.
MHLC
MHLC–1 Background information on the MHLC process – Excerpts from the report of the 6th MHLC.

101
National Tuna Fishery Reports
NFR–1 AMERICAN SAMOACurren, F. The offshore pelagic fisheries of American Samoa. Division of Fish and Wildlife. American
Samoa.
NFR–2 AUSTRALIAWard, P. and C. Robins. (2000) Tuna and billfish fisheries of the north-eastern Australian Fishing
Zone. Bureau of Resource Sciences. Australia.
NFR–3 CANADAArgue, A.W. and W. Shaw. An update for Canadian tuna fisheries in the north and south Pacific
through 1999. Fisheries and Oceans Canada.
NFR–4 COOK ISLANDSMitchell, J. Cook Islands Country Report. Ministry of Marine Resources. Cook Islands.
NFR–5 FSMPark, T. 1999 FSM Fisheries Review. Micronesian Maritime Authority. FSM
NFR–6 FIJITuwai, Iliapi L. National Tuna Fisheries Report of Fiji as of 1999. Ministry of Agriculture, Fisheries
and Forests. Fiji.
NFR–7 FRENCH POLYNESIAStein, A. Status of French Polynesia Tuna Fisheries. Service des Ressources Marines. Tahiti, French
Polynesia.
NFR–8 GUAMFlores, T. Guam’s Small Boat Pelagic Fishery. Division of Aquatic and Wildlife Resources, Department
of Agriculture, Guam
NFR–9 JAPANMiyabe, N. National tuna fisheries report of Japan as of 1999. National Research Institue of Far Seas
Fisheries. Japan.
NFR–10 KIRIBATITinga, R. Kiribati National tuna fisheries report. Ministry of Natural Resources. Kiribati.
NFR–11 KOREAKim, J-Y Korean tuna fisheries in the western Pacific Ocean. National Fisheries Research and
Development Institute (NFRDI). Republic of Korea.
NFR–12 MARSHALL ISLANDSJoseph, G. Country Statement – Republic of the Marshall Islands. Marshall Islands Marine Resources
Authority. Marshall Islands.
NFR–13 NEW CALEDONIAEtaix-Bonnin, R. New Caledonia Tuna Fishery. Service territorial de la marine marchande. Noumea,
New Caledonia.
NFR–14 NEW ZEALAND
102
Murray, T., K. Richardson, H. Dean & L. Griggs. NATIONAL TUNA FISHERY REPORT 2000 –NEW ZEALAND. National Institute of Water and Atmospheric Research Ltd. (NIWA),Wellington.
NFR–15 NIUELeolahi, S. Niue Country Report. Department of Agriculture, Forestry and Fisheries. Niue.
NFR–16 NORTHERN MARIANAS ISLANDSMasga, F. Northern Marianas Islands National tuna fishery report. Division of Fish and Wildlife.
Northern Marianas.
NFR–17 PAPUA NEW GUINEAKumoru, L. & P. Polon National Fisheroes Report – Papua New Guinea. National Fisheries Authority.
Papua New Guinea.
NFR–18 SAMOAMulipola, A. Status of the commercial tuna fishing in Samoa. Fisheries Division. Ministry of
Agriculture, Forests, Fisheries and Meteorology. Samoa.
NFR–19 TAIWANWang, S-B., S-K. Chang and C-L. Kuo. Tuna Fishery of Taiwan in the Pacific Region During 1995-
1999 period. Overseas Fisheries Development Council of the Republic of China and FisheriesAdministration, Council of Agriculture, R.O.C.
NFR–20 SOLOMON ISLANDSDiake, Sylvester. Solomon Islands Country Statement. Fisheries Division, Department of Agriculture &
Fisheries. Solomon Islands.
NFR–21 USACoan, A., J. Childers, R. Ito, B. Kikkawa & D. Hamm. Summary of U.S. fisheries statistics for highly
migratory species in the central-western Pacific, 1995-1999. National Marine Fisheries Service.USA.
NFR–22 VANUATUNaviti, William National Fisheries Report for Vanuatu. Fisheries Division. Ministry of Agriculture,
Quarantine, Forestry and Fisheries.

103
APPENDIX 3. LIST OF PARTICIPANTS
American Samoa Mr Flinn Curren [email protected] of Marine & Wildlife ResourcesPO Box 3730Pago Pago 96799Tel: (684) 633–4456Fax: (684) 633−5944
Australia Fisheries & Forestry Sciences DivisionBureau of Rural SciencesPO Box E11Kingston ACT 2604Tel: (61) 2 6272 5534Fax: (61) 2 6272 4014
Mr Peter Ward [email protected] Biologist
Mr Albert Caton [email protected] Biologist
Division of Marine ResearchCommonwealth Scientific and Industrial Research OrganisationGPO 1538Hobart, Tasmania 7001Tel: (61) 3 6232 5222Fax: (61) 3 6232 5012
Dr Robert Campbell [email protected] Scientist
Dr Jock Young [email protected] Scientist
Dr Tom Polacheck [email protected] .auLeader-Pelagic Ecosystems Subprogram
Mr Dale Kolody [email protected]
Dr Julian Pepperell [email protected] Research & Consulting Pty. Ltd.PO Box 818Caringbah NSWTel: (61) 2 9540 2220Fax: (61) 2 9540 1508
Canada Mr Sandy Argue [email protected], International and Intergovernmental Affairs,
Operations BranchDepartment of Fisheries and Oceans460-555 West Hastings StreetVancouverBritish Columbia, V6B 5G3Tel: (1 250) 472 0475Fax: (1 250) 721 0442

104
Canada (continued) Dr David A. Fournier [email protected] Research Ltd.PO Box 2040Sidney, B.C. V8L 3S3Tel: (1 250) 655 3364Fax: (1 250) 655 3364
Cook Islands Mr Joshua Mitchell [email protected] Fisheries OfficerMinistry of Marine ResourcesPO Box 85RarotongaTel: (682) 28721Fax: (682) 29721
Federated States of Micronesia Micronesian Maritime AuthorityPO Box PS 122Palikir, Pohnpei 96941Tel: (691) 320–2700Fax: (691) 320–2383
Mr Bernard Thoulag [email protected] Director
Mr Tim Park [email protected] Biologist
Fiji Mr Iliapi Tuwai [email protected] Officer – Offshore Fisheries DivisionMinistry of Agriculture, Fisheries, Forest & ALTAPrivate Mail BagRaiwaqaTel: (679) 361122Fax: (679) 361184
France Dr Francis Marsac [email protected] HEA - IRD911 Avenue AgropolisBP 504534032 Montpellier Cedex 1Tel: (33) 4 6763 6962Fax: (33) 4 6763 8778
French Polynesia Mr Arsene Stein [email protected] des Ressources MarinesPO Box 20 – 98713 PapeeteTahitiTel: (689) 42.81.48 or 43.93.14Fax: (689) 43.81.59 or 43.49.79
Guam Mr Tom Flores [email protected] Fisheries BiologistDepartment of Agriculture & Wildlife Resources192 Dairy RoadMangilao , GU 96923Tel: (671) 735 3987Fax: (671) 734 6570

105
Japan Division of Pelagic Fish ResourcesNational Research Institute of Far Seas Fisheries5–7–1 Orido, Shimizu-shiShizuoka-ken 424−8633Tel: (81) 543–36–6000Fax: (81) 543–35–9642
Dr Ziro Suzuki [email protected], Pelagic Fish Resources Division
Mr Naozumi Miyabe [email protected], Tropical Tuna Section
Mr Hiroshi Shono [email protected], Mathematical Biology Section
Western Pacific Tuna and Skipjack Resources Division
Dr Miki Ogura [email protected], Skipjack Section
Dr Yuji Uozumi [email protected], Western Pacific Tuna and Skipjack
Resources Division
Oceanography and Southern Ocean Resources Division
Dr Denzo Inagake [email protected] Low Latitude Oceanography Section
Mr Kouicki IshizukaDeputy DirectorResources and Environment Research DivisionFisheries Agency of Japan1–2–1 KasumigasekiChiyoda-ku, Tokyo 100–8907Tel: (81) 3–3501–5098Fax: (81) 3–3592–0759
Kiribati Mr Rimeta TingaActing Senior Fisheries Officer, LicensingMinistry of Natural Resource DevelopmentFisheries DivisionPO Box 64Bairiki, Tarawa [email protected]: (686) 28252Fax: (686) 28295
Korea Dr Jin Yeong Kim [email protected],Distant-Water Fisheries Resources DivisionNational Fisheries Research and Development Institute
106
408–1 Shirang-ri, Kijang-up, Kijang-KunPusan 619–900Tel: (82) 51–720–2310Fax: (82) 51–720–2337
Marshall Islands Mr Glen JosephChief Fisheries Officer, Oceanic DivisionMarshall Islands Marine Resources AuthorityPO Box 860Majuro 96960 [email protected]: (692) 625-8262/5632Fax: (692) 625-5447
New Caledonia Mr Régis Etaix-Bonnin [email protected]énieur chargé des pêchesService de la marine marchande
et des pêches maritimesPO Box 36NoumeaTel: (687) 27.26.26Fax: (687) 28.72.86
New Zealand Dr Talbot Murray [email protected] Director,Pelagic Fisheries National Institute of Water
and Atmospheric Research LtdPO 14901WellingtonTel: (64) 4 386 0300Fax: (64) 4 386 0574
Dr Chris O’Brien [email protected] Policy AnalystMinistry of FisheriesPO Box 1020WellingtonTel: (64) 4–470–2609Fax: (64) 4–470–2686
Niue Mr Sione Leolahi [email protected] Fisheries OfficerDepartment of Agriculture, Forestry and FisheriesP.O. Box 74Alofi, NiueTel: (683) 4032Fax: (683) 4010/4079
Northern Mariana Islands Mr Floyd Masga [email protected] of Lands and Natural Resources [email protected] OfficePO Box 10007Saipan MP 96950Tel: (1 670) 664-6000Fax: (1 670) 664-6060

107
Papua New Guinea National Fisheries AuthorityP.O. Box 2016Port MoresbyTel: (675) 321–2643 Ext 14Fax: (675) 320–2074 or 320–2069
Mr Philip Polon [email protected]/Executive Manager
Papua New Guinea (continued) Fisheries Management and Industry Support Division
Mr Ludwig KumoruTuna Biologist
Samoa Mr Antonio Mulipola [email protected] Fisheries OfficerFisheries DivisionMinistry of Agriculture, Forests, Fisheries and MeteorologyPO Box 1874ApiaTel: (685) 22624/20369 [email protected]: (685) 24292
Solomon Islands Ministry of Lands, Agriculture and FisheriesPO Box G13HoniaraTel: (677) 30107Fax: (677) 30256
Mr Sylvester DiakeDirector of Fisheries
Taiwan Institute of OceanographyNational Taiwan UniversityPO Box 23–13TaipeiTel: (886) 2 2363 0231Fax: (886) 2 2362 0880
Dr Chien-Hsiung Wang [email protected]
Dr Chi-Lu Sun [email protected]: (886) 2 2362 9842Fax: (886) 2 2362 9842
Overseas Fisheries Development Councilof the Republic of China
19, Lane 113, Roosevelt Rd, Sect.4TaipeiTel: (886) 2 2738 5486Fax: (886) 2 2738 4329
Dr Shyh-Bin Wang [email protected]
108
Taiwan (continued) Mr Ren-Fen Wu [email protected] Chin Lau KuoCouncil of AgricultureExecutive Yuan8, Sec.1,Chung Hsiao E. Rd,TaipeiFax: (886) 2 2341 1953
Tonga ’Akau’ola [email protected] of FisheriesPO Box 871Nuku’alofaTel: (676) 21399Fax: (676) 23891
United States of America Mr David Itano [email protected], Pelagic Fisheries Research ProgramJoint Institute of Marine and Atmospheric ResearchUniversity of Hawaii at Manoa1000 Pope Road, MSB 312Honolulu, Hawaii 96822Tel: (1) 808–956–4108Fax: (1) 808–956–4104
National Marine Fisheries ServiceSouthwest Fisheries Science CenterHonolulu Laboratory2570 Dole StreetHonolulu, Hawaii 96822–2396Tel: (1) 808–983–5360Fax: (1) 808–983–2901
Dr Mike Laurs [email protected]
Dr Pierre Kleiber [email protected] Scientist
Dr Robert Skillman [email protected] Biologist
National Marine Fisheries ServiceSouthwest Fisheries Science CenterLa Jolla LaboratoryPO Box 271La Jolla, California 92038Tel: (1) 858–546–7175Fax: (1) 858–546–7653
Dr Gary Sakagawa [email protected]: (1) 858-546-7175
Dr Ramon J. Conser [email protected]: (1) 858–546–5688
Mr Dave Foley [email protected]: (1) 858–546–5688
109
United States of America (continued) Dr Carol A. Reeb [email protected] AssociateHopkins Marine StationStanford UniversityOceaview Blvd.Pacific Gorve, CA 93950United States of America
Vanuatu Mr William NavitiDepartment of FisheriesPrivate Mail Bag 045Port VilaTel: (678) 23119Fax: (678) 23641
Wallis & Futuna Service de L’Economie Rurale et de la Peche
(c/- Noumea)Tel:Fax:Mr A. ViviantMr B. Gaveau
Organisations Food and Agriculture Organization of the United Nations (FAO)Via delle Terme di Caracalla00100 RomeItaly
Dr Jacek Majkowski [email protected] Resource OfficerMarine Resources ServiceFisheries Resources DivisionTel: (39) 06 5705 6656Fax: (39) 06 5705 3020
Mr Marc Taconet [email protected] Global Information System OfficerFishery Information, Data and Statistics UnitTel: (39) 06 570 53799Fax: (39) 06 570 55476
Mr David MacraeHead of DelegationEuropean Union4th floorFDB BuildingPrivate Mail Bag, GPOSUVATel: (679) 313 633Fax: (679) 300 370

110
Organisations (continued) Mr Karl Staisch [email protected] – Observation and Monitoring ProgrammesForum Fisheries AgencyPO Box 629HoniaraSolomon IslandsTel: (677) 21124/24312Fax: (677) 23995
Mr David Ardill [email protected] Ocean Tuna CommissionFishing PortP.O. Box 1011Victoria, MahéSeychelles
Inter-American Tropical Tuna Commission8604 La Jolla Shores DriveLa Jolla, CaliforniaUnited States of America 92037–1508Tel: (1) 858–546–7100Fax: (1) 858–546–7133
Dr Michael Hinton [email protected] Scientist
Dr Mark Maunder [email protected] Scientist
Secretariat of the Pacific CommunityPO Box D598848 Noumea CedexNew CaledoniaTel: (687) 26.20.00Fax: (687) 26.38.18
Dr Antony Lewis [email protected] Fisheries Coordinator
Dr Tim Adams [email protected] of Marine Resources
Dr John Hampton [email protected] Fisheries Scientist
Dr Patrick Lehodey [email protected] Fisheries Scientist (Tuna Ecology & Biology)
Dr Keith Bigelow [email protected] Research Scientist
Mr Wade Whitelaw [email protected] Research Scientist
Mr Timothy Lawson [email protected] Statistician

111
Mr Peter Williams [email protected] Database Supervisor
Organisations (continued) Mr Bruno Leroy [email protected] Technician
Mr Peter Sharples [email protected] Sampling/Observer Supervisor
Ms Deirdre Brogan [email protected] Monitoring Supervisor
Mr Babera Kaltongga [email protected] Research Officer
Mr Emmanuel Schneiter [email protected] Officer/Analyst
Mr Colin Millar [email protected]/Research Officer
Mr Fabrice BouceConsultant
Mr Mannaseh AvicksScientific Observer
Mrs Kay Legras [email protected]
Mrs Helene Ixeko [email protected]
Mrs Sonia Savea [email protected]
Mrs Christine Nguyen [email protected]
Ms. Karine Dreyfus [email protected] LeaderInterpreter
Ms. Marie Bayle [email protected]

112
Gerard De Haro [email protected]
Valérie HassanInterpreter Freelance
Dominique TouletInterpreter Freelance
Mr Phil Hardstaff [email protected] Support Engineer
Mr Patrick Rehmann [email protected] Engineer
113
APPENDIX 4. OPENING ADDRESS BY THE DIRECTOR-GENERAL OFTHE SECRETARIAT OF THE PACIFIC COMMUNITY
Distinguished colleagues, ladies and gentlemen, Good morning.
It is my pleasure to welcome you here to Nouméa for this - the 13th meeting of the StandingCommittee on Tuna and Billfish. It is so nice to see a large number of familiar faces from ourinternational fishery family - including our SPC member countries, the fishing nations and tunafishery organizations from all parts of the world. On behalf of my SPC executive colleagues, DeputyDirectors General Dr. Jimmie Rodgers and Yves Corbel, and the leaders of our SPC Fisheriesprogramme, Dr.Tim Adams and Dr. Tony Lewis, welcome indeed to the SPC headquarters and thismagnificent Conference facility.
La CPS est une organisation bilingue qui a l'anglais et le français comme langues de travail.Je tiens donc à souhaiter la bienvenue dans cette langue aux participants francophones. Je suisheureuse de vous accueillir à Nouméa pour cette conférence importante, et je vous souhaite unagréable séjour et un travail fructueux. Je me réjouis toujours d'avoir l'occasion de m'exprimer enfrançais, mais si vous le permettez, je poursuivrai en anglais.
The last Standing Committee Meeting hosted here in Noumea, the 9th SCTB in July 1996, was heldin conjunction with the Technical Consultation on the Collection and Exchange of Fisheries Data,Tuna Research and Stock Assessment. This was commissioned by the Multilateral High LevelConference (MHLC) process, and as I recall, was the first conference held in this magnificentJacques Iekawe Hall in our new home. It is now appropriate that you return to this same venue - at acritical time for the fisheries of our region and their management.
Much has happened since that time. In discharging its responsibility to co-ordinate collaborativeresearch leading to stock assessments of exploited oceanic species and general provision of scientificadvice, the Standing Committee (SCTB) has met in a revised and more effective format since 1996,encouraging full and effective participation by all of the parties in the group which now numbernearly 30. Though not formally constituted and meeting as individual scientists, it has establisheditself as an authoritative source of information and advice on tuna fishery issues.
At the same time, the MHLC process, to develop an effective conservation and managementarrangement for the highly migratory fish stocks of our region – perhaps the single most importantfishery development to our region - has met six times since December 1994, and may well beapproaching a conclusion.
Until the Convention which establishes this regime enters into force, SCTB will continue to functionas the key provider of scientific advice to the interim arrangement, the Preparatory Conference, - asrecommended in the Resolution of the most recent MHLC in April this year. This step recognizes thework already undertaken on several occasions by the Standing Committee for MHLC, and indeedconfirms its status as a credible and respected provider of scientific advice.
Recent years have seen interesting times also in the fishery itself, to say the least. A record catch of1.8 million mt of the main target species of tuna was recorded in the western and central Pacific in1998, and was not much less last year; despite less time spent fishing by some fleets. However,associated with this increased supply of tuna (and not just in the Western and Central Pacific Ocean),

114
have come difficult times for some sectors of the industry; with cannery fish prices now athistorically low levels in some markets.
One often hears of our tuna stocks spoken of as the last great underexploited ocean resource - andmore eyes are turning to the region seeking fishery access. Whilst the Western and Central PacificOcean is thought to be well endowed in tuna resource terms, there have been some concernsexpressed about the resilience of valuable bigeye stocks in the face of increased catches of smallerfish and more effective targeting on adult stocks. Awareness is also increasing of possible fisheryimpacts on species other than tunas taken in the course of tuna fishing.
In very recent days, we have seen the sad spectacle of the Hawai’ian longline fishery effectively shutdown as a result of concerns over by-catch species taken in small numbers in the fishery. Whether welike it or not, such concerns will require increasing and innovative efforts to address in fora such asthe SCTB. If your task was challenging enough with tuna stock assessment, even with theapplication of the precautionary approach, and increasing numbers of more vocal user groups to dealwith, - then think ahead to the more daunting challenges which await and which may requiredevelopment of different strategic approaches. I have every confidence that SCTB will meet thischallenge.
As you know, meetings such as the Standing Committee on Tuna and Billfish do not just happen,and the challenge for us is to ensure full participation in this important but essentially self-fundedforum by all interested parties. This is particularly the case with our Pacific Island member countries.With this 13th SCTB meeting, I would like to acknowledge the financial assistance of the Republicof Korea, the Govt of New Zealand and the Western Pacific Regional Fisheries Management Councilin making this possible. I would also like to acknowledge the continuing support by the EuropeanUnion, the Governments of Australia and France, and Taiwan, among many others.
My congratulations as well to the organisers of this meeting – Dr. Lewis and the OFP, and the staffof the SPC Marine Resources Division. We, in the SPC, are very happy to contribute to thisimportant gathering by providing logistical support and venue for your sessions, our simultaneousinterpretation staff and the participation of our various Programme officers in the sessions. Mycongratulation as well to all the participants from the various Pacific Island countries and territories,and members of the scientific community who are here with us this week.
In closing, it remains just to wish you well with your demanding agenda over the next seven days,and in developing outcomes from your deliberations which will be paid great heed in many quarters.I do hope you are able to take some time out to enjoy the hospitality of New Caledonia and ourorganization. Let me initiate that process by inviting you to join me for a social occasion thisevening. May wisdom be with you in your deliberations.
Merci – et bon courage.

115
APPENDIX 5. REVIEW OF CATCH AND EFFORT LOGSHEETS OF THESPC/FFA TUNA FISHERY DATA COLLECTION FORMS COMMITTEE
Background
At its inaugural meeting in June 1998, during SCTB11, the Statistics Working Group establishedprocedures for achieving its objectives of coordinating data collection, data compilation and disseminationof data. It agreed that two of the procedures for coordinating data collection would be to establishminimum standards for data collection forms and to review data collection forms used in the region. Atthe SWG Session on Data Collection Forms that was held from 14 to 15 June 1998, immediately prior toSCTB12, minimum standards for catch and effort logsheets were established and the logsheets of theAustralian Fisheries Management Authority and the New Zealand Ministry of Fisheries were reviewed(Anonymous, 1999). A second SWG Session on Data Collection Forms was held on 3 July 2000,immediately prior to SCTB13, to review the logsheets developed by the SPC/FFA Tuna Fishery DataCollection Forms Committee. The participants at the second session are listed in paragraph 120.
SPC/FFA Longline Logsheet
The review of the longline logsheet began by determining the presence or absence of essential anddesirable data items included in the minimum standards. The data items absent from the form includeseveral vessel and gear attributes, i.e. gross registered tonnage (GRT), length of the mainline, branchline,etc, engine power, rated speed, reel capacity, number of reels, storage capacity, storage method, etc. Itwas noted that the missing vessel and gear attributes were available from the Regional Register maintainedby the Forum Fisheries Agency. On the other hand, it was also noted that the reliability of the informationon the regional register was questionable and that the information on the Regional Register was updatedonly once a year, whereas certain vessel and gear attributes could change more often.
Regarding the use of GRT, it was noted that at its eighteenth meeting in July 1999, the CoordinatingWorking Party on Fishery Statistics recommended the use of vessel length, rather than GRT. Theminimum standards for logsheets that were developed at SCTB12 note that there are problems ofstandardisation with both vessel length and GRT, and that vessel length should be considered as anequivalent data item to GRT.
The lack of space for the missing vessel and gear attributes, and other information, prompted theobservation that one sheet per day, rather than one line per set or day, may be preferable. It was noted thatthe vessel’s log used by most longliners contain one sheet per day and that the amount of information thatwould need to be entered on computer would not increase greatly. On the other hand, the weight andspace taken up by the additional paper would be significant.
It was noted that the “number of hooks between floats” is included on the form in the header, such thatone value is recorded for the entire trip, whereas certain fleets, e.g. Taiwanese offshore longliners in theIndian Ocean and possibly in the Pacific, vary the number of hooks between floats while searching forconcentrations of fish. These vessels make multiple sets per day, using fewer hooks, until concentrationsare localised, whereupon full sets are made. It may therefore be appropriate to record the number ofhooks between floats for each set. On the other hand, there have been some logsheets provided to theOFP in the past on which the number of hooks per basket or the number of hooks between floats wererecorded for each set, but the values recorded almost never change during the entire trip.
116
Data items for the number if discards of albacore, bigeye, yellowfin and shark are on the form, but not fordiscards of billfish and other species. It was considered that even though there may be problems withfishermen recording information on discards, it should still be possible to record information on alldiscards. It was suggested that one solution may be to leave the species name at the top of each columnblank, such that there would be columns only for those species that were actually caught. While that mayeconomise on space, it was noted that the tendency of fishermen is not to record the information if thename of the species is not on the form. The problem of space to record the retained catch and discardswas suggested as another reason for having one sheet per day. In this regard, it was also noted that havingcomplete list of species somewhere in the logbook would avoid the problem of pooling the information forseveral species.
Whereas there were several reasons suggested for having one sheet per day and collecting more completeinformation, it was noted that for many fishermen, particularly those on smaller vessels, who tend to beless educated, it was preferable to have as simple a form as possible and to use observers to collect morecomplete information. It was suggested that consideration be given to having a detailed form for certainfleets, i.e. the distant-water longliners, and a simple sheet for others, i.e. the offshore longliners. Anothersuggestion was to keep the basic structure of the current form, but have two lines per set, rather than one.
It was also noted that the current logsheet contains only one column for sharks, but that certain longlinerstarget sharks. It was therefore suggested that consideration should also be given to developing a separateform for shark longliners, on which information on sharks can be recorded to the species level.
The importance of protected species in the Hawaiian longline fishery was discussed and it was generallyagreed that it would not be long before protected species would be a concern to all longline fisheries in theregion. It was therefore suggested that the longline logsheet should include data items on species that mayeventually be protected on a regional basis, such as turtles, birds, marine mammals and certain sharks.
It was also noted that the vessels of certain fleets carried no navigational equipment, such as the local fleetin American Samoa, and thus that it was not possible for the fishermen to record the position to thenearest minute of latitude and longitude. In such cases, positions could be recorded with the aid of a mapshowing statistical areas.
Predation of longline-caught fish by false killer whales is a serious problem for longliners in the IndianOcean and is beginning to be recognised as a serious problem in the Pacific. It was suggested thatconsideration be given to recording information on the incidence of predation on the longline logsheet.
The foreign fleets that use the SPC/FFA longline logsheet under access agreements with SPC/FFAmember countries almost always have the information in the vessel’s log transcribed to the SPC/FFAlogsheet after the vessel has returned to port. The SPC/FFA logsheet is then sent to the SPC/FFA membercountry, which then provides a copy of the logsheet to the OFP. It was recognised that transcription was amajor source of errors in logsheet data and that it would therefore be preferable to have a standard formwith copies that could be made available to the various parties. While it was agreed that transcription wasa serious problem, it was noted that the implementation of a standard form with multiple copies would beimpractical in the near term, given that this would necessitate cooperation from all the fishing nations andcoastal states in the region.
The use of observers to collect more detailed information was mentioned several times. However, it wasnoted that the observer data held by the OFP currently cover only 0.15 percent of the catch in the WCPOduring 1991–1999. Dr Suzuki mentioned that observer data is currently collected from training and
117
research vessels in Japan, but that consideration may be given to expanding the collection of observer datato the commercial fleets. He suggested that the target level of coverage may be on the order of about 5percent. Dr Laurs referred to recent work that indicated that monitoring of the impact of managementmeasures in the Hawaiian longline fishery would require observer coverage of about 20 percent.
The units of weight, i.e. whole weight or processed weights, are not given on the longline logsheet.However, it was noted that the practices of each of the fleets was consistent and known, so that it was notnecessary to include the units on the form. For example, most fleets landed albacore whole, while bigeyeand yellowfin are gilled and gutted, and marlin are headed and tailed.
While there are data items for the number of sharks retained and discarded, there is no information on thenumber of sharks that were finned and the trunk discarded. It was suggested that consideration be given toincluding a data item on the number of sharks that were finned.
SPC/FFA Pole-and-Line Logsheet
The review of the pole-and-line logsheet also began by determining the presence or absence of essentialand desirable data items included in the minimum standards. As for the longline logsheet, the pole-and-linelogsheet is missing several vessel and gear attributes that are available on the FFA Regional Register. Itwas noted that the number of poles can be estimated as the number of crew minus three. It was suggestedthat a separate sheet in a logbook could be developed for vessel and gear attributes, which would avoidhaving the same information recorded in the header of each logsheet and which would be updatedwhenever the vessel or gear attributes changed.
It was noted that the units of tuna discards is “number of fish” and that consideration should be given tohaving units of weight.
It was suggested that an activity code for “vessel sighted” be included on each of the logsheets in order toidentify vessels for which logsheets may not have been provided.
The problem of verifying logsheet data with unloadings data was discussed. Japanese distant-water pole-and-line vessels land their catch in Japan; hence no unloadings data are available from the ports of othercoastal states in the region. It was therefore suggested that consideration be given to including data itemson unloadings. On the other hand, it was recognised that, for verification purposes, it is better to obtain anindependent estimate of unloadings.
SPC/FFA Purse-Seine Logsheet
The review of the purse-seine logsheet also began by determining the presence or absence of essential anddesirable data items included in the minimum standards. As for the other logsheets, the purse-seinelogsheet is missing several vessel and gear attributes that are available on the FFA Regional Register. Inparticular, it was noted that the presence of sonar, bird radar, and the type and number of FADs were notincluded. The type of FADs could refer to the use of echo-sounders and satellite tracking, which isbecming increasingly common.
It was suggested that consideration be given to including activity codes for planting FADs and for drifting,since the use of FADs has increased considerably and these are now distinct activities for many vessels.
It was also noted that no environmental data, such as sea surface temperature, are included on thelogsheet. Environmental data are known to be correlated to catch rates and so this information may beuseful in explaining variation in catch rates.

118
The “set start time” is included on the form, but not the time at which the skiff is onboard, i.e. the time ofthe end of the set. This information is useful for calculating the searching time and thus to determine amore accurate measure of fishing effort.
Spanish purse seiners in the Indian Ocean make use of tender vessels to improve searching and to attractfish with lights at night. Some of these vessels are now operating in the Pacific and so considerationshould be given to including information on tender vessels.
It was suggested that a data item concerning the presence of an observer onboard should be included, toallow the logsheet data to be cross-referenced to the observer data.
Reference
Anonymous. 1999. Report of the Twelfth Meeting of the Standing Committee on Tuna and Billfish,16 – 23 June 1999, Tahiti, French Polynesia. Secretariat of the Pacific Community, Noumea,New Caledonia. 126 pp.
119
APPENDIX 6. REPORT OF THE OCEANOGRAPHIC DATABASE USERSGROUP MEETING
Convened by: Dave Foley (NOAA CoastWatch, Honolulu Laboratory)
Rapporteur: Pierre Kleiber (NOAA/NMFS, Honolulu Laboratory)
Participants:Keith Bigelow (SPC), Fabrice Bouly (SPC), Robert Campbell (CSIRO, Aus.), Dave Foley (NOAA,USA), Mike Hinton (IATTC), Denzo Inagake (NRIFSF, Japan), Pierre Kleiber (NOAA/NMFS,USA), Mike Laurs (NOAA/NMFS, USA), Patrick Lehodey (SPC), Tony Lewis (SPC), MarcMaunder (IATTC), Naozumi Miyabe (NRIFSF, Japan), Hiroshi Shono (NRIFSF, Japan), BobSkillman (NOAA/NMFS, USA), Ziro Suzuki (NRIFSF, Japan), Yuji Uozumi (NRIFSF, Japan).
Introduction:
Dave Foley presented the overall aims of a project, funded by PFRP, to make oceanographicand climatic data easily accessible in a common format and to facilitate the use of that data byresearchers and fishery managers. The purpose of the workshop was not only to inform interestedparties of the existence of the project but also to solicit information from potential users.
As currently envisioned, the database will draw upon three basic sources of information:• In situ (e.g., CTD profiling, XBTs, moorings, drifters, etc.)• Satellite Data (wind, surface height, surface temperature, ocean colour)• “Ocean re-analysis products”(e.g., data assimilation model output)
In order to meet the goal of supplying consistent and meaningful coverage for the entire Pacific basinover decadal-length timescales, emphasis will be placed on the latter two categories.
Time series for each data set will be produced at a variety of spatial and temporal resolutions. Aform soliciting user input was distributed to workshop participants to establish preferences for datatypes offered, including the resolutions and formats in which they are distributed. This form was alsomade available to all participants to SCTB13 and will be posted on the Pacific Atlas web page(http://coastwatch.nmfs.hawaii.edu/atlas.html, by 1 August 2000). Distribution of the climatologicaldata will be conducted primarily via the internet. Hard copies (printed book) and CD-ROMs will beproduced on a limited basis (available by request, subject to budgetary constraints). Long-termcontinuity of the project will be achieved through the Hawaii CoastWatch program, which alreadysupplies a subset of the likely products for US Pacific Island regions.
The target date for the completion of phase I (which includes the production of historical satellitetime series and the development of an internet-based data distribution system) is July 2001.
Discussion:
Several other participants gave presentations pertinent to the project.
Dr Laurs presented an example of the PFRP “Bigeye” project, in which researchers from theHonolulu Laboratory and the University of Hawaii utilise satellite data for both the acquisition andanalysis of the in situ components.
120
Dr Denzo Inagake described an oceanographic database maintained at the National ResearchInstitute for Far Seas Fisheries. The data are collected by Japanese research vessels, fishery trainingvessels, chartered fishing vessels and voluntary observations from fishing and merchant vessels. Thedatabase is publicly accessible via the internet.
Dr Hinton described another public source of oceanographic data in the Pacific, fundedinternationally and maintained by the Scripps Institution of Oceanography. It provides thermalprofile data from an array of oceanographic floats to be deployed on a 3° by 3° grid throughout theglobal ocean.
Dr Lehodey and Mr Fabrice Bouce presented a graphical interface used to preview and extractinformation from NOAA/NCEP model output. They have expressed a willingness to share theirwork
Dr Maunder identified several levels at which, generally, data should be supplied (paraphrased here):1. Raw data (e.g., single SeaWiFS Chlorophyll a pass)2. Interpolated/averaged data (e.g., Monthly median Chl a image)3. Value-added data (e.g., Modeled primary productivity)4. Highly-derived Indices (e.g., “frontiness”).
The usefulness of providing some kind of standardized anomalies was discussed. No consensus wasreached in regards to the specific nature of these products.
Conclusion:
Based on the constructive contributions of the participants, this workshop was considered a greatsuccess. Specific products that were identified as essential include the following (identified with thedata levels specified above).• Current vectors and current shear (type 2)• Thermocline depth (type 3)• Primary productivity, modeled from surface chlorophyll (type 3).• Index of “frontiness”(type 4)
Some work will be required to develop these products fully. This work is well within the scope ofthe project, though it will require further interaction with the atlas producers and the data users.
121
APPENDIX 7. PROPOSED TEMPLATE FOR SCTB WORKING GROUPREPORTS
This template is a device for summarizing and regularly updating information relevant to stock assessment andhighlighting areas where more information is required. It is intended that this or a similar template would beready for preparing the reports of the Species Working Groups from SCTB–14 and that it should serve as a“living” document to guide the work of these groups intersessionally.
I. Working Group Title — Year
II. Description of fisheries (including recent developments)• Changes in gear and/or fleets• Targeting practices• Data availability
III. Trends in catch• Catch by gear type• overview• recent developments• data adequacy• Catch composition (other major species)• Distribution of catches by gear type
IV. Trends in effort• Effort by gear type• overview• recent developments• data adequacy• Distribution of effort by gear type
V. CPUE• Nominal CPUE trends by gear type
VI. Biological information• Stock structure• Size composition by gear type• Size/age at maturity• Sex ratios• Growth rates• Mortality (F, Z, M, other sources)• Conversion factors
VII. Stock assessment• Tagging• Abundance indices• Population dynamic models• Environmental models• Other modeling approaches• Fisheries independent indicators• Factors influencing stock assessment• Reference points
VIII. Research requirements and work plan for next assessment cycle

122
IX. Status of stock summaryAPPENDIX 8. SCIENTIFIC NAMES OF SPECIES
ENGLISH NAME SCIENTIFIC NAME
Tuna and tuna-like species
Albacore Thunnus alalunga
Bigeye Thunnus obesus
Frigate tuna Auxis thazard
Skipjack Katsuwonus pelamis
Wahoo Acanthocybium solandri
Yellowfin Thunnus albacares
Billfish
Black marlin Makaira indica
Blue marlin Makaira mazara
Sailfish Istiophorus platypterus
Shortbill spearfish Tetrapturus angustirostris
Striped marlin Tetrapturus audax
Swordfish Xiphias gladius
Sharks
Blue shark Prionace glauca
Mako shark Isurus spp.
Oceanic whitetip shark Carcharhinus longimanus
Silky shark Carcharhinus falciformis
Thresher shark Alopias spp.
Other species
Escolar Lepidocybium flavobrunneum
Mahi mahi Coryphaena hippurus
Oceanic triggerfish Canthidermis maculatus
Rainbow runner Elagatis bipinnulata
123
APPENDIX 9. ACRONYMS AND ABBREVIATIONS
AFMA Australian Fisheries ManagementAuthority
AFZ Australian Fishing Zone
ARG Albacore Research Group
AusAID Australian Agency for InternationalDevelopment
BBRG Billfish and Bycatch Research Group
BRG Bigeye Research Group
CART Classification and Regression Tree
CCAMLR Commission for the Conservation ofAntarctic Marine Living Resources
CCSBT Commission for the Conservation ofSouthern Bluefin Tuna
cm centimetre
CNMI Commonwealth of the NorthernMariana Islands
CPUE catch per unit of effort
CSIRO Commonwealth Scientific andIndustrial Research Organisation
ECOTAP Etude de Comportement des Thonidéspar l’Acoustique et la Pêche
EEZ exclusive economic zone
ENSO El Niño Southern Oscillation
EPO eastern Pacific Ocean
ETP eastern tropical Pacific
F the instantaneous rate of fishingmortality
FAD fish aggregating device
FAO Food and Agriculture Organization ofthe United Nations
FFA South Pacific Forum Fisheries Agency
FSM Federated States of Micronesia
GAM general additive model
GLM general linear model
GRT gross registered tonnage
HMS highly mirgratory species
IATTC Inter-American Tropical TunaCommission
ICCAT International Commission for theConservation of Atlantic Tunas
ICES International Council for theExploration of the Sea
IFREMER Institut français de recherche pourl’exploitation de la mer
IMO International Maritime Organizationof the United Nations
in inch
IOTC Indian Ocean Tuna Commission
IRD Institut de la Recherche pour leDéveloppement (formerly ORSTOM)
JIMAR Joint Institute of Marine andAtmospheric Research
KFC Kuniyoshi Fishing Company
kg kilogram
LRP limit reference point
M the instantaneous rate of naturalmortality
MHLC Multilateral High-Level Consultationon the Conservation and Managementof Highly Migratory Fish Stocks inthe Western and Central PacificOcean
mi mile
MMR Ministry of Marine Resources
MSE Management Strategy Evaluation
mt metric tonnes
NAFO North Atlantic Fisheries Organization
nm nautical mile
NOAA National Oceanic and AtmosphericAdministration
NRIFSF National Research Institute of FarSeas Fisheries (Japan)
NAD non-target, associated and dependant(species)
OFDC Overseas Fisheries DevelopmentCouncil (Republic of China)
OFP Oceanic Fisheries Programme
OM Operational Model
OTC oxytetracycline
PEAC Pacific ENSO Application Center
PFRP Pelagic Fisheries Research Program
PITI Palau International TradersIncorporated
PMIC Palau Marine Industrial Corporation
PRP provisional reference point
RP reference point
SAM Stock Assessment Model
SCTB Standing Committee on Tuna andBillfish
SEAFDEC Southeast Asian FisheriesDevelopment Center
SEM scanning electron microscope
SOI southern oscillation index

124
SPAR South Pacific Albacore Research(Group)
SPC Secretariat of the Pacific Community(formerly the South PacificCommission)
SRG Skipjack Research Group
SSH sea surface height
SST sea surface temperature
STCZ Sub-tropical Convergent Zone
SWG Statistics Working Group
TAC total allowable catch
TAO Tropical Atmosphere Ocean (Project)
TRP target reference point
UNIA Agreement for the Implementation ofthe Provisions of UNCLOS Relatingto the Conservation and Managementof Straddling Fish Stocks and HighlyMigratory Fish Stocks
UNCLOS United Nations Convention on theLaw of the Sea
WCPO Western and Central Pacific Ocean
WPRFMC Western Pacific Regional FisheriesManagement Council
WPYR Western Pacific Yellowfin Research(Group)
VMS vessel monitoring system
VPA Virtual Population Analysis
XBT expendable bathythermograph
YRG Yellowfin Research Group

125