
Remote sensing of night lights_ A review and an outlook for ...
33
Contents lists available at ScienceDirect Remote Sensing of Environment journal homepage: www.elsevier.com/locate/rse Remote sensing of night lights: A review and an outlook for the future Noam Levin a,b,∗ , Christopher C.M. Kyba c,d , Qingling Zhang e , Alejandro Sánchez de Miguel f,g,q , Miguel O. Román h , Xi Li i , Boris A. Portnov j , Andrew L. Molthan k , Andreas Jechow c,d , Steven D. Miller l , Zhuosen Wang m,o , Ranjay M. Shrestha n,o , Christopher D. Elvidge p,r a Department of Geography, The Hebrew University of Jerusalem, Israel b Remote Sensing Research Center, School of Earth and Environmental Sciences, University of Queensland, Australia c GFZ German Research Centre for Geosciences, Germany d Leibniz-Institute of Freshwater Ecology and Inland Fisheries, Germany e School of Aeronautics and Astronautics, Sun Yat-Sen University, China f Environment and Sustainability Institute, University of Exeter, Penryn Campus, Penryn, Cornwall, TR10 9FE, United Kingdom g Dept. Física de la Tierra y Astrofísica, Instituto de Física de Partículas y del COSMOS (IPARCOS), Universidad Complutense de Madrid, 28040, Madrid, Spain h The Earth from Space Institute, Universities Space Research Association, Columbia, MD, USA i State Key Laboratory of Information Engineering in Surveying, Mapping and Remote Sensing, Wuhan University, Wuhan, China j Department of Natural Resources and Environmental Management, Faculty of Social Sciences, University of Haifa, Mt. Carmel, Haifa, 3498838, Israel k Earth Science Branch, NASA Marshall Space Flight Center, Huntsville, AL, United States l Cooperative Institute for Research in the Atmosphere, Colorado State University; Foothills Campus, 1375 Campus Delivery, Ft. Collins, CO 80523, 1375, USA m Earth System Science Interdisciplinary Center, University of Maryland, College Park, MD, United States n Science Systems and Applications, Inc., Lanham, MD, United States o Terrestrial Information Systems Laboratory, NASA Goddard Space Flight Center, Greenbelt, MD, United States p Earth Observation Group, NOAA National Centers for Environmental Information, United States q Instituto de Astrofísica de Andalucía, Glorieta de la Astronomía, s/n, C.P.18008 Granada, Spain r Earth Observation Group, Payne Institute for Public Policy, Colorado School of Mines, United States ARTICLE INFO Keywords: Night lights Light pollution DMSP/OLS VIIRS/DNB ISS Urban Human activity ABSTRACT Remote sensing of night light emissions in the visible band offers a unique opportunity to directly observe human activity from space. This has allowed a host of applications including mapping urban areas, estimating popu- lation and GDP, monitoring disasters and conflicts. More recently, remotely sensed night lights data have found use in understanding the environmental impacts of light emissions (light pollution), including their impacts on human health. In this review, we outline the historical development of night-time optical sensors up to the current state of the art sensors, highlight various applications of night light data, discuss the special challenges associated with remote sensing of night lights with a focus on the limitations of current sensors, and provide an outlook for the future of remote sensing of night lights. While the paper mainly focuses on space borne remote sensing, ground based sensing of night-time brightness for studies on astronomical and ecological light pollution, as well as for calibration and validation of space borne data, are also discussed. Although the development of night light sensors lags behind day-time sensors, we demonstrate that the field is in a stage of rapid development. The worldwide transition to LED lights poses a particular challenge for remote sensing of night lights, and strongly highlights the need for a new generation of space borne night lights instruments. This work shows that future sensors are needed to monitor temporal changes during the night (for example from a geostationary platform or constellation of satellites), and to better understand the angular patterns of light emission (roughly analogous to the BRDF in daylight sensing). Perhaps most importantly, we make the case that higher spatial resolution and multispectral sensors covering the range from blue to NIR are needed to more effectively identify lighting technologies, map urban functions, and monitor energy use. https://doi.org/10.1016/j.rse.2019.111443 Received 30 October 2018; Received in revised form 17 September 2019; Accepted 23 September 2019 ∗ Corresponding author. Department of Geography, The Hebrew University of Jerusalem, Israel E-mail addresses: [email protected] (N. Levin), [email protected] (C.D. Elvidge). Remote Sensing of Environment 237 (2020) 111443 Available online 04 December 2019 0034-4257/ © 2019 Elsevier Inc. All rights reserved. T
-
Upload
khangminh22 -
Category
Documents
-
view
0 -
download
0
Transcript of Remote sensing of night lights_ A review and an outlook for ...

Contents lists available at ScienceDirect
Remote Sensing of Environment
journal homepage: www.elsevier.com/locate/rse
Remote sensing of night lights: A review and an outlook for the future
Noam Levina,b,∗, Christopher C.M. Kybac,d, Qingling Zhange, Alejandro Sánchez de Miguelf,g,q,Miguel O. Románh, Xi Lii, Boris A. Portnovj, Andrew L. Molthank, Andreas Jechowc,d,Steven D. Millerl, Zhuosen Wangm,o, Ranjay M. Shresthan,o, Christopher D. Elvidgep,r
a Department of Geography, The Hebrew University of Jerusalem, Israelb Remote Sensing Research Center, School of Earth and Environmental Sciences, University of Queensland, AustraliacGFZ German Research Centre for Geosciences, Germanyd Leibniz-Institute of Freshwater Ecology and Inland Fisheries, Germanye School of Aeronautics and Astronautics, Sun Yat-Sen University, Chinaf Environment and Sustainability Institute, University of Exeter, Penryn Campus, Penryn, Cornwall, TR10 9FE, United Kingdomg Dept. Física de la Tierra y Astrofísica, Instituto de Física de Partículas y del COSMOS (IPARCOS), Universidad Complutense de Madrid, 28040, Madrid, Spainh The Earth from Space Institute, Universities Space Research Association, Columbia, MD, USAi State Key Laboratory of Information Engineering in Surveying, Mapping and Remote Sensing, Wuhan University, Wuhan, ChinajDepartment of Natural Resources and Environmental Management, Faculty of Social Sciences, University of Haifa, Mt. Carmel, Haifa, 3498838, Israelk Earth Science Branch, NASA Marshall Space Flight Center, Huntsville, AL, United Statesl Cooperative Institute for Research in the Atmosphere, Colorado State University; Foothills Campus, 1375 Campus Delivery, Ft. Collins, CO 80523, 1375, USAm Earth System Science Interdisciplinary Center, University of Maryland, College Park, MD, United Statesn Science Systems and Applications, Inc., Lanham, MD, United Stateso Terrestrial Information Systems Laboratory, NASA Goddard Space Flight Center, Greenbelt, MD, United Statesp Earth Observation Group, NOAA National Centers for Environmental Information, United Statesq Instituto de Astrofísica de Andalucía, Glorieta de la Astronomía, s/n, C.P.18008 Granada, Spainr Earth Observation Group, Payne Institute for Public Policy, Colorado School of Mines, United States
A R T I C L E I N F O
Keywords:Night lightsLight pollutionDMSP/OLSVIIRS/DNBISSUrbanHuman activity
A B S T R A C T
Remote sensing of night light emissions in the visible band offers a unique opportunity to directly observe humanactivity from space. This has allowed a host of applications including mapping urban areas, estimating popu-lation and GDP, monitoring disasters and conflicts. More recently, remotely sensed night lights data have founduse in understanding the environmental impacts of light emissions (light pollution), including their impacts onhuman health. In this review, we outline the historical development of night-time optical sensors up to thecurrent state of the art sensors, highlight various applications of night light data, discuss the special challengesassociated with remote sensing of night lights with a focus on the limitations of current sensors, and provide anoutlook for the future of remote sensing of night lights. While the paper mainly focuses on space borne remotesensing, ground based sensing of night-time brightness for studies on astronomical and ecological light pollution,as well as for calibration and validation of space borne data, are also discussed. Although the development ofnight light sensors lags behind day-time sensors, we demonstrate that the field is in a stage of rapid development.The worldwide transition to LED lights poses a particular challenge for remote sensing of night lights, andstrongly highlights the need for a new generation of space borne night lights instruments. This work shows thatfuture sensors are needed to monitor temporal changes during the night (for example from a geostationaryplatform or constellation of satellites), and to better understand the angular patterns of light emission (roughlyanalogous to the BRDF in daylight sensing). Perhaps most importantly, we make the case that higher spatialresolution and multispectral sensors covering the range from blue to NIR are needed to more effectively identifylighting technologies, map urban functions, and monitor energy use.
https://doi.org/10.1016/j.rse.2019.111443Received 30 October 2018; Received in revised form 17 September 2019; Accepted 23 September 2019
∗ Corresponding author. Department of Geography, The Hebrew University of Jerusalem, IsraelE-mail addresses: [email protected] (N. Levin), [email protected] (C.D. Elvidge).
Remote Sensing of Environment 237 (2020) 111443
Available online 04 December 20190034-4257/ © 2019 Elsevier Inc. All rights reserved.
T

1. Introduction
Human society has modified the Earth to such an extent, that thepresent geological era has been termed as the Anthropocene (Crutzen,2002). Monitoring human activity from space has largely been directedat mapping land cover and land use changes, such as deforestation(Hansen et al., 2013). Remote sensing of artificial lights, on the otherhand, provides a direct signature of human activity. Global images ofthe Earth at night are now iconic, thanks to NASA media releases suchas the “Bright Lights, Big City” (published in Oct 23rd, 2000, https://earthobservatory.nasa.gov/Features/Lights) or the “Earth at Night”(published in April 12th, 2017, https://earthobservatory.nasa.gov/Features/NightLights) and other communication channels (Pritchard,2017).
The availability of artificial lights is often associated with wealthand a modern society (Hölker et al., 2010a; Green et al., 2015). Brighterlights are strongly associated with increased security in the publicconsciousness, despite little evidence of a causal link. As a result, totalinstalled lighting increased rapidly during the past centuries (Fouquetand Pearson, 2006), and has continued to increase in most countriesduring recent years (Kyba et al., 2017). An example of recent lightingchanges is shown in Fig. 1. Nightscapes change when objects or areasare illuminated for the first time, as in new roads or neighbourhoods, orwhen lighting technologies change (Fig. 1). As a result, economic de-velopment goes in tandem with lighting.
Artificial lights at night can also provide insights on negative im-pacts, such as disasters (Molthan and Jedlovec, 2013), and armedconflict (Román and Stokes, 2015). The importance of monitoring theEarth at night is also demonstrated by the growing recognition of ar-tificial light as a pollutant (Navara and Nelson, 2007; Hölker et al.,2010b), the development of new lighting sources (such as LEDs, whichcan increase ecological light pollution; Pawson and Bader, 2014), andthe continuing growth in extent and radiance of artificially lit areas(Kyba et al., 2017). Light pollution can be defined as “the alteration ofnatural light levels in the night environment produced by the in-troduction of artificial light” (Falchi et al., 2011). Artificial light canalter species abundance or behavior due to changes in their circadianrhythms or due to their attraction to or repulsion from light (ecologicallight pollution; Longcore and Rich, 2004; Rich and Longcore, 2006),can decrease our ability to observe stars at night (astronomical light
pollution), and also leads to negative health impacts to humans throughthe suppression of melatonin production and insomnia (Hölker et al.,2010b; Falchi et al., 2011; Lunn et al., 2017).
With the development of new space borne, airborne and groundsensors for quantifying light at night, new research opportunities areemerging (Kyba et al., 2015a; Hänel et al., 2018). The first compre-hensive review on remote sensing of night lights was published by Doll(2008). Since that time, a variety of new sensors have become available(Fig. 2; Table 1). More recent reviews on remote sensing of night lightshave either focused solely on applications of the DMSP/OLS sensor(Elvidge et al., 2009c; Huang et al., 2014; Li and Zhou, 2017), on multi-temporal applications using DMSP/OLS and VIIRS/DNB (Bennett andSmith, 2017), on the various applications of night-time imagery (Liet al., 2016) and on the community of researchers active in this field(Hu et al., 2017). Since the recent review of Zhang et al. (2015b), newsensors, algorithms, and applications have emerged (Zhao et al., 2019).In this paper we therefore aim to provide a comprehensive review onthe field of remote sensing of night lights, focusing on the visiblespectral range, which is mostly related to artificial lights used by peopleto light the night so as to extend human activity hours. In our review wecover space borne, airborne, and ground based observations (recentlyreviewed in Hänel et al., 2018). We cover the historical development ofthis research area, the available sensors, the current state of the artalgorithms for routine data processing, key applications, the differencesto daytime remote sensing, upcoming space-based night lights missions,and future research challenges.
2. Historical overview
2.1. Earliest observations of night lights
Historically, technological developments in the energy industry(such as the transition from candles to gas, and later on to kerosene andthen to electricity) have led over the past centuries to a gradual de-crease in the price of lighting services, and were associated with in-creases in lighting efficiency and in the consumption of light per capita(Nordhaus, 1996; Fouquet and Pearson, 2006). The foundation of theEdison Electric Light Company can mark the modern era of lighting,and since the year 1800, the total consumption of light in the UnitedKingdom alone has grown by 25,600 times (Fouquet and Pearson,2006). Walker (1973) reports that already in the 1930s sky illuminationhas started to preclude astronomical viewing from certain observatories(and see Rosebrugh, 1935), and as Bertrand Russell famously wrote in1935, “In the streets of a modern city the night sky is invisible; in rural
Fig. 1. Lighting changes in Calgary, Alberta (Canada) between 24/12/2010(top) and 28/11/2015 (bottom). The neighborhood at left has converted fromhigh pressure sodium to white LED lights, while the highway at right is newlyilluminated with sodium lamps. The area has a roughly 7.5× 3 km extent.Images based on astronaut photographs ISS026-E−12438 and ISS045-E−155029.
Fig. 2. Space borne sensors with night-time lights capabilities, as a function ofthe year from which digital night-time images are available, and the spatialresolution of the sensor.
N. Levin, et al. Remote Sensing of Environment 237 (2020) 111443
2

Table1
Com
parisonof
availablespace-bo
rnesensorsfornigh
t-lig
htsmap
ping
,sortedby
spatialresolution
.
Sensor
Spatial
resolution
(m)
Ope
ration
alye
ars
Tempo
ralresolution
Prod
ucts
Rad
iometricrang
eSp
ectral
band
sMainreferenc
es
DMSP
/OLS
3000
Digital
arch
ive
availablefor
1992
–201
3
Globa
lco
verage
can
beob
tained
every
24h
Stab
lelig
hts,
Rad
ianc
ecalib
rated,
Ave
rage
DN
10−6to
10−9W/cm
2/sr/μm
Panc
hrom
atic
400–
1100
nmDoll(200
8);E
lvidge
etal.,(199
7b),20
09c
6bit
Min
detectab
lesign
al410
-5W/m
/sr
VIIRS/
DNB
740
Laun
ched
inOct
2011
Daily
imag
escanbe
downloa
ded.
Mon
thly
Cloud
-free
compo
sitesav
ailablefrom
April20
12on
wards
inradian
ceun
itsof
nano
-Watts/(cm
2*sr).
14bit
Panc
hrom
atic
505–
890nm
Miller
etal.,(201
2);E
lvidge
etal.,20
13a,b,c,
2017
;Rom
ánet
al.,20
18https://viirslan
d.gsfc.
nasa.gov
/
Daily
correctedprod
uct,
VNP4
6A1,
availablesinc
emid-201
9(N
ASA
Black
Marble).
Min
detectab
lesign
al310
-5W/m
/sr
https://ladsweb
.mod
aps.eo
sdis.nasa.go
v/search
/orde
r/1/
VNP4
6A1–
5000
Aeroc
ube4
500
Expe
rimen
tal
cube
sat,20
14Sp
orad
icN\A
Detection
thresholdof
abou
t20
nW/cm2/
srto
achiev
eSN
Rof
4or
more
RGB
Pack
andHardy
(201
6);P
acket
al.(20
17)
SAC-C
HST
C30
0La
unch
edin
Nov
2000
Sporad
icN\A
8bit
Panc
hrom
atic
450–
850nm
Colom
bet
al.(20
03)
SAC-D
HSC
200–
300
Laun
ched
inJu
ne20
11Sp
orad
icN\A
10bit
Panc
hrom
atic
450–
900nm
Senet
al.(20
06)
Astrona
utsph
otog
raph
son
boardthe
Internationa
lSp
ace
Station(ISS
)
5–20
0From
2003
onwards
(since
mission
ISS0
06)
Photos
take
nirregu
larly
Photos
canbe
search
edan
ddo
wnloa
dedfrom
:http://
eol.jsc.nasa.go
v/
8-14
bit
RGB
Doll(200
8);L
evin
andDuk
e(201
2);K
ybaet
al.,
2015
a;Sá
nche
zde
Migue
let
al.(20
14)
CUMULO
S15
0Ex
perimen
tal
cube
sat,20
18Sp
orad
icN\A
N\A
Panc
hrom
atic
Pack
etal.(20
18),20
19
LuoJ
ia1-01
130
Laun
ched
June
2018
15da
yrevisittime
Freely
available
DN
values
withlabcalib
ration
Panc
hrom
atic,46
0–98
0nm
Liet
al.(20
18b),2
019a
Aeroc
ube5
124
Expe
rimen
tal
cube
sat,20
15Sp
orad
icN\A
Detection
thresholdof
abou
t20
nW/cm2/
srto
achiev
eSN
Rof
4or
more
RGB
Pack
andHardy
(201
6);P
acket
al.(20
17)
Land
sat8
15–3
0La
unch
edin
2013
Night
timeim
ages
acqu
ired
irregu
larly
Freely
available
14bit
Seve
nba
nds
Roy
etal.(20
14);Le
vinan
dPh
inn(201
6)Onlyve
rybright
objectsare
detected
Jilin
-1(JL1
-3B)
0.9
Laun
ched
Janu
ary
2017
Com
mercial
satellite,a
cquires
imag
eson
deman
d
N\A
8bit
430–
512nm
(blue),
489–
585nm
(green
)an
d58
0–72
0nm
(red
)
Zhen
get
al.(20
18)
https://www.cgsatellite.co
m/imag
ery/
luminou
s-im
agery/
JL1-07
/08
<1
Laun
ched
Janu
ary
2018
Com
mercial
satellite,a
cquires
imag
eson
deman
d
N\A
N\A
Panc
hrom
atic
andmulti-
spectral
(blue,
green,
red,
reded
ge,a
ndne
ar-infrared
band
s)
Zhao
etal.(20
19)
EROS-B
0.7
Night
lightsim
ages
offered
sinc
emid-
2013
Com
mercial
satellite,a
cquires
imag
eson
deman
d
N\A
16bit
Panc
hrom
atic
Levinet
al.,20
14;K
atzan
dLe
vin(201
6)
N. Levin, et al. Remote Sensing of Environment 237 (2020) 111443
3

districts, we move in cars with bright headlights. We have blotted out theheavens, and only a few scientists remain aware of stars and planets, me-teorites and comets.” (Russell, 1935).
The Artificial Light at Night (ALAN) Research Literature Database(http://alandb.darksky.org/, accessed September 16th, 2019) whichcovers 2,545 publications on the topic of light pollution (Fig. 3; notehowever, that the ALAN database does not include all publications onlight pollution or on remote sensing of night lights), has as one of itsfirst papers that of Edison (1880). However, publications on light pol-lution were scarce until the mid-20th century (Fig. 3; compare withDavies and Smyth, 2018). The first paper mentioning light pollution inits title (within this database) was only published in 1972, and it al-ready suspected possible negative health impacts from exposure to ar-tificial light at night (Burne, 1972). Other papers published in the early1970s on light pollution were more concerned with the negative im-pacts that artificial lighting has on the ability of astronomers on viewthe night sky (e.g., Riegel, 1973), and the front cover of Vol. 179 No4080 of Science shows the dramatic increase of city lights in Los An-geles between 1911 and 1965, as observed from Mount Wilson.
One of the first famous observations of cities’ lights from space isattributed to US astronaut John Glenn, who in his orbit of the Earth inFebruary 20th, 1962, saw Perth as the “City of Lights”, thanks to localcitizens and businesses who have turned on as many lights as they couldas a sign of support for his mission (Biggs et al., 2012). In many ways,the subsequent development of remote sensing of night lights, can becompared to the general development of Earth observation using day-time images for environmental monitoring. However, as will be de-scribed below, remote sensing of night lights suffers from a lack ofsensors, and consequently there is a temporal lag in the development ofalgorithms and customer-ready products.
2.2. Space borne sensors for measuring night lights
During nighttime, most passive remote sensing applications havefocused on the thermal or microwave spectral regions, measuring ra-diation related to heat emission (Weng, 2009). In the following sectionswe detail the various sensors and platforms from which remote sensingof night lights in the visible range has been performed.
2.2.1. DMSP/OLSThe first American satellites for Earth observation, launched in the
1960s, were either aimed for weather monitoring (TIROS-1, launchedon April 1, 1960; Rao et al., 1990) or for military reconnaissance – theCorona program (McDonald, 1995). The Defense Meteorological Sa-tellite Program (DMSP), started in the mid-1960s as the meteorologicalprogram of the US Department of Defense, aiming to collect globalcloud cover data day and night. The era of global satellite observationof electric lighting started in 1971 with the launch of the SAP (SensorAerospace vehicle electronics Package) instrument flown by the De-fense Meteorological Satellite Program. The SAP collected global ima-ging data in a panchromatic band spanning from 500 nm to 900 nm anda long-wave infrared channel. The signal from the visible band wasintensified using a photomultiplier tube. Dickinson et al. (1974) pre-sented a November 1971 SAP image showing nighttime lights ofNorthern Europe and gas flares in the North Sea. The purpose of the lowlight imaging was to enable the detection of clouds in the visible usingmoonlight as the illumination source (see e.g. Fig. 4). The requirementfor this came from Air Force meteorologists. A second generation lowlight imager, known as the Operational Linescan System (OLS) wascarried on DMSP Block 5D satellites, with a first launch in 1976. Aseries of nineteen OLS instruments have been flown and data collectioncontinues to the present (2019). However, the overpass times vary, withsome satellites in dawn-dusk orbits and others in day-night orbits(Fig. 5). Only the day-night satellites provide nighttime data in suffi-cient quantities to produce global nighttime lights products. While theexistence of DMSP system was acknowledged in 1972, the use of night-time images of the Earth within the remote sensing community wasvery limited until the 1990s (Fig. 3). This is mostly because until 1992DMSP/OLS images were written to film and were not available in di-gital form. The University of Colorado, National Snow and Ice Data
1
10
100
1000
1870 1890 1910 1930 1950 1970 1990 2010
srepap fo rebmun evitalu
muC
Year
Remote sensing papers in the ALAN database
Papers in the ALAN database with the wordpollu on in their tleAll papers in the ALAN database
Papers cited in this manuscript
Fig. 3. Cumulative number of papers on artificial lights in the Artificial Light atNight (ALAN) Research Literature Database (n= 2545) (http://alandb.darksky.org/, accessed September 16th, 2019). Also shown are papers where the title ofthe paper included the word pollution (n=271), and papers published in re-mote sensing journals or where either one of the words “remote”, “sensing”,“satellite”, “DMSP”, “VIIRS”, “Luojia”, “SQM” appeared in the title of the paperor that Chris Elvidge was one of the co-authors (n=380). The green line showsthe yearly numbers of papers cited in this manuscript (n=384). (For inter-pretation of the references to color in this figure legend, the reader is referred tothe Web version of this article.)
Fig. 4. Lunar eclipse over North America on 2014/10/08, viewed by VIIRSDNB. At far right, the eclipse had not yet begun, and the instrument observedclouds illuminated by full moonlight. The next strip was taken with the moonpartially eclipsed, and the dark strip when the moon was near to fully eclipsed.The final strip (at left) was taken one day earlier. Image prepared byChristopher Kyba based on image and data processing by NOAA's NationalGeophysical Data Center. Image available under a CC BY license at https://tinyurl.com/us-eclipse-20141008.
Fig. 5. DMSP local times at the ascending equatorial crossing.
N. Levin, et al. Remote Sensing of Environment 237 (2020) 111443
4
Center operated a film archive. Nonetheless, early scientific papersusing DMSP/OLS observations of artificial lights from space were al-ready published in the 1970s, with regards to astronomical light pol-lution (Hoag et al., 1973; Walker, 1973) and concerning the ability tomonitor various human activities such as cities’ lights, waste gas
burning, agricultural fires and fishing fleets who use lights (Croft, 1973,1978, 1979; Welch, 1980) (Fig. 6). Sullivan (1989) produced the firstglobal map of DMSP nighttime lights by mosaicking hand selectedDMSP film segments (Fig. 7). In comparison, the Corona satellite pro-gram and its associated photos were declassified much later than the
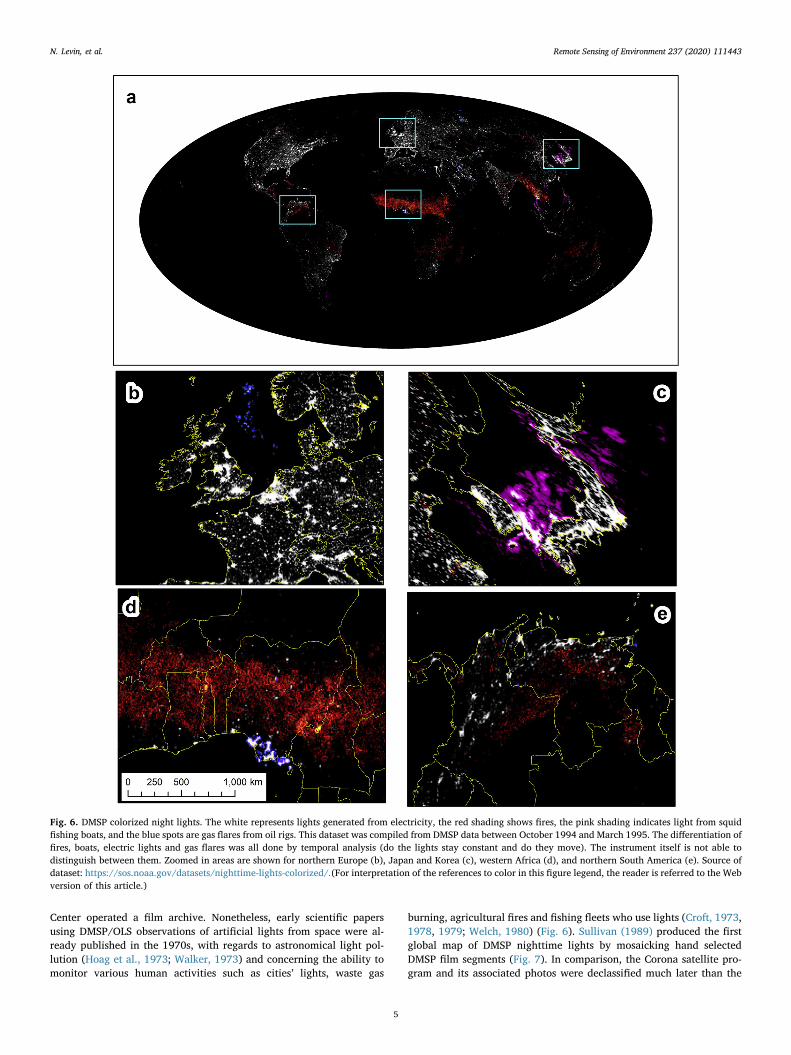
Fig. 6. DMSP colorized night lights. The white represents lights generated from electricity, the red shading shows fires, the pink shading indicates light from squidfishing boats, and the blue spots are gas flares from oil rigs. This dataset was compiled from DMSP data between October 1994 and March 1995. The differentiation offires, boats, electric lights and gas flares was all done by temporal analysis (do the lights stay constant and do they move). The instrument itself is not able todistinguish between them. Zoomed in areas are shown for northern Europe (b), Japan and Korea (c), western Africa (d), and northern South America (e). Source ofdataset: https://sos.noaa.gov/datasets/nighttime-lights-colorized/.(For interpretation of the references to color in this figure legend, the reader is referred to the Webversion of this article.)
N. Levin, et al. Remote Sensing of Environment 237 (2020) 111443
5
DMSP program, in 1995, and have since allowed the development ofvarious applications (Dashora et al., 2007).
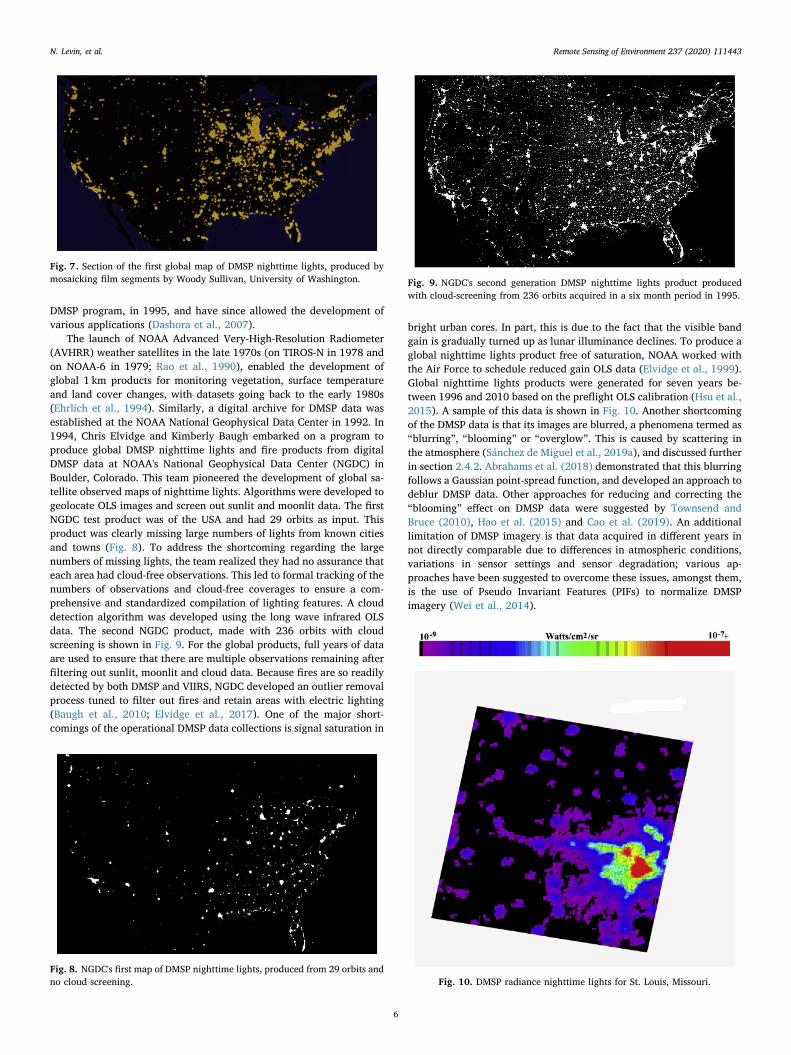
The launch of NOAA Advanced Very-High-Resolution Radiometer(AVHRR) weather satellites in the late 1970s (on TIROS-N in 1978 andon NOAA-6 in 1979; Rao et al., 1990), enabled the development ofglobal 1 km products for monitoring vegetation, surface temperatureand land cover changes, with datasets going back to the early 1980s(Ehrlich et al., 1994). Similarly, a digital archive for DMSP data wasestablished at the NOAA National Geophysical Data Center in 1992. In1994, Chris Elvidge and Kimberly Baugh embarked on a program toproduce global DMSP nighttime lights and fire products from digitalDMSP data at NOAA's National Geophysical Data Center (NGDC) inBoulder, Colorado. This team pioneered the development of global sa-tellite observed maps of nighttime lights. Algorithms were developed togeolocate OLS images and screen out sunlit and moonlit data. The firstNGDC test product was of the USA and had 29 orbits as input. Thisproduct was clearly missing large numbers of lights from known citiesand towns (Fig. 8). To address the shortcoming regarding the largenumbers of missing lights, the team realized they had no assurance thateach area had cloud-free observations. This led to formal tracking of thenumbers of observations and cloud-free coverages to ensure a com-prehensive and standardized compilation of lighting features. A clouddetection algorithm was developed using the long wave infrared OLSdata. The second NGDC product, made with 236 orbits with cloudscreening is shown in Fig. 9. For the global products, full years of dataare used to ensure that there are multiple observations remaining afterfiltering out sunlit, moonlit and cloud data. Because fires are so readilydetected by both DMSP and VIIRS, NGDC developed an outlier removalprocess tuned to filter out fires and retain areas with electric lighting(Baugh et al., 2010; Elvidge et al., 2017). One of the major short-comings of the operational DMSP data collections is signal saturation in
bright urban cores. In part, this is due to the fact that the visible bandgain is gradually turned up as lunar illuminance declines. To produce aglobal nighttime lights product free of saturation, NOAA worked withthe Air Force to schedule reduced gain OLS data (Elvidge et al., 1999).Global nighttime lights products were generated for seven years be-tween 1996 and 2010 based on the preflight OLS calibration (Hsu et al.,2015). A sample of this data is shown in Fig. 10. Another shortcomingof the DMSP data is that its images are blurred, a phenomena termed as“blurring”, “blooming” or “overglow”. This is caused by scattering inthe atmosphere (Sánchez de Miguel et al., 2019a), and discussed furtherin section 2.4.2. Abrahams et al. (2018) demonstrated that this blurringfollows a Gaussian point-spread function, and developed an approach todeblur DMSP data. Other approaches for reducing and correcting the“blooming” effect on DMSP data were suggested by Townsend andBruce (2010), Hao et al. (2015) and Cao et al. (2019). An additionallimitation of DMSP imagery is that data acquired in different years innot directly comparable due to differences in atmospheric conditions,variations in sensor settings and sensor degradation; various ap-proaches have been suggested to overcome these issues, amongst them,is the use of Pseudo Invariant Features (PIFs) to normalize DMSPimagery (Wei et al., 2014).
Fig. 7. Section of the first global map of DMSP nighttime lights, produced bymosaicking film segments by Woody Sullivan, University of Washington.
Fig. 8. NGDC's first map of DMSP nighttime lights, produced from 29 orbits andno cloud screening.
Fig. 9. NGDC's second generation DMSP nighttime lights product producedwith cloud-screening from 236 orbits acquired in a six month period in 1995.
Fig. 10. DMSP radiance nighttime lights for St. Louis, Missouri.
N. Levin, et al. Remote Sensing of Environment 237 (2020) 111443
6

Christopher Elvidge and his team NOAA-NGDC have led the de-velopment of the various annual products of DMSP/OLS (covering theyears between 1992 and 2013), which have been widely used, and arefreely accessible online athttps://ngdc.noaa.gov/eog/dmsp/downloadV4composites.html. The two major 1 km global products ofDMSP/OLS include average visible stable lights, and averagelights× percentage, and are further described below (Baugh et al.,2010), however a host of other products have also been developed withtime from DMSP/OLS data, including Global Radiance CalibratedNighttime Lights, global impervious surface area (Elvidge et al., 2007a),global gas flare time series (Elvidge et al., 2009a), and more. By pro-viding global time series of night lights, numerous papers have beenpublished utilizing this unique source to study urbanization, socio-economic changes and threats to biodiversity (Bennett and Smith,2017). False color composites of DMSP stable lights from different yearshave proven to be an effective way to visualize changes in artificiallighting and to follow patterns of urbanization, expansion of road net-works, economic expansion or decline and damages to infrastructure asthe result of armed conflicts (Fig. 11).
2.2.2. Landsat and nightsatEnvironmental monitoring of the Earth has been dramatically
boosted by the launch of the first Landsat satellite in 1972, and theongoing continuation of Landsat missions (whose entire archives be-came free to the public in 2009), and other civilian governmental sa-tellites, offering medium spatial resolutions between 5 and 100m atvarious spectral and temporal resolutions (Lauer et al., 1997; Roy et al.,2014). While Landsat satellites do acquire night-time images, these aremostly useful for their thermal information, as the optical sensors on-board the TM and ETM + sensors were not designed for low light levelsprevalent at night-time. However, the OLI sensor onboard Landsat 8,with its improved radiometric sensitivity, has been shown to be able todetect night-time lights from very bright areas such as gas flares andcity centers (Levin and Phinn, 2016). Unfortunately, no sensor has beenlaunched yet which offers operational multispectral monitoring of theEarth's night lights at medium spatial resolution. Nonetheless, the re-quirements of radiometric, spectral, spatial and temporal resolutions forsuch a sensor (termed NightSat) have been defined in a series of papers(Elvidge et al., 2007b; c, 2010), and are discussed in section 4.8 of thisreview paper. While two panchromatic sensors designed for observingnight lights and offering a spatial resolution of about 300m have beenlaunched in joint missions of CONAE and NASA (the SAC-C HSTC in2000, and the SAC-D HSC in 2011; Colomb et al., 2003; Sen et al.,2006), images from them are hardly available and few papers haveutilized them (but see Levin and Duke, 2012).
2.2.3. Remote sensing of night lights from the International Space Station2.2.3.1. Night-time astronauts photographs. Astronaut photography fromvarious NASA missions, including the Space Shuttle missions and theInternational Space Station (ISS), have long been used for observing avariety of environmental phenomena from low Earth orbits (Stefanovet al., 2017). The database of these photos is extensive, includes bothdaytime and nighttime photos, and is freely accessible via the Gatewayof Astronaut Photography of the Earth (https://eol.jsc.nasa.gov/). Thevery first human acquired images from the Earth at night that we knowof were the images taken by the astronauts of the Space Shuttle duringHercules/MSI mission (Simi et al., 1995). For example a picture ofCharlotte, US taken in 1993 was used to find the major sources of lightat night, with the result of identifying vertical signs near the roadstoward the airport that were lit on both sides with lights directedupwards to illuminate the signs.1 This pioneer and other works werelost during the pre-internet era.
From 2001 until the present, the crew of the ISS has been taking
images of Earth, space, and activities upon the station using digitalsingle lens reflex (DSLR) cameras. Their nighttime images are the oldestmultispectral images of the visible wavelengths emitted from the Earthat night. Most night-time ISS images of Earth and space were takeneither for outreach purposes or for the astronaut's pleasure, offering aunique perspective on our planet (Fig. 12). Nevertheless, they comprisea unique and valuable dataset. Although there are technical challengesassociated with radiometric calibration of such images (e.g. accountingfor window extinction), work done at the Complutense University ofMadrid over the last decade proves that calibration of ISS night lightimages is possible (Sánchez de Miguel et al., 2013a, 2013b, 2018;Sánchez de Miguel, 2015). One of the main problems of the astronautphotography is the motion blur produced by the orbital movement ofthe ISS. To solve this problem, astronaut Donald Pettit created ahandmade device to compensate the movement of the ISS on the mis-sion 006 (Pettit, 2009). Later, ESA created a special tripod calledNightpod (Sabbatini, 2014) used from the ISS030 to the ISS040 at least(precise date of decommissioning is unknown) (Fig. 13). While DSLRcameras can be modified and have their IR-filter removed, so as tomeasure incoming light also in the infrared band (which is useful bothfor astrophotography purposes and for monitoring artificial lightssources which emit light in the near infra-red; Andreić and Andreić,2010), the vast majority of astronaut night-time photography of theEarth, was limited to the visible range alone.
Fig. 11. False color composites of DMSP stable lights version 4, showing: (a)decrease in lights following the war in Syria; (b) expansion of roads in theUnited Arab Emirates (UAE); (c) the lit border between India and Pakistan; (d)urbanization in China; (e) economic decline in Ukraine and Moldova followingthe collapse of the Soviet Union; (f) temporal changes of gas flares from oilwells in Nigeria. (For interpretation of the references to color in this figurelegend, the reader is referred to the Web version of this article.)
1 Private communication. William Howard, 12 Aug 2015.
N. Levin, et al. Remote Sensing of Environment 237 (2020) 111443
7

The greatest advantages of night-time astronaut photos over othersources, are in their moderate spatial resolution (often between 5 and200m), and in being the first to provide color space borne night-time
images (Kyba et al., 2015a; ,Sánchez de Miguel et al., 2019b; Fig. 14),of hundreds of cities globally, albeit without any ordered acquisitionprogram (Fig. 13). Various studies have shown the value of thosephotos for studying socio-economic properties of cities at finer spatialresolutions than available by the DMSP/OLS (e.g., Levin and Duke,2012; Kotarba and Aleksandrowicz, 2016; Kuffer et al., 2018). Cali-brated DSLR images from the ISS have been used for epidemiologicalstudies (Garcia-Saenz et al., 2018), energy use and lighting technologystudies (Kyba et al., 2015a,b), environmental impact studies (Pauwelset al., 2019) and ecological studies (Mazor et al., 2013). In some cases,researchers have used ISS images without using, or at least withoutexplaining, a radiometric calibration; however, Sánchez de Miguel et al.(2013b) have developed a method to perform an absolute photometriccalibration of ISS photos. Two companies currently provide calibrationon demand of ISS images: www.noktosat.com and Eurosens. The “Citiesat Night” project team has occasionally produced radiance calibratedimages for scientific collaborations, and a project based at the Uni-versity of Exeter is currently working on a data processing pipeline toproduce a public database of calibrated images. The first mosaic of highresolution ISS images was made by Schmidt (2015), covering the ad-ministrative boundaries of the country of the Netherlands, and low
resolution mosaics were made using time lapses by Sánchez de Migueland Zamorano (2012), covering large parts of the US, Europe andmiddle-east.
Fig. 12. Night lights of the Levant, Astronaut photograph ISS053-E−50422,taken on 28/9/2017, 00:10:11 GMT. At the bottom of the image the denselypopulated Delta of the Nile can be seen, while the center of the image coversIsrael, the West Bank, Jordan and Lebanon. The consequences of the conflict inSyria are hinted in this photo, where Syria is mostly dark, in contrast with littowns and cities in Turkey to the north.
Fig. 13. The number of night-time ISS photos identified by the Cities at Night crowdsourcing project (http://citiesatnight.org/index.php/maps/). Note that in severalISS missions many night-time photos were taken, while in other missions hardly any night-time photos were taken. The data shown does not include the recent threeyears.
N. Levin, et al. Remote Sensing of Environment 237 (2020) 111443
8

2.2.3.2. Citizen science: cities at night. Currently, the astronautphotographs from the ISS are the largest online multispectral archiveof night-time images of the Earth (https://eol.jsc.nasa.gov), with aunique potential for light pollution studies and to track changes inlighting technologies. However, these images lack precise location andgeoreferencing, and in addition, all the images of the Earth at night aremixed with images of astronomical and meteorological images, makingit difficult to identify night-time images from the ISS, as they are oftennot tagged adequately. A citizen science program called “Cities atNight” was therefore launched with its major aim to provide animproved catalogue of night-time images from the ISS (Sánchez deMiguel et al., 2014). The project has three steps, classification/taggingto find the cities images called “Dark skies”, location of the cities called“Lost at Night” and georeferencing called “Night cities”. Thanks to thecollaboration of more than 20,000 volunteers, the project has been ableto tag more than 190,000 nocturnal images of mid and high spatialresolution (resolution from 5 to 200m). The project was also able tolocate more than 3000 images of cities with at least one control pointand 700 images of cities with enough control points to be georeferenced(Sánchez de Miguel, 2015). A fourth app had been created as a gamifiedversion of “Dark Skies” called “Night Knights” with all the unprocessedanswers of the project available from the beginning, but also someproducts (a large processed tagged catalogue of images with low precise
location and smaller sample precise located images) have been releasedand are available of the web page of the project (Sánchez de Miguelet al., 2018). The images located by the volunteers and the researchershave already been used on several papers concerning light pollutionmonitoring (Sánchez de Miguel. 2015), epidemiological studies(Garcia-Saenz et al., 2018) and ecological studies (Pauwels et al.,2019). Several groups have used the “Cities at Night” as training samplefor computer vision proposes, including Minh Hieu (2016), Calegariet al. (2018) and Sadler (2018). Based on this catalogue it can be seenthat ISS night-time photos are not representing all parts of the world,and are more common in the urban areas of North America, Europe, theMiddle East, eastern China and Japan (Fig. 15a).
2.2.3.3. Additional night-time sensors on the ISS. Another source ofimages of the Earth at night from the ISS is dedicatedinstrumentation on the ISS. For example, the experiment LRO(Lightning and Sprites Observation) (Farges and Blanc, 2016) wasable to produce around at least 100 night-time images of urban areas(see Figure S1 in Farges and Blanc, 2016); such imagery constituted thelargest sample of medium spatial resolution (at about 400m) images ofEarth at night taken before the ISS026 mission. However, these imagesinclude sensitivity in the infrared regime, so they are difficult tocompare to other images. Other instruments of similar science casesas ASIN recently arrived to the ISS might also be able to acquire somelight pollution measurements. Since 2011, the Japanese Space Agency(JAXA) has been using a series of highly sensitive cameras on the ISS forthe study of transient luminous event (TLEs) such as lightning of sprites,or other projects (Yair et al., 2013). In the first videos, the main goalwas the detection of TLEs, but light emissions from the Earth were alsoobvious. The second generation of these cameras was installed in 2016,and there is currently an ongoing collaboration between the Universityof Exeter and JAXA to provide radiometric calibration of this data.
2.2.4. VIIRS/DNBThe two MODIS sensors, onboard the Terra and Aqua satellites
(launched in 1999 and 2002, respectively), with their 36 spectralbands, have led to the development of dozens of global products atvarious spatial and temporal resolutions, for monitoring vegetation,snow, fires, surface temperature etc. (Justice et al., 2002). Providingcontinuity to MODIS, the Visible Infrared Imaging Radiometer Suite(VIIRS) sensor onboard the Suomi NPP (Murphy et al., 2001) waslaunched in October 2011, and has been fitted with a specific pan-chromatic sensor designed for measuring night time lights – the Dayand Night Band (DNB) (Miller et al., 2012, 2013). The VIIRS/DNBpresents a significant improvement over the DMSP/OLS sensor, in dataavailability (with daily images provided for free), in its higher spatialresolution (740m, instead of about 3 km for the DMSP), in providingradiometrically calibrated data which is sensitive to lower light levelsand does not saturate in urban areas, and in the reduced overglow (Liaoet al., 2013; Elvidge et al., 2013a, 2017, Fig. 12). Therefore, globalnighttime lights product generation has switched over from DMSP toVIIRS data in 2012, with the last annual products of DMSP produced forthe year 2013 (Elvidge et al., 2017). The first products made availablebased on VIIRS/DNB data provided global monthly composites of nightlights, starting in April 2012 (available athttps://eogdata.mines.edu/download_dnb_composites.html), which have already allowed to ad-vance our understanding on various topics, such as seasonal changes innight-time brightness (Levin, 2017), and detecting the negative impactsof military conflicts (Li et al., 2017). Raw VIIRS/DNB imagery are alsofreely available for downloading at a nightly basis (in contrast withDMSP/OLS data), and this has enabled to gain insights on the aniso-tropic characteristics of artificial lights (Li et al., 2019b). A novel pro-duct released in 2019, is NASA's Black Marble nighttime lights productsuite (VNP46A1), at a spatial resolution of 500m (Román et al., 2018).This product provides cloud-free, atmospheric-, terrain-, vegetation-,snow-, lunar-, and stray light-corrected radiances for estimating daily
Fig. 14. Berlin at day and night: (a) Landsat 8 OLI, April 2017, true color day-time composite; (b) Astronaut photography from the International SpaceStation, ISS047-E−29989, March 2016; (c) Luojia01 night-time image, August25th, 2018; (d) VIIRS/DNB monthly composite, October 2016. (For inter-pretation of the references to color in this figure legend, the reader is referred tothe Web version of this article.)
N. Levin, et al. Remote Sensing of Environment 237 (2020) 111443
9
nighttime lights (NTL) (Román et al., 2018), thus enabling fine trackingof conflict affected displaced populations, damages to the electricitygrid following disasters, and identification of events when and wherepeople congregate (Román and Stokes, 2015).
2.2.5. Commercial satellites and cubesatsA new phase in Earth observation from space ushered in 1999 with
the launch of Ikonos – the world's first high spatial resolution com-mercial satellite, and the first to offer a 1m panchromatic band fromspace (Belward and Skøien, 2015). Since then additional companieshave joined in, and at present the state of the art Earth observationcommercial satellites are Digital Globe's WorldView 3 and 4 (launchedin 2014 and 2016, respectively), offering a panchromatic band of31 cm, and 28 additional spectral bands at various spatial resolutions of1.24m, 3.7m and 30m. The first commercial satellite with high spatialresolution night-time capabilities (at 0.7 m), was the Israeli EROS-Bsatellite, which was launched in 2006, but only started offering night-time acquisition publicly in 2013 (Levin et al., 2014). The first com-mercial satellite to offer multispectral (red, green and blue) night-timelights images (at 0.92m) was launched in 2017: the Chinese JL1-3B(Jilin-1) satellite (Zheng et al., 2018). Such high spatial resolution sa-tellites enable to study urban land use in finer details (as in Katz andLevin, 2016) and possibly to start and classify lighting sources.
The current revolution in space borne remote sensing is that of using
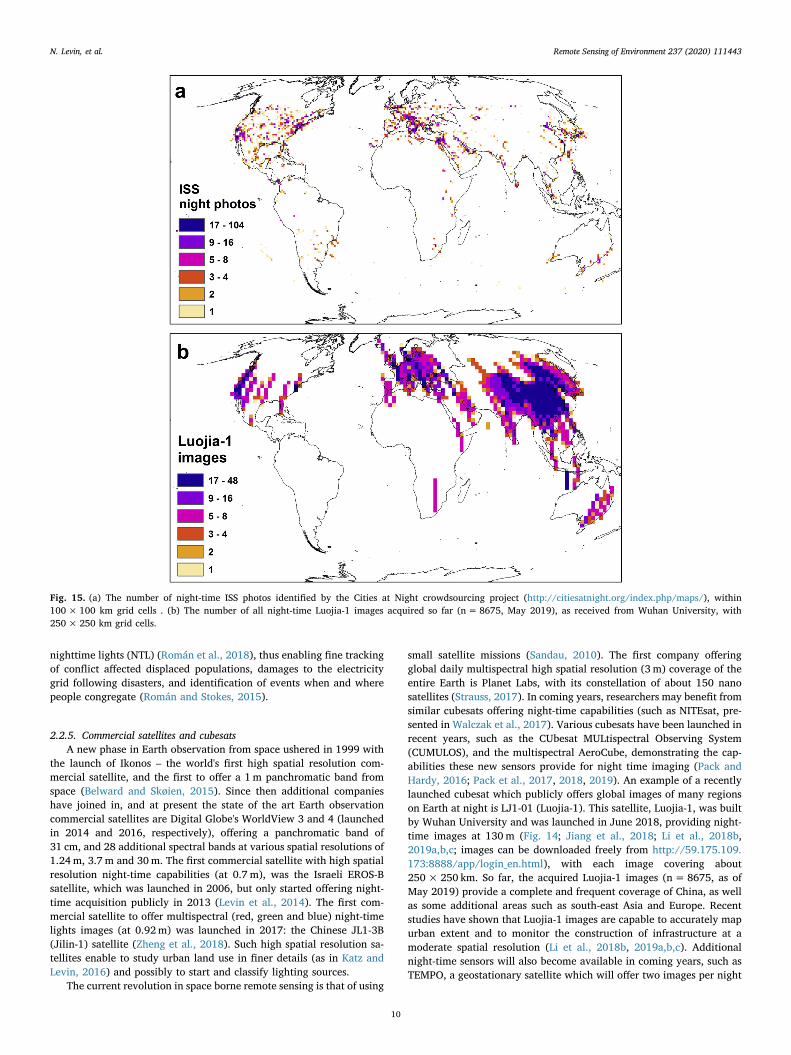
small satellite missions (Sandau, 2010). The first company offeringglobal daily multispectral high spatial resolution (3m) coverage of theentire Earth is Planet Labs, with its constellation of about 150 nanosatellites (Strauss, 2017). In coming years, researchers may benefit fromsimilar cubesats offering night-time capabilities (such as NITEsat, pre-sented in Walczak et al., 2017). Various cubesats have been launched inrecent years, such as the CUbesat MULtispectral Observing System(CUMULOS), and the multispectral AeroCube, demonstrating the cap-abilities these new sensors provide for night time imaging (Pack andHardy, 2016; Pack et al., 2017, 2018, 2019). An example of a recentlylaunched cubesat which publicly offers global images of many regionson Earth at night is LJ1-01 (Luojia-1). This satellite, Luojia-1, was builtby Wuhan University and was launched in June 2018, providing night-time images at 130m (Fig. 14; Jiang et al., 2018; Li et al., 2018b,2019a,b,c; images can be downloaded freely from http://59.175.109.173:8888/app/login_en.html), with each image covering about250× 250 km. So far, the acquired Luojia-1 images (n=8675, as ofMay 2019) provide a complete and frequent coverage of China, as wellas some additional areas such as south-east Asia and Europe. Recentstudies have shown that Luojia-1 images are capable to accurately mapurban extent and to monitor the construction of infrastructure at amoderate spatial resolution (Li et al., 2018b, 2019a,b,c). Additionalnight-time sensors will also become available in coming years, such asTEMPO, a geostationary satellite which will offer two images per night
Fig. 15. (a) The number of night-time ISS photos identified by the Cities at Night crowdsourcing project (http://citiesatnight.org/index.php/maps/), within100× 100 km grid cells . (b) The number of all night-time Luojia-1 images acquired so far (n= 8675, May 2019), as received from Wuhan University, with250× 250 km grid cells.
N. Levin, et al. Remote Sensing of Environment 237 (2020) 111443
10
over North America (Zoogman et al., 2017).
2.3. Airborne remote sensing of night lights
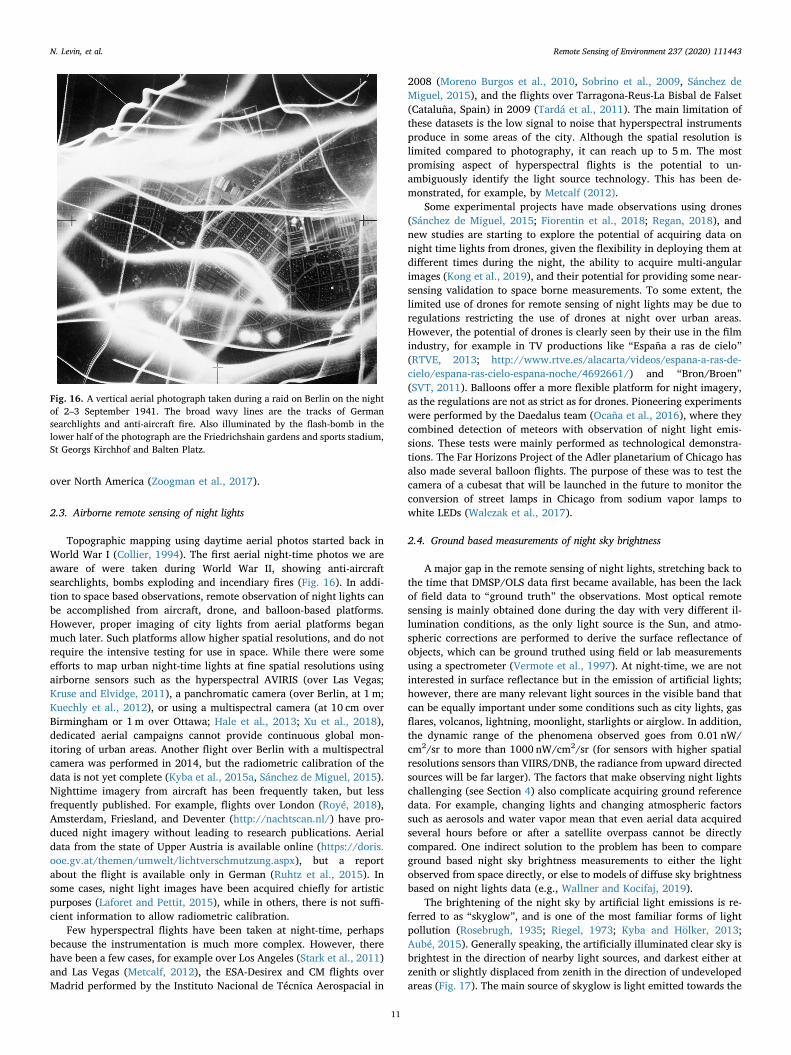
Topographic mapping using daytime aerial photos started back inWorld War I (Collier, 1994). The first aerial night-time photos we areaware of were taken during World War II, showing anti-aircraftsearchlights, bombs exploding and incendiary fires (Fig. 16). In addi-tion to space based observations, remote observation of night lights canbe accomplished from aircraft, drone, and balloon-based platforms.However, proper imaging of city lights from aerial platforms beganmuch later. Such platforms allow higher spatial resolutions, and do notrequire the intensive testing for use in space. While there were someefforts to map urban night-time lights at fine spatial resolutions usingairborne sensors such as the hyperspectral AVIRIS (over Las Vegas;Kruse and Elvidge, 2011), a panchromatic camera (over Berlin, at 1 m;Kuechly et al., 2012), or using a multispectral camera (at 10 cm overBirmingham or 1m over Ottawa; Hale et al., 2013; Xu et al., 2018),dedicated aerial campaigns cannot provide continuous global mon-itoring of urban areas. Another flight over Berlin with a multispectralcamera was performed in 2014, but the radiometric calibration of thedata is not yet complete (Kyba et al., 2015a, Sánchez de Miguel, 2015).Nighttime imagery from aircraft has been frequently taken, but lessfrequently published. For example, flights over London (Royé, 2018),Amsterdam, Friesland, and Deventer (http://nachtscan.nl/) have pro-duced night imagery without leading to research publications. Aerialdata from the state of Upper Austria is available online (https://doris.ooe.gv.at/themen/umwelt/lichtverschmutzung.aspx), but a reportabout the flight is available only in German (Ruhtz et al., 2015). Insome cases, night light images have been acquired chiefly for artisticpurposes (Laforet and Pettit, 2015), while in others, there is not suffi-cient information to allow radiometric calibration.
Few hyperspectral flights have been taken at night-time, perhapsbecause the instrumentation is much more complex. However, therehave been a few cases, for example over Los Angeles (Stark et al., 2011)and Las Vegas (Metcalf, 2012), the ESA-Desirex and CM flights overMadrid performed by the Instituto Nacional de Técnica Aerospacial in
2008 (Moreno Burgos et al., 2010, Sobrino et al., 2009, Sánchez deMiguel, 2015), and the flights over Tarragona-Reus-La Bisbal de Falset(Cataluña, Spain) in 2009 (Tardá et al., 2011). The main limitation ofthese datasets is the low signal to noise that hyperspectral instrumentsproduce in some areas of the city. Although the spatial resolution islimited compared to photography, it can reach up to 5m. The mostpromising aspect of hyperspectral flights is the potential to un-ambiguously identify the light source technology. This has been de-monstrated, for example, by Metcalf (2012).
Some experimental projects have made observations using drones(Sánchez de Miguel, 2015; Fiorentin et al., 2018; Regan, 2018), andnew studies are starting to explore the potential of acquiring data onnight time lights from drones, given the flexibility in deploying them atdifferent times during the night, the ability to acquire multi-angularimages (Kong et al., 2019), and their potential for providing some near-sensing validation to space borne measurements. To some extent, thelimited use of drones for remote sensing of night lights may be due toregulations restricting the use of drones at night over urban areas.However, the potential of drones is clearly seen by their use in the filmindustry, for example in TV productions like “España a ras de cielo”(RTVE, 2013; http://www.rtve.es/alacarta/videos/espana-a-ras-de-cielo/espana-ras-cielo-espana-noche/4692661/) and “Bron/Broen”(SVT, 2011). Balloons offer a more flexible platform for night imagery,as the regulations are not as strict as for drones. Pioneering experimentswere performed by the Daedalus team (Ocaña et al., 2016), where theycombined detection of meteors with observation of night light emis-sions. These tests were mainly performed as technological demonstra-tions. The Far Horizons Project of the Adler planetarium of Chicago hasalso made several balloon flights. The purpose of these was to test thecamera of a cubesat that will be launched in the future to monitor theconversion of street lamps in Chicago from sodium vapor lamps towhite LEDs (Walczak et al., 2017).
2.4. Ground based measurements of night sky brightness
A major gap in the remote sensing of night lights, stretching back tothe time that DMSP/OLS data first became available, has been the lackof field data to “ground truth” the observations. Most optical remotesensing is mainly obtained done during the day with very different il-lumination conditions, as the only light source is the Sun, and atmo-spheric corrections are performed to derive the surface reflectance ofobjects, which can be ground truthed using field or lab measurementsusing a spectrometer (Vermote et al., 1997). At night-time, we are notinterested in surface reflectance but in the emission of artificial lights;however, there are many relevant light sources in the visible band thatcan be equally important under some conditions such as city lights, gasflares, volcanos, lightning, moonlight, starlights or airglow. In addition,the dynamic range of the phenomena observed goes from 0.01 nW/cm2/sr to more than 1000 nW/cm2/sr (for sensors with higher spatialresolutions sensors than VIIRS/DNB, the radiance from upward directedsources will be far larger). The factors that make observing night lightschallenging (see Section 4) also complicate acquiring ground referencedata. For example, changing lights and changing atmospheric factorssuch as aerosols and water vapor mean that even aerial data acquiredseveral hours before or after a satellite overpass cannot be directlycompared. One indirect solution to the problem has been to compareground based night sky brightness measurements to either the lightobserved from space directly, or else to models of diffuse sky brightnessbased on night lights data (e.g., Wallner and Kocifaj, 2019).
The brightening of the night sky by artificial light emissions is re-ferred to as “skyglow”, and is one of the most familiar forms of lightpollution (Rosebrugh, 1935; Riegel, 1973; Kyba and Hölker, 2013;Aubé, 2015). Generally speaking, the artificially illuminated clear sky isbrightest in the direction of nearby light sources, and darkest either atzenith or slightly displaced from zenith in the direction of undevelopedareas (Fig. 17). The main source of skyglow is light emitted towards the
Fig. 16. A vertical aerial photograph taken during a raid on Berlin on the nightof 2–3 September 1941. The broad wavy lines are the tracks of Germansearchlights and anti-aircraft fire. Also illuminated by the flash-bomb in thelower half of the photograph are the Friedrichshain gardens and sports stadium,St Georgs Kirchhof and Balten Platz.
N. Levin, et al. Remote Sensing of Environment 237 (2020) 111443
11
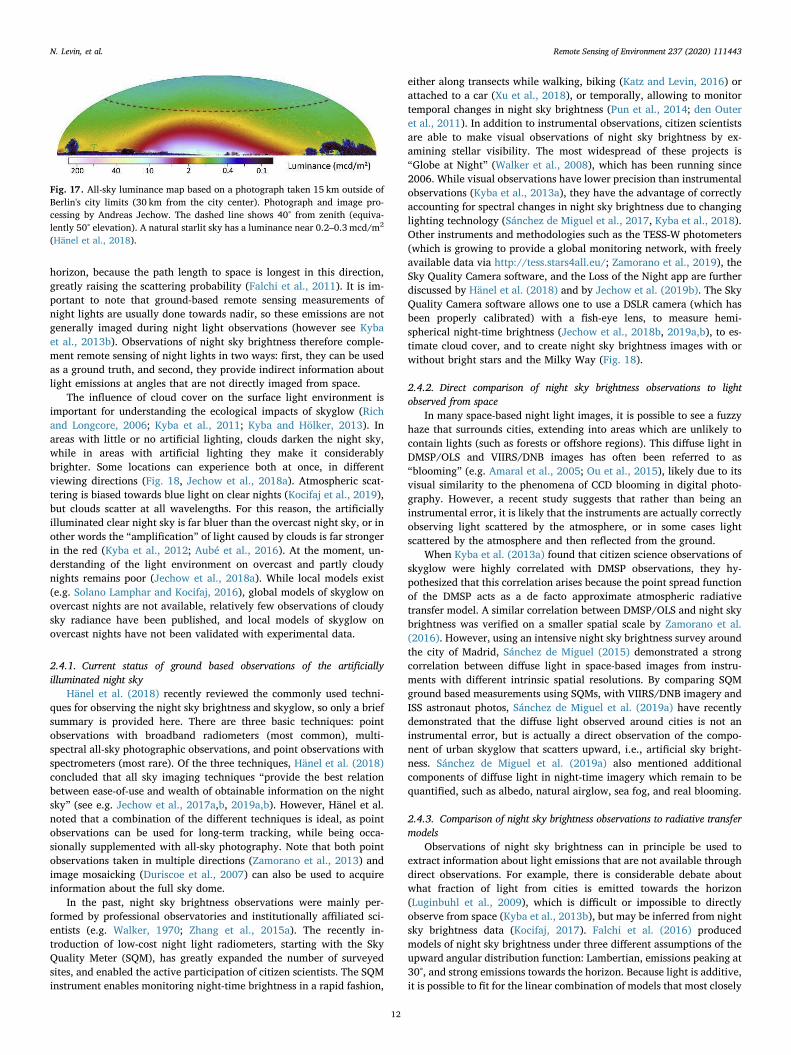
horizon, because the path length to space is longest in this direction,greatly raising the scattering probability (Falchi et al., 2011). It is im-portant to note that ground-based remote sensing measurements ofnight lights are usually done towards nadir, so these emissions are notgenerally imaged during night light observations (however see Kybaet al., 2013b). Observations of night sky brightness therefore comple-ment remote sensing of night lights in two ways: first, they can be usedas a ground truth, and second, they provide indirect information aboutlight emissions at angles that are not directly imaged from space.
The influence of cloud cover on the surface light environment isimportant for understanding the ecological impacts of skyglow (Richand Longcore, 2006; Kyba et al., 2011; Kyba and Hölker, 2013). Inareas with little or no artificial lighting, clouds darken the night sky,while in areas with artificial lighting they make it considerablybrighter. Some locations can experience both at once, in differentviewing directions (Fig. 18, Jechow et al., 2018a). Atmospheric scat-tering is biased towards blue light on clear nights (Kocifaj et al., 2019),but clouds scatter at all wavelengths. For this reason, the artificiallyilluminated clear night sky is far bluer than the overcast night sky, or inother words the “amplification” of light caused by clouds is far strongerin the red (Kyba et al., 2012; Aubé et al., 2016). At the moment, un-derstanding of the light environment on overcast and partly cloudynights remains poor (Jechow et al., 2018a). While local models exist(e.g. Solano Lamphar and Kocifaj, 2016), global models of skyglow onovercast nights are not available, relatively few observations of cloudysky radiance have been published, and local models of skyglow onovercast nights have not been validated with experimental data.
2.4.1. Current status of ground based observations of the artificiallyilluminated night sky
Hänel et al. (2018) recently reviewed the commonly used techni-ques for observing the night sky brightness and skyglow, so only a briefsummary is provided here. There are three basic techniques: pointobservations with broadband radiometers (most common), multi-spectral all-sky photographic observations, and point observations withspectrometers (most rare). Of the three techniques, Hänel et al. (2018)concluded that all sky imaging techniques “provide the best relationbetween ease-of-use and wealth of obtainable information on the nightsky” (see e.g. Jechow et al., 2017a,b, 2019a,b). However, Hänel et al.noted that a combination of the different techniques is ideal, as pointobservations can be used for long-term tracking, while being occa-sionally supplemented with all-sky photography. Note that both pointobservations taken in multiple directions (Zamorano et al., 2013) andimage mosaicking (Duriscoe et al., 2007) can also be used to acquireinformation about the full sky dome.
In the past, night sky brightness observations were mainly per-formed by professional observatories and institutionally affiliated sci-entists (e.g. Walker, 1970; Zhang et al., 2015a). The recently in-troduction of low-cost night light radiometers, starting with the SkyQuality Meter (SQM), has greatly expanded the number of surveyedsites, and enabled the active participation of citizen scientists. The SQMinstrument enables monitoring night-time brightness in a rapid fashion,
either along transects while walking, biking (Katz and Levin, 2016) orattached to a car (Xu et al., 2018), or temporally, allowing to monitortemporal changes in night sky brightness (Pun et al., 2014; den Outeret al., 2011). In addition to instrumental observations, citizen scientistsare able to make visual observations of night sky brightness by ex-amining stellar visibility. The most widespread of these projects is“Globe at Night” (Walker et al., 2008), which has been running since2006. While visual observations have lower precision than instrumentalobservations (Kyba et al., 2013a), they have the advantage of correctlyaccounting for spectral changes in night sky brightness due to changinglighting technology (Sánchez de Miguel et al., 2017, Kyba et al., 2018).Other instruments and methodologies such as the TESS-W photometers(which is growing to provide a global monitoring network, with freelyavailable data via http://tess.stars4all.eu/; Zamorano et al., 2019), theSky Quality Camera software, and the Loss of the Night app are furtherdiscussed by Hänel et al. (2018) and by Jechow et al. (2019b). The SkyQuality Camera software allows one to use a DSLR camera (which hasbeen properly calibrated) with a fish-eye lens, to measure hemi-spherical night-time brightness (Jechow et al., 2018b, 2019a,b), to es-timate cloud cover, and to create night sky brightness images with orwithout bright stars and the Milky Way (Fig. 18).
2.4.2. Direct comparison of night sky brightness observations to lightobserved from space
In many space-based night light images, it is possible to see a fuzzyhaze that surrounds cities, extending into areas which are unlikely tocontain lights (such as forests or offshore regions). This diffuse light inDMSP/OLS and VIIRS/DNB images has often been referred to as“blooming” (e.g. Amaral et al., 2005; Ou et al., 2015), likely due to itsvisual similarity to the phenomena of CCD blooming in digital photo-graphy. However, a recent study suggests that rather than being aninstrumental error, it is likely that the instruments are actually correctlyobserving light scattered by the atmosphere, or in some cases lightscattered by the atmosphere and then reflected from the ground.
When Kyba et al. (2013a) found that citizen science observations ofskyglow were highly correlated with DMSP observations, they hy-pothesized that this correlation arises because the point spread functionof the DMSP acts as a de facto approximate atmospheric radiativetransfer model. A similar correlation between DMSP/OLS and night skybrightness was verified on a smaller spatial scale by Zamorano et al.(2016). However, using an intensive night sky brightness survey aroundthe city of Madrid, Sánchez de Miguel (2015) demonstrated a strongcorrelation between diffuse light in space-based images from instru-ments with different intrinsic spatial resolutions. By comparing SQMground based measurements using SQMs, with VIIRS/DNB imagery andISS astronaut photos, Sánchez de Miguel et al. (2019a) have recentlydemonstrated that the diffuse light observed around cities is not aninstrumental error, but is actually a direct observation of the compo-nent of urban skyglow that scatters upward, i.e., artificial sky bright-ness. Sánchez de Miguel et al. (2019a) also mentioned additionalcomponents of diffuse light in night-time imagery which remain to bequantified, such as albedo, natural airglow, sea fog, and real blooming.
2.4.3. Comparison of night sky brightness observations to radiative transfermodels
Observations of night sky brightness can in principle be used toextract information about light emissions that are not available throughdirect observations. For example, there is considerable debate aboutwhat fraction of light from cities is emitted towards the horizon(Luginbuhl et al., 2009), which is difficult or impossible to directlyobserve from space (Kyba et al., 2013b), but may be inferred from nightsky brightness data (Kocifaj, 2017). Falchi et al. (2016) producedmodels of night sky brightness under three different assumptions of theupward angular distribution function: Lambertian, emissions peaking at30°, and strong emissions towards the horizon. Because light is additive,it is possible to fit for the linear combination of models that most closely
Fig. 17. All-sky luminance map based on a photograph taken 15 km outside ofBerlin's city limits (30 km from the city center). Photograph and image pro-cessing by Andreas Jechow. The dashed line shows 40° from zenith (equiva-lently 50° elevation). A natural starlit sky has a luminance near 0.2–0.3 mcd/m2
(Hänel et al., 2018).
N. Levin, et al. Remote Sensing of Environment 237 (2020) 111443
12
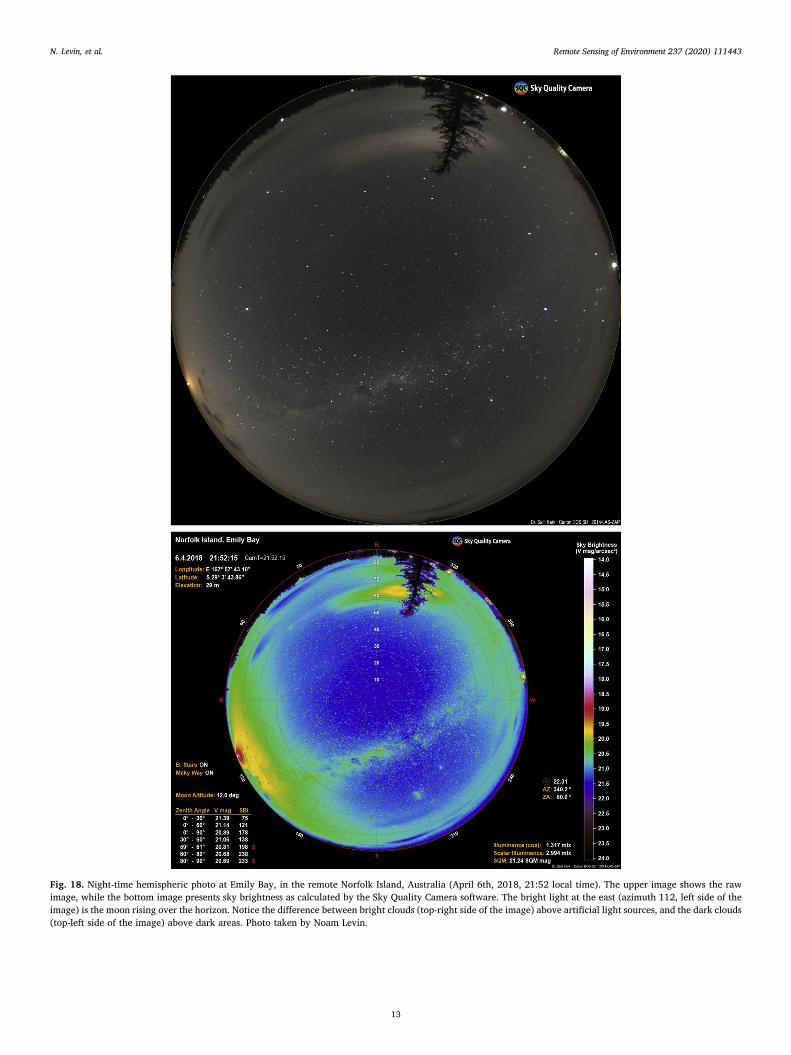
Fig. 18. Night-time hemispheric photo at Emily Bay, in the remote Norfolk Island, Australia (April 6th, 2018, 21:52 local time). The upper image shows the rawimage, while the bottom image presents sky brightness as calculated by the Sky Quality Camera software. The bright light at the east (azimuth 112, left side of theimage) is the moon rising over the horizon. Notice the difference between bright clouds (top-right side of the image) above artificial light sources, and the dark clouds(top-left side of the image) above dark areas. Photo taken by Noam Levin.
N. Levin, et al. Remote Sensing of Environment 237 (2020) 111443
13

matches the data. In the case of Falchi et al. (2016), the data were SQMobservations at zenith from a number of academically affiliated andcitizen scientists, notably including Ribas (2016), Zamorano et al.(2016), and Globe at Night. A similar procedure could in principle beused with all-sky camera data.
The conditions under which skyglow models are accurate remainsan open question. The global model of Falchi et al. (2016) does notconsider shadowing by mountains, for example, so it is likely that errorsare larger in mountainous regions. Ges et al. (2018) compared thepredictions of Falchi et al. (2016) to SQM observations made along atransect from Barcelona out to sea. They found extremely good agree-ment with the model under atmospheric conditions similar to thoseupon which the model is based, but disagreement of up to 50% on anight with better optical conditions. In particular, they found that on anight with low aerosol load, the sky was darker than predicted nearBarcelona, while far out to sea the sky was brighter than predicted.
There is a need for further comparison of models to observations,and direct comparisons of models to each other (e.g. Aubé and Kocifaj,2012). As skyglow models are used to make lighting policy re-commendations (e.g. Aubé et al., 2018), it is important to verify thattheir predictions are correct. Bará (2017) recently examined how denseobservations should be in order to provide reliable data on zenith nightsky brightness. He concluded that observations on a 1 km grid providesufficient resolution for interpolation between the points to accuratelyrepresent night sky brightness. A major challenge for comparing modelsto observations occurs in areas where natural light sources such asairglow and stars are brighter than the artificial component of night skybrightness (Bará et al., 2015). Finally, the shifting spectrum of skyglowdue to the change to LED technology poses a challenge for both ob-servations and modeling, and is discussed in detail in section 4.5.
3. Applications of remote sensing of night lights
In this section, we aim to provide a brief overview of some of themost common applications of night lights data made using the existingand historical sensors. The aim is to demonstrate the breadth of existingstudies, and to refer the reader to historical, key, and review papersabout each topic. Readers should understand that for each topic, aconsiderably larger base of scholarship exists, and that not all appli-cations of night lights are reviewed here. For example, we do not reviewstudies on whether lighting benefits public safety (and/or the percep-tion of safety), and on whether there is correspondence between highernight-time brightness, and decreased crime rates and car accidents(Painter, 1996; Marchant, 2004, 2017; Peña-García et al., 2015;Steinbach et al., 2015). Where relevant, we highlight some of the mainchallenges in the applications, and how these may be addressed withfuture sensors. These challenges and opportunities are then addressedin more detail in the following section.
3.1. Mapping urbanization processes
Our world has been rapidly urbanizing in recent decades. As of2014, more than 54% of the global population live in urban areas, andby 2100, 70%–90% of the world's population, which is projected toincrease by another three billion, will live in urban regions (UnitedNations, 2014). Due to broad impacts of the concentrated human ac-tivities and associated built environment, cities are now a major factorshaping the Earth system and are considered agents of global change(Mills, 2010). Cities worldwide now occupy only about 2% of the globalland surface (Akbari et al., 2009), but produce more than 90% of theworld gross domestic production (GDP) (Gutman, 2007), consumingmore than 70% of the available energy (Nakićenović, 2012), and gen-erating more than 71% of anthropogenic greenhouse gas emissions(Hoornweg et al., 2011). There is therefore an urgent need for timelyand reliable information on the extent of urban areas to support sus-tainable urban development and management (Ban et al., 2015). Recent
studies have highlighted the utility of NTL time-series data, alongsidedaytime land sensors and population censuses to help illuminate im-portant aspects about the character of urbanization, and to identifygrowing informal settlements with inadequate infrastructure (Stokesand Seto 2019). Both capabilities are particularly useful for monitoringprogress towards two of the United Nations Sustainable DevelopmentGoals under the Agenda 2030: Goal 7.1 (ensure universal access toaffordable, reliable and modern energy services) and Goal 11.1 (ensureaccess for all to adequate, safe and affordable housing and basic ser-vices and upgrade slums).
Due to the fact that cities are brightly lit during the night, urbanareas can be easily identified in nighttime light remote sensing data.Indeed, one of the first uses of NTL data from DMSP/OLS was to de-lineate urban extents, and DMSP/OLS data is one of the earliest datasetsavailable for mapping our urbanizing planet (Zhu et al., 2019), andhave been shown as useful for tracking electrification rates also in ruralareas (Min et al., 2013; Min and Gaba, 2014). The panchromatic natureof DMSP/OLS NTL data first encouraged researchers to find an optimalthreshold to separate urban areas from their backgrounds (e.g. Imhoffet al., 1997; Small et al., 2005). However, it turned out that it is notstraightforward to find a single optimal threshold that can accuratelydelineate both large cities and small cities simultaneously (Zhou et al.,2015). While a larger threshold might be good for delineating largecities but tends to overlook small towns, a smaller threshold can bringback small towns but often leads to overestimating the extents of largecities. Such a situation becomes even more complicated due to theoverglow effect in DMSP/OLS, and due to the use of different types oflighting together with different street lighting standards in differentcountries (Small, 2005). Optimal thresholds vary across space and ascheme of dynamic thresholds is required for large-scale and temporaldynamic urban extent mapping (Zhou et al., 2014; Elvidge et al. 1997b,2009b; Imhoff et al., 1997; Small et al., 2005; Cao et al., 2009).
Due to the saturation of DMSP/OLS within urban areas, theseimages lack textural information, making it very hard to map urbanpatterns within cities. However, with the improved radiometric per-formance of VIIRS/DNB, new methods are being developed, demon-strating for example the ability to map local urban centers (Chen et al.,2017). The newer VIIRS/DNB nighttime light data is also better thanDMSP/OLS data in mapping urban extents (Shi et al., 2014), and at-tention has been given to determine dynamic thresholds for mappingusing ancillary information (He et al., 2006; Cao et al., 2009; Zhouet al., 2014; Liu et al., 2015). Recently, researchers have started to lookinto the potential of integrating DMSP/OLS with the Moderate Re-solution Imaging Spectroradiometer (MODIS) (Guo et al., 2015; Lu andWeng, 2002; Zhang et al., 2013; Ouyang et al., 2019) or Landsat at afiner spatial resolution (Zhang et al., 2015b; Goldblatt et al., 2018), toimprove the accuracy and performance of regional and global urbanextent mapping, developing spectral indices such as the vegetationadjusted NTL urban index (VANUI) (Zhang et al., 2013).
The long historical archive of DMSP/OLS NTL data not only allowsstatic urban extent mapping but also has high potential in character-izing urban extent dynamics at regional and global scales (Small andElvidge, 2013). For example, Yi et al. (2014) utilized multitemporalDMSP/OLS NTL annual composites to study urbanization dynamics inNortheast China, Liu et al. (2012) and Ma et al. (2012, 2015) exploredurbanization in all of China, Álvarez-Berríos et al. (2013) examinedSouth America, Pandey et al. (2013) examined India, Zhang and Seto(2011) examined China, India, Japan and the conterminous UnitedStates, Castrence et al. (2014) studied Hanoi, Vietnam, and Zhang et al.(2016) did this for the entire globe. In a recent paper, Zhou et al. (2018)developed a new method to generate temporally and spatially con-sistent global urban mapping, finding that global urban area has in-creased from 0.23% in 1992 to 0.53% in 2013.
N. Levin, et al. Remote Sensing of Environment 237 (2020) 111443
14

3.2. Estimating GDP and mapping poverty
The connection between artificial lighting and urban areas de-scribed above has motivated many researchers to examine the possi-bility of using night lights data as an indicator of economic activity.Night-time light has been found to be positively correlated with GrossDomestic Product (GDP) or Gross Regional Product (GRP) at differentspatial scales (Elvidge et al., 1997a,b; Forbes, 2013; Li et al., 2013a).However, there are also considerable differences in per capita lightemissions observed for countries with similar GDP (e.g. Hendersonet al., 2012; Kyba et al., 2017; Levin and Zhang, 2017, Fig. 19). Thestrength of incorporating night lights data into economic analyses istherefore in: (1) estimating GDP at finer levels of spatial resolution thanare available through official statistics, (2) estimating GDP change (as
opposed to levels) at high temporal frequency (e.g., in Bennie et al.,2014a,b, Fig. 20), and (3) estimating GDP in areas with poor or noreporting (Henderson et al., 2012).
An example of the first point above is disaggregating National GDPdata to spatial grids. This was first carried out to produce 5 km re-solution GDP map for 11 European Union countries and the UnitedStates (Doll et al., 2006), and it was further used, supported by ancillarydata including a population density map (Landscan), to produce aglobal GDP map at 1 km resolution, showing that Singapore had thehighest GDP density (Ghosh et al., 2010). Similarly, night-time lightscan be used as a proxy of GDP for estimating wealth, allowing regionaleconomic phenomenon such as inequality (Elvidge et al., 2012; Xuet al., 2015) and poverty to be mapped (Elvidge et al., 2009b; Wanget al., 2012; Yu et al., 2015; Jean et al., 2016). Henderson et al. (2016)
Fig. 19. Mean VIIRS radiance values in July 2014 atthe country level (averaging all cities within acountry), as a function of national GDP per capita.Based on data from Levin and Zhang (2017). Notethat GDP on its own is not enough to explain night-time brightness differences of urban areas betweencountries. Additional variables include albedo, whe-ther countries have natural gas and oil resources, andlighting standards, among other factors.
Fig. 20. Temporal changes in monthly VIIRS night-time brightness, demonstrating various patterns(each of the sites was normalized between its ownminimum and maximum values). Aleppo, Syria:dramatic decrease in night-time lights due to the warin Syria. El Zaatari refugee camp, Jordan: influx ofrefugees from Syria makes this refugee camp one ofthe largest cities in Jordan. Dubai, UAE: A global cityand a business hub in the Middle East, with agrowing economy. San Juan, Puerto Rico: HurricaneMaria (September 20th, 2017) led to power outagesthroughout Puerto Rico. Caracas, Venezuela: In 2014Venezuela entered an economic recession, with adecrease in its GDP, evident in a decrease of nightlights in its capital city. Juliaca, Peru: A seasonalpattern is evident in night-time lights, commonlyattributed to seasonal changes in albedo related tovegetation and snow cover.
N. Levin, et al. Remote Sensing of Environment 237 (2020) 111443
15

showed that physical geography (such as climate, biomes, topography,etc.) has a strong influence on the spatial distribution of economic ac-tivity, however, that there are differences between developed and de-veloping countries in the relative importance of agriculture and tradevariables, to explain spatial variability in night-time lights.
An example of an application of the third point above is in cor-recting the statistical GDP or GDP growth rate data for developingcountries. This is based on econometric models which regard the realGDP (or GDP growth rate) as a linear combination of statistical GDP (orGDP growth rate) and estimated GDP (or GDP growth rate) derivedfrom night-time light images (Chen and Nordhaus, 2011; Hendersonet al. 2011, 2012). Based on this framework, economists have con-cluded for example that China's real GDP growth rate is higher that thevalues from official statistics (Clark et al., 2017).
3.3. Monitoring disasters
Disasters can affect night light emissions through damage to andinterruption of electric utility services, and related power outages canbe deteceted from space using night-time lights (Elvidge et al., 1998;Aubrecht et al., 2009). For example, tropical storms and hurricanes,heavy rains that cause flash or longer-term basin-wide flooding, da-maging straight-line winds or tornadoes, widespread ice storms, fires,and earthquakes, frequently interrupt utility services for varyinglengths of time. Outages can also occur from poorly maintained ordamaged infrastructure, industrial accidents, or regional conflicts (seesection 3.4). Disruptions can be on the order of hours for small, isolatedevents, to days, weeks, or even months, for particularly strong or long-lasting impacts such as those from major hurricanes (Román et al.,2018, 2019, Fig. 20) or earthquakes (Kohiyama et al., 2004). For me-teorological events, lingering cloud cover can impact the ability to re-liably detect changes following natural disasters (Zhao et al., 2018).Therefore, monitoring of nighttime lights is particularly well-suited toassessment of impacts from major events over longer-time scales, or fornon-meteorological events (e.g. failed infrastructure, earthquakes)where cloud cover may be less prevalent.
Gillespie et al. (2014) demonstrated the use of DMSP/OLS annual tomonitor the damage and recovery of areas affected by the December2004 earthquake and the tsunami which followed it, in Sumatra, In-donesia. Such applications have expanded with the advantages ofVIIRS/DNB night-time imagery. VIIRS/DNB has been used to capturepower outage and recovery from severe storms, for example. False colorcomposites of pre- and post-event lights were used by Department ofDefense and other partners in their response to Hurricane Sandy(Molthan and Jedlovec, 2013). Cao et al. (2013) used comparisons ofpre- and post-event emissions to identify loss and recovery of nighttimelights in Washington D.C. area from a derecho event (a wide-spreadstraight-line wind event), as well as following Hurricane Sandy, whenDepartment of Energy utility reports were used as validation. Cole et al.(2017) combined nighttime light information, population data, andutility information to model likely future outages and affected popu-lations, and documented outages and recovery following HurricaneSandy in the northeastern states. Miller et al. (2018) used a long-termpre-event nighttime light composite and cloud-free scenes followingHurricane Matthew as a false color composite, in order to estimateoutages. This work compared favorably to reported utility outages, andnighttime lights imagery also captured unique physical phenomenaassociated with the cyclone.
Zhao et al. (2018) investigated outages and recovery from earth-quakes, major tropical cyclones, and floods with validation of outagesagainst SAR-derived damage proxy estimates and flood mapping. Theyadopted the methodology of Cole et al. (2017) to derive a “percent ofnormal” condition as the ratio of a post-event scene to pre-eventnormal. For long-term outages in Puerto Rico following 2017's Hurri-cane Maria, Zhao et al. found a strong correlation between percent ofnormal light (low values) and reported outages (R2= 0.94), though
obtaining cloud-free pre-event and post-event scenes were difficult.Finer-scale observations of nighttime lights and change have been de-veloped from the NASA Black Marble Nighttime Light (NTL) compositeand ancillary data layers (Zhang et al., 2015c; Wang et al., 2018), usingspatial downscaling to estimate a 30m product for changes on neigh-borhood scales (Roman et al., 2019, Fig. 21). These and other analysesdemonstrate the utility of night lights in specifically examining impactsto electrical infrastructure, as opposed to other damage that may bemore readily assessed via daytime sensing (e.g. flooding, structuraldamage).
3.4. Monitoring armed conflicts
In addition to the environmental disasters discussed above, human-caused disasters also have strong impacts on night light emissions.Remote sensing of night lights therefore provides an opportunity tomonitor conflicts, where data is often scarce and governmental reportsmay be biased (Witmer, 2015). High spatial resolution daytime imageshave been proved effective to achieve this purpose (AmericanAssociation for the Advancement of Science, 2013; Prins, 2007), butbuilding a link between conflicts and these remote sensing imagessometimes requires human skills of image interpretation. Since there isa direct link between night-time lights and a number of socioeconomicparameters, dramatic decreases in night-time brightness may serve asan indicator for damage to infrastructure caused by armed conflicts. Inaddition to reductions in population size and Gross Domestic Product(GDP), decreases in light emissions also provide a warning that civiliansare likely lacking a stable electricity supply, which is essential for bothbasic living and operation of hospitals.
A pioneering study in this topic examined the war effect inChechnya and Georgia by using monthly DMSP/OLS composites(Witmer and O'Loughlin, 2011), which were used to examine move-ment of refugees and burning oil fields caused by the wars. A morecomprehensive examination of global conflicts was undertaken by Liet al. (2013b) using time series of annual DMSP/OLS composites. Theseauthors used 159 countries as research samples, and found that warslead to a sharp reduction of night-time lights, that peace agreements arefollowed by restoration of night-time brightness levels, and that war-torn countries have larger fluctuations of night-time lights thanpeaceful countries.
Since that time, night-time light images have been employed toevaluate the violent conflicts in Syria (Li and Li, 2014; Li et al., 2017,Fig. 11a), Iraq (Li et al. 2015, 2018a) and Yemen (Jiang et al., 2017)following the Arab Spring, showing that affected regions in thesecountries experienced dramatic reductions in light emissions after theconflict began (Fig. 20). Examining all Arab countries following theonset of the Arab Spring, Levin et al. (2018) found that reductions innight-time brightness correlated with decreases in the number oftourists (using Flickr photos as indicator of visitation), with increases inasylum seeker numbers, and with increases in the numbers of deathsfrom conflicts. Levin et al. (2019) have also suggested that reductions ofnight-time lights may serve as an indicator of risk to UNESCO WorldHeritage Sites from armed conflicts. As is the case with environmentaldisasters, the development of NASA's daily Black Marble product pro-vides another step forward towards fine temporal monitoring of theeffects of wars on internally displaced populations (Román et al., 2018).
3.5. Holiday and ornamental lights, and political, historical, and culturaldifferences in lighting
While disasters are evident from a temporal reduction in lightemissions, lighting associated with holidays can result in a temporaryincrease. The uniformities and variations between nighttime light sig-natures can provide new insights into how energy behaviors, motivatedby social incentives and economic activity, vary across national andcultural boundaries (Fig. 22). Temporal fluctuations in electricity
N. Levin, et al. Remote Sensing of Environment 237 (2020) 111443
16
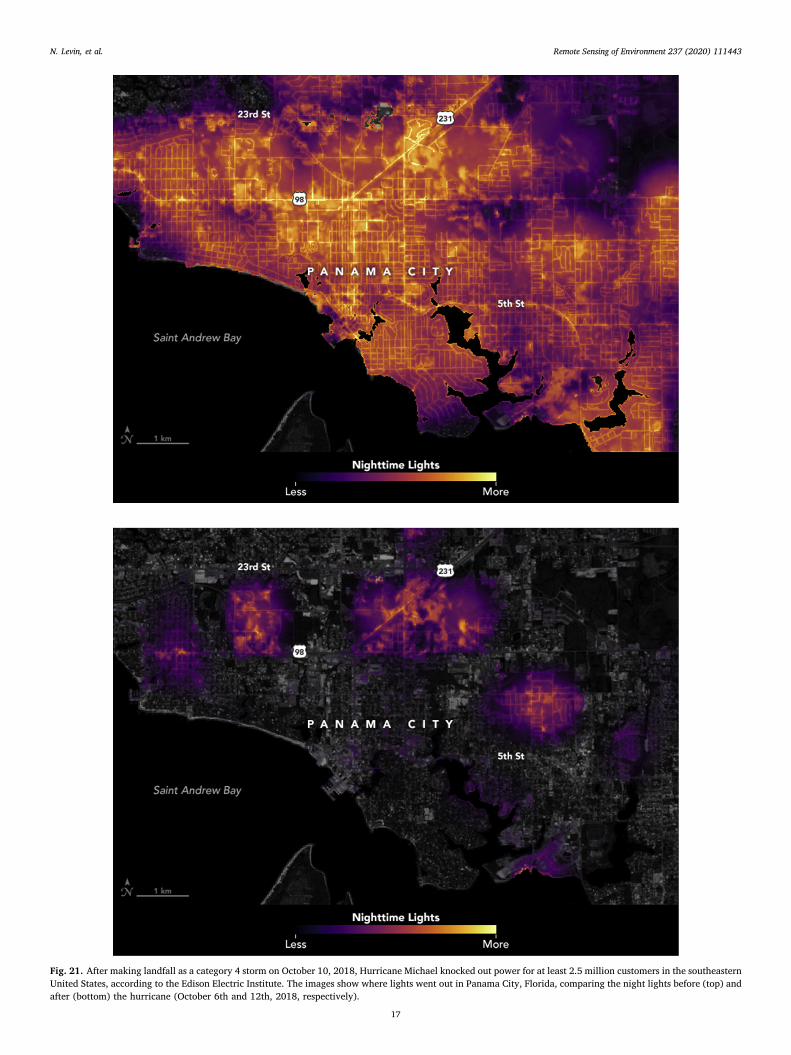
Fig. 21. After making landfall as a category 4 storm on October 10, 2018, Hurricane Michael knocked out power for at least 2.5 million customers in the southeasternUnited States, according to the Edison Electric Institute. The images show where lights went out in Panama City, Florida, comparing the night lights before (top) andafter (bottom) the hurricane (October 6th and 12th, 2018, respectively).
N. Levin, et al. Remote Sensing of Environment 237 (2020) 111443
17
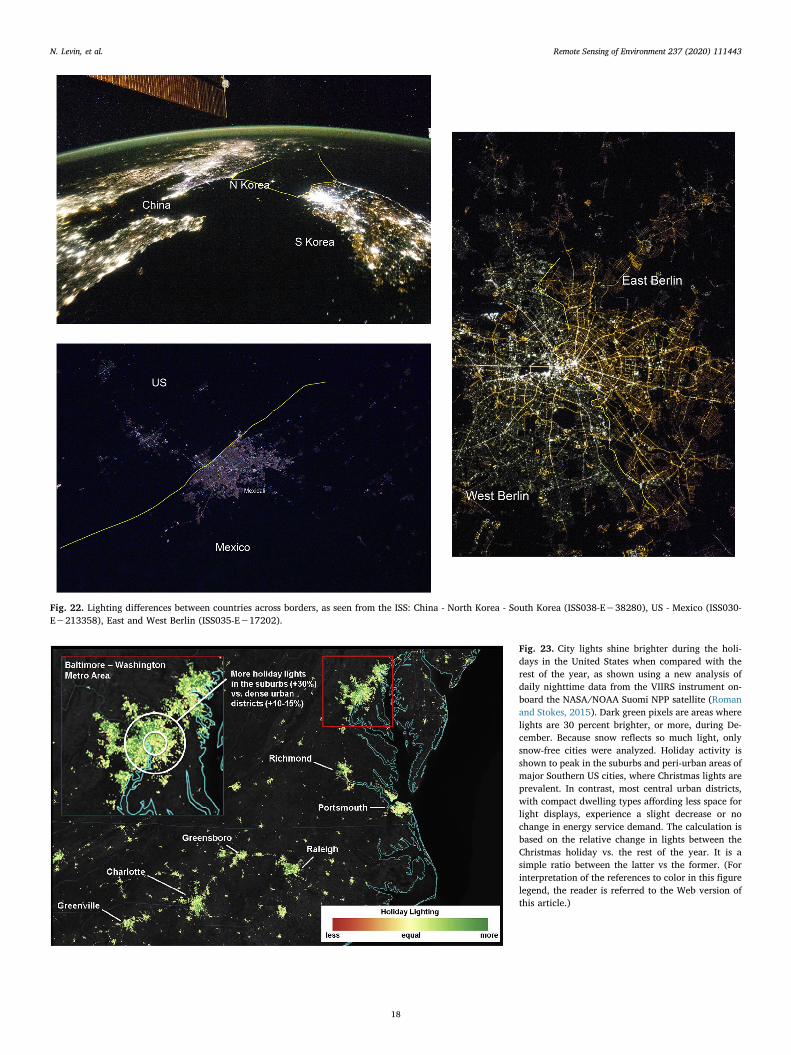
Fig. 22. Lighting differences between countries across borders, as seen from the ISS: China - North Korea - South Korea (ISS038-E−38280), US - Mexico (ISS030-E−213358), East and West Berlin (ISS035-E−17202).
Fig. 23. City lights shine brighter during the holi-days in the United States when compared with therest of the year, as shown using a new analysis ofdaily nighttime data from the VIIRS instrument on-board the NASA/NOAA Suomi NPP satellite (Romanand Stokes, 2015). Dark green pixels are areas wherelights are 30 percent brighter, or more, during De-cember. Because snow reflects so much light, onlysnow-free cities were analyzed. Holiday activity isshown to peak in the suburbs and peri-urban areas ofmajor Southern US cities, where Christmas lights areprevalent. In contrast, most central urban districts,with compact dwelling types affording less space forlight displays, experience a slight decrease or nochange in energy service demand. The calculation isbased on the relative change in lights between theChristmas holiday vs. the rest of the year. It is asimple ratio between the latter vs the former. (Forinterpretation of the references to color in this figurelegend, the reader is referred to the Web version ofthis article.)
N. Levin, et al. Remote Sensing of Environment 237 (2020) 111443
18

demand may represent changes in individual and macro-scale energybehaviors, for example during major cultural events such as Christmas,New Year, and the Holy month of Ramadan. During the Christmas andNew Year holidays in the USA, the patterns of total lighting electricityusage (units of Watt · hr) derived from nighttime radiance were shownto uniformly increase across US cities with diverse ethnicity and re-ligious backgrounds (Román and Stokes, 2015). Román and Stokessuggest that this shows that in addition of being a religious holiday,Christmas and New Year are also celebrated as a civic holiday across theUS through holiday lighting (Fig. 23). Patterns of energy service de-mand observed through nightlight images during the Holy month ofRamadan can also indicate different religions as well as cultural ob-servance practices. In the Middle East, cities with Muslim-majoritypopulation exhibit lighting peaks during and slightly after the 30 daysof Ramadan compared to non-arab cities in Israel (Román and Stokes,2015). Seasonal variations in nighttime lights have also been used totrack patterns in ambient population (mainly tourists) in Greece(Stathakis and Baltas, 2018).
Lighting for cultural or celebratory purposes (such as light festivals;Giordano and Ong, 2017) may result in particularly bright emissionsignals compared to more functional lighting such as for streets andparking lots. For example, floodlighting of churches or other culturalobjects often misses the facade, and can therefore be brightly visible onSuomi-NPP VIIRS/DNB images (eg. Kyba et al., 2018). Architecturallighting is often used to highlight significant buildings, and suchlighting may only be on when special events are held or at certain timesof the night (Meier, 2018). This may present a challenge for night lightsanalyses, with the inconsistent temporal pattern contributing to thevariability of night lights datasets (Coesfeld et al., 2018).
Administrative borders offer the possibility to observe clear con-trasts between different countries or regions, an area where the highresolution color photographs from the ISS can be quite useful (Fig. 22).The persistence of different lighting technologies in the former East andWest Berlin and the extraordinary drop of light at the border betweenNorth and South Korea are well known examples. However, there arealso large national differences between per capita light emissions inwealthy cities and countries (Kyba et al., 2015a, Sánchez de Miguel,2015; Levin and Zhang, 2017). The root causes behind these differencesare in some cases not well understood (and may be related to differentlighting standards between countries), and night lights data maytherefore play a useful role in some investigations based on the socialsciences.
3.6. Astronomy
Astronomy is perhaps the oldest remote sensing discipline, with itsgoal to obtain information about objects at vast distances through ob-servation of emitted, absorbed, scattered, or reflected light. Nearly allvisible band astronomy is undertaken at night, because light scatteredby sunlight in Earth's atmosphere outshines most celestial objects. Theartificial light emitted by cities is similarly scattered by the atmosphere,and as a result one third of humans (including nearly 80% of NorthAmericans) are no longer able to see the Milky Way from their homes(Falchi et al., 2016). This is an immense cultural loss (Gallaway, 2010).It also raises the cost of doing professional astronomy, as historicallyimportant and easily accessible sites such as Mount Wilson Observatorycan no longer be used for research in the visible range (Teare, 2000),and even remote sites are increasingly threatened by light pollution(Krisciunas et al., 2010; Aubé et al., 2018). Studies of night skybrightness and its changes are therefore important for amateur andprofessional astronomy.
Remote observation of upward light emissions is crucial for thestudy of artificial night sky brightness on large scales. These data can beused with radiative transfer models to predict night sky brightness onclear nights (Cinzano et al., 2001; Falchi et al., 2016). Both satelliteimagery and the derived night sky brightness maps are used by the
public to find locations for astronomical tourism (Collison and Poe,2013; Hiscoks and Kyba, 2017), and photometric indicators of visualnight sky quality can be derived from ground based hemisphericalphotos (Duriscoe, 2016). The global spectral shift due to adoption ofwhite LEDs is a major challenge for astronomy, both because the bluecomponent of white light produces more skyglow (section 2.4), andbecause many current ground and space-based sensors are not sensitiveto blue light (section 4.5, Fig. 24). Ground based observations of nightsky brightness are therefore crucial for calibrating skyglow models, andare necessary for long-term monitoring due to changes in lightingpractice (Kyba, 2018a; Hyde et al., 2019). A related topic is studiesusing ground based instruments to measure the impacts of cloud coveron night sky brightness (eg. Kyba et al., 2011, 2012; Jechow et al.,2017b, 2019a), but in this case the aim is usually to better understandthe ecological impacts of this form of global environmental change (seenext section).
3.7. Using night lights to estimate threats to ecosystems
Plants, animals, microorganisms, and entire ecological systems areaffected by artificial light pollution, due to changes in behavior, phy-siology (including circadian rhythms), timing of activities, and
Fig. 24. Spectral response of the most popular sensors and most popularspectra, from top to bottom. (a) the spectral response of the Nikon D3s Camerasused by the astronauts at the ISS; (b) a typical spectra of a Metal Halide lamp,popular on architectural lights; (c) a High pressure sodium light, popular until2014 on streelighting; (d) LEDs of 5000K (blue), 4000K (cyan), 2700K (grey)and PC-Amber(amber), popular on street lighting; (e) representative spectralresponse of DMSP/OLS(black) and SNPP/VIIRS/DNB(blue). Sources: Sánchezde Miguel (2015), Tapia Ayuga et al., (2015), Sánchez de Miguel et al., (2017),Elvidge. et al.,1999a,b,c and Liao et al., 2013. (For interpretation of the re-ferences to color in this figure legend, the reader is referred to the Web versionof this article.)
N. Levin, et al. Remote Sensing of Environment 237 (2020) 111443
19

disorientation, among many other reasons (Rich and Longcore, 2006;Navara and Nelson, 2007; Longcore et al., 2012; Gaston et al., 2013;Russart and Nelson, 2018). As this is a very active area of research inbiology and ecology (Davies and Smyth, 2018), many researchers makeuse of night lights data. For example, several studies have used themosaics of DMSP/OLS stable lights (as one of several variables), toglobally map the human footprint in terrestrial areas (Sanderson et al.,2002; Venter et al., 2016) as well as to map the human impact inmarine areas (Halpern et al., 2008, 2015). In a similar fashion, nightlights were used to globally map impervious surface area (Elvidge et al.,2007a) and to estimate human population at fine spatial resolutions(Bhaduri et al., 2002), as both impervious surface and populationdensity are known to negatively impact biodiversity.
Using a calibrated set of DMSP/OLS images (1992–2010), Gastonet al. (2015) demonstrated that protected areas were indeed darker(DN < 5.5) than unprotected areas; however, they found that naturaldarkness has been eroding in many protected areas, and especially so inEurope, South and Central America, and in Asia, where there was asignificant increase in mean nighttime lighting in 32–42% of all pro-tected areas. In a following study, Koen et al. (2018) have found thatareas with high species richness terrestrial and freshwater mammals,birds, reptiles, and amphibians, are suffering from encroachment ofartificial lights. Marcantonio et al. (2015) used VIIRS/DNB data to showthat a 10% reduction in light emissions near nature parks in Italy couldlead to a 5–8% increase in the area suitable for high biodiversity. Socialmedia (such as geotagged Flickr photos) has also been used in con-junction with night-time lights to estimate visitation of protected areasand the impact of human activity on them (Levin et al., 2015).
While most artificial lighting originates from land areas, marineecosystems are not devoid of light pollution. As of 2010, based onDMSP/OLS data (as of 2010), about 22% of the world's coastlines(except Antarctica) were subjected to light pollution based on DMSP/OLS data, with 54% of Europe's coastlines under light pollution, fol-lowed by Asia (34%) and Africa (22%) (Davies et al., 2014). Field ex-periments using an underwater spectrometer in the Gulf of Aqaba haveobserved artificial light in the blue band down to a depth of 25m nearthe coast, and up to 5 km from the coast at a depth of 5m depth at 5 kmfrom the coast (Tamir et al., 2017).
3.8. Using night lights to examine ecological light pollution
Studies which attempted to quantify the relationship between lightpollution and presence or behaviour of species have mostly focused onspecific organisms, such as sea turtles and birds (e.g. Van Doren et al.,2017). Using VIIRS/DNB data, La Sorte et al. (2017) showed thatnocturnally migrating birds are attracted to urban lit areas, affectingtheir migration behaviour. In a follow-up study, Cabrera-Cruz et al.(2018) have shown that light pollution experienced by nocturnallymigrating birds, is especially high during the migration season forspecies with smaller ranges. Recently, Horton et al. (2019) combinedVIIRS/DNB with weather surveillance radar data to examine the ex-posure of migratory birds to light pollution, in order to provide data fortargeted conservation actions. They found, for example, that over halfof all migratory birds typically pass a single radar location within asingle week, which suggests that targeted and relatively short term“lights out” campaigns for floodlit buildings could potentially greatlyreduce the impact of light pollution on migratory birds.
Sea turtles represent one of the most studied groups, for which thenegative impacts of artificial lights have been well known for decades(e.g. Witherington and Martin, 2000). Kamrowski et al. (2012, 2014)used DMSP/OLS imagery to identify which nesting sites of sea turtlesalong the Australian coastline are exposed to light pollution, and inwhich of these sites there was an increase in light pollution. Using finerspatial resolution imagery (ISS photographs and SAC-C), Mazor et al.(2013) have shown that nesting of sea turtles along the Mediterraneancoast of Israel was negatively correlated with night-time brightness, and
Weishampel et al. (2016) obtained similar results using DMSP data fornesting sea turtles in Florida, which was also confirmed by VIIRS data(Hu et al., 2018a). Given the differences between the light perceived byanimals and humans (mostly horizontal light) and the light measuredfrom space (mostly upwards reflected light; Katz and Levin, 2016), newground based methods are developed to measure night-time brightnessfor ecological studies, e.g., using sky quality meters (Kelly et al., 2017)or hemispheric cameras (Pendoley et al., 2012). Jechow et al. (2019b)recently provided an overview of how a DSLR camera with a fisheyelens can be used for characterizing night time brightness over a fullsphere, by taking two vertical plane photos. Such an approach isespecially useful for studies on ecological light pollution, because thefield of view of various species differs both in the horizontal as well asin the vertical plane.
Remote observations of night lights have also been used to examinethe influence of light on bats, all of which are nocturnal, and many ofwhich are extremely sensitive to artificial light. In a nationwide study ofbats in France, Azam et al. (2016) combined VIIRS/DNB data withlandcover data to examine the relative effects of impervious surface,intensive agriculture, and light emission. They found that agriculturehad the strongest negative influence on all four species tested, and thatlight emission also had a negative influence on 3 of the 4 species tested,and in all cases had a stronger negative influence than impervioussurface. Hale et al. (2015) used higher resolution (1m) data fromnighttime aerial photography and maps of tree cover together withobservations of bats to examine how light modulates the impact of gapsin tree cover for bat flights. They found that the negative impact of lightincreases as crossing distance between trees increases. In a recent study,Straka et al. (2019) found that the lamp spectra also had important andspecies-dependent effects, using land cover data and a 1m resolutionmap of light emission from Berlin (Kuechly et al., 2012) together withsurveys of bat activity.
3.9. Epidemiology
In modern societies, exposure to artificial light is suspected as acontributing factor to some diseases (e.g. some cancers, obesity, anddepression), through disruption of the circadian rhythm (Lunn et al.,2017) or sleep disturbance, as well as suppression of the hormonemelatonin, which is related to ambient light intensities (Haim andPortnov, 2013; Cho et al., 2015). Space-based night light data allowsstudies of population exposures to artificial outdoor light, which canthen be compared to data from either cohort studies or a set of patientsand healthy controls. The “Light at Night hypothesis” for breast cancerwas first proposed by Stevens (1987), who noted that if dim light is arisk factor, brightly lit communities could be expected to have higherlevels of breast cancer. The first empirical analysis linking DMSP/OLSnight lights data with breast cancer (BC) incidence was Kloog et al.(2008), which examined 147 urban localities in Israel. The study re-vealed a statistically significant association between ALAN and BC butnot with lung cancer, which was used in the study as a negative control.Follow-up studies confirmed adverse effects of ALAN on BC and pros-tate cancer in worldwide cohorts (Kloog et al., 2009, 2010). Otherstudies investigated DSMP-derived ALAN data in conjunction withdifferent health phenomena, including hormone-dependent cancers(Bauer et al., 2013; Hurley et al., 2014; Rybnikova et al., 2015, 2016b;Portnov et al., 2016; James et al., 2017; Kim et al., 2017; Rybnikovaet al., 2018), obesity (Rybnikova et al., 2016a; Rybnikova and Portnov,2016; Koo et al., 2016), and sleep quality (Koo et al., 2016). Thesestudies, carried out in different regions and population cohorts, providemutually complementing evidence about significant associations be-tween ALAN and a wide of range of adverse health phenomena.
A major question for this research is the extent to which remoteobservations of light match individual exposures. Kyba and Aronson(2015) argued that if ALAN is a cause of disease (rather than a corre-late), then estimated risk factors should increase with increasing spatial
N. Levin, et al. Remote Sensing of Environment 237 (2020) 111443
20

resolution of remotely sensed data. Rybnikova and Portnov (2017) thencompared results obtained from DMSP and VIIRS-DNB satellite images,and detected a stronger ALAN-BC association when using the higherspatial resolution VIIRS/DNB images. Recent studies have used evenhigher resolution multi-spectral images taken from the ISS. Both Garcia-Saenz et al. (2018) and Rybnikova and Portnov (2018) used ISS imagedata to conclude that exposures to short wavelength (blue) ALAN ap-pear to have stronger effects on hormone-dependent cancer incidencethan exposures to green and red light spectra. This conclusion is con-sistent with results of laboratory and small cohort studies, which em-phasize potential health risks associated with short wavelength illu-mination (Lunn et al., 2017). Keshet-Sitton et al., (2017) alsodemonstrated increased risk of breast cancer based on ground-levelmeasurements rather than remote observations. Further work in thisarea will greatly benefit from improvements in resolution, coverage,and multispectral information from space-based sensors, as well asconfirmation of the relevance of the data through ground-based mea-surements of a representative sample of individual exposures (Kyba andSpitschan, 2019).
3.10. Lighting technology
For some applications, identification of lighting technology as wellas their dynamics on short time scales is desirable. To discriminate lamptypes using airborne or spaceborn systems, high spatial and spectralresolution is necessary (Fig. 24). The ideal system would be to use ahyperspectral imaging spectrometer at low altitudes. Few studies withlimited spatial coverage exist, such as the first ever performed over1998 in Las Vegas, USA (Elvidge and Green, 2005; Alamús et al., 2017,see section 2.3 for more). Elvidge et al. (2010) showed that it was inprinciple possible to discriminate light sources with multispectral sen-sors, using detailed spectral field measurements and a modeling ap-proach for the pre LED technologies. This was later demonstrated inpractice with an aerial survey over Birmingham, UK. In that study, Haleet al. (2013) used a standard DSLR camera and supportive field mea-surements, and achieved a high success rate of distinguishing betweendifferent vapor lamps, although the technique used was fully phe-nomenological. Sensor requirements for satellite based surveys wereproposed (Elvidge et al., 2007b,c) but few attempts have been per-formed. Using the hyperspectral data of a flight over Las Vegas Metcalf(2012) and Tardà et al. (2011) were able to determine different lightingtechnologies, Sánchez de Miguel (2015) used ISS images, and Zhenget al. (2018) were also able to distinguish high-pressure sodium (HPS)lamps from white LEDs using the new Jilin-1 satellite. However, thereare fundamental limitations for multispectral sensors to distinguishbetween similar color light sources, like fluorescents/compact fluor-escents and LEDs of same color temperature or HPS lamps and PC-Amber LEDs (Sánchez de Miguel et al., 2019b). It should also be notedthat most of the research undertaken thus far has been done withoutradiometric calibrations of any kind or atmospheric corrections.
Ground-based measurements provide more freedom regardingtemporal and spectral resolution (section 2.4). Several studies haveused calibrated RGB cameras to track lighting remodelling from vaporlamps to LEDs (Kolláth et al., 2016; Barentine et al., 2018), or shortterm dynamics like the switching off of specific lights to assess theircontribution to skyglow (Cleaver, 1943; Jechow et al., 2018b). Ground-based measurements can provide a wider temporal range than spacebased sensors (section 4.3), and also fill in the blind spot of the lack ofsensitivity to blue light from LEDs (section 4.6, Kyba et al., 2017). Highfrequency data, for example as measured using ground based SQM, canbe used to remotely sense the contributions of different lighting types(streetlights, vehicles, residential light) due to their differing temporalpatterns (Bará et al., 2018). Systems used in urban science show pro-mising results at the cross section to remote sensing as shown by the“pulse of the city” studies with ground-based measurements, using ahyperspectral camera by unraveling aggregate human behavior
patterns (Dobler et al., 2015), lighting types (Dobler et al., 2016) ortemporal profiles using RGB images (Meier, 2018). In addition, thecombination of several remote sensing techniques (AstMON, SQM, ISSimages and Hyperspectral spectrograph [SAND] plus energy statistics)was used to trace the temporal evolution and population of the lightingtechnologies used in Madrid for an average night (Sánchez de Miguel,2015).
3.11. Mapping fires, gas flares, and greenhouse gas emissions
Wildfires are a major force shaping natural ecosystems, and theirignition and propagation are influenced by both natural and anthro-pogenic factors. Whereas during the industrial period the global fireregime has shifted from one driven primarily by rainfall, to one drivenby human influence on fire (ignition and suppression), in the futureclimate change may play a decisive role in global fire regime (Pechonyand Shindell, 2010). Fire management therefore requires mapping firein space and in time. It has long been known that visible light data fromDMSP had a capability to detect biomass burning and natural gasflaring (Croft, 1973, 1978, Fig. 6b). In the mid-1990s a nightly biomassburning algorithm was developed for DMSP low light imaging data andregionally implemented (Elvidge et al., 1996). This involved a lit pixeldetection algorithm and masking of persistent lights from cities, townsand gas flares. Later on, as the distribution of DMSP/OLS data waslowered to 3 h, it was perceived that DMSP/OLS data can be used foroperational fire monitoring (Elvidge et al., 2001b), and that active firemapping using DMSP/OLS was able to detect more fires than MODIS(Chand et al., 2007).
A high correlation was identified between the total lit area of acountry and total carbon dioxide (CO2) emissions (Doll et al., 2000),and even better results were obtained using the VIIRS/DNB (Ou et al.,2015). The first global satellite estimates of flared gas volumes camefrom DMSP, with flaring sites identified manually based on circularhaloes of glow present in the DMSP annual cloud-free nighttime lights(Elvidge et al., 2009a). With the advent of VIIRS, these capabilities havebeen substantially enhanced based on the nighttime detection of firesand flares in three spectral ranges: near infrared (NIR), shortwave in-frared (SWIR) and midwave infrared (MWIR). The VIIRS Nightfire(VNF) algorithm detects the presence of sub-pixel infrared emitters,such as fires and flares in six spectral bands and uses Planck curvefitting to derive temperature, source area, and radiant heat usingphysical laws (Elvidge et al., 2013b), which is an improvement oversatellite fire products which use one or two spectral bands (Elvidgeet al., 2013c). Daily VNF datasets are available for download fromhttps://eogdata.mines.edu/download_viirs_fire.html. The VNF data hasbeen successfully used to map and classify industrial heat sources (Liuet al., 2018), as well as to conduct annual surveys of natural gas flaringlocations and estimate flared gas volumes (Elvidge et al., 2015a). Theadvantage of VNF over both DMSP and traditional MWIR fire productsis the ability to calculate variables such as temperature using physicallaws. However, Elvidge et al. (2019) recently showed that the VIIRS/DNB retains a capability to detect combustion sources too small totrigger detection in VNF. These results indicate that more completecompilations of IR emitters could be achieved by adding a DNB fireproduct to complement VNF and other satellite derived fire products, asrecently reviewed by Chuvieco et al. (2019).
3.12. Monitoring fisheries
The earliest reporting on nighttime satellite detection of fishingboats using massive lighting to attract catch, traces back to DMSP data(Croft, 1978, Fig. 6c). From 2000 to 2012, NOAA provided regionalnear real time DMSP file transfer services to fishery agencies in Japan,Korea, Thailand, and Peru, where the boat detections were analyzedlocally. However, an automatic algorithm for reporting boat locationswas never developed for DMSP. The situation changed with VIIRS due
N. Levin, et al. Remote Sensing of Environment 237 (2020) 111443
21
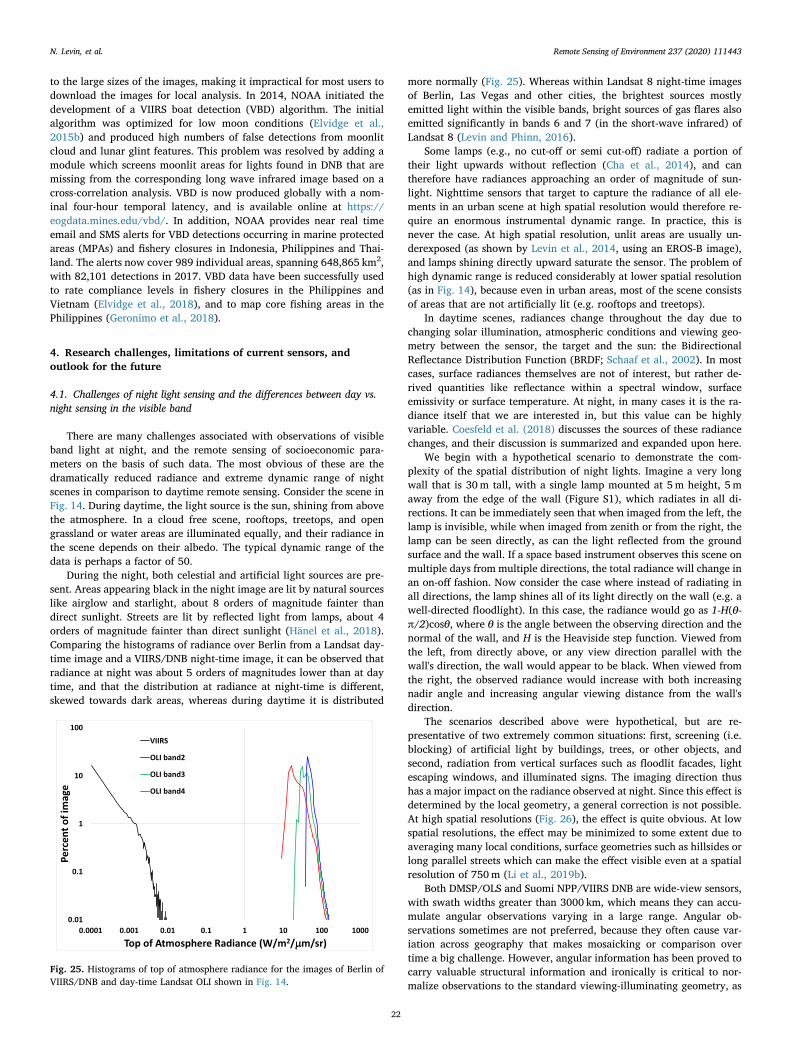
to the large sizes of the images, making it impractical for most users todownload the images for local analysis. In 2014, NOAA initiated thedevelopment of a VIIRS boat detection (VBD) algorithm. The initialalgorithm was optimized for low moon conditions (Elvidge et al.,2015b) and produced high numbers of false detections from moonlitcloud and lunar glint features. This problem was resolved by adding amodule which screens moonlit areas for lights found in DNB that aremissing from the corresponding long wave infrared image based on across-correlation analysis. VBD is now produced globally with a nom-inal four-hour temporal latency, and is available online at https://eogdata.mines.edu/vbd/. In addition, NOAA provides near real timeemail and SMS alerts for VBD detections occurring in marine protectedareas (MPAs) and fishery closures in Indonesia, Philippines and Thai-land. The alerts now cover 989 individual areas, spanning 648,865 km2,with 82,101 detections in 2017. VBD data have been successfully usedto rate compliance levels in fishery closures in the Philippines andVietnam (Elvidge et al., 2018), and to map core fishing areas in thePhilippines (Geronimo et al., 2018).
4. Research challenges, limitations of current sensors, andoutlook for the future
4.1. Challenges of night light sensing and the differences between day vs.night sensing in the visible band
There are many challenges associated with observations of visibleband light at night, and the remote sensing of socioeconomic para-meters on the basis of such data. The most obvious of these are thedramatically reduced radiance and extreme dynamic range of nightscenes in comparison to daytime remote sensing. Consider the scene inFig. 14. During daytime, the light source is the sun, shining from abovethe atmosphere. In a cloud free scene, rooftops, treetops, and opengrassland or water areas are illuminated equally, and their radiance inthe scene depends on their albedo. The typical dynamic range of thedata is perhaps a factor of 50.
During the night, both celestial and artificial light sources are pre-sent. Areas appearing black in the night image are lit by natural sourceslike airglow and starlight, about 8 orders of magnitude fainter thandirect sunlight. Streets are lit by reflected light from lamps, about 4orders of magnitude fainter than direct sunlight (Hänel et al., 2018).Comparing the histograms of radiance over Berlin from a Landsat day-time image and a VIIRS/DNB night-time image, it can be observed thatradiance at night was about 5 orders of magnitudes lower than at daytime, and that the distribution at radiance at night-time is different,skewed towards dark areas, whereas during daytime it is distributed
more normally (Fig. 25). Whereas within Landsat 8 night-time imagesof Berlin, Las Vegas and other cities, the brightest sources mostlyemitted light within the visible bands, bright sources of gas flares alsoemitted significantly in bands 6 and 7 (in the short-wave infrared) ofLandsat 8 (Levin and Phinn, 2016).
Some lamps (e.g., no cut-off or semi cut-off) radiate a portion oftheir light upwards without reflection (Cha et al., 2014), and cantherefore have radiances approaching an order of magnitude of sun-light. Nighttime sensors that target to capture the radiance of all ele-ments in an urban scene at high spatial resolution would therefore re-quire an enormous instrumental dynamic range. In practice, this isnever the case. At high spatial resolution, unlit areas are usually un-derexposed (as shown by Levin et al., 2014, using an EROS-B image),and lamps shining directly upward saturate the sensor. The problem ofhigh dynamic range is reduced considerably at lower spatial resolution(as in Fig. 14), because even in urban areas, most of the scene consistsof areas that are not artificially lit (e.g. rooftops and treetops).
In daytime scenes, radiances change throughout the day due tochanging solar illumination, atmospheric conditions and viewing geo-metry between the sensor, the target and the sun: the BidirectionalReflectance Distribution Function (BRDF; Schaaf et al., 2002). In mostcases, surface radiances themselves are not of interest, but rather de-rived quantities like reflectance within a spectral window, surfaceemissivity or surface temperature. At night, in many cases it is the ra-diance itself that we are interested in, but this value can be highlyvariable. Coesfeld et al. (2018) discusses the sources of these radiancechanges, and their discussion is summarized and expanded upon here.
We begin with a hypothetical scenario to demonstrate the com-plexity of the spatial distribution of night lights. Imagine a very longwall that is 30m tall, with a single lamp mounted at 5m height, 5 maway from the edge of the wall (Figure S1), which radiates in all di-rections. It can be immediately seen that when imaged from the left, thelamp is invisible, while when imaged from zenith or from the right, thelamp can be seen directly, as can the light reflected from the groundsurface and the wall. If a space based instrument observes this scene onmultiple days from multiple directions, the total radiance will change inan on-off fashion. Now consider the case where instead of radiating inall directions, the lamp shines all of its light directly on the wall (e.g. awell-directed floodlight). In this case, the radiance would go as 1-H(θ-π/2)cosθ, where θ is the angle between the observing direction and thenormal of the wall, and H is the Heaviside step function. Viewed fromthe left, from directly above, or any view direction parallel with thewall's direction, the wall would appear to be black. When viewed fromthe right, the observed radiance would increase with both increasingnadir angle and increasing angular viewing distance from the wall'sdirection.
The scenarios described above were hypothetical, but are re-presentative of two extremely common situations: first, screening (i.e.blocking) of artificial light by buildings, trees, or other objects, andsecond, radiation from vertical surfaces such as floodlit facades, lightescaping windows, and illuminated signs. The imaging direction thushas a major impact on the radiance observed at night. Since this effect isdetermined by the local geometry, a general correction is not possible.At high spatial resolutions (Fig. 26), the effect is quite obvious. At lowspatial resolutions, the effect may be minimized to some extent due toaveraging many local conditions, surface geometries such as hillsides orlong parallel streets which can make the effect visible even at a spatialresolution of 750m (Li et al., 2019b).
Both DMSP/OLS and Suomi NPP/VIIRS DNB are wide-view sensors,with swath widths greater than 3000 km, which means they can accu-mulate angular observations varying in a large range. Angular ob-servations sometimes are not preferred, because they often cause var-iation across geography that makes mosaicking or comparison overtime a big challenge. However, angular information has been proved tocarry valuable structural information and ironically is critical to nor-malize observations to the standard viewing-illuminating geometry, as
Fig. 25. Histograms of top of atmosphere radiance for the images of Berlin ofVIIRS/DNB and day-time Landsat OLI shown in Fig. 14.
N. Levin, et al. Remote Sensing of Environment 237 (2020) 111443
22

seen in MODIS (Schaaf et al., 2002) and MISR (Multi-angle ImagingSpectroRadiometer) (Diner et al., 1989). Due to the variation in streetlayout and building height, nighttime light is also expected to varyaccordingly (Kyba et al., 2015a). Angular observations from bothDMSP/OLS and VIIRS/DNB may thus provide structural and verticalinformation about urban areas, especially in the east-west direction,given the characteristic scanning geometry of sun-synchronous sensors.Such information still remains under-utilized up to date, howeverpreliminary results indicate that measured radiance is lower at nadirand increases towards the edge of the scan (Bai et al., 2015). In a recentpaper, Li et al. (2019b), have confirmed that the viewing angle ofVIIRS/DNB affects the amount of measured night-time brightness, andthat building height should be incorporated to understand the re-lationship between the satellite viewing zenith angle and emitted night-time lights. A different group (Li et al., 2019c) have approached theproblem from the other direction, using ground based all-sky imageryfrom Google Street View to examine how much light can escape tospace, and how this is affected by changes in vegetation. Future re-search is required to extract this invaluable information from bothDMSP/OLS and Suomi NPP/VIIRS DNB, and to remove angular effectsfrom night-time products.
4.2. Uncertainties due to moonlight, aerosol/cloud contamination, andseasonal vegetation effects
Uncertainties originating from angular, diurnal, and seasonal var-iations in atmospheric and surface optical properties are also a primarysource of measurement error in the nighttime lights (NTL). As de-monstrated by Román et al. (2018), characterizing these uncertaintiesis extremely crucial as a long-term record of NTL cannot be constraineddirectly from at-sensor top-of-atmosphere (TOA) radiances. The un-certainties can be separated into (1) environmental factors, such asmoon light, cloud/aerosols, and surface albedo (interferes with theobserved signal), and (2) errors stemming from seasonal variations invegetation or in snow cover and associated surface properties, whichcan significantly affect estimates of seasonal and long-term trends(Fig. 20).
Key to characterizing these factors is an accurate estimation of thesurface Bidirectional Reflectance Distribution Function (BRDF, or
reflectance anisotropy), a quantity that is governed by the angle andintensity of illumination – whether that illumination be solar or lunar(e.g., Miller and Turner, 2009) or from airglow emissions – and by thestructural complexity of the surface. Román et al. (2018) considered thesemi-empirical RossThickLiSparse Reciprocal (RTLSR, or Ross-Li) BRDFmodel (Román et al., 2010; Roujean et al., 1992; Schaaf et al., 2002;Wang et al., 2018) to correct the effects of contamination through anexternal illumination in the NTL. This modeling approach is advanta-geous as it has been shown to capture a wide range of conditions af-fecting the VIIRS/DNB on a global basis. Similarly the RTLSR modelalso allows analytical inversion with a pixel-specific estimate of un-certainty in the model parameters and linear combinations thereof(Lucht and Roujean, 2000). Finally, the scheme is also flexible enoughthat other kernels can be easily adopted should any become availableand should they be shown to be superior for a particular scenario.
Similar to day light sensing in visible band, NTL radiances alsosuffer from biases stemming from clouds and aerosols. A scene withopaque clouds can block the NTL radiance completely, whereas thinnerand transparent or semi-transparent atmosphere blocks the radiancepartially and scatters the light creating a fuzzy appearance (Elvidgeet al., 2017). The vector radiative transfer modeling of the coupledatmosphere-surface system (Vermote and Kotchenova, 2008) can beused to compensate for aerosols, water vapor, and ozone impacts on theNTL radiances (Román et al., 2018). This correction mitigates errorsstemming from poor-quality TOA retrievals, especially across regionswith heavy aerosol loadings and at Moon/sensor geometries yieldingstronger forward scatter contributions.
Seasonal variations such as those resulting from vegetation artifactscan also introduce challenges in the retrieval of satellite-derived NTLdue to the canopy-level foliage along the ground-to-sensor geometrypath. This effect occurs predominantly in urban areas where vegetationsuch as deciduous broadleaf canopies is present. The impact of thisobstruction of surface light by the cyclical canopy results in reduction inthe magnitude of NTL at city-wide scales (Levin, 2017; Levin andZhang, 2017, Fig. 20). This occlusion effect has been shown to be di-rectly proportional in magnitude to the density and vertical distributionpattern of the canopy. Román et al.(2018) proposed to use gap fractionto correct the vegetation effect. These seasonal changes may be viewedas a noise (when aiming to estimate socio-economic properties fromNTL) or as a signal (when aiming to estimate light pollution from NTL).
4.3. Challenges related to temporal sampling
In addition to the seasonal changes mentioned above, night lightsare dynamic throughout the course of individual nights (Figure S2).Observations of night sky brightness show typical decreases of typicallyaround 5% per hour (Kyba et al., 2015b; Falchi et al., 2016), with largerdecreases earlier at night. The decrease in light emission can also beseen through horizontal imaging (Dobler et al., 2015; Meier, 2018).Many municipalities intentionally dim or turn off street lights at latehours (Green et al., 2015), and these switch offs can produce very ob-vious signals in night sky brightness data (Puschnig et al., 2014,Sánchez de Miguel, 2015; Jechow et al., 2018b). The typical spectra ofartificial light emissions also appears to shift as the night progresses(Kyba et al., 2012; Aubé et al., 2016). This is presumably due tochanges in the fraction of lights coming from different types of lamps.Observations of low resolution ground spectra or sky spectra couldtherefore potentially be used to differentiate the relative contributionsof light sources at different times (Bará et al., 2018).
Orbital platforms with a (relatively) fixed overpass time, such asDMSP (early evening) or VIIRS DNB (∼1:30am) have limited ability toview such temporal changes. Depending on the application, this may bea disadvantage (they do not get the full picture of light use) or an ad-vantage (the observed radiance values are more consistent). Platformswith a non-fixed orbital time can fill in the gaps to some extent (Kybaet al., 2015a), but such imagery is then taken on different dates. Only a
Fig. 26. Visibility of lit facades depends on perspective. The top image is a cropof an photograph taken from the South, so North facing facades are visible. Thebottom image was taken from the North, so the South faces of buildingstherefore appear dark. Photos taken by Alejandro Sanchez de Miguel and theFreie University"at Berlin during the EU COST Action ES1204 LoNNe. Figureand caption reproduced from Coesfeld et al. (2018), available under a CreativeCommons Attribution license (CC-BY 4.0).
N. Levin, et al. Remote Sensing of Environment 237 (2020) 111443
23
geostationary platform could allow continuous, or at least repeated,tracking of radiance changes throughout the full night (e.g. Zoogmanet al., 2017). With routine and growing numbers of observational passesfrom Suomi-NPP, JPSS-1 (now NOAA-20) and subsequent JPSS series ofsatellites, nighttime light observations will become even more frequent,providing opportunities for multiple cloud-free observations per nightand greater temporal frequency to quantify the stability of light sources,their magnitude, and time to restoration following a disaster event.
Outside of the tropics, there is an important interaction betweenimaging time and the seasons in which an orbital platform can acquiredata about artificial lights. This is of particular importance for manycities in Europe. In Berlin, for example, astronomical night does notoccur in the period between May 19 and July 27. If the satellite over-pass time is displaced from midnight, this period is even longer. For asatellite with a 21:00 overpass time, Berlin would be illuminated bytwilight from early April until the start of September. Restricting theavailable night window to the period September–March means thatnights with snow cover will make up a much larger fraction of thedataset, especially at higher latitudes or elevations. Annual products forhigh latitude countries (e.g. Canada, Sweden, Norway, Finland,Iceland) are therefore likely to be biased upwards due to snow cover ifthe satellite overpass time is too far from midnight (Elvidge et al.,2001a).
4.4. Long-term instability of some light sources
Many light sources in countries with stable electricity emit rela-tively similar amounts of light from night to night. Coesfeld et al.(2018) reported that the distribution of radiances in the DNB monthlycomposite data for urban and suburban locations and airports was nearnormal, with a standard deviation of about 13–19%, depending onwhether all months or only autumn months were considered. Otherlight sources such as ship ports, stadiums, and power plants had largervariations, while some other light sources are much more dynamic(Coesfeld et al., 2018). Wildfires appear only during the time they areactive, and oil flares are not stable from year to year (Coesfeld et al.,2018). Large construction sites may be brightly lit for relatively longperiods (Kuechly et al., 2012), and eventually replaced by less brightlylit buildings. Greenhouses are among the brightest objects on Earth, butmay only be lit during a portion of the year (Coesfeld et al., 2018).Special events such as large-scale outdoor concerts or light festivals(Figure S3) can also produce considerable light only for short periods.All these types of unstable lights pose a challenge for defining monthlyand annual trends in light emissions.
4.5. Global spectral shift due to transitions to LEDs
The world is in the midst of a “lighting revolution” due to the de-velopment of light emitting diode (LED) technology (Pust et al., 2015).This is the fourth such revolution in the history of outdoor lighting:previous generations switched from oil to gas, gas to the first electriclights (arc lamps and incandescents), incandescent to high intensitydischarge lamps (Riegel, 1973; Jakle, 2001; Isenstadt et al., 2014). Eachnew technology has not only allowed for an increase in light emission,but has also dramatically changed lighting spectra, and allowed newforms of illumination. The global transition to LED lights therefore hasdramatic implications for remote sensing of night lights.
From a remote sensing perspective, there are two main con-sequences of the change towards LEDs. First, the “white” LEDs used forlighting outdoor areas have a broadband spectra, in dramatic contrastto the “line” type spectra of vapor lamps (Elvidge et al., 2010; Aubéet al., 2013, Fig. 24). Much of the world was lit by orange colored highpressure sodium lamps at the start of the 21st century, and existingbroadband monitoring instruments designed for 20th century lights cantherefore easily mistake a change in spectrum for a decrease in emittedlight (Kyba et al., 2015a,b; Sánchez de Miguel et al., 2017). For similar
reasons, the spectral change affects the perception of artificial lights byanimals, and therefore the ecological impacts of such light (Longcoreet al., 2018). Future research should be thus directed on examining theimpacts of the transition of artificial lighting to LEDs on various topics,including ecological light pollution, human health, crime and car ac-cidents, preferably using a before-after-control-impact (BACI) design, asin Plummer et al. (2016) and Manfrin et al. (2017).
The second major consequence of the introduction of LEDs is achange in illumination practices. For example, LEDs are more easilydimmed than vapor lamps, so lighting may become more temporallydynamic. Streetlights based on LEDs are less likely to directly emit lightinto the atmosphere, and may potentially result in less total emissionsthrough more careful direction of the light (Kinzey et al., 2017). Themost important change, however, may turn out to be a shift in the“typical” source of light observed from space, away from street lightingand towards lights emitted for advertising or artistic purposes (Kyba,2018b). This spectral shift will likely affect the ability to existing sen-sors such as VIIRS/DNB to quantify artificial lights from space, giventhat it is not measuring incoming light in the blue band (Fig. 24).Modelling work recently done by Bará et al. (2019) indicates that forcertain transition scenarios (from HPS to LED), the VIIRS may detectreduction in artificial zenithal sky brightness, even if sky brightness inreality increases, due to the loss of the HPS line in the near-infra red,and the inability of the VIIRS to detect blue light. The emission of bluelight from LED sources therefore requires future night-time sensos toinclude the blue channel (which is not covered by DMSP/OLS, VIIRS/DNB or Luojia-1), however blue light is scattered more (Kocifaj et al.,2019), and thus atmospheric haze removal techniques should be de-veloped for night-time imagery, for future products.
4.6. Challenges in calibrating ground and space borne measurements
While night light remote sensing has benefited various applications,there are certain research gaps that need to be overcome in order totransform this data to be more quantitative. While in traditional opticalremote sensing satellite images are atmospherically corrected to derivetheir reflectance values (Clark and Roush, 1984), it is not so clear whichunits should be used in night light imagery. The DMSP/OLS imageryproducts are distributed as stable lights or average lights x percent (DNvalues between 0 and 63). Often these products are used to calculatethe total lit area or the total lights, however, these data are not in lu-minance units. Photometry is the measurement of the intensity ofelectromagnetic radiation in photometric units, like lumen/lux/etc, ormagnitudes. Radiometry is the measurement of optical radiation, withsome of the many typical units encountered are Watts/m2 and photons/sec/steradian. The main difference between photometry and radio-metry is that photometry is limited to the visible spectra as defined bythe response of the human eye (Teikari, 2007). Of relevance for suchmeasurements, are the photopic and scotopic bands. Human photopicvision which allows color vision, takes place under daytime conditionsas well as under artificial illumination, and is based on the properties ofcone photoreceptors in the human retina. Human scotopic vision on theother hand, takes place under dark conditions, using the retinal rodsalone, when humans perceive the world in “grey scale”; in comparisonto photopic vision, scotopic vision is shifted towards shorter wave-lengths, mostly between 454 and 549 nm (Elvidge et al., 2007b).
In recent years there have been some attempts to calibrate finespatial resolution images to photometric units. Hale et al. (2013) usedground measurements of incident lux along linear transects to calibratetheir aerial night light images into illuminance units. A different ap-proach has been used by Cao and Bai (2014), who examined the tem-poral variability in light as measured by the VIIRS/DNB from variousfeatures which they expected to emit uniformly in different nights.Another approach for field mapping of night lights that can be used forcalibrating aerial or space borne night light imagery is using groundnetworks of instruments such as the Sky Quality Meter (SQM,
N. Levin, et al. Remote Sensing of Environment 237 (2020) 111443
24
manufactured by Unihedron, measuring the brightness of the night skyin magnitudes per square arc second;http://www.unihedron.com/projects/darksky/), however ground networks aimed at monitoringlight pollution are fairly recent (den Outer et al., 2011; Pun and So,2012; Zamorano et al., 2019). In an interesting study using ExtechEasyView 30 light meters to map night brightness along a 10-m sam-pling grid on the Virginia Tech campus, brightness was measured twice:First with the light meter pointing upward to catch direct light from thelight fixtures at 30 cm from the ground, then with the light meterpointing down to measure reflected light (Kim, 2012). Most groundnetworks of SQM are directed to measure zenith night sky brightness. Ina study comparing the correspondence between an EROS-B night-timeimage, and ground measurements done with SQMs in three directions(downwards, horizontally and upwards), Katz and Levin (2016) haveshown that the lowest correspondence was with ground measurementsdirected upwards (representing sky glow), whereas the strongest cor-respondence was found with ground measurements directed down-wards (representing street light reflected by the surface). Thus, in ad-dition to the inconsistency in the photometric units used for calibratingaerial night lights images, there is a gap with regards to how should onemeasure light on the ground so that it best corresponds with what anairborne or a space-borne captures.
4.7. Consistent nightlight time series across different platforms and sensors
Although the signal of change in the DMSP/OLS NTL time series islarger than the error signal and also large enough to render the errorsignal (noise) unimportant (Zhang and Seto, 2011), to facilitate accu-rate change analysis with NTL time series it is necessary to calibratefirst to minimize differences caused mainly by satellite shift (Zhanget al., 2016). The challenge to achieve successful radiometric calibra-tion of remote sensing imagery obtained at different times is to findinvariant ground targets that can be used as references for reliablecomparison over time. As the first attempt, Sicily, Italy was chosen asthe reference site to calibrate the reference image F121999 and otherimages individually (Elvidge et al., 2009a,b,c). These models were thenapplied to calibrate the entire DMSP/OLS time series from 1992 to2008. This method successfully reduced differences caused by satelliteshift to some order. However, models derived in Sicily might not begeneralized to cover the entire globe, since noises introduced by varioussources might not be geographically homogenous (Pandey et al., 2017).To address this problem, researchers studying regional urbanizationdynamics have chosen local reference sites to derive their models sothat they better fit their specific regions (Liu et al., 2012; Nagendraet al., 2012; Pandey et al., 2013). In an attempt to produce more gen-eralized models for the entire globe, Wu et al. (2013) extended theElvidge et al. (2009a,b,c) method by selecting more reference sites,including Mauritius, Puerto Rico, and Okinawa, Japan in addition toSicily, Italy. Despite that the Wu et al. (2013) method achieved im-provement, the way they chose invariant regions was not essentiallydifferent than that applied by Elvidge et al. (2009a,b,c) and also suffersfrom the limitation of subjectively choosing areas.
Li et al. (2013a,b) designed an automatic method to find invariantpixels in Beijing, China to avoid subjective errors. This automaticmethod can minimize the bias introduced by subjective selection ofinvariant regions and has the potential to be extended to the entireglobe. However, since the region of Beijing experienced dramaticchanges in the past decades, this method might lead to overcorrectionto the NTL time series. Furthermore, the iterative procedure to identifystable pixels is very computation intensive and thus cannot be directlyimplemented at the global scale, considering the gigantic amount ofpixels. Zhang et al. (2016) designed a ridge sampling and regressionmethod to calibrate the NTL time series over the entire globe. Thismethod is based on a novel sampling strategy to identify pseudo-in-variant features. Data points along a ridgeline-the densest part of adensity plot generated between the reference image and the target
image-were first identified and those data points were then used toderive calibration models to minimize inconsistencies in the NTL timeseries. In this way, only 63 pairs of data points were used to run aregression model for calibrating each target image, significantly redu-cing computation load. Since only the F152000 image was used as thereference image, target images close to the two ends of the time seriesmight be over corrected due to the increased time intervals. Li and Zhou(2017) proposed a stepwise calibration approach to address that issue.They first reduced temporal inconsistency within each satellite segmentand then systematically moved each satellite segment up or down togenerate a temporally consistent NTL time series from 1992 to 2013, bymaking full use of the temporally neighbored image as a reference forcalibration.
Each of the methods mentioned above has its strengths andshortages. A framework to assess and choose a right method for aspecific application was proposed by Pandey et al. (2017). Future ef-forts are still needed to design better NTL calibrating methods. Fur-thermore, there is a huge gap between DMSP/OLS and VIIRS/DNB. Atemporally consistent NTL time series extending from DMSP/OLS toVIIRS/DNB is highly desirable, yet still a huge challenge, due to dif-ferences in passing time, onboard calibration, spatial resolution, andother considerations (see Li et al., 2017, as well as Zheng et al., 2019,for examples of inter-calibration between DMSP/OLS and VIIRS/DNB).Ground-based stable and radiometrically calibrated light sources mayoffer a useful approach for inter-calibration between night-time lightssensors, as well as for validating the performance of these sensors, asattempted by Hu et al. (2018b) and Ryan et al. (2019).
4.8. Outlook for the future
4.8.1. The need for geostationary platformsDespite the benefits of its unique information content, a significant
limitation of current VIIRS/DNB measurements is infrequent revisits,and hence poor temporal resolution across the night. The low earth-orbiting (LEO) satellite platform offers only 1–2 passes per night at lowto mid-latitudes, meaning that the VIIRS/DNB information must beused in ‘snapshot mode.’ With the addition of NOAA-20 in November2017 to the same orbital plane as Suomi, there is now a 50-min updatearound 01:30 local time.
This second observation provides some information on the changingenvironment, but still cannot resolve parameter evolution or the diurnalcycle. For this, a geostationary-based (GEO) version of the DNB wouldbe needed in order to overcome this principal limitation. Having asensor that can provide low-light visible sensitivity from GEO wouldrepresent a significant advance over current nighttime imaging cap-abilities represented by the VIIRS/DNB. A pioneering study on thetemporal dynamics of urban lights was done by Dobler et al. (2015),using horizontal images from a fixed camera, every 10s over 22 nights,demonstrating the type of information which can be derived fromcontinuous monitoring of artificial lights throughout the night. Fre-quent monitoring of the Earth at night from sunset to sunrise will allowresearchers to uncover circadian patterns of human activity, not only toquantify temporal changes in light pollution, but also to better informus on changes in ambient population during night-time, e.g., peopleworking at night, or attending various night-time events.
Such a GEO platform would allow stare and thereby attain signal-to-noise on par or better (by a factor of 10) than the VIIRS/DNB. Dualproposing a nighttime GEO instrument as a star tracker, and conductingmultiple intermittent read-outs over the∼20s sampling interval, wouldfurther allow the instrument to achieve the necessary navigation andstability requirements for this measurement to attain 700m resolution.It would be very useful, but not required, to coordinate nighttime GEOoperations with a contemporary geostationary sensor (e.g., theAdvanced Baseline Imager on GOES-R) to leverage additional spectralinformation from those sensors. As noted in Miller et al. (2013), com-bining the visible band with near infrared (conventional) and thermal
N. Levin, et al. Remote Sensing of Environment 237 (2020) 111443
25
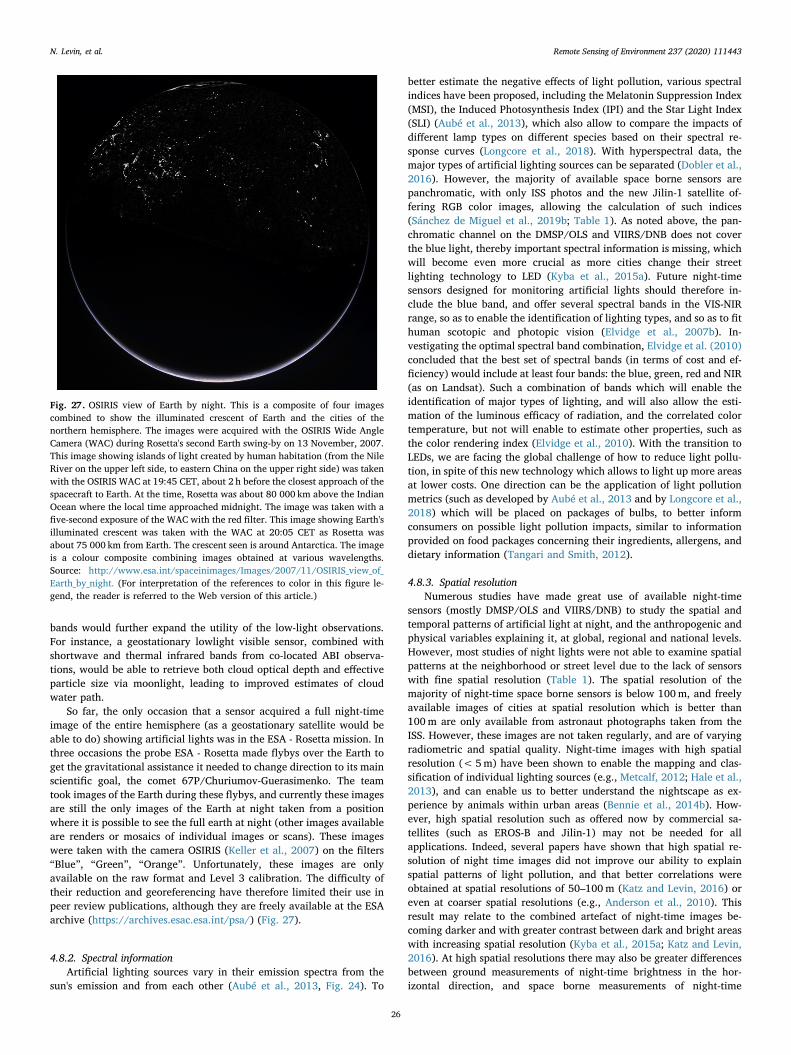
bands would further expand the utility of the low-light observations.For instance, a geostationary lowlight visible sensor, combined withshortwave and thermal infrared bands from co-located ABI observa-tions, would be able to retrieve both cloud optical depth and effectiveparticle size via moonlight, leading to improved estimates of cloudwater path.
So far, the only occasion that a sensor acquired a full night-timeimage of the entire hemisphere (as a geostationary satellite would beable to do) showing artificial lights was in the ESA - Rosetta mission. Inthree occasions the probe ESA - Rosetta made flybys over the Earth toget the gravitational assistance it needed to change direction to its mainscientific goal, the comet 67P/Churiumov-Guerasimenko. The teamtook images of the Earth during these flybys, and currently these imagesare still the only images of the Earth at night taken from a positionwhere it is possible to see the full earth at night (other images availableare renders or mosaics of individual images or scans). These imageswere taken with the camera OSIRIS (Keller et al., 2007) on the filters“Blue”, “Green”, “Orange”. Unfortunately, these images are onlyavailable on the raw format and Level 3 calibration. The difficulty oftheir reduction and georeferencing have therefore limited their use inpeer review publications, although they are freely available at the ESAarchive (https://archives.esac.esa.int/psa/) (Fig. 27).
4.8.2. Spectral informationArtificial lighting sources vary in their emission spectra from the
sun's emission and from each other (Aubé et al., 2013, Fig. 24). To
better estimate the negative effects of light pollution, various spectralindices have been proposed, including the Melatonin Suppression Index(MSI), the Induced Photosynthesis Index (IPI) and the Star Light Index(SLI) (Aubé et al., 2013), which also allow to compare the impacts ofdifferent lamp types on different species based on their spectral re-sponse curves (Longcore et al., 2018). With hyperspectral data, themajor types of artificial lighting sources can be separated (Dobler et al.,2016). However, the majority of available space borne sensors arepanchromatic, with only ISS photos and the new Jilin-1 satellite of-fering RGB color images, allowing the calculation of such indices(Sánchez de Miguel et al., 2019b; Table 1). As noted above, the pan-chromatic channel on the DMSP/OLS and VIIRS/DNB does not coverthe blue light, thereby important spectral information is missing, whichwill become even more crucial as more cities change their streetlighting technology to LED (Kyba et al., 2015a). Future night-timesensors designed for monitoring artificial lights should therefore in-clude the blue band, and offer several spectral bands in the VIS-NIRrange, so as to enable the identification of lighting types, and so as to fithuman scotopic and photopic vision (Elvidge et al., 2007b). In-vestigating the optimal spectral band combination, Elvidge et al. (2010)concluded that the best set of spectral bands (in terms of cost and ef-ficiency) would include at least four bands: the blue, green, red and NIR(as on Landsat). Such a combination of bands which will enable theidentification of major types of lighting, and will also allow the esti-mation of the luminous efficacy of radiation, and the correlated colortemperature, but not will enable to estimate other properties, such asthe color rendering index (Elvidge et al., 2010). With the transition toLEDs, we are facing the global challenge of how to reduce light pollu-tion, in spite of this new technology which allows to light up more areasat lower costs. One direction can be the application of light pollutionmetrics (such as developed by Aubé et al., 2013 and by Longcore et al.,2018) which will be placed on packages of bulbs, to better informconsumers on possible light pollution impacts, similar to informationprovided on food packages concerning their ingredients, allergens, anddietary information (Tangari and Smith, 2012).
4.8.3. Spatial resolutionNumerous studies have made great use of available night-time
sensors (mostly DMSP/OLS and VIIRS/DNB) to study the spatial andtemporal patterns of artificial light at night, and the anthropogenic andphysical variables explaining it, at global, regional and national levels.However, most studies of night lights were not able to examine spatialpatterns at the neighborhood or street level due to the lack of sensorswith fine spatial resolution (Table 1). The spatial resolution of themajority of night-time space borne sensors is below 100m, and freelyavailable images of cities at spatial resolution which is better than100m are only available from astronaut photographs taken from theISS. However, these images are not taken regularly, and are of varyingradiometric and spatial quality. Night-time images with high spatialresolution (< 5m) have been shown to enable the mapping and clas-sification of individual lighting sources (e.g., Metcalf, 2012; Hale et al.,2013), and can enable us to better understand the nightscape as ex-perience by animals within urban areas (Bennie et al., 2014b). How-ever, high spatial resolution such as offered now by commercial sa-tellites (such as EROS-B and Jilin-1) may not be needed for allapplications. Indeed, several papers have shown that high spatial re-solution of night time images did not improve our ability to explainspatial patterns of light pollution, and that better correlations wereobtained at spatial resolutions of 50–100m (Katz and Levin, 2016) oreven at coarser spatial resolutions (e.g., Anderson et al., 2010). Thisresult may relate to the combined artefact of night-time images be-coming darker and with greater contrast between dark and bright areaswith increasing spatial resolution (Kyba et al., 2015a; Katz and Levin,2016). At high spatial resolutions there may also be greater differencesbetween ground measurements of night-time brightness in the hor-izontal direction, and space borne measurements of night-time
Fig. 27. OSIRIS view of Earth by night. This is a composite of four imagescombined to show the illuminated crescent of Earth and the cities of thenorthern hemisphere. The images were acquired with the OSIRIS Wide AngleCamera (WAC) during Rosetta's second Earth swing-by on 13 November, 2007.This image showing islands of light created by human habitation (from the NileRiver on the upper left side, to eastern China on the upper right side) was takenwith the OSIRIS WAC at 19:45 CET, about 2 h before the closest approach of thespacecraft to Earth. At the time, Rosetta was about 80 000 km above the IndianOcean where the local time approached midnight. The image was taken with afive-second exposure of the WAC with the red filter. This image showing Earth'silluminated crescent was taken with the WAC at 20:05 CET as Rosetta wasabout 75 000 km from Earth. The crescent seen is around Antarctica. The imageis a colour composite combining images obtained at various wavelengths.Source: http://www.esa.int/spaceinimages/Images/2007/11/OSIRIS_view_of_Earth_by_night. (For interpretation of the references to color in this figure le-gend, the reader is referred to the Web version of this article.)
N. Levin, et al. Remote Sensing of Environment 237 (2020) 111443
26
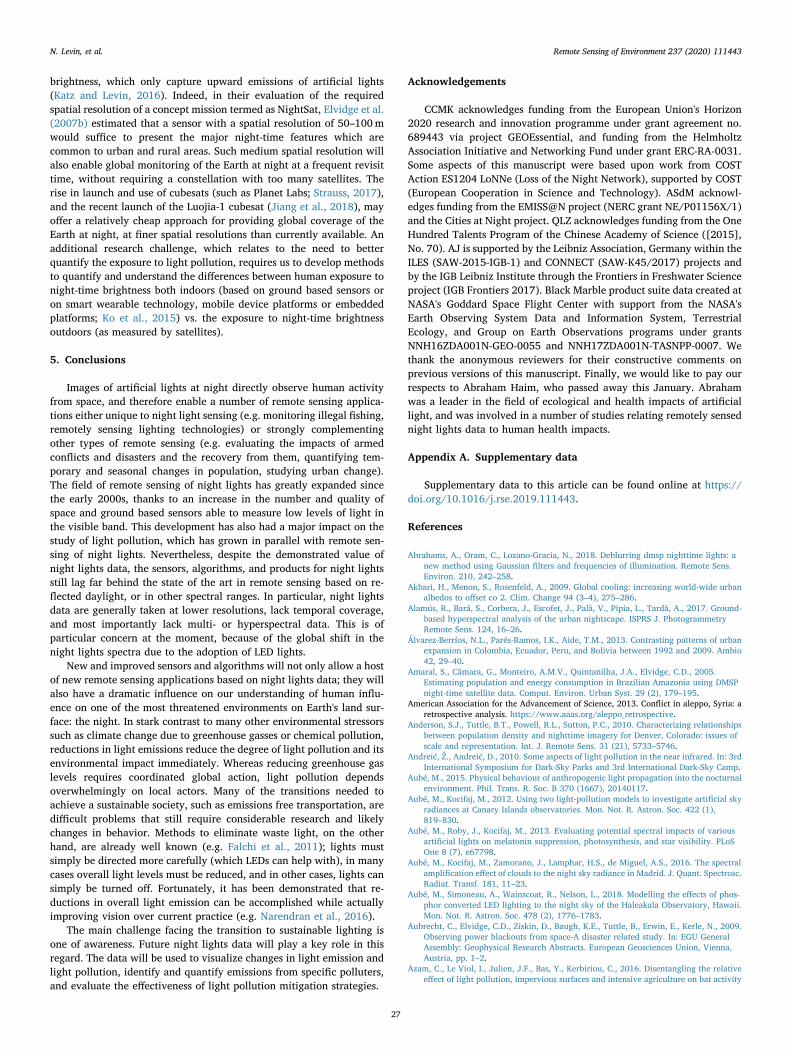
brightness, which only capture upward emissions of artificial lights(Katz and Levin, 2016). Indeed, in their evaluation of the requiredspatial resolution of a concept mission termed as NightSat, Elvidge et al.(2007b) estimated that a sensor with a spatial resolution of 50–100mwould suffice to present the major night-time features which arecommon to urban and rural areas. Such medium spatial resolution willalso enable global monitoring of the Earth at night at a frequent revisittime, without requiring a constellation with too many satellites. Therise in launch and use of cubesats (such as Planet Labs; Strauss, 2017),and the recent launch of the Luojia-1 cubesat (Jiang et al., 2018), mayoffer a relatively cheap approach for providing global coverage of theEarth at night, at finer spatial resolutions than currently available. Anadditional research challenge, which relates to the need to betterquantify the exposure to light pollution, requires us to develop methodsto quantify and understand the differences between human exposure tonight-time brightness both indoors (based on ground based sensors oron smart wearable technology, mobile device platforms or embeddedplatforms; Ko et al., 2015) vs. the exposure to night-time brightnessoutdoors (as measured by satellites).
5. Conclusions
Images of artificial lights at night directly observe human activityfrom space, and therefore enable a number of remote sensing applica-tions either unique to night light sensing (e.g. monitoring illegal fishing,remotely sensing lighting technologies) or strongly complementingother types of remote sensing (e.g. evaluating the impacts of armedconflicts and disasters and the recovery from them, quantifying tem-porary and seasonal changes in population, studying urban change).The field of remote sensing of night lights has greatly expanded sincethe early 2000s, thanks to an increase in the number and quality ofspace and ground based sensors able to measure low levels of light inthe visible band. This development has also had a major impact on thestudy of light pollution, which has grown in parallel with remote sen-sing of night lights. Nevertheless, despite the demonstrated value ofnight lights data, the sensors, algorithms, and products for night lightsstill lag far behind the state of the art in remote sensing based on re-flected daylight, or in other spectral ranges. In particular, night lightsdata are generally taken at lower resolutions, lack temporal coverage,and most importantly lack multi- or hyperspectral data. This is ofparticular concern at the moment, because of the global shift in thenight lights spectra due to the adoption of LED lights.
New and improved sensors and algorithms will not only allow a hostof new remote sensing applications based on night lights data; they willalso have a dramatic influence on our understanding of human influ-ence on one of the most threatened environments on Earth's land sur-face: the night. In stark contrast to many other environmental stressorssuch as climate change due to greenhouse gasses or chemical pollution,reductions in light emissions reduce the degree of light pollution and itsenvironmental impact immediately. Whereas reducing greenhouse gaslevels requires coordinated global action, light pollution dependsoverwhelmingly on local actors. Many of the transitions needed toachieve a sustainable society, such as emissions free transportation, aredifficult problems that still require considerable research and likelychanges in behavior. Methods to eliminate waste light, on the otherhand, are already well known (e.g. Falchi et al., 2011); lights mustsimply be directed more carefully (which LEDs can help with), in manycases overall light levels must be reduced, and in other cases, lights cansimply be turned off. Fortunately, it has been demonstrated that re-ductions in overall light emission can be accomplished while actuallyimproving vision over current practice (e.g. Narendran et al., 2016).
The main challenge facing the transition to sustainable lighting isone of awareness. Future night lights data will play a key role in thisregard. The data will be used to visualize changes in light emission andlight pollution, identify and quantify emissions from specific polluters,and evaluate the effectiveness of light pollution mitigation strategies.
Acknowledgements
CCMK acknowledges funding from the European Union's Horizon2020 research and innovation programme under grant agreement no.689443 via project GEOEssential, and funding from the HelmholtzAssociation Initiative and Networking Fund under grant ERC-RA-0031.Some aspects of this manuscript were based upon work from COSTAction ES1204 LoNNe (Loss of the Night Network), supported by COST(European Cooperation in Science and Technology). ASdM acknowl-edges funding from the EMISS@N project (NERC grant NE/P01156X/1)and the Cities at Night project. QLZ acknowledges funding from the OneHundred Talents Program of the Chinese Academy of Science ([2015],No. 70). AJ is supported by the Leibniz Association, Germany within theILES (SAW-2015-IGB-1) and CONNECT (SAW-K45/2017) projects andby the IGB Leibniz Institute through the Frontiers in Freshwater Scienceproject (IGB Frontiers 2017). Black Marble product suite data created atNASA's Goddard Space Flight Center with support from the NASA'sEarth Observing System Data and Information System, TerrestrialEcology, and Group on Earth Observations programs under grantsNNH16ZDA001N-GEO-0055 and NNH17ZDA001N-TASNPP-0007. Wethank the anonymous reviewers for their constructive comments onprevious versions of this manuscript. Finally, we would like to pay ourrespects to Abraham Haim, who passed away this January. Abrahamwas a leader in the field of ecological and health impacts of artificiallight, and was involved in a number of studies relating remotely sensednight lights data to human health impacts.
Appendix A. Supplementary data
Supplementary data to this article can be found online at https://doi.org/10.1016/j.rse.2019.111443.
References
Abrahams, A., Oram, C., Lozano-Gracia, N., 2018. Deblurring dmsp nighttime lights: anew method using Gaussian filters and frequencies of illumination. Remote Sens.Environ. 210, 242–258.
Akbari, H., Menon, S., Rosenfeld, A., 2009. Global cooling: increasing world-wide urbanalbedos to offset co 2. Clim. Change 94 (3–4), 275–286.
Alamús, R., Bará, S., Corbera, J., Escofet, J., Palà, V., Pipia, L., Tardà, A., 2017. Ground-based hyperspectral analysis of the urban nightscape. ISPRS J. PhotogrammetryRemote Sens. 124, 16–26.
Álvarez-Berríos, N.L., Parés-Ramos, I.K., Aide, T.M., 2013. Contrasting patterns of urbanexpansion in Colombia, Ecuador, Peru, and Bolivia between 1992 and 2009. Ambio42, 29–40.
Amaral, S., Câmara, G., Monteiro, A.M.V., Quintanilha, J.A., Elvidge, C.D., 2005.Estimating population and energy consumption in Brazilian Amazonia using DMSPnight-time satellite data. Comput. Environ. Urban Syst. 29 (2), 179–195.
American Association for the Advancement of Science, 2013. Conflict in aleppo, Syria: aretrospective analysis. https://www.aaas.org/aleppo_retrospective.
Anderson, S.J., Tuttle, B.T., Powell, R.L., Sutton, P.C., 2010. Characterizing relationshipsbetween population density and nighttime imagery for Denver, Colorado: issues ofscale and representation. Int. J. Remote Sens. 31 (21), 5733–5746.
Andreić, Ž., Andreić, D., 2010. Some aspects of light pollution in the near infrared. In: 3rdInternational Symposium for Dark-Sky Parks and 3rd International Dark-Sky Camp.
Aubé, M., 2015. Physical behaviour of anthropogenic light propagation into the nocturnalenvironment. Phil. Trans. R. Soc. B 370 (1667), 20140117.
Aubé, M., Kocifaj, M., 2012. Using two light-pollution models to investigate artificial skyradiances at Canary Islands observatories. Mon. Not. R. Astron. Soc. 422 (1),819–830.
Aubé, M., Roby, J., Kocifaj, M., 2013. Evaluating potential spectral impacts of variousartificial lights on melatonin suppression, photosynthesis, and star visibility. PLoSOne 8 (7), e67798.
Aubé, M., Kocifaj, M., Zamorano, J., Lamphar, H.S., de Miguel, A.S., 2016. The spectralamplification effect of clouds to the night sky radiance in Madrid. J. Quant. Spectrosc.Radiat. Transf. 181, 11–23.
Aubé, M., Simoneau, A., Wainscoat, R., Nelson, L., 2018. Modelling the effects of phos-phor converted LED lighting to the night sky of the Haleakala Observatory, Hawaii.Mon. Not. R. Astron. Soc. 478 (2), 1776–1783.
Aubrecht, C., Elvidge, C.D., Ziskin, D., Baugh, K.E., Tuttle, B., Erwin, E., Kerle, N., 2009.Observing power blackouts from space-A disaster related study. In: EGU GeneralAssembly: Geophysical Research Abstracts. European Geosciences Union, Vienna,Austria, pp. 1–2.
Azam, C., Le Viol, I., Julien, J.F., Bas, Y., Kerbiriou, C., 2016. Disentangling the relativeeffect of light pollution, impervious surfaces and intensive agriculture on bat activity
N. Levin, et al. Remote Sensing of Environment 237 (2020) 111443
27

with a national-scale monitoring program. Landsc. Ecol. 31 (10), 2471–2483.Bai, Y., Cao, C., Shao, X., 2015. Assessment of scan-angle dependent radiometric bias of
Suomi-NPP VIIRS day/night band from night light point source observations. In:Earth Observing Systems XX, vol. 9607. International Society for Optics andPhotonics, pp. 960727.
Ban, Y., Jacob, A., Gamba, P., 2015. Spaceborne sar data for global urban mapping at 30m resolution using a robust urban extractor. ISPRS J. Photogrammetry Remote Sens.103, 28–37.
Bará, S., 2017. Characterizing the zenithal night sky brightness in large territories: howmany samples per square kilometre are needed? Mon. Not. R. Astron. Soc. 473 (3),4164–4173.
Bará, S., Espey, B., Falchi, F., Kyba, C.C.M., Nievas Rosillo, M., 2015. Report of the 2014LoNNe intercomparison campaign. http://eprints.ucm.es/32989/ , Accessed date: 13May 2016 Accessed.
Bará, S., Rodríguez-Arós, Á., Pérez, M., Tosar, B., Lima, R.C., de Miguel, A.S., Zamorano,J., 2018. Estimating the relative contribution of streetlights, vehicles and residentiallighting to the urban night sky brightness. Lighting Research Tecnhology. https://doi.org/10.1177/1477153518808337.
Bará, S., Rigueiro, I., Lima, R.C., 2019. Monitoring transition: expected night skybrightness trends in different photometric bands. J. Quant. Spectrosc. Radiat. Transf.106644. https://doi.org/10.1016/j.jqsrt.2019.106644.
Barentine, J.C., Walker, C.E., Kocifaj, M., Kundracik, F., Juan, A., Kanemoto, J., Monrad,C.K., 2018. Skyglow changes over Tucson, Arizona, resulting from a municipal LEDstreet lighting conversion. J. Quant. Spectrosc. Radiat. Transf. 212, 10–23.
Bauer, S.E., Wagner, S.E., Burch, J., Bayakly, R., Vena, J.E., 2013. A case-referent study:light at night and breast cancer risk in Georgia. Int. J. Health Geogr. 12, 23.
Baugh, K., Elvidge, C.D., Ghosh, T., Ziskin, D., 2010. Development of a 2009 stable lightsproduct using DMSP-OLS data. Proc. Asia Pac. Adv. Netw. 30, 114–130.
Belward, A.S., Skøien, J.O., 2015. Who launched what, when and why; trends in globalland-cover observation capacity from civilian earth observation satellites. ISPRS J.Photogrammetry Remote Sens. 103, 115–128.
Bennett, M.M., Smith, L.C., 2017. Advances in using multitemporal night-time lights sa-tellite imagery to detect, estimate, and monitor socioeconomic dynamics. RemoteSens. Environ. 192, 176–197.
Bennie, J., Davies, T.W., Duffy, J.P., Inger, R., Gaston, K.J., 2014a. Contrasting trends inlight pollution across Europe based on satellite observed night time lights. Sci. Rep. 4,3789.
Bennie, J., Davies, T.W., Inger, R., Gaston, K.J., 2014b. Mapping artificial lightscapes forecological studies. Methods Ecol. Evol. 5, 534–540.
Bhaduri, B., Bright, E., Coleman, P., Dobson, J., 2002. LandScan. Geoinformatics 5 (2),34–37.
Biggs, J.D., Fouché, T., Bilki, F., Zadnik, M.G., 2012. Measuring and mapping the nightsky brightness of Perth, Western Australia. Mon. Not. R. Astron. Soc. 421 (2),1450–1464.
Burne, B.H., 1972. Pollution by light. The Lancet 299 (7751), 642.Cabrera-Cruz, S.A., Smolinsky, J.A., Buler, J.J., 2018. Light pollution is greatest within
migration passage areas for nocturnally-migrating birds around the world. Sci. Rep. 8(1), 3261.
Calegari, G.R., Nasi, N., Celino, I., 2018. Human computation vs. Machine learning: anexperimental comparison for image classification. Hum. Comput. J. 5 (1), 13–30.https://doi.org/10.15346/hc.v5i1.2. 2018.
Cao, C., Bai, Y., 2014. Quantitative analysis of VIIRS DNB nightlight point source for lightpower estimation and stability monitoring. Remote Sens. 6 (12), 11915–11935.
Cao, X., Chen, J., Imura, H., Higashi, O., 2009. A SVM-based method to extract urbanareas from DMSP-OLS and SPOT VGT data. Remote Sens. Environ. 113, 2205–2209.
Cao, C., Shao, X., Uprety, S., 2013. Detecting light outages after severe storms using the S-NPP/VIIRS day/night band radiances. IEEE Geosci. Remote Sens. Lett. 10 (6),1582–1586.
Cao, X., Hu, Y., Zhu, X., Shi, F., Zhuo, L., Chen, J., 2019. A simple self-adjusting model forcorrecting the blooming effects in DMSP-OLS nighttime light images. Remote Sens.Environ. 224, 401–411.
Castrence, M., Nong, D.H., Tran, C.C., Young, L., Fox, J., 2014. Mapping urban transitionsusing multi-temporal Landsat and DMSP-OLS night-time lights imagery of the redriver Delta in Vietnam. Land 3, 148–166.
Cha, J.S., Lee, J.W., Lee, W.S., Jung, J.W., Lee, K.M., Han, J.S., Gu, J.H., 2014. Policy andstatus of light pollution management in Korea. Light. Res. Technol. 46 (1), 78–88.
Chand, T.K., Badarinath, K.V.S., Murthy, M.S.R., Rajshekhar, G., Elvidge, C.D., Tuttle,B.T., 2007. Active forest fire monitoring in Uttaranchal State, India using multi‐-temporal DMSP‐OLS and MODIS data. Int. J. Remote Sens. 28 (10), 2123–2132.
Chen, X., Nordhaus, W.D., 2011. Using luminosity data as a proxy for economic statistics.Proc. Natl. Acad. Sci. 108, 8589–8594.
Chen, Z., Yu, B., Song, W., Liu, H., Wu, Q., Shi, K., Wu, J., 2017. A new approach fordetecting urban centers and their spatial structure with nighttime light remote sen-sing. IEEE Trans. Geosci. Remote Sens. 55 (11), 6305–6319.
Cho, Y., Ryu, S.H., Lee, B.R., Kim, K.H., Lee, E., Choi, J., 2015. Effects of artificial light atnight on human health: a literature review of observational and experimental studiesapplied to exposure assessment. Chronobiol. Int. 32 (9), 1294–1310.
Chuvieco, E., Mouillot, F., van der Werf, G.R., San Miguel, J., Tanasse, M., Koutsias, N., ...Heil, A., 2019. Historical background and current developments for mapping burnedarea from satellite Earth observation. Remote Sens. Environ. 225, 45–64.
Cinzano, P., Falchi, F., Elvidge, C.D., 2001. The first world atlas of the artificial night skybrightness. Mon. Not. R. Astron. Soc. 328 (3), 689–707.
Clark, R.N., Roush, T.L., 1984. Reflectance spectroscopy: quantitative analysis techniquesfor remote sensing applications. J. Geophys. Res.: Solid Earth 89 (B7), 6329–6340.
Clark, H., Pinkovskiy, M., Sala-i-Martin, X., 2017. China's GDP growth may be un-derstated. In: National Bureau of Economic Research.
Cleaver, O.P., 1943. Control of coastal lighting in anti-submarine warfare (No. 746).Engineer Board Fort Belvoir VA.
Coesfeld, J., Anderson, S., Baugh, K., Elvidge, C., Schernthanner, H., Kyba, C., 2018.Variation of individual location radiance in VIIRS DNB monthly composite images.Remote Sens. 10 (12), 1964.
Cole, T., Wanik, D., Molthan, A., Román, M., Griffin, R., 2017. Synergistic use of night-time satellite data, electric utility infrastructure, and ambient population to improvepower outage detections in urban areas. Remote Sensing 9 (3), 286.
Collier, P., 1994. Innovative military mapping using aerial photography in the first worldwar: sinai, Palestine and mesopotamia 1914–1919. Cartogr. J. 31 (2), 100–104.
Collison, F.M., Poe, K., 2013. “Astronomical tourism”: the astronomy and dark sky pro-gram at Bryce Canyon National park. Tourism Manag. Perspect. 7, 1–15.
Colomb, R., Alonso, C., Nollmann, I., 2003. SAC-C mission and the international amconstellation for earth observation. Acta Astronaut. 52 (9–12), 995–1006.
Croft, T.A., 1973. Burning waste gas in oil fields. Nature 245, 375–376.Croft, T.A., 1978. Night-time images of the Earth from space. Sci. Am. 239, 68–79.Croft, T.A., 1979. The Brightness of Lights on Earth at Night, Digitally Recorded by DMSP
Satellite (No. 80-167). US Geological Survey.Crutzen, P.J., 2002. Geology of mankind. Nature 415 (6867), 23.Dashora, A., Lohani, B., Malik, J.N., 2007. A repository of earth resource
information–CORONA satellite programme. Curr. Sci. 92 (7), 926–932.Davies, T.W., Smyth, T., 2018. Why artificial light at night should be a focus for global
change research in the 21st century. Glob. Chang. Biol. 24 (3), 872–882.Davies, T.W., Duffy, J.P., Bennie, J., Gaston, K.J., 2014. The nature, extent, and ecological
implications of marine light pollution. Front. Ecol. Environ. 12 (6), 347–355.den Outer, P., Lolkema, D., Haaima, M., Hoff, R.V.D., Spoelstra, H., Schmidt, W., 2011.
Intercomparisons of nine sky brightness detectors. Sensors 11 (10), 9603–9612.Dickinson, L.G., Boselly III, S.E., Burgmann, W.S., 1974. Defense Meteorological Satellite
Program (DMSP)-User's Guide (No. AWS-TR-74-250). Air Weather Service ScottAFB IL.
Diner, D.J., Bruegge, C.J., Martonchik, J.V., Ackerman, T.P., Davies, R., Gerstl, S.A.,, ...Danielson, E.D., 1989. MISR: a multiangle imaging spectroradiometer for geophysicaland climatological research from EOS. IEEE Trans. Geosci. Remote Sens. 27 (2),200–214.
Dobler, G., Ghandehari, M., Koonin, S.E., Nazari, R., Patrinos, A., Sharma, M.S., ...Wurtele, J.S., 2015. Dynamics of the urban lightscape. Inf. Syst. 54, 115–126.
Dobler, G., Ghandehari, M., Koonin, S.E., Sharma, M.S., 2016. A hyperspectral survey ofNew York city lighting technology. Sensors 16 (12), 2047.
Doll, C.N., 2008. CIESIN Thematic Guide to Night-Time Light Remote Sensing and itsApplications. Center for International Earth Science Information Network ofColumbia University, Palisades, NY.
Doll, C.H., Muller, J.P., Elvidge, C.D., 2000. Night-time imagery as a tool for globalmapping of socioeconomic parameters and greenhouse gas emissions. AMBIO A J.Hum. Environ. 29 (3), 157–162.
Doll, C.N.H., Muller, J.-P., Morley, J.G., 2006. Mapping regional economic activity fromnight-time light satellite imagery. Ecol. Econ. 57, 75–92.
Duriscoe, D.M., 2016. Photometric indicators of visual night sky quality derived from all-sky brightness maps. J. Quant. Spectrosc. Radiat. Transf. 181, 33–45.
Duriscoe, D.M., Luginbuhl, C.B., Moore, C.A., 2007. Measuring Night‐Sky Brightness witha Wide‐Field CCD Camera, vol. 119. Publications of the Astronomical Society of thePacific, pp. 192 852.
Edison, T.A., 1880. The success of the electric light. N. Am. Rev. 131 (287), 295–300.Ehrlich, D., Estes, J.E., Singh, A., 1994. Applications of NOAA-AVHRR 1 km data for
environmental monitoring. Int. J. Remote Sens. 15 (1), 145–161.Elvidge, C.D., Green, R.O., 2005. High-and low-altitude AVIRIS observations of nocturnal
lighting. In: Proceedings of the 13th JPL Airborne Earth Science Workshop.California, Pasadena May 24-27, 2005.
Elvidge, C.D., Kroehl, H.W., Kihn, E.A., Baugh, K.E., Davis, E.R., Hao, W.M., 1996.Algorithm for the retrieval of fire pixels from DMSP operational linescan system data.Biomass Burning Glob. Change: Remote Sens. Model. Inventory Dev. Biomass BurningAfrica 1, 73–85.
Elvidge, C.D., Baugh, K.E., Kihn, E.A., Kroehl, H.W., Davis, E.R., Davis, C.W., 1997a.Relation between satellite observed visible-near infrared emissions, population,economic activity and electric power consumption. Int. J. Remote Sens. 18 (6),1373–1379.
Elvidge, C.D., Baugh, K.E., Kihn, E.A., Kroehl, H.W., Davis, E.R., 1997b. Mapping citylights with nighttime data from the DMSP Operational Linescan System.Photogramm. Eng. Remote Sens. 63 (6), 727–734.
Elvidge, C.D., Baugh, K.E., Hobson, V.R., Kihn, E.A., Kroehl, H.W., 1998. Detection ofFires and Power Outages Using DMSP-OLS Data. Remote Sensing Change Detection:Environmental Monitoring Methods and Applications. Ann Arbor Press, Chelsea, MI,USA, pp. 123–135.
Elvidge, C.D., Baugh, K.E., Dietz, J.B., Bland, T., Sutton, P.C., Kroehl, H.W., 1999.Radiance calibration of DMSP-OLS low-light imaging data of human settlements.Remote Sens. Environ. 68 (1), 77–88.
Elvidge, C.D., Imhoff, M.L., Baugh, K.E., Hobson, V.R., Nelson, I., Safran, J.,, ... Tuttle,B.T., 2001a. Night-time lights of the world: 1994–1995. ISPRS J. PhotogrammetryRemote Sens. 56 (2), 81–99.
Elvidge, C.D., Nelson, I., Hobson, V.R., Safran, J., Baugh, K.E., 2001b. Detection of fires atnight using DMSP-OLS data. In: Ahern, Frank J., Goldammer, Johann G., Justice,Christopher 0 (Eds.), Global and Regional Vegetation Fire Monitoring from Space:Planning a Coordinated International Effort. SPB Academic Publishing bv/TheHague/The Netherlands, pp. 125–144.
Elvidge, C.D., Tuttle, B.T., Sutton, P.C., Baugh, K.E., Howard, A.T., Milesi, C.,, ... Nemani,R., 2007a. Global distribution and density of constructed impervious surfaces.Sensors 7 (9), 1962–1979.
N. Levin, et al. Remote Sensing of Environment 237 (2020) 111443
28
Elvidge, C.D., Cinzano, P., Pettit, D.R., Arvesen, J., Sutton, P., Small, C.,, ... Weeks, J.,2007b. The Nightsat mission concept. Int. J. Remote Sens. 28 (12), 2645–2670.
Elvidge, C.D., Safran, J., Tuttle, B., Sutton, P., Cinzano, P., Pettit, D.,, ... Small, C., 2007c.Potential for global mapping of development via a nightsat mission. Geojournal 69(1–2), 45–53.
Elvidge, C.D., Ziskin, D., Baugh, K.E., Tuttle, B.T., Ghosh, T., Pack, D.W., ... Zhizhin, M.,2009a. A fifteen year record of global natural gas flaring derived from satellite data.Energies 2 (3), 595–622.
Elvidge, C.D., Sutton, P.C., Ghosh, T., Tuttle, B.T., Baugh, K.E., Bhaduri, B., Bright, E.,2009b. A global poverty map derived from satellite data. Comput. Geosci. 35,1652–1660.
Elvidge, C.D., Erwin, E.H., Baugh, K.E., Ziskin, D., Tuttle, B.T., Ghosh, T., Sutton, P.C.,2009c. Overview of DMSP nightime lights and future possibilities. In: 2009 JointUrban Remote Sensing Event. IEEE, pp. 1–5.
Elvidge, C.D., Keith, D.M., Tuttle, B.T., Baugh, K.E., 2010. Spectral identification oflighting type and character. Sensors 10 (4), 3961–3988.
Elvidge, C., Baugh, K., Anderson, S., Sutton, P., Ghosh, T., 2012. The Night LightDevelopment Index (NLDI): a spatially explicit measure of human development fromsatellite data. Soc. Geogr. 7, 23–35.
Elvidge, C.D., Baugh, K.E., Zhizhin, M., Hsu, F.C., 2013a. Why VIIRS data are superior toDMSP for mapping nighttime lights. Proc. Asia-Pac. Adv. Netw., vol. 35 (62).
Elvidge, C.D., Zhizhin, M., Hsu, F.C., Baugh, K.E., 2013b. VIIRS nightfire: satellitepyrometry at night. Remote Sens. 5 (9), 4423–4449.
Elvidge, C.D., Zhizhin, M., Hsu, F.C., Baugh, K., 2013c. What is so great about nighttimeVIIRS data for the detection and characterization of combustion sources. Proc. AsiaPac. Adv. Netw. 35 (0), 33.
Elvidge, C.D., Zhizhin, M., Baugh, K., Hsu, F.C., Ghosh, T., 2015a. Methods for globalsurvey of natural gas flaring from visible infrared imaging radiometer suite data.Energies 9 (1), 14.
Elvidge, C.D., Zhizhin, M., Baugh, K., Hsu, F.C., 2015b. Automatic boat identificationsystem for VIIRS low light imaging data. Remote Sens. 7 (3), 3020–3036.
Elvidge, C.D., Baugh, K., Zhizhin, M., Hsu, F.C., Ghosh, T., 2017. VIIRS night-time lights.Int. J. Remote Sens. 38 (21), 5860–5879.
Elvidge, C.D., Ghosh, T., Baugh, K., Zhizhin, M., Hsu, F.C., Katada, N.S., Penalosa, W.,Hung, B.Q., 2018. Rating the effectiveness of fishery closures with Visible InfraredImaging Radiometer Suite boat detection data. Front. Mar. Sci. 5, 132 section MarineConservation and Sustainability.
Elvidge, C.D., Zhizhin, M., Baugh, K., Hsu, F.C., Ghosh, T., 2019. Extending nighttimecombustion source detection limits with short wavelength VIIRS Data. Remote Sens.11 (4), 395.
Falchi, F., Cinzano, P., Elvidge, C.D., Keith, D.M., Haim, A., 2011. Limiting the impact oflight pollution on human health, environment and stellar visibility. J. Environ.Manag. 92 (10), 2714–2722.
Falchi, F., Cinzano, P., Duriscoe, D., Kyba, C.C., Elvidge, C.D., Baugh, K.,, ... Furgoni, R.,2016. The new world atlas of artificial night sky brightness. Sci. Adv. 2 (6),e1600377.
Farges, T., Blanc, E., 2016. Characteristics of lightning, sprites, and human‐inducedemissions observed by nadir‐viewing cameras on board the International SpaceStation. J. Geophys. Res.: Atmospheres 121 (7), 3405–3420.
Fiorentin, P., Bettanini, C., Lorenzini, E., Aboudan, A., Colombatti, G., Ortolani, S.,Bertolo, A., 2018. June). MINLU: an instrumental suite for monitoring light pollutionfrom drones or airballoons. In: 2018 5th IEEE International Workshop on Metrologyfor AeroSpace (MetroAeroSpace). IEEE, pp. 274–278.
Forbes, D.J., 2013. Multi-scale analysis of the relationship between economic statisticsand DMSP-OLS night light images. GIScience Remote Sens. 50, 483–499.
Fouquet, R., Pearson, P.J., 2006. Seven centuries of energy services: the price and use oflight in the United Kingdom (1300-2000). Energy J. 139–177.
Gallaway, T., 2010. On light pollution, passive pleasures, and the instrumental value ofbeauty. J. Econ. Issues 44 (1), 71–88.
Garcia-Saenz, A., Sánchez de Miguel, A., Espinosa, A., Valentín, A., Aragonés, N., Llorca,J., Amiano, P., Martín Sánchez, V., Guevara, M., Capelo, R., Tardón, A., Peiró-Pérez,R., Jiménez-Moleón, J.J., Roca-Barceló, A., Pérez-Gómez, B., Dierssen-Sotos, T.,Fernández-Villa, T., Moreno-Iribas, C., Moreno, V., García-Pérez, J., Castaño-Vinyals,G., Pollán, M., Aubé, M., Kogevinas, M., 2018. Evaluating the association betweenartificial light-at-night exposure and breast and prostate cancer risk in Spain (MCC-Spain study). Environ. Health Perspect. 126 (4), 047011.
Gaston, K.J., Bennie, J., Davies, T.W., Hopkins, J., 2013. The ecological impacts ofnighttime light pollution: a mechanistic appraisal. Biol. Rev. 88 (4), 912–927.
Gaston, K.J., Duffy, J.P., Bennie, J., 2015. Quantifying the erosion of natural darkness inthe global protected area system. Conserv. Biol. 29 (4), 1132–1141.
Geronimo, R., Franklin, E., Brainard, R., Elvidge, C., Santos, M., Venegas, R., Mora, C.,2018. Mapping fishing activities and suitable fishing grounds using nighttime sa-tellite images and maximum entropy modelling. Remote Sens. 10 (10), 1604.
Ges, X., Bará, S., García-Gil, M., Zamorano, J., Ribas, S.J., Masana, E., 2018. Light pol-lution offshore: zenithal sky glow measurements in the Mediterranean coastal waters.J. Quant. Spectrosc. Radiat. Transf. 210, 91–100.
Ghosh, T., Powell, R.L., Elvidge, C.D., Baugh, K.E., Sutton, P.C., Anderson, S., 2010.Shedding light on the global distribution of economic activity. Open Geogr. J. 3,148–161.
Gillespie, T.W., Frankenberg, E., Fung Chum, K., Thomas, D., 2014. Night-time lights timeseries of tsunami damage, recovery, and economic metrics in Sumatra, Indonesia.Remote Sens. Lett. 5 (3), 286–294.
Giordano, E., Ong, C.E., 2017. Light festivals, policy mobilities and urban tourism. Tour.Geogr. 19 (5), 699–716.
Goldblatt, R., Stuhlmacher, M.F., Tellman, B., Clinton, N., Hanson, G., Georgescu, M.,, ...Balling, R.C., 2018. Using Landsat and nighttime lights for supervised pixel-based
image classification of urban land cover. Remote Sens. Environ. 205, 253–275.Green, J., Perkins, C., Steinbach, R., Edwards, P., 2015. Reduced street lighting at night
and health: a rapid appraisal of public views in England and Wales. Health Place 34,171–180.
Guo, W., Lu, D., Wu, Y., Zhang, J., 2015. Mapping impervious surface distribution withintegration of snnp viirs-dnb and modis ndvi data. Remote Sens. 7 (9), 12459–12477.
Gutman, P., 2007. Ecosystem services: foundations for a new rural–urban compact. Ecol.Econ. 62 (3), 383–387.
Haim, A., Portnov, B.A., 2013. Light Pollution as a New Risk Factor for Human Breast andProstate Cancers. Springer, Dordrecht, pp. 168.
Hale, J.D., Davies, G., Fairbrass, A.J., Matthews, T.J., Rogers, C.D., Sadler, J.P., 2013.Mapping lightscapes: spatial patterning of artificial lighting in an urban landscape.PLoS One 8 (5), e61460.
Hale, J.D., Fairbrass, A.J., Matthews, T.J., Davies, G., Sadler, J.P., 2015. The ecologicalimpact of city lighting scenarios: exploring gap crossing thresholds for urban bats.Glob. Chang. Biol. 21 (7), 2467–2478.
Halpern, B.S., Walbridge, S., Selkoe, K.A., Kappel, C.V., Micheli, F., D'agrosa, C.,, ...Fujita, R., 2008. A global map of human impact on marine ecosystems. Science 319(5865), 948–952.
Halpern, B.S., Frazier, M., Potapenko, J., Casey, K.S., Koenig, K., Longo, C.,, ... Walbridge,S., 2015. Spatial and temporal changes in cumulative human impacts on the world'socean. Nat. Commun. 6, 7615.
Hänel, A., Posch, T., Ribas, S.J., Aubé, M., Duriscoe, D., Jechow, A.,, ... Spoelstra, H.,2018. Measuring night sky brightness: methods and challenges. J. Quant. Spectrosc.Radiat. Transf. 205, 278–290.
Hansen, M.C., Potapov, P.V., Moore, R., Hancher, M., Turubanova, S.A.A., Tyukavina, A.,,... Kommareddy, A., 2013. High-resolution global maps of 21st-century forest coverchange. Science 342 (6160), 850–853.
Hao, R., Yu, D., Sun, Y., Cao, Q., Liu, Y., Liu, Y., 2015. Integrating multiple source data toenhance variation and weaken the blooming effect of DMSP-OLS light. Remote Sens.7 (2), 1422–1440.
He, C., Shi, P., Li, J., Chen, J., Pan, Y., Li, J., ... Ichinose, T., 2006. Restoring urbanizationprocess in China in the 1990s by using non-radiance-calibrated DMSP/OLS nighttimelight imagery and statistical data. Chin. Sci. Bull. 51 (13), 1614–1620.
Henderson, V., Storeygard, A., Weil, D.N., 2011. A bright idea for measuring economicgrowth. Am. Econ. Rev. 101, 194–199.
Henderson, J.V., Storeygard, A., Weil, D.N., 2012. Measuring economic growth fromouter space. Am. Econ. Rev. 102, 994–1028.
Henderson, J.V., Squires, T.L., Storeygard, A., Weil, D.N., 2016. The Global SpatialDistribution of Economic Activity: Nature, History, and the Role of Trade. NationalBureau of Economic Research Working Paper Series No. 22145.
Hiscocks, P.D., Kyba, C., 2017. Maps of light pollution. J. R. Astron. Soc. Can. 111, 154.Hoag, A.A., Schoening, W.E., Coucke, M., 1973. City sky glow monitoring at Kitt Peak.
Publications of the Astronomical Society of the Pacific 85 (507), 503.Hölker, F., Wolter, C., Perkin, E.K., Tockner, K., 2010a. Light pollution as a biodiversity
threat. Trends Ecol. Evol. 25 (12), 681–682.Hölker, F., Moss, T., Griefahn, B., Kloas, W., Voigt, C.C., Henckel, D.,, ... Franke, S.,
2010b. The dark side of light: a transdisciplinary research agenda for light pollutionpolicy. Ecol. Soc. 15 (4).
Hoornweg, D., Freire, M., Lee, M.J., Bhada-Tata, P., Yuen, B., 2011. Cities and ClimateChange: Responding to an Urgent Agenda. The World Bank.
Horton, K.G., Nilsson, C., Van Doren, B.M., La Sorte, F.A., Dokter, A.M., Farnsworth, A.,2019. Bright Lights in the Big Cities: Migratory Birds' Exposure to Artificial Light.Frontiers in Ecology and the Environment.
Hsu, F.C., Baugh, K.E., Ghosh, T., Zhizhin, M., Elvidge, C.D., 2015. DMSP-OLS radiancecalibrated nighttime lights time series with intercalibration. Remote Sens. 7 (2),1855–1876.
Hu, K., Qi, K., Guan, Q., Wu, C., Yu, J., Qing, Y.,, ... Li, X., 2017. A scientometric vi-sualization analysis for night-time light remote sensing research from 1991 to 2016.Remote Sens. 9 (8), 802.
Hu, Z., Hu, H., Huang, Y., 2018a. Association between nighttime artificial light pollutionand sea turtle nest density along Florida coast: a geospatial study using VIIRS remotesensing data. Environ. Pollut. 239, 30–42.
Hu, S., Ma, S., Yan, W., Lu, W., Zhao, X., 2018b. Feasibility of a specialized ground lightsource for night-time low-light calibration. Int. J. Remote Sens. 39 (8), 2543–2559.
Huang, Q., Yang, X., Gao, B., Yang, Y., Zhao, Y., 2014. Application of DMSP/OLSnighttime light images: a meta-analysis and a systematic literature review. RemoteSens. 6 (8), 6844–6866.
Hurley, S., Goldberg, D., Nelson, D., Hertz, A., Horn-Ross, P.L., Bernstein, L., Reynolds, P.,2014. Light at night and breast cancer risk among California teachers. Epidemiology25 (5), 697–706.
Hyde, E., Frank, S., Barentine, J.C., Kuechly, H., Kyba, C.C., 2019. Testing for changes inlight emissions from certified international dark sky places. Int. J. Sustain. Light. 21(1), 11–19.
Imhoff, M.L., Lawrence, W.T., Stutzer, D.C., Elvidge, C.D., 1997. A technique for usingcomposite DMSP/OLS “city lights” satellite data to map urban area. Remote Sens.Environ. 61, 361–370.
Isenstadt, S., Petty, M.M., Neumann, D., 2014. Cities of Light: Two Centuries of UrbanIllumination. Routledge.
Jakle, J.A., 2001. City Lights: Illuminating the American Night (Landscapes of the Night).John Hopkins University Press, Baltimore, MD, USA.
James, P., Bertrand, K.A., Hart, J.E., Schernhammer, E.S., Tamimi, R.M., Laden, F., 2017.Outdoor light at night and breast cancer incidence in the nurses' health study II.Environ. Health Perspect. 125 (8), 087010.
Jean, N., Burke, M., Xie, M., Davis, W.M., Lobell, D.B., Ermon, S., 2016. Combining sa-tellite imagery and machine learning to predict poverty. Science 353 (6301),
N. Levin, et al. Remote Sensing of Environment 237 (2020) 111443
29
790–794.Jechow, A., Kolláth, Z., Lerner, A., Hänel, A., Shashar, N., Hölker, F., Kyba, C., 2017a.
Measuring light pollution with fisheye lens imagery from a moving boat, a proof ofconcept. Int. J. Sustain. Light. 19, 15–25.
Jechow, A., Kolláth, Z., Ribas, S.J., Spoelstra, H., Hölker, F., Kyba, C.C., 2017b. Imagingand mapping the impact of clouds on skyglow with all-sky photometry. Sci. Rep. 7(1), 6741.
Jechow, A., Hölker, F., Kyba, C., 2018a. How Dark Can it Get at Night? Examining HowClouds Darken the Sky via All-Sky Differential Photometry. arXiv preprintarXiv:1807.10593.
Jechow, A., Ribas, S.J., Domingo, R.C., Hölker, F., Kolláth, Z., Kyba, C.C., 2018b.Tracking the dynamics of skyglow with differential photometry using a digitalcamera with fisheye lens. J. Quant. Spectrosc. Radiat. Transf. 209, 212–223.
Jechow, A., Hölker, F., Kyba, C.C., 2019a. Using all-sky differential photometry to in-vestigate how nocturnal clouds darken the night sky in rural areas. Sci. Rep. 9 (1),1391.
Jechow, A., Kyba, C., Hölker, F., 2019b. Beyond all-sky: assessing ecological light pol-lution using multi-spectral full-sphere fisheye lens imaging. J. Imaging 5 (4), 46.
Jiang, W., He, G., Long, T., Liu, H., 2017. Ongoing conflict makes Yemen dark: from theperspective of nighttime light. Remote Sens. 9, 798.
Jiang, W., He, G., Long, T., Guo, H., Yin, R., Leng, W.,, ... Wang, G., 2018. Potentiality ofusing Luojia 1-01 nighttime light imagery to investigate artificial light pollution.Sensors 18 (9), 2900.
Justice, C.O., Townshend, J.R.G., Vermote, E.F., Masuoka, E., Wolfe, R.E., Saleous, N.,, ...Morisette, J.T., 2002. An overview of MODIS Land data processing and productstatus. Remote Sens. Environ. 83 (1–2), 3–15.
Kamrowski, R.L., Limpus, C., Moloney, J., Hamann, M., 2012. Coastal light pollution andmarine turtles: assessing the magnitude of the problem. Endanger. Species Res. 19(1), 85–98.
Kamrowski, R.L., Limpus, C., Jones, R., Anderson, S., Hamann, M., 2014. Temporalchanges in artificial light exposure of marine turtle nesting areas. Glob. Chang. Biol.20 (8), 2437–2449.
Katz, Y., Levin, N., 2016. Quantifying urban light pollution—a comparison between fieldmeasurements and EROS-B imagery. Remote Sens. Environ. 177, 65–77.
Keller, H.U., Barbieri, C., Lamy, P., Rickman, H., Rodrigo, R., Wenzel, K.P.,, ... Bailey,M.E., 2007. OSIRIS–The scientific camera system onboard Rosetta. Space Sci. Rev.128 (1–4), 433–506.
Kelly, I., Leon, J.X., Gilby, B.L., Olds, A.D., Schlacher, T.A., 2017. Marine turtles are notfussy nesters: a novel test of small-scale nest site selection using structure from mo-tion beach terrain information. PeerJ 5, e2770.
Keshet-Sitton, A., Or-Chen, K., Huber, E., Haim, A., 2017. Illuminating a risk for breastcancer: a preliminary ecological study on the association between streetlight andbreast cancer. Integr. Cancer Ther. 16 (4), 451–463.
Kim, M., 2012. Modeling nightscapes of designed spaces–case studies of the University ofArizona and Virginia Tech campuses. In: 13th International Conference onInformation Technology in Landscape Architecture Proceedings, pp. 455–463.
Kim, K.Y., Lee, E., Kim, Y.J., Kim, J., 2017. The association between artificial light atnight and prostate cancer in Gwangju City and South Jeolla Province of South Korea.Chronobiol. Int. 34 (2), 203–211.
Kinzey, B.R., Perrin, T.E., Miller, N.J., Kocifaj, M., Aube, M., Lamphar, H.A., 2017. AnInvestigation of LED Street Lighting's Impact on Sky Glow (No. PNNL-26411). PacificNorthwest National Lab.(PNNL), Richland, WA (United States).
Kloog, I., Haim, A., Richard, G., Stevens, R.G., Barchana, M., Portnov, B.A., 2008. Light atnight Co-distributes with incident breast cancer but not lung cancer in the femalepopulation of Israel. Chronobiol. Int. 25 (1), 65–81.
Kloog, I., Haim, A., Stevens, R.G., Portnov, B.A., 2009. The global Co-distribution of lightat night (LAN) and cancers of prostate, colon and lung in men. Chronobiol. Int. 26(1), 108–125.
Kloog, I., Stevens, R.G., Haim, A., Portnov, B.A., 2010. Nighttime light level co-distributeswith breast cancer incidence worldwide. Cancer Causes Control 21, 2059–2068.
Ko, P.R.T., Kientz, J.A., Choe, E.K., Kay, M., Landis, C.A., Watson, N.F., 2015. Consumersleep technologies: a review of the landscape. J. Clin. Sleep Med. 11 (12), 1455–1461.
Kocifaj, M., 2017. Retrieval of angular emission function from whole-city light sourcesusing night-sky brightness measurements. Optica 4 (2), 255–262.
Kocifaj, M., Solano-Lamphar, H.A., Videen, G., 2019. Night-sky radiometry can re-volutionize the characterization of light-pollution sources globally. Proc. Natl. Acad.Sci. 116 (16), 7712–7717.
Koen, E.L., Minnaar, C., Roever, C.L., Boyles, J.G., 2018. Emerging threat of the 21stcentury lightscape to global biodiversity. Glob. Chang. Biol. 24 (6), 2315–2324.
Kohiyama, M., Hayashi, H., Maki, N., Higashida, M., Kroehl, H.W., Elvidge, C.D., Hobson,V.R., 2004. Early damaged area estimation system using DMSP-OLS night-timeimagery. Int. J. Remote Sens. 25 (11), 2015–2036.
Kolláth, Z., Dömény, A., Kolláth, K., Nagy, B., 2016. Qualifying lighting remodelling in aHungarian city based on light pollution effects. J. Quant. Spectrosc. Radiat. Transf.181, 46–51.
Kong, W., Cheng, J., Liu, X., Zhang, F., Fei, T., 2019. Incorporating nocturnal UAV side-view images with VIIRS data for accurate population estimation: a test at the urbanadministrative district scale. Int. J. Remote Sens. https://doi.org/10.1080/01431161.2019.1615653.
Koo, Y.S., Song, J.Y., Joo, E.Y., Lee, H.J., et al., 2016. Outdoor artificial light at night,obesity, and sleep health: cross-sectional analysis in the KoGES study. Chronobiol.Int. 33 (3), 301–314.
Kotarba, A.Z., Aleksandrowicz, S., 2016. Impervious surface detection with nighttimephotography from the International Space Station. Remote Sens. Environ. 176,295–307.
Krisciunas, K., Bogglio, H., Sanhueza, P., Smith, M.G., 2010. Light pollution at high zenith
angles, as measured at Cerro Tololo Inter-American Observatory. Publ. Astron. Soc.Pac. 122 (889), 373.
Kruse, F.A., Elvidge, C.D., 2011. March). Identifying and mapping night lights usingimaging spectrometry. In: Aerospace Conference, 2011. IEEE, pp. 1–6 (IEEE).
Kuechly, H.U., Kyba, C.C., Ruhtz, T., Lindemann, C., Wolter, C., Fischer, J., Hölker, F.,2012. Aerial survey and spatial analysis of sources of light pollution in Berlin,Germany. Remote Sens. Environ. 126, 39–50.
Kuffer, M., Pfeffer, K., Sliuzas, R., Taubenböck, H., Baud, I., van Maarseveen, M., 2018.Capturing the urban divide in nighttime light images from the international spacestation. IEEE J. Sel. Topics Appl. Earth Observ. Remote Sens.
Kyba, C.C., 2018a. Is light pollution getting better or worse? Nat. Astron. 2 (4), 267.Kyba, C.C.M., 2018b. A proposed method for estimating regional and global changes in
energy consumption for outdoor lighting. In: Presented at 5th InternationalConference on Artificial Light at Night Snowbird, USA, 12-14 November, 2018.
Kyba, C.C., Aronson, K.J., 2015. Assessing exposure to outdoor lighting and health risks.Epidemiology 26 (4), e50.
Kyba, C.C., Hölker, F., 2013. Do artificially illuminated skies affect biodiversity in noc-turnal landscapes? Landsc. Ecol. 28, 1637–1640.
Kyba, C.C.M., Spitschan, M., 2019. Comment on ‘Domestic light at night and breastcancer risk: a prospective analysis of 105000 UK women in the Generations Study’.Br. J. Canc. 120 (2), 276.
Kyba, C.C., Ruhtz, T., Fischer, J., Hölker, F., 2011. Cloud coverage acts as an amplifier forecological light pollution in urban ecosystems. PLoS One 6 (3), e17307.
Kyba, C.C.M., Ruhtz, T., Fischer, J., Hölker, F., 2012. Red is the new black: how the colourof urban skyglow varies with cloud cover. Mon. Not. R. Astron. Soc. 425 (1),701–708.
Kyba, C.C., Wagner, J.M., Kuechly, H.U., Walker, C.E., Elvidge, C.D., Falchi, F.,, ... Hölker,F., 2013a. Citizen science provides valuable data for monitoring global night skyluminance. Sci. Rep. 3, 1835.
Kyba, C.C., Ruhtz, T., Lindemann, C., Fischer, J., Hölker, F., 2013b. Two camera systemfor measurement of urban uplight angular distribution. In: AIP ConferenceProceedings, vol. 1531. AIP, pp. 568–571 No. 1.
Kyba, C., Garz, S., Kuechly, H., de Miguel, A.S., Zamorano, J., Fischer, J., Hölker, F.,2015a. High-resolution imagery of earth at night: new sources, opportunities andchallenges. Remote Sens. 7 (1), 1–23.
Kyba, C.C., Tong, K.P., Bennie, J., Birriel, I., Birriel, J.J., Cool, A., Ehlert, R., 2015b.Worldwide variations in artificial skyglow. Sci. Rep. 5, 8409.
Kyba, C.C., Kuester, T., de Miguel, A.S., Baugh, K., Jechow, A., Hölker, F.,, ... Guanter, L.,2017. Artificially lit surface of Earth at night increasing in radiance and extent. Sci.Adv. 3 (11), e1701528.
Kyba, C.C., Mohar, A., Pintar, G., Stare, J., 2018. A shining example of sustainable churchlighting using the EcoSky LED: 96% reduction in energy consumption, and dramaticreduction of light pollution. Int. J. Sustain. Light. 20 (1), 1–10.
La Sorte, F.A., Fink, D., Buler, J.J., Farnsworth, A., Cabrera‐Cruz, S.A., 2017. Seasonalassociations with urban light pollution for nocturnally migrating bird populations.Glob. Chang. Biol. 23 (11), 4609–4619.
Laforet, V., Pettit, D.R., 2015. Air,Press Syndication Group. 9780996058728.Lauer, D.T., Morain, S.A., Salomonson, V.V., 1997. The Landsat program: its origins,
evolution, and impacts. Photogramm. Eng. Remote Sens. 63 (7), 831–838.Levin, N., 2017. The impact of seasonal changes on observed nighttime brightness from
2014 to 2015 monthly VIIRS DNB composites. Remote Sens. Environ. 193, 150–164.Levin, N., Duke, Y., 2012sdf. High spatial resolution night-time light images for demo-
graphic and socio-economic studies. Remote Sens. Environ. 119, 1–10.Levin, N., Phinn, S., 2016. Illuminating the capabilities of Landsat 8 for mapping night
lights. Remote Sens. Environ. 182, 27–38.Levin, N., Zhang, Q., 2017. A global analysis of factors controlling VIIRS nighttime light
levels from densely populated areas. Remote Sensing of Environment 190, 366–382.Levin, N., Johansen, K., Hacker, J.M., Phinn, S., 2014. A new source for high spatial
resolution night time images—the EROS-B commercial satellite. Remote Sens.Environ. 149, 1–12.
Levin, N., Kark, S., Crandall, D., 2015. Where have all the people gone? Enhancing globalconservation using night lights and social media. Ecol. Appl. 25 (8), 2153–2167.
Levin, N., Ali, S., Crandall, D., 2018. Utilizing remote sensing and big data to quantifyconflict intensity: the Arab Spring as a case study. Appl. Geogr. 94, 1–17.
Levin, N., Ali, S., Crandall, D., Kark, S., 2019. World Heritage in danger: big data andremote sensing can help protect sites in conflict zones. Glob. Environ. Chang. 55,97–104.
Li, X., Zhou, Y., 2017. Urban mapping using DMSP/OLS stable night-time light: a review.Int. J. Remote Sens. 38 (21), 6030–6046.
Li, X., Xu, H., Chen, X., Li, C., 2013a. Potential of NPP-VIIRS nighttime light imagery formodeling the regional economy of China. Remote Sens. 5, 3057–3081.
Li, X., Chen, F., Chen, X., 2013b. Satellite-observed nighttime light variation as evidencefor global armed conflicts. IEEE J. Sel. Topics Appl. Earth Observ. Remote Sens. 6,2302–2315.
Li, X., Li, D., 2014. Can Night-Time Light Images Play a Role in Evaluating the SyrianCrisis? International Journal of Remote Sensing, vol. 35. pp. 6648–6661.
Li, X., Zhang, R., Huang, C., Li, D., 2015. Detecting 2014 Northern Iraq Insurgency usingnight-time light imagery. Int. J. Remote Sens. 36, 3446–3458.
Li, D., Zhao, X., Li, X., 2016. Remote sensing of human beings–a perspective fromnighttime light. Geo Spat. Inf. Sci. 19 (1), 69–79.
Li, X., Li, D., Xu, H., Wu, C., 2017. Intercalibration between DMSP/OLS and VIIRS night-time light images to evaluate city light dynamics of Syria's major human settlementduring Syrian Civil War. Int. J. Remote Sens. 38 (21), 5934–5951.
Li, X., Liu, S., Jendryke, M., Li, D., Wu, C., 2018a. Night-time light dynamics during theIraqi civil war. Remote Sens. 10, 858.
Li, X., Zhao, L., Li, D., Xu, H., 2018b. Mapping urban extent using Luojia 1-01 nighttime
N. Levin, et al. Remote Sensing of Environment 237 (2020) 111443
30

light imagery. Sensors 18 (11), 3665.Li, X., Li, X., Li, D., He, X., Jendryke, M., 2019a. A preliminary investigation of Luojia-1
night-time light imagery. Remote Sens. Lett. 10 (6), 526–535.Li, X., Ma, R., Zhang, Q., Li, D., Liu, S., He, T., Zhao, L., 2019b. Anisotropic characteristic
of artificial light at night–Systematic investigation with VIIRS DNB multi-temporalobservations. Remote Sens. Environ. 233, 111357. https://doi.org/10.1016/j.rse.2019.111357.
Li, X., Duarte, F., Ratti, C., 2019c. Analyzing the obstruction effects of obstacles on lightpollution caused by street lighting system in Cambridge, Massachusetts. Environmentand Planning B: Urban Analytics and City Science 2399808319861645.
Liao, L.B., Weiss, S., Mills, S., Hauss, B., 2013. Suomi NPP VIIRS day‐night band on‐orbitperformance. Journal of Geophysical Research: Atmospheres 118 (22), 12–705.
Liu, Z., He, C., Zhang, Q., Huang, Q., Yang, Y., 2012. Extracting the dynamics of urbanexpansion in China using DMSP-OLS nighttime light data from 1992 to 2008. Landsc.Urban Plan. 106, 62–72.
Liu, X., Guohua, H., Bin, A., Xia, L., Shi, Q., 2015. A normalized urban areas compositeindex (nuaci) based on combination of dmsp-ols and modis for mapping impervioussurface area. Remote Sens. 7 (12), 17168–17189. https://doi.org/10.3390/rs71215863.
Liu, Y., Hu, C., Zhan, W., Sun, C., Murch, B., Ma, L., 2018. Identifying industrial heatsources using time-series of the VIIRS Nightfire product with an object-oriented ap-proach. Remote Sens. Environ. 204, 347–365.
Longcore, T., Rich, C., 2004. Ecological light pollution. Front. Ecol. Environ. 2 (4),191–198.
Longcore, T., Rich, C., Mineau, P., MacDonald, B., Bert, D.G., Sullivan, L.M., ... ManvilleII, A.M., 2012. An estimate of avian mortality at communication towers in the UnitedStates and Canada. PLoS One, vol. 7, e34025 4.
Longcore, T., Rodríguez, A., Witherington, B., Penniman, J.F., Herf, L., Herf, M., 2018.Rapid assessment of lamp spectrum to quantify ecological effects of light at night. J.Exp. Zool. Part A: Ecological and Integrative Physiology. https://doi.org/10.1002/jez.2184.
Lu, D., Weng, Q., 2002. Use of impervious surface in urban land-use classification.Remote Sens. Environ. 102 (1), 146–160.
Lucht, W., Roujean, J.L., 2000. Considerations in the parametric modeling of BRDF andalbedo from multiangular satellite sensor observations. Remote Sensing Reviews 18(2-4), 343–379.
Luginbuhl, C.B., Duriscoe, D.M., Moore, C.W., Richman, A., Lockwood, G.W., Davis, D.R.,2009. From the Ground up II: Sky Glow and Near-Ground Artificial Light Propagationin Flagstaff, vol. 121. Publications of the Astronomical Society of the Pacific, Arizona,pp. 204 876.
Lunn, R.M., Blask, D.E., Coogan, A.N., Figueiro, M.G., Gorman, M.R., Hall, J.E., ...Stevens, R.G., 2017. Health consequences of electric lighting practices in the modernworld: a report on the National Toxicology Program's workshop on shift work atnight, artificial light at night, and circadian disruption. Sci. Total Environ. 607,1073–1084.
Ma, T., Zhou, C., Pei, T., Haynie, S., Fan, J., 2012. Quantitative estimation of urbanizationdynamics using time series of DMSP/OLS nighttime light data: a comparative casestudy from China's cities. Remote Sens. Environ. 124, 99–107.
Ma, T., Zhou, Y., Zhou, C., Haynie, S., Pei, T., Xu, T., 2015. Night-time light derivedestimation of spatio-temporal characteristics of urbanization dynamics using DMSP/OLS satellite data. Remote Sens. Environ. 158, 453–464.
Manfrin, A., Singer, G., Larsen, S., Weiß, N., van Grunsven, R.H., Weiß, N.S., ... Hölker, F.,2017. Artificial light at night affects organism flux across ecosystem boundaries anddrives community structure in the recipient ecosystem. Front. Environ. Sci. 5, 61.
Marcantonio, M., Pareeth, S., Rocchini, D., Metz, M., Garzon-Lopez, C.X., Neteler, M.,2015. The integration of Artificial Night-Time Lights in landscape ecology: a remotesensing approach. Ecol. Complex. 22, 109–120.
Marchant, P.R., 2004. A demonstration that the claim that brighter lighting reduces crimeis unfounded. Br. J. Criminol. 44 (3), 441–447.
Marchant, P., 2017. Why lighting claims might well be wrong. Int. J. Sustain. Light. 19(1), 69–74.
Mazor, T., Levin, N., Possingham, H.P., Levy, Y., Rocchini, D., Richardson, A.J., Kark, S.,2013. Can satellite-based night lights be used for conservation? The case of nestingsea turtles in the Mediterranean. Biol. Conserv. 159, 63–72.
McDonald, R.A., 1995. Corona: success for space reconnaissance, a look into the ColdWar, and a revolution in intelligence. Photogramm. Eng. Remote Sens. 61 (6),689–720.
Meier, J.M., 2018. Temporal Profiles of Urban Lighting: proposal for a research designand first results from three sites in Berlin. Int. J. Sustain. Light. 20 (1), 11–28.
Metcalf, J.P., 2012. Detecting and Characterizing Nighttime Lighting Using Multispectraland Hyperspectral Imaging. Doctoral dissertation. (Monterey, California. NavalPostgraduate School).
Miller, S.D., Turner, R.E., 2009. A dynamic lunar spectral irradiance dataset for NPOESS/VIIRS Day/Night Band nighttime environmental applications. IEEE Trans. Geosci.Remote Sens. 47 (7), 2316–2329.
Miller, S.D., Mills, S.P., Elvidge, C.D., Lindsey, D.T., Lee, T.F., Hawkins, J.D., 2012. Suomisatellite brings to light a unique frontier of nighttime environmental sensing cap-abilities. Proc. Natl. Acad. Sci. 109 (39), 15706–15711.
Miller, S.D., Straka III, W.C., Mills, S.P., Elvidge, C.D., Lee, T.F., Solbrig, J.E., Walther, A.,Heidinger, A.K., Weiss, S.C., 2013. Illuminating the capabilities of the Suomi nationalpolar-orbiting partnership (NPP) visible infrared imaging radiometer suite (VIIRS)day/night band. Remote Sens. 5 (12), 6717–6766.
Miller, S.D., Straka III, W.C., Yue, J., Seaman, C.J., Xu, S., Elvidge, C.D., Hoffman, L.,Azeem, I., 2018. The dark side of hurricane Matthew: unique perspectives from theVIIRS day/night band. Bulletin of the American Meteorological Society. available asan Early Online Release. https://journals.ametsoc.org/doi/pdf/10.1175/BAMS-D-
17-0097.1.Mills, G., 2010. Cities as agents of global change. Int. J. Climatol. 27 (14), 1849–1857.Min, B., Gaba, K.M., 2014. Tracking electrification in Vietnam using nighttime lights.
Remote Sens. 6 (10), 9511–9529.Min, B., Gaba, K.M., Sarr, O.F., Agalassou, A., 2013. Detection of rural electrification in
Africa using DMSP-OLS night lights imagery. Int. J. Remote Sens. 34 (22),8118–8141.
Minh Hieu, Nguyen, 2016. Transfer Learning for Classification of Nighttime Images.Zenodohttps://doi.org/10.5281/zenodo.1452011.
Molthan, A., Jedlovec, G., 2013. Satellite observations monitor outages from SuperstormSandy. Eos, Transactions American Geophysical Union 94 (5), 53–54.
Moreno Burgos, V., Palacios Morena, M., Carrasco Díaz, D., 2010. In: Documento Final delGrupo de trabajo 21 de Conama 10 Teledetección y sensores medioambientales.
Murphy, R.E., Barnes, W.L., Lyapustin, A.I., Privette, J., Welsch, C., DeLuccia, F.,, ...Kealy, P.S., 2001. Using VIIRS to provide data continuity with MODIS. In: Geoscienceand Remote Sensing Symposium, 2001. IGARSS'01, vol. 3. IEEE 2001 International,pp. 1212–1214 (IEEE).
Nagendra, H., Lucas, R., Honrado, J.P., Jongman, R.H.G., Tarantino, C., Adamo, M.,Mairota, P., 2012. Remote sensing for conservation monitoring: assessing protectedareas, habitat extent, habitat condition, species diversity, and threats. Ecol. Indicat.
Nakićenović, N., 2012. Summary for policy makers. In: Global Energy Assessment: towarda Sustainable Future. Cambridge University Press, Hong Kong, China, pp. 16–18.
Narendran, N., Freyssinier, J.P., Zhu, Y., 2016. Energy and user acceptability benefits ofimproved illuminance uniformity in parking lot illumination. Light. Res. Technol. 48(7), 789–809.
Navara, K.J., Nelson, R.J., 2007. The dark side of light at night: physiological, epide-miological, and ecological consequences. J. Pineal Res. 43 (3), 215–224.
Nordhaus, W.D., 1996. Do real-output and real-wage measures capture reality? The his-tory of lighting suggests not. In: The Economics of New Goods. University of ChicagoPress, pp. 27–70.
Ocaña, F., Sánchez de Miguel, A., Conde, A., 2016. Low cost multi-purpose balloon-borneplatform for wide-field imaging and video observation. Proc. SPIE 9, 9906. https://doi.org/10.1117/12.2233001.
Ou, J., Liu, X., Li, X., Li, M., Li, W., 2015. Evaluation of NPP-VIIRS nighttime light data formapping global fossil fuel combustion CO2 emissions: a comparison with DMSP-OLSnighttime light data. PLoS One 10 (9), e0138310.
Ouyang, Z., Lin, M., Chen, J., Fan, P., Qian, S.S., Park, H., 2019. Improving estimates ofbuilt-up area from night time light across globally distributed cities through hier-archical modeling. Sci. Total Environ. 647, 1266–1280.
Pack, D.W., Hardy, B.S., 2016. CubeSat Nighttime Lights. 30th Annual AAIA/USUConference on Small Satellites.
Pack, D., Hardy, B., Longcore, T., 2017. Studying the Earth at Night from CubeSats. 31st
Annual AAIA/USU Conference on Small Satellites.Pack, D.W., Coffman, C.M., Santiago, J.R., Russell, R.W., 2018. Earth remote sensing
results from the CUbesat MULtispectral Observing System, CUMULOS. In: AGU FallMeeting Abstracts.
Pack, D.W., Coffman, C.M., Santiago, J.R., 2019. A year in space for the CUbesatMULtispectral observing system: CUMULOS. In: 33rd Annual AIAA/USU Conferenceon Small Satellites, SSC19-XI-01.
Painter, K., 1996. The influence of street lighting improvements on crime, fear and pe-destrian street use, after dark. Landsc. Urban Plan. 35 (2–3), 193–201.
Pandey, B., Joshi, P.K., Seto, K.C., 2013. Monitoring urbanization dynamics in India usingdmsp/ols night time lights and spot-vgt data. Int. J. Appl. Earth Obs. Geoinf. 23 (1),49–61.
Pandey, B., Zhang, Q., Seto, K.C., 2017. Comparative evaluation of relative calibrationmethods for dmsp/ols nighttime lights. Remote Sens. Environ. 195, 67–78.
Pauwels, Julie, Le Viol, Isabelle, Azam, Clémentine, Valet, Nicolas, Julien, Jean-François,Bas, Yves, Lemarchand, Clément, Sánchez de Miguel, Alejandro, Kerbiriou, Christian,2019. Accounting for artificial light impact on bat activity for a biodiversity-friendlyurban planning. Landsc. Urban Plan. 183, 12–25.
Pawson, S.M., Bader, M.F., 2014. LED lighting increases the ecological impact of lightpollution irrespective of color temperature. Ecol. Appl. 24 (7), 1561–1568.
Pechony, O., Shindell, D.T., 2010. Driving forces of global wildfires over the past mil-lennium and the forthcoming century. Proc. Natl. Acad. Sci. 107 (45), 19167–19170.
Peña-García, A., Hurtado, A., Aguilar-Luzón, M.C., 2015. Impact of public lighting onpedestrians' perception of safety and well-being. Saf. Sci. 78, 142–148.
Pendoley, K.L., Verveer, A., Kahlon, A., Savage, J., Ryan, R.T., 2012. January). A noveltechnique for monitoring light pollution. In: International Conference on Health,Safety and Environment in Oil and Gas Exploration and Production. Society ofPetroleum Engineers.
Pettit, D., 2009. Exploring the frontier: science of opportunity on the international spacestation. Proc. Am. Philos. Soc. 153 (4), 381–402.
Plummer, K.E., Hale, J.D., O'Callaghan, M.J., Sadler, J.P., Siriwardena, G.M., 2016.Investigating the impact of street lighting changes on garden moth communities. J.Urban Econ. 2 (1), juw004.
Portnov, B.A., Stevens, R.G., Samociuk, H., Wakefield, D., Gregorio, D.I., 2016. Light atnight and breast cancer incidence in Connecticut: an ecological study of age groupeffects. Sci. Total Environ. 572, 1020–1024.
Prins, E., 2007. Use of low cost Landsat ETM+ to spot burnt villages in Darfur, Sudan. Int.J. Remote Sens. 29, 1207–1214.
Pritchard, S.B., 2017. The trouble with darkness: NASA's Suomi satellite images of Earthat night. Environ. Hist. 22 (2), 312–330.
Pun, C.S.J., So, C.W., 2012. Night-sky brightness monitoring in Hong Kong. Environ.Monit. Assess. 184 (4), 2537–2557.
Pun, C.S.J., So, C.W., Leung, W.Y., Wong, C.F., 2014. Contributions of artificial lightingsources on light pollution in Hong Kong measured through a night sky brightness
N. Levin, et al. Remote Sensing of Environment 237 (2020) 111443
31
monitoring network. J. Quant. Spectrosc. Radiat. Transf. 139, 90–108.Puschnig, J., Posch, T., Uttenthaler, S., 2014. Night sky photometry and spectroscopy
performed at the Vienna University Observatory. J. Quant. Spectrosc. Radiat. Transf.139, 64–75.
Pust, P., Schmidt, P.J., Schnick, W., 2015. A revolution in lighting. Nat. Mater. 14 (5),454.
Rao, P.K., Holmes, S.J., Anderson, R.K., Winston, J.S., Lehr, P.E., 1990. WeatherSatellites: Systems, Data, and Environmental Applications. American MeteorologicalSociety, Boston.
Reagan, Jason, 2018. Spanish company deploys drones to battle light pollution. https://dronelife.com/2018/02/13/spanish-company-deploys-drones-battle-light-pollution/.
Ribas, S.J.R., 2016. Caracterització de la contaminació lumínica en zones protegides iurbanes. Doctoral dissertation. Universitat de Barcelona.
Rich, C., Longcore, T. (Eds.), 2006. Ecological Consequences of Artificial Night Lighting.Island Press.
Riegel, K.W., 1973. Light Pollution: outdoor lighting is a growing threat to astronomy.Science 179 (4080), 1285–1291.
Román, M.O., Stokes, E.C., 2015. Holidays in lights: tracking cultural patterns in demandfor energy services. Earth's Future 3 (6), 182–205.
Román, M.O., Wang, Z., Sun, Q., Kalb, V., Miller, S.D., Molthan, A., ... Seto, K.C., 2018.NASA's Black Marble nighttime lights product suite. Remote Sens. Environ. 210,113–143.
Román, M.O., Schaaf, C.B., Lewis, P., Gao, F., Anderson, G.P., Privette, J.L., ... Barnsley,M., 2010. Assessing the coupling between surface albedo derived from MODIS andthe fraction of diffuse skylight over spatially-characterized landscapes. RemoteSensing of Environment 114 (4), 738–760.
Román, M.O., Stokes, E.C., Shrestha, R., Wang, Z., Schultz, L., Carlo, E.A.S., ... Ji, C.,2019. Satellite-based assessment of electricity restoration efforts in Puerto Rico afterHurricane Maria. PLoS One 14 (6), e0218883. https://doi.org/10.1371/journal.pone.0218883.
Rosebrugh, D.W., 1935. Sky-Glow from large cities. J. R. Astron. Soc. Can. 29, 79.Roujean, J.L., Leroy, M., Podaire, A., Deschamps, P.Y., 1992. Evidence of surface re-
flectance bidirectional effects from a NOAA/AVHRR multi-temporal data set.International Journal of Remote Sensing 13 (4), 685–698.
Roy, D.P., Wulder, M.A., Loveland, T.R., Woodcock, C.E., Allen, R.G., Anderson, M.C., ...Scambos, T.A., 2014. Landsat-8: science and product vision for terrestrial globalchange research. Remote Sens. Environ. 145, 154–172.
Royé, Dominic, 2018. https://twitter.com/dr_xeo/status/993770291431079936.RTVE, 2013. España a ras de cielo - españa de Noche. http://www.rtve.es/alacarta/
videos/espana-a-ras-de-cielo/espana-ras-cielo-espana-noche/4692661/.Ruhtz, T., Kyba, C.C.M., Posch, T., Puschnig, J., Kuechly, H., 2015. Lichtmesskampagne
Zentralraum Oberösterreich Erfassung des abgestrahlten Lichts mit einemnächtlichen Überflug.
Russart, K.L., Nelson, R.J., 2018. Artificial light at night alters behavior in laboratory andwild animals. J. Exp. Zool. Part A: Ecological and Integrative Physiology 329 (8–9),401–408.
Russell, B., 1935. In: Praise of Idleness and Other Essays. Routledge.Ryan, R.E., Pagnutti, M., Burch, K., Leigh, L., ruggles, t., cao, c., ... helder, d., 2019. The
Terra Vega active light source: a first step in a new approach to perform nighttimeabsolute radiometric calibrations and early results calibrating the VIIRS DNB. RemoteSens. 11 (6), 710.
Rybnikova, N., Portnov, B.A., 2016. Artificial light at night and obesity: does the spread ofwireless information and communication technology play a role? Int. J. Sustain.Light. 35, 16–20.
Rybnikova, N., Portnov, B.A., 2017. Outdoor light and breast cancer incidence: a com-parative analysis of DMSP and VIIRS-DNB satellite data. Int. J. Remote Sens. 38 (21),1–10.
Rybnikova, N., Portnov, B.A., 2018. Population-level Study Links Short WavelengthNighttime Illumination with Breast Cancer Incidence in a Major Metropolitan Area.Chronobiology International 2018.
Rybnikova, N., Haim, A., Portnov, B.A., 2015. Artificial light at night (ALAN) and breastcancer incidence worldwide: a revisit of earlier findings with analysis of currenttrends. Chronobiol. Int. 32 (6), 757–773.
Rybnikova, N., Haim, A., Portnov, B.A., 2016a. Does artificial light-at-night (ALAN) ex-posure contribute to the worldwide obesity pandemic? Int. J. Obes. 40 (5), 815–823.
Rybnikova, N., Haim, A., Portnov, B.A., 2016b. Is prostate cancer incidence worldwidelinked to artificial light at night exposures? Review of earlier findings and analysis ofcurrent trends. Arch. Environ. Occup. Health 72 (2), 111–122.
Rybnikova, N., Stevens, R., Gregorio, D., Samociuk, H., Portnov, B.A., 2018. Kerneldensity analysis reveals a halo pattern of breast cancer incidence in Connecticut.Spatial Spatio-Temporal Epidemiol. 26, 143–151.
Sabbatini, M., 2014. NightPod-Nodding Mechanism for the ISS. Technical Report.European Space Agency: Noordwijk, The Netherlands Experiment Record #9337.
Sadler, P., 2018. Detecting cities in aerial night-time images by learning structural in-variants using single reference augmentation. https://arxiv.org/abs/1810.08597.
Sánchez de Miguel, A., 2015. Variación espacial, temporal y espectral de lacontaminación lumínica y sus fuentes: Metodología y resultados. Doctoral dis-sertation. Universidad Complutense de Madrid.
Sánchez de Miguel, A., Zamorano, J., 2012. https://guaix.fis.ucm.es/node/1557.Sánchez de Miguel, A., Zamorano, J., Gómez, Castaño, J., Pascual, S., 2013a. European
Street Lighting Power Consumption Estimation Using DMSP/OLS Images. ALANConference.
Sánchez de Miguel, A., Zamorano, J., Pascual, S., López Cayuela, M., Ocaña, F.,Challupner, P.,, ... de Miguel, E., 2013b. ISS nocturnal images as a scientific toolagainst light pollution: flux calibration and colors. In: Highlights of Spanish
Astrophysics VII, vol. 1. Springer, Berlin, Germany, pp. 916–919.Sánchez de Miguel, A., Castaño, J.G., Zamorano, J., Pascual, S., Ángeles, M., Cayuela, L.,,
... Kyba, C.C., 2014. Atlas of astronaut photos of Earth at night. Astron. Geophys. 55(4), 4–36.
Sánchez de Miguel, A., Aubé, M., Zamorano, J., Kocifaj, M., Roby, J., Tapia, C., 2017. SkyQuality Meter measurements in a colour-changing world. Mon. Not. R. Astron. Soc.467 (3), 2966–2979.
Sánchez de Miguel, A., García, Lucía, Zamorano, Jaime, Gallego, Jesús, Gómez, José,Lombraña, Daniel, Esteban González, 2018. DarkSkies project (Cities At Night - 2014). Zenodo. http://doi.org/10.5281/zenodo.1255130.
Sánchez de Miguel, A., Kyba, C.C.M., Zamorano, J., Aubé, M., Gallego, J., 2019a. Thenature of the diffuse light near cities detected in nighttime satellite imagery. arXivpreprint arXiv:1908.05482.
Sánchez de Miguel, A., Kyba, C.C., Aubé, M., Zamorano, J., Cardiel, N., Tapia, C.,, ...Gaston, K.J., 2019b. Colour remote sensing of the impact of artificial light at night (I):the potential of the International Space Station and other DSLR-based platforms.Remote Sens. Environ. 224, 92–103.
Sandau, R., 2010. Status and trends of small satellite missions for Earth observation. ActaAstronaut. 66 (1–2), 1–12.
Sanderson, E.W., Jaiteh, M., Levy, M.A., Redford, K.H., Wannebo, A.V., Woolmer, G.,2002. The human footprint and the last of the wild: the human footprint is a globalmap of human influence on the land surface, which suggests that human beings arestewards of nature, whether we like it or not. AIBS (Am. Inst. Biol. Sci.) Bull. 52 (10),891–904.
Schaaf, C.B., Gao, F., Strahler, A.H., Lucht, W., Li, X., Tsang, T.,, ... Lewis, P., 2002. Firstoperational BRDF, albedo nadir reflectance products from MODIS. Remote Sens.Environ. 83 (1–2), 135–148.
Schmidt, W., 2015. AtlasNederland Verlicht. (NachtMeetnet).Sen, A., Kim, Y., Caruso, D., Lagerloef, G., Colomb, R., Yueh, S., Le Vine, D., 2006.
Aquarius/SAC-D mission overview. In: Sensors, Systems, and Next-Generation SatellitesX, vol. 6361. International Society for Optics and Photonics, pp. 63610I.
Shi, K., Huang, C., Yu, B., Yin, B., Huang, Y., Wu, J., 2014. Evaluation of NPP-VIIRS night-time light composite data for extracting built-up urban areas. Remote Sens. Lett. 5(4), 358–366.
Simi, C.G., Kindsfather, R., Pickard, H., Howard, W., Norton, M.C., Dixon, R., 1995.November). HERCULES/MSI: a multispectral imager with geolocation for STS-70. In:Remote Sensing for Agriculture, Forestry, and Natural Resources, vol. 2585.International Society for Optics and Photonics, pp. 267–283.
Small, C., 2005. A global analysis of urban reflectance. Int. J. Remote Sens. 26, 661–682.Small, C., Elvidge, C.D., 2013. Night on Earth: mapping decadal changes of anthropogenic
night light in Asia. Int. J. Appl. Earth Obs. Geoinf. 22, 40–52.Small, C., Pozzi, F., Elvidge, C., 2005. Spatial analysis of global urban extent from DMSP-
OLS night lights. Remote Sens. Environ. 96, 277–291.Sobrino, J.A., Sòria, G., Romaguera, M., Cuenca, J., 2009. Desirex 2008: Estudio de la isla
de calor en la Ciudad de Madrid. Revista de Teledetección 31, 80–92.Solano Lamphar, H.A., Kocifaj, M., 2016. Urban night-sky luminance due to different
cloud types: a numerical experiment. Light. Res. Technol. 48 (8), 1017–1033.Stark, H., Brown, S.S., Wong, K.W., Stutz, J., Elvidge, C.D., Pollack, I.B.,, ... Parrish, D.D.,
2011. City lights and urban air. Nat. Geosci. 4 (11), 730.Stathakis, D., Baltas, P., 2018. Seasonal population estimates based on night-time lights.
Comput. Environ. Urban Syst. 68, 133–141.Stefanov, W.L., Evans, C.A., Runco, S.K., Wilkinson, M.J., Higgins, M.D., Willis, K., 2017.
Astronaut photography: handheld camera imagery from low earth orbit. Handb.Satell. Appl. 847–899.
Steinbach, R., Perkins, C., Tompson, L., Johnson, S., Armstrong, B., Green, J.,, ... Edwards,P., 2015. The effect of reduced street lighting on road casualties and crime in Englandand Wales: controlled interrupted time series analysis. J. Epidemiol. CommunityHealth 69 (11), 1118–1124.
Stevens, R.G., 1987. Electric power use and breast cancer: a hypothesis. Am. J. Epidemiol.125 (4).
Stokes, E.C., Seto, K.C., 2019. Characterizing urban infrastructural transitions for theSustainable Development Goals using multi-temporal land, population, and nighttimelight data. Remote Sensing of Environment 234, 111430.
Straka, T.M., Wolf, M., Gras, P., Buchholz, S., Voigt, C.C., 2019. Tree cover mediates theeffect of artificial light on urban bats. Front. Ecol. Evol. 7, 91.
Strauss, M., 2017. Planet Earth to get a daily selfie. Science 355, 782–783.STV, 2011. Bron/Broen. https://www.svt.se/bron/.Sullivan III, W.T., 1989. A 10 km resolution image of the entire night-time Earth based on
cloud-free satellite photographs in the 400–1100 nm band. Int. J. Remote Sens. 10(1), 1–5.
Tamir, R., Lerner, A., Haspel, C., Dubinsky, Z., Iluz, D., 2017. The spectral and spatialdistribution of light pollution in the waters of the northern Gulf of Aqaba (Eilat). Sci.Rep. 7, 42329.
Tangari, A.H., Smith, R.J., 2012. How the temporal framing of energy savings influencesconsumer product evaluations and choice. Psychol. Mark. 29 (4), 198–208.
Tapia Ayuga, C., Sánchez de Miguel, A., Zamorano Calvo, J., 2015. LICA-‐UCM LampsSpectral Database. LICA Reports, Madrid.
Tardà, A., Palà, V., Arbiol, R., Pérez, F., Viñas, O., Pipia, L., Martínez, L., 2011. Detecciónde la iluminación exterior urbana nocturna con el sensor aerotransportado CASI 550.International Geomatic Week, Barcelona, Spain.
Teare, S.W., 2000. The night sky brightness at Mount Wilson Observatory. TheObservatory 120, 313–317.
Teikari, P., 2007. Light pollution: definition, legislation, measurement, modeling andenvironmental effects. Universitat Politecnica de Catalunya.
Townsend, A.C., Bruce, D.A., 2010. The use of night-time lights satellite imagery as ameasure of Australia's regional electricity consumption and population distribution.
N. Levin, et al. Remote Sensing of Environment 237 (2020) 111443
32

Int. J. Remote Sens. 31 (16), 4459–4480.United Nations, 2014. World Urbanization Prospects: the 2014 Revision, Highlights.
Department of Economic and Social Affairs. Population Division, United Nations.Van Doren, B.M., Horton, K.G., Dokter, A.M., Klinck, H., Elbin, S.B., Farnsworth, A., 2017.
High-intensity urban light installation dramatically alters nocturnal bird migration.Proc. Natl. Acad. Sci. 114 (42), 11175–11180.
Venter, O., Sanderson, E.W., Magrach, A., Allan, J.R., Beher, J., Jones, K.R.,, ... Levy,M.A., 2016. Sixteen years of change in the global terrestrial human footprint andimplications for biodiversity conservation. Nat. Commun. 7, 12558.
Vermote, E.F., Kotchenova, S., 2008. Atmospheric correction for the monitoring of landsurfaces. Journal of Geophysical Research: Atmospheres 113 (D23).
Vermote, E.F., El Saleous, N., Justice, C.O., Kaufman, Y.J., Privette, J.L., Remer, L.,, ...Tanre, D., 1997. Atmospheric correction of visible to middle‐infrared EOS‐MODISdata over land surfaces: background, operational algorithm and validation. J.Geophys. Res.: Atmospheres 102 (D14), 17131–17141.
Walczak, K., Gyuk, G., Kruger, A., Byers, E., Huerta, S., 2017. NITESat: a high resolution,full-color, light pollution imaging satellite mission. Int. J. Sustain. Light. 19 (1),48–55.
Walker, M.F., 1970. The California site survey. Publ. Astron. Soc. Pac. 82 (487), 672.Walker, M.F., 1973. Light pollution in California and Arizona. Publ. Astron. Soc. Pac. 85
(507), 508–519.Walker, C.E., Pompea, S.M., Isbell, D., 2008. June). GLOBE at night 2.0: on the road
toward IYA 2009. In: EPO and a Changing World: Creating Linkages and ExpandingPartnerships, vol. 389. pp. 423.
Wallner, S., Kocifaj, M., 2019. Impacts of surface albedo variations on the night skybrightness–A numerical and experimental analysis. Journal of QuantitativeSpectroscopy and Radiative Transfer 239, 106648.
Wang, W., Cheng, H., Zhang, L., 2012. Poverty assessment using DMSP/OLS night-timelight satellite imagery at a provincial scale in China. Adv. Space Res. 49, 1253–1264.
Wang, Z., Román, M.O., Sun, Q., Molthan, A.L., Schultz, L.A., Kalb, V.L., 2018.Monitoring disaster-related power outages using NASA black Marble nighttime lightproduct. Int. Arch. Photogramm. Remote Sens. Spat. Inf. Sci. 1853–1856.
Wei, Y., Liu, H., Song, W., Yu, B., Xiu, C., 2014. Normalization of time series DMSP-OLSnighttime light images for urban growth analysis with pseudo invariant features.Landsc. Urban Plan. 128, 1–13.
Weishampel, Z.A., Cheng, W.H., Weishampel, J.F., 2016. Sea turtle nesting patterns inFlorida vis‐à‐vis satellite‐derived measures of artificial lighting. Remote Sens. Ecol.Conserv. 2 (1), 59–72.
Welch, R., 1980. Monitoring urban population and energy utilization patterns from sa-tellite data. Remote Sens. Environ. 9 (1), 1–9.
Weng, Q., 2009. Thermal infrared remote sensing for urban climate and environmentalstudies: methods, applications, and trends. ISPRS J. Photogrammetry Remote Sens.64 (4), 335–344.
Witherington, B.E., Martin, R.E., 2000. Understanding, Assessing, and Resolving Light-Pollution Problems on Sea Turtle Nesting Beaches.
Witmer, F.D., 2015. Remote sensing of violent conflict: eyes from above. Int. J. RemoteSens. 36 (9), 2326–2352.
Witmer, F.D.W., O'Loughlin, J., 2011. Detecting the effects of wars in the Caucasus re-gions of Russia and Georgia using radiometrically normalized DMSP-OLS nighttimelights imagery. GIScience Remote Sens. 48, 478–500.
Wu, J., He, S., Peng, J., Li, W., Zhong, X., 2013. Intercalibration of DMSP-OLS night-timelight data by the invariant region method. Int. J. Remote Sens. 34, 7356–7368.
Xu, H., Yang, H., Li, X., Jin, H., Li, D., 2015. Multi-Scale measurement of regional in-equality in Mainland China during 2005–2010 using DMSP/OLS night light imageryand population density grid data. Sustainability 7, 13469.
Xu, Y., Knudby, A., Côté-Lussier, C., 2018. Mapping ambient light at night using fieldobservations and high-resolution remote sensing imagery for studies of urban en-vironments. Build. Environ. 145, 104–114.
Yair, Y., Rubanenko, L., Mezuman, K., Elhalel, G., Pariente, M., Glickman-Pariente, M.,, ...Inoue, T., 2013. New color images of transient luminous events from dedicated ob-servations on the International Space Station. J. Atmos. Sol. Terr. Phys. 102,140–147.
Yi, K., Tani, H., Li, Q., Zhang, J., Guo, M., Bao, Y., et al., 2014. Mapping and evaluatingthe urbanization process in northeast China using dmsp/ols nighttime light data.Sensors 14 (2), 3207–3226.
Yu, B., Shi, K., Hu, Y., Huang, C., Chen, Z., Wu, J., 2015. Poverty evaluation using NPP-VIIRS nighttime light composite data at the county level in China. Ieee J. Select.Topics Appl. Earth Observ.Remote Sens. 8, 1217–1229.
Zamorano, J., Sánchez de Miguel, A., Alfaro, E., Martínez-Delgado, D., Ocaña, F., Nievas,M., Castaño, J.G., 2013. May). NIXNOX project: enjoy the dark skies of Spain. In:Highlights of Spanish Astrophysics VIIpp. 962–970.
Zamorano, J., de Miguel, A.S., Ocaña, F., Pila-Diez, B., Castaño, J.G., Pascual, S.,, ...Nievas, M., 2016. Testing sky brightness models against radial dependency: a densetwo dimensional survey around the city of Madrid, Spain. J. Quant. Spectrosc. Radiat.Transf. 181, 52–66.
Zamorano, J., Tapia, C., Pascual, S., García, C., González, R., González, E., ... Solano, E.,2019, March. Night sky brightness monitoring in Spain. In highlights on Spanishastrophysics X. In: Montesinos, B., Asensio Ramos, A., Buitrago, F., Schödel, R.,Villaver, E., Pérez-Hoyos, S., Ordóñez-Etxeberria, I. (Eds.), Proceedings of the XIIIScientific Meeting of the Spanish Astronomical Society Held on July 16-20, 2018.978-84-09-09331-1, pp. 599–604 Salamanca, Spain.
Zhang, Q., Seto, K.C., 2011. Mapping urbanization dynamics at regional and global scalesusing multi-temporal DMSP/OLS nighttime light data. Remote Sens. Environ. 115,2320–2329.
Zhang, Q., Schaaf, C., Seto, K.C., 2013. The vegetation adjusted NTL urban index: a newapproach to reduce saturation and increase variation in nighttime luminosity.Remote Sens. Environ. 129, 32–41.
Zhang, J.C., Ge, L., Lu, X.M., Cao, Z.H., Chen, X., Mao, Y.N., Jiang, X.J., 2015a.Astronomical observing conditions at xinglong observatory from 2007 to 2014. Publ.Astron. Soc. Pac. 127 (958), 1292.
Zhang, Q., Levin, N., Chalkias, C., Letu, H., 2015b. Nighttime light remote sensing –Monitoring human societies from outer space. In: In: Thenkabail, P.S. (Ed.), Chapter11 in Remote Sensing Handbook ume 3. Taylor and Francis, pp. 289–310.
Zhang, Q., Li, B., Thau, D., Moore, R., 2015c. Building a better urban picture: combiningday and night remote sensing imagery. Remote Sens. 7 (9), 11887–11913.
Zhang, Q., Pandey, B., Seto, K.C., 2016. A robust method to generate a consistent timeseries from dmsp/ols nighttime light data. IEEE Trans. Geosci. Remote Sens. 54 (10),5821–5831.
Zhao, X., YU, B., Liu, Y., Yao, S., Lian, T., Chen, L., Yang, C., Chen, Z., Wu, J., 2018. NPP-VIIRS DNB daily data in natural disaster assessment: evidence from selected casestudies. Remote Sens. 10 (10), 1526. https://doi.org/10.3390/rs10101526.
Zhao, M., Zhou, Y., Li, X., Cao, W., He, C., Yu, B.,, ... Zhou, C., 2019. Applications ofsatellite remote sensing of nighttime light observations: advances, challenges, andperspectives. Remote Sens. 11 (17), 1971.
Zheng, Q., Weng, Q., Huang, L., Wang, K., Deng, J., Jiang, R.,, ... Gan, M., 2018. A newsource of multi-spectral high spatial resolution night-time light imagery—JL1-3B.Remote Sens. Environ. 215, 300–312.
Zheng, Q., Weng, Q., Wang, K., 2019. Developing a new cross-sensor calibration modelfor DMSP-OLS and Suomi-NPP VIIRS night-light imageries. ISPRS J. PhotogrammetryRemote Sens. 153, 36–47.
Zhou, Y., Smith, S.J., Elvidge, C.D., Zhao, K., Thomson, A., Imhoff, M., 2014. A cluster-based method to map urban area from dmsp/ols nightlights. Remote Sens. Environ.147 (18), 173–185.
Zhou, Y., Smith, S.J., Zhao, K., Imhoff, M., Thomson, A., Bondlamberty, B., et al., 2015. Aglobal map of urban extent from nightlights. Environ. Res. Lett. 10 (5).
Zhou, Y., Li, X., Asrar, G.R., Smith, S.J., Imhoff, M., 2018. A global record of annual urbandynamics (1992–2013) from nighttime lights. Remote Sens. Environ. 219, 206–220.
Zhu, Z., Zhou, Y., Seto, K.C., Stokes, E.C., Deng, C., Pickett, S.T., Taubenböck, H., 2019.Understanding an urbanizing planet: strategic directions for remote sensing. RemoteSens. Environ. 228, 164–182.
Zoogman, P., Liu, X., Suleiman, R.M., Pennington, W.F., Flittner, D.E., Al-Saadi, J.A., ...Janz, S.J., 2017. Tropospheric emissions: monitoring of pollution (TEMPO). J. Quant.Spectrosc. Radiat. Transf. 186, 17–39.
N. Levin, et al. Remote Sensing of Environment 237 (2020) 111443
33