Relationships Linking Amplification Level to Gene Over-Expression in Gliomas
7
Relationships Linking Amplification Level to Gene Over-Expression in Gliomas Nicolas Vogt 1,2,3 , Anne Gibaud 1,2,3 , Anna Almeida 1,2,3¤ , Isabelle Ourliac-Garnier 1,2,3 , Michelle Debatisse 1,2,3 , Bernard Malfoy 1,2,3 * 1 Institut Curie, Centre de Recherche, Paris, France, 2 CNRS UMR3244, Paris, France, 3 UPMC, Paris, France Abstract Background: Gene amplification is thought to promote over-expression of genes favouring tumour development. Because amplified regions are usually megabase-long, amplification often concerns numerous syntenic or non-syntenic genes, among which only a subset is over-expressed. The rationale for these differences remains poorly understood. Methodology/Principal Finding: To address this question, we used quantitative RT-PCR to determine the expression level of a series of co-amplified genes in five xenografted and one fresh human gliomas. These gliomas were chosen because we have previously characterised in detail the genetic content of their amplicons. In all the cases, the amplified sequences lie on extra-chromosomal DNA molecules, as commonly observed in gliomas. We show here that genes transcribed in non- amplified gliomas are over-expressed when amplified, roughly in proportion to their copy number, while non-expressed genes remain inactive. When specific antibodies were available, we also compared protein expression in amplified and non- amplified tumours. We found that protein accumulation barely correlates with the level of mRNA expression in some of these tumours. Conclusions/Significance: Here we show that the tissue-specific pattern of gene expression is maintained upon amplification in gliomas. Our study relies on a single type of tumour and a limited number of cases. However, it strongly suggests that, even when amplified, genes that are normally silent in a given cell type play no role in tumour progression. The loose relationships between mRNA level and protein accumulation and/or activity indicate that translational or post- translational events play a key role in fine-tuning the final outcome of amplification in gliomas. Citation: Vogt N, Gibaud A, Almeida A, Ourliac-Garnier I, Debatisse M, et al. (2010) Relationships Linking Amplification Level to Gene Over-Expression in Gliomas. PLoS ONE 5(12): e14249. doi:10.1371/journal.pone.0014249 Editor: Chris Jones, Institute of Cancer Research, United Kingdom Received July 9, 2010; Accepted November 12, 2010; Published December 8, 2010 Copyright: ß 2010 Vogt et al. This is an open-access article distributed under the terms of the Creative Commons Attribution License, which permits unrestricted use, distribution, and reproduction in any medium, provided the original author and source are credited. Funding: This work was partially supported by the Association pour la Recherche contre le Cancer, contract 3808 (http://www.arc-cancer.net/). The funder had no role in study design, data collection and analysis, decision to publish, or preparation of the manuscript. Competing Interests: The authors have declared that no competing interests exist. * E-mail: [email protected] ¤ Current address: Institut Curie, Translational Research Department, Paris, France Introduction The development of tumours often relies on genomic rear- rangements that alter the expression of genes favouring growth and survival pathways. Among rearrangements frequently in- volved in tumour progression is DNA amplification, which drastically modifies gene dosage in cancer cells [1,2]. Amplified sequences may be found within the chromosomes, clustered within homogeneously staining regions (HSRs) or spread among different loci. Alternatively, they may lie on circular extra-chromosomal DNA molecules called double minutes (dmins) [3,4]. Regardless of the localisation of extra copies, amplification events often lead to the co-amplification of groups of neighbouring genes originating from one or several genome regions. Each amplicon is supposed to bear at least one driver gene. Depending on the tumours, a few or most amplified genes may be over-expressed [5–10], so that several genes co-amplified within a given amplicon could be functionally relevant [11–13]. To determine the rationale for these differences in expression patterns, we analysed the expression level of all the co-amplified genes in five xenografted and one fresh human gliomas containing dmins, the sequence of which has been previously analysed in detail [14,15]. We found that the tissue- specific pattern of gene expression is not modified upon amplification. In contrast, protein accumulation and/or activity are not tightly related to mRNA over-expression. Results In five out of the six gliomas we analysed (tumours 4, 7, 21, 22 and 30) the amplification process involved sequences originating only from the 7p11 region, wherein lies the EGFR gene. We first focussed on these simple situations, in which the amplicons range from 0.7 to 2.1 megabases depending on the tumour, and all include the EGFR gene [14] (Figure 1A). In addition, a rearrangement leading to deletion of EGFR exons 2 to 7, which is commonly observed in gliomas [16], was seen in all the amplicons of tumour 21 [14] and in about 20% of those of tumour 22 (Supplementary data S1). The deleted genes encode the well-known variant III of EGFR (EGFRvIII) [17], a constitutively active EGFR protein. Screening of the human reference genome sequence revealed that 14 genes PLoS ONE | www.plosone.org 1 December 2010 | Volume 5 | Issue 12 | e14249
-
Upload
independent -
Category
Documents
-
view
1 -
download
0
Transcript of Relationships Linking Amplification Level to Gene Over-Expression in Gliomas
Relationships Linking Amplification Level to GeneOver-Expression in GliomasNicolas Vogt1,2,3, Anne Gibaud1,2,3, Anna Almeida1,2,3¤, Isabelle Ourliac-Garnier1,2,3, Michelle
Debatisse1,2,3, Bernard Malfoy1,2,3*
1 Institut Curie, Centre de Recherche, Paris, France, 2 CNRS UMR3244, Paris, France, 3 UPMC, Paris, France
Abstract
Background: Gene amplification is thought to promote over-expression of genes favouring tumour development. Becauseamplified regions are usually megabase-long, amplification often concerns numerous syntenic or non-syntenic genes,among which only a subset is over-expressed. The rationale for these differences remains poorly understood.
Methodology/Principal Finding: To address this question, we used quantitative RT-PCR to determine the expression levelof a series of co-amplified genes in five xenografted and one fresh human gliomas. These gliomas were chosen because wehave previously characterised in detail the genetic content of their amplicons. In all the cases, the amplified sequences lie onextra-chromosomal DNA molecules, as commonly observed in gliomas. We show here that genes transcribed in non-amplified gliomas are over-expressed when amplified, roughly in proportion to their copy number, while non-expressedgenes remain inactive. When specific antibodies were available, we also compared protein expression in amplified and non-amplified tumours. We found that protein accumulation barely correlates with the level of mRNA expression in some ofthese tumours.
Conclusions/Significance: Here we show that the tissue-specific pattern of gene expression is maintained uponamplification in gliomas. Our study relies on a single type of tumour and a limited number of cases. However, it stronglysuggests that, even when amplified, genes that are normally silent in a given cell type play no role in tumour progression.The loose relationships between mRNA level and protein accumulation and/or activity indicate that translational or post-translational events play a key role in fine-tuning the final outcome of amplification in gliomas.
Citation: Vogt N, Gibaud A, Almeida A, Ourliac-Garnier I, Debatisse M, et al. (2010) Relationships Linking Amplification Level to GeneOver-Expression in Gliomas. PLoS ONE 5(12): e14249. doi:10.1371/journal.pone.0014249
Editor: Chris Jones, Institute of Cancer Research, United Kingdom
Received July 9, 2010; Accepted November 12, 2010; Published December 8, 2010
Copyright: � 2010 Vogt et al. This is an open-access article distributed under the terms of the Creative Commons Attribution License, which permitsunrestricted use, distribution, and reproduction in any medium, provided the original author and source are credited.
Funding: This work was partially supported by the Association pour la Recherche contre le Cancer, contract 3808 (http://www.arc-cancer.net/). The funder hadno role in study design, data collection and analysis, decision to publish, or preparation of the manuscript.
Competing Interests: The authors have declared that no competing interests exist.
* E-mail: [email protected]
¤ Current address: Institut Curie, Translational Research Department, Paris, France
Introduction
The development of tumours often relies on genomic rear-
rangements that alter the expression of genes favouring growth
and survival pathways. Among rearrangements frequently in-
volved in tumour progression is DNA amplification, which
drastically modifies gene dosage in cancer cells [1,2]. Amplified
sequences may be found within the chromosomes, clustered within
homogeneously staining regions (HSRs) or spread among different
loci. Alternatively, they may lie on circular extra-chromosomal
DNA molecules called double minutes (dmins) [3,4]. Regardless of
the localisation of extra copies, amplification events often lead to
the co-amplification of groups of neighbouring genes originating
from one or several genome regions. Each amplicon is supposed to
bear at least one driver gene. Depending on the tumours, a few or
most amplified genes may be over-expressed [5–10], so that
several genes co-amplified within a given amplicon could be
functionally relevant [11–13]. To determine the rationale for these
differences in expression patterns, we analysed the expression level
of all the co-amplified genes in five xenografted and one fresh
human gliomas containing dmins, the sequence of which has been
previously analysed in detail [14,15]. We found that the tissue-
specific pattern of gene expression is not modified upon
amplification. In contrast, protein accumulation and/or activity
are not tightly related to mRNA over-expression.
Results
In five out of the six gliomas we analysed (tumours 4, 7, 21, 22
and 30) the amplification process involved sequences originating
only from the 7p11 region, wherein lies the EGFR gene. We first
focussed on these simple situations, in which the amplicons range
from 0.7 to 2.1 megabases depending on the tumour, and all include
the EGFR gene [14] (Figure 1A). In addition, a rearrangement
leading to deletion of EGFR exons 2 to 7, which is commonly
observed in gliomas [16], was seen in all the amplicons of tumour 21
[14] and in about 20% of those of tumour 22 (Supplementary data
S1). The deleted genes encode the well-known variant III of EGFR
(EGFRvIII) [17], a constitutively active EGFR protein. Screening of
the human reference genome sequence revealed that 14 genes
PLoS ONE | www.plosone.org 1 December 2010 | Volume 5 | Issue 12 | e14249
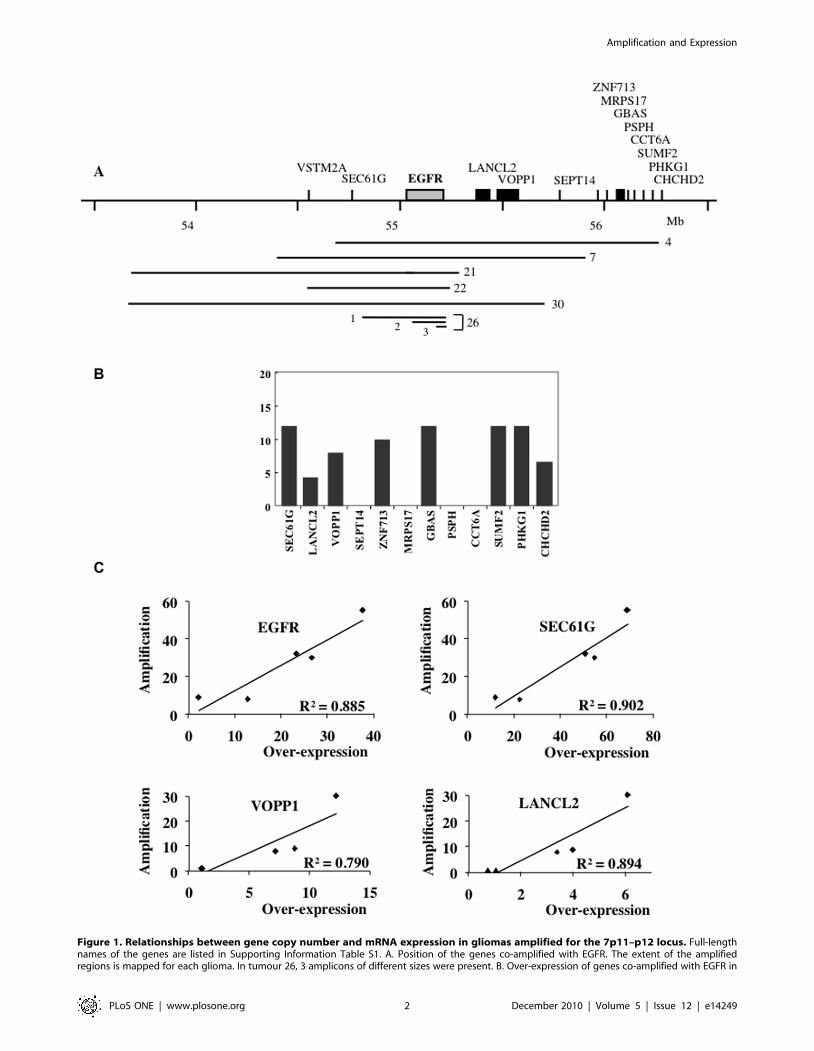
Figure 1. Relationships between gene copy number and mRNA expression in gliomas amplified for the 7p11–p12 locus. Full-lengthnames of the genes are listed in Supporting Information Table S1. A. Position of the genes co-amplified with EGFR. The extent of the amplifiedregions is mapped for each glioma. In tumour 26, 3 amplicons of different sizes were present. B. Over-expression of genes co-amplified with EGFR in
Amplification and Expression
PLoS ONE | www.plosone.org 2 December 2010 | Volume 5 | Issue 12 | e14249
coding for proteins lie in the region extending from 53 to 56.2 Mb,
which overlaps all the sequences amplified in this set of tumours
(Figure 1A, Supplementary Table S1). Among these genes, the
SEC61G gene was co-amplified with EGFR in 5 tumours and the
VSTM2A gene in 4 of them. Two genes (LANCL2 and VOPP1)
and SEPT14 were respectively amplified in 3 and 2 tumours. Eight
genes centromeric to SEPT14 (ZNF713, MRPS17, GBAS, PSPH,
CCT6A, SUMF2, PHKG1 and CHCHD2) were amplified in
tumour 4 only. The number of genes co-amplified with the EGFR
gene thus ranges from 2 (tumour 22) to 12 (tumour 4).
The expression of these 14 genes was measured by RT-Q-PCR
in tumours 4, 7, 21, 22 and 30 and in a reference set of 5 non-
amplified gliomas (for an example of the procedure, see
Supplementary data S2). The expression of 5 genes (VSTM2A,
SEPT14, MRPS17, PSPH and CCT6A) was undetectable in all
these gliomas, regardless of their amplification status. The other
genes were expressed both in control and amplified tumours, and
always over-expressed when amplified (Supplementary Table 1).
In tumour 4, for example, 8 expressed genes were co-amplified
with the EGFR gene. We found that these genes were over-
expressed 4- to 12-fold, which agrees with their 9-fold amplifica-
tion (Figure 1B). It is noticeable that original tumour 4 was
available in addition to the xenograft, and that similar levels of
expression were found in both cases (not shown). The fact that
tumours with different copy numbers of a given gene are available
offered us the possibility to determine the relationships linking the
level of amplification to that of mRNA expression. We observed a
linear relationship between these two parameters for the EGFR,
SEC61G, VOPP1 and LANCL2 genes (Figure 1C), which shows
that the level of mRNA expression correlates tightly with the gene
copy number for expressed genes.
Protein extracts were available for tumours 4, 7, 21 and 22 but
exhaustive analysis of the accumulation of proteins encoded by
amplified genes was prevented by the lack of adequate antibodies.
However, it was possible to perform western-blot analysis of
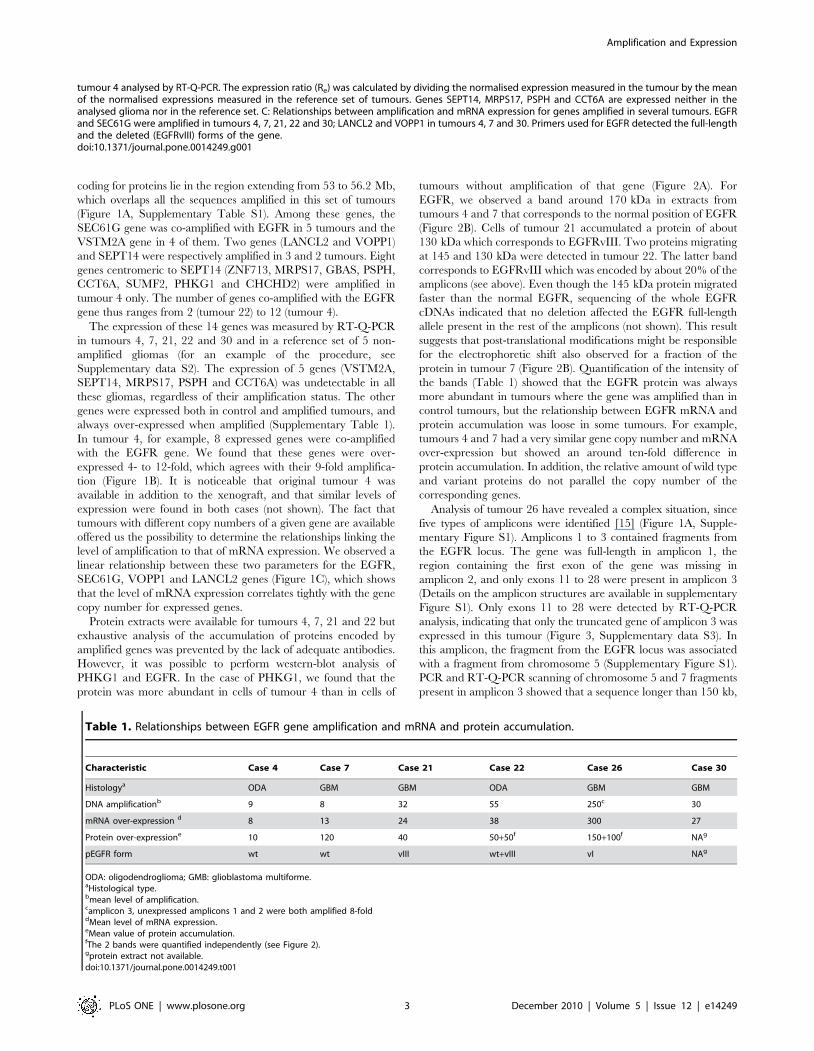
PHKG1 and EGFR. In the case of PHKG1, we found that the
protein was more abundant in cells of tumour 4 than in cells of
tumours without amplification of that gene (Figure 2A). For
EGFR, we observed a band around 170 kDa in extracts from
tumours 4 and 7 that corresponds to the normal position of EGFR
(Figure 2B). Cells of tumour 21 accumulated a protein of about
130 kDa which corresponds to EGFRvIII. Two proteins migrating
at 145 and 130 kDa were detected in tumour 22. The latter band
corresponds to EGFRvIII which was encoded by about 20% of the
amplicons (see above). Even though the 145 kDa protein migrated
faster than the normal EGFR, sequencing of the whole EGFR
cDNAs indicated that no deletion affected the EGFR full-length
allele present in the rest of the amplicons (not shown). This result
suggests that post-translational modifications might be responsible
for the electrophoretic shift also observed for a fraction of the
protein in tumour 7 (Figure 2B). Quantification of the intensity of
the bands (Table 1) showed that the EGFR protein was always
more abundant in tumours where the gene was amplified than in
control tumours, but the relationship between EGFR mRNA and
protein accumulation was loose in some tumours. For example,
tumours 4 and 7 had a very similar gene copy number and mRNA
over-expression but showed an around ten-fold difference in
protein accumulation. In addition, the relative amount of wild type
and variant proteins do not parallel the copy number of the
corresponding genes.
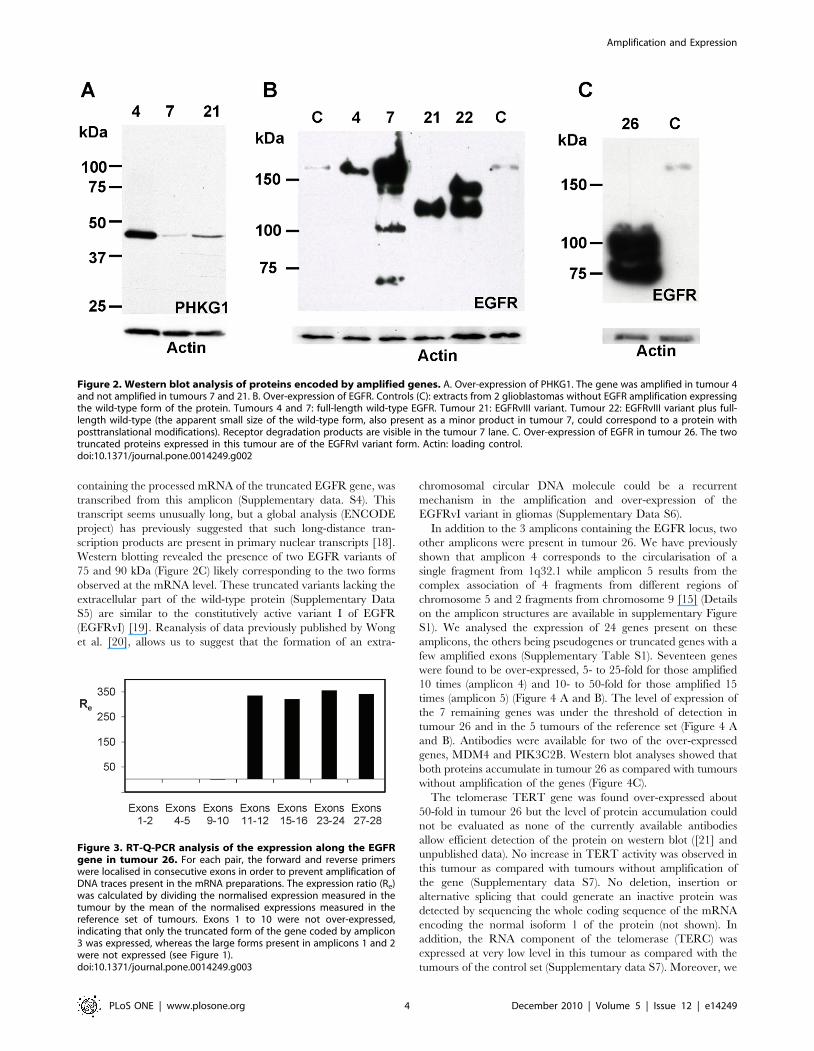
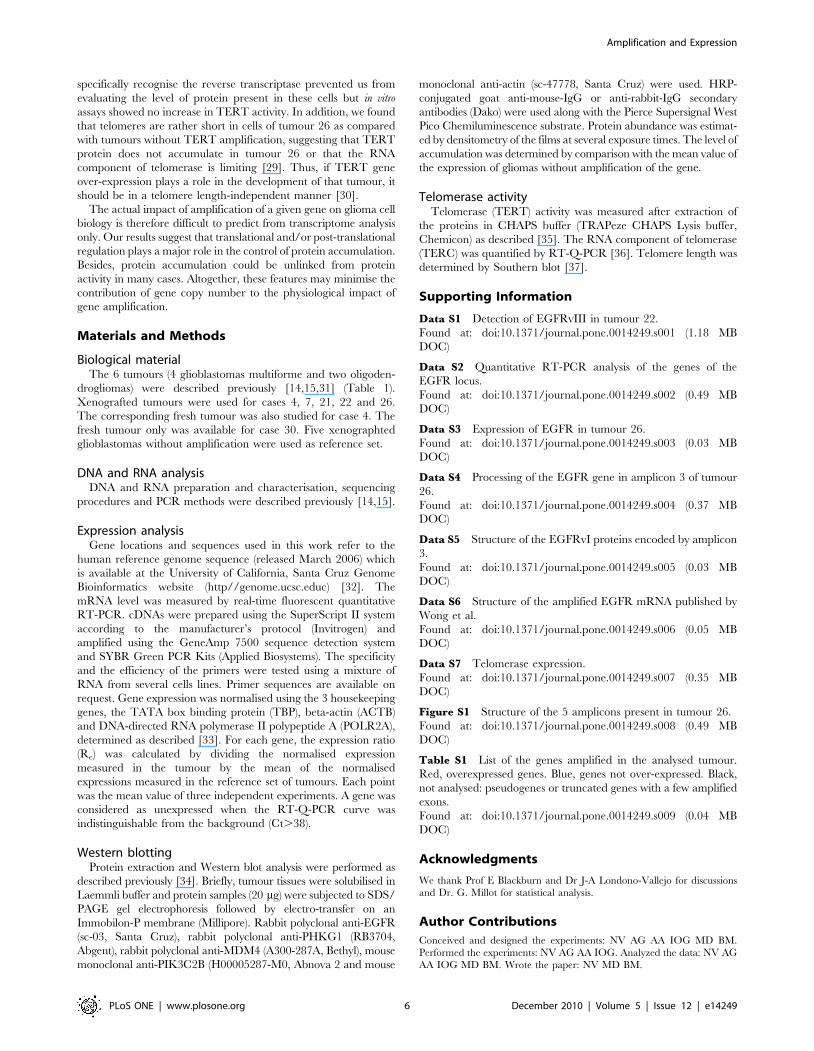
Analysis of tumour 26 have revealed a complex situation, since
five types of amplicons were identified [15] (Figure 1A, Supple-
mentary Figure S1). Amplicons 1 to 3 contained fragments from
the EGFR locus. The gene was full-length in amplicon 1, the
region containing the first exon of the gene was missing in
amplicon 2, and only exons 11 to 28 were present in amplicon 3
(Details on the amplicon structures are available in supplementary
Figure S1). Only exons 11 to 28 were detected by RT-Q-PCR
analysis, indicating that only the truncated gene of amplicon 3 was
expressed in this tumour (Figure 3, Supplementary data S3). In
this amplicon, the fragment from the EGFR locus was associated
with a fragment from chromosome 5 (Supplementary Figure S1).
PCR and RT-Q-PCR scanning of chromosome 5 and 7 fragments
present in amplicon 3 showed that a sequence longer than 150 kb,
tumour 4 analysed by RT-Q-PCR. The expression ratio (Re) was calculated by dividing the normalised expression measured in the tumour by the meanof the normalised expressions measured in the reference set of tumours. Genes SEPT14, MRPS17, PSPH and CCT6A are expressed neither in theanalysed glioma nor in the reference set. C: Relationships between amplification and mRNA expression for genes amplified in several tumours. EGFRand SEC61G were amplified in tumours 4, 7, 21, 22 and 30; LANCL2 and VOPP1 in tumours 4, 7 and 30. Primers used for EGFR detected the full-lengthand the deleted (EGFRvIII) forms of the gene.doi:10.1371/journal.pone.0014249.g001
Table 1. Relationships between EGFR gene amplification and mRNA and protein accumulation.
Characteristic Case 4 Case 7 Case 21 Case 22 Case 26 Case 30
Histologya ODA GBM GBM ODA GBM GBM
DNA amplificationb 9 8 32 55 250c 30
mRNA over-expression d 8 13 24 38 300 27
Protein over-expressione 10 120 40 50+50f 150+100f NAg
pEGFR form wt wt vIII wt+vIII vI NAg
ODA: oligodendroglioma; GMB: glioblastoma multiforme.aHistological type.bmean level of amplification.camplicon 3, unexpressed amplicons 1 and 2 were both amplified 8-folddMean level of mRNA expression.eMean value of protein accumulation.fThe 2 bands were quantified independently (see Figure 2).gprotein extract not available.doi:10.1371/journal.pone.0014249.t001
Amplification and Expression
PLoS ONE | www.plosone.org 3 December 2010 | Volume 5 | Issue 12 | e14249
containing the processed mRNA of the truncated EGFR gene, was
transcribed from this amplicon (Supplementary data. S4). This
transcript seems unusually long, but a global analysis (ENCODE
project) has previously suggested that such long-distance tran-
scription products are present in primary nuclear transcripts [18].
Western blotting revealed the presence of two EGFR variants of
75 and 90 kDa (Figure 2C) likely corresponding to the two forms
observed at the mRNA level. These truncated variants lacking the
extracellular part of the wild-type protein (Supplementary Data
S5) are similar to the constitutively active variant I of EGFR
(EGFRvI) [19]. Reanalysis of data previously published by Wong
et al. [20], allows us to suggest that the formation of an extra-
chromosomal circular DNA molecule could be a recurrent
mechanism in the amplification and over-expression of the
EGFRvI variant in gliomas (Supplementary Data S6).
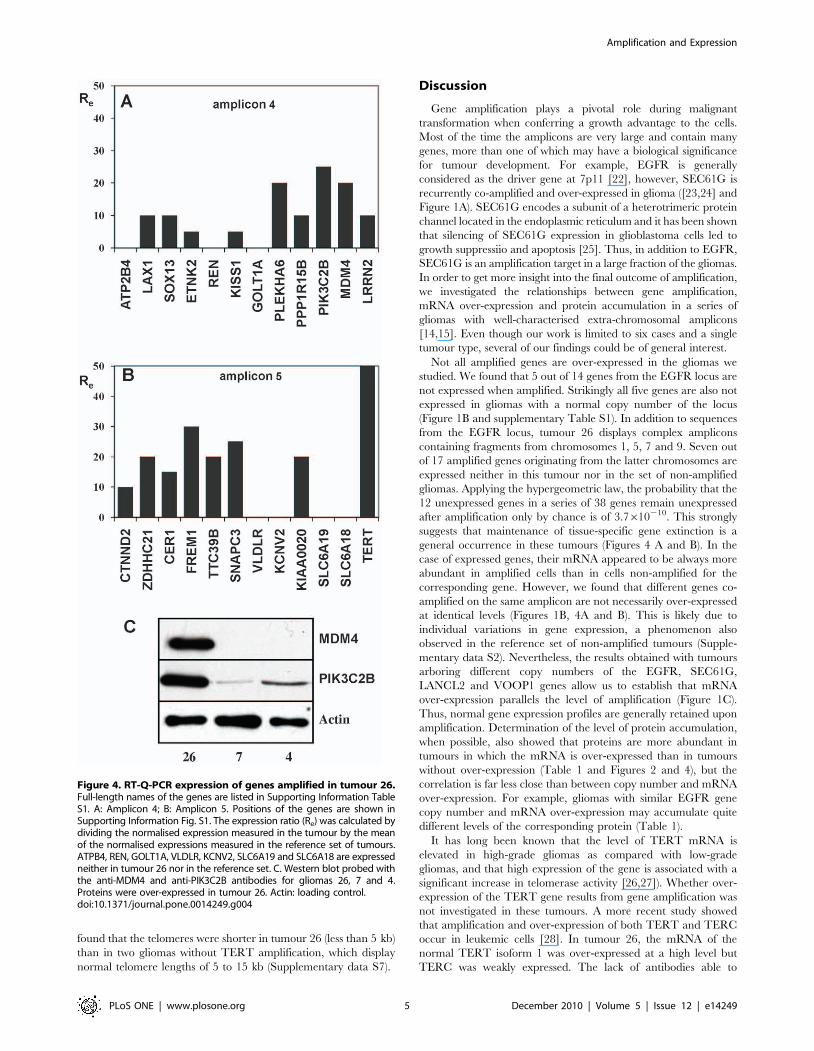
In addition to the 3 amplicons containing the EGFR locus, two
other amplicons were present in tumour 26. We have previously
shown that amplicon 4 corresponds to the circularisation of a
single fragment from 1q32.1 while amplicon 5 results from the
complex association of 4 fragments from different regions of
chromosome 5 and 2 fragments from chromosome 9 [15] (Details
on the amplicon structures are available in supplementary Figure
S1). We analysed the expression of 24 genes present on these
amplicons, the others being pseudogenes or truncated genes with a
few amplified exons (Supplementary Table S1). Seventeen genes
were found to be over-expressed, 5- to 25-fold for those amplified
10 times (amplicon 4) and 10- to 50-fold for those amplified 15
times (amplicon 5) (Figure 4 A and B). The level of expression of
the 7 remaining genes was under the threshold of detection in
tumour 26 and in the 5 tumours of the reference set (Figure 4 A
and B). Antibodies were available for two of the over-expressed
genes, MDM4 and PIK3C2B. Western blot analyses showed that
both proteins accumulate in tumour 26 as compared with tumours
without amplification of the genes (Figure 4C).
The telomerase TERT gene was found over-expressed about
50-fold in tumour 26 but the level of protein accumulation could
not be evaluated as none of the currently available antibodies
allow efficient detection of the protein on western blot ([21] and
unpublished data). No increase in TERT activity was observed in
this tumour as compared with tumours without amplification of
the gene (Supplementary data S7). No deletion, insertion or
alternative splicing that could generate an inactive protein was
detected by sequencing the whole coding sequence of the mRNA
encoding the normal isoform 1 of the protein (not shown). In
addition, the RNA component of the telomerase (TERC) was
expressed at very low level in this tumour as compared with the
tumours of the control set (Supplementary data S7). Moreover, we
Figure 2. Western blot analysis of proteins encoded by amplified genes. A. Over-expression of PHKG1. The gene was amplified in tumour 4and not amplified in tumours 7 and 21. B. Over-expression of EGFR. Controls (C): extracts from 2 glioblastomas without EGFR amplification expressingthe wild-type form of the protein. Tumours 4 and 7: full-length wild-type EGFR. Tumour 21: EGFRvIII variant. Tumour 22: EGFRvIII variant plus full-length wild-type (the apparent small size of the wild-type form, also present as a minor product in tumour 7, could correspond to a protein withposttranslational modifications). Receptor degradation products are visible in the tumour 7 lane. C. Over-expression of EGFR in tumour 26. The twotruncated proteins expressed in this tumour are of the EGFRvI variant form. Actin: loading control.doi:10.1371/journal.pone.0014249.g002
Figure 3. RT-Q-PCR analysis of the expression along the EGFRgene in tumour 26. For each pair, the forward and reverse primerswere localised in consecutive exons in order to prevent amplification ofDNA traces present in the mRNA preparations. The expression ratio (Re)was calculated by dividing the normalised expression measured in thetumour by the mean of the normalised expressions measured in thereference set of tumours. Exons 1 to 10 were not over-expressed,indicating that only the truncated form of the gene coded by amplicon3 was expressed, whereas the large forms present in amplicons 1 and 2were not expressed (see Figure 1).doi:10.1371/journal.pone.0014249.g003
Amplification and Expression
PLoS ONE | www.plosone.org 4 December 2010 | Volume 5 | Issue 12 | e14249
found that the telomeres were shorter in tumour 26 (less than 5 kb)
than in two gliomas without TERT amplification, which display
normal telomere lengths of 5 to 15 kb (Supplementary data S7).
Discussion
Gene amplification plays a pivotal role during malignant
transformation when conferring a growth advantage to the cells.
Most of the time the amplicons are very large and contain many
genes, more than one of which may have a biological significance
for tumour development. For example, EGFR is generally
considered as the driver gene at 7p11 [22], however, SEC61G is
recurrently co-amplified and over-expressed in glioma ([23,24] and
Figure 1A). SEC61G encodes a subunit of a heterotrimeric protein
channel located in the endoplasmic reticulum and it has been shown
that silencing of SEC61G expression in glioblastoma cells led to
growth suppressiio and apoptosis [25]. Thus, in addition to EGFR,
SEC61G is an amplification target in a large fraction of the gliomas.
In order to get more insight into the final outcome of amplification,
we investigated the relationships between gene amplification,
mRNA over-expression and protein accumulation in a series of
gliomas with well-characterised extra-chromosomal amplicons
[14,15]. Even though our work is limited to six cases and a single
tumour type, several of our findings could be of general interest.
Not all amplified genes are over-expressed in the gliomas we
studied. We found that 5 out of 14 genes from the EGFR locus are
not expressed when amplified. Strikingly all five genes are also not
expressed in gliomas with a normal copy number of the locus
(Figure 1B and supplementary Table S1). In addition to sequences
from the EGFR locus, tumour 26 displays complex amplicons
containing fragments from chromosomes 1, 5, 7 and 9. Seven out
of 17 amplified genes originating from the latter chromosomes are
expressed neither in this tumour nor in the set of non-amplified
gliomas. Applying the hypergeometric law, the probability that the
12 unexpressed genes in a series of 38 genes remain unexpressed
after amplification only by chance is of 3.7610210. This strongly
suggests that maintenance of tissue-specific gene extinction is a
general occurrence in these tumours (Figures 4 A and B). In the
case of expressed genes, their mRNA appeared to be always more
abundant in amplified cells than in cells non-amplified for the
corresponding gene. However, we found that different genes co-
amplified on the same amplicon are not necessarily over-expressed
at identical levels (Figures 1B, 4A and B). This is likely due to
individual variations in gene expression, a phenomenon also
observed in the reference set of non-amplified tumours (Supple-
mentary data S2). Nevertheless, the results obtained with tumours
arboring different copy numbers of the EGFR, SEC61G,
LANCL2 and VOOP1 genes allow us to establish that mRNA
over-expression parallels the level of amplification (Figure 1C).
Thus, normal gene expression profiles are generally retained upon
amplification. Determination of the level of protein accumulation,
when possible, also showed that proteins are more abundant in
tumours in which the mRNA is over-expressed than in tumours
without over-expression (Table 1 and Figures 2 and 4), but the
correlation is far less close than between copy number and mRNA
over-expression. For example, gliomas with similar EGFR gene
copy number and mRNA over-expression may accumulate quite
different levels of the corresponding protein (Table 1).
It has long been known that the level of TERT mRNA is
elevated in high-grade gliomas as compared with low-grade
gliomas, and that high expression of the gene is associated with a
significant increase in telomerase activity [26,27]). Whether over-
expression of the TERT gene results from gene amplification was
not investigated in these tumours. A more recent study showed
that amplification and over-expression of both TERT and TERC
occur in leukemic cells [28]. In tumour 26, the mRNA of the
normal TERT isoform 1 was over-expressed at a high level but
TERC was weakly expressed. The lack of antibodies able to
Figure 4. RT-Q-PCR expression of genes amplified in tumour 26.Full-length names of the genes are listed in Supporting Information TableS1. A: Amplicon 4; B: Amplicon 5. Positions of the genes are shown inSupporting Information Fig. S1. The expression ratio (Re) was calculated bydividing the normalised expression measured in the tumour by the meanof the normalised expressions measured in the reference set of tumours.ATPB4, REN, GOLT1A, VLDLR, KCNV2, SLC6A19 and SLC6A18 are expressedneither in tumour 26 nor in the reference set. C. Western blot probed withthe anti-MDM4 and anti-PIK3C2B antibodies for gliomas 26, 7 and 4.Proteins were over-expressed in tumour 26. Actin: loading control.doi:10.1371/journal.pone.0014249.g004
Amplification and Expression
PLoS ONE | www.plosone.org 5 December 2010 | Volume 5 | Issue 12 | e14249
specifically recognise the reverse transcriptase prevented us from
evaluating the level of protein present in these cells but in vitro
assays showed no increase in TERT activity. In addition, we found
that telomeres are rather short in cells of tumour 26 as compared
with tumours without TERT amplification, suggesting that TERT
protein does not accumulate in tumour 26 or that the RNA
component of telomerase is limiting [29]. Thus, if TERT gene
over-expression plays a role in the development of that tumour, it
should be in a telomere length-independent manner [30].
The actual impact of amplification of a given gene on glioma cell
biology is therefore difficult to predict from transcriptome analysis
only. Our results suggest that translational and/or post-translational
regulation plays a major role in the control of protein accumulation.
Besides, protein accumulation could be unlinked from protein
activity in many cases. Altogether, these features may minimise the
contribution of gene copy number to the physiological impact of
gene amplification.
Materials and Methods
Biological materialThe 6 tumours (4 glioblastomas multiforme and two oligoden-
drogliomas) were described previously [14,15,31] (Table 1).
Xenografted tumours were used for cases 4, 7, 21, 22 and 26.
The corresponding fresh tumour was also studied for case 4. The
fresh tumour only was available for case 30. Five xenographted
glioblastomas without amplification were used as reference set.
DNA and RNA analysisDNA and RNA preparation and characterisation, sequencing
procedures and PCR methods were described previously [14,15].
Expression analysisGene locations and sequences used in this work refer to the
human reference genome sequence (released March 2006) which
is available at the University of California, Santa Cruz Genome
Bioinformatics website (http//genome.ucsc.educ) [32]. The
mRNA level was measured by real-time fluorescent quantitative
RT-PCR. cDNAs were prepared using the SuperScript II system
according to the manufacturer’s protocol (Invitrogen) and
amplified using the GeneAmp 7500 sequence detection system
and SYBR Green PCR Kits (Applied Biosystems). The specificity
and the efficiency of the primers were tested using a mixture of
RNA from several cells lines. Primer sequences are available on
request. Gene expression was normalised using the 3 housekeeping
genes, the TATA box binding protein (TBP), beta-actin (ACTB)
and DNA-directed RNA polymerase II polypeptide A (POLR2A),
determined as described [33]. For each gene, the expression ratio
(Re) was calculated by dividing the normalised expression
measured in the tumour by the mean of the normalised
expressions measured in the reference set of tumours. Each point
was the mean value of three independent experiments. A gene was
considered as unexpressed when the RT-Q-PCR curve was
indistinguishable from the background (Ct.38).
Western blottingProtein extraction and Western blot analysis were performed as
described previously [34]. Briefly, tumour tissues were solubilised in
Laemmli buffer and protein samples (20 mg) were subjected to SDS/
PAGE gel electrophoresis followed by electro-transfer on an
Immobilon-P membrane (Millipore). Rabbit polyclonal anti-EGFR
(sc-03, Santa Cruz), rabbit polyclonal anti-PHKG1 (RB3704,
Abgent), rabbit polyclonal anti-MDM4 (A300-287A, Bethyl), mouse
monoclonal anti-PIK3C2B (H00005287-M0, Abnova 2 and mouse
monoclonal anti-actin (sc-47778, Santa Cruz) were used. HRP-
conjugated goat anti-mouse-IgG or anti-rabbit-IgG secondary
antibodies (Dako) were used along with the Pierce Supersignal West
Pico Chemiluminescence substrate. Protein abundance was estimat-
ed by densitometry of the films at several exposure times. The level of
accumulation was determined by comparison with the mean value of
the expression of gliomas without amplification of the gene.
Telomerase activityTelomerase (TERT) activity was measured after extraction of
the proteins in CHAPS buffer (TRAPeze CHAPS Lysis buffer,
Chemicon) as described [35]. The RNA component of telomerase
(TERC) was quantified by RT-Q-PCR [36]. Telomere length was
determined by Southern blot [37].
Supporting Information
Data S1 Detection of EGFRvIII in tumour 22.
Found at: doi:10.1371/journal.pone.0014249.s001 (1.18 MB
DOC)
Data S2 Quantitative RT-PCR analysis of the genes of the
EGFR locus.
Found at: doi:10.1371/journal.pone.0014249.s002 (0.49 MB
DOC)
Data S3 Expression of EGFR in tumour 26.
Found at: doi:10.1371/journal.pone.0014249.s003 (0.03 MB
DOC)
Data S4 Processing of the EGFR gene in amplicon 3 of tumour
26.
Found at: doi:10.1371/journal.pone.0014249.s004 (0.37 MB
DOC)
Data S5 Structure of the EGFRvI proteins encoded by amplicon
3.
Found at: doi:10.1371/journal.pone.0014249.s005 (0.03 MB
DOC)
Data S6 Structure of the amplified EGFR mRNA published by
Wong et al.
Found at: doi:10.1371/journal.pone.0014249.s006 (0.05 MB
DOC)
Data S7 Telomerase expression.
Found at: doi:10.1371/journal.pone.0014249.s007 (0.35 MB
DOC)
Figure S1 Structure of the 5 amplicons present in tumour 26.
Found at: doi:10.1371/journal.pone.0014249.s008 (0.49 MB
DOC)
Table S1 List of the genes amplified in the analysed tumour.
Red, overexpressed genes. Blue, genes not over-expressed. Black,
not analysed: pseudogenes or truncated genes with a few amplified
exons.
Found at: doi:10.1371/journal.pone.0014249.s009 (0.04 MB
DOC)
Acknowledgments
We thank Prof E Blackburn and Dr J-A Londono-Vallejo for discussions
and Dr. G. Millot for statistical analysis.
Author Contributions
Conceived and designed the experiments: NV AG AA IOG MD BM.
Performed the experiments: NV AG AA IOG. Analyzed the data: NV AG
AA IOG MD BM. Wrote the paper: NV MD BM.
Amplification and Expression
PLoS ONE | www.plosone.org 6 December 2010 | Volume 5 | Issue 12 | e14249
References
1. Myllykangas S, Bohling T, Knuutila S (2007) Specificity, selection andsignificance of gene amplifications in cancer. Semin Cancer Biol 17: 42–55.
2. Santarius T, Shipley J, Brewer D, Stratton MR, Cooper CS (2010) A census ofamplified and overexpressed human cancer genes. Nat Rev Cancer 10: 59–64.
3. Debatisse M, Malfoy B (2005) Gene amplification mechanisms. In: Nigg EA, ed.Genome instability in cancer development: Springer. pp 343–362.
4. Albertson DG (2006) Gene amplification in cancer. Trends Genet 22: 447–455.
5. Garcia MJ, Pole JC, Chin SF, Teschendorff A, Naderi A, et al. (2005) A 1 Mbminimal amplicon at 8p11–12 in breast cancer identifies new candidate
oncogenes. Oncogene 24: 5235–5245.6. Gelsi-Boyer V, Orsetti B, Cervera N, Finetti P, Sircoulomb F, et al. (2005)
Comprehensive profiling of 8p11–12 amplification in breast cancer. Mol Cancer
Res 3: 655–667.7. Huang X, Godfrey TE, Gooding WE, McCarty KS, Jr., Gollin SM (2006)
Comprehensive genome and transcriptome analysis of the 11q13 amplicon inhuman oral cancer and synteny to the 7F5 amplicon in murine oral carcinoma.
Genes Chromosomes Cancer 45: 1058–1069.
8. Kao J, Pollack JR (2006) RNA interference-based functional dissection of the17q12 amplicon in breast cancer reveals contribution of coamplified genes.
Genes Chromosomes Cancer 45: 761–769.9. Parssinen J, Kuukasjarvi T, Karhu R, Kallioniemi A (2007) High-level
amplification at 17q23 leads to coordinated overexpression of multiple adjacentgenes in breast cancer. Br J Cancer 96: 1258–1264.
10. Bralten LB, Kloosterhof NK, Gravendeel LA, Sacchetti A, Duijm EJ, et al.
(2010) Integrated genomic profiling identifies candidate genes implicated inglioma-genesis and a novel LEO1-SLC12A1 fusion gene. Genes Chromosomes
Cancer 49: 509–517.11. Zender L, Spector MS, Xue W, Flemming P, Cordon-Cardo C, et al. (2006)
Identification and validation of oncogenes in liver cancer using an integrative
oncogenomic approach. Cell 125: 1253–1267.12. Yang ZQ, Streicher KL, Ray ME, Abrams J, Ethier SP (2006) Multiple
interacting oncogenes on the 8p11–p12 amplicon in human breast cancer.Cancer Res 66: 11632–11643.
13. Kuuselo R, Savinainen K, Azorsa DO, Basu GD, Karhu R, et al. (2007)Intersex-like (IXL) is a cell survival regulator in pancreatic cancer with 19q13
amplification. Cancer Res 67: 1943–1949.
14. Vogt N, Lefevre SH, Apiou F, Dutrillaux AM, Cor A, et al. (2004) Molecularstructure of double-minute chromosomes bearing amplified copies of the
epidermal growth factor receptor gene in gliomas. Proc Natl Acad Sci U S A101: 11368–11373.
15. Gibaud A, Vogt N, Hadj-Hamou NS, Meyniel JP, Hupe P, et al. (2010)
Extrachromosomal amplification mechanisms in a glioma with amplifiedsequences from multiple chromosome loci. Hum Mol Genet 19: 1276–1285.
16. Gan HK, Kaye AH, Luwor RB (2009) The EGFRvIII variant in glioblastomamultiforme. J Clin Neurosci 16: 748–754.
17. Nicholas MK, Lukas RV, Jafri NF, Faoro L, Salgia R (2006) Epidermal growthfactor receptor - mediated signal transduction in the development and therapy of
gliomas. Clin Cancer Res 12: 7261–7270.
18. Denoeud F, Kapranov P, Ucla C, Frankish A, Castelo R, et al. (2007) Prominentuse of distal 59 transcription start sites and discovery of a large number of
additional exons in ENCODE regions. Genome Res 17: 746–759.19. Haley JD, Hsuan JJ, Waterfield MD (1989) Analysis of mammalian fibroblast
transformation by normal and mutated human EGF receptors. Oncogene 4:
273–283.
20. Wong AJ, Ruppert JM, Bigner SH, Grzeschik CH, Humphrey PA, et al. (1992)
Structural alterations of the epidermal growth factor receptor gene in human
gliomas. Proc Natl Acad Sci U S A 89: 2965–2969.
21. Wu YL, Dudognon C, Nguyen E, Hillion J, Pendino F, et al. (2006)
Immunodetection of human telomerase reverse-transcriptase (hTERT) re-
appraised: nucleolin and telomerase cross paths. J Cell Sci 119: 2797–2806.
22. Rao SK, Edwards J, Joshi AD, Siu IM, Riggins GJ (2009) A survey of
glioblastoma genomic amplifications and deletions. J Neurooncol 96: 169–179.
23. Ruano Y, Mollejo M, Ribalta T, Fiano C, Camacho FI, et al. (2006)
Identification of novel candidate target genes in amplicons of Glioblastoma
multiforme tumors detected by expression and CGH microarray profiling. Mol
Cancer 5: 39.
24. Kotliarov Y, Steed ME, Christopher N, Walling J, Su Q, et al. (2006) High-
resolution global genomic survey of 178 gliomas reveals novel regions of copy
number alteration and allelic imbalances. Cancer Res 66: 9428–9436.
25. Lu Z, Zhou L, Killela P, Rasheed AB, Di C, et al. (2009) Glioblastoma proto-
oncogene SEC61gamma is required for tumor cell survival and response to
endoplasmic reticulum stress. Cancer Res 69: 9105–9111.
26. Tchirkov A, Rolhion C, Kemeny JL, Irthum B, Puget S, et al. (2003) Clinical
implications of quantitative real-time RT-PCR analysis of hTERT gene
expression in human gliomas. Br J Cancer 88: 516–520.
27. Boldrini L, Pistolesi S, Gisfredi S, Ursino S, Ali G, et al. (2006) Telomerase
activity and hTERT mRNA expression in glial tumors. Int J Oncol 28:
1555–1560.
28. Nowak T, Januszkiewicz D, Zawada M, Pernak M, Lewandowski K, et al. (2006)
Amplification of hTERT and hTERC genes in leukemic cells with high
expression and activity of telomerase. Oncol Rep 16: 301–305.
29. Greider CW (2006) Telomerase RNA levels limit the telomere length
equilibrium. Cold Spring Harb Symp Quant Biol 71: 225–229.
30. Zhao P, Wang C, Fu Z, You Y, Cheng Y, et al. (2007) Lentiviral vector
mediated siRNA knock-down of hTERT results in diminished capacity in
invasiveness and in vivo growth of human glioma cells in a telomere length-
independent manner. Int J Oncol 31: 361–368.
31. Muleris M, Almeida A, Dutrillaux AM, Pruchon E, Vega F, et al. (1994)
Oncogene amplification in human gliomas: a molecular cytogenetic analysis.
Oncogene 9: 2717–2722.
32. Kent WJ, Sugnet CW, Furey TS, Roskin KM, Pringle TH, et al. (2002) The
human genome browser at UCSC. Genome Res 12: 996–1006.
33. Vandesompele J, De Preter K, Pattyn F, Poppe B, Van Roy N, et al. (2002)
Accurate normalization of real-time quantitative RT-PCR data by geometric
averaging of multiple internal control genes. Genome Biol 3: RESEARCH0034.
34. Gonin-Laurent N, Hadj-Hamou NS, Vogt N, Houdayer C, Gauthiers-Villars M,
et al. (2007) RB1 and TP53 pathways in radiation-induced sarcomas. Oncogene
26: 6106–6112.
35. Wege H, Chui MS, Le HT, Tran JM, Zern MA (2003) SYBR Green real-time
telomeric repeat amplification protocol for the rapid quantification of telomerase
activity. Nucleic Acids Res 31: E3–3.
36. Pelosi G, Del Curto B, Trubia M, Nicholson AG, Manzotti M, et al. (2007) 3q26
Amplification and polysomy of chromosome 3 in squamous cell lesions of the
lung: a fluorescence in situ hybridization study. Clin Cancer Res 13: 1995–2004.
37. Zhdanova NS, Minina JM, Karamisheva TV, Draskovic I, Rubtsov NB, et al.
(2007) The very long telomeres in Sorex granarius (Soricidae, Eulipothyphla)
contain ribosomal DNA. Chromosome Res 15: 881–890.
Amplification and Expression
PLoS ONE | www.plosone.org 7 December 2010 | Volume 5 | Issue 12 | e14249