Re Fi ecom iscal mme l Yea ende ar 20 ed Bu 011– udge –12 et
40
Re Fi Jun ecom iscal ne 10, mme l Yea , 2011 ende ar 20 1 ed Bu 011– udge –12 et
-
Upload
khangminh22 -
Category
Documents
-
view
0 -
download
0
Transcript of Re Fi ecom iscal mme l Yea ende ar 20 ed Bu 011– udge –12 et

ReFi Jun
ecomiscal
ne 10,
mmel Yea
, 2011
endear 20
1
ed Bu011–
udge–12
et

I.
II.
III.
IV.
Appe
ExecutiveRevenue ..Student HeCompensaSustainabl Fiscal YeOperating Grants andCapital Bu Cost of AFinancial A Other FinAggregate
endices Appendix Appendix Appendix Appendix
T
e Summary.....................eadcount ......
ation ..............e Cost Saving
ear 2011-12 Budget ........
d Contracts Budget .............
Attendance ..Aid and Disco
nancial Info Debt Service
A: OperatingB: Rate ScheC: EnrollmenD: Sustainab
Table o
y ..................................................................................gs ..................
Budget............................udget .................................
....................ounting .........
ormation ....e Schedule ....
g Budget Detaedule Detail ...nt Detail ........le Cost Savin
of Con
............................................................................................................
......................................................................................
..........................................
..........................................
ail ..............................................................ngs Detail ......
ntents
....................
.....................
.....................
.....................
.....................
....................
.....................
.....................
.....................
....................
.....................
....................
.....................
.....................
.....................
.....................
.....................
........................................................................................................
...................................................................................
.........................................
.........................................
.....................
.....................
.....................
.....................
..........1
........... 2
........... 4
........... 5
........... 7
..........9
........... 9
........... 11
........... 12
..........13
........... 13
..........17
........... 17
........... A-1
........... B-1
........... C-1
........... D-1

The Univchanges iinstitutioTrustees
Our fiscasustainab
Highligh
versity of Noin Colorado n. The propat its Augus
Conne Consi
financ Make
timely
al year 2011-bility:
Under Gradu Comp Comm
includ
hts of the pro
Loss oand 20
Sustai No sa Increa
Understuden
Increareside
Addit Room Gradu Off-ca
study Increa
I.
orthern Colohigher educ
posed budgetst 2010 retrea
ect resource ider long-tercial planninge decisions ey manner
-12 budget d
rgraduate enuate enrollmepensation, inmitment to idding at least
oposed fiscal
of $7.8 milli011-12) inable cost slary increase
ased cost of b Health ins
60/40 ratiorgraduate tuints (before dased on-cament credit houional investm
m and board ruate on-campampus and o
ased off-cam
Execu
orado develocation fundint builds on that, which inc
allocation wrm strategicg earlier so tha
discussions i
nrollment, prent, pricing,cluding saladentify $5 m$1.5 million
l year 2011-1
ion in state fu
savings of $1es for emplobenefits of $urance cost o ition rate inc
differential tumpus undergr
urs and flat nment of $2.4rate increasepus tuition raonline tuition
mpus and onl
Page 1
utive S
ped its fiscang while conhe multi-yeacluded the fo
with universc financial is
at changes c
ncluded maj
ricing, and diand discoun
aries and benmillion in susn to be imple
12 budget ar
funding ($11
1.9 million tooyees, except$3.4 millionincreases sh
crease of 13.uition, whichaduate credinon-resident4 million in ue averaging 5ate increase n rate increas
ine credit ho
Summ
al year 2011-ntinuing to fuar financial pollowing obj
ity plans anssues by mo
can be comm
jor topics tha
iscounting nting nefits tainable cos
emented in fi
re:
.3 million co
oward our $t faculty pro
hared by the
.2% or $620h is based onit hour produt credit hoursundergradua5% of 10% to 2se of 6.1% to
our productio
mary
-12 budget toulfill UNC’splan discussejectives:
nd prioritiesoving to the m
municated an
at are key to
t savings byfiscal year 20
ombined los
5 million coomotions ($1
University a
for the yearn program ofuction of 1%s)
ate financial
20%, dependo 15.5%, dep
on of 12%
o address sigs mission as ed by the Bo
s multi-year ap
nd implemen
o our fiscal
y fiscal year 2011-12
ss in fiscal ye
ommitment 100 thousand
and employe
r for full-timf study)
% (1.11% inc
aid
ding on progrpending on p
gnificant a public
oard of
pproach to
nted in a
2013-14,
ears 2010-11
d)
ees in a
me in-state
crease in
ram of studyprogram of
1
y

Revenue Total estiThis inclThe fundbalances The assuthe June decreasedin fiscal yUNC’s oand gradu
(1)Do
e
imated fiscaudes operati
ds for $6.1 mof earlier sta
mptions and2011-12 budd from $44.1year 2011-12
operating revuate tuition i
es not include
al year 2011-ing revenue
million capitaate capital ap
d major chandget book. O1 million to 2. Tuition, f
venue. Undeis $13.8 mill
the pending ac
-12 revenue of $190.6 m
al expenditurppropriation
nges in UNCOver the pas$32.8 milliofees, and rooergraduate tulion.
cquisition of A
Page 2
for the Univmillion and $8
res in fiscal yns, bond fund
’s $190.6 mst two fiscal on. State supom and boaruition is the s
rlington Park.
versity of No8.6 million iyear 2011-1ds, and trans
million operatyears UNC’
pport will berd charges tosingle larges
orthern Colorin restricted 2 will come
sfers from th
ting budget is state and f
e 17.2% of Uo students wist source of r
rado is $199grants and cfrom remain
he operating
is the primarfederal suppoUNC’s operaill account forevenue at $
9.2 million.(1
contracts. ning budget.
ry focus of ort has
ating revenueor 72.5% of 63.9 million
)
e
n,

Page 3
The fiscal year 2011-12 budget uses the undergraduate tuition rates, discussed at the March Board meeting. Enrollment has been budgeted to increase 1.0% and the resulting new revenue is $7.3 million.
The fiscal year 2011-12 budget uses the graduate tuition rates, discussed at the May Board meeting. Enrollment has been budgeted to increase 0.1% and the resulting new revenue is $1.7 million.
Graduate On-Campus Tuition Revenue
FY11 Budget
FY12 Budget
Credit Hours Revenue Credit Hours Revenue Resident
Master’s 15,628 $5,479,101 15,421 $6,159,429Doctoral 5,966 2,236,538 6,044 2,813,775
Non-Resident Master’s 2,631 2,602,061 2,597 2,414,365Doctoral 2,040 1,718,448 2,224 2,383,227
Total 26,265 $12,036,148 26,286 $13,770,796
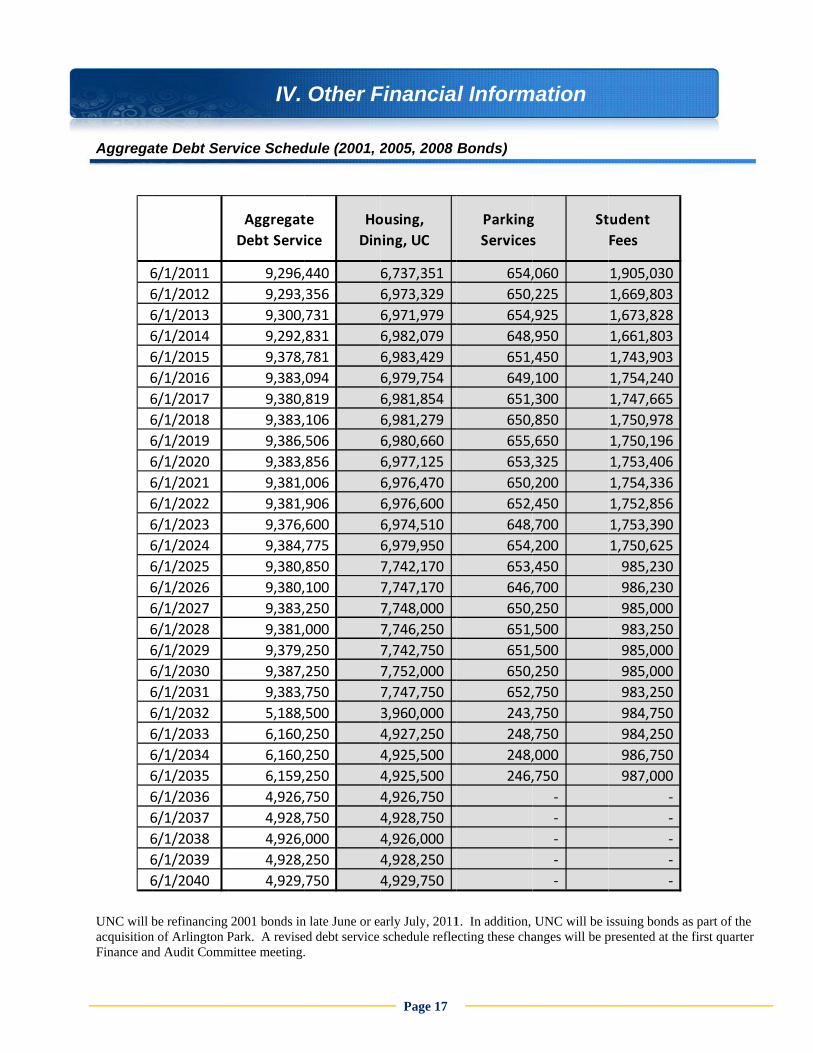
The fiscal year 2011-12 budget uses the Extended Studies tuition rates, discussed at the May Board meeting. Enrollment has been budgeted to increase 12% and the resulting new revenue is $3.8 million.
Extended Studies Enrollment FY11
Budget FY12
Budget Change Amount
Change Percent
Enrollment (Credit Hours) Undergraduate 10,149 11,679 1,530 15.1%Graduate 21,768 24,363 2,595 11.9%Other 268 0 (268) -100.0%
Total Enrollment 32,185 36,042 3,857 12.0%
Extended Studies Revenue FY 11
Budget FY12
Budget Change Amount
Change Percent
Revenue Undergraduate $3,575,362 $3,471,768 ($103,594) (2.9%)Graduate 6,569,077 10,490,314 3,921,237 59.7%Other 24,578 30,878 6,300 25.6%
Total Revenue $10,169,017 $13,992,960 $3,823,943 37.6%
Undergraduate On-Campus Tuition Revenue
FY11
Budget FY12
Budget Credit Hours Revenue Credit Hours Revenue Resident 246,589 $43,011,569 249,326 $48,662,922Non Resident 26,893 13,669,213 26,893 15,290,078
Total 273,482 $56,680,782 276,219 $63,953,000

FU
G
E
F
Student The folloheadcoun
FY11 BudgeteUndergradua
Due toDue toSubto
Graduate IncDue toDue toSubto
Extended StuDue toDue toSubto
FY12 Budgete
Headcount
owing tables nt growth fro
ed Tuition ate Increase (o rate increaso enrollment iotal Undergrarease o rate increaso enrollment iotal Graduateudies Increaso rate increaso enrollment iotal Extended
ed Tuition
t
demonstrateom fall 2010
New FreshNew TransContinuing
New Continuing
Tuition Re
(student shase increase aduate Incre
se increase e Increase se se increase and d Studies Inc
e the total un0 to fall 2011
Undergr
Bhman sfers g
Total
Gradu
B
g Total
Page 4
evenue Chan
are)
ease (student
shifts to highcrease
niversity (bo1:
raduate Head
FY11 Budget
2,290813
7,36110,464
uate Headco
FY11 Budget
3782,1882,566
nge Summar
t share)
her priced pro
oth on-campu
dcount - Fall
FY12 Budget
2,2490
7,4110,56
ount - Fall
FY12 Budget
432,262,69
ry
grams
us and off-ca
% Change
47 -1.9%00 10.7%
4 0.7%61 0.9%
% Change
38 15.9%61 3.3%99 5.2%
$78,885
6,802470
7,272
1,734
1,734
6713,1523,823
$91,716
ampus) budg
e % % % %
e % % %
5,947
2,2180,0002,218
4,6480
4,648
1,8002,1433,943
6,756
geted

Compen One of thhave worportion athan passfiscal yeaincreases The risinemployeein PERAemployeecontributreducing savings fmake the UNC eminceptionemployee While thiincreasedthis timefaculty p35% of U
nsation
he largest arerked over theand 40% empsing part of tar 2011-12, ts.
ng cost of supe benefits co
A. Since 200e. Legislatiotion for fiscatake-home p
for UNC, oure plan solven
mployees whon of the ORPe has contrib
is will be thed tuition that. In keepingromotions.
UNC employ
eas of finance past three yployee portiothe increase to maintain t
pporting the osts in the pr3 PERA hason passed inal year 2010-pay 2.5% for total requir
nt.
o are not in PP, the Univerbuted 8%. T
e third conset students wig with the prThe Legisla
yees) and the
cial impact fyears to estaon. The Union to emplothe 60/40 rat
state retiremroposed budgs had a contrn 2010, as a c-11 to 7.65%r employeesred contribut
PERA are enrsity has con
The proposed
ecutive year ill pay next yactice of the
ature sets basere will be n
Page 5
for compensaablish a healtiversity has ayees in ordetio, employe
ment plan (PEget. Approxribution rate cost-saving m
% for the emps in PERA. Wtion to PERA
nrolled in anntributed 11.5d budget con
without payyear, UNC de past two yese pay increao increase in
ation is the rth benefits cabsorbed the
er to achieveees will pay
ERA) is alsoximately halfof 10.15% f
measure for ployer and 1While this PA continues
n optional ret5% of the em
ntinues this a
y raises, givedoes not feel ears, the propases for classn fiscal year
rising cost ofcontribution re increases in
e this 60/40 r40% of the c
o a significanf of UNC’s efor the emplothe state, ch
10.5% for thePERA “flip”
to increase
tirement planmployee’s saapproach.
en the economit is prudent
posed budgesified emplo2011-12.
f health insuratio of 60%n benefits coratio. Beginncost of healt
nt factor in temployees aoyer and 8%
hanged the Pe employee,actually creas the state w
n (ORP). Sialary to the O
mic climate t to increase
et includes $oyees (appro
urance. We % employer osts rather ning in th insurance
the are enrolled
% for the ERA effectively
eates some works to
ince the ORP and the
and the e salaries at 100,000 for ximately
e

Page 6
Personnel expenses in the proposed budget total $116.4 million, including $23.4 million in fringe benefits detailed in the table below:
The proposed budget reflects an increase of $3.7 million from budgeted personnel expenses in fiscal year 2010-11. Changes include:
$3.4 million increase in fringe benefit rate increases (primarily due to cost increases in health insurance and PERA, as discussed above)
$1.1 million increase in teaching and graduate assistant tuition waivers (tuition discounting) $400 thousand increase in teaching and graduate assistant stipends (wages) $100 thousand increase in faculty promotions $200 thousand increase in faculty for growth in off-campus programs ($1.5 million) reduction in positions identified as sustainable cost savings
Note: In the operating budget on page 9, the $4.2 million increase in fringe benefits reflects a budgetary reclassification of fringe benefits that were previously included in summer faculty salaries.
Fringe Benefit Change (in millions)
Increase in benefit cost / rate $3.4 Sustainable cost savings (0.3) Reclassification from faculty salaries 1.1
Total $4.2
Faculty Salary Change
(in millions) Promotions $0.1 Sustainable cost savings (0.7) Growth in off campus programs 0.2 Reclassification of benefit portion of summer salaries
(1.1)
Total ($1.5)
Estimated FY12 Fringe Benefit Budget (in millions) Retirement $11.5Health, Life, Dental & Disability Insurance 8.9Workers Compensation 0.6Leave 0.5Tuition Waivers, Counseling & Other 1.2Estimated FY12 Fringe Benefit Expenses 22.7Fund FY11 Fringe Benefit Reserve Deficit 1.3Total Fringe Benefit Budget 24.0Less Portion Funded by Restricted Grants (0.6)FY12 Operating Budget Fringe Benefits $23.4

Sustaina UNC hasincluding$1.9 millcost savin
Implementi
Maximizing
University-w
Re-evaluati
Reconfigur
Reconfigur
Assessment
Realignme
Total Susta
Revisions in
able Cost S
s committed g at least $1.lion. The fongs:
ing change in d
Refresh lab desk
Convert scanning
Reconfiguration o
Change in techni
Re-evaluation of
g technology uti
Savings from acc
Savings from inte
Shifting of respon
Operating efficien
Efficiencies from
Transition from p
Eliminating print
wide budget red
Personnel lines
Non-Personnel li
ion of Big Sky C
ation of marketi
ation of Athletic
t of effectivenes
nt of instruction
Monfort College o
Humanities and S
Natural and Healand Tourism net
Performing and V
Education and B
ainable Cost Sav
n faculty summe
Savings
to identifyin5 million to llowing tabl
elivery of teleco
ktops every five ye
g of exams and co
of labor, technolog
ical support staffin
quality control sta
lization campus
countant restructu
egration of the pay
nsibilities and elim
ncies identified du
implementation o
print to electronic
version of Informa
ductions to align
nes
Conference trave
ing outreach an
cs coaching prog
ss of extended re
al budget by ac
of Business
Social Sciences
th Sciences - cosof savings from o
Visual Arts
ehavioral Science
vings
er salary proced
ng $5 millionbe implemee is a summ
ommunications a
ears instead of the
ourse evaluations
gies, and software
ng at the Center f
affing for web and
s-wide
ured duties due to
yroll processing a
mination of admin
ue to collaboration
of parking manage
format for library j
ation Managemen
n with historical
el
d community ou
gram for head c
etail and dining
ademic program
st of faculty positiother programs
es
Sust
F
dures and efficie
Page 7
n in sustainaented in fiscaary of the un
and technical su
e original four whi
s to a self service
e savings in the d
for the Enhancem
database manag
o system efficienc
and finance syste
istrative taks no l
n between purcha
ement software
journals
nt and Technology
expenditures
utreach activitie
coaches
g hours resulting
m
ions for two new p
tainable Cost
iscal Year 201
encies of class si
able cost saval year 2011niversity-wid
upport across ca
le developing plan
model
delivery of basic te
ment of Teaching a
gement
cies
ems due to use of
onger needed in p
asing and facilities
y newsletter
s
g in scaling back
programs in Biom
Savings
11-12
izes in program
vings by fisc-12. So far, de initiative
ampus
n for virtual labs
elephone services
and Learning (CET
f the Banner ERP
purchasing/accou
s management
k
medical Sciences
offerings
al year 2013UNC has idto identify s
s
TL)
system
unts payable
and Recreation
3-14, dentified sustainable
402,113
160,000
65,883
100,000
62,230
14,000
177,967
10,000
76,200
14,645
13,129
25,000
10,000
28,993
400,000
360,897
234,502
126,395
20,492
17,000
10,350
39,620
489,760
140,998
194,400
(26,933
40,258
141,037
1,918,199$
)

Page 8
The following table breaks out sustainable cost savings by personnel and non-personnel expenses:
A detailed schedule of sustainable cost savings by area of the University can be found in Appendix D.
Faculty Salaries 678,040$
Exempt Salaries 192,185
Classified Salaries 227,892
Student Wages 48,163
Other Wages/Compensation 24,000
Fringe Benefits 280,900
Total Personnel Expenses 1,451,180
Cost of Sales 18,274
Other Current Expenses 25,128
Purchased Services 170,300
Supplies 205,975
Travel 36,342
Capital 11,000
Total Non-Personnel Expenses 467,019
Total Sustainable Cost Savings 1,918,199$
Sustainable Cost Savings
Recap by Operating Budget Classification
Fiscal Year 2011-12

Operatin
ng Budget
REVENUResidenNon-ResCOF StFee ForFederal Long BiSubtota
ExtendeStudentOther FeRestrictRoom aOther AGrants aRestrictOther RNon-OpeSubtota
TOTAL
EXPENSFaculty ExemptGA / TAClassifieStudentOther WFringe BTOTAL
Cost of Other CPurchasSuppliesScholarsUtilitiesTravelCapitalTOTAL
MandatoMandatoMandatoNon-MaNon-MaNon-MaTOTAL
TOTAL
CONTR
II. Fis
UEnt Tuitionsident Tuitionipendr ServiceStimulus Revenull Appropriated Feal Appropriated
ed Studies Tuition Fees - Non-Apprees - Non-Approped Gifts for Operand Boarduxiliary Services and Contractsed Grant F & A R
Revenueerating Investmenal Non-Appropria
REVENUE
SES AND TRANSSalaries Salaries
A / RA Stipends aed Salaries Wages
Wages/CompensatBenefitsPERSONNEL EX
SalesCurrent Expensessed Servicessships
NONPERSONNE
ory Transfer Out -ory Transfer Out -ory Transfer Out -n Transfer Out-Prn Transfer In-Resen Transfer Out-CaTRANSFERS
EXPENSES/TRA
RIBUTION / (USE)
scal Ye
eeesRevenue
nropriatedpriatedations
Revenue
Recovery
nt and Other Revenated Revenue
SFERS
nd Waivers
tions
XPENSES
EL EXPENSES
- Debt- Cap Lease Pmt- Loan Matchrojectservesapital Reserves
ANSFERS
OF RESERVES
Page 9
ear 20
FY1Bud
50,7$ 17,915,619,55,44,9
114,2
10,110,0
2,529,56,2
88,8
nue 869,2
183,5
38,122,56,8
20,44,61,0
19,1112,7
4,85,6
11,110,113,06,13,42,7
57,2
9,28
3,113,4
183,3
1$
11-12
1 FYget Bu
727,208 57$ 989,722 20646,320 14530,558 17447,212930,544 5271,564 115
169,017 13014,742 985,471
583,732 2507,424 31269,996 610,000
881,000830,665 8892,266244,313 74
515,877 190
119,323 36528,510 22861,587 8430,801 20642,925 4018,501171,674 23773,321 116
858,617 5677,737 7197,684 11199,211 9006,587 15127,435 6405,795 3731,333 2204,399 62
296,441 9861,112
3,12059,160
0193,314 3413,147 13
390,867 192
125,010 (1$
Budge
Y12udget
,636,126 $ ,087,670,935,800,870,806
0,213,909,744,311
,992,960,977,514
89,770,600,000,163,552,483,870
10,000881,000
,764,532856,766
,819,964
,564,275
,592,816,486,376,554,340,168,040,471,884815,845
,360,312,449,613
,007,943,950,279,526,268,678,724,480,587,626,081,186,507,818,564,274,953
,293,355861,112
3,12059,200
0,465,662,682,449
,407,015
,842,740) $
et
Change
6,908,918 2,097,948(710,520)
(1,659,752)(5,447,212)
283,3651,472,747
3,823,943(37,228)
4,29916,268
1,656,128213,874
00
(66,133)(35,500)
5,575,651
7,048,398
(1,526,507)(42,134)
1,692,753(262,761)(171,041)(202,656)
4,188,6383,676,292
149,3262,272,542
328,584(520,487)
2,474,000498,646
(219,288)87,231
5,070,554
(3,086)00
400
272,348269,302
9,016,148
(1,967,750)

Summar
The 2011bonds anFinance a
FY11 Ad
FY12 C
State/F
On-Ca
On-Ca
Room
Extend
Acade
Develo
Other
Estima
FY11 Ad
FY12 C
Fringe
Underg
Gradu
Room
Sustai
Acade
Extend
Utilities
Instruc
Develo
Acade
Capita
Faculty
Debt S
Budge
Estima
FY12 E
(2) Growth p
Operating
Notes:
(1) Totals ex
ry of Chang
1-12 budget nd the acquisand Audit C
djusted Reve
Changes in Re
Federal Stimul
ampus Underg
ampus Gradua
and Board
ded Studies Tu
emic Fees
opment and Alu
Revenue
ated FY12 Re
djusted Expen
Changes in E
e Benefits due t
graduate Disco
ate Waivers, S
and Board Wa
nable Cost Sa
emic Innovation
ded Studies Pr
s
ctional Expens
opment and Alu
emic Fee Alloca
al Reserves an
y Promotions
Service
et Realignment
ated FY12 Ex
Estimated Us
percentages are g
g and Innovat
xclude $5 million
ges Fiscal Y
will be adjusition of Arliommittee m
nue Budget
evenue
us Funding
raduate Tuition
ate Tuition
uition
umni Relations
evenue Budge
nditure Budg
Expenditure
to Rate Increas
ounting
Scholarships &
aivers
avings
n and Enhance
rogram Growth
e from Differen
umni Relations
ations
d Projects
ts and Reducti
penditure Bu
se of Reserve
growth in credit h
tion Budget
in internal sales
Year 2011-12
usted in the fiington Park.
meeting.
n
s
et (1)
et
se
& Stipends
ements
h
ntial Tuition
s
ons
udget (1)
es
ours.
and include $2.6
Page 10
2
first quarter o The revised
13.2% Rate In
10-20% Rate I
5% Rate Incre
6-15% Rate In
2010 CPI Incre
See pages 5 a
See page 14
$70,375 is in aSchool (Stude
See page 7 an
Specific comm
Tech, Library,
Does not refle
6 million in restric
of the fiscal d budget wil
Comments
crease/1% Gr
Increases/0.1%
ease (average)
ncrease/12% G
ease 1.9%
and 6
areas other thaent Fee, Couns
nd 8
mitment to be d
Classroom
ect 2011A and 2
cted gifts for opera
year to inclull be presente
s
owth (2)
% Growth (2)
)
Growth (2)
an the Graduatseling Center)
determined
2011B Bonds
ations.
ude the refined at the firs
F
Propose
e
nancing of st quarter
FY12
ed Budget (1)
$183,515,877
(7,817,484)
7,272,218
1,734,648
1,656,128
3,823,943
283,365
329,128
(233,548)
$190,564,275
$183,390,867
3,391,770
2,374,000
1,696,375
69,120
(1,918,199)
1,331,839
825,104
498,646
362,135
256,680
283,365
216,445
130,300
(3,086)
(498,346)
$192,407,015
($1,842,740)
7
)
8
8
8
3
5
8
)
5
7
0
0
5
0
)
9
4
6
5
0
5
5
0
)
)
5
)

Grants a
and Contrac
A
cts Budget
REVENUEFederal GrantState & LocaUNC FoundatOther Private Investment In Subtotal
EXPENSES/TPersonnel ExFaculty SalarAdministrativeGraduate TeaGA/TA GRA TClassified SaStudent WageOther WagesFringe Benefit Subtotal
Non-PersonnCost of SalesOther CurrentScholarshipsTravelCapital Subtotal
TransfersNon-MandatoNon-Mandato Subtotal
Investment ITOTAL EXPEREVENUE LE
GranReve
tsl Grantstion - GrantsGrantscome-Net, NoRevenue
TRANSFERSxpensesriese Exempt Salaching AssistaTuition Scholalarieses/CompensatiotsPersonnel E
nel Expensesst Expenses
Non-Personn
ory Transfer Inory Transfer OTransfers
ncome-Net, ENSES/TRANESS EXPENS
Page 11
nts and Conue and E
on-Operating
ariesantsarships
ons
Expenses
s
nel Expenses
ut
NonOperatinNSFERSSES/TRANSFE
ontractsxpenses
$
s
ng
ERS $
FY12Budget
6,730,510 77,
1,656, 145,
8,609,
1,024, 1,482,
266, 88, 60,
125, 150, 650,
3,845,
3,186, 1,320,
234, 23,
4,763,
8,609,
0.01746115509
- 880
000000600300000000000000900
- 480000000500980
-
880-

Capital B
Budget
UNIVERSIT
Genera
FY
Pro
Mc
But
Gra
Mic
But
Ca
Subtota
Housing
FY
Pro
Ha
Ha
Ce
UC
Mic
Subtota
Restrict
Pro
Total R
Total U
NON-UNIVE
State C
Re
Total S
Bond/C
Ha
We
But
Total B
Total S
Total C
TY FUNDED PR
al Fund
12 projects not
ojects with budg
cKee Hall North
tler-Hancock Ex
ay Hall Window
chener Fire Ala
tler-Hancock In
rd Access Syst
al General Fun
g, Dining, Exte
12 projects not
ojects with budg
rrison Hall Stud
rrison Hall Bath
ntral Campus F
C Convenience S
chener Repairs
al Auxiliary an
ted Capital Gr
ojects with budg
Restricted Gran
niversity Fund
ERSITY FUNDE
Capital Approp
roof Candelaria
tate Capital A
COP Debt Fund
rrison Renovatio
est Campus/Tur
tler-Hancock In
Bond/COP Fund
tate Capital A
Capital Projects
ROJECTS
t yet assigned
gets less than $
Roof Replacem
xterior Gym Wa
w Replacement
rm System
terior Renovatio
tem Upgrade
nded Projects
ended Studies
t yet assigned
gets less than $
dent Rm Remod
hroom Remodel
FFE Replaceme
Store
nd Other Fund
rants/Gifts
gets less than $
nt/Gift Funded
ded Projects
ED PROJECTS
priations
, Butler-Hancoc
Appropriated P
ded
on
rner Housing Pr
terior Renovatio
ded Projects
Appropriated &
s
Capital
Page 12
$200,000
ment
all Replacemen
Phase I
on
s, Student Fee
$200,000
del
ent
ed Projects
$200,000
Projects
ck, McKee
Projects
roject - Final
on
& Debt Projects
l Project Exp
FY1
$
nt
es
s
$
penditures11 Budget FY
- $
1,164,447
-
-
309,139
100,000
160,294
215,000
1,948,879
-
1,118,238
756,904
-
-
373,812
-
2,248,953
54,705
54,705
4,252,537
179,801
179,801
119,297
992,326
1,473,274
2,584,897
2,764,698
7,017,235 $
Y12 Budget
21,000
853,500
350,000
300,000
59,000
200,000
120,000
35,000
1,938,500
524,560
1,653,500
700,000
500,000
250,000
400,000
134,784
4,162,844
11,000
11,000
6,112,344
-
-
-
-
-
-
-
6,112,344

TuitioStudeTechnLibrarStudeSubto Room Total
Financia Discussiothat contemind. Foaverage fto the ave
The purpUniversitperspectiThe metrinstitutio
UNC conand gradu The focuincludes financial
n (Student Shent Activity Fenology Fee – ry Fee – averent Success Fotal Tuition a
m and Board
Cost of Atte
al Aid and D
on of financiext, the focuor example, financial aiderage bill for
pose of underty of offerinive of net priric reflected nal scholars
ntinues to invuate assistan
us on financiathe institutioaid, private
hare) ees average age
Fee and Fees
(Low Tier)
endance
Discounting
ial aid and dus of the discone common
d package forr a freshman
rgraduate ang institutionice paid, the here (discouhips and wa
vest in institntship stipen
al aid is to shonal scholarsgifts, and lo
III. Co
Annual UnFreshma
F
g
discounting icussion is onn discountinr a freshmann (including
nd graduate dnal scholarsh
following taunt percentagaivers.
tutionally funds as part of
how all sourships and waoans.
Page 13
ost of A
ndergraduan Cost of Fiscal Year 2
Actual
$
s most oftenn the student ng metric forn (including ituition, fees
discounting iips and waivables use an ge) is the per
nded scholarf our overall
rces of finanaivers. Tota
Attend
uate ResideAttendanc
2010-11l
F
$4,680972280
65225
6,222
9,344
$15,566
n in the contet perspectiver enrollment institutional, and room a
is to focus overs. Therefinstitutional
rcent of gros
rships, tuitiopricing strat
ncial aid avaial financial a
dance
ent ce Fiscal Year 20
Budget
$
ext of enrollme, and data is
managemen, state, and fand board).
on the financfore, rather tl perspectivess tuition rev
on waivers, rategy.
ilable to UNaid also inclu
011-12 t
%
$5,300972285
66225
6,848
9,750
$16,598
ment manags presented wnt purposes mfederal aid) a
cial impact tothan using a e of discountvenue that is
room and bo
NC students, wudes state an
Increase
13.2%0%
1.9%2.0%
0%10.1%
4.3%
6.6%
gement. In with that in measures theas compared
o the student ted revenue.
s paid out in
oard waivers
which nd federal
e d
,

Page 14
Undergraduate Discounting
The fiscal year 2011-12 proposed budget includes $4.4 million in resident need-based financial aid, which exceeds the $4.1 million required by UNC’s Financial Accountability Plan approved by the CCHE. The additional $300 thousand UNC is investing will support low-income students who will be impacted by the $300 thousand reduction in state financial aid anticipated for fiscal year 2011-12. The total reduction in state aid for fiscal years 2010-11 and 2011-12 will be $833 thousand. The revenue impact of the undergraduate pricing and discounting for the fiscal year 2011-12 budget is shown in the table below:
Undergraduate Institutional Tuition Discounting FY09 – FY12
FY09
Actual FY10
Actual FY11
Forecast FY12
Budget Undergraduate Tuition $ 46,500,947 $ 51,958,675 $ 57,045,140 $ 63,953,000Institutional Scholarships (8,042,831) (12,550,855) (12,765,032) (14,770,697)
Discounted Revenue $ 38,458,116 $ 39,407,820 $ 44,280,108 $ 49,182,303 Discount Percent 17.3% 24.2% 22.4% 23.1%
Undergraduate Institutional Aid AllocationAid Type Total for FY12
Resident Need-Based $4,381,046 Non-Resident Need-Based 538,702 Athletics 2,017,236 Resident Merit 2,320,761 Non-Resident Merit 3,596,897
Membership-Based and Other 1,916,055 Total $14,770,697
Undergraduate Pricing & Discounting Net New Revenue (in millions)
FY12 Rate Increase $4.3 Enrollment Increase (1%) .5 Window Closure 1.3 Differential 1.2 Total Gross Tuition New Revenue 7.3 Less: New Institutional Aid (2.4) 1/3 Differential to Programs (0.4) Net New Revenue Available $4.5

Page 15
Graduate Discounting Graduate assistantships including tuition waivers, scholarships, and stipends are a key component of graduate pricing and discounting. The students who receive them also fulfill instructional and administrative responsibilities that help the University. Because stipends represent pay for teaching or conducting research, they are not included in discounting calculations. Graduate discounting varies by program of study. For example, relatively few students in Tier 1 Master’s programs, which enroll primarily K-12 teachers, expect to receive waivers or scholarships; however, significant discounting is necessary to compete for students in Tier 3 Doctoral programs. The on-campus tuition proposal will generate $1.7 million in new tuition revenue, primarily due to rate increases, since credit hours are budgeted to be flat. About 68% of this new revenue is to be used for scholarship and waiver discounting.
Graduate Institutional Tuition Discounting FY09 – FY12
FY09
Actual FY10
Actual FY11
Forecast FY12
Budget Graduate Tuition $ 7,931,216 $ 10,162,790 $ 11,707,381 $ 13,770,796Institutional Scholarships and Waivers (1,591,222) (2,347,145) (2,900,565) (4,139,579)
Discounted Revenue $ 6,339,994 $ 7,815,645 $ 8,806,816 $ 9,631,217 Discount Percent 20.1% 23.1% 24.8% 30.1%
Financial Aid The following tables show the total financial aid available to students from all funding sources including state, federal, institutional, private funds, and loans. The total financial aid available to UNC students in fiscal year 2011-12 will be $112.5 million.

G
SLT
1)
Sou
Grants & Scho
State Federal InstitutionaPrivate
Subtotal oans – All Sootal Financia
ScholarshWaivers1)
Total
) Waivers are
urce and Typ
olarships
al Scholarships
ources al Assistance
hips )
e embedded in
Total FinancUnderg
pe
s & Waivers
e
Institutiona
the Personnel
Page 16
cial Aid by Sgraduate and
FY11Forecas
$3,72912,68115,837
6,49338,74065,000
$103,740
l ScholarshiFY11
Forecas$13,473
2,363$15,837
section of the
ource and Td Graduate
st B
9,073,435
7,1663,0090,6830,0000,683 $1
ps and Waiv
st B3,847 $3,3197,166 $
operating budg
Type
FY12 Budget
$3,504,254 13,549,270 18,967,587
6,550,000 42,571,111 70,000,000
112,571,111
vers FY12
Budget $15,480,587
3,487,000 $18,967,587
get
Chang
$(224
863,13
53,835,00
$8,83
Chang
$2,001,12
$3,13
e
4,819)7,8350,4216,9910,4280,0000,428
e
6,7403,6810,421
Aggrega UNC will bacquisitionFinance an
6
6
6
6
6
6
6
6
6
6
6
6
6
6
6
6
6
6
6
6
6
6
6
6
6
6
6
6
6
6
ate Debt Ser
be refinancing n of Arlington Pnd Audit Comm
6/1/2011
6/1/2012
6/1/2013
6/1/2014
6/1/2015
6/1/2016
6/1/2017
6/1/2018
6/1/2019
6/1/2020
6/1/2021
6/1/2022
6/1/2023
6/1/2024
6/1/2025
6/1/2026
6/1/2027
6/1/2028
6/1/2029
6/1/2030
6/1/2031
6/1/2032
6/1/2033
6/1/2034
6/1/2035
6/1/2036
6/1/2037
6/1/2038
6/1/2039
6/1/2040
IV.
rvice Sched
2001 bonds inPark. A revise
mittee meeting.
Aggregat
Debt Servi
9,296,
9,293,
9,300,
9,292,
9,378,
9,383,
9,380,
9,383,
9,386,
9,383,
9,381,
9,381,
9,376,
9,384,
9,380,
9,380,
9,383,
9,381,
9,379,
9,387,
9,383,
5,188,
6,160,
6,160,
6,159,
4,926,
4,928,
4,926,
4,928,
4,929,
Other F
dule (2001,
n late June or eed debt service .
te
ice
Ho
Din
440
356
731
831
781
094
819
106
506
856
006
906
600
775
850
100
250
000
250
250
750
500
250
250
250
750
750
000
250
750
Page 17
Financia
2005, 2008
arly July, 2011schedule refle
ousing,
ning, UC
6,737,351
6,973,329
6,971,979
6,982,079
6,983,429
6,979,754
6,981,854
6,981,279
6,980,660
6,977,125
6,976,470
6,976,600
6,974,510
6,979,950
7,742,170
7,747,170
7,748,000
7,746,250
7,742,750
7,752,000
7,747,750
3,960,000
4,927,250
4,925,500
4,925,500
4,926,750
4,928,750
4,926,000
4,928,250
4,929,750
al Inform
Bonds)
1. In addition, ecting these cha
Parking
Services
654,
650,
654,
648,
651,
649,
651,
650,
655,
653,
650,
652,
648,
654,
653,
646,
650,
651,
651,
650,
652,
243,
248,
248,
246,
mation
UNC will be ianges will be p
g
s
St
,060
,225
,925
,950
,450
,100
,300
,850
,650
,325
,200
,450
,700
,200
,450
,700
,250
,500
,500
,250
,750
,750
,750
,000
,750
‐
‐
‐
‐
‐
issuing bonds apresented at the
tudent
Fees
1,905,030
1,669,803
1,673,828
1,661,803
1,743,903
1,754,240
1,747,665
1,750,978
1,750,196
1,753,406
1,754,336
1,752,856
1,753,390
1,750,625
985,230
986,230
985,000
983,250
985,000
985,000
983,250
984,750
984,250
986,750
987,000
‐
‐
‐
‐
‐
as part of the e first quarter


Appendices

Budgetb
REVENUES
Appropriated
Resident Tuiti
Non-Resident
COF Stipend
Fee-for-Servic
Federal Stimu
Long Bill App
Subtotal A
Non-Appropr
Extended Stu
Student Fees
Other Fees -
Restricted Gif
Restricted Gra
Grants and Co
Room and Bo
Other Auxiliar
Other Internal
Other Revenu
Net Investmen
Non Operating
Subtotal
TOTAL REVE
EXPENSES/T
Personnel Ex
Faculty Salar
Exempt Salar
Graduate Stip
Classified Sal
Student Wage
Other Wages/
Fringe Benefit
Subtotal
Non-Personn
Cost of Sales
Other Current
Purchased Se
Supplies
Scholarships
Utilities
Travel
Capital
Subtotal
Transfers
Mandatory Tra
Mandatory Tra
Mandatory Tra
Non-Mandato
Non-MandatoNon-Man TranNon-Man TranNon-Man TranNon-Man Tran Subtotal TTOTAL EXPE
REVENUES L
byActivityFi
d Revenues
ion
t Tuition
ce
ulus Revenue
ropriated Fees
Appropriated Reve
riated Revenues
udies Tuition
- Non-Appropriated
Non Appropriated
fts for Operations
rant F&A Recovery
ontracts
oard
ry Services Revenue
Income
e
nts
g Other Revenue
Non-Appropriated R
ENUES
TRANSFERS
xpenses
ries
ries
pends/Tuition and R&
laries
es
/Compensations
ts
Personnel Expense
nel Expenses
t Expenses
ervices
Non-Personnel Exp
ansfer Out-Debt
ansfer Out-Cap Lease
ansfer Out-Loan Matc
ry Transfer-In
ry Transfer-Outnsfer Out-Projectsnsfer In-Innovationnsfer Out-Innovationnsfer Out-ReservesTransfers
ENSES/TRANSFERS
LESS EXPENSES/TR
Append
iscalYear20
On-Educ
Ge
57$
20
14
17
5
nues 115
3
Revenues 4
120
3
15
&B Waivers 7
15
19
es 92
(4
5
7
15
3
2
penses 3
e Pmt
ch
(3
( S 122
RANSFERS ($
dixA:Ope
011‐12
-Campus ation and eneral
HousiDininand U
7,636,126 $
0,087,670
4,935,800
7,870,806
-
5,130,860
5,661,262
-
-
82,420
-
881,000
-
- 31,16
- 3,30
10,950 1,21
3,234,188 7
540,671 24
-
4,749,229 36,00
0,410,491 36,00
1,587,551
5,908,512 1,31
7,054,472 1,06
5,588,216 2,88
1,654,224 1,94
1,857,140 6
9,156,005 1,35
2,806,120 8,63
237,582 4,36
4,996,883) 7,82
5,812,859 73
7,228,682 63
5,423,276
3,951,878 2,90
1,067,478 5
2,538,426 7
1,263,298 16,60
- 6,97
359,385
3,120
3,994,451)
891,231 1,89 - -
104,000 886,500 1,80
1,750,215) 10,66 2,319,203 35,90
1,908,712) 10$
Page A‐1
eratingBu
ng, ng UC
Parking
- -$
-
-
-
-
-
-
-
-
-
-
-
-
63,552
01,125 2,041,99
5,359 40,00
76,000
47,500 12,00
-
03,536 2,093,99
03,536 2,093,99
-
6,399 58,00
67,598
85,733 196,36
41,690 39,40
67,225 6,00
56,549 84,64
35,194 384,42
69,714
23,341 656,83
38,874 40,75
37,892 18,20
-
07,728 70,00
55,371 20
70,000 82,00
02,920 867,98
73,329 650,22
-
-
-
91,514 - - -
00,000 166,36 64,843 816,59 02,957 2,068,99
00,579 25,00$
udgetDet
Extended Studies
-$
- -
- -
- -
- -
- 41,100
- 41,100
- 13,992,960
- -
- 9,400
- -
- -
- -
- -
94 -
00 -
- 181,612
00 -
- -
94 14,183,972
94 14,225,072
- 4,272,811
00 1,198,097
- 14,000
64 318,242
00 42,400
09 177,348
47 1,567,028
20 7,589,926
- -
33 4,414,700
50 626,382
00 85,664
- 18,000
00 -
00 279,576
00 14,775
83 5,439,097
25 -
- 3,725
- -
- (3,447,210)
- 4,743,534 - - - (2,284,144) - 2,180,144
66 - 91 1,196,049 94 14,225,072
00 -$
tails
All Other Re
GOp
-$ $
-
-
-
-
41,949
41,949
-
9,977,514
(2,050)
-
-
10,000
-
1,140,751
(1,266,309)
5,272,732
716
55,879
15,189,233
15,231,182
261,454
3,798,868
346,870
1,100,885
777,770
(1,342,277)
967,083
5,910,653
398,647
(347,295)
3,907,403
1,358,286
39,311
(303,845)
1,583,882
47,015
6,683,404
1,669,801
498,002
-
(151,500)
66,882 - - -
612,796 2,695,981
15,290,038
(58,856)$ $
estricted Gifts for perating
Tot
- 57,63$
- 20,08
- 14,93
- 17,87
-
- 5,2
- 115,74
- 13,99
- 9,97
- 8
2,600,000 2,60
- 88
-
- 31,16
- 6,48
-
- 8,76
- 80
- 5
2,600,000 74,8
2,600,000 190,56
471,000 36,59
206,500 22,48
71,400 8,55
78,600 20,16
16,400 4,47
50,400 8
229,000 23,36
1,123,300 116,44
2,000 5,00
399,583 7,95
400,000 11,52
350,000 9,67
- 15,48
320 6,62
200,000 3,18
66,348 2,8
1,418,251 62,27
- 9,29
- 86
-
- (7,59
- 7,59 59,200 5
- (2,28 - 2,28 - 3,46
59,200 13,68 2,600,751 192,40
(751) (1,84$
tal
36,126
87,670
35,800
70,806
-
13,909
44,311
92,960
77,514
89,770
00,000
81,000
10,000
63,552
83,870
-
64,532
00,887
55,879
19,964
64,275
92,816
86,376
54,340
68,040
71,884
15,845
60,312
49,613
07,943
50,279
26,268
78,724
80,587
26,081
86,507
18,564
74,953
93,355
61,112
3,120
93,161)
93,16159,20084,144)84,14465,66282,44907,015
42,740)

Universit
R
T
Restricte
tyFoundatio
Restricted GifAthletics Library EBS HSS MCB NHS PVA Stryker InTointon InOther
Total Restrict
edGrantsan
Federal Gr
MARIETacariTargetMcNaiSEED Prep oMath TUpwarTeachStudenCCAS TVI/O&MiddleTACE Math TUnder
SubState Gran
Under Sub
Non-GoverCenterFrontieDanielUNC FCO HeUnder Under
SubTotal Restr
onGiftstoU
fts
nstitute nstitute
ted Gifts
ndContracts
rants E RSA DOEDbe Virus Fruitted Partnershr GU
of Prof Ed InteTeacher Leadrd Bound Maiing w/Primarynt Support SeAdvance Ma
&M Mentoringe Ground ProjDOED
Teacher Lead$100,000
btotal Federants
$100,000 btotal State Grnmental Grar for Urban Eders of Science’s Fund Ethic
Foundation Atealth Fnd Nur$100,000 UN$100,000 Ot
btotal Non-Gricted Grants
UniversityOp
F
sDetailbyAw
D t Bats NIH
hip CSU
erpreters dership Centen DOED y Sources erv DOED ain NSF g DOED ect DOED
dership Cente
al Grants
Grants ants ducation e 625 cs Initiative MCthletic Scholarsing Grant 20NC Foundatioher Non-Gov
Governmentas and Contra
Page A‐2
perations
FY11 Forecast
$380,000295,385135,610141,526954,058101,598109,116194,988186,84784,604
$2,583,732
ward
er Part NSF
er Main NSF
CB arship 025 on ernmental
al Grants acts
FY12Budg
$421191111
$2,6
2 et C
415,890 271,674
33,564 41,371
953,014 01,486 09,198 95,154 86,643 92,006
600,000
FY12 Bu
$11111122222336
1,02,26,7
1126231
1,8 $8,6
FY12 Changes
$35,890(23,711)
(2,046)(155)
(1,044)(112)
82166
(204)7,402
$16,268
dget
100,970 134,263 160,713 161,305 177,599 185,443 202,222 210,543 241,477 284,065 296,021 302,232 362,438 625,461 030,878 254,880 730,510
77,746 77,746
101,338 117,500 250,000 650,000 209,044 328,233 145,509 801,624 609,880

LongBill
lReconciliat
Student Sha
Senate Bill FY12 Tuitio
UndergrGraduatTotal FY
Tuition Grea
Fees Senate Bill FY12 Budg
Fees Greate
State and FeFY11 ApproFY12 Appro
COF StiFFS ARRA Total FY
Change in A
tion
are of Tuition11-209
on raduate te Y12 Tuition ater Than Lon
11-209 eted Fees r Than Long
ederal Fundsopriation opriation pends
Y12 AppropriaAppropriation
n
ng Bill
g Bill
s
ation n
Page A‐3
FY12
$73
631377
4
55
40
1417
32($7,
2 Budget
3,534,005
3,953,0003,770,7967,723,7964,191,791
5,117,1405,213,909
96,769
0,624,090
4,935,8007,870,806
02,806,606,817,484)

On
ReUn
No
Pr
Di
Dif
On‐Camp
n-Campus Tu
esident Tuitiondergraduate
Tuition College OpStudent Sh
on-Resident Undergrad
rogram Fees Natural anPerforming
fferential TuSciences/SBusiness Music/DanNursing
fferential Tuition (1)Tuition is c(2)COF is ap
pusUndergr
uition (full-tim
on (13-16 credit ho
pportunity Fuhare of TuitionTuition
duate (13-16 cre
(per credit hour
d Health Scieg/Visual Arts-
ition (per cred
SES/Art
nce
does not apply to
charged for crediplied to resident
Appe
raduateTuit
e academic yea
ours per semeste
nd (COF) Stipn Net of Stipe
edit hours per se
charge) ences-NursingMusic/Theatr
dit hour charge)
o General Educa
its 1-13 and 17 aundergraduate c
endixB:R
tionandFee
ar rates)
er)(1)
pend(2) end
emester)(1)
g Majors re Arts Majors
ation Courses or
and higher; annuacredit hours
Page B‐1
RateSched
es
BPer
Credit
274.50(62.00212.50
684.25
17s 12
BPe
Individual Music
al rate is for 13-1
duleDeta
FY12 Budget
AcademicYear
0 7,160) (1,8600 5,300
5 16,822
7 5102 360
FY12 Budget er Credit
18.040.036.064.0
c Lessons
16 credits per se
ail
Actual FY11
c
0 6,5400) (1,860)0 4,680
2 15,864
0 5100 360
Actual FY11
0000 29.5000 23.5000 45.50
emester
Increase $
0 ) 00 620
4 958
0 00 0
Increase $
18.00
0 10.500 12.500 18.50
Increase %
13.2%
6.0%
Increase %
35.6%53.2%40.7%

On‐Camp
1Tuition is
MasterTier 1
MasterTier 2
MasterTier 3
DoctoraTier 2
DoctoraTier 3
MasterTier 1
MasterTier 2
MasterTier 3
DoctoraTier 2
DoctoraTier 3
(1)
pusGraduat
based on 9 credit
’s
EducationEduc, Read
’s 2
Applied Clinical CJustice, E
TechnoGerontolog
Math, NuCounse
Science, SEducation,
C’s
3 Biologic
B
al 2
Appld Stat/RSupervsn, CEducationalGrad InterdMathematicExercise ScEducationalSpecial Edu
al 3
AudioloEduc
’s
EducationEduc, Read
’s 2
Applied Clinical CJustice, E
TechnoGerontolog
Math, NuCounse
Science, SEducation,
C’s
3 Biologic
B
al 2
Appld SSupervsn, CEducationa
Grad IMathema
ExercEducatio
al 3
AudioloEduc
teTuitionan
hours per semeste
nal Psych, Educatding, School Libr
EducatiStat & Resrch M
Counseling, ComEducational Leadology, English, Fy, History, Interdursing, MAT- Phling, Sociology ,Speech Languag Higher EducatioCounseling, Earal Sciences, CheBiomedical ScienResrch Mthds, C
Counseling Psychl Tech, Higher E
dis Degree Prog, Ecs, Human Rehabcience, Educationl Psychology, Scucation ogy, Biological Ecation, Nursing E
nal Psych, Educatding, School Libr
EducatiStat & Resrch M
Counseling, ComEducational Leadology, English, Fy, History, Interdursing, MAT- Phling, Sociology ,Speech Language Higher EducatioCounseling, Earal Sciences, CheBiomedical ScienStat/Resrch MthdCounseling Psychal Tech, Higher EInterdis Degree P
atics, Human Rehcise Science, Eduonal Psychology,
Special Eduogy, Biological Ecation, Nursing E
ndFees
r
Residetion, Early Childrary Education, Sion
Mthds, Art & Desmmunication, Crim
dership, EducatioForeign Languagdisciplinary Prohysical Educ, Re, Sports & Exerc
ge Pathology, Theon Leadership, Srth Sciencesemistry, Accountnces, Music
Counselor Ed & h, Educational Ld
Ed/Stud Affrs LdrEducational bilitation, Sports nal Studies, chool Psychology
Education, ChemiEducation, Music
Non-Resition, Early Childrary Education, Sion
Mthds, Art & Desmmunication, Crim
dership, EducatioForeign Languagdisciplinary Prohysical Educ, Re, Sports & Exerce Pathology\, Thon Leadership, Srth Sciencesemistry, Accountnces, Music ds, Counselor Edh, Educational LEd/Stud Affrs LdProg, Educationahabilitation, Sporucational StudiesSchool Psycholo
ucationEducation, ChemiEducation, Music
Page B‐2
FY Rat
Credi
ent Graduate Pdhood Special 3
sign, minal onal
ge, grams,
ehab cise eatre
School
4
ting, 44
drship, rship,
&
y,
4
ical c
4
ident Graduatedhood Special 9
sign, minal onal
ge, grams,
ehab cise eatre
School
94
ting, 9
d & drship,
drship, al rts & s, ogy,
1,0
ical c
1,0
Y12 te Per t Hour
FYAcad
Yea
rograms
55 6,3
08 7,3
45 8,0
55 8,1
98 8,9
e Programs
07 16,3
43 16,9
78 17,6
071 19,2
091 19,6
Y12 demic ar(1)
ActualFY11
90 5,562
44 6,120
010 6,678
90 7,128
964 7,794
326 14,202
974 14,760
604 15,300
278 17,208
638 17,856
l Increase $
828
1,224
1,332
1,062
1,170
2,124
0 2,214
0 2,304
2,070
1,782
Increase %
15%
20%
20%
15%
15%
15%
15%
15%
12%
10%

Mandato
Mandatory F
Student ActStudent Activ
TechnologySpecific Cha TechnologySpecific Cha Library UndSpecific Cha Library GraSpecific Cha (1)A CPI increasto the nearest .0
oryFees
Fees (full-time
tivity Fees (1vity Fee inclu
y Undergraduarge by Major
y Graduate Farge by Major
dergraduate Farge by Major
duate Fee (aarge by Major
se of 1.9% was a05 resulting in a
e academic year
0 or more credits
des no CPI in
uate Fee (aver (15 credit hours
ee (average)r (9 credit hours p
Fee (averager (15 credit hours
average) r (9 credit hours p
pplied to the FY2.3% average in
r rates)
s per semester)
ncrease (1 yr lag
erage)s per semester)
EBS HSS MCB NHS PVA Other
) per semester)
EBS HSS MCB NHS PVA Other
e) s per semester)
EBS HSS MCB NHS PVA Other
per semester) EBS HSS MCB NHS PVA Other
11 Undergraduatncrease
Page B‐3
FB
Per Credit
) 48.60
9.51
9.109.10
10.659.609.209.40
9.51
9.109.10
10.659.609.209.40
2.21
2.302.202.102.402.002.25
2.75
2.852.752.603.002.502.80
te Library Fee; th
FY12 Budget
AcademicYear
972.00
285.30
273.00273.00319.50288.00276.00282.00
171.18
163.80163.80191.70172.80165.60169.20
66.30
69.0066.0063.0072.0060.0067.50
49.50
51.3049.5046.8054.0045.0050.40
he University’s p
Actual FY11
c
0 972.00
0 279.90
0 268.50 0 267.00 0 313.50 0 282.00 0 271.50 0 276.00
8 167.94
0 161.10 0 160.20 0 188.10 0 169.20 0 162.90 0 165.60
0 64.80
0 67.50 0 64.50 0 61.50 0 70.50 0 58.50 0 66.00
0 48.60
0 50.40 0 48.60 0 45.90 0 53.10 0 44.10 0 49.50 practice is to roun
Increase $
I
0
5.40
3.24
1.50
.90
nd the per credit
ncrease %
0.0%
1.9%
1.9%
2.3%(1)
1.9%
hour fee

Course,A
Natural an
Performin
Education
Education
Assessmenta
College
nd Health Sci
ng and Visual
College
n and Behavio
College
n and Behavio
andSupervi
CoPr
ences
BIO 5BIO 4BIO 5FND
Arts ART
ART ART
ART ART
CoPr
oral SciencesAPC
APC
APCAPC
APCAPCEDS
CoP
oral SciencesAPC
isionFees
Coourse refix
529 De442 Mo542 Mo446 Foo
Ma
274 FunPh
373 Dig478 Alte
Exp371 Ph372 Dig
Asseourse refix
s E 644 Ass
AcaE 646 Ass
andE 648 AssE 675 So
AssE 793 PsyE 794 PsyE 443 Su
Supeourse refix
s E 779 Pra
Page B‐4
ourse Fees
Desc
velopmental olecular and Colecular and Codservice Sys
anagement
ndamentals ootography gital Photograernative Photpression otographic Degital Photo Ba
essment Fees
Desc
sessment I: Cademic Functsessment II: Sd Behavioral sessment III: cial and Behasessment in Sychological Sychological Spport System
ervision FeesDesc
acticum in Sc
cription
Biology Cellular BiologCellular Biologstems
of Black and W
aphy Manipulatographic
esign asics
s
cription
Cognitive andtioning Socio-emotioFunctioningEarly Childho
avioral Schools
Services ClinicServices Clinicms in SPED
s cription
chool Psychol
CurrFe
gy gy
White
ation
55
CurrFe
onal
ood
c I c II
CurrFe
ogy
rent ee
PropoFe
0 0 10 10
0
0 0
6.00 6.00
rent ee
PropoFe
0 1
0 1
0 0
0 0 0
rent ee
PropoFe
0.00
osed ee
80.0050.0050.0030.00
60.00
60.0060.00
00
osed ee
25.00
25.00
70.0070.00
25.0025.0039.00
osed ee
20.00

StudentF
ST
TO
ST
TO
BO
TOTO*Ap
FeeAllocatio
UDENT ACTIVITAsian/PacCesar ChaClub SportDATE/CPEDATE MatGLBTA ReGraduate SInternationInternationMarcus GaNative AmStudent AcStudent SeUniversity UNC RadioWomen's Unallocate
OTAL STUDENT A
UDENT FACILITStudent SIntercollegStudent MeCounselingBear Bus PVACampus RStudent He SubtoAdministrAdministra SubtoBonded FOperating University Student ReCassidy HCassidy HScott-WillcButler FieldJackson F SubtoBonded FUniversity Student ReCassidy HCassidy HScott-WillcButler FieldJackson F Subto
OTAL STUDENT
OND REQUIREM UC Bond Campus Cassidy Recreati
OTAL BOND REQOTAL STUDENT
proved by Student S
onDetail
TIES PROGRAMSific American Studavez Cultural Cents Etch esource OfficeStudent Associati
nal Ed Centernal Film Seriesarvey Cultural Cenerican Student SectivitiesenateProgram Councilo StationResource Center
ed FY11 Quality ofACTIVITIES PRO
TIES & SERVICESServicesiate Athletics edia Corp. g Center
Recreation Centerealth Centerotal Student Ser
rative Servicesative Overheadotal Administrati
Facility OperatingReserveCenterecreation Center
Hall (Counseling CHall (Student Healtcoxon Hall (WRCd House Building
Field House Buildinotal Bonded FacFacility Repair & Centerecreation Center
Hall (Counseling CHall (Student Healtcoxon Hall (WRCd House
Field House Buildinotal Bonded FacFACILITIES & SE
ENTSd Requirementss Rec Center Bon
Hall Bond Requirion and Athletic Fa
QUIREMENTST FEESSenate April 6, 2011
Sdent Services
nter
on
nterervices
rf Life feesOGRAMS
S FEES
r - Wellness
rvices
ive Servicesg Costs
/ IntramuralsCenter)th Center))
ngility Operating CReplacement
Center)th Center))
ngcility Repair & ReERVICES FEES
d Requirementsrementsacilities
1
Page B‐5
A
$
Costs
eplacement
1$
FY11Allocation All
25,072 $ 24,87967,43038,89527,29136,66877,8364,4786,438
22,44124,153
306,537259,730207,372
5,872104,61075,000
1,314,702
1,912,657 72,435
1,121,226 275,000 120,000 125,000 132,349
3,758,667
571,400 571,400
7,721 672,266
1,112,849 67,995
101,992 39,789 8,993
94,420 2,106,025
183,821 126,489
8,840 13,259 4,500 2,342
19,667 358,918
6,795,010
198,000 594,430 127,706 984,893
1,905,02910,014,741 9$
FY12 location*
Ch
25,072 $ 28,000 67,430 77,808
0 42,000 77,836 11,953 10,269 22,441 26,153
336,993 259,730 214,407 10,000
104,610 -
1,314,702
1,912,657 72,435
1,121,226 275,000 120,000 125,000 132,349
3,758,667
571,400 571,400
7,721 672,266
1,112,849 67,995
101,992 39,789 8,993
94,420 2,106,025
381,821 1 126,489
8,840 13,259 4,500 2,342
19,667 556,918 1
6,993,010 1
- (1 555,680 129,466 984,655
1,669,801 (29,977,513 ($
hangeFYTot
- 2$ 3,121 2
- 6 38,913 7
(27,291) 5,332 4
- 7 7,475 1 3,831 1
- 2 2,000 2
30,456 33 - 25
7,035 21 4,128 1
- 10 (75,000)
0 1,31
- 1,91 - 7 - 1,12 - 27 - 12 - 12 - 13 - 3,75
- 57 - 57
- - 67 - 1,11 - 6 - 10 - 3 - - 9 - 2,10
198,000 38 - 12 - - 1 - - - 1
198,000 55 198,000 6,99
198,000) (38,750) 55
1,760 12 (238) 98
235,228) 1,6637,228) 9,97$
Y12 tal
25,07228,00067,43077,808
- 42,00077,83611,95310,26922,44126,15336,99359,73014,40710,00004,610
- 14,702
12,65772,43521,22675,00020,00025,00032,34958,667
71,40071,400
7,721 72,26612,84967,99501,99239,7898,993
94,42006,025
81,82126,4898,840
13,2594,500 2,342
19,66756,91893,010
- 55,68029,46684,65569,801
77,513

Rooman
Roo
Boa
ResiTier Tier Tier Tier
UserFees
Park
StudStudAdm
Care
Grad
ndBoardRat
om Rates
rd Rates
idence Hall T1 Harrison, B2 Brown, Luja3 Lawrenson4 North and S
s
king Fees Student (annStudent (semStudent K-LoStudent K-LoFaculty/StaffFaculty/StaffFaculty/StaffGraduate As
dent Health Idy Abroad Amission Fee
Freshman AFour-Year TUNC Bound Graduate (UInternationalStudent Suc
eer Services Teacher Em
duation Chec
tes
Tier 1Tier 1Tier 2Tier 2Tier 3Tier 3Tier 4Tier 4
200-m19-me250-m175-m
iers: Belford, Deckean, Dickeson
n Suites and TSouth Halls
nual) mester) ot (premium lot l
ot (premium lot l
f (annual) f (semester) f K-Lot (premiu
ssistant (annunsurance Prpplication Fe
pplication ransfer (Junior Colle.S.) (Graduate acess Fee Fees ployment Dayck Fee
Freshman Returner Freshman Returner Freshman Returner Freshman Returner
meal plan eal plan meal plan meal plan
er, Gordon, S, Bond, Hans
Turner Suites
imited spaces-an
imited spaces-se
m lot limited spa
ual) remium Plan ee
ege transfer)
nd Undergrad
ys
Page B‐6
FY12Budge
44545555
5454
Sabin, Snydersen-Willis, and
nnual) emester)
aces-annual)
(annual)
duate)
2 et
ActuaFY11
4,770 4,614,570 4,445,190 5,044,990 4,865,460 5,165,260 4,985,770 5,515,570 5,29
5,000 4,754,980 4,735,980 5,744,770 4,56
r, Wiebking, ad Lawrenson
FY12 Budget
255170275180290180310290
1,980300
4545205060
225
2550
al 1
Increas$
12 1542 1246 1464 1262 2980 2814 2594 27
52 2432 2442 2362 20
and Wilson Efficiencies
Actual FY11
5 230 0 155 5 250 0 165 0 260 0 165 0 280 0 260 0 1,830 0 300
5 45 5 45 0 20 0 50 0 60 5 225
5 25 0 50
e Increase%
58 3.43%28 2.88%44 2.85%26 2.59%98 3.77%80 5.62%56 4.64%76 5.21%
48 5.22%48 5.24%38 4.14%08 4.56%
Increase $
2515251530153030
1500
000000
00
e
%%%%%%%%
%%%%
5555050000
000000
00
Extended
Tier AMasterProgra
Tier BMasterProgra
Tier CMasterProgra
Tier APost
Master’sEdS
Tier BPost
Master’sDoctor
Ext
dStudiesTui
A r’s
ams
EducaRead
StudieLicensuInitial L
Na
B r’s
ams
Crimin
C r’s
ams
CoachEd
Pathol
A t s and
Educati
B t s and ate
NursinBSN a
SocioloAmericInterpreCompleDietetic
NursingNursing
ended StudiesIndepen Unde GradIntensivProfessContracNon-CrDual Cr** Rate
itionandFe
Eational Psych, Eding, Special Edes, Elementary ure, SecondaryLicensure, Ling
Endorsemeatural Science, S
Clinical C
nal Justice, Geoand Design, Th
hing, Sport Admducation-MAT,logy, Nursing C
Gerontolog
ional Studies, ESchool P
ng Education, Nand Post MSN,
Student Affa
Extogy BA Degreecan Sign Languetation, Dieteticetion c Internship Pro
g, 2nd Degree g, RN-BSN Professional D
ndent Study Tuergraduate duate ve English Progional Developmct Credit redit or Continuredit (High Sches vary dependi
eeRates
Extended StudEarly Childhooducation, CurriEducation with
y & K12 Post Bguistically Diveent, Reading School CounseCounseling
ography Certificheatre Educatio
ministration, Ph, Speech LanguClinical Nurse gy Certificate
Educational LeaPsychology
Nurse PractitionHigher Educat
airs Leadership
tended Studies Completion
uage: English cs BA Degree
ogram
Development, uition:
gram- Remediament Credit
uing Educationhool) ing on individu
Page B‐7
FR
CH
dies Graduate od Educ, iculum h Initial acc with erse K12
$
ling, $
cate, Art on
$
hysical uage Leader,
$
adership, $
ner: Post tion and $
s UndergraduaN
$
$5pr
$$
Independent S
$$
al $VaVa
nal Unit VaVa
al budgets
FY11 Rate Per
Credit Hour
FYRP
CrHo
Programs
$400 $4
$400 $4
$410 $4
$420 $4
$420 $4
$480 $5
ate ProgramsN/A $3
$300 $3
5,128/ ogram
$6,prog
$265 $3$340 $3Study, Dual C
$190 $2$293 $3$320 $3aries** aries** aries** aries**
Y12 Rate Per redit our
% Incre
430 7.5%
430 7.5%
435 6.1%
485 15.48
485 15.48
530 10.42
300
340 13.33
500/ gram
26.76
300 13.21385 13.24redit, Non Cre
200 5.25320 9.22320 0%
ase
CampuFY12 RPer Cr
Hou
% $355
% $408
% $408
8% $408
8% $455
2% $498
3%
6%
1% 4% edit, Contract
% %
%
us Rate
edit ur
5
8
8
8
5
8

EnrollmeFY12 E At the Febcontext foalong withenrollmen
Table 1
Dates May 13, 2011
June 10, 2011August 22, 20September 2, 2
October 6, 20
January 25, 2February 201
August 2012
(1)Fall Censpoint-in-tim– the IntegraFall Census
(2)Fall FinalCensus and Our Fall FinFinal totals would be co
(3)Spring Cefrom this poEducation a
entDetail
Enrollmen
bruary and Mor our FY12 rh informationnt and revenue
Early(camregul
1 011 Open2011 Fall C
mostdatab(e.g.
011 Repo
2012 Sprin2 Repo
Repo
sus Date – Apprme are used for a
ated Postsecond. Annual revenu
l – After Fall CeFinal is increase
nal enrollment stare the benchma
ompared to our c
ensus Date – Apoint are much lesand used internal
Appen
t and Rev
May Board merevenue budgen about our pre reporting cy
Key
y indicators of Fmpus visits, hou
larly updated a
ning Day enrollCensus Date(1
t external enrolbases and con, IPEDS, Peterort to the Board
ng Census Daort to the Boardort to the Board
oximately two wwide variety of ary Education D
ue forecasts are u
ensus there are soed enrollment frotatistics are highark for the size ocurrent Fall Fina
pproximately twss widely used thlly for enrollmen
P
ndixC:Enr
venue Cycl
etings we diset, we are prorogress towarycle.
y 2011-12 EnroEnrollment
Fall 2011 (FY1using contractsand shared at e
lment statistics1) – Official mealment reportingsumer publicat
rson’s, US Newd on Fall Cens
ate(3) d on Fall Final(
d on Spring Ce
weeks into the Famandated and v
Data System) andupdated based on
ome student withom classes that s
her than Fall Cenof our universityl enrollment of 1
wo weeks into thehan those from Fnt management a
Page C‐1
rollment
le
cussed the anoviding you wd those target
ollment And R
2) enrollment , applications,
each Board me
s reported publiasurement dayg, including nattions
ws) us(1) enrollmen
(2) enrollment ensus(3) enrollm
all semester is ouvoluntary externad consumer surven Fall Census en
hdrawals that destart throughout
nsus and best cap. If, for example13,000 students.
e Spring semesteFall Census, but and updated reve
Informat
nnual enrollmwith our Fall 2ts. Table 1 sh
Revenue Dates
etc.) eeting
FYthestufinto
FYicly y for tional
nt FYonBo
ment FY
onBo
Fin(qume
ur official censual reporting. Nateys (e.g., Peterso
nrollment.
ecrease revenue. the semester, pr
pture the concurre, we set a goal o
er is our official are still reported
enue forecasts.
tion
ment and reven2011 (FY12) hows where w
sRe
Y12 tuition and e Board [In an udents with mo
nancial aid inforfinalize rates s
Y12 budget app
Y12 revenue fon Fall Census aoard
Y12 revenue fon Fall Census aoard
nal revenue repuarterly Financeeting)
us date. Enrollmetional database con’s and US New
However, the brimarily our Off-rent enrollment sof growing to 15
census date. End to the Departm
nue cycle. As enrollment ta
we are in our
evenue fee rates appreffort to provid
ore timely pricermation, we wosooner in the yeproved by the B
orecast updatedand reported to
orecast updatedand reported to
port to the Boace & Audit Com
ent statistics fromcollection (e.g., Iws) require data
biggest change be-Campus/Cash csize of UNC. Fa,000 students, th
nrollment statisticment of Higher
arget
roved by de e and ould like ear.] Board
d based o the
d based o the
ard mmittee
m this IPEDS a from
etween classes. all hat
cs
Page C‐2
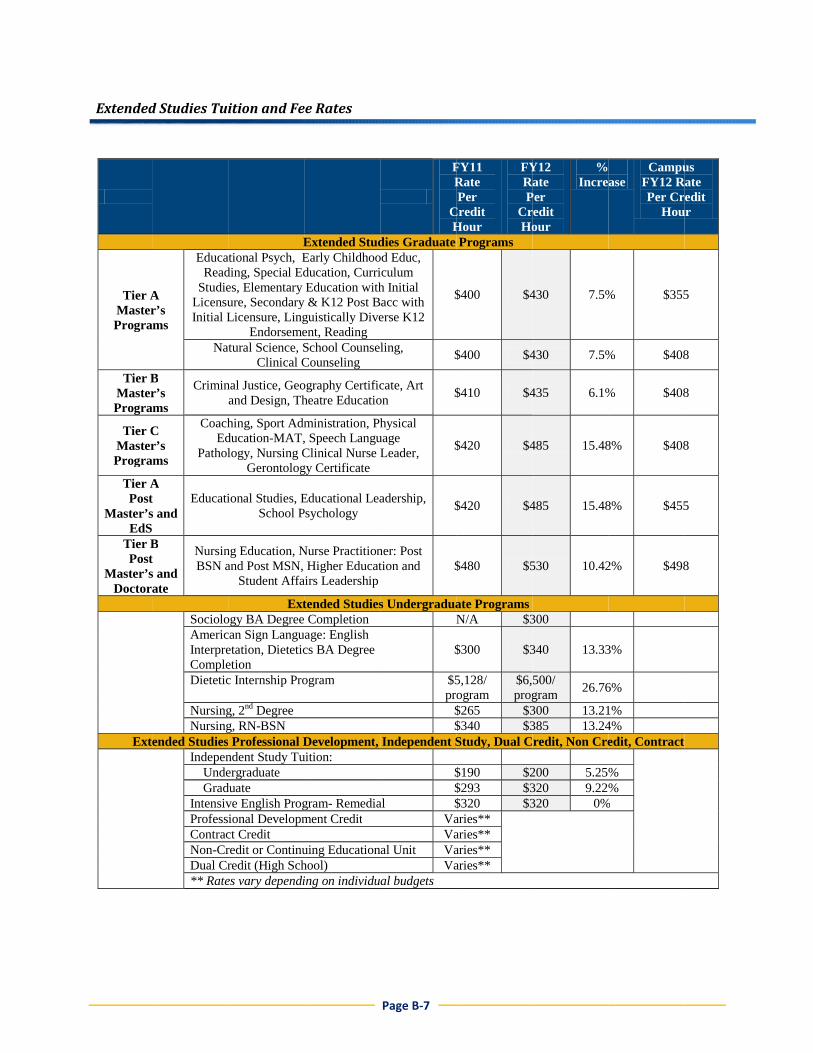
FY12 Budgeted Enrollment While we typically think of enrollment in terms of number of students, we translate headcount into credit hours to develop our revenue budget. For FY12 our budget is based upon 1.5% university-wide growth in student credit hour enrollment. We deliver most of our credit hours to on-campus undergraduate students and expect 1% growth to 276,219 credit hours. Our fastest growing enrollment is in off-campus graduate students, where we expect 11.4% growth to 24,363 credit hours. Table 2 shows the undergraduate, graduate, on-campus, and off-campus details of our expected 1.6% growth. Table 2
Note: SCH excludes Non-Credit Extended Studies; includes Colorado School of Public Health Fall 2011 (FY12) Enrollment Targets We expect to deliver about 47% of the total FY12 budgeted credit hours (338,214) in the Fall semester. Our enrollment target for Fall 2011 is 13,260 students (10,561 undergraduates and 2,699 graduates), which is a 1.8% increase in headcount. Table 3 shows our fall enrollment targets, including new freshmen (2,247), new undergraduate transfers (900), and new graduate students (438). Table 3
In the following sections on undergraduate and graduate enrollment, we discuss registration and admissions data as of May 23 as an indication of our progress toward Fall 2011 enrollment targets. Comparable point-in-time data is included for Fall 2010 and Fall 2009, but because enrollment cycles can vary from year-to-year, prior year comparisons are only a rough indication of our progress, especially since May 23 is still 13 weeks before the start of Fall 2011. This is updated from the April 25 data shown in the May budget proposal; the projections remain consistent.
Undergrad Grad Total Undergrad Grad Total Undergrad Grad Total
On-campus SCH 273,488 26,265 299,753 276,219 26,285 302,504 1.0% 0.1% 0.9%Off-campus SCH 11,437 21,879 33,316 11,679 24,363 36,042 2.1% 11.4% 8.2% Total SCH 284,925 48,144 333,069 287,898 50,648 338,546 1.0% 5.2% 1.6%
Fiscal Year 2011-12 Budgeted Enrollment by Student Credit Hours (SCH)FY11 Forecast
(Fall 10, Spring 11, Summer 11)
FY12 Budget(Fall 11, Spring 12, Summer 12)
FY12 Budget Changefrom FY11 Forecast
Undergrad Grad Total Undergrad Grad Total Undergrad Grad Total
Headcount 10,464 2,566 13,030 10,561 2,699 13,260 0.9% 5.2% 1.8%
Continuing Students 7,361 2,188 7,414 2,261 New Freshmen 2,290 2,247 New UG Transfers 813 900 New Grad Students 378 438
Fall 2011 (FY12) Enrollment TargetsFall Final 2010 Fall 2011 Targets Fall 2011 Budget Change
from Fall 2010 Actual
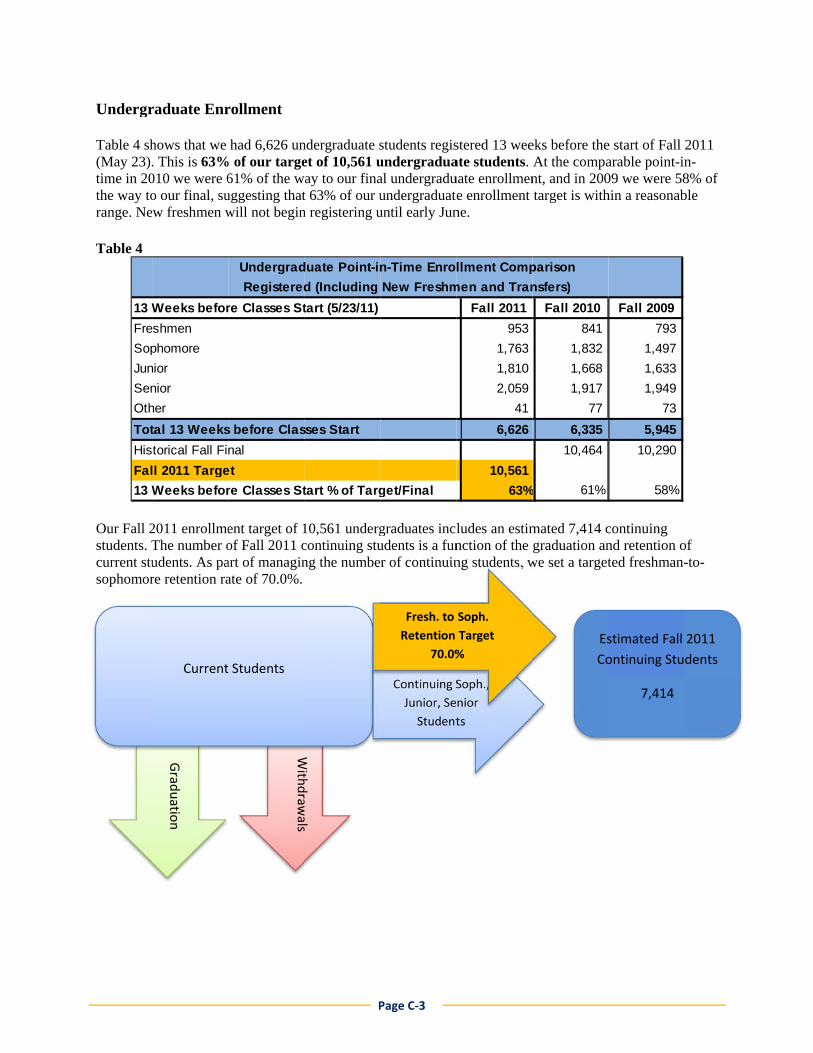
Undergr Table 4 sh(May 23).time in 20the way torange. Ne Table 4
Our Fall 2students. Tcurrent stusophomor Fresh. to S
13 W
Fre
Sop
Jun
Sen
Oth
Tot
His
Fal
13 W
raduate Enr
hows that we . This is 63%010 we were 6o our final, suew freshmen w
2011 enrollmeThe number oudents. As pare retention ra
oph. Fresh. to
Weeks befor
eshmen
phomore
nior
nior
her
tal 13 Weeks
torical Fall Fi
ll 2011 Targe
Weeks befor
Grad
uatio
n
Current
rollment
had 6,626 un% of our targe
61% of the wuggesting thatwill not begin
ent target of 1of Fall 2011 cart of managinate of 70.0%.
Soph.
re Classes St
s before Clas
nal
et
re Classes St
Undergrad
Registered
With
draw
als
t Students
P
ndergraduate set of 10,561 u
way to our finat 63% of our un registering u
10,561 undergcontinuing stung the numbe
tart (5/23/11)
sses Start
tart % of Targ
duate Point-in
d (Including
With
draw
als
Page C‐3
students regisundergraduaal undergraduundergraduateuntil early Jun
graduates includents is a funr of continuin
get/Final
n-Time Enro
New Freshm
Continuing S
Junior, Se
Student
Fresh. to
Retention
70.0%
stered 13 weeate students. uate enrollmene enrollment ne.
ludes an estimnction of the ng students, w
Fall 2011
953
1,763
1,810
2,059
41
6,626
10,561
63%
llment Comp
men and Tran
Soph.,
nior
ts
Soph.
Target
%
eks before theAt the compant, and in 200target is with
mated 7,414 cgraduation an
we set a target
Fall 2010
841
1,832
1,668
1,917
77
6,335
10,464
% 61%
parison
nsfers)
Es
Co
e start of Fall arable point-in09 we were 58hin a reasonab
continuing nd retention oted freshman-
Fall 2009
793
1,497
1,633
1,949
73
5,945
10,290
58%
stimated Fall
ontinuing Stu
7,414
2011 n-8% of ble
of -to-
2011
dents

Page C‐4
The remainder of our 10,561 undergraduate enrollment target is new students. We have enrollment targets for both new freshmen and new transfers. The process of enrolling new students starts with applications, which yields admitted students, which yields registered and enrolled students. We refer to this as the enrollment funnel, where the pool of students narrows at each step.
Our Fall 2011 target for new freshmen is 2,247 students. To yield this many enrolled freshmen, we need 5,350 new freshmen admits (based on a 42% yield rate at this step of the funnel). As shown in Table 5, as of May 23 we had 5,513 admitted new freshmen (103% of the number needed at this step). We anticipate that we will have additional new freshmen admits before classes start. If our 42% admit-to-enrolled yield holds, we will exceed our target of 2,247 new freshmen. Table 5
Our target for Fall 2011 transfers is 900 students, up from 813 in Fall 2010. To yield this many enrolled transfers, we need 1,500 new transfer admits (based on a 60% yield rate at this step of the funnel). As shown in Table 6, we had 805 transfer admits as of May 23. Our admits remain slightly behind where we generally expect to be at this point-in-time; however, completed transfer applications for Fall 2011 are slightly ahead of Fall 2010 (1,691 vs. 1,679). Admissions staff is working to convert these to transfer admits, and with 13 weeks until the start of classes, we believe the transfer target of 900 is attainable. Table 6
Applications
New Freshmen Admits (5,350)
New Transfer Admits (1,500)
Enrolled New Freshmen = 2,247
Enrolled Transfers = 900
Fall 2011 Fall 2010 Fall 2009
Admits 13 Weeks before Classes Start 5,513 5,522 5,527
Historical Final New Freshmen Admits 5,635 5,675
Targeted New Freshmen Admits 5,350
13‐Week Admits % of Target/Final 103% 98% 97%
Historical Enrolled New Freshmen 2,290 2,348
Fall 2011 Target Freshmen 2,247
New Freshmen Admit Yield % 42% 41% 41%
Undergraduate New Freshmen Enrollment Target
Admits‐to‐Enrollment Yield with Point‐in‐Time Comparison
Fall 2011 Fall 2010 Fall 2009
Admits 13 Weeks before Classes Start 805 900 760
Historical Final Transfer Admits 1,405 1,174
Targeted Transfer Admits 1,500
13‐Week Admits % of Target/Final 54% 64% 65%
Historical Enrolled Transfers 813 728
Fall 2011 Target Transfers 900
Transfer Admit Yield % 60% 58% 62%
Undergraduate Transfer Enrollment Target
Admits‐to‐Enrollment Yield with Point‐in‐Time Comparison

Page C‐5
Graduate Enrollment Table 7 shows that 926 graduate students are registered for Fall 2011. This is 34% of our 2,699 graduate student target. Graduate students tend to delay their registration longer than undergraduate students. Based on national standards, newly admitted graduate students, who have been offered any financial assistance, have until April 15 to make their enrollment decision. Graduate students often delay registration since they are essentially guaranteed enrollment into their program courses. Also, 40% of our graduate enrollment is in off-campus and online programs, which use a cohort model, often with start dates later than our on-campus start of classes. At comparable points-in-time in 2009 and 2010, we had 34% and 37% of our fall graduate enrollment, suggesting that 34% of our target is within the normal range.
Table 7
Like undergraduate enrollment, our total Fall 2011 target of 2,699 graduate students includes continuing students (2,261) and new students (438). Also like undergraduate enrollment, new graduate students flow through an enrollment funnel (applications, admissions, and enrolled) which narrows at each step. Our target for Fall 2011 new graduate students is 438, up from 378 in Fall 2010. To yield this many enrolled graduate students, we need 1,251 new admits (based on a 35% yield rate at this step of the funnel). As shown in Table 8, as of May 23 we had 1,032 admitted graduates (82% of our targeted admits). We are ahead of where we were in both Fall 2010 and Fall 2009 and believe that we may exceed our 438 new graduate student target.
Table 8
13 Weeks before Classes Start (5/23/11) Fall 2011 Fall 2010 Fall 2009
Licensure 30 23 22
Masters 571 636 536
Specialist 22 22 23
Doctoral 253 234 200
Other 50 36 34
Total 13 Weeks before Classes Start 926 951 815
Historical Fall Final 2,566 2,421
Fall 2011 Target 2,699
13 Weeks before Classes Start % of Target/Final 34% 37% 34%
Graduate Point-in-Time Enrollment Comparison
Registered
Fall 2011 Fall 2010 Fall 2009
Admits 13 Weeks before Classes Start 1,032 845 883
Historical Final Graduate Admits 1,140 1,231
Targeted Graduate Admits 1,251
13‐Week Admits % of Target/Final 82% 74% 72%
Historical New Graduate Students 378 454
Fall 2011 Target New Graduates 438
Graduate Admit Yield % 35% 33% 37%
Graduate New Student Enrollment Target
Admits‐to‐Enrollment Yield with Point‐in‐Time Comparison

On‐Camp
pusUndergr
R
N S
R
N S
R
N S
R
N S
R
NTot
Tot
Fall
Inte
Spr
Sum
raduateCred
Resident
Non-ResidenSubtotal Fa
Resident
Non-ResidenSubtotal Int
Resident
Non-ResidenSubtotal Sp
Resident
Non-ResidenSubtotal Su
Resident
Non-Residental Year
tal Year
l 2011
erim 2011-12
ring 2012
mmer 2012
P
ditHoursan
C
ntll
ntterim
ntpring
ntummer
nt
2
Page C‐6
ndTuitionRe
redit Hours
122,4
13,0135,5
1,5
11,6
111,9
12,5124,5
13,3
1,114,4
249,3
26,8276,2
FY1
evenue
s Tuition
483 2$
078561 3$
550 $
31 681 $
965 2$
553 518 2$
328 $
31 459 $
326 4$
893219 6$
12 Budget
n Revenue
23,390,233
7,390,49030,780,723
334,715
85,532 420,247
22,049,255
7,090,235 29,139,490
2,888,719
723,821 3,612,540
48,662,922
15,290,07863,953,000

On‐Camp
pusGraduat
Total
Fall 2
Interi
Sprin
Summ
Total
teCreditHou
Reside Non-Re Subtot
Reside Non-Re SubtotSubtotal
Reside Non-Re Subtot
Reside Non-Re SubtotSubtotal
Reside Non-Re Subtot
Reside Non-Re SubtotSubtotal S
Reside Non-Re Subtot
Reside Non-Re SubtotSubtotal S
Reside Non-Re Subtot
Reside Non-Re Subtot
Year
Doctoral
2011Master's
Doctoral
m 2011-12Master's
Doctoral
ng 2012Master's
Doctoral
mer 2012Master's
Doctoral
YearMaster's
P
ursandTuit
entesidenttal Master's
entesidenttal DoctoralFall
entesidenttal Master's
entesidenttal DoctoralInterim
entesidenttal Master's
entesidenttal DoctoralSpring
entesidenttal Master's
entesidenttal DoctoralSummer
entesidenttal Master's
entesidenttal Doctoral
Page C‐7
tionRevenue
Credit Hou
617
2
311
516
213
10
3
3
14
152
18
628
26
F
e
urs Tuition
6,452 $ ,187
7,639
2,584914
3,498,137 $
28 $ 6
34
202
36 $
5,886 $ ,040
6,926
2,589,012
3,6010,527 $
3,055 $ 364
3,419
869298,167
4,586 $
5,421 $ 2,5978,018
6,0442,2248,2686,286 $
FY12 Budgetn Revenue
2,574,147 1,105,2133,679,360
1,204,626980,089
2,184,7155,864,075
10,890 5,459
16,349
9910
99117,340
2,349,450 968,093
3,317,543
1,205,6261,084,4422,290,0685,607,611
1,224,942 335,600
1,560,542
402,532318,696721,228
2,281,770
6,159,429 2,414,3658,573,794
2,813,7752,383,2275,197,002
13,770,796

Extended
dStudiesCr
S
S
S
S
Tota
Tota
Fall
Inte
Spr
Sum
reditHoursa
Undergradu
Graduate
Non-CreditSubtotal Fa
Undergradu
Graduate
Non-CreditSubtotal Int
Undergradu
Graduate
Non-CreditSubtotal Sp
Undergradu
Graduate
Non-CreditSubtotal Su
Undergradu
Graduate
Non-Credital Year
al Year
2011
erim 2011-12
ring 2012
mmer 2012
P
andTuitionR
C
uate
ll
uate
erim
uate
pring
uate
ummer
uate
2
Page C‐8
Revenue
Credit Hours
4,4
7,5
11,9
3,7
7,9
11,6
3,4
8,9
12,4
11,6
24,3
36,0
FY1
s Tuition
476 $
500
0976 $
0 $
0
0 0 $
714 $
927
0 641 $
489 $
936
0 425 $
679 $
363
0042 $
12 Budget
n Revenue
1,186,075
3,258,634
13,4864,458,195
-
-
- -
1,113,650
3,405,085
- 4,518,735
1,172,043
3,826,595
17,392 5,016,030
3,471,768
10,490,314
30,87813,992,960

SSustainableCos
Self-servicCETL techWeb and dRestructurPayroll andPurchasinRestructurUse parkinEliminate ISummer sUniversity-Assess exMCB faculHSS facultNHS facultPVA facultEBS facult
Lab desktoTelephoneReduce libEliminate IUniversity-ReevaluateEliminate cReconfiguAssess ex
S
Total
stSavingsDetai
ce exam scanninghnical supportdatabase mgmtre accountant jobsd Finance integrationg & AP duties changre facilities purchasinng management systIM&T newslettersession faculty/class-wide budget realignmxt'd dining hrs/scale blty realignmentty realignmentty realignmentty realignmentty realignment
Subtotal Perso
op 5 yr vs 4 yr refrese services reconfigurbrary journal bindingIM&T newsletter-wide budget realignme Big Sky travelcoaches univ prograre marketing/outreac
xt'd dining hrs/scale b
Subtotal Non-Perso
App
ilFiscalYear20
President
ngedngtem
s sizementback
onnel
hred
ment 35,22
amchback
onnel 35,22$
35,22$
Pa
pendixD:Su
011‐12Budget
Board of Trustees/
Legal
38,174
38,174$
28 850
28 850$
28 39,024$
N
age D‐1
ustainableC
Athletics
-$ $
20,49210,350
30,842$ $
30,842$ $
Personnel
Non-Personnel
ostSavings
Provost
FinAdmin
62,230
400,000196,32821,346
140,998194,400-26,93340,258
141,037
1,169,664 $
10,000
4,317
5,00018,274
37,591 $
1,207,255 $
ance & nistration
UniverRelati
65,883
10,00076,20014,64513,12925,00024,485
229,342 1$
160,000100,000
4,50886,000
350,508 1$
579,850 2$
rsity ions Totals
65,62,
14,000 14,10,76,14,13,25,24,
400,234,21,
140,194,-26,40,
141,
14,000 1,451,1$
160,100,10,4,
126,20,10,
12,000 17,18,
12,000 467,0$
26,000 1,918,1$
,883,230,000,000,200,645,129,000,485,000,502,346,998,400,933,258,037
180
,000,000,000,508,395,492,350,000,274
019
199