public intergity audting-enabling public verifiability for storage ...
Upload
khangminh22Category
view
2download
0
Energy Company of ChoiceNovember, 2007 www.medcoenergi.com
Public ExposePT Medco Energi Internasional Tbk.
MEDCOENERGI
2
This document contains certain financial conditions and results of operation, and may also contain certain projections, plans, strategies, policies and objectives of the Company, which could be treated as forward looking statements within the meaning of applicable law. Forwards looking statements, by their nature, involve risks and uncertainties that could cause actual results and development to differ materially from those expressed or implied in these statements. PT MEDCO ENERGI INTERNASIONAL TBK. does not guarantee that any action, which should have been taken in reliance on this document will bring specific results as expected.
Disclaimer

3
Table of Contents
36Attachment 3 – Drilling Business
62Attachment 7 – Others
59Attachment 6 – Financial Ratios
47Attachment 5 – Energy Background
41Attachment 4 – Downstream
31Attachment 2 – International E&P Assets
24Attachment 1 – Domestic E&P Assets
13Strategy
8Company Performance
4Overview
PageContents

Overview
5
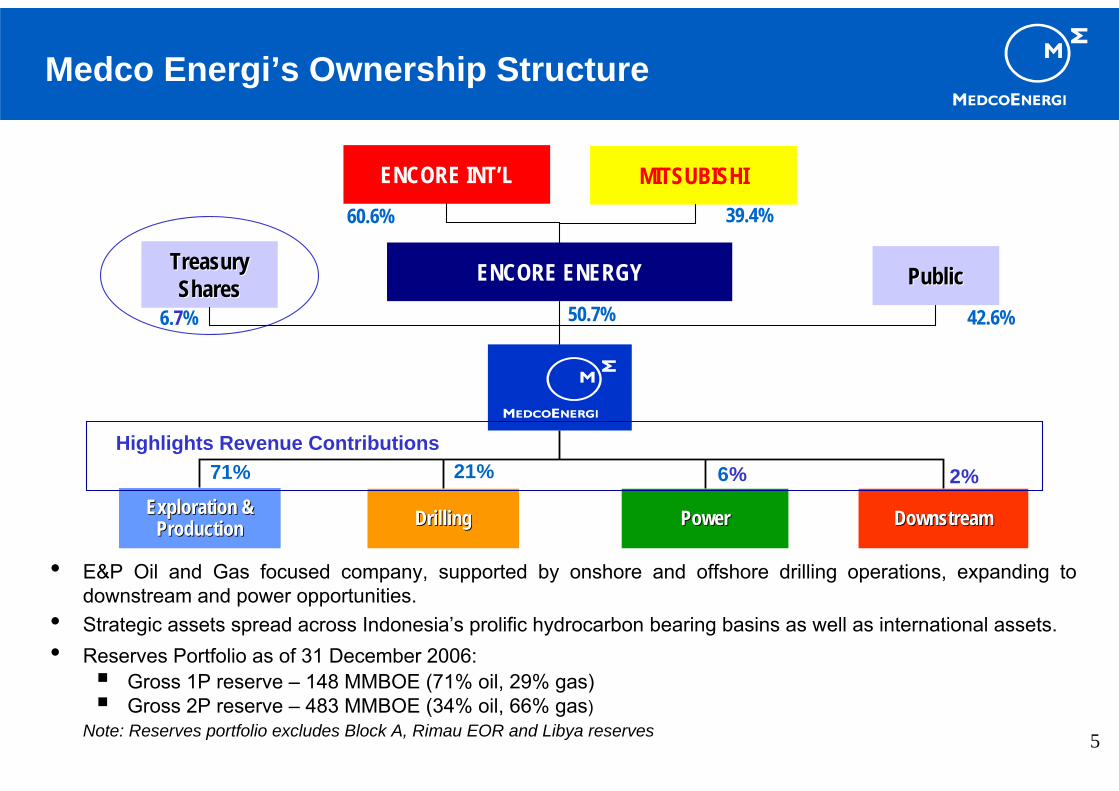
• E&P Oil and Gas focused company, supported by onshore and offshore drilling operations, expanding to downstream and power opportunities.
• Strategic assets spread across Indonesia’s prolific hydrocarbon bearing basins as well as international assets.• Reserves Portfolio as of 31 December 2006:
Gross 1P reserve – 148 MMBOE (71% oil, 29% gas)Gross 2P reserve – 483 MMBOE (34% oil, 66% gas)
Note: Reserves portfolio excludes Block A, Rimau EOR and Libya reserves
Medco Energi’s Ownership Structure
DrillingDrilling DownstreamDownstreamExploration & Exploration & ProductionProduction PowerPower
71% 21% 2%6%
ENCORE ENERGY PublicPublic42.6%6.7%
TreasuryTreasurySharesShares
50.7%
ENCORE INT’L MITSUBISHI39.4%60.6%
Highlights Revenue Contributions
6
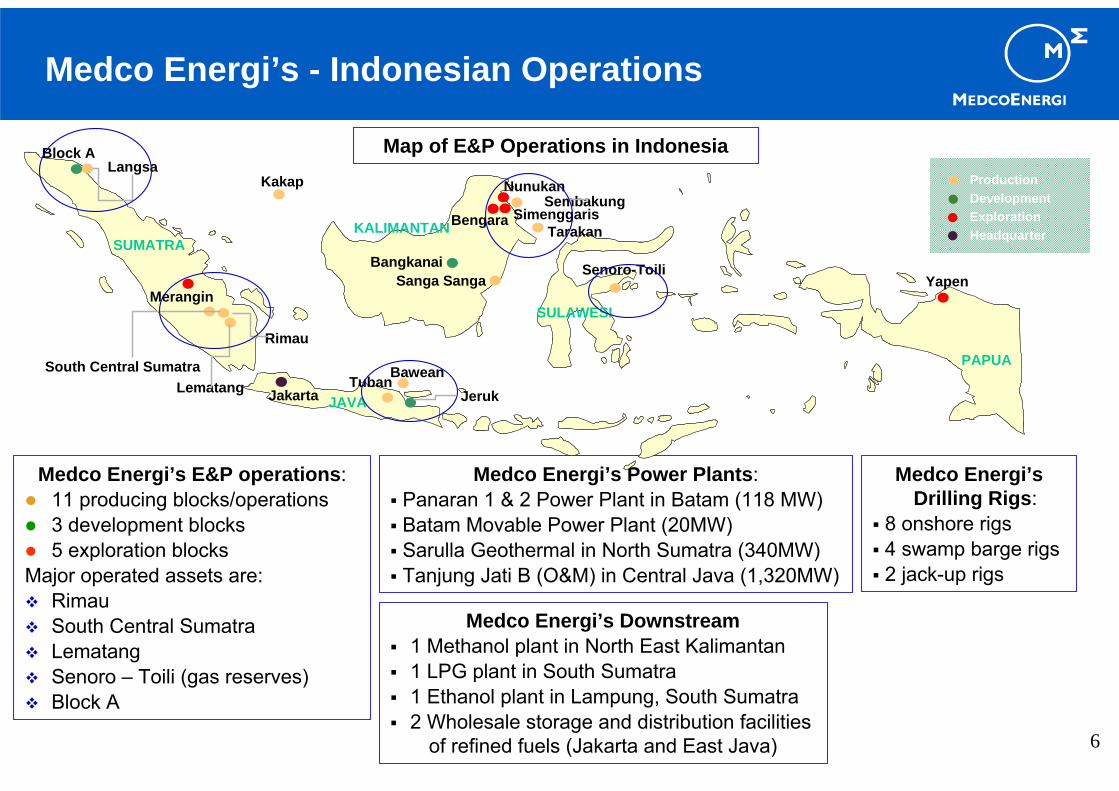
Medco Energi’s - Indonesian Operations
Medco Energi’s E&P operations:11 producing blocks/operations3 development blocks5 exploration blocks
Major operated assets are:RimauSouth Central SumatraLematangSenoro – Toili (gas reserves)Block A
Medco Energi’s Downstream1 Methanol plant in North East Kalimantan1 LPG plant in South Sumatra1 Ethanol plant in Lampung, South Sumatra2 Wholesale storage and distribution facilities
of refined fuels (Jakarta and East Java)
Medco Energi’sDrilling Rigs:
8 onshore rigs4 swamp barge rigs2 jack-up rigs
Medco Energi’s Power Plants:Panaran 1 & 2 Power Plant in Batam (118 MW)Batam Movable Power Plant (20MW)Sarulla Geothermal in North Sumatra (340MW)Tanjung Jati B (O&M) in Central Java (1,320MW)
ProductionDevelopmentExplorationHeadquarter
Map of E&P Operations in Indonesia
PAPUA
SULAWESI
KALIMANTAN
JAVA
SUMATRA
Langsa
Merangin
LematangSouth Central Sumatra
Rimau
Tuban
SimenggarisBengaraTarakan
Sanga SangaSenoro-Toili
Kakap Nunukan
Jakarta
Sembakung
Jeruk
BangkanaiYapen
Block A
Bawean

7
Medco Energi’s - International Operations
USA* USA* –– Producing (12 Producing (12 mmscfdmmscfd):):•• East CameronEast Cameron•• Main PassMain Pass
–– ExplorationExploration•• Mustang Island (May 2006)Mustang Island (May 2006)•• Brazos Area, Gulf of MexicoBrazos Area, Gulf of Mexico
(October 2006)(October 2006)•• West Delta, Gulf of MexicoWest Delta, Gulf of Mexico
(May 2007) (May 2007) Yemen* Yemen* -- Exploration:Exploration:
•• Block 82 & 83 (Dec. 2006)Block 82 & 83 (Dec. 2006)•• 45% working interest45% working interest
Libya Libya –– Exploration and Discovery:Exploration and Discovery:•• Area 47 (Feb. 2005)Area 47 (Feb. 2005)•• 50% working interest50% working interest•• Significant oil discoverySignificant oil discovery
Oman* Oman* –– Service Contract (12 Service Contract (12 mbodmbod):):•• Karim Small Fields (Aug. 2006)Karim Small Fields (Aug. 2006)
Cambodia* Cambodia* -- Exploration:Exploration:•• Block E (Sept. 2006)Block E (Sept. 2006)•• 41.25% working interest41.25% working interest
Tunisia Tunisia -- Exploration:Exploration:•• Anaguid BlockAnaguid Block•• 40% working interest40% working interest
** operatoroperator

Company Performance
9
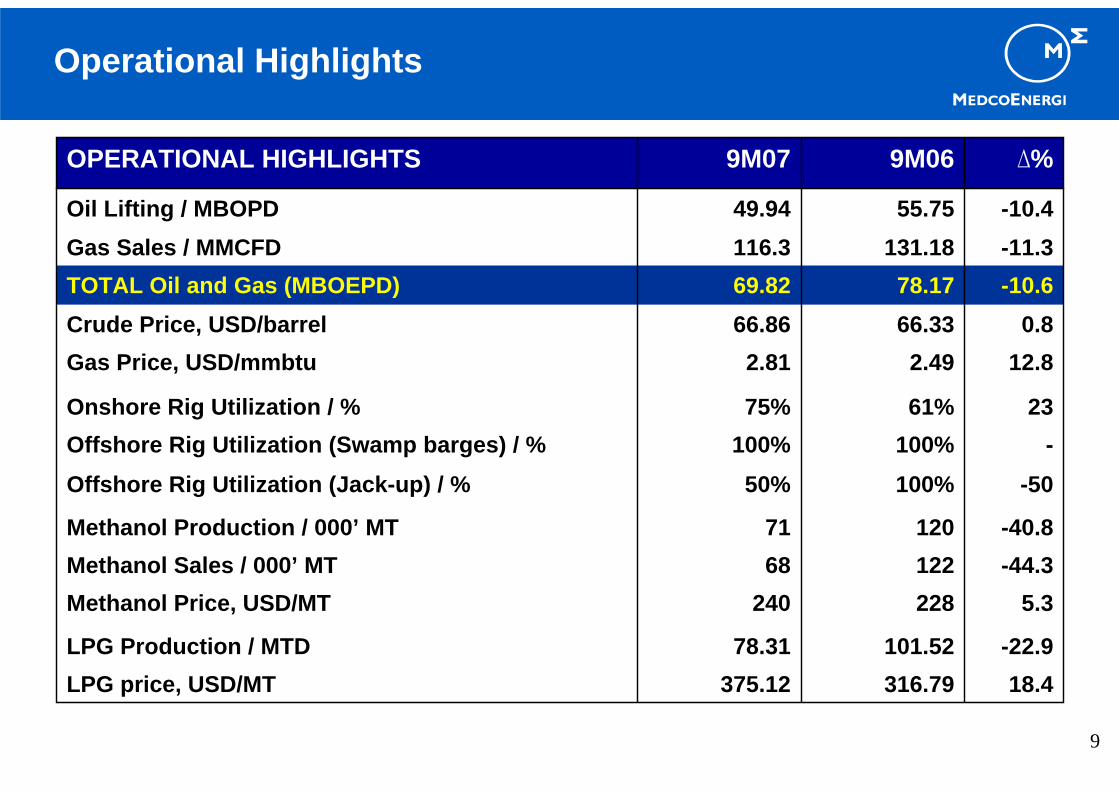
Operational Highlights
-100%100%Offshore Rig Utilization (Swamp barges) / %
18.4316.79375.12LPG price, USD/MT
0.866.3366.86Crude Price, USD/barrel12.82.492.81Gas Price, USD/mmbtu
-44.312268Methanol Sales / 000’ MT5.3228240Methanol Price, USD/MT
-22.9101.5278.31LPG Production / MTD
-40.812071Methanol Production / 000’ MT
-50100%50%Offshore Rig Utilization (Jack-up) / %
2361%75%Onshore Rig Utilization / %
-10.678.1769.82TOTAL Oil and Gas (MBOEPD)-11.3131.18116.3Gas Sales / MMCFD-10.455.7549.94Oil Lifting / MBOPD
∆%9M069M07OPERATIONAL HIGHLIGHTS

10
Financial Highlights
7.91.511.63Debt to Equity
17.81,723.92,030.8Total Assets
4.2533556Equity
13.90.01080.0123EPS (USD/share)
-41.13.682.17Current Ratio
13.43438Net Income-14.2153.5131.7Earnings Before Tax19.0260.9310.5EBITDA
19.1172.9206.0Income from Operations
Ratios
-27.08.516.21EBITDA/Interest Expense
17.0257.1300.7Gross Profit10.8578.7641.4Revenue
∆%9M069M07FINANCIAL HIGHLIGHTS (in million USD)
11
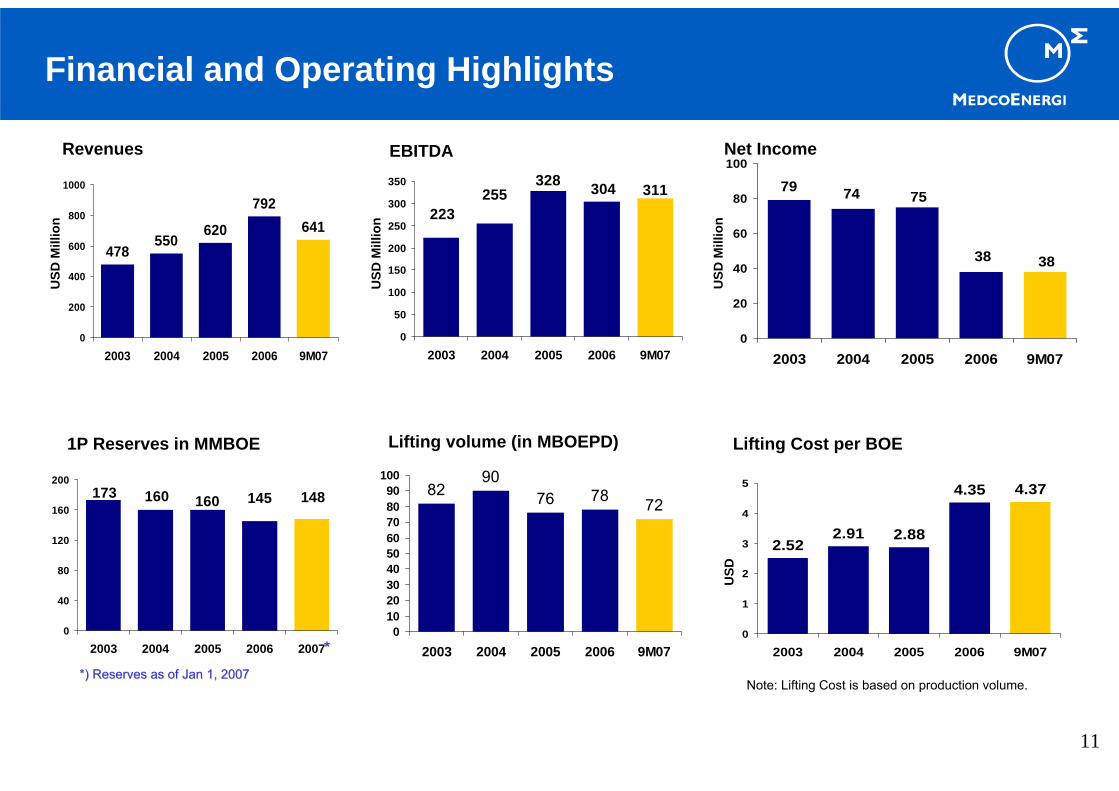
Financial and Operating Highlights
311223
255328 304
0
50
100
150
200
250
300
350
2003 2004 2005 2006 9M07
3838
757479
0
20
40
60
80
100
2003 2004 2005 2006 9M07
Net Income
478550
620
792641
0
200
400
600
800
1000
2003 2004 2005 2006 9M07
Revenues EBITDA
8290
76 78 72
0102030405060708090
100
2003 2004 2005 2006 9M07
148145173 160 160
0
40
80
120
160
200
2003 2004 2005 2006 2007
1P Reserves in MMBOE
2.522.91 2.88
4.35 4.37
0
1
2
3
4
5
2003 2004 2005 2006 9M07
Lifting Cost per BOELifting volume (in MBOEPD)
USD
Mill
ion
USD
Mill
ion
USD
Mill
ion
USD
Note: Lifting Cost is based on production volume.
***) Reserves as of Jan 1, 2007*) Reserves as of Jan 1, 2007

12
78%
100% 100% 100% 100%
0%
20%
40%
60%
80%
100%
120%
2003 2004 2005 2006 9M07
7,944 8,133 8,689
19,51522,827
0
10,000
20,000
30,000
2003 2004 2005 2006 9M07
57% 53% 51%
68%75%
0%
20%
40%
60%
80%
100%
2003 2004 2005 2006 9M07
Swampbarges utilization rate Onshore utilization rate
Swampbarges average daily revenues
24,861
44,774 47,054 49,689 50,819
0
20,000
40,000
60,000
2003 2004 2005 2006 9M07
Onshore average daily revenues
262241
200
137
68
0
50
100
150
200
250
300
2003 2004 2005 2006 9M07
Methanol sales
USD
USD
‘000
MT
Financial and Operating Highlights
78
421
706 689
0
200
400
600
800
2002 2004 2005 2006 9M07
Power production in MWH
Strategy
14
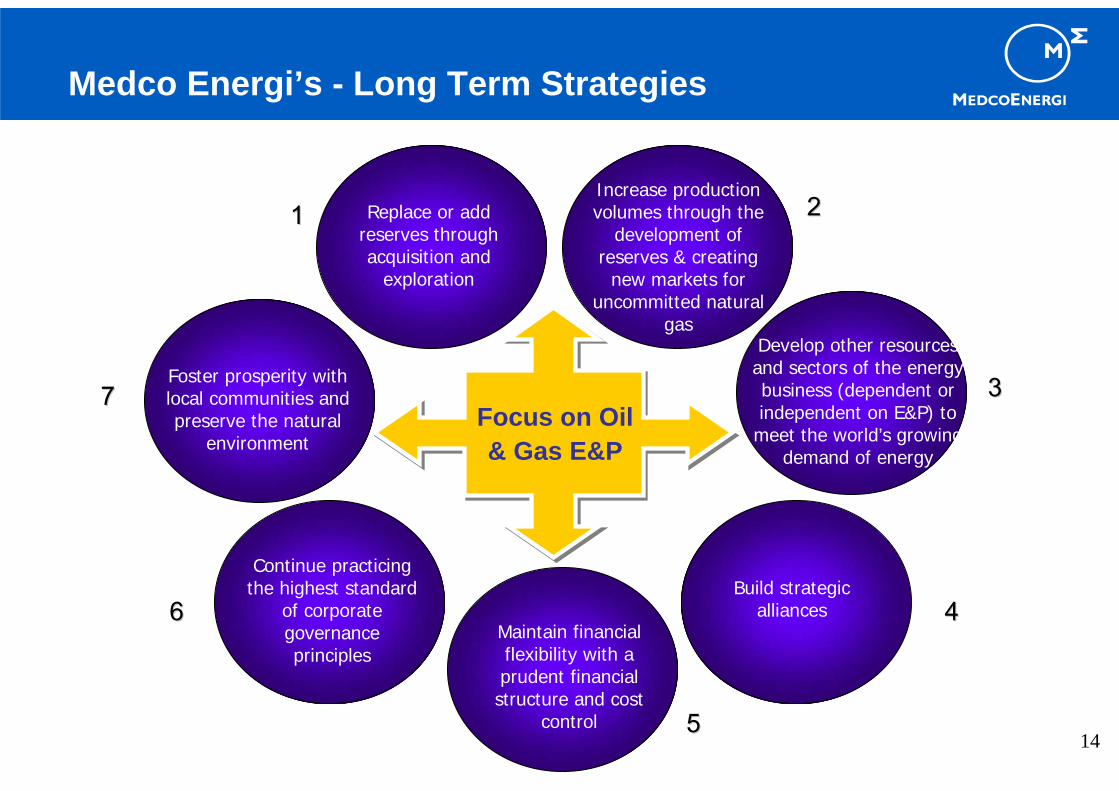
Medco Energi’s - Long Term Strategies
Continue practicing the highest standard
of corporate governance principles
Focus on Oil & Gas E&P
Replace or add reserves through acquisition and
exploration
Increase production volumes through the
development of reserves & creating
new markets for uncommitted natural
gasDevelop other resources and sectors of the energy business (dependent or independent on E&P) to
meet the world’s growing demand of energy
Maintain financial flexibility with a prudent financial structure and cost
control
Build strategic alliances
Foster prosperity with local communities and preserve the natural
environment
11 22
33
44
55
66
77

15
1. In line with our long term strategy to replace and add reserves through acquisitions and exploration:
Acquired Block A, North Sumatra, in 2 stages: 50% from Exxon-Mobil (through a consortium with Japex and Premier Oil) on April 26th 2006 and another50% from ConocoPhillips (with Premier Oil) on January 23rd 2007. 690 bcf of gas reserves and good upside.Acquired 40% of participating interest in Anaguid Block in Tunisia on June 12th
2007.Acquired 90% Block E in Cambodia on September 4th 2006, subsequently farmed-out to Kuwait Energy and Lundin making Medco’s stake 41.25%.Acquired 4 additional US assets on October 12th and 19th 2006; Block 435, 437, 492 and 514 in Brazos Area.Acquired blocks 82 and 83 in Yemen on December 9th 2006, through a consortium with Kuwait Energy Company, Indian Oil Corporation Limited, and Oil India Limited.
Delivering on Our Long-Term Strategies in 1H2007

16
2. In line with our long term strategy to increase production volume through development of reserves and creating new markets for uncommitted gas:
On March 21st 2007, signed a 9-year 130bcf Gas Sales Agreement with PLN for Lematang with an average price of USD 3.22/mmbtu.
3. In line with our long term strategy to develop other resources and sectors of the energy business to meet the world’s growing demand of energy:a. Downstream:
Acquired 28.4% of PT Trada International (a petroleum commodity trading company) on August 1st 2007 at a total price of USD 12.3 million.Acquired 100% of a fuel farm facility in Tanjung Priok Harbor - JakartaCommitted to the development of Lamongan fuel farms - East Java.
b. Power:On August 20th 2007, Signed Head of Agreement with PLN for SarullaGeothermal Project with consortium member ORMAT and Itochu. On October 8th 2007, Kyushu Electric Power Co., Inc became a new consortium partner.
Delivering on Our Long-Term Strategies in 1H2007

17
4. In line with our long term strategy to build strategic alliances and maintain prudent financial structure:
On June 27th 2007 Simmengaris farmed-out 21% to Salamander Energy (Simenggaris) Ltd at a price of USD 4.13 million.On July 4th 2007 Nunukan farmed-out 49% plus additional 11% to Anadarko Nunukan Indonesia Company.On June 24th 2007 Bawean farmed-out 35%, from 100% to 65%, to Kuwait Energy Company at a price of USD 23.5 million.On August 23rd 2007 Mitsubishi acquired an indirect 19.9% stake in PT Medco Energi Internasional Tbk.On October 24th 2007 farmed-out Block E in Cambodia to Lundin making their stake 34.00%, Medco 41.25%, with KEC and JHL 20.625% and 4.125% respectively.
Delivering on Our Long-Term Strategies in 1H2007
18
2014
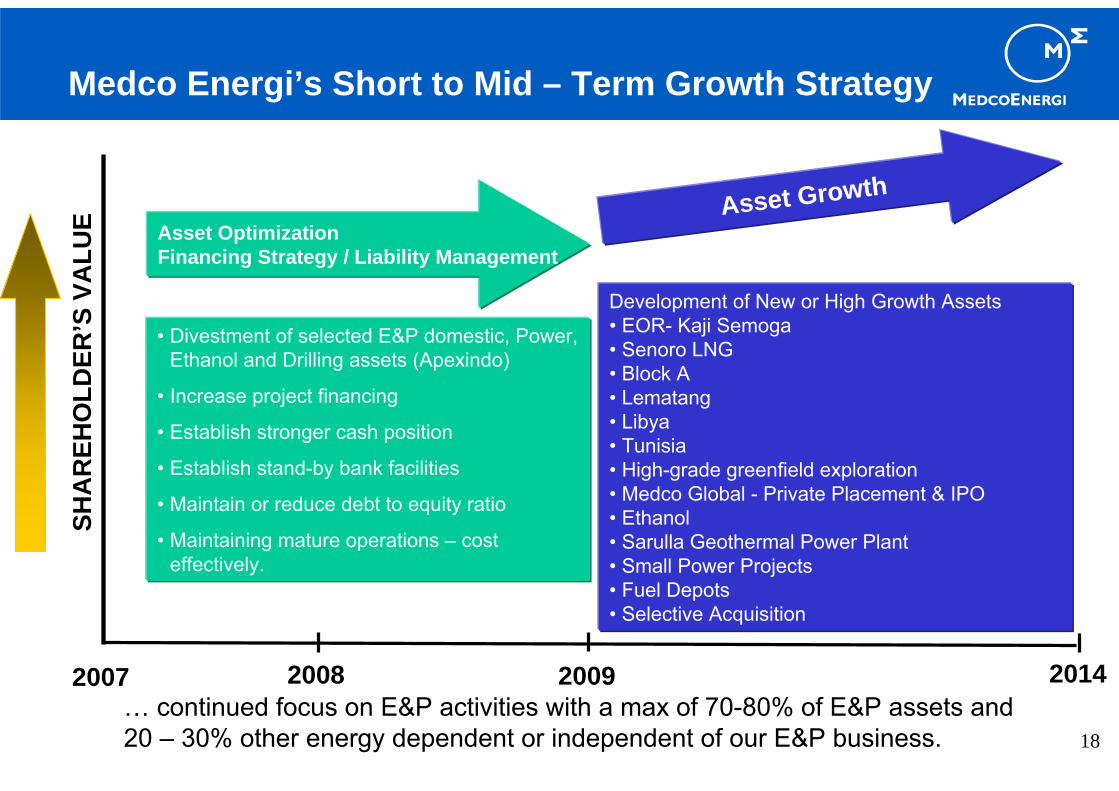
Asset OptimizationFinancing Strategy / Liability Management
Asset Growth
• Divestment of selected E&P domestic, Power, Ethanol and Drilling assets (Apexindo)
• Increase project financing
• Establish stronger cash position
• Establish stand-by bank facilities
• Maintain or reduce debt to equity ratio
• Maintaining mature operations – cost effectively.
Development of New or High Growth Assets• EOR- Kaji Semoga• Senoro LNG• Block A• Lematang• Libya• Tunisia• High-grade greenfield exploration• Medco Global - Private Placement & IPO • Ethanol• Sarulla Geothermal Power Plant• Small Power Projects• Fuel Depots• Selective Acquisition
2007 2008 2009
SHA
REH
OLD
ER’S
VA
LUE
… continued focus on E&P activities with a max of 70-80% of E&P assets and20 – 30% other energy dependent or independent of our E&P business.
Medco Energi’s Short to Mid – Term Growth Strategy

19
WHY ?
Good risk management – MEI or subsidiary maintains majority/operatorship but reduces operational and financial risks;
Good corporate governance – promotes further transparency and accountability by MEI and/or subsidiaries management;
Acquire expertise or technology from partner(s) – e.g. Enhanced Oil Recovery (EOR), deep water, LNG, refining, marketing, power etc;
Leverage off current high market valuations to monetize mature assets with limited upside and new undeveloped assets to fund future projects/operations;
Reshape asset portfolio to obtain a position which is not reliant on mature assets and related cash flows;
Improve cash position/strengthen balance sheet to reduce reliance on debt and have resources for new opportunities;
Increase MEI stock price by demonstrating the value of our assets through limited realized asset sales.
Asset Optimization-Divestment

20
• Strategically to have a long term sound, prudent and sustainable capital structures at optimal gearing (debt to equity ratio);
• Maintaining sufficient debt capacity and financing flexibility for future expansion in line with the corporate strategic plan;
• Manage our debt maturity profile and maintain a balance between short-term and long-term debt;
• Use of non or limited recourse financing (no parent guarantee) at the project or subsidiary level (Senoro, Block A, Sarulla, Lematang etc) to limit MEI exposure;
• Establish stand-by bank facilities or use asset optimization proceeds for:– establishing a safe position for put option on bonds;– retiring and/or restructuring debt to remove restrictive debt covenants;
• To reduce currency mismatch risk, to increase financing flexibility, to limit any restrictive covenants and to obtain competitive cost of fund on new or existing debt;
• Centralized liability management;• Disciplined on capital allocation;
Financing Strategy/Liability Management

21
• Creating a large cash position before 2009 elections as cost of borrowing is likely to increase, and reduce dependency on lenders;
• Centralize cash management to maximize investment returns on cash balances;• Continue using structured products for foreign currency and interest rate risks; • Provide and maintain non cash bank facility (L/C, bank guarantee) for operational
and other purposes.
Financing Strategy/Liability Management (cont’d)
22
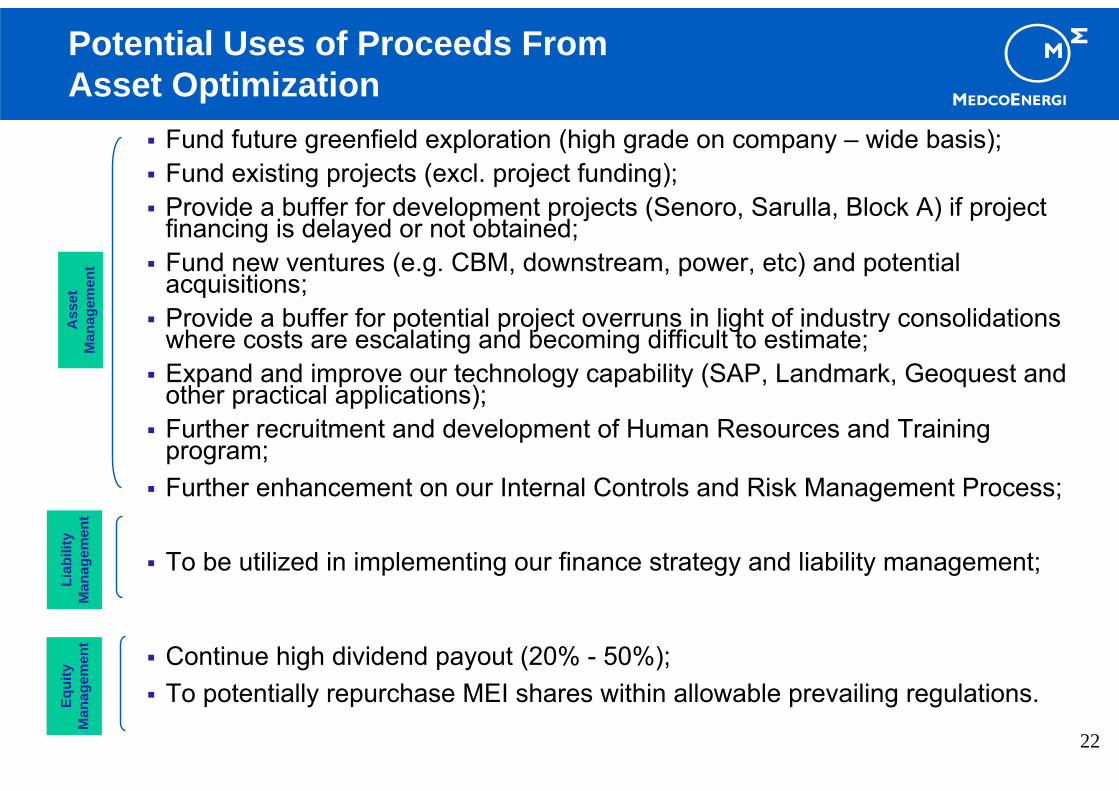
Fund future greenfield exploration (high grade on company – wide basis);Fund existing projects (excl. project funding);Provide a buffer for development projects (Senoro, Sarulla, Block A) if project financing is delayed or not obtained;Fund new ventures (e.g. CBM, downstream, power, etc) and potential acquisitions;Provide a buffer for potential project overruns in light of industry consolidations where costs are escalating and becoming difficult to estimate;Expand and improve our technology capability (SAP, Landmark, Geoquest and other practical applications);Further recruitment and development of Human Resources and Training program;Further enhancement on our Internal Controls and Risk Management Process;
To be utilized in implementing our finance strategy and liability management;
Continue high dividend payout (20% - 50%);To potentially repurchase MEI shares within allowable prevailing regulations.
Ass
et
Man
agem
ent
Liab
ility
M
anag
emen
tEq
uity
Man
agem
ent
Potential Uses of Proceeds From Asset Optimization
23
Consolidated Impact of Asset Optimization – maximum impact can be estimated as follows:On E& P Divestment• 12% decrease in total production;• 8% decrease in total disclosed 2P reserves;E&P divestment impact will be compensated by a significant amount of Cash from divestment with market valuation average : EV/2P around $7 - $10/boe.On Apexindo Divestment• reduction in assets will be compensated with the cash proceed;• elimination of $200mn debt from MEI Balance Sheet;• significant increase in Equity from transaction gain MV vs BV.On Power and Ethanol• a small positive financial statement impact is expected.
By leveraging off current market valuation it is very likely significant value will be unlocked from our asset optimization program.
Impact of Asset Optimization-Divestment
Attachment 1 – Domestic E&P Assets
25
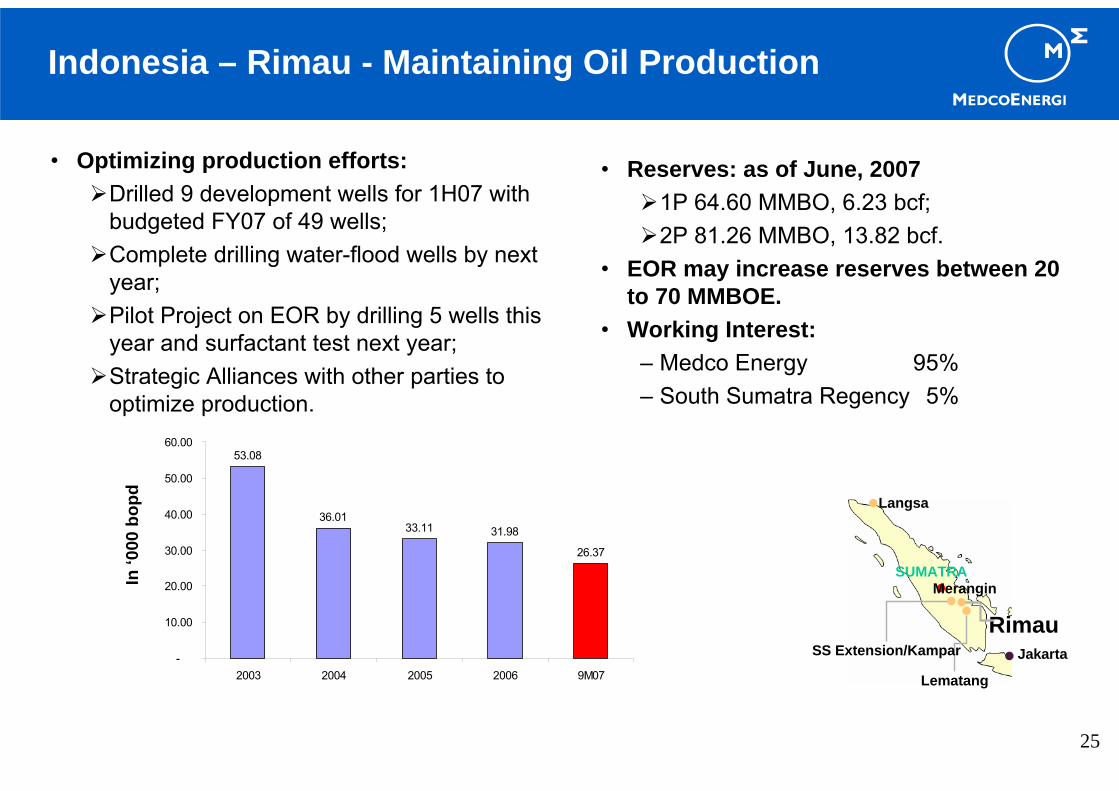
• Optimizing production efforts:Drilled 9 development wells for 1H07 with budgeted FY07 of 49 wells;Complete drilling water-flood wells by next year;Pilot Project on EOR by drilling 5 wells this year and surfactant test next year;Strategic Alliances with other parties to optimize production.
Indonesia – Rimau - Maintaining Oil Production
SUMATRA
Langsa
Merangin
Lematang
SS Extension/KamparRimau
Jakarta
53.08
36.0133.11 31.98
26.37
-
10.00
20.00
30.00
40.00
50.00
60.00
2003 2004 2005 2006 9M07
In ‘0
00 b
opd
• Reserves: as of June, 20071P 64.60 MMBO, 6.23 bcf;2P 81.26 MMBO, 13.82 bcf.
• EOR may increase reserves between 20 to 70 MMBOE.
• Working Interest:– Medco Energy 95%– South Sumatra Regency 5%
26
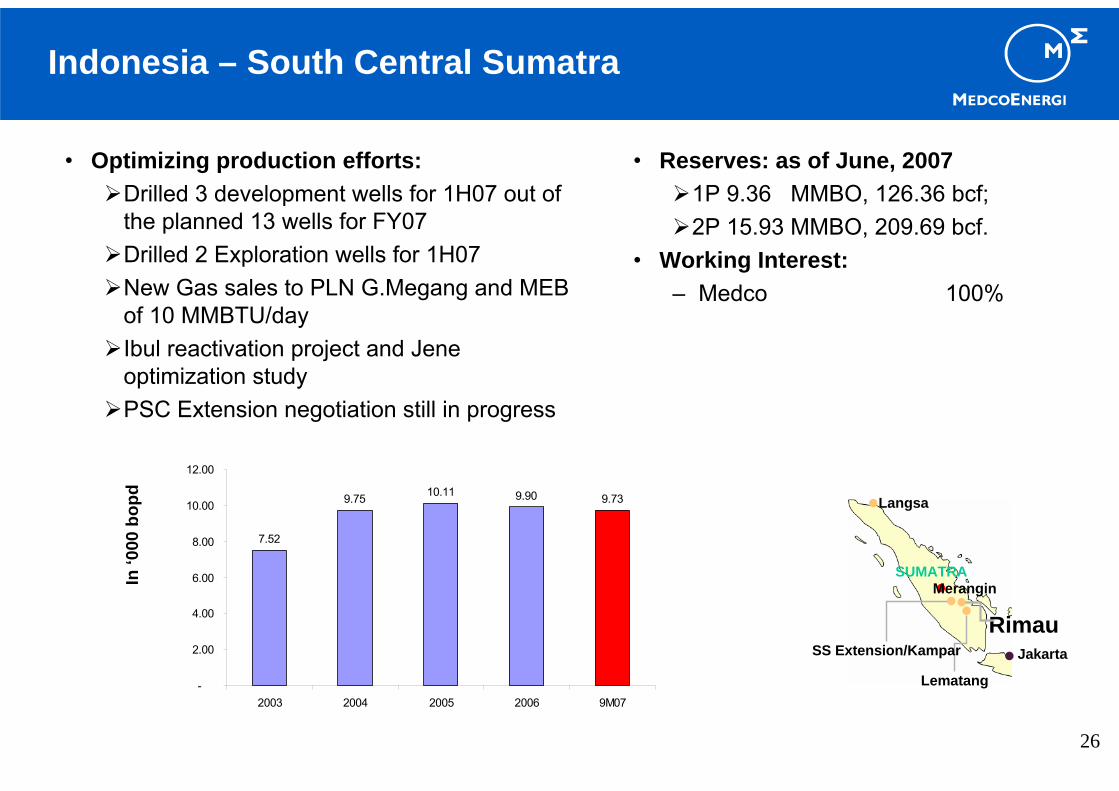
• Optimizing production efforts:Drilled 3 development wells for 1H07 out of the planned 13 wells for FY07Drilled 2 Exploration wells for 1H07New Gas sales to PLN G.Megang and MEB of 10 MMBTU/dayIbul reactivation project and Jeneoptimization studyPSC Extension negotiation still in progress
Indonesia – South Central Sumatra
SUMATRA
Langsa
Merangin
Lematang
SS Extension/KamparRimau
Jakarta
7.52
9.75 10.11 9.90 9.73
-
2.00
4.00
6.00
8.00
10.00
12.00
2003 2004 2005 2006 9M07
In ‘0
00 b
opd
• Reserves: as of June, 20071P 9.36 MMBO, 126.36 bcf;2P 15.93 MMBO, 209.69 bcf.
• Working Interest:– Medco 100%

27
• Recent DevelopmentPlan of Development has been approved by BPMIGAS in 2006.On March 21st 2007, signed a 9-year 130 bcfGas Sales Agreement with PLN with an average price of USD 3.22/mmbtu.Engineering Procurement & Construction Contract award waiting for BPMIGAS approval.USD 75.24 million will be spent during 2007 –2008 for production facilities.2 new production wells and 2 work-over wells will be done in 2008 at a cost of approximately USD 44.7 million.Expected commencement of production in 2009.
• Reserves: as of June, 20071P 130 bcf.2P 183 bcf.
SUMATRA
Langsa
Merangin
Lematang
SS Extension/KamparRimau
Jakarta
• Working Interest:- Medco 74%- Lundin Lematang 26%
Indonesia – Lematang
0.057
0.051
0.033
0.0260.030
-
0.010
0.020
0.030
0.040
0.050
0.060
2003 2004 2005 2006 9M07
In ‘0
00 b
opd
Harimau Field Production
28
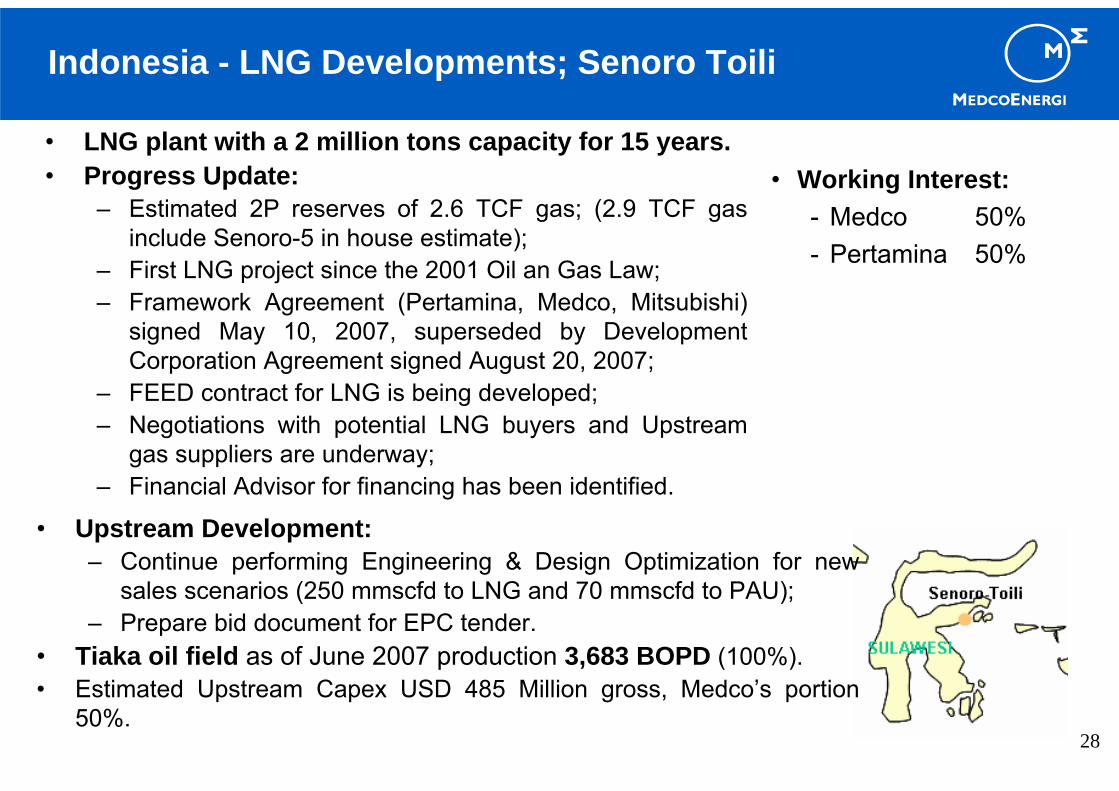
• LNG plant with a 2 million tons capacity for 15 years.• Progress Update:
– Estimated 2P reserves of 2.6 TCF gas; (2.9 TCF gas include Senoro-5 in house estimate);
– First LNG project since the 2001 Oil an Gas Law;– Framework Agreement (Pertamina, Medco, Mitsubishi)
signed May 10, 2007, superseded by Development Corporation Agreement signed August 20, 2007;
– FEED contract for LNG is being developed;– Negotiations with potential LNG buyers and Upstream
gas suppliers are underway;– Financial Advisor for financing has been identified.
Indonesia - LNG Developments; Senoro Toili
• Upstream Development:– Continue performing Engineering & Design Optimization for new
sales scenarios (250 mmscfd to LNG and 70 mmscfd to PAU);– Prepare bid document for EPC tender.
• Tiaka oil field as of June 2007 production 3,683 BOPD (100%).• Estimated Upstream Capex USD 485 Million gross, Medco’s portion
50%.
• Working Interest:- Medco 50%- Pertamina 50%
29
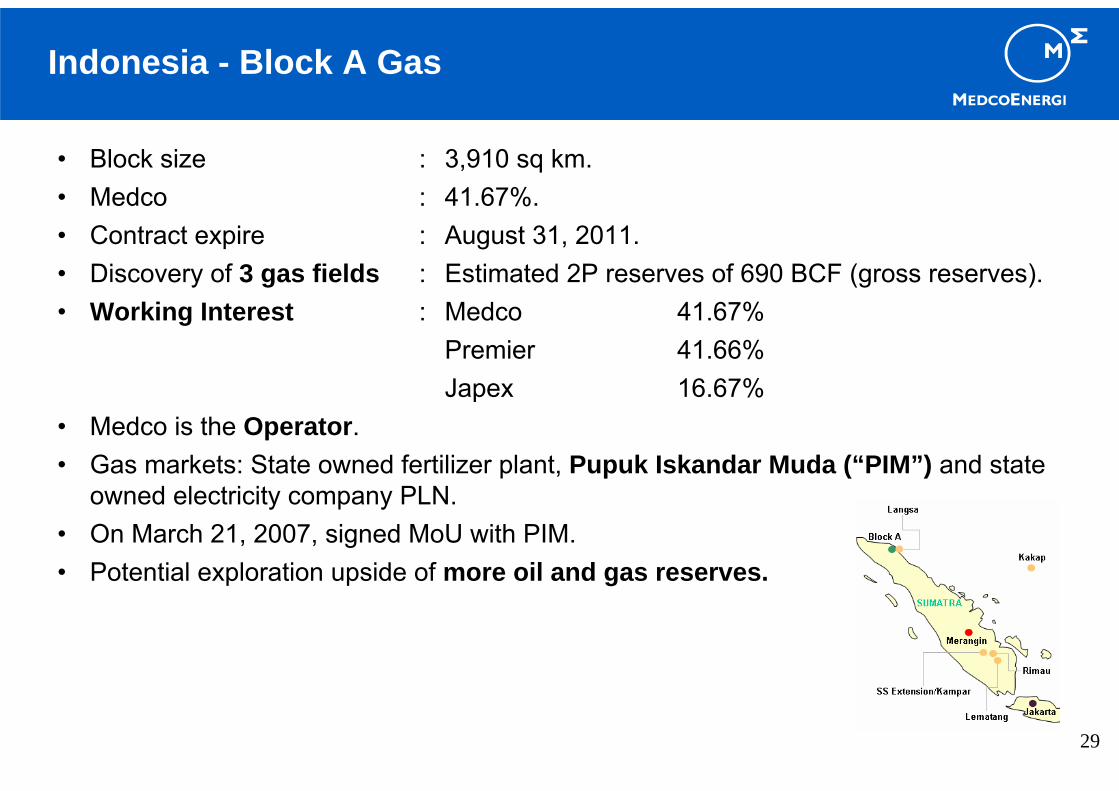
Indonesia - Block A Gas
• Block size : 3,910 sq km.• Medco : 41.67%.• Contract expire : August 31, 2011.• Discovery of 3 gas fields : Estimated 2P reserves of 690 BCF (gross reserves).• Working Interest : Medco 41.67%
Premier 41.66%Japex 16.67%
• Medco is the Operator.• Gas markets: State owned fertilizer plant, Pupuk Iskandar Muda (“PIM”) and state
owned electricity company PLN.• On March 21, 2007, signed MoU with PIM.• Potential exploration upside of more oil and gas reserves.

30
Indonesia – Anadarko’s Exploration Activities
• On July 26, 2005, Medco entered into an Exploration Joint Venture Agreement (“EJVA”) with a wholly-owned subsidiary of Anadarko Petroleum Corporation (“Anadarko”).
• Under the EJVA, Anadarko has committed to:− Medco’s Indonesian blocks (except Merangin)
at a cost USD 80 million, with a maximum cap of USD 25 million to be credit to USD 80 million as a result Anadarko farm-in to Nunukan PSC.
− Capex spent to June 2007 is USD 18.2 million which excludes the portion from the farm-in of Nunukan.
• Activities up-to-date:• Executed 3 implementation agreements on
EJVA; Simenggaris, Nunukan and Tarakan Seismic;
• Farmed-in 49% plus additional 11% in Nunukan Block

Attachment 2 – International E&P Assets
32
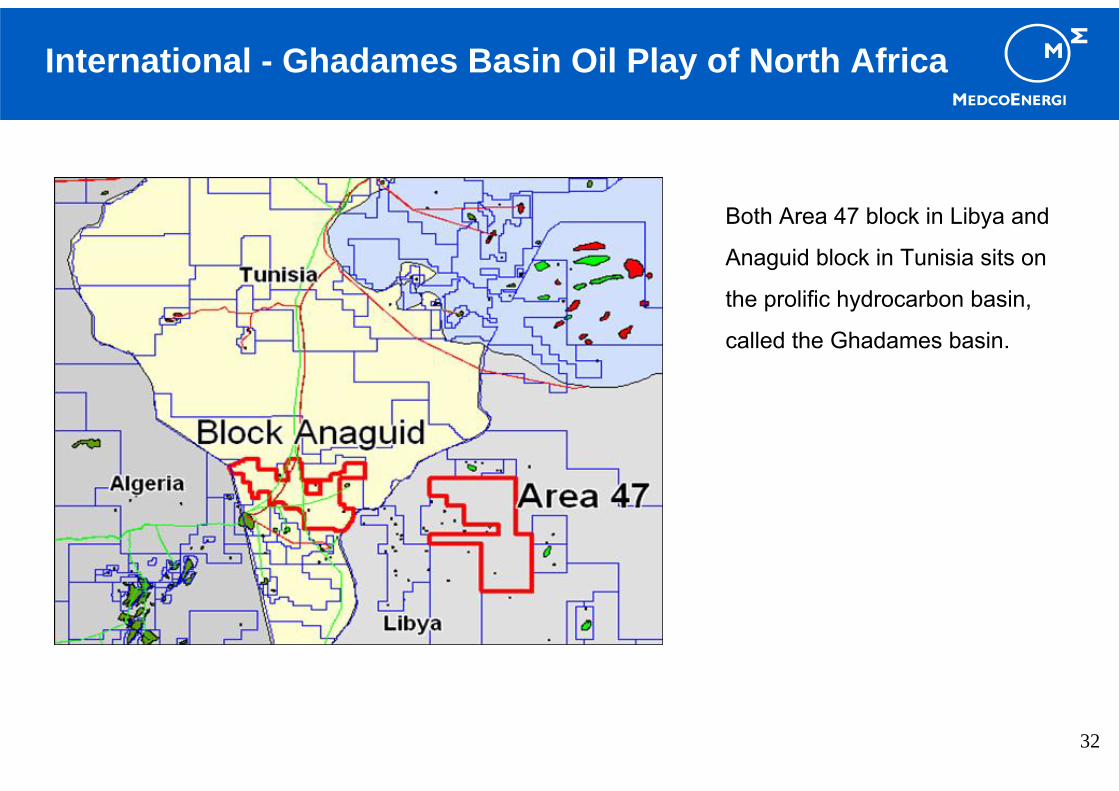
International - Ghadames Basin Oil Play of North Africa
Both Area 47 block in Libya and
Anaguid block in Tunisia sits on
the prolific hydrocarbon basin,
called the Ghadames basin.
33
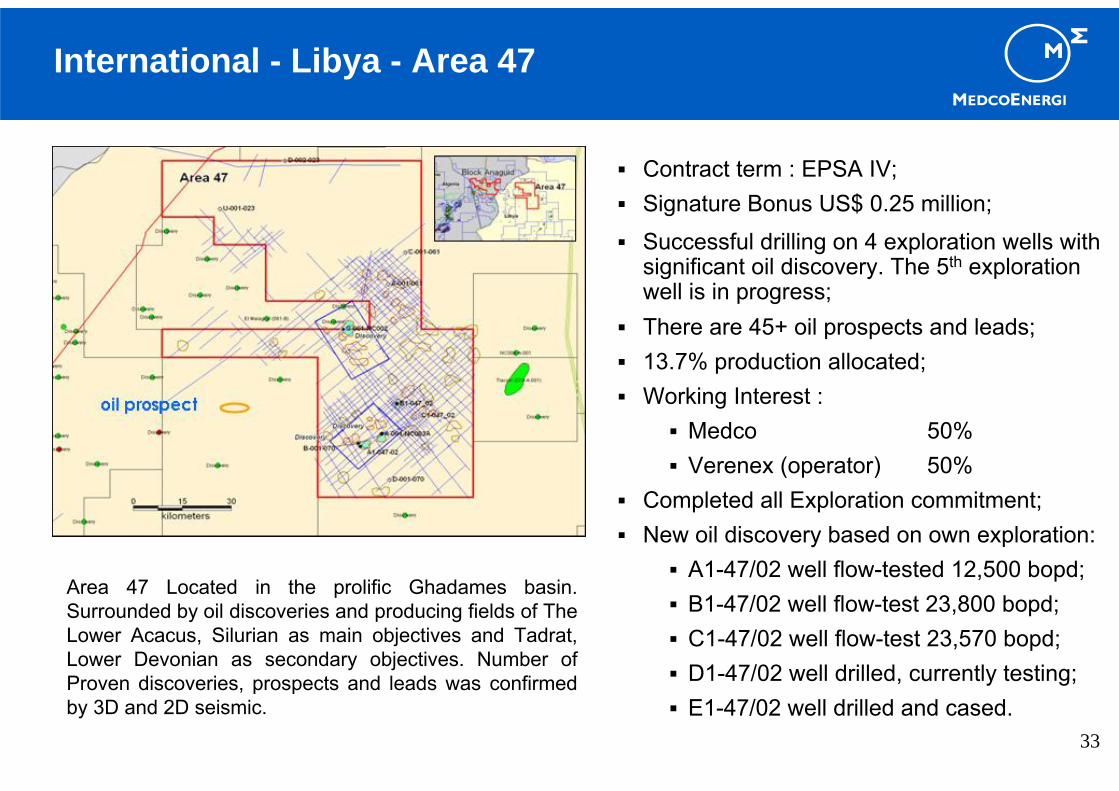
International - Libya - Area 47
Contract term : EPSA IV;Signature Bonus US$ 0.25 million;Successful drilling on 4 exploration wells with significant oil discovery. The 5th exploration well is in progress;There are 45+ oil prospects and leads;13.7% production allocated;Working Interest :
Medco 50%Verenex (operator) 50%
Completed all Exploration commitment;New oil discovery based on own exploration:
A1-47/02 well flow-tested 12,500 bopd;B1-47/02 well flow-test 23,800 bopd;C1-47/02 well flow-test 23,570 bopd;D1-47/02 well drilled, currently testing;E1-47/02 well drilled and cased.
Area 47 Located in the prolific Ghadames basin. Surrounded by oil discoveries and producing fields of The Lower Acacus, Silurian as main objectives and Tadrat, Lower Devonian as secondary objectives. Number of Proven discoveries, prospects and leads was confirmed by 3D and 2D seismic.
34
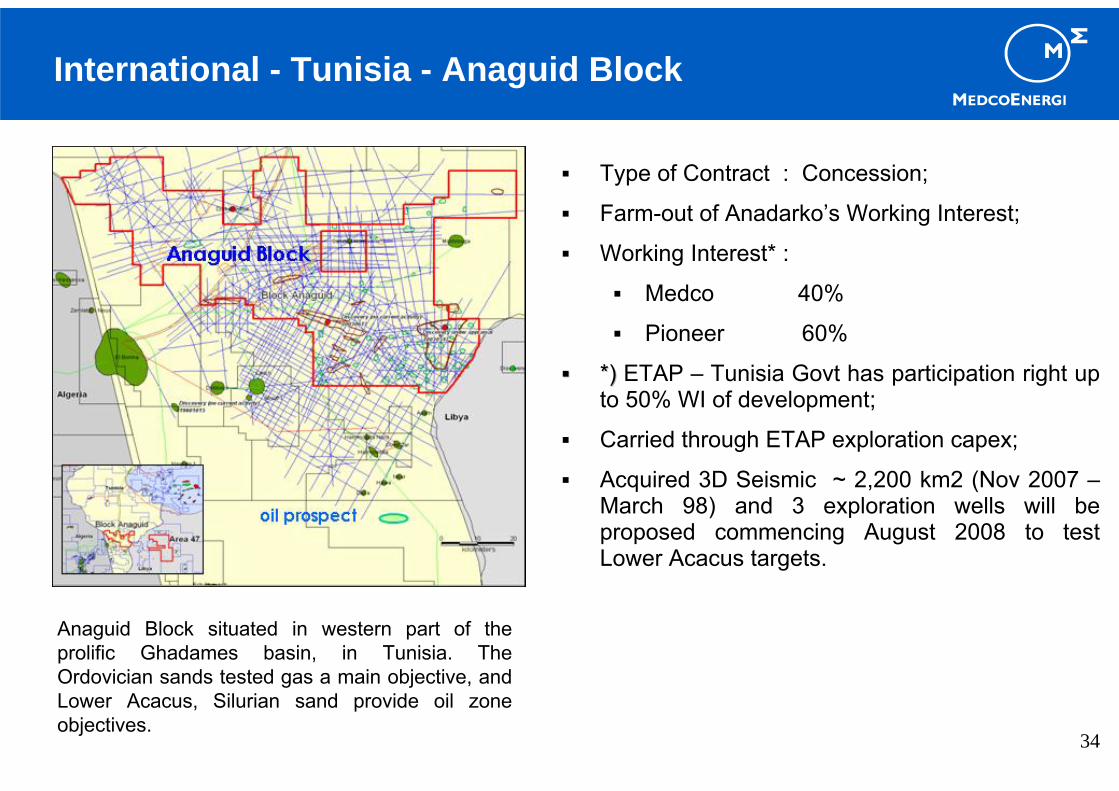
International - Tunisia - Anaguid Block
Type of Contract : Concession;
Farm-out of Anadarko’s Working Interest;
Working Interest* :
Medco 40%
Pioneer 60%
*) *) ETAP – Tunisia Govt has participation right up to 50% WI of development;
Carried through ETAP exploration capex;
Acquired 3D Seismic ~ 2,200 km2 (Nov 2007 –March 98) and 3 exploration wells will be proposed commencing August 2008 to test Lower Acacus targets.
Anaguid Block situated in western part of the prolific Ghadames basin, in Tunisia. The Ordovician sands tested gas a main objective, and Lower Acacus, Silurian sand provide oil zone objectives.
35
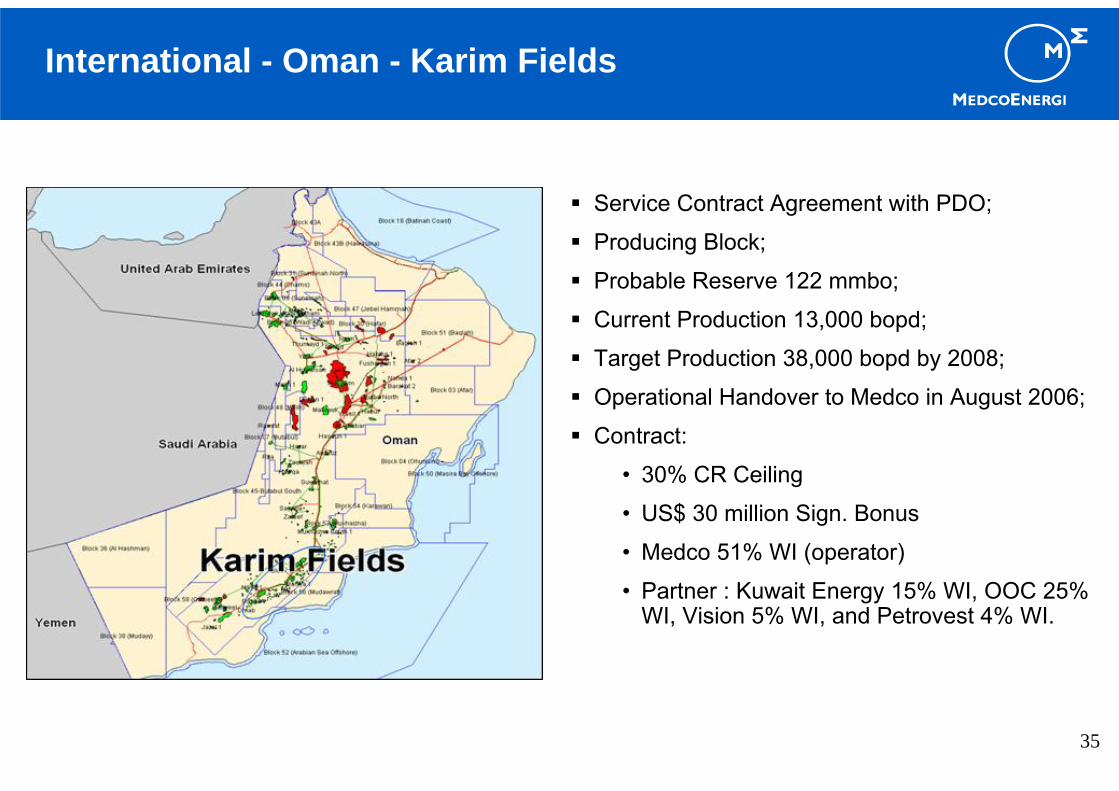
International - Oman - Karim Fields
Service Contract Agreement with PDO;
Producing Block;
Probable Reserve 122 mmbo;
Current Production 13,000 bopd;
Target Production 38,000 bopd by 2008;
Operational Handover to Medco in August 2006;
Contract:
• 30% CR Ceiling
• US$ 30 million Sign. Bonus
• Medco 51% WI (operator)
• Partner : Kuwait Energy 15% WI, OOC 25% WI, Vision 5% WI, and Petrovest 4% WI.
36
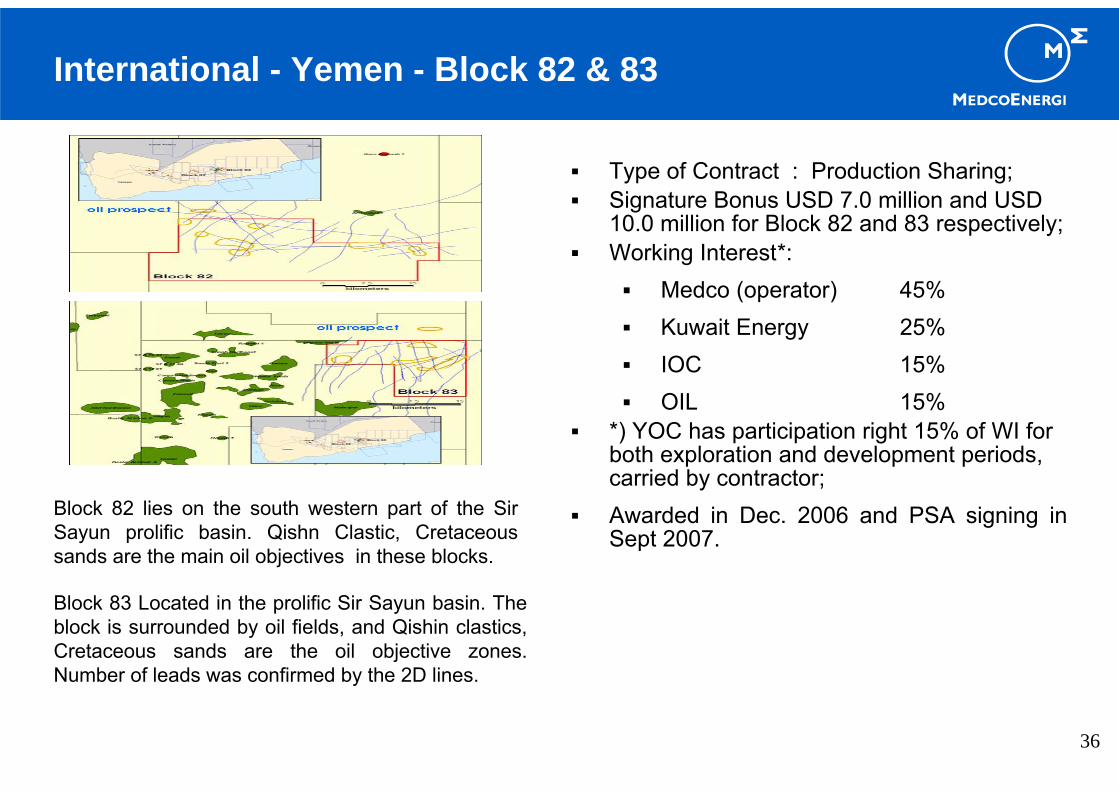
International - Yemen - Block 82 & 83
Type of Contract : Production Sharing;Signature Bonus USD 7.0 million and USD 10.0 million for Block 82 and 83 respectively;Working Interest*:
Medco (operator) 45%Kuwait Energy 25%IOC 15%OIL 15%
*) YOC has participation right 15% of WI for both exploration and development periods, carried by contractor;Awarded in Dec. 2006 and PSA signing in Sept 2007.
Block 82 lies on the south western part of the Sir Sayun prolific basin. Qishn Clastic, Cretaceous sands are the main oil objectives in these blocks.
Block 83 Located in the prolific Sir Sayun basin. The block is surrounded by oil fields, and Qishin clastics, Cretaceous sands are the oil objective zones. Number of leads was confirmed by the 2D lines.
37
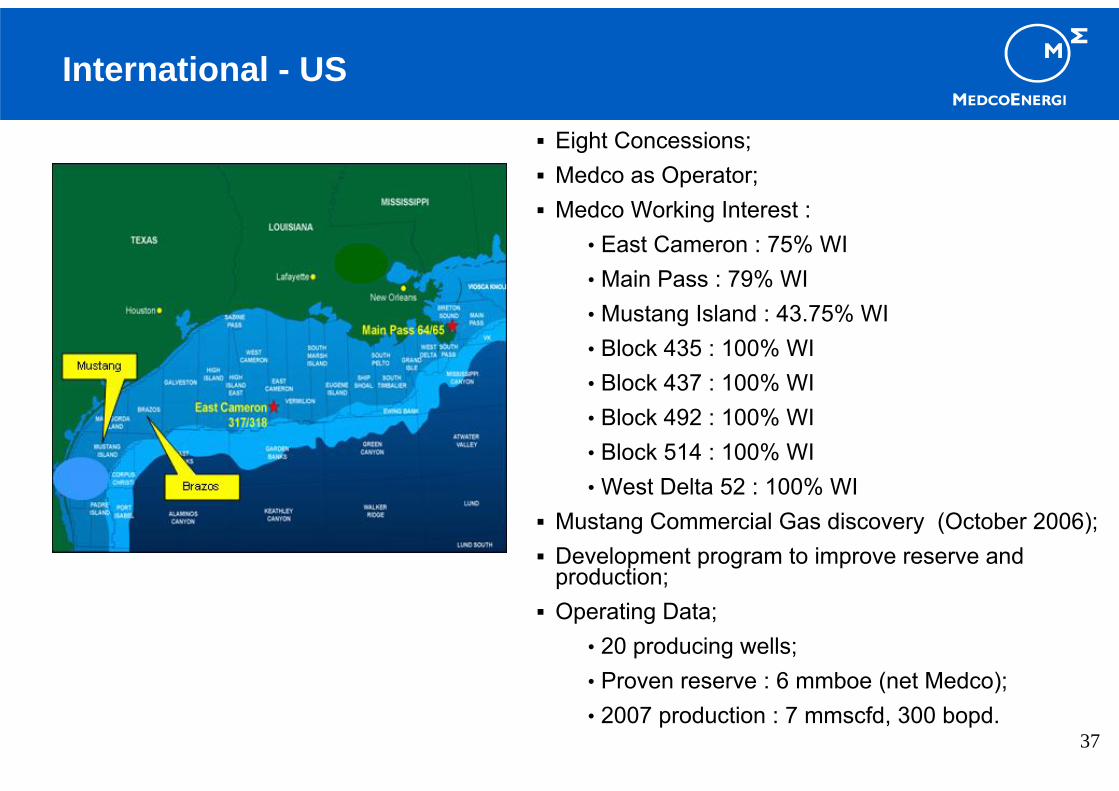
International - US
Eight Concessions;Medco as Operator;Medco Working Interest :
• East Cameron : 75% WI• Main Pass : 79% WI• Mustang Island : 43.75% WI• Block 435 : 100% WI• Block 437 : 100% WI• Block 492 : 100% WI• Block 514 : 100% WI• West Delta 52 : 100% WI
Mustang Commercial Gas discovery (October 2006);Development program to improve reserve and production;Operating Data;
• 20 producing wells;• Proven reserve : 6 mmboe (net Medco);• 2007 production : 7 mmscfd, 300 bopd.
38
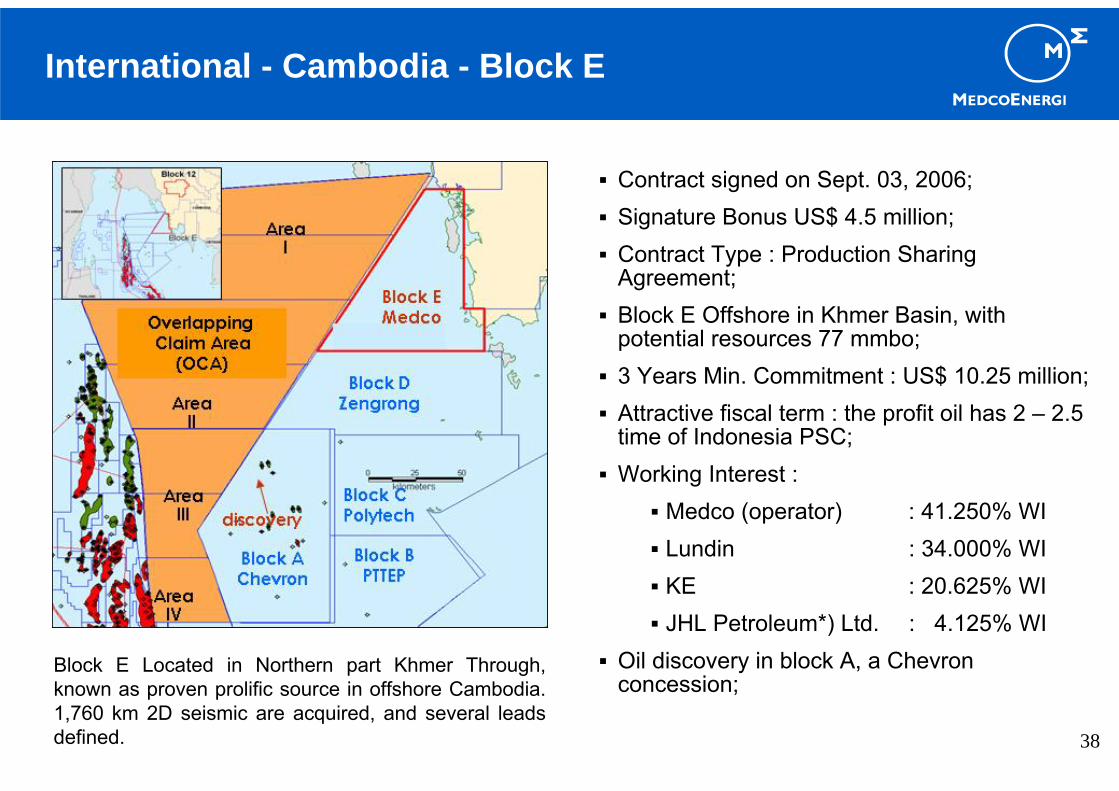
International - Cambodia - Block E
Contract signed on Sept. 03, 2006;Signature Bonus US$ 4.5 million;Contract Type : Production Sharing Agreement;Block E Offshore in Khmer Basin, with potential resources 77 mmbo;3 Years Min. Commitment : US$ 10.25 million;Attractive fiscal term : the profit oil has 2 – 2.5 time of Indonesia PSC;Working Interest :
Medco (operator) : 41.250% WILundin : 34.000% WIKE : 20.625% WIJHL Petroleum*) Ltd. : 4.125% WI
Oil discovery in block A, a Chevron concession;
Block E Located in Northern part Khmer Through, known as proven prolific source in offshore Cambodia. 1,760 km 2D seismic are acquired, and several leads defined.
Attachment 3 – Drilling Business
40
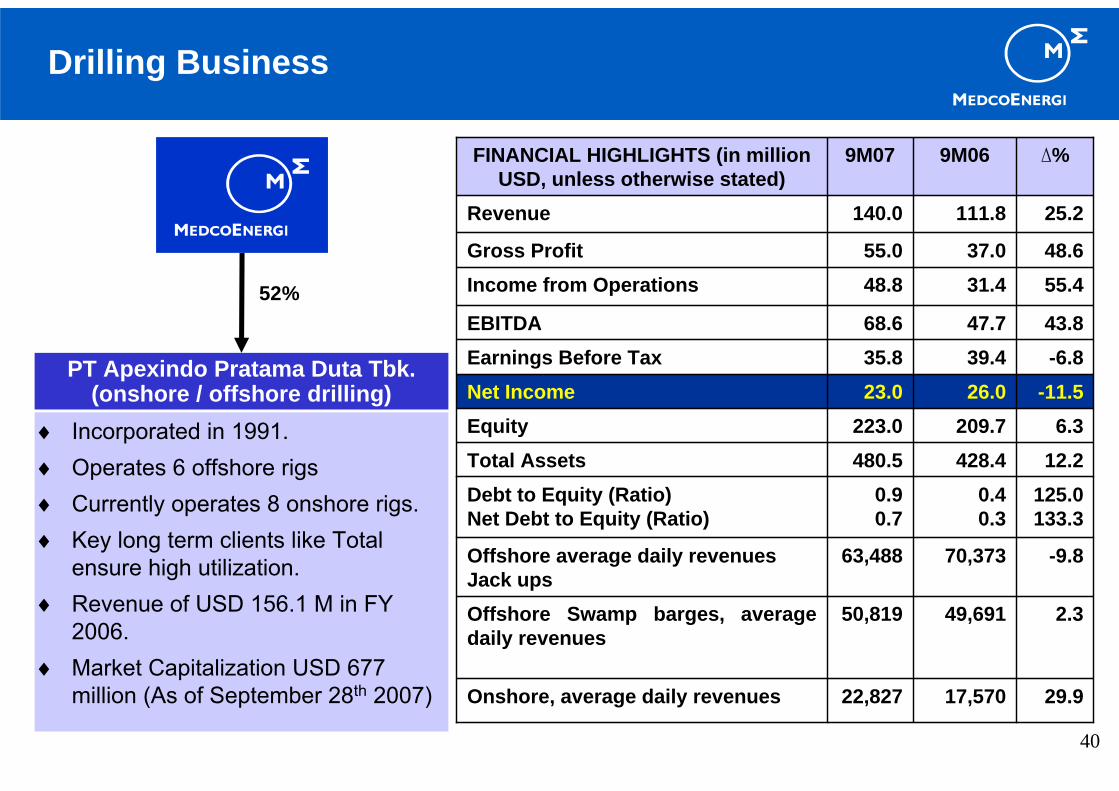
♦ Incorporated in 1991.♦ Operates 6 offshore rigs ♦ Currently operates 8 onshore rigs.♦ Key long term clients like Total
ensure high utilization.♦ Revenue of USD 156.1 M in FY
2006.♦ Market Capitalization USD 677
million (As of September 28th 2007)
PT Apexindo Pratama Duta Tbk.(onshore / offshore drilling)
52%
Drilling Business
-9.870,37363,488Offshore average daily revenuesJack ups
2.349,69150,819Offshore Swamp barges, average daily revenues
125.0133.3
0.40.3
0.90.7
Debt to Equity (Ratio)Net Debt to Equity (Ratio)
48.637.055.0Gross Profit
29.917,57022,827Onshore, average daily revenues
12.2428.4480.5Total Assets6.3209.7223.0Equity
-11.526.023.0Net Income-6.839.435.8Earnings Before Tax43.847.768.6EBITDA
55.431.448.8Income from Operations
25.2111.8140.0Revenue
∆%9M069M07FINANCIAL HIGHLIGHTS (in million USD, unless otherwise stated)
Attachment 4 – Downstream

42
Downstream – Power
Future Projects:• 20 MW Panaran back-up power, • Signed a Take Over Agreement of 65%
shares of 2x40 MW Gas Fired Power Plant in South Sumatra.
• Signed MoU Agreement with PLN Tarakanfor 20 MW Temporary Power Sengkang.
• Medco through South Central Sumatra will supply gas to Panaran I.
Ongoing Sarulla Geothermal Project:• Head of Agreement was signed by
Pertamina, PLN, Consortium on 20th August 2007.
• The Consortium also signed an MOU with Kyushu Electric Power Co., Inc a potential new consortium partner.
• Consortium members are ORMAT, Itochu and Medco.
Mitra Energi Batam• Panaran I with capacity of 2x31.5 MW.Dale Energy Batam• Panaran II with capacity of 2x27.5 MW.
43
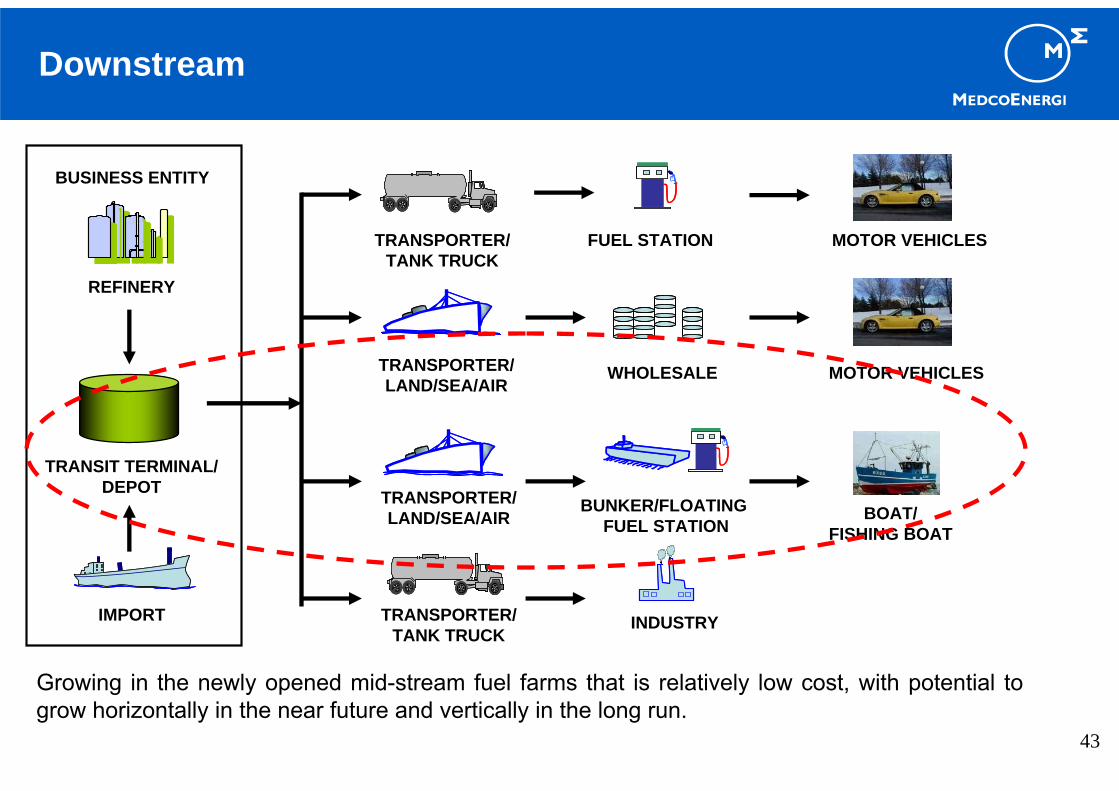
Downstream
REFINERY
TRANSIT TERMINAL/DEPOT
IMPORT
BUSINESS ENTITY
TRANSPORTER/TANK TRUCK
FUEL STATION
TRANSPORTER/LAND/SEA/AIR
TRANSPORTER/LAND/SEA/AIR
TRANSPORTER/TANK TRUCK
WHOLESALE
BUNKER/FLOATING FUEL STATION
INDUSTRY
MOTOR VEHICLES
MOTOR VEHICLES
BOAT/FISHING BOAT
Growing in the newly opened mid-stream fuel farms that is relatively low cost, with potential togrow horizontally in the near future and vertically in the long run.
44
Methanol• Plant location on Bunyu Island - East
Kalimantan;• Methanol plant owned by
PERTAMINA;• Capacity 330,000 tons per annum or
900 tons per day;• 60% export, 40% domestic market
sales.
Status• Lack of gas supply;• Possible plant shutdown;• Looking to find gas resources from
Sembakung, Simenggaris, Tarakanand Nunukan.
LPG Kaji• Plant located in Rimau PSC in South
Sumatra;• Plant Capacity 73,000 tons per
annum• Processed 5,301 MMCF of
associated gas from Kaji/Semogafields;
• LPG production of 36,510 tons in 2006 and 15,250 tons for first half of 2007;
• Produce 138,737 barrels of condensate and 2,710 MMCF of lean gas in 2006.
Status• Lack of gas supply due to lower
production of Rimau PSC.
Downstream

45
General• Raw Material of 396,000 MT of
cassava or 236,000 MT of molasses;• Operation 330days per year 24 hours
per day;• 13,200 ha of cassava plantation area,
run and owned by independent farmers;
• Commencement of production is expected to be in late 1Q08;
• Progress to date 70% completed;• Divestment of minority share.
Location• Kotabumi, North Lampung, Sumatra.
Plant Output• 180 kiloliters per day (1,130 boepd) or
60 million liters per year.
SUMATRA
Kotabumi, Lampung
Jakarta
Ethanol
Downstream
46
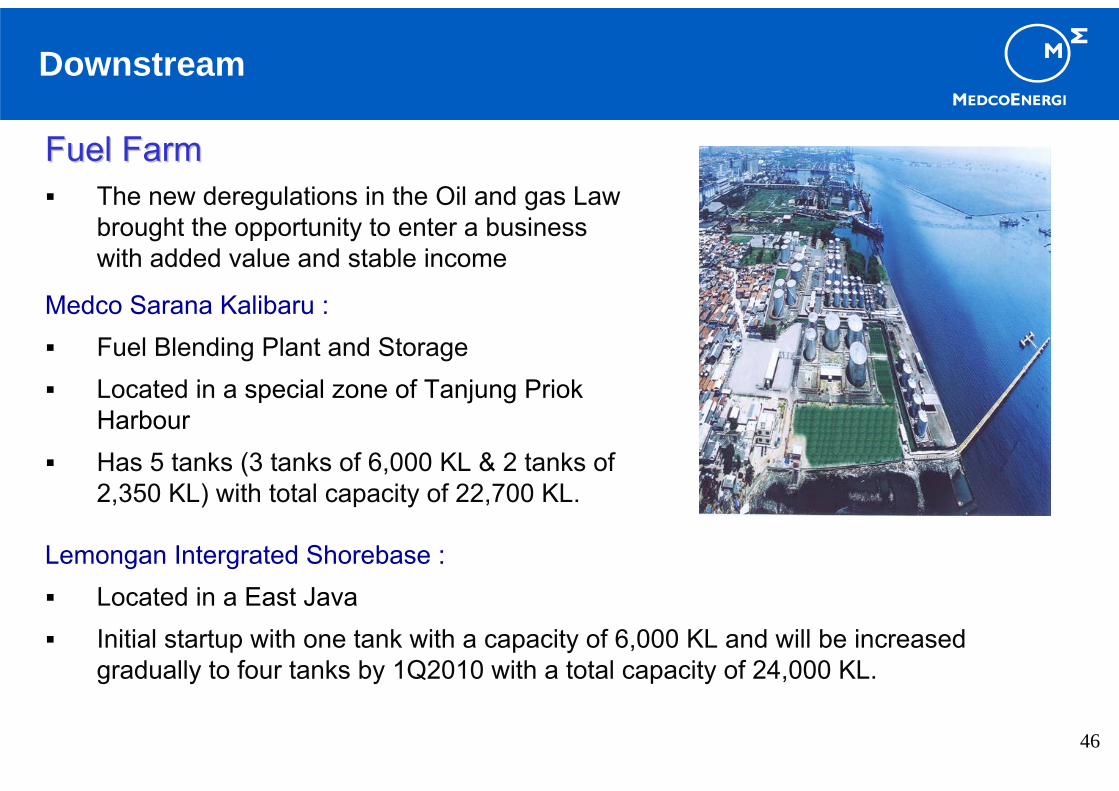
Fuel FarmFuel FarmThe new deregulations in the Oil and gas Law brought the opportunity to enter a business with added value and stable income
Downstream
Lemongan Intergrated Shorebase :Located in a East JavaInitial startup with one tank with a capacity of 6,000 KL and will be increased gradually to four tanks by 1Q2010 with a total capacity of 24,000 KL.
Medco Sarana Kalibaru :Fuel Blending Plant and StorageLocated in a special zone of Tanjung Priok HarbourHas 5 tanks (3 tanks of 6,000 KL & 2 tanks of 2,350 KL) with total capacity of 22,700 KL.
Attachment 5 – Industry Background
48
Indonesia has been in oil and gas business for more that 100 years and is still a significant producer of oil and gas. Indonesia is the only Asian member in OPEC.Albeit Indonesia is currently a net importer of oil.Most oil and gas in Indonesia is produced by foreign contractor under the Production Sharing Contract (“PSC”).Tenor on a PSC is typically 30 years.Upstream regulator has been taken over by BPMIGAS.Typical split for oil is 85% Government 15% Contractor and gas 70% for Government and 30% for Contractor. The split are net of taxes.Each block is held by a dedicated company and is “ring-fenced”Typical provisions on a a PSC are First Tranche Petroleum, Cost Recovery, Domestic Market Obligation.
Indonesian Oil and Gas
49
Oil : • Production 900,000 Bopd (barrels of oil per day).• Consumption 1 Million Bopd. • Growth in oil consumption - 1% per annum over five years.• Reserves 4.7 billion barrels, 11 years life.
Gas : • Production around 7 Bcfd (billion cubic feet per day) of gas. • Consumption 3 Bcfd, mostly for electricity and fertilizer production, which the
prices are subsidized. • Growth in gas consumption - 2% p.a.• Reserves 108.3 Tcf, over 40 years life.
Present Indonesian Oil and Gas Market
Source: BP Migas, Directorate General of Coal and Mineral Mining.
50
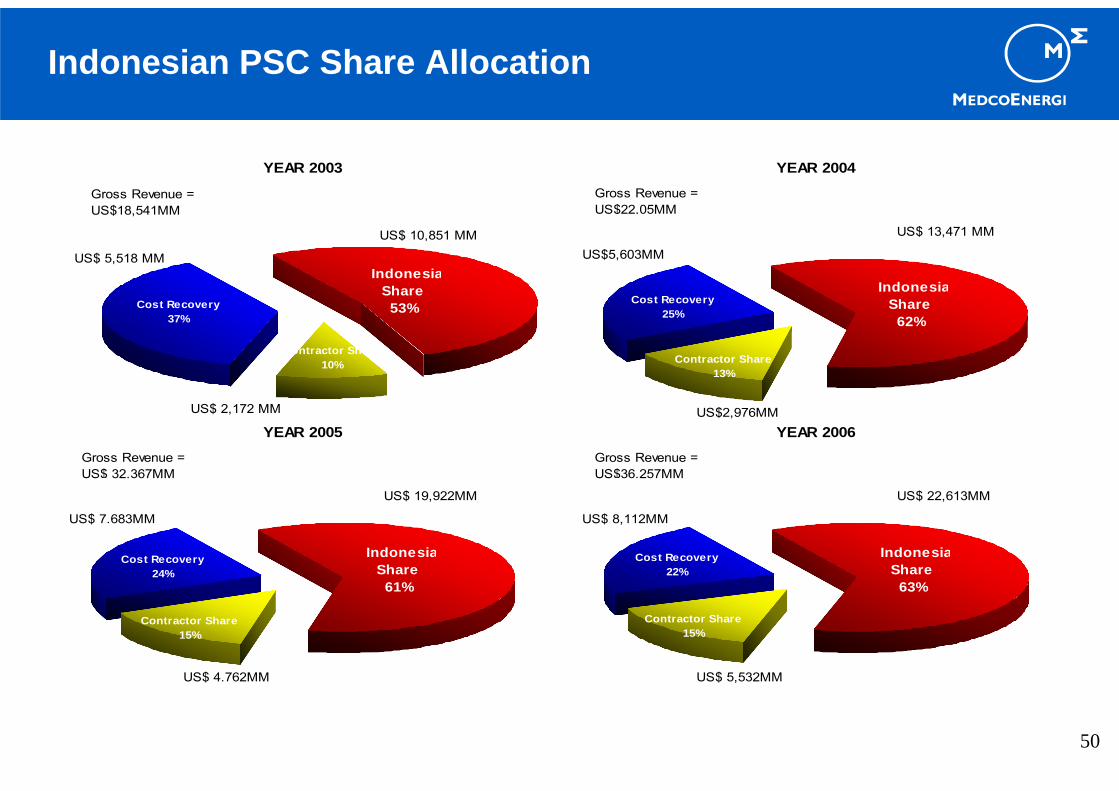
YEAR 2003
Contractor Share10%
Cost Recovery37%
IndonesiaShare
53%
Gross Revenue = US$18,541MM
US$ 10,851 MM
US$ 2,172 MM
US$ 5,518 MM
YEAR 2004
IndonesiaShare
62%Cost Recovery
25%
Contractor Share13%
Gross Revenue = US$22,05MM
US$ 13,471 MM
US$2,976MM
US$5,603MM
YEAR 2005
IndonesiaShare
61%
Cost Recovery24%
Contractor Share15%
Gross Revenue = US$ 32.367MM
US$ 19,922MM
US$ 4.762MM
US$ 7.683MM
YEAR 2006
IndonesiaShare
63%
Cost Recovery22%
Contractor Share15%
Gross Revenue = US$36,257MM
US$ 22,613MM
US$ 5,532MM
US$ 8,112MM
Indonesian PSC Share Allocation

51
Tax Rate
Cost RecoveryLimits
Royalty
Equity gas (in favor of the Gov) after tax
Equity oil (in favor of the Gov) after tax
44% above equity split after tax
80-85% for oil, none for gas
N/A
70-65%/30-35%
85%/15%
Indonesia
Oil 50 – 75%Gas 50 – 65%
N/A
2 – 15% based on R factor
N/A
N/A
Tunisia CambodiaLibyaYemen42-62%/38-58%Base Factor * A
Factor (4 – 85%)80-90%/20-10%
35%/65%A Factor (20 –85%)
75-82.5%/17.5-25%
12.5%N/AOil 12-18%Gas 12.5%
30% of Net petroleum minus fee
N/AN/A
90% revenue after royalty
13.7%33%
Oil and Gas Contract Comparisons

52
Source: Ministry of Mines and Energy.
Current energy mix at 857 MMboe Energy mix in 2025 at 3,754 MMboe
Indonesia Energy Mix
Oil, 55%
Gas, 27%
Water, 3% Geothermal, 1%
Coal, 14%
Oil, 41%
Gas, 21%
Water, 2% Geothermal, 1%
Coal, 35%
53
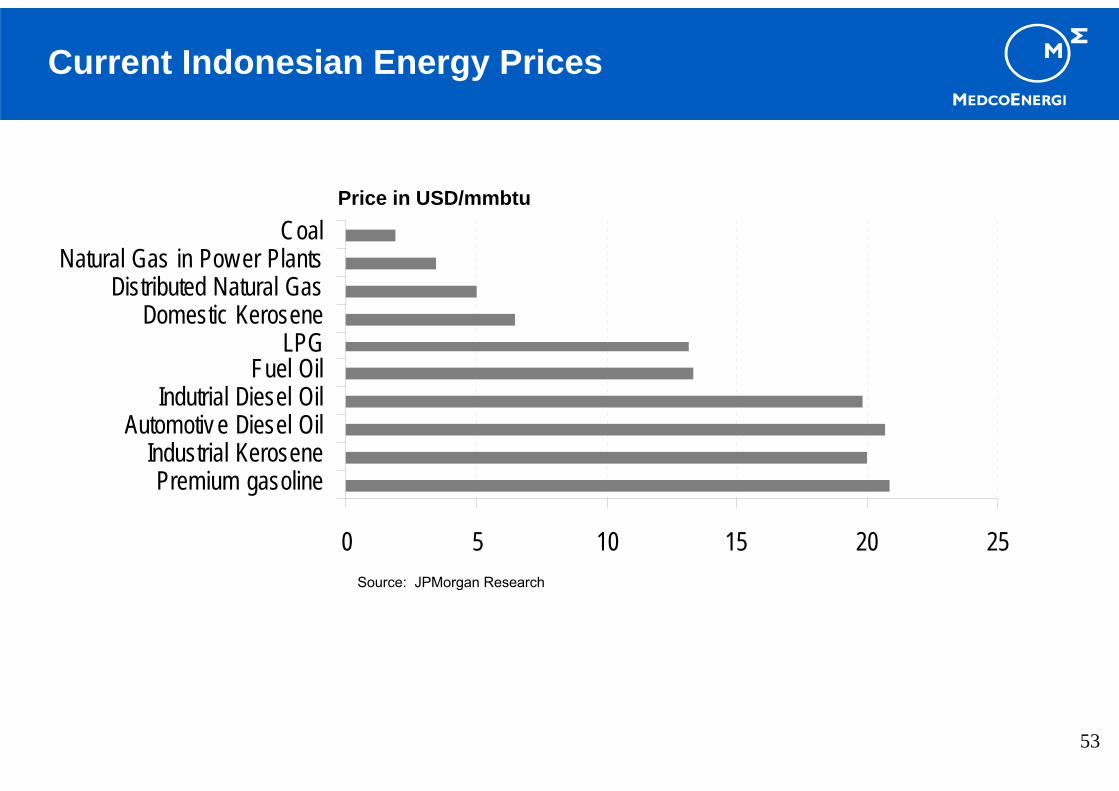
0 5 10 15 20 25
Premium gasolineIndustrial Kerosene
Automotiv e Diesel OilIndutrial Diesel Oil
Fuel OilLPG
Domestic KeroseneDistributed Natural Gas
Natural Gas in Pow er PlantsCoal
Price in USD/mmbtu
Current Indonesian Energy Prices
Source: JPMorgan Research
54
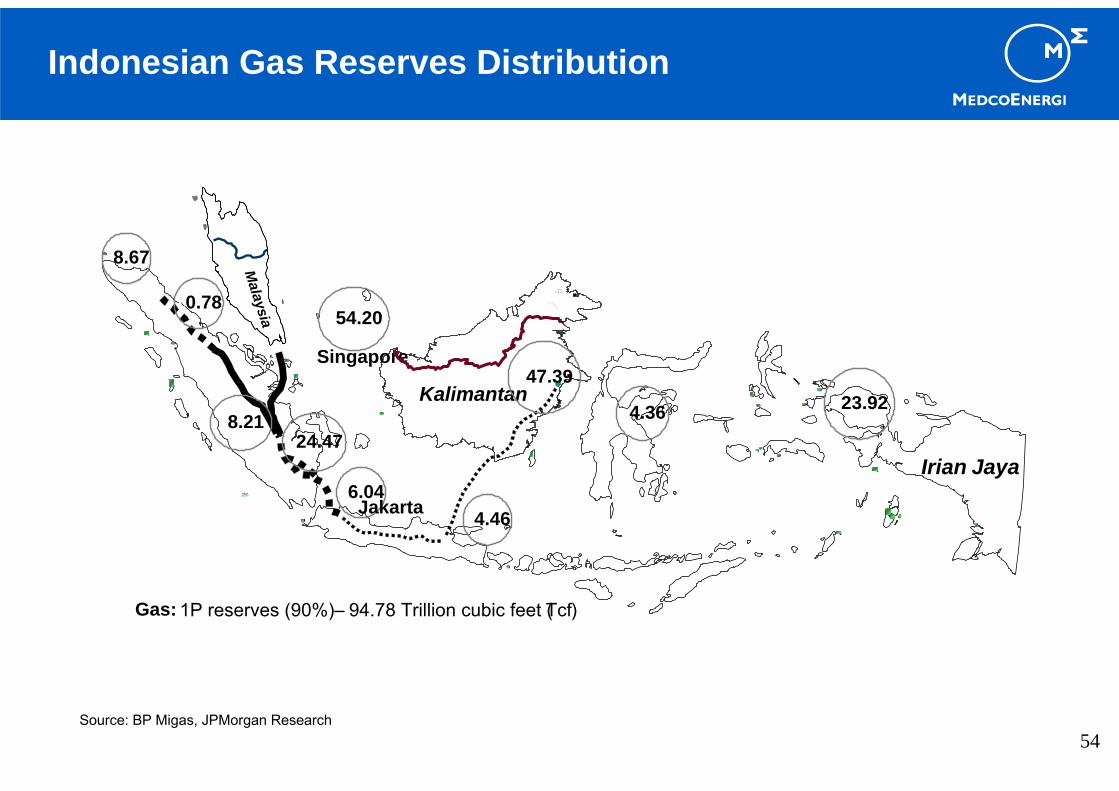
Irian Jaya
Singapore
Medan
Malaysia
Kalimantan47.39
8.2124.47
6.044.46
8.67
4.36 23.92
Jakarta
54.200.78
Gas: 1P reserves (90%) – 94.78 Trillion cubic feet (Tcf)
Source: BP Migas, JPMorgan Research
Indonesian Gas Reserves Distribution
55
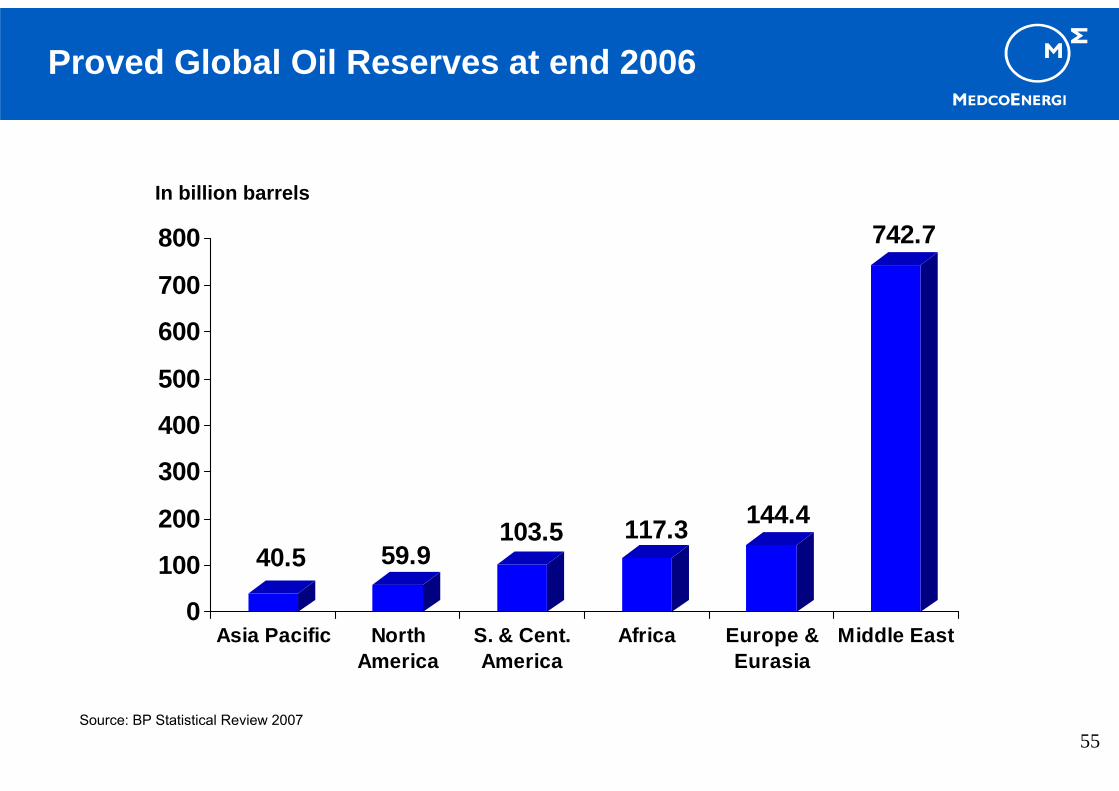
40.5 59.9103.5 117.3 144.4
742.7
0
100
200
300
400
500
600
700
800
Asia Pacific NorthAmerica
S. & Cent.America
Africa Europe &Eurasia
Middle East
In billion barrels
Proved Global Oil Reserves at end 2006
Source: BP Statistical Review 2007

56
North America, 16%
S. & Cent. America, 9%
Asia Pacific, 10%
Middle East, 31%
Africa, 12%
Europe & Eurasia, 22%
Global Oil Consumption: 83.7 million barrels/day
North America, 29%
S. & Cent. America, 6%
Asia Pacific, 30%
Middle East, 7%
Africa, 3%
Europe & Eurasia, 25%
Global Oil Production: 81.7 million barrels/day
Global Oil Supply and Demand
Source: BP Statistical Review 2007
57
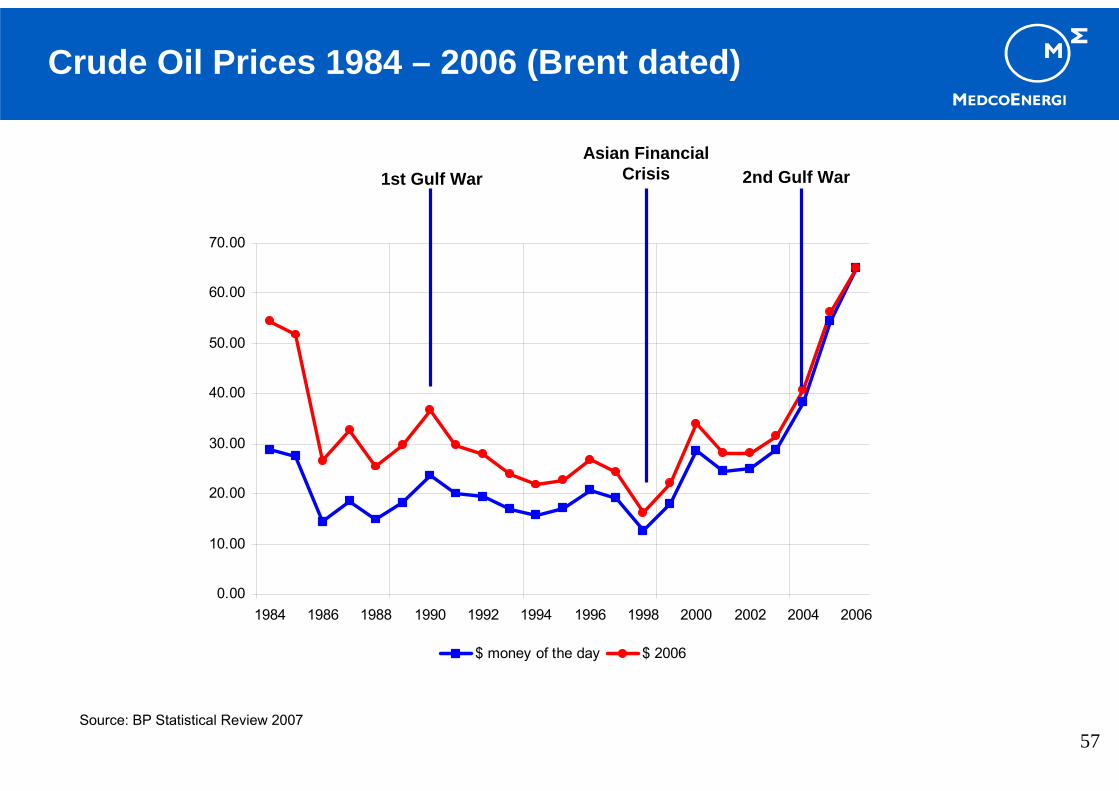
0.00
10.00
20.00
30.00
40.00
50.00
60.00
70.00
1984 1986 1988 1990 1992 1994 1996 1998 2000 2002 2004 2006
$ money of the day $ 2006
Source: BP Statistical Review 2007
Crude Oil Prices 1984 – 2006 (Brent dated)
1st Gulf WarAsian Financial
Crisis 2nd Gulf War
58
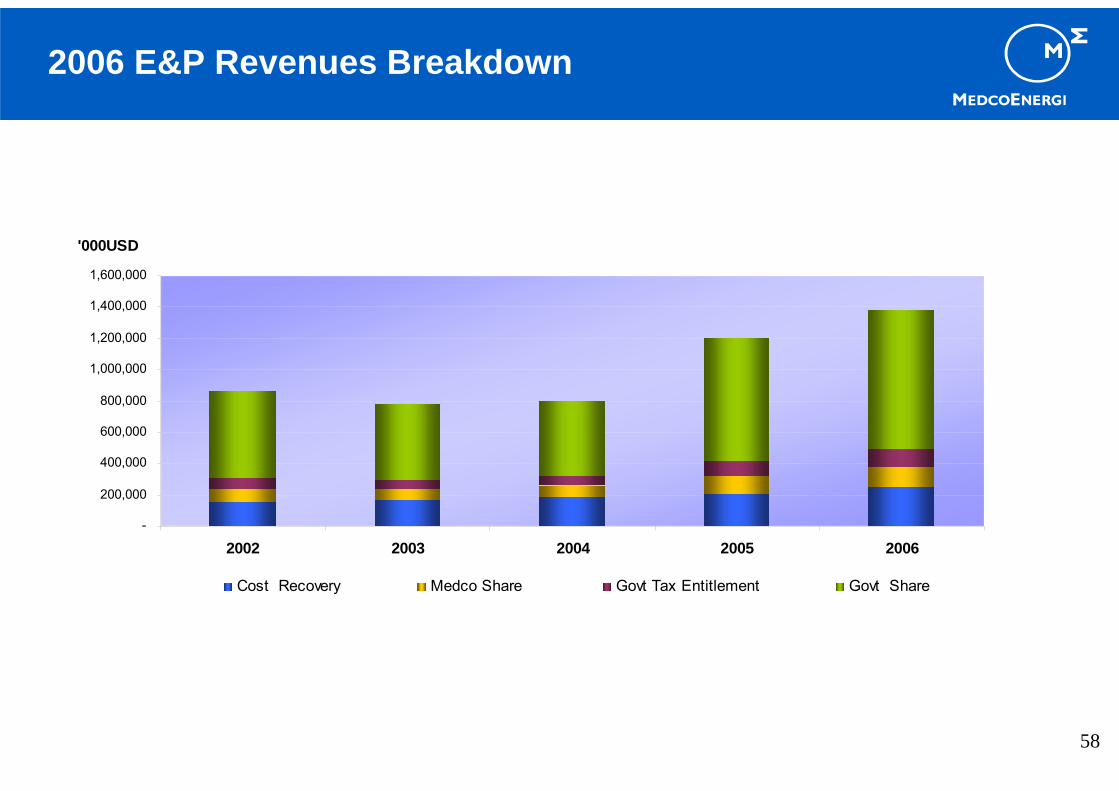
2006 E&P Revenues Breakdown
-
200,000
400,000
600,000
800,000
1,000,000
1,200,000
1,400,000
1,600,000
2002 2003 2004 2005 2006
'000USD
Cost Recovery Medco Share Govt Tax Entitlement Govt Share
Attachment 6 – Financial Ratios
60
Financial Ratios
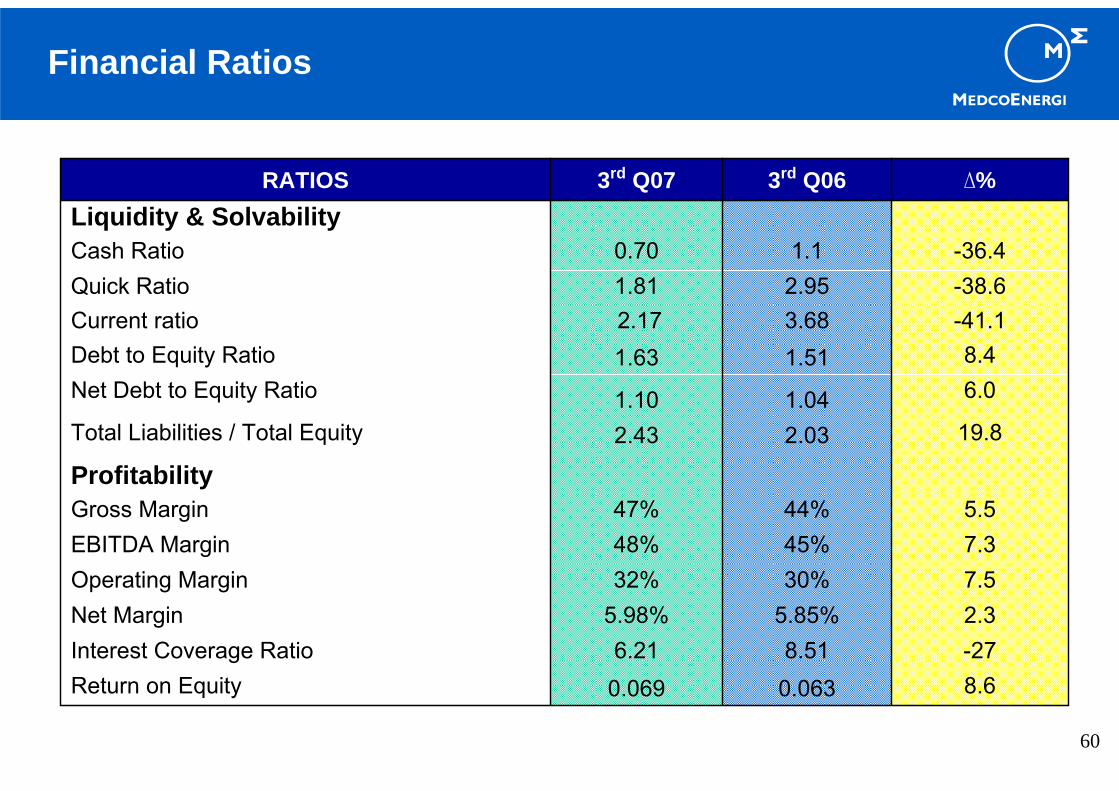
8.60.0630.069 Return on Equity-278.516.21Interest Coverage Ratio 2.35.85%5.98%Net Margin7.530%32%Operating Margin7.345%48%EBITDA Margin5.544%47%Gross Margin
Profitability19.82.03 2.43 Total Liabilities / Total Equity
6.01.041.10Net Debt to Equity Ratio8.41.511.63 Debt to Equity Ratio
-41.13.682.17Current ratio-38.62.951.81Quick Ratio-36.41.1 0.70Cash Ratio
Liquidity & Solvability∆%3rd Q063rd Q07RATIOS

61
Financial Ratios
Coverage Ratios (x)∆%3rd Q063rd Q07RATIOS
2.60.550.57 Net debt/ (net debt + equity)6.01.231.30Net debt/ total equity
Capital Structure (%)-43.61.530.86 CapEx/ depreciation54.00.23 0.36CapEx/ Revenue
Investment Ratios (x)24.71.662.07Revenue/ net working capital-2.60.570.55Revenue/ fixed assets
Efficiency Ratios (x)-7.02.512.33Net debt/ EBITDA0.00.47 0.47 Dividend payout ratio
-27.05.644.12 Income from Operations/ net interest
Attachment 7 – Others

63
MEDC Share Performance
Source: Bloomberg
64
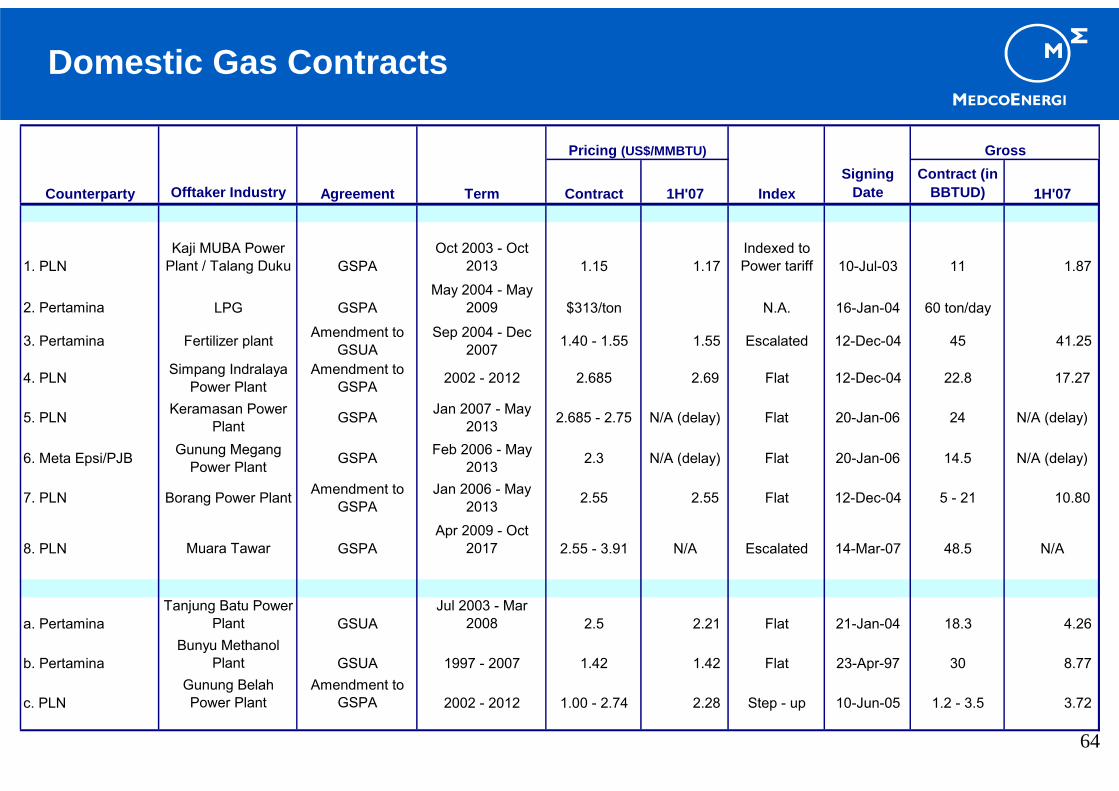
Domestic Gas Contracts
Counterparty Offtaker Industry Agreement Term Contract 1H'07 IndexSigning
DateContract (in
BBTUD) 1H'07
1. PLNKaji MUBA Power
Plant / Talang Duku GSPAOct 2003 - Oct
2013 1.15 1.17 Indexed to Power tariff 10-Jul-03 11 1.87
2. Pertamina LPG GSPAMay 2004 - May
2009 $313/ton N.A. 16-Jan-04 60 ton/day
3. Pertamina Fertilizer plant Amendment to GSUA
Sep 2004 - Dec 2007 1.40 - 1.55 1.55 Escalated 12-Dec-04 45 41.25
4. PLN Simpang Indralaya Power Plant
Amendment to GSPA 2002 - 2012 2.685 2.69 Flat 12-Dec-04 22.8 17.27
5. PLN Keramasan Power Plant GSPA Jan 2007 - May
2013 2.685 - 2.75 N/A (delay) Flat 20-Jan-06 24 N/A (delay)
6. Meta Epsi/PJB Gunung Megang Power Plant GSPA Feb 2006 - May
2013 2.3 N/A (delay) Flat 20-Jan-06 14.5 N/A (delay)
7. PLN Borang Power Plant Amendment to GSPA
Jan 2006 - May 2013 2.55 2.55 Flat 12-Dec-04 5 - 21 10.80
8. PLN Muara Tawar GSPAApr 2009 - Oct
2017 2.55 - 3.91 N/A Escalated 14-Mar-07 48.5 N/A
a. PertaminaTanjung Batu Power
Plant GSUAJul 2003 - Mar
2008 2.5 2.21 Flat 21-Jan-04 18.3 4.26
b. PertaminaBunyu Methanol
Plant GSUA 1997 - 2007 1.42 1.42 Flat 23-Apr-97 30 8.77
c. PLNGunung Belah Power Plant
Amendment to GSPA 2002 - 2012 1.00 - 2.74 2.28 Step - up 10-Jun-05 1.2 - 3.5 3.72
GrossPricing (US$/MMBTU)
65
• Banjar-Panji 1 well mudflow incident, Brantas PSC occurred May 29th 2006.
• On March 16, 2007, Medco signed an SPA for PT Medco E&P Brantas (“Medco Brantas”), which holds 32% working interest of Brantas PSC. Sales price of USD 100 for 100% of Medco Brantas.
• The Buyer (Prakarsa Group) shall assume: a. Any past, current or future potential liabilities to Medco Brantas; and b. All the future cash calls requested from Medco Brantas.
• Financial impact: a loss of USD 61.66 million in the P&L in 2006.
• The Company decided to divest Medco Brantas in order to allocate its resources to a more attractive assets within its portfolio.
Indonesia – Brantas Divestment
66
Company address:PT Medco Energi Internasional Tbk.Graha Niaga Building 16th FloorJl. Jend. Sudirman Kav. 58Jakarta 12190Indonesia.P. +62-21 250 5459F. +62-21 250 5536
Investor Relations:
Gamala KatoppoM. +62-812 802 3402Email: [email protected]
Website: www.medcoenergi.com
Contacts
Nusky SuyonoM. +62-816 895 928Email: [email protected]
Copyright © 2022 FDOKUMEN