Prospectus Initial Public Offering - Sphera Franchise Group
472
IMPORTANT NOTICE IMPORTANT: You must read the following disclaimer before continuing. This Document is not a prospectus. This Document is an unofficial translation of the Prospectus approved by the FSA for the initial public offering of shares in the Company by the Selling Shareholders. Neither the Company, nor the Managers makes any representation as to the accuracy, completeness or reliability of the information included in this Document and the Company cautions investors to take their investment decision exclusively based on the information included in this Prospectus and any supplement thereto, if published, as approved by the FSA in the Romanian language. The following disclaimer applies to the electronic version of the English translation of the Prospectus attached to this notice (the "Document"), received via email, accessed from an internet page or otherwise received as a result of electronic communication, and you are therefore advised to read this notice carefully before reading, accessing or making any other use of the attached Document. In accessing the Document, you agree to be bound by the following terms and conditions and in particular restrictions set out in the Prospectus, including any modifications to them from time to time, each time you receive any information from WOOD & Company Financial Services, a.s., Raiffeisen Bank S.A. and Alpha Finance Romania S.A. (the "Managers"), Sphera Franchise Group S.A. ("Sphera" or the "Company") and Lunic Franchising and Consulting Ltd and M.B.L. Computers S.R.L. (the "Selling Shareholders") as a result of such access. You acknowledge that this electronic transmission and the delivery of the attached Document is confidential and intended only for you and you agree you will not forward, reproduce or publish this electronic transmission or the attached Document (or any copy of it or part thereof) in any manner whatsoever to any other person. The document and the offer when made are only addressed to and directed at persons in member states of the European Economic Area ("EEA"), other than Romania, who are "qualified investors" within the meaning of Article 2(1)(e) of the Prospectus Directive (Directive 2003/71/EC) (the "Prospectus Directive") ("Qualified Investors"). Any investment or investment activity to which this document relates is available only to (i) the public in Romania, and (ii) in any member state of the EEA other than Romania, to Qualified Investors, and will be engaged in only with such persons. THIS DOCUMENT AND THE SECURITIES REFERENCED HEREIN MAY ONLY BE DISTRIBUTED IN "OFFSHORE TRANSACTIONS" AS DEFINED IN, AND AS PERMITTED BY, REGULATION S UNDER THE US SECURITIES ACT OF 1933, AS AMENDED (THE "SECURITIES ACT"). ANY FORWARDING, REDISTRIBUTION OR REPRODUCTION OF THIS DOCUMENT IN WHOLE OR IN PART IS UNAUTHORISED. FAILURE TO COMPLY WITH THIS NOTICE MAY RESULT IN A VIOLATION OF THE SECURITIES ACT OR THE APPLICABLE LAWS OF OTHER JURISDICTIONS. NOTHING IN THIS ELECTRONIC TRANSMISSION OF THE ATTACHED DOCUMENT CONSTITUTES AN OFFER OF SECURITIES FOR SALE IN THE UNITED STATES OR ANY OTHER JURISDICTION WHERE IT IS UNLAWFUL TO DO SO. THE SECURITIES HAVE NOT BEEN AND WILL NOT BE REGISTERED UNDER THE SECURITIES ACT OR WITH ANY SECURITIES REGULATORY AUTHORITY OF ANY STATE OR OTHER JURISDICTION OF THE UNITED STATES AND MAY NOT BE OFFERED OR SOLD IN THE UNITED STATES. Confirmation of your representation: The attached document is delivered to you at your request and on the basis that you have confirmed, and by accessing this Document you shall be deemed to have represented, to each of the Managers, the Company and the Selling Shareholders that (i) you are in Romania or (ii) you and the electronic mail address that you have provided are located outside United States (as defined in Regulation S under the Securities Act); or (iii) if you are in any member state of the EEA other than Romania, you are a Qualified Investor; or (iv) if you are acting as financial intermediary (as that term is used in Article 3(2) of the Prospectus Directive), the securities acquired by you as a financial intermediary in the offer have not been acquired on a non-discretionary basis on behalf of, nor have they been acquired with a view to their offer or resale to, any person in circumstances which may give rise to an offer of any securities to the public other than their offer or resale to Qualified Investors (as defined in the Prospectus Directive) in any member state of the EEA which has implemented the Prospectus Directive; or (v) you are outside the EEA (and the electronic mail addresses that you gave us and to which this document has been delivered are not located in such jurisdictions) or (vi) you are a person into whose possession this document may lawfully be delivered in accordance with the laws of the jurisdiction in which you are located. In addition, by accessing this Document you have confirmed to
-
Upload
khangminh22 -
Category
Documents
-
view
1 -
download
0
Transcript of Prospectus Initial Public Offering - Sphera Franchise Group

IMPORTANT NOTICE
IMPORTANT: You must read the following disclaimer before continuing.
This Document is not a prospectus. This Document is an unofficial translation of the Prospectus approved
by the FSA for the initial public offering of shares in the Company by the Selling Shareholders. Neither
the Company, nor the Managers makes any representation as to the accuracy, completeness or reliability
of the information included in this Document and the Company cautions investors to take their investment
decision exclusively based on the information included in this Prospectus and any supplement thereto, if
published, as approved by the FSA in the Romanian language.
The following disclaimer applies to the electronic version of the English translation of the Prospectus attached to
this notice (the "Document"), received via email, accessed from an internet page or otherwise received as a
result of electronic communication, and you are therefore advised to read this notice carefully before reading,
accessing or making any other use of the attached Document.
In accessing the Document, you agree to be bound by the following terms and conditions and in particular
restrictions set out in the Prospectus, including any modifications to them from time to time, each time you
receive any information from WOOD & Company Financial Services, a.s., Raiffeisen Bank S.A. and Alpha
Finance Romania S.A. (the "Managers"), Sphera Franchise Group S.A. ("Sphera" or the "Company") and
Lunic Franchising and Consulting Ltd and M.B.L. Computers S.R.L. (the "Selling Shareholders") as a result of
such access. You acknowledge that this electronic transmission and the delivery of the attached Document is
confidential and intended only for you and you agree you will not forward, reproduce or publish this
electronic transmission or the attached Document (or any copy of it or part thereof) in any manner
whatsoever to any other person.
The document and the offer when made are only addressed to and directed at persons in member states of the
European Economic Area ("EEA"), other than Romania, who are "qualified investors" within the meaning of
Article 2(1)(e) of the Prospectus Directive (Directive 2003/71/EC) (the "Prospectus Directive") ("Qualified
Investors"). Any investment or investment activity to which this document relates is available only to (i) the
public in Romania, and (ii) in any member state of the EEA other than Romania, to Qualified Investors, and will
be engaged in only with such persons.
THIS DOCUMENT AND THE SECURITIES REFERENCED HEREIN MAY ONLY BE DISTRIBUTED IN
"OFFSHORE TRANSACTIONS" AS DEFINED IN, AND AS PERMITTED BY, REGULATION S UNDER
THE US SECURITIES ACT OF 1933, AS AMENDED (THE "SECURITIES ACT"). ANY FORWARDING,
REDISTRIBUTION OR REPRODUCTION OF THIS DOCUMENT IN WHOLE OR IN PART IS
UNAUTHORISED. FAILURE TO COMPLY WITH THIS NOTICE MAY RESULT IN A VIOLATION OF
THE SECURITIES ACT OR THE APPLICABLE LAWS OF OTHER JURISDICTIONS.
NOTHING IN THIS ELECTRONIC TRANSMISSION OF THE ATTACHED DOCUMENT CONSTITUTES
AN OFFER OF SECURITIES FOR SALE IN THE UNITED STATES OR ANY OTHER JURISDICTION
WHERE IT IS UNLAWFUL TO DO SO. THE SECURITIES HAVE NOT BEEN AND WILL NOT BE
REGISTERED UNDER THE SECURITIES ACT OR WITH ANY SECURITIES REGULATORY
AUTHORITY OF ANY STATE OR OTHER JURISDICTION OF THE UNITED STATES AND MAY NOT BE
OFFERED OR SOLD IN THE UNITED STATES.
Confirmation of your representation: The attached document is delivered to you at your request and on the
basis that you have confirmed, and by accessing this Document you shall be deemed to have represented, to each
of the Managers, the Company and the Selling Shareholders that (i) you are in Romania or (ii) you and the
electronic mail address that you have provided are located outside United States (as defined in Regulation S
under the Securities Act); or (iii) if you are in any member state of the EEA other than Romania, you are a
Qualified Investor; or (iv) if you are acting as financial intermediary (as that term is used in Article 3(2) of the
Prospectus Directive), the securities acquired by you as a financial intermediary in the offer have not been
acquired on a non-discretionary basis on behalf of, nor have they been acquired with a view to their offer or
resale to, any person in circumstances which may give rise to an offer of any securities to the public other than
their offer or resale to Qualified Investors (as defined in the Prospectus Directive) in any member state of the
EEA which has implemented the Prospectus Directive; or (v) you are outside the EEA (and the electronic mail
addresses that you gave us and to which this document has been delivered are not located in such jurisdictions)
or (vi) you are a person into whose possession this document may lawfully be delivered in accordance with the
laws of the jurisdiction in which you are located. In addition, by accessing this Document you have confirmed to

the Managers, the Company and the Selling Shareholder, that (i) you have understood and agree to the terms set
out herein, (ii) you consent to delivery by electronic transmission, (iii) you acknowledge that you will make your
own assessment regarding any legal, taxation or other economic considerations with respect to your decision to
purchase shares subject to the offering under the Prospectus.
This document has been made available to you in an electronic form. You are reminded that documents
transmitted via this medium may be altered or changed during the process of electronic transmission and
consequently none of the Company, the Selling Shareholders, the Managers, persons that control the Managers
or any director, officer, employee or agent of them or affiliate of any such person accepts any liability or
responsibility whatsoever in respect of any difference between the document distributed to you in electronic
format and the hard copy version.
You are reminded that this Document has been delivered to you and you have accessed it on the basis that you
are a person into whose possession this Document may be lawfully delivered in accordance with the laws of the
jurisdiction in which you are located and you may not nor are you authorized to deliver this document,
electronically or otherwise, to any other person and in particular to any U.S. address.
Restriction: Nothing in this electronic transmission constitutes an offer of securities for sale to persons other
than the public in Romania or the specified qualified institutional buyers described above and to whom it is
directed and access has been limited so that it shall not constitute a general solicitation. If you have gained
access to this transmission contrary to the foregoing restrictions, you will be unable to purchase any of the
securities described therein.
The Managers are acting exclusively for the Selling Shareholders and no one else in connection with the offer.
They will not regard any other person (whether or not a recipient of this document) as its client in relation to the
offer and will not be responsible to anyone other than the Selling Shareholders and the Company, in accordance
with the specific contractual terms agreed between them, for providing the protections afforded to its clients nor
for giving advice in relation to the offer or any transaction or arrangement referred to herein.
You are responsible for protecting against viruses and other destructive items. Your receipt of the electronic
transmission is at your own risk and it is your responsibility to take precautions to ensure that it is free from
viruses and other items of a destructive nature.

Sphera Franchise Group S.A.
(A joint stock company incorporated under the laws of Romania)
Offering of up to 9,831,753 existing shares in Sphera Franchise Group S.A.
by Lunic Franchising and Consulting Ltd and by M.B.L. Computers S.R.L.
Price Range: RON 25/Share to RON 33/Share
This document has been approved by way of Decision 1508/20.10.2017 by the Romanian Financial Supervisory Authority (the "FSA"), which is the Romanian
competent authority for the purposes of Directive 2003/71/EC, as amended (the "Prospectus Directive") and relevant implementing measures in Romania, as a
prospectus (the "Prospectus") in accordance with Law no. 24/2017 on issuers of financial instruments and market operations (the "Issuers and Markets
Operations Law"), Regulation no. 1/2006 on issuers and operations with securities issued by the Romanian National Securities Commission (currently, the FSA)
and Commission Regulation (EC) No 809/2004 of 29 April 2004 implementing the Prospectus Directive as regards information contained in prospectuses as well as
the format, incorporation by reference and publication of such prospectuses and dissemination of advertisements, as amended (the "Prospectus Regulation").
This Prospectus relates to an offering (the "Offering") of an aggregate number of up to 9,831,753 nominative, ordinary shares ("Offered Shares") in Sphera
Franchise Group S.A., a joint stock company incorporated under the laws of Romania, registered with the Bucharest Trade Registry under number J40/7126/2017,
sole registration code 37586457, with registered seat in 239 Calea Dorobanți str., 2nd floor, office 4, district 1, Bucharest, Romania (the "Company"). The Company
has a share capital of RON 581,990,100 divided into 38,799,340 nominative, ordinary, book entry form shares, each of which is issued, fully paid with a par value of
RON 15 and carrying one vote in the Company's general meetings of shareholders (the "Shares"). The Offered Shares are offered in the Offering as follows: (1) up
to 8,667,773 ordinary shares in the Company by Lunic Franchising and Consulting Ltd, a company organized and existing under the laws of Cyprus, registered
under no. HE 80898, with registered office at Riga Feraiou nr. 2, Limassol Center, Block B, 4th floor, office 406, 3095 Limassol, Cyprus ("Lunic (Cyprus)"); and
(2) up to 1,163,980 ordinary shares in the Company by M.B.L. Computers S.R.L., a company organized and existing under the laws of Romania, registered with the
Bucharest Trade Registry under No. J40/6119/1991, having its registered office at 15 Fabrica de Glucoză street, Bucharest, Romania ("MBL (Romania)") (Lunic
(Cyprus) and MBL (Romania) are hereinafter referred to as the "Selling Shareholders").
The final offer price (the "Final Offer Price") of each Offered Share will be calculated based on the mechanics set out in "Subscription and Sale". After the
successful closing of the Offering, the Company intends to apply for admission of the Shares to trading on the spot regulated market operated by Bursa de Valori
Bucuresti S.A. (the Bucharest Stock Exchange) (the "BSE"), premium tier, under market symbol "SFG". The BSE is a regulated market in the European Economic
Area (the "EEA") for the purposes of Directive 2014/65/EU of the European Parliament and of the Council of 15 May 2014 on markets in financial instruments and
amending Directive 2002/92/EC and Directive 2011/61/EU (the "Directive on Markets in Financial Instruments"). Prior to the Offering, there has been no public
market for the Shares.
In connection with the Offering, the Selling Shareholders have agreed that the Stabilising Managers will retain 10% of the gross proceeds obtained by the Selling
Shareholders from the Offering (the "Stabilisation Proceeds") and will use such Stabilisation Proceeds for the purposes of conducting stabilisation activities, if any,
in the Shares, during the period of not more than 30 calendar days after the commencement of trading of the Shares on the BSE (the "Stabilisation Period"),
provided that the aggregate amount of Shares acquired by the Stabilising Managers in connection with such activities shall not exceed 983,175 Shares. Such
stabilisation activities, if commenced, may be discontinued at any time and may be commenced from time to time on one or more occasions. The Stabilising
Managers will not be required to take any stabilisation actions. No assurance may be given that such stabilisation actions, if taken, will bring the expected results.
The Offering is structured as an offering of Offered Shares: (1) in Romania to the public; and (2) outside the United States of America and outside Romania to non-
US institutional investors in ''offshore transactions'' as defined in, and as permitted by, Regulation S ("Regulation S") under the U.S. Securities Act of 1933, as
amended (the "Securities Act").
An investment in the Shares involves a high degree of risks and uncertainties. Prospective investors should read the entire document, and, in particular, should see
"Risk Factors" beginning on page 22 for a discussion of certain matters investors should consider prior to making an investment in the Shares. Prospective investors
must be able to bear the economic risk of an investment in the Shares and should be able to sustain a partial or total loss of their investment.
THIS PROSPECTUS HAS BEEN APPROVED BY THE ROMANIAN FINANCIAL SUPERVISORY AUTHORITY. THE APPROVAL VISA APPLIED ON
THIS PROSPECTUS DOES NOT CONSTITUTE A GUARANTEE OR ANY KIND OF ASSESSMENT BY THE ROMANIAN FINANCIAL SUPERVISORY
AUTHORITY WITH REGARD TO THE OPPORTUNITY, ADVANTAGES OR DISADVANTAGES, PROFIT OR RISKS INVOLVED IN TRANSACTIONS
TO BE EXECUTED FOLLOWING THE ACCEPTING OF THE OFFERING, OBJECT OF THE APPROVAL DECISION; THE APPROVAL CERTIFIES ONLY
THE CONFORMITY OF THIS PROSPECTUS WITH THE LEGAL REQUIREMENTS AND THE RULES ADOPTED FOR THE APPLICATION THEREOF.
Sole Global Coordinator and Joint Bookrunner
WOOD & Company
Joint Bookrunner Co-Lead Manager
Raiffeisen Bank Alpha Finance Romania
Financial Adviser
Rothschild
The date of this Prospectus is 20 October 2017.

1
CONTENTS
Page
SUMMARY ............................................................................................................................................................... 2
IMPORTANT INFORMATION ABOUT THIS PROSPECTUS ........................................................................... 17
RISK FACTORS ..................................................................................................................................................... 21
CAUTIONARY NOTE REGARDING FORWARD-LOOKING STATEMENTS ................................................ 42
SERVICE OF PROCESS AND ENFORCEMENT OF CIVIL LIABILITIES ........................................................ 43
PRESENTATION OF FINANCIAL AND OTHER INFORMATION ................................................................... 45
EXCHANGE RATE INFORMATION.................................................................................................................... 49
THE OFFERING ..................................................................................................................................................... 50
USE OF PROCEEDS ............................................................................................................................................... 54
DIVIDEND POLICY ............................................................................................................................................... 55
CAPITALIZATION AND INDEBTEDNESS......................................................................................................... 57
SELECTED FINANCIAL AND OPERATING INFORMATION .......................................................................... 58
PRO FORMA FINANCIAL INFORMATION........................................................................................................ 63
OPERATING AND FINANCIAL REVIEW ........................................................................................................... 73
FOODSERVICE SECTOR .................................................................................................................................... 107
BUSINESS ............................................................................................................................................................. 124
LEGAL PROCEEDINGS ...................................................................................................................................... 157
MANAGEMENT ................................................................................................................................................... 158
PRINCIPAL SHAREHOLDERS ........................................................................................................................... 165
DESCRIPTION OF SHARE CAPITAL AND CORPORATE STRUCTURE ...................................................... 166
RELATED PARTY TRANSACTIONS ................................................................................................................ 176
MATERIAL CONTRACTS .................................................................................................................................. 177
REGULATORY MATTERS ................................................................................................................................. 180
TAXATION ........................................................................................................................................................... 184
SUBSCRIPTION AND SALE ............................................................................................................................... 188
SELLING AND TRANSFER RESTRICTIONS ................................................................................................... 201
LEGAL MATTERS ............................................................................................................................................... 203
INDEPENDENT AUDITORS ............................................................................................................................... 204
GENERAL INFORMATION ................................................................................................................................ 205
DEFINITIONS AND GLOSSARY OF SELECTED TERMS .............................................................................. 207
APPENDIX 1 - DISTRIBUTION NETWORK OF RAIFFEISEN BANK S.A. ................................................... 213
APPENDIX 2 - GROUP FINANCIAL STATEMENTS ....................................................................................... 223

2
SUMMARY
Summaries are made up of disclosure requirements known as "Elements". These Elements are numbered in Sections A-
E (A.1–E.7).
This summary contains all the Elements required to be included in a summary for this type of securities and issuer.
Because some Elements are not required to be addressed, there may be gaps in the numbering sequence of the
Elements.
Even though an Element may be required to be inserted in the summary because of the type of securities and issuer, it is
possible that no relevant information can be given regarding the Element. In this case, a short description of the
Element is included in the summary with the note "not applicable".
Section A—Introduction and warnings
A.1 Warning. This summary should be read as introduction to this prospectus (the "Prospectus");
Any decision to invest in the shares the offering of which is the subject to this Prospectus (the "Offered
Shares") should be based on consideration of the Prospectus as a whole by the investor;
Where a claim relating to the information contained in the Prospectus is brought up before a court, the
plaintiff investor might, under the national legislation of the Member States ("Member States") of the
European Economic Area ("EEA"), have to bear the costs of translating the Prospectus before the legal
proceedings are initiated;
Civil liability attaches only to those persons who have tabled the summary, including any translation
thereof, but only if the summary is misleading, inaccurate or inconsistent when read together with the
other parts of the Prospectus or it does not provide, when read together with the other parts of the
Prospectus, key information in order to aid investors, when considering whether to invest in the Offered
Shares.
A.2 Consent by
the issuer or
person
responsible
for drawing
up the
prospectus to
the use of the
prospectus
for
subsequent
resale or
final
placement of
securities by
financial
intermediari
es.
Not applicable. Sphera Franchise Group S.A. (the "Company" or "Sphera") did not and does not
consent to the use of the Prospectus for subsequent resale or final placement of the shares issued by the
Company (the "Shares") by financial intermediaries or by any other third party.
Section B—Issuer and any guarantor
B.1 The legal
and
commercial
name of the
issuer.
The legal and commercial name of the issuer is Sphera Franchise Group S.A..
B.2 The domicile
and legal
form of the
issuer, the
legislation
under which
The Company is a joint stock company incorporated in Romania, registered with the Bucharest Trade
Registry under number J40/7126/2017, sole registration code 37586457, with registered seat in 239
Calea Dorobanți str., 2nd floor, office 4, district 1, Bucharest, Romania. The Company operates in
accordance with Romanian law and the Company's articles of association (the "AoAs").

3
the issuer
operates and
its country of
incorporatio
n.
B.3 A description
of, and key
factors
relating to,
the nature of
the issuer’s
current
operations
and its
principal
activities,
stating the
main
categories of
products sold
and/or
services
performed
and
identification
of the
principal
markets in
which the
issuer
competes.
Sphera is the holding company for the Group companies that hold rights to operate KFC branded
restaurants in Romania, Republic of Moldova and certain regions in Northern Italy, and Pizza Hut
branded restaurants and Taco Bell branded restaurants in Romania. As of 1 September 2017, it also
provides to the benefit of its subsidiaries USFN (Romania) and ARS (Romania) services with respect
to: finance and accounting, marketing, development, operational, and human resources activities.
The Group (as defined in B.5 below) operates in three segments of the foodservice sector: quick-service
restaurants (through the KFC brand), full-service restaurants (through the Pizza Hut Dine-In brand) and
home delivery (through the Pizza Hut Delivery brand).
In the KFC restaurants, we sell food and beverage products either individually or as a part of a price-
attractive bundle labelled "menu". Generally, the menus include three main components: a portion of a
chicken-based product (sandwiches, wrappers or pieces of chicken meat), a medium-sized portion of
French fries and a medium-sized non-alcoholic drink. A dipping sauce is also offered in some menu
offers. Whereas menus are normally sized for one person, we also offer products, called Buckets, that
are targeted for group consumption (normally, up to four people) and which consist of higher number of
chicken meat pieces and some include portions of French fries and non-alcoholic drinks.
In Pizza Hut restaurants, we sell pizza, pasta, side dishes, deserts and beverage products.
The food offered in our restaurants includes proprietary menu items, the recipes of which are generally
sourced from the Yum! restaurants across the world or developed in-house.
The first Taco Bell restaurant was opened on 12 October 2017.
B.4a A description
of the most
significant
recent trends
affecting the
issuer and
the industries
in which it
operates.
Sales in modern retailing have surpassed traditional retail throughout the country, leading to changes in
shopping habits, as well as in foodservice consumption generally. The main attraction of modern
shopping centres is easy access to both entertainment and shopping facilities in close proximity to food
courts that offer meals. With investors continuing to develop large shopping centres across major cities
whilst tracking shopping galleries around hypermarkets, this trend has significantly contributed to the
strong development of consumer foodservice through retail units, which increased by over 12% in value
terms and 10% in transaction terms in 2016 compared with the previous year (Euromonitor, Consumer
Foodservice in Romania, May 2017).
We believe that the following main factors that have supported the foodservice sector’s growth in recent
years will continue to play a key role in the sector’s development over the next few years:
• On average, the Romanian population eats out of home less frequently than in more developed
countries and we expect the Romanian average to move towards the international trend;
• Expected growth of disposable income and continuously increasing levels of female employment
will further support the trend of eating out;
• Romania remains underpenetrated in terms of foodservice restaurants per capita; and
• Strong minimum wage and average salary increase since 2014 resulted in strong price increase
across all foodservice formats; furthermore, the current Romanian Government has indicated its
intention to continue the policy of increasing the minimum wage at rates that are significantly
higher than overall economic growth and consumer price inflation, leading to further increases in
the purchasing power of the population. At the same time, the increases of the minimum wage and
average salary have also resulted in the increase of our labour costs.
B.5 If the issuer
is part of a
group, a
description
of the group
and the
issuer’s
position
Sphera is the parent company of:
• US Food Network S.A., Romania (USFN (Romania)) holding franchise rights to operate KFC
branded restaurants in Romania;
• American Restaurant System S.A., Romania (ARS (Romania)) holding franchise rights to operate
Pizza Hut branded restaurants in Romania;
• US Food Network S.A., Italy (USFN (Italy)) holding franchise rights to operate KFC branded
restaurants in certain northern regions of Italy;

4
within the
group. • US Food Network S.R.L., Republic of Moldova (USFN (Moldova)) operating KFC branded
restaurants in the Republic of Moldova;
• California Fresh Flavors S.R.L., Romania (California Fresh Flavors (Romania)) holding franchise
rights to operate Taco Bell restaurants in Romania.
Sphera together with its subsidiaries listed above are referred to in this Summary as the "Group".
The shareholders of Sphera are:
• Lunic Franchising and Consulting Ltd (Cyprus) ("Lunic (Cyprus)");
• M.B.L. Computers S.R.L. (Romania) ("MBL (Romania)");
• Tatika Investments Ltd. (Cyprus) ("Tatika (Cyrpus)");
• Anasa Properties S.R.L. (Romania) ("Anasa Properties (Romania)");
• Wellkept Group S.A. (Romania) ("Wellkept (Romania)").
Ultimately, Lunic (Cyprus) and Anasa Properties (Romania) are owned by Mr. Lucian Vlad, MBL
(Romania) is owned by Mr. Nicolae Badea and Tatika (Cyprus) and Wellkept (Romania) are owned by
Mr. Radu Dimofte.
B.6 In so far as is
known, the
name of any
person who,
directly or
indirectly, has
an interest in
the issuer’s
capital or
voting rights
which is
notifiable
under the
issuer’s
national law,
together with
the amount of
each such
person’s
interest.
Whether the
issuer’s
major
shareholders
have different
voting rights
if any. To the
extent known
to the issuer,
state whether
the issuer is
directly or
indirectly
owned or
controlled
and by whom
and describe
the nature of
such control.
On the date of the Prospectus, no voting rights in Sphera are notifiable according to the Romanian law.
The shareholders structure of Sphera on the date of the Prospectus is the following:
Shareholder Number of shares Percentage of
voting rights
Tatika Investments Ltd. 10,603,860 27.33%
Wellkept Group S.A. 6,339,812 16.34%
Lunic Franchising and Consulting Ltd. 8,667,773 22.34%
Anasa Properties S.R.L. 4,264,047 10.99%
M.B.L. Computers S.R.L. 8,923,848 23.00%
Total 38,799,340 100.00%
After the admission of the Shares to trading on the spot regulated market operated by the Bucharest
Stock Exchange ("BSE"), if following the acquisition or sale of or other operations in Shares, the
proportion of voting rights held by a person reaches, exceeds or falls below one of the thresholds of 5%,
10%, 15%, 20%, 25%, 33%, 50% or 75% of the total voting rights, that person must notify the
Company of the proportion of the voting rights held promptly, but not later than 4 trading days.
The shareholders of the Company have equal voting rights.
None of the shareholders listed above exercises control or common control over the Company.
B.7 Selected
historical key
financial
information
regarding
the issuer,
The following have been identified as the Group's historical financial statements for the purpose of this
Prospectus:
• US Food Network S.A. Consolidated Financial Statements prepared in accordance with the
International Financial Reporting Standards as adopted by the European Union for the years ended
31 December 2014, 31 December 2015 and 31 December 2016, respectively, audited ("USFN

5
presented for
each
financial
year of the
period
covered by
the historical
financial
information,
and any
subsequent
interim
financial
period
accompanied
by
comparative
data from the
same period
in the prior
financial
year except
that the
requirement
for
comparative
balance
sheet
information
is satisfied
by presenting
the year-end
balance
sheet
information.
This should
be
accompanied
by a
narrative
description
of significant
change to the
issuer’s
financial
condition
and
operating
results
during or
subsequent
to the period
covered by
the historical
key financial
information
(Romania) Annual Financial Statements");
• American Restaurant System S.A. Financial Statements prepared in accordance with the
International Financial Reporting Standards as adopted by the European Union for the years ended
31 December 2014, 31 December 2015 and 31 December 2016, respectively, audited ("ARS
(Romania) Annual Financial Statements");
• American Restaurant System S.A. Interim Consolidated Financial Statements prepared in
accordance with the International Financial Reporting Standards as adopted by the European
Union for the period ended 30 June 2017, unaudited ("ARS (Romania) Interim Financial
Statements"); and
• Sphera Franchise Group S.A. Interim Consolidated Financial Statements prepared in accordance
with the International Financial Reporting Standards as adopted by the European Union for the
period ended 30 June 2017, unaudited ("Sphera Interim Financial Statements").
Summary of the consolidated statement of comprehensive income of USFN (Romania) and
of Sphera
Year ended 31 December
Six months ended 30
June
All data are in RON thousand
unless otherwise stated 2014 2015 2016
2016 2017
Unaudited
Restaurant sales 261,782 329,963 417,535
193,220 242,204
Restaurant expenses 215,352 264,693 339,314
156,197 197,650
Food and materials 98,405 123,141 157,302
74,225 87,944
Payroll and employee benefits 40,400 50,513 69,577
30,623 43,430
Rent 20,366 22,544 27,498
12,984 17,001 Royalties 15,406 19,382 24,654
11,380 14,125
Advertising 13,187 16,715 20,736
8,457 11,724
Other operating expenses, net 19,350 24,565 30,313
14,330 18,474 Depreciation and amortization 8,238 7,833 9,234
4,198 4,952
Restaurant operating profit 46,430 65,270 78,221
37,023 44,554
General and administration expenses, net 15,299 16,132 22,975
10,625 15,832
Operating profit 31,131 49,138 55,246
26,398 28,722
Finance costs 978 531 825
978 440
Finance income 240 398 95
125 109
Profit before tax 30,393 49,005 54,516
25,545 28,391
Income tax expense/(credit) 4,528 7,251 5,783
3,315 1,189
Profit for the period 25,865 41,754 48,733
22,230 27,202
Attributable to:
Equity holders of the parent 25,716 41,597 48,693
22,216 27,090
Non-controlling interests 149 157 40
14 112
Other comprehensive income
Other comprehensive income to be
reclassified to profit or loss in subsequent periods (net of tax): 0 0 0
(21) (30)
Exchange differences on translation
of foreign operations (10) (92) 83 Total comprehensive income for
the period, net of tax 25,855 41,662 48,816
22,209 27,172
Attributable to:
Equity holders of the parent 25,708 41,513 48,774
22,198 27,060
Non-controlling interests 147 149 42
11 112
Source: USFN (Romania) Annual Financial Statements; Sphera Interim Financial Statements,
unaudited
Summary of the consolidated statement of financial position of USFN (Romania) and of
Sphera
31 December
All data are in RON thousand unless
otherwise stated 2014 2015 2016
30-Jun-17
Unaudited
Assets
Non-current assets 41,658 45,562 54,246
143,055
Property, plant and equipment 37,779 41,084 47,551
81,159
Intangible assets 3,765 4,298 6,365
60,475
Trade and other receivables
285

6
Deposits for rent guarantee 95 163 290
668
Deferred tax assets 19 17 40
468
Current assets 38,275 55,497 65,399
51,769
Inventories 4,161 5,717 5,744
7,458 Trade and other receivables 3,473 4,438 8,780
5,077
Prepayments 1,729 1,743 1,907
3,418
Cash and short-term deposits 28,912 43,599 48,968
35,816
Assets held for sale
195
Total assets 79,933 101,059 119,645
195,019
Equity and liabilities
Total equity 33,456 50,482 58,253
100,342
Equity attributable to equity holders
of the parent 33,449 50,479 58,292
100,339
Issued capital 190 190 190
581,990
Share premium
(520,557)
Other capital reserves 19 19 19
- Retained earnings 33,278 50,392 58,124
38,977
Foreign currency translation reserve (38) (122) (41)
(71)
Non-controlling interests 7 3 (39)
3
Non-current liabilities 12,010 15,349 16,304
33,223
Interest-bearing loans and
borrowings 8,773 11,787 14,630
31,227
Trade and other payables 1,597 1,827 1,674
1,996
Deferred tax liabilities 1,640 1,735 -
Current liabilities 34,467 35,228 45,088
61,454
Trade and other payables 27,950 28,594 37,292
45,650
Interest-bearing loans and borrowings 6,378 6,634 7,796
15,804
Provisions 139 - -
Total liabilities 46,477 50,577 61,391
94,677
Total equity and liabilities 79,933 101,059 119,645
195,019
Source: USFN (Romania) Annual Financial Statements; Sphera Interim Financial Statements,
unaudited
Summary of the consolidated statement of cash flows of USFN (Romania) and of Sphera
Year ended 31 December
Six months ended 30 June
All data are in RON thousand
unless otherwise stated 2014 2015 2016
2016 2017
Unaudited
Operating activities
Profit before tax 30,393 49,005 54,516
25,545 28,391 Adjustments to reconcile profit
before tax to net cash flows:
Depreciation and impairment of property, plant and equipment 8,044 7,628 8,977
4,394 5,692
Amortisation and impairment of
intangible assets 675 698 847
390 487 Net foreign exchange differences (116) 181 60
(65) (71)
Gain on disposal of property, plant
and equipment 740 (10) 92
148 - Finance income (240) (398) (95)
(125) (109)
Finance costs 555 424 536
332 395
Movement in current assets
allowances 165 12 5 Movements in provisions, pensions
and government grants (1,226) (139) 0
Working capital adjustments:
Decrease/(Increase) in trade and
other receivables and prepayments (553) (989) (4,574)
835 4,794
Decrease/(Increase) in inventories (652) (1,570) (27)
314 (516) Increase/(Decrease) in trade and
other payables 8,035 459 8,655
(2,933) (5,281)
Interest received 192 342 31
125 109
Interest paid (561) (453) (561)
(324) (434) Income tax paid (3,452) (6,698) (7,619)
(4,078) (1,848)
Net cash flows from operating
activities 41,999 48,491 60,843
24,558 31,609
Investing activities
Proceeds from sale of property, plant
and equipment 2 27 0
8 - Purchase of intangible assets (430) (1,246) (2,916)
(1,573) (1,132)

7
Purchase of property, plant and
equipment (4,108) (10,935) (15,536)
(6,294) (14,596)
Acquisition of subsidiary, net of cash
- 2,161
Net cash flows used in investing
activities (4,536) (12,154) (18,452)
(7,859) (13,567)
Financing activities
Capital contribution from shareholders of Sphera on set up, net
of transaction costs paid
- 1,151
Proceeds from borrowings 3,382 10,993 11,704
3,552 19,225 Repayment of borrowings (7,531) (7,730) (7,480)
(3,678) (5,051)
Payment of finance lease liabilities (155) (185) (284)
(156) (134) Dividends paid to equity holders of
the parent (12,664) (24,483) (40,961)
(40,961) (46,237)
Dividends paid to non-controlling interests (133) (153) (84)
- (70)
Net cash flows from/(used in)
financing activities (17,101) (21,558) (37,105)
(41,263) (31,116)
Net increase/(decrease) in cash and cash equivalents 20,362 14,779 5,286
(24,564) (13,074)
Net foreign exchange difference (10) (92) 83
(18) (78)
Cash and cash equivalents at 1 January 8,560 28,912 43,599
43,599 48,968
Cash and cash equivalents at end
of period 28,912 43,599 48,968
19,017 35,816
Source: USFN (Romania) Annual Financial Statements; Sphera Interim Financial Statements,
unaudited
Summary of the statement of comprehensive income of ARS (Romania)
Year ended 31 December
Six months ended 30
June
All data are in RON thousand
unless otherwise stated 2014 2015 2016
2016 2017
Unaudited
Restaurant sales 63,130 75,867 96,940
46,398 54,210
Restaurant expenses 51,952 59,962 82,329
37,684 46,486
Food and materials 16,881 19,718 26,107
12,606 14,830
Payroll and employee benefits 12,001 14,622 22,383
9,608 13,690 Rent 6,081 6,476 8,027
3,672 4,692
Royalties 3,697 4,448 5,702
2,721 3,166
Advertising 3,590 4,245 5,785
2,727 2,973
Other operating expenses, net 7,514 8,339 11,659
5,234 5,386
Depreciation and amortization 2,188 2,114 2,666
1,116 1,749
Restaurant operating profit 11,178 15,905 14,611
8,714 7,724
General and administration
expenses, net 6,094 7,751 8,982
4,338 5,732
Operating profit 5,084 8,154 5,629
4,376 1,992
Finance costs 309 482 213
81 187
Finance income 7 19 127
93 6
Profit before tax from continuing
operations 4,782 7,691 5,543
4,388 1,811
Income tax expense 667 1,170 361
626 772
Profit for the period from
continuing operations 4,115 6,521 5,182
3,762 1,039
Discontinued operations
Profit/(loss) after tax for the year from discontinued operations (595) (397) (1,953)
293 -
Profit for the period 3,520 6,124 3,229
4,055 1,039
Source: ARS (Romania) Annual Financial Statements; ARS (Romania) Interim Financial Statements,
unaudited.
Summary of the statement of financial position of ARS (Romania)
31 December

8
All data are in RON thousand unless
otherwise stated 2014 2015 2016
30-Jun-17
Unaudited
Assets
Non-current assets 10,777 15,262 21,374
22,799
Property, plant and equipment 9,653 13,265 18,201
19,511
Intangible assets 1,007 1,749 2,917
2,757 Trade and other receivables
285
Deposits for rent guarantee 117 248 256
246
Current assets 14,806 18,562 11,612
6,225
Inventories 6,986 6,758 1,111
1,206 Trade and other receivables 5,849 5,363 6,089
1,513
Prepayments 665 867 1,118
1,186 Cash and short-term deposits 1,306 5,574 3,294
2,320
Assets held for sale 0 0 195
195
Total assets 25,583 33,824 33,181
29,219
Equity and liabilities
Total equity 6,607 8,781 5,980
3,651
Issued capital 1,644 1,644 1,644
1,644
Share premium 0 0 0 Other capital reserves 21 21 21
21
Retained earnings 4,942 7,116 4,315
1,986
Non-current liabilities 1,243 4,448 7,865
7,273
Interest-bearing loans and borrowings 492 3,692 7,536
6,950
Trade and other payables 307 302 329
323 Deferred tax liabilities 444 454 0
Current liabilities 17,733 20,595 19,336
18,295
Trade and other payables 16,298 18,477 15,401
13,967
Interest-bearing loans and borrowings 1,435 2,118 3,935
4,328
Total liabilities 18,976 25,043 27,201
25,568
Total equity and liabilities 25,583 33,824 33,181
29,219
Source: ARS (Romania) Annual Financial Statements; ARS (Romania) Interim Financial Statements,
unaudited
Summary of the statement of cash flows of ARS (Romania)
Year ended 31 December Six months ended 30 June
All data are in RON thousand unless
otherwise stated 2014 2015 2016
2016 2017
Unaudited
Operating activities
Profit before tax from continuing
operations 4,782 7,691 5,543
4,388 1,811
Profit/(loss) before tax from discontinued operations (708) (477) (2,141)
349 -
Profit before tax 4,074 7,214 3,402
4,737 1,811
Adjustments to reconcile profit before tax to net cash flows:
Depreciation and impairment of
property, plant and equipment 2,268 2,208 2,862
1,294 1,609 Amortisation and impairment of
intangible assets 202 210 323
147 207
Impairment allowance of property, plant and equipment - - 966
Net foreign exchange differences (129) 3 54
2 (8)
Gain on disposal of property, plant and equipment 391 (56) 115
6 (4)
Finance income (7) (19) (18)
(15) (6)
Finance costs 100 97 213
81 157 Movements in current asset allowances 2 19 -
- (63)
Working capital adjustments:
Decrease/(increase) in trade and other
receivables and prepayments (2,146) 153 (985)
2,187 4,233 Decrease/(increase) in inventories (673) 209 5,647
(2,420) (32)
Increase/(Decrease) in trade and other
payables 1,828 1,896 (2,489)
(483) (2,212)
Interest received 7 19 18
15 6
Interest paid (100) (119) (240)
(96) (162)
Income tax paid (592) (801) (1,186)
(928) -
Net cash flows from operating 5,225 11,033 8,682
4,527 5,536

9
activities
Investing activities
Proceeds from sale of property, plant
and equipment 15 56 33
- 8 Purchase of intangible assets (44) (953) (1,491)
(496) (47)
Purchase of property, plant and
equipment (1,119) (5,819) (9,107)
(4,139) (2,923)
Net cash flows used in investing
activities (1,148) (6,716) (10,565)
(4,635) (2,962)
Financing activities
Proceeds from borrowings - 6,359 8,603
3,762 1,838
Repayment of borrowings (2,151) (2,458) (2,769)
(1,297) (1,920)
Payment of finance lease liabilities (107) - (201)
(81) (98) Dividends paid to equity holders (1,800) (3,950) (6,030)
(6,030) (3,368)
Net cash flows from/(used in)
financing activities (4,058) (49) (397)
(3,646) (3,548)
Net increase in cash and cash equivalents 19 4,268 (2,280)
(3,754) (974)
Cash and cash equivalents at 1 January 1,287 1,306 5,574
5,574 3,294
Cash and cash equivalents at end of
period 1,306 5,574 3,294
1,820 2,320
Source: ARS (Romania) Annual Financial Statements; ARS (Romania) Interim Financial Statements,
unaudited
Since 30 June 2017, the reference date of Sphera Interim Financial Statements, there has been no
significant change in the financial or trading position of the Group.
B.8 Selected key
pro forma
financial
information,
identified as
such.
The selected
key pro
forma
financial
information
must clearly
state the fact
that because
of its nature,
the pro
forma
financial
information
addresses a
hypothetical
situation
and,
therefore,
does not
represent the
company’s
actual
financial
position or
results
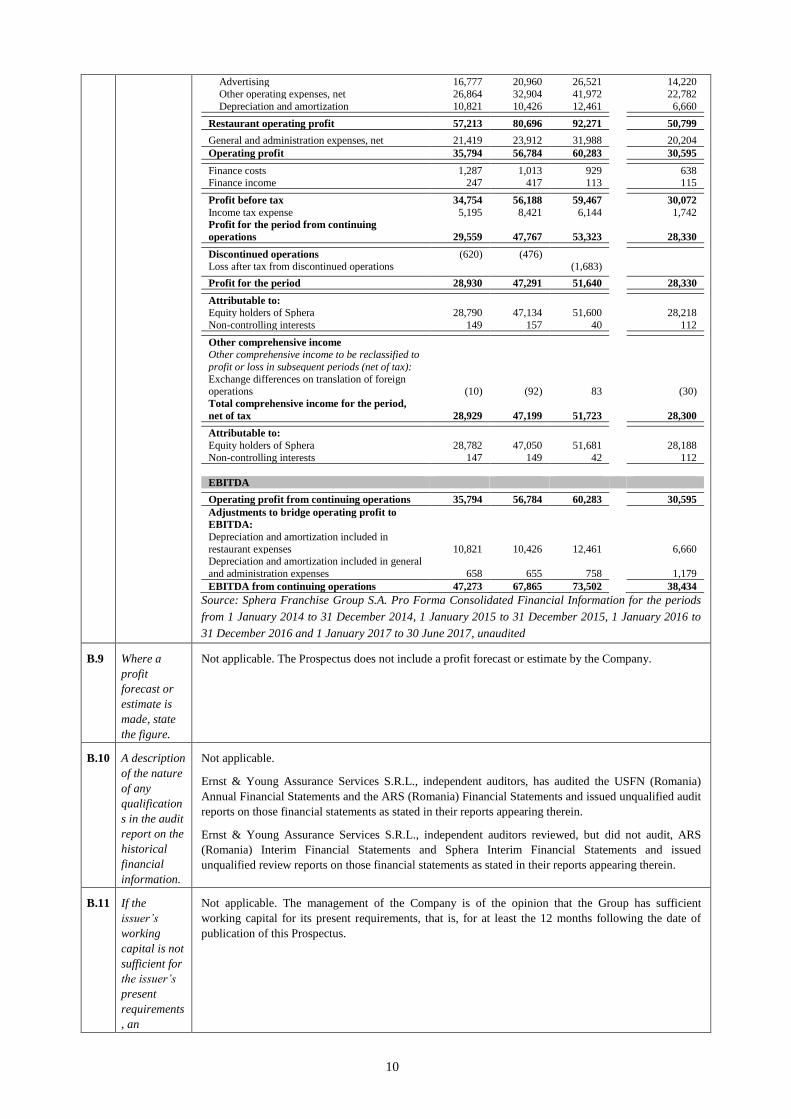
The Pro forma Financial Information was prepared to illustrate the consolidated operational
performance of the Group for the twelve months periods ended 31 December 2014, 31 December 2015
and 31 December 2016 and for the six-month period ended 30 June 2017, respectively, as if the
incorporation of the Company and the contribution of USFN (Romania) shares and of ARS (Romania)
shares to the Company's share capital took place on 1 January 2014, 1 January 2015 and 1 January
2016, and 1 January 2017, respectively. The acquisition by the Company of the shares in USFN (Italy)
and in USFN (Moldova) from USFN (Romania), which has no impact on the consolidated financial
statements of the Company, and the incorporation of California Fresh Flavors (Romania) are not
adjusted for in the Pro forma Consolidated Financial Information.
USFN (Romania) and ARS (Romania) had identical shareholder structures and also their key
management personnel was preponderantly the same since 2012. Therefore, although from an IFRS
perspective the criteria to qualify as being "under common control" are not met (since none of the
shareholders had control or common control), the presentation of the Pro forma Information is reflective
of the manner in which the two business segments (KFC operated by USFN (Romania) and Pizza Hut
operated by ARS (Romania)) were managed together.
Because of its nature, the Pro forma Financial Information describes a hypothetical situation and
has been prepared for illustrative purposes only and does not purport to represent the
Company’s actual financial position or results, nor are they necessarily indicative of future
consolidated operational results.
In addition, the statements are based on available information and various assumptions that
management believes to be reasonable. The actual results may differ from those reflected in the Pro
forma Financial Information for a number of reasons, including, but not limited to, differences between
the assumptions used to prepare the Pro forma Financial Information and actual amounts.
The Pro forma Financial Information only consists of the pro forma consolidated statement of
comprehensive income for the twelve-month period ended 31 December 2014, 31 December 2015 and
31 December 2016 and for the six months period ended 30 June 2017, respectively, and selected notes.
Summary of Pro forma consolidated statement of comprehensive income for the years ended 31
December 2014, 2015 and 2016 and for six months ended 30 June 2017
Year ended 31 December
Six months
ended 30
June
2014 2015 2016
2017
Unaudited
Restaurant sales 324,912 405,830 514,475
287,833
Restaurant expenses 267,699 325,134 422,204
237,034
Food and material expenses 115,286 142,859 183,409
100,472
Payroll and employee benefits 52,401 65,135 91,960
55,195
Rent 26,447 29,020 35,525
20,898 Royalties 19,103 23,830 30,356
16,807
10
Advertising 16,777 20,960 26,521
14,220
Other operating expenses, net 26,864 32,904 41,972
22,782
Depreciation and amortization 10,821 10,426 12,461
6,660
Restaurant operating profit 57,213 80,696 92,271
50,799
General and administration expenses, net 21,419 23,912 31,988
20,204
Operating profit 35,794 56,784 60,283
30,595
Finance costs 1,287 1,013 929
638 Finance income 247 417 113
115
Profit before tax 34,754 56,188 59,467
30,072
Income tax expense 5,195 8,421 6,144
1,742 Profit for the period from continuing
operations 29,559 47,767 53,323
28,330
Discontinued operations (620) (476)
Loss after tax from discontinued operations
(1,683)
Profit for the period 28,930 47,291 51,640 28,330
Attributable to: Equity holders of Sphera 28,790 47,134 51,600 28,218
Non-controlling interests 149 157 40 112
Other comprehensive income Other comprehensive income to be reclassified to
profit or loss in subsequent periods (net of tax):
Exchange differences on translation of foreign operations (10) (92) 83 (30)
Total comprehensive income for the period,
net of tax 28,929 47,199 51,723 28,300
Attributable to:
Equity holders of Sphera 28,782 47,050 51,681 28,188
Non-controlling interests 147 149 42 112
EBITDA
Operating profit from continuing operations 35,794 56,784 60,283 30,595
Adjustments to bridge operating profit to
EBITDA:
Depreciation and amortization included in
restaurant expenses 10,821 10,426 12,461 6,660 Depreciation and amortization included in general
and administration expenses 658 655 758 1,179
EBITDA from continuing operations 47,273 67,865 73,502 38,434
Source: Sphera Franchise Group S.A. Pro Forma Consolidated Financial Information for the periods
from 1 January 2014 to 31 December 2014, 1 January 2015 to 31 December 2015, 1 January 2016 to
31 December 2016 and 1 January 2017 to 30 June 2017, unaudited
B.9 Where a
profit
forecast or
estimate is
made, state
the figure.
Not applicable. The Prospectus does not include a profit forecast or estimate by the Company.
B.10 A description
of the nature
of any
qualification
s in the audit
report on the
historical
financial
information.
Not applicable.
Ernst & Young Assurance Services S.R.L., independent auditors, has audited the USFN (Romania)
Annual Financial Statements and the ARS (Romania) Financial Statements and issued unqualified audit
reports on those financial statements as stated in their reports appearing therein.
Ernst & Young Assurance Services S.R.L., independent auditors reviewed, but did not audit, ARS
(Romania) Interim Financial Statements and Sphera Interim Financial Statements and issued
unqualified review reports on those financial statements as stated in their reports appearing therein.
B.11 If the
issuer’s
working
capital is not
sufficient for
the issuer’s
present
requirements
, an
Not applicable. The management of the Company is of the opinion that the Group has sufficient
working capital for its present requirements, that is, for at least the 12 months following the date of
publication of this Prospectus.
11
explanation
should be
included.
Section C—Securities
C.1 A description
of the type
and the class
of the
securities
being offered
and/or
admitted to
trading,
including
any security
identification
number.
The Offering consists in an offering of an aggregate number of up to 9,831,753 nominative, ordinary
shares in the Company, offered as follows: (1) up to 8,667,773 ordinary shares in the Company by
Lunic (Cyprus); and (2) up to 1,163,980 ordinary shares in the Company by MBL (Romania).
In case of successful closing of the Offering, application will be made for the admission of the Shares to
trading on the spot regulated market operated by the BSE.
The security identification numbers of the Shares are:
ISIN: ROSFGPACNOR4;
CFI: ESVUFR;
LEI: 315700GSVZ0HSS7J1457;
BSE market symbol: SFG.
C.2 Currency of
the securities
issue.
The currency of the Shares is RON.
C.3 The number
of shares
issued and
fully paid
and issued
but not fully
paid. The par
value per
share, or that
the shares
have no par
value.
As at the date of the Prospectus, the issued, subscribed and paid-up share capital of the Company is
divided into 38,799,340 nominative, ordinary, book entry form shares, each of which is issued, fully
paid with a par value of RON 15 and carrying one vote in the Company's general shareholders
meetings.
C.4 A description
of the rights
attached to
the
securities.
Each Offered Share is an ordinary share of par value RON 15 carrying similar rights.
All shareholders are to be treated equally to other shareholders that own the same type of Shares, with
the material rights set forth below:
• the pre-emptive right of the shareholders to subscribe for any issue of new shares on a pro rata
basis, unless such pre-emptive right is limited by the general shareholders meeting in accordance
with the law and the articles of association;
• the right to vote and participate in the general meetings of the shareholders;
• the right to receive dividends, if declared;
• the right to information (e.g. to be informed about the activity of the Company in line with and
subject to the applicable law, to obtain any information regarding the exercise of voting rights and
information regarding the voting results in the general shareholders meetings);
• the right to add new items on the agenda of the meeting or propose draft resolution, in case of
shareholders holding severally or jointly at least 5% of the share capital;
• the right to withdraw from the Company and to request the Company to acquire their shares, in
case the shareholders did not vote in favour of a certain decision in the general meeting of
shareholders;
• the rights to proceeds derived from the liquidation of the Company, when applicable;
• the right to challenge the decisions of the general meeting of shareholders; and
• other rights provided under the Company’s articles of association, by-laws and applicable law.
C.5 A description
of any
restrictions
on the free
transferabilit
Starting with the first trading date on the BSE, the Shares will be freely transferable subject to the rules
of the regulated spot market operated by the BSE, and clearing and settlement rules of Depozitarul
Central S.A. (the "Romanian CSD").

12
y of the
securities.
C.6 An indication
as to whether
the securities
offered are
or will be the
object of an
application
for
admission to
trading on a
regulated
market and
the identity
of all the
regulated
markets
where the
securities are
or are to be
traded.
After the Offering is successfully closed in accordance with the provisions of the Prospectus and the
transactions in the Offered Shares are settled, the Company intends to apply for the admission of the
shares issued by the Company to trading on the spot regulated market operated by the BSE.
C.7 A description
of dividend
policy.
The Company's ability to pay dividends is based, among other things, on the Company's future profits,
including the distributable profits obtained by the Company's consolidated subsidiaries, as recorded in
the Company's financial statements. Dividends (if any) may only be declared and paid from the current
year’s statutory profit and accumulated profit from previous years, as recorded in the Company's annual
financial statements as approved by the ordinary general shareholders meeting ("OGSM") on the basis
of the report presented by the Company's board of directors ("BoD"). In determining the amount
available for distribution as dividends, the current year’s statutory profit and accumulated profit from
previous years will be adjusted to account for the creation of the required statutory reserves. In absence
of exceptional market conditions or circumstances, for future years the BoD intends to recommend to
the OGSM that the Company distributes 100% of its distributable profits each year, subject to any
restrictions due to Romanian legal and taxation regulation. Furthermore, the BoD may from time to
time propose to the shareholders cash distributions by way of restitution of capital to the shareholders, if
it finds that such distribution is appropriate and sustainable in the context of the Group's growth strategy
and provided that such distribution may be carried out in compliance with the applicable law.
Section D—Risks
D.1 Key
information
on the key
risks that are
specific to
the issuer or
its industry.
Risks Relating to the Group's Business and Industry
• Our rights to operate KFC, Pizza Hut and Taco Bell branded units are dependent on the Franchise
Agreements concluded with Yum!
• Our business depends on our relationship with Yum! and on our ability to comply with Yum!
requirements
• We may not be able to comply with the minimum roll-out of restaurants imposed by Yum!
• Failure by Yum! to protect its intellectual property rights, including its brands, could harm our
results of operations
• We operate in a highly competitive market, and competition is expected to increase in the coming
years
• We are dependent on our suppliers and the supply chain may be materially disrupted
• Increases in commodity prices or other operating costs could decrease our operating profit margins
• Product liability claims or poultry related health pandemics could have a negative impact on
consumers' confidence in the safety and quality of our products
• We may be unable to attract or retain sufficient qualified personnel, including due to increased
labour costs
• We are dependent on our management and key personnel
• We may not be able to implement our expansion strategy
• We have recently entered the Italian market by opening KFC restaurants in cities where the KFC
brand is novel

13
• We have launched and are further planning to develop Taco Bell brand in the Romanian market
• Failure to secure sub-franchisees may have an impact on the Pizza Hut Delivery business
• We operate in a sector where a number of approvals, licences and permits need to be in place for
each restaurant
• Our operational authorisations and permits may be deficient
• Fire safety permits are required for all our restaurants
• Operating and leasing a broad portfolio of locations exposes us to potential losses and liabilities
• Covenants and events of default in the agreements governing our outstanding indebtedness could
limit our ability to undertake certain types of transactions and adversely affect our liquidity
• We are exposed to fluctuations in foreign exchange rates
• We are exposed to fluctuations of the interest rate
• We may be exposed to claims or disputes in the ordinary course of business
• A potential failure to protect the integrity and security of personal information of our customers
and employees could result in substantial costs, expose us to litigation and damage our reputation
• We may not be able to ensure the traceability of the recovered/recycled package waste
• A number of insurance policies need to be in place to cover for a wide range of potential liabilities
• A strike or other labour disruption may have a material adverse effect on our business
• Poor maintenance of the road network in Romania may adversely affect our Pizza Hut Delivery
business
• Our information systems and the implementation of an Enterprise Resource Planning (ERP), may
fail or be damaged, which could harm our operations and our business
• Any changes to the current food law regime in Romania and in other countries in which we
operate may require engagement of significant costs to ensure compliance
• Any tax increase or change in tax legislation may adversely affect our operational results
• We may not be able to always comply with the transfer pricing rules
• Deductibility of expenses and VAT may be limited
• We may have to implement IFRS 16 (Leases) starting on or after 1 January 2019
• Our management team and the BoD members have limited experience in managing and governing
a public company, and regulatory compliance may divert our attention from the administration of
our business
• Our restaurants and the equipment in our restaurants may get damaged or destroyed as a result of
events or factors that are beyond our control
• We are exposed directly or indirectly to reputational risk
Country-Specific and Regional Risks
• Investor confidence in emerging economies, including Romania, may further decline due to
uncertainty regarding the global macroeconomic environment
• Recent political and social unrest risks weakening market confidence
• Deterioration in fiscal policies threatens growth in Romania
• Financing opportunities from internal and external sources are under-exploited which hinders
growth
• The Romanian national currency may register high levels of volatility
• Deficient and poor-quality infrastructure in Romania limits investments
• EU may apply sanctions if Romania fails to meet its post-accession obligations
• Law making processes often skip public consultation or impact study stages and adopted
legislation is not applied consistently by public authorities and courts and frequently lacks
transitional norms, which endangers competitiveness
• The European Commission has initiated infringement proceedings against Romania in a number
of areas, including waste management
• Corruption could create a difficult business climate
D.3 Key
information
Risks relating to the Shares
• The Offering may not result in an active or liquid trading market and investors may be unable to

14
on the key
risks that are
specific to
the
securities.
resell their Shares at or above the Final Offer Price
• The current shareholders of the Company will continue to have significant influence over the
Company after the Offering, and their interests may not be aligned with those of the other
shareholders of the Company
• The Shares may not be admitted to trading on the BSE or may be de-listed from the BSE
• As a holding company, the Company’s operating results, financial condition and ability to pay
dividends or other distributions are mainly dependent on dividends and other distributions
received from its subsidiaries
• Exchange rate variations may have an adverse impact on the value of non-Romanian holders of
Shares
• The price of the Shares may generally fluctuate
• Future sales of substantial amounts of our ordinary shares, or the perception that such sales could
occur, could adversely affect the market value of the Shares
• Due to a gap of five days between the pricing and the prospective first date of trading in the
shares, the initial trading price may be lower than the Final Offer Price
• Financing subscriptions in Offered Shares may create a misleading appearance with respect to
interest in the Offering
• There is no central counterparty for the spot market in Romania
Section E—Offer
E.1 The total net
proceeds and
an estimate
of the total
expenses of
the
issue/offer,
including
estimated
expenses
charged to
the investor
by the issuer
or the
offeror.
The Company will not receive any proceeds from the Offering.
The total estimated net proceeds obtained by the Selling Shareholders from the sale of the Offered
Shares in the Offering, after deduction of all fees, and charges incurred with the Offering, will be of
approximately RON 311,014,220 (assuming that all Offered Shares will be sold at the maximum price
of the Price Range and no proceeds will be used for stabilisation activities).The total estimated fees, and
charges payable by the Selling Shareholders in connection with the Offering are expected to be in the
range of RON 13,433,629 (assuming that all Offered Shares will be sold at the maximum price of the
Price Range).
The total fees and charges payable by the Company in connection with the Offering are expected to be
in the range of RON 424,769.
No commissions, fees or expenses in connection with the Offering will be charged to investors by the
Company or by any Selling Shareholder. However, the investors shall be charged costs (if any)
associated with opening and maintaining a securities account (unless such investor already has an
account) and any brokerage commissions payable by the institutional investors under any relevant
agreements or pursuant to the regulations of the entity accepting such purchase orders.
E.2a Reasons for
the offer, use
of proceeds,
estimated net
amount of
the proceeds.
The Offering is being conducted in order to allow the Selling Shareholders to dispose of a portion of
their shareholdings, while raising Sphera’s profile with the international investment community and
establishing a market for the Shares, which may benefit Sphera if it desires to access the equity markets
in the future.
The total estimated net proceeds obtained by the Selling Shareholders from the sale of the Offered
Shares in the Offering, after deduction of all fees, and charges incurred with the Offering, will be of
approximately RON 311,014,220 (assuming that all Offered Shares will be sold at the maximum price
of the price range and no proceeds will be used for stabilisation activities).
E.3 A description
of the terms
and
conditions of
the offer.
The Offer Shares will be offered at the Offer Price Range that is RON 25 to RON 33(the "Offer Price
Range") and will be sold at the final offer price determined in RON (the "Final Offer Price").
Subscriptions for Offered Shares can be made from 24 October 2017 to 2 November 2017 inclusively,
namely 8 (eight) Business Days (the "Offer Period"), unless extended or otherwise changed. The price
of the Offered shares is denominated in RON.
The Offering is split into two tranches (the "Offer Tranches") as follows:
• 15% of the Offered Shares (1,474,763 Offered Shares) will be initially offered to Retail Investors
(the "Retail Tranche"); and
• the remaining Offered Shares (8,356,990 Offered Shares) will be offered to Institutional Investors
(the "Institutional Tranche").
Retail Investors must subscribe for Offered Shares at the fixed price of RON 33 (i.e. the top of the Offer
Price Range).

15
Institutional Investors may validly subscribe for Offered Shares at any price within the Offer Price
Range (including the bottom and the top of the price range). The price tick for the subscription of
Offered Shares by Institutional Investors is RON 0.1.
In case of oversubscription in the Retail Tranche, the allocation shall be done pro-rata. The Selling
Shareholders will determine, in close consultation with Wood & Company Financial Services a.s., and
Raiffeisen Bank S.A., as Joint Bookrunners, the number of Offered Shares allocated to each
Institutional Investor, based on certain qualitative criteria.
The allocation factor for the Retail Tranche, together with the final number of allocated Offered Shares,
will be publicly announced on the last day of the Offer Period (the "Allocation Date").
The Final Offer Price for Retail Investors is equal to the Final Offer Price for Institutional Investors.
The Final Offer Price will be determined based on the expressions of interest made by the Institutional
Investors during the bookbuilding process. The Final Offer Price will be publicly announced no later
than one Business Day following the Allocation Date.
The transaction related to the Offered Shares will take place on the transaction date and the transfer of
the Offered Shares will be settled through the Romanian CSD's system within two business days from
the transaction date.
E.4 A description
of any
interest that
is material to
the
issue/offer
including
conflicting
interests.
The Managers and their respective affiliates may have engaged in transactions with, and performed
various investment banking, commercial banking, financial advisory and other services for, the
Company and the Selling Shareholders and their respective affiliates, for which they received
customary fees. The Managers and their respective affiliates may provide such services for the
Company and the Selling Shareholders and their respective affiliates in the future.
In connection with the Offering, each of the Managers and any affiliate, acting as an investor for its own
account may take up the Offered Shares and in that capacity may retain, purchase or sell for its own
account such Offered Shares and any related investments and may offer or sell such Offered Shares or
other investments otherwise than in connection with the Offering. Accordingly, references in this
Prospectus to the Offered Shares being offered or placed should be read as including any offering or
placement of Offered Shares to the Managers and any affiliate acting in such capacity. None of the
Managers intend to disclose the extent of any such investment or transactions otherwise than in
accordance with any legal or regulatory obligation to do so. In addition, in connection with the
Offering, certain of the Managers may enter into financing arrangements with investors, such as share
swap arrangements or lending arrangements where securities are used as collateral, which could result
in such Managers acquiring shareholdings in the Company.
E.5 Name of the
person or
entity
offering to
sell the
security.
Lock-up
agreements:
the parties
involved;
and
indication of
the period of
the lock up.
The Selling Shareholders are:
• Lunic Franchising and Consulting Ltd, a company organized and existing under the laws of
Cyprus, registered under no. HE 80898, with registered office at Riga Feraiou nr. 2, Limassol
Center, Block B, 4th floor, office 406, 3095 Limassol, Cyprus; and
• M.B.L. Computers S.R.L., a company organized and existing under the laws of Romania,
registered with the Bucharest Trade Registry under No. J40/6119/1991, having its registered office
at 15 Fabrica de Glucoză street, Bucharest, Romania.
Lunic (Cyprus) offers a number of up to 8,667,773 Shares in the Offering, while MBL (Romania) offers
a number of up to 1,163,980 Shares in the Offering (together the "Offered Shares").
The Company will agree with Wood & Company Financial Services a.s., Raiffeisen Bank S.A. and
Alpha Finance Romania S.A. (hereinafter together as, the "Managers") in the Placement Agreement to
be executed on or about the date of the Prospectus that it will not, and each of the Company's members
of the Board of Directors, will ensure that the Company will not, without the prior written consent of
the Sole Global Co-ordinator (on behalf of and after consultation with the Managers), not to be
unreasonably withheld, for a period of 180 days from the admission of Shares to trading on the BSE or
(if admission does not become effective on that date) at such other date (being the date on which
admission does become effective) as the Company and the Joint Bookrunners may agree in writing,
directly or indirectly: (a) issue, offer, lend, mortgage, assign, charge, pledge, sell, contract to sell or
issue, sell any option or contract to purchase, purchase any option or contract to sell or issue, grant any
option, right or warrant to purchase, lend or otherwise transfer or dispose of, directly or indirectly, any
Shares or any interest in Shares or any securities convertible into or exercisable or exchangeable for, or
substantially similar to, Shares or any interest in Shares or file any registration statement under the
Issuers and Markets Operations Law or file or publish any prospectus with respect to any of the
foregoing; or (b) enter into any swap or other agreement or transaction that transfers, in whole or in
part, any of the economic consequences of ownership of the Shares, whether any such swap or
transaction described in (a) or (b) is to be settled by delivery of the Shares or such other securities, in

16
cash or otherwise.
The lock up restrictions do not apply to any purchase by the Company of Shares and subsequently to the
allocation/transfer of the Shares so acquired to its BoD members and/or its managers, in each case
under any share incentive plan the Company may decide to implement.
Also, the current shareholders of the Company will agree with the Managers, acting severally and not
jointly, that none of them, nor any person acting on their behalf will, without the prior written consent
of the Sole Global Co-ordinator (on behalf of and after consultation with the Managers), not to be
unreasonably withheld, for a period of 180 days from the admission of the Shares to trading on the BSE
or (if admission does not become effective on that date) at such other time and/or date (being the date
on which admission does become effective) as the Company and the Joint Bookrunners may agree in
writing, directly or indirectly: (a) offer, sell, lend, assign, mortgage, pledge, charge, contract to sell or
otherwise transfer or dispose of (or publicly announce any such action), directly or indirectly, any
Shares, other equity securities of the Company or any securities convertible or exchangeable into or
exercisable for any equity securities of the Company or any security or financial product whose value is
determined directly or indirectly by reference to the price of the underlying securities, including equity
swaps, forward sales and options or depositary receipts representing the right to receive any such
securities; or (b) enter into any swap or other agreement that transfers, in whole or in part, any of the
economic consequences of ownership of any equity securities of the Company or enter into any
transaction with the same economic effect as, or agree to, or publicly announce any intention to enter
into any transaction described above, whether any such transaction described in (a) or (b) is to be settled
by delivery of Shares or such other securities, in cash or otherwise.
For the avoidance of doubt, the above restrictions do not apply to the Shares acquired during the
stabilisation period, for stabilisation purposes.
E.6 The amount
and
percentage of
immediate
dilution
resulting from
the offer. In
case of a
subscription
offer to
existing equity
holders, the
amount and
percentage of
immediate
dilution if they
do not
subscribe to
the new offer.
Not applicable. There will be no dilution resulting from the Offering.
E.7 Estimated
expenses
charged to the
investor by the
issuer or the
offeror.
No commissions, fees or expenses in connection with the Offering will be charged to investors by the
Company or by any Selling Shareholder, except for the costs (if any) associated with opening and
maintaining a securities account (unless such investor already has an account) and any brokerage
commissions payable by the institutional investors under any relevant agreements or pursuant to the
regulations of the entity accepting such purchase orders, which may not be estimated at the date of this
Prospectus.

17
IMPORTANT INFORMATION ABOUT THIS PROSPECTUS
This document comprises a prospectus relating to the Company, the Selling Shareholders and the Shares for the
purposes of the Prospectus Directive, as implemented and applicable in Romania.
The Offering does not constitute an offer to sell, or solicitation of an offer to buy, securities in any jurisdiction in
which such offer or solicitation would be unlawful.
The Shares have not been and will not be registered under the Securities Act or with any securities regulatory
authority of any state or jurisdiction of the United States and may not be offered or sold into or within the United
States. For a discussion of these and certain further restrictions on offers, sales and transfers of the Shares and the
distribution of this Prospectus, see "Selling and Transfer Restrictions" below.
The Offering may be extended at any time without cause, subject to approval by the FSA and publication of a
supplement to this Prospectus, in accordance with applicable law.
The Company and each Selling Shareholder accept responsibility for the information contained in this Prospectus.
To the best of the Company’s and of each Selling Shareholder’s knowledge, in each case having taken all
reasonable care to ensure that such is the case, the information contained in this Prospectus is in accordance with
the facts and contains no omission likely to affect its import.
Investors must also acknowledge that: (i) they have not relied on the Managers or any person affiliated with the
Managers in connection with any investigation of the accuracy of any information contained in this Prospectus;
and (ii) they have relied only on the information contained in this Prospectus. No person is authorised to give any
information or to make any representation in connection with the Offering or sale of the Offered Shares, other than
as contained in this Prospectus. If given or made, such information or representation must not be relied upon as
having been authorised by the Company, any Selling Shareholder or any of the Managers, the Financial Advisor or
their respective affiliates. If anyone provides any investor with different or inconsistent information, such investor
should not rely on it. Furthermore, the Company did not and does not consent to the use of the Prospectus for
subsequent resale or final placement of the Shares by financial intermediaries or by any other third party.
In particular, the Company warns investors that the Company, the Selling Shareholders, the Managers and the
Financial Adviser make no representation as to the accuracy, completeness or reliability of the information
published by media about the Group. To the extent such information is inconsistent with the information included
in the Prospectus, each of the Company, the Selling Shareholders, the Managers and the Financial Adviser
disclaims any responsibility with respect to such information. The Company cautions investors to take their
investment decision exclusively based on the information included in this Prospectus and any supplement thereto,
if published.
This Prospectus is being provided by the Company and by the Selling Shareholders for the purpose of enabling
prospective investors to consider subscribing for and purchasing the Offered Shares. This Prospectus is not
intended to provide the basis of any credit or other evaluation and should not be considered as a recommendation
by the Company, any Selling Shareholder, any Manager or the Financial Adviser that any recipient of this
Prospectus should subscribe for or purchase any Offered Shares. No representation or warranty, express or
implied, is made by any Manager, by the Financial Adviser or by any of their respective affiliates or advisers as to
the accuracy or completeness or verification of any information contained in this Prospectus, and nothing
contained in this Prospectus is, or shall be relied upon as, a promise or representation by any Manager or by the
Financial Adviser as to the past or the future. Any reproduction or distribution of this Prospectus, in whole or in
part, any disclosure of its contents, except where its contents are otherwise publicly available, and any use of any
information herein for any purpose other than considering an investment in the Offered Shares, is prohibited.
The information in this Prospectus is as of the date printed on the front cover, unless expressly stated otherwise.
Without prejudice to any obligation of the Company to publish a supplement to the Prospectus pursuant to the
Issuers and Markets Operations Law and Regulation no. 1/2006 on issuers and operations with securities issued by
the Romanian National Securities Commission (currently the FSA), neither the delivery of this Prospectus nor any
purchase made in connection therewith shall, under any circumstances, create any implication that there has been
no change in the affairs of the Group since, or that information contained herein is correct as at, any time
subsequent to the date of this Prospectus. Each prospective investor, by accepting delivery of this Prospectus,
agrees to the foregoing.
Prospective investors should not consider any information in this Prospectus to be investment, legal or tax advice.
In making an investment decision, investors should determine for themselves the relevance of the information
18
contained in this Prospectus and must rely on their own assessment, examination, analysis and enquiry of the
Company, the terms of the Offering and the contents of this Prospectus, including the merits and risks involved.
Each prospective investor should consult its own legal counsel, financial adviser, accountant and other advisers for
legal, tax, business, financial and related advice regarding subscription for or purchase of any Offered Shares.
Each prospective investor should also make its own determination of the suitability of any investment in the
Offered Shares, with particular reference to its own investment objectives and experience and any other factors
that may be relevant to the investor. Neither the Company, nor any Selling Shareholder, any Manager or the
Financial Adviser makes any representation to any offeree or purchaser of or subscriber for any Offered Shares
regarding the legality of an investment in the Offered Shares by such offeree or purchaser or subscriber under
appropriate investment or similar laws. The price of the Shares as well as the income and dividends, if any, from
them can go down as well as up.
In connection with the Offering, the Managers, the Financial Adviser and their respective affiliates acting as an
investor for its or their own account(s) may subscribe for or purchase Offered Shares and, in that capacity, may
retain, subscribe for, purchase, sell, offer to sell or otherwise deal for its or their own account(s) in such securities,
any other securities of the Company or other related investments in connection with the Offering or otherwise.
Accordingly, references in this Prospectus to the Shares being issued, offered, subscribed or otherwise dealt with
should be read as including any issue or offer to, or subscription or dealing by, the Managers, or the Financial
Adviser or any of their respective affiliates acting as an investor for its or their own account(s). Neither the
Managers nor the Financial Adviser intend to disclose the extent of any such investment or transactions otherwise
than in accordance with any legal or regulatory obligation to do so.
The Selling Shareholders and the Managers reserve the right, following the allocation procedure, to reject any
offer to subscribe for or purchase any Offered Shares, in whole or in part, and to sell to any prospective investor
less than the full amount of the Offered Shares sought by such investor, in any case in compliance with the terms
and conditions set out in this Prospectus.
Except as expressly set forth herein, information on the Company’s or a Selling Shareholder's website, any
website mentioned in this Prospectus or any website directly or indirectly linked to the Company’s or a Selling
Shareholder's website is not incorporated by reference into this Prospectus and any decision to subscribe for or
purchase any Offered Shares should not be made in reliance on such information.
The distribution of this Prospectus and the offer and sale of any Offered Shares may be restricted by law in certain
jurisdictions. You must inform yourself about, and observe any such restrictions. Any failure to comply with these
restrictions may constitute a violation of the securities laws of any such jurisdiction. None of the Company, the
Selling Shareholders or the Managers accepts any legal responsibility for any violation by any person, whether or
not a prospective purchaser of Shares, of any such restrictions. No action has been nor will be taken by the
Company, any Selling Shareholder, the Managers, or the Financial Adviser that would permit, otherwise than in
Romania pursuant to the Offering, an offer of any Offered Shares, or possession or distribution of this Prospectus
or any other offering material or an application for admission of Shares to trading, in any jurisdiction where action
for that purpose is required, other than in Romania for admission of Shares to trading on the BSE. This Prospectus
may not be used for, or in connection with, any offer to, or solicitation or an application for admission to trading
by, anyone in any jurisdiction or under any circumstances in which such offer or solicitation or application for
admission to trading is not authorised or is unlawful. Further information with regard to restrictions on offers and
sales of Shares is set forth below and under "Subscription and Sale" and "Selling and Transfer Restrictions".
The Managers are acting exclusively for the Company and the Selling Shareholders and no one else in connection
with the Offering, and will not be responsible to any other person to provide the protection afforded to their clients
or advice in relation to the Offering.
The Financial Adviser is acting exclusively for the Company and no one else in connection with the Offering, and
will not be responsible to any other person to provide the protection afforded to their clients or advice in relation
to the Offering.
None of the Managers or the Financial Adviser accepts any responsibility whatsoever for the contents of this
Prospectus or for any other statement made or purported to be made by it or any of them or on its or their behalf in
connection with the Company or the Shares. Each of the Managers and the Financial Adviser accordingly
disclaims, to the fullest extent permitted by applicable law, all and any liability whether arising in tort or contract
or otherwise (save as referred to above) which it might otherwise have in respect of this Prospectus or any such
statement.

19
This Prospectus will be available on the website of Raiffeisen Bank S.A. at www.raiffeisen.ro and on the website
of Alpha Finance Romania S.A. at www.alphafinance.ro and on the website of the BSE at www.bvb.ro. Pricing
information and other related disclosures are expected to be published on these websites. Copies thereof will be
provided upon request during normal business hours at the headquarters of Wood & Company a.s. (Bucharest
branch) located at Metropolis Center, 89-97 Grigore Alexandrescu St., East Wing, 3rd Floor, 010624 Bucharest 1,
Romania, at Raiffeisen Bank S.A. premises, located in By Tower Building, 246 D Calea Floreasca, Bucharest,
Romania, and at the headquarters of Alpha Finance Romania S.A. located at 237B Calea Dorobanti, 2nd floor,
Bucharest, Romania. The Prospectus will be available on the website of the Company at www.spheragroup.com.
The posting of the Prospectus on the internet does not constitute an offer to sell or a solicitation of an offer to buy
any of the Shares to or from any person in any jurisdiction in which it is unlawful to make such offer or
solicitation to such person. The electronic version may not be copied, made available or printed for distribution.
The Articles of Association are available on the Company’s website at www.spheragroup.com.
NOTICE TO INVESTORS IN THE UNITED STATES
The Offered Shares have not been and will not be registered under the Securities Act or with any securities
regulatory authority of any state or jurisdiction in the United States for offer or sale as part of their distribution and
may not be offered or sold in the United States. The Offered Shares are being offered and sold outside the United
States in offshore transactions in reliance on Regulation S. The Offered Shares, this Prospectus and any material
related to the Offering will not and may not be distributed, offered or marketed in or into the United States. For a
description of restrictions on offers, sales and transfers of the Offered Shares, and the distribution of the
Prospectus, please see "Selling and Transfer Restrictions".
Neither the SEC nor any state securities commission or any non-US securities authority, except for the FSA,
has approved or disapproved the Prospectus, or the distribution or the selling of the Offered Shares, or
determined that this Prospectus is accurate or complete. Any representation to the contrary is a criminal
offence.
NOTICE TO INVESTORS IN THE EEA
This Prospectus has been prepared on the basis that all offers of Offered Shares (other than in Romania) will be
made pursuant to an exemption under Article 3.2 of the Prospectus Directive, as implemented in member states of
the EEA, from the requirement to produce a prospectus for offers and admission to trading of shares. Accordingly,
any person making or intending to make any offer of Shares or seeking admission of Shares to trading on a spot
regulated market within the EEA should only do so in circumstances in which no obligation arises for the
Company, any Selling Shareholder, the Managers, the Financial Adviser or any other person to produce a
prospectus for such offer or application to trading.
None of the Company, the Selling Shareholders, the Managers or the Financial Adviser have authorised, nor do
they authorise, the making of any offer of the Shares through any financial intermediary, other than offers made by
the Managers, which constitute the final placement of the Offered Shares contemplated in this Prospectus nor have
any of them authorised any application of admission of Shares to trading on a regulated markets other than the
spot regulated market operated by the BSE.
Notwithstanding the foregoing, in relation to each member state of the EEA that has implemented the Prospectus
Directive (each, a "Relevant Member State"), with effect from and including the date on which the Prospectus
Directive is implemented in that Relevant Member State, the offer of any Offered Shares may be made in that
Relevant Members State: (i) to entities which are Qualified Investors; (ii) to fewer than 150 natural or legal
persons (other than qualified investors as defined in the Prospectus Directive) subject to obtaining the prior
consent of the Joint Bookrunners for any such offer; or (iii) in any other circumstances falling within Article 3(2)
of the Prospectus Directive, if applicable, provided that no such offer of Offered Shares shall require the
Company or any Selling Shareholder to publish a prospectus pursuant to Article 3 of the Prospectus Directive or
supplement a prospectus pursuant to Article 16 of the Prospectus Directive.
For the purposes of this notice to investors, the expression an "offer of (Offered) Shares" in any Relevant
Member State means the communication in any form and by any means of sufficient information on the terms of
the Offering and the Shares to be offered so as to enable an investor to decide to subscribe for or purchase the

20
Shares, as the same may be varied in that Relevant Member State by any measure implementing the Prospectus
Directive in that Relevant Member State.
Each subscriber for or purchaser of Shares in the Offering located within a member state of the EEA (other than in
Romania) will be deemed to have represented, acknowledged and agreed that it is a Qualified Investor. The
Company, each Selling Shareholder, the Managers and their affiliates, and others will rely upon the truth and
accuracy of the foregoing representation, acknowledgment and agreement.

21
RISK FACTORS
An investment in Shares involves a high degree of risk. You should carefully consider the following information
about these risks, together with the information contained elsewhere in this Prospectus, before deciding whether
to invest in Shares. If any of the following risks materialises, individually or together, there could be a material
adverse effect on our business, financial condition and results of operations, prospects, and the trading price of
Shares, and you could lose all or part of your investment.
We have described the risks and uncertainties that we believe are material, but these risks and uncertainties may
not be the only ones we face. Additional risks and uncertainties, including those of which we are currently not
aware or which we deem immaterial, could have the effects set forth above. Prospective investors should be aware
that the value of Shares and any income generated by Shares (if any) may increase or decrease and that investors
may not be able to realize their initial investment.
Thus, potential investors should apply special care when assessing the risks involved and should decide,
individually, if such an investment is appropriate considering these risks.
The order in which the following risk factors are presented does not necessarily reflect the likelihood of their
occurrence or the relative magnitude of their potential material adverse effect on the Group's business, financial
condition, results of operations and prospects, or the market price of the Shares.
Risks Relating to Our Business and Industry
Our rights to operate KFC, Pizza Hut and Taco Bell branded units are dependent on the
Franchise Agreements concluded with Yum!
The Group's ability to conduct business is dependent on its rights to operate KFC, Pizza Hut (Dine In restaurants
and Delivery units) and Taco Bell - branded restaurants in Romania, Republic of Moldova and Italy, which are
granted by Yum! on a non-exclusive basis and based on International Franchise Agreements ("Franchise
Agreements") entered into for each of the Group's restaurants. We run the risk that Yum! may grant franchise
rights to other restaurant operators, allowing such operators to open restaurants in areas where the Group is active.
This may create additional competition for the Group and may potentially lead to the oversaturation of the market
for the brands that are currently operated by the Group or to the overcrowding of restaurant locations in a specific
area. All these potential actions by Yum! arise from the fact that our franchise rights are granted on a non-
exclusive basis and may lead to a decrease of customer inflow to restaurants operated by us, and/or may put
pressure on the pricing of the products offered in our restaurants, which may have an impact on our sales.
However, the development agreements entered into with Yum! for KFC brand grants us, subject to compliance
with certain conditions, a territorial protection in Romania and in the Republic of Moldova during the incentive
term (i.e. 2017 - 2021) and a right of first refusal in Italy.
Furthermore, the Franchise Agreements provide generally for an initial franchise term of 10 years with the
possibility of extension for an additional term of 10 years, subject to the franchisee and the guarantors under the
Franchise Agreement complying with a series of conditions. For more details on the franchise agreements
conditions and description of guarantors thereunder, please see "Business - Our contractual relationship with
Yum!". As a result, the Group's ability to continue operating in its current capacity is fully dependent on the
continuity of its contractual relationship with Yum!. The Group members may not be able to satisfy the renewal
criteria, in which case Yum! may refuse the application for renewal after the expiry of the initial franchise term. In
case this occurs and the restaurant for which the renewal is sought is a profitable one, the Group may not be able
to secure another Franchise Agreement with Yum! for that restaurant or may be forced to negotiate terms
significantly more cumbersome to the Group than those which would have applied if the renewal would have been
granted. There is no assurance that the Group will be able to satisfy all renewal criteria and secure the franchise
for an additional franchise term.
In any case where a Franchise Agreement expires and is not renewed, the Group would be required to cease
operating the restaurant, cease identifying its business with Yum!’s and cease using any of Yum!’s intellectual
property with respect to that restaurant. The Group will also incur costs to de-identify the restaurant from any
marks affiliating the restaurant to Yum! brands, in accordance with Yum!'s instructions. Furthermore, the
Franchise Agreement prohibits the franchisee from engaging directly or indirectly in certain competitive

22
businesses, including preparation, marketing or sale of products similar to the food products offered in the
respective restaurant, during a 12-month period following termination of the Franchise Agreement. Yum! may also
terminate the Franchise Agreements for cause. For a detailed description of the events of default under the
Franchise Agreement that entitle Yum! to terminate the Franchise Agreements, please see chapter "Business – Our
relationship with Yum! " of this Prospectus.
Refusal by Yum! to renew terms or termination by Yum! for cause of some or all the Franchise Agreements of the
Group’s restaurants may have a material adverse effect on our business, results of operations and financial
condition.
Our business depends on our relationship with Yum! and on our ability to comply with Yum!
requirements
The Group's revenues are dependent on a mutually beneficial contractual relationship with Yum!. Based on the
Franchise Agreements, Yum! has the ability to exercise substantial influence over the conduct of the Group's
business. For example, the Group must comply at all times with Yum! quality standards, and can only prepare,
market or sell products approved by Yum!. The Group may only engage suppliers and distributors pre-approved
by Yum!. The Group also needs prior approval from Yum! before undertaking any corporate restructuring and may
not charge, pledge or encumber or create security interest or lien over any interest in, or right under, the Franchise
Agreements or in the business or in any assets of the business. The Group's advertising efforts are also linked to
Yum!'s instructions and standards. There is no assurance that the Group will be able to maintain a well-functioning
relationship with Yum! and also that at all times will comply with the commitments that Yum! imposes. Failure to
comply with these commitments could constitute a material breach of the Franchise Agreements and may lead to a
termination by Yum! of the Franchise Agreements.
If the Group is unable to maintain a well-functioning relationship with Yum! and/or satisfy the commitments set
by Yum!, this would lead to a breach of those agreements and could result in a material adverse impact on our
business, results of operations and financial condition.
We may not be able to comply with the minimum roll-out of restaurants imposed by Yum!
We have committed to Yum! to open a minimum number of restaurants for the KFC, Pizza Hut and Taco Bell
brands in Romania and Italy, under a number of development agreements and other commitments. For more
details on the development commitments towards Yum!, please see "Our relationship with Yum!" and "Strategy"
sections in the "Business" chapter. Under these commitments, we are required by Yum! to build a minimum target
number of restaurants within a specific period of time. Some commitments also set out a minimum trigger number
of restaurants that, in case we exceed, entitled us to certain incentives (e.g. waiver by Yum! of the initial royalty
for the new restaurants built and, subject to compliance with certain conditions, waiver of the advertising fees for
a period of time). The consequences of us failing to open the minimum committed number of restaurants vary,
depending on the arrangement entered with Yum! governing a particular brand, ranging from forfeiture of the
initial royalty for the restaurants that were committed but not opened in a particular year, to payment of a monthly
assumed continuing royalty with respect to each failed build and may, in certain cases, lead to Yum! being entitled
to terminate the Franchise Agreements (e.g. in case of Pizza Hut Master Franchise Agreement).
Failure by us to comply with the minimum number of restaurants required under our development commitments
towards Yum! could result in Yum! charging us additional royalties and may even entitle Yum! to terminate certain
of our Franchise Agreements, which may have a material adverse effect on our business, results of operations and
financial condition.
Failure by Yum! to protect its intellectual property rights, including its brands, could harm our
results of operations
Yum! is the owner of the trademarks the Group uses for its franchise business. The success of the Group's business
strategy depends on its continued ability to use Yum!'s existing trademarks and service marks in order to increase
brand awareness and further develop the products offered by the Group in the restaurants. If Yum!'s efforts to
protect its intellectual property used by the Group are not adequate, or if any third party misappropriates or
infringes Yum!'s intellectual property, the value of the brands used by the Group may be harmed. There can be no
assurance that the measures undertaken by Yum! to protect its intellectual property, particularly in Romania, Italy
and in the Republic of Moldova, will be adequate.

23
The Group maintains the recipes for its products, as well as certain standards, specifications and operating
procedures, as trade secrets or confidential information under the Franchise Agreements entered into with Yum!.
The Group may not be able to prevent the unauthorized disclosure or use of such trade secrets or information,
despite the existence of confidentiality agreements and other implementing measures. If any of our trade secrets or
proprietary information were to be disclosed to or independently developed by a competitor, Yum! may terminate
the Franchise Agreements.
Furthermore, our business is dependent on the strength and reputation of KFC, Pizza Hut and Taco Bell brands at
an international level and negative publicity in any region of the globe, even relating to another franchisee of
KFC, Pizza Hut and Taco Bell brands than ourselves, may result in a decrease of our customers, which could have
a material adverse effect on our business, results of operations and financial condition, and the recovery from such
a reputation fall may be outside the control of our management.
All these factors related to Yum!'s potential failure to protect its intellectual property rights may have a material
adverse effect on our business, results of operations and financial condition.
We operate in a highly competitive market, and competition is expected to increase in the coming
years
The food service industry, and particularly its quick service and full service segments, are competitive. In addition,
Bucharest, the primary market in which the Group operates, is the most competitive full service market in
Romania. The Group expects competition in the food service industry, and across all of geographical markets that
we operate in, to continue to increase at an accelerated pace. Such competition is primarily based on price,
convenience, quality of service, brand recognition, restaurant location and type and quality of food. If the Group
cannot compete successfully with other quick service and full service companies in new and existing markets, the
Group could lose market share and its revenue and profitability could decline. The Group's restaurants compete
with national and regional quick service and full service restaurant chains for customers, restaurant locations,
qualified management and employees. Some of the Group's competitors may have more efficient expansion plans,
may enjoy significantly greater financial strength, may have been in business longer, may have greater brand
recognition or may be better established in the markets where the Group's restaurants are located or are planned to
be located. New entrants may also move into the food service market and new models of activity and industry
trends driven by online ordering platforms, such as food aggregators, could increase their penetration and market
share. The Group's ability to compete efficiently will depend on the ability of its business to adapt quickly to
market and industry trends. These competitive factors, and the failure of the Group to successfully address them,
may have a material adverse effect on our business, results of operations and financial condition.
We are dependent on our suppliers and the supply chain may be materially disrupted
The industry in which the Group operates is generally heavily dependent on its suppliers for the timely and
adequate procurement of food supplies and other materials. At the same time, supply delivery can be interrupted
by a number of factors, including natural disaster, adverse weather, infrastructure issues, price increases or
damage to a supplier location, and an industry-specific occurrence such as widespread poultry disease. The loss,
even of a single dependable supplier can lead to a loss of income, and can affect the continuity, quality and
consistency of the service provided by the Group.
For some core ingredients, such as poultry and poultry products, we rely on a limited number of Yum! pre-
approved suppliers. In case one of the suppliers fails to supply the required ingredients, we would need to switch
to other suppliers swiftly. Supplier switching carries significant costs, potentially higher prices, delivery and
production delays, which may adversely affect the Group's business, results of operations and financial condition.
Some of the main ingredients required, such as mix of spices, are produced in, and sourced from, a small number
of countries and suppliers. If these countries are struck by general adverse conditions, ranging from political to
environmental, that would negatively impact the successful transportation and delivery of such products to the
Group, the Group’s restaurants may face supply shortages and this would induce price increases in raw materials.
Furthermore, the Group depends on its suppliers to be able at all times to fully comply with the regulatory
requirements set within their own industry. Although we specify performance standards with our suppliers and
providers, we do not ultimately control their performance, which may make our operations vulnerable to their
performance failures. Failure by the suppliers to comply with regulatory requirements at all times, resulting in any
material breach that would render them unable to provide their products, would have an adverse effect on the
Group’s supply function.

24
If the Group's suppliers fail to provide the Group with products in a timely manner due to unanticipated demand,
regulatory, production or distribution problems or financial distress, or if the suppliers decide to terminate their
relationship with the Group, or if Yum! determines that any product or service offered by an approved supplier is
not in compliance with its standards, and the Group is required to terminate its relationship with such supplier, the
Group may have difficulty identifying a replacement supplier due to the requirement that the Group is allowed to
use only Yum! approved suppliers. As a result, the Group may face inventory shortages that may have a material
adverse effect on our business, results of operations and financial condition.
Increases in commodity prices or other operating costs could decrease our operating profit
margin
The Group relies on commodities such as beef, chicken, dairy products and spices mixes, beverages and toppings.
The overall cost of food and supplies depends on several factors, including global supply and demand, new
product offerings, weather conditions and fluctuations in energy costs, all of which are outside the Group’s control
and make the Group susceptible to fluctuations in the price of its supplies. The Group is also faced with other
operating costs, including labour and energy costs, which are also outside its control. Due to the competitive
nature of the restaurant industry, the Group may be unable or fail to compensate any increase of its commodities,
food, supplies and generally operating costs by cost savings or product price increases. Such inability or failure
may have a material adverse effect on our business, results of operations and financial condition.
Product liability claims or poultry related health pandemics could have a negative impact on
consumers' confidence in the safety and quality of our products
The Group may from time to time be involved in product liability claims typical for the food industry, such as
product alteration or injury following consumption.
Also, incidents of health pandemics, food-borne illnesses or food tampering could force the Group to close a
number of restaurants for an undetermined period of time. Widespread illnesses such as avian influenza, the H1N1
influenza virus, e-coli, or hepatitis A generally affecting the population may cause customers to avoid certain
products, resulting in lack of confidence from customers in the products offered by the Group, especially in
poultry food. What is more, even if such poultry related health pandemics would not affect the products offered by
the Group, but by other restaurants, still a direct impact can be produced over consumers, who might avoid poultry
products irrespective of who is offering them. This would result in a decrease in the number of clients for the
Group's restaurants.
Furthermore, the Group's reliance on third-party food suppliers and distributors increases the risk of food-borne
illness incidents to all of the Group's restaurants that are served by the respective suppliers and distributors. Power
outages and other issues beyond the Group's control can result in costly spoilage or contamination of food. Also,
any media news or reports of inspection authorities released to the public identifying unsanitary preparation or
preservation of food products in restaurants that are not related to the Group or that are not under the Group's
control may change the perception of its customers about the quality of the products in restaurants in general.
Adverse publicity may negatively impact our reputation, regardless of whether the allegations are valid.
As our core business is the operation of restaurants, the Group depends on consumer confidence in the quality and
safety of food products offered in our restaurants. While the Group maintains high standards for the quality of
food products and dedicates substantial resources to ensure that these standards are met, the spread of these
illnesses is often beyond its control and the Group cannot assure that food-borne illnesses will not occur, as a
result of consumption of its products. Product liability risks are currently not covered by product liability
insurance.
In addition, the food service industry in general is subject to the threat of food tampering by suppliers, employees
or customers, such as addition of foreign objects to the food that the Group sells. Instances of food tampering,
even those occurring solely at competitor restaurants, in the markets where the Group operates, or even in other
markets, even totally unrelated with the Group’s market geographies, could cause negative publicity to the
restaurant industry in general, and to the Group in particular.
All of the above could (with immediate effect) result in significantly reduced demand for our food, reduced guest
traffic, severe declines in restaurant sales and financial losses as well as significant reputational damages and legal
claims of aggrieved guests, even if we were ultimately deemed not to be responsible for the issue or our liability
was limited. A decrease in customer confidence in the Group's products as a result of real or perceived public

25
health concerns or negative publicity may have a material adverse effect on our business, results of operations and
financial condition.
We may be unable to attract or retain sufficient qualified personnel, including due to increased
labour costs
The Group's ability to recruit, train and retain an appropriate number of qualified personnel capable of delivering
satisfactory services is key to the Group's success.
The Group may face problems attracting new personnel, as a significant proportion of the Romanian workforce
works abroad, leading to shortages in the local labour market. Even if the Group is able to recruit new personnel,
it may be unable to retain them after having invested in their training and qualification. Notably, among the
criteria that allow the Group to renew the Franchise Agreements is the ability of the Group to maintain and use the
training programmes in all the restaurants, and to have the restaurants managers and the area managers trained and
certified under Yum!'s management training programmes. However, after receiving training under the Group
training programmes, the employees may opt to leave the Group and seek employment at one of the Group’s
competitors or at another food service provider. In addition, we may be unable to prevent the disclosure or use of
our technical knowledge, practices or procedures by departed personnel.
The perennial staff shortage issue of the Romanian food sector and other factors progressively increase the
pressure on the wages that the Group must pay. In the last seven years, the gross minimum wage has more than
doubled from RON 600 to RON 1,450. Further increases are expected in the upcoming years. If these increases of
costs cannot be offset by increases in product prices or productivity gains, it would lead to a decrease in the
Group's operating profit margins. In addition, failure by the Group to successfully attract and retain personnel at
an acceptable cost level could raise difficulties for the Group to operate efficiently or reach its growth and
profitability targets, which ultimately may have a material adverse effect on our business, results of operations and
financial condition.
We are dependent on our management and key personnel
Our future success depends to a significant extent upon the leadership and performance of the members of our
senior management, as well as of certain other key employees, particularly sufficiently qualified general managers
and deputy managers for our restaurants, but also restaurant personnel and on our continued ability to be able to
attract and retain skilled and qualified executives and key personnel. We strengthened our senior management by
hiring professionals with extensive international experience in the food service sector in general, and in working
with Yum! in particular, as well as others with finance, capital markets and marketing background. If we lose the
services of any of our executive management members or key employees, we might not be able to find suitable
individuals to replace such personnel on a timely basis or without incurring increased costs, or at all. Furthermore,
as the Group expands and grows the business, we will face increasing personnel staffing requirements. Failure to
hire and retain qualified general managers and deputy managers for our restaurants could lead to operational
deficiencies and ultimately to decreased guest satisfaction and traffic, (e.g. due to longer waiting periods or poor
service). The current high level of competition for personnel and specialists in Romania, may hinder our efforts to
hire and retain qualified personnel, lead to higher than planned attrition or lead to increased personnel costs. This
increases the risk that we may not be able to recruit the necessary personnel and fill vacant positions adequately
and on a timely basis.
Furthermore, we may fail to maintain competitive compensation packages, including equity incentives.
Failure to retain executive management members or key employees or to attract such personnel in existing could
have a material adverse effect on our business, results of operations and financial condition.
We may not be able to implement our expansion strategy
Although the Group has been able to deliver high growth rates in recent years, we may fail or be unable to open
new KFC, Pizza Hut and Taco Bell restaurants or refurbish existing ones in accordance with our future capital
expenditure programme.
Our long-term success is dependent on the ability to identify and secure appropriate sites successfully, and
develop and expand our operations in new and existing markets. In the foreseeable future, one of the key means of
achieving further growth will be opening and operating new restaurants on a profitable basis. As the identification
of new target markets and specific restaurant locations depend on a number of uncertain factors such as, in case of
26
sites, traffic patterns and commercial, residential and infrastructure development, we cannot assure that we will
always be able to identify the most attractive locations and correctly analyse the suitability and quality of new
locations (due to e.g., time pressure, lack of diligence, improper supervision by the management, inappropriate
decision criteria or missing or false data).
Furthermore, we may not be able to open our planned new restaurants within budget, on a timely basis or at all, in
particular due to the following factors:
• unavailability of attractive locations for new restaurants or availability only at commercially unreasonable
terms;
• unavailability of locations for our restaurants in new markets due to lack of interested or appropriate counter
parties, trust or network;
• competition for appropriate restaurant locations;
• failure to obtain construction permits for us or for third parties;
• failure to get Yum! approval to open a new restaurant;
• failure of brownfield projects in shopping centres or other restaurant locations to be launched, developed or
operated as successfully as planned;
• failure to negotiate leases with acceptable terms;
• failure of the landlords to deliver real estate to us on a timely basis; and
• failure to recruit and train qualified personnel in the local job market.
As the choice of new locations for our restaurants might prove to be economically disadvantageous, we might fail
to achieve the benefits expected from the expansion of our business and the opening of new restaurants. In
addition, each time one of our long-term leases expires, we may incur significant costs in negotiating an extension
or finding a viable alternative.
Moreover, current restaurant locations may become unprofitable, and attractive new locations may not be easily
available for a reasonable price, if at all. Additionally, the closing or reallocation of traffic generators can also
render an existing location uneconomical.
Any failure to identify and secure appropriate restaurant sites may materially harm the Group’s ability to increase
its revenue and profitability.
In addition, our brands are present in a number of cities across different geographies and in many of those cities
we operates more than one restaurant. As the Group’s development plans unfold, more restaurants may be opened
in those cities and this could have a cannibalization effect on the performance of existing restaurants, meaning that
new restaurants may "eat up" part of the sales and the demands of the existing restaurants. This effect may be two
folded, as it may manifest among restaurants of the same brand, as well as among restaurants of different brands
operated by us. Sales cannibalization between our restaurants may affect the Group’s revenue and profitability and
may have a material adverse effect on our business, results of operations and financial condition.
Failure to maintain the same growth rates as those recorded in the past may have a material adverse effect on our
business, results of operations and financial condition.
We have recently entered the Italian market by opening KFC restaurants in cities where the KFC
brand is novel
We have recently opened our first KFC restaurants in Italy. The Italian market, although a competitive and mature
food market, has only a limited number of KFC restaurants in operation. We plan to continue our development in
Italy and open KFC restaurants in cities where the brand is a new entrant.
We have little operating experience in Italy and restaurants opened in Italy may take longer to reach the expected
sales and profit levels on a consistent basis. It is possible, at least initially, for these units to be less profitable on
average than our existing restaurants and may have higher construction, set-up costs or operating costs compared
to restaurants we open in Romania.
Failure to establish the brand in the Italian market, obtain a sizeable market share, and develop strong brand
awareness, may have a material adverse effect on our business, results of operations and financial condition.

27
We have launched and are further planning to develop Taco Bell brand in the Romanian market
Our first Taco Bell restaurant was opened in Romania on 12 October 2017. Although the Romanian food market is
growing, and new brands have been successfully introduced in the recent years, there is a risk that Taco Bell will
not be successful. Failure of the Taco Bell brand may have a material adverse effect on our business, results of
operations and financial condition.
Failure to secure sub-franchisees may have an impact on the Pizza Hut Delivery business
Yum! has granted us the Master Franchise rights for the development of Pizza Hut Delivery restaurants in
Romania, which means we can either open delivery restaurants ourselves or we may sub-franchise to third parties
the opening and development of Pizza Hut Delivery restaurants. Although we will plan to continue to open Group
operated Pizza Hut Delivery restaurants, we do expect also to be able to identify sub-franchisees who will open
incremental restaurants to our existing network. In case we, however, fail to do so, this may have an impact on the
Pizza Hut Delivery business, which may have a material adverse effect on our business, results of operations and
financial condition.
We operate in a sector where a number of approvals, licences and permits need to be in place for
each restaurant
We are subject to a large number of laws and regulations affecting the operation of our business, in particular,
European Union legislation, national and local laws and regulations concerning food safety and hygiene,
occupational safety and welfare, environment and consumer protection, employment, licensing requirements, and
rules imposed by numerous regulatory and enforcement authorities.
In the context of operating in a very strict regulatory environment, we seek to maintain high standards of service,
hygiene and consistency across our operations. In accordance with industry standards, the Group’s units operate
pursuant to regionally appropriate HACCP (Hazard Analysis Critical Control Point) documents. The HACCP is a
management system in which food safety is addressed through the analysis and control of biological, chemical,
and physical hazards from raw material production, procurement and handling, to manufacturing, distribution and
consumption of the finished product. We also carry audits across the Group’s brand portfolio with the aim of
ensuring that the Group is adhering to brand, operational and regulatory standards.
Our licences are subject to review, interpretation, modification or termination by the relevant authorities and the
regulatory framework applicable to them is also subject to frequent changes. There is no assurance that the
relevant authorities will not take any action that could materially adversely affect our operations. Some of these
licenses and other authorizations are particularly complicated and lengthy to obtain and may subject us to ongoing
compliance obligations. Failure to comply with the laws and regulations governing our business or with the terms
of our licences could result in suspension or withdrawal of those licences, could incur for us substantial costs and
liabilities vis-à-vis third parties or governmental authorities, as well as the closure of non-compliant restaurants.
As laws and regulations become more stringent, the amount and timing of future expenditures required to
maintain substantial compliance could vary materially from their current levels and could adversely affect the
availability of funds for capital expenditures and other purposes. To the extent that the cost of compliance
increases and we cannot pass on future increases to our customers, such increases may have an adverse effect on
our business, results of operations and financial condition.
Our operational authorisations and permits may be deficient
Our environmental and other operational authorisations and permits are generally issued for every restaurant in
which we operate. However, there are instances where the environmental authorisations were issued to third
parties in respect of the facilities (normally, shopping malls) in which we rent our locations.
The format and minimum content of the environmental authorizations are prescribed by law. Some of our
environmental authorizations do not comply with such minimum content or include inaccurate data with respect to
the activities carried out in our locations. For instance, certain authorisations provide that we do not handle
hazardous/dangerous substances, while we use industrial detergents and/or produce gas from the combustion of
fuel in the heating plants, both regarded as hazardous/dangerous substances. Furthermore, some of our sanitary-
veterinary permits contain material errors, such as incorrect references to locations for which permits were
granted. Consequently, there is a risk that such authorisations and permits may be suspended, cancelled or
declared void by the inspection authorities, in which case the affected restaurants may be closed. Also, some

28
authorizations do not make reference to the existence of any equipment on location for the retention, evacuation
and dispersion of pollutants in the air, as required by law for the type of activity carried out by us.
Furthermore, most of the operating authorisations are valid until 31 December 2017. The operating authorisations
are valid for one calendar year as per the current legislation and are generally renewable upon expiration. Prior to
the expiry of their validity, we will be required to apply for the renewal or for the issuance of new authorisations.
There is no assurance that we will be able to obtain the relevant operational authorisations and permits or the
renewal thereof in time to be able to carry out our business in the restaurants for which authorisations will expire.
Failure to comply with the requirements under our operational authorisations or inability to renew the existing
ones could result in substantial costs and liabilities vis-à-vis third parties or governmental authorities, as well as
the closure of non-compliant restaurants, which may have an adverse effect on our business, results of operations
and financial condition.
Fire safety permits are required for all our restaurants
The restaurant industry is at a high risk for fire due to the operation of hot surfaces and open flames. The Group
has undertaken all necessary fire-suppression steps as prescribed by law and regularly procures maintenance of
these processes.
The Group does not have firefighting permits (RO: autorizatii de securitate la incendiu) in place for few
restaurants, mostly for those recently opened where the documentation has been submitted but the permit is yet to
be issued. The completion of these procedures is subject to various requirements, which may include performance
of certain works and upgrades to the Group's facilities. The Group regards the amounts of the required
investments as being immaterial; however, the completion of the necessary works and upgrades is subject to, in
certain cases, additional authorisations and clearances, or other procedures in which the Group has engaged. For
more details on the issuance of firefighting permits in Romania, please see "Regulatory – Material Permits and
Approval – Firefighting permits".
There is no assurance that the Group will obtain the necessary firefighting permits for all of its restaurants, or that
the Group will be able to obtain these authorisations at reasonable cost. Operation of the Group's units without an
appropriate firefighting permit may lead to the authorities closing the respective restaurants for an undetermined
period of time, which may have a material adverse effect on our business, results of operations and financial
condition.
Operating and leasing a broad portfolio of locations exposes us to potential losses and liabilities
As of 30 September 2017, while the Group owned real estate locations for only one of the Group's 104 restaurants
operating at the time, the rest of the locations were leased from public or private persons. The value of these
owned real estate assets could decrease, or rental costs could increase, due to, for example, increases in rent under
the lease contracts, changes in local demographics, investment climate and tax increases.
The majority of the Group's restaurant locations, or those operated by the Group's franchisee are subject to
medium-term leases. The Group may not be able to renew leases on acceptable terms or at all, in which case the
Group would have to find new locations to lease (which may not be attainable) or be forced to close the
restaurants. Even if the Group is able to negotiate a new lease at an existing location, it may be subject to a rent
increase. In addition, current restaurant locations may become unattractive due to changes in neighbourhood
demographics or economic conditions (such as traffic patterns, proximity to cinemas or shopping malls, fuel
prices), which may result in reduced sales at these locations. Also, in some cases the owner of the property in
which a Group restaurant is located has, under the lease contract, a discretionary right to relocate the tenant within
the premises with no right for the tenant to refuse the relocation or to receive compensation. This could cause
business interruption if fit-out and permitting of the new space are not managed in a timely manner. Business
interruptions may also occur in case owners of the property leased by us for our restaurants become bankrupt and
the operations in the affected property must be ceased. At the same time, under most lease contacts concluded by
Group members as tenants, the owners considerably limit their liability towards the Group for damages caused as
a result of improper conduct by other tenants and third parties, criminal actions, failure to provide public utilities,
security system errors, and especially regarding the obligation to cover the tenants' lost profit, as well as in case of
physical/fortuitous damage to the location.
Furthermore, the properties currently owned or used by the Group may be subject to restitution claims by former
owners, on the grounds that such properties were abusively confiscated by the Romanian State during the

29
communist regime. As a general rule, former owners benefit from restitution in kind of their former properties.
However, if restitution claims may no longer be solved by restitution in kind, remedy through other compensatory
measures may be granted. Even if claimants potentially entitled to file restitution claims under specific restitution
laws have not asserted such claims, under the Romanian Civil Code they are theoretically entitled to reclaim their
former properties without any statute of limitations being applicable. If a court of law awards restitution in kind of
the property owned or used by a member of the Group, the latter may be forced by the new owner of such
property to cease any activity on that property and leave the premises. Such an occurrence may have a material
adverse effect on our business, results of operations and financial condition.
Covenants and events of default in the agreements governing our outstanding indebtedness could
limit our ability to undertake certain types of transactions and adversely affect our liquidity
As at 30 June 2017, our consolidated indebtedness (interest bearing loans and borrowings) amounted to RON 47
million. Our main debt exposure is through US Food Network S.A. ("USFN (Romania)") and through American
Restaurant System S.A. ("ARS (Romania)") towards Alpha Bank Romania S.A.. The credit facility contract
allows the companies to draw funds for their planned investments and for working capital needs. The credit
facility is granted subject to the companies and their guarantors complying with certain financial and other
covenants. In particular, prior approval of the bank is required for a series of corporate actions, such as: changes to
the corporate structure, or to its articles of association, or operational actions, such as: sale of and/or encumbrance
of assets, transfer of funds through advisory or similar arrangements with a value exceeding certain thresholds.
Furthermore, events such as: cross-default under the companies' other financial obligations, change of control
deemed by the bank to have a material adverse effect (as defined in the facility contract) entitle the bank to
accelerate the amounts extended under the facility and declare the amounts immediately due and payable. The
bank may also enforce the security rights and guarantees created in favour of the bank to secure the Group's
obligations under the facility. For more information about our covenants in the financing arrangements, please see
"Business – Financing Facilities".
If we fail to comply with the covenants or in the event of default under our current credit facility documentation,
our outstanding indebtedness may become immediately due and payable, in which case we may not have
sufficient liquidity to finance our investments and working capital needs. In this case we could be required to sell
assets, refinance all or part of our indebtedness or to obtain additional financing. Refinancing may not be possible
and additional financing may not be available on commercially acceptable terms, or at all.
Any event that gives our creditors the right to declare our current indebtedness immediately due and payable may
materially affect our liquidity, which may have a material adverse effect on our business, results of operations and
financial condition.
We are exposed to fluctuations in foreign exchange rates
Our functional currency for our Romanian operations is RON. However, our indebtedness towards the bank is
denominated in EUR and we pay our franchise related fees to Yum! under Franchise Agreements in USD.
During recent years, the volatility of the EUR/RON and of the USD/RON exchange rates was relatively low.
However, there can be no assurance that this trend will continue. Also, historically, we have not entered into
arrangements to hedge against foreign exchange fluctuations.
Furthermore, the presentation currency for the consolidated financial statements is RON, while the functional
currency for our Moldovan subsidiary is the MDL and the functional currency for our Italian subsidiary is the
EUR. Therefore, we are exposed to fluctuations in exchange rates when converting MDL and EUR amounts into
RON for reporting purposes.
Any material fluctuations in the foreign exchange rate for currencies which are relevant to our business may have
a material adverse effect on our business, results of operations and financial condition.
We are exposed to fluctuations of the interest rate
The Group's borrowings are usually exposed to interest rate risk through market value fluctuations of interest-
bearing long-term and short-term credit facilities. Group's policy is to resort mainly to variable interest rate
financing. However, at the time of raising new loans or borrowings the Group companies use their judgment to
decide whether they believe that fixed or variable rate would be more favourable to the Group over the expected
period until maturity.
30
Financial markets volatility may determine material fluctuations in the interbank market interest rate which may
have a material adverse effect on our business, results of operations and financial condition.
We may be exposed to claims or disputes in the ordinary course of business
We are involved in claims, disputes and legal proceedings from time to time in the ordinary course of business,
such as claims of the Group's former employees for allegedly unlawful termination of the individual labour
contacts, third party debt orders and other claims from public authorities. At the date of this Prospectus, we
believe that none of the litigation that we are party to is material to the Group's business. However, any future
material litigation or disputes may have a material adverse effect on our reputation, business, results of operations
and financial condition.
A potential failure to protect the integrity and security of personal information of our customers
and employees could result in substantial costs, expose us to litigation and damage our reputation
The Group employs a vast number of personnel and serves a wide customer base for which there are very strict
(and some very new) legal rules on personal data protection, including fines expressed as a percentage of the
turnover. Failure to protect the integrity and security of personal information of our customers and employees
could result in substantial costs, expose us to litigation and damage our reputation, and may have a material
adverse effect on our business, results of operations and financial condition.
We may not be able to ensure the traceability of the recovered/recycled package waste
We have transferred our responsibility to manage our package waste to authorised economic operators based on
specific contracts. If the authorised operators with whom we have entered into a responsibility transfer contract
are unable to collect and manage all the quantities of package waste for which responsibility was transferred, the
authorities may apply fines, default penalties and interest, or in certain circumstances, even commence criminal
investigations against the non-compliant operator. Although the responsibility is considered to be transferred to the
operator, the recently amended legislation provides for more stringent requirements also for the producers who
transferred their liability for package waste. Thus, we are obligated to keep evidence of all quantities of package
waste placed in the market from our activity, as well as of all quantities recovered or incinerated in energy
recovery incineration plants and all quantities of total packaging waste and each type of recycled material. In
order to be able to comply with these obligations, we have to check the information provided by the authorised
operators that we use in respect of such quantities and ensure that the traceability of the recovered/recycled
package waste is possible. This may not be possible at all times. Failure to comply with the regulatory framework
on package waste management exposes us to potential fines from the competent supervising authorities or in
certain cases, our operating licence may be cancelled, in which case we will be unable to carry out our activity in
the affected locations, which may have an adverse effect on our business, results of operations and financial
condition.
A number of insurance policies need to be in place to cover for a wide range of potential liabilities
We maintain insurance policies with respect to certain operating risks, including employer's and product liability,
property liability and "all risks" type coverage. There can be no assurance that the level of insurance we maintain
is appropriate for the risks to our business or adequate to cover all potential claims. Insurance policies currently in
place may not provide adequate coverage for all claims associated with our business operations. Failure to have in
place insurance policies that cover any potential liability may have a material adverse effect on our business,
results of operations and financial condition.
A strike or other labour disruption may have a material adverse effect on our business
A substantial number of the Group's employees are represented by employees' representatives. The Group's
initiatives to reduce costs and improve production efficiencies may include the reduction of its workforce. In the
event that agreements cannot be reached with the employees' representatives for the method through which the
workforce reduction occurs, this part of management initiative may fail, as it could be impaired by strikes, threats
of strikes or other work stoppages.
Furthermore, based on the recently introduced stricter regime under the Romanian labour law, any irregularities
found in the individual labour contracts entitles the competent labour authority to order closing of the restaurant
where the irregularities have been identified.

31
Any material labour disruption in our restaurants may have a material adverse effect on our business, results of
operations and financial condition.
Poor maintenance of the road network in Romania may adversely affect our Pizza Hut Delivery
business
Romania’s road network, even within its main cities, is in a constant state of maintenance and upgrade, and during
winter it requires regular up keeping in order to maintain its use due to snowfall. The timely and safe delivery of
our products for the Pizza Hut Delivery business depends on the road network, and any failure, due to
maintenance works or unsafe passage, may have an adverse effect on our business, results of operations and
financial condition.
Our information systems and the implementation of an Enterprise Resource Planning (ERP),
may fail or be damaged, which could harm our operations and our business
We maintain a number of information systems and platforms ("IT") that are critical to the proper functioning of
our operation, while some, like the on-line ordering platform for Pizza Hut Delivery, are business essential. IT
systems are vulnerable to a number of problems, such as software or hardware malfunctions, malicious hacking,
physical damage to vital IT centres and computer virus infection. IT systems need regular upgrading to meet the
needs of changing business and regulatory requirements and to keep pace with the requirements of our existing
operations and possible expansion into new markets. We may not be able to implement necessary upgrades on a
timely basis, and upgrades may fail to function as planned.
Also, we are in the process of implementing an ERP system in the Group that would enable greater integration and
functioning of our core processes and functions. Any failure, damage, temporary or permanent, as well as failure
to timely and successfully migrate to the new ERP system, may harm our operations and our business, while any
major disruption of our existing IT systems may also have a material adverse effect on our business, results of
operations and financial condition.
Any changes to the current food law regime in Romania and in other countries in which we
operate may require engagement of significant costs to ensure compliance
Food safety is one of the primary public concerns in every country. In Europe, the European Commission
developed an integrated approach to food safety "from farm to table", primarily set out in its White Paper on Food
Safety. It covers all sectors of the food chain, including feed production, primary production, food processing,
storage, transportation and retail sale. In 2002, the European Parliament and the Council adopted Regulation (EC)
No 178/2002 setting the general principles and requirements of food law. Ever since such regulatory actions,
Romania and other European countries constantly seek to comply with the European standards on food safety.
In addition, the European Commission is currently preparing a common methodology that would examine if food
quality is lower in some EU member states than others, after several leaders of central and eastern EU member
states have alleged that there is "dual food quality", with consumers in the relatively poorer countries of the bloc
being subject to inferior quality products. On 25 July 2017, the European Commission started a dialogue with
producers and retailers to discuss how to collaborate on this issue. It is unclear what measures will be proposed
after the testing stage is completed and the results revealed. The Group may have to adapt to new rules, laws and
regulations to be potentially passed with respect to food quality in case the European Commission decides to take
action following the completion of the test and such efforts to adapt may require significant expenditure on the
part of the Group.
In Romania, the Parliament introduced the food waste law in 2016, which requires local retailers to donate
unconsumed, but safe food products, close to their expiry threshold, to charitable institutions, or sell them at
reduced prices. Although the law officially came into force on 21 May 2017, its provisions are not clear enough to
be applicable in practice and application norms have not been issued. Its application has been postponed until 31
December 2017.
The Romanian Ministry of Finance has announced that it plans to introduce a new tax on foods and drinks
containing high sugar contents, also known as "sugar tax".
In Romania, according to Order no. 163/2016 of the National Authority of Consumer Protection, operators selling
bread, bakery and pastry, as well as restaurants that use frozen food in the preparation of their menu items, are
obliged to inform consumers regarding the products obtained from frozen foods. Recently, the Italian Court of

32
Cassation (Italy's highest civil court) ruled that it is illegal for restaurants to serve frozen food without disclosing
that fact to customers. As Italy is one of the markets in which the Group operates, court rulings such as this may
cause the Group to engage significant costs in replacing or amending the labelling used for the products offered in
its restaurants.
It is also expected that Romania will adopt a national regulation for implementation of sanctions under EU
Regulation 1169/2011 on the provision of food information to consumers (also known as, "FIC Regulation"),
whereby breaches related to consumer information will be subject to significantly higher fines.
Legislation in the food industry sector often lacks clear procedural direction, as food operators are not given clear
guidelines or instructions on how to implement the measures introduced by new legislation or secondary norms in
practice. Any failure to comply with applicable laws or regulations may result in fines or other sanctions applied
by the relevant regulator and may have negative reputational consequences. If the Group has to incur significant
costs to comply with new laws and regulations or if it incurs fines and/or reputational damage as a result of its
failure to comply with new laws and regulations, it may have a material adverse effect on our business, results of
operations and financial condition.
Any tax increase or change in tax legislation may adversely affect our operational results
Among the proposed changes to the Romanian Fiscal Code is the introduction of a new tax on products the
consumption of which has a major negative impact on public health. There is no list or definition of what may
constitute products that may have a negative impact on health. According to press releases, the officials have
announced that they will investigate the European practice in this respect and will consider the analysis performed
by the Ministry of Health. Considering that we operate in the fast-food business, if implemented, such measures
may increase the Group's tax liabilities, and negatively impact consolidated results of the Group.
Furthermore, a special VAT split payment mechanism is expected to become mandatory on 1 January 2018. This
will translate into the Group being required to adapt its management systems and internal policies to this new
mechanism in a relatively short timeframe. Moreover, given the volume of transactions carried out by the Group,
we expect the related costs, as well as the associated compliance burden to be significant. The VAT split payment
mechanism is still under discussions at the level of the Romanian Parliament. In this context, it cannot be
excluded that the law will be further amended due to increased controversy and following such amendments the
VAT split payment mechanism may not be applicable to the Group.
Any changes to the tax legislation in any jurisdiction in which we operate that increases our tax burden may have
a material adverse effect on our business, results of operations and financial condition.
We may not be able to always comply with the transfer pricing rules
Certain transactions made between various companies within the Group may have not been entered into at arm's
length. Tax authorities may adjust the revenues, interest income and expenses of the companies taking part in the
intra-group trades and financing, if the authorities believe that the Group may not justify or improperly justifies in
all instances the prices charged between related parties, which would result in corresponding adjustments to the
Group companies and potentially additional late payment interest and penalties for certain Group entities.
Furthermore, considering that the Company centralises all management functions and invoices its subsidiaries
various types of services (i.e. management services, sales support services, development services, human
resources activities, marketing services, IT support services, etc.), such transactions must be carried out in
compliance with the arm's length principle. Thus, special consideration should be given to transfer pricing rules. If
the Company cannot justify or improperly justifies the prices charged to related parties, there is a risk that the tax
authorities will adjust the taxable revenues of the Company. An increased level of corporate tax may adversely
affect the Company and its profitability, which have an adverse effect on our business, results of operations and
financial condition.
Deductibility of expenses and VAT may be limited
Given that the Company performs both business activities, by carrying out management functions for its
subsidiaries (as referred to above), as well as holding activities (i.e. holding and trading securities), the
deductibility of its expenses and of the related VAT may be limited. The reason for this limitation is that the
holding activity itself (i) does not allow for the deduction of those expenses and VAT directly attributable to the
holding activities; and (ii) allows only for the partial deduction of the Company’s general expenses and related

33
VAT (on a pro-rata basis). General expenses are those expenses (e.g. accounting, IT etc.) which cannot be directly
attributable either to the management activities or to the holding activities. A limited deductibility of expenses and
of the related VAT could have a material adverse effect on our business, results of operations and financial
condition.
We may have to implement IFRS 16 (Leases) starting on or after 1 January 2019
IFRS 16 sets out the principles for the recognition, measurement, presentation and disclosure of leases for both
parties to a contract, i.e. the customer ("lessee") and the supplier ("lessor"). The new standard requires lessees to
recognize most leases on their financial statements. Lessees will have a single accounting model for all leases,
with certain exemptions. The standard has not been yet endorsed by the EU. We have entered into operating lease
agreements as lessee for the premises of most of our restaurants. We are currently assessing the impact of the
standard on our financial statements. Taking into consideration the significant number and value of signed lease
agreements, we expect a significant impact following the adoption of the standard on our consolidated statement
of financial position, and a less significant impact on our statement of comprehensive income, which could have a
material adverse effect on our business, results of operations and financial condition.
Our management team and the BoD members have limited experience in managing and
governing a public company, and regulatory compliance may divert our attention from the
administration of our business
Our management team has limited experience managing a publicly-traded company or complying with the
increasingly complex laws pertaining to public companies. In particular, our chief executive officer has not
previously managed a publicly-traded company. In addition, most of our current BoD members have no relevant
experience serving on the boards of public companies and two BoD members have recently joined our board of
directors. In order to have an effective BoD, these new BoD members will need to integrate with our other BoD
members and management and become familiar with our operations and growth strategies.
We may incur significant costs to ensure compliance with new corporate governance, transparency and reporting
requirements that will become applicable to us following the admission of Shares to trading on the BSE. Also, we
may not successfully or efficiently manage to comply with the requirements associated with being a public
company. Our failure to comply with all applicable requirements could lead to the imposition of fines and
penalties, distract our management team from attending to the administration of our business, result in a loss of
investor confidence in our financial reports, which could have a material adverse effect on our business, results of
operations and financial condition, as well as on the price of the Shares.
Our restaurants and the equipment in our restaurants may get damaged or destroyed as a result
of events or factors that are beyond our control
Our ability to successfully provide satisfactory customer service depends on the efficient and uninterrupted
operation of restaurants and of the equipment that assists our employees to serve our customers in the restaurant.
Our restaurants as well as the business related equipment are vulnerable to damage or interruption from human
errors, fires, floods, power losses, telecommunications failures, terrorist attacks, acts of war, break-ins,
earthquakes and similar events. We may not have sufficient protection or recovery plans in certain circumstances.
The occurrence of any of the foregoing risks could have a material adverse effect on our business, results of
operations and financial condition.
We are exposed directly or indirectly to reputational risk
Our business and the Offering received press and other media coverage prior to the publication of this Prospectus.
The articles resulting from such coverage may include reference to events, information (particularly with respect
to valuation) and risks that are not included in this Prospectus. Furthermore, our brands have been wrongfully
associated in the mass media with persons who have been convicted of criminal offences. The strong recognition
of our brands on the one hand exposes us to an extensive media coverage, on the other, which can lead to
reputational issues for the Group and our name.
Any negative media coverage on our business or our history could harm the Group's reputation, which may have a
material adverse effect on our business, results of operations and financial condition.

34
Country-Specific and Regional Risks
Investor confidence in emerging economies, including Romania, may further decline due to
uncertainty regarding the global macroeconomic environment
Investor confidence in emerging economies, including Romania, could falter, due to persistent poor performance
of the global economy and political, especially geopolitical, uncertainties, which hamper recovery and growth in
various regions.
In the United States, the tightening monetary policies implemented by the United States Federal Reserve Board
starting in December 2015 have increased levels of uncertainty for global economic recovery. Economic growth in
Europe has been weak in recent years, and many European economies continue to face structural challenges,
including high levels of unemployment and structural debt levels. In addition, the United Kingdom held a
referendum on 23 June 2016, in which a majority voted for the United Kingdom to exit the European Union
("Brexit"). The effects of Brexit will depend on any agreements the United Kingdom makes to retain access to the
European Union markets either during the transitional period or on a permanent basis. Brexit could adversely
affect European or worldwide economic markets and contribute to instability in global financial and foreign
exchange markets. Europe is further affected by the increasing migration crisis absorbed unevenly by its countries,
maintenance of high alert levels due to acts of terror, and persistent banking sector problems in certain euro area
countries, which heighten uncertainty about future growth. The Chinese economy faces its own significant
uncertainties, including a high level of indebtedness (particularly of non-financial corporations) funded through an
increasingly opaque financial system. Further geopolitical tensions, especially those in the Middle East, North
Korea and Africa add yet more uncertainty to global growth prospects as does the recent recourse to protectionist
trade policies that could restrict international trade.
There can be no assurance that market disruptions in Europe and globally will not spread, nor can there be any
assurance that future assistance packages will be available or, even if provided, will be sufficient to stabilise the
affected countries and markets in Europe or elsewhere. The possible exit from the Eurozone of one or more
European states and/or the replacement of the euro by one or more successor currencies could cause significant
market dislocations and lead to adverse economic and operational impacts that are inherently difficult to predict or
evaluate. Market and economic disruptions stemming from these factors have affected, and may continue to affect,
inter alia, the inflow of investment capital, the balance of trade, consumer confidence and spending and
bankruptcy rates in Romania, which in turn could have a material adverse effect on our business, results of
operations and financial condition.
Recent political and social unrest risks weakening market confidence
Romanian political scene continues its unsettling trend of the recent years. In June 2017, the cabinet lead by Sorin
Grindeanu was voted out of office by way of a "no confidence" motion filed by the ruling party (PSD – Social
Democrats) claiming poor governmental performance, and was replaced by Mihai Tudose sworn in as Prime
Minister on 26 June 2017. These events occurred just months after the ruling party faced massive street protests
shortly after being sworn into office in January 2017. The protests were targeting retraction of the proposed bills
to facilitate the pardoning of officials imprisoned for bribery and increase in the financial threshold above which
official misconduct is punishable by prison. More recent, the Prime Minister announced a limited reshuffling of
the Government, as a result of which a number of ministers, some of whom are undergoing criminal
investigations, will have to leave the office.
Strategic priorities in Romania are often affected by the political cycle, changes in political authority, in line
ministries and other politically motivated factors. While many political and economic reforms have been enacted
in recent years, certain other key reforms have not been implemented and Romania still presents a number of
structural deficiencies, such as a widening trade deficit, an ageing population which will require greater
government expenditures on social services in the future and, historically, a current account imbalance, as well as
delayed absorption of EU funds. Each of these weaknesses may affect Romania’s creditworthiness.
Social and political uncertainty, as well as the ongoing investigations of a number of government officials could
exacerbate the perception of persistent corruption in the Romanian Government and adversely affect the
investment climate and the economy. If political and social uncertainty in Romania continues or increases, it could
have a material adverse effect on our business, results of operations and financial condition.

35
Deterioration in fiscal policies threatens growth in Romania
Romania’s economy grew by 4.8 percent in 2016, a new post-crisis high and one of the fastest in the EU. The
increase was fuelled by an expansionary fiscal policy and labour market improvements, which have boosted
consumption, the main current driver of economic growth in Romania. However, successive tax cuts in recent
years have reduced revenues, while wages and pensions have grown, outpacing labour productivity, and leading to
increasing unit labour costs. In addition, the current Government's 2017-2020 plan, published in June 2017,
envisages additional significant tax cuts (e.g. a decrease of the VAT rate from 19% to 18% from 1 January 2019
and exclusion of a series of taxes). Furthermore, the Unified Wage Law effective as of 1 July 2017, introduced to
eliminate distortions in the public remuneration system, provides for a significant increase in average public
wages, from 1 January 2018. Following debates with the National Bank of Romania and the Fiscal Council, the
government scaled down the scope of fiscal loosening measures for the rest of the year.
On 14 July 2017 Fitch Ratings affirmed Romania's Long-Term Foreign- and Local-Currency Issuer Default
Ratings (IDRs) at "BBB-" with Stable Outlooks. However, the rating agency cautioned that the rating is facing an
increase in downside risks owing to a substantial pro-cyclical fiscal loosening and rapid increase in wages in
excess of productivity growth, which pose risks to macroeconomic stability. Among the risks highlighted by the
agency is the widening of Romania's general government budget deficit to 3% of the GDP in 2016 from 0.8% of
the GDP in 2015, despite the booming economy. Fitch projects the deficit will widen to 3.7% of GDP in 2017,
above the government's target of 2.9%, owing to further cuts in VAT and excise rates, and increases in public
wages, pensions and other measures.
According to the European Commission, the structural budget deficit will widen to 3.9% of GDP in 2017, which
would represent an expansion of 3.3% of GDP in two years, contrary to national and EU fiscal rules. Romania is
at risk of re-entering the EU Excessive Deficit Procedure in 2017 (the EU's detailed procedure to correct excessive
deficit or debt levels). On 22 May 2017, the European Commission addressed a warning to Romania on the
existence of a significant deviation from the adjustment path toward the medium-term budgetary objective in 2016
and recommends the European Council to adopt a recommendation for Romania to take appropriate measures in
2017 with a view to correcting this significant deviation.
Further steep tax cuts without accelerating efforts to improve revenue collection and an additional spike in public
wages when the effectiveness of public sector reforms still lags, pose a significant risk of uncertainty with respect
to the fiscal and income policy outlook, which in turn could have a material adverse effect on our business, results
of operations and financial condition.
Financing opportunities from internal and external sources are under-exploited which hinders
growth
The main sources of investment financing in Romania are state budget funds, EU structural funds and loans from
international financial institutions such as the International Monetary Fund, the European Investment Bank and
the European Bank for Reconstruction and Development. According to the European Commission's 2016 Country
Report for Romania, Romania has the second lowest level of public investment among peer countries and it is
alone among its peers in that public investment has decreased every year since 2008. Capital expenditure is
frequently under-executed relative to the budgeted amounts and a substantial part of it tends to be spent towards
the end of the year.
Furthermore, during the first five months of 2017, Romania collected EUR 1 million in EU funds, corresponding
to an absorption rate of 0.004% from the total amount allocated for Romania for 2017, under the EU structural
funding for the 2014 – 2020 period. Prior to that, according to the Ministry of Public Finance, Romania absorbed
less than two thirds of the total funds (Structural and Cohesion Fund and European Agricultural Fund for Rural
Development) allocated under the 2007-2013 programming period (69% in December 2015). As a result, a
number of projects started but not finalised during the 2007-2013 programming period are financed in the 2014-
2020 programming period.
These self-induced barriers in financing investments restrain potential growth in Romania, which in turn could
have a material adverse effect on our business, results of operations and financial condition.
The Romanian national currency may register high levels of volatility
The Romanian Leu's value against foreign currencies is determined in the interbank foreign exchange market. The
National Bank of Romania (the "NBR") may limit volatility of the Romanian Leu, depending on a number of

36
economic and political factors, including the availability of foreign currency reserves and foreign direct
investment inflows, as well as developments in market sentiment and investors’ risk aversion. Any changes to
global investors' perceptions of Romanian or global economic prospects may lead to depreciation of the Romanian
Leu. A significant depreciation of the Romanian Leu could adversely affect the country’s economic and financial
condition. Any higher than expected inflation resulting from the depreciation of the Romanian Leu could lead to a
reduction in customer purchasing power and erosion of customer confidence, which may have a material adverse
effect on our business, results of operations and financial condition.
Deficient and poor-quality infrastructure in Romania limits investments
The underdeveloped infrastructure, particularly the transportation system, is among the most problematic aspects
of doing business in Romania. According to the 2016-2017 Global Competitiveness Report, Romania still ranks
last among its regional peers in the perceived quality of transport and communication infrastructure. Romania has
been slow to expand and urgent repairs are often necessary even on newly built roads, despite the numerous
development projects undertaken in the past years to improve infrastructure (including the use of public-private
partnerships) and the available funding from the EU.
The insufficient development of infrastructure is a barrier to trade and economic development, may generally limit
investments in Romania, and restrain potential growth in Romania, which in turn could have a material adverse
effect on our business, results of operations and financial condition.
EU may apply sanctions if Romania fails to meet its post-accession obligations
Romania joined the EU in January 2007 and is subject to certain post-accession benchmarks mandated by the EU
under the Cooperation and Verification Mechanism ("CVM") to help Romania address shortcomings in judicial
reform and fight corruption. The CVM will end when all benchmarks applying to Romania are satisfactorily met.
On 25 January 2017, the European Commission published its latest report on the progress of Romania under the
CVM, marking the 10th year anniversary since Romania was placed under CVM. The report shows that, despite
some periods when reform lost momentum and was questioned, Romania has made major progress towards the
CVM benchmarks. A number of key institutions and important legislation are in place and an established track
record was seen in many areas. However, the European Commission indicates that important shortcomings prevail
and need to be addressed, such as inconsistencies in court decisions triggered mainly by follow-up of
jurisprudence by public administration and excessive workload of courts and non-implementation or delayed
implementation of court decisions by the administration, which erode confidence in justice and waste time and
resources in follow-up cases or appeals on repetitive decisions. The European Commission considers that anti-
corruption policies remain weak, particularly in public procurement.
If Romania fails to adequately address the recommendations of the European Commission regarding actions to be
taken by the Romanian State, the EU is entitled to apply certain sanctions against Romania, including suspension
of the obligation of other EU member states to recognise and enforce, under the conditions laid down in EU law,
the decisions of Romanian courts. The application of any of the sanctions referred above may have a negative
effect on investor confidence in Romania, which could have a material adverse effect on our business, results of
operations and financial condition.
Law making processes often skip public consultation or impact study stages and adopted
legislation is not applied consistently by public authorities and courts and frequently lacks
transitional norms, which endangers competitiveness
Since its accession to the European Union in 2007, Romania has laboriously pursued the convergence of its legal
framework to facilitate a prosperous market economy and investments. This process is supported by the
requirement to enact EU-compatible legislation. In many cases, the adaptation of Romanian law to EU legislation
tends to follow an imitation path rather than true adaptation, which may result in existing laws and regulations
being applied inconsistently. Due to these changes, precedents will often not be available and interpretation of
laws and regulations may be subject to significant uncertainties. Additionally, in some circumstances, it may not
be possible to obtain the legal remedies provided for under these laws and regulations in a reasonably timely
manner. Although institutions and a legal and regulatory system characteristic of a parliamentary democracy have
been developed, there is still a lack of institutional history and there may be no generally observed procedural
guidelines. As a result, shifts in government policies and regulations tend to be less predictable than in the
countries of Western Europe.

37
Furthermore, legislative initiatives of the Government and the Parliament members rarely take into consideration
public opinion or pass through the legislative process without a proper impact assessment. A few recent examples
in this respect include the draft law seeking pardoning of public officials imprisoned for bribery and the initiative
to liquidate Pillar II pension funds (mandatory private pension funds). According to the Vice chairman of the FSA
responsible for the Investments and Financial Instruments sector, Pillar II pension funds are the largest local
institutional investors in shares traded on the BSE, ensuring 10% of the BSE's liquidity. Also, fiscal relaxation
measures are not adopted in full compliance with the provisions of the fiscal responsibility law, according to
which new legislative initiatives that involve an increase in public spending or a reduction of public revenues must
include an impact assessment verified by the Ministry of Finance. For a number of legislative initiatives in 2015
these provisions were breached. These include Parliament's initiatives to reintroduce special pensions and increase
wages outside the expenditure ceilings and without proper impact assessment, as well as the significant tax cuts
included in the Fiscal Code amendments without compensating measures and without the endorsement of the
Fiscal Council.
Another frequent, inhibiting practice in Romania is the replacement of the normal legislative process by
government emergency ordinances, with a single ordinance occasionally covering several policy areas.
Furthermore, adopted legislation often takes immediate effect on publication and before secondary regulations
have been prepared. The complexity of administrative procedures as well as fast-changing legislation and policies
constitute major obstacles to doing business in Romania. According to the World Bank 2016 Worldwide
Governance Indicators, Romania's scores for regulatory quality and rule of law are well below the EU average: its
regulatory quality score has decreased from 0.64 in 2010 to 0.59 in 2015, whilst the rule of law score has only
slightly increased from 0.04 in 2010 to 0.15 in 2015 (the total range is -2.5 to 2.5).
Accordingly, the Group may face difficulties in rapidly adjusting its operations to comply with newly introduced
laws and regulations. Any failure to comply with applicable laws or regulations may result in fines or other
sanctions imposed by the relevant regulator and may have negative reputational consequences. Legislative
uncertainty, bureaucratic inefficiency as well as the additional costs of having to adapt to constantly changing
legal requirements, often without any transitional periods for conformation, could have a material adverse effect
on our business, results of operations and financial condition.
The European Commission has initiated infringement proceedings against Romania in a number
of areas, including waste management
The Group operates in a strongly regulated environment, particularly in food product and waste management
sectors, both locally and on the European level. A large number of regulations the Group must comply with are
norms implementing European directives in Romania and Italy. In certain areas, Romania fails to comply with its
obligations under EU law, in which case the European Commission is entitled to initiate infringement proceedings
against Romania.
In April 2017, the European Commission referred Romania to the European Court of Justice for failure to review
and update its national waste management plan and waste prevention programme in line with the objectives of EU
Waste Framework Directive (Directive 2008/08/EC), despite having sent early warnings. The revision should have
taken place at the latest by 2013. Such plans and programmes are intended to reduce the impact of waste on
human health and the environment, and to improve resource efficiency across the EU. They are also key to
accessing EU funds and setting the framework for the development of sustainable waste infrastructure. EU
member states have to re-evaluate their waste management plans at least every six years and revise them as
appropriate. The European Commission initiated the infringement procedure in September 2015 and sent a
reasoned opinion to Romania in May 2016, urging the authorities to promptly adopt the instruments required by
the waste legislation. According to the European Commission, Romania is one of the most underperforming EU
member states in terms of managing municipal solid waste, with the highest landfilling rate of 72%, far above the
EU average of 25.6%, in 2015. Earlier in February 2017, the European Commission referred Romania to the
European Court of Justice for its failure to close and rehabilitate 68 illegal landfills, which represent a serious risk
to human health and the environment.
Also, in February 2017, the European Commission sent a letter of formal notice to Romania on the grounds that
its national rules on retail of agricultural and food products ran against EU law. Specifically, large retailers in
Romania are required to purchase at least 51% of food and agricultural products from local producers, which
raises concerns with respect to freedom of movement of goods. The same law also requires retailers to promote
products of Romanian origin, restricting their commercial decision as to which products to place on offer, which
in turn is contrary to EU core principle of freedom of establishment. According to EU law, restrictions of these

38
freedoms are only permitted when there is a justified need to protect an overriding public interest, such as public
health. Romania has not provided evidence that its national measures are justified and proportionate.
Consequently, the local food and waste management legislation may undergo significant and rapid changes
leading to additional costs being incurred to comply with such regulatory changes, which may have a material
adverse effect on our business, results of operations and financial condition.
Corruption could create a difficult business climate
Corruption in Romania and in other countries in which we operate is a systemic risk to our business. In Romania
corruption is present in many economic sectors and involves appointed and elected officials at all levels of
government as well as civil servants and employees of public institutions. The 2012-2015 national anti-corruption
strategy managed to provide some progress in enacting corruption prevention measures at the level of national
administration. However, local administration structures are lagging behind in terms of building up the necessary
capacity to prevent corruption effectively and Romania is still listed among the most corrupt EU member states,
according to the 2016 Transparency International Corruption Perceptions Index (ranking 57 among the 176
countries assessed), followed by Italy (ranking 60) and further down by the Republic of Moldova (ranking 123).
Corruption materially affects the perception of a country's stability and quality of investment potential and thus
impedes economic performance, which in turn adversely affects our business, results of operations and financial
condition.
Risks relating to the Shares and the Trading Market
The Offering may not result in an active or liquid trading market and investors may be unable to
resell their Shares at or above the Final Offer Price
Prior to the Offering, there has been no public market for the Shares. Following the successful closing of the
Offering and admission of Shares to trading on the BSE, an active trading market for the Shares may not develop
or, if it develops, may not be sustained or be liquid. Active, liquid trading markets generally result in lower price
volatility, and more efficient execution of trading orders for investors. If a liquid trading market for the Shares
does not develop, the price of the Shares may be more volatile and it may be more difficult to execute trades in
Shares.
The Offer Price will be determined by the Company and the Selling Shareholders together with the Joint
Bookrunners and may not be indicative of the price at which the Shares will trade following the admission of
Shares to trading on the spot regulated market operated by the BSE. Furthermore, sales of a substantial number of
Shares after the admission thereof to trading or the perception that these sales may occur, could have a material
adverse effect on the price of the Shares.
The current shareholders of the Company will continue to have significant influence over the
Company after the Offering, and their interests may not be aligned with those of the other
shareholders of the Company
Following the Offering, the current shareholders of the Company will still own more than 74% of the Shares,
making them the majority shareholders of the Company. As a result, they may be able to exercise significant
influence over the Group and over matters requiring shareholder approval, including election of directors,
business strategy, dividend distribution and significant corporate transactions, including acquisitions of
participations in other entities. Complying with such decisions could lead to significant capital expenditure or may
have the effect of delaying, deferring or preventing a change in control, impeding a merger, consolidation,
takeover or other business combination. Therefore, there can be no assurance that any matter which is to be put to
the shareholders for decision will be resolved in a manner that other holders of the Shares would consider to be in
their or our best interest. In addition, the current shareholders may have an interest in pursuing acquisitions,
divestitures, financings or other transactions that, in its judgment, could enhance its equity investment, even
though such transactions may involve risks to other holders of the Shares. Differences between the interests of the
current shareholders of the Company and the other future shareholders of the Company may lead to conflicts or
may restrict the Group's ability to implement its business strategy, which may have a material adverse effect on
our business, results of operations and financial condition.

39
The Shares may not be admitted to trading on the BSE or may be de-listed from the BSE
The admission of the Shares to trading on the spot regulated market operated by the BSE involves the BSE
approving the Company's application for admission to trading. The Company intends to take all necessary steps to
ensure that the Shares are admitted to trading as soon as possible after the closing of the Offering. However, there
is no guarantee that all listing and/or trading conditions will be met. Consequently, there is no assurance that the
Shares will be admitted to trading on the spot regulated market operated by the BSE on the estimated date or at
all.
Furthermore, the FSA and/or the BSE may suspend trading in Shares if the Company fails to comply with the
applicable regulations (such as, for example, specific disclosure requirements) or if such suspension is necessary
to protect the interests of market participants or in case the orderly functioning of the market is temporarily
endangered. There can be no assurance that trading in the Shares will not be suspended. Any suspension of trading
could adversely affect the trading price of the Shares.
Also, if the Company fails to fulfil certain requirements or obligations under the laws and regulations applicable
to companies the shares of which are listed on the BSE, or if the orderly stock exchange trading, the safety of
trading thereon or investors' interests are endangered, the Shares can, subject to certain conditions being fulfilled,
be excluded from trading on the stock exchange. There can be no assurance that such event will not occur in
relation to the Shares. All these risks would, if they materialise, have a material adverse effect on the price of the
Shares and on the ability of the investors to sell their Shares on the stock exchange.
As a holding company, the Company’s operating results, financial condition and ability to pay
dividends or other distributions are mainly dependent on dividends and other distributions
received from its subsidiaries
Declaration and payment of dividends in the future will be decided by the Company's shareholders. The
Company's ability to pay dividends in the future will depend on, among other things, the Company's future profits
(including the distributable profits obtained by the Company's consolidated subsidiaries), cash flows, financial
position and capital requirements, the sufficiency of distributable reserves, prospects, credit terms, the ability of
the subsidiaries to pay dividends to the Company, general economic conditions and other factors that the BoD
members and/or the shareholders deem to be important from time to time in deciding the dividends, if any. For
details on the contractual restrictions applicable to the Company's distribution of profits see the section "—
Material Contracts" below. Furthermore, the dividends declared by the subsidiaries, if any, are paid to the
Company in the year subsequent to that for which the dividends are distributed. Such dividends are then
recognised as revenue and generate profits which may be distributed to the Company's shareholders (provided that
the Company has registered distributable profit in its annual financial statements), based on the shareholders'
resolution, in the year subsequent to that when the subsidiaries declare dividends to be paid to the Company.
In addition, under Romanian law the Company must allocate an amount of 5% of its annual profit to a legal
reserve until the reserve equals at least 20% of the Company’s share capital. The Company’s legal reserve
currently does not meet this requirement nor will it meet the requirement at the time of the closing of the Offering.
Accordingly, 5% of our annual profit will need to be allocated to the legal reserve until the minimum threshold is
reached.
As a consequence of all these factors, there can be no assurance that the Company will declare, distribute or pay
dividends in the future. Also, if the shareholders decide against declaring dividends in the future, the price of the
Shares may be adversely affected.
Exchange rate variations may have an adverse impact on the value of non-Romanian holders of
Shares
The Shares and any potential dividends that the Company's shareholders may decide to distribute will be
denominated in RON. Investments by investors that use a different currency as their reference currency will
expose such investors to foreign currency exchange rate risks. Any depreciation of the RON in relation to such
foreign currency will reduce the value of the investment in the Shares or of the dividends payable by the Company
for those investors.

40
The price of the Shares may generally fluctuate
Publicly traded securities from time to time experience significant price and volume fluctuations that may be
unrelated to the operating performance of the companies that have issued them and may be triggered by external
factors which are beyond the Company's control. In addition, the market price of the Shares may prove to be
highly volatile and may fluctuate significantly in response to a number of factors. The price of the Shares will
depend on general economic developments, interest rate changes, changes in financial estimates by securities
analysts, changes in market valuation of similar companies, additions or departures of key personnel, the
development of the individual markets concerned (including Romania) and on the commercial performance and
future prospects of the Group. The price of the Shares will also be dependent on the current and future
development of the Romanian capital markets. The performance of the Shares may accordingly correlate with
developments on the local and regional or international capital markets, potentially independently of the
underlying performance of the Group. Accordingly, no forecast can be given as to a specific price or performance
of the Shares. For example if several negative developments on the food service market and/or on capital markets
occur, there could, ultimately, be a risk of a partial or complete loss of the capital originally invested in the Shares.
Future sales of substantial amounts of Shares, or the perception that such sales could occur, could
adversely affect the market value of the Shares
The Company, and the current shareholders of the Company are expected to agree that, subject to certain
exceptions, they will not, without the prior written consent of the Joint Bookrunners, issue, offer or sell any
ordinary shares of the Company or securities convertible or exchangeable into ordinary shares of the Company for
a period of 180 days following the date of admission of Shares to trading on the BSE, as described in chapter
"Subscription and Sale". Following the expiration of these lock-up provisions, future sales of the Shares could be
made by the current shareholders of the Company or by the Company. If the Company were to raise funds through
additional equity offerings, this could cause dilution for its shareholders to the extent they do not participate.
Moreover, sales of a substantial number of Shares by any such party or parties to the Placement Agreement, or the
perception that such sales could occur, could adversely affect the market price of the Shares.
Due to a gap of five days between the pricing and the prospective first date of trading in the
shares, the initial trading price may be lower than the Final Offer Price
The Final Offer Price will be published at the latest on the Business Day following the Allocation Date. However,
provided that the Company's application for admission to trading on the spot regulated market operated by the
BSE is approved immediately, the Shares are expected to start trading five days after the Allocation Date. As a
result, investors will not be able to sell or otherwise deal in the Company's shares during that period, and thus will
be subject to the risk that the market price of the Shares could fall below the Final Offer Price as trading begins, as
a result of various factors, among which adverse market conditions and adverse developments in the Group's
business.
Financing subscriptions in Offered Shares may create a misleading appearance with respect to
interest in the Offering
Investors are entitled to show as evidence for the payment of the price for the subscribed Offered Shares inter alia
the settlement commitment statement issued by a Manager or an affiliate thereof. Under such settlement
commitment, a manager of an offering or its affiliate undertakes the responsibility for the settlement of the trade in
the subscribed offered shares. Such settlement commitments are regulated by the FSA and the FSA imposed
certain limitations thereto, including with respect to the total amount of commitments that may be issued by
reference to the investment firm's equity. Also, the settlement risk may be guaranteed by bank guaranteed letters
issued by any EU credit institution or investors may take bank loans to subscribe in the offered shares.
The precedents of public offerings of securities in Romania where these financing tools were used showed that,
for the retail tranche of the offering, they had the effect of distorting the actual interest of investors in subscribing
in the offered shares. Anticipating an oversubscription on the tranche, usually investors would top-up their initial
subscription with additional subscriptions by using the financing products offered by investment firms/credit
institutions, in order to avoid getting diluted during allocation, as a result of the oversubscription. In the past, this
practice has resulted in the retail tranche being significantly oversubscribed, without investors actually intending
to acquire the number of shares for which they have subscribed. Such practice may create an artificial and

41
misleading appearance with respect to the investor interest in the Offering and may have an adverse effect on the
Share price or on the actual investor interest in the Shares in the secondary market.
There is no central counterparty for the spot market in Romania
The Romanian CSD acts as agent in the settlement of the financial instruments traded on the BSE and, in that
capacity, implements measures and procedures to mitigate the risk of settlement failure. The settlement guarantee
measures instituted by the Romanian CSD are not sufficient to fully ensure the timely settlement in the event a
participant with a large payment obligation is unable to settle, due to the inadequate size of the guarantee fund and
of the settlement limit.
Furthermore, the settlement of the transactions related to a public offering of securities is not covered by the
Settlement Guarantee Fund.
A central counterparty clearing house ("CCP") is an entity whose purpose is to reduce settlement risk. A CCP
becomes the counterparty to the buyer and the seller and guarantees the terms of a trade when a party defaults.
The CCP collects money from each buyer and seller to cover potential losses incurred in case of failure to comply
with the terms of the agreement, resulting in the CCP replacing the trade at the current market price. To date, there
is no CCP established in Romania to manage the counterparty risk.

42
CAUTIONARY NOTE REGARDING FORWARD-LOOKING
STATEMENTS
Certain statements in this Prospectus are not historical facts and are "forward-looking" within the meaning of
Section 27A of the Securities Act and Section 21E of the US Securities Exchange Act of 1934, as amended (the
"Exchange Act"). This Prospectus includes forward-looking statements, which include, without limitation, any
statements preceded by, followed by or that include words "may", "will", "would", "should", "expect", "intend",
"estimate", "forecast", "anticipate", "project", "believe", "seek", "plan", "predict", "continue", "commit",
"undertake", "on-going", "potential", "target", "should" and similar expressions or their negatives. Such
forward-looking statements involve known and unknown risks, uncertainties and other important factors beyond
the Group’s control that could cause its actual results, performance or achievements to be materially different
from future results, performance or achievements expressed in or implied by such forward-looking statements.
Such forward-looking statements are based on numerous assumptions regarding the Group’s present and future
business strategies and the environment in which it will operate in the future. Among the important factors that
could cause the Group’s actual results, performance or achievements to differ materially from those expressed in
such forward-looking statements are those in "Operating and Financial Review", "Business", "Risk Factors" and
elsewhere in this Prospectus. These factors include, but are not limited to:
• Impact of certain laws, regulations and standards and the interpretation or application thereof;
• Changes in the Romanian food services market and in economic conditions in general;
• Changes in market expectations of the Group;
• Risks resulting from currency fluctuations;
• Interest rate increases;
• Risks from changes/volatility in raw materials;
• Failure to meet product quality standards;
• Potential of operational incidents;
• Government intervention and changes in regulation;
• Changes in taxes and fees imposed on the Group's operations;
• Failure to successfully implement management’s business strategy;
• Political, legal and economic uncertainty in Romania and other developing markets; and
• Entrance of new competitors on the markets on which the Group currently operates.
The above list of important factors is not exhaustive. New risks can emerge from time to time, and it is not
possible to predict all such risks, nor can the Company assess the impact of all such risks on its business or the
extent to which any risks, or combination of risks and other variables, may cause actual results to differ materially
from those contained in any forward-looking statements. When reviewing forward-looking statements, investors
should carefully consider the foregoing factors and other uncertainties and events, especially in light of the
political, economic, social and legal environment in which the Group operates. Forward-looking statements
contained in this Prospectus speak only as at the date of this Prospectus. The Company expressly disclaims any
obligation or undertaking to disseminate any updates or revisions to any forward-looking statements contained
herein to reflect any change in the Group’s expectations with regard thereto or any change in events, conditions or
circumstances on which any of such statements are based, unless required to do so by any applicable regulatory
regime.

43
SERVICE OF PROCESS AND ENFORCEMENT OF CIVIL LIABILITIES
The Company is incorporated under the laws of Romania. Certain members of the Company’s BoD and managers
are residents of Romania and certain entities referred to herein are organised under the laws of Romania. All or a
substantial portion of the assets of such persons and entities are located in Romania. As a result, it may not be
possible for investors to:
• effect service of process within the United States or countries other than Romania upon any of the Company’s
members of the BoD and managers named in this Prospectus; or
• enforce, in the United States or countries other than Romania, judgments obtained in courts of the United
States or such other countries against the Company or any of its BoD members and managers named in this
Prospectus in any action.
In addition, it may be difficult for investors to enforce, in original actions brought in courts in jurisdictions located
outside the United States, liabilities predicated upon US securities laws.
Furthermore, the United States and Romania have not entered into treaties providing for reciprocal recognition
and enforcement of judgments (other than arbitration awards) in civil and commercial matters. A final and
conclusive judgment for the payment of money rendered by any federal or state court in the United States based
on civil liability, whether or not predicated solely upon US federal securities laws, would not automatically be
recognised or enforceable in Romania.
A judgment of a court of law of a non-EU member state made in personam for a certain sum, which is not
impeachable as void or voidable under the internal laws of the foreign jurisdiction (a "Non-EU Judgment")
would be recognised in Romania, provided that: (a) the Non-EU Judgment is final (RO: hotarare definitivă)
according to the law of the state where it was given; (b) the court rendering such Non-EU Judgment had,
according to lex fori, jurisdiction to try the relevant litigation, but without relying exclusively on the presence in
that jurisdiction of the defendant or of some of its assets which are not directly connected with that litigation; (c)
there is reciprocity regarding the effects of foreign judgments between Romania and the foreign jurisdiction which
rendered the Non-EU Judgment whose recognition is sought; (d) when given in default of appearance, the party
who lost the trial was served in due course with the summoning for appearance for the hearing where the court
tried the merits of the case and with the document which instituted the proceedings, was given the possibility to
defend itself and was given the possibility to challenge the Non-EU Judgment. The recognition of a Non-EU
Judgment may be rejected in any of the following cases: (a) the Non-EU Judgment is manifestly inconsistent with
or contrary to public order of Romanian international private law; (b) the Non-EU Judgment is rendered in an area
of law where persons cannot dispose freely of their rights and it was obtained exclusively for the purpose of
withholding the matter from the incidence of the law that would otherwise be applicable pursuant to Romanian
conflict of law rules; (c) the action or proceeding involving the same parties resulted in a judgment (even if not
final) of the Romanian courts or is pending before Romanian courts as at the date the action or proceeding
commenced before the foreign court which rendered the Non-EU Judgment; (d) the Non-EU Judgment is
irreconcilable with a prior foreign judgment which may be recognised in Romania; (e) Romanian courts had
exclusive jurisdiction to try the subject matter of the Non-EU Judgment pursuant to Romanian civil procedure
laws; (f) the right of defence was breached; and (g) the Non-EU Judgment may be challenged in any other manner
in the state where it was rendered. The application for recognition before Romanian courts should be made
according to Romanian procedural rules and should enclose all the documentation thereby required. Additionally,
the recognition of the Non-EU Judgment may not be refused solely for the reason that the foreign court rendering
the Non-EU Judgment applied a law other than the law that would have been applicable according to Romanian
conflict of law rules, except where the trial concerns the civil status and the capacity of a Romanian citizen and
the solution adopted by the court differs from the solution that would have been reached according to the
Romanian law.
A Non-EU Judgment can be enforced in Romania based on a final decision of a Romanian competent court
approving the enforcement, only if: (i) the requirements mentioned above for the recognition in Romania of Non-
EU Judgments are met; (ii) the Non-EU Judgment is enforceable according to the law of the jurisdiction where it
was rendered; (iii) where the Non-EU Judgment establishes an obligation arising from a foreign fiscal law, there is
reciprocity with respect to the effects of foreign judgments in the relevant fiscal matter between Romania and the
foreign jurisdiction which rendered the Non-EU Judgment; (iv) arguably, the right to require enforcement is not
time barred according to the statute of limitation provisions (RO: prescriptia dreptului de a cere executarea silita)

44
of the Romanian law; and (v) the application for enforcement before Romanian courts is duly made according to
the Romanian procedural rules and encloses all the documentation thereby required.
A court judgment rendered in an EU member state other than Romania (an "EU Judgment") is recognised in
Romania by operation of law without any special procedure. Such recognition is rejected upon the request of any
interested parties in the following circumstances: (a) such recognition is manifestly contrary to public order in
Romania; (b) where the EU Judgment was given in default of appearance, if the defendant was not served with the
document which instituted the proceedings or with an equivalent document in sufficient time and in such a way as
to enable him to arrange for his defence, unless the defendant failed to commence proceedings to challenge the
judgment when it was possible for him to do so; (c) it is irreconcilable with a judgment given in a dispute between
the same parties in Romania; (d) it is irreconcilable with an earlier judgment given in a EU member state (other
than Romania) or in a third state involving the same cause of action and between the same parties, provided that
the earlier judgment fulfils the conditions necessary for its recognition in Romania; and (e) the EU Judgment
conflicts with the provisions of Council Regulation (EU) no. 1215/2012 of the European Parliament and of the
Council on jurisdiction and the recognition and enforcement of judgments in civil and commercial matters
("Regulation no. 1215/2012") in respect of jurisdiction in matters relating to insurance, jurisdiction over
consumer contracts and individual employment contracts and exclusive jurisdiction.
An EU Judgment can be enforced in Romania pursuant to Regulation no. 1215/2012 without any decision of a
Romanian competent court approving the enforcement being necessary only if: (i) it is enforceable in the EU
member state where the EU Judgment was rendered; (ii) the Romanian competent court is provided with a copy of
the EU Judgment which satisfies the conditions necessary to establish its authenticity; (iii) the Romanian
competent court is provided with an original certificate issued by the relevant EU member state’s court in the form
set out in Annex I of Regulation no. 1215/2012 and none of the conditions above preventing the recognition of an
EU Judgment is satisfied; (iv) where the EU Judgment orders a periodic payment by way of penalty, (including,
but not limited to, default interest), the amount of the payment has been finally determined by the courts of the EU
member state of origin; and (v) enforcement is made under the same conditions as a judgment given in Romania.

45
PRESENTATION OF FINANCIAL AND OTHER INFORMATION
Incorporation of Certain Information by Reference
No information is incorporated by reference in this Prospectus.
Financial and Operating Information
Financial statements of the Group
The Company was incorporated in May 2017 and consequently no annual separate financial statements are
available for the Company as at the date of this Prospectus.
On 30 May 2017 the Company acquired shares in USFN (Romania) and in ARS (Romania), by way of
contribution of the respective shares to the share capital of the Company (for more detail on the acquisition, please
see "Description of share capital and corporate structure"). The consolidated financial statements of the Group
have been prepared in accordance with the requirements of IFRS 3 (Combination of enterprises) and in particular
the application guidelines set out in Annex B thereto, in order to determine the acquirer. USFN (Romania) has
been identified as the acquirer (given that the size of the USFN (Romania) business is significantly larger than that
of the Company or of ARS (Romania)). As a result, although the Company was legally incorporated only in May
2017, its IFRS consolidated financial statements are a continuation of the consolidated financial statements of
USFN (Romania), thus the consolidated financial statements of USFN (Romania) represent the historical
information for the Company.
At the same time, given the significance of the acquisition of ARS (Romania) for an accurate and comprehensive
description of the Group's financial position and performance, we believe it is also highly relevant to present the
historical financial information of ARS (Romania) in this Prospectus.
Therefore, we have included and analysed in this Prospectus, particularly in the "Business" and in the "Operating
and Financial review" chapters, historical information derived from the following financial statements:
• US Food Network S.A. Consolidated Financial Statements prepared in accordance with the International
Financial Reporting Standards as adopted by the European Union for the years ended 31 December 2014, 31
December 2015 and 31 December 2016, respectively, audited (hereinafter, "USFN (Romania) Annual
Financial Statements");
• American Restaurant System S.A. Financial Statements prepared in accordance with the International
Financial Reporting Standards as adopted by the European Union for the years ended 31 December 2014, 31
December 2015 and 31 December 2016, respectively, audited (hereinafter, "ARS (Romania) Annual
Financial Statements");
• American Restaurant System S.A. Interim Financial Statements prepared in accordance with International
Financial Reporting Standards applicable to interim financial reporting as adopted by the European Union
(EU) (IAS 34) for the six months ended 30 June 2017, unaudited (hereinafter, "ARS (Romania) Interim
Financial Statements"; and
• Sphera Franchise Group S.A. Interim Consolidated Financial Statements prepared in accordance with the
International Financial Reporting Standards applicable to interim financial reporting as adopted by the
European Union (EU) (IAS 34) for the six months ended 30 June 2017, unaudited (hereinafter, "Sphera
Interim Financial Statements").
USFN (Romania) Annual Financial Statements, ARS (Romania) Annual Financial Statements, ARS (Romania)
Interim Financial Statements and Sphera Interim Financial Statements are hereinafter referred to collectively as
"Group Financial Statements". The Group Financial Statements are presented in Romanian Leu.
Pro forma Financial Information
Where indicated, the Prospectus includes pro forma consolidated financial information of Sphera for the periods
from 1 January 2014 to 31 December 2014, 1 January 2015 to 31 December 2015, 1 January 2016 to 31
December 2016, and 1 January 2017 to 30 June 2017, respectively, ("Pro Forma Financial Information")
compiled in compliance with the accounting policies of the Group with the purpose of illustrating the consolidated
operational performance of the Group, as if the incorporation of the Company and the contribution of USFN

46
(Romania) shares and of ARS (Romania) shares to the Company's share capital took place on 1 January 2014, 1
January 2015, 1 January 2016 and 1 January 2017, respectively.
The Pro Forma Financial Information for the periods from 1 January 2014 to 31 December 2014, 1 January 2015
to 31 December 2015, 1 January 2016 to 31 December 2016 has been derived from the USFN (Romania) Annual
Financial Statements and, respectively, the ARS (Romania) Annual Financial Statements, adjusted for the
applicable pro forma adjustments related to (i) the reclassification of discontinued operations of ARS (Romania)
relating to transactions with USFN (Romania) to continuing operations, (ii) elimination of intercompany
transactions and (iii) purchase price allocation adjustments, as further explained into the Note "3. Basis of
preparation of the pro forma consolidated financial information" to Pro Forma Financial Information.
The Pro Forma Financial Information for the period from 1 January 2017 to 30 June 2017 has been derived from
the Sphera Interim Financial Statements, adjusted for the applicable pro forma adjustments related to (i) adding
the ARS (Romania) statement of comprehensive income for the period 1 January 2017 - 31 May 2017, which has
been derived from the ARS (Romania) Interim Financial Statements, (ii) elimination of intercompany transactions
and (iii) purchase price allocation adjustments, as further explained into the Note "3. Basis of preparation of the
pro forma consolidated financial information" to Pro Forma Financial Information.
Pro forma Financial Information are presented in Romanian Leu.
We believe that the presentation of pro forma consolidated financial information of Sphera for the periods from 1
January 2014 to 31 December 2014 and from 1 January 2015 to 31 December 2015 in the Prospectus is highly
relevant to the potential investors for the following reasons:
• The effect of the acquisition of ARS (Romania) is material for 2014 and 2015 financial years, particularly
with respect to the revenues from our core business;
• Lack of comparative data on an aggregated basis for 2014 and 2015 will burden the investors' understanding
of the real dynamics of Sphera's performance for the past three years and consequently the analysis of the
financial and operational performance for the current year; and
• Although USFN (Romania) and ARS (Romania) are not under "common control" from IFRS perspective,
USFN (Romania) and ARS (Romania) have been managed together since 2012, as an integrated group of
companies, with identical shareholding structure and preponderantly the same management team.
The independent auditor of the Company has issued reports in compliance with the Prospectus Regulation for the
compilation of the Pro forma Financial Information, as indicated in the reports drawn up by the independent
auditor, and included in this Prospectus. The preparation and presentation of the Pro forma Financial Information
for the periods from 1 January 2014 to 31 December 2014 and from 1 January 2015 to 31 December 2015 was
authorized by the Financial Supervisory Authority in a letter dated 11 August 2017.
Non-IFRS measures
The Company presents non-IFRS measures because it believes that they and similar measures are widely used by
certain investors, securities analysts and other interested parties as supplemental measures of performance and
liquidity. The non-IFRS measures may not be comparable to similarly titled measures of other companies and
have limitations as analytical tools and should not be considered in isolation or as a substitute for analysis of the
Company’s operating results as reported under IFRS-EU.
Certain parts of this Prospectus contain references to EBITDA and like-for-like sales. We compute EBITDA by
adding back to our consolidated operating profit or loss the expenses with depreciation, amortization and
impairment of property, plant and equipment and intangible assets and by adding back or deducting any
significant one-off items. We compute like-for-like sales by taking into account the restaurant sales only for the
restaurants that have been in uninterrupted operation from the beginning of the preceding year until the end of the
current year/period.
EBITDA, and like-for-like sales are not measures of performance under IFRS-EU and should not be considered
by prospective investors as an alternative to (a) net profit/(loss) as a measure of operating performance; or (b) any
other measure of performance under IFRS-EU. We believe that EBITDA provides a useful indication of the
Group’s cash flow generation capacity that disregards temporary variations in the working capital. We believe that
like-for-like sales provide a useful indication of the underlying performance of the Group’s operations because it
helps isolate and understand growth catalysts, as it eliminates the effect of new store openings and of acquisitions.

47
Since EBITDA and like-for-like sales are not measures of performance under IFRS-EU, not all companies may
calculate these measures on a consistent basis and our presentation of EBITDA, and like-for-like sales may not be
comparable to measures used by other companies under the same or similar names. Accordingly, undue reliance
should not be placed on the EBITDA, and on like-for-like sales contained in this Prospectus. We encourage you to
evaluate these items and the limitations for purposes of analysis in excluding them.
Unaudited operating information
The Group’s unaudited operating information in relation to its business is derived from the following sources: (i)
internal operating records of each member of the Group; (ii) accounting systems (based on invoices issued and/or
received); (iii) internal reporting systems supporting the preparation of financial statements; (iv) management
assumptions and analyses; and (v) discussions with key operating personnel. Operating information derived from
management accounts or internal reporting systems in relations to the Group’s business is to be found principally
in "Operating and Financial Review" and "Business".
Abbreviations
The following abbreviations of operating data have the following meanings as used in this Prospectus:
Sqm Square meter
CAGR Compound annual growth rate, being the geometrical average annual growth rate over a specified period
of time longer than one year
Miscellaneous
Market information
Market data used in this Prospectus under in chapters "Summary", "Risk Factors", "Operating and Financial
Review", "Foodservice Sector" and "Business" have been extracted from official and industry sources and other
sources the Company believes to be reliable. Sources of such information, data and statistics include: reports,
press releases and other official documentation issued or adopted by European Commission, National Bank of
Romania, World Economic Forum, Romanian National Statistics Institute, Financial Supervisory Authority,
Euromonitor International Limited, Kantar Millward Brown, and Deloitte Consultanta S.R.L.. The third party
sources the Company has used generally state that the information they contain has been obtained from sources
believed to be reliable. These third-party sources also state, however, that the accuracy and completeness of such
information is not guaranteed and that the projections they contain are based on significant assumptions. As the
Company does not have access to the facts and assumptions underlying such market data, or statistical information
and economic indicators contained in these third-party sources, the Company is unable to verify such information.
Thus while such information, data and statistics have been accurately reproduced and, as far as the Company is
aware and is able to ascertain from information published or provided by the aforementioned sources, no facts
have been omitted which would render the reproduced information, data and statistics inaccurate or misleading,
the Company cannot guarantee its overall accuracy or completeness.
Deloitte Consultanta S.R.L. has prepared at the request of the Company a market analysis, based on publicly
available information ("Deloitte Analysis"). The Deloitte Analysis is part of a larger market study report, which
has been prepared for the internal use of the Company. Deloitte Consultanta S.R.L. has given and maintained its
written consent to inclusion in this Prospectus of the information contained in the Deloitte Analysis, in the form
and under context that supported inclusion thereof in the Prospectus, and approved the content of such
information, for the purpose of item 23.1 of Annex I of the Prospectus Regulation. Deloitte Consultanta S.R.L. is a
limited liability company, organised and functioning under Romanian law, with registered seat in Romania,
Bucharest, 4-8 Nicolae Titulescu str., floor 2 Deloitte Area and floor 3, registered with the Bucharest Trade
Registry under no. J40/8360/1992, with sole registration code 2626460. Deloitte Consultanta S.R.L. has acted in
accordance with its contract concluded with Sphera and has no responsibility to any other party for the Deloitte
Analysis, but only to its client in accordance with the contract between the parties.

48
Information in this Prospectus on the Romanian Foodservice market is from independent market research carried
out by Euromonitor International Limited ("Euromonitor") but should not be relied upon in making, or refraining
from making, any investment decision.
In addition, certain information in this Prospectus is not based on published data obtained from independent third
parties or extrapolations therefrom, but rather is based upon the Company’s best estimates, which are in turn based
upon information obtained from trade and business organizations and associations, consultants and other contacts
within the industries in which the Company competes, information published by competitors, and the Company’s
own experience and knowledge of conditions and trends in the markets in which it operates. The Company cannot
assure you that any of the assumptions that it has made while compiling this data from third party sources are
accurate or correctly reflect the Company’s position in the industry and none of our internal estimates has been
verified by any independent sources. None of the Company, the Selling Shareholders or the Managers makes any
representation or warrants as to the accuracy or completeness of this information. None of the Company, the
Selling Shareholders or the Managers has independently verified this information and, while the Company
believes it to be reliable, none of the Company, the Selling Shareholders or the Managers can guarantee its
accuracy. The Company declares that all third-party data contained in this Prospectus has been accurately
reproduced and, so far as the Company is aware and able to ascertain from information published by that third-
party, no facts have been omitted that would render the reproduced information inaccurate or misleading.
Countries
In this Prospectus, all references to "US" or to "United States" are to the United States of America, all references
to the "EU" are to the European Union and its member states as of the date of this Prospectus, and all references to
the "EEA" are to the European Economic Area and its member states as of the date of this Prospectus.
Currencies
In this Prospectus, all references to "RON" and "Leu" are to the lawful currency of Romania, all references to "€",
"EUR" and "euro" are to the lawful currency introduced at the start of the third stage of European economic and
monetary union, and as defined in Article 2 of Council Regulation (EC) No. 974/98 of 3 May 1998 on the
introduction of the euro, as amended, all references to "US$", "$", "US dollar", "USD" and "dollar" are to the
lawful currency of the United States, and all references to "MDL" are to the lawful currency of the Republic of
Moldova.
Rounding
Certain figures included in this Prospectus have been subject to rounding adjustments; accordingly, figures shown
for the same category presented in different tables may vary slightly and figures shown as totals in certain tables
may not be an exact arithmetic aggregation of the figures that precede them.
References to the Company
In this Prospectus, the "Company" and "Sphera" refer to Sphera Franchise Group S.A., and the terms "we", "us",
"our", and the "Group" refer to Sphera Franchise Group S.A. and its consolidated subsidiaries, taken as a whole,
unless the context otherwise requires.
Legal references
Except where expressly mentioned otherwise, a reference in this Prospectus to a legal provision is considered a
reference to the respective provision as it was amended and/or republished and in force as at the date of this
Prospectus.

49
EXCHANGE RATE INFORMATION
The following tables show, for the periods and dates indicated, information relating to the exchange rates between
the Romanian Leu and the US dollar, based on information derived from the NBR. The columns titled "Average"
in the tables below show the annual average rate calculated as average of the average monthly rates for the
respective periods.
Years ended 31 December High Low Average Period end
(RON per USD)
2014 3.6885 3.1799 3.3492 3.6868
2015 4.2220 3.7742 4.0057 4.1477
2016 4.3504 3.8697 4.0592 4.3033
Source: NBR.
Six-month period ended 30 June High Low Average Period end
(RON per USD)
2016 4.2141 4.2141 4.2141 4.2141
2017 4.3408 4.3408 4.3408 4.3408
Source: NBR.
The following tables show, for the periods indicated, information relating to the exchange rates between the
Romanian Leu and the EUR, based on information derived from the NBR. The columns titled "Average" in the
tables below show the annual average rate calculated as average of the average monthly rates for the respective
periods.
Years ended 31 December High Low Average Period end
(RON per EUR)
2014 4.5447 4.5447 4.5447 4.5447
2015 4.5381 4.5381 4.5381 4.5381
2016 4.5411 4.5411 4.5411 4.5411
Source: NBR.
Six-month period ended 30 June High Low Average Period end
(RON per EUR)
2016 4.5396 4.5396 4.5396 4.5396
2017 4.5987 4.5987 4.5987 4.5987
Source: NBR.
The Company makes no representation that the Romanian Leu amounts referred to in this Prospectus could have
been or could be converted into any currency at the above exchange rates, at any other rate or at all.
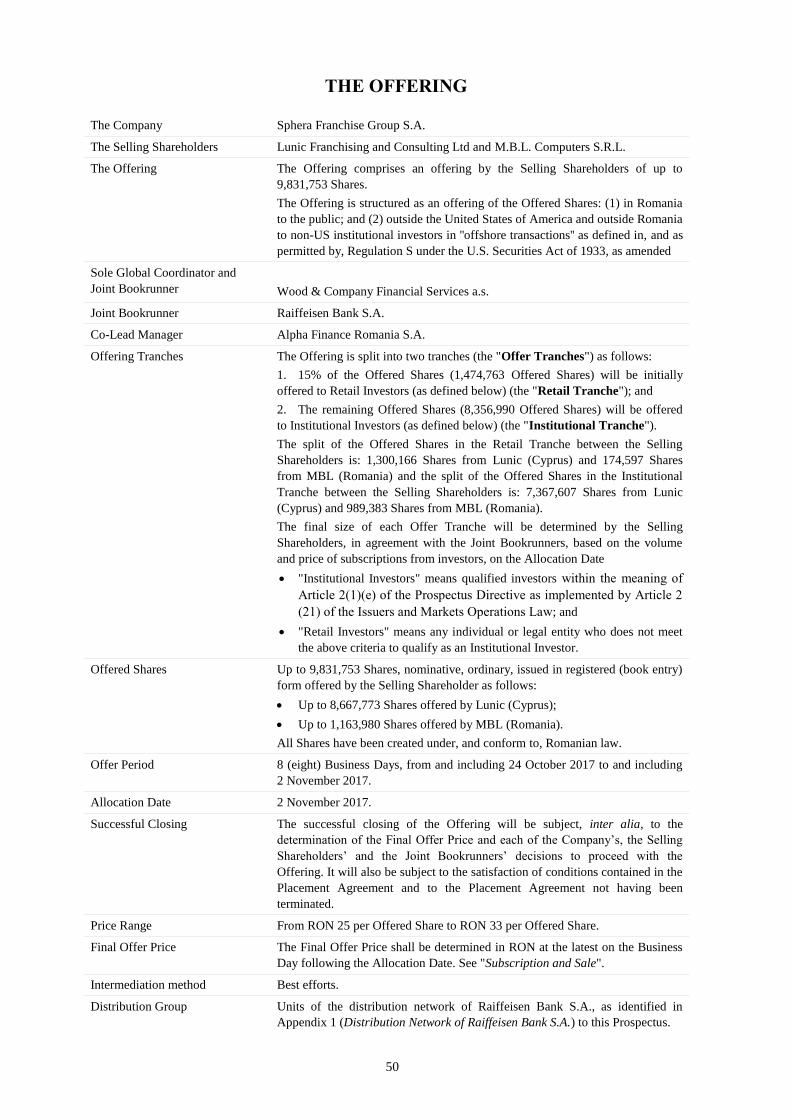
50
THE OFFERING
The Company Sphera Franchise Group S.A.
The Selling Shareholders Lunic Franchising and Consulting Ltd and M.B.L. Computers S.R.L.
The Offering The Offering comprises an offering by the Selling Shareholders of up to
9,831,753 Shares.
The Offering is structured as an offering of the Offered Shares: (1) in Romania
to the public; and (2) outside the United States of America and outside Romania
to non-US institutional investors in ''offshore transactions'' as defined in, and as
permitted by, Regulation S under the U.S. Securities Act of 1933, as amended
Sole Global Coordinator and
Joint Bookrunner
Wood & Company Financial Services a.s.
Joint Bookrunner Raiffeisen Bank S.A.
Co-Lead Manager Alpha Finance Romania S.A.
Offering Tranches The Offering is split into two tranches (the "Offer Tranches") as follows:
1. 15% of the Offered Shares (1,474,763 Offered Shares) will be initially
offered to Retail Investors (as defined below) (the "Retail Tranche"); and
2. The remaining Offered Shares (8,356,990 Offered Shares) will be offered
to Institutional Investors (as defined below) (the "Institutional Tranche").
The split of the Offered Shares in the Retail Tranche between the Selling
Shareholders is: 1,300,166 Shares from Lunic (Cyprus) and 174,597 Shares
from MBL (Romania) and the split of the Offered Shares in the Institutional
Tranche between the Selling Shareholders is: 7,367,607 Shares from Lunic
(Cyprus) and 989,383 Shares from MBL (Romania).
The final size of each Offer Tranche will be determined by the Selling
Shareholders, in agreement with the Joint Bookrunners, based on the volume
and price of subscriptions from investors, on the Allocation Date
• "Institutional Investors" means qualified investors within the meaning of
Article 2(1)(e) of the Prospectus Directive as implemented by Article 2
(21) of the Issuers and Markets Operations Law; and
• "Retail Investors" means any individual or legal entity who does not meet
the above criteria to qualify as an Institutional Investor.
Offered Shares Up to 9,831,753 Shares, nominative, ordinary, issued in registered (book entry)
form offered by the Selling Shareholder as follows:
• Up to 8,667,773 Shares offered by Lunic (Cyprus);
• Up to 1,163,980 Shares offered by MBL (Romania).
All Shares have been created under, and conform to, Romanian law.
Offer Period 8 (eight) Business Days, from and including 24 October 2017 to and including
2 November 2017.
Allocation Date 2 November 2017.
Successful Closing The successful closing of the Offering will be subject, inter alia, to the
determination of the Final Offer Price and each of the Company’s, the Selling
Shareholders’ and the Joint Bookrunners’ decisions to proceed with the
Offering. It will also be subject to the satisfaction of conditions contained in the
Placement Agreement and to the Placement Agreement not having been
terminated.
Price Range From RON 25 per Offered Share to RON 33 per Offered Share.
Final Offer Price The Final Offer Price shall be determined in RON at the latest on the Business
Day following the Allocation Date. See "Subscription and Sale".
Intermediation method Best efforts.
Distribution Group Units of the distribution network of Raiffeisen Bank S.A., as identified in
Appendix 1 (Distribution Network of Raiffeisen Bank S.A.) to this Prospectus.

51
Shareholders registry The shareholders' registry is currently kept by the Company's BoD. Once the
Shares are admitted to trading on the BSE, the function of the shareholders'
registry will be held by the Romanian CSD (Depozitarul Central S.A., with the
registered office in 34-36 Bulevardul Carol I, 3rd, 8th and 9th floors, District 2,
postal code 020922, Bucharest, Romania).
Listing and Trading Application will be made to the BSE for the admission of Shares to trading on
the spot regulated market operated by it, in premium tier. The BSE is a
regulated market for the purposes of the Directive on Markets in Financial
Instruments.
The security identification numbers and trading symbols of the Shares are
(expected to be) as follows:
ISIN: ROSFGPACNOR4;
CFI: ESVUFR;
LEI: 315700GSVZ0HSS7J1457;
BSE Share trading symbol: SFG.
Settlement and Transfer Payment for the Offered Shares is expected to be made in RON through
RoClear (Romanian Clearing Settlement, Custody, Depository and Registration
System), which is managed by the Romanian CSD. Transfers of Shares within
the Offering and secondary market sales of Shares will be settled and cleared
through the settlement system managed by the Romanian CSD, in accordance
with applicable Romanian regulations.
Stabilising Managers Wood & Company Financial Services a.s. and Raiffeisen Bank S.A.
Stabilisation In connection with the Offering, the Stabilising Managers (or persons acting on
behalf of them) may (but will be under no obligation to), to the extent permitted
by applicable law, effect transactions with a view to supporting the market price
of the Shares at a level higher than that which might otherwise prevail in an
open market for a limited period. However, there is no assurance that the
Stabilising Managers (or persons acting on behalf of them) will undertake
stabilisation action. Any stabilisation action in respect of Shares may begin on
the date of commencement of trading of the Shares on the BSE and, if begun,
may be ended at any time but not later than 30 calendar days thereafter (the
"Stabilisation Period"). Any stabilisation action must be undertaken in
accordance with applicable laws and regulations. Save as required by law or
regulation, the Stabilising Managers do not intend to disclose the extent of any
stabilisation transactions concluded in relation to the Offering.
In connection with the Offering, the Selling Shareholders have agreed that the
Stabilising Managers will retain 10% of the gross proceeds obtained by the
Selling Shareholders from the Offering (the "Stabilisation Proceeds") and will
use such Stabilisation Proceeds for the purposes of conducting stabilisation
activities, if any, in the Shares, during the Stabilisation Period. The Selling
Shareholders anticipate that in connection with the Offering the Stabilising
Managers will have the right to acquire not more than 983,175 Shares on the
regular market of the BSE in order to stabilise the price of the Shares at a level
higher than that which may otherwise prevail if stabilisation actions were not
taken. In the context of Stabilisation, the Selling Shareholders have agreed to
grant to the Stabilising Managers a put option according to which a number of
up to 983,175 Shares shall be transferred to the Selling Shareholders by the
Stabilising Managers but not more than the actual number of Shares bought by
the Stabilising Managers on the BSE for the Stabilisation purposes. For more
details, please see section "Stabilisation" from "Subscription and sale" chapter
of the Prospectus.
52
Lock-Up The Company will agree with the Managers in the Placement Agreement to be
executed on or about the date of the Prospectus that it will not, and each of the
Company's BoD members will ensure that the Company will not, without the
prior written consent of the Sole Global Co-ordinator (on behalf of and after
consultation with the Managers), not to be unreasonably withheld, for a period
of 180 days from the admission of Shares to trading on the BSE or (if
admission does not become effective on that date) at such other date (being the
date on which admission does become effective) as the Company and the Joint
Bookrunners may agree in writing (the "Company Lock Up Period"), directly
or indirectly: (a) issue, offer, lend, mortgage, assign, charge, pledge, sell,
contract to sell or issue, sell any option or contract to purchase, purchase any
option or contract to sell or issue, grant any option, right or warrant to purchase,
lend or otherwise transfer or dispose of, directly or indirectly, any Shares or any
interest in Shares or any securities convertible into or exercisable or
exchangeable for, or substantially similar to, Shares or any interest in Shares or
file any registration statement under the Issuers and Markets Operations Law or
file or publish any prospectus with respect to any of the foregoing; or (b) enter
into any swap or other agreement or transaction that transfers, in whole or in
part, any of the economic consequences of ownership of the Shares, whether
any such swap or transaction described in (a) or (b) is to be settled by delivery
of the Shares or such other securities, in cash or otherwise.
The lock up restrictions do not apply to any purchase by the Company of Shares
and subsequently to the allocation/transfer of the Shares so acquired to its BoD
members and/or its managers, in each case under any share incentive plan the
Company may decide to implement.
Also, the current shareholders of the Company will agree with the Managers,
acting severally and not jointly, that none of them, nor any person acting on
their behalf will, without the prior written consent of the Sole Global Co-
ordinator (on behalf of and after consultation with the Managers), not to be
unreasonably withheld, for a period of 180 days from the admission of the
Shares to trading on the BSE or (if admission does not become effective on that
date) at such other date (being the date on which admission does become
effective) as the Company and the Joint Bookrunners may agree in writing (the
"Selling Shareholders Lock Up Period"), directly or indirectly: (a) offer, sell,
lend, assign, mortgage, pledge, charge, contract to sell or otherwise transfer or
dispose of (or publicly announce any such action), directly or indirectly, any
Shares, other equity securities of the Company or any securities convertible or
exchangeable into or exercisable for any equity securities of the Company or
any security or financial product whose value is determined directly or
indirectly by reference to the price of the underlying securities, including equity
swaps, forward sales and options or depositary receipts representing the right to
receive any such securities; or (b) enter into any swap or other agreement that
transfers, in whole or in part, any of the economic consequences of ownership
of any equity securities of the Company or enter into any transaction with the
same economic effect as, or agree to, or publicly announce any intention to
enter into any transaction described above, whether any such transaction
described in (a) or (b) is to be settled by delivery of Shares or such other
securities, in cash or otherwise.
Use of Proceeds The Company will not receive any proceeds from the Offering. The Offering is
being conducted in order to allow the Selling Shareholders to dispose of a
portion of their shareholdings, while raising Sphera’s profile with the
international investment community and establishing a market for the Shares,
which may benefit Sphera if it desires to access the equity markets in the future.
Taxation For a discussion of certain Romanian tax consequences of purchasing and
holding the Shares, see "Taxation".

53
Dividend Policy Under the current legislation and in accordance with the Company’s articles of
association, each fully paid Share gives its owner (other than the Company) the
right to receive dividends. Dividends are distributed to the shareholders on a
pro-rata basis proportionately to their participation in the paid-up share capital
of the Company. In absence of exceptional market conditions or circumstances,
for future years the BoD intends to recommend to the OGSM that the Company
distributes 100% of its distributable profits each year, subject to any restrictions
due to Romanian legal and taxation regulation, e.g. the allocation of an amount
of at least 5% of the annual profit to a legal reserve until the reserve equals at
least 20% of the Company’s share capital. Furthermore, the BoD may from
time to time propose to the GSM cash distributions by way of restitution of
capital to the shareholders, if it finds that such distribution is appropriate and
sustainable in the context of the Group's growth strategy and provided that such
distribution may be carried out in compliance with the applicable law. See
"Dividend Policy" and "Description of Share Capital and Corporate Structure".
Voting Rights Each Share carries one vote for the purposes of shareholder meetings. See
"Description of Share Capital and Corporate Structure".
Selling and Transfer Restrictions The Shares will be freely transferable, subject to certain restrictions as
described under "Selling and Transfer Restrictions".
Risk Factors Investors should consider carefully certain risks discussed under "Risk
Factors".

54
USE OF PROCEEDS
The Company will not receive any proceeds from the Offering.
The estimated gross income obtained by the Selling Shareholders from the sale of the Offered Shares in the
Offering will be of approximately RON 324,447,849 (assuming that all Offered Shares will be sold at the
maximum price of the Price Range and no proceeds will be used for stabilisation activities).
The total estimated net proceeds obtained by the Selling Shareholders from the sale of the Offered Shares in the
Offering, after deduction of all fees and charges incurred with the Offering, will be of approximately RON
311,014,220 (assuming that all Offered Shares will be sold at the maximum price of the Price Range and no
proceeds will be used for stabilisation activities).
The total estimated fees and charges payable by the Selling Shareholders in connection with the Offering are
expected to be in the range of RON 13,433,629 (assuming that all Offered Shares will be sold at the maximum
price of the Price Range).
The total fees and charges payable by the Company in connection with the Offering are expected to be in the
range of RON 424,769.
No commissions, fees or expenses in connection with the Offering will be charged to investors by the Company or
by any Selling Shareholder. However, the investors shall be charged costs (if any) associated with opening and
maintaining a securities account (unless such investor already has an account) and any brokerage commissions
payable under any relevant agreements or pursuant to the regulations of the entity accepting such purchase orders.
The Offering is being conducted in order to allow the Selling Shareholders to dispose of a portion of their
shareholdings, while raising Sphera’s profile with the international investment community and establishing a
market for the Shares, which may benefit Sphera if it desires to access the equity markets in the future.

55
DIVIDEND POLICY
Shares owned by the Company's shareholders (other than treasury Shares owned by the Company) bear equal and
full rights to dividends.
The GSM has the sole discretion to decide on the distribution of dividends based on the proposal of the BoD.
Shareholders holding individually or collectively at least 5% of the voting rights may also request to add to the
agenda of a GSM an item on the distribution of dividends, including the distribution quota. Dividends can only be
distributed out of profits determined by law, based on and according to the annual financial statements approved
by the GSM, pro rata with the contribution to the paid share capital. No interim dividends may be distributed.
Under Romanian law the Company must allocate an amount of at least 5% of its annual profit to a legal reserve
until the reserve equals at least 20% of the Company’s share capital. The Company’s legal reserve currently does
not meet this requirement nor will it meet the requirement at the time of the closing of the Offering. Accordingly,
5% of our annual profit will need to be allocated to the legal reserve until the minimum threshold is reached.
The GSM approving the annual financial statements establishes also the amount of the gross dividend per share to
be paid to the entitled shareholder, as well as the payment process.
According to the Issuers and Markets Operations Law which will become applicable to the Company only after
admission of the Shares to trading on the BSE, the GSM approving the distribution of dividends must also set the
period during which the dividends will be paid to the entitled shareholders. The beginning of the payment period
shall not be set later than 6 months from the date of the GSM. If the GSM does not decide on a dividend payment
period, the dividends shall be payable within 30 days from the date of publication of the GSM resolution
approving the payment of dividends in the Official Gazette of Romania. Upon expiry of such period, the Company
would be deemed to be in payment default by operation of law.
Following the admission of Shares to trading on the spot regulated market operated by the BSE, payment of
dividends shall be made to the shareholders registered in the shareholders' registry of the Company on the record
date set by the GSM. The record date must be set on a date that occurs at least 10 business days after the date of
the GSM. Furthermore, the payment date set by the GSM must not occur later than 15 business days after the
record date, within the six months period from the date of the GSM approving dividend distribution.
Before the dividend payment date, the Company must issue a press release in a nationwide newspaper specifying
at least: the gross amount of the dividend per share, the dividend ex date, the record date and the dividend
payment date, as approved by the GSM, as well as the means by which the dividends will be paid and
identification details of the paying agent.
Any dividends that are not claimed within three years from the date on which their payment becomes due may be
retained by the Company.
The Company's ability to pay dividends is based, among other things, on the Company's future profits as recorded
in its separate financial statements, which in turn depend on the distributable profits obtained by the Company's
subsidiaries. It is worthwhile noting that the dividends are declared by the subsidiaries, if any (and included in the
revenues of the Company) in the year subsequent to the year in which the profits of the subsidiaries are recorded.
The dividends from the subsidiaries paid to the Company will then be distributed as profit, to the Company's
shareholders, in the year subsequent to that when the subsidiaries pay such dividends, based on the OGSM
resolution. Dividends (if any) may only be declared and paid from the current year’s statutory profit and
accumulated profit from previous years, as recorded in the Company's annual financial statements as approved by
OGSM on the basis of the BoD report. In determining the amount available for distribution as dividends, the
current year’s statutory profit and accumulated profit from previous years will be adjusted to account for the
creation of the required statutory reserves. In absence of exceptional market conditions or circumstances, for
future years the BoD intends to recommend to the OGSM that the Company distributes 100% of its distributable
profits each year, subject to any restrictions due to Romanian legal and taxation regulation. Furthermore, the BoD
may from time to time propose to the GSM cash distributions by way of restitution of capital to the shareholders,
if it finds that such distribution is appropriate and sustainable in the context of the Group's growth strategy and
provided that such distribution may be carried out in compliance with the applicable law.
According to the Companies Law, a dividend distribution out of fictitious profits or from sources that cannot be
distributed, in absence of annual financial statements or contrary to the relevant data included in the financial
statements, is a criminal offence of which members of the board of directors, managers or the legal representatives
of the Company may be held responsible. Furthermore, if the Company registers a loss in its net asset, the share

56
capital must be replenished or reduced before any dividend distribution. Also, if the Company has accumulated
losses, it may not pay dividends until the losses are offset.
The Company’s financial year begins on 1 January and ends on 31 December.
The distribution of dividends by the Company and by other Group companies is subject to restrictions included in
the Group's loan facilities contracts. Please see a description of these restrictions in section "Material Contracts—
Financing Facilities".
Since the Company was incorporated in 2017, no dividends have been paid to date.

57
CAPITALIZATION AND INDEBTEDNESS
The following table sets forth the capitalization and indebtedness of the Company as at 30 September 2017. The
following tables should be read in conjunction with "Selected Financial and Operating Information", "Use of
Proceeds", "Operating and Financial Review", "Business" and the Group Financial Statements and the related
notes thereto.
Total capitalization is calculated as the sum of total equity and interest-bearing loans and borrowings.
All data in RON thousand As at 30 September 2017
Equity*
Issued capital 581.990
Share premium (520.557)
Retained earnings* 38.977
Foreign currency translation reserve* (71)
Equity attributable to equity holders of the parent 100.339
Non-controlling interests* 3
Total equity* 100.342
Interest-bearing loans and borrowings
Current debt 17.472
Non-current debt 33.560
Total Interest-bearing loans and borrowings 51.032
- of which: Unsecured portion of loans and borrowings -
Total Capitalization 151.374
Source: Management data, unaudited.
*) The amounts for the retained earnings, foreign currency translation reserve and non-controlling interests from total equity
are as of 30 June 2017 and do not include any changes that took place in the consolidated statement of comprehensive income
during the 1 July – 30 September 2017 period.
The management states that no material changes in the retained earnings, foreign currency translation reserve and
non-controlling interest positions have occurred since 30 June 2017.
The following table sets forth net financial indebtedness of the Company as at 30 September 2017. Net debt is
calculated as the difference between the interest-bearing loans and borrowing sand the cash and short-term
deposits.
All data in RON thousand As at 30 September 2017
Interest-bearing loans and borrowings 51.032
Cash and short-term deposits 42.436
Net debt 8.596
Source: Management data, unaudited.
The management of the Company declares that, as of 30 September 2017, the total value of interest-bearing
liabilities was RON 51.0 million, the total value of its capitalization was RON 151.4 million, while the value of its
net debt was RON 8.60 million.
There has been no significant change since 30 September 2017 in the capitalization of the Company.
The management of the Company is of the opinion that the Group has sufficient working capital for its present
requirements, that is, for at least the 12 months following the date of publication of this Prospectus.

58
SELECTED FINANCIAL AND OPERATING INFORMATION
The summary historical financial and operating information for USFN (Romania) and for ARS (Romania) as of
and for the years ended 31 December 2014, 2015 and 2016 and the summary historical financial and operating
information for the Company as of and for the six months ended 30 June 2016 and 2017 has been derived from the
Group Financial Statements included elsewhere in this Prospectus.
The summary financial and operating information should be read in conjunction with "Operating and Financial
Review", "Presentation of Financial and Other Information", as well as with the Group Financial Statements and
the notes thereto contained elsewhere in this Prospectus.
Summary of the consolidated statement of comprehensive income of USFN (Romania)
and of Sphera
The following table presents the summary of the consolidated statement of comprehensive income of USFN
(Romania) for the years ended 31 December 2014, 2015 and 2016, as well as of the consolidated statement of
comprehensive income of Sphera for the six months ended 30 June 2016 and 2017.
Year ended 31 December
Six months ended
30 June
All data are in RON thousand unless otherwise
stated 2014 2015 2016
2016 2017
Unaudited
Restaurant sales 261,782 329,963 417,535
193,220 242,204
Restaurant expenses 215,352 264,693 339,314
156,197 197,650
Food and materials 98,405 123,141 157,302
74,225 87,944
Payroll and employee benefits 40,400 50,513 69,577
30,623 43,430
Rent 20,366 22,544 27,498
12,984 17,001
Royalties 15,406 19,382 24,654
11,380 14,125
Advertising 13,187 16,715 20,736
8,457 11,724
Other operating expenses, net 19,350 24,565 30,313
14,330 18,474
Depreciation and amortization 8,238 7,833 9,234
4,198 4,952
Restaurant operating profit 46,430 65,270 78,221
37,023 44,554
General and administration expenses, net 15,299 16,132 22,975
10,625 15,832
Operating profit 31,131 49,138 55,246
26,398 28,722
Finance costs 978 531 825
978 440
Finance income 240 398 95
125 109
Profit before tax 30,393 49,005 54,516
25,545 28,391
Income tax expense/(credit) 4,528 7,251 5,783
3,315 1,189
Profit for the period 25,865 41,754 48,733
22,230 27,202
Attributable to:
Equity holders of the parent 25,716 41,597 48,693
22,216 27,090
Non-controlling interests 149 157 40
14 112
Other comprehensive income
Other comprehensive income to be reclassified to
profit or loss in subsequent periods (net of tax): 0 0 0
(21) (30)
Exchange differences on translation of foreign
operations (10) (92) 83
Total comprehensive income for the period, net of
tax 25,855 41,662 48,816
22,209 27,172
Attributable to:
Equity holders of the parent 25,708 41,513 48,774
22,198 27,060
Non-controlling interests 147 149 42
11 112
Source: USFN (Romania) Annual Financial Statements; Sphera Interim Financial Statements, unaudited.

59
Summary of the consolidated statement of financial position of USFN (Romania) and of
Sphera
The following table presents the summary of the consolidated statement of financial position of USFN (Romania)
as of 31 December 2014, 2015 and 2016, as well as of the consolidated statement of financial position of Sphera
as of 30 June 2017.
31 December 30 June
All data are in RON thousand unless otherwise stated 2014 2015 2016
2017
Unaudited
Assets
Non-current assets 41,658 45,562 54,246
143,055
Property, plant and equipment 37,779 41,084 47,551
81,159
Intangible assets 3,765 4,298 6,365
60,475
Trade and other receivables
285
Deposits for rent guarantee 95 163 290
668
Deferred tax assets 19 17 40
468
Current assets 38,275 55,497 65,399
51,769
Inventories 4,161 5,717 5,744
7,458
Trade and other receivables 3,473 4,438 8,780
5,077
Prepayments 1,729 1,743 1,907
3,418
Cash and short-term deposits 28,912 43,599 48,968
35,816
Assets held for sale
195
Total assets 79,933 101,059 119,645
195,019
Equity and liabilities
Total equity 33,456 50,482 58,253
100,342
Equity attributable to equity holders of the parent 33,449 50,479 58,292
100,339
Issued capital 190 190 190
581,990
Share premium
(520,557)
Other capital reserves 19 19 19
-
Retained earnings 33,278 50,392 58,124
38,977
Foreign currency translation reserve (38) (122) (41)
(71)
Non-controlling interests 7 3 (39)
3
Non-current liabilities 12,010 15,349 16,304
33,223
Interest-bearing loans and borrowings 8,773 11,787 14,630
31,227
Trade and other payables 1,597 1,827 1,674
1,996
Deferred tax liabilities 1,640 1,735 -
Current liabilities 34,467 35,228 45,088
61,454
Trade and other payables 27,950 28,594 37,292
45,650
Interest-bearing loans and borrowings 6,378 6,634 7,796
15,804
Provisions 139 - -
Total liabilities 46,477 50,577 61,391
94,677
Total equity and liabilities 79,933 101,059 119,645
195,019
Source: USFN (Romania) Annual Financial Statements; Sphera Interim Financial Statements, unaudited

60
Summary of the consolidated statement of cash flows of USFN (Romania) and of Sphera
The following table presents the summary of the consolidated statement of cash flows of USFN (Romania) for the
years ended 31 December 2014, 2015 and 2016, as well as of the consolidated statement of cash flows of Sphera
for the six months ended 30 June 2016 and 2017.
Year ended 31 December
Six months ended 30
June
All data are in RON thousand unless otherwise
stated 2014 2015 2016
2016 2017
Unaudited
Operating activities
Profit before tax 30,393 49,005 54,516
25,545 28,391
Adjustments to reconcile profit before tax to net cash
flows:
Depreciation and impairment of property, plant and
equipment 8,044 7,628 8,977
4,394 5,692
Amortisation and impairment of intangible assets 675 698 847
390 487
Net foreign exchange differences (116) 181 60
(65) (71)
Gain on disposal of property, plant and equipment 740 (10) 92
148 -
Finance income (240) (398) (95)
(125) (109)
Finance costs 555 424 536
332 395
Movement in current assets allowances 165 12 5
Movements in provisions, pensions and government
grants (1,226) (139) 0
Working capital adjustments:
Decrease/(Increase) in trade and other receivables and
prepayments (553) (989) (4,574)
835 4,794
Decrease/(Increase) in inventories (652) (1,570) (27)
314 (516)
Increase/(Decrease) in trade and other payables 8,035 459 8,655
(2,933) (5,281)
Interest received 192 342 31
125 109
Interest paid (561) (453) (561)
(324) (434)
Income tax paid (3,452) (6,698) (7,619)
(4,078) (1,848)
Net cash flows from operating activities 41,999 48,491 60,843
24,558 31,609
Investing activities
Proceeds from sale of property, plant and equipment 2 27 0
8 -
Purchase of intangible assets (430) (1,246) (2,916)
(1,573) (1,132)
Purchase of property, plant and equipment (4,108) (10,935) (15,536)
(6,294) (14,596)
Acquisition of subsidiary, net of cash
- 2,161
Net cash flows used in investing activities (4,536) (12,154) (18,452)
(7,859) (13,567)
Financing activities
Capital contribution from shareholders of Sphera on set
up, net of transaction costs paid
- 1,151
Proceeds from borrowings 3,382 10,993 11,704
3,552 19,225
Repayment of borrowings (7,531) (7,730) (7,480)
(3,678) (5,051)
Payment of finance lease liabilities (155) (185) (284)
(156) (134)
Dividends paid to equity holders of the parent (12,664) (24,483) (40,961)
(40,961) (46,237)
Dividends paid to non-controlling interests (133) (153) (84)
- (70)
Net cash flows from/(used in) financing activities (17,101) (21,558) (37,105)
(41,263) (31,116)
Net increase/(decrease) in cash and cash equivalents 20,362 14,779 5,286
(24,564) (13,074)
Net foreign exchange difference (10) (92) 83
(18) (78)
Cash and cash equivalents at 1 January 8,560 28,912 43,599
43,599 48,968
Cash and cash equivalents at end of period 28,912 43,599 48,968
19,017 35,816
Source: USFN (Romania) Annual Financial Statements; Sphera Interim Financial Statements, unaudited

61
Summary of the statement of comprehensive income of ARS (Romania)
The following table presents the summary of the statement of comprehensive income of ARS (Romania) for the
years ended 31 December 2014, 2015 and 2016, as well as for the six months ended 30 June 2016 and 2017.
Year ended 31 December
Six months ended
30 June
All data are in RON thousand unless otherwise stated 2014 2015 2016
2016 2017
Unaudited
Restaurant sales 63,130 75,867 96,940
46,398 54,210
Restaurant expenses 51,952 59,962 82,329
37,684 46,486
Food and materials 16,881 19,718 26,107
12,606 14,830
Payroll and employee benefits 12,001 14,622 22,383
9,608 13,690
Rent 6,081 6,476 8,027
3,672 4,692
Royalties 3,697 4,448 5,702
2,721 3,166
Advertising 3,590 4,245 5,785
2,727 2,973
Other operating expenses, net 7,514 8,339 11,659
5,234 5,386
Depreciation and amortization 2,188 2,114 2,666
1,116 1,749
Restaurant operating profit 11,178 15,905 14,611
8,714 7,724
General and administration expenses, net 6,094 7,751 8,982
4,338 5,732
Operating profit 5,084 8,154 5,629
4,376 1,992
Finance costs 309 482 213
81 187
Finance income 7 19 127
93 6
Profit before tax from continuing operations 4,782 7,691 5,543
4,388 1,811
Income tax expense 667 1,170 361
626 772
Profit for the period from continuing operations 4,115 6,521 5,182
3,762 1,039
Discontinued operations
Profit/(loss) after tax for the year from discontinued
operations (595) (397) (1,953)
293 -
Profit for the period 3,520 6,124 3,229
4,055 1,039
Source: ARS (Romania) Annual Financial Statements; ARS (Romania) Interim Financial Statements, unaudited
Summary of the statement of financial position of ARS (Romania)
The following table presents the summary of the statement of financial position of ARS (Romania) as of 31
December 2014, 2015 and 2016, as well as of 30 June 2017.
31 December 30 June
All data are in RON thousand unless otherwise stated 2014 2015 2016
2017
Unaudited
Assets
Non-current assets 10,777 15,262 21,374
22,799
Property, plant and equipment 9,653 13,265 18,201
19,511
Intangible assets 1,007 1,749 2,917
2,757
Trade and other receivables
285
Deposits for rent guarantee 117 248 256
246
Current assets 14,806 18,562 11,612
6,225
Inventories 6,986 6,758 1,111
1,206
Trade and other receivables 5,849 5,363 6,089
1,513
Prepayments 665 867 1,118
1,186
Cash and short-term deposits 1,306 5,574 3,294
2,320
Assets held for sale 0 0 195
195
Total assets 25,583 33,824 33,181
29,219
Equity and liabilities
Total equity 6,607 8,781 5,980
3,651
Issued capital 1,644 1,644 1,644
1,644
Share premium 0 0 0
Other capital reserves 21 21 21
21
Retained earnings 4,942 7,116 4,315
1,986

62
31 December 30 June
All data are in RON thousand unless otherwise stated 2014 2015 2016
2017
Unaudited
Non-current liabilities 1,243 4,448 7,865
7,273
Interest-bearing loans and borrowings 492 3,692 7,536
6,950
Trade and other payables 307 302 329
323
Deferred tax liabilities 444 454 0
Current liabilities 17,733 20,595 19,336
18,295
Trade and other payables 16,298 18,477 15,401
13,967
Interest-bearing loans and borrowings 1,435 2,118 3,935
4,328
Total liabilities 18,976 25,043 27,201
25,568
Total equity and liabilities 25,583 33,824 33,181
29,219
Source: ARS (Romania) Annual Financial Statements; ARS (Romania) Interim Financial Statements, unaudited
Summary of the statement of cash flows of ARS (Romania)
The following table presents the summary of the statement of cash flows of ARS (Romania) for the years ended
31 December 2014, 2015 and 2016, as well as for the six months ended 30 June 2016 and 2017.
Year ended 31 December
Six months ended
30 June
All data are in RON thousand unless otherwise stated 2014 2015 2016
2016 2017
Unaudited
Operating activities
Profit before tax from continuing operations 4,782 7,691 5,543
4,388 1,811
Profit/(loss) before tax from discontinued operations (708) (477) (2,141)
349 -
Profit before tax 4,074 7,214 3,402
4,737 1,811
Adjustments to reconcile profit before tax to net cash
flows:
Depreciation and impairment of property, plant and
equipment 2,268 2,208 2,862
1,294 1,609
Amortisation and impairment of intangible assets 202 210 323
147 207
Impairment allowance of property, plant and equipment - - 966
Net foreign exchange differences (129) 3 54
2 (8)
Gain on disposal of property, plant and equipment 391 (56) 115
6 (4)
Finance income (7) (19) (18)
(15) (6)
Finance costs 100 97 213
81 157
Movements in current asset allowances 2 19 -
- (63)
Working capital adjustments:
Decrease/(increase) in trade and other receivables and
prepayments (2,146) 153 (985)
2,187 4,233
Decrease/(increase) in inventories (673) 209 5,647
(2,420) (32)
Increase/(Decrease) in trade and other payables 1,828 1,896 (2,489)
(483) (2,212)
Interest received 7 19 18
15 6
Interest paid (100) (119) (240)
(96) (162)
Income tax paid (592) (801) (1,186)
(928) -
Net cash flows from operating activities 5,225 11,033 8,682
4,527 5,536
Investing activities
Proceeds from sale of property, plant and equipment 15 56 33
- 8
Purchase of intangible assets (44) (953) (1,491)
(496) (47)
Purchase of property, plant and equipment (1,119) (5,819) (9,107)
(4,139) (2,923)
Net cash flows used in investing activities (1,148) (6,716) (10,565)
(4,635) (2,962)
Financing activities
Proceeds from borrowings - 6,359 8,603
3,762 1,838
Repayment of borrowings (2,151) (2,458) (2,769)
(1,297) (1,920)
Payment of finance lease liabilities (107) - (201)
(81) (98)
Dividends paid to equity holders (1,800) (3,950) (6,030)
(6,030) (3,368)
Net cash flows from/(used in) financing activities (4,058) (49) (397)
(3,646) (3,548)
Net increase in cash and cash equivalents 19 4,268 (2,280)
(3,754) (974)
Cash and cash equivalents at 1 January 1,287 1,306 5,574
5,574 3,294
Cash and cash equivalents at end of period 1,306 5,574 3,294
1,820 2,320
Source: ARS (Romania) Annual Financial Statements; ARS (Romania) Interim Financial Statements, unaudited

63
PRO FORMA FINANCIAL INFORMATION
Introduction
The Company was incorporated on 16 May 2017 by Tatika (Cyprus), Lunic (Cyprus), Wellkept (Romania), MBL
(Romania) and Anasa Properties (Romania) who at the time of the incorporation of the Company were also the
shareholders of USFN (Romania) and ARS (Romania). As a result of a corporate reorganisation process
undertaken in May-June 2017, the Company became the legal parent of USFN (Romania), ARS (Romania),
USFN (Italy), USFN (Moldova) and California Fresh Flavors (Romania), to ensure a better coordination of
activities and enhance value creation, by taking advantage of the synergies at group level and by achieving
economies of scale. In September 2017, the Company has finalised the taking over of certain activities as well as
certain employees from USFN (Romania) and from ARS (Romania) and currently renders to the benefit of the
Group entities services such as management services, marketing support, development, sales support, human
resources and other services.
The Company became the parent of both USFN (Romania) and ARS (Romania) on 30 May 2017, following the
contribution by the Company's shareholders of their shares in USFN (Romania) (379,999 shares out of total
380,000 shares) and in ARS (Romania) (379,999 shares out of total 380,000 shares) and in exchange received new
shares in Sphera. By applying the criteria set in IFRS 3, the transaction qualified as a business combination and
USFN (Romania) was identified as the acquirer of the Company and of ARS (Romania).
On 8 June 2017 USFN (Romania) sold all its shares (a participation of 100%) in USFN (Italy) to the Company
and on 14 June 2017 USFN (Romania) sold all its shares (a participation of 80%) in USFN (Moldova) to the
Company. These transactions had no effect on the consolidated financial statements of the Company, as there was
no change of control, or in the percentage owned by the Company's shareholders.
On 19 June 2017, the Company set up a new subsidiary, California Fresh Flavors (Romania) that holds the licence
to operate Taco Bell restaurants in Romania, and holds 9,999 shares of its 10,000 shares. The new subsidiary had
no activity up to 30 June 2017.
Purpose of Pro Forma Financial Information
The Pro Forma Financial Information included in this chapter was prepared to illustrate the consolidated
operational performance of the Group for the twelve months periods ended 31 December 2014, 31 December
2015 and 31 December 2016 and for the six-month period ended 30 June 2017, respectively, as if the
incorporation of the Company and the contribution of USFN (Romania) shares and of ARS (Romania) shares to
the Company's share capital took place on 1 January 2014, 1 January 2015, and 1 January 2016 and 1 January
2017, respectively. The acquisition by the Company of the shares in USFN (Italy) and in USFN (Moldova) from
USFN (Romania), which has no impact on the consolidated financial statements of the Company, and the
incorporation of California Fresh Flavors (Romania) are not adjusted for in the Pro Forma Financial Information.
USFN (Romania) and ARS (Romania) have had identical shareholder structures and also their key management
personnel have been preponderantly the same since 2012. Therefore, although from an IFRS perspective the
criteria to qualify as being "under common control" are not met (since none of the shareholders had control or
common control), the presentation of the Pro Forma Financial Information is reflective of the manner in which the
two business segments (KFC operated by USFN (Romania) and Pizza Hut operated by ARS (Romania)) were
managed together.
Because of its nature, the Pro Forma Financial Information describes a hypothetical situation and has been
prepared for illustrative purposes only and does not purport to represent the Company’s actual financial position
or results, nor are they necessarily indicative of future consolidated operational results.
In addition, the statements are based on available information and various assumptions that management believes
to be reasonable. The actual results may differ from those reflected in the Pro forma Financial Information for a
number of reasons, including, but not limited to, differences between the assumptions used to prepare the Pro
forma Financial Information and actual amounts.
The Pro forma Financial Information only consists of the pro forma consolidated statement of comprehensive
income for the twelve-month period ended 31 December 2014, 31 December 2015 and 31 December 2016 and for
the six months period ended 30 June 2017, respectively, and selected notes.

64
The pro forma consolidated statement of comprehensive income included in the Pro forma Financial Information
for the twelve-month periods ended 31 December 2014, 31 December 2015 and 31 December 2016 is based on
the statements of comprehensive income for the year ended 31 December 2014, 31 December 2015 and 31
December 2016, respectively, included in USFN (Romania) Annual Financial Statements and in ARS (Romania)
Annual Financial Statements, with pro forma adjustments as described in Note 3 and summarized below.
The pro forma consolidated statement of comprehensive income included in the Pro forma Financial Information
for the six months ended 30 June 2017 is based on the statement of comprehensive income for the six months
ended 30 June 2017 included in the Sphera Interim Financial Statements and ARS (Romania) statement of
comprehensive income for the period 1 January – 31 May 2017, which is derived from ARS (Romania) Interim
Financial Statements, with pro forma adjustments as described in Note 3 and summarized below.
Basis of preparation of the Pro forma Financial Information – pro forma adjustments
Pro forma adjustments: reclassification of discontinued operations to profit or loss
Up to the second half of 2016, ARS (Romania) acted as a purchase hub for some related entities, mainly the
USFN Group. For the purpose of this Chapter, USFN Group comprises USFN (Romania), USFN (Moldova) and
USFN (Italy). All food supplies, beverages or other consumables were purchased by ARS (Romania) and sold at a
mark-up designed to broadly cover any other operating costs directly associated with this line of business. In
November 2016, ARS (Romania) together with USFN (Romania) have outsourced this activity to Havi
(Romania); a third-party company specialized in integrated logistics services for the food industry. In the ARS
(Romania) Annual Financial Statements, the after-tax result from the discontinued supply activity was disclosed
separately, as a single profit or loss caption, in line with the IFRS requirements.
In the process of preparation of the pro forma consolidated statement of comprehensive income, for the twelve-
month periods ended 31 December 2014, 31 December 2015 and 31 December 2016, the ARS (Romania) loss for
the year from discontinued operations, net of tax was reclassified to the original profit or loss captions (e.g. sales,
food and materials, etc.) to the extent that the sales of ARS (Romania) were made towards the USFN Group.
Pro forma adjustments: ARS (Romania) statement of comprehensive income for the period 1
January - 31 May 2017
On 30 May 2017, Sphera acquired 99.9997% of the shares in ARS (Romania), in exchange for Sphera shares. The
Statement of comprehensive income for the six-month period ended 30 June 2017 from Sphera Interim Financial
Statements, unaudited, includes the results of ARS (Romania) from the date of acquisition, i.e. from 31 May 2017
to 30 June 2017. As such, the pre-acquisition statement of comprehensive income of ARS (Romania) for the
period 1 January 2017 to 31 May 2017 has been added, as if the acquisition took place on 1 January 2017.
Pro forma adjustments: elimination of intercompany transactions
In the process of preparation of the pro forma consolidated statement of comprehensive income for the twelve-
month periods ended 31 December 2014, 31 December 2015 and 31 December 2016, amounts as per the USFN
(Romania) Annual Financial Statements were added to the amounts as per the ARS (Romania) Annual Financial
Statements, with the transactions carried out during 2016 between the two entities being eliminated.
In the process of preparation of the pro forma consolidated statement of comprehensive income for the six-month
period ended 30 June 2017, pre-acquisition amounts for the period 1 January 2017 to 31 May 2017 from the
statement of comprehensive income of ARS were added to the amounts from the Sphera consolidated statement of
comprehensive income for the six months ended 30 June 2017, thus the transactions carried out during the first
five months of 2017 between the two entities had to be eliminated.
No synergies or integration costs following the re-organization through which the Company has become the legal
parent of USFN (Romania) and ARS (Romania) have been taken into consideration in the preparation of the pro
forma consolidated financial information
Additionally, only for the twelve-month periods ended 31 December 2016, this category also includes the
reclassification of the net foreign exchange gain from ARS (Romania), to be netted off against the net foreign
exchange loss of USFN (Romania), for presentation consistency purposes.

65
Pro forma adjustments: Purchase price allocation ("PPA") adjustments
Adjustments have been made to account for the effect of the purchase price allocation performed as of 30 May
2017, the date of acquisition of the Company and of ARS (Romania) by USFN (Romania), from the perspective of
IFRS 3. Specifically, there are fair value adjustments recorded for the property, plant and equipment of ARS
(Romania). The adjustment recorded in the pro forma financial information has been computed by applying the
fair value adjustments to the property, plant and equipment of ARS (Romania) (as determined on 31 May 2017) to
their net book values on 1 January of the respective year or from the date of acquisition, and by re-computing the
depreciation expense for the years 2014, 2015 and 2016 as well as for the period 1 January 2017 – 31 May 2017
based on the amounts thus adjusted.
Summary of Pro forma consolidated statement of comprehensive income for the years
ended 31 December 2014, 2015 and 2016 and for six months ended 30 June 2017
All data are in RON thousand unless otherwise stated Year ended 31 December
Six months
ended 30 June
2014 2015 2016
2017
Unaudited Unaudited
Restaurant sales 324,912 405,830 514,475
287,833
Restaurant expenses 267,699 325,134 422,204
237,034
Food and material expenses 115,286 142,859 183,409
100,472
Payroll and employee benefits 52,401 65,135 91,960
55,195
Rent 26,447 29,020 35,525
20,898
Royalties 19,103 23,830 30,356
16,807
Advertising 16,777 20,960 26,521
14,220
Other operating expenses, net 26,864 32,904 41,972
22,782
Depreciation and amortization 10,821 10,426 12,461
6,660
Restaurant operating profit 57,213 80,696 92,271
50,799
General and administration expenses, net 21,419 23,912 31,988
20,204
Operating profit 35,794 56,784 60,283
30,595
Finance costs 1,287 1,013 929
638
Finance income 247 417 113
115
Profit before tax 34,754 56,188 59,467
30,072
Income tax expense 5,195 8,421 6,144
1,742
Profit for the period from continuing operations 29,559 47,767 53,323
28,330
Discontinued operations
Loss after tax from discontinued operations (620) (476) (1,683)
-
Profit for the period 28,930 47,291 51,640 28,330
Attributable to:
Equity holders of Sphera 28,790 47,134 51,600 28,218
Non-controlling interests 149 157 40 112
Other comprehensive income
Other comprehensive income to be reclassified to profit
or loss in subsequent periods (net of tax):
Exchange differences on translation of foreign operations (10) (92) 83 (30)
Total comprehensive income for the period, net of tax 28,929 47,199 51,723 28,300
Attributable to:
Equity holders of Sphera 28,782 47,050 51,681 28,188
Non-controlling interests 147 149 42 112
Earnings per share
Profit from continuing operations attributable to ordinary
equity holders of Sphera 29,410 47,610 53,283 28,218
Number of Sphera shares 38,799,340 38,799,340 38,799,340 38,799,340
Earnings per share, basic and diluted (RON/share) 0.76 1.23 1.37 0.73

66
All data are in RON thousand unless otherwise stated Year ended 31 December
Six months
ended 30 June
2014 2015 2016
2017
Unaudited Unaudited
EBITDA
Operating profit from continuing operations 35,794 56,784 60,283 30,595
Adjustments to bridge operating profit to EBITDA:
Depreciation and amortization included in restaurant
expenses 10,821 10,426 12,461 6,660
Depreciation and amortization included in general and
administration expenses 658 655 758 1,179
EBITDA from continuing operations 47,273 67,865 73,502 38,434
Segment reporting
Revenue breakdown by countries
Romania 320,675 400,273 506,983 280,221
Republic of Moldova 4,237 5,557 7,492 4,131
Italy 3,481
Total restaurant revenue 324,912 405,830 514,475 287,833
Revenue breakdown by brands
KFC 260,692 328,510 415,535 232,439
Pizza Hut 64,220 77,320 98,940 55,394
Total restaurant revenue 324,912 405,830 514,475 287,833
Source: Sphera Franchise Group S.A. Pro Forma Consolidated Financial Information for the periods from 1 January 2014 to
31 December 2014, 1 January 2015 to 31 December 2015, 1 January 2016 to 31 December 2016 and 1 January 2017 to 30
June 2017, unaudited.
Pro forma consolidated statement of comprehensive income for the year ended 31
December 2014
Year ended 31 December 2014
Unaudited
USFN
Group ARS
Reclassification
of discontinued
operations
Intercompany
elimination
PPA
effect Pro forma
Restaurant sales 261,782 63,130 62,412 (62,412) - 324,912
Restaurant expenses 215,352 51,952 62,448 (62,448) 395 267,699
Food and material expenses 98,405 16,881 60,847 (60,847) - 115,286
Payroll and employee benefits 40,400 12,001 - - - 52,401
Rent 20,366 6,081 - - - 26,447
Royalties 15,406 3,697 - - - 19,103
Advertising 13,187 3,590 - - - 16,777
Other operating expenses, net 19,350 7,514 1,601 (1,601) - 26,864
Depreciation and amortization 8,238 2,188 - - 395 10,821
Restaurant operating profit 46,430 11,178 (36) 36 (395) 57,213
General and administration
expenses, net 15,299 6,094 (66) 66 26 21,419
Operating profit 31,131 5,084 30 (30) (421) 35,794
Finance costs 978 309 - - - 1,287
Finance income 240 7 - - - 247
Profit before tax 30,393 4,782 30 (30) (421) 34,754
Income tax expense 4,528 667 5 (5) - 5,195
Profit for the period from
continuing operations 25,865 4,115 25 (25) (421) 29,559
Discontinued operations - (595) (25) - - (620)
Loss after tax from discontinued
operations
Profit for the year 25,865 3,520 - (25) (421) 28,930
Attributable to:
Equity holders of Sphera 25,716 3,520 - (25) (421) 28,790

67
Year ended 31 December 2014
Unaudited
USFN
Group ARS
Reclassification
of discontinued
operations
Intercompany
elimination
PPA
effect Pro forma
Non-controlling interests 149 - - - - 149
Other comprehensive income
Other comprehensive income to
be reclassified to profit or loss in
subsequent periods (net of tax):
Exchange differences on
translation of foreign operations (10) - - - - (10)
Total comprehensive income for
the period, net of tax 25,855 3,520 - (25) (421) 28,929
Attributable to:
Equity holders of Sphera 25,708 3,520 - (25) (421) 28,782
Non-controlling interests 147 - - - - 147
Earnings per share
Profit from continuing operations
attributable to ordinary equity
holders of Sphera 29,410
Number of Sphera shares 38,799,340
Earnings per share, basic and
diluted (RON/share) 0.76
EBITDA
Operating profit from
continuing operations 31,131 5,084 30 (30) (421) 35,794
Adjustments to bridge
operating profit to EBITDA:
Depreciation and amortization
included in restaurant expenses 8,238 2,188 - - 395 10,821
Depreciation and amortization
included in general and
administration expenses 481 151 - - 26 658
EBITDA from continuing
operations 39,850 7,423 30 (30) - 47,273
Segment reporting
Revenue breakdown by
countries
Romania 257,545 63,130 320,675
Republic of Moldova 4,237 - 4,237
Italy
Total restaurant revenue 261,782 63,130 324,912
Revenue breakdown by brands
KFC 260,692
Pizza Hut 64,220
Total restaurant revenue 324,912
Source: Sphera Franchise Group S.A. Pro Forma Consolidated Financial Information for the period from 1 January 2014 to
31 December 2014, unaudited.

68
Pro forma consolidated statement of comprehensive income for the year ended 31
December 2015
Year ended 31 December 2015
Unaudited
USFN
Group ARS
Reclassification
of discontinued
operations
Intercompany
elimination
PPA
effect Pro forma
Restaurant sales 329,963 75,867 80,704 (80,704) - 405,830
Restaurant expenses 264,693 59,962 80,608 (80,608) 479 325,134
Food and material expenses 123,141 19,718 78,020 (78,020) - 142,859
Payroll and employee benefits 50,513 14,622 - - - 65,135
Rent 22,544 6,476 27 (27) - 29,020
Royalties 19,382 4,448 - - - 23,830
Advertising 16,715 4,245 2 (2) - 20,960
Other operating expenses, net 24,565 8,339 2,559 (2,559) - 32,904
Depreciation and amortization 7,833 2,114 - - 479 10,426
Restaurant operating profit 65,270 15,905 96 (96) (479) 80,696
General and administration
expenses, net 16,132 7,751 3 (3) 29 23,912
Operating profit 49,138 8,154 93 (93) (508) 56,784
Finance costs 531 482 - - - 1,013
Finance income 398 19 - - - 417
Profit before tax 49,005 7,691 93 (93) (508) 56,188
Income tax expense 7,251 1,170 14 (14) - 8,421
Profit for the period from
continuing operations 41,754 6,521 79 (79) (508) 47,767
Discontinued operations - (397) (79) - - (476)
Loss after tax from discontinued
operations
Profit for the year 41,754 6,124 - (79) (508) 47,291
Attributable to:
Equity holders of Sphera 41,597 6,124 - (79) (508) 47,134
Non-controlling interests 157 - - - - 157
Other comprehensive income
Other comprehensive income to be
reclassified to profit or loss in
subsequent periods (net of tax):
Exchange differences on translation
of foreign operations (92) - - - - (92)
Total comprehensive income for
the year, net of tax 41,662 6,124 - (79) (508) 47,199
Attributable to:
Equity holders of Sphera 41,513 6,124 - (79) (508) 47,050
Non-controlling interests 149 - - - - 149
Earnings per share
Profit from continuing operations
attributable to ordinary equity
holders of Sphera 47,610
Number of Sphera shares 38,799,340
Earnings per share, basic and
diluted (RON/share) 1.23
EBITDA
Operating profit from continuing
operations 49,138 8,154 93 (93) (508) 56,784
Adjustments to bridge operating
profit to EBITDA:
Depreciation and amortization
included in restaurant expenses 7,833 2,114 - - 479 10,426
Depreciation and amortization
included in general and
administration expenses 493 133 - - 29 655

69
Year ended 31 December 2015
Unaudited
USFN
Group ARS
Reclassification
of discontinued
operations
Intercompany
elimination
PPA
effect Pro forma
EBITDA from continuing
operations 57,464 10,401 93 (93) - 67,865
Segment reporting
Revenue breakdown by countries
Romania 324,406 75,867 400,273 Republic of Moldova 5,557 - 5,557 Italy
Total restaurant revenue 329,963 75,867 405,830
Revenue breakdown by brands
KFC 328,510 Pizza Hut 77,320
Total restaurant revenue 405,830
Source: Sphera Franchise Group S.A. Pro Forma Consolidated Financial Information for the period from 1 January 2015 to
31 December 2015, unaudited.
Pro forma consolidated statement of comprehensive income for the year ended 31
December 2016
Year ended 31 December 2016
Unaudited
USFN
Group ARS
Reclassificati
on of
discontinued
operations
Intercompan
y elimination
PPA
effect Pro forma
Restaurant sales 417,535 96,940 77,650 (77,650) - 514,475
Restaurant expenses 339,314 82,329 77,979 (77,979) 561 422,204
Food and material expenses 157,302 26,107 75,272 (75,272) - 183,409
Payroll and employee benefits 69,577 22,383 - - - 91,960
Rent 27,498 8,027 13 (13) - 35,525
Royalties 24,654 5,702 - - - 30,356
Advertising 20,736 5,785 17 (17) - 26,521
Other operating expenses, net 30,313 11,659 2,677 (2,677) - 41,972
Depreciation and amortization 9,234 2,666 - - 561 12,461
Restaurant operating profit 78,221 14,611 (329) 329 (561) 92,271
General and administration
expenses, net 22,975 8,982 (9) 9 31 31,988
Operating profit 55,246 5,629 (320) 320 (592) 60,283
Finance costs 825 213 - (109) - 929
Finance income 95 127 - (109) - 113
Profit before tax 54,516 5,543 (320) 320 (592) 59,467
Income tax expense 5,783 361 (50) 50 - 6,144
Profit for the year from
continuing operations 48,733 5,182 (270) 270 (592) 53,323
Discontinued operations
Loss after tax from discontinued
operations - (1,953) 270 - - (1,683)
Profit for the year 48,733 3,229 - 270 (592) 51,640
Attributable to:
Equity holders of Sphera 48,693 3,229 - 270 (592) 51,600
Non-controlling interests 40 - - - - 40

70
Year ended 31 December 2016
Unaudited
USFN
Group ARS
Reclassificati
on of
discontinued
operations
Intercompan
y elimination
PPA
effect Pro forma
Other comprehensive income
Other comprehensive income to be
reclassified to profit or loss in
subsequent periods (net of tax):
Exchange differences on translation
of foreign operations 83 - - - - 83
Total comprehensive income for
the year, net of tax 48,816 3,229 - 270 (592) 51,723
Attributable to:
Equity holders of Sphera 48,774 3,229 - 270 (592) 51,681
Non-controlling interests 42 - - - - 42
Earnings per share
Profit from continuing operations
attributable to ordinary equity
holders of Sphera 53,283
Number of Sphera shares 38,799,340
Earnings per share, basic and
diluted (RON/share) 1.37
EBITDA
Operating profit from continuing
operations 55,246 5,629 (320) 320 (592) 60,283
Adjustments to bridge operating
profit to EBITDA:
Depreciation and amortization
included in restaurant expenses 9,234 2,666 - - 561 12,461
Depreciation and amortization
included in general and
administration expenses 590 137 - - 31 758
EBITDA from continuing
operations 65,070 8,432 (320) 320 - 73,502
Segment reporting
Revenue breakdown by countries
Romania 410,043 96,940 506,983
Republic of Moldova 7,492 - 7,492
Italy
Total restaurant revenue 417,535 96,940 514,475
Revenue breakdown by brands
KFC 415,535
Pizza Hut 98,940
Total restaurant revenue 514,475
Source: Sphera Franchise Group S.A. Pro Forma Consolidated Financial Information for the period from 1 January 2016 to
31 December 2016, unaudited.

71
Pro forma consolidated statement of comprehensive income for the six months ended 30
June 2017
Six months ended 30 June 2017
Unaudited
Sphera
ARS for the period
1 January - 31 May 2017
Intercompany
elimination
PPA
effect Pro forma
Restaurant sales 242,204 45,630 (1) - 287,833
Restaurant expenses 197,650 39,144 (1) 241 237,034
Food and material expenses 87,944 12,530 (2) - 100,472
Payroll and employee benefits 43,430 11,765 - - 55,195
Rent 17,001 3,897 - - 20,898
Royalties 14,125 2,682 - - 16,807
Advertising 11,724 2,517 (21) - 14,220
Other operating expenses, net 18,474 4,286 22 - 22,782
Depreciation and amortization 4,952 1,467 - 241 6,660
Restaurant operating profit 44,554 6,486 - (241) 50,799
General and administration
expenses, net 15,832 4,372 - - 20,204
Operating profit 28,722 2,114 - (241) 30,595
Finance costs 440 198 - - 638
Finance income 109 6 - - 115
Profit before tax 28,391 1,922 - (241) 30,072
Income tax expense 1,189 553 - - 1,742
Profit for the period 27,202 1,369 - (241) 28,330
Attributable to:
Equity holders of Sphera 27,090 1,369 - (241) 28,218
Non-controlling interests 112 - - - 112
Other comprehensive income
Other comprehensive income to be
reclassified to profit or loss in
subsequent periods (net of tax):
Exchange differences on translation
of foreign operations (30) - - - (30)
Total comprehensive income for
the period, net of tax 27,172 1,369 - (241) 28,300
Attributable to:
Equity holders of Sphera 27,060 1,369 - (241) 28,188
Non-controlling interests 112 - - - 112
Earnings per share
Profit from continuing operations
attributable to ordinary equity
holders of Sphera 28,218
Number of Sphera shares 38,799,340
Earnings per share, basic and
diluted (RON/share) 0.73
EBITDA
Operating profit 28,722 2,114 - (241) 30,595
Adjustments to bridge operating
profit to EBITDA:
Depreciation and amortization
included in restaurant expenses 4,952 1,467 - 241 6,660
Depreciation and amortization
included in general and
administration expenses 1,119 60 - - 1,179
EBITDA 34,793 3,641 - - 38,434

72
Six months ended 30 June 2017
Unaudited
Sphera
ARS for the period
1 January - 31 May 2017
Intercompany
elimination
PPA
effect Pro forma
Segment reporting
Revenue breakdown by countries
Romania 234,591 45,630 280,221
Republic of Moldova 4,131 - 4,131
Italy 3,481 - 3,481
Total restaurant revenue 242,203 45,630 287,833
Revenue breakdown by brands
KFC 232,439
Pizza Hut 55,394
Total restaurant revenue 287,833
Source: Sphera Franchise Group S.A. Pro Forma Consolidated Financial Information for the period from 1 January 2017 to
30 June 2017, unaudited.

73
OPERATING AND FINANCIAL REVIEW
The following discussion and analysis of the financial condition and results of operations of the Group should be
read in conjunction with the information in sections captioned "Presentation of Financial and Other Information"
and "Selected Financial and Operating Information" of this Prospectus. The following discussion should also be
read in conjunction with, and is qualified by reference to, the Group Financial Statements, in each case with the
related notes, prepared in accordance with IFRS-EU and appended to this Prospectus.
The following discussion includes trend information and forward-looking statements based on assumptions about
our future business. Our actual results could differ materially from those contained in these forward-looking
statements as a result of many factors, including but not limited to those described in section captioned "Forward-
Looking Statements" and under chapter "Risk Factors" of this Prospectus.
Overview
Sphera was incorporated on 16 May 2017 by the former shareholders of USFN (Romania) and of ARS (Romania)
to ensure a better coordination of activities and enhancing value creation, by taking advantage of the synergies at a
group level and by achieving economies of scale. Sphera became the parent of both USFN (Romania) and ARS
(Romania) on 30 May 2017, following the in-kind contribution by the existing shareholders of their shares in
USFN (Romania) (379,999 shares out of total 380,000 shares) and in ARS (Romania) (379,999 shares out of total
380,000 shares), in exchange for shares in Sphera. By applying the criteria set in IFRS 3, the transaction qualified
as a business combination and USFN (Romania) was identified as the acquirer of the Company and of ARS
(Romania). Therefore, the historical financial statements consist of the consolidated financial statements of USFN
(Romania) for the years ended 31 December 2014, 2015 and 2016 and the consolidated interim financial
statements of Sphera for the six months ended 30 June 2017. Additionally, historical financial information for
ARS (Romania) (consisting of the financial statements for the years ended 31 December 2014, 2015 and 2016 and
the interim financial statements for the six months ended 30 June 2017) has also been presented due to the
significance of the acquisition of ARS (Romania).
Key factors affecting the Group's results of operations
The Group’s results of operations have been and are expected to continue to be affected by a number of key
factors.
General economic environment in our markets
The Group’s results of operations are affected by specific local economic conditions in the markets and
geographic areas in which it operates. Such conditions include levels of employment, commodity inflation, real
disposable income, private consumption, the availability of consumer credit, consumer confidence, applicable
taxes, and consumer willingness to spend. In an unfavourable economic environment with a decrease in
disposable income, the Group’s customers may reduce the frequency with which they dine out or order-in or may
choose more inexpensive dining options. This trend is however offset by the general affordability of our products,
as customers may substitute the Group’s products for other, more expensive, options. Positive economic
conditions, in contrast, tend to increase consumer demand for the Group’s products. Changes in general economic
conditions therefore affect customer traffic, average ticket price and the Group’s ability to pass through cost
increases to customers.
Competitive environment
The Group operates in a highly competitive market, particularly with respect to food quality, price, service,
convenience and concept, which in turn may be affected by considerations such as changes in consumer
preferences. The Group competes against international chains, as well as many national, regional and local
businesses in the quick-service, casual dine-in and delivery/takeaway restaurant sectors not only for customers,
but also for management and store employees, suitable real estate sites and qualified sub-franchisees. This
competition can put downward pressure on product prices and demand for the Group’s products as well as upward
pressure on wages and rents, resulting in reduced profitability.

74
Network rollout
In order to attract new customers and consolidate our brand’s market share, we seek to expand our restaurant
network in both existing and new territories. Over the 2014-2016 period, we have opened 23 units, reaching a total
of 98 units by the end of 2016. Over the medium term, we plan to accelerate the rollout of new stores to an annual
average of approximately 25 stores. As a result, new store openings have been a significant driver of our revenue
growth in the period under review, and will continue to materially affect our results of operations for the
foreseeable future.
We will continue to expand in Romania with the existing brands, as we believe that, given the current
macroeconomic environment, there is significant potential for new stores. Based on our analysis, we believe the
current potential in Romania is of approximately 110 stores for KFC (63 in operation as of the end of 2016), 30
stores for Pizza Hut Dine-In (21 in operation as of the end of 2016) and 40 stores for Pizza Hut Delivery (12 in
operation as of the end of 2016). In the longer term, we expect this store network potential to continue to increase,
mainly on the back of the further expected growth of the Romanian economy, with positive impact on nominal
and real-terms personal disposable income, but also of further migration of the population from the rural areas
towards larger cities.
A significant component of future network rollout will be the successful entering into new territories. During the
first half of the year 2017, we have signed two development agreements with Yum! for opening at least 32 KFC
stores in the North-Eastern part of Italy within five years.
At the same time, we are looking for opportunities to add more food concepts into our portfolio, which would be
complementary to our current offer. To this extent, we have already signed a development agreement with Yum!
for opening 10 Taco Bell restaurants within the following three years.
Performance of existing restaurants
The growth of our revenues over the 2014-2016 period was driven almost equally by opening of new restaurants
and the strong like-for-like performance of our existing restaurants. KFC was the main contributor to this
performance, both in terms of store count and year-on-year growth rates.
In the following years, we expect the like-for-like performance to be influenced positively by the continuous
improvement in the purchasing power of the population, higher propensity for dining-out or delivery ordering,
increased awareness of our brands across the territories we operate and negatively by the number and speed with
which we open new units in cities where we are already present, as well as by the increased competition
Price of raw materials
Cost of sales represents our most important expense, accounting for 35.6% of our consolidated pro forma sales in
2016. Our gross margin is affected by a number of factors, including movements in the cost of sales (including
with respect to the prices of raw materials), the extent to which the Group can negotiate favourable prices and
rebates from suppliers as well as the mix of products that it sells from time to time.
The Group’s principal raw materials are chicken meat, cheese, sauce, flour, vegetables, as well as cardboard
packaging. The Group seeks to procure its principal inputs from multiple suppliers, in the event that the Group’s
primary suppliers cannot deliver the components in the contracted amounts and specifications, the Group’s
requirements exceed the Group’s minimum contracted amounts or the Group is subjected to unanticipated price
increases. Prices of the Group’s raw materials are generally set by market conditions and the Group is not always
able to pass these changes along to the Group’s customers, particularly in the short term.
The Group seeks to manage factors which put pressure on the Group’s gross margin. For example, the Group
maintains relationships with additional suppliers. The Group’s suppliers also often offer rebates, which are
discounts usually based on the purchase of a certain quantity. The Group reflects these rebates as a reduction in the
Group’s cost of sales. These rebates vary from period to period, based on the Group’s relationship with a
particular supplier and overall market conditions. As the volume of the Group’s system stores in a territory
increases, the Group is generally able to negotiate more favourable pricing with suppliers, and also qualify for
greater levels of rebates.

75
Payroll
Cost of labour represent our second most important expense and was the fastest growing expense item at
restaurant level over the 2014-2016 period, accounting for 17.9% of our consolidated pro forma sales in 2016. We
expect our personnel costs to grow proportionally with the growth of the number of our restaurants and our
restaurant revenue complemented by appropriate increase in sales prices. Factors that influence fluctuations in our
labour costs include minimum wage and payroll tax legislation, the frequency and severity of labour-related
claims, health care costs, the performance of our restaurants, new openings and whether new employees are fixed
overhead costs or are restaurant hires.
Marketing and advertising activities
The Group’s marketing and advertising activities are an essential part of attracting new customers as well as
retaining existing customers. Marketing is particularly important for the Group to communicate its product
innovation and price promotion programs to customers and to reinforce the Group’s brand awareness, build the
Group’s image and drive customer volumes. According to the franchise agreements signed so far, the Group is
obliged to spend at least 5% of its restaurant sales on marketing and advertising activities.
The effectiveness of the marketing and advertising activities can vary from one year to another and from one
campaign to another, depending on the products under promotion, the quality of our communication as well as on
the ability of our employees to communicate to customers the ongoing campaigns and promote trade-up products.
The Group also monitors closely the expenditure and frequency of marketing and advertising campaigns by the
Group’s competition, and seeks to maintain a relatively constant presence in the market.
Consumer preferences
Consumer preferences in the quick-service, casual dine-in and delivery/takeaway foodservice segments are
affected by a range of factors, including consumer tastes, national, regional and local economic conditions and
demographic trends. For instance, prevailing health or dietary preferences may cause consumers to avoid fast-food
products or pizza products offered by the Group in favour of foods that are perceived to be healthier. Changes in
consumer preferences can significantly impact demand for the Group’s products, but this impact may be somehow
limited by our exposure to multiple segments of the foodservice sector.
The Group seeks to maintain the appeal of its products to customers through product innovation, characterized by
frequent introduction of new product offerings, and the consumer reaction to new product launches can affect the
Group’s sales.
Accordingly, the Group’s results of operations are affected by the Group’s success against the Group’s
competitors in the quick-service, casual dine-in and delivery/takeaway foodservice segments, which is dependent
on a variety of factors, including the comparative attractiveness and taste of the Group’s products, perceived
product and service quality and the availability of comparable products from its competitors. The pricing of the
Group’s products, and in particular, the timing and terms of specially-priced offers to customers, can have a
significant impact on both the volume of the Group’s sales and the Group’s margins, as well as the Group’s
market share against competitors.
Foreign exchange variations
Most of our operations are denominated in RON. In Romania, the operations that are denominated in foreign
currencies are the acquisition of food supplies and materials, rent and bank borrowings. Approximately 30% of
our acquisitions of food supplies and materials are denominated in either EUR or USD. Although most rent
contracts are denominated in EUR (with subsequent changes being pegged to changes in EU CPI rate), more than
half of our rent expenses vary in direct relationship with restaurant sales and we expect the percentage of variable
rent to further increase in the following year. In addition, virtually all our bank borrowings are denominated in
EUR.
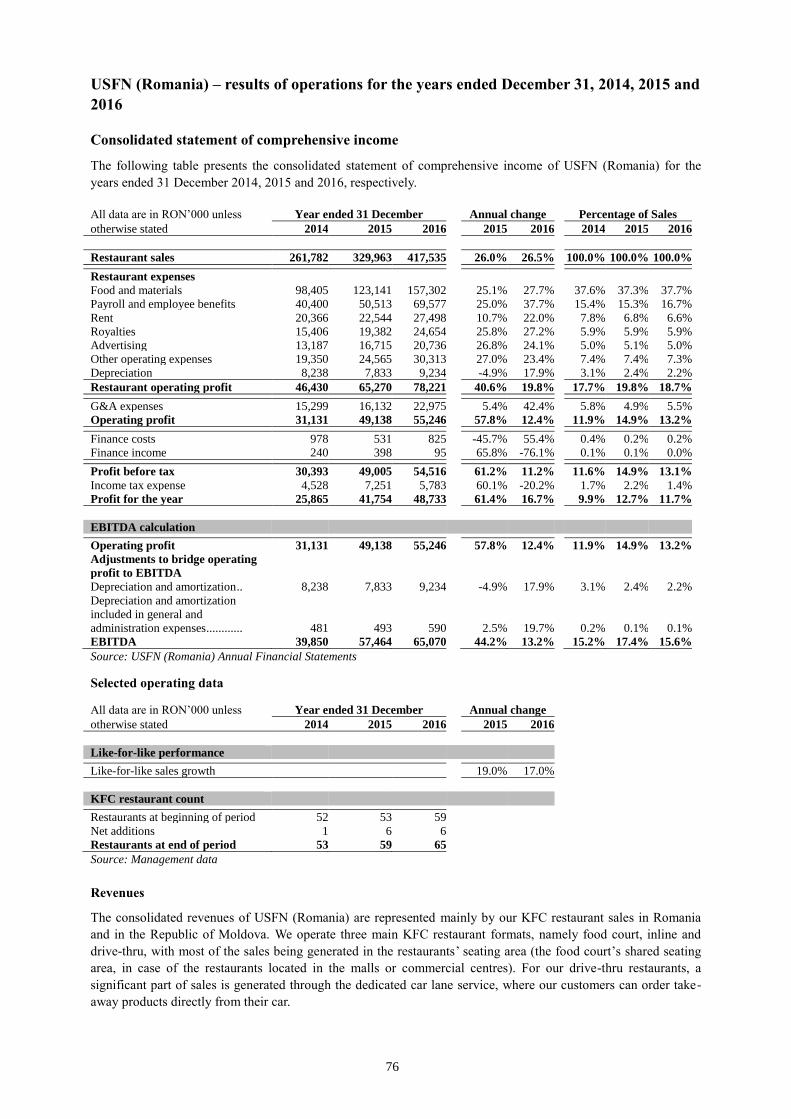
76
USFN (Romania) – results of operations for the years ended December 31, 2014, 2015 and
2016
Consolidated statement of comprehensive income
The following table presents the consolidated statement of comprehensive income of USFN (Romania) for the
years ended 31 December 2014, 2015 and 2016, respectively.
All data are in RON’000 unless Year ended 31 December Annual change Percentage of Sales
otherwise stated 2014 2015 2016 2015 2016 2014 2015 2016
Restaurant sales 261,782 329,963 417,535 26.0% 26.5% 100.0% 100.0% 100.0%
Restaurant expenses
Food and materials 98,405 123,141 157,302 25.1% 27.7% 37.6% 37.3% 37.7%
Payroll and employee benefits 40,400 50,513 69,577 25.0% 37.7% 15.4% 15.3% 16.7%
Rent 20,366 22,544 27,498 10.7% 22.0% 7.8% 6.8% 6.6%
Royalties 15,406 19,382 24,654 25.8% 27.2% 5.9% 5.9% 5.9%
Advertising 13,187 16,715 20,736 26.8% 24.1% 5.0% 5.1% 5.0%
Other operating expenses 19,350 24,565 30,313 27.0% 23.4% 7.4% 7.4% 7.3%
Depreciation 8,238 7,833 9,234 -4.9% 17.9% 3.1% 2.4% 2.2%
Restaurant operating profit 46,430 65,270 78,221 40.6% 19.8% 17.7% 19.8% 18.7%
G&A expenses 15,299 16,132 22,975 5.4% 42.4% 5.8% 4.9% 5.5%
Operating profit 31,131 49,138 55,246 57.8% 12.4% 11.9% 14.9% 13.2%
Finance costs 978 531 825 -45.7% 55.4% 0.4% 0.2% 0.2%
Finance income 240 398 95 65.8% -76.1% 0.1% 0.1% 0.0%
Profit before tax 30,393 49,005 54,516 61.2% 11.2% 11.6% 14.9% 13.1%
Income tax expense 4,528 7,251 5,783 60.1% -20.2% 1.7% 2.2% 1.4%
Profit for the year 25,865 41,754 48,733 61.4% 16.7% 9.9% 12.7% 11.7%
EBITDA calculation
Operating profit 31,131 49,138 55,246 57.8% 12.4% 11.9% 14.9% 13.2%
Adjustments to bridge operating
profit to EBITDA
Depreciation and amortization .. 8,238 7,833 9,234 -4.9% 17.9% 3.1% 2.4% 2.2%
Depreciation and amortization
included in general and
administration expenses ............ 481 493 590 2.5% 19.7% 0.2% 0.1% 0.1%
EBITDA 39,850 57,464 65,070 44.2% 13.2% 15.2% 17.4% 15.6%
Source: USFN (Romania) Annual Financial Statements
Selected operating data
All data are in RON’000 unless Year ended 31 December Annual change
otherwise stated 2014 2015 2016 2015 2016
Like-for-like performance
Like-for-like sales growth 19.0% 17.0%
KFC restaurant count
Restaurants at beginning of period 52 53 59
Net additions 1 6 6
Restaurants at end of period 53 59 65
Source: Management data
Revenues
The consolidated revenues of USFN (Romania) are represented mainly by our KFC restaurant sales in Romania
and in the Republic of Moldova. We operate three main KFC restaurant formats, namely food court, inline and
drive-thru, with most of the sales being generated in the restaurants’ seating area (the food court’s shared seating
area, in case of the restaurants located in the malls or commercial centres). For our drive-thru restaurants, a
significant part of sales is generated through the dedicated car lane service, where our customers can order take-
away products directly from their car.

77
In our KFC restaurants, we sell food and beverage products either individually or as a part of a price-attractive
bundle labelled "menu". Generally, the menus include three main components: a portion of a chicken-based
product (sandwiches, wrappers or pieces of chicken meat), a medium-sized portion of French fries and a medium-
sized non-alcoholic drink. For an additional price, our customers can choose the "Go Large" version of the menu,
which comprises a large-sized portion of French fries and a non-alcoholic drink. A dipping sauce is also offered in
some menu offers. Whereas menus are normally sized for one person, we also offer products, called Buckets, that
are targeted for group consumption (normally, up to four people). Buckets generally consist of higher number of
chicken meat pieces and some include portions of French fries and non-alcoholic drinks.
Consolidated restaurant sales reached RON 417.5 million for the year ended 31 December 2016, compared with
RON 330.0 million for the year ended 31 December 2015, marking an increase of 26.5%. This growth was fuelled
mainly by the performance of the 53 restaurants that were already in operation on 1 January 2015, the cumulated
sales of which increased by 17.0%, but also by the performance of the 12 net new restaurants that have been
opened between 1 January 2015 and 31 December 2016.
Consolidated restaurant sales reached RON 330.0 million for the year ended 31 December 2015, compared with
RON 261.8 million for the year ended 31 December 2014, marking an increase of 26.0%. This growth was mainly
fuelled by the performance of the 52 restaurants that were already in operation on 1 January 2014, the cumulated
sales of which increased by 19.0%, but also by the performance of the 7 net new restaurants that have been
opened between 1 January 2014 and 31 December 2015.
Although we have increased our selling prices both in 2015 and 2016, the impact on the overall sales growth was
not significant, as the key drivers of growth were the increase in transactions of the like-for-like restaurants and
the opening of new restaurants, as detailed above.
Most of the restaurant sales were generated in Romania, which accounted for 98.2% of the consolidated sales for
the year ended 31 December 2016, 98.3% of the consolidated sales for the year ended 31 December 2015 and
98.4% of the consolidated sales for the year ended 31 December 2014.
Food and materials expenses
Food and materials expenses include the cost of all raw materials, finished products and packaging that were
included in the products sold to our customers. The main items in this category include various pieces of chicken
meat (inner fillets, drumsticks, thighs, wings, breasts), frozen potatoes fries, beverages supplied by the Coca-Cola
Romania, shortening, dipping sauces and toys. Based on our product pricing policy, we monitor the evolution of
this expense category mainly as percentage of restaurant sales.
Food and materials expenses reached RON 157.3 million for the year ended 31 December 2016, compared with
RON 123.1 million for the year ended 31 December 2015, representing an increase of 27.7%. The increase of this
expense category to 37.7% of restaurant sales for the year ended 31 December 2016 from 37.3% of sales for the
year ended 31 December 2015, or by 0.4 percentage points, was mainly due to a significant increase in the
acquisition prices of potato fries starting the second half of the year, which was triggered by a crisis in the
international potato commodity market induced by bad crops. Based on the average acquisition price that we
incurred in the first six months of the year 2016, we estimate that the total impact of the higher potato prices for
the full year 2016 was approximately 0.7% of food and materials expenses, respectively 0.3% of sales.
Food and materials expenses reached RON 123.1 million, or 37.3% of sales, for the year ended 31 December
2015, compared with RON 98.4 million, or 37.6% of sales, for the year ended 31 December 2014, representing an
increase of 25.1%. The reduction as a percentage of sales of our cost of sales during the year 2015 was mainly due
to the slightly faster increase of our selling prices compared with the prices we paid for our food supplies.
Payroll and employee benefits
Payroll and employee benefits include the gross salaries, gross bonuses and related company contribution taxes
that we pay for our restaurant employees. All employees at the restaurant level are hired on various shifts (full
time and part time) and are paid a fixed base salary. Employee benefits consist mainly of performance related
bonuses, which are paid to the restaurant’s management team (restaurant general manager, deputy managers,
assistant managers) on a quarterly basis, based on a comprehensive evaluation that takes into account a number of
quantitative and qualitative criteria, including the performance of restaurant sales and profitability compared with
the previous year and budgeted levels.

78
Payroll and employee benefits expenses reached RON 69.6 million for the year ended 31 December 2016,
compared with RON 50.5 million for the year ended 31 December 2015, marking an increase of 37.7%. This
expense category reached 16.7% of restaurant sales in 2016 compared with 15.3% in 2015, representing a 1.4
percentage point increase. The faster increase of payroll and employee benefits expenses compared to the increase
in restaurant sales was mainly due to significant adjustments in the salaries paid to our restaurant staff, following
the increase of the economy’s minimum mandatory gross salary from RON 1,050 to RON 1,250 since May 2016
(representing a 19% increase) and further to RON 1,450 since February 2017 (representing an 11% increase). In
anticipation of this regulatory salary increase, we significantly increased the salaries of our restaurant staff during
the year 2016, by an average of 17% in February 2016 and by another 11% in November 2016.
Payroll and employee benefits expenses reached RON 50.5 million for the year ended 31 December 2015,
compared with RON 40.4 million for the year ended 31 December 2014, marking an increase of 25.0%. This
expense category reached 15.3% of restaurant sales in 2015 compared with 15.4% in 2014, representing a 0.1
percentage point decrease. This stable weight of payroll and employee benefits expenses as percentage of
restaurant sales was due to a number of factors, among which the most important were: opening of new
restaurants, increase in the number of employees in the restaurants, increase of base gross salaries paid to the
employees, as well as a significant increase in the value of bonuses paid, in correlation with the strong
improvement of our restaurants’ profitability during the year 2015.
Rent
Rent comprises costs of leasing the sites in which we operate our restaurants. All KFC restaurants operate in
leased locations. Rent terms are negotiated on an individual basis for each site, hence, there are significant
differences between rent terms of various sites. In terms of rent levels, most of our contracts provide for a
combination of a fixed rent (payable when sales are below a pre-agreed certain level) and a variable rent,
calculated as a certain percentage of sales (payable when sales exceed the pre-agreed level). We also have
contracts that provide for the payment of fixed rents only.
Rent expenses reached RON 27.5 million for the year ended 31 December 2016, compared with RON 22.5
million for the year ended 31 December 2015, marking an increase of 22.0%. Rent expenses reached RON 22.5
million for the year ended 31 December 2015, compared with RON 20.4 million for the year ended 31 December
2014, marking an increase of 10.7%. The reduction of the rent expense to 6.6% of restaurant sales for the year
ended 31 December 2016 from 6.8% of sales for the year ended 31 December 2015 and further from 7.8% of sales
for the year ended 31 December 2014, was mainly due to the fixed component of our rent contracts for some
restaurants, which increased much slower than the increase of our sales generated by those restaurants.
Royalties
Royalty expenses are the contractual obligations that we pay Yum! for the right to operate the KFC brand in
Romania and in the Republic of Moldova. These expenses are set by contract at 6% of sales and are paid on a
monthly basis.
Royalty expenses reached RON 24.7 million for the year ended 31 December 2016, compared with RON 19.4
million for the year ended 31 December 2015, representing an annual increase of 27.2% and compared to RON
15.4 million for the year ended 31 December 2014, representing an annual increase of 25.8%. During the entire
2014-2016 period, royalty expenses represented 6% of restaurant sales, which is in line with our contractual
obligations towards Yum! (royalties for KFC Moldova restaurant being mapped in rent expenses).
Advertising
Advertising expenses cover all marketing activities that are aimed at supporting KFC brand awareness in general
and restaurant sales in particular. We are obliged by Yum! to spend at least 5% of our annual restaurant sales on
advertising activities each year and should we fail to spend this amount, we are obliged to pay Yum! the difference
not spent.
Advertising expenses reached RON 20.7 million for the year ended 31 December 2016, compared with RON 16.7
million for the year ended 31 December 2015, representing an annual increase of 24.1% and compared to RON
13.2 million for the year ended 31 December 2014, representing an annual increase of 26.8%. The advertising
expenses stood at approximately 5.0% of restaurant sales for the entire 2014-2016 period, which is in line with our
contractual obligations towards Yum!.

79
Other operating expenses
Other operating expenses include all other expenses that are incurred at restaurant level, of which the more
important categories are utilities, third-party expenses, maintenance & repairs, small-wares and cleaning supplies.
Some of these expenses may be partly influenced by the level of sales (such as utilities, third-party expenses and
cleaning supplies), while other categories are mainly influenced by the restaurant development and remodelling
activities (such as maintenance & repairs and small-wares).
All data in RON’000 2014 2015 2016
2015 2016
2014 2015 2016
unless otherwise stated
Annual change
% of Restaurant sales
Third-party expenses 6,193 7,501 9,330
21.1% 24.4%
2.4% 2.3% 2.2%
Utilities 7,387 7,893 8,721
6.8% 10.5%
2.8% 2.4% 2.1%
Maintenance & Repairs 2,542 2,978 3,906
17.2% 31.2%
1.0% 0.9% 0.9%
Small-wares 762 1,784 2,725
134.1% 52.7%
0.3% 0.5% 0.7%
Cleaning Supplies 1,207 1,938 2,535
60.6% 30.8%
0.5% 0.6% 0.6%
Other items 1,259 2,471 3,096
96.3% 25.3%
0.5% 0.7% 0.7%
Total Other operating expenses,
net 19,350 24,565 30,313
27.0% 23.4%
7.4% 7.4% 7.3%
Source: USFN (Romania) Annual Financial Statements
Other operating expenses reached RON 30.3 million for the year ended 31 December 2016, compared with RON
24.6 million for the year ended 31 December 2015, representing an increase of 23.4%. The slight reduction of
these expenses to 7.3% of restaurant sales for the year ended 31 December 2016 from 7.4% of sales for the year
ended 31 December 2015 was mainly due to greater operational efficiency of the existing restaurants (supported
by the faster sales growth), which was partly offset by the normally higher expenses of the new restaurants (those
opened after 1 January 2015).
Other operating expenses reached RON 24.6 million for the year ended 31 December 2015, compared with RON
19.4 million for the year ended 31 December 2014, representing an increase of 27.0%. The share of these
expenses in total restaurant sales reached 7.4% for the year ended 31 December 2015, similar to the level recorded
for the year ended 31 December 2014. During the year 2015, our existing restaurants improved their operational
performance (with other operational expenses growing slower than sales), while the new restaurants opened after
1 January 2014 incurred larger expenses, due mainly to the pre-opening costs (various expenses and small-value
items that do not qualify for fixed asset treatment).
Depreciation and amortisation
The majority of our assets are represented by the tangible and intangible investments in our restaurants, such as
leasehold improvements, kitchen equipment, furniture, IT technology (both hardware and software), as well as the
opening fees payable to Yum!. Depreciation is calculated on a straight-line basis over the estimated useful lives of
the assets as follows: leasehold improvements – 10 years, computers and IT equipment - 3 to 5 years, vehicles - 5
years, other property, plant and equipment - 2 to 10 years.
Depreciation and amortisation expenses reached RON 9.23 million for the year ended 31 December 2016,
compared with RON 7.83 million for the year ended 31 December 2015, representing an increase of 17.9%. As a
result, depreciation expense as percentage of sales decreased to 2.2% for the year ended 31 December 2016 from
2.4% for the year ended 31 December 2015. The 17.9% increase in the depreciation and amortisation expenses
during the year 2016 was mainly due to the opening of 12 new restaurants between 1 January 2015 and 31
December 2016 and to a lesser extent by the investment in remodelling of the existing restaurants.
Depreciation and amortisation expenses reached RON 7.83 million for the year ended 31 December 2015,
compared with RON 8.24 million for the year ended 31 December 2014, representing a decrease of 4.9%. As a
result, depreciation and amortisation expenses as percentage of sales decreased to 2.4% for the year ended 31
December 2015 from 3.1% for the year ended 31 December 2014. The 4.9% decrease in the depreciation and
amortisation expenses during the year 2015 was mainly due to the lower depreciation and amortisation expenses
for the restaurants in operation before 1 January 2014, which was partly offset by the depreciation and
amortisation expenses of the 7 net restaurants that were opened between 1 January 2014 and 31 December 2015.
Restaurant operating profit
The restaurant operating profit reached RON 78.2 million for the year ended 31 December 2016, compared with
RON 65.3 million for the year ended 31 December 2015, representing an increase of 19.8%. As a result, restaurant

80
operating profit as percentage of sales reached 18.7% for the year ended 31 December 2016 from 19.8% for the
year ended 31 December 2015, representing a 1.0 percentage point decrease. This decrease was mainly triggered
by the faster increase of the payroll and employee benefits expenses (+1.4 percentage points increase in restaurant
sales) and to a lesser extent by the higher food and materials expenses (+0.4 percentage points increase in
restaurant sales), as explained above.
The restaurant operating profit reached RON 65.3 million for the year ended 31 December 2015, compared with
RON 46.4 million for the year ended 31 December 2014, representing an increase of 40.6%. As a result, restaurant
operating profit as percentage of sales reached 19.8% for the year ended 31 December 2015 from 17.7% for the
year ended 31 December 2014, representing a 2.0 percentage point increase. This increase was mainly due to the
slower growth in the rent expenses (0.9 percentage points decrease in restaurant sales) and depreciation expenses
(0.8 percentage points decrease in restaurant sales) and to a lesser extent by the slower growth in food and
materials expenses (0.3 percentage points decrease in restaurant sales), as explained above.
General & Administrative (G&A)
The G&A expenses include all costs incurred at the head-office level with the management of the company,
including the management of the restaurant network. The main expense categories are payroll and employee
benefits, third-party expenses, depreciation and amortisation expenses, rent expenses and banking charges.
The G&A expenses reached RON 23.0 million for the year ended 31 December 2016, compared with RON 16.1
million for the year ended 31 December 2015, representing an increase of 42.4%. As a result, G&A expenses as
percentage of sales reached 5.5% for the year ended 31 December 2016 from 4.9% for the year ended 31
December 2015, representing a 0.6 percentage point increase. The 42.4% annual increase in the G&A expenses
was mainly due to higher payroll expenses, driven by additional staff hired to support the operational and training
activities at the restaurant level, as well as by higher third-party expenses.
The G&A expenses reached RON 16.1 million for the year ended 31 December 2015, compared with RON 15.3
million for the year ended 31 December 2014, representing an increase of 5.4%. As a result, G&A expenses as
percentage of sales reached 4.9% for the year ended 31 December 2015 from 5.8% for the year ended 31
December 2014, representing a 1.0 percentage point decrease. The 5.4% annual increase in the G&A expenses
was mainly due to higher payroll expenses, driven by the adjustments to the head office staff salaries.
EBITDA
EBITDA reached RON 65.1 million for the year ended 31 December 2016, compared with RON 57.5 million for
the year ended 31 December 2015, representing an increase of 13.2%. As a result, EBITDA margin reached 15.6%
for the year ended 31 December 2016 compared with 17.4% for the year ended 31 December 2015, representing a
1.8 percentage point decrease. This decrease was mainly triggered by the higher increase of the restaurant
operating expenses, excluding depreciation and impairment expenses (1.2 percentage points increase in restaurant
sales) as well as to a faster increase of the G&A expenses (0.6 percentage points increase in restaurant sales), as
explained above.
EBITDA reached RON 57.5 million for the year ended 31 December 2015, compared with RON 39.9 million for
the year ended 31 December 2014, representing an increase of 44.2%. As a result, EBITDA margin reached 17.4%
for the year ended 31 December 2015 compared with 15.2% for the year ended 31 December 2014, representing a
2.2 percentage point increase. This increase was mainly triggered by the slower increase of the restaurant
operating expenses, excluding depreciation and impairment expenses (1.3 percentage points decrease in restaurant
sales) as well as to a slower increase of the G&A expenses (1.0 percentage points decrease in restaurant sales), as
explained above.
Operating profit
The operating profit reached RON 55.2 million for the year ended 31 December 2016, compared with RON 49.1
million for the year ended 31 December 2015, representing an increase of 12.4%. As a result, operating profit as
percentage of sales reached 13.2% for the year ended 31 December 2016 from 14.9% for the year ended 31
December 2015, representing a 1.7 percentage point decrease. This decrease was mainly triggered by the slower
increase of the restaurant operating profit (1.0 percentage point decrease in restaurant sales), as well as to a faster
increase of the G&A expenses (0.6 percentage points increase in restaurant sales), as explained above.
The operating profit reached RON 49.1 million for the year ended 31 December 2015, compared with RON 31.1
million for the year ended 31 December 2014, an increase of 57.8%. As a result, operating profit as percentage of

81
sales reached 14.9% for the year ended 31 December 2015 from 11.9% for the year ended 31 December 2014,
representing a 3.0 percentage point increase. This increase was mainly triggered by the faster increase of the
restaurant operating profit (2.0 percentage points increase in restaurant sales) as well as to a slower increase of the
G&A expenses (1.0 percentage points decrease in restaurant sales), as explained above.
Finance result
Finance expenses include mainly the interest expense associated with the interest-bearing liabilities that we have
contracted in order to finance our activity and the net foreign exchange result generated by our operational and
financial operations (both realized and unrealized). Finance revenues include the interest revenues we receive
from placing our excess cash liquidities into short-term bank deposits.
Finance expenses reached RON 825 thousand for the year ended 31 December 2016, compared with RON 531
thousand for the year ended 31 December 2015, representing an increase of 55.4%. This increase was mainly due
to the financing cost associated with the opening of 12 new restaurants between 1 January 2015 and 31 December
2016, but also to a higher foreign exchange loss generated by the slight depreciation of the RON against the EUR
during the year 2016.
Finance income reached RON 95 thousand for the year ended 31 December 2016, compared with RON 398
thousand for the year ended 31 December 2015, representing a decrease of 76.1%. This decrease was mainly due
to lower income revenues from placing our excess cash liquidities into short-term bank deposits.
Finance expenses reached RON 531 thousand for the year ended 31 December 2015, compared with RON 978
thousand for the year ended 31 December 2014, representing a decrease of 45.7%. This decrease was mainly due
to the significantly lower foreign exchange losses as compared to the previous year.
Finance income reached RON 398 thousand for the year ended 31 December 2015, compared with RON 240
thousand for the year ended 31 December 2014, representing an increase of 65.8%. This increase was mainly due
to higher income revenues from placing our excess cash liquidities into short-term bank deposits.
Overall, the net finance result reached RON 730 thousand for the year ended 31 December 2016 (representing
0.2% of sales), compared with RON 133 thousand for the year ended 31 December 2015 (representing 0.04% of
sales) and RON 738 thousand for the year ended 31 December 2014 (representing 0.3% of sales).
Profit before tax
Profit before tax reached RON 54.5 million for the year ended 31 December 2016, compared with RON 49.0
million for the year ended 31 December 2015, representing an increase of 11.2%. As a result, profit before tax as
percentage of sales reached 13.1% for the year ended 31 December 2016 from 14.9% for the year ended 31
December 2015, representing a 1.8 percentage point decrease. This decrease was virtually due to the reduction in
the operating profit margin by 1.7 percentage points of sales, as explained above.
Profit before tax reached RON 49.0 million for the year ended 31 December 2015, compared with RON 30.4
million for the year ended 31 December 2014, representing an increase of 61.2%. As a result, profit before tax as
percentage of sales reached 14.9% for the year ended 31 December 2015 from 11.6% for the year ended 31
December 2014, representing a 3.2 percentage point increase. This increase was virtually due to the growth in the
operating profit margin by 3.0 percentage points of sales, as explained above.
Income tax expense
Income tax expense reached RON 5.78 million for the year ended 31 December 2016, compared with RON 7.25
million for the year ended 31 December 2015, representing a decrease of 20.2%. The effective tax rate stood at
10.6% for the year ended 31 December 2016 compared to 14.8% for the year ended 31 December 2015. The drop
of the effective tax rate was due to the release of a deferred tax liability of RON 1.89 million generated by the
change in the tax legislation starting January 2017. At the same time, we have further reduced our income tax
expense by using a sponsorship tax credit in amount of RON 1.63 million for the year ended 31 December 2016
and RON 1.02 million the year ended 31 December 2015.
Income tax expense reached RON 7.25 million for the year ended 31 December 2015, compared with RON 4.53
million for the year ended 31 December 2014, representing an increase of 60.1%. The effective tax rate stood at
14.8% for the year ended 31 December 2015 compared to 14.9% for the year ended 31 December 2014. Our
effective tax rate has been below the statutory income tax level of 16.0% in both years as we have used a

82
sponsorship tax credit in amount of RON 1.02 million for the year ended 31 December 2015 and RON 0.70
million for the year ended 31 December 2014.
Profit after tax
Profit after tax reached RON 48.7 million for the year ended 31 December 2016, compared with RON 41.8
million for the year ended 31 December 2015, representing an increase of 16.7%. As a result, profit after tax as
percentage of sales reached 11.7% for the year ended 31 December 2016 from 12.7% for the year ended 31
December 2015, representing a 1.0 percentage point decrease.
Profit after tax reached RON 41.8 million for the year ended 31 December 2015, compared with RON 25.9
million for the year ended 31 December 2014, representing an increase of 61.4%. As a result, profit after tax as
percentage of sales reached 12.7% for the year ended 31 December 2015 from 9.9% for the year ended 31
December 2014, representing a 2.8 percentage point increase.
Liquidity and Capital Resources
Historically, we have used two major sources of liquidity: the operating cash flows and bank financing. The
operating cash flows have been mainly directed to support the general working capital requirements of the Group
and the payment of dividends, while bank loans have been used mostly to finance our development plan.
Our cash and cash equivalents reached RON 49.0 million as at 31 December 2016, compared to RON 43.6 million
as at 31 December 2015 and RON 28.9 million as at 31 December 2014. In addition, USFN (Romania) together
with ARS (Romania) had available RON 50.3 million of undrawn committed borrowing facilities as at 31
December 2016, compared to RON 59.9 million as at 31 December 2015 and RON 67.7 million as at 31
December 2014.
We will continue to make significant investments in the following years in the growth of our business, primarily
through opening new restaurants, but also by investing in existing restaurants.
Consolidated statement of cash flows
The following table sets forth, for the years ended December 31, 2014, 2015 and 2016, our consolidated cash
flows from operating activities, investing activities and financing activities.
Year ended 31 December
All data are in RON’000 unless otherwise stated 2014 2015 2016
Operating activities
Profit before tax 30,393 49,005 54,516
Adjustments to reconcile profit before tax to net cash flows:
Depreciation and impairment of property, plant and equipment 8,044 7,628 8,977
Amortisation and impairment of intangible assets 675 698 847
Net foreign exchange differences (116) 181 60
Gain on disposal of property, plant and equipment 740 (10) 92
Finance income (240) (398) (95)
Finance costs 555 424 536
Movement in current assets allowances 165 12 5
Movements in provisions, pensions and government grants (1,226) (139) -
Working capital adjustments:
Decrease/(increase) in trade and other receivables and prepayments (553) (989) (4,574)
Decrease/(increase) in inventories (652) (1,570) (27)
Increase/(decrease) in trade and other payables 8,035 459 8,655
Interest received 192 342 31
Interest paid (561) (453) (561)
Income tax paid (3,452) (6,698) (7,619)
Net cash flows from operating activities 41,999 48,491 60,843
Investing activities
Proceeds from sale of property, plant and equipment 2 27 -
Purchase of intangible assets (430) (1,246) (2,916)
Purchase of property, plant and equipment (4,108) (10,935) (15,536)
Net cash flows used in investing activities (4,536) (12,154) (18,452)

83
Financing activities
Payment of finance lease liabilities (155) (185) (284)
Proceeds from borrowings 3,382 10,993 11,704
Repayment of borrowings (7,531) (7,730) (7,480)
Dividends paid to equity holders of the parent (12,664) (24,483) (40,961)
Dividends paid to non-controlling interests (133) (153) (84)
Net cash flows from/(used in) financing activities (17,101) (21,558) (37,105)
Net increase in cash and cash equivalents 20,362 14,779 5,286
Net foreign exchange difference (10) (92) 83
Cash and cash equivalents at 1 January 8,560 28,912 43,599
Cash and cash equivalents at 31 December 28,912 43,599 48,968
Source: USFN (Romania) Annual Financial Statements
Cash flows from operating activities
Net cash flows from operating activities reached RON 60.8 million for the year ended 31 December 2016,
compared to RON 48.5 million for the year ended 31 December 2015, representing an increase of 25.5%. The
main drivers of the increase in the net cash flows from operating activities by 25.5%, or RON 12.4 million, were
the increase in the trade and other payables (by RON 8.20 million) and the increase in EBITDA (by RON 7.61
million).
Net cash flows from operating activities reached RON 48.5 million for the year ended 31 December 2015,
compared to RON 42.0 million for the year ended 31 December 2014, representing an increase of 15.5%. The
main driver of the increase in the net cash flows from operating activities by 15.5%, or RON 6.49 million, was the
increase in EBTDA (by RON 17.6 million), which was partly offset by a decrease in the variance of trade and
other payables (RON 7.58 million).
The company operates with negative net working capital most of the time, which leads to an increase of the
available cash flow from operations on the back of higher sales. This negative net working capital is explained by
the fact that most of our sales are collected immediately via cash payments or card payments from customers, our
inventory levels are held generally for up to two weeks of sales, while payment terms to suppliers average
generally from 45 to 60 days.
Cash flows from investing activities
Net cash flows used in investing activities reached RON 18.5 million for the year ended 31 December 2016,
compared to RON 12.2 million for the year ended 31 December 2015, representing an increase of 51.8%. This
increase was due to the expansion of our restaurant development plan, which led to the opening of 6 new
restaurants during the year 2016 and the significant investments in the opening of other restaurants planned for the
year 2017.
Net cash flows used in investing activities reached RON 12.2 million for the year ended 31 December 2015,
compared to RON 4.54 million for the year ended 31 December 2014, representing an increase of 168%. This
increase was due to the acceleration of our restaurant development plan, which materialised in the opening of 6
new restaurants during the year 2015 compared to only 2 in the preceding year.
Cash flows from financing activities
Net cash flows used in financing activities reached RON 37.1 million for the year ended 31 December 2016,
compared to RON 21.6 million for the year ended 31 December 2015, representing an increase of 72.1%. Within
the net cash flows from the financing activities, the main uses were for dividends paid to the shareholders (RON
41.0 million) and repayment of bank borrowings (RON 7.5 million) for restaurants opened in the previous years,
while the main source were drawings from bank borrowings (RON 11.7 million) for financing the restaurants
opened during the year 2016 or to be opened during the year 2017. This increase in the cash flows used in the
financing activities of 72.1%, or RON 15.5 million, was principally generated by the increase in the payments of
the dividends to shareholders (by RON 16.5 million) out of the profits corresponding to the year 2015.
Net cash flows used in financing activities reached RON 21.6 million for the year ended 31 December 2015,
compared to RON 17.1 million for the year ended 31 December 2014, representing an increase of 26.1%. Within
the net cash flows from financing activities, the main uses were for dividends paid to the shareholders (RON 24.5
million) and repayment of bank borrowings (RON 7.7 million) for restaurants opened in the previous years, while
the main source were drawings from bank borrowings (RON 11.0 million) for financing the restaurants opened

84
during the year 2015 or to be opened during the year 2016. This increase in the cash flows used in financing
activities of 26.1%, or RON 4.6 million, was due to the increase in the payments of the dividends to shareholders
(by RON 11.8 million) out of the year 2014 profits, which were partly offset by additional bank borrowings (by
RON 7.6 million) for the financing of the restaurants opened during the year 2015 or to be opened during the year
2016.
Indebtedness
The following table sets forth, for the years ended December 31, 2014, 2015 and 2016, our consolidated interest-
bearing liabilities.
All data are in RON’000 unless otherwise stated 31-Dec-14 31-Dec-15 31-Dec-16
Interest-bearing loans and borrowings - long-term* 8,773 11,787 14,630
Interest-bearing loans and borrowings - short-term* 6,378 6,634 7,796
Total interest-bearing liabilities* 15,151 18,421 22,426
Cash and short-term deposits* 28,912 43,599 48,968
Total net debt (13,761) (25,178) (26,542)
*Source: USFN (Romania) Annual Financial Statements
Total interest-bearing liabilities reached RON 22.4 million as at 31 December 2016, compared to RON 18.4
million as at 31 December 2015 and RON 15.2 million as at 31 December 2014. The increase of RON 4.0 million
during the year 2016 and of RON 3.3 million during the year 2015 were mainly due to the new borrowings drawn
from the credit line with Alpha Bank Romania for financing the opening of new restaurants, which exceeded the
repayment of borrowings for financing the opening of the restaurants opened in the previous years.
Total net debt reached a negative value of RON 26.5 million as at 31 December 2016, compared to a negative
value of RON 25.2 million as at 31 December 2015 and a negative value of RON 13.8 million as at 31 December
2014. This evolution of net debt was mainly due to our liquidity position increasing faster than bank borrowings.
USFN (Romania) and ARS (Romania) have contracted a credit facility from Alpha Bank Romania with a total
limit of EUR 21 million (approximately RON 95.4 million as at 31 December 2016), which is split in three sub-
limits, as follows: credit facility for the development of new locations, issuance of bank guarantee letters and
credit card. The loan is secured with property, plant and equipment of each restaurant location for which the credit
line has been utilised.
ARS (Romania) – results of operations for the years ended December 31, 2016, 2015 and
2014
Statement of comprehensive income
The following table presents the profit and loss account of ARS (Romania) for the years ended 31 December
2014, 2015 and 2016.
All data are in RON’000 unless Year ended 31 December Annual change Percentage of Sales
otherwise stated 2014 2015 2016 2015 2016 2014 2015 2016
Restaurant sales 63,130 75,867 96,940 20.2% 27.8% 100.0% 100.0% 100.0%
Restaurant expenses
Food and materials 16,881 19,718 26,107 16.8% 32.4% 26.7% 26.0% 26.9%
Payroll and employee benefits 12,001 14,622 22,383 21.8% 53.1% 19.0% 19.3% 23.1%
Rent 6,081 6,476 8,027 6.5% 23.9% 9.6% 8.5% 8.3%
Royalties 3,697 4,448 5,702 20.3% 28.2% 5.9% 5.9% 5.9%
Advertising 3,590 4,245 5,785 18.2% 36.3% 5.7% 5.6% 6.0%
Other operating expenses 7,514 8,339 11,659 11.0% 39.8% 11.9% 11.0% 12.0%
Depreciation 2,188 2,114 2,666 -3.4% 26.1% 3.5% 2.8% 2.8%
Restaurant operating profit 11,178 15,905 14,611 42.3% -8.1% 17.7% 21.0% 15.1%
G&A expenses 6,094 7,751 8,982 27.2% 15.9% 9.7% 10.2% 9.3%
Operating profit 5,084 8,154 5,629 60.4% -31.0% 8.1% 10.7% 5.8%
Finance costs 309 482 213 56.0% -55.8% 0.5% 0.6% 0.2%
Finance income 7 19 127 171.4% 568.4% 0.0% 0.0% 0.1%
Profit before tax from continuing
operations 4,782 7,691 5,543 60.8% -27.9%
7.6% 10.1% 5.7%

85
All data are in RON’000 unless Year ended 31 December Annual change Percentage of Sales
otherwise stated 2014 2015 2016 2015 2016 2014 2015 2016
Income tax expense 667 1,170 361 75.4% -69.1% 1.1% 1.5% 0.4%
Profit for the year from
continuing operations 4,115 6,521 5,182 58.5% -20.5%
6.5% 8.6% 5.3%
Discontinued operations
Profit/(loss) after tax for the year
from discontinued operations -595 -397 -1,953 -33.3% 391.9%
-0.9% -0.5% -2.0%
Profit for the year 3,520 6,124 3,229 74.0% -47.3% 5.6% 8.1% 3.3%
EBITDA calculation
Operating profit from continuing
operations 5,084 8,154 5,629 60.4% -31.0% 8.1% 10.7% 5.8%
Adjustments to bridge operating
profit to EBITDA
Depreciation and amortization 2,188 2,114 2,666 -3.4% 26.1% 3.5% 2.8% 2.8%
Depreciation and amortization
included in general and
administration expenses 151 133 137 -11.9% 3.0% 0.2% 0.2% 0.1%
EBITDA from continuing
operations 7,423 10,401 8,432 40.1% -18.9% 11.8% 13.7% 8.7%
Operating profit from
discontinued operations -708 -477 -2,141 -32.6% 348.8% -1.1% -0.6% -2.2%
Adjustments to bridge operating
profit to EBITDA
Depreciation and amortization 131 171 382 30.5% 123.4% 0.2% 0.2% 0.4%
Impairment
966
0.0% 0.0% 1.0%
EBITDA from discontinued
operations -577 -306 -793 -47.0% 159.2% -0.9% -0.4% -0.8%
EBITDA 6,846 10,095 7,639 47.5% -24.3% 10.8% 13.3% 7.9%
Source: ARS (Romania) Annual Financial Statements
Selected operating data
All data are in RON’000 unless Year ended 31 December Annual change
otherwise stated 2014 2015 2016 2015 2016
Like-for-like performance
Like-for-like sales growth 10.0% 13.0%
Pizza Hut own restaurant count
Restaurants at beginning of period 23 22 25
Net additions (1)* 3 7
Restaurants at end of period 22 25 32
Source: Management data. *) A Pizza Hut Delivery restaurant was subfranchised during the year 2014.
Revenues
The revenues of ARS (Romania) are represented by our restaurant sales in both Pizza Hut Dine-in and Pizza Hut
Delivery units.
Restaurant sales reached RON 96.9 million for the year ended 31 December 2016, compared with RON 75.9
million for the year ended 31 December 2015, representing an increase of 27.8%. This growth was almost equally
driven by the performance of the 22 restaurants that were already in operation on 1 January 2015, whose
cumulated sales increased by 13.0%, and respectively by the performance of the 11 net new restaurants that have
been opened between 1 January 2015 and 31 December 2016.
Restaurant sales reached RON 75.9 million for the year ended 31 December 2015, compared with RON 63.1
million for the year ended 31 December 2014, representing an increase of 20.2%. This growth was equally driven
by the performance of the 22 restaurants operated by us that were already in operation on 1 January 2014, whose
cumulated sales increased by 10%, and respectively by the performance of the 4 new net restaurants that have
been opened between 1 January 2014 and 31 December 2015.

86
Although we have increased our selling prices both in 2015 and 2016, the impact on the overall sales growth was
not significant, as the key drivers of growth were the increase in transactions of the like-for-like restaurants and
the opening of new restaurants, as detailed above.
Food and materials expenses
Food and materials expenses include the cost of all raw materials, finished products and packaging that were
included in the products sold to our customers. The main items in this category include flour, various types of
cheeses, various pizza topping ingredients (pepperoni, ham, mushrooms, vegetables, tomato paste), beverages
provided by the Coca-Cola Romania and pizza boxes. Based on our product pricing policy, we monitor the
evolution of this expense category mainly as percentage of restaurant sales.
Food and materials expenses reached RON 26.1 million for the year ended 31 December 2016, compared with
RON 19.7 million for the year ended 31 December 2015, representing an increase of 32.4%. The increase of this
expense category to 26.9% of restaurant sales for the year ended 31 December 2016 from 26.0% of sales for the
year ended 31 December 2015, or by 0.9 percentage points, was mainly due to discontinuation of the in-house
warehousing and logistics operations and the externalization of these services to a third party (Havi (Romania)).
Food and materials expenses reached RON 19.7 million, or 26.0% of sales, for the year ended 31 December 2015,
compared with RON 16.9 million, or 26.7% of sales, for the year ended 31 December 2014, representing an
increase of 16.8%. The reduction as a percentage of sales in our cost of sales during the year 2015 was mainly due
to the slightly faster increase of our selling prices than the prices we paid for our food supplies.
Payroll and employee benefits
Payroll and employee benefits include the gross salaries, gross bonuses and related company contribution taxes
that we pay for our restaurant employees. All employees at the restaurant level are hired on various shifts (full
time and part time) and are paid a fixed base salary. Employee benefits consist mainly of performance related
bonuses, which are paid to the restaurant’s management team (restaurant general manager, deputy managers,
assistant managers) on a quarterly basis, based on a comprehensive evaluation that takes into account a number of
quantitative and qualitative criteria, among which the performance of restaurant sales and profitability compared
with the previous year and the budgeted levels.
Payroll and employee benefits expenses reached RON 22.4 million for the year ended 31 December 2016,
compared with RON 14.6 million for the year ended 31 December 2015, representing an increase of 53.1%. This
expense category reached 23.1% of restaurant sales in 2016 compared with 19.3% in 2015, representing a 3.8
percentage point increase. The faster increase of this expense category compared to the increase in restaurant sales
was mainly due to the significant adjustments in the salaries that we pay to our restaurant staff, following the
increase of the economy’s minimum mandatory gross salary from RON 1,050 to RON 1,250 starting May 2016,
representing a 19% increase, and further to RON 1,450 starting February 2017, representing an 11% increase. In
anticipation of this regulatory salary increase, we significantly increased the salaries of our restaurant staff during
the year 2016, by an average of 21% in February 2016 and by another 13% in November 2016.
Payroll and employee benefits expenses reached RON 14.6 million for the year ended 31 December 2015,
compared with RON 12.0 million for the year ended 31 December 2014, representing an increase of 21.8%. This
expense category reached 19.3% of restaurant sales in 2015 compared with 19.0% in 2014, representing a 0.3
percentage point increase. This relatively stable weight of payroll and employee benefits expenses as percentage
of restaurant sales was due to a number of factors, among which the most important were: increase of the number
of employees in the restaurants, increase of base gross salaries paid to the employees, as well as a significant
increase in the value of bonuses paid, in correlation with the strong improvement of our restaurants’ profitability
during the year 2015.
Rent
Rent comprises costs of leasing the sites in which we operate our restaurants. All except one of our Pizza Hut
Dine-in and Pizza Hut Delivery restaurants operate in leased locations. Rent terms are negotiated on an individual
basis for each site hence, there are significant differences between rent terms of various sites. In terms of rent
levels, most of our contracts provide for a combination of a fixed rent (payable when sales are below a pre-agreed
certain level) and a variable rent, calculated as a certain percentage of sales (payable when sales exceed the pre-
agreed level). We also have contracts that provide for the payment of fixed rents only.

87
Rent expenses reached RON 8.03 million for the year ended 31 December 2016, compared with RON 6.48
million for the year ended 31 December 2015, representing an increase of 23.9%. Rent expenses reached RON
6.48 million for the year ended 31 December 2015, compared with RON 6.08 million for the year ended 31
December 2014, representing an increase of 6.5%. The reduction of the rent expense to 8.3% of restaurant sales
for the year ended 31 December 2016 from 8.5% of sales for the year ended 31 December 2015 and 9.6% of sales
for the year ended 31 December 2014, was mainly due to the fixed component of our rent contracts for some
restaurants, which increased much slower than the increase of sales of those restaurants.
Royalties
Royalty expenses are the contractual obligations that we pay to Yum! for the right to operate the Pizza Hut brand
in Romania. These expenses are set by contract at 6% of sales for Pizza Hut Dine-In restaurants and 5% for some
Pizza Hut Delivery restaurants for the initial term and 6% for the renewal term for all Pizza Hut Delivery
restaurants. They are paid on a monthly basis.
Royalty expenses reached RON 5.70 million for the year ended 31 December 2016, compared with RON 4.45
million for the year ended 31 December 2015, representing an annual increase of 28.2% and compared to RON
3.70 million for the year ended 31 December 2014, representing an annual increase of 20.3%. During the entire
2014-2016 period, royalty expenses stood at 5.9% of restaurant sales, which is in line with our contractual
obligations towards Yum!.
Advertising
Advertising expenses cover all marketing activities aimed at supporting Pizza Hut brand awareness in general and
restaurant sales in particular. We are obliged by Yum! to spend each year at least 5% of our annual restaurant sales
on advertising activities and should we fail to spend this amount, we are obliged to pay Yum! the difference not
spent.
Advertising expenses reached RON 5.79 million for the year ended 31 December 2016, compared with RON 4.25
million for the year ended 31 December 2015, representing an annual increase of 36.3% and compared to RON
3.59 million for the year ended 31 December 2014, representing an annual increase of 18.2%. The advertising
expenses stood at approximately 6.0% of restaurant sales for the year ended 31 December 2016, compared to
5.6% for the year ended 31 December 2015 and 5.7% for the year ended 31 December 2016, higher than our
contractual obligations towards Yum!, due to our decision to invest more in marketing activities in order to
support brand awareness and generate higher sales.
Other operating expenses
Other operating expenses include all other expenses incurred at the restaurant level, of which the more important
categories are utilities, third-party expenses, maintenance & repairs, small-wares and cleaning supplies. Some of
these expenses may be partly influenced by the level of sales (such as utilities, third-party expenses and cleaning
supplies), while other categories are mainly influenced by the restaurant development and remodelling activities
(such as maintenance & repairs and small-wares).
All data in RON’000 2014 2015 2016
2015 2016
2014 2015 2016
unless otherwise stated
Annual change
% of Restaurant sales
Utilities 3,627 3,896 4,192
7.4% 7.6%
5.7% 5.1% 4.3%
Third-party expenses 1,579 1,775 2,734
12.4% 54.0%
2.5% 2.3% 2.8%
Smallwares 262 1,217 1,829
364.5% 50.3%
0.4% 1.6% 1.9%
Maintenance & Repairs 990 790 1,266
-20.2% 60.3%
1.6% 1.0% 1.3%
Other items 1,056 661 1,638
-37.4% 147.8%
1.7% 0.9% 1.7%
Total Other operating expenses,
net 7,514 8,339 11,659
11.0% 39.8%
11.9% 11.0% 12.0%
Source: ARS (Romania) Annual Financial Statements
Other operating expenses reached RON 11.7 million for the year ended 31 December 2016, compared with RON
8.34 million for the year ended 31 December 2015, representing an increase of 39.8%. The increase of these
expenses to 12.0% of restaurant sales for the year ended 31 December 2016 from 11.0% of sales for the year
ended 31 December 2015 was mainly due to higher expenses of the new restaurants (those opened after 1 January
2015), which offset a modest improvement of efficiency of the comparable restaurants (supported by the faster
sales growth).

88
Other operating expenses reached RON 8.34 million for the year ended 31 December 2015, compared with RON
7.51 million for the year ended 31 December 2014, representing an increase of 11.0%. The share of these
expenses in total restaurant revenues decreased to 11.0% for the year ended 31 December 2015, compared to
11.9% for the year ended 31 December 2014, mainly due to the improved operational performance of the
comparable restaurants (with other operational expenses growing slower than sales), with a smaller impact coming
from the new restaurants opened after 1 January 2014, due mainly to the pre-opening costs.
Depreciation and Amortisation
The majority of our assets are represented by the tangible and intangible investments in our restaurants, such as
leasehold improvements, kitchen equipment, furniture, IT technology (both hardware and software), as well as the
opening fees payable to Yum!. Depreciation is calculated on a straight-line basis over the estimated useful lives of
the assets as follows: leasehold improvements – 10 years, computers and IT equipment - 3 to 5 years, vehicles - 5
years, other property, plant and equipment - 2 to 10 years.
Depreciation and amortisation expenses reached RON 2.67 million for the year ended 31 December 2016,
compared with RON 2.11 million for the year ended 31 December 2015, representing an increase of 26.1%. As a
result, depreciation and amortisation expenses as percentage of sales stood at 2.8% for the year ended 31
December 2016, the same level as for the year ended 31 December 2015. The 26.1% increase in the depreciation
and amortisation expenses during the year 2016 was mainly due to the opening of 11 new restaurants between 1
January 2015 and 31 December 2016 and to a lesser extent by the investment in remodelling of the existing
restaurants.
Depreciation and amortisation expenses reached RON 2.11 million for the year ended 31 December 2015,
compared with RON 2.19 million for the year ended 31 December 2014, representing a decrease of 3.4%. As a
result, depreciation and amortisation expenses as percentage of sales decreased to 2.8% for the year ended 31
December 2015 from 3.5% for the year ended 31 December 2014. The 3.4% decrease in the depreciation and
amortisation expenses during the year 2015 was mainly due to the lower depreciation and amortisation expenses
for the existing restaurants (those in operation before 1 January 2014), which was partly offset by the depreciation
and amortisation expenses of the 4 restaurants that were opened between 1 January 2014 and 31 December 2015.
Restaurant operating profit
The restaurant operating profit reached RON 14.6 million for the year ended 31 December 2016, compared with
RON 15.9 million for the year ended 31 December 2015, representing a decrease of 8.1%. As a result, restaurant
operating profit as percentage of sales reached 15.1% for the year ended 31 December 2016 from 21.0% for the
year ended 31 December 2015, representing a decrease of 5.9 percentage points. This decrease was mainly
triggered by the faster increase of the payroll and employee benefits expenses (3.8 percentage points increase in
restaurant sales) and to a lesser extent by the increase in other operating expenses (1.0 percentage points increase
in restaurant sales) and food and materials expenses (0.9 percentage points increase in restaurant sales), as
explained above.
The restaurant operating profit reached RON 15.9 million for the year ended 31 December 2015, compared with
RON 11.2 million for the year ended 31 December 2014, representing an increase of 42.3%. As a result, restaurant
operating profit as percentage of sales reached 21.0% for the year ended 31 December 2015 from 17.7% for the
year ended 31 December 2014, representing an increase of 3.3 percentage points. This increase was mainly due to
the slower growth in rent expenses (1.1 percentage points decrease in restaurant sales), other operational expenses
(0.9 percentage points decrease in restaurant sales), food and materials expenses (0.7 percentage points decrease
in restaurant sales) and depreciation expenses (0.7 percentage points decrease in restaurant sales).
General & Administrative (G&A)
The G&A expenses include all costs incurred at the head-office level with regards to the management of company,
including the management of the restaurant network. The main expense categories are payroll and employee
benefits, third-party expenses, depreciation and amortisation expenses, rent expenses and banking charges.
The G&A expenses reached RON 8.98 million for the year ended 31 December 2016, compared with RON 7.75
million for the year ended 31 December 2015, representing an increase of 15.9%. As a result, G&A expenses as
percentage of sales reached 9.3% for the year ended 31 December 2016 from 10.2% for the year ended 31
December 2015, a 0.9 percentage point decrease. The 15.9% annual increase in the G&A expenses was mainly

89
due to higher payroll expenses, driven by additional staff hired to support the operational and training activities at
the restaurant level.
The G&A expenses reached RON 7.75 million for the year ended 31 December 2015, compared with RON 6.09
million for the year ended 31 December 2014, representing an increase of 27.2%. As a result, G&A expenses as
percentage of sales reached 10.2% for the year ended 31 December 2015 from 9.7% for the year ended 31
December 2014, representing an increase of 0.5 percentage points. The 27.2% annual increase in the G&A
expenses was mainly due to higher payroll expenses, driven by the adjustment of head office staff salaries.
EBITDA from continuing operations
EBITDA reached RON 8.43 million for the year ended 31 December 2016, compared with RON 10.4 million for
the year ended 31 December 2015, representing a decrease of 18.9%. As a result, EBITDA margin reached 8.7%
for the year ended 31 December 2016, compared with 13.7% for the year ended 31 December 2015, representing a
5.0 percentage point decrease. This decrease was mainly triggered by the higher increase of the restaurant
operating expense, excluding depreciation and impairment expenses (5.9 percentage points increase in restaurant
sales), which was partly offset by a slower increase of the G&A expenses (1.0 percentage point decrease in
restaurant sales), as explained above.
EBITDA reached RON 10.4 million for the year ended 31 December 2015, compared with RON 7.42 million for
the year ended 31 December 2014, representing an increase of 40.1%. As a result, EBITDA margin reached 13.7%
for the year ended 31 December 2015, compared with 11.8% for the year ended 31 December 2014, representing a
1.9 percentage points increase. This increase was mainly triggered by the slower increase of the restaurant
operating expense, excluding depreciation and impairment expenses (2.6 percentage points decrease in restaurant
sales), which was partly offset by a faster increase of the G&A expenses (0.6 percentage points increase in
restaurant sales), as explained above.
Operating profit
The operating profit reached RON 5.63 million for the year ended 31 December 2016, compared with RON 8.15
million for the year ended 31 December 2015, representing a decrease of 31.0%. As a result, operating profit as
percentage of sales reached 5.8% for the year ended 31 December 2016 from 10.7% for the year ended 31
December 2015, representing a decrease of 4.9 percentage points. This decrease was mainly triggered by the
decrease of the restaurant operating profit (5.9 percentage points decrease in restaurant sales), which was partly
offset by a slower increase of the G&A expenses (1.0 percentage points decrease in restaurant sales), as explained
above.
The operating profit reached RON 8.15 million for the year ended 31 December 2015, compared with RON 5.08
million for the year ended 31 December 2014, representing an increase of 60.4%. As a result, operating profit as
percentage of sales reached 10.7% for the year ended 31 December 2015 from 8.1% for the year ended 31
December 2014, representing a 2.7 percentage points increase. This increase was mainly triggered by the faster
increase of the restaurant operating profit (3.3 percentage points increase in restaurant sales), which was partly
offset by a faster increase of the G&A expenses (0.6 percentage points decrease in restaurant sales), as explained
above.
Finance result
Finance expenses include mainly the interest expense associated with the interest-bearing liabilities that we have
contracted in order to finance our development activity and the net foreign exchange loss generated by our
operational and financial operations (both realized and unrealized). Finance revenues include the interest revenues
we receive from placing our excess cash liquidities into short-term bank deposits and the net foreign exchange
gains generated by our operational and financial operations (both realized and unrealized).
Finance expenses reached RON 213 thousand for the year ended 31 December 2016, compared with RON 482
thousand for the year ended 31 December 2015, representing a decrease of 55.8%. This decrease was mainly due
to the significant improvement in the net foreign exchange result generated by the depreciation of the RON
against the EUR during the year 2016.
Finance income reached RON 127 thousand for the year ended 31 December 2016, compared with RON 19
thousand for the year ended 31 December 2015, representing an increase of 568%. This increase was mainly due
to the existence of a net foreign exchange gain of RON 109 thousand in 2016 compared with a net loss of RON
385 thousand in the previous year.

90
Finance expenses reached RON 482 thousand for the year ended 31 December 2015, compared with RON 309
thousand for the year ended 31 December 2014, representing an increase of 56.0%. This increase was mainly due
to the slightly higher net foreign exchange losses as compared to the previous year.
Finance income reached RON 19 thousand for the year ended 31 December 2015, compared with RON 7
thousand for the year ended 31 December 2014, representing an increase of 171%.
Overall, the net finance expense reached RON 86 thousand for the year ended 31 December 2016 (representing
0.1% of sales), compared with RON 463 thousand for the year ended 31 December 2015 (representing 0.6% of
sales) and RON 302 thousand for the year ended 31 December 2014 (representing 0.5% of sales).
Profit before tax from continuing operations
Profit before tax from continuing operations reached RON 5.54 million for the year ended 31 December 2016,
compared with RON 7.69 million for the year ended 31 December 2015, representing a decrease of 27.9%. As a
result, profit before tax as percentage of sales reached 5.7% for the year ended 31 December 2016 from 10.1% for
the year ended 31 December 2015, representing a 4.4 percentage point decrease. This decrease was virtually due
to the reduction in the operating profit margin, by 4.9 percentage points of sales, as explained above.
Profit before tax from continuing operations reached RON 7.69 million for the year ended 31 December 2015,
compared with RON 4.78 million for the year ended 31 December 2014, representing an increase of 60.8%. As a
result, profit before tax as percentage of sales reached 10.1% for the year ended 31 December 2015 from 7.6% for
the year ended 31 December 2014, representing a 2.6 percentage point increase. This increase was virtually due to
the growth in the operating profit margin, by 2.7 percentage points of sales, as explained above.
Income tax expense
Income tax expense reached RON 0.36 million for the year ended 31 December 2016, compared with RON 1.17
million for the year ended 31 December 2015, representing a decrease of 69.1%. The effective tax rate stood at
6.5% for the year ended 31 December 2016 compared to 15.2% for the year ended 31 December 2015. The drop
of the effective tax rate was due to the release of a deferred tax liability of RON 0.46 million generated by the
change in the tax legislation starting January 2017. At the same time, we have further reduced our income tax
expense by using a sponsorship tax credit in the amount of RON 0.16 million for the year ended 31 December
2016 and RON 0.20 million for the year ended 31 December 2015.
Income tax expense reached RON 1.17 million for the year ended 31 December 2015, compared with RON 0.67
million for the year ended 31 December 2014, representing an increase of 75.4%. The effective tax rate stood at
15.2% for the year ended 31 December 2015 compared to 13.9% for the year ended 31 December 2014. Our
effective tax rate remained below the statutory income tax level of 16.0% for both years, mainly because we used
a sponsorship tax credit amounting to RON 0.20 million for the year ended 31 December 2015 and RON 0.16
million for the year ended 31 December 2014.
Profit after tax from continuing operations
Profit after tax from continuing operations reached RON 5.18 million for the year ended 31 December 2016,
compared with RON 6.52 million for the year ended 31 December 2015, representing a decrease of 20.5%. As a
result, profit after tax from continuing operations as percentage of sales reached 5.3% for the year ended 31
December 2016 from 8.6% for the year ended 31 December 2015, representing a 3.2 percentage point decrease.
Profit after tax from continuing operations reached RON 6.52 million for the year ended 31 December 2015,
compared with RON 4.12 million for the year ended 31 December 2014, representing an increase of 58.5%. As a
result, profit after tax as percentage of sales reached 8.6% for the year ended 31 December 2015 from 6.5% for the
year ended 31 December 2014, representing a 2.1 percentage point increase.
Profit/(loss) after tax for the year from discontinued operations
In November 2016, ARS (Romania) ceased the activities of warehousing and distribution of food supplies and
materials that was performed both for its own necessities as well as for a number of related parties. These
activities were transferred to Havi (Romania), an independent provider of logistics services. The impact on ARS
(Romania) from these discontinued operations has two components: (i) the derecognition of a part of the
warehousing and distribution expenses, related to the needs of the Pizza Hut restaurants, which starting November

91
2016 were included in the cost of food and materials (as acquired from Havi (Romania)) and (ii) the derecognition
of the net result related to these activities that were performed for the related parties.
Loss after tax for the year from discontinued operations reached RON 1.95 million for the year ended 31
December 2016, compared with RON 0.40 million for the year ended 31 December 2015 and RON 0.60 million
for the year ended 31 December 2014. The increase in the loss for the year ended 31 December 2016, of RON
1.56 million, was mainly due to the registration of a provision of RON 0.97 million for the impairment of assets
related to the ceased warehousing and distribution activities.
Profit after tax
Profit after tax reached RON 3.23 million for the year ended 31 December 2016, compared with RON 6.12
million for the year ended 31 December 2015, representing a decrease of 47.3%. As a result, profit after tax as
percentage of sales reached 3.3% for the year ended 31 December 2016 from 8.1% for the year ended 31
December 2015, representing a 4.8 percentage point decrease.
Profit after tax reached RON 6.12 million for the year ended 31 December 2015, compared with RON 3.52
million for the year ended 31 December 2014, representing an increase of 74.0%. As a result, profit after tax as
percentage of sales reached 8.1% for the year ended 31 December 2015 from 5.6% for the year ended 31
December 2014, representing a 2.5 percentage point increase.
Liquidity and Capital Resources
Historically, we have used two major sources of liquidity: the operating cash flows and bank financing. The
operating cash flows have been mainly directed to support the general working capital requirements of the
company and the payment of dividends, while bank loans have been used mostly to finance our development plan.
Our cash and cash equivalents reached RON 3.29 million as at 31 December 2016, compared to RON 5.57 million
as at 31 December 2015 and RON 1.31 million as at 31 December 2014. In addition, ARS (Romania) together
with USFN (Romania) had available RON 50.3 million of undrawn committed borrowing facilities as at 31
December 2016, compared to RON 59.9 million as at 31 December 2015 and RON 67.7 million as at 31
December 2014.
We will continue to make significant investments in the following years in the growth of our business, primarily
through opening new restaurants, but also by investing in existing restaurants.
Statement of cash flows
The following table sets forth, for the years ended December 31, 2014, 2015 and 2016, our cash flows from
operating activities, investing activities and financing activities.
All data are in RON’000 unless otherwise stated Year ended 31 December
2014 2015 2016
Operating activities
Profit before tax from continuing operations 4,782 7,691 5,543
Profit/(loss) before tax from discontinued operations (708) (477) (2,141)
Profit before tax 4,074 7,214 3,402
Adjustments to reconcile profit before tax to net cash flows:
Depreciation and impairment of property, plant and equipment 2,268 2,208 2,862
Amortisation and impairment of intangible assets 202 210 323
Impairment allowance of property, plant and equipment - - 966
Net foreign exchange differences (129) 3 54
Gain on disposal of property, plant and equipment 391 (56) 115
Finance income (7) (19) (18)
Finance costs 100 97 213
Movements in current asset allowances 2 19 -
Working capital adjustments:
Decrease/(increase) in trade and other receivables and prepayments (2,146) 153 (985)
Decrease/(increase) in inventories (673) 209 5,647
Increase/(decrease) in trade and other payables 1,828 1,896 (2,489)
Interest received 7 19 18
Interest paid (100) (119) (240)
Income tax paid (592) (801) (1,186)
Net cash flows from operating activities 5,225 11,033 8,682

92
All data are in RON’000 unless otherwise stated Year ended 31 December
2014 2015 2016
Investing activities
Proceeds from sale of property, plant and equipment 15 56 33
Purchase of intangible assets (44) (953) (1,491)
Purchase of property, plant and equipment (1,119) (5,819) (9,107)
Net cash flows used in investing activities (1,148) (6,716) (10,565)
Financing activities
Payment of finance lease liabilities (107) - (201)
Proceeds from borrowings - 6,359 8,603
Repayment of borrowings (2,151) (2,458) (2,769)
Dividends paid to equity holders of the parent (1,800) (3,950) (6,030)
Net cash flows from/(used in) financing activities (4,058) (49) (397)
Net increase in cash and cash equivalents 19 4,268 (2,280)
Cash and cash equivalents at 1 January 1,287 1,306 5,574
Cash and cash equivalents at 31 December 1,306 5,574 3,294
Source: ARS (Romania) Annual Financial Statements
Cash flows from operating activities
Net cash flows from operating activities reached RON 8.68 million for the year ended 31 December 2016,
compared to RON 11.0 million for the year ended 31 December 2015, representing a decrease of 21.3%. The main
driver of the decrease in the net cash flows from operating activities by 21.3%, or RON 2.35 million, was the
decrease in EBITDA (by RON 2.46 million).
Net cash flows from operating activities reached RON 11.0 million for the year ended 31 December 2015,
compared to RON 5.23 million for the year ended 31 December 2014, representing an increase of 111.2%. The
main driver of the increase in net cash flows from operating activities by 111.2%, or RON 5.81 million, was the
increase in EBITDA (by RON 3.25 million), as well as the improvement in the net working capital (by RON 3.25
million).
The company operates with negative net working capital most of the time, which leads to an increase of the
available cash flow from operations on the back of higher sales. This negative net working capital is explained by
the fact that most of our sales are collected immediately via cash payments or card payments from customers, our
inventory levels are held generally for up to two weeks of sales, while payment terms to suppliers average
generally from 45 to 60 days.
Cash flows from investing activities
Net cash flows used in investing activities reached RON 10.6 million for the year ended 31 December 2016,
compared to RON 6.72 million for the year ended 31 December 2015, representing an increase of 57.3%. This
increase was due to the expansion of our restaurant development plan, which led to the opening of 8 new
restaurants during the year 2016, and investments in the opening of other restaurants planned for the year 2017.
Net cash flows used in investing activities reached RON 6.72 million for the year ended 31 December 2015,
compared to RON 1.15 million for the year ended 31 December 2014, representing an increase of 485%. This
increase was due to the acceleration of our restaurant development plan, which materialised in the opening of 4
net restaurants during the year 2015 compared to none in the preceding year.
Cash flows from financing activities
Net cash flows used in financing activities reached RON 0.40 million for the year ended 31 December 2016,
compared to RON 0.05 million for the year ended 31 December 2015, representing an increase of 710%. Within
the net cash flows from the financing activities, the main uses were for dividends paid to the shareholders (RON
6.03 million) and repayment of bank borrowings (RON 2.77 million) for restaurants opened in the previous years,
while the main source were drawings from bank borrowings (RON 8.60 million) for financing the restaurants
opened during the year 2016 or to be opened during the year 2017. This increase in the cash flows used in the
financing activities of 710%, or by RON 0.35 million, was principally generated by the increase in the payments
of the dividends to shareholders (by RON 2.08 million) out of the profits corresponding to the year 2015.
Net cash flows used in financing activities reached RON 0.05 million for the year ended 31 December 2015,
compared to RON 4.06 million for the year ended 31 December 2014, representing a decrease of 98.8%. Within

93
the net cash flows from the financing activities, the main uses were for dividends paid to the shareholders (RON
3.95 million) and repayment of bank borrowings (RON 2.46 million) for restaurants opened in the previous years,
while the main source were drawings from bank borrowings (RON 6.36 million) for financing the restaurants
opened during the year 2015 or to be opened during the year 2016. This decrease in the cash flows used in the
financing activities of 98.8%, or by RON 4.01 million, was due to the significant increase in the bank borrowings
(by RON 6.36 million) for the financing of the restaurants opened during the year 2015 or to be opened during the
year 2016, which was partly offset by increased payments of the dividends to shareholders (by RON 2.15 million).
Indebtedness
The following table sets forth, for the years ended December 31, 2014, 2015 and 2016, our interest-bearing
liabilities.
All data are in RON’000 unless otherwise stated 31-Dec-14 31-Dec-15 31-Dec-16
Interest-bearing loans and borrowings - long-term* 492 3,692 7,536
Interest-bearing loans and borrowings - short-term* 1,435 2,118 3,935
Total interest-bearing liabilities* 1,927 5,810 11,471
Cash and short-term deposits* 1,306 5,574 3,294
Total net debt 621 236 8,177
*Source: ARS (Romania) Annual Financial Statements
Total interest-bearing liabilities reached RON 11.5 million as at 31 December 2016, compared to RON 5.81
million as at 31 December 2015 and RON 1.93 million as at 31 December 2014. The increase of RON 5.66
million during the year 2016 and of RON 3.88 million during the year 2015 were mainly due to the new
borrowings drawn from the credit line with Alpha Bank Romania for financing the opening of new restaurants,
which exceeded the repayment of borrowings for financing the opening of the restaurants opened in the previous
years. The decrease of RON 2.39 million during the year 2014 was mainly due to the repayment of borrowings for
financing the opening of the restaurants in the previous years.
Total net debt reached RON 8.18 million as at 31 December 2016, compared to RON 0.24 million as at 31
December 2015 and RON 0.62 million as at 31 December 2014. The increase of RON 7.94 million during the year
2016 was mainly due to the net new borrowings from the credit line with Alpha Bank Romania for financing the
opening of new restaurants (up by RON 5.66 million), coupled with a reduction in the cash and cash equivalents
(by RON 2.28 million). The decrease of RON 0.39 million during the year 2015 was mainly due to the increase in
the cash and cash equivalents (by RON 4.27 million).
ARS (Romania) and USFN (Romania) have contracted a credit facility from Alpha Bank Romania with a total
limit of EUR 21 million (approximately RON 95.4 million as at 31 December 2016), which is split in three sub-
limits, as follows: credit facility for the development of new locations, issuance of bank guarantee letters and
credit card. The loan is secured with property, plant and equipment of each restaurant location for which the credit
limited has been utilised.
Sphera - results of operations for the six months ended 30 June 2016 and 2017
Consolidated statement of comprehensive income
The consolidated profit and loss account of the Company for the six months ended 30 June 2017 include the
performance of USFN Group for the entire period, as well as the performance of ARS (Romania) for June 2017.
In 2017, we opened 2 restaurants in Italy, the first one on 30 March 2017, and the second one on 21 June 2017.
The following table presents the consolidated profit and loss account of the Company for the six months ended 30
June 2016 and 2017.

94
All data are in RON’000 unless otherwise Six months ended 30 June Change Percentage of Sales
Stated 2016 2017 2017 2016 2017
Restaurant sales 193,220 242,204 25.4% 100.0% 100.0%
Restaurant expenses
Food and materials 74,225 87,944 18.5% 38.4% 36.3%
Payroll and employee benefits 30,623 43,430 41.8% 15.8% 17.9%
Rent 12,984 17,001 30.9% 6.7% 7.0%
Royalties 11,380 14,125 24.1% 5.9% 5.8%
Advertising 8,457 11,724 38.6% 4.4% 4.8%
Other operating expenses 14,330 18,474 28.9% 7.4% 7.6%
Depreciation 4,198 4,952 18.0% 2.2% 2.0%
Restaurant operating profit 37,023 44,554 20.3% 19.2% 18.4%
G&A expenses 10,625 15,832 49.0% 5.5% 6.5%
Operating profit 26,398 28,722 8.8% 13.7% 11.9%
Finance costs 978 440 -55.0% 0.5% 0.2%
Finance income 125 109 -12.8% 0.1% 0.0%
Profit before tax 25,545 28,391 11.1% 13.2% 11.7%
Income tax expense 3,315 1,189 -64.1% 1.7% 0.5%
Profit for the year 22,230 27,202 22.4% 11.5% 11.2%
EBITDA
Operating profit 26,398 28,722 8.8% 13.7% 11.9%
Adjustments to bridge operating profit to
EBITDA:
Depreciation and amortization 4,198 4,952 18.0% 2.2% 2.0%
Depreciation and amortization included in
general and administration expenses 586 1,119 91.0% 0.3% 0.5%
EBITDA 31,182 34,793 11.6% 16.1% 14.4%
Source: Sphera Interim Financial Statements, unaudited
Selected operating data
All data are in RON’000 unless
Six months
ended 30 June
Change
otherwise stated 2016 2017 2017
Like-for-like performance
Like-for-like sales growth 13.0%
KFC restaurant count
Restaurants at beginning of period 59 65
Net additions 2 1
Restaurants at end of period 61 66
Source: Management data. 1) Including the revenues from ARS (Romania) for the 1 January – 31 May 2017 period and the
new stores opened in Italy.
Revenues
Consolidated restaurant sales reached RON 242.2 million for the six months ended 30 June 2017, compared with
RON 193.2 million for the six months ended 30 June 2016, an increase of 25.4%. This growth was mainly fuelled
by performance of the existing 59 KFC restaurants in operation on 1 January 2016, whose cumulated sales
increased by 13.0%, but also by performance of the 6 net new KFC restaurants opened in Romania between 1
January 2016 and 30 June 2017, as well as the consolidation of one month of ARS (Romania) sales and of the
sales of the two new KFC restaurants opened in Italy. Contribution of ARS (Romania) and of USFN (Italy) to the
revenues for the six months ended 30 June 2017 was RON 8.58 million and RON 3.48 million, respectively.
Although we have increased our selling prices both in 2016 and 2017, the impact on the overall sales growth was
not significant, as the key drivers of growth were the increase in transactions of the like-for-like restaurants and
the opening of new restaurants, as detailed above.
Most of the restaurant sales were generated in Romania, which accounted for 96.9% of the consolidated sales for
the six months ended 30 June 2017 compared with 98.1% of the consolidated sales for the six months ended 30
June 2016.

95
Food and materials expenses
Food and materials expenses reached RON 87.9 million for the six months ended 30 June 2017, compared with
RON 74.2 million for the six months ended 30 June 2016, representing an increase of 18.5%. The decrease of this
expense category to 36.3% of restaurant sales for the six months ended 30 June 2017 from 38.4% of sales for the
six months ended 30 June 2016, or by 2.1 percentage points, was mainly due to increase in the selling prices that
took place starting with the second half of 2016.
Payroll and employee benefits
Payroll and employee benefits expenses reached RON 43.4 million for the six months ended 30 June 2017,
compared with RON 30.6 million for the six months ended 30 June 2016, an increase of 41.8%. This expense
category reached 17.9% of restaurant sales in the six months ended 30 June 2017 compared with 15.8% in the six
months ended 30 June 2016, representing a 2.1 percentage point increase. The faster increase of this expense
category compared to the increase in restaurant sales was due to the increase in average salaries that we pay to our
restaurant staff, the start of the operations in Italy, where we incurred pre-opening expenses related to the training
of restaurant employees, as well as the consolidation of one month of ARS (Romania) payroll expense.
Rent
Rent expenses reached RON 17.0 million for the six months ended 30 June 2017, compared with RON 13.0
million for the six months ended 30 June 2016, representing an increase of 30.9%. The increase of the rent
expense to 7.0% of restaurant sales for the six months ended 30 June 2017 from 6.7% of sales for the six months
ended 30 June 2016 was mainly due to consolidation of ARS (Romania) and USFN (Italy) into the financial
statements for the six months ended 30 June 2017.
Royalties
Royalty expenses reached RON 14.1 million for the six months ended 30 June 2017, compared with RON 11.4
million for the six months ended 30 June 2016, representing an annual increase of 24.1%. This increase was
determined by the increase in revenues, so that royalty expenses stood at 5.8% of restaurant sales for the six
months ended 30 June 2017, compared with 5.9% for the six months ended 30 June 2016.
Advertising
Advertising expenses reached RON 11.7 million for the six months ended 30 June 2017, compared with RON
8.46 million for the six months ended 30 June 2016, representing an increase of 38.6%. The advertising expenses
stood at approximately 4.8% of restaurant sales for the six months ended 30 June 2017, compared with 4.4% for
the six months ended 30 June 2016. The increase in the advertising expense is temporary and was mainly due to a
different timing of incurring these expenses in the first six months of 2016; we expect advertising expenses to
reach approximately 5.0% for the full year 2017 (5.0% for the year ended 31 December 2016).
Other operating expenses
The following table presents the main components of other operating expenses registered by our restaurants for
the six months ended 30 June 2016 and 2017.
All data in RON’000 30-Jun-16 30-Jun-17
30-Jun-17
30-Jun-16 30-Jun-17
unless otherwise stated
Annual change
% of Restaurant sales
Third-party expenses 4,402 5,823
32.3%
2.3% 2.4%
Utilities 4,115 4,718
14.7%
2.1% 1.9%
Maintenance & Repairs 1,784 2,656
48.9%
0.9% 1.1%
Smallwares 1,049 1,215
15.8%
0.5% 0.5%
Cleaning Supplies 1,218 1,402
15.1%
0.6% 0.6%
Other items 1,762 2,660
51.0%
0.9% 1.1%
Total Other operating expenses, net 14,330 18,474
28.9%
7.4% 7.6%
Source: Sphera Interim Financial Statements, unaudited
Other operating expenses reached RON 18.5 million for the six months ended 30 June 2017, compared with RON
14.3 million for the six months ended 30 June 2016, representing an increase of 28.9%. The increase of these
expenses to 7.6% of restaurant sales for the six months ended 30 June 2017 from 7.4% of sales for the six months

96
ended 30 June 2016 was mainly due to the consolidation of ARS (Romania) and of USFN (Italy) into the financial
statements for the six months ended 30 June 2017.
Depreciation and Amortisation
Depreciation expenses reached RON 4.95 million for the six months ended 30 June 2017, compared with RON
4.20 million for the six months ended 30 June 2016, representing an increase of 18.0%. As a result, depreciation
expense as percentage of sales decreased to 2.0% for the six months ended 30 June 2017 from 2.2% for the six
months ended 30 June 2016. The 18.0% increase in the depreciation expense during the six months ended 30 June
2017 was mainly due to the opening of 8 new KFC restaurants between 1 January 2016 and 30 June 2017.
Restaurant operating profit
The restaurant operating profit reached RON 44.6 million for the six months ended 30 June 2017, compared with
RON 37.0 million for the six months ended 30 June 2016, representing an increase of 20.3%. As a result,
restaurant operating profit as percentage of sales reached 18.4% for the six months ended 30 June 2017 from
19.2% for the six months ended 30 June 2016, representing a 0.8 percentage point decrease. This decrease was
mainly triggered by the higher advertising expenses (+0.5 percentage points increase in restaurant sales) and to a
lesser extent by higher other operating expenses (+0.2 percentage points increase in restaurant sales), as explained
above.
General & Administrative (G&A)
The G&A expenses reached RON 15.8 million for the six months ended 30 June 2017, compared with RON 10.6
million for the six months ended 30 June 2016, representing an increase of 49.0%. As a result, G&A expenses as
percentage of sales reached 6.5% for the six months ended 30 June 2017 from 5.5% for the six months ended 30
June 2016, representing a 1.0 percentage point increase. This increase was mainly due to the consolidation of ARS
(Romania) and (USFN) Italy into the financial statements for the six months ended 30 June 2017, as well as
higher payroll and third-party expenses.
EBITDA
EBITDA reached RON 34.8 million for the six months ended 30 June 2017, compared with RON 31.2 million for
the six months ended 30 June 2016, representing an increase of 11.6%. As a result, EBITDA margin reached
14.4% for the six months ended 30 June 2017 compared with 16.1% for the six months ended 30 June 2016,
representing a 1.8 percentage point decrease. This decrease was mainly triggered by the higher increase of the
restaurant operating expense, excluding depreciation and impairment expenses (0.9 percentage points increase in
restaurant sales) as well as to a faster increase of the G&A expenses (1.0 percentage point increase in restaurant
sales), as explained above.
Operating profit
The operating profit reached RON 28.7 million for the six months ended 30 June 2017, compared with RON 26.4
million for the six months ended 30 June 2016, representing an increase of 8.8%. As a result, operating profit as
percentage of sales reached 11.9% for the six months ended 30 June 2017 from 13.7% for the six months ended 30
June 2016, representing a 1.8 percentage point decrease. This decrease was mainly triggered by the higher
increase in the restaurant operating expense (0.8 percentage points increase in restaurant sales) as well as by a
faster increase of the G&A expenses (1.0 percentage points increase in restaurant sales), as explained above.
Finance result
Net finance expense (calculated as finance cost less finance income) reached RON 331 thousand for the six
months ended 30 June 2017, compared with RON 853 thousand for the six months ended 30 June 2016,
representing a decrease of 61.2%. This decrease was mainly due lower foreign exchange loss, which decreased by
RON 601 thousand in the six months ended 30 June 2017 compared with the six months ended 30 June 2016.
Profit before tax
Profit before tax reached RON 28.4 million for the six months ended 30 June 2017, compared with RON 25.5
million for the six months ended 30 June 2016, representing an increase of 11.2%. As a result, profit before tax as
percentage of sales reached 11.7% for the six months ended 30 June 2017, compared with 13.2% for the six
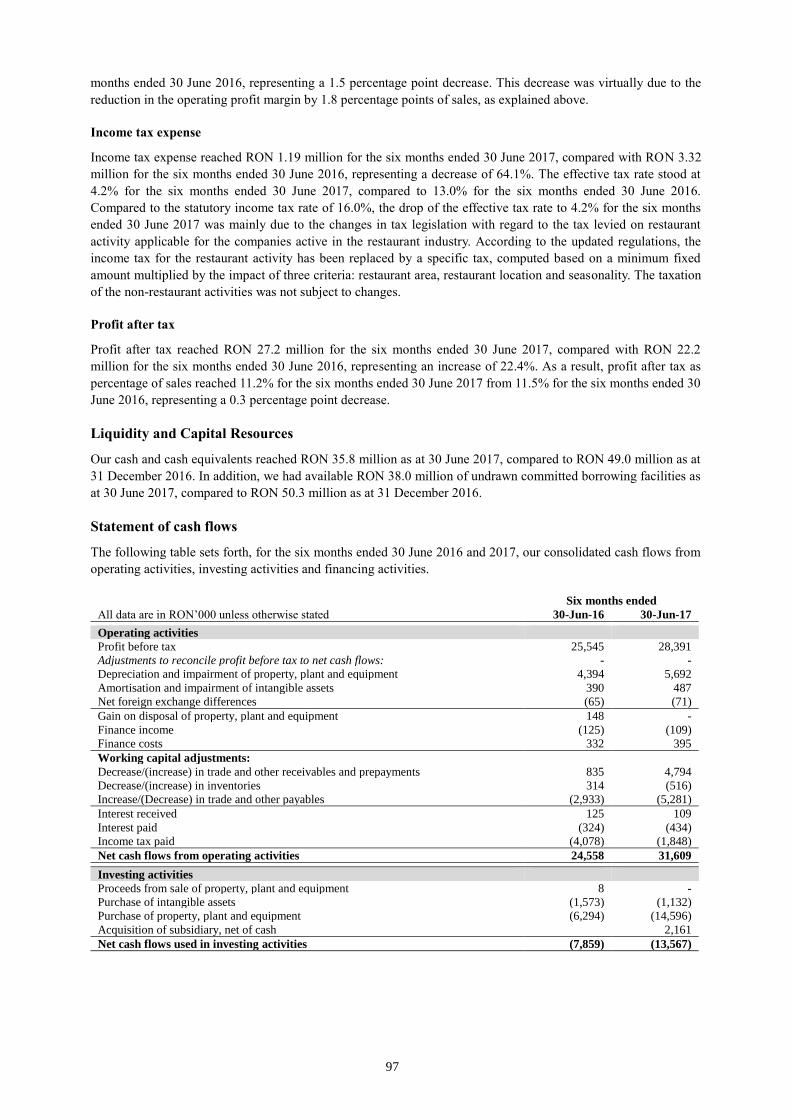
97
months ended 30 June 2016, representing a 1.5 percentage point decrease. This decrease was virtually due to the
reduction in the operating profit margin by 1.8 percentage points of sales, as explained above.
Income tax expense
Income tax expense reached RON 1.19 million for the six months ended 30 June 2017, compared with RON 3.32
million for the six months ended 30 June 2016, representing a decrease of 64.1%. The effective tax rate stood at
4.2% for the six months ended 30 June 2017, compared to 13.0% for the six months ended 30 June 2016.
Compared to the statutory income tax rate of 16.0%, the drop of the effective tax rate to 4.2% for the six months
ended 30 June 2017 was mainly due to the changes in tax legislation with regard to the tax levied on restaurant
activity applicable for the companies active in the restaurant industry. According to the updated regulations, the
income tax for the restaurant activity has been replaced by a specific tax, computed based on a minimum fixed
amount multiplied by the impact of three criteria: restaurant area, restaurant location and seasonality. The taxation
of the non-restaurant activities was not subject to changes.
Profit after tax
Profit after tax reached RON 27.2 million for the six months ended 30 June 2017, compared with RON 22.2
million for the six months ended 30 June 2016, representing an increase of 22.4%. As a result, profit after tax as
percentage of sales reached 11.2% for the six months ended 30 June 2017 from 11.5% for the six months ended 30
June 2016, representing a 0.3 percentage point decrease.
Liquidity and Capital Resources
Our cash and cash equivalents reached RON 35.8 million as at 30 June 2017, compared to RON 49.0 million as at
31 December 2016. In addition, we had available RON 38.0 million of undrawn committed borrowing facilities as
at 30 June 2017, compared to RON 50.3 million as at 31 December 2016.
Statement of cash flows
The following table sets forth, for the six months ended 30 June 2016 and 2017, our consolidated cash flows from
operating activities, investing activities and financing activities.
Six months ended
All data are in RON’000 unless otherwise stated 30-Jun-16 30-Jun-17
Operating activities
Profit before tax 25,545 28,391
Adjustments to reconcile profit before tax to net cash flows: - -
Depreciation and impairment of property, plant and equipment 4,394 5,692
Amortisation and impairment of intangible assets 390 487
Net foreign exchange differences (65) (71)
Gain on disposal of property, plant and equipment 148 -
Finance income (125) (109)
Finance costs 332 395
Working capital adjustments:
Decrease/(increase) in trade and other receivables and prepayments 835 4,794
Decrease/(increase) in inventories 314 (516)
Increase/(Decrease) in trade and other payables (2,933) (5,281)
Interest received 125 109
Interest paid (324) (434)
Income tax paid (4,078) (1,848)
Net cash flows from operating activities 24,558 31,609
Investing activities
Proceeds from sale of property, plant and equipment 8 -
Purchase of intangible assets (1,573) (1,132)
Purchase of property, plant and equipment (6,294) (14,596)
Acquisition of subsidiary, net of cash 2,161
Net cash flows used in investing activities (7,859) (13,567)

98
Financing activities
Capital contribution from shareholders - 1,151
Proceeds from borrowings 3,532 19,225
Repayment of borrowings (3,678) (5,051)
Payment of finance lease liabilities (156) (134)
Dividends paid to equity holders of the parent (40,961) (46,237)
Dividends paid to non-controlling interests - (70)
Net cash flows from/(used in) financing activities (41,263) (31,116)
Net increase in cash and cash equivalents (24,564) (13,074)
Net foreign exchange difference (18) (78)
Cash and cash equivalents at 1 January 43,599 48,968
Cash and cash equivalents at 30 June 19,017 35,816
Source: Sphera Interim Financial Statements, unaudited.
Cash flows from operating activities
Net cash flows from operating activities reached RON 31.6 million for the six months ended 30 June 2017,
compared to RON 24.6 million for the six months ended 30 June 2016, representing an increase of 28.7%. The
main drivers of the increase in the net cash flows from operating activities by 28.7%, or RON 7.05 million, were
the increase in EBITDA (by RON 3.61 million and the decrease in the income tax paid (by RON 2.23 million).
Cash flows from investing activities
Net cash flows used in investing activities reached RON 13.6 million for the six months ended 30 June 2017,
compared to RON 7.86 million for the six months ended 30 June 2016, representing an increase of 72.6%. This
increase was due to the investment in the new restaurants that have been opened starting with the second half of
year 2016, including our first two KFC restaurants in Italy, as well as significant investments in other restaurants
planned to be opened in the second part of the year 2017.
Cash flows from financing activities
Net cash flows used in financing activities reached RON 31.1 million for the six months ended 30 June 2017,
compared to RON 41.3 million for the six months ended 30 June 2016, representing a decrease of 24.6%. Within
the net cash flows from the financing activities, the main uses were for dividends paid to the shareholders (RON
46.2 million) and repayment of bank borrowings (RON 5.05 million) for restaurants opened in the previous years,
while the main source were drawings from bank borrowings (RON 19.2 million) to finance the restaurants opened
or to be opened during the year 2017. The decrease in the cash flows used in the financing activities by 24.6%, or
RON 10.15 million, was principally generated by the increase in the proceeds from bank borrowings (by RON
15.7 million), which were partly offset by the higher dividends paid to the shareholders (by RON 5.28 million).
Indebtedness
The following table sets forth our consolidated interest-bearing liabilities for the six months ended 30 June 2017
compared with the year ended 31 December 2016.
All data are in RON’000 unless otherwise stated 31-Dec-16 30-Jun-17
Interest-bearing loans and borrowings - long-term* 14,630 31,227
Interest-bearing loans and borrowings - short-term* 7,796 15,804
Total interest-bearing liabilities* 22,426 47,031
Cash and short-term deposits* 48,968 35,816
Total net debt (26,542) 11,215
*Source: Sphera Interim Financial Statements, unaudited
Total interest-bearing liabilities reached RON 47.0 million as at 30 June 2017, compared to RON 22.4 million as
at 31 December 2016. This increase of 109.7%, or by RON 24.6 million, was due to both the increase in the bank
borrowings to finance the opening of KFC restaurants and to consolidate the ARS (Romania)'s debt position into
the financial statements of the Company.
Total net debt reached RON 11.2 million as at 30 June 2017 compared to a negative value of RON 26.5 million as
at 31 December 2016. The increase in net debt by RON 37.7 million was mainly due to the reduction in the cash
and short-term deposits from 31 December 2016 to 30 June 2017, but also to the increase in bank borrowings.

99
ARS (Romania) - results of operations for the six months ended 30 June 2016 and 2017
Statement of comprehensive income
The following table presents the profit and loss account of ARS (Romania) for the periods of six months ended 30
June 2016 and 2017, respectively.
All data are in RON’000 unless otherwise Six months ended 30 June Change Percentage of Sales
stated 2016 2017 2017 2016 2017
Restaurant sales 46,398 54,210 16.8% 100.0% 100.0%
Restaurant expenses
Food and materials 12,606 14,830 17.6% 27.2% 27.4%
Payroll and employee benefits 9,608 13,690 42.5% 20.7% 25.3%
Rent 3,672 4,692 27.8% 7.9% 8.7%
Royalties 2,721 3,166 16.4% 5.9% 5.8%
Advertising 2,727 2,973 9.0% 5.9% 5.5%
Other operating expenses 5,234 5,386 2.9% 11.3% 9.9%
Depreciation 1,116 1,749 56.7% 2.4% 3.2%
Restaurant operating profit 8,714 7,724 -11.4% 18.8% 14.2%
General and administration expenses, net 4,338 5,732 32.1% 9.3% 10.6%
Operating profit 4,376 1,992 -54.5% 9.4% 3.7%
Finance costs 81 187 130.9% 0.2% 0.3%
Finance income 93 6 -93.5% 0.2% 0.0%
Profit before tax from continuing
operations 4,388 1,811 -58.7% 9.5% 3.3%
Income tax expense 626 772 23.3% 1.3% 1.4%
Profit for the period from continuing
operations 3,762 1,039 -72.4% 8.1% 1.9%
Discontinued operations
Profit for the period from discontinued
operations, net of tax 293 0 -100.0% 0.6% 0.0%
Profit for the period 4,055 1,039 -74.4% 8.7% 1.9%
EBITDA
Operating profit 4,376 1,992 -54.5% 9.4% 3.7%
Adjustments to bridge operating profit to
EBITDA:
Depreciation and amortization 1,116 1,749 56.7% 2.4% 3.2%
Depreciation and amortization included in
general and administration expenses 92 67 -27.2% 0.2% 0.1%
EBITDA from continuing operations 5,584 3,808 -31.8% 12.0% 7.0%
Profit from discontinued operations 349 0 -100.0% 0.8% 0.0%
Adjustments to bridge operating profit to
EBITDA:
Depreciation and amortization 233 0 -100.0% 0.5% 0.0%
EBITDA from discontinued operations 582 0 -100.0% 1.3% 0.0%
Total profit 4,725 0 -100.0% 10.2% 0.0%
Total adjustments for depreciation and
amortization 1,441 0 -100.0% 3.1% 0.0%
Total EBITDA: 6,166 3,808 -38.2% 13.3% 7.0%
Source: ARS (Romania) Interim Financial Statements, unaudited
Selected operating data
All data are in RON’000 unless
Six months
ended 30 June
Change
otherwise stated 2016 2017 2017
Like-for-like performance
Like-for-like sales growth 3.4%

100
All data are in RON’000 unless
Six months
ended 30 June
Change
otherwise stated 2016 2017 2017
Pizza Hut restaurant count
Restaurants at beginning of period 25 32
Net additions 3 1
Restaurants at end of period 28 33
Source: Management data.
Revenues
Restaurant sales reached RON 54.2 million for the six months ended 30 June 2017, compared with RON 46.4
million for the six months ended 30 June 2016, marking an increase of 16.8%. This growth was mainly fuelled by
the performance of the 8 net new restaurants that have been opened between 1 January 2016 and 30 June 2017,
but also by the performance of the existing 26 restaurants that were already in operation on 1 January 2016, whose
cumulated sales increased by 3.4%. Although we have increased our selling prices both in 2016 and 2017, the
impact on the overall sales growth was not significant, as the key drivers of growth were the increase in
transactions of the like-for-like restaurants and the opening of new restaurants, as detailed above.
Food and materials expenses
Food and materials expenses reached RON 14.8 million for the six months ended 30 June 2017, compared with
RON 12.6 million for the six months ended 30 June 2016, representing an increase of 17.6%. In percentage of
sales terms, this expense category remained relatively stable at 27.4% for the six months ended 30 June 2017
compared to 27.2% for the six months ended 30 June 2016.
Payroll and employee benefits
Payroll and employee benefits expenses reached RON 13.7 million for the six months ended 30 June 2017,
compared with RON 9.61 million for the six months ended 30 June 2016, representing an increase of 42.5%. This
expense category reached 25.3% of restaurant sales in in the six months ended 30 June 2017, compared with
20.7% in in the six months ended 30 June 2016, representing a 4.6 percentage point increase. The faster increase
of this expense category compared to the increase in restaurant sales was due in part to the increase in the average
salaries that we pay to our restaurant staff, as well as to the increase in the total number of restaurants in operation.
Rent
Rent expenses reached RON 4.69 million for the six months ended 30 June 2017, compared with RON 3.67
million for the six months ended 30 June 2016, representing an increase of 27.8%. The increase of the rent
expense to 8.7% of restaurant sales for the six months ended 30 June 2017 from 7.9% of sales for the six months
ended 30 June 2016 was mainly due to the increased contractual rent expense in some of our locations.
Royalties
Royalty expenses reached RON 3.17 million for the six months ended 30 June 2017, compared with RON 2.72
million for the six months ended 30 June 2016, representing an annual increase of 16.4%. This increase was
determined by the increase in revenues, so that royalty expenses stood at 5.8% of restaurant sales for the six
months ended 30 June 2017, compared with 5.9% for the six months ended 30 June 2016.
Advertising
Advertising expenses reached RON 2.97 million for the six months ended 30 June 2017, compared with RON
2.73 million for the six months ended 30 June 2016, representing an increase of 9.0%. The advertising expenses
stood at approximately 5.5% of restaurant sales for the six months ended 30 June 2017, compared with 5.9% for
the six months ended 30 June 2016.
Other operational expenses
The following table presents the main components of other operational expenses registered by our restaurants for
the six months ended 30 June 2016 and 2017.

101
All data in RON’000 30-Jun-16 30-Jun-17
30-Jun-17
30-Jun-16 30-Jun-17
unless otherwise stated
Annual change
% of Restaurant sales
Third-party expenses 1,117 1,617
44.8%
2.4% 3.0%
Utilities 2,088 2,218
6.2%
4.5% 4.1%
Maintenance & Repairs 606 454
-25.1%
1.3% 0.8%
Smallwares 672 443
-34.1%
1.4% 0.8%
Cleaning Supplies 254 310
22.0%
0.5% 0.6%
Other items 497 344
-30.8%
1.1% 0.6%
Total Other operating expenses, net 5,234 5,386
2.9%
11.3% 9.9%
Source: ARS (Romania) Interim Financial Statements, unaudited
Other operational expenses reached RON 5.39 million for the six months ended 30 June 2017, compared with
RON 5.23 million for the six months ended 30 June 2016, representing an increase of 2.9%. The decrease of these
expenses to 9.9% of restaurant sales for the six months ended 30 June 2017 from 11.3% of sales for the six
months ended 30 June 2016 was mainly due to lower expenses related to smallwares and maintenance & repairs.
Depreciation and Amortisation
Depreciation expenses reached RON 1.75 million for the six months ended 30 June 2017, compared with RON
1.12 million for the six months ended 30 June 2016, representing an increase of 56.7%. As a result, depreciation
expense as percentage of sales increased to 3.2% for the six months ended 30 June 2017 from 2.4% for the six
months ended 30 June 2016. The 56.7% increase in the depreciation expense during the six months ended 30 June
2017 was mainly due to the opening of 7 net restaurants between 1 January 2016 and 30 June 2017.
Restaurant operating profit
The restaurant operating profit reached RON 7.72 million for the six months ended 30 June 2017, compared with
RON 8.71 million for the six months ended 30 June 2016, representing a decrease of 11.4%. As a result, restaurant
operating profit as percentage of sales reached 14.2% for the six months ended 30 June 2017 from 18.8% for the
six months ended 30 June 2016, representing a 4.5 percentage point decrease. This decrease was mainly driven by
higher payroll expenses (+4.5 percentage points increase in restaurant sales) and to a lesser extent by higher
depreciation expenses (+0.8 percentage points increase in restaurant sales), as explained above.
General & Administrative (G&A)
The G&A expenses reached RON 5.73 million for the six months ended 30 June 2017, compared with RON 4.34
million for the six months ended 30 June 2016, representing an increase of 32.1%. As a result, G&A expenses as
percentage of sales reached 10.6% for the six months ended 30 June 2017 from 9.3% for the six months ended 30
June 2016, representing a 1.2 percentage point increase. This increase was mainly due to higher payroll and third-
party expenses.
EBITDA from continuing operations
EBITDA from continuing operations reached RON 3.81 million for the six months ended 30 June 2017, compared
with RON 5.58 million for the six months ended 30 June 2016, representing a decrease of 31.8%. As a result,
EBITDA margin reached 7.0% for the six months ended 30 June 2017 compared with 12.0% for the six months
ended 30 June 2016, representing a 5.0 percentage point decrease. This decrease was mainly triggered by the
higher increase of the restaurant operating expense excluding depreciation and impairment expenses (3.7
percentage points increase in restaurant sales) as well as by a faster increase of the G&A expenses (1.2 percentage
points increase in restaurant sales), as explained above.
Operating profit from continuing operations
The operating profit reached RON 1.99 million for the six months ended 30 June 2017, compared with RON 4.38
million for the six months ended 30 June 2016, representing a decrease of 54.5%. As a result, operating profit as
percentage of sales reached 3.7% for the six months ended 30 June 2017 from 9.4% for the six months ended 30
June 2016, representing a 5.8 percentage point decrease. This decrease was mainly driven by higher increase of
the restaurant operating expense (4.5 percentage points increase in restaurant sales) as well as to a faster increase
of the G&A expenses (1.2 percentage points increase in restaurant sales), as explained above.

102
Finance result
Net finance expense (calculated as finance cost less finance income) reached RON 181 thousand for the six
months ended 30 June 2017, compared with a net gain of RON 12 thousand for the six months ended 30 June
2016. This increase was mainly due higher foreign exchange losses (up by RON 108 thousand) as well as by
higher interest expenses (by RON 76 thousand), due to the increased bank borrowings for the financing of new
restaurants.
Profit before tax from continuing operations
Profit before tax from continuing operations reached RON 1.81 million for the six months ended 30 June 2017,
compared with RON 4.39 million for the six months ended 30 June 2016, representing a decrease of 58.7%. As a
result, profit before tax from continuing operations as percentage of sales reached 3.3% for the six months ended
30 June 2017 compared with 9.5% for the six months ended 30 June 2016, representing a 6.1 percentage point
decrease. This decrease was virtually due to the reduction in the operating profit margin by 5.8 percentage points
of sales, as explained above.
Income tax expense
Income tax expense reached RON 772 thousand for the six months ended 30 June 2017, compared with RON 626
thousand for the six months ended 30 June 2016, representing an increase of 23.3%. The effective tax rate stood at
42.6% for the six months ended 30 June 2017 compared to 14.3% for the six months ended 30 June 2016.
Compared to the statutory income tax rate of 16.0%, the increase of the effective tax rate to 42.6% for the six
months ended 30 June 2017 was mainly due to the changes in tax legislation with respect to tax levied on
restaurant activity applicable for the companies active in the restaurant industry. According to the updated
regulations, the income tax for the restaurant activity has been replaced by a specific tax, computed on the basis of
a minimum fixed amount multiplied by the impact of three criteria: restaurant area, restaurant location and
seasonality. The taxation of the non-restaurant activities has not suffered changes.
Profit after tax from continuing operations
Profit after tax reached RON 1.04 million for the six months ended 30 June 2017, compared with RON 3.76
million for the six months ended 30 June 2016, representing a decrease of 72.4%. As a result, profit after tax as
percentage of sales reached 1.9% for the six months ended 30 June 2017 from 8.1% for the six months ended 30
June 2016, representing a 6.2 percentage point decrease.
Liquidity and Capital Resources
Our cash and cash equivalents reached RON 2.32 million as at 30 June 2017, compared to RON 3.29 million as at
31 December 2016.
Statement of cash flows
The following table sets forth, for the six months ended 30 June 2016 and 2017, our cash flows from operating
activities, investing activities and financing activities.
All data are in RON’000 unless otherwise stated 30-Jun-16 30-Jun-17
RON RON
Operating activities
Profit before tax from continuing operations 4,388 1,811
Profit/(loss) before tax from discontinued operations 349 -
Profit before tax 4,737 1,811
Adjustments to reconcile profit before tax to net cash flows:
Depreciation and impairment of property, plant and equipment 1,294 1,609
Amortisation and impairment of intangible assets 147 207
Net foreign exchange differences 2 (8)
Gain on disposal of property, plant and equipment 6 (4)
Finance income (15) (6)
Finance costs 81 157
Movement in current assets allowances - (63)
Movements in provisions, pensions and government grants

103
All data are in RON’000 unless otherwise stated 30-Jun-16 30-Jun-17
RON RON
Working capital adjustments:
Decrease/(Increase) in trade and other receivables and prepayments 2,187 4,233
Decrease/(Increase) in inventories (2,420) (32)
Increase/(Decrease) in trade and other payables (483) (2,212)
Interest received 15 6
Interest paid (96) (162)
Income tax paid (928) -
Net cash flows from operating activities 4,527 5,536
Investing activities
Proceeds from sale of property, plant and equipment - 8
Purchase of intangible assets (496) (47)
Purchase of property, plant and equipment (4,139) (2,923)
Net cash flows used in investing activities (4,635) (2,962)
Financing activities
Proceeds from borrowings 3,762 1,838
Repayment of borrowings (1,297) (1,920)
Payment of finance lease liabilities (81) (98)
Dividends paid to equity holders of the parent (6,030) (3,368)
Net cash flows from/(used in) financing activities (3,646) (3,548)
Net increase in cash and cash equivalents (3,754) (974)
Cash and cash equivalents at 1 January 5,574 3,294
Cash and cash equivalents at 30 June 1,820 2,320
Source: ARS (Romania) Interim Financial Statements, unaudited
Cash flows from operating activities
Net cash flows from operating activities reached RON 5.54 million for the six months ended 30 June 2017,
compared to RON 4.53 million for the six months ended 30 June 2016, representing an increase of 22.3%. The
main driver of the increase in the net cash flows from operating activities by 22.3%, or RON 1.01 million, was the
improvement in the working capital (by RON 2.71 million), which was partly offset by the decrease in EBITDA
(by RON 2.36 million).
Cash flows from investing activities
Net cash flows used in investing activities reached RON 2.96 million for the six months ended 30 June 2017,
compared to RON 4.64 million for the six months ended 30 June 2016, representing a decrease of 36.1%. This
decrease was due to the lower number of new restaurants opened starting with the first half of year 2017.
Cash flows from financing activities
Net cash flows used in financing activities reached RON 3.55 million for the six months ended 30 June 2017,
compared to RON 3.65 million for the six months ended 30 June 2016, representing a decrease of 2.7%. Within
the net cash flows from financing activities, the main uses were to pay dividends the shareholders (RON 3.37
million) and to repay bank borrowings (RON 1.92 million) for restaurants opened in the previous years, while the
main source were drawings from bank borrowings (RON 1.84 million) to finance the restaurants opened or to be
opened during the year 2017. The decrease in the cash flows used in the financing activities of 2.7%, or RON 98
thousand, was principally driven by the decrease in dividends paid to the shareholders (by RON 2.66 million),
which were partly offset by the lower proceeds from bank borrowings (by RON 1.92 million).
Indebtedness
The following table sets forth our interest-bearing liabilities for the six months ended 30 June 2017 compared with
the year ended 31 December 2016.
All data are in RON’000 unless otherwise stated 31-Dec-16 30-Jun-17
Interest-bearing loans and borrowings - long-term* 7,536 6,950
Interest-bearing loans and borrowings - short-term* 3,935 4,328
Total interest-bearing liabilities* 11,471 11,278
Cash and short-term deposits* 3,294 2,320
Total net debt 8,177 8,958
*Source: ARS (Romania) Interim Financial Statements, unaudited

104
Total interest-bearing liabilities reached RON 11.28 million as at 30 June 2017, compared to RON 11.47 million
as at 31 December 2016, representing a decrease of 1.7%.
Total net debt reached RON 8.96 million as at 30 June 2017 compared to a RON 8.18 million as at 31 December
2016. The increase in net debt by RON 781 thousand was mainly due to the reduction in the cash and short-term
deposits from 31 December 2016 to 30 June 2017.
Significant accounting judgements, estimates and assumptions
The preparation of the Group’s consolidated financial statements requires management to make judgements,
estimates and assumptions that affect the reported amounts of revenues, expenses, assets and liabilities, and the
accompanying disclosures, and the disclosure of contingent liabilities. Uncertainty about these assumptions and
estimates could result in outcomes that require a material adjustment to the carrying amount of asset or liability
affected in future periods.
Judgements
In the process of applying the Group’s accounting policies, management has made the following judgements,
which have the most significant effect on the amounts recognised in the financial statements:
Classification of lease agreements
A lease is classified as a finance lease if it transfers to the Group substantially all the risks and rewards incidental
to ownership; otherwise it is classified as an operating lease. Whether a lease is a finance lease or an operating
lease depends on the substance of the transaction rather than the form of the contract. If the lease term is longer
than 75 percent of the economic life of the asset, or if at the inception of the lease the present value of the
minimum lease payments amounts to at least 90 percent of the fair value of the leased asset, the lease is classified
by the Group as finance lease, unless it is clearly demonstrated otherwise.
Estimates and assumptions
The key assumptions concerning the future and other key sources of estimation uncertainty at the reporting date,
that have a significant risk of causing a material adjustment to the carrying amounts of assets and liabilities within
the next financial year, are described below. The Group based its assumptions and estimates on parameters
available when the financial statements were prepared. Existing circumstances and assumptions about future
developments, however, may change due to market changes or circumstances arising beyond the control of the
Group. Such changes are reflected in the assumptions when they occur.
Useful lives of property and equipment
The Group assesses the remaining useful lives of items of property and equipment at least at each financial year-
end. If expectations differ from previous estimates, the changes are accounted for as a change in an accounting
estimate in accordance with IAS 8 "Accounting Policies, Changes in Accounting Estimates and Errors". These
estimates may have a material impact on the amount of the carrying values of property and equipment and on
depreciation recognised in profit or loss.
In particular, the Group assesses for its operating leases that generally have an initial term of 5 years with renewal
option for another 5 years, that the leasehold improvements’ useful life is of 10 years due to the fact that
historically most of such leases have been renewed after the initial term of 5 years, that the refurbishment needed
after the first 5 years is of significantly less value compared to the initial set-up, and that 10 years is also the
duration of the related franchise.
Financial instruments risk management
The Group’s principal financial liabilities comprise loans and borrowings, including finance leases and trade and
other payables. The main purpose of these financial liabilities is to finance the Group’s operations. The Group’s
financial assets are represented by loans, trade and other receivables, and cash and short-term deposits that derive
directly from its operations, as well as long-term deposits to guarantee rent payables.
The Group is exposed to interest rate risk, foreign exchange rate risk, credit risk and liquidity risk. The Group’s
senior management oversees the management of these risks. The Group’s senior management ensures the Group’s

105
financial risk activities are performed under appropriate procedures and that financial risks are identified,
measured and managed in accordance with Group risk appetite.
Interest rate risk
The Group's income and operating cash flows are substantially independent of changes in market interest rates.
Trade and other receivables and payables are non-interest bearing financial assets and liabilities. The borrowings
are usually exposed to interest rate risk through market value fluctuations of interest-bearing long-term and short-
term credit facilities. Management policy is to resort mainly to variable rate financing. However, at the time of
raising new loans or borrowings management uses its judgment to decide whether it believes that fixed or variable
rate would be more favourable to the Group over the expected period until maturity.
The Group does not have a significant exposure to the interest rate risk as of 30 June 2017. Please refer to Note 14
of the Sphera Interim Financial Statements for additional disclosures.
Foreign currency risk
Foreign currency risk is the risk that the fair value or future cash flows of a financial instrument will fluctuate
because of changes in foreign exchange rates. The Group’s exposure to the risk of changes in foreign exchange
rates relates primarily to the Group’s financing activities, as the financing contracted by the Group is Euro based.
The vast majority of revenues and expenses, trade and other receivables and payables are in RON.
The Group monitors the currency risk by following changes in exchange rates in currencies in which its
intercompany balances and external debts are denominated.
The Group does not have a significant exposure to the foreign currency risk as of 30 June 2017. Please refer to
Note 14 of the Sphera Interim Financial Statements for additional disclosures.
Credit risk
The Group is not significantly exposed to credit risk as the majority of its sales are on a cash basis. The Group's
credit risk is primarily attributed to trade and other receivables and balances with banks. The carrying amount of
trade and other receivables, net of allowance for impairment plus balances with banks, represent the maximum
amount exposed to credit risk. Management believes that there is no significant risk of loss to the Group beyond
the allowances already recorded.
The Group invests cash and cash equivalents with highly reliable financial institutions. The Group has only plain
vanilla deposits with reputable banks, none of which has experienced any difficulties in 2017. The majority of
cash is transacted through and placed with Alpha Bank Romania, member of Alpha Bank Group from Greece and
Banca Romana de Dezvoltare (BRD), a member of Societe Generale Group from France, as well as with Unicredit
Bank Italy.
There is no significant concentration of credit risk in respect of trade and other receivables due to the fact that
sales are based mainly on cash and credit card payments. Therefore, there are no formal policies in the Group to
manage credit risk for trade receivables. The Group's credit risk is primarily attributed to loans and receivables
from related parties, for which the probability of losses is considered remote.
Please refer to Note 14 and Note 16 of the Sphera Interim Financial Statements for additional disclosures.
Liquidity risk
The Group has adopted a prudent financial liquidity management approach, assuming that sufficient cash and cash
equivalents are maintained and that further financing is available from guaranteed funds from credit lines. The
Group does not have a significant exposure to the liquidity risk as of 30 June 2017. Please refer to Note 14 of the
Sphera Interim Financial Statements for additional disclosures.
Capital management
Capital includes the equity attributable to the equity holders of the parent.
The primary objective of the Group’s capital management is to ensure that it maintains a strong credit rating and
healthy capital ratios in order to support its business and maximise shareholder value.

106
The Group manages its capital structure and makes adjustments to it in light of changes in economic conditions
and the requirements of the financial covenants. To maintain or adjust the capital structure, the Group may adjust
the dividend payment to shareholders, return capital to shareholders or issue new shares.
The Group may monitor capital using a gearing ratio, which is net debt divided by total capital plus net debt. The
Group does not have a target gearing ratio, as the overall gearing is low. The Group includes within net debt,
interest bearing loans and borrowings, trade and other payables, less cash and cash deposits.
The Group’s capital management, amongst other things, aims to ensure that it meets financial covenants attached
to the interest-bearing loans and borrowings that define capital structure requirements.
Please refer to Note 14 and Note 13 of the Sphera Interim Financial Statements for additional disclosures.
Fair values
The Group has no financial instruments carried at fair value in the statement of financial position.
The carrying amount of the interest-bearing loans and borrowings approximate their fair value. Management
estimates that the margin applicable over Euribor at the balance sheet date would be similar to the ones at the
dates of each previous withdrawal, due to the fact that the Group maintained over the past years a low gearing
ratio and a stable financial condition, and also based on statistics published by the National Bank of Romania.
Financial instruments which are not carried at fair value on the statement of financial position also include
deposits to guarantee rent, trade and other receivables, cash and cash equivalents, and trade and other payables.
The carrying amounts of these financial instruments are considered to approximate their fair values, due to their
short-term nature (in majority) and low transaction costs of these instruments

107
FOODSERVICE SECTOR
Macroeconomic environment
Romania
Romania is located at the crossroad of Central and South-Eastern Europe, north of the Balkan Peninsula, on the
Lower Danube, and is bordered by the Black Sea. Romania shares borders with the following countries: Hungary,
Serbia, Republic of Moldova, Ukraine and Bulgaria. Romania is the second largest country in Central and Eastern
Europe by area and population after Poland and the third largest by GDP after Poland and Czech Republic (based
on 2016 data).
The table below sets out the evolution of certain key economic indicators for Romania for the years ended 31
December 2012-2016.
As at or for the year ended 31 December
Key economic indicators 2012 2013 2014 2015 2016
Population (million) 20.1 20 19.9 19.9 19.8
Nominal GDP (RON billion) 595 637 668 711 761
Real GDP growth rate 0.6% 3.5% 3.1% 3.9% 4.8%
GDP growth by components
Households 1.7% -2.4% 4.4% 5.5% 7.3%
Government -5.6% 23.7% 0.5% -0.7% 3.3%
Investment -4.8% 0.5% 1.7% 7.5% 1.1%
Exports 1.0% 19.7% 8.0% 5.4% 8.3%
Imports -1.8% 8.8% 8.7% 9.2% 9.8%
Inflation (annual average) 3.3% 4.0% 1.1% -0.6% -1.6%
Policy rate (NBR, end of period) 5.25% 4.00% 2.75% 1.75% 1.75%
RON/EUR average rate 4.4560 4.4190 4.4446 4.4450 4.4908
Annual growth rate 5.2% -0.8% 0.6% 0.0% 1.0%
Current account (% of GDP) -4.8% -1.1% -0.7% -1.2% -2.3%
Foreign Direct Investment (% of GDP) 1.9% 1.9% 1.6% 2.2% 2.7%
Consolidated budget balance (% of GDP) -3.7% -2.1% -1.4% -0.8% -3.0%
Domestic public debt (% of GDP) 37.3% 37.8% 39.4% 38.0% 37.6%
Total external debt (% of GDP) 75.5% 68.0% 63.0% 56.5% 54.5%
Employed population (% of total population) 40.9% 40.9% 41.4% 41.4% 41.3%
Unemployment rate (% average) 6.8% 7.1% 6.8% 6.8% 5.9%
Retail trade growth rate 4.1% 0.5% 6.4% 8.9% 13.5%
Average gross salary (RON) 2,063 2,163 2,328 2,555 2,887
Annual growth rate 4.2% 4.8% 7.6% 9.8% 13.0%
Minimum gross salary at year-end (RON) 700 800 900 1,050 1,250
Annual growth rate 4.5% 14.3% 12.5% 16.7% 19.0%
Source: INSSE, NBR, Eurostat.
Romania’s GDP increased by 4.8% in 2016, compared with 3.9% in 2015 and 3.1% in 2014, representing a 3-year
CAGR of 3.9%, faster than the average growth rate of European Union GDP (CAGR of 2% over the 2014-2016
period). The main driver and contributor of the increase in Romania’s GDP has been the household consumption,
which increased by 7.3% in 2016, compared with 5.5% in 2015 and 4.4% in 2014, representing a 3-year CAGR of
5.7%. A significant part of the household consumption has been directed into the retail sector, whose average
growth rate reached 13.5% in 2016, compared with 8.9% in 2015 and 6.4% in 2014. This robust growth in
household consumptions in general and retail trade in particular was positively influenced by a number of factors
which boosted the purchasing power of the population, such as the continuous increase in the average salary and
reductions in the sales tax rates and employee social contribution taxes.
The economy-wide average gross salary reached RON 2,887 in 2016 compared to RON 2,163 in 2013,
representing a 3-year CAGR of 10.1%. This performance is mainly explained by the continuous increase in the
mandatory minimum gross salary, which grew by a 3-year CAGR of 16.0% to RON 1,250 at the end of 2016, but
also by the general improvements in the labour market, which resulted in the decrease of the unemployment rate
to 5.9% in 2016 from 7.1% in 2013.
Regarding tax reductions, VAT for food products was reduced from 24% to 9% starting June 2015, while VAT for
all other products and services was reduced from 24% to 20% starting from January 2016 and decreased further to

108
19% as of January 2017. Another important tax action was the reduction of the social security contributions paid
by employers by 5 percentage points starting October 2014.
The Romanian economy has also enjoyed an improved macroeconomic stability over the past three years.
Inflation rate reached a negative 1.6% in 2016 (mainly on the back of the lower food prices following the
reduction in the VAT rate for food products), compared to negative 0.6% in 2015 and a positive 1.1% in 2014.
During the same period, the national currency RON has been relatively stable, reaching an annual average of RON
4.49/EUR in 2016 compared with RON 4.44/EUR in 2014. The currency remained stable in spite of the
deterioration of the current account, whose deficit reached 2.3% of GDP in 2016 compared to 1.1% in 2013, but
still remained within sustainable levels, being especially financed by foreign direct investments, which stood at
2.7% of GDP in 2016 compared to 1.9% in 2013.
The consolidated budget deficit marked a significant worsening in 2016, reaching 3.0% of GDP compared to 0.8%
in 2015 and 1.4% in 2014. This reversal of trend was influenced by a number of pro-cyclical measures taken by
the Government, such as the significant increase in public sector wages, the reduction of VAT as well as the
reduction of the social security contributions. The increased public deficit has not yet impacted the domestic
public debt, which hovered at around 38-39% for the past four years, while total external debt continued to fall,
reaching 54.5% of GDP in 2016, compared to 56.5% in 2015 and 63.0% in 2014.
Italy
Italy is located in Southern Europe, sharing land borders with the following countries: France, Switzerland,
Austria and Slovenia. Italy is the eighth largest country in Europe by area, the fourth largest by population and the
fourth largest by GDP (based on 2016 data).
The table below sets out the evolution of certain key economic indicators for Italy for the years ended 31
December 2013-2016.
As at or for the year ended 31 December
Key economic indicators 2013 2014 2015 2016
Population (million) 59.7 60.8 60.8 61.2
Nominal GDP (EUR billion) 1,604 1,623 1,644 1,673
Real GDP growth rate -1.7% 0.1% 0.8% 0.9%
GDP growth by components
Households -2.5% 0.3% 1.6% 1.4%
Government -0.3% -0.7% -0.7% 0.6%
Investment -6.6% -2.3% 1.6% 2.9%
Exports 0.7% 2.7% 4.4% 2.4%
Imports -2.4% 3.2% 6.8% 2.9%
Harmonised CPI 1.2% 0.2% 0.1% -0.1%
Current account (% of GDP) 1.0% 1.9% 1.4% 2.6%
Consolidated budget balance (% of GDP) -2.9% -3.0% -2.7% -2.4%
General government gross debt (% of GDP) 129.0% 131.8% 132.1% 132.6%
Unemployment rate 12.1% 12.7% 11.9% 11.7%
Unit labour cost growth rate (whole economy) 0.6% 0.1% 0.4% 0.8%
Source: European Commission
Italy has undergone a modest economic recovery in the past three years, with GDP increasing by 0.9% in 2016,
compared to 0.8% in 2015 and 0.1% in 2014. The main driver of growth was the expansion of domestic demand,
with investment enjoying a sizeable increase, supported by the accommodative monetary policy stance and by tax
incentives. After eight years of contraction, construction investment rose only moderately, as the sector is still
affected by financing constraints, and public investment declined. Private consumption continued to grow faster
than real GDP mainly thanks to solid job creation, sustained by the implementation of labour market reforms and
the reduction in the labour tax wedge. Exports and imports both decelerated compared with 2015, mirroring
developments in global trade.
During the 2014-2016, consumer prices have been stable, with the harmonized CPI falling by 0.1% in 2016
compared to a growth of 0.1% in 2015 and 0.2% in 2014.
Labour market conditions have improved over the past three years, supported by reforms and the reduction in the
labour tax wedge. Employment growth started to recover in 2014 when the economy was still stagnating, and this
trend continued in 2015 and 2016; as a result, unemployment rate reached 11.7% in 2016, compared to 12.7% in
2014.

109
An improved export performance coupled with slow nominal import dynamics led to a steady increase in the
current account balance, leading to a current account surplus of 2.6% of GDP in 2016, compared to 1.9% in 2014.
The headline government deficit broadly stabilised thanks to lower interest expenditure (mainly driven by the
ECB's accommodative monetary policy stance) and improving cyclical conditions, reaching 2.4% in 2016
compared to 3.0% in 2014.
Although still at a very high level, Italy’s gross public indebtedness has stabilized over the past three years,
reaching 132.6% of GDP in 2016, compared to 131.8% in 2014.
Romanian foodservice market
Information in this Prospectus on the Foodservice sector is from independent market research carried out inter
alios by Euromonitor International Limited, but should not be relied upon in making, or refraining from making,
any investment decision.
The Romanian foodservice market has enjoyed continuous growth over the 2011-2016 period on the back of the
improving macroeconomic environment and developing consumer appetite. We believe that the key factors that
have driven the growth in demand for the foodservice sector are the following:
• Significant increase in the population’s purchasing power, which was supported by the increase of the
minimum gross salary from RON 600 in December 2010 to RON 1,250 (+108%) in December 2016 and of
the average gross salary from RON 2,067 in December 2010 to RON 3,257 (+58%) in December 2016;
• Reduction in the VAT rate for food products from 24% to 9% starting June 2015 and for non-food products
from 24% to 20% starting January 2016;
• Decreasing inflationary environment, with CPI (Consumer Price Index) falling from 6.1% in 2010 to a
negative 1.5% rate in 2016; and
• Low unemployment rate, which decreased from 7.0% in 2010 to 5.9% in 2016.
The sector is highly fragmented, with independent restaurants accounting for 92% of total units and 85.5% of
sales value as of year 2016 (Euromonitor, Consumer Foodservice in Romania, May 2017), while the chained
restaurants segment is dominated by international brands such as McDonald’s, KFC and Pizza Hut.
In terms of recent trends, sales in modern retailing have surpassed traditional retail throughout the country, leading
to changes in shopping habits, as well as in foodservice consumption generally. The main attraction of modern
shopping centres is easy access to both entertainment and shopping facilities in close proximity to food courts that
offer meals. With investors continuing to develop large shopping centres across major cities whilst tracking
shopping galleries around hypermarkets, this trend has significantly contributed to the strong development of
consumer foodservice through retail units, which increased by over 12% in value terms and 10% in transaction
terms in 2016 compared with the previous year (Euromonitor, Consumer Foodservice in Romania, May 2017).
We believe that the following main factors that have supported the foodservice sector’s growth in recent years will
continue to play a key role in the sector’s development over the next few years:
• On average, the Romanian population eats out of home less frequently than in more developed countries and
we expect the Romanian average to move towards the international trend;
• Expected growth of disposable income and continuously increasing levels of female employment will further
support the trend of eating out;
• Romania remains underpenetrated in terms of foodservice restaurants per capita; and
• Strong minimum wage and average salary increase since 2014 resulted in strong price increase across all
foodservice formats; furthermore, the current Romanian Government has indicated its intention to continue
the policy of increasing the minimum wage at rates that are significantly higher than overall economic growth
and consumer price inflation, leading to further increase in purchasing power of the population.
Sector development
According to Euromonitor data, the Romanian foodservice sector has grown at a CAGR of 3.4% between 2011
and 2016 to a total value of RON 17,831 million, supported mainly by more transactions, which increased at an

110
average annual growth rate of 3.7% during the same period. According to Deloitte Analysis1, the Romanian
foodservice sector is expected to grow at an average annual growth rate of 4.6% between 2017 and 2022.
Units, Transactions and Value Sales in Consumer Foodservice 2011-2016
Indicator 2011 2012 2013 2014 2015 2016
Absolute values
Units 24,118 24,085 24,127 24,414 24,469 24,572
Transactions (millions) 649 659 671 696 736 778
Values sales (RON million) 15,120 15,575 15,794 16,222 16,852 17,831
Annual growth rates
Units
-0.1% 0.2% 1.2% 0.2% 0.4%
Transactions (millions)
1.6% 1.7% 3.7% 5.8% 5.7%
Values sales (RON million)
3.0% 1.4% 2.7% 3.9% 5.8%
Source: Euromonitor, Consumer Foodservice in Romania, May 2017
The foodservice sector continues to be dominated by independent players, which controlled 92% of total
foodservice units in operations during the year 2016. There are notable differences between independent and chain
restaurant operators in terms of unit types: 42.9% of the independent units are cafés/bars, while only 17.4% of
chain units are cafés/bars, 24.1% of the independent units are full-service restaurants versus only 4.0% for chain
units, with only 5.0% of the independent units being fast-food restaurants versus 33.8% for chain units.
Consumer Foodservice by Independent vs Chain: Units/Outlets 2016
Unit/Outlet type Independent Chain Total
Independent Chain Total
Units
Percentage of category
100% Home Delivery/Takeaway 103 56 159
0.5% 2.7% 0.6%
Cafés/Bars 9,664 360 10,024
42.9% 17.4% 40.8%
Full-Service Restaurants 5,422 82 5,504
24.1% 4.0% 22.4%
Fast Food 1,118 698 1,816
5.0% 33.8% 7.4%
Self-Service Cafeterias 278 1 279
1.2% 0.0% 1.1%
Street Stalls/Kiosks 5,920 870 6,790
26.3% 42.1% 27.6%
Consumer Foodservice by Type 22,505 2,067 24,572
100.0% 100.0% 100.0%
Source: Euromonitor, Consumer Foodservice in Romania, May 2017.
In value terms, the vast majority of sales are still generated by the independent units, but the growth rate has been
significantly slower than those of the chained units. Sales by independent units have increased by a CAGR of
2.5% between 2011 and 2016 to a total value of RON 15,241 million, representing 85.5% of the foodservice
sector’s total sales. During the same period, the sales of chain units increased by a CAGR of 9.8% to a total value
of RON 2,591 million.
Value Sales in Consumer Foodservice by Type, Current prices (RON million)
Subcategory 2011 2012 2013 2014 2015 2016
Absolute values
Chained units 1,626 1,704 1,858 2,059 2,341 2,591
Independent units 13,494 13,871 13,937 14,162 14,510 15,241
Total foodservice market 15,121 15,575 15,794 16,222 16,852 17,831
Percentage of total
Chained units 10.8% 10.9% 11.8% 12.7% 13.9% 14.5%
Independent units 89.2% 89.1% 88.2% 87.3% 86.1% 85.5%
Source: Euromonitor, Consumer Foodservice in Romania, May 2017.
In terms of sales breakdown by unit type, the largest segment is represented by full-service restaurants, which
accounted for 37.7% of the sector’s sales in 2016, followed by cafés/bars (31.4%) and street stalls/kiosks (14.1%).
1 Analysis performed by Deloitte Consultanta SRL, based on publicly available information; this Analysis is part of a larger market
study report, which has been prepared for the internal use of Sphera

111
However, the most dynamic segments during the 2011-2016 period were the 100% home delivery/takeaway units,
with a CAGR of 10.8%, self-service cafeterias (+7.4%), fast food (+5.6%) and full-service restaurants (+4.0%).
Value Sales in Consumer Foodservice by Type, Current prices (RON million)
Subcategory 2011 2012 2013 2014 2015 2016
Absolute values
100% Home Delivery/Takeaway 121 136 150 165 173 202
Cafés/Bars 5,248 5,159 5,149 5,247 5,388 5,604
Full-Service Restaurants 5,532 5,653 5,820 6,010 6,235 6,715
Fast Food 1,661 1,718 1,795 1,938 2,078 2,182
Self-Service Cafeterias 423 483 524 564 590 605
Street Stalls/Kiosks 2,135 2,426 2,356 2,298 2,388 2,522
Total foodservice market 15,120 15,575 15,794 16,221 16,852 17,831
2
Percentage of total
100% Home Delivery/Takeaway 0.8% 0.9% 0.9% 1.0% 1.0% 1.1%
Cafés/Bars 34.7% 33.1% 32.6% 32.3% 32.0% 31.4%
Full-Service Restaurants 36.6% 36.3% 36.9% 37.1% 37.0% 37.7%
Fast Food 11.0% 11.0% 11.4% 11.9% 12.3% 12.2%
Self-Service Cafeterias 2.8% 3.1% 3.3% 3.5% 3.5% 3.4%
Street Stalls/Kiosks 14.1% 15.6% 14.9% 14.2% 14.2% 14.1%
Source: Euromonitor, Consumer Foodservice in Romania, May 2017.
The following table depicts the evolution of the average ticket per main segment of the foodservice sector during
the 2013-2016 period.
Average ticket size per main market segments, 2013-2016 (RON)
Source: Euromonitor, Consumer Foodservice in Romania, May 2017.
In 2016, the highest average ticket was registered by the full-service segment (RON 72.7), followed by café/bars
segment (RON 34.6), delivery/takeaway segment (RON 34.5) and quick-service segment (RON 19.7).
The chained foodservice segment has been dominated by a relatively small number of brands over the past four
years; the cumulative market share of the top 10 brands has been relatively constant, namely - 66.2% in 2016 from
66.6% in 2013. In the same period, the market has witnessed the erosion of McDonald’s market share and the
steady growth of new entrants to the Romanian market, such as Starbucks, Subway and Salad Box, albeit still with
relatively lower shares.
72.3
44.3
36.334.0
19.8
7.1
73.7
45.1
36.3 35.3
20.1
6.7
72.7
43.9
35.6 34.0
19.3
6.6
72.7
44.5
34.6 34.5
19.7
6.7
0.0
10.0
20.0
30.0
40.0
50.0
60.0
70.0
80.0
FSR Pizza Places Cafes/Bars Delivery/Takeaway QSR Street Stalls/Kiosks
2013 2014 2015 2016

112
Brand Global Brand Owner 2013 2014 2015 2016
Units in
2016
McDonald's McDonald's Corp 28.0% 28.3% 26.1% 24.6%
68
KFC Yum! Brands Inc 14.2% 15.3% 15.8% 15.2%
63
Pizza Hut Yum! Brands Inc 6.6% 6.2% 6.2% 7.2%
21
Fornetti Aryzta AG 6.8% 5.5% 5.2% 5.2%
603
Starbucks Starbucks Corp 2.1% 2.2% 2.7% 3.3%
25
Subway Doctor's Associates Inc 1.9% 2.1% 2.6% 2.7%
31
Salad Box Emma Salad SRL 0.8% 1.7% 2.2% 2.5%
44
OMV Viva OMV Tankstellen AG 2.9% 2.3% 2.1% 1.9%
140
Tip Top Tip Top Food Industry SRL 1.8% 1.8% 2.0% 1.9%
27
Jerry's Pizza Jerry's Pizza SRL 1.5% 1.7% 1.7% 1.7%
15
Top 10 brands
66.6% 67.1% 66.6% 66.2%
1,036
Other brands
33.4% 32.9% 33.4% 33.8%
1,031
Total
100.0% 100.0% 100.0% 100.0%
2,067
Source: Euromonitor, Consumer Foodservice in Romania, May 2017
Comparison with other European markets
The following chart presents the number of consumer foodservice outlets per thousand inhabitants and the
consumer foodservice spend per capita in Romania as well as selected Central and Eastern Europe as well as
Western Europe countries.
Source: Deloitte Analysis.
Romania lags other markets in Central and Eastern Europe or Western Europe both in terms of density of
restaurants and consumer foodservice spend per capital. According to Deloitte Analysis based on data for the year
2016, Romania has approximately 1.3 consumer foodservice outlets per thousand inhabitants, compared to 1.8 in
Poland and between 3.4 and 4.9 for Czech Republic, Slovakia, Hungary and Bulgaria. In Western Europe, the
highest densities of consumer foodservice outlets are in Spain (5.8) and Italy (4.8), countries where the
foodservice sector remains dominated by independent players offering mostly local cuisine. In other developed
markets, where international chains have a larger presence (such as the United Kingdom, France and Germany),
the number of consumer foodservice outlets is approximately 2.5 per thousand inhabitants.
The lower restaurant density in Romania compared with other markets is mainly explained by the lower consumer
foodservice spend per capita. According to Deloitte Analysis, the consumer foodservice spend per capita stood at
EUR 205 in 2016, slightly higher than in Poland (EUR 188) but significantly lower than Bulgaria (EUR 300),
Hungary (EUR 310), Slovakia (EUR 340) and Czech Republic (EUR 466). In Western Europe, the consumer
foodservice spend per capita ranges from approximately EUR 510 in Germany to EUR 1,620 in Spain.
The following charts present information on the overall development of shopping malls in Romania, the vacancy
rates for the existing units, as well as a comparison of the penetration of shopping malls in Romania compared
with selected countries in Central and Eastern Europe.
0
400
800
1,200
1,600
2,000
0.0 0.5 1.0 1.5 2.0 2.5 3.0 3.5 4.0 4.5 5.0 5.5 6.0 6.5 7.0
Consumer foodservice outlets versus spending per capita
Czech Republic
Spain
ItalyUK
France
Germany
Romania Poland Hungary
SlovakiaBulgaria
WE countries
CEE countries
EUR, 2016
Bubble size indicates
foodservice spend in
2016, EUR m
10,000
Number of consumer foodservice outlets per thousand inhabitants
Consu
mer
foodse
rvic
e s
pend p
er
capita

113
Source: Deloitte Analysis. Note: (1) Data for 2015.
According to Deloitte Analysis, the number of shopping malls in Romania has continued to grow over the past
three years, with the gross letting area increasing from 2.9 million square meters in 2014 to 3.5 million square
meters in 2016. Gross letting area is expected to reach 3.7 million square meters in 2018, mainly on the back of
new projects outside of Bucharest. In addition, vacancy rates remain at very low levels, especially in Bucharest
(4%), with primary retail projects having a vacancy rate of just 2%.
Despite this growth, the penetration of shopping malls in Romania remains among the lowest in the Central and
Eastern Europe ("CEE") region. According to Deloitte Analysis as of the year 2016, Romania had approximately
177 square meters of shopping mall gross letting area per thousand inhabitants, compared to 211 sqm in Hungary
(based on 2015 data), 227 in the Czech Republic, 291 in Poland and 294 in Slovakia.
The following chart shows a comparison of the penetration rate of online food purchases for selected countries in
Central and Eastern Europe as well as in Western Europe.
Source: Deloitte Analysis; Data refers to a three month period preceding the report date in each year
0.9 1 1.2 1.2 1.2
1.9 22.3 2.4 2.5
2.9 33.5 3.6 3.7
2014 2015 2016 2017f 2018f
Romanian shopping malls
development, 2014-2018 (million sqm.)
Bucharest Province
294 291
227211
177
Slovakia Poland Czech
Republic
Hungary(1) Romania
Penetration of shopping malls in CEE
countries, 2016, Sqm per ths of population
42
8
12.5
Bucharest
average
Primary
retail
projects
Secondary
retail
projects
Tertiary
retail
projects
Vacancy rate in Romanian
shopping malls, H1-2016 (%)
Vacancy rate
60
48
40
19 1720
1510 9
3 2
78
64
52
4135
31 29 27
20
118
United
Kingdom
Germany France Slovakia Spain Poland Czech Rep. Hungary Italy Bulgaria Romania
2010 2016
Penetration of online purchase of food in the last 3 months (%)

114
According to the data in the above chart, although Romania has enjoyed a significant increase in the penetration
rate of online purchases of food from 2% in the year 2010 to 8% in the year 2016, it still lags behind most other
countries: as of 2016, the average penetration rate in Central and Eastern Europe was 28% (with a minimum of
11% in Bulgaria and a maximum of 41% in Slovakia), while the average penetration rate in Western Europe was
50% (with a minimum of 20% in Italy and a maximum of 78% in United Kingdom).
Competition
The Group operates in three segments of the foodservice sector: quick-service restaurants (through the KFC
brand), full-service restaurants (through the Pizza Hut Dine-In brand) and delivery (through the Pizza Hut
Delivery brand).
Quick-service restaurants
Quick-service restaurants (QSR) are a specific type of restaurants that offer ready-to-eat food, with a quick
ordering and serving time and minimal table service. While the food served in fast food restaurants can vary
substantially, it is generally cooked in bulk in advance and kept hot, finished and packaged to order, and usually
available for take away, though seating may be provided at the restaurant. Fast food restaurants are typically part
of a restaurant chain or franchise operation that provisions standardized ingredients and/or partially prepared
foods and supplies to each restaurant through controlled supply channels.
The following chart depicts the development of value sales of the quick-service restaurant segment during the
2011-2016 period, as well as the expected level by the year 2022.
Development of Quick-service segment during 2011-2016 and expected growth until 2022
Source: Euromonitor, Consumer Foodservice in Romania, May 2017; forecasts according to Deloitte Analysis.
The value sales of quick-service restaurants reached RON 2.18 billion in 2016 compared to RON 1.66 billion in
2011, representing a CAGR of 5.6%. For the 2017-2022 period, based on the Deloitte Analysis, the quick-service
segment is expected to grow at an average annual growth rate of 7.2% to a total value of RON 3.31 billion by year
2022. This growth rate is expected to be fuelled by the opening of new restaurants and the increase in the
frequency of eating out on the back of higher disposable income of the Romanian population.
The following chart presents a comparison of the market penetration of quick-service segment in Romania versus
CEE and Western Europe for the year 2016.
1.66 1.72 1.801.94
2.08 2.18
3.31
3.4%
4.5%
8.0%
7.2%
5.0%
0%
1%
2%
3%
4%
5%
6%
7%
8%
9%
10%
1
2
3
4
5
2011 2012 2013 2014 2015 2016 2022f
Value Sales (RON bn) % yoy growth
CAGR: +7.2%

115
Market penetration of quick-service segment in Romania versus CEE and Western Europe
Source: Deloitte Analysis.
According to the data in the chart above, in 2016, Romania had both the lowest density of quick-service
restaurants, but also the lowest quick-service sales as a proportion of personal disposable income. Romania had 32
quick-service restaurants per million inhabitants, compared to a range of between 43 (Bulgaria) and 69 (Poland) in
Central and Eastern Europe, while Western European countries range between 86 (Italy) and 326 (United
Kingdom). At the same time, quick-service sales as a proportion of personal disposable income stood at 0.5% in
Romania compared to a range of between 0.7% (Bulgaria and Czech Republic) and 0.9% (Poland) in Central and
Eastern Europe, while Western European countries range between 0.7% (Italy) and 2.3% (United Kingdom).
Management expects that over time the average Romanian spend on QSRs is likely to move toward international
norms.
The following chart depicts the structure of the quick-service foodservice segment by food type and by ownership
as of the year 2016.
Structure of the quick-service foodservice segment by food type and by ownership as of the year 2016
Breakdown by food type Breakdown by ownership
(% of sales) (% of outlets)
Source: Euromonitor, Consumer Foodservice in Romania, May 2017
The quick-service service market, which is 38% owned by chain operators (the highest percentage among all
segments of the foodservice sector), is dominated by three food types, namely burger (32% market share), chicken
(24% market share) and bakery products (22% market share).
69 62 43 65 57 32 326 187 173 90 86
0.9%0.8%
0.7% 0.7%0.8%
0.5%
2.3%
1.3%1.0%
0.9%
0.7%
0
50
100
150
200
250
300
350
Poland Hungary Bulgaria Czech
Rep.
Slovakia Romania United
Kingdom
France Germany Spain Italy
0.0%
0.5%
1.0%
1.5%
2.0%
2.5%
QSR outlets per capita, 2016 (per million inhabitants) QSR sales as % of Personal Disposable Income, 2016
32%
24%22%
7%4%
11%
38%
62%
Burger Chicken Bakery
products
Middle
Eastern
Food
Asian Food Other QSR Chained Independent

116
The Romanian quick-service market is dominated by chained restaurants and particularly those operating under
international brands. The market leader remains McDonald’s, with a market share of 29.2% in 2016 (compared to
30.4% in 2011), followed by KFC (with market share of 18.0% in 2016 compared to 12.2% in 2011) and Subway
(which entered the Romanian market in 2011 and reached a market share of 3.2% in 2016).
Market share of the main brands in the fast food segment
Brand National Brand Owner 2011 2012 2013 2014 2015 2016
McDonald's Premier Restaurants Romania SRL 30.4% 29.5% 29.0% 30.1% 29.4% 29.2%
KFC US Food Network SA 12.2% 13.5% 14.7% 16.2% 17.8% 18.0%
Subway Doctor's Associates Inc
1.5% 1.9% 2.3% 2.9% 3.2%
Salad Box Emma Salad SRL
0.9% 1.8% 2.5% 2.9%
OMV Viva OMV Romania Mineraloel SRL 3.1% 3.1% 3.0% 2.5% 2.4% 2.3%
Tip Top Tip Top Food Industry SRL 3.1% 2.8% 1.8% 2.0% 2.3% 2.3%
Springtime Spring Prod Com SRL 3.1% 2.3% 2.4% 2.0% 2.2% 1.9%
Paul Moulin d'Or SRL 1.1% 1.4% 1.6% 1.6% 1.6% 1.8%
Chopstix MLS Invest Trading SRL 1.3% 1.4% 1.7% 1.7% 1.7% 1.8%
Hei KMG Rompetrol 1.6% 1.5% 1.4% 1.3% 1.3% 1.3%
Top 10 brands
55.9% 57.0% 58.4% 61.5% 64.1% 64.7%
Others Others 44.1% 43.0% 41.6% 38.5% 35.9% 35.3%
Total Total 100.0% 100.0% 100.0% 100.0% 100.0% 100.0%
Source: Euromonitor, Consumer Foodservice in Romania, May 2017
Full-service restaurants
Full-service restaurants are restaurants offering a wide range of made-to-order food that is served directly to the
customers’ table. These restaurants may sell alcoholic beverages; provide takeout, delivery or present live
entertainment. The term "full service" can encompass anything from a family-style eatery to an elegant restaurant,
ranging from casual dining to fine dining. The range of food offered is generally local traditional, with an
increasing number of establishments offering international, country-specific cuisine (such as Italian, French,
Greek, Mexican, Asian/Chinese etc.).
The following chart depicts the development of value sales of the full-service restaurant segment during the 2011-
2016 period, as well as the expected level by the year 2022.
Development of full-service segment during 2011-2016 and expected growth until 2022
Source: Euromonitor, Consumer Foodservice in Romania, May 2017; forecasts according to Deloitte Analysis.
The value sales of the full-service restaurants sector reached RON 6.72 billion in 2016 compared to RON 5.53
billion in 2011, representing a CAGR of 4.0%. For the 2017-2022 period, based on the Deloitte Analysis a CAGR
of 5.1% to a total value of RON 9.05 billion is expected by year 2022. This growth rate is expected to be fuelled
by the opening of new restaurants and the increase in the frequency of eating out on the back of higher disposable
income of the Romanian population.
5.53 5.65 5.82 6.016.24
6.72
9.05
2.2%3.0% 3.3% 3.7%
7.7%
-10%
-8%
-6%
-4%
-2%
0%
2%
4%
6%
8%
10%
2
3
4
5
6
7
8
9
10
2011 2012 2013 2014 2015 2016 2022f
Value Sales (RON bn) % yoy growth
CAGR: +5.1%

117
The following chart presents a comparison of the market penetration of full-service segment in Romania versus
CEE and Western Europe for the year 2016.
Market penetration of full-service segment in Romania versus CEE and Western Europe
Source: Deloitte Analysis.
According to the data in the chart above, with a restaurant density of 77 per million inhabitants and full-service
restaurant sales of 1.1% of the personal disposable income, Romania ranks higher than Slovakia and Poland, but is
significantly lower than Hungary, Czech Republic and Bulgaria. In Western Europe, restaurant density ranges
between 216 units in Germany and 969 units in Italy, while the full-service restaurant sales as percentage of
personal disposable income ranges between 1.2% in Germany and 5.8% in Italy.
In Romania, the full-service market is still largely dominated by the small independent restaurants, with an overall
market share slightly decreasing from 97.6% in 2011 to 95.2% in 2016. The leading brand in this segment is Pizza
Hut Dine-In, with a market share of 2.8% in 2016 (2011: 2.0%), followed by Trattoria Il Calcio (market share of
0.6% in 2016) and Taverna Sarbului (market share of 0.5% in 2016).
Market share of the main brands in the full-service segment
Brand National Brand Owner 2011 2012 2013 2014 2015 2016
Pizza Hut American Restaurant System SA 2.0% 2.1% 2.1% 2.1% 2.3% 2.8%
Trattoria Il Calcio Restaurante Trattoria IL Calcio SRL
0.6% 0.5% 0.6% 0.6%
Taverna Sarbului Taverna Sarbului SRL
0.4% 0.4% 0.4% 0.5% 0.5%
City Grill Trotter Prim SRL 0.4% 0.4% 0.5% 0.5% 0.5% 0.5%
La Placinte Andy's Pizza SRL
0.0% 0.2% 0.4% 0.4%
Top 5 brands
2.4% 2.9% 3.6% 3.7% 4.3% 4.8%
Others Others 97.6% 97.1% 96.4% 96.3% 95.7% 95.2%
Total Total 100% 100% 100% 100% 100% 100%
Source: Euromonitor, Consumer Foodservice in Romania, May 2017.
In terms of network size, Pizza Hut (Dine-In) operates 21 restaurants, compared to 18 for City Grill, 14 by
Trattoria Il Calcio, 13 for La Placinte and 6 for Taverna Sarbului. At the same time, Pizza Hut (Dine-In) has the
largest restaurant network outside Bucharest, with 10 restaurants opened in 8 cities, followed by Taverna Sarbului
with 5 restaurants, La Placinte with 4 restaurants, Trattoria Il Calcio with 2 restaurants, while City Grill does not
have any restaurants outside Bucharest.
Home Delivery/Takeaway
Home Delivery/Takeaway units are businesses selling food that is intended to be eaten off the premises. Food can
either be taken "to go" by the consumer or delivered to the consumer’s home or place of choice. Some of the
restaurants may offer take out, delivery and catering services alongside the main "sit down" area of the restaurant
whereas other units offer only take-out and delivery services.
The following chart depicts the development of value sales of the home delivery/takeaway segment during the
2011-2016 period, as well as the expected level by the year 2022.
124 140 94 77 75 65 696 538 458 350 216
2.0%1.5%
1.2% 1.1% 1.0% 0.9%
5.8%
5.2%
3.3%
2.4%
1.2%
0
100
200
300
400
500
600
700
800
Bulgaria Czech
Rep.
Hungary Romania Poland Slovakia Italy Spain France United
Kingdom
Germany
0.0%
1.0%
2.0%
3.0%
4.0%
5.0%
6.0%
7.0%
FSR outlets per capita, 2016 (per million inhabitants) FSR sales as % of Personal Disposable Income, 2016

118
Development of home delivery/takeaway segment during 2011-2016 and expected growth until 2022
Source: Euromonitor, Consumer Foodservice in Romania, May 2017; forecasts according to Deloitte Analysis.
The value sales of the home delivery/takeaway foodservice segment reached RON 0.20 billion in 2016 compared
to RON 0.12 billion in 2011, representing a CAGR of 10.8%. For the 2017-2022 period, based on the Deloitte
Analysis, an average annual growth rate of 9.2% to a total value of RON 0.34 billion is expected by year 2022.
This growth rate is expected to be fuelled by the opening of new delivery units and the increase in the frequency
of ordering-in on the back of higher disposable income of the Romanian population and developing consumer
dining trends.
The following chart presents a comparison of the market penetration of home delivery/takeaway foodservice
segment in Romania versus CEE and Western Europe for the year 2016.
Market penetration of home delivery/takeaway segment in Romania versus CEE and Western Europe
Source: Deloitte Analysis
According to the data in the chart above, Romania has a similar density of delivery/takeaway outlets as Poland
and Czech Republic (2 outlets per million inhabitants), compared to a maximum of 6 in Hungary and Slovakia. In
Western Europe, this density varies between 13 outlets in France and 168 outlets in Italy.
The following chart presents the breakdown of pizza ordering frequency in Bucharest, based on a survey
conducted by Kantar Millward Brown in February 2016 ("Usage & attitudes on the pizza delivery market") among
the population in the 16-49 age group who ordered pizza within the past three months.
0.120.14
0.150.17 0.17
0.20
0.34
12.4%
10.3% 10.0%
4.8%
16.8%
-10%
-5%
0%
5%
10%
15%
20%
0
2011 2012 2013 2014 2015 2016 2022f
Value Sales (RON bn) % yoy growth
CAGR: +9.2%

119
Pizza ordering frequency (Feb 2016) on the 16-49 age group in Bucharest
Source: Kantar Millward Brown Report – Usage & attitudes on the pizza delivery market, February 2016.
According to the data in the above chart, approximately 79% of the population within the 16-49 age group in
Bucharest who ordered pizza within the past three months have an ordering frequency of at least once a month; in
our opinion, this shows that as an increasing share of the population starts making use of delivery services
(especially pizza), a significant proportion of them may become more frequent customers of the delivery services.
The delivery market is mainly controlled by a few local and international brands; top four players in this segment
focus on pizza, though some offer more extended menus including pasta, meat dishes or salads. As of 2016, the
market leader was Jerry’s Pizza (with a market share of 22.3%), followed by Pizza Hut Delivery (with a market
share of 20.6%) and Domino’s Pizza (with a market share of 13.6%).
Market share of the top 5 brands in the 100% Home Delivery/Takeaway segment
Brand National Brand Owner 2011 2012 2013 2014 2015 2016
Jerry's Pizza Jerry's Pizza SRL 16.6% 18.6% 18.9% 21.1% 23.1% 22.3%
Pizza Hut Delivery American Restaurant System SA 10.4% 14.7% 18.5% 20.2% 21.1% 20.6%
Domino's Pizza Domino's Pizza Maxim SRL 8.9% 6.6% 6.4% 5.1% 6.6% 13.6%
Trenta Pizza Infop Perfectionare si Dezvoltare 12.0% 11.7% 11.4% 11.4% 10.0% 10.5%
Wu Xing Quick Best Food SRL 4.8% 3.8% 3.5% 3.5% 3.3% 2.8%
Top 5 brands
52.7% 55.4% 58.7% 61.3% 64.1% 69.8%
Others Others 47.3% 44.6% 41.2% 38.7% 35.8% 30.2%
Total Total 100% 100% 100% 100% 100% 100%
Source: Euromonitor, Consumer Foodservice in Romania, May 2017.
The foodservice sector in Italy
The following chart depicts the development of the foodservice sector in Italy during the 2011-2016 period, as
well as the expected level by the year 2022.
1%
4%16%
30%
26%
17%
6%
n = 400
2-3 times a week or more often
Once a week
Once every two weeks
Once a month
1-2 times every 3 months
Once in 6 months
Less than once in 6 months
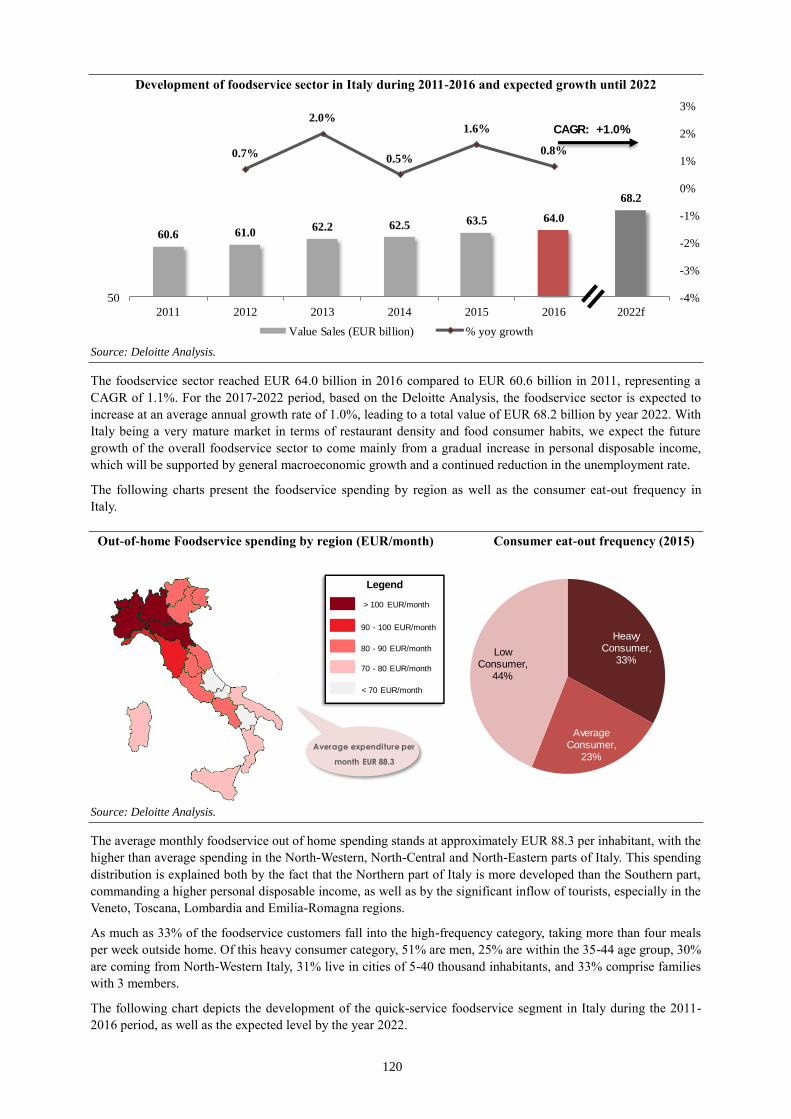
120
Development of foodservice sector in Italy during 2011-2016 and expected growth until 2022
Source: Deloitte Analysis.
The foodservice sector reached EUR 64.0 billion in 2016 compared to EUR 60.6 billion in 2011, representing a
CAGR of 1.1%. For the 2017-2022 period, based on the Deloitte Analysis, the foodservice sector is expected to
increase at an average annual growth rate of 1.0%, leading to a total value of EUR 68.2 billion by year 2022. With
Italy being a very mature market in terms of restaurant density and food consumer habits, we expect the future
growth of the overall foodservice sector to come mainly from a gradual increase in personal disposable income,
which will be supported by general macroeconomic growth and a continued reduction in the unemployment rate.
The following charts present the foodservice spending by region as well as the consumer eat-out frequency in
Italy.
Out-of-home Foodservice spending by region (EUR/month) Consumer eat-out frequency (2015)
Source: Deloitte Analysis.
The average monthly foodservice out of home spending stands at approximately EUR 88.3 per inhabitant, with the
higher than average spending in the North-Western, North-Central and North-Eastern parts of Italy. This spending
distribution is explained both by the fact that the Northern part of Italy is more developed than the Southern part,
commanding a higher personal disposable income, as well as by the significant inflow of tourists, especially in the
Veneto, Toscana, Lombardia and Emilia-Romagna regions.
As much as 33% of the foodservice customers fall into the high-frequency category, taking more than four meals
per week outside home. Of this heavy consumer category, 51% are men, 25% are within the 35-44 age group, 30%
are coming from North-Western Italy, 31% live in cities of 5-40 thousand inhabitants, and 33% comprise families
with 3 members.
The following chart depicts the development of the quick-service foodservice segment in Italy during the 2011-
2016 period, as well as the expected level by the year 2022.
60.6 61.062.2 62.5 63.5 64.0
68.2
0.7%
2.0%
0.5%
1.6%
0.8%
-4%
-3%
-2%
-1%
0%
1%
2%
3%
50
2011 2012 2013 2014 2015 2016 2022f
Value Sales (EUR billion) % yoy growth
CAGR: +1.0%
Legend
> 100 EUR/month
90 - 100 EUR/month
80 - 90 EUR/month
70 - 80 EUR/month
< 70 EUR/month
Average expenditure per
month EUR 88.3
Heavy Consumer,
33%
Average Consumer,
23%
Low Consumer,
44%

121
Development of quick-service foodservice sector in Italy during 2011-2016 and expected growth until 2022
Source: Deloitte Analysis.
The quick-service foodservice sector reached EUR 20.4 billion in 2016 compared to EUR 17.8 billion in 2011,
representing a CAGR of 2.7%. For the 2017-2022 period, based on the Deloitte Analysis the average annual
growth rate to reach 3.8%, leading to a total value of EUR 25.5 billion is expected by year 2022. This more
accelerated growth, both compared with the overall foodservice sector growth and the historic growth of the
quick-service segment, is expected to be fuelled by the continuous proliferation of chained networks, especially
well established international brands, which might grow at the expense of the traditional cuisine offered mainly
through independent full-service operators.
The following chart depicts the development of the quick-service revenues and outlets by main segments during
the 2011-2016 period.
Development of quick-service revenues and outlets by main segments during 2011-2016
Revenues (EUR billion) Number of restaurants (in thousand)
Source: Deloitte Analysis. Notes *) Includes bars, cafes and other typical Italian cafeterias.
The number of the American-branded quick-service restaurant outlets increased by a CAGR of 10.5% over the
2011-2016 period to a total of 710 units, while the number of other quick-service restaurant outlets increased
during this period by only 1.6% to 233.3 thousand. At the same time, the overall sales of the American-branded
quick-service restaurant outlets increased by a CAGR of 3.2% over the 2011-2016 period to a total of EUR 1.3
billion, while the sales of other quick-service restaurant outlets increased during this period by 2.7% to EUR 19.1
billion.
The following chart presents a comparison of the market penetration of quick-service segment in Italy versus
other large Western Europe countries for the year 2016.
17.8 18.3 18.7 18.9 19.7 20.4
25.5
2.8%2.2%
1.1%
4.2%3.6%
-4%
-3%
-2%
-1%
0%
1%
2%
3%
4%
5%
0
2011 2012 2013 2014 2015 2016 2022f
Value Sales (EUR billion) % yoy growth
CAGR: +3.8%
16.7 17.3 17.6 17.8 18.419.1
1.1 1.0 1.1 1.2 1.21.3
2011 2012 2013 2014 2015 2016
215.9
223.1
230.3 230.8 231.2233.3
0.43
0.47
0.52 0.57 0.660.71
2011 2012 2013 2014 2015 2016
American Branded QSR outlets Other QSR Outlets*
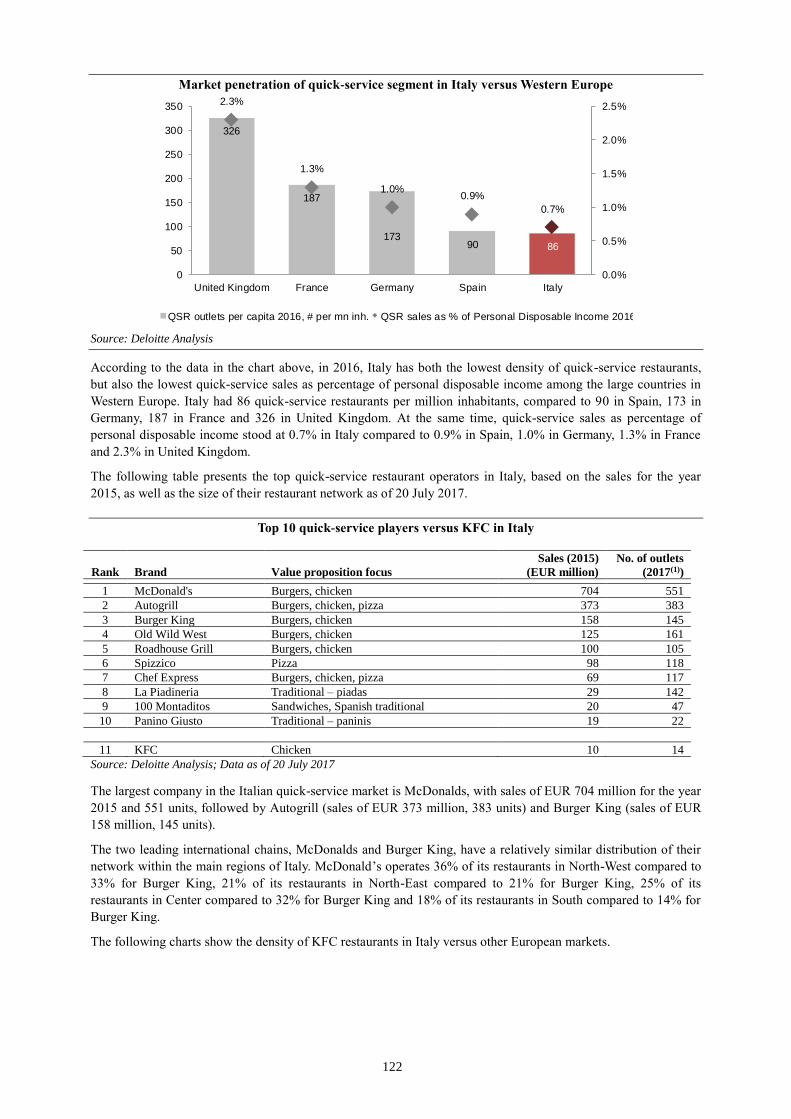
122
Market penetration of quick-service segment in Italy versus Western Europe
Source: Deloitte Analysis
According to the data in the chart above, in 2016, Italy has both the lowest density of quick-service restaurants,
but also the lowest quick-service sales as percentage of personal disposable income among the large countries in
Western Europe. Italy had 86 quick-service restaurants per million inhabitants, compared to 90 in Spain, 173 in
Germany, 187 in France and 326 in United Kingdom. At the same time, quick-service sales as percentage of
personal disposable income stood at 0.7% in Italy compared to 0.9% in Spain, 1.0% in Germany, 1.3% in France
and 2.3% in United Kingdom.
The following table presents the top quick-service restaurant operators in Italy, based on the sales for the year
2015, as well as the size of their restaurant network as of 20 July 2017.
Top 10 quick-service players versus KFC in Italy
Rank Brand Value proposition focus
Sales (2015)
(EUR million)
No. of outlets
(2017(1))
1 McDonald's Burgers, chicken 704 551
2 Autogrill Burgers, chicken, pizza 373 383
3 Burger King Burgers, chicken 158 145
4 Old Wild West Burgers, chicken 125 161
5 Roadhouse Grill Burgers, chicken 100 105
6 Spizzico Pizza 98 118
7 Chef Express Burgers, chicken, pizza 69 117
8 La Piadineria Traditional – piadas 29 142
9 100 Montaditos Sandwiches, Spanish traditional 20 47
10 Panino Giusto Traditional – paninis 19 22
11 KFC Chicken 10 14
Source: Deloitte Analysis; Data as of 20 July 2017
The largest company in the Italian quick-service market is McDonalds, with sales of EUR 704 million for the year
2015 and 551 units, followed by Autogrill (sales of EUR 373 million, 383 units) and Burger King (sales of EUR
158 million, 145 units).
The two leading international chains, McDonalds and Burger King, have a relatively similar distribution of their
network within the main regions of Italy. McDonald’s operates 36% of its restaurants in North-West compared to
33% for Burger King, 21% of its restaurants in North-East compared to 21% for Burger King, 25% of its
restaurants in Center compared to 32% for Burger King and 18% of its restaurants in South compared to 14% for
Burger King.
The following charts show the density of KFC restaurants in Italy versus other European markets.
326
187
17390 86
2.3%
1.3%
1.0%0.9%
0.7%
0
50
100
150
200
250
300
350
United Kingdom France Germany Spain Italy
0.0%
0.5%
1.0%
1.5%
2.0%
2.5%
QSR outlets per capita 2016, # per mn inh. QSR sales as % of Personal Disposable Income 2016

123
Density of KFC restaurants in Italy versus other European markets (units/million inhabitants)
Source: Eurostat, Yum! website.
Italy has one of the lowest densities of KFC units in Europe, with only 0.2 units per million inhabitants.
Comparatively, Romania has a density of 3.2 units, Poland – 5.8, Czech Republic – 7.2, while UK – 13.0.
Management believes that the low density of KFC units compared to other European countries and to McDonald’s
in Italy indicates a significant expansion opportunity for the Group.
13.0
7.2
5.8
4.3
3.5 3.4 3.2 3.1 3.1
2.0 1.8 1.7
1.10.7 0.7 0.7 0.6
0.2 0.2 0.2
Median: 1.9

124
BUSINESS
Overview
The Company's principal business is holding and managing the participations in a number of companies operating
restaurants under the KFC, Pizza Hut and Taco Bell franchises in Romania, the Republic of Moldova and Italy.
The Company was established in May 2017 to bring under the same entity the members of the Group. It holds as
of the date of this Prospectus (a) a controlling stake of 99.99% in the companies: USFN (Romania) (a joint-stock
company established in 1994, holding the franchise rights to operate KFC-branded restaurants in Romania), ARS
(Romania) (a joint-stock company established in 1994, holding the franchise rights to operate Pizza Hut-branded
restaurants in Romania) and California Fresh Flavors (Romania) (a limited liability company established in June
2017, holding the franchise rights to operate Taco Bell branded restaurants in Romania), (b) a controlling stake of
80% in USFN (Moldova) (a limited liability company established in 2008, holding the franchise rights to operate
KFC branded restaurants in the Republic of Moldova), and (c) full ownership (100%) in USFN (Italy) (a limited
liability company established in 2016, which holds the franchise rights to operate KFC branded restaurants in
certain regions of Italy). The Company acquired the holdings in USFN (Romania) and ARS (Romania) by way of
an in-kind share capital increase carried out in 2017, whereby the current shareholders of the Company have
contributed to the Company's share capital all (but one share) held in USFN (Romania) and ARS (Romania). Also
in 2017, the current shareholders of the Company transferred their holdings in USFN (Moldova) and USFN (Italy)
to the Company. For more details on the current Group structure, please see "Corporate Structure" below.
The Company's ultimate beneficial owners are Mr. Radu Dimofte (holding a 43.67% indirect stake in the
Company), Mr. Lucian Vlad (holding a 33.33% indirect stake in the Company) and Mr. Nicolae Badea (holding a
23.00% indirect stake in the Company). The three shareholders have been part of the founding shareholders that
have developed KFC and Pizza Hut franchised restaurants in Romania.
The Group’s franchised foodservice business was launched in 1994, long before the establishment of the
Company, with the opening of the first Pizza Hut location, which was followed by the opening in 1997 of the first
KFC location, both in Bucharest. As of 30 September 2017, the Group operates 104 restaurants, of which 67 KFC
restaurants (63 restaurants located in Romania, 2 restaurants located in the Republic of Moldova and 2 restaurants
in Italy) and 37 Pizza Hut units (of which 16 are delivery units). On 12 October 2017, California Fresh Flavors
(Romania) opened the first Taco Bell restaurant in Romania. Through USFN (Romania), with consolidated
restaurant sales of RON 418 million in 2016, we are the second largest restaurant group in the quick-service
restaurant sector in Romania and, through ARS (Romania), with restaurant sales of RON 97 million in 2016, we
are the largest restaurant group in the full-service restaurant sector in Romania.
Our business is conducted through the following segments:
• Quick-service restaurants - through our KFC restaurants, in Romania, the Republic of Moldova, and Italy;
• Full-service restaurants - through our Pizza Hut Dine-In restaurants in Romania;
• Delivery restaurants - through our Pizza Hut delivery units in Romania.
In the years ended 31 December 2014, 2015 and 2016, our pro-forma consolidated sales were RON 325 million,
RON 406 million and RON 514 million, respectively. In the six months ended 30 June 2017, we had total sales
revenues of RON 288 million.
The Company's core value proposition
Our core value proposition centres around the following four pillars, which over the years have contributed to our
strong operating performance and track record, based on the following value drivers: (1) the internationally
recognizable and successful brands that we operate in our portfolio, (2) the successful selection of key locations
for the roll-out of our restaurant network, (3) our strong marketing efforts and partnerships, and (4) our product
quality and positioning.
Successful international brands in our restaurant portfolio
We are operating brands with a strong market recognition, locally and internationally. Our brand portfolio is
complimentary, with no product overlaps, and we are continuously focused on the expansion and diversification of
our brand portfolio.

125
Location identification and selection process
We have been highly effective in selecting and securing locations that are value accretive through extensive
research in order to identify the optimal geographic area and format for our restaurant roll-out plans over the
years. Our typical pattern of development focuses on building significant customer penetration, brand affection
and loyalty in the Bucharest market first, before continuing our expansion into major cities (over 200,000
population) and smaller ones (below 200,000 population).
Strong marketing effort and partnerships
We are cooperating throughout the spectrum of our marketing and PR activities with B.V. McCann - Erickson
S.R.L., a leader in Advertising & Media in Romania, and with Golin Harris Public Relations S.A., one of the most
awarded PR agencies in Romania, who together with our highly effective and skilled marketing professionals
maximize the results of our marketing effort. We operate our marketing activities through a wide range of
communication channels including social media and other online channels, with increased technology and digital
focus across all brands, having a positive impact on brand loyalty and consumer awareness. Our success in digital
marketing has led to a number of campaigns “going viral” amongst our customer base and potential customer base
which we believe has generated increased brand recognition and group sales.
Product quality and positioning
We are able to offer a wide product range that is identified by its high quality and execution, as well as its
affordable price positioning within the markets that we operate and across our brands. We are offering products
that are popular among our customer base, with price positioning that enhances value options and deals, as well as
increasing convenience of ordering. We are also continuously expanding the menu offering across our brands
driving high existing customer retention but also appealing to new customer segments.
Competitive Strengths
We believe that the following competitive strengths have been key factors for the Group's up to date performance
and to our leading position in the food service industry in Romania, and that these will continue to support our
business in the coming years: (1) highly successful organizational transformation, (2) a scalable platform allowing
for efficient restaurant roll-out, (3) enhanced and efficient marketing capabilities, (4) operational excellence, (5) a
highly profitable business model with strong margins, and (6) benefit from being part of the Yum! system.
Organizational transformation
Starting in 2012, a number of significant transformational events at the Group level took place, with a view to
accelerate sales growth and improve internal processes and capabilities, as activities became increasingly more
complex.
We strengthened our senior management by hiring professionals with extensive international experience in the
food service sector in general, and in working with Yum! in particular, as well as others with finance, capital
markets and marketing background.
Further key initiatives were also taken in the human resources area, by creating our HR Department, entrusted
with the development of strategic initiatives around employee branding, as well as with the implementation of
business best practices to drive performance through alignment of functional levels and salaries, objective setting,
appraisals and bonus remuneration. At the same time, we have opened a dedicated training centre to support
brands training and develop people in taking key positioning within our organisation.
Strategic business changes that have taken place include contracting a new marketing agency and a new PR
agency, a new beverages supplier and outsourcing of the in-house warehouse and distribution system:
• B.V. McCann - Erickson S.R.L. – a leader in Advertising & Media in Romania, which provided a significant
boost in campaign creativity and media efficiency for the Group;
• Coca-Cola Romania, providing competitive pricing and cross-marketing cooperation;
• Havi (Romania) – the supply chain service provider, providing state-of-the art and rapidly scalable logistics
services at competitive prices;
• Golin Harris Romania – a top PR agency in Romania.
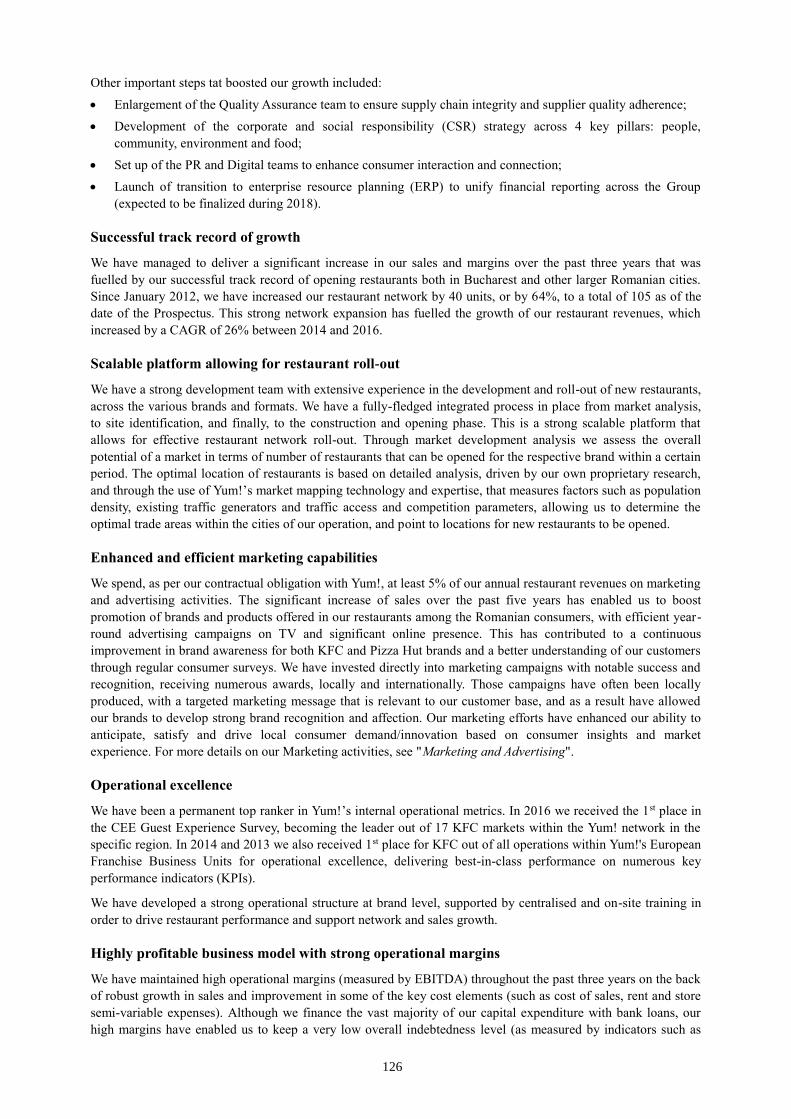
126
Other important steps tat boosted our growth included:
• Enlargement of the Quality Assurance team to ensure supply chain integrity and supplier quality adherence;
• Development of the corporate and social responsibility (CSR) strategy across 4 key pillars: people,
community, environment and food;
• Set up of the PR and Digital teams to enhance consumer interaction and connection;
• Launch of transition to enterprise resource planning (ERP) to unify financial reporting across the Group
(expected to be finalized during 2018).
Successful track record of growth
We have managed to deliver a significant increase in our sales and margins over the past three years that was
fuelled by our successful track record of opening restaurants both in Bucharest and other larger Romanian cities.
Since January 2012, we have increased our restaurant network by 40 units, or by 64%, to a total of 105 as of the
date of the Prospectus. This strong network expansion has fuelled the growth of our restaurant revenues, which
increased by a CAGR of 26% between 2014 and 2016.
Scalable platform allowing for restaurant roll-out
We have a strong development team with extensive experience in the development and roll-out of new restaurants,
across the various brands and formats. We have a fully-fledged integrated process in place from market analysis,
to site identification, and finally, to the construction and opening phase. This is a strong scalable platform that
allows for effective restaurant network roll-out. Through market development analysis we assess the overall
potential of a market in terms of number of restaurants that can be opened for the respective brand within a certain
period. The optimal location of restaurants is based on detailed analysis, driven by our own proprietary research,
and through the use of Yum!’s market mapping technology and expertise, that measures factors such as population
density, existing traffic generators and traffic access and competition parameters, allowing us to determine the
optimal trade areas within the cities of our operation, and point to locations for new restaurants to be opened.
Enhanced and efficient marketing capabilities
We spend, as per our contractual obligation with Yum!, at least 5% of our annual restaurant revenues on marketing
and advertising activities. The significant increase of sales over the past five years has enabled us to boost
promotion of brands and products offered in our restaurants among the Romanian consumers, with efficient year-
round advertising campaigns on TV and significant online presence. This has contributed to a continuous
improvement in brand awareness for both KFC and Pizza Hut brands and a better understanding of our customers
through regular consumer surveys. We have invested directly into marketing campaigns with notable success and
recognition, receiving numerous awards, locally and internationally. Those campaigns have often been locally
produced, with a targeted marketing message that is relevant to our customer base, and as a result have allowed
our brands to develop strong brand recognition and affection. Our marketing efforts have enhanced our ability to
anticipate, satisfy and drive local consumer demand/innovation based on consumer insights and market
experience. For more details on our Marketing activities, see "Marketing and Advertising".
Operational excellence
We have been a permanent top ranker in Yum!’s internal operational metrics. In 2016 we received the 1st place in
the CEE Guest Experience Survey, becoming the leader out of 17 KFC markets within the Yum! network in the
specific region. In 2014 and 2013 we also received 1st place for KFC out of all operations within Yum!'s European
Franchise Business Units for operational excellence, delivering best-in-class performance on numerous key
performance indicators (KPIs).
We have developed a strong operational structure at brand level, supported by centralised and on-site training in
order to drive restaurant performance and support network and sales growth.
Highly profitable business model with strong operational margins
We have maintained high operational margins (measured by EBITDA) throughout the past three years on the back
of robust growth in sales and improvement in some of the key cost elements (such as cost of sales, rent and store
semi-variable expenses). Although we finance the vast majority of our capital expenditure with bank loans, our
high margins have enabled us to keep a very low overall indebtedness level (as measured by indicators such as

127
interest-bearing debt/EBITDA or Interest Coverage ratio), while maintaining a high dividend pay-out ratio. For
detailed information on our financial performance, please consult section "Operating and financial review ".
Benefits from being part of the Yum! system
Based in Louisville, Kentucky, United Stated of America, Yum! Brands, Inc. ("Yum!") is one of the world's largest
fast food restaurant companies in terms of system units, with 43,617 restaurants (of which 40,758 are franchised)
around the world in over 135 countries and territories as of the end of year 2016. With total system sales of USD
44,888 million in 2016, Yum! is the second largest restaurant chain in the world.
As part of the Yum!’s network, the Group takes advantage of a number of benefits that spread across multiple
levels within the Group:
Corporate level
• Brand awareness generated by scale and size of brands operating over 43,000 restaurants in more than 130
countries that helps drive brand awareness to levels that are expensive and difficult to achieve without the
scale and heritage of the brands;
• Substantial knowledge pool and expertise to tap into and numerous best practice examples to learn from and
adapt for our own business;
• Global conventions and functional meetings and workshops to provide best practice learnings, product
development, brand positioning, functional expertise as well as outstanding networking that provide
significant opportunities to enhance and improve our own business;
• Access to processes and procedures via brand manuals to coach and support teams across all functions.
Marketing
• Developing marketing campaigns based on best practices from other markets;
• Access to food photography and commercials from other regions that can be utilized in local communication;
• Sharing of product recipes that are ready for customer research and potential launch;
• Brand Image Tracker methodology to better understand strengths and weaknesses;
• Development of Style guide and global brand book;
• Support in developing marketing calendars and products for different day parts/week parts, value and
innovation.
Operations & Development
• Access to centers of excellence via the Franchise Business Units that have been established to support
franchisee performance;
• Access to new equipment and technology that enhances our ability to drive efficiency and effectiveness of
performance;
• Operational programs that continually enable us to execute new ideas to enhance operational performance;
• New design elements that enable restaurant upgrades or new builds to keep the brands relevant;
• Insights and access to capability in new formats to improve business through technology and digital best
practice.
Purchasing
• Access to pricing leverage on key product categories through centrally negotiated prices on core products and
services;
• Product and supplier audits to help ensure product integrity and food safety.
Support & Training
• Motivational support of the business through Yum! company culture cascaded throughout the business
through recognition and coaching and training programs to help grow not only the business but the teams
working with the business, through initiatives like "Leading with Heart".

128
The Company's phases of historical development
We have developed our business through three distinctive phases of development and operational evolution, which
we could broadly identify as, the Early-steps phase, the Development acceleration phase, and the Transformation
phase.
The first one, the Early-steps phase, lasted for almost ten years from early introduction of our brands in the
market, with the first Pizza Hut unit opening in 1994 and the first KFC opening in 1997, until almost 2004. The
Romanian food service market in the 1990s was a heavily unpenetrated market, with only a small number of
recognizable restaurant brands, let alone international ones like the ones we introduced. Pizza Hut and KFC
swiftly became one of the most recognised and loved restaurant concepts in the market, a success that allowed us
to consolidate our position, and build our internal operational, marketing and development capabilities to an
adequate level that would be required for a more rapid restaurant roll-out.
In the second phase, noted as the Development acceleration phase, the market presented to us the growth
opportunity that we had prepared and planned for Romania, since 2004, saw a rapid development of mall and
commercial centres, both in Bucharest and elsewhere. Our brands had already established a strong customer base,
we commanded a high market share in the food service market, and we secured the necessary finance to allow us
to grow. Our brands became anchor tenants in the food court areas of those malls and commercial centres, and we
rolled-out an increased number of restaurants, mainly restaurants of the Food-Court format. In this phase, we did
our first KFC restaurant outside Bucharest, our first KFC restaurant outside Romania (Republic of Moldova), our
first KFC Drive-Thru restaurant, as well launched Pizza Hut Delivery in the market. The restaurant network
jumped from 11 restaurants in 2004, to 59 restaurants in 2010, having regional and geographical diversification as
well format and brand diversification.
In 2010, the Romanian economy showed signs that the rapidly unfolding world economic crisis was making an
impact. This was a turning point for our evolution, marking the third phase of our historical development, namely
the Transformation phase. As competing brands halted their restaurant development plans, we took the strategic
decision to strengthen our senior management by hiring senior professionals with extensive international
experience, amplify our internal processes, controls and IT platforms, align with key service and supply partners,
outsource our supply and logistics function, and most notably, continue to grow our network by adding new
restaurant across all of our brands. We have also taken up new international opportunities such as KFC in Italy, as
well as new brands in our local market, such as Taco Bell. In this phase, the restaurant network jumped from 59
restaurants at the end of 2010 to 104 restaurants as at 30 September 2017.
The significant events in our history are:
1994 First Pizza Hut Dine-In restaurant in Romania
1997 First KFC restaurant in Romania
1999 First Pizza Hut Dine-In restaurant outside Bucharest
2005 First KFC restaurant outside Bucharest
2007 First Pizza Hut Delivery restaurant in Romania
25th restaurant of the Group
2008 First KFC restaurant in Republic of Moldova
2009 50th restaurant of the Group
2009 First KFC Drive-Thru restaurant in Romania
2011 First Pizza Hut Delivery restaurant outside Bucharest
2013 75th restaurant of the Group
2017 First KFC restaurant in Italy
Incorporation of the Company and corporate restructuring of the Group
100th restaurant of the Group
Opening of the First Taco Bell restaurant
Corporate structure
The following chart describes the corporate structure of the Company, presenting its direct shareholders, ultimate
beneficial owners, as well as all subsidiaries controlled by Sphera at the date of this Prospectus.

129
The Company holds 99.99% of the share capital and voting rights in the Romanian companies that operate the
restaurants under the Yum! brand, as follows:
• USFN (Romania) holds the franchise rights to operate KFC branded restaurants in Romania;
• ARS (Romania) holds the franchise rights to operate Pizza Hut branded restaurants (Pizza Hut Dine-in and
Pizza Hut Delivery) in Romania; ARS (Romania) holds also sub-franchise rights;
• California Fresh Flavors (Romania) holds the franchise rights to operate Taco Bell branded restaurants in
Romania.
The Company is also the sole shareholder of USFN (Italy) operating KFC restaurants in certain regions in Italy
and holds 80% of the share capital and voting rights in USFN (Moldova) operating KFC restaurants in the
Republic of Moldova.
Strategy
We believe we have significant growth potential in the following years, both in the performance of our existing
restaurants and also through the continued organic network roll-out of new restaurants, as a result of the strong
awareness of our brands, a clear differentiation of our products against our competition, a strong drive to keep up
with evolving key consumer trends though product innovation in the markets and segments that we operate, our
continuous commitment of offering a dining experience that fits our customers' expectations, a clearly identified
new site roll-out pipeline and our track record on delivering strong results from operation. We also believe that we
have significant value accretive opportunities across diversified markets of operation, such as through the
development of a sizeable KFC business in Italy, as well as our secured commitment to expand our brand portfolio
through the roll-out of Taco Bell restaurants in Romania. In our strategic growth areas, we believe we have a
strong management and operational capacity, adequate financial resources, structures and processes in place, and
have identified strong partners for our various operational models. In areas where we believe we still have room
for improvement we have implemented, or are in the process of implementing, remedial actions and
enhancements, such as the upgrade of our information technology systems.
We have defined a number of strategic goals to drive our growth and profitability in the coming years, namely: a)
organic network roll-out of existing brands, b) maintain strong like-for-like sales growth in our restaurants across
our brand portfolio, c) international expansion through the development of a significant KFC business in Italy, and
d) expansion of our brand portfolio across new but proven internationally restaurant concepts, such as Taco Bell in
the Romanian market. The underlining commitment to the aforementioned strategic goals is centred on the
following key pillars of our operation: a) customer satisfaction, b) focus on operational excellence, c) product
quality and execution, d) employee satisfaction and empowerment, e) ethical trade relations with our partners, and
f) a positive contribution to the wider communities and markets in which we operate.
Organic network roll-out expansion of existing brands in Romania
Our principal objective in the following years is to continue the organic expansion of our restaurant network in the
markets and geographies in which we operate, in line with our commitments towards Yum!, taking into
consideration the general changes in the macroeconomic and consumer environments as well as the changes in the
perceived market potential of these markets and economies. In Romania, our network growth strategy will focus
on the following main directions:
Wellkept Group S.A.Anasa Properties S.R.L. MBL Computers S.R.L.Lunic Franchising &
Consulting Ltd.Tatika Investments Ltd.
Sphera Franchise
Group S.A.
16.34%10.99%22.34% 27.33% 23.00%
US Food Network S.A. California Fresh Flavors SRLAmerican Restaurant System S.A. US Food Network SRL - Italy US Food Network SRL - Moldova
99.9% 99.9% 99.9%
1 share1 share1 share
Mr. Radu DIMOFTE Mr. Nicolae BADEAMr. Lucian VLAD
100% 80%
Mr. Dorin RECEAN
Mr Catalin GIOSAN
20%

130
• KFC
We will continue to develop the KFC network in Romania, with a dedicated focus on the currently
underpenetrated cities, as well as cities below 100,000 inhabitants. We will favour the opening of drive-thru
locations, which have a higher sales potential given their larger format, the ability to locate them in high-
traffic areas, as well as the growing attractiveness of the ordering format. We believe that the Romanian
market currently has an estimated potential capacity of circa 110 restaurants, and we aim to drive the roll-out
of our network, across the different formats, in order to capitalize on this opportunity for expansion. By the
end of year 2022, we plan to open a number of 51 KFC restaurants in Romania, which compares with 43 as
committed in our development agreement with Yum!.
2017 2018 2019 2020 2021 2022 Total 2017-2022
Development agreement with Yum 4 6 7 8 9 9 43
Company's development plan 7 7 7 10 10 10 51
• Pizza Hut
Dine In. We expect that the continuous improvement in the population’s purchasing power, developing
consumer tastes and propensity to dine out and migration to the urban areas to allow us to open profitable
restaurants in cities below 150,000 inhabitants. We will focus mainly on restaurants with their own dedicated
seating near the mall food courts within shopping malls or large commercial centers, as these locations can
attract significant traffic. We believe that the Romanian market has an estimated potential capacity of circa 30
restaurants, and we aim to drive the roll-out of our network, in order to capitalize on this opportunity for
expansion.
Delivery. Although Bucharest still offers a number of new restaurant location opportunities, we will mainly
focus on opening restaurants in other large Romanian cities (initially, with a population above 200,000
inhabitants), where we will seek well-placed locations able to generate both delivery and takeaway sales. We
have secured the Master Sub-Franchise rights for Romania from Yum!, which allows us to open sub-
franchised restaurants. We will continue to open our own restaurants based on the prevailing favourable
market conditions, as well as accelerate our network roll-out development with focus on smaller cities
through both own and sub-franchised locations. We believe that the Romanian market has an estimated
potential capacity of circa 40 restaurants, and we aim to drive the roll-out of our network, in order to
capitalize on this opportunity for expansion.
By the end of year 2022, we plan to open a number of 44 Pizza Hut restaurants in Romania, while we have
committed to Yum! to develop a minimum of 34 new Pizza Hut restaurants.
2017 2018 2019 2020 2021 2022 Total 2017-2021
Development agreement with Yum 5 5 7 8 9 - 34
Company development plan, of which: 6 7 7 8 8 8 44
Pizza Hut Dine-In 1 2 2 2 2 2 11
Pizza Hut Delivery 5 5 5 6 6 6 33
Maintain strong like-for-like sales growth in our restaurants across our brand portfolio
We expect the like-for-like performance of our restaurants to continue to grow through a combination of higher
transactions and average ticket growth, in line with the continuous improvements in the overall macroeconomic
environment in general and consumer purchasing power in particular. We believe the main growth drivers will
continue to be the increase in the population’s disposable income and the low rate of unemployment that will help
increase the frequency of eating out among many consumer age brackets of the Romanian population.
At the same time, we are actively looking to generate incremental sales by improving offers for various day parts
(such as breakfast) or create new visit occasions (such as the KFC Coffee Corner) and new usage occasions such
as delivery using either our own drivers or through aggregators.
We will also continue to increase the use of technology in our operations, through online and mobile apps or
improving the ordering process through the use of ordering kiosks in the KFC restaurants).

131
International expansion through the development of KFC in Italy
We will accelerate our roll-out of restaurants in the Italian market within the regions where we have secured
developments rights from Yum!. We believe that the market for fast-casual restaurants represents a key positive
strength within the Italian quick-service restaurant sector which is significantly underpenetrated, and we believe
that KFC can be gaining market share from full service restaurants. Local consumers are changing their food
consumption behaviour patterns, and we have identified shifting habits that play to our competitive advantage
leading to viable market opportunities for KFC and quick-service restaurant players. American branded chains
have strongly penetrated the Italian market, with McDonalds operating over 550 restaurants nationwide, and
Burger King operating over 140 restaurants nationwide. As Italy posts the 3rd largest economy in the Eurozone
and the world’s 8th largest one, with consistent high rankings in terms of tourist incomings, we believe that our
strategy to continue to penetrate the northern and more economically developed areas of the country, which are
within our development scope of commitment, will be significantly value accretive for our Company. Our strategy
for Italy centres around efforts to, a) identify and develop the restaurant locations that we have already secured
within our areas of operation by the end of 2022, b) develop a sizeable KFC network in North East Italy and
Piedmont, c) secure further geographic development opportunities in the North of the country as they come
available, d) build a diversified portfolio of restaurants, including initially Food Court restaurants, but further on
also drive-thru restaurants as the opportunities may arise, e) hire and retain a dedicated management team that will
drive the business and the network expansion in the country.
Our committed development agreement with Yum! for Italy calls for a total of 32 net new KFC restaurants, within
the areas of our operation within the next six years.
2017 2018 2019 2020 2021 2022 Total 2017-2021
Development agreement with Yum 3 6 8 7 7 1 32
Company development plan 3 6 8 8 7 2 34
Our development agreement with Yum! for the North-East region runs from 2017 until 2021, while development
agreement for the Piedmont region runs from 2018 to 2022. We have committed to roll-out 22 restaurants in North
East Italy, and 10 restaurants in the area of Piedmont, within our agreed development periods, as shown in the
table above. Currently, we have 2 restaurants in operation in North East Italy and we plan to have 3 restaurants
within this region by 31 March 2018 (for the TriVeneto trade zone area, the development agreement allows for an
extended term to complete the development for 2017). Subject to availability of other regions in Italy, we may
decide to secure further development rights so that we gain enough critical mass and start achieving economies of
scale that are critical to developing a profitable business in Italy.
Expansion of our brand portfolio
Our immediate strategic focus is to successfully operate the first Taco Bell restaurant in Romania opened on 12
October 2017. We believe that Taco Bell has strong market potential within the quick-service restaurant market in
Romania and that it is a brand that can have network scalability, as the restaurant profile and format as well as the
targeted customer profile is similar to KFC. The brand, which is one of the most profitable quick-service
restaurant brands in the American market, focuses on young consumers, and we believe, following market
research that we have conducted, that Romanian consumers are open to greater variety in the foodservice offering
that is currently available in the market, and that are willing to try Mexican food. Our quantitative and qualitative
studies indicated a high acceptance of the tested products, a favourable brand image that is associated with
innovation and a perceived modern look of the restaurants that are expected to generate a positive dining
experience. Our initial development agreement with Yum! calls for the opening of 10 units within the 2017-2019
period (with the first 2 restaurants to be opened in the last quarter of the year 2017, of which the first restaurant
was opened on 12 October 2017), and subsequent roll-out being subject to the overall consumer acceptance and
restaurant profitability of this initial development stage.
2017 2018 2019 2020 2021 Total 2017-2021
Development agreement with Yum 2 3 5 10
Company development plan 2 3 5 2 2 14
We plan to position Taco Bell as a contemporary and dynamic brand, and see further expand the network of
restaurants after the initial 3-year roll-out, steadily across the country. Our initial development focus is in

132
Bucharest and the more affluent cities with a population over 200,000, i.e. Constanta, Cluj, Timisoara. All initial
restaurants will be located in malls, while other restaurant formats, such as in-line and drive-thru, will be
considered as the opportunity may arise and depending on the performance of the brand and the dynamic of its
customer base.
At the same time, we believe the Romanian market still offers ample opportunities for new concepts with
scalability potential, which would be in direct competition with the segments that we are currently active in.
Potential for further international expansion
While our current strategic focus is on the development of the business in its current markets, we may consider
acquiring other brands and expanding to territories currently unpenetrated by the Yum!’s system. Such
international expansion is a discretionary strategy of the Group and we will consider and pursue it on an
opportunistic basis. Our criteria for entry into new markets would be based on the size, growth parameters,
average age and disposable income of the population, the level of fast-food and pizza market penetration, and the
market capacity for roll-out.
Leverage scale advantage to further improve profitability
We believe that our continuous network expansion both within and across brands will continue to provide
significant scale advantages that will contribute to a steady improvement of our operating leverage. We expect
these scale advantages to manifest primarily on the following main fields:
• Procurement: we expect our acquisition power to increase gradually over the next years, which will help us
achieve better raw material prices (either lower acquisition prices, or acquisition prices that will grow slower
than our selling prices);
• Marketing: as we keep our marketing budget as a fixed percentage of sales, we expect that a growing
marketing budget will enable us to improve or consolidate the awareness of our brands, through year-round
promotions on the most relevant media platforms (traditional and digital);
• Operational expenses: we expect higher restaurant sales to increase their operating efficiency, especially
through a relative reduction of the utilities and other costs which are not directly linked to sales;
• General & Administrative: although we will continue to increase our head office staff and third-party services
to manage the increased complexities of a much larger business (especially related to IT systems, restaurant
network management and public listing requirements), we expect such overall costs to increase slower than
the increase in our revenues.
Commitment to customer satisfaction
We are committed to providing our customers with a memorable dining experience through freshly-prepared, top
quality products, served promptly and friendly by our staff in an inviting, differentiated restaurant atmosphere. To
this end, we will permanently strive to:
• maintain a consistently high quality of our products, by cooking them from fresh, top quality ingredients
directly in the restaurants and supported by a high level of operational excellence;
• offer a high level of service quality through adequate staffing of our restaurants;
• maintain a modern look of our restaurants through regular upgrading to the design and use of high-quality
finishes;
• use customer surveys to provide senior management with regular feedback from customers on the quality of
its products and services.
Business Operations
The Company operates, through its subsidiaries, KFC restaurants in Romania, Republic of Moldova and Italy, and
Pizza Hut Dine-In and Pizza Hut Delivery restaurants in Romania. The food offered in our restaurants includes
proprietary menu items (the recipes of which are generally sourced from the Yum! restaurants across the world or
developed in-house) and are prepared from fresh ingredients.

133
KFC
KFC was founded in Corbin, Kentucky, by Colonel Harland D. Sanders, an early developer of the quick service
food business and a pioneer of the restaurant franchise concept. The Colonel perfected his secret blend of 11 herbs
and spices for Kentucky Fried Chicken in 1939 and signed up his first franchisee in 1952. Today, KFC is the
world’s largest quick service chicken restaurant chain in terms of number of restaurants and operates
approximately 20,000 outlets in 123 countries and territories throughout the world under the name "Kentucky
Fried Chicken" and/or "KFC". The Colonel ranks as one of the world’s best-known commercial trademarks.
KFC is the leading chicken restaurant chain in Romania in terms of both total sales and number of restaurants. The
first KFC restaurant in Romania opened in 1997 in Bucharest and, at the end of 2016, there were 63 KFC
restaurants in Romania. In 2008, we opened the first KFC restaurant in the Republic of Moldova, where we
currently operate two restaurants (both in Chisinau), while in 2017 we opened our first two restaurants in Italy
(one in Verona and the other one in Mestre, located in the metropolitan city of Venice).
The charts below show trends in KFC’s spontaneous and top-of-mind brand awareness figures in Romania as
determined by Brand Image Tracker, an independent research undertaken by Kantar Millward Brown, for the
periods shown. Spontaneous brand awareness tracks the percentage of respondents naming KFC when asked to
name quick service restaurants. Top-of-mind brand awareness tracks the percentage of respondents choosing KFC
as the first brand coming to mind when asked to name quick service restaurants.
Source: Kantar Millward Brown, "Brand Image Tracker" report, Q2-2017.
Both spontaneous and top of mind brand awareness for KFC have remained at high level since the beginning of
2016. The spontaneous brand awareness reached 81% in Q2-2017, similar to the average of 81% for the full year
2016, being very close to that of McDonald’s (85% in Q2-2017, 84% for full-year 2016). At the same time, the
top of mind brand awareness stood at 39% in Q2-2017, compared with an average of 40% for the full-year 2016,
ranking better than McDonald’s (30% in Q2-2017, 30% for full-year 2016). For comparison purposes, for other
brands active in the quick-service restaurant sector, top of mind awareness is less than 5%, while spontaneous
awareness is below 30%.
The following table depicts the evolution of our KFC restaurants (including our restaurants in Italy and in the
Republic of Moldova) since 1997 to 30 September 2017.
82%76%
85%79% 80% 81%
Q1-2016 Q2-2016 Q3-2016 Q4-2016 Q1-2017 Q2-2017
Spontaneous awareness
40% 38%42% 39% 36% 39%
Q1-2016 Q2-2016 Q3-2016 Q4-2016 Q1-2017 Q2-2017
Top of mind awareness
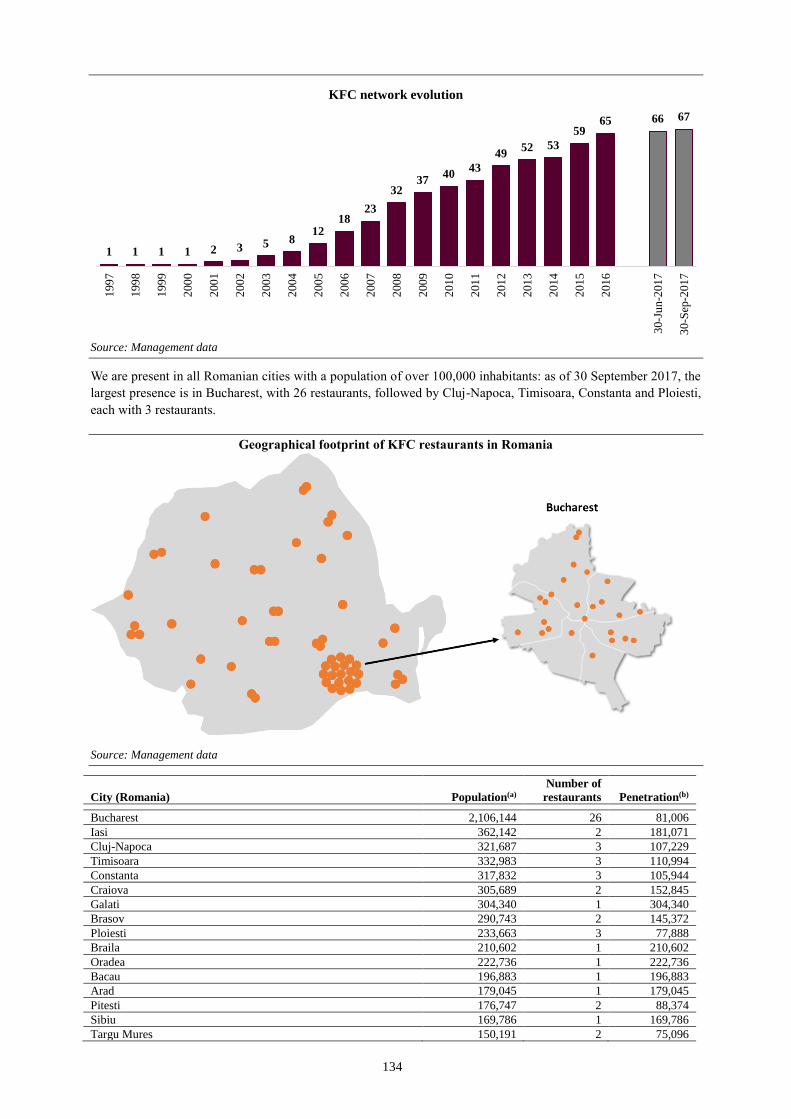
134
Source: Management data
We are present in all Romanian cities with a population of over 100,000 inhabitants: as of 30 September 2017, the
largest presence is in Bucharest, with 26 restaurants, followed by Cluj-Napoca, Timisoara, Constanta and Ploiesti,
each with 3 restaurants.
Geographical footprint of KFC restaurants in Romania
Source: Management data
City (Romania) Population(a)
Number of
restaurants Penetration(b)
Bucharest 2,106,144 26 81,006
Iasi 362,142 2 181,071
Cluj-Napoca 321,687 3 107,229
Timisoara 332,983 3 110,994
Constanta 317,832 3 105,944
Craiova 305,689 2 152,845
Galati 304,340 1 304,340
Brasov 290,743 2 145,372
Ploiesti 233,663 3 77,888
Braila 210,602 1 210,602
Oradea 222,736 1 222,736
Bacau 196,883 1 196,883
Arad 179,045 1 179,045
Pitesti 176,747 2 88,374
Sibiu 169,786 1 169,786
Targu Mures 150,191 2 75,096
1 1 1 1 2 3 5 812
1823
3237
4043
4952 53
5965 66 67
199
7
199
8
199
9
200
0
200
1
200
2
200
3
200
4
200
5
200
6
200
7
200
8
200
9
201
0
201
1
201
2
201
3
201
4
201
5
201
6
30-J
un-2
01
7
30-S
ep-2
01
7
KFC network evolution

135
City (Romania) Population(a)
Number of
restaurants Penetration(b)
Baia Mare 147,801 1 147,801
Buzau 135,601 1 135,601
Ramnicu Valcea 118,775 1 118,775
Suceava 116,404 2 58,202
Piatra Neamt 115,273 1 115,273
Drobeta-Turnu Severin 109,647 1 109,647
Targu Jiu 96,852 1 96,852
Deva 70,407 1 70,407
Total Romania 22,241,718 63
Source: Management data on 30 September 2017 (a) Population as of 1 January 2016, according to the National Statistics Institute of Romania; (b)Penetration calculated as population divided by number of restaurants
Of the 63 KFC restaurants operating in Romania as at 30 September 2017, 42 are food court locations (in malls or
commercial centres), 13 are inline (street locations), while another 8 are Drive-Thru locations. In the Republic of
Moldova, we operate one food court restaurant and one inline restaurant, while both restaurants in Italy are food
court locations. All our inline and Drive-Thru locations offer seating area.
The following chart depicts the evolution of the average sales per restaurant by total KFC brand in Romania, as
well as by each restaurant format (food court, inline and drive-thru) during the 2014-2016 period.
Average sales per restaurant (RON million) during 2014-2016
Source: Management data
During the 2014-2016 period, the average sales per restaurant increased by a CAGR of 18% across the entire
brand, from RON 4.9 million in 2014 to RON 6.9 million in 2016. This performance was mainly driven by the
strong increase in average sales of the Drive-Thru restaurants, which increased by a CAGR of 25%, from RON
7.0 million in 2014 to RON 10.9 million in 2016. The other two formats also performed well, with the average
sales of food court units increasing by a CAGR of 17%, from RON 4.8 million in 2014 to RON 6.5 million in
2016 and the average sales of inline units increasing by a CAGR of 16%, from RON 4.6 million in 2014 to RON
6.2 million in 2016.
The following table presents the typical data on our KFC restaurants by format, including size range, average
number of employees and target payback period.
Typical restaurant data
KFC Romania
Restaurant format
Food court Inline Drive
Unit size range (sqm)
80-120 250-500 400-500
Average no. of employees (all shifts)
40 45 60
Average capital expenditure (EUR, current cost) 350,000 650,000 900,000
Restaurant operating margin* (%, for year 2016)
21.5% 21.5% 21.5%
Source: Management data; * Restaurant operating margin is calculated across the entire brand, taking into account all
restaurants with full-year sales in 2016.
4.9 4.8 4.6
7.0
5.95.6 5.4
8.8
6.96.5
6.2
10.9
0
2
4
6
8
10
12
Total KFC Foodcourt Inline Drive
2014 2015 2016

136
KFC’s principal target customers in Romania are between 16 and 34 years old, but there is also a significant
demand from the 40-59 age group. According to the data from the National Statistics Institute of Romania, the 15-
34 age group comprised 26.1% and the 35-59 age group comprised 37.2% of the population in Romania as at 1
January 2016, respectively. Based on the Brand Image Tracker research report for the second quarter of 2017
undertaken by Kantar Millward Brown, which interviewed customers of quick-service restaurants aged between
16-59 years, 33% of total customers are in the 25-34 age group, 22% are in the 18-24 age group and another 22%
are in the 35-44 age group.
The following charts depict the demographic data of the quick-service restaurant customers in cities where KFC
restaurants are opened, based on the Brand Image Tracker research report for the second quarter of 2017
undertaken by Kantar Millward Brown.
Source: Kantar Millward Brown, "Brand Image Tracker" report, Q2-2017
In our KFC restaurants, we sell food and beverages products either individually or part of a price-attractive bundle
labelled "menu". Generally, the menus include three main components: a portion of a chicken-based product
(sandwiches, wrappers or pieces of chicken meat), a medium-sized portion of French fries and a medium-sized
non-alcoholic drink. For an additional price, our customers can choose to opt for the "Go Large" version of the
menu, which consists of large-sized portions of French fries and non-alcoholic drink. A dipping sauce is also
offered in some menu offers. Whereas menus are normally sized for one person, we also offer products, called
Buckets, that are targeted for group consumption (normally, up to four persons). Buckets generally consist of
higher number of chicken meat pieces and some include portions of French fries and non-alcoholic drinks.
The product portfolio of the KFC restaurants is well diversified and we continuously strive to offer customers a
very innovative product offering.
The following table depicts the sales seasonality of KFC sales in Romania, computed for all restaurants in
operation before 1 January 2016.
Source: Management data
The overall seasonality of our KFC restaurants is relatively stable and is not significant across each calendar year:
based on the 2016 data, the first half of the year accounted for 47% of total sales, while the second half accounted
23% 24%26% 27%
47.0%
53.0%
Q1
Q2
Q3
Q4
Q4
2
H1
H2
KFC sales seasonality in 2016 - quarterly and half-yearly

137
for the remaining 53%. By quarters, the lowest sales were recorded in the first quarter of the year (23%), while the
highest were recorded in the last quarter (27%).
In Italy, we have secured two regions where we can develop KFC restaurants, namely Trivenetto and Piedmont.
Our first two restaurants were opened in the Trivenetto region, in Verona (Adigeo mall) and Mestre (Valecenter
mall, in the metropolitan area of Venice). In the following period, we plan to open further food court restaurants,
which we expect to be of similar size (80-120 square meters) and to require same level of staff (approximately 40
employees) as our units in Romania, with average investment being expected to stand at around EUR 800,000.
Geographical footprint of KFC restaurants in Italy
Source: Management data
Pizza Hut
Pizza Hut is an American restaurant chain and international franchise founded in 1958 by Dan and Frank Carney.
The company is known for its Italian-American cuisine menu including pizza and pasta, as well as side dishes and
desserts. Today, Pizza Hut operates approximately 12,000 restaurants in 85 countries and territories worldwide
under the name "Pizza Hut" and is the largest restaurant chain in the world by number of restaurants specialising
in ready-to-eat pizza products.
Pizza Hut is the largest casual dine-in restaurant chain in Romania in terms of both total sales and number of
restaurants. The first Pizza Hut Dine-In restaurant opened in 1994 in Bucharest and, at the end of 2016, there were
21 Pizza Hut Dine-In restaurants across the major cities of Romania. In 2008, we opened the first delivery
restaurant, and by the end of the year 2016, our Pizza Hut Delivery network totalled 12 restaurants.
The charts below show trends in Pizza Hut’s spontaneous and top-of-mind brand awareness figures in Romania as
determined by Brand Image Tracker, an independent research undertaken by Kantar Millward Brown for the
periods shown. Spontaneous brand awareness tracks the percentage of respondents naming Pizza Hut when asked
to name casual dine-in service restaurants. Top-of-mind brand awareness tracks the percentage of respondents
choosing Pizza Hut as the first brand coming to mind when asked to name quick service restaurants.

138
Source: Kantar Millward Brown, “Brand Image Tracker” report, Q2-2017.
Both spontaneous and top of mind brand awareness for Pizza Hut are the highest among the casual dine-in
restaurant chains. The spontaneous brand awareness has been constant at 49% in the first three quarters of 2016,
while top of mind brand awareness was around 24-25% during the same period.
The following table depicts the evolution of our Pizza Hut restaurants in Romania since 1997.
Source: Management data
We are present in most of the Romanian cities with a population of over 200,000 inhabitants: as of 30 September
2017, the largest presence is in Bucharest, with 11 restaurants, followed by Cluj-Napoca with 3 restaurants and
Timisoara, Brasov, Ploiesti, each with 2 restaurants.
49% 49% 49%57%
Q1-2016 Q2-2016 Q3-2016 Q4-2016 Q1-2017 Q2-2017
Spontaneous awareness
25% 25% 24%30%
Q1-2016 Q2-2016 Q3-2016 Q4-2016 Q1-2017 Q2-2017
Top of mind awareness
1 1 1 1 3 3 3 3 3 3 4 4 511 13 13 13 13 15 14 14
1821 21 21
1 3 47 8
109 9
9
12 1316
199
4
199
5
199
6
199
7
199
8
199
9
200
0
200
1
200
2
200
3
200
4
200
5
200
6
200
7
200
8
200
9
201
0
201
1
201
2
201
3
201
4
201
5
201
6
30-J
un-2
01
7
30-S
ep-2
01
7
Pizza Hut network evolution
Pizza Hut Dine-In Pizza Hut Delivery
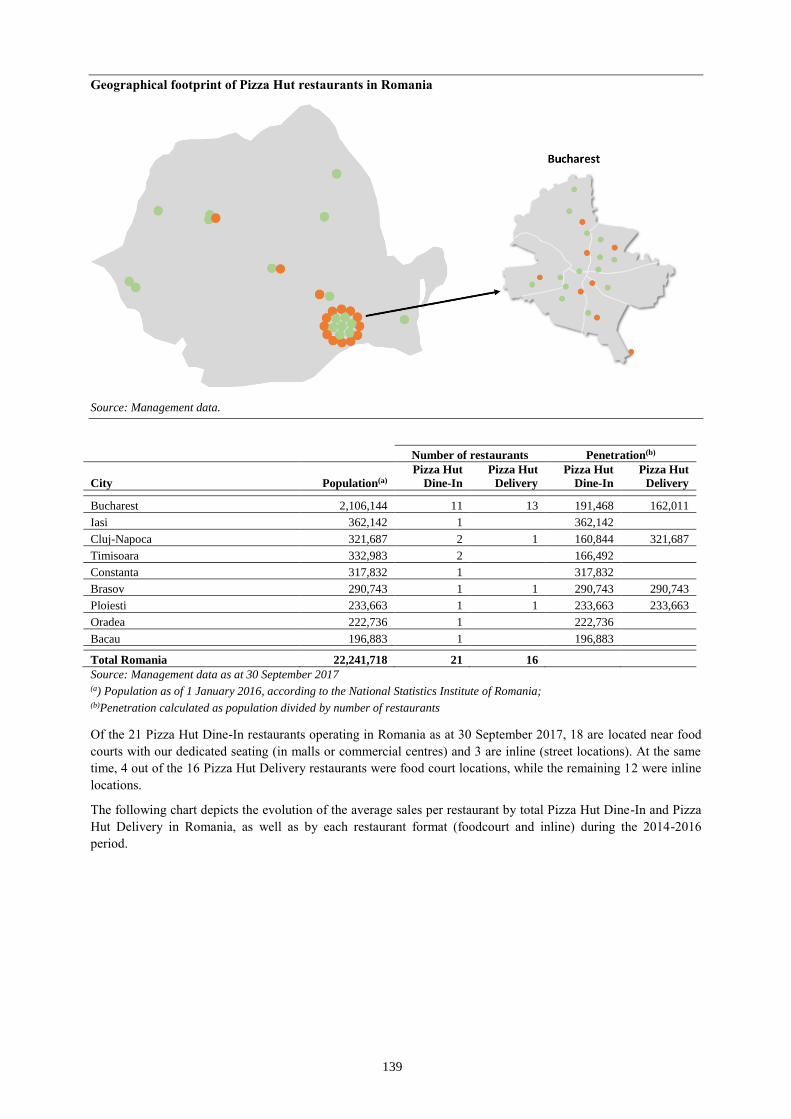
139
Geographical footprint of Pizza Hut restaurants in Romania
Source: Management data.
Number of restaurants Penetration(b)
City Population(a)
Pizza Hut
Dine-In
Pizza Hut
Delivery
Pizza Hut
Dine-In
Pizza Hut
Delivery
Bucharest 2,106,144 11 13 191,468 162,011
Iasi 362,142 1 362,142
Cluj-Napoca 321,687 2 1 160,844 321,687
Timisoara 332,983 2 166,492
Constanta 317,832 1 317,832
Brasov 290,743 1 1 290,743 290,743
Ploiesti 233,663 1 1 233,663 233,663
Oradea 222,736 1 222,736
Bacau 196,883 1 196,883
Total Romania 22,241,718 21 16
Source: Management data as at 30 September 2017 (a) Population as of 1 January 2016, according to the National Statistics Institute of Romania; (b)Penetration calculated as population divided by number of restaurants
Of the 21 Pizza Hut Dine-In restaurants operating in Romania as at 30 September 2017, 18 are located near food
courts with our dedicated seating (in malls or commercial centres) and 3 are inline (street locations). At the same
time, 4 out of the 16 Pizza Hut Delivery restaurants were food court locations, while the remaining 12 were inline
locations.
The following chart depicts the evolution of the average sales per restaurant by total Pizza Hut Dine-In and Pizza
Hut Delivery in Romania, as well as by each restaurant format (foodcourt and inline) during the 2014-2016
period.

140
Average sales per restaurant (RON million) during 2014-2016
Pizza Hut Dine-In Pizza Hut Delivery
Source: Management data
During the 2014-2016 period, the average sales per restaurant increased by a CAGR of 6% across the entire Pizza
Hut Dine-In channel, from RON 3.4 million in 2014 to RON 3.8 million in 2016. This performance was mainly
driven by the better performance in the average sales of the food court restaurants, which increased by a CAGR of
7%, from RON 3.3 million in 2014 to RON 3.8 million in 2016, while the average sales of inline units increased
by a CAGR of 3%, from RON 3.8 million in 2014 to RON 4.0 million in 2016.
During the 2014-2016 period, the average sales per restaurant increased by a CAGR of 22% across the entire
Pizza Hut Delivery channel, from RON 1.9 million in 2014 to RON 2.9 million in 2016. This performance was
almost equally driven by both formats, with the average sales of the inline restaurants increasing by a CAGR of
22%, from RON 1.9 million in 2014 to RON 2.8 million in 2016 and the average sales of food court units
increasing by a CAGR of 21%, from RON 1.9 million in 2014 to RON 2.9 million in 2016.
The following table presents the typical data on our Pizza Hut Dine-In and Pizza Hut Delivery restaurants by
format, including size range, average number of employees and target payback period.
Typical restaurant data
Pizza Hut Dine-In
Pizza Hut Delivery
Restaurant format
Food court Inline
Food court Inline
Unit size range (sqm)
200-400 200-700
80-100 80-120
Average no. of employees (all shifts)
32 37
26 26
Average capital expenditure (EUR, current
cost) 420,000 650,000 250,000 250,000
Restaurant operating margin* (%, for year
2016)
20.5% 20.5%
17.0% 17.0%
Source: Management data; * Restaurant operating margin is calculated across the entire brand (Pizza Hut Dine-In and Pizza
Hut Delivery, respectively), taking into account all restaurants with full-year sales in 2016
Pizza Hut’s target customers in Romania are between 16 and 34-year old, but there is significant demand also
from the 35-59 age group. According to the data from the National Statistics Institute of Romania, the 15-34 age
group comprised 26.1% and the 35-59 age group comprised 37.2% of the population in Romania as at 1 January
2016, respectively. Based on the Brand Image Tracker research report for second quarter of 2017 undertaken by
Kantar Millward Brown, which interviewed customers of quick-service restaurants aged between 16-59 years,
32% of total customers are in the 25-34 age group, 23% are in the 18-24 age group and another 23% are in the 35-
44 age group.
The following charts depict the demographic data of the casual dine-in restaurant customers in cities where Pizza
Hut restaurants are opened, based on the Brand Image Tracker research report for second quarter of 2017
undertaken by Kantar Millward Brown.
3.43.3
3.83.7
3.6
4.0
3.8 3.8
4.0
2
3
3
4
4
5
Total Pizza Hut Dine-In Mall Inline
2014 2015 2016
1.9 1.9 1.9
2.2 2.2 2.2
2.9 2.8 2.9
0
1
1
2
2
3
3
4
Total Pizza Hut Delivery Mall Inline
2014 2015 2016

141
Source: Kantar Millward Brown, "Brand Image Tracker" report, Q2-2017
The following chart depicts the sales seasonality of Pizza Hut sales in Romania, computed for all restaurants in
operation before 1 January 2016.
Source: Management data
The overall seasonality of our Pizza Hut restaurants is relatively stable across the year: based on the 2016 data,
our sales were equally split between the two halves of the year. By quarters, the lowest sales were recorded in the
third quarter of the year (24%), while the highest were recorded in the last quarter (27%).
Restaurant management and operation
The management of each brand’s restaurant network has a two-tier structure: a line of regional managers
(generally, one for Bucharest and one for our restaurants outside Bucharest) coordinating area coaches, who
oversee the activity of a number of restaurants (usually six to nine) located in a designated area. Area coaches
allocate most of their time at restaurant level and their main responsibilities are, among others, to ensure that the
restaurants under their supervision operate at all times according to the internal quality standards and are properly
staffed based on the volume of activity, to coordinate local promotions and to help restaurants meet the sales and
profit budgets.
The management of the two KFC restaurants in Moldova is integrated into the network management of the KFC
restaurants in Romania. The operation of the two restaurants in Italy is currently under the responsibility of the
Chief Operations Officer, but we expect to hire and retain a dedicated management team headquartered in Milan,
including an Operations Manager or Brand Manager that will drive the business and network expansion in the
country.
At the restaurant level across all restaurant formats, the management team is generally comprised of a restaurant
manager, deputy managers and manager assistants, who coordinate the work of the restaurant crew (cooks,
cashiers, waiters, drivers etc.).
26%24% 24%
27%
50.0% 50.0%
Q1
Q2
Q3
Q4
Q4
2
H1
H2
Pizza Hut sales seasonality in 2016 - quarterly and half-yearly

142
Restaurant development
The overall restaurant development process is a comprehensive methodology of estimating the total market
potential for a specific brand taking into account a number of factors, the identification of main trade areas and the
positioning of the new restaurants within these trade areas, the negotiation of the main contractual terms for the
proposed sites, the design and effective construction of the restaurants as well as their ongoing management after
opening. The key components of the restaurant development process are:
• Market development strategic plan
• Market planning
• Site selection and approval
• Restaurant design and construction
• Asset management
Market development strategic plan is the first step comprising assessment of the overall potential of a market in
terms of total number of restaurants that can be opened for the respective brand at a certain period. Key factors
that are considered in determining the market potential are the total population of the country, the proportion of
urban population and density, as well as the purchasing power. The market potential is reviewed periodically
based on the changes in its underlying factors.
Market planning determines the optimal location of restaurants based on the detailed analysis of such factors as
population density, existing traffic generators (such as shopping centres, entertainment/cinema centres,
hypermarkets, DIY & furniture retailers, schools/universities), traffic (car, public transportation and pedestrian)
and competition. Based on the market planning analysis, cities are divided into several trade areas, in which new
locations are considered to be developed.
Site selection and approval phase, in which multiple sites are assessed before selecting the optimal location, based
on factors such as lease cost and planning-related issues (such as zoning restrictions). We usually lease sites for a
minimum five years for food court and inline locations and 10-20 years for drive-thru locations, with a break up
option after three years for food court and inline locations and five years for drive-thru locations. Contract
extensions are generally made by way of a notification served within the 12 months before the expiration of the
contract, when lease terms can be renegotiated.
Given the strong brand awareness of both KFC and Pizza Hut brands among the Romanian consumers and their
proven ability to attract traffic to commercial centres, we believe we have been generally able to secure favourable
locations and lease terms for the majority of the sites we operate.
Once a suitable site is identified and pre-agreed by Yum!, an estimated capex is drafted together with a 10-year
profit & loss forecast, which requires approval by the top management team before the lease contract is signed.
Restaurant design is done by our dedicated staff working together with external architecture service providers,
with the final design being validated by Yum! on a restaurant-by-restaurant basis. Actual construction of our
restaurants is undertaken by third-party construction firms, and may take between two to six months, depending
on the restaurant format and specific site features.
Investments
The following table depicts the investments in fixed assets that we have made over the past three years and a half.
Investments by Company (RON million) 2014 2015 2016 30-Jun-2017
USFN (Romania)
Purchase of intangible assets 0.43 1.25 2.92 1.13
Purchase of property, plant and equipment 4.11 10.94 15.54 14.60
ARS (Romania)
Purchase of intangibles 0.04 0.95 1.49 0.05
Purchase of property, plant and equipment 1.12 5.82 9.11 2.92
Total investments 5.70 18.95 29.05 18.70
Sources: USFN (Romania) Annual Financial Statements and of ARS (Romania) Annual Financial Statements; Sphera Interim
Financial Statements, unaudited; ARS (Romania) Interim Financial Statements, unaudited
Our investments are principally directed to the opening of new restaurants, with a smaller portion being allocated
for the remodelling of the existing restaurants. We opened two KFC restaurants in 2014, six KFC and four Pizza

143
Hut Dine-In restaurants in 2015 and six KFC, four Pizza Hut Dine-In and three Pizza Hut Delivery restaurants in
2016.
Our future investment plan is mainly linked to the network development commitment that we have signed with
Yum!, through development agreements for each brand and market. For more information in the development
commitments to Yum!, please see section "Strategy" in this chapter of the Prospectus.
Given the relatively long period until a proper site location is identified and developed into a fully functioning
restaurant and in order to safely meet the minimum restaurant commitments as agreed with Yum!, we are
assessing a number of potential units on an ongoing basis, with the current pipeline of identified new locations
covering the years 2018 and 2019 of approximately 30 possible locations.
The following table depicts the main investment costs associated with the opening of new restaurants and the
remodelling of the existing ones, for the main restaurant formats that we expect to open in the following years.
Data in EUR
KFC Romania
KFC
Italy
Pizza Hut
Dine-In
Pizza Hut
Delivery
Food
court Inline
Drive-
Thru
Food
court
Food
court
Inline
New restaurant investment*
350,000 650,000 900,000
800,000
420,000
250,000
Franchise fee
Initial**
50,100 50,100 50,100
50,100
50,100
25,100
Renewal
25,500 25,500 25,500
25,500
25,500
12,500
Existing restaurants - remodeling
Minor remodeling
30,000 30,000 30,000
55,000
55,000
30,000
Major remodeling
50,000 50,000 50,000
130,000
130,000
50,000
Source: Management data
* Expected average cost for new restaurants starting year 2017;
** The initial franchise fee is included in the new store investment
Expected average investment costs associated with the opening of new Taco Bell food court restaurants for the
main restaurant format that we expect to open in the following years is Euro 350,000.
We will continue to make significant investments in the following years in the growth of our business, primarily
through opening new restaurants, but also by investing in existing restaurants. We believe that the current loan
facility from Alpha Bank Romania that we are in the process of extending is adequate for financing our capital
expenditure needs over the following 12 months.
Supply Chain Management
In order to safeguard the quality and food safety standards of our products, we develop supply relationships only
with producers or suppliers that are able to demonstrate high standards of food safety, product consistency and
availability. For the food supplies and ingredients that either present food safety risks, are critical to the brands,
have a supply risk or are complex to produce (such as meat, cheese, some pizza toppings, tomato paste, flour and
some spice mixes), suppliers need to be pre-approved by Yum! and audits on their operations are conducted on an
annual basis. These audits are performed by independent specialized companies approved by Yum!.
Moreover, we are constantly researching the market to identify new prospective suppliers and monitor market
prices of our key food supplies in order to achieve better purchasing terms and improve our supply flow.
Over 70% of the Group’s food supplies and ingredients are sourced from the Romanian market, covering
important categories such as meat, cheese and vegetables. Some products, of which a few are critical to the
brand’s product identity (such as seasonings, tomato paste, pizza flour) are procured through Yum!’s international
procurement agreements.
For KFC, our top suppliers for chicken meat are Agrisol International S.A. (Romania), Safir S.R.L. (Romania) and
Pilco Ltd (Bulgaria). All of them make deliveries both to the warehouse and directly to the restaurants, while
payment terms vary between 20 and 30 days. We supply shortening from Zaklady Tluszczowe (Poland), with
deliveries directly to the central warehouse and payment terms of 30 days. The non-alcoholic beverages are
supplied by the Coca-Cola Romania, which delivers directly to the restaurants and has a payment term of 15 days.
For Pizza Hut, we work with Ceres (Belgium) for flour (deliveries to the central warehouse and payment term of
60 days), Indalco Mures S.R.L. and International Food Link Ltd (UK) for various types of cheese (deliveries to

144
the central warehouse and payment term of 15-30 days), Ifantis for ham products (deliveries to the central
warehouse and payment term of 21 days) and Coca-Cola Romania for non-alcoholic beverages (same conditions
as for KFC).
We seek to have more than one supplier for each of its food supplies in order to maintain adequate price
competition and ensure alternative procurement channels; for chicken meat, where product calibration is
important, we work with multiple suppliers so that we can safely secure adequate quantities at all times; other
important products such as non-alcoholic beverages are almost exclusively supplied from a single supplier, as the
market is dominated by two large players. We have extended our contract with the Coca-Cola Romania in
February 2017 for another five-year term, maintaining favourable commercial terms on product prices, equipment
and product distribution to the restaurants, on a non-exclusive basis.
We have our own quality assurance team which ensures compliance with all relevant health and sanitation
requirements, establishes key performance indicators for suppliers and monitors compliance with them, liaises
with Yum! quality assurance personnel and provides training and other technical support to restaurant staff.
At the same time, we are able to ensure the traceability of all our raw materials and ingredients from suppliers to
restaurants, in accordance with local food safety regulations.
Quality Assurance
In all our restaurants, we are committed to providing the highest standards of food quality and safety. We have a
dedicated Quality Assurance team that ensures compliance with all relevant health and sanitation requirements,
establishes key performance indicators for suppliers and monitors compliance with them, liaises with Yum! quality
assurance personnel and provides training and other technical support to restaurant staff.
Quality assurance at supplier level
Suppliers of the food products, ingredients and food-contact packing materials that either present food safety risks,
are critical to the brands, have a supply risk or are complex to produce (such as meat, cheeses, some pizza
toppings, tomato paste, flour and some spice mixes) are required to be pre-approved by Yum!, following several
specialized audits whose requirements are generally higher than the ones imposed by the current legislation. These
suppliers must also conduct annual audits on their operations, which are carried out by independent specialized
companies approved by Yum!. In case of non-conformities, suppliers are required to perform another audit within
60 days to close such non-conformities. In this respect, we use a dedicated Yum! website platform (Starnet)
through which we ensure the permanent information of the suppliers with our requirements, the availability of the
audit reports and their monitoring online.
Together with suppliers, we organise "cutting sessions" on a periodic basis, which consist of the verification of the
physical and sensory testing for the core products. Following these sessions, we assess the conformity of the tested
products against our standards and make proposals for the continuous improvement of their product quality. We
also offer permanent support for all our suppliers in order to comply with our food safety and quality
requirements.
Quality assurance at restaurant level
All our restaurants have implemented food safety procedures in accordance with HACCP principles, which are
provided by the EU and local legislation (EU Regulation 852/2004, EU Regulation 853/2004; Romania’s
Government Decisions 924/2005 and 925/2005). Through these procedures, we continuously monitor all
parameters with potential impact on consumer health, such as product storing temperature, cooking temperature,
personnel hygiene and of the restaurant’s facilities. We ensure the safety of our products through monthly self-
testing programs of the microbiological parameters of the finished products, water, ice and working surfaces.
We are monitoring the traceability of all our raw materials and ingredients from suppliers to restaurants, in
accordance with local food safety regulations. We also conduct annual mock recovery tests, in order to identify
and improve potential traceability gaps.
A key objective of our Quality Assurance department is the proper and continuous training of the food safety team
of each restaurant and the quick updating of the changes in legislation and the research in the food safety field
(such as EFSA – European Food Safety Authority and GFSI - Global Food Safety Initiative).
We have also implemented a food safety crisis management procedure at the restaurant level, which sets in detail
the responsible persons and the steps that need to be followed for a swift resolution of a potential crisis. We train

145
our restaurant staff on this food safety crisis management procedure on an annual basis. In the past three years, we
have never had any significant events related to the food safety in our restaurants.
We also strive to provide our customers with detailed information regarding the ingredients, nutritional values and
allergens of our products.
Our Quality Assurance department ensures the interface with the State authorities on the food safety, such as DSP
(Public Health Department, ANSVSA (National Sanitary Veterinary and Food Safety Association), ANPC
(Consumer Protection National Association) during all the controls initiated by these authorities and provides all
required feedback.
Distribution
Since November 2016, warehousing and transportation activities have been outsourced to Havi (Romania), which
is the Romanian subsidiary of the US-based logistics services provider HAVI Group, with a strong European
presence. Havi (Romania)'s warehousing facilities meet the highest applicable logistics and food safety standards,
including product traceability.
As part of the contract we have with them, most of the products are acquired directly by Havi (Romania) from our
pre-agreed suppliers (with a few notable exceptions, such as beverages from Coca-Cola Romania and part of
chicken deliveries, which are supplied directly to the restaurants), stored in Havi (Romania)’s warehouses and
delivered to the restaurants on demand. Each restaurant in our network estimates its own inventory needs based on
the current and prospective short-term sales forecasts, as well as on the pre-set delivery schedules and sends the
inventory acquisition requests to Havi (Romania), which consolidates them and initiates purchasing orders from
our suppliers. The responsibility of stocking lies generally with Havi (Romania), except for special periods such as
the promotion of novelty products or during winter period, when we take responsibility for the volume of
acquisition initiated to certain suppliers.
Transportation is provided by Havi (Romania) and is based on pre-set delivery schedules to all the restaurants,
which generally takes place on a daily basis for Bucharest restaurants and twice a week for restaurants outside
Bucharest.
Distribution of restaurant supplies to our KFC restaurants in the Republic of Moldova is done directly from
Romania, through Havi (Romania). In Italy, we supply our KFC restaurants from the distribution network
developed and maintained by Yum! in Italy. This means that we have access to the same restaurant supplies and
prices as any of the other franchisees operating in Italy.
Marketing and Advertising
Our marketing strategy aims at growing sales and margins by strengthening or consolidating the KFC and Pizza
Hut brand awareness among our consumers, through various actions and targeted messages that boost the appeal
for our brands, promote the quality of our products, outline our innovative drive, and our desire to offer an
elevated guest experience. Through a combination of innovative products and attractive value-for-money deals
offered in our restaurants, we aim at increasing our customers’ visit frequency as well as their loyalty towards our
brands.
To this end, we are actively surveying consumers’ perception patterns towards our brands, products and services
as well as on their food consumption patterns and lifestyle preferences in order to continuously improve our
offering and thus remain relevant with our consumers. The main types of consumer research that we are
conducting are the following:
• Brand Image Tracking reports
The main purpose of Brand Image Tracking reports is to identify quick-service and full-service restaurant
market’s size and consumption incidence, measure the progress made by the brands quarter by quarter,
benchmarking our brands against appropriate major competitors, on a set of critical image attributes, identify
our brands’ strength and discover the communication pillars that will help the brand grow, as well as assess
campaigns’ performance.

146
• Usage & Attitudes reports
These reports identify people attitudes towards quick-service and full-service restaurant concepts,
consumption habits, triggers and barriers towards these foodservice categories, and identify market segments
with the strongest potential to be targeted by our brands and opportunities for growth.
• Concept and Product tests
For each innovation window, we test the new concepts and products to be launched in order to choose the
most successful product between several variants, optimize the products in order to make sure they fit
consumers taste and optimize the selling price. For existing products, we test potential improvements in
ingredients, taste and perception in order to boost their appeal with our consumers.
• Business opportunity studies
These studies assess the potential of launching a new brand on the market, by identifying the competitive set
and expected financial performance, whether there is room for another player, assess customers’ appeal
towards the type of restaurant intended to be open and test the products of the new brand with consumers.
Our consistent marketing activity has enabled our brands to enjoy one of the highest levels of awareness among
the Romanian restaurant customers. According to the "Brand Image Tracker" report, January-March 2017,
prepared by Kantar Millward Brown, the spontaneous (unaided) awareness of KFC averaged 80% during 2016,
being close second to that of McDonald’s, our main competitor (83%) and much higher than the next competitor
on the QSR segment (Subway, with 25%). During the same period, the spontaneous awareness of Pizza Hut
reached 49% by the end of year 2016, ranking first, with the next competitor having reached 16%.
The overall marketing activity generally relies on several different pillars, but strategically there are four key
directions that are present in the communication plan:
• Reinforce core products;
• Strengthen innovation;
• Grow new layers;
• Value always on.
Reinforcing core products refers to the promotion of products that are considered as defining the essence of our
brands (such as Buckets, Twister sandwiches, Hot Wings or Crispy Strips products for KFC, certain pizza recipes
on pan, classic and stuffed crust dough for Pizza Hut). These products represent an important part of our sales mix
and generally command above average gross margins. Innovation refers to the launch of new product offerings,
generally over a limited period, aiming to bring novelty into our menus and increase the perception of variety
among our customers. Over the past few years, we were particularly successful in launching new products such as
Fillet Bites, Burritos and American Bites for KFC, Cheesy Bites Remix, Cheese and Pepperoni and Flatbread
pizzas for Pizza Hut. Growing new layers offers the possibility of tapping into new consumer segments or
dayparts by introducing breakfast & coffee, sandwiches, portable snacks, new range of beverages & desserts or
delivery. Value always on refers to our strategy to maintain attractive value-for-money offerings permanently into
our menus, though we also run dedicated campaigns on value products during each year.
As per the franchise agreements signed with Yum!, we spend at least 5% of our revenues on marketing and
advertising activities. For 2016, this expense amounted to RON 26.5 million; of this amount, approximately 65%
was spent on media (mostly on TV, outdoor and digital media). Given the size of the marketing budget, we have
been increasingly able to produce the TV commercials and digital activations locally, which enable us to
personalize the messages based on the local consumer insights. In the past 3 years, we moved from tactical
communication to 360° campaigns which build a genuine emotional connection to the Romanian consumer and
allowed for the brands to be relevant for the target consumer.
For the KFC brand, we are now present with TV advertisements in all our six main marketing campaigns
(covering 48 weeks in the year 2016), with all TV commercials being produced locally. For Pizza Hut, two out of
the five commercials broadcasted on TV during 2016 were filmed locally and we have increased our total TV
coverage to 36 weeks during the year 2016. TV is used as the main reach builder for young adults and we increase
visibility by generally placing our television commercials in premium positions. Our out of home strategy is
focused on covering the proximity of our restaurants, but also identifying new relevant areas of interest for our
target customers. We also use tactical supports to spread the news when needed (branded buses, poster frames,
branded subway, full branded bus stations). We are also highly present following our consumer’s increased digital

147
use and general online habits, focusing campaigns to that specific segment and leveraging on our brand awareness
and visibility.
Our communication partners are McCann Worldgroup Romania for creative services, MRM McCann for digital
content, Universal McCann for media strategy and planning and Golin Romania for PR and social media, all of
them globally awarded agencies with strong track records on the Romanian market.
In Italy, we pay the contractual advertising contribution (set at 5% of sales) directly to KFC Italy SRL, which is in
charge with all marketing activities across the country.
The quality and efficiency of our marketing campaigns in Romania have been recognized over the past years by
marketing institutions across the world through a large number of awards. The most important of these awards and
recognitions are the following:
• EFFIE Awards – one of the most significant awards in the industry, evaluating a campaign’s both creative
idea and efficiency (as measured by sales performance). The competition is a national award spread
internationally and it has been organized since 1968 by the New York American Marketing Association.
- 2017 - SILVER EFFIE for KFC – "Christmas Bucket", "Smart Menu", Sustained Success (performance
of last 3 years);
- 2017 - KFC – Brand of the Year;
- 2016 - SILVER EFFIE for KFC – "American Bites";
- 2016 - BRONZE EFFIE for KFC – "Duetos", "Fakation";
- 2016 - BRONZE EFFIE for PH – "No Keyboard" campaign.
• Golden Drum Awards – established in 2004, the Golden Drum Advertising Festival of New Europe is one of
advertising's biggest and most important events, celebrating excellence in marketing and communication
across different cultures
- 2015 - SILVER Drum for "Little Money Big Fun" in Digital Campaigns;
- 2014 - SILVER Drum for "Best Part of Pizza" in Direct Marketing;
- 2013 - SILVER Drum for "Bite to Win" in Digital Campaigns;
- 2013 - SILVER Drum for "Bite to Win" in Mobile Campaigns.
• Eurobest Awards - the organizer of Cannes Lions, Eurobest is the celebration of European creativity. It’s a
festival that draws on the continent’s varied cultures and vibrant communities to inspire learning, interaction,
debate, and a healthy dose of competition.
- 2015 - GOLD in PR – "Little Money Big Fun" campaign.
• Internetics Awards – the first branding, marketing and online advertising festival in Romania. Organized
since 2001, the competition contributes to the development and improvement of the online and digital
industry in the country.
- 2016 - GOLD – KFC: The most creative brand of the year;
- 2016 - GOLD – Social Media: Special Mechanics – "Little Money Big Fun";
- 2016 - GOLD – Social Media: Special Mechanics – "Fakation";
- 2016 - SILVER – Interactive Campaigns: Full Digital Campaign – "Wi-Fi Test".
• One Show Pencils – a very prestigious awards show recognizing the best creative work in advertising,
interactive, design and branded entertainment organized every year in New York and opened to brands and
agencies from around the world.
- 2016 - BRONZE for KFC "Rich Kids of Instagram" campaign (digital).
• Festival of Media Global – Rewarding the very best media campaigns from around the globe, the Festival of
Media Awards is established as the leading recognition for brands, agencies, media brands and
digital/marketing specialists. The Awards provide the benchmark for innovation in media across its Global,
MENA, APAC and LatAm editions.
- 2016 - SILVER Best Use of Content - "#littlemoneybigfun".

148
Our contractual relationship with Yum!
Franchise Agreements
We enter into franchise agreements with Yum! entities upon the opening of and in respect of carrying business in
each of our restaurants (the "Franchise Agreements"). Each Franchise Agreement requires that certain guarantors
(the "Guarantors") enter into a shareholder deed with the Franchisor whereby the Guarantors guarantee
Franchisee's obligations and liabilities under the Franchise Agreement.
On the date of this Prospectus, members of our Group have entered into a number of 105 Franchise Agreements
with Yum! entities for the operation of our restaurants under the Yum! franchise.
All Franchise Agreements are based on the standard international franchise agreement, the main terms and
conditions of which are summarised hereinafter:
Franchisors: Yum! Restaurants International entities.
Franchisees: USFN (Romania) for KFC, ARS (Romania) for Pizza Hut and Pizza Hut Delivery, and California
Fresh Flavors (Romania) for Taco Bell, where KFC, Pizza Hut & Pizza Hut Delivery and Taco Bell, are referred
hereinafter to as "Concepts".
Licence: right to use (i) the system for preparation, marketing and sale of food products used in operating the
Concepts (the "System"), (ii) the contents of the manuals and all other know-how, information, specifications,
systems, and data used in, or in respect of, the System, including trade secrets, copyrights, design, patents and
other intellectual property rights (the "System Property") and (iii) the trademarks, service marks, trade names and
other similar rights owned by the Franchisor or its affiliates and designated from time to time for use in the
business (the "Marks").
General terms and conditions:
Non-exclusivity: the Licence is granted on a non-exclusive basis; the Franchisor and its affiliates operate and may
operate restaurants (other than the restaurant for which the Franchise Agreement is entered into with the
Franchisee) or other systems for the sale of food products and services, which may compete directly with the
business operated by the Franchisee under the Franchise Agreement.
Use only: the Marks, the System Property and the goodwill associated with them are the exclusive property of the
Franchisor and its affiliates. The Franchisee does not acquire any rights, interests or benefits to them, other than
the right of use, based on the Franchise Agreement. The Franchisor may at any time change or withdraw any of
the Marks or designate new Marks and the Franchisee must implement such changes.
Term: typically 10 years. The Franchisee may renew the Franchise Agreement for a one-time renewal term with
identical contractual and financial terms (except for the contract renewal clause), subject to satisfaction of a series
of conditions (e.g. notice period, no breach of contract, no payment default, upgrade of the restaurant, training and
certification under Franchisor's management training programmes etc.) and payment of the renewal fee.
Fee structure: exclusively for the grant – a fixed amount initial fee paid upon grant ("Initial Fee") and continuous
fees payable during the term of the Franchise Agreement (expressed as a percentage of the revenues)
("Continuing Fees"). The amounts to be paid must be free of any deduction, without set off, and free of any taxes
payable in respect of such amounts, other than as required by law. Any late payments shall trigger accrual of
default interest.
Conduct of business: the business must be conducted in strict compliance with the manuals and standards imposed
by the Franchisor.
Pricing: the Franchisee is free to set its own prices of the Approved Products; the Franchisor may recommend
prices.
Guarantee: provision of a guarantee by the Guarantors to secure the Franchisee's obligations and liabilities under
the Franchise Agreement.
Right to inspect locations: the Franchisor has the right at all times during the opening hours to enter and inspect
the restaurant without prior notice to the Franchisee.
Right to inspect accounting records: the Franchisor has the right to inspect and audit at any reasonable time the
records of the Franchisee. In case any deficiency is found in the Franchisee's payment of any amount payable or

149
required to be spent by the Franchisee, the Franchisee shall immediately pay the deficiency plus a late payment
interest and, in certain cases, all audit or inspection costs.
Other discretions: the Franchisor may apply payments from the Franchisee in any manner and to any indebtedness
owed to Franchisor as the Franchisor may deem appropriate.
Upgrades: the Franchisee must upgrade the restaurant in accordance with the Franchisor's instructions, with
generally no upgrade obligation during the last 2 years of the term.
Insurance: maintained at all times by the Franchisee, and the Franchisor named as an insured party.
Approved Products: the Franchisee may only prepare, market or sell products or services approved by the
Franchisor in advance (the "Approved Products"). The Franchisor notifies the Franchisee of the Approved
Products to be offered for sale at the restaurant as permanent menu items and specifies the times during which the
products are to be offered.
Future Rebranding: the Franchisor may at any time and for any reason, at its discretion, withdraw the right to use
any or all Marks related to the Concept at the restaurant and require the Franchisee to adopt alternative marks
specified at that time by the Franchisor.
Exclusive suppliers: the Franchisee may purchase the supplies, materials, equipment or services used for the
business exclusively from suppliers and using the distributors approved by the Franchisor or from other
franchisees of the Franchisor, prior to the time of supply or distribution. The Franchisee waived any claims against
the Franchisor for any non-delivery, delayed delivery or non-conforming delivery by any supplier or distributor or
by another franchisee.
Advertising: any advertising, marketing, research or promotional activity of the business must be carried out only
with the prior approval of the Franchisor. A percentage of the Franchisee's revenues from the restaurant
("Advertising Contribution") must be directed for this purpose in accordance with the Franchisor's instructions,
including, to a co-operative advertising/marketing fund. The amounts paid to the co-operative
advertising/marketing fund are not required to be spent for the specific benefit of the Franchisee or its business.
For certain restaurants only, subject to strict compliance by the Franchisee with its obligations under the Franchise
Agreement, the Franchisor agreed to re-pay to the Franchisee each month during the first 2 years of the agreement
term 100% of the Continuing Fees that the Franchisor receives timely and the Franchisee agreed to use such
amounts for advertising purposes and only for such expenses as the Franchisor approves in writing. The
Franchisor may terminate such payments in case of certain events.
Indemnity: full indemnity of the Franchisor and its affiliates in connection with the Franchisee's conduct of
business and exercise of rights under the Franchise Agreement or with any act or omission by any agent,
representative, contractor, licensee, or invitee of the Franchisee (except in case of Franchisor's fault or
negligence).
Non-compete: for wholesale or retail preparation, marketing or sale of any food products by the Franchisee, on
own account or as a member, shareholder, director, employee, agent, partner, joint venturer, advisor, consultant or
lender – applicable within a radius of 5 km of any Pizza Hut restaurant located in the country where the restaurant
is located. Yum! cannot reasonably withhold approval if requested by us other than when the following products
constitute more than 20% of products sold: Pizza, Chicken, Ready to eat Chicken, Mexican, Beef burger products.
No assignment/encumbrance: the Franchisee may not charge, pledge or encumber or create security interest or
lien over any interest in or right under the Franchise Agreement or in the business or in any assets of the business.
Subject to satisfaction of a series of conditions, the Franchisor may transfer an ownership interest in the Franchise
Agreement to a spouse or a child without the consent of the Franchisee being required. In case of permitted
assignments, transfer fees and costs apply. These restrictions apply also to: (i) sale, transfer, charge, gift or pledge
by any party of any interest or share in the Franchisee, (ii) issue of any new shares in the Franchisee to any party
who is not a shareholder in the Franchisee at the date of grant and (iii) reconstruction, reorganisation,
amalgamation or other material change in the structure or financial condition of the Franchisee (the "Corporate
Restructuring Events"). The Company, acting on behalf of each Franchisee under the Franchise Agreements,
applied and obtained the written approval of Yum! acting on behalf of each Franchisor under the Franchise
Agreements for the restructuring of the Group prior to the Offering and for the Offering and of any and all
transactions and operations carried out or to be carried out in connection therewith.
Sale Transfer Policies: the Franchisor may at its sole discretion introduce or withdraw from time to time Sale
Transfer Policies that would be reflected in the Franchise Policies Manual.

150
Termination:
By the Franchisor with prior notice to the Franchisee, in case of inter alia the following events of default:
• Preparation, marketing or sale of products or services other than the Approved Products;
• Sub-lease of business or any parts thereof or conduct of business outside the restaurant without the approval
of the Franchisor;
• Breach of obligations related to Marks and System Properties;
• Breach of confidentiality obligations;
• Breach of prohibitions and related obligations with respect to the non-assignability of the business or of the
Franchise Agreements, including in case of Corporate Restructuring Events;
• Breach of the guarantee by the Guarantors (subject to a cure period);
• Any crime, offence or act carried out by the Franchisee or any Guarantor likely to adversely affect the
goodwill of the business, the Marks, the System or the System Property;
• False records maintained by the Franchisee or false data reports to the Franchisor;
• Abandonment or cessation of business operations for more than 3 consecutive days;
• Cross-default with any agreements related to the business (subject to a cure period).
Rights in addition to termination: In case any of the events described above occur, additionally the Franchisor
may take the following actions:
• Termination of Franchisee's right to renew the Franchise Agreement;
• Termination of any development or option rights in respect of any system or concept granted to the
Franchisee pursuant to any agreement between the Franchisor and the Franchisee (or their affiliates);
• Take any action deemed necessary to cure the breach at the Franchisee's cost; or
• Limit or withhold the supply of any products, supplies, material, equipment or services supplied to the
Franchisee by the Franchisor or its affiliates.
The Franchisor may also take control of business for such period as it deems necessary at the Franchisee's cost.
Consequences of termination: Immediately upon the expiration or termination of the Franchise Agreement, the
Franchisee will:
• Pay all amounts owing to the Franchisor;
• Discontinue use of Marks, System and System Property and cease holding out any affiliation with or
association to the Franchisor or the System;
• Dispose of all materials bearing the Marks, and all proprietary supplies in accordance with the Franchisor's
instructions; and
• De-identify the restaurant if required by and in accordance with the instructions of the Franchisor.
Based on our Master Franchise Agreement entered into with P.H. Europe S.a.r.l. on 11 April 2016 for the franchise
rights to operate Pizza Hut Delivery restaurants, in April 2016 we have sub-franchised the right to develop and
operate a Pizza Hut Delivery restaurant to American Delivery System S.R.L., a Romanian private limited liability
company, under substantially the same terms and conditions as set out in our Franchise Agreements with Yum!.
Development commitments
We have committed to Yum! to develop and operate a certain number of restaurants for the Yum! brands within a
specific period of time, as detailed in section "Business - Strategy" of this Prospectus. Under the development
commitments, subject to us reaching certain trigger number of restaurants and fulfilling other minimum
conditions, Yum! may grant us certain incentives. There are also consequences in case we fail to develop the
minimum number of restaurants, as detailed above.
KFC (Romania)
In case we fail to develop the minimum committed number of restaurants per year, we must forego the initial fees
for each restaurant not opened during the respective year and remain obligated to open any such outstanding
restaurants in the subsequent year. Also, we are required to pay an assumed continuing fee of USD
5,000/month/restaurant commencing on the first day of the subsequent year in respect of each month or part of the

151
month that the minimum target is not satisfied. The assumed continuing fee falls due on the earlier of: (i) date of
opening of restaurant, at which point the assumed continuing fee shall be paid in full and shall then cease to
accrue, and from which point the standard continuing fee shall begin to accrue; and (ii) last day of the year
subsequent to the year in which the development target has not been met (for a period of 10 years). If a third party
opens a restaurant in the development area, the initial fee will be refunded and the assumed continuing fee shall
cease.
We benefit from a waiver by Yum! of the standard initial fee for all new restaurants exceeding the trigger number
(as shown in the table above). Any incremental restaurants will not count towards the required number of the
scheduled net new restaurants in any subsequent year. Also, subject to compliance with certain conditions, we
have a territorial protection in Romania and in the Republic of Moldova during the incentive term 2017 – 2021.
KFC (Italy)
In case we fail to develop the minimum committed number of restaurants per year, we must forego the initial fees
for each restaurant not opened during the respective year and remain obligated to open any such outstanding
restaurants in the subsequent year. Also, in case of KFC Piedmont, we are required to pay a royalty recovery fee of
USD 50,000 per unopened KFC restaurant for each period and an additional royalty recovery fee of USD 50,000
for each restaurant failed to be built during the term.
We benefit from a waiver by Yum! of the standard initial fee for all new restaurants exceeding the trigger number
(as shown in the table above). Also, we benefit of a right of first refusal for any new KFC restaurants intended to
be developed in the North-East Italy (subject to us complying with certain conditions) and, in case of KFC
Piedmont, again subject to us complying with certain conditions, Yum! has undertaken not to permit third party
franchisees to open new restaurants and not to open own restaurants in the areas listed in the development plan.
Pizza Hut
For Pizza Hut restaurants (Dine-In and Delivery) we must pre-pay on the 1st of January the initial fees that are due
for each year for which the development commitment was set. If a new restaurant is a Dine-In, we must pay the
balance of the initial fee for the Dine-In restaurant prior to opening.
In case we fail to develop the minimum committed number of restaurants per year, we must forego the initial fees
for each restaurant not opened during the respective year and remain obligated to open any such outstanding
restaurants in the subsequent year. Also, we are required to pay an assumed continuing fee of USD
5,000/month/restaurant commencing on the first day of the subsequent year in respect of each month or part of the
month that the minimum target is not satisfied. The assumed continuing fee falls due on the earlier of: (i) date of
opening of restaurant, at which point the assumed continuing fee shall be paid in full and shall then cease to
accrue, and from which point the standard continuing fee shall begin to accrue; and (ii) last day of the year
subsequent to the year in which the development target has not been met (for a period of 10 years). If a third party
opens a restaurant in the development area, the initial fee is refunded and the assumed continuing fee shall cease.
In case we develop the trigger number of new net restaurants in any given year (as specified in the "Strategy"
chapter of the Prospectus), Yum! will reimburse us with 50% of the initial fee for the 2 previous restaurants
(before reaching the trigger number) and the entire initial fee for the threshold restaurant, and any additional new
net restaurants beyond the threshold restaurant is the same given year will benefit of a 50% reimbursement on the
initial fee paid.
Taco Bell
As incentive to reach the development targets, Yum! has agreed to credit against the monthly continuing fees due
for each incentive restaurant (for a maximum of 10 restaurants): (a) 4% of the revenues for the 1st to 12th month
since opening; and (b) 2% of the revenues for the 13th to the 24th month since opening. In case we fail to develop
the minimum committed number of restaurants per year, Yum! has the right to terminate any incentives.
Real Estate, Equipment and Technology
Our current business model relies on leasing the locations in which we operate our restaurants; therefore real-
estate ownership is insignificant in our assets and operations. We own a real-estate property, in Bucharest, in
which we operate the Pizza Hut Mosilor restaurant. In addition, we also own a small warehouse in Constanta (on
10 Răscoalei 1907 Street), which is not used at present for operational activities.

152
In our restaurants, we use equipment and technology that is generally specific for the restaurant business: kitchen
equipment, customer ordering equipment and supporting IT technology to record inventory movement, sales and
payments. All our kitchen equipment complies with the Yum!’s requirements.
Our restaurants are endowed with various kitchen equipment for the proper storage, preparation and display of
food (raw materials, ingredients and finished products).
The main equipment used by a KFC restaurant includes:
• Food preparation: fryers (open fryers, pressure fryers), ovens, toasters, blenders, slicers, Holding equipment,
breading machines, marinators;
• Food display: Hot Display cabinets and merchandisers;
• Storage: Walk-in and cabinet fridges and freezers;
• Other equipment: coffee machines, ice cream machine, ice-making machine, beverages mix station.
The main equipment used by a Pizza Hut restaurant includes:
• Food preparation: pizza ovens, pasta stations, bain marie, dough mixers, proofers, retarders, induction
cookers, open fryers, grills,
• Storage: Walk-in and cabinet fridges and freezers;
• Other equipment: washing machines, scooters and pizza boxes and hot pouches (for Pizza Hut Delivery units)
coffee machines, slicers, ice-making machine.
Sales and inventory of products for our KFC and Pizza Hut restaurants in Romania are managed through Micros
Suite, an integrated point-of-sale software and hardware solution: it principally covers the touchscreen terminals
that are used by cashiers to operate orders from clients and initiate the collection process and the back-office
software, called MyMicros or Oracle Hospitality Reporting and Analytics that provides inventory management
and sales reporting tools. The Micros systems allow us to monitor sales and theoretical inventory levels in real
time across all restaurants. In our KFC restaurants in Italy as well for the Taco Bell restaurants, we use an
integrated IT solution provided by NCR, which is based on Aloha POS front-end terminals and NDO back-end
solution, which provide similar level functionality as Micros system. On a practical level, we closely monitor sales
on a daily basis against the performance versus previous year and budget, with weekly, monthly sales reports
being similarly analyzed at the end of each period.
We also employ additional technology for speeding up the ordering process. All our newer KFC restaurants (17
restaurants opened starting December 2012) feature the Fusion ordering system, which separates the ordering
from the front-office preparation of the order. Under this system, we operate with only three ordering points
(compared to five to six terminals in a standard restaurant), where cashiers input a customer’s order at the
touchscreen terminal, which is then routed automatically to the kitchen for preparation. The customer receives an
order number which is queued on a monitor screen (as order in progress) and when the order is finalized by a
dedicated front-of-house staff, the order can be picked up by the customer. The Fusion system represents a
significant improvement in the speed of service and preparation efficiency compared to the standard system, when
the cashier deals with both the input of the order, the communication of the order to the kitchen and the final
assembly of the order.
For Pizza Hut Delivery, we use technology to improve our delivery services and accessibility of our products to
customers. The delivery activity is supported by a dedicated mapping software application, which optimally maps
the delivery areas between our restaurants so that we minimize the delivery times and routes and ensures the
management of the customer information database. In terms of ordering accessibility, in addition to the classic call
center lines (at 021 210-1010 or *1010), customers can also place orders electronically through our dedicated
website platform (www.pizzahutdelivery.ro) or our mobile application (currently available on both Android and
iOS platform). Both the website ordering platform and mobile applications are owned by us, being developed by
third-party software developers. In Cluj Napoca, we also have our products available for ordering through an
independent web-based food integration service called HipMenu. As of September 2017, the share of electronic
orders was circa 30% of all delivery orders.
In the KFC restaurants, we use QPM ("Quality Product Management"), which is a Yum!-recommended software
tool developed by the US company Kitchen Brains that wirelessly networks cooking appliances and sales
terminal, providing real-time production monitoring and administration capabilities. The key advantages of QPM
are the exact monitoring of the restaurant’s food production’s freshness, availability and waste.

153
In terms of customer feedback, we employ GES ("Guest Experience Survey"), which is a Yum!-recommended
software tool developed by the US company SMG that collect opinions from our customers in all our restaurants
on a number of areas (taste of food, speed of service, order accuracy, staff friendliness, cleanliness of restaurant,
overall value, incidence and resolution of problems, overall satisfaction and likelihood to return).
Intellectual Property
The Group has rights to use, among others, the KFC and Pizza Hut names, logos and products to operate the
restaurants on the basis of the Franchise Agreements. The Franchise Agreements grant us the right to use the
trademarks, the system and the system property developed by Yum! for the preparation, marketing and sale of
food products in accordance with the KFC and/or Pizza Hut concepts at each restaurant location. The KFC and
Pizza Hut trademarks, system and system property are owned by Yum! and/or its subsidiaries and affiliates.
Responsibility for enforcing any infringement of the intellectual property licensed to the Group lies with Yum!.
Environmental protection
Our philosophy is to minimize our impact on the environment and leave the smallest footprint possible. We are
committed to creating a sustainable business, in the way we source our chicken meat and other food products, in
our design and use of packaging and in how we build our restaurants. Since 2015, we have started a sustainability
program and we are continuously striving to make our brands as environmentally friendly as possible. We are
committed to safety and quality. At the same time, we work hard to preserve and protect nature and its resources
by using only what is necessary, and focus each day to enhance the livelihoods of our team members and
surrounding communities.
Environmentally friendly packaging
We aim to make our packaging as environmentally friendly as possible. All our paper-based packaging suppliers
fulfil the Forest Stewardship Council (FSC) standards and are certificated to process products originated from
forests that are managed in accordance with the principles and criteria of the FSC. The FSC is a global not-for-
profit organization that sets the standards for what is a responsibly managed forest, both environmentally and
socially. We work continuously with our partners to remove, reuse or reduce packaging while ensuring the quality
of our food.
No use of Palm Oil
We eliminated palm oil from our food production in 2016 and replaced it with sunflower and rapeseed oils. We do
not use trans fat oil in our operations.
Recycling cooking oil as biodiesel
We are collecting the used cooking oil from all our restaurants and turn it over to specialized collection companies
in view of its recycling.
Fairtrade Coffee
Each coffee we sell to our customers has Fairtrade certification and comes from 100% Arabica beans.
Aiming for zero food waste
We are currently developing our Food Donation Scheme in order to be able to donate unsold chicken from our
KFC restaurants to local charities. We aim to roll out the pilot program by Q2 2018.
Employees
As of 30 June 2017, the Group had 3,651 employees (including both full-time and part-time employees), all of
them hired on undetermined tenure, of which 3,499 were employed in the restaurants. The increase in the number
of our employees over the past three years was mainly due to the opening of new restaurants.

154
The following table depicts the number of our employees as at 31 December 2014, 2015 and 2016 as well as at 30
June 2017, broken down by main category of activity (restaurants and administrative).
31-Dec-14 31-Dec-15 31-Dec-16 30-Jun-17
Restaurant employees
USFN (Romania) 1,934 2,196 2,593 2,769
ARS (Romania) 530 677 861 860
Total restaurant employees, of which: 2,464 2,873 3,454 3,629
- Full-time employees 1,668 1,928 2,180 2,270
- Part-time employees 796 945 1,274 1,359
Administrative 108 116 158 154
Total employees 2,572 2,989 3,612 3,783
Source: Management data
Between 30 June 2017 and the date of this Prospectus, there have been no significant changes to the number of
employees, other than the transfer of approximately 105 employees from USFN (Romania) and ARS (Romania) to
the Company following the consolidation by the Company of certain functions from the subsidiaries.
USFN (Romania) has in place a collective bargaining agreement with its employees' representatives, which was
registered with the Labour Territorial Inspectorate under no. 329 of 08 August 2016 and ARS (Romania) also has
in place a collective bargaining agreement with the employees' representatives that was registered with the Labour
Territorial Inspectorate under no. 330 of 08 August 2016. The validity of the current collective bargaining
agreements is of 2 (two) years starting with 08 August 2016. If none of the parties terminates the agreement with
30 days before its expiry, it shall prolong for a new period of 12 months. The collective bargaining agreements do
not provide for any severance payments upon collective dismissal, termination of employment or on reaching
normal retirement age, having standard rights for company's specific activity.
With respect to individual labour agreements concluded with their employees, both USFN (Romania) and ARS
(Romania) use a standard template based on the requirements of the labour legislation its employees. USFN
(Romania) and ARS (Romania) do not have employees with specific activity which leads to the necessity to have
special templates.
USFN (Romania) and ARS (Romania) also have in place internal regulations which provide for the rights and
obligations of USFN (Romania), respectively ARS (Romania) and of the employees during the employment
relationship. The internal regulations provide for all the mandatory provisions, as required by the employment
legislation.
Training and career development
We are committed to offer our employees the chance for a continuous learning opportunity and personal
development that will allow them to continue their career development.
All our new employees go through a thorough training process of up to 40 hours for familiarizing with overall
standards of operations and job-specific procedures. This training process covers both the theoretical knowledge,
which is accessed through Yum!’s online Learning Zone platform as well as practical knowledge, which is
performed under the supervision of restaurant trainers.
In order to be promoted, our restaurant crew is offered dedicated training programs that last up to one month (up
to two months for candidates with no previous experience in our restaurants, which consist of online courses, tests
and 1:1 coaching sessions. We are proud that ever since our first restaurants were opened, most of our restaurant
general managers and area managers, as well as our Chief Operating Officer, Chief Development Officer and most
of Brand General Managers, Area Managers and Restaurant Managers have started as crew members in our
restaurants.
The Company’s employee base comprises predominantly young labour force, and often their employment with
our brands is their first ever work experience.
While we understand that addressing the labour needs of our labour base is critical to our success, we have over
time, and through active collaboration with Yum!, developed training practices and key processes within our
company aimed to support employee engagement, retention and continuous learning.

155
We have actively sought to create training programs that address not only the job skill set necessary to perform
day-to-day tasks within our restaurants, but also extended skills such as active responsibility, accountability, time
keeping, customer service, communication skills and team work.
Our training programs across the various brands and geographies that we operate come to ensure an effective and
decentralized control structure, and create an organizational culture that drives workforce engagement.
As a company, we continuously invest in training at all levels throughout our business. Training takes place
typically in three mediums, "on the job", class room type, and e-learning. As an example, some of the typical
courses that we have deployed in 2017 include:
• various work-shops involving more than 500 participants;
• internally designed leadership course on Leader vs Manager to more than 140 store level leaders;
• Recruitment Training for circa 200 managers to help interview and recruit talent at store level.
As a business, we have to adapt to the rapid changes within the workforce, and our training and coaching
programmes have been designed to assist towards this end. One of our key training programs on this direction is
called "Leading with Heart", a personal development program that helps drive self-awareness, including a 360-
degree feedback tool.
"Leading with Heart" was launched in 2016 and has since been cascaded across the restaurant general managers in
2017 and planned to further include store management teams soon. Our senior managers within the organization
are being trained on an additional program named “Coaching with Heart”, to ensure that they are able to support
teams with the skills that Leading with Heart provides.
"Leading with Heart" has been delivered to-date to nearly all the staff at the Head Office and will have been rolled
out across Romania to more than 120 senior restaurant managers by the end of 2017. "Coaching with Heart"
program has been delivered to nearly 50 senior managers.
Training is developing around three core trends emerging in leadership development:
• evolving from focusing on leadership behaviours to values driven leadership;
• evolving from focusing on managing teams to building coaching cultures;
• evolving from employee’s satisfaction to employee wellbeing.
Through the afore-mentioned training programs and coaching initiatives, we aim to be promote an organizational
culture based on active employee dialogue with regular and consistent feedback.
We are looking to further evolve our coaching and leadership programs through the introduction of iFly (Inspiring
the Future Leader in You) comprising of training modules that aim to:
• Develop more effective, motivated and engaged leaders able to better manage teams, build the company
culture and lead strategic projects to help drive business growth;
• Deliver strategic recommendations from the workforce on current business challenges.
We actively also participate in various job fairs throughout the country (Bucharest, Iasi, Cluj, Timisoara, Oradea,
Sibiu), as well as maintain an active internship program.
Corporate Social Responsibility
We have been actively involved in social-related activities for the last ten years and, on the back of our sustained
growth and profitability, we expect to further consolidate our commitment as a socially responsible company. One
of our CSR strategic pillars is children’s education, which is complemented through three different initiatives.
"I want to go to high-school" - an education program in partnership with "World Vision Romania" since
2008
The partnership started back in 2008 between World Vision Romania and KFC & Pizza Hut Romania, as part of
the World Hunger Relief program, the biggest international private initiative in the sector, launched by Yum!
Brands Inc.
The program is a fund-gathering campaign that takes place in all KFC and Pizza Hut Dine-In restaurants in
Romania each year in October. The restaurants act like infrastructure for gathering the funds from the customers
who are willing to donate any amount of cash without being asked to purchase a product or provide a proof of
156
purchase, with money being collected in dedicated donation boxes. We are actively promoting this campaign
through dedicated promotional materials that are displayed in all restaurants under the message "Donate 1 leu, so
that children living in villages can continue their education in high-school."
In parallel, our employees in the restaurants and at head office also organize auctions or various internal contests
during October to gather funds for the program and, at the end of the campaign, we also contribute a certain
amount of money as a corporate donation. At the end of each campaign, the funds raised are transferred directly to
World Vision based on a collaboration convention.
The funds are managed entirely by World Vision Romania, which offers each child a RON 250 monthly
scholarship that allows him to go to high-school. In the 9 years of the program, the funds raised sum up to 520,000
euro, which benefited over 1,000 children.
Sponsorship program to support children who have lost their biological care takers, in partnership with
"SOS Children’s Villages Bucharest"
The partnership started in 2015 by ‘adopting’ a house in SOS Children’s Villages Bucharest through a sponsorship
program. The mechanism of the campaign implies donating RON 1 from each Hot Bucket product sold in KFC
restaurants in Romania, based on a sponsorship contract. As of 2016, KFC "adopted" the second house and
reached an annual donation of around EUR 50,000, amount that covers all the necessary expenses of the houses
(such as food supplies, clothes, utilities, medical care, and educational activities for children).
"Physics (taught) differently" Initiative, a sponsorship program in partnership with ‘Educational Analysis
and Evaluation Center’ (CEAE)
Through this partnership, initiated in February 2017, KFC supports the initiative of the NGO to help transform the
educational system in Romania by replacing the old teaching methods used in schools. The program aims at
training the professors to teach Physics in schools through investigation method: discover, understand, think and
question.
The project’s purpose is to train as many physics teachers as possible in Romania a new method of teaching in
order to revitalize children’s interest for sciences and their capacity to understand concepts instead of memorizing
them, to generate self-confidence and self-esteem.
KFC provided a sponsorship of EUR 9,500 for this program.
In a partnership with "Hospice, House of Hope" since February 2017
Through this sponsorship project, Pizza Hut & Pizza Hut Delivery, support patients with incurable illness,
children and adults, through medical care and social support offered at "Hospice House of Hope". The mechanism
of the campaign implies donating 1 leu from each medium and large European recipe pizza sold in Pizza Hut and
Pizza Hut Delivery restaurants in Romania, based on a sponsorship contract.
Each month, around 2,000 euro is donated to "Hospice House of Hope" as part of the program.

157
LEGAL PROCEEDINGS
The Group companies are party to various proceedings arising in the ordinary course of business, both as plaintiff
and as defendant. During the 12 months preceding Prospectus date, the Group has not been involved in, nor is the
Group aware of, any legal, arbitral or administrative proceedings or governmental investigations that could
reasonably be expected to have a material adverse effect on the Group's business, financial condition or results of
operations.

158
MANAGEMENT
General
The Company is managed in a one-tier system by the BoD that delegated the management of the Company to the
managers. The BoD consists of seven (7) members appointed by the OGSM for a term of four years, with the
possibility of re-election for subsequent four year tenures, except for the first members of the BoD who were
elected for a term of two years. The Chairman and Vice-Chairman of the BoD are elected from among its
members.
The BoD has to carry out all acts that are useful or necessary for the Company to carry out its activities, except for
the duties that are allocated by law to the GSM.
Board of Directors
As at the date of this Prospectus, the BoD comprises the following members, appointed for a mandate of 2 years:
Name Date of birth
Date of
appointment
Title
Cristian Osiac 23 October 1968 16 May 2017 Chairman of the BoD Stylianos Bairaktaris 24 September 1973 16 May 2017 Member of the BoD Mark Nicholas Hilton 5 December 1964 16 May 2017 Member of the BoD Silviu Gabriel Cârmaciu 1 January 1980 16 May 2017 Member of the BoD Ion Marius Nasta 17 May 1967 16 May 2017 Member of the BoD Elyakim Davidai 20 September 1954 5 October 2017 Vice-Chairman of the
BoD
Konstantinos Mitzalis 8 October 1967 5 October 2017 Member of the BoD
Mr. Cristian Osiac, Mr. Stylianos Bairaktaris, Mr. Mark Nicholas Hilton, Mr. Silviu Gabriel Cârmaciu and Mr. Ion
Marius Nasta were appointed as BoD members on the date of the Company’s incorporation (16 May 2017) and
their mandate expires on 16 May 2019. Mr. Elyakim Davidai and Mr. Konstantinos Mitzalis were appointed as
BoD members on 5 October 2017 and their mandate will expire on 5 October 2019. The business address for each
BoD member is the registered office of the Company.
Cristian Osiac
Cristian Osiac has been a member of the Company's BoD since May 2017 and the Chief Development Officer of
the Company since June 2017. He holds a BSc in Electronics and Telecommunications from the Polytechnic
University of Bucharest. Cristian Osiac has been with the Group since 1994, in which year he managed the
opening of the first Pizza Hut in Romania, as Technical Director. In 1997 he coordinated the opening of the first
KFC restaurant in Bucharest, as Development Director and from this position, Mr. Osiac coordinated the main
development and technical activities for all the Group's brands. After 2007, Mr. Osiac also held executive
positions in other companies operating food or restaurant brands in Romania, such as Paul and Cinnabon bakeries,
where he was in charge of development operations. He also actively participated in the development of Hard Rock
Café restaurant in Bucharest. Moreover, in 2008, he was appointed as chairman of the board of directors of ARS
(Romania) and USFN (Romania). During this time Mr. Osiac actively coordinated and supervised all expansion of
the KFC and Pizza Hut brands in Romania, in the Republic of Moldova and, most recently, in Northern and
Western Italy, where USFN (Romania) opened two KFC restaurants.
Stylianos Bairaktaris
Stylianos Bairaktaris has been a member of the Company's BoD since May 2017 and was recently appointed as
the Company's CFO, having supported the Group since 2012. He holds an MSc in Finance, as well as a BA in
Business Administration, both from Strathclyde Business School, Glasgow, Scotland. Up until September 2017,
Mr. Bairaktaris was the CEO of Monogram Advisory, an advisory and investment banking boutique focused on a
select number of clients across various industry fields including Retail, IT, Fast Moving Consumer Goods, and
Energy. Prior to being the CEO of Monogram Advisory, Mr. Bairaktaris held several management positions,
including those of CEO of Alpha Finance Romania S.A. (Member of Alpha Bank Group) between 2006 and 2012,
and CFO of the shipping company P&A SHIPPING INC between 2005 and 2006. As CEO of Alpha Finance
Romania S.A., Mr. Bairaktaris headed the Brokerage, Investment Banking and Strategic Planning operations,

159
managing the divisions of Capital Markets, M&A, Advisory, Research/Strategic Planning (team of 17 employees)
and directed operations in the field of brokerage, corporate finance and advisory business in the Romanian market.
During his tenure there, Alpha Finance Romania S.A successfully executed two IPO transactions on the Bucharest
Stock Exchange, acting as lead manager.
Mark Nicholas Hilton
Mark Nicholas Hilton has been a member of the Company’s BoD and its CEO since May 2017. He holds a BSc
Honours Degree in Hotel and Catering Management from Oxford Brookes University, England. Mr. Hilton is also
a founder, and was a shareholder until September 2017, of a consultancy business boutique, Kikkirossi Sarl, which
particularly helps restaurant and hospitality sector companies with franchising, operations, supply chain and
general strategy. Between 2013 and 2015, Mr. Hilton worked with Food Concepts Nigeria as an independent non-
executive director. Up until June 2017, Mr. Hilton also occupied management positions within companies
operating food franchises in Romania, such as Moulin D'Or S.R.L. which operates Paul franchises, and in the
subsidiaries of the Company, such as ARS (Romania) and USFN (Romania). Between 1989 and 2011, Mr. Hilton
had numerous operational and management positions in various international hotel and food sector companies,
such as Hilton Hotel, Pepsico, Sbarro Inc and Yum! Restaurants International, where he had roles as Supply Chain
Director, Franchise Executive Director, Franchise Regional Executive Director and Chief Operations Officer for
the Franchise Business Unit in Europe.
Silviu Gabriel Cârmaciu
Silviu Cârmaciu has been a non-executive member of the BoD of the Company since May 2017. Mr. Cârmaciu
holds a B.A. in Economics, with a specialization in Finance, Banking and Accounting, from "Dimitrie Cantemir"
University, Bucharest and also holds an LLM in International Economic Relations from "Alexandru Ioan Cuza"
Academy. Mr. Cârmaciu's career started in the Banking industry, at banks specialized in international operations of
trade finance between Western and Central Europe and Eastern Europe: respectively Frankfurt Bukarest Bank AG,
Anglo Romanian Bank Limited, and Italo Romena Bank SpA. Between 2006 and 2012 he held management
positions with responsibilities in various areas such as Loans and Advances, Deposits, Business Development and
Customer Relationship Management, Credit Risk Management and Anti Money Laundering. Since 2013, Mr.
Cârmaciu has been an Executive Director of MBL (Romania) - Computerland Group Romania, responsible for
Financial and Strategic Management. Since mid-2013, Mr. Cârmaciu has acted as counsellor of the General
Manager of Griro S.A..
Ion Marius Nasta
Marius Nasta has been a non-executive member of the Company's BoD since May 2017. Mr. Nasta holds an LLM
in international law from Queens’ College, Cambridge, as well as a B.A. in law and one in philosophy from the
Free University of Brussels. He currently serves as the chief executive of Redress Solutions PLC, a leading UK
based investor in commercial litigation and arbitration claims. Previously, Mr. Nasta held several senior executive
positions at Cendant Corporation, a US conglomerate comprised of AVIS Budget, Travelport, Realogy and
Wyndham Worldwide. As Senior Vice President and General Counsel at Cendant Europe and Cendant Asia
Pacific, Mr. Nasta set up and ran the legal, compliance and regulatory department and became an expert in
running large multi-jurisdictional and complex commercial litigation cases. He also played a significant role in
major corporate transactions with a combined value of over USD 4.5 billion aimed at reorganizing and growing
Cendant internationally. Mr. Nasta came to Cendant Corporation from Slaughter and May, where he trained and
qualified as a Solicitor of the Supreme Court of England and Wales. Mr. Nasta is a supporter of the Law Faculty at
Cambridge University, where he has lectured to both graduate and undergraduate students.
Elyakim Davidai
Elyakim Davidai has been an independent member of the Company's BoD and its Vice-Chairman since October
2017. Mr. Elyakim Davidai is a well-respected and successful Israeli businessman who owns and operates
businesses in seven countries and three continents in fields such as IT, consumer goods, media, and education. He
is the Managing Director of Quadrant Management Inc., a USD 3 billion fund, overseeing the Fund’s Pepsi
bottling company Quadrant Bottling Company (QAB). Under his leadership, the first operation of QAB was
developed in 1992 in Romania as exclusive PepsiCo bottling franchisee. QAB was later sold in July 2006 to
PepsiAmericas. Mr. Davidai has a Degree in Industrial Engineering from Technion Institute of Technology, Haifa,
Israel and an MBA from the Reccanati Business School of Tel Aviv. Mr. Davidai graduated from the Owner
President Management programme from Harvard Business School.

160
Konstantinos Mitzalis
Konstantinos Mitzalis has been an independent member of the Company's BoD since October 2017. He holds a
BBA in International Business from Schiller International University Paris, France. Mr. Mitzalis has over 25 years
of experience in the Fast Moving Consumer Goods industry. Since 2009, he has been the CEO of Golden Foods
Romania, and between 2007 and 2009 he was the CEO of Golden Foods Ukraine. From 1993 to 2004, Mr.
Mitzalis was Chairman and the CEO of Star Foods Romania of which he was also founder. Between 1990 and
2006, Mr. Mitzalis served as a board member of Star Foods Poland and from 1990 up until 2002, he was the CEO
of EM Delicatessen GmbH, Germany, a producer and distributor of Gyros - Doner Kebab products. Mr. Mitzalis is
a member of the Young Presidents' Organization, a global network of chief executives with approximately 24,000
members in more than 130 countries and since 2010 has been the President of ANOG Athletic Nautical Club of
Glyfada for which he was a swimmer for 13 years (1977-1989).
Consultative committees
The BoD established an Audit Committee and a Nomination and Remuneration Committee, both of which will
become operational after the admission of the Shares to trading on the BSE.
Each of the Audit Committee and the Nomination and Remuneration Committee comprises three members of the
BoD, of which one is elected chairman. All members of the Audit Committee are non-executive BoD members.
At the date of the Prospectus, the appointed members of the Audit Committee are:
• Elyakim Davidai
• Konstantinos Mitzalis
• Silviu Gabriel Cârmaciu.
The Audit Committee assembles in regular meetings at least twice per year to analyse the audit report and/or the
financial auditors' opinion on essential matters resulting from the financial audit/review procedures, as well as on
the financial reporting process and recommends measures that are required to be undertaken. The Audit
Committee holds in special meetings whenever necessary to discuss and provide recommendations on matters
related to its duties and responsibilities or when the Company's financial or internal auditor reports material
findings to the committee. The Audit Committee meeting is duly assembled if at least 2/3 of the members are
present and decisions are adopted with a majority of at least 2/3 of its members.
The Audit Committee has the following main duties and responsibilities: (a) overseeing the activity of the internal
and the financial auditors of the Company and the financial reporting process within the Company (including
reviewing the external financial auditor's reports) and issues recommendations on those matters to the BoD; (b)
overseeing the activity of the internal auditor function of the Company and the effectiveness of and issues
recommendations on the internal control, internal audit and risk managements systems within the Company; (c)
reviewing for the approval by the BoD the Company's annual individual and/or consolidated financial statements
and the proposal for the distribution of profits; (d) recommending to the BoD the appointment and/or dismissal
and/or replacement of the external financial auditor and proposes the terms of remuneration thereof; (e) endorsing
the financial audit scope and the frequency of audit engagements; (f) checking whether the managers addressed
the deficiencies identified in the internal control area; (g) reviewing the conflicts of interest policy of the
Company; (h) issuing an opinion on every transaction entered into by the Company with its related parties the
value of which is equal to or exceeds 5% of the net assets of the Company (as stated in the latest audited financial
statements); (i) save for the mandate contracts which are concluded by the Company with the managers/BoD
members, issuing an opinion on every transaction between the Company and its managers/BoD members with a
value equal to or exceeding EUR 50,000 (or RON equivalent).
At the date of the Prospectus, the appointed members of the Nomination and Remuneration Committee are:
• Elyakim Davidai
• Konstantinos Mitzalis
• Ion Marius Nasta.
The Nomination and Remuneration Committee holds meetings whenever necessary to discuss and provide
recommendations on matters related to its duties and responsibilities. It is duly assembled if at least 2/3 of the
members are present and decisions are adopted with a majority of at least 2/3 of its members.

161
The duties and responsibilities of the Nomination and Remuneration Committee include: (a) reviewing the
remuneration policy of the Company; (b) establishing the eligibility criteria for managers appointed under
mandate contract; (c) carrying out the selection process of the potential candidates for the BoD member position;
(d) preparing succession planning for the managers with a mandate contract.
Managers
At the date of this Prospectus, the individuals holding management positions to whom management of the
Company was delegated by the BoD, are presented in the table below. At the date of this Prospectus, all managers
fulfil these functions based on mandate contracts. The managers carry out their duties at the registered office of
the Company.
Name Date of birth Title Date of Appointment
Mark Nicholas Hilton 5 December 1964 Chief Executive Officer (CEO) 16 May 2017
Stylianos Bairaktaris 24 September 1973 Chief Financial Officer (CFO) 6 October 2017
Cristian Osiac 23 October 1968 Chief Development Officer (CDO) 15 June 2017
Călin Viorel Ionescu 16 July 1969 Chief Operating Officer (COO) 29 August 2017
Oana Monica Eftimie 15 August 1979 Chief Marketing Officer (CMO) 29 August 2017
For the biographies of Mr. Hilton, Mr. Bairaktaris and Mr. Osiac, please see the "Board of Directors" section
above.
Călin Viorel Ionescu
Călin Ionescu has been Chief Operations Officer (COO) of the Company since August 2017. Mr. Ionescu studied
Marketing and Management at the Romanian-American University in Bucharest. Mr. Ionescu has been involved
in the restaurant business since 1994 when the first Pizza Hut restaurant operated by ARS (Romania) was opened.
He has occupied various operational positions, from Restaurant General Manager to General Manager and, in
2012 Mr. Ionescu was promoted to COO for the Pizza Hut, Pizza Hut Delivery and KFC brands, which were then
operated by ARS (Romania) and USFN (Romania). During this time, he has actively participated in all expansions
of the KFC and Pizza Hut brands in Romania and the Republic of Moldova and in 2016, he laid the foundations
for developing the KFC brand in North East and North-Western Italy. Under Mr. Ionescu's supervision, the KFC
and Pizza Hut brands in Romania ranked consistently in the top three countries in terms of Yum!'s operational
performance standards. Additionally, Mr. Ionescu coordinates and holds executive and operational positions in
other companies operating restaurant brands in Romania, such as Hard Rock Café and Cinnabon bakery.
Oana Monica Eftimie
Oana Monica Eftimie has been Chief Marketing Officer (CMO) of the Company since August 2017. She holds a
BS from Northwestern University and an MBA from Georgetown University. Since 2013, Ms. Eftimie has been
the chief marketing officer of ARS (Romania) and USFN (Romania), overseeing the marketing operations for the
KFC, Pizza Hut, Pizza Hut Delivery brands and developing and implementing national marketing campaigns for
these brands. Ms. Eftimie was also chief marketing officer in the company that operates the Paul brand in
Romania. With over 10 years of professional experience in the food industry, Ms. Eftimie started her career in
marketing with internships at the Accor Group (France) and Saatchi & Saatchi Advertising. She further developed
comprehensive marketing campaigns for some of the best-known companies in the food industry, such as
McDonald’s.
Key persons
Daniel Paliță
Daniel Paliță is a key person for the Company and since September 2017 has held the position of Manager of
Strategic Planning and Investor Relations, based on employment contract. He holds an MSc in International
Relations from the Academy of Economic Studies, Bucharest. Between 2012 and September 2017, Mr. Paliță was
a Director of Monogram Advisory, an advisory and investment banking boutique focused on a select number of
clients across various industry fields including Retail, IT, Fast Moving Consumer Goods, and Energy, including
USFN (Romania) and ARS (Romania), which he actively advised on various finance related activities, including
management reporting and budgeting. Between 1996 and 2012, Mr. Paliță worked for Alpha Finance Romania

162
S.A. (member of Alpha Bank Group), where he held several management positions, including Head of Research
and later Head of Corporate Finance, and was involved in all IPO transactions undertaken by Alpha Finance
Romania S.A. on the BSE. From 2009 until 2012, he was also one of the two authorized Managers of Alpha
Finance Romania S.A..
Experience outside the Group
In addition to their roles in the Company, the BoD members, managers and key persons of the Company hold, or
have held in the past five years, the following management or supervisory positions that are relevant to their roles
in the Company:
Name Name of the entity Title Period
Still in office:
Yes (Y)/No
(N)
Mark Hilton Food Concepts Plc, Nigeria Independent board member 2013 - 2015 N
Kikkirossi Sarl, Switzerland Owner/founder 2010 - September 2017 N
Cristian Osiac US Food Network S.A. Development director 1997 - June 2017 N
Board chairman 2008 - June 2017 N
American Restaurant System S.A. Development director
Board chairman 1996 - June 2017
2008 - June 2017
N
N
Cinnamon Bake and Roll S.R.L. Board member 2009 - 2013 N
Monica Eftimie US Food Network S.A. Marketing director 2012 - September 2017 N
American Restaurant System S.A. Marketing director 2013 - September 2017 N
Moulin D'or S.R.L. Marketing director 2013 - September 2017 N
Călin Ionescu American Restaurant System S.A. Chief operations officer 2012 - August 2017 N
US Food Network S.A. General manager 2009 - 2012 N
Chief operations officer
and board member
2012 - June 2017 N
Cinnamon Bake and Roll S.R.L. Board member 2009 - ongoing Y
Midi Developments S.R.L. Board member 2011 - ongoing Y
US Food Network Srl, Italy Sole director 2016 - ongoing Y
Elyakim Davidai Quadrant Management Inc., USA Managing director 2013 - ongoing Y
Stylianos Bairaktaris Monogram Advisory S.R.L. Managing director,
founder/shareholder
2012 - September 2017 N
Daniel Paliţă Monogram Advisory S.R.L. Director 2012 - September 2017 N
Silviu Cârmaciu M.B.L. Computers S.R.L. Executive manager 2013 - ongoing Y
Griro S.A. Counsellor to general
manager
2013 - ongoing Y
Remuneration
The total amount paid by USFN (Romania) to the Company’s current BoD members and managers for any
functions held or services rendered, directly or indirectly to USFN (Romania), including any benefits, during 2016
year amounted to RON 4.99 million.
The total amount paid by ARS (Romania) to the Company’s current BoD members and managers for any
functions held or services rendered, directly or indirectly to ARS (Romania), including any benefits, during 2016
year amounted to RON 1.94 million.
During 2016 year, the Company’s current BoD members and managers were paid by USFN (Romania) and ARS
(Romania) for positions held in and/or for other activities or services rendered to USFN (Romania) and ARS
(Romania), such as consultancy services.
In line with the Company’s Remuneration Policy and based on the contracts entered into between the Company
and the managers to whom the management of the Company was delegated, if the mandate of any such manager is
terminated early and without cause, the respective manager is entitled to a severance compensation not exceeding

163
the non-variable component of his or her remuneration for two years. For more details on the Remuneration
Policy of the Company, please see section "Corporate Governance Statement" below.
Furthermore, the Company intends to set up an equity-based incentive plan for the managers and, after the
admission of the Shares on the BSE, the shareholders might approve a Shares buy-back programme on the BSE to
fulfil the purpose of the plan.
Ownership in Shares and Options
At the date of this Prospectus, none of the members of the BoD, the managers, or the key persons of the Company
hold any Shares. At the date of this Prospectus, the Company has not issued any stock options.
Conduct
Each member of the BoD, each manager and key person of the Company represents that on and as at 16 October
2017, he/she:
(i) has not been and is not convicted of fraud during the last five years preceding the date of the Prospectus;
(ii) acting as a member of the administrative, management or supervisory bodies or as manager or founder of a
company or a partnership, has not been associated with any bankruptcy, sequestration or liquidation
procedure over the last five years preceding the date of the Prospectus;
(iii) has not been publicly incriminated and/or sanctioned by statutory or regulatory authorities (including by
designated professional bodies) and was not prohibited by the court to act as a member of the
administrative, management or supervisory bodies of an issuer or from acting in the management or
conduct the affairs of any issuer during the last 5 years prior to the date of the Prospectus;
(iv) does not carry out activities outside the Company which are material to the Company, other than those
presented in section "Experience outside the Group" above;
(v) has not been elected as member of the administrative, management or supervisory body, or manager within
the Company, based on an understanding or agreement with the Company's major shareholders, customers,
suppliers or others;
(vi) has not entered into any contract with the Company or with its subsidiaries that provide for benefits upon
termination of the contract, other than those provided in section "Remuneration" above;
(vii) does not hold shares in the share capital of the Company, and therefore there is no restriction on the
assignment, within a certain period of time, of the shares owned in the Company;
(viii) there is no family relationship between any of them and other members of the administrative, management,
supervisory bodies of the Company or the Company's managers or founders;
(ix) With the following further exceptions:
• Mr. Silviu Cârmaciu was manager and founder of Performance Financial Services S.R.L. (carrying out
activities auxiliary to financial intermediation), holding, directly and indirectly, 100% of the share
capital, when the company underwent voluntary liquidation in September 2015, at his request;
• Mr. Silviu Cârmaciu is an executive manager in MBL (Romania), which may potentially create
conflicts of interest. In case a conflict of interest situation occurs, Mr. Cârmaciu will act in compliance
with the applicable law, abstaining from deliberations and voting or taking part in the decision making
process for the conflicting matter and will disclose such conflict accordingly;
• Mr. Călin Ionescu is a board member in Cinnamon Bake & Rolls S.R.L., and in Midi Developments
S.R.L. and is also the sole director of USFN (Italy) (affiliates of the Company), which may potentially
create conflicts of interest. In case a conflict of interest situation occurs, Mr. Ionescu will act in
compliance with the applicable law, abstaining from deliberations and voting or taking part in the
decision making process for the conflicting matter and will disclose such conflict accordingly.
Conflict of interests
Except as provided above, there is no actual conflict of interest between the obligations of members of the BoD,
the managers and the key persons of the Company and their private interests or other obligations thereof.

164
The BoD approved a Conflict of Interest Policy on 25 September 2017, which will become applicable on the first
date of trading of the Shares on the BSE. Members of the BoD and the managers of the Company are required to
immediately disclose any personal interests they may have in transactions with the Company, as well as all other
conflicts of interest. All business transactions between the Company and members of the BoD or between the
Company and its managers and with persons or companies located in close relations with them are entered into at
arms' length in compliance with applicable laws and regulations.
Liability insurance policies
Currently, the Company has in place liability insurance policies/contracts for members of the BoD and for the
managers.
Corporate Governance Statement
At the date of this Prospectus, the Shares are not admitted to trading on a regulated market. Thus, the Company is
required to comply with the corporate governance regime established mainly by the Companies Law. The
Company and its corporate bodies comply with the corporate governance regime established by the Companies
Law. After the admission of Shares to the spot regulated market operated by the BSE, the Company will be
required to comply with a more extensive framework of corporate governance rules, among which is the BSE
Corporate Governance Code (applicable to all listed issuers as of 4 January 2016). According to the BSE
Corporate Governance Code, issuers must include a corporate governance statement in a dedicated section of the
annual report, which contains a self-assessment on how the "provisions to comply with" are observed. Such
section must also specify the measures taken to comply with the provisions of the code that are not fully complied
with. Any change that may arise concerning the corporate governance statement must be notified to the market by
an ad hoc report.
Furthermore, to ensure compliance with the Corporate Governance Code at a very early stage, the Company has
approved by way of the EGSM resolution of 15 September 2017 the Dividend Policy, the Forecast Policy, the
Remuneration Policy and the GSM Procedure, which will enter into force on the date of admission of Shares to
trading on the BSE. For the Company's Dividend Policy, please see Chapter "Dividend Policy" of this Prospectus.
The GSM Procedure sets out the framework for the convening and the carrying out of the GSMs, in compliance
with the applicable law and the corporate governance standards. The Company has also set up an Audit
Committee and a Nomination and Remuneration Committee.
According to the Remuneration Policy, the BoD has the following responsibilities with respect to remuneration:
(i) approves the Remuneration Policy, as endorsed by the shareholders prior to the admission of Shares to trading
on the BSE and reviews it, if necessary, to ensure its consistency with the corporate governance considerations
and legal requirements; (ii) approves any additional remuneration for the members of the consultative committees;
and (iii) approves the remuneration for managers. The principles based on which the remuneration package is
decided includes: market competitiveness and best practices, long-term sustainability, remuneration based on
performance that is linked to responsibilities, motivation and rewarding. The remuneration for the BoD is
approved for an entire mandate by the OGSM that approves also the general limits for any additional
remuneration, if applicable. The remuneration of the BoD members consists of a fixed monthly remuneration plus
an additional remuneration, in case of BoD members who are also members in the consultative committees. The
remuneration of the managers comprises a fixed monthly remuneration, the amount of which depends on the
services rendered and the responsibility of the position as decided by the BoD. The managers are entitled to
receive performance bonuses (either cash bonuses or stock bonuses) determined in direct correlation with the
Company's performance and/or liquidity events. Award of the variable component of remuneration (such as
performance bonuses) will be subject to predetermined performance criteria, which may include both financial
and non-financial criteria that are relevant to the Company's value creation.
The Forecast Policy sets out that the Company will not provide to the public any financial forecast other than the
mandatory financial forecasts required under the applicable law such as the revenues and expenses budget (the
"Annual Budget") and the business plan approved by the shareholders in the GSM.

165
PRINCIPAL SHAREHOLDERS
The table below sets forth certain information regarding the ownership of the Shares prior to the Offering, and the
ownership of the Shares by the current shareholders immediately following the Offering, assuming all Shares are
sold in the Offering, the other shareholders do not buy any Shares in the Offering, and that the Stabilisation
Proceeds are not used by the Stabilising Manager(s) to buy any Shares in the market:
Shareholder Shares owned before
the Offering
Shares owned after the Offering
(provided the maximum number of
Offered Shares are sold)
(Number) % (Number) %
Tatika Investments Ltd. 10,603,860 27.33 10,603,860 27.33
Wellkept Group S.A. 6,339,812 16.34 6,339,812 16.34
Lunic Franchising and Consulting Ltd. 8,667,773 22.34 0 0.00
Anasa Properties S.R.L. 4,264,047 10.99 4,264,047 10.99
M.B.L. Computers S.R.L. 8,923,848 23.00 7,759,868 20.00
Total 38,799,340 100.00 28,967,587 74.66
According to the Issuers and Markets Operations Law, if following the acquisition or sale of or other operations in
Shares, the proportion of voting rights held by a person reaches, exceeds or falls below one of the thresholds of
5%, 10%, 15%, 20%, 25%, 33%, 50% or 75% of the total voting rights, that person must notify the Company of
the proportion of the voting rights held, promptly, but not later than 4 trading days starting on the day on which
that person (i) finds about the acquisition or disposal or of the possibility of exercising voting rights, or on which,
having regard to the circumstances, should have found about it, regardless of the date on which the acquisition,
disposal or possibility of exercising voting rights takes effect or (ii) is informed with respect to an event that
changes the breakdown of voting rights. The reporting requirements described above will apply after the
admission of Shares to trading on the BSE.
Neither the AoAs nor any other by-laws of the Company provide for any other obligation to disclose ownership of
shares above a certain threshold.
The shares issued by Company grant equal voting rights to all shareholders of the Company.
None of the shareholders listed above exercises control or common control over the Company.
To the best of the Company’s knowledge, there is no agreement or understanding that may result in future changes
in the control of the Company.
Founders
The ultimate beneficial owners of all Shares currently issued by the Company are: Mr. Radu Dimofte (holding a
43.67% indirect stake in the Company), Mr. Lucian Vlad (holding a 33.33% indirect stake in the Company) and
Mr. Nicolae Badea (holding a 23.00% indirect stake in the Company). The three shareholders have been part of
the founding shareholders that have developed KFC and Pizza Hut franchised restaurants in Romania.

166
DESCRIPTION OF SHARE CAPITAL AND CORPORATE STRUCTURE
General
The Company was incorporated on 16 May 2017 and is organised and operating as a joint stock company under
the laws of Romania, is registered with the Trade Registry Office in Bucharest under number J40/7126/2017 and
was assigned the sole registration code 37586457. The legal and commercial name of the Company is Sphera
Franchise Group S.A.. The Company’s registered seat is located at 239 Calea Dorobanti street, 2nd floor, office 4,
district 1, Romania. The telephone number at the Company’s registered office is +40 (21) 201 1757. The
Company was established for an indefinite period and operates under the laws of Romania.
The Company conducts its business in accordance with its AoAs, and inter alia with the Companies Law.
On 15 September 2017 and further on 5 October 2017, the Company’s EGSMs updated the AoAs to implement
inter alia the corporate governance requirements appropriate for a company the shares of which are admitted to
trading on a spot regulated market. Certain changes will apply starting with the first trading day of the Shares on
the spot regulated market operated by BSE, such as:
• The shareholders' registry will be kept by the Romanian CSD (Article 6.1. of the AoAs). Currently, the
shareholders registry is kept by the BoD;
• The transfer of Shares will be effected through the trading system of BSE, the transactions being cleared and
settled by the Romanian CSD or through direct transfer in the shareholders' registry kept with the Romanian
CSD (Article 7.1. of the AoAs). Currently, the transfer of shares is effected by making the relevant
annotations in the shareholders registry of the Company;
• Approval by the EGSM of the main terms and conditions of the following acts, before their implementation
by the BoD:
a) acquisition, disposal, lease, exchange or encumbrance of the Company's assets, the book value of which
exceeds on the date when such legal act is concluded 20% of the book value of the Company’s assets, as
recorded in the latest annual financial statements of the Company (Article 9.3 letter l) of the AoAs);
b) acquisition, disposal, exchange or encumbrance of the Company's fixed assets, the book value of which
exceeds, during one financial exercise, individually or cumulatively, 20% of the total fixed assets less
receivables, as recorded in the latest audited financial statements of the Company (Article 9.3 letter n) of
the AoAs);
c) any lease of tangible assets, for a period exceeding one year, the book value of which exceeds,
individually or cumulatively, in respect of the same co-contractor or persons involved or persons acting
in concert therewith, 20% of the total fixed assets of the Company, less receivables as set out in the latest
audited financial statements of the Company (Article 9.3 letter n1 of the AoAs);
d) any association for a period exceeding one year, which involves amounts that exceed, individually or
cumulatively, 20% of the total fixed assets of the Company, less receivables as set out in the latest
audited financial statements of the Company(Article 9.3 letter n2 of the AoAs);
• New general minimum quorum and majority requirements for the Company's GSMs (Article 13.1 of the
AoAs):
a) OGSM first convening: quorum - at least 70% of the total number of votes, majority - at least 2/3 of the
total votes held by the shareholders present, represented and voting by correspondence;
b) OGSM second convening: quorum – no minimum, majority – at least 50% plus 1 vote of the votes
expressed by the shareholders present, represented and voting by correspondence;
c) EGSM first convening: quorum – at least 70% of the total number of voting rights, majority - at least 2/3
of the total votes held by the shareholders present, represented and voting by correspondence;
d) EGSM second convening: quorum - at least 70% of the total number of voting rights, majority - at least
2/3 of the total votes held by the shareholders present, represented and voting by correspondence;
• New special minimum quorum and majority requirements for the Company's GSMs (Article 13.2 of the
AoAs):
a) In case of limitation or suspension of the Company's shareholders' preference rights in the context of a
share capital increase - a quorum of at least 85% of the subscribed share capital and a majority of at least
75% of the total voting rights;

167
b) In case of share capital increase by increasing the nominal value of the shares, other than by
incorporating reserves, benefits or premiums - unanimity.
The special quorum or majority requirements set out above apply only as long as they are required by
applicable law (Article 13.3 of the AoAs).
• Where there are voting rights the exercise of which is suspended, the voting rights in question shall not be
taken into account when determining the quorum/majority or the basis of calculation, respectively all the
voting rights (Article 13.4 of the AoAs).
Corporate purpose and core business
According to article 2 of the AoAs, the Company’s main area of business and main object of activity consists in
"Activities of centralised administrative offices and of (central) departments", as classified under the National
Classification of Economic Activities ("NCEA") (NCEA code 701/7010).
The Company carries out a series of secondary and ancillary business objects, including a variety of activities
listed in article 3 of the AoAs.
Share Capital
Subscribed and paid up share capital
Company's share capital is fully subscribed and paid and amounts to RON 581,990,100, of which RON 1,500,000
are cash contributions (in amount of RON 1,090,050, paid in RON and in amount of RON 409,950, paid in EUR,
at the EUR/RON exchange rate of RON 4.5468/EUR), and RON 580,490,100 are in kind contribution. The in-
kind contribution comprises 379,999 shares in USFN (Romania) and 379,999 shares in ARS (Romania).
The Company's share capital is divided into 38,799,340 nominative, fully paid, ordinary Shares, each having a
nominal value of RON 15, issued in dematerialized form by registration in Company’s shareholders registry. The
Shares are freely transferable starting with the first trading day thereof on the spot regulated market operated by
BSE, subject to the rules of the regulated spot market of the BSE, and of the Romanian CSD. There are no shares
issued that do not represent share capital of the Company. The Company issued only one class of shares: ordinary.
There are no shares in the Company held by the Company itself or by its subsidiaries. The Company did not issue
convertible or exchangeable securities or securities with warrants attached.
According to the excerpt from the Company's shareholders registry and to the excerpt from the Bucharest trade
registry dated 16 October 2017, the Company's shareholding structure as at 16 October 2017 was the following:
Shareholder Number of shares % of voting rights
Tatika Investments Ltd. 10,603,860 27.33
Wellkept Group S.A. 6,339,812 16.34
Lunic Franchising and Consulting Ltd. 8,667,773 22.34
Anasa Properties S.R.L. 4,264,047 10.99
M.B.L. Computers S.R.L. 8,923,848 23.00
Total 38,799,340 100.00
On 30 June 2017, the date of the most recent balance sheet included in Sphera Interim Financial Statements, as
well as on the date of this Prospectus, the share capital structure of the Company was:
Number of authorized shares 0 shares
Nominal value per share RON 15
Subscribed and paid in share capital RON 581,990,100
Subscribed and not paid in share capital RON 0
Own shares 0 shares
Shares held by Company’s subsidiaries 0 shares
Total number of shares 38,799,340 shares
The share capital of the Company is expected to be the same upon the admission of the Shares to trading on the
spot regulated market operated by the BSE.

168
After admission of the Shares to trading on the spot regulated market operated by the BSE, the shareholders'
registry will be kept by the Romanian CSD (Depozitarul Central S.A.), with registered seat at 34/36 Carol I bd.,
floors 3, 8 and 9, district 2, postal code 020922, Bucharest, Romania.
Authorised share capital
Currently, the Company's share capital is fully subscribed and paid, with no authorized share capital issue. To the
best of its knowledge, the Company is not aware of any acquisition rights and/or obligations related to the
unissued capital of the Company.
History of the share capital
Upon incorporation on 16 May 2017, the Company's share capital was RON 1,500,000. By way of resolution no.
2 of 30 May 2017, the EGSM of the Company decided to increase the share capital from RON 1,500,000 to RON
581,990,100. The share capital increase was carried out by the current shareholders of the Company contributing
in aggregate a number of 379,999 shares in USFN (Romania) and a number of 379,999 shares in ARS (Romania).
The share capital increase was registered with the trade registry on 8 June 2017.
Rights, preferences and restrictions attaching to existing shares
According to the AoAs, each Share subscribed and fully paid by the shareholders grants equal rights to its holder,
including right to one vote in the GSM, right to elect and be elected for the administrative and management bodies
of the Company, right to dividend distribution and other rights. Holding a share issued by the Company certifies
the holder’s adherence to the AoAs.
Treasury shares held by the Company, if any, do not grant voting or dividend rights.
According to the Companies Law, every shareholder must exercise its rights in good faith, observing the rights
and legitimate interests of the Company and of the other shareholders. Such rights are, essentially, related to the
shareholders’ involvement in the corporate development of the Company, by attending and casting votes in the
GSMs, exercising the right to elect and be elected in the Company’s administrative and management bodies and
taking part in the profit distribution.
According to the Company's AoAs, any share assignment made, irrespective of its form, by any shareholder of the
Company is affected by a first-degree pre-emption right in favour of the Company's shareholders and by a second
degree pre-emption right in favour of the Company. These provisions instituting a pre-emption right for the
transfer of shares will be eliminated starting with the first trading day of the Shares on the spot regulated market
operated by BSE, as described above, under section "General" of this chapter, when the Shares will become freely
transferable.
Certain rights will become applicable to the shareholders only after admission of the Shares to trading on the BSE,
in accordance with the Issuers and Markets Operations Law and its implementing regulations.
Pre-emptive right
According to the AoAs and to the capital markets regulations, the newly issued shares in relation to a share capital
increase by contribution in cash, must be offered pre-emptively to the existing shareholders of the Company
registered in the shareholders registry on the record date.
According to the regulations implementing the Issuers and Markets Operations Law, after the admission of Shares
to trading on the spot regulated market operated by the BSE, the pre-emptive right may be exercised within a
minimum period of one month, as set out in the proportionate disclosure document. The beginning of the period
shall be set subsequent to the record date and to the date of publication of the EGSM resolution/BoD resolution
approving the share capital increase in the Official Gazette of Romania.
The suspension or cancellation of the pre-emptive right to subscribe in the new shares may be effected, provided
that it is approved by the EGSM with a minimum quorum of 85% of the subscribed share capital and by a
majority of at least ¾ of the voting rights.
Rights related to GSMs
The shareholders’ fundamental rights include the right to attend the GSM and the right to vote. See "General
Shareholders Meeting" below.

169
In addition to the provisions of the AoAs and the Companies Law, the provisions of the FSA Regulation no.
6/2009 on the exercise of certain shareholders’ rights at the GSMs set out the following rights:
• the right of one or more shareholders holding severally or jointly at least 5% of the share capital: (i) to add
items to the agenda of the GSM, if each added item is accompanied by a justification or a draft resolution
proposed to the GSM for adoption and (ii) to present draft resolutions for the items added or proposed to be
added to the agenda of the GSM. These rights may be exercised only in writing and within 15 days from the
publication of the convening notice for the GSM in the Official Gazette of Romania. If exercise of the right
referred to in point (i) above requires a change to the agenda already published, the Company must re-publish
the convening notice with the updated agenda, using the same procedure as the one used for the previous
agenda, before the reference date set out by the BoD and no later than 10 days before the date of the GSM;
• the right of all shareholders to equal treatment as concerns attendance and exercise of voting rights in the
GSM;
• the right of all shareholders to have access to adequate information and documents with respect to items to be
discussed at the GSM, to enable them to exercise their rights at the GSM;
• the right of all shareholders to fast and non-discriminatory access to the convening notice of the GSM;
• the right of each shareholder to ask questions regarding the items on the agenda of the GSM and to receive
answers from the Company;
• the right to attend the GSM, directly or indirectly, including by electronic means, by correspondence or by
proxy.
Right to information
According to the AoAs, the Company makes available materials with respect to each item on the agenda of the
GSM at least 30 days before the meeting, at the Company's registered office and by publication on its website. If
the agenda of the OGSM includes the proposal to appoint BoD members, the Company must provide the
shareholders with information concerning the name, address and qualifications of candidates for the BoD member
office and the shareholders will supplement such list no later than 15 days before the first convening of the
meeting. When the agenda of the GSM includes proposals to amend the AoAs, the convening notice shall contain
the full text of such proposals.
In addition, at least 30 days before each GSM, shareholders of companies listed on a regulated market are entitled
to receive a number of documents and information, in Romanian and in English languages, to facilitate their
exercise of rights in the meeting, such as: the convening notice, special proxy forms for participation by
representation and the form of voting ballots by correspondence, the total number of voting rights, draft
resolutions for each item on the agenda. In case of the OGSM, the BoD must provide to the shareholders the
annual financial statements, the annual report of the BoD, the financial auditor's report and the proposed
distribution of dividends at least 30 days prior to the meeting.
The Company must use mass media to provide information that reasonably endures effective dissemination to the
public throughout the European Union after the Shares are admitted to trading on the regulated market of the BSE.
Right to dividends
Dividends, provided the dividend distribution is approved by the OGSM, are distributed to the shareholders
registered in the shareholders registry of the Company on the record date, proportionally to the number of shares
held in the Company. Dividends may be distributed only if the Company registers profit, as recorded in the annual
financial statements approved by the OGSM and if the OGSM decides to distribute dividends. For more details on
the right to dividends, please see chapter "Dividend policy" in this Prospectus.
Right derived from liquidation
In case of the Company's liquidation, all its assets remaining after payment of all debts shall be distributed to the
shareholders based on their participation to the share capital.
Other rights of the shareholders
Other shareholders’ rights are set out in Companies Law and in the capital markets legal framework only in favour
of shareholders holding a minimum proportion of the Company's share capital, such as:
170
• right of shareholder(s) holding individually or jointly at least 5% in the Company's total voting rights to
require the financial auditors to investigate allegations concerning the Company’s management and to prepare
reports, based on the information provided by the BoD;
• right of shareholder(s) holding individually or jointly at least 5% in the Company's share capital to ask for the
convening of a GSM;
• right of shareholder(s) holding individually or jointly at least 10% in the Company's share capital to request
the court to appoint one or more experts to review the management operations and prepare a written report in
this respect;
• if the GSM does not resolve to commence a court action seeking to engage the liability of the founders,
members of the BoD, managers or of the internal or financial auditors of the Company for damages caused to
the Company as a result of any of them acting in breach of their duties towards the Company, the right of the
shareholder(s) holding, individually or jointly, at least 5% in the Company's share capital to take legal action
in this respect;
• right of a significant shareholder to request the appointment of BoD members by cumulative voting. If the
cumulative voting is not used in the GSM, that shareholder has the right to ask the court to immediately
convene the GSM. Under the Issuers and Markets Operations Law, a "significant shareholder" is a person, or
a group of persons acting in concert, holding directly or indirectly a participation of at least 10% of the
company's share capital or voting rights.
• right of shareholder(s) holding individually or jointly at least 5% in the Company's share capital to ask once
in a financial year the convening of a GSM having on the agenda the election of the BoD members by
cumulative voting.
Withdrawal right
According to the Companies Law, shareholders that do not vote in favour of certain corporate actions in a GSM
have the right to withdraw from the Company and to request the Company to buy their shares. Such corporate
actions refer to: (i) change in the Company’s main object of activity as set out in the AoAs; (ii) relocation of the
Company’s registered seat to another country; (iii) change of the Company’s legal form; or (iv) merger or spin-
off/split up of the Company.
Right to challenge the GSM resolutions
The GSM resolutions that are contrary to the law or the AoAs may be challenged for annulment in court, within
15 days of their publication in the Official Gazette of Romania, Part IV, by any shareholder who did not attend the
meeting or who voted against and requested its vote to be noted it the minutes of the meeting. When claiming
absolute nullity of the GSM resolution, the court motion may be filed by any interested person at any time, with
no statute of limitation.
Obligation to refrain from deliberations
The shareholder that, in a certain operation, has an interest contrary to that of the Company must refrain from
deliberations. The shareholder who fails to observe this legal requirement may be held liable for damages caused
to the Company if without the vote of that shareholder the required majority for the adoption of the respective
resolution would have not been met. Voting in conflict of interest is also a criminal offence.
Obligation to notify major shareholdings
According to the Issuers and Markets Operations Law, if following the acquisition or sale of or other operations in
Shares, the proportion of voting rights held by a person reaches, exceeds or falls below one of the thresholds of
5%, 10%, 15%, 20%, 25%, 33%, 50% or 75% of the total voting rights, that person must notify, the Company of
the proportion of the voting rights held, promptly, but not later than 4 trading days starting on the day on which (i)
it finds about the acquisition or disposal or of the possibility of exercising voting rights, or on which, having
regard to the circumstances, should have found out about it, regardless of the date on which the acquisition,
disposal or possibility of exercising voting rights takes effect or (ii) it is informed with respect to an event that
changes the breakdown of voting rights. Neither the AoAs nor any other by-laws of the Company provide any
other obligation to disclose ownership of shares above a certain threshold.

171
Obligation to launch a mandatory takeover bid
According to the Issuers and Markets Operations Law, where a person, as a result of its direct acquisitions or
acquisitions by persons acting in concert therewith, holds securities in a listed company, which added to the
previous holdings of that person or of the persons acting in concert therewith, grant to that person, directly or
indirectly, more than 33% of the voting rights in a company, the respective person is required to launch a
mandatory takeover bid addressed to all security holders for all their holdings at a fair price as soon as possible,
but no later than two months after this threshold is reached.
Prior to launching the mandatory takeover bid, the voting rights attached to securities exceeding 33% of the total
voting rights in the company are suspended and the respective person together with the persons acting in concert
therewith are prohibited from acquiring, by any other operations, shares in the company.
The obligation to launch a mandatory takeover bid does not apply to persons that have acquired the respective
holdings: (i) as a result of an excepted transaction or (ii) unintentionally.
An excepted transaction is the acquisition of securities that lead to the respective holding position:
• within the privatisation process;
• by acquisition of shares from the Ministry of Public Finance or from other legally authorised entities, within
the process of enforcement of budgetary claims;
• as a result of transfer of shares between a parent company and its subsidiaries or between subsidiaries of the
same parent company;
• resulting from a voluntary takeover bid addressed to all holders of the respective securities for all their
holdings.
Unintentional attainment of the 33% threshold results from operations such as:
• share capital reduction, as a result of a share buy-back followed by cancellation of the acquired shares;
• exercise of the pre-emption, subscription or conversion rights in relation to certain rights initially conferred,
or as a result of conversion of the preferential shares into ordinary shares;
• merger/spin-off or inheritance.
Furthermore, following a bid made to all the holders of the offeree company’s securities for all of their securities,
the offeror is entitled to require all the holders of the remaining securities to sell him/her those securities at a fair
price in one of the following situations:
• where the offeror holds securities representing not less than 95% of the total number of shares carrying voting
rights and not less than 95% of the voting rights in the offeree company that are effectively exercisable; or
• where, following acceptance of the bid, he/she has acquired securities representing not less than 90% of the
offeree company’s shares carrying voting rights and not less than 90% of the voting rights comprised in the
bid.
The squeeze-out right of the offeror described above corresponds to the right of the other shareholders of the
offeree company to sell out, by requiring the respective offeror to acquire their shares. If any of the remaining
shareholders exercises this right, the offeror is under the obligation to buy the shares held by the selling
shareholders.
The squeeze-out and the sell-out rights may be exercised within three months from the closing date of the bid.
Rules regarding changes in the share capital of the Company
According to the Company's AoAs, the EGSM has the power to decide to increase and reduce the share capital.
The share capital increase may be effected: (i) in exchange of contributions in cash or in kind from shareholders;
and/or (ii) by incorporating profits, premiums and reserves, except for legal reserves; and/or (iii) by offsetting
certain and outstanding receivables of the shareholders against the Company, due on the date when the resolution
on capital increase is passed. The GSM determines the number of new shares to be issued and the amount of the
increase. BoD may be authorized by the Company’s EGSM to determine the other elements of the increase, such
as: the issue price and the offer period. The BoD also approves the documentation prepared for the
implementation of the share capital increase.

172
The Company’s EGSM or the AoAs may authorise the BoD to increase the share capital up to a maximum limit.
The authorisation is granted for a period of up to three years and may be renewed for further periods of up to three
years for each renewal.
The share capital may be reduced by: (i) decreasing the number of shares; (ii) reducing the nominal value of each
share; or (iii) acquisition of own shares followed by cancellation thereof. Where not justified by losses, the
reduction of the share capital may also be effected by: (i) total or partial write-off of contributions due by the
shareholders; (ii) restitution to shareholders of a part of their contribution, pro rata to the share capital reduction
and calculated equally for each share; or (iii) other methods permitted by law.
The share capital may be effectively reduced only upon expiry of a two-month period as of the publication of the
GSM resolution approving the share capital reduction in the Official Gazette of Romania, Part IV.
According to the Companies Law, the share capital increase and the share capital reduction must be resolved upon
by a majority of at least two-thirds of the voting rights held by the shareholders who are present or represented in
the GSM duly assembled with a minimum quorum of at least one-fourth of the total number of voting rights in the
first convocation or a minimum quorum of one-fifth of the total number of voting rights in subsequent
convocations.
However, the AoAs impose GSM quorum and majority requirements higher than those set by law for share capital
increase or reduction: a minimum quorum of 75% of the total voting rights is necessary for the first convocation
and of 60% of the total voting rights is necessary for the second convocation. The resolution on share capital
reduction or increase is adopted with a minimum majority of 75% of the voting rights of the shareholders present,
represented or voting by correspondence in the GSM. These quorum and majorities requirements will be modified
starting with the first trading day of the Shares on the spot regulated market operated by BSE, as described above,
under section General of this chapter.
The AoAs contain no provisions that would lead to delaying, deferring or preventing a change in the control of the
Company.
Corporate bodies
General Shareholders Meeting
Whenever necessary, the BoD convenes a GSM. The convening notice is published in the Official Gazette of
Romania, Part IV, and in a newspaper of general circulation at least 30 days before the date of the meeting.
The shareholders generally hold the Company’s GSM at the registered seat of the Company, unless the members
of the BoD decide otherwise, in which case the convening notice must expressly indicate the address of the
location where the meeting will be held.
According to the AoAs, the OGSM resolves upon the following matters related to the Company:
• approves or amends the Company's annual standalone and consolidated financial statements, based on the
reports presented by the BoD and by the financial auditor;
• approves distribution of profits as dividends;
• appoints and revokes the BoD members;
• appoints and revokes the financial auditor and sets the minimum term of the financial audit contract;
• decides on the remuneration of the BoD members for the current financial year;
• releases the BoD members from their management responsibility for the activity performed in the previous
financial year;
• approves the income and expenditure budget and, if applicable, the business plan for the next financial year;
• initiates court claims for damages against the BoD members, the managers and the financial auditor and
appoints the person authorized to represent the Company before the competent courts.
The minimum quorum for the first convocation of the OGSM is 50% of the total voting rights and the resolutions
are adopted with a minimum majority of 50% of the voting rights plus one vote expressed by the shareholders
presented, represented or voting by correspondence. These quorum and majority requirements will be modified
starting with the first trading day of the Shares on the spot regulated market operated by BSE, as described above,
under section General of this chapter. There is no minimum quorum for the second convocation of the OGSM.

173
The EGSM resolves on the following matters related to the Company:
• changes in the legal form;
• changes in main activity;
• relocation of the registered seat abroad;
• increase and reduction of the share capital;
• merger, spin off or split up, except in case these types of operation do not require the approval of the GSM;
• liquidation and dissolution;
• issuance of bonds and conversion of a bond category to another category or into shares;
• conversion of shares from one category to another;
• direct or indirect acquisition of own shares, except where such operation results from another corporate
action, such as acquisition by the Company of shares offered by the shareholders exercising their right to
withdraw from the Company;
• admission of shares issued by the Company to trading on a regulated market, on an alternative trading system,
on a multilateral trading facility or on any other organised trading system;
• prior approval of the main terms and conditions of the legal deeds entered into by the BoD on behalf of the
Company related to the association, acquisition, disposal, lease, exchange of or creation of a security interest
over the Company’s assets, the individual value of which exceeds the amount of RON 20 million. This item
will be modified starting with the first trading day of the Shares on the spot regulated market operated by
BSE, as described above, under section General of this chapter;
• any acquisition or disposal of assets by or to the Company effected by any BoD member(s) on his/her own
account, if the individual value of such legal deed exceeds the amount of RON 4 million;
• loan agreements and/or commercial credits, including external loans/credits, setting the powers, the
contracting limits of the credits/loans and the means of providing security interests/guarantees. This item will
be modified starting with the first trading day of the Shares on the spot regulated market operated by BSE, as
described above, under section General of this chapter;
• any other matters included in the agenda of the meeting on which EGSM is competent to adopt resolutions;
and
• any amendments to the AoAs, including the adoption of new AoAs, except where amendments can be decided
by the BoD.
The minimum quorum for the first convocation of the EGSM is 75% of the total voting rights and the resolutions
are adopted in the first or second convening with a minimum majority of 75% of the voting rights held by the
shareholders that are present, represented or who vote by correspondence in the meeting. The minimum quorum
requirement for the second convening is of 60% of the total voting rights. These quorum and majorities will be
modified starting with the first trading day of the Shares on the spot regulated market operated by BSE, as
described above under section General of this chapter;
The AoAs provide for special quorum and majority requirements for the GSM when resolving on the following
matters:
• limitation or suspension of the pre-emptive right of the shareholders to subscribe in newly issued shares as a
result of the share capital increase or share capital increase by in kind contribution:
✓ minimum quorum of 85% of the subscribed share capital and a minimum majority of ¾ of the total
voting rights;
• change in the main business object, increase or reduction of the share capital, change in the legal form,
merger, spin off, dissolution
✓ minimum majority of 2/3 of the total voting rights of the shareholders present, represented or voting by
correspondence;
• increase of share capital by increasing the nominal value of shares, other than by incorporating reserves,
benefits or premiums:
✓ unanimity;
• change in the number of shares or in the nominal value of each share, other than as set out above:

174
✓ minimum majority of 75% of the total voting rights;
• increase or reduction of the share capital by issuance/annulment of shares:
✓ minimum majority of 75% of the total voting rights;
• any changes to the AoAs, including adoption of new AoAs, except for changes that can be adopted by the
BoD:
✓ minimum majority of 75% of the total voting rights; In case voting rights are suspended, the respective
voting rights shall not be taken into account when determining the quorum/majority or the
computation base therefor, i.e. the total number of voting rights.
• buy back of shares according to article 7 of the AoAs
✓ minimum majority of 75% of the total voting rights.
Some of these special quorum or majority requirements will cease to apply starting with the first trading day of the
Shares on the spot regulated market operated by BSE and will be replaced by other requirements, as detailed
under section "General" of this chapter.
The Company’s shareholders registered in the shareholders' registry on the reference date set by the BoD may
attend the GSM in person (through their legal representative, for legal persons) or by representation, based on a
general or special proxy, in accordance with the applicable law and the procedure established by the Company in
the convening notice. The dully filled in power of attorney shall be submitted with the Company at least two (2)
business days before the date of first convening of the GSM as set in the convening notice. Shareholders and their
representatives shall prove their identity in the GSM with the identity document and, if applicable, submit the
power of attorney.
Board of Directors
The Company is managed in a one tier board system by a BoD consisting of seven (7) members appointed by the
OGSM for a four-year term, except for the first (current) BoD members who are appointed for a two-year term.
BoD members can be Romanian or foreign citizens, individuals or legal entities. The majority BoD members are
non-executive.
The BoD meetings may validly pass decisions if at least five (5) members are present or represented in the
meeting. The decisions are adopted with a majority of at least 50%+1 of the votes of the members of the BoD
present in the meeting. In case of a voting deadlock, the vote of the BoD chairman is decisive.
The BoD is responsible to carry out all useful and necessary acts to fulfil the objectives of the Company, including
the management of Company's subsidiaries and investments, except for the powers that are assigned by law to the
GSM.
The management of the Company is delegated by the BoD to the General Manager (CEO), to the Chief Financial
Officer (CFO), to the Chief Development Officer (CDO), to the Chief Marketing Officer (CMO) and to the Chief
Operations Officer (COO). The BoD may appoint other managers with delegated management powers. The
segregation of duties between the BoD and the CEO or other manager as well as the transaction value thresholds
are set in the internal bylaws of the BoD or may be established by decision of the BoD.
According to the AoAs, the following responsibilities of the BoD may not be delegated to the general manager
and/or other managers:
• setting the main business and development strategies for the Company;
• setting the accounting policies and the financial control policy and approving financial planning;
• appointing and revoking the Company's CEO and other managers, setting their powers and responsibilities,
supervising their work and deciding on the amount of their remuneration;
• preparing the annual report, approving the annual standalone/consolidated and interim financial statements,
preparing the business plan and the income and expenditure budget for the next year, organizing the GSM and
implementing the GSM resolutions;
• applying for insolvency of the Company, when required;
• executing the powers delegated by the GSM;
• deciding on the establishment or closing of the Company's secondary offices in Romania or outside Romania
and appointing or revoking their managers;

175
• approving the BoD bylaws;
• representing the Company in its relation with the CEO and other managers of the Company.
Managers
The BoD appoints the CEO for a mandate of four (4) years with the exception of the first CEO appointed for a
mandate of two (2) years. The BoD may change the management structure of the Company. The CEO is generally
responsible for running the daily business of the Company within the limits set by the BoD decisions, in the AoAs
and by the applicable law. The BoD may revoke at any time the CEO or the other managers with or without just
cause. Revocation with cause may occur if: (i) in exercising his/her duties and responsibilities, the manager
exceeds the limits set out by the BoD; (ii) the manager fails to carry the actions set out by the BoD; (iii) he/she
fails his/her duty of operating in good faith and in the interests of the Company; or (iv) he/she is in breach of the
conflict of interest regime.
The Company is represented by the CEO who can legally bind the Company by his/her sole signature. In case the
Company appoints other managers with delegated powers, the Company may be represented by any such manager
who may legally bind the Company by his or her sole signature. The power to represent the Company can be
transferred based on a power of attorney issued by the person who has representation powers.
176
RELATED PARTY TRANSACTIONS
For information on material transactions with related parties as defined in the Group Financial Statements, as of
and for the periods ended 31 December 2014, 2015 and 2016, and 30 June 2017, please see Sphera Interim
Financial Statements (Note 24), USFN (Romania) Annual Financial Statements (Note 24), the ARS (Romania)
Annual Financial Statements (Note 22) and ARS Interim Financial Statements (Note 22).
In the ordinary course of business and on a constant and regular basis, we enter into transactions for the supply of
goods and services, on arm’s length terms, with companies from the Group, including our subsidiaries. The
balances of purchases, payables, revenues and receivables (as applicable) in respect of significant transactions
with related parties as at 30 June 2017 are disclosed in Sphera Interim Financial Statements and in ARS
(Romania) Interim Financial Statements.
Up to the second half of 2016, ARS (Romania) has acted as a purchase hub for some related entities, mainly the
USFN Group. All food supplies, beverages or other consumables were purchased by ARS (Romania) and sold at a
mark-up designed to broadly cover any other operating costs directly associated with this line of business. In
November 2016, ARS (Romania) together with USFN (Romania) have outsourced this activity to Havi
(Romania), a third party company specialized in integrated logistics services for the food industry.
USFN (Romania) granted USFN (Moldova) a EUR 550,000 loan to finance USFN (Moldova)'s costs to develop
and operate a KFC restaurant in Chisinau, Republic of Moldova, based on a credit contract entered into on 23 July
2015. The loan must be reimbursed within 72 months from withdrawal of the first tranche under the loan. The
security interest package includes movable mortgage over (i) bank accounts and sub-accounts opened by the
borrower with BC Mobiasbanca Groupe Societe Generale S.A. and (ii) equipment, machineries and all assets used
for USFN (Moldova)'s business.
USFN (Romania) granted USFN (Italy) a 3,000,000 EUR loan to finance USFN (Italy)'s costs to develop and
operate the first KFC restaurant in Italy, and to acquire the necessary logistic, based on a credit contract entered
into on 19 December 2016, subsequently amended. The loan must be reimbursed on 19 December 2021. There are
no security interests created by USFN (Italy) in favour of USFN (Romania) to secure its obligations under the
credit contract.
As of 1 September 2017, the Company has consolidated and provides to the benefit of its subsidiaries USFN
(Romania) and ARS (Romania) services with respect to: finance and accounting, marketing, development,
operational, and human resources activities. The process included the transfer from the subsidiaries of the
personnel, assets and contracts related to the consolidated services.
Furthermore, by way of decision no. 27 of 29 August 2017, the BoD approved the loan contract entered into by
the Company, as lender, and its subsidiary California Fresh Flavors (Romania), as borrower. The loan has a
maturity of 5 years, in a maximum amount of EUR 1 million, and bearing an annual interest rate of 4%.
On 25 August 2017, the Company, as borrower, entered into a loan agreement, with USFN (Romania) as lender.
The amount of credit facility was increased from EUR 3 million to EUR 7 million by way of BoD decision passed
on 6 October 2017.
By way of BoD decision no. 31 of 11 September 2017, the BoD approved the loan contract entered into by the
Company, as lender, and its subsidiary USFN (Italy), as borrower. The loan has a maturity of maximum 1 year, in
a maximum amount of EUR 3 million, and bearing an annual interest rate of 4%.
177
MATERIAL CONTRACTS
The following selected contracts or series of contracts of the same type that have been concluded by the members
of the Group and are, or may be, in the Company's opinion, either individually or in aggregate, material or
contain provisions under which a member of the Group has an obligation or entitlement which is, or may be,
material to the Group as of the date of this Prospectus.
Franchise Agreements and Development Commitments concluded with Yum!
For a detailed description of the standard terms and conditions of our franchise agreements, and of our
development commitments towards Yum!, please see section "Our relationship with Yum!" in the "Business"
chapter of the Prospectus.
Lease contracts
As at 30 June 2017, the Group was operating restaurants in Romania, the Republic of Moldova and Italy under:
• the KFC brand, based on 67 lease contracts entered into by USFN (Romania), 2 lease contracts entered into
by USFN (Moldova), and 2 lease contracts entered into by USFN (Italy);
• the Pizza Hut brand, based on 20 lease contracts entered into by ARS (Romania); and
• the Pizza Hut Delivery brand, based on 15 lease contracts entered into by ARS (Romania).
Object: lease of units in shopping malls and retail parks, standalone restaurants, drive-through units, and small
standalone commercial units (more common for the Pizza Hut Delivery brand). Leased spaces usually measure
around 100 sqm for Pizza Hut Delivery units, 100 - 200 sqm in case of shopping malls and retail parks, and up to
300 - 400 sqm, for some Pizza Hut units and KFC drive-through units.
Term: typically, 5 years with no automatic renewal right. In some cases, the leases are concluded for a (i) 3-year
term, for some Pizza Hut units, (ii) up to 10-year term, in case of some standalone restaurants and shopping malls,
and (iii) up to a 20-year term, in case of some drive-through units. In rare cases, an automatic renewal mechanism
is provided. In most cases, the owner's approval for renewal is needed, opening the possibility to negotiate a new
term and a new rent. In rare cases, renewal is subject to satisfaction of certain conditions related to the commercial
performance of the leased unit.
Rent: generally comprised of a fixed minimum rent and/or a variable turnover-based percentage rent. For certain
leases, the variable percentage applies only if specific turnover thresholds are met. Normally, the payable rent is
the higher amount between the fixed and the variable rent. In limited cases, the rent is fixed, more commonly in
case of Pizza Hut Delivery units. The rent is payable monthly or quarterly in advance, and is normally subject to
automatic indexation (only upwards). In case of failure to timely pay the rent, the Group normally has short
remedy periods of 5 to 15 days (up to 30 in rare cases), with the failure to comply rendering the lease in danger of
early termination by the owner.
The cost structure is usually comprised of individual utilities' costs, owner's service charge, administration,
marketing, decoration, technical charges, and costs of insurance (the minimum insured amount for each of the
Group's unit is usually set between EUR 50,000 and EUR 200,000), ownership charges taxes (either included in
the service charge or to be paid to the owner separately, pro rata). The service charge and included services are
usually subject to unilateral modification by the owner, and in rare cases the automatic increase of some costs with
a pre-determined percentage is stipulated. The cost structure is usually simplified in case of Pizza Hut Delivery
units, in that it only includes the individual utilities' costs and owner's service charge, with rare additional costs
such as marketing charges in case of retail parks.
Rights and obligations: in some cases a change of control clause is stipulated in favour of the owner, whereby the
Group is either obliged to seek the owner's approval under risk of termination (hard clause) or to simply notify the
owner without requesting its approval (soft clause). Normally, the owner reserves the right to assign the lease or
sell the leased premises without the Group's consent, and only in some cases with a protection clause for the
Group's rights deriving from the current contract. In case of shopping malls and retail parks, the contracts usually
feature a non-exclusivity clause, whereby the owner may lease appropriate space to any of the Group's
competitors. In limited cases, the Group has a free break option (more commonly in the case of Pizza Hut
Delivery units), usually at a specific point in time or at certain anniversary dates. In rare cases, the Group has a
178
free break option conditional on the brand franchisor's justified policy decision to withdraw. In some cases, the
Group also has an indirect break option, the triggering of which causes payment of a penalty equivalent to the rent
and/or full costs for a specific number of months (i.e. 2-12 months).
Limitation of liability: the owner normally limits its liability considerably, sometimes excluding the eviction and
hidden defects warranty. The Group's liability is exhaustive, and covers direct and indirect, predictable and
unpredictable damages, claims and/or actions of third parties, repairs to the leased space and its accessories and/or
to the rest of the premises. The Group also agreed to waive any claims in most cases where the owner's liability is
restricted or excluded, including claims for damages and/or loss of profit.
In most cases, the contracts are concluded with special regard to the Group's identity and activity, and so their
continuity is subject to the Group continuing to have the proper rights to operate the proposed activity under the
proposed brand names; consequently, with certain exceptions, assignment and subleasing are generally prohibited.
Termination: in case of termination, normally the owner has a privilege, lien and/or retention right over the
Group's movable assets in the leased space, as well as extended rights to evict. In some cases, the Group must also
pay a supplementary penalty for termination, regardless of cause, equivalent to either the rent and/or full costs for
a specific number of months (i.e. 2-8 months) or until the end of the remaining term, sometimes mitigated if the
premises are leased by a new tenant.
Other property related contracts
Joint venture contracts
USFN (Romania) concluded a joint venture contract with R.A.-A.P.P.S until 2021 for development and operation
of a KFC restaurant located on 28-30 Gheorghe Magheru str., district 1, Bucharest, Romania. USFN (Romania)
committed to (i) a total investment of EUR 885,000 over the period 2011-2018, (ii) its right of use of the Concept
under the Franchise Agreement in connection with the restaurant and (iii ) equipment in the total amount of EUR
78,885. USFN (Romania) has the right to operate the restaurant. The minimum amount payable to R.A. -A.P.P.S.
may be renegotiated once every 3 years.
USFN (Romania) concluded a joint venture contract for an undetermined period with Polin for the KFC unit
located in Bucharest, Gara de Nord train station. In this case, Polin's title to the space is wholly dependent on the
lease agreement it concluded with the Romanian National Railway Company (RO: Compania Naţională de Căi
Ferate "CFR" – S.A.). The term of the lease has been entered into is not a fixed term; the lease is granted until the
public tender for the leased premises will be carried out. This joint venture agreement represents an operating
lease agreement from an IFRS perspective.
Superficies contracts
USFN (Romania) concluded a superficies contract for a land situated in Bucharest, 259 Colentina Rd., where the
company intends to develop a drive-through unit. The contract specifies that the land is subject to a restitution
claim, and that it may be terminated by the Company should such risk materialize or cause failure of proper
authorization of the construction works;
Owned properties
ARS (Romania) owns the Pizza Hut Mosilor location and a small warehouse in Constanta (on 10 Răscoalei 1907
street), which is not used at present for operational activities.
Lease contracts concluded with public authorities and other entities
USFN (Romania) concluded a lease contract with Cluj-Napoca Municipality for a standalone KFC unit, the term
of which is due to expire on 1 August 2019.
USFN (Romania) concluded a lease contract with the Evangelic Church of Romania – Brasov parish for a location
which is a historical monument. USFN (Romania) undertook to perform restoration works for the façade of the
building and also has specific obligations deriving from the historical monument status of the property.

179
Financing facilities
Term credit facility contract: inter alios ARS (Romania) and USFN (Romania) as debtors and guarantors and
Alpha Bank (Romania), as creditor (no. 120/2006/1 of 31 October 2006, subsequently amended)
Object: revocable term credit facility (denominated in EUR, USD and RON) up to a maximum amount of
20,630,000 EUR, with certain sub-limits with targeted purpose, (e.g. (re)financing development and equipment
acquisition costs for the entire network of Pizza Hut and KFC restaurants in Romania and the costs of acquisition
of plots of land on which the new restaurants operated by USFN (Romania) and ARS (Romania) are planned to be
built and the costs of construction of such restaurants, for lease related letters of guarantee, on-lending to members
of the Group located outside Romania and as working capital). Certain sub-limits of the facility may be
reallocated with Alpha Bank (Romania)'s consent.
Reimbursement: (i) equal monthly tranches, for amount drawn under certain sub-limits; and (ii) bullet payment
prior to 31 May 2017, for amounts drawn under other sub-limits.
Security interest package: inter alia (i) immovable mortgage over certain restaurants, (ii) movable mortgage over
equipment, machineries, trade funds, credit accounts, insurance policies and certain receivables consisting in
present and future dividends paid in relation to shares held by USFN (Romania) in USFN (Moldova) and in USFN
(Italy), as well as over certain other receivables resulting from the loan contracts concluded between USFN
(Romania) and USFN (Moldova), and USFN (Italy), respectively and (iii) blank promissory notes.
Material negative covenants: prohibition to (i) distribute dividends and repay loans in favour of the shareholders
of the borrowers; (ii) sell significant assets or create security interests over assets of ARS (Romania), and USFN
(Romania); (iii) take loans from other banks or financial institutions; (iv) substantially change the object and
nature of business; and (v) grant any loans to third parties, without the bank's prior written consent.
Notices: prior notices to the bank in case of (i) any resolution/decision to change/amend the borrowers' articles of
association, organisation and operation structure, the shareholders or the management composition and (ii) any
ongoing judicial or arbitral procedure.
Termination: breach of negative covenants, obligation of prior notice, and other termination events such as:
change of control, cross default and breach of restrictions on capital expenditure.
Contracts related to the Offering
For the contracts related to the Offering, please see "Subscription and Sale" chapter below.

180
REGULATORY MATTERS
Overview
We are subject to a large number of laws and regulations affecting the operation of our business, in particular,
European Union legislation, national and local laws and regulations concerning food safety and hygiene,
occupational safety and welfare, environment and consumer protection, employment, licensing requirements, and
rules imposed by numerous regulatory and enforcement authorities.
In the context of operating in a very strict regulatory environment, we seek to maintain high standards of service,
hygiene and consistency across our operations. In accordance with industry standards, the Group’s units operate
pursuant to regionally appropriate HACCP (Hazard Analysis Critical Control Point) documents. The Group’s
compliance with such processes within each country is then monitored by internal audit teams where appropriate.
Audits are carried out across the Group’s portfolio with the aim of ensuring that the Group is adhering to brand
and operational standards. Results are recorded by the relevant audit team and are used to drive unit performance.
The Group has processes for self-audit to ensure compliance with these legal requirements and is also subject to
regular audits from the Group's franchise partners. The Group’s business is also inspected by various national and
local regulatory authorities in the ordinary course to ensure compliance with applicable regulations.
Material permits and approvals
In order to operate as a food and beverage operator in Romania, we are required to obtain and maintain various
permits and approvals from competent authorities.
The following steps are generally required to secure our operations in Romania from a regulatory perspective:
(i) Authorization by the Trade Registry of the activities to be performed at a certain business unit
When registering a business unit with the trade registry, the company's representatives issue and affidavit
declaring that the activities to be carried out in the respective unit shall comply with the applicable legislation
concerning the sanitary, sanitary veterinary, environmental protection and health protection.
Where specific operations permits need to be issued, generally such documents have to be obtained prior to
starting the operations.
(ii) Environmental permit
The environmental permit sets out the conditions and the parameters to operate a business with potential
significant environmental impact. Generally, the environmental permit is valid for five years and has to be revised
whenever the authorized conditions change.
The Group has to comply with GEO 195/2005 on environmental protection. Additionally, there are also special
regulations that the Group is required to observe, such as Order 1798/2007 on the approval of the Procedure for
the issuance of the environmental authorization (issued by the Ministry of Environment and Sustainable
Development), Government Decision 188/2002 on the approval of some norms on the discharge of waste waters
into aquatic environment, Order 119/2014 on the approval of Norms of hygiene and public sanitation regarding
the living environment of the population (issued by the Ministry of Health).
One of the main principles governing Romanian environmental law is the "polluter pays" principle. GEO
195/2005 provides that generally, the polluters’ liability is strict and joint in case of more polluters. For our
restaurants we are required to have environmental permits where the minimum seating in our restaurants is 100
seats. The Group is generally required to comply with the following obligations: (a) apply for and obtain the
necessary permits, as provided by GEO 195/2005, (b) observe and comply with the conditions imposed by such
permits, (c) allow access to persons qualified to verify, inspect and control the technological installations
generating environmental impact, as well as the corresponding areas, (d) carry out, entirely and in due time, the
measures imposed, as set out in the documents/decisions issued by the persons who are qualified to carry out
verification, inspection and control activities, (e) repair the damage and remove the consequences produced by it,
restoring the conditions prior to the occurrence of the damage, according to the "polluter pays" principle, (f)
inform the competent authorities in case of accidental disposal of environmental pollutants or major accidents.

181
Moreover, considering the nature of the activities carried, the Group has the obligation to ensure special measures
and equipment for the isolation and noise protection of the vibration generating sources, so that they do not lead to
exceeding the ambient noise limits. The Group must observe the following limit values of noise indicators: (a)
during the day the maximum limit is 55 dB and the noise curve Cz 50 and (b) during the night, from 23:00 until
7:00, 45 dB and the noise curve Cz 40. Violation of the provisions regulating this obligation is a
contravention/misdemeanor and is punishable by fine amounting from RON 30,000 to RON 60,000.
(iii) Firefighting permit
According to Law 307/2006 and Government Decision 571/2016, any construction/location with surfaces
exceeding 200 square meters, where public food services take place should be authorised by the local competent
Emergency Situations Inspectorate as compliant with the fire security requirements.
Thus, commencement of new construction works, modification to existing constructions and/or change of their
purpose of operation, as well as commissioning thereof are subject to obtaining the firefighting endorsement or
permit, as applicable. The firefighting endorsement is a document certifying that the technical design
documentation complies with firefighting legislation, whereas the firefighting permit certifies, after on site and
document verification, that the buildings and installations comply with applicable legislation and allows the holder
to construct, commission and operate them.
In respect of existing buildings that have been commissioned without obtaining the firefighting permit, the law
requires such document to be obtained by 30 September 2017. In case of a serious breach that triggers cessation of
operation or of the usage of the buildings, the exception does not apply. According to Law 146/2017, operators
that have submitted the documentation for the firefighting permit by 30 September 2017 will not be sanctioned if
the permit is obtained by 31 December 2017. Since the applicability of the firefighting permit to existing
operating buildings is not consistently dealt with by the authorities, in practice the opinion of the relevant
authority whether a firefighting permit is required even if no modifications are made is sought.
In practice, the firefighting permit is usually obtained for the entire building and, therefore, may not be under the
control of the Group. However, operating in the absence of firefighting permits may lead to the repeated
application of fines up to suspension of the operations.
(iv) Sanitary veterinary registration and inspections
Food safety is an integral part of the Group’s business as a food and beverage operator. Serving food that is safe
and has been purchased, distributed, stored, prepared and sold in accordance with the applicable legislation is an
underlying prerequisite for our customers. The Group is subject to extensive local and national laws and other
requirements regarding food safety, including traceability, quality and safety of raw materials and final products;
control of water drinkability; staff training, health control, pest elimination, waste management, maintenance and
hygiene of the areas and of the equipment, application of hygiene best practice procedures, based on HACCP
principles. The Group is subject also to the requirements imposed at EU level for its operations with the European
Union.
Retail sale of foodstuff of animal and non-animal origin, including in restaurants and similar locations, requires a
sanitary veterinary and food safety registration in accordance with the NSVFSA Order 111/2008. Such NSVFSA
Order regulates the registration procedure for obtaining and direct sale and/or retail of foodstuff of animal and
non-animal origin, as well as of production, processing, storage, transportation and trade of foodstuff of non-
animal origin. The registration document is issued by local sanitary veterinary authority after checking the
documentation and performing on site visits to check compliance with the requirements of the specific field, as
well as with the requirements of EU Regulation 852/2004/EC on general foodstuff hygiene rules. Specific hygiene
rules for food of animal origin are laid down in EU Regulation 853/2004/EC. The registration document is valid
as long as the underlying conditions remain the same.
The Group (in respect of its business in the European Union) is subject to both EU regulations indicated above.
Regulation (EC) 852/2004 has been transposed in Romania by Government Decision 924/2005 approving the
general rules for foodstuff hygiene, while Regulation (EC) 853/2004 has been transposed by Government
Decision 954/2005 laying down specific rules for food of animal origin.
The Group ensures compliance with the applicable food and health legislation and the Group is adequately
controlling the risks across its operations and business units. The inspections are generally performed under EU
Regulation 882/2004/EC and EU Regulation 854/2004/EC which have been transposed at national level by
Government Decision 925/2005 approving the Rules on official inspections to ensure compliance with food and

182
feed legislation as well as health and protection of animals, respectively Government Decision 955/2005
approving the Rules on official inspections related to animal origin products intended for human consumption.
The official inspection legislation will be subject to substantial changes upon the application of the Official
Controls Regulation (EU) 2017/625 from 14 December 2019. Said Regulation shall repeal EU Regulation
882/2004/EC and EU Regulation 854/2004/EC as well as several other pieces of EU legislation. National
legislation is thus expected to change as well in order to comply with the new rules
(v) Operating permit
Public food services may be carried out on the basis of an operating permit issued by the local administration
authorities (i.e. city halls). The issuance procedure is a matter of local practice and varies from one authority to
another. The operating permit is valid for one calendar year.
Other material regulatory framework
Fair commercial practices, consumer protection and foodstuffs labelling
The general rules regulating the production, circulation and marketing of foodstuff are established in the GEO
97/2001. It creates a legal framework regarding the production, packaging, storage, transportation and marketing
of foodstuff, the responsibilities of foodstuff's manufacturers and sellers, organization of official inspections and
imposition of sanctions in order to protect food quality. The legal requirements for each specific area are further
developed in a large number of pieces of secondary legislation (such as legislation on metrology obligations, batch
identification, price indication, etc.), sometimes overlapping.
Requirements regarding fair commercial practices as well as misleading advertising and the unfair consequences
thereof and conditions under which comparative advertising is permitted are also applicable to the Group's
business. Said requirements are provided under Directive 2005/29/EC and Directive 2006/114/EC which have
been implemented at national level by Law 363/2007 and Law 158/2008, respectively.
Pre-packed food, as well as non-prepacked food that the Group sells (within the European Union) must comply
with provisions on labelling at EU level, and notably with EU Regulation 1169/2011 on the provision of food
information to consumers. The same regulation contains also the requirements on nutrition labelling, which aims
to help consumers choose an appropriate diet and encourage public nutrition education as well as on allergens
labelling, allowing consumers to identify allergenic ingredients in foodstuffs.
Although EU Regulations are directly applicable into EU Member States, there are still cases where former
national legislation has not been formally repealed or adapted to the new EU provisions. For example, this is the
case of foodstuff labelling where Government Decision 106/2002 still applies.
Romania has not yet implemented sanctions for non-compliance with the provisions of the EU Regulation
1169/2011, but applies specific sanctions based on general consumer protection legislation which is generally
scattered in multiple pieces of legislation. A draft law currently exists that envisages significant sanctions for
breaches to the specific provisions provided in EU Regulation 1169/2011.
Waste management
In respect of waste management, the Group has to comply with Law 211/2011 on waste regime.
In order to obtain the sanitary veterinary registration authorization, among other, the Group must conclude an
agreement for the collection of used oils resulting from its activity, use fat separators and conclude an agreement
for hygiene of the fat separators. In this respect, the Group is subject to a set of restrictions on the discharge of
wastewater into municipal sewage networks and directly in the sewage treatment plants, respectively the Group
must ensure that the used water resulted from its activity and which is discharged in the municipal sewage
networks and directly in the sewage treatment plants does not contain oil, fats or other materials that could lead to
creating deposits of accumulations on the collector channel. According to other special environmental legislation,
the Group is required to conclude service agreements with an authorized entity for collection of waste of animal
origin which is not for human consumption, resulting from the Group's activity. Failure to observe such obligation
is an offence under Romanian law.
Cleaning and disinfection operations carried out by the Group as part of its operation specifics involve using
biocide substances, as well as other specific substances regarded as dangerous for the human health and for the

183
environment, as set out in Regulation (EC) 1272/2008 on classification, labelling and packaging of substances and
mixtures. The Group is required to control the dangerous substances and chemicals and comply with obligations
such as: (a) certain substances and chemicals must be accompanied by the product's safety data sheet, as issued by
the producer, (b) the staff handling such substances and dangerous chemicals must be trained in this field and sign
the training sheet for work safety, (c) the substances and dangerous chemicals must be used according to the
producer's instructions.
In addition, as concerns packaging and packaging waste, the Group has to comply with Law 249/2015 regarding
the management of packaging and waste packaging and with the GEO 196/2005 regarding the Environmental
Fund, as well as subsequent regulations. In particular, the Group is required to keep record of and report on the
quantities of packaging introduced on the market, as well as of the recovered packaging waste. In line with EU
legislation, there are certain annual targets to be achieved in relation to recovery of packaging waste, e.g. for paper
and cardboard: 60% of the weight of the paper and cardboard introduced on the market by the relevant operator, or
for plastic: 22.5% of the plastic weight introduced on the market. The recovery targets may be achieved by the
relevant operator individually or by transferring the liability to one or more authorized operators ("OTRs"). The
Group is required to observe the obligation to keep record of and report the quantities of packaging it has placed
on the market even in case of transfer of liability to OTRs. Failure to achieve the targets will result in payment of
a fee of RON 2 per kilogram for the difference between the quantities of packaging waste corresponding to the
minimum targets and the quantity of waste effectively recovered. In addition, the authorities may apply fines,
default penalties and interest rates, or in certain circumstances, even commence criminal investigations against the
non-compliant companies. As per Law 211/2011, in order to ensure a high degree of waste recovery, package
waste producers and package waste holders are required to collect separately at least the following categories of
package waste: paper, metal, plastic and glass. Other obligations may refer to classifying each type of waste
generated as a result of the Group's activity in a waste list. Also, the Group has the obligation to appoint an
employee to pursue and ensure compliance with legal obligations related to waste management or to delegate this
obligation to a third party. The person(s) appointed for this purpose should be trained in waste management,
including dangerous waste, as a result of graduating from a specialized course.
Data protection
In its normal course of business, the Group collects personal data from its employees and customers. Processing of
personal data is regulated by Law no. 677/2001 for the protection of individuals with regard to the processing of
personal data and the free movement of such data, transposing in Romania Directive 95/46/EC of 24 October
1995 on the protection of individuals with regard to the processing of personal data and the free movement of such
data. In general, the collection of personal data should be performed for specified, explicit and legitimate
purposes. The law imposes operators, among others, obligations to inform the data subjects about the content of
their personal data that can be processed, to maintain the privacy of the acquired data and to notify the supervisory
authority.
Failure to comply with the law on personal data processing constitutes an offense unless committed under such
conditions as to constitute a criminal offense and is punishable with fines as low as RON 500 and as high as RON
500,000, depending on the type of infringement.
On 27 April 2016, Council Regulation (EU) 679/2016 on the protection of individuals with regard to the
processing of personal data and on the free movement of such data and repealing Directive 95/46/EC was
approved. This regulation will apply as of 25 May 2018. Some of the major changes brought about by this
regulation are the increase of the administrative fines applicable for violations of the protection of personal data,
which can reach up to the highest value of EUR 20 million or 4% of total worldwide annual turnover
corresponding to the financial year.

184
TAXATION
The following summary of certain Romanian tax consequences of ownership of the Shares is based upon laws,
regulations, decrees, tax rulings, income tax conventions (treaties) for the avoidance of double taxation,
administrative practice and judicial decisions in effect at the date of this Prospectus. Legislative, judicial or
administrative changes or interpretations may, however, be forthcoming that could alter or modify the statements
and conclusions set forth herein. Any interpretations may be retroactive and could affect the tax regime applicable
to the holders of the Shares.
The following information is a summary of the most significant Romanian tax considerations relevant to the
holders of the Shares.
This summary is based on laws, regulations and administrative procedures in Romania and in the EU in force at
the date of this Prospectus and is not intended to represent a legal opinion or to be a comprehensive analysis of all
possible tax considerations that may be relevant for Romanian and foreign legal entities and individuals who
acquire the Shares.
Prior to investing in the Shares, potential investors should seek advice from their tax and financial advisers with
respect to Romanian and/or EU tax regulations applicable in their specific case, including the applicability of
double taxation treaties, pending or proposed changes in applicable tax laws as of the date of this Prospectus and
any actual changes in applicable tax laws after such date.
Under Law No. 227/2015 on the Fiscal Code, as subsequently amended, in force as of 1 January 2016 (the "Fiscal
Code") and the related implementing instructions, as subsequently amended and supplemented (approved by
Government Decision no. 1/2016 on the Norms implementing the Fiscal Code) (the "Norms"), certain types of
income received from Romania by residents or by non-residents may be subject to tax in Romania at the tax rates
stipulated by the Fiscal Code.
Definitions
Within the meaning of the Fiscal Code:
• a "resident" means any Romanian legal entity, any foreign legal entity which has its place of effective
management in Romania, any legal entity having its headquarters in Romania, incorporated according to
European legislation and any resident individual;
• a "resident individual" means any individual who either (a) has his/her domicile in Romania, or (b) has
his/her centre of vital interests located in Romania, or (c) is present in Romania for a period or several
periods exceeding, in aggregate, 183 days during any 12 consecutive months, and that period(s) end(s) in
the calendar year relevant for tax purposes, or (d) is a Romanian citizen who works abroad as an officer or
an employee of the Romanian State. By way of exception from the provisions (a) to (d) above, a foreign
citizen enjoying diplomatic or consular status in Romania, a foreign citizen who is an employee or an
officer of an international or intergovernmental organization registered in Romania, a foreign citizen who is
an officer or an employee of a foreign state in Romania, or their family members will not be deemed to be
resident in Romania;
• a "non-resident" means any foreign legal entity, any non-resident individual and any other foreign entity,
including an undertaking for collective investment in transferable securities without legal personality,
which are not registered in Romania according to the law;
• a "non-resident individual" means any individual who does not meet the criteria to be qualified as a
resident individual;
• a "foreign legal entity" means any legal entity which is not a Romanian legal entity and any legal entity
established pursuant to European law which is not headquartered in Romania;
• a "Romanian legal entity" means any legal entity established and operating in accordance with Romanian
law;
• a "legal entity established pursuant to European law" means any legal entity established in accordance
with and by the mechanics contemplated by European regulations; and
• a "micro-company" means a Romanian legal entity which fulfils the following conditions cumulatively:
(i) as at 31 December of the previous tax year had a turnover of no more than EUR 500 thousand; and (ii)

185
as at 31 December of the previous tax year its income from consulting and management activities, if any, is
under 20% of its total turnover; and (iii) is not active in any of the following sectors: banking, insurance
and reassurance, capital markets, gambling, upstream oil & gas activities.
Taxation of dividends
Tax rate
Dividends paid by Romanian legal entities to individuals or legal entities (either Romanian or non-Romanian tax
residents) are subject to a tax of 5% withheld at source.
Exemption from tax on dividends applicable to the shareholders under certain conditions
According to the Fiscal Code, Romanian legal entities which are corporate income taxpayers may be exempt from
the 5% dividend tax, if said persons have held a minimum of 10% in the Company's share capital, for a continuous
period of one year at the dividend payment date.
Under the Parent Subsidiary Directive, transposed in the Fiscal Code, shareholders that are legal entities and tax
resident in a member state of the EU may benefit from the same exemption from the Romanian dividend tax,
subject to the conditions specified above. In addition, the holders of Shares which are legal entities must be
organised in one of the corporate legal forms provided for in the Parent Subsidiary Directive and must be liable to
pay one of the taxes provided for in the Parent Subsidiary Directive or a tax similar to corporate income tax
(without being entitled to any options or exemptions) in their country of residence.
If the conditions regarding the minimum holding and the minimum period of holding are not met at the payment
date, when paying dividends, the Company will withhold the 5% dividend tax. Subsequently, in the fiscal year in
which the condition is met, the tax paid may be reclaimed from the Romanian budget.
To qualify for dividend tax exemption in Romania under the Parent Subsidiary Directive, the legal entity that is a
shareholder resident in an EU Member State, must provide the Company, directly or through its custodian, with
the original or a notarized copy of the tax residency certificate issued by the tax authority of the state of residency
or with another document issued by an authority (other than the tax authority) responsible for the certification of
residency under the domestic law of that state, confirming the shareholder's tax residency on the dividend payment
date. The shareholder must also provide the Company with an affidavit confirming it as the beneficiary under the
EU law, with a certified translation into the Romanian language.
Dividends, if any, distributed/paid by the Company to voluntary pension funds, to privately managed pension
funds, and to public administration bodies exercising the rights and obligations of the Romanian State as
shareholder in that Romanian legal entity are also exempt from payment of the tax on dividend.
Application of double taxation treaties for non-resident shareholders (individuals or legal entities)
If the EU Parent Subsidiary Directive does not apply, the 5% dividend tax imposed by the Fiscal Code may be
reduced or eliminated depending on the country of residence of the non-resident shareholder (individual or legal
entity), based on the double taxation treaties (if any) concluded between Romania and the country of residence of
the non-resident shareholder.
To benefit from the provisions of double taxation treaties, a non-resident shareholder is required to provide the
Company with the tax residency certificate issued by the tax authority from the relevant state or another document
issued by an authority (other than the tax authority) responsible for the certification of the tax residency under the
domestic law of that state, valid for the year in which the tax is owed, in original or as notarised copy, together
with an authorised translation into the Romanian language. In the absence of a tax residency certificate at the time
of dividend payment, the Romanian dividend tax rate will apply. The non-resident shareholder may provide to the
Company the tax residency certificate for a certain period of time, within five years (the statute of limitation) as of
the dividend payment date. This will allow for the recovery of the dividend tax from the Romanian state budget.
Taxation of dividend income
Dividend income received from a Romanian legal entity is exempt for corporate income tax purposes in Romania.
For Romanian legal entities, which qualify as micro-companies, the dividend income will be part of that their
taxable income and will be subject to the 1% or 3% turnover tax.

186
Taxation of capital gains
Tax rate
The taxable gain from the transfer of shares is calculated as the positive difference between the sale price and the
purchase price of those shares, less any fees, charges and other amounts related to the transaction. According to
the Romanian tax legislation, capital gains realised by legal entities or individuals from the sale of the Shares are
subject to 16% tax.
Exemption from tax on capital gains applicable to shareholders under certain conditions
The capital gain derived by the shareholders that are legal entities, resident in Romania or in a state with which
Romania has concluded a double taxation treaty can be eligible for exemption from the 16% tax on capital gains,
in Romania, provided that said shareholders have held more than 10% of the share capital of the Company for a
continuous period of at least one year, on the date of the sale. In order to benefit from this exemption, Romanian
shareholders, which are legal entities, must be corporate income taxpayers (not micro-company taxpayers).
Application of double taxation treaties
If the tax exemption described above does not apply, capital gains tax imposed on non-residents by the Fiscal
Code may be reduced to nil by virtue of a double taxation treaty entered into by Romania and the country of
residence of the seller of the Shares.
To benefit from the provisions of a double taxation treaty, a non-resident seller of Shares must provide a tax
residency certificate issued by the tax authorities of its country of residence (valid for the year in which capital
gains were realised) to the Romanian intermediary who is performing the transaction, or, if there is no
intermediary involved, directly to the Company. In the absence of a tax residency certificate at the time when the
capital gains are realised, the Romanian capital gains tax of 16% will be due for the total amount of realised
capital gains. The non-resident seller of Shares may provide the tax residency certificate valid at the time of
payment within five years (the statute of limitations) following the date of payment. This will allow for the
recovery of the tax from the Romanian budget.
Declaration and payment of capital gains tax by resident or non-resident individuals
Resident individuals realising capital gains from the sale of Shares in the Company are required to file with the
competent tax office an annual tax return with respect to the capital gains realised in the respective year by 25
May of the following year. Based on this return, the competent tax office establishes the annual tax due, by
applying the tax rate to the taxable annual net income obtained as a result of the transfer of Shares.
The above rules are also applicable to non-resident individuals, who are required to fulfil the obligations to pay
tax and file tax returns in connection with capital gains tax due in Romania, for which they are required to register
with the competent tax authority. Non-resident individuals for whom Romania is not a tax domicile, who have tax
liabilities in Romania, must appoint a proxy with a tax domicile in Romania, to declare and pay any taxes on
behalf of the non-resident individuals. The requirement to appoint a proxy does not apply to taxpayers who are
resident in an EU member state, a state of the European Economic Area or a state with which Romania has
concluded an accord for tax administrative cooperation and recovery of tax receivables. Non-resident individuals
are not required to declare in Romania gains/losses resulting from transactions performed within a year, provided
that the double taxation treaty concluded between Romania and the residence country of the individual does not
grant taxation rights to Romania and that non-resident individual provides the Company with his/her tax residency
certificate.
Declaration and payment of capital gains tax by Romanian legal entities
If the exemption above does not apply, capital gains realised by a Romanian corporate income taxpayer from the
sale of Shares shall be part of that company’s taxable result (profit or loss) and shall be subject to corporate
income tax, as appropriate. In what concerns capital gains derived by a Romanian company which is subject to
micro-company tax, the income from the sale of the Shares (not the gain) shall be part of that company’s taxable
income and shall be subject to the 1% or 3% turnover tax, depending on the number of employees said company
has.

187
Declaration and payment of capital gains tax by foreign legal entities
As a rule, a foreign legal entity deriving income from the sale of Shares must register with the tax authority for the
declaration and payment of the capital gains tax to the Romanian tax authorities. The formalities regarding the
declaration and payment of the capital gains tax by foreign legal entities are similar to the formalities applicable to
Romanian legal entities. Any non-resident seller of Shares may appoint a proxy in Romania in order to comply
with these obligations.
If the non-resident seller relies on the provisions of a double taxation treaty in respect of Romanian capital gains
tax, it must provide the Company with the tax residency certificate (which entitles the non-resident seller to
invoke the double taxation treaty protection). If the non-resident seller is required to file a tax return in Romania
for other transactions performed for which double taxation treaties do not provide a tax exemption in Romania,
when submitting said tax return, the seller must attach a notarised copy of the tax residency certificate and a
certified Romanian translation thereof for cases when the seller benefited from treaty protection for its capital
gains.
Other taxation related matters
Dividend income and capital gains obtained by resident individuals are also subject to a 5.5% social healthcare
contribution. The contribution is not due for these particular types of income if the individual obtains other types
of income (i.e. salary) for which he/she already pays the healthcare contribution.

188
SUBSCRIPTION AND SALE
Offering Summary
In the framework of the Offering, the Selling Shareholders will offer for sale up to 9,831,753 existing Offered
Shares, of which 8,667,773 Shares will be offered by Lunic (Cyprus) and 1,163,980 Shares will be offered by
MBL (Romania). The Offered Shares will be offered at the Offer Price Range (see "Offer Price - Offer Price
Range" below) and the Offered Shares allocated in the Offering will be sold at the Final Offer Price. The Final
Offer Price will be determined in RON.
Subscriptions can be made from 24 October 2017 to 2 November 2017 inclusively, namely 8 (eight) Business
Days (the "Offer Period"). The Selling Shareholders and the Company, in agreement with the Joint Bookrunners,
may: (i) extend the Offer Period; (ii) decide on the early closing of the Offering in case the Offering is fully
subscribed; any early closing of the Offering Period will be publicly announced using the same methods as the
announcement of the Final Offer Price, and the dates for each of pricing, allocation, publication of the Final Price,
results of the Offering and trading in Shares will in such case be adjusted accordingly; or (iii) change other dates
related to the Offering, in each case in compliance with Romanian legislation.
The allocation factor for the Retail Tranche, together with the final number of allocated Offered Shares will be
publicly announced, on the last day of the Offer Period (the "Allocation Date"), expected to be on 2 November
2017. The Final Offer Price shall be publicly announced at the latest on the Business Day following the Allocation
Date (see "––Offer Price" and "––Allocation of the Offered Shares" below).
The transaction related to the allocated Offered Shares will take place the next Business Day following the
Allocation Date, expected to be on or around 3 November 2017 (the "Transaction Date") and the transfer of the
allocated Offered Shares will be settled through the Romanian CSD's system within two Business Days from the
Transaction Date (that is on or around 7 November 2017 (the "Settlement Date") (see "Settlement" below).
Offer Tranches
Any Romanian or foreign investor, individual or entity (with or without legal personality) may participate in the
Offering, except for those investors whose subscription in the Offering would constitute a violation of applicable
legislation. Investors who intend to subscribe for Offered Shares must be familiar and comply with the terms and
conditions of the Offering set out in this Prospectus and with the laws applicable to the Offering in their
jurisdictions and the restrictions set out in "Selling and Transfer Restrictions" below.
The Offering is split into two tranches (the "Offer Tranches") as follows:
1) 15% of the Offered Shares (1,474,763 Shares) will be initially offered to Retail Investors (as defined below)
(the "Retail Tranche"); and
2) The remaining Offered Shares (8,356,990 Shares) will be offered to Institutional Investors (as defined below)
(the "Institutional Tranche").
For the avoidance of doubt, the split of Shares offered in the Retail Tranche between the Selling Shareholders will
be: 1,300,166 Shares from Lunic (Cyprus) and 174,597 Shares from MBL (Romania) and the split of Shares
offered in the Institutional Tranche between the Selling Shareholders will be: 7,367,607 Shares from Lunic
(Cyprus) and 989,383 Shares from MBL (Romania).
The final size of each Offer Tranche will be determined by the Selling Shareholders, in agreement with the Joint
Bookrunners, based on the volume and price of subscriptions from investors, on the Allocation Date (see
"Allocation of the Offered Shares" below). In agreement with the Joint Bookrunners, the Selling Shareholders may
decide to re-allocate Offered Shares from one Offer Tranche to the other Offer Tranche on the basis of the
subscription levels in each Offer Tranche. Reallocation of Shares from one Offer Tranche to the other will be
made without altering the respective proportions of shares for Lunic (Cyprus) and MBL (Romania) in the total
number of shares of each Offer Tranche.
For the purposes of this Prospectus:
• "Institutional Investors" means qualified investors within the meaning of Article 2(1)(e) of the Prospectus
Directive as implemented by Article 2 (21) of the Issuers and Markets Operations Law; and

189
• "Retail Investors" means any individual or legal entity who does not meet the above criteria to qualify as an
Institutional Investor.
The Offered Shares within each of the Offer Tranches above are of the same class (ordinary shares), are subject to
the same legal provisions and confer the same rights and obligations to their owners.
Offer Price
Offer Price Range
The Offered Shares are offered at the Offer Price Range of RON 25 to RON 33 per Offer Share. Subscriptions for
Offered Shares will be made in RON.
Retail Investors must subscribe for Offered Shares at the fixed price of RON 33 (i.e. the top of the Offer Price
Range).
Institutional Investors may validly subscribe for Offered Shares at any price within the Offer Price Range
(including the bottom and the top of the price range). The price tick for the subscription of Offered Shares by
Institutional Investors is RON 0.1.
Payment of the subscription price for Offered Shares by investors must be made as set out in "––Subscription of
Offered Shares by Retail Investors Payment Evidence for Subscriptions by Retail Investors" and "––Subscription
of Offered Shares by Institutional Investors–Subscription Documentation for Institutional Investors" below, as
applicable.
Bank charges or any other charges, including any applicable commissions of the relevant market institutions,
relating to the payment of the subscription price shall be borne separately by the investors. Such charges cannot be
quantified by the Managers, the Selling Shareholders, or the Company.
Bookbuilding
During the Offer Period, a bookbuilding process for the Offered Shares will be carried out. During the
bookbuilding process, the Joint Bookrunners will gauge the level of interest in the Offering on the part of
Institutional Investors and the price sensitivity of such Institutional Investors in relation to the Offered Shares.
Institutional Investors will be required to specify the number of Offered Shares which they would be prepared to
acquire and the related price for such Offered Shares. Such number of Offered Shares and the price at which such
investors express their interest will be recorded in a book maintained by the Joint Bookrunners (the "Book").
Subscriptions received from Retail Investors in relation to the Offered Shares will not be included in the
bookbuilding process.
The Offered Shares in the Institutional Investors Tranche are only to be sold at the Final Offer Price and only to
those investors who subscribed Offered Shares at a price equal to, or higher than, the Final Offer Price.
Final Offer Price
The Final Offer Price for Retail Investors is equal to the Final Offer Price for Institutional Investors. The Final
Offer Price will be determined by the Selling Shareholders within the Offer Price Range in agreement with the
Joint Bookrunners, at the latest on the Business Day following the Allocation Date, on the basis of the expressions
of interest made by the Institutional Investors during the bookbuilding process.
The allocated Offered Shares will be sold to Retail Investors and to the Institutional Investors at the Final Offer
Price.
The successful closing of the Offering will be subject, inter alia, to the determination of the Final Offer Price and
each of the Company’s, the Selling Shareholders’ and the Joint Bookrunners’ decisions to proceed with the
Offering. It will also be subject to the satisfaction of conditions contained in the Placement Agreement and to the
Placement Agreement not having been terminated. Further details of the Placement Agreement are set out in
paragraph "Placement Agreement" below.
The Selling Shareholders will notify investors, the FSA and the BSE with respect to the Final Offer Price at the
latest on the Business Day following the Allocation Date. The relevant pricing notification will be published on
the websites of the BSE (www.bvb.ro), Raiffeisen Bank S.A. (www.raiffeisen.ro), Alpha Finance Romania S.A.
(www.alphafinance.ro) and of the Company (www.spheragroup.com).

190
If the Final Offer Price is lower than the price paid by an investor for each Offered Share that it subscribed for, an
amount equal to the difference between (a) the total consideration paid in advance by that investor for the Offered
Shares that it subscribed; and (b) the number of Offered Shares sold to the relevant investor multiplied by the
Final Offer Price, will be returned to the relevant investor, in each case less any bank transfer commissions and
any applicable commissions of the relevant market institutions, to the investor’s bank account indicated in the
subscription form submitted in relation to the subscription of Offered Shares (the "Subscription Form"), in the
investment services agreement or as otherwise agreed with the Managers or the Eligible Participant (as defined
below) with whom the application for subscription is made, as applicable, within maximum 5 (five) Business
Days from the end of the Offer Period. No interest shall be payable to investors in respect of such amounts.
If an investor has indicated more than one account for the reimbursement of any such amounts, the Managers or
the Eligible Participant reserve the right to pay the whole amount to be reimbursed to only one of the accounts
indicated by the investor. Payments to the investors' bank accounts will be made firstly for validated subscriptions
and subsequently for the invalidated subscriptions. The Managers will not be liable for any failure to transfer such
amounts, which occur as a result of the information provided by an investor for such purposes having been
incomplete or incorrect.
Subscription of Offered Shares by Institutional Investors
By subscribing for Offered Shares, each Institutional Investor confirms that it has read this Prospectus,
that it has accepted the terms and conditions set out in this Prospectus and that it has made the
subscription according to the terms included in this Prospectus.
Valid subscriptions for Offered Shares by Institutional Investors will be collected in the Book. The Managers do
not intend to make public the contents of the Book or any information related to subscriptions for Offered Shares
by Institutional Investors (including, but not limited to, the subscription level).
No minimum subscription requirement applies to Institutional Investors. Institutional Investors may submit
multiple subscriptions for Offered Shares.
Institutional Investors will pay brokerage fees in accordance with the relevant investment services agreement
concluded with a Manager or an affiliate of a Manager. Investors will not bear any additional costs or taxes in
connection with the submission of purchase orders for the Offered Shares, except for the costs (if any) associated
with opening and maintaining a securities account (unless such investor already has an account) and any
brokerage commissions payable under any relevant agreements or pursuant to the regulations of the entity
accepting such purchase orders.
Time schedule and locations for subscriptions within the Institutional Tranche
Subscriptions of Offered Shares within the Institutional Tranche can be made only through the Managers.
Institutional Investors can subscribe for Offered Shares during the entire Offer Period, during the working hours of
the relevant Managers.
Subscription documentation for Institutional Investors
If an Institutional Investor has concluded an investment services agreement with a Manager or an affiliate of a
Manager, such Institutional Investor may validly subscribe for Offered Shares on the basis of orders given as a
regular investment services business and by any means of communication provided by that agreement, without
being required to submit any Subscription Form or identification documentation. Institutional Investors which
have not concluded an investment services agreement with a Manager or an affiliate of a Manager may validly
subscribe for Offered Shares only if they submit a Subscription Form and the applicable identification
documentation listed at "Subscription of Offered Shares by Retail Investors - Subscription Documents for Retail
Investors" below.
The value of the Offered Shares allocated to an Institutional Investor must be guaranteed through:
• Payment order evidencing that the price for the allocated Offered Shares has been transferred to the
Collection Accounts (as defined below), provided that such amount is credited to the Collection Accounts
before 16:00 (Romania time) on the Transaction Date.

191
The collection account for the subscriptions of Offered Shares via Raiffeisen Bank S.A. is the RON bank
account having the IBAN RO93 RZBR 0000 0600 0459 2833 opened with Raiffeisen Bank S.A., beneficiary
Raiffeisen Bank S.A., and the collection account for the subscriptions of Offered Shares via Alpha Finance
Romania S.A. is the RON bank account having the IBAN RO12BUCU041017172511RO15 opened with
Alpha Bank Romania S.A., beneficiary Alpha Finance Romania S.A. (collectively referred to as the
"Collection Accounts" and individually the "Collection Account"). The payment order must contain the
unique registration code of the Institutional Investor. Investors must take into account possible transfer fees
and, if applicable, account opening fees/management fees. No deposit in cash directly to the Collection
Accounts is accepted. The amounts transferred by Institutional Investors, representing the value of the
allocated Offered Shares, will not bear interest in favour of such Institutional Investors.
No Manager will be liable if, for reasons outside its control, any of the Collection Accounts is not effectively
credited with the amounts representing the value of the allocated Offered Shares at the latest at 16:00
(Romania time) on the Transaction Date.
• A settlement commitment statement issued by the custodian agent undertaking the responsibility for the
settlement;
• A bank guarantee letter issued by a credit institution from the European Union covering the settlement risk
undertaken by the relevant Manager; or
• A settlement commitment statement issued by the relevant Manager or an affiliate of that Manager
undertaking the responsibility for the settlement in compliance with the FSA limitations.
The guarantee must include any applicable fees.
Subscription of Offered Shares by Retail Investors
By subscribing for Offered Shares, each Retail Investor confirms that it has read this Prospectus, that it has
accepted the terms and conditions set out in this Prospectus and that it has made the subscription according
to the terms included in this Prospectus.
The minimum subscription of Offered Shares by a Retail Investor is 100 Offered Shares. Retail Investors
are allowed to submit multiple subscriptions.
No brokerage fees will be payable in relation to subscriptions by Retail Investors.
Time schedule and locations for subscriptions within the Retail Tranches
Subscriptions for Offered Shares by Retail Investors can be made during the entire Offer Period, on each Business
Day during the working hours of the relevant unit of Raiffeisen Bank S.A., Alpha Finance Romania S.A. or of the
relevant Eligible Participant (as applicable), but no later than 12:00 p.m. (Romania time) on the last day of the
Offer Period.
Retail Investors can subscribe for Offered Shares:
1) through Raiffeisen Bank S.A., at the units listed in Appendix 1 (Distribution Network of Raiffeisen Bank S.A.)
to this Prospectus; or
2) through Alpha Finance Romania S.A. at its headquarters in Calea Dorobanti 237B sector 1, 2nd floor,
Bucharest; or
3) at the authorised venues of any Eligible Participant.
"Eligible Participants" means any intermediaries (other than the Managers), which are investment firms or credit
institutions qualified as participants to the trading system of the BSE, and which (i) have signed an irrevocable
and unconditional undertaking (the "Engagement Letter") to observe the provisions of this Prospectus and the
applicable law, in the form made available by the Sole Global Coordinator and (ii) have submitted the
Engagement Letter to the Sole Global Coordinator in the form agreed therewith.
Eligible Participants may not accept, register, process and/or validate subscriptions prior to the execution and
submission to Sole Global Coordinator of a signed copy of the Engagement Letter. Each Eligible Participant must
comply (and must ensure that its internal systems allow it to comply) and is exclusively liable for any non-
compliance with the requirements set out in this Prospectus including, without being limited to, the requirements

192
regarding the availability of funds and the settlement of the transactions carried out following the acceptance of
subscriptions by the respective Eligible Participant. The Managers will not be liable for any non-compliance with
the requirements set out in this Prospectus by any Eligible Participant.
Trading orders corresponding to each subscription of Offered Shares made by Retail Investors will be registered,
during the Offer Period, in the BSE system dedicated to public offerings, by Raiffeisen Bank S.A., Alpha Finance
Romania S.A. or/and by any Eligible Participant that received and validated the respective subscription, as
applicable.
Subscription Form for Retail Investors
A subscription of Offered Shares by a Retail Investor is made by submitting the duly filled in Subscription Form
together with the Payment Evidence (as defined below) and the requested documents (see "Subscription of
Offered Shares by Retail Investors - Subscription Documents for Retail Investors" below) with a relevant Manager
or with an Eligible Participant. The Subscription Form will be available at the headquarters of Alpha Finance
Romania S.A. as set out above, at the locations set out in Appendix 1 (Distribution network of Raiffeisen Bank
S.A.) to this Prospectus, at the authorised venues of the Eligible Participants or as otherwise communicated by
Raiffeisen Bank S.A. and Alpha Finance Romania S.A. or the relevant Eligible Participant.
If a Retail Investor has concluded an investment services agreement with Raiffeisen Bank S.A., Alpha Finance
Romania S.A. or with an Eligible Participant, such Retail Investor may validly subscribe for Offered Shares on the
basis of orders given as a regular investment services business and by any means of communication provided by
that agreement, without being required to submit any Subscription Form or identification documents.
Subscription Forms related to Offered Shares for which:
• the amount transferred into the Collection Account or indicated in the settlement commitment statement or the
bank guarantee is less than the number of Offered Shares subscribed by that Retail Investor multiplied by the
maximum price within the Offer Price Range; or
• the subscription procedures were not complied with,
will not be validated. Subscriptions that are not validated will not be considered in the allocation process. Retail
Investors whose Subscription Forms for Offered Shares were not validated will be notified accordingly and the
amounts transferred will be returned in the investor’s account referred to in the Subscription Form for Offered
Shares within maximum 5 (five) Business Days from the end of the Offer Period.
Payment Evidence for subscriptions by Retail Investors
Subscriptions for Offered Shares by Retail Investors will be validated only if Subscription Forms are accompanied
by the documents listed at "Subscription of Offered Shares by Retail Investors - Subscription Documents for Retail
Investors" below and by one of the following documents (each, a "Payment Evidence"):
1) Evidence that the price for the Offered Shares subscribed by that Retail Investor has been paid, as follows:
• for subscriptions through Raiffeisen Bank S.A. or Alpha Finance Romania S.A. - payment order
evidencing that the price for the subscribed Offered Shares has been transferred to the respective
Collection Account, provided that such amount credits the relevant account before 17:00 (Romania time)
on the last day of the Offer Period; and
• for subscriptions through an Eligible Participant - the subscription price for the Offered Shares can be
paid, in cash or by bank transfer, depending on the internal procedures of the respective Eligible
Participant, as communicated by each Eligible Participant to the relevant Retail Investors.
The payment order must contain the personal number/passport number/unique registration code of the Retail
Investor. Investors must take into account possible transfer fees and, if applicable, account opening fees. No
deposit in cash directly to the Collection Accounts is accepted, unless the subscription is made through an
Eligible Participant which has internal procedures allowing cash payments. The amounts transferred by Retail
Investors, representing the value of the subscribed Offered Shares, will not bear interest in favour of the
Retail Investors.
Each payment order is equivalent to a subscription and combining several payment orders for one single
subscription is not possible. The amount transferred by a Retail Investor in relation to a subscription of
Offered Shares which is invalidated, can be used as payment for a new subscription of Offered Shares.

193
No Manager will be liable if, for reasons outside its control, any of the Collection Accounts is not effectively
credited with the amounts representing the value of the subscriptions before 17:00 (Romania time) on the last
day of the Offer Period;
2) Settlement commitment statement issued by the custodian agent undertaking the responsibility for the
settlement;
3) Bank guarantee letter issued by a credit institution from the European Union for the purpose of covering the
settlement risk undertaken by Raiffeisen Bank S.A., Alpha Finance Romania S.A. or the relevant Eligible
Participant; or
4) Settlement commitment statement issued by Raiffeisen Bank S.A., Alpha Finance Romania S.A. or the
relevant Eligible Participant, undertaking the responsibility for the settlement in compliance with the FSA
limitations.
Retail Investors which have an investment services agreement with Raiffeisen Bank S.A., Alpha Finance Romania
S.A. or with an Eligible Participant and which subscribe through Raiffeisen Bank S.A., Alpha Finance Romania
S.A. or that Eligible Participant, as applicable, may also subscribe using either (i) the amounts existing in the
brokerage account(s) or (ii) a settlement commitment statement, being understood that a mix of the sources set out
at (i) and (ii) above is not allowed. In this case, Retail Investors shall ensure that the existing amounts from their
brokerage account(s) or the settlement commitment statement fully cover the subscribed amount. A subscription
cannot be covered by a mix of amounts available in the brokerage account(s) and a payment order for the
remaining amount. The existing cash from the client account opened with Raiffeisen Bank S.A., Alpha Finance
Romania S.A. or the respective Eligible Participant, which is designed for the payment of the subscribed Offered
Shares, cannot be used by the Retail Investor for other transactions.
If the amount transferred by a Retail Investor into any of the Collection Accounts or indicated in the bank
guarantee or settlement commitment statement is higher than the maximum price within the Offer Price Range
multiplied by the number of Offered Shares indicated by that Retail Investor in the Subscription Form, the
subscription will only be validated for the number of Offered Shares indicated in the Subscription Form. In
circumstances where the amount transferred to the Collection Accounts or indicated in the settlement commitment
statement or in the bank guarantee letter is lower than the subscribed amount, the Subscription Form will be
invalidated for the entire subscribed amount.
Subscription Documents for Retail Investors
In order to be accepted, Subscription Forms for Offered Shares subscribed for by Retail Investors must be
accompanied by a Payment Evidence and by the documents set out below, depending on each type of Retail
Investor and on whether the relevant Retail Investor subscribes through Raiffeisen Bank S.A., Alpha Finance
Romania S.A. or through an Eligible Participant.
If a Retail Investor concluded an investment services agreement with Raiffeisen Bank S.A., Alpha Finance
Romania S.A. or with an Eligible Participant, that Retail Investor may validly subscribe for Offered Shares,
without being required to submit the identification documentation listed below, unless any changes occurred in
relation to his/her/its identification data since the latest update.
In case a Retail Investor did not conclude a valid investment services agreement with Raiffeisen Bank S.A., Alpha
Finance Romania S.A. or with an Eligible Participant, the Subscription Form duly filled in by the Retail Investor
in two original copies shall be accompanied by a Payment Evidence and by the documents listed below, which
shall be provided in English or Romanian language. For the avoidance of any doubt, the Eligible Participants shall
be liable for verifying the documents corresponding to subscriptions they are receiving.
Resident individuals subscribing
in their own name:
- ID (original and copy).
Resident individuals subscribing
in the name of other individuals:
- ID (original and copy) of the representative and the ID (in copy) of the
represented individual; and
- Power of attorney in authenticated form (original and copy).
Resident individuals with no
legal capacity (impaired
judgment) or placed under
guardianship:
- ID (original and copy) of the resident individual subscribing for the represented
individual and the ID of the person with no legal capacity (copy);
- Passport (original and copy) and/or residence permit (original and copy) of the
individual subscribing for the person with no legal capacity—applicable only to

194
foreign citizens; and
- The guardianship document or, as appropriate, the trustee or the special trustee
document.
Resident corporate entities
subscribing in their own name:
- Registration certificate issued by the Trade Registry (copy);
- Updated constitutive act (copy certified for its conformity with the original by
the legal representative of the legal person);
- Original certificate of current standing (certificat constatator) issued by the
Trade Registry (issued no more than 30 business days prior to the date of
subscription);
- Power of attorney/Mandate in original for the person(s) signing the
Subscription Form, issued as stipulated by the constitutive act, or proof that the
person concerned is legally representing the subscribing corporate entity, with
individual representation right (if the company is collectively represented by
two or more persons who all are present for the signing of the Subscription
Form, such proof shall be presented for all such persons) (power of attorney in
original and any other documents certified for their conformity with the
original by the legal representative of the legal entity); and
- ID (original and copy) of the person subscribing in the name of the legal
person.
Non-resident individual
subscribing in their own name:
- Passport and proof of domicile if it’s not stated on the passport or ID issued by
a member state of the EU/EEA (original and copy).
Non-resident individual
subscribing through resident
authorised representatives:
- Passport and proof of domicile if it’s not stated on the passport or ID issued by
a member state of the EU/EEA (copy) for the represented individual;
- ID for the authorised representative (original and copy); and
- Authenticated power of attorney (and, if the case, apostilled) setting out that the
representative is authorised to act in the name of the non-resident individual
(original and copy).
Non-resident corporate entities
subscribing in their own name:
- Certificate of incorporation of the non-resident corporate entity issued by the
Trade Registry or by any equivalent institution, if existing (copy);
- Updated constitutive act of the non-resident corporate entity (copy certified as
true to the original by the legal representatives of the non-resident corporate
entity);
- Certificate of current standing, in original, for the non-resident corporate entity
evidencing the legal representatives of the non-resident entity issued by the
Trade Registry or by an equivalent institution (issued no more than 30 business
days prior to the date of subscription). If no authority or institution is
authorised to issue such certificate, any corporate document evidencing the
legal representatives of the non-resident corporate entity shall be submitted
(issued no more than 30 business days prior to the date of subscription); such
corporate document of the non-resident corporate entity shall set out clearly
whether the legal representatives are entitled to act individually or jointly;
- In case subscriptions are made through a person other than the legal
representative(s) of the non-resident corporate entity, the power of
attorney/mandate signed by the legal representatives of the non-resident
corporate entity empowering the respective person to subscribe on behalf of the
non-resident corporate entity in the Offered Shares (in original and in copy);
and
- IDs for the person making the subscription as legal representative or attorney in
fact of the non-resident corporate entity: passport and proof of domicile if it’s
not stated on the passport, ID (for citizens of EU/EEA) (copy).
Non-resident corporate entities
subscribing through a resident
corporate entity
- Certificate of incorporation of the non-resident corporate entity issued by the
Trade Registry or by any equivalent institution, if existing (copy);
- Updated constitutive act of the non-resident corporate entity (copy certified as
true to the original by the legal representatives of the non-resident corporate
entity);
- Certificate of current standing, in original, for the non-resident corporate entity
evidencing the legal representatives of the non-resident entity issued by the

195
Trade Registry or by an equivalent institution (issued no more than 30 business
days prior to the date of subscription). If no authority or institution is
authorised to issue such certificate, any corporate document evidencing the
legal representatives of the non-resident corporate entity shall be submitted
(issued no more than 30 business days prior to the date of subscription); such
corporate document shall set out clearly whether the legal representatives are
entitled to act individually or jointly;
- Incorporation certificate for the representing resident corporate entity issued by
the Trade Registry (copy);
- Updated constitutive act of the representing resident corporate entity (copy
certified for its conformity with the original by the legal representative of the
legal person);
- Certificate of current standing (certificat constatator), in original, for the
representing resident corporate entity issued by the Trade Registry (not older
than 30 business days prior to the date of subscription);
- ID for the legal representative of the representing resident corporate entity
subscribing on behalf of the non-resident corporate entity (original and copy);
and
- Power of attorney signed by the legal representative(s) of the non-resident
corporate entity empowering the resident corporate entity to subscribe to the
Offering (in original and in copy).
IFIs - Constitutive act of the IFI or a copy of the Romanian law whereby Romania
accepts or adheres to the constitutive act of the relevant IFI;
- Power of attorney/Certificate empowering the person who will sign the
Subscription Form to subscribe on behalf of the IFI (in original or notarised
copy); and
- ID for the person who signs the Subscription Form on behalf of the IFI (copy).
Resident/non-resident
individual represented by an
asset management company
through a portfolio management
mandate
- ID (copy), in case of resident individuals;
- Passport and proof of domicile if it’s not stated on the passport or ID for
citizens of the EU/EEA (copy), in case of non-resident individuals;
- Representation mandate (original and copy);
Documents for the asset
management company
- Registration certificate issued by the Trade Registry (copy);
- Updated constitutive act (copy certified for its conformity with the original by
the legal representative of the legal person);
- Original certificate of current standing (certificat constatator) issued by the
Trade Registry (issued no more than 30 business days prior to the date of
subscription);
- Power of attorney/Mandate in original for the person signing the Subscription
Form, issued as stipulated by the constitutive act, or proof that the person
concerned is legally representing the subscribing corporate entity, with
individual representation right (if the company is collectively represented by
two or more persons who all are present for the signing of the Subscription
Form, such proof shall be presented for all such persons) (power of attorney in
original and any other documents certified for their conformity with the
original by the legal representative of the legal entity); and
- ID (original and copy) of the person subscribing in the name of the legal
person.
Entities managed by other
resident or non-resident
corporate entities (e.g.
Investment funds, pension
funds)
- The documents listed below shall be submitted for the corporate entity that
manages the respective entity and shall be accompanied by the authorisation
received by the respective entity from the competent supervisory authority
- Registration certificate issued by the Trade Registry (copy);
- Updated constitutive act (copy certified for its conformity with the original by
the legal representative of the legal person);
- Original certificate of current standing (certificat constatator) issued by the
Trade Registry (issued no more than 30 business days prior to the date of
subscription);

196
- Power of attorney/Mandate in original for the person signing the Subscription
Form, issued as stipulated by the constitutive act, or proof that the person
concerned is legally representing the subscribing corporate entity, with
individual representation right (if the company is collectively represented by
two or more persons who all are present for the signing of the Subscription
Form, such proof shall be presented for all such persons) (power of attorney in
original and any other documents certified for their conformity with the
original by the legal representative of the legal entity); and
- ID (original and copy) of the person subscribing in the name of the legal person
Raiffeisen Bank S.A., Alpha Finance Romania S.A. or the relevant Eligible Participant is entitled to request any
additional documents for the purpose of carrying out its duty to comply with the "know your customer" rules,
based on its internal norms and procedures of client identification.
Documents submitted by an investor in a language other than Romanian or English language shall be
accompanied by a notarised translation thereof in Romanian or English language.
In case of investors without legal personality, the identification documents of the management company must be
submitted.
Change and Withdrawal of Subscriptions
Institutional Investors may change the number of subscribed Offered Shares or withdraw their initial subscription
of Offered Shares until and including the last day of the Offer Period. Retail Investors may not change or
withdraw any subscriptions for Offered Shares unless the Prospectus is subject to a supplement.
If the Prospectus is subject to a supplement, subscriptions may be withdrawn by any Retail or Institutional
Investor within 2 (two) Business Days from the date when the respective supplement to the Prospectus is
published.
If a supplement to the Prospectus is published, the change or withdrawal of subscriptions by Institutional Investors
will be subject to the same submission, processing and validation requirements as the ones for the initial
subscription.
Retail Investors may withdraw their subscriptions for Offered Shares by submitting a duly filled in subscription
revocation form at the same unit of Raiffeisen Bank S.A., Alpha Finance Romania S.A. or of the Eligible
Participant through which the subscription was made.
The change of subscriptions by Retail Investors may be done by withdrawing the initial subscription and
submission of new subscriptions subject to the same submission, processing and validation requirements as the
ones for the initial subscription.
If subscriptions are withdrawn, investors shall be reimbursed the entire amount paid by them corresponding to the
withdrawn subscriptions, in each case less any bank transfer commissions and any applicable commissions
charged by the relevant market institutions, to the bank account indicated by each investor for the reimbursement
of any such amounts, within maximum 5 (five) Business Days as of the date the relevant subscriptions have been
withdrawn by the investors. No interest shall be payable to investors in respect of such amounts.
If an investor has indicated more than one account for the reimbursement of any such amounts, the whole amount
may be reimbursed to only one of the accounts indicated by the investor. The Managers will not be liable for any
failure to transfer the amounts corresponding to withdrawn subscriptions which occur as a result of the
information provided by an investor for such purposes having been incomplete or incorrect.
Allocation of the Offered Shares
The subscribed Offered Shares will be allocated to investors by the Selling Shareholders, in close consultation
with the Joint Bookrunners, on the Allocation Date.
In agreement with the Joint Bookrunners, the Selling Shareholders may re-allocate Offered Shares from one Offer
Tranche to the other Offer Tranche on the basis of the subscription level in each Offer Tranche. The final number

197
of Offered Shares and the final size of each Offer Tranche will be decided by the Selling Shareholders in
agreement with the Joint Bookrunners, based on the level of subscriptions in the Book, on the Allocation Date.
Allocation of Offered Shares within the Retail Tranche
If the number of Offered Shares validly subscribed within the Retail Tranche is lower than, or equal to, the
Offered Shares allocated to the Retail Tranche (as determined on the Allocation Date), each Retail Investor will
receive the number of subscribed Offered Shares.
If the number of Offered Shares validly subscribed within the Retail Tranche is higher than the Offered Shares
allocated to the Retail Tranche, the Offered Shares from the Retail Tranche will be allocated to each Retail
Investor proportionally to the number of Offered Shares subscribed by such investor (pro-rata allocation).
If the number of Offered Shares allocated to a subscription after the pro rata allocation is not an integer, the
number of Offered Shares allocated to the relevant subscription shall be rounded down to the immediately lower
integer.
For the purpose of allocating any remaining Offered Shares (resulting from such rounding down of the number of
Offered Shares within the process of pro rata allocation), Retail Investors shall be ranked in decreasing order
based on the number of Offered Shares subscribed by each of them and, if one or more Retail Investors subscribed
the exact number of Offered Shares they will be ranked in increasing order based on the time stamp in the BSE
electronic system associated with their trading order, and the resulting unallocated Offered Shares shall be
allocated one per Retail Investor (but so that the number of Offered Shares allocated in aggregate to a subscription
does not exceed the number of Offered Shares initially requested through that subscription), starting with the
largest allocation.
In case of over-subscription, Retail Investors will be reimbursed the difference between the amount paid for the
subscribed Offered Shares and the Final Offer Price of the allocated Offered Shares (less the bank transfer
commissions and any applicable commissions of the relevant market institutions) as detailed in "Offer Price –
Final Offer Price" above.
Shares allocated to Retail Investors will be automatically transferred into "Section 1" of the Romanian CSD on the
Settlement Date, except for the Offered Shares allocated to those Retail Investors who have a valid investment
services contract with Raiffeisen Bank S.A., Alpha Finance Romania S.A. or with the Eligible Participant through
which they have subscribed.
Allocation of Offered Shares within the Institutional Tranche
The Selling Shareholders will determine, in close consultation with the Joint Bookrunners, the number of Offered
Shares allocated to each Institutional Investor, on the basis of the Book.
When allocating the Offered Shares within the Institutional Tranche, the Selling Shareholders and the Joint
Bookrunners may consider, among others, certain qualitative criteria such as: investment policy; number of
subscribed Offered Shares and support of the Offering; whether the subscription was received at the beginning of,
or early in, the Offer Period; the price offered for the Offered Shares; qualitative feedback during the pre-deal
investor education process; focus on the food service sector and/or on the Central and Eastern European region;
assets under management; equity investments in Romania or Central and Eastern European; other criteria that
allow a high quality investor base and a positive evolution of the market price after the closing of the Offering.
By subscribing in the Offering, Institutional Investors acknowledge and agree that they may be allocated fewer
Offered Shares than they have subscribed for or they may receive no Offered Shares at all. Institutional Investors
also acknowledge and agree that they will have no right to request, and the Selling Shareholders and the Managers
shall have no obligation to disclose, the reasons for their allocation and pricing decisions.
Transaction
Orders corresponding to validated subscriptions for Offered Shares made by the Retail Investors are entered by
Raiffeisen Bank S.A., Alpha Finance Romania S.A. and the Eligible Participants into the relevant segment of the
public offerings market of the BSE anytime during the Offer Period and until 18:00 (Romania time) on the last
day of the Offer Period. The Sole Global Coordinator can extend this period to the extent necessary.

198
On the Transaction Date the orders corresponding to the Offered Shares allocated to the Institutional Investors
shall be registered in the relevant segment of the public offerings market of the BSE, exclusively in accordance
with the allocations made by the Selling Shareholders in close consultation with the Joint Bookrunners, provided
that the corresponding subscriptions are validated and the payment, settlement commitment or bank guarantee
letter for the allocated Offered Shares has been received.
The allocation of the Offered Shares made by the Selling Shareholder in close consultation with the Joint
Bookrunners is mandatory and is legally binding for the Institutional Investors.
On the Transaction Date, the Managers will place the sell orders for the Offered Shares in the BSE.
In circumstances where, until the hour on the Transaction Date indicated by the Sole Global Coordinator there will
be Institutional Investors that have not guaranteed the payment of the Offered Shares allocated to them using any
of the options detailed in "Subscription of Offered Shares by Institutional Investors – Subscription documentation
for Institutional Investors", the Manager through which that Institutional Investor subscribed will re-allocate the
relevant Offered Shares to other Institutional Investor(s), with the latter's consent and provided that such
Institutional Investor(s) can guarantee the payment for the additionally allocated Offered Shares, as described
above, until the time limit set by the Sole Global Coordinator. The Managers will carry out the trades related to the
Offered Shares through the BSE markets dedicated for the transactions of public offerings on the Transaction
Date.
Settlement
Settlement of the allocated Offered Shares will be made through the Romanian CSD clearing settlement system on
the Settlement Date.
Placement Agreement
The Company, the Selling Shareholders and the Managers will enter into the placement agreement on or around
the date of this Prospectus (the "Placement Agreement") and each Manager will severally agree to use its
reasonable endeavours to procure, as agent for the Selling Shareholders, purchasers for the Offered Shares and
not, for the avoidance of doubt, in any circumstance to subscribe for any Offered Shares themselves.
Under the Placement Agreement, the Company and the Selling Shareholders will give certain customary
representations and warranties (including, as appropriate, in relation to the Company’s business, financial
statements and legal compliance in relation to the Offered Shares and in relation to the contents of this Prospectus)
and indemnities to the Managers in connection with the Offering. The obligations of the parties to the Placement
Agreement will be subject to certain conditions that are typical for an agreement of this nature, including, amongst
other, the accuracy of the representations and warranties under the Placement Agreement and the execution of a
pricing agreement between the Selling Shareholders and the Managers in relation to the Final Offer Price on or
around the Allocation Date.
The Managers will be able to terminate the Placement Agreement at any time prior to the first trading of trading in
Shares in certain specified circumstances that are typical for an agreement of this nature.
Stabilisation
The Selling Shareholders have agreed, pursuant to the Placement Agreement, that Wood and Raiffeisen (the
"Stabilising Managers") will undertake stabilisation actions as further detailed below, for the purpose of
supporting the market price of the Shares at a level higher than that which might otherwise prevail in an open
market for a limited period.
The Selling Shareholders anticipate that in connection with the Offering the Stabilising Managers will have the
right to acquire not more than 983,175 Shares on the regular market of the BSE in order to stabilise the price of
the Shares at a level higher than that which may otherwise prevail if stabilisation actions were not taken. The
acquisition by the Stabilising Managers of the Shares as part of stabilisation transactions shall be conducted in
accordance with all European and national applicable laws and regulations. The stabilisation activities may be
carried out for no longer than 30 days as of the date when trading in the Shares commences on the BSE (the
"Stabilisation Period") at a price not higher than the Final Offer Price. The Stabilising Managers will not,

199
however, be required to take any of the above stabilisation actions. If such actions are taken by the Stabilising
Manager, they may be discontinued at any time, however, not later than before the end of the Stabilisation Period.
In the context of Stabilisation, the Selling Shareholders have agreed to grant to the Stabilising Managers a put
option according to which a number of up to 983,175 Shares shall be transferred to the Selling Shareholders by
the Stabilising Managers but not more than the actual number of Shares bought by the Stabilising Managers on the
BSE for the stabilisation purposes. In connection with the stabilising actions that may be performed by the
Stabilising Managers, the Selling Shareholders have agreed in the Placement Agreement, that the Stabilising
Managers will retain 10% out of the gross proceeds obtained by the Selling Shareholders from the Offering to
finance the stabilising actions.
No assurance may be given that stabilisation actions, if taken, will bring the expected results.
Lock-Up Arrangements
Pursuant to the Placement Agreement the Company will agree with the Managers that it will not, and each of the
Company's BoD members will ensure that the Company will not, without the prior written consent of the Sole
Global Co-ordinator (on behalf of and after consultation with the Managers), which consent shall not to be
unreasonably withheld, during a period of 180 days after the Closing Date (the "Lock Up Period"), directly or
indirectly: (a) issue, offer, lend, mortgage, assign, charge, pledge, sell, contract to sell or issue, sell any option or
contract to purchase, purchase any option or contract to sell or issue, grant any option, right or warrant to
purchase, lend or otherwise transfer or dispose of, directly or indirectly, any Shares or any interest in Shares or any
securities convertible into or exercisable or exchangeable for, or substantially similar to, Shares or any interest in
Shares or file any registration statement under the Issuers and Markets Operations Law or file or publish any
prospectus with respect to any of the foregoing; or (b) enter into any swap or other agreement or transaction that
transfers, in whole or in part, any of the economic consequences of ownership of the Shares, whether any such
swap or transaction described in (a) or (b) is to be settled by delivery of the Shares or such other securities, in cash
or otherwise.
Closing Date means the date for admission of Shares to trading on the BSE, expected to be on or around 8
November 2017, or (if admission does not become effective on that date) at such other time (being the date on
which admission does become effective) as the Company and the Joint Bookrunners may agree in writing.
The above restrictions do not apply to any purchase by the Company of Shares and subsequently to the
allocation/transfer of the Shares so acquired to BoD members and/or its managers, in each case under any share
incentive plan the Company may decide to implement.
At the same time, pursuant to the Placement Agreement, the current shareholders of the Company will agree with
the Managers, acting severally and not jointly, that none of them, acting severally and not jointly, nor any person
acting on their behalf will, without the prior written consent of the Sole Global Co-ordinator (on behalf of and
after consultation with the Managers), which consent shall not to be unreasonably withheld, during the Lock Up
Period, directly or indirectly: (a) offer, sell, lend, assign, mortgage, pledge, charge, contract to sell or otherwise
transfer or dispose of (or publicly announce any such action), directly or indirectly, any Shares, other equity
securities of the Company or any securities convertible or exchangeable into or exercisable for any equity
securities of the Company or any security or financial product whose value is determined directly or indirectly by
reference to the price of the underlying securities, including equity swaps, forward sales and options or depositary
receipts representing the right to receive any such securities; or (b) enter into any swap or other agreement that
transfers, in whole or in part, any of the economic consequences of ownership of any equity securities of the
Company or enter into any transaction with the same economic effect as, or agree to, or publicly announce any
intention to enter into any transaction described above, whether any such transaction described in (a) or (b) is to
be settled by delivery of Shares or such other securities, in cash or otherwise.
For the avoidance of doubt, the above restrictions do not apply to the Shares acquired during the Stabilisation
Period for stabilisation purposes.
The Sole Global Co-ordinator undertakes to respond to a waiver request within 3 Business Days as of the receipt
of the waiver application; failure to observe the three Business Days response deadline will be construed and
interpreted as tacit acceptance of granting the waiver.

200
Other Relationships
The Managers and their respective affiliates may have engaged in transactions with, and performed various
investment banking, commercial banking, financial advisory and other services for, the Company and the Selling
Shareholders and their respective affiliates, for which they received customary fees. The Managers and their
respective affiliates may provide such services for the Company and the Selling Shareholders and their respective
affiliates in the future.
In connection with the Offering, each of the Managers and any affiliate, acting as an investor for its own account
may take up the Offered Shares and in that capacity may retain, purchase or sell for its own account such Offered
Shares and any related investments and may offer or sell such Offered Shares or other investments otherwise than
in connection with the Offering. Accordingly, references in this Prospectus to the Offered Shares being offered or
placed should be read as including any offering or placement of Offered Shares to the Managers and any affiliate
acting in such capacity. None of the Managers intend to disclose the extent of any such investment or transactions
otherwise than in accordance with any legal or regulatory obligation to do so. In addition, in connection with the
Offering, certain of the Managers may enter into financing arrangements with investors, such as share swap
arrangements or lending arrangements where securities are used as collateral, which could result in such Managers
acquiring shareholdings in the Company.

201
SELLING AND TRANSFER RESTRICTIONS
General
The distribution of this Prospectus and the offering of the Shares in certain jurisdictions may be restricted by law
and, therefore, persons into whose possession this Prospectus comes should inform themselves about and observe
any restrictions, including those set out in the paragraphs that follow. Any failure to comply with these restrictions
may constitute a violation of the securities laws of any such jurisdiction.
This Prospectus does not constitute an offer to subscribe for or purchase any of the Shares offered hereby to any
person in any jurisdiction where it is unlawful to make such offer or solicitation in such jurisdiction.
Subscribers for or purchasers of the Offered Shares may be required to pay stamp duty and other charges in
accordance with the laws and practices of the country of subscription or purchase, as the case may be, in addition
to the Final Offer Price.
No public offering outside Romania
No action has been or will be taken in any country or jurisdiction (other than in Romania) that would permit a
public offering of the Offered Shares or possession or distribution of this Prospectus (or any other offering or
publicity material relating to the Offered Shares) in any country or jurisdiction where action for that purpose is
required or doing so may be restricted by law.
This Prospectus may only be distributed to the public and the Offered Shares may only be offered for sale or
purchase in Romania in compliance with the Issuers and Markets Operations Law, the Romanian National
Securities Commission Regulation no. 1/2006 on issuers and operations with securities, Regulation (EC) No
809/2004 of 29 April 2004 implementing Directive 2003/71/EC with respect to information contained in
prospectuses as well as the format, incorporation by reference and publication of such prospectuses and the
dissemination of advertisements, and other applicable mandatory provisions of law.
European Economic Area
In relation to each member state that has implemented the Prospectus Directive (each, a "Relevant Member
State") (except for Romania), with effect from and including the date on which the Prospectus Directive is
implemented in that member state (the "Relevant Implementation Date"), the Offered Shares may not be offered
to the public in that Relevant Member State, except that, with effect from and including the Relevant
Implementation Date, the Offered Shares may be offered to the public in that Relevant Member State under the
following exemptions under the Prospectus Directive:
(i) at any time to legal entities which are authorised or regulated to operate in the financial markets or, if not so
authorised or regulated, whose corporate purpose is solely to invest in securities;
(ii) at any time to any legal entity which has two or more of: (a) an average of at least 250 employees during the
last financial year; (b) a total balance sheet of more than EUR 43 million; and (c) an annual net turnover of
more than EUR 50 million, as shown in its last annual or consolidated accounts
(iii) to fewer than 150 natural or legal persons (other than qualified investors as defined in the Prospectus
Directive) subject to obtaining the prior consent of the Managers for any such offer; or
(iv) in any other circumstances falling within Article 3(2) of the Prospectus Directive,
provided that no such offer of the Offered Shares shall result in a requirement for the publication by the Company,
the Selling Shareholders, any Manager or the Financial Adviser of a prospectus pursuant to Article 3 of the
Prospectus Directive.
This Prospectus has been approved by the FSA and it has not been, and will not be, approved by or notified to any
other competent authority of any other country, state or jurisdiction.
For the purposes of this section, the expression "offer of Shares" in relation to any of the Offered Shares in any
Relevant Member State means the communication in any form and by any means of sufficient information on the
terms of the offer and the Shares to be offered so as to enable an investor to decide to purchase or subscribe for the

202
Offered Shares as the same may be varied in that Relevant Member State by any measure implementing the
Prospectus Directive in that Relevant Member state.
Each subscriber for or purchaser of the Offered Shares in the Offering located within a Relevant Member State
(other than Romania) will be deemed to have represented, acknowledged and agreed that it is a "qualified
investor" within the meaning of Article 2(1)I of the Prospectus Directive. The Company, the Selling Shareholders,
the Managers, their affiliates and others will rely upon the truth and accuracy of the foregoing representation,
acknowledgement, and agreement.
United States of America
The Offered Shares have not been and will not be registered under the Securities Act or with any securities
regulatory authority of any state or other jurisdiction of the United States of America and, consequently, may not
be offered or sold within the United States. The Offered Shares may be offered or sold outside the United States in
offshore transactions pursuant to Regulation S under the Securities Act. Terms used in this paragraph that are
defined in Regulation S are used herein as so defined.
Regulation S
Each purchaser of the Offered Shares outside the United States, by accepting delivery of this Prospectus, will be
deemed to have represented, agreed and acknowledged as follows. The purchaser:
(i) Is aware that the sale of the Offered Shares is being made pursuant to and in accordance with Rule 903 or 904
of Regulation S;
(ii) Is, or at the time such Offered Shares are purchased will be, the beneficial owner of those Offered Shares;
(iii) Is, and the person, if any, for whose account it is acquiring such Offered Shares is, located outside the United
States (within the meaning of Regulation S) and is purchasing the Offered Shares in an offshore transaction
meeting the requirements of Regulation S;
(iv) Is not an affiliate of the Company or of any of the Selling Shareholders or a person acting on behalf of such
an affiliate;
(v) Understands that the Offered Shares have not been and will not be registered under the Securities Act with
any securities regulatory authority of any state or other jurisdiction of the United States and may not be
offered, resold, pledged or otherwise transferred except for an offshore transaction in accordance with Rule
903 or 904 of Regulation S; and
(vi) Acknowledges that the Company, the Selling Shareholders, the Managers, the Financial Adviser and each of
their respective affiliates will rely upon the truth and accuracy of the acknowledgements, representations and
agreements in the foregoing paragraphs.
The Company will not recognise any resale or other transfer, or attempted resale or other transfer, in respect of the
Offered Shares made other than in compliance with the above stated restrictions.
Other Jurisdictions
The Shares have not been and will not be registered under the applicable securities laws of Australia, Canada or
Japan. The Shares may not be offered or sold in Australia, Canada or Japan or to or for the account or benefit of
any resident of the United States, Australia, Canada or Japan.

203
LEGAL MATTERS
Sphera and the Selling Shareholders were assisted on the Romanian law matters of the Offering by by Schoenherr
și Asociații SCA.
The Managers were assisted on the Romanian law matters of the Offering by Radu Tărăcilă Pădurari Retevoescu
SCA in association with Allen & Overy LLP.

204
INDEPENDENT AUDITORS
Ernst & Young Assurance Services S.R.L., independent auditors, has audited the USFN (Romania) Annual
Financial Statements and the ARS (Romania) Annual Financial Statements and issued unqualified audit reports on
those financial statements as stated in their reports appearing therein.
Ernst & Young Assurance Services S.R.L., independent auditors has reviewed, but not audited, ARS (Romania)
Interim Financial Statements and Sphera Interim Financial Statements and issued unqualified review reports on
those financial statements as stated in their reports appearing therein.
Ernst & Young Assurance Services S.R.L. reported on the Pro forma consolidated financial information of Sphera
Franchise Group S.A. for the periods from 1 January 2014 to 31 December 2014, 1 January 2015 to 31 December
2015, 1 January 2016 to 31 December 2016, and 1 January 2017 to 30 June 2017 included in the Prospectus, and
provided unqualified reports on the Pro Forma consolidated financial information.
Ernst & Young Assurance Services S.R.L., with its business address at 15-17 Ion Mihalache Bd., district 1,
Bucharest Tower Center Building, 21st floor, Bucharest, Romania, is registered with the Bucharest trade registry
under no. J40/10259/1992, having sole registration code 11909783, and is a member of the Chamber of Financial
Auditors of Romania, being registered in the Public Registry of Financial Auditors.
Ernst & Young Assurance Services S.R.L. has given and not withdrawn its written consent to the inclusion of its
reports in this Prospectus in the form and format in which such reports are presented and to the references to its
name in the form and context in which it appears in this Prospectus.
For the purposes of Commission Regulation (EC) 809/2004, Ernst & Young Assurance Services S.R.L. has stated
that it is responsible for the reports that are part of this Prospectus and declare that they have taken all reasonable
care to ensure that the information in the reports is, to the best of their knowledge, in accordance with the facts
and contains no omission likely to affect its import. This declaration is included in the Prospectus in compliance
with item 1.2 of Annex I of Commission Regulation (EC) 809/2004.

205
GENERAL INFORMATION
Listing and Trading
Shares are intended to start trading on the spot regulated market operated by the BSE on or around 8 November
2017. At the date of this Prospectus, the Company has filed with the BSE a provisional application for admission
to trading together with this Prospectus, in accordance with the applicable law.
Authorisations
The Company has approved the Prospectus by way of BoD decision dated 15 October 2017, EGSM resolution
date 16 October 2017, and BoD decision and EGSM resolution dated 20 October 2017.
The Company has approved the admission of the Shares to trading on the spot regulated market operated by the
BSE by way of EGSM resolution of 15 September 2017.
Lunic (Cyprus) has approved the offering of and sale of up to 8,667,773 Shares in the Offering based on this
Prospectus, by way of sole director resolution dated 11 October 2017.
MBL (Romania) has approved the offering of and sale of up to 1,163,980 Shares in the Offering based on this
Prospectus, by way of the sole shareholder decision dated 11 October 2017.
Identification of the Selling Shareholders
The Selling Shareholders are:
(i) Lunic Franchising and Consulting Ltd, a company organized and existing under the laws of Cyprus,
registered under no. HE 80898, with registered office at Riga Feraiou no. 2, Limassol Center, Block B, 4th
floor, office 406, 3095 Limassol, Cyprus; and
(ii) M.B.L. Computers S.R.L., a company organized and existing under the laws of Romania, registered with the
Bucharest Trade Registry under No. J40/6119/1991, having its registered office at 15 Fabrica de Glucoză
street, Bucharest, Romania.
Lunic (Cyprus) offers a number of up to 8,667,773 Shares in the Offering, while MBL (Romania) offers a number
of up to 1,163,980 Shares in the Offering.
Documents Available for Inspection
During the term of this Prospectus, the following documents will be available to investors at the registered seat of
the Company in Bucharest, Romania at 239 Calea Dorobanți str., 2nd floor, office 4, district 1 during the regular
business hours of the Business Days in Romania and are published on the Company’s website at
www.spheragroup.com:
(i) Articles of Association;
(ii) Group Financial Statements, including the audit/review reports issued in connection with the Group Financial
Statements; and
(iii) Pro forma Financial Information of Sphera for the periods from 1 January 2014 to 31 December 2014, 1
January 2015 to 31 December 2015, 1 January 2016 to 31 December 2016, and 1 January 2017 to 30 June
2017 and the auditor's reports thereon.
The Prospectus, including any supplements thereto, will be made available on the Company's website at
www.spheragroup.com.
Significant Change Statement
Since 30 June 2017, there has been no significant change in the financial or trading position of the Group.

206
Information not applicable to the Prospectus in accordance with Annex I and Annex III
of Regulation (EC) no. 809/2004
The following sections of Annexes I and III of Regulation (EC) 809/2004, based on which this Prospectus has
been drawn up, are not applicable to the Company and/or to the Shares:
• Annex I: 2.2, 6.1.2, 6.3, 10.4, 11, 13, 15.2, 17.3, 20.4.2, 21.1.2-21.1.6, 21.2.6.
• Annex III: 4.6, 4.7, 4.9, 4.10, 5.1.10, 5.2.2, 5.2.3 b), d), e) and f), 5.2.5, 5.3.3, 5.3.4, 5.4.2, 5.4.4, 6.2, 6.3, 6.4,
9.1, 9.2.

207
DEFINITIONS AND GLOSSARY OF SELECTED TERMS
Allocation Date Date when the Offered Shares will be allocated, identified in section "Subscription and
Sale—Offering Summary" of this Prospectus
Anasa (Romania) Anasa Properties S.R.L., a company organized and existing under the laws of Romania,
registered with the Bucharest trade registry under no. J40/8931/2013, having its
registered office at 239 Calea Dorobanti, office 1, 2nd floor, district 1, Bucharest,
Romania
ANEVAR National Association of Authorised Valuers in Romania
ARS (Romania) American Restaurant System S.A. a company organized and existing under the laws of
Romania, registered with the Bucharest trade registry under no. J40/19307/1994,
having its registered office at 5-7 Calea Dorobanti, ground floor, building C, D and the
terrace, office 79, district 1, Bucharest, Romania.
AoAs Company's articles of association, in force on the date of this Prospectus
BoD Company's Board of Directors, regardless of its composition from time to time
Brand Image Tracker A brand research company that conducts longitudinal studies to examine the attitudes
toward and awareness of a brand over a period of time
BSE Bucharest Stock Exchange S.A., operator of the spot regulated market, with
headquarters at 34-36 Carol I Boulevard, 14th floor, 2nd district, Bucharest, Romania
Business Day A day in which both the Romanian interbanking market and the trading system of the
BSE are opened for business
California Fresh Flavors
(Romania)
California Fresh Flavors S.R.L., limited liability company organised and existing under
the laws of Romania, registered with the Bucharest trade registry under number
J40/9570/2017, with registered seat in 239 Calea Dorobanti, 2nd floor, room 11, district
1, Bucharest, Romania
Issuers and Markets
Operations Law
Law no. 24/2017 on issuers of financial instruments and market operations, as amended
and supplemented
CEE Central and Eastern Europe
Coca-Cola Romania Coca-Cola HBC Romania S.R.L., a company organized and existing under the laws of
Romania, registered with Ilfov trade registry under no. J23/2300/2009, sole registration
code 474152, with registered seat in Voluntari, șoseaua București Nord no. 10, O23
building, 1st floor, Ilfov County, Romania
Company or Sphera Sphera Franchise Group S.A., a joint stock company incorporated under the laws of
Romania, registered with the Bucharest trade registry under number J40/7126/2017,
sole registration code 37586457, with registered seat in 239 Calea Dorobanți str., 2nd
floor, office 4, district 1, Bucharest, Romania
Companies Law Law no. 31/1990 on companies, republished, as amended and supplemented
Deloitte Analysis Analysis performed by Deloitte Consultanta SRL, based on publicly available
information; the Deloitte Analysis is part of a larger market study report, which has
been prepared for the internal use of Sphera
EEA European Economic Area
EGSM or the
Extraordinary General
Shareholders Meeting
The Company's extraordinary general shareholders' meeting
Financial Adviser or
Rothschild
N M Rothschild & Sons Limited
EU European Union

208
Final Offer Price The price at which the Offered Shares will be sold within the Offering, in accordance
with the provisions of the section "Subscription and Sale" of this Prospectus
Fiscal Code Law no. 227/2015 on the fiscal code, as amended and supplemented
FSA Financial Supervisory Authority
FSC Forest Stewardship Council, a global not-for-profit organization that sets the standards
for what is a responsibly managed forest, both environmentally and socially
GDP A country's gross domestic product
GEO Government Emergency Ordinance
Golin Harris Romania Golin Harris Public Relations S.A., a company organized and operating under
Romanian law, registered with the Bucharest trade registry under the no.
J40/4863/1998, sole registration code 10596424, with registered seat in 89-97 Grigore
Alexandrescu street, building B, 4th floor, module A, district 1, Bucharest, Romania
Group The Company together with its subsidiaries, as presented in section "Business—
Corporate Structure" of this Prospectus
Havi (Romania) HAVI Logistics S.R.L., a company organized and existing under the laws of Romania,
registered with the Bucharest trade registry under no. J40/2734/1995, having its
registered office at 35-45 Intrarea Straulesti, district 1, Bucharest, Romania
IFRS The International Financial Reporting Standards adopted by the European Union via the
Commission Regulation (EC) No 1126/2008 of 3 November 2008 adopting certain
international accounting standards in accordance with Regulation (EC) No 1606/2002
of the European Parliament and of the Council
IFRS 3 IFRS 3 (Business Combinations) outlines the accounting when an acquirer obtains
control of a business (e.g. an acquisition or merger)
IT Information technology systems
Lunic (Cyprus) Lunic Franchising and Consulting Ltd, a company organized and existing under the
laws of Cyprus, registered under no. HE 80898, with registered office at Riga Feraiou
no. 2, Limassol Center, Block B, 4th floor, office 406, 3095 Limassol, Cyprus, a Selling
Shareholder
Managers Wood & Company Financial Services a.s., as Sole Global Coordinator and Joint
Bookrunner, Raiffeisen Bank S.A. as Joint Bookrunner and Alpha Finance Romania
S.A., as Co-Lead Manager.
Markets in Financial
Instruments Directive
Directive 2004/39/EC of the European Parliament and of the Council of 21 April 2004
on markets in financial instruments amending Council Directives 85/611/EEC and
93/6/EEC and Directive 2000/12/EC of the European Parliament and of the Council
and repealing Council Directive 93/22/EEC
MBL (Romania) M.B.L. Computers S.R.L., a company organized and existing under the laws of
Romania, registered with the Bucharest trade registry under no. J40/6119/1991, having
its registered office at 15 Fabrica de Glucoză street, Bucharest, Romania, as Selling
Shareholder.
Member State Member State of the European Union
NBR National Bank of Romania
Norms The Fiscal Code application norms, approved via the Government Decision no. 1/2016
on the Norms for the application of the Fiscal Code, as amended and supplemented
NSVFSA National Sanitary Veterinary and Food Safety Authority in Romania
Offer Period The period during which the Offer Shares will be offered for subscription based on this
Prospectus, as provided for in section "Subscription and Sale—Offering Summary" of
this Prospectus

209
Offer Tranches The tranches of the Offering, as such are described in section "Subscription and Sale—
Offer Tranches" of this Prospectus
Offered Shares An aggregate number of up to 9,831,753 nominative, ordinary shares in the Company,
offered as follows: (1) up to 8,667,773 ordinary shares in the Company by Lunic
(Cyprus); and (2) up to 1,163,980 ordinary shares in the Company by MBL (Romania);
in the initial public offering initiated based on this Prospectus
Offering The initial public offering of the Offered Shares on the basis of this Prospectus
OGSM or the Ordinary
General Shareholders
Meeting
The Company's ordinary general shareholders' meeting
Parent Subsidiary
Directive
Council Directive 2011/96/EU of 30 November 2011 on the common system of
taxation applicable in the case of parent companies and subsidiaries of different
Member States
Polin Polin International S.R.L., a company organized and existing under the laws of
Romania, registered with the Bucharest trade registry under no. J40/1417/2008, with
registered seat in 11 Jean Steriadi street, Bucharest, Romania
Prospectus This prospectus, as approved by the FSA
Prospectus Directive Directive 2003/71/EC (and amendments thereto, including the 2010 PD Amending
Directive, and includes any relevant implementing measure in each Relevant Member
State of the EEA and the expression "2010 PD Amending Directive" means Directive
2010/73/EU.
R.A.-A.P.P.S Regia Autonomă – Administrația Patrimoniului Protocolului de Stat, a legal person
registered with Bucharest Trade Registry under no. J40/234/1991, sole registration code
RO 2351555, with registered seat in 6-8 Moliere street, Bucharest, Romania
Regulation no. 1/2006 The Regulation of the National Securities Commission (currently, the FSA) no. 1/2006
on issuers and securities transactions
Regulation no. 1215/2012 Regulation (EU) No 1215/2012 of the European Parliament and of the Council of 12
December 2012 on jurisdiction and the recognition and enforcement of judgments in
civil and commercial matters
Regulation S Regulation S from the Securities Act in place in the United States of America
Romanian CSD Depozitarul Central S.A., the entity operating the Romanian Clearing Settlement,
Custody, Depository and Registration System for financial instruments listed on the
BSE, with registered seat at 34/36 Carol I bd., floors 3, 8 and 9, district 2, Bucharest,
Romania
Qualified Investors The qualified investors, as defined by Article 2(1)(e) of the Prospectus Directive as
implemented by Article 2 (21) of the Issuers and Markets Operations Law, respectively
(i) professional investors or (ii) persons qualified upon request as professional investors
or eligible counterparties, in accordance with the applicable law.
Placement Agreement The placement agreement entered into on or about the date of this Prospectus between
the Selling Shareholders, the Company and the Managers, having as main object the
performance of the Offering with a view to admission of the Company's shares to
trading on the spot regulated market operated by the BSE
Relevant Implementation
Date
The date when the Prospectus Directive was implemented in any Relevant Member
State
Relevant Member State EEA Member State that implemented the Prospectus Directive
Selling Shareholders Lunic (Cyprus) and MBL (Romania)
Shares Any and all ordinary nominative shares issued from time to time by the Company in
dematerialised form

210
Stabilising Managers Wood & Company Financial Services a.s. and Raiffeisen Bank S.A.
Subscription Form Subscription form for the Offered Shares, as defined in section "Subscription and Sale"
of this Prospectus
Tatika (Cyprus) Tatika Investments Ltd., a company organized and existing under the laws of Cyprus,
registered under no. HE 101319, with registered office at Evagorou & Menandrou, 1,
Frosia Building, 3rd floor, P.C. 1066 Nicosia, Cyprus
Transaction Date The date when the transactions related to the Offered Shares will take place, identified
in section "Subscription and Sale—Offering Summary" of this Prospectus
USFN Group USFN (Romania), USFN (Moldova) and USFN (Italy)
USFN (Italy) US Food Network S.R.L., a company organised and existing under the laws of Italy,
registered with the Milan trade registry under no. 09681280963with registered seat in
Milano, Via Pietro Paleocapa no. 6, 20121, Italy
USFN (Moldova) US Food Network S.R.L., a company organised and existing under the laws of the
Republic of Moldova, registered under fiscal registration number (IDNO)
1008600044173, with registered seat in Chisinau, Buiucani district, 45 Bănulescu-
Bodoni str., Republic of Moldova
USFN (Romania) US Food Network S.A., a company organized and existing under the laws of Romania,
registered with the Bucharest trade registry under no. J40/24660/1994, having its
registered office at 28-30 Gheorghe Magheru bd., district 1, Bucharest, Romania
Wellkept (Romania) Wellkept Group S.A., a company organized and existing under the laws of Romania,
registered with the Bucharest trade registry under no. J40/6207/2005, having its
registered office at 5-7 Calea Dorobanti, 2nd floor, office 5, district 1, Bucharest,
Romania
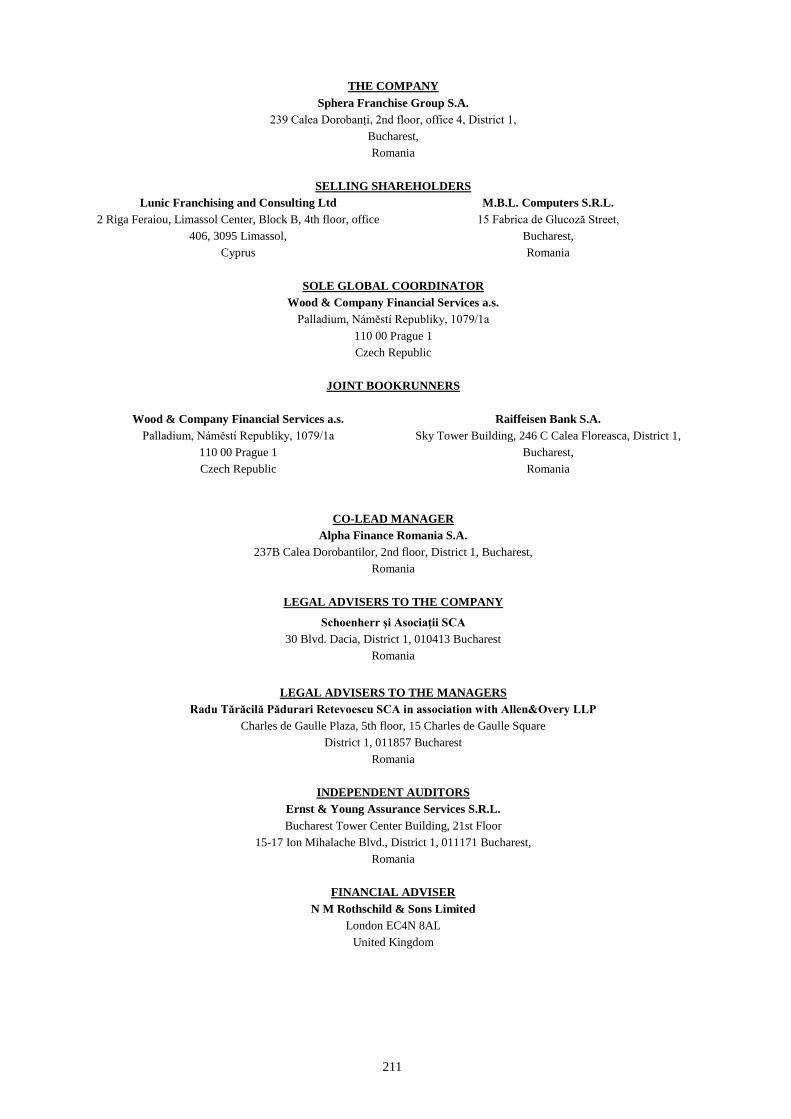
211
THE COMPANY
Sphera Franchise Group S.A.
239 Calea Dorobanți, 2nd floor, office 4, District 1,
Bucharest,
Romania
SELLING SHAREHOLDERS
Lunic Franchising and Consulting Ltd
2 Riga Feraiou, Limassol Center, Block B, 4th floor, office
406, 3095 Limassol,
Cyprus
M.B.L. Computers S.R.L.
15 Fabrica de Glucoză Street,
Bucharest,
Romania
SOLE GLOBAL COORDINATOR
Wood & Company Financial Services a.s.
Palladium, Náměstí Republiky, 1079/1a
110 00 Prague 1
Czech Republic
JOINT BOOKRUNNERS
Wood & Company Financial Services a.s.
Palladium, Náměstí Republiky, 1079/1a
110 00 Prague 1
Czech Republic
Raiffeisen Bank S.A.
Sky Tower Building, 246 C Calea Floreasca, District 1,
Bucharest,
Romania
CO-LEAD MANAGER
Alpha Finance Romania S.A.
237B Calea Dorobantilor, 2nd floor, District 1, Bucharest,
Romania
LEGAL ADVISERS TO THE COMPANY
Schoenherr şi Asociaţii SCA
30 Blvd. Dacia, District 1, 010413 Bucharest
Romania
LEGAL ADVISERS TO THE MANAGERS
Radu Tărăcilă Pădurari Retevoescu SCA in association with Allen&Overy LLP
Charles de Gaulle Plaza, 5th floor, 15 Charles de Gaulle Square
District 1, 011857 Bucharest
Romania
INDEPENDENT AUDITORS
Ernst & Young Assurance Services S.R.L.
Bucharest Tower Center Building, 21st Floor
15-17 Ion Mihalache Blvd., District 1, 011171 Bucharest,
Romania
FINANCIAL ADVISER
N M Rothschild & Sons Limited
London EC4N 8AL
United Kingdom

212
Sphera Franchise Group S.A.
the Company
__________________
Mark Nicholas Hilton, CEO
M.B.L. Computers S.R.L.
as Selling Shareholder
__________________
Adrian Neacşu
Sole Director
Lunic Franchising and Consulting Ltd
as Selling Shareholder
__________________
Ricardo-Marian David
Empowered person

213
APPENDIX 1 - DISTRIBUTION NETWORK OF RAIFFEISEN BANK S.A.
No County Name of the unit City Address
1 Alba Ag. Alba Alba Iulia Piata Iuliu Maniu, Nr. 4, spatiu comercial I
2 Alba Ag. Apullum Alba Iulia B-dul. Revolutiei 1989, Nr. 77, Bloc A19, Ap. 2
3 Alba Ag. Sebes Sebes Str. Lucian Blaga, Nr. 47
4 Alba Ag. Cugir Cugir Str. Al. Sahia, Nr. 19, Bloc 19, Scara E si F, Jud. Alba
5 Alba Ag. Campeni Campeni Str. Calea Turzii, Nr. 1, subapartamentul III.1
6 Alba Ag. Cetate Alba Iulia B-dul Victoriei, Nr. 25, Bl. 3CD
7 Alba Ag. Aiud Aiud Str. Iuliu Maniu, Nr. 2
8 Alba Ag. Ocna Mures Ocna Mures Str. 9 Mai, Nr. 3, jud. Alba
9 Alba Ag. Blaj Blaj Str. Timotei Cipariu, Bloc T6
10 Arad Ag. Arad Arad Str. Andrei Saguna, Nr. 1-3
11 Arad Ag. Lipova Lipova Str. Nicolae Balcescu, Nr. 29
12 Arad Ag. Sebis Sebis Bd-ul Republicii, Nr. 45A
13 Arad Ag. Teatru Arad Str. Unirii, Nr. 1, Ap. 30
14 Arad Ag. Radnei (Selgros) Arad Calea Radnei, Nr. 294
15 Arad Ag. Ioan Slavici Arad Aleea Borsec, Nr. 2, Bl. 511, Sc. C, Ap. 17
16 Arad Ag. Aurel Vlaicu Arad Str. Aurel Vlaicu, nr. 114, Bl. Z 20-a, Ap. 25
17 Arad Ag. Aradul Nou Arad Aradul Nou, Bloc 5, Scara A, Ap. 17/b, Loc. Arad, Jud. Arad
18 Arad Ag. Ineu Ineu Str. Republicii, Nr. 24
19 Arad Ag. Curtici Curtici Strada Primariei, Nr. 58, Apartament nr. 2, Corp A
20 Arad Ag. Podgoria Arad B-dul Revolutiei, Nr. 8, Bloc 8, Ap. 27
21 Arad Ag. Chisineu Cris Chisineu Cris Str. Garii, Nr. 1/B
22 Arges Ag. Arges Pitesti Calea Craiovei, nr. 42
23 Arges Ag. Campulung Campulung Muscel Str. Negru Voda, nr. 117, bl 1, parter
24 Arges Ag. Mioveni Mioveni Bdul Dacia, bl. V 2 B
25 Arges Ag. Pitesti Pitesti Calea Bucuresti, Bl. U1-U2
26 Arges Ag. Pitesti 2 Pitesti Piata Vasile Milea, bl. A4, parter
27 Arges Ag. Exercitiu Pitesti Str. Bibescu Voda, bl. A
28 Arges Ag. Balcescu Pitesti Bd. Nicolae Balcescu, Str. Gh. Titeica, bloc S5, sc. Tronson D si
E, Pitesti
29 Arges Ag. Fratii Golesti Pitesti B-dul Petrochimistilor, Bloc B32
30 Arges Ag. Topoloveni Topoloveni Str. Calea Bucuresti, Bl. P26
31 Arges Ag. Curtea de Arges Curtea de Arges Str. Basarabilor, nr. 27-29
32 Arges Ag. Ivancea Curtea de Arges Str. Albesti, Bloc Z2, parter
33 Arges Ag. Domnesti Domnesti B-dul. Alexandru Ioan Cuza, Nr. 3, in incinta Casei de Cultura
34 Arges Ag. Costesti Costesti Str. Victoriei, Bl. L21
35 Bacau Ag. Bacau Bacau Str. Dumbrava Rosie, Nr. 2, Bacau, Jud. Bacau
36 Bacau Ag. Cora Bacau Bacau Str. Milcov, Nr. 2A si 2-4, Spatiul G31, Bacau
37 Bacau Ag. Comanesti Comanesti Str. Republicii, Nr. 22, Comanesti
38 Bacau Ag. Onesti Onesti B-dul Oituz, Nr. 19, Onesti
39 Bacau Ag. Vasile
Alecsandri
Bacau Str. Pasajul Revolutiei, Nr. 8, Zona A, Parter, Bacau, jud. Bacau
40 Bacau Ag. George Bacovia Bacau Str. Unirii, Nr. 15, Sc. C
41 Bacau Ag. Bradului
(Selgros)
Bacau Prelungirea Bradului, Nr. 135 B, Bacau
42 Bacau Ag. Vasile Lupu Bacau Str. 9 Mai, Nr. 56, Sc. B, poz 1
43 Bacau Ag. Castanilor Bacau Str. Marasesti, Nr. 165, Tronson 2
44 Bacau Ag. Moinesti Moinesti Str. Tudor Vladimirescu, Nr. 177
45 Bacau Ag. Buhusi Buhusi Str. Republicii, Nr. 1
46 Bihor Ag. Bihor Oradea Str. Nufarului, Nr. 30
47 Bihor Ag. Marghita Marghita Str. Republicii, Nr. 13
48 Bihor Ag. Crisul Repede Oradea Str. Erofte Grigore, Nr. 22
49 Bihor Ag. Vulturul Negru Oradea Piata Unirii, Nr. 2-4
50 Bihor Ag. Dacia Oradea B-dul Dacia, Nr. 35, Bl. AN 55

214
51 Bihor Ag. Oradea 4
(Selgros)
Oradea Str. Ogorului, Nr. 65B
52 Bihor Ag. Rogerius Oradea Str. Transilvaniei, Nr. 2
53 Bihor Ag. Bulevard Oradea Str. Decebal, Nr. 66/A, Jud. Bihor
54 Bihor Ag. Alesd Alesd Piata Unirii, Nr. 2
55 Bihor Ag. Salonta Salonta Str. Libertatii, Nr. 1-3, Bl. A
56 Bihor Ag. Corso Oradea Str. Republicii, Nr. 16
57 Bistrita Nasaud Ag. Bistrita Bistrita Str. Liviu Rebreanu, Nr. 51
58 Bistrita Nasaud Ag. Viisoara Bistrita Bistrita, Str. Independentei, Bloc D1, Scara D, Jud. Bistrita
Nasaud
59 Bistrita Nasaud Ag. Nasaud Nasaud Str. Granicerilor, Nr. 20
60 Bistrita Nasaud Ag. Gloria Bistrita B-dul Decebal, Nr. 27
61 Bistrita Nasaud Ag. Calea Moldovei Bistrita Calea Moldovei, Nr. 1, Scara C
62 Botosani Ag. Botosani Botosani Calea Nationala, Nr. 68
63 Botosani Ag. Nicolae Iorga Botosani B-dul George Enescu, Nr. 2
64 Botosani Ag. Dorohoi Dorohoi B-dul Victoriei, Nr. 3-5, Bloc A1 si A3, zona B
65 Braila Ag. Braila Braila Str. Calea Calarasilor, nr. 34
66 Braila Ag. 1 Decembrie Braila Str. 1 Decembrie 1918, nr. 2
67 Braila Ag. Panait Istrati Braila Piata Dorobanti, nr. 1, bl. 20B
68 Braila Ag. Belvedere Braila Str. Dorobanti, nr. 31, Bl. A30
69 Braila Ag. Vidin Braila Str. Galati, nr. 325, Bl. 2 (magazin nr. 34)
70 Braila Ag. Piscului Braila Bulevardul Dorobantilor, nr. 621 Bloc 1, parter judetul Braila
71 Braila Ag. Ianca Ianca Str. Calea Brailei, Bloc B3, zona A, jud. Braila
72 Braila Ag. Viziru Braila Calea Calarasilor, nr. 319, Bl. B1, Viziru
73 Braila Ag. Braila Vest
(Selgros)
Braila Str. Ramnicu Sarat, nr. 92, Braila
74 Brasov Ag. Fagaras Fagaras Str. Republicii, Nr. 27
75 Brasov Ag. Rupea Rupea Str. Republicii, Nr. 153
76 Brasov Ag. Brasov Brasov Str. Harmanului, Nr. 24, Jud. Brasov, Zona A si Zona B, Zona C
77 Brasov Ag. Calea Bucuresti Brasov Calea Bucuresti, Nr. 54
78 Brasov Ag. Piata Sfatului Brasov Str. Piata Sfatului, Nr. 18
79 Brasov Ag. Star Brasov Brasov, in cadrul Complexului Duplex 1, B-dul Nicolae Balcescu,
Nr. 49, Jud. Brasov
80 Brasov Ag. Codlea Codlea Str. Lunga, Nr. 117
81 Brasov Ag. Sacele Sacele Piata Libertatii, Nr. 20
82 Brasov Ag. Rasnov Rasnov Str. Republicii, Nr. 24, jud. Brasov
83 Brasov Ag. Brasov 1
(Selgros)
Brasov Calea Bucuresti, Nr. 231
84 Brasov Ag. Racadau Brasov B-dul Muncii, Nr. 4, Sc. D
85 Brasov Ag. Astra Brasov Libraria 19, Complex Astra I, Str. Saturn
86 Brasov Ag. Tractorul Brasov Str. 1 Decembrie 1918, Nr. 8, Bl. 305,306,307, 308 si Str. Oltet
nr. 29,31,33
87 Brasov Ag. Barsei Brasov Str.Mihai Viteazul, Nr. 42, Bl. 62
88 Brasov Ag. Zarnesti Zarnesti Str. Mitropolit Ioan Metianu, Nr. 4, zona A
89 Brasov Ag. Bartolomeu
(Altex)
Brasov Str. Caramidariei, nr. 1
90 Bucuresti Ag. Campineanu Bucuresti Str. Ion Campineanu, Nr. 33, Sector 1
91 Bucuresti Ag. Bucuresti
(persoane fizice)
Bucuresti Calea Victoriei, nr. 224, bl. D5, Sector 1
92 Bucuresti Ag. Bucuresti
(persoane juridice)
Bucuresti Str. Grigore Alexandrescu, nr. 4A, Sector 1
93 Bucuresti Ag. Grivita Bucuresti Calea Grivitei, nr. 163, Sector 1
94 Bucuresti Ag. Ion Mihalache Bucuresti Str. Ion Mihalache, nr. 109, bl 13 A, Sector 1
95 Bucuresti Ag. Stirbei Voda Bucuresti Calea Stirbei Voda, nr. 152, bl. 26B
96 Bucuresti Ag. Chibrit Bucuresti Calea Grivitei, Nr. 236, Sector 1
97 Bucuresti Ag. Titulescu Bucuresti Bd. Nicolae Titulescu, nr. 18, bl. 23, Sector 1
98 Bucuresti Ag. Magheru Bucuresti Strada Bdul. Nicolae Balcescu Nr. 23A, Sector 1
99 Bucuresti Ag. Giulesti Bucuresti Calea Giulesti, nr. 123, Sector 6

215
100 Bucuresti Ag. Pajura Bucuresti Str. Pajurei, Nr. 7, apartament SP. COM, Zona A, Sector 1
101 Bucuresti Ag. Chitila Bucuresti Str. Chitilei, nr. 197, Sector 1
102 Bucuresti Ag. Domenii Bucuresti Bdl Ion Mihalache, nr. 187, Bl. 4, ap. Sp. Com. Dreapta
103 Bucuresti Ag. Bucurestii Noi Bucuresti Bdul Bucurestii Noi, Nr. 56, Bloc 56, Scara B, Sector 1
104 Bucuresti Ag. Piata Amzei Bucuresti Piata Amzei, nr. 19, Sector 1
105 Bucuresti Ag. Perla Bucuresti Bdul. Iancu de Hunedoara, Nr. 64, Bl. 12B, Sector 1, zona B
106 Bucuresti Ag. Feeria Bucuresti Centrul comercial Baneasa Shopping City, Soseaua Bucuresti-
Ploiesti 42D, Sector 1
107 Bucuresti Ag. Baneasa
(Selgros)
Bucuresti Sos. Bucuresti-Ploiesti, nr. 55-65, Sector 1
108 Bucuresti Ag. Calea Dorobanti Bucuresti Calea Dorobanti, nr. 134, Sector 1
109 Bucuresti Ag. Dorobanti Bucuresti Piata Dorobanti, nr. 1, Sector 1
110 Bucuresti Ag. Pipera Bucuresti Bdul. Dimitrie Pompei, nr. 9-9A, Sector 2
111 Bucuresti Ag. Aviatiei Bucuresti Sos. Pipera, Nr. 21-23, Bl. E3, Sector 1
112 Bucuresti Ag. Aerogarii Bucuresti B-dul. Aerogarii, nr. 2-8, bloc II 1, zona A, Sector 1
113 Bucuresti Ag. Lizeanu Bucuresti Sos. Stefan cel Mare, nr. 52, bl. 36, Sector 2
114 Bucuresti Ag. Lacul Tei Bucuresti Strada Lacul Tei, nr.75, bl. 16, zona A, Sector 2
115 Bucuresti Ag. Barbu Vacarescu Bucuresti Sos. Stefan Cel Mare, Nr. 24, Bloc 24B, zona A, Sector 2
116 Bucuresti Ag. Teiul Doamnei Bucuresti Strada Teiul Doamnei Nr. 15, Bloc 37, Zona A, Sector 2
117 Bucuresti Ag. Piata Presei Bucuresti P-ta Presei Libere, nr. 3-5, cladirea City Gate, Turnul de Nord,
Sector 1
118 Bucuresti Ag. Friedrich
Wilhelm
Bucuresti Str. Roma, nr. 37, Sector 1
119 Bucuresti Ag. Promenada
(mall)
Bucuresti Calea Floreasca, Nr. 246B, Sector 1
120 Bucuresti Ag. Floreasca City
Center
Bucuresti Calea Floreasca, Nr. 246D, Sector 1
121 Bucuresti Ag. Colentina Bucuresti Sos. Colentina, nr. 24, Sector 2
122 Bucuresti Ag. Rosetti Bucuresti Piata Rosetti, nr. 4, Sector 2
123 Bucuresti Ag. Obor Bucuresti Sos. Colentina, nr. 1, bloc 34, Sector 2
124 Bucuresti Ag. Armeneasca Bucuresti Calea Mosilor, Nr. 256-258, Bloc 4Bis, Sector 2
125 Bucuresti Ag. Bratianu Bucuresti Str. Lipscani, nr. 90A, Sector 3
126 Bucuresti Ag. Iancului Bucuresti Sos. Iancului, nr. 2, Bl. 113C
127 Bucuresti Ag. Mosilor
(dedicata PJ)
Bucuresti Calea Mosilor, nr. 221, Bl. 31A, Corp A, Sector 2
128 Bucuresti Ag. Delfinului Bucuresti Sos. Pantelimon, nr. 254, Sector 2
129 Bucuresti Ag. Colentina 1
(Carrefour)
Bucuresti Sos Colentina, nr. 426-426A
130 Bucuresti Ag. Pantelimon Bucuresti Sos. Pantelimon, nr. 300, Sector 2
131 Bucuresti Ag. Pantelimon 1
(Selgros)
Com. Pantelimon B-dul Biruintei, nr. 90, comuna Pantelimon
132 Bucuresti Ag. Vergului (Cora) Bucuresti Sos Vergului, nr. 20, Sector 2
133 Bucuresti Ag. Veranda Mall
(fosta Dimitrov)
Bucuresti Strada Ziduri Moși 23, Sector 2, Bucuresti
134 Bucuresti Ag. Calea Mosilor
(dedicata PF)
Bucuresti Calea Mosilor, nr. 225, Bl. 33-35, sector 2
135 Bucuresti Ag. Lucretiu
Patrascanu
Bucuresti Str. Lucretiu Patrascanu, nr. 17, bl. MC18, Sector 3
136 Bucuresti Ag. Delea Veche Bucuresti Calea Calarasi, nr. 180, bl. 61, sector 3
137 Bucuresti Ag. Basarabia Bucuresti Bld. Basarabia, Nr. 55, Bl. M22, Sector 2
138 Bucuresti Ag. Unirea Bucuresti Bdv. Bratianu, Nr. 39, Bl. P6, Sector 3
139 Bucuresti Ag. Titan Mall Bucuresti Bd. 1 Decembrie 1918, nr. 33A, Sector 3
140 Bucuresti Ag. Bucuresti Mall Bucuresti Calea Vitan, nr. 58, sc. Zona A
141 Bucuresti Ag. Decebal Bucuresti Bd. Decebal nr. 16, bl. S5, sc. Tronson II si III, cod postal
030968, Bucuresti
142 Bucuresti Ag. Vitan Bucuresti Piata Alba Iulia, Nr. 1, Sector 3
143 Bucuresti Ag. Camil Ressu Bucuresti B-dul Camil Ressu, Nr. 62, Bl. 1D
144 Bucuresti Ag. Rebreanu Bucuresti Str. Liviu Rebreanu, nr. 14, bl. K3
145 Bucuresti Ag. Nerva Traian Bucuresti Str. Nerva Traian, Nr. 15, Bl. M69

216
146 Bucuresti Ag. Piata Muncii Bucuresti Sos. Mihai Bravu, nr. 288, Bl. C3, Sector 3
147 Bucuresti Ag. Titan Bucuresti Bld. Nicolae Grigorescu, nr. 53, Ca 13, Sector 3
148 Bucuresti Ag. Titan Est Bucuresti B-dul. 1 Decembrie 1918, Nr. 37, zona A, Sector 3
149 Bucuresti Ag. Vitan Sud Bucuresti Sos. Mihai Bravu, Nr. 325, Bloc 55, spatiu comercial CA 38,
zona A, Sector 3
150 Bucuresti Ag. Rond Baba
Novac
Bucuresti Sos. Mihai Bravu, Nr. 302-304, Bl. B13, Sc. 1, Apartament Sp
Com, Sector 3
151 Bucuresti Ag. Dristor Bucuresti B-dul. Camil Ressu, Nr. 2, Bloc R1, Sector 3
152 Bucuresti Ag. Sebastian Bucuresti Calea 13 Septembrie, Nr. 221-225, Sector 5
153 Bucuresti Ag. Victoria Bucuresti Calea Victoriei, Nr. 21, Sector 3, corp B
154 Bucuresti Ag. Toporasi Bucuresti Sos. Giurgiului, Nr. 131, Sector 4
155 Bucuresti Ag. Progresul Bucuresti Str. Giurgiului, Nr. 118, Bl. 12, Sector 4
156 Bucuresti Ag. Ferentari Bucuresti Calea Ferentari, Nr. 20, Bl. 126, Lotul A, Sector 5
157 Bucuresti Ag. Rond Cosbuc Bucuresti B-dul Libertatii, Nr. 4, Bl. 117, Sector 4
158 Bucuresti Ag. Liberty Center
(mall)
Bucuresti Sos. Progresului, nr. 151-171, Unitatea nr. 1.26, Sector 5
159 Bucuresti Ag. Berceni (Selgros) Bucuresti Sos. Turnu Magurele, Nr. 92-108, Sector 4
160 Bucuresti Ag. Brancoveanu Bucuresti Sos. Oltenitei, Nr. 56, Bl. 11C, Sector 4
161 Bucuresti Ag. Obregia Bucuresti B-dul Alexandru Obregia, Nr. 7A, Bl. 128, Sector 4
162 Bucuresti Ag. Sincai Bucuresti B-dul Tineretului, Nr. 1, Bl. 5
163 Bucuresti Ag. Barzesti Bucuresti Soseaua Oltenitei, Nr. 254, Bl. 151, Sector 4
164 Bucuresti Ag. Cantemir Bucuresti Str. Dimitrie Cantemir, Nr. 13, Sector 4
165 Bucuresti Ag. Aparatorii Patriei Bucuresti Sos. Berceni, Nr. 183, Sector 4, zona C
166 Bucuresti Ag. Sun Plaza (fosta
Vacaresti)
Bucuresti Calea Văcărești, Nr. 391, Sector 4, București
167 Bucuresti Ag. Crangasi Bucuresti Calea Crangasi, nr. 12, Sector 6
168 Bucuresti Ag. Apusului Bucuresti Str. Iuliu Maniu, nr. 73, bl. C3, Sector 6
169 Bucuresti Ag. Drumul Taberei Bucuresti Str. Drumul Taberei, nr. 94, Bl. 519, Sector 6
170 Bucuresti Ag. Lujerului Bucuresti B-dul Iuliu Maniu, nr. 16, bl. 14, Sector 6
171 Bucuresti Ag. Rahova Bucuresti Str. Calea Rahovei, nr. 327, bloc 11, Sector 5
172 Bucuresti Ag. Romancierilor Bucuresti B-dul Timisoara, nr. 73, bl. C12, Sector 6
173 Bucuresti Ag. Prelungirea
Ghencea
Bucuresti Str. Prelungirea Ghencea, Nr. 65B, Bloc C1, Scara 5, Sector 6
174 Bucuresti Ag. Ghencea Bucuresti Bucuresti, Bdul. Ghencea, nr. 34, bl. 65, Sector 6
175 Bucuresti Ag. Uverturii Bucuresti B-dul Uverturii, nr. 83, bl. O15, Sector 6
176 Bucuresti Ag. Gorjului Bucuresti B-dul Iuliu Maniu, nr.67, bl. 6, Sector 6
177 Bucuresti Ag. Rahova Sud Bucuresti Soseaua Alexandriei, Nr. 11, Bl. 11C, Sector 5
178 Bucuresti Ag. Valea Cascadelor
(Selgros)
Bucuresti Str. Valea Cascadelor, Nr. 26 B, Sector 6
179 Bucuresti Ag. 13 Septembrie Bucuresti Calea 13 Septembrie, Nr. 107-109, bloc 103, Sector 5
180 Bucuresti Ag. Cotroceni (mall) Bucuresti Unitatea nr. C128, Centrul Comercial AFI Palace Cotroceni din
Bucuresti, B-dul Vasile Milea, Nr. 4, Sector 6
181 Bucuresti Ag. Cora Lujerului Bucuresti B-dul Iuliu Maniu, Nr. 19, Sector 6
182 Buzau Ag. Buzau Buzau Str. Nicolae Balcescu, Nr. 2
183 Buzau Ag. Nehoiu Nehoiu Str. Mihai Viteazul, Nr. 16
184 Buzau Ag. Ramnicu Sarat Ramnicu Sarat Str. Victoriei, Nr. 2
185 Buzau Ag. Unirii Sud Buzau Str. Unirii, Bl. O2
186 Buzau Ag. Marghiloman Buzau Str. Dorobanti, Bl. 7C, Buzau
187 Buzau Ag. Orizont Buzau Str. Unirii, Bl. H3
188 Calarasi Ag. Calarasi Calarasi Str. Bucuresti, Nr. 111, si 1, Municipiul Calarasi, Judetul Calarasi
189 Calarasi Ag. Belsugului Calarasi Str. Belsugului, Bl. D2, Sc. 1
190 Calarasi Ag. Flacara Calarasi Str. Flacara, Nr. 5, Bl C16, Sc. 4
191 Calarasi Ag. Lehliu Lehliu Gara Str. Nicolae Titulescu, nr. 56
192 Calarasi Ag. Dimitrie Ghica Oltenita Str. Argesului, nr. 33-35, Bloc 107, scara A
193 Calarasi Ag. Oltenita Oltenita B-dul Tineretului, nr. 121, bl. Sahia 1, sc. C
194 Caras Severin Ag. Resita Resita Piata 1 Decembrie 1918, Nr. 4
195 Caras Severin Ag. Caransebes Caransebes Str. Traian Doda, Nr. 1

217
196 Caras Severin Ag. Bocsa Bocsa Str. Funicularului, Nr. 93, Sc. I
197 Caras Severin Ag. Moldova Noua Moldova Noua Str. N. Titulescu, Bloc 56, Moldova Noua, jud. Caras Severin
198 Caras Severin Ag. Barzavei Resita B-dul Republicii, Bl. 8, sc. III, Ap. 42
199 Caras Severin Ag. Oravita Oravita Str. 1 Decembrie 1918, Nr. 1
200 Cluj Ag. Huedin Huedin Piata Republicii, Nr. 39, Bl.A1, Ap. 65/2
201 Cluj Ag. Dej Dej Str. 1 Mai, Nr. 1
202 Cluj Ag. Gherla Gherla Piata Libertatii, Nr. 2
203 Cluj Ag. Cluj Cluj-Napoca Str. Aviator Badescu, Nr. 1
204 Cluj Ag. Horea Cluj-Napoca Str. Cuza Voda, Nr.1
205 Cluj Ag. Turda Turda Str. Libertatii, Nr. 4, Bl. A1
206 Cluj Ag. Oprisani Turda Calea Victoriei, Nr. 100, Bloc B120, Ap. nr. 1, Jud. Cluj
207 Cluj Ag. Floresti Floresti Str. Avram Iancu, Nr. 278, jud. Cluj
208 Cluj Ag. Manastur Cluj-Napoca Str. Bucegi, Nr. 11, Ap. 1A
209 Cluj Ag. Marasti Cluj-Napoca Str. Aurel Vlaicu, Nr. 2, Ap. 91C
210 Cluj Ag. Someseni
(Selgros)
Cluj-Napoca Calea Someseni, Nr. 8
211 Cluj Ag. Zorilor Cluj-Napoca Str. Pasteur, Nr. 73, Ap. 49
212 Cluj Ag. Grigorescu
(Cora)
Cluj-Napoca B-dul 1 Decembrie 1918, Nr. 142
213 Cluj Ag. Napoca Cluj-Napoca Str. Aurel Vlaicu, Nr. 80, Ap. 1, jud. Cluj
214 Cluj Ag. Garii Cluj-Napoca Str. Horea, Nr. 96-106, jud. Cluj
215 Cluj Ag. Brancusi Cluj-Napoca B-dul C. Brancusi, Nr. 149
216 Cluj Ag. Piata Unirii Cluj-Napoca Str. Piata Unirii, Nr. 16
217 Cluj Ag. Ardealul Cluj-Napoca Bulevardul 21 Decembrie 1989, 77, Cluj-Napoca, 400124
218 Constanta Ag. Constanta Constanta Bdul. Al. Lapusneanu, Nr. 163C, Constanta, jud Constanta
219 Constanta Ag. Marea Neagra Constanta Bulevardul Tomis, Nr. 56, Magazin 62, Constanta
220 Constanta Ag. Eforie Nord Eforie Nord B-dul Republicii, nr. 2
221 Constanta Ag. Mangalia Mangalia Sos. Constantei, nr. 32, Bl. PY2
222 Constanta Ag. Callatis Mangalia B-dul 1, Decembrie 1918
223 Constanta Ag. Lazu (Selgros) Agigea Sos Mangaliei, nr. 1, Loc. Lazu, comuna Agigea
224 Constanta Ag. Farul Constanta Str. Dunarii, Bl. P F4
225 Constanta Ag. Balada Constanta B-dul 1 Decembrie 1918, nr. 10, bl. L 52A
226 Constanta Ag. Histria Constanta B-dul Aurel Vlaicu, nr. 92, Bl. AV21
227 Constanta Ag. Mercur Constanta B-dul Tomis, Nr. 213, Bl. TS 8
228 Constanta Ag. Capitol Constanta Bd. Tomis, nr. 141, Bloc T1
229 Constanta Ag. Dobrogea Constanta Sos. Mangaliei, nr. 185, Bloc 4
230 Constanta Ag. Delfinarium Constanta B-dul Mamaia, nr. 264, bl. PS 5
231 Constanta Ag. Harsova Harsova Str. Vadului, Bloc V2, spatiu comercial nr. 17
232 Constanta Ag. Medgidia Medgidia Str. Republicii, nr. 12, Bl. G4, mag 40 si mag 107
233 Constanta Ag. Lucian
Grigorescu
Medgidia Str. Independentei, Bloc E1, judetul Constanta
234 Constanta Ag. Tomis Constanta Str.Cismelei, nr. 16, Bl. B 5
235 Constanta Ag. Soveja Constanta Str. Dezrobirii, Nr. 143, Bl. IV22
236 Constanta Ag. Navodari Navodari Bulevardul Navodari, Nr. 159
237 Constanta Ag. Valu lui Traian Valu lui Traian Str. Calea Dobrogei, Nr. 78, jud. Constanta
238 Constanta Ag. Trocadero Constanta B-dul Alexandru Lapusneanu, nr. 89, Bl. LE 33
239 Constanta Ag. Litoral (Selgros) Constanta B-dul Tomis, nr. 387
240 Constanta Ag. Ovidiu Ovidiu Str. Nationala, nr. 74
241 Constanta Ag. Cernavoda Cernavoda Str. Lt. Ion Musat, nr. 3A
242 Constanta Ag. Basarabi Murfatlar Calea Bucuresti, Nr. 13, Bloc BA5
243 Constanta Ag. Navodari 1 Navodari Str. Constantei, nr. 12, bloc B2, sc. C
244 Covasna Ag. Sfantu Gheorghe Sfantu Gheorghe Str. 1 Decembrie 1918, Nr. 33-37
245 Covasna Ag. Mikes Sfantu Gheorghe Str. 1 Decembrie 1918, Nr. 137, Jud. Covasna
246 Covasna Ag. Covasna Covasna Str. Libertatii, Nr. 24, Bl. 24, Sc. A
247 Covasna Ag. Intorsura
Buzaului
Intorsura Buzaului Str. Mihai Viteazu, Nr. 143, Bloc 6, Scara C, Intrarea A
248 Covasna Ag. Tirgu Secuiesc Targu Secuiesc Str. Curtea 20, Nr. 1

218
249 Dambovita Ag. Targoviste Targoviste B-dul Mircea cel Batran, nr. 8, zona A, et. 1, jud. Dambovita
250 Dambovita Ag. Chindia Targoviste Str. Constantin Brancoveanu, Bl. 11, Sc. D
251 Dambovita Ag. Pucioasa Pucioasa Str. Republicii, Bl. Delia, Sc. B
252 Dambovita Ag. Caraiman Targoviste B-dul Independentei, nr. 24-25
253 Dambovita Ag. Crizantemelor Targoviste Str. Calea Bucuresti, Bloc O1, Scara B, jud. Dambovita
254 Dambovita Ag. Moreni Moreni Str. Culturii, Bl. D1, sc. D
255 Dambovita Ag. Titu Titu Str. Petru Rares, nr. 6
256 Dambovita Ag. Gaesti Gaesti Str. 13 Decembrie, Nr. 39, Bl. 46, Sc. F
257 Dolj Ag. Dolj Craiova Str. Sfantu Dumitru, nr. 8, Craiova, Jud. Dolj
258 Dolj Ag. Calafat Calafat Str. 22 Decembrie, Nr. 8
259 Dolj Ag. Oltenia Craiova Str. Calea Bucuresti, Bl. A14-A15
260 Dolj Ag. Craiova Est
(Selgros)
Craiova Str. Caracal, nr. 258
261 Dolj Ag. Romanescu Craiova Str. Nicolae Romanescu, nr. 6 C
262 Dolj Ag. Nicolae
Titulescu
Craiova Str. Nicolae Titulescu, Nr. 8
263 Dolj Ag. Cetatea Baniei Craiova Bdul. Olteniei, bloc 2, parter
264 Dolj Ag. Expres Craiova B-dul. Dacia, nr. 136, bl. G
265 Dolj Ag. Sarari Craiova Cartier Lapus, Str. Calea Bucuresti, Bloc N16-17
266 Dolj Brazda lui Novac Craiova Str.1 Decembrie 1918, nr. 27
267 Galati Ag. Galati Galati Strada Brailei, Nr. 85, corp adiacent, Bl. BR5A, zona A
268 Galati Ag. Tecuci Tecuci Str. 1 Decembrie 1918, nr.42
269 Galati Ag. Anghel Saligny Galati Str. Anghel Saligny, bl G4, sc.3
270 Galati Ag. Dunarea de Jos Galati Str. Brailei, nr.232, bl E4
271 Galati Ag. Henri Coanda Galati Str. Graurului, Nr. 1, Bl. J5, Sc. 1, Ap. 1, Micro 39
272 Galati Ag. Costache Negri Galati Str. Brailei, aferent bloc I 1, cartier Tiglina I
273 Galati Ag. Domneasca Galati Str Domneasca, nr. 20, Bl A
274 Galati Ag. Traian Galati Str. Traian, nr. 67, zona A, Jud.Galati
275 Galati Ag. Brates Galati Galati, Micro 14, Str. 1 Decembrie 1918, Nr. 12, Bloc S9E, Scara
2, Jud Galati
276 Galati Ag. Liesti Liesti Comuna Liesti
277 Galati Ag. Siret (Selgros) Galati B-dul Galati, nr. 1C
278 Giurgiu Ag. Giurgiu Giurgiu Str. Vlad Tepes, nr. 20
279 Giurgiu Ag. Turn Giurgiu Sos. Bucuresti, bl. 28/853
280 Giurgiu Ag. Bolintin Vale Bolintin Vale Str. Republicii, bl. B5
281 Gorj Ag. Gorj Targu Jiu Str. Tudor Vladimirescu, nr. 17
282 Gorj Ag. Targu Jiu Targu Jiu Str. Republicii, Bl. 25, Sc. 3
283 Gorj Ag. Rovinari Rovinari Str. Prieteniei, Nr. 13 bis
284 Gorj Ag. Targu Carbunesti Targu Carbunesti Str. Trandafirilor, Bl. B4
285 Gorj Ag. Motru Motru Str. Trandafirilor
286 Gorj Ag. Ecaterina
Teodoroiu
Targu Jiu Str. Victoriei, bl. 194
287 Gorj Ag. Turceni Turceni Str. Uzinei, nr. 1, Bl. 27
288 Harghita Ag. Miercurea Ciuc Miercurea Ciuc Str. Kossuth Lajos, Nr. 20, Bl. 27
289 Harghita Ag. Gheorgheni Gheorghieni Piata Libertatii, Nr. 7
290 Harghita Ag. Odorheiul
Secuiesc
Odorheiul Secuiesc Str. Rakoczi, Nr. 13
291 Harghita Ag. Toplita Toplita Str. Nicolae Balcescu, Nr. 37
292 Harghita Ag. Petofi Miercurea Ciuc B-dul Fratiei, Nr. 5, Sc. B
293 Hunedoara Ag. Deva Deva Blvd. Decebal, Bloc 5 (5A)
294 Hunedoara Ag. Hateg Hateg Str. Tudor Vladimirescu, Bl. S1
295 Hunedoara Ag. Orastie Orastie Str. Eroilor, Bl. C2, Sc. B si C
296 Hunedoara Ag. Calan Calan Str. Independentei, Nr. 13
297 Hunedoara Ag. Petrosani Petrosani B-dul 1 Decembrie 1918, Nr. 92, Bl. B1
298 Hunedoara Ag. Germisara Deva B-dul Iuliu Maniu, Bl. 1A+1B
299 Hunedoara Ag. Ulpia Deva Str. Mihai Eminescu, Bloc 13A, Jud. Hunedoara
300 Hunedoara Ag. Corvinul Hunedoara B-dul Dacia, Bl. A2/2
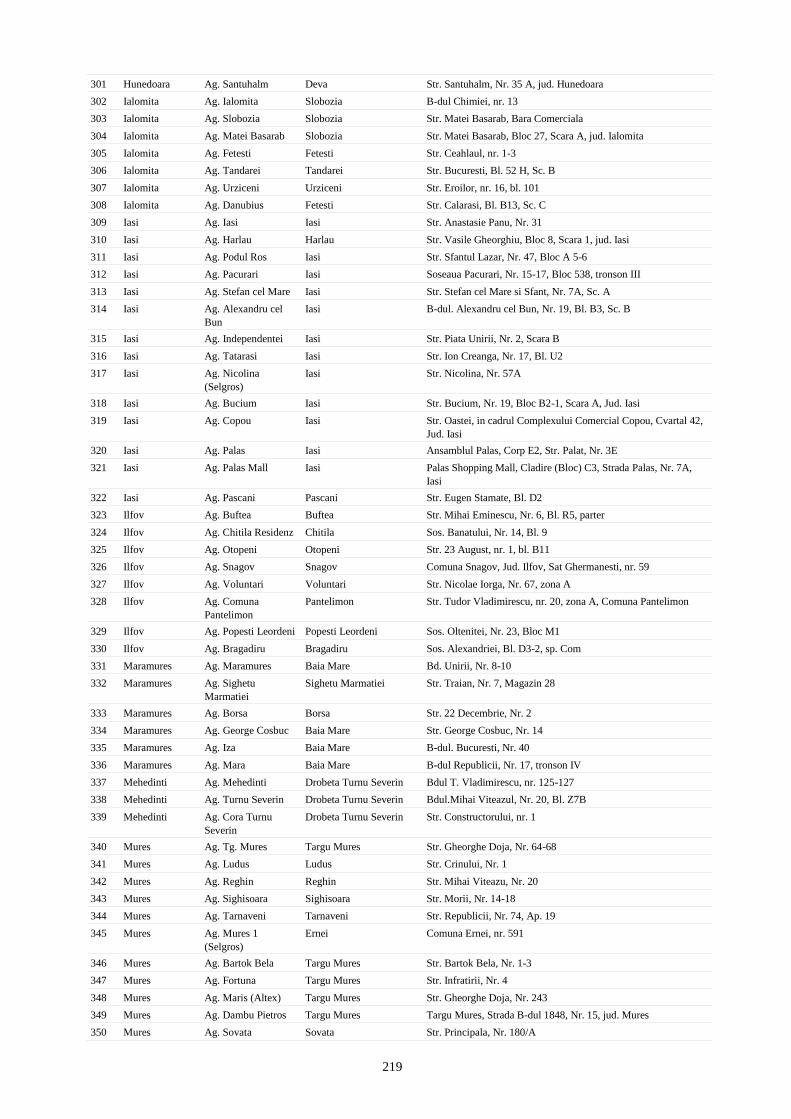
219
301 Hunedoara Ag. Santuhalm Deva Str. Santuhalm, Nr. 35 A, jud. Hunedoara
302 Ialomita Ag. Ialomita Slobozia B-dul Chimiei, nr. 13
303 Ialomita Ag. Slobozia Slobozia Str. Matei Basarab, Bara Comerciala
304 Ialomita Ag. Matei Basarab Slobozia Str. Matei Basarab, Bloc 27, Scara A, jud. Ialomita
305 Ialomita Ag. Fetesti Fetesti Str. Ceahlaul, nr. 1-3
306 Ialomita Ag. Tandarei Tandarei Str. Bucuresti, Bl. 52 H, Sc. B
307 Ialomita Ag. Urziceni Urziceni Str. Eroilor, nr. 16, bl. 101
308 Ialomita Ag. Danubius Fetesti Str. Calarasi, Bl. B13, Sc. C
309 Iasi Ag. Iasi Iasi Str. Anastasie Panu, Nr. 31
310 Iasi Ag. Harlau Harlau Str. Vasile Gheorghiu, Bloc 8, Scara 1, jud. Iasi
311 Iasi Ag. Podul Ros Iasi Str. Sfantul Lazar, Nr. 47, Bloc A 5-6
312 Iasi Ag. Pacurari Iasi Soseaua Pacurari, Nr. 15-17, Bloc 538, tronson III
313 Iasi Ag. Stefan cel Mare Iasi Str. Stefan cel Mare si Sfant, Nr. 7A, Sc. A
314 Iasi Ag. Alexandru cel
Bun
Iasi B-dul. Alexandru cel Bun, Nr. 19, Bl. B3, Sc. B
315 Iasi Ag. Independentei Iasi Str. Piata Unirii, Nr. 2, Scara B
316 Iasi Ag. Tatarasi Iasi Str. Ion Creanga, Nr. 17, Bl. U2
317 Iasi Ag. Nicolina
(Selgros)
Iasi Str. Nicolina, Nr. 57A
318 Iasi Ag. Bucium Iasi Str. Bucium, Nr. 19, Bloc B2-1, Scara A, Jud. Iasi
319 Iasi Ag. Copou Iasi Str. Oastei, in cadrul Complexului Comercial Copou, Cvartal 42,
Jud. Iasi
320 Iasi Ag. Palas Iasi Ansamblul Palas, Corp E2, Str. Palat, Nr. 3E
321 Iasi Ag. Palas Mall Iasi Palas Shopping Mall, Cladire (Bloc) C3, Strada Palas, Nr. 7A,
Iasi
322 Iasi Ag. Pascani Pascani Str. Eugen Stamate, Bl. D2
323 Ilfov Ag. Buftea Buftea Str. Mihai Eminescu, Nr. 6, Bl. R5, parter
324 Ilfov Ag. Chitila Residenz Chitila Sos. Banatului, Nr. 14, Bl. 9
325 Ilfov Ag. Otopeni Otopeni Str. 23 August, nr. 1, bl. B11
326 Ilfov Ag. Snagov Snagov Comuna Snagov, Jud. Ilfov, Sat Ghermanesti, nr. 59
327 Ilfov Ag. Voluntari Voluntari Str. Nicolae Iorga, Nr. 67, zona A
328 Ilfov Ag. Comuna
Pantelimon
Pantelimon Str. Tudor Vladimirescu, nr. 20, zona A, Comuna Pantelimon
329 Ilfov Ag. Popesti Leordeni Popesti Leordeni Sos. Oltenitei, Nr. 23, Bloc M1
330 Ilfov Ag. Bragadiru Bragadiru Sos. Alexandriei, Bl. D3-2, sp. Com
331 Maramures Ag. Maramures Baia Mare Bd. Unirii, Nr. 8-10
332 Maramures Ag. Sighetu
Marmatiei
Sighetu Marmatiei Str. Traian, Nr. 7, Magazin 28
333 Maramures Ag. Borsa Borsa Str. 22 Decembrie, Nr. 2
334 Maramures Ag. George Cosbuc Baia Mare Str. George Cosbuc, Nr. 14
335 Maramures Ag. Iza Baia Mare B-dul. Bucuresti, Nr. 40
336 Maramures Ag. Mara Baia Mare B-dul Republicii, Nr. 17, tronson IV
337 Mehedinti Ag. Mehedinti Drobeta Turnu Severin Bdul T. Vladimirescu, nr. 125-127
338 Mehedinti Ag. Turnu Severin Drobeta Turnu Severin Bdul.Mihai Viteazul, Nr. 20, Bl. Z7B
339 Mehedinti Ag. Cora Turnu
Severin
Drobeta Turnu Severin Str. Constructorului, nr. 1
340 Mures Ag. Tg. Mures Targu Mures Str. Gheorghe Doja, Nr. 64-68
341 Mures Ag. Ludus Ludus Str. Crinului, Nr. 1
342 Mures Ag. Reghin Reghin Str. Mihai Viteazu, Nr. 20
343 Mures Ag. Sighisoara Sighisoara Str. Morii, Nr. 14-18
344 Mures Ag. Tarnaveni Tarnaveni Str. Republicii, Nr. 74, Ap. 19
345 Mures Ag. Mures 1
(Selgros)
Ernei Comuna Ernei, nr. 591
346 Mures Ag. Bartok Bela Targu Mures Str. Bartok Bela, Nr. 1-3
347 Mures Ag. Fortuna Targu Mures Str. Infratirii, Nr. 4
348 Mures Ag. Maris (Altex) Targu Mures Str. Gheorghe Doja, Nr. 243
349 Mures Ag. Dambu Pietros Targu Mures Targu Mures, Strada B-dul 1848, Nr. 15, jud. Mures
350 Mures Ag. Sovata Sovata Str. Principala, Nr. 180/A

220
351 Neamt Ag. Neamt Piatra Neamt Piata Stefan cel Mare, Nr. 3
352 Neamt Ag. Poiana Teiului Poiana Teiului Loc. Poiana Teiului
353 Neamt Ag. Roman Roman Str. Nicolae Titulescu, Nr. 42
354 Neamt Ag. Targu Neamt Targu Neamt Aleea Salcamilor, Nr. 1, Complex comercial, Zona R
355 Neamt Ag. Mira Piatra Neamt B-dul Traian, Nr. 15, Bl. A3
356 Neamt Ag. Cozla Piatra Neamt Str. Mihai Viteazul, Nr. 6A
357 Olt Ag. Olt Slatina Str. Basarabilor, Nr. 2
358 Olt Ag. Caracal Caracal Str. Parangului, Bl. 4A
359 Olt Ag. Draganesti Olt Draganesti Olt Str. Nicolae Titulescu, nr. 129
360 Olt Ag. Scornicesti Scornicesti B-dul. Muncii nr. 7, Bloc 1A, Scara B, parter
361 Olt Ag. Slatina Slatina B-dul. Alex Ioan Cuza, Bl. D9,D10
362 Olt Ag. Minulescu Slatina Str. Arcului, nr. 1A
363 Olt Ag. Crisan Slatina Str. Crisan II, nr. 4
364 Olt Ag. Corabia Corabia Str. 1 Mai, Bl. 32-33
365 Prahova Ag. Prahova Ploiesti Str. Constantin Dobrogeanu Gherea, nr. 1A, Bl. D (zonele a.1 si
a.2) si nr. 1B, bl. E (zonele b.1, b.2)
366 Prahova Ag. Mizil Mizil Str. Nicolae Balcescu, nr. 38, bl. 43 B
367 Prahova Ag. Ploiesti 1 Ploiesti B-dul.Republicii, nr. 118, bl. 15 B2
368 Prahova Ag. Ploiesti Vest
(Selgros)
Ploiesti Str. Gh. Grigore Cantacuzino, nr. 366A
369 Prahova Ag. Mihai Bravu Ploiesti Str. Mihai Bravu, Aleea Chimiei 5, bloc 4B, si Str. Mihai Bravu,
nr. 4A-4B, magazin 125, bl. 4A
370 Prahova Ag. Orient Ploiesti B-dul Bucuresti, nr. 11, bloc 8C
371 Prahova Ag. Ploiesti Nord Ploiesti Sos Nordului, nr. 1A
372 Prahova Ag. Caragiale Ploiesti Str. Grivitei, nr. 2, bloc H, zona B
373 Prahova Ag. Bucov (AFI
mall)
Ploiesti Str. Calomfirescu, Nr. 2, Ploiesti, Jud. Prahova, România,
Unitatea nr. G130, in incinta Centrului Comercial AFI Palace
Ploiesti
374 Prahova Ag. Valenii de Munte Valenii de Munte Str. Nicolae Iorga, nr. 76, bl. C2
375 Prahova Ag. Urlati Urlati Str. 1 Mai, Nr. 116
376 Prahova Ag. Busteni Busteni B-dul Libertatii, nr. 166
377 Prahova Ag. Campina Campina Str.1 Mai, bl 12 G, parter
378 Prahova Ag. Carol Campina Bld. Carol I, nr. 17, bl. 17 D1, Campina
379 Prahova Ag. Baicoi Baicoi Str.Republicii, nr. 20, bl. 28
380 Prahova Ag. Breaza Breaza Str. Republicii, nr. 21
381 Salaj Ag. Zalau Zalau Str. Unirii, Nr. 19
382 Salaj Ag. Meses Zalau Str. Tudor Vladimirescu, Nr. 54
383 Salaj Ag. Porolissum Zalau Str. Mihai Viteazul, Bloc B120/B, Ap. 33/I
384 Salaj Ag. Jibou Jibou Str. 1 Mai, Bloc M30, Ap. 13/1
385 Salaj Ag. Simleu Silvaniei Simleu Silvaniei Str. 1 Decembrie, Nr. 5, Bloc D5
386 Satu Mare Ag. Satu Mare Satu Mare Piata Libertatii, Nr. 11
387 Satu Mare Ag. Soarelui Satu Mare Str. Lucian Blaga, bloc UU18, Parter
388 Satu Mare Ag. Carei Carei Str. 1 Decembrie 1918, Nr. 19
389 Satu Mare Ag. Negresti - Oas Negresti Oas Strada Victoriei, Bloc 9
390 Satu Mare Ag. Nufarul Satu Mare Str. Careiului, Bl. C25
391 Sibiu Ag. Sibiu Sibiu Piata Aurel Vlaicu, Nr. 9
392 Sibiu Ag. Agnita Agnita Str. Avram Iancu, Nr. 1
393 Sibiu Ag. Avrig Avrig Str. Samuel Brukenthal, Nr. 4
394 Sibiu Ag. Medias Medias Str. I.C. Bratianu, Nr. 3
395 Sibiu Ag. Brukenthal Sibiu Str. Tribunei, Nr. 2, Ap. 1/2, Sibiu, Jud. Sibiu
396 Sibiu Ag. Saliste Saliste Piata Junilor, Nr. 15
397 Sibiu Ag. Hermannstadt Sibiu Str. 9 Mai, Nr. 2
398 Sibiu Ag. Vasile Aaron Sibiu Cartier Vasile Aaron, Str. Semaforului, Bl. 14
399 Sibiu Ag. Emil Cioran Sibiu Str. Gorjului, Nr. 4, Bl. 15, Ap. 9, Parter
400 Sibiu Ag. Tineretului Sibiu Str. Uzinei, Nr. 2A, Jud. Sibiu
401 Sibiu Ag. Selimbar (Altex) Sibiu Com. Selimbar, DN1-km 306
402 Suceava Ag. Falticeni Falticeni B-dul 2 Graniceri, Bl. 51

221
403 Suceava Ag. Suceava Suceava B-dul George Enescu, Nr. 16
404 Suceava Ag. Gura Humorului Gura Humorului Piata Republicii, Nr. 16
405 Suceava Ag. Radauti Radauti Piata Unirii, Nr. 33
406 Suceava Ag. Vatra Dornei Vatra Dornei Str. Mihai Eminescu, Nr. 28
407 Suceava Ag. Bucovina Suceava Str. Nicolae Balcescu, Nr. 2
408 Suceava Ag. Itcani (Selgros) Suceava Str. Cernauti, nr. 118
409 Suceava Ag. Burdujeni Suceava Calea Unirii, Nr. 39, Bl. 92, Sc. F
410 Suceava Ag. Campulung
Moldovenesc
Campulung Moldovenesc Calea Transilvaniei, Nr. 13-15
411 Teleorman Ag. Teleorman Alexandria Str. Av. Al.Colfescu, nr. 63
412 Teleorman Ag. Alexandria Alexandria Str. Libertatii, Nr. 202, jud. Teleorman
413 Teleorman Ag. Rosiori de Vede Rosiorii de Vede Strada Dunarii, Bl. D3
414 Teleorman Ag. Turnu Magurele Turnu Magurele Str. Republicii, bl G4
415 Teleorman Ag. Videle Videle Sos. Giurgiului, nr. 21, Complex Stejarul
416 Teleorman Ag. Zimnicea Zimnicea Str. Mihai Viteazul, bl. 18C
417 Teleorman Ag. Unic Rosiorii de Vede Str. Rahovei, Bl. 102-103
418 Timis Ag. Timisoara Timisoara Str. Coriolan Brediceanu, Nr. 10, Corp B
419 Timis Ag. Deta Deta Str. Victoriei, Nr. 3
420 Timis Centrul Operational
de Afaceri Timisoara
Timisoara Str. Grigore T. Popa, Nr. 81, Ap. SAD 2, Jud. Timis
421 Timis Ag. Sannicolau Mare Sannicolau Mare Bdul. Republicii, nr. 12
422 Timis Ag. Jimbolia Jimbolia Str. Republicii, nr. 44, Ap. 1, Jimbolia, Jud. Timis
423 Timis Ag. Aries Timisoara Str. Aries, nr. 20
424 Timis Ag. Timisoara 2
(Selgros)
Timisoara Calea Aradului, nr. 64, Timisoara
425 Timis Ag. Fabric Timisoara Str. Stefan cel Mare, nr. 53, corp B, spatiul comercial nr. 2
426 Timis Ag. Timisoara Nord Timisoara Str. Gen. Ioan Dragalina, Nr. 47
427 Timis Ag. Stiintei Timisoara Str. Stiintei, Nr. 5
428 Timis Ag. Simion Barnutiu Timisoara Str. Simion Barnutiu, Nr. 56
429 Timis Ag. Bega Timisoara Str. Paris, Nr. 2A, Zona B
430 Timis Ag. Tisa Timisoara Str. Nicolae Balcescu, Nr. 5
431 Timis Ag. Banat Timisoara Calea Sever Bocu, Nr. 43, Bl. 35
432 Timis Ag. Calea Aradului Timisoara Str. Calea Aradului, Nr. 42, Scara B
433 Timis Ag. Iulius Mall
Timisoara
Timisoara Str. Aristide Demetriade, Nr. 1, Timisoara, Jud. Timis
434 Timis Ag. Sagului Timisoara Timisoara, Calea Sagului nr. 100, 104-106-108-110, Unitatea nr.
C055, in cadrul Shopping City Timisoara, Jud. Timis
435 Timis Ag. Lugoj Lugoj Str. 20 Decembrie 1989, Nr. 36
436 Timis Ag. Faget Faget Str. 1 Decembrie 1918, Nr. 1
437 Tulcea Ag. Tulcea Tulcea Str. Grivitei, Nr. 19
438 Tulcea Ag. Babadag Babadag Str. Republicii, nr. 98, zona A, Babadag
439 Tulcea Ag. Dunarea Tulcea Str. Isaccei, nr. 4, Bl. G0
440 Tulcea Ag. Egreta Tulcea Str. Isaccei, Bloc U2, judetul Tulcea
441 Tulcea Ag. Delta Tulcea Str. Frasinului, nr. 4, bl. 4, sc. B
442 Valcea Ag. Valcea Ramnicu Valcea Str. Stirbei Voda, nr. 2, bl T1
443 Valcea Ag. Calimanesti Calimanesti Str. Calea lui Traian, nr. 322
444 Valcea Ag. Berbesti Berbesti Bl. B1, Berbesti
445 Valcea Ag. Horezu Horezu Str. 1 Decembrie, Nr. 5
446 Valcea Ag. Ostroveni Ramnicu Valcea B-dul Tineretului, Nr. 8
447 Valcea Ag. Valcea Nord Ramnicu Valcea Str. Calea lui Traian, nr. 160, Bl. 21, zona A
448 Valcea Ag. Dragasani Dragasani Str. Gib Mihaescu, Nr. 20, Bl. 52
449 Vaslui Ag. Vaslui Vaslui Str. Stefan cel Mare, Bl. 94, Sc. C, D, Nr. 2-4
450 Vaslui Ag. Husi Husi Str. Gral. Telman, Nr. 1
451 Vaslui Ag. Podul Inalt Vaslui Str. Traian, Bl. C2, Sc. A
452 Vaslui Ag. Barlad Barlad Str. V Lupu si Str. 1 Decembrie, bl. M4, sc. B si D
453 Vaslui Ag. Fagului Barlad Str. Fagului, Nr. 3, Bloc D1-8, Scara 6, Apartament 1, jud. Vaslui
454 Vrancea Ag. Vrancea Focsani Focsani, Bulevardul Unirii, Nr. 28, jud. Vrancea

222
455 Vrancea Ag. Adjud Adjud Str. Republicii, Nr. 43, Bl. 92
456 Vrancea Ag. Odobesti Odobesti Str. Stefan cel Mare, Nr. 40, Bl. G1
457 Vrancea Ag. Panciu Panciu Str. Nicolae Titulescu, Nr. 75
458 Vrancea Ag. Republicii Focsani Str. Republicii, Nr. 18

223
APPENDIX 2 - GROUP FINANCIAL STATEMENTS
US Food Network SA – Consolidated financial statements as at 31.12.2016 prepared in
accordance with International Financial Reporting Standards as adopted by the European Union
F - 1
American Restaurant System S.A. – Financial statements as at 31.12.2016 prepared in
accordance with International Financial Reporting Standards as adopted by the European Union
F - 50
Sphera Franchise Group SA – Interim consolidated financial statements as at 30.06.2017
prepared in accordance with International Financial Reporting Standards as adopted by the
European Union
F - 97
American Restaurant System S.A. – Interim financial statements as at 30.06.2017 prepared in
accordance with International Financial Reporting Standards as adopted by the European Union
F - 144
Sphera Franchise Group SA – Pro forma consolidated financial information for the period from
1 January 2014 to 31 December 2014
F – 181
Sphera Franchise Group SA – Pro forma consolidated financial information for the period from
1 January 2015 to 31 December 2015
F – 198
Sphera Franchise Group SA – Pro forma consolidated financial information for the period from
1 January 2016 to 31 December 2016
F – 215
Sphera Franchise Group SA – Pro forma consolidated financial information for the period from
1 January 2017 to 30 June 2017
F –232

F - 1
US FOOD NETWORK SA
CONSOLIDATED FINANCIAL STATEMENTS Prepared in accordance with International Financial Reporting Standards as adopted by the European Union 31 DECEMBER 2016

US FOOD NETWORK SA CONSOLIDATED FINANCIAL STATEMENTS Prepared in accordance with International Financial Reporting Standards 31 DECEMBER 2016
F - 2
CONTENTS Independent auditors’ report to the shareholders of US FOOD NETWORK SA F - 3 Consolidated statement of comprehensive income F - 6 Consolidated statement of financial position F - 7 Consolidated statement of changes in equity F - 8 Consolidated statement of cash flows F - 9 Notes to the consolidated financial statements F - 10

Ernst & Young Assurance Services SRL Cladirea Bucharest Tower Center, et. 21 Bd. Ion Mihalache nr. 15-17, Sector 1
011171 Bucuresti, Romania
Tel: +40 21 402 4000 Fax: +40 21 310 7193 [email protected]
ey.com
INDEPENDENT AUDITOR’S REPORT
To the Shareholders of US FOOD NETWORK SA
Report on the Audit of the Consolidated Financial Statements
Opinion
We have audited the consolidated financial statements of US FOOD NETWORK SA (“the
Company”) and its subsidiaries (together “The Group”) , which comprise the consolidated
statement of financial position as at 31 December 2016, 31 December 2015, 31 December
2014 and 1 January 2014 and the consolidated statement of comprehensive income,
consolidated statement of changes in equity and consolidated statement of cash flows for the
years ended 31 December 2016, 31 December 2015 and 31 December 2014 and a summary of
significant accounting policies and other explanatory information.
In our opinion, the accompanying consolidated financial statements give a true and fair view of
the consolidated financial position of the Group as at 31 December 2016, 31 December 2015,
31 December 2014 and 1 January 2014 and of its consolidated financial performance and its
consolidated cash flows for the years ended 31 December 2016, 31 December 2015 and 31
December 2014 in accordance with the International Financial Reporting Standards as adopted
by the European Union and the accounting policies described in the notes to the consolidated
financial statements.
Basis for opinion
We conducted our audit in accordance with International Standards on Auditing (ISAs). Our
responsibilities under those standards are further described in the “Auditor’s Responsibilities for
the Audit of the Financial Statements” section of our report. We are independent of the Group in
accordance with the International Ethics Standards Board for Accountants' Code of Ethics for
Professional Accountants (IESBA Code) together with the ethical requirements that are relevant
to the audit of the financial statements in Romania, and we have fulfilled our other ethical
responsibilities in accordance with these requirements and the IESBA Code. We believe that
the audit evidence we have obtained is sufficient and appropriate to provide a basis for our
opinion.
Responsibilities of Management and those charged with governance for the
Consolidated Financial Statements
Management is responsible for the preparation and fair presentation of the consolidated
financial statements in accordance with the International Financial Reporting Standards as
adopted by the European Union, and for such internal control as management determines is
necessary to enable the preparation of consolidated financial statements that are free from
material misstatement, whether due to fraud or error.

F - 4
In preparing the consolidated financial statements, management is responsible for assessing
the Group's ability to continue as a going concern, disclosing, as applicable, matters related to
going concern and using the going concern basis of accounting unless management either
intends to liquidate the Group or to cease operations, or has no realistic alternative but to do so.
Those charged with governance are responsible for overseeing the Group's financial reporting
process.
Auditor’s Responsibilities for the Audit of the Consolidated Financial Statements
Our objectives are to obtain reasonable assurance about whether the consolidated financial
statements as a whole are free from material misstatement, whether due to fraud or error, and
to issue an auditors’ report that includes our opinion. Reasonable assurance is a high level of
assurance, but is not a guarantee that an audit conducted in accordance with ISAs will always
detect a material misstatement when it exists. Misstatements can arise from fraud or error and
are considered material if, individually or in the aggregate, they could reasonably be expected to
influence the economic decisions of users taken on the basis of these consolidated financial
statements.
As part of an audit in accordance with ISAs, we exercise professional judgment and
maintain professional skepticism throughout the audit. We also:
• Identify and assess the risks of material misstatement of the consolidated financial
statements, whether due to fraud or error, design and perform audit procedures responsive
to those risks, and obtain audit evidence that is sufficient and appropriate to provide a basis
for our opinion. The risk of not detecting a material misstatement resulting from fraud is
higher than for one resulting from error, as fraud may involve collusion, forgery, intentional
omissions, misrepresentations, or the override of internal control.
• Obtain an understanding of internal control relevant to the audit in order to design audit
procedures that are appropriate in the circumstances, but not for the purpose of expressing
an opinion on the effectiveness of the Group's internal control.
• Evaluate the appropriateness of accounting policies used and the reasonableness of
accounting estimates and related disclosures made by management.
Conclude on the appropriateness of management's use of the going concern basis of
accounting and, based on the audit evidence obtained, whether a material uncertainty exists
related to events or conditions that may cast significant doubt on the Group's ability to
continue as a going concern. If we conclude that a material uncertainty exists, we are
required to draw attention in our auditors’ report to the related disclosures in the
consolidated financial statements or, if such disclosures are inadequate, to modify our
opinion. Our conclusions are based on the audit evidence obtained up to the date of our
auditors’ report. However, future events or conditions may cause the Group to cease to
continue as a going concern.

F - 5
• Evaluate the overall presentation, structure and content of the consolidated financial
statements, including the disclosures, and whether the consolidated financial statements
represent the underlying transactions and events in a manner that achieves fair
presentation.
We communicate with those charged with governance regarding, among other matters, the
planned scope and timing of the audit and significant audit findings, including any significant
deficiencies in internal control that we identify during our audit.
On behalf of
Ernst & Young Assurance Services SRL
Alina Dimitriu
Executive Director
Bucharest Romania
August 09, 2017

US FOOD NETWORK SA CONSOLIDATED STATEMENT OF COMPREHENSIVE INCOME FOR THE YEAR ENDED 31 DECEMBER 2016 All amounts in RON thousand, unless specified otherwise
F - 6
NNote 2016 2015 2014
Restaurant sales 417,535 329,963 261,782
Restaurant expenses Food and material expenses 157,302 123,141 98,405 Payroll and employee benefits 8.1 69,577 50,513 40,400 Rent 27,498 22,544 20,366 Royalties 24,654 19,382 15,406 Advertising 20,736 16,715 13,187 Other operating expenses, net 6 30,313 24,565 19,350 Depreciation and amortization 8.2 9,234 7,833 8,238
Restaurant operating profit 78,221 65,270 46,430
General and administration expenses, net 7 22,975 16,132 15,299
Operating profit 55,246 49,138 31,131
Finance costs 9.1 825 531 978 Finance income 9.2 95 398 240
Profit before tax 54,516 49,005 30,393
Income tax expense 10 5,783 7,251 4,528
Profit for the year 48,733 41,754 25,865
Attributable to:
Equity holders of the parent 48,693 41,597 25,716 Non-controlling interests 40 157 149
Other comprehensive income
Other comprehensive income to be reclassified to profit or loss in subsequent periods (net of tax):
- - - Exchange differences on translation of foreign operations
83 (92) (10)
Total comprehensive income for the year, net of tax
48,816 41,662 25,855
Attributable to:
Equity holders of the parent 48,774 41,513 25,708 Non-controlling interests 42 149 147 These consolidated financial statements from page 3 to page 46 were approved by the Board of Directors and were authorised for issue on 9 June 2017.
Marian Gogu General Manager US Food Network SA

US FOOD NETWORK SA CONSOLIDATED STATEMENT OF FINANCIAL POSITION AS AT 31 DECEMBER 2016 All amounts in RON thousand, unless specified otherwise
F - 7
Notes
31 December 2016
31 December 2015
31 December 2014
1 January 2014
Assets
Non-current assets
54,246 45,562 41,658 46,642
Property, plant and equipment 11
47,551 41,084 37,779 42,311 Intangible assets 12
6,365 4,298 3,765 4,152
Deposits for rent guarantee
290 163 95 164 Deferred tax assets 10
40 17 19 15
Current assets
65,399 55,497 38,275 16,766
Inventories 15
5,744 5,717 4,161 3,509 Trade and other receivables 16
8,780 4,438 3,473 3,062
Prepayments
1,907 1,743 1,729 1,635 Cash and short-term deposits 17
48,968 43,599 28,912 8,560
Total assets
119,645 101,059 79,933 63,408
Equity and liabilities
Equity
Issued capital 18
190 190 190 190 Other capital reserves
19 19 19 19
Retained earnings
58,124 50,392 33,278 20,226 Foreign currency translation reserve
(41) (122) (38) (30)
Equity attributable to equity holders of the parent
58,292 50,479 33,449 20,405
Non-controlling interests
(39) 3 7 (7)
Total equity
58,253 50,482 33,456 20,398
Non-current liabilities
16,304 15,349 12,010 15,421
Interest-bearing loans and borrowings
13 14,630 11,787 8,773 12,184
Trade and other payables 21
1,674 1,827 1,597 1,788 Deferred tax liabilities 10 - 1,735 1,640 1,449
Current liabilities
45,088 35,228 34,467 27,589
Trade and other payables 21
37,292 28,594 27,950 18,834 Interest-bearing loans and borrowings
13 7,796 6,634 6,378 7,390
Provisions 20
- - 139 1,365
Total liabilities
61,391 50,577 46,477 43,010
Total equity and liabilities
119,645 101,059 79,933 63,408
These consolidated financial statements from page 3 to page 46 were approved by the Board of Directors and were authorised for issue on 9 June 2017.

US FOOD NETWORK SA CONSOLIDATED STATEMENT OF CHANGES IN EQUITY FOR THE YEAR ENDED 31 DECEMBER 2016 All amounts in RON thousand, unless specified otherwise
F - 8
Issued capital
Other capital reserves
Retained earnings
Foreign currency translation
reserve
Total equity
Non-controlling
interest
Total equity
As at 1 January 2016 190
19
50,392
(122)
50,479
3
50,482
Profit for the period -
-
48,693
-
48,693
40
48,733 Other comprehensive income
Translation differences -
-
-
81
81
2
83
Total comprehensive income -
-
48,693
81
48,774
42
48,816 Cash dividends -
-
(40,961)
-
(40,961)
(84)
(41,045)
At 31 December 2016 190
19
58,124
(41)
58,292
(39)
58,253
Issued capital
Other capital reserves
Retained earnings
Foreign currency translation
reserve
Total equity
Non-controlling
interest
Total equity
As at 1 January 2015 190
19
33,278
(38)
33,449
7
33,456
Profit for the period -
-
41,597
-
41,597
157
41,754 Other comprehensive income
Translation differences -
-
-
(84)
(84)
(8)
(92)
Total comprehensive income -
-
41,597
(84)
41,513
149
41,662
Cash dividends -
-
(24,483)
-
(24,483)
(153)
(24,636)
At 31 December 2015 190
19
50,392
(122)
50,479
3
50,482
Issued capital
Other capital reserves
Retained earnings
Foreign currency translation
reserve
Total equity
Non-controlling interests
Total equity
As at 1 January 2014 190
19
20,226
(30)
20,405
(7)
20,398
Profit for the period -
-
25,716
-
25,716
149
25,865 Other comprehensive income
Translation differences -
-
-
(8)
(8)
(2)
(10)
Total comprehensive income -
-
25,716
(8)
25,708
147
25,855
Cash dividends -
-
(12,665)
-
(12,665)
(133)
(12,798)
At 31 December 2014 190
19
33,278
(38)
33,449
7
33,456
These consolidated financial statements from page 3 to page 46 were approved by the Board of Directors and were authorised for issue on 9 June 2017.

US FOOD NETWORK SA CONSOLIDATED STATEMENT OF CASH FLOWS FOR THE YEAR ENDED 31 DECEMBER 2016 All amounts in RON thousand, unless specified otherwise
F - 9
Note 2016 2015 2014
Operating activities Profit before tax
54,516 49,005 30,393
Adjustments to reconcile profit before tax to net cash flows:
Depreciation of property, plant and equipment 11 8,977 7,628 8,044 Amortisation of intangible assets 12 847 698 675 Net foreign exchange differences
60 181 (116)
Loss/(Gain) on disposal of property, plant and equipment
92 (10) 740
Finance income 9.2 (95) (398) (240) Finance costs 9.1 536 424 555 Movement in current assets allowances
5 12 165
Movements in provisions
- (139) (1,226) Working capital adjustments:
Increase in trade and other receivables and prepayments
(4,574) (989) (553)
Increase in inventories
(27) (1,570) (652) Increase in trade and other payables
8,655 459 8,035
Interest received
31 342 192 Interest paid
(561) (453) (561)
Income tax paid
(7,619) (6,698) (3,452)
Net cash flows from operating activities
60,843 48,491 41,999
Investing activities
Proceeds from sale of property, plant and equipment
- 27 2
Purchase of intangible assets
(2,916) (1,246) (430) Purchase of property, plant and equipment
(15,536) (10,935) (4,108)
Net cash flows used in investing activities
(18,452) (12,154) (4,536)
Financing activities
Payment of finance lease liabilities
(284) (185) (155) Proceeds from borrowings
11,704 10,993 3,382
Repayment of borrowings
(7,480) (7,730) (7,531) Dividends paid to equity holders of the parent
(40,961) (24,483) (12,664)
Dividends paid to non-controlling interests
(84) (153) (133)
Net cash flows used in financing activities
(37,105) (21,558) (17,101)
Net increase in cash and cash equivalents
5,286 14,779 20,362
Net foreign exchange differences
83 (92) (10)
Cash and cash equivalents at 1 January
43,599 28,912 8,560
Cash and cash equivalents at 31 December
48,968 43,599 28,912
These consolidated financial statements from page 3 to page 46 were approved by the Board of Directors and were authorised for issue on 9 June 2017.

US FOOD NETWORK SA NOTES TO CONSOLIDATED FINANCIAL STATEMENTS FOR THE YEAR ENDED 31 DECEMBER 2016 All amounts in RON thousand, unless specified otherwise
F - 10
1. Corporate information These consolidated financial statements are prepared by US Food Network SA and comprise its activities and those of its subsidiaries, together referred hereinafter as ‘’USFN’’ or ‘’the Group’’. The consolidated financial statements for the year ended 31 December 2016 were authorized for issue in accordance with the resolution of the Board of Directors dated 9 June 2017. The Group operates quick service and takeaway restaurant concepts (a chain of 65 restaurants) under the Kentucky Fried Chicken (‘’KFC’’) brand, spread across Romania and the Republic of Moldova and also plans to further develop the network in Italy. The Group also operates one restaurant under Paul brand and one pizza delivery point under Pizza Hut Delivery (“PHD”) brand. The Group’s number of employees at 31 December 2016 was 2,942 (31 December 2015: 2,613, 31 December 2014: 2,268, 1 January 2014: 1,895). US Food Network SA (“the parent Company” or “the Parent”) was incorporated in 1994 as a joint stock company and is registered at No. 28-30 Gheorghe Magheru Boulevard, Bucharest, Romania. ICS US Food Network SRL (“Moldavian subsidiary”) was incorporated in 2008 as a joint stock company and is registered at No. 45 Banulescu Bodoni Street, Chisinau, Republic of Moldova. The Group owns 80% of the company’s shares. US Food Network SRL (“Italian subsidiary”) was incorporated in 2016 as a limited liability company and is registered at No. 6 Via Pietro Paleocapa Street, Milano, Italy. The Group owns 100% of the company’s shares. 2. Significant accounting policies The following are the significant accounting policies applied by the Group in preparing its financial statements. 2.1 Basis of preparation Statement of Compliance The financial statements of the Group have been prepared in accordance with International Financial Reporting Standards as issued by the International Accounting Standards Board (IASB) and adopted by the European Union (EU) (IFRS). For all periods up to and including the year ended 31 December 2015, the Group prepared its consolidated financial statements in accordance with local generally accepted accounting principles (Local GAAP) of Romania. These consolidated financial statements for the year ended 31 December 2016 are the first the Group has prepared in accordance with IFRS. Refer to Note 2.4 for information on how the Group adopted IFRS. The financial statements have been prepared on a historical cost basis. The financial statements are presented in Romanian Lei (‘’RON’’) and all values are rounded to the nearest thousand RON, except when otherwise indicated.

US FOOD NETWORK SA NOTES TO CONSOLIDATED FINANCIAL STATEMENTS FOR THE YEAR ENDED 31 DECEMBER 2016 All amounts in RON thousand, unless specified otherwise
F - 11
2. Significant accounting policies (continued) 2.2 Basis of consolidation The consolidated financial statements comprise the financial statements of the Group and its subsidiaries as at 31 December 2016. Control is achieved when the Group is exposed, or has rights, to variable returns from its involvement with the investee and has the ability to affect those returns through its power over the investee. Specifically, the Group controls an investee if, and only if, the Group has:
➢ Power over the investee (i.e., existing rights that give it the current ability to direct the relevant activities of the investee)
➢ Exposure, or rights, to variable returns from its involvement with the investee ➢ The ability to use its power over the investee to affect its returns
Generally, there is a presumption that a majority of voting rights results in control. To support this presumption and when the Group has less than a majority of the voting or similar rights of an investee, the Group considers all relevant facts and circumstances in assessing whether it has power over an investee, including:
➢ The contractual arrangement(s) with the other vote holders of the investee ➢ Rights arising from other contractual arrangements ➢ The Group’s voting rights and potential voting rights
The Group re-assesses whether or not it controls an investee if facts and circumstances indicate that there are changes to one or more of the three elements of control. Consolidation of a subsidiary begins when the Group obtains control over the subsidiary and ceases when the Group loses control of the subsidiary. Assets, liabilities, income and expenses of a subsidiary acquired or disposed of during the year are included in the consolidated financial statements from the date the Group gains control until the date the Group ceases to control the subsidiary. Profit or loss and each component of other comprehensive income (OCI) are attributed to the equity holders of the parent of the Group and to the non-controlling interests, even if this results in the non-controlling interests having a deficit balance. When necessary, adjustments are made to the financial statements of subsidiaries to bring their accounting policies into line with the Group’s accounting policies. All intra-group assets and liabilities, equity, income, expenses and cash flows relating to transactions between members of the Group are eliminated in full on consolidation. A change in the ownership interest of a subsidiary, without a loss of control, is accounted for as an equity transaction. If the Group loses control over a subsidiary, it:
➢ Derecognises the assets (including goodwill) and liabilities of the subsidiary ➢ Derecognises the carrying amount of any non-controlling interest ➢ Derecognises the cumulative translation differences, recorded in equity ➢ Recognises the fair value of the consideration received ➢ Recognises the fair value of any investment retained ➢ Recognises any surplus or deficit in profit or loss ➢ Reclassifies the parent’s share of components previously recognised in other comprehensive
income to profit or loss or retained earnings, as appropriate, as would be required if the Group had directly disposed of the related assets or liabilities

US FOOD NETWORK SA NOTES TO CONSOLIDATED FINANCIAL STATEMENTS FOR THE YEAR ENDED 31 DECEMBER 2016 All amounts in RON thousand, unless specified otherwise
F - 12
2. Significant accounting policies (continued) 2.3.1 Current versus non-current classification The Group presents assets and liabilities in the statement of financial position based on current/non-current classification. An asset is current when it is: • Expected to be realised or intended to sold or consumed in the normal operating cycle • Held primarily for the purpose of trading • Expected to be realised within twelve months after the reporting period, or • Cash or cash equivalent unless restricted from being exchanged or used to settle a liability for at
least twelve months after the reporting period All other assets are classified as non-current. A liability is current when: • It is expected to be settled in the normal operating cycle • It is held primarily for the purpose of trading • It is due to be settled within twelve months after the reporting period, or • There is no unconditional right to defer the settlement of the liability for at least twelve months after
the reporting period The Group classifies all other liabilities as non-current. Deferred tax assets and liabilities are classified as non-current assets and liabilities. 2.3.2 Fair value measurement Fair value related disclosures for financial instruments and non-financial assets that are measured at fair value or where fair values are disclosed, are summarised in the relevant notes. Fair value is the price that would be received to sell an asset or paid to transfer a liability in an orderly transaction between market participants at the measurement date. The fair value measurement is based on the presumption that the transaction to sell the asset or transfer the liability takes place either: • In the principal market for the asset or liability
Or • In the absence of a principal market, in the most advantageous market for the asset or liability. The principal or the most advantageous market must be accessible by the Group. The fair value of an asset or a liability is measured using the assumptions that market participants would use when pricing the asset or liability, assuming that market participants act in their economic best interest. A fair value measurement of a non-financial asset takes into account a market participant's ability to generate economic benefits from the asset’s highest and best use or by selling it to another market participant that would utilise the asset in its highest and best use. The Group uses valuation techniques that are appropriate in the circumstances and for which sufficient data are available to measure fair value, maximising the use of relevant observable inputs and minimising the use of unobservable inputs.

US FOOD NETWORK SA NOTES TO CONSOLIDATED FINANCIAL STATEMENTS FOR THE YEAR ENDED 31 DECEMBER 2016 All amounts in RON thousand, unless specified otherwise
F - 13
2. Significant accounting policies (continued) All assets and liabilities for which fair value is measured or disclosed in the financial statements are categorised within the fair value hierarchy. This is described, as follows, based on the lowest level input that is significant to the fair value measurement as a whole: • Level 1 — Quoted (unadjusted) market prices in active markets for identical assets or liabilities • Level 2 — Valuation techniques for which the lowest level input that is significant to the fair value
measurement is directly or indirectly observable • Level 3 — Valuation techniques for which the lowest level input that is significant to the fair value
measurement is unobservable For the purpose of fair value disclosures, the Group has determined classes of assets and liabilities on the basis of the nature, characteristics and risks of the asset or liability and the level of the fair value hierarchy, as explained above. 2.3.3 Revenue recognition Revenue is recognised to the extent that it is probable that the economic benefits will flow to the Group and the revenue can be reliably measured, regardless of when the payment is received. Revenue is measured at the fair value of the consideration received or receivable, and excluding taxes or duty. The following specific recognition criteria must also be met before revenue is recognised: Restaurant revenue Restaurant revenues are recognised when food and beverages are served. Revenues are recognised at fair value of meals and services delivered, net of value added tax charged to customers. Rental income Rental income is accounted for on a straight-line basis over the lease terms. Interest income Interest income or expense is recorded using the effective interest rate (EIR). The EIR is the rate that exactly discounts the estimated future cash receipts through the expected life of the financial instrument or a shorter period, where appropriate, to the net carrying amount of the financial asset. Interest income is included in ‘’Finance income’’ in profit or loss. 2.3.4 Foreign currencies The Group’s financial statements are presented in Romanian New Lei (‘’RON’’), which is also the parent Company's functional currency. Each entity in the Group determines its own functional currency and items included in the financial statements of each entity are measured using that functional currency (namely Moldavian Leu ‘’MDL’’ for the Moldavian subsidiary and the Euro ‘’EUR’’ for the Italian subsidiary). The Group uses the direct method of consolidation and on disposal of a foreign operation, the gain or loss that is reclassified to profit or loss reflects the amount that arises from using this method.

US FOOD NETWORK SA NOTES TO CONSOLIDATED FINANCIAL STATEMENTS FOR THE YEAR ENDED 31 DECEMBER 2016 All amounts in RON thousand, unless specified otherwise
F - 14
2. Significant accounting policies (continued) The exchange rate RON – EUR as at 31 December 2016, 31 December 2015, 31 December 2014 and 1 January 2014 were:
31 December 2016
31 December 2015
31 December 2014
1 January 2014
RON - EUR 4.5411 4.5245 4.4821 4.4847 RON - USD 4.3033 4.1477 3.6868 3.2551 RON - MDL 0.2174 0.2107 0.2359 0.2496 Transactions and balances Transactions in foreign currencies are initially recorded by the Group entities at their respective functional currency spot rate at the date the transaction first qualifies for recognition. Monetary assets and liabilities denominated in foreign currencies are retranslated at the functional currency spot rate of exchange ruling at the reporting date. Differences arising on settlement or translation of monetary items are recognised in profit or loss with the exception of monetary items that are designated as part of the hedge of the Group’s net investment of a foreign operation. These are recognised in OCI until the net investment is disposed of, at which time, the cumulative amount is classified to profit or loss. Tax charges and credits attributable to exchange differences on those monetary items are also recorded in OCI. Group companies On consolidation, the assets and liabilities of foreign operations are translated into RON at the rate of exchange prevailing at the reporting date and their revenues and expenses are translated at exchange rates prevailing at the dates of the transactions. The exchange differences arising on the translation are recognised in OCI. On disposal of a foreign operation, the component of OCI relating to that particular foreign operation is recognised in the profit or loss. 2.3.5 Taxes Current income tax Current income tax assets and liabilities for the current period are measured at the amount expected to be recovered from or paid to the taxation authorities. The tax rates and tax laws used to compute the amount are those that are enacted, or substantively enacted at the reporting date in the countries where the Group operates and generates taxable income. Current income tax relating to items recognised directly in equity is recognised in equity and not in profit or loss. Management periodically evaluates positions taken in the tax returns with respect to situations in which applicable tax regulations are subject to interpretation, and it establishes provisions where appropriate.

US FOOD NETWORK SA NOTES TO CONSOLIDATED FINANCIAL STATEMENTS FOR THE YEAR ENDED 31 DECEMBER 2016 All amounts in RON thousand, unless specified otherwise
F - 15
2. Significant accounting policies (continued) Deferred tax Deferred tax is provided using the liability method on temporary differences between the tax bases of assets and liabilities and their carrying amounts for financial reporting purposes at the reporting date. Deferred tax liabilities are recognised for all taxable temporary differences, except:
• When the deferred tax liability arises from the initial recognition of goodwill or an asset or liability in a transaction that is not a business combination and, at the time of the transaction, affects neither the accounting profit nor taxable profit or loss
• In respect of taxable temporary differences associated with investments in subsidiaries, associates and interests in joint arrangements, when the timing of the reversal of the temporary differences can be controlled and it is probable that the temporary differences will not reverse in the foreseeable future.
Deferred tax assets are recognised for: all deductible temporary differences and the carry forward of unused tax credits and unused tax losses, to the extent that it is probable that taxable profit will be available against which the deductible temporary differences, the carry forward of unused tax credits and any unused tax losses that can be utilised, except:
• When the deferred tax asset relating to the deductible temporary difference arises from the initial recognition of an asset or liability in a transaction that is not a business combination and, at the time of the transaction, affects neither the accounting profit nor taxable profit or loss, no deferred tax is recognized, and
• In respect of deductible temporary differences associated with investments in subsidiaries, associates and interests in joint arrangements, deferred tax assets are recognised only to the extent that it is probable that the temporary differences will reverse in the foreseeable future and taxable profit will be available against which the temporary differences can be utilised.
The carrying amount of deferred tax assets is reviewed at each reporting date and reduced to the extent that it is no longer probable that sufficient taxable profit will be available to allow all or part of the deferred tax asset to be utilised. Unrecognised deferred tax assets are reassessed at each reporting date and are recognised to the extent that it has become probable that future taxable profits will allow the deferred tax asset to be recovered. Deferred tax assets and liabilities are measured at the tax rates that are expected to apply in the year when the asset is realised or the liability is settled, based on tax rates (and tax laws) that have been enacted or substantively enacted at the reporting date. Deferred tax relating to items recognised outside profit or loss is recognised outside profit or loss. Deferred tax items are recognised in correlation to the underlying transaction either in other comprehensive income or directly in equity. Deferred tax assets and deferred tax liabilities are offset if a legally enforceable right exists to set off current tax assets against current income tax liabilities and the deferred taxes relate to the same taxable entity and the same taxation authority. Sales tax (VAT and similar taxes) Revenues, expenses and assets are recognised net of the amount of sales tax, except:
• Where the sales tax incurred on a purchase of assets or services is not recoverable from the taxation authority, in which case, the sales tax is recognised as part of the cost of acquisition of the asset or as part of the expense item, as applicable
• Receivables and payables are stated with the amount of sales tax included The net amount of sales tax recoverable from, or payable to, the taxation authority is included as part of receivables or payables in the statement of financial position.

US FOOD NETWORK SA NOTES TO CONSOLIDATED FINANCIAL STATEMENTS FOR THE YEAR ENDED 31 DECEMBER 2016 All amounts in RON thousand, unless specified otherwise
F - 16
2. Significant accounting policies (continued) 2.3.6 Property, plant and equipment Property, plant and equipment is measured at cost less accumulated depreciation and impairment losses. Where appropriate, the cost of property, plant and equipment includes site preparation costs, installation costs and the cost of obtaining permits required to bring the asset ready for use. Subsequent costs are included in the asset’s carrying amount or recognized as a separate asset, as appropriate, only when it is probable that future economic benefits associated with the item will flow to the Group and the cost of the item can be measured reliably. The cost of property, plant and equipment also includes the cost of replacing parts of the property, plant and equipment. All repair and maintenance costs are recognised in the profit or loss as incurred. The Group leases its restaurant locations by way of operating leases, which are not recognised in the Group’s statement of financial position. The cost of improvements to leasehold assets is recognised as leasehold improvements and then depreciated as outlined below. Costs directly related to purchasing of assets connected with opening restaurants in leased locations, including the costs of architecture design, legal assistance, wages and salaries, and benefits of employees directly involved in launching a given location are included in “property, plant and equipment”. These assets are depreciated over the expected useful life of the restaurant. Depreciation is calculated on a straight-line basis over the estimated useful lives of the assets as follows:
Leasehold improvements over the lease contract duration (usually 10 years, including first renewal period)
Computers and IT equipment 3 to 5 years Vehicles 5 years Other property, plant and equipment 2 to 10 years An item of property, plant and equipment is derecognised upon disposal or when no future economic benefits are expected from its use or disposal. Any gain or loss arising on de-recognition of the asset (calculated as the difference between the net disposal proceeds and the carrying amount of the asset) is included in profit or loss when the asset is derecognised. The useful lives and methods of depreciation of property, plant and equipment are reviewed at each financial year end and adjusted prospectively, if appropriate. Start-up expenses for new restaurants Start-up expenses for new restaurants represent costs related to the opening of new restaurant premises. Such expenses include rent and payroll expenses, new personnel training and other overhead expenses that arise before the opening of new restaurants. Start-up expenses for new restaurants are recognised as operating expense in the accounting period in which the related work was performed. 2.3.7 Leases The determination of whether an arrangement is, or contains, a lease is based on the substance of the arrangement at the inception date. The arrangement is, or contains a lease, if fulfilment of the arrangement is dependent on the use of a specific asset or assets or the arrangement conveys a right to use the asset or assets, even if that right is not explicitly specified in an arrangement. For arrangements entered into prior to 1 January 2014, the date of inception is deemed to be 1 January 2014 in accordance with IFRS 1 First-time Adoption of International Reporting Standards.

US FOOD NETWORK SA NOTES TO CONSOLIDATED FINANCIAL STATEMENTS FOR THE YEAR ENDED 31 DECEMBER 2016 All amounts in RON thousand, unless specified otherwise
F - 17
2. Significant accounting policies (continued) Group as a lessee A lease is classified at the inception date as a finance lease or an operating lease. A lease that transfers substantially all the risks and rewards incidental to ownership to the Group is classified as a finance lease. Finance leases are capitalised at the commencement of the lease at the inception date fair value of the leased property or, if lower, at the present value of the minimum lease payments. Lease payments are apportioned between finance charges and a reduction in the lease liability so as to achieve a constant rate of interest on the remaining balance of the liability. Finance charges are recognised in finance costs in profit or loss. A leased asset is depreciated over the useful life of the asset. However, if there is no reasonable certainty that the Group will obtain ownership by the end of the lease term, the asset is depreciated over the shorter of the estimated useful life of the asset and the lease term. An operating lease is a lease other than a finance lease. Operating lease payments are recognised as an operating expense in profit or loss on a straight-line basis over the lease term. Depending on contractual terms, the operating lease payment amounts are calculated for each restaurant as either a percentage of revenue (i.e. sales levels) with a minimum fixed monthly payment or as a fixed monthly payment. Some lease agreements contain escalation clauses. For leases with fixed escalating payments and/or fit-out works incentives received, the Group records rent expense on a straight-line basis over the lease term. Contingent rentals are based on sales levels in excess of stipulated amounts, and thus are not considered minimum lease payments and are included in rent expense when attainment of the contingency is considered probable (i.e. when Group’s sales occur). Group as a lessor Leases in which the Group does not transfer substantially all the risks and benefits of ownership of the asset are classified as operating leases. Initial direct costs incurred in negotiating and arranging an operating lease are added to the carrying amount of the leased asset and depreciated over the lease term on the same bases as rental income. Contingent rents are recognised as revenue in the period in which they are earned. 2.3.8 Intangible assets Intangible assets acquired separately are measured on initial recognition at cost. Following initial recognition, intangible assets are carried at cost less accumulated amortisation and accumulated impairment losses, if any. The useful lives of intangible assets are assessed as either finite or indefinite. Intangible assets with finite useful lives are amortised on a straight-line basis over the useful economic lives from 3 to 10 years and assessed for impairment whenever there is an indication that the intangible asset may be impaired. Amortisation periods are reviewed at least at each financial year end. Changes in the expected useful life or the expected pattern of consumption of future economic benefits embodied in the asset are accounted for by changing the amortisation period or method, as appropriate, and treated as changes in accounting estimates.

US FOOD NETWORK SA NOTES TO CONSOLIDATED FINANCIAL STATEMENTS FOR THE YEAR ENDED 31 DECEMBER 2016 All amounts in RON thousand, unless specified otherwise
F - 18
2. Significant accounting policies (continued) Franchise rights Franchise costs are incurred in obtaining franchise rights or licences to operate quick service and take-away restaurant concepts. They include the initial fee paid to the system franchisor when a new restaurant is opened or when the rights and licences are renewed. These are measured at cost less accumulated amortisation and accumulated impairment. Amortisation is on a straight line basis over the life of the applicable franchise or licence agreement, of 10 years. Gains or losses arising from de-recognition of an intangible asset are measured as the difference between the net disposal proceeds and the carrying amount of the asset and are recognised in profit or loss when the asset is derecognised. 2.3.9 Impairment of non-financial assets At each reporting date, management assesses whether there is any indication of impairment for property, plant and equipment or intangible assets. If any such indication exists, management estimates the recoverable amount, which is determined as the higher of an asset's fair value less costs to sell and its value in use. The carrying amount is reduced to the recoverable amount, and the difference is recognised as an expense (impairment loss) in the statement of comprehensive income. An impairment loss recognised for an asset in prior years is reversed if there has been a change in the estimates used to determine the asset’s recoverable amount. An impairment loss is reversed only to the extent that the asset’s carrying amount does not exceed the carrying amount that would have been determined, net of depreciation or amortisation, if no impairment loss had been recognised. For the purpose of impairment testing each restaurant is a cash generating unit. 2.3.10 Financial instruments A financial instrument is any contract that gives rise to a financial asset of one entity and a financial liability or equity instrument of another entity. i) Financial assets Initial recognition and measurement Financial assets are classified, at initial recognition, as financial assets at fair value through profit or loss, loans and receivables, held-to-maturity investments, available-for-sale (AFS) financial assets, or as derivatives designated as hedging instruments in an effective hedge, as appropriate. The Group determines the classification of its financial assets at initial recognition. The Group’s financial assets are represented by loans and receivables and cash and cash equivalents. All financial assets are recognised initially at fair value plus, in the case of assets not at fair value through profit or loss, transaction costs that are attributable to the acquisition of the financial asset. Purchases or sales of financial assets that require delivery of assets within a time frame established by regulation or convention in the marketplace (regular way trades) are recognised on the trade date, i.e., the date on which the Group commits to purchase or sell the asset.

US FOOD NETWORK SA NOTES TO CONSOLIDATED FINANCIAL STATEMENTS FOR THE YEAR ENDED 31 DECEMBER 2016 All amounts in RON thousand, unless specified otherwise
F - 19
2. Significant accounting policies (continued) Subsequent measurement Loans and receivables are non-derivative financial assets with fixed or determinable payments that are not quoted in an active market. After initial measurement, such financial assets are subsequently measured at amortised cost using the effective interest rate (EIR) method, less impairment. Amortised cost is calculated by taking into account any discount or premium on acquisition and fees or costs that are an integral part of the EIR. The EIR amortisation is included in finance income in profit or loss. For more information on receivables, refer to Note 16. Receivables due in less than 12 months are not discounted. De-recognition A financial asset (or, where applicable, a part of a financial asset or part of a Group of similar financial assets) is derecognised when:
• The rights to receive cash flows from the asset have expired, or • The Group has transferred its rights to receive cash flows from the asset or has assumed an
obligation to pay the received cash flows in full without material delay to a third party under a ‘pass-through’ arrangement, and either (a) the Group has transferred substantially all the risks and rewards of the asset, or (b) the Group has neither transferred nor retained substantially all the risks and rewards of the asset, but has transferred control of the asset.
When the Group has transferred its rights to receive cash flows from an asset or has entered into a pass-through arrangement, it evaluates if and, to what extent, it has retained the risks and rewards of ownership. When it has neither transferred nor retained substantially all of the risks and rewards of the asset nor transferred control of it, the asset is recognised to the extent of its continuing involvement in it. In that case, the Group also recognises an associated liability. The transferred asset and the associated liability are measured on a basis that reflects the rights and obligations that the Group has retained. Continuing involvement that takes the form of a guarantee over the transferred asset is measured at the lower of the original carrying amount of the asset and the maximum amount of consideration that the Group could be required to repay. ii) Impairment of financial assets Disclosures relating to impairment of financial assets are summarised in the following notes:
• Financial instruments risk management Note 14 • Trade receivables Note 16
The Group assesses, at each reporting date, whether there is any objective evidence that a financial asset or a Group of financial assets is impaired. An impairment exists if one or more events that has occurred since the initial recognition of the asset (an incurred ‘loss event’), has an impact on the estimated future cash flows of the financial asset or the Group of financial assets that can be reliably estimated. Evidence of impairment may include indications that the debtors or a Group of debtors is experiencing significant financial difficulty, default or delinquency in interest or principal payments, the probability that they will enter bankruptcy or other financial reorganisation and where observable data indicate that there is a measurable decrease in the estimated future cash flows, such as changes in arrears or economic conditions that correlate with defaults.

US FOOD NETWORK SA NOTES TO CONSOLIDATED FINANCIAL STATEMENTS FOR THE YEAR ENDED 31 DECEMBER 2016 All amounts in RON thousand, unless specified otherwise
F - 20
2. Significant accounting policies (continued) Financial assets carried at amortised cost For financial assets carried at amortised cost, the Group first assesses whether impairment exists individually for financial assets that are individually significant, or collectively for financial assets that are not individually significant. If the Group determines that no objective evidence of impairment exists for an individually assessed financial asset, whether significant or not, it includes the asset in a Group of financial assets with similar credit risk characteristics and collectively assesses them for impairment. Assets that are individually assessed for impairment and for which an impairment loss is, or continues to be, recognised are not included in a collective assessment of impairment. The amount of any impairment loss identified is measured as the difference between the asset’s carrying amount and the present value of estimated future cash flows (excluding future expected credit losses that have not yet been incurred). The present value of the estimated future cash flows is discounted at the financial asset’s original effective interest rate. The carrying amount of the asset is reduced through the use of an allowance account and the losses arising from impairment are recognised in profit or loss in ‘’Finance costs’’ for loans and in ‘’Other operating expenses’’ for receivables. If, in a subsequent year, the amount of the estimated impairment loss increases or decreases because of an event occurring after the impairment was recognised, the previously recognised impairment loss is increased or reduced by adjusting the allowance account. Interest income continues to be accrued on the reduced carrying amount using the rate of interest used to discount the future cash flows for the purpose of measuring the impairment loss. Loans, together with the associated allowance, are written off when there is no realistic prospect of future recovery and all collateral has been realised or has been transferred to the Group. If a write-off is later recovered, the recovery is credited to profit or loss in “Finance costs” for loans and in “Other operating expenses, net” for trade receivables. iii) Financial liabilities Initial recognition and measurement Financial liabilities are classified, at initial recognition, as financial liabilities at fair value through profit or loss, financial liabilities measured at amortized cost, or as derivatives designated as hedging instruments in an effective hedge, as appropriate. All financial liabilities are recognised initially at fair value and, in the case of financial liabilities measured at amortised cost, net of directly attributable transaction costs. The Group’s financial liabilities include only financial liabilities measured at amortised cost (trade and other payables and loans and borrowings). Subsequent measurement After initial recognition, interest bearing loans and borrowings and any other long-term payables are subsequently measured at amortised cost using the effective interest rate method. Gains and losses are recognised in profit or loss when the liabilities are derecognised as well as through the effective interest rate method (EIR) amortisation process. Amortised cost is calculated by taking into account any discount or premium on acquisition and fees or costs that are an integral part of the EIR. The EIR amortisation is included in finance costs in profit or loss. Trade and other payables with a maturity of 12 months or less are not discounted.

US FOOD NETWORK SA NOTES TO CONSOLIDATED FINANCIAL STATEMENTS FOR THE YEAR ENDED 31 DECEMBER 2016 All amounts in RON thousand, unless specified otherwise
F - 21
2. Significant accounting policies (continued) De-recognition A financial liability is derecognised when the obligation under the liability is discharged or cancelled or expires. When an existing financial liability is replaced by another from the same lender on substantially different terms, or the terms of an existing liability are substantially modified, such an exchange or modification is treated as a de-recognition of the original liability and the recognition of a new liability. The difference in the respective carrying amounts is recognised in profit or loss. iv) Offsetting of financial instruments Financial assets and financial liabilities are offset with the net amount reported in the statement of financial position only if there is a current enforceable legal right to offset the recognised amounts and an intent to settle on a net basis, or to realise the assets and settle the liabilities simultaneously. 2.3.11 Inventories Inventories, which include food, beverages and other supplies, are stated at the lower of cost or net realisable value. Cost of inventory is determined on the weighted-average basis and includes expenditures incurred in acquiring inventories and bringing them to their existing location and condition. Net realisable value is the estimated selling price in the ordinary course of business, less estimated costs necessary to make the sale. When inventories are sold, the carrying amount of those inventories is recognised as an expense and reported as a component of cost of sales in the statement of comprehensive income in the period in which the related revenue is recognised. The amount of any write-down of inventories to net realisable value and all losses of inventories is recognised as an expense in the same component of the statement of comprehensive income as the consumption of the respective inventory, in the period the write-down or loss occurs. 2.3.12 Cash and short-term deposits Cash and short-term deposits in the statement of financial position comprise cash at banks and on hand and short-term deposits. For the purpose of the statement cash flows, cash and cash equivalents consist of cash and short-term deposits, as defined above. 2.3.13 Prepayments Prepayments are carried at cost less provision for impairment. A prepayment is classified as non-current when the goods or services relating to the prepayment are expected to be obtained after one year. Prepayments to acquire current assets are transferred to the carrying amount of the asset once the Group has obtained control of the asset and it is probable that future economic benefits associated with the asset will flow to the Group. Prepayments to acquire property, plant and equipment are classified as construction in progress. Other prepayments are written off to profit or loss when the goods or services relating to the prepayments are received. If there is an indication that the assets, goods or services relating to a prepayment will not be received, the carrying value of the prepayment is written down accordingly and a corresponding impairment loss is recognized in profit or loss.

US FOOD NETWORK SA NOTES TO CONSOLIDATED FINANCIAL STATEMENTS FOR THE YEAR ENDED 31 DECEMBER 2016 All amounts in RON thousand, unless specified otherwise
F - 22
2. Significant accounting policies (continued) 2.3.14 Equity Share capital Ordinary shares are classified as equity. External costs directly attributable to the issue of new shares are shown as a deduction in equity from the proceeds. Any excess of the fair value of consideration received over the par value of shares issued is recognised as additional paid-in capital. Dividends The Group recognises a liability to make cash or non-cash distributions to owners of equity when the distribution is authorised and the distribution is no longer at the discretion of the Group. As per the corporate laws of Romania, a distribution is authorised when it is approved by the shareholders. A corresponding amount is recognised directly in equity. 2.3.15 Royalties Royalties in connection to franchise rights are recognised as an expense as restaurants revenue is earned. 2.3.16 Provisions General Provisions are recognised when the Group has a present obligation (legal or constructive) as a result of a past event, it is probable that an outflow of resources embodying economic benefits will be required to settle the obligation and a reliable estimate can be made of the amount of the obligation. Where the Group expects some or all of a provision to be reimbursed, for example under an insurance contract, the reimbursement is recognised as a separate asset but only when the reimbursement is virtually certain. The expense relating to a provision is presented in profit or loss net of any reimbursement. If the effect of the time value of money is material, provisions are discounted using a current pre-tax rate that reflects, when appropriate, the risks specific to the liability. When discounting is used, the increase in the provision due to the passage of time is recognised as a finance cost. Onerous contracts A provision for onerous contracts is recognised when the expected benefits to be derived by the Group from a contract are lower than the unavoidable cost of meeting its obligations under the contract. The provision is measured at the present value of the lower of the expected cost of terminating the contract and the expected net cost of continuing with the contract. Before a provision is established, the Group recognises any impairment loss on the assets associated with that contract. 2.3.17 Employee benefits The Group, in the normal course of business, makes payments on behalf of its employees for pensions (defined contribution plans), health care, employment and personnel tax which are calculated according to the statutory rates in force during the year, based on gross salaries and wages. Food allowances, travel expenses and holiday allowances are also calculated according to the local legislation. The cost of these payments is charged to the statement of comprehensive income in the same period as the related salary cost. Accruals are created for holiday allowances if there are non-used holidays according the local legislation.

US FOOD NETWORK SA NOTES TO CONSOLIDATED FINANCIAL STATEMENTS FOR THE YEAR ENDED 31 DECEMBER 2016 All amounts in RON thousand, unless specified otherwise
F - 23
2. Significant accounting policies (continued) The Group does not operate any other pension scheme or post-retirement benefits plan and consequently, has no obligation in respect of pensions. 2.4 First-time adoption of IFRS These financial statements, for the year ended 31 December 2016, are the first the Group has prepared in accordance with IFRS. For periods up to and including the year ended 31 December 2015, the Group prepared its consolidated financial statements in accordance with Romanian Accounting Regulations (‘’RAR’’ or ‘’Local GAAP’’). The Group has prepared financial statements that comply with IFRS applicable for the year ended 31 December 2016, together with the comparative period data for the years ended 31 December 2015 and 2014, as described in the summary of significant accounting policies. In preparing these consolidated financial statements, the Group’s opening statement of financial position was prepared as at 1 January 2014, being the Group’s date of transition to IFRS. This note explains the principal adjustments made by the Group in restating its Local GAAP financial statements, including the statement of financial position as at 1 January 2014, the statement of financial position as at 31 December 2016 and the statement of comprehensive income for the year ended 31 December 2016. As of 1 January 2014, the reconciliation of equity was performed between the Group’s RAR and IFRS consolidated accounts. The Group did not prepare and issue its consolidated accounts under RAR for 31 December 2016, and therefore the reconciliation of equity and total comprehensive income as of this date is performed between US Food Network SA and its subsidiaries stand-alone statutory accounts, prepared in accordance with RAR, Moldavian and Italian GAAP, and the Group IFRS consolidated accounts. Exemptions applied IFRS 1 allows first-time adopters certain exemptions from the retrospective application of certain requirements under IFRS. The Group did not apply any of the optional exemptions. Estimates The estimates at 1 January 2014 and at 31 December 2014, 2015 and 2016 are consistent with those made for the same dates in accordance with Local GAAP (after adjustments to reflect any differences in accounting policies). The estimates used by the Group to present these amounts in accordance with IFRS reflect conditions at 1 January 2014, the date of transition to IFRS, and as at 31 December 2014, 2015 and 2016.

US FOOD NETWORK SA NOTES TO CONSOLIDATED FINANCIAL STATEMENTS FOR THE YEAR ENDED 31 DECEMBER 2016 All amounts in RON thousand, unless specified otherwise
F - 24
2. Significant accounting policies (continued) Group reconciliation of equity as at 1 January 2014 (date of transition to IFRS) (only the elements affected by re-measurements are presented)
Note
Local GAAP
Re-measurement
IFRS as at 1 January 2014
Assets Non-current assets
36,311
10,331
46,642
Property, plant and equipment
11 33,844 8,467 42,311
Intangible assets 10
2,303
1,849
4,152 Deferred tax assets 1 - 15 15
Current assets
16,956
(190)
16,766
Trade and other receivables 2
3,252
(190)
3,062
Total assets
53,267
10,141
63,408 Equity and liabilities
Equity Issued capital 3
95
95
190 Retained earnings 1, 2, 3, 4, 5, 11
12,807
7,419
20,226
Equity attributable to equity holders of the parent
12,891
7,514
20,405
Total equity
12,884
7,514
20,398
Non-current liabilities
12,829
2,592
15,421
Trade and other payables 4
645
1,143
1,788
Deferred tax liabilities 1, 10 - 1,449 1,449
Current liabilities
27,554
35
27,589
Trade and other payables 5
18,775
59
18,834 Interest-bearing loans and borrowings
7,414
(24)
7,390
Total liabilities
40,383
2,627
43,010
Total equity and liabilities
53,267
10,141
63,408

US FOOD NETWORK SA NOTES TO CONSOLIDATED FINANCIAL STATEMENTS FOR THE YEAR ENDED 31 DECEMBER 2016 All amounts in RON thousand, unless specified otherwise
F - 25
2. Significant accounting policies (continued) Group reconciliation of equity as at 31 December 2016 (only the elements affected by re-measurements are presented)
Note Local GAAP Re-measurement
IFRS as at 31 December
2016
Assets
Non-current assets 41,868 12,378 54,246
Property, plant and equipment 11 35,956 11,595 47,551 Intangible assets 10 5,622 743 6,365 Deferred tax assets 1 - 40 40
Current assets 65,422 (23) 65,399
Trade and other receivables 2 8,803 (23) 8,780
Total assets 107,290 12,355 119,645
Equity and liabilities
Equity Issued capital 3 95 95 190
Retained earnings 1, 2, 3, 4, 5,
10, 11
46,507 11,617 58,124
Total equity 46,541 11,712 58,253
Non-current liabilities 15,637 667 16,304
Trade and other payables 4 1,007 667 1,674 Deferred tax liabilities 1, 10 - - -
Current liabilities 45,112 (24) 45,088
Trade and other payables 4,6 34,546 2,746 37,292 Interest-bearing loans and borrowings
5 7,880 (84) 7,796
Provisions 6 2,686 (2,686) -
Total liabilities 60,749 643 61,392
Total equity and liabilities 107,290 12,355 119,645

US FOOD NETWORK SA NOTES TO CONSOLIDATED FINANCIAL STATEMENTS FOR THE YEAR ENDED 31 DECEMBER 2016 All amounts in RON thousand, unless specified otherwise
F - 26
2. Significant accounting policies (continued) Reconciliation of total comprehensive income for the year ended 31 December 2016
Note Local GAAP Re-measurement
IFRS for the year
2016
Restaurant sales 9 412,520 5,015 417,535
Restaurant expenses: Food and material expenses 8, 9 161,840 (4,538) 157,302 Payroll and employee benefits 6, 9 66,878 2,699 69,577 Rent 4, 9 27,696 (198) 27,498 Royalties 9 24,371 283 24,654 Advertising 9 20,506 230 20,736 Other operating expenses 6, 9 24,264 6,049 30,313 Depreciation and amortization 9, 10, 11 8,733 501 9,234
Restaurants operating profit 78,232 (11) 78,221
General and administration expenses, net
6, 9 23,837 (862) 22,975
Operating profit 54,395 851 55,246
Finance costs 5 849 (24) 825 Finance income 2 31 64 95
Profit before tax 53,577 939 54,516
Income tax expense 1 7,541 (1,758) 5,783
Profit for the year 46,036 2,697 48,733
Notes to the reconciliation of equity as at 1 January 2014 and 31 December 2016 and total comprehensive income for the year ended 31 December 2016 The IFRS re-measurements comprise the following: Note 1- RAR does not provide for the recognition of deferred tax. For IFRS purposes, the Group recognised deferred tax, in line with the accounting policy presented in Note 2.3.5. For a comprehensive description of the main temporary differences giving rise to deferred tax and subsequent changes in tax legislation, please refer to Note 10. Note 2 - before the date of transition to IFRS, the Group has granted an interest free loan to Cinnamon Bake&Roll SRL, a related party. Under Local GAAP, the Group has recognized the loan receivable at its nominal value, while IAS 39 requires that financial instruments are initially recognised at fair value. Where loans between related parties are not on arm's length terms, the fair value of such loans is not usually the same as the loan amount, In accordance with IAS 39 AG 64, the Group re-measured the loan at fair value, by determining the present value of future cash receipts using a market rate of interest for a similar instrument. Subsequently, the loan is measured at amortised cost, using the effective interest method, such that, at repayment, the carrying value of the loan will equal the amount to be repaid. The unwinding of the discount is reported as interest income. Note 3 – the parent Company was set up in 1994 and operated during the period 1994-2003, when the Romania was classified as a hyperinflationary economy. As a result, the Group has restated the share capital contributions made until 31 December 2003. The impact on the net book value of property, plant and equipment acquired up 31 December 2003 which was still in operation as of the date of transition to IFRS was immaterial thus no related IAS 29 re-measurement of property, plant and equipment was recorded.

US FOOD NETWORK SA NOTES TO CONSOLIDATED FINANCIAL STATEMENTS FOR THE YEAR ENDED 31 DECEMBER 2016 All amounts in RON thousand, unless specified otherwise
F - 27
2. Significant accounting policies (continued) Note 4 - the Group has concluded operating lease agreements containing fixed escalating payments. IAS 17 requires a straight-line recognition of the lease expenses over the lease agreement term. As a result, the Group has recorded an operating lease accrual in order reflect the requirements of IAS 17 and the increase in the overall rent expense in the first years of the contracts. The accrual balance as at 31 December 2016 is of 725, out of which 58 is included in the current portion of trade and other payables and 667 within the non-current portion of trade and other payables. The accrual balance as at 1 January 2014 is of 1,203, out of which 60 is included in the current portion of trade and other payables and 1,143 within the non-current portion of trade and other payables. In 2016 the Group has released to profit or loss, within ‘’Rent’’ expenses, a portion of the accrual amounting to 198. Note 5 - RAR does not provide for the initial recognition of financial liabilities at fair value net of transaction costs, nor for their subsequent measurement at amortised cost. As a result, the Group has re-measured the loans received at fair value, net of any origination fees and recognized the amortisation of these fees as a finance cost. Note 6 - the Group has reclassified the untaken vacation accrual from short term provisions (recorded per local GAAP requirements) to trade and other payables in the statement of financial position. In the statement of comprehensive income for the year ended 31 December 2016, the impact of the reclassification was the following: - Decrease of other operating income and expenses, net of 1,561 - Increase in payroll and employee benefits from restaurant expenses of 1,374 Increase in payroll and
employee benefits from general and administrative expenses of 187
Note 7 - under the operating lease agreements concluded, the Group has received incentives for fit-out works provided free of charge by the landlords. Under RAR, the Group has deferred the amounts received for fit-out works over the contract term and recognised them in profit or loss in other operating income. IFRS requires the recognition of the aggregate benefit of incentives as a reduction of rental expense over the lease term, on a straight-line basis. Consequently, the Group reclassified an amount of 640 from other operating income as a reduction in rent expenses. Note 8 - under RAR, the Group has recognised amounts invoiced to its suppliers for marketing and promotion activities as other operating income. The substance of such arrangements has been deemed to be that of a sale incentive (i.e. rebates) given to the Group by the suppliers. Under IFRS, consideration characterized as a sales incentive given by a vendor to a customer is presumed to be a reduction of the selling prices of the supplier's goods or services. Accordingly, an amount of 6,492 was reclassified from other operating income as a reduction to the cost of goods purchased from the suppliers in ‘’Food and material’’ expenses. Note 9 - the Group has accounted under RAR one agreement concluded with a third party as a joint operation, in which each party to the agreement uses its own property, plant and equipment, carries its own inventories, incurs its own expenses and liabilities in order to contribute to the economic activities of the arrangement. According to the provisions of the arrangement, the Group has to make payments either in an agreed percentage of the restaurant net profit or as a minimum guaranteed amount.

US FOOD NETWORK SA NOTES TO CONSOLIDATED FINANCIAL STATEMENTS FOR THE YEAR ENDED 31 DECEMBER 2016 All amounts in RON thousand, unless specified otherwise
F - 28
2. Significant accounting policies (continued) Under IFRS, the arrangement did not meet the criteria for joint control. Rather, in accordance with its substance, the minimum guaranteed payments represent an operating lease expenses made for the right to use the current restaurant location, with any excess amounts being treated as contingent rent. As a result, the Group has reversed the entries made under RAR and recognised for the year ended 31 December 2016 the net rent expense of 640: - Increase in restaurant sales of 5,015 - Increase in food and material expenses of 1,955 - Increase in payroll and employee benefits of 1,325 - Increase in rent expenses of 640 - Increase in advertising expenses of 230 - Increase in royalties of 283 - Increase in depreciation of 160 - Decrease in general and administration expenses of 56 - Increase of other operating expenses of 479
Note 10 – Up to 2011, the Group has expensed under RAR the costs of the franchise rights acquired. Under the requirements of IAS 38, the Group has recognised these costs as an intangible asset, as follows:
- An increase in the net carrying amount of intangible assets (franchise rights) of 1,849 as at 1 January 2014
- An increase in the net carrying amount of intangible assets (franchise rights) of 743 as at 31 December 2016
- Recognition of an additional amortisation charge for franchise rights in 2016 of 327, presented under ‘’Depreciation and amortisation’’ in ‘’Restaurant expenses’’
Note 11 – Upon the date of transition to IFRS, the Group has applied the principles of IAS 16 and has reviewed the useful lives of its property, plant and equipment. The net carrying amount of property, plant and equipment has increased by 8,467 as at 1 January 2014 and by 11,595 respectively as at 31 December 2016. As a result of this change, the depreciation charge for the year 2016 decreased by 980. 3. Significant accounting judgements, estimates and assumptions The preparation of the Group’s consolidated financial statements requires management to make judgements, estimates and assumptions that affect the reported amounts of revenues, expenses, assets and liabilities, and the accompanying disclosures, and the disclosure of contingent liabilities. Uncertainty about these assumptions and estimates could result in outcomes that require a material adjustment to the carrying amount of asset or liability affected in future periods. Judgements In the process of applying the Group’s accounting policies, management has made the following judgements, which have the most significant effect on the amounts recognised in the financial statements: Classification of lease agreements A lease is classified as a finance lease if it transfers to the Group substantially all the risks and rewards incidental to ownership, otherwise it is classified as an operating lease. Whether a lease is a finance lease or an operating lease depends on the substance of the transaction rather than the form of the contract. If the lease term is longer than 75 percent of the economic life of the asset, or if at the inception of the lease the present value of the minimum lease payments amounts to at least 90 percent of the fair value of the leased asset, the lease is classified by the Group as finance lease, unless it is clearly demonstrated otherwise.

US FOOD NETWORK SA NOTES TO CONSOLIDATED FINANCIAL STATEMENTS FOR THE YEAR ENDED 31 DECEMBER 2016 All amounts in RON thousand, unless specified otherwise
F - 29
3. Significant accounting judgements, estimates and assumptions (continued) Estimates and assumptions The key assumptions concerning the future and other key sources of estimation uncertainty at the reporting date, that have a significant risk of causing a material adjustment to the carrying amounts of assets and liabilities within the next financial year, are described below. The Group based its assumptions and estimates on parameters available when the financial statements were prepared. Existing circumstances and assumptions about future developments, however, may change due to market changes or circumstances arising beyond the control of the Group. Such changes are reflected in the assumptions when they occur. Useful lives of property and equipment The Group assesses the remaining useful lives of items of property and equipment at least at each financial year-end. If expectations differ from previous estimates, the changes are accounted for as a change in an accounting estimate in accordance with IAS 8 ‘’Accounting Policies, Changes in Accounting Estimates and Errors’’. These estimates may have a material impact on the amount of the carrying values of property and equipment and on depreciation recognised in profit or loss. In particular, the Group assesses for its operating leases that generally have an initial term of 5 years with renewal option for another 5 years, that the leasehold improvements’ useful life is of 10 years due to the fact that historically most of such leases have been renewed after the initial term of 5 years, that the refurbishment needed after the first 5 years is of significantly less value compared to the initial set-up, and that 10 years is also the duration of the related franchise. 4. New standards, amendments and interpretations issued but not effective for the financial
year beginning 1 January 2016 and not early adopted The standards and interpretations that are issued, but not yet effective, up to the date of issuance of the Group’s financial statements are disclosed below. The Group intends to adopt these standards, if applicable, when they become effective. IFRS 9 Financial Instruments: Classification and Measurement The standard is effective for annual periods beginning on or after 1 January 2018, with early application permitted. The final version of IFRS 9 Financial Instruments reflects all phases of the financial instruments project and replaces IAS 39 Financial Instruments: Recognition and Measurement and all previous versions of IFRS 9. The standard introduces new requirements for classification and measurement, impairment, and hedge accounting. Management has assessed that the application of this standard will not have any significant impact on the financial position or performance of the Group. IFRS 15 Revenue from Contracts with Customers The standard is effective for annual periods beginning on or after 1 January 2018. IFRS 15 establishes a five-step model that will apply to revenue earned from a contract with a customer (with limited exceptions), regardless of the type of revenue transaction or the industry. The standard’s requirements will also apply to the recognition and measurement of gains and losses on the sale of some non-financial assets that are not an output of the entity’s ordinary activities (e.g., sales of property, plant and equipment or intangibles). Extensive disclosures will be required, including disaggregation of total revenue; information about performance obligations; changes in contract asset and liability account balances between periods and key judgments and estimates. Management has assessed that the application of this standard will not have any significant impact on the financial position or performance of the Group.

US FOOD NETWORK SA NOTES TO CONSOLIDATED FINANCIAL STATEMENTS FOR THE YEAR ENDED 31 DECEMBER 2016 All amounts in RON thousand, unless specified otherwise
F - 30
4. New standards, amendments and interpretations issued but not effective for the financial year beginning 1 January 2016 and not early adopted (continued)
IFRS 15: Revenue from Contracts with Customers (Clarifications) The Clarifications apply for annual periods beginning on or after 1 January 2018 with earlier application permitted. The objective of the Clarifications is to clarify the IASB’s intentions when developing the requirements in IFRS 15 Revenue from Contracts with Customers, particularly the accounting of identifying performance obligations amending the wording of the “separately identifiable” principle, of principal versus agent considerations including the assessment of whether an entity is a principal or an agent as well as applications of control principle and of licensing providing additional guidance for accounting of intellectual property and royalties. The Clarifications also provide additional practical expedients for entities that either apply IFRS 15 fully retrospectively or that elect to apply the modified retrospective approach. Management has assessed that the application of this standard (including the clarifications) will not have any significant impact on the financial position or performance of the Group. IFRS 16: Leases The standard is effective for annual periods beginning on or after 1 January 2019. IFRS 16 sets out the principles for the recognition, measurement, presentation and disclosure of leases for both parties to a contract, i.e. the customer (‘lessee’) and the supplier (‘lessor’). The new standard requires lessees to recognize most leases on their financial statements. Lessees will have a single accounting model for all leases, with certain exemptions. Lessor accounting is substantially unchanged. The Group is currently assessing the impact of the standard on its financial statements. Taking into consideration the significant number and value of signed lease agreements, the Group expects a significant impact following the adoption of the standard on its consolidated statement of financial position, and a less significant impact on its statement of comprehensive income. Amendment in IFRS 10 Consolidated Financial Statements and IAS 28 Investments in Associates and Joint Ventures: Sale or Contribution of Assets between an Investor and its Associate or Joint Venture The amendments address an acknowledged inconsistency between the requirements in IFRS 10 and those in IAS 28, in dealing with the sale or contribution of assets between an investor and its associate or joint venture. The main consequence of the amendments is that a full gain or loss is recognized when a transaction involves a business (whether it is housed in a subsidiary or not). A partial gain or loss is recognized when a transaction involves assets that do not constitute a business, even if these assets are housed in a subsidiary. In December 2015 the IASB postponed the effective date of this amendment indefinitely pending the outcome of its research project on the equity method of accounting. Management has assessed that the application of the amendments will not have any impact on the financial position or performance of the Group. IAS 12: Recognition of Deferred Tax Assets for Unrealized Losses (Amendments) The Amendments become effective for annual periods beginning on or after 1 January 2017 with earlier application permitted. The objective of the Amendments is to clarify the requirements of deferred tax assets for unrealized losses in order to address diversity in practice in the application of IAS 12 Income Taxes. The specific issues where diversity in practice existed relate to the existence of a deductible temporary difference upon a decrease in fair value, to recovering an asset for more than its carrying amount, to probable future taxable profit and to combined versus separate assessment. Management has assessed that the application of the amendments will not have any impact on the financial position or performance of the Group.

US FOOD NETWORK SA NOTES TO CONSOLIDATED FINANCIAL STATEMENTS FOR THE YEAR ENDED 31 DECEMBER 2016 All amounts in RON thousand, unless specified otherwise
F - 31
4. New standards, amendments and interpretations issued but not effective for the financial year beginning 1 January 2016 and not early adopted (continued)
IAS 7: Disclosure Initiative (Amendments) The Amendments are effective for annual periods beginning on or after 1 January 2017 with earlier application permitted. The objective of the Amendments is to provide disclosures that enable users of financial statements to evaluate changes in liabilities arising from financing activities, including both changes arising from cash flows and non-cash changes. The Amendments specify that one way to fulfil the disclosure requirement is by providing a tabular reconciliation between the opening and closing balances in the statement of financial position for liabilities arising from financing activities, including changes from financing cash flows, changes arising from obtaining or losing control of subsidiaries or other businesses, the effect of changes in foreign exchange rates, changes in fair values and other changes. Management has assessed that the application of these amendments will not have a significant impact on the disclosures from the financial statements of the Group. IFRS 2: Classification and Measurement of Share based Payment Transactions (Amendments) The Amendments are effective for annual periods beginning on or after 1 January 2018 with earlier application permitted. The Amendments provide requirements on the accounting for the effects of vesting and non-vesting conditions on the measurement of cash-settled share-based payments, for share-based payment transactions with a net settlement feature for withholding tax obligations and for modifications to the terms and conditions of a share-based payment that changes the classification of the transaction from cash-settled to equity-settled. Management has assessed that the application of these amendments will not have any impact on the financial position or performance of the Group. IFRS 4: Applying IFRS 9 Financial Instruments with IFRS 4 Insurance Contracts (Amendments) The Amendments are effective for annual periods beginning on or after 1 January 2018. The amendments address concerns arising from implementing the new financial instruments Standard, IFRS 9, before implementing the new insurance contracts standard that the Board is developing to replace IFRS 4. The amendments introduce two options for entities issuing insurance contracts: a temporary exemption from applying IFRS 9 and an overlay approach, which would permit entities that issue contracts within the scope of IFRS 4 to reclassify, from profit or loss to other comprehensive income, some of the income or expenses arising from designated financial assets. Management has assessed that the application of these amendments will not have any impact on the financial position or performance of the Group. IFRIC Interpretation 22: Foreign Currency Transactions and Advance Consideration The Interpretation is effective for annual periods beginning on or after 1 January 2018 with earlier application permitted. The Interpretation clarifies the accounting for transactions that include the receipt or payment of advance consideration in a foreign currency. The Interpretation covers foreign currency transactions when an entity recognizes a non-monetary asset or a non-monetary liability arising from the payment or receipt of advance consideration before the entity recognizes the related asset, expense or income. The Interpretation states that the date of the transaction, for the purpose of determining the exchange rate, is the date of initial recognition of the non-monetary prepayment asset or deferred income liability. If there are multiple payments or receipts in advance, then the entity must determine a date of the transactions for each payment or receipt of advance consideration. Management has assessed that the application of these amendments will not have any impact on the financial position or performance of the Group, as it already followed an approach aligned with these requirements. The IASB has issued the Annual Improvements to IFRSs 2014 – 2016 Cycle, which is a collection of amendments to IFRSs. The amendments are effective for annual periods beginning on or after 1 January 2017 for IFRS 12 Disclosure of Interests in Other Entities and on or after 1 January 2018 for IFRS 1 First-time Adoption of International Financial Reporting Standards and for IAS 28 Investments in Associates and Joint Ventures. Earlier application is permitted for IAS 28 Investments in Associates and Joint Ventures. Management has assessed that the application of these improvements will not have any impact on the financial position or performance of the Group.
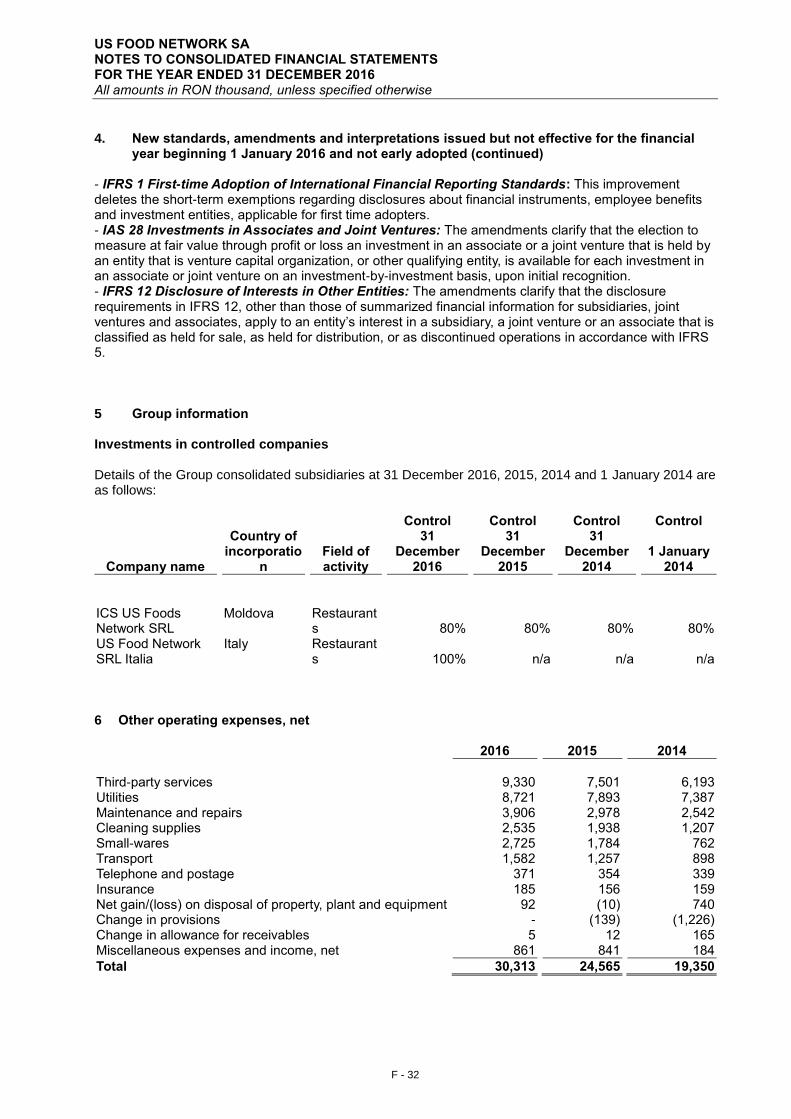
US FOOD NETWORK SA NOTES TO CONSOLIDATED FINANCIAL STATEMENTS FOR THE YEAR ENDED 31 DECEMBER 2016 All amounts in RON thousand, unless specified otherwise
F - 32
4. New standards, amendments and interpretations issued but not effective for the financial year beginning 1 January 2016 and not early adopted (continued)
- IFRS 1 First-time Adoption of International Financial Reporting Standards: This improvement deletes the short-term exemptions regarding disclosures about financial instruments, employee benefits and investment entities, applicable for first time adopters. - IAS 28 Investments in Associates and Joint Ventures: The amendments clarify that the election to measure at fair value through profit or loss an investment in an associate or a joint venture that is held by an entity that is venture capital organization, or other qualifying entity, is available for each investment in an associate or joint venture on an investment-by-investment basis, upon initial recognition. - IFRS 12 Disclosure of Interests in Other Entities: The amendments clarify that the disclosure requirements in IFRS 12, other than those of summarized financial information for subsidiaries, joint ventures and associates, apply to an entity’s interest in a subsidiary, a joint venture or an associate that is classified as held for sale, as held for distribution, or as discontinued operations in accordance with IFRS 5. 5 Group information Investments in controlled companies Details of the Group consolidated subsidiaries at 31 December 2016, 2015, 2014 and 1 January 2014 are as follows:
Company name
Country of
incorporation
Field of activity
Control
Control
Control
Control
31 December
2016
31 December
2015
31 December
2014 1 January
2014
ICS US Foods Network SRL
Moldova Restaurants
80%
80%
80%
80%
US Food Network SRL Italia
Italy Restaurants
100% n/a n/a n/a
6 Other operating expenses, net
2016 2015 2014
Third-party services 9,330
7,501
6,193
Utilities 8,721
7,893
7,387 Maintenance and repairs 3,906
2,978
2,542
Cleaning supplies 2,535
1,938
1,207 Small-wares 2,725
1,784
762
Transport 1,582
1,257
898 Telephone and postage 371
354
339
Insurance 185
156
159 Net gain/(loss) on disposal of property, plant and equipment 92
(10)
740
Change in provisions -
(139)
(1,226) Change in allowance for receivables 5
12
165
Miscellaneous expenses and income, net 861
841
184
Total 30,313 24,565 19,350
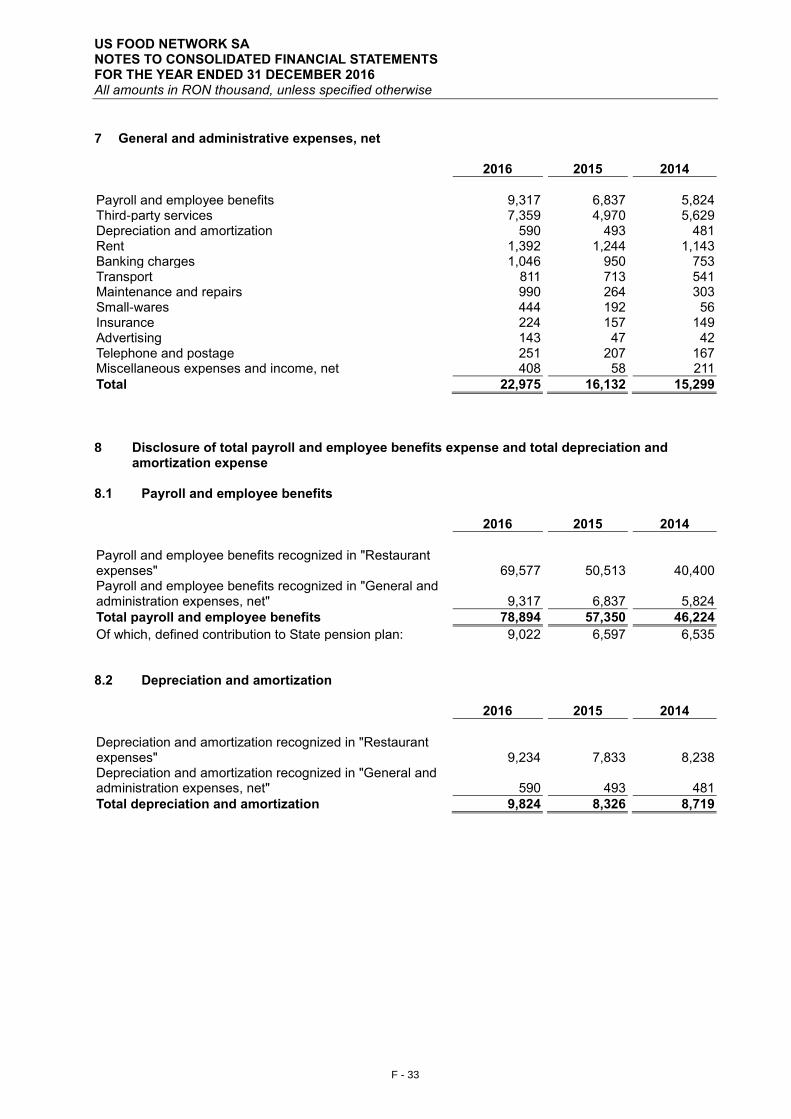
US FOOD NETWORK SA NOTES TO CONSOLIDATED FINANCIAL STATEMENTS FOR THE YEAR ENDED 31 DECEMBER 2016 All amounts in RON thousand, unless specified otherwise
F - 33
7 General and administrative expenses, net
2016
2015
2014
Payroll and employee benefits 9,317
6,837
5,824
Third-party services 7,359
4,970
5,629 Depreciation and amortization 590
493
481
Rent 1,392
1,244
1,143 Banking charges 1,046
950
753
Transport 811
713
541 Maintenance and repairs 990
264
303
Small-wares 444
192
56 Insurance 224
157
149
Advertising 143
47
42 Telephone and postage 251
207
167
Miscellaneous expenses and income, net 408
58
211
Total 22,975 16,132 15,299
8 Disclosure of total payroll and employee benefits expense and total depreciation and
amortization expense 8.1 Payroll and employee benefits
2016
2015
2014
Payroll and employee benefits recognized in "Restaurant expenses" 69,577 50,513 40,400 Payroll and employee benefits recognized in "General and administration expenses, net" 9,317 6,837 5,824
Total payroll and employee benefits 78,894 57,350 46,224
Of which, defined contribution to State pension plan: 9,022 6,597 6,535 8.2 Depreciation and amortization
2016
2015
2014
Depreciation and amortization recognized in "Restaurant expenses" 9,234 7,833 8,238 Depreciation and amortization recognized in "General and administration expenses, net" 590 493 481
Total depreciation and amortization 9,824 8,326 8,719

US FOOD NETWORK SA NOTES TO CONSOLIDATED FINANCIAL STATEMENTS FOR THE YEAR ENDED 31 DECEMBER 2016 All amounts in RON thousand, unless specified otherwise
F - 34
9 Finance costs and income
9.1 Finance costs
2016
2015
2014
Interest on loans and borrowings 518
406
534
Finance charges payable under finance leases 18
18
21 Foreign exchange loss, net 289
107
423
Total finance costs 825 531 978
9.2. Finance income
2016
2015
2014
Interest income 95
398
240
Total finance income 95 398 240
10 Income tax The major components of income tax expense for the years ended 31 December 2016, 2015 and 2014 are:
2016
2015
2014
Current income tax: Current income tax charge 7,541
7,154
4,341
Deferred tax: Relating to origination and reversal of temporary
differences (1,758)
97
187
Income tax expense reported in the statement of comprehensive income 5,783 7,251 4,528
A reconciliation between tax expense and the product of accounting profit multiplied by Romania’s domestic tax rate for the years ended 31 December 2016, 2015 and 2014 is as follows:
2016
2015
2014
Accounting profit before income tax 54,516 49,005 30,393
At statutory income tax rate of 16% 8,723
7,841
4,863 Effect of lower tax rates in the Republic of Moldova (13)
(40)
(37)
Other income exempted from tax (49)
-
- Utilisation of previously unrecognised tax losses -
-
(18)
Sponsorship fiscal credit (1,633)
(1,015)
(699) Effect of changes in the tax legislation and tax rates (1,892) - - Non-deductible expenses for tax purposes 647
465
419
At the effective income tax rate 5,783 7,251 4,528

US FOOD NETWORK SA NOTES TO CONSOLIDATED FINANCIAL STATEMENTS FOR THE YEAR ENDED 31 DECEMBER 2016 All amounts in RON thousand, unless specified otherwise
F - 35
10 Income tax (continued) Deferred tax Deferred tax reconciliation with corresponding items in the consolidated statement of financial position and consolidated statement of comprehensive income is as follows:
Statement of financial position
Statement of comprehensive income
2016
2015
2014
1 Jan 2014
2016 2015 2014
Deferred tax relates to the following:
Property, plant and equipment 22
(1,693)
(1,588) (1,353)
(1,715) 105 235 Franchise rights - (172) (231) (296) (172) (59) (65) Operating lease incentives 18
143
180 188
125 37 8
Loans and borrowings -
4
18 27
4 14 9
Deferred tax expense/(credit) (1,758) 97 187
Net deferred tax assets/(liabilities) 40
(1,718)
(1,621) (1,434) The Group offsets tax assets and liabilities if and only if it has a legally enforceable right to set off current tax assets and current tax liabilities and the deferred tax assets and deferred tax liabilities relate to income taxes levied by the same tax authority. In January 2017, the Romanian taxation regulations have changed for the companies active in the restaurant industry. Specifically, per the updated regulations, the income tax for the restaurant activity has been replaced by a specific tax, computed based on a minimum fix amount multiplied by the impact of three criteria: restaurant area, restaurant location and seasonality. The taxation of the non-restaurant activities has not suffered changes. Given that as at 31 December 2016 the new taxation system applicable to the Romanian entity (the parent Company) was substantively enacted (becoming effective from January 2017), the parent Company has reversed previously recognised deferred tax balances, as this constitutes in substance a change to a zero tax rate (the reversal of temporary differences in the future will not create any taxable or deductible amounts). The remaining deferred tax in balance as of 31 December 2016 refers to taxable differences of the Moldavian subsidiary.

US FOOD NETWORK SA NOTES TO CONSOLIDATED FINANCIAL STATEMENTS FOR THE YEAR ENDED 31 DECEMBER 2016 All amounts in RON thousand, unless specified otherwise
F - 36
11. Property, plant and equipment
Leasehold improvemen
ts
Plant and machinery
Other equipment
Construction in progress Total
Cost
At 1 January 2014 36,544
32,103
8,758 84 77,489
Additions 1,600
1,056
781 1,139 4,576 Disposals 2,407
112
229 468 3,216
At 31 December 2014 35,737
33,047
9,310 755 78,849
Additions 4,235
4,040
2,047 977 11,299 Disposals -
9
403 364 776
At 31 December 2015 39,972
37,078
10,954 1,368 89,372
Additions 4,746
6,074
2,778 2,451 16,049 Disposals 92
-
- 513 605
At 31 December 2016 44,626
43,152
13,732 3,306 104,816
Depreciation
At 1 January 2014 14,501
15,897
4,780 - 35,178
Depreciation charge for the year 3,997
2,709
1,338 - 8,044
Disposals 1,848
83
221 - 2,152
At 31 December 2014 16,650
18,523
5,897 - 41,070
Depreciation charge for the year 3,458
2,755
1,415 - 7,628
Disposals -
9
401 - 410
At 31 December 2015 20,108
21,269
6,911 - 48,288
Depreciation charge for the year 3,757
3,792
1,428 - 8,977
At 31 December 2016 23,865
25,061
8,339 - 57,265
Net Book Value
At 1 January 2014 22,043
16,206
3,978 84 42,311
At 31 December 2014 19,087
14,524
3,413 755 37,779
At 31 December 2015 19,864
15,809
4,043 1,368 41,084
At 31 December 2016 20,761
18,091
5,393 3,306 47,551
The Group has several finance lease contracts for motor vehicles. The carrying value of the leased assets as of 31 December 2016, 31 December 2015, 31 December 2014 and 1 January 2014 was: 485, 423, 425 and 605 respectively. The assets acquired under finance lease are pledged in favour of the leasing company. As of 31 December 2016, 31 December 2015, 31 December 2014 and 1 January 2014, the gross book value of fully depreciated property, plant and equipment that were still in use amounted to 18,926, 14,842, 11,092 and 8,503 respectively. The Group has pledged non-current assets (mostly equipment) in favour of Alpha Bank for the financing received. The net carrying amount of pledged assets as at 31 December 2016 is of 35,517 (31 December 2015: 28,659 31 December 2014: 25,786 and 1 January 2014: 26,428). The additions in 2016, 2015 and 2014 consist mainly in new restaurants’ leasehold improvements, as well as restaurants’ kitchen equipment.

US FOOD NETWORK SA NOTES TO CONSOLIDATED FINANCIAL STATEMENTS FOR THE YEAR ENDED 31 DECEMBER 2016 All amounts in RON thousand, unless specified otherwise
F - 37
12. Intangible assets
Franchise rights
Other intangible
assets Intangibles in progress Total
Cost
At 1 January 2014 6,725 11 131 6,867
Additions 561 4 79 644 Disposals 172 - 210 382
At 1 January 2015 7,114 15 - 7,129
Additions 1,086 9 151 1,246 Disposals 26 - - 26
At 31 December 2015 8,174 24 151 8,349
Additions 2,257 63 594 2,914
At 31 December 2016 10,431 87 745 11,263
Amortisation
At 1 January 2014 2,704 11 - 2,715
Amortisation 675 - - 675 Disposals 26 - - 26
At 1 January 2015 3,353 11 - 3,364
Amortisation 698 - - 698 Disposals 11 - - 11
At 31 December 2015 4,040 11 - 4,051
Amortisation 838 9 - 847
At 31 December 2016 4,878 20 - 4,898
Net book value
At 1 January 2014 4,021 - 131 4,152
At 31 December 2014 3,761 4 - 3,765
At 31 December 2015 4,134 13 151 4,298
At 31 December 2016 5,553 67 745 6,365
Additions during 2016, 2015 and 2014 consisted mainly in franchise operating licenses acquired for newly opened restaurants each year.

US FOOD NETWORK SA NOTES TO CONSOLIDATED FINANCIAL STATEMENTS FOR THE YEAR ENDED 31 DECEMBER 2016 All amounts in RON thousand, unless specified otherwise
F - 38
13. Interest-bearing loans and borrowings
Interest rate, % Maturity 2016 2015 2014 1 Jan 2014
Current interest-bearing loans and borrowings
Obligations under finance leases EURIBOR 3M+4.5% 11.03.2017 - - 153 146
EURIBOR 3M+4.5% 21.05.2019 174 194 - -
Bank loan EURIBOR 3M + 2.85% 5 years from each withdrawal
7,622 6,440 6,225 7,244
Total current interest-bearing loans and borrowings
7,796 6,634 6,378 7,390
Non-current interest-bearing loans and borrowings
Obligations under finance leases EURIBOR 3M+4.5% 11.03.2017 - - 209 362
EURIBOR 3M+4.5% 21.05.2019 226 201 - -
Bank loan EURIBOR 3M + 2.85% 5 years from each withdrawal
14,404 11,586 8,564 11,822
Total non-current interest-bearing loans and borrowings
14,630 11,787 8,773 12,184
Total interest-bearing loans and borrowings 22,426 18,421 15,151 19,574
The Group has a credit facility from Alpha Bank Romania made up of 3 sub-limits, as follows: credit facility for the development of new locations, issuance of bank guarantee letters and credit card. The loan is secured with property, plant and equipment of each restaurant location for which the credit limited has been utilised. The carrying amount of pledged property, plant and equipment and cash and cash equivalents is disclosed in Notes 11 and 17. Covenants: The Group’s borrowing arrangement with the Bank contains several covenants, mainly of quantitative nature, out of which the most important relates to the level of the service debt (whereby service debt is equal to EBITDA/ [principal plus interest payable]), which should exceed for any month 2.5. Breaches in meeting the financial covenants would permit the bank to immediately call loans and borrowings. There have been no breaches of the financial covenants of for the years ended 31 December 2016, 2015 and 2014.

US FOOD NETWORK SA NOTES TO CONSOLIDATED FINANCIAL STATEMENTS FOR THE YEAR ENDED 31 DECEMBER 2016 All amounts in RON thousand, unless specified otherwise
F - 39
14. Financial instruments risk management The Group’s principal financial liabilities comprise loans and borrowings, including finance leases and trade and other payables. The main purpose of these financial liabilities is to finance the Group’s operations. The Group’s financial assets are represented by loans, trade and other receivables, and cash and short-term deposits that derive directly from its operations, as well as long-term deposits to guarantee rent payables. The Group is exposed to interest rate risk, foreign exchange rate risk, credit risk and liquidity risk. The Group’s senior management oversees the management of these risks. The Group’s senior management ensures the Group’s financial risk activities are performed under appropriate procedures and that financial risks are identified, measured and managed in accordance with Group risk appetite. Interest rate risk The Group's income and operating cash flows are substantially independent of changes in market interest rates. Trade and other receivables and payables are non-interest bearing financial assets and liabilities. The borrowings are usually exposed to interest rate risk through market value fluctuations of interest-bearing long-term and short-term credit facilities. Interest rates on the Group's debt finance are variable. The interest rates on credit facilities of the Group are disclosed in Note 13. Changes in interest rates impact primarily loans and borrowings by changing either their future cash flows (variable rate debt). Management policy is to resort mainly to variable rate financing. However, at the time of rising new loans or borrowings management uses its judgment to decide whether it believes that fixed or variable rate would be more favourable to the Group over the expected period until maturity. Interest rate sensitivity The following table demonstrates the sensitivity to a reasonably possible change in interest rates on loans and borrowings. With all other variables held constant, the Group’s profit before tax and equity are affected through the impact on floating rate borrowings, as follows:
Increase in basis
points Effect on profit
before tax
2016 EUR 1%
(224) 2015
EUR 1%
(184) 2014
EUR 1%
(151) 1 Jan 2014 1%
EUR
(195) The Group does not hedge its interest rate risk. The assumed movement in basis points for interest rate sensitivity analysis is based on the currently observable market environment. An equal decrease of the interest rate would have the same effect but of opposite impact.

US FOOD NETWORK SA NOTES TO CONSOLIDATED FINANCIAL STATEMENTS FOR THE YEAR ENDED 31 DECEMBER 2016 All amounts in RON thousand, unless specified otherwise
F - 40
14. Financial instruments risk management (continued) Foreign currency risk Foreign currency risk is the risk that the fair value or future cash flows of a financial instrument will fluctuate because of changes in foreign exchange rates. The Group’s exposure to the risk of changes in foreign exchange rates relates primarily to the Group’s financing activities, as the financing contracted by the Group is Euro based. The vast majority of revenues and expenses, trade and other receivables and payables is in RON. The Group monitors the currency risk by following changes in exchange rates in currencies in which its intercompany balances and external debts are denominated. The Group does not have formal arrangements to mitigate its currency risk. Foreign currency sensitivity The following table demonstrates the sensitivity to a reasonably possible change in the EUR and US dollar exchange rate. The Group’s exposure to foreign currency changes for all other currencies is not material. With all other variables held constant the Group’s profit before tax and equity (excluding translation of Italian subsidiary for presentation into RON) are affected as follows:
Increase in
Effect on profit
before tax Increase in Effect on profit
before tax
EUR rate
USD rate
31 December 2016 1%
(229)
1% (23) 31 December 2015 1%
(186)
1% (19)
31 December 2014 1%
(154)
1% (27) 1 January 2014 1%
(197)
1% (12)
An equal decrease of the EUR/USD rate would have the same effect but of opposite impact. Credit risk The Group is not significantly exposed to credit risk as the majority of its sales are on a cash basis. The Group's credit risk is primarily attributed to trade and other receivables and balances with banks. The carrying amount of trade and other receivables, net of allowance for impairment (Note 16 and deposits for rent guarantee as per statement of financial position) plus balances with banks (Note 17), represent the maximum amount exposed to credit risk. Management believes that there is no significant risk of loss to the Group beyond the allowances already recorded. The Group invests cash and cash equivalents with highly reliable financial institutions. The Group has only plain vanilla deposits with reputable banks, none of which has experienced any difficulties in 2016 or up to the date of these consolidated financial statements. The majority of cash is transacted through and placed with Alpha Bank Romania, member of Alpha Bank Group from Greece and Banca Romana de Dezvoltare (BRD), a member of Societe Generale Group from France. The long-term credit rating of Alpha Bank Greece is Caa3 as provided by Moody’s rating agency, no credit rating being available for its Romanian subsidiary. The long-term credit rating of BRD provided by Moody’s is Baa3. There is no significant concentration of credit risk in respect of trade and other receivables due to the fact that sales are based mainly on cash and credit card payments. Therefore there are no formal policies in the Group to manage credit risk for trade receivables. The Group's credit risk is primarily attributed to loans and receivables from related parties, for which the probability of losses is considered remote.

US FOOD NETWORK SA NOTES TO CONSOLIDATED FINANCIAL STATEMENTS FOR THE YEAR ENDED 31 DECEMBER 2016 All amounts in RON thousand, unless specified otherwise
F - 41
14. Financial instruments risk management (continued) Liquidity risk The Group has adopted a prudent financial liquidity management approach, assuming that sufficient cash and cash equivalents are maintained and that further financing is available from guaranteed funds from credit lines. The tables below summarizes the maturity profile of the Group's financial liabilities, including principal amounts and interests according to contractual terms, at 31 December 2016, 31 December 2015, 31 December 2014 and 1 January 2014 based on contractual undiscounted payments.
31 December 2016 On
Less than
3 to 12
1 to 5
demand
3 months
months
years
> 5 years
Total
Interest-bearing loans and borrowings 20
2,203
6,105
15,017
190
23,535
Trade and other payables 4,391
20,058
43
1,674
-
26,166
Total: 4,411
22,261
6,148
16,691
190
49,701
31 December 2015 On
Less than
3 to 12
1 to 5
demand
3 months
months
years
> 5 years
Total
Interest-bearing loans and borrowings 15
1,892
5,111
11,821
479
19,318
Trade and other payables 2,345
16,696
248
1,827
-
21,116
Total: 2,360
18,588
5,359
13,648
479
40,434
31 December 2014 On
Less than
3 to 12
1 to 5
demand
3 months
months
years
> 5 years
Total
Interest-bearing loans and borrowings 13
2,014
4,675
9,105
-
15,807
Trade and other payables 4,713
14,523
177
1,597
-
21,010
Total: 4,726
16,537
4,852
10,702
-
36,817
1 January 2014 On
Less than
3 to 12
1 to 5
demand
3 months
months
years
> 5 years
Total
Interest-bearing loans and borrowings 19
2,139
5,752
12,589
108
20,607
Trade and other payables 7,374
4,212
45
1,788
-
13,419
Total: 7,393
6,351
5,797
14,377
108
34,026
At 31 December 2016, the Group had available 50,323 of undrawn committed borrowing facilities (31 December 2015: 59,936, 31 December 2014: 67,736 and 1 January 2014: 60,046), thus being able to respond to any unforeseen higher cash outflow needs. The credit facilities above are available to both the Group and American Restaurant System SA (a related party, see Note 24) for drawing, without a limit between them.
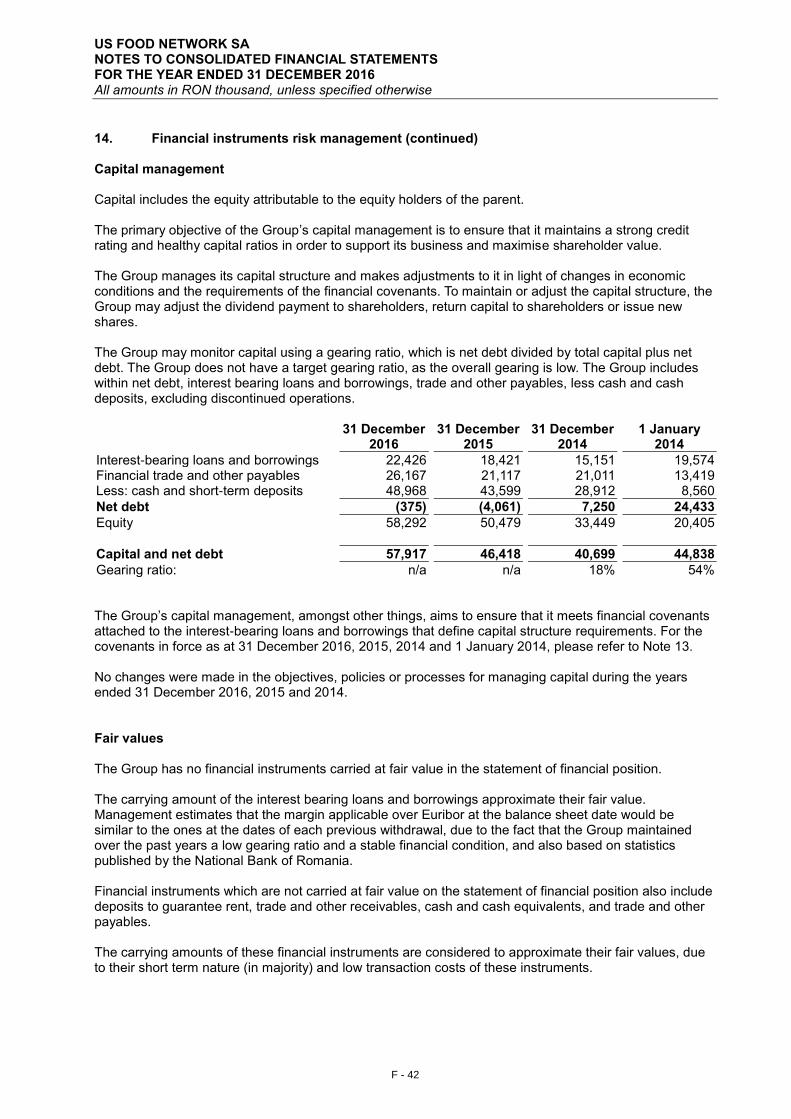
US FOOD NETWORK SA NOTES TO CONSOLIDATED FINANCIAL STATEMENTS FOR THE YEAR ENDED 31 DECEMBER 2016 All amounts in RON thousand, unless specified otherwise
F - 42
14. Financial instruments risk management (continued) Capital management Capital includes the equity attributable to the equity holders of the parent. The primary objective of the Group’s capital management is to ensure that it maintains a strong credit rating and healthy capital ratios in order to support its business and maximise shareholder value. The Group manages its capital structure and makes adjustments to it in light of changes in economic conditions and the requirements of the financial covenants. To maintain or adjust the capital structure, the Group may adjust the dividend payment to shareholders, return capital to shareholders or issue new shares. The Group may monitor capital using a gearing ratio, which is net debt divided by total capital plus net debt. The Group does not have a target gearing ratio, as the overall gearing is low. The Group includes within net debt, interest bearing loans and borrowings, trade and other payables, less cash and cash deposits, excluding discontinued operations.
31 December 2016
31 December 2015
31 December 2014
1 January 2014
Interest-bearing loans and borrowings 22,426
18,421
15,151
19,574 Financial trade and other payables 26,167
21,117
21,011
13,419
Less: cash and short-term deposits 48,968
43,599
28,912
8,560
Net debt (375)
(4,061)
7,250
24,433
Equity 58,292
50,479
33,449
20,405
Capital and net debt 57,917
46,418
40,699
44,838
Gearing ratio: n/a
n/a
18%
54% The Group’s capital management, amongst other things, aims to ensure that it meets financial covenants attached to the interest-bearing loans and borrowings that define capital structure requirements. For the covenants in force as at 31 December 2016, 2015, 2014 and 1 January 2014, please refer to Note 13. No changes were made in the objectives, policies or processes for managing capital during the years ended 31 December 2016, 2015 and 2014. Fair values The Group has no financial instruments carried at fair value in the statement of financial position. The carrying amount of the interest bearing loans and borrowings approximate their fair value. Management estimates that the margin applicable over Euribor at the balance sheet date would be similar to the ones at the dates of each previous withdrawal, due to the fact that the Group maintained over the past years a low gearing ratio and a stable financial condition, and also based on statistics published by the National Bank of Romania. Financial instruments which are not carried at fair value on the statement of financial position also include deposits to guarantee rent, trade and other receivables, cash and cash equivalents, and trade and other payables. The carrying amounts of these financial instruments are considered to approximate their fair values, due to their short term nature (in majority) and low transaction costs of these instruments.

US FOOD NETWORK SA NOTES TO CONSOLIDATED FINANCIAL STATEMENTS FOR THE YEAR ENDED 31 DECEMBER 2016 All amounts in RON thousand, unless specified otherwise
F - 43
15. Inventories
31 December 2016
31 December 2015
31 December 2014
1 January 2014
Raw materials 3,979 3,704 3,039 2,748 Consumables 1,211 1,428 810 535 Finished goods 554 585 312 226
Total inventories 5,744 5,717 4,161 3,509
During 2016, inventories amounting to 163,006 (2015: 127,055, 2014: 100,430) were recognised as an expense in profit or loss, in ‘’Food and materials’’ as well as in ‘’General and administrative expenses, net’’ (“Small-wares” and “Cleaning supplies”). 16. Trade and other receivables
31 December 2016
31 December 2015
31 December 2014
1 January 2014
Trade receivables, net 1,233 1,394 1,252 217
Trade receivables from related parties 442 826 806 1,312 Advances to related parties 4,531 - - - Loans to related parties 483 419 364 509 Tax receivables 440 861 160 47 Advance to suppliers 974 315 231 412 Meal tickets 677 604 586 514 Other debtors - 19 74 51
Total 8,780 4,438 3,473 3,062
Terms and conditions relating to related party transactions are described in Note 24. Trade receivables are non-interest bearing and are generally on terms of 30-90 days. As at 31 December 2016, trade receivables with a value of 384 were impaired and fully provided for. See below for the movements in the provision for impairment of receivables:
Total
At 1 January 2014 203
Charge for the year 165
At 31 December 2014 368
Charge for the year 12
At 31 December 2015 380
Charge for the year 4
At 31 December 2016 384

US FOOD NETWORK SA NOTES TO CONSOLIDATED FINANCIAL STATEMENTS FOR THE YEAR ENDED 31 DECEMBER 2016 All amounts in RON thousand, unless specified otherwise
F - 44
16. Trade and other receivables (continued) The ageing analysis of trade receivables and trade receivables from related parties, net of allowances, is, as follows:
Past due but not impaired
Total
Neither past due not impaired
< 30 days
30-60 days
61-90 days
91-120 days
> 120 days
2016 1,675
361
1,061
75
10
3
165 2015 2,220
1,968
102
14
43
10
83
2014 2,058
1,874
65
68
13
3
35 1 Jan 2014 1,529
879
65
103
42
62
378
17. Cash and short-term deposits
31 December 2016
31 December 2015
31 December 2014
1 January 2014
Cash at banks and on hand 35,874 31,798 16,403 1,720 Cash in transit 340 70 55 36 Short-term deposits 12,754 11,731 12,454 6,804
Total 48,968 43,599 28,912 8,560
Deposits at banks earn interest at floating rates based on daily bank deposit rates. Short-term deposits are made for varying periods of between one day and three months, depending on the immediate cash requirements of the Group. As part of the financing agreement with Alpha Bank the Group has pledged the cash available in the accounts opened with the bank. The balance of the pledged bank accounts as at 31 December 2016 is of 44,239 (31 December 2015: 41,014, 31 December 2014: 26,640 and 1 January 2014: 6,689). 18. Issued capital
The Group’s shareholders at 31 December 2016 are Lunic Franchising and Consulting Ltd. (22.34%), Tatika Investments (27.33%), M.B.L. Computers (23%), Wellkept Group SA (16.34%) and Anasa Properties SRL (10.99%). The Group’s shareholders at 31 December 2015 and 2014 were: Lunic Franchising and Consulting Ltd. (22.34%), Tatika Investments (27.33%), Blandon Enterprises Ltd. (27.33%) and M.B.L. Computers (23%). The Group’s shareholders at 1 January 2014 were: Lunic Franchising and Consulting Ltd. (22.22%), Tatika Investments (27.5%), Blandon Enterprises Ltd. (27.5%) and M.B.L. Computers (22.78%).
31 December
2016 31 December
2015 31 December
2014 1 January
2014
Authorised shares
Ordinary shares of 0.25 RON each 380,000
380,000
380,000
380,000 Share capital (RON thousand) 95
95
95
95
Hyperinflation (RON thousand) 95 95 95 95

US FOOD NETWORK SA NOTES TO CONSOLIDATED FINANCIAL STATEMENTS FOR THE YEAR ENDED 31 DECEMBER 2016 All amounts in RON thousand, unless specified otherwise
F - 45
19. Distributions made and proposed
2016
2015
2014
Declared and paid during the year:
To owners of the parent 40,961
24,483
12,665
To non-controlling interests 84
153
133
Total dividends for the year 41,045
24,636
12,798
Dividends per share (RON/share)
To owners of the parent 107.79
64.43
33.33
During 2017, the Group distributed dividends to owners of the parent in amount of 46,236 (dividends per share of RON 121.67/share) and to non-controlling interests in amount of 70. 20. Provisions
Other provisions for risks and charges Total
At 1 January 2014 1,365 1,365
Utilised 1,226 1,226
At 31 December 2014 139 139
Unused amounts reversed 139 139
At 31 December 2015 - -
At 31 December 2016 - -
21. Trade and other payables
31 December 2016
31 December 2015
31 December 2014
1 January 2014
Trade payables 23,781 14,882 14,474 9,235 Trade payables to related parties 55 3,369 4,015 1,667 Salary liability 7,679 4,615 2,849 2,665 Social contribution liability 2,001 1,734 1,072 963 Other employee related liabilities 739 658 384 345 Current income tax 1,848 1,925 1,431 542 VAT payable 32 - 2,489 2,173 Other taxes 500 372 311 515 Other payables 2,331 2,866 2,522 2,517
Total 38,966 30,421 29,547 20,622
Less: non-current portion of other payables 1,674 1,827 1,597 1,788
Trade and other payables, current 37,292 28,594 27,950 18,834
Terms and conditions of the above financial liabilities:
• Trade payables are non-interest bearing and are normally settled on 30-day terms • For terms and conditions relating to related parties, refer to Note 24

US FOOD NETWORK SA NOTES TO CONSOLIDATED FINANCIAL STATEMENTS FOR THE YEAR ENDED 31 DECEMBER 2016 All amounts in RON thousand, unless specified otherwise
F - 46
21. Trade and other payables (continued) The other current and non-current payables are summarized below:
31 December 2016
31 December 2015
31 December 2014
1 January 2014
Lease incentives (current and non-current) 725 922 1,150 1,203 Free of charge fit-outs (current and non-current) 1,528 1,875 1,361 1,235 Other payables (current) 78 69 11 79
Total 2,331 2,866 2,522 2,517
The lease incentive amounts relate to accruals recorded by the Group in order to allocate the lease incentives provided by landlords over the contractual period on a straight line basis. The free of charge fit-outs are represented by free of charge fit-out works/cash incentives received from landlords. The Group has recognized the amounts received in other payables and releases it to profit and loss over the contractual period. For additional information, please refer to Note 2.4 ‘’First time adoption’’. 22. EBITDA
Note 2016 2015 2014
Operating profit
55,246 49,138 31,131
Adjustments to bridge operating profit to EBITDA:
Depreciation and amortization included in restaurant expenses 8.2 9,234 7,833 8,238 Depreciation and amortization included in general and administration expenses
8.2 590 493 481
EBITDA
65,070 57,464 39,850
EBITDA is one of the key performance measures monitored by senior management. EBITDA would be normalized to exclude any significant one-off items (either revenues or expenses) but no such exclusions were necessary for the years ended 31 December 2016, 2015 and 2014. 23. Commitments and contingencies Operating lease commitments — Group as lessee The Group has entered into operating lease agreements for the premises of most of its restaurants. The lease terms are between five and ten years. Future minimum rentals payable under non-cancellable operating leases are as follows:
31 December
2016 31 December
2015 31 December
2014
1 January 2014
Within one year 23,303
21,352
21,405
20,632
After one year but not more than five years 56,836
57,988
66,423
73,540 More than five years 23,987
18,519
23,015
31,987
Total: 104,126
97,859
110,843
126,159

US FOOD NETWORK SA NOTES TO CONSOLIDATED FINANCIAL STATEMENTS FOR THE YEAR ENDED 31 DECEMBER 2016 All amounts in RON thousand, unless specified otherwise
F - 47
23. Commitments and contingencies (continued)
Finance leases The Group has finance leases for vehicles. The Group’s obligations under finance leases are secured by the lessor’s title to the leased assets. Future minimum lease payments under finance leases and hire purchase contracts, together with the present value of the net minimum lease payments are, as follows:
31 December 2016
31 December 2015
31 December 2014
1 January 2014
Minimum payments
Present value of
payments
Minimum payments
Present value of
payments
Minimum payments
Present value of
payments
Minimum payments
Present value of
payments
Within one year 186 174
209 194
166 153
167 146 After one year but not more than five years 239 226
210 201
216 209
382 362
More than five years - -
- -
- -
- -
Total minimum lease payments 425 400
419 395
382 362
549 508
Less amounts representing finance charges 25 -
24 -
20 -
41 -
Present value of minimum lease payments 400 400
395 395
362 362
508 508
Bank letter of guarantees The Group has issued bank letters of guarantee in favour of suppliers as at 31 December 2016 in amount of 5,257 (31 December 2015: 4,719, 31 December 2014: 4,160 and 1 January 2014: 3,874).

US FOOD NETWORK SA NOTES TO CONSOLIDATED FINANCIAL STATEMENTS FOR THE YEAR ENDED 31 DECEMBER 2016 All amounts in RON thousand, unless specified otherwise
F - 48
24. Related party disclosures During the period from 1 January 2014 to 31 December2016, the Group has carried out transactions with the following related parties:
Related party
Nature of the relationship Country of
incorporation Nature of transactions
Cinnamon Bake&Roll SRL Entity with several common members
of key management personnel Romania Sale of goods and
services, loans provided American Restaurant System SA
Entity with several common members of key management personnel
Romania Sale of services, acquisition of goods
Moulin D'Or SRL Entity with several common members of key management personnel
Romania Sale of goods and services
The following table provides the total amount of transactions that have been entered into with related parties for the relevant financial year:
Sales to related parties
Purchases from related
parties
Amounts owed by related
parties
Amounts owed to related
parties
Related party
Cinnamon Bake&Roll SRL 2016 22 5 257 5 American Restaurant System SA
721 76,069 4,694 50
Moulin D'Or SRL 136 648 22 -
879 76,722 4,973 55
Cinnamon Bake&Roll SRL 2015 191 16 737 - American Restaurant System SA
554 79,171 89 3,369
745 79,187 826 3,369
Cinnamon Bake&Roll SRL 2014 19 9 713 3 American Restaurant System SA
449 61,749 93 4,012
468 61,758 806 4,015
Cinnamon Bake&Roll SRL 1 Jan
2014 - - 883 2
American Restaurant System SA - - 429 1,665
- - 1,312 1,667
During 2010-2013, the Group has granted an interest free loan to Cinnamon Bake&Roll SRL. The loan balance as at 31 December 2016 was of 483 (31 December 2015: 419, 31 December 2014: 364 and 1 January 2014: 509).

US FOOD NETWORK SA NOTES TO CONSOLIDATED FINANCIAL STATEMENTS FOR THE YEAR ENDED 31 DECEMBER 2016 All amounts in RON thousand, unless specified otherwise
F - 49
24. Related party disclosures (continued) Terms and conditions of transactions with related parties The sales to and purchases from related parties are made at terms equivalent to those that prevail in arm’s length transactions. Outstanding balances at the year-end are unsecured, interest free and settled in cash. There have been no guarantees provided or received for any related party receivables or payables. For the years ended 31 December 2016, 2015, and 2014, the Group has not recorded any impairment of receivables relating to amounts owed by related parties. This assessment is undertaken each financial year by examining the financial position of the related party and the market in which the related party operates. Compensation of key management personnel of the Group:
2016 2015 2014
Short-term employee benefits
1,929 1,140 844
Fees paid to management entity 3,057 2,191 2,384
Total compensation paid to key management personnel
4,986
3,331
3,228
The amounts disclosed in the table are the amounts recognised as an expense during each reporting period. 25. Events after the reporting period In 2017, the shareholders of the parent Company have set-up a new entity called Sphera Franchise Group SA (‘’Sphera’’). As of the date of these consolidated financial statements, Sphera has become the parent company of USFN, following the contribution by the existing shareholders of their shares in USFN in exchange for shares in Sphera. The purpose of the group reorganization was to ensure a better coordination of activities and enhance value creation, by taking advantage of the synergies at group level and by achieving economies of scale. In terms of activities, In January 2017, the Romanian taxation regulations have changed for the companies active in the restaurant industry, more comprehensive details being provided in Note 10. During 2017, the Group distributed dividends to owners of the parent in amount of 46,236 (dividends per share of RON 121.67/share) and to non-controlling interests in amount of 70. In June 2017, the Group has ceased the operation of its restaurant located in Oradea Shopping Centre, as a result of the landlord facing financial difficulties and foreclosure procedures. Up to the date of these financial statements, the Group has drawn additional EUR 4 million from its borrowing facility concluded with Alpha Bank.
AMERICAN RESTAURANT SYSTEM SA FINANCIAL STATEMENTS Prepared in accordance with International Financial Reporting Standards 31 DECEMBER 2016
F - 50
AMERICAN RESTAURANT SYSTEM SA
FINANCIAL STATEMENTS Prepared in accordance with International Financial Reporting Standards as adopted by the European Union 31 DECEMBER 2016

AMERICAN RESTAURANT SYSTEM SA FINANCIAL STATEMENTS Prepared in accordance with International Financial Reporting Standards 31 DECEMBER 2016
F - 51
Contents Independent auditors’ report to the shareholders of American Restaurant System SA F - 52 Statement of comprehensive income F - 55 Statement of financial position F - 56 Statement of changes in equity F - 57 Statement of cash flows F - 58 Notes to the financial statements F - 59

Ernst & Young Assurance Services SRL Cladirea Bucharest Tower Center, et. 21 Bd. Ion Mihalache nr. 15-17, Sector 1
011171 Bucuresti, Romania
Tel: +40 21 402 4000 Fax: +40 21 310 7193 [email protected]
ey.com
INDEPENDENT AUDITOR’S REPORT
To the Shareholders of AMERICAN RESTAURANT SYSTEM SA
Report on the Audit of the Financial Statements
Opinion
We have audited the financial statements of AMERICAN RESTAURANT SYSTEM SA (“the
Company”), which comprise the statement of financial position as at 31 December 2016, 31
December 2015, 31 December 2014 and 1 January 2014 and the statement of comprehensive
income, statement of changes in equity and statement of cash flows for the years ended 31
December 2016, 31 December 2015 and 31 December 2014 and a summary of significant
accounting policies and other explanatory information.
In our opinion, the accompanying financial statements give a true and fair view of the financial
position of the Company as at 31 December 2016, 31 December 2015, 31 December 2014 and
1 January 2014 and of its financial performance and its cash flows for the years ended 31
December 2016, 31 December 2015 and 31 December 2014 in accordance with the
International Financial Reporting Standards as adopted by the European Union and the
accounting policies described in the notes to the financial statements.
Basis for opinion
We conducted our audit in accordance with International Standards on Auditing (ISAs). Our
responsibilities under those standards are further described in the “Auditor’s Responsibilities for
the Audit of the Financial Statements” section of our report. We are independent of the
Company in accordance with the International Ethics Standards Board for Accountants' Code of
Ethics for Professional Accountants (IESBA Code) together with the ethical requirements that
are relevant to the audit of the financial statements in Romania, and we have fulfilled our other
ethical responsibilities in accordance with these requirements and the IESBA Code. We believe
that the audit evidence we have obtained is sufficient and appropriate to provide a basis for our
opinion.
Responsibilities of Management and those charged with governance for the Financial
Statements
Management is responsible for the preparation and fair presentation of the financial statements
in accordance with the International Financial Reporting Standards as adopted by the European
Union, and for such internal control as management determines is necessary to enable the
preparation of financial statements that are free from material misstatement, whether due to
fraud or error.

F - 53
In preparing the financial statements, management is responsible for assessing the Company's
ability to continue as a going concern, disclosing, as applicable, matters related to going
concern and using the going concern basis of accounting unless management either intends to
liquidate the Company or to cease operations, or has no realistic alternative but to do so.
Those charged with governance are responsible for overseeing the Company's financial
reporting process.
Auditor’s Responsibilities for the Audit of the Financial Statements
Our objectives are to obtain reasonable assurance about whether the financial statements as a
whole are free from material misstatement, whether due to fraud or error, and to issue an
auditors’ report that includes our opinion. Reasonable assurance is a high level of assurance,
but is not a guarantee that an audit conducted in accordance with ISAs will always detect a
material misstatement when it exists. Misstatements can arise from fraud or error and are
considered material if, individually or in the aggregate, they could reasonably be expected to
influence the economic decisions of users taken on the basis of these financial statements.
As part of an audit in accordance with ISAs, we exercise professional judgment and maintain
professional skepticism throughout the audit. We also:
• Identify and assess the risks of material misstatement of the financial statements, whether
due to fraud or error, design and perform audit procedures responsive to those risks, and
obtain audit evidence that is sufficient and appropriate to provide a basis for our opinion. The
risk of not detecting a material misstatement resulting from fraud is higher than for one
resulting from error, as fraud may involve collusion, forgery, intentional omissions,
misrepresentations, or the override of internal control.
• Obtain an understanding of internal control relevant to the audit in order to design audit
procedures that are appropriate in the circumstances, but not for the purpose of expressing
an opinion on the effectiveness of the Company's internal control.
• Evaluate the appropriateness of accounting policies used and the reasonableness of
accounting estimates and related disclosures made by management.
• Conclude on the appropriateness of management's use of the going concern basis of
accounting and, based on the audit evidence obtained, whether a material uncertainty exists
related to events or conditions that may cast significant doubt on the Company's ability to
continue as a going concern. If we conclude that a material uncertainty exists, we are
required to draw attention in our auditors’ report to the related disclosures in the financial
statements or, if such disclosures are inadequate, to modify our opinion. Our conclusions
are based on the audit evidence obtained up to the date of our auditors’ report. However,
future events or conditions may cause the Company to cease to continue as a going
concern.
• Evaluate the overall presentation, structure and content of the financial statements, including
the disclosures, and whether the financial statements represent the underlying transactions
and events in a manner that achieves fair presentation.

F - 54
We communicate with those charged with governance regarding, among other matters, the
planned scope and timing of the audit and significant audit findings, including any significant
deficiencies in internal control that we identify during our audit.
On behalf of
Ernst & Young Assurance Services SRL
Alina Dimitriu
Executive Director
Bucharest, Romania
August 9, 2017

AMERICAN RESTAURANT SYSTEM SA STATEMENT OF COMPREHENSIVE INCOME FOR THE YEAR ENDED 31 DECEMBER 2016 All amounts in RON thousand, unless specified otherwise
F - 55
NNotes 2016 2015 2014
Continuing operations Restaurant sales
96,940 75,867 63,130
Restaurant expenses: Food and material 26,107 19,718 16,881 Payroll and employee benefits 7.1 22,383 14,622 12,001 Rent 8,027 6,476 6,081 Advertising 5,785 4,245 3,590 Royalties 5,702 4,448 3,697 Other operating expenses, net 5 11,659 8,339 7,514 Depreciation and amortization 7.2 2,666 2,114 2,188
Restaurant operating profit 14,611 15,905 11,178
General and administration expenses, net 6 8,982 7,751 6,094
Operating profit 5,629 8,154 5,084
Finance costs 8.1 213 482 309 Finance income 8.2 127 19 7
Profit before tax from continuing operations
5,543 7,691 4,782
Income tax expense 9 361 1,170 667
Profit for the year from continuing operations
5,182 6,521 4,115
Discontinued operations
Loss for the year from discontinued operations, net of tax
23 (1,953) (397) (595)
Profit for the year 3,229 6,124 3,520
Other comprehensive income - - -
Total comprehensive income for the year, net of tax
3,229 6,124 3,520
These financial statements from page 3 to page 44 were approved by the Board of Directors and were authorised for issue on 9 June 2017.
Adrian Hulubescu
General Manager American Restaurant System SA

AMERICAN RESTAURANT SYSTEM SA STATEMENT OF FINANCIAL POSITION AS AT 31 DECEMBER 2016 All amounts in RON thousand, unless specified otherwise
F - 56
Notes
31 December 2016
31 December 2015
31 December 2014
1 January 2014
Assets
Non-current assets
21,374 15,262 10,777 12,500
Property, plant and equipment 10 18,201 13,265 9,653 11,208 Intangible assets 11 2,917 1,749 1,007 1,165 Deposits for rent guarantee
256 248 117 127
Current assets
11,612 18,562 14,806 11,960
Inventories 14 1,111 6,758 6,986 6,307 Trade and other receivables 15 6,089 5,363 5,849 3,849 Prepayments
1,118 867 665 517
Cash and short-term deposits 16 3,294 5,574 1,306 1,287 Assets held for sale 23 195 - - -
Total assets
33,181 33,824 25,583 24,460
Equity and liabilities
Equity
Issued capital 17 1,644 1,644 1,644 1,644 Share premium
- - - 2
Other capital reserves
21 21 21 21 Retained earnings
4,315 7,116 4,942 3,220
Total equity
5,980 8,781 6,607 4,887
Non-current liabilities
7,865 4,448 1,243 2,607
Interest-bearing loans and borrowings 12
7,536 3,692 492 1,927
Trade and other payables 19 329 302 307 151 Deferred tax liabilities 9 - 454 444 529
Current liabilities
19,336 20,595 17,733 16,966
Trade and other payables 19 15,401 18,477 16,298 14,579 Interest-bearing loans and borrowings 12
3,935 2,118 1,435 2,387
Total liabilities
27,201 25,043 18,976 19,573
Total equity and liabilities
33,181 33,824 25,583 24,460
These financial statements from page 3 to page 44 were approved by the Board of Directors and were authorised for issue on 9 June 2017.

AMERICAN RESTAURANT SYSTEM SA STATEMENT OF CHANGES IN EQUITY FOR THE YEAR ENDED 31 DECEMBER 2016 All amounts in RON thousand, unless specified otherwise
F - 57
Issued capital Share premium Legal reserve Retained earnings Total equity
As at 1 January 2016 1,644 - 21 7,116 8,781
Profit for the period - - - 3,229 3,229 Other comprehensive income - - - - -
Total comprehensive income - - - 3,229 3,229
Cash dividends - - - (6,030) (6,030)
At 31 December 2016 1,644 - 21 4,315 5,980
Issued capital Share premium Legal reserve Retained earnings Total equity
As at 1 January 2015 1,644 - 21 4,942 6,607
Profit for the period - - - 6,124 6,124 Other comprehensive income - - - - -
Total comprehensive income - - - 6,124 6,124
Cash dividends - - - (3,950) (3,950)
At 31 December 2015 1,644 - 21 7,116 8,781
Issued capital Share premium Legal reserve Retained earnings Total equity
As at 1 January 2014 1,644 2 21 3,220 4,887
Profit for the period - - - 3,520 3,520 Other comprehensive income - - - - -
Total comprehensive income - - - 3,520 3,520
Transfer to reserves - (2) - 2 - Cash dividends - - - (1,801) (1,801)
At 31 December 2014 1,644 - 21 4,942 6,607
These financial statements from page 3 to page 44 were approved by the Board of Directors and were authorised for issue on 9 June 2017.
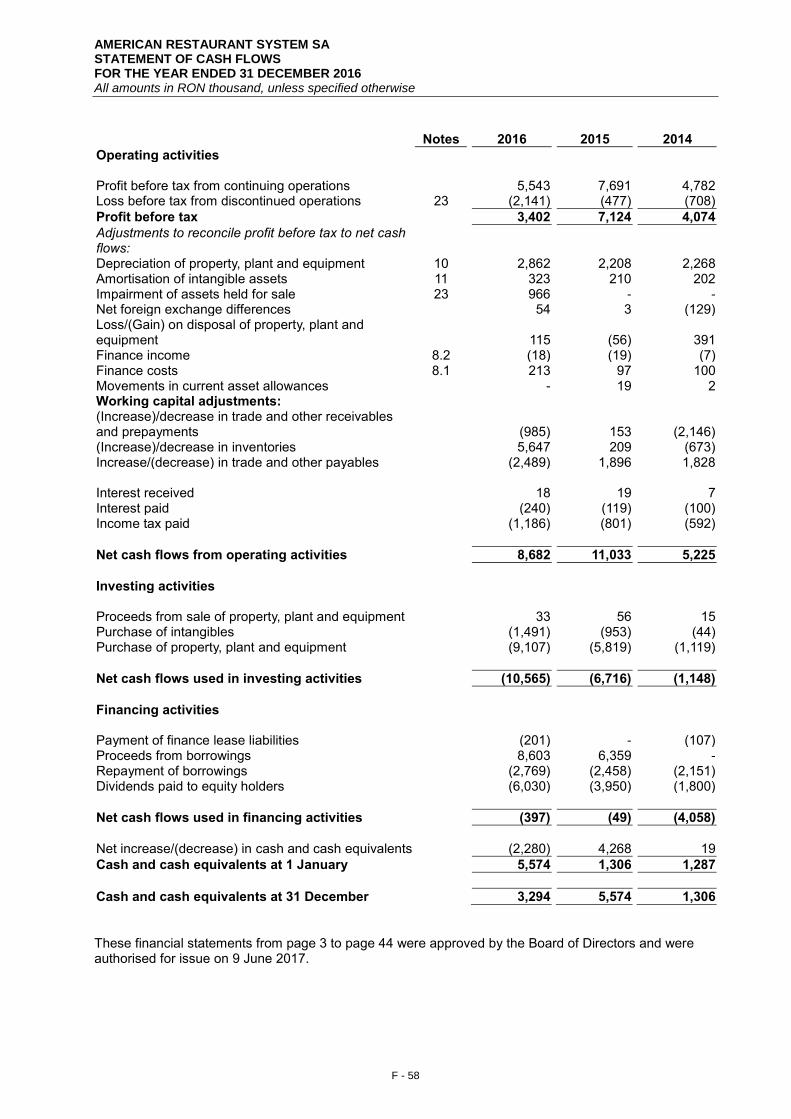
AMERICAN RESTAURANT SYSTEM SA STATEMENT OF CASH FLOWS FOR THE YEAR ENDED 31 DECEMBER 2016 All amounts in RON thousand, unless specified otherwise
F - 58
Notes 2016 2015 2014
Operating activities
Profit before tax from continuing operations
5,543 7,691 4,782 Loss before tax from discontinued operations 23 (2,141) (477) (708)
Profit before tax 3,402 7,124 4,074
Adjustments to reconcile profit before tax to net cash flows:
Depreciation of property, plant and equipment 10 2,862 2,208 2,268 Amortisation of intangible assets 11 323 210 202 Impairment of assets held for sale 23 966 - - Net foreign exchange differences
54 3 (129)
Loss/(Gain) on disposal of property, plant and equipment
115 (56) 391
Finance income 8.2 (18) (19) (7) Finance costs 8.1 213 97 100 Movements in current asset allowances
- 19 2
Working capital adjustments:
(Increase)/decrease in trade and other receivables and prepayments
(985) 153 (2,146)
(Increase)/decrease in inventories
5,647 209 (673) Increase/(decrease) in trade and other payables
(2,489) 1,896 1,828
Interest received
18 19 7 Interest paid
(240) (119) (100)
Income tax paid
(1,186) (801) (592)
Net cash flows from operating activities
8,682 11,033 5,225
Investing activities
Proceeds from sale of property, plant and equipment
33 56 15 Purchase of intangibles
(1,491) (953) (44)
Purchase of property, plant and equipment
(9,107) (5,819) (1,119)
Net cash flows used in investing activities
(10,565) (6,716) (1,148)
Financing activities
Payment of finance lease liabilities
(201) - (107) Proceeds from borrowings
8,603 6,359 -
Repayment of borrowings
(2,769) (2,458) (2,151) Dividends paid to equity holders
(6,030) (3,950) (1,800)
Net cash flows used in financing activities
(397) (49) (4,058)
Net increase/(decrease) in cash and cash equivalents
(2,280) 4,268 19
Cash and cash equivalents at 1 January
5,574 1,306 1,287
Cash and cash equivalents at 31 December
3,294 5,574 1,306
These financial statements from page 3 to page 44 were approved by the Board of Directors and were authorised for issue on 9 June 2017.

AMERICAN RESTAURANT SYSTEM SA NOTES TO THE FINANCIAL STATEMENTS FOR THE YEAR ENDED 31 DECEMBER 2016 All amounts in RON thousand, unless specified otherwise
F - 59
1. Corporate information These financial statements are prepared by American Restaurant System SA, referred hereinafter as ‘’ARS’ or ‘’the Company’’, and reflect the results of its operations and activities. The financial statements for the year ended 31 December 2016 were authorized for issue in accordance with the resolution of the Board of Directors dated 9 June 2017. The Company operates a chain of pizza restaurants (21 restaurants as at 31 December 2016) as well as pizza delivery points (11 locations as at 31 December 2016, including 1 sub-franchised location) under the Pizza Hut (“PH”) and Pizza Hut Delivery (“PHD”) brands, spread across Romania. The Company’s number of employees at 31 December 2016 was 1,007 (31 December 2015: 869, 31 December 2014: 705, 1 January 2014: 745). The Company was incorporated in 1994 as a joint stock company and is registered at No. 5-7 Calea Dorobantilor Street, Bucharest, Romania. 2. Significant accounting policies 2.1 Basis of preparation Statement of Compliance The financial statements of the Company have been prepared in accordance with International Financial Reporting Standards as issued by the International Accounting Standards Board (IASB) and adopted by the European Union (EU) (IFRS). For all periods up to and including the year ended 31 December 2016, the Company prepared its financial statements in accordance with local generally accepted accounting principles (Local GAAP) of Romania. These financial statements for the year ended 31 December 2016 are the first the Company has prepared in accordance with IFRS. Refer to Note 2.3 for information on how the Company adopted IFRS. The financial statements have been prepared on a historical cost basis. The financial statements are presented in Romanian New Lei (‘’RON’’) and all values are rounded to the nearest thousand RON, except when otherwise indicated. 2.2 Summary of significant accounting policies The following are the significant accounting policies applied by the Company in preparing its financial statements. 2.2.1 Current versus non-current classification The Company presents assets and liabilities in the statement of financial position based on current/non-current classification. An asset is current when it is: • Expected to be realised or intended to sold or consumed in the normal operating cycle • Held primarily for the purpose of trading • Expected to be realised within twelve months after the reporting period, or • Cash or cash equivalent unless restricted from being exchanged or used to settle a liability for at
least twelve months after the reporting period All other assets are classified as non-current.

AMERICAN RESTAURANT SYSTEM SA NOTES TO THE FINANCIAL STATEMENTS FOR THE YEAR ENDED 31 DECEMBER 2016 All amounts in RON thousand, unless specified otherwise
F - 60
2. Significant accounting policies (continued) A liability is current when: • It is expected to be settled in the normal operating cycle • It is held primarily for the purpose of trading • It is due to be settled within twelve months after the reporting period, or • There is no unconditional right to defer the settlement of the liability for at least twelve months after
the reporting period The Company classifies all other liabilities as non-current. Deferred tax assets and liabilities are classified as non-current assets and liabilities. 2.2.2 Fair value measurement Fair value related disclosures for financial instruments and non-financial assets that are measured at fair value or where fair values are disclosed, are summarised in the relevant notes. Fair value is the price that would be received to sell an asset or paid to transfer a liability in an orderly transaction between market participants at the measurement date. The fair value measurement is based on the presumption that the transaction to sell the asset or transfer the liability takes place either: • In the principal market for the asset or liability
Or • In the absence of a principal market, in the most advantageous market for the asset or liability The principal or the most advantageous market must be accessible by the Company. The fair value of an asset or a liability is measured using the assumptions that market participants would use when pricing the asset or liability, assuming that market participants act in their economic best interest. A fair value measurement of a non-financial asset takes into account a market participant's ability to generate economic benefits from the asset’s highest and best use or by selling it to another market participant that would utilise the asset in its highest and best use. The Company uses valuation techniques that are appropriate in the circumstances and for which sufficient data are available to measure fair value, maximising the use of relevant observable inputs and minimising the use of unobservable inputs. All assets and liabilities for which fair value is measured or disclosed in the financial statements are categorised within the fair value hierarchy. This is described, as follows, based on the lowest level input that is significant to the fair \value measurement as a whole: • Level 1 — Quoted (unadjusted) market prices in active markets for identical assets or liabilities • Level 2 — Valuation techniques for which the lowest level input that is significant to the fair value
measurement is directly or indirectly observable • Level 3 — Valuation techniques for which the lowest level input that is significant to the fair value
measurement is unobservable
For the purpose of fair value disclosures, the Company has determined classes of assets and liabilities on the basis of the nature, characteristics and risks of the asset or liability and the level of the fair value hierarchy, as explained above.

AMERICAN RESTAURANT SYSTEM SA NOTES TO THE FINANCIAL STATEMENTS FOR THE YEAR ENDED 31 DECEMBER 2016 All amounts in RON thousand, unless specified otherwise
F - 61
2. Significant accounting policies (continued) 2.2.3 Revenue recognition Revenue is recognised to the extent that it is probable that the economic benefits will flow to the Company and the revenue can be reliably measured, regardless of when the payment is received. Revenue is measured at the fair value of the consideration received or receivable and excluding taxes or duty. The following specific recognition criteria must also be met before revenue is recognised: Restaurant revenue Restaurant revenues are recognised when food and beverages are served. Revenues are recognised at fair value of meals and services delivered, net of value added tax charged to customers. Rental income Rental income is accounted for on a straight-line basis over the lease terms. Interest income Interest income or expense is recorded using the effective interest rate (EIR). The EIR is the rate that exactly discounts the estimated future cash receipts through the expected life of the financial instrument or a shorter period, where appropriate, to the net carrying amount of the financial asset. Interest income is included in “Finance income” in profit or loss. 2.2.4 Foreign currencies The Company’s financial statements are presented in RON, which is also its functional currency. Transactions in foreign currencies are translated into RON by applying the exchange rates prevailing at the time of the transaction. Monetary assets and liabilities denominated in foreign currencies at year-end are translated to RON at the exchange rates prevailing on that date. Realized and unrealized exchange gains and losses are recognized in profit or loss. The exchange rate RON – EUR and RON – USD as at 31 December 2016, 2015, 2014 and 1 January 2014 was:
31 December 2016
31 December 2015
31 December 2014
1 January 2014
RON - EUR 4.5411 4.5245 4.4821 4.4847 RON - USD 4.3033 4.1477 3.6868 3.2551 2.2.5 Taxes Current income tax Current income tax assets and liabilities for the current period are measured at the amount expected to be recovered from or paid to the taxation authorities. The tax rates and tax laws used to compute the amount are those that are enacted, or substantively enacted at the reporting date in Romania, the country where the Company operates and generates taxable income. Current income tax relating to items recognised directly in equity is recognised in equity and not in profit or loss. Management periodically evaluates positions taken in the tax returns with respect to situations in which applicable tax regulations are subject to interpretation, and it establishes provisions where appropriate.

AMERICAN RESTAURANT SYSTEM SA NOTES TO THE FINANCIAL STATEMENTS FOR THE YEAR ENDED 31 DECEMBER 2016 All amounts in RON thousand, unless specified otherwise
F - 62
2. Significant accounting policies (continued) Deferred tax Deferred tax is provided using the liability method on temporary differences between the tax bases of assets and liabilities and their carrying amounts for financial reporting purposes at the reporting date. Deferred tax liabilities are recognised for all taxable temporary differences, except:
• When the deferred tax liability arises from the initial recognition of goodwill or an asset or liability in a transaction that is not a business combination and, at the time of the transaction, affects neither the accounting profit nor taxable profit or loss
• In respect of taxable temporary differences associated with investments in subsidiaries, associates and interests in joint arrangements, when the timing of the reversal of the temporary differences can be controlled and it is probable that the temporary differences will not reverse in the foreseeable future
Deferred tax assets are recognised for: all deductible temporary differences: the carry forward of unused tax credits and unused tax losses, to the extent that it is probable that taxable profit will be available against which the deductible temporary differences, the carry forward of unused tax credits and any unused tax losses that can be utilised, except:
• When the deferred tax asset relating to the deductible temporary difference arises from the initial recognition of an asset or liability in a transaction that is not a business combination and, at the time of the transaction, affects neither the accounting profit nor taxable profit or loss, no deferred tax is recognized, and
• In respect of deductible temporary differences associated with investments in subsidiaries, associates and interests in joint arrangements, deferred tax assets are recognised only to the extent that it is probable that the temporary differences will reverse in the foreseeable future and taxable profit will be available against which the temporary differences can be utilised
The carrying amount of deferred tax assets is reviewed at each reporting date and reduced to the extent that it is no longer probable that sufficient taxable profit will be available to allow all or part of the deferred tax asset to be utilised. Unrecognised deferred tax assets are reassessed at each reporting date and are recognised to the extent that it has become probable that future taxable profits will allow the deferred tax asset to be recovered. Deferred tax assets and liabilities are measured at the tax rates that are expected to apply in the year when the asset is realised or the liability is settled, based on tax rates (and tax laws) that have been enacted or substantively enacted at the reporting date. Deferred tax relating to items recognised outside profit or loss is recognised outside profit or loss. Deferred tax items are recognised in correlation to the underlying transaction either in other comprehensive income or directly in equity. Deferred tax assets and deferred tax liabilities are offset if a legally enforceable right exists to set off current tax assets against current income tax liabilities and the deferred taxes relate to the same taxable entity and the same taxation authority. Sales tax (VAT and similar taxes) Revenues, expenses and assets are recognised net of the amount of sales tax, except:
• Where the sales tax incurred on a purchase of assets or services is not recoverable from the taxation authority, in which case, the sales tax is recognised as part of the cost of acquisition of the asset or as part of the expense item, as applicable
• Receivables and payables are stated with the amount of sales tax included The net amount of sales tax recoverable from, or payable to, the taxation authority is included as part of receivables or payables in the statement of financial position.

AMERICAN RESTAURANT SYSTEM SA NOTES TO THE FINANCIAL STATEMENTS FOR THE YEAR ENDED 31 DECEMBER 2016 All amounts in RON thousand, unless specified otherwise
F - 63
2. Significant accounting policies (continued) 2.2.6 Property, plant and equipment Property, plant and equipment is measured at cost less accumulated depreciation and impairment losses. Where appropriate, the cost of property, plant and equipment includes site preparation costs, installation costs and the cost of obtaining permits required to bring the asset ready for use. Subsequent costs are included in the asset’s carrying amount or recognized as a separate asset, as appropriate, only when it is probable that future economic benefits associated with the item will flow to the Company and the cost of the item can be measured reliably. The cost of property, plant and equipment also includes the cost of replacing parts of the property, plant and equipment. All repair and maintenance costs are recognised in the profit or loss as incurred. The Company leases most of its restaurant locations by way of operating leases which are not recognised in the Company’s statement of financial position. The cost of improvements to leasehold assets is capitalised as buildings or recognised as leasehold improvements and then depreciated as outlined below. Costs directly related to purchasing of assets connected with opening restaurants in leased locations, including the costs of architecture design, legal assistance, wages and salaries, and benefits of employees directly involved in launching a given location are included in “property, plant and equipment”. These assets are depreciated over the expected useful life of the restaurant. Depreciation is calculated on a straight-line basis over the estimated useful lives of the assets as follows: Freehold buildings 40 years
Leasehold improvements over the lease contract duration (usually 10 years, including first renewal period)
Computers and IT equipment 3 to 5 years Vehicles 5 years Other property, plant and equipment 2 to 10 years An item of property, plant and equipment is de-recognised upon disposal or when no future economic benefits are expected from its use or disposal. Any gain or loss arising on de-recognition of the asset (calculated as the difference between the net disposal proceeds and the carrying amount of the asset) is included in profit or loss when the asset is de-recognised. The useful lives and methods of depreciation of property, plant and equipment are reviewed at each financial year end and adjusted prospectively, if appropriate. Start-up expenses for new restaurants Start-up expenses for new restaurants represent costs related to the opening of new restaurant premises. Such expenses include rent and payroll expenses, new personnel training and other overhead expenses that arise before the opening of new restaurants. Start-up expenses for new restaurants are recognised as operating expense in the accounting period in which the related work was performed. 2.2.7 Leases The determination of whether an arrangement is, or contains, a lease is based on the substance of the arrangement at the inception date. The arrangement is, or contains a lease if fulfilment of the arrangement is dependent on the use of a specific asset or assets or the arrangement conveys a right to use the asset or assets, even if that right is not explicitly specified in an arrangement. For arrangements entered into prior to 1 January 2014, the date of inception is deemed to be 1 January 2014 in accordance with IFRS 1 First-time Adoption of International Reporting Standards.

AMERICAN RESTAURANT SYSTEM SA NOTES TO THE FINANCIAL STATEMENTS FOR THE YEAR ENDED 31 DECEMBER 2016 All amounts in RON thousand, unless specified otherwise
F - 64
2. Significant accounting policies (continued) Company as a lessee A lease is classified at the inception date as a finance lease or an operating lease. A lease that transfers substantially all the risks and rewards incidental to ownership to the Company is classified as a finance lease. Finance leases are capitalised at the commencement of the lease at the inception date fair value of the leased property or, if lower, at the present value of the minimum lease payments. Lease payments are apportioned between finance charges and a reduction in the lease liability so as to achieve a constant rate of interest on the remaining balance of the liability. Finance charges are recognised in finance costs in profit or loss. A leased asset is depreciated over the useful life of the asset. However, if there is no reasonable certainty that the Company will obtain ownership by the end of the lease term, the asset is depreciated over the shorter of the estimated useful life of the asset and the lease term. An operating lease is a lease other than a finance lease. Operating lease payments are recognised as an operating expense in profit or loss on a straight-line basis over the lease term. Depending on contractual terms, the operating lease payment amounts are calculated for each restaurant as either a percentage of revenue (i.e. sales levels) with a minimum fixed monthly payment or as a fixed monthly payment. Some lease agreements contain escalation clauses. For leases with fixed escalating payments and/or fit-out works incentives received, the Company records rent expense on a straight-line basis over the lease term, including any option periods considered in the determination of that lease term. Contingent rentals are generally based on sales levels in excess of stipulated amounts, and thus are not considered minimum lease payments and are included in rent expense when attainment of the contingency is considered probable (i.e. when Company sales occur). Company as a lessor Leases in which the Company does not transfer substantially all the risks and benefits of ownership of the asset are classified as operating leases. Initial direct costs incurred in negotiating and arranging an operating lease are added to the carrying amount of the leased asset and depreciated over the lease term on the same bases as rental income. Contingent rents are recognised as revenue in the period in which they are earned. 2.2.8 Intangible assets Intangible assets acquired separately are measured on initial recognition at cost. Following initial recognition, intangible assets are carried at cost less accumulated amortisation and accumulated impairment losses, if any. The useful lives of intangible assets are assessed as either finite or indefinite. Intangible assets with finite useful lives are amortised on a straight-line basis over the useful economic lives from 3 to 10 years and assessed for impairment whenever there is an indication that the intangible asset may be impaired. Amortisations periods are reviewed at least at each financial year end. Changes in the expected useful life or the expected pattern of consumption of future economic benefits embodied in the asset are accounted for by changing the amortisation period or method, as appropriate, and treated as changes in accounting estimates.

AMERICAN RESTAURANT SYSTEM SA NOTES TO THE FINANCIAL STATEMENTS FOR THE YEAR ENDED 31 DECEMBER 2016 All amounts in RON thousand, unless specified otherwise
F - 65
2. Significant accounting policies (continued) Franchise rights Franchise costs are incurred in obtaining franchise rights or licences to operate the pizza restaurants and pizza delivery points. They include the initial fee paid to the system franchisor when a new restaurant is opened or when the rights and licences are renewed. These are measured at cost less accumulated amortisation and accumulated impairment. Amortisation is on a straight line basis over the life of the applicable franchise or licence agreement of 10 years. Gains or losses arising from de-recognition of an intangible asset are measured as the difference between the net disposal proceeds and the carrying amount of the asset and are recognised in profit or loss when the asset is derecognised. 2.2.9 Impairment of non-financial assets At each reporting date, management assesses whether there is any indication of impairment for property, plant and equipment or intangible assets. If any such indication exists, management estimates the recoverable amount, which is determined as the higher of an asset's fair value less costs to sell and its value in use. The carrying amount is reduced to the recoverable amount, and the difference is recognised as an expense (impairment loss) in the statement of comprehensive income. An impairment loss recognised for an asset in prior years is reversed if there has been a change in the estimates used to determine the asset’s recoverable amount. An impairment loss is reversed only to the extent that the asset’s carrying amount does not exceed the carrying amount that would have been determined, net of depreciation or amortisation, if no impairment loss had been recognised. For the purpose of impairment testing each restaurant is a cash generating unit. 2.2.10 Financial instruments A financial instrument is any contract that gives rise to a financial asset of one entity and a financial liability or equity instrument of another entity. i) Financial assets Initial recognition and measurement Financial assets are classified, at initial recognition, as financial assets at fair value through profit or loss, loans and receivables, held-to-maturity investments, available-for-sale (AFS) financial assets, or as derivatives designated as hedging instruments in an effective hedge, as appropriate. The Company determines the classification of its financial assets at initial recognition. The Company’s financial assets are represented solely by loans and receivables and cash and cash equivalents. All financial assets are recognised initially at fair value plus, in the case of assets not at fair value through profit or loss, transaction costs that are attributable to the acquisition of the financial asset. Purchases or sales of financial assets that require delivery of assets within a time frame established by regulation or convention in the marketplace (regular way trades) are recognised on the trade date, i.e., the date on which the Company commits to purchase or sell the asset.

AMERICAN RESTAURANT SYSTEM SA NOTES TO THE FINANCIAL STATEMENTS FOR THE YEAR ENDED 31 DECEMBER 2016 All amounts in RON thousand, unless specified otherwise
F - 66
2. Significant accounting policies (continued) Subsequent measurement Loans and receivables are non-derivative financial assets with fixed or determinable payments that are not quoted in an active market. After initial measurement, such financial assets are subsequently measured at amortised cost using the effective interest rate (EIR) method, less impairment. Amortised cost is calculated by taking into account any discount or premium on acquisition and fees or costs that are an integral part of the EIR. The EIR amortisation is included in ‘’Finance income’’ in profit or loss. For more information on receivables, refer to Note 15. Receivables due in less than 12 months are not discounted. De-recognition A financial asset (or, where applicable, a part of a financial asset or part of a Company of similar financial assets) is de-recognised when:
• The rights to receive cash flows from the asset have expired, or • The Company has transferred its rights to receive cash flows from the asset or has assumed an
obligation to pay the received cash flows in full without material delay to a third party under a ‘pass-through’ arrangement, and either (a) the Company has transferred substantially all the risks and rewards of the asset, or (b) the Company has neither transferred nor retained substantially all the risks and rewards of the asset, but has transferred control of the asset.
When the Company has transferred its rights to receive cash flows from an asset or has entered into a pass-through arrangement, it evaluates if and, to what extent, it has retained the risks and rewards of ownership. When it has neither transferred nor retained substantially all of the risks and rewards of the asset nor transferred control of it, the asset is recognised to the extent of its continuing involvement in it. In that case, the Company also recognises an associated liability. The transferred asset and the associated liability are measured on a basis that reflects the rights and obligations that the Company has retained. Continuing involvement that takes the form of a guarantee over the transferred asset is measured at the lower of the original carrying amount of the asset and the maximum amount of consideration that the Company could be required to repay. ii) Impairment of financial assets Disclosures relating to impairment of financial assets are summarised in the following notes:
• Financial instruments risk management Note 13 • Trade receivables Note 15
The Company assesses, at each reporting date, whether there is any objective evidence that a financial asset or a Company of financial assets is impaired. An impairment exists if one or more events that has occurred since the initial recognition of the asset (an incurred ‘loss event’), has an impact on the estimated future cash flows of the financial asset or the Company of financial assets that can be reliably estimated. Evidence of impairment may include indications that the debtors or a Company of debtors is experiencing significant financial difficulty, default or delinquency in interest or principal payments, the probability that they will enter bankruptcy or other financial reorganisation and where observable data indicate that there is a measurable decrease in the estimated future cash flows, such as changes in arrears or economic conditions that correlate with defaults.

AMERICAN RESTAURANT SYSTEM SA NOTES TO THE FINANCIAL STATEMENTS FOR THE YEAR ENDED 31 DECEMBER 2016 All amounts in RON thousand, unless specified otherwise
F - 67
2. Significant accounting policies (continued) Financial assets carried at amortised cost For financial assets carried at amortised cost, the Company first assesses whether impairment exists individually for financial assets that are individually significant, or collectively for financial assets that are not individually significant. If the Company determines that no objective evidence of impairment exists for an individually assessed financial asset, whether significant or not, it includes the asset in a group of financial assets with similar credit risk characteristics and collectively assesses them for impairment. Assets that are individually assessed for impairment and for which an impairment loss is, or continues to be, recognised are not included in a collective assessment of impairment. The amount of any impairment loss identified is measured as the difference between the asset’s carrying amount and the present value of estimated future cash flows (excluding future expected credit losses that have not yet been incurred). The present value of the estimated future cash flows is discounted at the financial asset’s original effective interest rate. The carrying amount of the asset is reduced through the use of an allowance account and the losses arising from impairment are recognised in profit or loss in “Finance costs” for loans and in “Other operating expenses, net” for receivables. If, in a subsequent year, the amount of the estimated impairment loss increases or decreases because of an event occurring after the impairment was recognised, the previously recognised impairment loss is increased or reduced by adjusting the allowance account. Interest income continues to be accrued on the reduced carrying amount using the rate of interest used to discount the future cash flows for the purpose of measuring the impairment loss. Loans, together with the associated allowance are written off when there is no realistic prospect of future recovery and all collateral has been realised or has been transferred to the Company. If a write-off is later recovered, the recovery is credited to finance costs in profit or loss in “Finance costs” for loans and in “Other operating expenses, net” for trade receivables. iii) Financial liabilities Initial recognition and measurement Financial liabilities are classified, at initial recognition, as financial liabilities at fair value through profit or loss, financial liabilities measured at amortized cost, or as derivatives designated as hedging instruments in an effective hedge, as appropriate. All financial liabilities are recognised initially at fair value and, in the case of financial liabilities measured at amortised cost, net of directly attributable transaction costs. The Company’s financial liabilities include only financial liabilities measured at amortised cost (trade and other payables and loans and borrowings). Subsequent measurement After initial recognition, interest bearing loans and borrowings and any other long-term payables are subsequently measured at amortised cost using the effective interest rate method. Gains and losses are recognised in profit or loss when the liabilities are derecognised as well as through the effective interest rate method (EIR) amortisation process. Amortised cost is calculated by taking into account any discount or premium on acquisition and fees or costs that are an integral part of the EIR. The EIR amortisation is included in ‘’Finance costs’’ in profit or loss. Trade and other payables with a maturity of 12 months or less are not discounted.

AMERICAN RESTAURANT SYSTEM SA NOTES TO THE FINANCIAL STATEMENTS FOR THE YEAR ENDED 31 DECEMBER 2016 All amounts in RON thousand, unless specified otherwise
F - 68
2. Significant accounting policies (continued) De-recognition A financial liability is de-recognised when the obligation under the liability is discharged or cancelled or expires. When an existing financial liability is replaced by another from the same lender on substantially different terms, or the terms of an existing liability are substantially modified, such an exchange or modification is treated as a de-recognition of the original liability and the recognition of a new liability. The difference in the respective carrying amounts is recognised in profit or loss. iv) Offsetting of financial instruments Financial assets and financial liabilities are offset with the net amount reported in the statement of financial position only if there is a current enforceable legal right to offset the recognised amounts and an intent to settle on a net basis, or to realise the assets and settle the liabilities simultaneously. 2.2.11 Inventories Inventories, which include food, beverages and other supplies, are stated at the lower of cost or net realisable value. Cost of inventory is determined on the weighted-average basis and includes expenditures incurred in acquiring inventories and bringing them to their existing location and condition. Net realisable value is the estimated selling price in the ordinary course of business, less estimated costs necessary to make the sale. When inventories are sold, the carrying amount of those inventories is recognised as an expense and reported as a component of cost of sales in the statement of comprehensive income in the period in which the related revenue is recognised. The amount of any write-down of inventories to net realisable value and all losses of inventories is recognised as an expense in the same component of the statement of comprehensive income as the consumption of the respective inventory, in the period the write-down or loss occurs. 2.2.12 Cash and short-term deposits Cash and short-term deposits in the statement of financial position comprise cash at banks and on hand and short-term deposits. For the purpose of the statement cash flows, cash and cash equivalents consist of cash and short-term deposits with a maturity of three months or less, which are subject to an insignificant risk of changes in value 2.2.13 Prepayments Prepayments are carried at cost less provision for impairment. A prepayment is classified as non-current when the goods or services relating to the prepayment are expected to be obtained after one year. Prepayments to acquire current assets are transferred to the carrying amount of the asset once the Company has obtained control of the asset and it is probable that future economic benefits associated with the asset will flow to the Company. Prepayments to acquire property, plant and equipment are classified as construction in progress. Other prepayments are written off to profit or loss when the goods or services relating to the prepayments are received. If there is an indication that the assets, goods or services relating to a prepayment will not be received, the carrying value of the prepayment is written down accordingly and a corresponding impairment loss is recognized in profit or loss.

AMERICAN RESTAURANT SYSTEM SA NOTES TO THE FINANCIAL STATEMENTS FOR THE YEAR ENDED 31 DECEMBER 2016 All amounts in RON thousand, unless specified otherwise
F - 69
2. Significant accounting policies (continued) 2.2.14 Equity Share capital Ordinary shares are classified as equity. External costs directly attributable to the issue of new shares are shown as a deduction in equity from the proceeds. Any excess of the fair value of consideration received over the par value of shares issued is recognised as additional paid-in capital. Dividends The Company recognises a liability to make cash or non-cash distributions to owners of equity when the distribution is authorised and the distribution is no longer at the discretion of the Company. As per the corporate laws of Romania, a distribution is authorised when it is approved by the shareholders. A corresponding amount is recognised directly in equity. 2.2.15 Royalties Royalties in connection to franchise rights are recognised as an expense as restaurants revenue is earned. 2.2.16 Provisions General Provisions are recognised when the Company has a present obligation (legal or constructive) as a result of a past event, it is probable that an outflow of resources embodying economic benefits will be required to settle the obligation and a reliable estimate can be made of the amount of the obligation. Where the Company expects some or all of a provision to be reimbursed, for example under an insurance contract, the reimbursement is recognised as a separate asset but only when the reimbursement is virtually certain. The expense relating to a provision is presented in profit or loss net of any reimbursement. If the effect of the time value of money is material, provisions are discounted using a current pre-tax rate that reflects, when appropriate, the risks specific to the liability. When discounting is used, the increase in the provision due to the passage of time is recognised as a finance cost. Onerous contracts A provision for onerous contracts is recognised when the expected benefits to be derived by the Company from a contract are lower than the unavoidable cost of meeting its obligations under the contract. The provision is measured at the present value of the lower of the expected cost of terminating the contract and the expected net cost of continuing with the contract. Before a provision is established, the Company recognises any impairment loss on the assets associated with that contract. 2.2.17 Employee benefits The Company, in the normal course of business, makes payments on behalf of its employees for pensions (defined contribution plans), health care, employment and personnel tax which are calculated according to the statutory rates in force during the year, based on gross salaries and wages. Food allowances, travel expenses and holiday allowances are also calculated according to the local legislation. The cost of these payments is charged to the statement of comprehensive income in the same period as the related salary cost. Accruals are created for holiday allowances if there are non-used holidays according the local legislation.

AMERICAN RESTAURANT SYSTEM SA NOTES TO THE FINANCIAL STATEMENTS FOR THE YEAR ENDED 31 DECEMBER 2016 All amounts in RON thousand, unless specified otherwise
F - 70
2. Significant accounting policies (continued) The Company does not operate any other pension scheme or post-retirement benefits plan and consequently, has no obligation in respect of pensions. 2.2.18 Discontinued operations Discontinued operations are excluded from the results of continuing operations and are presented as a single amount as profit or loss after tax from discontinued operations in the statement of comprehensive income, for the period in which the operations are discontinued as well as in the comparative periods presented. No changes are made to the statement of financial position or statement of cash flows. Additional disclosures are provided in Note 23. 2.3 First-time adoption of IFRS
These financial statements, for the year ended 31 December 2016, are the first the Company has prepared in accordance with IFRS. For periods up to and including the year ended 31 December 2016, the Company prepared its financial statements in accordance with Romanian Accounting Regulations (“RAR” or “Local GAAP”). The Company has prepared financial statements that comply with IFRS applicable for the year ended 31 December 2016, together with the comparative periods for the years ended at 31 December 2015 and 31 December 2014, as described in the summary of significant accounting policies. In preparing these financial statements, the Company’s opening statement of financial position was prepared as at 1 January 2014, being the Company’s date of transition to IFRS. This note explains the principal adjustments made by the Company in restating its Local GAAP financial statements, including the statement of financial position as at 1 January 2014, the statement of financial position as at 31 December 2016 and the statement of comprehensive income for the year ended 31 December 2016. As of 1 January 2014 and 31 December 2016, the reconciliation of equity was performed between the Company’s RAR and IFRS accounts. Exemptions applied IFRS 1 allows first-time adopters certain exemptions from the retrospective application of certain requirements under IFRS. The Company has applied the following exemptions: Deemed cost The Company decided to use the exemption provided by IFRS 1.D6, whereby freehold buildings were carried in the statement of financial position prepared in accordance with Local GAAP on the basis of valuations performed on 31 December 2014, with previous valuations performed as at 31 December 2011. The Company has elected to regard the valuation performed as of 31 December 2011 as deemed cost under IFRS at that respective date, since the valuation was broadly comparable to fair value. Estimates The estimates at 1 January 2014 and at 31 December, 2014, 2015 and 2016 are consistent with those made for the same dates in accordance with Local GAAP (after adjustments to reflect any differences in accounting policies). The estimates used by the Company to present these amounts in accordance with IFRS reflect conditions at 1 January 2014, the date of transition to IFRS and as at 31 December 2014, 2015 and 2016.

AMERICAN RESTAURANT SYSTEM SA NOTES TO THE FINANCIAL STATEMENTS FOR THE YEAR ENDED 31 DECEMBER 2016 All amounts in RON thousand, unless specified otherwise
F - 71
2. Significant accounting policies (continued) Company reconciliation of equity as at 1 January 2014 (date of transition to IFRS) (only the elements affected by re-measurements are presented)
Note Local GAAP Re-measurement
IFRS as at 1 January
2014
Non-current assets
9,579 2,921 12,500
Property, plant and equipment 12 8,458 2,750 11,208 Intangible assets 10 994 171 1,165
Total assets
21,539 2,921 24,460
Equity and liabilities
Issued capital 2 95 1,549 1,644
Retained earnings 1, 2,
7,10,12
2,506 714 3,220
Equity
2,624 2,263 4,887
Total equity
2,624 2,263 4,887
Non-current liabilities
1,927 680 2,607
Trade and other payables 1 - 151 151 Deferred tax liabilities 7,10,12 - 529 529
Current liabilities
16,988 (22) 16,966
Trade and other payables 1 14,601 (22) 14,579
Total liabilities
18,915 658 19,573
Total equity and liabilities
21,539 2,921 24,460

AMERICAN RESTAURANT SYSTEM SA NOTES TO THE FINANCIAL STATEMENTS FOR THE YEAR ENDED 31 DECEMBER 2016 All amounts in RON thousand, unless specified otherwise
F - 72
2. Significant accounting policies (continued) Company reconciliation of equity as at 31 December 2016: (only the elements affected by re-measurements are presented)
Note Local GAAP Re-measurement
IFRS as at 31 December
2016
Assets
Non-current assets
20,422 952 21,374
Property, plant and equipment 3, 11, 12 17,305 896 18,201 Intangible assets 10 2,861 56 2,917
Assets held for sale 9 - 195 195
Total assets
32,034 1,147 33,181
Equity and liabilities
Equity
Issued capital 2 95 1,549 1,644 Retained earnings 1, 2, 3, 6, 7, 10, 12 5,025 (710) 4,315
Total equity
5,141 839 5,980
Non-current liabilities
7,536 329 7,865
Trade and other payables 1 - 329 329 Deferred tax liabilities 7 - - -
Current liabilities
19,357 (21) 19,337
Trade and other payables 1, 5 14,512 889 15,401 Provisions 5 862 (862) - Interest-bearing loans and borrowings 6
3,983 (48) 3,935
Total liabilities
26,893 308 27,201
Total equity and liabilities
32,034 1,147 33,181

AMERICAN RESTAURANT SYSTEM SA NOTES TO THE FINANCIAL STATEMENTS FOR THE YEAR ENDED 31 DECEMBER 2016 All amounts in RON thousand, unless specified otherwise
F - 73
2. Significant accounting policies (continued) Reconciliation of total comprehensive income for the year ended 31 December 2016: (only the elements affected by re-measurements are presented)
Note Local GAAP Re-measurement
IFRS for the year 2016
Restaurant sales 9 181,643 (84,703) 96,940
Food and material 8, 9 101,116 (75,009) 26,107 Payroll and employee benefits 5, 9 24,274 (1,891) 22,383 Rent 1, 4 8,018 9 8,027 Depreciation and amortization expenses
2, 3, 9, 10, 12 3,444 (778) 2,666
Other operating expenses, net 4, 5, 8, 9 19,046 (7,387) 11,659
Restaurants operating profit 14,258 353 14,611
General and administration expenses, net
5, 9, 12 10,329 (1,346) 8,982
Operating profit 3,929 1,699 5,629
Finance costs 6 239 (26) 213
Profit before tax from continuing operations
3,817 1,725 5,543
Income tax expense 7 627 (266) 361
Profit for the year from continuing operations
3,190 1,991 5,182
Loss from the year from discontinued operations
9, 11 - (2,141) (1,953)
Profit for the year 3,190 (150) 3,229
Notes to the reconciliation of equity as at 1 January 2014 and 31 December 2016 and total comprehensive income for the year ended 31 December 2016 The IFRS re-measurements comprise the following: Note 1. The Company has concluded operating lease agreements containing fixed escalating payments. IAS 17 requires a straight-line recognition of the lease expenses over the lease agreement term. As a result, the Company has recorded an operating lease accrual in order reflect the requirements of IAS 17 and the increase in the overall rent expense in the first years of the contracts. The accrual balance as at 31 December 2016 is of 358, out of which 29 is included in the current portion of trade and other payables and 329 within the non-current portion of trade and other payables. The accrual balance as at 1 January 2014 is of 127, out of which (22) is included in the current portion of trade and other payables and 151 within the non-current portion of trade and other payables. In 2016 the Company has set-up through profit or loss, within ‘’Rent’’ expenses, a net accrual amounting to 9. Note 2. The Company was set up in 1994 and operated during the period 1994-2003, when the Romania was classified as a hyperinflationary economy. As a result, the Company has restated the share capital contributions made until 31 December 2013. The impact on the net book value of property, plant and equipment acquired up 31 December 2003 which was still in operation as of the date of transition to IFRS was immaterial thus no related IAS 29 re-measurement of property, plant and equipment was recorded.

AMERICAN RESTAURANT SYSTEM SA NOTES TO THE FINANCIAL STATEMENTS FOR THE YEAR ENDED 31 DECEMBER 2016 All amounts in RON thousand, unless specified otherwise
F - 74
2. Significant accounting policies (continued) Note 3. The Company has elected to measure the freehold buildings classified as property, plant and equipment at fair value determined at 31 December 2011 being the deemed cost for the transition to IFRS. Under RAR, these are measured at fair value. Consequently, the Company has reversed the impact of the revaluation recorded under RAR after the transition to IFRS, as well as the related depreciation. The impact of re-measurement as at 31 December 2016 was the following:
- Statement of financial position: decrease carrying amount of 893 relating to the 2014 revaluation and the related accumulated depreciation impact
- Statement of comprehensive income for the year 2016: depreciation charge decrease of 29 Note 4. Under the operating lease agreements concluded, the Company has received incentives for fit-out works provided free of charge by the landlords. Under RAR, the Company has deferred the amounts received for fit-out works over the contract term and recognised them in profit or loss in other operating income. IFRS requires the recognition of the aggregate benefit of incentives as a reduction of rental expense over the lease term, on a straight-line basis. Consequently, the Company reclassified an amount of 18 from other operating income as a reduction in rent expenses. Note 5. The Company has reclassified the untaken vacation accrual from short term provisions (recorded per local GAAP requirements) to trade and other payables in the statement of financial position. In the statement of comprehensive income for the year ended 31 December 2016, the reclassification was the following:
- Increase in payroll and employee benefits from restaurant expenses of 430
- Increase in payroll and employee benefits from general and administration expenses of 76
- Decrease in other operating expenses of 506 The impact in the 2016 financial position of the reclassification was the following:
- Decrease in current provisions of 862
- Increase in current trade and other payables of 862 Note 6. RAR does not provide for the initial recognition of financial liabilities at fair value net of transaction costs, nor for their subsequent measurement at amortised cost. As a result, the Company has re-measured the loans received at fair value, net of any origination fees and recognized the amortisation of these fees as a finance cost. Note 7. RAR does not provide for the recognition of deferred tax. For IFRS purposes, the Company recognised deferred tax, in line with the accounting policy presented in Note 2.2.5. For a comprehensive description of the main temporary differences giving rise to deferred tax and subsequent changes in tax legislation, refer to Note 9. Note 8. Under RAR, the Company has recognised amounts invoiced to its suppliers for marketing and promotion activities as other operating income. The substance of such arrangements has been deemed to be that of a sale incentive (i.e. rebates) given to the Company by the suppliers. Under IFRS, consideration characterized as a sales incentive given by a vendor to a customer is presumed to be a reduction of the selling prices of the supplier's goods or services.

AMERICAN RESTAURANT SYSTEM SA NOTES TO THE FINANCIAL STATEMENTS FOR THE YEAR ENDED 31 DECEMBER 2016 All amounts in RON thousand, unless specified otherwise
F - 75
2. Significant accounting policies (continued) Accordingly, an amount of 658 was reclassified from other operating income as a reduction to the cost of goods purchased from the suppliers in ‘’Food and material’’ expenses. Note 9. No concepts of ‘’discontinued operations’’ or ‘’assets held for sale’’ exist under RAR, while for IFRS reporting purposes the Company has presented separately those assets held for sale and the results associated with discontinued lines of business. For more details, in particular the impact on each caption of the statement of comprehensive income, refer to Note 23. Note 10 – Up to 2011, the Company has expensed under RAR the costs of the franchise rights acquired. Under the requirements of IAS 38, the Company has recognised these costs as an intangible asset, as follows:
- An increase in the net carrying amount of intangible assets (franchise rights) of 171 as at 1 January 2014
- An increase in the net carrying amount of intangible assets (franchise rights) of 56 as at 31 December 2016
- Recognition of an additional amortisation charge for franchise rights in 2016 of 38, presented under ‘’Depreciation and amortisation’’ in ‘’Restaurant expenses’’.
Note 11 – Following the transfer of the supply activity to Havi Logistics (see Note 23 for more details), the Company has identified equipment relating to that activity with a net carrying amount of 1,161 which would no longer be used for other purposes. As a result, the Company has recorded an impairment allowance for this equipment of 966, in order to reduce it to its recoverable amount, taking into account subsequent events up to the date of approval of these financial statements. Note 12 – Upon the date of transition to IFRS, the Company has applied the principles of IAS 16 and has reviewed the useful lives of its property, plant and equipment. The net carrying amount of property, plant and equipment has increased by 2,750 as at 1 January 2014 and by 2,951 respectively as at 31 December 2016. As a result of this change, the depreciation charge for the year 2016 decreased by 448 and the expense with the net book value of disposed assets increased by 65. 3. Significant accounting judgements, estimates and assumptions The preparation of the Company’s financial statements requires management to make judgements, estimates and assumptions that affect the reported amounts of revenues, expenses, assets and liabilities, and the accompanying disclosures, and the disclosure of contingent liabilities. Uncertainty about these assumptions and estimates could result in outcomes that require a material adjustment to the carrying amount of asset or liability affected in future periods. Judgements In the process of applying the Company’s accounting policies, management has made the following judgements, which have the most significant effect on the amounts recognised in the financial statements: Classification of lease agreements A lease is classified as a finance lease if it transfers to the Company substantially all the risks and rewards incidental to ownership, otherwise it is classified as an operating lease. Whether a lease is a finance lease or an operating lease depends on the substance of the transaction rather than the form of the contract. If the lease term is longer than 75 percent of the economic life of the asset, or if at the inception of the lease the present value of the minimum lease payments amounts to at least 90 percent of the fair value of the leased asset, the lease is classified by the Company as finance lease, unless it is clearly demonstrated otherwise.

AMERICAN RESTAURANT SYSTEM SA NOTES TO THE FINANCIAL STATEMENTS FOR THE YEAR ENDED 31 DECEMBER 2016 All amounts in RON thousand, unless specified otherwise
F - 76
3. Significant accounting judgements, estimates and assumptions (continued) Estimates and assumptions The key assumptions concerning the future and other key sources of estimation uncertainty at the reporting date, that have a significant risk of causing a material adjustment to the carrying amounts of assets and liabilities within the next financial year, are described below. The Company based its assumptions and estimates on parameters available when the financial statements were prepared. Existing circumstances and assumptions about future developments, however, may change due to market changes or circumstances arising beyond the control of the Company. Such changes are reflected in the assumptions when they occur. Useful lives of property and equipment The Company assesses the remaining useful lives of items of property and equipment at least at each financial year-end. If expectations differ from previous estimates, the changes are accounted for as a change in an accounting estimate in accordance with IAS 8 Accounting Policies, Changes in Accounting Estimates and Errors. These estimates may have a material impact on the amount of the carrying values of property and equipment and on depreciation recognised in profit or loss. In particular, the Company assesses for its operating leases, that generally have an initial term of 5 years with renewal option for another 5 years, that the leasehold improvements’ useful life is of 10 years due to the fact that historically most of such leases have been renewed after the initial term of 5 years, that the refurbishment needed after the first 5 years is of significantly less value compared to the initial set-up, and that 10 years is also the duration of the related franchise. 4. New standards, amendments and interpretations issued but not effective for the financial
year beginning 1 January 2016 and not early adopted
The standards and interpretations that are issued, but not yet effective, up to the date of issuance of the Company’s financial statements are disclosed below. The Company intends to adopt these standards, if applicable, when they become effective. IFRS 9 Financial Instruments: Classification and Measurement The standard is effective for annual periods beginning on or after 1 January 2018, with early application permitted. The final version of IFRS 9 Financial Instruments reflects all phases of the financial instruments project and replaces IAS 39 Financial Instruments: Recognition and Measurement and all previous versions of IFRS 9. The standard introduces new requirements for classification and measurement, impairment, and hedge accounting. Management has assessed that the application of this standard will not have any significant impact on the presentation and financial position or performance of the Company. IFRS 15 Revenue from Contracts with Customers The standard is effective for annual periods beginning on or after 1 January 2018. IFRS 15 establishes a five-step model that will apply to revenue earned from a contract with a customer (with limited exceptions), regardless of the type of revenue transaction or the industry. The standard’s requirements will also apply to the recognition and measurement of gains and losses on the sale of some non-financial assets that are not an output of the Company’s ordinary activities (e.g., sales of property, plant and equipment or intangibles). Extensive disclosures will be required, including disaggregation of total revenue; information about performance obligations; changes in contract asset and liability account balances between periods and key judgments and estimates. Management has assessed that the application of this standard will not have any significant impact on the financial position or performance of the Company.

AMERICAN RESTAURANT SYSTEM SA NOTES TO THE FINANCIAL STATEMENTS FOR THE YEAR ENDED 31 DECEMBER 2016 All amounts in RON thousand, unless specified otherwise
F - 77
4. New standards, amendments and interpretations issued but not effective for the financial year beginning 1 January 2016 and not early adopted (continued)
IFRS 15: Revenue from Contracts with Customers (Clarifications) The Clarifications apply for annual periods beginning on or after 1 January 2018 with earlier application permitted. The objective of the Clarifications is to clarify the IASB’s intentions when developing the requirements in IFRS 15 Revenue from Contracts with Customers, particularly the accounting of identifying performance obligations amending the wording of the “separately identifiable” principle, of principal versus agent considerations including the assessment of whether an entity is a principal or an agent as well as applications of control principle and of licensing providing additional guidance for accounting of intellectual property and royalties. The Clarifications also provide additional practical expedients for entities that either apply IFRS 15 fully retrospectively or that elect to apply the modified retrospective approach. Management has assessed that the application of this standard (including the clarifications) will not have any impact on the financial position or performance of the Company IFRS 16: Leases The standard is effective for annual periods beginning on or after 1 January 2019. IFRS 16 sets out the principles for the recognition, measurement, presentation and disclosure of leases for both parties to a contract, i.e. the customer (‘lessee’) and the supplier (‘lessor’). The new standard requires lessees to recognize most leases on their financial statements. Lessees will have a single accounting model for all leases, with certain exemptions. Lessor accounting is substantially unchanged. The Company is currently assessing the impact of the standard on its financial statements. Taking into consideration the significant number and value of signed lease agreements, the Company expects a significant impact following the adoption of the standard on its statement of financial position, and a less significant impact on its statement of comprehensive income. Amendment in IFRS 10 Consolidated Financial Statements and IAS 28 Investments in Associates and Joint Ventures: Sale or Contribution of Assets between an Investor and its Associate or Joint Venture The amendments address an acknowledged inconsistency between the requirements in IFRS 10 and those in IAS 28, in dealing with the sale or contribution of assets between an investor and its associate or joint venture. The main consequence of the amendments is that a full gain or loss is recognized when a transaction involves a business (whether it is housed in a subsidiary or not). A partial gain or loss is recognized when a transaction involves assets that do not constitute a business, even if these assets are housed in a subsidiary. In December 2015 the IASB postponed the effective date of this amendment indefinitely pending the outcome of its research project on the equity method of accounting. The amendment is not applicable to the Company as it does not have subsidiaries, associates or joint ventures. IAS 12: Recognition of Deferred Tax Assets for Unrealized Losses (Amendments) The Amendments become effective for annual periods beginning on or after 1 January 2017 with earlier application permitted. The objective of the Amendments is to clarify the requirements of deferred tax assets for unrealized losses in order to address diversity in practice in the application of IAS 12 Income Taxes. The specific issues where diversity in practice existed relate to the existence of a deductible temporary difference upon a decrease in fair value, to recovering an asset for more than its carrying amount, to probable future taxable profit and to combined versus separate assessment. Management has assessed that the application of the amendments will not have any impact on the financial position or performance of the Company.

AMERICAN RESTAURANT SYSTEM SA NOTES TO THE FINANCIAL STATEMENTS FOR THE YEAR ENDED 31 DECEMBER 2016 All amounts in RON thousand, unless specified otherwise
F - 78
4. New standards, amendments and interpretations issued but not effective for the financial year beginning 1 January 2016 and not early adopted (continued)
IAS 7: Disclosure Initiative (Amendments) The Amendments are effective for annual periods beginning on or after 1 January 2017 with earlier application permitted. The objective of the Amendments is to provide disclosures that enable users of financial statements to evaluate changes in liabilities arising from financing activities, including both changes arising from cash flows and non-cash changes. The Amendments specify that one way to fulfil the disclosure requirement is by providing a tabular reconciliation between the opening and closing balances in the statement of financial position for liabilities arising from financing activities, including changes from financing cash flows, changes arising from obtaining or losing control of subsidiaries or other businesses, the effect of changes in foreign exchange rates, changes in fair values and other changes. Management has assessed that the application of these amendments will not have a significant impact on the disclosures from the financial statements of the Company. IFRS 2: Classification and Measurement of Share based Payment Transactions (Amendments) The Amendments are effective for annual periods beginning on or after 1 January 2018 with earlier application permitted. The Amendments provide requirements on the accounting for the effects of vesting and non-vesting conditions on the measurement of cash-settled share-based payments, for share-based payment transactions with a net settlement feature for withholding tax obligations and for modifications to the terms and conditions of a share-based payment that changes the classification of the transaction from cash-settled to equity-settled. Management has assessed that the application of these amendments will not have any impact on the financial position or performance of the Company. IFRS 4: Applying IFRS 9 Financial Instruments with IFRS 4 Insurance Contracts (Amendments) The Amendments are effective for annual periods beginning on or after 1 January 2018. The amendments address concerns arising from implementing the new financial instruments Standard, IFRS 9, before implementing the new insurance contracts standard that the Board is developing to replace IFRS 4. The amendments introduce two options for entities issuing insurance contracts: a temporary exemption from applying IFRS 9 and an overlay approach, which would permit entities that issue contracts within the scope of IFRS 4 to reclassify, from profit or loss to other comprehensive income, some of the income or expenses arising from designated financial assets. Management has assessed that the application of these amendments will not have any impact on the financial position or performance of the Company. IFRIC Interpretation 22: Foreign Currency Transactions and Advance Consideration The Interpretation is effective for annual periods beginning on or after 1 January 2018 with earlier application permitted. The Interpretation clarifies the accounting for transactions that include the receipt or payment of advance consideration in a foreign currency. The Interpretation covers foreign currency transactions when an entity recognizes a non-monetary asset or a non-monetary liability arising from the payment or receipt of advance consideration before the Company recognizes the related asset, expense or income. The Interpretation states that the date of the transaction, for the purpose of determining the exchange rate, is the date of initial recognition of the non-monetary prepayment asset or deferred income liability. If there are multiple payments or receipts in advance, then the Company must determine a date of the transactions for each payment or receipt of advance consideration. Management has assessed that the application of these amendments will not have any impact on the financial position or performance of the Company, as it already followed an approach aligned with these requirements. The IASB has issued the Annual Improvements to IFRSs 2014 – 2016 Cycle, which is a collection of amendments to IFRSs. The amendments are effective for annual periods beginning on or after 1 January 2017 for IFRS 12 Disclosure of Interests in Other Entities and on or after 1 January 2018 for IFRS 1 First-time Adoption of International Financial Reporting Standards and for IAS 28 Investments in Associates and Joint Ventures. Earlier application is permitted for IAS 28 Investments in Associates and Joint Ventures. Management has assessed that the application of these improvements will not have any impact on the financial position or performance of the Company.

AMERICAN RESTAURANT SYSTEM SA NOTES TO THE FINANCIAL STATEMENTS FOR THE YEAR ENDED 31 DECEMBER 2016 All amounts in RON thousand, unless specified otherwise
F - 79
4. New standards, amendments and interpretations issued but not effective for the financial year beginning 1 January 2016 and not early adopted (continued)
- IFRS 1 First-time Adoption of International Financial Reporting Standards: This improvement deletes the short-term exemptions regarding disclosures about financial instruments, employee benefits and investment entities, applicable for first time adopters. - IAS 28 Investments in Associates and Joint Ventures: The amendments clarify that the election to measure at fair value through profit or loss an investment in an associate or a joint venture that is held by an entity that is venture capital organization, or other qualifying entity, is available for each investment in an associate or joint venture on an investment-by-investment basis, upon initial recognition. - IFRS 12 Disclosure of Interests in Other Entities: The amendments clarify that the disclosure requirements in IFRS 12, other than those of summarized financial information for subsidiaries, joint ventures and associates, apply to an entity’s interest in a subsidiary, a joint venture or an associate that is classified as held for sale, as held for distribution, or as discontinued operations in accordance with IFRS 5. 5. Other operating expenses, net
2016 2015 2014
Third-party services 2,734 1,775 1,579 Utilities 4,192 3,896 3,627 Maintenance and repairs 1,266 790 990 Transport 563 417 250 Small-wares 1,829 1,217 262 Cleaning supplies 523 361 277 Insurance 158 121 104 Telephone and postage 74 75 67 Net (gain)/ loss on disposal of property, plant and equipment 115 (56) 391 Change in allowance for receivables, net - 19 2 Miscellaneous expenses/(income), net 205 (276) (35)
Total 11,659 8,339 7,514
6. General and administrative expenses, net
2016 2015 2014
Payroll and employee benefits 4,247 3,438 2,669 Third-party services 2,838 2,334 1,869 Transport 503 464 415 Rent 344 339 333 Banking charges 479 430 292 Small-wares 442 428 237 Maintenance and repairs 101 43 29 Depreciation, and amortization 137 133 151 Telephone and postage 116 133 111 Insurance 34 27 26 Miscellaneous income, net (259) (18) (38)
Total 8,982 7,751 6,094

AMERICAN RESTAURANT SYSTEM SA NOTES TO THE FINANCIAL STATEMENTS FOR THE YEAR ENDED 31 DECEMBER 2016 All amounts in RON thousand, unless specified otherwise
F - 80
7. Disclosure of total payroll and employee benefits expense and total depreciation and amortization expense
7.1 Payroll and employee benefits
2016 2015 2014
Payroll and employee benefits recognized in "Restaurant
expenses" 22,383 14,622 12,001 Payroll and employee benefits recognized in "General and administration expenses, net’’ 4,247 3,438 2,669
Total payroll and employee benefits for continued operations 26,630 18,060 14,670
Of which, defined contribution to State pension plan: 3,429 2,446 2,528 Additionally, an amount of 2,321 refers to payroll and employee benefits relating to discontinued operations for the year 2016 (2015: 2,720, 2014: 2,853). For more details, please refer to Note 23. 7.2 Depreciation and amortization
2016 2015 2014
Depreciation and amortization recognized in "Restaurant
expenses" 2,666 2,114 2,188 Depreciation, and amortization recognized in "General and administration expenses, net" 137 133 151
Total depreciation and amortization for continued operations 2,803 2,247 2,339
Additionally, an amount of 382 refers to depreciation and amortisation relating to discontinued operations for the year 2016 (2015: 171, 2014: 131). For more details, please refer to Note 23. 8. Finance costs and income
8.1 Finance costs
2016 2015 2014
Interest on loans and borrowings 202 87 90
Finance charges payable under finance leases 11 10 10 Foreign exchange loss, net - 385 209
Total finance costs 213 482 309
8.2 Finance income
2016 2015 2014
Interest income 18 19 7
Foreign exchange gain, net 109 - -
Total finance income 127 19 7
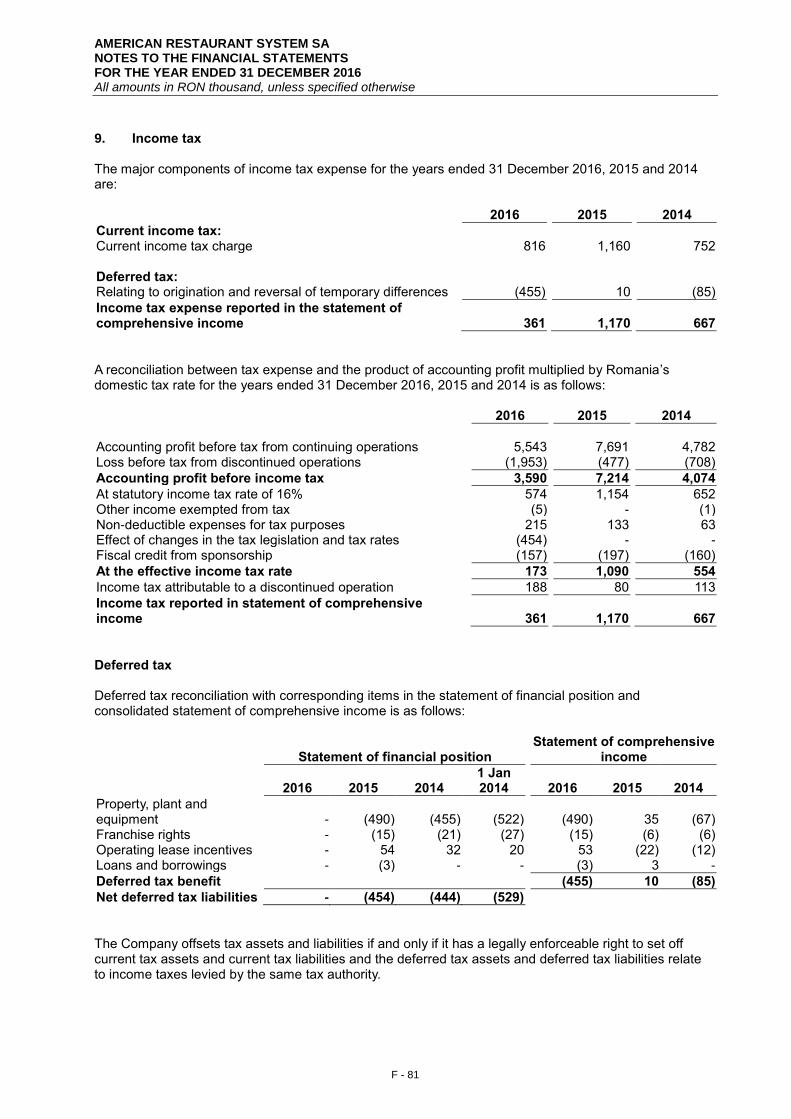
AMERICAN RESTAURANT SYSTEM SA NOTES TO THE FINANCIAL STATEMENTS FOR THE YEAR ENDED 31 DECEMBER 2016 All amounts in RON thousand, unless specified otherwise
F - 81
9. Income tax The major components of income tax expense for the years ended 31 December 2016, 2015 and 2014 are:
2016 2015 2014
Current income tax:
Current income tax charge 816 1,160 752
Deferred tax:
Relating to origination and reversal of temporary differences (455) 10 (85)
Income tax expense reported in the statement of comprehensive income 361 1,170 667
A reconciliation between tax expense and the product of accounting profit multiplied by Romania’s domestic tax rate for the years ended 31 December 2016, 2015 and 2014 is as follows:
2016 2015 2014
Accounting profit before tax from continuing operations 5,543 7,691 4,782 Loss before tax from discontinued operations (1,953) (477) (708)
Accounting profit before income tax 3,590 7,214 4,074
At statutory income tax rate of 16% 574 1,154 652 Other income exempted from tax (5) - (1) Non-deductible expenses for tax purposes 215 133 63 Effect of changes in the tax legislation and tax rates (454) - - Fiscal credit from sponsorship (157) (197) (160)
At the effective income tax rate 173 1,090 554
Income tax attributable to a discontinued operation 188 80 113
Income tax reported in statement of comprehensive income 361 1,170 667
Deferred tax Deferred tax reconciliation with corresponding items in the statement of financial position and consolidated statement of comprehensive income is as follows:
Statement of financial position
Statement of comprehensive income
2016 2015 2014
1 Jan 2014
2016 2015 2014
Property, plant and equipment - (490) (455) (522)
(490) 35 (67)
Franchise rights - (15) (21) (27) (15) (6) (6) Operating lease incentives - 54 32 20
53 (22) (12)
Loans and borrowings - (3) - -
(3) 3 -
Deferred tax benefit
(455) 10 (85)
Net deferred tax liabilities - (454) (444) (529)
The Company offsets tax assets and liabilities if and only if it has a legally enforceable right to set off current tax assets and current tax liabilities and the deferred tax assets and deferred tax liabilities relate to income taxes levied by the same tax authority.

AMERICAN RESTAURANT SYSTEM SA NOTES TO THE FINANCIAL STATEMENTS FOR THE YEAR ENDED 31 DECEMBER 2016 All amounts in RON thousand, unless specified otherwise
F - 82
9. Income tax (continued) In January 2017, the local taxation regulations have changed for the companies active in the restaurant industry. Specifically, per the updated regulations, the income tax for the restaurant activity has been replaced by a specific tax, computed based on a minimum fixed amount multiplied by the impact of three criteria: restaurant area, restaurant location and seasonality. The taxation of the non-restaurant activities has not suffered changes. Given that as at 31 December 2016 the new taxation system applicable to the entity was substantively enacted (becoming effective from January 2017), the Company has reversed previously recognised deferred tax balances, as this constitutes in substance a change to a zero tax rate (the reversal of temporary differences in the future will not create any taxable or deductible amounts). 10. Property, plant and equipment
Freehold buildings and
leasehold improvements
Plant and machinery
Other equipment
Construction in progress Total
Cost
At 1 January 2014 10,522 12,971 1,391 11 24,895
Additions - 90 50 1,139 1,279 Disposals 1,348 87 40 160 1,635
At 31 December 2014 9,174 12,974 1,401 990 24,539
Additions 3,397 2,602 737 3,627 10,363 Disposals - 725 23 4,543 5,291
At 31 December 2015 12,571 14,851 2,115 74 29,611
Additions 3,929 3,667 838 4,619 13,053 Transfers to assets held for sale 885 3,135 275 - 4,295
Disposals 525 373 14 3,946 4,858
At 31 December 2016 15,090 15,010 2,664 747 33,511
Depreciation
At 1 January 2014 5,097 7,900 690 - 13,687
Depreciation charge for the year 922 1,181 165 - 2,268 Disposals 948 83 38 - 1,069
At 31 December 2014 5,071 8,998 817 - 14,886
Depreciation charge for the year 894 1,126 188 - 2,208 Disposals - 725 23 - 748
At 31 December 2015 5,965 9,399 982 - 16,346
Depreciation charge for the year 1,166 1,359 337 - 2,862 Transfers to assets held for sale 617 2,343 174 - 3,134 Disposals 460 291 13 - 764
At 31 December 2016 6,054 8,124 1,132 - 15,310
Net book value
At 1 January 2014 5,425 5,071 701 11 11,208
At 31 December 2014 4,103 3,976 584 990 9,653
At 31 December 2015 6,606 5,452 1,133 74 13,265
At 31 December 2016 9,036 6,886 1,532 747 18,201

AMERICAN RESTAURANT SYSTEM SA NOTES TO THE FINANCIAL STATEMENTS FOR THE YEAR ENDED 31 DECEMBER 2016 All amounts in RON thousand, unless specified otherwise
F - 83
10. Property, plant and equipment (continued) The Company has several finance lease contracts for motor vehicles. The carrying value of the leased assets as of 31 December, 2016 is of 329 (31 December 2015: 432 31 December 2014: 223 and 1 January 2014: 333 respectively). The assets acquired under finance lease are pledged in favour of the leasing company. As of 31 December 2016 the gross book value of fully depreciated property, plant and equipment that were still in use is of 8,069 (31 December 2015: 5,493, 31 December 2014: 6,093 and 1 January 2014: 4,234 respectively). The Company has pledged non-current assets (mostly equipment) in favour of Alpha Bank for the financing received. The net carrying amount of pledged assets as at 31 December 2016 is of 3,328 (31 December 2015: 7,229, 31 December 2014: 5,532 and 1 January 2014: 2,592 respectively). The additions in 2016, 2015 and 2014 consist mainly in new restaurants’ leasehold improvements, as well as restaurants’ kitchen equipment. 11. Intangible assets
Franchise rights
Other intangible
assets Intangibles in
progress Total
Cost
At 1 January 2014 1,712 71 41 1,824
Additions 85 - - 85 Disposals - - 41 41
At 31 December 2014 1,797 71 - 1,868
Additions 786 121 45 952
At 31 December 2015 2,583 192 45 2,820
Additions 1,009 166 406 1,581 Disposals - - 90 90
At 31 December 2016 3,592 358 361 4,311
Amortisation
At 1 January 2014 610 49 - 659
Amortisation 189 13 - 202
At 31 December 2014 799 62 - 861
Amortisation 210 - - 210
At 31 December 2015 1,009 62 - 1,071
Amortisation 291 32 - 323
At 31 December 2016 1,300 94 - 1,394
Net book value
At 1 January 2014 1,102 22 41 1,165
At 31 December 2014 998 9 - 1,007
At 31 December 2015 1,574 130 45 1,749
At 31 December 2016 2,292 264 361 2,917
Additions during 2016, 2015 and 2014 consisted mainly in franchise operating licenses acquired for newly opened restaurants each year.

AMERICAN RESTAURANT SYSTEM SA NOTES TO THE FINANCIAL STATEMENTS FOR THE YEAR ENDED 31 DECEMBER 2016 All amounts in RON thousand, unless specified otherwise
F - 84
12. Interest-bearing loans and borrowings
Interest rate Maturity 2016 2015 2014 1 Jan 2014
%
Current interest-bearing loans and borrowings
Obligations under finance leases EURIBOR 3M +4.5% 11.03.2017 - - 78 103
EURIBOR 3M +4.5% 11.03.2019 145 174 - -
Bank loan EURIBOR 3M + 2.85-4%
5 years from each withdrawal
3,790 1,944 1,357 2,284
Total current interest-bearing loans and borrowings 3,935 2,118 1,435 2,387
Non-current interest-bearing loans and borrowings
Obligations under finance leases EURIBOR 3M +4.5% 11.03.2017 - - 72 151
EURIBOR 3M +4.5% 11.03.2019 91 147 - -
Bank loan EURIBOR 3M + 2.85-4%
5 years from each withdrawal
7,445 3,545 420 1,776
Total non-current interest-bearing loans and borrowings
7,536 3,692 492 1,927
Total interest-bearing loans and borrowings 11,471 5,810 1,927 4,314
The Company has a credit facility from Alpha Bank Romania made up of 3 sub-limits, as follows: credit facility for the development of new locations, issuance of bank guarantee letters and credit card. The loan is secured with property, plant and equipment of each restaurant location for which the credit limited has been utilised. The carrying amount of pledged property, plant and equipment and cash and cash equivalents is disclosed in Notes 10 and 16. Covenants: The Company’s borrowing arrangement with the Bank contains several covenants, mainly of quantitative nature, out of which the most important relates to the level of the service debt (whereby service debt is equal to EBITDA/ [principal plus interest payable]), which should exceed for any month 2.5. Breaches in meeting the financial covenants would permit the bank to immediately call loans and borrowings. There have been no breaches of the financial covenants of for the years ended 31 December 2016, 2015 and 2014.

AMERICAN RESTAURANT SYSTEM SA NOTES TO THE FINANCIAL STATEMENTS FOR THE YEAR ENDED 31 DECEMBER 2016 All amounts in RON thousand, unless specified otherwise
F - 85
13. Financial instruments risk management The Company’s principal financial liabilities comprise loans and borrowings, including finance leases and trade and other payables. The main purpose of these financial liabilities is to finance the Company’s operations. The Company’s principal financial assets are represented by trade and other receivables and cash and short-term deposits that derive directly from its operations, as well as long-term deposits to guarantee rent payables. The Company is exposed to interest rate risk, foreign exchange risk, credit risk and liquidity risk. The Company’s senior management oversees the management of these risks. The Company’s senior management ensures that the Company’s financial risk activities are performed under appropriate procedures and that financial risks are identified, measured and managed in accordance with Company’s risk appetite. Interest rate risk The Company's income and operating cash flows are substantially independent of changes in market interest rates. Trade and other receivables and payables are non-interest bearing financial assets and liabilities. The borrowings are usually exposed to interest rate risk through market value fluctuations of interest-bearing long-term and short-term credit facilities. Interest rates on the Company's debt finance are variable. The interest rates on credit facilities of the Company are disclosed in Note 12. Changes in interest rates impact primarily loans and borrowings by changing either their future cash flows (variable rate debt). Management policy is to resort mainly to variable rate financing. However, at the time of rising new loans or borrowings management uses its judgment to decide whether it believes that fixed or variable rate would be more favourable to the Company over the expected period until maturity. Interest rate sensitivity The following table demonstrates the sensitivity to a reasonably possible change in interest rates on loans and borrowings. With all other variables held constant, the Company’s profit before tax and equity are affected through the impact on floating rate borrowings, as follows:
Increase
Effect on profit
in basis points
before tax
31 December 2016
EUR 1%
(115) 31 December 2015
EUR 1%
(58)
31 December 2014 EUR 1%
(19)
1 January 2014 1% EUR
(43)
The Company does not hedge its interest rate risk. The assumed movement in basis points for interest rate sensitivity analysis is based on the currently observable market environment. An equal decrease of the interest rate would have the same effect but of opposite impact.

AMERICAN RESTAURANT SYSTEM SA NOTES TO THE FINANCIAL STATEMENTS FOR THE YEAR ENDED 31 DECEMBER 2016 All amounts in RON thousand, unless specified otherwise
F - 86
13. Financial instruments risk management (continued) Foreign currency risk Foreign currency risk is the risk that the fair value or future cash flows of a financial instrument will fluctuate because of changes in foreign exchange rates. The Company’s exposure to the risk of changes in foreign exchange rates relates primarily to the Company’s financing activities, as the financing contracted by the Company is Euro based. The vast majority of revenues, expenses, trade and other receivables and payables is in RON. The Company monitors the currency risk by following changes in exchange rates in currencies in which its intercompany balances and external debts are denominated. The Company does not have formal arrangements to mitigate its currency risk. Foreign currency sensitivity The following table demonstrates the sensitivity to a reasonably possible change in the EUR exchange rate. The Company’s exposure to foreign currency changes for all other currencies is not material. With all other variables held constant the Company’s profit before tax and equity are affected as follows:
Change in EUR rate
Effect on profit before tax
Effect on pre-tax equity
31 December 2016 1%
(116)
(116)
31 December 2015 1%
(112)
(112) 31 December 2014 1%
(45)
(45)
1 January 2014 1%
(62)
(62) Credit risk The Company is not significantly exposed to credit risk as the majority of its sales are on a cash basis. The Company's credit risk is primarily attributed to trade and other receivables and balances with banks. The carrying amount of trade and other receivables, net of allowance for impairment (Note 15) and deposits for rent guarantee as per statement of financial position plus balances with banks (Note 16) represent the maximum amount exposed to credit risk. Management believes that there is no significant risk of loss to the Company beyond the allowance already recorded. The Company invests cash and cash equivalents with highly reliable financial institutions. The Company has only plain vanilla deposits with reputable banks, none of which has experienced any difficulties in 2016 or up to the date of these financial statements. The majority of cash is transacted through and placed with Alpha Bank Romania, member of Alpha Bank Group from Greece and Banca Romana de Dezvoltare (BRD), a member of Societe Generale Group from France. The long-term credit rating of Alpha Bank Greece is Caa3 as provided by Moody’s rating agency, no credit rating being available for its Romanian subsidiary. The long-term credit rating of BRD provided by Moody’s is Baa3. There is no significant concentration of credit risk in respect of trade and other receivables due to the fact that sales are based mainly on cash and credit card payments. Therefore there are no formal policies in the Group to manage credit risk for trade receivables. The Company's credit risk is primarily attributed to loans and receivables from related parties, for which the probability of losses is considered remote.

AMERICAN RESTAURANT SYSTEM SA NOTES TO THE FINANCIAL STATEMENTS FOR THE YEAR ENDED 31 DECEMBER 2016 All amounts in RON thousand, unless specified otherwise
F - 87
13. Financial instruments risk management (continued) Liquidity risk The Company has adopted a prudent financial liquidity management approach, assuming that sufficient cash and cash equivalents are maintained and that further financing is available from guaranteed funds from credit lines. The tables below summarizes the maturity profile of the Company’s financial liabilities, including principal amounts and interests according to contractual terms, at 31 December 2016, 31 December 2015, 31 December 2014 and 1 January 2014 based on contractual undiscounted payments.
31 December 2016 On
Less than
3 to 12
1 to 5
demand
3 months
months
years
Total
Interest-bearing loans and borrowings 10
1,064
3,136
7,793
12,003 Trade and other payables 1,133
10,544
21
329
12,027
Total: 1,143
11,608
3,157
8,122
24,030
31 December 2015 On
Less than
3 to 12
1 to 5
demand
3 months
months
years
Total
Interest-bearing loans and borrowings 5
708
1,547
3,820
6,080 Trade and other payables 3,774
11,483
22
302
15,581
Total: 3,779
12,191
1,569
4,122
21,661
31 December 2014 On
Less than
3 to 12
1 to 5
demand 3 months
months
years
Total
Interest-bearing loans and borrowings 1
587
884
499
1,971 Trade and other payables 5,451
7,802
(80)
307
13,480
Total: 5,452
8,389
804
806
15,451
1 January 2014 On
Less than
3 to 12
1 to 5
demand 3 months
months
years
Total
Interest-bearing loans and borrowings 4
673
1,815
1,971
4,463 Trade and other payables 4,891
6,250
330
151
11,622
Total: 4,895
6,923
2,145
2,122
16,085
At 31 December 2016, the Company had available undrawn committed borrowing facilities in amount of 49,693 (31 December 2015: 59,719, 31 December 2014: 64,216 and 1 January 2014: 60,002, thus being able to respond to any unforeseen higher cash outflow needs. The credit facilities above are available to both the Company and US Foods Network SA (a related party, see Note 22) for drawing, without a limit between them.

AMERICAN RESTAURANT SYSTEM SA NOTES TO THE FINANCIAL STATEMENTS FOR THE YEAR ENDED 31 DECEMBER 2016 All amounts in RON thousand, unless specified otherwise
F - 88
13. Financial instruments risk management (continued) Capital management Capital includes the equity attributable to the equity holders. The primary objective of the Company’s capital management is to ensure that it maintains a strong credit rating and healthy capital ratios in order to support its business and maximise shareholder value. The Company manages its capital structure and makes adjustments to it in light of changes in economic conditions and the requirements of the financial covenants. To maintain or adjust the capital structure, the Company may adjust the dividend payment to shareholders, return capital to shareholders or issue new shares. The Company may monitor capital using a gearing ratio, which is net debt divided by total capital plus net debt. The Company does not have a target gearing ratio. The Company includes within net debt, interest bearing loans and borrowings, trade and other payables, less cash and cash deposits.
31 December 2016
31 December 2015
31 December 2014
1 January 2014
Interest-bearing loans and borrowings 11,471 5,810 1,927 4,314 Trade and other payables 12,027 15,581 13,479 11,622 Less: cash and short-term deposits 3,294 5,574 1,306 1,287
Net debt 20,204 15,817 14,100 14,649
Equity 5,980 8,781 6,607 4,887
Capital and net debt 26,184 24,598 20,707 19,536
Gearing ratio 77% 64% 68% 75% The Company’s capital management, amongst other things, aims to ensure that it meets financial covenants attached to the interest-bearing loans and borrowings that define capital structure requirements. For the covenants in force as at 31 December 2016, 2015, 2014 and 1 January 2014, please refer to Note 12. No changes were made in the objectives, policies or processes for managing capital during the years ended 31 December 2016, 2015 and 2014. Fair values The Company has no financial instruments carried at fair value in the statement of financial position. The carrying amount of the interest bearing loans and borrowings approximate their fair value. Management estimates that the margin applicable over Euribor at the balance sheet date would be similar to the ones at the dates of each previous withdrawal, due to the fact that the Company maintained over the past years a stable financial condition, and also based on the statistics published by the National Bank of Romania. Financial instruments which are not carried at fair value on the statement of financial position also include deposits to guarantee rent, trade and other receivables, cash and cash equivalents, and trade and other payables. The carrying amounts of these financial instruments are considered to approximate their fair values, due to their short term nature (in majority) and low transaction costs of these instruments.

AMERICAN RESTAURANT SYSTEM SA NOTES TO THE FINANCIAL STATEMENTS FOR THE YEAR ENDED 31 DECEMBER 2016 All amounts in RON thousand, unless specified otherwise
F - 89
14. Inventories
31 December
2016
31 December
2015
31 December
2014
1 January
2014
Raw materials 522 3,038 2,393 2,337 Consumables 410 1,579 1,421 1,203 Finished goods 179 2,141 3,172 2,767
Total inventories 1,111 6,758 6,986 6,307
During 2016, inventories amounting to 28,901 (2015: 21,724, 2014: 17,657) were recognised as an expense in profit or loss, in ‘’Food and materials’’ as well as in ‘’General and administrative expenses, net’’ (“Small-wares” and “Cleaning supplies”). 15. Trade and other receivables
31
December 2016
31 December
2015
31 December
2014
1 January
2014
Trade receivables, net 4,429 430 293 393
Trade receivables from related parties 1,032 4,676 5,364 3,209 Tax receivables 354 - - - Meal tickets 245 228 179 217 Other debtors 29 29 13 30
Total 6,089 5,363 5,849 3,849
Terms and conditions relating to related party transactions are described in Note 22. Trade receivables are non-interest bearing and are generally on terms of 30-90 days. As at 31 December 2016, 2015 and 2014, trade and other receivables with a value of 8 were impaired and fully provided for.
Total
At 1 January 2014 -
Charge for the year 8
At 31 December 2014 8
At 31 December 2015 8
At 31 December 2016 8

AMERICAN RESTAURANT SYSTEM SA NOTES TO THE FINANCIAL STATEMENTS FOR THE YEAR ENDED 31 DECEMBER 2016 All amounts in RON thousand, unless specified otherwise
F - 90
15. Trade and other receivables (continued) The ageing analysis of trade receivables and trade receivables from related parties, net of allowances is, as follows:
Past due but not impaired
Total
Neither past due nor impaired
< 30 days
30-60 days
61-90 days
91-120 days
> 120 days
2016 5,461
174
2,455
1,811
45
21
955 2015 5,106
2,575
1,205
44
26
25
1,231
2014 5,657
2,207
2,111
25
31
23
1,260 1 Jan 2014 3,602
459
1,474
135
36
28
1,470
16. Cash and short-term deposits
31 December 2016
31 December 2015
31 December 2014
1 January 2014
Cash at banks and on hand 3,149 5,540 1,282 1,270 Cash in transit 145 34 24 17
Total 3,294 5,574 1,306 1,287
Deposits at banks earns interest at floating rates based on daily bank deposit rates. Short-term deposits are made for varying periods of between one day and three months, depending on the immediate cash requirements of the Group. As part of the financing agreement with Alpha Bank the Company has pledged the cash available in the accounts opened with the bank. The balance of the pledged bank accounts as at 31 December 2016 is of 1,589 (31 December 2015: 3,019, 31 December 2014: 377 and 1 January 2014: 199). 17. Issued capital
The Company’s shareholders at 31 December 2016 are Lunic Franchising and Consulting Ltd. (22.34%), Tatika Investments (27.33%), M.B.L. Computers (23%), Wellkept Group SA (16.34%) and Anasa Properties SRL (10.99%). The Company’s shareholders at 31 December 2015 and 2014 were: Lunic Franchising and Consulting Ltd. (22.34%), Tatika Investments (27.33%), Blandon Enterprises Ltd. (27.33%) and M.B.L. Computers (23%). The Company’s shareholders at 1 January 2014 were: Lunic Franchising and Consulting Ltd. (22.22%), Tatika Investments (27.5%), Blandon Enterprises Ltd. (27.5%) and M.B.L. Computers (22.78%).
31 December 2016
31 December 2015
31 December 2014
1 January 2014
Authorised shares
Ordinary shares of 0.25 RON each 380,000
380,000
380,000
380,000 Share capital (RON, thousand) 95
95
95
95
Hyperinflation (RON, thousand) 1,549 1,549 1,549 1,549
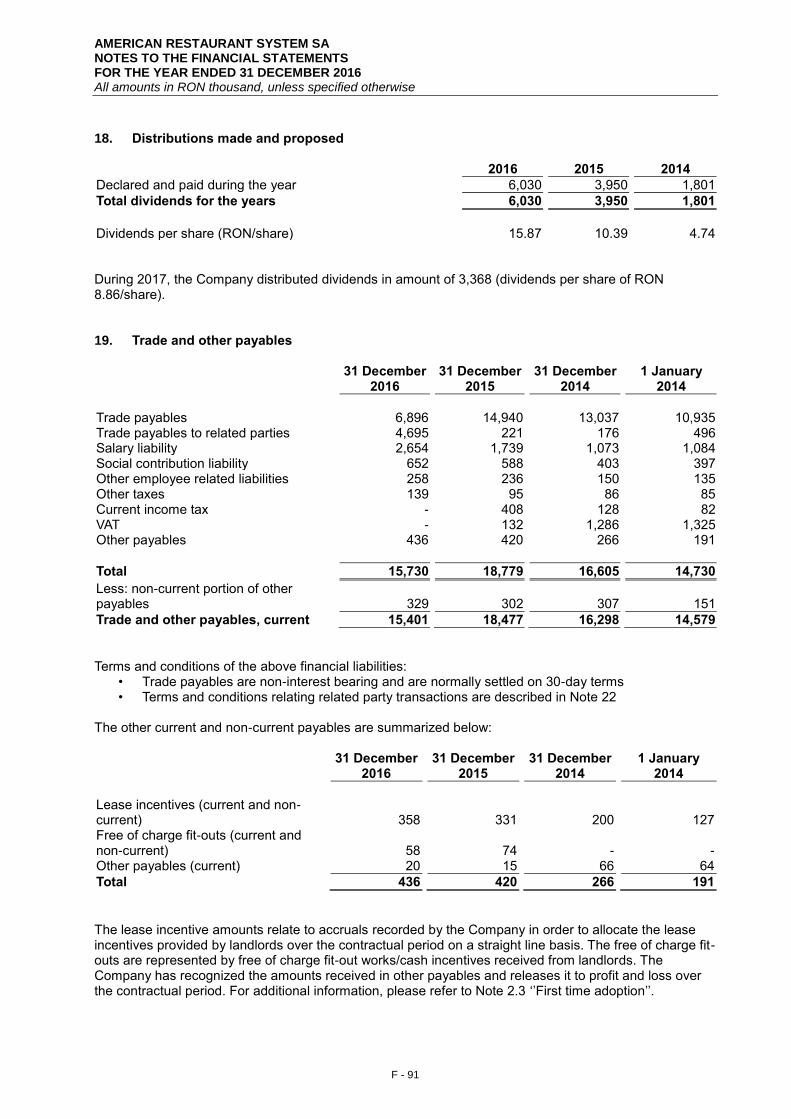
AMERICAN RESTAURANT SYSTEM SA NOTES TO THE FINANCIAL STATEMENTS FOR THE YEAR ENDED 31 DECEMBER 2016 All amounts in RON thousand, unless specified otherwise
F - 91
18. Distributions made and proposed
2016
2015
2014
Declared and paid during the year 6,030
3,950
1,801
Total dividends for the years 6,030
3,950
1,801
Dividends per share (RON/share) 15.87
10.39
4.74
During 2017, the Company distributed dividends in amount of 3,368 (dividends per share of RON 8.86/share).
19. Trade and other payables
31 December 2016
31 December 2015
31 December 2014
1 January 2014
Trade payables 6,896 14,940 13,037 10,935 Trade payables to related parties 4,695 221 176 496 Salary liability 2,654 1,739 1,073 1,084 Social contribution liability 652 588 403 397 Other employee related liabilities 258 236 150 135 Other taxes 139 95 86 85 Current income tax - 408 128 82 VAT - 132 1,286 1,325 Other payables 436 420 266 191
Total 15,730 18,779 16,605 14,730
Less: non-current portion of other payables 329 302 307 151
Trade and other payables, current 15,401 18,477 16,298 14,579
Terms and conditions of the above financial liabilities:
• Trade payables are non-interest bearing and are normally settled on 30-day terms • Terms and conditions relating related party transactions are described in Note 22
The other current and non-current payables are summarized below:
31 December 2016
31 December 2015
31 December 2014
1 January 2014
Lease incentives (current and non-current) 358 331 200 127 Free of charge fit-outs (current and non-current) 58 74 - - Other payables (current) 20 15 66 64
Total 436 420 266 191
The lease incentive amounts relate to accruals recorded by the Company in order to allocate the lease incentives provided by landlords over the contractual period on a straight line basis. The free of charge fit-outs are represented by free of charge fit-out works/cash incentives received from landlords. The Company has recognized the amounts received in other payables and releases it to profit and loss over the contractual period. For additional information, please refer to Note 2.3 ‘’First time adoption’’.

AMERICAN RESTAURANT SYSTEM SA NOTES TO THE FINANCIAL STATEMENTS FOR THE YEAR ENDED 31 DECEMBER 2016 All amounts in RON thousand, unless specified otherwise
F - 92
20. EBITDA
Note 2016 2015 2014
Operating profit from continuing operations
5,629 8,154 5,084
Adjustments to bridge operating profit to EBITDA:
Depreciation and amortization included in restaurant expenses Note 7 2,666 2,114 2,188 Depreciation and amortization included in general and administration expenses Note 7 137 133 151
EBITDA from continuing operations
8,432 10,401 7,423
Operating loss from discontinued operations
(2,141) (477) (708)
Adjustments to bridge operating profit to EBITDA:
Depreciation and amortization expenses
Note 23 382 171 131
Impairment of assets held for sale Note 23 966 - -
EBITDA from discontinued operations
(793) (306) (577)
Total operating profit 3,466 7,454 4,782 Total adjustments for depreciation, amortization and impairment
4,237 2,641 2,213
Total EBITDA:
7,639 10,095 6,846
EBITDA is one of the key performance measures monitored by senior management. EBITDA would be normalized to exclude any significant one-off items (either revenues or expenses) but no such exclusions were necessary for the years ended 31 December 2016, 2015 and 2014. 21. Commitments and contingencies Operating lease commitments — Company as lessee The Company has entered into operating lease agreements for the premises of most of its restaurants. The lease terms are between five and ten years. Future minimum rentals payable under non-cancellable operating leases are, as follows:
31 December
2016 31 December
2015 31 December
2014 1 January
2014
Within one year 8,056 7,627
6,033 5,825
After one year but not more than five years 18,521 15,838
15,619 18,132
More than five years 1,378 126
803 2,799
Total: 27,955 23,591
22,455 26,756

AMERICAN RESTAURANT SYSTEM SA NOTES TO THE FINANCIAL STATEMENTS FOR THE YEAR ENDED 31 DECEMBER 2016 All amounts in RON thousand, unless specified otherwise
F - 93
21. Commitments and contingencies (continued) Finance lease The Company has finance leases for vehicles. The Company’s obligations under finance leases are secured by the lessor’s title to the leased assets. Future minimum lease payments under finance leases and hire purchase contracts, together with the present value of the net minimum lease payments are, as follows:
31 December 2016
31 December 2015
31 December 2014
As at 1 January 2014
Minimum payments
Present value of
payments
Minimum payments
Present value of
payments
Minimum payments
Present value of
payments
Minimum payments
Present value of
payments
Within one year 162 155
188 178
84 79
113 103 After one year but not more than five years 83 81
149 143
74 71
158 151
More than five years - -
- -
- -
- -
Total minimum lease payments 245 236
337 321
158 150
271 254
Less amounts representing finance charges 9 -
16 -
8 -
18 -
Present value of minimum lease payments 236 236
321 321
150 150
253 254
Bank letter of guarantee The Company has issued bank letters of guarantee in favour of suppliers as at 31 December 2016 in amount of 2,228 (31 December 2015: 1,791, 31 December 2014: 1,203 and 1 January 2014: 1,450).
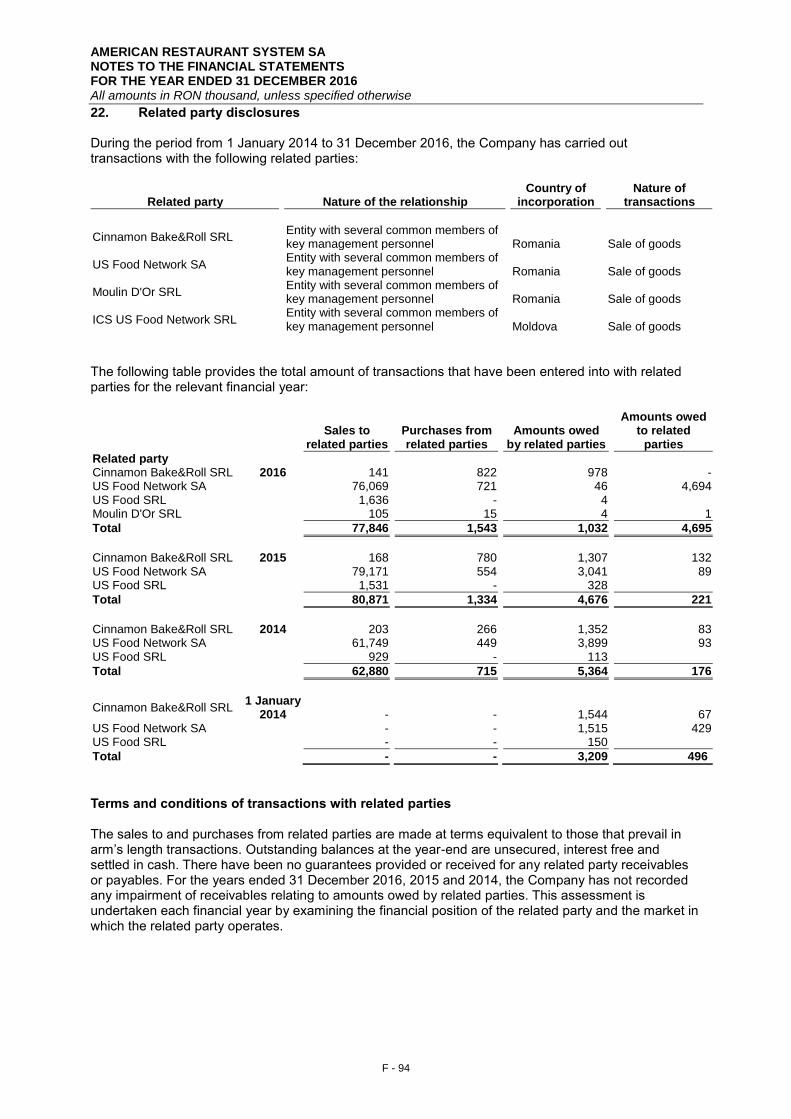
AMERICAN RESTAURANT SYSTEM SA NOTES TO THE FINANCIAL STATEMENTS FOR THE YEAR ENDED 31 DECEMBER 2016 All amounts in RON thousand, unless specified otherwise
F - 94
22. Related party disclosures During the period from 1 January 2014 to 31 December 2016, the Company has carried out transactions with the following related parties:
Related party
Nature of the relationship Country of
incorporation Nature of
transactions
Cinnamon Bake&Roll SRL Entity with several common members of key management personnel
Romania
Sale of goods
US Food Network SA Entity with several common members of key management personnel
Romania
Sale of goods
Moulin D'Or SRL Entity with several common members of key management personnel
Romania
Sale of goods
ICS US Food Network SRL Entity with several common members of key management personnel
Moldova
Sale of goods
The following table provides the total amount of transactions that have been entered into with related parties for the relevant financial year:
Sales to related parties
Purchases from related parties
Amounts owed
by related parties
Amounts owed to related
parties
Related party
Cinnamon Bake&Roll SRL 2016 141 822 978 - US Food Network SA 76,069 721 46 4,694 US Food SRL 1,636 - 4
Moulin D'Or SRL 105 15 4 1
Total 77,846 1,543 1,032 4,695
Cinnamon Bake&Roll SRL 2015 168 780 1,307 132 US Food Network SA 79,171 554 3,041 89 US Food SRL 1,531 - 328
Total 80,871 1,334 4,676 221
Cinnamon Bake&Roll SRL 2014 203 266 1,352 83 US Food Network SA 61,749 449 3,899 93 US Food SRL 929 - 113
Total 62,880 715 5,364 176
Cinnamon Bake&Roll SRL
1 January 2014 - - 1,544 67
US Food Network SA - - 1,515 429 US Food SRL - - 150
Total - - 3,209 496
Terms and conditions of transactions with related parties The sales to and purchases from related parties are made at terms equivalent to those that prevail in arm’s length transactions. Outstanding balances at the year-end are unsecured, interest free and settled in cash. There have been no guarantees provided or received for any related party receivables or payables. For the years ended 31 December 2016, 2015 and 2014, the Company has not recorded any impairment of receivables relating to amounts owed by related parties. This assessment is undertaken each financial year by examining the financial position of the related party and the market in which the related party operates.

AMERICAN RESTAURANT SYSTEM SA NOTES TO THE FINANCIAL STATEMENTS FOR THE YEAR ENDED 31 DECEMBER 2016 All amounts in RON thousand, unless specified otherwise
F - 95
22. Related party disclosures (continued) Compensation of key management personnel of the Company:
2016 2015 2014
Short-term employee benefits
838 814 621
Fees paid to management entities 1,106 800 457
Total compensation paid to key management personnel
1,944 1,614 1,078
The amounts disclosed in the table are the amounts recognised as an expense during each reporting period. 23. Discontinued operations Up to the second half of 2016, the Company has acted as a purchase hub for some related entities, such as US Food Network SA (both Romanian and Moldavian operations) or Cinnamon Bake & Roll SRL. All food supplies, beverages or other consumables were purchased by the Company and sold at a mark-up designed to broadly cover any other operating costs directly associated with this line of business. In November 2016, the Company together with US Food Network SA and the other related parties have outsourced this activity to Havi Logistics SA, a third party company specialized in integrated logistics services for the food industry. Accordingly, in these financial statements, this line of business has been classified and disclosed as a discontinued operation. The results of the purchasing hub line of business for the past years are presented below:
2016 2015 2014
Sales of goods 84,703 81,857 63,111
Direct expenses: Food and material 74,351 72,738 56,107 Payroll and employee benefits 2,321 2,720 2,853 Depreciation and amortization 382 171 131 Impairment of assets held for sale 966 - - Other operating expenses, net 7,621 5,057 2,860
Operating profit/(loss) (938) 1,171 1,160
General and administration expenses, net 1,203 1,648 1,868
Profit/(loss) before tax (2,141) (477) (708)
Income tax benefit: 188 80 113
Profit/(loss) for the year (1,953) (397) (595)
The net cash flows incurred by this line of business were as follows:
2016 2015 2014
Cash flow from operating activities (6,681) 2,002 (1,758) Cash flow from investing activities - (705) (20)
Net cash inflow/(outflow) (6,681) 1,297 (1,778)
Prior to outsourcing, the supply activity involved 43 employees. Following the outsourcing, a number of 14 employees were redeployed within the Company, while the rest left it.

AMERICAN RESTAURANT SYSTEM SA NOTES TO THE FINANCIAL STATEMENTS FOR THE YEAR ENDED 31 DECEMBER 2016 All amounts in RON thousand, unless specified otherwise
F - 96
24. Events after the reporting period On 5 January, 2017 the Company has concluded an agreement with Cinnamon Bake & Roll SRL (a related party) for the rescheduling of its payable towards the Company in amount of 978 over a two year period (up to 31 January 2019). In 2017, the shareholders of the Company have set-up a new entity called Sphera Franchise Group SA (‘’Sphera’’). As of the date of these financial statements, Sphera has become the parent company of ARS, following the contribution by the existing shareholders of their shares in ARS in exchange for shares in Sphera. The purpose of the reorganization was to ensure a better coordination of activities and enhance value creation, by taking advantage of the synergies at group level and by achieving economies of scale. In January 2017, the local taxation regulations have changed for the companies active in the restaurant industry, more comprehensive details being provided in Note 9. During 2017, the Company distributed dividends in amount of 3,368 (dividends per share of RON 8.86/share). Up to the date of these financial statements, the Company has drawn additional EUR 403 thousand from its borrowing facility concluded with Alpha Bank.

SPHERA FRANCHISE GROUP SA INTERIM CONSOLIDATED FINANCIAL STATEMENTS Prepared in accordance with International Financial Reporting Standards 30 June 2017
F - 97
SPHERA FRANCHISE GROUP SA
INTERIM CONSOLIDATED FINANCIAL STATEMENTS Prepared in accordance with International Financial Reporting Standards as adopted by the European Union 30 June 2017

SPHERA FRANCHISE GROUP SA INTERIM CONSOLIDATED FINANCIAL STATEMENTS Prepared in accordance with International Financial Reporting Standards 30 June 2017
F - 98
CONTENTS Independent auditors’ review report to the shareholders of Sphera Franchise Group SA F - 99 Interim consolidated statement of comprehensive income F - 100 Interim consolidated statement of financial position F – 101 Interim consolidated statement of changes in equity F - 102 Interim consolidated statement of cash flows F - 103 Notes to the interim consolidated financial statements F - 104

Ernst & Young Assurance Services SRL Cladirea Bucharest Tower Center, et. 21 Bd. Ion Mihalache nr. 15-17, Sector 1
011171 Bucuresti, Romania
Tel: +40 21 402 4000 Fax: +40 21 310 7193 [email protected]
ey.com
Report on review of interim consolidated financial information
To the Shareholders of Sphera Franchise Group S.A.
Introduction
We have reviewed the accompanying interim consolidated financial statements of Sphera
Franchise Group S.A. (“the Company”) and its subsidiaries (together the “Group”), which
comprise the interim consolidated statement of financial position as at 30 June 2017 and the
consolidated interim statement of comprehensive income, statement of changes in equity and
statement of cash flows for the six months period ended 30 June 2017 and a summary of
accounting policies and other explanatory information. Management is responsible for the
preparation and fair presentation of this consolidated interim financial information in accordance
with International Financial Reporting Standards applicable to interim financial reporting as
adopted by the European Union (“IAS 34”). Our responsibility is to express a conclusion on the
accompanying consolidated interim financial information based on our review.
Scope of review
We conducted our review in accordance with International Standard on Review Engagements
2410, “Review of Interim Financial Information Performed by the Independent Auditor of the
Entity.” A review of interim financial information consists of making inquiries, primarily of persons
responsible for financial and accounting matters, and applying analytical and other review
procedures. A review is substantially less in scope than an audit conducted in accordance with
International Standards on Auditing and consequently does not enable us to obtain assurance
that we would become aware of all significant matters that might be identified in an audit.
Accordingly, we do not express an audit opinion.
Conclusion
Based on our review, nothing has come to our attention that causes us to believe that the
accompanying interim consolidated financial statements do not give a true and fair view of the
consolidated financial position of the Group as at 30 June 2017, and of its consolidated financial
performance and its cash flows for the six month period then ended in accordance with
International Financial Reporting Standards applicable to interim financial reporting as adopted
by the European Union (“IAS 34”).
On behalf of
Ernst & Young Assurance Services SRL
Alina Dimitriu Bucharest, Romania
Executive Director 14 September 2017

SPHERA FRANCHISE GROUP SA INTERIM CONSOLIDATED STATEMENT OF COMPREHENSIVE INCOME FOR THE SIX MONTHS ENDED 30 JUNE 2017 All amounts in RON thousand, unless specified otherwise
F - 100
NNote 30 June 2017 30 June 2016
Restaurant sales 242,204 193,220 Restaurant expenses Food and material expenses 87,944 74,225 Payroll and employee benefits 8.1 43,430 30,623 Rent 17,001 12,984 Royalties 14,125 11,380 Advertising 11,724 8,457 Other operating expenses, net 6 18,474 14,330 Depreciation and amortization 8.2 4,952 4,198
Restaurant operating profit 44,554 37,023
General and administration expenses, net 7 15,832 10,625
Operating profit 28,722 26,398
Finance costs 9.1 440 978 Finance income 9.2 109 125
Profit before tax 28,391 25,545
Income tax expense/(credit) 10 1,189 3,315
Profit for the period 27,202 22,230
Attributable to:
Equity holders of the parent 27,090 22,216 Non-controlling interests 112 14
Other comprehensive income Other comprehensive income to be reclassified to profit or loss in subsequent periods (net of tax):
(30) (21)
Exchange differences on translation of foreign operations
Total comprehensive income for the period, net of tax 27,172 22,209
Attributable to: Equity holders of the parent 27,060 22,198 Non-controlling interests 112 11 Earnings per share, basic and diluted (RON/share) 22 0.7667 0.6412 These interim consolidated financial statements from page 3 to page 45 were approved by the Board of Directors and were authorised for issue on 29 August 2017. Mark Hilton
General Manager Sphera Franchise Group SA

SPHERA FRANCHISE GROUP SA INTERIM CONSOLIDATED STATEMENT OF FINANCIAL POSITION AS AT 30 JUNE 2017 All amounts in RON thousand, unless specified otherwise
F - 101
Notes
30 June 2017
31 December 2016
Assets
Non-current assets
143,055 54,246
Property, plant and equipment 11
81,159 47,551 Intangible assets 12
60,475 6,365
Trade and other receivables 285 - Deposits for rent guarantee
668 290
Deferred tax assets 10
468 40
Current assets
51,769 65,399
Inventories 15
7,458 5,744 Trade and other receivables 16
5,077 8,780
Prepayments
3,418 1,907 Cash and short-term deposits 17
35,816 48,968
Assets held for sale 195 -
Total assets
195,019 119,645
Equity and liabilities
Equity
Issued capital 18
581,990 190 Share premium 18 (520,557) - Other capital reserves
- 19
Retained earnings
38,977 58,124 Foreign currency translation reserve
(71) (41)
Equity attributable to equity holders of the parent
100,339 58,292
Non-controlling interests
3 (39)
Total equity
100,342 58,253
Non-current liabilities
33,223 16,304
Interest-bearing loans and borrowings 13
31,227 14,630 Trade and other payables 20
1,996 1,674
Current liabilities
61,454 45,088
Trade and other payables 20
45,650 37,292 Interest-bearing loans and borrowings 13
15,804 7,796
Total liabilities
94,677 61,391
Total equity and liabilities
195,019 119,645
These interim consolidated financial statements from page 3 to page 45 were approved by the Board of Directors and were authorised for issue on 29 August 2017.

SPHERA FRANCHISE GROUP SA INTERIM CONSOLIDATED STATEMENT OF CHANGES IN EQUITY FOR THE SIX MONTHS ENDED 30 JUNE 2017 All amounts in RON thousand, unless specified otherwise
F - 102
Issued capital
Share premium
Other capital
reserves
Retained earnings
Foreign currency
translation reserve
Total equity
Non-controlling
interest
Total equity
As at 1 January 2017 190 - 19 58,124 (41) 58,292 (39) 58,253
Profit for the period - - - 27,090 - 27,090 112 27,202
Other comprehensive income Translation differences - - - - (30) (30) - (30)
Total comprehensive income - - - 27,090 (30) 27,060 112 27,172 Capital contribution from shareholders (Note 1, Note 18) 1,500 - - - - 1,500 - 1,500 Group reorganization (Note 1, Note 5.2, Note 18) 580,300 (519,495) (19) - - 60,786 - 60,786 Costs related to reorganization and anticipated listing (Note 18) - (1,062)
- - - (1,062) - (1,062)
Cash dividends - - - (46,237) - (46,237) (70) (46,307)
At 30 June 2017 581,990 (520,557) - 38,977 (71) 100,339 3 100,342
Issued capital
Share premium
Other capital
reserves
Retained earnings
Foreign currency
translation reserve
Total equity
Non-controlling
interest
Total equity
As at 1 January 2016 190
- 19
50,392
(122)
50,479
3
50,482
Profit for the period -
- -
22,216
-
22,216
14
22,230
Other comprehensive income
Translation differences -
- -
-
(18)
(18)
(3)
(21)
Total comprehensive income -
- -
22,216
(18)
22,198
11
22,209
Cash dividends -
- -
(40,961)
-
(40,961)
-
(40,961)
At 30 June 2016 190
- 19
31,647
(140)
31,716
14
31,730
These interim consolidated financial statements from page 3 to page 45 were approved by the Board of Directors and were authorised for issue on 29 August 2017.

SPHERA FRANCHISE GROUP SA INTERIM CONSOLIDATED STATEMENT OF CASH FLOWS FOR THE SIX MONTHS ENDED 30 JUNE 2017 All amounts in RON thousand, unless specified otherwise
F - 103
Note
30 June 2017
30 June 2016
Operating activities Profit before tax
28,391 25,545
Adjustments to reconcile profit before tax to net cash flows:
Depreciation of property, plant and equipment 11 5,692 4,394 Amortisation of intangible assets 12 487 390 Net foreign exchange differences
(71) (65)
Loss on disposal of property, plant and equipment
- 148 Finance income 9.2 (109) (125) Finance costs 9.1 395 332 Working capital adjustments:
Decrease in trade and other receivables and prepayments
4,794 835 (Increase)/decrease in inventories
(516) 314
Decrease in trade and other payables
(5,281) (2,933) Interest received
109 125
Interest paid
(434) (324) Income tax paid
(1,848) (4,078)
Net cash flows from operating activities
31,609 24,558
Investing activities
Proceeds from sale of property, plant and equipment
- 8
Purchase of intangible assets
(1,132) (1,573) Purchase of property, plant and equipment
(14,596) (6,294)
Acquisition of subsidiary, net of cash 5.2 2,161 -
Net cash flows used in investing activities
(13,567) (7,859)
Financing activities
Capital contribution from shareholders of Sphera on set up, net of transaction costs paid 18
1,151 -
Proceeds from borrowings
19,225 3,552 Repayment of borrowings
(5,051) (3,678)
Payment of finance lease liabilities (134) (156) Dividends paid to equity holders of the parent
(46,237) (40,961)
Dividends paid to non-controlling interests
(70) -
Net cash flows used in financing activities
(31,116) (41,263)
Net decrease in cash and cash equivalents
(13,074) (24,564)
Net foreign exchange differences
(78) (18)
Cash and cash equivalents at 1 January
48,968 43,599
Cash and cash equivalents at 30 June
35,816 19,017
These interim consolidated financial statements from page 3 to page 45 were approved by the Board of Directors and were authorised for issue on 29 August 2017.

SPHERA FRANCHISE GROUP SA NOTES TO INTERIM CONSOLIDATED FINANCIAL STATEMENTS FOR THE SIX MONTHS ENDED 30 JUNE 2017 All amounts in RON thousand, unless specified otherwise
F - 104
1. CORPORATE INFORMATION These interim consolidated financial statements are prepared by Sphera Franchise Group SA and comprise its activities and those of its subsidiaries, together referred hereinafter as ‘’SFG’’ or ‘’the Group’’. The interim consolidated financial statements for the six months ended 30 June 2017 were authorized for issue in accordance with the resolution of the Board of Directors dated 29 August 2017. The Group operates quick service and takeaway restaurant concepts (a chain of 66 restaurants) under the Kentucky Fried Chicken (‘’KFC’’), spread across Romania as well as in the Republic of Moldova and in Italy, out of which one is not opened to public, as at 30 June 2017. The Group also operates a chain of pizza restaurants (21 restaurants as at 30 June 2017) as well as pizza delivery points (13 locations as at 30 June 2017) under the Pizza Hut (“PH”) and Pizza Hut Delivery (“PHD”) brands, spread across Romania, and one restaurant under Paul brand, in Romania. The Group’s number of employees at 30 June 2017 was 4,238 (31 December 2016: 2,942). Sphera Franchise Group SA (‘’the legal Parent’’, or ‘’Sphera’’) was incorporated on 16 May 2017 as a joint stock company and is registered at No. 239 Calea Dorobanti, Bucharest, Romania. The purpose of the Group reorganization that resulted in the establishment of Sphera as the legal parent company of US Food Network SA (USFN), American Restaurant System SA (ARS), US Food Network SRL (USFN Italy or Italian subsidiary), US Food Network SRL (USFN Moldova or Moldavian subsidiary) and California Fresh Flavors SRL (Taco Bell) was to ensure a better coordination of activities and enhance value creation, by taking advantage of the synergies at group level and by achieving economies of scale. In terms of activities, Sphera will take over gradually until the end of September 2017 certain activities as well as 105 employees from USFN and ARS and will render to the benefit of the Group entities services such as management services, marketing support, development, sales support, human resources and other services. Sphera has become the parent company of USFN and ARS on 30 May 2017, following the contribution by shareholders of USFN and ARS of 99.9997% of the shares in the two companies in exchange for shares in Sphera. On 8 June 2017 and 14 June 2017, Sphera purchased the shares held by USFN in US Food Network SRL (Republic of Moldova) and respectively US Food Network SRL (Italy). USFN was incorporated in 1994 as a joint stock company and is registered at No. 28-30 Gheorghe Magheru Boulevard, Bucharest, Romania. For the purpose of preparing IFRS consolidated financial statements, USFN has been identified as being the acquirer of ARS on 30 May 2017, in accordance with the requirements of IFRS 3 (further detailed in Note 2.3). On this basis, the consolidated financial statements of SFG are a continuation of the consolidated financial statements of USFN. The acquisition of ARS is further detailed in Note 5.2. Since Sphera was not a business, the transition from USFN to Sphera as legal parent of the Group was accounted for as described in Note 18. ARS’ was incorporated in 1994 as a joint stock company and is registered at No. 5-7 Calea Dorobantilor Street, Bucharest, Romania. The Moldavian subsidiary was incorporated in 2008 as a limited liability company and is registered at No. 45 Banulescu Bodoni Street, Chisinau, Republic of Moldova. The Group owns 80% of the company’s shares. The Italian subsidiary was incorporated in 2016 as a limited liability company and is registered at No. 6 Via Pietro Paleocapa Street, Milano, Italy. The Group owns 100% of the company’s shares. On 19 June 2017 Sphera has set up a new subsidiary, California Fresh Flavors SRL (“Taco Bell”), and holds 9,999 shares of its 10,000 shares (99.99% holding). The new subsidiary had no activity up to 30 June 2017. The company will operate as a limited liability one and is registered at No. 239 Calea Dorobanti, Bucharest, Romania.
SPHERA FRANCHISE GROUP SA NOTES TO INTERIM CONSOLIDATED FINANCIAL STATEMENTS FOR THE SIX MONTHS ENDED 30 JUNE 2017 All amounts in RON thousand, unless specified otherwise
F - 105
2. SIGNIFICANT ACCOUNTING POLICIES The following are the significant accounting policies applied by the Group in preparing its interim financial statements. 2.1 Basis of preparation Statement of Compliance The interim financial statements of the Group have been prepared in accordance with International Financial Reporting Standards applicable to interim financial reporting as issued by the International Accounting Standards Board (IASB) and adopted by the European Union (EU) (IAS 34). The financial statements have been prepared on a historical cost basis. The financial statements are presented in Romanian Lei (‘’RON’’) and all values are rounded to the nearest thousand RON, except when otherwise indicated. 2.2 Basis of consolidation The interim consolidated financial statements comprise the financial statements of the Group and its subsidiaries as at 30 June 2017. Control is achieved when the Group is exposed, or has rights, to variable returns from its involvement with the investee and has the ability to affect those returns through its power over the investee. Specifically, the Group controls an investee if, and only if, the Group has:
➢ Power over the investee (i.e., existing rights that give it the current ability to direct the relevant activities of the investee)
➢ Exposure, or rights, to variable returns from its involvement with the investee ➢ The ability to use its power over the investee to affect its returns
Generally, there is a presumption that a majority of voting rights results in control. To support this presumption and when the Group has less than a majority of the voting or similar rights of an investee, the Group considers all relevant facts and circumstances in assessing whether it has power over an investee, including:
➢ The contractual arrangement(s) with the other vote holders of the investee ➢ Rights arising from other contractual arrangements ➢ The Group’s voting rights and potential voting rights
The Group re-assesses whether or not it controls an investee if facts and circumstances indicate that there are changes to one or more of the three elements of control. Consolidation of a subsidiary begins when the Group obtains control over the subsidiary and ceases when the Group loses control of the subsidiary. Assets, liabilities, income and expenses of a subsidiary acquired or disposed of during the year are included in the consolidated financial statements from the date the Group gains control until the date the Group ceases to control the subsidiary. Profit or loss and each component of other comprehensive income (OCI) are attributed to the equity holders of the parent of the Group and to the non-controlling interests, even if this results in the non-controlling interests having a deficit balance. When necessary, adjustments are made to the financial statements of subsidiaries to bring their accounting policies into line with the Group’s accounting policies. All intra-group assets and liabilities, equity, income, expenses and cash flows relating to transactions between members of the Group are eliminated in full on consolidation. A change in the ownership interest of a subsidiary, without a loss of control, is accounted for as an equity transaction.
SPHERA FRANCHISE GROUP SA NOTES TO INTERIM CONSOLIDATED FINANCIAL STATEMENTS FOR THE SIX MONTHS ENDED 30 JUNE 2017 All amounts in RON thousand, unless specified otherwise
F - 106
2. SIGNIFICANT ACCOUNTING POLICIES (continued) If the Group loses control over a subsidiary, it:
➢ Derecognises the assets (including goodwill) and liabilities of the subsidiary ➢ Derecognises the carrying amount of any non-controlling interest ➢ Derecognises the cumulative translation differences, recorded in equity ➢ Recognises the fair value of the consideration received ➢ Recognises the fair value of any investment retained ➢ Recognises any surplus or deficit in profit or loss ➢ Reclassifies the parent’s share of components previously recognised in other comprehensive
income to profit or loss or retained earnings, as appropriate, as would be required if the Group had directly disposed of the related assets or liabilities
2.3 Business combination and goodwill Business combinations are accounted for using the acquisition method. The cost of an acquisition is measured as the aggregate of the consideration transferred, which is measured at acquisition date fair value, and the amount of any non-controlling interests in the acquiree. For each business combination, the Group elects whether to measure the non-controlling interests in the acquiree at fair value or at the proportionate share of the acquiree’s identifiable net assets. Acquisition-related costs are expensed as incurred and included in profit or loss. When the Group acquires a business, it assesses the financial assets and liabilities assumed for appropriate classification and designation in accordance with the contractual terms, economic circumstances and pertinent conditions as at the acquisition date. Where a business combination is effected primarily by exchanging equity interests, the acquirer is usually the entity that issues the equity. However, when a new entity is set up to issue equity shares to effect a business combination, the new entity has no economic substance and cannot be the acquirer. A combination between two or more entities that is structured so that a new entity issues equity instruments to the owners of the other entity(ies) is no different from a transaction in which one of the combining entities directly acquires the other(s). In such circumstances, the Group takes into consideration the following indicators in order to determine the acquirer:
- the relative size of the combining entities; - relative voting rights after the combination; - existence of a large minority voting interest in the combined entity if no other owner or organised
group of owners has a significant voting interest; - the composition of the governing bodies; - the composition of the senior management of the combined entity ; - the terms of the exchange of equity interests - the acquirer is usually the combining entity that
pays a premium over the pre-combination fair value of the equity interests of the other combining entity or entities.
Goodwill is initially measured at cost (being the excess of the aggregate of the consideration transferred and the amount recognised for non-controlling interests and any previous interest held over the net identifiable assets acquired and liabilities assumed). If the fair value of the net assets acquired is in excess of the aggregate consideration transferred, the Group re-assesses whether it has correctly identified all of the assets acquired and all of the liabilities assumed and reviews the procedures used to measure the amounts to be recognised at the acquisition date. If the reassessment still results in an excess of the fair value of net assets acquired over the aggregate consideration transferred, then the gain is recognised in profit or loss. After initial recognition, goodwill is measured at cost less any accumulated impairment losses. For the purpose of impairment testing, goodwill acquired in a business combination is, from the acquisition date, allocated to each of the Group’s cash-generating units that are expected to benefit from the combination, irrespective of whether other assets or liabilities of the acquiree are assigned to those units.
SPHERA FRANCHISE GROUP SA NOTES TO INTERIM CONSOLIDATED FINANCIAL STATEMENTS FOR THE SIX MONTHS ENDED 30 JUNE 2017 All amounts in RON thousand, unless specified otherwise
F - 107
2. SIGNIFICANT ACCOUNTING POLICIES (continued) 2.4.1 Current versus non-current classification The Group presents assets and liabilities in the statement of financial position based on current/non-current classification. An asset is current when it is: • Expected to be realised or intended to sold or consumed in the normal operating cycle • Held primarily for the purpose of trading • Expected to be realised within twelve months after the reporting period, or • Cash or cash equivalent unless restricted from being exchanged or used to settle a liability for at
least twelve months after the reporting period All other assets are classified as non-current. A liability is current when: • It is expected to be settled in the normal operating cycle • It is held primarily for the purpose of trading • It is due to be settled within twelve months after the reporting period, or • There is no unconditional right to defer the settlement of the liability for at least twelve months after
the reporting period The Group classifies all other liabilities as non-current. Deferred tax assets and liabilities are classified as non-current assets and liabilities. 2.4.2 Fair value measurement Fair value related disclosures for financial instruments and non-financial assets that are measured at fair value or where fair values are disclosed, are summarised in the relevant notes. Fair value is the price that would be received to sell an asset or paid to transfer a liability in an orderly transaction between market participants at the measurement date. The fair value measurement is based on the presumption that the transaction to sell the asset or transfer the liability takes place either: • In the principal market for the asset or liability
Or • In the absence of a principal market, in the most advantageous market for the asset or liability. The principal or the most advantageous market must be accessible by the Group. The fair value of an asset or a liability is measured using the assumptions that market participants would use when pricing the asset or liability, assuming that market participants act in their economic best interest. A fair value measurement of a non-financial asset takes into account a market participant's ability to generate economic benefits from the asset’s highest and best use or by selling it to another market participant that would utilise the asset in its highest and best use. The Group uses valuation techniques that are appropriate in the circumstances and for which sufficient data are available to measure fair value, maximising the use of relevant observable inputs and minimising the use of unobservable inputs.

SPHERA FRANCHISE GROUP SA NOTES TO INTERIM CONSOLIDATED FINANCIAL STATEMENTS FOR THE SIX MONTHS ENDED 30 JUNE 2017 All amounts in RON thousand, unless specified otherwise
F - 108
2. SIGNIFICANT ACCOUNTING POLICIES (continued) All assets and liabilities for which fair value is measured or disclosed in the financial statements are categorised within the fair value hierarchy. This is described, as follows, based on the lowest level input that is significant to the fair value measurement as a whole: • Level 1 — Quoted (unadjusted) market prices in active markets for identical assets or liabilities • Level 2 — Valuation techniques for which the lowest level input that is significant to the fair value
measurement is directly or indirectly observable • Level 3 — Valuation techniques for which the lowest level input that is significant to the fair value
measurement is unobservable For the purpose of fair value disclosures, the Group has determined classes of assets and liabilities on the basis of the nature, characteristics and risks of the asset or liability and the level of the fair value hierarchy, as explained above. 2.4.3 Revenue recognition Revenue is recognised to the extent that it is probable that the economic benefits will flow to the Group and the revenue can be reliably measured, regardless of when the payment is received. Revenue is measured at the fair value of the consideration received or receivable, and excluding taxes or duty. The following specific recognition criteria must also be met before revenue is recognised: Restaurant revenue Restaurant revenues are recognised when food and beverages are served. Revenues are recognised at fair value of meals and services delivered, net of value added tax charged to customers. Rental income Rental income is accounted for on a straight-line basis over the lease terms. Interest income Interest income or expense is recorded using the effective interest rate (EIR). The EIR is the rate that exactly discounts the estimated future cash receipts through the expected life of the financial instrument or a shorter period, where appropriate, to the net carrying amount of the financial asset. Interest income is included in ‘’Finance income’’ in profit or loss. 2.4.4 Foreign currencies The Group’s financial statements are presented in Romanian New Lei (‘’RON’’), which is also the legal parent Company's functional currency, as well as that of USFN. Each entity in the Group determines its own functional currency and items included in the financial statements of each entity are measured using that functional currency (namely Moldavian Leu ‘’MDL’’ for the Moldavian subsidiary and the Euro ‘’EUR’’ for the Italian subsidiary). The Group uses the direct method of consolidation and on disposal of a foreign operation, the gain or loss that is reclassified to profit or loss reflects the amount that arises from using this method. The exchange rate RON – EUR as at 30 June 2017 and 31 December 2016 were:
30 June 2017
31 December 2016
RON - EUR 4.5539 4.5411 RON - USD 3.9915 4.3033 RON - MDL 0.2199 0.2174

SPHERA FRANCHISE GROUP SA NOTES TO INTERIM CONSOLIDATED FINANCIAL STATEMENTS FOR THE SIX MONTHS ENDED 30 JUNE 2017 All amounts in RON thousand, unless specified otherwise
F - 109
2. SIGNIFICANT ACCOUNTING POLICIES (continued) Transactions and balances Transactions in foreign currencies are initially recorded by the Group entities at their respective functional currency spot rate at the date the transaction first qualifies for recognition. Monetary assets and liabilities denominated in foreign currencies are retranslated at the functional currency spot rate of exchange ruling at the reporting date. Differences arising on settlement or translation of monetary items are recognised in profit or loss with the exception of monetary items that are designated as part of the hedge of the Group’s net investment of a foreign operation. These are recognised in OCI until the net investment is disposed of, at which time, the cumulative amount is classified to profit or loss. Tax charges and credits attributable to exchange differences on those monetary items are also recorded in OCI. Group companies On consolidation, the assets and liabilities of foreign operations are translated into RON at the rate of exchange prevailing at the reporting date and their revenues and expenses are translated at exchange rates prevailing at the dates of the transactions. The exchange differences arising on the translation are recognised in OCI. On disposal of a foreign operation, the component of OCI relating to that particular foreign operation is recognised in the profit or loss. 2.4.5 Taxes Current income tax Current income tax assets and liabilities for the current period are measured at the amount expected to be recovered from or paid to the taxation authorities. The tax rates and tax laws used to compute the amount are those that are enacted, or substantively enacted at the reporting date in the countries where the Group operates and generates taxable income. Current income tax relating to items recognised directly in equity is recognised in equity and not in profit or loss. Management periodically evaluates positions taken in the tax returns with respect to situations in which applicable tax regulations are subject to interpretation, and it establishes provisions where appropriate. Deferred tax Deferred tax is provided using the liability method on temporary differences between the tax bases of assets and liabilities and their carrying amounts for financial reporting purposes at the reporting date. Deferred tax liabilities are recognised for all taxable temporary differences, except:
• When the deferred tax liability arises from the initial recognition of goodwill or an asset or liability in a transaction that is not a business combination and, at the time of the transaction, affects neither the accounting profit nor taxable profit or loss
• In respect of taxable temporary differences associated with investments in subsidiaries, associates and interests in joint arrangements, when the timing of the reversal of the temporary differences can be controlled and it is probable that the temporary differences will not reverse in the foreseeable future.
Deferred tax assets are recognised for: all deductible temporary differences and the carry forward of unused tax credits and unused tax losses, to the extent that it is probable that taxable profit will be available against which the deductible temporary differences, the carry forward of unused tax credits and any unused tax losses that can be utilised, except:

SPHERA FRANCHISE GROUP SA NOTES TO INTERIM CONSOLIDATED FINANCIAL STATEMENTS FOR THE SIX MONTHS ENDED 30 JUNE 2017 All amounts in RON thousand, unless specified otherwise
F - 110
2. SIGNIFICANT ACCOUNTING POLICIES (continued)
• When the deferred tax asset relating to the deductible temporary difference arises from the initial recognition of an asset or liability in a transaction that is not a business combination and, at the time of the transaction, affects neither the accounting profit nor taxable profit or loss, no deffered tax is recognized, and
• In respect of deductible temporary differences associated with investments in subsidiaries, associates and interests in joint arrangements, deferred tax assets are recognised only to the extent that it is probable that the temporary differences will reverse in the foreseeable future and taxable profit will be available against which the temporary differences can be utilised.
The carrying amount of deferred tax assets is reviewed at each reporting date and reduced to the extent that it is no longer probable that sufficient taxable profit will be available to allow all or part of the deferred tax asset to be utilised. Unrecognised deferred tax assets are reassessed at each reporting date and are recognised to the extent that it has become probable that future taxable profits will allow the deferred tax asset to be recovered. Deferred tax assets and liabilities are measured at the tax rates that are expected to apply in the year when the asset is realised or the liability is settled, based on tax rates (and tax laws) that have been enacted or substantively enacted at the reporting date. Deferred tax relating to items recognised outside profit or loss is recognised outside profit or loss. Deferred tax items are recognised in correlation to the underlying transaction either in other comprehensive income or directly in equity. Deferred tax assets and deferred tax liabilities are offset if a legally enforceable right exists to set off current tax assets against current income tax liabilities and the deferred taxes relate to the same taxable entity and the same taxation authority. Sales tax (VAT and similar taxes) Revenues, expenses and assets are recognised net of the amount of sales tax, except:
• Where the sales tax incurred on a purchase of assets or services is not recoverable from the taxation authority, in which case, the sales tax is recognised as part of the cost of acquisition of the asset or as part of the expense item, as applicable
• Receivables and payables are stated with the amount of sales tax included. The net amount of sales tax recoverable from, or payable to, the taxation authority is included as part of receivables or payables in the statement of financial position. 2.4.6 Property, plant and equipment Property, plant and equipment is measured at cost less accumulated depreciation and impairment losses. Where appropriate, the cost of property, plant and equipment includes site preparation costs, installation costs and the cost of obtaining permits required to bring the asset ready for use. Subsequent costs are included in the asset’s carrying amount or recognized as a separate asset, as appropriate, only when it is probable that future economic benefits associated with the item will flow to the Group and the cost of the item can be measured reliably. The cost of property, plant and equipment also includes the cost of replacing parts of the property, plant and equipment. All repair and maintenance costs are recognised in the profit or loss as incurred. The Group leases its restaurant locations by way of operating leases, which are not recognised in the Group’s statement of financial position. The cost of improvements to leasehold assets is recognised as leasehold improvements and then depreciated as outlined below.

SPHERA FRANCHISE GROUP SA NOTES TO INTERIM CONSOLIDATED FINANCIAL STATEMENTS FOR THE SIX MONTHS ENDED 30 JUNE 2017 All amounts in RON thousand, unless specified otherwise
F - 111
2. SIGNIFICANT ACCOUNTING POLICIES (continued) Costs directly related to purchasing of assets connected with opening restaurants in leased locations, including the costs of architecture design, legal assistance, wages and salaries, and benefits of employees directly involved in launching a given location are included in “property, plant and equipment”. These assets are depreciated over the expected useful life of the restaurant. Depreciation is calculated on a straight-line basis over the estimated useful lives of the assets as follows: Freehold buildings 40 years
Leasehold improvements over the lease contract duration (usually 10 years, including first renewal period)
Computers and IT equipment 3 to 5 years Vehicles 5 years Other property, plant and equipment 2 to 10 years An item of property, plant and equipment is derecognised upon disposal or when no future economic benefits are expected from its use or disposal. Any gain or loss arising on de-recognition of the asset (calculated as the difference between the net disposal proceeds and the carrying amount of the asset) is included in profit or loss when the asset is derecognised. The useful lives and methods of depreciation of property, plant and equipment are reviewed at each financial year end and adjusted prospectively, if appropriate. Start-up expenses for new restaurants Start-up expenses for new restaurants represent costs related to the opening of new restaurant premises. Such expenses include rent and payroll expenses, new personnel training and other overhead expenses that arise before the opening of new restaurants. Start-up expenses for new restaurants are recognised as operating expense in the accounting period in which the related work was performed. 2.4.7 Leases The determination of whether an arrangement is, or contains, a lease is based on the substance of the arrangement at the inception date. The arrangement is, or contains a lease, if fulfilment of the arrangement is dependent on the use of a specific asset or assets or the arrangement conveys a right to use the asset or assets, even if that right is not explicitly specified in an arrangement. Group as a lessee A lease is classified at the inception date as a finance lease or an operating lease. A lease that transfers substantially all the risks and rewards incidental to ownership to the Group is classified as a finance lease. Finance leases are capitalised at the commencement of the lease at the inception date fair value of the leased property or, if lower, at the present value of the minimum lease payments. Lease payments are apportioned between finance charges and a reduction in the lease liability so as to achieve a constant rate of interest on the remaining balance of the liability. Finance charges are recognised in finance costs in profit or loss. A leased asset is depreciated over the useful life of the asset. However, if there is no reasonable certainty that the Group will obtain ownership by the end of the lease term, the asset is depreciated over the shorter of the estimated useful life of the asset and the lease term.

SPHERA FRANCHISE GROUP SA NOTES TO INTERIM CONSOLIDATED FINANCIAL STATEMENTS FOR THE SIX MONTHS ENDED 30 JUNE 2017 All amounts in RON thousand, unless specified otherwise
F - 112
2. SIGNIFICANT ACCOUNTING POLICIES (continued) An operating lease is a lease other than a finance lease. Operating lease payments are recognised as an operating expense in profit or loss on a straight-line basis over the lease term. Depending on contractual terms, the operating lease payment amounts are calculated for each restaurant as either a percentage of revenue (i.e. sales levels) with a minimum fixed monthly payment or as a fixed monthly payment. Some lease agreements contain escalation clauses. For leases with fixed escalating payments and/or fit-out works incentives received, the Group records rent expense on a straight-line basis over the lease term. Contingent rentals are based on sales levels in excess of stipulated amounts, and thus are not considered minimum lease payments and are included in rent expense when attainment of the contingency is considered probable (i.e. when Group’s sales occur). Group as a lessor Leases in which the Group does not transfer substantially all the risks and benefits of ownership of the asset are classified as operating leases. Initial direct costs incurred in negotiating and arranging an operating lease are added to the carrying amount of the leased asset and recognised over the lease term on the same bases as rental income. Contingent rents are recognised as revenue in the period in which they are earned. 2.4.8 Intangible assets Intangible assets acquired separately are measured on initial recognition at cost. Following initial recognition, intangible assets are carried at cost less accumulated amortisation and accumulated impairment losses, if any. The useful lives of intangible assets are assessed as either finite or indefinite. Intangible assets with finite useful lives are amortised on a straight-line basis over the useful economic lives from 3 to 10 years and assessed for impairment whenever there is an indication that the intangible asset may be impaired. Amortisation periods are reviewed at least at each financial year end. Changes in the expected useful life or the expected pattern of consumption of future economic benefits embodied in the asset are accounted for by changing the amortisation period or method, as appropriate, and treated as changes in accounting estimates. Gains or losses arising from de-recognition of an intangible asset are measured as the difference between the net disposal proceeds and the carrying amount of the asset and are recognised in profit or loss when the asset is derecognised. Franchise rights Franchise costs are incurred in obtaining franchise rights or licences to operate quick service and take-away restaurant concepts. They include the initial fee paid to the system franchisor when a new restaurant is opened or when the rights and licences are renewed. These are measured at cost less accumulated amortisation and accumulated impairment. Amortisation is on a straight line basis over the life of the applicable franchise or licence agreement, of 10 years. Gains or losses arising from de-recognition of an intangible asset are measured as the difference between the net disposal proceeds and the carrying amount of the asset and are recognised in profit or loss when the asset is derecognised.

SPHERA FRANCHISE GROUP SA NOTES TO INTERIM CONSOLIDATED FINANCIAL STATEMENTS FOR THE SIX MONTHS ENDED 30 JUNE 2017 All amounts in RON thousand, unless specified otherwise
F - 113
2. SIGNIFICANT ACCOUNTING POLICIES (continued) 2.4.9 Impairment of non-financial assets, including goodwill At each reporting date, management assesses whether there is any indication of impairment for property, plant and equipment or intangible assets. If any such indication exists, management estimates the recoverable amount, which is determined as the higher of an asset's fair value less costs to sell and its value in use. The carrying amount is reduced to the recoverable amount, and the difference is recognised as an expense (impairment loss) in the statement of comprehensive income. An impairment loss recognised for an asset in prior years is reversed if there has been a change in the estimates used to determine the asset’s recoverable amount. An impairment loss is reversed only to the extent that the asset’s carrying amount does not exceed the carrying amount that would have been determined, net of depreciation or amortisation, if no impairment loss had been recognised. For the purpose of impairment testing each restaurant is a cash generating unit. Goodwill is tested for impairment annually and when circumstances indicate that the carrying value may be impaired. Impairment is determined for goodwill by assessing the recoverable amount of the cash generating unit (CGU) (or group of CGUs) to which the goodwill relates. When the recoverable amount of the CGU is less than its carrying amount, an impairment loss is recognised. Impairment losses relating to goodwill cannot be reversed in future periods. 2.4.10 Financial instruments A financial instrument is any contract that gives rise to a financial asset of one entity and a financial liability or equity instrument of another entity. i) Financial assets Initial recognition and measurement Financial assets are classified, at initial recognition, as financial assets at fair value through profit or loss, loans and receivables, held-to-maturity investments, available-for-sale (AFS) financial assets, or as derivatives designated as hedging instruments in an effective hedge, as appropriate. The Group determines the classification of its financial assets at initial recognition. The Group’s financial assets are represented by loans and receivables and cash and cash equivalents. All financial assets are recognised initially at fair value plus, in the case of assets not at fair value through profit or loss, transaction costs that are attributable to the acquisition of the financial asset. Purchases or sales of financial assets that require delivery of assets within a time frame established by regulation or convention in the marketplace (regular way trades) are recognised on the trade date, i.e., the date on which the Group commits to purchase or sell the asset. Subsequent measurement Loans and receivables are non-derivative financial assets with fixed or determinable payments that are not quoted in an active market. After initial measurement, such financial assets are subsequently measured at amortised cost using the effective interest rate (EIR) method, less impairment. Amortised cost is calculated by taking into account any discount or premium on acquisition and fees or costs that are an integral part of the EIR. The EIR amortisation is included in finance income in profit or loss. For more information on receivables, refer to Note 16. Receivables due in less than 12 months are not discounted.

SPHERA FRANCHISE GROUP SA NOTES TO INTERIM CONSOLIDATED FINANCIAL STATEMENTS FOR THE SIX MONTHS ENDED 30 JUNE 2017 All amounts in RON thousand, unless specified otherwise
F - 114
2. SIGNIFICANT ACCOUNTING POLICIES (continued) De-recognition A financial asset (or, where applicable, a part of a financial asset or part of a Group of similar financial assets) is derecognised when:
• The rights to receive cash flows from the asset have expired, or • The Group has transferred its rights to receive cash flows from the asset or has assumed an
obligation to pay the received cash flows in full without material delay to a third party under a ‘pass-through’ arrangement, and either (a) the Group has transferred substantially all the risks and rewards of the asset, or (b) the Group has neither transferred nor retained substantially all the risks and rewards of the asset, but has transferred control of the asset.
When the Group has transferred its rights to receive cash flows from an asset or has entered into a pass-through arrangement, it evaluates if and, to what extent, it has retained the risks and rewards of ownership. When it has neither transferred nor retained substantially all of the risks and rewards of the asset nor transferred control of it, the asset is recognised to the extent of its continuing involvement in it. In that case, the Group also recognises an associated liability. The transferred asset and the associated liability are measured on a basis that reflects the rights and obligations that the Group has retained. Continuing involvement that takes the form of a guarantee over the transferred asset is measured at the lower of the original carrying amount of the asset and the maximum amount of consideration that the Group could be required to repay. ii) Impairment of financial assets Disclosures relating to impairment of financial assets are summarised in the following notes:
• Financial instruments risk management Note 14 • Trade receivables Note 16
The Group assesses, at each reporting date, whether there is any objective evidence that a financial asset or a Group of financial assets is impaired. An impairment exists if one or more events that has occurred since the initial recognition of the asset (an incurred ‘loss event’), has an impact on the estimated future cash flows of the financial asset or the Group of financial assets that can be reliably estimated. Evidence of impairment may include indications that the debtors or a Group of debtors is experiencing significant financial difficulty, default or delinquency in interest or principal payments, the probability that they will enter bankruptcy or other financial reorganisation and where observable data indicate that there is a measurable decrease in the estimated future cash flows, such as changes in arrears or economic conditions that correlate with defaults. Financial assets carried at amortised cost For financial assets carried at amortised cost, the Group first assesses whether impairment exists individually for financial assets that are individually significant, or collectively for financial assets that are not individually significant. If the Group determines that no objective evidence of impairment exists for an individually assessed financial asset, whether significant or not, it includes the asset in a Group of financial assets with similar credit risk characteristics and collectively assesses them for impairment. Assets that are individually assessed for impairment and for which an impairment loss is, or continues to be, recognised are not included in a collective assessment of impairment. The amount of any impairment loss identified is measured as the difference between the asset’s carrying amount and the present value of estimated future cash flows (excluding future expected credit losses that have not yet been incurred). The present value of the estimated future cash flows is discounted at the financial asset’s original effective interest rate.

SPHERA FRANCHISE GROUP SA NOTES TO INTERIM CONSOLIDATED FINANCIAL STATEMENTS FOR THE SIX MONTHS ENDED 30 JUNE 2017 All amounts in RON thousand, unless specified otherwise
F - 115
2. SIGNIFICANT ACCOUNTING POLICIES (continued) The carrying amount of the asset is reduced through the use of an allowance account and the losses arising from impairment are recognised in profit or loss in ‘’Finance costs’’ for loans and in ‘’Other operating expenses’’ for receivables. If, in a subsequent year, the amount of the estimated impairment loss increases or decreases because of an event occurring after the impairment was recognised, the previously recognised impairment loss is increased or reduced by adjusting the allowance account. Interest income continues to be accrued on the reduced carrying amount using the rate of interest used to discount the future cash flows for the purpose of measuring the impairment loss. Loans, together with the associated allowance, are written off when there is no realistic prospect of future recovery and all collateral has been realised or has been transferred to the Group. If a write-off is later recovered, the recovery is credited to profit or loss in “Finance costs” for loans and in “Other operating expenses,net” for trade receivables. iii) Financial liabilities Initial recognition and measurement Financial liabilities are classified, at initial recognition, as financial liabilities at fair value through profit or loss, financial liabilities measured at amortized cost, or as derivatives designated as hedging instruments in an effective hedge, as appropriate. All financial liabilities are recognised initially at fair value and, in the case of financial liabilities measured at amortised cost, net of directly attributable transaction costs. The Group’s financial liabilities include only financial liabilities measured at amortised cost (trade and other payables and loans and borrowings). Subsequent measurement After initial recognition, interest bearing loans and borrowings and any other long-term payables are subsequently measured at amortised cost using the effective interest rate method. Gains and losses are recognised in profit or loss when the liabilities are derecognised as well as through the effective interest rate method (EIR) amortisation process. Amortised cost is calculated by taking into account any discount or premium on acquisition and fees or costs that are an integral part of the EIR. The EIR amortisation is included in finance costs in profit or loss. Trade and other payables with a maturity of 12 months or less are not discounted. De-recognition A financial liability is derecognised when the obligation under the liability is discharged or cancelled or expires. When an existing financial liability is replaced by another from the same lender on substantially different terms, or the terms of an existing liability are substantially modified, such an exchange or modification is treated as a de-recognition of the original liability and the recognition of a new liability. The difference in the respective carrying amounts is recognised in profit or loss. iv) Offsetting of financial instruments Financial assets and financial liabilities are offset with the net amount reported in the statement of financial position only if there is a current enforceable legal right to offset the recognised amounts and an intent to settle on a net basis, or to realise the assets and settle the liabilities simultaneously.

SPHERA FRANCHISE GROUP SA NOTES TO INTERIM CONSOLIDATED FINANCIAL STATEMENTS FOR THE SIX MONTHS ENDED 30 JUNE 2017 All amounts in RON thousand, unless specified otherwise
F - 116
2. SIGNIFICANT ACCOUNTING POLICIES (continued) 2.4.11 Inventories Inventories, which include food, beverages and other supplies, are stated at the lower of cost or net realisable value. Cost of inventory is determined on the weighted-average basis and includes expenditures incurred in acquiring inventories and bringing them to their existing location and condition. Net realisable value is the estimated selling price in the ordinary course of business, less estimated costs necessary to make the sale. When inventories are sold, the carrying amount of those inventories is recognised as an expense and reported as a component of cost of sales in the statement of comprehensive income in the period in which the related revenue is recognised. The amount of any write-down of inventories to net realisable value and all losses of inventories is recognised as an expense in the same component of the statement of comprehensive income as the consumption of the respective inventory, in the period the write-down or loss occurs. 2.4.12 Cash and short-term deposits Cash and short-term deposits in the statement of financial position comprise cash at banks and on hand and short-term deposits. For the purpose of the statement cash flows, cash and cash equivalents consist of cash and short-term deposits, as defined above. 2.4.13 Prepayments Prepayments are carried at cost less provision for impairment. A prepayment is classified as non-current when the goods or services relating to the prepayment are expected to be obtained after one year. Prepayments to acquire current assets are transferred to the carrying amount of the asset once the Group has obtained control of the asset and it is probable that future economic benefits associated with the asset will flow to the Group. Prepayments to acquire property, plant and equipment are classified as construction in progress. Other prepayments are written off to profit or loss when the goods or services relating to the prepayments are received. If there is an indication that the assets, goods or services relating to a prepayment will not be received, the carrying value of the prepayment is written down accordingly and a corresponding impairment loss is recognized in profit or loss. 2.4.14 Equity Share capital Ordinary shares are classified as equity. External costs directly attributable to the issue of new shares are shown as a deduction in equity from the proceeds. Any excess or deficit of the fair value of consideration received over the par value of shares issued is recognised as share premium. Dividends The Group recognises a liability to make cash or non-cash distributions to owners of equity when the distribution is authorised and the distribution is no longer at the discretion of the Group. As per the corporate laws of Romania, a distribution is authorised when it is approved by the shareholders. A corresponding amount is recognised directly in equity.
SPHERA FRANCHISE GROUP SA NOTES TO INTERIM CONSOLIDATED FINANCIAL STATEMENTS FOR THE SIX MONTHS ENDED 30 JUNE 2017 All amounts in RON thousand, unless specified otherwise
F - 117
2. SIGNIFICANT ACCOUNTING POLICIES (continued) 2.4.15 Royalties Royalties in connection to franchise rights are recognised as an expense as restaurants revenue is earned. 2.4.16 Provisions General Provisions are recognised when the Group has a present obligation (legal or constructive) as a result of a past event, it is probable that an outflow of resources embodying economic benefits will be required to settle the obligation and a reliable estimate can be made of the amount of the obligation. Where the Group expects some or all of a provision to be reimbursed, for example under an insurance contract, the reimbursement is recognised as a separate asset but only when the reimbursement is virtually certain. The expense relating to a provision is presented in profit or loss net of any reimbursement. If the effect of the time value of money is material, provisions are discounted using a current pre-tax rate that reflects, when appropriate, the risks specific to the liability. When discounting is used, the increase in the provision due to the passage of time is recognised as a finance cost. Onerous contracts A provision for onerous contracts is recognised when the expected benefits to be derived by the Group from a contract are lower than the unavoidable cost of meeting its obligations under the contract. The provision is measured at the present value of the lower of the expected cost of terminating the contract and the expected net cost of continuing with the contract. Before a provision is established, the Group recognises any impairment loss on the assets associated with that contract. 2.4.17 Employee benefits The Group, in the normal course of business, makes payments on behalf of its employees for pensions (defined contribution plans), health care, employment and personnel tax which are calculated according to the statutory rates in force during the year, based on gross salaries and wages. Food allowances, travel expenses and holiday allowances are also calculated according to the local legislation. The cost of these payments is charged to the statement of comprehensive income in the same period as the related salary cost. Accruals are created for holiday allowances if there are non-used holidays according the local legislation. The Group does not operate any other pension scheme or post-retirement benefits plan and consequently, has no obligation in respect of pensions.

SPHERA FRANCHISE GROUP SA NOTES TO INTERIM CONSOLIDATED FINANCIAL STATEMENTS FOR THE SIX MONTHS ENDED 30 JUNE 2017 All amounts in RON thousand, unless specified otherwise
F - 118
3. SIGNIFICANT ACCOUNTING JUDGEMENTS, ESTIMATES AND ASSUMPTIONS The preparation of the Group’s consolidated financial statements requires management to make judgements, estimates and assumptions that affect the reported amounts of revenues, expenses, assets and liabilities, and the accompanying disclosures, and the disclosure of contingent liabilities. Uncertainty about these assumptions and estimates could result in outcomes that require a material adjustment to the carrying amount of asset or liability affected in future periods. Judgements In the process of applying the Group’s accounting policies, management has made the following judgements, which have the most significant effect on the amounts recognised in the financial statements: Classification of lease agreements A lease is classified as a finance lease if it transfers to the Group substantially all the risks and rewards incidental to ownership, otherwise it is classified as an operating lease. Whether a lease is a finance lease or an operating lease depends on the substance of the transaction rather than the form of the contract. If the lease term is longer than 75 percent of the economic life of the asset, or if at the inception of the lease the present value of the minimum lease payments amounts to at least 90 percent of the fair value of the leased asset, the lease is classified by the Group as finance lease, unless it is clearly demonstrated otherwise. Estimates and assumptions The key assumptions concerning the future and other key sources of estimation uncertainty at the reporting date, that have a significant risk of causing a material adjustment to the carrying amounts of assets and liabilities within the next financial year, are described below. The Group based its assumptions and estimates on parameters available when the financial statements were prepared. Existing circumstances and assumptions about future developments, however, may change due to market changes or circumstances arising beyond the control of the Group. Such changes are reflected in the assumptions when they occur. Useful lives of property and equipment The Group assesses the remaining useful lives of items of property and equipment at least at each financial year-end. If expectations differ from previous estimates, the changes are accounted for as a change in an accounting estimate in accordance with IAS 8 ‘’Accounting Policies, Changes in Accounting Estimates and Errors’’. These estimates may have a material impact on the amount of the carrying values of property and equipment and on depreciation recognised in profit or loss. In particular, the Group assesses for its operating leases that generally have an initial term of 5 years with renewal option for another 5 years, that the leasehold improvements’ useful life is of 10 years due to the fact that historically most of such leases have been renewed after the initial term of 5 years, that the refurbishment needed after the first 5 years is of significantly less value compared to the initial set-up, and that 10 years is also the duration of the related franchise.

SPHERA FRANCHISE GROUP SA NOTES TO INTERIM CONSOLIDATED FINANCIAL STATEMENTS FOR THE SIX MONTHS ENDED 30 JUNE 2017 All amounts in RON thousand, unless specified otherwise
F - 119
4. CHANGES IN ACCOUNTING POLICIES 4.1 CHANGES IN ACCOUNTING POLICIES FROM 1 JANUARY 2017
The accounting policies adopted are consistent with those of the previous financial year except for the following amended IFRSs which have been adopted by the Group as of 1 January 2017:
IAS 12: Recognition of Deferred Tax Assets for Unrealized Losses (Amendments) The objective of the Amendments is to clarify the requirements of deferred tax assets for unrealized losses in order to address diversity in practice in the application of IAS 12 Income Taxes. The specific issues where diversity in practice existed relate to the existence of a deductible temporary difference upon a decrease in fair value, to recovering an asset for more than its carrying amount, to probable future taxable profit and to combined versus separate assessment. These amendments have not yet been endorsed by the EU. Management has not made use of this amendment.
IAS 7: Disclosure Initiative (Amendments) The objective of the Amendments is to provide disclosures that enable users of financial statements to evaluate changes in liabilities arising from financing activities, including both changes arising from cash flows and non-cash changes. The Amendments specify that one way to fulfil the disclosure requirement is by providing a tabular reconciliation between the opening and closing balances in the statement of financial position for liabilities arising from financing activities, including changes from financing cash flows, changes arising from obtaining or losing control of subsidiaries or other businesses, the effect of changes in foreign exchange rates, changes in fair values and other changes. These Amendments have not yet been endorsed by the EU. Management has not made use of this amendment. The IASB has issued the Annual Improvements to IFRSs 2014 – 2016 Cycle, which is a collection of amendments to IFRSs. The following annual improvement has not yet been endorsed by the EU. This improvement did not have an effect on the Group’s financial statements.
➢ IFRS 12 Disclosure of Interests in Other Entities: The amendments clarify that the disclosure
requirements in IFRS 12, other than those of summarized financial information for subsidiaries, joint ventures and associates, apply to an entity’s interest in a subsidiary, a joint venture or an associate that is classified as held for sale, as held for distribution, or as discontinued operations in accordance with IFRS 5.
4.2 NEW STANDARDS, AMENDMENTS AND INTERPRETATIONS ISSUED BUT NOT EFFECTIVE FOR THE FINANCIAL YEAR BEGINNING 1 JANUARY 2017 AND NOT EARLY ADOPTED The standards and interpretations that are issued, but not yet effective, up to the date of issuance of the Group’s financial statements are disclosed below. The Group intends to adopt these standards, if applicable, when they become effective. IFRS 9 Financial Instruments: Classification and Measurement The standard is effective for annual periods beginning on or after 1 January 2018, with early application permitted. The final version of IFRS 9 Financial Instruments reflects all phases of the financial instruments project and replaces IAS 39 Financial Instruments: Recognition and Measurement and all previous versions of IFRS 9. The standard introduces new requirements for classification and measurement, impairment, and hedge accounting. Management has assessed that the application of this standard will not have any significant impact on the financial position or performance of the Group.

SPHERA FRANCHISE GROUP SA NOTES TO INTERIM CONSOLIDATED FINANCIAL STATEMENTS FOR THE SIX MONTHS ENDED 30 JUNE 2017 All amounts in RON thousand, unless specified otherwise
F - 120
4. CHANGES IN ACCOUNTING POLICIES (continued) IFRS 15 Revenue from Contracts with Customers The standard is effective for annual periods beginning on or after 1 January 2018. IFRS 15 establishes a five-step model that will apply to revenue earned from a contract with a customer (with limited exceptions), regardless of the type of revenue transaction or the industry. The standard’s requirements will also apply to the recognition and measurement of gains and losses on the sale of some non-financial assets that are not an output of the entity’s ordinary activities (e.g., sales of property, plant and equipment or intangibles). Extensive disclosures will be required, including disaggregation of total revenue; information about performance obligations; changes in contract asset and liability account balances between periods and key judgments and estimates. Management has assessed that the application of this standard will not have any significant impact on the financial position or performance of the Group. IFRS 15: Revenue from Contracts with Customers (Clarifications) The Clarifications apply for annual periods beginning on or after 1 January 2018 with earlier application permitted. The objective of the Clarifications is to clarify the IASB’s intentions when developing the requirements in IFRS 15, particularly the accounting of identifying performance obligations amending the wording of the “separately identifiable” principle, of principal versus agent considerations including the assessment of whether an entity is a principal or an agent as well as applications of control principle and of licensing providing additional guidance for accounting of intellectual property and royalties. The Clarifications also provide additional practical expedients for entities that either apply IFRS 15 fully retrospectively or that elect to apply the modified retrospective approach. These Clarifications have not yet been endorsed by the EU. Management has assessed that the application of this standard (including the clarifications) will not have any significant impact on the financial position or performance of the Group. IFRS 16: Leases The standard is effective for annual periods beginning on or after 1 January 2019. IFRS 16 sets out the principles for the recognition, measurement, presentation and disclosure of leases for both parties to a contract, i.e. the customer (‘lessee’) and the supplier (‘lessor’). The new standard requires lessees to recognize most leases on their financial statements. Lessees will have a single accounting model for all leases, with certain exemptions. Lessor accounting is substantially unchanged. The standard has not been yet endorsed by the EU. The Group is currently assessing the impact of the standard on its financial statements. Taking into consideration the significant number and value of signed lease agreements, the Group expects a significant impact following the adoption of the standard on its consolidated statement of financial position, and a less significant impact on its statement of comprehensive income. IFRS 17: Insurance Contracts The standard is effective for annual periods beginning on or after 1 January 2021 with earlier application permitted if both IFRS 15 Revenue from Contracts with Customers and IFRS 9 Financial Instruments have also been applied. IFRS 17 Insurance Contracts establishes principles for the recognition, measurement, presentation and disclosure of insurance contracts issued. It also requires similar principles to be applied to reinsurance contracts held and investment contracts with discretionary participation features issued. The objective is to ensure that entities provide relevant information in a way that faithfully represents those contracts. This information gives a basis for users of financial statements to assess the effect that contracts within the scope of IFRS 17 have on the financial position, financial performance and cash flows of an entity. The standard has not been yet endorsed by the EU. Management has assessed that the application of this standard will not have any impact on the financial position or performance of the Group.

SPHERA FRANCHISE GROUP SA NOTES TO INTERIM CONSOLIDATED FINANCIAL STATEMENTS FOR THE SIX MONTHS ENDED 30 JUNE 2017 All amounts in RON thousand, unless specified otherwise
F - 121
4. CHANGES IN ACCOUNTING POLICIES (continued) Amendment in IFRS 10 Consolidated Financial Statements and IAS 28 Investments in Associates and Joint Ventures: Sale or Contribution of Assets between an Investor and its Associate or Joint Venture The amendments address an acknowledged inconsistency between the requirements in IFRS 10 and those in IAS 28, in dealing with the sale or contribution of assets between an investor and its associate or joint venture. The main consequence of the amendments is that a full gain or loss is recognized when a transaction involves a business (whether it is housed in a subsidiary or not). A partial gain or loss is recognized when a transaction involves assets that do not constitute a business, even if these assets are housed in a subsidiary. In December 2015 the IASB postponed the effective date of this amendment indefinitely pending the outcome of its research project on the equity method of accounting. The amendments have not yet been endorsed by the EU. Management has assessed that the application of the amendments will not have any impact on the financial position or performance of the Group. IFRS 2: Classification and Measurement of Share based Payment Transactions (Amendments) The Amendments are effective for annual periods beginning on or after 1 January 2018 with earlier application permitted. The Amendments provide requirements on the accounting for the effects of vesting and non-vesting conditions on the measurement of cash-settled share-based payments, for share-based payment transactions with a net settlement feature for withholding tax obligations and for modifications to the terms and conditions of a share-based payment that changes the classification of the transaction from cash-settled to equity-settled. These Amendments have not yet been endorsed by the EU. Management has assessed that the application of these amendments will not have any impact on the financial position or performance of the Group. IFRS 4: Applying IFRS 9 Financial Instruments with IFRS 4 Insurance Contracts (Amendments) The Amendments are effective for annual periods beginning on or after 1 January 2018. The amendments address concerns arising from implementing the new financial instruments Standard, IFRS 9, before implementing the new insurance contracts standard that the Board is developing to replace IFRS 4. The amendments introduce two options for entities issuing insurance contracts: a temporary exemption from applying IFRS 9 and an overlay approach, which would permit entities that issue contracts within the scope of IFRS 4 to reclassify, from profit or loss to other comprehensive income, some of the income or expenses arising from designated financial assets. These Amendments have not yet been endorsed by the EU. Management has assessed that the application of these amendments will not have any impact on the financial position or performance of the Group. IFRIC Interpretation 22: Foreign Currency Transactions and Advance Consideration The Interpretation is effective for annual periods beginning on or after 1 January 2018 with earlier application permitted. The Interpretation clarifies the accounting for transactions that include the receipt or payment of advance consideration in a foreign currency. The Interpretation covers foreign currency transactions when an entity recognizes a non-monetary asset or a non-monetary liability arising from the payment or receipt of advance consideration before the entity recognizes the related asset, expense or income. The Interpretation states that the date of the transaction, for the purpose of determining the exchange rate, is the date of initial recognition of the non-monetary prepayment asset or deferred income liability. If there are multiple payments or receipts in advance, then the entity must determine a date of the transactions for each payment or receipt of advance consideration. This Interpretation has not yet been endorsed by the EU. Management has assessed that the application of these amendments will not have any impact on the financial position or performance of the Group, as it already followed an approach aligned with these requirements. The IASB has issued the Annual Improvements to IFRSs 2014 – 2016 Cycle, which is a collection of amendments to IFRSs. The amendments below are effective for annual periods beginning on or after 1 January 2018. Earlier application is permitted for IAS 28 Investments in Associates and Joint Ventures. These annual improvements have not yet been endorsed by the EU. Management has assessed that the application of these improvements will not have any impact on the financial position or performance of the Group.

SPHERA FRANCHISE GROUP SA NOTES TO INTERIM CONSOLIDATED FINANCIAL STATEMENTS FOR THE SIX MONTHS ENDED 30 JUNE 2017 All amounts in RON thousand, unless specified otherwise
F - 122
4. CHANGES IN ACCOUNTING POLICIES (continued) - IFRS 1 First-time Adoption of International Financial Reporting Standards: This improvement deletes the short-term exemptions regarding disclosures about financial instruments, employee benefits and investment entities, applicable for first time adopters. - IAS 28 Investments in Associates and Joint Ventures: The amendments clarify that the election to measure at fair value through profit or loss an investment in an associate or a joint venture that is held by an entity that is venture capital organization, or other qualifying entity, is available for each investment in an associate or joint venture on an investment-by-investment basis, upon initial recognition. IFRIC Interpretation 23: Uncertainty over Income Tax Treatments The Interpretation is effective for annual periods beginning on or after 1 January 2019 with earlier application permitted. The Interpretation addresses the accounting for income taxes when tax treatments involve uncertainty that affects the application of IAS 12. The Interpretation provides guidance on considering uncertain tax treatments separately or together, examination by tax authorities, the appropriate method to reflect uncertainty and accounting for changes in facts and circumstances. This Interpretation has not yet been endorsed by the EU. Management has assessed that the application of this interpretation will not have any impact on the financial position or performance of the Group. IAS 40: Transfers to Investment Property (Amendments) The Amendments are effective for annual periods beginning on or after 1 January 2018 with earlier application permitted. The Amendments clarify when an entity should transfer property, including property under construction or development into, or out of investment property. The Amendments state that a change in use occurs when the property meets, or ceases to meet, the definition of investment property and there is evidence of the change in use. A mere change in management’s intentions for the use of a property does not provide evidence of a change in use. These Amendments have not yet been endorsed by the EU. Management has assessed that the application of this amendment will not have any impact on the financial position or performance of the Group. 11 GROUP INFORMATION 5.1 Investments in controlled companies Details of the Group consolidated subsidiaries at 30 June 2017 and 31 December 2016 are as follows:
Company name
Country of
incorporation
Field of activity
Control
Control
30 June
2017 31 December
2016
US Food Network SA Romania Restaurants 99.9997% Parent American Restaurant System SA Romania Restaurants 99.9997% n/a California Fresh Flavours SRL Romania Restaurants 99.9900% n/a US Foods Network SRL Moldova Restaurants 80.0000% 80.0000% US Food Network SRL Italy Restaurants 100.0000% 100.0000% The value of non-controlling interests in USFN and ARS as of 30 June 2017 is below 1 thousand RON therefore there are no other presentations thereof. 5.2 Business combinations On 30 May 2017, Sphera acquired 99.9997% of the shares in USFN and ARS, in exchange for Sphera shares. As Sphera is a new entity with no significant activities, USFN has been identified as the acquirer of ARS, mainly due to its relative size, USFN being far larger then ARS. Since Sphera was not a business, the transition from USFN to Sphera as legal parent of the Group was accounted for as described in Note 18.

SPHERA FRANCHISE GROUP SA NOTES TO INTERIM CONSOLIDATED FINANCIAL STATEMENTS FOR THE SIX MONTHS ENDED 30 JUNE 2017 All amounts in RON thousand, unless specified otherwise
F - 123
5 GROUP INFORMATION (continued) The fair values of the identifiable assets and liabilities of ARS as at the date of acquisition were:
Fair values recognised on
acquisition
Assets Property, plant and equipment 24,661 Intangible assets 2,874 Deposits for guarantees 235 Trade and other receivables 3,030 Inventories 1,198 Cash and cash equivalents 2,162 Assets held for sale 195 Liabilities Interest-bearing loans and borrowings 10,675 Trade and other payables 13,479 Total identifiable net assets at fair value 10,201 Goodwill arising on acquisition 50,585
Fair value of ARS business, equal to the nominal value of the shares issued by Sphera for the contribution of ARS shares 60,786
The fair value of the assets and liabilities acquired at the date of acquisition as well as the fair value of the business of ARS (based on which was effected the share capital increase of Sphera) were determined by an independent appraiser. Goodwill arises from the acquired customer base and economies of scale expected from combining the operations of the Group and ARS. From the date of acquisition, ARS contributed 8,580 of revenue and (221) to profit before tax of the Group. If the combination had taken place at the beginning of the year, Group restaurant sales would have been 287,834 and profit before tax for the Group would have been 30,312.
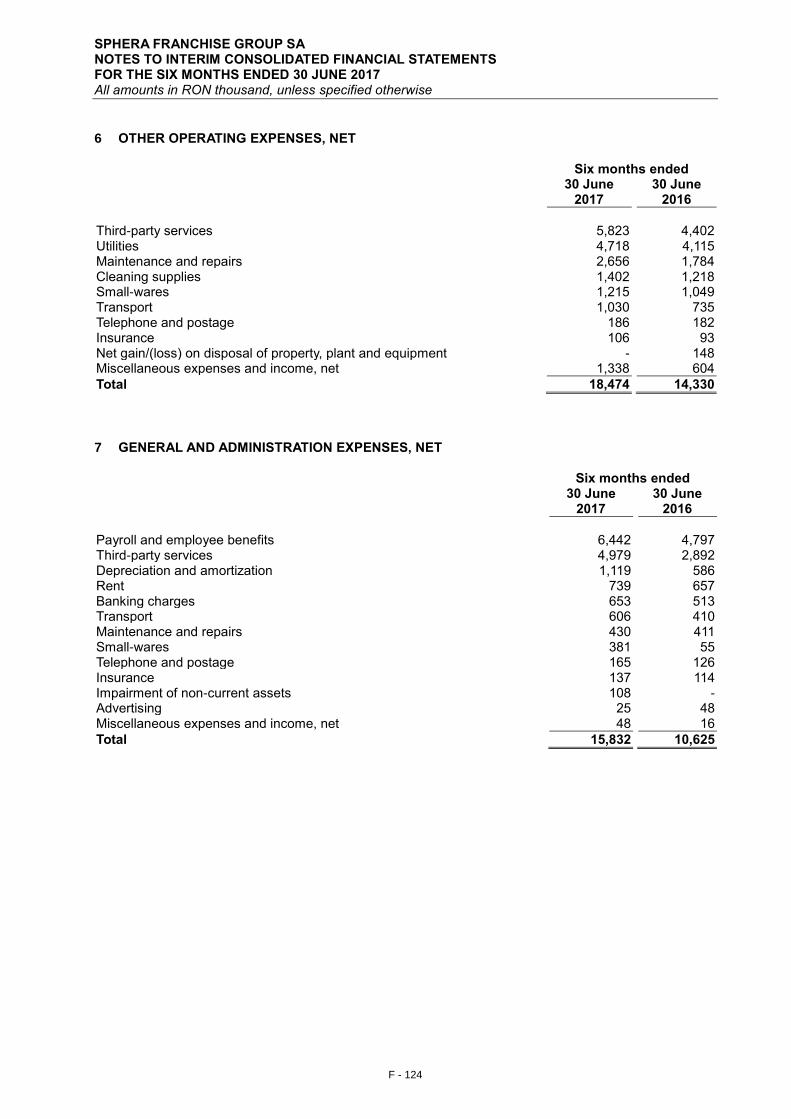
SPHERA FRANCHISE GROUP SA NOTES TO INTERIM CONSOLIDATED FINANCIAL STATEMENTS FOR THE SIX MONTHS ENDED 30 JUNE 2017 All amounts in RON thousand, unless specified otherwise
F - 124
6 OTHER OPERATING EXPENSES, NET Six months ended
30 June
2017 30 June
2016
Third-party services 5,823 4,402 Utilities 4,718 4,115 Maintenance and repairs 2,656 1,784 Cleaning supplies 1,402 1,218 Small-wares 1,215 1,049 Transport 1,030 735 Telephone and postage 186 182 Insurance 106 93 Net gain/(loss) on disposal of property, plant and equipment - 148 Miscellaneous expenses and income, net 1,338 604
Total 18,474 14,330
7 GENERAL AND ADMINISTRATION EXPENSES, NET
Six months ended
30 June 2017
30 June 2016
Payroll and employee benefits 6,442 4,797 Third-party services 4,979 2,892 Depreciation and amortization 1,119 586 Rent 739 657 Banking charges 653 513 Transport 606 410 Maintenance and repairs 430 411 Small-wares 381 55 Telephone and postage 165 126 Insurance 137 114 Impairment of non-current assets 108 - Advertising 25 48 Miscellaneous expenses and income, net 48 16
Total 15,832 10,625
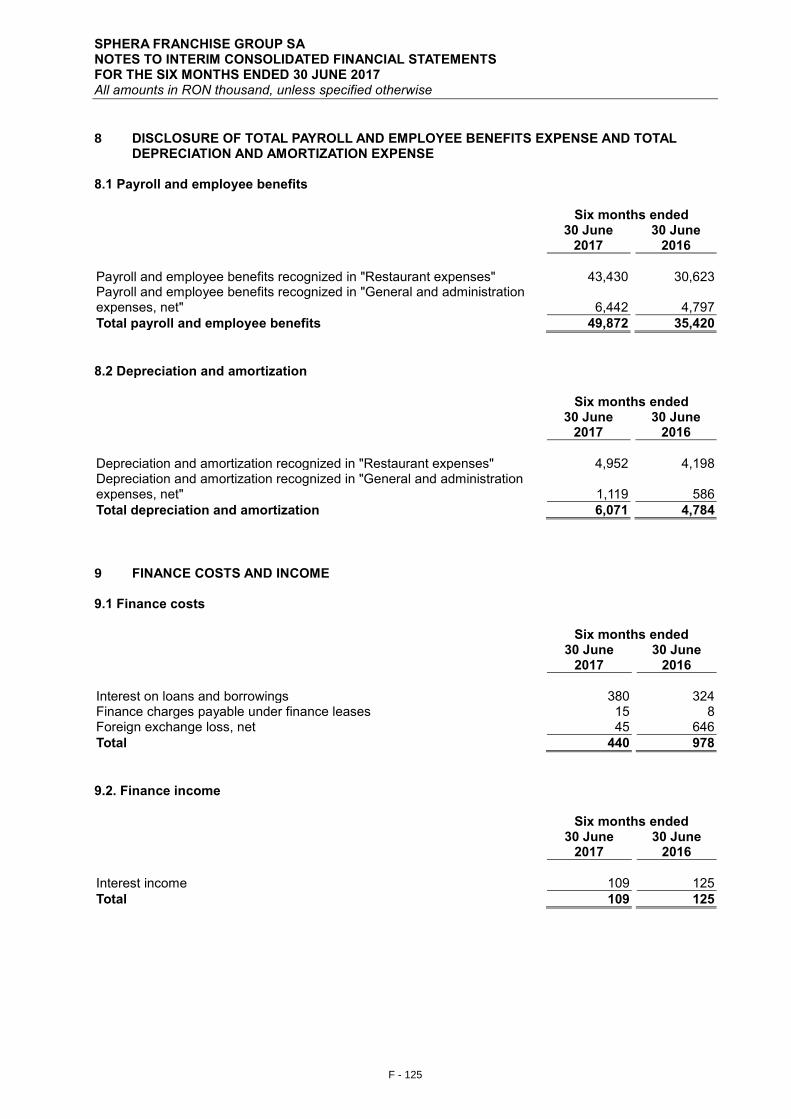
SPHERA FRANCHISE GROUP SA NOTES TO INTERIM CONSOLIDATED FINANCIAL STATEMENTS FOR THE SIX MONTHS ENDED 30 JUNE 2017 All amounts in RON thousand, unless specified otherwise
F - 125
8 DISCLOSURE OF TOTAL PAYROLL AND EMPLOYEE BENEFITS EXPENSE AND TOTAL DEPRECIATION AND AMORTIZATION EXPENSE
8.1 Payroll and employee benefits
Six months ended
30 June 2017
30 June 2016
Payroll and employee benefits recognized in "Restaurant expenses" 43,430 30,623 Payroll and employee benefits recognized in "General and administration expenses, net" 6,442 4,797
Total payroll and employee benefits 49,872 35,420
8.2 Depreciation and amortization
Six months ended
30 June 2017
30 June 2016
Depreciation and amortization recognized in "Restaurant expenses" 4,952 4,198 Depreciation and amortization recognized in "General and administration expenses, net" 1,119 586
Total depreciation and amortization 6,071 4,784
9 FINANCE COSTS AND INCOME
9.1 Finance costs
Six months ended
30 June 2017
30 June 2016
Interest on loans and borrowings 380 324 Finance charges payable under finance leases 15 8 Foreign exchange loss, net 45 646
Total 440 978
9.2. Finance income
Six months ended
30 June 2017
30 June 2016
Interest income 109 125
Total 109 125

SPHERA FRANCHISE GROUP SA NOTES TO INTERIM CONSOLIDATED FINANCIAL STATEMENTS FOR THE SIX MONTHS ENDED 30 JUNE 2017 All amounts in RON thousand, unless specified otherwise
F - 126
10 INCOME TAX The major components of income tax expense for the six months ended 30 June 2017 and 30 June 2016 are:
Six months ended
30 June 2017 30 June 2016
Current income tax: Current income tax charge 1,617 3,277
Deferred tax: Relating to origination and reversal of temporary differences (428) 38
Income tax expense reported in the statement of comprehensive income 1,189 3,315
A reconciliation between tax expense and the product of accounting profit multiplied by Romania’s domestic tax rate for the six months ended 30 June 2017 and 30 June 2016 is as follows:
Six months ended
30 June 2017 30 June 2016
Accounting profit before income tax 28,391 25,545
At statutory income tax rate of 16% 4,543 4,087 Effect of higher tax rates in Italy on fiscal loss (138) - Effect of lower tax rates in the Republic of Moldova (16) 4 Other income exempted from tax (94) (132) Effect of changes in the tax legislation and tax rates (3,324) - Sponsorship fiscal credit (13) (886) Non-deductible expenses for tax purposes 231 242
At the effective income tax rate 1,189 3,315
The changes in tax legislation and tax rates relate to the tax levied on restaurant activity applicable for the companies active in the restaurant industry starting with 1 January 2017. Specifically, per the updated regulations, the income tax for the restaurant activity has been replaced by a specific tax, computed based on a minimum fixed amount multiplied by the impact of three criteria: restaurant area, restaurant location and seasonality (amounting to 1,155 for 6 months ended 30 June 2017). The taxation of the non-restaurant activities has not suffered changes. Deferred tax Deferred tax reconciliation with corresponding items in the consolidated statement of financial position and consolidated statement of comprehensive income is as follows:
Statement of financial position
Statement of comprehensive income
30 June 2017 31 December 2016
30 June 2017 30 June 2016
Property, plant and equipment 11 22 11 37 Intangible assets - - - (27) Fiscal losses 334 - (334) - Operating lease incentives 33 18 (15) 23 Accruals 90 - (90) - Loans and borrowings - - - 5
Deferred tax benefit - - (428) 38
Net deferred tax assets/(liabilities) 468 40
The Group offsets tax assets and liabilities if and only if it has a legally enforceable right to set off current tax assets and current tax liabilities and the deferred tax assets and deferred tax liabilities relate to income taxes levied by the same tax authority.

SPHERA FRANCHISE GROUP SA NOTES TO INTERIM CONSOLIDATED FINANCIAL STATEMENTS FOR THE SIX MONTHS ENDED 30 JUNE 2017 All amounts in RON thousand, unless specified otherwise
F - 127
11. PROPERTY, PLANT AND EQUIPMENT
Freehold buildings and
leasehold improvements
Plant and machinery
Other equipment
Construction in progress Total
Cost
At 1 January 2016 39,972 37,078 10,954 1,368 89,372
Additions 4,746 6,074 2,778 2,451 16,049 Disposals 92 - - 513 605
At 31 December 2016 44,626 43,152 13,732 3,306 104,816
Additions 5,179 3,627 1,086 8,816 18,708 Acquisition of subsidiary (Note 5.2) 12,345 8,910 2,048 1,358 24,661 Disposals - - - 4,112 4,112 Exchange differences 29 24 4 - 57
At 30 June 2017 62,179 55,713 16,870 9,368 144,130
Depreciation
At 1 January 2016 20,108 21,269 6,911 - 48,288
Depreciation charge for the year 3,757 3,792 1,428 - 8,977 Disposals - - - - -
At 31 December 2016 23,865 25,061 8,339 - 57,265 Depreciation charge for the period 2,231 2,413 940 - 5,584 Impairment 108 - - - 108 Exchange differences 3 9 2 - 14
At 30 June 2017 26,207 27,483 9,281 - 62,971
Net Book Value
At 1 January 2016 19,864 15,809 4,043 1,368 41,084
At 31 December 2016 20,761 18,091 5,393 3,306 47,551
At 30 June 2017 35,972 28,230 7,589 9,368 81,159
The Group has several finance lease contracts for motor vehicles. The carrying value of the leased assets as of 30 June 2017 and 31 December 2016 was: 739 and 485 respectively. The assets acquired under finance lease are pledged in favour of the leasing company. As of 30 June 2017 and 31 December 2016, the gross book value of fully depreciated property, plant and equipment that were still in use amounted to 21,433 and 18,926 respectively. The Group has pledged non-current assets (mostly equipment) in favour of Alpha Bank for the financing received. The net carrying amount of pledged assets as at 30 June 2017 is of 37,672 (31 December 2016: 35,517). The additions during the six months ended 30 June 2017 and 31 December 2016 consist mainly in new restaurants’ leasehold improvements, as well as restaurants’ kitchen equipment.

SPHERA FRANCHISE GROUP SA NOTES TO INTERIM CONSOLIDATED FINANCIAL STATEMENTS FOR THE SIX MONTHS ENDED 30 JUNE 2017 All amounts in RON thousand, unless specified otherwise
F - 128
12. INTANGIBLE ASSETS
Goodwill
Franchise
rights
Other intangible
assets Intangibles in progress Total
Cost
At 1 January 2016 - 8,174 24 151 8,349
Additions - 2,257 63 594 2,914
At 31 December 2016 - 10,431 87 745 11,263
Additions - 890 132 110 1,132 Acquisition of subsidiary (Note 5.2) 50,585 2,245 237 393 53,460 Exchange differences - 5 1 - 6
At 30 June 2017 50,585 13,571 457 1,248 65,861
Amortisation
At 1 January 2016 - 4,040 11 - 4,051
Amortisation - 838 9 - 847
At 31 December 2016 - 4,878 20 - 4,898
Amortisation - 476 11 - 487 Exchange differences - 1 - - 1
At 30 June 2017 - 5,355 31 - 5,386
Net book value
At 1 January 2016 - 4,134 13 151 4,298
At 31 December 2016 - 5,553 67 745 6,365
At 30 June 2017 50,585 8,216 426 1,248 60,475
Additions during the six months ended 30 June 2017 and 31 December 2016 consisted mainly in franchise operating licenses acquired for newly opened restaurants.

SPHERA FRANCHISE GROUP SA NOTES TO INTERIM CONSOLIDATED FINANCIAL STATEMENTS FOR THE SIX MONTHS ENDED 30 JUNE 2017 All amounts in RON thousand, unless specified otherwise
F - 129
13. INTEREST-BEARING LOANS AND BORROWINGS
Interest rate, % Maturity
30 June 2017
31 December 2016
Current interest-bearing loans and borrowings
Obligations under finance leases EURIBOR 3M+4.5% 21.05.2019 201 174 Bank loan EURIBOR 3M + 2.85% 5 years from each
withdrawal
15,603 7,622
Total current interest-bearing loans and borrowings 15,804 7,796
Non-current interest-bearing loans and borrowings Obligations under finance leases EURIBOR 3M+4.5% 21.05.2019 214 226 Bank loan EURIBOR 3M + 2.85% 5 years from each
withdrawal
31,013 14,404
Total non-current interest-bearing loans and borrowings 31,227 14,630
Total interest-bearing loans and borrowings 47,031 22,426
The Group has a credit facility from Alpha Bank Romania made up of 3 sub-limits, as follows: credit facility for the development of new locations, issuance of bank guarantee letters and credit card. The loan is secured with property, plant and equipment of each restaurant location for which the credit limited has been utilised. The carrying amount of pledged property, plant and equipment and cash and cash equivalents is disclosed in Notes 11 and 17. Covenants: The Group’s borrowing arrangement with the Bank contains several covenants, mainly of quantitative nature, out of which the most important relates to the level of the service debt (whereby service debt is equal to EBITDA/ [principal plus interest payable]), which should exceed for any month 2.5. Breaches in meeting the financial covenants would permit the bank to immediately call loans and borrowings. There have been no breaches of the financial covenants of for the six months ended 30 June 2017 and for the year ended 31 December 2016.

SPHERA FRANCHISE GROUP SA NOTES TO INTERIM CONSOLIDATED FINANCIAL STATEMENTS FOR THE SIX MONTHS ENDED 30 JUNE 2017 All amounts in RON thousand, unless specified otherwise
F - 130
14. FINANCIAL INSTRUMENTS RISK MANAGEMENT The Group’s principal financial liabilities comprise loans and borrowings, including finance leases and trade and other payables. The main purpose of these financial liabilities is to finance the Group’s operations. The Group’s financial assets are represented by loans, trade and other receivables, and cash and short-term deposits that derive directly from its operations, as well as long-term deposits to guarantee rent payables. The Group is exposed to interest rate risk, foreign exchange rate risk, credit risk and liquidity risk. The Group’s senior management oversees the management of these risks. The Group’s senior management ensures the Group’s financial risk activities are performed under appropriate procedures and that financial risks are identified, measured and managed in accordance with Group risk appetite. Interest rate risk The Group's income and operating cash flows are substantially independent of changes in market interest rates. Trade and other receivables and payables are non-interest bearing financial assets and liabilities. The borrowings are usually exposed to interest rate risk through market value fluctuations of interest-bearing long-term and short-term credit facilities. Interest rates on the Group's debt finance are variable. The interest rates on credit facilities of the Group are disclosed in Note 13. Changes in interest rates impact primarily loans and borrowings by changing either their future cash flows (variable rate debt). Management policy is to resort mainly to variable rate financing. However, at the time of rising new loans or borrowings management uses its judgment to decide whether it believes that fixed or variable rate would be more favourable to the Group over the expected period until maturity. Interest rate sensitivity The following table demonstrates the sensitivity to a reasonably possible change in interest rates on loans and borrowings. With all other variables held constant, the Group’s profit before tax and equity are affected through the impact on floating rate borrowings, as follows:
Increase in basis
points Effect on profit
before tax
30 June 2017 (for six months) 1%
(235) EUR
31 December 2016 (for one year) EUR 1% (224) The Group does not hedge its interest rate risk. The assumed movement in basis points for interest rate sensitivity analysis is based on the currently observable market environment. An equal decrease of the interest rate would have the same effect but of opposite impact.

SPHERA FRANCHISE GROUP SA NOTES TO INTERIM CONSOLIDATED FINANCIAL STATEMENTS FOR THE SIX MONTHS ENDED 30 JUNE 2017 All amounts in RON thousand, unless specified otherwise
F - 131
14. FINANCIAL INSTRUMENTS RISK MANAGEMENT (continued) Foreign currency risk Foreign currency risk is the risk that the fair value or future cash flows of a financial instrument will fluctuate because of changes in foreign exchange rates. The Group’s exposure to the risk of changes in foreign exchange rates relates primarily to the Group’s financing activities, as the financing contracted by the Group is Euro based. The vast majority of revenues and expenses, trade and other receivables and payables is in RON. The Group monitors the currency risk by following changes in exchange rates in currencies in which its intercompany balances and external debts are denominated. The Group does not have formal arrangements to mitigate its currency risk. Foreign currency sensitivity The following table demonstrates the sensitivity to a reasonably possible change in the EUR and US dollar exchange rate. The Group’s exposure to foreign currency changes for all other currencies is not material. With all other variables held constant the Group’s profit before tax and equity (excluding translation of Italian subsidiary for presentation into RON) are affected as follows:
Increase in
Effect on profit
before tax Increase in Effect on profit
before tax
EUR rate
USD rate
30 June 2017 (for six months) 1% (237) 1% (10) 31 December 2016 (for one year) 1% (229) 1% (23) An equal decrease of the EUR/USD rate would have the same effect but of opposite impact. Credit risk The Group is not significantly exposed to credit risk as the majority of its sales are on a cash basis. The Group's credit risk is primarily attributed to trade and other receivables and balances with banks. The carrying amount of trade and other receivables, net of allowance for impairment (Note 16 and deposits for rent guarantee as per statement of financial position) plus balances with banks (Note 17), represent the maximum amount exposed to credit risk. Management believes that there is no significant risk of loss to the Group beyond the allowances already recorded. The Group invests cash and cash equivalents with highly reliable financial institutions. The Group has only plain vanilla deposits with reputable banks, none of which has experienced any difficulties in 2017 or up to the date of these consolidated financial statements. The majority of cash is transacted through and placed with Alpha Bank Romania, member of Alpha Bank Group from Greece and Banca Romana de Dezvoltare (BRD), a member of Societe Generale Group from France, as well as with Unicredit Bank Italy. The long-term credit rating of Alpha Bank Greece is Caa3 as provided by Moody’s rating agency, no credit rating being available for its Romanian subsidiary. The long-term credit rating of BRD is Baa3, while the one for Unicredit is Baa1, both provided by Moody’s There is no significant concentration of credit risk in respect of trade and other receivables due to the fact that sales are based mainly on cash and credit card payments. Therefore there are no formal policies in the Group to manage credit risk for trade receivables. The Group's credit risk is primarily attributed to loans and receivables from related parties, for which the probability of losses is considered remote.

SPHERA FRANCHISE GROUP SA NOTES TO INTERIM CONSOLIDATED FINANCIAL STATEMENTS FOR THE SIX MONTHS ENDED 30 JUNE 2017 All amounts in RON thousand, unless specified otherwise
F - 132
14. FINANCIAL INSTRUMENTS RISK MANAGEMENT (continued) Liquidity risk The Group has adopted a prudent financial liquidity management approach, assuming that sufficient cash and cash equivalents are maintained and that further financing is available from guaranteed funds from credit lines. The tables below summarizes the maturity profile of the Group's financial liabilities, including principal amounts and interests according to contractual terms, at 30 June 2017 and 31 December 2016 based on contractual undiscounted payments.
30 June 2017 On
Less than
3 to 12
1 to 5
demand
3 months
months
years > 5 years
Total
Interest-bearing loans and borrowings 40 4,115 12,505 31,918 26 48,604 Trade and other payables 3,454 25,151 97 1,330 - 30,032
Total: 3,494 29,266 12,602 33,248 26 78,636
31 December 2016 On
Less than
3 to 12
1 to 5
demand
3 months
months
years > 5 years
Total
Interest-bearing loans and borrowings 20
2,203
6,105
15,017
190
23,535
Trade and other payables 4,391
20,058
43
1,674
-
26,166
Total: 4,411
22,261
6,148
16,691
190
49,701
At 30 June 2017, the Group had available 38,020 of undrawn committed borrowing facilities (31 December 2016: 50,323), thus being able to respond to any unforeseen higher cash outflow needs. Capital management Capital includes the equity attributable to the equity holders of the parent. The primary objective of the Group’s capital management is to ensure that it maintains a strong credit rating and healthy capital ratios in order to support its business and maximise shareholder value. The Group manages its capital structure and makes adjustments to it in light of changes in economic conditions and the requirements of the financial covenants. To maintain or adjust the capital structure, the Group may adjust the dividend payment to shareholders, return capital to shareholders or issue new shares. The Group may monitor capital using a gearing ratio, which is net debt divided by total capital plus net debt. The Group does not have a target gearing ratio, as the overall gearing is low. The Group includes within net debt, interest bearing loans and borrowings, trade and other payables, less cash and cash deposits.

SPHERA FRANCHISE GROUP SA NOTES TO INTERIM CONSOLIDATED FINANCIAL STATEMENTS FOR THE SIX MONTHS ENDED 30 JUNE 2017 All amounts in RON thousand, unless specified otherwise
F - 133
14. FINANCIAL INSTRUMENTS RISK MANAGEMENT (continued)
30 June 2017
31 December 2016
Interest-bearing loans and borrowings 47,030
22,426 Financial trade and other payables 30,412
26,167
Less: cash and short-term deposits 35,816
48,968
Net debt 41,626
(375)
Equity 100,339
58,292
Capital and net debt 141,965
57,917
Gearing ratio: 29%
n/a The Group’s capital management, amongst other things, aims to ensure that it meets financial covenants attached to the interest-bearing loans and borrowings that define capital structure requirements. For the covenants in force as at 30 June 2017 and 31 December 2016 please refer to Note 13. No changes were made in the objectives, policies or processes for managing capital during the 6 months ended 30 June 2017 or the year ended 31 December 2016. Fair values The Group has no financial instruments carried at fair value in the statement of financial position. The carrying amount of the interest bearing loans and borrowings approximate their fair value. Management estimates that the margin applicable over Euribor at the balance sheet date would be similar to the ones at the dates of each previous withdrawal, due to the fact that the Group maintained over the past years a low gearing ratio and a stable financial condition, and also based on statistics published by the National Bank of Romania. Financial instruments which are not carried at fair value on the statement of financial position also include deposits to guarantee rent, trade and other receivables, cash and cash equivalents, and trade and other payables. The carrying amounts of these financial instruments are considered to approximate their fair values, due to their short term nature (in majority) and low transaction costs of these instruments. 15. INVENTORIES
30 June 2017
31 December 2016
Raw materials 4,656 3,979 Consumables 2,028 1,211 Finished goods 774 554
Total 7,458 5,744
For the six months ended 30 June 2017, inventories amounting to 90,942 (30 June 2016: 77,747) were recognised as an expense in profit or loss, in ‘’Food and materials’’ as well as in ‘’General and administrative expenses, net’’ (“Small-wares” and “Cleaning supplies”).

SPHERA FRANCHISE GROUP SA NOTES TO INTERIM CONSOLIDATED FINANCIAL STATEMENTS FOR THE SIX MONTHS ENDED 30 JUNE 2017 All amounts in RON thousand, unless specified otherwise
F - 134
16. TRADE AND OTHER RECEIVABLES
30 June 2017
31 December 2016
Trade receivables, net 305 1,233
Trade receivables from related parties 802 442 Advances to related parties - 4,531 Loans to related parties 489 483 Tax receivables 1,063 440 Advance to suppliers 1,331 974 Meal tickets 950 677 Other debtors 422 -
Total 5,362 8,780
Less non-current portion: Trade receivables from related parties 285 -
Trade and other receivables, current 5,077 8,780
Terms and conditions relating to related party transactions are described in Note 24. Trade receivables are non-interest bearing and are generally on terms of 30-90 days. As at 30 June 2017, trade receivables with a value of 392 were impaired and fully provided for. See below for the movements in the provision for impairment of receivables:
Total
At 1 January 2016 380
Charge for the year 4
At 31 December 2016 384
Acquisition of subsidiary 8
At 30 June 2017 392
As at 30 June 2017 and 31 December 2016, the ageing analysis of trade receivables and trade receivables from related parties, net of allowances, is, as follows:
Neither past due nor impaired
Past due but not impaired
Total
< 30 days
30-60 days
61-90 days
91-120 days
> 120 days
30 June 2017 1,107 825 43 26 50 2 160 31 December 2016 1,675 361 1,061 75 10 3 165

SPHERA FRANCHISE GROUP SA NOTES TO INTERIM CONSOLIDATED FINANCIAL STATEMENTS FOR THE SIX MONTHS ENDED 30 JUNE 2017 All amounts in RON thousand, unless specified otherwise
F - 135
17. CASH AND SHORT-TERM DEPOSITS
30 June 2017
31 December 2016
Cash at banks and on hand 13,816 35,874 Cash in transit 493 340 Short-term deposits 21,507 12,754
Total 35,816 48,968
Deposits at banks earn interest at floating rates based on daily bank deposit rates. Short-term deposits are made for varying periods of between one day and three months, depending on the immediate cash requirements of the Group. As part of the financing agreement with Alpha Bank the Group has pledged the cash available in the accounts opened with the bank. The balance of the pledged bank accounts as at 30 June 2017 is of 30,449 (31 December 2016: 44,239). 18. ISSUED CAPITAL
31 December
2016
Authorised shares (USFN)
Ordinary shares of 0.25 RON each 380,000 Share capital (RON thousand) 95 Hyperinflation (RON thousand) 95 The shareholders of USFN as of 31 December 2016 were Lunic Franchising and Consulting Ltd. (22.34%), Tatika Investments Ltd. (27.33%), M.B.L. Computers SRL (23%), Wellkept Group SA (16.34%) and Anasa Properties SRL (10.99%).
30 June
2017
Authorised shares (Sphera)
Ordinary shares of 15 RON each 38,799,340 Share capital (RON thousand) 581,990 The shareholders of Sphera at 30 June 2017 are Lunic Franchising and Consulting Ltd. (22.34%), Tatika Investments Ltd. (27.33%), M.B.L. Computers SRL (23%), Wellkept Group SA (16.34%) and Anasa Properties SRL (10.99%).

SPHERA FRANCHISE GROUP SA NOTES TO INTERIM CONSOLIDATED FINANCIAL STATEMENTS FOR THE SIX MONTHS ENDED 30 JUNE 2017 All amounts in RON thousand, unless specified otherwise
F - 136
18. ISSUED CAPITAL (continued) The following changes took place as a result of the Group reorganization: Share capital Share premium
Balance as at 1 January 2017 (including the hyperinflation adjustment) 190 - Share capital contribution in cash upon set-up of Sphera 1,500 - Increase of Sphera share capital upon contribution of ARS shares (at fair value of ARS business) 60,786 - Increase of Sphera share capital upon contribution of USFN shares (at fair value of USFN business) 519,704 (519,704) Sphera becoming legal parent of the Group (190) 190 Reclassification of USFN legal reserves - 19 Costs related to reorganization and anticipated listing - (1,062)
Balance as at 30 June 2017 581,990 (520,557)
Due to the fact that USFN is identified as the acquirer of ARS and the consolidated financial statements of SFG are a continuation of the consolidated financial statements of USFN, the fair value of the USFN business cannot increase the equity of the Group, thus there is a negative share premium recorded for the entire amount of the respective share capital increase of Sphera. 19. DISTRIBUTIONS MADE AND PROPOSED
Six months ended 30 June 2017
2016
Declared and paid during the six months period/year:
To owners of USFN 46,237
40,961
To non-controlling interests 70
84
Total dividends for the six months period/year 46,307
41,045
Dividends per share (RON/share) – USFN shares 122
108
20. TRADE AND OTHER PAYABLES
30 June 2017
31 December 2016
Trade payables 27,604 23,781 Other payables to related parties 2 55 Salary liability 10,442 7,679 Social contribution liability 3,014 2,001 Other employee related liabilities 1,218 739 Current income tax 1,355 1,848 VAT payable - 32 Other taxes 1,205 500 Other payables 2,805 2,331
Total 47,645 38,966
Less: non-current portion of other payables 1,995 1,674
Trade and other payables, current 45,650 37,292

SPHERA FRANCHISE GROUP SA NOTES TO INTERIM CONSOLIDATED FINANCIAL STATEMENTS FOR THE SIX MONTHS ENDED 30 JUNE 2017 All amounts in RON thousand, unless specified otherwise
F - 137
20. Trade and other payables (continued) Terms and conditions of the above financial liabilities:
• Trade payables are non-interest bearing and are normally settled on 30-day terms • For terms and conditions relating to related parties, refer to Note 24
The other current and non-current payables are summarized below:
30 June 2017
31 December 2016
Lease incentives (current and non-current) 1,438 725 Free of charge fit-outs (current and non-current) 1,244 1,528 Other payables (current) 124 77
Total 2,806 2,330
The lease incentive amounts relate to accruals recorded by the Group in order to allocate the lease incentives provided by landlords over the contractual period on a straight line basis. The free of charge fit-outs are represented by free of charge fit-out works/cash incentives received from landlords. The Group has recognized the amounts received in other payables and releases it to profit and loss over the contractual period. 21. EBITDA
Six months ended
Note
30 June 2017
30 June 2016
Operating profit
28,722 26,398
Adjustments to bridge operating profit to EBITDA:
Depreciation and amortization included in restaurant expenses 8.2 4,952 4,198 Depreciation and amortization included in general and administration expenses
8.2 1,119 586
EBITDA
34,793 31,182
EBITDA is one of the key performance measures monitored by senior management. EBITDA would be normalized to exclude any significant one-off items (either revenues or expenses) but no such exclusions were necessary for the six months periods ended 30 June 2017 and 30 June 2016.
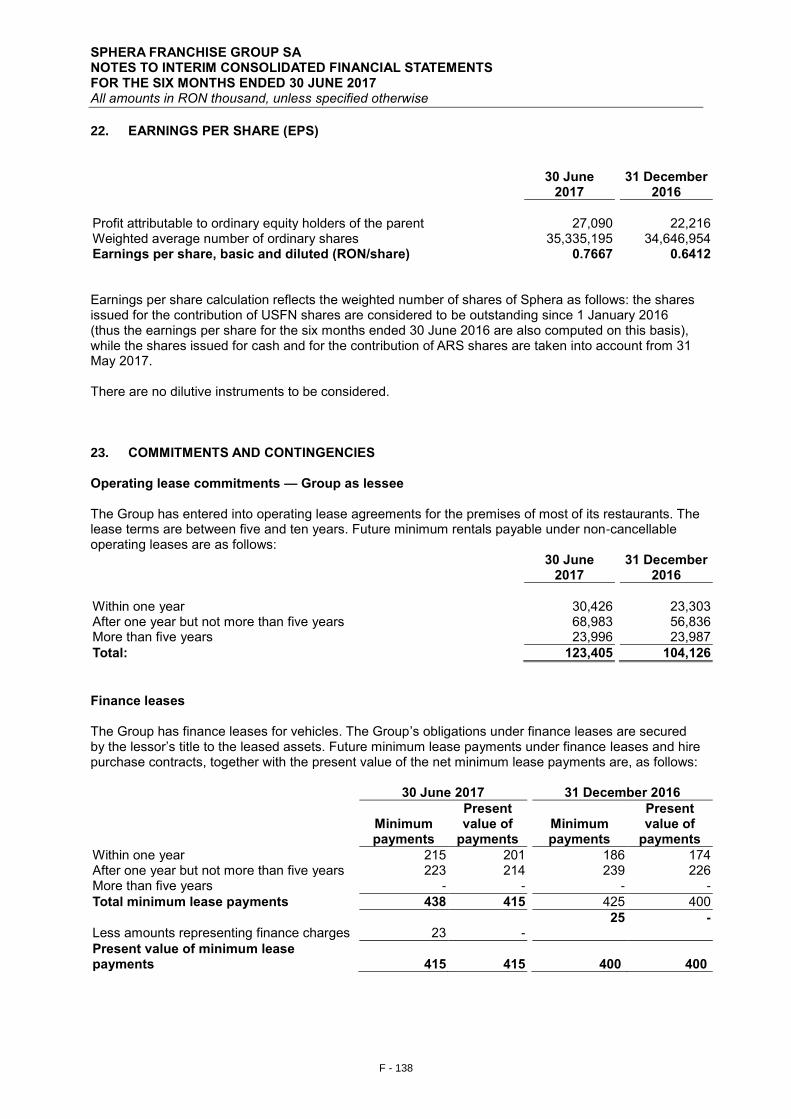
SPHERA FRANCHISE GROUP SA NOTES TO INTERIM CONSOLIDATED FINANCIAL STATEMENTS FOR THE SIX MONTHS ENDED 30 JUNE 2017 All amounts in RON thousand, unless specified otherwise
F - 138
22. EARNINGS PER SHARE (EPS)
30 June
2017 31 December
2016
Profit attributable to ordinary equity holders of the parent 27,090
22,216
Weighted average number of ordinary shares 35,335,195 34,646,954 Earnings per share, basic and diluted (RON/share) 0.7667 0.6412 Earnings per share calculation reflects the weighted number of shares of Sphera as follows: the shares issued for the contribution of USFN shares are considered to be outstanding since 1 January 2016 (thus the earnings per share for the six months ended 30 June 2016 are also computed on this basis), while the shares issued for cash and for the contribution of ARS shares are taken into account from 31 May 2017. There are no dilutive instruments to be considered. 23. COMMITMENTS AND CONTINGENCIES Operating lease commitments — Group as lessee The Group has entered into operating lease agreements for the premises of most of its restaurants. The lease terms are between five and ten years. Future minimum rentals payable under non-cancellable operating leases are as follows:
30 June
2017 31 December
2016
Within one year 30,426
23,303
After one year but not more than five years 68,983
56,836 More than five years 23,996
23,987
Total: 123,405
104,126
Finance leases The Group has finance leases for vehicles. The Group’s obligations under finance leases are secured by the lessor’s title to the leased assets. Future minimum lease payments under finance leases and hire purchase contracts, together with the present value of the net minimum lease payments are, as follows:
30 June 2017
31 December 2016
Minimum payments
Present value of
payments
Minimum payments
Present value of
payments
Within one year 215 201
186 174 After one year but not more than five years 223 214
239 226
More than five years - -
- -
Total minimum lease payments 438 415
425 400
25 -
Less amounts representing finance charges 23 -
Present value of minimum lease payments 415 415
400 400

SPHERA FRANCHISE GROUP SA NOTES TO INTERIM CONSOLIDATED FINANCIAL STATEMENTS FOR THE SIX MONTHS ENDED 30 JUNE 2017 All amounts in RON thousand, unless specified otherwise
F - 139
23. COMMITMENTS AND CONTINGENCIES (continued) Other commitments Per the Italy network development plan, the Group has agreed with KFC Europe to open a minimum of 15 KFC locations during the years 2017- 2021 (3 locations per year) in the Tretino, Aldo Adige, Friuli and Veneto regions. In 2017 the Group has opened two locations. During the first 6 months of 2017 the Group has opened one location and the second one will be opened shortly. Should the Group fail to achieve these targets, the Group will pay KFC Europe a penalty equivalent to the initial franchise rights fee for each such location. The average initial rights fee is in amount of 200. Per the Romania network development plan, the Group has agreed with KFC Europe to open a minimum of 12 KFC locations during the years 2017- 2019 (4 locations per year). During the first six months of 2017, no location was opened. However in July 2017, a drive thru was opened and another two are under development. Should the Group fail to achieve these targets, the Group will pay KFC Europe a penalty equivalent to the initial franchise rights fee for each such location. The average initial rights fee is in amount of 196. Per the Romania network development plan concluded with Pizza Hut Europe (Master Franchisor), the Group has agreed to open a minimum of 9 Pizza Hut pizza delivery locations during the years 2017- 2018 (4 locations in 2017 and 5 locations in 2018). Should the Group fail to achieve these targets (up until 1 year from notification received from Pizza Hut Europe), the Master Franchisor will be free to grant any other party the right to develop the outlets in breach. During the first six months of 2017 the Group has opened one delivery point and another 6 are under development. Per the Romania network development plan concluded with TB International Holdings II SARL (the Franchisor), the Group has agreed to open a minimum of 10 Taco Bell restaurants during the years 2017- 2019 (2 restaurants in 2017, 3 restaurants in 2018 and 5 restaurants in 2019). Should the Group fail to achieve these targets, the Franchisor may terminate the incentives granted to the group (a reduction in franchise rights payable by the Group of 4% of each restaurant’s turnover for the first year and 2% for the second year). Bank letter of guarantees The Group has issued bank letters of guarantee in favour of suppliers as at 30 June 2017 in amount of 7,641 (31 December 2016: 5,257). 24. RELATED PARTY DISCLOSURES During the six months ended 30 June 2016 and 30 June 2017, the Group has carried out transactions with the following related parties:
Related party
Nature of the relationship
Country of incorporatio
n
Nature of transactions
Cinnamon Bake&Roll SRL Entity with several
common members of key management personnel
Romania Sale of goods and services, loans provided
American Restaurant System SA
Entity with several common members of key management personnel
Romania Sale of services, acquisition of goods
Moulin D'Or SRL Entity with several common members of key management personnel
Romania Sale of goods and services

SPHERA FRANCHISE GROUP SA NOTES TO INTERIM CONSOLIDATED FINANCIAL STATEMENTS FOR THE SIX MONTHS ENDED 30 JUNE 2017 All amounts in RON thousand, unless specified otherwise
F - 140
24. RELATED PARTY DISCLOSURES (continued)
Up to 30 May 2017, until the Group obtained control over it as described in Note 5.2, American Restaurant System SA was a related party of the Group. As a result, transactions for the 5 months of 2017, until the acquisition date, are disclosed below.
Sales to
related parties
Purchases from related
parties
American Restaurant System SA 1 57 The following table provides the total amount of transactions that have been entered into with related parties for the relevant period:
Sales to related parties
Purchases
from related parties
Amounts owed by related parties
Amounts owed to related parties
Related party 30 June 2017
Cinnamon Bake&Roll SRL 6 - 797 2 Moulin D'Or SRL 1 4 5 - American Restaurant System SA 1 57 - -
8 61 802 2
Related party 30 June 2016 and 31 December 2016
Cinnamon Bake&Roll SRL 10 1 257 5 American Restaurant System SA 321 45,879 4,694 50 Moulin D'Or SRL 71 391 22
402 46,271 4,973 55
During 2010-2013, the Group has granted an interest free loan to Cinnamon Bake&Roll SRL. The loan balance as at 30 June 2017 was of 489 (31 December 2016: 483).
Terms and conditions of transactions with related parties The sales to and purchases from related parties are made at terms equivalent to those that prevail in arm’s length transactions. Outstanding balances at the period end are unsecured, interest free and settled in cash. There have been no guarantees provided or received for any related party receivables or payables. For the six months periods ended 30 June 2017 and for the year 2016, the Group has not recorded any impairment of receivables relating to amounts owed by related parties. This assessment is undertaken each financial year by examining the financial position of the related party and the market in which the related party operates. Compensation of key management personnel of the Group:
Six months ended
30 June 2017 30 June 2016
Short-term employee benefits 202 830 Fees paid to management entity 1,895 1,332
Total compensation paid to key management personnel 2,097 2,162
The amounts disclosed in the table are the amounts recognised as an expense during each reporting period.

SPHERA FRANCHISE GROUP SA NOTES TO INTERIM CONSOLIDATED FINANCIAL STATEMENTS FOR THE SIX MONTHS ENDED 30 JUNE 2017 All amounts in RON thousand, unless specified otherwise
F - 141
25. SEGMENT INFORMATION
For management purposes, the Group is organised into business units based on the restaurants’ brands, as follows:
- KFC restaurants - Pizza Hut restaurants.
For the six months ended 30 June 2017 the Group also had one more immaterial operating segment, being one Paul restaurant which is managed by USFN, and which was aggregated into the KFC segment. The Board of Directors monitors the operating results of the operating segments separately for the purpose of making decisions about resource allocation and performance assessment. Segment performance is evaluated based on segment operating profit and is measured consistently with ‘’Restaurant operating profit’’ in the statement of comprehensive income in the special purpose financial statements.
Six months ended 30 June 2017 KFC
Pizza Hut
Other
Eliminations
Consolidated
Revenues from external customers 232,440
9,764
-
-
242,204
Inter-segment revenues 268
-
-
(268)
- Operating expenses 189,595
8,323
-
(268)
197,650
Segment operating profit 43,113 1,441 - - 44,554
Finance costs -
-
440
-
440 Finance income -
-
109
-
109
Income taxes -
-
1,189
-
1,189
Net profit/(loss) 28,708
14
(1,520)
-
27,202
Total assets 112,980
85,700
-
(3,661)-
195,019
Total liabilities 72,770
25,568
-
(3,661)-
94,677
Capital expenditure 18,571
1,269
-
-
19,840 Depreciation, amortization and impairment 5,456
615
-
-
6,071
Inter-segment revenues are eliminated and reflected in the “Eliminations” column. For the six months ended 30 June 2016 the only reportable segment was KFC (USFN also manages one pizza delivery point but its revenues, expenses, assets and liabilities were not significant enough to become a separate reporting segment). Geographic information:
Six months ended Revenue from external customers 30 June 2017
30 June 2016
Romania 234,592
189,568
Italy 3,481 - Republic of Moldova 4,131
3,652
Total restaurant revenue 242,204 193,220
The revenue information above is based on the location of the customers.

SPHERA FRANCHISE GROUP SA NOTES TO INTERIM CONSOLIDATED FINANCIAL STATEMENTS FOR THE SIX MONTHS ENDED 30 JUNE 2017 All amounts in RON thousand, unless specified otherwise
F - 142
25. SEGMENT INFORMATION (continued)
Non-current assets 30 June
2017
31 December 2016
Romania 133,959
52,004
Italy 6,999 - Republic of Moldova 2,097
2,242
Total 143,055 54,246
Non-current assets consist mainly on leasehold improvements and kitchen related equipment. The amounts for Italy as of 31 December 2016 were immaterial and were therefore aggregated into Romania line. Transfer prices between operating segments are on an arm’s length’s basis in a manner similar to transactions with third parties. 26. EVENTS AFTER THE REPORTING PERIOD
After 30 June 2017, the Group opened one new restaurant: KFC John, as well as two new pizza delivery points: PHD Ploiesti and PHD Drumul Taberei. In August 2017, the Group has concluded an additional development agreement with KFC Europe, concerning the Italy network development plan. Per this agreement, the Group has agreed to open a minimum of 10 KFC locations during the years 2017- 2022 (2 locations in 2017-18, 3 locations in 2019, 2 locations in 2020, 2 locations in 2021 and 1 location in 2022) in Piedmont region. Should the Group fail to achieve these targets, the Group will pay KFC Europe a penalty equivalent to the initial franchise rights fee for each such location. The average initial rights fee is in amount of 200.

AMERICAN RESTAURANT SYSTEM SA INTERIM FINANCIAL STATEMENTS Prepared in accordance with International Financial Reporting Standards
30 June 2017
F - 143
AMERICAN RESTAURANT SYSTEM SA
INTERIM FINANCIAL STATEMENTS Prepared in accordance with International Financial Reporting Standards as adopted by the European Union 30 JUNE 2017

AMERICAN RESTAURANT SYSTEM SA INTERIM FINANCIAL STATEMENTS Prepared in accordance with International Financial Reporting Standards
30 June 2017
F - 144
Contents Independent auditors’ review report to the shareholders of American Restaurant System SA F - 145 Interim Statement of comprehensive income F - 146 Interim Statement of financial position F - 147 Interim Statement of changes in equity F - 148 Interim Statement of cash flows F - 149 Notes to the interim financial statements F - 150
Ernst & Young Assurance Services SRL Cladirea Bucharest Tower Center, et. 21 Bd. Ion Mihalache nr. 15-17, Sector 1
011171 Bucuresti, Romania
Tel: +40 21 402 4000 Fax: +40 21 310 7193 [email protected]
ey.com
F - 145
Report on review of interim financial information
To the Shareholders of American Restaurant System S.A.
Introduction
We have reviewed the accompanying interim financial statements of American Restaurant
System S.A. (“the Company”), which comprise the interim statement of financial position as at
30 June 2017 and the interim statement of comprehensive income, statement of changes in
equity and statement of cash flows for the six months period ended 30 June 2017 and a
summary of accounting policies and other explanatory information. Management is responsible
for the preparation and fair presentation of this interim financial information in accordance with
International Financial Reporting Standards applicable to interim financial reporting as adopted
by the European Union (“IAS 34”). Our responsibility is to express a conclusion on the
accompanying interim financial information based on our review.
Scope of review
We conducted our review in accordance with International Standard on Review Engagements
2410, “Review of Interim Financial Information Performed by the Independent Auditor of the
Entity.” A review of interim financial information consists of making inquiries, primarily of persons
responsible for financial and accounting matters, and applying analytical and other review
procedures. A review is substantially less in scope than an audit conducted in accordance with
International Standards on Auditing and consequently does not enable us to obtain assurance
that we would become aware of all significant matters that might be identified in an audit.
Accordingly, we do not express an audit opinion.
Conclusion
Based on our review, nothing has come to our attention that causes us to believe that the
accompanying interim financial statements do not give a true and fair view of the financial
position of the entity as at 30 June 2017, and of its financial performance and its cash flows for
the six month period then ended in accordance with International Financial Reporting Standards
applicable to interim financial reporting as adopted by the European Union (“IAS 34”).
On behalf of
Ernst & Young Assurance Services SRL
Alina Dimitriu Bucharest, Romania
Executive Director 14 September 2017

AMERICAN RESTAURANT SYSTEM SA INTERIM STATEMENT OF COMPREHENSIVE INCOME for the six months ended 30 June 2017 All amounts in RON thousand, unless specified otherwise
F - 146
Notes 30 June 2017 30 June 2016
Continuing operations Restaurant sales
54,210 46,398
Restaurant expenses: Food and material
14,830 12,606
Payroll and employee benefits 7.1 13,690 9,608 Rent
4,692 3,672
Advertising
2,973 2,727 Royalties
3,166 2,721
Other operating expenses, net 5 5,386 5,234 Depreciation and amortization 7.2 1,749 1,116
Restaurant operating profit
7,724 8,714
General and administration expenses, net 6 5,732 4,338
Operating profit
1,992 4,376
Finance costs 8.1 187 81 Finance income 8.2 6 93
Profit before tax from continuing operations
1,811 4,388
Income tax expense 9 772 626
Profit for the period from continuing operations
1,039 3,762
Discontinued operations
Profit for the period from discontinued operations, net of tax 23 - 293
Profit for the period 1,039 4,055
Other comprehensive income
- -
Total comprehensive income for the period, net of tax
1,039 4,055
These interim financial statements from page 3 to page 37 were approved by the Board of Directors and were authorised for issue on 30 August 2017. Adrian Hulubescu General Manager American Restaurant System SA

AMERICAN RESTAURANT SYSTEM SA INTERIM STATEMENT OF FINANCIAL POSITION As at 30 June 2017 All amounts in RON thousand, unless specified otherwise
F - 147
Notes
30 June 2017
31 December 2016
Assets
Non-current assets
22,799 21,374
Property, plant and equipment 10 19,511 18,201 Intangible assets 11 2,757 2,917 Trade and other receivables 15 285 - Deposits for rent guarantee
246 256
Current assets
6,225 11,612
Inventories 14 1,206 1,111 Trade and other receivables 15 1,513 6,089 Prepayments
1,186 1,118
Cash and short-term deposits 16 2,320 3,294 Assets held for sale 195 195
Total assets
29,219 33,181
Equity and liabilities
Equity
Issued capital 17 1,644 1,644 Other capital reserves
21 21
Retained earnings
1,986 4,315
Total equity
3,651 5,980
Non-current liabilities
7,273 7,865
Interest-bearing loans and borrowings 12 6,950 7,536 Trade and other payables 19 323 329
Current liabilities
18,295 19,336
Trade and other payables 20 13,967 15,401 Interest-bearing loans and borrowings 12 4,328 3,935
Total liabilities
25,568 27,201
Total equity and liabilities
29,219 33,181
These interim financial statements from page 3 to page 37 were approved by the Board of Directors and were authorised for issue on 30 August 2017.

AMERICAN RESTAURANT SYSTEM SA INTERIM STATEMENT OF CHANGES IN EQUITY For the six months ended 30 June 2017 All amounts in RON thousand, unless specified otherwise
F - 148
Issued capital Share premium Legal reserve Retained earnings Total equity
As at 1 January 2017 1,644 - 21 4,315 5,980
Profit for the period - - - 1,039 1,039 Other comprehensive income - - - - -
Total comprehensive income - - - 1,039 1,039
Cash dividends - - - (3,368) (3,368)
At 30 June 2017 1,644 - 21 1,986 3,651
Issued capital Share premium Legal reserve Retained earnings Total equity
As at 1 January 2016 1,644 - 21 7,116 8,781
Profit for the period - - - 4,055 4,055 Other comprehensive income - - - - -
Total comprehensive income - - - 4,055 4,055
Cash dividends - - - (6,030) (6,030)
At 30 June 2016 1,644 - 21 5,141 6,806
These interim financial statements from page 3 to page 37 were approved by the Board of Directors and were authorised for issue on 30 August 2017.

AMERICAN RESTAURANTS SYSTEMS SA INTERIM STATEMENT OF CASH FLOWS For the six months ended 30 June 2017 All amounts in RON thousand, unless specified otherwise
F - 149
Notes 30 June 2017 30 June 2016
Operating activities
Profit before tax from continuing operations
1,811 4,388 Profit before tax from discontinued operations - 349
Profit before tax 1,811 4,737
Adjustments to reconcile profit before tax to net cash flows:
Depreciation of property, plant and equipment 10 1,609 1,294 Amortisation of intangible assets 11 207 147 Net foreign exchange differences
(8) 2
Loss/(Gain) on disposal of property, plant and equipment
(4) 6 Finance income 8.2 (6) (15) Finance costs 8.1 157 81 Movements in current asset allowances
(63) -
Working capital adjustments:
Decrease in trade and other receivables and prepayments
4,233 2,187 Increase in inventories
(32) (2,420)
Decrease in trade and other payables
(2,212) (483) Interest received
6 15
Interest paid
(162) (96) Income tax paid
- (928)
Net cash flows from operating activities
5,536 4,527
Investing activities
Proceeds from sale of property, plant and equipment
8 -
Purchase of intangibles
(47) (496) Purchase of property, plant and equipment
(2,923) (4,139)
Net cash flows used in investing activities
(2,962) (4,635)
Financing activities
Payment of finance lease liabilities
(98) (81) Proceeds from borrowings
1,838 3,762
Repayment of borrowings
(1,920) (1,297) Dividends paid to equity holders
(3,368) (6,030)
Net cash flows used in financing activities
(3,548) (3,646)
Net decrease in cash and cash equivalents
(974) (3,754)
Cash and cash equivalents at 1 January
3,294 5,574
Cash and cash equivalents at 30 June
2,320 1,820
These interim financial statements from page 3 to page 37 were approved by the Board of Directors and were authorised for issue on 30 August 2017.

AMERICAN RESTAURANT SYSTEM SA NOTES TO THE INTERIM FINANCIAL STATEMENTS For the six months ended 30 June 2017 All amounts in RON thousand, unless specified otherwise
F - 150
1. CORPORATE INFORMATION These interim financial statements are prepared by American Restaurant System SA, referred hereinafter as ‘’ARS’ or ‘’the Company’’, and reflect the results of its operations and activities. The interim financial statements for the six months ended 30 June 2017 were authorized for issue in accordance with the resolution of the Board of Directors dated 30 August 2017. The Company operates a chain of pizza restaurants (21 restaurants as at 30 June 2017) as well as pizza delivery points (13 locations as at 30 June 2017) under the Pizza Hut (“PH”) and Pizza Hut Delivery (“PHD”) brands, spread across Romania. The Company’s number of employees at 30 June 2017 was 1,044 (31 December 2016: 1,007). The Company was incorporated in 1994 as a joint stock company and is registered at No. 5-7 Calea Dorobantilor Street, Bucharest, Romania. During May 2017, the shareholders of the Company have set-up a new entity called Sphera Franchise Group SA (‘’Sphera’’). The purpose of the reorganization that resulted in the establishment of Sphera as the legal parent company of US Food Network SA (USFN), American Restaurant System SA (ARS), US Food Network SRL (USFN Italy or Italian subsidiary), US Food Network SRL (USFN Moldova or Moldavian subsidiary) and California Fresh Flavors SRL (Taco Bell) was to ensure a better coordination of activities and enhance value creation, by taking advantage of the synergies at group level and by achieving economies of scale. In terms of activities, Sphera will take over gradually until the end of September 2017 certain activities as well as 105 employees from USFN and ARS and will render to the benefit of the Group entities services such as management services, marketing support, development, sales support, human resources and other services. Sphera has become the parent company of ARS on 30 May 2017, following the contribution by the existing shareholders of 99.9997% of the shares in ARS in exchange for shares in Sphera (please refer also to Note 17). 2. SIGNIFICANT ACCOUNTING POLICIES 2.1 Basis of preparation Statement of Compliance The interim financial statements of the Company have been prepared in accordance with International Financial Reporting Standards applicable to interim financial reporting as issued by the International Accounting Standards Board (IASB) and adopted by the European Union (EU) (IAS 34). The interim financial statements have been prepared on a historical cost basis. The financial statements are presented in Romanian New Lei (‘’RON’’) and all values are rounded to the nearest thousand RON, except when otherwise indicated. 2.2 Summary of significant accounting policies The following are the significant accounting policies applied by the Company in preparing its interim financial statements. 2.2.1 Current versus non-current classification The Company presents assets and liabilities in the statement of financial position based on current/non-current classification. An asset is current when it is: • Expected to be realised or intended to sold or consumed in the normal operating cycle • Held primarily for the purpose of trading • Expected to be realised within twelve months after the reporting period, or • Cash or cash equivalent unless restricted from being exchanged or used to settle a liability for at
least twelve months after the reporting period.

AMERICAN RESTAURANT SYSTEM SA NOTES TO THE INTERIM FINANCIAL STATEMENTS For the six months ended 30 June 2017 All amounts in RON thousand, unless specified otherwise
F - 151
2. SIGNIFICANT ACCOUNTING POLICIES (continued) All other assets are classified as non-current. A liability is current when: • It is expected to be settled in the normal operating cycle • It is held primarily for the purpose of trading • It is due to be settled within twelve months after the reporting period, or • There is no unconditional right to defer the settlement of the liability for at least twelve months after
the reporting period. The Company classifies all other liabilities as non-current. Deferred tax assets and liabilities are classified as non-current assets and liabilities. 2.2.2 Fair value measurement Fair value related disclosures for financial instruments and non-financial assets that are measured at fair value or where fair values are disclosed, are summarised in the relevant notes. Fair value is the price that would be received to sell an asset or paid to transfer a liability in an orderly transaction between market participants at the measurement date. The fair value measurement is based on the presumption that the transaction to sell the asset or transfer the liability takes place either: • In the principal market for the asset or liability
Or • In the absence of a principal market, in the most advantageous market for the asset or liability The principal or the most advantageous market must be accessible by the Company. The fair value of an asset or a liability is measured using the assumptions that market participants would use when pricing the asset or liability, assuming that market participants act in their economic best interest. A fair value measurement of a non-financial asset takes into account a market participant's ability to generate economic benefits from the asset’s highest and best use or by selling it to another market participant that would utilise the asset in its highest and best use. The Company uses valuation techniques that are appropriate in the circumstances and for which sufficient data are available to measure fair value, maximising the use of relevant observable inputs and minimising the use of unobservable inputs. All assets and liabilities for which fair value is measured or disclosed in the financial statements are categorised within the fair value hierarchy. This is described, as follows, based on the lowest level input that is significant to the fair \value measurement as a whole: • Level 1 — Quoted (unadjusted) market prices in active markets for identical assets or liabilities • Level 2 — Valuation techniques for which the lowest level input that is significant to the fair value
measurement is directly or indirectly observable • Level 3 — Valuation techniques for which the lowest level input that is significant to the fair value
measurement is unobservable. For the purpose of fair value disclosures, the Company has determined classes of assets and liabilities on the basis of the nature, characteristics and risks of the asset or liability and the level of the fair value hierarchy, as explained above.

AMERICAN RESTAURANT SYSTEM SA NOTES TO THE INTERIM FINANCIAL STATEMENTS For the six months ended 30 June 2017 All amounts in RON thousand, unless specified otherwise
F - 152
2. SIGNIFICANT ACCOUNTING POLICIES (continued) 2.2.3 Revenue recognition Revenue is recognised to the extent that it is probable that the economic benefits will flow to the Company and the revenue can be reliably measured, regardless of when the payment is received. Revenue is measured at the fair value of the consideration received or receivable and excluding taxes or duty. The following specific recognition criteria must also be met before revenue is recognised: Restaurant revenue Restaurant revenues are recognised when food and beverages are served. Revenues are recognised at fair value of meals and services delivered, net of value added tax charged to customers. Rental income Rental income is accounted for on a straight-line basis over the lease terms. Interest income Interest income or expense is recorded using the effective interest rate (EIR). The EIR is the rate that exactly discounts the estimated future cash receipts through the expected life of the financial instrument or a shorter period, where appropriate, to the net carrying amount of the financial asset. Interest income is included in “Finance income” in profit or loss. 2.2.4 Foreign currencies The Company’s financial statements are presented in RON, which is also its functional currency. Transactions in foreign currencies are translated into RON by applying the exchange rates prevailing at the time of the transaction. Monetary assets and liabilities denominated in foreign currencies at year-end are translated to RON at the exchange rates prevailing on that date. Realized and unrealized exchange gains and losses are recognized in profit or loss. The exchange rate RON – EUR and RON – USD as at 30 June 2017 and 31 December 2016 was:
30 June 2017
31 December 2016
RON - EUR 4.5539 4.5411 RON - USD 3.9915 4.3033 2.2.5 Taxes Current income tax Current income tax assets and liabilities for the current period are measured at the amount expected to be recovered from or paid to the taxation authorities. The tax rates and tax laws used to compute the amount are those that are enacted, or substantively enacted at the reporting date in Romania, the country where the Company operates and generates taxable income. Current income tax relating to items recognised directly in equity is recognised in equity and not in profit or loss. Management periodically evaluates positions taken in the tax returns with respect to situations in which applicable tax regulations are subject to interpretation, and it establishes provisions where appropriate.

AMERICAN RESTAURANT SYSTEM SA NOTES TO THE INTERIM FINANCIAL STATEMENTS For the six months ended 30 June 2017 All amounts in RON thousand, unless specified otherwise
F - 153
2. SIGNIFICANT ACCOUNTING POLICIES (continued) Deferred tax Deferred tax is provided using the liability method on temporary differences between the tax bases of assets and liabilities and their carrying amounts for financial reporting purposes at the reporting date. Deferred tax liabilities are recognised for all taxable temporary differences, except:
• When the deferred tax liability arises from the initial recognition of goodwill or an asset or liability in a transaction that is not a business combination and, at the time of the transaction, affects neither the accounting profit nor taxable profit or loss
• In respect of taxable temporary differences associated with investments in subsidiaries, associates and interests in joint arrangements, when the timing of the reversal of the temporary differences can be controlled and it is probable that the temporary differences will not reverse in the foreseeable future.
Deferred tax assets are recognised for: all deductible temporary differences: the carry forward of unused tax credits and unused tax losses, to the extent that it is probable that taxable profit will be available against which the deductible temporary differences, the carry forward of unused tax credits and unused tax losses can be utilised, except:
• When the deferred tax asset relating to the deductible temporary difference arises from the initial recognition of an asset or liability in a transaction that is not a business combination and, at the time of the transaction, affects neither the accounting profit nor taxable profit or loss
• In respect of deductible temporary differences associated with investments in subsidiaries, associates and interests in joint arrangements, deferred tax assets are recognised only to the extent that it is probable that the temporary differences will reverse in the foreseeable future and taxable profit will be available against which the temporary differences can be utilised
The carrying amount of deferred tax assets is reviewed at each reporting date and reduced to the extent that it is no longer probable that sufficient taxable profit will be available to allow all or part of the deferred tax asset to be utilised. Unrecognised deferred tax assets are reassessed at each reporting date and are recognised to the extent that it has become probable that future taxable profits will allow the deferred tax asset to be recovered. Deferred tax assets and liabilities are measured at the tax rates that are expected to apply in the year when the asset is realised or the liability is settled, based on tax rates (and tax laws) that have been enacted or substantively enacted at the reporting date. Deferred tax relating to items recognised outside profit or loss is recognised outside profit or loss. Deferred tax items are recognised in correlation to the underlying transaction either in other comprehensive income or directly in equity. Deferred tax assets and deferred tax liabilities are offset if a legally enforceable right exists to set off current tax assets against current income tax liabilities and the deferred taxes relate to the same taxable entity and the same taxation authority. Sales tax (Value added tax and similar) Revenues, expenses and assets are recognised net of the amount of sales tax, except:
• Where the sales tax incurred on a purchase of assets or services is not recoverable from the taxation authority, in which case, the sales tax is recognised as part of the cost of acquisition of the asset or as part of the expense item, as applicable
• Receivables and payables are stated with the amount of sales tax included The net amount of sales tax recoverable from, or payable to, the taxation authority is included as part of receivables or payables in the statement of financial position.

AMERICAN RESTAURANT SYSTEM SA NOTES TO THE INTERIM FINANCIAL STATEMENTS For the six months ended 30 June 2017 All amounts in RON thousand, unless specified otherwise
F - 154
2. SIGNIFICANT ACCOUNTING POLICIES (continued) 2.2.6 Property, plant and equipment Property, plant and equipment is measured at cost less accumulated depreciation and impairment losses. Where appropriate, the cost of property, plant and equipment includes site preparation costs, installation costs and the cost of obtaining permits required to bring the asset ready for use. Subsequent costs are included in the asset’s carrying amount or recognized as a separate asset, as appropriate, only when it is probable that future economic benefits associated with the item will flow to the Company and the cost of the item can be measured reliably. The cost of property, plant and equipment also includes the cost of replacing parts of the property, plant and equipment. All repair and maintenance costs are recognised in the profit or loss as incurred. The Company leases most of its restaurant locations by way of operating leases which are not recognised in the Company’s statement of financial position. The cost of improvements to leasehold assets is capitalised as buildings or recognised as leasehold improvements and then depreciated as outlined below. Costs directly related to purchasing of assets connected with opening restaurants in leased locations, including the costs of architecture design, legal assistance, wages and salaries, and benefits of employees directly involved in launching a given location are included in “property, plant and equipment”. These assets are depreciated over the expected useful life of the restaurant. Depreciation is calculated on a straight-line basis over the estimated useful lives of the assets as follows: Freehold buildings 40 years
Leasehold improvements over the lease contract duration (usually 10 years, including first renewal period)
Computers and IT equipment 3 to 5 years Vehicles 5 years Other property, plant and equipment 2 to 10 years An item of property, plant and equipment is de-recognised upon disposal or when no future economic benefits are expected from its use or disposal. Any gain or loss arising on de-recognition of the asset (calculated as the difference between the net disposal proceeds and the carrying amount of the asset) is included in profit or loss when the asset is de-recognised. The useful lives and methods of depreciation of property, plant and equipment are reviewed at each financial year end and adjusted prospectively, if appropriate.
Start-up expenses for new restaurants Start-up expenses for new restaurants represent costs related to the opening of new restaurant premises. Such expenses include rent and payroll expenses, new personnel training and other overhead expenses that arise before the opening of new restaurants. Start-up expenses for new restaurants are recognised as operating expense in the accounting period in which the related work was performed. 2.2.7 Leases The determination of whether an arrangement is, or contains, a lease is based on the substance of the arrangement at the inception date. The arrangement is, or contains a lease if fulfilment of the arrangement is dependent on the use of a specific asset or assets or the arrangement conveys a right to use the asset or assets, even if that right is not explicitly specified in an arrangement.

AMERICAN RESTAURANT SYSTEM SA NOTES TO THE INTERIM FINANCIAL STATEMENTS For the six months ended 30 June 2017 All amounts in RON thousand, unless specified otherwise
F - 155
2. SIGNIFICANT ACCOUNTING POLICIES (continued) Company as a lessee A lease is classified at the inception date as a finance lease or an operating lease. A lease that transfers substantially all the risks and rewards incidental to ownership to the Company is classified as a finance lease. Finance leases are capitalised at the commencement of the lease at the inception date fair value of the leased property or, if lower, at the present value of the minimum lease payments. Lease payments are apportioned between finance charges and a reduction in the lease liability so as to achieve a constant rate of interest on the remaining balance of the liability. Finance charges are recognised in finance costs in profit or loss. A leased asset is depreciated over the useful life of the asset. However, if there is no reasonable certainty that the Company will obtain ownership by the end of the lease term, the asset is depreciated over the shorter of the estimated useful life of the asset and the lease term. An operating lease is a lease other than a finance lease. Operating lease payments are recognised as an operating expense in profit or loss on a straight-line basis over the lease term. Depending on contractual terms, the operating lease payment amounts are calculated for each restaurant as either a percentage of revenue (i.e. sales levels) with a minimum fixed monthly payment or as a fixed monthly payment. Some lease agreements contain escalation clauses. For leases with fixed escalating payments and/or fit-out works incentives received, the Company records rent expense on a straight-line basis over the lease term, including any option periods considered in the determination of that lease term. Contingent rentals are generally based on sales levels in excess of stipulated amounts, and thus are not considered minimum lease payments and are included in rent expense when attainment of the contingency is considered probable (i.e. when Company sales occur). Company as a lessor Leases in which the Company does not transfer substantially all the risks and benefits of ownership of the asset are classified as operating leases. Initial direct costs incurred in negotiating and arranging an operating lease are added to the carrying amount of the leased asset and recognised over the lease term on the same bases as rental income. Contingent rents are recognised as revenue in the period in which they are earned. 2.2.8 Intangible assets Intangible assets acquired separately are measured on initial recognition at cost. Following initial recognition, intangible assets are carried at cost less accumulated amortisation and accumulated impairment losses, if any. The useful lives of intangible assets are assessed as either finite or indefinite. Intangible assets with finite useful lives are amortised on a straight-line basis over the useful economic lives from 3 to 10 years and assessed for impairment whenever there is an indication that the intangible asset may be impaired. Amortisations periods are reviewed at least at each financial year end. Changes in the expected useful life or the expected pattern of consumption of future economic benefits embodied in the asset are accounted for by changing the amortisation period or method, as appropriate, and treated as changes in accounting estimates. Gains or losses arising from de-recognition of an intangible asset are measured as the difference between the net disposal proceeds and the carrying amount of the asset and are recognised in profit or loss when the asset is derecognised.

AMERICAN RESTAURANT SYSTEM SA NOTES TO THE INTERIM FINANCIAL STATEMENTS For the six months ended 30 June 2017 All amounts in RON thousand, unless specified otherwise
F - 156
2. SIGNIFICANT ACCOUNTING POLICIES (continued) Franchise rights Franchise costs are incurred in obtaining franchise rights or licences to operate the pizza restaurants and pizza delivery points. They include the initial fee paid to the system franchisor when a new restaurant is opened or when the rights and licences are renewed. These are measured at cost less accumulated amortisation and accumulated impairment. Amortisation is on a straight line basis over the life of the applicable franchise or licence agreement of 10 years. 2.2.9 Impairment of non-financial assets At each reporting date, management assesses whether there is any indication of impairment for property, plant and equipment or intangible assets. If any such indication exists, management estimates the recoverable amount, which is determined as the higher of an asset's fair value less costs to sell and its value in use. The carrying amount is reduced to the recoverable amount, and the difference is recognised as an expense (impairment loss) in the statement of comprehensive income. An impairment loss recognised for an asset in prior years is reversed if there has been a change in the estimates used to determine the asset’s recoverable amount. An impairment loss is reversed only to the extent that the asset’s carrying amount does not exceed the carrying amount that would have been determined, net of depreciation or amortisation, if no impairment loss had been recognised. For the purpose of impairment testing each restaurant is a cash generating unit. 2.2.10 Financial instruments A financial instrument is any contract that gives rise to a financial asset of one entity and a financial liability or equity instrument of another entity. i) Financial assets Initial recognition and measurement Financial assets are classified, at initial recognition, as financial assets at fair value through profit or loss, loans and receivables, held-to-maturity investments, available-for-sale (AFS) financial assets, or as derivatives designated as hedging instruments in an effective hedge, as appropriate. The Company determines the classification of its financial assets at initial recognition. The Company’s financial assets are represented solely by loans and receivables and cash and cash equivalents. All financial assets are recognised initially at fair value plus, in the case of assets not at fair value through profit or loss, transaction costs that are attributable to the acquisition of the financial asset. Purchases or sales of financial assets that require delivery of assets within a time frame established by regulation or convention in the marketplace (regular way trades) are recognised on the trade date, i.e., the date on which the Company commits to purchase or sell the asset. Subsequent measurement Loans and receivables are non-derivative financial assets with fixed or determinable payments that are not quoted in an active market. After initial measurement, such financial assets are subsequently measured at amortised cost using the effective interest rate (EIR) method, less impairment. Amortised cost is calculated by taking into account any discount or premium on acquisition and fees or costs that are an integral part of the EIR. The EIR amortisation is included in ‘’Finance income’’ in profit or loss. For more information on receivables, refer to Note 15. Receivables due in less than 12 months are not discounted.

AMERICAN RESTAURANT SYSTEM SA NOTES TO THE INTERIM FINANCIAL STATEMENTS For the six months ended 30 June 2017 All amounts in RON thousand, unless specified otherwise
F - 157
2. SIGNIFICANT ACCOUNTING POLICIES (continued) De-recognition A financial asset (or, where applicable, a part of a financial asset or part of a Company of similar financial assets) is de-recognised when:
• The rights to receive cash flows from the asset have expired, or The Company has transferred its rights to receive cash flows from the asset or has assumed an obligation to pay the received cash flows in full without material delay to a third party under a ‘pass-through’ arrangement, and either a) the Company has transferred substantially all the risks and rewards of the asset, or b) the Company has neither transferred nor retained substantially all the risks and rewards of the asset, but has transferred control of the asset.
When the Company has transferred its rights to receive cash flows from an asset or has entered into a pass-through arrangement, it evaluates if and, to what extent, it has retained the risks and rewards of ownership. When it has neither transferred nor retained substantially all of the risks and rewards of the asset nor transferred control of it, the asset is recognised to the extent of its continuing involvement in it. In that case, the Company also recognises an associated liability. The transferred asset and the associated liability are measured on a basis that reflects the rights and obligations that the Company has retained. Continuing involvement that takes the form of a guarantee over the transferred asset is measured at the lower of the original carrying amount of the asset and the maximum amount of consideration that the Company could be required to repay. ii) Impairment of financial assets Disclosures relating to impairment of financial assets are summarised in the following notes:
• Financial instruments risk management Note 13 • Trade receivables Note 15
The Company assesses, at each reporting date, whether there is any objective evidence that a financial asset or a Company of financial assets is impaired. An impairment exists if one or more events that has occurred since the initial recognition of the asset (an incurred ‘loss event’), has an impact on the estimated future cash flows of the financial asset or the Company of financial assets that can be reliably estimated. Evidence of impairment may include indications that the debtors or a Company of debtors is experiencing significant financial difficulty, default or delinquency in interest or principal payments, the probability that they will enter bankruptcy or other financial reorganisation and where observable data indicate that there is a measurable decrease in the estimated future cash flows, such as changes in arrears or economic conditions that correlate with defaults. Financial assets carried at amortised cost For financial assets carried at amortised cost, the Company first assesses whether impairment exists individually for financial assets that are individually significant, or collectively for financial assets that are not individually significant. If the Company determines that no objective evidence of impairment exists for an individually assessed financial asset, whether significant or not, it includes the asset in a group of financial assets with similar credit risk characteristics and collectively assesses them for impairment. Assets that are individually assessed for impairment and for which an impairment loss is, or continues to be, recognised are not included in a collective assessment of impairment. The amount of any impairment loss identified is measured as the difference between the asset’s carrying amount and the present value of estimated future cash flows (excluding future expected credit losses that have not yet been incurred). The present value of the estimated future cash flows is discounted at the financial asset’s original effective interest rate.
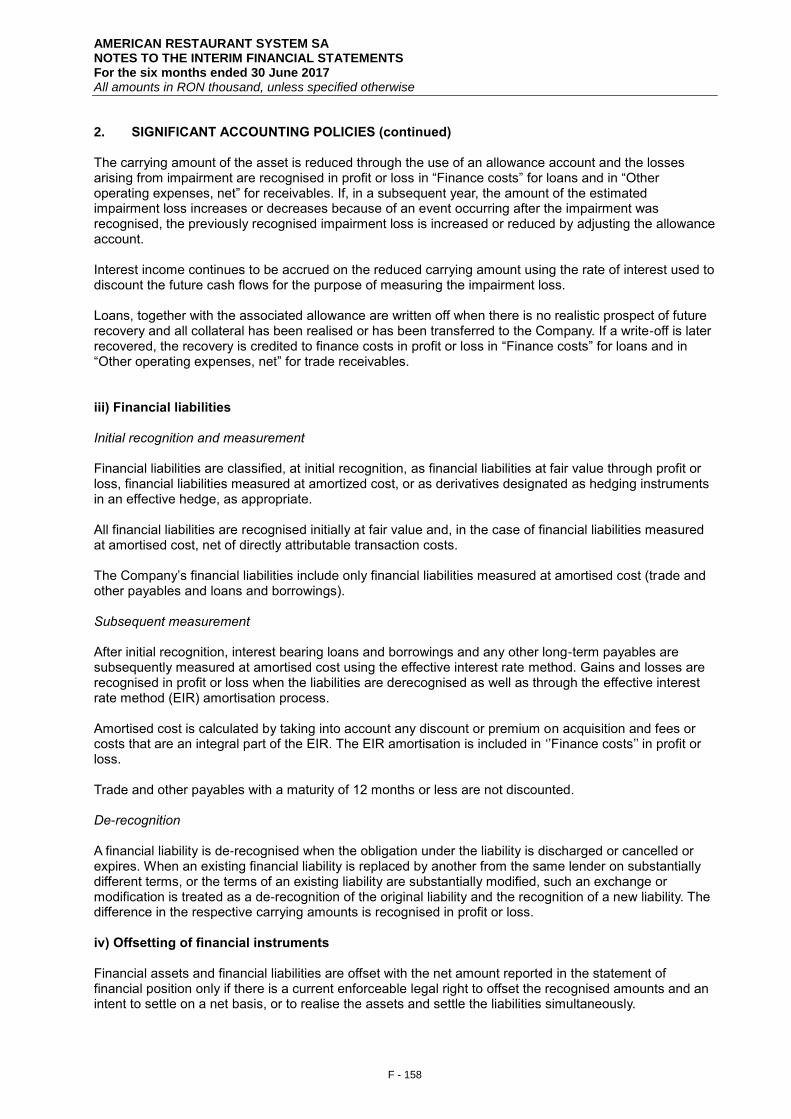
AMERICAN RESTAURANT SYSTEM SA NOTES TO THE INTERIM FINANCIAL STATEMENTS For the six months ended 30 June 2017 All amounts in RON thousand, unless specified otherwise
F - 158
2. SIGNIFICANT ACCOUNTING POLICIES (continued) The carrying amount of the asset is reduced through the use of an allowance account and the losses arising from impairment are recognised in profit or loss in “Finance costs” for loans and in “Other operating expenses, net” for receivables. If, in a subsequent year, the amount of the estimated impairment loss increases or decreases because of an event occurring after the impairment was recognised, the previously recognised impairment loss is increased or reduced by adjusting the allowance account. Interest income continues to be accrued on the reduced carrying amount using the rate of interest used to discount the future cash flows for the purpose of measuring the impairment loss. Loans, together with the associated allowance are written off when there is no realistic prospect of future recovery and all collateral has been realised or has been transferred to the Company. If a write-off is later recovered, the recovery is credited to finance costs in profit or loss in “Finance costs” for loans and in “Other operating expenses, net” for trade receivables. iii) Financial liabilities Initial recognition and measurement Financial liabilities are classified, at initial recognition, as financial liabilities at fair value through profit or loss, financial liabilities measured at amortized cost, or as derivatives designated as hedging instruments in an effective hedge, as appropriate. All financial liabilities are recognised initially at fair value and, in the case of financial liabilities measured at amortised cost, net of directly attributable transaction costs. The Company’s financial liabilities include only financial liabilities measured at amortised cost (trade and other payables and loans and borrowings). Subsequent measurement After initial recognition, interest bearing loans and borrowings and any other long-term payables are subsequently measured at amortised cost using the effective interest rate method. Gains and losses are recognised in profit or loss when the liabilities are derecognised as well as through the effective interest rate method (EIR) amortisation process. Amortised cost is calculated by taking into account any discount or premium on acquisition and fees or costs that are an integral part of the EIR. The EIR amortisation is included in ‘’Finance costs’’ in profit or loss. Trade and other payables with a maturity of 12 months or less are not discounted. De-recognition A financial liability is de-recognised when the obligation under the liability is discharged or cancelled or expires. When an existing financial liability is replaced by another from the same lender on substantially different terms, or the terms of an existing liability are substantially modified, such an exchange or modification is treated as a de-recognition of the original liability and the recognition of a new liability. The difference in the respective carrying amounts is recognised in profit or loss. iv) Offsetting of financial instruments Financial assets and financial liabilities are offset with the net amount reported in the statement of financial position only if there is a current enforceable legal right to offset the recognised amounts and an intent to settle on a net basis, or to realise the assets and settle the liabilities simultaneously.

AMERICAN RESTAURANT SYSTEM SA NOTES TO THE INTERIM FINANCIAL STATEMENTS For the six months ended 30 June 2017 All amounts in RON thousand, unless specified otherwise
F - 159
2. SIGNIFICANT ACCOUNTING POLICIES (continued) 2.2.11 Inventories Inventories, which include food, beverages and other supplies, are stated at the lower of cost or net realisable value. Cost of inventory is determined on the weighted-average basis and includes expenditures incurred in acquiring inventories and bringing them to their existing location and condition. Net realisable value is the estimated selling price in the ordinary course of business, less estimated costs necessary to make the sale. When inventories are sold, the carrying amount of those inventories is recognised as an expense and reported as a component of cost of sales in the statement of comprehensive income in the period in which the related revenue is recognised. The amount of any write-down of inventories to net realisable value and all losses of inventories is recognised as an expense in the same component of the statement of comprehensive income as the consumption of the respective inventory, in the period the write-down or loss occurs. 2.2.12 Cash and short-term deposits Cash and short-term deposits in the statement of financial position comprise cash at banks and on hand and short-term deposits. For the purpose of the statement cash flows, cash and cash equivalents consist of cash and short-term deposits with a maturity of three months or less, which are subject to an insignificant risk of changes in value 2.2.13 Prepayments Prepayments are carried at cost less provision for impairment. A prepayment is classified as non-current when the goods or services relating to the prepayment are expected to be obtained after one year. Prepayments to acquire current assets are transferred to the carrying amount of the asset once the Company has obtained control of the asset and it is probable that future economic benefits associated with the asset will flow to the Company. Prepayments to acquire property, plant and equipment are classified as construction in progress. Other prepayments are written off to profit or loss when the goods or services relating to the prepayments are received. If there is an indication that the assets, goods or services relating to a prepayment will not be received, the carrying value of the prepayment is written down accordingly and a corresponding impairment loss is recognized in profit or loss. 2.2.14 Equity Share capital Ordinary shares are classified as equity. External costs directly attributable to the issue of new shares are shown as a deduction in equity from the proceeds. Any excess of the fair value of consideration received over the par value of shares issued is recognised as additional paid-in capital. Dividends The Company recognises a liability to make cash or non-cash distributions to owners of equity when the distribution is authorised and the distribution is no longer at the discretion of the Company. As per the corporate laws of Romania, a distribution is authorised when it is approved by the shareholders. A corresponding amount is recognised directly in equity.

AMERICAN RESTAURANT SYSTEM SA NOTES TO THE INTERIM FINANCIAL STATEMENTS For the six months ended 30 June 2017 All amounts in RON thousand, unless specified otherwise
F - 160
2. SIGNIFICANT ACCOUNTING POLICIES (continued) 2.2.15 Royalties Royalties in connection to franchise rights are recognised as an expense as restaurants revenue is earned. 2.2.16 Provisions General Provisions are recognised when the Company has a present obligation (legal or constructive) as a result of a past event, it is probable that an outflow of resources embodying economic benefits will be required to settle the obligation and a reliable estimate can be made of the amount of the obligation. Where the Company expects some or all of a provision to be reimbursed, for example under an insurance contract, the reimbursement is recognised as a separate asset but only when the reimbursement is virtually certain. The expense relating to a provision is presented in profit or loss net of any reimbursement. If the effect of the time value of money is material, provisions are discounted using a current pre-tax rate that reflects, when appropriate, the risks specific to the liability. When discounting is used, the increase in the provision due to the passage of time is recognised as a finance cost. Onerous contracts A provision for onerous contracts is recognised when the expected benefits to be derived by the Company from a contract are lower than the unavoidable cost of meeting its obligations under the contract. The provision is measured at the present value of the lower of the expected cost of terminating the contract and the expected net cost of continuing with the contract. Before a provision is established, the Company recognises any impairment loss on the assets associated with that contract. 2.2.17 Employee benefits The Company, in the normal course of business, makes payments on behalf of its employees for pensions (defined contribution plans), health care, employment and personnel tax which are calculated according to the statutory rates in force during the year, based on gross salaries and wages. Food allowances, travel expenses and holiday allowances are also calculated according to the local legislation. The cost of these payments is charged to the statement of comprehensive income in the same period as the related salary cost. Accruals are created for holiday allowances if there are non-used holidays according the local legislation. The Company does not operate any other pension scheme or post-retirement benefits plan and consequently, has no obligation in respect of pensions. 2.2.18 Discontinued operations Discontinued operations are excluded from the results of continuing operations and are presented as a single amount as profit or loss after tax from discontinued operations in the statement of comprehensive income, for the period in which the operations are discontinued as well as in the comparative periods presented. No changes are made to the statement of financial position or statement of cash flows. Additional disclosures are provided in Note 23.

AMERICAN RESTAURANT SYSTEM SA NOTES TO THE INTERIM FINANCIAL STATEMENTS For the six months ended 30 June 2017 All amounts in RON thousand, unless specified otherwise
F - 161
3. SIGNIFICANT ACCOUNTING JUDGEMENTS, ESTIMATES AND ASSUMPTIONS The preparation of the Company’s financial statements requires management to make judgements, estimates and assumptions that affect the reported amounts of revenues, expenses, assets and liabilities, and the accompanying disclosures, and the disclosure of contingent liabilities. Uncertainty about these assumptions and estimates could result in outcomes that require a material adjustment to the carrying amount of asset or liability affected in future periods. Judgements In the process of applying the Company’s accounting policies, management has made the following judgements, which have the most significant effect on the amounts recognised in the financial statements: Classification of lease agreements A lease is classified as a finance lease if it transfers to the Company substantially all the risks and rewards incidental to ownership, otherwise it is classified as an operating lease. Whether a lease is a finance lease or an operating lease depends on the substance of the transaction rather than the form of the contract. If the lease term is longer than 75 percent of the economic life of the asset, or if at the inception of the lease the present value of the minimum lease payments amounts to at least 90 percent of the fair value of the leased asset, the lease is classified by the Company as finance lease, unless it is clearly demonstrated otherwise. Estimates and assumptions The key assumptions concerning the future and other key sources of estimation uncertainty at the reporting date, that have a significant risk of causing a material adjustment to the carrying amounts of assets and liabilities within the next financial year, are described below. The Company based its assumptions and estimates on parameters available when the financial statements were prepared. Existing circumstances and assumptions about future developments, however, may change due to market changes or circumstances arising beyond the control of the Company. Such changes are reflected in the assumptions when they occur. Useful lives of property and equipment The Company assesses the remaining useful lives of items of property and equipment at least at each financial year-end. If expectations differ from previous estimates, the changes are accounted for as a change in an accounting estimate in accordance with IAS 8 Accounting Policies, Changes in Accounting Estimates and Errors. These estimates may have a material impact on the amount of the carrying values of property and equipment and on depreciation recognised in profit or loss. In particular, the Company assesses for its operating leases, that generally have an initial term of 5 years with renewal option for another 5 years, that the leasehold improvements’ useful life is of 10 years due to the fact that historically most of such leases have been renewed after the initial term of 5 years, that the refurbishment needed after the first 5 years is of significantly less value compared to the initial set-up, and that 10 years is also the duration of the related franchise.

AMERICAN RESTAURANT SYSTEM SA NOTES TO THE INTERIM FINANCIAL STATEMENTS For the six months ended 30 June 2017 All amounts in RON thousand, unless specified otherwise
F - 162
4. CHANGES IN ACCOUNTING POLICIES
4.1 CHANGES IN ACCOUNTING POLICIES FROM 1 JANUARY 2017 The accounting policies adopted are consistent with those of the previous financial year except for the following amended IFRSs which have been adopted by the Company as of 1 January 2017:
IAS 12: Recognition of Deferred Tax Assets for Unrealized Losses (Amendments) The objective of the Amendments is to clarify the requirements of deferred tax assets for unrealized losses in order to address diversity in practice in the application of IAS 12 Income Taxes. The specific issues where diversity in practice existed relate to the existence of a deductible temporary difference upon a decrease in fair value, to recovering an asset for more than its carrying amount, to probable future taxable profit and to combined versus separate assessment. These amendments have not yet been endorsed by the EU. Management has not made use of this amendment.
IAS 7: Disclosure Initiative (Amendments) The objective of the Amendments is to provide disclosures that enable users of financial statements to evaluate changes in liabilities arising from financing activities, including both changes arising from cash flows and non-cash changes. The Amendments specify that one way to fulfil the disclosure requirement is by providing a tabular reconciliation between the opening and closing balances in the statement of financial position for liabilities arising from financing activities, including changes from financing cash flows, changes arising from obtaining or losing control of subsidiaries or other businesses, the effect of changes in foreign exchange rates, changes in fair values and other changes. These Amendments have not yet been endorsed by the EU. Management has not made use of this amendment. The IASB has issued the Annual Improvements to IFRSs 2014 – 2016 Cycle, which is a collection of amendments to IFRSs. The following annual improvement has not yet been endorsed by the EU. This improvement did not have an effect on the Company’s financial statements.
➢ IFRS 12 Disclosure of Interests in Other Entities: The amendments clarify that the disclosure
requirements in IFRS 12, other than those of summarized financial information for subsidiaries, joint ventures and associates, apply to an entity’s interest in a subsidiary, a joint venture or an associate that is classified as held for sale, as held for distribution, or as discontinued operations in accordance with IFRS 5.
4.2 NEW STANDARDS, AMENDMENTS AND INTERPRETATIONS ISSUED BUT NOT EFFECTIVE FOR THE FINANCIAL YEAR BEGINNING 1 JANUARY 2017 AND NOT EARLY ADOPTED The standards and interpretations that are issued, but not yet effective, up to the date of issuance of the Company’s financial statements are disclosed below. The Company intends to adopt these standards, if applicable, when they become effective. IFRS 9 Financial Instruments: Classification and Measurement The standard is effective for annual periods beginning on or after 1 January 2018, with early application permitted. The final version of IFRS 9 Financial Instruments reflects all phases of the financial instruments project and replaces IAS 39 Financial Instruments: Recognition and Measurement and all previous versions of IFRS 9. The standard introduces new requirements for classification and measurement, impairment, and hedge accounting. Management has assessed that the application of this standard will not have any significant impact on the presentation and financial position or performance of the Company.

AMERICAN RESTAURANT SYSTEM SA NOTES TO THE INTERIM FINANCIAL STATEMENTS For the six months ended 30 June 2017 All amounts in RON thousand, unless specified otherwise
F - 163
4. CHANGES IN ACCOUNTING POLICIES (continued) IFRS 15 Revenue from Contracts with Customers The standard is effective for annual periods beginning on or after 1 January 2018. IFRS 15 establishes a five-step model that will apply to revenue earned from a contract with a customer (with limited exceptions), regardless of the type of revenue transaction or the industry. The standard’s requirements will also apply to the recognition and measurement of gains and losses on the sale of some non-financial assets that are not an output of the Company’s ordinary activities (e.g., sales of property, plant and equipment or intangibles). Extensive disclosures will be required, including disaggregation of total revenue; information about performance obligations; changes in contract asset and liability account balances between periods and key judgments and estimates. Management has assessed that the application of this standard will not have any significant impact on the financial position or performance of the Company. IFRS 15: Revenue from Contracts with Customers (Clarifications) The Clarifications apply for annual periods beginning on or after 1 January 2018 with earlier application permitted. The objective of the Clarifications is to clarify the IASB’s intentions when developing the requirements in IFRS 15, particularly the accounting of identifying performance obligations amending the wording of the “separately identifiable” principle, of principal versus agent considerations including the assessment of whether an entity is a principal or an agent as well as applications of control principle and of licensing providing additional guidance for accounting of intellectual property and royalties. The Clarifications also provide additional practical expedients for entities that either apply IFRS 15 fully retrospectively or that elect to apply the modified retrospective approach. These Clarifications have not yet been endorsed by the EU. Management has assessed that the application of this standard (including the clarifications) will not have any significant impact on the financial position or performance of the Company IFRS 16: Leases The standard is effective for annual periods beginning on or after 1 January 2019. IFRS 16 sets out the principles for the recognition, measurement, presentation and disclosure of leases for both parties to a contract, i.e. the customer (‘lessee’) and the supplier (‘lessor’). The new standard requires lessees to recognize most leases on their financial statements. Lessees will have a single accounting model for all leases, with certain exemptions. Lessor accounting is substantially unchanged. The standard has not been yet endorsed by the EU. The Company is currently assessing the impact of the standard on its financial statements. Taking into consideration the significant number and value of signed lease agreements, the Company expects a significant impact following the adoption of the standard on its statement of financial position, and a less significant impact on its statement of comprehensive income. IFRS 17: Insurance Contracts The standard is effective for annual periods beginning on or after 1 January 2021 with earlier application permitted if both IFRS 15 Revenue from Contracts with Customers and IFRS 9 Financial Instruments have also been applied. IFRS 17 Insurance Contracts establishes principles for the recognition, measurement, presentation and disclosure of insurance contracts issued. It also requires similar principles to be applied to reinsurance contracts held and investment contracts with discretionary participation features issued. The objective is to ensure that entities provide relevant information in a way that faithfully represents those contracts. This information gives a basis for users of financial statements to assess the effect that contracts within the scope of IFRS 17 have on the financial position, financial performance and cash flows of an entity. The standard has not been yet endorsed by the EU. Management has assessed that the application of this standard will not have any impact on the financial position or performance of the Company.

AMERICAN RESTAURANT SYSTEM SA NOTES TO THE INTERIM FINANCIAL STATEMENTS For the six months ended 30 June 2017 All amounts in RON thousand, unless specified otherwise
F - 164
4. CHANGES IN ACCOUNTING POLICIES (continued) IFRS 2: Classification and Measurement of Share based Payment Transactions (Amendments) The Amendments are effective for annual periods beginning on or after 1 January 2018 with earlier application permitted. The Amendments provide requirements on the accounting for the effects of vesting and non-vesting conditions on the measurement of cash-settled share-based payments, for share-based payment transactions with a net settlement feature for withholding tax obligations and for modifications to the terms and conditions of a share-based payment that changes the classification of the transaction from cash-settled to equity-settled. These Amendments have not yet been endorsed by the EU. Management has assessed that the application of these amendments will not have any impact on the financial position or performance of the Company. IFRS 4: Applying IFRS 9 Financial Instruments with IFRS 4 Insurance Contracts (Amendments) The Amendments are effective for annual periods beginning on or after 1 January 2018. The amendments address concerns arising from implementing the new financial instruments Standard, IFRS 9, before implementing the new insurance contracts standard that the Board is developing to replace IFRS 4. The amendments introduce two options for entities issuing insurance contracts: a temporary exemption from applying IFRS 9 and an overlay approach, which would permit entities that issue contracts within the scope of IFRS 4 to reclassify, from profit or loss to other comprehensive income, some of the income or expenses arising from designated financial assets. These Amendments have not yet been endorsed by the EU. Management has assessed that the application of these amendments will not have any impact on the financial position or performance of the Company. IFRIC Interpretation 22: Foreign Currency Transactions and Advance Consideration The Interpretation is effective for annual periods beginning on or after 1 January 2018 with earlier application permitted. The Interpretation clarifies the accounting for transactions that include the receipt or payment of advance consideration in a foreign currency. The Interpretation covers foreign currency transactions when an entity recognizes a non-monetary asset or a non-monetary liability arising from the payment or receipt of advance consideration before the Company recognizes the related asset, expense or income. The Interpretation states that the date of the transaction, for the purpose of determining the exchange rate, is the date of initial recognition of the non-monetary prepayment asset or deferred income liability. If there are multiple payments or receipts in advance, then the Company must determine a date of the transactions for each payment or receipt of advance consideration. This Interpretation has not yet been endorsed by the EU. Management has assessed that the application of these amendments will not have any impact on the financial position or performance of the Company, as it already followed an approach aligned with these requirements. The IASB has issued the Annual Improvements to IFRSs 2014 – 2016 Cycle, which is a collection of amendments to IFRSs. The below amendments are effective for annual periods beginning on or after 1 January 2018. Earlier application is permitted for IAS 28 Investments in Associates and Joint Ventures. These annual improvements have not yet been endorsed by the EU. Management has assessed that the application of these improvements will not have any impact on the financial position or performance of the Company. - IFRS 1 First-time Adoption of International Financial Reporting Standards: This improvement
deletes the short-term exemptions regarding disclosures about financial instruments, employee benefits and investment entities, applicable for first time adopters.
- IAS 28 Investments in Associates and Joint Ventures: The amendments clarify that the election to measure at fair value through profit or loss an investment in an associate or a joint venture that is held by an entity that is venture capital organization, or other qualifying entity, is available for each investment in an associate or joint venture on an investment-by-investment basis, upon initial recognition.
IFRIC Interpretation 23: Uncertainty over Income Tax Treatments The Interpretation is effective for annual periods beginning on or after 1 January 2019 with earlier application permitted. The Interpretation addresses the accounting for income taxes when tax treatments involve uncertainty that affects the application of IAS 12. The Interpretation provides guidance on considering uncertain tax treatments separately or together, examination by tax authorities, the appropriate method to reflect uncertainty and accounting for changes in facts and circumstances. This Interpretation has not yet been endorsed by the EU. Management has assessed that the application of this interpretation will not have any impact on the financial position or performance of the Company.

AMERICAN RESTAURANT SYSTEM SA NOTES TO THE INTERIM FINANCIAL STATEMENTS For the six months ended 30 June 2017 All amounts in RON thousand, unless specified otherwise
F - 165
4. CHANGES IN ACCOUNTING POLICIES (continued) IAS 40: Transfers to Investment Property (Amendments) The Amendments are effective for annual periods beginning on or after 1 January 2018 with earlier application permitted. The Amendments clarify when an entity should transfer property, including property under construction or development into, or out of investment property. The Amendments state that a change in use occurs when the property meets, or ceases to meet, the definition of investment property and there is evidence of the change in use. A mere change in management’s intentions for the use of a property does not provide evidence of a change in use. These Amendments have not yet been endorsed by the EU. Management has assessed that the application of this amendment will not have any impact on the financial position or performance of the Company. 5. OTHER OPERATING EXPENSES, NET
Six months ended
30 June 2017
30 June 2016
Third-party services 1,617 1,117 Utilities 2,218 2,088 Maintenance and repairs 454 606 Transport 232 242 Small-wares 443 672 Cleaning supplies 310 254 Insurance 123 67 Telephone and postage 40 38 Net (gain)/ loss on disposal of property, plant and equipment (4) 6 Change in allowance for current assets, net (63) - Miscellaneous expenses/(income), net 16 144
Total 5,386 5,234
6. GENERAL AND ADMINISTRATION EXPENSES, NET
Six months ended
30 June 2017
30 June 2016
Payroll and employee benefits 3,204 2,158 Third-party services 1,741 1,243 Transport 359 259 Rent 133 159 Banking charges 182 262 Small-wares 20 237 Maintenance and repairs 51 18 Depreciation and amortization 67 92 Telephone and postage 59 59 Insurance 25 16 Miscellaneous income, net (109) (165)
Total 5,732 4,338

AMERICAN RESTAURANT SYSTEM SA NOTES TO THE INTERIM FINANCIAL STATEMENTS For the six months ended 30 June 2017 All amounts in RON thousand, unless specified otherwise
F - 166
7. DISCLOSURE OF TOTAL PAYROLL AND EMPLOYEE BENEFITS EXPENSE AND TOTAL DEPRECIATION AND AMORTIZATION EXPENSE
7.1 Payroll and employee benefits
Six months ended
30 June
2017 30 June
2016
Payroll and employee benefits recognized in "Restaurant expenses" 13,690 9,608
Payroll and employee benefits recognized in "General and administration expenses, net’’ 3,204 1,243
Total payroll and employee benefits for continued operations 16,894 10,851
Additionally, a total of 1,228 refers to payroll and employee benefits relating to discontinued operations for the six months ended 30 June 2016. For more details, please refer to Note 23. 7.2 Depreciation and amortization
Six months ended
30 June
2017 30 June
2016
Depreciation and amortization recognized in "Restaurant expenses" 1,749 1,116
Depreciation and amortization recognized in "General and administration expenses, net" 67 92
Total depreciation and amortization for continued operations 1,816 1,208
Additionally, a total of 233 refers to depreciation and amortisation relating to discontinued operations for the six months ended 30 June 2016. For more details, please refer to Note 23. 8. FINANCE COSTS AND INCOME
8.1 Finance costs Six months ended
30 June
2017 30 June
2016
Interest on loans and borrowings 152 76
Finance charges payable under finance leases 5 5 Foreign exchange loss, net 30 -
Total 187 81
8.2 Finance income Six months ended
30 June
2017 30 June
2016
Interest income 6 15
Foreign exchange gain, net - 78
Total 6 93

AMERICAN RESTAURANT SYSTEM SA NOTES TO THE INTERIM FINANCIAL STATEMENTS For the six months ended 30 June 2017 All amounts in RON thousand, unless specified otherwise
F - 167
9. INCOME TAX The major components of income tax expense for the six months ended 30 June 2017 and 30 June 2016 are: Six months ended
30 June
2017 30 June
2016
Current income tax:
Current income tax charge 772 586
Deferred tax: Relating to origination and reversal of temporary differences - 40
Income tax expense reported in the statement of comprehensive income 772 626
A reconciliation between tax expense and the product of accounting profit multiplied by Romania’s domestic tax rate for the six months ended 30 June 2017 and 30 June 2016 is as follows: Six months ended
30 June 2017
30 June 2016
Accounting profit before tax from continuing operations 1,811 4,388 Profit before tax from a discontinued operation - 349
Accounting profit before income tax 1,811 4,737
At statutory income tax rate of 16% 290 758 Other income exempted from tax - (5) Non-deductible expenses for tax purposes - 52 Effect of changes in the tax legislation and tax rates 493 - Fiscal credit from sponsorship (11) (123)
At the effective income tax rate 772 682
Income tax attributable to a discontinued operation - (56)
Income tax reported in statement of comprehensive income: 772 626 The changes in tax legislation and tax rates relate to the tax levied on restaurant activity applicable starting with 1 January 2017 for the companies active in the restaurant industry. Specifically, per the updated regulations, the income tax for the restaurant activity has been replaced by a specific tax computed based on a minimum fixed amount multiplied by the impact of three criteria: restaurant area, restaurant location and seasonality (amounting to 625 for 6 months ended 30 June 2017). The taxation of the non-restaurant activities has not suffered changes. Deferred tax Deferred tax reconciliation with corresponding items in the statement of financial position and interim statement of comprehensive income is as follows:
Statement of comprehensive income
1 – 30 June 2017 1 – 30 June 2016
Property, plant and equipment - 39
Franchise rights - (3) Operating lease incentives - 2 Loans and borrowings - 2
Deferred tax benefit - 40
The Company offsets tax assets and liabilities if and only if it has a legally enforceable right to set off current tax assets and current tax liabilities and the deferred tax assets and deferred tax liabilities relate to income taxes levied by the same tax authority.

AMERICAN RESTAURANT SYSTEM SA NOTES TO THE INTERIM FINANCIAL STATEMENTS For the six months ended 30 June 2017 All amounts in RON thousand, unless specified otherwise
F - 168
10. PROPERTY, PLANT AND EQUIPMENT
Freehold buildings and
leasehold improvements
Plant and machinery
Other equipmen
t
Construction in
progress Total
Cost
At 1 January 2016 12,571 14,851 2,115 74 29,611
Additions 3,929 3,667 838 4,619 13,053 Transfers to asset held for sale 885 3,135 275 - 4,295 Disposals 525 373 14 3,946 4,858
At 31 December 2016 15,090 15,010 2,664 747 33,511
Additions 674 766 281 1,686 3,407 Disposals - 70 6 484 560
At 30 June 2017 15,764 15,706 2,939 1,949 36,358
Depreciation
At 1 January 2016 5,965 9,399 982 - 16,346
Depreciation charge for the year 1,166 1,359 337 - 2,862 Transfers to assets held for sale 617 2,343 174 - 3,134 Disposals 460 291 13 - 764
At 31 December 2016 6,054 8,124 1,132 - 15,310
Depreciation charge for the period 660 745 204 - 1,609 Disposals - 66 6 - 72
At 30 June 2017 6,714 8,803 1,330 - 16,847
Net book value
At 1 January 2016 6,606 5,452 1,133 74 13,265
At 31 December 2016 9,036 6,886 1,532 747 18,201
At 30 June 2017 9,050 6,903 1,609 1,949 19,511
The Company has several finance lease contracts for motor vehicles. The carrying value of the leased assets as of 30 June, 2017 is of 337 (31 December 2016: 329). The assets acquired under finance lease are pledged in favour of the leasing company. As of 30 June 2017 the gross book value of fully depreciated property, plant and equipment that were still in use is of 7,771 (31 December 2016: 8,069). The Company has pledged non-current assets (mostly equipment) in favour of Alpha Bank for the financing received. The net carrying amount of pledged assets as at 30 June 2017 is of 2,512 (31 December 2016: 3,328). The additions as at 30 June 2017 and 31 December 2016 consist mainly in new restaurants’ leasehold improvements, as well as restaurants’ kitchen equipment.

AMERICAN RESTAURANT SYSTEM SA NOTES TO THE INTERIM FINANCIAL STATEMENTS For the six months ended 30 June 2017 All amounts in RON thousand, unless specified otherwise
F - 169
11. INTANGIBLE ASSETS
Franchise rights
Other intangible
assets Intangibles in progress Total
Cost
At 1 January 2016 2,583 192 45 2,820
Additions 1,009 166 406 1,581 Disposals - - 90 90
At 31 December 2016 3,592 358 361 4,311
Additions - - 47 47 Disposals - - - -
At 30 June 2017 3,592 358 408 4,358
Amortisation
At 1 January 2016 1,009 62 - 1,071
Amortisation 291 32 - 323
At 31 December 2016 1,300 94 - 1,394
Amortisation 174 33 - 207
At 30 June 2017 1,474 127 - 1,601
Net book value
At 1 January 2016 1,574 130 45 1,749
At 31 December 2016 2,292 264 361 2,917
At 30 June 2017 2,118 231 408 2,757
Additions during the periods ended 30 June 2017 and 31 December 2016 consisted mainly in franchise operating licenses acquired for newly opened restaurants.

AMERICAN RESTAURANT SYSTEM SA NOTES TO THE INTERIM FINANCIAL STATEMENTS For the six months ended 30 June 2017 All amounts in RON thousand, unless specified otherwise
F - 170
12. INTEREST-BEARING LOANS AND BORROWINGS
Interest rate %
Maturity
30 June 2017
31 December 2016
Current interest-bearing loans and borrowings
Obligations under finance leases EURIBOR 3M +4.5% 11.03.2019 101 145 Bank loan EURIBOR 3M + 2.85-4% 5 years from each withdrawal 4,227 3,790
Total current interest-bearing loans and borrowings 4,328 3,935
Non-current interest-bearing loans and borrowings
Obligations under finance leases EURIBOR 3M +4.5% 11.03.2019 36 91 Bank loan EURIBOR 3M + 2.85-4% 5 years from each withdrawal 6,914 7,445
Total non-current interest-bearing loans and borrowings 6,950 7,536
Total interest-bearing loans and borrowings 11,278 11,471
The Company has a credit facility from Alpha Bank Romania made up of 3 sub-limits, as follows: credit facility for the development of new locations, issuance of bank guarantee letters and credit card. The loan is secured with property, plant and equipment of each restaurant location for which the credit limited has been utilised. The carrying amount of pledged property, plant and equipment and cash and cash equivalents is disclosed in Notes 10 and 16. Covenants: The Company’s borrowing arrangement with the Bank contains several covenants, mainly of quantitative nature, out of which the most important relates to the level of the service debt (whereby service debt is equal to EBITDA/ [principal plus interest payable]), which should exceed for any month 2.5. Breaches in meeting the financial covenants would permit the bank to immediately call loans and borrowings. There have been no breaches of the financial covenants of for the six months ended 30 June 2017 and for the year ended 31 December 2016.

AMERICAN RESTAURANT SYSTEM SA NOTES TO THE INTERIM FINANCIAL STATEMENTS For the six months ended 30 June 2017 All amounts in RON thousand, unless specified otherwise
F - 171
13. FINANCIAL INSTRUMENTS RISK MANAGEMENT The Company’s principal financial liabilities comprise loans and borrowings, including finance leases and trade and other payables. The main purpose of these financial liabilities is to finance the Company’s operations. The Company’s principal financial assets are represented by trade and other receivables and cash and short-term deposits that derive directly from its operations, as well as long-term deposits to guarantee rent payables. The Company is exposed to interest rate risk, foreign exchange risk, credit risk and liquidity risk. The Company’s senior management oversees the management of these risks. The Company’s senior management ensures that the Company’s financial risk activities are performed under appropriate procedures and that financial risks are identified, measured and managed in accordance with Company’s risk appetite. Interest rate risk The Company's income and operating cash flows are substantially independent of changes in market interest rates. Trade and other receivables and payables are non-interest bearing financial assets and liabilities. The borrowings are usually exposed to interest rate risk through market value fluctuations of interest-bearing long-term and short-term credit facilities. Interest rates on the Company's debt finance are variable. The interest rates on credit facilities of the Company are disclosed in Note 12. Changes in interest rates impact primarily loans and borrowings by changing either their future cash flows (variable rate debt). Management policy is to resort mainly to variable rate financing. However, at the time of rising new loans or borrowings management uses its judgment to decide whether it believes that fixed or variable rate would be more favourable to the Company over the expected period until maturity. Interest rate sensitivity The following table demonstrates the sensitivity to a reasonably possible change in interest rates on loans and borrowings. With all other variables held constant, the Company’s profit before tax and equity are affected through the impact on floating rate borrowings, as follows:
Increase
Effect on profit
in basis points
before tax
30 June 2017 (for six months)
EUR 1% (57) 31 December 2016 (for one year)
EUR 1% (115) The Company does not hedge its interest rate risk. The assumed movement in basis points for interest rate sensitivity analysis is based on the currently observable market environment. An equal decrease of the interest rate would have the same effect but of opposite impact.

AMERICAN RESTAURANT SYSTEM SA NOTES TO THE INTERIM FINANCIAL STATEMENTS For the six months ended 30 June 2017 All amounts in RON thousand, unless specified otherwise
F - 172
13. FINANCIAL INSTRUMENTS RISK MANAGEMENT (continued) Foreign currency risk Foreign currency risk is the risk that the fair value or future cash flows of a financial instrument will fluctuate because of changes in foreign exchange rates. The Company’s exposure to the risk of changes in foreign exchange rates relates primarily to the Company’s financing activities, as the financing contracted by the Company is Euro based. The vast majority of revenues, expenses, trade and other receivables and payables is in RON. The Company monitors the currency risk by following changes in exchange rates in currencies in which its intercompany balances and external debts are denominated. The Company does not have formal arrangements to mitigate its currency risk. Foreign currency sensitivity The following table demonstrates the sensitivity to a reasonably possible change in the EUR exchange rate. The Company’s exposure to foreign currency changes for all other currencies is not material. With all other variables held constant the Company’s profit before tax and equity are affected as follows:
Change in EUR rate
Effect on profit before tax
Effect on pre-tax equity
30 June 2017 (for six months) 1% (58) (58) 31 December 2016 (for one year) 1% (116) (116) Credit risk The Company is not significantly exposed to credit risk as the majority of its sales are on a cash basis. The Company's credit risk is primarily attributed to trade and other receivables and balances with banks. The carrying amount of trade and other receivables, net of allowance for impairment (Note 15) and deposits for rent guarantee as per statement of financial position plus balances with banks (Note 16) represent the maximum amount exposed to credit risk. Management believes that there is no significant risk of loss to the Company beyond the allowance already recorded. The Company invests cash and cash equivalents with highly reliable financial institutions. The Company has only plain vanilla deposits with reputable banks, none of which has experienced any difficulties in 2017 or up to the date of these interim standalone financial statements. The majority of cash is transacted through and placed with Alpha Bank Romania, member of Alpha Bank Group from Greece and Banca Romana de Dezvoltare (BRD), a member of Societe Generale Group from France. The long-term credit rating of Alpha Bank Greece is Caa3 as provided by Moody’s rating agency, no credit rating being available for its Romanian subsidiary. The long-term credit rating of BRD provided by Moody’s is Baa3. There is no significant concentration of credit risk in respect of trade and other receivables due to the fact that sales are based mainly on cash and credit card payments. Therefore there are no formal policies in the Company to manage credit risk for trade receivables. The Company's credit risk is primarily attributed to loans and receivables from related parties, for which the probability of losses is considered remote.

AMERICAN RESTAURANT SYSTEM SA NOTES TO THE INTERIM FINANCIAL STATEMENTS For the six months ended 30 June 2017 All amounts in RON thousand, unless specified otherwise
F - 173
13. FINANCIAL INSTRUMENTS RISK MANAGEMENT (continued)
Liquidity risk The Company has adopted a prudent financial liquidity management approach, assuming that sufficient cash and cash equivalents are maintained and that further financing is available from guaranteed funds from credit lines. The tables below summarizes the maturity profile of the Company’s financial liabilities, including principal amounts and interests according to contractual terms, at 30 June 2017 and 31 December 2016 based on contractual undiscounted payments.
30 June 2017 On
Less than
3 to 12
1 to 5
demand 3 months
months
years
Total
Interest-bearing loans and borrowings
9 1,127 3,481 7,151 11,768
Trade and other payables 1,629 4,445 3,380 301 9,755
Total 1,638 5,572 6,861 7,452 21,523
31 December 2016 On
Less than
3 to 12
1 to 5
demand
3 months
months
years
Total
Interest-bearing loans and borrowings
10 1,064 3,136 7,793 12,003
Trade and other payables 1,133 10,544 21 329 12,027
Total 1,143 11,608 3,157 8,122 24,030
At 30 June 2017, the Company had available undrawn committed borrowing facilities in amount of 36,616 (31 December 2016: 49,693), thus being able to respond to any unforeseen higher cash outflow needs. The credit facilities above are available to both the Company and US Food Network SA (a related party, see Note 22) for drawing, without a limit between them. Capital management Capital includes the equity attributable to the equity holders. The primary objective of the Company’s capital management is to ensure that it maintains a strong credit rating and healthy capital ratios in order to support its business and maximise shareholder value. The Company manages its capital structure and makes adjustments to it in light of changes in economic conditions and the requirements of the financial covenants. To maintain or adjust the capital structure, the Company may adjust the dividend payment to shareholders, return capital to shareholders or issue new shares. The Company may monitor capital using a gearing ratio, which is net debt divided by total capital plus net debt. The Company does not have a target gearing ratio. The Company includes within net debt, interest bearing loans and borrowings, trade and other payables, less cash and cash deposits.
30 June 2017
31 December 2016
Interest-bearing loans and borrowings 11,278 11,471 Trade and other payables 9,755 12,027 Less: cash and short-term deposits 2,320 3,294
Net debt 18,713 20,204
Equity 3,651 5,980
Capital and net debt 22,364 26,185
Gearing ratio 84% 77%

AMERICAN RESTAURANT SYSTEM SA NOTES TO THE INTERIM FINANCIAL STATEMENTS For the six months ended 30 June 2017 All amounts in RON thousand, unless specified otherwise
F - 174
13. FINANCIAL INSTRUMENTS RISK MANAGEMENT (continued) The Company’s capital management, amongst other things, aims to ensure that it meets financial covenants attached to the interest-bearing loans and borrowings that define capital structure requirements. For the covenants in force as at 30 June 2017 and 31 December 2016, please refer to Note 12. No changes were made in the objectives, policies or processes for managing capital during the six months ended 30 June 2017 and for the year ended 31 December 2016. Fair values The Company has no financial instruments carried at fair value in the statement of financial position. The carrying amount of the interest bearing loans and borrowings approximate their fair value. Management estimates that the margin applicable over Euribor at the balance sheet date would be similar to the ones at the dates of each previous withdrawal, due to the fact that the Company maintained over the past years a stable financial condition, and also based on the statistics published by the National Bank of Romania. Financial instruments which are not carried at fair value on the statement of financial position also include deposits to guarantee rent, trade and other receivables, cash and cash equivalents, and trade and other payables. The carrying amounts of these financial instruments are considered to approximate their fair values, due to their short term nature (in majority) and low transaction costs of these instruments. 14. INVENTORIES
30 June 2017
31 December 2016
Raw materials 526 522 Consumables 507 410 Finished goods 173 179
Total 1,206 1,111
For the six months ended 30 June 2017, inventories amounting to 15,603 (30 June 2016: 13,769) were recognised as an expense in profit or loss, in ‘’Food and materials’’ as well as in ‘’General and administrative expenses, net’’ (“Small-wares” and “Cleaning supplies”). 15. TRADE AND OTHER RECEIVABLES
30 June
2017 31 December
2016
Trade receivables, net 77 4,429
Trade receivables from related parties 1,048 1,032 Tax receivables 224 354 Meal tickets 245 245 Other debtors 204 29
Total 1,798 6,089
Less non-current portion: Trade receivables from related parties 285 -
Current portion 1,513 6,089

AMERICAN RESTAURANT SYSTEM SA NOTES TO THE INTERIM FINANCIAL STATEMENTS For the six months ended 30 June 2017 All amounts in RON thousand, unless specified otherwise
F - 175
15. TRADE AND OTHER RECEIVABLES (continued) Terms and conditions relating to related party transactions are described in Note 22. Trade receivables are non-interest bearing and are generally on terms of 30-90 days. As at 30 June 2017 and 31 December 2016, trade and other receivables with a value of 8 were impaired and fully provided for.
Total
At 1 January 2016 8
At 31 December 2016 8
At 30 June 2017 8
As at 30 June 2017 and 31 December 2016, the ageing analysis of trade receivables and trade receivables from related parties, net of allowances is, as follows:
Past due but not impaired
Total
Neither past due nor impaired
< 30 days
30-60 days
61-90 days
91-120 days
> 120 days
30 June 2017 1,125 1,103 7 5 - 2 8 31 December 2016 5,461 174 2,455 1,811 45 21 955 16. CASH AND SHORT-TERM DEPOSITS
30 June 2017
31 December 2016
Cash at banks and on hand 2,208 3,149 Cash in transit 112 145
Total 2,320 3,294
Deposits at banks earns interest at floating rates based on daily bank deposit rates. Short-term deposits are made for varying periods of between one day and three months, depending on the immediate cash requirements of the Company. As part of the financing agreement with Alpha Bank the Company has pledged the cash available in the accounts opened with the bank. The balance of the pledged bank accounts as at 30 June 2017 is of 741 (31 December 2016: 1,589)

AMERICAN RESTAURANT SYSTEM SA NOTES TO THE INTERIM FINANCIAL STATEMENTS For the six months ended 30 June 2017 All amounts in RON thousand, unless specified otherwise
F - 176
17. ISSUED CAPITAL
30 June 2017
31 December 2016
Authorised shares
Ordinary shares of 0.25 RON each 380,000
380,000
Share capital (RON, thousand) 95
95 Hyperinflation (RON, thousand) 1,549 1,549 The Company’s shareholders at 30 June 2017 are Sphera Franchise Group SA (99.9997%) and Lunic Franchising and Consulting Ltd. (0.0003%) The Company’s shareholders at 31 December 2016 are Lunic Franchising and Consulting Ltd. (22.34%), Tatika Investments (27.33%), M.B.L. Computers (23%), Wellkept Group SA (16.34%) and Anasa Properties SRL (10.99%). 18. DISTRIBUTIONS MADE AND PROPOSED
Six months ended
30 June 2017
2016
Declared and paid during the six months period/year 3,368
6,030
Total dividends for the six months period/year 3,368
6,030
Dividends per share (RON/share) 9
16
19. TRADE AND OTHER PAYABLES
30 June 2017
31 December 2016
Trade payables 5,891 6,896 Other payables to related parties 3,418 4,695 Salary liability 2,658 2,654 Social contribution liability 843 652 Other employee related liabilities 350 258 Other taxes 684 139 Other payables 446 436
Total 14,290 15,730
Less: non-current portion of other payables 323 329
Trade and other payables, current 13,967 15,401
Terms and conditions of the above financial liabilities:
• Trade payables are non-interest bearing and are normally settled on 30-day terms • Terms and conditions relating related party transactions are described in Note 22.

AMERICAN RESTAURANT SYSTEM SA NOTES TO THE INTERIM FINANCIAL STATEMENTS For the six months ended 30 June 2017 All amounts in RON thousand, unless specified otherwise
F - 177
19. TRADE AND OTHER PAYABLES (continued) The other current and non-current payables are summarized below:
30 June 2017
31 December 2016
Lease incentives (current and non-current) 384 358 Free of charge fit-outs (current and non-current) 48 58 Other payables (current) 14 20
Total 446 436
The lease incentive amounts relate to accruals recorded by the Company in order to allocate the lease incentives provided by landlords over the contractual period on a straight line basis. The free of charge fit-outs are represented by free of charge fit-out works/cash incentives received from landlords. The Company has recognized the amounts received in other payables and releases it to profit and loss over the contractual period. 20. EBITDA Six months ended
Note
30 June 2017
30 June 2016
Operating profit from continuing operations
1,992 4,376
Adjustments to bridge operating profit to EBITDA:
Depreciation and amortization included in restaurant expenses Note 7 1,749 1,116 Depreciation and amortization included in general and administration expenses Note 7 67 92
EBITDA from continuing operations
3,808 5,584
Profit from discontinued operations
- 349
Adjustments to bridge profit to EBITDA:
Depreciation and amortization expenses Note 23 - 233
EBITDA from discontinued operations
- 582
Total profit - 4,725 Total adjustments for depreciation and amortization - 1,441
Total EBITDA:
3,808 6,166
EBITDA is one of the key performance measures monitored by senior management. EBITDA would be normalized to exclude any significant one-off items (either revenues or expenses) but no such exclusions were necessary for the six months periods ended 30 June 2017 and 30 June 2016.

AMERICAN RESTAURANT SYSTEM SA NOTES TO THE INTERIM FINANCIAL STATEMENTS For the six months ended 30 June 2017 All amounts in RON thousand, unless specified otherwise
F - 178
21. COMMITMENTS AND CONTINGENCIES Operating lease commitments — Company as lessee The Company has entered into operating lease agreements for the premises of most of its restaurants. The lease terms are between five and ten years. Future minimum rentals payable under non-cancellable operating leases are, as follows:
30 June
2017 31 December
2016
Within one year 8,150 8,056 After one year but not more than five years 18,312 18,521 More than five years 1,095 1,378
Total: 27,557 27,955
Finance lease The Company has finance leases for vehicles. The Company’s obligations under finance leases are secured by the lessor’s title to the leased assets. Future minimum lease payments under finance leases and hire purchase contracts, together with the present value of the net minimum lease payments are, as follows:
30 June 2017
31 December 2016
Minimum payments
Present value of
payments
Minimum payments
Present value of
payments
Within one year 105 102
162 155 After one year but not more than five years 37 1
83 81
More than five years
Total minimum lease payments 142 103
245 236
Less amounts representing finance charges 5
9
Present value of minimum lease payments 137 103
236 236
Bank letter of guarantee The Company has issued bank letters of guarantee in favour of suppliers as at 30 June 2017 in amount of 2,259 (31 December 2016: 2,228). Other commitments Per the Romania network development plan, the Company has agreed with Pizza Hut Europe (Master Franchisor) to open a minimum of 9 pizza delivery locations during the years 2017- 2018 (4 locations in 2017 and 5 locations in 2018). Should the Company fail to achieve these targets (up until 1 year from notification received from Pizza Hut Europe), the Master Franchisor will be free to grant any other party the right to develop the outlets in breach.

AMERICAN RESTAURANT SYSTEM SA NOTES TO THE INTERIM FINANCIAL STATEMENTS For the six months ended 30 June 2017 All amounts in RON thousand, unless specified otherwise
F - 179
22. RELATED PARTY DISCLOSURES During the periods ended 30 June 2016 and 30 June 2017, the Company has carried out transactions with the following related parties:
Related party
Nature of the relationship
Country of incorporatio
n
Nature of
transactions
Sphera Franchise Group SA
Parent company Romania Purchase of services
Cinnamon Bake&Roll SRL Entity with several common members of key management personnel
Romania Sale of goods
US Food Network SA Entity with several common members of key management personnel
Romania Sale of goods
Moulin D'Or SRL Entity with several common members of key management personnel
Romania Sale of goods
ICS US Food Network SRL Entity with several common members of key management personnel
Moldova Sale of goods
The following table provides the total amount of transactions that have been entered into with related parties for the relevant financial year:
Sales to related parties
Purchases from related
parties
Amounts owed by
related parties
Amounts owed to related
parties
Related party 30 June 2017
Cinnamon Bake&Roll SRL 7 - 747 - US Food Network SA 257 81 238 3,417 US Food SRL 23 - 8 - Sphera Franchise Group SA - - 50 - Moulin D'Or SRL 1 2 5 1
Total 288 83 1,048 3,418
30 June 2016 and 31 December 2016
Cinnamon Bake&Roll SRL
84 545 978 - US Food Network SA
45,879 321 46 4,694
US Food SRL
967 - 4 - Moulin D'Or SRL
56 10 4 1
Total
46,986 876 1,032 4,695
Terms and conditions of transactions with related parties The sales to and purchases from related parties are made at terms equivalent to those that prevail in arm’s length transactions. Outstanding balances at the year-end are unsecured, interest free and settled in cash. There have been no guarantees provided or received for any related party receivables or payables. For the six months period ended 30 June 2017 and for the year 2016, the Company has not recorded any impairment of receivables relating to amounts owed by related parties. This assessment is undertaken each financial year by examining the financial position of the related party and the market in which the related party operates. Compensation of key management personnel of the Company: Six months ended
30 June 2017 30 June 2016
Short-term employee benefits
151 174
Fees paid to management entities 716 451
Total compensation paid to key management personnel
867 625
The amounts disclosed in the table are the amounts recognised as an expense during each reporting period.

AMERICAN RESTAURANT SYSTEM SA NOTES TO THE INTERIM FINANCIAL STATEMENTS For the six months ended 30 June 2017 All amounts in RON thousand, unless specified otherwise
F - 180
23. DISCONTINUED OPERATIONS Up to the second half of 2016, the Company has acted as a purchase hub for some related entities, such as US Food Network SA (both Romanian and Moldavian operations) or Cinnamon Bake & Roll SRL. All food supplies, beverages or other consumables were purchased by the Company and sold at a mark-up designed to broadly cover any other operating costs directly associated with this line of business. In November 2016, the Company together with US Food Network SA and the other related parties have outsourced this activity to Havi Logistics SA, a third party company specialized in integrated logistics services for the food industry. Accordingly, in these financial statements, this line of business has been classified and disclosed as a discontinued operation. Following this transfer, the Company has identified equipment relating to this activity with a net carrying amount of 1,161 which would no longer be used for other purposes. As a result, the Company has recorded an impairment allowance for this equipment of 966 as of 31 December 2016, in order to reduce it to its recoverable amount. The results of the purchasing hub line of business for the past periods are presented below:
Six months ended
30 June 2017 30 June 2016
Sales of goods - 47,582
Direct expenses: Food and material - 41,496 Payroll and employee benefits - 1,228 Depreciation and amortization - 233 Other operating expenses, net - 3,603
Operating profit - 1,022
General and administration expenses, net - 673
Profit before tax - 349
Income tax expense: - (56)
Profit/(loss) for the period - 293
The net cash flows incurred by this line of business were as follows:
Six months ended
30 June 2017 30 June 2016
Cash flow from operating activities - 2,495 Cash flow from investing activities - -
Net cash inflow/(outflow) - 2,495
24. EVENTS AFTER THE REPORTING PERIOD After 30 June 2017, the Company opened two new pizza delivery points: PHD Ploiesti and PHD Drumul Taberei.

SPHERA FRANCHISE GROUP SA PRO FORMA CONSOLIDATED STATEMENT OF COMPREHENSIVE INCOME FOR THE PERIOD FROM 1 JANUARY 2014 TO 31 DECEMBER 2014
F - 181
SPHERA FRANCHISE GROUP SA
PRO FORMA CONSOLIDATED FINANCIAL INFORMATION FOR THE PERIOD FROM 1 JANUARY 2014 TO 31 DECEMBER 2014

SPHERA FRANCHISE GROUP SA PRO FORMA CONSOLIDATED STATEMENT OF COMPREHENSIVE INCOME FOR THE PERIOD FROM 1 JANUARY 2014 TO 31 DECEMBER 2014
F - 182
CONTENT Independent auditor’s assurance report on the compilation of pro forma consolidated financial information included in a prospectus F - 183 Pro forma consolidated statement of comprehensive income F - 186 Notes to pro forma consolidated statement of comprehensive income F - 188

Ernst & Young Assurance Services SRL Cladirea Bucharest Tower Center, et. 21 Bd. Ion Mihalache nr. 15-17, Sector 1
011171 Bucuresti, Romania
Tel: +40 21 402 4000 Fax: +40 21 310 7193 [email protected]
ey.com
INDEPENDENT AUDITOR’S ASSURANCE REPORT ON THE COMPILATION OF PRO
FORMA CONSOLIDATED FINANCIAL INFORMATION INCLUDED IN A PROSPECTUS
To the Board of Directors of Sphera Franchise Group S.A.
We have completed our assurance engagement to report on the compilation of pro forma
consolidated financial information of Sphera Franchise Group S.A. (“Sphera”) and its
subsidiaries (together “the Group”) by management. The pro forma consolidated financial
information consists of the pro forma consolidated statement of comprehensive income for the
period from 1 January 2014 to 31 December 2014 and related explanatory notes. The
applicable criteria on the basis of which management has compiled the pro forma consolidated
financial information are specified in the European Commission Regulation (EC) No. 809/2004
and the basis of compilation is described in Note 3 to the pro forma consolidated financial
information.
The pro forma consolidated financial information has been compiled by management of Sphera
Franchise Group S.A. to illustrate the consolidated operational performance of the Group for the
twelve months period ended 31 December 2014, as if the set-up of Sphera completed on 16
May 2017 and the contribution of US Food Network S.A. shares and American Restaurant
Systems S.A. shares to Sphera completed on 30 May 2017, as described in Note 1, took place
on 1 January 2014. As part of this process, information about the Group's financial performance
has been extracted by management from US Food Network S.A. consolidated financial
statements that comprise the statement of comprehensive income for the years ended 31
December 2016, 31 December 2015 and 31 December 2014 prepared in accordance with
International Financial Reporting Standards (“IFRS”) as adopted by the European Union, on
which we issued an audit report on 9 August 2017 and from the American Restaurant Systems
S.A. financial statements that comprise the statement of comprehensive income for the years
ended 31 December 2016, 31 December 2015 and 31 December 2014 prepared in accordance
with International Financial Reporting Standards as adopted by the European Union, on which
we issued an audit report on 9 August 2017.
Management's responsibility for the Pro Forma Financial Information
Management is responsible for compiling the pro forma consolidated financial information on
the basis of the requirements of the European Commission Regulation (EC) No. 809/2004 and
criteria described in Note 3 to the pro forma consolidated financial information.
Our Independence and Quality Control
We have complied with the independence and other ethical requirements of the Code of Ethics
for Professional Accountants issued by the International Ethics Standards Board for
Accountants , which is founded on fundamental principles of integrity, objectivity, professional
competence and due care, confidentiality and professional behavior. The firm applies
International Standard on Quality Control 1, Quality Control for Firms that Perform Audits and
Reviews of Financial Statements, and Other Assurance and Related Services Engagements.

F - 184
Auditor’s responsibility
Our responsibility is to express an opinion, as required by item 7 of Annex II of the European
Commission Regulation (EC) No. 809/2004, about whether the pro forma consolidated financial
information has been compiled, in all material respects, by management on the basis of
compilation described in Note 3 to the pro forma consolidated financial information.
We conducted our engagement in accordance with International Standard on Assurance
Engagements (ISAE) 3420, Assurance Engagements to Report on the Compilation of Pro
Forma Financial Information Included in a Prospectus, issued by the International Auditing and
Assurance Standards Board. This standard requires that the auditors comply with ethical
requirements and plan and perform procedures to obtain reasonable assurance about whether
management has compiled, in all material respects, the pro forma financial information on the
basis of compilation described in Note 3 to the pro forma consolidated financial information.
For purposes of this engagement, we are not responsible for updating or reissuing any reports
or opinions on any historical financial information used in compiling the pro forma consolidated
financial information, nor have we, in the course of this engagement, performed an audit or
review of the financial information used in compiling the pro forma financial information.
The purpose of pro forma consolidated financial information included in a prospectus is solely to
illustrate the impact of a significant event or transaction on unadjusted financial information of
the entity as if the event had occurred or the transaction had been undertaken at an earlier date
selected for purposes of the illustration. Accordingly, we do not provide any assurance that the
actual outcome if the set-up of Sphera and the contribution of US Food Network S.A. shares
and American Restaurant Systems S.A. shares to Sphera took place on 1 January 2014 would
have been as presented.
A reasonable assurance engagement to report on whether the pro forma financial information
has been compiled, in all material respects, on the basis of the applicable criteria involves
performing procedures to assess whether the applicable criteria used by management in the
compilation of the pro forma financial information provide a reasonable basis for presenting the
significant effects directly attributable to the event or transaction, and to obtain sufficient
appropriate evidence about whether:
• The related pro forma adjustments give appropriate effect to those criteria; and
• The pro forma financial information reflects the proper application of those adjustments to
the unadjusted financial information.
The procedures selected depend on the auditor's judgment, having regard to the auditor's
understanding of the nature of the company, the event or transaction in respect of which the pro
forma financial information has been compiled, and other relevant engagement circumstances.

F - 185
The engagement also involves evaluating the overall presentation of the pro forma financial
information.
We believe that the evidence we have obtained is sufficient and appropriate to provide a basis
for our opinion.
Opinion
In our opinion, (a) the pro forma consolidated financial information has been properly compiled
on the basis stated; and (b) that basis is consistent with the accounting policies of Sphera
Franchise Group S.A.
Other matter
This report is issued for the sole purpose of the public offering in Romania and the admission of
the existing and new common shares to the regulated market operated by the Bucharest Stock
Exchange. Therefore, this report is not appropriate in other jurisdictions and should not be used
or relied upon for any purpose other than the public offering described above. We accept no
duty or responsibility to and deny any liability to any party in respect of any use of, or reliance
upon, this report in connection with any type of transaction, including the sale of securities other
than the offer to the public of the existing and new common shares on the regulated market
operated by the Bucharest Stock Exchange.
On behalf of
Ernst & Young Assurance Services SRL
Alina Dimitriu
Executive Director
Bucharest, Romania
14 September 2017

SPHERA FRANCHISE GROUP SA PRO FORMA CONSOLIDATED STATEMENT OF COMPREHENSIVE INCOME FOR THE PERIOD FROM 1 JANUARY 2014 TO 31 DECEMBER 2014 All amounts in RON thousand, unless specified otherwise
F - 186
NNote
USFN Group ARS
Reclassification discontinued
operations (Note 3.1)
Intercompany elimination
(Note 3.2)
PPA effect
(Note 3.3) Pro forma
(a) (b) (c) (d) (e) (f) =
(a)+(b)+(c)+(d)+(e)
Restaurant sales 261,782 63,130 62,412 (62,412) - 324,912
Restaurant expenses
Food and material expenses 98,405 16,881 60,847 (60,847) - 115,286 Payroll and employee benefits 6.1 40,400 12,001 - - - 52,401 Rent 20,366 6,081 - - - 26,447 Royalties 15,406 3,697 - - - 19,103 Advertising 13,187 3,590 - - - 16,777
Other operating expenses, net 4 19,350 7,514 1,601 (1,601) - 26,864
Depreciation and amortization 6.2 8,238 2,188 - - 395 10,821
Restaurant operating profit 46,430 11,178 (36) 36 (395) 57,213
General and administration expenses, net 5 15,299 6,094 (66) 66 26 21,419
Operating profit 31,131 5,084 30 (30) (421) 35,794
Finance costs 7.1 978 309 - - - 1,287 Finance income 7.2 240 7 - - - 247
Profit before tax 30,393 4,782 30 (30) (421) 34,754
Income tax expense 4,528 667 5 (5) - 5,195
Profit for the year from continuing operations 25,865 4,115 25 (25) (421) 29,559
Discontinued operations Loss after tax from discontinued operations
8
- (595) (25) - - (620)
Profit for the year 25,865 3,520 - (25) (421) 28,930
Attributable to:
Equity holders of Sphera 25,716 3,520 - (25) (421) 28,790 Non-controlling interests 149 - - - - 149

SPHERA FRANCHISE GROUP SA PRO FORMA CONSOLIDATED STATEMENT OF COMPREHENSIVE INCOME FOR THE PERIOD FROM 1 JANUARY 2014 TO 31 DECEMBER 2014 All amounts in RON thousand, unless specified otherwise
F - 187
NNote
USFN Group ARS
Reclassification discontinued
operations (Note 3.1)
Intercompany elimination
(Note 3.2)
PPA effect
(Note 3.3) Pro forma
(a) (b) (c) (d) (e) (f) =
(a)+(b)+(c)+(d)+(e)
Other comprehensive income
Other comprehensive income to be reclassified to profit or loss in subsequent periods (net of tax):
Exchange differences on translation of foreign operations
(10) - - - - (10)
Total comprehensive income for the year, net of tax
25,855 3,520 - (25) (421) 28,929
Attributable to:
Equity holders of Sphera 25,708 3,520 - (25) (421) 28,782 Non-controlling interests 147 - - - - 147
Earnings per share, basic and diluted (RON/share) (Note 11) 0.7580 This pro forma consolidated financial information has been authorised by the Board of Directors for issue on 29 August 2017.
Mark Hilton General Manager Sphera Franchise Group SA

SPHERA FRANCHISE GROUP SA NOTES TO PRO FORMA CONSOLIDATED FINANCIAL INFORMATION FOR THE PERIOD FROM 1 JANUARY 2014 TO 31 DECEMBER 2014 All amounts in RON thousand, unless specified otherwise
F - 188
1. Introduction Sphera Franchise Group SA (“Sphera”), together with its subsidiaries: US Food Network SA (“USFN”), US Food Network SRL Italy (“USFN Italy”), US Food Network SRL Moldova (“USFN Moldova”) (USFN together with USFN Italy and USFN Moldova being the “USFN Group”), California Fresh Flavors SRL (Taco Bell) and American Restaurant System SA (“ARS”) form “the Group”. Sphera was set up on 16 May 2017 by the shareholders of USFN and ARS. The purpose of the reorganization that resulted in the establishment of Sphera as the legal parent of USFN, ARS, USFN Italy, USFN Moldova and Taco Bell was to ensure a better coordination of activities and enhance value creation, by taking advantage of the synergies at group level and by achieving economies of scale. In terms of activities, Sphera will take over gradually until the end of September 2017 certain activities as well as 105 employees from USFN and ARS and will render to the benefit of the Group entities services such as management services, marketing support, development, sales support, human resources and other services. Sphera has become the parent of both USFN and ARS on 30 May 2017, following the contribution by the existing shareholders of their shares in USFN (379,999 shares out of total 380,000 shares) and ARS (379,999 shares out of total 380,000 shares) in exchange for shares in Sphera. By applying the criteria set in IFRS 3, the transaction qualified as a business combination and USFN has been identified as the acquirer of Sphera and ARS. On 8 June 2017 USFN has sold all the 100% shares it held in its subsidiary USFN Italy to Sphera and on 14 June 2017 USFN has sold all the 80% shares it held in its subsidiary USFN Moldova to Sphera. These transactions had no effect on the consolidated financial statements of SFG, as there was no change of control, nor of the percentage owned by Sphera shareholders. On 19 June 2017 Sphera has set up a new subsidiary, California Fresh Flavors SRL (“Taco Bell”), and holds 9,999 shares of its 10,000 shares. The new subsidiary had no activity up to 30 June 2017. This pro forma consolidated financial information has been authorised by the Board of Directors for issue on 29 August 2017.

SPHERA FRANCHISE GROUP SA NOTES TO PRO FORMA CONSOLIDATED FINANCIAL INFORMATION FOR THE PERIOD FROM 1 JANUARY 2014 TO 31 DECEMBER 2014 All amounts in RON thousand, unless specified otherwise
F - 189
2. Purpose of pro forma consolidated financial information This pro forma consolidated financial information was prepared to illustrate the consolidated operational performance of the Group for the twelve months period ended 31 December 2014, as if the set-up of Sphera and the contribution of USFN shares and ARS shares to Sphera took place on 1 January 2014. (The sale of the shares in USFN Italy and USFN Moldova by USFN to Sphera, which has no impact on the consolidated financial statements of SFG, as well as the set-up of Taco Bell in 2017 and the start of commercial activity of USFN Italy in 2017 are not adjusted for in the pro forma consolidated financial information). USFN and ARS had identical shareholder structure and also their key management personnel was in majority the same since 2012. Therefore, although from an IFRS perspective the criteria are not met in order to qualify as “under common control” (since none of the shareholders had control or common control), the presentation of the pro forma information is reflective of the manner in which the two business segments (KFC for USFN and Pizza Hut for ARS) were managed together. The pro forma consolidated statement of comprehensive income describes a hypothetical situation and has been prepared solely for illustrative purposes and do not purport to represent what the actual consolidated results of operations of the Group would have been had the control been gained on the date assumed, nor are they necessarily indicative of future consolidated operational results. In addition, the statements are based on available information and various assumptions that management believes to be reasonable. The actual results may differ from those reflected in the pro forma consolidated financial information for a number of reasons, including, but not limited to, differences between the assumptions used to prepare the pro forma consolidated financial information and actual amounts. The pro forma consolidated financial information only consists of the pro forma consolidated statement of comprehensive income for the twelve month period ended 31 December 2014 and selected notes. The statement of comprehensive income is based on the statements of comprehensive income for the year ended 31 December 2014 included in the USFN Group consolidated IFRS financial statements (audited) and ARS IFRS financial statements (audited), with pro forma adjustments as described in Note 3. The USFN Group consolidated IFRS financial statements and the ARS IFRS financial statements have been prepared in accordance with International Financial Reporting Standards as issued by the International Accounting Standards Board (IASB) and adopted by the European Union (EU) (IFRS). The applicable criteria on the basis of which management has compiled the pro forma consolidated financial information consisting of the pro forma consolidated statement of comprehensive income for the period from 1 January 2015 to 31 December 2015 and related explanatory notes included in the prospectus are specified in Commission Regulation (EC) No. 809/2004 and supplemented by the provisions of the Financial Supervisory Authority letter dated 11 August 2017.

SPHERA FRANCHISE GROUP SA NOTES TO PRO FORMA CONSOLIDATED FINANCIAL INFORMATION FOR THE PERIOD FROM 1 JANUARY 2014 TO 31 DECEMBER 2014 All amounts in RON thousand, unless specified otherwise
F - 190
3. Basis of preparation of the pro forma consolidated financial information 3.1 Pro forma adjustments: reclassification of discontinued operations to profit or loss Up to the second half of 2016, ARS has acted as a purchase hub for some related entities, mainly the USFN Group. All food supplies, beverages or other consumables were purchased by ARS and sold at a mark-up designed to broadly cover any other operating costs directly associated with this line of business. In November 2016, ARS together with USFN and the other related parties have outsourced this activity to Havi Logistics SA, a third party company specialized in integrated logistics services for the food industry. In the ARS individual financial statements the after tax result from the discontinued supply activity was disclosed separately, as a single profit or loss caption, in line with the IFRS requirements. In the process of preparation of the pro forma consolidated statement of comprehensive income, the ARS loss for the year from discontinued operations, net of tax was reclassified to the original profit or loss captions (e.g. sales, food and materials, etc.) to the extent that the sales of ARS were made towards the USFN Group (for the year ended 31 December 2014 the discontinued operation had revenues of 63,111of which 62,412 were sales to USFN Group, the remaining amount were sales to other related parties – please refer also to Note 9). 3.2 Pro forma adjustments: elimination of intercompany transactions In the process of preparation of the pro forma consolidated statement of comprehensive income, amounts as per the USFN Group audited IFRS consolidated financial statements were added to the amounts as per the ARS audited IFRS financial statements, with the transactions carried out during 2014 between the two entities being eliminated. No synergies or integration costs following the acquisition of USFN Group and ARS by Sphera have been taken into consideration in the preparation of the pro forma consolidated financial information. 3.3 Purchase price allocation adjustments Adjustments have been made to account for the effect of the purchase price allocation performed as of the date of acquisition of Sphera and ARS by USFN (30 May 2017). Specifically, there are fair value adjustments recorded for the property, plant and equipment of ARS. The adjustment recorded in the pro forma has been computed by applying the fair value adjustments to the property, plant and equipment of ARS (as determined on 31 May 2017) to their net book values on 1 January 2014 or from the date of acquisition in 2014, and by re-computing the depreciation expense for the year 2014 based on the amounts thus adjusted. 3.4 Preparation of the selected notes With respect to:
- Note 4 Other operating expenses, net - Note 5 General and administrative expenses, net - Note 6 Total employee benefits expense and total depreciation and amortization expense - Note 7 Finance costs and income, - Note 8 EBITDA - Note 9 Discontinued operations,
the information presented in these notes is based on amounts derived directly from the similar notes from the audited IFRS consolidated financial statements of USFN Group and, respectively, the audited IFRS financial statements of ARS, adjusted for the applicable pro forma adjustments described above.

SPHERA FRANCHISE GROUP SA NOTES TO PRO FORMA CONSOLIDATED FINANCIAL INFORMATION FOR THE PERIOD FROM 1 JANUARY 2014 TO 31 DECEMBER 2014 All amounts in RON thousand, unless specified otherwise
F - 191
3. Basis of preparation of the pro forma consolidated financial information (continued) With respect to Note 10 Segment information: The amounts related to the statement of comprehensive income were split between corresponding brands based on the same accounting policy as adopted for SFG consolidated financial statements in 2017; all amounts related to KFC brand were derived from USFN Group for 2014 while the amounts related to Pizza Hut brand were derived from ARS for 2014 plus one pizza delivery point from USFN Group. The revenue from restaurants was split between Romania and Republic of Moldova based on the same accounting policy as adopted for SFG consolidated financial statements in 2017; all amounts related to Republic of Moldova were derived from USFN Moldova entity in 2014 while the amounts for the Romanian entities USFN and ARS are presented as amounts related to Romania. (Sphera has no revenues to be presented). 11 Other operating expenses, net:
USFN Group
ARS
Reclassification discontinued
operations (Note 3.1)
Intercompany elimination
(Note 3.2)
PPA effect
(Note 3.3) Pro forma
Third-party services 6,193
1,579 5 (5)
- 7,772
Utilities 7,387
3,627 - -
- 11,014 Maintenance and repairs 2,542
990 602 (602)
- 3,532
Cleaning supplies 1,207
277 1,149 (1,149)
- 1,484 Small-wares 762
262 385 (385)
- 1,024
Transport 898
250 - -
- 1,148 Telephone and postage 339
67 - -
- 406
Insurance 159
104 - -
- 263 Net loss/(gain) on disposal of property, plant and equipment 740
391 - -
- 1,131
Change in allowance for receivables 165
2 - -
- 167 Change in provisions (1,226) - - - - (1,226) Miscellaneous expenses and income, net 184
(35) (540) 540
- 149
Total 19,350
7,514 1,601 (1,601)
- 26,864

SPHERA FRANCHISE GROUP SA NOTES TO PRO FORMA CONSOLIDATED FINANCIAL INFORMATION FOR THE PERIOD FROM 1 JANUARY 2014 TO 31 DECEMBER 2014 All amounts in RON thousand, unless specified otherwise
F - 192
12 General and administrative expenses, net
USFN Group
ARS
Reclassification discontinued
operations (Note 3.1)
Intercompany elimination
(Note 3.2)
PPA effect
(Note 3.3) Pro forma
Payroll and employee benefits 5,824
2,669 -
8,493
Third-party services 5,629
1,869 - -
7,498 Rent 1,143
333 - -
1,476
Depreciation and amortisation 481
151 -
26 658 Transport 541
415 - -
956
Banking charges 753
292 - -
1,045 Maintenance and repairs 303
29 - -
332
Small-wares 56
237 - -
293 Telephone and postage 167
111 - -
278
Insurance 149
26 - -
175 Advertising 42
- - -
42
Miscellaneous expenses and income, net 211
(38) (66) 66
173
Total 15,299
6,094 (66) 66
26 21,419
13 Total payroll and employee benefits expense and total depreciation and amortization expense 6.1 Payroll and employee benefits
USFN Group
ARS
Reclassification discontinued
operations (Note 3.1)
Intercompany elimination
(Note 3.2)
PPA effect
(Note 3.3) Pro forma
Payroll and employee benefits recognized in "Restaurant expenses" 40,400 12,001 - - - 52,401 Payroll and employee benefits recognized in "General and administration expenses, net" 5,824 2,669 - - - 8,493
Total payroll and employee benefits 46,224 14,670 - - - 60,894

SPHERA FRANCHISE GROUP SA NOTES TO PRO FORMA CONSOLIDATED FINANCIAL INFORMATION FOR THE PERIOD FROM 1 JANUARY 2014 TO 31 DECEMBER 2014 All amounts in RON thousand, unless specified otherwise
F - 193
6 Total payroll and employee benefits expense and total depreciation and amortization expense (continued) 6.2 Depreciation and amortization
USFN Group
ARS
Reclassification discontinued
operations (Note 3.1)
Intercompany elimination
(Note 3.2)
PPA effect
(Note 3.3) Pro forma
Depreciation and amortization, recognized in "Restaurant expenses" 8,238 2,188 - - 395 10,821 Depreciation and amortization, recognized in "General and administration expenses, net" 481 151 - - 26 658
Total depreciation and amortization 8,719 2,339 - - 421 11,479
7 Finance costs and income 7.1 Finance costs
USFN Group
ARS
Reclassification discontinued
operations (Note 3.1)
Intercompany elimination
(Note 3.2)
PPA effect
(Note 3.3) Pro forma
Interest on loans and borrowings 534
90 - -
624
Finance charges payable under finance leases 21
10 - -
31 Foreign exchange loss, net 423
209 - -
632
Total finance costs 978
309 - -
1,287
7.2. Finance income
USFN Group
ARS
Reclassification discontinued
operations (Note 3.1)
Intercompany elimination
(Note 3.2)
PPA effect
(Note 3.3) Pro forma
Interest income 240
7 - -
- 247
Total finance income 240
7 - -
- 247

SPHERA FRANCHISE GROUP SA NOTES TO PRO FORMA CONSOLIDATED FINANCIAL INFORMATION FOR THE PERIOD FROM 1 JANUARY 2014 TO 31 DECEMBER 2014 All amounts in RON thousand, unless specified otherwise
F - 194
8 EBITDA
USFN Group
ARS
Reclassification discontinued
operations (Note 3.1)
Intercompany elimination
(Note 3.2)
PPA effect
(Note 3.3) Pro forma
Operating profit from continuing operations 31,131 5,084 30 (30) (421) 35,794 Adjustments to bridge operating profit to EBITDA: Depreciation and amortization included in restaurant expenses 8,238 2,188 - - 395 10,821 Depreciation and amortization included in general and administration expenses 481 151 - - 26 658
EBITDA from continuing operations 39,850 7,423 30 (30) - 47,273
EBITDA is one of the key performance measures monitored by senior management. EBITDA would be normalized to exclude any significant one-off items (either revenues or expenses) but no such exclusions were necessary for year ended 31 December 2014.

SPHERA FRANCHISE GROUP SA NOTES TO PRO FORMA CONSOLIDATED FINANCIAL INFORMATION FOR THE PERIOD FROM 1 JANUARY 2014 TO 31 DECEMBER 2014 All amounts in RON thousand, unless specified otherwise
F - 195
9 Discontinued operations Up to the second half of 2016, ARS has acted as a purchase hub for some related entities, such as USFN Group or Cinnamon Bake & Roll SRL. All food supplies, beverages or other consumables were purchased by ARS and sold at a mark-up designed to broadly cover any other operating costs directly associated with this line of business. In November 2016, ARS together with USFN Group and the other related parties have outsourced this activity to Havi Logistics SA, a third party company specialized in integrated logistics services for the food industry. Accordingly, in the financial statements of ARS, this line of business has been classified and disclosed as a discontinued operation. The results of the purchasing hub line of business for 2014 are presented below:
2014
Sales of goods 63,111
Direct expenses:
Food and material 56,107
Payroll and employee benefits 2,853
Depreciation and amortization 131
Impairment of assets held for sale -
Other operating expenses, net 2,860
Operating profit 1,160
General and administration expenses, net 1,868
Profit before tax (708)
Income tax benefit: 113
Profit/(loss) for the year: (595)
Prior to outsourcing, the supply activity involved 43 employees. Following the outsourcing, a number of 23 employees were redeployed within the Group (14 with ARS and 9 with USFN), while the rest left the Group.
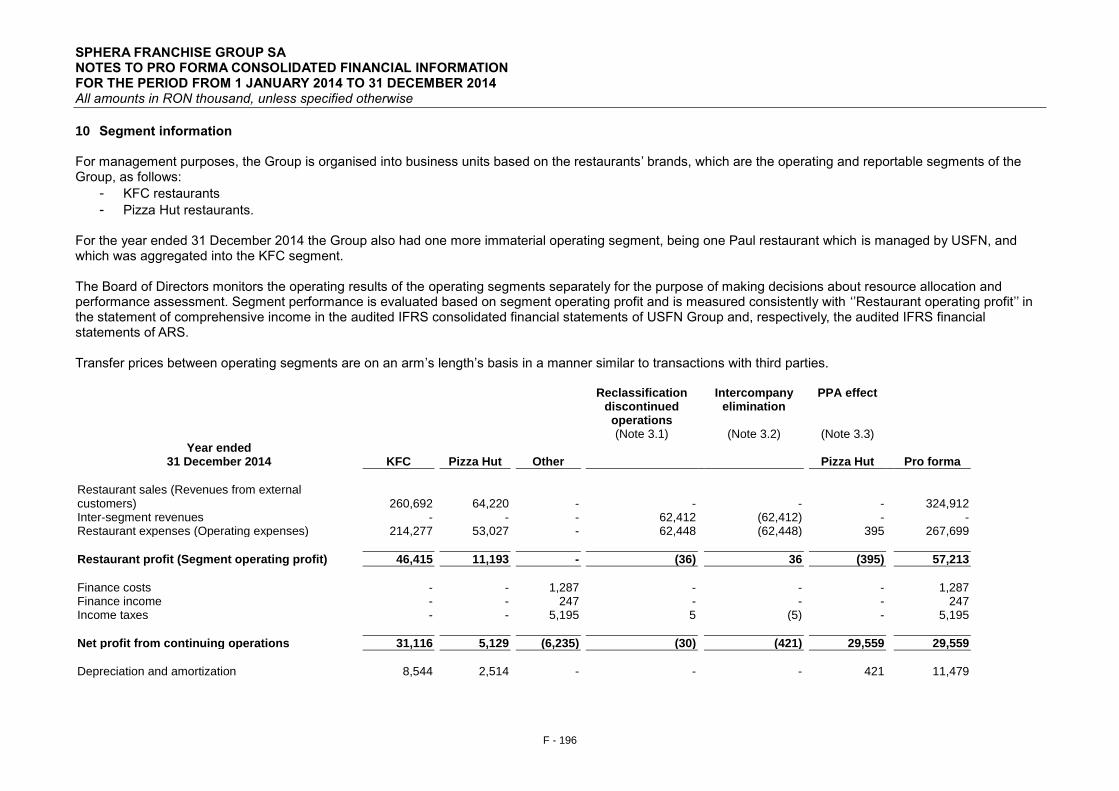
SPHERA FRANCHISE GROUP SA NOTES TO PRO FORMA CONSOLIDATED FINANCIAL INFORMATION FOR THE PERIOD FROM 1 JANUARY 2014 TO 31 DECEMBER 2014 All amounts in RON thousand, unless specified otherwise
F - 196
10 Segment information
For management purposes, the Group is organised into business units based on the restaurants’ brands, which are the operating and reportable segments of the Group, as follows:
- KFC restaurants
- Pizza Hut restaurants.
For the year ended 31 December 2014 the Group also had one more immaterial operating segment, being one Paul restaurant which is managed by USFN, and which was aggregated into the KFC segment. The Board of Directors monitors the operating results of the operating segments separately for the purpose of making decisions about resource allocation and performance assessment. Segment performance is evaluated based on segment operating profit and is measured consistently with ‘’Restaurant operating profit’’ in the statement of comprehensive income in the audited IFRS consolidated financial statements of USFN Group and, respectively, the audited IFRS financial statements of ARS. Transfer prices between operating segments are on an arm’s length’s basis in a manner similar to transactions with third parties.
Year ended 31 December 2014 KFC
Pizza Hut
Other
Reclassification discontinued
operations (Note 3.1)
Intercompany elimination
(Note 3.2)
PPA effect
(Note 3.3)
Pizza Hut
Pro forma
Restaurant sales (Revenues from external customers) 260,692
64,220
-
-
-
-
324,912
Inter-segment revenues -
-
-
62,412 (62,412)
- - Restaurant expenses (Operating expenses) 214,277
53,027
-
62,448 (62,448)
395 267,699
Restaurant profit (Segment operating profit) 46,415 11,193 - (36) 36 (395) 57,213
Finance costs -
-
1,287
- -
- 1,287
Finance income -
-
247
- -
- 247 Income taxes -
-
5,195
5 (5)
- 5,195
Net profit from continuing operations 31,116
5,129
(6,235)
(30) (421)
29,559 29,559
Depreciation and amortization 8,544 2,514 - - - 421 11,479

SPHERA FRANCHISE GROUP SA NOTES TO PRO FORMA CONSOLIDATED FINANCIAL INFORMATION FOR THE PERIOD FROM 1 JANUARY 2014 TO 31 DECEMBER 2014 All amounts in RON thousand, unless specified otherwise
F - 197
10. Segment information (continued) Geographic information:
Revenue from external customers USFN group
ARS
Pro forma adjustments
Pro forma
Romania 257,545 63,130 - 320,675 Republic of Moldova 4,237 - - 4,237
Total restaurant revenue 261,782 63,130 - 324,912
The revenue information above is based on the location of the customers. 11. Earnings per share (EPS) EPS is calculated by dividing the profit for the year attributable to shareholders of Sphera by the number of ordinary shares issued by Sphera, after the contribution of USFN shares and ARS shares by the existing shareholders.
2014
Profit from continuing operations attributable to ordinary equity holders of Sphera (RON thousand) 29,410 Number of Sphera shares 38,799,340
Earnings per share, basic and diluted (RON/share) 0.7580
There are no dilutive instruments to be considered.

SPHERA FRANCHISE GROUP SA PRO FORMA CONSOLIDATED STATEMENT OF COMPREHENSIVE INCOME FOR THE PERIOD FROM 1 JANUARY 2015 TO 31 DECEMBER 2015
F - 198
SPHERA FRANCHISE GROUP SA
PRO FORMA CONSOLIDATED FINANCIAL INFORMATION FOR THE PERIOD FROM 1 JANUARY 2015 TO 31 DECEMBER 2015

SPHERA FRANCHISE GROUP SA PRO FORMA CONSOLIDATED STATEMENT OF COMPREHENSIVE INCOME FOR THE PERIOD FROM 1 JANUARY 2015 TO 31 DECEMBER 2015
F - 199
CONTENT Independent auditor’s assurance report on the compilation of pro forma consolidated financial information included in a prospectus F - 200 Pro forma consolidated statement of comprehensive income F - 203 Notes to pro forma consolidated statement of comprehensive income F - 205

Ernst & Young Assurance Services SRL Cladirea Bucharest Tower Center, et. 21 Bd. Ion Mihalache nr. 15-17, Sector 1
011171 Bucuresti, Romania
Tel: +40 21 402 4000 Fax: +40 21 310 7193 [email protected]
ey.com
INDEPENDENT AUDITOR’S ASSURANCE REPORT ON THE COMPILATION OF PRO
FORMA CONSOLIDATED FINANCIAL INFORMATION INCLUDED IN A PROSPECTUS
To the Board of Directors of Sphera Franchise Group S.A.
We have completed our assurance engagement to report on the compilation of pro forma
consolidated financial information of Sphera Franchise Group S.A. (“Sphera”) and its
subsidiaries (together “the Group”) by management. The pro forma consolidated financial
information consists of the pro forma consolidated statement of comprehensive income for the
period from 1 January 2015 to 31 December 2015 and related explanatory notes. The
applicable criteria on the basis of which management has compiled the pro forma consolidated
financial information are specified in the European Commission Regulation (EC) No. 809/2004
and the basis of compilation is described in Note 3 to the pro forma consolidated financial
information.
The pro forma consolidated financial information has been compiled by management of Sphera
Franchise Group S.A. to illustrate the consolidated operational performance of the Group for the
twelve months period ended 31 December 2015, as if the set-up of Sphera completed on 16
May 2017 and the contribution of US Food Network S.A. shares and American Restaurant
Systems S.A. shares to Sphera completed on 30 May 2017, as described in Note 1, took place
on 1 January 2015. As part of this process, information about the Group's financial performance
has been extracted by management from US Food Network S.A. consolidated financial
statements for the year ended 31 December 2016 prepared in accordance with International
Financial Reporting Standards (“IFRS”) as adopted by the European Union, on which we issued
an audit report on 9 August 2017 and from the American Restaurant Systems S.A. financial
statements for the year ended 31 December 2016 prepared in accordance with International
Financial Reporting Standards (“IFRS”) as adopted by the European Union, on which we issued
an audit report on 9 August 2017.
Management's responsibility for the Pro Forma Financial Information
Management is responsible for compiling the pro forma consolidated financial information on
the basis of the requirements of the European Commission Regulation (EC) No. 809/2004 and
criteria described in Note 3 to the pro forma consolidated financial information.
Our Independence and Quality Control
We have complied with the independence and other ethical requirements of the Code of Ethics
for Professional Accountants issued by the International Ethics Standards Board for
Accountants , which is founded on fundamental principles of integrity, objectivity, professional
competence and due care, confidentiality and professional behavior. The firm applies
International Standard on Quality Control 1, Quality Control for Firms that Perform Audits and
Reviews of Financial Statements, and Other Assurance and Related Services Engagements.

F - 201
Auditor’s responsibility
Our responsibility is to express an opinion, as required by item 7 of Annex II of the European
Commission Regulation (EC) No. 809/2004, about whether the pro forma consolidated financial
information has been compiled, in all material respects, by management on the basis of
compilation described in Note 3 to the pro forma consolidated financial information.
We conducted our engagement in accordance with International Standard on Assurance
Engagements (ISAE) 3420, Assurance Engagements to Report on the Compilation of Pro
Forma Financial Information Included in a Prospectus, issued by the International Auditing and
Assurance Standards Board. This standard requires that the auditors comply with ethical
requirements and plan and perform procedures to obtain reasonable assurance about whether
management has compiled, in all material respects, the pro forma financial information on the
basis of compilation described in Note 3 to the pro forma consolidated financial information.
For purposes of this engagement, we are not responsible for updating or reissuing any reports
or opinions on any historical financial information used in compiling the pro forma consolidated
financial information, nor have we, in the course of this engagement, performed an audit or
review of the financial information used in compiling the pro forma financial information.
The purpose of pro forma consolidated financial information included in a prospectus is solely to
illustrate the impact of a significant event or transaction on unadjusted financial information of
the entity as if the event had occurred or the transaction had been undertaken at an earlier date
selected for purposes of the illustration. Accordingly, we do not provide any assurance that the
actual outcome if the set-up of Sphera and the contribution of US Food Network S.A. shares
and American Restaurant Systems S.A. shares to Sphera took place on 1 January 2015 would
have been as presented.
A reasonable assurance engagement to report on whether the pro forma financial information
has been compiled, in all material respects, on the basis of the applicable criteria involves
performing procedures to assess whether the applicable criteria used by management in the
compilation of the pro forma financial information provide a reasonable basis for presenting the
significant effects directly attributable to the event or transaction, and to obtain sufficient
appropriate evidence about whether:
• The related pro forma adjustments give appropriate effect to those criteria; and
• The pro forma financial information reflects the proper application of those adjustments to
the unadjusted financial information.
The procedures selected depend on the auditor's judgment, having regard to the auditor's
understanding of the nature of the company, the event or transaction in respect of which the pro
forma financial information has been compiled, and other relevant engagement circumstances.

F - 202
The engagement also involves evaluating the overall presentation of the pro forma financial
information.
We believe that the evidence we have obtained is sufficient and appropriate to provide a basis
for our opinion.
Opinion
In our opinion, (a) the pro forma consolidated financial information has been properly compiled
on the basis stated; and (b) that basis is consistent with the accounting policies of Sphera
Franchise Group S.A.
Other matter
This report is issued for the sole purpose of the public offering in Romania and the admission of
the existing and new common shares to the regulated market operated by the Bucharest Stock
Exchange. Therefore, this report is not appropriate in other jurisdictions and should not be used
or relied upon for any purpose other than the public offering described above. We accept no
duty or responsibility to and deny any liability to any party in respect of any use of, or reliance
upon, this report in connection with any type of transaction, including the sale of securities other
than the offer to the public of the existing and new common shares on the regulated market
operated by the Bucharest Stock Exchange.
On behalf of
Ernst & Young Assurance Services SRL
Alina Dimitriu
Executive Director
Bucharest, Romania
14 September 2017

SPHERA FRANCHISE GROUP SA PRO FORMA CONSOLIDATED STATEMENT OF COMPREHENSIVE INCOME FOR THE PERIOD FROM 1 JANUARY 2015 TO 31 DECEMBER 2015 All amounts in RON thousand, unless specified otherwise
F - 203
NNote
USFN Group ARS
Reclassification discontinued
operations (Note 3.1)
Intercompany elimination
(Note 3.2)
PPA effect
(Note 3.3) Pro forma
(a) (b) (c) (d) (e) (f) =
(a)+(b)+(c)+(d)+(e)
Restaurant sales 329,963 75,867 80,704 (80,704) - 405,830
Restaurant expenses
Food and material expenses 123,141 19,718 78,020 (78,020) - 142,859 Payroll and employee benefits 6.1 50,513 14,622 - - - 65,135 Rent 22,544 6,476 27 (27) - 29,020 Royalties 19,382 4,448 - - - 23,830 Advertising 16,715 4,245 2 (2) - 20,960
Other operating expenses, net 4 24,565 8,339 2,559 (2,559) - 32,904
Depreciation and amortization 6.2 7,833 2,114 - - 479 10,426
Restaurant operating profit 65,270 15,905 96 (96) (479) 80,696
General and administration expenses, net 5 16,132 7,751 3 (3) 29 23,912
Operating profit 49,138 8,154 93 (93) (508) 56,784
Finance costs 7.1 531 482 - - - 1,013 Finance income 7.2 398 19 - - - 417
Profit before tax 49,005 7,691 93 (93) (508) 56,188
Income tax expense 7,251 1,170 14 (14) - 8,421
Profit for the year from continuing operations 41,754 6,521 79 (79) (508) 47,767
Discontinued operations Loss after tax from discontinued operations
8
- (397) (79) - - (476)
Profit for the year 41,754 6,124 - (79) (508) 47,291
Attributable to:
Equity holders of Sphera 41,597 6,124 - (79) (508) 47,134 Non-controlling interests 157 - - - - 157

SPHERA FRANCHISE GROUP SA PRO FORMA CONSOLIDATED STATEMENT OF COMPREHENSIVE INCOME FOR THE PERIOD FROM 1 JANUARY 2015 TO 31 DECEMBER 2015 All amounts in RON thousand, unless specified otherwise
F - 204
NNote
USFN Group ARS
Reclassification discontinued
operations (Note 3.1)
Intercompany elimination
(Note 3.2)
PPA effect
(Note 3.3) Pro forma
(a) (b) (c) (d) (e) (f) =
(a)+(b)+(c)+(d)+(e)
Other comprehensive income
Other comprehensive income to be reclassified to profit or loss in subsequent periods (net of tax):
Exchange differences on translation of foreign operations
(92) - - - - (92)
Total comprehensive income for the year, net of tax
41,662 6,124 - (79) (508) 47,199
Attributable to:
Equity holders of Sphera 41,513 6,124 - (79) (508) 47,050 Non-controlling interests 149 - - - - 149
Earnings per share, basic and diluted (RON/share) (Note 11) 1.2271 This pro forma consolidated financial information has been authorised by the Board of Directors for issue on 29 August 2017.
Mark Hilton General Manager Sphera Franchise Group SA

SPHERA FRANCHISE GROUP SA NOTES TO PRO FORMA CONSOLIDATED FINANCIAL INFORMATION FOR THE PERIOD FROM 1 JANUARY 2015 TO 31 DECEMBER 2015 All amounts in RON thousand, unless specified otherwise
F - 205
1. Introduction Sphera Franchise Group SA (“Sphera”), together with its subsidiaries: US Food Network SA (“USFN”), US Food Network SRL Italy (“USFN Italy”), US Food Network SRL Moldova (“USFN Moldova”) (USFN together with USFN Italy and USFN Moldova being the “USFN Group”), California Fresh Flavors SRL (Taco Bell) and American Restaurant System SA (“ARS”) form “the Group” (or “SFG”). Sphera was set up on 16 May 2017 by the shareholders of USFN and ARS. The purpose of the reorganization that resulted in the establishment of Sphera as the legal parent of USFN, ARS, USFN Italy, USFN Moldova and Taco Bell was to ensure a better coordination of activities and enhance value creation, by taking advantage of the synergies at group level and by achieving economies of scale. In terms of activities, Sphera will take over gradually until the end of September 2017 certain activities as well as 105 employees from USFN and ARS and will render to the benefit of the Group entities services such as management services, marketing support, development, sales support, human resources and other services. Sphera has become the parent of both USFN and ARS on 30 May 2017, following the contribution by the existing shareholders of their shares in USFN (379,999 shares out of total 380,000 shares) and ARS (379,999 shares out of total 380,000 shares) in exchange for shares in Sphera. By applying the criteria set in IFRS 3, the transaction qualified as a business combination and USFN has been identified as the acquirer of Sphera and ARS. On 8 June 2017 USFN has sold all the 100% shares it held in its subsidiary USFN Italy to Sphera and on 14 June 2017 USFN has sold all the 80% shares it held in its subsidiary USFN Moldova to Sphera. These transactions had no effect on the consolidated financial statements of SFG, as there was no change of control, nor of the percentage owned by Sphera shareholders. On 19 June 2017 Sphera has set up a new subsidiary, California Fresh Flavors SRL (“Taco Bell”), and holds 9,999 shares of its 10,000 shares. The new subsidiary had no activity up to 30 June 2017. This pro forma consolidated financial information has been authorised by the Board of Directors for issue on 29 August 2017.

SPHERA FRANCHISE GROUP SA NOTES TO PRO FORMA CONSOLIDATED FINANCIAL INFORMATION FOR THE PERIOD FROM 1 JANUARY 2015 TO 31 DECEMBER 2015 All amounts in RON thousand, unless specified otherwise
F - 206
2. Purpose of pro forma consolidated financial information This pro forma consolidated financial information was prepared to illustrate the consolidated operational performance of the Group for the twelve months period ended 31 December 2015, as if the set-up of Sphera and the contribution of USFN shares and ARS shares to Sphera took place on 1 January 2015. (The sale of the shares in USFN Italy and USFN Moldova by USFN to Sphera, which has no impact on the consolidated financial statements of SFG, as well as the set-up of Taco Bell in 2017 and the start of commercial activity of USFN Italy in 2017 are not adjusted for in the pro forma consolidated financial information). USFN and ARS had identical shareholder structure and also their key management personnel was in majority the same since 2012. Therefore, although from an IFRS perspective the criteria are not met in order to qualify as “under common control” (since none of the shareholders had control or common control), the presentation of the pro forma information is reflective of the manner in which the two business segments (KFC for USFN and Pizza Hut for ARS) were managed together. The pro forma consolidated statement of comprehensive income describes a hypothetical situation and has been prepared solely for illustrative purposes and do not purport to represent what the actual consolidated results of operations of the Group would have been had the control been gained on the date assumed, nor are they necessarily indicative of future consolidated operational results. In addition, the statements are based on available information and various assumptions that management believes to be reasonable. The actual results may differ from those reflected in the pro forma consolidated financial information for a number of reasons, including, but not limited to, differences between the assumptions used to prepare the pro forma consolidated financial information and actual amounts. The pro forma consolidated financial information only consists of the pro forma consolidated statement of comprehensive income for the twelve month period ended 31 December 2015 and selected notes. The statement of comprehensive income is based on the statements of comprehensive income for the year ended 31 December 2015 included in the USFN Group consolidated IFRS financial statements (audited) and ARS IFRS financial statements (audited), with pro forma adjustments as described in Note 3. The USFN Group consolidated IFRS financial statements and the ARS IFRS financial statements have been prepared in accordance with International Financial Reporting Standards as issued by the International Accounting Standards Board (IASB) and adopted by the European Union (EU) (IFRS). The applicable criteria on the basis of which management has compiled the pro forma consolidated financial information consisting of the pro forma consolidated statement of comprehensive income for the period from 1 January 2015 to 31 December 2015 and related explanatory notes included in the prospectus are specified in Commission Regulation (EC) No. 809/2004 and supplemented by the provisions of the Financial Supervisory Authority letter dated 11 August 2017.

SPHERA FRANCHISE GROUP SA NOTES TO PRO FORMA CONSOLIDATED FINANCIAL INFORMATION FOR THE PERIOD FROM 1 JANUARY 2015 TO 31 DECEMBER 2015 All amounts in RON thousand, unless specified otherwise
F - 207
3. Basis of preparation of the pro forma consolidated financial information 3.1 Pro forma adjustments: reclassification of discontinued operations to profit or loss Up to the second half of 2016, ARS has acted as a purchase hub for some related entities, mainly the USFN Group. All food supplies, beverages or other consumables were purchased by ARS and sold at a mark-up designed to broadly cover any other operating costs directly associated with this line of business. In November 2016, ARS together with USFN and the other related parties have outsourced this activity to Havi Logistics SA, a third party company specialized in integrated logistics services for the food industry. In the ARS individual financial statements the after tax result from the discontinued supply activity was disclosed separately, as a single profit or loss caption, in line with the IFRS requirements. In the process of preparation of the pro forma consolidated statement of comprehensive income, the ARS loss for the year from discontinued operations, net of tax was reclassified to the original profit or loss captions (e.g. sales, food and materials, etc.) to the extent that the sales of ARS were made towards the USFN Group (for the year ended 31 December 2015 the discontinued operation had revenues of 81,857 of which 80,704 were sales to USFN Group, the remaining amount were sales to other related parties – please refer also to Note 9). 3.2 Pro forma adjustments: elimination of intercompany transactions In the process of preparation of the pro forma consolidated statement of comprehensive income, amounts as per the USFN Group audited IFRS consolidated financial statements were added to the amounts as per the ARS audited IFRS financial statements, with the transactions carried out during 2015 between the two entities being eliminated. No synergies or integration costs following the acquisition of USFN Group and ARS by Sphera have been taken into consideration in the preparation of the pro forma consolidated financial information. 3.3 Purchase price allocation adjustments Adjustments have been made to account for the effect of the purchase price allocation performed as of the date of acquisition of Sphera and ARS by USFN (30 May 2017). Specifically, there are fair value adjustments recorded for the property, plant and equipment of ARS. The adjustment recorded in the pro forma has been computed by applying the fair value adjustments to the property, plant and equipment of ARS (as determined on 31 May 2017) to their net book values on 1 January 2015 or from the date of acquisition in 2015, and by re-computing the depreciation expense for the year 2015 based on the amounts thus adjusted. 3.4 Preparation of the selected notes With respect to:
- Note 4 Other operating expenses, net - Note 5 General and administrative expenses, net - Note 6 Total employee benefits expense and total depreciation and amortization expense - Note 7 Finance costs and income, - Note 8 EBITDA - Note 9 Discontinued operations,
the information presented in these notes is based on amounts derived directly from the similar notes from the audited IFRS consolidated financial statements of USFN Group and, respectively, the audited IFRS financial statements of ARS, adjusted for the applicable pro forma adjustments described above.

SPHERA FRANCHISE GROUP SA NOTES TO PRO FORMA CONSOLIDATED FINANCIAL INFORMATION FOR THE PERIOD FROM 1 JANUARY 2015 TO 31 DECEMBER 2015 All amounts in RON thousand, unless specified otherwise
F - 208
3. Basis of preparation of the pro forma consolidated financial information (continued) With respect to Note 10 Segment information: The amounts related to the statement of comprehensive income were split between corresponding brands based on the same accounting policy as adopted for SFG consolidated financial statements in 2017; all amounts related to KFC brand were derived from USFN Group for 2015 while the amounts related to Pizza Hut brand were derived from ARS for 2015 plus one pizza delivery point from USFN Group. The revenue from restaurants was split between Romania and Republic of Moldova based on the same accounting policy as adopted for SFG consolidated financial statements in 2017; all amounts related to Republic of Moldova were derived from USFN Moldova entity in 2015 while the amounts for the Romanian entities USFN and ARS are presented as amounts related to Romania. (Sphera has no revenues to be presented). 4 Other operating expenses, net:
USFN Group
ARS
Reclassification discontinued
operations (Note 3.1)
Intercompany elimination
(Note 3.2)
PPA effect
(Note 3.3) Pro forma
Third-party services 7,501
1,775 - -
- 9,276
Utilities 7,893
3,896 - -
- 11,789 Maintenance and repairs 2,978
790 315 (315)
- 3,768
Cleaning supplies 1,938
361 1,928 (1,928)
- 2,299 Small-wares 1,784
1,217 661 (661)
- 3,001
Transport 1,257
417 - -
- 1,674 Telephone and postage 354
75 - -
- 429
Insurance 156
121 - -
- 277 Net loss/(gain) on disposal of property, plant and equipment (10)
(56) - -
- (66)
Change in allowance for receivables 12
19 - -
- 31 Change in provisions (139) - - - - (139) Miscellaneous expenses and income, net 841
(276) (345) 345
- 565
Total 24,565
8,339 2,559 (2,559)
- 32,904

SPHERA FRANCHISE GROUP SA NOTES TO PRO FORMA CONSOLIDATED FINANCIAL INFORMATION FOR THE PERIOD FROM 1 JANUARY 2015 TO 31 DECEMBER 2015 All amounts in RON thousand, unless specified otherwise
F - 209
5 General and administrative expenses, net
USFN Group
ARS
Reclassification discontinued
operations (Note 3.1)
Intercompany elimination
(Note 3.2)
PPA effect
(Note 3.3) Pro forma
Employee benefits 6,837
3,438 -
10,275
Third-party services 4,970
2,334 - -
7,304 Rent 1,244
339 - -
1,583
Depreciation and amortisation 493
133 -
29 655 Transport 713
464 - -
1,177
Banking charges 950
430 -
1,380 Maintenance and repairs 264
43 23 (23)
307
Small-wares 192
428 -
620 Telephone and postage 207
133 -
340
Insurance 157
27 -
184 Advertising 47
- -
47
Miscellaneous expenses and income, net 58
(18) (20) 20
40
Total 16,132
7,751 3 (3)
29 23,912
6 Total payroll and employee benefits expense and total depreciation and amortization expense 6.1 Payroll and employee benefits
USFN Group
ARS
Reclassification discontinued
operations (Note 3.1)
Intercompany elimination
(Note 3.2)
PPA effect
(Note 3.3) Pro forma
Payroll and employee benefits recognized in "Restaurant expenses" 50,513 14,622 - - - 65,135 Payroll and employee benefits recognized in "General and administration expenses, net" 6,837 3,438 - - - 10,275
Total payroll and employee benefits 57,350 18,060 - - - 75,410

SPHERA FRANCHISE GROUP SA NOTES TO PRO FORMA CONSOLIDATED FINANCIAL INFORMATION FOR THE PERIOD FROM 1 JANUARY 2015 TO 31 DECEMBER 2015 All amounts in RON thousand, unless specified otherwise
F - 210
6 Total employee benefits expense and total depreciation and amortization expense (continued) 6.2 Depreciation and amortization
USFN Group
ARS
Reclassification discontinued
operations (Note 3.1)
Intercompany elimination
(Note 3.2)
PPA effect
(Note 3.3) Pro forma
Depreciation and amortization recognized in "Restaurant expenses" 7,833 2,114 - - 479 10,426 Depreciation and amortization recognized in "General and administration expenses, net" 493 133 - - 29 655
Total depreciation and amortization 8,326 2,247 - - 508 11,081
7 Finance costs and income 7.1 Finance costs
USFN Group
ARS
Reclassification discontinued
operations (Note 3.1)
Intercompany elimination
(Note 3.2)
PPA effect
(Note 3.3) Pro forma
Interest on loans and borrowings 406
87 - -
493
Finance charges payable under finance leases 18
10 - -
28 Foreign exchange loss, net 107
385 - -
492
Total finance costs 531
482 - -
1,013
7.2. Finance income
USFN Group
ARS
Reclassification discontinued
operations (Note 3.1)
Intercompany elimination
(Note 3.2)
PPA effect
(Note 3.3) Pro forma
Interest income 398
19 - -
- 417
Total finance income 398
19 - -
- 417

SPHERA FRANCHISE GROUP SA NOTES TO PRO FORMA CONSOLIDATED FINANCIAL INFORMATION FOR THE PERIOD FROM 1 JANUARY 2015 TO 31 DECEMBER 2015 All amounts in RON thousand, unless specified otherwise
F - 211
8 EBITDA
USFN Group
ARS
Reclassification discontinued
operations (Note 3.1)
Intercompany elimination
(Note 3.2)
PPA effect
(Note 3.3) Pro forma
Operating profit from continuing operations 49,138 8,154 93 (93) (508) 56,784 Adjustments to bridge operating profit to EBITDA: Depreciation and amortization included in restaurant expenses 7,833 2,114 - - 479 10,426 Depreciation and amortization included in general and administration expenses 493 133 - - 29 655
EBITDA from continuing operations 57,464 10,401 93 (93) - 67,865
EBITDA is one of the key performance measures monitored by senior management. EBITDA would be normalized to exclude any significant one-off items (either revenues or expenses) but no such exclusions were necessary for year ended 31 December 2015.
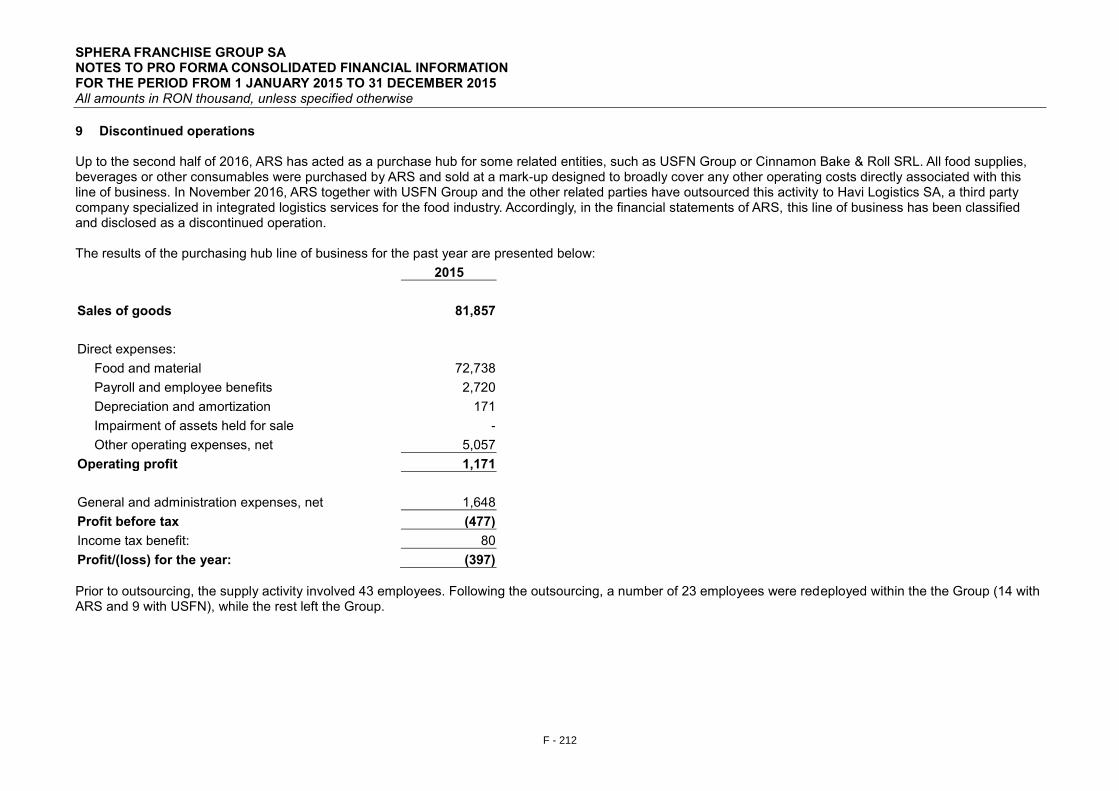
SPHERA FRANCHISE GROUP SA NOTES TO PRO FORMA CONSOLIDATED FINANCIAL INFORMATION FOR THE PERIOD FROM 1 JANUARY 2015 TO 31 DECEMBER 2015 All amounts in RON thousand, unless specified otherwise
F - 212
9 Discontinued operations Up to the second half of 2016, ARS has acted as a purchase hub for some related entities, such as USFN Group or Cinnamon Bake & Roll SRL. All food supplies, beverages or other consumables were purchased by ARS and sold at a mark-up designed to broadly cover any other operating costs directly associated with this line of business. In November 2016, ARS together with USFN Group and the other related parties have outsourced this activity to Havi Logistics SA, a third party company specialized in integrated logistics services for the food industry. Accordingly, in the financial statements of ARS, this line of business has been classified and disclosed as a discontinued operation. The results of the purchasing hub line of business for the past year are presented below:
2015
Sales of goods 81,857
Direct expenses:
Food and material 72,738
Payroll and employee benefits 2,720
Depreciation and amortization 171
Impairment of assets held for sale -
Other operating expenses, net 5,057
Operating profit 1,171
General and administration expenses, net 1,648
Profit before tax (477)
Income tax benefit: 80
Profit/(loss) for the year: (397)
Prior to outsourcing, the supply activity involved 43 employees. Following the outsourcing, a number of 23 employees were redeployed within the the Group (14 with ARS and 9 with USFN), while the rest left the Group.

SPHERA FRANCHISE GROUP SA NOTES TO PRO FORMA CONSOLIDATED FINANCIAL INFORMATION FOR THE PERIOD FROM 1 JANUARY 2015 TO 31 DECEMBER 2015 All amounts in RON thousand, unless specified otherwise
F - 213
10 Segment information
For management purposes, the Group is organised into business units based on the restaurants’ brands, which are the operating and reportable segments of the Group, as follows:
- KFC restaurants
- Pizza Hut restaurants.
For the year ended 31 December 2015 the Group also had one more immaterial operating segment, being one Paul restaurant which is managed by USFN, and which was aggregated into the KFC segment. The Board of Directors monitors the operating results of the operating segments separately for the purpose of making decisions about resource allocation and performance assessment. Segment performance is evaluated based on segment operating profit and is measured consistently with ‘’Restaurant operating profit’’ in the statement of comprehensive income in the audited IFRS consolidated financial statements of USFN Group and, respectively, the audited IFRS financial statements of ARS. Transfer prices between operating segments are on an arm’s length’s basis in a manner similar to transactions with third parties.
Year ended 31 December 2015 KFC
Pizza Hut
Other
Reclassification discontinued
operations (Note 3.1)
Intercompany elimination
(Note 3.2)
PPA effect
(Note 3.3)
Pizza Hut
Pro forma
Restaurant sales (Revenues from external customers) 328,510
77,320
-
-
-
-
405,830
Inter-segment revenues -
-
-
81,857 (81,857)
- - Restaurant expenses (Operating expenses) 263,410
61,245
-
80,608 (80,608)
479 325,134
Restaurant profit (Segment operating profit) 65,100 16,075 - 1,249 (1,249) (479) 80,696
Finance costs -
-
1,013
- -
- 1,013
Finance income -
-
417
- -
- 417 Income taxes -
-
8,421
14 (14)
- 8,421
Net profit from continuing operations 48,968
8,416
(9,017)
- (93)
(507) 47,767
Depreciation and amortization 8,169 2,405 - - - 507 11,081

SPHERA FRANCHISE GROUP SA NOTES TO PRO FORMA CONSOLIDATED FINANCIAL INFORMATION FOR THE PERIOD FROM 1 JANUARY 2015 TO 31 DECEMBER 2015 All amounts in RON thousand, unless specified otherwise
F - 214
10. Segment information (continued) Geographic information:
Revenue from external customers USFN group
ARS
Pro forma adjustments
Pro forma
Romania 324,406 75,867 - 400,273 Republic of Moldova 5,557 - - 5,557
Total restaurant revenue 329,963 75,867 - 405,830
The revenue information above is based on the location of the customers. 11. Earnings per share (EPS) EPS is calculated by dividing the profit for the year attributable to shareholders of Sphera by the number of ordinary shares issued by Sphera, after the contribution of USFN shares and ARS shares by the existing shareholders.
2015
Profit from continuing operations attributable to ordinary equity holders of Sphera (RON thousand) 47,610 Number of Sphera shares 38,799,340
Earnings per share, basic and diluted (RON/share) 1.2271
There are no dilutive instruments to be considered.

SPHERA FRANCHISE GROUP SA PRO FORMA CONSOLIDATED STATEMENT OF COMPREHENSIVE INCOME FOR THE PERIOD FROM 1 JANUARY 2016 TO 31 DECEMBER 2016
F - 215
SPHERA FRANCHISE GROUP SA
PRO FORMA CONSOLIDATED FINANCIAL INFORMATION FOR THE PERIOD FROM 1 JANUARY 2016 TO 31 DECEMBER 2016

SPHERA FRANCHISE GROUP SA PRO FORMA CONSOLIDATED STATEMENT OF COMPREHENSIVE INCOME FOR THE PERIOD FROM 1 JANUARY 2016 TO 31 DECEMBER 2016
F - 216
CONTENT Independent auditor’s assurance report on the compilation of pro forma consolidated financial information included in a prospectus F - 217 Pro forma consolidated statement of comprehensive income F - 220 Notes to pro forma consolidated statement of comprehensive income F - 222

Ernst & Young Assurance Services SRL Cladirea Bucharest Tower Center, et. 21 Bd. Ion Mihalache nr. 15-17, Sector 1
011171 Bucuresti, Romania
Tel: +40 21 402 4000 Fax: +40 21 310 7193 [email protected]
ey.com
INDEPENDENT AUDITOR’S ASSURANCE REPORT ON THE COMPILATION OF PRO
FORMA CONSOLIDATED FINANCIAL INFORMATION INCLUDED IN A PROSPECTUS
To the Board of Directors of Sphera Franchise Group S.A.
We have completed our assurance engagement to report on the compilation of pro forma
consolidated financial information of Sphera Franchise Group S.A. (“Sphera”) and its
subsidiaries (together “the Group”) by management. The pro forma consolidated financial
information consists of the pro forma consolidated statement of comprehensive income for the
period from 1 January 2016 to 31 December 2016 and related explanatory notes. The
applicable criteria on the basis of which management has compiled the pro forma consolidated
financial information are specified in the European Commission Regulation (EC) No. 809/2004
and the basis of compilation is described in Note 3 to the pro forma consolidated financial
information.
The pro forma consolidated financial information has been compiled by management of Sphera
Franchise Group S.A. to illustrate the consolidated operational performance of the Group for the
twelve months period ended 31 December 2016, as if the set-up of Sphera completed on 16
May 2017 and the contribution of US Food Network S.A. shares and American Restaurant
Systems S.A. shares to Sphera completed on 30 May 2017, as described in Note 1, took place
on 1 January 2016. As part of this process, information about the Group's financial performance
has been extracted by management from US Food Network S.A. consolidated financial
statements for the year ended 31 December 2016 prepared in accordance with International
Financial Reporting Standards (“IFRS”) as adopted by the European Union, on which we issued
an audit report on 9 August 2017 and from the American Restaurant Systems S.A. financial
statements for the year ended 31 December 2016 prepared in accordance with International
Financial Reporting Standards (“IFRS”) as adopted by the European Union, on which we issued
an audit report on 9 August 2017.
Management's responsibility for the Pro Forma Financial Information
Management is responsible for compiling the pro forma consolidated financial information on
the basis of the requirements of the European Commission Regulation (EC) No. 809/2004 and
criteria described in Note 3 to the pro forma consolidated financial information.
Our Independence and Quality Control
We have complied with the independence and other ethical requirements of the Code of Ethics
for Professional Accountants issued by the International Ethics Standards Board for
Accountants , which is founded on fundamental principles of integrity, objectivity, professional
competence and due care, confidentiality and professional behavior. The firm applies
International Standard on Quality Control 1, Quality Control for Firms that Perform Audits and
Reviews of Financial Statements, and Other Assurance and Related Services Engagements.

F - 218
Auditor’s responsibility
Our responsibility is to express an opinion, as required by item 7 of Annex II of the European
Commission Regulation (EC) No. 809/2004, about whether the pro forma consolidated financial
information has been compiled, in all material respects, by management on the basis of
compilation described in Note 3 to the pro forma consolidated financial information.
We conducted our engagement in accordance with International Standard on Assurance
Engagements (ISAE) 3420, Assurance Engagements to Report on the Compilation of Pro
Forma Financial Information Included in a Prospectus, issued by the International Auditing and
Assurance Standards Board. This standard requires that the auditors comply with ethical
requirements and plan and perform procedures to obtain reasonable assurance about whether
management has compiled, in all material respects, the pro forma financial information on the
basis of compilation described in Note 3 to the pro forma consolidated financial information.
For purposes of this engagement, we are not responsible for updating or reissuing any reports
or opinions on any historical financial information used in compiling the pro forma consolidated
financial information, nor have we, in the course of this engagement, performed an audit or
review of the financial information used in compiling the pro forma financial information.
The purpose of pro forma consolidated financial information included in a prospectus is solely to
illustrate the impact of a significant event or transaction on unadjusted financial information of
the entity as if the event had occurred or the transaction had been undertaken at an earlier date
selected for purposes of the illustration. Accordingly, we do not provide any assurance that the
actual outcome if the set-up of Sphera and the contribution of US Food Network S.A. shares
and American Restaurant Systems S.A. shares to Sphera took place on 1 January 2016 would
have been as presented.
A reasonable assurance engagement to report on whether the pro forma financial information
has been compiled, in all material respects, on the basis of the applicable criteria involves
performing procedures to assess whether the applicable criteria used by management in the
compilation of the pro forma financial information provide a reasonable basis for presenting the
significant effects directly attributable to the event or transaction, and to obtain sufficient
appropriate evidence about whether:
• The related pro forma adjustments give appropriate effect to those criteria; and
• The pro forma financial information reflects the proper application of those
adjustments to the unadjusted financial information.
The procedures selected depend on the auditor's judgment, having regard to the auditor's
understanding of the nature of the company, the event or transaction in respect of which the pro
forma financial information has been compiled, and other relevant engagement circumstances.

F - 219
The engagement also involves evaluating the overall presentation of the pro forma financial
information.
We believe that the evidence we have obtained is sufficient and appropriate to provide a basis
for our opinion.
Opinion
In our opinion, (a) the pro forma consolidated financial information has been properly compiled
on the basis stated; and (b) that basis is consistent with the accounting policies of Sphera
Franchise Group S.A.
Other matter
This report is issued for the sole purpose of the public offering in Romania and the admission of
the existing and new common shares to the regulated market operated by the Bucharest Stock
Exchange. Therefore, this report is not appropriate in other jurisdictions and should not be used
or relied upon for any purpose other than the public offering described above. We accept no
duty or responsibility to and deny any liability to any party in respect of any use of, or reliance
upon, this report in connection with any type of transaction, including the sale of securities other
than the offer to the public of the existing and new common shares on the regulated market
operated by the Bucharest Stock Exchange.
On behalf of
Ernst & Young Assurance Services SRL
Alina Dimitriu
Executive Director
Bucharest, Romania
14 September 2017

SPHERA FRANCHISE GROUP SA PRO FORMA CONSOLIDATED STATEMENT OF COMPREHENSIVE INCOME FOR THE PERIOD FROM 1 JANUARY 2016 TO 31 DECEMBER 2016 All amounts in RON thousand, unless specified otherwise
F - 220
NNote
USFN Group ARS
Reclassification discontinued
operations (Note 3.1)
Intercompany elimination
(Note 3.2)
PPA effect
(Note 3.3) Pro forma
(a) (b) (c) (d) (e) (f) =
(a)+(b)+(c)+(d)+(e)
Restaurant sales 417,535 96,940 77,650 (77,650) - 514,475
Restaurant expenses
Food and material expenses 157,302 26,107 75,272 (75,272) - 183,409 Payroll and employee benefits 6.1 69,577 22,383 - - - 91,960 Rent 27,498 8,027 13 (13) - 35,525 Royalties 24,654 5,702 - - - 30,356 Advertising 20,736 5,785 17 (17) - 26,521
Other operating expenses, net 4 30,313 11,659 2,677 (2,677) - 41,972
Depreciation and amortization 6.2 9,234 2,666 - - 561 12,461
Restaurant operating profit 78,221 14,611 (329) 329 (561) 92,271
General and administration expenses, net 5 22,975 8,982 (9) 9 31 31,988
Operating profit 55,246 5,629 (320) 320 (592) 60,283
Finance costs 7.1 825 213 - (109) - 929 Finance income 7.2 95 127 - (109) - 113
Profit before tax 54,516 5,543 (320) 320 (592) 59,467
Income tax expense 5,783 361 (50) 50 - 6,144
Profit for the year from continuing operations 48,733 5,182 (270) 270 (592) 53,323
Discontinued operations Loss after tax from discontinued operations
8
- (1,953) 270 - - (1,683)
Profit for the year 48,733 3,229 - 270 (592) 51,640
Attributable to:
Equity holders of Sphera 48,693 3,229 - 270 (592) 51,600 Non-controlling interests 40 - - - - 40

SPHERA FRANCHISE GROUP SA PRO FORMA CONSOLIDATED STATEMENT OF COMPREHENSIVE INCOME FOR THE PERIOD FROM 1 JANUARY 2016 TO 31 DECEMBER 2016 All amounts in RON thousand, unless specified otherwise
F - 221
NNote
USFN Group ARS
Reclassification discontinued
operations (Note 3.1)
Intercompany elimination
(Note 3.2)
PPA effect
(Note 3.3) Pro forma
(a) (b) (c) (d) (e) (f) =
(a)+(b)+(c)+(d)+(e)
Other comprehensive income
Other comprehensive income to be reclassified to profit or loss in subsequent periods (net of tax):
Exchange differences on translation of foreign operations
83 - - - - 83
Total comprehensive income for the year, net of tax
48,816 3,229 - 270 (592) 51,723
Attributable to:
Equity holders of Sphera 48,774 3,229 - 270 (592) 51,681 Non-controlling interests 42 - - - - 42
Earnings per share, basic and diluted (RON/share) (Note 11) 1.3733 This pro forma consolidated financial information has been authorised by the Board of Directors for issue on 29 August 2017.
Mark Hilton General Manager Sphera Franchise Group SA

SPHERA FRANCHISE GROUP SA NOTES TO PRO FORMA CONSOLIDATED FINANCIAL INFORMATION FOR THE PERIOD FROM 1 JANUARY 2016 TO 31 DECEMBER 2016 All amounts in RON thousand, unless specified otherwise
F - 222
1. Introduction Sphera Franchise Group SA (“Sphera”), together with its subsidiaries: US Food Network SA (“USFN”), US Food Network SRL Italy (“USFN Italy”), US Food Network SRL Moldova (“USFN Moldova”) (USFN together with USFN Italy and USFN Moldova being the “USFN Group”), California Fresh Flavors SRL (Taco Bell) and American Restaurants System SA (“ARS”) form “the Group” (or “SFG”). Sphera was set up on 16 May 2017 by the shareholders of USFN and ARS. The purpose of the reorganization that resulted in the establishment of Sphera as the legal parent of USFN, ARS, USFN Italy, USFN Moldova and Taco Bell was to ensure a better coordination of activities and enhance value creation, by taking advantage of the synergies at group level and by achieving economies of scale. In terms of activities, Sphera will take over gradually until the end of September 2017 certain activities as well as 105 employees from USFN and ARS and will render to the benefit of the Group entities services such as management services, marketing support, development, sales support, human resources and other services. Sphera has become the parent of both USFN and ARS on 30 May 2017, following the contribution by the existing shareholders of their shares in USFN (379,999 shares out of total 380,000 shares) and ARS (379,999 shares out of total 380,000 shares) in exchange for shares in Sphera. By applying the criteria set in IFRS 3, the transaction qualified as a business combination and USFN has been identified as the acquirer of Sphera and ARS. On 8 June 2017 USFN has sold all the 100% shares it held in its subsidiary USFN Italy to Sphera and on 14 June 2017 USFN has sold all the 80% shares it held in its subsidiary USFN Moldova to Sphera. These transactions had no effect on the consolidated financial statements of SFG, as there was no change of control, nor of the percentage owned by Sphera shareholders. On 19 June 2017 Sphera has set up a new subsidiary, California Fresh Flavors SRL (“Taco Bell”), and holds 9,999 shares of its 10,000 shares. The new subsidiary had no activity up to 30 June 2017. This pro forma consolidated financial information has been authorised by the Board of Directors for issue on 29 August 2017.

SPHERA FRANCHISE GROUP SA NOTES TO PRO FORMA CONSOLIDATED FINANCIAL INFORMATION FOR THE PERIOD FROM 1 JANUARY 2016 TO 31 DECEMBER 2016 All amounts in RON thousand, unless specified otherwise
F - 223
2. Purpose of pro forma consolidated financial information This pro forma consolidated financial information was prepared to illustrate the consolidated operational performance of the Group for the twelve months period ended 31 December 2016, as if the set-up of Sphera and the contribution of USFN shares and ARS shares to Sphera took place on 1 January 2016. (The sale of the shares in USFN Italy and USFN Moldova by USFN to Sphera, which has no impact on the consolidated financial statements of SFG, as well as the set-up of Taco Bell are not adjusted for in the pro forma consolidated financial information). USFN and ARS had identical shareholder structure and also their key management personnel was in majority the same since 2012. Therefore, although from an IFRS perspective the criteria are not met in order to qualify as “under common control” (since none of the shareholders had control or common control), the presentation of the pro forma information is reflective of the manner in which the two business segments (KFC for USFN and Pizza Hut for ARS) were managed together. The pro forma consolidated statement of comprehensive income describes a hypothetical situation and has been prepared solely for illustrative purposes and do not purport to represent what the actual consolidated results of operations of the Group would have been had the control been gained on the date assumed, nor are they necessarily indicative of future consolidated operational results. In addition, the statements are based on available information and various assumptions that management believes to be reasonable. The actual results may differ from those reflected in the pro forma consolidated financial information for a number of reasons, including, but not limited to, differences between the assumptions used to prepare the pro forma consolidated financial information and actual amounts. The pro forma consolidated financial information only consists of the pro forma consolidated statement of comprehensive income for the twelve month period ended 31 December 2016 and selected notes. The statement of comprehensive income is based on the statements of comprehensive income for the year ended 31 December 2016 included in the USFN Group consolidated IFRS financial statements (audited) and ARS IFRS financial statements (audited), with pro forma adjustments as described in Note 3. The USFN Group consolidated IFRS financial statements and the ARS IFRS financial statements have been prepared in accordance with International Financial Reporting Standards as issued by the International Accounting Standards Board (IASB) and adopted by the European Union (EU) (IFRS).

SPHERA FRANCHISE GROUP SA NOTES TO PRO FORMA CONSOLIDATED FINANCIAL INFORMATION FOR THE PERIOD FROM 1 JANUARY 2016 TO 31 DECEMBER 2016 All amounts in RON thousand, unless specified otherwise
F - 224
3. Basis of preparation of the pro forma consolidated financial information 3.1 Pro forma adjustments: reclassification of discontinued operations to profit or loss Up to the second half of 2016, ARS has acted as a purchase hub for some related entities, mainly the USFN Group. All food supplies, beverages or other consumables were purchased by ARS and sold at a mark-up designed to broadly cover any other operating costs directly associated with this line of business. In November 2016, ARS together with USFN and the other related parties have outsourced this activity to Havi Logistics SA, a third party company specialized in integrated logistics services for the food industry. In the ARS individual financial statements the after tax result from the discontinued supply activity was disclosed separately, as a single profit or loss caption, in line with the IFRS requirements. In the process of preparation of the pro forma consolidated statement of comprehensive income, the ARS loss for the year from discontinued operations, net of tax was reclassified to the original profit or loss captions (e.g. sales, food and materials, etc.) to the extent that the sales of ARS were made towards the USFN Group (for the year ended 31 December 2016 the discontinued operation had revenues of 84,703 of which 77,650 were sales to USFN Group, 246 were sales to other related parties and the rest were the proceeds from selling the remaining inventories to Havi Logistics S.A. – please refer also to Note 9). 3.2 Pro forma adjustments: elimination of intercompany transactions In the process of preparation of the pro forma consolidated statement of comprehensive income, amounts as per the USFN Group audited IFRS consolidated financial statements were added to the amounts as per the ARS audited IFRS financial statements, with the transactions carried out during 2016 between the two entities being eliminated. No synergies or integration costs following the acquisition of USFN Group and ARS by Sphera have been taken into consideration in the preparation of the pro forma consolidated financial information. Additionally in this category is presented the reclassification of the net foreign exchange gain from ARS, to be netted off against the net foreign exchange loss of USFN Group, for presentation consistency purposes. 3.3 Purchase price allocation adjustments Adjustments have been made to account for the effect of the purchase price allocation performed as of the date of acquisition of Sphera and ARS by USFN (30 May 2017). Specifically, there are fair value adjustments recorded for the property, plant and equipment of ARS. The adjustment recorded in the pro forma has been computed by applying the fair value adjustments to the property, plant and equipment of ARS (as determined on 31 May 2017) to their net book values on 1 January 2016 or from the date of acquisition in 2016, and by re-computing the depreciation expense for the year 2016 based on the amounts thus adjusted. 3.4 Preparation of the selected notes With respect to:
- Note 4 Other operating expenses, net - Note 5 General and administrative expenses, net - Note 6 Total employee benefits expense and total depreciation and amortization expense - Note 7 Finance costs and income, - Note 8 EBITDA - Note 9 Discontinued operations,
the information presented in these notes is based on amounts derived directly from the similar notes from the audited IFRS consolidated financial statements of USFN Group and, respectively, the audited IFRS financial statements of ARS, adjusted for the applicable pro forma adjustments described above.

SPHERA FRANCHISE GROUP SA NOTES TO PRO FORMA CONSOLIDATED FINANCIAL INFORMATION FOR THE PERIOD FROM 1 JANUARY 2016 TO 31 DECEMBER 2016 All amounts in RON thousand, unless specified otherwise
F - 225
3. Basis of preparation of the pro forma consolidated financial information (continued) With respect to Note 10 Segment information: The amounts related to the statement of comprehensive income were split between corresponding brands based on the same accounting policy as adopted for SFG consolidated financial statements in 2017; all amounts related to KFC brand were derived from USFN Group for 2016 while the amounts related to Pizza Hut brand were derived from ARS for 2016 plus one pizza delivery point from USFN Group. The revenue from restaurants was split between Romania and Republic of Moldova based on the same accounting policy as adopted for SFG consolidated financial statements in 2017; all amounts related to Republic of Moldova were derived from USFN Moldova entity in 2016 while the amounts for the Romanian entities USFN and ARS (and immaterial amounts for USFN Italy) are presented as amounts related to Romania. (Sphera has no revenues to be presented). 4 Other operating expenses, net:
USFN Group
ARS
Reclassification discontinued
operations (Note 3.1)
Intercompany elimination
(Note 3.2)
PPA effect
(Note 3.3) Pro forma
Third-party services 9,330
2,734 14 (14)
- 12,064
Utilities 8,721
4,192 - -
- 12,913 Maintenance and repairs 3,906
1,266 543 (543)
- 5,172
Cleaning supplies 2,535
523 2,027 (2,027)
- 3,058 Small-wares 2,725
1,829 671 (671)
- 4,554
Transport 1,582
563 - -
- 2,145 Telephone and postage 371
74 2 (2)
- 445
Insurance 185
158 -
- 343 Net gain on disposal of property, plant and equipment 92
115 -
- 207
Change in allowance for receivables 5
- -
- 5 Miscellaneous expenses and income, net 861
205 (580) 580
- 1,066
Total 30,313
11,659 2,677 (2,677)
- 41,972

SPHERA FRANCHISE GROUP SA NOTES TO PRO FORMA CONSOLIDATED FINANCIAL INFORMATION FOR THE PERIOD FROM 1 JANUARY 2016 TO 31 DECEMBER 2016 All amounts in RON thousand, unless specified otherwise
F - 226
5 General and administrative expenses, net
USFN Group
ARS
Reclassification discontinued
operations (Note 3.1)
Intercompany elimination
(Note 3.2)
PPA effect
(Note 3.3) Pro forma
Employee benefits 9,317
4,247 -
13,564
Third-party services 7,359
2,838 - -
10,197 Rent 1,392
344 - -
1,736
Depreciation and amortisation 590
137 -
31 758 Transport 811
503 1 (1)
1,314
Banking charges 1,046
479 -
1,525 Maintenance and repairs 990
101 3 (3)
1,091
Small-wares 444
442 -
886 Telephone and postage 251
116 -
367
Insurance 224
34 -
258 Advertising 143
- -
143
Miscellaneous expenses and income, net 408
(259) (13) 13
149
Total 22,975
8,982 (9) 9
31 31,988
6 Total payroll and employee benefits expense and total depreciation and amortization expense 6.1 Payroll and employee benefits
USFN Group
ARS
Reclassification discontinued
operations (Note 3.1)
Intercompany elimination
(Note 3.2)
PPA effect
(Note 3.3) Pro forma
Payroll and employee benefits recognized in "Restaurant expenses" 69,577 22,383 - - - 91,960 Payroll and employee benefits recognized in "General and administration expenses, net" 9,317 4,247 - - - 13,564
Total employee benefits 78,894 26,630 - - - 105,524

SPHERA FRANCHISE GROUP SA NOTES TO PRO FORMA CONSOLIDATED FINANCIAL INFORMATION FOR THE PERIOD FROM 1 JANUARY 2016 TO 31 DECEMBER 2016 All amounts in RON thousand, unless specified otherwise
F - 227
6 Total payroll and employee benefits expense and total depreciation and amortization expense (continued) 6.2 Depreciation and amortization
USFN Group
ARS
Reclassification discontinued
operations (Note 3.1)
Intercompany elimination
(Note 3.2)
PPA effect
(Note 3.3) Pro forma
Depreciation and amortization recognized in "Restaurant expenses" 9,234 2,666 - - 561 12,461 Depreciation and amortization recognized in "General and administration expenses, net" 590 137 - - 31 758
Total depreciation and amortization 9,824 2,803 - - 592 13,219
7 Finance costs and income 7.1 Finance costs
USFN Group
ARS
Reclassification discontinued
operations (Note 3.1)
Intercompany elimination
(Note 3.2)
PPA effect
(Note 3.3) Pro forma
Interest on loans and borrowings 518
202 - -
720
Finance charges payable under finance leases 18
11 - -
29 Foreign exchange loss, net 289
- - (109)
180
Total finance costs 825
213 - (109)
929
7.2. Finance income
USFN Group
ARS
Reclassification discontinued
operations (Note 3.1)
Intercompany elimination
(Note 3.2)
PPA effect
(Note 3.3) Pro forma
Interest income 95
18 - -
- 113
Foreign exchange gain, net -
109 - (109)
- -
Total finance income 95
127 - (109)
- 113
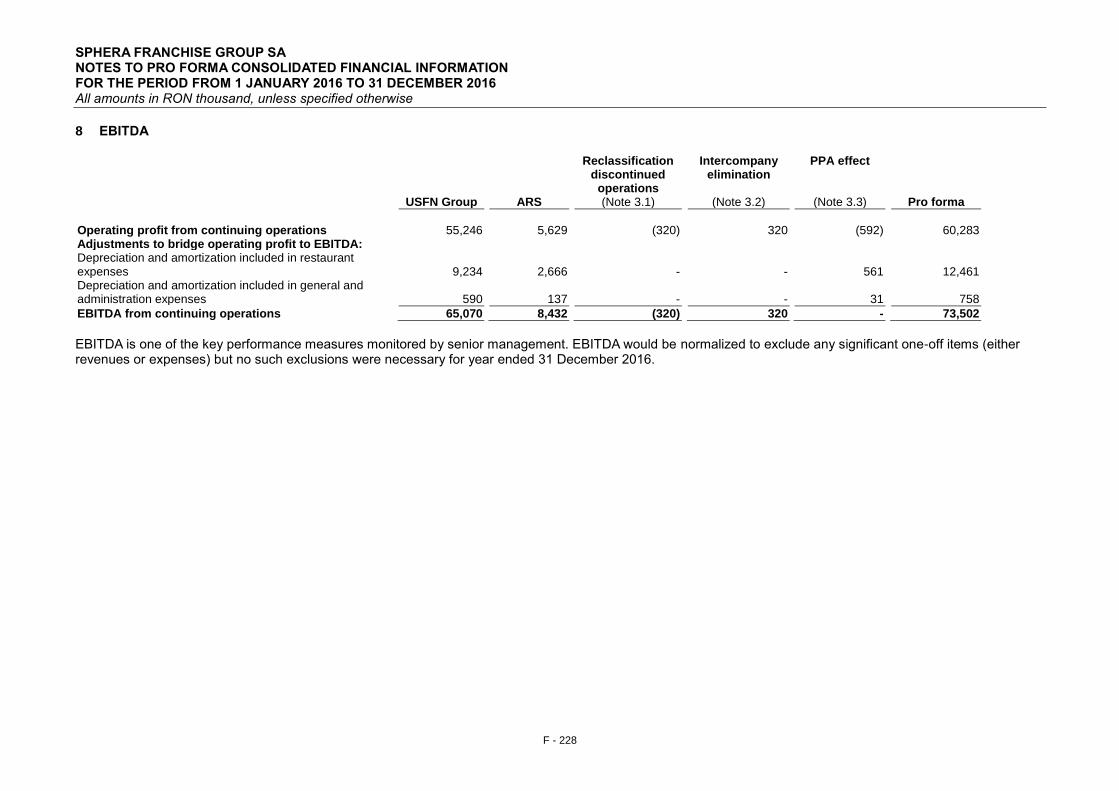
SPHERA FRANCHISE GROUP SA NOTES TO PRO FORMA CONSOLIDATED FINANCIAL INFORMATION FOR THE PERIOD FROM 1 JANUARY 2016 TO 31 DECEMBER 2016 All amounts in RON thousand, unless specified otherwise
F - 228
8 EBITDA
USFN Group
ARS
Reclassification discontinued
operations (Note 3.1)
Intercompany elimination
(Note 3.2)
PPA effect
(Note 3.3) Pro forma
Operating profit from continuing operations 55,246 5,629 (320) 320 (592) 60,283 Adjustments to bridge operating profit to EBITDA: Depreciation and amortization included in restaurant expenses 9,234 2,666 - - 561 12,461 Depreciation and amortization included in general and administration expenses 590 137 - - 31 758
EBITDA from continuing operations 65,070 8,432 (320) 320 - 73,502
EBITDA is one of the key performance measures monitored by senior management. EBITDA would be normalized to exclude any significant one-off items (either revenues or expenses) but no such exclusions were necessary for year ended 31 December 2016.

SPHERA FRANCHISE GROUP SA NOTES TO PRO FORMA CONSOLIDATED FINANCIAL INFORMATION FOR THE PERIOD FROM 1 JANUARY 2016 TO 31 DECEMBER 2016 All amounts in RON thousand, unless specified otherwise
F - 229
9 Discontinued operations Up to the second half of 2016, ARS has acted as a purchase hub for some related entities, such as USFN Group or Cinnamon Bake & Roll SRL. All food supplies, beverages or other consumables were purchased by ARS and sold at a mark-up designed to broadly cover any other operating costs directly associated with this line of business. In November 2016, ARS together with USFN Group and the other related parties have outsourced this activity to Havi Logistics SA, a third party company specialized in integrated logistics services for the food industry. Accordingly, in the financial statements of ARS, this line of business has been classified and disclosed as a discontinued operation. The results of the purchasing hub line of business for the past years are presented below:
2016 2015 2014
Sales of goods 84,703 81,857 63,111
Direct expenses:
Food and material 74,351 72,738 56,107
Payroll and employee benefits 2,321 2,720 2,853
Depreciation and amortization 382 171 131
Impairment of assets held for sale 966 - -
Other operating expenses, net 7,621 5,057 2,860
Operating profit (938) 1,171 1,160
General and administration expenses, net 1,203 1,648 1,868
Profit before tax (2,141) (477) (708)
Income tax benefit: 188 80 113
Profit/(loss) for the year: (1,953) (397) (595)
Prior to outsourcing, the supply activity involved 43 employees. Following the outsourcing, a number of 23 employees were redeployed within the Group (14 with ARS and 9 with USFN), while the rest left the Group.

SPHERA FRANCHISE GROUP SA NOTES TO PRO FORMA CONSOLIDATED FINANCIAL INFORMATION FOR THE PERIOD FROM 1 JANUARY 2016 TO 31 DECEMBER 2016 All amounts in RON thousand, unless specified otherwise
F - 230
10 Segment information
For management purposes, the Group is organised into business units based on the restaurants’ brands, which are the operating and reportable segments of the Group, as follows:
- KFC restaurants
- Pizza Hut restaurants.
For the year ended 31 December 2016 the Group also had one more immaterial operating segment, being one Paul restaurant which is managed by USFN, and which was aggregated into the KFC segment. The Board of Directors monitors the operating results of the operating segments separately for the purpose of making decisions about resource allocation and performance assessment. Segment performance is evaluated based on segment operating profit and is measured consistently with ‘’Restaurant operating profit’’ in the statement of comprehensive income in the audited IFRS consolidated financial statements of USFN Group and, respectively, the audited IFRS financial statements of ARS. Transfer prices between operating segments are on an arm’s length’s basis in a manner similar to transactions with third parties.
Year ended 31 December 2016 KFC
Pizza Hut
Other
Reclassification discontinued operations (Note 3.1)
Intercompany elimination
(Note 3.2)
PPA effect
(Note 3.3)
Pizza Hut
Pro forma
Restaurant sales (Revenues from external customers) 415,535
98,940
-
-
-
-
514,475
Inter-segment revenues -
-
-
77,650 (77,650)
- - Restaurant expenses (Operating expenses) 337,628
84,016
-
77,979 (77,979)
561 422,204
Restaurant profit (Segment operating profit) 77,908 14,923 - (329) 329 (561) 92,271
Finance costs -
-
929
- -
- 929
Finance income -
-
113
- -
- 113 Income taxes -
-
6,144
(50) 50
- 6,144
Net profit from continuing operations 54,933
5,942
(6,960)
(270) 270
(592) 53,323

SPHERA FRANCHISE GROUP SA NOTES TO PRO FORMA CONSOLIDATED FINANCIAL INFORMATION FOR THE PERIOD FROM 1 JANUARY 2016 TO 31 DECEMBER 2016 All amounts in RON thousand, unless specified otherwise
F - 231
Depreciation and amortization 9,669 2,958 - - - 592 13,219 12. Segment information (continued) Geographic information:
Revenue from external customers USFN group
ARS
Pro forma adjustments
Pro forma
Romania 410,043 96,940 - 506,983 Republic of Moldova 7,492 - - 7,492
Total restaurant revenue 417,535 96,940 - 514,475
The revenue information above is based on the location of the customers. 13. Earnings per share (EPS) EPS is calculated by dividing the profit for the year attributable to shareholders of Sphera by the number of ordinary shares issued by Sphera, after the contribution of USFN shares and ARS shares by the existing shareholders.
2016
Profit from continuing operations attributable to ordinary equity holders of Sphera (RON thousand) 53,283 Number of Sphera shares 38,799,340
Earnings per share, basic and diluted (RON/share) 1.3733
There are no dilutive instruments to be considered.

SPHERA FRANCHISE GROUP SA PRO FORMA CONSOLIDATED FINANCIAL INFORMATION FOR THE PERIOD FROM 1 JANUARY 2017 TO 30 JUNE 2017
F - 232
SPHERA FRANCHISE GROUP SA
PRO FORMA CONSOLIDATED FINANCIAL INFORMATION FOR THE PERIOD FROM 1 JANUARY 2017 TO 30 JUNE 2017

SPHERA FRANCHISE GROUP SA PRO FORMA CONSOLIDATED FINANCIAL INFORMATION FOR THE PERIOD FROM 1 JANUARY 2017 TO 30 JUNE 2017
F - 233
CONTENT Independent auditor’s assurance report on the compilation of pro forma consolidated financial information included in a prospectus F - 234 Pro forma consolidated statement of comprehensive income F - 237 Notes to pro forma consolidated statement of comprehensive income F - 239

Ernst & Young Assurance Services SRL Cladirea Bucharest Tower Center, et. 21 Bd. Ion Mihalache nr. 15-17, Sector 1
011171 Bucuresti, Romania
Tel: +40 21 402 4000 Fax: +40 21 310 7193 [email protected]
ey.com
INDEPENDENT AUDITOR’S ASSURANCE REPORT ON THE COMPILATION OF PRO
FORMA CONSOLIDATED FINANCIAL INFORMATION INCLUDED IN A PROSPECTUS
To the Board of Directors of Sphera Franchise Group S.A.
We have completed our assurance engagement to report on the compilation of pro forma
consolidated financial information of Sphera Franchise Group S.A. (“Sphera”) and its
subsidiaries (together “the Group”) by management. The pro forma consolidated financial
information consists of the pro forma consolidated statement of comprehensive income for the
period from 1 January 2017 to 30 June 2017 and related explanatory notes. The applicable
criteria on the basis of which management has compiled the pro forma consolidated financial
information are specified in the European Commission Regulation (EC) No. 809/2004 and the
basis of compilation is described in Note 3 to the pro forma consolidated financial information.
The pro forma consolidated financial information has been compiled by management of Sphera
Franchise Group S.A. to illustrate the consolidated operational performance of the Group for the
six months period ended 30 June 2017, as if the set-up of Sphera completed on 16 May 2017
and the contribution of US Food Network S.A. shares and American Restaurant Systems S.A.
shares to Sphera completed on 30 May 2017, as described in Note 1, took place on 1 January
2017.
As part of this process, information about the Group's financial performance has been extracted
by management from the Group's interim consolidated financial statements for the 6 months
period ended 30 June 2017 prepared in accordance with International Financial Reporting
Standards applicable to interim financial reporting as adopted by the European Union (“IAS
34”), on which we issued a review report on 14 September 2017 and from the statement of
comprehensive income of American Restaurant System S.A. for the period 1 January – 31 May
2017, which is not audited or reviewed, which has been derived from the interim financial
statements of American Restaurant System S.A. for the 6 months period ended 30 June 2017
prepared in accordance with International Financial Reporting Standards applicable to interim
financial reporting as adopted by the European Union (“IAS 34”), on which we issued a review
report on 14 September 2017.
Management's responsibility for the Pro Forma Financial Information
Management is responsible for compiling the pro forma consolidated financial information on
the basis of the requirements of the European Commission Regulation (EC) No. 809/2004 and
criteria described in Note 3 to the pro forma consolidated financial information.
Our Independence and Quality Control
We have complied with the independence and other ethical requirements of the Code of Ethics
for Professional Accountants issued by the International Ethics Standards Board for
Accountants, which is founded on fundamental principles of integrity, objectivity, professional

F - 235
competence and due care, confidentiality and professional behavior. The firm applies
International Standard on Quality Control 1, Quality Control for Firms that Perform Audits and
Reviews of Financial Statements, and Other Assurance and Related Services Engagements.
Auditor’s responsibility
Our responsibility is to express an opinion, as required by item 7 of Annex II of the European
Commission Regulation (EC) No. 809/2004, about whether the pro forma consolidated financial
information has been compiled, in all material respects, by management on the basis of
compilation described in Note 3 to the pro forma consolidated financial information.
We conducted our engagement in accordance with International Standard on Assurance
Engagements (ISAE) 3420, Assurance Engagements to Report on the Compilation of Pro
Forma Financial Information Included in a Prospectus, issued by the International Auditing and
Assurance Standards Board. This standard requires that the auditors comply with ethical
requirements and plan and perform procedures to obtain reasonable assurance about whether
management has compiled, in all material respects, the pro forma financial information on the
basis of compilation described in Note 3 to the pro forma consolidated financial information.
For purposes of this engagement, we are not responsible for updating or reissuing any reports
or opinions on any historical financial information used in compiling the pro forma consolidated
financial information, nor have we, in the course of this engagement, performed an audit or
review of the financial information used in compiling the pro forma financial information.
The purpose of pro forma consolidated financial information included in a prospectus is solely to
illustrate the impact of a significant event or transaction on unadjusted financial information of
the entity as if the event had occurred or the transaction had been undertaken at an earlier date
selected for purposes of the illustration. Accordingly, we do not provide any assurance that the
actual outcome if the set-up of Sphera and the contribution of US Food Network S.A. shares
and American Restaurant Systems S.A. shares to Sphera took place on 1 January 2017 would
have been as presented.
A reasonable assurance engagement to report on whether the pro forma financial information
has been compiled, in all material respects, on the basis of the applicable criteria involves
performing procedures to assess whether the applicable criteria used by management in the
compilation of the pro forma financial information provide a reasonable basis for presenting the
significant effects directly attributable to the event or transaction, and to obtain sufficient
appropriate evidence about whether:
• The related pro forma adjustments give appropriate effect to those criteria; and
• The pro forma financial information reflects the proper application of those
adjustments to the unadjusted financial information.

F - 236
The procedures selected depend on the auditor's judgment, having regard to the auditor's
understanding of the nature of the company, the event or transaction in respect of which the pro
forma financial information has been compiled, and other relevant engagement circumstances.
The engagement also involves evaluating the overall presentation of the pro forma financial
information.
We believe that the evidence we have obtained is sufficient and appropriate to provide a basis
for our opinion.
Opinion
In our opinion, (a) the pro forma consolidated financial information has been properly compiled
on the basis stated; and (b) that basis is consistent with the accounting policies of Sphera
Franchise Group S.A.
Other matter
This report is issued for the sole purpose of the public offering in Romania and the admission of
the existing and new common shares to the regulated market operated by the Bucharest Stock
Exchange. Therefore, this report is not appropriate in other jurisdictions and should not be used
or relied upon for any purpose other than the public offering described above. We accept no
duty or responsibility to and deny any liability to any party in respect of any use of, or reliance
upon, this report in connection with any type of transaction, including the sale of securities other
than the offer to the public of the existing and new common shares on the regulated market
operated by the Bucharest Stock Exchange.
On behalf of
Ernst & Young Assurance Services SRL
Alina Dimitriu
Executive Director
Bucharest, Romania
14 September 2017

SPHERA FRANCHISE GROUP SA PRO FORMA CONSOLIDATED STATEMENT OF COMPREHENSIVE INCOME FOR THE PERIOD FROM 1 JANUARY 2017 TO 30 JUNE 2017 All amounts in RON thousand, unless specified otherwise
F - 237
NNote SFG
ARS for the period
1 January – 31 May 2017
(Note 3.1)
Intercompany
elimination (Note 3.2)
PPA effect
(Note 3.3) Pro forma
(a) (b) (c) (d) (e) =
(a)+(b)+(c)+(d)
Restaurant sales 242,204 45,630 (1) - 287,833
Restaurant expenses Food and material expenses 87,944 12,530 (2) - 100,472 Payroll and employee benefits 6.1 43,430 11,765 - - 55,195 Rent 17,001 3,897 - - 20,898 Royalties 14,125 2,682 - - 16,807 Advertising 11,724 2,517 (21) - 14,220 Other operating expenses, net 4 18,474 4,286 22 - 22,782 Depreciation and amortization 6.2 4,952 1,467 - 241 6,660
Restaurant operating profit 44,554 6,486 - (241) 50,799
General and administration expenses, net 5 15,832 4,372 - - 20,204
Operating profit 28,722 2,114 - (241) 30,595
Finance costs 7.1 440 198 - - 638 Finance income 7.2 109 6 - - 115
Profit before tax 28,391 1,922 - (241) 30,072
Income tax expense/(credit) 1,189 553 - - 1,742
Profit for the period 27,202 1,369 - (241) 28,330
Attributable to:
Equity holders of Sphera 27,090 1,369 - (241) 28,218 Non-controlling interests 112 - - - 112

SPHERA FRANCHISE GROUP SA PRO FORMA CONSOLIDATED STATEMENT OF COMPREHENSIVE INCOME FOR THE PERIOD FROM 1 JANUARY 2017 TO 30 JUNE 2017 All amounts in RON thousand, unless specified otherwise
F - 238
Note
SFG
ARS for the period
1 January – 31 May 2017
(Note 3.1) (b)
Intercompany
elimination (Note 3.2)
PPA effect
(Note 3.3) Pro forma
(a) (c) (c)
(f) = (a)+(b)+(c)
Other comprehensive income
Other comprehensive income to be reclassified to profit or loss in subsequent periods (net of tax):
Exchange differences on translation of foreign operations (30) - - - (30)
Total comprehensive income for the period, net of tax 27,172 1,369 - (241) 28,300
Attributable to:
Equity holders of Sphera 27,060 1,369 - (241) 28,188 Non-controlling interests 112 - - - 112 Earnings per share, basic and diluted (RON/share) (Note 10) 0.7273 This pro forma consolidated financial information has been authorised by the Board of Directors for issue on 29 August 2017. Mark Hilton General Manager Sphera Franchise Group SA

SPHERA FRANCHISE GROUP SA NOTES TO PRO FORMA CONSOLIDATED FINANCIAL INFORMATION FOR THE PERIOD FROM 1 JANUARY 2017 TO 30 JUNE 2017 All amounts in RON thousand, unless specified otherwise
F - 239
1. INTRODUCTION Sphera Franchise Group SA (“Sphera”), together with its subsidiaries: US Food Network SA (“USFN”), US Food Network SRL Italy (“USFN Italy”), US Food Network SRL Moldova (“USFN Moldova”) (USFN together with USFN Italy and USFN Moldova being the “USFN Group”), California Fresh Flavours SRL (“Taco Bell”) and American Restaurant System SA (“ARS”) form “the Group” (or “SFG”). Sphera was set up on 16 May 2017 by the shareholders of USFN and ARS. The purpose of the reorganization that resulted in the establishment of Sphera as the legal parent of USFN, ARS, USFN Italy, USFN Moldova and Taco Bell was to ensure a better coordination of activities and enhance value creation, by taking advantage of the synergies at group level and by achieving economies of scale. In terms of activities, Sphera will take over gradually until the end of September 2017 certain activities as well as 105 employees from USFN and ARS and will render to the benefit of the Group entities services such as management services, marketing support, development, sales support, human resources and other services. Sphera has become the parent of both USFN and ARS on 30 May 2017, following the contribution by the existing shareholders of their shares in USFN (379,999 shares out of total 380,000 shares) and ARS (379,999 shares out of total 380,000 shares) in exchange for shares in Sphera. By applying the criteria set in IFRS 3, the transaction qualified as a business combination and USFN has been identified as the acquirer of Sphera and ARS. On 8 June 2017 USFN has sold all the 100% shares it held in its subsidiary USFN Italy to Sphera and on 14 June 2017 USFN has sold all the 80% shares it held in its subsidiary USFN Moldova to Sphera. These transactions had no effect on the consolidated financial statements of SFG, as there was no change of control, nor of the percentage owned by Sphera shareholders. On 19 June 2017 Sphera has set up a new subsidiary, California Fresh Flavours SRL (“Taco Bell”), and holds 9,999 shares of its 10,000 shares. The new subsidiary had no activity up to 30 June 2017. This pro forma consolidated financial information has been authorised by the Board of Directors for issue on 29 August 2017.

SPHERA FRANCHISE GROUP SA NOTES TO PRO FORMA CONSOLIDATED FINANCIAL INFORMATION FOR THE PERIOD FROM 1 JANUARY 2017 TO 30 JUNE 2017 All amounts in RON thousand, unless specified otherwise
F - 240
2. PURPOSE OF PRO FORMA CONSOLIDATED FINANCIAL INFORMATION This pro forma consolidated financial information was prepared to illustrate the consolidated operational performance of the Group for the six months period ended 30 June 2017, as if the set-up of Sphera and the contribution of USFN shares and ARS shares to Sphera took place on 1 January 2017. (The sale of the shares in USFN Italy and USFN Moldova by USFN to Sphera, which has no impact on the consolidated financial statements of SFG, as well as the set-up of Taco Bell are not adjusted for in the pro forma consolidated financial information). USFN and ARS had identical shareholder structure and also their key management personnel was in majority the same since 2012. Therefore, although from an IFRS perspective the criteria are not met in order to qualify as “under common control” (since none of the shareholders had control or common control), the presentation of the pro forma information is reflective of the manner in which the two business segments (KFC for USFN and Pizza Hut for ARS) were managed together. The pro forma consolidated statement of comprehensive income describes a hypothetical situation and has been prepared solely for illustrative purposes and do not purport to represent what the actual consolidated results of operations of the Group would have been had the control been gained on the date assumed, nor are they necessarily indicative of future consolidated operational results. In addition, the statements are based on available information and various assumptions that management believes to be reasonable. The actual results may differ from those reflected in the pro forma consolidated financial information for a number of reasons, including, but not limited to, differences between the assumptions used to prepare the pro forma consolidated financial information and actual amounts. The pro forma consolidated financial information only consists of the pro forma consolidated statement of comprehensive income for the six month period ended 30 June 2017 and selected notes. The statement of comprehensive income is based on the statement of comprehensive income for the six months ended 30 June 2017 included in the SFG consolidated IFRS financial statements (unaudited) and ARS statement of comprehensive income for the period 1 January – 31 May 2017 (unaudited), with pro forma adjustments as described in Note 3. The SFG consolidated IFRS financial statements have been prepared in accordance with International Financial Reporting Standards applicable to interim financial reporting as issued by the International Accounting Standards Board (IASB) and adopted by the European Union (EU) (IAS 34).

SPHERA FRANCHISE GROUP SA NOTES TO PRO FORMA CONSOLIDATED FINANCIAL INFORMATION FOR THE PERIOD FROM 1 JANUARY 2017 TO 30 JUNE 2017 All amounts in RON thousand, unless specified otherwise
F - 241
3. BASIS OF PREPARATION OF THE PRO FORMA CONSOLIDATED FINANCIAL INFORMATION 3.1 ARS statement of comprehensive income for the period 1 January - 31 May 2017 On 30 May 2017, Sphera acquired 99.9997% of the shares in ARS, in exchange for Sphera shares. The consolidated statement of comprehensive income of SFG includes the results of ARS from the date of acquisition, i.e. from 31 May 2017 to 30 June 2017. As such, the pre-acquisition statement of comprehensive income of ARS for the period 1 January 2017 to 31 May 2017 has been added, as if the acquisition took place on 1 January 2017. 3.2 Pro forma adjustments: elimination of intercompany transactions In the process of preparation of the pro forma consolidated statement of comprehensive income, pre-acquisition amounts for the period 1 January 2017 to 31 May 2017 from the statement of comprehensive income of ARS were added to the amounts from the SFG IFRS consolidated statement of comprehensive income for the six months ended 30 June 2017, thus the transactions carried out during the first five months of 2017 between the two entities had to be eliminated. No synergies or integration costs following the acquisition of USFN Group and ARS by Sphera have been taken into consideration in the preparation of the pro forma consolidated financial information. 3.3 Purchase price allocation adjustments Adjustments have been made to account for the effect of the purchase price allocation performed as of the date of acquisition of Sphera and ARS by USFN (30 May 2017). Specifically, there are fair value adjustments recorded for the property, plant and equipment of ARS. The adjustment recorded in the pro forma has been computed by applying the fair value adjustments to the property, plant and equipment of ARS (as determined on 31 May 2017) to their net book values on 1 January 2017 or from the date of acquisition in 2017, and by re-computing the depreciation expense for the period 1 January – 31 May 2017 based on the amounts thus adjusted. 3.4 Preparation of the selected notes With respect to:
- Note 4 Other operating expenses, net - Note 5 General and administrative expenses, net - Note 6 Total employee benefits expense and total depreciation and amortization expense - Note 7 Finance costs and income, - Note 8 EBITDA
The information presented in these notes is based on amounts derived directly from the similar notes from the unaudited IFRS consolidated financial statements of SFG for the six months ended 30 June 2017 and, respectively, the unaudited financial statements of ARS for the six months ended 30 June 2017, from which is derived the statement of comprehensive income of ARS for the period 1 January – 31 May 2017, adjusted for the applicable pro forma adjustments described above. With respect to Note 9 Segment information: The amounts related to the statement of comprehensive income were split between corresponding brands based on the same accounting policy as adopted for the SFG consolidated financial statements in 2017. The revenue from restaurants was split between Romania, Republic of Moldova and Italy based on the same accounting policy as adopted for the SFG consolidated financial statements in 2017; all amounts related to Republic of Moldova and Italy were derived from USFN Moldova and USFN Italy entities in 2017 while the amounts for the Romanian entities USFN and ARS are presented as amounts related to Romania. (Sphera has no revenues to be presented).

SPHERA FRANCHISE GROUP SA NOTES TO PRO FORMA CONSOLIDATED FINANCIAL INFORMATION FOR THE PERIOD FROM 1 JANUARY 2017 TO 30 JUNE 2017 All amounts in RON thousand, unless specified otherwise
F - 242
4 OTHER OPERATING EXPENSES, NET:
SFG
ARS for the period 1 January – 31 May 2017
(Note 3.1)
Intercompany elimination (Note 3.2)
PPA effect
(Note 3.3) Pro forma
Third-party services 5,823 1,253
(2) - 7,074
Utilities 4,718 1,839
- - 6,557 Maintenance and repairs 2,656 323
(1) - 2,978
Cleaning supplies 1,402 267
- - 1,669 Small-wares 1,215 332
(32) - 1,515
Transport 1,030 203
- - 1,233 Telephone and postage 186 33
- - 219
Insurance 106 106
- - 212 Net gain on disposal of property, plant and equipment - (8)
- - (8)
Change in allowance for current assets - (63)
- - (63) Miscellaneous expenses and income, net 1,338 1
57 - 1,396
Total 18,474 4,286
22 - 22,782
5 GENERAL AND ADMINISTRATIVE EXPENSES, NET
SFG
ARS for the period 1 January – 31 May 2017
(Note 3.1)
Intercompany elimination (Note 3.2)
PPA effect
(Note 3.1) Pro forma
Payroll and employee benefits 6,442 2,327
- - 8,769
Third-party services 4,979 1,232
- - 6,211 Rent 739 91
- - 830
Depreciation and amortisation 1,119 60
- - 1,179 Transport 606 321
- - 927
Banking charges 653 150
- - 803 Maintenance and repairs 430 37
- - 467
Small-wares 381 20
- - 401 Telephone and postage 165 48
- - 213
Insurance 137 17
- - 154 Impairment of non-current assets 108 - - - 108 Advertising 25 -
- - 25
Miscellaneous expenses and income, net 48 69
- - 117
Total 15,832 4,372
- - 20,204

SPHERA FRANCHISE GROUP SA NOTES TO PRO FORMA CONSOLIDATED FINANCIAL INFORMATION FOR THE PERIOD FROM 1 JANUARY 2017 TO 30 JUNE 2017 All amounts in RON thousand, unless specified otherwise
F - 243
6 TOTAL PAYROLL AND EMPLOYEE BENEFITS EXPENSE AND TOTAL DEPRECIATION AND AMORTIZATION EXPENSE
6.1 Payroll and employee benefits
SFG
ARS for the period 1 January – 31 May 2017
Intercompany elimination
PPA effect
Pro forma (Note 3.1) (Note 3.2) (Note 3.3)
Payroll and employee benefits recognized in "Restaurant expenses" 43,430 11,765 - - 55,195 Payroll and employee benefits recognized in "General and administration expenses, net" 6,442 2,327 - - 8,769
Total payroll and employee benefits 49,872 14,092 - - 63,964
6.2 Depreciation and amortization
SFG
ARS for the period 1 January – 31 May 2017
Intercompany elimination
PPA effect
Pro forma (Note 3.1) (Note 3.2) (Note 3.3)
Depreciation and amortization recognized in "Restaurant expenses" 4,952
1,467 - 241 6,660
Depreciation and amortization recognized in "General and administration expenses, net" 1,119
60 - - 1,179
Total depreciation and amortization 6,071 1,527 - 241 7,839
7 FINANCE COSTS AND INCOME 7.1 Finance costs
SFG
ARS for the period 1 January – 31 May 2017
Intercompany elimination
PPA effect
Pro forma (Note 3.1) (Note 3.2) (Note 3.3)
Interest on loans and borrowings 380 123 -
- 503
Finance charges payable under finance leases 15 3 -
- 18
Foreign exchange loss, net 45 72 -
- 117
Total finance costs 440 198 -
- 638
7.2. Finance income
SFG
ARS for the period 1 January – 31 May 2017
Intercompany elimination
PPA effect
Pro forma (Note 3.1) (Note 3.2) (Note 3.3)
Interest income 109 6 -
- 115
Total finance income 109 6 -
- 115

SPHERA FRANCHISE GROUP SA NOTES TO PRO FORMA CONSOLIDATED FINANCIAL INFORMATION FOR THE PERIOD FROM 1 JANUARY 2017 TO 30 JUNE 2017 All amounts in RON thousand, unless specified otherwise
F - 244
8 EBITDA
SFG
ARS for the period 1 January – 31 May 2017
Intercompany elimination
PPA effect
Pro forma (Note 3.1) (Note 3.2) (Note 3.3)
Operating profit 28,722 2,114 - (241) 30,595
Adjustments to bridge operating profit to EBITDA: Depreciation and amortization included in restaurant expenses 4,952 1,467 - 241 6,660 Depreciation and amortization included in general and administration expenses 1,119 60 - - 1,179
EBITDA 34,793 3,641 - - 38,434
EBITDA is one of the key performance measures monitored by senior management. EBITDA would be normalized to exclude any significant one-off items (either revenues or expenses) but no such exclusions were necessary for the six months period ended 30 June 2017. 9 SEGMENT INFORMATION
For management purposes, the Group is organised into business units based on the restaurants’ brands, which are the operating and reportable segments of the Group, as follows:
- KFC restaurants
- Pizza Hut restaurants.
For the six months ended 30 June 2017 the Group also had one more immaterial operating segment, being one Paul restaurant which is managed by USFN, and which was aggregated into the KFC segment. The Board of Directors monitors the operating results of the operating segments separately for the purpose of making decisions about resource allocation and performance assessment. Segment performance is evaluated based on segment operating profit and is measured consistently with ‘’Restaurant operating profit’’ in the statement of comprehensive income in the unaudited IFRS consolidated financial statements of the Group and, respectively, the unaudited financial statements of ARS for the six months ended 30 June 2017, from which is derived the statement of comprehensive income of ARS for the period 1 January 2017 – 31 May 2017.
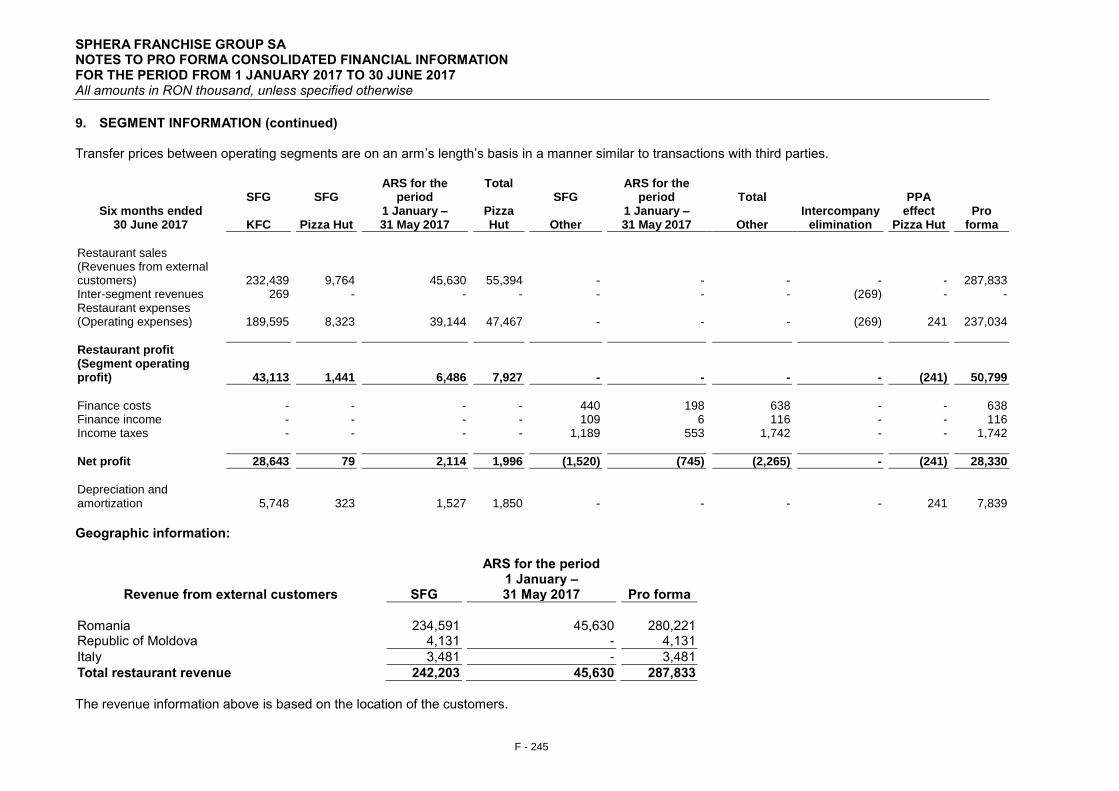
SPHERA FRANCHISE GROUP SA NOTES TO PRO FORMA CONSOLIDATED FINANCIAL INFORMATION FOR THE PERIOD FROM 1 JANUARY 2017 TO 30 JUNE 2017 All amounts in RON thousand, unless specified otherwise
F - 245
9. SEGMENT INFORMATION (continued) Transfer prices between operating segments are on an arm’s length’s basis in a manner similar to transactions with third parties.
Six months ended 30 June 2017
SFG
KFC
SFG
Pizza Hut
ARS for the period
1 January – 31 May 2017
Total
Pizza Hut
SFG
Other
ARS for the period
1 January – 31 May 2017
Total
Other Intercompany
elimination
PPA effect
Pizza Hut
Pro forma
Restaurant sales (Revenues from external customers) 232,439
9,764 45,630 55,394 -
- - -
-
287,833 Inter-segment revenues 269
- - - -
- - (269)
- -
Restaurant expenses (Operating expenses) 189,595
8,323 39,144 47,467 -
- - (269)
241
237,034
Restaurant profit
(Segment operating profit) 43,113 1,441 6,486 7,927 - - - - (241)
50,799
Finance costs -
- - - 440
198 638 -
- 638
Finance income -
- - - 109
6 116 -
- 116 Income taxes -
- - - 1,189
553 1,742 -
- 1,742
Net profit 28,643
79 2,114 1,996 (1,520)
(745) (2,265) -
(241) 28,330
Depreciation and amortization 5,748 323 1,527 1,850 - - - - 241
7,839
Geographic information:
Revenue from external customers SFG
ARS for the period 1 January – 31 May 2017
Pro forma
Romania 234,591 45,630 280,221 Republic of Moldova 4,131 - 4,131
Italy 3,481 - 3,481
Total restaurant revenue 242,203 45,630 287,833
The revenue information above is based on the location of the customers.

SPHERA FRANCHISE GROUP SA NOTES TO PRO FORMA CONSOLIDATED FINANCIAL INFORMATION FOR THE PERIOD FROM 1 JANUARY 2017 TO 30 JUNE 2017 All amounts in RON thousand, unless specified otherwise
F - 246
10. EARNINGS PER SHARE (EPS) EPS is calculated by dividing the profit for the period attributable to shareholders of Sphera by the number of ordinary shares issued by Sphera, after the contribution of USFN shares and ARS shares by the existing shareholders.
30 June 2017
Profit attributable to ordinary equity holders of Sphera 28,218 Number of Sphera shares 38,799,340
Earnings per share, basic and diluted (RON/share) 0.7273
There are no dilutive instruments to be considered.