The Pacific Island Countries Fiji, Papua New Guinea (PNG), Samoa ...
Upload
khangminh22Category
view
0download
0
Final report Project Promoting diverse fuelwood
production systems in Papua New Guinea
project number FST/2006/088
date published September 2013
prepared by Ian Nuberg Senior Lecturer in Agroforestry School of Agriculture, Food and Wine, University of Adelaide.
co-authors/ contributors/ collaborators
Brian Gunn, CSIRO John Paul, Maman Tavune, Agnes Sumareke; Jessie Abiuda-Mitir, Forest Research Institute Kumani Kuman, HOPEworldwide Joseph Pumai, Randall Mangapangkek; Peoples Action for Rural Development Yati Bun, Foundation for People and Community Development
approved by Tony Bartlett, Forestry Research Program Manager
final report number FR2013-14
ISBN 978 1 922137 69 2
published by ACIAR GPO Box 1571 Canberra ACT 2601 Australia

This publication is published by ACIAR ABN 34 864 955 427. Care is taken to ensure the accuracy of the information contained in this publication. However ACIAR cannot accept responsibility for the accuracy or completeness of the information or opinions contained in the publication. You should make your own enquiries before making decisions concerning your interests.
© Australian Centre for International Agricultural Research (ACIAR) 2013 - This work is copyright. Apart from any use as permitted under the Copyright Act 1968, no part may be reproduced by any process without prior written permission from ACIAR, GPO Box 1571, Canberra ACT 2601, Australia, [email protected].

Page 3 of 108
Contents
1 Acknowledgments ....................................................................................6
1.1 Acronyms and Abbreviations ............................................................................................... 6
2 Executive summary ..................................................................................7
3 Background ...............................................................................................9
4 Objectives ................................................................................................ 11
5 Methodology ........................................................................................... 12
5.1 Fuelwood Survey ............................................................................................................... 12 5.1.1 Survey Design and partners ................................................................................... 12
5.1.2 Questionnaire Survey ............................................................................................. 12
5.2 Field trials of fuelwood Short-Rotation Coppicing systems ............................................... 15 5.2.1 Species selection .................................................................................................... 15
5.2.2 Establishment and management ............................................................................ 16
5.2.3 Tree growth measurement and harvest.................................................................. 17 5.2.4 Coppice measurement ........................................................................................... 17
5.2.5 Evaluation of burning characteristics of fuelwood and charcoal ............................ 18
5.2.6 Statistical treatment of growth studies .................................................................... 19
5.2.7 Agroforestry trials and demonstrations ................................................................... 20
5.3 Consumer evaluation and extension of fuelwood .............................................................. 20 5.3.1 Consumer evaluation of fuelwood species ............................................................. 20
5.3.2 Evaluation of extension activity .............................................................................. 21
6 Achievements against activities and outputs/milestones ................... 22
7 Key results and discussion ................................................................... 26
7.1 Fuelwood survey ................................................................................................................ 26 7.1.1 Overview of fuelwood survey .................................................................................. 26
7.1.2 Q-survey of domestic fuelwood users .................................................................... 27
7.1.3 Q-survey of fuelwood sellers .................................................................................. 30 7.1.4 Case Study Monitoring ........................................................................................... 30
7.1.5 Semi-Structured Interviews .................................................................................... 31
7.1.6 Estimates of fuelwood value and volume ............................................................... 33
7.2 Field trials of fuelwood Short-Rotation Coppicing systems ............................................... 34
Page 4 of 108
7.2.1 Replicated evaluation of SRC species ................................................................... 34
7.2.2 Agroforestry trials and demonstrations ................................................................... 39
7.3 Discussion of field trials and evaluation of SRC systems .................................................. 42 7.3.1 Burning properties of SRC fuelwood ...................................................................... 43
7.3.2 Acceptance of SRC fuelwood ................................................................................. 44
7.3.3 Comparison with other landuse options ................................................................. 44
7.4 Evaluation and extension of fuelwood ............................................................................... 46 7.4.1 Consumer and vendor of SRC fuelwood ................................................................ 46
7.4.2 Public understanding of extension material ............................................................ 47 7.4.3 Overview of results of ‘Community of Practice’ activity .......................................... 49
8 Impacts .................................................................................................... 51
8.1 Scientific impacts – now and in 5 years ............................................................................. 51
8.2 Capacity impacts – now and in 5 years ............................................................................. 52
8.3 Community impacts – now and in 5 years ......................................................................... 52 8.3.1 Economic impacts................................................................................................... 52
8.3.2 Social impacts ......................................................................................................... 53 8.3.3 Environmental impacts ........................................................................................... 54
8.4 Communication and dissemination activities ..................................................................... 54
9 Conclusions and recommendations ..................................................... 55
9.1 Conclusions ....................................................................................................................... 55
9.2 Recommendations ............................................................................................................. 57
10 References .............................................................................................. 59
10.1 References cited in report .................................................................................................. 59 10.2 List of publications so far produced by project .................................................................. 61
11 Appendixes ............................................................................................. 62
11.1 Appendix 1: Survey of Fuelwood-Stressed Regions of PNG............................................... 62
11.2 Appendix 2: Field trials of SRC systems .............................................................................. 62 Kui Womens Group, Pugamp, Western Highlands .......................................................... 65
Manaka Bore, Maratabu site near Bautama / Gereka, NCD ............................................ 66
Barbara Elias, Bomana site .............................................................................................. 68 Mt Sinai Church Group, near Mt Hagen ........................................................................... 68
Help Each Other Youth Group (John Eka) near Mt Hagen ............................................. 69
Ulkamara site, near Kerowagi Chimbu Province .............................................................. 70
Domestic evaluation of firewood species.......................................................................... 72
Commercial evaluation of firewood species ..................................................................... 76
11.3 Appendix 3: Developing a Community of Fuelwood Practice .............................................. 79

Page 5 of 108
Method .............................................................................................................................. 80
Results .............................................................................................................................. 81
Cost of Charcoal ............................................................................................................... 81 Discussion ......................................................................................................................... 82
Conclusion ........................................................................................................................ 82
Potential networks ............................................................................................................. 85
Extension Materials ........................................................................................................... 89
11.4 Appendix 4: Internal project documents and files submitted on CD with Final Report ...... 103
Page 6 of 108
1 Acknowledgments The contributions of the following people, while not listed as contributors on the title page, were essential for the successful completion of the project. Their contributions are gratefully acknowledged:
• ACIAR: Russell Haines for his support and direction in early stages of the project when he was the Research Program Manager; Tony Bartlett for continuing the encouragement and support as incoming RPM; Cathy Pianga and Emily Flowers as PNG Country Managers
• FRI: Eddie Nir, Roy Banka, Simon Saulei who were all in-country project leaders at various stages.
• HOPEworldwide: Vanoa Geno, Titus Tobias, Tom Yale, Alex Aruai for liaison and oversight of the NCD sites; the Director Graham Ogle for his support in project development.
• FPCD: Israel Bewang, Bazakie Baput, Bonti Krasi, Fletcher Onise, Kafuri Yaro, and Linzon Zamang for effective delivery of a very complex survey; the Director Yati Bun for his support in project development.
• PARD: Alice Joseph, Agnes Frank, Jon Kupp for support in highland activity • Landholders: Patrick Barkri, Yona Mark, John Eka, Ulkamara Womens Group, Mt
Sinai Bible College, Manaka Bore, Barbara Elias for their commitment to see it through to the end.
• University of Adelaide: Dessy Kusbandi for collating the social survey data, Olena Kravchuk and David Price for statistical analysis of fuelwood growth and quality data.
• Contractors: Miriam Murphy for assistance with group facilitation, David Lea for assistance with field establishment
1.1 Acronyms and Abbreviations
DBH Diameter at Breast Height (centimetres)
EHP Eastern Highlands Province
FPCD Foundation for People and Community Development. Project Partner
FRI Forest Research Institute of the PNGFA in Lae, Project Partner
HOPEww HOPEworldwide. Project Partner
LLG Local Level Government (an administrative and census category)
NCD National Capital District
PARD People’s Action for Rural Development. Project Partner.
PMV Private Motor Vehicle
PNGFA Papua New Guinea Forest Authority
PNGSEL PNG Sustainable Energy Limited
PNGSDP Papua New Guinea Sustainable Development Program
SRC Short Rotation Coppice
WHP Western Highlands Province

Page 7 of 108
2 Executive summary Fuelwood is integral part of the PNG’s domestic economy and the aims of this project were to: 1] describe and quantify this economy; 2] to evaluate short-rotation coppicing (SRC) fuelwood production systems as a small business opportunity; 3] develop extension material to promote a community of fuelwood practice.
A large survey of domestic and commercial fuelwood use was undertaken over 2008-9 comprising: 3,966 questionnaires of urban and rural domestic fuelwood users; interviews with 156 fuelwood sellers; monitoring of daily fuelwood use of 36 households; interviews of 50 commercial or industrial users of fuelwood and institutional stakeholders in the fuelwood economy. Broadly, the fuelwood economy in PNG has a very short and direct supply chain in an informal environment with no public engagement in supply, marketing, distribution, pricing, or taxation.
Fuelwood is regularly used by most of the population for domestic and commercial cooking, even in urban areas where there is good access to electricity and other energy sources. PNG’s per capita fuelwood consumption is 6 times greater than the average value (0.3 m3/person/year) for 16 Asian countries in the FAO Regional Wood Energy Development Program. Fuelwood consumption is estimated to be1.8m3/person/year and about 2.1million m3/y was collected in the surveyed regions in 2007-8; an extrapolation for a national value would be 9.34million m3/y, or 12.34million m3/y for the estimated population of 6.9 million in 2012. The annual expenditure on fuelwood over 2007-8 was in the order of PGK6.6million/y across the surveyed districts.
There is significant variation in the price of fuelwood across urban and rural regions. About 3% of urban and 10% of rural people will sell fuelwood, mainly on a part-time basis. While 88% of fuelwood users also use other energy sources which are becoming more accessible, fuelwood will remain the dominant domestic energy source for quite some time, especially in rural areas. There is a great opportunity for entrepreneurs to create a more sophisticated fuelwood supply chain that could deliver sustainably harvested and value-added fuelwood to consumers, especially in urban areas and the commercial sector.
Ten fuelwood species were evaluated in short-rotation coppicing (SRC) systems in replicated field sites around Mt Hagen and Port Moresby. They were grown at 2 spacings and evaluated against locally used, but non-coppicing species (e.g. Casuarina oligodon in highlands). Some candidates were also grown in farmer-managed woodlots and alley-farming systems. The evaluation included: growth measurements after 2 years; coppice vigor; burning characteristics as firewood and as charcoal; and consumer and market acceptance. In terms of fuelwood production Eucalyptus grandis and E.robusta in Western Highlands Province (WHP) and E. tereticornis in the National Capital District (NCD), performed best with values of 2.97, 2.55, and 0.92 m3 for a 500 m2 woodlot respectively at the denser spacing. The narrower spacing (1.0m*1.5m) produced more wood volume, but the wider spacing (2.0m*1.5m) produced thicker stems which is a consideration if farmers want to grow poles as well. E.grandis and E.robusta produced best tree form in the WHP while E.pellita produced best form in NCD. Best coppice performance was observed in E.robusta in WHP and E.tereticornis in the NCD. The poor growth rates around the NCD make a 2 year rotation cycle unfeasible. Calliandra calothrysus may also be a suitable SRC species for alley systems in highland gardens.
SRC systems can produce firewood with very high returns to labour (e.g K43/person/day compared with coffee K15/person/day) provided operators can market the wood effectively. While the SRC-grown wood also has favorable burning characteristics, marketing will require thought to presentation and pricing as SRC firewood looks different than conventional firewood. Also it will be important to a small-business model that integrates well with the

Page 8 of 108
indigenous non-market economy. The greatest potential for small business development based on SRC woodlots is with the conversion of the wood into charcoal. Extension material about SRC fuelwood production and especially charcoal production and use was developed and promoted by the Forest Research Institute at Lae. A database was developed of organizations that could be interested in SRC-fuelwood production as a part of community development activities. Cooking demonstrations, brochures and posters were presented at cultural shows and other events. Public understanding of the extension posters was evaluated by way of competitions. The general understanding of the extension information on posters was patchy and only modest at best. Physical demonstration of cooking with charcoal had a greater impact on public interest and understanding. Further promotion of SRC-fuelwood production systems should be based on establishing charcoal businesses. People can readily see the value of charcoal as a product and will need SRC-systems to supply fuelstock.
Page 9 of 108
3 Background Fuelwood is a crucial, but undeveloped, component of the domestic economy of PNG. Previous to this project the fuelwood economy had only been studied on a very generalised national level. For example, FAO estimated of the amount of fuelwood consumed to be 5.5mill m3 /y or 1.38 m3 /person/y. The value of the national fuelwood economy was estimated as US$105million/y within the World Bank Poverty Assessment (Bourke 1997). Fuelwood is the primary energy source for cooking and heating especially in the highlands where over 40% of the population lives. It also represents a part of the economy that many people can contribute albeit mostly in small degree. In 1996, over 1 million people were estimated to be engaged in fuelwood sales, but only contributing to about 2.3% of total agricultural income(Allen et al. 2001).
Many districts in PNG are under intense agricultural pressure and socioeconomic disadvantage and fuelwood collection has led to increasing pressure on the environment; e.g. the already minimal forest cover in some highland provinces and the degradation of mangrove forests associated with the National Capital District (NCD). In the highland districts dominated by grasslands, people need to walk many kilometres in search of fuelwood. In and around urban areas it has led to an increasingly serious shortage of fuelwood at affordable prices. Fuelwood will continue to play a major role in the energy economy of PNG for the foreseeable future.
Without any published or anecdotal evidence to the contrary, it is fair to conclude that the vast majority of fuelwood consumed in PNG is collected from trees and other vegetation that have not been specifically planted for this purpose. This is gathered in an ad hoc and opportunistic manner with no planning or regulatory control to ensure continuity of supply. In many districts competition for fuelwood resources leads to conflict. While fuelwood is used across the whole nation, the main districts where it is recognised as a significant part of the local economy are found in the highland provinces of Simbu, Enga and the Eastern, Western and Southern Highlands. Many of these districts have been assessed to be under significant agricultural pressure and overall relative social disadvantage(Hanson et al. 2001).
Taking an all-Asia perspective, a significant amount of firewood is harvested from non-forested lands and therefore not a key factor behind deforestation (FAO 1997). (A broader background paper discussing global fuelwood trends is given in Appendix 1). However in PNG the estimated population growth of 2.3% is increasing at 3 times the rate at which the area of land in significant use is increasing. Consequently the intensity of land use is increasing and the availability of non-forest firewood is decreasing (Allen et al 2001). This is putting pressure on, for example, the mangrove forests near Port Moresby and the already bare hills in the more heavily settled districts of the highland provinces. Even the existing highland bush fallow systems do not provide adequate fuelwood as evidenced by the inferior firewood often used (e.g. bamboo and grass) and the long hours spent in fuelwood gathering.
There is little documented understanding of the fuelwood economy in PNG. The most recent survey of fuelwood use was undertaken to the south of Goroka in the Eastern Highlands as part of an AusAID-funded PNG Forestry Human Resource Development Project (1997-2001)(Murphy 2006). Using proxy values, Murphy estimated that value of a day collecting wood was K15/d (and for season K300) when compared with working in coffee gardens and K5/d (K260/y) when compared with the minimum rural income. Either way a day collecting fuelwood can cost the household the equivalent of 15-20% of potential household income. When these values are extrapolated nationally (probably a dangerous extrapolation given the geographic narrowness of the original data), Murphy estimates that the national fuelwood consumption based on market price is K550 mill (US$176 mill) for 2.75 mill tons/y. However, because only 5% households buy wood (at least in her survey area) then the market based
Page 10 of 108
economy could be worth K3.9 mill. Combining with the value of collected wood, the total fuelwood economy is then estimated to be worth K9159 mill/y (US$2,928 mill/y). This estimate should be compared with the World Bank Poverty Assessment estimate) placed the value of the fuelwood economy at US$105million/y (Bourke 1997). In summary, information on the fuelwood economy is either very localised or over generalised. There is clearly the need for a well stratified national survey, encompassing both domestic and commercial fuelwood users, and focusing on fuelwood-stressed highland areas and lowland urban areas.
Conventional forestry interventions to supplement a fuelwood economy usually consist of relatively long-term and large woodlots. These are beyond the planning horizons of most landholders who are used to annual and short-term perennial crops. The central premise of this project was that short-rotation coppicing (SRC) systems, that provide fuelwood in cycles of ≤ 2 years, may be more readily adopted by landholders interested in growing fuelwood on small areas. That is SRC systems will produce fuelwood in agricultural time-scales rather than traditional forestry time-scales for fuelwood (>10-15 yr).
This project was designed to understand the fuelwood economy with more precision and to develop and promote SRC systems that will supply that economy. These regenerating fuelwood production systems can directly enhance smallholder income and provide a pathway for rehabilitating grasslands. Business opportunities can be created to supply a growing fuelwood market while at the same time providing opportunities to produce other products including seedlings, poles and fodder (depending on species grown).
The development of fuelwood production systems will lead to appropriate intensification of small-holder agriculture. The potential direct beneficiaries are broad and many; people (especially women) who have to carry fuelwood long distances will have more time available for other more productive pursuits. Individual landholders and community groups will have opportunity for extra income generation. The creation of such small business opportunities will absorb surplus unemployed labour which is believed to be one of the causes of increasing lawlessness and violence. Urban fuelwood users will have a source of fuelwood at stable and reasonable prices, while industrial fuelwood users will have assured continuity of supply and will make production efficiencies. NGOs involved with village and community development will have information on a new enterprise model to offer their clients.
This project addressed many of the priorities that ACIAR has identified for PNG. It is applied research aimed to enhance smallholder incomes, with an emphasis on agroforestry and woodlot systems. The project developed institutional capacity through the engagement of NGOs and government forestry personnel.
Page 11 of 108
4 Objectives The aim of the project, as set out in the original proposal, was to establish a national fuelwood economy based on woodlots and agroforestry systems.
The objectives were as follows:
1. To describe and quantify the national fuelwood market. Activities:
• Assemble existing information on fuelwood and energy use • Conduct targeted survey of fuelwood users and vendors in NCD and
highlands. • Market testing for short-rotation coppice (SRC) fuelwood and charcoal
2. To establish in both lowland peri-urban and highland rural regions a range of fuelwood production systems as pilot projects. Activities:
• Establish collaborative relationships between partners and project participants;
• Fuelwood site establishment, maintenance and monitoring; 5 peri-urban community-based woodlots in Port Moresby NCD (and perhaps Lae), and 7 highland village-based agroforestry systems which will include woodlots and contour-hedgerow systems called Biological Contour Terrace Gardens (BCTG, but also referred to in this report as ‘alley cropping’)
3. To establish a community of practice which will ensure the wider adoption and long-term development of fuelwood production.
Activities:
• Training of landowner participants in charcoal production and fuelwood business development
• Establish a National Fuelwood Network by identifying relevant actors and communication channels
• Prepare a range of extension material for a range of target audiences; via the FRI website and pushing out the URL to development NGOs.
Page 12 of 108
5 Methodology
5.1 Fuelwood Survey The complete description of methods of the Fuelwood Survey is given in Appendix 1
5.1.1 Survey Design and partners The design of the survey was a participative process that began at the Fuelwood Survey Design Workshop held at the Forest Research Institute, Lae 15-16th April 2008. There were 25 attendees from FRI, FPCD, HOPEworldwide, PARD, CSIRO, ACIAR and University of Adelaide.
There were three components of the Fuelwood Survey
1. Questionnaire (Q-survey) of 3,966 domestic users and 156 vendors; 2. Case Study Monitoring of fuelwood used over 2-week period by 36 households; 3. Semi-Structured Interviews of 63 commercial fuelwood users and stakeholders.
As the Q-survey was most complex component, a pilot survey was run for two weeks in May 2008; the results of which were reviewed and refined in a follow-up workshop with key FPCD interviewers in 24-25th July 2008.
5.1.2 Questionnaire Survey The survey was designed to focus on areas where there is known fuelwood stress in PNG. At the Workshop, these regions were determined to be the NCD, Lae, Western Highlands Province (Mt Hagen District), Chimbu (Chuave District) and Eastern Highlands Province (Henganofi District). Table 1 presents the relative proportion of population of these regions. In terms of populations, the provinces from which these districts are selected represent 36% of the national population of 5,190,000 (PNG National Census 2000). The population of districts sampled represent about 10.7% of the national population.
Q-survey Sampling strategy The Q-survey survey sample was segregated based on the relative proportion of population over the 5 survey regions. Table 1 shows the sub-sample sizes of each region, the number of sampling strata and the approximate proportion of regional sub-sample to whole survey sample. This sample can also be segregated into other meaningful categories: Urban 51% and Rural 49%; or Lowland 68% and Highland 32%. Table 5.1 Proportional segregation of the Q-survey sample
Regional Sample areas % of PNG
in sampled area
Regional sample
size
No. Sampling
strata
% of Total
Sample Urban / rural
NCD 4.9 1,868 9 46 Urban Lae, Morobe Province 2.3 845 30 22 ½ urban : ½ rural Mt Hagen, WHP 1.7 628 8 16 Rural / minor urban Chuave, Chimbu Province 0.7 254 4 6 Rural Henganofi, EHP 1.1 401 4 10 Rural
TOTAL 10.7% 3,996 55 100%
The randomised stratification of the survey population was made using information from the PNG National Census 2000. This is accessible through the Community Profile System (CPS) which provides a wide range of demographic and socio-economic information. The

Page 13 of 108
regional sample sizes reflect the relative population size of the sample region. The sampling strata are based on Local Level Government units and Wards. Randomisation within this level of organisation of census data was based on Census Units using the criteria of “Proportion aged 10 years and over economically active”. The distribution of this indicator was separated into three equal thirds and an equal number of census units were randomly selected from each third.
The total sample represents 0.9% of the total regional population in the recognised firewood-stress regions. By all comparisons this is a very intense and robust survey. Similar fuelwood surveys in India were considered very robust with sampling intensities of 0.5%(Pandey 2002).
Q-Survey data collection and collation The Q-survey was undertaken over two rounds, October-December 2008 and March-May 2009, by trained staff from Foundation for People and Community Development (FPCD). There were three variants of the Q-survey:
1. Survey of Urban Fuelwood Users
2. Survey of Rural Fuelwood Users
3. Survey of Fuelwood Sellers
For the Users surveys the interviewers worked in pairs for security reasons. They worked on either side of a road and called upon every third dwelling along the road. If no-one was home or declined the survey, the interviewer moved to the next house until a willing interviewee was found. The interviewers continued through the Sample Stratum like this until the required number of interviews were made for that Sample Stratum.
The nature of the data collected in the User surveys were as follows:
• Age and gender of family members who collect and/or buy firewood • Environment in which they lived: housing, access to electricity, fuelwood resource • Frequency, purpose and manner in which firewood is used • Use of alternative energy sources • Whether, when and where firewood is collected or purchased • The volumes, species and amount spent on firewood • The distance and mode of transporting firewood • Knowledge and attitudes about firewood, charcoal, and tree planting • Income generated from using firewood
The Sellers survey was administered as interviewers approached sellers in markets and along roadsides in the sampling strata areas. In addition to asking questions, if the seller was agreeable the interviewers also weighed bundles of different categories of firewood on sale.
The nature of the data collected in the Seller survey were as follows: • Age and gender of seller • Point of sale and size of operation; wholesale or retail • Type of clients • Frequency of selling • Firewood sources, collection, transport and landholder arrangements • Weight and cost of firewood on sale in different categories • Income from sale of firewood • Knowledge of charcoal • Problems associated with selling firewood
Page 14 of 108
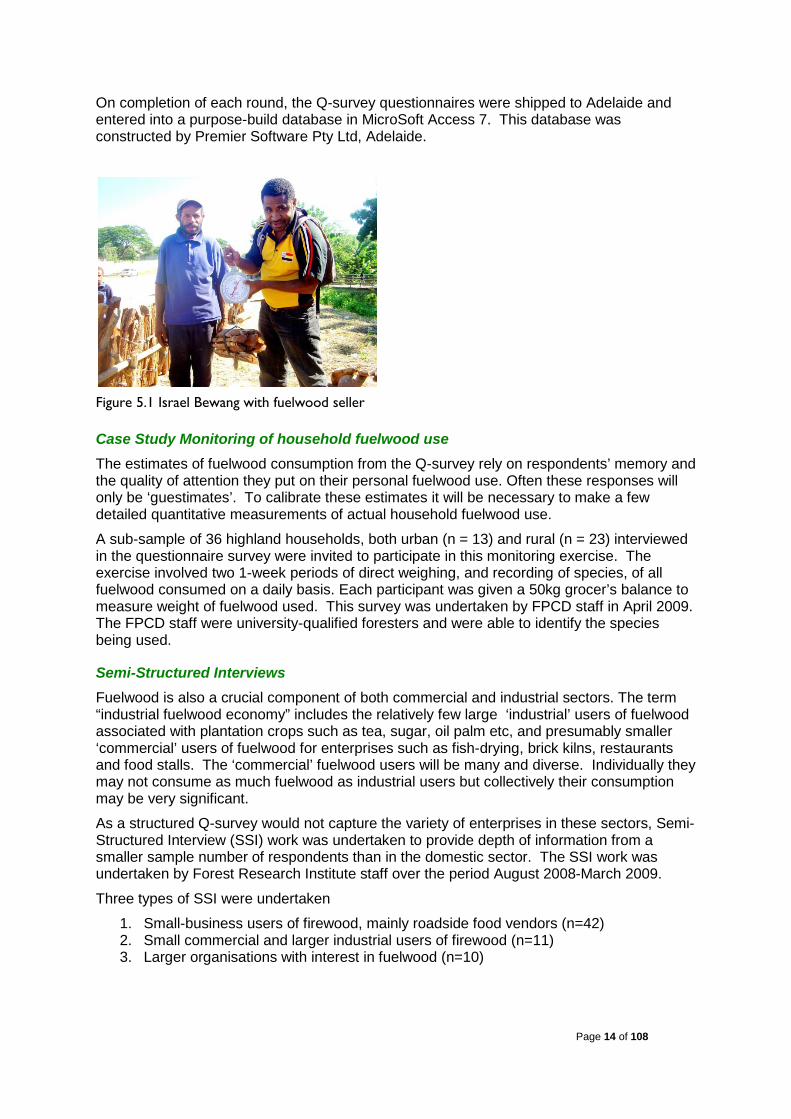
On completion of each round, the Q-survey questionnaires were shipped to Adelaide and entered into a purpose-build database in MicroSoft Access 7. This database was constructed by Premier Software Pty Ltd, Adelaide.
Figure 5.1 Israel Bewang with fuelwood seller
Case Study Monitoring of household fuelwood use The estimates of fuelwood consumption from the Q-survey rely on respondents’ memory and the quality of attention they put on their personal fuelwood use. Often these responses will only be ‘guestimates’. To calibrate these estimates it will be necessary to make a few detailed quantitative measurements of actual household fuelwood use.
A sub-sample of 36 highland households, both urban (n = 13) and rural (n = 23) interviewed in the questionnaire survey were invited to participate in this monitoring exercise. The exercise involved two 1-week periods of direct weighing, and recording of species, of all fuelwood consumed on a daily basis. Each participant was given a 50kg grocer’s balance to measure weight of fuelwood used. This survey was undertaken by FPCD staff in April 2009. The FPCD staff were university-qualified foresters and were able to identify the species being used.
Semi-Structured Interviews Fuelwood is also a crucial component of both commercial and industrial sectors. The term “industrial fuelwood economy” includes the relatively few large ‘industrial’ users of fuelwood associated with plantation crops such as tea, sugar, oil palm etc, and presumably smaller ‘commercial’ users of fuelwood for enterprises such as fish-drying, brick kilns, restaurants and food stalls. The ‘commercial’ fuelwood users will be many and diverse. Individually they may not consume as much fuelwood as industrial users but collectively their consumption may be very significant.
As a structured Q-survey would not capture the variety of enterprises in these sectors, Semi-Structured Interview (SSI) work was undertaken to provide depth of information from a smaller sample number of respondents than in the domestic sector. The SSI work was undertaken by Forest Research Institute staff over the period August 2008-March 2009.
Three types of SSI were undertaken
1. Small-business users of firewood, mainly roadside food vendors (n=42) 2. Small commercial and larger industrial users of firewood (n=11) 3. Larger organisations with interest in fuelwood (n=10)
Page 15 of 108
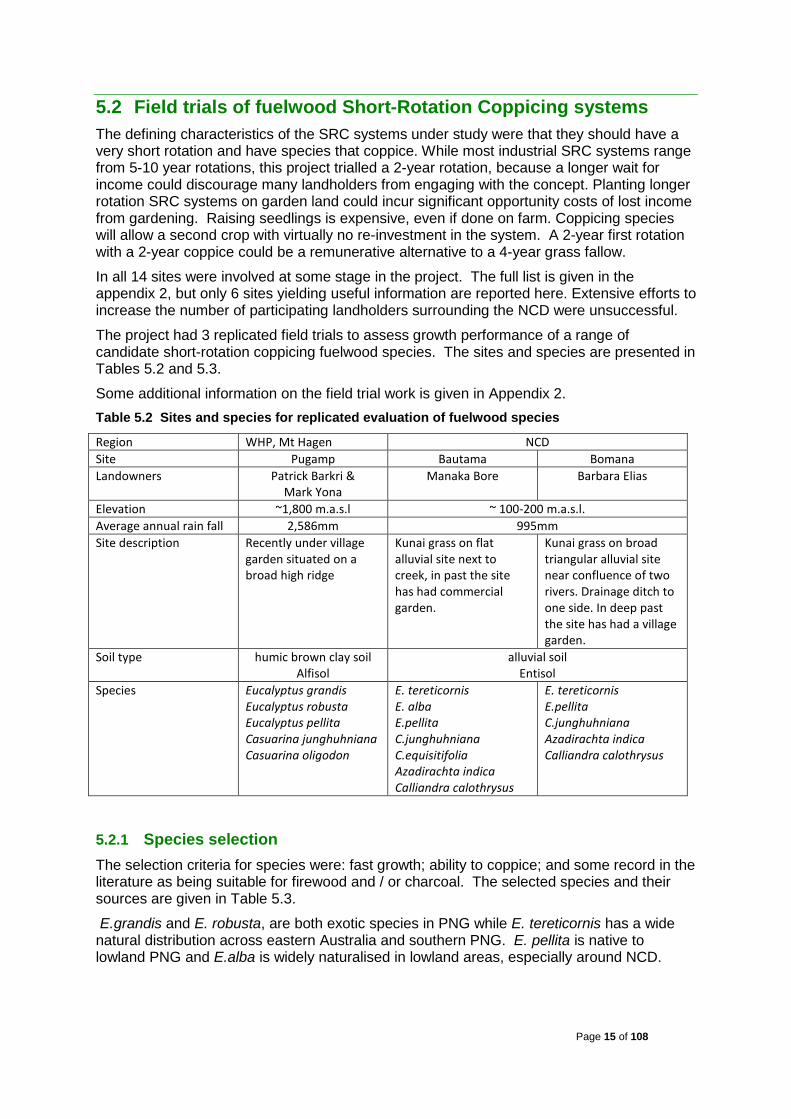
5.2 Field trials of fuelwood Short-Rotation Coppicing systems The defining characteristics of the SRC systems under study were that they should have a very short rotation and have species that coppice. While most industrial SRC systems range from 5-10 year rotations, this project trialled a 2-year rotation, because a longer wait for income could discourage many landholders from engaging with the concept. Planting longer rotation SRC systems on garden land could incur significant opportunity costs of lost income from gardening. Raising seedlings is expensive, even if done on farm. Coppicing species will allow a second crop with virtually no re-investment in the system. A 2-year first rotation with a 2-year coppice could be a remunerative alternative to a 4-year grass fallow.
In all 14 sites were involved at some stage in the project. The full list is given in the appendix 2, but only 6 sites yielding useful information are reported here. Extensive efforts to increase the number of participating landholders surrounding the NCD were unsuccessful.
The project had 3 replicated field trials to assess growth performance of a range of candidate short-rotation coppicing fuelwood species. The sites and species are presented in Tables 5.2 and 5.3.
Some additional information on the field trial work is given in Appendix 2. Table 5.2 Sites and species for replicated evaluation of fuelwood species
Region WHP, Mt Hagen NCD Site Pugamp Bautama Bomana Landowners Patrick Barkri &
Mark Yona Manaka Bore Barbara Elias
Elevation ~1,800 m.a.s.l ~ 100-200 m.a.s.l. Average annual rain fall 2,586mm 995mm Site description Recently under village
garden situated on a broad high ridge
Kunai grass on flat alluvial site next to creek, in past the site has had commercial garden.
Kunai grass on broad triangular alluvial site near confluence of two rivers. Drainage ditch to one side. In deep past the site has had a village garden.
Soil type
humic brown clay soil Alfisol
alluvial soil Entisol
Species Eucalyptus grandis Eucalyptus robusta Eucalyptus pellita Casuarina junghuhniana Casuarina oligodon
E. tereticornis E. alba E.pellita C.junghuhniana C.equisitifolia Azadirachta indica Calliandra calothrysus
E. tereticornis E.pellita C.junghuhniana Azadirachta indica Calliandra calothrysus
5.2.1 Species selection The selection criteria for species were: fast growth; ability to coppice; and some record in the literature as being suitable for firewood and / or charcoal. The selected species and their sources are given in Table 5.3.
E.grandis and E. robusta, are both exotic species in PNG while E. tereticornis has a wide natural distribution across eastern Australia and southern PNG. E. pellita is native to lowland PNG and E.alba is widely naturalised in lowland areas, especially around NCD.

Page 16 of 108
Table 5.3 Seedlots used in the fuelwood trials
Species Seed source C. oligodon (local yar) From planted trees ex NTSC Bulolo, PNG C. junghuhniana (indo yar) Seedlot 19237 ex CSIRO ATSC sourced from seed stand Meru,
Kenya originating from Indonesia C. equisetifolia (coastal yar) Single tree growing in yard near HOPE nursery, Port Moresby, PNG E. pellita NTSC seed stand Bulolo originating from Western Province, PNG E. grandis Seedlot 19968, Tinaroo Creek, NQLD ex CSIRO, ATSC (10 trees) E. tereticornis/ camaldulensis Seedlot 20930, Kennedy R. , NQLD ex CSIRO, ATSC (34 trees) E. alba (local white gum) NW of Port Moresby ex J. Boslogo PNGFA (4 trees) E.robusta Collected by PARD from local sources, Mt Hagen Azadirachta indica (Neem) Port Moresby street trees Calliandra calothyrsus Seed from Queensland DPI, Walkerman Leucaena diversifolia Collected by PARD from local sources, Mt Hagen
The preferred firewood species for highlanders is the native Yar or C.oligodon. Around coastal areas C.equisitifolia, called “Coastal Yar” in the project, is sometimes used. Unfortunately neither Yar coppices so cannot become SRC species. They are included at Pugamp and Bautama for comparison against C.junghuhniana. This species is native to Indonesia so it became known as “Indoyar” for the project. It is grown in Thailand for fuelwood and reported to coppice and pollard well.
Neem (A.indica) was included because of its reputation for vigorous coppicing and producing excellent charcoal and firewood. It has been widely planted for road side shade around NCD and grows well over a wide range of conditions in tropical lowlands.
Calliandra calothrysus was included as a nitrogen-fixing species with excellent reputation for firewood and charcoal plantations in Indonesia. It is also very successfully grown in alley cropping systems which are trialled in the “fuelwood agroforestry systems’ component of this project. It is not widely found in PNG although there are some specimens in the Lae Botanical Gardens. The seed used in this project was sourced from QLD Department of Primary Industries. The rhizobial inoculum used in the project was taken from soil around a Calliandra tree in the FRI grounds and from Bulolo Forestry College.
Leucaena diversifolia is an exotic nitrogen-fixing species now now widely found in PNG. Rhizobial inoculums for Leucaena species appear to have naturalised.
In the early phase of the project there were attempts to find more native species, especially in the highlands, that satisfy the SRC criteria. A local plant was observed grown as a fast coppicing hedgerow in Pugamp. It was identified as Gumpuck (Phylanthus flaviflorus). It grows naturally in the forests at the foot of Mt Hagen. Cuttings were taken and planted around the field nursery but not enough survived for further evaluation.
Staff of project partners received training in tree nursery construction and management and then raised seedlings for their sites in field nurseries. Seedlings (~ 6 month old) were planted in November 2008 (Pugamp) and February 2009 (NCD).
5.2.2 Establishment and management In all three sites seedlings were planted at 1.5m * 1.0m (6,666sph) and 1.5m * 2.0m (3,333sph) spacings in randomised complete blocks with 4 replicates and 36 tree plots including a 20 tree buffer around each plot. The closer spacing was considered the densest feasible configuration that will provide canopy closure within two years without too much inter-tree competition. The wider spacing was a more conservative option that was likely to provide thicker stems. The Pugamp site was planted in November 2008 from 5 month-old seedlings. The NCD sites were planted in February 2009 from 4 month-old seedlings. The

Page 17 of 108
number of trees planted in each site were 1,600 Pugamp (plus 108 trees of 9 species planted as demonstration plots), 2,300 Bautama and 1,664 Bomana. All trees were planted within a day at each site because of community participation. No fertilisers were added and it was not necessary to water the seedlings in.
The Pugamp site had recently been a sweet potato plot. The 0.3 ha site was prepared by manual cultivation and partial filling of drains to leave a relatively flat area for tree planting. A pig-proof fence was constructed. Weed control was by way of gardening as the landowner planted an intercrop of kurusako (or choko vine, Sechium edule) in the first year before canopy closure.
The Bautama (0.48ha) and Bomana (0.37ha) sites were situated in kunai grassland (Imperata spp). The sites were prepared by slashing and burning, but no cultivation. Before planting, the regrowth was controlled with glyphosate and grass-clump removal. After planting weed control was by slashing with bush knives. Wild fire is a common problem in this area so 10 m firebreaks were maintained around each site.
5.2.3 Tree growth measurement and harvest The 3 trial sites were measured in February 2010 and 2011 for Height (m) using poles, Diameter at Breast Height using diameter tapes, Survival and Form using the criteria in Table 5.4. Trees at Pugamp and Bautama were selectively harvested in February 2011 in consultation with landowners who wished to grow some trees on for poles. However, at least one whole block was clear-felled at each site, so that the trees measured for coppice regrowth were un-shaded. Table 5.4 Criteria used for scoring Form of trees and Vigour of coppice.
SCORE Criteria Tree FORM
1 Very crooked: > 2 serious bends, 2 + stems 2 Crooked: > 2 small bends or < 2 serious bends 3 Almost straight: 1–2 small bends 4 Completely straight
Coppice VIGOUR 0 No or coppice buds only 1 Coppice shoot(s) present up to ~20 cm long but weak 2 1-2 coppice shoots more than 20 (20-50) cm long 3 Several coppice shoots (>3) well developed, leaves fully extended, healthy and
potentially able to produce fuelwood
The wood harvested from the Pugamp was 30 months old from planting, while that from Bautama was 28 months old. The wood from these sites was cut to 60cm lengths similar to how it is presented for sale in the market. The wood was bundled, labelled and stored to dry under tarpaulins for up to 3 months. This wood was then distributed to households and fuelwood sellers for user evaluation (Section 7.3.2). Samples were also sent to FRI for laboratory evaluation of burning characteristics.
Some of the wood was also converted to charcoal on-site using the Tongan Drum method. Samples of the charcoal from each species were sent to FRI for evaluation of burning characteristics. This charcoal was also used as part of demonstrations at the extension events.
5.2.4 Coppice measurement The coppice regrowth at Pugamp and Bautama was measured in May and October 2011. The measurements taken were: Height of tallest shoot, Stump diameter under bark, and a Coppice Vigour score using the criteria in Table 4.
Page 18 of 108
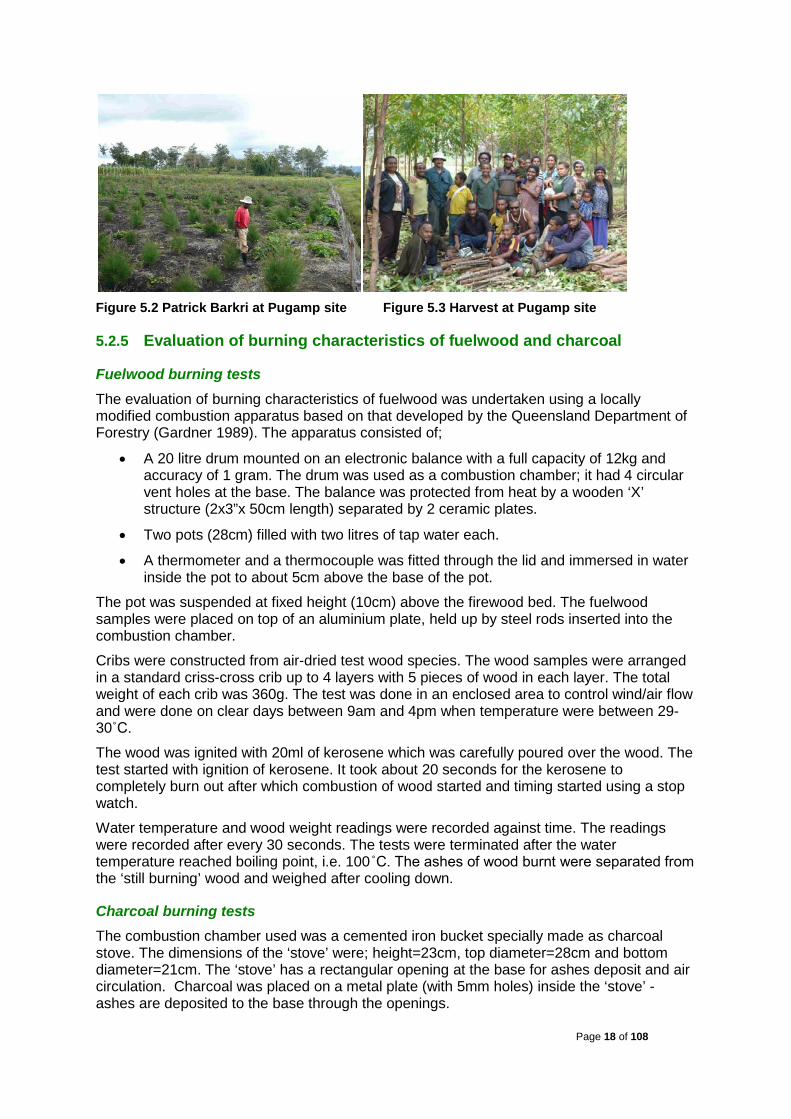
Figure 5.2 Patrick Barkri at Pugamp site Figure 5.3 Harvest at Pugamp site
5.2.5 Evaluation of burning characteristics of fuelwood and charcoal
Fuelwood burning tests The evaluation of burning characteristics of fuelwood was undertaken using a locally modified combustion apparatus based on that developed by the Queensland Department of Forestry (Gardner 1989). The apparatus consisted of;
• A 20 litre drum mounted on an electronic balance with a full capacity of 12kg and accuracy of 1 gram. The drum was used as a combustion chamber; it had 4 circular vent holes at the base. The balance was protected from heat by a wooden ‘X’ structure (2x3”x 50cm length) separated by 2 ceramic plates.
• Two pots (28cm) filled with two litres of tap water each.
• A thermometer and a thermocouple was fitted through the lid and immersed in water inside the pot to about 5cm above the base of the pot.
The pot was suspended at fixed height (10cm) above the firewood bed. The fuelwood samples were placed on top of an aluminium plate, held up by steel rods inserted into the combustion chamber.
Cribs were constructed from air-dried test wood species. The wood samples were arranged in a standard criss-cross crib up to 4 layers with 5 pieces of wood in each layer. The total weight of each crib was 360g. The test was done in an enclosed area to control wind/air flow and were done on clear days between 9am and 4pm when temperature were between 29-30˚C.
The wood was ignited with 20ml of kerosene which was carefully poured over the wood. The test started with ignition of kerosene. It took about 20 seconds for the kerosene to completely burn out after which combustion of wood started and timing started using a stop watch.
Water temperature and wood weight readings were recorded against time. The readings were recorded after every 30 seconds. The tests were terminated after the water temperature reached boiling point, i.e. 100˚C. The ashes of wood burnt were separated from the ‘still burning’ wood and weighed after cooling down.
Charcoal burning tests The combustion chamber used was a cemented iron bucket specially made as charcoal stove. The dimensions of the ‘stove’ were; height=23cm, top diameter=28cm and bottom diameter=21cm. The ‘stove’ has a rectangular opening at the base for ashes deposit and air circulation. Charcoal was placed on a metal plate (with 5mm holes) inside the ‘stove’ - ashes are deposited to the base through the openings.

Page 19 of 108
The stove was mounted on an electronic weighing scale separated by ceramic plates and a wooden x-structure to protect the electronic balance. A thermometer was suspended into the kettle of water (2L), through a 5mm hole on the kettle’s lid, to about 5cm from the base. An iron rod (1.5m) hung from a beam was used to hold up the kettle. 360g of charcoal was used for each burning tests. 20mL of kerosene was used to ignite fire.
The 20mL of kerosene was poured over the charcoal and given 20 seconds for the charcoal to soak up kerosene then ignited using a lighter. Kerosene was burn up (~30 seconds) and then the kettle of water was suspended over the ‘stove’ (10cm above charcoal fire) and timing started using a stop watch.
Water temperature and weight of charcoal was recorded against time after every 30 seconds. Qualitative data collected include smokiness, ease of ignition, ease of combustion and heat emitted. The experiment was terminated after the water temperature reached 100°C.
The tests were done in an enclosed area to control air flow and were done on clear days between 9am and 4pm when temperature were between 29-31˚C.
5.2.6 Statistical treatment of growth studies Strip-plot (spacing in strips, species in main plots) analyses were conducted for the field trials to estimate the allometric and coppicing characteristics of species. The linear mixed model equation for an observation y of a trait Y (height, DBH, etc.) on a tree l of a species (spp) i planted with spacing (sp) j in the kth block (β), can be expressed as:
𝑦𝑖𝑗𝑘𝑙 = 𝜇𝑌 + 𝛽𝑘 + 𝑠𝑝𝑝𝑖 + 𝑠𝑝𝑗 + 𝜀(𝑠𝑝𝑝)𝑖𝑘 + 𝜀(𝑠𝑝)𝑗𝑘 + (𝑠𝑝𝑝 × 𝑠𝑝)𝑖𝑗 + 𝜀(𝑠𝑝𝑝 × 𝑠𝑝)𝑖𝑗𝑘 + 𝜀𝑖𝑗𝑘𝑙, (1)
where an ε with brackets refers to the corresponding error term for the fixed effects of species, spacing and their interaction. The average value of the trait in the absence of species and spacing effects is denoted by µ. Notice that the blocks are estimated as random effects. In other words, we do not adjust the expected value of a trait for a systematic block effect; the effect of blocks rather mitigates itself in the additional variation of the data in the field. The errors ε’s for fixed effects of spacing, species and their interactions are set up as the corresponding block-by-factor interaction. A comprehensive discussion of the separation of error terms in the analysis for strip-plot designs can be found in a classical text by (Cochran and Cox 1957) (pp. 306 – 309).
There was a serious problem with missing data in Bautama and Bomana, which caused the lost of balance in the design. For the allometric traits, Eq. (1) was thus fitted with the likelihood (REML) method rather than algebraically (ANOVA). The denominator degrees of freedom for approximate F-tests were calculated using algebraic derivatives.
It was assumed that the data were missing completely at random in each plot; no spatial or other additional explanations were attempted at the level of an individual plot. The proportion (p) of observed trees out of planted trees in each plot was analyzed with the general linear mixed model for systematic effects of species, spacing, species-by-spacing interactions and blocks. The model is similar to Eq. (1) but without the last error term for individual tree. Species with the proportion of surviving trees below 20% were completely removed from the analysis of allometric data. Trees with missing observations of height or diameter were not included in the analysis (no missing values estimates were calculated). The inference relates, therefore, only to trees that will successfully survive a two year period after planting under conditions similar to the field trials in our project.
The measured diameter (DBH, cm) and the tree height (Ht, cm) were converted to the estimated volume of a tree (V), m3, with the simple conical volume equation,
𝑉 = (𝜋 𝐻𝑡 (𝐷𝐵𝐻 200⁄ )2) 3⁄ (2)

Page 20 of 108
The volume data were log-transformed for the analysis. Strictly speaking, the distribution of V is not log-normal, and the residuals from linear models on log-transformed data are negatively biased. However, we have checked the goodness of fit of normal distributions to the residuals of log-transformed (natural logarithm) data and found the fit satisfactory and the bias negligible (the analysis is not shown). As the volume analysis is only needed for a rough estimation of the productivity, we accept the log-transformation adequate. The linear model fitted to the log-transformed volume data is given by Eq. (1). The back-transformed estimators were not corrected for bias, and thus represent the median volume on the linear scale rather than the mean. The predicted tree volume was adjusted to the standard plot size of 500 m2 and the estimated proportion of survival in the following way:
𝑉𝑝 = 𝑝 5001.5×(1 𝑜𝑟 2)
𝑉. (3)
It was assumed that the performance of remaining trees does not depend on the survival rate but represents the actual species-by-environment performance. Therefore, the relative error of the adjusted volume (Eq. 3) was calculated as the sum of the relative errors of the p and V factors of the product.
The analysis of burning trials was conducted on the recorded times to boil a 2L kettle of water with a simple general linear model for a randomized complete block design.
The analysis of household evaluation was done separately for each species with the chi-square analysis of a simple three-choice model: ‘worse than the common firewood’, ‘same’, ‘better’. Assuming the independence of assessment of different species within and between households, five out of five agreements corresponds to the 1% significance.
5.2.7 Agroforestry trials and demonstrations The agroforestry trials for which data are presented in this report are:
1. John Eka’s 10-belt Alley cropping site Calliandra and Leucaena 2. Mt Sinai 5-belt Alley cropping site Calliandra and Leucaena 3. Ulkamara 6-belt Alley cropping site Calliandra and Leucaena 4. Ulkamara Farmer woodlot site Calliandra, Leucaena and Indoyar
All these sites were on steeply sloping ground and established from seedlings at the same time as the species*spacing trials. Seedlings in the alley cropping sites were planted at a spacing of 50 cm between trees along rows and 50 cm between rows in a double-row belt. Belts were spaced between 5 to 10 m apart depending on slope. A make-shift A-frame with plumbob was used to ensure the tree belts followed the contour.
The woodlots were spaced at 1.0m * 2.0m. In early stages of establishment the trees were being attacked by cutworm which was controlled using Karate™ (a.i. λ-Cyclohalothryin) from a knapsack sprayer.
The only site which was harvested to measure biomass production was the John Eka site.
5.3 Consumer evaluation and extension of fuelwood
5.3.1 Consumer evaluation of fuelwood species Bundled samples of each species of firewood harvested from the Pugamp and Bautama sites (Section 5.2.3) were distributed to 5 households each in Mt Hagen and NCD. These evaluations were conducted by PARD and HOPE at these locations respectively. The householders were given evaluation forms to rate each species in comparison to the normal firewood they use for the following qualities: smokiness, time to cook a meal, amount of wood used to cook a meal, heat produced, light produced, life of coals, ease of handling, and appearance. The rating system was a 1 to 5 likert scale where 1 = “much worse”; 3 =

Page 21 of 108
“same as normal firewood”; 5 = “much better”. The evaluation also gathered details of how and which firewood is normally used as well as comments offered by participants.
Samples of each species were also given to 2 firewood sellers each at Mt Hagen and NCD. Records were taken of the weights and prices of wholesale and retail bundles of each species, the time taken for all bundles to be sold and the sellers’ initial and final opinions of the saleability of each species. Other details of the sellers’ enterprise were recorded.
5.3.2 Evaluation of extension activity Several extension events and products were delivered during the project life: the Mt Hagen Cultural Show (August 2011), the Morobe Show (October 2011) and the launch of the International Year of Forest at FRI in Lae. The activity evaluated was of the posters presented at the Hagen Show and IYF launch. At all events a stall was constructed in a prominent position demonstrating cooking with charcoal, firewood seedlings and displaying 6 posters in both English and Tok Pisin.
The poster titles were: 1. “You can grow self-replacing trees for firewood and poles - harvest every 2 years” describing the
configuration and management of a SRC-woodlot 2. "You can grow firewood and fertiliser trees in your hillside garden” describing the configuration and
management of hillside alley cropping systems 3. “See how to grow your own seedlings” describing the methods for a simple bush nursery to grow tree
seedlings 4. “What highlanders think of fast-grown firewood” describing the results of the household evaluation
outlined in Section 5.3.2. 5. “Charcoal, your alternative to fuelwood” outlining the benefits of charcoal and how to use a charcoal
stove 6. “How to make charcoal” outlining the procedure for making charcoal using the Tongan Drum method
Competitions were staged with cash prizes of K100 and K50 for the most successful completion of a questionnaire that evaluated the participants understanding of the 5 posters. The results of the competition were analysed to determine the level of understanding of the ideas and information that the project was attempting to promote.
Page 22 of 108
6 Achievements against activities and outputs/milestones
Objective 1: To describe and quantify the national fuelwood market. No. Activity Outputs/
Milestones Completion
date Comments (working paper and report references in Appendix 11.4)
1.1 Assemble existing information on fuelwood and energy use
Report identifying target fuel-stressed districts for survey and describing general fuelwood vis-à-vis energy economy.
31/03/08 12/08/08
This information is gathered in two documents: 1] Paper delivered at Fuelwood Survey Design Workshop 15-16 April 2008, Lae (Ref 4/08*) 2] Survey of PNG Fuelwood Market: Working paper 5 (Ref 3/08)
1.2 Conduct targeted survey of fuelwood (FW) users and vendors in NCD and highlands.
FRI and NGO staff trained in social survey methods
27/07/08 24/09/08
Trained FRI staff on semi-structured interview techniques. (ref : 7/08) Trained FPCD staff on Q-survey and Case Study Monitoring activity (Ref: 7/08)
Design and field-test questionnaires and protocols for semi-structured interviews
May 2008 27/07/08
Field testing of questionnaires undertaken over 2 weeks by FPCD staff. The SSIs were designed but not field tested before they applied.
Refined questionnaires and semi-structured interview protocol
26/07/08 Reported in Survey of PNG Fuelwood Market: Working paper 5 (Ref: 3/08)
1st Round of questionnaire surveys of vendors and users completed
17/3/09
The original proposal had this milestone to be delivered by Yr1 Q2 = June 08. However the survey delivery was delayed by a late start of the project, delays in getting FPCD staff and competing FPCD activity. Collation of Round 1 took much longer than expected because of problems with the Access database used to collate results. FPCD did not undertake vendor surveys as planned. They were instructed to go back and do so.
1st Round of case-study monitoring completed
April 2009
Fieldwork undertaken by FPCD in April 2009.
2nd Round of questionnaire surveys of vendors and users completed
October 2009
Even though the field work for the questionnaire survey, for users and sellers, was completed by May 2009, the last of the field forms did not arrive in Adelaide until October 2009. Technical problems with the database meant the collation of survey forms was not completed until 30/7/2010
Page 23 of 108
2nd Round of case-study monitoring completed
Only one round of case-study monitoring was deemed necessary. Only 12 case studies were planned but FPCD managed to get data from 37 households.
Semi-structured interviews of industrial and commercial FW users completed
25/4/09 FRI partners have completed the interviews. Reported in ref: 1/09.
Reports on: A] Domestic, commercial and industrial fuelwood use and preferences; Fuelwood supply and market chain; Constraints on adoption of commercial fuelwood production.
Dec 2012
This information is presented in Appendix 11.1 Survey of Fuelwood-stress regions of PNG. Constraints on adoption of commercial fuelwood production also discussed in Nuberg et al (2013) “Evaluation of short-rotation coppicing fuelwood production systems for PNG”
B] Comparison of NCD and Mt Hagen districts re: land tenure issues; indigenous tree knowledge supporting FW production; effective structures for involving industrial FW users
Dec 2012 Comparison NCD and Mt Hagen (and other survey districts) made in Survey of Fuelwood stress regions of PNG. See general comments below regarding land tenure and industrial engagement.
C] Time-cost model FW collection
Not done Doubt in the feasibility of this task discussed in ref: 2/09 Replaced by more intensive evaluation of the burning characteristics of SRC firewood and charcoal as part of Objective 2 See general comments below.
1.3 Market testing for short-rotation coppice (SRC) fuelwood and charcoal
Assembly of test charcoal and SRC fuelwood; Selection and negotiation with domestic and commercial participants; Case-study monitoring of charcoal/SRC-FW use; Analyse and document
Nov 2011 Dec 2012
This activity used wood harvested from the Bautama and Pugamp field sites. Involved evaluation of householder and vendors attitudes to SRC firewood species. Documentation of market value of SRC FW & charcoal in Nuberg et al (2013)
Comments on Objective 1. The original schedule had Objective 1 completed by the end of Year 3 but this did not happen for several reasons: the time and resources to collate the survey was grossly underestimated; the principle investigator was deployed on university commitments which interrupted supervision; FPCD staff deployed on non-project related activity which interrupted field survey work. Nevertheless the Fuelwood Survey was completed and presented in Appendix 11.1 .
Some of the scheduled activity that did not occur, and our responses.
• A Participatory Market Chain Analysis workshop had been planned to interpret the results of the survey. As the survey was so late in completion the workshop could not be held.
Page 24 of 108
• The comparison of indigenous tree knowledge in NCD and Mt Hagen listed for Report B is incorporated in the Fuelwood Survey Report. However, specific information on “land tenure issues” (apart from conflict over fuelwood access) or “effective structure for involving industrial fuelwood users” did not emerge from either the Q-survey or semi-structured interviews as expected.
• Report C was not attempted. As the nature of the survey data became apparent the idea of a time-cost model was replaced by that of a choice modelling exercise. However this did not eventuate because of lack of engagement. In its place the project undertook more intensive evaluation of the burning characteristics of SRC firewood and charcoal produced as part of Objective 2.
Objective 2: To establish in both lowland peri-urban and highland rural regions a range of fuelwood production systems as pilot projects No. Activity Outputs/
Milestones Completion
date Comments (working paper and report references in Appendix 11.4)
2.1 Establish collaborative relationships between partners and project participants
Collaborative team of partners and participants with clearly defined roles, responsibilities and expectations.
26/4/08 Achieved at (and reported in) Initial Project Leader Tour (Ref: 5/08) and Inception Tour & Fuelwood Survey Design Workshop (Ref: 6/08)*. The roles of partners and participants in the survey work are outlined in Survey of National Fuelwood Market: Working paper 3 (Ref: 1/08)
2.2 Fuelwood site establishment, maintenance and monitoring
Participant input into design Pilot SRC-FW systems: * community-based woodlots in NCD * highland village agroforestry systems Final Report: silviculture, harvest and processing; financial analysis of SRC systems; recommendations for fuelwood development
Nov. 2008 Feb. 2009
Field nurseries were established in both NCD and Mt Hagen run by the partner NGOs and not PNG Forestry as originally planned. 6 sites established in Western Highlands and 2 sites in Chimbu Province by PARD 2 sites established in NCD by HOPEww. Report on success detailed in Ref: 1/09 Monitoring of these sites in 2009/10 reported in Refs: 1/10, 2/10, 3/10 Final report: trial results and SRC financial analysis in Nuberg et al (2013) and this Final Report.
Page 25 of 108
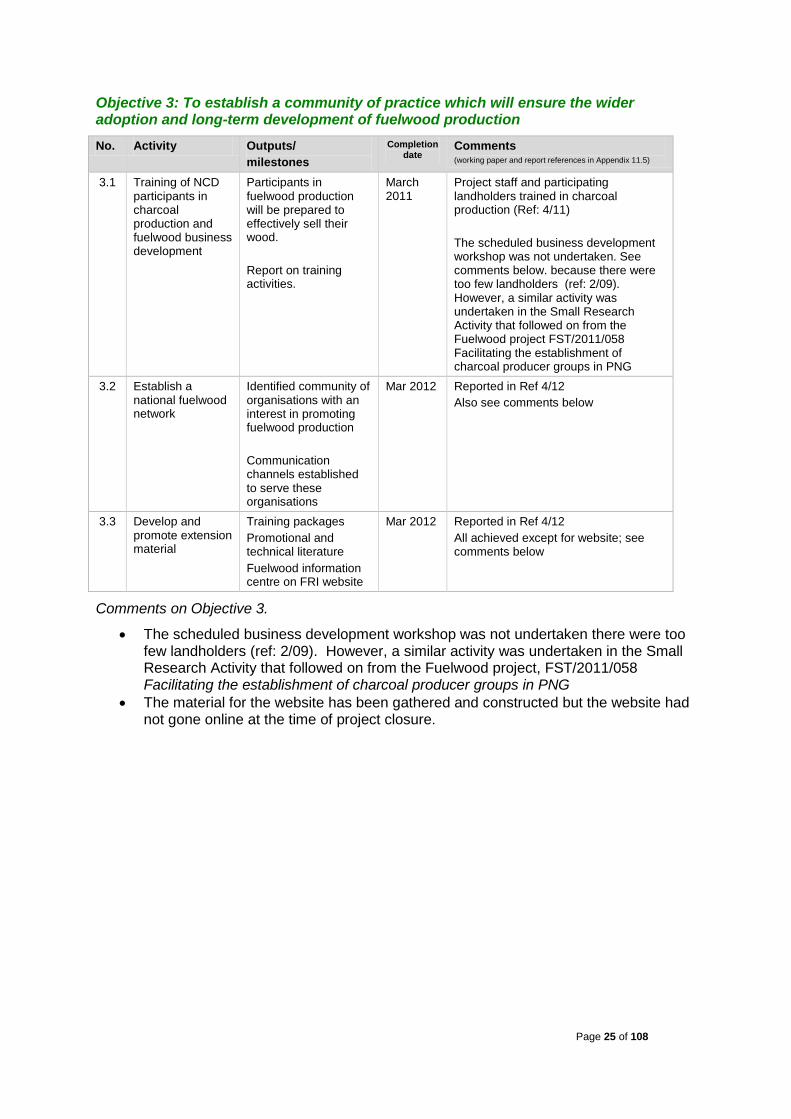
Objective 3: To establish a community of practice which will ensure the wider adoption and long-term development of fuelwood production No. Activity Outputs/
milestones Completion
date Comments (working paper and report references in Appendix 11.5)
3.1 Training of NCD participants in charcoal production and fuelwood business development
Participants in fuelwood production will be prepared to effectively sell their wood. Report on training activities.
March 2011
Project staff and participating landholders trained in charcoal production (Ref: 4/11) The scheduled business development workshop was not undertaken. See comments below. because there were too few landholders (ref: 2/09). However, a similar activity was undertaken in the Small Research Activity that followed on from the Fuelwood project FST/2011/058 Facilitating the establishment of charcoal producer groups in PNG
3.2 Establish a national fuelwood network
Identified community of organisations with an interest in promoting fuelwood production Communication channels established to serve these organisations
Mar 2012 Reported in Ref 4/12 Also see comments below
3.3 Develop and promote extension material
Training packages Promotional and technical literature Fuelwood information centre on FRI website
Mar 2012 Reported in Ref 4/12 All achieved except for website; see comments below
Comments on Objective 3.
• The scheduled business development workshop was not undertaken there were too few landholders (ref: 2/09). However, a similar activity was undertaken in the Small Research Activity that followed on from the Fuelwood project, FST/2011/058 Facilitating the establishment of charcoal producer groups in PNG
• The material for the website has been gathered and constructed but the website had not gone online at the time of project closure.
Page 26 of 108
7 Key results and discussion
7.1 Fuelwood survey The complete results of the Fuelwood Survey are given in Appendix 11.1. The results and discussion presented below are extracts from the executive summary and key points section of that much larger document.
7.1.1 Overview of fuelwood survey In a broad view, the fuelwood economy in PNG, compared to other developing countries where similar studies have been done, has a relatively flat structure with a very short and direct supply chain. Fuelwood is regularly used by most of the population for domestic and commercial cooking, even in urban areas where there is good access to electricity and other energy sources. In the domestic market, most fuelwood sellers are collectors although larger sellers may buy from landholders and sell on to smaller sellers as well as selling directly themselves. In the industrial market it is largely supplied by local traders who pick up wood from roadside collection points. Selling fuelwood is an easy market to enter with many people entering it on a part-time basis. It is an informal economy in that there is no public engagement in supply, marketing, distribution, pricing, taxation, and use (except for instances of the prohibition of firewood use in some urban areas). Tree planting is widely practiced and many of these trees would be used for fuelwood. Value-adding of fuelwood into charcoal exists but it is on a very small scale, fragmented and infrequent. Fuelwood consumption is estimated to be1.8m3/person/year which is 6 times greater than the average consumption of 16 south and south-east Asian countries in the FAO Regional Wood Energy Development Program (and only exceeded by Bhutan). In PNG there will be at most (and rarely) 2 intermediaries between landholder and fuelwood consumer; this compares with RWEDP countries which can have up to 7-8 intermediaries. PNG also contrasts with these countries in the absences of government involvement in either trade or regulation of the fuelwood market, a significant organized private sector, and a charcoal market. Most (85%) people surveyed had used fuelwood in the previous 12 months, with the proportions high even in urban areas (73% in NCD and 90% in Lae) and virtually all rural people using it. It is estimated that about 2.1million m3/y was collected in the surveyed regions in 2007-8; an extrapolation for a national value would be 9.34million m3/y. The annual expenditure on fuelwood over 2007-8 was in the order of K6.6million/y across the surveyed districts. There is significant variation in the price of fuelwood across urban and rural regions with values ranging from K0.30/kg in the NCD to K1.15/kg in Mt Hagen urban. Along the Highlands Highway the average price is K0.26/kg. About 3% of urban and 10% of rural people will sell fuelwood, mainly on a part-time basis, as only 8% of fuelwood sellers interviewed earn more than K5,000/y from this activity. Access to fuelwood is becoming increasingly difficult for 65% of urban (particularly in NCD) and 41% of rural users with very high reportage of conflict associated with fuelwood collection. Nevertheless, most fuelwood users had planted trees in recent years, and with the caveat that this is highly flexible ‘recalled information’, it is estimated that about 3.6million trees were planted by people in the survey regions in the 2 years previous to the survey.
Page 27 of 108
While 88% of fuelwood users also use other energy sources which are becoming more accessible, fuelwood will remain the dominant domestic energy source for quite some time, especially in rural areas. There is a great opportunity for entrepreneurs to create a more sophisticated fuelwood supply chain that could deliver sustainably harvested and value-added fuelwood to consumers, especially in urban areas and the commercial sector. The market is free of government regulatory restrictions, but also support for developing new fuelwood businesses. The potential for developing a fuelwood economy based on short-rotation coppicing (SRC) species maybe greatest in the production of charcoal rather than fuelwood directly. The effort put into growing SRC trees would give better returns if directed to a value-added product. Locally produced charcoal is likely to be much cheaper than imported charcoal while still yielding good returns to the producer. The industry development effort should focus on extension of the practical use of charcoal as an energy source as this was one of the draw-back of previous attempts to promote a charcoal industry. The Western Highlands (and most likely other highland provinces) require further detailed study. The high consumption levels and price for fuelwood, and the levels of conflict associated with fuelwood collection, indicate that fuelwood-stress is even greater here than in the lowland urban areas. The impact of fuelwood collection on natural forest is still ambiguous as it needs to be differentiated from the expansion of garden clearing while still considering the influence of natural regeneration and tree planting.
7.1.2 Q-survey of domestic fuelwood users 1. The Questionnaire survey (Q-survey) interviewed 3,966 households selected across the
National Capital District, Lae District (Morobe), Mt Hagen District (Western Highlands), Chuave district (Chimbu) and Henganofi District (Eastern Highlands). There was a relatively even balance of male and female interviewees in the urban survey (54% vs 43%) while the proportion of male interviewees was much higher in the rural survey (80% vs 18%). It sampled 0.72% of the population in the target fuelwood-stressed districts. This population of the fuelwood-stressed districts represents 10.6% of the national population.
2. In the NCD there is a moderate correlation (R2 = 0.55) between the proportion of dwellings with access to powerlines with the proportion of non-fuelwood users in each of the 9 NCD wards. However, even in wards with almost 100% access to power, 47% of inhabitants still use fuelwood.
3. In the highland rural survey 48% of dwellings were surrounded by trees that had been planted (eg yar and eucalypt), 45% bush fallows and 22% coffee gardens which could be considered as relatively good fuelwood resources. Only 5% of respondents were living within natural forest.
4. Overall 85% of the surveyed population used fuelwood in the previous 12 months. The proportions of regional sample populations regularly using fuelwood were 73% in NCD, 90% in Lae urban, 87% in Mt Hagen urban, 98% in Lae rural and 100% in Highlands rural regions.
5. Local government regulations (or landlords) forbid the use of fuelwood in 25% of NCD and 9% in both Lae and Mt Hagen urban samples.
6. While domestic cooking is the most important use of fuelwood, 17% of the interviewed population cooks their food by other means. Only 4 % of rural people use other energy for cooking.
7. An index of intensity of fuelwood use was devised. When the index of the whole survey population is set at 0, then the index for NCD users is -3.0, Lae urban users -2.1, Mt Hagen
Page 28 of 108
urban users +0.2 and rural users +6.8 Use of fuelwood for heating is 3-4 times more reported in the rural and Mt Hagen urban groups.
8. The most common form of fireplace is a simple open fire outside the house (51%) or similarly open fire inside the house (34%), the preferences for these arrangements much higher in rural areas (69% and 68% respectively). Many respondents had more than one type of arrangement associated with their dwelling. The use of drum ovens outside (32%) and inside (34%) also figures highly. More fuel conserving arrangements, such as metal boxes, were not common.
9. Responses concerning charcoal use are likely to be confounded by a misunderstanding of what charcoal is; i.e. a value-added fuelwood product vs the coals left over from last night’s fire. That said, 3.l% of all respondents have used charcoal in the 12 months prior to the interview. While still relatively low compared to some other energy sources, charcoal use is more prevalent in the highland with 9.3% of regional sample in Mt Hagen urban area other rural areas 4.2%, compared with only 2.7% in NCD and 0.9% in Lae .
10. 88% of fuelwood users also used alternative sources of energy. The most common response was to use kerosene for lighting, then the hierarchy went from gas for cooking, gensets for appliances, then mains access. About 15% of the sample population had access to mains power and 30% access to gensets, which may be communally owned.
11. Rural residents can gather fuelwood more widely over the range of sources available, again with coffee lands being the richest source of fuelwood (22%) followed by ‘around house’ (21%), ‘bushfallow’ (15%), ‘garden clearing’ (14%) and ‘planted forest’ (12%). Most urban fuelwood is collected ‘around the house’ (47%), in ‘surrounding hills’ (14%), ‘garden clearings’ (12%) and stream banks (9%).
12. The proportion of fuelwood collected from ‘natural habitat’, i.e. mangroves around NCD (3%) and natural forest in highlands (9%), is relatively low.
13. Rural respondents have access to more of the high quality fuelwood than urban people. The proportions of low quality fuelwood (fast burning, low heat, smokey) used by rural and urban users are 8% and 38% respectively.
14. In all the urban areas a significant proportion of the interviewees travelled between 1-3km into the surrounding hills to gather fuelwood. The proportions were 27% in NCD, 32% in Lae and 32% in Mt Hagen. A further 11%, 25% and 2% respectively travelled more than 3km into the surrounding hills and beyond. The average estimated distance travelled beyond 3km was 10.1km (range 4 – 30km, n=96).
15. In rural areas 11% of interviewees travelled > 3 km to collect fuelwood, mainly in natural forest, garden clearings and old gardens.
16. The most common form of transporting wood that was collected was on foot which accounted for 68% of respondents. Of the 32% respondents who used vehicles to transport collected fuelwood, most of these used PMVs (31%), their own car (29%), or had it delivered (22%).
17. For every 100 fuelwood users in the various regions 33 buy fuelwood in NCD, 27 in Lae urban and 53 in Mt Hagen urban areas, and 7 in Lae rural and 3 in rural highlands. In NCD and Lae the majority of buyers (68% and 78% respectively) buy their fuelwood 1 to 2 times a week. In the Mt Hagen urban sample, the majority (60%) buy their fuelwood 2-3 times per week.
18. The average expenditure per household on fuelwood for domestic use over a 2 week period was K20.65 in NCD, K21.60 in Lae urban, and K20.39 in Mt Hagen urban, and K27.60 in Lae rural and K24.10 in rural highlands. (This estimate excludes purchases ≥ K100 deemed for ceremonial and commercial uses)
Page 29 of 108
19. A gender equity index showed that while males and females (across all age classes) share the responsibility of fuelwood collection and purchase equally in NCD, this is not so in other regions. For example, while males collect fuelwood more than women in Mt Hagen Urban, the relationship is opposite Lae Rural. In particular, in rural households men are twice as likely to buy fuelwood as women.
20. In the NCD 46% of fuelwood purchases are made at mixed markets and roadside stalls. Specialty fuelwood markets provide 30% of the market (Baruni 9%, Tatana 5%, Gerehu sawmill 5%, Cloudy Bay 5%, Sabura 3%, Gerehu 2%, Bomana Road 1%). The remaining 24% of the market are direct purchases from landholders, some of whom deliver.
21. Use of fuelwood for income generation is high among both urban (26%) and rural (58%) domestic respondents. This included activities such as baking and hot food vending, and smoking fish. The proportions earning some income from selling fuelwood were 3% and 10% respectively.
22. The average annual incomes generated using fuelwood were K3,500/y in urban areas and K1,560/y in rural areas. The proportion of respondents earning >K5,000/y were 14% in urban and 5% in rural areas.
23. Access to fuelwood has become more difficult for 65% of urban and 41% of rural respondents over the 2 year period previous to the survey.
24. Changes in access to fuelwood are much more severe in the NCD particularly in the LLGs of Kilakila/Kaugere, Laloki/Napanapa, Hanuabada and Gerehu.
25. Of the fuelwood users in the survey regions, those planting trees in the 2 years previous to the survey were 78% NCD, 48% Lae urban, 73% Mt Hagen urban, 55% Lae rural and >90% for all Highland rural. The trees were not necessarily planted within the actual survey region.
26. It is estimated that about 3.6million trees were planted by the population in the survey regions in the 2 years previous to the survey. By extrapolation, the value for non-surveyed highland districts may be as much as 11.9million trees.
27. Of the fuelwood users in the survey regions, high proportions had experienced conflict over access to fuelwood: 48% NCD, 40% Lae urban, 58% Mt Hagen urban, 51% Lae rural, 61% Mt Hagen rural, 88% Henganofi rural, 72% Chuave rural.
28. There was strong agreement (62-95%) with the need to plant more fuelwood trees, but this was by no means universal for reasons ranging from lack of good sites to abundant natural supply.
29. Within the NCD, the LLGs with the strongest demand for more fuelwood trees were in Laloki/Napa-napa (91%), Kila-kila/Kaugere (75%), Bomana (75%), and Gerehu (74%).
30. Preferred fuelwood species in the NCD were eucalypt (64%), raintree (18%), coastal yar (15%), neem (14%), mango (13%) and mangrove (11%).
31. In Lae urban and rural respectively the preferred species were Kwila (14 & 3%), Taun (31 & 24%), Yar (37 & 129%) and Okari (11 & 20%) are much preferred. The aggressive weed Piper aduncum is widely used in both the urban (13%) and rural (31%) areas.
32. Across the highlands yar is by far the most preferred species (>85%). In Mt Hagen there is also a preference for the introduced eucalypts (87%, mainly E.grandis and E.robusta), while in Henganofi and Chuave the PNG Oak is highly favoured (85 & 91%). Naturalised Leucaena is also an important fuelwood use in these areas (22 & 29% respectively).
Page 30 of 108
7.1.3 Q-survey of fuelwood sellers 33. 157 fuelwood sellers were interviewed. At a glance 83% were male, 49% in the 30-50y age
category, and 50% in the Mt Hagen (urban and rural) sampling districts. Most (51%) sellers presented <100kg of wood for sale on non-permanent sites, while 33% were on semi-permanent sites. There were twice as many fulltime sellers (5-7days/week) than part-time (1-4 days/week). 11% of the sample were larger suppliers to factories, commercial users etc. operating on an irregular basis. 40% of sellers operate from their home village.
34. 46% of sellers source fuelwood from their own land, 24% from natural forests and 22% buy some of the wood they sell (NB these and other sources given in the report are not mutually exclusive).
35. The bulk of fuelwood is delivered to point of sale by either PMV (42%) or foot (42%). 6% of sellers have the fuelwood delivered to them by a landowner.
36. The distance fuelwood is transported to market varies for district with averages (and maxima) being: NCD 10 (25)km; Lae 3(5)km, Hagen 6 (30)km and Henganofi / Chuave 23(40)km.
37. There was a very clear difference between sampling districts with the average value of fuelwood ranging from K0.30/kg in NCD to K1.15/kg in Mt Hagen urban. Along the Highlands Highway the average price is K0.26/kg.
38. Estimates of price/kg of wood decreases as the product category gets larger, with kindling and bundles of cut branches in the order of K1.20/kg and cut and split logs K0.50/kg. Only 52% (and only 33% in NCD) of sellers consented to having their wood weighed by the survey team.
39. 36% of sellers identified fuelwood sales as their sole source of income. 92% of sellers earned K5,000 or less in the previous 12 months. (The official minimum wage for PNG is K5,240) So, only 8% of sellers earned >K5,000. The maximum income was recorded as K70,000 of a large seller (family group) in Mt Hagen.
40. The average price of imported charcoal for sale is K10.12/kg (range 8.65-16.33, n=9). Locally produced charcoal can be purchased in NCD for K1.00/kg and Lae K1.50/kg. About a quarter of sellers said they knew how to use charcoal and only half of these knew how to produce it; as in point 9 above there may be confusion about what is meant by charcoal. Nevertheless, 66% said they would sell it if it was available.
41. Most (78%) sellers have access to land to grow trees for fuelwood. Interestingly, 86% of NCD sellers have access to land for growing trees while relatively few (39%) of the Lae sellers had enough land. The highland fuelwood sellers also have good access to land for tree growing (89%).
42. The ranking of problems involved with fuelwood selling were (with % citing this problem): transport (37%), supply (17%), hard labour (16%), market issues (16%), competition (12%), safety and fatigue (10%), conflict (10%), theft (7%). However, 15% of sellers said there were no problems and that it made a good living.
7.1.4 Case Study Monitoring 43. The fuelwood use of 36 case study households (13 urban, 23 rural) was monitored daily over
a 2-week period. The average daily fuelwood use was 24.8 kg/d with a range from 2.2 to 97.4 kg/d. The median is 16.0 kg/d. The average (and median) values for urban and rural case-study groups were 11.1 (11.6) kg/d and 32.5 (27.3) kg/d respectively.
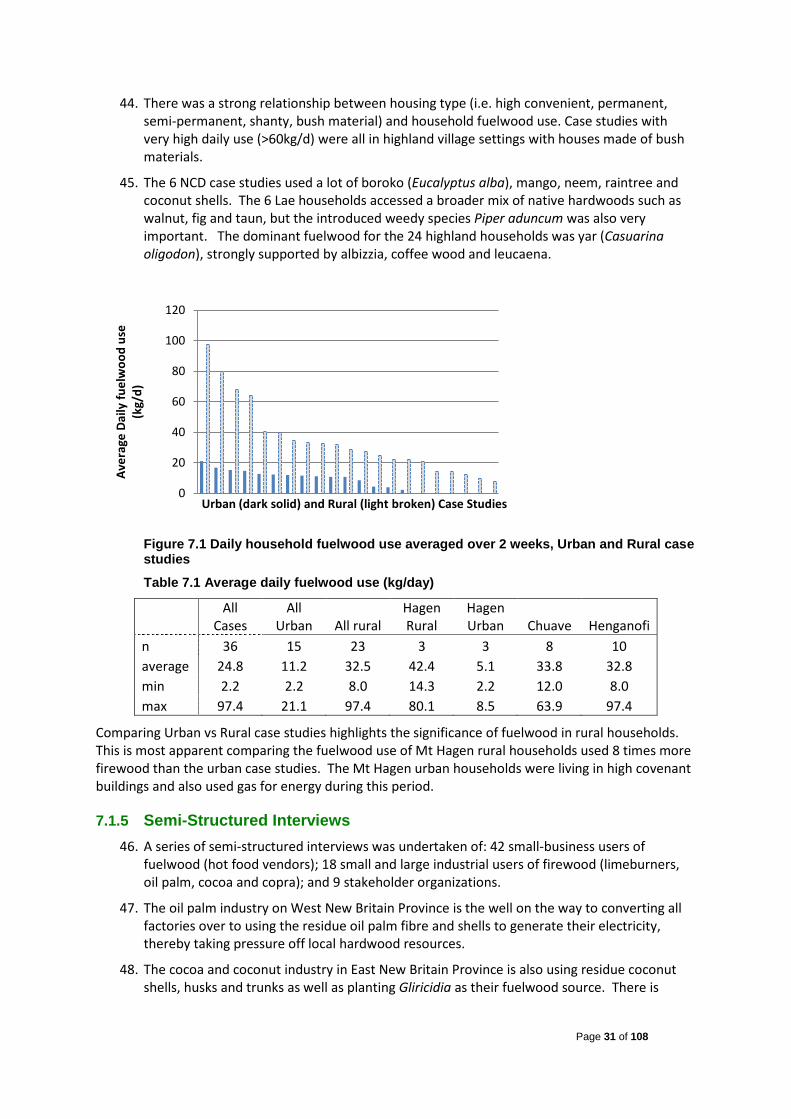
Page 31 of 108
44. There was a strong relationship between housing type (i.e. high convenient, permanent, semi-permanent, shanty, bush material) and household fuelwood use. Case studies with very high daily use (>60kg/d) were all in highland village settings with houses made of bush materials.
45. The 6 NCD case studies used a lot of boroko (Eucalyptus alba), mango, neem, raintree and coconut shells. The 6 Lae households accessed a broader mix of native hardwoods such as walnut, fig and taun, but the introduced weedy species Piper aduncum was also very important. The dominant fuelwood for the 24 highland households was yar (Casuarina oligodon), strongly supported by albizzia, coffee wood and leucaena.
Figure 7.1 Daily household fuelwood use averaged over 2 weeks, Urban and Rural case studies
Table 7.1 Average daily fuelwood use (kg/day)
All Cases
All Urban All rural
Hagen Rural
Hagen Urban Chuave Henganofi
n 36 15 23 3 3 8 10 average 24.8 11.2 32.5 42.4 5.1 33.8 32.8 min 2.2 2.2 8.0 14.3 2.2 12.0 8.0 max 97.4 21.1 97.4 80.1 8.5 63.9 97.4
Comparing Urban vs Rural case studies highlights the significance of fuelwood in rural households. This is most apparent comparing the fuelwood use of Mt Hagen rural households used 8 times more firewood than the urban case studies. The Mt Hagen urban households were living in high covenant buildings and also used gas for energy during this period.
7.1.5 Semi-Structured Interviews 46. A series of semi-structured interviews was undertaken of: 42 small-business users of
fuelwood (hot food vendors); 18 small and large industrial users of firewood (limeburners, oil palm, cocoa and copra); and 9 stakeholder organizations.
47. The oil palm industry on West New Britain Province is the well on the way to converting all factories over to using the residue oil palm fibre and shells to generate their electricity, thereby taking pressure off local hardwood resources.
48. The cocoa and coconut industry in East New Britain Province is also using residue coconut shells, husks and trunks as well as planting Gliricidia as their fuelwood source. There is
0
20
40
60
80
100
120
Aver
age
Daily
fuel
woo
d us
e (k
g/d)
Urban (dark solid) and Rural (light broken) Case Studies

Page 32 of 108
strong interest in further development of short-rotation coppicing systems for bioenergy fuelstock.
49. The Mt Hagen WR Carpenters tea industry spends K3million/y on fuelwood, mainly yar, eucalypt and coffee wood but refuse wood from indigenous forest species. Attempts to encourage tree planting by distributing yar seedlings have failed, (probably because wood deliverers are not the landowners).
50. Limeburning is a major source of income for many villages along the Morobe coast. The net (i.e. income after costs) efficiency of burning wood to make lime is K2.96 / kg for bamboo but only K0.33/kg for mixed hardwood species. Access to fuelwood through collection or purchase did not seem to be a problem in this region; mangroves are protected from wood collection and reefs from live coral collection.
51. Incomes among lime burning groups ranged from K850 – K48,000/y . Estimated annual fuelwood use of these groups ranged from 1,920 – 60,000 kg/y .
52. Hot food vendors were interviewed along the Highlands Highway from Markham Bridge (Morobe) to Walia Water fall (Enga). Estimated incomes ranged from K70 to K900 /week and daily fuelwood consumption ranging from 10 to 30 kg/day. Some of this is freely collected; but that which is purchased varies greatly in cost; e.g. bamboo K0.15/kg ; native hardwoods K0.29-0.38/kg; yar K0.19-0.34 /kg .
53. Eight national organisations with a stake in the fuelwood economy were interviewed to ascertain their interest in short-rotation coppicing (SRC) fuelwood production systems.
54. PNG Forest Authority does not have an explicit fuelwood policy, however the significance of fuelwood is generally understood and is an assumed consideration in forestry projects. While there is a clear need for fuelwood plantings, and opportunities on grasslands that might attract ‘climate-change’ funds, there is currently no capacity to undertake fuelwood plantings by the PNG Forestry Authority or in concert with Dept Agriculture & Livestock and NGOs.
55. PNG Power is strongly committed to its Rural Electrification Program. While most of this is based on diesel and hydro generation, with the climate change issue PNG power plans to venture into the use of biomass (e.g. from oil palms) as another form of energy, especially on small-scale generators in rural areas. PNG Power would consider a proposal for SRC-biomass fuelstock for electricity generation in remote rural villages.
56. PNG Sustainable Development Program (PNG SDP) is a funding agency financed by the mining industry. It promotes sustainable forestry practices through sustainable harvest, afforestation and reforestation programs. Its mandate includes funding biomass energy projects and welcomes any SRC-biomass energy proposal in line with its goals.
57. PNG Sustainable Energy Limited (PNGSEL) is a company of its own under the PNG SDP with the job of developing rural electrification and infrastructure in the Western Province. It has projects, mostly in the feasibility stage, in biodiesel, solar power, hydro, and waste-wood biomass. PNGSEL sees a potential in using biomass especially in areas where forestry and oil palm projects are progressing so that the waste streams can be used. PNGSEL would also be interested in a pilot project of SRC-biomass energy. Somewhere in Madang is suggested.
58. The Department of Energy and Petroleum: Division of Energy has a policy on renewable energy but very little has been enacted or enforced. Accordingly, energy sector operations have been hindered due to this poor policy framework. The Energy Division gave the same in-principle approval to biomass-energy generation as did PNG Power and PNGSEL, but also the same reservations expressing the lack of relevant information on feasibility.

Page 33 of 108
7.1.6 Estimates of fuelwood value and volume 59. Annual domestic expenditure on fuelwood is estimated (at time of survey) at K6.6 million/y
in the NCD, K2.7million/y in Lae Urban, K0.3million/y in Lae Rural K1.5million Mt Hagen Urban and K5.7million/y for all other fuelwood-stressed districts in the highlands. This yields a total estimated expenditure of K18.2million/y.
60. The total volume of fuelwood collected over the fuelwood-stressed regions of PNG is about 2.1million m3/y with an average use of 1.8m3/person/year in the years of the survey (2008-9). This ranged from 0.50 m3 in Mt Hagen urban, to 0.93 m3 in NCD to 2.41m3/person/year in the highland rural areas.
61. An estimate of national volume of fuelwood consumed will be about 9.34million m3/y at the time of survey, or 12.34million m3/y for the estimated population of 6.9 million in 2012.
62. PNG’s per capita fuelwood consumption is 6 times greater than the average value (0.3 m3/person/year) for 16 Asian countries in the FAO Regional Wood Energy Development Program. The only country to exceed PNG was Bhutan (2.4 m3/person/year).
63. The national estimate of the gross value of the wood consumed domestically (both purchased and freely collected) is K2,409 million/y in the years of the survey, (K2,708 million/y in 2012).
Page 34 of 108
7.2 Field trials of fuelwood Short-Rotation Coppicing systems There were two categories of trials: replicated evaluation of SRC fuelwood species and fuelwood agroforestry systems. Additional results for the field trials of SRC systems are given in Appendix 2.
7.2.1 Replicated evaluation of SRC species There were 3 replicated field trials evaluating growth of candidate fuelwood species. These trials were located at Pugamp, near Mt Hagen, and Bautama and Bomana both of which are in the NCD. The results presented in Section 7.2.1 are extracted from Nuberg et al (2013).
Stem Height and DBH Predicted means of stem height, DBH and proportion of surviving trees are presented in Table 7.2. At Pugamp, the survival rate was above 90% for each species. E. grandis and E. robusta are the best performing candidates with E.grandis being the tallest and E.robusta the thickest. The difference between species was significant for both height and DBH (sig. p < 0.001). The double spacing had an overall positive effect on DBH (sig. p = 0.02), while the single spacing had an overall positive effect on height (sig. p = 0.02). There is no significant change in the effect of spacing between species either for DBH or for height. The REML analysis of this site converged adequately and the predicted means are not biased. A few negative variance estimates returned by the REML procedure were neither large nor significant.
At Bautama, the survival was below 75% for all species, and only about 50% for E.pellita and A.indica. Nevertheless, E.pellita was the tallest candidate species. Calliandra calothyrsus and the two Casuarina species were excluded from the analysis completely due to very low survival. Due to the low survival rate, the spacing effect was less profound than in Pugamp. It only marginally shows its effect on the DBH (sig. p = 0.041), mostly due to the fact that E.pellita had thicker trees in the plots with the wider spacing. The difference between species was significant in DBH (sig. p=0.003) as well as in height (sig. p < 0.001).
At Bomana, the survival rate of the species included in the analysis were above 60%. However, the Calliandra and Casuarianas survived poorly and were eliminated from the analysis. Similarly to Bautama, no spacing effect was noticed. The difference between species was significant only for height (sig. p = 0.014). E pellita and E.tereticornis performed better than A. indica.
Volume and pole length estimates Table 7.3 presents the estimates for wood volumes and pole lengths for a standardized 500 m2 woodlot, at the two spacings, adjusted for the expected percentage of surviving trees. The ranking of species for volume estimates is similar to the height and DBH estimates as wood volume was approximated with a simple conic volume equation based solely on these two parameters, Eq. (2). The inference (Wald test) was done on individual trees’ volume data. However, the standard errors reported in Table 2 for adjusted volumes at a 500 m2 block can still be used if one wants to compare various species or spacing.
At Pugamp, E.grandis, followed closely by E.robusta, produced significantly more wood than the locally grown C.oligodon with mean volumes of 2.97, 2.55 and 1.57m3 respectively at the narrower spacing. The narrower spacing (1.5m x 1m, or 6666sph) also produced more wood with 80%, 84% and 52% more wood for these three species than the wider spacing (1.5m x 2m, or 3333sph). The extent to which these percentages are less than 100% is an indicator of the degree of inter-tree competition within each species.

Page 35 of 108
Table 7.2: Predicted mean height, DBH and proportion of surviving trees of selected species, and the Walt tests of significance of species, spacing and their interaction, 2 years after planting.
Pugamp (Highland site) Species DBH, cm Height, m Proportion
survived 1.5m x 1m 1.5m x 2m Overall 1.5m x 1m 1.5m x 2m Overall E.grandis 6.08 (.254) 6.52 (.254) 6.30 (.209) 8.14 (.329) 7.22 (.329) 7.68 (.276) .95 (.035) C.junghuhniana 3.33 (.254) 4.29 (.254) 3.89 (.209) 4.13 (.329) 4.22 (.329) 4.17 (.276) .91 (.035) E.pellita 4.80 (.254) 5.71 (.254) 5.25 (.209) 6.41 (.329) 5.63 (.329) 6.02 (.276) .96 (.035) E.robusta 6.20 (.254) 7.01 (.254) 6.60 (.209) 7.46 (.329) 6.46 (.329) 6.96 (.276) .95 (.035) C.oligodon 5.29 (.254) 6.09 (.254) 5.69 (.209) 6.71 (.329) 6.59 (.329) 6.65 (.276) .99 (.035) Overall 5.14 (.110) 5.92 (.110) 6.57 (.141) 6.02 (.141) 0.91 Wald test, sig. Spacing 0.019 0.021 0.32 Species <0.001 <0.001 0.66 spacing.spp 0.69 0.21 0.87 Correlation between DBH and height, r = 0.75
Bautama (Lowland site) Species DBH, cm Height, m Proportion
survived 1.5m x 1m 1.5m x 2m Overall 1.5m x 1m 1.5m x 2m Overall E.alba 3.51 (.211) 3.59 (.211) 3.55 (.174) 3.72 (.243) 3.69 (.243) 3.71 (.203) .66 (.049) A.indica 4.46 (.211) 4.80 (.211) 4.63 (.174) 4.60 (.243) 4.64 (.243) 4.62 (.203) .50 (.049) E.pellita 4.36 (.211) 5.51 (.211) 4.94 (.174) 6.15 (.243) 6.55 (.243) 6.35 (.203) .42 (.049) E.tereticonis 4.29 (.211) 4.59 (.211) 4.44 (.174) 5.67 (.243) 5.71 (.243) 5.69 (.203) .74 (.049) Overall 4.16 (.090) 4.24 (.090) 5.03 (.124) 5.14 (.124) 0.66 Wald tests, sig. Spacing 0.054 0.60 0.055 Species 0.003 <0.001 0.003 spacing.spp 0.041 0.50 0.031 Correlation between DBH and height, r = 0.71
Bomana(Lowland site) Species DBH, cm Height, m Proportion
survived 1.5m x 1m 1.5m x 2m Overall 1.5m x 1m 1.5m x 2m Overall A.indica 3.60 (.485) 3.54 (.485) 3.57 (.414) 4.25 (.520) 3.64 (.520) 3.94 (.468) .76 (.11) E.pellita 3.85 (.485) 5.17 (.485) 4.51 (.414) 4.47 (.520) 5.67 (.520) 5.71 (.468) .61 (.11) E.tereticonis 4.04 (.485) 4.92 (.485) 4.48 (.414) 5.56 (.520) 5.71 (.520) 5.63 (.468) .77 (.11) Overall 3.83 (.365) 4.55 (.365) 4.75 (.443) 5.00 (.443) 0.68 Wald tests, sig. Spacing 0.055 0.52 0.70 Species 0.101 0.014 0.008 spacing.spp 0.27 0.057 0.074 Correlation between DBH and height, r = 0.85 Note: Values in round brackets are SEM as estimated in the REML analysis Although the predicted mean volume of E.grandis was greater than E.robusta the ranking of median values was reversed (2.03 m3 and 2.20 m3 respectively for the narrow spacing). This skewness indicates that E.robusta may be expected to be more reliable, indeed ‘robust’, over a range of environmental conditions than E. grandis.
The wood volume at the lowland Bautama and Bomana sites was much less than at the highland Pugamp site. The only species common across all sites that survived was E.pellita, and the lowland sites produced 50% and 33% less wood respectively than Pugamp for this species. The best performing species at the two lowland sites was E.tereticornis producing
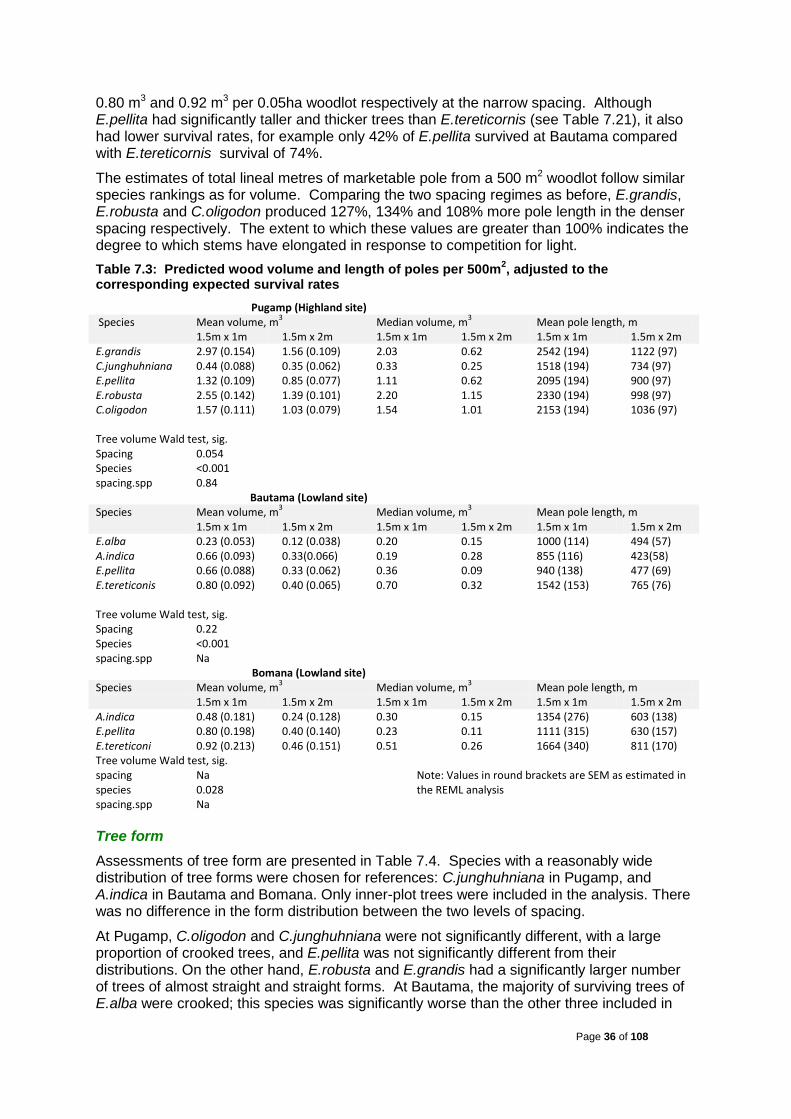
Page 36 of 108
0.80 m3 and 0.92 m3 per 0.05ha woodlot respectively at the narrow spacing. Although E.pellita had significantly taller and thicker trees than E.tereticornis (see Table 7.21), it also had lower survival rates, for example only 42% of E.pellita survived at Bautama compared with E.tereticornis survival of 74%.
The estimates of total lineal metres of marketable pole from a 500 m2 woodlot follow similar species rankings as for volume. Comparing the two spacing regimes as before, E.grandis, E.robusta and C.oligodon produced 127%, 134% and 108% more pole length in the denser spacing respectively. The extent to which these values are greater than 100% indicates the degree to which stems have elongated in response to competition for light. Table 7.3: Predicted wood volume and length of poles per 500m2, adjusted to the corresponding expected survival rates
Pugamp (Highland site) Species Mean volume, m3 Median volume, m3 Mean pole length, m
1.5m x 1m 1.5m x 2m 1.5m x 1m 1.5m x 2m 1.5m x 1m 1.5m x 2m E.grandis 2.97 (0.154) 1.56 (0.109) 2.03 0.62 2542 (194) 1122 (97) C.junghuhniana 0.44 (0.088) 0.35 (0.062) 0.33 0.25 1518 (194) 734 (97) E.pellita 1.32 (0.109) 0.85 (0.077) 1.11 0.62 2095 (194) 900 (97) E.robusta 2.55 (0.142) 1.39 (0.101) 2.20 1.15 2330 (194) 998 (97) C.oligodon 1.57 (0.111) 1.03 (0.079) 1.54 1.01 2153 (194) 1036 (97) Tree volume Wald test, sig. Spacing 0.054 Species <0.001 spacing.spp 0.84
Bautama (Lowland site) Species Mean volume, m3 Median volume, m3 Mean pole length, m
1.5m x 1m 1.5m x 2m 1.5m x 1m 1.5m x 2m 1.5m x 1m 1.5m x 2m E.alba 0.23 (0.053) 0.12 (0.038) 0.20 0.15 1000 (114) 494 (57) A.indica 0.66 (0.093) 0.33(0.066) 0.19 0.28 855 (116) 423(58) E.pellita 0.66 (0.088) 0.33 (0.062) 0.36 0.09 940 (138) 477 (69) E.tereticonis 0.80 (0.092) 0.40 (0.065) 0.70 0.32 1542 (153) 765 (76) Tree volume Wald test, sig. Spacing 0.22 Species <0.001 spacing.spp Na
Bomana (Lowland site) Species Mean volume, m3 Median volume, m3 Mean pole length, m
1.5m x 1m 1.5m x 2m 1.5m x 1m 1.5m x 2m 1.5m x 1m 1.5m x 2m A.indica 0.48 (0.181) 0.24 (0.128) 0.30 0.15 1354 (276) 603 (138) E.pellita 0.80 (0.198) 0.40 (0.140) 0.23 0.11 1111 (315) 630 (157) E.tereticoni 0.92 (0.213) 0.46 (0.151) 0.51 0.26 1664 (340) 811 (170) Tree volume Wald test, sig. spacing Na Note: Values in round brackets are SEM as estimated in
the REML analysis
species 0.028 spacing.spp Na
Tree form Assessments of tree form are presented in Table 7.4. Species with a reasonably wide distribution of tree forms were chosen for references: C.junghuhniana in Pugamp, and A.indica in Bautama and Bomana. Only inner-plot trees were included in the analysis. There was no difference in the form distribution between the two levels of spacing.
At Pugamp, C.oligodon and C.junghuhniana were not significantly different, with a large proportion of crooked trees, and E.pellita was not significantly different from their distributions. On the other hand, E.robusta and E.grandis had a significantly larger number of trees of almost straight and straight forms. At Bautama, the majority of surviving trees of E.alba were crooked; this species was significantly worse than the other three included in
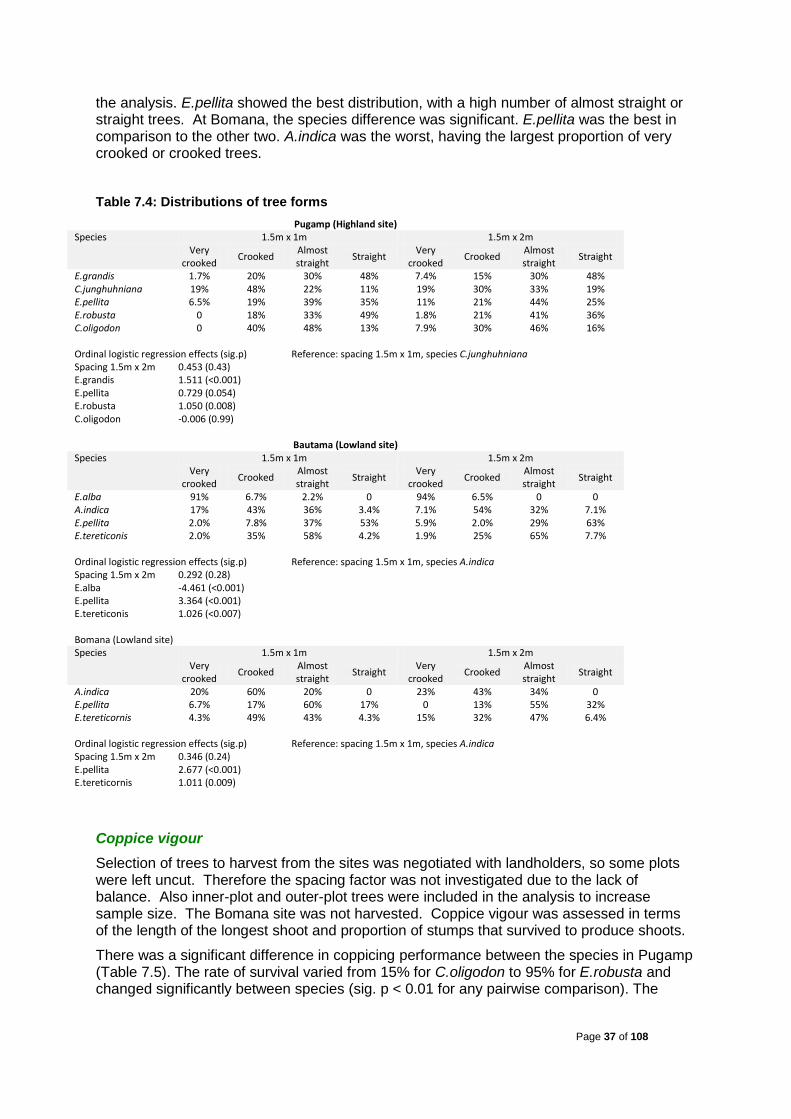
Page 37 of 108
the analysis. E.pellita showed the best distribution, with a high number of almost straight or straight trees. At Bomana, the species difference was significant. E.pellita was the best in comparison to the other two. A.indica was the worst, having the largest proportion of very crooked or crooked trees.
Table 7.4: Distributions of tree forms
Pugamp (Highland site) Species 1.5m x 1m 1.5m x 2m
Very crooked Crooked Almost
straight Straight Very crooked Crooked Almost
straight Straight
E.grandis 1.7% 20% 30% 48% 7.4% 15% 30% 48% C.junghuhniana 19% 48% 22% 11% 19% 30% 33% 19% E.pellita 6.5% 19% 39% 35% 11% 21% 44% 25% E.robusta 0 18% 33% 49% 1.8% 21% 41% 36% C.oligodon 0 40% 48% 13% 7.9% 30% 46% 16% Ordinal logistic regression effects (sig.p) Reference: spacing 1.5m x 1m, species C.junghuhniana Spacing 1.5m x 2m 0.453 (0.43) E.grandis 1.511 (<0.001) E.pellita 0.729 (0.054) E.robusta 1.050 (0.008) C.oligodon -0.006 (0.99)
Bautama (Lowland site) Species 1.5m x 1m 1.5m x 2m
Very crooked Crooked Almost
straight Straight Very crooked Crooked Almost
straight Straight
E.alba 91% 6.7% 2.2% 0 94% 6.5% 0 0 A.indica 17% 43% 36% 3.4% 7.1% 54% 32% 7.1% E.pellita 2.0% 7.8% 37% 53% 5.9% 2.0% 29% 63% E.tereticonis 2.0% 35% 58% 4.2% 1.9% 25% 65% 7.7% Ordinal logistic regression effects (sig.p) Reference: spacing 1.5m x 1m, species A.indica Spacing 1.5m x 2m 0.292 (0.28) E.alba -4.461 (<0.001) E.pellita 3.364 (<0.001) E.tereticonis 1.026 (<0.007) Bomana (Lowland site) Species 1.5m x 1m 1.5m x 2m
Very crooked Crooked Almost
straight Straight Very crooked Crooked Almost
straight Straight
A.indica 20% 60% 20% 0 23% 43% 34% 0 E.pellita 6.7% 17% 60% 17% 0 13% 55% 32% E.tereticornis 4.3% 49% 43% 4.3% 15% 32% 47% 6.4% Ordinal logistic regression effects (sig.p) Reference: spacing 1.5m x 1m, species A.indica Spacing 1.5m x 2m 0.346 (0.24) E.pellita 2.677 (<0.001) E.tereticornis 1.011 (0.009)
Coppice vigour Selection of trees to harvest from the sites was negotiated with landholders, so some plots were left uncut. Therefore the spacing factor was not investigated due to the lack of balance. Also inner-plot and outer-plot trees were included in the analysis to increase sample size. The Bomana site was not harvested. Coppice vigour was assessed in terms of the length of the longest shoot and proportion of stumps that survived to produce shoots.
There was a significant difference in coppicing performance between the species in Pugamp (Table 7.5). The rate of survival varied from 15% for C.oligodon to 95% for E.robusta and changed significantly between species (sig. p < 0.01 for any pairwise comparison). The

Page 38 of 108
vigour of shoots also differed between tree species. The average stump diameter under bark did not significantly differ between species and was 5.0 cm (SEM = 0.28cm).
Table 7.5: Coppicing performance of species in Pugamp and Bautama, six months after harvesting
Pugamp (Highland site)
Species Shoot length, cm Proportion survived E.grandis 102b (12.2) 0.67 (0.065) C.junghuhniana 49a (13.2) 0.42 (0.064) E.pellita 83b (12.2) 0.83 (0.048) E.robusta 139c (12.2) 0.95 (0.029) C.oligodon 46a (16.0) 0.15 (0.050) Wald test, sig species <0.001 <0.001
Bautama (Lowland site) Species Shoot length, cm E.alba 129b (8.0) A.indica 87a (8.0) E.pellita 125b (8.0) E.tereticornis 157c (8.0) Wald test, sig Species <0.001 Note: Values in round brackets are SEM as estimated in the REML analysis; different letters indicate significant differences between species
Evaluation of burning characteristics of fuelwood and charcoal Firewood from the field sites, and charcoal made from this wood, were evaluated for the time to boil water (a practical index of fire intensity) and the un-burnt residue (a practical index of fire longevity). The samples of Leuceana and Calliandra evaluated here were harvested from alley farming sites related to the project but whose production data is not presented here. The SRC candidate species were also compared alongside mature wood sourced from the market. In the highlands, this wood was C.oligodon in the lowlands it was E.alba.
Among Pugamp samples, the time to boil a 2L kettle was not found to change significantly between species, even compared with mature wood sourced from the market. However, the mature C.oligodon wood from the market left significantly more unburnt wood (40-45% cf 27% for E.grandis and 32% for immature C.oligodon). Even the SRC L.diversifolia left more residual wood (43%) after boiling the water than did the eucalypts. In the charcoal burning trial the time to boil a kettle differed significantly between species (sig.p = .003), with C.calothyrsus and E.pellita charcoal taking longer to boil than the other samples. The amount of charcoal left varied significantly between species (sig.p = 0.01); 53% of E.robusta charcoal remained unburnt at boiling point whereas only 16% for L.diversifolia .
Among Bautama samples, the time to boil a kettle changed significantly between species, with C.calothyrsus heating the quickest, while the mature E.alba sourced from the market left significantly more unburnt wood at the end of the tests (50% cf 24-36% for the SRC samples). There was a large degree of variation in the charcoal burning trials, and only a marginal significant difference in the time to boil the kettle was detected (sig. p = 0.047). The amount of charcoal used to boil a kettle did not differ significantly between species. The results of the assessment are presented in Table 7.6.
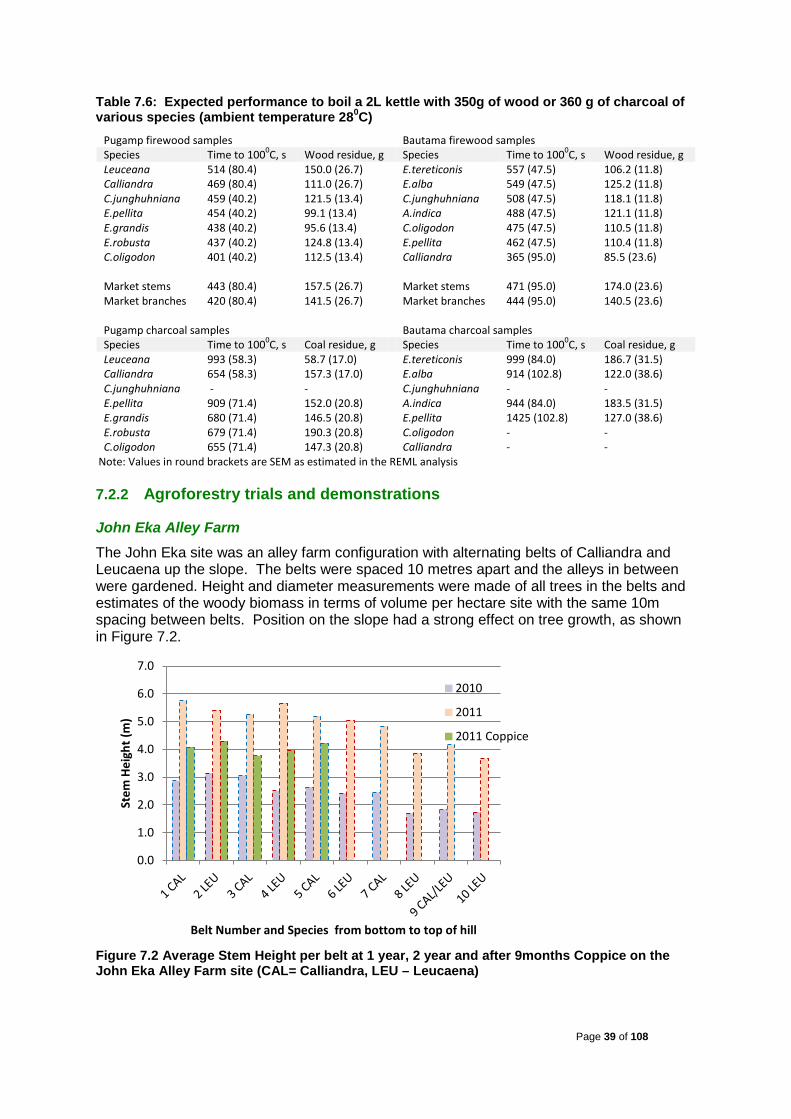
Page 39 of 108
Table 7.6: Expected performance to boil a 2L kettle with 350g of wood or 360 g of charcoal of various species (ambient temperature 280C)
Pugamp firewood samples Bautama firewood samples Species Time to 1000C, s Wood residue, g Species Time to 1000C, s Wood residue, g Leuceana 514 (80.4) 150.0 (26.7) E.tereticonis 557 (47.5) 106.2 (11.8) Calliandra 469 (80.4) 111.0 (26.7) E.alba 549 (47.5) 125.2 (11.8) C.junghuhniana 459 (40.2) 121.5 (13.4) C.junghuhniana 508 (47.5) 118.1 (11.8) E.pellita 454 (40.2) 99.1 (13.4) A.indica 488 (47.5) 121.1 (11.8) E.grandis 438 (40.2) 95.6 (13.4) C.oligodon 475 (47.5) 110.5 (11.8) E.robusta 437 (40.2) 124.8 (13.4) E.pellita 462 (47.5) 110.4 (11.8) C.oligodon 401 (40.2) 112.5 (13.4) Calliandra 365 (95.0) 85.5 (23.6) Market stems 443 (80.4) 157.5 (26.7) Market stems 471 (95.0) 174.0 (23.6) Market branches 420 (80.4) 141.5 (26.7) Market branches 444 (95.0) 140.5 (23.6) Pugamp charcoal samples Bautama charcoal samples Species Time to 1000C, s Coal residue, g Species Time to 1000C, s Coal residue, g Leuceana 993 (58.3) 58.7 (17.0) E.tereticonis 999 (84.0) 186.7 (31.5) Calliandra 654 (58.3) 157.3 (17.0) E.alba 914 (102.8) 122.0 (38.6) C.junghuhniana - - C.junghuhniana - - E.pellita 909 (71.4) 152.0 (20.8) A.indica 944 (84.0) 183.5 (31.5) E.grandis 680 (71.4) 146.5 (20.8) E.pellita 1425 (102.8) 127.0 (38.6) E.robusta 679 (71.4) 190.3 (20.8) C.oligodon - - C.oligodon 655 (71.4) 147.3 (20.8) Calliandra - -
Note: Values in round brackets are SEM as estimated in the REML analysis
7.2.2 Agroforestry trials and demonstrations
John Eka Alley Farm The John Eka site was an alley farm configuration with alternating belts of Calliandra and Leucaena up the slope. The belts were spaced 10 metres apart and the alleys in between were gardened. Height and diameter measurements were made of all trees in the belts and estimates of the woody biomass in terms of volume per hectare site with the same 10m spacing between belts. Position on the slope had a strong effect on tree growth, as shown in Figure 7.2.
Figure 7.2 Average Stem Height per belt at 1 year, 2 year and after 9months Coppice on the John Eka Alley Farm site (CAL= Calliandra, LEU – Leucaena)
0.0
1.0
2.0
3.0
4.0
5.0
6.0
7.0
Stem
Hei
ght (
m)
Belt Number and Species from bottom to top of hill
2010
2011
2011 Coppice
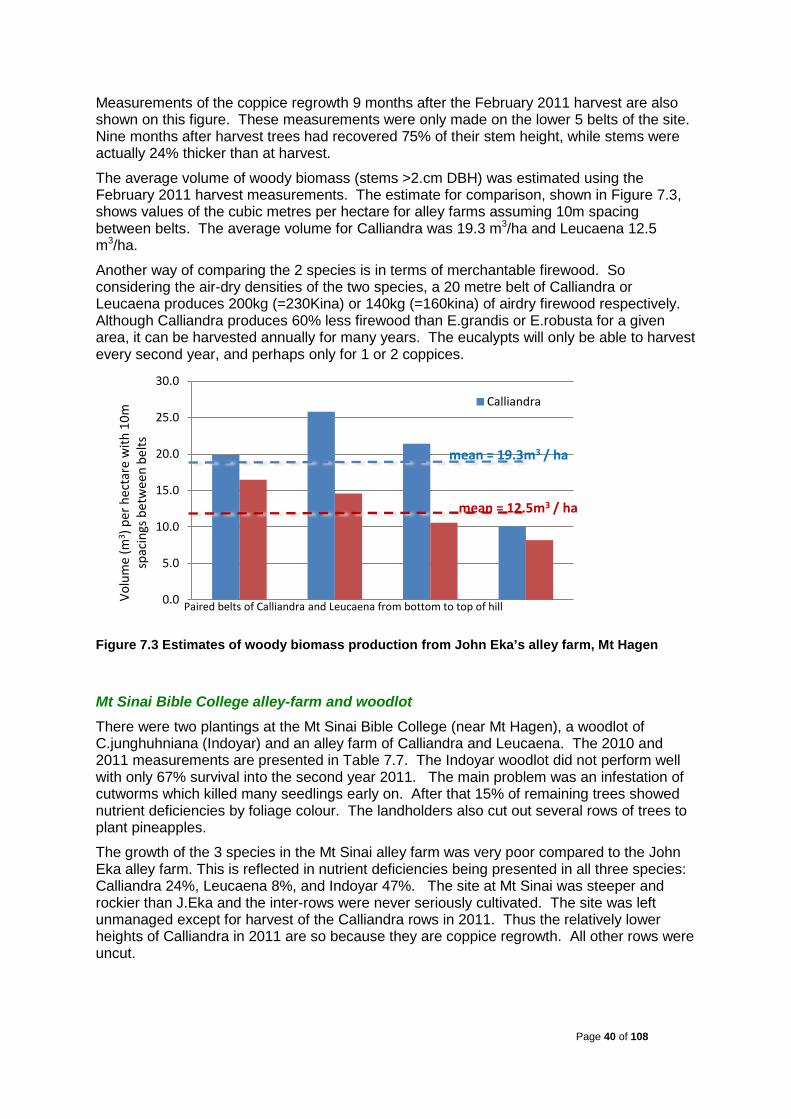
Page 40 of 108
Measurements of the coppice regrowth 9 months after the February 2011 harvest are also shown on this figure. These measurements were only made on the lower 5 belts of the site. Nine months after harvest trees had recovered 75% of their stem height, while stems were actually 24% thicker than at harvest.
The average volume of woody biomass (stems >2.cm DBH) was estimated using the February 2011 harvest measurements. The estimate for comparison, shown in Figure 7.3, shows values of the cubic metres per hectare for alley farms assuming 10m spacing between belts. The average volume for Calliandra was 19.3 m3/ha and Leucaena 12.5 m3/ha.
Another way of comparing the 2 species is in terms of merchantable firewood. So considering the air-dry densities of the two species, a 20 metre belt of Calliandra or Leucaena produces 200kg (=230Kina) or 140kg (=160kina) of airdry firewood respectively. Although Calliandra produces 60% less firewood than E.grandis or E.robusta for a given area, it can be harvested annually for many years. The eucalypts will only be able to harvest every second year, and perhaps only for 1 or 2 coppices.
Figure 7.3 Estimates of woody biomass production from John Eka’s alley farm, Mt Hagen
Mt Sinai Bible College alley-farm and woodlot There were two plantings at the Mt Sinai Bible College (near Mt Hagen), a woodlot of C.junghuhniana (Indoyar) and an alley farm of Calliandra and Leucaena. The 2010 and 2011 measurements are presented in Table 7.7. The Indoyar woodlot did not perform well with only 67% survival into the second year 2011. The main problem was an infestation of cutworms which killed many seedlings early on. After that 15% of remaining trees showed nutrient deficiencies by foliage colour. The landholders also cut out several rows of trees to plant pineapples.
The growth of the 3 species in the Mt Sinai alley farm was very poor compared to the John Eka alley farm. This is reflected in nutrient deficiencies being presented in all three species: Calliandra 24%, Leucaena 8%, and Indoyar 47%. The site at Mt Sinai was steeper and rockier than J.Eka and the inter-rows were never seriously cultivated. The site was left unmanaged except for harvest of the Calliandra rows in 2011. Thus the relatively lower heights of Calliandra in 2011 are so because they are coppice regrowth. All other rows were uncut.
0.0
5.0
10.0
15.0
20.0
25.0
30.0
Volu
me
(m3 )
per
hec
tare
with
10m
sp
acin
gs b
etw
een
belts
Paired belts of Calliandra and Leucaena from bottom to top of hill
Calliandra
mean = 19.3m3 / ha
mean = 12.5m3 / ha
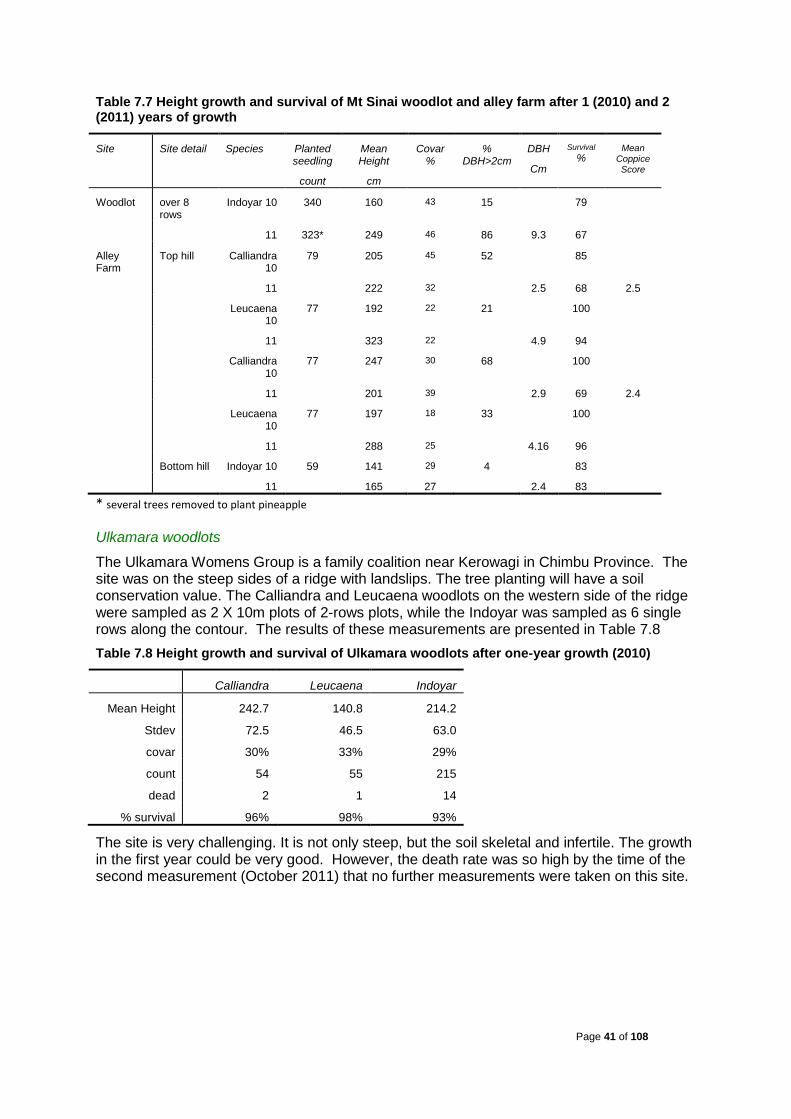
Page 41 of 108
Table 7.7 Height growth and survival of Mt Sinai woodlot and alley farm after 1 (2010) and 2 (2011) years of growth
Site Site detail Species Planted seedling
count
Mean Height
cm
Covar %
% DBH>2cm
DBH
Cm
Survival %
Mean Coppice Score
Woodlot over 8 rows
Indoyar 10 340 160 43 15 79
11 323* 249 46 86 9.3 67
Alley Farm
Top hill Calliandra 10
79 205 45 52 85
11 222 32 2.5 68 2.5
Leucaena 10
77 192 22 21 100
11 323 22 4.9 94
Calliandra 10
77 247 30 68 100
11 201 39 2.9 69 2.4
Leucaena 10
77 197 18 33 100
11 288 25 4.16 96
Bottom hill Indoyar 10 59 141 29 4 83
11 165 27 2.4 83
* several trees removed to plant pineapple
Ulkamara woodlots The Ulkamara Womens Group is a family coalition near Kerowagi in Chimbu Province. The site was on the steep sides of a ridge with landslips. The tree planting will have a soil conservation value. The Calliandra and Leucaena woodlots on the western side of the ridge were sampled as 2 X 10m plots of 2-rows plots, while the Indoyar was sampled as 6 single rows along the contour. The results of these measurements are presented in Table 7.8 Table 7.8 Height growth and survival of Ulkamara woodlots after one-year growth (2010)
Calliandra Leucaena Indoyar
Mean Height 242.7 140.8 214.2
Stdev 72.5 46.5 63.0
covar 30% 33% 29%
count 54 55 215
dead 2 1 14
% survival 96% 98% 93%
The site is very challenging. It is not only steep, but the soil skeletal and infertile. The growth in the first year could be very good. However, the death rate was so high by the time of the second measurement (October 2011) that no further measurements were taken on this site.
Page 42 of 108
7.3 Discussion of field trials and evaluation of SRC systems This discussion covers the results replicated field trials, burning trials (Section 7.2.1) and consumer evaluation (Section 7.4.1) extracted and modified from Nuberg et al (2013)
The overarching objective of this project was to test whether SRC fuelwood production systems have potential as a small-business option in two regions of PNG, in the NCD surrounding Port Moresby and in the Western Highlands around Mt Hagen. These are two regions with large populations and environmental, social and economic demands for an alternative to fuelwood gathered from forests, roadsides and agricultural fields. The evaluation reported here screened some candidate species for their growth potential, their burning qualities and the likelihood of adoption in the market place. The value of this wood grown as poles or converted to charcoal was also considered. Table 7.9 summarises the results of the field and laboratory trials.
Table 7.9 Ranking results from field trial and laboratory tests
Pugamp site, Highland
Evaluation of field production Heat value tests
Firewood Heat value tests
Charcoal Air dry
Volume Pole
prodn Pole form Coppice Time to boil
Residual wood
Time to boil
Residual charcoal
Cal.calothrysus - - - - 1 2 1 2 Cas.junghuhniana 5 3 3 4 1 2 - - Cas.oligodon 3 2 3 4 1 2 1 2 E.grandis 1 1 1 2 1 2 1 2 E.pellita 4 2 2 3 1 2 2 2 E.robusta 2 1,2 1 1 1 2 1 1 L.diversifolia - - - - 1 1 2 3 Market firewood (C.oligodon) n.a. n.a. n.a. n.a. 1 1 - -
Bautama site, Lowland
Evaluation of field production Heat value tests
Firewood Heat value tests
Charcoal Air dry
Volume Pole
prodn Pole form Coppice Time to boil
Residual wood
Time to boil
Residual charcoal
A.indica 2 2 3 3 2 2 1 1 Cal.calothrysus - - - - 1 3 - - Cas.junghuhniana - - - - 2 2 - - Cas.oligodon - - - - 2 2 - - E.alba 3 2 4 2 2 2 1 1 E.pellita 2 2 1 2 2 2 2 1 E.tereticonis 1 1 2 1 2 2 1 1 Market firewood (E.alba) n.a. n.a. n.a. n.a. 2 1 - -
Notes: Rankings based on results of analyses in Tables 7.2, 7.3, 7.4 and 7.5. Ranking ‘1’ is statistically the most favourable, i.e. greatest wood volume, lineal metres of poles, pole form, coppicing ability, quickest to boil water, or greatest amount of residual wood or charcoal. Pugamp and Bautama sites are analysed independently; n.a. = not applicable ; - = sample unavailable or deleted because unbalanced sample
The first filter was growth rates and production of fuelwood. That the highland site produced much more than the sites around NCD may not be surprising –Pugamp had a much higher rainfall, more fertile soil and was unchallenged by fire and flood – but does indicate which region will favour the promulgation of SRC systems. In the highlands the best candidate species were E.grandis and E.robusta. E.robusta will possibly perform more consistently over a range of conditions. E.grandis produced a greater volume of fuelwood over the 2 year production cycle, but E.robusta had slightly thicker stems and would be favoured if the
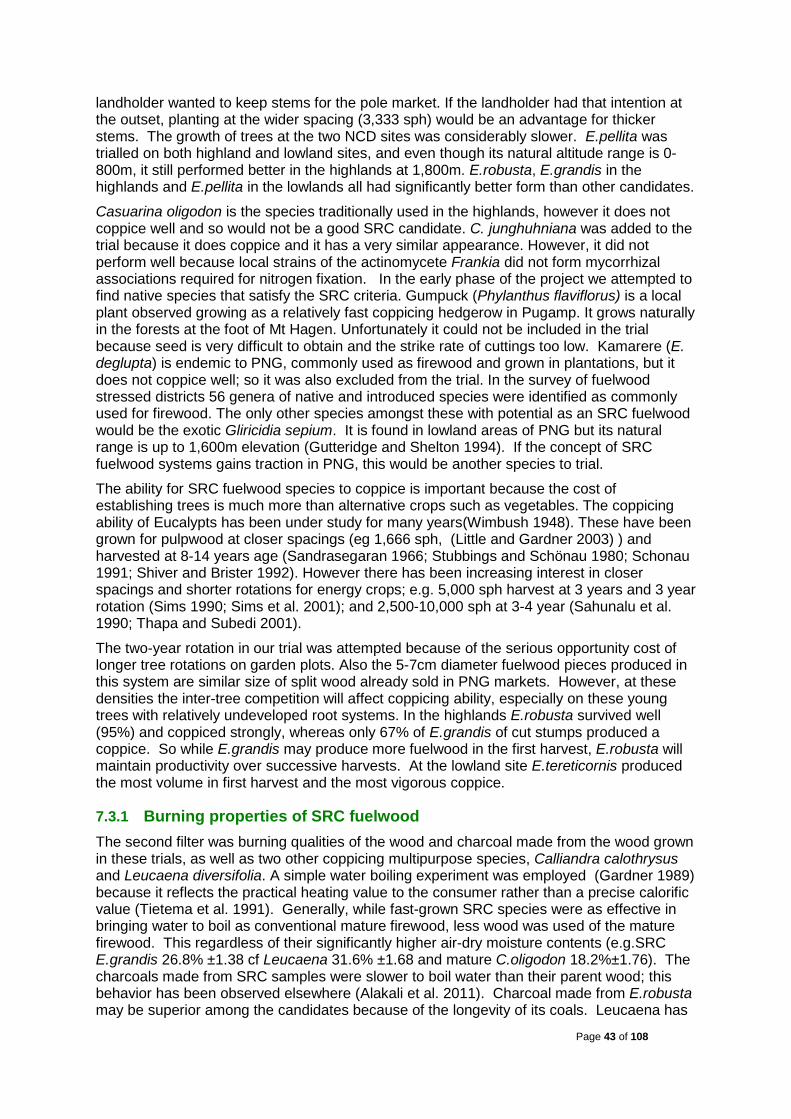
Page 43 of 108
landholder wanted to keep stems for the pole market. If the landholder had that intention at the outset, planting at the wider spacing (3,333 sph) would be an advantage for thicker stems. The growth of trees at the two NCD sites was considerably slower. E.pellita was trialled on both highland and lowland sites, and even though its natural altitude range is 0-800m, it still performed better in the highlands at 1,800m. E.robusta, E.grandis in the highlands and E.pellita in the lowlands all had significantly better form than other candidates.
Casuarina oligodon is the species traditionally used in the highlands, however it does not coppice well and so would not be a good SRC candidate. C. junghuhniana was added to the trial because it does coppice and it has a very similar appearance. However, it did not perform well because local strains of the actinomycete Frankia did not form mycorrhizal associations required for nitrogen fixation. In the early phase of the project we attempted to find native species that satisfy the SRC criteria. Gumpuck (Phylanthus flaviflorus) is a local plant observed growing as a relatively fast coppicing hedgerow in Pugamp. It grows naturally in the forests at the foot of Mt Hagen. Unfortunately it could not be included in the trial because seed is very difficult to obtain and the strike rate of cuttings too low. Kamarere (E. deglupta) is endemic to PNG, commonly used as firewood and grown in plantations, but it does not coppice well; so it was also excluded from the trial. In the survey of fuelwood stressed districts 56 genera of native and introduced species were identified as commonly used for firewood. The only other species amongst these with potential as an SRC fuelwood would be the exotic Gliricidia sepium. It is found in lowland areas of PNG but its natural range is up to 1,600m elevation (Gutteridge and Shelton 1994). If the concept of SRC fuelwood systems gains traction in PNG, this would be another species to trial.
The ability for SRC fuelwood species to coppice is important because the cost of establishing trees is much more than alternative crops such as vegetables. The coppicing ability of Eucalypts has been under study for many years(Wimbush 1948). These have been grown for pulpwood at closer spacings (eg 1,666 sph, (Little and Gardner 2003) ) and harvested at 8-14 years age (Sandrasegaran 1966; Stubbings and Schönau 1980; Schonau 1991; Shiver and Brister 1992). However there has been increasing interest in closer spacings and shorter rotations for energy crops; e.g. 5,000 sph harvest at 3 years and 3 year rotation (Sims 1990; Sims et al. 2001); and 2,500-10,000 sph at 3-4 year (Sahunalu et al. 1990; Thapa and Subedi 2001).
The two-year rotation in our trial was attempted because of the serious opportunity cost of longer tree rotations on garden plots. Also the 5-7cm diameter fuelwood pieces produced in this system are similar size of split wood already sold in PNG markets. However, at these densities the inter-tree competition will affect coppicing ability, especially on these young trees with relatively undeveloped root systems. In the highlands E.robusta survived well (95%) and coppiced strongly, whereas only 67% of E.grandis of cut stumps produced a coppice. So while E.grandis may produce more fuelwood in the first harvest, E.robusta will maintain productivity over successive harvests. At the lowland site E.tereticornis produced the most volume in first harvest and the most vigorous coppice.
7.3.1 Burning properties of SRC fuelwood The second filter was burning qualities of the wood and charcoal made from the wood grown in these trials, as well as two other coppicing multipurpose species, Calliandra calothrysus and Leucaena diversifolia. A simple water boiling experiment was employed (Gardner 1989) because it reflects the practical heating value to the consumer rather than a precise calorific value (Tietema et al. 1991). Generally, while fast-grown SRC species were as effective in bringing water to boil as conventional mature firewood, less wood was used of the mature firewood. This regardless of their significantly higher air-dry moisture contents (e.g.SRC E.grandis 26.8% ±1.38 cf Leucaena 31.6% ±1.68 and mature C.oligodon 18.2%±1.76). The charcoals made from SRC samples were slower to boil water than their parent wood; this behavior has been observed elsewhere (Alakali et al. 2011). Charcoal made from E.robusta may be superior among the candidates because of the longevity of its coals. Leucaena has
Page 44 of 108
been widely promoted for its value as charcoal (NAS 1977; Brouard et al. 1989), however it did not rank well in this trial. While the heat of combustion of Leucaena charcoal has been measured elsewhere as 54% greater than its wood (Fuwape and Akindele 1997), in this trial its charcoal took twice as long as a similar amount of wood to boil water.
7.3.2 Acceptance of SRC fuelwood The third filter applied to candidate SRC species was acceptance by users. The SRC firewood was presented as 80cm lengths with bark attached, and householders were asked to compare the wood against their normal firewood. The Mt Hagen results clearly showed that 2-year old E.grandis is at least as good as the local mature C.oligodon for cooking, and is easier to use and its smooth bark has a more appealing appearance. The results in Port Moresby were equivocal possibly because those households use a wider range of species to compare against. The firewood sellers only found it very easy to sell fast-grown specimens of the species already in the market, i.e. C.oligodon and E.alba, or which had a similar appearance to existing firewood, i.e. C.junghuniana. Unfortunately none of these species have good growth rates or form.
Fuelwood is sold in the market in bundles and large pieces at prices set for easy transaction (e.g. Kina 1, 2, 5, 10, 20 etc), however there is considerable regional variation in the weight of wood in bundles of similar price. For example, the market value of fuelwood in Mt Hagen was surveyed at K1.10/kg while in the NCD market it was only K0.35/kg. The sellers presented the other SRC fuelwoods as K5 bundles but packed so they were much better value on a per kilogram basis, yet still they found it difficult to sell these specimens, except perhaps the E.grandis. The SRC firewood just does not look like normal firewood and it seems the adage ‘perception is reality’ applies to consumer attitudes to firewood.
From all of the above it seems that the best candidate species for SRC firewood-pole production system in the highlands to be either E.robusta or E.grandis. Even though E.grandis does not survive the coppicing regime as well as E.robusta the remaining shoots are likely to grow thick stems and produce an acceptable second crop. We were not able to test that claim within the time allotted to this trial. Around the NCD the best candidate appears to be E.tereticornis, however, the much slower growth rates and tree survival problems in this area indicate that a longer rotation will be needed and considerable attention paid to fire control and theft.
Unfortunately, the early indications are that SRC firewood will not be easy to sell without well-considered marketing. An alternative may be to add value to this firewood by transforming it into charcoal. Despite its higher price charcoal can be a popular alternative to firewood because it is nearly smokeless and once it is lit, requires little further attention from the cook (Wood and Baldwin 1985). Charcoal is not widely used in PNG, and that which is for sale for the barbeques of the urban elite is all imported from Australia. At an average retail price of K10/kg (range K7-16/kg) this product is out of reach of the village consumer. There was an attempt in the 1980s to introduce charcoal into the domestic energy economy in Port Moresby (Gamser and Harwood 1982). However this failed apparently due to the unreliability of charcoal supply and an effective demonstration and extension system (Gamser and Harwood 1983). There is a good body of knowledge about its local potential (Harris 1979) and institutions for its delivery (e.g. Appropriate Technology & Community Development Institute, PNG University of Technology). Demonstrations of charcoal stoves at rural cultural events as part of our project generated keen public interest. For this reason the evaluation of burning characteristics included the charcoal produced from SRC systems.
7.3.3 Comparison with other landuse options The final test of whether SRC production systems can be a viable small-business is how it will compete with other landuses and activities. PNG villagers have many demands on their

Page 45 of 108
time: production of food for subsistence; generation of income for consumer goods, school fees, and healthcare; and social exchange and cultural activities. They are very sensitive to returns to labour, and they are able to switch in or out of cash cropping because their subsistence food production can sustain them in periods of no cash income (Curry 2005).
Table 7.10 compares the returns to labour of two important sources of rural highland income against our estimates for SRC firewood, pole production and charcoal production. SRC options should yield competitive returns to labour. However, it would be a mistake to line these options up and treat these returns to labour as the “bottom line” in villager decision making. The options have very different profiles and the rural market economy is highly influenced by the indigenous non-market economy.
Table 7.10: Comparison of gross returns and return to labour of SRC, coffee and sweet potato crops
Alternatives to SRC SRC-Firewood SRC-Poles SRC-Charcoal
Sweet potato
Coffee arabica E,grandis E.robusta E.robusta E,grandis
E.robusta
Yield kg/ha ; lineal m/ha 12,000 900 10,425 8,951 2,330 2,085
Price Kina/kg Kina/m 0.6 4.5 0.7 0.7 1.0 2.5
Gross Return Kina/ha 7200 4050 7297 6265 2330 5212
Labour Inputs persondays/ha 350 275 170 170 150 220
Return to Labour Kina/person/day 21 15 43 37 16 24
Notes: Sweet potato and Coffee values from Table 5.20.1 in ‘Food and Agriculture in PNG’ Bourke et al (2009) (Bourke and Harwood 2009)(Bourke and Harwood 2009)(Bourke and Harwood 2009)(Bourke and Harwood 2009) with update from Bourke pers.com. 20 Feb. 2013. SRC Firewood and pole gross margin based on volume and pole length data of 1.5m*1.0m spacing in Table 7.2; price is conservatively set at 70% of surveyed firewood prices in Mt Hagen;observed pole value in Mt Hagen market. SRC Labour inputs estimated as: ground preparation 60; planting 30; weeding in first year 20; harvest and prepare for market firewood 60, poles 40, charcoal 110. SRC Charcoal gross return and return to labour based on Table 7.2 volumes and charcoal business plan prepared by Randall Manapangkec, PARD.
Sweet potato is the staple food source for highland people and their pigs and is the foundation of subsistence agriculture. Yields under village conditions are difficult to measure because of the progressive harvesting method used and experimental yields typically range from 5-30t/ha (Bourke et al. 2009). The yield given here assumes a commercial system with healthy and improved planting material and good agronomy. The returns to labour as a commercial crop are good in comparison to the official minimum rural wage around Mt Hagen of K13/day(IPA 2013). Most village gardeners are opportunistic sellers of small amounts of sweet potato but relatively few (<10%) regard themselves as commercial suppliers (Wegener et al. 2009). It is difficult to transport to distant urban markets, and most sweet potato sold on the highland market is a by-product of the subsistence garden. Sweet potato production systems employ fallows periods of 5 -15 years with 2-5 years of production between fallows (Bourke and Ramakrishna 2009), so SRC crops could be integrated in these fallow periods.
Coffee has a comparatively lower return to labour compared with sweet potato but it is a perennial crop with established market linkages. It is commonly grown under the shade of C.oligodon in highland village agriculture (Bourke 1985), and in the mid 1990s about 53% of rural households earned some income from coffee (Bourke and Harwood 2009). Coffee has a peak harvesting period from April to August where household labour, mainly that of women, is re-directed from other activities. The women, however, receive only one third of
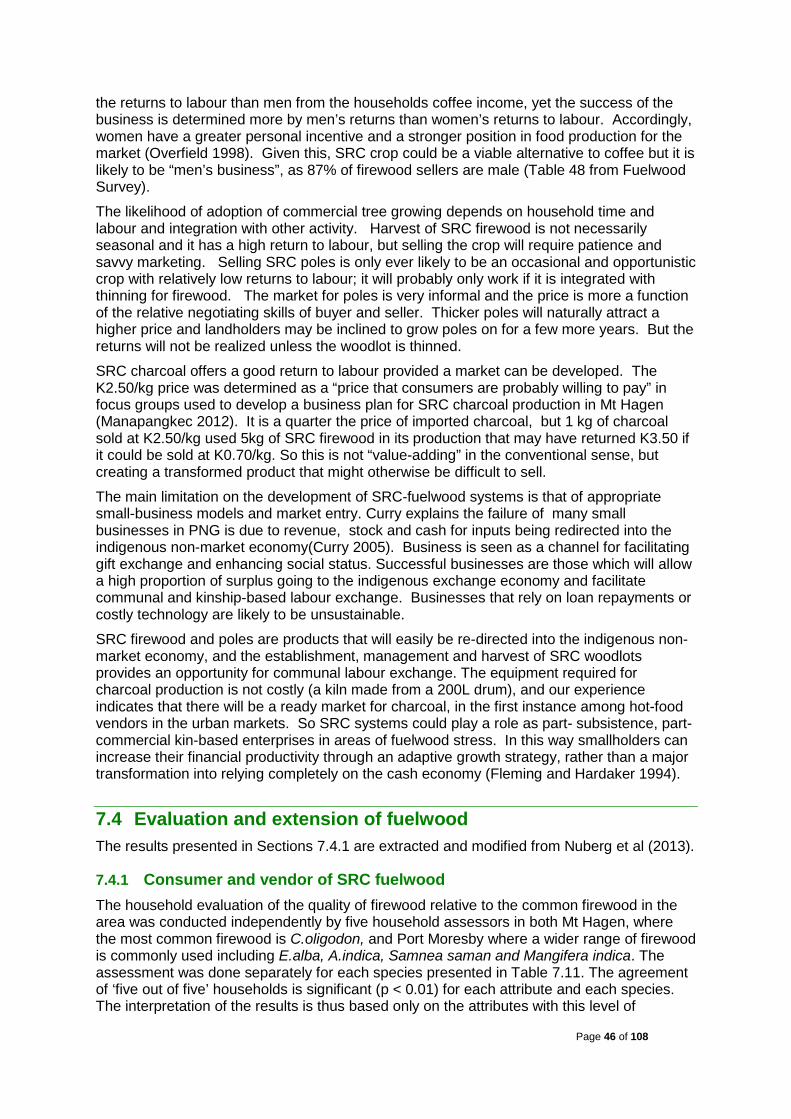
Page 46 of 108
the returns to labour than men from the households coffee income, yet the success of the business is determined more by men’s returns than women’s returns to labour. Accordingly, women have a greater personal incentive and a stronger position in food production for the market (Overfield 1998). Given this, SRC crop could be a viable alternative to coffee but it is likely to be “men’s business”, as 87% of firewood sellers are male (Table 48 from Fuelwood Survey).
The likelihood of adoption of commercial tree growing depends on household time and labour and integration with other activity. Harvest of SRC firewood is not necessarily seasonal and it has a high return to labour, but selling the crop will require patience and savvy marketing. Selling SRC poles is only ever likely to be an occasional and opportunistic crop with relatively low returns to labour; it will probably only work if it is integrated with thinning for firewood. The market for poles is very informal and the price is more a function of the relative negotiating skills of buyer and seller. Thicker poles will naturally attract a higher price and landholders may be inclined to grow poles on for a few more years. But the returns will not be realized unless the woodlot is thinned.
SRC charcoal offers a good return to labour provided a market can be developed. The K2.50/kg price was determined as a “price that consumers are probably willing to pay” in focus groups used to develop a business plan for SRC charcoal production in Mt Hagen (Manapangkec 2012). It is a quarter the price of imported charcoal, but 1 kg of charcoal sold at K2.50/kg used 5kg of SRC firewood in its production that may have returned K3.50 if it could be sold at K0.70/kg. So this is not “value-adding” in the conventional sense, but creating a transformed product that might otherwise be difficult to sell.
The main limitation on the development of SRC-fuelwood systems is that of appropriate small-business models and market entry. Curry explains the failure of many small businesses in PNG is due to revenue, stock and cash for inputs being redirected into the indigenous non-market economy(Curry 2005). Business is seen as a channel for facilitating gift exchange and enhancing social status. Successful businesses are those which will allow a high proportion of surplus going to the indigenous exchange economy and facilitate communal and kinship-based labour exchange. Businesses that rely on loan repayments or costly technology are likely to be unsustainable.
SRC firewood and poles are products that will easily be re-directed into the indigenous non-market economy, and the establishment, management and harvest of SRC woodlots provides an opportunity for communal labour exchange. The equipment required for charcoal production is not costly (a kiln made from a 200L drum), and our experience indicates that there will be a ready market for charcoal, in the first instance among hot-food vendors in the urban markets. So SRC systems could play a role as part- subsistence, part-commercial kin-based enterprises in areas of fuelwood stress. In this way smallholders can increase their financial productivity through an adaptive growth strategy, rather than a major transformation into relying completely on the cash economy (Fleming and Hardaker 1994).
7.4 Evaluation and extension of fuelwood The results presented in Sections 7.4.1 are extracted and modified from Nuberg et al (2013).
7.4.1 Consumer and vendor of SRC fuelwood The household evaluation of the quality of firewood relative to the common firewood in the area was conducted independently by five household assessors in both Mt Hagen, where the most common firewood is C.oligodon, and Port Moresby where a wider range of firewood is commonly used including E.alba, A.indica, Samnea saman and Mangifera indica. The assessment was done separately for each species presented in Table 7.11. The agreement of ‘five out of five’ households is significant (p < 0.01) for each attribute and each species. The interpretation of the results is thus based only on the attributes with this level of
Page 47 of 108
agreement. E.grandis ranked ‘same’ for time to cook, heat and weight and better for ease and appearance. C. junghuhniana ranked ‘worse’ for the easiness to handle and appearance. E.pellita ranked ‘worse’ for coal life, otherwise it was not different from the common firewood. The results for Port Moresby evaluation was not as clear, possibly because of the diversity of wood that householders commonly use. Nevertheless, this assessment was overall consistent with the heat and longevity measurements in the burning trials (Table 7.6). Table 7.11 Distribution of responses in five household evaluations of the quality of wood relative to the common firewood: worse (-1), same (0) or better (1)
Criteria
Species
Smokiness Time to cook
Heat Light Coal life Weight of wood
Ease of use
Appearance
Rank -1 0 1 -1 0 1 -1 0 1 -1 0 1 -1 0 1 -1 0 1 -1 0 1 -1 0 1
C.junghuhniana 1 4 0 0 2 3 0 0 5 0 4 1 0 3 2 0 1 4 5 0 0 5 0 0
E.grandis 0 1 4 0 5 0 0 5 0 0 1 4 1 3 1 0 5 0 0 0 5 0 0 5
E.pellita 0 5 0 2 3 0 2 3 0 1 4 0 5 0 0 1 4 0 2 3 0 0 5 0
E.robusta 2 3 0 0 4 1 1 2 2 0 4 1 3 2 0 0 5 0 3 2 0 1 4 0
Calliandra 0 1 4 5 0 0 5 0 0 1 4 0 5 0 0 5 0 0 0 0 5 0 0 5
Leucaena 0 5 0 3 2 0 5 0 0 1 4 0 4 0 0 4 1 0 0 5 0 0 0 5
In bold, independent species evaluations ranked significantly (p<0.01) worse or better than the commonly used firewood.
In general, SRC fuelwood did not perform well in either the Mt Hagen or Port Moresby market places. The species that already exist in the market as mature wood, C.oligodon and E.alba respective, sold well. C.junghuhniana was also easy to sell presumably because it has a similar appearance to C.oligodon, however the sellers did complain about the difficulty to split this wood. The sellers all found the other SRC woods sold slightly slower than normal firewood presented at the same time. For example in Mt Hagen, where the C.oligodon also sold in 2-3 days, the E.grandis took 4 days, and the E. pellita and E. robusta took 5-6 days to sell the equivalent volume of wood. The sellers intuitively packed more wood into a K5 bundle in an effort to make it more appealing. For example, the eucalypt SRC bundles were 8.5 kg (± 0.28, n =29) compared to C.oligodon 6.0 kg (± 0.34, n =25). Eventually, they adopted the strategy of mixing the eucalypts as splits in bundles of their local mature Yar (i.e. C.oligodon) or E.alba bundles. The A.indica, C.calothrysus and L.diversifolia were very difficult to sell. Some of the A.indica did not sell at all.
7.4.2 Public understanding of extension material Extension material was developed as part of Objective 3: Developing a Community of Fuelwood Practice. The activity in this objective is discussed in Section 8.4 and Appendix 3. However as part of that activity there was an evaluation of public understanding of fuelwood posters on display at two events, the Mt Hagen Cultural Show and the launch of the Forest at FRI (both events in August 2011).
Table 7.12 presents a analysis of the understanding of the information in the posters. The Comprehension Index is a measure of the relative proportion of correct and incorrect answers in each question set. An index of 1.0 would indicate that all respondents in a sample group got the all question options correct. An index of -1.0 would indicate all questions were incorrectly answered by all respondents. An index of 0 would indicate a 50:50 spread of correct : incorrect answers.

Page 48 of 108
Table 7.12 Comprehension Index of Information in Posters
Question options
Lae (n = 25)
Mt Hagen (n =34)
SRC poster The best trees to use 4 -0.18 0.11 When you can harvest firewood 3 0.10 0.35 The best tree spacing 5 0.35 0.57 To grow on to poles 4 0.18 0.39 Possible to garden between trees 2 -0.03 0.63 Value of leaves for mulch or pigs 2 -0.38 0.02 Overall 0.05 0.36 Alley Garden poster The best trees to use 4 -0.05 0.11 When you can harvest firewood 3 -0.02 0.16 Correct tree spacing 2 -0.07 0.62 Size of gardens between trees 2 0.16 0.40 To grow on to poles 4 -0.14 0.16 How long can garden between trees 2 -0.35 -0.38 Value of leaves for mulch or pigs 2 0.44 0.35 Over all -0.02 0.18 Nursery poster Nursery position and seeding 5 0.48 0.34 Watering 3 0.29 0.34 Shading 3 0.03 0.07 When to plant seedling 4 0.39 0.65 Over all 0.32 0.37 Firewood poster Firewood that makes least smoke 5 -0.02 -0.08 Firewood good to start fire 5 -0.12 -0.04 Firewood long lasting coals 5 0.12 -0.04 Over all -0.01 -0.05 Cooking with charcoal poster 2 0.57 0.90
Interpretation 1. For the SRC-woodlot poster, respondents understood the concept and particulars of the
close-spaced planting arrangement, ability to intercrop in first year, its harvest and to an extent the recommended species. However their understanding of other elements of the SRC woodlot cannot be reliably assessed because of the level of contradictory responses to the other questions.
2. For the Hillside alley farm poster, respondents understood the concept and particulars of the planting arrangement of the alley farm and the value of the leaves for mulch and fodder. However their understanding of other elements of the alley farm cannot be reliably assessed because of the level of contradictory responses to the other questions.
3. For the Nursery poster, respondents showed a good general understanding of managing a home nursery except for the aspect of shading.
4. For the Firewood characteristics poster, respondents were probably confused by the mismatch in names between the poster (in English) and on the questionnaire (in Tok Pisin). They did not recognise the value of the main species being promoted, E.grandis, but a minor proportion of respondents did recognise the value of Calliandra for starting a fire and Indoyar for its long lasting coals.
5. For the Cooking with charcoal and Making charcoal posters, respondents showed a good understanding of both processes. Generally they saw cooking with charcoal neither too difficult nor expensive and there was strong interest in buying charcoal if available. They generally saw charcoal making as a good business opportunity that would not be too difficult to carry out
Page 49 of 108
The two groups undertaking the evaluation were quite different. In Mt Hagen, 34 people (28 male and 6 female) attempted the questionnaire. Of those 20 supplied their age, so the average age of the group was 27 years (range 14-56y). At Lae 25 students took up the challenge with 20 females and 5 males aged between 13 – 16 years. The Mt Hagen group scored significantly better than the Lae group.
The interpretation of the questionnaire results was not as straightforward as wished as many respondents gave ‘yes’ responses to more than one option, so that their responses were contradictory. Perhaps a general interpretation of this is that this way of evaluating people’s understanding is just too complex. Perhaps some respondents were ticking as many boxes as possible ‘just to be sure’. It is also possible that some linguistic nuances of Tok Pisin may be at play as well. There can be confusion with Yes/No answers where the colloquial response ‘nogat’ should sometimes be interpreted as ‘yes’ and not ‘no’ (using double negative to imply a positive).
The poor results for the Firewoods poster (should have been the most straightforward poster) may be due to some ambiguity in names between the firewood species poster and the questionnaire.
The generally good understanding of the nursery poster may be due to the existing culture and knowledge of tree growing among highlanders. The good understanding and appreciation of cooking and making charcoal, which is a relatively foreign technology, must be due to the fact they could actually see it in use at the stall.
7.4.3 Overview of results of ‘Community of Practice’ activity The concept of a ‘fuelwood community of practice’ was built into this project because it is recognised that the development of a fuelwood industry requires a body of knowledge that is carried by all the active stakeholders in the industry. It is of no value for the results of research to remain only with the researchers. In the context of this research, the community of practice will include:
• government sectors involved not only with forestry and agriculture, but community and economic development;
• industrial and plantation sector that relies on woody biomass for its energy requirements;
• non-government sector concerned with community development; and • finally, and certainly not least, the innovative individual landholders and family groups
that are looking for opportunities to develop forest-based small to medium enterprises.
The project’s achievements towards this objective have been:
• Training of charcoal production. This capacity is now with staff of FRI, PARD and HOPEww, and can be further exploited.
• Development of a suite of extension products (posters and brochures) that capture the knowledge about SRC production systems and charcoal use generated by the project. This material is housed at FRI.
• Assembling a list of non-government agencies that could be interested in promulgation of SRC-fuelwood knowledge
• Feedback from domestic firewood users and sellers on the acceptability of SRC-grown firewood.
• Developed an understanding that the general public will not respond as well as might be expected to static visual extension methods (i.e. posters), and other forms of delivery (e.g. demonstration) need to be developed.
The stated goals not achieved were:

Page 50 of 108
• Training in small-business management. This activity was premature and not attempted. The participating landholders were not sufficiently motivated to warrant the investment. This training became part of the follow-on small research activity, FST/2011/058
• Establishment of online fuelwood database was not achieved in the time-frame of the project. Web-editing software resources were made available and drafts of online material were developed, but all efforts to get permission or assistance in putting this material on the PNGFA website, or anywhere else, were denied.
Page 51 of 108
8 Impacts
8.1 Scientific impacts – now and in 5 years The scientific impact of the fuelwood survey is significant because it is the largest and most comprehensive survey of its kind ever undertaken in PNG. It lays the foundation for important energy policy and planning. It also indicates the best direction for further fuelwood research in PNG (see Section 9.2 Recommendations). There is still a lot of information to be drawn from the survey database that has not been presented in this report or the longer appendix. The database file is available on the CD attached to this report for other researchers to interrogate.
The 2-year rotation SRC trialled is novel and it is important to know that it is possible to grow usable fuelwood in such a short time, at least in the highlands. It is equally important to know that 2-year is too short a time to expect reasonable wood production around NCD. Woodlots in this region will require longer time and more work protecting against wildfire, flood and theft. It is a model that requires further development now that we have a good idea of the relative performance of various species. The work shows the burning properties of these fast-grown species are not significantly different from slow-grown mature wood in the market. It also shows that while SRC fuelwood has acceptable burning properties to domestic users, this will not translate to ready acceptance in the market place. There is a need to familiarise consumers with the strange looking new product.
The project has shown that the returns to labour of SRC systems in the highlands are much better than sweet potato and coffee production. However, if this opportunity is to be realised then some effort needs to be made in developing a SRC business model that can be sustainably embedded in the indigenous non-market economy.
Modifications of the model, eg along the lines of alley-gardens, and other species, e.g. Gliricidia sepium, are worthwhile exploring. As these fuelwood production systems are operating in agricultural, rather than forestry, timeframes and context, an agency such as NARI may choose to further develop this model.
The project’s experience with disseminating information using conventional extension methods such as posters and brochures indicates that these are not as effective as could be expected. This lesson should be learnt before planning any further extension of fuelwood, or any other agroforestry knowledge.
The project produced significant knowledge that is being formally disseminated through the following publications in preparation
Nuberg IK, Gunn B, Tavune M, Sumareke A, Kravchuk O (2013) Evaluation of short-rotation coppicing fuelwood production systems for Papua New Guinea. Biomass and Bioenergy submitted....
Nuberg IK (2013) Fuelwood use and markets of Papua New Guinea. Energy for Sustainable Development submitted
Nuberg IK and Abiuda-Mitir J (2013) Development of agroforestry based micro-enterprises in Papua New Guinea. Agroforestry Systems to be submitted

Page 52 of 108
8.2 Capacity impacts – now and in 5 years The project has had clear impact on the capacity of many individuals and organisations to work with fuelwood, and indeed any other future ACIAR work.
There were several training sessions in nursery management (ref 4/10) and charcoal production (re 4/11). These were open to landholders and staff of PARD, HOPEww and FRI. Formal training in tree nursery design, construction and operation was given to 4 individuals from HOPE and about 10 individuals associated with the PARD nursery at Pugamp. However, many more people received informal training at the Pugamp nursery through actually working in it at various stages. Also this nursery was on a foot-track heavily used by the local population, all of whom would have paid very close attention to its progress. PARD could not meet the demands for requests for seedlings from local people. From this experience PARD also established another large nursery in Kerowagi, Chimbu province. This nursery was opposite the local regional high school and informal demonstrations were given to students and teachers.
About 30 individuals underwent training in charcoal production in March 2011. As part of the follow-on Small Research Activity (FST/2011/058) the knowledge from this training has been transferred to two producer groups in Mt Hagen and ten producer groups around Lae and Morobe Province. The groups are made up of women and youths in urban settlements in Lae and landowner groups from Morobe and Mt Hagen. These people have also had training in nursery skills as they are being encourage to grow and harvest their own trees for charcoal production.
This project was the first contract for PARD working from Mt Hagen. From involvement in project PARD developed capacity to attract further (much larger) funding from EU for a micro-credit finance system and a national Agricultural Innovation Grant for integrating fuelwood into garden systems and extending it into Chimbu province. PARD are now set to be a major NGO providing community-based development activity in the region. ACIAR should consider PARD for further work in Western Highlands and Chimbu Provinces.
This project was also one of the first agricultural projects that HOPEworldwide was engaged with. HOPE has a very prominent profile in community health work around NCD and Chimbu Province, and its entry into agricultural work is a strategy to diversify and increase its connection with communities; not only providing health, but providing income through agriculture.
For the FRI staff involved in project, this was their first research activity that involved close working with landholders and community. They learned techniques of semi-structured interviews for gathering socioeconomic data and the processes of public extension activity.
Finally, the project also supported a J.Allwright Fellowship for Jessie Abiuda-Mitir, FRI Publications officer, to get a Masters in Science Communication from University of Melbourne. This enhanced her capacity to engage in forestry extension work. She has proven herself to be very capable in the area of community engagement and will be a valuable asset for FRI in this field.
8.3 Community impacts – now and in 5 years The immediate community impacts of the project are localised and modest. However, the longer term impact could be significant given certain conditions (see recommendations section 9.2), and these could begin to be realised within 5 years.
8.3.1 Economic impacts The knowledge generated by the fuelwood survey has potential to have great impact on the national energy policy if the results are can be made more widely known. It is not only a
Page 53 of 108
comprehensive survey of fuelwood use, but also includes information on people’s non-fuelwood energy choices. So it has great value for national energy planners. The differences between lowland and highland fuelwood markets revealed by the survey can be used to develop energy delivery programs that are sensitive to regional differences in need and capacity to change.
The survey also shows there is also great potential for developing a more sophisticated fuelwood market. It is a high volume market and a large proportion of the population is uses fuelwood domestically, even when alternatives are available, and use it for generating their incomes. There are no indications that this is likely to change in the foreseeable future. However, it is entirely informal and unregulated, and because of this it is likely that there can be great efficiencies in the delivery of affordable wood energy, especially to the urban populations. Along with these efficiencies are opportunities for small-business development in a better structured market. There is clearly room for a lot more targeted research how to achieve this goal. The fuelwood survey provides a rigorously quantified basis for such further research and development which could have significant national economic impact.
Realistically, most landholders would probably only invest in relatively small woodlots, at least in the beginning. It is also important to realise that the gross margin and profit of an enterprise is less concern to landholders than the return to labour and opportunities to generate social capital from an enterprise.
From Table 7.10 the return to labour of an E.grandis SRC fuelwood system is PGK43 /person/day which is much more favourable than the main alternatives in the highlands, viz: sweet potato at PGK21/person/day, and coffee at PGK15/person/day. Regardless of the size of the SRC woodlot it is a much more profitable use of farmer’s time than the conventional alternatives. A farmer could have two small garden-sized woodlots with staggered planting times to ensure an annual income from the SRC system. SRC woodlots require relatively small amounts of labour to manage a woodlot and the timing of labour input is not dependent on seasons. As landholders usually have a several income sources, SRC woodlots can be very compatible with other income-generation activities. A 4-year SRC fuelwood system (2 year primary crop, 2 year coppice crop) is also a good alternative to a grass fallow in those areas where fallowing is practiced. (Most of the nutrients in the trees are in the leaves and roots and these will be left on site).
An SRC fuelwood system provides a landholder social capital in the form of allowing neighbours and family to collect non-commercial branches for fuelwood. There are also opportunities for traditional reciprocal labour exchange in the main labour events such as planting and harvest.
While the participating groups in the SRC trials and farmer woodlots benefit greatly from sale of firewood and poles, these pilot systems were not spontaneously replicated by neighbours. In Mt Hagen there was extra production and sale of fuelwood seedlings, but no records were kept of where they went. Unfortunately it is likely there is still a mindset that the only way to establish something like this is if a project comes along to fund it.
The aim of the small research activity that was developed from this project (FST/2011/058) is to facilitate the establishment of charcoal producer groups in Mt Hagen and Lae. This will be the best chance to realise some real economic impact from the SRC trials. That project will not only provide training and assistance in setting up charcoal businesses, but also trains and supports participants in establishing SRC systems.
8.3.2 Social impacts The fuelwood survey gathered important, quantified information on domestic expenditure, income generation, and gender and conflict issues around fuelwood. The social impacts of

Page 54 of 108
National Fuelwood Policy (see recommendations in Section 9.2) would be profound and widely felt.
The social impact of SRC trials will depend of course on the adoption of SRC systems. However, regardless of the level of adoption it is likely that these businesses based on SRC systems will be still be “mens’ business” as is coffee production, and to a large extent fuelwood sales. SRC fuelwood systems are not likely to be an opportunity for women to gain economic independence. This is not a characteristic of SRC systems per se, but the prevailing socio-cultural dynamic in land ownership.
It must also be said that the current model of project work we use will not overcome this problem. International funders, including ACIAR, for all the right reasons stipulate that the research should engage communities, rather than individuals, and should seek gender balance (if not affirmative action for women). In process of designing a project these parameters are understood and affirmed by the in-country partners. They know they won’t get the funding unless they say they can deliver these results; and they probably believe they can do it.
However, despite all the best intentions of our local NGO partners of attracting gender-balanced community groups genuinely interested in “owning the trees and business idea”, we generally worked with individual male landholders. PNG is a highly culturally and socially diverse country. The main project workers from HOPE originated from Chimbu Province and Bougainville and were expected to liaise comfortably with Motu speaking people from Central Province. It appeared that even the PARD workers in Mt Hagen had limits to their comfort zones within clan lines (which, to their credit, tried to extend). The FRI researchers are a mix of highland and coastal heritage. They will attest to limits of their reach when they are outside their traditional cultural setting. In short, without proper training and support, it may be too much to expect PNG project workers to transcend the cultural limitations within which they live.
There needs to be a better understanding of ways to engage landholders in projects that are trying to develop forest-based entrepreneurship.
8.3.3 Environmental impacts The fuelwood survey identified most common fuelwood species, product categories and sources across the fuelwood-stressed urban and rural districts. Apart from the decline of mangroves around the NCD there is no strong evidence for natural forest decline as a result of fuelwood gathering. However, this situation is dynamic and we may witness the decline of traditional quality fuelwood sources such as Yar in the Waghi valley. In time this may well begin to impact forest structure or force people to use alternative fuel sources in agricultural areas. The survey provides a solid foundation for a plan for strategic fuelwood action that could ensure the fuelwood economy does not negatively impact natural forest.
The potential for a charcoal industry emerged from the SRC work. In countries like Africa charcoal production is often associated with deforestation. In PNG, as we are linking charcoal production with SRC systems, this is very unlikely to be a problem. The overriding environmental impact of charcoal production could be cleaner cooking areas and improved respiratory health.
8.4 Communication and dissemination activities These have been summarised in section 7.4. They are also fully described in the Appendix 11.2 Development of a Fuelwood Community of Practice.
Page 55 of 108
9 Conclusions and recommendations
9.1 Conclusions The key conclusions from the three project components are:
To describe and quantify the national fuelwood market.
• Fuelwood consumption is estimated to be1.8m3/person/year. Estimated annual expenditure on fuelwood over the surveyed districts in 2009 was K18.2million. The national estimate of the gross value of the wood consumed domestically (both purchased and freely collected) is K2,409 million/y in the years of the survey.
• Fuelwood will remain a dominant component of the energy sector in both rural and urban areas. In rural areas 10% of people earn income from selling fuelwood and 58% earn income using fuelwood. In urban areas 3% of people earn income from selling fuelwood, and another 26% earn income using fuelwood. Fuelwood remains in use alongside alternative energy sources such as kerosene, gas and electricity
• Access to fuelwood is becoming increasingly more difficult and leading to conflict especially in the highlands where the price of fuelwood can be very high.
• The fuelwood economy is simple and flat with very few intermediaries between collector and seller. There are possibilities to develop more efficient supply chains that would overcome some of the diseconomies of scale associated with a high number of low volume traders.
• While there is gender equity in both collection and purchase of fuelwood in NCD, in rural areas men are twice as likely to purchase fuelwood than women.
• Selling fuelwood is an easy market to enter. The most cited problem in the trade is transport of fuelwood to market. This problem might be overcome by more organised and capitalised traders.
• The fuelwood economy in PNG is very large and mostly informal. There is no government participation, intervention or regulation of the fuelwood market. While this means there is no institutional support for fuelwood traders at least there are no barriers or extra costs associated with permits to cut, transport and trade.
• Use of fuelwood for income generation is high among both urban (26%) and rural (58%) domestic respondents.. The proportions earning some income from selling fuelwood were 3% and 10% respectively.
• Access to fuelwood has become more difficult for 65% of urban and 41% of rural respondents over the 2 year period previous to the survey.
• 46% of sellers source fuelwood from their own land, 24% from natural forests and 22% buy some of the wood they sell
• 36% of sellers identified fuelwood sales as their sole source of income. 92% of sellers earned K5,000 or less in the previous 12 months.
Short-rotation coppicing fuelwood production systems Specific conclusions:
• Of the 10 species tested, the best production of firewood was from Eucalyptus grandis and E.robusta in WHP and E.tereticornis in the NCD, with values of 2.97, 2.55, and 0.92 m3 for a 500 m2 woodlot respectively at the denser spacing.

Page 56 of 108
• E.grandis and E.robusta produced best tree form in the WHP while E.pellita produced best form in NCD.
• Best coppice performance was observed in E.robusta in WHP and E.tereticornis in the NCD.
• The burning characteristics of SRC firewood and charcoal produced from it were also assessed, as well as an indication of how SRC firewood will appeal to consumers.
• In the highlands SRC firewood and charcoal production yield higher estimated returns to labour (43 and 24 Kina/person/day) compared with main alternative crops of sweet potato and coffee (21 and 15 Kina/person/day respectively).
• SRC pole production has a relatively low return to labour (16 Kina/person/day) but could complement SRC firewood and charcoal production as part of a thinning regime.
• The main limitation on the promulgation of SRC systems could be market acceptance and finding a small-business model that integrates well with the indigenous non-market economy.
• The poor growth rates around the NCD make a 2 year rotation cycle unfeasible.
Overall conclusion of SRC systems:
Short-rotation coppicing systems can produce firewood with very high returns to labour provided operators can market the wood effectively. Marketing will require thought to presentation and pricing as SRC firewood looks different than conventional firewood. The cooking value of this fast-grown wood is in practice at least equivalent to mature wood sold in the market, and it is much easier to handle, so consumers will eventually adopt it. The returns to labour of SRC charcoal is also high and SRC poles can be sold as an opportunistic secondary product from these systems. The SRC species of choice in the highlands are E.grandis and E.robusta, while around the NCD E.tereticornis provides best local yields.
SRC production systems could be integrated with village garden systems as a quasi-bush fallow or as an alternative to coffee production in the highlands. They present a business option that could be sustainably embedded within the indigenous non-market economy. They are most likely to be successful in highland areas where rainfall, growth rates and market price for firewood are all very high. The slower growth rates of SRC species in the NCD will mean that rotations will have to be a lot longer than 2 years. However, they could be a consideration for those households already engaged in supplying the NCD firewood market. Therefore their feasibility will depend largely on the availability of land and family labour.
Establish a community of practice which will ensure the wider adoption and long-term development of fuelwood production The conclusions of the activity under this objective are:
• Establishing a community of fuelwood practice is not easy within the existing forestry institutional framework because there is little capacity for extension and community engagement.
• More attention needs to be given to appropriate extension methods for different potential members of the fuelwood community of practice. Do not assume literacy means that all members of public will comprehend information delivered through literature.
• There needs to be a better understanding of ways to engage landholders in projects that are trying to develop forest-based entrepreneurship.
• The public showed a strong interest in charcoal stoves. While charcoal is not widely used there is a good body of institutional knowledge of this technology that is ready for promulgation
Page 57 of 108
9.2 Recommendations Firewood will remain a key component of PNG’s domestic energy economy for long into the foreseeable future, especially in rural areas. The way this firewood is accessed must change in response to population growth and increasing intensification of landuse otherwise there will increasing conflict over fuelwood, and unacceptable fuelwood prices and resource degradation. Its socio-economic value needs to be formally recognised and integrated into the domestic energy economy along with modern, imported fuels. Formal recognition is necessary so that market instruments can be devised to stimulate the growth of an efficient private sector based on a fuelwood resource of SRC woodlots and plantations.
The first step to achieve a more sustainable and efficient fuelwood industry would be for the PNG Government to develop a National Fuelwood Policy and appropriate implementation strategies.
Clearly, such a policy is not just a forestry issue, but embraces the sectors of: energy, agriculture, education, community development and regional economic development. Without pre-empting this policy, it seems that the Government intervention should not be of the sort to tax or regulate the flow of this trade, as people will easily find ways around these regulations. However, the Government of PNG could create conditions to encourage the organised private sector to invest in fuelwood trade and create economies of scale. The Government’s regulatory role would then be to ensure that this firewood is sustainably harvested or grown, and that actors in the informal market are still protected. Local and provincial governments could encourage the use of clean burning charcoal in public places (some local jurisdictions, eg Goroka, already prohibit firewood in market place).
The development of such a policy could be informed by further research, such as:
• Undertaking detailed modelling of local woodflows in communities to understand the role of regeneration of wood harvest from village gardens, bush fallows, natural forests, plantations, public areas. Such models would help pinpoint areas where fuelwood gathering is, or will be, causing deforestation and areas where fuelwood collection is buffered by natural regeneration.
• Conducting both econometric and social studies of the domestic energy market could explain the very large difference price (per kg) of fuelwood around the country, as well as help design market instruments to encourage the organised private sector to invest in the fuelwood market. Consumers’ choice about energy sources is very complicated and likely to concern much more than relative prices.
There is a need to understand the structures and processes required to establish effective and sustainable community-based, commercial entities in the forestry sector. This knowledge may be generated through an action learning process to facilitate the establishment of charcoal producer groups. The initial market for this charcoal would be hot-food vendors, as they will more readily appreciate the value of charcoal (smoke free, long-lasting consistent heat, light to carry). As the general public becomes acquainted with charcoal in the market place, it may also become a fuel for home use. Based on experience with community groups in this project, the best places to do this will be Mt Hagen and Lae. The fuelwood market is strong in both these centres. This idea has already been initiated in the small research activity developed as the current project concluded; FST/2011/058 Facilitating the establishment of charcoal producer groups in PNG.
However, regardless of what knowledge is gained by that exercise, the promotion of fuelwood knowledge and small business requires better institutional support than what currently exists. There is a need for developing an extension capacity in the government forestry sector. While individuals in the forestry sector in PNG may have the talent and interest to work with communities in the development of forest resources, the
Page 58 of 108
government forestry institutions are not well equipped for extension work. The development of this capacity will be enhanced it there is a natural and easy communication with the agricultural extension sector (i.e. with NARI), as much community-based forestry work will involve agroforestry systems which are embedded within agricultural practice.
Across both forestry and agriculture there could be further research into appropriate extension methods for Melanesian culture. The models of extension that apply to industrialised economies, or even developed in other emerging economies may not necessarily apply to PNG. Certainly the ‘diffusion of innovations’ model does not accommodate the complexity of indigenous non-market economy and cultural practice. We need research to get to the core motivating and facilitating change in PNG rural communities. This is an area of fundamental anthropological research into which ACIAR has not yet ventured. However, it needs to be done if any of ACIAR’s work is to gain traction in PNG.
On a more applied level, we know that the SRC-systems developed in this project “work” in that they deliver competitive returns to labour, at least in the highlands. A way to take advantage of this opportunity is to engage the industrial sector to invest in SRC-systems. For example, WR Carpenters state they are concerned about fuelwood shortages to supply their tea factories. A rural development project could be implemented around fuelwood out-growers using SRC-woodlots and alley-cropping systems based on Calliandra.
Furthermore, the knowledge generated by this project could be used as foundation for further work on community-based biomass-electricity generation. The majority of PNG’s rural electrification will be though locally distributed systems; these are mostly based on diesel generators, and a few on mini-hydro. Biomass gasification technology suitable for village application, that could use small diameter wood grown by farmers using SRC systems, is well-developed and available ‘off the shelf’ from India. An opportunity exists for exciting partnerships with PNG Power, PNGSEL and others in the national energy sector.

Page 59 of 108
10 References
10.1 References cited in report Alakali, J. S., G. T. Kachataiya and C. T. Kucha (2011). "Evaluation of powered charcoal
stove by using different biomass fuels." International Journal of Agricultural and Biological Engineering
Allen, B., R. Bourke and L. Hanson (2001). Dimensions of PNG village agriculture.
4(2): 9.
Food Security for Papua New Guinea
Bourke, R. (1985). "Food, coffee and casuarina: an agroforestry system from the Papua New Guinea highlands."
. R. Bourke, M. Allen and J. Salisbury. PNG University of Technology, Lae, Australian Centre for International Agricultural Research: 529-553.
Agroforestry Systems
Bourke, R. (1997). Management of fallow species composition with tree planting in PNG.
2(4): 6.
Resource Management in Asia-Pacific
Bourke, R., J. Gibson, A. Quartermain, K. Barclay, B. Alan and J. Kennedy (2009). Food consumption, production and imports.
. A. Casson. Canberra, Division of Pacific and Asian History, Research School for Pacific and Asian Studies, Australian National University.
Food and Agriculture in Papua New Guinea
Bourke, R. and T. Harwood, Eds. (2009).
. R. Bourke and B. Alan. Canberra, australia, ANU E Press.
Food and Agriculture in Papua New Guinea
Bourke, R. and A. Ramakrishna (2009). Sweetpotato in highlands agricultural systems of Papau New Guinea.
. Canberra, ANU E Press The Australian National University.
Soil fertility in sweetpotato-based cropping systems in the highlands of Papua New Guinea
Brouard, J. S., R. M. D. Jesus and N. C. Rossman (1989). "Eucalyptus Leucaena Mixture Experiment Ii. Wood Properties."
. G. Kirchhof. Canberra, Australian Centre for International Agricultural Research: 126.
International Tree Crops Journal
Cochran, W. and G. Cox (1957).
5(4): 7.
Experimental Designs
Curry, G. N. (2005). "Doing "business" in Papua New Guinea: the social embeddedness of small business enterprises."
. New York, Wiley.
Journal of Small Business and Entrepreneurship
FAO (1997).
18(2): 5.
Regional study on wood energy: Today and tomorrow in Asia.
Fleming, E. and J. Hardaker (1994).
Bangkok, Food and Agriculture Organisation of the United Nations Regional Wood Energy Development Programme in Asia.
Strategies for Melanisian Agriculture for 2010: Tough Choices.
Fuwape, J. A. and S. O. Akindele (1997). "Biomass yield and energy value of some fast-growing multipurpose trees in Nigeria."
Canberra, National Centre for Development Studies.
Biomass & Bioenergy
Gamser, M. and C. Harwood (1983). "The implementation of new energy technologies in developing nations: problems and policies in the introduction of charcoal in Papua New Guinea."
12(2): 5.
GeoJournal
Gamser, M. S. and C. Harwood (1982). Charcoal production and use in Papua New Guinea. Konedobu, PNG, Energy Planning Unity, Department of Minerals and Energy: 44.
7(1): 5.
Gardner, W. (1989). Fuelwood evluation using a simple crib test. Trees for the Tropics: Growing Australian Multipurpose Trees and Shrubs in Developing Counties. D. Boland. Canberra, Australian Centre for International Agricultural Research: 247.
Page 60 of 108
Gutteridge, R. and H. Shelton, Eds. (1994). Forage Tree Legumes in Tropical Agriculture
Hanson, L., B. Allen and R. Bourke (2001).
. Wallinford, UK, CAB International.
Papua New Guinea Rural Development Handbook
Harris, A. (1979). Charcoal production in Papua New Guinea: an assessment of selected sites, technologies and feedstocks. Port Moresby, PNG: 32.
. Canberra, Australian National University.
IPA. (2013). "Investment Promotion Authority of Papua New Guinea." Retrieved 22/02/2013, from http://www.ipa.gov.pg/.
Little, K. M. and R. A. W. Gardner (2003). "Coppicing ability of 20 Eucalyptus species grown at two high-altitude sites in South Africa." Canadian Journal of Forest Research
Manapangkec, R. (2012). Business plan for Mt Hagen charcoal producer-vendor groups.
33(2): 8.
As part of ACIAR project FST/2011/058 "Facilitating the Establishment of Charcoal Producer Groups in PNG"
Murphy, M. (2006).
. Mt Hagen, PNG, Peoples Action for Rural Development: 14.
What is free about fuelwood?: a critique
NAS (1977).
. PhD, Southern Cross University.
Leucaena: promising forage and tree crop for the tropics
Overfield, D. (1998). "An Investigation of the Household Economy: Coffee Production and Gender Relations in Papua New Guinea."
. Washington DC, National Academy of Sciences.
Journal of Development Studies
Pandey, D. (2002).
34(5): 18.
Fuelwood Studies in India: myth and reality
Sahunalu, P., B. Puriyakorn, P. Dhanmanonda and P. Hiranpan (1990). "Production of small size fuelwood from the thinning of Eucalyptus camaldulensis Dehnh. plantation."
. Jakarta, Center for International Forestry Research.
Kasetsart Journal, Natural Sciences
Sandrasegaran, K. (1966). "A fuelwood volume table for Eucalyptus robusta Sm."
24(3): 13.
Malay. Forester
Schonau, A. P. G. (1991). "Role of eucalypt plantations in timber supply and forest conservation in sub-Saharan Africa."
29(2): 3.
South African Forestry Journal
Shiver, B. D. and G. H. Brister (1992). "Tree and stand volume functions for Eucalyptus saligna."
156(1): 4.
Forest Ecology and Management
Sims, R. E. H. (1990). "Growing, harvesting and marketing coppice eucalyptus trees for fuelwood."
47(1-4): 12.
Solar & wind technology
Sims, R. E. H., T. G. Maiava and B. T. Bullock (2001). "Short rotation coppice tree species selection for woody biomass production in New Zealand."
7(1): 4.
Biomass and Bioenergy
Stubbings, J. A. and A. P. G. Schönau (1980). "Management of Short Rotation Coppice Crops of Eucalyptus grandis Hill ex Maiden."
20(5): 6.
South African Forestry Journal
Thapa, H. B. and N. Subedi (2001). "Growth and fuelwood production of Cassia siamea and Eucalyptus camaldulensis under short rotation in the eastern Terai of Nepal."
115(1): 8.
Banko Janakari
Tietema, T., M. Ditlhogo, C. Tibone and N. Mathalaza (1991). "Characteristics of eight firewood species of Botswana."
11(2): 7.
Biomass and Bioenergy
Wegener, M., G. Kirchoff and T. Wilson (2009). An analysis of village garden management in th Papua New Guinea highlands.
1(1): 41-46.
Soil fertility in sweetpotato-based cropping systems in the highlands of Papua New Guinea. G. Kirchhof. Canberra, Australian Centre for International Agricultural Rsearch: 88-94.
Page 61 of 108
Wimbush, S. H. (1948). "Blue Gum coppice for wood fuel." E. Afr. Agric. J.
Wood, T. and S. Baldwin (1985). "Fuelwood and charcoal use in developing countries."
13(3).
Annual Review of Energy
10.2 List of publications so far produced by project
10: 12.
Nuberg I and Gunn B (2009) Promoting diverse fuelwood production systems in Papua New Guinea APANews Asia-Pacific Agroforestry Newsletter No. 35: 11-1
Nuberg I, Gunn B and Bewang I (2009) Promoting diverse fuelwood production systems in Papua New Guinea. Paper presented to the Papua New Guinea National Research Institute forum on Community Transformation – Networking and Ownership in the Development Process, 16-18 June 2009. Port Moresby.
Nuberg IK, Gunn B, Tavune M, Sumareke A, Kravchuk O (2013) Evaluation of short-rotation coppicing fuelwood production systems for Papua New Guinea. Biomass and Bioenergy submitted 13/03/13
Nuberg IK (2013) Fuelwood use and markets of Papua New Guinea. Energy for Sustainable Development in preparation
Nuberg IK and Abiuda-Mitir J (2013) Development of agroforestry based micro-enterprises in Papua New Guinea. Agroforestry Systems to be submitted
Page 62 of 108
11 Appendixes
11.1 Appendix 1: Survey of Fuelwood-Stressed Regions of PNG This appendix is a stand-alone document separate from this report because its length is over 160 pages. It includes
• Key and specific findings of the survey (included in Final Report) • Details of survey methods and sampling rationale • All results presented in 90 tables and 32 figures • Analysis and discussion of these results • Record of the Fuelwood Survey Design Workshop held at FRI on 15-16 April 2008 • A paper delivered at this workshop on “Fuelwood surveys: lessons from other
countries” • Reproductions of the Questionnaire forms used in the survey
11.2 Appendix 2: Field trials of SRC systems
This appendix provides additional information about the field work that is not included in the main body of the report.
1. Site selection, description and history 2. Nursery training and management 3. Descriptions of main landholders and sites 4. A comparison of height and survival % of all species across all sites 5. Data and interpretation from evaluation of domestic users and firewood sellers
Site selection, description and history The difference in seasonal rainfall distribution between the NCD and Mt Hagen sites is illustrated in Figure 11.2.1
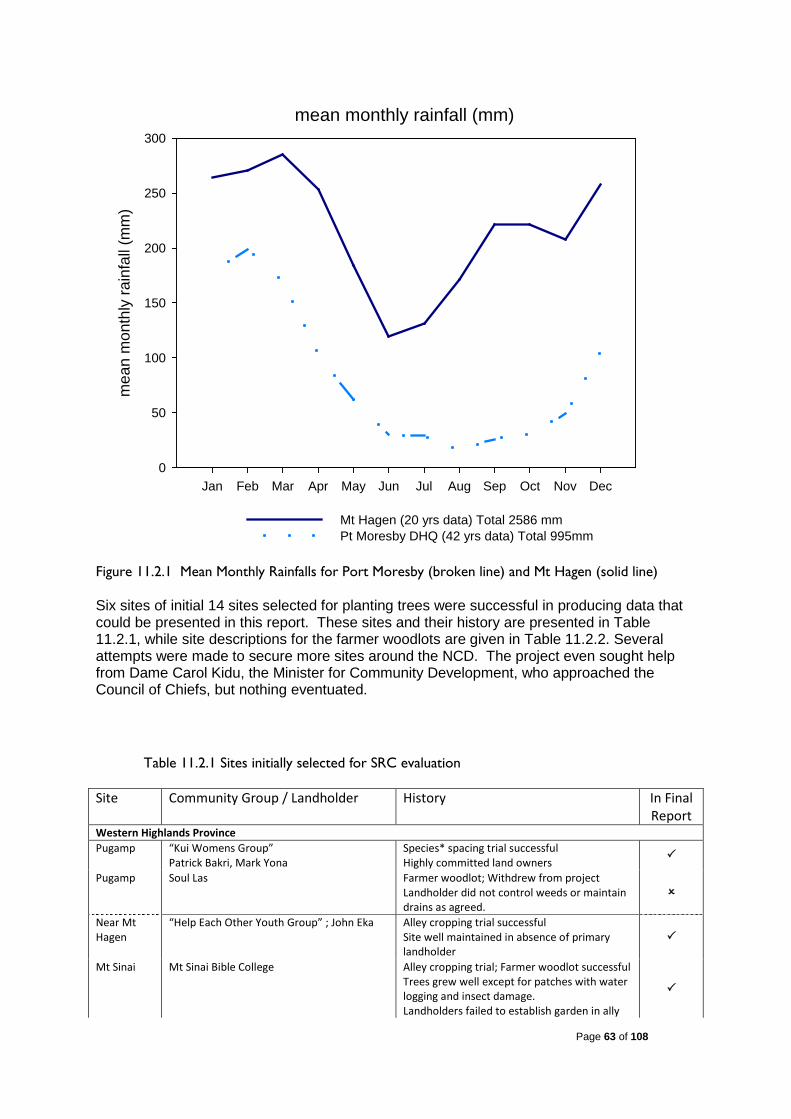
Page 63 of 108
mean monthly rainfall (mm)
Jan Feb Mar Apr May Jun Jul Aug Sep Oct Nov Dec
mea
n m
onth
ly ra
infa
ll (m
m)
0
50
100
150
200
250
300
Mt Hagen (20 yrs data) Total 2586 mmPt Moresby DHQ (42 yrs data) Total 995mm
Figure 11.2.1 Mean Monthly Rainfalls for Port Moresby (broken line) and Mt Hagen (solid line)
Six sites of initial 14 sites selected for planting trees were successful in producing data that could be presented in this report. These sites and their history are presented in Table 11.2.1, while site descriptions for the farmer woodlots are given in Table 11.2.2. Several attempts were made to secure more sites around the NCD. The project even sought help from Dame Carol Kidu, the Minister for Community Development, who approached the Council of Chiefs, but nothing eventuated.
Table 11.2.1 Sites initially selected for SRC evaluation
Site Community Group / Landholder History In Final Report
Western Highlands Province Pugamp “Kui Womens Group”
Patrick Bakri, Mark Yona Species* spacing trial successful Highly committed land owners
Pugamp Soul Las Farmer woodlot; Withdrew from project Landholder did not control weeds or maintain drains as agreed.
Near Mt Hagen
“Help Each Other Youth Group” ; John Eka Alley cropping trial successful Site well maintained in absence of primary landholder
Mt Sinai Mt Sinai Bible College Alley cropping trial; Farmer woodlot successful Trees grew well except for patches with water logging and insect damage. Landholders failed to establish garden in ally

Page 64 of 108
crop site Mt Hagen / Kimininga
Poimend Childrens Group
Alley cropping demonstration; Land ownership change during project
Phillip Farmer woodlot; did not manage trees well. Kept expecting handouts.
Mudfoot Clan; Piais Tikili Withdrew from project before planting Chimbu Province Kerowagi Kerowagi Secondary School Species demonstration destroyed by goats
Lack of commitment to continue
Barowagi Ulkamara Womens Group Alley cropping trial; Farmer woodlot successful National Capital District Bautama Manake Bore Species* spacing trial successful
Some fire damage despite fire breaks
Bomana Barbara Elias Species* spacing trial successful Significant flood damage, followed by fire and some theft of better trees
Taurama Ken Rabura Farmer woodlot. Withdrew from project; The landholders showed inconsistent commitment after grant of trees
Gaire Blocked from planting due to conflict over land Sabusa John Gaudi Guba Withdrawn before planting; too remote
Table 11.2.2 Sites and species for farmer woodlots and alley-gardens
Region Western Highlands, around Mt Hagen Chimbu Province Site Alley-garden Woodlot and Alley-garden Woodlot and Alley-garden Landowners John Eka Mt Sinai Bible College Ulkamara Womens Group Site description Moderate slope with
northern aspect. Lower part was ex-garden. Waterlogging evident
Two moderately sloping sites, with north and east aspects.
Woodlot to west of ridge on steep slopes with landslip evident. Alley-garden along the east face.
Soils Shallow loam over clay, requires drains to shed water
Shallow loam over clay. Some waterlogged patches
Shallow, stoney, eroded.
Species Calliandra calothrysus Leucaena diverisifolia
Calliandra calothrysus Leucaena diverisifolia Casuarina junghuhniana
Calliandra calothrysus Leucaena diverisifolia C.junghuhniana
2 Nursery training, management and measurements Staff of project partners received training in tree nursery construction and management and then raised seedlings for their sites in field nurseries. Seedlings (~ 6 month old) were planted in November 2008 (Highlands) and February 2009 (NCD).
Two field nurseries were established: one near the Pugamp Species*Spacing trial in Mt Hagen and the other , providing seedlings for the Bautama and Bomana trials, was in the backyard of as HOPE staff-member in Gerehu, Port Moresby. Training sessions in nursery establishment and management to PARD and HOPE staff were provided by Brian Gunn, Maman Tavune and Agnes Sumareke. FRI staff also monitored nursery progress.
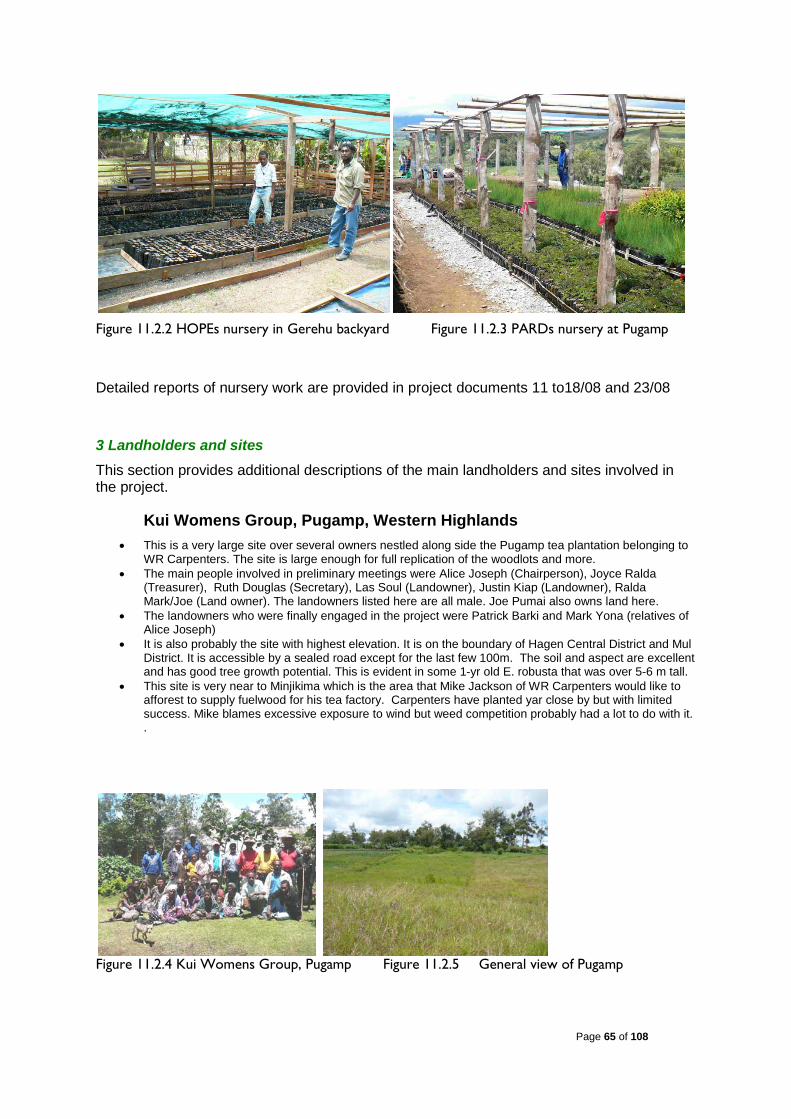
Page 65 of 108
Figure 11.2.2 HOPEs nursery in Gerehu backyard Figure 11.2.3 PARDs nursery at Pugamp
Detailed reports of nursery work are provided in project documents 11 to18/08 and 23/08
3 Landholders and sites This section provides additional descriptions of the main landholders and sites involved in the project.
Kui Womens Group, Pugamp, Western Highlands • This is a very large site over several owners nestled along side the Pugamp tea plantation belonging to
WR Carpenters. The site is large enough for full replication of the woodlots and more. • The main people involved in preliminary meetings were Alice Joseph (Chairperson), Joyce Ralda
(Treasurer), Ruth Douglas (Secretary), Las Soul (Landowner), Justin Kiap (Landowner), Ralda Mark/Joe (Land owner). The landowners listed here are all male. Joe Pumai also owns land here.
• The landowners who were finally engaged in the project were Patrick Barki and Mark Yona (relatives of Alice Joseph)
• It is also probably the site with highest elevation. It is on the boundary of Hagen Central District and Mul District. It is accessible by a sealed road except for the last few 100m. The soil and aspect are excellent and has good tree growth potential. This is evident in some 1-yr old E. robusta that was over 5-6 m tall.
• This site is very near to Minjikima which is the area that Mike Jackson of WR Carpenters would like to afforest to supply fuelwood for his tea factory. Carpenters have planted yar close by but with limited success. Mike blames excessive exposure to wind but weed competition probably had a lot to do with it. .
Figure 11.2.4 Kui Womens Group, Pugamp Figure 11.2.5 General view of Pugamp

Page 66 of 108
Figure 11.2.6 Planting day Figure 11.2.7 Harvest day
Figure 11.2.8 Site plan of the Pugamp Species * Spacing trial Left hand numbers indicate spacing between rows1= 1.0m ; 2 = 2.0m
Manaka Bore, Maratabu site near Bautama / Gereka, NCD Manaka is a farmer with larger plots of a wide variety of vegetables (watermelon, pumpkin, onion, tomato cabbage, ibeka greens etc) which he markets in Port Moresby. He is hardworking, enterprising and market savvy. His land is accessed by an unsealed road. The actual site offered is on the other side of the creek and not accessible with vehicle. He offered a large (>2ha), relatively open site with kunai grass on an alluvial soil in the loop of a large creek. He has an irrigation pump and also a bore nearby the proposed site. It has well structured soil with good drainage with the wet-season watertable about 2m below surface. A permanent firebreak around the woodlots will be important. There are termite mounds near the site and termite damage to pandanus trees but not apparently to the eucalypts.
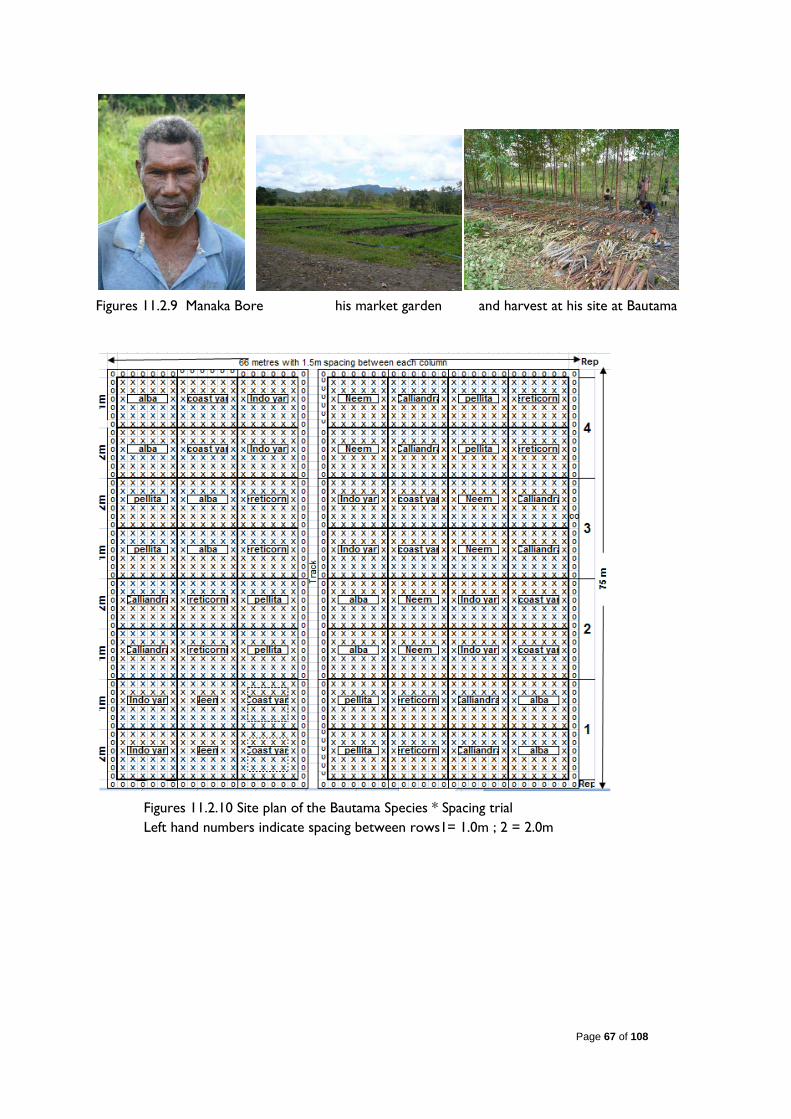
Page 67 of 108
Figures 11.2.9 Manaka Bore his market garden and harvest at his site at Bautama
Figures 11.2.10 Site plan of the Bautama Species * Spacing trial Left hand numbers indicate spacing between rows1= 1.0m ; 2 = 2.0m
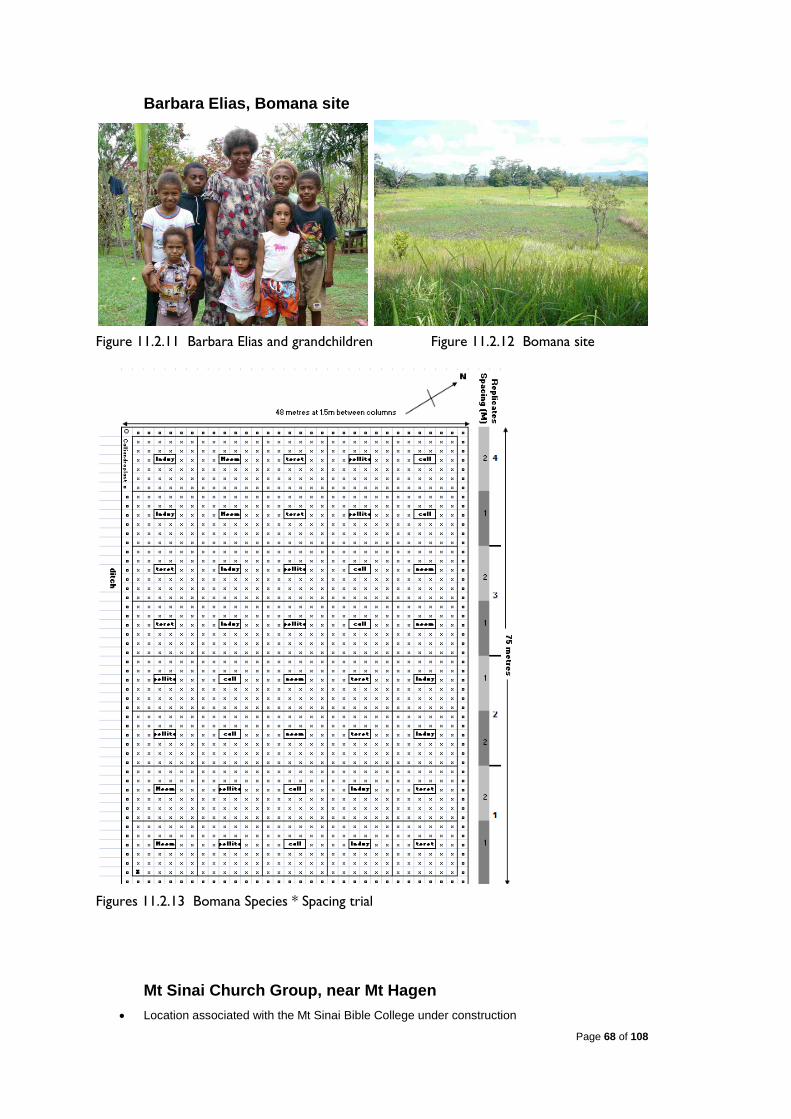
Page 68 of 108
Barbara Elias, Bomana site
Figure 11.2.11 Barbara Elias and grandchildren Figure 11.2.12 Bomana site
Figures 11.2.13 Bomana Species * Spacing trial
Mt Sinai Church Group, near Mt Hagen • Location associated with the Mt Sinai Bible College under construction

Page 69 of 108
• This is about 10-15km NE out of Mt Hagen on a sealed road. The key contact is Pastor Michael Moge and the land is owned by the bible college. Other people concerned with the project seem to be Paul Bras, Ivan Kuri, Nathan Radda, Joel Kute, Moses Keowa, Anis Tam.
• The site has a challenging steep area for the hedgerow alley cropping but relatively good sites for the woodlots. As the property has to accommodate gardens for students at the Bible College there maybe competition for good land between gardens and woodlots. This may impact on the adequate replication of woodlots for statistical purposes. If so we may need to reduce the number of species trialled at this site.
Figure 11.2.14 Mt Sinai community group Figure 11.2.15 Mt Sinai site, Ivan Kuri to the right of
picture
Help Each Other Youth Group (John Eka) near Mt Hagen • This is the Komkui clan community. The main contacts for this CBO are Markus Kiap (councillor), Jacob
Wari (community leader), Peter Kiap (landowner), John Eka (landowner). • This is a relatively steep sloping site adjacent a sealed road within 20 minutes Southwest of Mt Hagen.
The proposed sites are on a series of spurs which are close to the ridge top. There appear to be permanent creeks, and at this time of year the ground is subject to waterlogging on even steeply sloping areas. Drains will need to be cut for the woodlots and BCTG as is the custom for gardens anyway. .
Figure 11.2.15 Komkui community, Help Each Other Youth Group; Figure 11.2.16 Looking down on site for alley-garden

Page 70 of 108
Figure 11.2.17 Calliandra and Leucaena Alley garden at John Eka’s
Ulkamara site, near Kerowagi Chimbu Province
Figure 11.2.18 Ulkamara planting day Figure 11.2.19 Ulkamara after one year growth
Figure 11.2.20 Mud map of Ulkamara site
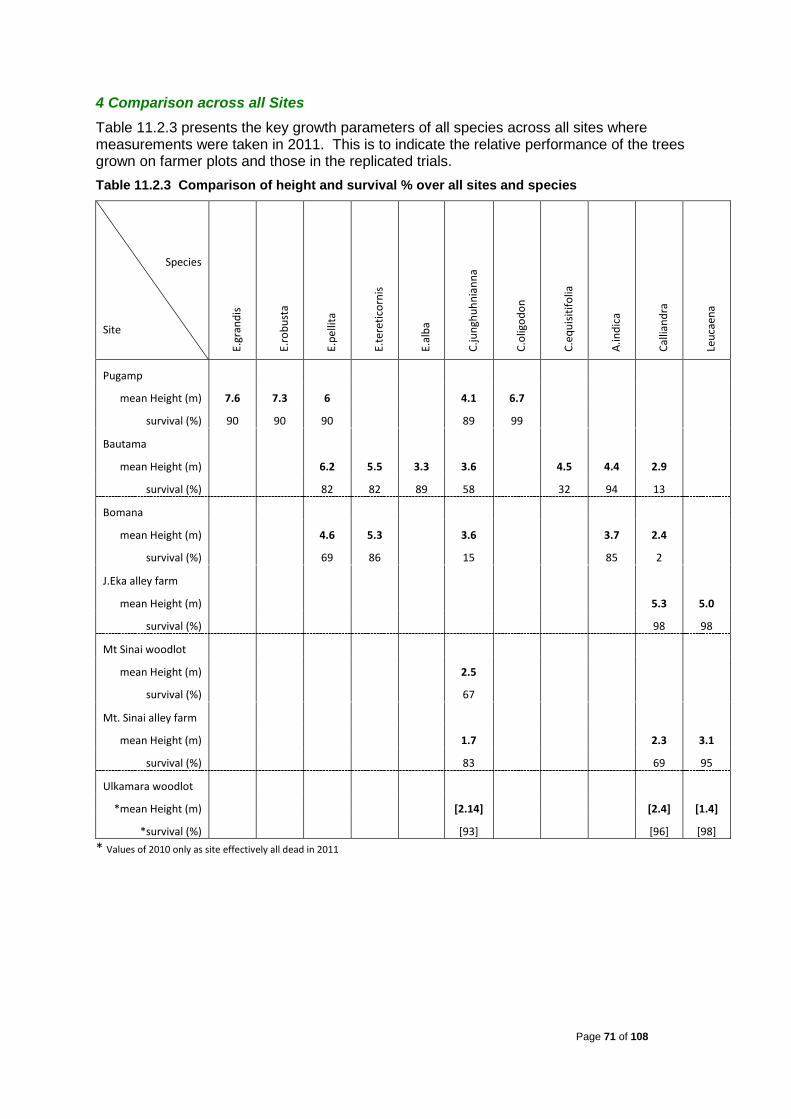
Page 71 of 108
4 Comparison across all Sites Table 11.2.3 presents the key growth parameters of all species across all sites where measurements were taken in 2011. This is to indicate the relative performance of the trees grown on farmer plots and those in the replicated trials. Table 11.2.3 Comparison of height and survival % over all sites and species
Species
Site
E.gr
andi
s
E.ro
bust
a
E.pe
llita
E.te
retic
orni
s
E.al
ba
C.ju
nghu
hnia
nna
C.ol
igod
on
C.eq
uisit
ifolia
A.in
dica
Calli
andr
a
Leuc
aena
Pugamp
mean Height (m) 7.6 7.3 6
4.1 6.7
survival (%) 90 90 90
89 99
Bautama
mean Height (m)
6.2 5.5 3.3 3.6
4.5 4.4 2.9
survival (%)
82 82 89 58
32 94 13
Bomana
mean Height (m)
4.6 5.3
3.6
3.7 2.4
survival (%)
69 86
15
85 2
J.Eka alley farm
mean Height (m)
5.3 5.0
survival (%)
98 98
Mt Sinai woodlot
mean Height (m)
2.5
survival (%)
67
Mt. Sinai alley farm
mean Height (m)
1.7
2.3 3.1
survival (%)
83
69 95
Ulkamara woodlot
*mean Height (m)
[2.14]
[2.4] [1.4]
*survival (%)
[93]
[96] [98] * Values of 2010 only as site effectively all dead in 2011
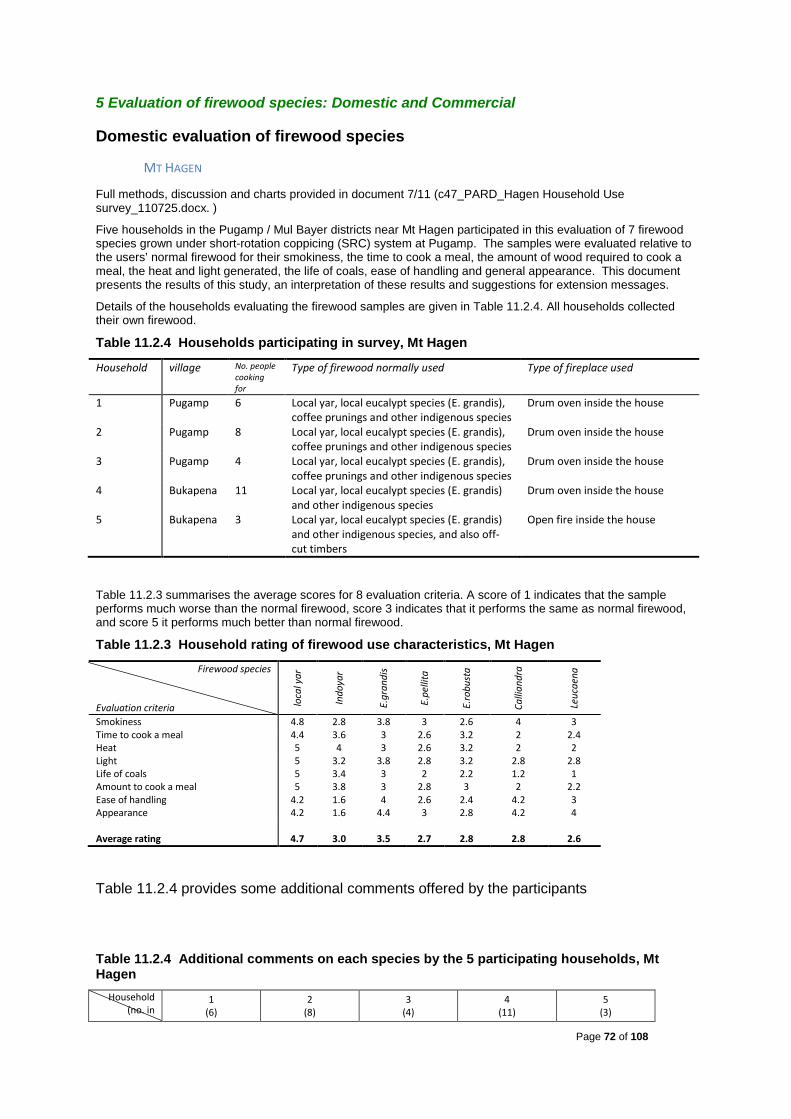
Page 72 of 108
5 Evaluation of firewood species: Domestic and Commercial
Domestic evaluation of firewood species
MT HAGEN
Full methods, discussion and charts provided in document 7/11 (c47_PARD_Hagen Household Use survey_110725.docx. )
Five households in the Pugamp / Mul Bayer districts near Mt Hagen participated in this evaluation of 7 firewood species grown under short-rotation coppicing (SRC) system at Pugamp. The samples were evaluated relative to the users’ normal firewood for their smokiness, the time to cook a meal, the amount of wood required to cook a meal, the heat and light generated, the life of coals, ease of handling and general appearance. This document presents the results of this study, an interpretation of these results and suggestions for extension messages.
Details of the households evaluating the firewood samples are given in Table 11.2.4. All households collected their own firewood.
Table 11.2.4 Households participating in survey, Mt Hagen
Household village No. people cooking for
Type of firewood normally used Type of fireplace used
1 Pugamp 6 Local yar, local eucalypt species (E. grandis), coffee prunings and other indigenous species
Drum oven inside the house
2 Pugamp 8 Local yar, local eucalypt species (E. grandis), coffee prunings and other indigenous species
Drum oven inside the house
3 Pugamp 4 Local yar, local eucalypt species (E. grandis), coffee prunings and other indigenous species
Drum oven inside the house
4 Bukapena 11 Local yar, local eucalypt species (E. grandis) and other indigenous species
Drum oven inside the house
5 Bukapena 3 Local yar, local eucalypt species (E. grandis) and other indigenous species, and also off-cut timbers
Open fire inside the house
Table 11.2.3 summarises the average scores for 8 evaluation criteria. A score of 1 indicates that the sample performs much worse than the normal firewood, score 3 indicates that it performs the same as normal firewood, and score 5 it performs much better than normal firewood.
Table 11.2.3 Household rating of firewood use characteristics, Mt Hagen
Firewood species Evaluation criteria lo
cal y
ar
Indo
yar
E.gr
andi
s
E.pe
llita
E.ro
bust
a
Calli
andr
a
Leuc
aena
Smokiness 4.8 2.8 3.8 3 2.6 4 3 Time to cook a meal 4.4 3.6 3 2.6 3.2 2 2.4 Heat 5 4 3 2.6 3.2 2 2 Light 5 3.2 3.8 2.8 3.2 2.8 2.8 Life of coals 5 3.4 3 2 2.2 1.2 1 Amount to cook a meal 5 3.8 3 2.8 3 2 2.2 Ease of handling 4.2 1.6 4 2.6 2.4 4.2 3 Appearance 4.2 1.6 4.4 3 2.8 4.2 4 Average rating 4.7 3.0 3.5 2.7 2.8 2.8 2.6
Table 11.2.4 provides some additional comments offered by the participants
Table 11.2.4 Additional comments on each species by the 5 participating households, Mt Hagen
Household (no. in
1 (6)
2 (8)
3 (4)
4 (11)
5 (3)

Page 73 of 108
house) Species
Leucaena
I used more woods (6-7 splits) to cook a meal compared to local yar (4-5 splits). I would prefer this firewood during dry season.
I used 6-7 non-splits/splits to cook a meal and there is no difference for product types that includes other firewood because we normally split bigger woods.
I used more woods (7-8 non-splits/splits) compared to local yar which is 4-5 splits to cook a meal. It took four days to finish the 2 bundles.
Used 6-7 splits and took four days. Its good for cooking meals but cannot produce enough heat to keep my house warm in the night.
This firewood burns out quickly so I add more firewood to cook a meal. Used 6-7 splits to cook a meal compared to my local yar which is 3-4 splits.
Calliandra
I used more woods (7-8 splits) to cook a meal compared to local yar. This firewood burns out quickly so I had to add more woods to cook my meal.
I used more woods (7-8) to cook a meal. This firewood is good to start fire with. It took 2 days to finish the two bundles.
I used more woods (7-8 non-splits/splits) to cook a meal. Dries quickly & easy to start fire. Its best to mix with other firewood to cook a meal. It not good to use in wet season as it will not produce enough heat to keep my house warm during the night.
This firewood burns out quickly so I add more firewood to cook a pot of kaukau. I used 7-8 splits. it took 3 days to finish two bundles. It cannot produce enough heat to keep my house warm during wet season when compared with our local yar.
This firewood burns out quickly so I add more woods to cook a meal. Its better to burn it together with other firewood (our local yar). I used 6-7 splits to cook a pot of kaukau.
Robusta
The bark should be removed before drying for ease of burning. The bark produced a lot of smoke.
I used the non-splits bundle to heat stones for mumu. The heat for this firewood was good, stones got hot quickly. Other bundle used for 3 days to cook meals.
This firewood is not good to start fire with so I used other materials. It has thick bark which produced a lot of smoke. It took four days to finish two bundles.
Bark is thick (bottom trunk) so its better remove bark before drying for ease of burning. Used 6-7 splits to cook and it took four days to finish two bundles.
The bark is thick so it should be removed before drying for ease of burning. The splits have thick bark (lower trunk) thus producing a lot of smoke.
Pellita
I used 5-6 woods to cook a meal like my normal firewood except local yar.
I used 6-7 splits to cook a meal. This firewood is not good to start fire with. Better to mix with local yar for cooking.
I used 6-7 non-splits/splits to cook a meal. It took four days to finish the two bundles.
I used 6-7 non-splits/splits to cook a meal and it took four days to finish two bundles. There is no difference for product types.
I used 5 splits to cook a pot of kaukau/rice. Good for cooking. The coals didn’t last long to keep my house warm.
Grandis
Good because I used 5-6 splits to cook a meal = is same as normal firewood except local yar, i.e, 4-5 splits.
I used 6-7 split same as my normal firewood. 5 days to finish the 2 bundles and its good for both dry & wet seasons.
I used 5-6 splits to cook a meal and this firewood is easy to start fire with (ignite fire).
I took 4 days to finish two bundles and I used 6-7 splits to cook a meal.
Used 4-5 splits to cook a pot of kaukau and 3 splits to boil a pot of tea for 3 people. Took 5 days to finish two bundles.
Indoyar
I like this firewood regardless of its appearance and ease of handling because it produced good heat and light. Also it can coppice unlike local yar.
This is my first time to use this firewood. It is difficult to split compared to our local yar & no difference for non-splits/splits. Its good this species coppice
I used 6 splits to cook a meal. This firewood is rough but is produced good heat. I like it because it can coppice.
I used 5-6 non-splits/splits to cook a pot of kaukau. Splitting is a bit difficult for this firewood. I like to plant this species as it can coppice
I used 4-5 splits to cook a meal. It took 5 days to finish the two bundles. No difference for product types. It is a bit difficult for splitting.
Local Yar
I used 4-5 woods to cook a pot of kaukau. This is my favourite firewood.
This is my favourite firewood because I used less number of woods (4-5) to cook a meal and it gives more heat and the coals last long. It’s good to use in both dry and wet seasons.
I used 5 splits to cook a meal. I prefer it for both dry and wet seasons. It also dries quickly compared to other firewood.
I used 5-6 non-splits/splits to cook a meal for 11 people compared to my normal firewood [not our local yar] which is 7-8 woods. It took four days to finish the two bundles. We only cook in the afternoons.
Used 3-4 splits to cook a meal & it took 6 days to finish two bundles. This is my favourite firewood.
INTERPRETATION
The households participating in the evaluation were very similar in what they classify as their normal firewood; i.e. a mixture of local yar, local eucalyptus (E.grandis) and indigenous species. Three households supplement this
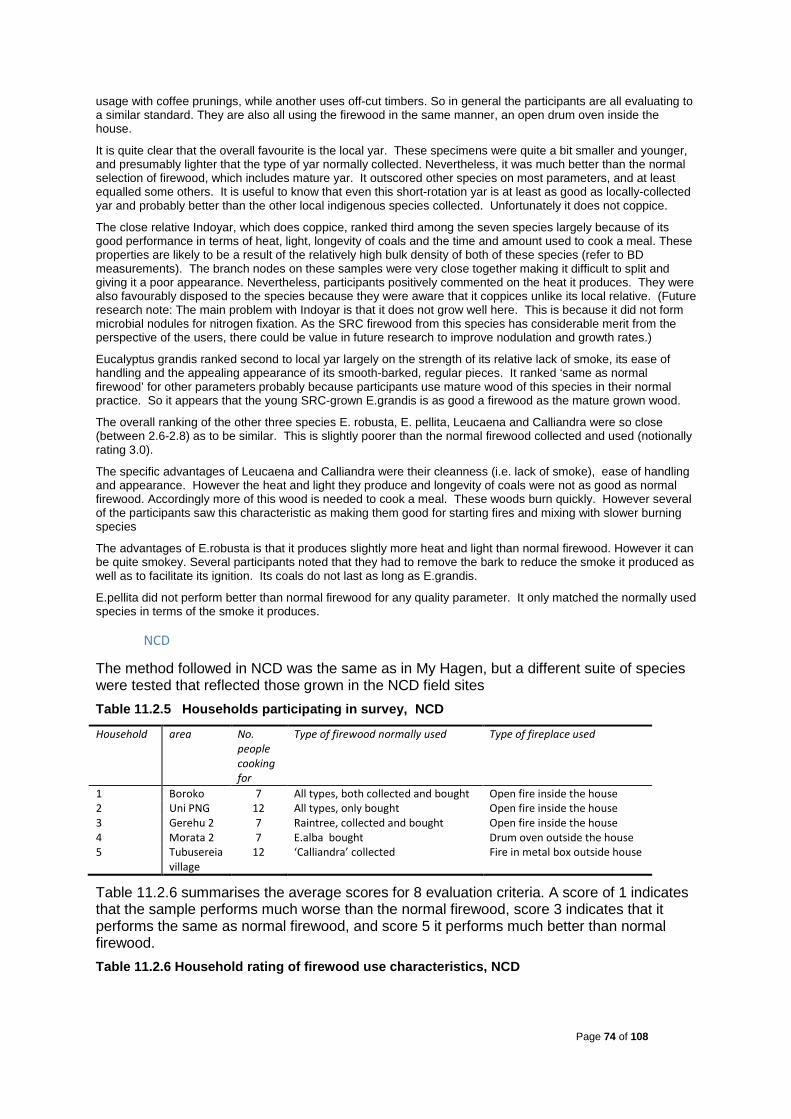
Page 74 of 108
usage with coffee prunings, while another uses off-cut timbers. So in general the participants are all evaluating to a similar standard. They are also all using the firewood in the same manner, an open drum oven inside the house.
It is quite clear that the overall favourite is the local yar. These specimens were quite a bit smaller and younger, and presumably lighter that the type of yar normally collected. Nevertheless, it was much better than the normal selection of firewood, which includes mature yar. It outscored other species on most parameters, and at least equalled some others. It is useful to know that even this short-rotation yar is at least as good as locally-collected yar and probably better than the other local indigenous species collected. Unfortunately it does not coppice.
The close relative Indoyar, which does coppice, ranked third among the seven species largely because of its good performance in terms of heat, light, longevity of coals and the time and amount used to cook a meal. These properties are likely to be a result of the relatively high bulk density of both of these species (refer to BD measurements). The branch nodes on these samples were very close together making it difficult to split and giving it a poor appearance. Nevertheless, participants positively commented on the heat it produces. They were also favourably disposed to the species because they were aware that it coppices unlike its local relative. (Future research note: The main problem with Indoyar is that it does not grow well here. This is because it did not form microbial nodules for nitrogen fixation. As the SRC firewood from this species has considerable merit from the perspective of the users, there could be value in future research to improve nodulation and growth rates.)
Eucalyptus grandis ranked second to local yar largely on the strength of its relative lack of smoke, its ease of handling and the appealing appearance of its smooth-barked, regular pieces. It ranked ‘same as normal firewood’ for other parameters probably because participants use mature wood of this species in their normal practice. So it appears that the young SRC-grown E.grandis is as good a firewood as the mature grown wood.
The overall ranking of the other three species E. robusta, E. pellita, Leucaena and Calliandra were so close (between 2.6-2.8) as to be similar. This is slightly poorer than the normal firewood collected and used (notionally rating 3.0).
The specific advantages of Leucaena and Calliandra were their cleanness (i.e. lack of smoke), ease of handling and appearance. However the heat and light they produce and longevity of coals were not as good as normal firewood. Accordingly more of this wood is needed to cook a meal. These woods burn quickly. However several of the participants saw this characteristic as making them good for starting fires and mixing with slower burning species
The advantages of E.robusta is that it produces slightly more heat and light than normal firewood. However it can be quite smokey. Several participants noted that they had to remove the bark to reduce the smoke it produced as well as to facilitate its ignition. Its coals do not last as long as E.grandis.
E.pellita did not perform better than normal firewood for any quality parameter. It only matched the normally used species in terms of the smoke it produces.
NCD
The method followed in NCD was the same as in My Hagen, but a different suite of species were tested that reflected those grown in the NCD field sites Table 11.2.5 Households participating in survey, NCD
Household area No. people cooking for
Type of firewood normally used Type of fireplace used
1 Boroko 7 All types, both collected and bought Open fire inside the house 2 Uni PNG 12 All types, only bought Open fire inside the house 3 Gerehu 2 7 Raintree, collected and bought Open fire inside the house 4 Morata 2 7 E.alba bought Drum oven outside the house 5 Tubusereia
village 12 ‘Calliandra’ collected Fire in metal box outside house
Table 11.2.6 summarises the average scores for 8 evaluation criteria. A score of 1 indicates that the sample performs much worse than the normal firewood, score 3 indicates that it performs the same as normal firewood, and score 5 it performs much better than normal firewood. Table 11.2.6 Household rating of firewood use characteristics, NCD
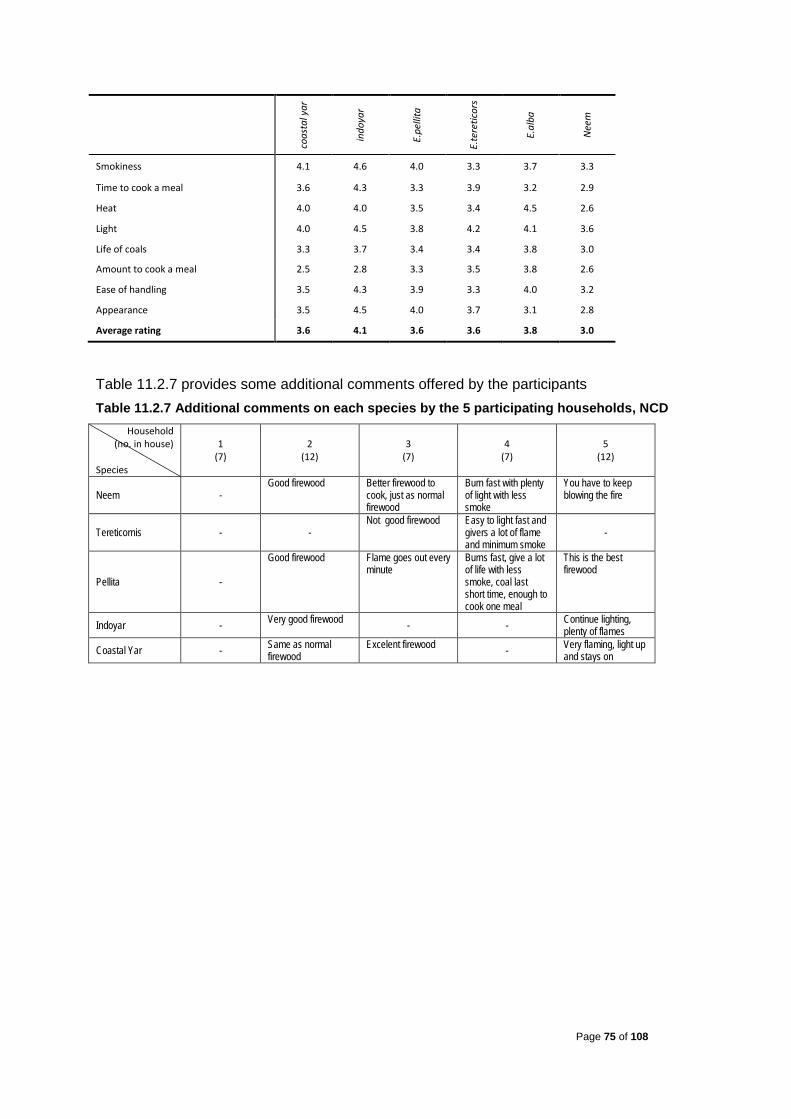
Page 75 of 108
co
asta
l yar
indo
yar
E.pe
llita
E.te
retic
ors
E.al
ba
Nee
m
Smokiness 4.1 4.6 4.0 3.3 3.7 3.3
Time to cook a meal 3.6 4.3 3.3 3.9 3.2 2.9
Heat 4.0 4.0 3.5 3.4 4.5 2.6
Light 4.0 4.5 3.8 4.2 4.1 3.6
Life of coals 3.3 3.7 3.4 3.4 3.8 3.0
Amount to cook a meal 2.5 2.8 3.3 3.5 3.8 2.6
Ease of handling 3.5 4.3 3.9 3.3 4.0 3.2
Appearance 3.5 4.5 4.0 3.7 3.1 2.8
Average rating 3.6 4.1 3.6 3.6 3.8 3.0
Table 11.2.7 provides some additional comments offered by the participants Table 11.2.7 Additional comments on each species by the 5 participating households, NCD
Household (no. in house)
Species
1 (7)
2 (12)
3 (7)
4 (7)
5 (12)
Neem - Good firewood Better firewood to
cook, just as normal firewood
Burn fast with plenty of light with less smoke
You have to keep blowing the fire
Tereticornis - - Not good firewood Easy to light fast and
givers a lot of flame and minimum smoke
-
Pellita -
Good firewood Flame goes out every minute
Burns fast, give a lot of life with less smoke, coal last short time, enough to cook one meal
This is the best firewood
Indoyar - Very good firewood - - Continue lighting, plenty of flames
Coastal Yar - Same as normal firewood
Excelent firewood - Very flaming, light up and stays on
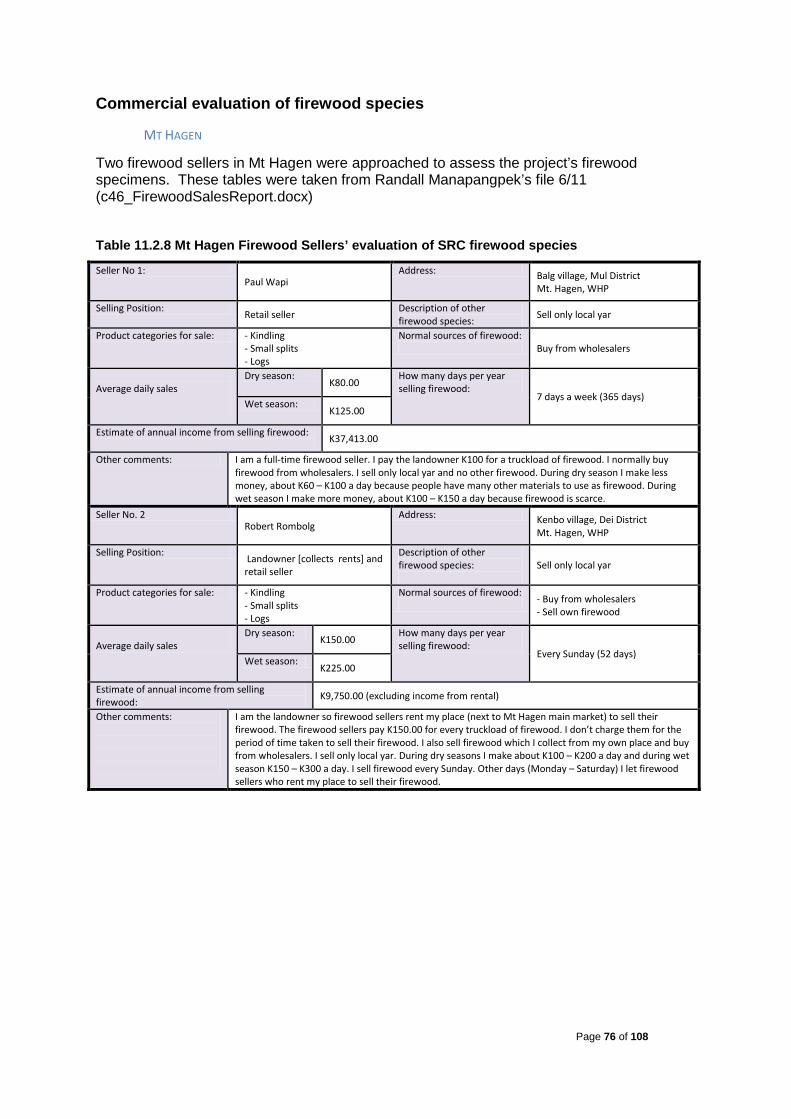
Page 76 of 108
Commercial evaluation of firewood species
MT HAGEN
Two firewood sellers in Mt Hagen were approached to assess the project’s firewood specimens. These tables were taken from Randall Manapangpek’s file 6/11 (c46_FirewoodSalesReport.docx)
Table 11.2.8 Mt Hagen Firewood Sellers’ evaluation of SRC firewood species
Seller No 1: Paul Wapi
Address: Balg village, Mul District Mt. Hagen, WHP
Selling Position: Retail seller Description of other firewood species: Sell only local yar
Product categories for sale: - Kindling - Small splits - Logs
Normal sources of firewood: Buy from wholesalers
Average daily sales
Dry season: K80.00
How many days per year selling firewood:
7 days a week (365 days) Wet season:
K125.00
Estimate of annual income from selling firewood: K37,413.00
Other comments: I am a full-time firewood seller. I pay the landowner K100 for a truckload of firewood. I normally buy firewood from wholesalers. I sell only local yar and no other firewood. During dry season I make less money, about K60 – K100 a day because people have many other materials to use as firewood. During wet season I make more money, about K100 – K150 a day because firewood is scarce.
Seller No. 2 Robert Rombolg
Address: Kenbo village, Dei District Mt. Hagen, WHP
Selling Position: Landowner [collects rents] and retail seller
Description of other firewood species:
Sell only local yar
Product categories for sale: - Kindling - Small splits - Logs
Normal sources of firewood: - Buy from wholesalers
- Sell own firewood
Average daily sales
Dry season: K150.00
How many days per year selling firewood:
Every Sunday (52 days) Wet season:
K225.00
Estimate of annual income from selling firewood: K9,750.00 (excluding income from rental)
Other comments:
I am the landowner so firewood sellers rent my place (next to Mt Hagen main market) to sell their firewood. The firewood sellers pay K150.00 for every truckload of firewood. I don’t charge them for the period of time taken to sell their firewood. I also sell firewood which I collect from my own place and buy from wholesalers. I sell only local yar. During dry seasons I make about K100 – K200 a day and during wet season K150 – K300 a day. I sell firewood every Sunday. Other days (Monday – Saturday) I let firewood sellers who rent my place to sell their firewood.
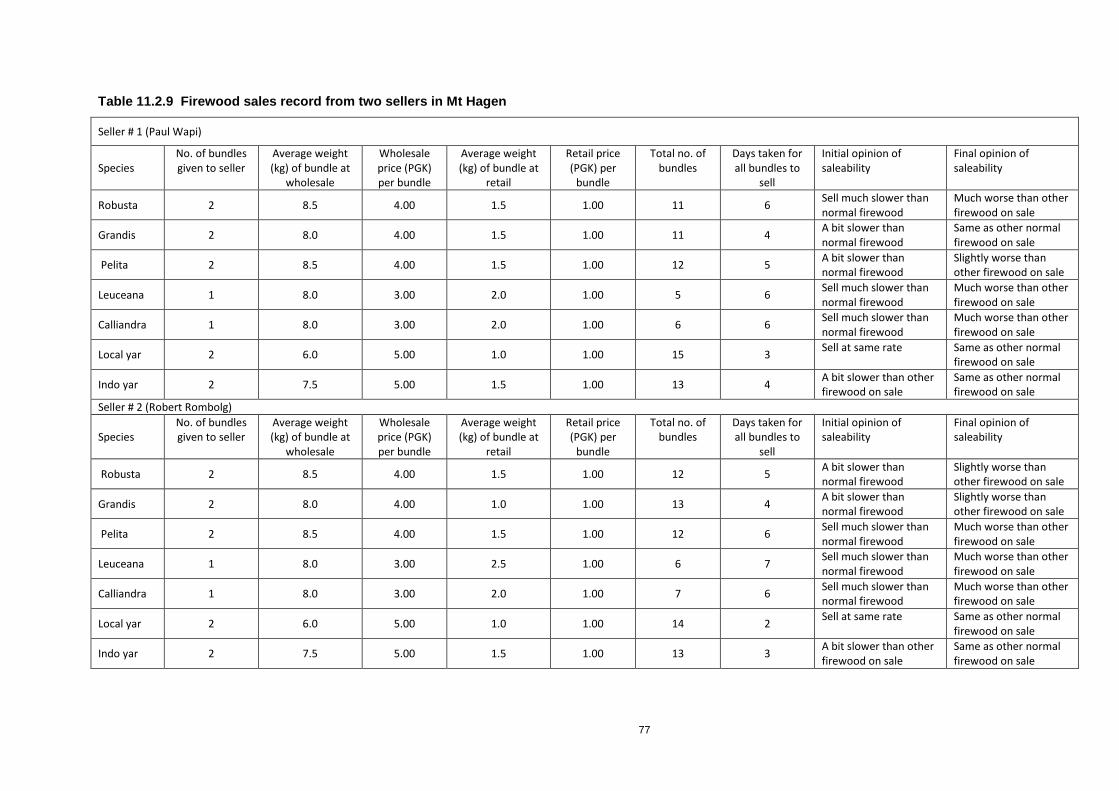
77
Table 11.2.9 Firewood sales record from two sellers in Mt Hagen
Seller # 1 (Paul Wapi)
Species No. of bundles given to seller
Average weight (kg) of bundle at
wholesale
Wholesale price (PGK) per bundle
Average weight (kg) of bundle at
retail
Retail price (PGK) per
bundle
Total no. of bundles
Days taken for all bundles to
sell
Initial opinion of saleability
Final opinion of saleability
Robusta 2 8.5 4.00 1.5 1.00 11 6 Sell much slower than normal firewood
Much worse than other firewood on sale
Grandis 2 8.0 4.00 1.5 1.00 11 4 A bit slower than normal firewood
Same as other normal firewood on sale
Pelita 2 8.5 4.00 1.5 1.00 12 5 A bit slower than normal firewood
Slightly worse than other firewood on sale
Leuceana 1 8.0 3.00 2.0 1.00 5 6 Sell much slower than normal firewood
Much worse than other firewood on sale
Calliandra 1 8.0 3.00 2.0 1.00 6 6 Sell much slower than normal firewood
Much worse than other firewood on sale
Local yar 2 6.0 5.00 1.0 1.00 15 3 Sell at same rate Same as other normal firewood on sale
Indo yar 2 7.5 5.00 1.5 1.00 13 4 A bit slower than other firewood on sale
Same as other normal firewood on sale
Seller # 2 (Robert Rombolg)
Species No. of bundles given to seller
Average weight (kg) of bundle at
wholesale
Wholesale price (PGK) per bundle
Average weight (kg) of bundle at
retail
Retail price (PGK) per
bundle
Total no. of bundles
Days taken for all bundles to
sell
Initial opinion of saleability
Final opinion of saleability
Robusta 2 8.5 4.00 1.5 1.00 12 5 A bit slower than normal firewood
Slightly worse than other firewood on sale
Grandis 2 8.0 4.00 1.0 1.00 13 4 A bit slower than normal firewood
Slightly worse than other firewood on sale
Pelita 2 8.5 4.00 1.5 1.00 12 6 Sell much slower than normal firewood
Much worse than other firewood on sale
Leuceana 1 8.0 3.00 2.5 1.00 6 7 Sell much slower than normal firewood
Much worse than other firewood on sale
Calliandra 1 8.0 3.00 2.0 1.00 7 6 Sell much slower than normal firewood
Much worse than other firewood on sale
Local yar 2 6.0 5.00 1.0 1.00 14 2 Sell at same rate Same as other normal firewood on sale
Indo yar 2 7.5 5.00 1.5 1.00 13 3 A bit slower than other firewood on sale
Same as other normal firewood on sale
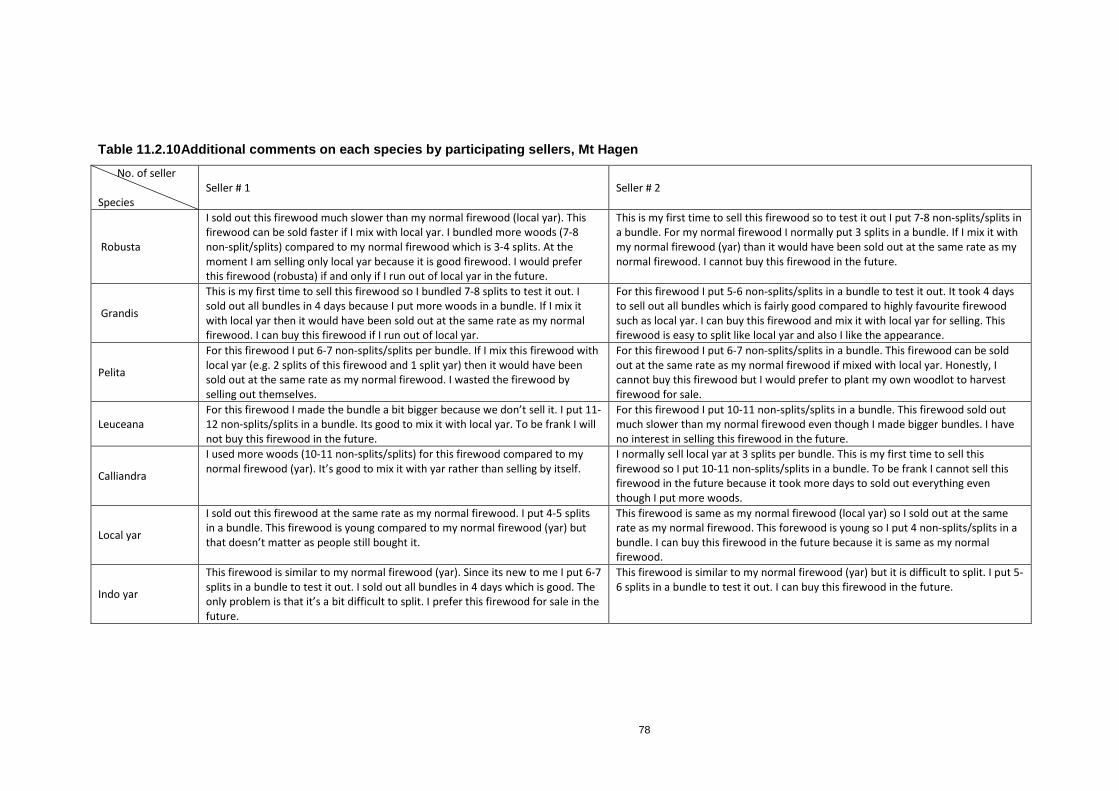
78
Table 11.2.10Additional comments on each species by participating sellers, Mt Hagen
No. of seller Species
Seller # 1 Seller # 2
Robusta
I sold out this firewood much slower than my normal firewood (local yar). This firewood can be sold faster if I mix with local yar. I bundled more woods (7-8 non-split/splits) compared to my normal firewood which is 3-4 splits. At the moment I am selling only local yar because it is good firewood. I would prefer this firewood (robusta) if and only if I run out of local yar in the future.
This is my first time to sell this firewood so to test it out I put 7-8 non-splits/splits in a bundle. For my normal firewood I normally put 3 splits in a bundle. If I mix it with my normal firewood (yar) than it would have been sold out at the same rate as my normal firewood. I cannot buy this firewood in the future.
Grandis
This is my first time to sell this firewood so I bundled 7-8 splits to test it out. I sold out all bundles in 4 days because I put more woods in a bundle. If I mix it with local yar then it would have been sold out at the same rate as my normal firewood. I can buy this firewood if I run out of local yar.
For this firewood I put 5-6 non-splits/splits in a bundle to test it out. It took 4 days to sell out all bundles which is fairly good compared to highly favourite firewood such as local yar. I can buy this firewood and mix it with local yar for selling. This firewood is easy to split like local yar and also I like the appearance.
Pelita
For this firewood I put 6-7 non-splits/splits per bundle. If I mix this firewood with local yar (e.g. 2 splits of this firewood and 1 split yar) then it would have been sold out at the same rate as my normal firewood. I wasted the firewood by selling out themselves.
For this firewood I put 6-7 non-splits/splits in a bundle. This firewood can be sold out at the same rate as my normal firewood if mixed with local yar. Honestly, I cannot buy this firewood but I would prefer to plant my own woodlot to harvest firewood for sale.
Leuceana For this firewood I made the bundle a bit bigger because we don’t sell it. I put 11-12 non-splits/splits in a bundle. Its good to mix it with local yar. To be frank I will not buy this firewood in the future.
For this firewood I put 10-11 non-splits/splits in a bundle. This firewood sold out much slower than my normal firewood even though I made bigger bundles. I have no interest in selling this firewood in the future.
Calliandra
I used more woods (10-11 non-splits/splits) for this firewood compared to my normal firewood (yar). It’s good to mix it with yar rather than selling by itself.
I normally sell local yar at 3 splits per bundle. This is my first time to sell this firewood so I put 10-11 non-splits/splits in a bundle. To be frank I cannot sell this firewood in the future because it took more days to sold out everything even though I put more woods.
Local yar
I sold out this firewood at the same rate as my normal firewood. I put 4-5 splits in a bundle. This firewood is young compared to my normal firewood (yar) but that doesn’t matter as people still bought it.
This firewood is same as my normal firewood (local yar) so I sold out at the same rate as my normal firewood. This forewood is young so I put 4 non-splits/splits in a bundle. I can buy this firewood in the future because it is same as my normal firewood.
Indo yar
This firewood is similar to my normal firewood (yar). Since its new to me I put 6-7 splits in a bundle to test it out. I sold out all bundles in 4 days which is good. The only problem is that it’s a bit difficult to split. I prefer this firewood for sale in the future.
This firewood is similar to my normal firewood (yar) but it is difficult to split. I put 5-6 splits in a bundle to test it out. I can buy this firewood in the future.
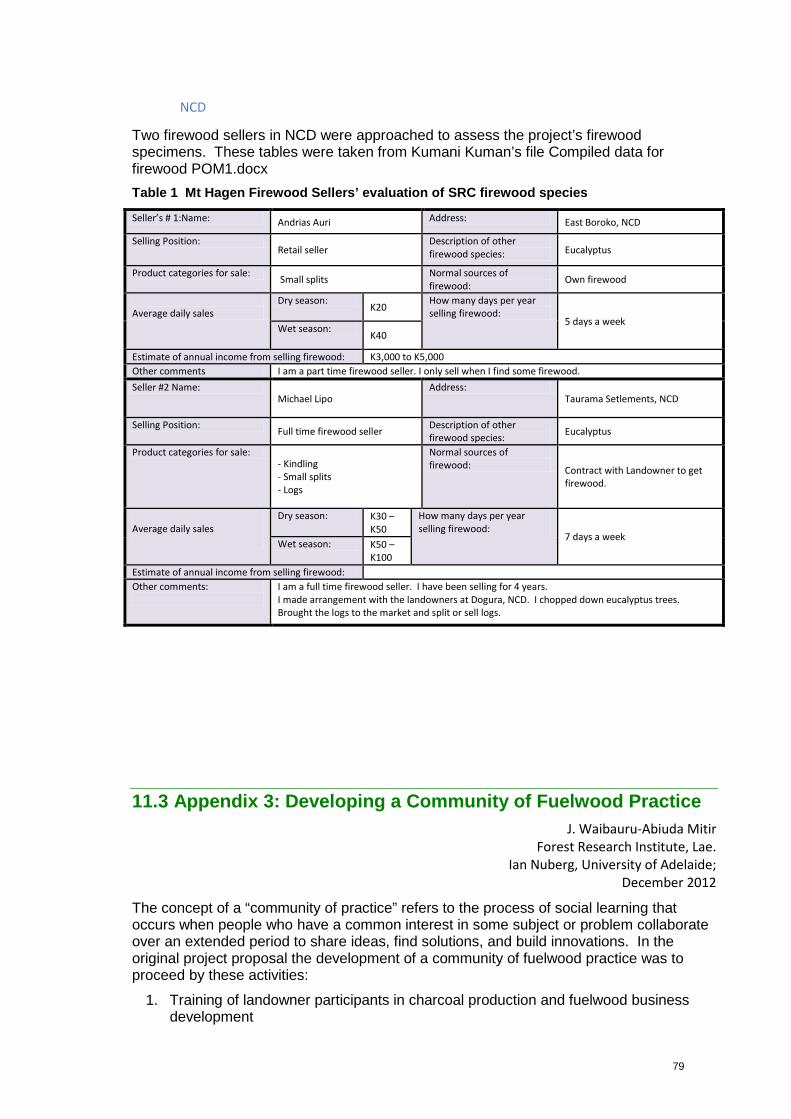
79
NCD
Two firewood sellers in NCD were approached to assess the project’s firewood specimens. These tables were taken from Kumani Kuman’s file Compiled data for firewood POM1.docx Table 1 Mt Hagen Firewood Sellers’ evaluation of SRC firewood species
Seller’s # 1:Name: Andrias Auri Address: East Boroko, NCD
Selling Position: Retail seller
Description of other firewood species: Eucalyptus
Product categories for sale: Small splits Normal sources of firewood: Own firewood
Average daily sales
Dry season: K20
How many days per year selling firewood:
5 days a week Wet season:
K40
Estimate of annual income from selling firewood: K3,000 to K5,000 Other comments I am a part time firewood seller. I only sell when I find some firewood. Seller #2 Name:
Michael Lipo Address:
Taurama Setlements, NCD
Selling Position: Full time firewood seller Description of other firewood species: Eucalyptus
Product categories for sale: - Kindling - Small splits - Logs
Normal sources of firewood: Contract with Landowner to get
firewood.
Average daily sales
Dry season: K30 – K50
How many days per year selling firewood:
7 days a week Wet season: K50 –
K100 Estimate of annual income from selling firewood: Other comments:
I am a full time firewood seller. I have been selling for 4 years. I made arrangement with the landowners at Dogura, NCD. I chopped down eucalyptus trees. Brought the logs to the market and split or sell logs.
11.3 Appendix 3: Developing a Community of Fuelwood Practice J. Waibauru-Abiuda Mitir
Forest Research Institute, Lae. Ian Nuberg, University of Adelaide;
December 2012
The concept of a “community of practice” refers to the process of social learning that occurs when people who have a common interest in some subject or problem collaborate over an extended period to share ideas, find solutions, and build innovations. In the original project proposal the development of a community of fuelwood practice was to proceed by these activities:
1. Training of landowner participants in charcoal production and fuelwood business development
80
2. Establish a National Fuelwood Network by identifying relevant actors and communication channels
3. Prepare a range of extension material for a range of target audiences; via the FRI website and pushing out the URL to development NGOs
As the project was firmly based in an action research framework these activities were revised as the project progressed. The first activity was abandoned because very few of the participating landholders showed enough interest and commitment to warrant the considerable investment of training courses. So this activity was revised to train the trainers, i.e. personnel in research and community development organisations that will spread the knowledge of charcoal technology as a part of their own activities.
In the process of developing extension material the team took the opportunity to present demonstrations at the Highlands Cultural Show in Mt Hagen (August 2011), the launch of the International Year of Forest and the Morobe Agricultural and Cultural show in Lae (October 2011). This also became an opportunity to evaluate how well the public can understand our extension material in such a context.
So the activities actually undertaken in the project and which are presented in the results are the following:
1. Training the Trainer of Charcoal Production;
2. Development of extension networks and material .
3. Evaluation of public understanding of SRC production systems and charcoal.
11.3.1 Training the Trainer of Charcoal Production Training of Trainers (TOT) is a method that is intended to train a group of people to reach out and impact others in the community about programme or project concepts. The fuelwood project has used the TOT method to equip Project Partners in charcoal production so that they can use the knowledge and skills to promote charcoal production in line with the project objectives.
The TOT in charcoal production is basically to enable the Project Partners in producing charcoal from the short rotation coppicing (SRC) tree species established in Pugamp (WHP), Bautama and Bomana in NCD amongst other sites of the fuelwood project providing alternative fuelwood energy for urban areas of Papua New Guinea, which can be produced by interested people as another source of income. However for the trainers, it is a challenge that they have to seriously consider not only within the life of the project but in the long-term as well.
This section describes the charcoal production training that was undertaken from 11th – 12th March 2011 at Mempanaron, Morobe Province, Papua New Guinea. The objective of this training was to train project partners from FRI, Hopeww and PARD as Trainers of charcoal production. This is in line with the project’s third objective: To establish a community of practice which will ensure the wider adoption and long-term development of fuelwood production.
Method The method for charcoal production was based on the Tongan Oil Drum Kiln, which is ‘low-capital, small scale method of producing charcoal from woods’(Gamser and Harwood, 1982)
1. Each of the 5 drums were cut about 20 cm wide along the vertical side. 2. The drums were placed on their sides with the openings facing the prevailing winds. 3. Fire was lit inside with the short woods added first followed by the longer ones. 4. As the fire burned progressively more firewood was added until the drums were full. 5. When there was more smoke, it was an indication of the fire being smothered and the need
for oxygen to revive the flame so the drums were turned facing the prevailing breeze to help keep the fire burning.
6. Charring had already started at the bottom of the drum 7. Finally there was no more space to add more woods as the burning became rapid. 8. At around 2pm the drums were sealed and rolled over with the openings facing the ground.
81
9. Spades were used to pack soil around the bottom of the drums to prevent smoke from escaping.
10. The drums were left over night to cool off. 11. The next morning the participants opened the drums and sorted the charcoals into grades
before bagging and weighing them.
Results The charcoals were sorted out manually based on their size and colour. Woods that were partially brown were placed aside to be burnt again. After the sorting the charcoals were placed on a wire, used as a sieve to remove the dust particles. Table 11.3.1 shows the charcoals graded out of each oven and the weights. The ovens were numbered from one (1) to five (5) and the charcoals grade from A-big (average of 8 cm), B-medium (average of 5 cm) and C-small (<5cm); and each graded charcoal weighed. The grading of the briquettes was not based on quality but the sizes that were produced during the charring.
Out of the five drums, a total of 92kg of charcoal was produced. The table further illustrates that more briquettes were produced as A-grade.
Table 11.3.1: Charcoal graded from Tongan Drum Kilns.
Oven # Grade Weight (kg) Oven # Grade Weight (kg)
1
A 7
4
A 16
B 6 B 2
C 3 C 1
Sub-total 16 Sub-total 19
2
A 14
5
A 21
B 1 B 2
C 1 C 2
Sub-total 16 Sub-total 25
3
A 13 Totals of each
grade
A 71
B 2 B 13
C 1 C 8
Sub-total 16 92
Cost of Charcoal As part of the charcoal activity we carried out a market research for charcoals sold in the local markets in Port Moresby (Hopeww), Madang, Goroka, Lae (FRI) and Mt Hagen (PARD). Using a simple questionnaire, we found that only major supermarkets and department store sold imported charcoal. Papindo (Goroka) was the only store that sold local made charcoals packed in shopping bags. Majority of charcoal users were Asians.
Table 11.3.2 shows cost of charcoal sold by the major stores in NCD, Mt Hagen, Goroka, Madang and Lae. In Lae, Alternate Technology for Community Development (ATCDI) confirmed two local villagers who produced charcoal and sold them in bulk to ATCDI who then sells it at a retail price of K1.50/kg. Majority of users are The PNG University of Technology staff.
Table 11.3.2: Charcoal costs at various retail outlets
# Location Wholsaler/Retailer Cost/kg Remarks 1 NCD Vision City K86.65/10kg
K63.40/ 5kg
Boroko Foodworld K29.50/4kg
2 Mt Hagen Brian Bell K49.00/3 kg Imported
3 Goroka Papindo K27/~3kg
Packed in a shopping Bag. Local (area unconfirmed)
82
K32.50/4kg Imported from NSW, Australia
K27.00 @ approx 2-3kg Check with Papindo HQ, Lae
5 Madang Brian Bell K36.00/3.5kg Imported from Vic, Australia
6 Lae Andersons foodland K32.30/4kg Black and Gold BBQ fuel - Imported NSW, Aust.
K42.25/4kg Heat Beads BBQ Briquettes - Imported from Australia
Discussion Bris Kanda’s General Manager Lukis Romaso was engaged to train the trainers. Lukis bought five 200L drums, each for K5 from Niugini Oil. The drums were than cut along the vertical side at a cost of K25/drum and transported to Mempanaron village in Tararang, Wampar District, which is about 60 kilometers out of Lae.
Lukis engaged Daniel Mokang through the Bris Kanda cocoa production project to assist with the training. The Mokang family own acres of land that produces cattle, which feed on Leucaena; and according to Lukis has a potential for producing charcoal. Although Leucaena produces very palatable, nutritious, high protein for cattle Lukis thinks it is a ‘pest’ and is growing abundantly; therefore it can be used to make charcoal.
The training was held in the cow paddocks in Mempanaron where we were surrounded by Leucaena trees, good shade to rest from the midday sun and discuss charcoal production, a creek to wash off the heat and dirt and cool prevailing breeze to help fan the flames in the oven.
Although the training was for trainers from FRI, Hopeww and PARD, the Mokang family and their extended family members of about 20 were there to witness and participate in the charcoal production. The trainers only produced the first drum of charcoal (oven#1). The rest of the charcoal was produced by the family members, while Jessie Abiuda Mitir showed the women how to set up one drum after Lukis’s first demonstration.
The training was very practical and the trainers did not do any theory before going out to do the actual production. However, they were told by Lukis that the hardest and driest wood was the best. To remove the moisture from the wood they had to be stacked cross ways for air to circulate. The woods had to be cut into sizable lengths to fit the drum. He told the participants that the method they were going to use was called ‘Tongan Kiln’.
While discussing the importance of charcoal to the local participants, one of their fears was the setback in market. Questions were raised on how to sell the product, who would be the buyers, where to sell the product, transportation, how they would package it and how much they would charge per kilo. These were vital questions that were discussed by Lukis and noted by the Trainers.
Conclusion Overall, the training was successful and met its objective of training the trainers with a bonus of training the locals as well. The lessons from the production and discussions are a baseline that can be used to the trainers’ advantage in future endeavors.
The training was also an eye opener for the trainers who learnt many things from a seasoned man like Lukis who has developed and produced charcoal stoves and charcoals when he was with Appropriate Technology Development Unit. The trainers are now equipped with the knowledge and skills to impact on interested charcoal producers; however, the onus is now on the trainers to assist those who are interested in producing charcoal as an alternative source of income.
Although the training was meant for the trainers, it was participation between the trainers and the local community, something we did not expect but fully appreciated. Daniel who was the spokes person was enthusiastic about the new found knowledge and is looking forward to producing charcoal and selling it. If the charcoal is going to be produced Lukis suggests they be labeled as organic charcoal. Trainers from FRI, Hopeww and PARD will have to provide vital market information to people such as Daniel who is a potential charcoal producer.
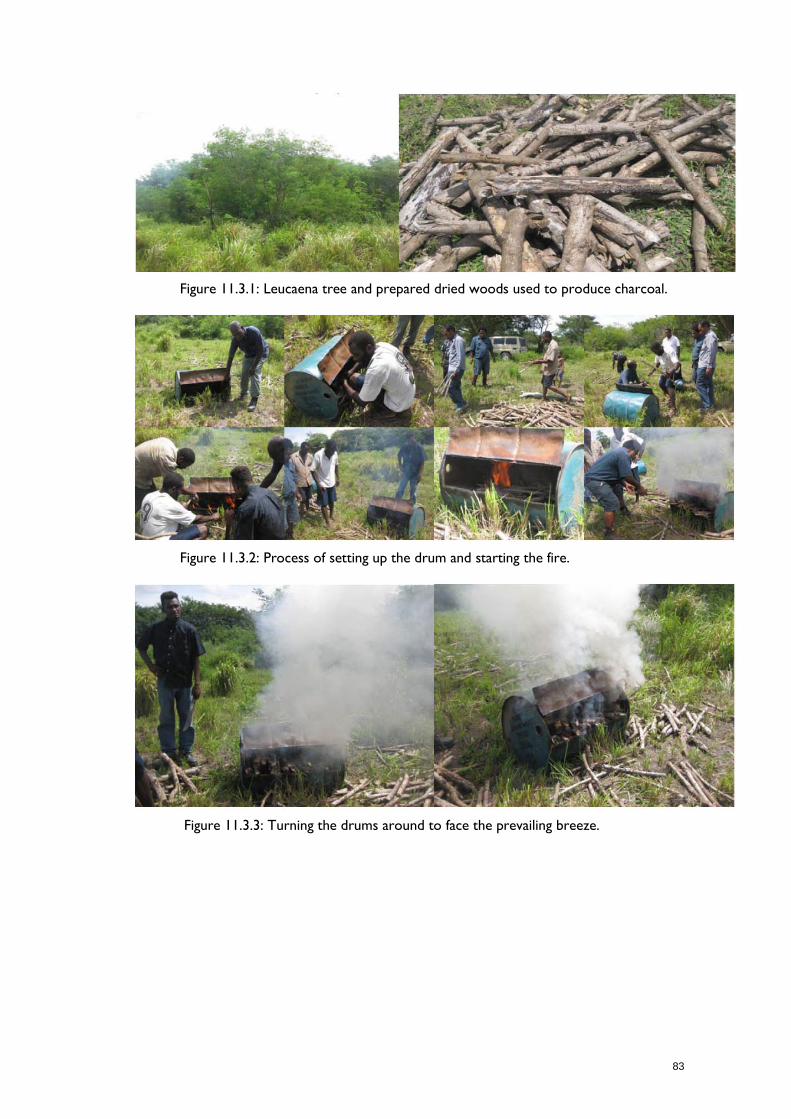
83
Figure 11.3.1: Leucaena tree and prepared dried woods used to produce charcoal.
Figure 11.3.2: Process of setting up the drum and starting the fire.
Figure 11.3.3: Turning the drums around to face the prevailing breeze.
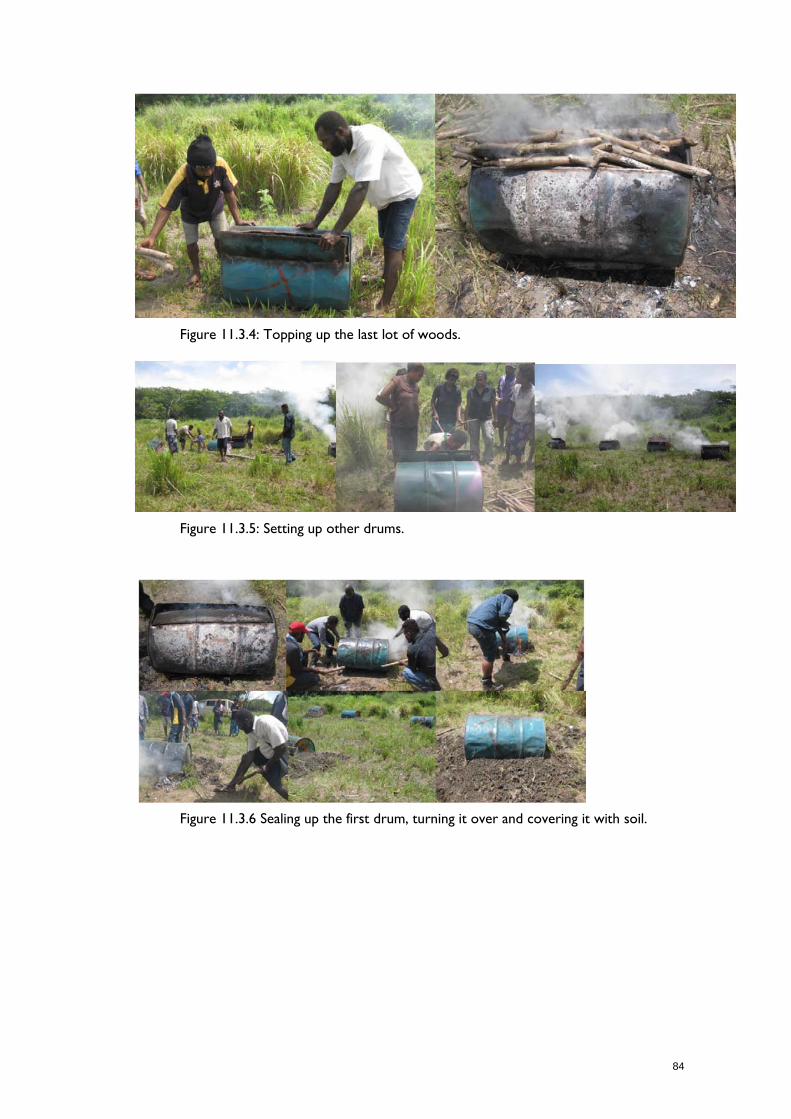
84
Figure 11.3.4: Topping up the last lot of woods.
Figure 11.3.5: Setting up other drums.
Figure 11.3.6 Sealing up the first drum, turning it over and covering it with soil.

85
Figure 11.3.7 Removing the charcoals and grading them.
Figure 11.3.8 Discussing charcoal production.
11.3.2 Development of extension networks and material.
Potential networks A community of fuelwood practice is will include individuals and groups directly involved in growing and selling fuelwood, and also stakeholders organisations whose mandate embraces the community development or environmental aspects of a fuelwood industry.
Table 3 lists some like government and large institutional stakeholders that are potential stakeholders in fuelwood knowledge, while Table 4. is a compilation of all appropriate NGOs. Table 5, is a list of individuals specifically interested in fuelwood and charcoal production identified during the Mt Hagen Cultural and Morobe Agricultural Shows and the Highlands road demonstration.
Table 11.3.3 List of potential government and larger institutional stakeholders in fuelwood knowledge.
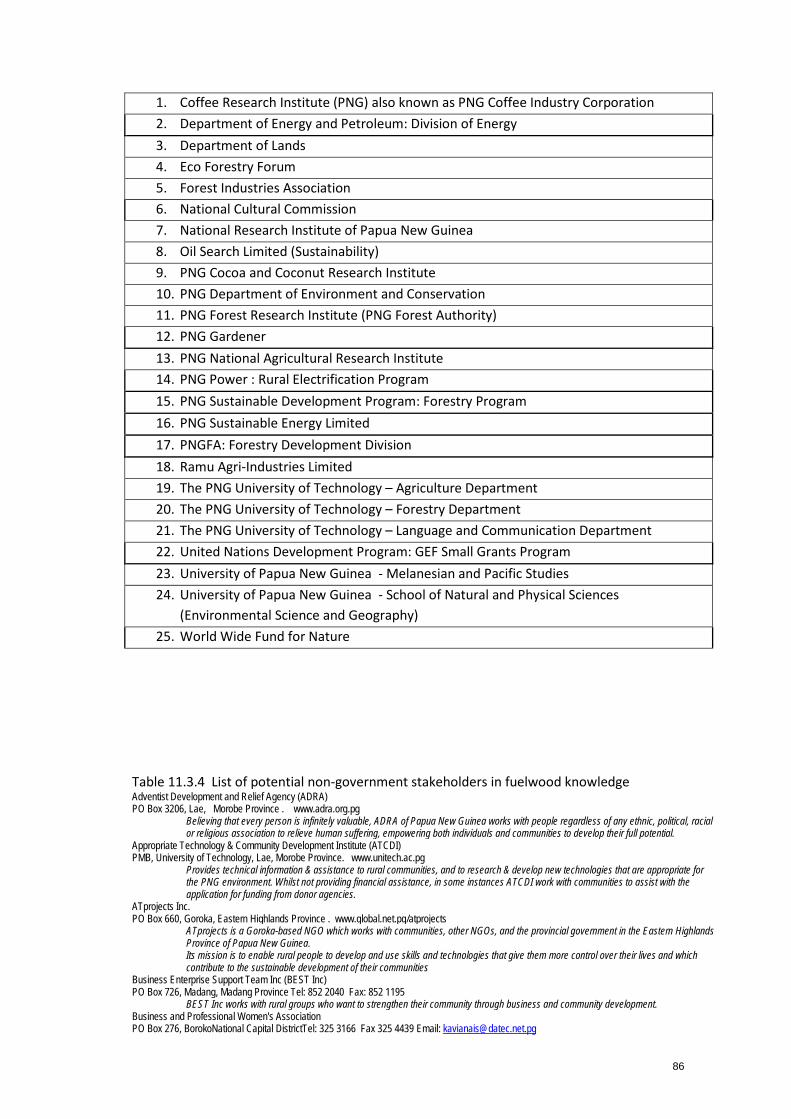
86
1. Coffee Research Institute (PNG) also known as PNG Coffee Industry Corporation 2. Department of Energy and Petroleum: Division of Energy 3. Department of Lands 4. Eco Forestry Forum 5. Forest Industries Association 6. National Cultural Commission 7. National Research Institute of Papua New Guinea 8. Oil Search Limited (Sustainability) 9. PNG Cocoa and Coconut Research Institute 10. PNG Department of Environment and Conservation 11. PNG Forest Research Institute (PNG Forest Authority) 12. PNG Gardener 13. PNG National Agricultural Research Institute 14. PNG Power : Rural Electrification Program 15. PNG Sustainable Development Program: Forestry Program 16. PNG Sustainable Energy Limited 17. PNGFA: Forestry Development Division 18. Ramu Agri-Industries Limited 19. The PNG University of Technology – Agriculture Department 20. The PNG University of Technology – Forestry Department 21. The PNG University of Technology – Language and Communication Department 22. United Nations Development Program: GEF Small Grants Program 23. University of Papua New Guinea - Melanesian and Pacific Studies 24. University of Papua New Guinea - School of Natural and Physical Sciences
(Environmental Science and Geography) 25. World Wide Fund for Nature
Table 11.3.4 List of potential non-government stakeholders in fuelwood knowledge Adventist Development and Relief Agency (ADRA) PO Box 3206, Lae, Morobe Province . www.adra.org.pg Believing that every person is infinitely valuable, ADRA of Papua New Guinea works with people regardless of any ethnic, political, racial
or religious association to relieve human suffering, empowering both individuals and communities to develop their full potential. Appropriate Technology & Community Development Institute (ATCDI) PMB, University of Technology, Lae, Morobe Province. www.unitech.ac.pg Provides technical information & assistance to rural communities, and to research & develop new technologies that are appropriate for
the PNG environment. Whilst not providing financial assistance, in some instances ATCDI work with communities to assist with the application for funding from donor agencies.
ATprojects Inc. PO Box 660, Goroka, Eastern Highlands Province . www.global.net.pg/atprojects ATprojects is a Goroka-based NGO which works with communities, other NGOs, and the provincial government in the Eastern Highlands
Province of Papua New Guinea. Its mission is to enable rural people to develop and use skills and technologies that give them more control over their lives and which contribute to the sustainable development of their communities
Business Enterprise Support Team Inc (BEST Inc) PO Box 726, Madang, Madang Province Tel: 852 2040 Fax: 852 1195 BEST Inc works with rural groups who want to strengthen their community through business and community development. Business and Professional Women's Association PO Box 276, BorokoNational Capital DistrictTel: 325 3166 Fax 325 4439 Email: [email protected]
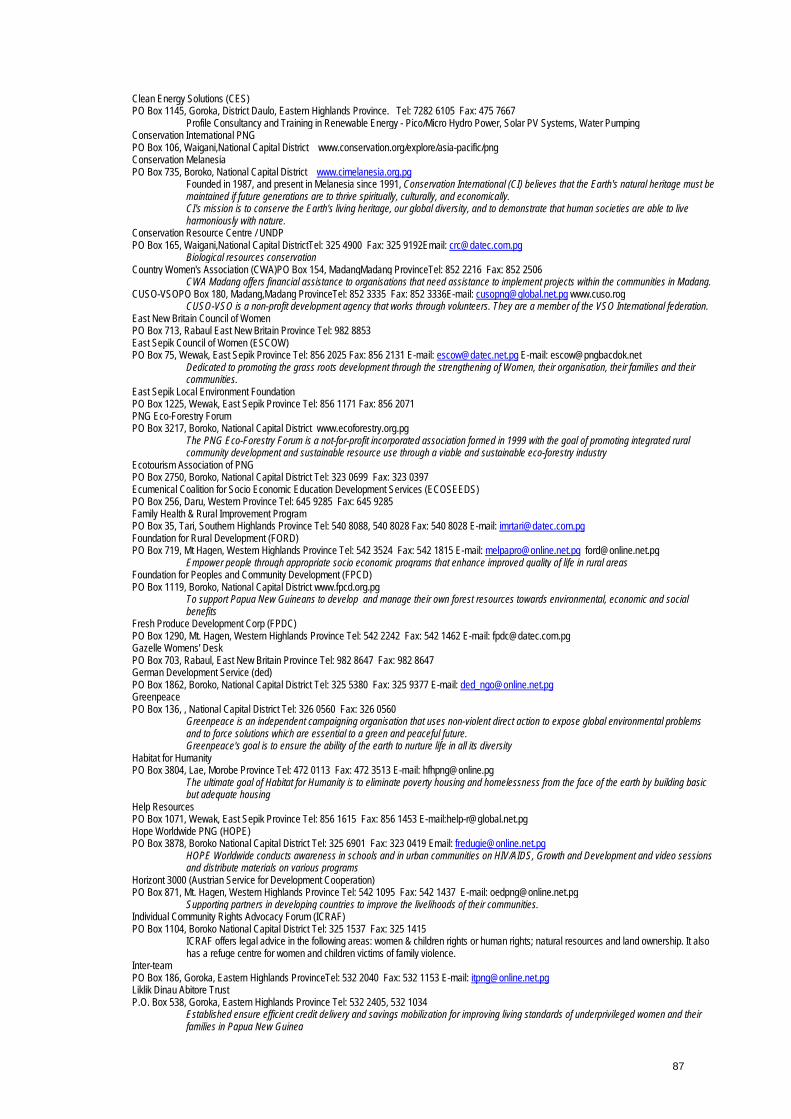
87
Clean Energy Solutions (CES) PO Box 1145, Goroka, District Daulo, Eastern Highlands Province. Tel: 7282 6105 Fax: 475 7667 Profile Consultancy and Training in Renewable Energy - Pico/Micro Hydro Power, Solar PV Systems, Water Pumping Conservation International PNG PO Box 106, Waigani,National Capital District www.conservation.org/explore/asia-pacific/png Conservation Melanesia PO Box 735, Boroko, National Capital District www.cimelanesia.org.pg Founded in 1987, and present in Melanesia since 1991, Conservation International (CI) believes that the Earth's natural heritage must be
maintained if future generations are to thrive spiritually, culturally, and economically. CI's mission is to conserve the Earth's living heritage, our global diversity, and to demonstrate that human societies are able to live harmoniously with nature.
Conservation Resource Centre / UNDP PO Box 165, Waigani,National Capital DistrictTel: 325 4900 Fax: 325 9192Email: [email protected] Biological resources conservation Country Women's Association (CWA)PO Box 154, MadangMadang ProvinceTel: 852 2216 Fax: 852 2506 CWA Madang offers financial assistance to organisations that need assistance to implement projects within the communities in Madang. CUSO-VSOPO Box 180, Madang,Madang ProvinceTel: 852 3335 Fax: 852 3336E-mail: [email protected] www.cuso.rog CUSO-VSO is a non-profit development agency that works through volunteers. They are a member of the VSO International federation. East New Britain Council of Women PO Box 713, Rabaul East New Britain Province Tel: 982 8853 East Sepik Council of Women (ESCOW) PO Box 75, Wewak, East Sepik Province Tel: 856 2025 Fax: 856 2131 E-mail: [email protected] E-mail: [email protected] Dedicated to promoting the grass roots development through the strengthening of Women, their organisation, their families and their
communities. East Sepik Local Environment Foundation PO Box 1225, Wewak, East Sepik Province Tel: 856 1171 Fax: 856 2071 PNG Eco-Forestry Forum PO Box 3217, Boroko, National Capital District www.ecoforestry.org.pg The PNG Eco-Forestry Forum is a not-for-profit incorporated association formed in 1999 with the goal of promoting integrated rural
community development and sustainable resource use through a viable and sustainable eco-forestry industry Ecotourism Association of PNG PO Box 2750, Boroko, National Capital District Tel: 323 0699 Fax: 323 0397 Ecumenical Coalition for Socio Economic Education Development Services (ECOSEEDS) PO Box 256, Daru, Western Province Tel: 645 9285 Fax: 645 9285 Family Health & Rural Improvement Program PO Box 35, Tari, Southern Highlands Province Tel: 540 8088, 540 8028 Fax: 540 8028 E-mail: [email protected] Foundation for Rural Development (FORD) PO Box 719, Mt Hagen, Western Highlands Province Tel: 542 3524 Fax: 542 1815 E-mail: [email protected] [email protected] Empower people through appropriate socio economic programs that enhance improved quality of life in rural areas Foundation for Peoples and Community Development (FPCD) PO Box 1119, Boroko, National Capital District www.fpcd.org.pg To support Papua New Guineans to develop and manage their own forest resources towards environmental, economic and social
benefits Fresh Produce Development Corp (FPDC) PO Box 1290, Mt. Hagen, Western Highlands Province Tel: 542 2242 Fax: 542 1462 E-mail: [email protected] Gazelle Womens' Desk PO Box 703, Rabaul, East New Britain Province Tel: 982 8647 Fax: 982 8647 German Development Service (ded) PO Box 1862, Boroko, National Capital District Tel: 325 5380 Fax: 325 9377 E-mail: [email protected] Greenpeace PO Box 136, , National Capital District Tel: 326 0560 Fax: 326 0560 Greenpeace is an independent campaigning organisation that uses non-violent direct action to expose global environmental problems
and to force solutions which are essential to a green and peaceful future. Greenpeace's goal is to ensure the ability of the earth to nurture life in all its diversity
Habitat for Humanity PO Box 3804, Lae, Morobe Province Tel: 472 0113 Fax: 472 3513 E-mail: [email protected] The ultimate goal of Habitat for Humanity is to eliminate poverty housing and homelessness from the face of the earth by building basic
but adequate housing Help Resources PO Box 1071, Wewak, East Sepik Province Tel: 856 1615 Fax: 856 1453 E-mail:[email protected] Hope Worldwide PNG (HOPE) PO Box 3878, Boroko National Capital District Tel: 325 6901 Fax: 323 0419 Email: [email protected] HOPE Worldwide conducts awareness in schools and in urban communities on HIV/AIDS, Growth and Development and video sessions
and distribute materials on various programs Horizont 3000 (Austrian Service for Development Cooperation) PO Box 871, Mt. Hagen, Western Highlands Province Tel: 542 1095 Fax: 542 1437 E-mail: [email protected] Supporting partners in developing countries to improve the livelihoods of their communities. Individual Community Rights Advocacy Forum (ICRAF) PO Box 1104, Boroko National Capital District Tel: 325 1537 Fax: 325 1415 ICRAF offers legal advice in the following areas: women & children rights or human rights; natural resources and land ownership. It also
has a refuge centre for women and children victims of family violence. Inter-team PO Box 186, Goroka, Eastern Highlands ProvinceTel: 532 2040 Fax: 532 1153 E-mail: [email protected] Liklik Dinau Abitore Trust P.O. Box 538, Goroka, Eastern Highlands Province Tel: 532 2405, 532 1034 Established ensure efficient credit delivery and savings mobilization for improving living standards of underprivileged women and their
families in Papua New Guinea
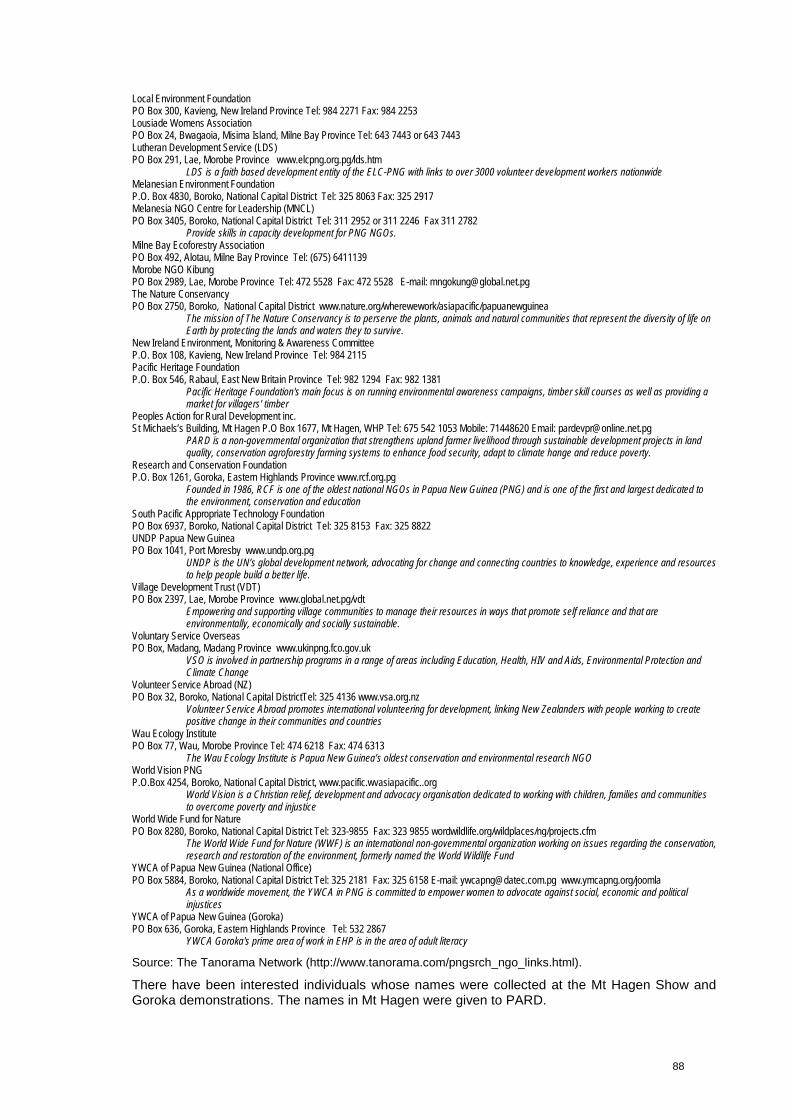
88
Local Environment Foundation PO Box 300, Kavieng, New Ireland Province Tel: 984 2271 Fax: 984 2253 Lousiade Womens Association PO Box 24, Bwagaoia, Misima Island, Milne Bay Province Tel: 643 7443 or 643 7443 Lutheran Development Service (LDS) PO Box 291, Lae, Morobe Province www.elcpng.org.pg/lds.htm LDS is a faith based development entity of the ELC-PNG with links to over 3000 volunteer development workers nationwide Melanesian Environment Foundation P.O. Box 4830, Boroko, National Capital District Tel: 325 8063 Fax: 325 2917 Melanesia NGO Centre for Leadership (MNCL) PO Box 3405, Boroko, National Capital District Tel: 311 2952 or 311 2246 Fax 311 2782 Provide skills in capacity development for PNG NGOs. Milne Bay Ecoforestry Association PO Box 492, Alotau, Milne Bay Province Tel: (675) 6411139 Morobe NGO Kibung PO Box 2989, Lae, Morobe Province Tel: 472 5528 Fax: 472 5528 E-mail: [email protected] The Nature Conservancy PO Box 2750, Boroko, National Capital District www.nature.org/wherewework/asiapacific/papuanewguinea The mission of The Nature Conservancy is to perserve the plants, animals and natural communities that represent the diversity of life on
Earth by protecting the lands and waters they to survive. New Ireland Environment, Monitoring & Awareness Committee P.O. Box 108, Kavieng, New Ireland Province Tel: 984 2115 Pacific Heritage Foundation P.O. Box 546, Rabaul, East New Britain Province Tel: 982 1294 Fax: 982 1381 Pacific Heritage Foundation's main focus is on running environmental awareness campaigns, timber skill courses as well as providing a
market for villagers' timber Peoples Action for Rural Development inc. St Michaels’s Building, Mt Hagen P.O Box 1677, Mt Hagen, WHP Tel: 675 542 1053 Mobile: 71448620 Email: [email protected] PARD is a non-governmental organization that strengthens upland farmer livelihood through sustainable development projects in land
quality, conservation agroforestry farming systems to enhance food security, adapt to climate hange and reduce poverty. Research and Conservation Foundation P.O. Box 1261, Goroka, Eastern Highlands Province www.rcf.org.pg Founded in 1986, RCF is one of the oldest national NGOs in Papua New Guinea (PNG) and is one of the first and largest dedicated to
the environment, conservation and education South Pacific Appropriate Technology Foundation PO Box 6937, Boroko, National Capital District Tel: 325 8153 Fax: 325 8822 UNDP Papua New Guinea PO Box 1041, Port Moresby www.undp.org.pg UNDP is the UN’s global development network, advocating for change and connecting countries to knowledge, experience and resources
to help people build a better life. Village Development Trust (VDT) PO Box 2397, Lae, Morobe Province www.global.net.pg/vdt Empowering and supporting village communities to manage their resources in ways that promote self reliance and that are
environmentally, economically and socially sustainable. Voluntary Service Overseas PO Box, Madang, Madang Province www.ukinpng.fco.gov.uk VSO is involved in partnership programs in a range of areas including Education, Health, HIV and Aids, Environmental Protection and
Climate Change Volunteer Service Abroad (NZ) PO Box 32, Boroko, National Capital DistrictTel: 325 4136 www.vsa.org.nz Volunteer Service Abroad promotes international volunteering for development, linking New Zealanders with people working to create
positive change in their communities and countries Wau Ecology Institute PO Box 77, Wau, Morobe Province Tel: 474 6218 Fax: 474 6313 The Wau Ecology Institute is Papua New Guinea’s oldest conservation and environmental research NGO World Vision PNG P.O.Box 4254, Boroko, National Capital District, www.pacific.wvasiapacific..org World Vision is a Christian relief, development and advocacy organisation dedicated to working with children, families and communities
to overcome poverty and injustice World Wide Fund for Nature PO Box 8280, Boroko, National Capital District Tel: 323-9855 Fax: 323 9855 wordwildlife.org/wildplaces/ng/projects.cfm The World Wide Fund for Nature (WWF) is an international non-governmental organization working on issues regarding the conservation,
research and restoration of the environment, formerly named the World Wildlife Fund YWCA of Papua New Guinea (National Office) PO Box 5884, Boroko, National Capital District Tel: 325 2181 Fax: 325 6158 E-mail: [email protected] www.ymcapng.org/joomla As a worldwide movement, the YWCA in PNG is committed to empower women to advocate against social, economic and political
injustices YWCA of Papua New Guinea (Goroka) PO Box 636, Goroka, Eastern Highlands Province Tel: 532 2867 YWCA Goroka's prime area of work in EHP is in the area of adult literacy
Source: The Tanorama Network (http://www.tanorama.com/pngsrch_ngo_links.html).
There have been interested individuals whose names were collected at the Mt Hagen Show and Goroka demonstrations. The names in Mt Hagen were given to PARD.
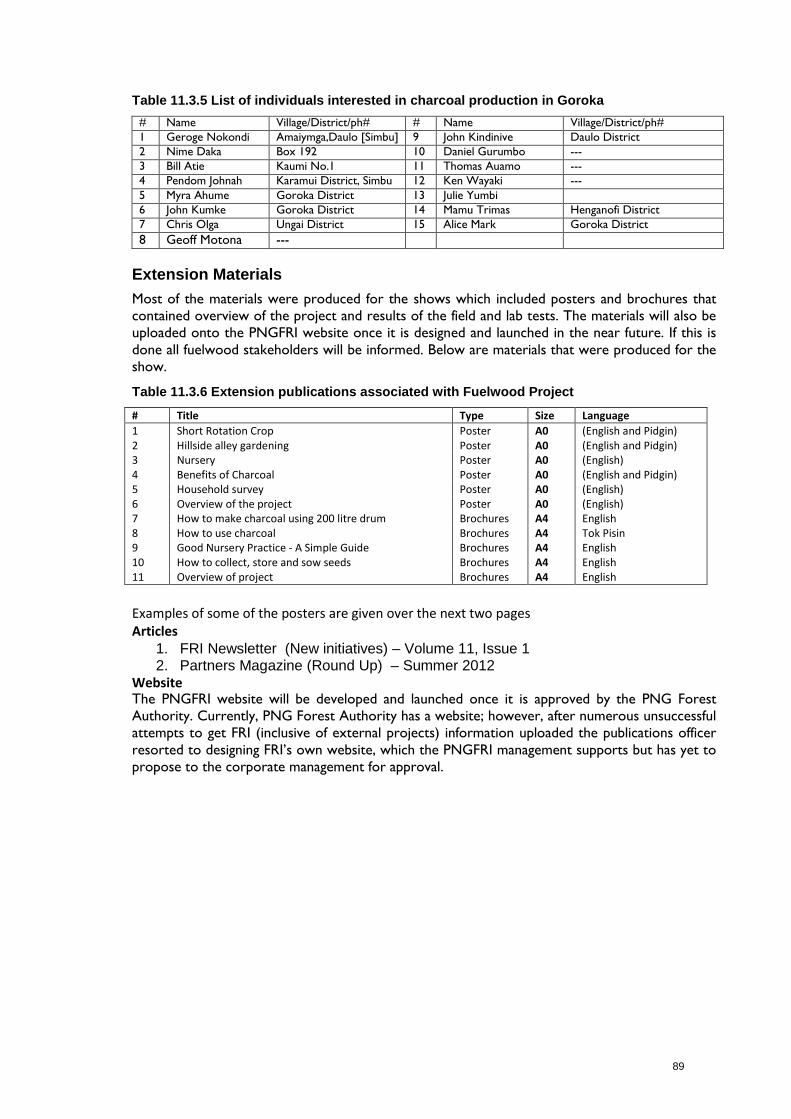
89
Table 11.3.5 List of individuals interested in charcoal production in Goroka # Name Village/District/ph# # Name Village/District/ph# 1 Geroge Nokondi Amaiymga,Daulo [Simbu] 9 John Kindinive Daulo District 2 Nime Daka Box 192 10 Daniel Gurumbo --- 3 Bill Atie Kaumi No.1 11 Thomas Auamo --- 4 Pendom Johnah Karamui District, Simbu 12 Ken Wayaki --- 5 Myra Ahume Goroka District 13 Julie Yumbi 6 John Kumke Goroka District 14 Mamu Trimas Henganofi District 7 Chris Olga Ungai District 15 Alice Mark Goroka District 8 Geoff Motona ---
Extension Materials Most of the materials were produced for the shows which included posters and brochures that contained overview of the project and results of the field and lab tests. The materials will also be uploaded onto the PNGFRI website once it is designed and launched in the near future. If this is done all fuelwood stakeholders will be informed. Below are materials that were produced for the show.
Table 11.3.6 Extension publications associated with Fuelwood Project
# Title Type Size Language 1 Short Rotation Crop Poster A0 (English and Pidgin) 2 Hillside alley gardening Poster A0 (English and Pidgin) 3 Nursery Poster A0 (English) 4 Benefits of Charcoal Poster A0 (English and Pidgin) 5 Household survey Poster A0 (English) 6 Overview of the project Poster A0 (English) 7 How to make charcoal using 200 litre drum Brochures A4 English 8 How to use charcoal Brochures A4 Tok Pisin 9 Good Nursery Practice - A Simple Guide Brochures A4 English 10 How to collect, store and sow seeds Brochures A4 English 11 Overview of project Brochures A4 English
Examples of some of the posters are given over the next two pages Articles
1. FRI Newsletter (New initiatives) – Volume 11, Issue 1 2. Partners Magazine (Round Up) – Summer 2012
Website The PNGFRI website will be developed and launched once it is approved by the PNG Forest Authority. Currently, PNG Forest Authority has a website; however, after numerous unsuccessful attempts to get FRI (inclusive of external projects) information uploaded the publications officer resorted to designing FRI’s own website, which the PNGFRI management supports but has yet to propose to the corporate management for approval.
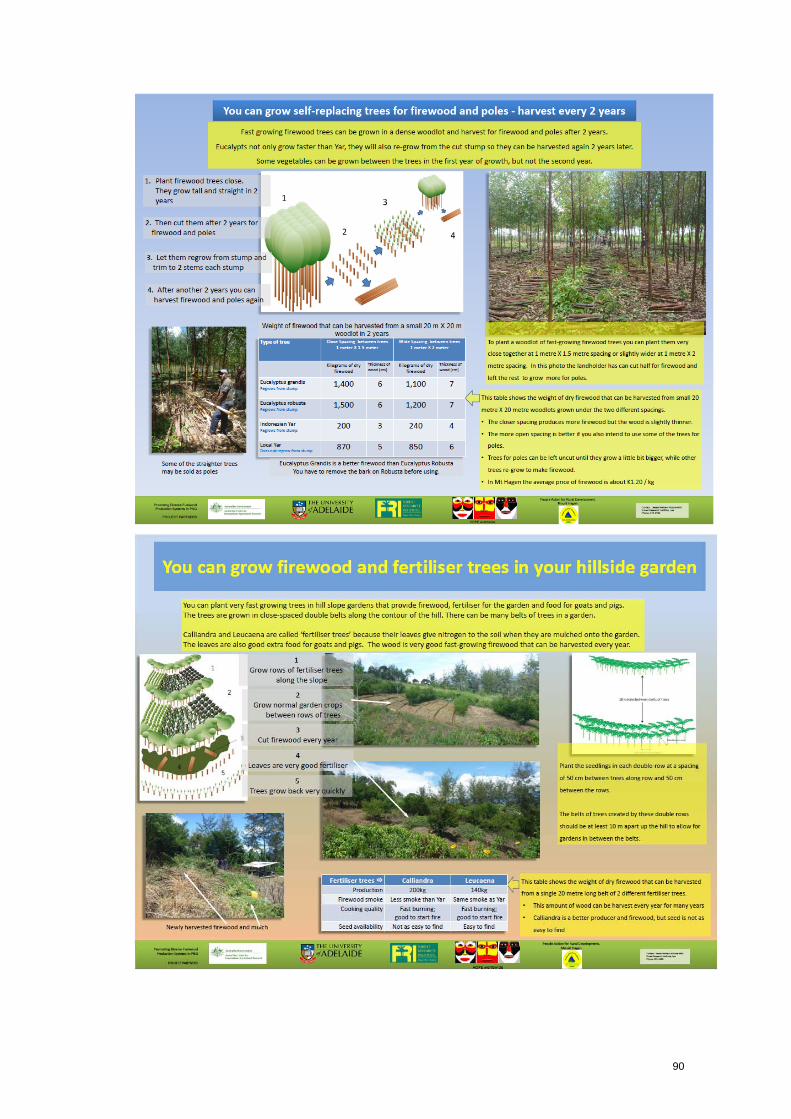
90

91

92
11.3.3 Evaluation of public understanding of SRC production systems and charcoal As part of the project’s dissemination activity the FRI team took extension material to cultural shows and along the Highlands Highway. This was also an excellent opportunity to evaluate the public’s understanding of the extension messages. This section details this activity and the evaluation of the public understanding.
Mt Hagen Show The Mt Hagen Cultural Show took place over from 12-14 August 2011. Although, it was a cultural show we achieved our objective of displaying all posters, giving out questionnaires, displaying firewood specimen, seedlings and charcoal cooking demonstration.
During the day 34 people (28 male and 6 female) with ages ranging from 14 – 56 years took part in a competition attempting the questionnaire. The questionnaires were later marked by Maman and Jessie with the first prize of K100 going to a male and a runner-up winner of K50 going to a female.
Goroka Demonstration After the Mt Hagen Show, we traveled down to the township of Goroka, Eastern Highlands Province to carry out demonstration. This was part of the Highlands highway road show. In Goroka, we set up the posters and charcoal stove cooking demonstration near the market as a vantage point. The crowd was lured with a load speaker to witness the demonstration of the charcoal stove. We took names of those who were interested in charcoal production. We did not do any poster evaluation because most of the market goers did not have biros. The purpose of the demonstration was to show the public who frequently accessed the market to see the difference between using the kerosene stove and the charcoal stove with the benefits of using the latter. According to John Paul’s survey (SSI 2009), the Goroka Town Authority allows market food cooking vendors to use kerosene and restricts the use of firewood because of smoke. A demonstration was also done in Kainantu with similar outcome.
Jessie talks to the crowd in Goroka. Maman lets a local get a feel of charcoal heat.
Morobe Show Posters displays and cooking with charcoal demonstration was set up at the Morobe Show from 14 – 16th October 2011. We did not carry out the poster evaluation because there was not enough space to put all the posters up. More than 20 people interested in eucalypts were referred to the FRI Planted Forest officers’ who gave away eucalypts seedlings for free to commemorate the International Year of Forests.
International Year of Forest The International Year of the Forest 2011 was launched in Lae at the PNG Forest Research Institute on 23 August 2011. It included poster displays from various forestry organisations. Local primary schools around Lae city were also invited to attend. Fuelwood project displayed

93
seven posters out of which six were used to gauge students’ knowledge by filling the questionnaires. Due to space limit only English versions of the posters were displayed. The International Year of the Forest 2011 launching was not part of the extension schedule but was a window opportunity to present the fuelwood concepts. Apart from the poster displays there was a demonstration of how to use the charcoal stove which was placed next to the charcoal poster. There was a lot of interest in the charcoal stove and we took time to explain how charcoal was made and the use of the low cost charcoal stove. Primary school teachers were interested in the concept and asked if we could distribute informational materials to their schools. PNG Forest Authority female staff were impressed in the stove and wanted to know more about how charcoal was produced. While Jessie discussed the concept of how to produce charcoal using the Tongan Kiln a women told her about other methods that they were familiar with. We anticipated that anyone would take up the challenge of answering the questionnaire but because primary school students were interested in the information on the posters we asked them to participate with the best respondents receiving prizes. There was constant number of students and invited guest that viewed the posters. A total of 25 students took up the challenge with 20 females and 5 males aged between 13 – 16 years. Each student filled the questionnaire after going through the posters and explanations by Maman, Jessie and Agnes. There were many who were interested in answering the questions but we had to restrict the number and ask them to submit the sheets at 3pm to give us time to mark the papers and present prizes to the winners. The winner was a female grade 8 student from St Mary’s Primary School (K50), while the runner-up was a female Grade 9 student from Busu Secondary School (K30). The presentation was done by PNGFA Managing Director Kanawi Pouru who was impressed with the activity.
Students view posters and answer the questionnaires. A good number of females took up the challenge coming out winners.
Maman explains the use of charcoal stove.

94
Evaluation of posters The evaluation of posters was an attempt to judge the public’s understanding of the key principles the project was promoting. When the posters were presented at the Mt Hagen Cultural Show and the International Year of Forest launch the public were invited to answer questionnaires which tested their comprehension of the posters.
Six posters were presented:
1. You can grow self-replacing trees for firewood and poles: harvest every 2 years • The poster presented the short-rotation coppicing woodlot options, emphasising the value of E.
grandis. It was available in English and Tok Pisin 2. You can grow firewood and fertiliser trees in your hillside garden
• This poster presented the alley cropping option emphasising the value of Calliandra. It was available in English and Tok Pisin
3. See how to grow your own seedlings • This poster outlined the process for growing seedlings at home.
4. What highlander think of fast-grown firewood • This poster summarise the results of the household evaluation of 7 SRC fuelwood species for their
smokiness, heat, longevity, ease of handling. Available only in English. 5. How to cook with charcoal
• This poster outlined the principles of cooking with a charcoal stove. It was posted next to the live demonstration of its use where we were cooking food for sale.
6. How to make charcoal • This poster outlined the process for making charcoal. It was also posted near the active charcoal
stove and charcoal on display.
Questionnaire Results At Mt Hagen 34 people (28 male and 6 female) attempted the questionnaire. Of those 20 supplied their age, so the average age of the group was 27 years (range 14-56y). 20 participants chose the English version while 14 chose the Tok Pisin version of the questionnaire. At Lae 25 students took up the challenge with 20 females and 5 males aged between 13 – 16 years.
The tables on the following pages present the percentage responses to each of the questions in the questionnaire. The shaded cells are incorrect answers, at least as far as the information given on the posters. Interpretation of the results for each question is given under each table.
While the results table just show raw % yes or no to any question, it should be kept in mind that many respondents either chose both yes and no options, or just declined to answer some questions. This explains how the %s may be over or below 100%.
The differences between Lae and Mt Hagen can be largely explained by the fact that the Lae respondents were 100 percent primary school children with age ranging from 13 – 16 years old, while the Mt Hagen respondents were a much more diverse and older group.
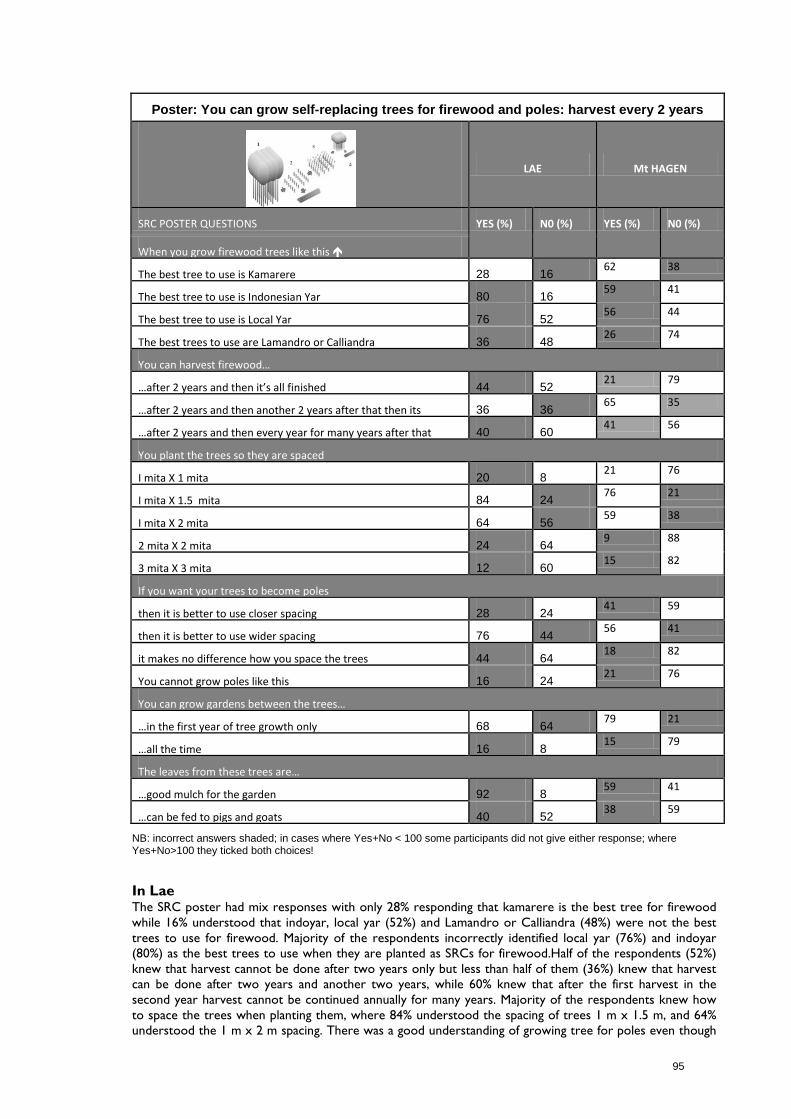
95
Poster: You can grow self-replacing trees for firewood and poles: harvest every 2 years
LAE Mt HAGEN
SRC POSTER QUESTIONS YES (%) N0 (%) YES (%) N0 (%)
When you grow firewood trees like this
The best tree to use is Kamarere 28 16 62 38
The best tree to use is Indonesian Yar 80 16 59 41
The best tree to use is Local Yar 76 52 56 44
The best trees to use are Lamandro or Calliandra 36 48 26 74
You can harvest firewood…
…after 2 years and then it’s all finished 44 52 21 79
…after 2 years and then another 2 years after that then its
36 36 65 35
…after 2 years and then every year for many years after that 40 60 41 56
You plant the trees so they are spaced
I mita X 1 mita 20 8 21 76
I mita X 1.5 mita 84 24 76 21
I mita X 2 mita 64 56 59 38
2 mita X 2 mita 24 64 9 88
3 mita X 3 mita 12 60 15 82
If you want your trees to become poles
then it is better to use closer spacing 28 24 41 59
then it is better to use wider spacing 76 44 56 41
it makes no difference how you space the trees 44 64 18 82
You cannot grow poles like this 16 24 21 76
You can grow gardens between the trees…
…in the first year of tree growth only 68 64 79 21
…all the time 16 8 15 79
The leaves from these trees are…
…good mulch for the garden 92 8 59 41
…can be fed to pigs and goats 40 52 38 59
NB: incorrect answers shaded; in cases where Yes+No < 100 some participants did not give either response; where Yes+No>100 they ticked both choices!
In Lae The SRC poster had mix responses with only 28% responding that kamarere is the best tree for firewood while 16% understood that indoyar, local yar (52%) and Lamandro or Calliandra (48%) were not the best trees to use for firewood. Majority of the respondents incorrectly identified local yar (76%) and indoyar (80%) as the best trees to use when they are planted as SRCs for firewood.Half of the respondents (52%) knew that harvest cannot be done after two years only but less than half of them (36%) knew that harvest can be done after two years and another two years, while 60% knew that after the first harvest in the second year harvest cannot be continued annually for many years. Majority of the respondents knew how to space the trees when planting them, where 84% understood the spacing of trees 1 m x 1.5 m, and 64% understood the 1 m x 2 m spacing. There was a good understanding of growing tree for poles even though
96
only 24% of respondents correctly answered that close spacing was not recommended for growing trees majority (76%) knew that wider spacing was recommended for pole growing trees. A slender majority (64%) understood that spacing was a factor to produce good poles while a minority of 24% knew that poles can also be grown this way. There was a bit of confusion in making gardens between trees because while 68% understood that garden crops can be planted between the trees in the first year only a low of 8% respondents knew that gardens cannot be planted after the first year. Only 8% responded correctly that the leaves are not good for mulch, while 52% understood that the leaves were not good food for goats and pigs.
In Mt Hagen
While a modest majority (62%) knew that kamare was the best species for the SRC woodlot, and that lamandro and calliandra were not ideal for this arrangement, more than half respondents incorrectly considered yar, and perhaps by association indoyar, as being suitable for this system as well. There seemed some confusion about how long this system lasts with several respondents providing contradictory answers. With this confusion acknowledged, more respondents (76%) thought that this is a once-off system with no second crop. This is compared with the 65% who understood that the system allows a second crop 2 years after the first crop.
Generally the respondents understood the two recommended tree spacings in this system. A strong majority (76%) knew that one of the spacings was 1*1.5m while 59% also nominated the 1*2m spacing which is also correct. Nominations of the other spacings on offer were very low. A slender majority (56-9%) understood the practice of planting trees wider to grow them on to become poles. But there was a larger majority of responses (82%) that said spacing made no difference or even that you cannot grow poles like this (76%).
A large majority (79%) recognised that gardens can be grown between the trees in the first year of growth only, but there was the same proportion of responses to the contradictory option that gardens could be grown between the trees all the time. A modest majority (59%) realised that the leaves from these trees could not be fed to pigs and goats, but the same proportion considered these leaves (kamarere) as good mulch for the garden.
In summary, there was mix understanding of the SRC system of planting for firewood. The type of species selected for firewood was not well understood; however, there was a good understanding of the harvesting times, and spacing when planting for firewood and poles. There was some confusion in planting gardens between trees and the use of leaves. In general their understanding of other elements of the SRC woodlot cannot be reliably assessed because of the level of contradictory responses to the other questions.
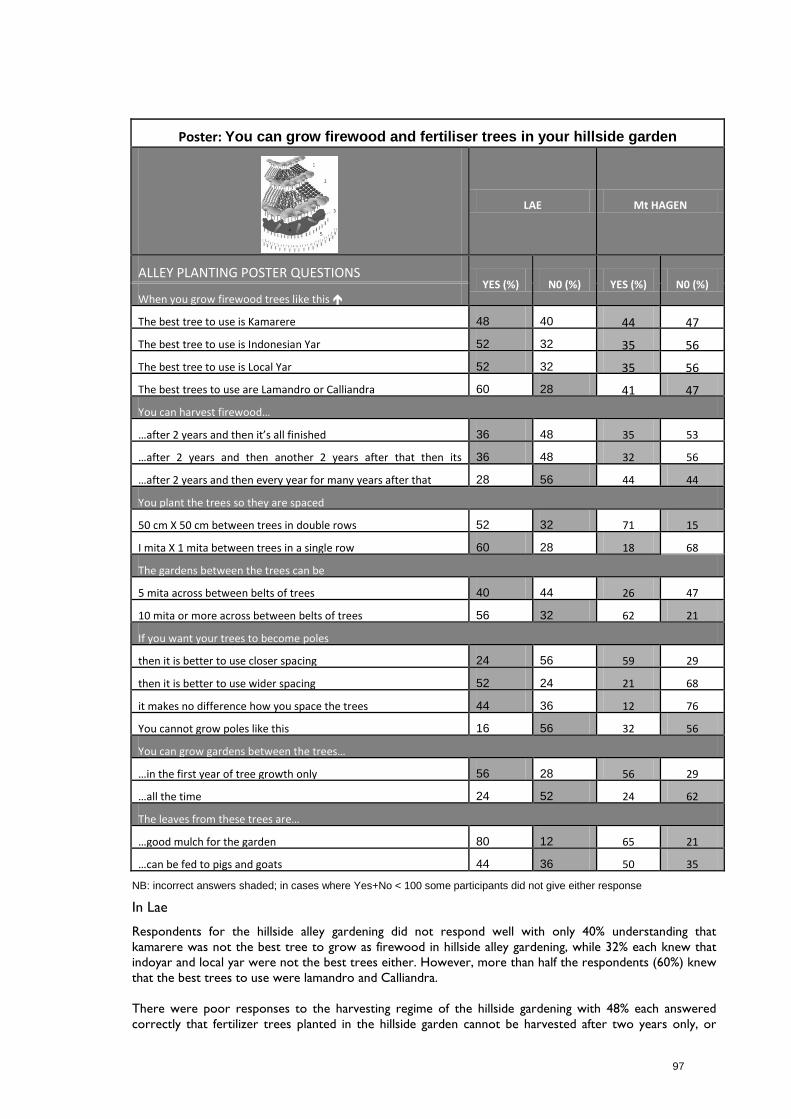
97
Poster: You can grow firewood and fertiliser trees in your hillside garden
LAE Mt HAGEN
ALLEY PLANTING POSTER QUESTIONS YES (%) N0 (%) YES (%) N0 (%)
When you grow firewood trees like this
The best tree to use is Kamarere 48 40 44 47
The best tree to use is Indonesian Yar 52 32 35 56
The best tree to use is Local Yar 52 32 35 56
The best trees to use are Lamandro or Calliandra 60 28 41 47
You can harvest firewood…
…after 2 years and then it’s all finished 36 48 35 53
…after 2 years and then another 2 years after that then its
36 48 32 56
…after 2 years and then every year for many years after that 28 56 44 44
You plant the trees so they are spaced
50 cm X 50 cm between trees in double rows 52 32 71 15
I mita X 1 mita between trees in a single row 60 28 18 68
The gardens between the trees can be
5 mita across between belts of trees 40 44 26 47
10 mita or more across between belts of trees 56 32 62 21
If you want your trees to become poles
then it is better to use closer spacing 24 56 59 29
then it is better to use wider spacing 52 24 21 68
it makes no difference how you space the trees 44 36 12 76
You cannot grow poles like this 16 56 32 56
You can grow gardens between the trees…
…in the first year of tree growth only 56 28 56 29
…all the time 24 52 24 62
The leaves from these trees are…
…good mulch for the garden 80 12 65 21
…can be fed to pigs and goats 44 36 50 35
NB: incorrect answers shaded; in cases where Yes+No < 100 some participants did not give either response
In Lae
Respondents for the hillside alley gardening did not respond well with only 40% understanding that kamarere was not the best tree to grow as firewood in hillside alley gardening, while 32% each knew that indoyar and local yar were not the best trees either. However, more than half the respondents (60%) knew that the best trees to use were lamandro and Calliandra. There were poor responses to the harvesting regime of the hillside gardening with 48% each answered correctly that fertilizer trees planted in the hillside garden cannot be harvested after two years only, or
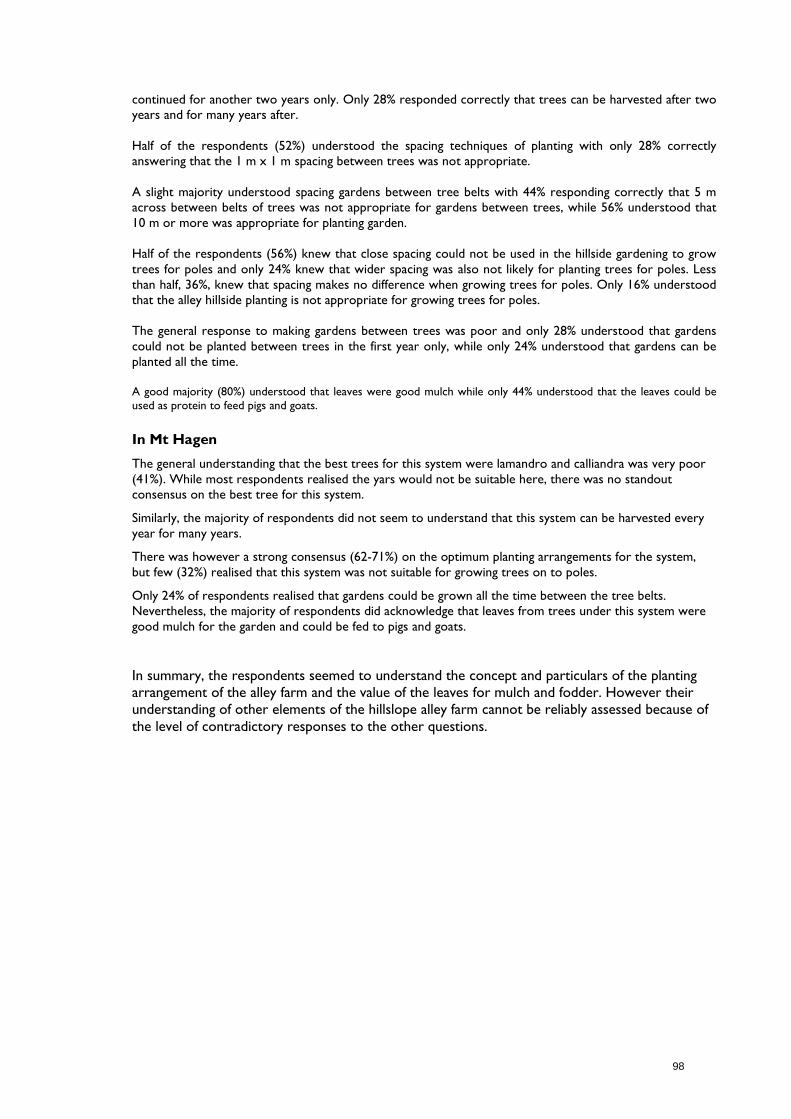
98
continued for another two years only. Only 28% responded correctly that trees can be harvested after two years and for many years after. Half of the respondents (52%) understood the spacing techniques of planting with only 28% correctly answering that the 1 m x 1 m spacing between trees was not appropriate. A slight majority understood spacing gardens between tree belts with 44% responding correctly that 5 m across between belts of trees was not appropriate for gardens between trees, while 56% understood that 10 m or more was appropriate for planting garden. Half of the respondents (56%) knew that close spacing could not be used in the hillside gardening to grow trees for poles and only 24% knew that wider spacing was also not likely for planting trees for poles. Less than half, 36%, knew that spacing makes no difference when growing trees for poles. Only 16% understood that the alley hillside planting is not appropriate for growing trees for poles. The general response to making gardens between trees was poor and only 28% understood that gardens could not be planted between trees in the first year only, while only 24% understood that gardens can be planted all the time. A good majority (80%) understood that leaves were good mulch while only 44% understood that the leaves could be used as protein to feed pigs and goats. In Mt Hagen
The general understanding that the best trees for this system were lamandro and calliandra was very poor (41%). While most respondents realised the yars would not be suitable here, there was no standout consensus on the best tree for this system.
Similarly, the majority of respondents did not seem to understand that this system can be harvested every year for many years.
There was however a strong consensus (62-71%) on the optimum planting arrangements for the system, but few (32%) realised that this system was not suitable for growing trees on to poles.
Only 24% of respondents realised that gardens could be grown all the time between the tree belts. Nevertheless, the majority of respondents did acknowledge that leaves from trees under this system were good mulch for the garden and could be fed to pigs and goats.
In summary, the respondents seemed to understand the concept and particulars of the planting arrangement of the alley farm and the value of the leaves for mulch and fodder. However their understanding of other elements of the hillslope alley farm cannot be reliably assessed because of the level of contradictory responses to the other questions.

99
Poster: See how to grow your own seedlings
LAE Mt HAGEN
NURSERY POSTER QUESTIONS
To grow my own seedlings for firewood and poles YES (%) N0 (%) YES (%) N0 (%)
I can do this close to my house 60 24 79 18
I need a small fence to keep animals away from seedlings 80 4 88 12
I start the seeds in a tray and put in bag after 1 month 60 24 62 38
I start the seeds in a tray and put in bag after 5 month 20 72 41 56
I can also plant seed directly into polybags 44 40 41 53
I need to water the seedlings
2 times a day at beginning, then every day as they get bigger 64 28 79 18
every day at the beginning, then every week as they get bigger 60 32 56 41
three times a week 12 84 21 74
The seedlings need to be
..in the full sun all their time in nursery 28 64 9 85
. .under shade until they are ready to plant in ground 56 32 47 44
..under shade only while they are younger than 2 months 48 52 21 74
I can plant the trees in the ground…
…after 2 months growth 44 44 2 71
…after 3 months growth 16 64 12 88
…after 5 months growth 56 32 68 29
…after 7 months growth 12 72 21 74
NB: incorrect answers shaded; in cases where Yes+No < 100 some participants did not give either response
In Lae
There was a very good understanding of nursery techniques. More than half of the respondents (60%) knew they could plant their trees close to their house and the majority (80%) understood that it was important to build a good fence to keep their plants away from animals. Slight majority (60%) understood that they could start their planting in a tray while 72% understood that it was unlikely for seedlings to be transferred from trays to bags after 5 months. There was not much difference in the respondents understanding the technique of direct planting with 44% (correctly answering) and 40% (incorrectly answering) that they can plant seed directly to polybags.

100
Watering plants for the respondents seemed essential because 64% of them understood that the seedlings had to be watered twice a day. A low of 32% understood that it was not necessary to water the seedlings every day but majority (84%) knew that they could not water their seedlings three times a week. Sixty four percent knew that too much sunlight would affect the seedlings while there was less than half (32%) who understood that the seedlings do not have to be under the shade until ready for planting. Only 48% thought that the seedlings need to be under shade while they are under two months. An equal number of respondents (44% for and against) thought that they can plant trees in the ground after two months while 64% understood that planting trees after three months is not good. Half of the respondents (56%) understood that trees could be planted after five months while 72% knew that it was inappropriate to plant trees after seven.
In Mt Hagen Most respondents (79%) understood these nurseries were a simple affair that could be managed close to the home. Closer inspection of the address of respondents who said No to this question showed they lived in various dormitories or urban settlements; so in their case it really was not possible to have a home nursery. Most respondents understood the need to fence the nursery off (88%), to start the seeds in a tray and prick out after 1 month (62%), but only 41% understood that seed could also be sown directly into polybags.
Most respondents (79%) understood the requirement to water twice a day at the beginning. Most (85%) also thought that seedlings needed to be kept shaded all the time in the nursery; only 21% understood that seedlings need to be hardened-off after 2 months.
Most respondents (68%) understood that the best time to plant trees is after 5 months in the nursery.
In summary, respondents showed a good general understanding of a management of home nursery except for the aspect of shading.
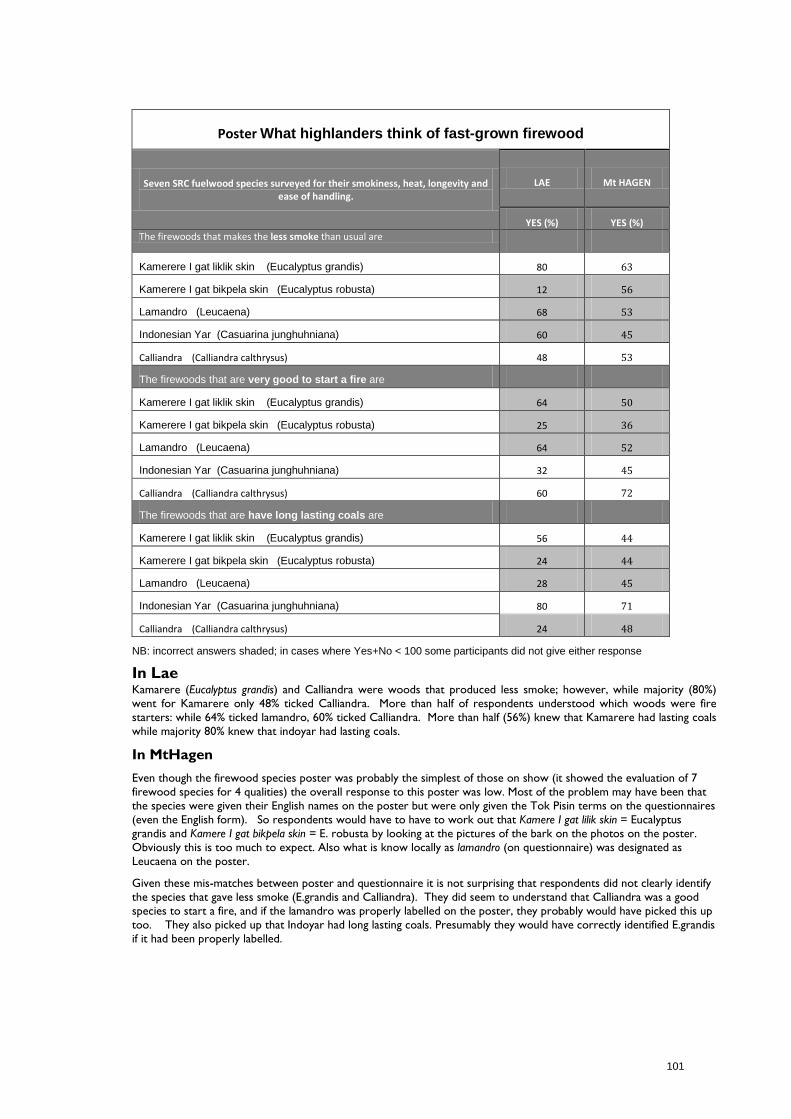
101
Poster What highlanders think of fast-grown firewood
Seven SRC fuelwood species surveyed for their smokiness, heat, longevity and ease of handling.
LAE Mt HAGEN
YES (%) YES (%) The firewoods that makes the less smoke than usual are
Kamerere I gat liklik skin (Eucalyptus grandis) 80 63
Kamerere I gat bikpela skin (Eucalyptus robusta) 12 56
Lamandro (Leucaena) 68 53
Indonesian Yar (Casuarina junghuhniana) 60 45
Calliandra (Calliandra calthrysus) 48 53
The firewoods that are very good to start a fire are
Kamerere I gat liklik skin (Eucalyptus grandis) 64 50
Kamerere I gat bikpela skin (Eucalyptus robusta) 25 36
Lamandro (Leucaena) 64 52
Indonesian Yar (Casuarina junghuhniana) 32 45
Calliandra (Calliandra calthrysus) 60 72
The firewoods that are have long lasting coals are
Kamerere I gat liklik skin (Eucalyptus grandis) 56 44
Kamerere I gat bikpela skin (Eucalyptus robusta) 24 44
Lamandro (Leucaena) 28 45
Indonesian Yar (Casuarina junghuhniana) 80 71
Calliandra (Calliandra calthrysus) 24 48
NB: incorrect answers shaded; in cases where Yes+No < 100 some participants did not give either response
In Lae Kamarere (Eucalyptus grandis) and Calliandra were woods that produced less smoke; however, while majority (80%) went for Kamarere only 48% ticked Calliandra. More than half of respondents understood which woods were fire starters: while 64% ticked lamandro, 60% ticked Calliandra. More than half (56%) knew that Kamarere had lasting coals while majority 80% knew that indoyar had lasting coals.
In MtHagen Even though the firewood species poster was probably the simplest of those on show (it showed the evaluation of 7 firewood species for 4 qualities) the overall response to this poster was low. Most of the problem may have been that the species were given their English names on the poster but were only given the Tok Pisin terms on the questionnaires (even the English form). So respondents would have to have to work out that Kamere I gat lilik skin = Eucalyptus grandis and Kamere I gat bikpela skin = E. robusta by looking at the pictures of the bark on the photos on the poster. Obviously this is too much to expect. Also what is know locally as lamandro (on questionnaire) was designated as Leucaena on the poster.
Given these mis-matches between poster and questionnaire it is not surprising that respondents did not clearly identify the species that gave less smoke (E.grandis and Calliandra). They did seem to understand that Calliandra was a good species to start a fire, and if the lamandro was properly labelled on the poster, they probably would have picked this up too. They also picked up that Indoyar had long lasting coals. Presumably they would have correctly identified E.grandis if it had been properly labelled.

102
Posters How to cook with and make charcoal
LAE Mt HAGEN
HOW TO COOK WITH AND MAKE CHARCOAL POSTER YES (%) NO (%) YES (%) NO (%)
Cooking with charcoal...
is better than firewood because it is hotter and there is
88 8 94 6
requires a special charcoal stove 56 32 71 12
looks too difficult for me 16 72 15 79
is too expensive for me 16 76 6 88
I would buy charcoal to cook with if it was always available in market
28 28 56 15
Making charcoal...
is a good business opportunity for me 76 20 76 18
looks too difficult for me 16 80 24 62
NB: incorrect answers shaded; lines with no shading indicate no right or wrong answer
In Lae
Majority of the respondents understood that charcoal was better than firewood while half of them (56%) knew that to use charcoal a special stove was needed. Seventy-two percent responded that it was not too difficult to make while 76% stated that it was not too expensive to make charcoal. Although it was less than half, an equal percentage (28% each) of respondents were for and against the idea of buying the charcoal if it was available. Businesswise, 76% understood that it was a good business venture. Eighty percent thought that charcoal making was not too difficult.
In Mt Hagen
Just about all (94%) respondents understood the value of cooking with charcoal versus conventional fires, and most (71%) realised that it requires a special stove. Such stoves were being demonstrated at the stall while answering the survey. Most (79%) respondents did not consider cooking with charcoal to be particularly difficult or expensive. Indeed 56% of respondents said that they would buy charcoal if it were available. Only 15% said no to this question and another 19% were uncommitted. Most (76%) considered charcoal production a good business opportunity, with 18% saying no and 6% uncommitted. Only 24% of them thought that the process looked too difficult for them, with 14% uncommitted on this question.
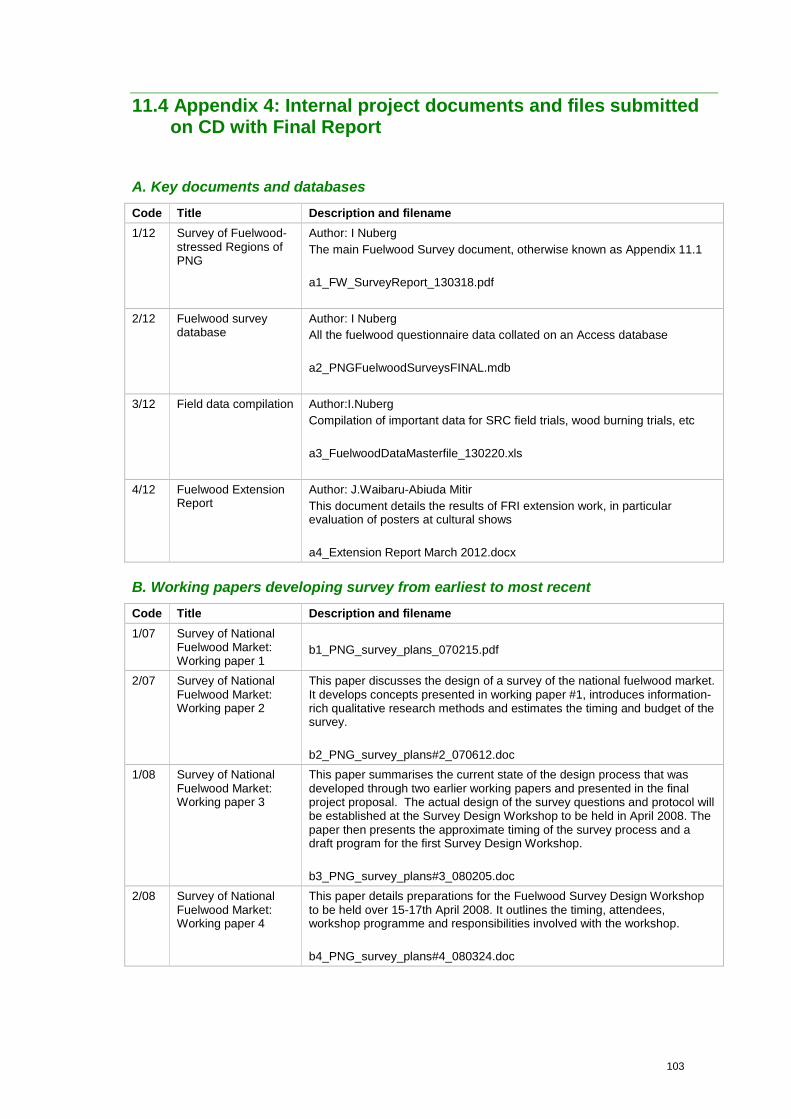
103
11.4 Appendix 4: Internal project documents and files submitted on CD with Final Report
A. Key documents and databases Code Title Description and filename 1/12 Survey of Fuelwood-
stressed Regions of PNG
Author: I Nuberg The main Fuelwood Survey document, otherwise known as Appendix 11.1 a1_FW_SurveyReport_130318.pdf
2/12 Fuelwood survey database
Author: I Nuberg All the fuelwood questionnaire data collated on an Access database a2_PNGFuelwoodSurveysFINAL.mdb
3/12 Field data compilation Author:I.Nuberg Compilation of important data for SRC field trials, wood burning trials, etc a3_FuelwoodDataMasterfile_130220.xls
4/12 Fuelwood Extension Report
Author: J.Waibaru-Abiuda Mitir This document details the results of FRI extension work, in particular evaluation of posters at cultural shows a4_Extension Report March 2012.docx
B. Working papers developing survey from earliest to most recent Code Title Description and filename 1/07 Survey of National
Fuelwood Market: Working paper 1
b1_PNG_survey_plans_070215.pdf
2/07 Survey of National Fuelwood Market: Working paper 2
This paper discusses the design of a survey of the national fuelwood market. It develops concepts presented in working paper #1, introduces information-rich qualitative research methods and estimates the timing and budget of the survey. b2_PNG_survey_plans#2_070612.doc
1/08 Survey of National Fuelwood Market: Working paper 3
This paper summarises the current state of the design process that was developed through two earlier working papers and presented in the final project proposal. The actual design of the survey questions and protocol will be established at the Survey Design Workshop to be held in April 2008. The paper then presents the approximate timing of the survey process and a draft program for the first Survey Design Workshop. b3_PNG_survey_plans#3_080205.doc
2/08 Survey of National Fuelwood Market: Working paper 4
This paper details preparations for the Fuelwood Survey Design Workshop to be held over 15-17th April 2008. It outlines the timing, attendees, workshop programme and responsibilities involved with the workshop. b4_PNG_survey_plans#4_080324.doc
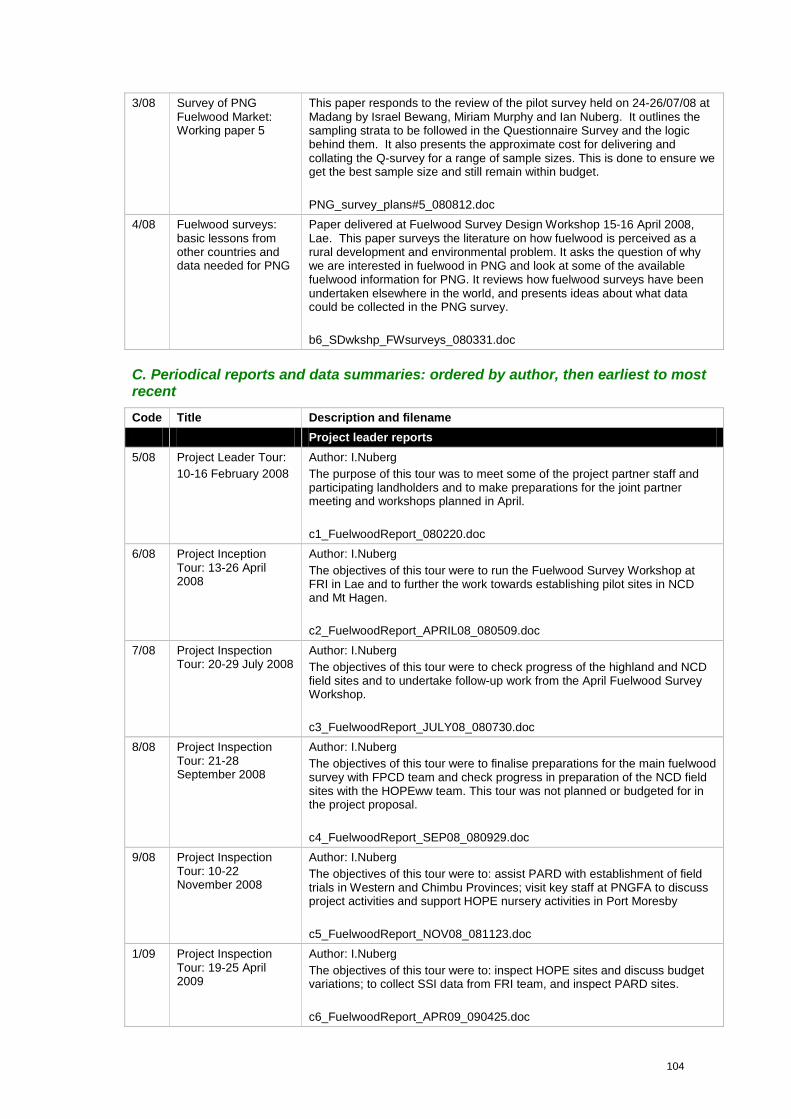
104
3/08 Survey of PNG Fuelwood Market: Working paper 5
This paper responds to the review of the pilot survey held on 24-26/07/08 at Madang by Israel Bewang, Miriam Murphy and Ian Nuberg. It outlines the sampling strata to be followed in the Questionnaire Survey and the logic behind them. It also presents the approximate cost for delivering and collating the Q-survey for a range of sample sizes. This is done to ensure we get the best sample size and still remain within budget. PNG_survey_plans#5_080812.doc
4/08 Fuelwood surveys: basic lessons from other countries and data needed for PNG
Paper delivered at Fuelwood Survey Design Workshop 15-16 April 2008, Lae. This paper surveys the literature on how fuelwood is perceived as a rural development and environmental problem. It asks the question of why we are interested in fuelwood in PNG and look at some of the available fuelwood information for PNG. It reviews how fuelwood surveys have been undertaken elsewhere in the world, and presents ideas about what data could be collected in the PNG survey. b6_SDwkshp_FWsurveys_080331.doc
C. Periodical reports and data summaries: ordered by author, then earliest to most recent Code Title Description and filename Project leader reports
5/08 Project Leader Tour: 10-16 February 2008
Author: I.Nuberg The purpose of this tour was to meet some of the project partner staff and participating landholders and to make preparations for the joint partner meeting and workshops planned in April. c1_FuelwoodReport_080220.doc
6/08 Project Inception Tour: 13-26 April 2008
Author: I.Nuberg The objectives of this tour were to run the Fuelwood Survey Workshop at FRI in Lae and to further the work towards establishing pilot sites in NCD and Mt Hagen. c2_FuelwoodReport_APRIL08_080509.doc
7/08 Project Inspection Tour: 20-29 July 2008
Author: I.Nuberg The objectives of this tour were to check progress of the highland and NCD field sites and to undertake follow-up work from the April Fuelwood Survey Workshop. c3_FuelwoodReport_JULY08_080730.doc
8/08 Project Inspection Tour: 21-28 September 2008
Author: I.Nuberg The objectives of this tour were to finalise preparations for the main fuelwood survey with FPCD team and check progress in preparation of the NCD field sites with the HOPEww team. This tour was not planned or budgeted for in the project proposal. c4_FuelwoodReport_SEP08_080929.doc
9/08 Project Inspection Tour: 10-22 November 2008
Author: I.Nuberg The objectives of this tour were to: assist PARD with establishment of field trials in Western and Chimbu Provinces; visit key staff at PNGFA to discuss project activities and support HOPE nursery activities in Port Moresby c5_FuelwoodReport_NOV08_081123.doc
1/09 Project Inspection Tour: 19-25 April 2009
Author: I.Nuberg The objectives of this tour were to: inspect HOPE sites and discuss budget variations; to collect SSI data from FRI team, and inspect PARD sites. c6_FuelwoodReport_APR09_090425.doc
105
2/09 Year 2 project catchup
Author: I Nuberg. This document arose from a meeting between Haines, Gunn & Nuberg on 15/10/09. It discusses the feasibility of realising various project outputs in the light of better understanding of the field situation. It is in the form of the original project Outputs Table with an assessment of what can and cannot be achieved. c7_PNGFuelwood_Year2_091015.docx
1/10 Report on assessment of the highland fuelwood sites at 1 year's growth
Author: I Nuberg. Uni of Adelaide This report presents growth results and statistical analysis of the replicated fuelwood trial at Pugamp near Mt Hagen. It also includes measurements of the unreplicated woodlot and alley plantings in the highlands c8_ReportHighlandMeasurements2010_100806.docx
1/11 Fuelwood Extension Plans
Author: I.Nuberg This document provides details of the revised and final extension plan for 2011 determined at meetings on 19-20 April 2011 at FRI c9_FW_ExtensionPlans_110420.docx
2/11 Evaluation of Posters Author: I.Nuberg Evaluation of Posters at Mt Hagen Cultural Show, Sept 2011 c10_Results Hagen Post Evaluation_110901.pdf
10/08 Early project inspection
Author: B.Gunn Assist PARD with establishment of field trials in Western and Chimbu Provinces, visit key staff at PNGFA to discuss project activities and support HOPE nursery activities in Port Moresby c11_BG_Fuelwood Trip report-BG Nov08.doc
3/09 Mid-term project inspection
Author: B.Gunn Report to inspect trials round Mount Hagen and establish trials in vicinity of Port Moresby; 9-19th Feb 2009 c12_BG_PNG trip report Feb09.doc
2/10 Report on assessment of Bautama and Bomana fuelwood trials at age one year. 17/3/10
Author: B. Gunn CSIRO Report on assessment of Bautama and Bomana fuelwood trials at age one year, March 2010 c13_BG_Fuelwood-1st yr assessment report.pdf
Forest Research Institute reports 11/08 FRI progress: Lae
nursery Authors: Maman Tavune and Agnes Sumareke Nursery activity at Lae, May 2008 c14_FRI_WEEKLY PROGRESSIVE REPORT # 3.doc
12/08 FRI progress: Lae nursery
Authors: Maman Tavune and Agnes Sumareke Nursery activity at Lae c15_FRI_WEEKLY PROGRESSIVE REPORT # 4.doc
13/08 FRI progress: Pugamp nursery
Authors: Maman Tavune and Agnes Sumareke Pugamp nursery inspection June 2008 c16_FRI_WEEKLY PROGRESSIVE REPORT # 5
14/08 FRI progress: root nodules
Authors: Maman Tavune and Agnes Sumareke Root nodule collection August 2008 c17_FRI_WEEKLY PROGRESSIVE REPORT # 7.doc
15/08 FRI progress: NCD nursery
Authors: Maman Tavune and Agnes Sumareke NCD nursery inspection August 2008 c18_FRI_WEEKLY PROGRESSIVE REPORT#8.doc
106
16/08 FRI progress: NCD nursery
Author: Maman Tavune NCD nursery inspection October 2008 c19_FRI_PROGRESSIVE REPORT#9 (NCD).doc
4/09 FRI progress: NCD field site
M.Tavune NCD Trial establishment report, Feb 2009 c20_FRI_Trial establishment report NCD Feb09.doc
3/10 Status Report on Fuelwood Project (FRI) April2008-March 2010
Authors: J.Paul, M.Tavune and A. Sumereke from FRI. This report summarises all FRI activity to date in the project including their role in establishment of the highland and lowland planting trials, germination and pre-treatment tests of candidate species, field nursery establishment. It also includes a summary of FRI activity in the Semi-Structured Interviews of fuelwood users c21_FRI_STATUS REPORT of FWD PROJECT 12032010.docx
4/10 Updated Status Report on Fuelwood Project (FRI) April2008-November 2010
J.Paul, M.Tavune, A.Sumareke Summary report of FRI activities April 2008-November 2010 Including nursery, field trial and survey work c22_FRI_Fuelwood Project Status Report -- 2010.pdf
3/11 Trial measurement, harvesting and evaluation of wood from fuelwood trials in Port Moresby and Mt Hagen : Feb 2011
Authors: A. Sumareke from FRI. This report summarises all FRI involvement in the field and preliminary laboratory measurement activity in February 2011. c23_ACIAR-Duty Trip POM HGN 6TH-20TH FEB 2011.pdf
4/11 Training of Trainers in Charcoal Production
Authors: J. Abiuda Mitir , M.Tavune and John Paul FRI. Report on workshop training staff from FRI, HOPE and PARD in the process of charcoal production. The workshop was held on11-12 /03/2011 at Mempanaron, Morobe Province. The facilitator was Lukis Romaso from Briskanda c24_FRI_Training of the Trainers in Charcoal Production.pdf
5/11 Extension Action Plan Author: J. Abiuda Mitir FRI Outlines the first cut for an extension plan and budget for 2011. c25_Objective3 Action Plans.docx
5/12 Extension report J.Abiuda-Mitir This forms the basis of the Fuelwood Extension Report c26_FRI_Extension Report March 2012.docx
HOPEworldwide reports 17/08 HOPE progress
report Author: Alex Aruai Nursery data c27_HOPE Weekly Report-Fuelwood_081205
18/08 HOPE progress report
Author: Kumani Kuman Update of NCD nursery and field sites c28_HOPE weekly report2_081205.doc
5/09 HOPE progress report
Author: Kumani Kuman Update of nursery and field activity c29_HOPE_reportJan2009 2.doc
6/09 HOPE progress report
Author: Tom Yale Brief description for field activities done so far at Bautama Trial Site and Bomana includes number of seedlings dead and surviving. c30_HOPE weekly Report-4th April, 2009.doc
7/09 HOPE progress report
Author: Kumani Kuman Data on NCD workplan c31_HOPE Weekly Report 3-2009.xls
8/09 HOPE progress report
Author: Tom Yale c32_HOPE Weekly Report 13 May 2009.doc
107
9/09 HOPE progress report
Author: Tom Yale c33_HOPE Weekly Report-Fuel wood June 2009.doc
10/09 HOPE progress report
Author: Tom Yale c34_HOPE Weekly Report-Fuel wood, 27, Nov, 2009
11/09 HOPE progress report
Author: Tom Yale Report of field site maintenance c35_HOPE Weekly Report-Weeding 5 June 2009
5/10 HOPE report August 2010
Author: Kumani Kuman This brief report provides details of fire damage to the Bomana field site. c36_HOPE_Report August 2010.docx
Peoples Action for Rural Development reports 1/07 PARD project
development Author: J.Pumai Details of PARD project staff, potential community participants, and proposed workplan; July 2007 c37_PARD_070719.doc
2/07 PARD project development
Author: J.Pumai Additional information on community based organisations in highlands c38_PARD_revisedsites_071228.doc
19/08 PARD project development
Author: J.Pumai Work plan, Gantt chart for highland activity 2008 c39_PARD_Work plan woodlot BCGT.doc
20/08 PARD progress report
Authors: J.Pumai, R.Manapangkec, A.Frank Report of early PARD activity in highlands May 2008 c40_PARD_Monthly progressive reports_080613.doc
21/08 PARD progress report
Authors:J.Pumai, R.Manapangkec, A.Frank Pictorial report of PARD activity in highlands June 2008 c41_PARD ACIAR FUELWOOD PROJECT JUNE REPORT.doc
22/08 PARD progress report
Authors:J.Pumai, R.Manapangkec, A.Frank Report of PARD activity in highlands July 2008 c42_PARD ACIAR RESEARCH Report July2008.doc
23/08 PARD nursery data Authors:J. Pumai, R.Manapangkec Data and charts of growth of the highlands nursery stock. October 2008 c43_PARD_Nursery_Growth measurement_081017.xls
12/09 PARD progress report
Authors:J.Pumai, R.Manapangkec, A.Frank Report of PARD activity in highlands January 2009 c44_PARD ACIAR Fuelwood Report_090126.doc
6/10 Australian High Commissioner Visit
Author:J.Pumai Report on the Visit of Mr. Ian Kemish , the Australian High Commissioner to the Pugamp Main Fuelwood Research Trial With scanned copy of article from newspaper Post Courier December 2010 c45_PARD_Report on Mr Kemish Ian visit.docx
6/11 Firewood sales report Author: R. Manapangkec Reports the activity of monitoring sale of firewood and sellers comments c46_FirewoodSalesReport.docx
7/11 Domestic evaluation: Mt Hagen
Author: R. Manapangkec Reports the activity of household evaluation of firewood near Mt Hagen c47_Hagen Household Use survey_110725.docx
8/11 Final measurements of farmer woodlot and alley farms
Author: R. Manapangkec Data of final measurements of the alley garden and farmer woodlots at c48_J.Eka, Mt Sinai and Ulkamra

108
D. Articles related to the project Code Title Description and filename 13/09 Promoting rural
based fuelwood production systems in Papua New Guinea NRI conference
I.Nuberg, B.Gunn, I.Bewang Paper presented to the Papua New Guinea National Research Institute forum on Community Transformation – Networking and Ownership in the Development Process 16-18th June 2009 d1_NRI_fuelwood paper_Nuberg090526a.docx
14/09 APAN newsletter I.Nuberg and B.Gunn Promoting diverse fuelwood production systems in Papua New Guinea Asia-Pacific Agroforestry Newsletter No.35 Dec 2009 pp11-12 d2_APANews_No35_Dec2009.pdf
9/11 Fuelwood tensions spark opportunity Partners Magazine
G.Braidotti “Fuelwood tensions spark opportunity” Partners, March-May 2011 d3_PartnersArticle.jpg
Promoting diverse fuelwood production systems in PNG Australian Centre for International Agricultural Research ▪ University of Adelaide ▪ CSIRO -Plant Industry ▪ PNG Forest Research Institute
HOPEworldwide ▪ Foundation for People and Community Development▪ Peoples Action for Rural Development FST/2006/088
Appendix 11.1 of FR2013-14 Page 1 of 165
Survey of the fuelwood-stressed regions of PNG
Appendix 11.1 to the Final Report of FST/2006/088
Ian Nuberg, University of Adelaide With contributions from
J.Paul, M.Tavune and A.Sumareke, Forest Research Institute, Lae.
May 2012
Appendix 11.1 of FR2013-14 Page 2 of 165
Contents List of Tables .................................................................................................................................................................4
List of Figures ................................................................................................................................................................7
List of Questions Asked in Questionnaire Survey ...............................................................................................8
Acknowledgements ......................................................................................................................................................9
Executive summary ................................................................................................................................................... 10
Key and specific findings of the survey. ........................................................................................................... 12
Introduction ................................................................................................................................................................ 18
Survey structure and methods ............................................................................................................................... 18
1 Q-Survey Methods ............................................................................................................................................ 18
Sampling strategy .............................................................................................................................................. 18
Q-survey data collection and collation ....................................................................................................... 19
2 Case Study Monitoring Survey Methods ..................................................................................................... 25
3 Semi-Structured Interview Methods ............................................................................................................ 25
Results and Discussion ............................................................................................................................................. 26
1 Q-survey of fuelwood users ........................................................................................................................... 26
The nature of the Q-survey respondents .................................................................................................. 26
What is the nature of their household energy use? ................................................................................ 30
How is fuelwood collected? .......................................................................................................................... 37
How is fuelwood purchased? ........................................................................................................................ 44
Opportunities and Constraints ..................................................................................................................... 53
2 Q-Survey Seller Results ................................................................................................................................... 69
The nature of the Q-survey respondents .................................................................................................. 69
Fuelwood retail ................................................................................................................................................. 77
Fuelwood on sale ............................................................................................................................................. 78
Income from fuelwood ................................................................................................................................... 81
Case study high earners ................................................................................................................................. 82
Other information on average incomes ..................................................................................................... 83
Opportunities and constraints in selling fuelwood .................................................................................. 84
2 Case Study Monitoring survey ............................................................................................................................ 87
3 Semi-Structured Interviews ................................................................................................................................. 91
Introduction ........................................................................................................................................................... 91
Appendix 11.1 of FR2013-14 Page 3 of 165
Industrial fuelwood users.................................................................................................................................... 91
Oil palm industry – West New Britain Province ..................................................................................... 91
Cocoa and coconut industry – East New Britain Province ................................................................... 91
Tea Industry – W.R Carpenters, Western Highlands Province ........................................................... 91
Commercial fuelwood users .............................................................................................................................. 92
Lime burners – Morobe Coast ..................................................................................................................... 92
Roadside vendors along Highlands Highway ............................................................................................. 96
City and Town Market Vendors................................................................................................................... 98
Semi-Structured Interviews in NCD.............................................................................................................. 102
General Discussion ................................................................................................................................................. 109
A robust survey .................................................................................................................................................. 109
Descriptions of wood-flows in the Asian region ........................................................................................ 111
A picture of woodflows in the survey region .............................................................................................. 114
A relatively flat structure and short supply chain................................................................................... 115
Fuelwood expenditure .................................................................................................................................. 115
Fuelwood collection and consumption ..................................................................................................... 120
What is the aggregate value of the domestic fuelwood economy?.................................................... 121
Comparison with other studies .................................................................................................................. 122
Fuelwood is commonly used even in presence of alternatives ........................................................... 126
Selling or using fuelwood to generate income ........................................................................................ 127
Social impact of fuelwood collection ......................................................................................................... 127
Environmental impact of fuelwood collection ......................................................................................... 128
Planting trees for fuelwood and value-adding ......................................................................................... 132
Development of a fuelwood market based on farm-grown timber ....................................................... 134
Appendices................................................................................................................................................................ 137
A1 Fuelwood Survey Design Workshop ...................................................................................................... 137
A2 Questionnaire Survey forms ..................................................................................................................... 138
A3 Determining Sampling Strata ..................................................................................................................... 150
A4 Fuelwood surveys: basic lessons from other countries .................................................................... 154
Appendix 11.1 of FR2013-14 Page 4 of 165
List of Tables Table 1 Relative proportions of population in survey areas. ............................................................................................. 20 Table 2a: Sample numbers for the 55 sampling strata in Urban and Rural Users Surveys and Sellers Survey;
Coastal provinces. .................................................................................................................................................. 21 Table 2b: Sample numbers for the 55 sampling strata in Urban and Rural Users Surveys and Sellers Survey;
Highland provinces. ................................................................................................................................................ 22 Table 2c: Estimate of total population represented by survey ......................................................................................... 22 Table 2d: Sample numbers for the 27 sampling strata in Sellers Survey ........................................................................ 23 Table 3: Concordance between intended and actual sample size, by Province and by District .............................. 24 Table 4a Gender and Age profile of Urban Fuelwood Users ............................................................................................ 26 Table 4b Gender and Age profile of Rural Fuelwood Users .............................................................................................. 27 Table 5 Housing class and access to sealed roads and powerlines in NCD, Lae and Mt Hagen urban areas ....... 27 Table 6 Proportions of surveyed residences with mains power available across the 9 NCD wards...................... 29 Table 7 Housing class, landscape and access to services of fuelwood users in highland Rural Areas ..................... 29 Table 8 Proportions of sample populations using and not using fuelwood .................................................................... 31 Table 9 Use of fuelwood or charcoal in last 12 months by housing type in the Urban Survey. ............................... 32 Table 10 Reasons given for not using fuelwood in different regions ............................................................................... 32 Table 11How fuelwood use varies in different areas. .......................................................................................................... 33 Table 12 Different times when fuelwood is used in urban and rural areas .................................................................... 33 Table 13 Different methods for using fuelwood in urban and rural areas ..................................................................... 34 Table 14 Alternatives to fuelwood use in Urban and Rural survey samples areas....................................................... 35 Table 14a Charcoal users ............................................................................................................................................................ 36 Table 15. Reasons for using energy sources other than fuelwood in Rural areas ........................................................ 36 Table 16. Examples of the types of reasons for alternative energy use in rural areas ................................................ 37 Table 17 Sources and types of collected fuelwood in Urban areas of NCD, Lae and Mt Hagen............................. 38 Table 18 Sources and types of collected fuelwood in Rural areas ................................................................................... 38 Table 19 Travel distances for collecting fuelwood from different sources in Urban areas ....................................... 39 Table 20 Travel distances for collecting fuelwood from different sources in Rural areas ......................................... 39 Table 21Fuelwood collection behaviour in the 5 survey regions. .................................................................................... 41 Table 22 Selection of comments on fuelwood collection. .................................................................................................. 42 Table 23 Modes of transport most used for collecting fuelwood in Urban areas ........................................................ 43 Table 24 Relative proportion of vehicular transport used for collected fuelwood in Urban areas ......................... 43 Table 25 Frequency of buying fuelwood in Urban and Rural areas .................................................................................. 44 Table 26 Average expenditure of fuelwood in different regions. ..................................................................................... 46 Table 27 Relative proportions of Age-Gender classes who COLLECTS fuelwood for each survey region ......... 48 Table 28 Relative proportions of Age-Gender classes who BUYS fuelwood for each survey region .................... 48 Table 29 Age and Gender distributions of populations of survey regions ..................................................................... 50 Table 30 Range of prices for different product categories at main sources in NCD .................................................. 52 Table 31 Proportions of Rural and Urban sample populations using firewood to earn an income. ........................ 54 Table 32 Frequency of Income categories in enterprises using fuelwood in previous 12 months .......................... 54 Table 33 Change in access to fuelwood over 2 and 10 years in Urban and Rural regions ........................................ 55 Table 34 Selection of comments relating to access to fuelwood ..................................................................................... 56 Table 35 Change in access to fuelwood over 2 and 10 years in NCD Local Level Government areas ................. 58 Table 36 Socio-economic Indicators of the 9 NCD Local Level Government areas .................................................. 58 Table 37 Coefficients of Variation of Socio-Economic indices across 9 LLGs of the NCD ..................................... 59 Table 38 Correlations between Socio-Economic indices and % Fuelwood Use in LLGs .......................................... 59 Table 39 Tree planting activity ................................................................................................................................................... 59 Table 40 Number of trees planted over past 2 and 10 years for each survey region. ................................................ 60 Table 41 Conflict over access to fuelwood, aggregated to survey region ...................................................................... 61 Table 42 Randomly selected comments on conflict ............................................................................................................. 61
Appendix 11.1 of FR2013-14 Page 5 of 165
Table 43 Attitudes to fuelwood planting ................................................................................................................................. 62 Table 44 Attitudes to fuelwood planting in NCD LLGs...................................................................................................... 62 Table 45 Randomly selected reasons for NOT planting woodlots across main regions ............................................ 63 Table 46 Fuelwood species preferences across the survey regions................................................................................. 65 Table 47 Knowledge and attitudes to charcoal in rural and urban areas ....................................................................... 67 Table 48 Gender and Age profile of Fuelwood Sellers ........................................................................................................ 69 Table 49 Distribution of Sellers Interviews across Sampling Strata ................................................................................. 70 Table 50 Relative proportions of 4 Enterprise categories in Sellers Survey................................................................. 70 Table 51 Fuelwood Enterprise categories by Survey District .......................................................................................... 71 Table 52 Comments indicative of the reasons behind selling for the part-time and full-time sellers ..................... 73 Table 53 Comments indicative of irregular sellers. .............................................................................................................. 74 Table 54 Fuelwood sources for sellers .................................................................................................................................... 74 Table 55 Selected comments concerning landholder arrangements .............................................................................. 75 Table 56 Transport modes used by fuelwood sellers .......................................................................................................... 76 Table 57 Distances sellers transport fuelwood ..................................................................................................................... 76 Table 58 Informal retail ................................................................................................................................................................ 77 Table 59 Prices for 7 fuelwood categories ............................................................................................................................. 79 Table 60 Average and range of weights for 5 fuelwood categories. ................................................................................ 79 Table 61 Price per kilogram for 5 fuelwood categories. ..................................................................................................... 80 Table 62 Average price and range in Kina per kilogram paid in various districts ......................................................... 80 Table 63 Frequency of Income categories from fuelwood sales in previous 12 months ............................................ 81 Table 64 Average income of different enterprise types in previous 12 months ........................................................... 82 Table 65 Other information on daily incomes in Mt Hagen district ................................................................................ 83 Table 66 Comments on income from fuelwood sales. ........................................................................................................ 84 Table 67 Seller charcoal knowledge ......................................................................................................................................... 85 Table 68 Charcoal retail prices around PNG......................................................................................................................... 85 Table 69 Opportunity to grow trees for fuelwood by Enterprise type .......................................................................... 85 Table 70 Opportunity to grow trees for fuelwood by Survey region ............................................................................. 85 Table 71 Main problems associated with selling fuelwood ................................................................................................. 86 Table 72 Average and Median Daily Fuelwood Use (kg/day) in Case Studies ............................................................... 87 Table 73 Census Household sizes in Survey regions ........................................................................................................... 88 Table 74 Species used in 36 case study households; case-study %s and overall ranking ............................................ 89 Table 75 Survey of lime burners along the Morobe coast .................................................................................................. 95 Table 76 Summary of data from food vendors along Highlands Highway ..................................................................... 99 Table 77: Observations of hot food vendors along Highlands Highway ....................................................................... 100 Table 78 List of organizations approached in Semi-Structured Interviews ................................................................. 102 Table 79 Estimate of annual domestic expenditure on fuelwood in survey and other fuelwood stressed regions
................................................................................................................................................................................... 117 Table 80 Fuelwood stressed districts (unshaded) in Highland provinces ..................................................................... 118 Table 81 Populations and household sizes of fuelwood-stressed highland districts not included in survey ....... 118 Table 82 Estimate of annual domestic expenditure on fuelwood for regular use (≤K100) in survey regions .... 119 Table 83 Estimate of annual domestic expenditure on fuelwood for occasional use in survey regions ............... 119 Table 84 Estimates of tonnage and volume of fuelwood collected in fuelwood-stressed districts ........................ 120 Table 85 Estimates of gross value of domestic fuelwood economy ............................................................................... 122 Table 86 Comparison of this survey with other PNG estimates .................................................................................... 125 Table 87 Comparison of this survey with RWEDP estimates ......................................................................................... 125 Table 88 Area (ha) deforestation and degradation of forests by region between 1972- 2002 ............................... 130 Table 89 Area (ha) Forests and degraded forests by Region and Province in 2002 .................................................. 131 Table 90 Estimate of trees planted in fuelwood-stressed districts ................................................................................. 132 Table A3.1 Segregation of Census Units (CU) into groups based on economic activity across the 2 LLGs in Lae
................................................................................................................................................................................... 150
Appendix 11.1 of FR2013-14 Page 6 of 165
Table A3.2 Breakdown of sampling strata and sample sizes for 2 LLGs in Lae for a total sample size of 840 ... 151 Table A3.3 Breakdown of sampling strata and sample sizes for 9 Wards in NCD for a total sample size of 1800
................................................................................................................................................................................... 152 Table A3.4 Breakdown of sampling strata and sample sizes for 2 LLGs in Mt Hagen District for a total sample
size of 600............................................................................................................................................................... 153 Table A3.5 Breakdown of sampling strata and sample sizes for 3 LLGs in Chuave District for a total sample size
of 240 ....................................................................................................................................................................... 153 Table A3.6 Breakdown of sampling strata and sample sizes for the 1 LLG in Henganofi District for a total
sample size of 360 ................................................................................................................................................ 153 Table A4.2 Overview of the amount of forest and non-forest fuelwoods consumed (RWEDP 1996) ................ 159
Appendix 11.1 of FR2013-14 Page 7 of 165
List of Figures Figure 1 Proportions of different housing classes in Urban users survey. ...................................................................... 28 Figure 2 Proportions of access to sealed roads for the different housing classes in the three Urban areas. ....... 28 Figure 3 Proportions of powerlines to house for each different housing classes in Urban users survey. ............. 29 Figure 4 Proportions of different landscape types close to dwellings surveyed ........................................................... 30 Figure 5 Access to powerlines correlated with non-fuelwood use for the 9 NCD wards ........................................ 31 Figure 6 Fireplaces a] raised metal box; b] open fire in house ......................................................................................... 34 Figure 7 Frequency of the number of times a week that fuelwood is purchased in the three urban regions. ..... 45 Figure 8 Frequency d of the number of times a week that fuelwood is purchased in the rural regions. ............... 45 Figure 9 Frequency distribution of expenditure classes in urban areas .......................................................................... 47 Figure 10 Frequency distribution of expenditure classes in rural areas .......................................................................... 47 Figure 11a and b Who Collects and who Buys fuelwood: Proportions of Age classes for 5 regions ..................... 51 Figure 12a-e Contribution of different Age Classes in fuelwood collection in the 5 survey regions ...................... 51 Figure 13a Charcoal knowledge 1 ............................................................................................................................................. 68 Figure 13b Charcoal knowledge 2 ............................................................................................................................................. 68 Figure 14 Age class distribution of fuelwood sellers ............................................................................................................ 70 Figure 15 Days per week engaged in selling fuelwood ........................................................................................................ 72 Figure 16 Frequency distribution of transport distances .................................................................................................... 77 Figures 17 a-d Various fuelwood product categories on sale ......................................................................................... 78 Figure 18 Only 50% of sellers agreed to have fuelwood weighed (Israel Bewang on right) ...................................... 79 Figure 19 Variation in Kina/Kilogram for 4 fuelwood product categories...................................................................... 81 Figure 20 Large fuelwood seller on permanent site near main market, Mt Hagen ...................................................... 84 Figure 21 Daily household fuelwood use averaged over 2 weeks, Urban and Rural case studies ........................... 87 Figure 22 Daily Housing type vs daily fuelwood use: Urban and Rural case studies.................................................... 88 Figure 23 Lime burning under way, Morobe coast .............................................................................................................. 93 Figure 24 Relative financial efficiency of bamboo vs mixed hardwoods in lime production ...................................... 95 Figure 25 Bundle of bamboo costing K2 at Yonki ................................................................................................................ 97 Figure 26 Fuelwood for sale at Daulo Pass ............................................................................................................................. 97 Figure 27 About 20 kg/day of fuelwood is used to cook here at the Walia Waterfall market ................................. 97 Figure 28 Fuelwood wholesale market in Kampong Speu, Cambodia. .......................................................................... 112 Figure 29 Fuelwood transport on bicycles in Prey Veng Province, Cambodia .......................................................... 112 Figures 30 RWEDP fuelwood flows. ..................................................................................................................................... 113 Figure 31 Fuelwood flows, volumes and value in fuelwood stressed districts of PNG ............................................. 114 Figure 32 Proportion of forest cleared due to subsistence agriculture in relation to population density ........... 130 Figure A3.1 How Census Units of Lae Urban LLG were segregated into 3 sections based on economic activity
of the population. ..................................................................................................................................................... 151 Figure A3.2 How Census Units of Lae Ahi Rural LLG were segregated into 3 sections based on economic
activity of the population. ...................................................................................................................................... 151 Figure A3.3 Range of ‘Proportion aged 10 years and economically active’ for the 9 Wards of the NCD ................. 152 Figure A4.1 Relationship between income and energy use in urban areas in 12 countries ..................................... 156 Figure A4.2 The 16 countries in the Regional Wood Energy Development Program .............................................. 158 Figure A4.2 Residential fuelwood consumption in Cebu City, Philippines (RWEDP 1996) .................................... 160 Figure A4.3 Overview of fuelwood flows within three different sub-systems (RWEDP 1996) .............................. 161
Appendix 11.1 of FR2013-14 Page 8 of 165
List of Questions Asked in Questionnaire Survey Domestic Users Survey
Q1 Who were the people we interviewed? ......................................................................................... 26
Q2 What was the nature of the environment in which they lived? ............................................... 27
Q3 What proportion of the sample population is and is not using fuelwood? ............................ 30
Q4 How is fuelwood used, and how does this differ across environments ? .............................. 32
Q5 When is fuelwood used, and how does this differ across environments? ............................. 33
Q6 How do the various ways of burning fuelwood differ across environments? ....................... 34
Q7 What energy sources other than fuelwood are used, and for what purposes, and how does this differ across environments? .................................................................................................... 34
Q8 What influences the decision to use other sources other than fuelwood for energy? ...... 36
Q9 What type of fuelwood is collected, and where is it collected from? ..................................... 37
Q10 How far are people travelling to collect fuelwood? .................................................................. 38
Q11 What is the fuelwood collection behaviour of domestic users? ............................................ 40
Q12 What modes of transport do people use to collect fuelwood and how much does it cost? ................................................................................................................................................................ 43
Q13 How frequently do people buy fuelwood? .................................................................................. 44
Q14 How much do people usually spend on fuelwood? ................................................................... 46
Q15 Who collects and who buys fuelwood in the household? ....................................................... 47
Q16 What type of products do people buy and where from? ........................................................ 52
Q17 Do you earn any income from fuelwood? ................................................................................... 53
Q18 How has access to fuelwood changed over last 2 and 10 years? ........................................... 54
Q19 If you own land, have you ever planted fuelwood trees: how many in last 2 and 10 years? ......................................................................................................................................................................... 59
Q20 Has there been any conflict over access to fuelwood? ............................................................ 60
Q21 Is there a need to plant fuel woodlots here? .............................................................................. 62
Q22 Which species do you prefer for fuelwood? ............................................................................... 64
Q23 Knowledge and attitudes about charcoal ..................................................................................... 67
Q24 Who and where were the sellers we interviewed?................................................................... 69
Q25 How large were the sellers enterprises? ..................................................................................... 70
Q26 How often did they engage in selling? ........................................................................................... 71
Q27 What were the reasons behind their frequency of selling? ..................................................... 72
Q28 Source of fuelwood and what arrangements made with landholders? ................................. 74
Q29 How is fuelwood transported to point of sale? .......................................................................... 76
Q30 Do you buy then on-sell your fuelwood? .................................................................................... 77
Appendix 11.1 of FR2013-14 Page 9 of 165
Q31 What are the price and weights for different fuelwood products? ....................................... 78
Q32 What is annual income from selling fuelwood? .......................................................................... 81
Q33 What do you know about charcoal? ............................................................................................. 84
Q34 Are you in a position to grow trees for fuelwood?................................................................... 85
Q35 What are some problems with selling fuelwood? ...................................................................... 86
Acknowledgements Many people contributed to the design and implementation of this survey. The staff of professional foresters from Foundation for People and Community Development who very capably implemented the questionnaire survey and case-study monitoring activity were: Israel Bewang (coordinator), Bazakie Baput, Bonti Krasi, Fletcher Onise, Kafuri Yaro, and Linzon Zamang. Yati Bun, the director of FPCD, contributed to the design and oversaw the field survey activities. Others who were engaged as interviewers in the Questionnaire Survey were F. Amos, Rose Bafe, Seko Bafeo, Bondi, Hetinu Buka, Jonkiso Fikyame, John Foky, J. Woko, N.Jokema, Grace Kintoneka, Barina Kuhimpa, Michelle Kumbuli, Sari Kunoe, Alphones Manaha, Hocksy Maneo, John Morena, Onave Motoa, Basae Mupe, Mason Nefame, Sikompa Nesame, Masuo Okofa, Philip Onke, Fore Onto, L.Peniel, Steven Save, Peter Sio, James Sokilo, Gaga Sonkenu, Danny Taki, Moses Timayame, Fanao Tume, Siga Utenu, Charles Waka, Brian Warahau, and Taki Zamang. Staff from the PNG Forest Research Institute, Lae, who undertook the Semi-Structured Interviews were John Paul, Agnes Sumareke and Maman Tavune. The Access database which carries all the questionnaire survey data was constructed by Frank Pepper from Premier Software. The herculean task of entering all the data into the database and preparing some of the preliminary tables was undertaken by Dessy Kusbandi. The author is very grateful to all these people and thanks them for their efforts. Any error in the analysis and interpretation of the data is entirely the author’s.
Appendix 11.1 of FR2013-14 Page 10 of 165
Executive summary Fuelwood surveys reveal the dimensions and significance of fuelwood in the domestic economy and its regional variations. As such they can better inform public policy and private business decisions that can have wide-reaching impacts on industrial and small-business development, public health, and natural resource management. This survey of the fuelwood economy of PNG was designed to quantify the key dimensions of the fuelwood economy in regions of the country which are ‘fuelwood-stressed’; i.e. where ready access to fuelwood is not available to all, and at times leads to conflict. The survey had 3 components: a large questionnaire survey of domestic users and sellers, a case-study monitoring activity; and semi-structured interviews of industrial and commercial operations using fuelwood and other fuelwood stakeholders. In a broad view, the fuelwood economy in PNG, compared to other developing countries where similar studies have been done, has a relatively flat structure with a very short and direct supply chain. Fuelwood is regularly used by most of the population for domestic and commercial cooking, even in urban areas where there is good access to electricity and other energy sources. In the domestic market, most fuelwood sellers are collectors although larger sellers may buy from landholders and sell on to smaller sellers as well as selling directly themselves. In the industrial market it is largely supplied by local traders who pick up wood from roadside collection points. Selling fuelwood is an easy market to enter with many people entering it on a part-time basis. It is an informal economy in that there is no public engagement in supply, marketing, distribution, pricing, taxation, and use (except for instances of the prohibition of firewood use in some urban areas). Tree planting is widely practiced and many of these trees would be used for fuelwood. Value-adding of fuelwood into charcoal exists but it is on a very small scale, fragmented and infrequent. Fuelwood consumption is estimated to be1.8m3/person/year which is 6 times greater than the average consumption of 16 south and south-east Asian countries in the FAO Regional Wood Energy Development Program (and only exceeded by Bhutan). In PNG there will be at most (and rarely) 2 intermediaries between landholder and fuelwood consumer; this compares with RWEDP countries which can have up to 7-8 intermediaries. PNG also contrasts with these countries in the absences of government involvement in either trade or regulation of the fuelwood market, a significant organized private sector, and a charcoal market. Most (85%) people surveyed had used fuelwood in the previous 12 months, with the proportions high even in urban areas (73% in NCD and 90% in Lae) and virtually all rural people using it. It is estimated that about 2.1million m3/y was collected in the surveyed regions in 2007-8; an extrapolation for a national value would be 9.34million m3/y. The annual expenditure on fuelwood over 2007-8 was in the order of K6.6million/y across the surveyed districts. There is significant variation in the price of fuelwood across urban and rural regions with values ranging from K0.30/kg in the NCD to K1.15/kg in Mt Hagen urban. Along the Highlands Highway the average price is K0.26/kg. About 3% of urban and 10% of rural people will sell fuelwood, mainly on a part-time basis, as only 8% of fuelwood sellers interviewed earn more than K5,000/y from this activity. Access to fuelwood is becoming increasingly difficult for 65% of urban (particularly in NCD) and 41% of rural users with very high reportage of conflict associated with fuelwood collection. Nevertheless, most fuelwood users had planted trees in recent years, and with the caveat that this is highly flexible ‘recalled information’, it is estimated that about 3.6million trees were planted by people in the survey regions in the 2 years previous to the survey. While 88% of fuelwood users also use other energy sources which are becoming more accessible, fuelwood will remain the dominant domestic energy source for quite some time, especially in rural areas. There is a great opportunity for entrepreneurs to create a more sophisticated fuelwood

Appendix 11.1 of FR2013-14 Page 11 of 165
supply chain that could deliver sustainably harvested and value-added fuelwood to consumers, especially in urban areas and the commercial sector. The market is free of government regulatory restrictions, but also support for developing new fuelwood businesses. The potential for developing a fuelwood economy based on short-rotation coppicing (SRC) species maybe greatest in the production of charcoal rather than fuelwood directly. The effort put into growing SRC trees would give better returns if directed to a value-added product. Locally produced charcoal is likely to be much cheaper than imported charcoal while still yielding good returns to the producer. The industry development effort should focus on extension of the practical use of charcoal as an energy source as this was one of the draw-back of previous attempts to promote a charcoal industry. The Western Highlands (and most likely other highland provinces) require further detailed study. The high consumption levels and price for fuelwood, and the levels of conflict associated with fuelwood collection, indicate that fuelwood-stress is even greater here than in the lowland urban areas. The impact of fuelwood collection on natural forest is still ambiguous as it needs to be differentiated from the expansion of garden clearing while still considering the influence of natural regeneration and tree planting.

Appendix 11.1 of FR2013-14 Page 12 of 165
Key and specific findings of the survey. Domestic Users Survey
1. The Questionnaire survey (Q-survey) interviewed 3,966 households selected across the National Capital District, Lae District (Morobe), Mt Hagen District (Western Highlands), Chuave district (Chimbu) and Henganofi District (Eastern Highlands). There was a relatively even balance of male and female interviewees in the urban survey (54% vs 43%) while the proportion of male interviewees was much higher in the rural survey (80% vs 18%). It sampled 0.72% of the population in the target fuelwood-stressed districts. This population of the fuelwood-stressed districts represents 10.6% of the national population. (Tables 1, 2a-d, 4a & b)
2. In the NCD there is a moderate correlation (R2 = 0.55) between the proportion of dwellings with access to powerlines with the proportion of non-fuelwood users in each of the 9 NCD wards. However, even in wards with almost 100% access to power, 47% of inhabitants still use fuelwood. (Figure 5)
3. In the highland rural survey 48% of dwellings were surrounded by trees that had been planted (eg yar and eucalypt), 45% bush fallows and 22% coffee gardens which could be considered as relatively good fuelwood resources. Only 5% of respondents were living within natural forest. (Table 7)
4. Overall 85% of the surveyed population used fuelwood in the previous 12 months. The proportions of regional sample populations regularly using fuelwood were 73% in NCD, 90% in Lae urban, 87% in Mt Hagen urban, 98% in Lae rural and 100% in Highlands rural regions. (Table 8)
5. Local government regulations (or landlords) forbid the use of fuelwood in 25% of NCD and 9% in both Lae and Mt Hagen urban samples. (Table 10)
6. While domestic cooking is the most important use of fuelwood, 17% of the interviewed population cooks their food by other means. Only 4 % of rural people use other energy for cooking. (Table 11)
7. An index of intensity of fuelwood use was devised. When the index of the whole survey population is set at 0, then the index for NCD users is -3.0, Lae urban users -2.1, Mt Hagen urban users +0.2 and rural users +6.8 Use of fuelwood for heating is 3-4 times more reported in the rural and Mt Hagen urban groups. (Table 11)
8. The most common form of fireplace is a simple open fire outside the house (51%) or similarly open fire inside the house (34%), the preferences for these arrangements much higher in rural areas (69% and 68% respectively). Many respondents had more than one type of arrangement associated with their dwelling. The use of drum ovens outside (32%) and inside (34%) also figures highly. More fuel conserving arrangements, such as metal boxes, were not common. (Table 13)
9. Responses concerning charcoal use are likely to be confounded by a misunderstanding of what charcoal is; i.e. a value-added fuelwood product vs the coals left over from last night’s fire. That said, 3.l% of all respondents have used charcoal in the 12 months prior to the interview. While still relatively low compared to some other energy sources, charcoal use is more prevalent in the highland with 9.3% of regional sample in Mt Hagen urban area other rural areas 4.2%, compared with only 2.7% in NCD and 0.9% in Lae . (Table 14a, Figs13 a&b)
10. 88% of fuelwood users also used alternative sources of energy. The most common response was to use kerosene for lighting, then the hierarchy went from gas for cooking, gensets for appliances, then mains access. About 15% of the sample population had access to mains power and 30% access to gensets, which may be communally owned. (Table 14 & 15)
Appendix 11.1 of FR2013-14 Page 13 of 165
11. Rural residents can gather fuelwood more widely over the range of sources available, again with coffee lands being the richest source of fuelwood (22%) followed by ‘around house’ (21%), ‘bushfallow’ (15%), ‘garden clearing’ (14%) and ‘planted forest’ (12%). Most urban fuelwood is collected ‘around the house’ (47%), in ‘surrounding hills’ (14%), ‘garden clearings’ (12%) and stream banks (9%). (Table 18)
12. The proportion of fuelwood collected from ‘natural habitat’, i.e. mangroves around NCD (3%) and natural forest in highlands (9%), is relatively low. (Tables 17&18)
13. Rural respondents have access to more of the high quality fuelwood than urban people. The proportions of low quality fuelwood (fast burning, low heat, smokey) used by rural and urban users are 8% and 38% respectively. (Tables 17&18)
14. In all the urban areas a significant proportion of the interviewees travelled between 1-3km into the surrounding hills to gather fuelwood. The proportions were 27% in NCD, 32% in Lae and 32% in Mt Hagen. A further 11%, 25% and 2% respectively travelled more than 3km into the surrounding hills and beyond. The average estimated distance travelled beyond 3km was 10.1km (range 4 – 30km, n=96). (Table 19)
15. In rural areas 11% of interviewees travelled > 3 km to collect fuelwood, mainly in natural forest, garden clearings and old gardens. (Table 20)
16. The most common form of transporting wood that was collected was on foot which accounted for 68% of respondents. Of the 32% respondents who used vehicles to transport collected fuelwood, most of these used PMVs (31%), their own car (29%), or had it delivered (22%). (Tables 23 & 24)
17. For every 100 fuelwood users in the various regions 33 buy fuelwood in NCD, 27 in Lae urban and 53 in Mt Hagen urban areas, and 7 in Lae rural and 3 in rural highlands. In NCD and Lae the majority of buyers (68% and 78% respectively) buy their fuelwood 1 to 2 times a week. In the Mt Hagen urban sample, the majority (60%) buy their fuelwood 2-3 times per week. (Table 25, Figures 7&8)
18. The average expenditure per household on fuelwood for domestic use over a 2 week period was K20.65 in NCD, K21.60 in Lae urban, and K20.39 in Mt Hagen urban, and K27.60 in Lae rural and K24.10 in rural highlands. (This estimate excludes purchases ≥ K100 deemed for ceremonial and commercial uses) (Table 26)
19. A gender equity index showed that while males and females (across all age classes) share the responsibility of fuelwood collection and purchase equally in NCD, this is not so in other regions. For example, while males collect fuelwood more than women in Mt Hagen Urban, the relationship is opposite Lae Rural. In particular, in rural households men are twice as likely to buy fuelwood as women. (Tables 27 & 28)
20. In the NCD 46% of fuelwood purchases are made at mixed markets and roadside stalls. Specialty fuelwood markets provide 30% of the market (Baruni 9%, Tatana 5%, Gerehu sawmill 5%, Cloudy Bay 5%, Sabura 3%, Gerehu 2%, Bomana Rd 1%). The remaining 24% of the market are direct purchases from landholders, some of whom deliver. (Table 30)
21. Use of fuelwood for income generation is high among both urban (26%) and rural (58%) domestic respondents. This included activities such as baking and hot food vending, and smoking fish. The proportions earning some income from selling fuelwood were 3% and 10% respectively. (Table 31)
22. The average annual incomes generated using fuelwood were K3,500/y in urban areas and K1,560/y in rural areas. The proportion of respondents earning >K5,000/y were 14% in urban and 5% in rural areas. (Table 32)
Appendix 11.1 of FR2013-14 Page 14 of 165
23. Access to fuelwood has become more difficult for 65% of urban and 41% of rural respondents over the 2 year period previous to the survey. (Table 33)
24. Changes in access to fuelwood are much more severe in the NCD particularly in the LLGs of Kilakila/Kaugere, Laloki/Napanapa, Hanuabada and Gerehu (Table 35)
25. Of the fuelwood users in the survey regions, those planting trees in the 2 years previous to the survey were 78% NCD, 48% Lae urban, 73% Mt Hagen urban, 55% Lae rural and >90% for all Highland rural. The trees were not necessarily planted within the actual survey region(Table 39)
26. It is estimated that about 3.6million trees were planted by the population in the survey regions in the 2 years previous to the survey. By extrapolation, the value for non-surveyed highland districts may be as much as 11.9million trees. (Table 90)
27. Of the fuelwood users in the survey regions, high proportions had experienced conflict over access to fuelwood: 48% NCD, 40% Lae urban, 58% Mt Hagen urban, 51% Lae rual, 61% Mt Hagen rural, 88% Henganofi rural, 72% Chuave rural. (Table 41)
28. There was strong agreement (62-95%) with the need to plant more fuelwood trees (Table 43), but this was by no means universal for reasons ranging from lack of good sites to abundant natural supply (Table 45)
29. Within the NCD, the LLGs with the strongest demand for more fuelwood trees were in Laloki/Napa-napa (91%), Kila-kila/Kaugere (75%), Bomana (75%), and Gerehu (74%). (Table 44)
30. Preferred fuelwood species in the NCD were eucalypt (64%), raintree (18%), coastal yar (15%), neem (14%), mango (13%) and mangrove (11%) (Table 46)
31. In Lae urban and rural respectively the preferred species were Kwila (14 & 3%), Taun (31 & 24%), Yar (37 & 129%) and Okari (11 & 20%) are much preferred. The aggressive weed Piper aduncum is widely used in both the urban (13%) and rural (31%) areas. (Table 46)
32. Across the highlands yar is by far the most preferred species (>85%). In Mt Hagen there is also a preference for the introduced eucalypts (87%, mainly E.grandis and E.robusta), while in Henganofi and Chuave the PNG Oak is highly favoured (85 & 91%). Naturalised Leucaena is also an important fuelwood use in these areas (22 & 29% respectively) (Table 46)
Fuelwood sellers survey
33. 157 fuelwood sellers were interviewed. At a glance 83% were male, 49% in the 30-50y age category, and 50% in the Mt Hagen (urban and rural) sampling districts. Most (51%) sellers presented <100kg of wood for sale on non-permanent sites, while 33% were on semi-permanent sites. There were twice as many fulltime sellers (5-7days/week) than part-time (1-4 days/week). 11% of the sample were larger suppliers to factories, commercial users etc. operating on an irregular basis. 40% of sellers operate from their home village. (Tables 48-51; Figures 14 & 15)
34. 46% of sellers source fuelwood from their own land, 24% from natural forests and 22% buy some of the wood they sell (NB these and other sources given in the report are not mutually exclusive) (Table 54)
35. The bulk of fuelwood is delivered to point of sale by either PMV (42%) or foot (42%). 6% of sellers have the fuelwood delivered to them by a landowner. (Table 56)
36. The distance fuelwood is transported to market varies for district with averages (and maxima) being: NCD 10 (25)km; Lae 3(5)km, Hagen 6 (30)km and Henganofi / Chuave 23(40)km. (Table 57)
Appendix 11.1 of FR2013-14 Page 15 of 165
37. There was a very clear difference between sampling districts with the average value of fuelwood ranging from K0.30/kg in NCD to K1.15/kg in Mt Hagen urban. Along the Highlands Highway the average price is K0.26/kg. (Table 62)
38. Estimates of price/kg of wood decreases as the product category gets larger, with kindling and bundles of cut branches in the order of K1.20/kg and cut and split logs K0.50/kg. Only 52% (and only 33% in NCD) of sellers consented to having their wood weighed by the survey team. (Table 61)
39. 36% of sellers identified fuelwood sales as their sole source of income. 92% of sellers earned K5,000 or less in the previous 12 months. (The official minimum wage for PNG is K5,240) So, only 8% of sellers earned >K5,000. The maximum income was recorded as K70,000 of a large seller (family group) in Mt Hagen. (Table 63)
40. The average price of imported charcoal for sale is K10.12/kg (range 8.65-16.33, n=9). Locally produced charcoal can be purchased in NCD for K1.00/kg and Lae K1.50/kg. About a quarter of sellers said they knew how to use charcoal and only half of these knew how to produce it; as in point 9 above there may be confusion about what is meant by charcoal. Nevertheless, 66% said they would sell it if it was available. (Tables 67& 68)
41. Most (78%) sellers have access to land to grow trees for fuelwood. Interestingly, 86% of NCD sellers have access to land for growing trees while relatively few (39%) of the Lae sellers had enough land. The highland fuelwood sellers also have good access to land for tree growing (89%). (Tables 69&70)
42. The ranking of problems involved with fuelwood selling were (with % citing this problem): transport (37%), supply (17%), hard labour (16%), market issues (16%), competition (12%), safety and fatigue (10%), conflict (10%), theft (7%). However, 15% of sellers said there were no problems and that it made a good living. (Table 71)
Case study monitoring survey
43. The fuelwood use of 36 case study households (13 urban, 23 rural) was monitored daily over a 2-week period. The average daily fuelwood use was 24.8 kg/d with a range from 2.2 to 97.4 kg/d. The median is 16.0 kg/d. The average (and median) values for urban and rural case-study groups were 11.1 (11.6) kg/d and 32.5 (27.3) kg/d respectively (Table 72)
44. There was a strong relationship between housing type (i.e. high convenient, permanent, semi-permanent, shanty, bush material) and household fuelwood use. Case studies with very high daily use (>60kg/d) were all in highland village settings with houses made of bush materials. (Figure 20)
45. The 6 NCD case studies used a lot of boroko (Eucalyptus alba), mango, neem, raintree and coconut shells. The 6 Lae households accessed a broader mix of native hardwoods such as walnut, fig and taun, but the introduced weedy species Piper aduncum was also very important. The dominant fuelwood for the 24 highland households was yar (Casuarina oligodon), strongly supported by albizzia, coffee wood and leucaena. (Table 74)
Semi-Structured Interviews
46. A series of semi-structured interviews was undertaken of: 42 small-business users of fuelwood (hot food vendors); 18 small and large industrial users of firewood (limeburners, oil palm, cocoa and copra); and 9 stakeholder organizations.
47. The oil palm industry on West New Britain Province is the well on the way to converting all factories over to using the residue oil palm fibre and shells to generate their electricity, thereby taking pressure off local hardwood resources.

Appendix 11.1 of FR2013-14 Page 16 of 165
48. The cocoa and coconut industry in East New Britain Province is also using residue coconut shells, husks and trunks as well as planting Gliricidia as their fuelwood source. There is strong interest in further development of short-rotation coppicing systems for bioenergy fuelstock.
49. The Mt Hagen WR Carpenters tea industry spends K3million/y on fuelwood, mainly yar, eucalypt and coffee wood but refuse wood from indigenous forest species. Attempts to encourage tree planting by distributing yar seedlings have failed, (probably because wood deliverers are not the landowners).
50. Limeburning is a major source of income for many villages along the Morobe coast. The net (i.e. income after costs) efficiency of burning wood to make lime is K2.96 / kg for bamboo but only K0.33/kg for mixed hardwood species (Figure 24). Access to fuelwood through collection or purchase did not seem to be a problem in this region; mangroves are protected from wood collection and reefs from live coral collection.
51. Incomes among lime burning groups ranged from K850 – K48,000/y . Estimated annual fuelwood use of these groups ranged from 1,920 – 60,000 kg/y (Table 75)
52. Hot food vendors were interviewed along the Highlands Highway from Markham Bridge (Morobe) to Walia Water fall (Enga). Estimated incomes ranged from K70 to K900 /week and daily fuelwood consumption ranging from 10 to 30 kg/day. Some of this is freely collected; but that which is purchased varies greatly in cost; e.g. bamboo K0.15/kg ; native hardwoods K0.29-0.38/kg; yar K0.19-0.34 /kg (Table 76)
53. Eight national organisations with a stake in the fuelwood economy were interviewed to ascertain their interest in short-rotation coppicing (SRC) fuelwood production systems. (Table 78)
54. PNG Forest Authority does not have an explicit fuelwood policy, however the significance of fuelwood is generally understood and is an assumed consideration in forestry projects. While there is a clear need for fuelwood plantings, and opportunities on grasslands that might attract ‘climate-change’ funds, there is currently no capacity to undertake fuelwood plantings by the PNG Forestry Authority or in concert with Dept Agriculture & Livestock and NGOs.
55. PNG Power is strongly committed to its Rural Electrification Program. While most of this is based on diesel and hydro generation, with the climate change issue PNG power plans to venture into the use of biomass (e.g. from oil palms) as another form of energy, especially on small-scale generators in rural areas. PNG Power would consider a proposal for SRC-biomass fuelstock for electricity generation in remote rural villages.
56. PNG Sustainable Development Program (PNG SDP) is a funding agency financed by the mining industry. It promotes sustainable forestry practices through sustainable harvest, afforestation and reforestation programs. Its mandate includes funding biomass energy projects and welcomes any SRC-biomass energy proposal in line with its goals.
57. PNG Sustainable Energy Limited (PNGSEL) is a company of its own under the PNG SDP with the job of developing rural electrification and infrastructure in the Western Province. It has projects, mostly in the feasibility stage, in biodiesel, solar power, hydro, and waste-wood biomass. PNGSEL sees a potential in using biomass especially in areas where forestry and oil palm projects are progressing so that the waste streams can be used. PNGSEL would also be interested in a pilot project of SRC-biomass energy. Somewhere in Madang is suggested.
58. The Department of Energy and Petroleum: Division of Energy has a policy on renewable energy but very little has been enacted or enforced. Accordingly, energy sector operations have been hindered due to this poor policy framework. The Energy Division gave the same in-principle approval to biomass-energy generation as did PNG Power and PNGSEL, but also the same reservations expressing the lack of relevant information on feasibility.
Estimates of fuelwood value and volume

Appendix 11.1 of FR2013-14 Page 17 of 165
59. Annual domestic expenditure on fuelwood is estimated (at time of survey) at K6.6 million/y in the NCD, K2.7million/y in Lae Urban, K0.3million/y in Lae Rural K1.5million Mt Hagen Urban and K5.7million/y for all other fuelwood-stressed districts in the highlands. This yields a total estimated expenditure of K18.2million/y. (Table 79)
60. The total volume of fuelwood collected over the fuelwood-stressed regions of PNG is about 2.1million m3/y with an average use of 1.8m3/person/year in the years of the survey (2008-9). This ranged from 0.50 m3 in Mt Hagen urban, to 0.93 m3 in NCD to 2.41m3/person/year in the highland rural areas. (Table 84)
61. An estimate of national volume of fuelwood consumed will be about 9.34million m3/y at the time of survey, or 12.34million m3/y for the estimated population of 6.9 million in 2012. (text to Table 84)
62. PNG’s per capita fuelwood consumption is 6 times greater than the average value (0.3 m3/person/year) for 16 Asian countries in the FAO Regional Wood Energy Development Program. The only country to exceed PNG was Bhutan (2.4 m3/person/year). (Table 87)
63. The national estimate of the gross value of the wood consumed domestically (both
purchased and freely collected) is K2,409 million/y in the years of the survey, (K2,708 million/y in 2012). (Table 85)

Appendix 11.1 of FR2013-14 Page 18 of 165
Introduction Fuelwood is a crucial, but undeveloped, component of the domestic economy of PNG. Many districts in PNG are under intense agricultural pressure and socioeconomic disadvantage and fuelwood collection has led to social conflict and increasing pressure on the environment. Fuelwood will also continue to play a major role in the energy economy of PNG for the foreseeable future. In order to develop this part of the economy it is necessary to have a clear and quantified assessment of the fuelwood economy. This Fuelwood Survey, undertaken over the period October 2008 to June 2009, provides this assessment. The survey focuses only recognized fuelwood-stressed districts. The survey was a primary objective of the ACIAR project ‘Promoting diverse fuelwood production systems in PNG” (FST/2006/088). This document summarises the structure and methods of the survey and the key results.
Survey structure and methods The survey has three components:
1. Questionnaire survey (Q-survey) of fuelwood users and sellers in selected lowland and highland districts
2. Case-Study Monitoring of the amount of fuelwood actually used over a 2-week period of 36 households
3. Semi-Structured Interviews of commercial and industrial users of fuelwood.
1 Q-Survey Methods The initial drafting of questions for the Q-survey was made in a facilitated participative process in a Fuelwood Survey Design Workshop held at the Forest Research Institute, Lae 15-16th April 2008. There were 25 attendees from FRI, FPCD, HOPEworldwide, PARD, CSIRO, ACIAR and University of Adelaide (see Appendix). A pilot survey was undertaken over a two week period in May 2008, the results of which were reviewed in a follow-up workshop with the key FPCD interviewers in 24-25th July 2008. This review refined the survey design so that there would be consistency of interpretation and recording among the interviewers. This was followed by a training session for the 6 key FPCD interviewers. These men further instructed the other 35 people who were employed as interviewers. Most of the interviews were undertaken in Tok Pisin, but the results recorded in English on the Q-survey forms. There also had to be consistency in how interviewers recorded weights, times and distances. The Q-survey was undertaken over two periods October-December 2008 and March-May 2009 by staff from Foundation for People and Community Development (FPCD). There were three variants of the Q-survey:
1. Survey of Urban Fuelwood Users 2. Survey of Rural Fuelwood Users 3. Survey of Fuelwood Seller
Copies of these questionnaires are provided in the Appendix.
Sampling strategy The survey was designed to focus on areas where there is known fuelwood stress in PNG. At the Fuelwood Survey Design Workshop, these areas were determined to be the NCD, Lae, WHL (Mt Hagen District), Chimbu (Chuave District) and EHL (Henganofi District). Table 1 presents the relative proportion of population of these Districts. In terms of populations, the provinces from which these districts are selected represent 36% of the national population of 5,190,000 (PNG National Census 2000). The actual districts represent about 10.6% of the national population. Segregating the survey sample size based on the relative proportion of population over the 5 survey districts produced the following approximate balance of sampling:
Appendix 11.1 of FR2013-14 Page 19 of 165
% of sample NCD 46% urban Lae 22% ½ urban: ½ rural Mt Hagen 16% rural / minor urban Chuave 6% rural Henganofi 10% rural Total 100
Breaking this down into other possible categories: Urban 51% and Rural 49%; or Lowland 68% and Highland 32%. The stratification of the survey population was made using information from the PNG National Census 2000. This is accessible through the Community Profile System (CPS) which provides a wide range of demographic and socio-economic information. Within each of the survey Districts the appropriate sample size for each LLG or Ward was determined on the basis of relative population. The Census Unit is the finest level in the census hierarchy and represents entities such as roads, hamlets, villages, compounds, barracks etc. Each of these wards had different numbers of Census Units. It was not feasible to survey all Census Units in a district so a further level of sample discrimination was necessary. For each District the key indicator used to segregate Census Units was “Proportion aged 10 years and over economically active”. This indicator includes both males and females. The distribution of this indicator was separated into three equal thirds. An equal number of Census Units were randomly selected from each third of this distribution. An example of this process is given in the Appendix. The selected Census Units were allocated a sample size and identified on maps. Only these Census Units were surveyed. In all, there were 55 sampling strata (see Table 2a and 2b). Some of these were at the level of LLG/Ward some were at the level of Census Unit.
Q-survey data collection and collation For the Users surveys there were two rounds of data collection: periods 6/10/2008 to 30/12/2008 and 3/03/2009 to 30/04/2009. The interviewers worked in pairs for security reasons. They worked on either side of a road and called upon every third dwelling along the road. If no-one was home or declined the survey, the interviewer moved to the next house until a willing interviewee was found. The interviewers continued through the Sample Stratum like this until the requisite number of interviews were made for that Sample Stratum. The Fuelwood Sellers survey was undertaken opportunistically during the second round. Sellers were generally approached as they were encountered on the street in the progress of the User surveys. The interviewers also visited all the known fuelwood markets in each sample stratum. On completion of each Round, the Q-survey questionnaires were shipped to Adelaide and entered into a database in MicroSoft Access 7. The sample size for each sampling stratum, survey type and round is shown in Tables 2a, 2b and 2d, while Table 2c estimates the total population represented considering the different average household sizes. In Table 2a it will be noted (by red box and arrow) that 7 of the sampling strata in 15 Lae Rural (n=243) were surveyed using the Urban Survey, and not the Rural Survey as intended. The concordance between intended proportion sampling density across the strata and the actual sampling is indicated in Table 3. There is a very strong correlation between the Target and Actual sampling proportions across the strata (r2= 0.99). It shows that the team of interviewers was very successful in managing to maintain appropriate proportional sample sizes across the sample strata.
Appendix 11.1 of FR2013-14 Page 20 of 165
Table 1 Relative proportions of population in survey areas.
PNG National Population 5,190,786 Province District LLG / Ward No. of
Wards Province % nation District % province LLG % district % of nation
Morobe 539,404 10% Lae 2 119,178 22% 2.3% 15 Ahi Rural * 1 40,486 34% 1% 16 Lae Urban* 1 78,692 66% 2% WHL 440,025 8% Mt Hagen 42 86,951 20% 1.7% 04 Mt Hagen Rural 40 59,074 68% 1.1% 05 Mt Hagen Urban 2 27,877 32% 0.5% Chimbu 259,703 5% Chuave 57 36,074 14% 0.7% 01 Chuave Rural 14 11,983 33% 0.2% 02 Elimbari Rural 16 12,828 36% 0.2% 03 Siane Rural 27 11,263 31% 0.2% EHL 432,972 8% Henganofi 30 55,768 13% 04 Henganofi Rural 30 55,768 100% 1.1%
- NCD 9 5% 254,158 100% 4.9% 80 Gerehu ** 1 25,178 10% 0.5% 81 Waigani/University ** 1 28,315 11% 0.5% 82 Tokarara/Hohola ** 1 40,590 16% 0.8% 83 Gordons/Saraga ** 1 34,229 13% 0.7% 84 Boroko / Korobosea ** 1 34,725 14% 0.7% 85 Kilakila / Kaugere ** 1 32,204 13% 0.6% 86 Town / Hanuabada ** 1 29,917 12% 0.6% 87 Laloki / Napanapa ** 1 11,937 5% 0.2% 88 Bomana ** 1 17,063 7% 0.3%
Source: PNG 2000 Census; Community Profile System. * in Lae District, the 2 LLGs are also the Wards ** in NCD, there is 1 LLG and 9 wards LLG = Local Level Govern
Appendix 11.1 of FR2013-14 Page 21 of 165
Table 2a: Sample numbers for the 55 sampling strata in Urban and Rural Users Surveys and Sellers Survey; Coastal provinces.
Province District LLG/Ward Sample Stratum Code
Urban Users survey
Rural Users Survey
Sellers Survey
Round 1 Round 2 Round 1 Round 2 U R NCD NCD 80 Gerehu 10 88 90 2 81 Waigani/University 11 103 99 12 82 Tokarara/Hohola 16 145 145 8 83 Gordons/Saraga 13 108 158 84 Boroko / Korobosea 14 122 127 85 Kilakila / Kaugere 15 115 117 86 Town / Hanuabada 12 122 108 6 87 Laloki / Napanapa 5 45 46 88 Bomana 7 67 63 2 ∑ 915
953
0 0 ∑∑ 1868
0 Morobe Lae 15 Ahi Rural Butibum Rural 32 11 40 Seken Seven Rural 33 15 13 ** *Maus Wara Markham 48 23 Hengali 49 30 2 *Sipaiya/Bush 50 28 *Gubadik 51 31 Kamkumung Village 52 52 Ahi Rural A 53 6 3 Ahi Rural B 54 16 3 Ahi Rural C 55 20 ∑ 26 259 ∑∑ 285 16 Lae Urban *CDCA & SP Compound 17 19 30 3 Papuan Compound 18 21 30 3 Dowsett 19 19 Boundary Road 20 30 *Telikom College 21 20 Buimo Police Barrack 22 19 North Eriku 23 25 South-West Eriku 24 25 Cassowary Road 25 25 Huon Road 26 22 West Taraka 27 22 East Taraka 28 19 Tent Siti 29 29 3 Bumayong S. School 30 17 4 Igam Barracks 31 29 *Talair Compound 43 40 Bundi Camp & Nawae Block 44 43 Unitech 45 31 2-3 mile Lae 46 21 3 4-5 mile Lae 47 22 5 ∑ 341 217 26 259 51 8 ∑∑ 558 285 59 *Sample unit not indicated as a census unit or ward in the Community Profile System. ** These Rural strata, though interviewed with the Urban survey form, were analysed as Rural strata where feasible.

Appendix 11.1 of FR2013-14 Page 22 of 165
Table 2b: Sample numbers for the 55 sampling strata in Urban and Rural Users Surveys and Sellers Survey; Highland provinces.
Province District LLG/Ward Sample Stratum Code
Urban Users Survey
Rural Users Survey
Sellers Survey
Round 1 Round 2 Round 1 Round 2 U R Western Highlands
Mt Hagen 04 Mt Hagen Rural Mt Hagen Rural-Plantation 37 51 23
Mt Hagen Rural-Valley 39 51 56 3 Mt Hagen Rural-Slope 40 51 51 8 Mt Hagen Rural-Mountain 41 51 51 7 *Western Highlands 42 19 05 Mt Hagen Urban Mt Hagen Urban-Kagamuga 34 11 10 3 Mt Hagen Urban-Plantation 35 51 Mt Hagen Urban-Town 36 88 87 35 ∑ 99 148 223 158 ∑∑ 247 381 Chimbu Chuave 01 Chuave Rural 9 56 23 4 02 Elimbari Rural West Elimbari 6 32 21 2 East Elimbari 38 11 44 1 03 Siane Rural 8 34 33 4 ∑ 0 0 132 122 ∑∑ 0 254 Eastern Highlands
Henganofi 04 Henganofi Rural Kafetina 1 42 51 3
Kamanontina 2 43 44 2 Dunantina 3 67 63 Faiyantina 4 47 44 2 ∑ 0 0 199 202 38 59 ∑∑ 0 401 97 Table 2a + 2b ALL SURVEY GRAND
TOTAL 2673 1321 156
Urban + Rural Users 3994 *Sample unit not indicated as a census unit or ward in the Community Profile System.
Table 2c: Estimate of total population represented by survey
Sampling district
Household Sub-sample
size
Average household
size No. of
households
Estimate of population
represented NCD 1,868 7.1 35,188 13,263
Lae Urban 558 6.9 11,205 3,850
Lae Rural 285 6.1 6,590 1,739
Mt Hagen Urban 247 6.4 4,314 1,581
Mt Hagen Rural 381 4.4 13,496 1,676
Chuave 254 3.8 9,396 965
Henganofi 401 4.2 13,317 1,684
TOTAL 3,994 93,506 24,758
Appendix 11.1 of FR2013-14 Page 23 of 165
Table 2d: Sample numbers for the 27 sampling strata in Sellers Survey
Region LLG/Ward
SS code
Sample size
Region sub-totals
Rural Eastern Highands 04 Henganofi Rural / Kafetina 1 3
04 Henganofi Rural / Kamanontina 2 2
04 Henganofi Rural / Faiyantina 4 2
7
Chimbu 01 Chuave Rural 9 4
02 Elimbari Rural / West Elimbari 6 2
02 Elimbari Rural / East Elimbari 38 1
03 Siane Rural 8 4
11
Lae 15 Ahi Rural / Hengali 49 2
15 Ahi Rural / Ahi Rural A 53 3
15 Ahi Rural / Ahi Rural B 54 3
8
Mt Hagen 04 Mt Hagen Rural-Plantation 37 23
04 Mt Hagen Rural-Valley 39 3
04 Mt Hagen Rural-Slope 40 8
04 Mt Hagen Rural-Mountain 41 7
41
67 Urban NCD 88 Bomana 7 2
80 Gerehu 10 2
81 Waigani / University 11 12
86 Town / Hanuabada 12 6
82 Tokarara / Hohola 16 8
30
Lae 16 Lae Urban / CDCA & SP Compound 17 3
16 Lae Urban / Papuan Compound 18 3
16 Lae Urban / Tent Siti 29 3
16 Lae Urban / Bumayong S. School 30 4
16 Lae Urban / 2-3 mile Lae 46 3
16 Lae Urban / 4-5 mile Lae 47 5
21
Mt Hagen 05 Mt Hagen Urban-Kagamuga 34 3
05 Mt Hagen Urban-Town 36 35
38 89
156
Source: tblInterview_S_export_120131.xlsx
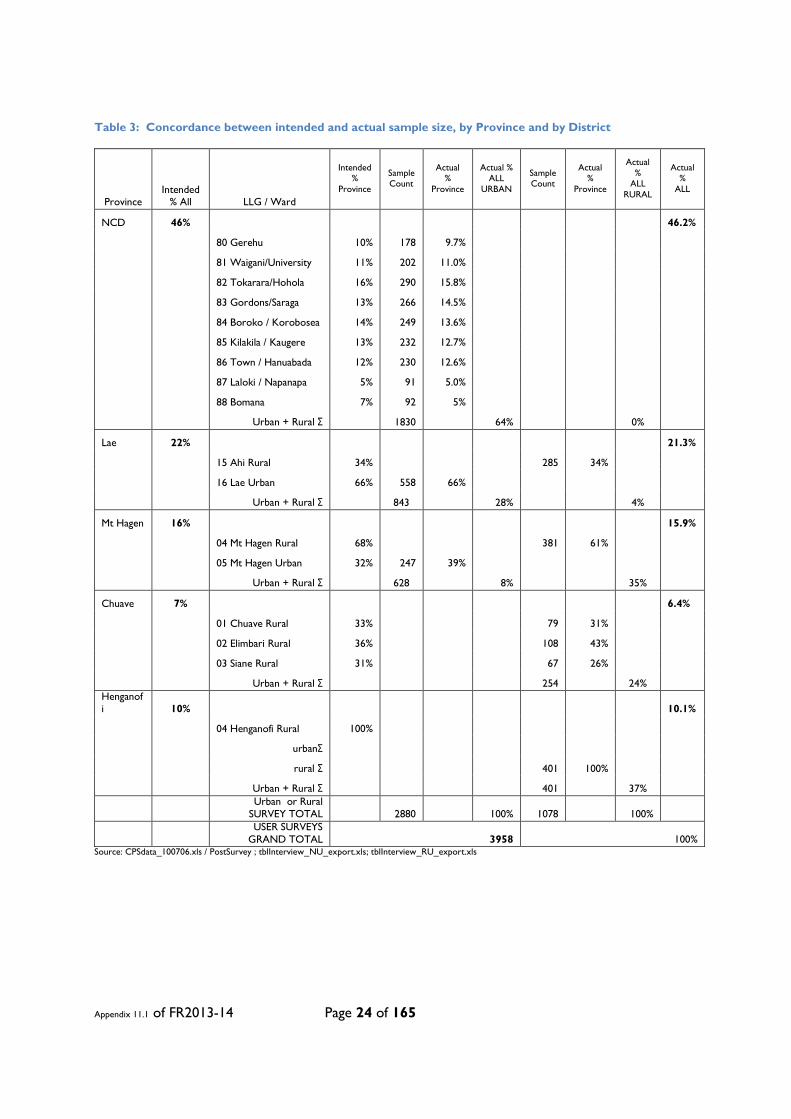
Appendix 11.1 of FR2013-14 Page 24 of 165
Table 3: Concordance between intended and actual sample size, by Province and by District
Province Intended
% All LLG / Ward
Intended %
Province
Sample Count
Actual %
Province
Actual % ALL
URBAN
Sample Count
Actual %
Province
Actual %
ALL RURAL
Actual %
ALL
NCD 46%
46.2%
80 Gerehu 10% 178 9.7%
81 Waigani/University 11% 202 11.0%
82 Tokarara/Hohola 16% 290 15.8%
83 Gordons/Saraga 13% 266 14.5%
84 Boroko / Korobosea 14% 249 13.6%
85 Kilakila / Kaugere 13% 232 12.7%
86 Town / Hanuabada 12% 230 12.6%
87 Laloki / Napanapa 5% 91 5.0%
88 Bomana 7% 92 5%
Urban + Rural Σ
1830
64%
0%
Lae 22%
21.3%
15 Ahi Rural 34%
285 34%
16 Lae Urban 66% 558 66%
Urban + Rural Σ
843
28%
4%
Mt Hagen 16%
15.9%
04 Mt Hagen Rural 68%
381 61%
05 Mt Hagen Urban 32% 247 39%
Urban + Rural Σ
628
8%
35%
Chuave 7%
6.4%
01 Chuave Rural 33%
79 31%
02 Elimbari Rural 36%
108 43%
03 Siane Rural 31%
67 26%
Urban + Rural Σ
254
24%
Henganofi 10%
10.1%
04 Henganofi Rural 100%
urbanΣ
rural Σ
401 100%
Urban + Rural Σ
401
37%
Urban or Rural SURVEY TOTAL
2880
100% 1078
100%
USER SURVEYS GRAND TOTAL 3958 100%
Source: CPSdata_100706.xls / PostSurvey ; tblInterview_NU_export.xls; tblInterview_RU_export.xls
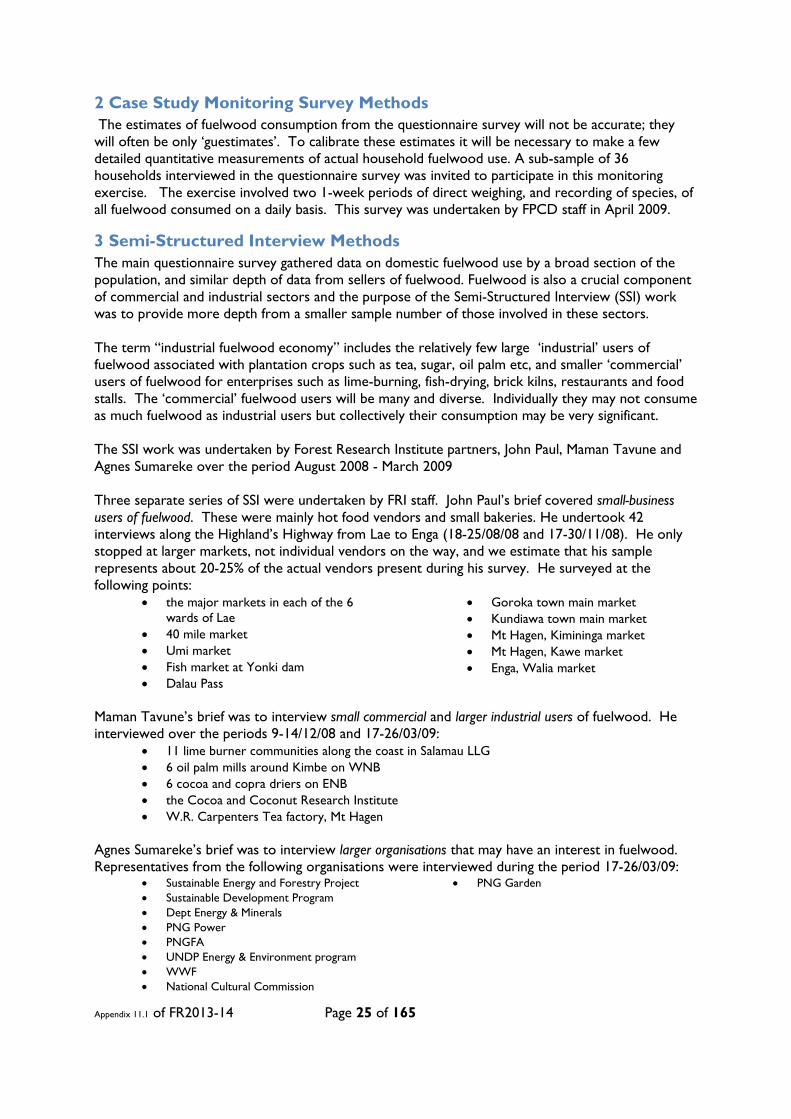
Appendix 11.1 of FR2013-14 Page 25 of 165
2 Case Study Monitoring Survey Methods The estimates of fuelwood consumption from the questionnaire survey will not be accurate; they will often be only ‘guestimates’. To calibrate these estimates it will be necessary to make a few detailed quantitative measurements of actual household fuelwood use. A sub-sample of 36 households interviewed in the questionnaire survey was invited to participate in this monitoring exercise. The exercise involved two 1-week periods of direct weighing, and recording of species, of all fuelwood consumed on a daily basis. This survey was undertaken by FPCD staff in April 2009.
3 Semi-Structured Interview Methods The main questionnaire survey gathered data on domestic fuelwood use by a broad section of the population, and similar depth of data from sellers of fuelwood. Fuelwood is also a crucial component of commercial and industrial sectors and the purpose of the Semi-Structured Interview (SSI) work was to provide more depth from a smaller sample number of those involved in these sectors. The term “industrial fuelwood economy” includes the relatively few large ‘industrial’ users of fuelwood associated with plantation crops such as tea, sugar, oil palm etc, and smaller ‘commercial’ users of fuelwood for enterprises such as lime-burning, fish-drying, brick kilns, restaurants and food stalls. The ‘commercial’ fuelwood users will be many and diverse. Individually they may not consume as much fuelwood as industrial users but collectively their consumption may be very significant. The SSI work was undertaken by Forest Research Institute partners, John Paul, Maman Tavune and Agnes Sumareke over the period August 2008 - March 2009 Three separate series of SSI were undertaken by FRI staff. John Paul’s brief covered small-business users of fuelwood. These were mainly hot food vendors and small bakeries. He undertook 42 interviews along the Highland’s Highway from Lae to Enga (18-25/08/08 and 17-30/11/08). He only stopped at larger markets, not individual vendors on the way, and we estimate that his sample represents about 20-25% of the actual vendors present during his survey. He surveyed at the following points:
• the major markets in each of the 6 wards of Lae
• 40 mile market • Umi market • Fish market at Yonki dam • Dalau Pass
• Goroka town main market • Kundiawa town main market • Mt Hagen, Kimininga market • Mt Hagen, Kawe market • Enga, Walia market
Maman Tavune’s brief was to interview small commercial and larger industrial users of fuelwood. He interviewed over the periods 9-14/12/08 and 17-26/03/09:
• 11 lime burner communities along the coast in Salamau LLG • 6 oil palm mills around Kimbe on WNB • 6 cocoa and copra driers on ENB • the Cocoa and Coconut Research Institute • W.R. Carpenters Tea factory, Mt Hagen
Agnes Sumareke’s brief was to interview larger organisations that may have an interest in fuelwood. Representatives from the following organisations were interviewed during the period 17-26/03/09:
• Sustainable Energy and Forestry Project • Sustainable Development Program • Dept Energy & Minerals • PNG Power • PNGFA • UNDP Energy & Environment program • WWF • National Cultural Commission
• PNG Garden
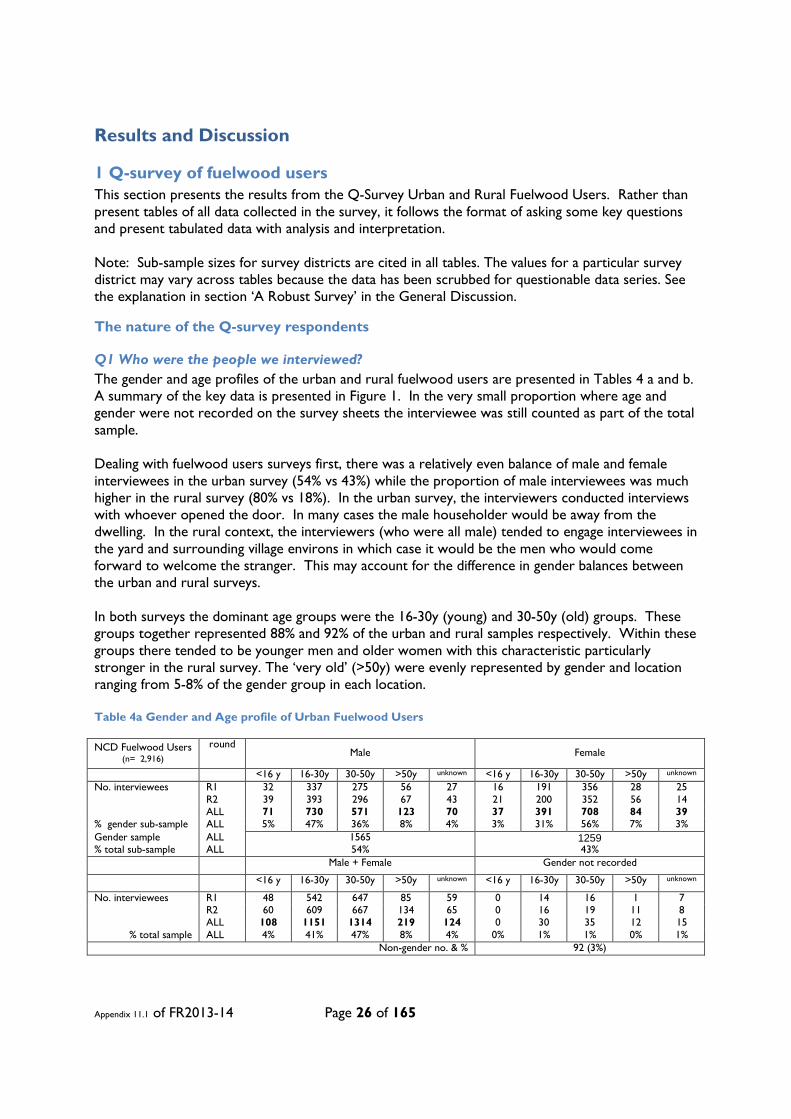
Appendix 11.1 of FR2013-14 Page 26 of 165
Results and Discussion
1 Q-survey of fuelwood users This section presents the results from the Q-Survey Urban and Rural Fuelwood Users. Rather than present tables of all data collected in the survey, it follows the format of asking some key questions and present tabulated data with analysis and interpretation. Note: Sub-sample sizes for survey districts are cited in all tables. The values for a particular survey district may vary across tables because the data has been scrubbed for questionable data series. See the explanation in section ‘A Robust Survey’ in the General Discussion.
The nature of the Q-survey respondents
Q1 Who were the people we interviewed? The gender and age profiles of the urban and rural fuelwood users are presented in Tables 4 a and b. A summary of the key data is presented in Figure 1. In the very small proportion where age and gender were not recorded on the survey sheets the interviewee was still counted as part of the total sample. Dealing with fuelwood users surveys first, there was a relatively even balance of male and female interviewees in the urban survey (54% vs 43%) while the proportion of male interviewees was much higher in the rural survey (80% vs 18%). In the urban survey, the interviewers conducted interviews with whoever opened the door. In many cases the male householder would be away from the dwelling. In the rural context, the interviewers (who were all male) tended to engage interviewees in the yard and surrounding village environs in which case it would be the men who would come forward to welcome the stranger. This may account for the difference in gender balances between the urban and rural surveys. In both surveys the dominant age groups were the 16-30y (young) and 30-50y (old) groups. These groups together represented 88% and 92% of the urban and rural samples respectively. Within these groups there tended to be younger men and older women with this characteristic particularly stronger in the rural survey. The ‘very old’ (>50y) were evenly represented by gender and location ranging from 5-8% of the gender group in each location. Table 4a Gender and Age profile of Urban Fuelwood Users
NCD Fuelwood Users (n= 2,916)
round Male Female
<16 y 16-30y 30-50y >50y unknown <16 y 16-30y 30-50y >50y unknown No. interviewees R1 32 337 275 56 27 16 191 356 28 25 R2 39 393 296 67 43 21 200 352 56 14 ALL 71 730 571 123 70 37 391 708 84 39 % gender sub-sample ALL 5% 47% 36% 8% 4% 3% 31% 56% 7% 3% Gender sample ALL 1565 1259 % total sub-sample ALL 54% 43% Male + Female Gender not recorded
<16 y 16-30y 30-50y >50y unknown <16 y 16-30y 30-50y >50y unknown
No. interviewees R1 48 542 647 85 59 0 14 16 1 7 R2 60 609 667 134 65 0 16 19 11 8 ALL 108 1151 1314 219 124 0 30 35 12 15
% total sample ALL 4% 41% 47% 8% 4% 0% 1% 1% 0% 1% Non-gender no. & % 92 (3%)

Appendix 11.1 of FR2013-14 Page 27 of 165
Table 4b Gender and Age profile of Rural Fuelwood Users
Rural Fuelwood Users (n= 1,038)
round Male Female
<16 y 16-30y 30-50y >50y unknown <16 y 16-30y 30-50y >50y unknown No. interviewees R1 10 201 211 23 2 3 25 44 5 1 R2 7 263 97 15 0 3 36 68 6 0 ALL 17 464 308 38 2 6 61 112 11 1 % gender sub-sample ALL 2% 56% 37% 5% 0% 3% 32% 59% 6% 1% Gender sample ALL 829 191 % total sub-sample ALL 80% 18% All interviewees Gender not recorded
<16 y 16-30y 30-50y >50y unknown <16 y 16-30y 30-50y >50y unknown
No. interviewees R1 13 229 261 29 4 0 3 6 1 1 R2 10 301 165 22 4 0 2 0 1 4 ALL 23 530 426 51 8 0 5 6 2 5
% total sample ALL 2% 51% 41% 5% 1% 0% 0.5% 0.6% 0.2% 0.5% Non-gender no. & % 18 (2%)
Q2 What was the nature of the environment in which they lived? It is important to know something of the physical circumstances of respondents because these will influence access to and decisions about domestic energy sources, including fuelwood. Figure 1 shows the relative proportions of the four main urban housing categories used for this survey: high covenant, housing commission, semi-permanent housing, and settlement or shanty housing. The difference between NCD, Lae and Mt Hagen in the relative proportions of high covenant and settlement housing agrees with common understanding of the economic and social processes in these areas. It indicates that the survey captured a representative mix of living circumstances in each area. Table 5 indicates the housing classes for the NCD, Lae and Mt Hagen urban areas and their access to sealed roads and powerlines to the house. Table 5 Housing class and access to sealed roads and powerlines in NCD, Lae and Mt Hagen urban areas
High
Covenant Housing
commission Semi-
Permanent Settlement/
Shanty Not stated
NCD (n =1,868)
% of NCD sample 26 34 25 11 4
Access to sealed road (n=1,581)
% of those with access to sealed road 30 39 21 7 4
% of total NCD sample 25 33 17 6 3 85 No. with powerlines to house (n=1,539)
% of those with powerlines 32 40 21 4 3 % of total NCD sample 26 33 17 4 3 82
Lae Urban (n=801) % of Lae sample 23 25 34 13 6
Access to sealed road (n=320) % of those with access to sealed road 43 34 14 1 8
% of total Lae sample 52 31 2 0.6 14 40 No. with powerlines to house (n=449)
% of those with powerlines 40 38 13 1 7 % of total Lae sample 23 22 7 0.5 4 56
Mt Hagen Urban (n=247) % of Hagen sample 12 29 26 32 1
Access to sealed road (n=164) % of those with access to sealed road 18 40 26 17 0
% of total Hagen sample 18 26 17 11 0 66 No. with powerlines to house (n=187)
% of those with powerlines 16 36 27 20 0.5 % of total Hagen sample 12 28 20 15 0.4 76
Source: qryInterview_NU_ExportData; Table2abc-URBAN-Round1&2IKN

Appendix 11.1 of FR2013-14 Page 28 of 165
This data is reconfigured in Figure 2 to show the relative access to sealed roads from the dwellings in different housing classes. This is another indicator of the state of community infrastructure. The striking feature here is the relatively low access to sealed roads for all housing classes in Lae. It shows how the sprawl of urban development in Lae has overtaken the development of road infrastructure, while in Mt Hagen the urban development has concentrated along existing sealed roads. Access to powerlines from the dwelling creates the opportunity to switch from fuelwood use to electricity, albeit at a significant cost in appliances and power bills. Figure 3 shows the relative proportion of access to powerlines for each housing category in the three urban areas. High covenant and housing commission dwellings in all areas are well supplied with electricity. Even most semi-permanent dwelling in NCD and Mt Hagen have powerlines nearby. Even 49% of settlement dwellings in Mt Hagen urban area are within reach of powerlines. However, only 22% of semi-permanent and 4% of settlement dwellings in Lae are within reach of powerlines.
Figure 1 Proportions of different housing classes in Urban users survey.
Figure 2 Proportions of access to sealed roads for the different housing classes in the three Urban areas.
0 5
10 15 20 25 30 35 40
% o
f are
a sa
mpl
e
NCD (n=1868) Lae (n=801) Mt Hagen (n=247)
0 20 40 60 80
100 120
% o
f are
a sa
mpl
e
NCD (n=1581) Lae (n=320) Mt Hagen (n=164)

Appendix 11.1 of FR2013-14 Page 29 of 165
Figure 3 Proportions of powerlines to house for each different housing classes in Urban users survey.
Access to powerlines varies considerably across the 9 wards in the NCD (Table 6). This is important because for many residents of the NCD the alternatives to fuelwood will still only be kerosene, gas or gensets. This is explored further in Question 3. Table 6 Proportions of surveyed residences with mains power available across the 9 NCD wards
Ward n %yes Gerehu 178 85 Waigani / University 202 97 Town / Hanuabada 230 82 Gordons / Saraga 266 82 Boroko / Korobosea 249 96 Kilakila / Kaugere 232 80 Tokorara / Hohola 290 79 Laloki / Napanapa 91 71 Bomana 130 53
𝛴 1868 Source: qryInterview_Stratum-URBAN-170610.xls; SurveyTableWorkbook.xls
The respondents living in rural areas will have very different constraints and opportunities with respect to domestic energy compared to urban dwellers. Table 7 shows that the majority of respondents living in bush materials (43%) or semi-permanent dwellings (34%). Across all dwelling types 30% were on dry weather only roads or foot tracks. The survey reached dwellings across all upland topographic zones (valley floor, foothills, mountain valley, mountain) in proportions appropriate to the density of settlement in those zones.
Table 7 Housing class, landscape and access to services of fuelwood users in highland Rural Areas
Housing (n=1,038) Permanent Semi- permanent Bush materials not known
% of sub-sample 18 34 43 5 Accessibility Sealed road Gravel road Dry weather road Foot track Unknown
% of sub-sample 34 34 19 11 2 Topography Valley bottom Foothill High valley Mountain Unknown
% of sub-sample 32 36 10 20 2 Infrastructure School Medical Market Church Other
% of sub-sample 76 52 71 89 16 Landscape Grassland Bush Fallows Planted Forest Gardens Coffee
% of sub-sample 76 45 48 81 22 Swamp River plains Natural Forest Other
3 2 5 6
Source: qryInterview_Stratum-RURAL-150610.xls; Table2d-RURAL-Round1&2IKN
0 20 40 60 80
100 120
% o
f are
a sa
mpl
e NCD (n=1539) Lae (n=449) Mt Hagen (n=187)
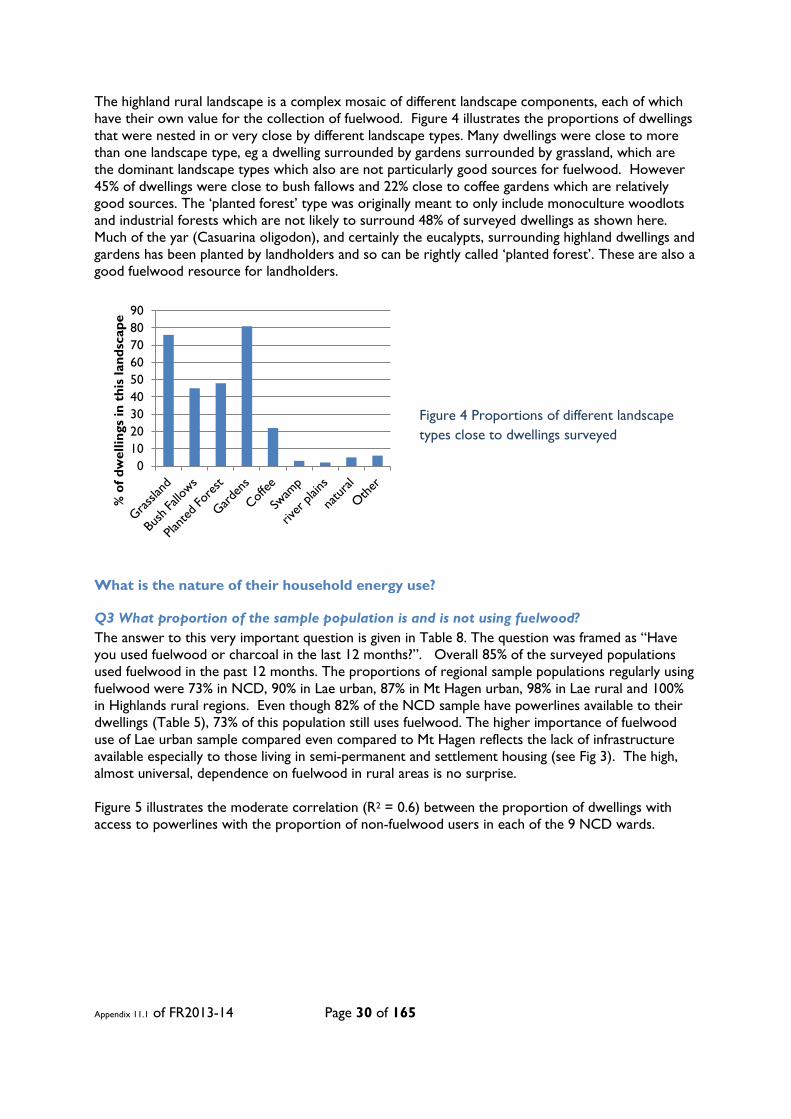
Appendix 11.1 of FR2013-14 Page 30 of 165
The highland rural landscape is a complex mosaic of different landscape components, each of which have their own value for the collection of fuelwood. Figure 4 illustrates the proportions of dwellings that were nested in or very close by different landscape types. Many dwellings were close to more than one landscape type, eg a dwelling surrounded by gardens surrounded by grassland, which are the dominant landscape types which also are not particularly good sources for fuelwood. However 45% of dwellings were close to bush fallows and 22% close to coffee gardens which are relatively good sources. The ‘planted forest’ type was originally meant to only include monoculture woodlots and industrial forests which are not likely to surround 48% of surveyed dwellings as shown here. Much of the yar (Casuarina oligodon), and certainly the eucalypts, surrounding highland dwellings and gardens has been planted by landholders and so can be rightly called ‘planted forest’. These are also a good fuelwood resource for landholders.
Figure 4 Proportions of different landscape types close to dwellings surveyed
What is the nature of their household energy use?
Q3 What proportion of the sample population is and is not using fuelwood? The answer to this very important question is given in Table 8. The question was framed as “Have you used fuelwood or charcoal in the last 12 months?”. Overall 85% of the surveyed populations used fuelwood in the past 12 months. The proportions of regional sample populations regularly using fuelwood were 73% in NCD, 90% in Lae urban, 87% in Mt Hagen urban, 98% in Lae rural and 100% in Highlands rural regions. Even though 82% of the NCD sample have powerlines available to their dwellings (Table 5), 73% of this population still uses fuelwood. The higher importance of fuelwood use of Lae urban sample compared even compared to Mt Hagen reflects the lack of infrastructure available especially to those living in semi-permanent and settlement housing (see Fig 3). The high, almost universal, dependence on fuelwood in rural areas is no surprise. Figure 5 illustrates the moderate correlation (R2 = 0.6) between the proportion of dwellings with access to powerlines with the proportion of non-fuelwood users in each of the 9 NCD wards.
0 10 20 30 40 50 60 70 80 90
% o
f dw
ellin
gs in
thi
s la
ndsc
ape
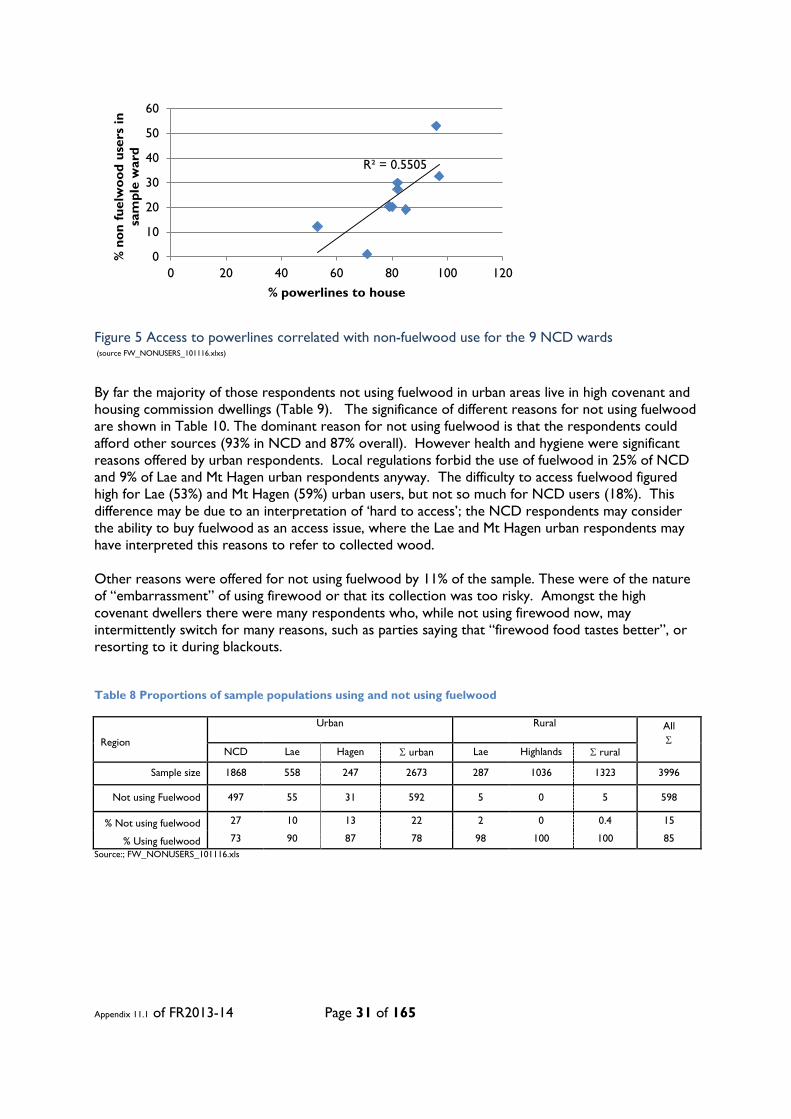
Appendix 11.1 of FR2013-14 Page 31 of 165
Figure 5 Access to powerlines correlated with non-fuelwood use for the 9 NCD wards (source FW_NONUSERS_101116.xlxs)
By far the majority of those respondents not using fuelwood in urban areas live in high covenant and housing commission dwellings (Table 9). The significance of different reasons for not using fuelwood are shown in Table 10. The dominant reason for not using fuelwood is that the respondents could afford other sources (93% in NCD and 87% overall). However health and hygiene were significant reasons offered by urban respondents. Local regulations forbid the use of fuelwood in 25% of NCD and 9% of Lae and Mt Hagen urban respondents anyway. The difficulty to access fuelwood figured high for Lae (53%) and Mt Hagen (59%) urban users, but not so much for NCD users (18%). This difference may be due to an interpretation of ‘hard to access’; the NCD respondents may consider the ability to buy fuelwood as an access issue, where the Lae and Mt Hagen urban respondents may have interpreted this reasons to refer to collected wood. Other reasons were offered for not using fuelwood by 11% of the sample. These were of the nature of “embarrassment” of using firewood or that its collection was too risky. Amongst the high covenant dwellers there were many respondents who, while not using firewood now, may intermittently switch for many reasons, such as parties saying that “firewood food tastes better”, or resorting to it during blackouts.
Table 8 Proportions of sample populations using and not using fuelwood
Region
Urban
Rural
All Σ NCD Lae Hagen Σ urban Lae Highlands Σ rural
Sample size 1868 558 247 2673 287 1036 1323 3996
Not using Fuelwood 497 55 31 592 5 0 5 598
% Not using fuelwood 27 10 13 22 2 0 0.4 15
% Using fuelwood 73 90 87 78 98 100 100 85 Source:; FW_NONUSERS_101116.xls
R² = 0.5505
0
10
20
30
40
50
60
0 20 40 60 80 100 120
% n
on fu
elw
ood
user
s in
sa
mpl
e w
ard
% powerlines to house

Appendix 11.1 of FR2013-14 Page 32 of 165
Table 9 Use of fuelwood or charcoal in last 12 months by housing type in the Urban Survey.
Housing type n % yes
High Covenant 708 49
Housing Commission 898 81
Semi-permanent 809 95
Bush materials 36 100
Shanty 345 98
none given 119 83
Total 2915 79
Table 10 Reasons given for not using fuelwood in different regions
Regions (n = sample of respondents not using fuelwood)
Reasons Local
regulation Health reasons Too dirty
Too hard to access
Can afford other source
Too expensive Other
NCD ( n=519) % of region sample 25 40 43 18 93 3 8
Lae urban (n = 87) % of region sample 9 14 32 53 74 2 26
Hagen urban (n=54)% of region sample 9 19 13 59 57 15 13
Lae rural (n=0)% of region sample 0 0 0 0 0 0 0
Highland rural (n=7)% of region sample 0 0 0 43 57 14 0 % Respondents in reason class across regions (
n=667) 22 35 39 26 87 4 11 Source: qryInterview_Stratum-URBAN-fuelwoodusagestopped-270610.xls; qryInterview_Stratum-RURAL-150610.xls; Table3b(9b)-URBAN&RURAL.Round1&2IKN.xls
Q4 How is fuelwood used, and how does this differ across environments ? Table 11 presents the aggregated results for how fuelwood is used. It is based on the question “What do you use fuelwood for?” While domestic cooking is the most important use of fuelwood, 17% of the whole interviewed population cook their food by other means (see Table 14 other energy). Only 4 % of rural people use other energy for cooking. The second most frequently reported use of fuelwood (63%) was for ceremonies. This constituted the traditional mu mu used at Christmas, church gatherings and graduation ceremonies. The use of fuelwood for heating is 3-4 times more reported in the rural and Mt Hagen urban groups. This is not surprising as most of the rural population in this survey is in the highlands. The use of fuelwood for commercial cooking (43%) and baking (25%) for products sold at street markets is much higher than may have been expected, and very high in rural areas. The survey did not capture the frequency at which respondents engaged in this activity, but for most people it is likely to be an occasional and opportunistic activity to earn some ready money rather than a regular occupation. It is in itself an interesting indication of the proportion of the population that resorts to selling cooked food at markets for extra income. An indication of the relative importance of fuelwood in the lives of people in the urban and rural sample groups is given in the far right column of the table. The intensity of fuelwood use for each sample group is calculated as the total number of incidences of use divided by the sample group size. The relative intensity of fuelwood use the sample group intensity value relative to the overall population (i.e. total sample). Using this index, where the intensity of fuelwood use of the whole survey population is set at 0, then index for NCD users is -3.0, Lae urban users -2.1, Mt Hagen urban users +0.2 and rural users +6.8
Appendix 11.1 of FR2013-14 Page 33 of 165
The uses of fuelwood reported as ‘Other’ were various and included: • Insect repellent • Hot water for clothes washing and bathing • Traditional youth counseling (e.g. upon young woman’s first menstruation) • Burning lime • Burning rubbish • Smoking /drying fish • Feeding pigs • Steam bath for malaria treatment
Table 11How fuelwood use varies in different areas.
Use class
Regional Sample groups
Cooking Lighting Ceremony
Commercial Cooking
Commercial Baking Heating Other
Relative intensity of FW use *
Urban: NCD (n=1868) % of total sub-sample 72 22 55 30 11 17 1 -3.0
Urban: Lae (n=803)
% of total sub-sample 91 20 52 34 11 24 1 -2.1
Urban: Mt Hagen (n=247)
% of total sub-sample 87 44 61 33 14 60 2 +0.2
Rural (n=1078)
% of total sub-sample 96 88 85 74 61 87 6 +6.8
Overall (N=3996)
% of total sub-sample 83 41 63 43 25 40 3 0
Source: qryInterview_Stratum-URBAN-fuelwoodusedfor-270610.xls; qryInterview_Stratum-RURAL-150610.xls; Table3-URBAN&RURAL-Round1&2IKN.xls
* Relative intensity of fuelwood use = �𝑖𝑛𝑐𝑖𝑑𝑒𝑛𝑡𝑠 𝑜𝑣𝑒𝑟 𝑎𝑙𝑙 𝑐𝑙𝑎𝑠𝑠𝑒𝑠 𝑓𝑜𝑟 𝑟𝑒𝑔𝑖𝑜𝑛
𝑟𝑒𝑔𝑖𝑜𝑛 𝑠𝑎𝑚𝑝𝑙𝑒 𝑠𝑖𝑧𝑒,𝑛� �
�𝑎𝑙𝑙 𝑖𝑛𝑐𝑖𝑑𝑒𝑛𝑡𝑠 𝑜𝑣𝑒𝑟 𝑎𝑙𝑙 𝑐𝑙𝑎𝑠𝑠𝑒𝑠 𝑓𝑜𝑟 𝑎𝑙𝑙 𝑟𝑒𝑔𝑖𝑜𝑛𝑠𝑡𝑜𝑡𝑎𝑙 𝑠𝑎𝑚𝑝𝑙𝑒 𝑠𝑖𝑧𝑒,𝑁� �
− 1
Q5 When is fuelwood used, and how does this differ across environments? The most significant finding from the question about seasonal spread of fuelwood use is the relative proportion of population who use fuelwood all year around (column A in Table 12). The values in the shaded column (sums of %s across the row) are to check the correlation in responses in this table with that of Table 8. The % values in this table are based on those respondents who have used fuelwood in the previous 12 months. The ‘All year round’ values provide the best estimate of those individuals who use fuelwood on a daily basis all year around. There is evidence that there may be a significant population of ‘Occasional’ users; i.e. resort to fuelwood when other energy sources run out or for special times such as parties, ceremonies and weekend BBQs.
Table 12 Different times when fuelwood is used in urban and rural areas
Times when used
Sub-Sample groups
All year Round
A
Wet season Only
B
Dry season Only
C
Illness D
Other E A+B+C
Urban: NCD (n=1868, 1371) % of sub-sample 52 3 4 4 7 59
Urban: Lae (n=803) % of sub-sample 75 9 13 10 17 97
Urban: Mt Hagen (n=247, 216) % of sub-sample 68 11 16 14 6 94
Rural (n=1318) % of sub-sample 94 3 4 15 4 101
Overall (N=3996, 3398) % of sub-sample 69 7 9 13 11 85
Source: qryInterview_Stratum-URBAN-170610.xls; qryInterview_Stratum-RURAL-150610.xls; Table4-URBAN&RURAL-Round1&2IKN.xls NB: Sample n; 1st value is total sample, 2nd value is number of fuelwood users
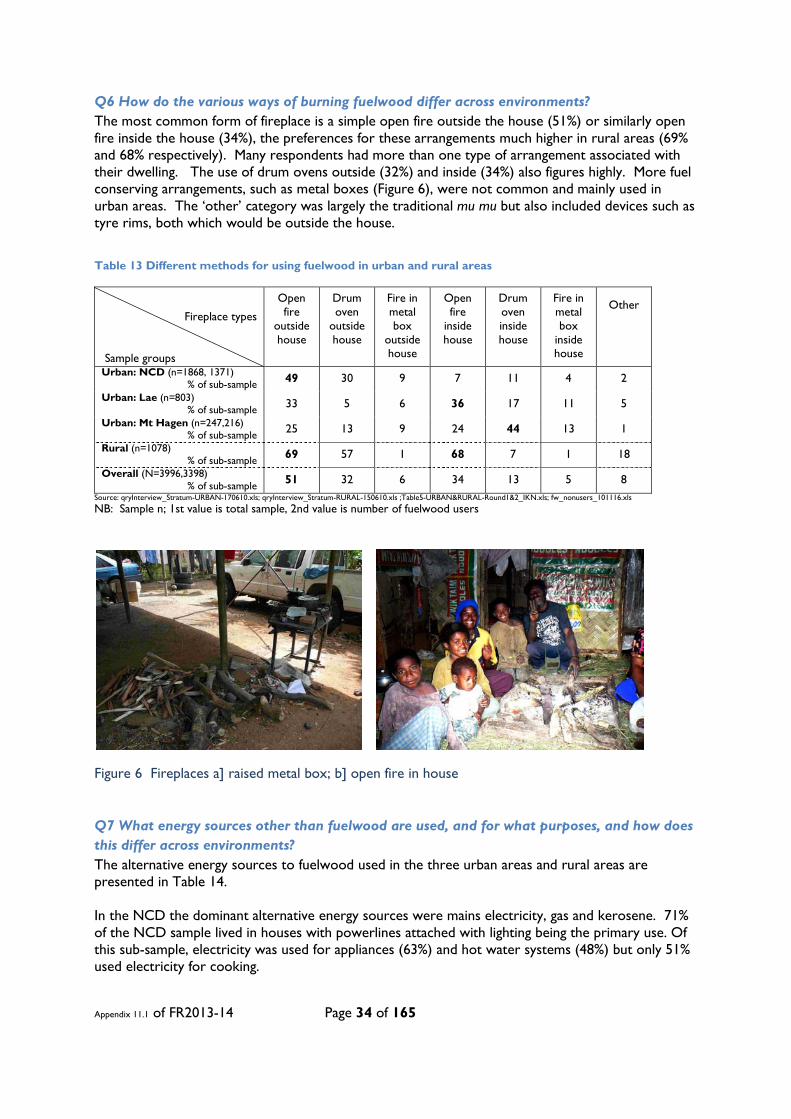
Appendix 11.1 of FR2013-14 Page 34 of 165
Q6 How do the various ways of burning fuelwood differ across environments? The most common form of fireplace is a simple open fire outside the house (51%) or similarly open fire inside the house (34%), the preferences for these arrangements much higher in rural areas (69% and 68% respectively). Many respondents had more than one type of arrangement associated with their dwelling. The use of drum ovens outside (32%) and inside (34%) also figures highly. More fuel conserving arrangements, such as metal boxes (Figure 6), were not common and mainly used in urban areas. The ‘other’ category was largely the traditional mu mu but also included devices such as tyre rims, both which would be outside the house.
Table 13 Different methods for using fuelwood in urban and rural areas
Fireplace types
Sample groups
Open fire
outside house
Drum oven
outside house
Fire in metal box
outside house
Open fire
inside house
Drum oven inside house
Fire in metal box
inside house
Other
Urban: NCD (n=1868, 1371) % of sub-sample 49 30 9 7 11 4 2
Urban: Lae (n=803) % of sub-sample 33 5 6 36 17 11 5
Urban: Mt Hagen (n=247,216) % of sub-sample 25 13 9 24 44 13 1
Rural (n=1078) % of sub-sample 69 57 1 68 7 1 18
Overall (N=3996,3398) % of sub-sample 51 32 6 34 13 5 8
Source: qryInterview_Stratum-URBAN-170610.xls; qryInterview_Stratum-RURAL-150610.xls ;Table5-URBAN&RURAL-Round1&2_IKN.xls; fw_nonusers_101116.xls
NB: Sample n; 1st value is total sample, 2nd value is number of fuelwood users
Figure 6 Fireplaces a] raised metal box; b] open fire in house
Q7 What energy sources other than fuelwood are used, and for what purposes, and how does this differ across environments? The alternative energy sources to fuelwood used in the three urban areas and rural areas are presented in Table 14. In the NCD the dominant alternative energy sources were mains electricity, gas and kerosene. 71% of the NCD sample lived in houses with powerlines attached with lighting being the primary use. Of this sub-sample, electricity was used for appliances (63%) and hot water systems (48%) but only 51% used electricity for cooking.
Appendix 11.1 of FR2013-14 Page 35 of 165
Table 14 Alternatives to fuelwood use in Urban and Rural survey samples areas
Energy Sources
% ALL urban samples (n=2,918) Cooking Room
Heating Hot Water Lighting Appliances
Charcoal 2.7 0.3 0.9 0.1 Gas 43.2 0.4 26.9 1.2
Kerosene 31.7 1.5 17.5 26.7 Solar Hot Water 0.7 3.4
Wet Cell (non-solar) 0.1 0.7 2.5 1.6 Electricity (mains) 44.0 10.3 39.2 63.4 55.6
Electricity (genset) 1.9 0.8 1.5 3.2 2.7 Electricity (solar) 0.4 0.4 1.1 0.8 0.4
Candle 2.6
% of NCD urban sample (n=1868) Cooking Room heating Hot water Lighting Appliances
Charcoal 2.7 0.1 0.7 0 - Gas 47.3 0.6 33.0 1.0 0.2
Kerosene 35.3 2.0 20.9 17.0 0.1 Solar hot water 0.8 0.1 2.8 0.3 0.3
Wet cell (non-solar) 0.2 0.1 1.0 1.7 1.1 Electricity (mains) 51.3 13.3 48.3 71.4 63.0
Electricity (genset) 2.1 1.0 1.8 2.2 2.0 Electricity (solar) 0.4 0.3 1.2 0.5 0.4
Other 0.1 0 0.1 1.3 0
% of Lae urban sample (n=560) Cooking Room heating Hot water Lighting Appliances
Charcoal 1.3 0 0.5 0 0 Gas 42.9 0 16.4 0.9 0
Kerosene 23.4 0.4 8.0 28.0 0 Solar hot water 0 0 4.5 0.4 0
Wet cell (non-solar) 0 0 0 1.6 0.4 Electricity (mains) 39.3 3.9 28.8 58.0 56.8
Electricity (genset) 0.9 0.2 0.9 2.5 2.3 Electricity (solar) 0 0 0 1.1 0.2
Other 0.4 0 0 3.4 0
% Mt Hagen urban sample (n=247) Cooking Room heating Hot water Lighting Appliances
Charcoal 9.3 3.2 3.6 1.2 0 Gas 32.4 0 15.0 3.2 0.4
Kerosene 23.5 0.4 13.8 40.1 0 Solar hot water 2.0 1.2 8.9 1.2 0
Wet cell (non-solar) 0. 0 0.4 5.7 9.3 Electricity (mains) 37.2 11.7 25.9 59.9 36.0
Electricity (genset) 3.6 1.6 2.4 6.5 3.6 Electricity (solar) 1.2 2.8 3.2 2.0 1.6
Other % 0.4 0 0 10.1 0.4
% Rural sample (n=1,078) Cooking Room heating Hot water Lighting Appliances
Charcoal 4.2 4.2 0 0.4 - Gas 15.4 0 2.1 2.0 0.1
Kerosene 15.0 0.5 2.3 82.2 0 Solar hot water 0 0.1 0.2 0.2 0
Wet cell (non-solar) 0 0 0 1.9 1.5 Electricity (mains) 6.9 0.3 5.9 15.1 12.2
Electricity (genset) 0.6 0 0.4 30.1 29.0 Electricity (solar) 0.6 0.1 0.1 9.6 8.2
Other 0 0.4 0 2.6 0.6 Source: qryInterview_Stratum-RURAL-150610.xls; Table6b-RURAL-Round1&2_IKN.xls Source: Round1&2-URBAN-2.4 EnergySourcesIKN.xls
Looking specifically at the data on charcoal use, about 4.2% of all fuelwood users (3.6% of all respondents) have used charcoal in the 12 months prior to the interview. While still relatively low compared to some other energy sources, charcoal use is more prevalent in the highland with 9.3% of regional sample in Mt Hagen urban area other rural areas 4.2%, compared with only 2.7% in NCD and 1.1% in Lae urban. A relatively high proportion (8.9%) of Lae rural respondents had used charcoal too. This data is reorganized in Table 14a. The survey did not ask whether the charcoal used was purchased or was simply the re-using of coals that remains from a previous fire. However the interpretation of Q23 (see later) is that most people understood charcoal to be embers and not the specially prepared product.

Appendix 11.1 of FR2013-14 Page 36 of 165
Table 14a Charcoal users
Charcoal users Region sample size n
Charcoal users as % of region sample
population
Charcoal users as % of total
sample population
Region as a proportion of total
charcoal user population %
NCD 50 1868 2.7 1.3 35 Lae Urban 7 613 1.1 0.2 5 Mt Hagen Urban 23 247 9.3 0.6 16 Lae Rural* 17 190 8.9 0.4 12 Highlands Rural 45 1078 4.2 1.1 32 Total 142 3996 3.6 100
Extract non-FWusers from sample 3398 4.2
Q8 What influences the decision to use other sources other than fuelwood for energy? Respondents were asked to provide reasons for using alternative energy sources. This was asked as an open questions (i.e. suggested responses were not supplied) so the range in responses was very broad. Nevertheless, 14 categories of response were detected and the response for the Rural survey are presented in Table 15, with selected examples in Table 16. While the whole rural population had used firewood in the year of the survey, 88% confirmed that they also used alternative sources of energy by providing responses. The most dominant reason was for the better light, which by referring to Table 14, was supplied by kerosene lanterns and gensets. Other common responses were the efficiency and labour-saving characteristics of the alternatives as well as the speed and control over cooking and general cleanliness. Gas and kerosene are the main alternatives to firewood for cooking. About 15% of the population sampled has access to mains power and 30% access to gensets, which may be communally owned. The hierarchy of alternative energy use was generally kerosene for lighting, gas for cooking and gensets for appliances, then mains access for appliance and lighting. Table 15. Reasons for using energy sources other than fuelwood in Rural areas
Reason (n=954)
% of sample Reason % of sample
Better light 64.4 Cleanliness 9.4 Space heat 0.1 Charcoal heat 2.7 Labour saving 11.2 Efficiency 6.3 Speed and control 8.3 Portability 5.8 Mains available 3.1 When no firewood available 5.7 Commercial 0.3 Affordability issues 4.1 Appliances 14.8 Reliability of power 0.8
Appendix 11.1 of FR2013-14 Page 37 of 165
Table 16. Examples of the types of reasons for alternative energy use in rural areas
Examples of reasons given for using alternatives to firewood Gas is fast and easy to control and cleaner Kerosene better lighting and affordable use in coleman pressure lamps and hurricane lamps Many use gas when firewood not available, eg in wet season or when stocks run out Gensets very portable often used for occasional appliances eg video Use gas / gensets for larger gatherings, eg church, or on Sabbath Genset energy often communally shared Charcoal used as a heat source in cool times Kerosene the most affordable and standby alternative energy source when other sources run out Some people prefer to use firewood to cook even when other sources available and used, eg electricity Cleanliness in no smoke and less soot on pots Kerosene better because it is affordable and easy to get Portability of gensets Some users fluctuate in use as fuel prices fluctuate
How is fuelwood collected?
Q9 What type of fuelwood is collected, and where is it collected from? Tables 17 and 18 present the sources and types of fuelwood collected in the urban and rural surveys respectively. The values in the cells of the main body of the tables are the aggregated % of a specific fuelwood types in a specific source. Perhaps the more useful values are the bold %s which indicate the relative proportions (as %) of the different fuelwood types and the sources. In the urban areas (Table 17) most collected fuelwood which could be considered relatively good quality is in the form of small branches (22%), trunks (18%), roots (13%) and coconut refuse (9%). The remaining 38% of fuelwood collected is relatively poor quality –i.e. fast burning, low heat, smoky –and mostly represented by bark (12%), cartons (6%) and plastic (6%). The greater part (47%) of this fuelwood is collected ‘around the house’ while 14% is collected from the surrounding hills and 12% from garden clearings. Rural respondents have access to more of the high quality fuelwood than urban people. Only 8% of their fuelwood is relatively poor quality (grass, bamboo, ferns.) Coffee prunings (11%) are a significant source of fuelwood as new ‘used building materials’ (9%). As 43% of rural people live in houses made of ‘bush materials’ (Table 7) it is likely that their houses are largely recycled as fuelwood when repaired or renewed. Rural residents can gather fuelwood more widely over the range of sources available, again with coffee lands a rich source of fuelwood (22%) over most types of fuelwood. The proportion of fuelwood collected from ‘natural habitat’, i.e. mangroves around NCD (3%) and natural forest in highlands (9%), is relatively low. The ‘surrounding hills’ category in the urban survey refer to the hills in the NCD and behind Lae, which are heavily exploited secondary regrowth. The ‘bushfallow’ category in the rural survey is garden areas which have been allowed to grow back (and in most cases will likely be re-cleared for gardens).

Appendix 11.1 of FR2013-14 Page 38 of 165
Table 17 Sources and types of collected fuelwood in Urban areas of NCD, Lae and Mt Hagen
Source
(n=2,916) Fuelwood Types
Around House
Surround-ing Hills
Your Own Land
Garden Clearing
Stream Banks Mangrove Other %
Fuelwood type class % in
source % in source % in source % in source % in source % in source % in source
Small branch 38.4 18.6 8.7 14.8 10.5 4.4 4.5 22 Trunk 27.1 22.1 10.5 16.9 12.6 4.9 5.9 18 Roots 25.6 20.8 9.6 18.9 15.0 5.1 5.0 13 Bark 30.9 22.5 10.1 17.5 10.3 4.3 4.4 12 Grass 57.7 6.1 5.6 12.1 10.9 3.6 4.0 1 Bamboo 44.4 3.8 17.5 12.6 18.0 1.1 2.6 4 Ferns / fronds 69.4 5.1 7.1 7.1 7.4 2.5 1.4 3 Coconut husk/shell 88.5 1.9 1.1 0.7 1.9 0.2 5.7 9 Off-cuts 65.1 1.8 0.9 0.9 1.8 0.1 29.4 5 Sawdust 54.0 2.0 1.0 0.0 1.0 0.0 42.1 2 Cartons 92.4 2.1 0.2 0.2 0.5 0.0 4.6 6 Plastic 93.6 2.2 0.3 0.2 0.7 0.0 3.1 6 Other* 32.1 0.0 0.0 0.0 0.0 0.0 68.0 0.4
% total source 47 14 7 12 9 3 7 100** Source: Round1&2-URBAN-3.1 FuelwoodTypesIKN.xls
* Remarks: Building construction refuse, coconut leaves, leaves, newspaper & copra bags, old pallets, roadside, seeds, SP/Plum trade ** with rounding error
Table 18 Sources and types of collected fuelwood in Rural areas
Source
(n=1,078) Fuelwood Types
Around House
Garden Clearing
Stream Banks
Bush fallow
Planted forest
Natural forest
Coffee land %
Fuelwood type class % in
source % in source % in source % in source % in source % in source % in source
Small branch 19.7 15.7 7.1 18.0 8.4 12.8 18.2 36 Trunk 13.1 17.3 8.9 17.6 18.1 7.9 17.1 33 Roots 20.0 0.0 8.6 2.9 17.1 8.6 42.9 0.3 Bark 14.7 8.4 10.5 8.9 20.9 31.9 4.7 2 Grass 22.9 18.8 6.9 18.8 5.3 14.4 12.9 3 Bamboo 38.5 4.9 10.6 16.8 3.9 9.9 15.6 5 Ferns / fronds 5.9 17.5 9.3 25.3 27.1 5.9 8.9 2 Coffee prunings 19.8 3.7 2.3 1.7 0.3 2.8 69.4 11 Tea prunings 50.0 33.3 0.0 0.0 0.0 0.0 16.7 0.05 Used building 52.8 7.8 1.2 9.6 14.2 4.2 10.2 9 Other* 20.0 0.0 8.6 2.9 17.1 8.6 42.9 0.3
% total source 21 14 7 15 12 9 22 100** ** with rounding error
Q10 How far are people travelling to collect fuelwood? Tables 19 and 20 present, for the urban and rural surveys respectively, the percentage of the sample that collects fuelwood from different sources and 4 distance categories. Respondents usually gave more than one source and distance category, so it is not appropriate to say, for example, that 44% of all firewood is collected <100m from the house in the urban survey. It just means that 44% of the 4,530 responses from the 2,918 respondents lay in the <100 category. That being clear, comparing the “% distance category” summations and the bottom of the two tables shows that information that could be counter-intuitive. Urban respondents are travelling less to
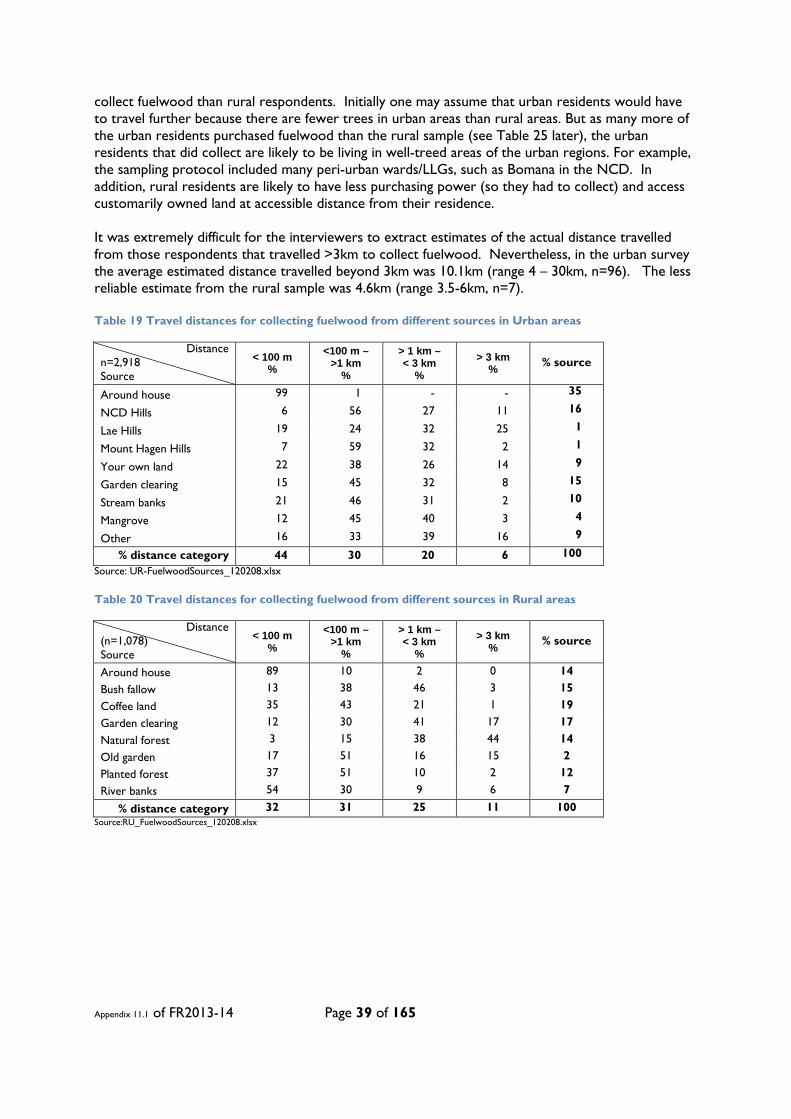
Appendix 11.1 of FR2013-14 Page 39 of 165
collect fuelwood than rural respondents. Initially one may assume that urban residents would have to travel further because there are fewer trees in urban areas than rural areas. But as many more of the urban residents purchased fuelwood than the rural sample (see Table 25 later), the urban residents that did collect are likely to be living in well-treed areas of the urban regions. For example, the sampling protocol included many peri-urban wards/LLGs, such as Bomana in the NCD. In addition, rural residents are likely to have less purchasing power (so they had to collect) and access customarily owned land at accessible distance from their residence. It was extremely difficult for the interviewers to extract estimates of the actual distance travelled from those respondents that travelled >3km to collect fuelwood. Nevertheless, in the urban survey the average estimated distance travelled beyond 3km was 10.1km (range 4 – 30km, n=96). The less reliable estimate from the rural sample was 4.6km (range 3.5-6km, n=7). Table 19 Travel distances for collecting fuelwood from different sources in Urban areas
Distance n=2,918 Source
< 100 m %
<100 m – >1 km
%
> 1 km – < 3 km
% > 3 km
% % source
Around house 99 1 - - 35
NCD Hills 6 56 27 11 16
Lae Hills 19 24 32 25 1
Mount Hagen Hills 7 59 32 2 1
Your own land 22 38 26 14 9
Garden clearing 15 45 32 8 15
Stream banks 21 46 31 2 10
Mangrove 12 45 40 3 4
Other 16 33 39 16 9
% distance category 44 30 20 6 100 Source: UR-FuelwoodSources_120208.xlsx
Table 20 Travel distances for collecting fuelwood from different sources in Rural areas
Distance (n=1,078) Source
< 100 m %
<100 m – >1 km
%
> 1 km – < 3 km
% > 3 km
% % source
Around house 89 10 2 0 14 Bush fallow 13 38 46 3 15 Coffee land 35 43 21 1 19 Garden clearing 12 30 41 17 17 Natural forest 3 15 38 44 14 Old garden 17 51 16 15 2 Planted forest 37 51 10 2 12 River banks 54 30 9 6 7
% distance category 32 31 25 11 100 Source:RU_FuelwoodSources_120208.xlsx
Appendix 11.1 of FR2013-14 Page 40 of 165
Q11 What is the fuelwood collection behaviour of domestic users? The respondents who did use and collect fuelwood were asked a series of questions to determine their behavior. The actual questions asked were?
• how much (in kilogram) do you collect each week (shown 10kg bag rice as standard weight)? • how long does it take to collect for each trip? • how often did you collect this and last week? • how many of these trips are you also doing something else (eg shopping etc)
In an attempt to quantify the amount of fuelwood collected they were first shown a 10kg bag of rice (as a standard weight) and then asked, in terms of weight, how many of these would they collect. Where fuelwood was at hand in the household, a bundle was held along with the rice to get a feel for the relationship between the volume of fuelwood to weight of bag. Then they were asked how long each collection trip would last in hours. They were also asked how often they took such trips the last week and the previous week to that, and if this was usual. The results from these questions are presented in Table 21. Unfortunately, the first two questions did not go into the highlands rural survey (not included in that batch of survey forms!). Some of the highland interviewers did gather collection weight information in another way and this is provided in the shaded section of the table. Respondents were allowed to provide some explanations surrounding these responses, and a representative selection of these comments is listed in Table 22. One gets the distinct impression that firewood collection is an irregular and ad hoc practice for many people, especially in urban areas. For a large proportion of the survey sample fuelwood collection is not a weekly even, but occasional. For some it is opportunistic but for many it is a planned event for collection a large amount of wood that will last for some time. This explains the large range and standard deviations in collection estimates. Respondents were also were asked on how many of these trips were specifically for fuelwood collection and how many were they doing something else (e.g. shopping, travelling from gardens etc). However, it seems that either the respondents (or some of the interviewers) did not understand the question. Across the survey regions between 23-50% of respondents stated more trips than fuelwood trips to this question; probably interpreting the question as “how many trips do you take a week, regardless of reason?”

Appendix 11.1 of FR2013-14 Page 41 of 165
Table 21Fuelwood collection behaviour in the 5 survey regions.
NCD Lae Urban Hagen Urban Lae Rural Highlands Rural
How many equivalents of this (10kg bag of rice), would you collect in fuelwood each week? count sample 1334 473 205 195 294
% respond 82 86 96 99 - Average (kg) 67 74 39 62 148
min 3 20 2 10 60 max 1000 (!) 200 500 100 350
stdev 10.50 16.31 5.51 8.55 49.6 On average how long (in hours) would it take you to collect this each trip?
count sample 1334 473 205 195 - % respond 82 84 95 98 -
average 3.1 2.6 1.9 3.5 - min 0.08 0.03 0.33 0.16 - max 30 25 7 12 -
stdev 2.54 3.12 1.32 2.65 - How many times did you collect firewood this week?
count sample 1334 473 205 195 1036 % respond 65 68 81 97 98
average 1.3 1.4 2.8 4.9 3.1 min 0 0 0 0 0 max 15 10 7 20 11
stdev 1.49 1.95 1.54 3.27 1.29 Was this week’s collection usual?
count response 1334 473 206 195 1036 % respond YES 39 44 51 79 74
How many times did you collect firewood last week? Average 1.4 2.0 2.9 4.8 3.4
Min 0.0 0.0 0.0 0.0 0.0 Max 7.0 15.0 7.0 20.0 12.0
Stdev 1.47 2.09 1.58 3.36 1.36 Was last week’s collection usual?
count response 1334 473 206 195 1036 % respond YES 43 49 55 81 84
(source : FW_USE_n_COLLECT_101125.xlsx)

Appendix 11.1 of FR2013-14 Page 42 of 165
Table 22 Selection of comments on fuelwood collection.
Comments offered about fuelwood collection
Sometimes we collect pile there near the road and hire PMV to transport them to our houses Wet weather this week so we haven't go out to find firewood We normally collect firewood 1/fortnight because we do use kerosene We use electricity and also firewood so we haven't buy any firewood this week We have enough stock for 2 months use We normally collect once per 5 weeks We hire vehicle to bring f/wood over to us. After 2 months we go back and collect It depends on number of families that participate. When more families participate we have more f/wood stock We collect twice in a week to keep our stock steady We collect only when we do pruning to trees around the house We collect once every two months or three months We collect once a week that lasts for two weeks We collect occasionally that lasts for 2-3 weeks We collect around our house once a week because we've got plenty big trees around our house We all go out in numbers and collect enough stock to keep us for a month. We sometimes hire P.M.V. They still have enough f/wood to cook this week and last week too Only during gardening periods we collect firewood Only when we have occasions like parties, birthday, wedding then we collect wood. F/wood collected can last 1-2 weeks depending on intensity of cooking activity 850 kg of f/wood would last 1 month, approximately 212 kg per week A fee of K20.00 to a neighbour is given to bring a truck load of sawmill off-cuts and sawdust When buy from small roadsides it lasts for a few days but when buy from sawmill it takes weeks to finish They reside in town so whenever they came across f/wood they collect it The f/wood is for the last 4 weeks but we use when electricity is out (blackouts) Stocks of firewood collected previously not exhausted Rainy weather affected f/wood collection Once for 3 weeks per truck load It is not average because we buy a log until it is completely burn we buy again/collect Suppose small children do the collection, they do 3 times, but adults just go out about twice/week I buy coffee trees in large quantity which lasts me for 2-3 months It is not average because last week I chopped a whole tree for f/wood for two days which is enough for two to three weeks Friends brought some f/wood from the village Since we reside besides the river, collect as much as possible during flood time so our supply does not run out It is not average because this week we cut a whole tree to use it for the whole week unlike last week where we collected small branches for cooking and heating It is not average because some days are spent on other activities Everyday work when coming home from gardening, but collecting f/wood approx 3 times per week, approx 30 kg Everyday we collect firewood, except on weekends; approx 15-20 kg per collection approx 100 kg per week
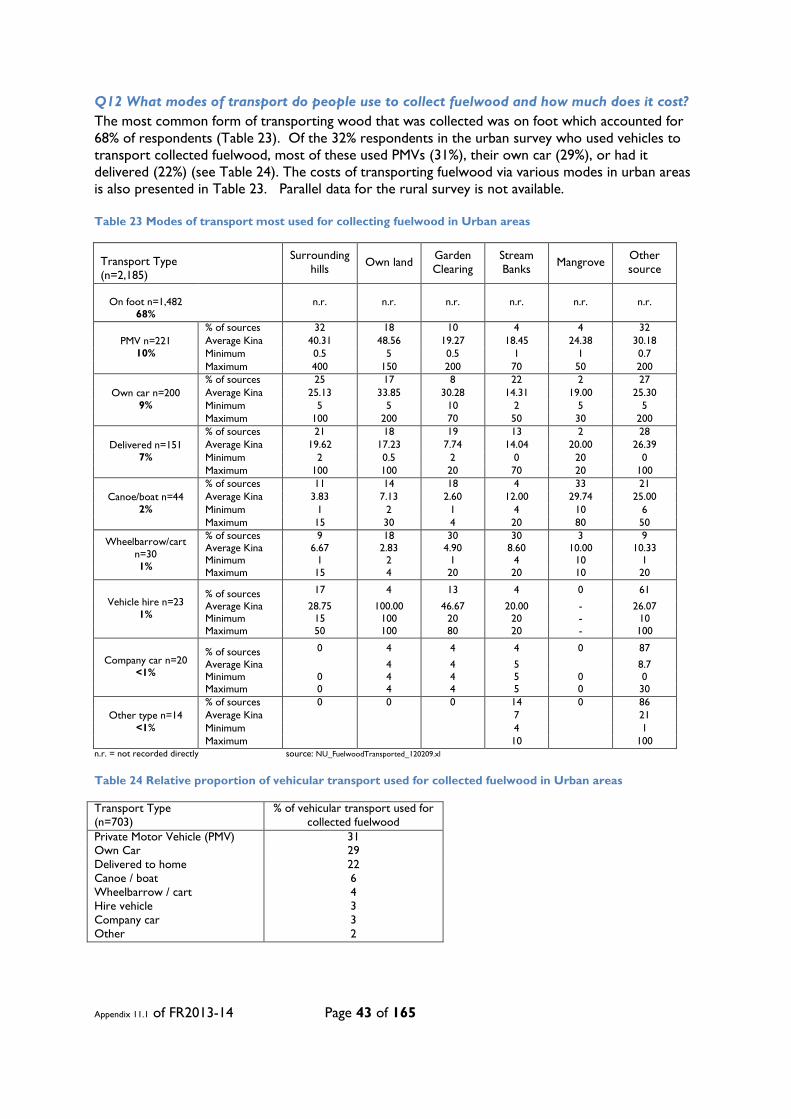
Appendix 11.1 of FR2013-14 Page 43 of 165
Q12 What modes of transport do people use to collect fuelwood and how much does it cost? The most common form of transporting wood that was collected was on foot which accounted for 68% of respondents (Table 23). Of the 32% respondents in the urban survey who used vehicles to transport collected fuelwood, most of these used PMVs (31%), their own car (29%), or had it delivered (22%) (see Table 24). The costs of transporting fuelwood via various modes in urban areas is also presented in Table 23. Parallel data for the rural survey is not available. Table 23 Modes of transport most used for collecting fuelwood in Urban areas
Transport Type (n=2,185)
Surrounding hills Own land Garden
Clearing Stream Banks Mangrove Other
source
On foot n=1,482
68% n.r. n.r. n.r. n.r. n.r. n.r.
PMV n=221 10%
% of sources 32 18 10 4 4 32 Average Kina 40.31 48.56 19.27 18.45 24.38 30.18 Minimum 0.5 5 0.5 1 1 0.7 Maximum 400 150 200 70 50 200
Own car n=200 9%
% of sources 25 17 8 22 2 27 Average Kina 25.13 33.85 30.28 14.31 19.00 25.30 Minimum 5 5 10 2 5 5 Maximum 100 200 70 50 30 200
Delivered n=151 7%
% of sources 21 18 19 13 2 28 Average Kina 19.62 17.23 7.74 14.04 20.00 26.39 Minimum 2 0.5 2 0 20 0 Maximum 100 100 20 70 20 100
Canoe/boat n=44 2%
% of sources 11 14 18 4 33 21 Average Kina 3.83 7.13 2.60 12.00 29.74 25.00 Minimum 1 2 1 4 10 6 Maximum 15 30 4 20 80 50
Wheelbarrow/cart n=30 1%
% of sources 9 18 30 30 3 9 Average Kina 6.67 2.83 4.90 8.60 10.00 10.33 Minimum 1 2 1 4 10 1 Maximum 15 4 20 20 10 20
Vehicle hire n=23 1%
% of sources 17 4 13 4 0 61
Average Kina 28.75 100.00 46.67 20.00 - 26.07 Minimum 15 100 20 20 - 10 Maximum 50 100 80 20 - 100
Company car n=20 <1%
% of sources 0 4 4 4 0 87
Average Kina 4 4 5 8.7 Minimum 0 4 4 5 0 0 Maximum 0 4 4 5 0 30
Other type n=14 <1%
% of sources 0 0 0 14 0 86 Average Kina 7 21 Minimum 4 1 Maximum 10 100
n.r. = not recorded directly source: NU_FuelwoodTransported_120209.xl
Table 24 Relative proportion of vehicular transport used for collected fuelwood in Urban areas
Transport Type (n=703)
% of vehicular transport used for collected fuelwood
Private Motor Vehicle (PMV) 31 Own Car 29 Delivered to home 22 Canoe / boat 6 Wheelbarrow / cart 4 Hire vehicle 3 Company car 3 Other 2

Appendix 11.1 of FR2013-14 Page 44 of 165
How is fuelwood purchased?
Q13 How frequently do people buy fuelwood? Of the respondents who did buy fuelwood regularly, they were asked how many times they bought fuelwood in the current week, and in the week previous. The average and range of responses to these questions are present in Table 25. The proportions of respondents who bought fuelwood was 24% in both NCD and Lae and 46% in Mt Hagen urban areas, 7% in Lae rural and 4% in rural highlands. As the different regions have different proportions of the population actually using fuelwood (Table 8), this table then shows the ratios of buyers to users. So for every 100 fuelwood users in the various regions 33 buy fuelwood in NCD, 27 in Lae urban and 53 in Mt Hagen urban areas, and 7 in Lae rural and 3 in rural highlands. This could be used as an indicator of the relative accessibility to collected firewood as well as ability to buy fuelwood in the different regions. Table 25 Frequency of buying fuelwood in Urban and Rural areas
Urban Rural NCD Lae Mt Hagen Lae Highlands Sample size 1868 558 247 285 996 How many times did you BUY firewood this week? % sample bought fuelwood 23 22 45 6 3 Average frequency 2.3 1.9 2.7 1.8 1.8 Maximum frequency 7 7 7 6 4 How many times did you BUY firewood last week? % sample bought fuelwood 26 27 47 7 4 Average frequency 2.5 2.1 2.6 2.5 1.9 Maximum frequency 10 10 7 6 7
Average % sample buying firewood over the 2 weeks 24 24 46 6.7 3.5 % sample using firewood 73 90 87 98 100
Buyer : User 3.0 3.7 1.9 14.7 28.9 So for every …. 100 users 100 users 100 users 100 users 100 users
….there are… 33 buyers 27 buyers 53 buyers 7 buyers 3 buyers Source: URBAN_Complete_FW_Costs.xlsx; FW_NONUSERS_101116.xlsx; RURAL_Complete_FW_Costs.xlsx
The frequency distribution of the responses are presented in Figures 7 and 8. A very few respondents said they bought fuelwood up to 10 times a week and so they are not represented in this figure. In NCD and Lae the majority of buyers (68% and 78% respectively) buy their fuelwood 1 to 2 times a week. In the Mt Hagen urban sample, the majority (60%) buy their fuelwood 2-3 times per week.

Appendix 11.1 of FR2013-14 Page 45 of 165
Figure 7 Frequency of the number of times a week that fuelwood is purchased in the three urban regions.
Figure 8 Frequency d of the number of times a week that fuelwood is purchased in the rural regions.
0
10
20
30
40
50
60
1 2 3 4 5 6 7
% fr
eque
ncy
Average number of times per week that fuelwood is purchased
NCD Lae HGN
0
10
20
30
40
50
60
1 2 3 4 5 6 7
% fr
eque
ncy
Average number of times per week that fuelwood is purchased
Lae Rural Highlands Rural
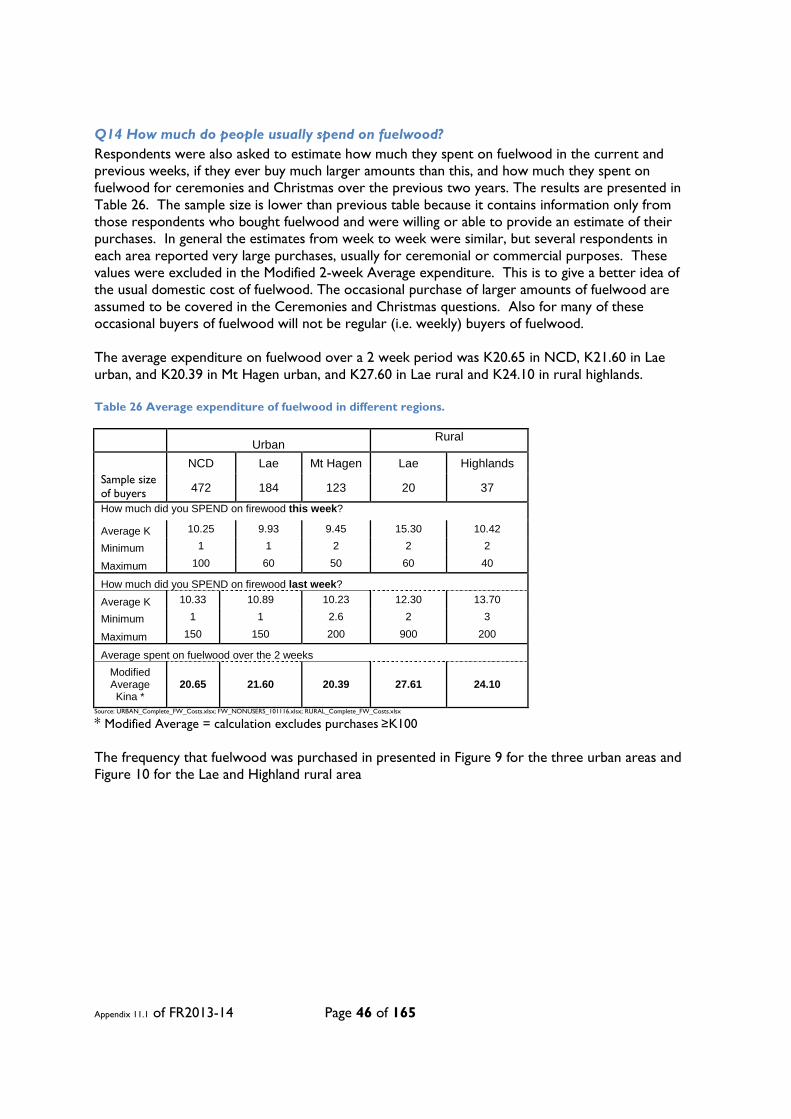
Appendix 11.1 of FR2013-14 Page 46 of 165
Q14 How much do people usually spend on fuelwood? Respondents were also asked to estimate how much they spent on fuelwood in the current and previous weeks, if they ever buy much larger amounts than this, and how much they spent on fuelwood for ceremonies and Christmas over the previous two years. The results are presented in Table 26. The sample size is lower than previous table because it contains information only from those respondents who bought fuelwood and were willing or able to provide an estimate of their purchases. In general the estimates from week to week were similar, but several respondents in each area reported very large purchases, usually for ceremonial or commercial purposes. These values were excluded in the Modified 2-week Average expenditure. This is to give a better idea of the usual domestic cost of fuelwood. The occasional purchase of larger amounts of fuelwood are assumed to be covered in the Ceremonies and Christmas questions. Also for many of these occasional buyers of fuelwood will not be regular (i.e. weekly) buyers of fuelwood. The average expenditure on fuelwood over a 2 week period was K20.65 in NCD, K21.60 in Lae urban, and K20.39 in Mt Hagen urban, and K27.60 in Lae rural and K24.10 in rural highlands. Table 26 Average expenditure of fuelwood in different regions.
Urban
Rural
NCD Lae Mt Hagen Lae Highlands Sample size of buyers 472 184 123 20 37
How much did you SPEND on firewood this week?
Average K 10.25 9.93 9.45 15.30 10.42
Minimum 1 1 2 2 2
Maximum 100 60 50 60 40
How much did you SPEND on firewood last week? Average K 10.33 10.89 10.23 12.30 13.70
Minimum 1 1 2.6 2 3
Maximum 150 150 200 900 200
Average spent on fuelwood over the 2 weeks Modified Average Kina *
20.65 21.60 20.39 27.61 24.10
Source: URBAN_Complete_FW_Costs.xlsx; FW_NONUSERS_101116.xlsx; RURAL_Complete_FW_Costs.xlsx
* Modified Average = calculation excludes purchases ≥K100 The frequency that fuelwood was purchased in presented in Figure 9 for the three urban areas and Figure 10 for the Lae and Highland rural area

Appendix 11.1 of FR2013-14 Page 47 of 165
Figure 9 Frequency distribution of expenditure classes in urban areas In the urban survey small (<10 Kina) fuelwood purchases were dominant, especially in the NCD were over 50% of purchases were <6 Kina (probably 5kg splits). In contrast the dominant purchase category in Lae rural was 16-20 Kina. The dominant category in the highlands rural sample was >50 Kina. This is not surprising given that most highland people collect fuelwood rather than purchase. So the distribution of expenditure classes in the Highlands rural may be influenced by the relative higher number of large purchases for ceremonial and celebratory mu mu’s and commercial uses.
Figure 10 Frequency distribution of expenditure classes in rural areas
Q15 Who collects and who buys fuelwood in the household? The interviewees were asked who collects and who buys fuelwood in their household. They were asked to indicate the age class and gender of their household members. The survey did not ask for the relative contribution of the different household members to these tasks, only whether each age-gender class was involved. It is important to remember this when considering this data.
0
10
20
30
40
50
60
<6 6-10 11-15 16-20 21-25 26-30 31-35 36-40 41-50 >50
% fr
eque
ncy
expenditure classes Kina
NCD Lae urban Mt Hagen urban
0
5
10
15
20
25
30
35
40
<6 6-10 11-15 16-20 21-25 26-30 31-35 36-40 41-50 >50
% fr
eque
ncy
expenditure classes Kina
Lae rural Highlands rural
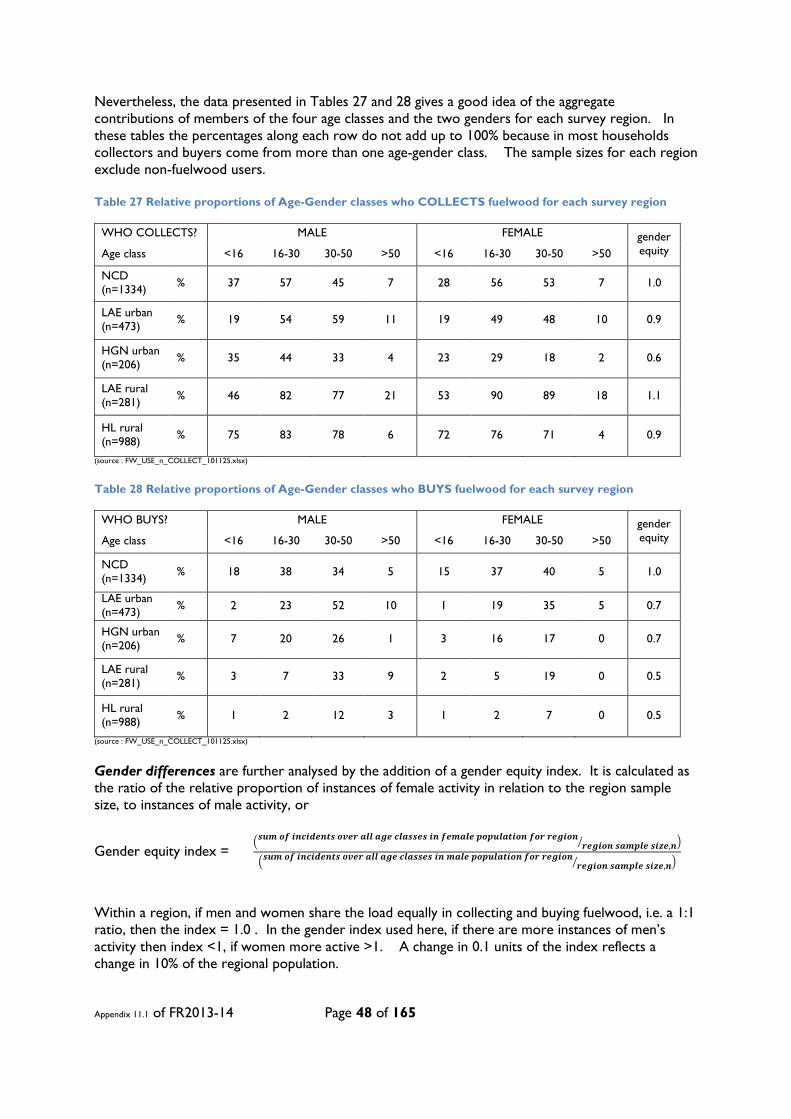
Appendix 11.1 of FR2013-14 Page 48 of 165
Nevertheless, the data presented in Tables 27 and 28 gives a good idea of the aggregate contributions of members of the four age classes and the two genders for each survey region. In these tables the percentages along each row do not add up to 100% because in most households collectors and buyers come from more than one age-gender class. The sample sizes for each region exclude non-fuelwood users. Table 27 Relative proportions of Age-Gender classes who COLLECTS fuelwood for each survey region
WHO COLLECTS? MALE FEMALE gender equity Age class <16 16-30 30-50 >50 <16 16-30 30-50 >50
NCD (n=1334) % 37 57 45 7 28 56 53 7 1.0
LAE urban (n=473) % 19 54 59 11 19 49 48 10 0.9
HGN urban (n=206) % 35 44 33 4 23 29 18 2 0.6
LAE rural (n=281) % 46 82 77 21 53 90 89 18 1.1
HL rural (n=988) % 75 83 78 6 72 76 71 4 0.9
(source : FW_USE_n_COLLECT_101125.xlsx) Table 28 Relative proportions of Age-Gender classes who BUYS fuelwood for each survey region
WHO BUYS? MALE FEMALE gender equity Age class <16 16-30 30-50 >50 <16 16-30 30-50 >50
NCD (n=1334) % 18 38 34 5 15 37 40 5 1.0
LAE urban (n=473) % 2 23 52 10 1 19 35 5 0.7
HGN urban (n=206) % 7 20 26 1 3 16 17 0 0.7
LAE rural (n=281) % 3 7 33 9 2 5 19 0 0.5
HL rural (n=988) % 1 2 12 3 1 2 7 0 0.5
(source : FW_USE_n_COLLECT_101125.xlsx)
Gender differences are further analysed by the addition of a gender equity index. It is calculated as the ratio of the relative proportion of instances of female activity in relation to the region sample size, to instances of male activity, or
Gender equity index = �𝒔𝒖𝒎 𝒐𝒇 𝒊𝒏𝒄𝒊𝒅𝒆𝒏𝒕𝒔 𝒐𝒗𝒆𝒓 𝒂𝒍𝒍 𝒂𝒈𝒆 𝒄𝒍𝒂𝒔𝒔𝒆𝒔 𝒊𝒏 𝒇𝒆𝒎𝒂𝒍𝒆 𝒑𝒐𝒑𝒖𝒍𝒂𝒕𝒊𝒐𝒏 𝒇𝒐𝒓 𝒓𝒆𝒈𝒊𝒐𝒏
𝒓𝒆𝒈𝒊𝒐𝒏 𝒔𝒂𝒎𝒑𝒍𝒆 𝒔𝒊𝒛𝒆,𝒏� �
�𝒔𝒖𝒎 𝒐𝒇 𝒊𝒏𝒄𝒊𝒅𝒆𝒏𝒕𝒔 𝒐𝒗𝒆𝒓 𝒂𝒍𝒍 𝒂𝒈𝒆 𝒄𝒍𝒂𝒔𝒔𝒆𝒔 𝒊𝒏 𝒎𝒂𝒍𝒆 𝒑𝒐𝒑𝒖𝒍𝒂𝒕𝒊𝒐𝒏 𝒇𝒐𝒓 𝒓𝒆𝒈𝒊𝒐𝒏𝒓𝒆𝒈𝒊𝒐𝒏 𝒔𝒂𝒎𝒑𝒍𝒆 𝒔𝒊𝒛𝒆,𝒏� �
Within a region, if men and women share the load equally in collecting and buying fuelwood, i.e. a 1:1 ratio, then the index = 1.0 . In the gender index used here, if there are more instances of men’s activity then index <1, if women more active >1. A change in 0.1 units of the index reflects a change in 10% of the regional population.
Appendix 11.1 of FR2013-14 Page 49 of 165
Relative to NCD, where there appears to be household gender equity in both collection and buying of fuelwood, males are marginally more involved with collecting fuelwood in Lae Urban and Highlands Rural regions, and even more so in the Mt Hagen Urban region. In contrast females across all age classes are more involved in fuelwood collection in Lae Rural. Note, it is important to remember the data does not represent how frequently men and women collect fuelwood relative to each other, just the reports of what age-gender classes within each household are involved with this activity. Perhaps the value of this gender equity index is more apparent in Table 28 that presents the data on who buys fuelwood in the household. Again while there appears to be gender equity in NCD, the males in households in other regions clearly have more control of the household purse with respect to fuelwood purchase. This is particularly strong in the rural regions where men are twice as likely to buy fuelwood than women in the household. Analysis of age differences are not readily amenable to an index and are best understood through Figures 11a and b. Four age classes were assigned as <16 years, 16-30 years, 31-50 years, and >50 years. It is clear and understandable that the middle-age groups are more active and that the very old are appear to be less involved with fuelwood collection. However, it should be borne in mind that the >50 years group is a related small proportion of the population. Table 29 presents the relative proportions of the age classes in the survey regions, derived from the 2000 National Census data. For PNG as a whole, the >50year age class represents 9% of the population. For most of the survey regions this age class is 5 or 6 % of the regional population; in the highlands rural area it is 12%. The set of Figures 12a-e presents the contribution of different age classes to collecting fuelwood alongside the proportion of that age class in the regional population.
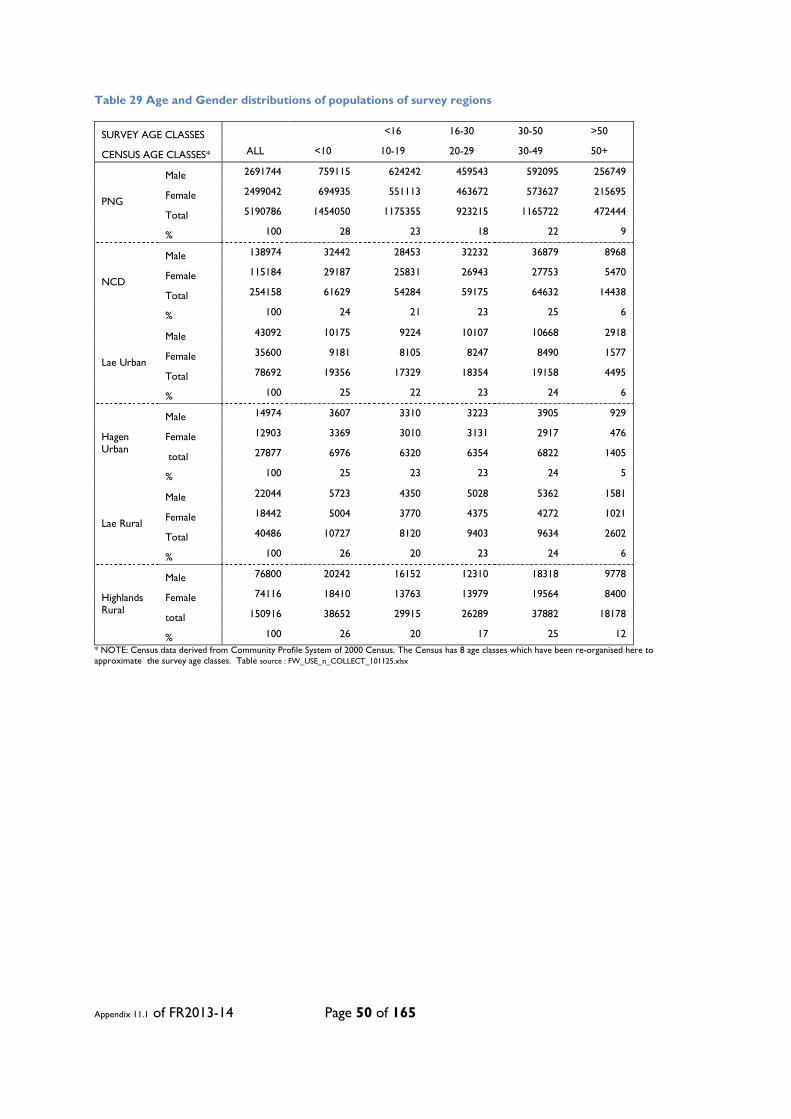
Appendix 11.1 of FR2013-14 Page 50 of 165
Table 29 Age and Gender distributions of populations of survey regions
SURVEY AGE CLASSES <16 16-30 30-50 >50
CENSUS AGE CLASSES* ALL <10 10-19 20-29 30-49 50+
PNG
Male 2691744 759115 624242 459543 592095 256749
Female 2499042 694935 551113 463672 573627 215695
Total 5190786 1454050 1175355 923215 1165722 472444
% 100 28 23 18 22 9
NCD
Male 138974 32442 28453 32232 36879 8968
Female 115184 29187 25831 26943 27753 5470
Total 254158 61629 54284 59175 64632 14438
% 100 24 21 23 25 6
Lae Urban
Male 43092 10175 9224 10107 10668 2918
Female 35600 9181 8105 8247 8490 1577
Total 78692 19356 17329 18354 19158 4495
% 100 25 22 23 24 6
Hagen Urban
Male 14974 3607 3310 3223 3905 929
Female 12903 3369 3010 3131 2917 476
total 27877 6976 6320 6354 6822 1405
% 100 25 23 23 24 5
Lae Rural
Male 22044 5723 4350 5028 5362 1581
Female 18442 5004 3770 4375 4272 1021
Total 40486 10727 8120 9403 9634 2602
% 100 26 20 23 24 6
Highlands Rural
Male 76800 20242 16152 12310 18318 9778
Female 74116 18410 13763 13979 19564 8400
total 150916 38652 29915 26289 37882 18178
% 100 26 20 17 25 12 * NOTE: Census data derived from Community Profile System of 2000 Census. The Census has 8 age classes which have been re-organised here to approximate the survey age classes. Table source : FW_USE_n_COLLECT_101125.xlsx
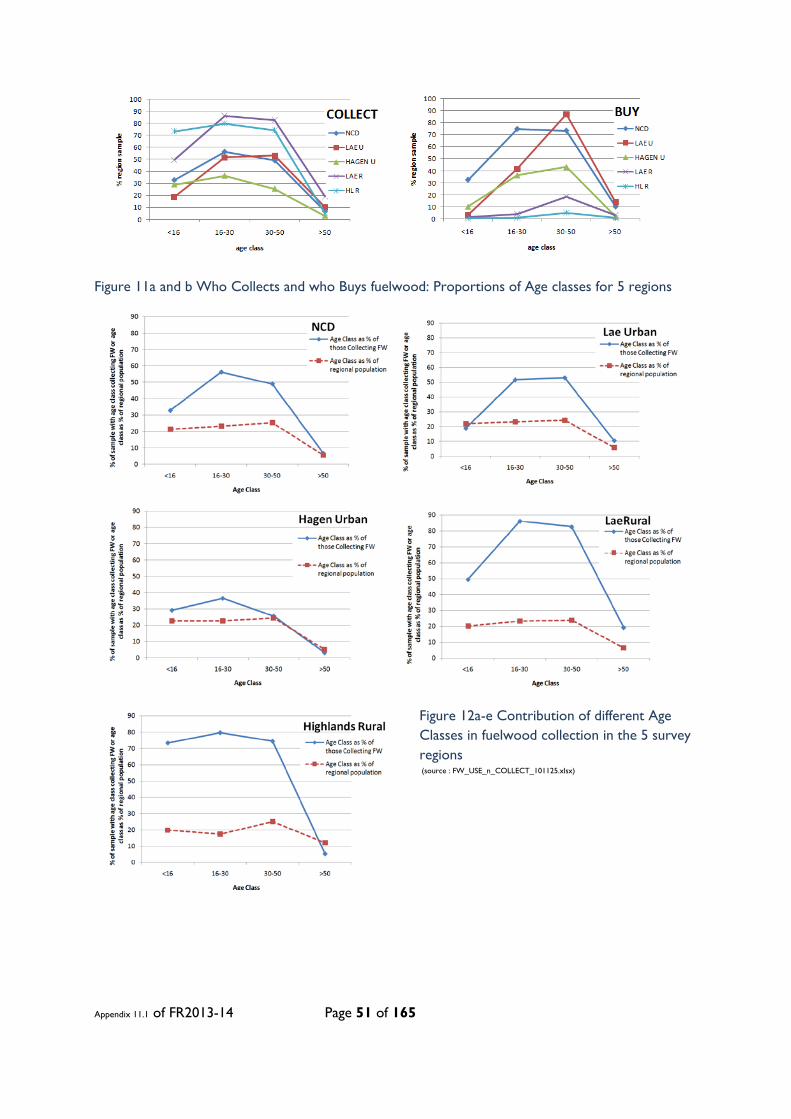
Appendix 11.1 of FR2013-14 Page 51 of 165
Figure 11a and b Who Collects and who Buys fuelwood: Proportions of Age classes for 5 regions
Figure 12a-e Contribution of different Age Classes in fuelwood collection in the 5 survey regions (source : FW_USE_n_COLLECT_101125.xlsx)
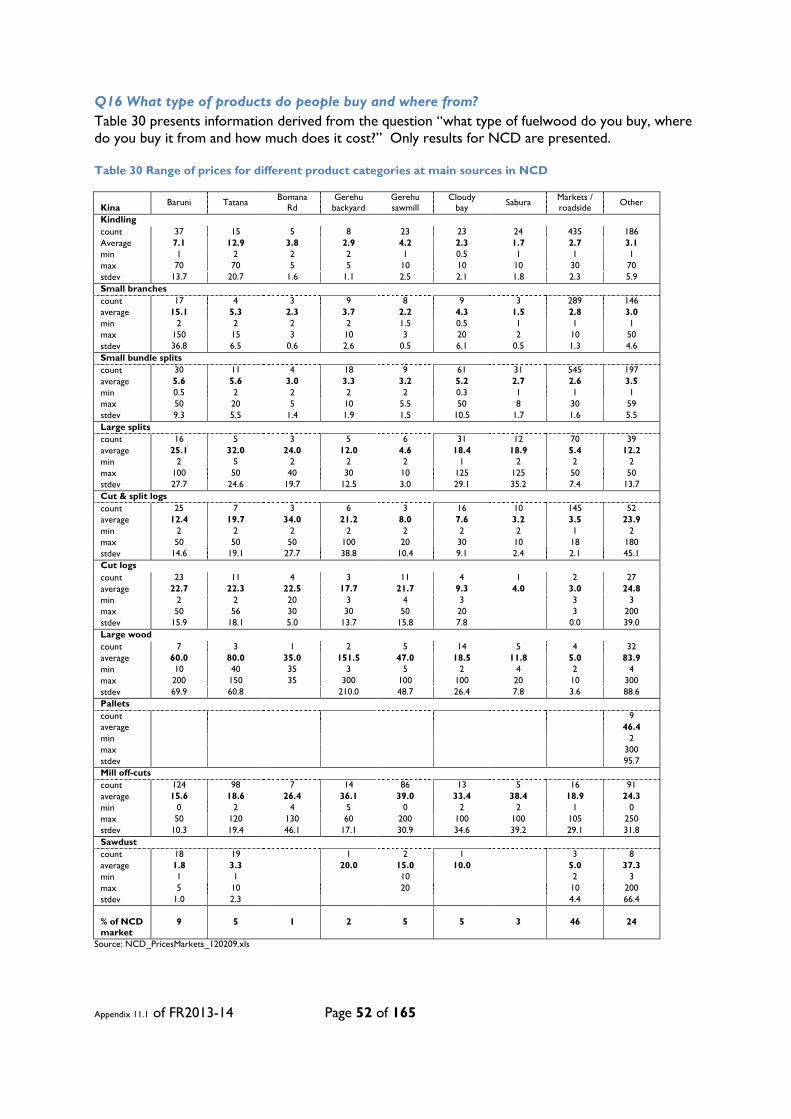
Appendix 11.1 of FR2013-14 Page 52 of 165
Q16 What type of products do people buy and where from? Table 30 presents information derived from the question “what type of fuelwood do you buy, where do you buy it from and how much does it cost?” Only results for NCD are presented. Table 30 Range of prices for different product categories at main sources in NCD
Kina Baruni Tatana Bomana Rd
Gerehu backyard
Gerehu sawmill
Cloudy bay Sabura Markets /
roadside Other
Kindling count 37 15 5 8 23 23 24 435 186 Average 7.1 12.9 3.8 2.9 4.2 2.3 1.7 2.7 3.1 min 1 2 2 2 1 0.5 1 1 1 max 70 70 5 5 10 10 10 30 70 stdev 13.7 20.7 1.6 1.1 2.5 2.1 1.8 2.3 5.9 Small branches count 17 4 3 9 8 9 3 289 146 average 15.1 5.3 2.3 3.7 2.2 4.3 1.5 2.8 3.0 min 2 2 2 2 1.5 0.5 1 1 1 max 150 15 3 10 3 20 2 10 50 stdev 36.8 6.5 0.6 2.6 0.5 6.1 0.5 1.3 4.6 Small bundle splits count 30 11 4 18 9 61 31 545 197 average 5.6 5.6 3.0 3.3 3.2 5.2 2.7 2.6 3.5 min 0.5 2 2 2 2 0.3 1 1 1 max 50 20 5 10 5.5 50 8 30 59 stdev 9.3 5.5 1.4 1.9 1.5 10.5 1.7 1.6 5.5 Large splits count 16 5 3 5 6 31 12 70 39 average 25.1 32.0 24.0 12.0 4.6 18.4 18.9 5.4 12.2 min 2 5 2 2 2 1 2 2 2 max 100 50 40 30 10 125 125 50 50 stdev 27.7 24.6 19.7 12.5 3.0 29.1 35.2 7.4 13.7 Cut & split logs count 25 7 3 6 3 16 10 145 52 average 12.4 19.7 34.0 21.2 8.0 7.6 3.2 3.5 23.9 min 2 2 2 2 2 2 2 1 2 max 50 50 50 100 20 30 10 18 180 stdev 14.6 19.1 27.7 38.8 10.4 9.1 2.4 2.1 45.1 Cut logs count 23 11 4 3 11 4 1 2 27 average 22.7 22.3 22.5 17.7 21.7 9.3 4.0 3.0 24.8 min 2 2 20 3 4 3 3 3 max 50 56 30 30 50 20 3 200 stdev 15.9 18.1 5.0 13.7 15.8 7.8 0.0 39.0 Large wood count 7 3 1 2 5 14 5 4 32 average 60.0 80.0 35.0 151.5 47.0 18.5 11.8 5.0 83.9 min 10 40 35 3 5 2 4 2 4 max 200 150 35 300 100 100 20 10 300 stdev 69.9 60.8 210.0 48.7 26.4 7.8 3.6 88.6 Pallets count 9 average 46.4 min 2 max 300 stdev 95.7 Mill off-cuts count 124 98 7 14 86 13 5 16 91 average 15.6 18.6 26.4 36.1 39.0 33.4 38.4 18.9 24.3 min 0 2 4 5 0 2 2 1 0 max 50 120 130 60 200 100 100 105 250 stdev 10.3 19.4 46.1 17.1 30.9 34.6 39.2 29.1 31.8 Sawdust count 18 19 1 2 1 3 8 average 1.8 3.3 20.0 15.0 10.0 5.0 37.3 min 1 1 10 2 3 max 5 10 20 10 200 stdev 1.0 2.3 4.4 66.4 % of NCD market
9 5 1 2 5 5 3 46 24
Source: NCD_PricesMarkets_120209.xls
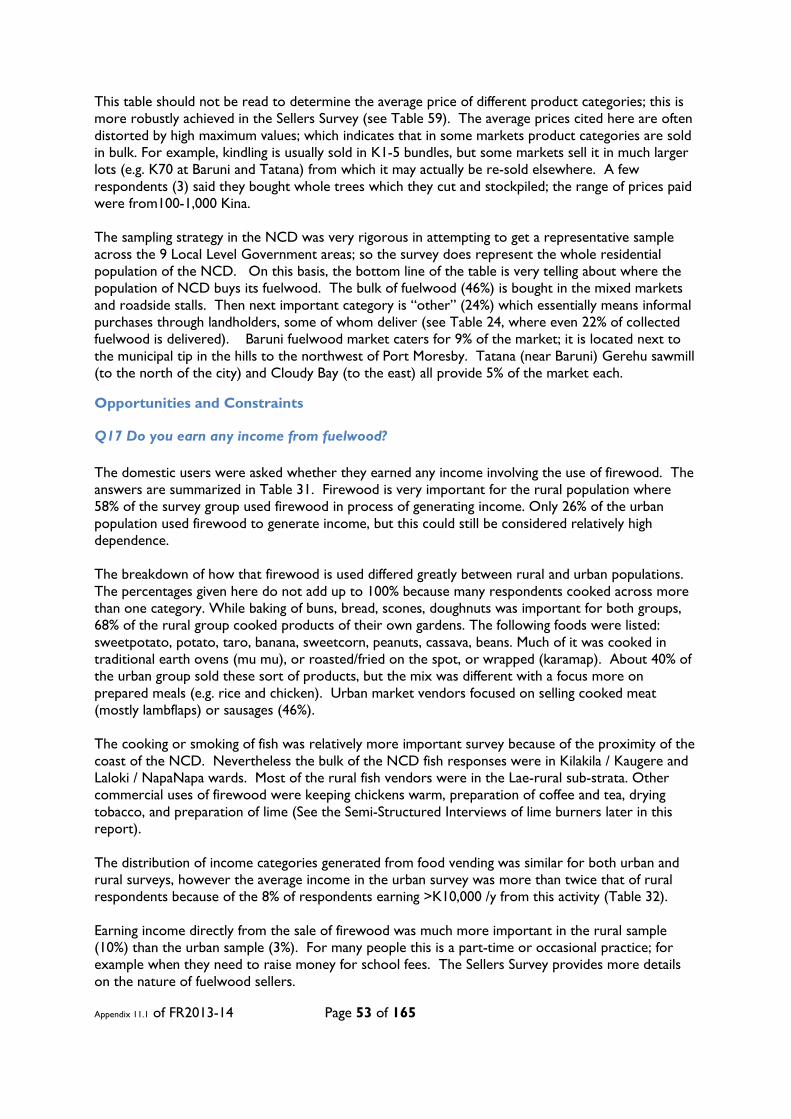
Appendix 11.1 of FR2013-14 Page 53 of 165
This table should not be read to determine the average price of different product categories; this is more robustly achieved in the Sellers Survey (see Table 59). The average prices cited here are often distorted by high maximum values; which indicates that in some markets product categories are sold in bulk. For example, kindling is usually sold in K1-5 bundles, but some markets sell it in much larger lots (e.g. K70 at Baruni and Tatana) from which it may actually be re-sold elsewhere. A few respondents (3) said they bought whole trees which they cut and stockpiled; the range of prices paid were from100-1,000 Kina. The sampling strategy in the NCD was very rigorous in attempting to get a representative sample across the 9 Local Level Government areas; so the survey does represent the whole residential population of the NCD. On this basis, the bottom line of the table is very telling about where the population of NCD buys its fuelwood. The bulk of fuelwood (46%) is bought in the mixed markets and roadside stalls. Then next important category is “other” (24%) which essentially means informal purchases through landholders, some of whom deliver (see Table 24, where even 22% of collected fuelwood is delivered). Baruni fuelwood market caters for 9% of the market; it is located next to the municipal tip in the hills to the northwest of Port Moresby. Tatana (near Baruni) Gerehu sawmill (to the north of the city) and Cloudy Bay (to the east) all provide 5% of the market each.
Opportunities and Constraints
Q17 Do you earn any income from fuelwood? The domestic users were asked whether they earned any income involving the use of firewood. The answers are summarized in Table 31. Firewood is very important for the rural population where 58% of the survey group used firewood in process of generating income. Only 26% of the urban population used firewood to generate income, but this could still be considered relatively high dependence. The breakdown of how that firewood is used differed greatly between rural and urban populations. The percentages given here do not add up to 100% because many respondents cooked across more than one category. While baking of buns, bread, scones, doughnuts was important for both groups, 68% of the rural group cooked products of their own gardens. The following foods were listed: sweetpotato, potato, taro, banana, sweetcorn, peanuts, cassava, beans. Much of it was cooked in traditional earth ovens (mu mu), or roasted/fried on the spot, or wrapped (karamap). About 40% of the urban group sold these sort of products, but the mix was different with a focus more on prepared meals (e.g. rice and chicken). Urban market vendors focused on selling cooked meat (mostly lambflaps) or sausages (46%). The cooking or smoking of fish was relatively more important survey because of the proximity of the coast of the NCD. Nevertheless the bulk of the NCD fish responses were in Kilakila / Kaugere and Laloki / NapaNapa wards. Most of the rural fish vendors were in the Lae-rural sub-strata. Other commercial uses of firewood were keeping chickens warm, preparation of coffee and tea, drying tobacco, and preparation of lime (See the Semi-Structured Interviews of lime burners later in this report). The distribution of income categories generated from food vending was similar for both urban and rural surveys, however the average income in the urban survey was more than twice that of rural respondents because of the 8% of respondents earning >K10,000 /y from this activity (Table 32). Earning income directly from the sale of firewood was much more important in the rural sample (10%) than the urban sample (3%). For many people this is a part-time or occasional practice; for example when they need to raise money for school fees. The Sellers Survey provides more details on the nature of fuelwood sellers.
Appendix 11.1 of FR2013-14 Page 54 of 165
Overall, 68% of the rural sample and 29% of the urban sample earned some income from the use or sale of firewood. Table 31 Proportions of Rural and Urban sample populations using firewood to earn an income.
Urban survey Rural survey Sample size, n 2,916 1,028 % YES, earn some income using firewood 26 58 % of the sub-sample who answered Yes
Baking 38 37 Garden vegetables and fruit 40 68
Meat / sausages / chicken 27 9 Cook / smoke fish 7 2
*‘commercial cooking’ 11 n.a. Other 2 2
% willing/able to state income 98 99 % YES, earn some income selling firewood 3 10 % total using firewood for income 29 68 Source: U&R_USERS_FWincome_110506.xls * some urban respondents did not specify the nature of their commercial cooking Table 32 Frequency of Income categories in enterprises using fuelwood in previous 12 months
Income previous 12 months
URBAN (n=2,916)
RURAL (n=1,028)
% frequency % frequency
<100 PGK 3 3
100-500 PGK 36 24
500-999 PGK 24 36
1000-4999 PGK 22 32
5-10000 PGK 6 2
>10000 PGK 8 3
Average PGK 3,503 1,557
Minimum 20 30
Maximum 73,000 33,600 Source: IncomeFuelwoodUsers_120424.xls
Q18 How has access to fuelwood changed over last 2 and 10 years? Respondents were asked how their access to trees for fuelwood collection has changed over the previous 2 and 10 year periods. Table 33 shows the breakdown in results for the urban and rural surveys, while Table 34 shows the change in access over the 9 LLGs in the NCD. Of the urban population sample 22% gave no response to this question because they do not use fuelwood. The urban data in the tables represents only those respondents who use fuelwood (see shaded columns in Table 35). In the rural sample, virtually all respondents use fuelwood and provided responses to these questions.

Appendix 11.1 of FR2013-14 Page 55 of 165
Table 33 Change in access to fuelwood over 2 and 10 years in Urban and Rural regions
% Survey region
Much easier to obtain
Easier to obtain No change
More difficult to
obtain
Much more
difficult to obtain
How has your access to fuelwood changed over the
last 2 years?
URBAN 3 16 16 41 24
RURAL 5 40 14 38 3 How has your access to
fuelwood changed over the last 10 years?
URBAN 16 34 14 25 11
RURAL 22 55 12 8 3 Considering first the aggregated regional data, the segregation of responses is not particularly striking which indicates that there is considerable variation in personal access to fuelwood across the 2 regions. Over the two years previous to the time of the survey, most (65%) urban respondents have found it more or much more difficult to access fuelwood, compared with rural respondents where only 41% experience similar problems. Indeed a small majority (45%) of rural respondents claim that it has been easier to access fuelwood. Quite a different picture emerges when the same question is posed for the previous10 year period. Only 46% of the urban sample expressed that it was more difficult to access fuelwood. This could indicate that for roughly 24% of the urban population accessing fuelwood has been a relatively recent problem. Using the same logic for the rural population 30% has seen accessing fuelwood as a recent problem. Respondents were asked to elaborate on their responses (Table 34). Of the 1,270 comments offered 83% felt that accessing fuelwood was getting much difficult citing population increases and immigration into urban areas the main problem; while of the 17% of the urban survey had no problems accessing fuelwood. Reasons provided for why fuelwood access was easy were: for urban respondents, living in village on outskirts of city, living close to sawmills, mangroves, and NCD hills, or that it was now easier to buy fuelwood nearby; for rural respondents their ease of access to fuelwood was based on their proximity to coffee gardens and natural forests. Considering now the data specifically for the NCD. The data is disaggregated into Local Level Government (LLG) areas in Table 38 while the published socio-economic indicators for the 9 LLGs are given in Table 39. To make sense of the socio-economic data, the co-efficient of variation was calculated for all the indices to highlight which indices showed the greatest variation across the 9 LLGs (see Table 37). The indices on the left show considerable variation across the LLGs and may be useful for discussing possible causes for differences in fuelwood behavior across the LLGs. The index ‘Traditional dwellings” is not used. Even though it has a very high covar (139%) it is meaningless for our purposes. Even the highest incidence of 1.8% (mean value across the 9 LLGs was only 0.4%) indicates that traditional dwellings, as defined by the census, are a very minor feature of the NCD landscape. Compare it with the national value of 76% dwellings being considered traditional.
Appendix 11.1 of FR2013-14 Page 56 of 165
Table 34 Selection of comments relating to access to fuelwood
Selected comments on access to fuelwood in urban survey Difficult 10 years ago f/wood access around homes & streets. Today cost money, every tree is owned, NCDC protected 10 years ago we collect f/wood but now all the trees are gone and we depend on sold f/wood 5-10 years back f/wood accessibility was quite difficult but now after planting more trees we have more f/wood A bit difficult to look for woods due to increase in settlements and immigration A lot of f/wood around POM Tech. Campus, NCD hills & Mangrove Access to f/wood is becoming hard sometimes we come back home without firewood because there is no fire to collect All the matured trees are gone and we are left with young saplings. Almost everybody around uses firewood, and it is very hard to find firewood around the nearby hills Although we are living near the mountains, we still find it difficult looking for f/wood At home (village) it is easy but in HGN city is difficult to access Because during 1999 to 2000 there is plenty trees around hills but today it is very difficult to obtain Developments taking place-meaning removing of f/wood. More settlers-clearing garden sites contributed to disappearing of f/wood Dry wood is often unavailable. Live trees have to be cut and dried for f/wood Few trees on the surroundings. High population density. People chase each other over f/wood Firewood is finished here in the NCD. We travel distance to country side - highway (Hiritano/Magi) I collect firewood from just nearby in the 70's and 80's. Now I am only buying f/wood. It is becoming hard I saw that firewood was becoming was becoming scarce for the last 12 years In the central town is very very difficult but the suburb like Tokara is also getting much more difficult to access f/wood In this area people are prohibited for collecting f/wood because of shortage of f/wood It is not freely collected as before, every tree is owned and protected It is risky for mothers to go out collecting f/wood Land owner blocking their way to go to the mountains to collect firewoods Long distance to collect f/wood. Usually drive 1-2 hours to Brown River to collect f/wood NCD hills are far away. Trees on the streets are protected by NCDC so it is difficult to collect Often land owners dispute other villagers collecting f/wood on their land Over the last 5 years observed great change in the demand and use of f/wood in Lae city - f/wood becoming scarce Risky to climb hills looking for f/wood Road would ease the access to f/wood Settled in a new block that has a lot fuelwood in supply Some land area were free to collect but have restricted to family access now Today landowners don't allow them to find firewood around the hills Easy Access to f/wood is easy. I can readily collect from my own land Access to mangrove, NCD hills & college campus Because on the mountains still there is enough trees where they can use as f/wood Because there is an area of constant supply of f/wood Because there is few people and lots of trees on the mountain Because they can access to a vehicle to look for firewood Can easily collect f/wood on nearby NCD hills Collect firewood on own land, therefore easy to access f/wood Collects around the house, easily available Constant supply of f/wood around the house and the nearby gardens Have good relationship with landowners so it would be easy to collect f/wood from their land Live near beach front so very easy to access f/wood Now it's easy to access. After some years it might be more difficult to access f/wood Now we have planted trees around house that provides f/wood from prunings and dry branches Outside the POM city is ok but within city areas is very difficult Stay close to where there is a lot of f/wood Supply of f/wood is still plenty due to the fact that the surrounding area is full of trees providing shade and firewood for residents They live near tea plantation and planted forest so it is easy to access f/wood We use coffee branches and wood can be found around our block of land Easier to obtain from garden clearing from own land Easier to obtain because we are close to the bush

Appendix 11.1 of FR2013-14 Page 57 of 165
Respondents who are engaged in growing food for their own use or in other agricultural activities are likely to be living in environments that will be relatively richer in fuelwood resources. Many of these people will also be engaged in selling food that they have produced in these environments. Indeed, the correlation between growing food and selling food is very high (R2 = 0.89). Similarly, those employed in the education and health sectors will tend to live in the more urbanised LLGs with hospitals, the university and more schools. The correlations between % Fuelwood Use in an LLG and the values for the selected socioeconomic indices are represented in Table 38. None of the correlations were very strong, but the standout is ‘Employment in the education and health sectors’ (R2 = 0.54). The LLGs with relatively strong concentration of this group were Gerehu, Waigani/University and Boroko/Korobosea. This group tended to be non-fuelwood users. Next in significance is the group ‘Engaged in selling food’ (R2 = 0.33) with relatively larger concentrations in LLGs on the periphery of the NCD such as Bomana and Laloki/Napanapa. This group tended to be strong fuelwood users as a great deal of market and street vendors sell cooked food. Those LLGs with higher ‘Home ownership’ and ‘Dependency ratios’ were also moderately correlated with fuelwood use (R2 = 0.34 and 0.25 respectively). Private homeowners are more likely to be free from restrictions from landlords on fuelwood use. Households with more dependents are more likely to rely on the cheaper energy source of fuelwood. Despite the high covars for ‘Growing food for own use’ and ‘Engaged in agricultural activity’, these indices were weakly correlated with fuelwood use (R2 = 0.17 and 0.23 respectively). The proportion of residents of peripheral LLGS such as Laloki/NapaNapa and Bomana Urban growing their own food was more than double that of other LLGs. These are LLGs with very high fuelwood use too (99% and 88% respectively). The low correlations for these indices may indicate that many residents of the more urban LLGs with relatively low fuelwood use still have access to rural land, presumably home village plots outside of the city.
Appendix 11.1 of FR2013-14 Page 58 of 165
Table 35 Change in access to fuelwood over 2 and 10 years in NCD Local Level Government areas
% Local Level Government (n)
% Non-FW
users
% No
response
Much easier
to obtain
Easier to obtain
No change
More difficult to
obtain
Much more difficult to
obtain
How has your access to fuelwood changed over the last 2 years?
80 Gerehu 178 19 20 1 9 15 49 26
81 Waigani/University 202 33 35 0 9 18 46 27
82 Tokarara/Hohola 290 30 19 1 14 14 36 36
83 Gordons/ Saraga 266 27 28 1 15 27 43 14
84 Boroko/Korobosea 249 53 59 2 14 23 27 34
85 Kilakila/Kaugere 232 20 22 1 4 11 34 50
86 Town / Hanuabada 230 20 30 1 11 13 32 44
87 Laloki / Napanapa 91 1 1 0 4 13 42 40
88 Bomana 130 12 16 4 6 22 49 19
How has your access to fuelwood changed over the last 10 years?
80 Gerehu 178 19 21 9 42 8 32 9
81 Waigani/University 202 33 34 10 44 20 21 6
82 Tokarara/Hohola 290 30 19 15 43 7 23 12
83 Gordons/ Saraga 266 27 28 15 41 20 16 9
84 Boroko/Korobosea 249 53 59 4 24 18 22 33
85 Kilakila/Kaugere 232 20 22 16 22 7 45 11
86 Town / Hanuabada 230 20 30 22 32 8 15 23
87 Laloki / Napanapa 91 1 1 2 18 11 30 40
88 Bomana 130 12 15 26 35 16 16 8
Table 36 Socio-economic Indicators of the 9 NCD Local Level Government areas
Source: National Census 2000 Community Profile System
LLG
Household indicators Citizen indicators
Hou
seho
lds
Av
hous
ehol
d siz
e
Hom
e ow
ners
hip
%
Trad
ition
al
dwel
lings
%
Enga
ged
in a
ny
agri
cultu
ral
activ
ity %
Gro
win
g fo
od
for
own
use
%
Enga
ged
in
Inco
me
gene
ratin
g
En
gage
d in
se
lling
food
%
Lite
racy
of
>10y
r ol
d
% o
ver
10yr
s ec
onom
ical
ly
activ
e
% e
mpl
oyed
am
ong
econ
omic
ally
Mig
rant
%
Mig
rant
bor
n PN
G
%
Dep
ende
ncy
ratio
Ed
ucat
ion
&
heal
th %
Gerehu 3,251 7.7 62 0 15 6.6 28 11 97 44 87 62 89 56 7.5
Waigani / University
4,055 6.9 65 0.2 20 6.4 39 21 89 52 84 70 91 51 10.4
Tokarara / Hohola 5,445 7.3 54 0.3 17 7.4 26 13 95 49 80 59 88 58 5.5
Gordons / Saraga 4,862 6.8 53 1.8 19 6.3 38 20 89 51 84 70 92 53 5.8
Boroko Korobosea 4,904 6.8 51 0.2 23 12 30 16 91 48 86 59 89 54 8.9
Kilakila / Kaugere 4,108 7.8 82 0.2 26 7.7 42 22 86 46 75 45 92 62 4.2
Town / Hanuabada 3,900 7.3 67 0.1 20 9.9 28 15 94 44 80 35 85 61 4.1
Laloki / Napanapa 2,038 5.9 83 0.4 35 17.8 45 35 88 55 82 67 95 60 2.3
Bomana (urban) 2,625 6.4 60 0.3 34 17.8 41 28 83 53 83 69 92 57 3.9
PNG aggregate 943,767 5.5 91 75.5 88 62.3 66 55 56 68 97 20 46 74 1.7
Census definitions Households: number of households where the head of household is PNG citizen Average household size: total persons in households divided by total households Home ownership %: proportion of households who own their own dwelling Traditional dwellings %: a house made of traditional materials such as grass, bamboo, pitpit or wood Engaged in any agricultural activity %: proportion of households involved in growing any crop or raising livestock Growing food for own use %: proportion of households growing food for own use Income generating activity: households receiving money from selling food, fish, meat, products, running PMV or store etc Engaged in selling food: households receiving money for selling food crops or cooked food at market/roadside Literacy: ability to read and write with basic understanding in at least one of these languages: English, Motu, Pidgin or Tokples
Migrant: a person whose place of birth and place of enumeration were different, or if they were the same, someone who has not lived in their place of enumeration continuously since birth. All persons born overseas classified as migrants.
Migrant born in PNG %: Proportion of migrants born in PNG who migrated between provinces
Dependency ration: proportion aged 0-14 years and the population aged 65 years and over (the dependent population) divided by the population aged 15-64 years (the working age population)
Education & Health %: proportion of employed in either the Education or Health industries. Source: PNG National Census 2000 through the Community Profile System. PNG National Statistics Office Note: Most of the values in the table were published with accuracy to one decimal place. Many have had the decimal place rounded off
for simplicity of presentation Table source: URBAN_RURAL_AccessToTrees.xlsx
Appendix 11.1 of FR2013-14 Page 59 of 165
Table 37 Coefficients of Variation of Socio-Economic indices across 9 LLGs of the NCD
Indices showing considerable variation across the 9 LLGs
Covar* %
Indices showing little or irrelevant variation across the 9 LLGs
Covar %
Growing food for own use 46 Household size 9
Employed in education and health sectors 45 Proportion >10yrs economically active 8
Engaged in selling food 38 Dependency ratio 6
Engaged in agricultural activity 30 Literacy of >10 year olds 5
Engaged in income generating activity 21 Proportion of employed among economically active 4
Migrant 20 Migrants born in PNG 3
Home ownership 18 (Traditional dwellings) (139)
* Coefficient of Variation = mean / standard deviation expressed as percentage
Table 38 Correlations between Socio-Economic indices and % Fuelwood Use in LLGs
Indices showing considerable variation across the 9 LLGs R2 Indices showing little or irrelevant
variation across the 9 LLGs R2
Growing food for own use 0.17 Household size 0.07
Employed in education and health sectors 0.54 Proportion >10yrs economically active 0.15
Engaged in selling food 0.33 Dependency ratio 0.25
Engaged in agricultural activity 0.23 Literacy of >10 year olds 0.06
Engaged in income generating activity 0.22 Proportion of employed among economically active 0.09
Migrant 0.04 Migrants born in PNG 0.24
Home ownership 0.34 (Traditional dwellings) (0.0002) Source: URBAN_RURAL_AccessToTrees.xlsx
Q19 If you own land, have you ever planted fuelwood trees: how many in last 2 and 10 years? We asked whether respondents had planted any trees themselves over the past 2 and 10 year periods; and then asked if they can estimate how many trees they planted. The responses for the10 year period are given in Table 39. Only those respondents who actually use fuelwood were considered in this question. Table 39 Tree planting activity
Survey region n
No. FW user
respondents
% yes I have planted trees in last 10 years
NCD 1868 1344 78 Lae urban 558 476 48 Hagen urban 247 208 73 Lae rural 285 285 55 Mt Hagen rural 379 379 91 Henganofi rural 363 363 96 Chuave rural 254 254 94
Source: URBAN_RURAL_AccessToTrees.xlsx
Tree planting is common practice among the highland rural population (>90%). Around Lae the proportion is considerably lower and the reasons for this may be complicated. The hills around Lae

Appendix 11.1 of FR2013-14 Page 60 of 165
are heavily vegetated, but they are also highly populated and guarded by owners. Perhaps there is less of an opportunity for planting trees around Lae, as there is in the highlands. The value of 78% for NCD respondents seems high considering there is little evidence of private tree planting in the NCD hills. Perhaps these trees are occasional trees on house blocks or around gardens outside of the city. Also many respondents may be recent residents so some of these trees will have been planted outside of the NCD altogether. Table 19b presents the estimates of numbers of trees planted per person over the last 2 and 10 year periods for the various regions. These averages are based on only those respondents who said they planted trees. The low values for NCD are probably due to the lack of opportunities. For Lae rural the low values may be more likely to lack of need to plant trees. Table 40 Number of trees planted over past 2 and 10 years for each survey region.
Last 2 years Last 10 years Last 2 years Last 10 years NCD Henaganofi Rural
No. responses 827 944 344 56 as % sample 44 51 95 15
Average trees 9 20 78 383 Minimum 1 1 6 10 Maximum 500 1000 1500 2000
StDev 23.84 63.43 125.42 455.54 Total trees planted 7313 19044 19691 20478
Lae Urban Lae Rural No. responses 140 137 140 133
as % sample 25 25 49 47 Average trees 37 34 13 18
Minimum 1 0 1 1 Maximum 1500 1000 342 210
StDev 135.10 106.44 32.66 33.45 Total trees planted 5115 4641 1730 2303
Mt Hagen Urban Mt Hagen Rural No. responses 133 138 314 313
as % sample 54 56 83 83 Average trees 41 74 50 128
Minimum 2 1 1 1 Maximum 1200 1000 600 2800
StDev 146.06 138.73 89.61 264.77 Total trees planted 16264 10264 15571 39956
Chuave Rural No. responses 236 21
as % sample 93 8 Average trees 85 120
Minimum 4 25 Maximum 2800 300
StDev 298.70 75.29 Total trees planted 20154 2521
Source: ALL_AccessToTrees_120210.xlsx
Q20 Has there been any conflict over access to fuelwood? Table 41 presents the frequency of fuelwood-related conflict in the 7 survey regions, while some randomly selected comments are in Table 42. All values should be considered as high; even if 40% (Lae urban) of the sample experiences, or is fearful of conflict associated with fuelwood collection, then this is a serious social issue. The relatively low values for Lae urban and NCD (48%) may be explained by these populations having high proportions of people who buy fuelwood (27% and 33% respectively, see Tab 12). The very high values for Henganofi (Eastern Highlands) and Chuave (Simbu Province) can be explained by fact the virtually everybody uses fuelwood in these areas but only 3% of users actually buy it. Mt Hagen urban is an interesting case in that conflict is high (58%) even
Appendix 11.1 of FR2013-14 Page 61 of 165
though this region has the highest proportion of buyers (53%, see Table 25). It appears that competition for, and conflict over, fuelwood is particularly high in Mt Hagen urban area. Table 41 Conflict over access to fuelwood, aggregated to survey region
Survey region n
No. FW user
respondents % yes response
among fuelwood users NCD 1868 1344 48 Lae urban 558 476 40 Hagen urban 247 208 58 Lae rural 285 285 51 Mt Hagen rural 379 379 61 Henganofi rural 363 363 88 Chuave rural 254 254 72
Source: URBAN_RURAL_AccessToTrees.xlsx
Table 42 Randomly selected comments on conflict
Randomly selected comments on conflict Definitely we encounter conflicts. It is becoming an issue here. F/wood theft is increasing in the settlements Conflicts especially with people collecting f/wood in somebody's territory especially along the river Conflict between people from settlement and the village over the usage of land Yes sometimes Usually chase other people away from our land boundary area We do exchange fist in heated argument over f/wood They charged them money When collected from other people's residence conflicts occur When cutting firewood, they haven't distribute the firewood equally When we collect wood from the nearby creek, the landowners came after us demanding money Settlers and other village members never respect each other's f/wood Others steal my f/wood trees Landowners are far from their camp so they can not monitor their land
Witnessed settlement people fighting over f/wood on common ground/land Heard about it but not actually seen it myself No, we do not encounter conflict with other community members For my case I only buy and I think there is no conflict If a person put a mark on the dried firewood tree and when another person goes and cuts it If by mistake and you collected someone's else firewood that she/he has gathered Yes we do have quarrels but we haven't fought. Yes, collect it in your own traditional ground otherwise buy it No big conflicts, arguments only When people claim as their's don't touch. Seek permission Yes we had conflict with land owners Because everybody around have trees planted in their area, so they don't bother arguing for firewood Landowners often get crossed and chased us away Serious conflicts There is often clashes/conflicts with land owners regarding f/wood & making garden Yes, sometimes the PNGDF soldiers chase us out because it's their area When I send my kids into someone's boundary they seize my children Rape, harassments, ownership to block o garden lands Didn't see any conflicts Just last week I attended a peace talk in Watong with two men fought over fallen Casuarina tree No conflict because NCD hills is state land
Appendix 11.1 of FR2013-14 Page 62 of 165
Q21 Is there a need to plant fuel woodlots here? Overall the surveyed population who used fuelwood expressed a strong need to plant woodlots for fuelwood as shown in Table 43. This level of support was relatively consistent (90-96%) over all regions except Lae. In Lae, only 62% of the urban sample and 70% of the rural sample felt there was a need for woodlots. Table 43 Attitudes to fuelwood planting
Survey region n
No. FW user
respondents % yes we need to plant
fuelwood trees here NCD 1868 1344 92 Lae urban 558 476 62 Hagen urban 247 208 94 Lae rural 285 285 70 Mt Hagen rural 379 379 90 Henganofi rural 363 363 96 Chuave rural 254 254 95
Source: URBAN_RURAL_AccessToTrees.xlsx
Table 44 presents the results for the 9 Local Level Government districts in the NCD for the whole surveyed population; i.e. both users (73%) and non-users (27%) of fuelwood (see Table 8). So among the total NCD sample the positive attitude towards woodlots is naturally reduced (66%). However, there are marked differences between the LLGs . It is instructive to unpack the attitudes of those respondents who said there was no need for woodlots. Table 45 lists random comments from the ‘nay-sayers’ from each region. Common negative attitudes among NCD respondents were that this is not an easy place to grow trees (dry and poor soil), no physical space, no legal control of land; or that they didn’t use fuelwood so saw no personal need for woodlots. Around Lae urban and rural there is perception among the nay-sayers that there was plenty of forest nearby and fuelwood wasn’t a problem. In the three highland rural areas there was the perception of plenty of firewood, but maybe a need to plant trees for timber and afforestation of grasslands. Table 44 Attitudes to fuelwood planting in NCD LLGs
Local Level Government areas of NCD
LLG sample size
% yes we need to plant fuelwood trees here
Gerehu 178 74 Waigani-Uni 202 63 Tokarara/Hohola 290 74 Gordons/Saraga 266 62 Boroko/Korobosea 249 39 Kila-kila/Kaugere 232 75 Town/Hanuabada 230 61 Napa-napa 91 91 Bomana 130 75
NCD total 1868
NCD total % 66
Appendix 11.1 of FR2013-14 Page 63 of 165
Table 45 Randomly selected reasons for NOT planting woodlots across main regions
Randomly selected reasons given for NOT planting woodlots NCD The soil here is not fertile to plant trees. There is not enough good land for tree growing. Dry place and the trees can not grow Trees don’t grow by themselves. Hard to grow & care for them I don't know about that. It's up to you guys. There is plenty of trees to provide f/wood. It will take years for trees to grow. Planting for f/wood is not ok, only for beautification is ok A lot of land disputes. Everything cost money. Plant trees would need proper negotiation No it will not be feasible because this is city and life is hard and there's no tree land here Good to plant but most people are careless & can't take care. They can chop any time they wish The surrounding community has many trees but need for replanting in other parts of NCD We are not landlords of the land therefore we cannot plant trees We don't want to plant trees only fruit trees should be planted, trees make lots of rubbish No, breeding place for mosquitoes No water to irrigate the trees planted in the hills This is a city, we cannot encourage people to live like their ancestors lived. We have to change by not planting trees for firewood Lae urban Huge land pressure within Lae City due to settlement establishment & infrastructure development If in town there is great demand but in the rural areas it is readily available Because with little portion of land it is impossible Not really, Lae is a city Not difficult to find f/wood No need to plant woodlots, there are lots on Morobe ground, so create/set up marketing opportunities for selling f/wood No space for planting trees. No need as there are lots of forests Land is not mine, people's land. If plant trees where am I suppose to make garden Plenty of woodlots/vast forest in Morobe. Encourage landowners to look after them, so that in later time would be surplus Still got vast forests to collect f/wood from. Encourage people not to destroy f/wood I don't think I should plant trees I am just a tenant, this is not my land Customary land so land tenure exist Surplus of f/wood in Morobe province Lae rural At this stage I think it is not really a need yet because there are still many bushes around Maybe for shade etc Morobe has vast forests to meet the demand. Lots of f/wood out there. Plant for beautification - good idea Vast forests so no need to plant woodlots. Educate people on how to look after trees and control how they are using f/wood Plenty forest, not yet really facing f/wood shortage Plant and educate people to control the use of f/wood Eastern Highlands I don't think it is necessary for f/wood, but for other purposes eg. Timber It is a great need to plant trees because of…… uses like building fence & f/wood No need of plant fuel woodlots but we need reforestation of our grassland There is many coffee gardens with trees for fuelwood Fuelwood is not yet a problem. In Tevega area there is no need to plant f/wood due to the fact that we still have our forest F/wood is surplus here, we only need reforestation of our grassland. Chimbu Not necessarily for firewood but trees for timber and for environment especially soil improvement. I don't think it is necessary for f/wood, but for other purposes eg. Timber For f/wood I don't think it is necessary, but for other purposes eg timber I think would be useful Mainly for other purposes, I don't think it is necessary for f/wood Western Highlands Most land is covered by trees (natural forest) and no need to plant All over reserve land is full of planted trees, therefore, no need to plant trees There is plenty of planted trees to access timber and f/wood, therefore no need to plant trees We have a lot of f/wood so there is no need for me to plant trees Available land has been allocated for food gardens and cash crops - coffee/tea plantation
Appendix 11.1 of FR2013-14 Page 64 of 165
Q22 Which species do you prefer for fuelwood? The species that people prefer to use will be determined by the inherent burning qualities of the wood, its local availability and familiarity through customary use. The favoured local species in the NCD are eucalypts (64% most likely Boroko or E.alba) followed by Mangrove (11%) and Yar (15%). The local coastal yar is Casuarina equisitfolia, a different species that highland immigrants would treat as C.oligodon. Species introduced as part of civic tree plantings, such as Raintree (18%) and Neem (14%) and the multipurpose Mango (13%) are also important contributors to local fuelwood use. In Lae urban and rural respectively, local species Kwila (14 & 3%), Taun (31 & 24%), Yar (37 & 129%) and Okari (11 & 20%) are much preferred. The eucalypt available here is probably E. deglupta. The aggressive weed Piper aduncum is widely used in both the urban (13%) and rural (31%) areas. Across the highland districts surveyed, Yar (C.oligodon) is the most preferred species by far (>85%). In Mt Hagen there is also a preference for the introduced eucalypts (87%, mainly E.grandis and E.robusta), while in Henganofi (Eastern Highlands) and Chuave (Simbu) the PNG Oak is highly favoured (85 & 91%). Naturalised Leucaena (most likely L. diversifolia)is also an important fuelwood use in these areas (22 & 29% respectively)

Appendix 11.1 of FR2013-14 Page 65 of 165
Table 46 Fuelwood species preferences across the survey regions
Preferred species as % of responding region sample
NCD Lae Urban Mt Hagen Urban Lae rural Mt Hagen
rural Henganofi
rural Chuave rural
Region sample size 1868 558 247 285 379 363 254 % sample responding 70 64 73 92 96 98 99
Any tree 2 14 1 10 0.3 Native tree 2 5 Acacia sp 1 Albizzia spp 2 3 1 5 Alphitonia spp 5 2
Alstonia scholaris 0.4 Altocarpus altilis 1 Annona muricata (Custard apple) 1 Artocarpus spp 1 0.4 Azadirachta indica (Neem) 14 Calliandra spp 1 Callophylum spp 0.3 0.4 Camelia sinensis (Tea) 0.3
Canarium indicum (Gaslip) 0.3 Castonopsis acuminatissima (PNG Oak) 0.4 1 37 23 Casuarina spp (Yar) 15 37 87 19 87 85 91 Chloroquine Cocos nucifera (Coconut) 1 1 1 Cordia spp. 2 0.4 Coffea (Coffee) 0.2 12 21 1 1 Dracontomelon spp (Walnut PNG) 1.4 15.6 Dysoxylum spp (Flower tree) 0.2 Endospermum spp (Basswood, Ant Plant) 1 Eucalyptus spp (eg. E. alba or Boroko, Kea) 64 3 54 1 47 7 7 Euphobealea 1 Ficus spp (Kapiak) 0.1 1 2 Gliricidia sepium 2 1 Gymnostoma papuana 2
Appendix 11.1 of FR2013-14 Page 66 of 165
Table 46 Fuelwood species preferences across the survey regions (continued) Preferred species as % of responding region sample NCD Lae Urban Mt Hagen
Urban Lae rural Mt Hagen rural
Henganofi rural
Chuave rural
Homalum foetidum (Malas) 0.3 5 3 Instia bijuga (Kwila) 1 14 3 Leucaena spp 1 4 1 1 22 29 Lithocarpus 12 9 Mangifera indica (Mango) 13 8 7 Myristica 0.4 Nephelium lappaceum (Rambutan) 3 8 Nothofagus spp (Beech PNG) 1 0.4 15 6 Octomeles sumantrana (Erima) 0.3 1 Palaquium spp (Cedar PNG) 6.2
Persa americana (Avocado) 0.4 Pinus spp (Forestri) 1 3 11 6 10 1 1 Piper aduncum (wild daka) 12.6 31.4 1
Podocarpus spp 1 0.4 Pometia pinnata (Taun) 0.1 31 24 Psidium spp (Guava) 1 4 4 5 1
Pterocarpus indicus (Rosewood PNG) 0.8 5.9 9.6 Rhizophora spp (Mangrove) 11 1 Samanea saman (Rain tree) 18 7 1 15 0.3 Schumaniana (Malmal) 0.1 1 Spartodia 0.0 1 2 Syzygium spp 0.1 1 1 Tectonia grandis (Teak) 0.2 6 0.4 Terminalia spp (Talis, Katapa, Okari) 1 11 20 Timonial timon 2 Trema orientalis 1 Urticacea 0.1 Vitex spp. (Garamut) 4 2 various spp (Bamboo) 1 0.4 0.3
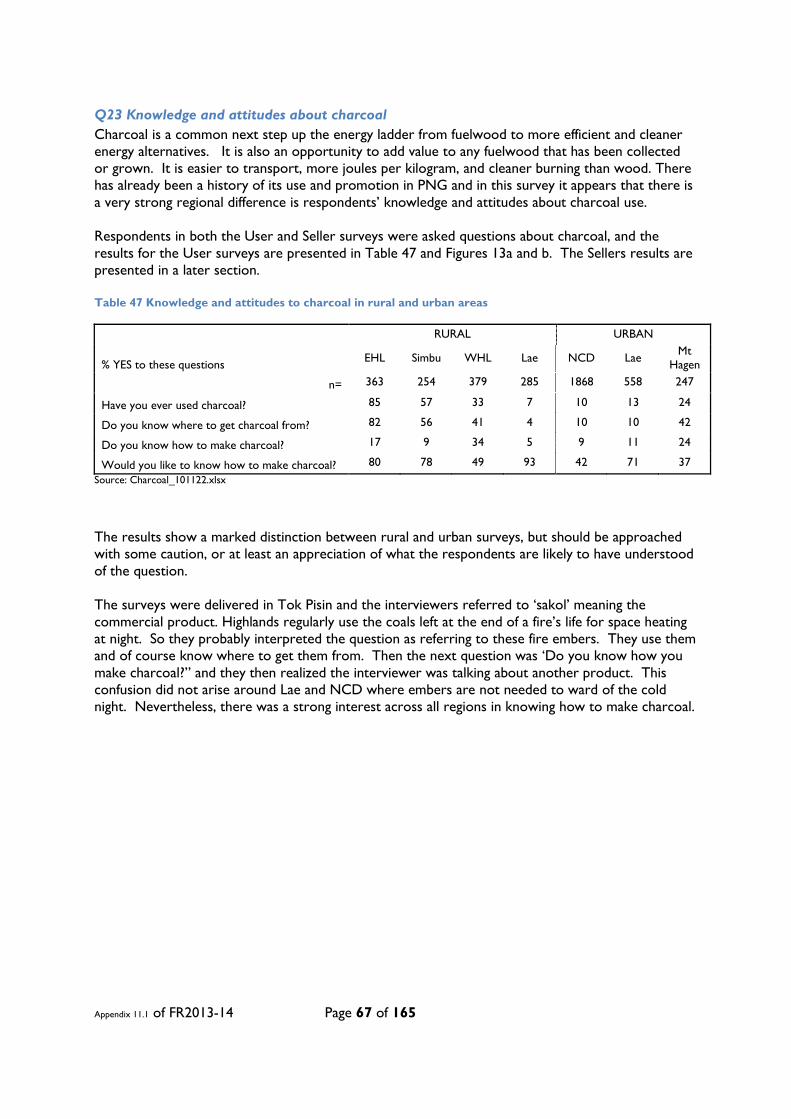
Appendix 11.1 of FR2013-14 Page 67 of 165
Q23 Knowledge and attitudes about charcoal Charcoal is a common next step up the energy ladder from fuelwood to more efficient and cleaner energy alternatives. It is also an opportunity to add value to any fuelwood that has been collected or grown. It is easier to transport, more joules per kilogram, and cleaner burning than wood. There has already been a history of its use and promotion in PNG and in this survey it appears that there is a very strong regional difference is respondents’ knowledge and attitudes about charcoal use. Respondents in both the User and Seller surveys were asked questions about charcoal, and the results for the User surveys are presented in Table 47 and Figures 13a and b. The Sellers results are presented in a later section. Table 47 Knowledge and attitudes to charcoal in rural and urban areas
RURAL URBAN
% YES to these questions EHL Simbu WHL Lae NCD Lae Mt Hagen
n= 363 254 379 285 1868 558 247
Have you ever used charcoal? 85 57 33 7 10 13 24
Do you know where to get charcoal from? 82 56 41 4 10 10 42
Do you know how to make charcoal? 17 9 34 5 9 11 24
Would you like to know how to make charcoal? 80 78 49 93 42 71 37 Source: Charcoal_101122.xlsx
The results show a marked distinction between rural and urban surveys, but should be approached with some caution, or at least an appreciation of what the respondents are likely to have understood of the question. The surveys were delivered in Tok Pisin and the interviewers referred to ‘sakol’ meaning the commercial product. Highlands regularly use the coals left at the end of a fire’s life for space heating at night. So they probably interpreted the question as referring to these fire embers. They use them and of course know where to get them from. Then the next question was ‘Do you know how you make charcoal?” and they then realized the interviewer was talking about another product. This confusion did not arise around Lae and NCD where embers are not needed to ward of the cold night. Nevertheless, there was a strong interest across all regions in knowing how to make charcoal.
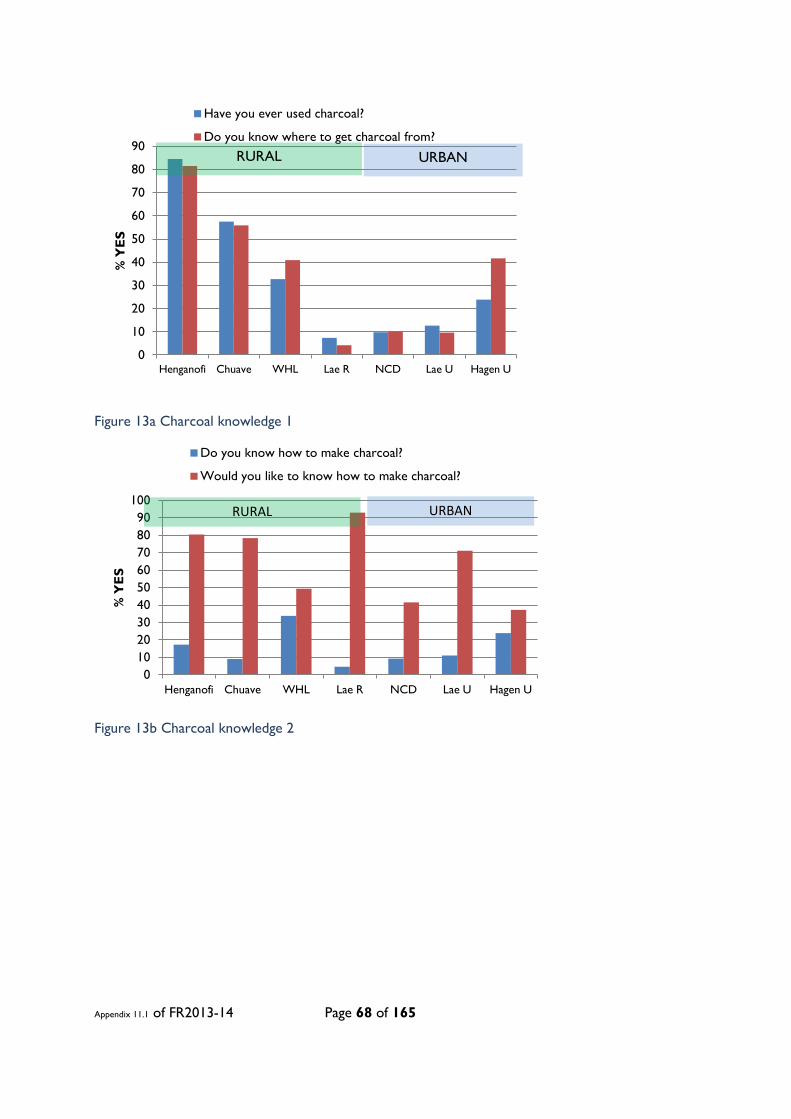
Appendix 11.1 of FR2013-14 Page 68 of 165
Figure 13a Charcoal knowledge 1
Figure 13b Charcoal knowledge 2
0
10
20
30
40
50
60
70
80
90
Henganofi Chuave WHL Lae R NCD Lae U Hagen U
% Y
ES
Have you ever used charcoal?
Do you know where to get charcoal from?
RURAL URBAN
0 10 20 30 40 50 60 70 80 90
100
Henganofi Chuave WHL Lae R NCD Lae U Hagen U
% Y
ES
Do you know how to make charcoal?
Would you like to know how to make charcoal?
RURAL URBAN
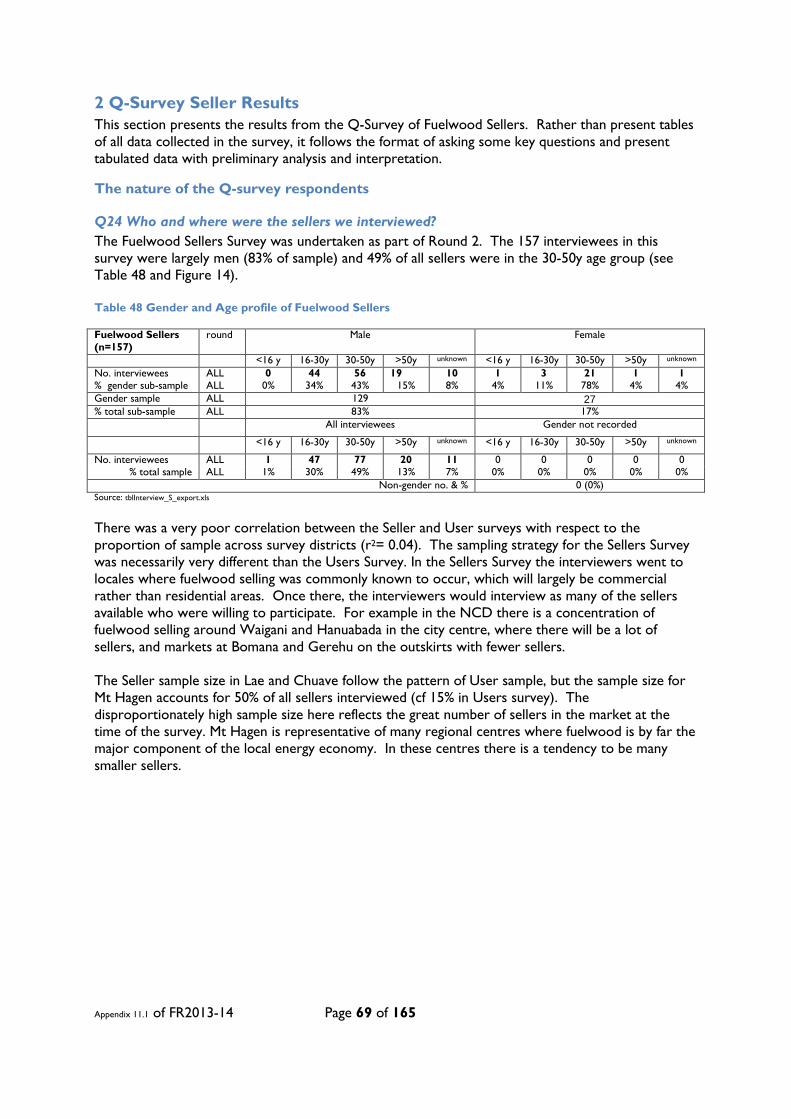
Appendix 11.1 of FR2013-14 Page 69 of 165
2 Q-Survey Seller Results This section presents the results from the Q-Survey of Fuelwood Sellers. Rather than present tables of all data collected in the survey, it follows the format of asking some key questions and present tabulated data with preliminary analysis and interpretation.
The nature of the Q-survey respondents
Q24 Who and where were the sellers we interviewed? The Fuelwood Sellers Survey was undertaken as part of Round 2. The 157 interviewees in this survey were largely men (83% of sample) and 49% of all sellers were in the 30-50y age group (see Table 48 and Figure 14). Table 48 Gender and Age profile of Fuelwood Sellers
Fuelwood Sellers (n=157)
round
Male Female
<16 y 16-30y 30-50y >50y unknown <16 y 16-30y 30-50y >50y unknown No. interviewees ALL 0 44 56 19 10 1 3 21 1 1 % gender sub-sample ALL 0% 34% 43% 15% 8% 4% 11% 78% 4% 4% Gender sample ALL 129 27 % total sub-sample ALL 83% 17% All interviewees Gender not recorded
<16 y 16-30y 30-50y >50y unknown <16 y 16-30y 30-50y >50y unknown
No. interviewees ALL 1 47 77 20 11 0 0 0 0 0 % total sample ALL 1% 30% 49% 13% 7% 0% 0% 0% 0% 0%
Non-gender no. & % 0 (0%) Source: tblInterview_S_export.xls
There was a very poor correlation between the Seller and User surveys with respect to the proportion of sample across survey districts (r2= 0.04). The sampling strategy for the Sellers Survey was necessarily very different than the Users Survey. In the Sellers Survey the interviewers went to locales where fuelwood selling was commonly known to occur, which will largely be commercial rather than residential areas. Once there, the interviewers would interview as many of the sellers available who were willing to participate. For example in the NCD there is a concentration of fuelwood selling around Waigani and Hanuabada in the city centre, where there will be a lot of sellers, and markets at Bomana and Gerehu on the outskirts with fewer sellers. The Seller sample size in Lae and Chuave follow the pattern of User sample, but the sample size for Mt Hagen accounts for 50% of all sellers interviewed (cf 15% in Users survey). The disproportionately high sample size here reflects the great number of sellers in the market at the time of the survey. Mt Hagen is representative of many regional centres where fuelwood is by far the major component of the local energy economy. In these centres there is a tendency to be many smaller sellers.
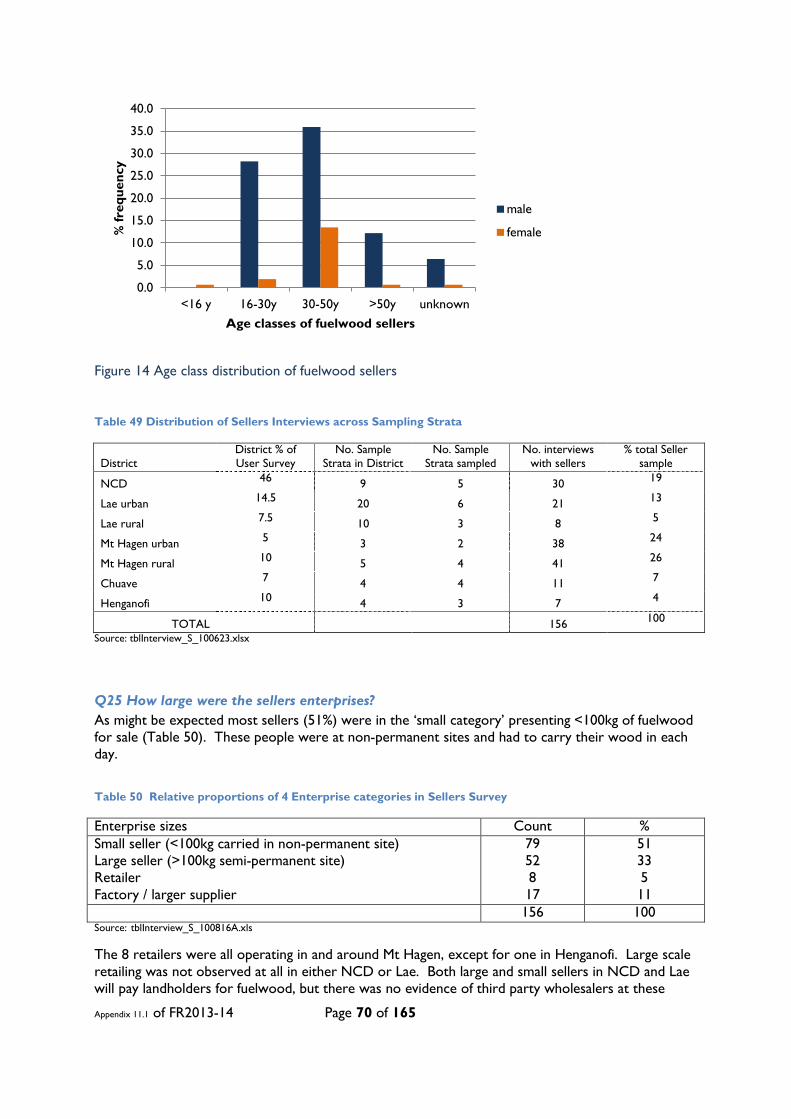
Appendix 11.1 of FR2013-14 Page 70 of 165
Figure 14 Age class distribution of fuelwood sellers
Table 49 Distribution of Sellers Interviews across Sampling Strata
District District % of User Survey
No. Sample Strata in District
No. Sample Strata sampled
No. interviews with sellers
% total Seller sample
NCD 46 9 5 30 19
Lae urban 14.5 20 6 21 13
Lae rural 7.5 10 3 8 5
Mt Hagen urban 5 3 2 38 24
Mt Hagen rural 10 5 4 41 26
Chuave 7 4 4 11 7
Henganofi 10 4 3 7 4
TOTAL 156 100
Source: tblInterview_S_100623.xlsx
Q25 How large were the sellers enterprises? As might be expected most sellers (51%) were in the ‘small category’ presenting <100kg of fuelwood for sale (Table 50). These people were at non-permanent sites and had to carry their wood in each day.
Table 50 Relative proportions of 4 Enterprise categories in Sellers Survey
Enterprise sizes Count % Small seller (<100kg carried in non-permanent site) 79 51 Large seller (>100kg semi-permanent site) 52 33 Retailer 8 5 Factory / larger supplier 17 11 156 100 Source: tblInterview_S_100816A.xls The 8 retailers were all operating in and around Mt Hagen, except for one in Henganofi. Large scale retailing was not observed at all in either NCD or Lae. Both large and small sellers in NCD and Lae will pay landholders for fuelwood, but there was no evidence of third party wholesalers at these
0.0
5.0
10.0
15.0
20.0
25.0
30.0
35.0
40.0
<16 y 16-30y 30-50y >50y unknown
% fr
eque
ncy
Age classes of fuelwood sellers
male
female
Appendix 11.1 of FR2013-14 Page 71 of 165
markets. The factory suppliers in Mt Hagen were providing split yar trunks and coffee prunings for WR Carpenters Tea factory in Mt Hagen.
Table 51 Fuelwood Enterprise categories by Survey District
Enterprise category
Survey District
1 Small Seller <100kg non-permanent
site
2 Large Seller
>100kg Semi-
permanent site
3
Retailer Permanent
site
4 Factory Supplier
Sum
% Surveyed districts
NCD 21 7 - 2 30 19%
Lae urban 20 1 - - 21 13%
Lae rural 8 - - - 8 5%
Mt Hagen urban 17 19 2 - 38 24%
Mt Hagen rural 12 13 5 12 42 27%
Chuave - 9 - 1 10 6%
Henganofi 2 3 1 1 7 4%
sum 80 52 8 16 156 % of enterprise
categories 51% 33% 5% 10%
100% Source: tblInterview_S_100623.xlsx
The Sellers were asked where their home village is and where they currently reside. 40% responded that they continue to live in their home village while 55% have moved from another province. 5% responded that they come in from their village to stay in town while they are selling fuelwood. Clients There are essentially four situations where clients and sellers interact:
1] clients approach sellers on foot either in a market place, along roadside or in front of dwelling 2] clients approach sellers while driving past a roadside stall 3] trucks come to sellers land and picks up fuelwood either for domestic, commercial or industrial use 4] sellers deliver fuelwood to clients who may be either commercial / institutional /industrial or domestic clients
Most sellers (64%) deal with buyers approaching them on foot while 48% of sellers are on roadsides and also deal with passing motor traffic. The 22% of sellers who deliver firewood to their clients are mainly in the highland rural areas and some in the NCD. Of this group 60% (ie 13% of total) deliver firewood to clients as the only way they trade. In contrast, none of the sellers in Lae urban or rural offer this service. 40% of sellers service the truck pick-up trade. Of these sellers 36% (ie 17% total) exclusively trade like this. Many of these exclusive sellers are in the Mt Hagen rural areas servicing the tea factory, but others also exist in sub-sample areas on the outskirts of NCD and Lae. (source: tblInterview_S_BuyersTransport.xlxs)
Q26 How often did they engage in selling? Sellers were asked how many days a week they were engaged in selling. Figure 15 illustrates the frequency distribution of their responses. The distribution suggests fuelwood sellers can be divided into 3 categories based on frequency of selling: part-time, fulltime and irregular. Among the Small
Appendix 11.1 of FR2013-14 Page 72 of 165
and Large sellers, the full-time group (i.e. spent 4 to 7 days/week engaged in selling) was twice as large as the part-time group (1 to 3 days/week). The Formal Retailers were all fulltime. The suppliers to factories and other large consumers were all irregular depending on demand.
Figure 15 Days per week engaged in selling fuelwood
Q27 What were the reasons behind their frequency of selling?
Dividing sellers into part-time and full-time categories is fairly arbitrary and was not a question asked of the sellers themselves but imposed on those selling ≤3 days/week. From the selected comments in Table 52 part-time sellers engage in this market in times of opportunity or urgency. Most full-time sellers still observe reasonable regular breaks such as Sabbath (either Saturday or Sunday) and public holidays, and pauses due to the wet season and social commitments. Irregular sellers (Table 53) sell larger quantities to schools, hospitals, factories etc.
0
5
10
15
20
25
30
freq
uenc
y
Days per week Selling
Small Seller
Large Seller
Formal Retailer
Factory / large supplier

Appendix 11.1 of FR2013-14 Page 73 of 165
Table 52 Comments indicative of the reasons behind selling for the part-time and full-time sellers
Comments from part-time fuelwood sellers
We depend mostly on sea tides - when high tide, logs are being washed away by sea I don't sell f/wood often because I only sell when there is more (surplus) f/wood in my house When I feel like and also when I have little or no money When I have no bus fares to go to school When there is surplus f/wood at home to use for cooking We collect for maybe two days and again sell for another two days - it depends on the customers Find trees, cut splits and sell if available nearby, if not I had to go to the swamp I collect f/wood for home use and surplus is always for sale When there is a big supply we sell. During the rainy seasons we don't sell because we can't go out to collect Occasionally sold. Depend on availability of dry wood or matured tree to be cut When need such as school fees, bride price compensation payment arises Buyers don't come often so I deliver to high schools and hospitals if they place order I sell split logs to retailers at my village once a week or sometimes twice a month depending on buyers request. I
don't sell split woods
Comments from full-time fuelwood sellers Only rest on Sunday - otherwise sells f/wood most (6) days Rest on Sabbath - Saturday It is normal as other business thing I sell on weekdays and sometimes on most weekends Sometimes when wet season appears I quit from selling on roadside Sometimes I rest on weekends I stop selling on weekends and public holidays I normally sell woods in the afternoons near the tyre service station because most buyers come in the afternoon Sell f/wood everyday but only when there is a shortage and that is when they don't sell I sell f/wood everyday but only when there is not enough f/wood I won't sell Everyday but when there is enough f/wood to sell and also when there is rainy season I sell f/woods everyday, however, if large sellers ran out of woods when demand are high, they increase the price
so I temporarily stops selling until the normal price resumes We sell f/wood regularly to Hagen town drive by buyers I stop selling on Sundays and Christmas or during special occasions There is no limit to time or day of selling f/wood, customers come anytime of the day/night to buy f/wood\ I sell to customers in my village only. Only 1 tree is felled and sold, then after a while he cut another and sell I cut 2 trees per 2 months A tree felled and sold, then new tree is felled F/wood demand in the city is high, we sell everyday We only split enough for day's sales, we sell everyday I sell f/wood regularly because this is the main activity that I earn most of the income to meet my family needs Only Sunday half day I sell f/wood everyday. People living in the settlement come to my house and buy woods I stop selling woods for indefinite periods when my relative dies or during tribal fights
Appendix 11.1 of FR2013-14 Page 74 of 165
Table 53 Comments indicative of irregular sellers.
Comments from irregular fuelwood sellers
Some buyers of f/wood suppliers to tea buy on emergency. Mostly occasional sales to Kiam Coffee Factory Very few domestic buyers occasionally buy, I sell logs to factory suppliers - once every 2 weeks Some buyers come with their trucks once a week I don't sell in urban markets; however I supply for high schools and hospitals Many of my orders are from high schools I sell whole trees to buyers who cut the trees themselves and transport to town. Selling of woods depend on
request by sellers I do not sell firewood in the urban market, however I usually supply high schools, prison camps and occasionally
hospitals. There are some buyers who come with their truck to buy in large volume at times but not so common (Mostly supply on order request - quarterly basis)
I sell only once a year because I don't have enough firewood Twice a year (factory supplier - only supply when requested by factory) I only sell once a year because I do not have enough f/wood in my own land Twice a year (factory supplier) I am a contract factory supplier. Frequency of sales depend on factory use of f/wood/need of f/wood, usually after 2
weeks, we supply 6-12 tons of f/wood to the factory After 2 weeks time interval. We supply to factory upon call Wait for the company demand. Usually supply after every 2 weeks I sell f/wood 3 times a year because the factory that buys f/wood only allows 3 times a year I only sell twice a year because the factory that buys f/wood only allows the whole tribe to sell their f/wood 3 times a
year Only supply to factory - every 2 weeks basis In 2008 I sell some split logs to W.R. Carpenters - once in a year (2008) Usually I supply high schools and prison camps, every month (twice in a month)
Q28 Source of fuelwood and what arrangements made with landholders? When asked about what arrangements were made with landholders 46% of the fuelwood sellers stated they collected fuelwood from their own lands, or that they had lived on that land for so long that they had de facto right to the land (Table 54). 34% of sellers stated this to be from their coffee lands, but 16% (all in Mt Hagen area) said they harvest yar trees that they or their fathers had planted (‘own land’ category). The terms ‘planted forest’ and ‘natural forest’ were intended to mean plantations and forest that were not owned by the seller, and 31% and 24% of sellers sourced their fuelwood from these resources respectively. Bushfallows, which may or may not have been owned by the seller were a source for 22% of sellers. River banks and swamps were sources for 18% of sellers and 3% of sellers collected wood from the beach. 22% of sellers bought wood from landholders in various ways. 20% of sellers collected fuelwood from the natural forest or along rivers without consent of landholders. In a few situations, 5%, sellers were allowed to collect fuelwood for free. Table 54 Fuelwood sources for sellers
Sources % sellers using source Sources % sellers using source
Own land 46 Riverbanks /swamp 18 Coffee land 34 Beach 3 Planted forest 31 Buy & Sell 22 Natural Forest 24 Other 1 Bushfallow 22
Source: tblInterview_S_Fuelwoodsources.xls

Appendix 11.1 of FR2013-14 Page 75 of 165
The diversity of arrangements for accessing fuelwood is reflected in the selected comments listed in Table 55.
Table 55 Selected comments concerning landholder arrangements
NCD Sometimes I get from NCDC clearing on main roads Buy K50.00 - K60.00 depending on the size of the tree
I usually buy a standing tree more than 45cm is around K150.00 and the log (shorten) usually cost me K300.00-K400.00
No arrangements. They allow us to collect only from hills Usually yar is collected from my own coffee land therefore no arrangement of consent is necessary No arrangement. Sometimes I collect it at Baruni Dump Its state land, my initiative to cut logs split and sell Lae urban
I collect from my own land so there is no necessary arrangements /coffee land & nearby forest No arrangement because the landowners don't argue with us
Each person owns certain part of the river bank, therefore I collect within the section that I own
There is no formal arrangement but with the understanding that we have been living here for a long time I bought land of about 3 hectares forest therefore I collect from that area When there is a heavy flood we collect from the logs washed over by the flood
Lae rural Organize my family to collect from own land, there are no other arrangements / mostly from coffee lands
No arrangements because I go further inside the bush No arrangements, we go further inside the bush; Sometimes I paid landlords if I don't want to go further Seek permission Free of charge Mostly I collect from the Busu river The landholders are not really concerned on who collect woods on their land
Mt Hagen
Don't make any arrangements; collect from Morata swamp We don't make arrangement but just go and look for it. Sometimes we kill tree and return to cut it when dry
Cut trees planted by myself when I was young I collect without landholders concern We went further inside the bush where landlords won't see us We collect outside of city where land holders cannot spot us or sometimes we chopped down fall trees
Landholders knew us well and upon our notice for purchase of f/wood they sell whole tree We collect f/wood from our own land mostly; We also buy from village wood sellers
Collect from own land/planted trees by fathers I collect woods from my own land (planted forest) Friends give them or negotiates to share profit so they allow/give tree to be cut and sold In-law travel around much so he purchases heaps of f/wood on roadside and bring it and re-sell it Drive/PMV and buy f/wood from villagers and buy them Drive out and purchase from villagers outside Town area Most of the f/wood are collected from the natural forest Landholders sell to me K1.00/K2.00 per log. I sell to the factory suppliers K3.00/K4.00 per log Travel along highway and purchase from small sellers I only collect woods from my own land and from the natural forest (my village is close to Mt. Hagen range)
Any garden clearings, we buy f/wood trees
Source: tblInterview_S_100830.xls

Appendix 11.1 of FR2013-14 Page 76 of 165
Q29 How is fuelwood transported to point of sale? The bulk of firewood is delivered to its point of sale either by PMV (42%) or on foot (42%) while 10% of sellers have their own car or at least access to a friends vehicle (Table 56). For larger loads 17% of sellers hire a vehicle which can be a truck or tractor with trailer. 6% of sellers, retailers, have their fuelwood delivered to their point of sale by the wholesaler. Another 4% of sellers use boats or bikes in transporting their wood. Table 56 Transport modes used by fuelwood sellers
Mode of transport % sellers using mode PMV 42% Hire vehicle 17% Someone delivers 6% On foot 42% Own Car 10% Boats and bikes 4%
Source: tblInterview_S_FuelwoodTransported.xl
The range and average distances travelled to transport fuelwood to market are shown in Table 56 while the frequency distribution across 4 distance categories is illustrated in Figure 16. In Lae all fuelwood on sale is gathered within 5 km of point of sale. Most sellers (65%) in Mt Hagen transport similar distances. In contrast about 50% of sellers in Henganofi and Chuave transport wood considerable distances (20-40km) from their land into the towns using PMVs. The outlier who transports wood 100km buys it from the roadside along Okuk highway - Southern Highway, in Simbu and Enga provinces. His father who works with health/hospital supply division does this while out on the road for work. In the NCD, sellers bring fuelwood in from all distance categories, but all within the NCD boundary itself. Table 57 Distances sellers transport fuelwood
Survey region NCD Lae Urban
& Rural
Hagen urban &
rural
Henganofi & Chuave
Sample size 29 29 81 17 %response 59 52 90 47
Average distance Km 10 3 6 23
min 3 1 1 2
max 25 5 30 40*
* an outlier of 100km is excluded
Appendix 11.1 of FR2013-14 Page 77 of 165
Figure 16 Frequency distribution of transport distances
Fuelwood retail
Q30 Do you buy then on-sell your fuelwood? One of the first questions in the survey was to ascertain the size of the fuelwood enterprise. The four categories used were: Small sellers (<100kg on non-permanent site); Large Sellers (>100kg on semi-permanent site); Retailers (>100kg on permanent site); Factory suppliers (usually roadside pickup). These categories were determined from a pilot survey and participatory workshop with PNG nationals. The determination of enterprise category was made by visual interpretation of the interviewer and the sub-sample sizes of each category were: 79, 52, 8 and 17 respectively (see Table 50). For the sake of clarity, the “Retailer” category will now be referred to as ‘formal retailer’ to make a distinction with informal retailers. When asking sellers if they buy the wood they on-sell, a different picture emerges. While most sellers collect and sell their own fuelwood, 28% practiced retail (and not 5% as indicated by the size of the “Retailer” enterprise category). This practice crossed all enterprise categories. The 23% who are not in the formal retailer category will be called here ‘informal retailers’. Table 58 shows the breakdown of relatively proportions of retailers across these categories. It is also largely a Mt Hagen practice. About a quarter of these informal retailers in Mt Hagen will buy large pieces from larger sellers along the road or in town, split them and re-sell. It may come from as far away as the Southern Highway in Simbu and Enga provinces or from villages around Mt Hagen. Many buy fuelwood directly from within family and clan, while others notify landholders who cut and prepare wood for collection as whole tree of split log and re-sell it as splits. Only 3 of 41 informal retailers were operating in NCD (Gerehu and Town/Hanuabada areas) and they were ‘large sellers’. Table 58 Informal retail
Enterprise category “Yes, I buy fuelwood and on-sell” Informal retailer (count)
As % total sample
As % of enterprise category
Small seller (<100kg carried in non-permanent site)n=79 16 10 20
Large seller (>100kg semi-permanent site) n=52 15 10 29
“Retailer” (>100kg Permanent site) n=8 8 5 100
Factory / larger supplier (usually roadside collection) n=17 4 3 24
ALL n=156 43 28 -
0
20
40
60
80
100
≤5 6-10 11-20 >20
%
distance categories (Km)
EHL&SIM NCD Lae HGN

Appendix 11.1 of FR2013-14 Page 78 of 165
Fuelwood on sale Fuelwood is sold in many forms but the main forms are:
1. kindling bundles 2. small bundles of split wood 3. large bundles of split wood 4. bundles of cut branches 5. small cut and split logs 6. large cut and split logs 7. whole trees
Other categories of fuelwood observed in the sellers survey were roots and sawmill wastes but in lesser quantities than listed above.
Cut logs at Baruni market Bundles of cut branches
Cut & Split logs at Bomana Small bundles of splits & kindling in foreground
Figures 17 a-d Various fuelwood product categories on sale
Q31 What are the price and weights for different fuelwood products? The interview team collected data on prices for different fuelwood products and asked permission from sellers to weigh up to 4 representative samples of each product on display. The interviewers travelled with a grocer’s scale that weighed up to 50kg. Only 33% of sellers agreed to have their fuelwood weighed by the interviewers which accounts for the variation in sample sizes for each category in the following set of tables. All product categories were found on sale in all survey districts, and several other categories as well (e.g whole or partial trees, large cut and split logs, roots) but were available for weighing, so not presented here.

Appendix 11.1 of FR2013-14 Page 79 of 165
Figure 18 Only 50% of sellers agreed to have fuelwood weighed (Israel Bewang on right) For each fuelwood category there was a wide range of asking prices (Table 59). This is not unusual as there are no standard bundle sizes. This is shown also in the variation in weights of different fuelwood categories (Table 60).
Table 59 Prices for 7 fuelwood categories
Kina / product category average min max stdev n
Kindling 1.1 0.5 2 0.7 22
Bundle of cut branches 3.0 1 6 2.0 6
Small bundle of split wood 1.9 0.5 5 1.0 42
Large bundle of split wood 2.1 1 7 1.2 22
Cut & split logs B 5.7 2 12 3.2 14
Cut & split logs A 432.4 100 1000 187.0 17
Whole tree 275.0 250 300 35.4 2
Table 60 Average and range of weights for 5 fuelwood categories.
Kgs / product category average min max Stdev n Kindling 2.1 0.2 3.7 1.13 21 Bundle of cut branches 3.6 0.2 6.4 1.77 16 Small bundle of split wood 3.7 0.5 10.0 1.63 48 Large bundle of split wood 12.8 5.8 50.0 14.38 9 Cut & split logs A 15.1 5.0 150.0 22.99 38
(Source: FuelWoodOnSale_120425.xlsx)
However, when the data is analysed to determine the prices paid per kilogram for each product category, there is still great variation (Table 61). Furthermore, estimates of price/kg of wood decreases as the product category gets larger, with kindling and bundles of cut branches in the order of K1.2/kg and cut and split logs K0.5/kg.

Appendix 11.1 of FR2013-14 Page 80 of 165
Table 61 Price per kilogram for 5 fuelwood categories.
PGK / Kg Av min max Stdev N Kindling 1.1 0.2 5.0 1.5 21
Bundle of cut branches 1.2 0.3 3.0 1.1 8 Small bundle of split wood 0.9 0.1 6.0 1.2 34 Large bundle of split wood 0.4 0.2 0.7 0.2 7
Cut & split logs A 0.5 0.1 1.2 0.3 37 (Source: FuelWoodOnSale_120425.xlsx
This data has been re-arranged to show the average price/kilogram across all fuelwood categories in the 6 regions (Table 62). Measurements of fuelwood for sale were also made during another part of the survey, the Semi-Structured Interviews of hot food vendors along the Highlands Highway. The results are also listed in the table. This is fuelwood for sale away from larger population centres where the other measurements were made.
Table 62 Average price and range in Kina per kilogram paid in various districts
PGK / kg
Sample District Average Min Max stdev
No. Samples
measured
No. Sellers
interview
No. Agree to
weigh
Urban
NCD 0.30 0.1 0.5 0.10 16 28 8
Lae urban 0.49 0.3 0.9 0.14 25 22 20
Hagen urban 1.15 0.2 6.0 1.62 31 38 11
Rural
Lae rural 0.58 0.3 1.2 0.24 13 10 8
Hagen rural 1.04 0.2 3.0 0.82 30 40 19
EH & Chimbu rural 0.33 0.1 0.7 0.15 20 19 16
134 157 82
52% agree to weigh Along Highlands Highway 0.26 0.15 0.34 0.07 20
Source: FuelWoodOnSale_120510.xls
There is considerable variation in these values as shown in the standard deviations and also in Figure 19. (Some of the outlier data in this figure have been scrubbed to facilitate presentation, e.g. 150kg cut&split log for K50). There was a very clear difference between sampling districts with the average value of fuelwood ranging from K0.30/kg in NCD to K1.20/kg in Mt Hagen urban.

Appendix 11.1 of FR2013-14 Page 81 of 165
Figure 19 Variation in Kina/Kilogram for 4 fuelwood product categories The variation in these results was corroborated by discussion with local partners, at least for the highlands. There are considerable climatic differences within the highlands. Enga Province, SHP and western parts of WHP regularly experience frost because of altitude and aspect. Households here use a lot of fuelwood for domestic heating in mornings and at night as well as for cooking. On the other hand, the eastern part of WHP, SHP and EHP rarely or never experience frost, so less fuelwood is used in households. Accordingly, roadside fuelwood prices will also vary greatly between the two sets of regions.
Income from fuelwood
Q32 What is annual income from selling fuelwood? 74% of sellers were willing to state their income from sale of fuelwood so the following data is derived from a sample of 116 respondents. The frequency distribution of 5 income categories is shown in Table 63, along with the average and range. 36% of sellers identified fuelwood sales as their sole source of income in that previous 12 month period. Table 63 Frequency of Income categories from fuelwood sales in previous 12 months
Income previous 12 months (n=116) % frequency
<500 PGK 25
500-999 PGK 32
1000-4999 PGK 35
5-10000 PGK 6
>10000 PGK 2
Average 2,326 PGK
Minimum 60 PGK
Maximum 70,000 PGK Source: tblInterview_S_Income.xls
0
2
4
6
8
10
12
14
16
18
0 10 20 30 40 50 60
Kin
a
Kilogram
Small bundle of split wood
Large bundle of split wood
Kindling
Cut & split logs

Appendix 11.1 of FR2013-14 Page 82 of 165
By way of reference, the minimum wage for PNG is International $3,304 ≈5,240 Kina.1
So, only 8% of the sellers who gave income details are earning over the minimum wage. Bear in mind that the formal employment sector to which a minimum wage applies covers only15% of the workforce. Another way to cut the same ‘data-pie’ is across the enterprise types as in Table 64. Case studies of 2 of the Large Sellers are provided in the next section.
Table 64 Average income of different enterprise types in previous 12 months
Enterprise type Small seller
<100kg non-permanent site
Large Seller >100kg semi-
permanent site
Retailer >100kg
permanent site
Factory Supplier (roadside collection)
Sample size 79 52 8 18 % response from sample 70 83 29 61
Average income Kina over past 12 months 861 4,693 1,800 2,424
Minimum income 60 300 1,000 250 Maximum income 7,000 70,000 2,600 15,550
As a proportion of total income Sample size 53 42 2 11
Average proportion 82 82 93 79 Minimum 33 22 87 60
No. whose income 100% from selling 20 (38%) 13 (31%) 1 (50%) 3 (27%)
Case study high earners
1] The seller who earns K70,000 / year operates in Mt Hagen . He is between 30-50y and operates as a large seller with a permanent site in the market which he operates alone 7 days a week. Customers come to him on foot, drive by and he sells larger quantities to customers with trucks. While he comes from village of Kulga (in the Tambul/Nebilyer District, about 20km southwest of Mt Hagen) he regularly sleeps overnight in the market. All fuelwood on sale was yar for the following prices:
1.5kg bundle of kindling for 0.50 Kina 2.6kg small bundle of splits for 1 Kina 7kg large bundle of splits for 2 kina 150kg split logs for 50 kina
He sells yar because it is easy to access. The wood is collected by other men in his family group from their own land including coffee land and planted forest. They deliver the wood to the market by PMV. Wood is usually bought from relatives at a rate of K200 per tree (30cm dbh). Other costs of production were transport K150, market fees K100 and chainsaw fuel K700 His comment on fuelwood selling was “I always give priority for parents who are in need to pay school fees to sell firewood within my area, therefore from this area most of the highly educated one come from this area, both from the village and urban”.[?]
1 Source List of minimum wages by country: Wikipedia, January 2010.
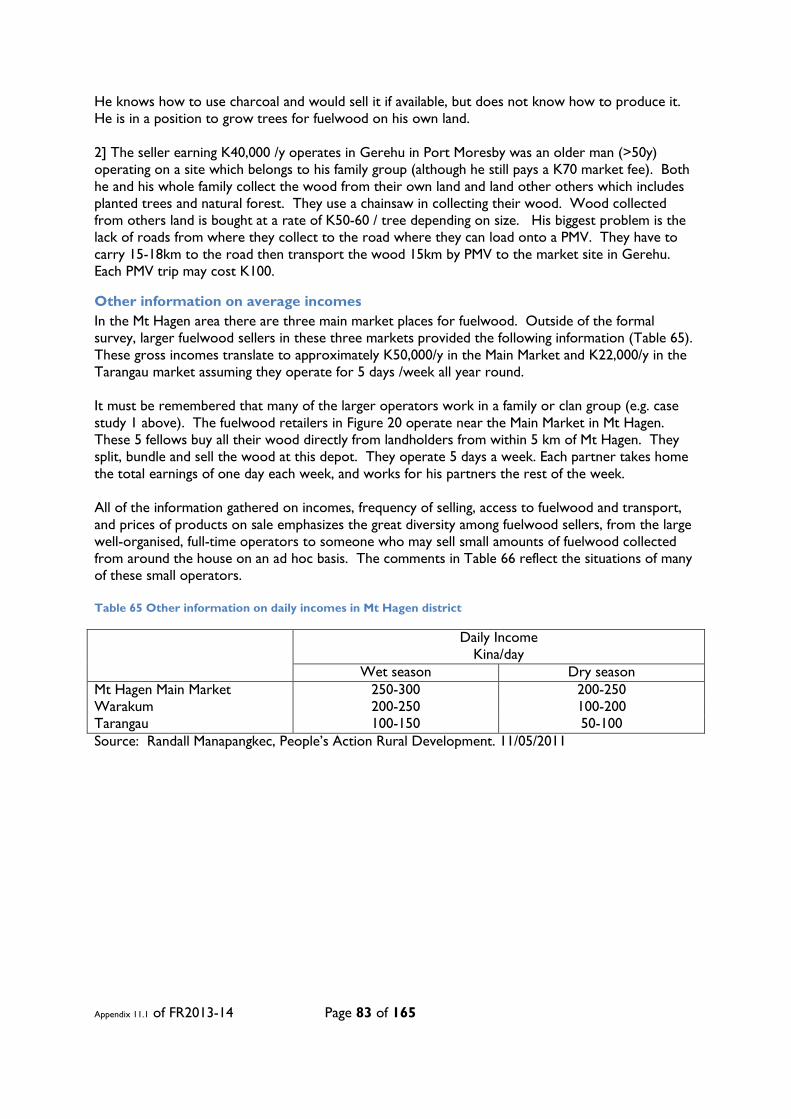
Appendix 11.1 of FR2013-14 Page 83 of 165
He knows how to use charcoal and would sell it if available, but does not know how to produce it. He is in a position to grow trees for fuelwood on his own land. 2] The seller earning K40,000 /y operates in Gerehu in Port Moresby was an older man (>50y) operating on a site which belongs to his family group (although he still pays a K70 market fee). Both he and his whole family collect the wood from their own land and land other others which includes planted trees and natural forest. They use a chainsaw in collecting their wood. Wood collected from others land is bought at a rate of K50-60 / tree depending on size. His biggest problem is the lack of roads from where they collect to the road where they can load onto a PMV. They have to carry 15-18km to the road then transport the wood 15km by PMV to the market site in Gerehu. Each PMV trip may cost K100.
Other information on average incomes In the Mt Hagen area there are three main market places for fuelwood. Outside of the formal survey, larger fuelwood sellers in these three markets provided the following information (Table 65). These gross incomes translate to approximately K50,000/y in the Main Market and K22,000/y in the Tarangau market assuming they operate for 5 days /week all year round. It must be remembered that many of the larger operators work in a family or clan group (e.g. case study 1 above). The fuelwood retailers in Figure 20 operate near the Main Market in Mt Hagen. These 5 fellows buy all their wood directly from landholders from within 5 km of Mt Hagen. They split, bundle and sell the wood at this depot. They operate 5 days a week. Each partner takes home the total earnings of one day each week, and works for his partners the rest of the week. All of the information gathered on incomes, frequency of selling, access to fuelwood and transport, and prices of products on sale emphasizes the great diversity among fuelwood sellers, from the large well-organised, full-time operators to someone who may sell small amounts of fuelwood collected from around the house on an ad hoc basis. The comments in Table 66 reflect the situations of many of these small operators. Table 65 Other information on daily incomes in Mt Hagen district
Daily Income Kina/day
Wet season Dry season Mt Hagen Main Market 250-300 200-250 Warakum 200-250 100-200 Tarangau 100-150 50-100 Source: Randall Manapangkec, People’s Action Rural Development. 11/05/2011

Appendix 11.1 of FR2013-14 Page 84 of 165
Figure 20 Large fuelwood seller on permanent site near main market, Mt Hagen (Photo: I.Nuberg)
Table 66 Comments on income from fuelwood sales.
Comments offered on income from fuelwood sales Don't really know my earnings It depends on how much I can find and sometimes its affected by bad weather I do not sell f/wood that often If I continuously sell f/wood within a year I get more than K1,000 Depend on availability of trees from locals/street tree to be purchased I sell woods regularly so my income ranges between K700-800 Weather affects profit, wet season - high profit, dry season - low profit It helps me pay outstanding school fees Don’t keep any records, so don’t know how much I earn I quit selling my own lands f/wood two years ago because I ran out of f/wood I have no children - only myself and my wife therefore surplus f/wood Not often, but when I find big trees which are fallen such as rain tree No cost to sell. I don't sell f/wood often but once in a while at weekends Only sell when order is received from local high schools and prison camps Weather affects wood quality when exposed so sometimes make less money Weather, public holidays, special events, affect our wood sales Source: Sellers_120213.xls
Opportunities and constraints in selling fuelwood
Q33 What do you know about charcoal? About a quarter of the sellers knew how to use charcoal and only half of these knew how to produce it (Table 67). However 2/3 of the sample would be prepared to sell charcoal if available. Charcoal is for sale from the big retailers in the larger towns, and representative prices are given in Table 68. The average price is K10.12 / kg. The Appropriate Technology and Community Development Institute at Unitech in Lae has been promoting charcoal as a smoke-free alternative to fuelwood for over a decade (Kamila1998). They facilitate a small local trade in Lae where charcoal is bought at K1.25/kg from producer and sold on at K1.50/kg . It is bought largely by the local Asian population (Chinese, Filipino).

Appendix 11.1 of FR2013-14 Page 85 of 165
Table 67 Seller charcoal knowledge
Charcoal knowledge and use % yes Do you know how to use charcoal? 26 Do you know how to make charcoal? 13 Would you sell charcoal? 66 Source: Seller_Opportunity_120213.xls
Table 68 Charcoal retail prices around PNG
Location Retailer Product on sale
Kina / kg comments Cost (Kina)
Product size (Kg)
NCD Vision City 86.65 10 8.65 63.40 5 12.68 Boroko Foodworld 29.50 4 7.38 PNG Gardener 10.00 10 1.00 Locally produced, sold for orchid growing; 2 types
chunks made from eucalypts, dust from mangrove Mt Hagen Brian Bell 49.00 3 16.33 Imported
Goroka Papindo 32.50 4 8.13 Imported NSW, Australia
27.00 ~2-3 9 Packed in plastic shopping bag; source unknown
Madang Brian Bell 36.00 3.5 10.29 Imported Victoria, Australia
Lae Andersons Foodland 32.30 4 8.08 Black & Gold BBQ fuel; imported NSW
42.25 4 10.56
Heat Beads BBQ Briquettes; imported Australia
Imported charcoal for cooking, Average price /kg 10.12
Source: Randall Manapangkec, PARD; Agnes Sumareke FRI
Q34 Are you in a position to grow trees for fuelwood? A large majority (78%) of fuelwood sellers had access to land to grow trees for fuelwood (Table 69). This is particularly the case for sellers who have large enterprises. Many of these larger sellers not only have their own land but also access to a network of family / clan members who supply and share in the profits of sale. On the other hand many of the smaller sellers appear to be more constrained in their access to land. Table 69 Opportunity to grow trees for fuelwood by Enterprise type
Are you in a position to grow trees for fuelwood? % yes All sellers 78 Small seller (<100kg carried in non-permanent site) n=79 67 Large seller (>100kg semi-permanent site)n=52 96 Retailer n=8 75 Factory / larger supplier n=17 76 Source: Seller_Opportunity_120213.xls Interestingly, 86% of NCD sellers have access to land for growing trees while relatively few (39%) of the Lae sellers had enough land (Table 70). The highland fuelwood sellers also have good access to land for tree growing (89%). Table 70 Opportunity to grow trees for fuelwood by Survey region
Are you in a position to grow trees for fuelwood? % yes NCD 86 Lae urban & rural 39 Mt Hagen urban & rural 88 Henganofi & Chuave 89 Source: Seller_Opportunity_120213.xls
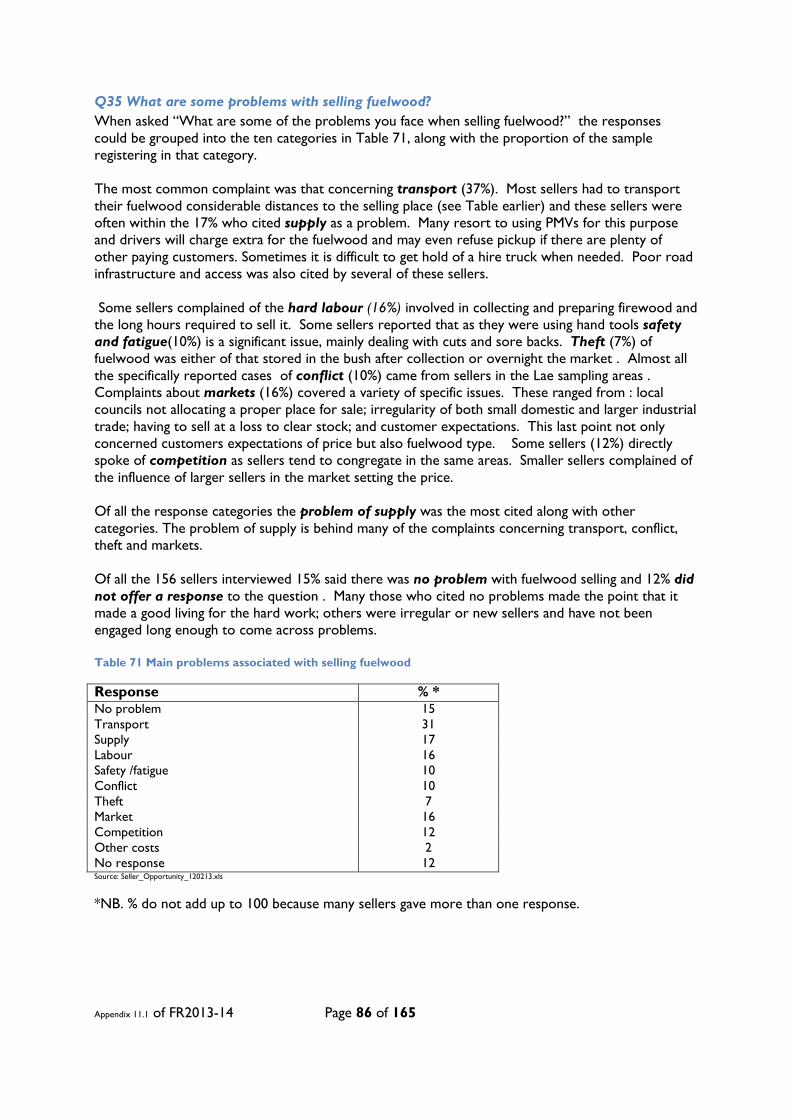
Appendix 11.1 of FR2013-14 Page 86 of 165
Q35 What are some problems with selling fuelwood? When asked “What are some of the problems you face when selling fuelwood?” the responses could be grouped into the ten categories in Table 71, along with the proportion of the sample registering in that category. The most common complaint was that concerning transport (37%). Most sellers had to transport their fuelwood considerable distances to the selling place (see Table earlier) and these sellers were often within the 17% who cited supply as a problem. Many resort to using PMVs for this purpose and drivers will charge extra for the fuelwood and may even refuse pickup if there are plenty of other paying customers. Sometimes it is difficult to get hold of a hire truck when needed. Poor road infrastructure and access was also cited by several of these sellers. Some sellers complained of the hard labour (16%) involved in collecting and preparing firewood and the long hours required to sell it. Some sellers reported that as they were using hand tools safety and fatigue(10%) is a significant issue, mainly dealing with cuts and sore backs. Theft (7%) of fuelwood was either of that stored in the bush after collection or overnight the market . Almost all the specifically reported cases of conflict (10%) came from sellers in the Lae sampling areas . Complaints about markets (16%) covered a variety of specific issues. These ranged from : local councils not allocating a proper place for sale; irregularity of both small domestic and larger industrial trade; having to sell at a loss to clear stock; and customer expectations. This last point not only concerned customers expectations of price but also fuelwood type. Some sellers (12%) directly spoke of competition as sellers tend to congregate in the same areas. Smaller sellers complained of the influence of larger sellers in the market setting the price. Of all the response categories the problem of supply was the most cited along with other categories. The problem of supply is behind many of the complaints concerning transport, conflict, theft and markets. Of all the 156 sellers interviewed 15% said there was no problem with fuelwood selling and 12% did not offer a response to the question . Many those who cited no problems made the point that it made a good living for the hard work; others were irregular or new sellers and have not been engaged long enough to come across problems. Table 71 Main problems associated with selling fuelwood
Response % * No problem 15 Transport 31 Supply 17 Labour 16 Safety /fatigue 10 Conflict 10 Theft 7 Market 16 Competition 12 Other costs 2 No response 12 Source: Seller_Opportunity_120213.xls
*NB. % do not add up to 100 because many sellers gave more than one response.
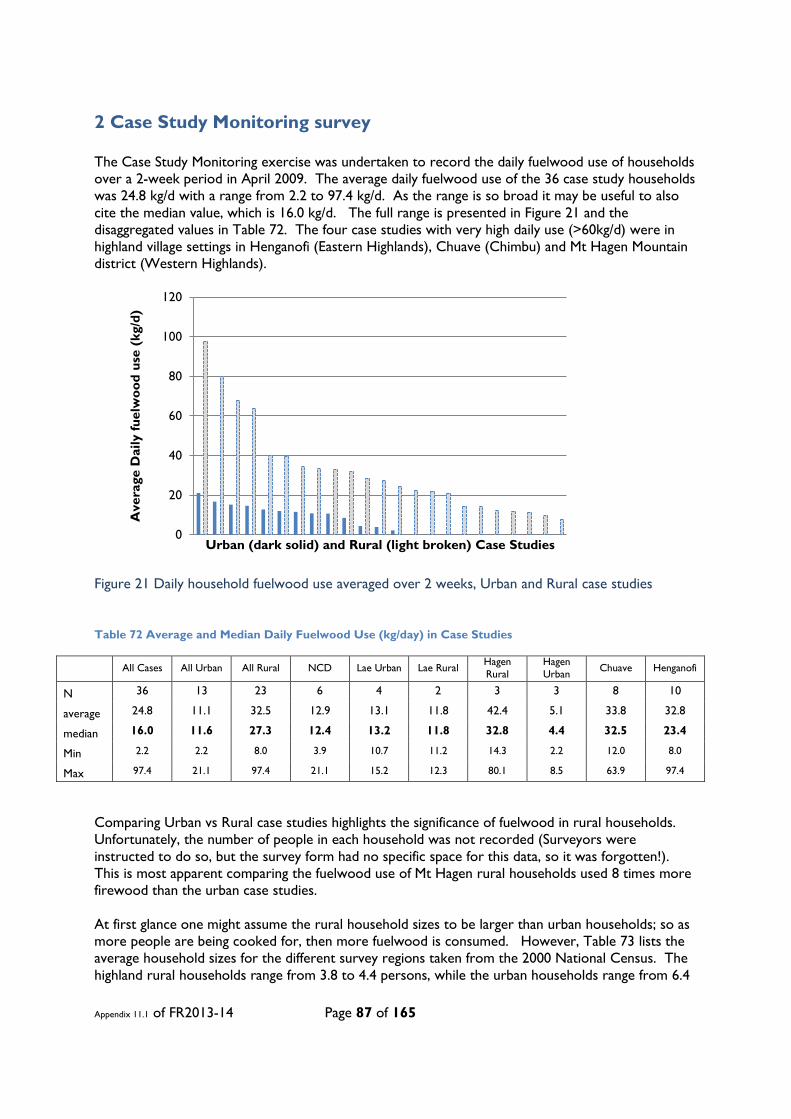
Appendix 11.1 of FR2013-14 Page 87 of 165
2 Case Study Monitoring survey The Case Study Monitoring exercise was undertaken to record the daily fuelwood use of households over a 2-week period in April 2009. The average daily fuelwood use of the 36 case study households was 24.8 kg/d with a range from 2.2 to 97.4 kg/d. As the range is so broad it may be useful to also cite the median value, which is 16.0 kg/d. The full range is presented in Figure 21 and the disaggregated values in Table 72. The four case studies with very high daily use (>60kg/d) were in highland village settings in Henganofi (Eastern Highlands), Chuave (Chimbu) and Mt Hagen Mountain district (Western Highlands).
Figure 21 Daily household fuelwood use averaged over 2 weeks, Urban and Rural case studies
Table 72 Average and Median Daily Fuelwood Use (kg/day) in Case Studies
All Cases All Urban All Rural NCD Lae Urban Lae Rural Hagen Rural
Hagen Urban Chuave Henganofi
N 36 13 23 6 4 2 3 3 8 10
average 24.8 11.1 32.5 12.9 13.1 11.8 42.4 5.1 33.8 32.8
median 16.0 11.6 27.3 12.4 13.2 11.8 32.8 4.4 32.5 23.4
Min 2.2 2.2 8.0 3.9 10.7 11.2 14.3 2.2 12.0 8.0
Max 97.4 21.1 97.4 21.1 15.2 12.3 80.1 8.5 63.9 97.4
Comparing Urban vs Rural case studies highlights the significance of fuelwood in rural households. Unfortunately, the number of people in each household was not recorded (Surveyors were instructed to do so, but the survey form had no specific space for this data, so it was forgotten!). This is most apparent comparing the fuelwood use of Mt Hagen rural households used 8 times more firewood than the urban case studies. At first glance one might assume the rural household sizes to be larger than urban households; so as more people are being cooked for, then more fuelwood is consumed. However, Table 73 lists the average household sizes for the different survey regions taken from the 2000 National Census. The highland rural households range from 3.8 to 4.4 persons, while the urban households range from 6.4
0
20
40
60
80
100
120
Ave
rage
Dai
ly fu
elw
ood
use
(kg/
d)
Urban (dark solid) and Rural (light broken) Case Studies

Appendix 11.1 of FR2013-14 Page 88 of 165
in Mt Hagen to 7.1 in NCD. Urban households are larger because they are likely to include members of the extended family who have come in to town to look for work. More of the urban households were living in higher quality buildings and in Figure 22 there appears to be a relationship between housing type fuelwood use. The actual correlation between these variables is poor (R2 =0.20) because of the wide range in daily fuelwood use overall. The cluster of lower values in the bush material class may have been relatively small households; there is no way of telling from records. However, the relationship between upper values in each housing category and the decreasing quality of that housing is quite clear.
Table 73 Census Household sizes in Survey regions
Survey region Average household
Size
NCD 7.1
Lae rural 6.1
Lae urban 6.9
Mt. Hagen rural 4.4
Mt. Hagen urban 6.4
Henganofi rural 4.2
Chuave rural 3.8
Source: Community Profile System, 2000 Census
Figure 22 Daily Housing type vs daily fuelwood use: Urban and Rural case studies Participants in this CSM exercise were asked to indicate the species actually used each day in the fire. Some households used more than one species at any time; this was recorded too. The names of the species were verified by the surveyors who were all professional foresters. Table 74 presents the percentage of each species used in each of the case study households. At the bottom of the table is a ranking based on the incidence of use over all households. As there are twice as many highland than lowland case studies, this ranking will bias highland species. Nevertheless it is clear to see significance of Casuarina (C.oligodon in highlands, C.equisitifolia in lowlands), Eucalyptus (E.alba in NCD,
0
200
400
600
800
1000
1200
1400
1600
Dai
ly fu
elw
ood
use
(kg/
d)
Housing type
urban
rural
High covenant Permanent Semi-Permanent Shanty Bush material
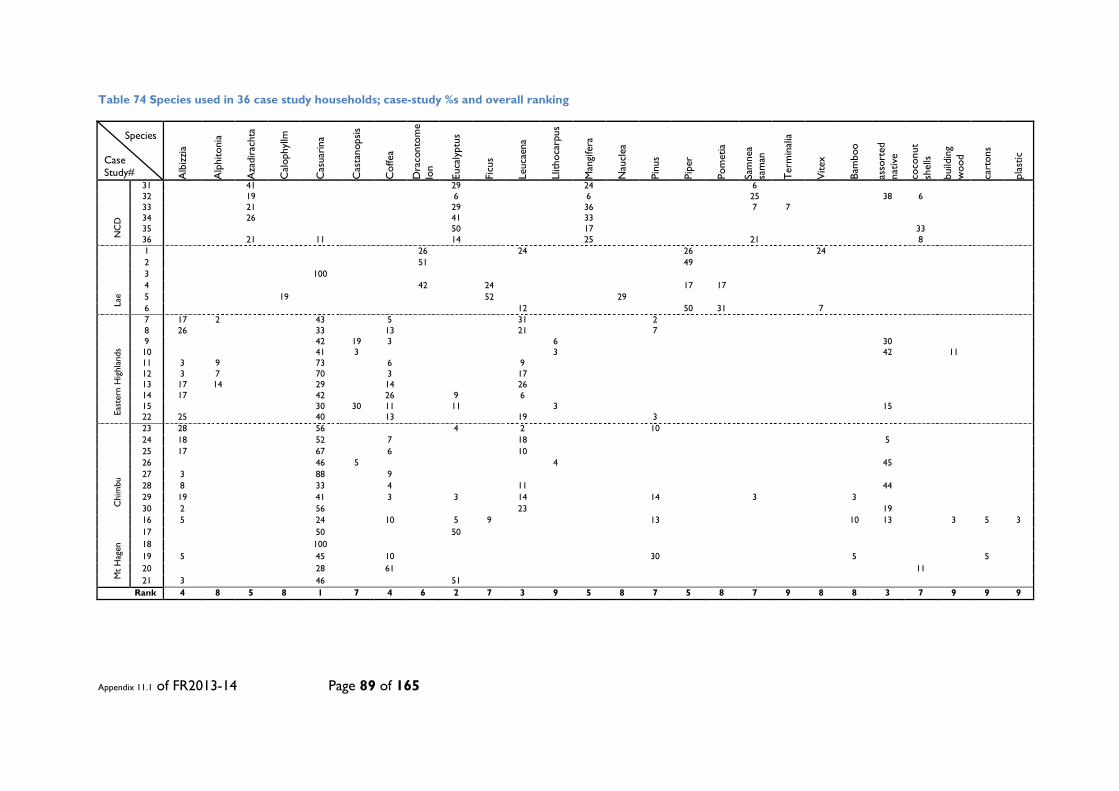
Appendix 11.1 of FR2013-14 Page 89 of 165
Table 74 Species used in 36 case study households; case-study %s and overall ranking
Species Case Study# A
lbiz
zia
Alp
hito
nia
Aza
dira
chta
Cal
ophy
llm
Cas
uarin
a
Cas
tano
psis
Cof
fea
Dra
cont
ome
lon
Euca
lypt
us
Ficu
s
Leuc
aena
Llith
ocar
pus
Man
gife
ra
Nau
clea
Pinu
s
Pipe
r
Pom
etia
Sam
nea
sam
an
Term
inal
ia
Vite
x
Bam
boo
asso
rted
na
tive
coco
nut
shel
ls
build
ing
woo
d
cart
ons
plas
tic
NC
D
31
41
29
24
6 32
19
6
6
25
38 6
33
21
29
36
7 7 34
26
41
33
35
50
17
33 36
21
11
14
25
21
8
Lae
1
26
24
26
24 2
51
49
3
100 4
42
24
17 17
5
19
52
29 6
12
50 31
7
East
ern
Hig
hlan
ds
7 17 2
43
5
31
2 8 26
33
13
21
7
9
42 19 3
6
30 10
41 3
3
42
11
11 3 9
73
6
9 12 3 7
70
3
17
13 17 14
29
14
26 14 17
42
26
9
6
15
30 30 11
11
3
15 22 25
40
13
19
3
Chi
mbu
23 28
56
4
2
10 24 18
52
7
18
5
25 17
67
6
10 26
46 5
4
45
27 3
88
9 28 8
33
4
11
44
29 19
41
3
3
14
14
3
3 30 2
56
23
19
Mt
Hag
en
16 5
24
10
5 9
13
10 13
3 5 3 17
50
50
18
100 19 5
45
10
30
5
5
20
28
61
11 21 3
46
51
Rank 4 8 5 8 1 7 4 6 2 7 3 9 5 8 7 5 8 7 9 8 8 3 7 9 9 9

Appendix 11.1 of FR2013-14 Page 90 of 165
E.grandis, E.robusta, E.deglupta in highlands), and Leucaena. The 6 NCD case studies also used a lot of mango, neem, raintree and coconut shells. The 6 Lae households accessed a broader mix of native hardwoods such as walnut, fig and taun, but the introduced weedy species Piper aduncum was also very important. The dominant fuelwood for highland households was yar, strongly supported by albizzia, coffee wood and leucaena.
Appendix 11.1 of FR2013-14 Page 91 of 165
3 Semi-Structured Interviews
Introduction While the Q-survey gathers quantitative data over a broad and stratified-random sample the purpose Semi-Structured Interviews (SSIs) was to gather deeper, more qualitative information from a limited and specific sample. The SSIs were carried out for both Industrial and Commercial fuelwood users to determine the trend in fuelwood supply and demand of various fuelwood users. Industrial fuelwood users include the plantation processing sector (tea, coffee, oil palm, sugar, copra, etc.) and timber mills that use their own off-cuts, brick and ceramic manufacturers and other industries that requires industrial heat. Enterprises using fuelwood for cooking are considered ‘Commercial fuelwood users’. This series of SSIs were undertaken and reported on by the FRI team members.
Industrial fuelwood users For Industrial fuelwood users, Oil Palm Factories (owned by New Britain Palm Oil Ltd) in West New Britain including various Cocoa and Coconut Industries in East New Britain Province were interviewed including the PNG Balsa Company in ENBP. This survey, and that of Commercial fuelwood users (lime burners), was undertaken by Maman Tavune. The interview of W.R. Carpenters Tea Factory was undertaken by Ian Nuberg.
Oil palm industry – West New Britain Province The oil palm factories mainly utilize the by-products from the processed oil palm fruit (fibre and shells) as bio-energy to generate electricity through generation of steam. Most of the factories visited are now not using timber to generate heat except for the Kapiura and Kumbango factories that use about 3 tons of mix hardwood species to start off fire in the furnace, after which fibre and shells are used once production is underway. Supply of energy source (fibre and shells) for the oil palm factories is sustainable and in some cases surplus fibre and shells are produced. This practice of using fibre and shells for electricity generation is environmentally friendly as less smoke is emitted and also a cost saving exercise for the company in light of increasing fuel prices.
Cocoa and coconut industry – East New Britain Province For the cocoa and coconut industry, six major plantation fermentries were visited including a Balsa Processing Plant (PNG Balsa) outside Kokopo Town. Fuelwood used at the Cocoa and coconut fermentries including coconut shells, coconut husk, dry coconut trunk, dry Gliricidia and cocoa trees. The WR Carpenters owned Coconut Products Limited (CPL) plantation are venturing into planting Gliricidia blocks solely for the purpose as fuelwood source and at the same time can provide shade to cocoa trees. Fuelwood source for most of the plantation fermentries is sustainable since they re-use most of their wastes (by-products) such as coconut shells and coconut husk as fuelwood source. Only the Agmark owned Talina Cocoa Fermentry/Dryer is using diesel for its cocoa dryer and there’s option to venture into using bio-energy at its cocoa dryer because of diesoline fuel is very expensive. During the interview, the area manager (Mr. Graham McNally) expressed great interest in doing collaboration work in any bio-energy research project if there is any that would come about in future.
Tea Industry – W.R Carpenters, Western Highlands Province WR Carpenters spend about K3 million/y purchasing fuelwood from former traditional landowners. The price paid for fuelwood delivered to the factory in Mt Hagen is 38 toya/cub.ft, which converts to approximately only K19 / dry tonne (or K0.0019/kg). They accept casuarina, eucalypt and coffee prunings but refuse wood from indigenous species. The fuelwood is used for indirect firing of tea to 130°C after the oxidation process. This reduces the moisture content of the tea from 50% to 3% in 19 minutes. Mike Jackson, General Manager, claims that current easy supply of fuelwood will effectively run out in about 3 years. Naphtha, a by-product
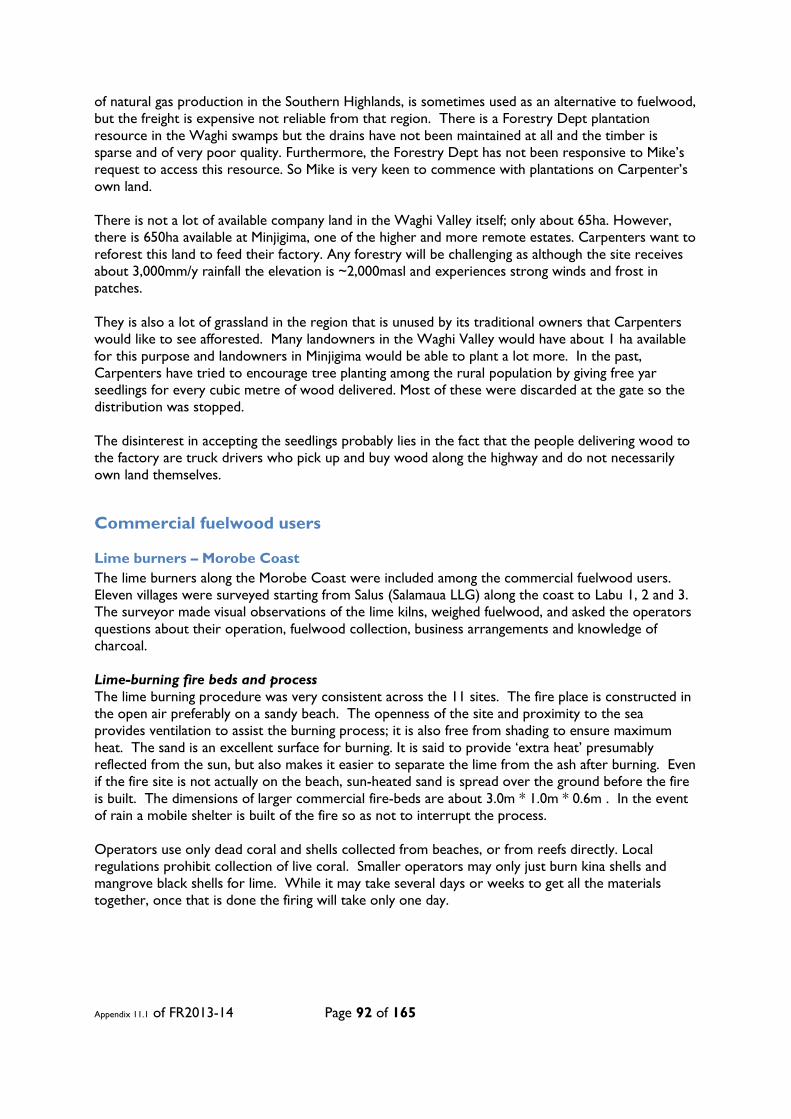
Appendix 11.1 of FR2013-14 Page 92 of 165
of natural gas production in the Southern Highlands, is sometimes used as an alternative to fuelwood, but the freight is expensive not reliable from that region. There is a Forestry Dept plantation resource in the Waghi swamps but the drains have not been maintained at all and the timber is sparse and of very poor quality. Furthermore, the Forestry Dept has not been responsive to Mike’s request to access this resource. So Mike is very keen to commence with plantations on Carpenter’s own land. There is not a lot of available company land in the Waghi Valley itself; only about 65ha. However, there is 650ha available at Minjigima, one of the higher and more remote estates. Carpenters want to reforest this land to feed their factory. Any forestry will be challenging as although the site receives about 3,000mm/y rainfall the elevation is ~2,000masl and experiences strong winds and frost in patches. They is also a lot of grassland in the region that is unused by its traditional owners that Carpenters would like to see afforested. Many landowners in the Waghi Valley would have about 1 ha available for this purpose and landowners in Minjigima would be able to plant a lot more. In the past, Carpenters have tried to encourage tree planting among the rural population by giving free yar seedlings for every cubic metre of wood delivered. Most of these were discarded at the gate so the distribution was stopped. The disinterest in accepting the seedlings probably lies in the fact that the people delivering wood to the factory are truck drivers who pick up and buy wood along the highway and do not necessarily own land themselves.
Commercial fuelwood users
Lime burners – Morobe Coast The lime burners along the Morobe Coast were included among the commercial fuelwood users. Eleven villages were surveyed starting from Salus (Salamaua LLG) along the coast to Labu 1, 2 and 3. The surveyor made visual observations of the lime kilns, weighed fuelwood, and asked the operators questions about their operation, fuelwood collection, business arrangements and knowledge of charcoal. Lime-burning fire beds and process The lime burning procedure was very consistent across the 11 sites. The fire place is constructed in the open air preferably on a sandy beach. The openness of the site and proximity to the sea provides ventilation to assist the burning process; it is also free from shading to ensure maximum heat. The sand is an excellent surface for burning. It is said to provide ‘extra heat’ presumably reflected from the sun, but also makes it easier to separate the lime from the ash after burning. Even if the fire site is not actually on the beach, sun-heated sand is spread over the ground before the fire is built. The dimensions of larger commercial fire-beds are about 3.0m * 1.0m * 0.6m . In the event of rain a mobile shelter is built of the fire so as not to interrupt the process. Operators use only dead coral and shells collected from beaches, or from reefs directly. Local regulations prohibit collection of live coral. Smaller operators may only just burn kina shells and mangrove black shells for lime. While it may take several days or weeks to get all the materials together, once that is done the firing will take only one day.
Appendix 11.1 of FR2013-14 Page 93 of 165
Figure 23 Lime burning under way, Morobe coast (Photo: M.Tavune)
Fuelwood species and access Preference of fuelwood species differs amongst the villages. Villages such as Salus and towards the Morobe Patrol Post preferred bamboo for burning lime since it produced very good quality lime, whilst the three Labu villages preferred other tree species such as Pterocarpus, Barringtonia, Calophyllum and Pometia. The choice could reflect availability of the wood, but operators indicated that their preferences were based on inherent burning qualities of particular species. Five of the 11 lime burners exclusively, and preferentially, used bamboo as fuelwood. They claim that its ash is easily separated from lime after burning and that its supply is readily available and sustainably harvested from natural forests and riverbanks. Only dry bamboo is collected and when the family does not have enough time to collect the bamboo themselves they will buy it from youths at a rate of K50.00/bundle (10pcs of about 10m long). Bamboos are transported in bundles down the river to the village. Sometimes they may even buy the bamboo rafts (K5.00/raft) used by inland people to travel downstream. Other operators preferred burning with sago and coconut fronds which can be collected free of charge from old gardens, garden clearings, natural forests and river banks. Sago fronds are easy to obtain if they own the trees and are especially collected for burning lime. Fronds may burn quickly but are still adequate for producing lime from kina shells and mangrove black shells which are not strong hence easily burnt using fronds. Importantly there is no cost, and so no market, in fronds. Three of the operators preferred solid tree fuelwood especially species like Barringtonia, Pterocarpus, Pometia and mangrove species since they produce good heat. This can still be collected freely from old gardens, mangroves, natural forests and logs that wash ashore at the beach; but some people have to travel further inland to access as it becomes scarce. They also buy it from youths who collect and sell to lime burners. This may cost K20-30 / firewood heap (~1m3) of mix species at any one time. Markets, sales and costs. Lime production is a good business for this area and several of the operations interviewed followed this practice as the sole or main source of income. Other smaller operators engaged in it as an

Appendix 11.1 of FR2013-14 Page 94 of 165
occasional addition to income. Table 42 presents some of the main dimensions of the information gathered. For the larger operators lime is sold at Lae City main market 2-5 times per month. There may be up to 10 people involved in the larger operations. They are known to produce the best quality lime and it sells very fast. Their main customers are highlanders during coffee season when most come to coastal areas to buy bettlenut, among other goods to re-sell in the highlands. Individually they may sell 15-20 10kg bags/month with a price range of K20 -K30/ 10kg bag.
The costs involved in production are of the like: K2 /bag for stockfeed bag for storing lime; boatfare to market between K2 - 40/head/trip depending on route; freight K2-20 per 20-50Kg bag of lime depending on carrier. Other costs are for food for helping hands during a coral collection and burn (e.g. K100-150). When fuelwood is purchased, the costs range from K5 for a used bamboo raft, to K30 for a 1.4m3 stack of hardwood to K50/large bundle of bamboo, Smaller operators (2-3 people involved) are usually only producing lime for local production and gather fuelwood from the own gardens or sago palms at no cost. These producers might be selling lime at rates of K 2 / 1800g tin, (~ K1.10 / Kg), or 10 toea per teaspoon In some of the villages visited lime production was the major economic activity. For example most of the 1800 people in Labu No.2 (village 8) produced lime using the same technique. In those villages where lime-burning is not that important (eg Busama, Buakap) only ~ 10 people in the village might be involved. Regulations Local level regulations exist for collection of resources for lime burning in all but one village. Operators are not allowed to collect from live coral reefs. They can only use dead coral and shells collected from the shore. Rights to collecting from specific patches along the shore are also observed. In the villages where lime burning is a major activity, coral and shells are also bought from neighboring villages. Some villages also forbid collection of firewood from mangroves as they recognize this protects marine life, their main source of protein. Collection of sago fronds is reserved for recognized owners of the trees. Financial efficiency of fuelwood burning The net income generated per kilogram of fuelwood consumed varied markedly between the different fuelwood types. Bamboo produced lime at an average of K2.96 / kg bamboo consumed (range K1.9-5.1, n=8). Mixed hardwood only yielded K0.33/kg fuelwood consumed (range K0.16-0.58, n= 5). The data for these estimates is admittedly coarse. The sample sizes are small, the estimates of fuelwood consumed were based on a professional forester’s visual assessments, and the annual income was provided by the operators (2 declined to release this information). Nevertheless, the difference between the two fuelwood types is quite startling (see Figure 24). It should be noted that the villages using bamboo were all at a greater distance from the Lae market, and these operators incurred larger transport costs (e.g. K20-30/person/boat trip, compared to K2-5/person/trip for the hardwood users). So while bamboo maybe considered an inferior fuelwood in other situations, it appears to be a very efficient in the production of lime.
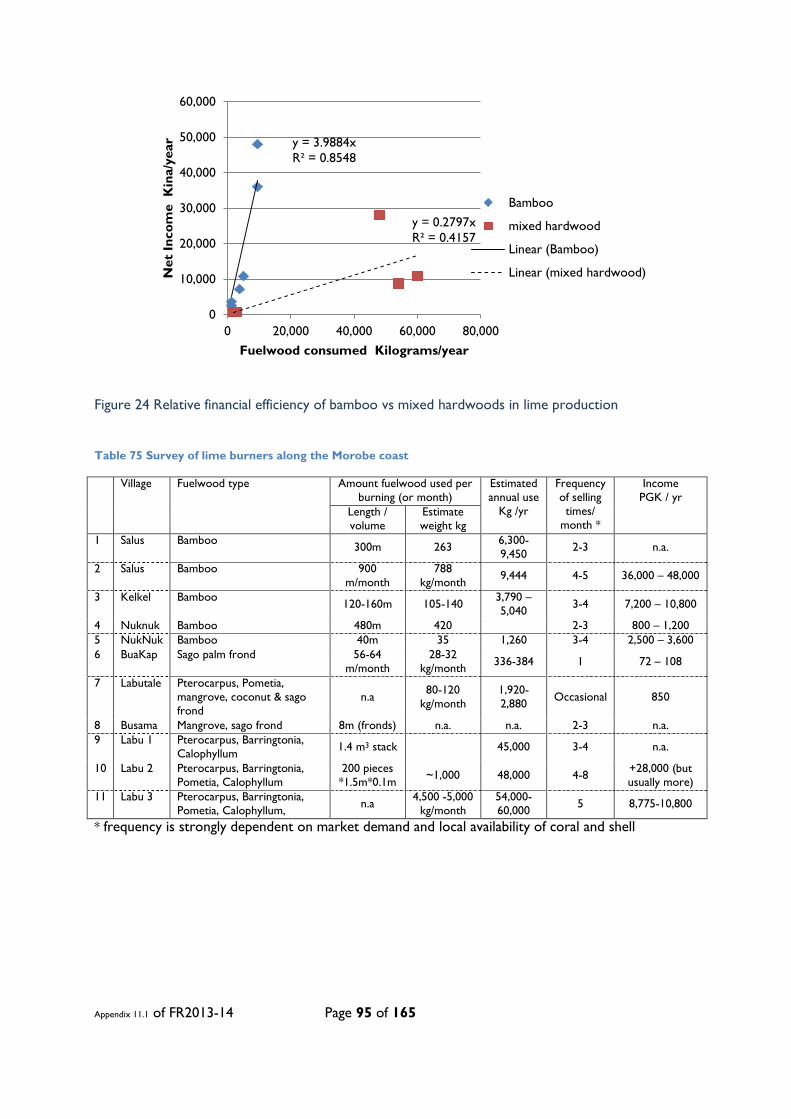
Appendix 11.1 of FR2013-14 Page 95 of 165
Figure 24 Relative financial efficiency of bamboo vs mixed hardwoods in lime production
Table 75 Survey of lime burners along the Morobe coast
Village
Fuelwood type Amount fuelwood used per burning (or month)
Estimated annual use
Kg /yr
Frequency of selling times/
month *
Income PGK / yr
Length / volume
Estimate weight kg
1 Salus Bamboo 300m 263 6,300-9,450 2-3 n.a.
2 Salus Bamboo 900 m/month
788 kg/month 9,444 4-5 36,000 – 48,000
3 Kelkel Bamboo 120-160m 105-140 3,790 – 5,040 3-4 7,200 – 10,800
4 Nuknuk Bamboo 480m 420 2-3 800 – 1,200 5 NukNuk Bamboo 40m 35 1,260 3-4 2,500 – 3,600 6 BuaKap Sago palm frond 56-64
m/month 28-32
kg/month 336-384 1 72 – 108
7 Labutale Pterocarpus, Pometia, mangrove, coconut & sago frond
n.a 80-120 kg/month
1,920-2,880 Occasional 850
8 Busama Mangrove, sago frond 8m (fronds) n.a. n.a. 2-3 n.a. 9 Labu 1 Pterocarpus, Barringtonia,
Calophyllum 1.4 m3 stack 45,000 3-4 n.a.
10 Labu 2 Pterocarpus, Barringtonia, Pometia, Calophyllum
200 pieces *1.5m*0.1m ~1,000 48,000 4-8 +28,000 (but
usually more) 11 Labu 3 Pterocarpus, Barringtonia,
Pometia, Calophyllum, n.a 4,500 -5,000 kg/month
54,000-60,000 5 8,775-10,800
* frequency is strongly dependent on market demand and local availability of coral and shell
y = 3.9884x R² = 0.8548
y = 0.2797x R² = 0.4157
0
10,000
20,000
30,000
40,000
50,000
60,000
0 20,000 40,000 60,000 80,000
Net
Inco
me
Kin
a/ye
ar
Fuelwood consumed Kilograms/year
Bamboo
mixed hardwood
Linear (Bamboo)
Linear (mixed hardwood)
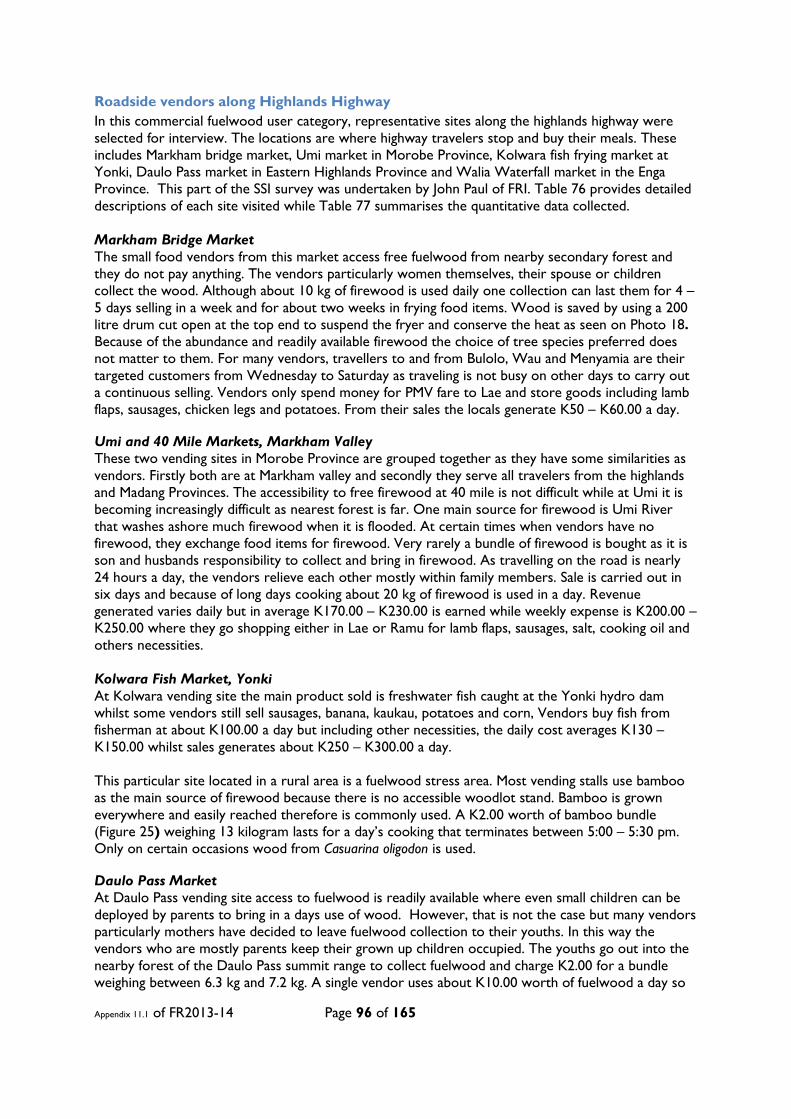
Appendix 11.1 of FR2013-14 Page 96 of 165
Roadside vendors along Highlands Highway In this commercial fuelwood user category, representative sites along the highlands highway were selected for interview. The locations are where highway travelers stop and buy their meals. These includes Markham bridge market, Umi market in Morobe Province, Kolwara fish frying market at Yonki, Daulo Pass market in Eastern Highlands Province and Walia Waterfall market in the Enga Province. This part of the SSI survey was undertaken by John Paul of FRI. Table 76 provides detailed descriptions of each site visited while Table 77 summarises the quantitative data collected. Markham Bridge Market The small food vendors from this market access free fuelwood from nearby secondary forest and they do not pay anything. The vendors particularly women themselves, their spouse or children collect the wood. Although about 10 kg of firewood is used daily one collection can last them for 4 – 5 days selling in a week and for about two weeks in frying food items. Wood is saved by using a 200 litre drum cut open at the top end to suspend the fryer and conserve the heat as seen on Photo 18. Because of the abundance and readily available firewood the choice of tree species preferred does not matter to them. For many vendors, travellers to and from Bulolo, Wau and Menyamia are their targeted customers from Wednesday to Saturday as traveling is not busy on other days to carry out a continuous selling. Vendors only spend money for PMV fare to Lae and store goods including lamb flaps, sausages, chicken legs and potatoes. From their sales the locals generate K50 – K60.00 a day. Umi and 40 Mile Markets, Markham Valley These two vending sites in Morobe Province are grouped together as they have some similarities as vendors. Firstly both are at Markham valley and secondly they serve all travelers from the highlands and Madang Provinces. The accessibility to free firewood at 40 mile is not difficult while at Umi it is becoming increasingly difficult as nearest forest is far. One main source for firewood is Umi River that washes ashore much firewood when it is flooded. At certain times when vendors have no firewood, they exchange food items for firewood. Very rarely a bundle of firewood is bought as it is son and husbands responsibility to collect and bring in firewood. As travelling on the road is nearly 24 hours a day, the vendors relieve each other mostly within family members. Sale is carried out in six days and because of long days cooking about 20 kg of firewood is used in a day. Revenue generated varies daily but in average K170.00 – K230.00 is earned while weekly expense is K200.00 – K250.00 where they go shopping either in Lae or Ramu for lamb flaps, sausages, salt, cooking oil and others necessities. Kolwara Fish Market, Yonki At Kolwara vending site the main product sold is freshwater fish caught at the Yonki hydro dam whilst some vendors still sell sausages, banana, kaukau, potatoes and corn, Vendors buy fish from fisherman at about K100.00 a day but including other necessities, the daily cost averages K130 – K150.00 whilst sales generates about K250 – K300.00 a day. This particular site located in a rural area is a fuelwood stress area. Most vending stalls use bamboo as the main source of firewood because there is no accessible woodlot stand. Bamboo is grown everywhere and easily reached therefore is commonly used. A K2.00 worth of bamboo bundle (Figure 25) weighing 13 kilogram lasts for a day’s cooking that terminates between 5:00 – 5:30 pm. Only on certain occasions wood from Casuarina oligodon is used. Daulo Pass Market At Daulo Pass vending site access to fuelwood is readily available where even small children can be deployed by parents to bring in a days use of wood. However, that is not the case but many vendors particularly mothers have decided to leave fuelwood collection to their youths. In this way the vendors who are mostly parents keep their grown up children occupied. The youths go out into the nearby forest of the Daulo Pass summit range to collect fuelwood and charge K2.00 for a bundle weighing between 6.3 kg and 7.2 kg. A single vendor uses about K10.00 worth of fuelwood a day so
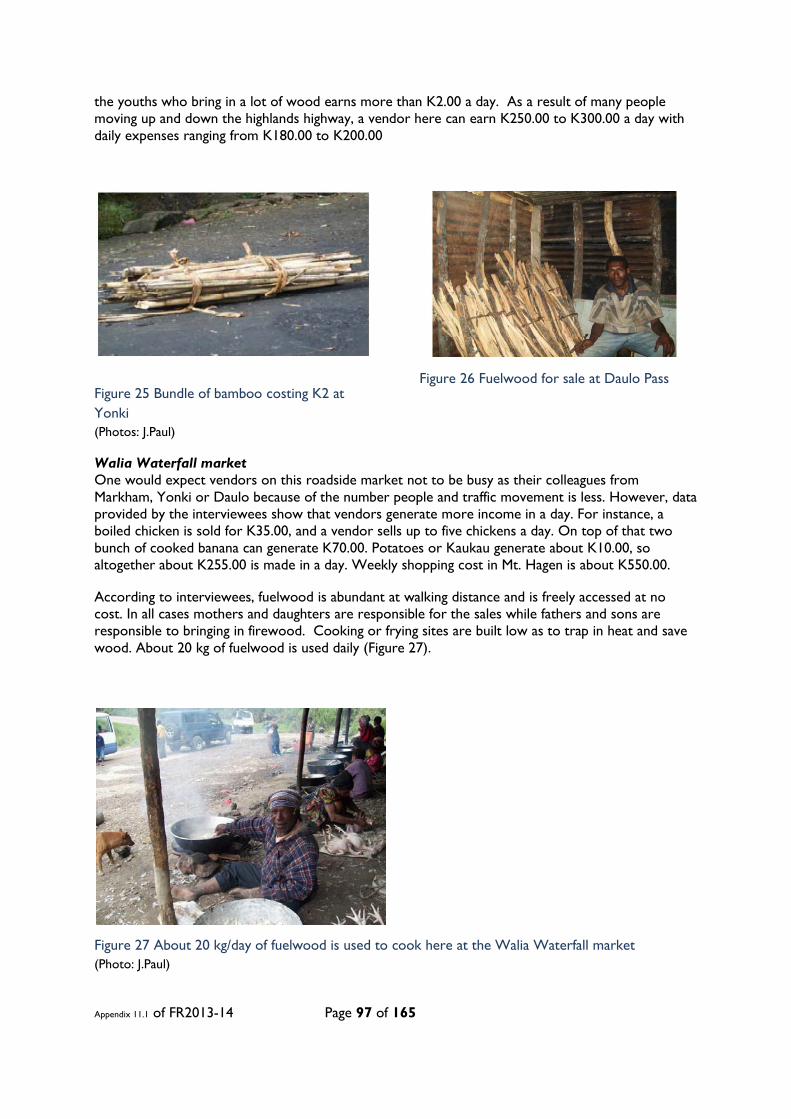
Appendix 11.1 of FR2013-14 Page 97 of 165
the youths who bring in a lot of wood earns more than K2.00 a day. As a result of many people moving up and down the highlands highway, a vendor here can earn K250.00 to K300.00 a day with daily expenses ranging from K180.00 to K200.00
Figure 25 Bundle of bamboo costing K2 at Yonki (Photos: J.Paul)
Figure 26 Fuelwood for sale at Daulo Pass
Walia Waterfall market One would expect vendors on this roadside market not to be busy as their colleagues from Markham, Yonki or Daulo because of the number people and traffic movement is less. However, data provided by the interviewees show that vendors generate more income in a day. For instance, a boiled chicken is sold for K35.00, and a vendor sells up to five chickens a day. On top of that two bunch of cooked banana can generate K70.00. Potatoes or Kaukau generate about K10.00, so altogether about K255.00 is made in a day. Weekly shopping cost in Mt. Hagen is about K550.00. According to interviewees, fuelwood is abundant at walking distance and is freely accessed at no cost. In all cases mothers and daughters are responsible for the sales while fathers and sons are responsible to bringing in firewood. Cooking or frying sites are built low as to trap in heat and save wood. About 20 kg of fuelwood is used daily (Figure 27).
Figure 27 About 20 kg/day of fuelwood is used to cook here at the Walia Waterfall market (Photo: J.Paul)
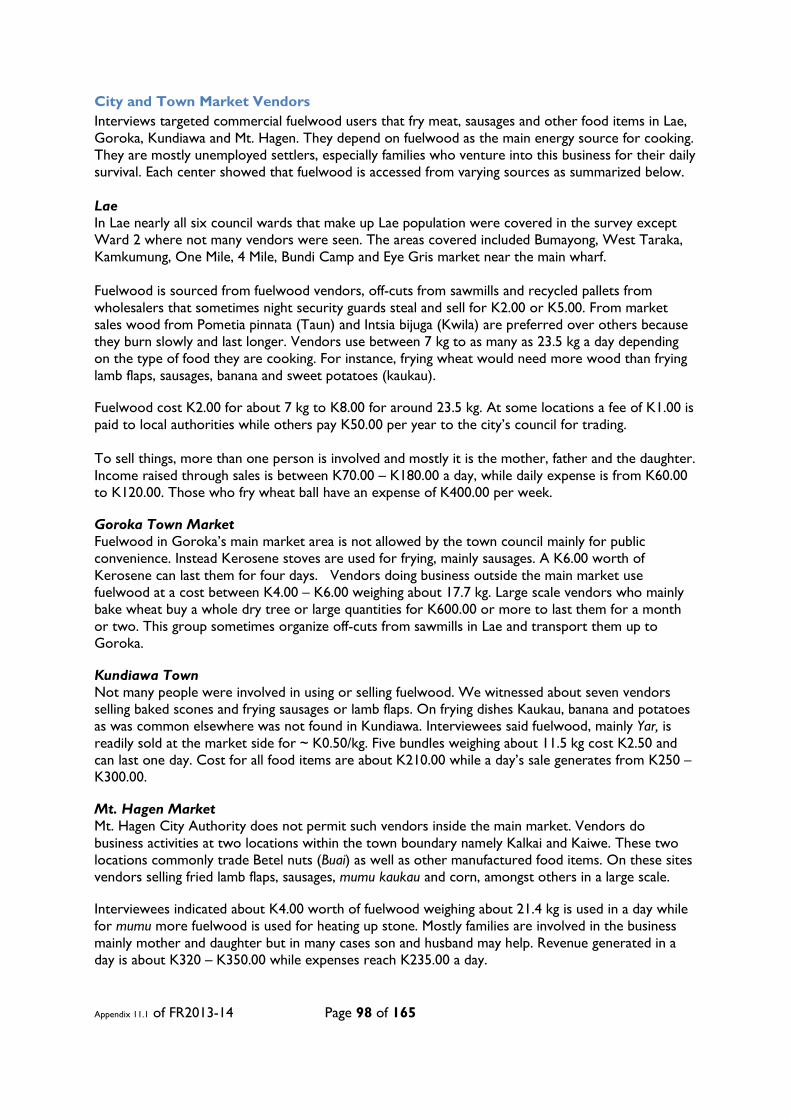
Appendix 11.1 of FR2013-14 Page 98 of 165
City and Town Market Vendors Interviews targeted commercial fuelwood users that fry meat, sausages and other food items in Lae, Goroka, Kundiawa and Mt. Hagen. They depend on fuelwood as the main energy source for cooking. They are mostly unemployed settlers, especially families who venture into this business for their daily survival. Each center showed that fuelwood is accessed from varying sources as summarized below. Lae In Lae nearly all six council wards that make up Lae population were covered in the survey except Ward 2 where not many vendors were seen. The areas covered included Bumayong, West Taraka, Kamkumung, One Mile, 4 Mile, Bundi Camp and Eye Gris market near the main wharf. Fuelwood is sourced from fuelwood vendors, off-cuts from sawmills and recycled pallets from wholesalers that sometimes night security guards steal and sell for K2.00 or K5.00. From market sales wood from Pometia pinnata (Taun) and Intsia bijuga (Kwila) are preferred over others because they burn slowly and last longer. Vendors use between 7 kg to as many as 23.5 kg a day depending on the type of food they are cooking. For instance, frying wheat would need more wood than frying lamb flaps, sausages, banana and sweet potatoes (kaukau). Fuelwood cost K2.00 for about 7 kg to K8.00 for around 23.5 kg. At some locations a fee of K1.00 is paid to local authorities while others pay K50.00 per year to the city’s council for trading. To sell things, more than one person is involved and mostly it is the mother, father and the daughter. Income raised through sales is between K70.00 – K180.00 a day, while daily expense is from K60.00 to K120.00. Those who fry wheat ball have an expense of K400.00 per week. Goroka Town Market Fuelwood in Goroka’s main market area is not allowed by the town council mainly for public convenience. Instead Kerosene stoves are used for frying, mainly sausages. A K6.00 worth of Kerosene can last them for four days. Vendors doing business outside the main market use fuelwood at a cost between K4.00 – K6.00 weighing about 17.7 kg. Large scale vendors who mainly bake wheat buy a whole dry tree or large quantities for K600.00 or more to last them for a month or two. This group sometimes organize off-cuts from sawmills in Lae and transport them up to Goroka. Kundiawa Town Not many people were involved in using or selling fuelwood. We witnessed about seven vendors selling baked scones and frying sausages or lamb flaps. On frying dishes Kaukau, banana and potatoes as was common elsewhere was not found in Kundiawa. Interviewees said fuelwood, mainly Yar, is readily sold at the market side for ~ K0.50/kg. Five bundles weighing about 11.5 kg cost K2.50 and can last one day. Cost for all food items are about K210.00 while a day’s sale generates from K250 – K300.00. Mt. Hagen Market Mt. Hagen City Authority does not permit such vendors inside the main market. Vendors do business activities at two locations within the town boundary namely Kalkai and Kaiwe. These two locations commonly trade Betel nuts (Buai) as well as other manufactured food items. On these sites vendors selling fried lamb flaps, sausages, mumu kaukau and corn, amongst others in a large scale. Interviewees indicated about K4.00 worth of fuelwood weighing about 21.4 kg is used in a day while for mumu more fuelwood is used for heating up stone. Mostly families are involved in the business mainly mother and daughter but in many cases son and husband may help. Revenue generated in a day is about K320 – K350.00 while expenses reach K235.00 a day.
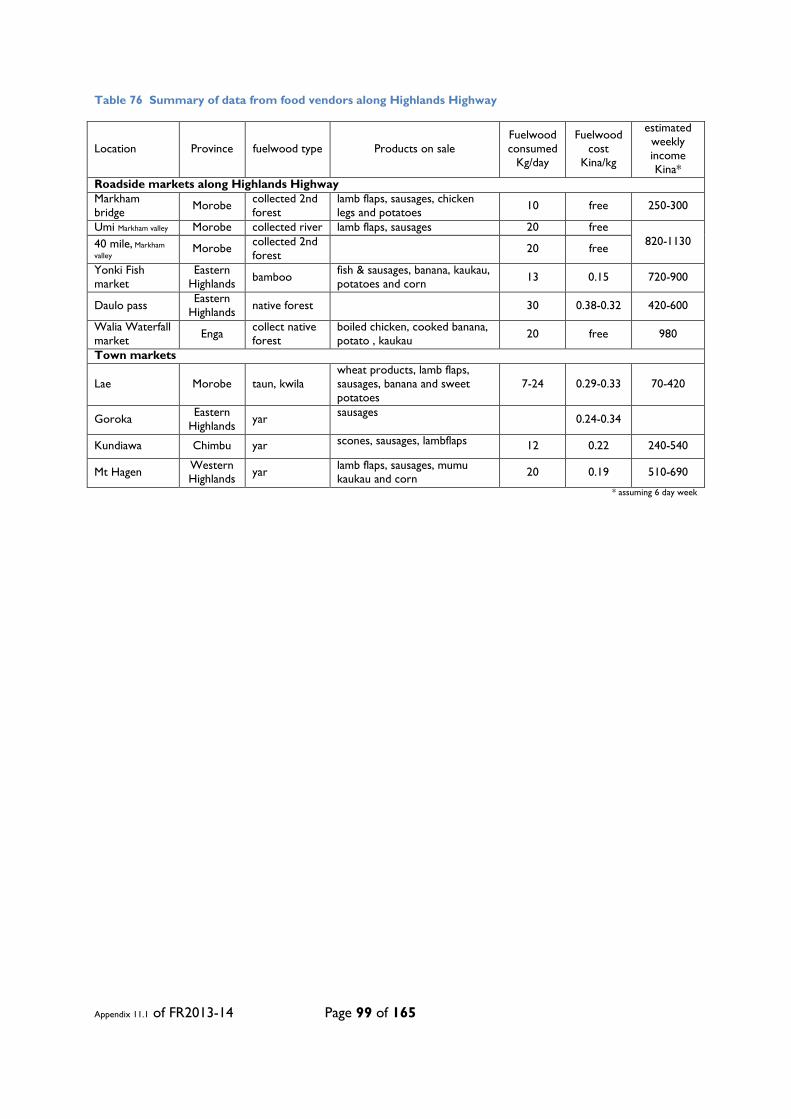
Appendix 11.1 of FR2013-14 Page 99 of 165
Table 76 Summary of data from food vendors along Highlands Highway
Location Province fuelwood type Products on sale Fuelwood consumed
Kg/day
Fuelwood cost
Kina/kg
estimated weekly income Kina*
Roadside markets along Highlands Highway Markham bridge Morobe collected 2nd
forest lamb flaps, sausages, chicken legs and potatoes 10 free 250-300
Umi Markham valley Morobe collected river lamb flaps, sausages 20 free 820-1130 40 mile, Markham
valley Morobe collected 2nd forest
20 free
Yonki Fish market
Eastern Highlands bamboo fish & sausages, banana, kaukau,
potatoes and corn 13 0.15 720-900
Daulo pass Eastern Highlands native forest 30 0.38-0.32 420-600
Walia Waterfall market Enga collect native
forest boiled chicken, cooked banana, potato , kaukau 20 free 980
Town markets
Lae Morobe taun, kwila wheat products, lamb flaps, sausages, banana and sweet potatoes
7-24 0.29-0.33 70-420
Goroka Eastern Highlands yar sausages 0.24-0.34
Kundiawa Chimbu yar scones, sausages, lambflaps 12 0.22 240-540
Mt Hagen Western Highlands yar lamb flaps, sausages, mumu
kaukau and corn 20 0.19 510-690
* assuming 6 day week
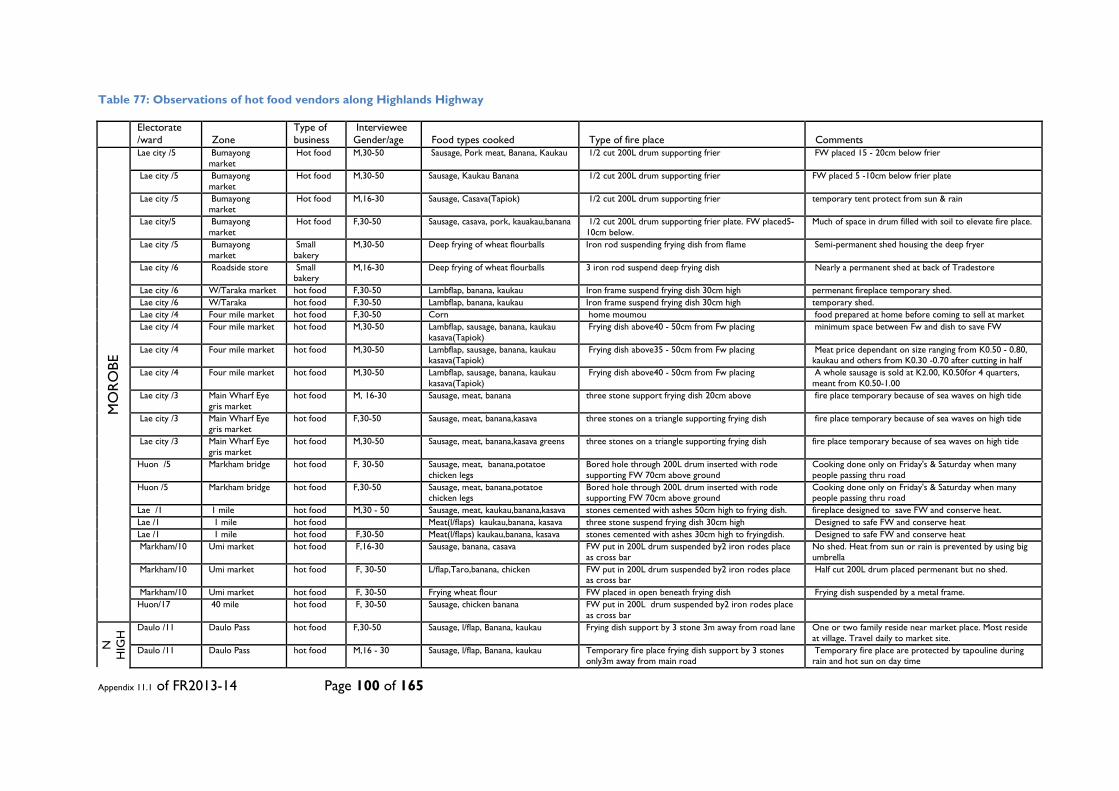
Appendix 11.1 of FR2013-14 Page 100 of 165
Table 77: Observations of hot food vendors along Highlands Highway
Electorate /ward Zone
Type of business
Interviewee Gender/age Food types cooked Type of fire place Comments
MO
RO
BE
Lae city /5 Bumayong market
Hot food M,30-50 Sausage, Pork meat, Banana, Kaukau 1/2 cut 200L drum supporting frier FW placed 15 - 20cm below frier
Lae city /5 Bumayong market
Hot food M,30-50 Sausage, Kaukau Banana 1/2 cut 200L drum supporting frier FW placed 5 -10cm below frier plate
Lae city /5 Bumayong market
Hot food M,16-30 Sausage, Casava(Tapiok) 1/2 cut 200L drum supporting frier temporary tent protect from sun & rain
Lae city/5 Bumayong market
Hot food F,30-50 Sausage, casava, pork, kauakau,banana 1/2 cut 200L drum supporting frier plate. FW placed5-10cm below.
Much of space in drum filled with soil to elevate fire place.
Lae city /5 Bumayong market
Small bakery
M,30-50 Deep frying of wheat flourballs Iron rod suspending frying dish from flame Semi-permanent shed housing the deep fryer
Lae city /6 Roadside store Small bakery
M,16-30 Deep frying of wheat flourballs 3 iron rod suspend deep frying dish Nearly a permanent shed at back of Tradestore
Lae city /6 W/Taraka market hot food F,30-50 Lambflap, banana, kaukau Iron frame suspend frying dish 30cm high permenant fireplace temporary shed. Lae city /6 W/Taraka hot food F,30-50 Lambflap, banana, kaukau Iron frame suspend frying dish 30cm high temporary shed. Lae city /4 Four mile market hot food F,30-50 Corn home moumou food prepared at home before coming to sell at market Lae city /4 Four mile market hot food M,30-50 Lambflap, sausage, banana, kaukau
kasava(Tapiok) Frying dish above40 - 50cm from Fw placing minimum space between Fw and dish to save FW
Lae city /4 Four mile market hot food M,30-50 Lambflap, sausage, banana, kaukau kasava(Tapiok)
Frying dish above35 - 50cm from Fw placing Meat price dependant on size ranging from K0.50 - 0.80, kaukau and others from K0.30 -0.70 after cutting in half
Lae city /4 Four mile market hot food M,30-50 Lambflap, sausage, banana, kaukau kasava(Tapiok)
Frying dish above40 - 50cm from Fw placing A whole sausage is sold at K2.00, K0.50for 4 quarters, meant from K0.50-1.00
Lae city /3 Main Wharf Eye gris market
hot food M, 16-30 Sausage, meat, banana three stone support frying dish 20cm above fire place temporary because of sea waves on high tide
Lae city /3 Main Wharf Eye gris market
hot food F,30-50 Sausage, meat, banana,kasava three stones on a triangle supporting frying dish fire place temporary because of sea waves on high tide
Lae city /3 Main Wharf Eye gris market
hot food M,30-50 Sausage, meat, banana,kasava greens three stones on a triangle supporting frying dish fire place temporary because of sea waves on high tide
Huon /5 Markham bridge hot food F, 30-50 Sausage, meat, banana,potatoe chicken legs
Bored hole through 200L drum inserted with rode supporting FW 70cm above ground
Cooking done only on Friday's & Saturday when many people passing thru road
Huon /5 Markham bridge hot food F,30-50 Sausage, meat, banana,potatoe chicken legs
Bored hole through 200L drum inserted with rode supporting FW 70cm above ground
Cooking done only on Friday's & Saturday when many people passing thru road
Lae /1 1 mile hot food M,30 - 50 Sausage, meat, kaukau,banana,kasava stones cemented with ashes 50cm high to frying dish. fireplace designed to save FW and conserve heat. Lae /1 1 mile hot food Meat(l/flaps) kaukau,banana, kasava three stone suspend frying dish 30cm high Designed to safe FW and conserve heat Lae /1 1 mile hot food F,30-50 Meat(l/flaps) kaukau,banana, kasava stones cemented with ashes 30cm high to fryingdish. Designed to safe FW and conserve heat Markham/10 Umi market hot food F,16-30 Sausage, banana, casava FW put in 200L drum suspended by2 iron rodes place
as cross bar No shed. Heat from sun or rain is prevented by using big umbrella
Markham/10 Umi market hot food F, 30-50 L/flap,Taro,banana, chicken FW put in 200L drum suspended by2 iron rodes place as cross bar
Half cut 200L drum placed permenant but no shed.
Markham/10 Umi market hot food F, 30-50 Frying wheat flour FW placed in open beneath frying dish Frying dish suspended by a metal frame. Huon/17 40 mile hot food F, 30-50 Sausage, chicken banana FW put in 200L drum suspended by2 iron rodes place
as cross bar
N
HIG
H
Daulo /11 Daulo Pass hot food F,30-50 Sausage, l/flap, Banana, kaukau Frying dish support by 3 stone 3m away from road lane One or two family reside near market place. Most reside at village. Travel daily to market site.
Daulo /11 Daulo Pass hot food M,16 - 30 Sausage, l/flap, Banana, kaukau Temporary fire place frying dish support by 3 stones only3m away from main road
Temporary fire place are protected by tapouline during rain and hot sun on day time

Appendix 11.1 of FR2013-14 Page 101 of 165
Kaintantu/8 Yonki Fish market hot food F,30-50 Fish, sausage, banana Frying dish support by rectangular iron taken back home20cm -25cm high
Because of cool temperature definitely needs products like charcoal to keep food warm
Kaintantu/8 Yonki Fish market hot food F, 16-30 Fish, sausage, banana, Kaukau Frying dish and support iron frame taken home and brought back next day
FW supply seems limiting as bamboo seen used by every vendore
Goroka/10 Goroka Main markt
hot food F,30 -50 On site frying sausage Kerosene stove Exceptional case where FW is not used. Town Authority banned use of FW inside market
Goroka/10 Goroka Main markt
hot food M, 16-30 On site frying sausage Kerosene stove Presence of kerosene odour but better than FW making a lot of smoke
Goroka/10 Goroka Main markt
small bakery
M,16-30 Flour balls deep fried in large quantity Deep fries(boilers) suspended by iron bars allowing FW inserting
Product sold in store and at two stalls at market
Goroka/10 Fainifa hot food M, 16-30 Lamp flap, banana kaukau Temp. shed, frying dish fitted to iron rod Young man selling for family as a whole Goroka/10 Chuave market hot food M,30-50 Lamp flap, banana kaukau, Potatoe Temp. shed, frying dish fitted to iron rod, 20-25cm
from earthsurface Vending site only few hundred meters away from main market
Goroka/10 Buai market hot food F,30-50 Baked/moumou kaukau Heating stone for baking/moumou done at home Unlike moumou/baking of corn at WHP where a lot of FW is used, here only K2 worth of FW is used.
CH
IMBU
Kundiawa/6 Kundiawa Buaimarket
hot food M,30-50 Lamp flaps,sausage Half-cut 200L drum temporary installed for frying Baked scones sold together with fried food
Kundiawa/6 Kundiawa Buaimarket
hot food M,15 - 30 Kaukau frying Shallow hole dug to insert FW. Three(3) sticks suspend fry
Newly married married couple
Kundiawa/6 Kundiawa Buaimarket
hot food F,30-50 Lamp flaps,sausage scone, cordial Frying dish suspend from iron rods Just by look of it others don't do heavy cooking as this vendore in comparison to what was seen in Hagen
WES
TERN
H
IGH
LAN
DS
Mt.Hagen/1 Kaiwe Market hot food F, 30 – 50 L/Flap, kaukau banana, Potatoe Frying dish permanentaly fitted on steel rod FW from prunned coffee trees is a regular source K0.50 and K1.00 bundles of bothe local yar and coffee stems are sold.
Mt.Hagen/1 Kaiwe Market hot food M, 16-30 Lamp flap, sausage banana Frying dish fitted to steel frame 30cm above surface Regularly FW bought from truck load brought in from Tambul and Nebilyer. Rarely FW brought from Baiyer area
Mt.Hagen/2 Kalakai market hot food F, 30-50 Sausage,Lamp flaps kaukau, potatoe, banana
Cooking plate fitted to iron rod FW placed 25-30cm above frying dish
Rest on Sabath, Current high prices forced may vendores out of business
Mt.Hagen/1 Kaiwe hot food M,30-50 moumoued corn Moumou done at house Moumou done at Nebilyer Less FW used if corn baking done in half-cut200L drum, otherwise heating up stone and mou- mou uses a lot of FW.
ENG
A
Wapena- manda /17
Waliyia hot food F,30=50 Chickhen, banana, potatoe, greens three iron rode suspending cooking dish 30cm high, permanent hut 2m away from road
Cooking is done in a similar way as it would be done at home but is done along road for travelling public
Wapena- manda /17
Waliyia hot food vendor
M,>50 Chickhen, banana, potatoe, greens
Cooking dish suspended by stone and iron frame. Hut built 2m away from road
Cooking is done in a similar way as it would be done at home but is done along road for travelling public

102
Semi-Structured Interviews in NCD The third part of the SSI involved several government and non government organizations considered to be stakeholders in the future of the fuelwood economy. Nine organizations, all headquartered in the NCD, were interviewed. The following NGOs and government organizations were visited.
The following discussion is built on the questions asked by Agnes Sumareke of FRI and the transcribed responses from the various interviewees. The organizations and individuals interviewed are listed in Table 78. The full transcript of interviews is recorded in project document: 7/10 (5SSIResults_100809.docx)
Table 78 List of organizations approached in Semi-Structured Interviews
Organisation Interviewees PNGFA: Forestry Development Division
Francis Vilamur; Acting Director- Forest Development
PNG Power : Rural Electrification Program
Peter Hairai; Manager- Rural Electrification
PNG Sustainable Development Program: Forestry Program
Michael Poesi, Senior Project Officer
PNG Sustainable Energy Limited
Ben Mehuwa; Manager – Project Development
Department of Energy and Petroleum: Division of Energy
Mase Heni; Principal Engineer-Alternative Energy.
United Nations Development Program: GEF Small Grants Program
Gwen Maru, Program Analyst – Energy and Environment
World Wide Fund for Nature
Ted Mamu, Martina Kua, Zola Sanga; Forestry Coordinator and Forest Officers
PNG Gardener
Aukam Tauwaigu; Orchid Grower-Nursery Man
National Cultural Commission Chris Isaac, research officer
The PNG Forest Authority is the primary stakeholder in the development of forest resources in PNG and its reforestation policy only emphasizes reforestation and afforestation and not much about fuel wood. Fuelwood is an assumed, but not explicit, consideration in forestry extension projects. As the demand in firewood is increasing, PNGFA recognizes the need to review its policy and take fuel wood on board. PNGFA’s involvement in the ACIAR Fuelwood project (via Forest Research Institute) is evidence that the organization informally recognizes the importance of fuelwood work; but a formal policy still needs to be written.
“PNGFA recognizes fuelwood as a big problem in some parts of the country where reforestation projects are established. Fuelwood is a needed commodity in villages, urban centers and even industries and firewood is becoming very demanding. In places where plantations are established, people are collecting fallen branches for use as fuelwood and of course the trees planted for reforestation are purposely for timber or round log for export and not for fuel wood use. Therefore fuel wood has to be addressed, and the SRC crops and other fast growing tree species have to be established for fuel wood usage and can be recommended for mass production for continuous supply to meet the increasing demand.”
103
Any community outreach programs to encourage the planting of fuelwood trees by the PNGFA should be in concert with the Department of Agriculture and Livestock and NGOs. At the moment the capacity to do this just does not exist. Perhaps there are opportunities in the move to address climate change.
“One contributing factor to forest depletion is fuel wood, so as long as the project is making awareness to the people on the good of SRC trees, then, they could be convinced and plant trees on their land so that they don’t go into the bush for fuel wood, poles etc. At the moment there are problems arising with the degraded grassland and forests in Markham, Sepik Plains, Goroka and other parts of PNG that are contributing to global warming. These areas are covered with vast grassland and trees are scarce here and fuel wood is a big problem. These areas need to be rehabilitated with trees. There is a biggest task for PNGFA lying ahead. PNGFA is the only government department taking the lead in rehabilitation project but on a small scale due to limited funding. However, the government is raising some concern on the climatic problems and they should be diverting money into PNGFA and with the help of projects from Donor funding agencies like ACIAR Fuel wood project, NGOs, CBOs can encourage people in tree planting. This money from the government should be allocated to the people on the ground to work collaboratively with other organization to implement such project like, fuel wood, rehabilitation and reforestation.”
Recently, PNGFA went through a restructure process, and the former Forest Management Division is now known as Forest Development Division( FDD). Under this Division, most activity will be surrounded around business. Therefore, the FDD is now looking out for ways to make money for PNGFA. Therefore establishment of SRC crops is ideal for this purpose and also, fast growing tree species will be considered for this purpose too. There is a plan for establishing a much bigger nursery that cater for both timber tree species to trees for fuel wood to be raised and plant out on the grassland of Port Moresby. NCDC and the youths could be involved in tree planting and they can take ownership of the trees. Once the trees are ready they can cut and sell for firewood to sustain their living. This should not have any negative effect on PNGFA’s log / timber business activity because the fuel wood business should stand on its own with specific tree species for fuel wood production and “short production cycles”. The interviewee’s concept of short production cycle for fuelwood is at least 10 years. This is a commonly held concept among professional foresters; however it is at variance with the 2-3 year cycles in the Fuelwood projects short-rotation coppicing systems.
PNG Power Ltd is the public company responsible for provision and maintenance of electrical infrastructure and supply. In 2005 it released a national and provincial 10 year power development plan (2006-2015) and a five year rural electrification plan (2006-2010). While the NCD is about 80% electrified, rural areas are poorly supplied. PNG Power has the task to expand its rural supply and much of this will be from small scale diesel plants distributed through small local networks. In 2006 alone, 17 diesel sets, ranging in capacity from 65-1400kW, were installed. Also 21 large hydro sets are planned for installation over the years up to 2013. Much of this power will be distributed through relatively inexpensive SWER lines over rural areas. PNG Powers plans also state the proactive promotion of co-generation, e.g. from oil palms.
The Rural Electrification Plan is particularly interesting in that it ranks various projects across districts and provinces on the basis of their net social benefit. Most power infrastructure developments require internal rates of return of at least 10% before they are considered viable investments. This plan recognises that most of these rural projects will not generate this sort of return on investment, and so
104
it is not greatly considered in the project ranking. Instead, the ranking is based on indices like population, number of schools and health clinics etc.
PNG Power is strongly committed to its Rural Electrification Program. PNG’s mountainous topography makes it very difficult to have extensive power transmission and distribution systems (as in Australia), so the development of the rural electrification focuses around medium and small-scale distributed generation, largely based on fossil-fuel generators. However, with climate change issue PNG power plans to venture into the use of biomass as another form of energy, especially on small-scale generators in rural areas.
Currently, the potential is seen in using biomass from waste products of trees and agriculture produce. There are large scale agriculture activities like Ramu and NBPOL already using waste products to generate electricity.
PNG Power is charged with providing service to village communities and is supportive of the concept using SRC crops to supply biomass to the incinerator for generating power for them. For example, Finschafen town consumes 230 kilowatt/hr and it is considered that a SRC crops plantation could supply electricity in that area or similar towns. Hybrid biomass - solar systems may be the answer.
The potential for SRC-biomass systems would be appropriate in small or remote government districts or remote areas where there is currently no electricity. Care should also be taken in implementing such a scheme only on customary land where land ownership is clearly defined. PNG Power could still possibly make money by providing this most needed service to the people. However, on a bigger scale SRC-biomass would not be viable as it would consume huge amount of kilojoules to generate power.
The biomass-energy sector has not been properly developed yet in PNG. There are still unknowns concerning the heat generation capacity of tree species and wood flows to feed generators. For example if a log weighs about 800kg and only lasts for 10 minutes (in a conventional combustion system), its going to take a lot of logs, and a continuous supply, to generate power 24 hour. So for PNG Power there is still a lot to consider into consider concerning the design of the incinerator and whether it be for wood/timber / waste agriculture produce etc. Another consideration is the economics of investing in the local distribution lines.
However, even with those considerations Peter Hairai considered that a proposal submitted to the PNG Power Management might go a long way, not only for economic purposes but also providing service to the rural community of PNG.
PNG Sustainable Development Program (PNG SDP) is a funding agency financed by the mining industry. It was approached because it is potential support for future extension of the ACAIR Fuelwood Projects outputs.
PNG SDP Forestry program has number of projects including the commercial Eaglewood education project that include PNGFRI as a partner, the Cloudy Bay Forestry project that promotes sustainable forestry practices and the Afforestation and Reforestation programs. The forestry program is embarking on use of the biomass energy under the Cloudy Bay project with the Sustainable Energy Limited to work on that in which it is believed that the project is in progress.
105
PNG SDP has a responsibility in sustainable forest management as forestry is one of the major project which has a role to play in sustainable timber harvesting in natural forest as in Cloudy Bay Forestry project and rehabilitation of degraded areas/forests.
However, PNGSDP as a developing partner is not in the best position to formulate policies/regulations relating to fuelwood. The PNG Forest Authority itself is better placed to develop and implement policies relating to fuelwood. PNGSDP cannot formulate policy but could provide advice to regulators to formulate.
Nevertheless, the ACIAR Fuelwood Project does support PNG SDP’s interests in terms of its biofuel activities. At the moment, no research has adequately determined the specific tree species that would be suitable for bio fuel purposes, especially the amount of heat energy or kilojoules that can be produced by burning specific tree species etc. In addition, the Fuelwood Project complements SDP’s reforestation and afforestation programs for rehabilitation purposes.
SDP welcomes any proposal that is in line or is linking with PNGSDP’s goals, aims and functions. PNG SDP works through credible partners including international development institutions, NGOs Government agencies and community based organizations; therefore it wouldn’t be a problem in being seeing as playing a role in any development in sustaining livelihood of the people of PNG.
For example PNGSDP could be involved in further extension of the ACIAR fuelwood Projects outputs as long as the submission is put forward and the project has the social, and economic value to it. PNGSDP is just lacking the capacity to implement and monitor on ground situations. Thus, as long as you showcase the interest PNG SDP can support.
The PNG Sustainable Energy Limited is a company of its own under the PNG Sustainable Development Program and was established in December 2004. It was established to pursue the development of rural electrification and infrastructure in Western province. Some of the programs include development of mini-grid rural power and communications infrastructure in Awaba, Balimo, Lake Murray, Obo, Wipim and Morehead. There were about 1,800 solar home systems installed in Ngao, Kodoro and other areas of Western Province.
Most of the activities conducted by PNGSEL are in feasibility stages. A bio-diesel project is in the production stage and is located at Aroma Coast in the Central Province. Otherwise, PNGSEL has genset operations in Western Province. PNGSEL is also investigating further into geothermal, hydro, and biomass energy. In addition, an investigation is progressing in Cloudy Bay where PNG SDP Forestry Project is going on to find out whether there is a possibility in using the waste wood/ timbers from logging as biomass for generating electricity. A hydro system in Togaruo village in Bougainville is in tender stage.
One of PNGSEL’s objectives is providing the land owners up to 30%equity in any joint venture created between PNGSEL and the resources owners. Apart from mini hydro and solar systems, electricity generated from biomass could be an option.
PNGSEL plans to develop biomass energy especially in the rural areas. One of PNGSEL’s objectives is to use locally available renewable energy sources, including debris from agricultural produce, firewood, waste woods, grass etc . PNGSEL sees a potential in using biomass especially in areas where forestry and oil palm projects are progressing so that the waste streams can be used.

106
As with PNG Power, there is still a lack of information on the logistics of biomass-energy; e.g. considerations of generator load and heat generation of biomass species. However, PNGSEL would encourage the use of SRC crops for biomass supply once these questions of supply continuity and heat generation are answered.
PNGSEL would also be willing to collaborate with Forestry and Agriculture programs in the future to promote and encourage the establishment of the woodlots of SRC crops for as a pilot project to produce fuelstock for generating energy. PNGSEL is already collaborating with the PNGSDP Forestry and Agriculture programs to utilize the waste of crop and logs/wood as biomass at Cloudy Bay. Important conditions for such a project would be where there is accessibility to road and where there are no land disputes. Somewhere in Madang is suggested.
The Department of Energy and Petroleum: Division of Energy has a policy on renewable energy but very little has been enacted or enforced. Accordingly, energy sector operations have been hindered due to this poor policy framework. It is now seen that the rural electrification policy framework was the best way to go about, given that lots of interest have been generated in this area.
There have been surveys in energy use; the last collection was done in 2000. At time of interview (March 2009) a team was about to commence collecting data on household energy; this will be incorporated with the 2007 census. The survey will also gather data on the use of energy especially, electricity, in industry and agriculture.
The DEP has conducted several assessments with the assistance from Asian Development Bank on development of energy sources, but not on biomass and wind energy. However, the Energy division has been promoting solar energy in rural areas for the preservation of medicine and vaccines. The recent project is in Central and Gulf province. The Energy Division gave the same in-principle approval to biomass-energy generation as did PNG Power and PNGSEL, but also the same reservations expressing the lack if relevant information on feasibility. However, it seems very unlikely that they would provide financial support for collaborative projects to develop this technology.
The UNDP Global Environment Facility (GEF) has Small Grant Program operating from Port Moresby and has established a number of forestry projects around PNG. UNDP mainly focuses on Environment Conservation and reforestation projects. UNDP currently has forest conservation and rehabilitation projects going on up in the highlands, especially Mt Hagen and Goroka. UNDP only funds projects relating to these areas for mitigation of climate change.
While The GEF does take into consideration the end uses of tree planting, this is more focused on the ecosystem management such as soil fertility and soil erosion control, wildlife habitat etc. the program has never considered fuel wood as one of the end products, and so has never funded fuelwood projects. There has not been any submission of projects relating to fuel wood in the past. If there any applicant submitting proposal for a project relating fuel wood, UNDP would possibly fund the project depending on the design o and the content of the proposal, because the selection criteria of the project is very specific and the proposal must tie in together with the main aim of forest environment biodiversity conservation and prevention of land degradation.
Nevertheless, Ms Maru claimed there is a need in fuel wood promotion to sustain livelihood because, firewood is used as alternate source of energy in urban and peri urban centers of PNG and almost 100% of the rural household of PNG rely entirely on firewood. Introducing fuel wood business can help individuals/landowners in generating income for themselves. In Port Moresby, the Motu Koitabu

107
people can do the fuel wood business. It is a good income making opportunity for land owners living around the cities and towns.
So UNDP could play a role in encouraging the farmers in planting the SRC crops as long as the project is in line with our aims and functions and also if it is sustainable and if it will sustain the livelihood of the people. However, UNDP would not financially support it.
The aims of the fuel wood project were seen as enhancing the UNDP-GEFs project roles and regulation in context of energy generation apart from electricity, gas etc. Hopefully the outcomes of the fuelwood project will gradually stop people from going further into the forests and mangroves in search of wood for burning. In addition, energy generated from firewood will contribute less carbon into the atmosphere compared to other energy sources.
The World Wide Fund for Nature has a community forestry program which essentially deals with natural forests. It focuses on small scale community based forest enterprises working towards promoting sustainable forest management of natural Forest. The main partner to this project is Forest Certification (FORCERT). So WWF activities are based on the forest certification process. Projects are carried out mostly in Momase and New Guinea Island region of the country. WWF alone has not established any projects alone but has worked in partnership with FORCERT and Foundation for People & Community Development (FPCD).
WWF also works with communities in areas where the land is dominated non-woody species and left abandoned and degraded. WWF has on a small scale supported some of the communities in Eastern Highands and Simbu provinces by assisting them with small grants and by working with small local NGOs. One of the partners NGO is ‘Partners with Melanesians’. This NGO was supported by WWF by providing funds from small grants who worked with Forest , Goroka office where they have established woodlots with about 6,000 Pinus species to revegetate the degraded sites.
WWF also supports the people around coastal Port Moresby by funding the Motu Pore Island Research Center from UPNG. The UPNG students work with the communities along the degraded areas of the coast to regenerate the mangroves which are disappearing from fuelwood harvest. The aim of this project is not only to is restoring wildlife habitat but also sustain local need for fuelwood. Awareness of this project has been extended to the people in the Hiri Coast, Motu Koitabu areas and NCDC. The essential message “to plant a seedling when you cut a tree”. Several species were selected for they have established nursery to raise their seedlings for planting. They are focused on fast growing mangrove species. The NCDC and politicians in NCD are behind this project to support it as long as it sustains the livelihood of the local community.
WWF considers planting woodlots as important parallel activity to working with natural forest community forestry, especially in the areas where is dominated by grassland. WWF had two projects at EHP in Henganofi and Barola which involved community forestry. The community participated collectively in establishing wood lots in their areas. From Eastern Highland experience, it was seen that planting of trees brought back water quality and people had water nearby, where previously they used to walk some distance in search for water. Of course woodlots help communities in terms of firewood, habitats for wildlife and other benefits.
WWF is always interesting in cross-involvement with other projects that have biodiversity and conservation objectives and that includes those involving community participation. This could include projects involving SRC fuelwood production systems, but consideration would have to be given to the
108
potential invasiveness of exotic species in the SRC system. Also WWF does not have the capacity in nursery and tree plantation establishment, but can support initiatives of partners who have both resources and capacity in executing the projects.
From WWF’s perspective, future projects would be better in areas which are degraded, or dominated with grassland and approach whoever is responsible for that area and introduce the project and the purpose and see if he or the community is interested. Looking around POM, especially the city area, all the areas are dominated with grassland, thus there would a possibility in introducing one in city as a trial so that people around POM city can see and try it out. The appropriate people to approach would be NCDC and Lands Department to negotiate for a piece of land that is on government land. However, in customary land, the story is different. So in Port Moresby, it would be better to introduce the project to Baruni and Tatana areas where, fuelwood is badly needed and people are cutting mangroves for this purpose. The NCD governor is very supportive to these type of projects as he is supporting one of WWF’s project in regenerating degraded mangrove forests along the coastlines of Port Moresby.
The horticultural business PNG Gardener was included in the survey because they are significant purchaser and retailer of charcoal; not for its energy value, but for its use as a substrate in orchid culture. The charcoal is brought to the Port Moresby premises by producers who mostly come from Rigo. This occurs on an annual basis where the producers deliver hundreds of pre-packed 10kg bags at a time.
Charcoal comes in two forms, small dust and big chunks. The two types of charcoal are used for specific orchids or plants in the nursery. The charcoal in big chunks is mostly made from Eucalyptus whereas the small dust is produced mainly from mangrove trees.
PNG Gardener buys charcoal per bag for K5.00 for a 10kg bag and K10 for a 20kg bag at a whole sale price. It then retails the charcoal for a 10kg is K10 and K20 for 20kg bag.
The National Cultural Commission (NCC) was approached because they deal in, and have a good knowledge of the status of craftwoods in PNG. NCC does not buy the craftwood; they are brought in for display to promote the crafts only. NCC display grafts from all over PNG; e.g. Southern HP, Sepik, East and West New Britain, Milne bay, Western Province, Oro, Eastern HP, etc. NCC is a Statutory Organization under the Ministry of Culture and Tourism and is currently developing a policy on traditional knowledge which is in an infant stage.
Most of the wood materials NCC displays is carved from specific trees for each provinces. For example, Sepik carving is carved from Kwila or Rosewood etc to get a desired and attractive finish product. Other wood crafts such as Garamuts, kundu drums, bows and arrows etc are carved from trees that have been passed from generation to generation. The indigenous species used for carving are becoming scarce and craftsmen are now using very low valued trees for crafts wood. Scarcity of these trees or wood is also associated with fire wood consumption in villages. So conservation of these high valued indigenous tree species for carving is very important for the NCC. At the moment NCC does not have any program which considers the species used for carving because of financial limitations. However, NCC is interested to work in collaboration with ACIAR to promote the indigenous woods or trees of PNG that are of high value in carving (e.g Kwila, Rosewood, Ebony). This would be done by establishing a little forest that captures all kinds of trees that has been traditionally used for different purposes in the past for cultural purposes and tourist attraction. NCC will welcome ACIAR for any collaboration work in the future
109
General Discussion This discussion will use the information gathered in this survey to describe and, as much as is reasonable, quantify the fuelwood market in the fuelwood-stressed regions of PNG. Comparisons are made with other fuelwood surveys and related literature in PNG and internationally. This discussion begins with an assessment of the rigor of the survey; drawing attention to its strengths as well as weaknesses. This is followed by a short description of similar fuelwood studies undertaken in Asia; these serve as a useful background for understanding the PNG study. This is followed by the description of the PNG fuelwood economy based on the information collected in this survey. Financial and physical estimates of the size of the fuelwood economy are presented along with comparison with similar estimates made elsewhere. Some of key characteristics of the fuelwood economy are discussed along with the social and environmental impact of fuelwood collection. The discussion concludes with an assessment of the potential for developing a fuelwood market based on short-rotation coppicing species.
A robust survey The design of this survey followed the principles outlined in the FAO manual for fuelwood surveys (FAO 1983). The manual emphasises that a good fuelwood survey is really a social survey because it deals not only with wood but with how a particular society manages its resources with factors such as control of and access to trees, division and organisation of labour, and patterns of using fuel. A good survey should cover not only the wood and other fuel sources, but also the rules and technology that society uses for managing that resource. The questionnaire therefore collected a lot of qualitative as well as quantitative information. The breadth of the survey information required that it be focussed in key areas. It would have been impossible, and unnecessary, to survey the whole country in this manner.
Therefore the survey focused on regions of PNG where there is commonly understood to be fuelwood stress. The term “fuelwood stress” covers the perception that fuelwood is either becoming difficult to obtain freely or without conflict, or the cost of purchased fuelwood is becoming an increasing burden on consumers. Associated with this is the perception that fuelwood collection is having an unsustainable impact on the natural environment, specifically forests. The regions studied in this survey were determined through a participative process of PNG foresters and community development workers in the survey design workshop.
Their perceptions arise from personal experience as consumers and professional observations and understanding of forestry issues. An outsider flying over the heavily forested landscape of PNG would be justified in asking “what fuelwood crisis?” Fuelwood stress, however, is very locale-specific associated with areas of high population density, and the first signs of some stress in the development of a fuelwood market when it might have otherwise been freely gathered. In the Papua New Guinea Rural Development Handbook Hanson et al (1991) characterised each administrative district in PNG in terms of agricultural pressure, land potential, access to services, cash income and a measure of overall relative dis/advantage. They note that fuelwood is a visible component of the local economy in 15 out of the 80+ districts in PNG. Within this group it was very easy for the local participants of the survey team to nominate target districts. That being said, the survey has not covered all fuelwood-stressed districts in PNG, just the most notable districts that were amenable for survey (in terms of cost and time).
The fuelwood-stress regions covered 8 Local Level Government areas and the 9 Wards of the NCD which constitute 10.6% (or 552,129 people) of the national population. The sample size of the
110
Questionnaire Survey was 3,994. It was proportionally and randomly stratified across the 17 census areas into 55 sampling strata. The sample represented 4.4% of the population (24,758) when adjusting for household sizes as in Table 2c. By all international standards this is a very thorough survey, at least in terms of sampling density. For example, a review of fuelwood surveys undertaken in India considered 0.5% to be a high level of sampling density (Pandey 2002).
The FPCD survey team was very diligent in ensuring the required number of interviews were made in each of the 55 sampling strata (see concordance in Table 3), however certain errors were detected and corrected for as much as possible. Known errors and deficiencies in the survey are:
• Several forms showed signs that the interviewer took short-cuts (i.e. gave identical responses for some difficult questions over a range of consecutive forms and /or skipped some questions altogether). These were recognized and the potentially compromised data excised from the survey. This explains the variation in sample numbers over many tables. While the FPCD team was well trained and disciplined, a couple of the 35 interviewers on short contracts were less so.
• 150 of the Lae rural sample were interviewed with the urban survey form. The urban and rural forms have different questions to suit the different contexts. The affected forms were transferred and analysed along with other rural forms, but some questions have smaller sample numbers.
• The survey made the incorrect assumption that everybody knows what charcoal is. The high proportion of charcoal users in the highlands (Table 14, Fig 13a) reflects the habit of using coals from the previous night’s fire, rather than purposively-prepared charcoal.
• Survey forms used in the highlands rural survey did not have the questions on amount of fuelwood collected per trip and time spent on fuelwood collection (Table 21)
• The definition of ‘retailer’ in the Fuelwood Sellers form was too restrictive and so initially underestimated the phenomenon. The real extent of retailing only became apparent after scanning the ‘offered comments’ tables.
• The sample size of the Sellers Survey was less than expected. Also the unwillingness of half the sellers to have their products weighed meant estimations of important parameters such as price/kilogram are just adequate.
• The interviewers overseeing the Case-Study Monitoring survey forgot to record the household size of the case-study households. So it was only possible to determine the weekly fuelwood use per household, and not per person. These calculations were supposed to be calibrated against the householders’ estimates of their fuelwood use at the beginning of the monitoring exercise. This could not done.
Despite these deficiencies, this survey is the most comprehensive and rigorous survey of fuelwood, and general domestic energy use, ever undertaken in PNG.
111
Descriptions of wood-flows in the Asian region Before describing the PNG fuelwood system it will be useful to discuss similar studies in Asia to provide a context for understanding PNG. Part of this discussion is elaborated in a longer paper in Appendix 4.
The Regional Wood Energy Development Programme in Asia (RWEDP) ran from 1985 through 2001 and was implemented by the Food and Agriculture Organization of the UN and funded by the Government of the Netherlands. Its aim was to assist 16 developing countries in South and Southeast Asia in establishing and strengthening their capabilities to: assess wood energy situations; plan wood energy development strategies; and implement wood energy supply and utilization programs.
In RWEDP countries the various actors found in the flow of fuelwood from tree to consumer were:
• owners of trees • caretakers of trees • wood fuel cutters, converters • assemblers who collect small amounts from local collectors • commission agents for buyers and sellers, • transporters • wholesalers and retailers
The fuelwood trade systems were found to be quite simple and direct (collector to customer) or very complex with up to 7-8 intermediaries. Both systems can exist at same time in the one national economy. Figure 30a provides a generic overview of fuelwood flows found in the RWEDP countries, while Figures 30b-d show specific examples for The Philippines, Thailand and Java.
There are three parallel sectors.
The informal sector fuelwood supplies bypass in generally operates outside of government regulation and involves mostly poor, maybe landless, people with few other livelihood options. The people who gather the wood usually also transport and sell it directly to the end-users or retailers. Such supplies are normally used in the same area from which they were obtained i.e. there has to be a ready market nearby for the system to operate. The quantities involved are normally small, i.e. what can be cut and transported by one person, and mostly destined for domestic use. Some of this fuelwood may be picked up truck drivers who transport it to distant markets. Earnings of the fuelwood trade with this system remain almost completely with the persons involved i.e. the gatherers, with only small amounts required for transport, etc. The owners of the trees, i.e. the forest department or the community in general, do not receive any stumpage fees and this trading system may therefore have a detrimental effect on the forest cover.
The formal sector supply system is much more regulated than the two other systems, because the supplies originate from formal organizations such as the Forest Department. Consequently this sector is easier to measure and the quantities involved are often large and are almost exclusively traded.
The private sector supply system is in general thought to have the largest impact on the overall traded fuelwood supply but at the same time is also the least transparent. It is thought that this system is prevalent in those areas where markets are located at some distance from the source i.e. fuelwood owners may not have direct access or have difficulties in getting direct access to the markets. The fuelwood can come from many different sources. Where in the other two systems the fuelwood is cut
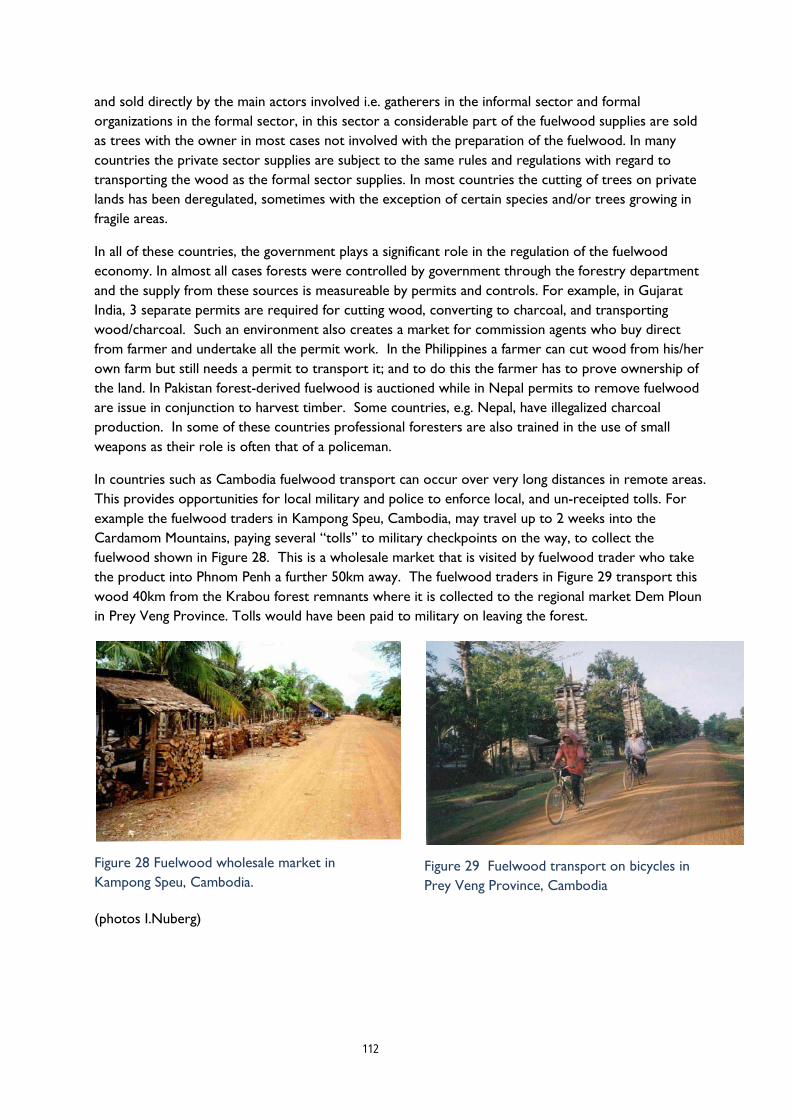
112
and sold directly by the main actors involved i.e. gatherers in the informal sector and formal organizations in the formal sector, in this sector a considerable part of the fuelwood supplies are sold as trees with the owner in most cases not involved with the preparation of the fuelwood. In many countries the private sector supplies are subject to the same rules and regulations with regard to transporting the wood as the formal sector supplies. In most countries the cutting of trees on private lands has been deregulated, sometimes with the exception of certain species and/or trees growing in fragile areas.
In all of these countries, the government plays a significant role in the regulation of the fuelwood economy. In almost all cases forests were controlled by government through the forestry department and the supply from these sources is measureable by permits and controls. For example, in Gujarat India, 3 separate permits are required for cutting wood, converting to charcoal, and transporting wood/charcoal. Such an environment also creates a market for commission agents who buy direct from farmer and undertake all the permit work. In the Philippines a farmer can cut wood from his/her own farm but still needs a permit to transport it; and to do this the farmer has to prove ownership of the land. In Pakistan forest-derived fuelwood is auctioned while in Nepal permits to remove fuelwood are issue in conjunction to harvest timber. Some countries, e.g. Nepal, have illegalized charcoal production. In some of these countries professional foresters are also trained in the use of small weapons as their role is often that of a policeman.
In countries such as Cambodia fuelwood transport can occur over very long distances in remote areas. This provides opportunities for local military and police to enforce local, and un-receipted tolls. For example the fuelwood traders in Kampong Speu, Cambodia, may travel up to 2 weeks into the Cardamom Mountains, paying several “tolls” to military checkpoints on the way, to collect the fuelwood shown in Figure 28. This is a wholesale market that is visited by fuelwood trader who take the product into Phnom Penh a further 50km away. The fuelwood traders in Figure 29 transport this wood 40km from the Krabou forest remnants where it is collected to the regional market Dem Ploun in Prey Veng Province. Tolls would have been paid to military on leaving the forest.
Figure 28 Fuelwood wholesale market in Kampong Speu, Cambodia.
Figure 29 Fuelwood transport on bicycles in Prey Veng Province, Cambodia
(photos I.Nuberg)
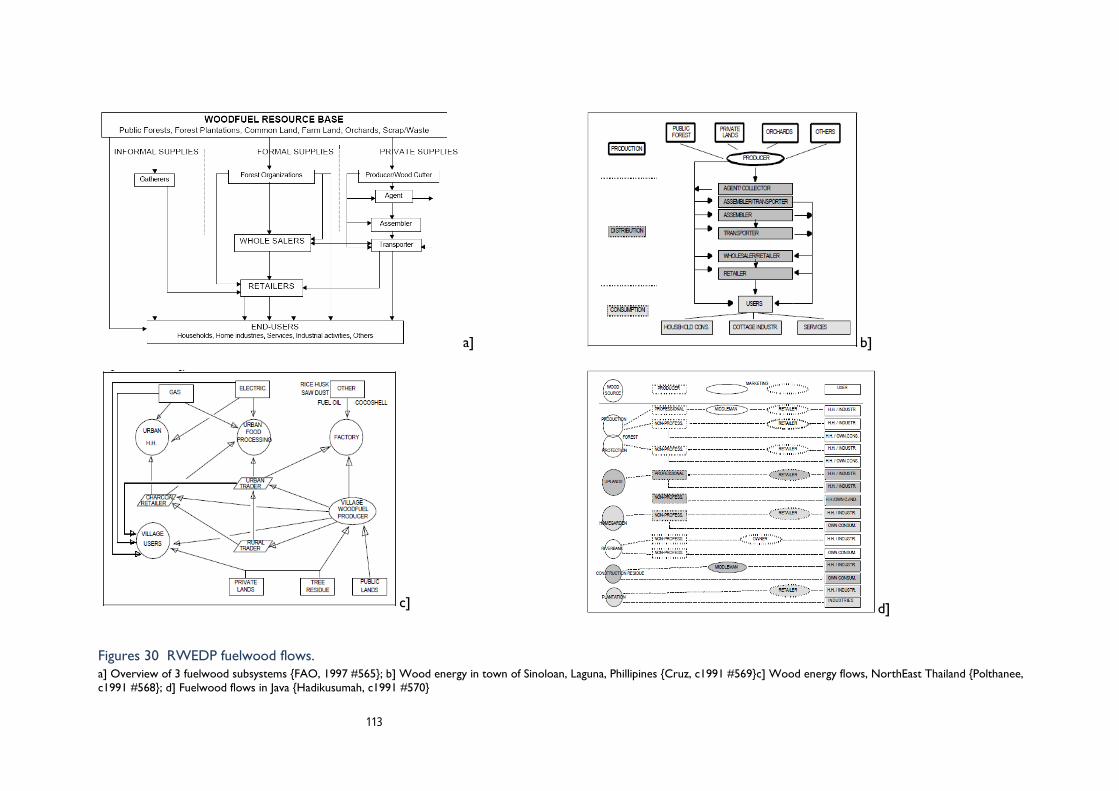
113
a]
c]
b]
d]
Figures 30 RWEDP fuelwood flows. a] Overview of 3 fuelwood subsystems {FAO, 1997 #565}; b] Wood energy in town of Sinoloan, Laguna, Phillipines {Cruz, c1991 #569}c] Wood energy flows, NorthEast Thailand {Polthanee, c1991 #568}; d] Fuelwood flows in Java {Hadikusumah, c1991 #570}
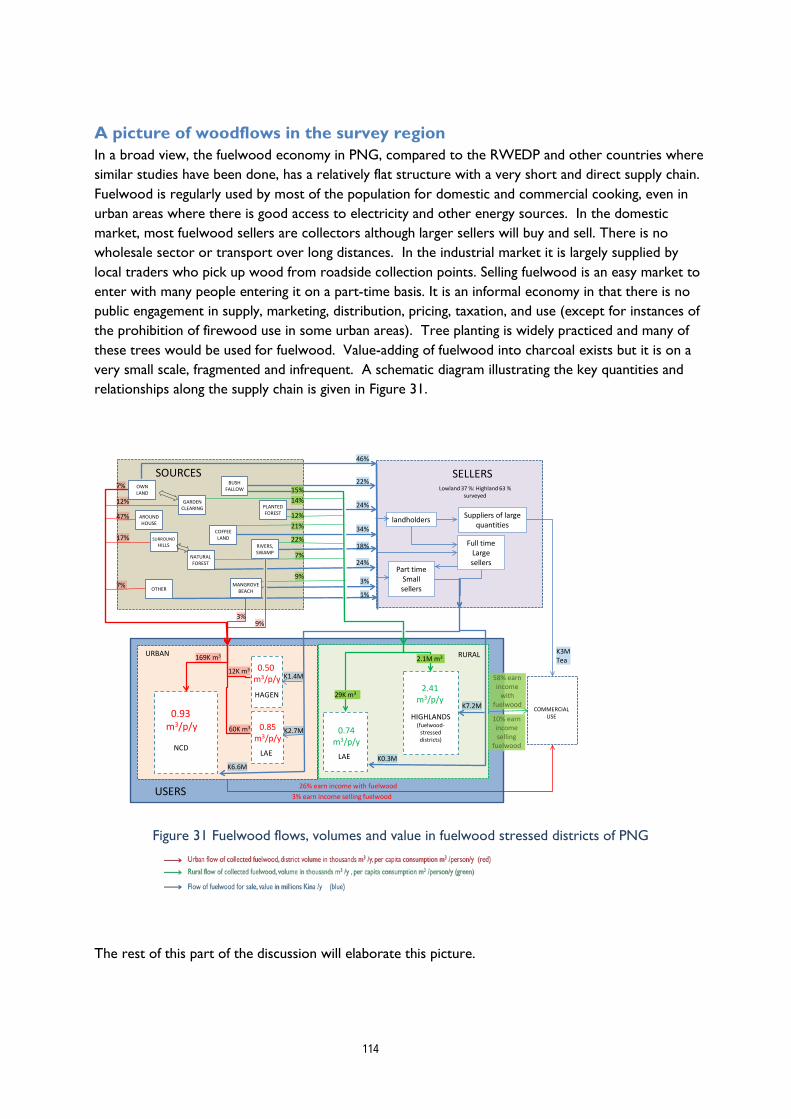
114
A picture of woodflows in the survey region In a broad view, the fuelwood economy in PNG, compared to the RWEDP and other countries where similar studies have been done, has a relatively flat structure with a very short and direct supply chain. Fuelwood is regularly used by most of the population for domestic and commercial cooking, even in urban areas where there is good access to electricity and other energy sources. In the domestic market, most fuelwood sellers are collectors although larger sellers will buy and sell. There is no wholesale sector or transport over long distances. In the industrial market it is largely supplied by local traders who pick up wood from roadside collection points. Selling fuelwood is an easy market to enter with many people entering it on a part-time basis. It is an informal economy in that there is no public engagement in supply, marketing, distribution, pricing, taxation, and use (except for instances of the prohibition of firewood use in some urban areas). Tree planting is widely practiced and many of these trees would be used for fuelwood. Value-adding of fuelwood into charcoal exists but it is on a very small scale, fragmented and infrequent. A schematic diagram illustrating the key quantities and relationships along the supply chain is given in Figure 31.
Figure 31 Fuelwood flows, volumes and value in fuelwood stressed districts of PNG
The rest of this part of the discussion will elaborate this picture.
OWN LAND
COFFEE LAND
NATURAL FOREST
OTHERMANGROVE
BEACH
SURROUNDHILLS
BUSH FALLOW
PLANTED FOREST
GARDEN CLEARING
SOURCES SELLERS
USERS
COMMERCIAL USE
RURALURBAN
46%
22%
24%
34%
24%
18%
3%
Lowland 37 %: Highland 63 %surveyed
NCDLAE
HIGHLANDS(fuelwood-
stressed districts)
HAGEN
AROUND HOUSE
7%
3%9%
LAE
169K m3
60K m3
2.1M m3
29K m3
9%
7%
22%
12%21%
1%
0.93 m3/p/y
0.50 m3/p/y
0.85m3/p/y
0.74 m3/p/y
2.41 m3/p/y
landholders
Full time Large sellers
Suppliers of large quantities
Part time Smallsellers
47%
12%
17%
7%
K1.4M
K2.7M
K6.6MK0.3M
K7.2M
12K m3
RIVERS, SWAMP
K3MTea
26% earn income with fuelwood3% earn income selling fuelwood
58% earn income
with fuelwood
10% earn income selling
fuelwood
15%14%
115
A relatively flat structure and short supply chain The flow of fuelwood in PNG is quite different than the model that emerged from the RWEDP countries. In PNG the flow of fuelwood trees to the consumer shows a flat structure and short supply chain. Most of the fuelwood economy in PNG is in the Informal sector with a large proportion of small-scale and part-time operators who collect wood themselves and sell directly. While some sellers may buy wood from landholders (either as a whole tree or pile of collected wood) they will re-sell it directly as retail. No formal wholesale market was found where an operator solely buys wood from landholders for re-assembling and selling on to other sellers. Some of the larger sellers in NCD and Mt Hagen may trade wood with other smaller sellers, but this is not their main operation.
There is no Formal sector delivering fuelwood to the market, In RWEDP countries government agencies attempt to control the supply of fuelwood from its forests through permits to access, harvest, transport and trade. The PNGFA is not involved in managing forests, either natural or plantation, for delivery of fuelwood. It does not have a fuelwood policy, but fuelwood is an ‘assumed’ consideration in dealing with the community. From this survey this appears to be a relatively benign acceptance of local people collecting fallen fuelwood for personal or small commercial use.
The Private sector does operate in PNG but not to the extent as it does in RWEDP countries. As there is no formal sector with permits and regulations relating to fuelwood, the private sector is not subject to any regulation either. Examples of this private sector are the truck drivers who pick up yar and coffee wood stacked on the side of the Highlands Highway to sell to Carpenters Tea Factory in Mt Hagen. Also some of the larger traders in Mt Hagen and NCD may be classed as ‘private’ in that they are full-time operators dealing with relatively large amounts of wood. However, even these traders are dealing directly with the landholders (which in many cases are relatives) and the consumer.
Whereas some of the RWEDP fuelwood systems may have up to 7-8 intermediaries with the transport of fuelwood over long distances from source to sink, the PNG fuelwood system at most has two intermediaries (i.e landholder → full-time large seller→ part-time small seller → consumer). Also most fuelwood is sourced within 10-20km of urban markets. A small proportion of the NCD market (10%) that comes over longer distances are the off-cuts purchased from sawmills.
of the lack of a formal sector and the rudimentary form of the private sector it is not possible to quantify the volume of fuelwood trade using records of harvest and transport permits, and receipts of payment etc, Even in the RWEDP studies, the informal sector was always the most difficult to quantify. However, the following section makes conservative estimates of the volume of fuelwood collected, the volume and value of traded domestic fuelwood based on data from the survey.
Fuelwood expenditure The estimates of expenditure on fuelwood are presented over 5 tables. Table 79 provides an aggregate estimate of all fuelwood expenditure in fuelwood stressed districts in 2008-9 (time of survey). It necessarily has to rely on population data for the survey districts taken from the 2000 Census but it is possible to extrapolated values to 2012 terms (with the assumption that the relative distribution of population across districts is the same). This table combines estimates for the districts in the survey
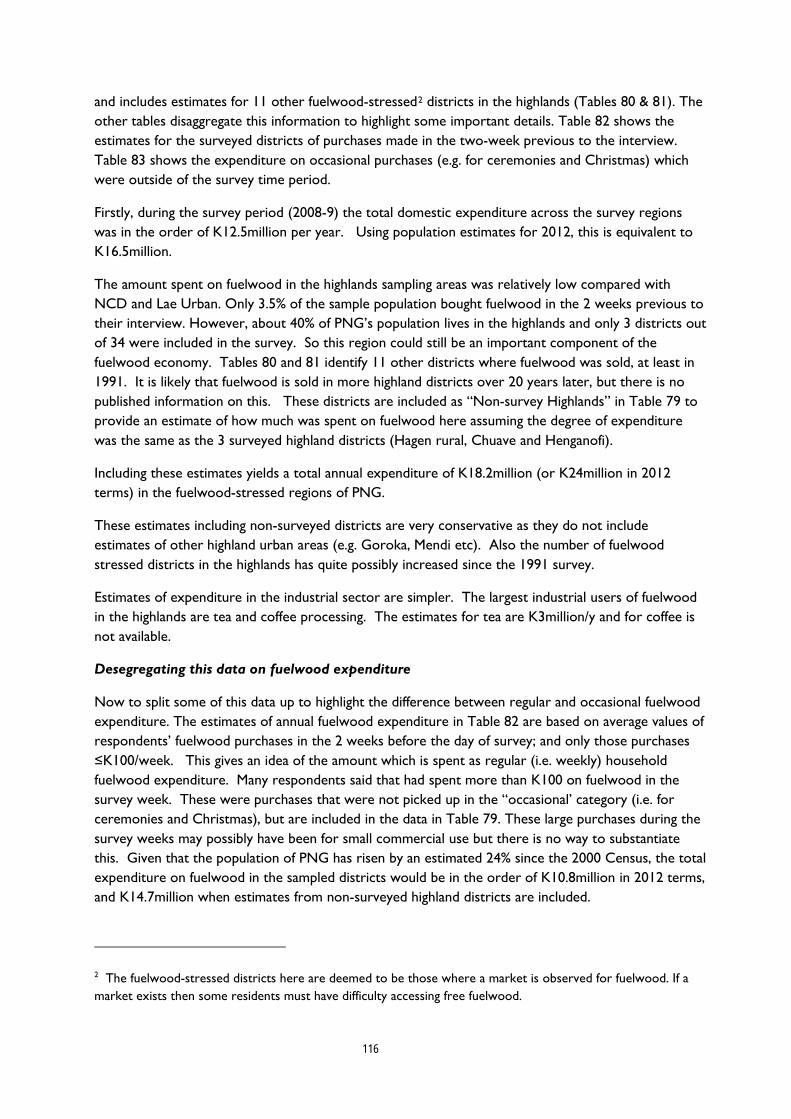
116
and includes estimates for 11 other fuelwood-stressed2
Firstly, during the survey period (2008-9) the total domestic expenditure across the survey regions was in the order of K12.5million per year. Using population estimates for 2012, this is equivalent to K16.5million.
districts in the highlands (Tables 80 & 81). The other tables disaggregate this information to highlight some important details. Table 82 shows the estimates for the surveyed districts of purchases made in the two-week previous to the interview. Table 83 shows the expenditure on occasional purchases (e.g. for ceremonies and Christmas) which were outside of the survey time period.
The amount spent on fuelwood in the highlands sampling areas was relatively low compared with NCD and Lae Urban. Only 3.5% of the sample population bought fuelwood in the 2 weeks previous to their interview. However, about 40% of PNG’s population lives in the highlands and only 3 districts out of 34 were included in the survey. So this region could still be an important component of the fuelwood economy. Tables 80 and 81 identify 11 other districts where fuelwood was sold, at least in 1991. It is likely that fuelwood is sold in more highland districts over 20 years later, but there is no published information on this. These districts are included as “Non-survey Highlands” in Table 79 to provide an estimate of how much was spent on fuelwood here assuming the degree of expenditure was the same as the 3 surveyed highland districts (Hagen rural, Chuave and Henganofi).
Including these estimates yields a total annual expenditure of K18.2million (or K24million in 2012 terms) in the fuelwood-stressed regions of PNG.
These estimates including non-surveyed districts are very conservative as they do not include estimates of other highland urban areas (e.g. Goroka, Mendi etc). Also the number of fuelwood stressed districts in the highlands has quite possibly increased since the 1991 survey.
Estimates of expenditure in the industrial sector are simpler. The largest industrial users of fuelwood in the highlands are tea and coffee processing. The estimates for tea are K3million/y and for coffee is not available.
Desegregating this data on fuelwood expenditure
Now to split some of this data up to highlight the difference between regular and occasional fuelwood expenditure. The estimates of annual fuelwood expenditure in Table 82 are based on average values of respondents’ fuelwood purchases in the 2 weeks before the day of survey; and only those purchases ≤K100/week. This gives an idea of the amount which is spent as regular (i.e. weekly) household fuelwood expenditure. Many respondents said that had spent more than K100 on fuelwood in the survey week. These were purchases that were not picked up in the “occasional’ category (i.e. for ceremonies and Christmas), but are included in the data in Table 79. These large purchases during the survey weeks may possibly have been for small commercial use but there is no way to substantiate this. Given that the population of PNG has risen by an estimated 24% since the 2000 Census, the total expenditure on fuelwood in the sampled districts would be in the order of K10.8million in 2012 terms, and K14.7million when estimates from non-surveyed highland districts are included.
2 The fuelwood-stressed districts here are deemed to be those where a market is observed for fuelwood. If a market exists then some residents must have difficulty accessing free fuelwood.
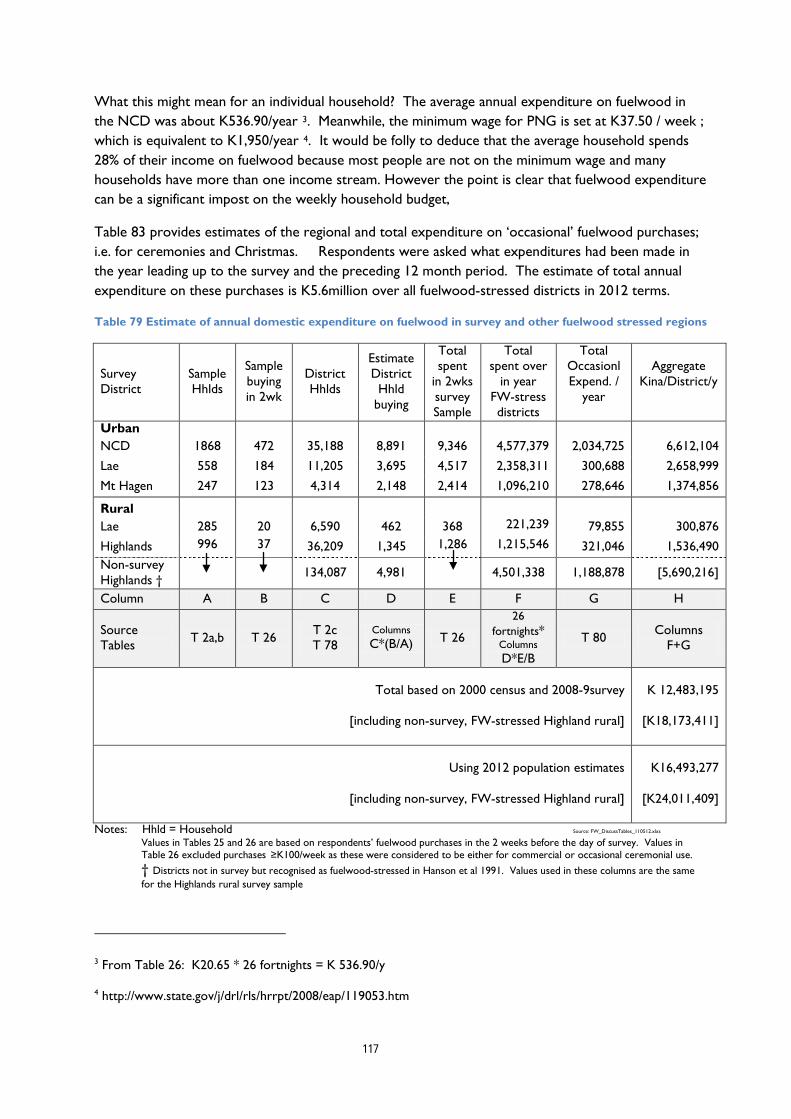
117
What this might mean for an individual household? The average annual expenditure on fuelwood in the NCD was about K536.90/year 3. Meanwhile, the minimum wage for PNG is set at K37.50 / week ; which is equivalent to K1,950/year 4
Table 83 provides estimates of the regional and total expenditure on ‘occasional’ fuelwood purchases; i.e. for ceremonies and Christmas. Respondents were asked what expenditures had been made in the year leading up to the survey and the preceding 12 month period. The estimate of total annual expenditure on these purchases is K5.6million over all fuelwood-stressed districts in 2012 terms.
. It would be folly to deduce that the average household spends 28% of their income on fuelwood because most people are not on the minimum wage and many households have more than one income stream. However the point is clear that fuelwood expenditure can be a significant impost on the weekly household budget,
Table 79 Estimate of annual domestic expenditure on fuelwood in survey and other fuelwood stressed regions
Survey District
Sample Hhlds
Sample buying in 2wk
District Hhlds
Estimate District Hhld
buying
Total spent
in 2wks survey Sample
Total spent over
in year FW-stress districts
Total Occasionl Expend. /
year
Aggregate Kina/District/y
Urban NCD 1868 472 35,188 8,891 9,346 4,577,379 2,034,725 6,612,104
Lae 558 184 11,205 3,695 4,517 2,358,311 300,688 2,658,999
Mt Hagen 247 123 4,314 2,148 2,414 1,096,210 278,646 1,374,856
Rural
Lae 285 20 6,590 462 368 221,239 79,855 300,876
Highlands 996 37 36,209 1,345 1,286 1,215,546 321,046 1,536,490 Non-survey Highlands † 134,087 4,981 4,501,338 1,188,878 [5,690,216]
Column A B C D E F G H
Source Tables T 2a,b T 26 T 2c
T 78 Columns C*(B/A) T 26
26 fortnights*
Columns D*E/B
T 80 Columns F+G
Total based on 2000 census and 2008-9survey
[including non-survey, FW-stressed Highland rural]
K 12,483,195
[K18,173,411]
Using 2012 population estimates
[including non-survey, FW-stressed Highland rural]
K16,493,277
[K24,011,409]
Notes: Hhld = Household Source: FW_DiscussTables_110512.xlxs
Values in Tables 25 and 26 are based on respondents’ fuelwood purchases in the 2 weeks before the day of survey. Values in Table 26 excluded purchases ≥K100/week as these were considered to be either for commercial or occasional ceremonial use. † Districts not in survey but recognised as fuelwood-stressed in Hanson et al 1991. Values used in these columns are the same for the Highlands rural survey sample
3 From Table 26: K20.65 * 26 fortnights = K 536.90/y
4 http://www.state.gov/j/drl/rls/hrrpt/2008/eap/119053.htm

118
Table 80 Fuelwood stressed districts (unshaded) in Highland provinces
Province District Agricultural pressure
Land potential
Access to services
Cash income
Overall relative
dis/advantage Comments
Southern Ialibu-Pangia Some Mod Mod Mod Slightly Some cash income from Firewood espc in upper Wage & Lai valleys Upper Wage valley have acess to markets in Mendi
Imbonggu Some Good Good V low Slightly Kagua-Erave Some Mod Good V low Serious Kom-Margarima Some Mod Mod V low Serious Koroba-lake Kopiago Some Low Poor V low Extreme Mendi Significant Mod Good V low Serious Firewood sold Nipa-Kutubu Some Low Good V low Extreme Tari Some High Mod V low Moderate Enga Kandep Strong Low Mod Low Extreme Kompian-Ambum Considerable Low Mod Low Extreme Lagaip-Porgera Considerable Low Poor V low Extreme Firewood sold Wabag Some Mod Good Mod Slight Wapenamanda Some V high Good Mod No disadv Western Angalimp-S’th Wahgi Some V high Good High Not Highlands Baiyer-Mul Some High Good Low Not Firewood sold Dei Little High V good High Not Hagen Little High V good High Not Firewood sold Jimi None Low Poor Low Serious North Wahgi Little High Good High Not Tambul-Nebilyer Some V high Good Mod Not Firewood sold Simbu Chuave Some Mod Good Low Slightly Firewood sold Gumine Some Mod Good Low Moderately Karimui-Nomane None Low Mod Low Moderately Kerowagi Some V high Good High Not Firewood sold in higher altitudes Kundiawa Significant Low Good V low Seriously Sina-Sina-Yonggamugl Significant Low Good V low Seriously Eastern Daulo Some Mod V good V high Not Highlands Goroka Limited V high V good High Not Firewood sold in higher altitudes Henganofi Significant Low Good High Moderate Firewood sold Kainantu Some Low Good High Moderate Firewood sold Lufa Little Mod Good Low Slightly Firewood sold Obura-Wonenara Some Low Mod Mod Serious Okapa Little Mod Mod Mod Moderate Unggai-Bena Limited Mod Good High Not
Source: PNG Rural Development Handbook. Hanson et al 1991 Source:
FW_DiscussTables_110512.xlxs
Table 81 Populations and household sizes of fuelwood-stressed highland districts not included in survey
Province District persons households household size
Southern Ialibu-Pangia 50,799 9,852 5.2
Imbonggu 60,086 10,585 5.7
Mendi 96,413 14,952 6.4
Enga Lagaip-Porgera 91,002 14,895 6.1 Western Highlands Baiyer-Mul 56,686 13,153 4.3 Tambul-Nebilyer 60,823 13,350 4.6
Simbu Kerowagi 54,850 10,215 5.4 Eastern Highlands Goroka 71,870 16,369 4.4 Kainantu 91,771 19,709 4.7
Lufa 45,868 11,007 4.2
Totals 680,168 134,087
As PNG Population = 5,190,786
= 13.1% national
population
Average Household
size 5.1
Source: PNG National Census 2000, Community Profile System Source: FW_DiscussTables_110512.xlxs

119
Table 82 Estimate of annual domestic expenditure on fuelwood for regular use (≤K100) in survey regions
Survey District
Sample Hhlds
District Hhld
% Weeklybuyers
No. Hhlds buying
Kina/ Hhld /2week
Kina/ Hhld /y
Kina/District/y
Urban NCD 1868 35,188 24 8,445 20.65 537 4,534,185
Lae 558 11,205 24 2,689 21.60 562 1,510,255
Mt Hagen 247 4,314 46 1,984 20.39 530 1,052,031
Rural Lae 285 6,590 6.7 442 27.61 718 316,957
Highlands 996 36,209 3.5 1,267 24.10 627 794,100 Non-survey Highlands †
134,087
4,693
[2,940,662]
Column A B C D E F G
Source Tables 2a,b 2c 25 Columns
B *C /100
26 Columns
E * 26fortnights
Columns D * F
Total based on 2000 census and 2008-9survey [including non-survey, FW-stressed Highland rural]
K 8,207,527 [K11,148,189]
Using 2012 population estimates [including non-survey, FW-stressed Highland rural]
Source: FW_DiscussTables_110512.xlxs
K10,844,100 [K14,729,416]
Notes: Hhld = Household ; Values in Tables 25 and 26 are based on respondents’ fuelwood purchases in the 2 weeks before the day of survey. Values in Table 26 excluded purchases ≥K100/week as these were considered to be either for commercial or occasional ceremonial use. † Districts not in survey but recognised as fuelwood-stressed in Hanson et al 1991. Values used in these columns are the same for the Highlands rural survey sample
Table 83 Estimate of annual domestic expenditure on fuelwood for occasional use in survey regions
Survey District
Sample Hhlds
District Hhlds
Occasional purchases Kina/ sample district/y
Occasional purchases Kina/ whole district/y
Urban NCD 1868 35,188 108,016 2,034,725
Lae 558 11,205 14,793 300,688
Mt Hagen 247 4,314 15,954 278,646
Rural Lae 285 6,590 3,454 79,855
Highlands 996 36,209 8,831 321,046 Non-survey Highlands †
134,087 [1,188,878]
Column A B C D
Source Tables 2a,b 2c Derived from 25
Columns C * B/A
Total based on 2000 census and 2008-9survey [including non-survey, FW-stressed Highland rural]
K3,014,951 [K4,203,829]
Using 2012 population estimates [including non-survey, FW-stressed Highland rural]
Source: FW_DiscussTables_110512.xlxs
K3,983,469 [K5,554,260]
Notes: Hhld = Household ; Values in Table 25 are based on respondents’ fuelwood purchases in the 2 weeks before the day of survey.
† Districts not in survey but recognised as fuelwood-stressed in Hanson et al 1991. Values used in these columns are the same for the Highlands rural survey sample
120
Fuelwood collection and consumption The following data and assumptions are used to estimate the total tonnage and volume of fuelwood collected and consumed
• Average reported estimate of fuelwood collected per week during 2 weeks of Users Survey (Table 21)
• 2000 Census data on number of households and average household size (Tab 2c) • The proportion of survey sample who used fuelwood in the year of the survey (Table 8) • Kilogram to Volume conversion using 0.725tn/m3 (FAO 1993)
These estimates and their reasoning are presented in Table 84. Table 84 Estimates of tonnage and volume of fuelwood collected in fuelwood-stressed districts
Survey District
Ave kg collect
/wk
No. Hhld in district
% FW
users
No. Hhld using FW
Av collect kg/wk
Tot Hhld
Total tons
collect/y
Total volume
collected/y
Vol m3/ Hhld
Average Hhld size
Vol m3/
Person
No. persons
Urban NCD 67 35,188 73 25,687 2,357,596 122,595 169,097 6.6 7.1 0.93 182,379
Lae 74 11,205 90 10,085 829,170 43,117 59,472 5.9 6.9 0.85 69,583
Hagen 39 4,314 87 3,753 168,246 8,749 12,067 3.2 6.4 0.50 24,020
Rural Lae 62 6,590 98 6,458 408,580 21,246 29,305 4.5 6.1 0.74 39,395
Highland 148 36,209 100 36,209 5,358,932 278,664 384,365 10.6 4.4 2.41 159,320
Non-survey Highld †
148 134,087 100 134,087 19,844,876 1,031,934 1,423,357 10.6 5.1 2.08 680,168
Sums 1,506,305 2,077,662 1,154,865
Average
1.80 ∞
Column A B C D E F G H I S T
Source table / column
T21 T2c, T78 T8 B*C/100 B*A
E*
52wks/ 1000
‡ F/0.725
G/D T2c H/I D*I
∞ ∑G/∑T
Hhld = Household ; FW = Fuelwood Source:
FW_DiscussTables_110512.xlxs † Districts not in survey but recognised as fuelwood-stressed in Hanson et al 1991. Values used in these columns are the same for the Highlands rural survey sample ‡ weight to volume conversion based basic density of 0.725 gm/cm3 (FAO 1993)
∞ Estimate of average volume / person based on total volume collected / total population of users represented The total volume of fuelwood collected over the fuelwood-stressed regions of PNG is about 2.1million m3/y with an average use of 1.8m3/person/year in the years of the survey (2008-9).
The surveyed districts represent 10.6% of the national population, and the non-surveyed, fuelwood-stressed districts in the highlands represent another 13.1% of the population. Assuming the fuelwood use of the rest of PNG is at the same intensity, then the national volume of fuelwood consumed will be about 9.34million m3/y at the time of survey, or 12.34million m3/y for the estimated population of 6.9 million in 2012. This is likely to be an underestimate because the rest of PNG not included in this survey is largely rural, island and towns where the populations will rely more on fuelwood than the NCD and Lae urban centres.
121
The estimate of 1.8m3/person/year for fuelwood consumption is a highly aggregated value, as are the estimates for the 6 surveyed and extrapolated districts. It is important to remember that one of the primary data sets was the respondents’ estimates of how much wood they collect in a week. They were given 10kg bags of rice as a standard against which to make this estimate. Many respondents were able to make reasonably accurate assessments by comparing the weight of the bag with fuelwood at hand in the house; but of course this is still a highly subjective assessment. It is worthwhile to compare these values with those measured in the Case-Study Monitoring (CSM) exercise.
The CSM exercise asked 36 householders to measure accurately (with a 50kg grocer’s scale) how much fuelwood they used every day over a two week period. On the basis of the median daily fuelwood use for 13 urban and 23 rural case studies (Table 72), the estimated volume of fuelwood consumption was 3.1 m3/household/y and 7.2 m3/household/y respectively5
• do not include the use of large volumes of fuelwood for ceremonial and other occasional uses or for cottage industries reliant on fuelwood;
. The corresponding estimates in Table 84 are around 6 m3/household/y in urban areas and 10.6 m3/household/y in highland rural areas. While the CSM estimates are more precise measurements for household fuelwood use for regular purposes, it is not valid to expect a direct equivalence between the two ways of estimating fuelwood consumption, because the CSM estimates:
• it is possible that they represented relatively small households by the nature of the way that they were invited to participate in the exercise.
• the urban households in the CSM exercise all used other sources of energy (e.g. gas, kerosene, electricity) and did not use fuelwood every day (unlike many households in the Q-survey).
The CSM exercise highlights the vast difference between urban and fuelwood consumption (see for example Fig 21). This is also suggested in Table 84 (Column H). The low fuelwood use in Hagen urban is probably due to: restrictions on fuelwood use in high covenant housing stock, and the relatively high cost of fuelwood in Mt Hagen which makes alternative energy sources more cost-effective.
What is the aggregate value of the domestic fuelwood economy? It is possible to estimate the size of the fuelwood economy using the following:
• Estimates of the fuelwood expenditure in fuelwood-stressed districts • Estimates of the tonnage of fuelwood collected in fuelwood-stressed districts, and nationally • A conservative price/kg for fuelwood based on measurements in the survey6
The national estimate of the gross value of the wood consumed domestically is K2,409 million/y (K2,708 million/y in 2012) (Table 85). This is likely to be an underestimate, but it is the best that can be done with available data.
.
5 Comparisons are made on the basis of households rather than persons because the CSM study did not record the number of people in each case study household.
6 The value of K0.3/kg was used as this is close to the value measured in NCD, Eastern Highlands and Chimbu provinces (Table 62) . it is the lower end value measured.
122
Missing from this data are estimates of fuelwood expenditure in the non-fuelwood-stressed districts of PNG. It could be argued that in these areas most fuelwood is collected. The volume of fuelwood purchased will be even lower than that in the fuelwood-stressed rural districts of the highlands in this survey (where only 3.5% buy fuelwood). Unfortunately, there is no credible data to use or even extrapolate from. In addition, these estimates do not consider the money spent on harvesting, transporting, or selling fuelwood; so they do not constitute all the data that might be give a ‘gross domestic product’ of fuelwood in the national economy.
One should also take care with pari passu extrapolations which assume that the fuelwood use of population has not changed between 2008-9 and 2012, and that the relative distribution of population across districts of PNG has also remained the same since 2000. The second of these assumptions is particularly fraught, but more recent census data was not available to correct for these changes.
Table 85 Estimates of gross value of domestic fuelwood economy
Source
At time of survey 2008-9
Extrapolating to 2012 values
Total fuelwood purchased in 2008-9 fuelwood-stressed districts Table 77 [A]
K18,173,411 [A]
K24,011,409 Total fuelwood collected
in FW-stressed districts Extrapolating nationally
Table 82
1,506,305 tn/y 6,770,408 tn/y
8,945,323 tn /y Value of collected fuelwood @ K0.3/kg
In FW-stressed districts Extrapolating nationally
Table 62
K451,891,500 /y [B]
K2,031,122,314/y
[B] K2,683,596,879/y
Total value of national fuelwood economy
[A] + [B] K 2,049,295,726 K2,707,608,289
Source: PurchasesFW_120511a.xlxs
Comparison with other studies This study is the seventh known attempt to estimate the value of the fuelwood economy, either by desktop study or survey. The key results from 3 of these studies which provide national estimates that can be compared with this study are presented in Table 86.
The Department of Minerals and Energy surveyed household energy consumption in Port Moresby in 1980 (Gamser, 1980). The survey covered 1,800 low cost, domestic quarters, urban village, and squatter settlement households that comprise 79 percent of the city's dwellings. It was undertaken in July/August by 57 student surveyors from the University of PNG. There has been another fuelwood survey undertaken by students of University of PNG in 2000’s, but the report could not be located despite several attempts.
The key findings of the 1980 survey were that 98% percent of the homes surveyed used firewood or kerosene for cooking and lighting. Electricity was rarely used for purposes other than lighting because of its high cost. Almost everyone surveyed paid to obtain firewood, either to buy bundles from sellers or to travel great distances to gather it. They claimed that few areas in Port Moresby possess adequate firewood supplies within walking distance from their households. Certainly access to electricity has improved in the 28 years between surveys, but the variance between these findings and those of the current survey (where only 73% used fuelwood in the NCD, and of those only 33% bought fuelwood) may be due to sampling differences. The current survey was stratified to represent
123
the whole population of the NCD, not just those in lower cost housing and settlements. Also in the current survey 26% of respondents who collected wood had access to private vehicles, used PMVs or had fuelwood delivered (Table 23).
The 1980 survey focused on kerosene as an alternative to fuelwood reporting that the average price paid for kerosene was over 13 times greater than the price controlled price for this fuel at the time of the survey. Kerosene purchased in small containers from trade stores cost 4 to 5 times as much as the controlled price charged at petrol stations. Nevertheless, the rapidly decreasing firewood supplies make this fuel more difficult and expensive to obtain each day, and many people were switching to cooking with imported kerosene. Gamser proposed that firewood and charcoal produced from sawmill wastes and sold at community distribution centres could undercut the then present energy cost of firewood by 19 to 60 percent and the energy cost of kerosene by over 50 percent. The charcoal idea was followed by a program of promoting charcoal production and use of charcoal stoves (Gamser and Harwood, 1982), but it is believed this stalled because of the lack of continuity of supply of charcoal.
The next two attempts in the1990s at understanding the fuelwood economy (shown in Table 86) were desktop studies (Brown 1994, Bourke 1997), both apparently based on other desktop studies (FAO and World Bank). It has not been possible to un-earth the assumptions behind the relatively low estimate of the fuelwood economy in Bourke (1997); so it remains unexamined. However, the estimates of volume and per capita consumption in Brown (1994) are remarkably close to that of the current study. The population at the time of Brown’s study was about 4million. Assuming fuelwood consumption increases linearly with population growth, the 5.5 mill m3 extrapolated to 2012 terms would be 9.4mill m3, which is very close to the 8.95 mill m3 estimate in the current study. Similarly, Brown’s estimate of 1.38 m3 per capita consumption is very close to the current studies 1.80 m3/ person.
Considering the layers of assumptions upon assumptions that is the nature of desktop studies this concurrence is either remarkable or just fortuitous. Brown’s values are based on FAO estimates of roundwood production from the industrial forestry sector. This is reasonable if a considerable proportion of nation’s fuelwood is sourced from the forestry sector (as it is in the RWEDP countries), but in PNG there is no formal fuelwood supply from industrial forests. Waste wood may be purchased from mills, but this is a minor part of the economy. About 10% of fuelwood purchased in the NCD comes from sawmills (Table 30).
A project completed in 1999 known as the Mapping Agricultural Systems of PNG (MASP) project estimated the value of the fuelwood along with 19 other income sources. The income from fuelwood in rural PNG in 1996 was estimated to be K4,442,004 . As the number of people engaged in fuelwood business was 1,032,259 the average income was calculated at K4/person. The current survey’s estimate of fuelwood expenditure in the rural fuelwood-stressed regions in 2008-9 is K7,226,706 (from Table 79)7
7 Table 79, Column H: 1,536,490+5,690,216= K7,226,706
. The current survey’s values represent a smaller geographical area than the MASP value, but the population growth over the intervening decade may account for the difference in total value. However, the average income from sellers interviewed in the current survey was K2,326/seller (Table 63) ,which considering average rural household size of 5 would equate to K465/person. Only 25% of respondents earned < K500/y. Perhaps the MASP values included a much greater number of

124
individuals who sell fuelwood on an infrequent basis than the current survey detected. However, the MASP estimate of proportion of rural population earning income from the sale of fuelwood was 8.2%, which is very similar to the 10% estimated in the current survey.
The most recent available survey of fuelwood use was undertaken to the south of Goroka in the Eastern Highlands as part of an AusAID-funded PNG Forestry Human Resource Development Project of 1997-2001 (Murphy 2006). The sample size of this survey was 401 and only 5% of households in her survey area bought wood (which is in accord with the 3.5% over the rural highlands estimated in the current survey). The estimate of market value of fuelwood in the area was K2 for 10kg bundle (or K0.20/kg, n=4). This estimate was from just four samples. However it is not that different from the average of K0.35/kg (n=18) for Eastern Highlands measured in the current survey (Table 62).
As most wood in the district is collected, Murphy used proxy values to estimate the value of the local and national fuelwood economy. She proposed that the value of a day collecting wood was K15/d (and for season K300) when compared with working in coffee gardens, and K5/d (K260/y) when compared with the minimum rural income. Either way, Murphy reasoned that a day collecting fuelwood can cost the household the equivalent of 15-20% of potential household income. When these values were extrapolated nationally (probably a dangerous extrapolation given the geographic narrowness of the original data), Murphy estimated that the national fuelwood consumption (both collected and purchased) based on market price is K550 mill for 2.75 mill tons/y.
Murphy’s estimates of the value of the market (K3.9mill) and full economy (K 500 mill) based on market values do not agree at all with the current study. Even if the higher market price for fuelwood (K0.30/kg) is used, and adjusted for population growth, these values are still considerably lower than the current study. The problem may be the market estimates were based on only 5% of respondents who bought fuelwood out of the 401 total survey (i.e. about 20 respondents in a very localized highland setting). The current study bases its estimates on the response of 750 respondents across 55 sampling strata.
Meanwhile Murphy’s other estimate of the economy, K9,159 mill, is far too high. It is based on proxy values of the time spent collecting fuelwood, the minimum rural wage, and income that could otherwise be generated though coffee production. This opportunity-cost estimate is a valid approach. However, the basic values it uses are invalid, especially for national extrapolation. In the current survey, most people said they collected fuelwood in the process of their other gardening or travel activity; it was not always a single-purpose trip for collection. Also, many people collecting, the young and elderly, are not in a position to collect the minimum rural wage anyway. Finally, using an opportunity cost for coffee production is only valid in the highland areas where coffee is grown.
Finally, it is instructive to compare the current survey with those of the RWEDP countries discussed earlier. Table 87 combines the national estimates of 2010 fuelwood consumption for the 16 RWEDP countries with their populations in the same year. PNG’s per capita consumption of fuelwood is six times that of the RWDEP average. Bhutan was the only country that had higher fuelwood consumption (2.35 m3/person) than PNG (1.80 m3/person).
125
Table 86 Comparison of this survey with other PNG estimates
Brown (1994)
MASP (1996)
Bourke (1997)
Murphy (2006) Current study
Value fuelwood economy Kina/year
K5.03mill K 350 mill K 550 mill b
K 9,159 mill c K 2,409 mill(2008)e K 2,707 mill (2012)
Value of fuelwood market Kina/year
K3.9 mill K 18.2 mill (2008) K 24.0 mill (2012)
National fuelwood consumption
5.5 mill m3
[7.59 mill ton]
a
2.75 mill tons
6.77 mill tons (2008) [4.9 mill m3] a
8.95 mill tons (2012) [6.5 mill m3] a
Per capita fuelwood consumption 1.38 m3 887 kgd
[ =0.64m3] a 1.80 m3
Comments Based on estimates of national roundwood production in FAO Forestry Yearbook 1993
a using 0.725 tn/m3 conversion
Estimated cash income based on 1990-1995 population Allen et al (2009) {Allen, 2009 #814}
From World Bank Poverty Assessment; details not available
b Based on market price (K0.20/kg) c based on proxy values of minimum wage and coffee income in 2000 d the basis of this estimate is not clear but could be based on an average head-load (method of determination not given) , and collection frequencies
e Based on market price K0.30/kg, respondents estimates of purchases and/or proxy weight of fuelwood collected in 2008
Table 87 Comparison of this survey with RWEDP estimates
RWEDP country
† 2010 consumption
(kton)
‡ 2010 Population (million)
2010 kton/mill tons/person * m3/person
Bangladesh 13320 164.4 81 0.08 0.11 Bhutan 1195 0.7 1707 1.71 2.35
Cambodia 7553 15.1 500 0.50 0.69 China 252819 1338.1 189 0.19 0.26 India 225725 1188.8 190 0.19 0.26
Indonesia 67465 235.5 286 0.29 0.40 Laos 3496 6.4 546 0.55 0.75
Malaysia 8216 28.9 284 0.28 0.39 Maldives 123 0.3 410 0.41 0.57 Myanmar 31183 53.4 584 0.58 0.81
Nepal 18378 28 656 0.66 0.91 Pakistan 52167 184.8 282 0.28 0.39
Philippines 30329 94 323 0.32 0.45 Sri Lanka 6769 20.7 327 0.33 0.45 Thailand 53390 68.1 784 0.78 1.08 Vietnam 39418 88.9 443 0.44 0.61
RWEDP 811546 3516.1 231 0.23 0.32
PNG 6770 5.2 1302 1.30 1.80
Sources: † FAO 1997; ‡PRB 2010; * conversion 0.725tn/m3

126
Fuelwood is commonly used even in presence of alternatives Switching to other energy sources requires the presence and reliability of other sources, the capacity to pay for other sources and preference for the different utility the other sources provide. These conditions are growing for many PNG’s people, especially in urban areas. Yet the preference for, or at least reliance on, fuelwood is very high in PNG even in the presence of alternatives.
Across the whole survey area 85% of respondents had used fuelwood in the year of the survey. In is no surprise that the highest proportion of non-users (27%) was found in the NCD sample, and that most of these were living in high covenant and housing commission houses (Table 8). These households would have higher incomes and powerline access to the house. Indeed 51% of residents in high covenant houses did not use fuelwood (Table 9). Many of these houses (25%) were also subject to local regulations prohibiting fuelwood use, but health and dirtiness of fuelwood were also commonly given as reasons for not using it (Table 10). In other urban areas (Lae and Mt Hagen) the main reasons for switching from fuelwood were that the respondent could afford another source and that fuelwood was getting to difficult to access. In Mt Hagen fuelwood was also considered too expensive. This is supported by the fact that the average price for fuelwood in Mt Hagen urban area was K1.15/kg, compared with only K0.30/kg in the NCD (Table 62).
Nevertheless, the use of fuelwood in urban areas of PNG is very high compared to RWEDP countries. Access to powerlines does not by itself switch a household away from using fuelwood (Figure 5). Many urban residents still need fuelwood for the traditional mu mu used on weekends, ceremonies and holidays. Many residents with access to power said that they used fuelwood in a response to blackouts. A very high proportion of both urban (26%) and rural (58%) respondents used fuelwood for earning an income, usually for occasional small-scale baking or hot food preparation at markets (Table 31) . The average annual incomes for these activities were K3,503 (urban) and K1,557 (rural) (Table 32).
While the whole rural population had used firewood in the year of the survey, 88% confirmed that they also used alternative sources of energy. The most dominant reason was for the better light which was supplied by kerosene lanterns and gensets (Table 15). Other common responses were the efficiency and labour-saving characteristics of the alternatives as well as the speed and control over cooking and general cleanliness. Gas and kerosene are the main alternatives to firewood for cooking. About 15% of the population sampled has access to mains power and 30% access to gensets, which may be communally owned. The hierarchy of alternative energy use was generally kerosene for lighting, gas for cooking and gensets for appliances, then mains access for appliance and lighting.
Even though fuelwood use is so widespread, the technology of using it is undeveloped, but shows great potential for development. The most common methods of using fuelwood is with open fires either inside (34%) or outside (51%) the house. Drum ovens are also used inside (13%) and outside (32%) the house, but more fuel-efficient devices such as metal boxes are not that common (Table 13). If fuelwood purchase and collection is placing an increasing burden on household budgets, then this could be alleviated by encouraging simple technologies for more efficient use of fuelwood.
The use of value-added fuelwood in the form of charcoal was very low. Indeed the responses to questions about charcoal are likely to be spurious because of a general mis-understanding of its nature (Figs 13a & b). The ‘sakol’ that highlanders commonly use are the coals left over from the previous fire. Charcoal is made in PNG infrequently and in small amounts in Lae and the NCD, but most charcoal for sale is imported and most likely used in the BBQs of the more cosmopolitan residents of PNG. There was a very positive interest shown in charcoal-cooking demonstrations at the Hagen Highland

127
Show and Morobe Cultural Show in 2011. Charcoal is another way in which the fuelwood economy of PNG could be developed. As mentioned earlier, this was attempted in the NCD in the 1980s {Gamser, 1982 #564} but apparently failed due to lack of continuity of supply of charcoal to the market. It is the charcoal production system that needs development.
Concluding this section, other energy sources are available and PNG people are using them alongside the traditional use of fuelwood. Even when they have access to electricity or gas at home, they may prefer fuelwood for occasional cooking or cooking away from home. In the highlands people look to other sources of energy for lighting and electrical appliances, but fuelwood still remains the preferred energy source for most people for cooking and providing heat at night. Fuelwood provides some utility that other energy sources lack. It is also the ready fall-back position when finances are low. It is not going to be wholly replaced by other energy sources in any foreseeable future.
Selling or using fuelwood to generate income Fuelwood is integral to earning an income for a large proportion of the population. It is easy to enter the market for selling fuelwood and 3% of urban and 10% of rural respondents in the User Surveys do so on an occasional basis. Similarly 26% of urban respondents and 58% of rural respondents used fuelwood in cottage industries such as hot food vending, baking, smoking fish etc. (Table 31). Many people engage in such activities opportunistically (e.g. they collect fuelwood in excess of personal requirements, or approached by sellers) or as a matter of urgency (e.g. to pay school fees or for medicine). The majority of people (86% urban, 95% rural) earn less than K5,000/y from this activity (Table 32).
In the Sellers Survey 92% of sellers earned less than K5,000 / y, but some of the more organized seller-groups earned up to K70,000/y (Table 63). The main problems encountered in this industry appear to be transporting the fuelwood to point of sale, followed by access to fuelwood, competition, safety / fatigue, then theft and conflict (Table 71). However, most sellers were still optimistic about the trade seeing it as easy to enter and a relatively assured market.
For the cottage industries studied in the Semi-Structured Interviews, estimates of the annual use of fuelwood were very high compared to domestic use summarized in Table 77. For example, the hot food vendors interviewed along the Highlands Highway will use between 2 -6 tonnes of fuelwood a year (assuming working 200 days in the year) (Table 76). This helped them generate incomes of between K250 – K1,300 per week (~ K10-40,000 /y).
Similarly, some of the lime burners along the Morobe coast using bamboo consumed between 4-9.5 tons bamboo per year. Those groups using hardwood for the same purpose consumed between 40-60 tons of hardwood per year (Table 75). Most of this bamboo and hardwood had to be purchased. Interestingly, the financial efficiency of bamboo was much higher than the hardwood; K2.96/kg bamboo vs K0.33/kg hardwood (see Figure 15). Estimated incomes of the larger lime burning groups (of up to 10 members) were between K7-48,000 /y.
Social impact of fuelwood collection Before the survey the general perception was that fuelwood is becoming more difficult to access. There is a solid logic to this: the population is growing, especially in urban areas; and trees, while they may seem abundant to the casual viewer, are either under customary or municipal ownership. The seeming abundance of trees is not the same as a supply of fuelwood or alleviation of fuelwood scarcity (Mahiri, 2003). The survey indicates that the reality of access to fuelwood is more nuanced; it depends on who and where you are.
128
It appears that for about 24% of the urban and 3% of the rural population access to fuelwood has only been a recent problem (i.e. it was much more difficult to access wood over the previous 2 year period compared with previous 10 year period). The main reason cited for the problem in urban areas was immigration. However 17% of the urban population felt there was no problem at all accessing fuelwood as they either lived close to city margin, NCD hills, a sawmill, or mangroves (Table 33). Rural respondents had ready access to coffee gardens and trees on their own land or nearby.
Nevertheless, the level of conflict associated with fuelwood collection is alarming. In the NCD, 48% of fuelwood users experienced conflict in the process of fuelwood collection. If the NCD hills were under customary ownership, this figure would probably be much higher. The levels of conflict were even higher in the rural areas, with 61% in Mt Hagen rural to 88% in Henagnofi (Table 41). Some of the conflict arising over competition for fuelwood is far from trivial (see selected comments in Table 42). Accordingly, there is a strong agreement for the need to plant fuelwood trees across all districts, but less so around Lae. Levels of conflict over trees are relatively low in Lae as it appears that fuelwood is still relatively easy to access nearby.
Both collection and purchase of fuelwood is a relatively gender neutral activity in the NCD. Outside the NCD men are more likely to buy the fuelwood for the household, and only in Lae rural do women collect fuelwood more than the men (Tables 27 and 28). This is very different from many developing countries where women are the main fuelwood collectors. On average fuelwood collection trips will take about 3 hours, and will occur between 1 to 3 times week in urban areas and about 4 times a week in rural areas (Table 21); and 68% of these trips are on foot in urban areas (Table 23).
Environmental impact of fuelwood collection There was also the common perception before the survey that fuelwood collection is a cause of deforestation. This claim cannot be directly supported from the survey, and it is probably too simplistic a claim to make. The relationship between fuelwood collection, per se, and deforestation may be very location specific and not a general problem.
In urban areas 66% of fuelwood is collected from the sources such as: around the house, own land, garden clearings. The ‘surrounding hills’ accounts for about 14% of wood collected, but these hills are at best secondary regrowth, and within 30km of the NCD. Another 9% is sourced from stream banks and only 3% from mangroves (Table 17). That 3% may have a significant effect on the mangroves, but the point is that fuelwood collection for urban areas is not impacting on natural (non-mangrove) forests (mangroves are discussed later).
Similarly in rural areas 43% of fuelwood is collected from around the house and coffee lands. Another 15% is collected from bush fallows, 12% from planted forests, and 7% from stream banks (Table 18). It is possible that the 12% from garden clearings and 9% from natural forests could be impacting on forest integrity.
The garden clearings have evolved from the traditional swidden cycle which left the land to recover for decades before re-clearing. With population growth the recovery periods have grown much shorter as a response to land pressure. The survey did not determine whether the garden clearings were new from natural forests, or from bush fallows, grassland or just garden fallows. So it is difficult to assess their direct impact on standing forest. However, it is estimated that 56% of land used for cultivation across all PNG is covered in secondary forest before it is cleared for planting {Allen, 2001 #567}.
129
It is likely that much of the wood collected from garden clearings and even under the ‘natural forest’ category was re-growth and could have been included under ‘bush fallows’. Bush fallows are essentially a long-cycle agroforestry system and should not be considered as forest degradation. Nevertheless, the fuelwood collected from ‘garden clearings’ is equivalent to 602,870 tn/y (or 43,708 m3/y). The 9% collected from ‘natural forests’ is equivalent to 117,934 tons / y (or 8,552 m3 /y) in the fuelwood-stressed districts8. Is this a significant and unsustainable harvest?9
A survey of PNG forests using remote sensing imagery showed that over the period1972-2002 15% of PNG’s rainforest was cleared and 9% degraded to secondary forest. Of this 48% was due to logging, 1.2% from plantation agriculture (e.g. oil palm) and only 0.6% from mine development. The expansion of subsistence agriculture contributed to 46% of the net forest change over this period. This was in the form of clearing 3.6 Mil ha or 11% of the intact forest in 1972. A further 4.4% of forest was lost due to fire associated with subsistence agriculture {Shearman, 2008 #560}. .
The PNG population grew from 2.7 to 5.6 million in this period and the highest population densities exist in highlands between 1200-2500m. There is a strong relationship between population density and forest loss in lowland and island regions, and this relationship is also apparent in the highlands (see Figure 32). About 30-40% of the population lives in the highlands, growing at 3.2%/y and showing no signs of slowing. The average population density is 22 persons/km2 with patches of 200person/km2 {Allen, 2001 #567}. The next densely populated region is the islands (10 person/km2).
Given the high population in the highlands one could be struck by how relatively little deforestation and degradation of rainforests has occurred in the highland provinces (see Table 88). Earlier studies analysing forest change between1975-1996 claimed that population increase in the highlands was accommodated by intensification of garden systems rather than clearing for more gardens (McAlpine & Freyne, 2001). The Shearman (2008) study, which is over a longer time span and finer resolution, disputes this and squarely points the finger at garden clearing being the main cause of deforestation. The low rates of ‘degradation’ (which is caused by the logging process) in the highlands, supports this view. (Table 89 shows how this small amount of degradation is restricted to Southern and Eastern Highlands.)
Neither study adequately quantifies the relationship between clearing for gardens, tree planting in gardens, collecting fuelwood, fires caused by clearing and the processes of regeneration. Elsewhere in the world (eg Nepal: Bajracharya,1983) deforestation is understood to be primarily a response to clear forest for food cultivation, not so much for fuelwood. So it is the food-fuel system that needs to be understood.
It would be useful to undertake a detailed woodflow study in, for example, the Waghi Valley which also considers the sustainable subsistence harvest and regenerative capacity of these forests. It would also be useful to determine to what extent clearing for gardens is motivated by fuelwood collection, or as is more likely the case, food production. If fuelwood collection is just a by-product of garden
8 46% and 9% respectively of the estimated 1,310,598 tn/y collected in the Rural highlands survey district as well as the extrapolated tonnage from fuelwood-stressed districts not included in the survey. Table 82, Column F 9 This is difficult to answer and wont be attempted here. The only comparison available is the total raw log export volume for PNG in 2006 which was about 2.7million m3 {Shearman, 2008 #560}.

130
clearing then it can’t be blamed for deforestation. A similar study in the NCD hills would be an interesting comparison. Both areas have very high population densities, the regenerative capacity of the forests surrounding the Waghi Valley is arguably greater than that of the NCD hills, yet the average market price for fuelwood in Mt Hagen is K1.10/kg and NCD K0.30/kg. What is happening here?
In contrast to this disputed relationship between fuelwood collection and deforestation, fuelwood collection is likely to be a significant, though very localized, cause of the decline of mangroves. In NCD and Lae urban areas 3% of respondents collected wood from mangroves (Table 17). Assuming these residents collected all their wood from this source, this could amount to about 4,970 tons/year (or 6,860 m3/y) around those population centres collectively10
. Such collection may only be a problem in the NCD and Lae. In the survey of 11 lime burners along the Morobe coast (Salamaua LLG) only one, very small time, operator used mangrove wood. All other operators respected local regulations prohibiting the use of mangrove wood. Only bamboo and forest hardwoods were observed on the fires. An assessment of the effect of fuelwood collection on mangroves needs a targeted study which also considers the regenerative capacity of mangroves after cutting.
Figure 32 Proportion of forest cleared due to subsistence agriculture in relation to population density (Shearman et al 2008).
Table 88 Area (ha) deforestation and degradation of forests by region between 1972- 2002
Region
all rainforest accessible rainforest
1972 (ha) 2002 (ha) % change 1972 (ha) 2002 (ha) % change Primary Primary DF DG ∑ Primary Primary DF DG ∑
Islands 4,885,727 2,699,103 21 24 45 2,877,354 1064717 22 41 63
Highlands 4,776,533 4,104,916 14 0 14 507,092 436716 11 3 14
Lowland Coastal 23,565,330 18,528,234 14 7 21 1,009,0542 7182347 12 17 29
Total 33,227,590 25,332,253 15 9 24 13,474,988 8683780 14 22 36
Source: Shearman et al, 2008.
DF = deforestation; replacement of primary forest with other vegetation types such as subsistence gardens, plantations, grasslands etc; DG = degradation; conversion of primary or climax forest into secondary forest through commercial logging or low intensity burning
10 derived from Table 82 columns F and G * 0.3
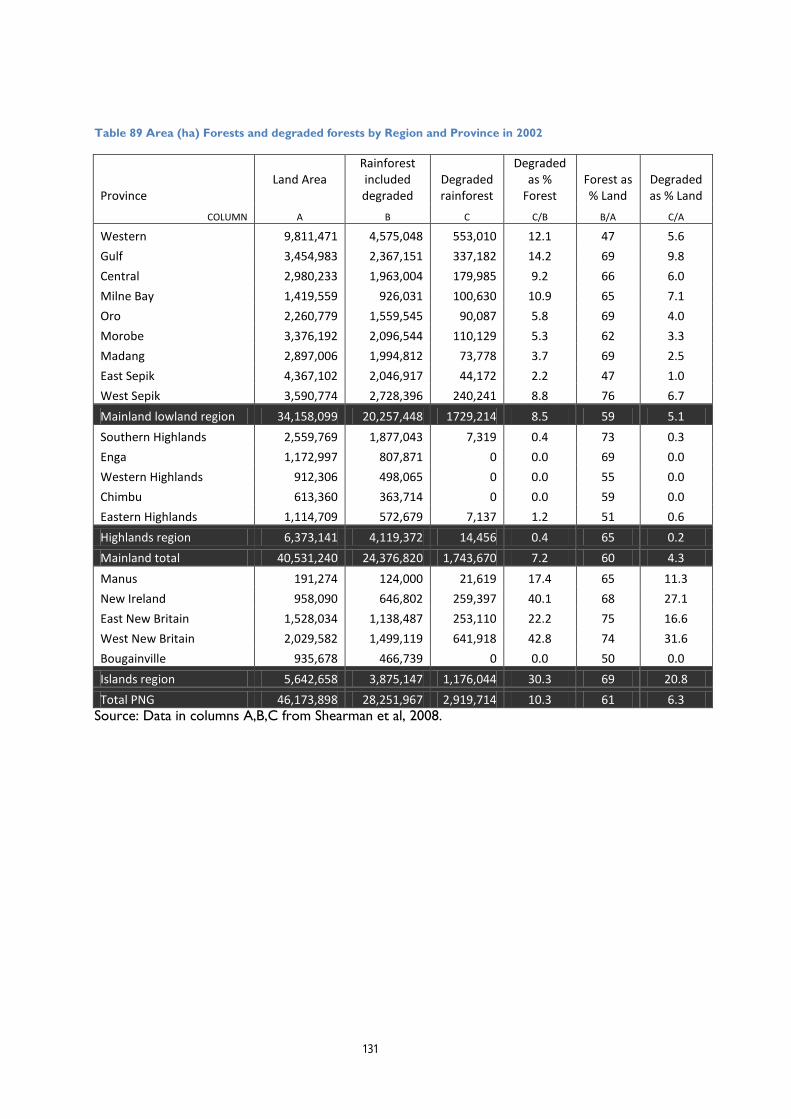
131
Table 89 Area (ha) Forests and degraded forests by Region and Province in 2002
Province Land Area
Rainforest included degraded
Degraded rainforest
Degraded as %
Forest
Forest as % Land
Degraded as % Land
COLUMN A B C C/B B/A C/A
Western 9,811,471 4,575,048 553,010 12.1 47 5.6 Gulf 3,454,983 2,367,151 337,182 14.2 69 9.8 Central 2,980,233 1,963,004 179,985 9.2 66 6.0 Milne Bay 1,419,559 926,031 100,630 10.9 65 7.1 Oro 2,260,779 1,559,545 90,087 5.8 69 4.0 Morobe 3,376,192 2,096,544 110,129 5.3 62 3.3 Madang 2,897,006 1,994,812 73,778 3.7 69 2.5 East Sepik 4,367,102 2,046,917 44,172 2.2 47 1.0 West Sepik 3,590,774 2,728,396 240,241 8.8 76 6.7 Mainland lowland region 34,158,099 20,257,448 1729,214 8.5 59 5.1 Southern Highlands 2,559,769 1,877,043 7,319 0.4 73 0.3 Enga 1,172,997 807,871 0 0.0 69 0.0 Western Highlands 912,306 498,065 0 0.0 55 0.0 Chimbu 613,360 363,714 0 0.0 59 0.0 Eastern Highlands 1,114,709 572,679 7,137 1.2 51 0.6 Highlands region 6,373,141 4,119,372 14,456 0.4 65 0.2 Mainland total 40,531,240 24,376,820 1,743,670 7.2 60 4.3 Manus 191,274 124,000 21,619 17.4 65 11.3 New Ireland 958,090 646,802 259,397 40.1 68 27.1 East New Britain 1,528,034 1,138,487 253,110 22.2 75 16.6 West New Britain 2,029,582 1,499,119 641,918 42.8 74 31.6 Bougainville 935,678 466,739 0 0.0 50 0.0 Islands region 5,642,658 3,875,147 1,176,044 30.3 69 20.8 Total PNG 46,173,898 28,251,967 2,919,714 10.3 61 6.3
Source: Data in columns A,B,C from Shearman et al, 2008.

132
Planting trees for fuelwood and value-adding The survey gathered enough data to roughly estimate how many trees have been planted by residents in the different survey districts (Table 90). One should be mindful how this data was collected and associated caveats.
• Respondents in the Q-survey were asked “How many trees have you planted over the last 2 years?” and then “How many trees have you planted over the last 10 years?” Recall data will usually be highly generalized and most responses were of the nature “100”, “500” “1,000” etc. In contrast, many respondents were confidently specific; e.g. “15”, “110”, “2,800”. In aggregate, this data should only be taken as representing the respondents’ general feeling for how many trees they have planted.
• Even though the district estimates are also presented, many of the trees that the respondents remember planting may have been planted in other districts, particularly for the NCD and other urban survey districts.
• The trees planted would have included fruit and ornamental trees, as well as forest trees.
Table 90 Estimate of trees planted in fuelwood-stressed districts
Survey District
Survey sample
No. Hhld in district
No. Tree planters
No. Trees planted
% Sample planting trees
No. Hhld in district planting
No. Trees planted in District
TOTALS
Planted in last 2 years
Urban
3,573,989
NCD 1,868 35,188 827 7,313 44 15,578 311,161
Lae 558 11,205 140 5,115 25 2,811 409,383
Hagen 247 4,314 133 16,264 54 2,323 527,541
Rural Lae 285 6,590 140 1,730 49 3,237 81,434
Highland 996 36,209 894 55,416 90 32,501 2,244,472
Non-survey Highld † 134,087 90 120,355 8,311,594 11,885,584
Planted in last 10 years
Urban
7,369,394
NCD 1,868 35,188 944 19,044 51 17,782 709,873
Lae 558 11,205 137 4641 25 2,751 379,580
Hagen 247 4,314 138 10,264 56 2,410 320,862
Rural Lae 285 6,590 133 2,303 47 3,075 114,111
Highland 996 36,209 390 62,955 39 14,178 5,844,968
Non-survey Highld † 134,087 39 52,504 21,644,736 29,014,130
‡
Column A B C D E F G
Source Table / Column T2a,b T2c T40 T40 100*C/A B*E/100 B*D/C
Hhld = Household ; FW = Fuelwood Source: FW_DiscussTables_110512.xlxs † Districts not in survey but recognised as fuelwood-stressed in Hanson et al 1991. Values used in these columns are the same for the Highlands rural survey sample; ‡ Non-surveyHighld F * HighldF/HighldG
133
The number of trees planted over the 2 year previous to the survey is in the order of 3.6 million scaled to represent the total population across the surveyed districts. If the non-surveyed fuelwood-stressed highland districts are included, this value is 11.9 million. There is a very strong tree planting culture in the highlands with 90% of the sample having planted trees in that 2 year period.
The corresponding estimates for the “10 year” question are 7.4 million and 29.0 million. This is likely to be an underestimate because the number of highlanders responding to this second question was only 39%. Tree planting is not a recent phenomenon in the highlands. The discrepancy in highland tree planters between the 2 year and 10 year questions seems to be a problem in how the questions were asked or recorded. Either the respondents could not recall their tree planting activity over the longer time period or some of the interviewers skipped over the 10year question.
These values should be considered as ‘order of magnitude’ estimates because of the nature of recall data. Nevertheless, the numbers of trees planted is astonishing with even 25-54% of urban respondents planting trees. Not all these trees will be destined for fuelwood but it is likely that most could be considered as fuelwood sources. The fuelwood collected from ‘around the house’ by 47% of urban respondents and 21% of rural respondents (Tables 17 and 18) would have come from planted trees.
Planted trees were also strongly represented in the species that respondents preferred (Table 46). For example in the NCD, mango, neem and raintree were strongly preferred. Eucalypts were also favourites in NCD and the Mt Hagen area. In the NCD much of this would be the local Boroko (E.alba) but in the highlands there is a lot of introduced, and therefore planted, E.grandis and E. robusta. Indeed, seedlings of these trees were seen for sale on the roadside in Mt Hagen. The most favoured species in general were the various yar (Casuarina oligodon in the highlands, C.equistitfolia in lowlands). Yar seedlings were also seen on sale in highland markets. Other local preferences were the woody weed Piper aduncum around Lae, the naturalized and weedy Leucaena spp in Chimbu and Eastern Highlands, and plantation coffee in the Western Highlands. Planted species will become favourites for their inherent burning qualities, but also because they are easily accessible and relatively fast growing.
For balance, specific native hardwoods were also strongly favoured; e.g. PNG Oak (Castonopsis acuminatissima), PNG Beech (Nothofagus spp) and Lithocarpus spp in Eastern Highlands and Chimbu; PNG Walnut (Dracontomelon spp), Taun (Pometia pinnata) and Terminalia spp around Lae, and mangrove (Rhizophora spp) around NCD. It is not known if any of the local rainforest species are being planted by landholders. They were not observed for sale in markets.
The issue of value-adding fuelwood concerns charcoal as this is a common option across the tropics, and certainly a significant component of the wood-energy economies of the RWEDP countries. The charcoal market in PNG is very small and barely obvious. There was a good effort in the mid-1970s and early 1980s to establish charcoal as a relatively clean and affordable energy source in the NCD. Research into the most appropriate charcoal kilns produced the TPI kiln (Tropical Products Institute) and the simpler Tongan Drum kiln. Equally simple and cheap charcoal stoves were also developed {Nakau, n.d. #571}. These stoves were even distributed among public servants at cost to prime the charcoal economy. However, the attempt stalled because of lack of charcoal supply {Romaso, 2009 #572}.
Imported charcoal was observed for sale in NCD, Mt Hagen, Goroka, Madang and Lae at an average price of K10.12 / kg (Table 68). Small amounts of locally produced charcoal are sold in Lae at about
134
K1.50/kg. Charcoal is also occasionally produced in the Rigo district near the NCD. Local eucalypts and mangroves are cut to produce charcoal that is used to grow orchids. It retails at K1.00/kg. It is fair to assume that nearly the cooking charcoal is being used by foreign residents and wealthier urban locals. The knowledge of using of charcoal for cooking is not widespread. During the survey it is believed most highland respondents were not aware that charcoal is a commercial product. ‘Sakol’ to them was just the coals left in the fireplace from the previous night.
In the other, non-survey, component of the Fuelwood Project, the team gave charcoal cooking demonstrations at the Highland Cultural Show and Morobe Agricultural and Cultural Show (August and October 2011). Both events attracted great curiosity and positive interest in this method of cooking.
Development of a fuelwood market based on farm-grown timber This section discusses the potential for developing a fuelwood market based on farm-grown timber. It combines the knowledge gained from the fuelwood survey as well as the other research activities in the Fuelwood Project.
From the survey, some of the key points that are encouraging for purpose-grown fuelwood are:
• Fuelwood will remain a dominant component of the energy sector in both rural and urban areas. In rural areas 10% of people earn income from selling fuelwood and 58% earn income using fuelwood. In urban areas 3% of people earn income from selling fuelwood, and another 26% earn income using fuelwood. Fuelwood remains in use alongside alternative energy sources such as kerosene, gas and electricity
• Access to fuelwood is becoming increasingly more difficult and leading to conflict especially in the highlands where the price of fuelwood can be very high.
• The fuelwood economy is simple and flat with very few intermediaries between collector and seller. There are possibilities to develop more efficient supply chains that would overcome some of the diseconomies of scale associated with a high number of low volume traders.
• Selling fuelwood is an easy market to enter. The most cited problem in the trade is transport of fuelwood to market. This problem might be overcome by more organised and capitalised traders.
• The fuelwood economy in PNG is very large and mostly informal. There is no government participation, intervention or regulation of the fuelwood market. While this means there is no institutional support for fuelwood traders at least there are no barriers or extra costs associated with permits to cut, transport and trade.
Meanwhile key results from the field trials11
• It is possible to grow commercial quantities of short-rotation (2 year) coppice (SRC) fuelwood in both the NCD and Mt Hagen, but growth rates and final production of air-dry fuelwood is 2-3 times greater in Mt Hagen. The best species are likely to be E.robusta and E.grandis in the
are:
11 These field, laboratory and market trials associated with the Fuelwood Project are presented in “Evaluation of Short-Rotation Coppicing Fuelwood Species for Papua New Guinea”
135
highlands and E.pellita around the NCD. Calliandra, and as second choice Leucaena, grown in alley garden systems may also be a good option in the highlands.
• Evaluation of fuelwood produced in these systems showed that householders ranked E.grandis in Mt Hagen as the best SRC species, but not as good as local yar. In the NCD householders ranked E.pellita and E.tereticornis as better than neem (Azadirachta indica) but not as good as the local boroko (E.alba). However, fuelwood sellers generally had a hard time selling this SRC wood because it looks very much different than normal fuelwood on sale.
• The charcoal produced from E.grandis and E.pellita ranked much better in terms of minimum smoke production than other species including the local eucalypt. These species and Calliandra also ranked favourably in terms of heating quality (i.e. time taken to boil water).
• Public interest in using charcoal for cooking is strong. • Public understanding of how to grow SRC species and make charcoal is weak and requires a
well designed extension program.
The potential for developing a fuelwood economy based on short-rotation coppicing species maybe greatest in the production of charcoal rather than fuelwood directly. The gross value of fuelwood produced from the Mt Hagen trial was about K32,500/ha12
Charcoal is commonly the first step up the energy ladder in other developing economies. The technology to produce and use charcoal has existed in PNG since the 1980s but it has not been taken up. This is possibly due to poor promotion and supply chains, and perhaps the fuelwood stress was not intense enough to encourage institutional persistence in developing it. It remains to be seen whether the PNGFA, DME and other stakeholders wish to revisit charcoal as an alternative energy source.
. This value was generated in two years while vegetables were still being grown between the trees in the first year. Unfortunately, even though SRC fuelwood has good burning qualities there may be resistance to this wood in the market place because of its appearance; it just does not look like normal fuelwood. Also selling SRC fuelwood to the tea factory in Mt Hagen would not make sense because of low prices received. So the effort put into growing SRC trees would give better returns if it focussed on a value-added product; and charcoal is the easiest way to add value to fuelwood. Locally produced charcoal is likely to be much cheaper than imported charcoal while still yielding good returns to the producer. However the details of this claim still need to be determined.
People in PNG are familiar with re-using left-over coals in a fire, especially in the highlands, but they are not familiar with using specially-prepared charcoal. Even though charcoal would be a new product on the market, it is likely that most people would appreciate its value as an energy source from this experience. Most sellers in the survey said they would sell charcoal if it were available and there were buyers. A critical element for the successful promotion of charcoal is that people really understand how it is used, and this cannot be done just by cooking demonstrations and free food as was attempt in the 1980s (Gamser and Harwood 1982).
The highlands, in particular Mt Hagen, may be the best place to pilot a farm-grown charcoal industry. The trees grow better than in the NCD and the price of normal fuelwood is very high. However
12 Ideally this value would be compared with gross margins on crops that would otherwise been grown, e.g. sweet potato. Unfortunately, efforts to find gross margins of sweet potato in Mt Hagen were unsuccessful. However the gross margin of sweet potato production in Tonga is the equivalent of PGK 4,800/ha

136
fuelwood energy supply cannot be treated in isolation from equally pressing issues of poverty, labour, food, culture and values (Mahiri and Howorth 2001). Farm-grown fuelwood and charcoal would compete with food crops, require a new use of labour, and also would require a considerable amount of capital to enter. Favourable output prices are a necessary but not sufficient condition to induce smallholders to undertake commercial fuelwood cultivation (Godoy, 1992). Land tenure issues are sure to come into play when a semi-permanent landuse like a fuel woodlot appears.
Finally, a farm-grown charcoal industry is less likely to succeed with individual entrepreneurs than it is with well-organised and well-informed groups. Working in groups allows individuals to benefit from economies of scale in production, transport and marketing that are not otherwise available.
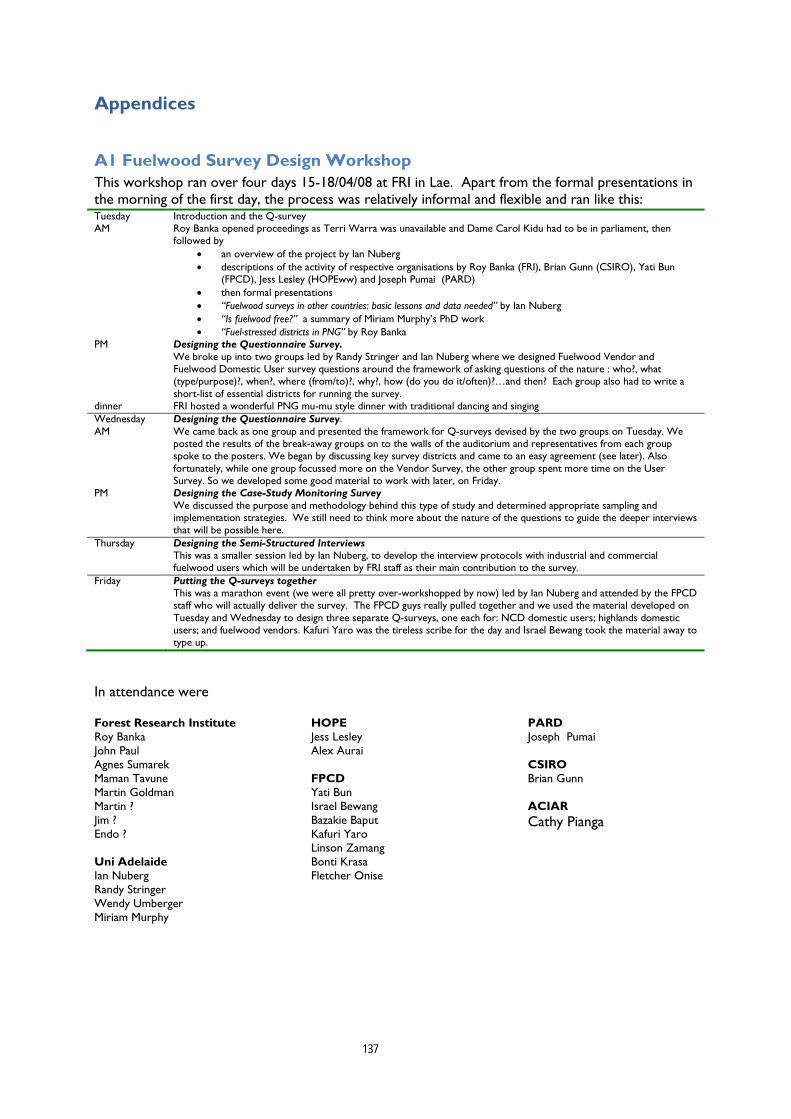
137
Appendices
A1 Fuelwood Survey Design Workshop This workshop ran over four days 15-18/04/08 at FRI in Lae. Apart from the formal presentations in the morning of the first day, the process was relatively informal and flexible and ran like this: Tuesday Introduction and the Q-survey AM Roy Banka opened proceedings as Terri Warra was unavailable and Dame Carol Kidu had to be in parliament, then
followed by • an overview of the project by Ian Nuberg • descriptions of the activity of respective organisations by Roy Banka (FRI), Brian Gunn (CSIRO), Yati Bun
(FPCD), Jess Lesley (HOPEww) and Joseph Pumai (PARD) • then formal presentations • “Fuelwood surveys in other countries: basic lessons and data needed” by Ian Nuberg • “Is fuelwood free?” a summary of Miriam Murphy’s PhD work • “Fuel-stressed districts in PNG” by Roy Banka
PM Designing the Questionnaire Survey. We broke up into two groups led by Randy Stringer and Ian Nuberg where we designed Fuelwood Vendor and Fuelwood Domestic User survey questions around the framework of asking questions of the nature : who?, what (type/purpose)?, when?, where (from/to)?, why?, how (do you do it/often)?…and then? Each group also had to write a short-list of essential districts for running the survey.
dinner FRI hosted a wonderful PNG mu-mu style dinner with traditional dancing and singing Wednesday AM
Designing the Questionnaire Survey. We came back as one group and presented the framework for Q-surveys devised by the two groups on Tuesday. We posted the results of the break-away groups on to the walls of the auditorium and representatives from each group spoke to the posters. We began by discussing key survey districts and came to an easy agreement (see later). Also fortunately, while one group focussed more on the Vendor Survey, the other group spent more time on the User Survey. So we developed some good material to work with later, on Friday.
PM Designing the Case-Study Monitoring Survey We discussed the purpose and methodology behind this type of study and determined appropriate sampling and implementation strategies. We still need to think more about the nature of the questions to guide the deeper interviews that will be possible here.
Thursday Designing the Semi-Structured Interviews This was a smaller session led by Ian Nuberg, to develop the interview protocols with industrial and commercial fuelwood users which will be undertaken by FRI staff as their main contribution to the survey.
Friday Putting the Q-surveys together This was a marathon event (we were all pretty over-workshopped by now) led by Ian Nuberg and attended by the FPCD staff who will actually deliver the survey. The FPCD guys really pulled together and we used the material developed on Tuesday and Wednesday to design three separate Q-surveys, one each for: NCD domestic users; highlands domestic users; and fuelwood vendors. Kafuri Yaro was the tireless scribe for the day and Israel Bewang took the material away to type up.
In attendance were
Forest Research Institute Roy Banka John Paul Agnes Sumarek Maman Tavune Martin Goldman Martin ? Jim ? Endo ? Uni Adelaide Ian Nuberg Randy Stringer Wendy Umberger Miriam Murphy
HOPE Jess Lesley Alex Aurai FPCD Yati Bun Israel Bewang Bazakie Baput Kafuri Yaro Linson Zamang Bonti Krasa Fletcher Onise
PARD Joseph Pumai CSIRO Brian Gunn ACIAR Cathy Pianga

Appendix 11.1 of FR2013-14 138
A2 Questionnaire Survey forms
Over the following 12 pages are reproductions of:
NCD Fuelwood Users Survey (also adapted for Lae and Mt Hagen Urban)
Rural Fuelwood Users Survey
Fuelwood Sellers Survey
Screen-grab of one view of Access database collating the information

Appendix 11.1 of FR2013-14 139

Appendix 11.1 of FR2013-14 140
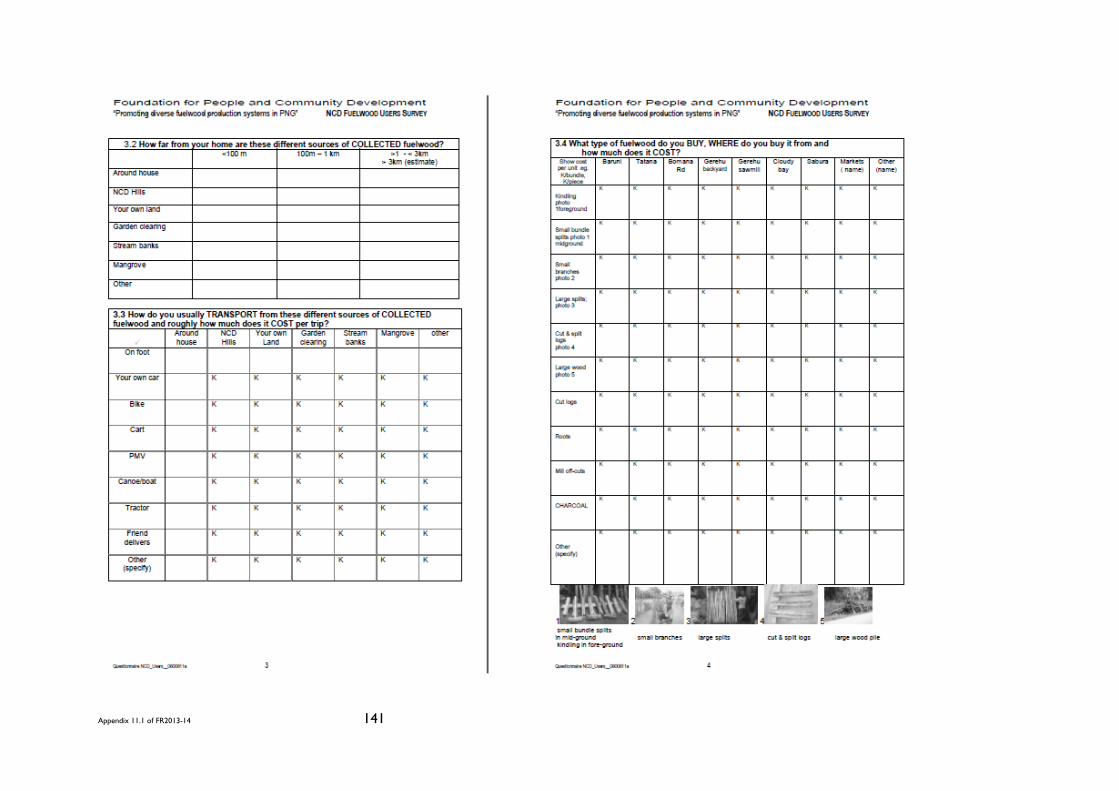
Appendix 11.1 of FR2013-14 141
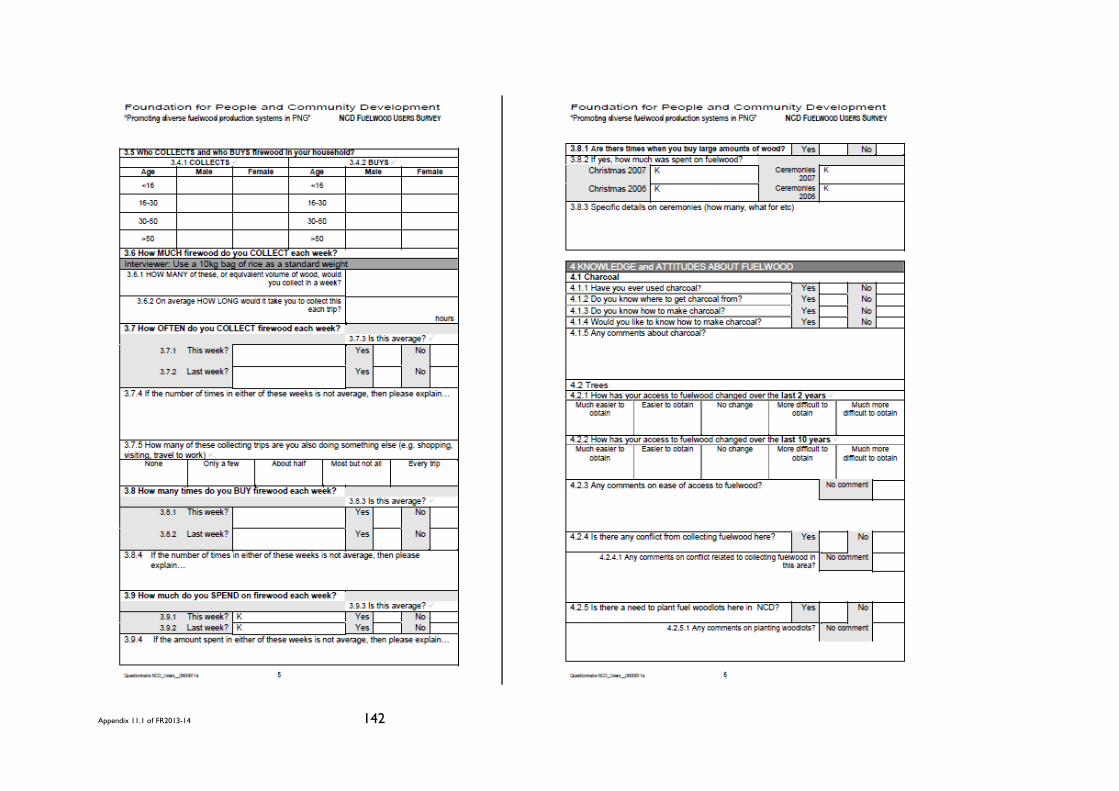
Appendix 11.1 of FR2013-14 142

Appendix 11.1 of FR2013-14 143
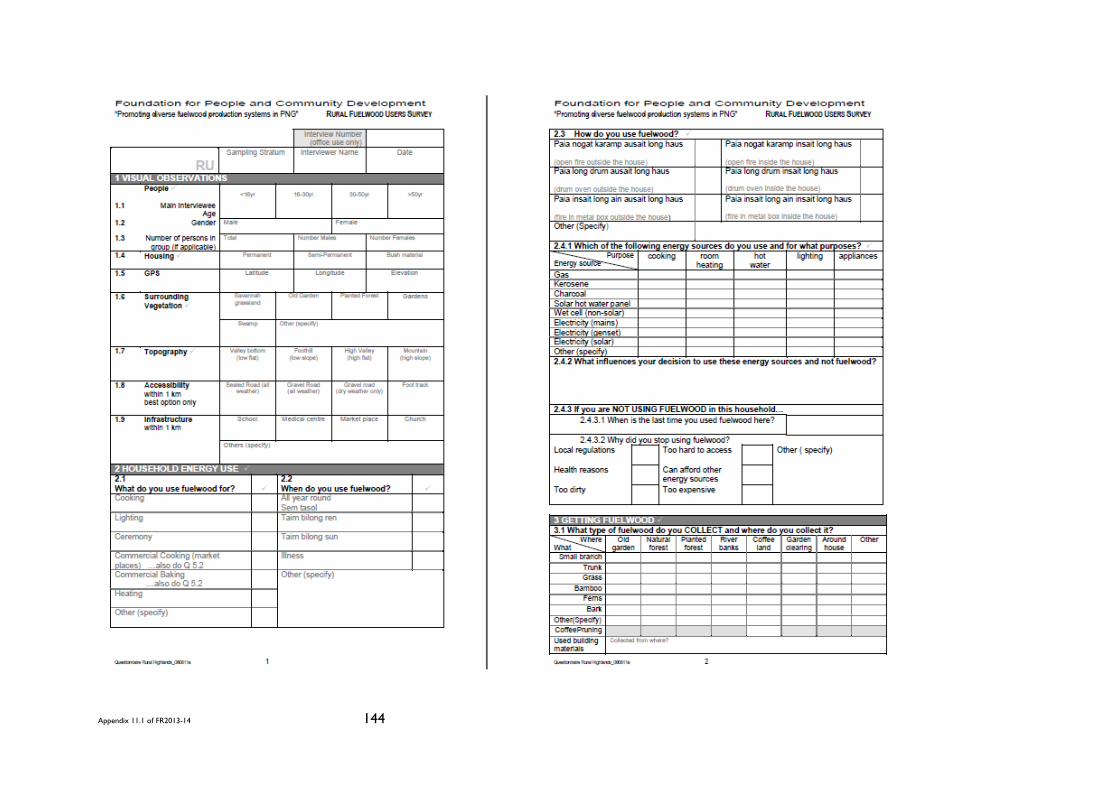
Appendix 11.1 of FR2013-14 144

Appendix 11.1 of FR2013-14 145
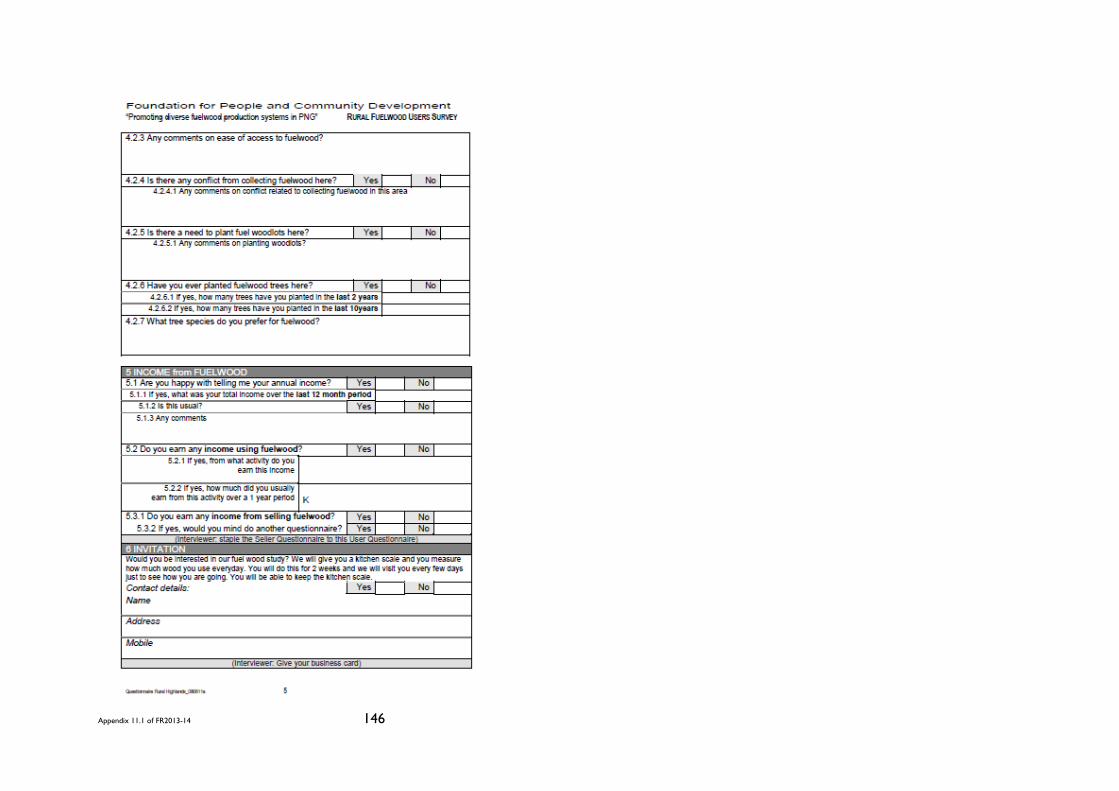
Appendix 11.1 of FR2013-14 146
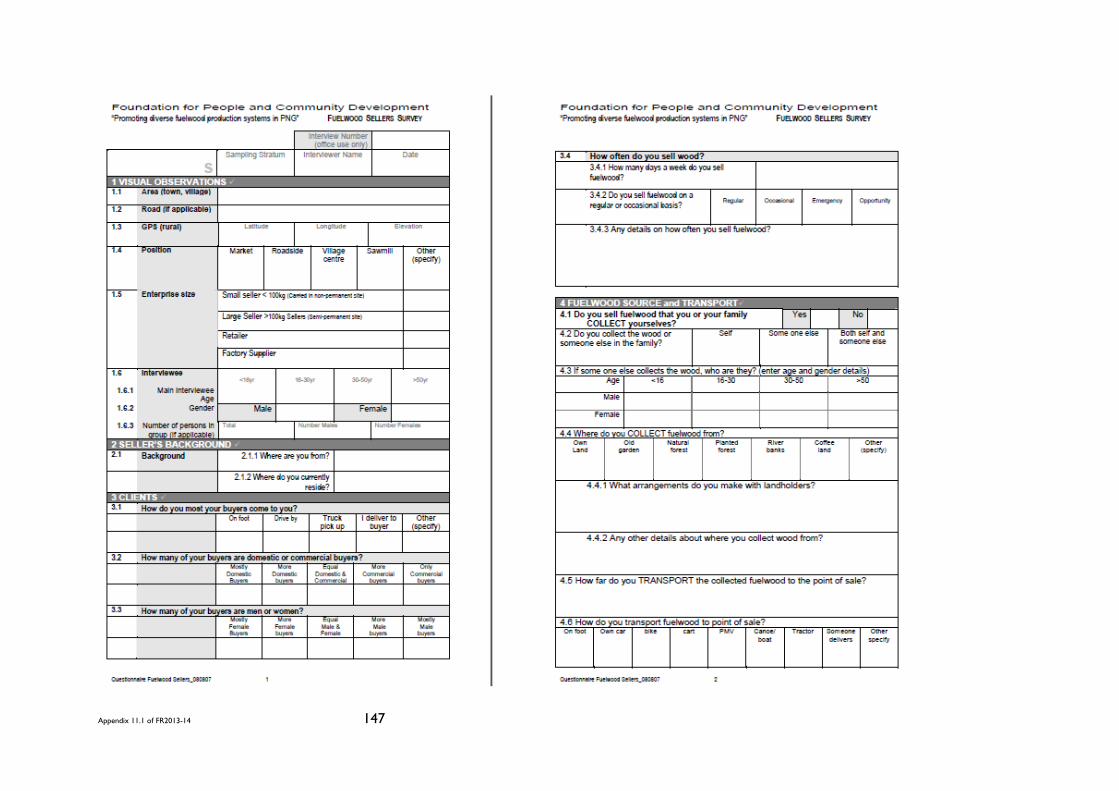
Appendix 11.1 of FR2013-14 147
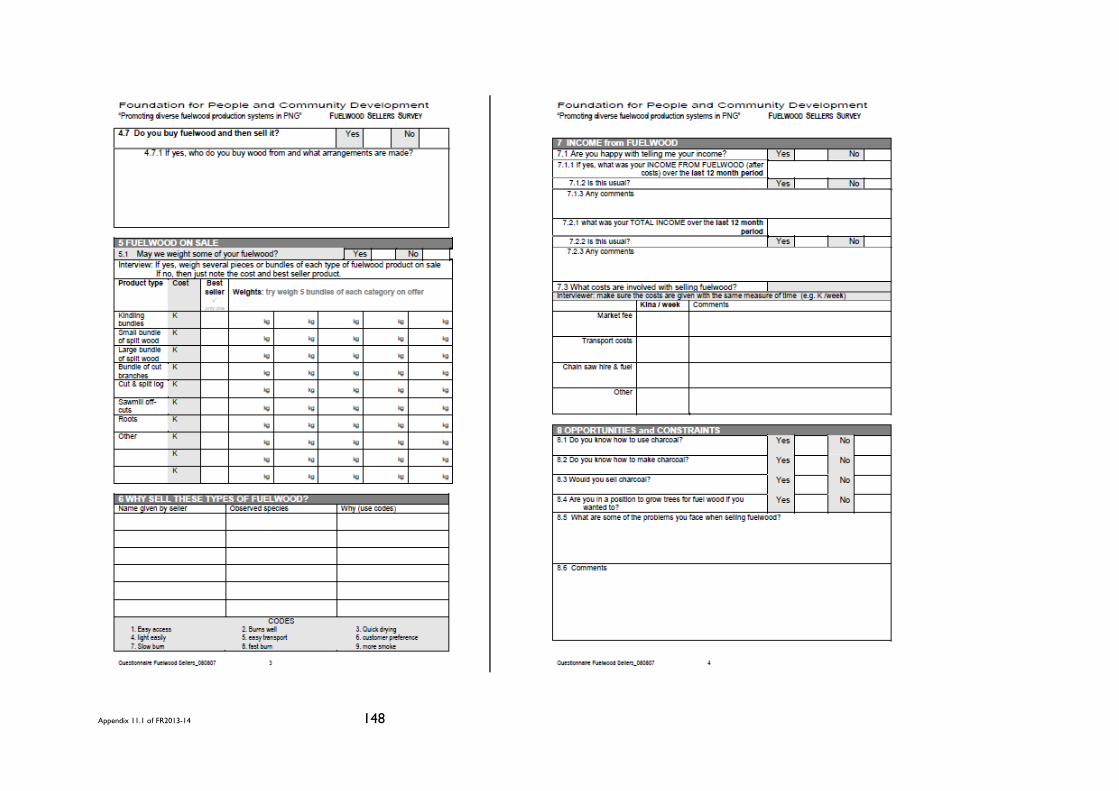
Appendix 11.1 of FR2013-14 148

Appendix 11.1 of FR2013-14 149
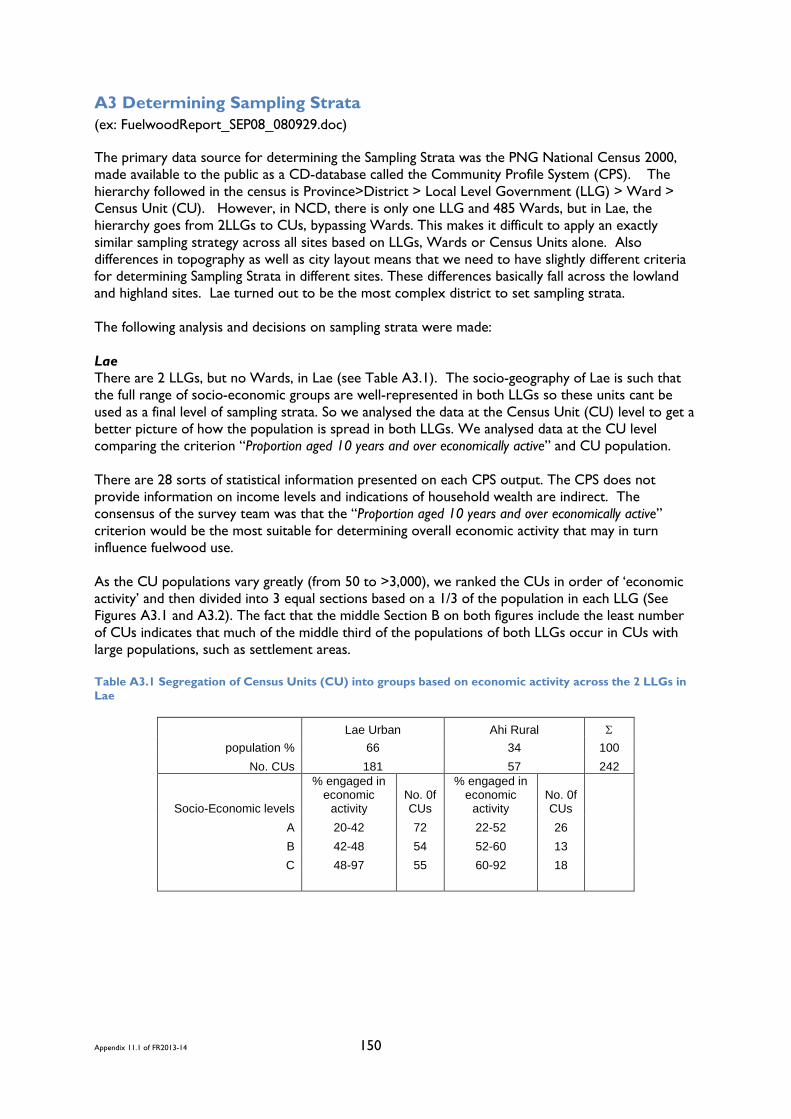
Appendix 11.1 of FR2013-14 150
A3 Determining Sampling Strata (ex: FuelwoodReport_SEP08_080929.doc)
The primary data source for determining the Sampling Strata was the PNG National Census 2000, made available to the public as a CD-database called the Community Profile System (CPS). The hierarchy followed in the census is Province>District > Local Level Government (LLG) > Ward > Census Unit (CU). However, in NCD, there is only one LLG and 485 Wards, but in Lae, the hierarchy goes from 2LLGs to CUs, bypassing Wards. This makes it difficult to apply an exactly similar sampling strategy across all sites based on LLGs, Wards or Census Units alone. Also differences in topography as well as city layout means that we need to have slightly different criteria for determining Sampling Strata in different sites. These differences basically fall across the lowland and highland sites. Lae turned out to be the most complex district to set sampling strata. The following analysis and decisions on sampling strata were made: Lae There are 2 LLGs, but no Wards, in Lae (see Table A3.1). The socio-geography of Lae is such that the full range of socio-economic groups are well-represented in both LLGs so these units cant be used as a final level of sampling strata. So we analysed the data at the Census Unit (CU) level to get a better picture of how the population is spread in both LLGs. We analysed data at the CU level comparing the criterion “Proportion aged 10 years and over economically active” and CU population. There are 28 sorts of statistical information presented on each CPS output. The CPS does not provide information on income levels and indications of household wealth are indirect. The consensus of the survey team was that the “Proportion aged 10 years and over economically active” criterion would be the most suitable for determining overall economic activity that may in turn influence fuelwood use. As the CU populations vary greatly (from 50 to >3,000), we ranked the CUs in order of ‘economic activity’ and then divided into 3 equal sections based on a 1/3 of the population in each LLG (See Figures A3.1 and A3.2). The fact that the middle Section B on both figures include the least number of CUs indicates that much of the middle third of the populations of both LLGs occur in CUs with large populations, such as settlement areas. Table A3.1 Segregation of Census Units (CU) into groups based on economic activity across the 2 LLGs in Lae
Lae Urban Ahi Rural Σ population % 66 34 100
No. CUs 181 57 242
Socio-Economic levels
% engaged in economic
activity No. 0f CUs
% engaged in economic
activity No. 0f CUs
A 20-42 72 22-52 26 B 42-48 54 52-60 13 C 48-97 55 60-92 18

Appendix 11.1 of FR2013-14 151
Figure A3.1 How Census Units of Lae Urban LLG were segregated into 3 sections based on economic activity of the population. The 3 sections represent equal proportions (14,063) of the LLG population (44,888)
Figure A3.2 How Census Units of Lae Ahi Rural LLG were segregated into 3 sections based on economic activity of the population. The 3 sections represent roughly equal proportions (6400) of the LLG population (19,227).
Table A3.2 Breakdown of sampling strata and sample sizes for 2 LLGs in Lae for a total sample size of 840
District Lae Σ LLG Lae Urban Ahi Rural % population 66% 34% 100 Socio-economic section a B c d e f % sample 22 22 22 11 11 11 ~100 Sample numbers Round 1 80 80 80 40 40 40 360 Round 2 106 106 106 54 54 54 480 Total 186 186 186 94 94 94 840 NCD Fortunately the determination of sampling strata for NCD was not nearly as complicated as it is for Lae. The NCD is a LLG in itself and within it are 9 Wards and 485 CUs. The socio-geography of NCD is such that there are clear areas of social advantage and disadvantage and the Wards generally follow these. The range of the census criterion “Proportion aged 10 years and economically active” is not as great in NCD as it is Lae, but it will suffice to show that the existing Wards are an adequate basis to segregate the NCD sample (see Figure A3.3). The breakdown of target sample size across these Wards is given in Table A3.3 The sampling protocol in the NCD was to randomly select Census Units from each Ward such that the number of CUs selected is the same as the population proportion for that Ward; i.e. 10 CUs for Gerehu, 12 CUs for Town etc. When 18 households were surveyed in each CU then the required sample size was surveyed.
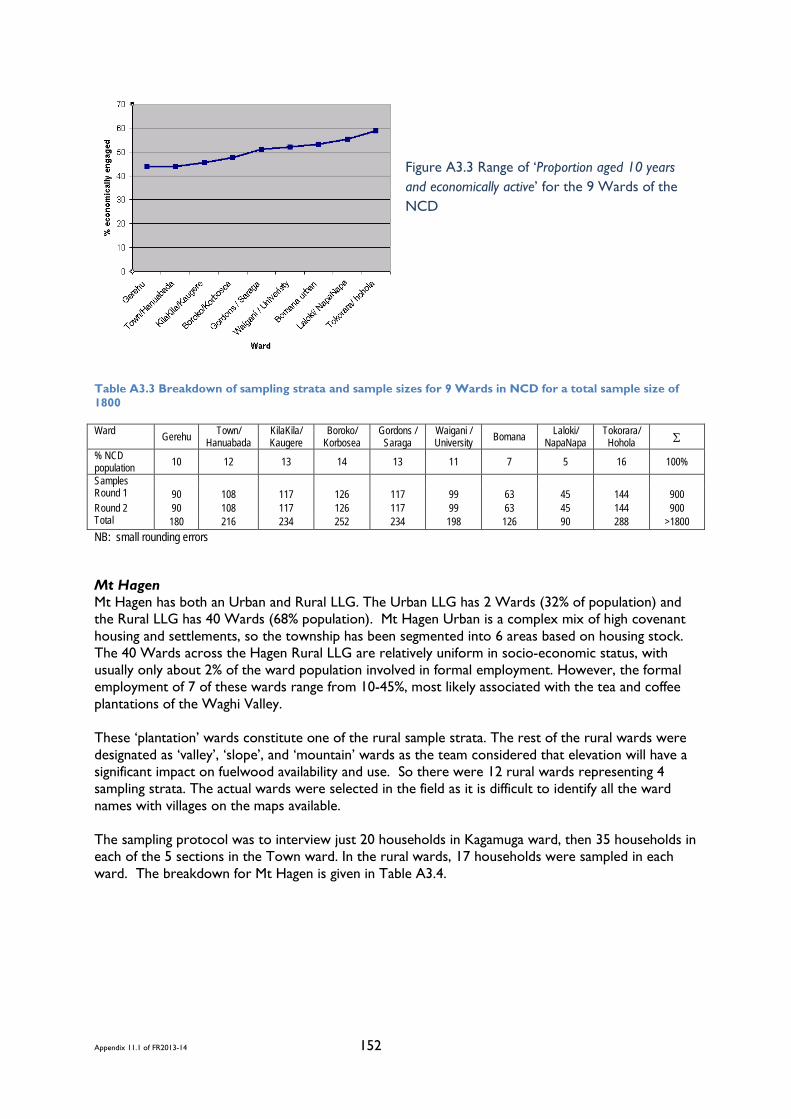
Appendix 11.1 of FR2013-14 152
Figure A3.3 Range of ‘Proportion aged 10 years and economically active’ for the 9 Wards of the NCD
Table A3.3 Breakdown of sampling strata and sample sizes for 9 Wards in NCD for a total sample size of 1800
Ward Gerehu Town/ Hanuabada
KilaKila/ Kaugere
Boroko/ Korbosea
Gordons / Saraga
Waigani / University Bomana Laloki/
NapaNapa Tokorara/
Hohola Σ % NCD population 10 12 13 14 13 11 7 5 16 100%
Samples Round 1 90 108 117 126 117 99 63 45 144 900 Round 2 90 108 117 126 117 99 63 45 144 900 Total 180 216 234 252 234 198 126 90 288 >1800 NB: small rounding errors Mt Hagen Mt Hagen has both an Urban and Rural LLG. The Urban LLG has 2 Wards (32% of population) and the Rural LLG has 40 Wards (68% population). Mt Hagen Urban is a complex mix of high covenant housing and settlements, so the township has been segmented into 6 areas based on housing stock. The 40 Wards across the Hagen Rural LLG are relatively uniform in socio-economic status, with usually only about 2% of the ward population involved in formal employment. However, the formal employment of 7 of these wards range from 10-45%, most likely associated with the tea and coffee plantations of the Waghi Valley. These ‘plantation’ wards constitute one of the rural sample strata. The rest of the rural wards were designated as ‘valley’, ‘slope’, and ‘mountain’ wards as the team considered that elevation will have a significant impact on fuelwood availability and use. So there were 12 rural wards representing 4 sampling strata. The actual wards were selected in the field as it is difficult to identify all the ward names with villages on the maps available. The sampling protocol was to interview just 20 households in Kagamuga ward, then 35 households in each of the 5 sections in the Town ward. In the rural wards, 17 households were sampled in each ward. The breakdown for Mt Hagen is given in Table A3.4.

Appendix 11.1 of FR2013-14 153
Table A3.4 Breakdown of sampling strata and sample sizes for 2 LLGs in Mt Hagen District for a total sample size of 600
District Mt Hagen Σ LLG Mt Hagen Urban Mt Hagen Rural % population 32% 68% 100 Sample strata 1 Kagamuga 2-6 Town 7 Plantation 8 Valley 9 Slope 10 Mountain 10 No. Wards 1 1 3 3 3 3 14 % population 3.2% 28.8% 17% 17% 17% 17% 100 Samples Round 1 10 87 51 51 51 51 300 Round 2 10 87 51 51 51 51 300 Total 20 174 102 102 102 102 >600 NB: small rounding errors Chuave Chuave is a relatively homogenous district with respect to basic socio-economic data. It has 3 LLGs with 57 wards. Three of the FPCD team are highlanders and know this country well. They nominated the wards in Table A3.5 as representing a fair range of wards that are still readily accessible for the project. Seven Wards were selected from each LLG. Ten to twelve samples were taken from each Ward. The table also presents the breakdown of samples required for each ward. Table A3.5 Breakdown of sampling strata and sample sizes for 3 LLGs in Chuave District for a total sample size of 240
District Chuave LLG Chuave Rural Elimbari Rural Siane Rural Σ Selected Wards Sirikoge
Membimangi Agugu Goi
Mainamo Keu No.2 Eigun
Monono Gogo No.1 Kureri No.1 Giriu No.1
KorurumeNo.1 Yorori Karaweri No.1
Waisime Fokowe Kumo Komuni No.1
Seine Loandi Nomane
No. samples taken Round 1 40 40 40 120 Round 2 40 40 40 120 Total 80 80 80 240 Henganofi There is only one LLG for Henganofi and it contains 30 Wards. However, there are four administrative districts (not included in the Census hierarchy) which provide a geographical order to the wards. So 5 wards were nominated from each of the administrative districts, as in Table A3.6. Eighteen samples were taken from each Ward. Table A3.6 Breakdown of sampling strata and sample sizes for the 1 LLG in Henganofi District for a total sample size of 360
District Henganofi LLG Henganofi Σ Admin areas Kafetina Dunantina Fayantina Kamanotina Nominated wards Kompri
Krevanopi Ababe Yohotegave Forumename
Lihona Kuyahapa Kesevaka No. 1 Haguragave Kiviringka
Yate Kuru Krimpave Kuana Kofionka
Kemenave Finintugu Kamanonka Tebega Station
No. samples taken Round 1 45 45 45 45 180 Round 2 45 45 45 45 180 Total 90 90 90 90 360
Appendix 11.1 of FR2013-14 154
A4 Fuelwood surveys: basic lessons from other countries Part of paper delivered at: Fuelwood Survey Design Workshop 15-16 April 2008, by Ian Nuberg
Introduction In this presentation I will bring together here some of the knowledge gathered from the literature to share with you about how fuelwood is perceived as a rural development and environmental problem. We will ask the question of why we are interested in fuelwood in PNG and look at some of the available fuelwood information for PNG. I will then talk generally about how fuelwood surveys have been undertaken elsewhere in the world, then my ideas about what data we could collect in our survey. I emphasise the word ‘could’ because this information is presented as a starting point for our collaborative process where we as a group determine the specific parameters and process of the survey. International perceptions of fuelwood as a rural development and environmental issue Why should we be interested in fuelwood in PNG? Compared to some regions like Africa and India there are apparently plentiful wood resources which are relatively easy to access to most people. Also, if fuelwood were a scarce resource in PNG then one may expect that, as in other areas of the world where fuelwood is clearly scarce, vigorous multi-tiered wood flows and economies would develop naturally. In such situations there are strong drivers for improving the efficiency and equitability of the market; there may also be positive environmental impacts on forest resources. Our interest in fuelwood production in PNG is not driven by a concern for reducing the impact of wood collection on natural forests; at this stage I do not think it is really that much of a problem in PNG. There may be localised instances of fuelwood-related deforestation of primary forest, but overall it is not so much a problem. Please correct me if I am wrong. Our essential concern is to develop small-business opportunities for community wealth development. Over the last 40 years there has been immense, but also fluctuating, interest in fuelwood in the developing world. The most recent summary of this has been made by Michael Arnold et al in 2003 CIFOR publication Fuelwood revisited: what has changed in the last decade? (Arnold, Kohlin et al. 2003). I will present a summary from this and then review some other fuelwood related material since 2003. I will also present some findings from the Regional Wood Energy Development Programme in Asia.
The Fuelwood Gap The initial interest in fuelwood work began in the mid-1970s when there was a perception of the potential devastating effect of fuelwood collection on forest resources due to the exploding populations in less developed countries. The concept of the ‘fuelwood gap’ emerged as development planners made estimates of fuelwood demand from these populations and the potential supply from forest resources. Estimates of the fuelwood gap were alarming; e.g. FAO estimates for 1980 were that 2000 million people would depend on fuelwood and other biomass fuel and 100 million people would be living in acute energy shortage. Extrapolating this to 2000, and we should have expected 2,700 million dependant on traditional fuels of which 2,400 million in acute scarcity or deficit. Underlying these estimates was the assumption that the gap would be filled by over-cutting forest resources. Apart from the environmental crisis there was also the recognition of the social crisis associated with the fuelwood gap. Erik Eckholm’s famous ‘The Other Energy Crisis: firewood” in 1975 (Eckholm 1975) showed how the fuelwood gap impacts women and children who have to travel further to gather fuelwood and how they have less time for other work or education; how inferior, smokier fuelwoods cause health problems; how fuelwood scarcity can lead to less cooking and greater nutritional problems; how animal dung used for energy detracts from its use as a fertiliser; and how scarce income is diverted to purchasing increasingly expensive fuels.
Appendix 11.1 of FR2013-14 155
So there was a lot of funding through the FAO and UNDP directed towards fuelwood which was seen as a ‘basic need’ essential to social and economic development. The fuelwood shortages were to be met by substitution programs (eg biogas, kero, LPG electricity), fuel-efficient stoves, charcoal development where appropriate, improved management of existing resources and creating new resources through plantations and agroforestry. The Tropical Forestry Action Plan of 1985 –which had fuelwood as one of its five action programs – set a five-fold increase in tree planting (e.g. the Social Forestry program in India).
Re-appraisal in the 1980s By the late 1980s, the collective understanding of fuelwood economies and the impact of fuelwood collection on forests had time to mature. Questions were raised, in some sectors, about the concept of the ‘fuelwood gap’. It was being recognised as a very coarse and inaccurate approach to understanding fuelwood from both physical and social perspectives. Firstly, the approach relied on stock and yield figures from forests and did not consider other woody plant sources; such as scrub, bush fallow, farm trees etc which can regenerate. Also a lot of fuelwood came from felling of trees on land being cleared for agriculture. So, while agricultural expansion may be responsible for deforestation, it was not specifically fuelwood demand. It became apparent that the balance between fuelwood supply and demand was seldom an issue that required forestry intervention at a national scale. Secondly, the approach did not consider that as fuelwood demand increased with population growth, people made adjustments to their household energy needs in response to shortages. In Africa, for example, people economise their fuelwood use by: cooking fewer meals, shifting to food that takes less time or fuel to cook, changing cooking method, substituting home cooked food with purchased, reducing space and water heating, and reducing the use of fire for protecting livestock. Furthermore, in some rural areas growing out-migration for employment led to reduction in labour, which had flow-on effects on household fuelwood use. Also ‘fuelwood gap’ approach did not pick up the location-specific aspects of fuelwood supply and how reductions in access to fuelwood can particularly negatively affect poor subsistence users. The success of large fuelwood plantation programs in this era was limited because they were supervised by forestry departments which did not have the institutional capacity to manage and deliver the fuelwood to local rural users. Also the subsidised prices for other forms of energy depressed the price for fuelwood in urban areas as did competition from fuelwood collected from natural forests. Encouraging farmers to plant fuelwood trees also had limitations as they did not necessarily rate fuelwood shortages as a priority problem along lines as originally expected. Planted and managed trees were likely to create wood outputs with too high an alternate value and produce too high a cost for growers to be able to burn for household use. It became clear that there were few situations where farmers were growing trees to use solely for fuelwood purposes. Farm forestry programs lived on but more directed at outputs with greater value as well as protective functions of shelterbelts, contour plantings shade etc. Essentially it was accepted that the spontaneous adaptations to fuelwood shortages that households adopted involved lower costs and were more efficient that farm forestry interventions. The response to revised supply-demand estimates and lack-lustre fuelwood forestry programs was to shift to ‘participatory forestry’ approaches which held a broader set of objectives like: reducing and spreading agricultural risk over space and time, reducing vulnerability to external shock, and strategies to alleviate poverty. Fuelwood was seen as just one component of such rural forestry programs, rather than the principal activity. While fuelwood had lost its place as a key development objective, there was still an understanding that critical fuelwood shortages exist, that these shortages are locationally-specific (as opposed to national) and rural fuelwood production had to be considered as part of broad-based interventions for rural development and livelihood enhancement.
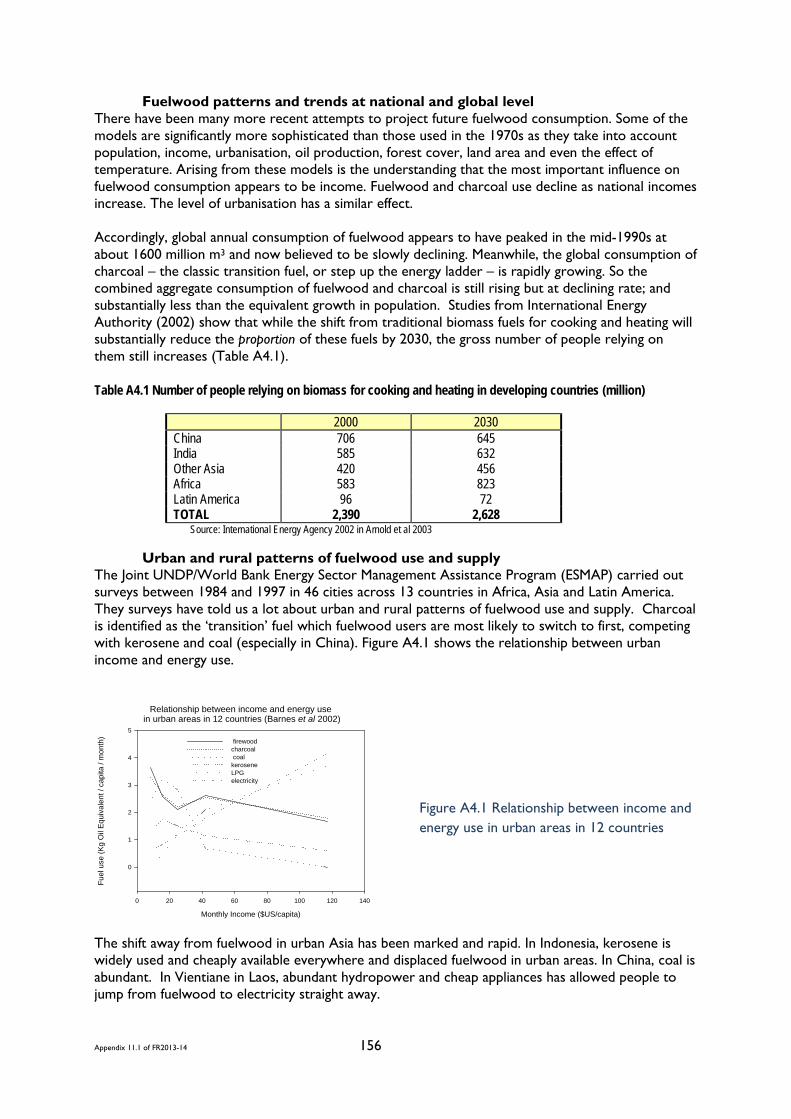
Appendix 11.1 of FR2013-14 156
Fuelwood patterns and trends at national and global level There have been many more recent attempts to project future fuelwood consumption. Some of the models are significantly more sophisticated than those used in the 1970s as they take into account population, income, urbanisation, oil production, forest cover, land area and even the effect of temperature. Arising from these models is the understanding that the most important influence on fuelwood consumption appears to be income. Fuelwood and charcoal use decline as national incomes increase. The level of urbanisation has a similar effect. Accordingly, global annual consumption of fuelwood appears to have peaked in the mid-1990s at about 1600 million m3 and now believed to be slowly declining. Meanwhile, the global consumption of charcoal – the classic transition fuel, or step up the energy ladder – is rapidly growing. So the combined aggregate consumption of fuelwood and charcoal is still rising but at declining rate; and substantially less than the equivalent growth in population. Studies from International Energy Authority (2002) show that while the shift from traditional biomass fuels for cooking and heating will substantially reduce the proportion of these fuels by 2030, the gross number of people relying on them still increases (Table A4.1). Table A4.1 Number of people relying on biomass for cooking and heating in developing countries (million)
2000 2030 China 706 645 India 585 632 Other Asia 420 456 Africa 583 823 Latin America 96 72 TOTAL 2,390 2,628
Source: International Energy Agency 2002 in Arnold et al 2003
Urban and rural patterns of fuelwood use and supply The Joint UNDP/World Bank Energy Sector Management Assistance Program (ESMAP) carried out surveys between 1984 and 1997 in 46 cities across 13 countries in Africa, Asia and Latin America. They surveys have told us a lot about urban and rural patterns of fuelwood use and supply. Charcoal is identified as the ‘transition’ fuel which fuelwood users are most likely to switch to first, competing with kerosene and coal (especially in China). Figure A4.1 shows the relationship between urban income and energy use.
Relationship between income and energy use in urban areas in 12 countries (Barnes et al 2002)
Monthly Income ($US/capita)
0 20 40 60 80 100 120 140
Fuel
use
(Kg
Oil
Equi
vale
nt /
capi
ta /
mon
th)
0
1
2
3
4
5
firewood charcoal coal kerosene LPG electricity
Figure A4.1 Relationship between income and energy use in urban areas in 12 countries
The shift away from fuelwood in urban Asia has been marked and rapid. In Indonesia, kerosene is widely used and cheaply available everywhere and displaced fuelwood in urban areas. In China, coal is abundant. In Vientiane in Laos, abundant hydropower and cheap appliances has allowed people to jump from fuelwood to electricity straight away.
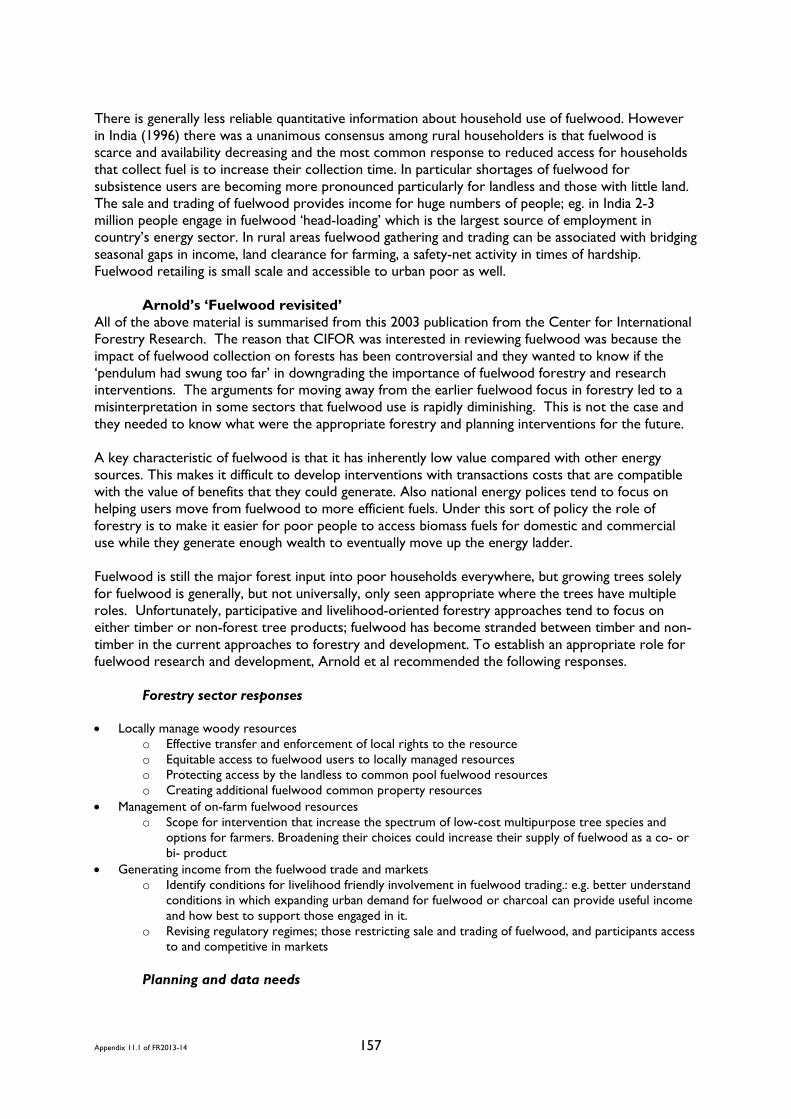
Appendix 11.1 of FR2013-14 157
There is generally less reliable quantitative information about household use of fuelwood. However in India (1996) there was a unanimous consensus among rural householders is that fuelwood is scarce and availability decreasing and the most common response to reduced access for households that collect fuel is to increase their collection time. In particular shortages of fuelwood for subsistence users are becoming more pronounced particularly for landless and those with little land. The sale and trading of fuelwood provides income for huge numbers of people; eg. in India 2-3 million people engage in fuelwood ‘head-loading’ which is the largest source of employment in country’s energy sector. In rural areas fuelwood gathering and trading can be associated with bridging seasonal gaps in income, land clearance for farming, a safety-net activity in times of hardship. Fuelwood retailing is small scale and accessible to urban poor as well.
Arnold’s ‘Fuelwood revisited’ All of the above material is summarised from this 2003 publication from the Center for International Forestry Research. The reason that CIFOR was interested in reviewing fuelwood was because the impact of fuelwood collection on forests has been controversial and they wanted to know if the ‘pendulum had swung too far’ in downgrading the importance of fuelwood forestry and research interventions. The arguments for moving away from the earlier fuelwood focus in forestry led to a misinterpretation in some sectors that fuelwood use is rapidly diminishing. This is not the case and they needed to know what were the appropriate forestry and planning interventions for the future. A key characteristic of fuelwood is that it has inherently low value compared with other energy sources. This makes it difficult to develop interventions with transactions costs that are compatible with the value of benefits that they could generate. Also national energy polices tend to focus on helping users move from fuelwood to more efficient fuels. Under this sort of policy the role of forestry is to make it easier for poor people to access biomass fuels for domestic and commercial use while they generate enough wealth to eventually move up the energy ladder. Fuelwood is still the major forest input into poor households everywhere, but growing trees solely for fuelwood is generally, but not universally, only seen appropriate where the trees have multiple roles. Unfortunately, participative and livelihood-oriented forestry approaches tend to focus on either timber or non-forest tree products; fuelwood has become stranded between timber and non-timber in the current approaches to forestry and development. To establish an appropriate role for fuelwood research and development, Arnold et al recommended the following responses.
Forestry sector responses
• Locally manage woody resources o Effective transfer and enforcement of local rights to the resource o Equitable access to fuelwood users to locally managed resources o Protecting access by the landless to common pool fuelwood resources o Creating additional fuelwood common property resources
• Management of on-farm fuelwood resources o Scope for intervention that increase the spectrum of low-cost multipurpose tree species and
options for farmers. Broadening their choices could increase their supply of fuelwood as a co- or bi- product
• Generating income from the fuelwood trade and markets o Identify conditions for livelihood friendly involvement in fuelwood trading.: e.g. better understand
conditions in which expanding urban demand for fuelwood or charcoal can provide useful income and how best to support those engaged in it.
o Revising regulatory regimes; those restricting sale and trading of fuelwood, and participants access to and competitive in markets
Planning and data needs
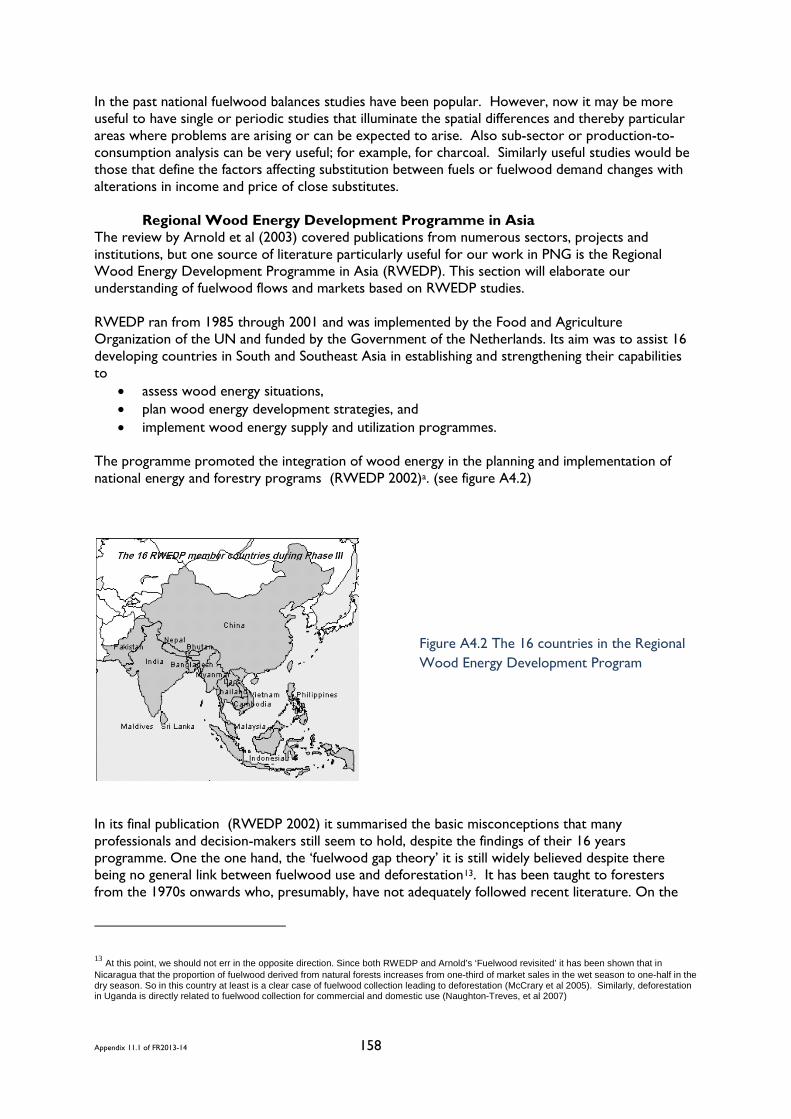
Appendix 11.1 of FR2013-14 158
In the past national fuelwood balances studies have been popular. However, now it may be more useful to have single or periodic studies that illuminate the spatial differences and thereby particular areas where problems are arising or can be expected to arise. Also sub-sector or production-to-consumption analysis can be very useful; for example, for charcoal. Similarly useful studies would be those that define the factors affecting substitution between fuels or fuelwood demand changes with alterations in income and price of close substitutes.
Regional Wood Energy Development Programme in Asia The review by Arnold et al (2003) covered publications from numerous sectors, projects and institutions, but one source of literature particularly useful for our work in PNG is the Regional Wood Energy Development Programme in Asia (RWEDP). This section will elaborate our understanding of fuelwood flows and markets based on RWEDP studies. RWEDP ran from 1985 through 2001 and was implemented by the Food and Agriculture Organization of the UN and funded by the Government of the Netherlands. Its aim was to assist 16 developing countries in South and Southeast Asia in establishing and strengthening their capabilities to
• assess wood energy situations, • plan wood energy development strategies, and • implement wood energy supply and utilization programmes.
The programme promoted the integration of wood energy in the planning and implementation of national energy and forestry programs (RWEDP 2002)a. (see figure A4.2)
Figure A4.2 The 16 countries in the Regional Wood Energy Development Program
In its final publication (RWEDP 2002) it summarised the basic misconceptions that many professionals and decision-makers still seem to hold, despite the findings of their 16 years programme. One the one hand, the ‘fuelwood gap theory’ it is still widely believed despite there being no general link between fuelwood use and deforestation13
13 At this point, we should not err in the opposite direction. Since both RWEDP and Arnold’s ‘Fuelwood revisited’ it has been shown that in Nicaragua that the proportion of fuelwood derived from natural forests increases from one-third of market sales in the wet season to one-half in the dry season. So in this country at least is a clear case of fuelwood collection leading to deforestation (McCrary et al 2005). Similarly, deforestation in Uganda is directly related to fuelwood collection for commercial and domestic use (Naughton-Treves, et al 2007)
. It has been taught to foresters from the 1970s onwards who, presumably, have not adequately followed recent literature. On the
Appendix 11.1 of FR2013-14 159
other hand, among those who have followed this story there is a misconception that fuelwood is a marginal product and its use is being phased out as national economies develop. Although fuelwood is globally declining in its proportion of the energy economy, the aggregate amounts of fuelwood use is still increasing and it is not being substituted by modern energy forms, but being complemented by them.
RWEDP undertook and published scores of studies, many of which were fuelwood surveys. However, one useful for our purposes presents a general description of fuelwood flows based on surveys undertaken in the Philippines, Pakistan, Indonesia and Myanmar (RWEDP 1996). The key, most interesting points are summarised below. We could consider undertaking similar analyses in our survey.
Origin and sources of fuelwood Surveys in the RWEDP participant countries revealed the importance of non-forest sources of fuelwoods in their national economies (Table A4.2). To clarify terminology here, forest-based fuelwood is directly sourced from natural forests whether as trees directly harvested for fuelwood or fuelwood derived from in-forest residues associated with logging. Non-forest fuelwoods consists of trees growing outside the forest such as those growing on farms, communal land, along roads, streams canals, etc. as well as wood waste such as off-cuts from sawmills, construction sites, discarded wooden packing materials etc.. Table A4.2 Overview of the amount of forest and non-forest fuelwoods consumed (RWEDP 1996)
These are national figures and there is large variation in these proportions at the local level depending on access to forest, population density, cash incomes etc. Table 3 illustrates such variations in Indonesia.
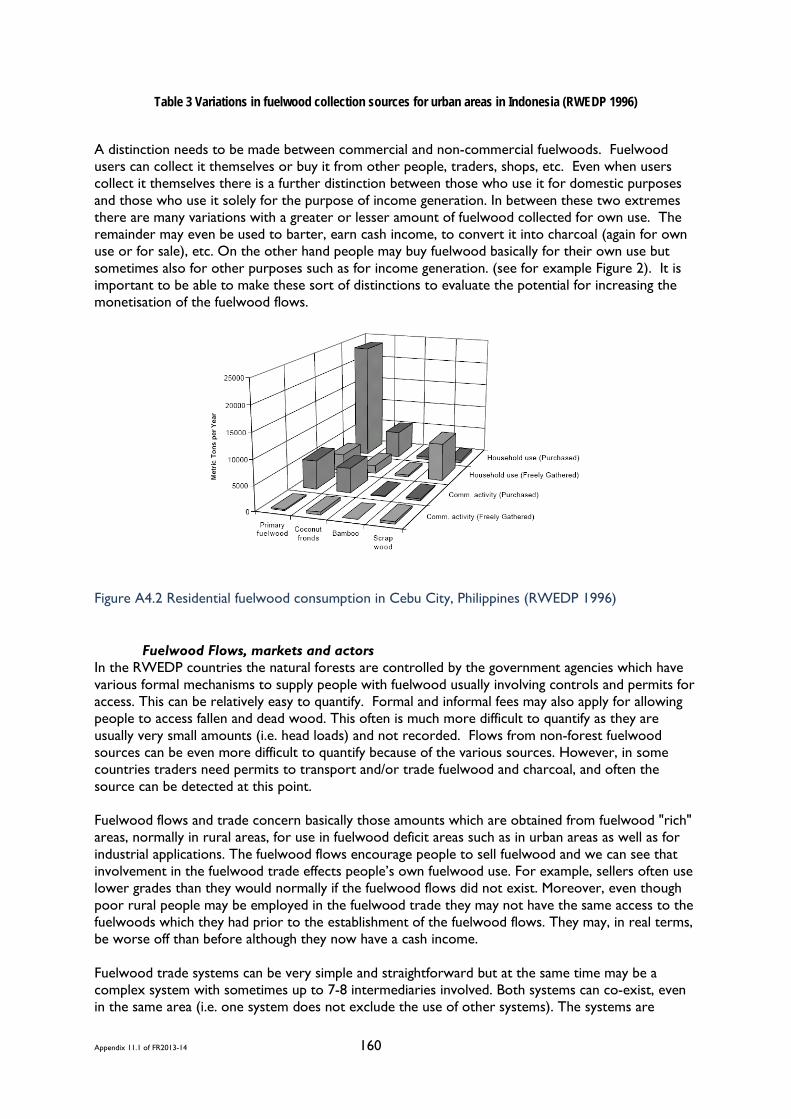
Appendix 11.1 of FR2013-14 160
Table 3 Variations in fuelwood collection sources for urban areas in Indonesia (RWEDP 1996)
A distinction needs to be made between commercial and non-commercial fuelwoods. Fuelwood users can collect it themselves or buy it from other people, traders, shops, etc. Even when users collect it themselves there is a further distinction between those who use it for domestic purposes and those who use it solely for the purpose of income generation. In between these two extremes there are many variations with a greater or lesser amount of fuelwood collected for own use. The remainder may even be used to barter, earn cash income, to convert it into charcoal (again for own use or for sale), etc. On the other hand people may buy fuelwood basically for their own use but sometimes also for other purposes such as for income generation. (see for example Figure 2). It is important to be able to make these sort of distinctions to evaluate the potential for increasing the monetisation of the fuelwood flows.
Figure A4.2 Residential fuelwood consumption in Cebu City, Philippines (RWEDP 1996)
Fuelwood Flows, markets and actors In the RWEDP countries the natural forests are controlled by the government agencies which have various formal mechanisms to supply people with fuelwood usually involving controls and permits for access. This can be relatively easy to quantify. Formal and informal fees may also apply for allowing people to access fallen and dead wood. This often is much more difficult to quantify as they are usually very small amounts (i.e. head loads) and not recorded. Flows from non-forest fuelwood sources can be even more difficult to quantify because of the various sources. However, in some countries traders need permits to transport and/or trade fuelwood and charcoal, and often the source can be detected at this point. Fuelwood flows and trade concern basically those amounts which are obtained from fuelwood "rich" areas, normally in rural areas, for use in fuelwood deficit areas such as in urban areas as well as for industrial applications. The fuelwood flows encourage people to sell fuelwood and we can see that involvement in the fuelwood trade effects people’s own fuelwood use. For example, sellers often use lower grades than they would normally if the fuelwood flows did not exist. Moreover, even though poor rural people may be employed in the fuelwood trade they may not have the same access to the fuelwoods which they had prior to the establishment of the fuelwood flows. They may, in real terms, be worse off than before although they now have a cash income. Fuelwood trade systems can be very simple and straightforward but at the same time may be a complex system with sometimes up to 7-8 intermediaries involved. Both systems can co-exist, even in the same area (i.e. one system does not exclude the use of other systems). The systems are

Appendix 11.1 of FR2013-14 161
extremely flexible in that intermediaries, used for one trade, may be by-passed in other trades. Fuelwood trade systems do often result in specialization i.e. the users of fuelwoods are separated from the sources of supply. The complexity and possibility of parallel trading systems is illustrated in Figure A4.3.
Figure A4.3 Overview of fuelwood flows within three different sub-systems (RWEDP 1996)
There are three parallel sectors.
The informal sector fuelwood supplies bypass in generally operates outside of government regulation and involves mostly poor, maybe landless, people with few other livelihood options. The people who gather the wood usually also transport and sell it directly to the end-users or retailers. Such supplies are normally used in the same area from which they were obtained i.e. there has to be a ready market nearby for the system to operate. The quantities involved are normally small, i.e. what can be cut and transported by one person, and mostly destined for domestic use. Some of this fuelwood may be picked up truck drivers who transport it to distant markets. Earnings of the fuelwood trade with this system remain almost completely with the persons involved i.e. the gatherers, with only small amounts required for transport, etc. The owners of the trees, i.e. the forest department or the community in general, do not receive any stumpage fees and this trading system may therefore have a detrimental effect on the forest cover. The formal sector supply system is much more regulated than the two other systems, because the supplies originate from formal organizations such as the Forest Department. Consequently this sector is easier to measure and the quantities involved are often large and are almost exclusively traded. The private sector supply system is in general thought to have the largest impact on the overall traded fuelwood supply but at the same time is also the least transparent. It is thought that this system is prevalent in those areas where markets are located at some distance from the source i.e. fuelwood owners may not have direct access or have difficulties in getting direct access to the markets. The fuelwood can come from many different sources. Where in the other two systems the fuelwood is cut and sold directly by the main actors involved i.e. gatherers in the informal sector and formal organizations in the formal sector, in this sector a considerable part of the fuelwood supplies
Appendix 11.1 of FR2013-14 162
are sold as trees with the owner in most cases not involved with the preparation of the fuelwood. In many countries the private sector supplies are subject to the same rules and regulations with regard to transporting the wood as the formal sector supplies. In most countries the cutting of trees on private lands has been deregulated, sometimes with the exception of certain species and/or trees growing in fragile areas. The price structure in the private sector markets of RWEDP countries was found, perhaps surprisingly, to be fairly constant. Tree owners and tree cutters earn about 50% of the final end-use selling price with the tree owners receiving about 20%, equal to about 5 - 15 US$ per ton depending on area, species, etc. In some regions, e.g of Pakistan, this makes growing trees for fuelwood more attractive than growing food crops. For charcoal the same 50% share was found to be valid for the tree owners and charcoal makers combined. Where large quantities are involved, the price the tree owner, wood cutter and/or the charcoal maker receives may be higher as in that case some of the intermediary steps can be cut out of the system. In both cases transport costs ranged from 10-30% while the traders retained from 20-40% of the final selling price. However, these amounts include all costs and should not be assumed to be profits only. Transport apparently accounts for 10-30% of the cost price of fuelwood. Part of these costs are directly attributable to real costs (vehicle, loading and unloading) and another part attributable to licenses, fees, etc. While there is a generally held belief that traders earn most in the fuelwood supply, the RWEDP surveys showed that this may not be so. Traders who are rich probably did not get rich from fuelwood trading. Indeed it is sometimes suggested that only the rich can afford to engage in fuelwood trading. Evidence for this is anecdotal and suggests that much of the trade involves credit. To support this argument, it is stated that some traders would like to opt out of the trade due to the financial risks involved but that this is not possible due to "social" obligations. Further studies will be required to provide a more convincing picture of the monetary and non-monetary earnings from the fuelwood trade. Fuelwood in PNG Fuelwood is a crucial, but undeveloped, component of the domestic economy of PNG. The actual magnitude consumed is unknown but estimated to be 5.5mill m3 /y or 1.38 m3 /person/y. Many districts in PNG are under intense agricultural pressure and socioeconomic disadvantage and fuelwood collection has led to increasing pressure on the environment; e.g. the already minimal forest cover in some highland provinces and the degradation of mangrove forests associated with the National Capital District. In the highland districts dominated by grasslands, people need to walk many kilometres in search of fuelwood. In and around urban areas it has led to an increasingly serious shortage of fuelwood at affordable prices. Fuelwood will continue to play a major role in the energy economy of PNG for the foreseeable future. Taking an all-Asia perspective, a significant amount of firewood is harvested from non-forested lands and therefore not a key factor behind deforestation (RWEDP 1997). However in PNG the estimated population growth of 2.3% is increasing at 3 times the rate at which the area of land in significant use is increasing. Consequently the intensity of land use is increasing and the availability of non-forest firewood is decreasing (Allen et al 2001). This is putting pressure on, for example, the mangrove forests near Port Moresby and the already bare hills in the more heavily settled districts of the highland provinces. Even the existing highland bush fallow systems do not provide adequate fuelwood as evidenced by the inferior firewood often used (e.g. bamboo and grass) and the long hours spent in fuelwood gathering. The value of the national fuelwood economy has been estimated as US$105million/y within the World Bank Poverty Assessment (Bourke 1997). Fuelwood is the primary energy source for cooking and heating especially in the highlands where over 40% of the population lives. In 1996, over 1 million people were engaged in fuelwood sales but it only amounted to about 2.3% of total agricultural income. At an average income per person of 4K/y it is small compared to incomes gathered from
Appendix 11.1 of FR2013-14 163
arabica coffee (43K/y) or fresh food (13K/y) but similar to that earned from growing, for example, tobacco, cattle, rubber and rice (Allen et al 2001). However, these figures should be understood in the context that an estimated 1/3 of total rural population, about 1.4 million, earn incomes of <20 K/person/yr. While fuelwood is used across the whole nation, the main districts where it is recognised as a significant part of the local economy are found in the highland provinces of Simbu, Enga and the Eastern, Western and Southern Highlands. Many of these districts have been assessed to be under significant agricultural pressure and overall relative social disadvantage (Hanson et al 2001). There is little documented understanding of the fuelwood economy in PNG. Miriam Murphy will outline her fuelwood research undertaken during1997-2001 in the Eastern Highlands in the next presentation. Other surveys have apparently been made but they are difficult to locate. However, the Department of Minerals and Energy did undertake a survey of Household Energy Consumption in Port Moresby in 1980 (Gamser, 1980). The survey covered 1,800 low cost, domestic quarters, urban village, and squatter settlement households that comprise 79 percent of the city's dwellings. It was undertaken in July/August by 57 student surveyors from the University of PNG. The key findings were:
• 97.8 percent of the homes surveyed used firewood or kerosene for cooking and lighting. • Electricity is rarely used for purposes other than lighting because of its high cost. • Almost everyone surveyed paid to obtain firewood, either to buy bundles from sellers or to travel great
distances to gather it. Few areas in Port Moresby possess adequate firewood supplies within walking distance from their households.
• Average price paid for kerosene in the survey was 39.7 toya/litre, over 13t greater than the price controlled price for this fuel at the time of the survey.
• Kerosene purchased in small containers from trade stores can cost 4 to 5 times as much as the controlled price charged at petrol stations.
• Rapidly decreasing firewood supplies make this fuel more difficult and expensive to obtain each day, and many people are switching to cooking with imported kerosene.
• Firewood and charcoal produced from sawmill wastes and sold at community distribution centres can undercut the present energy cost of firewood by 19 to 60 percent and the energy cost of kerosene by over 50 percent.
• “Port Moresby households pay far too much for domestic fuels and rely far too heavily on imported kerosene. The development of firewood, charcoal and other indigenous energy resources is essential for the city's future, and that of other areas in Papua New Guinea.”
The practice of fuelwood surveys The best manual for carrying out fuelwood surveys still appears to be that published by FAO in 1983 (FAO 1983). It makes the point that a good fuelwood survey is really a social survey because it deals not only with wood but with how a particular society manages its resources with factors such as control of and access to trees, division and organisation of labour, and patterns of using fuel. A good survey should cover not only the wood and other fuel sources, but also the rules and technology that society uses for managing that resource.
Understanding the general context of fuelwood use Brokensha and Castro (in FAO 1983) suggest these general categories on which to gather information to understand fuelwood systems.
• Demography: how the patterns of population affect fuelwood use and transport • Environment: how the patterns of climate and land use capability affect availability and
productivity of the fuelwood resource and the demand by the population

Appendix 11.1 of FR2013-14 164
• History: patterns of fuelwood use are not static and changes in population, expansion of farming, building of roads, growth of markets, etc may have impact on fuel use. The present can only be understood in relation to the past.
• Community: the degree of cooperation and competition or conflict between groups (e.g. men and women, clans, rich and poor, rural and urban, young and old, landlords and tenants etc) will be played out in access, attitudes and usage of fuelwoods.
• Domestic: there is no ‘average household’ but a range of household types, so a typology of households needs to be found. So we look for proxy indicators which give good indicators of income and wealth. This typology can be used to establish the range and extent of inequality and variation between households and to relate this to patterns of fuelwood use.
• Society and Economy: there should be further differentiation on topics such as access to and control of land and trees; the main production systems (subsistence vs commercial agriculture and forestry); patterns of technology, markets, credit and indebtedness, communications, and how all these relate to economic status.
• Services: services provided by government or non-government agencies in education, health, agriculture and forestry extension, community development and commerce.
• Political administration: what are formal and informal channels of authority; extent of local participation in making decisions; laws, regulations and local informal sanctions affecting fuelwood?
This list is not comprehensive nor is it presented as a framework around which we should design our survey. It is presented here as some categories to consider when asking appropriate questions to understand the general context of our fuelwood study.
Data collection in fuelwood studies A range of methods are used to gather data about fuelwood. No one method is superior, many will be necessary in our study to some extent. Written sources Government reports may contain relevant community level data, as well as formal policy and administrative issues affecting the fuelwood economy. Historic and ethnographic literature can be useful for understanding the social and cultural issues underpinning fuelwood use. Universities and research institutions may be good sources of unpublished research. Key informants and informal information networks A key informant is someone who is knowledgeable, who has contacts and is willing to talk. While they are often a useful source of information that is otherwise inaccessible, there may be problems of bias and representation. Participant observation This is a major strategy for anthropologists involving a combination of informal interviewing data being collected in a relatively unstructured and flexible manner. It also usually occurs over a prolonged period. However, the principle Non-participant observation Here the observer remains unobtrusively separate from the activity of the people under study. It may be possible to structure the observation to focus on a particular activity such as wood-collecting, cooking, tree-planting, or fuelwood sales. Time-allocation studies

Appendix 11.1 of FR2013-14 165
Understanding how households allocate their time to fuelwood related activities can provide valuable information underpinning local involvement in the fuelwood economy. It involves studying activities in collecting wood, preparing charcoal, cooking, and other energy-related activity. The problem with directly asking people about their time allocation is that they may perceive and evaluate ‘time’ in a different way from the investigator. This can be overcome by direct and random spot observations of people, timing them ‘in the act’ and noting basic details along the line of ‘when?, where?, what?, how?, with whom?, and how long?' However, this can take a long time and can lead to over-collecting data that cant be used. Individual and group interviews These are best led by a set of open-ended questions, but this doesn’t preclude using questionnaires for collecting preliminary basic information. The questions should be carefully phrased to be properly understood and delivered in a logical order and to remind people of aspects on which they might comment. Group interviews may be arranged or may occur spontaneously around an individual interview. It is a short-cut method for gathering a lot of data but should not be considered as providing a representative sample. Questionnaires This is a very popular form of data gathering on specific items which can easily be quantified and analysed. Questionnaires compel the use of a highly organised structure which often need to verified by findings from personal observations and other sources of knowledge. The problems of questionnaires, especially where it is the primary source of information, are:
• they can impose rigid , pre-conceived ideas and miss the real issue; • errors can occur in recording data especially if there are many field enumerators who are
inadequately supervised; • respondents can conceal, misreport or misunderstand questions; • recall errors can occur especially with regard to seasonal activities.
So questions must be very carefully selected and phrased. They should also be tested to allow for refining, and clarifying the questions so that they really gather the right information. The length of the questionnaire, and therefore the amount of information gathered, will be determined by the necessary sample size, available time and human resources. Questionnaire surveys require constant supervision and cross-checking. They are not necessarily the cheapest or easiest way to gather information and certainly, on their own, inadequate for gaining the deeper understanding of the situation. Two of the common mistakes made with fuelwood questionnaire surveys are to deliver them only in the dry season and only along major roads. Concluding remarks on planning fuelwood surveys:
• use a combination of methods to give a more complete and accurate view of energy use • be aware of local knowledge, expertise and perceptions; invite local participation in the
planning, implementation and analysis of the survey • be aware of numerous biases: dry season, elite, male, roadsides, project, etc, that can skew
the description and analysis of local fuel situations.
Copyright © 2022 FDOKUMEN