Promoting corporate social responsibility in small and medium ...
66
Project Document Economic Commission for Latin America and the Caribbean (ECLAC) Promoting corporate social responsibility in small and medium enterprises in the Caribbean: methodology report Kalim U. Shah Maria Hinostroza Georgina Núnez (Coordinator)
-
Upload
khangminh22 -
Category
Documents
-
view
1 -
download
0
Transcript of Promoting corporate social responsibility in small and medium ...
Project Document
Economic Commission for Latin America and the Caribbean (ECLAC)
Promoting corporate social responsibility in small and medium
enterprises in the Caribbean: methodology report
Kalim U. Shah Maria Hinostroza
Georgina Núnez (Coordinator)
This report is a result of component II “Improvement of quality and access to regional CSR specific data” of the project titled “Promotion of Corporate Social Responsibility (CSR) among Small and Medium-sized Enterprises in the Caribbean region” (Project OEA 07-001), coordinated by the Organization of American States (OAS), in partnership with the Economic Commission for Latin America and the Caribbean (ECLAC), Young American Business Trust (YABT) and the Caribbean Association of Industry and Commerce (CAIC). This project was financed by the Government of Canada -, Association of Industry and Commerce (CAIC). The report was coordinated by Georgina Núñez, Expert of the Washington Office. Additional comments and observations were provided by Inés Bustillo, Fernando Flores and Sarah Miers of the ECLAC Washington Office, Zakaria El Gourmiri of the OAS, Sinovia Moonie of the ECLAC sub-headquarters in Port of Spain Office, and Louis Viguria of the YABT. The views expressed in this document, which has been reproduced without formal editing, are those of the authors and do not necessarily reflect the views of the Organization. United Nations Publication LC/W.213 – LC/WAS/W.5 Copyright © United Nations, December 2008. All rights reserved Printed in Santiago, Chile – United Nations Applications for the right to reproduce this work are welcomed and should be sent to the Secretary of the Publications Board, United Nations Headquarters, New York, N.Y. 10017, U.S.A. Member States and their governmental institutions may reproduce this work without prior authorization, but are requested to mention the source and inform the United Nations of such reproduction.
ECLAC – Project Documents collection Promoting corporate social responsibility…: methodology report
3
Table of contents
I. Introduction......................................................................................................................... 5
II. CSR Principles and Guidelines for the Caribbean................................................................ 9 A. The millennium development goals.............................................................................10 B. The United Nations global compact.............................................................................11 1. Human Rights .....................................................................................................12 2. Labor ..................................................................................................................12 3. Environment........................................................................................................13 4. Anti-Corruption....................................................................................................13 III. CSR in the Caribbean Context ...........................................................................................15 A. Caribbean CSR activities ...........................................................................................16 B. The role of CSR in sustainable development...............................................................17 C. Promoting CSR practices throughout industries ..........................................................18 IV. Economic Overview of the Caribbean Region.....................................................................21
A. Countries included in the pilot studies .........................................................................24 B. Selection of industry sectors .......................................................................................24 1. Contribution of the industry sector to gross domestic product (Constant GDP).....25 2. Average rate of sectoral GDP growth (for the period 2000-2005) .........................25 3. Level of employment by industry sector...............................................................25 4. Number of established SMEs operating in each industry sector ...........................25 C. Data limitations and quality .........................................................................................25 1. Insufficiency of national business registries .........................................................25 2. Differences in aggregation of sectors in each country ..........................................26 3. Segregation into micro, small, medium and large companies...............................26 D. Pilot country profiles and industry selection.................................................................27 1. Barbados ............................................................................................................27 2. Jamaica ..............................................................................................................31 3. Trinidad and Tobago ...........................................................................................34 4. St. Lucia..............................................................................................................40
5. Guyana...............................................................................................................44 V. Definition of the Sample Frame and Sample Selection .......................................................49 A. Parameters.................................................................................................................49 1. Pilot Countries.....................................................................................................49 2. Selected industry sectors ....................................................................................49 3. Definition of small, medium, and large companies ...............................................49
ECLAC – Project Documents collection Promoting corporate social responsibility…: methodology report
4
B. Exclusions..................................................................................................................50 1. Government services ..........................................................................................50 2. Agriculture sector ................................................................................................51 3. Other less defined sectors...................................................................................51 4. Micro enterprises.................................................................................................51 C. Statistical methods .....................................................................................................51 1. Confidence levels ...............................................................................................51 2. Proportional representation .................................................................................51 3. Stratified sampling by company size ...................................................................52 D. Sample selection ........................................................................................................52 VI. Survey Design ...................................................................................................................57
Bibliography ..............................................................................................................................59
Annex 1 ...................................................................................................................................62
Annex 2 ...................................................................................................................................65
ECLAC – Project Documents collection Promoting corporate social responsibility…: methodology report
5
I. Introduction
Over the past decade, a growing number of companies have recognized the business benefits of Corporate Social Responsibility (CSR) policies and practices. Their experiences are bolstered by a growing body of empirical studies that demonstrates that CSR has a positive impact on business economic performance and is not detrimental to shareholder value. Maximization of profits is perhaps the most important element for ensuring the continuity of the business over the time. However, value creation is also related to social issues such as health and safety, equality and environmental protection, under a “triple bottom line” approach. In this perspective the social and the environmental levels should be considered as important as the economic-financial level.
In developed countries, companies have increasingly been encouraged to adopt or expand CSR efforts due to the result of pressures from governments, customers, suppliers, employees, communities, investors, activist organizations and other stakeholders. As a result, CSR projects have grown dramatically in recent years, with companies of all sizes and sectors developing innovative strategies. Firms have come to realize that CSR is good for businesses, since it increases productivity, contributes to competitiveness and creates a positive corporate image in the eyes of consumers, investors, employees and the community at large. By the same token, socially responsible businesses, with a purpose beyond making profit, can have a positive social, economic, and environmental impact at the country level by helping to improve the working and surrounding conditions, including those of its small business suppliers.
Despite growing evidence that CSR practices can strengthen market share and potentially reduce long term costs, there has been reluctance by many companies to adopt these practices for a number of reasons. Among them, many companies do not fully understand what CSR is or how it can be employed to improve their bottom-line and reduce risks and liabilities. Increasingly SMEs that are part of the supply chains of large companies are being required to implement CSR measures. If these firms want to compete in the global marketplace, they must begin making changes and incorporating CSR measures.
Part of the corporate performance indicators design comes from surveys, questionnaires, etc in which not only the firms but also other stakeholders participate, to allow the identification of best practices. The purpose of this gathering of information is to measure the firm interest level on CSR issues, and how this is strengthened by a proactive attitude from governments, consumers and civil society. Currently, the information on best practices is very limited at regional level
ECLAC – Project Documents collection Promoting corporate social responsibility…: methodology report
6
especially within the Caribbean countries. Moreover the lack of methodology tools restricts an appropriate measurement of social and environmental activities of private sector. The primary purpose of this report is therefore to provide a methodology for investigating CSR awareness and activity in the Caribbean region. Furthermore, this methodology document will focus directly on small and medium enterprises and secondarily on the other large and multinational companies that also operate in the Caribbean region.
Thus this component of the project seeks to know approximately how many companies in five of the Caribbean countries selected have CSR programs incorporated into their business strategy. It also seeks to provide information to the rest of the components about the “state of the art” of CSR in the region in order to address key CSR needs and identify best practices in the Caribbean community (CARICOM). This information would also contribute to the design of tools for assessing, monitoring and ensuring compliance with CSR practices. The data will be compiled through a proposed questionnaire that aims to cover three main dimensions of a sustainable development approach i.e. economic, social (human rights, labor practices), community (investment in health and education) and environmental protection measures.
Facilitating the adoption of CSR measures in companies will contribute to the process of increasingly sustainable development in the region and will result in direct tangible benefits to the companies, which will be used to demonstrate the benefits of CSR to other firms. Awareness of CSR and its associated benefits has only recently begun to be developed in some countries of the region, with the hope of expanding such benefits. For this reason, it is necessary to quantify the degree of integration of CSR policies taken upon by companies, governments and societies as a whole.
While businesses have always held an important role in shaping community and economic well being, the influence of businesses has increased dramatically worldwide over the last few decades. Even though this project focuses on SMEs, it recognizes the influence of large companies as a catalyst for CSR best practices. In fact, at the turn of the millennium, fifty-one of the largest one hundred economies in the world are corporations. Multinational companies have been attracted to the Caribbean region for various reasons including to exploit natural resources such as oil and gas in Trinidad and Tobago or minerals and ores in Guyana and Jamaica; for offshore banking as in Barbados; or to benefit from low cost labor as in many territories. Currently in the region, large multinationals originating from the US, Canada, Europe and elsewhere operate in sectors such as energy, financial services, manufacturing, transportation and communications and others.
As multinational firms have proliferated, fewer companies are affecting the lives of more and more people, as employees, supply chain partners and customers. The extent to which these large transnational corporations as well as their smaller supply chain partners adopt and practice CSR holds strong implications for the environmental, financial and social well-being of millions of people and thousands of communities throughout the region.
According to the WBCSD, “CSR is the continuing commitment by business to behave ethically and contribute to economic development while improving the quality of life of the workforce and their families as well as of the local community and society at large.” Therefore, the main goal of this project is to strengthen the competitiveness of CARICOM SMEs and; the specific objective is to incorporate CSR in the business strategy of the regions’ SMEs taking into account the country’s social needs and creating national and regional capacity building at firm-level.
The paper discusses importance of CSR analysis and measurements in the selected Caribbean countries (between 75-80% of the region’s product and representative of main industry sectors). Based on human rights, labor rights, anticorruption practices, and environmental performance this paper develops variables to assess CSR performance of firms.

ECLAC – Project Documents collection Promoting corporate social responsibility…: methodology report
7
After the Introduction section, this paper is structured as follows: Chapter 2 provides guidelines that will be the foundation for this CSR study. Chapter 3 provides an overview of CSR in the Caribbean, current perception of the CSR concept and previous initiatives taken. Chapter 4 begins setting up the context of this study providing highlights, the selection criteria of the pilot group of countries and industry sectors, and detailed country profiles, which include contextual information and justification for industry selection. Chapter 5 defines the frame (parameters, exclusions and methods) and characteristics of the sample. Finally Chapter 6 describes the design of the CSR questionnaire and the process to be used to collect data.

ECLAC – Project Documents collection Promoting corporate social responsibility…: methodology report
9
II. CSR Principles and Guidelines for the Caribbean
As the first Caribbean regional survey on CSR practices by business and industry, this survey is based on the principles set forth in internationally recognized guidelines including the:
i) United Nations Millennium Development Goals (MDGs)
ii) United Nations Global Compact
These agreements set forth broad, overarching principles of CSR which will guide the development of more Caribbean specific CSR indicators and suitable measurement for each major facet of CSR which are labor, human rights, environment and anti-corruption.
In essence CSR means addressing in a balanced way the economic, social and environmental impact of business operations whilst building shareholder value. While mainly linked to corporate regulation, the idea of CSR also has far reaching sustainable development implications in that a primary driver for the rise of CSR on the socio-political agenda has been the recognition of the need for fundamental change in the role of business in the world that must develop in a sustainable manner.
Important elements for the definition of CSR:
• Serving all the company’s stakeholders is accepted as the best way to produce long term business success and to create a growing, prosperous company.
• The company’s products and technologies are directed to contribute to the culture, benefits and welfare of people and communities.
• The company creates win-win relationships with stakeholders that are distinctly characterized by endurance over time.
• Company prosperity is directly linked to the prosperity of customers, suppliers and shareholders.
ECLAC – Project Documents collection Promoting corporate social responsibility…: methodology report
10
While the definition of CSR may differ somewhat according to various organizations, experts, practitioners and academics, there is consensus on key elements that comprise the concept of CSR. These include welfare of employees, firm governance, community support, environmental concern. CSR is more than a collection of discrete activities or initiatives motivated by marketing, public relations or other business benefits. Rather, it is viewed as a comprehensive set of policies, practices and programs that are integrated throughout business operations and decision-making processes. For the purposes of this project, the following eleven elements should be included within the rubric of CSR:
i) mission and vision
ii) ethics
iii) workplace health and safety
iv) environment
v) production processes
vi) community development
vii) responsible marketing
viii) public policies
ix) corporate governance (transparency and accountability)
x) anti-corruption practices
xi) human rights.
A. The Millennium Development Goals
Following from the 1995 Copenhagen Declaration on Social Development and the Program of Action the Millennium Summit was held in 2000 and served as another watershed event in the process of strengthening the capacity of the international community to address the world’s main development challenges. It marked the culmination of the consensus reached during the previous decade in such fields as peace, security and disarmament, poverty eradication, human rights, protection of the environment, population and gender equity. A critical role was identified for the private sector and business and industry was challenged to be part of national development efforts on poverty and unemployment alleviation, social integration, economic and fiscal policies; capacity building and institution building; and giving priority to investments in education, health, social protection and basic social services. These MDGs (see table II.1) are currently used as the global point of reference for development matters. This is due, not only to their specific and multidimensional nature, but also to the fact that 192 Member States of the United Nations have made a formal commitment to achieve them.
An initial investigation of the Caribbean situation may result in an overall positive assessment of the region’s progress in achieving the MDGs. Human Development Indicators (HDI) for the Caribbean, with the exception of Haiti, are relatively high compared to their Latin American counterparts. Some Caribbean countries such as Barbados (30), St. Kitts and Nevis (49), Bahamas (50), Cuba (52) and Trinidad and Tobago (57) have continually obtained rankings within the high human development category (see Annex 2). Similarly, the Caribbean region as a whole has performed well in achieving universal primary education, gender equality in schooling, reducing child mortality, access to safe drinking water and the control of HIV/AIDS when
ECLAC – Project Documents collection Promoting corporate social responsibility…: methodology report
11
compared to many other developing countries in the hemisphere (ECLAC, 2005). The progress of Caribbean countries is more accurately described as being very uneven.
There is progress being made towards the MDGs in the Caribbean. This analysis of each group’s progress towards the Goals reveals that, although the region’s less developed countries have experienced greater difficulty than the ones with intermediate and high levels of development in reducing extreme poverty and hunger, they have nevertheless made significant headway in these areas. Consequently, it appears that more domestic and external resources are needed to complement the efforts being made in the countries of the region that are lagging furthest behind.
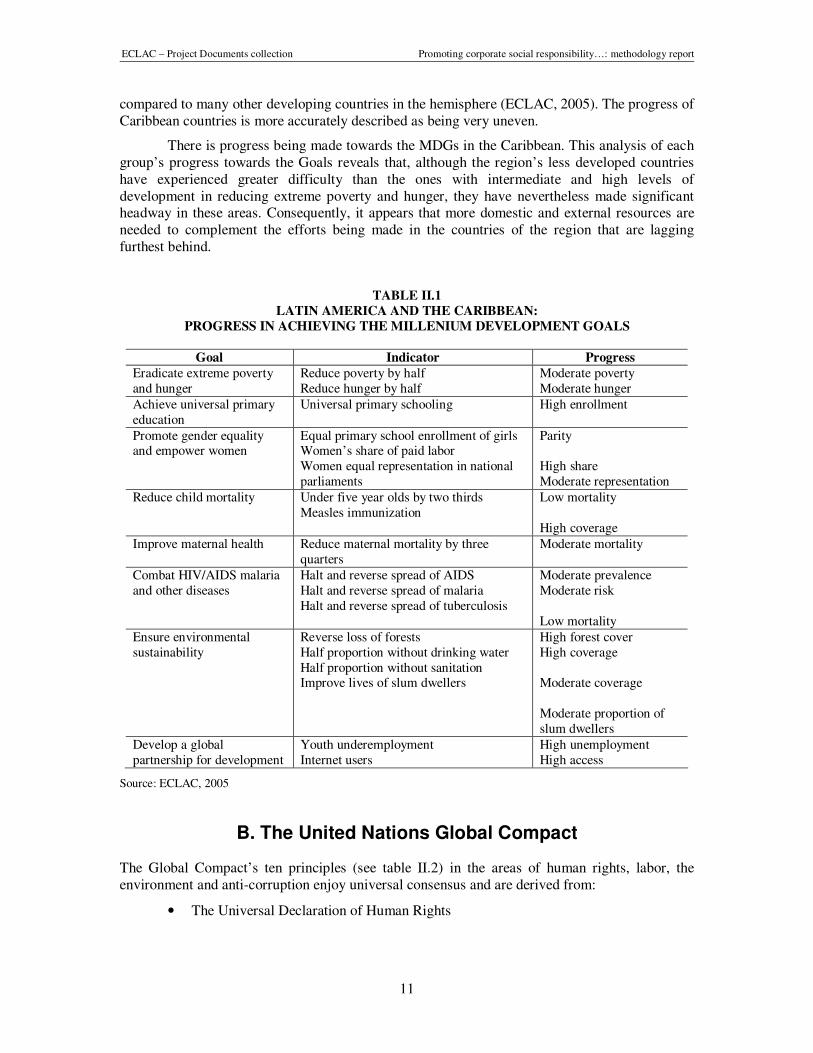
TABLE II.1
LATIN AMERICA AND THE CARIBBEAN:
PROGRESS IN ACHIEVING THE MILLENIUM DEVELOPMENT GOALS
Goal Indicator Progress
Eradicate extreme poverty and hunger
Reduce poverty by half Reduce hunger by half
Moderate poverty Moderate hunger
Achieve universal primary education
Universal primary schooling High enrollment
Promote gender equality and empower women
Equal primary school enrollment of girls Women’s share of paid labor Women equal representation in national parliaments
Parity High share Moderate representation
Reduce child mortality Under five year olds by two thirds Measles immunization
Low mortality High coverage
Improve maternal health Reduce maternal mortality by three quarters
Moderate mortality
Combat HIV/AIDS malaria and other diseases
Halt and reverse spread of AIDS Halt and reverse spread of malaria Halt and reverse spread of tuberculosis
Moderate prevalence Moderate risk Low mortality
Ensure environmental sustainability
Reverse loss of forests Half proportion without drinking water Half proportion without sanitation Improve lives of slum dwellers
High forest cover High coverage Moderate coverage Moderate proportion of slum dwellers
Develop a global partnership for development
Youth underemployment Internet users
High unemployment High access
Source: ECLAC, 2005
B. The United Nations Global Compact
The Global Compact’s ten principles (see table II.2) in the areas of human rights, labor, the environment and anti-corruption enjoy universal consensus and are derived from:
• The Universal Declaration of Human Rights
ECLAC – Project Documents collection Promoting corporate social responsibility…: methodology report
12
• The International Labor Organization’s Declaration on Fundamental Principles and Rights at Work
• The Rio Declaration on Environment and Development
• The United Nations Convention Against Corruption
These principles provide a reputable and justified foundation from which CSR practices can be structured and practiced. The Global Compact asks companies to embrace, support and enact, within their sphere of influence this set of core values. While not standards, these principles act as global guidelines to leading companies interested in improving their CSR in a structured manner that contributes to sustainable development in their spheres of operation and their overall competitiveness in the markets which they occupy. According to the UN Global Compact website database, to date, of the five Caribbean pilot countries there is a total of six Global Compact signatory organizations1 – four in Trinidad and Tobago, one each in Barbados and St. Lucia and none in Jamaica or St. Lucia. For the Caribbean region to embrace the goals and benefits of CSR, the region’s businesses should likewise utilize the principles set forth, as a basis for future activities, initiatives and improvements. An overview of the four pillars of CSR (human rights, labor, environment and anti-corruption) is provided below:
1. Human Rights
The origin of Principles One and Two is in the 1948 Universal Declaration of Human Rights (UDHR). The aim of this Declaration was to set basic minimum international standards for the protection of the rights and freedoms of the individual. The fundamental nature of these provisions means that they are now widely regarded as forming a foundation of international law. In particular, the principles of the UDHR are considered to be international customary law and do not require signature or ratification by the state to be recognized as a legal standard. While some principles may not be directly applicable to business, consistency with the declaration is important.
Touching some aspects of the daily lives of people, the Declaration proclaims the right to social security and to the economic, social and cultural right indispensable to human dignity and the free development of each individual’s personality. These rights are to be realized through national efforts and international co-operation in accordance with conditions in each state. The right to work is set out, and to equal pay for equal work and to just and favorable remuneration ensuring for the worker and the worker’s family an existence worthy of human dignity. The Declaration also recognizes that right to form and join trade unions, the right to rest and leisure, reasonable limitations on working hours and periodic holidays with pay. The right to a standard of living adequate for health and well being, including food, clothing, housing, medical care, and to social services and security, if necessary, are also proclaimed as are the rights to education, and to participate in the cultural life of the community, and to the protection of the moral and material interests resulting from any scientific, literary or artistic production.
2. Labor
The four labor principles of the Global Compact are taken from the ILO’s Declaration on Fundamental Principles and Rights at Work. This Declaration was adopted in 1998 by the International Labor Conference, a yearly tripartite meeting that brings together governments, employers and workers from 181 countries. The Declaration calls upon all ILO Member States to
1 Barbados signatory- Greystone LLC; Guyana signatory- Amazon Caribbean Guyana Limited; Trinidad and Tobago
– The University of the West Indies, Graduate Business School, Electrical Industries Limited, South Trinidad Chamber of Commerce, TnT Manufacturers Association.
ECLAC – Project Documents collection Promoting corporate social responsibility…: methodology report
13
apply the principles in line with the original intent of the core Conventions on which it is based. A universal consensus now exists that all countries, regardless of level of economic development, cultural values, or ratifications of the relevant ILO Conventions, have an obligation to respect, promote, and realize these fundamental principles and rights. The Principles and Rights identified in the ILO Declaration comprise the labor portion of the Global Compact. They are:
• to promote and realize in good faith the right of workers and employers to freedom of association and the effective recognition of the right to collective bargaining;
• to work towards the elimination of all forms of forced or compulsory labor;
• the effective abolition of child labor; and
• the elimination of discrimination in respect of employment and occupation.
3. Environment
The three environmental principles of the Global Compact are drawn from a Declaration of Principles and an International Action Plan (Agenda 21) that emerged from the United Nations Conference on Environment and Development (the Earth Summit) held in Rio de Janeiro in 1992. Chapter 30 of Agenda 21, identified that the policies and operations of business and industry can play a major role in reducing impacts on resource use and the environment. In particular, business can contribute through the promotion of cleaner production and responsible entrepreneurship.
The environmental principles of the Global Compact provide an entry point for business to address the key environmental challenges. In particular, the principles direct activity to areas such as research, innovation, co-operation, education, and self-regulation that can positively address the significant environmental degradation, and damage to the planet’s life support systems, brought by human activity. The key environmental challenges are:
• loss of biodiversity and long-term damage to ecosystems
• pollution of the atmosphere and the consequences of climate change
• damage to aquatic ecosystems
• land degradation
• the impacts of chemicals use and disposal
• waste production
• depletion of non-renewable resources
4. Anti-Corruption
On 2004 the UN Global Compact Leaders included a tenth principle against corruption. This was adopted after extensive consultations and all participants yielded overwhelming expressions of support, sending a strong worldwide signal that the private sector shares responsibility for the challenges of eliminating corruption. It also demonstrated a new willingness in the business community to play its part in the fight against corruption. With the adoption of the United Nations Convention against Corruption in Mérida, Mexico in December 2003, an important global tool to fight corruption was introduced. The Convention is the underlying legal instrument for the 10th principle against corruption and entered into force on 14 December 2005.
The adoption of the tenth principle commits UN Global Compact participants not only to avoid bribery, extortion and other forms of corruption, but also to develop policies and concrete programs to address corruption. Companies are challenged to join governments, UN agencies and
ECLAC – Project Documents collection Promoting corporate social responsibility…: methodology report
14
civil society to realize a more transparent global economy. Corruption can take many forms that vary in degree from the minor use of influence to institutionalized bribery. Transparency International’s definition of corruption is “the abuse of entrusted power for private gain”. This can mean not only financial gain but also non-financial advantages.
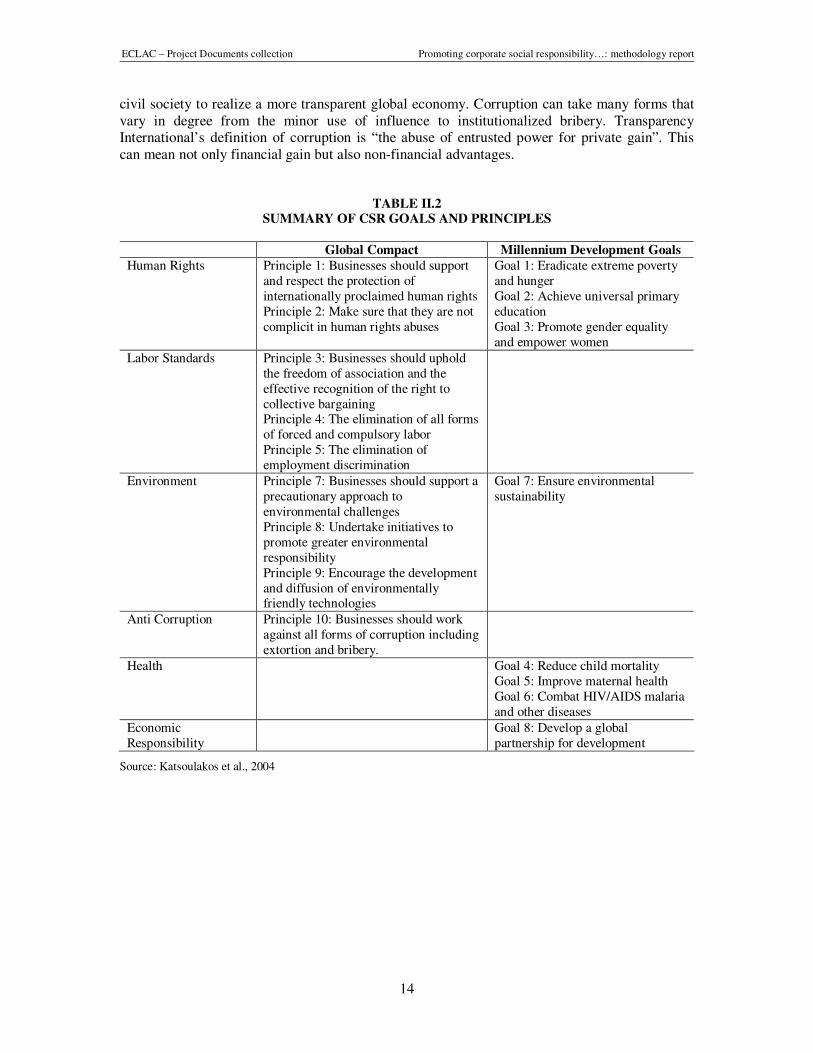
TABLE II.2 SUMMARY OF CSR GOALS AND PRINCIPLES
Global Compact Millennium Development Goals
Human Rights Principle 1: Businesses should support and respect the protection of internationally proclaimed human rights Principle 2: Make sure that they are not complicit in human rights abuses
Goal 1: Eradicate extreme poverty and hunger Goal 2: Achieve universal primary education Goal 3: Promote gender equality and empower women
Labor Standards Principle 3: Businesses should uphold the freedom of association and the effective recognition of the right to collective bargaining Principle 4: The elimination of all forms of forced and compulsory labor Principle 5: The elimination of employment discrimination
Environment Principle 7: Businesses should support a precautionary approach to environmental challenges Principle 8: Undertake initiatives to promote greater environmental responsibility Principle 9: Encourage the development and diffusion of environmentally friendly technologies
Goal 7: Ensure environmental sustainability
Anti Corruption Principle 10: Businesses should work against all forms of corruption including extortion and bribery.
Health Goal 4: Reduce child mortality Goal 5: Improve maternal health Goal 6: Combat HIV/AIDS malaria and other diseases
Economic Responsibility
Goal 8: Develop a global partnership for development
Source: Katsoulakos et al., 2004
ECLAC – Project Documents collection Promoting corporate social responsibility…: methodology report
15
III. CSR in the Caribbean context
While CSR has developed a significant following in industrialized countries, progress in the Caribbean is still at a somewhat underdeveloped stage. However, growing interest in CSR around the world is placing increased pressure on companies worldwide, including those in the Caribbean region, to incorporate such concepts in order to compete effectively. Such pressures may be institutionally based coming from governments and regulators or they may be derived from local communities and the non governmental activist sector. Furthermore, apart from pressures, companies may also be motivated to improve CSR in order to catch up with market leaders or to mimic more successful competitors (Shah, 2007). Demand for CSR is being fueled by the increasing pace of firms worldwide in enhancing performance and by continued economic deregulation and trade reforms that are putting pressure on firms to improve their overall performance and respond to market demands and conditions. For example, non-compliance with international labor standards has the potential to be used as a barrier to export certain products and simple compliance with national laws may not suffice. Firms in the region need to be aware of the standards to which they will be held accountable in the increasingly globalized markets. Some factors2 that are increasing CSR use among firms in the region include:
• supply chain responsibility;
• importance for maintaining access to export markets;
• increased customer interest;
• demands for increased disclosure (transparency);
• risk management; and
• corporate governance issues.
A company must work with its stakeholders, including its suppliers, to be considered socially responsible. This alone has been an effective mechanism to promote and encourage SMEs to implement CSR systems, as a means to maintain access, and possibly even opening up new contacts, with large company clients.
Despite the fact that CSR is increasingly being recognized as an effective means of decreasing costs and strengthening market share, there has been reluctance by many companies in the region to adopt these practices due to the following two reasons:
2 Please see Organization of American States Project Profile, Promoting Corporate Social Responsibility in Small
and Medium Enterprises in the Caribbean, November 2006.
ECLAC – Project Documents collection Promoting corporate social responsibility…: methodology report
16
i) First, many companies do not fully understand what CSR is or how it can be employed to improve their bottom-line and reduce risks and liabilities. A key hurdle that must be overcome in order to foster CSR implementation in the region is disabusing companies in the region of the notion that CSR is simply philanthropy or that it is only useful for larger companies.
ii) Second, there is a dearth of local experts in the region to assist them with implementing CSR measures, making the cost of consulting assistance prohibitive, especially for smaller businesses.
However, if these firms want to compete in the global marketplace, they must begin making changes and incorporating CSR measures.
There is clearly a need and indeed an opportunity to advance our understanding of CSR promotion and advocacy in the Caribbean. It begins by contextualizing the relative importance of, and commitment to, CSR in the Americas through a cross-national comparison of levels of CSR activity. From this essential data base we can elaborate on the key relationships and influences on the development of the CSR culture in the region, define the major actors such as multilateral organizations, governments, private firms, private associations, educational institutions and civil society organizations. By understanding CSR it is possible to identify the pressure points where the CSR agenda can be best moved forward.
A. Caribbean CSR activities
In a recent study undertaken by Canadian Foundation for the Americas (FOCAL) selected countries in North America, Latin America and the Caribbean were reviewed to determine their levels of CSR activity. The review included the involvement of private sector, public sector and level of public awareness. Comparisons were made based on “levels of activity” apparent through internet searches on key CSR related topics. While a somewhat course methodology, it gave an important gauge of the level of CSR activity at the national levels and a basis for some comparisons. It was found that there is a huge gap between the most developed countries of the Americas (Canada and the US) and the rest of the region, very similar to the gap existing in other areas of economic and business development. Overall, the study suggests that there are four different levels of CSR activity in the Americas. The most CSR activity from the US and Canada, the larger most developed Latin countries such as Brazil, Mexico and Argentina are “catching up” while the rest of Latin America is “walking” and Central America and the Caribbean is in a “stalled” state with respect to CSR activity.
This low level of CSR activity is somewhat surprising considering the relatively high-income levels of the Caribbean countries and the numerous foreign firms that cater to Northern consumers in the Tourism industry. While Caribbean CSR activity is not as high as in other parts of the Hemisphere, there are strong movements to correct this, such as the ENACT environment program in Jamaica sponsored by the Canadian government and notable private sector driven initiatives in Trinidad and Tobago. There have also been CSR studies done by the Community Tourism Foundation and the Caribbean Policy Development Center in Barbados which covered all the English speaking Caribbean countries (Jones, 2003).
The Inter-American Development Bank also conducted a detailed study (Vives, 2005) on SME development in the Caribbean. While this informative study explicitly deals with development of SMEs, expansion in Caribbean countries and investment in SMEs by governments, it is not focused on CSR issues. This IDB study however is authoritative on regional SME development. In addition, the most recent CSR focused initiative is one being
ECLAC – Project Documents collection Promoting corporate social responsibility…: methodology report
17
undertaken by the UNDP regional office in Trinidad. Under their initiative they are spearheading the creation of a CSR network in conjunction with local business associations and are supporting a nationwide CSR mapping study among other activities.
Notwithstanding these efforts it can generally be observed that in the Caribbean region overall (i) private sector CSR activity is relatively weak or only philanthropic in nature; (ii) government involvement and promotion is also relatively weak and not integrated into the whole of government policy; (iii) public awareness across the region, media coverage and interest by academia is growing.
B. The role of CSR in sustainable development
There is growing pressure on business to become engaged in sustainability issues due to the expanding global wealth and influence of the private sector. Additionally, many of the traditional development actors in the public and civil society sectors now recognize the increasing difficulty of tackling certain global problems in a unilateral manner. There are occasions when the private sector, often in partnership with government, civil society or both, can be better positioned to provide solutions because of its resources (financial and in-kind), innovation and management skills. At the same time, the private sector is increasingly finding competitive benefits in embracing a more proactive and collaborative role in development. These benefits include risk mitigation, new market opportunities and increased value added. The market (society or community) ultimately determines the success of a company hence this becomes an important drive for companies to contribute to society. The private sector remains the key driver of growth and wealth creation as employer, investor, source of finance, motor of competitiveness and in building capacity and human capital. Beyond this core role of providing opportunities for people to lift themselves out of poverty, business can contribute to resolving particular development issues. It can be the source of valuable expertise, ingenuity and capacity that help find new solutions, be it to educational needs, health needs, environmental problems, or the supply of public goods. Multinationals already have a particularly important role to play in upholding and advancing principles on human rights, labor, environmental and anti-corruption practices in countries with weak regulatory capacity.
Business and economic development reinforce one another in many easy including the creation of new markets. Business can contribute to accelerating the rise in employment and income and opportunity by investing in infrastructure, research and development (R&D) and technologies for the developing world; dissemination of best practices; hiring and developing local talent; buying from local suppliers; volunteering talent and time toward a particular issue; donating surplus or used equipment; and making financial donations through corporate foundations. Increasing evidence suggests that this makes good business sense.
The private sector continues to find itself having more opportunities and influence but also more new risks and responsibilities in the globalization process. Public attitudes shift on a range of issues ranging from climate change to business community relations to corruption and corporate transparency and accountability. Firms may prefer not to shoulder the burdens of increased risks and penalties and hence more and more companies feel the need to demonstrate that they are good corporate citizens. The philosophy of CSR is therefore beginning to take hold on business, industry, government and civil society and reach further than mere corporate philanthropy and charity. From the development perspective therefore, good corporate governance contributes by enhancing the performance of companies and increasing their access to outside capital especially from developed to developing world but also from urban to rural areas.
ECLAC – Project Documents collection Promoting corporate social responsibility…: methodology report
18
In summary, some of the main incentives for the Caribbean private sector to be involved in sustainable development through CSR practices include (Shah, 2007):
• New Markets: Per capita income is rising, opening up markets for developing countries
• Vast Markets: As incomes rise for regional peoples currently in or near poverty, market opportunities expand exponentially
• Investment: Improved governance increases opportunities for investment
• Labor: A healthier workforce improves productivity and creates a more reliable workforce
• Advocate: Firms can serve in a leadership position to change government policies
• Expansion: Firms can provide affordable products and services while expanding into new markets
• Image: Consumers increasingly want to buy from firms that care about development issues
• Lobby: Firms engaged in CSR often take the lead in regulatory and financial reform
• Responsibility: Firms around the globe are being held more accountable for their financial performance and transparency in transactions
• Lower costs: Lower production and transportation costs can be achieved by producing in-market
C. Promoting CSR practices throughout industries
In the Caribbean, as elsewhere in the developing world, the most important industry sectors, especially those that are most resource and/ or service intensive (e.g. Tourism, Energy, and Financial Services) tend to be structured around a relatively small number of large corporations or large dominant market leader firms. The vast majority of SMEs are therefore interlinked to these larger companies by suppliers, contractors, partnerships and service relationships at the front, back and throughout the business value chain. The CSR practices of these larger business entities therefore become central to the challenge of diffusing CSR practices amongst SMEs. As large firms adopt and practice CSR they can disseminate CSR learning and knowledge along their supply and value chains to the benefit of related SMEs.
Whereas the CSR agenda is gaining momentum among large corporations and investors, there is now a strong call for further engagement of SMEs. The rationale behind this effort is that SMEs account for the majority of business in the Caribbean, are often longstanding and dynamic players in local communities and are significant contributors to employment and national economies. Over 80% of registered businesses are classified as SMEs and they employ over 70% of the workforce in nearly all Caribbean countries. One of the key issues is whether or not there is a business case for promoting CSR among SMEs. Some reasons why CSR should be promoted to Caribbean SMEs are as follows:
• SMEs tend to be more labor intensive in production processes than large companies. By provision of productive employment they become an important source of income to reduce poverty.
ECLAC – Project Documents collection Promoting corporate social responsibility…: methodology report
19
• Evidence suggests that countries with higher proportions of SMEs more often have more equitable income distribution; hence ensuring the long term social sustainability of these SMEs can reduce economic disparities especially between urban and rural areas.
• SMEs are key to moving from natural resource intensive, environmentally degradative industries to higher value added less natural resource intensive industries.
• SMEs serve as interlinkages, inter and intra industry and sectors which induce resilience in economic systems and promotes stability.
• SMEs are a constant source of innovative new technologies and production methods often derived in a resource scarce environment that promotes efficiency.
• SMEs often act as suppliers and contractors to multinational corporations which encourage/ pressure firms to conform to labor and environmental standards. This pressure reflects the degree to which the larger multinationals value CSR and can affect the survival of SMEs doing business with them.
• Weak regulatory systems, poor enforcement regimes and lack of monitoring capacities in developing countries often leave the less visible SME sector unregulated. Promotion of CSR practices in SMEs alleviates regulatory burden and costs and ensures SMEs are not neglected.

ECLAC – Project Documents collection Promoting corporate social responsibility…: methodology report
21
IV. Economic overview of the Caribbean region
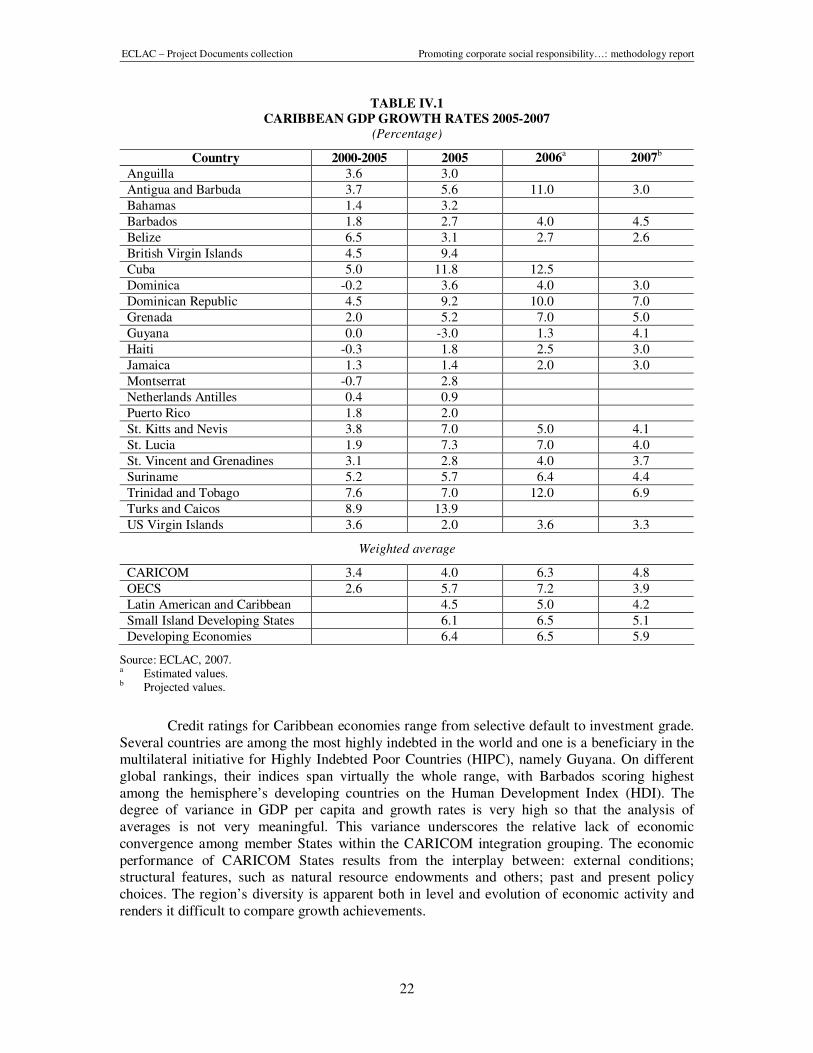
The member countries of CARICOM 3, for which preliminary estimates could be obtained, show a remarkable performance in terms of GDP growth for the current three-year period between 2005 and 2007. Estimated 2006 GDP growth in CARICOM member countries as a group is the highest of the past 25 years (weighted average 6.3; unweighted average 5.2). The same is true for the Organization of Eastern Caribbean States (OECS)4 member countries. The CARICOM countries including five associate members with constitutional ties to the United States, the United Kingdom or the Netherlands represent an extremely diverse region. It includes the pair of developing countries of the Western Hemisphere with the highest and lowest GDP per capita, which, significantly, share a sea-border: the Bahamas and Haiti.
The world economy is expected to slow and, therefore, after a record year of growth in 2006, projections for 2007 are lower for the 11 countries for which the Economic Commission for Latin America and the Caribbean (ECLAC) obtained available official 2007 estimates; in five countries growth is expected to pick up. Overall, growth rates should drop as the Caribbean economies are, by nature, highly vulnerable to a deterioration of external conditions.
While economic growth in 2006 in the Caribbean was high by historical standards, CARICOM’s estimated 6.3% GDP growth is a little short of the 6.5% posted by developing countries as a group. Estimates indicate that the OECS member countries (7.2%) performed better than other CARICOM groupings. CARICOM’s average growth in 2006 is just below that of the group of Small Island Developing States (SIDS) (6.5%), of which they form a part. It compares favorably, however, with the growth rate of developing countries in the Western Hemisphere all of which have recorded an estimated average GDP growth of 5.0%.
3 The Caribbean Community and Common Market (CARICOM) were established by the Treaty of Chaguaramas,
which came into effect on August 1, 1973. Caricom Members are: Antigua and Barbuda, Belize, Grenada, Montserrat, St. Vincent and the Grenadines, The Bahamas, Guyana, St. Kitts and Nevis, Suriname, Barbados, Dominica, Jamaica, Haiti, Saint Lucia, and Trinidad & Tobago. Caricom Associated are: Turks and Caicos Islands, British Virgin Islands, Angilla, Bermuda and Cayman Island. Caricom Observers are: Puerto Rico, Aruba, Colombia, Mexico, Venezuela, Dominican Republic, Netherlands Antilles. Caricom aims at the eventual integration of its members and economies, and the creation of a common market. From its inception, the Community has concentrated on the promotion of the integration of the economies of Member States, coordinating the foreign policies of the independent Member States and in Functional Cooperation, especially in relation to various areas of social and human endeavor.
4 The Organization of Eastern Caribbean States comprises of nine members - Antigua and Barbuda, Commonwealth of Dominica, Grenada, Montserrat, St Kitts and Nevis, St. Lucia and St Vincent and the Grenadines. Anguilla and the British Virgin Islands are associate members of the OECS.
ECLAC – Project Documents collection Promoting corporate social responsibility…: methodology report
22
TABLE IV.1
CARIBBEAN GDP GROWTH RATES 2005-2007 (Percentage)
Country 2000-2005 2005 2006a 2007
b
Anguilla 3.6 3.0
Antigua and Barbuda 3.7 5.6 11.0 3.0
Bahamas 1.4 3.2
Barbados 1.8 2.7 4.0 4.5
Belize 6.5 3.1 2.7 2.6
British Virgin Islands 4.5 9.4
Cuba 5.0 11.8 12.5
Dominica -0.2 3.6 4.0 3.0
Dominican Republic 4.5 9.2 10.0 7.0
Grenada 2.0 5.2 7.0 5.0
Guyana 0.0 -3.0 1.3 4.1
Haiti -0.3 1.8 2.5 3.0
Jamaica 1.3 1.4 2.0 3.0
Montserrat -0.7 2.8
Netherlands Antilles 0.4 0.9
Puerto Rico 1.8 2.0
St. Kitts and Nevis 3.8 7.0 5.0 4.1
St. Lucia 1.9 7.3 7.0 4.0
St. Vincent and Grenadines 3.1 2.8 4.0 3.7
Suriname 5.2 5.7 6.4 4.4
Trinidad and Tobago 7.6 7.0 12.0 6.9
Turks and Caicos 8.9 13.9
US Virgin Islands 3.6 2.0 3.6 3.3
Weighted average
CARICOM 3.4 4.0 6.3 4.8
OECS 2.6 5.7 7.2 3.9
Latin American and Caribbean 4.5 5.0 4.2
Small Island Developing States 6.1 6.5 5.1
Developing Economies 6.4 6.5 5.9
Source: ECLAC, 2007. a Estimated values. b Projected values.
Credit ratings for Caribbean economies range from selective default to investment grade. Several countries are among the most highly indebted in the world and one is a beneficiary in the multilateral initiative for Highly Indebted Poor Countries (HIPC), namely Guyana. On different global rankings, their indices span virtually the whole range, with Barbados scoring highest among the hemisphere’s developing countries on the Human Development Index (HDI). The degree of variance in GDP per capita and growth rates is very high so that the analysis of averages is not very meaningful. This variance underscores the relative lack of economic convergence among member States within the CARICOM integration grouping. The economic performance of CARICOM States results from the interplay between: external conditions; structural features, such as natural resource endowments and others; past and present policy choices. The region’s diversity is apparent both in level and evolution of economic activity and renders it difficult to compare growth achievements.
ECLAC – Project Documents collection Promoting corporate social responsibility…: methodology report
23
The strong growth performance of Caribbean economies in 2006 builds on another year of favorable external conditions, such as dynamic demand for Tourism and Financial Services, high prices for commodity exports, inflow of capital, and low financing costs stemming from lower international interest rates. The consequence of these conditions in small, developing economies with high import propensity is a persistently high and widening deficit on the current account of the balance of payments, as can be observed for the Bahamas, Guyana and the OECS economies as a group. In Belize, Barbados and Jamaica the current account deficit remains wide but the trend is stable. Preliminary data for Suriname report a modest surplus whereas that of Trinidad and Tobago continues to be extraordinarily high on account of exports of Energy products.
On the export side, prices of petroleum and natural gas appear to have reached a peak in early or mid-2006 but remain high by historical standards. Aluminum and gold prices also seem to have halted their increase and have stabilized since mid-2006. Relevant prices for agricultural commodities have been favorable for Caribbean exporters. Trinidad and Tobago’s Energy exports almost doubled in value in 2006 but also non-Energy exports increased as the country continues its drive to enhance its downstream processing capacity. Belize started to export petroleum. Jamaica, Suriname and Guyana have benefited from high aluminum prices. Suriname also registered a sharp increase in the value of gold exports. Some agricultural exports also benefited from higher world market prices, such as sugar and rice in Guyana, and citrus in Belize and Jamaica. Banana production increased in Saint Lucia and in most other banana producing countries; coffee exports from Jamaica have also expanded. Caribbean agricultural exports also showed a positive trend because of favorable weather conditions and a benign hurricane season this year.
Tourism accounts for around half of the Caribbean’s earnings from goods and services exports. In most countries, an increase in Tourism related services is reported, even if in some cases the number of visitor arrivals actually decreased. Cruise-ship Tourism, which contributes relatively less to GDP than stay-over tourists, registered a decline in the number of passengers in the first part of the year compared to the same period a year earlier. Stay-over tourists and their per capita expenditures increased, however, more than offsetting the drop in cruise-ship arrivals. The upswing in export earnings was offset by the increase in imports, resulting in a widening of current account deficits in most countries.
Construction activity and large-scale investment projects as well as private consumption and the increase in the prices of imported fuel during the first eight months of the year explain the steep surge of the import bill. The financing gap was narrowed by an increase in private capital inflows, mostly related to Tourism, both in large-scale projects and in private vacation homes; also bond issues (Jamaica) and debt forgiveness (Guyana) boosted the financial and capital account surpluses. A significant and increasing part of foreign investment in the Caribbean comes from the region itself, mostly from Trinidad and Tobago, where corporate holdings continue to increase their foreign assets.
Caribbean territories continue to face significant challenges such as high rates of poverty, food insecurity, high incidence of HIV/AIDS, male underachievement, deficiencies in the quality of education, life style diseases, crime, violence and illicit drug trafficking, and vulnerability to natural disasters. The growth prospects for most Caribbean countries were overshadowed by the increase in oil prices and adverse climatic conditions. Regional Country Reports have highlighted that even with significant improvements in income distribution there is need for economic growth to bring more benefits to the poor.
The issue of poverty is seen as a major threat to social harmony, especially where it is associated with rising urbanization, growing inequality in income distribution, and the breakdown of traditional community structures. Several complex, interrelated factors have contributed to poverty in the Caribbean. These include low economic growth, macroeconomic instability,
ECLAC – Project Documents collection Promoting corporate social responsibility…: methodology report
24
deficiencies in the labor market resulting in limited job growth, low productivity and low wages in the informal sector, and a decline in the quality of social services. Accordingly, countries that have sustained high economic growth rates over time and invested heavily in the social sectors have achieved relatively low levels of poverty, notably Antigua, the Bahamas, Barbados, and St. Kitts and Nevis. A clear strategy for social development in the region is needed if these challenges are to be overcome. As an approach to addressing poverty eradication, a major thrust in Caribbean territories is in the area of employment creation so as to ensure that the twin goals of full and productive employment and decent work for all are achieved.
According to The Millennium Development Goals: A Latin American and Caribbean Perspective report (ECLAC, 2005) particular attention has been placed on youth development since the unemployment problem in the Caribbean is predominantly a youth phenomenon. Research has also pointed to the need to address the gender dichotomy in employment since the unemployment rate for young females is generally higher than that of their male counterparts for most countries in the region. However, although Caribbean governments emphasize the reduction of poverty in national development goals, precise targets are rarely set to focus these efforts.
A. Countries included in the pilot study
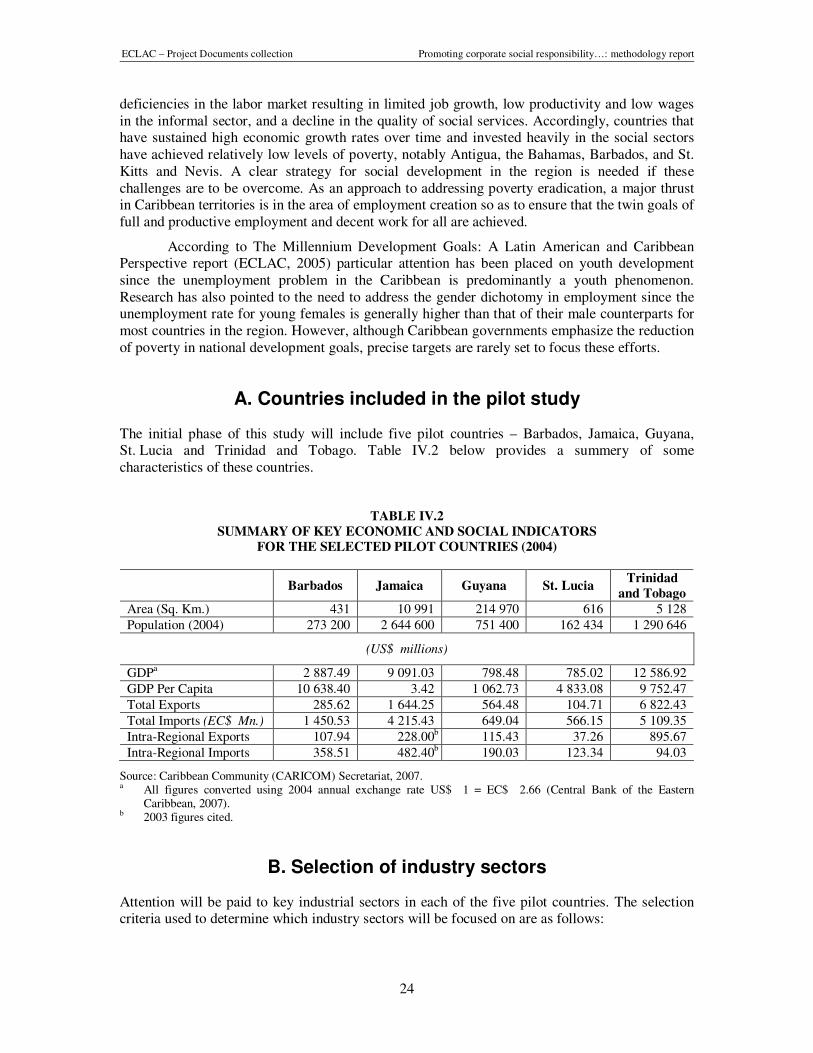
The initial phase of this study will include five pilot countries – Barbados, Jamaica, Guyana, St. Lucia and Trinidad and Tobago. Table IV.2 below provides a summery of some characteristics of these countries.
TABLE IV.2
SUMMARY OF KEY ECONOMIC AND SOCIAL INDICATORS
FOR THE SELECTED PILOT COUNTRIES (2004)
Barbados Jamaica Guyana St. Lucia
Trinidad
and Tobago
Area (Sq. Km.) 431 10 991 214 970 616 5 128
Population (2004) 273 200 2 644 600 751 400 162 434 1 290 646
(US$ millions)
GDPa 2 887.49 9 091.03 798.48 785.02 12 586.92
GDP Per Capita 10 638.40 3.42 1 062.73 4 833.08 9 752.47
Total Exports 285.62 1 644.25 564.48 104.71 6 822.43
Total Imports (EC$ Mn.) 1 450.53 4 215.43 649.04 566.15 5 109.35
Intra-Regional Exports 107.94 228.00b 115.43 37.26 895.67
Intra-Regional Imports 358.51 482.40b 190.03 123.34 94.03
Source: Caribbean Community (CARICOM) Secretariat, 2007. a All figures converted using 2004 annual exchange rate US$ 1 = EC$ 2.66 (Central Bank of the Eastern
Caribbean, 2007). b 2003 figures cited.
B. Selection of industry sectors
Attention will be paid to key industrial sectors in each of the five pilot countries. The selection criteria used to determine which industry sectors will be focused on are as follows:
ECLAC – Project Documents collection Promoting corporate social responsibility…: methodology report
25
1. Contribution of the industry sector to GDP
The sectoral GDP provides a measure of the size of the sectoral economy. It is the market value of the sector’s goods and/ or services produced by the specific sector in a given time period (usually yearly). It can also be considered the sum of the value added at each stage of the production of the final goods and services within the sector in a given time. This measure therefore provides a baseline for comparison of how much each sector contributes to the national economy or GDP and hence the importance of growth, competitiveness and sustainability of the sector.
2. Average rate of sectoral GDP growth
This measure provides information on the growth and expansion or in some cases the decline of industry sectors over the recent medium term between 2000-2005. The performance of each sector within this time period provides a basis for understanding the present and current prospects of the sector. Growth trends can also be used to estimate projections of future sectoral performance and hence the potential importance of the sector to national economic development. The 2000-2005 period selected is the most recent for which reliable data can be accessed for all five pilot countries.
3. Level of employment by industry sector
Economic development and improving the standard of living of national communities depends on the capacity for employment of the available labor force and hence the earning of sustainable wages. The level of employment is therefore a critical measure of the importance of a particular industrial activity to the building of the national economy and the sustaining of the community. Employment at the sectoral level also provides a measure of the relative size of each sector and the dependence of the labor force on particular business and industry activities for their livelihoods.
4. Number of established SMEs operating in each industry sector
This is a measure of the relative size as well as the level of activity within the respective sector. Sectors experiencing the most earning opportunities may attract more investment and expansion hence becoming more important to national economic development. The number of firms in a particular sector also has implications for competitiveness, productivity, investment and the overall development and evolution of the sector on the national scale. The focus here will therefore be on sectors with higher firm intensities.
C. Data limitations and quality
1. Insufficiency of national business registries
The deficiencies in the ability of country statistical offices to collect and manage business establishment data has been one of concern and the weaknesses and inflexibility of the data. Reference can be made on this point to the CARICOM 28th Meeting of the Standing Committee of Caribbean Statisticians in Turks and Caicos, 2003 and at the UN Regional Caribbean workshop on National Sustainable Strategies and Indicators of Sustainable Development in St. Lucia, 2004 where the lack of business establishment data and data on SMEs was pointed out. Quite recently in August 2007 at the Second Caricom Regional Demographic Analysis Workshop at the University of the West Indies this deficiency was again pointed out.
ECLAC – Project Documents collection Promoting corporate social responsibility…: methodology report
26
Information from the business establishment database was not available for Guyana at the time of writing this methodology. To overcome this challenge the major business associations in Guyana were contacted and information on their members was obtained. The business associations which supplied information were the Georgetown Chamber of Commerce, Linden Chamber of Commerce, Guyana Tourism and Hotel Association, Guyana Manufacturers Association, Guyana Shippers Association. The names of all companies in each member registry of each business association were recorded and classified into industry sector as listed by respective business associations. Duplication of companies, listed under two or more business associations were eliminated. Thereby a final list of Guyanese companies was produced.
2. Differences in aggregation of sectors in each country
In some cases, in each of the five pilot countries, different industry sectors are defined differently and hence the collection of data on these sectors varies. Some examples include inclusion of Mining in the Energy sector definition of Trinidad and Tobago but defined separately in Jamaica; inclusion of “Real Estate Services” in financial and business sector in Barbados but defined separately in Guyana; and inclusion of restaurants in Commercial Trade in St. Lucia, which consequently was desegregated and included in Tourism. Understanding these differences, effort was made in this study to align sectors across the pilot studies to the extent allowed by the level of data available. That is, data was aggregated/ disaggregated as necessary to standardize industry sectors. This would allow better comparative analysis at later stages.
3. Segregation into micro, small, medium and large companies
Data with respect to numbers of small, medium and large companies in each economic sector was obtained with the assistance of UN ECLAC Statistical services, the CARICOM Statistical database, and the Central banks and Government Statistical Agencies in each of the pilot countries. While sufficiently accurate data was readily obtained on most economic indicators such as GDPs and employment statistics it was much more difficult to obtain business establishment data in some cases. Business establishment databases exist in Jamaica, Trinidad and Tobago, Barbados and St. Lucia and vary in the level of detail collected and made available as well as the ability to manipulate the data sets to extract details such as in the case of this study – the size of business establishments and division by sectors.
Notwithstanding these challenges, sufficient official and accurate data on numbers of small, medium and large companies in each economic sector was obtained for all countries except Guyana, providing a very robust population from which to draw a representative sample. While the Guyana dataset is incomplete it is representative enough of the major industry sectors to provide us with a suitable country sample of businesses until more data is forthcoming. A summary of definitions for small, medium and large companies and the Caribbean Development Bank (CDB) definition for the region which is used in this study are listed on page 51.
ECLAC – Project Documents collection Promoting corporate social responsibility…: methodology report
27
D. Pilot country profiles and industry selection
1. Barbados
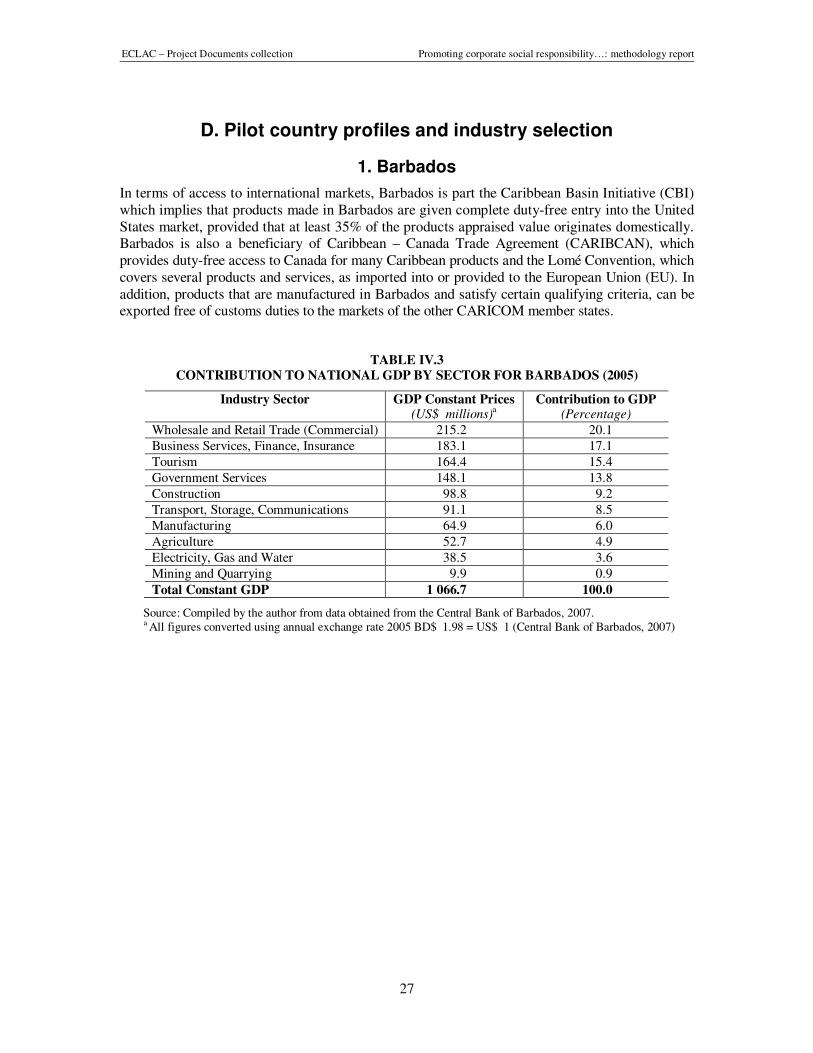
In terms of access to international markets, Barbados is part the Caribbean Basin Initiative (CBI) which implies that products made in Barbados are given complete duty-free entry into the United States market, provided that at least 35% of the products appraised value originates domestically. Barbados is also a beneficiary of Caribbean – Canada Trade Agreement (CARIBCAN), which provides duty-free access to Canada for many Caribbean products and the Lomé Convention, which covers several products and services, as imported into or provided to the European Union (EU). In addition, products that are manufactured in Barbados and satisfy certain qualifying criteria, can be exported free of customs duties to the markets of the other CARICOM member states.
TABLE IV.3
CONTRIBUTION TO NATIONAL GDP BY SECTOR FOR BARBADOS (2005)
Industry Sector GDP Constant Prices (US$ millions)a
Contribution to GDP (Percentage)
Wholesale and Retail Trade (Commercial) 215.2 20.1
Business Services, Finance, Insurance 183.1 17.1
Tourism 164.4 15.4
Government Services 148.1 13.8
Construction 98.8 9.2
Transport, Storage, Communications 91.1 8.5
Manufacturing 64.9 6.0
Agriculture 52.7 4.9
Electricity, Gas and Water 38.5 3.6
Mining and Quarrying 9.9 0.9
Total Constant GDP 1 066.7 100.0
Source: Compiled by the author from data obtained from the Central Bank of Barbados, 2007. a All figures converted using annual exchange rate 2005 BD$ 1.98 = US$ 1 (Central Bank of Barbados, 2007)
ECLAC – Project Documents collection Promoting corporate social responsibility…: methodology report
28
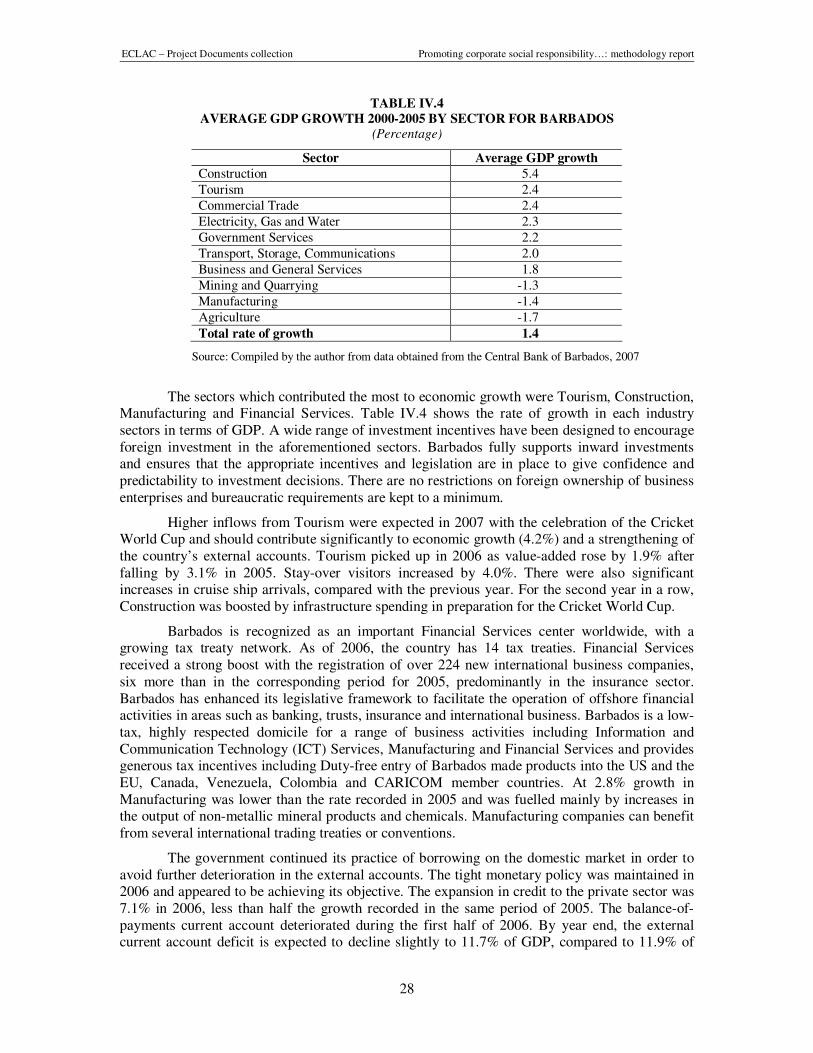
TABLE IV.4
AVERAGE GDP GROWTH 2000-2005 BY SECTOR FOR BARBADOS (Percentage)
Sector Average GDP growth
Construction 5.4
Tourism 2.4
Commercial Trade 2.4
Electricity, Gas and Water 2.3
Government Services 2.2
Transport, Storage, Communications 2.0
Business and General Services 1.8
Mining and Quarrying -1.3
Manufacturing -1.4
Agriculture -1.7
Total rate of growth 1.4
Source: Compiled by the author from data obtained from the Central Bank of Barbados, 2007
The sectors which contributed the most to economic growth were Tourism, Construction, Manufacturing and Financial Services. Table IV.4 shows the rate of growth in each industry sectors in terms of GDP. A wide range of investment incentives have been designed to encourage foreign investment in the aforementioned sectors. Barbados fully supports inward investments and ensures that the appropriate incentives and legislation are in place to give confidence and predictability to investment decisions. There are no restrictions on foreign ownership of business enterprises and bureaucratic requirements are kept to a minimum.
Higher inflows from Tourism were expected in 2007 with the celebration of the Cricket World Cup and should contribute significantly to economic growth (4.2%) and a strengthening of the country’s external accounts. Tourism picked up in 2006 as value-added rose by 1.9% after falling by 3.1% in 2005. Stay-over visitors increased by 4.0%. There were also significant increases in cruise ship arrivals, compared with the previous year. For the second year in a row, Construction was boosted by infrastructure spending in preparation for the Cricket World Cup.
Barbados is recognized as an important Financial Services center worldwide, with a growing tax treaty network. As of 2006, the country has 14 tax treaties. Financial Services received a strong boost with the registration of over 224 new international business companies, six more than in the corresponding period for 2005, predominantly in the insurance sector. Barbados has enhanced its legislative framework to facilitate the operation of offshore financial activities in areas such as banking, trusts, insurance and international business. Barbados is a low-tax, highly respected domicile for a range of business activities including Information and Communication Technology (ICT) Services, Manufacturing and Financial Services and provides generous tax incentives including Duty-free entry of Barbados made products into the US and the EU, Canada, Venezuela, Colombia and CARICOM member countries. At 2.8% growth in Manufacturing was lower than the rate recorded in 2005 and was fuelled mainly by increases in the output of non-metallic mineral products and chemicals. Manufacturing companies can benefit from several international trading treaties or conventions.
The government continued its practice of borrowing on the domestic market in order to avoid further deterioration in the external accounts. The tight monetary policy was maintained in 2006 and appeared to be achieving its objective. The expansion in credit to the private sector was 7.1% in 2006, less than half the growth recorded in the same period of 2005. The balance-of-payments current account deteriorated during the first half of 2006. By year end, the external current account deficit is expected to decline slightly to 11.7% of GDP, compared to 11.9% of
ECLAC – Project Documents collection Promoting corporate social responsibility…: methodology report
29
GDP in 2005. This improvement could be attributed to the effects of the temporary increase in tariffs on extra regional imports. Increased spending on imports of fuel and capital goods, together with increased debt service payments, led to a decline in the net international reserves of the monetary authorities.
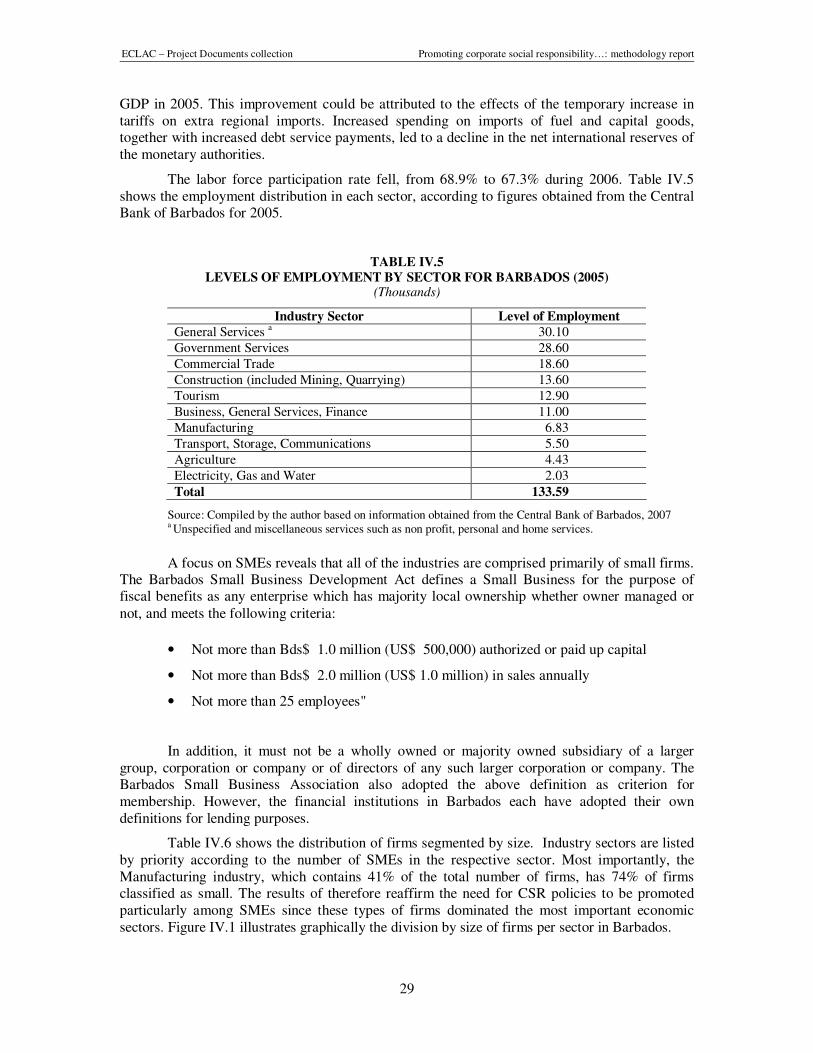
The labor force participation rate fell, from 68.9% to 67.3% during 2006. Table IV.5 shows the employment distribution in each sector, according to figures obtained from the Central Bank of Barbados for 2005.
TABLE IV.5
LEVELS OF EMPLOYMENT BY SECTOR FOR BARBADOS (2005) (Thousands)
Industry Sector Level of Employment
General Services a 30.10
Government Services 28.60
Commercial Trade 18.60
Construction (included Mining, Quarrying) 13.60
Tourism 12.90
Business, General Services, Finance 11.00
Manufacturing 6.83
Transport, Storage, Communications 5.50
Agriculture 4.43
Electricity, Gas and Water 2.03
Total 133.59
Source: Compiled by the author based on information obtained from the Central Bank of Barbados, 2007 a Unspecified and miscellaneous services such as non profit, personal and home services.
A focus on SMEs reveals that all of the industries are comprised primarily of small firms. The Barbados Small Business Development Act defines a Small Business for the purpose of fiscal benefits as any enterprise which has majority local ownership whether owner managed or not, and meets the following criteria:
• Not more than Bds$ 1.0 million (US$ 500,000) authorized or paid up capital
• Not more than Bds$ 2.0 million (US$ 1.0 million) in sales annually
• Not more than 25 employees"
In addition, it must not be a wholly owned or majority owned subsidiary of a larger group, corporation or company or of directors of any such larger corporation or company. The Barbados Small Business Association also adopted the above definition as criterion for membership. However, the financial institutions in Barbados each have adopted their own definitions for lending purposes.
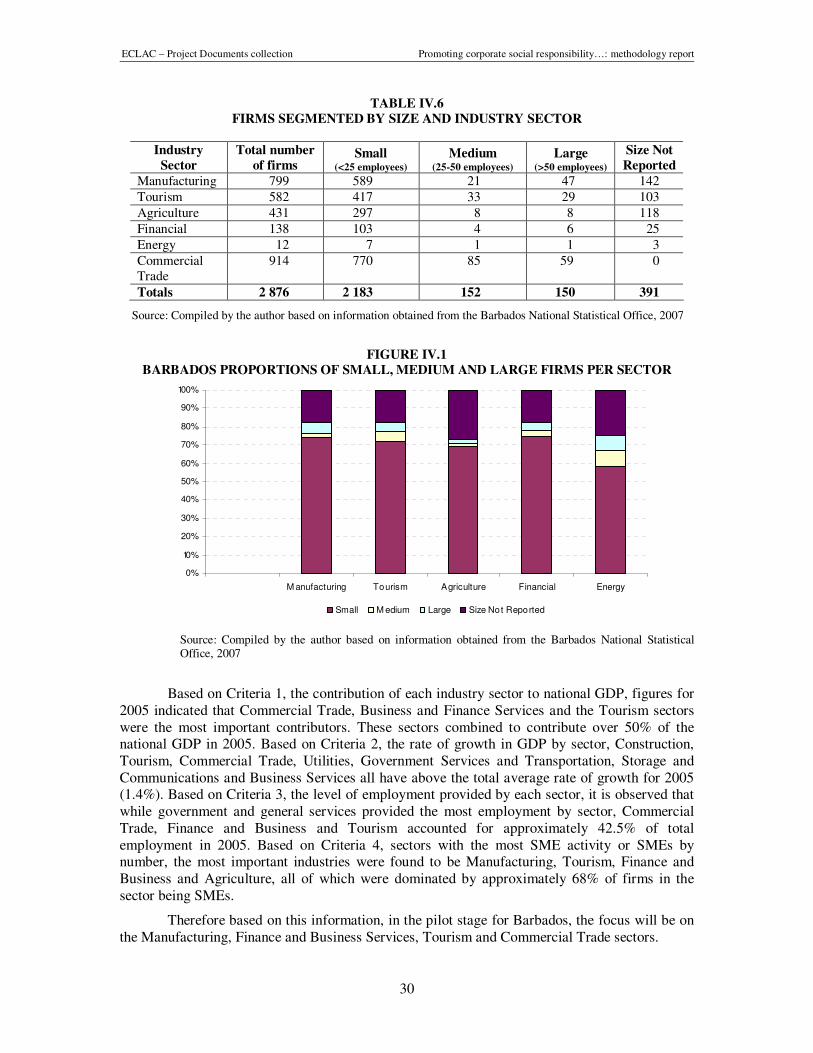
Table IV.6 shows the distribution of firms segmented by size. Industry sectors are listed by priority according to the number of SMEs in the respective sector. Most importantly, the Manufacturing industry, which contains 41% of the total number of firms, has 74% of firms classified as small. The results of therefore reaffirm the need for CSR policies to be promoted particularly among SMEs since these types of firms dominated the most important economic sectors. Figure IV.1 illustrates graphically the division by size of firms per sector in Barbados.
ECLAC – Project Documents collection Promoting corporate social responsibility…: methodology report
30
TABLE IV.6
FIRMS SEGMENTED BY SIZE AND INDUSTRY SECTOR
Industry
Sector
Total number
of firms Small
(<25 employees)
Medium (25-50 employees)
Large (>50 employees)
Size Not
Reported
Manufacturing 799 589 21 47 142
Tourism 582 417 33 29 103
Agriculture 431 297 8 8 118
Financial 138 103 4 6 25
Energy 12 7 1 1 3
Commercial Trade
914 770 85 59 0
Totals 2 876 2 183 152 150 391
Source: Compiled by the author based on information obtained from the Barbados National Statistical Office, 2007
FIGURE IV.1
BARBADOS PROPORTIONS OF SMALL, MEDIUM AND LARGE FIRMS PER SECTOR
0%
10%
20%
30%
40%
50%
60%
70%
80%
90%
100%
M anufacturing Tourism Agriculture Financial Energy
Small M edium Large Size Not Reported
Source: Compiled by the author based on information obtained from the Barbados National Statistical Office, 2007
Based on Criteria 1, the contribution of each industry sector to national GDP, figures for 2005 indicated that Commercial Trade, Business and Finance Services and the Tourism sectors were the most important contributors. These sectors combined to contribute over 50% of the national GDP in 2005. Based on Criteria 2, the rate of growth in GDP by sector, Construction, Tourism, Commercial Trade, Utilities, Government Services and Transportation, Storage and Communications and Business Services all have above the total average rate of growth for 2005 (1.4%). Based on Criteria 3, the level of employment provided by each sector, it is observed that while government and general services provided the most employment by sector, Commercial Trade, Finance and Business and Tourism accounted for approximately 42.5% of total employment in 2005. Based on Criteria 4, sectors with the most SME activity or SMEs by number, the most important industries were found to be Manufacturing, Tourism, Finance and Business and Agriculture, all of which were dominated by approximately 68% of firms in the sector being SMEs.
Therefore based on this information, in the pilot stage for Barbados, the focus will be on the Manufacturing, Finance and Business Services, Tourism and Commercial Trade sectors.
ECLAC – Project Documents collection Promoting corporate social responsibility…: methodology report
31
2. Jamaica
Jamaica is the third largest country in the Caribbean and the largest of the English-speaking islands. The Jamaican economy is heavily dependent on the service sectors (including financial, tourism, government, distribution, transportation, business) which accounted for nearly 60% of GDP in 2006 (CCAA, 2006). The country continues to derive most of its foreign exchange from Tourism, remittances, and bauxite. Jamaica’s economic performance improved compared to the previous year (2.6% growth in 2006, up from 1.4% in 2005), with the upturn led by Agriculture and Tourism (ECLAC, 2007). Mining slowed and Construction and Manufacturing stagnated. According to ECLAC (2007) the containment of current expenditure and capital expenditure underpinned the government’s efforts to narrow the fiscal deficit (from 3.3% in fiscal year 2005-2006 to 2.4% for 2006-2007). The external sector performed well, since the capital and financial account surplus more than offset the current account deficit and the stock of net international reserves therefore increased.
The pace of economic activity rose in 2006, led mainly by Agriculture and Tourism. The performance of Agriculture (down 7.3% in 2005 and up 14% in 2006) reflected the sector’s recovery following the damage caused by natural disasters the year before (ECLAC, 2007). The recovery was most visible in the traditional export products, including bananas, coffee and citrus. Mining slackened its pace of growth slightly with respect to the previous year (2.8% in 2005 and 2.5% in 2006) (ECLAC, 2007). In general, the sector benefited from the increase in external demand. The positive effects of fuller utilization of capacity in bauxite plants were partly offset by technical difficulties in aluminum refineries.
Manufacturing contracted by 1.3% in 2006 (after shrinking by 1% in 2005), reflecting the closure of Jamaica’s only cigarette factory and the decline in cement supply in the first two quarters (ECLAC, 2007). Construction (7% in 2005 and -2.0% in 2006) reflected the shortage of cement, which caused postponements and delays in infrastructure projects (ECLAC, 2007). Tourism saw a strong upswing of 14% in 2006, as a result of favorable international conditions, improved marketing efforts and the hosting of leisure events (ECLAC, 2007).
The rate of unemployment fell slightly, in line with the overall performance of the economy. The balance of payments posted an overall surplus, since the current account deficit was more than offset by the capital and financial account surplus. As a result, the stock of net international reserves rose by US$ 240 million. The wider current account deficit (US$ 1.117 billion in 2006, compared with US$ 1.079 billion in 2005) was attributable mainly to a large rise in merchandise imports (16%) which cancelled out the gains in exports of traditional goods and growth in the tourist sector (ECLAC, 2007). The capital and financial account surplus reflects the rise in private capital flows (US$ 674 million in 2006, up from US$ 582 million in 2005), mainly to the tourist sector, and the resources generated by an international bond issue (ECLAC, 2007).
A range of goods produced by the country still enjoys preferential access to the EU (Cotonou Agreement). Jamaica is also a beneficiary of the CBI (U.S.), Lomé Convention (Europe) and CARIBCAN (Canada) trade programs, and a member of CARICOM and the Association of the Caribbean States.
Under the Jamaican Free Zones Act, investors are allowed to operate solely with foreign exchange in certain activities such as warehousing and storing, Manufacturing, redistribution, processing, refining, assembling, packaging, and service operations such as insurance, banking, and professional services. Incentives to attract foreign investment include a 100% tax exemption, no import licensing requirements, and exemption from customs duties on capital goods, raw materials, construction material, and office equipment. Manufacturing companies operating in the free zone are allowed to sell 15% of their production on the local market with official approval it offers investment opportunities to companies from all over the world and is in the process of
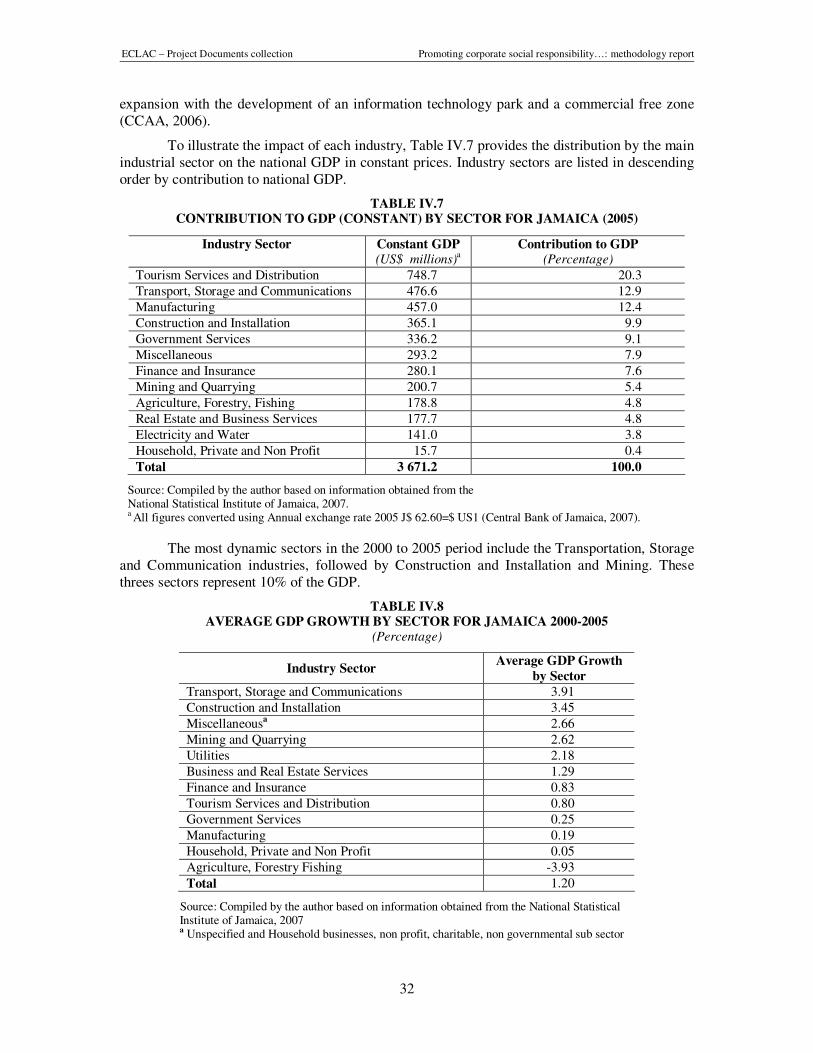
ECLAC – Project Documents collection Promoting corporate social responsibility…: methodology report
32
expansion with the development of an information technology park and a commercial free zone (CCAA, 2006).
To illustrate the impact of each industry, Table IV.7 provides the distribution by the main industrial sector on the national GDP in constant prices. Industry sectors are listed in descending order by contribution to national GDP.
TABLE IV.7 CONTRIBUTION TO GDP (CONSTANT) BY SECTOR FOR JAMAICA (2005)
Industry Sector Constant GDP (US$ millions)a
Contribution to GDP (Percentage)
Tourism Services and Distribution 748.7 20.3
Transport, Storage and Communications 476.6 12.9
Manufacturing 457.0 12.4
Construction and Installation 365.1 9.9
Government Services 336.2 9.1
Miscellaneous 293.2 7.9
Finance and Insurance 280.1 7.6
Mining and Quarrying 200.7 5.4
Agriculture, Forestry, Fishing 178.8 4.8
Real Estate and Business Services 177.7 4.8
Electricity and Water 141.0 3.8
Household, Private and Non Profit 15.7 0.4
Total 3 671.2 100.0
Source: Compiled by the author based on information obtained from the National Statistical Institute of Jamaica, 2007. a All figures converted using Annual exchange rate 2005 J$ 62.60=$ US1 (Central Bank of Jamaica, 2007).
The most dynamic sectors in the 2000 to 2005 period include the Transportation, Storage and Communication industries, followed by Construction and Installation and Mining. These threes sectors represent 10% of the GDP.
TABLE IV.8 AVERAGE GDP GROWTH BY SECTOR FOR JAMAICA 2000-2005
(Percentage)
Industry Sector Average GDP Growth
by Sector
Transport, Storage and Communications 3.91
Construction and Installation 3.45
Miscellaneousa 2.66
Mining and Quarrying 2.62
Utilities 2.18
Business and Real Estate Services 1.29
Finance and Insurance 0.83
Tourism Services and Distribution 0.80
Government Services 0.25
Manufacturing 0.19
Household, Private and Non Profit 0.05
Agriculture, Forestry Fishing -3.93
Total 1.20
Source: Compiled by the author based on information obtained from the National Statistical Institute of Jamaica, 2007 a Unspecified and Household businesses, non profit, charitable, non governmental sub sector
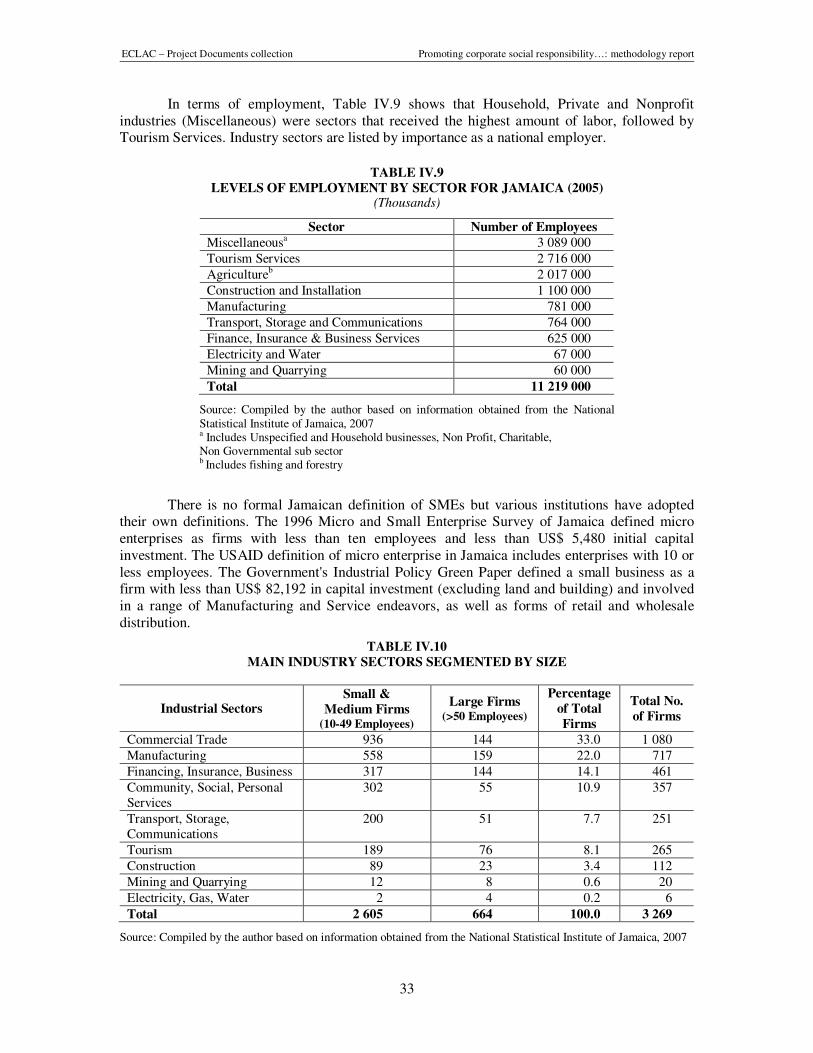
ECLAC – Project Documents collection Promoting corporate social responsibility…: methodology report
33
In terms of employment, Table IV.9 shows that Household, Private and Nonprofit industries (Miscellaneous) were sectors that received the highest amount of labor, followed by Tourism Services. Industry sectors are listed by importance as a national employer.
TABLE IV.9
LEVELS OF EMPLOYMENT BY SECTOR FOR JAMAICA (2005) (Thousands)
Sector Number of Employees
Miscellaneousa 3 089 000
Tourism Services 2 716 000
Agricultureb 2 017 000
Construction and Installation 1 100 000
Manufacturing 781 000
Transport, Storage and Communications 764 000
Finance, Insurance & Business Services 625 000
Electricity and Water 67 000
Mining and Quarrying 60 000
Total 11 219 000
Source: Compiled by the author based on information obtained from the National Statistical Institute of Jamaica, 2007 a Includes Unspecified and Household businesses, Non Profit, Charitable, Non Governmental sub sector b Includes fishing and forestry
There is no formal Jamaican definition of SMEs but various institutions have adopted their own definitions. The 1996 Micro and Small Enterprise Survey of Jamaica defined micro enterprises as firms with less than ten employees and less than US$ 5,480 initial capital investment. The USAID definition of micro enterprise in Jamaica includes enterprises with 10 or less employees. The Government's Industrial Policy Green Paper defined a small business as a firm with less than US$ 82,192 in capital investment (excluding land and building) and involved in a range of Manufacturing and Service endeavors, as well as forms of retail and wholesale distribution.
TABLE IV.10
MAIN INDUSTRY SECTORS SEGMENTED BY SIZE
Industrial Sectors Small &
Medium Firms (10-49 Employees)
Large Firms (>50 Employees)
Percentage
of Total
Firms
Total No.
of Firms
Commercial Trade 936 144 33.0 1 080
Manufacturing 558 159 22.0 717
Financing, Insurance, Business 317 144 14.1 461
Community, Social, Personal Services
302 55 10.9 357
Transport, Storage, Communications
200 51 7.7 251
Tourism 189 76 8.1 265
Construction 89 23 3.4 112
Mining and Quarrying 12 8 0.6 20
Electricity, Gas, Water 2 4 0.2 6
Total 2 605 664 100.0 3 269
Source: Compiled by the author based on information obtained from the National Statistical Institute of Jamaica, 2007
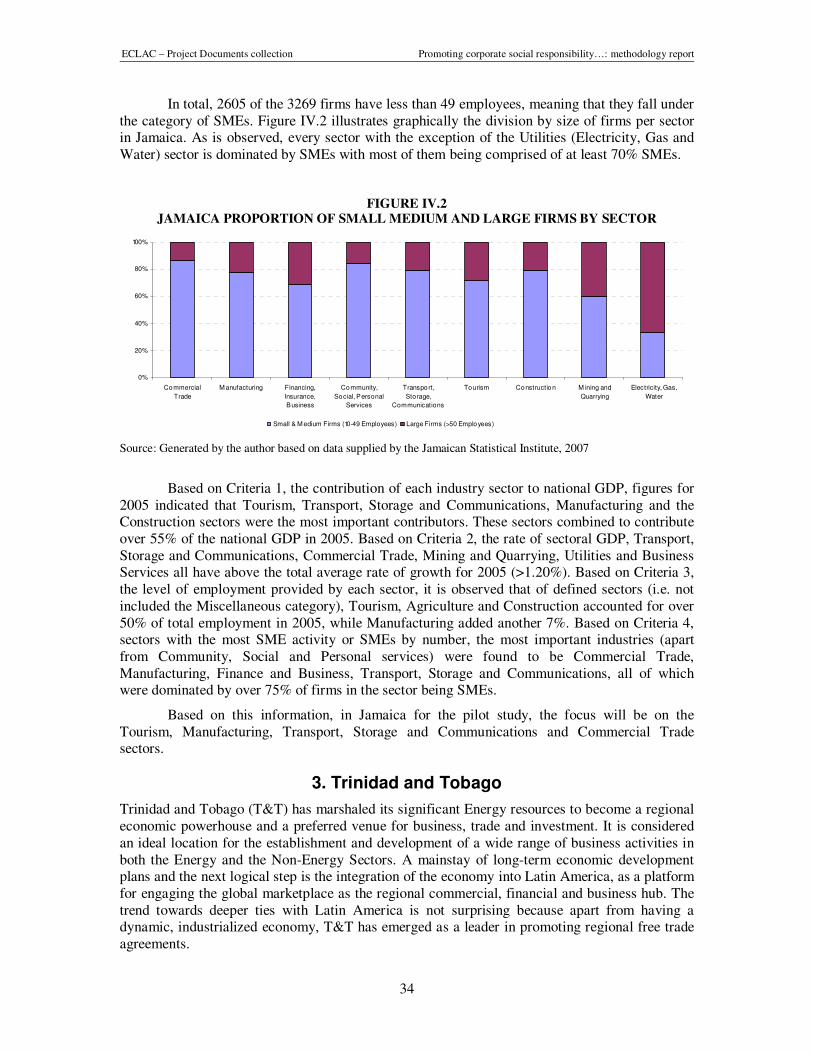
ECLAC – Project Documents collection Promoting corporate social responsibility…: methodology report
34
In total, 2605 of the 3269 firms have less than 49 employees, meaning that they fall under the category of SMEs. Figure IV.2 illustrates graphically the division by size of firms per sector in Jamaica. As is observed, every sector with the exception of the Utilities (Electricity, Gas and Water) sector is dominated by SMEs with most of them being comprised of at least 70% SMEs.
FIGURE IV.2 JAMAICA PROPORTION OF SMALL MEDIUM AND LARGE FIRMS BY SECTOR
0%
20%
40%
60%
80%
100%
Commercial
Trade
M anufacturing Financing,
Insurance,
Business
Community,
Social, Personal
Services
Transport,
Storage,
Communications
Tourism Construction M ining and
Quarrying
Electricity, Gas,
Water
Small & M edium Firms (10-49 Employees) Large Firms (>50 Employees)
Source: Generated by the author based on data supplied by the Jamaican Statistical Institute, 2007
Based on Criteria 1, the contribution of each industry sector to national GDP, figures for 2005 indicated that Tourism, Transport, Storage and Communications, Manufacturing and the Construction sectors were the most important contributors. These sectors combined to contribute over 55% of the national GDP in 2005. Based on Criteria 2, the rate of sectoral GDP, Transport, Storage and Communications, Commercial Trade, Mining and Quarrying, Utilities and Business Services all have above the total average rate of growth for 2005 (>1.20%). Based on Criteria 3, the level of employment provided by each sector, it is observed that of defined sectors (i.e. not included the Miscellaneous category), Tourism, Agriculture and Construction accounted for over 50% of total employment in 2005, while Manufacturing added another 7%. Based on Criteria 4, sectors with the most SME activity or SMEs by number, the most important industries (apart from Community, Social and Personal services) were found to be Commercial Trade, Manufacturing, Finance and Business, Transport, Storage and Communications, all of which were dominated by over 75% of firms in the sector being SMEs.
Based on this information, in Jamaica for the pilot study, the focus will be on the Tourism, Manufacturing, Transport, Storage and Communications and Commercial Trade sectors.
3. Trinidad and Tobago
Trinidad and Tobago (T&T) has marshaled its significant Energy resources to become a regional economic powerhouse and a preferred venue for business, trade and investment. It is considered an ideal location for the establishment and development of a wide range of business activities in both the Energy and the Non-Energy Sectors. A mainstay of long-term economic development plans and the next logical step is the integration of the economy into Latin America, as a platform for engaging the global marketplace as the regional commercial, financial and business hub. The trend towards deeper ties with Latin America is not surprising because apart from having a dynamic, industrialized economy, T&T has emerged as a leader in promoting regional free trade agreements.
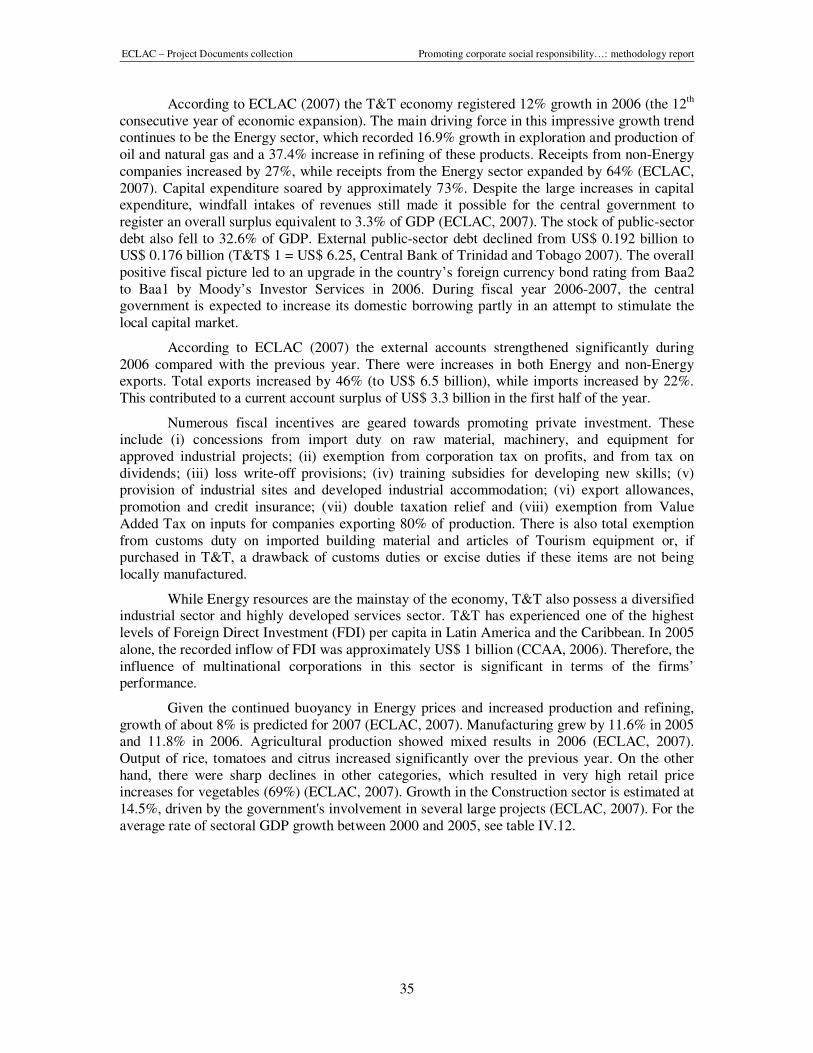
ECLAC – Project Documents collection Promoting corporate social responsibility…: methodology report
35
According to ECLAC (2007) the T&T economy registered 12% growth in 2006 (the 12th consecutive year of economic expansion). The main driving force in this impressive growth trend continues to be the Energy sector, which recorded 16.9% growth in exploration and production of oil and natural gas and a 37.4% increase in refining of these products. Receipts from non-Energy companies increased by 27%, while receipts from the Energy sector expanded by 64% (ECLAC, 2007). Capital expenditure soared by approximately 73%. Despite the large increases in capital expenditure, windfall intakes of revenues still made it possible for the central government to register an overall surplus equivalent to 3.3% of GDP (ECLAC, 2007). The stock of public-sector debt also fell to 32.6% of GDP. External public-sector debt declined from US$ 0.192 billion to US$ 0.176 billion (T&T$ 1 = US$ 6.25, Central Bank of Trinidad and Tobago 2007). The overall positive fiscal picture led to an upgrade in the country’s foreign currency bond rating from Baa2 to Baa1 by Moody’s Investor Services in 2006. During fiscal year 2006-2007, the central government is expected to increase its domestic borrowing partly in an attempt to stimulate the local capital market.
According to ECLAC (2007) the external accounts strengthened significantly during 2006 compared with the previous year. There were increases in both Energy and non-Energy exports. Total exports increased by 46% (to US$ 6.5 billion), while imports increased by 22%. This contributed to a current account surplus of US$ 3.3 billion in the first half of the year.
Numerous fiscal incentives are geared towards promoting private investment. These include (i) concessions from import duty on raw material, machinery, and equipment for approved industrial projects; (ii) exemption from corporation tax on profits, and from tax on dividends; (iii) loss write-off provisions; (iv) training subsidies for developing new skills; (v) provision of industrial sites and developed industrial accommodation; (vi) export allowances, promotion and credit insurance; (vii) double taxation relief and (viii) exemption from Value Added Tax on inputs for companies exporting 80% of production. There is also total exemption from customs duty on imported building material and articles of Tourism equipment or, if purchased in T&T, a drawback of customs duties or excise duties if these items are not being locally manufactured.
While Energy resources are the mainstay of the economy, T&T also possess a diversified industrial sector and highly developed services sector. T&T has experienced one of the highest levels of Foreign Direct Investment (FDI) per capita in Latin America and the Caribbean. In 2005 alone, the recorded inflow of FDI was approximately US$ 1 billion (CCAA, 2006). Therefore, the influence of multinational corporations in this sector is significant in terms of the firms’ performance.
Given the continued buoyancy in Energy prices and increased production and refining, growth of about 8% is predicted for 2007 (ECLAC, 2007). Manufacturing grew by 11.6% in 2005 and 11.8% in 2006. Agricultural production showed mixed results in 2006 (ECLAC, 2007). Output of rice, tomatoes and citrus increased significantly over the previous year. On the other hand, there were sharp declines in other categories, which resulted in very high retail price increases for vegetables (69%) (ECLAC, 2007). Growth in the Construction sector is estimated at 14.5%, driven by the government's involvement in several large projects (ECLAC, 2007). For the average rate of sectoral GDP growth between 2000 and 2005, see table IV.12.
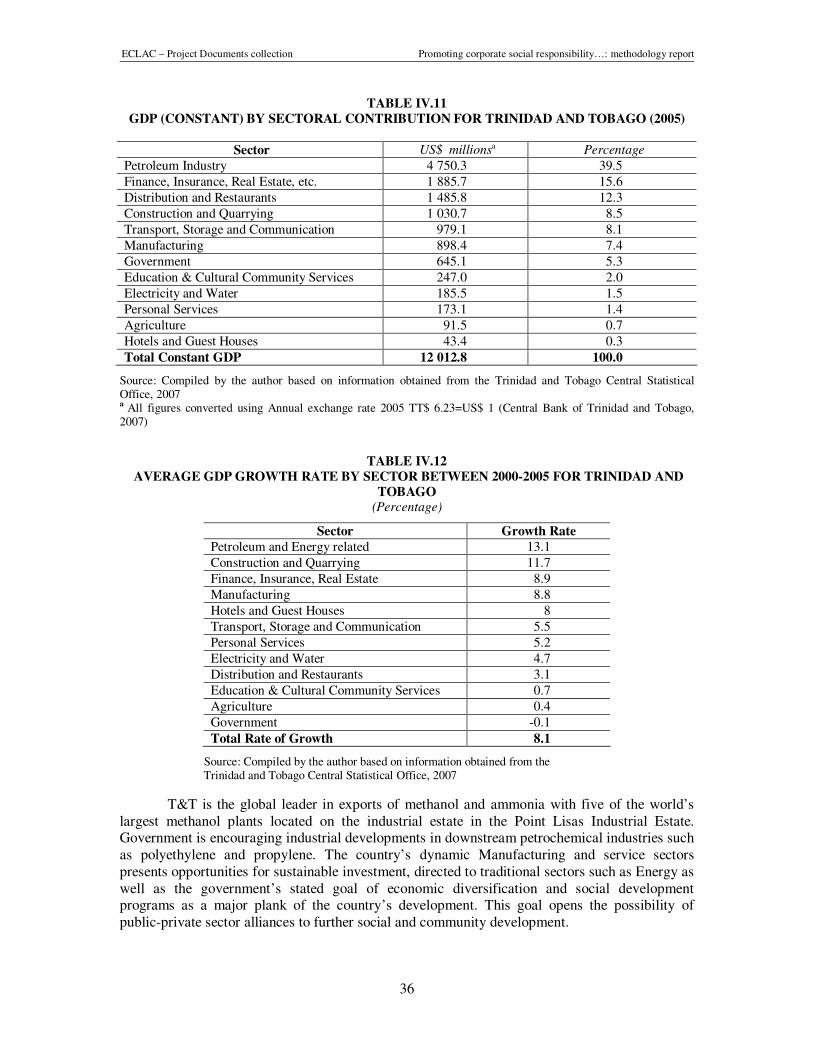
ECLAC – Project Documents collection Promoting corporate social responsibility…: methodology report
36
TABLE IV.11
GDP (CONSTANT) BY SECTORAL CONTRIBUTION FOR TRINIDAD AND TOBAGO (2005)
Sector US$ millionsa Percentage
Petroleum Industry 4 750.3 39.5
Finance, Insurance, Real Estate, etc. 1 885.7 15.6
Distribution and Restaurants 1 485.8 12.3
Construction and Quarrying 1 030.7 8.5
Transport, Storage and Communication 979.1 8.1
Manufacturing 898.4 7.4
Government 645.1 5.3
Education & Cultural Community Services 247.0 2.0
Electricity and Water 185.5 1.5
Personal Services 173.1 1.4
Agriculture 91.5 0.7
Hotels and Guest Houses 43.4 0.3
Total Constant GDP 12 012.8 100.0
Source: Compiled by the author based on information obtained from the Trinidad and Tobago Central Statistical Office, 2007 a All figures converted using Annual exchange rate 2005 TT$ 6.23=US$ 1 (Central Bank of Trinidad and Tobago, 2007)
TABLE IV.12
AVERAGE GDP GROWTH RATE BY SECTOR BETWEEN 2000-2005 FOR TRINIDAD AND
TOBAGO (Percentage)
Sector Growth Rate
Petroleum and Energy related 13.1
Construction and Quarrying 11.7
Finance, Insurance, Real Estate 8.9
Manufacturing 8.8
Hotels and Guest Houses 8
Transport, Storage and Communication 5.5
Personal Services 5.2
Electricity and Water 4.7
Distribution and Restaurants 3.1
Education & Cultural Community Services 0.7
Agriculture 0.4
Government -0.1
Total Rate of Growth 8.1
Source: Compiled by the author based on information obtained from the Trinidad and Tobago Central Statistical Office, 2007
T&T is the global leader in exports of methanol and ammonia with five of the world’s largest methanol plants located on the industrial estate in the Point Lisas Industrial Estate. Government is encouraging industrial developments in downstream petrochemical industries such as polyethylene and propylene. The country’s dynamic Manufacturing and service sectors presents opportunities for sustainable investment, directed to traditional sectors such as Energy as well as the government’s stated goal of economic diversification and social development programs as a major plank of the country’s development. This goal opens the possibility of public-private sector alliances to further social and community development.
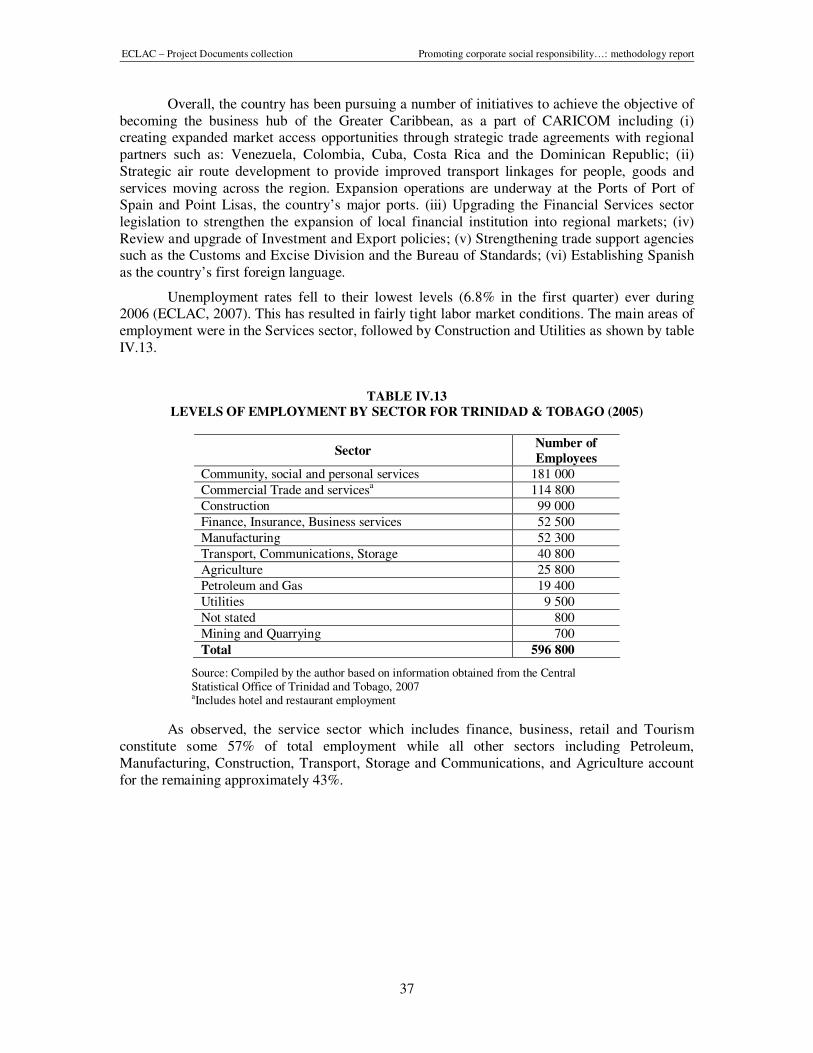
ECLAC – Project Documents collection Promoting corporate social responsibility…: methodology report
37
Overall, the country has been pursuing a number of initiatives to achieve the objective of becoming the business hub of the Greater Caribbean, as a part of CARICOM including (i) creating expanded market access opportunities through strategic trade agreements with regional partners such as: Venezuela, Colombia, Cuba, Costa Rica and the Dominican Republic; (ii) Strategic air route development to provide improved transport linkages for people, goods and services moving across the region. Expansion operations are underway at the Ports of Port of Spain and Point Lisas, the country’s major ports. (iii) Upgrading the Financial Services sector legislation to strengthen the expansion of local financial institution into regional markets; (iv) Review and upgrade of Investment and Export policies; (v) Strengthening trade support agencies such as the Customs and Excise Division and the Bureau of Standards; (vi) Establishing Spanish as the country’s first foreign language.
Unemployment rates fell to their lowest levels (6.8% in the first quarter) ever during 2006 (ECLAC, 2007). This has resulted in fairly tight labor market conditions. The main areas of employment were in the Services sector, followed by Construction and Utilities as shown by table IV.13.
TABLE IV.13
LEVELS OF EMPLOYMENT BY SECTOR FOR TRINIDAD & TOBAGO (2005)
Sector Number of
Employees
Community, social and personal services 181 000
Commercial Trade and servicesa 114 800
Construction 99 000
Finance, Insurance, Business services 52 500
Manufacturing 52 300
Transport, Communications, Storage 40 800
Agriculture 25 800
Petroleum and Gas 19 400
Utilities 9 500
Not stated 800
Mining and Quarrying 700
Total 596 800
Source: Compiled by the author based on information obtained from the Central Statistical Office of Trinidad and Tobago, 2007 aIncludes hotel and restaurant employment
As observed, the service sector which includes finance, business, retail and Tourism constitute some 57% of total employment while all other sectors including Petroleum, Manufacturing, Construction, Transport, Storage and Communications, and Agriculture account for the remaining approximately 43%.
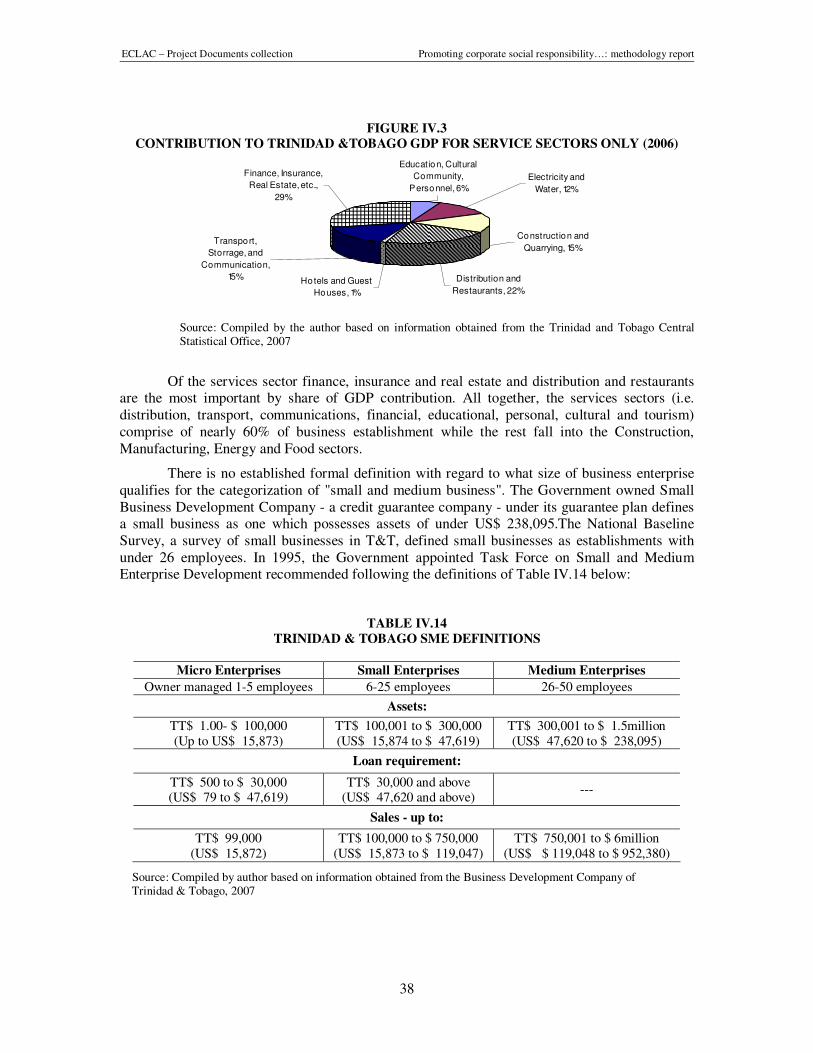
ECLAC – Project Documents collection Promoting corporate social responsibility…: methodology report
38
FIGURE IV.3
CONTRIBUTION TO TRINIDAD &TOBAGO GDP FOR SERVICE SECTORS ONLY (2006)
Transport,
Storrage, and
Communication,
15%
Finance, Insurance,
Real Estate, etc.,
29%
Education, Cultural
Community,
Personnel, 6%
Electricity and
Water, 12%
Construction and
Quarrying, 15%
Distribution and
Restaurants, 22%Hotels and Guest
Houses, 1%
Source: Compiled by the author based on information obtained from the Trinidad and Tobago Central Statistical Office, 2007
Of the services sector finance, insurance and real estate and distribution and restaurants are the most important by share of GDP contribution. All together, the services sectors (i.e. distribution, transport, communications, financial, educational, personal, cultural and tourism) comprise of nearly 60% of business establishment while the rest fall into the Construction, Manufacturing, Energy and Food sectors.
There is no established formal definition with regard to what size of business enterprise qualifies for the categorization of "small and medium business". The Government owned Small Business Development Company - a credit guarantee company - under its guarantee plan defines a small business as one which possesses assets of under US$ 238,095.The National Baseline Survey, a survey of small businesses in T&T, defined small businesses as establishments with under 26 employees. In 1995, the Government appointed Task Force on Small and Medium Enterprise Development recommended following the definitions of Table IV.14 below:
TABLE IV.14
TRINIDAD & TOBAGO SME DEFINITIONS
Micro Enterprises Small Enterprises Medium Enterprises
Owner managed 1-5 employees 6-25 employees 26-50 employees
Assets:
TT$ 1.00- $ 100,000 (Up to US$ 15,873)
TT$ 100,001 to $ 300,000 (US$ 15,874 to $ 47,619)
TT$ 300,001 to $ 1.5million (US$ 47,620 to $ 238,095)
Loan requirement:
TT$ 500 to $ 30,000 (US$ 79 to $ 47,619)
TT$ 30,000 and above (US$ 47,620 and above)
---
Sales - up to:
TT$ 99,000 (US$ 15,872)
TT$ 100,000 to $ 750,000 (US$ 15,873 to $ 119,047)
TT$ 750,001 to $ 6million (US$ $ 119,048 to $ 952,380)
Source: Compiled by author based on information obtained from the Business Development Company of Trinidad & Tobago, 2007
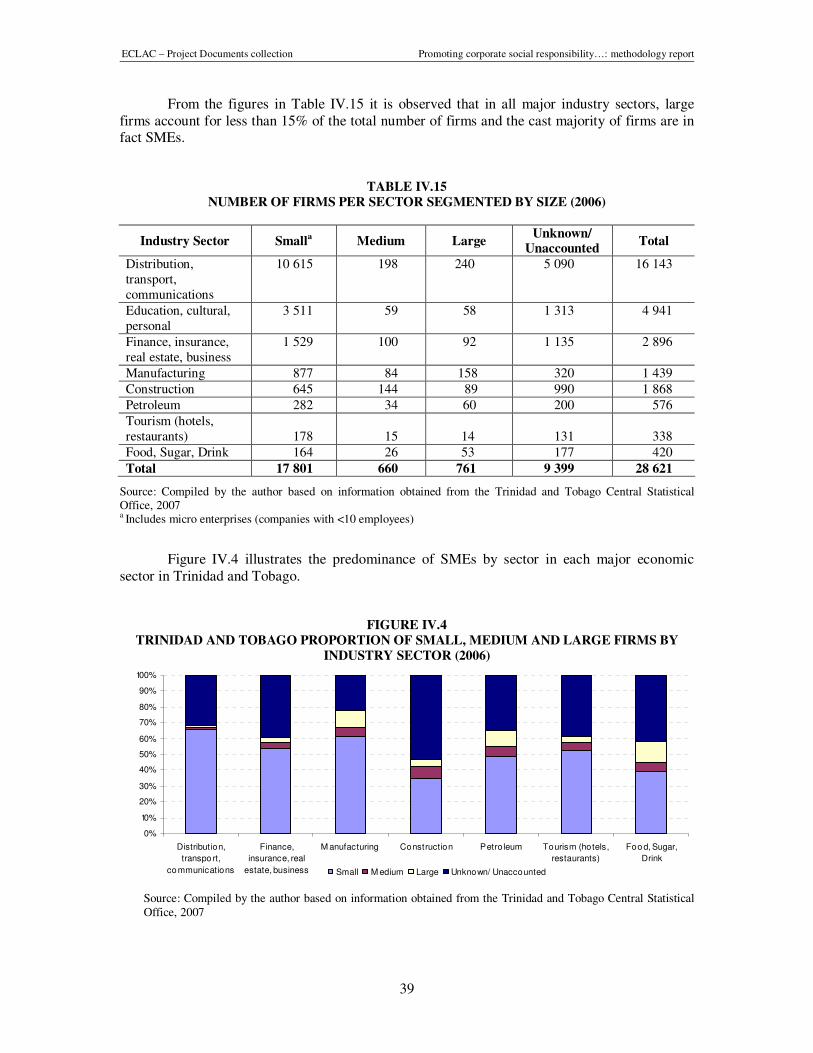
ECLAC – Project Documents collection Promoting corporate social responsibility…: methodology report
39
From the figures in Table IV.15 it is observed that in all major industry sectors, large firms account for less than 15% of the total number of firms and the cast majority of firms are in fact SMEs.
TABLE IV.15
NUMBER OF FIRMS PER SECTOR SEGMENTED BY SIZE (2006)
Industry Sector Smalla
Medium Large Unknown/
Unaccounted Total
Distribution, transport, communications
10 615 198 240 5 090 16 143
Education, cultural, personal
3 511 59 58 1 313 4 941
Finance, insurance, real estate, business
1 529 100 92 1 135 2 896
Manufacturing 877 84 158 320 1 439
Construction 645 144 89 990 1 868
Petroleum 282 34 60 200 576
Tourism (hotels, restaurants) 178 15 14 131 338
Food, Sugar, Drink 164 26 53 177 420
Total 17 801 660 761 9 399 28 621
Source: Compiled by the author based on information obtained from the Trinidad and Tobago Central Statistical Office, 2007 a Includes micro enterprises (companies with <10 employees)
Figure IV.4 illustrates the predominance of SMEs by sector in each major economic sector in Trinidad and Tobago.
FIGURE IV.4
TRINIDAD AND TOBAGO PROPORTION OF SMALL, MEDIUM AND LARGE FIRMS BY
INDUSTRY SECTOR (2006)
0%
10%
20%
30%
40%
50%
60%
70%
80%
90%
100%
Distribution,
transpo rt,
co mmunications
Finance,
insurance, real
estate, business
M anufacturing Construction Petro leum Tourism (hotels,
restaurants)
Foo d, Sugar,
Drink
Small M edium Large Unknown/ Unaccounted
Source: Compiled by the author based on information obtained from the Trinidad and Tobago Central Statistical Office, 2007
ECLAC – Project Documents collection Promoting corporate social responsibility…: methodology report
40
Based on Criteria 1, the contribution of each industry sector to national GDP, figures for 2005 indicated that Energy and Finance and Business Services were the most important contributors. These sectors combined to contribute over 55% of the national GDP in 2005. Based on Criteria 2, the rate of growth in GDP by sector, Energy, Construction, Finance and Business Services and Manufacturing all had above average (>8.1%) growth rates. Based on Criteria 3, the level of employment provided by each sector, it is observed that services including Finance and Business Services, Commercial Trade, Tourism and Government Services accounted for over 55% of employment in 2006, while Construction added another 18%. Based on Criteria 4, sectors with the most SME activity or SMEs by number, the most important industries were found to be Communication, Transportation and Distribution, Education services, Finance and Business Services, Manufacturing and Construction, all of which were dominated by over 85% of firms in the sector being SMEs.
Based on this information, in T&T for the pilot study, the focus will be on the Finance and Business Services, Energy, Manufacturing, Transport, Storage and Distribution sectors.
4. St. Lucia
The economy depends primarily on revenue from Tourism and banana production, with some contribution from small-scale Manufacturing. Tourism continues to demonstrate its attractiveness to investors by its high market demand and positive returns. The economy grew by an estimated 5.4% in 2006, primarily led by robust activity in the Construction sector. St. Lucia recorded its fifth consecutive year of real growth driven by increased value-added in the Construction, road transport, electricity and Financial Services sectors. In contrast to the positive growth and contribution by most sectors to this general economic expansion, the Tourism sector is estimated to have contracted by 2.7% while maintaining a leading share of GDP). Although its contribution to GDP declined from 13.5% to 12.4%, the Tourism sector remains the principal source of growth and foreign exchange in St. Lucia (Commonwealth Secretariat, 2006). Preliminary data indicate that gross Tourism revenue contracted by 23% to US$ 297.2 million (Government Statistics Dept., 2007).
TABLE IV.16
ST. LUCIA SECTORAL GDP (CONSTANT) 2005
Industry Sector US$ millionsb Percentage
Finance, Real Estate, Insurance, Business Services 119.5 19.0
Transport and Communications 110.0 17.4
Tourism (Hotels & Restaurants) 68.0 10.8
Government Services 60.8 9.6
Wholesale & Retail Trade 60.3 9.6
Construction 40.0 6.3
Manufacturing 34.0 5.4
Utilities 25.2 4.0
Other Services 20.8 3.3
Agriculturea 16.8 2.7
Mining and Quarrying 2.1 0.3
Less Imputed Service Charge 46.3 7.3
Plus: Product Taxes less Subsidies 119.0 18.9
Total Constant GDP 630.7 100.0
Source: Compiled by the author based on information obtained from the St. Lucia Department of Statistics, 2007 aIncludes Forestry and Fisheries bAll figures converted using Annual exchange rate 2005 EC$ 2.69=$ US1 (Central Bank of the Eastern Caribbean, 2007)
ECLAC – Project Documents collection Promoting corporate social responsibility…: methodology report
41
According to the Government of St. Lucia (Commonwealth Secretariat, 2006), overall output in the Agriculture sector expanded by 9.8%, partially recovering from consecutive periods of contraction. This was led by an appreciable growth of 11.4% in the banana industry alongside higher production in all active sub-sectors with the exception of livestock. As a result, Agriculture's share of GDP increased to 3.2% in 2006, still much lower than historical levels. Of this, value added in the banana sub-sector accounted for 1.3% of GDP. The non-traditional crops and fisheries sub-sectors grew by 9.7% and 24.1% respectively. However, output in the livestock sub-sector contracted by 9.7% in 2006.
Saint Lucia is a signatory of the CBI, CARIBCAN, Lomé IV Convention and the CARICOM. These treaties permit duty free entry of products to the United States, Canada, the EU, and CARICOM members respectively once relevant standards are met.
Following two years of growth, value added in the Manufacturing sector rose by 6.7% on the strength of the performance of the beverage sub-sector. The sector contributed 6.8% to real GDP in 2006. The value of production in the Manufacturing sector grew by 5.6% to US$ 63.9 million. Manufacturing output remains concentrated on the production of a few products, namely beverages, paper products and electrical items which together accounted for 78% of total output in 2006. Construction activity in both the public and private sectors provided a major impetus to growth in 2006. Building on the momentum in 2005, real economic activity in the Construction sector was estimated to expand by 13.2% (Commonwealth Secretariat, 2006). As a result, the Construction sector accounted for an increased share of GDP from 8.1% to 8.7%. Public sector Construction expenditure increased by 23.3% to US $ 80.7 million in 2006.
Activity in the banking and insurance sector grew by 9.0% reflecting increased value added in both banking and insurance. Led by banking, the financial sector made a greater contribution to GDP, increasing from 11.1% to 11.5% in 2006. Domestic credit expanded by 28.7% to US$ 866.6 million, on account of strong demand by the private sector, including households. Net credit to the central government decreased substantially from US$ 29.9 million to US$ 10.2 million. Inflationary pressures, albeit moderated, emanated from the direct effects of increases in international oil prices particularly in the first half of 2006. Strong aggregate demand and upward movements in the costs of transport and fuel & light were chiefly responsible for the general increase in the price level. In keeping with higher international oil prices and the expansion in economic activity, particularly Construction, the value of imports increased by 22.7% to US$ 534.5 million. The value of merchandise exports was estimated at US$ 70.8 million, an increase of 9.2%, partly due to a recovery in banana revenue. Liberalization of the telecommunications sector has created opportunities for investment in information technology enterprises and serves as a catalyst for growth of a wide range of commercial services. The Agriculture sector (including forestry and fisheries) account for some 7% of GDP in 2006 (Government Statistics Dept., 2007).
In special development areas including Vieux-Fort, Anse La Raye, Soufriere, Canaries and Dennery businesses that qualify for government concessions are (i) conference centers; (ii) residential complexes (iii) commercial or industrial buildings (iv) other facilities directed towards the improvement or expansion of services to the Tourism sector (v) water-based activities (vi) Tourism projects highlighting the heritage and natural environment (vii) arts and cultural investments (viii) agricultural-based and fisheries-based activities.
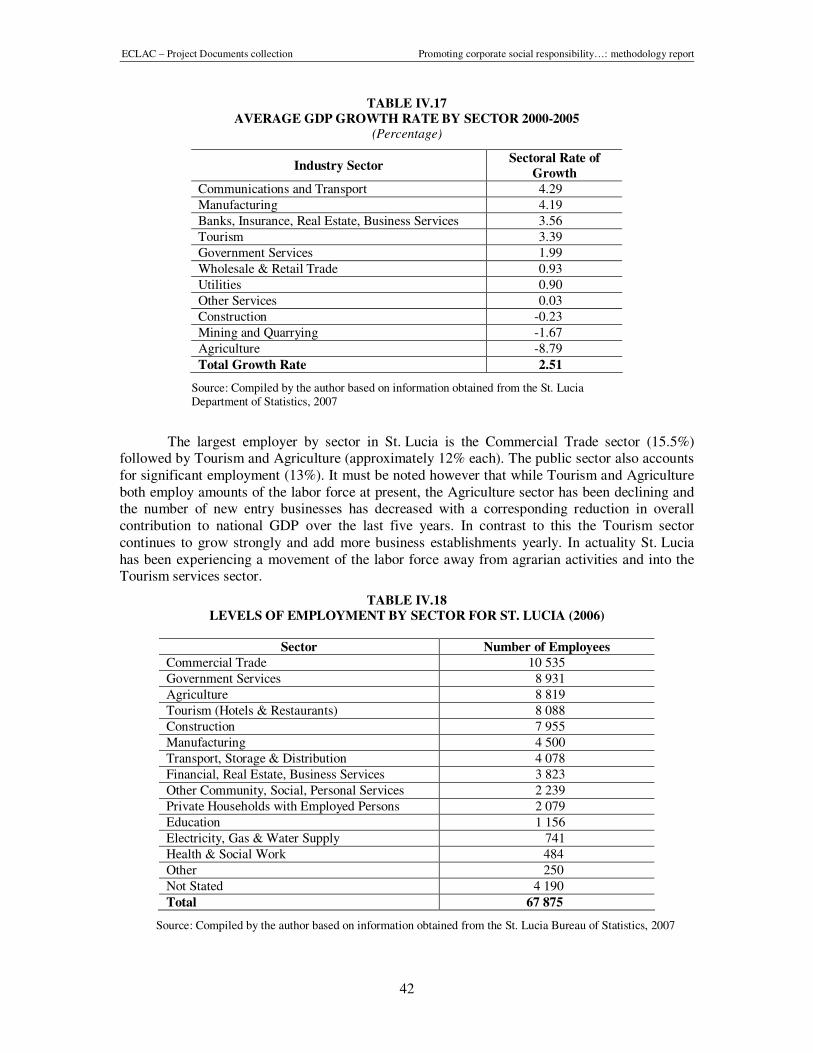
ECLAC – Project Documents collection Promoting corporate social responsibility…: methodology report
42
TABLE IV.17
AVERAGE GDP GROWTH RATE BY SECTOR 2000-2005 (Percentage)
Industry Sector Sectoral Rate of
Growth
Communications and Transport 4.29
Manufacturing 4.19
Banks, Insurance, Real Estate, Business Services 3.56
Tourism 3.39
Government Services 1.99
Wholesale & Retail Trade 0.93
Utilities 0.90
Other Services 0.03
Construction -0.23
Mining and Quarrying -1.67
Agriculture -8.79
Total Growth Rate 2.51
Source: Compiled by the author based on information obtained from the St. Lucia Department of Statistics, 2007
The largest employer by sector in St. Lucia is the Commercial Trade sector (15.5%) followed by Tourism and Agriculture (approximately 12% each). The public sector also accounts for significant employment (13%). It must be noted however that while Tourism and Agriculture both employ amounts of the labor force at present, the Agriculture sector has been declining and the number of new entry businesses has decreased with a corresponding reduction in overall contribution to national GDP over the last five years. In contrast to this the Tourism sector continues to grow strongly and add more business establishments yearly. In actuality St. Lucia has been experiencing a movement of the labor force away from agrarian activities and into the Tourism services sector.
TABLE IV.18
LEVELS OF EMPLOYMENT BY SECTOR FOR ST. LUCIA (2006)
Sector Number of Employees
Commercial Trade 10 535
Government Services 8 931
Agriculture 8 819
Tourism (Hotels & Restaurants) 8 088
Construction 7 955
Manufacturing 4 500
Transport, Storage & Distribution 4 078
Financial, Real Estate, Business Services 3 823
Other Community, Social, Personal Services 2 239
Private Households with Employed Persons 2 079
Education 1 156
Electricity, Gas & Water Supply 741
Health & Social Work 484
Other 250
Not Stated 4 190
Total 67 875
Source: Compiled by the author based on information obtained from the St. Lucia Bureau of Statistics, 2007
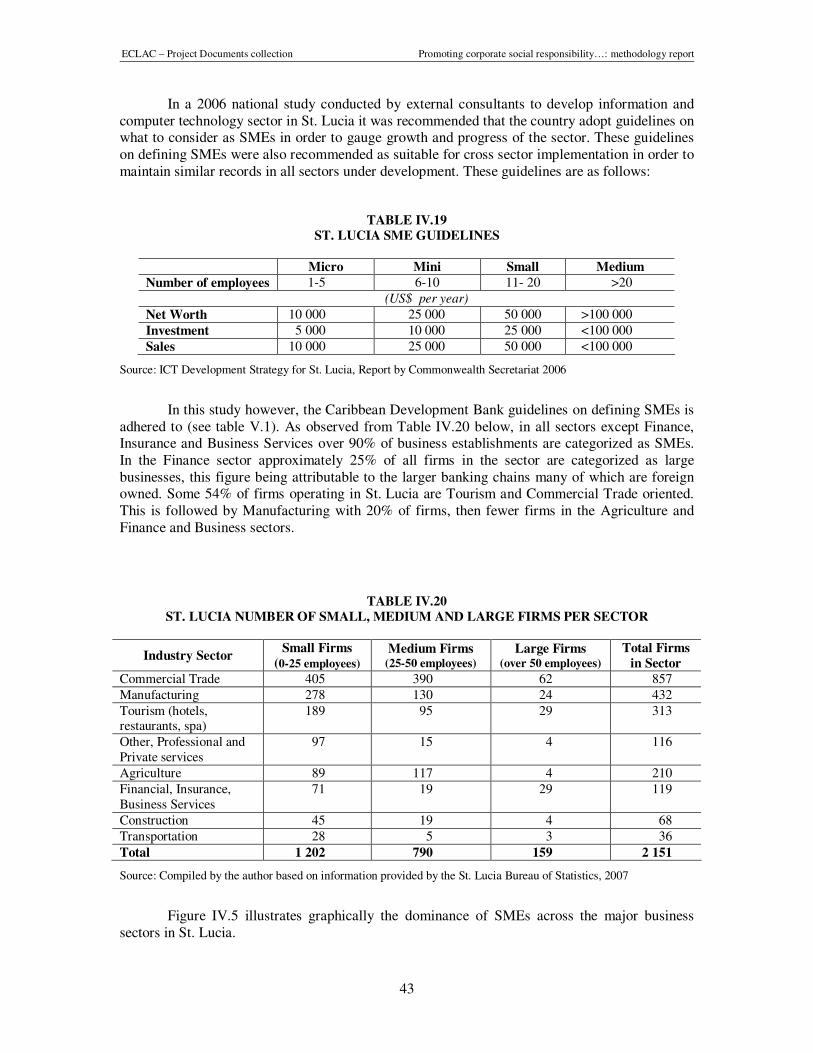
ECLAC – Project Documents collection Promoting corporate social responsibility…: methodology report
43
In a 2006 national study conducted by external consultants to develop information and computer technology sector in St. Lucia it was recommended that the country adopt guidelines on what to consider as SMEs in order to gauge growth and progress of the sector. These guidelines on defining SMEs were also recommended as suitable for cross sector implementation in order to maintain similar records in all sectors under development. These guidelines are as follows:
TABLE IV.19
ST. LUCIA SME GUIDELINES
Micro Mini Small Medium
Number of employees 1-5 6-10 11- 20 >20
(US$ per year)
Net Worth 10 000 25 000 50 000 >100 000
Investment 5 000 10 000 25 000 <100 000
Sales 10 000 25 000 50 000 <100 000
Source: ICT Development Strategy for St. Lucia, Report by Commonwealth Secretariat 2006
In this study however, the Caribbean Development Bank guidelines on defining SMEs is adhered to (see table V.1). As observed from Table IV.20 below, in all sectors except Finance, Insurance and Business Services over 90% of business establishments are categorized as SMEs. In the Finance sector approximately 25% of all firms in the sector are categorized as large businesses, this figure being attributable to the larger banking chains many of which are foreign owned. Some 54% of firms operating in St. Lucia are Tourism and Commercial Trade oriented. This is followed by Manufacturing with 20% of firms, then fewer firms in the Agriculture and Finance and Business sectors.
TABLE IV.20
ST. LUCIA NUMBER OF SMALL, MEDIUM AND LARGE FIRMS PER SECTOR
Industry Sector Small Firms
(0-25 employees) Medium Firms
(25-50 employees) Large Firms
(over 50 employees) Total Firms
in Sector
Commercial Trade 405 390 62 857
Manufacturing 278 130 24 432
Tourism (hotels, restaurants, spa)
189 95 29 313
Other, Professional and Private services
97 15 4 116
Agriculture 89 117 4 210
Financial, Insurance, Business Services
71 19 29 119
Construction 45 19 4 68
Transportation 28 5 3 36
Total 1 202 790 159 2 151
Source: Compiled by the author based on information provided by the St. Lucia Bureau of Statistics, 2007
Figure IV.5 illustrates graphically the dominance of SMEs across the major business sectors in St. Lucia.
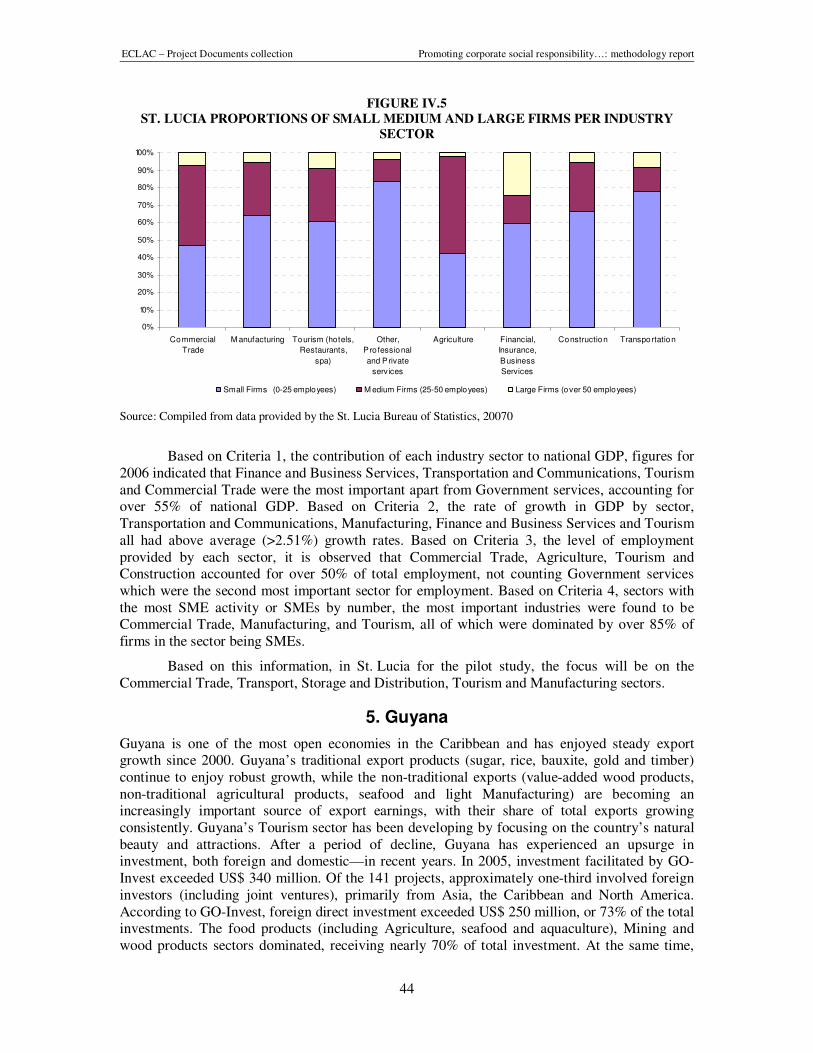
ECLAC – Project Documents collection Promoting corporate social responsibility…: methodology report
44
FIGURE IV.5
ST. LUCIA PROPORTIONS OF SMALL MEDIUM AND LARGE FIRMS PER INDUSTRY
SECTOR
0%
10%
20%
30%
40%
50%
60%
70%
80%
90%
100%
Commercial
Trade
M anufacturing Tourism (hotels,
Restaurants,
spa)
Other,
Pro fessional
and Private
services
Agriculture Financial,
Insurance,
Business
Services
Construction Transportation
Small Firms (0-25 employees) M edium Firms (25-50 employees) Large Firms (over 50 employees)
Source: Compiled from data provided by the St. Lucia Bureau of Statistics, 20070
Based on Criteria 1, the contribution of each industry sector to national GDP, figures for 2006 indicated that Finance and Business Services, Transportation and Communications, Tourism and Commercial Trade were the most important apart from Government services, accounting for over 55% of national GDP. Based on Criteria 2, the rate of growth in GDP by sector, Transportation and Communications, Manufacturing, Finance and Business Services and Tourism all had above average (>2.51%) growth rates. Based on Criteria 3, the level of employment provided by each sector, it is observed that Commercial Trade, Agriculture, Tourism and Construction accounted for over 50% of total employment, not counting Government services which were the second most important sector for employment. Based on Criteria 4, sectors with the most SME activity or SMEs by number, the most important industries were found to be Commercial Trade, Manufacturing, and Tourism, all of which were dominated by over 85% of firms in the sector being SMEs.
Based on this information, in St. Lucia for the pilot study, the focus will be on the Commercial Trade, Transport, Storage and Distribution, Tourism and Manufacturing sectors.
5. Guyana
Guyana is one of the most open economies in the Caribbean and has enjoyed steady export growth since 2000. Guyana’s traditional export products (sugar, rice, bauxite, gold and timber) continue to enjoy robust growth, while the non-traditional exports (value-added wood products, non-traditional agricultural products, seafood and light Manufacturing) are becoming an increasingly important source of export earnings, with their share of total exports growing consistently. Guyana’s Tourism sector has been developing by focusing on the country’s natural beauty and attractions. After a period of decline, Guyana has experienced an upsurge in investment, both foreign and domestic—in recent years. In 2005, investment facilitated by GO-Invest exceeded US$ 340 million. Of the 141 projects, approximately one-third involved foreign investors (including joint ventures), primarily from Asia, the Caribbean and North America. According to GO-Invest, foreign direct investment exceeded US$ 250 million, or 73% of the total investments. The food products (including Agriculture, seafood and aquaculture), Mining and wood products sectors dominated, receiving nearly 70% of total investment. At the same time,
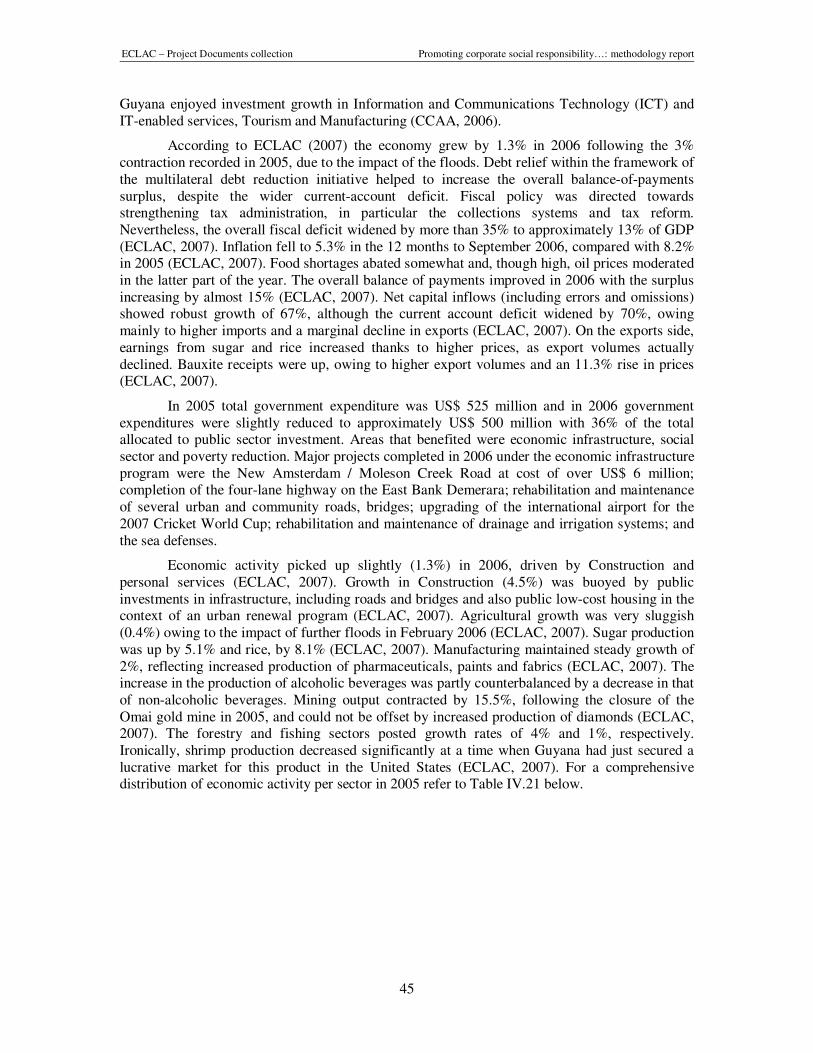
ECLAC – Project Documents collection Promoting corporate social responsibility…: methodology report
45
Guyana enjoyed investment growth in Information and Communications Technology (ICT) and IT-enabled services, Tourism and Manufacturing (CCAA, 2006).
According to ECLAC (2007) the economy grew by 1.3% in 2006 following the 3% contraction recorded in 2005, due to the impact of the floods. Debt relief within the framework of the multilateral debt reduction initiative helped to increase the overall balance-of-payments surplus, despite the wider current-account deficit. Fiscal policy was directed towards strengthening tax administration, in particular the collections systems and tax reform. Nevertheless, the overall fiscal deficit widened by more than 35% to approximately 13% of GDP (ECLAC, 2007). Inflation fell to 5.3% in the 12 months to September 2006, compared with 8.2% in 2005 (ECLAC, 2007). Food shortages abated somewhat and, though high, oil prices moderated in the latter part of the year. The overall balance of payments improved in 2006 with the surplus increasing by almost 15% (ECLAC, 2007). Net capital inflows (including errors and omissions) showed robust growth of 67%, although the current account deficit widened by 70%, owing mainly to higher imports and a marginal decline in exports (ECLAC, 2007). On the exports side, earnings from sugar and rice increased thanks to higher prices, as export volumes actually declined. Bauxite receipts were up, owing to higher export volumes and an 11.3% rise in prices (ECLAC, 2007).
In 2005 total government expenditure was US$ 525 million and in 2006 government expenditures were slightly reduced to approximately US$ 500 million with 36% of the total allocated to public sector investment. Areas that benefited were economic infrastructure, social sector and poverty reduction. Major projects completed in 2006 under the economic infrastructure program were the New Amsterdam / Moleson Creek Road at cost of over US$ 6 million; completion of the four-lane highway on the East Bank Demerara; rehabilitation and maintenance of several urban and community roads, bridges; upgrading of the international airport for the 2007 Cricket World Cup; rehabilitation and maintenance of drainage and irrigation systems; and the sea defenses.
Economic activity picked up slightly (1.3%) in 2006, driven by Construction and personal services (ECLAC, 2007). Growth in Construction (4.5%) was buoyed by public investments in infrastructure, including roads and bridges and also public low-cost housing in the context of an urban renewal program (ECLAC, 2007). Agricultural growth was very sluggish (0.4%) owing to the impact of further floods in February 2006 (ECLAC, 2007). Sugar production was up by 5.1% and rice, by 8.1% (ECLAC, 2007). Manufacturing maintained steady growth of 2%, reflecting increased production of pharmaceuticals, paints and fabrics (ECLAC, 2007). The increase in the production of alcoholic beverages was partly counterbalanced by a decrease in that of non-alcoholic beverages. Mining output contracted by 15.5%, following the closure of the Omai gold mine in 2005, and could not be offset by increased production of diamonds (ECLAC, 2007). The forestry and fishing sectors posted growth rates of 4% and 1%, respectively. Ironically, shrimp production decreased significantly at a time when Guyana had just secured a lucrative market for this product in the United States (ECLAC, 2007). For a comprehensive distribution of economic activity per sector in 2005 refer to Table IV.21 below.
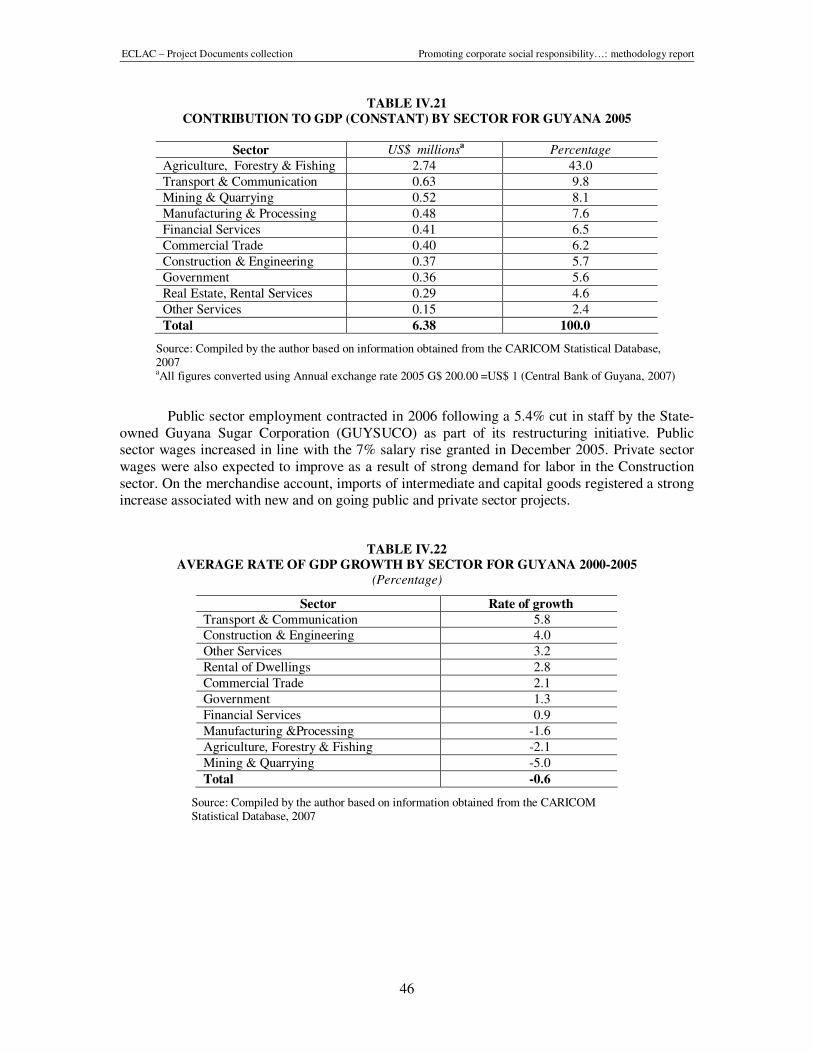
ECLAC – Project Documents collection Promoting corporate social responsibility…: methodology report
46
TABLE IV.21
CONTRIBUTION TO GDP (CONSTANT) BY SECTOR FOR GUYANA 2005
Sector US$ millionsa Percentage
Agriculture, Forestry & Fishing 2.74 43.0
Transport & Communication 0.63 9.8
Mining & Quarrying 0.52 8.1
Manufacturing & Processing 0.48 7.6
Financial Services 0.41 6.5
Commercial Trade 0.40 6.2
Construction & Engineering 0.37 5.7
Government 0.36 5.6
Real Estate, Rental Services 0.29 4.6
Other Services 0.15 2.4
Total 6.38 100.0
Source: Compiled by the author based on information obtained from the CARICOM Statistical Database, 2007 aAll figures converted using Annual exchange rate 2005 G$ 200.00 =US$ 1 (Central Bank of Guyana, 2007)
Public sector employment contracted in 2006 following a 5.4% cut in staff by the State-owned Guyana Sugar Corporation (GUYSUCO) as part of its restructuring initiative. Public sector wages increased in line with the 7% salary rise granted in December 2005. Private sector wages were also expected to improve as a result of strong demand for labor in the Construction
sector. On the merchandise account, imports of intermediate and capital goods registered a strong increase associated with new and on going public and private sector projects.
TABLE IV.22
AVERAGE RATE OF GDP GROWTH BY SECTOR FOR GUYANA 2000-2005 (Percentage)
Sector Rate of growth
Transport & Communication 5.8 Construction & Engineering 4.0
Other Services 3.2
Rental of Dwellings 2.8
Commercial Trade 2.1
Government 1.3
Financial Services 0.9
Manufacturing &Processing -1.6
Agriculture, Forestry & Fishing -2.1
Mining & Quarrying -5.0
Total -0.6
Source: Compiled by the author based on information obtained from the CARICOM Statistical Database, 2007
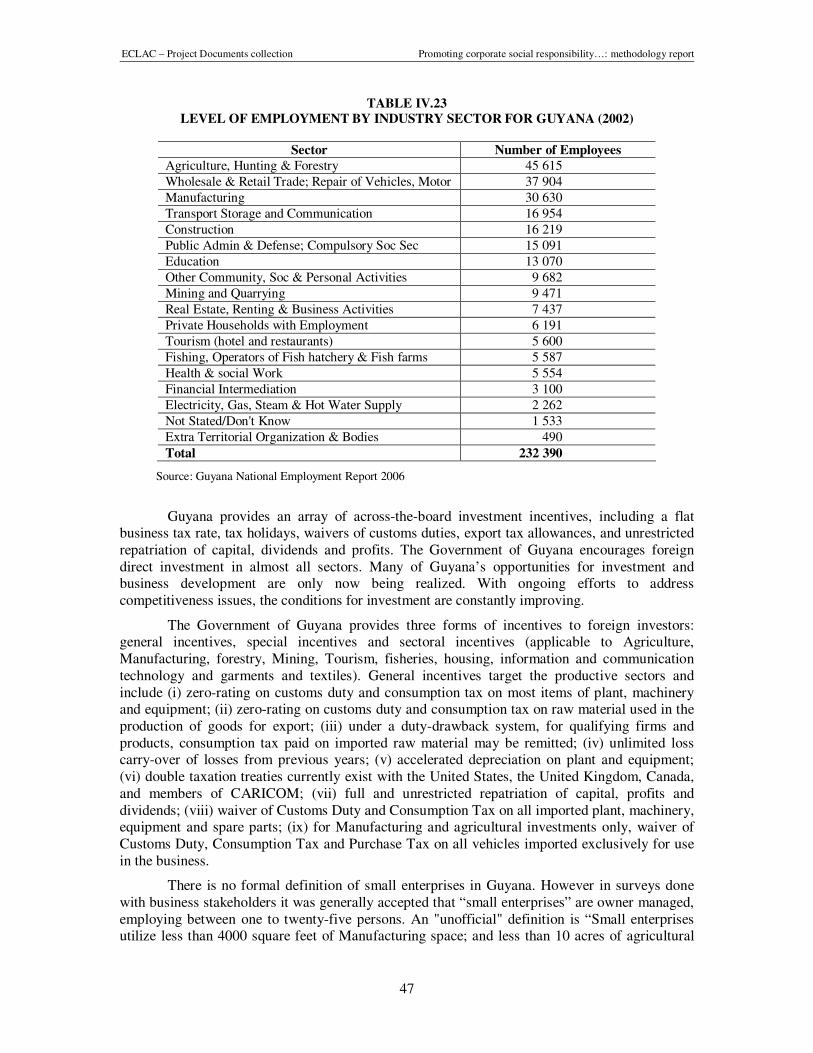
ECLAC – Project Documents collection Promoting corporate social responsibility…: methodology report
47
TABLE IV.23
LEVEL OF EMPLOYMENT BY INDUSTRY SECTOR FOR GUYANA (2002)
Sector Number of Employees
Agriculture, Hunting & Forestry 45 615
Wholesale & Retail Trade; Repair of Vehicles, Motor 37 904
Manufacturing 30 630
Transport Storage and Communication 16 954
Construction 16 219
Public Admin & Defense; Compulsory Soc Sec 15 091
Education 13 070
Other Community, Soc & Personal Activities 9 682
Mining and Quarrying 9 471
Real Estate, Renting & Business Activities 7 437
Private Households with Employment 6 191
Tourism (hotel and restaurants) 5 600
Fishing, Operators of Fish hatchery & Fish farms 5 587
Health & social Work 5 554
Financial Intermediation 3 100
Electricity, Gas, Steam & Hot Water Supply 2 262
Not Stated/Don't Know 1 533
Extra Territorial Organization & Bodies 490
Total 232 390
Source: Guyana National Employment Report 2006
Guyana provides an array of across-the-board investment incentives, including a flat business tax rate, tax holidays, waivers of customs duties, export tax allowances, and unrestricted repatriation of capital, dividends and profits. The Government of Guyana encourages foreign direct investment in almost all sectors. Many of Guyana’s opportunities for investment and business development are only now being realized. With ongoing efforts to address competitiveness issues, the conditions for investment are constantly improving.
The Government of Guyana provides three forms of incentives to foreign investors: general incentives, special incentives and sectoral incentives (applicable to Agriculture, Manufacturing, forestry, Mining, Tourism, fisheries, housing, information and communication technology and garments and textiles). General incentives target the productive sectors and include (i) zero-rating on customs duty and consumption tax on most items of plant, machinery and equipment; (ii) zero-rating on customs duty and consumption tax on raw material used in the production of goods for export; (iii) under a duty-drawback system, for qualifying firms and products, consumption tax paid on imported raw material may be remitted; (iv) unlimited loss carry-over of losses from previous years; (v) accelerated depreciation on plant and equipment; (vi) double taxation treaties currently exist with the United States, the United Kingdom, Canada, and members of CARICOM; (vii) full and unrestricted repatriation of capital, profits and dividends; (viii) waiver of Customs Duty and Consumption Tax on all imported plant, machinery, equipment and spare parts; (ix) for Manufacturing and agricultural investments only, waiver of Customs Duty, Consumption Tax and Purchase Tax on all vehicles imported exclusively for use in the business.
There is no formal definition of small enterprises in Guyana. However in surveys done with business stakeholders it was generally accepted that “small enterprises” are owner managed, employing between one to twenty-five persons. An "unofficial" definition is “Small enterprises utilize less than 4000 square feet of Manufacturing space; and less than 10 acres of agricultural
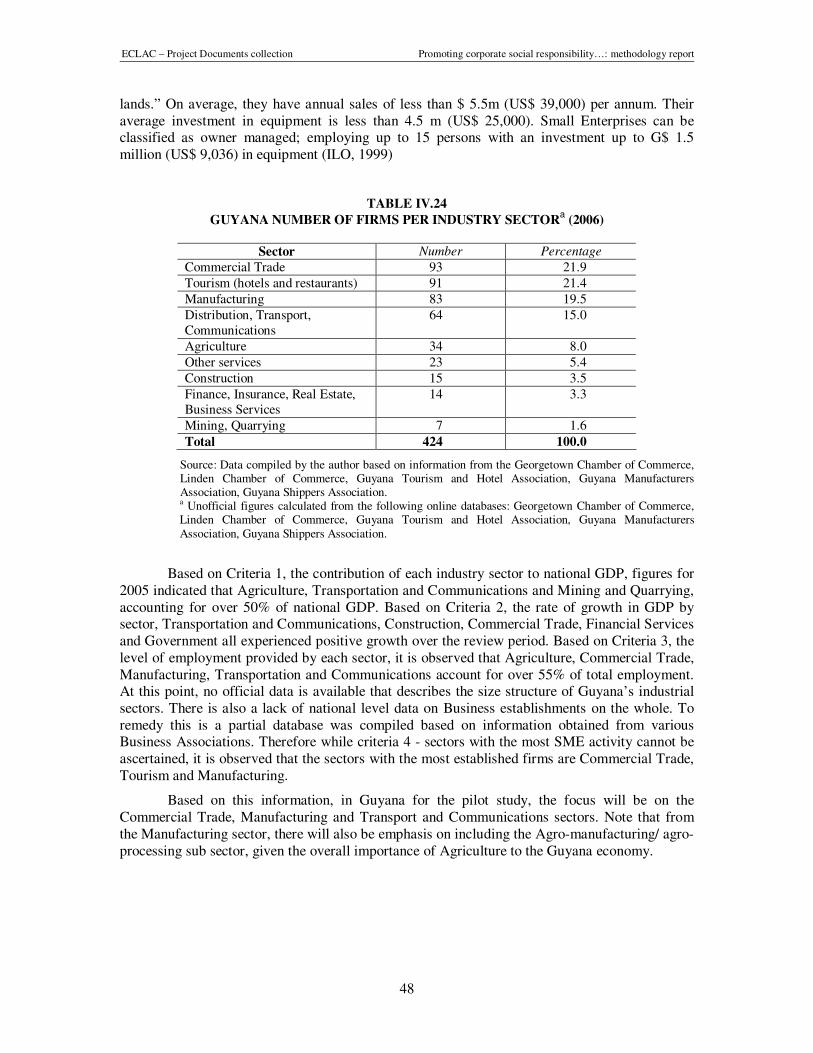
ECLAC – Project Documents collection Promoting corporate social responsibility…: methodology report
48
lands.” On average, they have annual sales of less than $ 5.5m (US$ 39,000) per annum. Their average investment in equipment is less than 4.5 m (US$ 25,000). Small Enterprises can be classified as owner managed; employing up to 15 persons with an investment up to G$ 1.5 million (US$ 9,036) in equipment (ILO, 1999)
TABLE IV.24
GUYANA NUMBER OF FIRMS PER INDUSTRY SECTORa (2006)
Sector Number Percentage
Commercial Trade 93 21.9
Tourism (hotels and restaurants) 91 21.4
Manufacturing 83 19.5
Distribution, Transport, Communications
64 15.0
Agriculture 34 8.0
Other services 23 5.4
Construction 15 3.5
Finance, Insurance, Real Estate, Business Services
14 3.3
Mining, Quarrying 7 1.6
Total 424 100.0
Source: Data compiled by the author based on information from the Georgetown Chamber of Commerce, Linden Chamber of Commerce, Guyana Tourism and Hotel Association, Guyana Manufacturers Association, Guyana Shippers Association. a Unofficial figures calculated from the following online databases: Georgetown Chamber of Commerce, Linden Chamber of Commerce, Guyana Tourism and Hotel Association, Guyana Manufacturers Association, Guyana Shippers Association.
Based on Criteria 1, the contribution of each industry sector to national GDP, figures for 2005 indicated that Agriculture, Transportation and Communications and Mining and Quarrying, accounting for over 50% of national GDP. Based on Criteria 2, the rate of growth in GDP by sector, Transportation and Communications, Construction, Commercial Trade, Financial Services and Government all experienced positive growth over the review period. Based on Criteria 3, the level of employment provided by each sector, it is observed that Agriculture, Commercial Trade, Manufacturing, Transportation and Communications account for over 55% of total employment. At this point, no official data is available that describes the size structure of Guyana’s industrial sectors. There is also a lack of national level data on Business establishments on the whole. To remedy this is a partial database was compiled based on information obtained from various Business Associations. Therefore while criteria 4 - sectors with the most SME activity cannot be ascertained, it is observed that the sectors with the most established firms are Commercial Trade, Tourism and Manufacturing.
Based on this information, in Guyana for the pilot study, the focus will be on the Commercial Trade, Manufacturing and Transport and Communications sectors. Note that from the Manufacturing sector, there will also be emphasis on including the Agro-manufacturing/ agro-processing sub sector, given the overall importance of Agriculture to the Guyana economy.
ECLAC – Project Documents collection Promoting corporate social responsibility…: methodology report
49
V. Definition of the sample frame and sample selection
A. Parameters
1. Pilot countries
Five pilot countries were selected for inclusion in the study based on the criteria outlined in section IV.D above. These countries are Barbados, Jamaica, Trinidad and Tobago, St. Lucia and Guyana.
2. Selected industry sectors
Six industry sectors were identified for inclusion in this pilot study. These industry sectors represent the most important across the group of pilot countries and by extension are the most economically important within the CARICOM region as a whole. The sectors included are:
i) Financial Services, Insurance, Real Estate and Business Services
ii) Energy, Oil, Gas, Petroleum
iii) Transportation, Storage and Communications
iv) Commercial, Wholesale and Retail Trade
v) Tourism and Hospitality
vi) Manufacturing
A full description of each of these sectors and their sub-sectors/ sub-divisions is provided in Annex 1.
3. Definition of small, medium and large companies
In the Caribbean, as in other parts of the world, there is no universal definition of "small" and "medium" sized businesses. In fact, within each country different institutions adopt various broad definitions either from a quantitative perspective such as: (i) the number of persons employed; (ii) the volume of output or sales; (iii) the level of investment in the fixed assets; (iv) the use of factory space or Energy, etc; or from a qualitative aspect, such as whether (v) the owner of the enterprise works alongside his/her workers and (vi) the enterprise is classified in the "formal" sector.
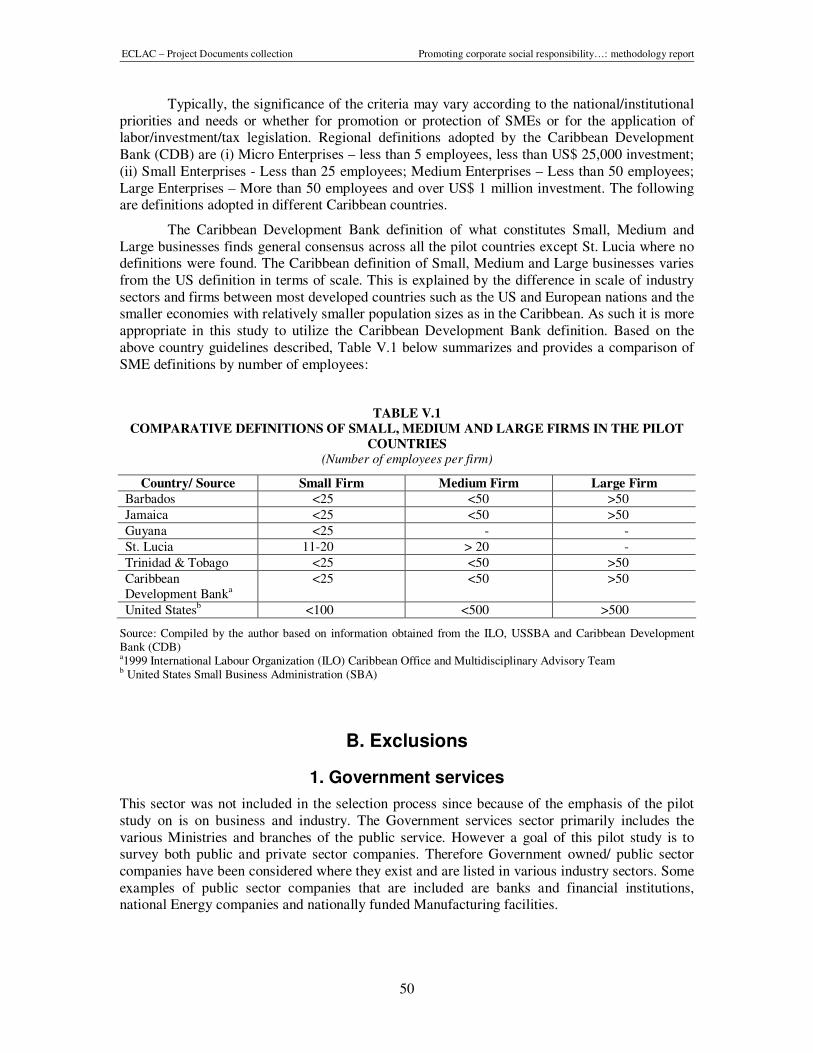
ECLAC – Project Documents collection Promoting corporate social responsibility…: methodology report
50
Typically, the significance of the criteria may vary according to the national/institutional priorities and needs or whether for promotion or protection of SMEs or for the application of labor/investment/tax legislation. Regional definitions adopted by the Caribbean Development Bank (CDB) are (i) Micro Enterprises – less than 5 employees, less than US$ 25,000 investment; (ii) Small Enterprises - Less than 25 employees; Medium Enterprises – Less than 50 employees; Large Enterprises – More than 50 employees and over US$ 1 million investment. The following are definitions adopted in different Caribbean countries.
The Caribbean Development Bank definition of what constitutes Small, Medium and Large businesses finds general consensus across all the pilot countries except St. Lucia where no definitions were found. The Caribbean definition of Small, Medium and Large businesses varies from the US definition in terms of scale. This is explained by the difference in scale of industry sectors and firms between most developed countries such as the US and European nations and the smaller economies with relatively smaller population sizes as in the Caribbean. As such it is more appropriate in this study to utilize the Caribbean Development Bank definition. Based on the above country guidelines described, Table V.1 below summarizes and provides a comparison of SME definitions by number of employees:
TABLE V.1
COMPARATIVE DEFINITIONS OF SMALL, MEDIUM AND LARGE FIRMS IN THE PILOT
COUNTRIES (Number of employees per firm)
Country/ Source Small Firm Medium Firm Large Firm
Barbados <25 <50 >50
Jamaica <25 <50 >50
Guyana <25 - -
St. Lucia 11-20 > 20 -
Trinidad & Tobago <25 <50 >50
Caribbean Development Banka
<25 <50 >50
United Statesb <100 <500 >500
Source: Compiled by the author based on information obtained from the ILO, USSBA and Caribbean Development Bank (CDB) a1999 International Labour Organization (ILO) Caribbean Office and Multidisciplinary Advisory Team b United States Small Business Administration (SBA)
B. Exclusions
1. Government services
This sector was not included in the selection process since because of the emphasis of the pilot study on is on business and industry. The Government services sector primarily includes the various Ministries and branches of the public service. However a goal of this pilot study is to survey both public and private sector companies. Therefore Government owned/ public sector companies have been considered where they exist and are listed in various industry sectors. Some examples of public sector companies that are included are banks and financial institutions, national Energy companies and nationally funded Manufacturing facilities.
ECLAC – Project Documents collection Promoting corporate social responsibility…: methodology report
51
2. Agriculture sector
The Agriculture sector including fishing, hunting and forestry was not included in the selection process of the pilot study. Although Agriculture is observed to be a primary economic sector in Guyana and Jamaica it is a sector that will require particular and separate attention in a later expansion of this CSR survey owing to its vulnerability, sensitivities and socio-cultural history. The survey approach to be used in this pilot may not deal with the Agriculture sector in the manner required.
That being stated however, a special effort will be made to include the sub-sector of Agro-manufacturing/ agro-processing in the survey. Agro-manufacturing as a sub set of Manufacturing will be included especially in Guyana and Jamaica. This sub-sector will include such businesses as food and beverage processors, packagers and canners, distilleries and sugar mills among others.
3. Other less defined sectors
Categories such as Miscellaneous; Professional Services; and Other services including household and private services and non governmental and charitable service sectors were excluded from consideration in this pilot phase.
4. Micro enterprises
Where the data allowed for identification of “micro-enterprises”, which are by definition, businesses with less than 10 employees, these were also excluded from the sample frame. Micro-enterprise information was available for Trinidad and Tobago and to a lesser extent Barbados and Jamaica. Micro-enterprises for these countries were therefore not included in the sample frame.
It has been shown in previous studies (Shah, 2007) that regional micro-enterprises are by and large not sufficiently capable of responding to surveys of the nature and detail required for SME level surveys. Later expansion of the CSR study may look into conducting a micro-enterprise specific questionnaire which is designed to collect accurate information from this sector with an appropriately designed questionnaire instrument.
C. Statistical methods
1. Confidence levels
A minimum sample will be randomly selected from the sample frame to meet the requirements of a 99% Confidence Level and a + 5% Confidence Interval. It should be noted that similar surveys, especially those collecting social science data require at least a 95% confidence Level and +5% Confidence Interval (error) (Dillman, 1978). As calculated below, this gives an overall minimum sample size that represents approximately 8.5% of the sample frame.
2. Proportional representation
A sample was selected to proportionally represent the six selected industry sectors and the five pilot countries.
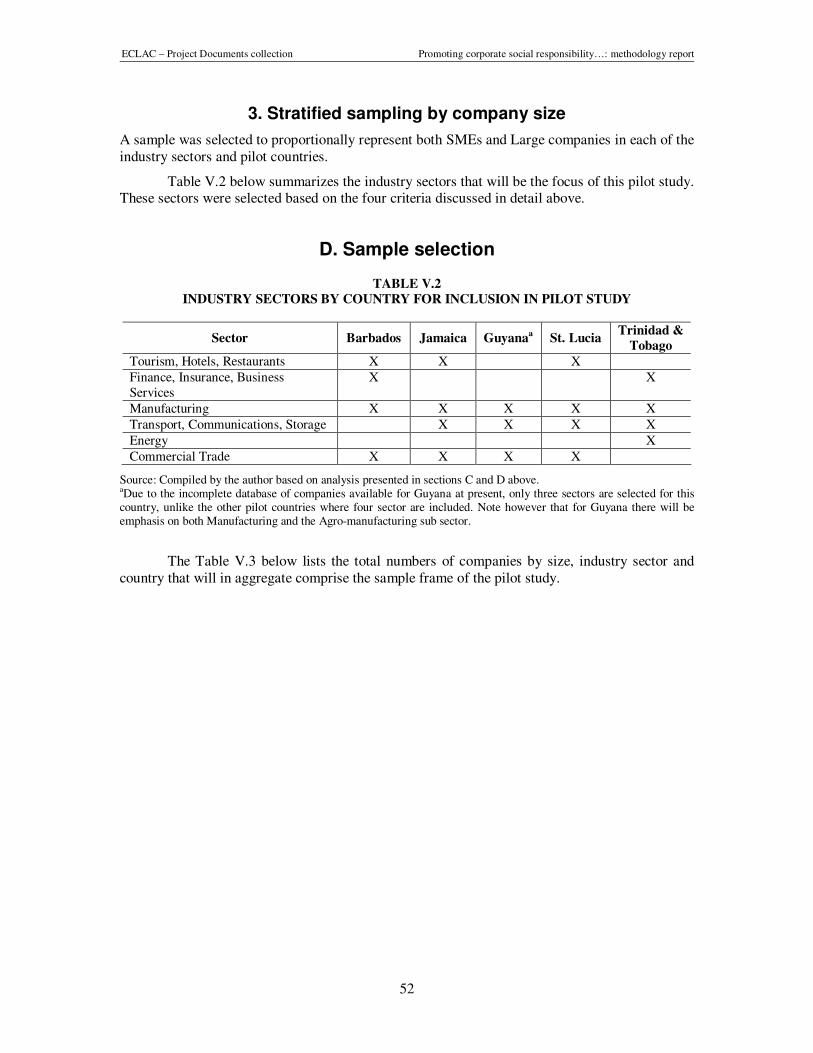
ECLAC – Project Documents collection Promoting corporate social responsibility…: methodology report
52
3. Stratified sampling by company size
A sample was selected to proportionally represent both SMEs and Large companies in each of the industry sectors and pilot countries.
Table V.2 below summarizes the industry sectors that will be the focus of this pilot study. These sectors were selected based on the four criteria discussed in detail above.
D. Sample selection
TABLE V.2
INDUSTRY SECTORS BY COUNTRY FOR INCLUSION IN PILOT STUDY
Sector Barbados Jamaica Guyanaa
St. Lucia Trinidad &
Tobago
Tourism, Hotels, Restaurants X X X
Finance, Insurance, Business Services
X X
Manufacturing X X X X X
Transport, Communications, Storage X X X X
Energy X
Commercial Trade X X X X
Source: Compiled by the author based on analysis presented in sections C and D above. aDue to the incomplete database of companies available for Guyana at present, only three sectors are selected for this country, unlike the other pilot countries where four sector are included. Note however that for Guyana there will be emphasis on both Manufacturing and the Agro-manufacturing sub sector.
The Table V.3 below lists the total numbers of companies by size, industry sector and country that will in aggregate comprise the sample frame of the pilot study.
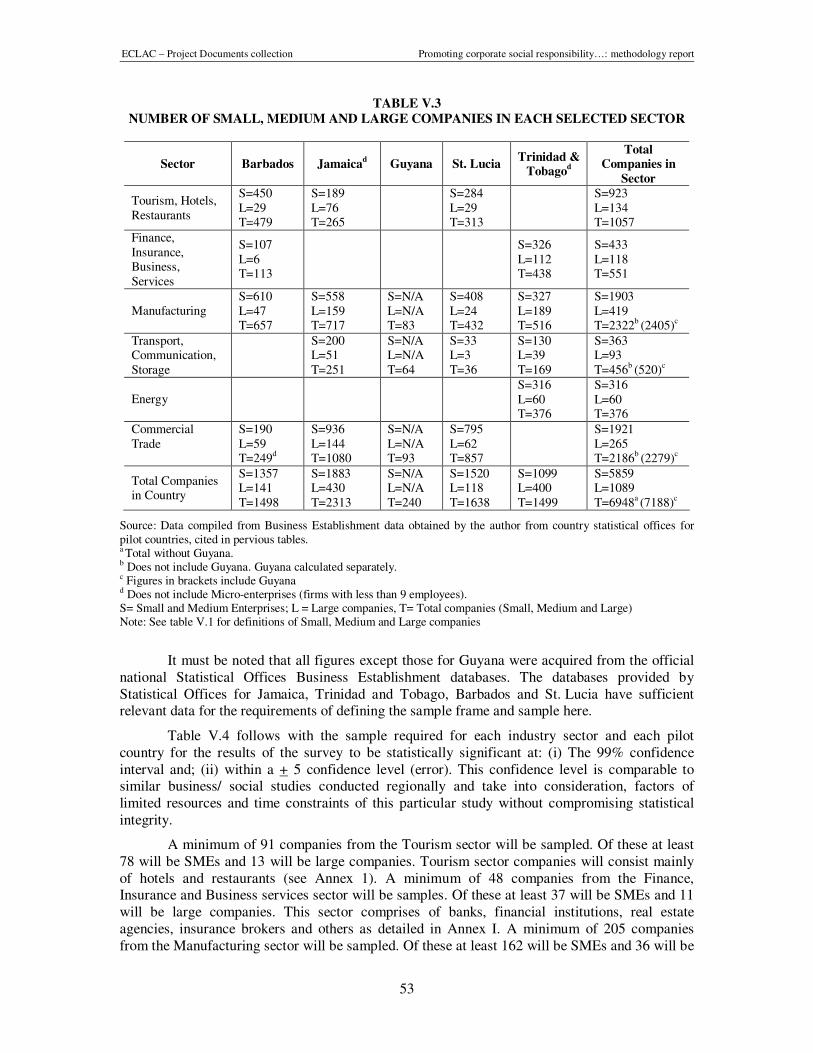
ECLAC – Project Documents collection Promoting corporate social responsibility…: methodology report
53
TABLE V.3
NUMBER OF SMALL, MEDIUM AND LARGE COMPANIES IN EACH SELECTED SECTOR
Sector Barbados Jamaicad
Guyana St. Lucia Trinidad &
Tobagod
Total Companies in
Sector
Tourism, Hotels, Restaurants
S=450 L=29 T=479
S=189 L=76 T=265
S=284 L=29 T=313
S=923 L=134 T=1057
Finance, Insurance, Business, Services
S=107 L=6 T=113
S=326 L=112 T=438
S=433 L=118 T=551
Manufacturing S=610 L=47 T=657
S=558 L=159 T=717
S=N/A L=N/A T=83
S=408 L=24 T=432
S=327 L=189 T=516
S=1903 L=419 T=2322
b (2405)
c
Transport, Communication, Storage
S=200 L=51 T=251
S=N/A L=N/A T=64
S=33 L=3 T=36
S=130 L=39 T=169
S=363 L=93 T=456
b (520)
c
Energy S=316 L=60 T=376
S=316 L=60 T=376
Commercial Trade
S=190 L=59 T=249
d
S=936 L=144 T=1080
S=N/A L=N/A T=93
S=795 L=62 T=857
S=1921 L=265 T=2186
b (2279)
c
Total Companies in Country
S=1357 L=141 T=1498
S=1883 L=430 T=2313
S=N/A L=N/A T=240
S=1520 L=118 T=1638
S=1099 L=400 T=1499
S=5859 L=1089 T=6948
a (7188)
c
Source: Data compiled from Business Establishment data obtained by the author from country statistical offices for pilot countries, cited in pervious tables. a Total without Guyana. b Does not include Guyana. Guyana calculated separately. c Figures in brackets include Guyana d Does not include Micro-enterprises (firms with less than 9 employees). S= Small and Medium Enterprises; L = Large companies, T= Total companies (Small, Medium and Large) Note: See table V.1 for definitions of Small, Medium and Large companies
It must be noted that all figures except those for Guyana were acquired from the official national Statistical Offices Business Establishment databases. The databases provided by Statistical Offices for Jamaica, Trinidad and Tobago, Barbados and St. Lucia have sufficient relevant data for the requirements of defining the sample frame and sample here.
Table V.4 follows with the sample required for each industry sector and each pilot country for the results of the survey to be statistically significant at: (i) The 99% confidence interval and; (ii) within a + 5 confidence level (error). This confidence level is comparable to similar business/ social studies conducted regionally and take into consideration, factors of limited resources and time constraints of this particular study without compromising statistical integrity.
A minimum of 91 companies from the Tourism sector will be sampled. Of these at least 78 will be SMEs and 13 will be large companies. Tourism sector companies will consist mainly of hotels and restaurants (see Annex 1). A minimum of 48 companies from the Finance, Insurance and Business services sector will be samples. Of these at least 37 will be SMEs and 11 will be large companies. This sector comprises of banks, financial institutions, real estate agencies, insurance brokers and others as detailed in Annex I. A minimum of 205 companies from the Manufacturing sector will be sampled. Of these at least 162 will be SMEs and 36 will be
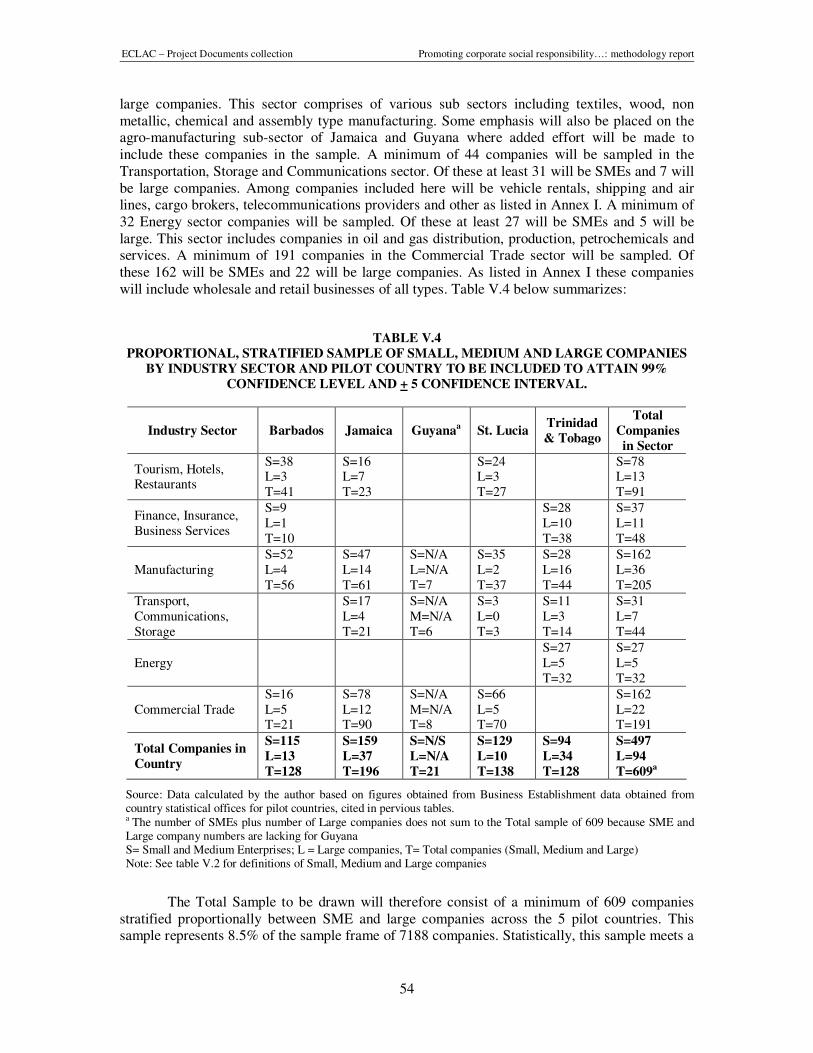
ECLAC – Project Documents collection Promoting corporate social responsibility…: methodology report
54
large companies. This sector comprises of various sub sectors including textiles, wood, non metallic, chemical and assembly type manufacturing. Some emphasis will also be placed on the agro-manufacturing sub-sector of Jamaica and Guyana where added effort will be made to include these companies in the sample. A minimum of 44 companies will be sampled in the Transportation, Storage and Communications sector. Of these at least 31 will be SMEs and 7 will be large companies. Among companies included here will be vehicle rentals, shipping and air lines, cargo brokers, telecommunications providers and other as listed in Annex I. A minimum of 32 Energy sector companies will be sampled. Of these at least 27 will be SMEs and 5 will be large. This sector includes companies in oil and gas distribution, production, petrochemicals and services. A minimum of 191 companies in the Commercial Trade sector will be sampled. Of these 162 will be SMEs and 22 will be large companies. As listed in Annex I these companies will include wholesale and retail businesses of all types. Table V.4 below summarizes:
TABLE V.4
PROPORTIONAL, STRATIFIED SAMPLE OF SMALL, MEDIUM AND LARGE COMPANIES
BY INDUSTRY SECTOR AND PILOT COUNTRY TO BE INCLUDED TO ATTAIN 99%
CONFIDENCE LEVEL AND + 5 CONFIDENCE INTERVAL.
Industry Sector Barbados Jamaica Guyanaa
St. Lucia Trinidad
& Tobago
Total
Companies
in Sector
Tourism, Hotels, Restaurants
S=38 L=3 T=41
S=16 L=7 T=23
S=24 L=3 T=27
S=78 L=13 T=91
Finance, Insurance, Business Services
S=9 L=1 T=10
S=28 L=10 T=38
S=37 L=11 T=48
Manufacturing S=52 L=4 T=56
S=47 L=14 T=61
S=N/A L=N/A T=7
S=35 L=2 T=37
S=28 L=16 T=44
S=162 L=36 T=205
Transport, Communications, Storage
S=17 L=4 T=21
S=N/A M=N/A T=6
S=3 L=0 T=3
S=11 L=3 T=14
S=31 L=7 T=44
Energy S=27 L=5 T=32
S=27 L=5 T=32
Commercial Trade S=16 L=5 T=21
S=78 L=12 T=90
S=N/A M=N/A T=8
S=66 L=5 T=70
S=162 L=22 T=191
Total Companies in
Country
S=115
L=13
T=128
S=159
L=37
T=196
S=N/S
L=N/A
T=21
S=129
L=10
T=138
S=94
L=34
T=128
S=497
L=94
T=609a
Source: Data calculated by the author based on figures obtained from Business Establishment data obtained from country statistical offices for pilot countries, cited in pervious tables. a The number of SMEs plus number of Large companies does not sum to the Total sample of 609 because SME and Large company numbers are lacking for Guyana S= Small and Medium Enterprises; L = Large companies, T= Total companies (Small, Medium and Large) Note: See table V.2 for definitions of Small, Medium and Large companies
The Total Sample to be drawn will therefore consist of a minimum of 609 companies stratified proportionally between SME and large companies across the 5 pilot countries. This sample represents 8.5% of the sample frame of 7188 companies. Statistically, this sample meets a

ECLAC – Project Documents collection Promoting corporate social responsibility…: methodology report
55
99% Confidence Level and +5% Confidence Interval. It should be noted that similar surveys, especially those collecting social science data require at least a 95% confidence Level and +5% Confidence Interval (error). If the latter confidence level is required then a sample of only 365 companies is required. Hence, the Sample size set out in this study and detailed in Table V.4 goes beyond that minimum guideline. The sample selected effectively ensures that all 5 pilot countries and 6 industry sectors are equitably included.

ECLAC – Project Documents collection Promoting corporate social responsibility…: methodology report
57
VI. Survey Design
Data in this study will be collected by cross sectional survey method. To undertake the survey an original questionnaire will be designed to gather data on CSR variables of interest.
A. Questionnaire format
The questionnaire is based on four essential dimensions to achieve CSR goals. These elements are human rights, labor, environment and anti-corruption. The questionnaire is divided into three main sections:
a) Company Profile
This section of the questionnaire is designed to gather general information about the company’s economic and business activities, interests, corporate structure, size and ownership. It provides researchers with a context from which to understand more detailed CSR related data collected later in the questionnaire.
b) CSR Profile
This section of the questionnaire is designed to gather an understanding of the level of awareness of CSR in general within the company and how aware the company is on broad elements of environment, anti-corruption, labor and human rights. This section therefore sets the stage for more detailed questions in later sections.
c) CSR Activities
The CSR Activities section of the questionnaire is further divided into three sections internal, external or environmental as follows:
i) Internal responsibility refers to socially responsible behavior as it relates to workers and suppliers. It is expressed in concern for the health and well being of the workers, their training and participation in the business, equality of opportunities, work-family relationship, and internal control of corrupt practices.
Included here is CSR with respect to labor which can be described as a firm's commitment to realize the necessary actions and policies to the greatest extent in
ECLAC – Project Documents collection Promoting corporate social responsibility…: methodology report
58
order to achieve the objectives of creating more and better employment, reducing informality, fighting against child labor, promoting youth employment, extending and improving the coverage of social protection, fostering labor capacity-building and education, reinforcing productivity and competitiveness, strengthening labor rights, inclusion and socioeconomic development of surroundings and the personal and professional growth of the employees.
ii) External responsibility is defined as support for social and cultural community activities as well as community related development.
iii) Environmental responsibility covers activities geared towards the reduction of the environmental impact of their operations including such issues as reducing waste and consumption of natural resources, recycling and implementing environmental management systems.
B. Questionnaire administration
For the sectors identified in the pilot countries, the business establishment database will be obtained from the respective National Statistical Offices. These databases should contain listings of establishments in the sectors of interest. The list will be computer randomized and starting from the top of the randomized list, firms will be contacted to respond to the survey. The researcher stops contacting firms on the list when the desired number of firms, as specified for the sample, is met. This process is done for each industry sector as identified for each pilot country. The assistance of in-country project partners will be solicited to assist in identification of respondents and completion of the survey.
All questionnaire instruments were designed following Dillman’s Total Design Methods to maximize response rates (Dillman, 1978). Questionnaires are designed to be applied in face to face interviews with respondents. Before meeting for in person interviews, the questionnaire will be mailed out to target respondents – CEOs/ top managers for their perusal. This mechanism will allow respondents the opportunity to consult with their internal staff and specialists before the interview. This method should enhance the accuracy of responses.
Interviewers/ researchers will seek the participation in the survey from Company CEOs or other top level executives in charge of CSR programs. Interviews will be limited to one representative per company although it is expected that the representative in question, such as the CEO, may request information from line managers in order to provide the necessary details required in the questionnaire. UNECLAC will undertake a pilot survey after which adjustments will be made accordingly to the attached draft questionnaire. The estimated time required for completion of the questionnaire is 30 minutes. Information obtained through the survey process will be strictly confidential and this confidentiality will be emphasized to respondents at the beginning of questioning.
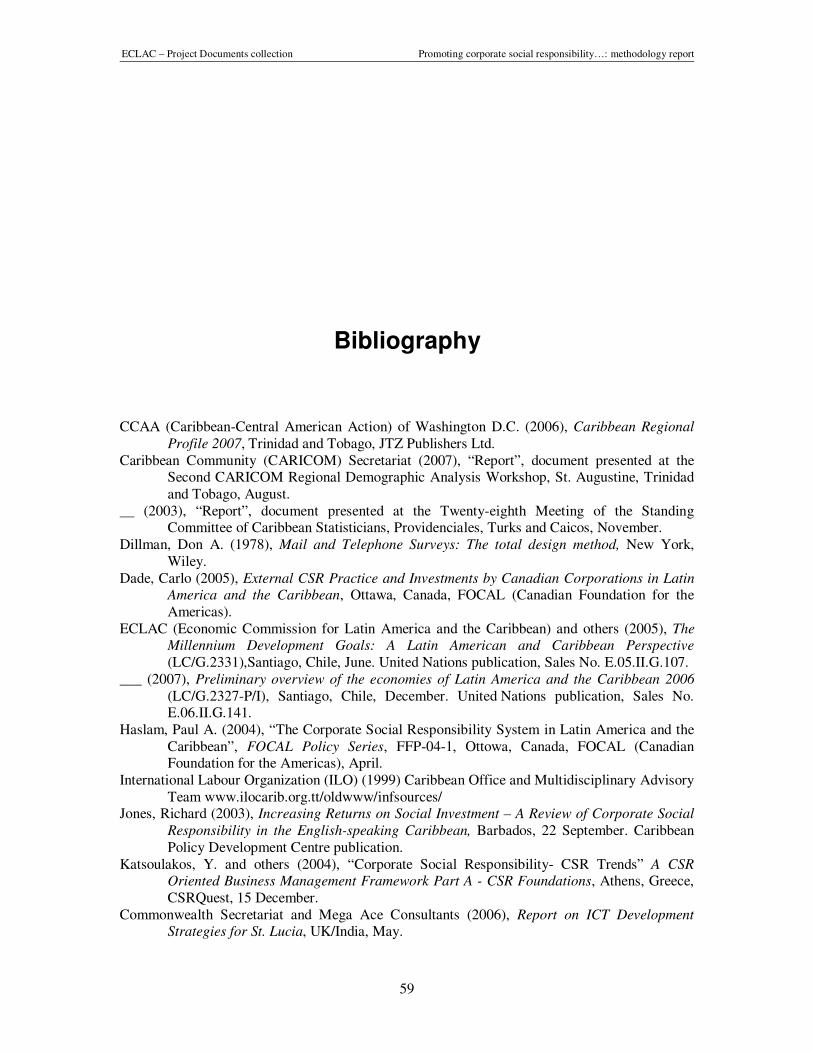
ECLAC – Project Documents collection Promoting corporate social responsibility…: methodology report
59
Bibliography
CCAA (Caribbean-Central American Action) of Washington D.C. (2006), Caribbean Regional Profile 2007, Trinidad and Tobago, JTZ Publishers Ltd.
Caribbean Community (CARICOM) Secretariat (2007), “Report”, document presented at the Second CARICOM Regional Demographic Analysis Workshop, St. Augustine, Trinidad and Tobago, August.
__ (2003), “Report”, document presented at the Twenty-eighth Meeting of the Standing Committee of Caribbean Statisticians, Providenciales, Turks and Caicos, November.
Dillman, Don A. (1978), Mail and Telephone Surveys: The total design method, New York, Wiley.
Dade, Carlo (2005), External CSR Practice and Investments by Canadian Corporations in Latin America and the Caribbean, Ottawa, Canada, FOCAL (Canadian Foundation for the Americas).
ECLAC (Economic Commission for Latin America and the Caribbean) and others (2005), The Millennium Development Goals: A Latin American and Caribbean Perspective (LC/G.2331),Santiago, Chile, June. United Nations publication, Sales No. E.05.II.G.107.
___ (2007), Preliminary overview of the economies of Latin America and the Caribbean 2006 (LC/G.2327-P/I), Santiago, Chile, December. United Nations publication, Sales No. E.06.II.G.141.
Haslam, Paul A. (2004), “The Corporate Social Responsibility System in Latin America and the Caribbean”, FOCAL Policy Series, FFP-04-1, Ottowa, Canada, FOCAL (Canadian Foundation for the Americas), April.
International Labour Organization (ILO) (1999) Caribbean Office and Multidisciplinary Advisory Team www.ilocarib.org.tt/oldwww/infsources/
Jones, Richard (2003), Increasing Returns on Social Investment – A Review of Corporate Social Responsibility in the English-speaking Caribbean, Barbados, 22 September. Caribbean Policy Development Centre publication.
Katsoulakos, Y. and others (2004), “Corporate Social Responsibility- CSR Trends” A CSR Oriented Business Management Framework Part A - CSR Foundations, Athens, Greece, CSRQuest, 15 December.
Commonwealth Secretariat and Mega Ace Consultants (2006), Report on ICT Development Strategies for St. Lucia, UK/India, May.
ECLAC – Project Documents collection Promoting corporate social responsibility…: methodology report
60
Ministry of Labor, Human Services and Social Security, Labor Market Information Unit (2007), Guyana National Employment Report 2006, Stabroek, Georgetown, June.
National Statistics Department (2007), National Statistics [online], Castries, St. Lucia <http://www.stats.gov.lc.>.
Shah, Kalim U. (2007), “Strategic and Organizational Determinants of Corporate Environmental Responsibility in Emerging Economies: The Oil, Gas and Chemical Sectors of Trinidad and Tobago”, doctoral thesis, Fairfax, Virgina, George Mason University.
United Nations Department for Sustainable Development (2004), “Final Report”, document presented at the Regional Caribbean Workshop on National Sustainable Development Strategies and Indicators of Sustainable Development meeting, United Nations Department of Economic and Social Affairs, Castries, St. Lucia, January.
Vives, Antonio (Inter-American Development Bank), Antonio Corral (IKEI) and Iñigo Isusi (IKEI) (2005), Responsibilidad Social de la Empresa en los PyMEs de Latinoamérica, Washington, DC, Inter-American Development Bank.
Websites Referenced
Bank of Guyana (2007) [online], <http://www.bankofguyana.org.gy/>.
Bank of Jamaica (2007) [online], <www.boj.org.jm/>.
Barbados Statistical Services (2007) [online], <http://www.barbados.gov.bb/bgis.htm>.
Bureau of Statistics- Guyana (2007) [online], <www.statisticsguyana.gov.gy>.
Caribbean Community (CARICOM) Secretariat (2007) [online], <http://www.caricom.org>.
__ Statistics (2007) [online], <http://www.caricomstats.org/>.
Central Bank of Barbados (2007) [online], <http://www.centralbank.org.bb>.
Central Bank of Trinidad and Tobago (2007) [online], <http://www.central-bank.org.tt/>.
Central Statistical Office-Trinidad and Tobago (2007) [online], <http://www.cso.gov.tt/>.
Eastern Caribbean Central Bank (2007) [online], <http://www.eccb-centralbank.org>.
Guyana Office of Investment; GO-Invest (2007) [online], <http://www.goinvest.gov.gy/>.
Statistical Institute of Jamaica (2007) [online], <http://www.statinja.com/>.
St. Lucia’s Official Statistics (2007) [online], <http://www.stats.gov.lc>.

ECLAC – Project Documents collection Promoting corporate social responsibility…: methodology report
61
Annexes
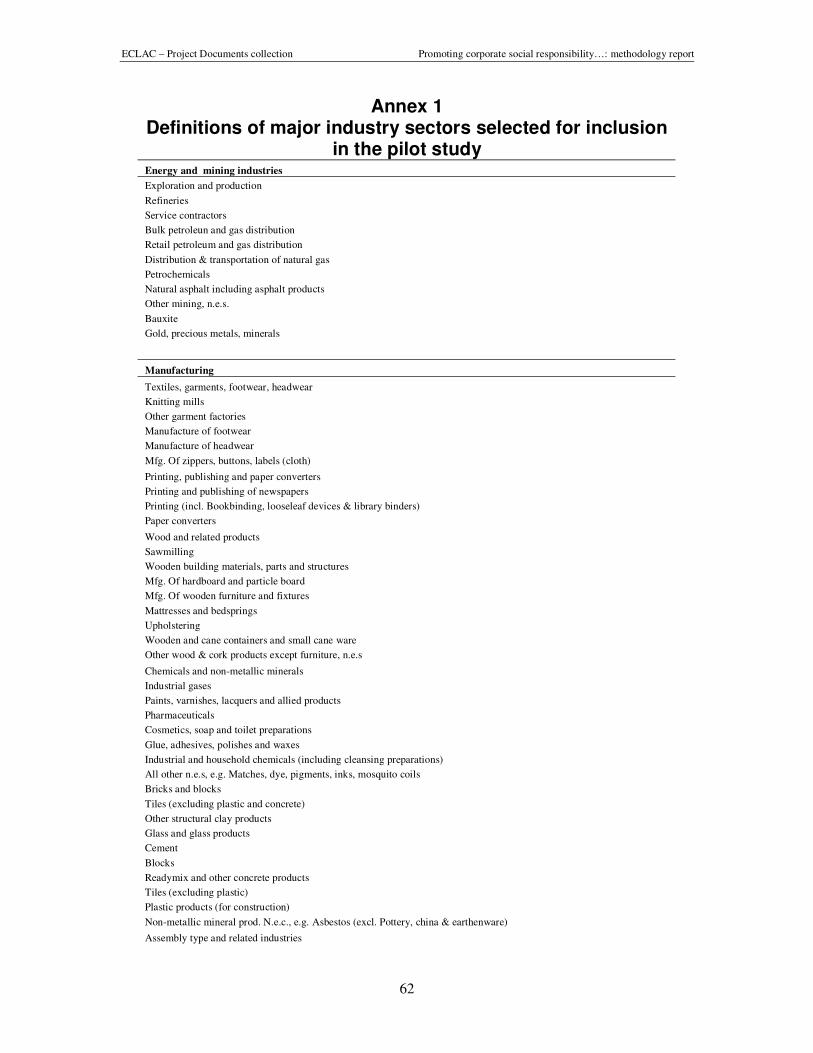
ECLAC – Project Documents collection Promoting corporate social responsibility…: methodology report
62
Annex 1 Definitions of major industry sectors selected for inclusion
in the pilot study Energy and mining industries
Exploration and production
Refineries
Service contractors
Bulk petroleun and gas distribution
Retail petroleum and gas distribution
Distribution & transportation of natural gas
Petrochemicals
Natural asphalt including asphalt products
Other mining, n.e.s.
Bauxite
Gold, precious metals, minerals
Manufacturing
Textiles, garments, footwear, headwear
Knitting mills
Other garment factories
Manufacture of footwear
Manufacture of headwear
Mfg. Of zippers, buttons, labels (cloth)
Printing, publishing and paper converters
Printing and publishing of newspapers
Printing (incl. Bookbinding, looseleaf devices & library binders)
Paper converters
Wood and related products
Sawmilling
Wooden building materials, parts and structures
Mfg. Of hardboard and particle board
Mfg. Of wooden furniture and fixtures
Mattresses and bedsprings
Upholstering
Wooden and cane containers and small cane ware
Other wood & cork products except furniture, n.e.s
Chemicals and non-metallic minerals
Industrial gases
Paints, varnishes, lacquers and allied products
Pharmaceuticals
Cosmetics, soap and toilet preparations
Glue, adhesives, polishes and waxes
Industrial and household chemicals (including cleansing preparations)
All other n.e.s, e.g. Matches, dye, pigments, inks, mosquito coils
Bricks and blocks
Tiles (excluding plastic and concrete)
Other structural clay products
Glass and glass products
Cement
Blocks
Readymix and other concrete products
Tiles (excluding plastic)
Plastic products (for construction)
Non-metallic mineral prod. N.e.c., e.g. Asbestos (excl. Pottery, china & earthenware)
Assembly type and related industries
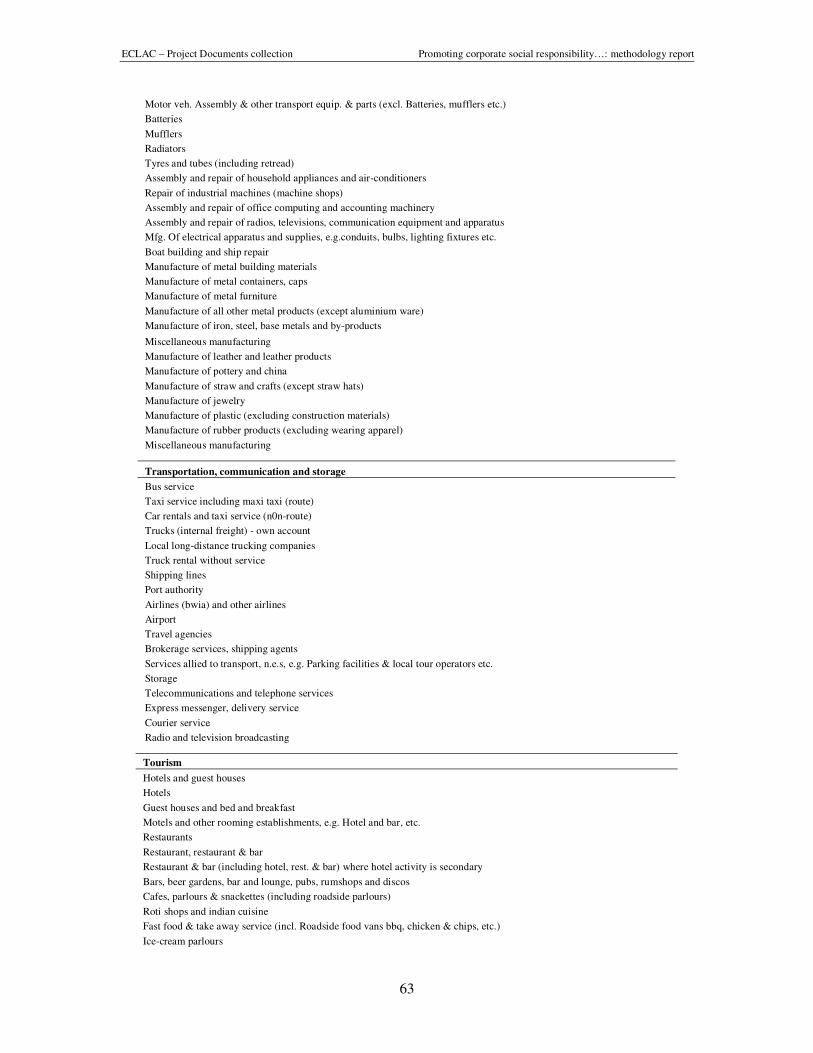
ECLAC – Project Documents collection Promoting corporate social responsibility…: methodology report
63
Motor veh. Assembly & other transport equip. & parts (excl. Batteries, mufflers etc.)
Batteries
Mufflers
Radiators
Tyres and tubes (including retread)
Assembly and repair of household appliances and air-conditioners
Repair of industrial machines (machine shops)
Assembly and repair of office computing and accounting machinery
Assembly and repair of radios, televisions, communication equipment and apparatus
Mfg. Of electrical apparatus and supplies, e.g.conduits, bulbs, lighting fixtures etc.
Boat building and ship repair
Manufacture of metal building materials
Manufacture of metal containers, caps
Manufacture of metal furniture
Manufacture of all other metal products (except aluminium ware)
Manufacture of iron, steel, base metals and by-products
Miscellaneous manufacturing
Manufacture of leather and leather products
Manufacture of pottery and china
Manufacture of straw and crafts (except straw hats)
Manufacture of jewelry
Manufacture of plastic (excluding construction materials)
Manufacture of rubber products (excluding wearing apparel)
Miscellaneous manufacturing
Transportation, communication and storage
Bus service
Taxi service including maxi taxi (route)
Car rentals and taxi service (n0n-route)
Trucks (internal freight) - own account
Local long-distance trucking companies
Truck rental without service
Shipping lines
Port authority
Airlines (bwia) and other airlines
Airport
Travel agencies
Brokerage services, shipping agents
Services allied to transport, n.e.s, e.g. Parking facilities & local tour operators etc.
Storage
Telecommunications and telephone services
Express messenger, delivery service
Courier service
Radio and television broadcasting
Tourism
Hotels and guest houses
Hotels
Guest houses and bed and breakfast
Motels and other rooming establishments, e.g. Hotel and bar, etc.
Restaurants
Restaurant, restaurant & bar
Restaurant & bar (including hotel, rest. & bar) where hotel activity is secondary
Bars, beer gardens, bar and lounge, pubs, rumshops and discos
Cafes, parlours & snackettes (including roadside parlours)
Roti shops and indian cuisine
Fast food & take away service (incl. Roadside food vans bbq, chicken & chips, etc.)
Ice-cream parlours
ECLAC – Project Documents collection Promoting corporate social responsibility…: methodology report
64
Caterers and large scale (institutional) food preparation
Restaurant, restaurant & bar
Restaurant & bar (including hotel, rest. & bar) where hotel activity is secondary
Bars, beer gardens, bar and lounge, pubs, rumshops and discos
Cafes, parlours & snackettes (including roadside parlours)
Fast food & take away service (incl. Roadside food vans bbq, chicken & chips, etc.)
Ice-cream parlours
Commercial trade/ distribution
Wholesale trade - commission agents, ship chandlers, mfg's representative, etc.
Wholesale trade - food, drink and tobacco
Wholesale trade - construction materials and hardware
Wholesale trade - household appliances, furniture and other furnishings
Wholesale trade - textiles and wearing apparel
Wholesale trade - machinery and equipment
Wholesale trade - chemicals, pharmaceuticals (including cosmetics)
Wholesale trade - other n.e.s.
Retail trade - department, dry goods store
Retail trade - grain and prepared animal feeds
Retail trade - supermarkets, groceries, provision shops, liquor shops
Retail trade - construction materials and hardware
Retail trade - household appliances, furniture and other furnishings
Retail trade - textiles and wearing apparel
Retail trade - machinery & non-transport equipment excluding computer & computer accessories
Retail trade - transport vehicles & equipment (including parts & accessories)
Retail trade - pharmaceuticals, cosmetics and chemicals
Retail trade - books and stationery
Retail trade - jewelry
Retail trade - other n.e.s.
Retail trade - rental of household and personal goods
Retail trade- computer, computer accessories and computer software
Caterers and large scale (institutional) food preparation
Any other retail sales of food and drinks, n.e.s.
Finance, insurance and business services
Central bank
Commercial banks, merchant banks
Finance companies
Trust companies and mortgage finance companies
Development banks
Thrift and other financial institutions, credit unions
Financial services, n.e.s.
Insurance
Real estate (excluding dwelling services)
Legal services
Accountants, actuaries, actuarial scientists, tax consultants
Architects, quantity surveyors
Engineers
Data processing, etc.
Advertising
Miscellaneous business services, e.g. Publishers' representatives, screen printing
Machinery and equipment rental
National insurance board
Investment (holding) companies
Source: Compiled from Business Establishment Definitions as listed by Country Statistical Offices of Barbados, Jamaica, Trinidad Tobago and St. Lucia
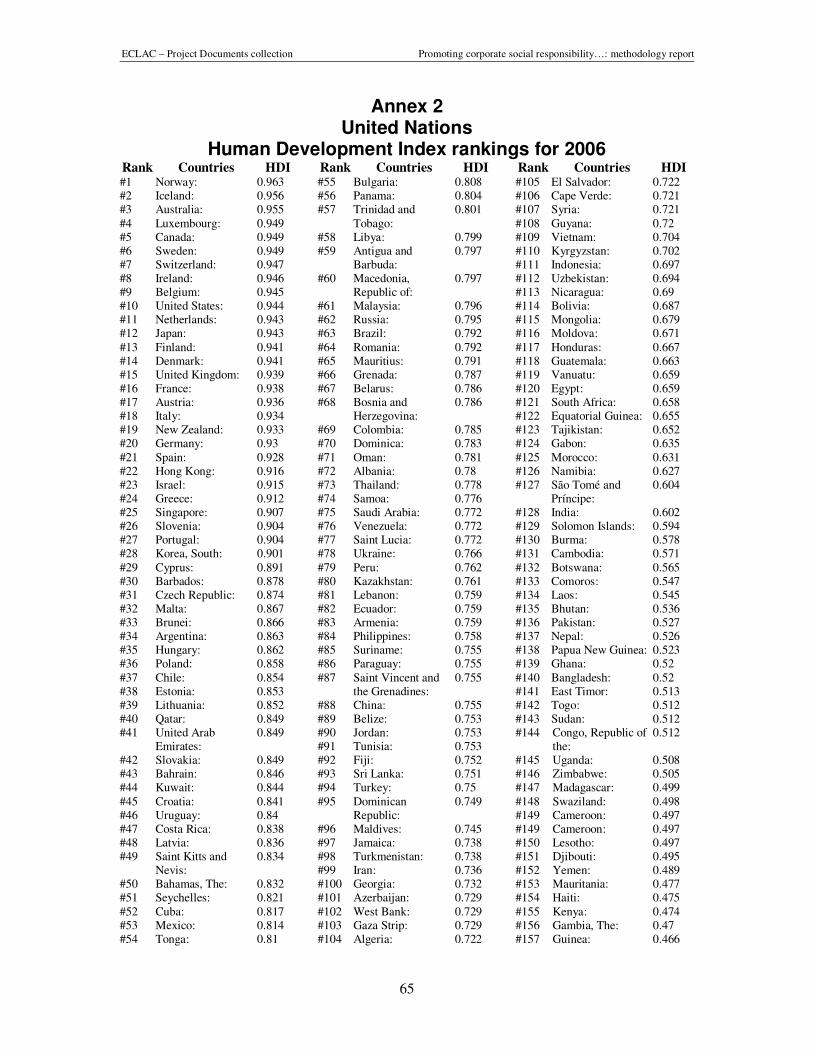
ECLAC – Project Documents collection Promoting corporate social responsibility…: methodology report
65
Annex 2 United Nations
Human Development Index rankings for 2006 Rank Countries HDI #1 Norway: 0.963 #2 Iceland: 0.956 #3 Australia: 0.955 #4 Luxembourg: 0.949 #5 Canada: 0.949 #6 Sweden: 0.949 #7 Switzerland: 0.947 #8 Ireland: 0.946 #9 Belgium: 0.945 #10 United States: 0.944 #11 Netherlands: 0.943 #12 Japan: 0.943 #13 Finland: 0.941 #14 Denmark: 0.941 #15 United Kingdom: 0.939 #16 France: 0.938 #17 Austria: 0.936 #18 Italy: 0.934 #19 New Zealand: 0.933 #20 Germany: 0.93 #21 Spain: 0.928 #22 Hong Kong: 0.916 #23 Israel: 0.915 #24 Greece: 0.912 #25 Singapore: 0.907 #26 Slovenia: 0.904 #27 Portugal: 0.904 #28 Korea, South: 0.901 #29 Cyprus: 0.891 #30 Barbados: 0.878 #31 Czech Republic: 0.874 #32 Malta: 0.867 #33 Brunei: 0.866 #34 Argentina: 0.863 #35 Hungary: 0.862 #36 Poland: 0.858 #37 Chile: 0.854 #38 Estonia: 0.853 #39 Lithuania: 0.852 #40 Qatar: 0.849 #41 United Arab
Emirates: 0.849
#42 Slovakia: 0.849 #43 Bahrain: 0.846 #44 Kuwait: 0.844 #45 Croatia: 0.841 #46 Uruguay: 0.84 #47 Costa Rica: 0.838 #48 Latvia: 0.836 #49 Saint Kitts and
Nevis: 0.834
#50 Bahamas, The: 0.832 #51 Seychelles: 0.821 #52 Cuba: 0.817 #53 Mexico: 0.814 #54 Tonga: 0.81
Rank Countries HDI #55 Bulgaria: 0.808 #56 Panama: 0.804 #57 Trinidad and
Tobago: 0.801
#58 Libya: 0.799 #59 Antigua and
Barbuda: 0.797
#60 Macedonia, Republic of:
0.797
#61 Malaysia: 0.796 #62 Russia: 0.795 #63 Brazil: 0.792 #64 Romania: 0.792 #65 Mauritius: 0.791 #66 Grenada: 0.787 #67 Belarus: 0.786 #68 Bosnia and
Herzegovina: 0.786
#69 Colombia: 0.785 #70 Dominica: 0.783 #71 Oman: 0.781 #72 Albania: 0.78 #73 Thailand: 0.778 #74 Samoa: 0.776 #75 Saudi Arabia: 0.772 #76 Venezuela: 0.772 #77 Saint Lucia: 0.772 #78 Ukraine: 0.766 #79 Peru: 0.762 #80 Kazakhstan: 0.761 #81 Lebanon: 0.759 #82 Ecuador: 0.759 #83 Armenia: 0.759 #84 Philippines: 0.758 #85 Suriname: 0.755 #86 Paraguay: 0.755 #87 Saint Vincent and
the Grenadines: 0.755
#88 China: 0.755 #89 Belize: 0.753 #90 Jordan: 0.753 #91 Tunisia: 0.753 #92 Fiji: 0.752 #93 Sri Lanka: 0.751 #94 Turkey: 0.75 #95 Dominican
Republic: 0.749
#96 Maldives: 0.745 #97 Jamaica: 0.738 #98 Turkmenistan: 0.738 #99 Iran: 0.736 #100 Georgia: 0.732 #101 Azerbaijan: 0.729 #102 West Bank: 0.729 #103 Gaza Strip: 0.729 #104 Algeria: 0.722
Rank Countries HDI #105 El Salvador: 0.722 #106 Cape Verde: 0.721 #107 Syria: 0.721 #108 Guyana: 0.72 #109 Vietnam: 0.704 #110 Kyrgyzstan: 0.702 #111 Indonesia: 0.697 #112 Uzbekistan: 0.694 #113 Nicaragua: 0.69 #114 Bolivia: 0.687 #115 Mongolia: 0.679 #116 Moldova: 0.671 #117 Honduras: 0.667 #118 Guatemala: 0.663 #119 Vanuatu: 0.659 #120 Egypt: 0.659 #121 South Africa: 0.658 #122 Equatorial Guinea: 0.655 #123 Tajikistan: 0.652 #124 Gabon: 0.635 #125 Morocco: 0.631 #126 Namibia: 0.627 #127 São Tomé and
Príncipe: 0.604
#128 India: 0.602 #129 Solomon Islands: 0.594 #130 Burma: 0.578 #131 Cambodia: 0.571 #132 Botswana: 0.565 #133 Comoros: 0.547 #134 Laos: 0.545 #135 Bhutan: 0.536 #136 Pakistan: 0.527 #137 Nepal: 0.526 #138 Papua New Guinea: 0.523 #139 Ghana: 0.52 #140 Bangladesh: 0.52 #141 East Timor: 0.513 #142 Togo: 0.512 #143 Sudan: 0.512 #144 Congo, Republic of
the: 0.512
#145 Uganda: 0.508 #146 Zimbabwe: 0.505 #147 Madagascar: 0.499 #148 Swaziland: 0.498 #149 Cameroon: 0.497 #149 Cameroon: 0.497 #150 Lesotho: 0.497 #151 Djibouti: 0.495 #152 Yemen: 0.489 #153 Mauritania: 0.477 #154 Haiti: 0.475 #155 Kenya: 0.474 #156 Gambia, The: 0.47 #157 Guinea: 0.466
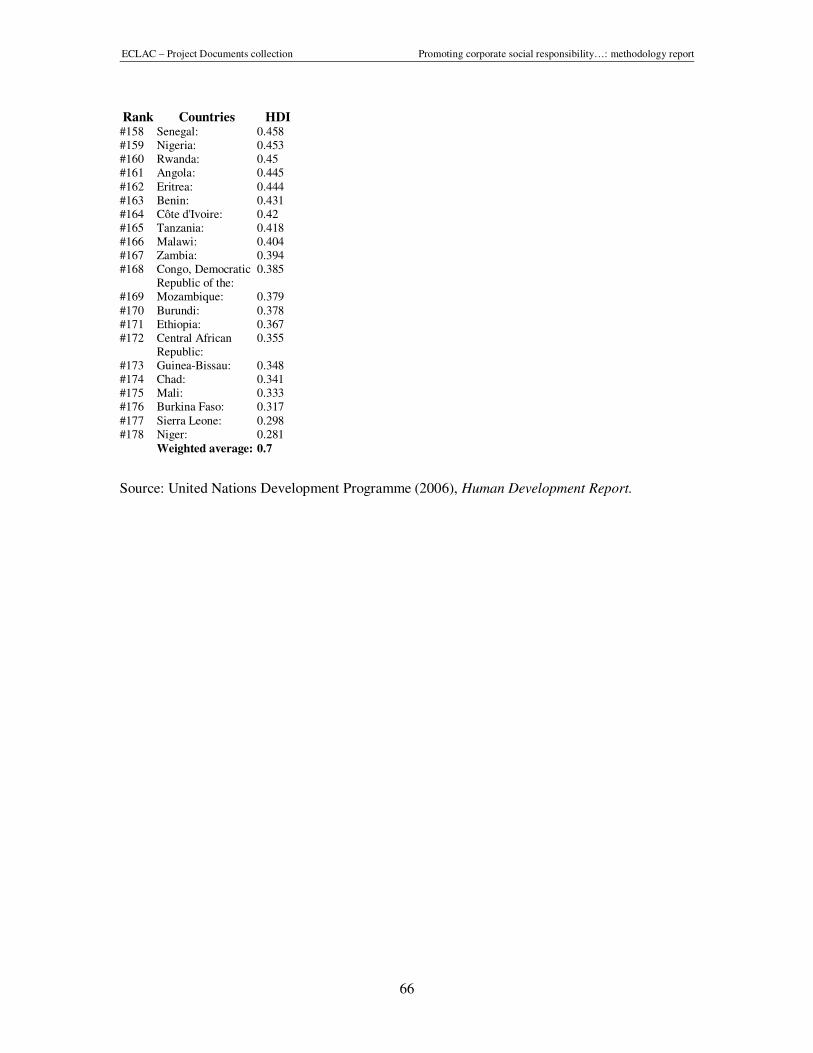
ECLAC – Project Documents collection Promoting corporate social responsibility…: methodology report
66
Rank Countries HDI #158 Senegal: 0.458 #159 Nigeria: 0.453 #160 Rwanda: 0.45 #161 Angola: 0.445 #162 Eritrea: 0.444 #163 Benin: 0.431 #164 Côte d'Ivoire: 0.42 #165 Tanzania: 0.418 #166 Malawi: 0.404 #167 Zambia: 0.394 #168 Congo, Democratic
Republic of the: 0.385
#169 Mozambique: 0.379 #170 Burundi: 0.378 #171 Ethiopia: 0.367 #172 Central African
Republic: 0.355
#173 Guinea-Bissau: 0.348 #174 Chad: 0.341 #175 Mali: 0.333 #176 Burkina Faso: 0.317 #177 Sierra Leone: 0.298 #178 Niger: 0.281 Weighted average: 0.7
Source: United Nations Development Programme (2006), Human Development Report.